Table of Contents
UNITED STATES
SECURITIES AND EXCHANGE COMMISSION
Washington, D.C. 20549
FORM N-CSR
CERTIFIED SHAREHOLDER REPORT OF REGISTERED
MANAGEMENT INVESTMENT COMPANIES
Investment Company Act file number: 811-08194
FINANCIAL INVESTORS TRUST
(Exact name of Registrant as specified in charter)
1290 Broadway, Suite 1100, Denver, Colorado 80203
(Address of principal executive offices) (Zip code)
JoEllen L. Legg, Esq., Secretary
Financial Investors Trust
1290 Broadway, Suite 1100
Denver, Colorado 80203
(Name and address of agent for service)
Registrant’s telephone number, including area code: 303-623-2577
Date of fiscal year end: April 30
Date of reporting period: May 1, 2015 – October 31, 2015
Table of Contents
Item 1. Reports to Stockholders.
Table of Contents
Table of Contents
| TABLE OF CONTENTS |
|
| PAGE | ||||
| 1 | ||||
| 4 | ||||
| 5 | ||||
| 7 | ||||
| 8 | ||||
| 9 | ||||
| 10 | ||||
| 12 | ||||
| 19 | ||||
Table of Contents
| Aspen Managed Futures Strategy Fund | Manager Commentary | |
October 31, 2015 (Unaudited)
|
October 31, 2015
Performance Results
For the six-month period ending October 31, 2015, the Class I shares of the Aspen Managed Futures Strategy Fund (the “Fund”) posted a loss of 4.88%. Per its mandate, the Fund maintained very tight correlation1 to the Aspen Managed Futures Beta Index (“Aspen MFBI” or the “Index”)2. The Index uses a combination of trend and counter-trend algorithms to determine exposures to 23 futures markets. In following the Index, the Fund can take long or short exposures to each of the eligible markets. A long position in a futures market will profit if the price of the futures contract rises, and a short position will profit if the price of the futures contract falls.
The Newedge CTA Index3, a managed futures benchmark, returned -3.57% in the same timeframe. Another benchmark, the BTOP50 Index4, returned -4.00%. It is important to note that there are substantive differences between the Fund and these indices in terms of construction. There were no significant changes to the Fund strategy during this period.
Explanation of Fund Performance
Despite qualms about Greek debt and conflicting signals from global central banks, the markets were relatively calm throughout the May-July period. The Fund produced a gain in May (+0.49%) and a loss in June (-1.66%).
Market volatility picked up somewhat more in July. Renewed downtrends in commodities and currencies led the fund to a positive return for the month (+1.99%). The commodity moves in particular were driven by concerns about economic growth in China, though in July those concerns had not yet spilled over into the global financial markets.
In August, slowing Chinese economic growth and a series of perplexing decisions by Chinese authorities did lead to declines in global financial markets, largely in a single burst toward the end of the month. At mid-month, the S&P 500 Index5 was within 1.3% of all-time highs, but a week later it had fallen by more than 10%--the first “correction” on that index in four years. The rapidity of the drawdown was such that the Aspen MFBI’s trend model was only very mildly short risk assets, insufficient to overcome losses incurred that week by the counter-trend model, exposure to which had been relatively high, due to the lack of elevated global risk indicators prior to the quick reversal. The Fund returned -4.00% for the month.
By early September, the Aspen MFBI had entered what we informally call “hedge mode” (mostly trend, very little counter-trend, with risk asset trends generally short across the spectrum). This enabled the fund to offset strongly the high volatility experienced by risk assets over the course of the month. End-to-end, however, risk asset returns were only mildly negative, leading to a +1.02% return for the fund.
October returns (-2.72%) were negative, as risk assets staged a very strong rally. The S&P 500 Index, for example, was up 8.4% on a total return basis—that indicator’s best month in four years. By mid-month, the Fund had fully exited “hedge mode” and adopted an internally hedged portfolio that was producing a very low volatility profile as the calendar turned over to November.
Outlook
After a huge drop in September, stocks once again appear in vogue. In fact, seasonal factors favor stocks as we near the end of the year. However, the Federal Reserve (“FED”) has recently indicated that they will raise rates as early as December. Traditionally, bonds are held alongside stocks to add diversification and reduce volatility. The performance of fixed income positions during higher interest rate regimes is a subject of considerable interest from investors.
In our research, we define a rising (falling) rate regime as any period over which the most recent rate action on the Fed Funds target rate was an increase (or decrease). Since the Fed only changes its target rate on a periodic basis and because Fed funds rate changes tend to occur in series of multiple increases or decreases, these regimes can often last months or even years. As a result, if the Fed does raise rates, it is likely to continue in that direction for the foreseeable future.
We have also analyzed the returns of several asset classes during rising and falling regimes. As one might expect, we concluded that fixed income investments tend to perform much worse in a rising rate regime. Similarly Real Estate Investment Trusts, which are highly rate sensitive, also suffered during those periods. Gold returns typically dropped during periods of higher rates, which we think weakens the argument to hold the precious metal as an inflation hedge.
Conversely, we believe managed futures historically have performed better in a rising rate environment, both on an absolute and a risk-adjusted basis. The reason is likely related to increased market trendiness during periods of higher rates, which gives the asset class more opportunities for profit. In our view, domestic interest rates will eventually head higher. We believe that the return benefits of managing futures during periods of rising rates justify its inclusion in a thoughtfully diversified portfolio.
Sincerely,
Bryan R. Fisher
William Ware Bush
Aspen Partners Ltd.
| Semi-Annual Report | October 31, 2015 | 1 |
Table of Contents
| Aspen Managed Futures Strategy Fund | Manager Commentary | |
October 31, 2015 (Unaudited)
|
Performance data quoted represents past performance. Past performance does not guarantee future results. Investment return and principal value of an investment will fluctuate so that an investor’s shares, when sold or redeemed, may be worth more or less than the original cost. Current performance data may be higher or lower than actual data quoted. For the most current month-end performance data please call 1-855-845-9444.
The views of Aspen Partners, Ltd. and information discussed in this commentary are as of the date of publication, are subject to change, and may not reflect the writers’ current views. The views expressed are those of the Fund’s adviser only, and represent an assessment of market conditions at a specific point in time, are opinions only and should not be relied upon as investment advice regarding a particular investment or markets in general. Such information does not constitute a recommendation to buy or sell specific securities or investment vehicles. It should not be assumed that any investment will be profitable or will equal the performance of the portfolios or any securities or any sectors mentioned in this letter. The subject matter contained in this letter has been derived from several sources believed to be reliable and accurate at the time of compilation. Neither Aspen Partners Ltd. nor the Fund accepts any liability for losses either direct or consequential caused by the use of this information.
The Aspen Managed Futures Strategy Fund is distributed by ALPS Distributors, Inc.
The Fund is subject to investment risks, including possible loss of the principal amount invested and therefore is not suitable for all investors. The Fund may not achieve its objectives.
Diversification does not eliminate the risk of experiencing investment losses.
| 1 | Correlation - a statistical measure of how two securities move in relation to each other. |
| 2 | Aspen Managed Futures Beta Index (Aspen MFBI) is constructed using a quantitative, rules-based model designed to replicate the trend-following and counter-trend exposure of futures markets by allocating assets to liquid futures contracts of certain financial and commodities futures markets. The Index therefore seeks to reflect the performance of strategies and exposures common to a broad universe of futures markets, i.e., managed futures beta. The Index is not actively managed and does not reflect any deduction for fees, expenses or taxes. An investor cannot invest directly in the Index |
| 3 | The Newedge CTA Index provides the market with a reliable daily performance benchmark of major commodity trading advisors (CTAs). The Newedge CTA Index calculates the daily rate of return for a pool of CTAs selected from the larger managers that are open to new investment. Selection of the pool of qualified CTAs used in construction of the Index will be conducted annually, with re-balancing on January 1st of each year. A committee of industry professionals has been established to monitor the methodology of the index on a regular basis. You cannot invest directly in the index. |
| 4 | Barclay BTOP50 Index is an index of the largest investable CTA programs as measured by assets under management. The index is not actively managed and does not reflect any deduction for fees, expenses or taxes. An investor cannot invest directly in the Index |
| 5 | The S&P 500® Index is an unmanaged index of 500 common stocks chosen for the market size, liquidity and industry group representation. It is a market-value weighted index. The Index is not actively managed and does not reflect any deduction for fees, expenses or taxes. An investor may not invest directly into the Index. |
2 | www.aspenfuturesfund.com |
Table of Contents
| Aspen Managed Futures Strategy Fund | Manager Commentary | |
October 31, 2015 (Unaudited)
|
Cumulative Total Return Performance as of October 31, 2015
| Aspen Managed Futures Strategy Fund | Calendar Year-to-Date | 1 Year | 3 Year | Since Inception* | ||||||||||||||||
Aspen Managed Futures Strategy Fund - Class A (NAV)(1) | -3.74% | 2.81% | 3.50% | -0.37% | ||||||||||||||||
Aspen Managed Futures Strategy Fund - Class A (MOP)(2) | -9.08% | -2.85% | 1.56% | -1.68% | ||||||||||||||||
Aspen Managed Futures Strategy Fund - Class I | -3.59% | 3.19% | 3.91% | 0.02% | ||||||||||||||||
Newedge CTA Index(3) | -1.18% | 6.00% | 4.42% | 1.52% | ||||||||||||||||
Aspen Managed Futures Beta Index(4) | -2.72% | 3.57% | 4.28% | 0.51% | ||||||||||||||||
Performance data quoted represents past performance. Past performance does not guarantee future results. Investment return and principal value of an investment will fluctuate so that an investor’s shares, when sold or redeemed, may be worth more or less than the original cost. Current performance data may be higher or lower than actual data quoted. For the most current month-end performance data please call 1-855-845-9444.
The table does not reflect the deduction of taxes that a shareholder would pay on Fund distributions or the redemption of Fund shares.
| * | Fund Inception date of August 2, 2011. |
| (1) | Net Asset Value (NAV) is the share price without sales charges. |
| (2) | Maximum Offering Price (MOP) includes sales charges. Class A returns include effects of the Fund’s maximum sales charge of 5.50%. |
| (3) | The Newedge CTA Index provides the market with daily performance benchmark of major commodity trading advisors (CTAs). The Newedge CTA Index calculates the daily rate of return for a pool of CTAs selected from the larger managers that are open to new investment. Selection of the pool of qualified CTAs used in construction of the Index will be conducted annually, with re-balancing on January 1st of each year. The index is not actively managed and does not reflect any deductions for fees, expense or taxes. An investor may not invest directly in an index. |
| (4) | Aspen Managed Futures Beta Index – The Managed Futures Beta Index is constructed using a quantitative, rules-based model designed to replicate the trend-following and counter-trend exposure of futures markets by allocating assets to liquid futures contracts of certain financial and commodities futures markets. The Index therefore seeks to reflect the performance of strategies and exposures common to a broad universe of futures markets, i.e., managed futures beta. The index is not actively managed and does not reflect any deductions for fees, expense or taxes. An investor may not invest directly in an index. |
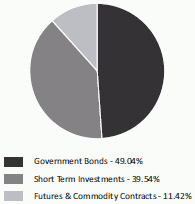
Portfolio Composition as of October 31, 2015
As a percentage of Net Assets^
^ Holdings subject to change, and may not reflect the current or future position of the portfolio.
|
Performance of $10,000 Initial Investment (as of October 31, 2015)
Comparison of change in value of a $10,000 investment (includes applicable sales loads)
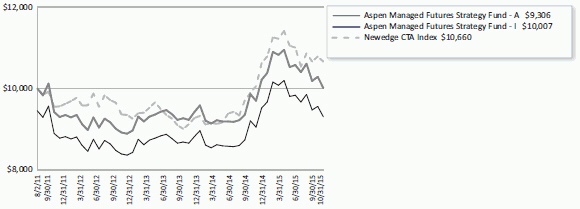
The chart represents historical performance of a hypothetical investment of $10,000 in the Fund since inception. Past performance does not guarantee future results. This chart does not reflect the deduction of taxes that a shareholder would pay on Fund distributions or the redemption of Fund shares.
| Semi-Annual Report | October 31, 2015 | 3 |
Table of Contents
| Aspen Managed Futures Strategy Fund | Consolidated Disclosure of Fund Expenses | |
October 31, 2015 (Unaudited)
|
As a shareholder of a Fund, you incur two types of costs: (1) transaction costs, including applicable sales charges (loads), redemption fees, wire fees and low balance fees; and (2) ongoing costs, including management fees, distribution and service (12b-1) fees, shareholder services fees and other Fund expenses. This example is intended to help you understand your indirect costs, also referred to as “ongoing costs” (in dollars), of investing in the Fund and to compare these costs with the ongoing costs of investing in other mutual funds.
This example is based on an investment of $1,000 invested at the beginning of the period and held for the entire six-month period of May 1, 2015 through October 31, 2015.
Actual Expenses The first line of the table below provides information about actual account values and actual expenses. You may use the information in this line, together with the amount you invested at the beginning of the period, to estimate the expenses that you paid over the period. Simply divide your account value by $1,000 (for example, an $8,600 account value divided by $1,000 = 8.6), then multiply the result by the number in the first line under the heading “Expenses Paid During Period” to estimate the expenses you paid on your account during this period.
Hypothetical Example for Comparison Purposes The second line of the table provides information about hypothetical account values and hypothetical expenses based on the Fund’s actual expense ratio and an assumed rate of return of 5% per year before expenses, which is not the Fund’s actual return. The hypothetical account values and expenses may not be used to estimate the actual ending account balance or expenses you paid for the period. You may use this information to compare ongoing costs of investing in the Fund and other funds. To do so, compare this 5% hypothetical example with the 5% hypothetical examples that appear in the shareholder reports of other funds.
Please note that the expenses shown in the table are meant to highlight your ongoing costs only and do not reflect any transactional costs, such as applicable sales charges (loads), redemption fees, wire fees and low balance fees. Therefore, the second line of the table is useful in comparing ongoing costs only and will not help you determine the relative total costs of owning different funds. In addition, if these transaction costs were included, your costs would be higher.
| Beginning Account Value 5/1/15 | Ending Account Value 10/31/15 | Expense Ratio(a) | Expenses Paid During period | |||||||||||||||||
Class A | ||||||||||||||||||||
Actual | $ | 1,000.00 | $ | 950.00 | 1.52 | % | $ | 7.45 | ||||||||||||
Hypothetical (5% return before expenses) | $ | 1,000.00 | $ | 1,017.50 | 1.52 | % | $ | 7.71 | ||||||||||||
Class I | ||||||||||||||||||||
Actual | $ | 1,000.00 | $ | 950.80 | 1.19 | % | $ | 5.84 | ||||||||||||
Hypothetical (5% return before expenses) | $ | 1,000.00 | $ | 1,019.15 | 1.19 | % | $ | 6.04 | ||||||||||||
| (a) | The Fund’s expense ratios have been based on the Fund’s most recent fiscal half-year expenses. |
| (b) | Expenses are equal to the Fund’s annualized expense ratio multiplied by the average account value over the period, multiplied by the number of days in the most recent fiscal half-year (184)/366 (to reflect the half-year period). |
4 | www.aspenfuturesfund.com |
Table of Contents
| Aspen Managed Futures Strategy Fund | Consolidated Schedule of Investments | |
October 31, 2015 (Unaudited)
|
| Principal Amount/ Shares | Value (Note 2) | |||||||
| ||||||||
GOVERNMENT BONDS (49.04%) | ||||||||
U.S. TREASURY NOTES (49.04%) | ||||||||
0.250%, 10/31/2015 | $ 5,000,000 | $ | 5,000,000 | |||||
0.375%, 01/31/2016 | 6,006,000 | 6,009,321 | ||||||
0.375%, 01/31/2016 | 3,325,000 | 3,326,839 | ||||||
0.250%, 02/29/2016 | 10,019,000 | 10,023,178 | ||||||
0.375%, 03/31/2016 | 5,042,000 | 5,045,413 | ||||||
0.375%, 03/31/2016 | 3,300,000 | 3,302,234 | ||||||
0.250%, 04/15/2016 | 10,000,000 | 10,001,110 | ||||||
0.375%, 04/30/2016 | 10,034,000 | 10,039,880 | ||||||
0.250%, 05/15/2016 | 5,000,000 | 4,998,635 | ||||||
0.375%, 05/31/2016 | 7,029,000 | 7,031,790 | ||||||
0.500%, 06/30/2016 | 5,000,000 | 5,004,980 | ||||||
0.500%, 07/31/2016 | 5,000,000 | 5,004,330 | ||||||
0.500%, 08/31/2016 | 15,042,000 | 15,053,462 | ||||||
0.500%, 09/30/2016 | 3,350,000 | 3,352,248 | ||||||
0.500%, 09/30/2016 | 7,500,000 | 7,505,032 | ||||||
0.375%, 10/31/2016 | 5,041,000 | 5,037,749 | ||||||
0.500%, 11/30/2016 | 13,000,000 | 13,003,302 | ||||||
0.500%, 01/31/2017 | 13,000,000 | 12,996,867 | ||||||
0.625%, 07/31/2017 | 6,518,000 | 6,513,757 | ||||||
0.625%, 09/30/2017 | 6,050,000 | 6,038,360 | ||||||
TOTAL GOVERNMENT BONDS | ||||||||
|
| |||||||
(Cost $144,248,512) | 144,288,487 | |||||||
|
| |||||||
SHORT TERM INVESTMENTS (39.54%) | ||||||||
MONEY MARKET FUND (6.82%) | ||||||||
Dreyfus Treasury & Agency Cash Management Fund - Institutional Shares, 7-day yield, 0.010% | 20,088,610 | 20,088,610 | ||||||
|
| |||||||
U.S. TREASURY BILLS (32.72%) | ||||||||
0.151%, 11/12/2015(a) | 5,000,000 | 4,999,768 | ||||||
0.156%, 12/10/2015(a) | 9,300,000 | 9,298,432 | ||||||
0.159%, 01/07/2016(a) | 10,000,000 | 9,998,850 | ||||||
0.179%, 02/04/2016(a) | 10,000,000 | 9,997,420 | ||||||
0.212%, 03/03/2016(a) | 10,500,000 | 10,496,535 | ||||||
0.190%, 03/31/2016(a) | 1,161,000 | 1,160,160 | ||||||
0.222%, 04/28/2016(a) | 15,300,000 | 15,282,604 | ||||||
0.243%, 05/26/2016(a) | 10,600,000 | 10,586,050 | ||||||
0.285%, 06/23/2016(a) | 10,500,000 | 10,480,806 | ||||||
0.333%, 07/21/2016(a) | 10,000,000 | 9,977,890 | ||||||
0.418%, 08/18/2016(a) | 4,000,000 | 3,990,092 | ||||||
|
| |||||||
| 96,268,607 | ||||||||
|
| |||||||
TOTAL SHORT TERM INVESTMENTS | ||||||||
(Cost $116,342,503) | 116,357,217 | |||||||
|
| |||||||
TOTAL INVESTMENTS (88.58%) | ||||||||
(Cost $260,591,015) | $ | 260,645,704 | ||||||
|
| |||||||
Other Assets In Excess Of Liabilities (11.42%) | 33,592,083 (b) | |||||||
|
| |||||||
NET ASSETS (100.00%) | $ | 294,237,787 | ||||||
|
| |||||||
| See Notes to Consolidated Financial Statements. | ||
| Semi-Annual Report | October 31, 2015 | 5 |
Table of Contents
| Aspen Managed Futures Strategy Fund | Consolidated Schedule of Investments | |
October 31, 2015 (Unaudited)
|
| (a) | Rate shown represents the bond equivalent yield to maturity at date of purchase. |
| (b) | Includes cash which is being held as collateral for futures contracts. |
FUTURES CONTRACTS
At October 31, 2015, the Fund had outstanding futures contracts:
| Description | Position | Contracts | Expiration Date | Underlying Face Amount at Value | Unrealized Appreciation | |||||||||||||||||||
| ||||||||||||||||||||||||
Commodity Contracts | ||||||||||||||||||||||||
Copper Future | Short | 63 | 12/30/2015 | $ | (3,650,063) | $ | 99,423 | |||||||||||||||||
Gold 100 Oz Future | Short | 31 | 12/30/2015 | (3,538,340) | 79,570 | |||||||||||||||||||
Sugar No. 11 (World) Future | Long | 474 | 03/01/2016 | 7,708,378 | 263,714 | |||||||||||||||||||
Equity Contracts | ||||||||||||||||||||||||
Euro STOXX 50® Index Future | Long | 206 | 12/21/2015 | 7,708,747 | 306,832 | |||||||||||||||||||
Fixed Income Contracts | ||||||||||||||||||||||||
Euro-Bund Future | Long | 188 | 12/09/2015 | 32,500,693 | 8,087 | |||||||||||||||||||
Foreign Currency Contracts | ||||||||||||||||||||||||
Euro FX Currency Future | Short | 684 | 12/15/2015 | (94,126,950) | 322,927 | |||||||||||||||||||
New Zealand Dollar Currency Future | Long | 890 | 11/30/2015 | 60,092,800 | 341,520 | |||||||||||||||||||
Swiss Franc Currency Future | Short | 474 | 12/15/2015 | (60,026,175) | 1,954,245 | |||||||||||||||||||
|
| |||||||||||||||||||||||
| $ | (53,330,910) | $ | 3,376,318 | |||||||||||||||||||||
|
| |||||||||||||||||||||||
| Description | Position | Contracts | Expiration Date | Underlying Face Amount at Value | Unrealized Depreciation | |||||||||||||||||||
| ||||||||||||||||||||||||
Commodity Contracts | ||||||||||||||||||||||||
Corn Future | Long | 201 | 12/15/2015 | $ | 3,841,613 | $ | (81,383) | |||||||||||||||||
New York Harbor ULSD Future | Short | 188 | 12/01/2015 | (11,975,863) | (100,093) | |||||||||||||||||||
Silver Future | Long | 49 | 12/30/2015 | 3,813,915 | (178,027) | |||||||||||||||||||
Soybean Future | Short | 170 | 01/15/2016 | (7,528,875) | (26,131) | |||||||||||||||||||
WTI Crude Future | Short | 179 | 11/23/2015 | (8,339,610) | (237,065) | |||||||||||||||||||
Equity Contracts | ||||||||||||||||||||||||
FTSE® 100 Index Future | Short | 80 | 12/21/2015 | (7,794,338) | (110,527) | |||||||||||||||||||
Nikkei 225 Index Future | Long | 80 | 12/11/2015 | 7,566,000 | (129,684) | |||||||||||||||||||
S&P 500® E-Mini Future | Long | 152 | 12/21/2015 | 15,760,120 | (82,036) | |||||||||||||||||||
Fixed Income Contracts | ||||||||||||||||||||||||
Canadian 10 Year Bond Future | Long | 309 | 12/21/2015 | 33,201,667 | (267,772) | |||||||||||||||||||
Long Gilt Future | Long | 183 | 12/30/2015 | 33,218,818 | (277,667) | |||||||||||||||||||
U.S. 10 Year Treasury Note Future | Long | 259 | 12/22/2015 | 33,071,063 | (205,128) | |||||||||||||||||||
Foreign Currency Contracts | ||||||||||||||||||||||||
Australian Dollar Currency Future | Long | 599 | 12/15/2015 | 42,630,830 | (288,642) | |||||||||||||||||||
Canadian Dollar Currency Future | Short | 456 | 12/16/2015 | (34,861,200) | (345,302) | |||||||||||||||||||
Japanese Yen Currency Future | Short | 165 | 12/15/2015 | (17,094,000) | (78,755) | |||||||||||||||||||
|
| |||||||||||||||||||||||
| $ | 85,510,140 | $ | (2,408,212) | |||||||||||||||||||||
|
| |||||||||||||||||||||||
Common Abbreviations:
FTSE - Financial Times and the London Stock Exchange
FX - Foreign
No. - Number
Oz - Ounce
S&P - Standard and Poor’s
ULSD - Ultra Low Sulfur Diesel
Holdings are subject to change.
For Fund compliance purposes, the Fund’s industry classifications refer to any one or more of the industry sub-classifications used by one or more widely recognized market indexes or ratings group indexes, and/or as defined by Fund management. This definition may not apply for purposes of this report, which may combine industry sub-classifications for reporting ease. Industries are shown as a percentage of net assets.
| See Notes to Consolidated Financial Statements. | ||
6 | www.aspenfuturesfund.com | |
Table of Contents
| Aspen Managed Futures Strategy Fund | Consolidated Statement of Assets & Liabilities | |
October 31, 2015 (Unaudited)
|
ASSETS: | ||||
Investments, at value | $ | 260,645,704 | ||
Cash | 152,025 | |||
Deposit with broker for futures contracts, foreign currency (Cost $383,783) (Note 3) | 384,401 | |||
Deposit with broker for futures contracts (Note 3) | 32,008,415 | |||
Receivable for shares sold | 349,746 | |||
Variation margin receivable | 3,376,318 | |||
Interest receivable | 125,369 | |||
Prepaid and other assets | 22,228 | |||
| ||||
Total assets | 297,064,206 | |||
| ||||
LIABILITIES: | ||||
Payable to advisor | 186,295 | |||
Variation margin payable | 2,408,212 | |||
Payable for shares redeemed | 50,429 | |||
Payable for administration fees | 36,485 | |||
Payable for distribution and service fees | ||||
Class A | 14,332 | |||
Payable for transfer agency fees | 7,587 | |||
Payable for trustee fees and expenses | 10,365 | |||
Payable for professional fees | 27,088 | |||
Payable for chief compliance officer fees | 5,872 | |||
Payable for principal financial officer fees | 847 | |||
Payable for licensing fees | 62,098 | |||
Accrued expenses and other liabilities | 16,809 | |||
| ||||
Total liabilities | 2,826,419 | |||
| ||||
NET ASSETS | $ | 294,237,787 | ||
| ||||
NET ASSETS CONSIST OF: | ||||
Paid-in capital (Note 5) | $ | 287,542,567 | ||
Accumulated net investment income | 3,713,270 | |||
Accumulated net realized gain on investments, futures contracts and foreign currency transactions | 1,958,537 | |||
Net unrealized appreciation on investments, futures contracts and foreign currency translations | 1,023,413 | |||
| ||||
NET ASSETS | $ | 294,237,787 | ||
| ||||
INVESTMENTS, AT COST | $ | 260,591,015 | ||
PRICING OF SHARES: | ||||
Class A: | ||||
Net Asset Value, offering and redemption price per share | $ | 9.51 | ||
Net Assets | $ | 19,778,090 | ||
Shares of beneficial interest outstanding | 2,080,330 | |||
Maximum offering price per share (NAV/0.9450), based on maximum sales charge of 5.50% of the offering price | $ | 10.06 | ||
Class I: | ||||
Net Asset Value, offering and redemption price per share | $ | 9.67 | ||
Net Assets | $ | 274,459,697 | ||
Shares of beneficial interest outstanding | 28,369,212 | |||
| See Notes to Consolidated Financial Statements. | ||
| Semi-Annual Report | October 31, 2015 | 7 |
Table of Contents
| Aspen Managed Futures Strategy Fund | Consolidated Statement of Operations | |
For the Six Months Ended October 31, 2015 (Unaudited)
|
| ||||
INVESTMENT INCOME: | ||||
Interest | $ | 310,566 | ||
Dividends | 1,048 | |||
| ||||
Total Investment Income | 311,614 | |||
| ||||
EXPENSES: | ||||
Investment advisory fees (Note 6) | 1,071,073 | |||
Investment advisory fees - subsidiary | 110,139 | |||
Administrative fees | 114,515 | |||
Distribution and service fees | ||||
Class A | 37,510 | |||
Transfer agency fees | 69,812 | |||
Professional fees | 22,622 | |||
Custodian fees | 6,053 | |||
Trustee fees and expenses | 10,389 | |||
Principal financial officer fees | 2,514 | |||
Chief compliance officer fees | 17,448 | |||
Licensing fees | 357,024 | |||
Other | 34,057 | |||
| ||||
Total expenses before waiver/reimbursement | 1,853,156 | |||
Waiver of investment advisory fees - subsidiary | (110,139) | |||
| ||||
Total Net Expenses | 1,743,017 | |||
| ||||
NET INVESTMENT LOSS | (1,431,403) | |||
| ||||
Net realized gain on investments | 12,271 | |||
Net realized loss on futures contracts | (18,939,126) | |||
Net realized loss on foreign currency transactions | (130,889) | |||
Net change in unrealized depreciation of investments | (63,609) | |||
Net change in unrealized appreciation on futures contracts | 5,819,954 | |||
Net change in unrealized depreciation on translation of assets and liabilities denominated in foreign currency transactions | (9,133) | |||
| ||||
NET REALIZED AND UNREALIZED LOSS ON INVESTMENTS | (13,310,532) | |||
| ||||
NET DECREASE IN NET ASSETS RESULTING FROM OPERATIONS | $ (14,741,935) | |||
| ||||
| See Notes to Consolidated Financial Statements. | ||
8 | www.aspenfuturesfund.com | |
Table of Contents
| Aspen Managed Futures Strategy Fund | Consolidated Statements |
For the Six Months Ended | For the Year Ended | |||||||
| ||||||||
OPERATIONS: | ||||||||
Net investment loss | $ | (1,431,403) | $ | (2,422,171) | ||||
Net realized gain/(loss) on investments, futures contracts and foreign | (19,057,744) | 36,321,277 | ||||||
Net change in unrealized appreciation/(depreciation) on investments, futures | 5,747,212 | (7,020,209) | ||||||
| ||||||||
Net increase/(decrease) in net assets resulting from operations | (14,741,935) | 26,878,897 | ||||||
| ||||||||
DISTRIBUTIONS TO SHAREHOLDERS (Note 4): | ||||||||
From net realized gains on investments | ||||||||
Class A | – | (309,900) | ||||||
Class I | – | (4,218,836) | ||||||
| ||||||||
Net decrease in net assets from distributions | – | (4,528,736) | ||||||
| ||||||||
SHARE TRANSACTIONS (Note 5): | ||||||||
Class A | ||||||||
Proceeds from sales of shares | 11,782,293 | 13,068,693 | ||||||
Distributions reinvested | – | 298,289 | ||||||
Cost of shares redeemed | (15,001,405) | (3,700,970) | ||||||
Redemption fees | 5,100 | 531 | ||||||
Class I | ||||||||
Proceeds from sales of shares | 61,098,556 | 75,913,390 | ||||||
Distributions reinvested | – | 3,994,682 | ||||||
Cost of shares redeemed | (15,330,814) | (25,671,930) | ||||||
Redemption fees | 1,093 | 1,186 | ||||||
| ||||||||
Net increase from share transactions | 42,554,823 | 63,903,871 | ||||||
| ||||||||
Net increase in net assets | 27,812,888 | 86,254,032 | ||||||
| ||||||||
NET ASSETS: | ||||||||
Beginning of period | 266,424,899 | 180,170,867 | ||||||
| ||||||||
End of period* | $ | 294,237,787 | $ | 266,424,899 | ||||
| ||||||||
*Includes accumulated net investment income of: | $ | 3,713,270 | $ | 5,144,673 | ||||
Other Information: | ||||||||
SHARE TRANSACTIONS: | ||||||||
Class A | ||||||||
Sold | 1,191,608 | 1,300,095 | ||||||
Distributions reinvested | – | 30,594 | ||||||
Redeemed | (1,493,039) | (388,614) | ||||||
| ||||||||
Net increase/(decrease) in shares outstanding | (301,431) | 942,075 | ||||||
| ||||||||
Class I | ||||||||
Sold | 6,048,094 | 7,614,314 | ||||||
Distributions reinvested | – | 403,911 | ||||||
Redeemed | (1,523,332) | (2,608,713) | ||||||
| ||||||||
Net increase in shares outstanding | 4,524,762 | 5,409,512 | ||||||
| ||||||||
| See Notes to Consolidated Financial Statements. | ||
| Semi-Annual Report | October 31, 2015 | 9 |
Table of Contents
| Aspen Managed Futures Strategy Fund – Class A | Consolidated Financial Highlights | |
| For a share outstanding throughout the periods presented. |
| For the Six Months Ended October 31, 2015 (Unaudited) (a) | For the Year Ended April 30, 2015 (a) | For the Year Ended April 30, 2014 (a) | For the Year Ended April 30, 2013 (a) | For the Period August 2, 2011 (Inception) to April 30, 2012 (a) | ||||||||||||||||
| ||||||||||||||||||||
NET ASSET VALUE, | $ 10.01 | $ 8.97 | $ 9.29 | $ 8.95 | $ 10.00 | |||||||||||||||
INCOME/(LOSS) FROM | ||||||||||||||||||||
Net investment loss(b) | (0.07) | (0.14) | (0.16) | (0.16) | (0.13) | |||||||||||||||
Net realized and unrealized | (0.43) | 1.39 | (0.05) | 0.50 | (0.92) | |||||||||||||||
| ||||||||||||||||||||
Total from investment | (0.50) | 1.25 | (0.21) | 0.34 | (1.05) | |||||||||||||||
| ||||||||||||||||||||
LESS DISTRIBUTIONS: | ||||||||||||||||||||
Distributions from net realized | – | (0.21) | (0.12) | – | – | |||||||||||||||
| ||||||||||||||||||||
Total distributions | – | (0.21) | (0.12) | – | – | |||||||||||||||
| ||||||||||||||||||||
REDEMPTION FEES ADDED | 0.00 (c) | 0.00 (c) | 0.01 | 0.00 (c) | – | |||||||||||||||
| ||||||||||||||||||||
INCREASE/(DECREASE) IN | (0.50) | 1.04 | (0.32) | 0.34 | (1.05) | |||||||||||||||
| ||||||||||||||||||||
NET ASSET VALUE, END OF | $ 9.51 | $ 10.01 | $ 8.97 | $ 9.29 | $ 8.95 | |||||||||||||||
| ||||||||||||||||||||
TOTAL RETURN (d) | (5.00%) (e) | 14.00% | (2.15%) | 3.80% | (10.50%) (e) | |||||||||||||||
RATIOS AND | ||||||||||||||||||||
Net assets, end of | $ 19,778 | $23,850 | $ 12,914 | $ 3,350 | $ 1,254 | |||||||||||||||
RATIOS TO AVERAGE NET | ||||||||||||||||||||
Operating expenses excluding fee | 1.52% (f) | 1.64% | 1.83% | 1.80% | 2.53%(f) | |||||||||||||||
Operating expenses including fee | 1.52% (f) | 1.64% | 1.83% | 1.80% | 1.80%(f) | |||||||||||||||
Net investment loss including fee | (1.31%) (f) | (1.50%) | (1.72%) | (1.75%) | (1.79%)(f) | |||||||||||||||
PORTFOLIO TURNOVER | 24% (e) | 38% | 90% | 0% | 0%(e) | |||||||||||||||
| (a) | Per share amounts and ratios to average net assets include income and expenses of the Aspen Futures Fund Ltd. (subsidiary), exclusive of the subsidiary’s management fee. |
| (b) | Per share numbers have been calculated using the average shares method. |
| (c) | Less than $0.005 per share. |
| (d) | Total return does not reflect the effect of sales charges. |
| (e) | Not annualized. |
| (f) | Annualized. |
See Notes to Consolidated Financial Statements. | ||
10 | www.aspenfuturesfund.com | |
Table of Contents
| Aspen Managed Futures Strategy Fund – Class I | Consolidated Financial Highlights | |
| For a share outstanding throughout the periods presented. |
| For the Six Months Ended October 31, 2015 (Unaudited) (a) | For the Year Ended April 30, 2015 (a) | For the April 30, 2014 (a) | For the April 30, 2013 (a) | For the Period April 30, 2012 (a) | ||||||||||||||||
| ||||||||||||||||||||
NET ASSET VALUE, | $ 10.17 | $ 9.07 | $ 9.36 | $ 8.98 | $ 10.00 | |||||||||||||||
INCOME/(LOSS) FROM | ||||||||||||||||||||
Net investment loss(b) | (0.05) | (0.11) | (0.11) | (0.11) | (0.11) | |||||||||||||||
Net realized and | (0.45) | 1.42 | (0.06) | 0.49 | (0.91) | |||||||||||||||
| ||||||||||||||||||||
Total from investment | (0.50) | 1.31 | (0.17) | 0.38 | (1.02) | |||||||||||||||
| ||||||||||||||||||||
LESS DISTRIBUTIONS: | ||||||||||||||||||||
Distributions from net | – | (0.21) | (0.12) | – | – | |||||||||||||||
| ||||||||||||||||||||
Total distributions | – | (0.21) | (0.12) | – | – | |||||||||||||||
| ||||||||||||||||||||
REDEMPTION FEES | 0.00 (c) | 0.00 (c) | 0.00 (c) | 0.00 (c) | 0.00 (c) | |||||||||||||||
| ||||||||||||||||||||
INCREASE/(DECREASE) | (0.50) | 1.10 | (0.29) | 0.38 | (1.02) | |||||||||||||||
| ||||||||||||||||||||
NET ASSET VALUE, END | $ 9.67 | $ 10.17 | $ 9.07 | $ 9.36 | $ 8.98 | |||||||||||||||
| ||||||||||||||||||||
TOTAL RETURN | (4.92%) (d) | 14.51% | (1.81%) | 4.23% | (10.20%) (d) | |||||||||||||||
RATIOS AND | ||||||||||||||||||||
Net assets, end of period (000’s) | $274,460 | $242,575 | $167,258 | $120,769 | $90,450 | |||||||||||||||
RATIOS TO AVERAGE NET | ||||||||||||||||||||
Operating expenses | 1.19% (e) | 1.25% | 1.30% | 1.25% | 1.75% (e) | |||||||||||||||
Operating expenses | 1.19%(e) | 1.25% | 1.30% | 1.25% | 1.55% (e) | |||||||||||||||
Net investment loss | (0.98%)(e) | (1.11%) | (1.20%) | (1.20%) | (1.54%) (e) | |||||||||||||||
PORTFOLIO TURNOVER | 24%(d) | 38% | 90% | 0% | 0% (d) | |||||||||||||||
| (a) | Per share amounts and ratios to average net assets include income and expenses of the Aspen Futures Fund Ltd. (subsidiary), exclusive of the subsidiary’s management fee. |
| (b) | Per share numbers have been calculated using the average shares method. |
| (c) | Less than $0.005 per share. |
| (d) | Not annualized. |
| (e) | Annualized. |
See Notes to Consolidated Financial Statements. | ||
| Semi-Annual Report | October 31, 2015 | 11 |
Table of Contents
| Aspen Managed Futures Strategy Fund | Financial Statements | |
| October 31, 2015 (Unaudited) |
1. ORGANIZATION
Financial Investors Trust (the “Trust”), a Delaware statutory trust, is an open-end management investment company registered under the Investment Company Act of 1940, as amended (“1940 Act”). As of October 31, 2015, the Trust had 34 registered funds. This semi-annual report describes the Aspen Managed Futures Strategy Fund (the “Fund”). The Fund seeks investment results that replicate as closely as possible, before fees and expenses, the price and yield performance of the Aspen Managed Futures Beta Index (the “MFBI” or “Index”). The Aspen Managed Futures Strategy Fund offers Class A and Class I shares.
Basis of Consolidation for the Aspen Futures Fund, Ltd.
Aspen Futures Fund, Ltd. (the “Subsidiary”), a Cayman Islands exempted company, is a wholly owned subsidiary of the Fund. The Subsidiary’s investment objective is designed to enhance the ability of the Fund to obtain exposure to equities, financial, currency and commodities markets consistent with the limits of the U.S. federal tax law requirements applicable to registered investment companies. The Subsidiary is subject to substantially the same investment policies and investment restrictions as the Fund. The Subsidiary acts as an investment vehicle for the Fund in order to effect certain commodity-related investments on behalf of the Fund. Investments in the Subsidiary are expected to provide the Fund with exposure to the commodity markets within the limitations of Subchapter M of the Internal Revenue Code of 1986, as amended (the “Code”), and recent IRS revenue rulings, as discussed below under “Federal Income Taxes”. The Fund is the sole shareholder of the Subsidiary pursuant to a subscription agreement dated as of August 2, 2011, and it is intended that the Fund will remain the sole shareholder and will continue to control the Subsidiary. Under the Articles of Association of the Subsidiary, shares issued by the Subsidiary confer upon a shareholder the right to wholly own and vote at general meetings of the Subsidiary and certain rights in connection with any winding-up or repayment of capital, as well as the right to participate in the profits or assets of the Subsidiary. The Fund may invest up to 25% of its total assets in shares of the Subsidiary. As a wholly owned subsidiary of the Fund, all assets and liabilities, income and expenses of the Subsidiary are consolidated in the financial statements and financial highlights of the Fund. All investments held by the Subsidiary are disclosed in the accounts of the Fund. As of October 31, 2015, net assets of the Fund were $294,237,787, of which $27,557,617 or 9.37%, represented the Fund’s ownership of all issued shares and voting rights of the Subsidiary.
2. SIGNIFICANT ACCOUNTING POLICIES
The accompanying financial statements were prepared in accordance with accounting principles generally accepted in the United States of America (“U.S. GAAP”). The preparation of financial statements in conformity with U.S. GAAP requires management to make certain estimates and assumptions that affect the reported amounts of assets and liabilities and disclosures of contingent assets and liabilities at the date of the financial statements and the reported amounts of revenue and expenses during the period. Actual results could differ from those estimates. The Fund is considered an investment company for financial reporting purposes under U.S. GAAP. The following is a summary of significant accounting policies consistently followed by the Fund and subsidiary in preparation of the financial statements.
Investment Valuation: The Fund generally values its securities based on market prices determined at the close of regular trading on the New York Stock Exchange (“NYSE”), normally 4:00 p.m. Eastern Time, on each day the NYSE is open for trading.
For equity securities and mutual funds that are traded on an exchange, the market price is usually the closing sale or official closing price on that exchange. In the case of equity securities not traded on an exchange, or if such closing prices are not otherwise available, the securities are valued at the mean of the most recent bid and ask prices on such day. Redeemable securities issued by open-end registered investment companies are valued at the investment company’s applicable net asset value, with the exception of exchange-traded open-end investment companies, which are priced as equity securities.
The market price for debt obligations is generally the price supplied by an independent third-party pricing service approved by the Board of Trustees (the “Board”), which may use a matrix, formula or other objective method that takes into consideration quotations from dealers, market transactions in comparable investments, market indices and yield curves. If vendors are unable to supply a price, or if the price supplied is deemed to be unreliable, the market price may be determined using quotations received from one or more brokers–dealers that make a market in the security. Short–term debt obligations that will mature in 60 days or less are valued at amortized cost, unless it is determined that using this method would not reflect an investment’s fair value.
Futures contracts that are listed or traded on a national securities exchange, commodities exchange, contract market or comparable over-the-counter market, and that are freely transferable, are valued at their closing settlement price on the exchange on which they are primarily traded or based upon the current settlement price for a like instrument acquired on the day on which the instrument is being valued. A settlement price may not be used if the market makes a limit move with respect to a particular commodity.
Forward currency exchange contracts have a market value determined by the prevailing foreign currency exchange daily rates and current foreign currency exchange forward rates. The foreign currency exchange forward rates are calculated using an automated system that estimates rates on the basis of the current day foreign currency exchange rates and forward foreign currency exchange rates supplied by a pricing service.
12 | www.aspenfuturesfund.com |
Table of Contents
| Aspen Managed Futures Strategy Fund | Notes to Consolidated Financial Statements | |
October 31, 2015 (Unaudited)
|
Investment securities that are primarily traded on foreign securities exchanges are valued at the preceding closing values of such securities on their respective exchanges, except when an occurrence subsequent to the time a value was so established is likely to have changed such value. In such an event, the fair value of those securities are determined in good faith through consideration of other factors in accordance with procedures established by and under the general supervision of the Board.
When such prices or quotations are not available, or when Aspen Partners, Ltd. (the “Adviser”) believes that they are unreliable, securities may be priced using fair value procedures approved by the Board.
Fair Value Measurements: The Fund discloses the classification of its fair value measurements following a three-tier hierarchy based on the inputs used to measure fair value. Inputs refer broadly to the assumptions that market participants would use in pricing the asset or liability, including assumptions about risk. Inputs may be observable or unobservable. Observable inputs reflect the assumptions market participants would use in pricing the asset or liability that are developed based on market data obtained from sources independent of the reporting entity. Unobservable inputs reflect the reporting entity’s own assumptions about the assumptions market participants would use in pricing the asset or liability that are developed based on the best information available.
Various inputs are used in determining the value of the Fund’s investments as of the end of the reporting period. When inputs used fall into different levels of the fair value hierarchy, the level in the hierarchy within which the fair value measurement falls is determined based on the lowest level input that is significant to the fair value measurement in its entirety. The designated input levels are not necessarily an indication of the risk or liquidity associated with these investments. These inputs are categorized in the following hierarchy under applicable financial accounting standards:
Level 1 – | Unadjusted quoted prices in active markets for identical investments, unrestricted assets or liabilities that the Fund has the ability to access at the measurement date; | |
Level 2 – | Quoted prices which are not active, quoted prices for similar assets or liabilities in active markets or inputs other than quoted prices that are observable (either directly or indirectly) for substantially the full term of the asset or liability; and | |
Level 3 – | Significant unobservable prices or inputs (including the Fund’s own assumptions in determining the fair value of investments) where there is little or no market activity for the asset or liability at the measurement date. | |
The following is a summary of each input used to value the Fund as of October 31, 2015:
| Investments in Securities at Value | Level 1 - Quoted Prices | Level 2 - Other Significant | Level 3 - Significant Unobservable Inputs | Total | ||||||||||||
| ||||||||||||||||
Government Bonds | $ | – | $ | 144,288,487 | $ | – | $ | 144,288,487 | ||||||||
Short Term Investments | ||||||||||||||||
Money Market Fund | 20,088,610 | – | – | 20,088,610 | ||||||||||||
U.S. Treasury Bills | – | 96,268,607 | – | 96,268,607 | ||||||||||||
| ||||||||||||||||
TOTAL | $ | 20,088,610 | $ | 240,557,094 | $ | – | $ | 260,645,704 | ||||||||
| ||||||||||||||||
Other Financial Instruments | ||||||||||||||||
Assets: | ||||||||||||||||
Futures Contracts | ||||||||||||||||
Commodity Contracts | $ | 442,707 | $ | – | $ | – | $ | 442,707 | ||||||||
Equity Contracts | 306,832 | – | – | 306,832 | ||||||||||||
Fixed Income Contracts | 8,087 | – | – | 8,087 | ||||||||||||
Foreign Currency Contracts | 2,618,692 | – | – | 2,618,692 | ||||||||||||
Liabilities: | ||||||||||||||||
Futures Contracts | ||||||||||||||||
Commodity Contracts | (622,699) | – | – | (622,699) | ||||||||||||
Equity Contracts | (322,247) | – | – | (322,247) | ||||||||||||
Fixed Income Contracts | (750,567) | – | – | (750,567) | ||||||||||||
Foreign Currency Contracts | (712,699) | – | – | (712,699) | ||||||||||||
| ||||||||||||||||
TOTAL | $ | 968,106 | $ | – | $ | – | $ | 968,106 | ||||||||
| ||||||||||||||||
The Fund recognizes transfers between levels as of the end of the period. For the six months ended October 31, 2015, the Fund did not have any transfers between Level 1 and Level 2 securities. For the six months ended October 31, 2015, the Fund did not have any securities that used significant unobservable inputs (Level 3) in determining fair value.
| Semi-Annual Report | October 31, 2015 | 13 |
Table of Contents
| Aspen Managed Futures Strategy Fund | Notes to Consolidated Financial Statements | |
October 31, 2015 (Unaudited)
|
Investment Transactions and Investment Income: Investment transactions are accounted for on the date the investments are purchased or sold (trade date). Realized gains and losses from investment transactions are reported on an identified cost basis. Interest income, which includes accretion of discounts, is accrued and recorded as earned. Dividend income is recognized on the ex-dividend date or for certain foreign securities, as soon as information is available to the Fund. All of the realized and unrealized gains and losses and net investment income, are allocated daily to each class in proportion to its average daily net assets.
Foreign Securities: The Fund may directly purchase securities of foreign issuers. Investing in securities of foreign issuers involves special risks not typically associated with investing in securities of U.S. issuers. The risks include possible reevaluation of currencies, the inability to repatriate foreign currency, less complete financial information about companies and possible future adverse political and economic developments. Moreover, securities of many foreign issuers and their markets may be less liquid and their prices more volatile than those of securities of comparable U.S. issuers.
Foreign Currency Translation: The books and records of the Fund are maintained in U.S. dollars. Investment valuations and other assets and liabilities initially expressed in foreign currencies are converted each business day into U.S. dollars based upon current exchange rates. Prevailing foreign exchange rates may generally be obtained at the close of the NYSE (normally, 4:00 p.m. Eastern Time). The portion of realized and unrealized gains or losses on investments due to fluctuations in foreign currency exchange rates is not separately disclosed and is included in realized and unrealized gains or losses on investments, when applicable.
Foreign Currency Spot Contracts: The Fund may enter into foreign currency spot contracts to facilitate transactions in foreign securities or to convert foreign currency receipts into U.S. dollars. A foreign currency spot contract is an agreement between two parties to buy and sell currencies at the current market rate, for settlement generally within two business days. The U.S. dollar value of the contracts is determined using current currency exchange rates supplied by a pricing service. The contract is marked-to-market daily for settlements beyond one day and any change in market value is recorded as an unrealized gain or loss. When the contract is closed, the Fund records a realized gain or loss equal to the difference between the value on the open and close date. Losses may arise from changes in the value of the foreign currency, or if the counterparties do not perform under the contract’s terms. The maximum potential loss from such contracts is the aggregate face value in U.S. dollars at the time the contract was opened.
Trust Expenses: Some expenses of the Trust can be directly attributed to the Fund. Expenses which cannot be directly attributed to the Fund are apportioned among all funds in the Trust based on average net assets of each fund.
Fund and Class Expenses: Expenses that are specific to a class of shares of the Fund, including distribution fees (Rule 12b-1 fees) and shareholder servicing fees, are charged directly to that share class. All expenses of the Fund, other than class specific expenses, are allocated daily to each class in proportion to its average daily net assets.
Federal Income Taxes: The Fund complies with the requirements under Subchapter M of the Internal Revenue Code of 1986, as amended, applicable to regulated investment companies and intends to distribute substantially all of their net taxable income and net capital gains, if any, each year so that it will not be subject to excise tax on distributed income and gains. The Fund is not subject to income taxes to the extent such distributions are made.
As of and during the six months ended October 31, 2015, the Fund did not have a liability for any unrecognized tax benefits. The Fund files U.S. federal, state, and local tax returns as required. The Fund’s tax returns are subject to examination by the relevant tax authorities until expiration of the applicable statute of limitations, which is generally three years after the filing of the tax return for federal purposes and four years for most state returns. Tax returns for open years have incorporated no uncertain tax positions that require a provision for income taxes.
Distributions to Shareholders: The Fund normally pays dividends and distributes capital gains, if any, on an annual basis. Income dividend distributions are derived from interest and other income the Fund receives from its investments, including short term capital gains. Long term capital gains distributions are derived from gains realized when the Fund sells a security it has owned for more than a year. The Fund may make additional distributions and dividends at other times if the portfolio manager believes doing so may be necessary for the Fund to avoid or reduce taxes.
3. DERIVATIVE INSTRUMENTS
The Fund uses derivatives (including futures) to pursue its investment objective. The Fund’s use of derivative instruments involves risks different from, or possibly greater than, the risks associated with investing directly in securities and other traditional investments. These risks may include (i) the risk that the counterparty to a derivative transaction may not fulfill its contractual obligations, (ii) risk of mispricing or improper valuation, and (iii) the risk that changes in the value of the derivative may not correlate perfectly with the underlying asset, rate or index. These risks could cause the Fund to lose more than the principal amount invested. In addition, investments in derivatives involve leverage, which means a small percentage of assets invested in derivatives can have a disproportionately large impact on the Fund.
14 | www.aspenfuturesfund.com |
Table of Contents
| Aspen Managed Futures Strategy Fund | Notes to Consolidated Financial Statements | |
October 31, 2015 (Unaudited)
|
The Fund’s use of derivatives can result in losses due to unanticipated changes in the market risk factors and the overall market. In instances where the Fund is using derivatives to decrease, or hedge, exposures to market risk factors for securities held by the Fund, there are also risks that those derivatives may not perform as expected resulting in losses for the combined or hedged positions. Derivatives may have little or no initial cash investment relative to their market value exposure and therefore can produce significant gains or losses in excess of their cost. This use of embedded leverage allows the Fund to increase its market value exposure relative to its net assets and can substantially increase the volatility of the Fund’s performance.
In addition, use of derivatives may increase or decrease exposure to the following risk factors:
| ● | Equity Risk: Equity risk relates to the change in value of equity securities as they relate to increases or decreases in the general market. |
| ● | Fixed Income Risk: When the Fund invests in fixed-income securities or derivatives, the value of an investment in the Fund will fluctuate with changes in interest rates. Typically, a rise in interest rates causes a decline in the value of fixed-income securities or derivatives owned by the Fund. In general, the market price of debt securities with longer maturities will increase or decrease more in response to changes in interest rates than shorter-term securities. Other risk factors include credit risk (the debtor may default) and prepayment risk (the debtor may pay its obligation early, reducing the amount of interest payments). |
| ● | Foreign Currency Risk: Currency trading involves significant risks, including market risk, interest rate risk, country risk, counterparty credit risk and short sale risk. Market risk results from the price movement of foreign currency values in response to shifting market supply and demand. Interest rate risk arises whenever a country changes its stated interest rate target associated with its currency. Country risk arises because virtually every country has interfered with international transactions in its currency. Counterparty credit risk arises when the counterparty will not fulfill its obligations to the Fund. Short sale risk arises from the sale of a security that is not owned, or any sale that is completed by the delivery of a security borrowed. |
| ● | Commodity Risk: Exposure to the commodities markets may subject the Fund to greater volatility than investments in traditional securities. Commodity prices are influenced by unfavorable weather, animal and plant disease, geologic and environmental factors, as well as changes in government regulation such as tariffs, embargoes or burdensome production rules and restrictions. |
Futures: The Fund and the Subsidiary may enter into futures contracts. Futures contracts are agreements between two parties to buy and sell a particular commodity, instrument or index for a specified price on a specified future date. When the Fund or the Subsidiary enters into a futures contract, it is required to deposit with (or for the benefit of) its broker an amount of cash or short-term high-quality securities as “initial margin”. The margin requirements are set by the exchange on which the contract is traded and may be modified during the term of the contract. The initial margin is in the nature of a performance bond or good faith deposit on the futures contract that is returned to the Fund upon termination of the contract, assuming all contractual obligations have been satisfied. As the value of the contract changes, the value of the futures contract position increases or declines. Subsequent payments, known as “variation margin”, are made or received by the Fund or the Subsidiary, depending on the price fluctuations in the fair value of the contract and the value of cash or securities on deposit with the broker. The aggregate principal amounts of the contracts are not recorded in the financial statements. Fluctuations in the value of the contracts are recorded in the Consolidated Statements of Assets and Liabilities as an asset (liability) and in the Consolidated Statements of Operations as unrealized appreciation (depreciation) until the contracts are closed, when they are recorded as realized gains (losses). Realized gain or loss on a futures position is equal to the difference between the value of the contract at the time it was opened and the value at the time it was closed, minus brokerage commissions. When the Fund or the Subsidiary enters into a futures contract certain risks may arise, such as illiquidity in the futures market, which may limit the Fund’s or the Subsidiary’s ability to close out a futures contract prior to settlement date, and unanticipated movements in the value of securities, commodities or interest rates. Futures contracts are exchange-traded. Exchange-traded futures are standardized contracts and are settled through a clearing house with fulfillment supported by the credit of the exchange. Therefore, counterparty credit risk to the Fund and the Subsidiary is reduced. In addition, the Fund could be exposed to risk if the counterparties to the contracts are unable to meet the terms of their contracts. With exchange traded futures, there is minimal counterparty credit risk to the Funds since futures are exchange traded and the exchange’s clearinghouse, as a counterparty to all exchange traded futures, guarantees the futures against default.
| Semi-Annual Report | October 31, 2015 | 15 |
Table of Contents
| Aspen Managed Futures Strategy Fund | Notes to Consolidated Financial Statements | |
| October 31, 2015 (Unaudited) |
Consolidated Balance Sheet – Fair Value of Derivative Instruments as of October 31, 2015(a):
| Risk Exposure | Asset Derivatives Balance Sheet Location | Fair Value | Liabilities Derivatives Balance Sheet Location | Fair Value | ||||||||
| ||||||||||||
Futures Contracts | Variation margin receivable | $ | 3,376,318 | Variation margin payable | $ | (2,408,212) | ||||||
| ||||||||||||
| $ | 3,376,318 | $ | (2,408,212) | |||||||||
| ||||||||||||
| Risk Exposure to Fund | ||||||||||||
| Commodity Contracts | $ | 442,707 | $ | 622,699 | ||||||||
| Equity Contracts | 306,832 | 322,247 | ||||||||||
| Fixed Income Contracts | 8,087 | 750,567 | ||||||||||
| Foreign Currency Contracts | 2,618,692 | 712,699 | ||||||||||
|
| |||||||||||
| $ | 3,376,318 | $ | 2,408,212 | |||||||||
|
| |||||||||||
| (a) | The number of futures contracts held at October 31, 2015 is representative of activity during the six months ended October 31, 2015. |
Consolidated Statement of Operations – The effect of Derivative Instruments for the six months ended October 31, 2015:
| Location of Gain/(Loss) on Derivatives | Realized Gain/(Loss) on Derivatives | Change in Unrealized Gain/(Loss) on | ||||||||
| Derivatives Instruments | Recognized in Income | Recognized in Income | Derivatives Recognized in Income | |||||||
| ||||||||||
Futures Contracts | Net realized loss on futures contracts/Net change in unrealized appreciation on futures contracts | $ | (18,939,126) | $ | 5,819,954 | |||||
|
| |||||||||
| $ | (18,939,126) | $ | 5,819,954 | |||||||
|
| |||||||||
| Risk Exposure to Fund | ||||||||||
| Commodity Contracts | $ | (500,261) | $ | 65,061 | ||||||
| Equity Contracts | (4,309,366) | (90,928) | ||||||||
| Fixed Income Contracts | (4,895,594) | 531,408 | ||||||||
| Foreign Currency Contracts | (9,233,905) | 5,314,413 | ||||||||
|
| |||||||||
| $ | (18,939,126) | $ | 5,819,954 | |||||||
|
| |||||||||
The average number of net futures contracts held by the fund during the period was $(2,132).
4. TAX BASIS INFORMATION
Tax Basis of Investments: As of October 31, 2015, the aggregate cost of investments, gross unrealized appreciation/(depreciation) and net unrealized appreciation for Federal tax purposes was as follows:
| Gross Appreciation | Gross Depreciation | |||||||||||||||
| (excess of value over tax | (excess of tax cost over | Net Appreciation on | ||||||||||||||
| Cost of Investments | cost) | value) | Investments | |||||||||||||
Aspen Managed Futures Strategy Fund | $ | 260,591,015 | $ | 879,073 | $ | (824,384) | $ | 54,689 | ||||||||
Tax Basis of Distributions to Shareholders: Distributions are determined in accordance with federal income tax regulations, which differ from GAAP, and, therefore, may differ significantly in amount or character from net investment income and realized gains for financial reporting purposes. Financial reporting records are adjusted for permanent book/tax differences to reflect tax character but are not adjusted for temporary differences.
The tax character of distributions paid during the year ending April 30, 2015 were as follows:
| Ordinary Income | Long-Term Capital Gain | |||||||
Aspen Managed Futures Strategy Fund | $ | 399,962 | $ | 4,128,774 | ||||
The amounts and characteristics of tax basis distributions and composition of distributable earnings/(accumulated losses) are finalized at fiscal year-end. Accordingly, tax basis balances have not been determined as of October 31, 2015.
16 | www.aspenfuturesfund.com |
Table of Contents
| Aspen Managed Futures Strategy Fund | Notes to Consolidated Financial Statements | |
| October 31, 2015 (Unaudited) |
5. SHARES OF BENEFICIAL INTEREST
The capitalization of the Trust consists of an unlimited number of shares of beneficial interest with no par value per share. Holders of the shares of the Fund of the Trust have one vote for each share held and a proportionate fraction of a vote for each fractional share. All shares issued and outstanding are fully paid and are transferable and redeemable at the option of the shareholder. Purchasers of the shares do not have any obligation to make payments to the Trust or its creditors (other than the purchase price for the shares) or make contributions to the Trust or its creditors solely by reason of the purchasers’ ownership of the shares. Shares have no pre-emptive rights.
Fund shares redeemed within 30 days of purchase may incur a 2% short-term redemption fee deducted from the redemption amount. The amount of redemption fees received during the period are presented in the Consolidated Statement of Changes in Net Assets.
6. MANAGEMENT AND RELATED-PARTY TRANSACTIONS
The Adviser, subject to the authority of the Board, is responsible for the overall management and administration of the Fund’s business affairs. The Adviser manages the investments of the Fund in accordance with the Fund’s investment objective, policies and limitations and investment guidelines established jointly by the Adviser and the Board. Pursuant to the Investment Advisory Agreement, (the “Advisory Agreement”), the Fund will pay the Adviser an annual management fee of 0.75%, based on the Fund’s average daily net assets. The management fee is paid on a monthly basis.
The Subsidiary has entered into a separate advisory agreement (the “Subsidiary Advisory Agreement”) with Aspen, the Subsidiary’s investment adviser and the Fund’s investment adviser, for the management of the Subsidiary’s portfolio pursuant to which the Subsidiary is obligated to pay the Adviser a management fee at the same rate that the Fund pays the Adviser for investment advisory services provided to the Fund. The Adviser has agreed to waive the advisory fee it receives from the Fund in an amount equal to the management fee paid by the Subsidiary. This waiver may not be terminated or modified without the consent of the Board.
The Adviser has contractually agreed to waive and/or reimburse fees or expenses in order to limit total annual fund operating expenses after fee waiver/expense reimbursements (excluding distribution and service (Rule 12b-1) fees, shareholder services fees, acquired fund fees and expenses, brokerage expenses, interest expenses, taxes and extraordinary expenses) to 1.55% of the Fund’s average daily net assets. This agreement is in effect through August 31, 2016. This agreement may not be terminated or modified prior to this date except with the approval of the Board. For the period ended October 31, 2015, this amount equaled $110,139.
Pursuant to this agreement, the Fund will reimburse the Adviser for any fee waivers and expense reimbursements made by the Adviser, provided that any such reimbursements made by the Fund to the Adviser will not cause the Fund’s expense limitation to exceed expense limitations in existence at the time the expense was incurred, or at the time of the reimbursement, whichever is lower, and the reimbursement is made within three years after the expenses were incurred.
Fund Accounting Fees and Expenses
ALPS Fund Services, Inc. (“ALPS”) serves as administrator to the Fund and the Fund has agreed to pay expenses incurred in connection with their administrative activities. Pursuant to an Administration Agreement, ALPS provides operational services to the Fund including, but not limited to, fund accounting and fund administration and generally assist in the Fund’s operations. Officers of the Trust are employees of ALPS. The Fund’s administration fee is accrued on a daily basis and paid monthly. Administration fees paid by the Fund for the six months ended October 31, 2015 are disclosed in the Consolidated Statement of Operations.
ALPS is reimbursed by the Fund for certain out-of-pocket expenses.
Transfer Agent
ALPS serves as transfer, dividend paying and shareholder servicing agent for the Fund. ALPS receives an annual minimum fee, a fee based upon the number of shareholder accounts, and is also reimbursed by the Fund for certain out-of-pocket expenses.
Compliance Services
ALPS provides services that assist the Trust’s chief compliance officer in monitoring and testing the policies and procedures of the Trust in conjunction with requirements under Rule 38a-1 under the 1940 Act and receives an annual base fee. ALPS is reimbursed for certain out-of-pocket expenses by the Fund.
Principal Financial Officer
ALPS receives an annual fee for providing principal financial officer services to the Fund.
| Semi-Annual Report | October 31, 2015 | 17 |
Table of Contents
| Aspen Managed Futures Strategy Fund | Notes to Consolidated Financial Statements | |
| October 31, 2015 (Unaudited) |
Distributor
ALPS Distributors, Inc. (“ADI” or the “Distributor”) (an affiliate of ALPS) acts as the distributor of the Fund’s shares pursuant to a Distribution Agreement with the Trust. Shares are sold on a continuous basis by ADI as agent for the Fund, and ADI has agreed to use its best efforts to solicit orders for the sale of the Fund’s shares, although it is not obliged to sell any particular amount of shares. ADI is not entitled to any compensation for its services as Distributor. ADI is registered as a broker-dealer with the Securities and Exchange Commission.
The Fund has adopted a plan of distribution for Class A shares pursuant to Rule 12b-1 under the 1940 Act (the “Plan”). The Plan allows the Fund to use Class A assets to pay fees in connection with the distribution and marketing of Class A shares and/or the provision of shareholder services to Class A shareholders. The Plan permits payment for services in connection with the administration of plans or programs that use Class A shares as their funding medium and for related expenses. The Plan permits the Fund to use its Class A assets to make total payments at an annual rate of up to 0.25% of the Fund’s average daily net assets attributable to its Class A shares. The expenses of the plan are reflected as distribution and service fees in the Consolidated Statement of Operations.
The Fund has adopted a shareholder service plan (a “Shareholder Services Plan”) for Class A shares. Under the Shareholder Services Plan the Fund is authorized to pay banks and their affiliates and other institutions, including broker-dealers and Fund affiliates (“Participating Organizations”), an aggregate fee in an amount not to exceed on an annual basis 0.15% for Class A shares of the average daily net asset value of the Class A shares, respectively, attributable to or held in the name of a Participating Organizations for its clients as compensation for providing shareholder service activities, which do not include distribution services, pursuant to an agreement with a Participating Organizations. Any amount of such payment not paid to the Participating Organizations during the Fund’s fiscal year for such service activities shall be reimbursed to the Fund. Shareholder Services Plan fees are included with distribution and service fees on the Consolidated Statement of Operations.
Index Licensing Services
The Fund has adopted an Index Licensing Agreement with Quantitative Equity Strategies, LLC (“QES”) and the Adviser, joint owners of the Index, pursuant to which the Fund pays QES a monthly annualized licensing fee of 0.25%, based on the Fund’s average daily net assets for the right to use the Index in connection with the Fund.
7. SECURITIES TRANSACTIONS
The cost of purchases and proceeds from sales of U.S. Government securities (excluding short-term securities) during the six months ended October 31, 2015 were as follows:
| Aspen Managed Futures Strategy Fund | ||
Cost of Investments Purchased | $ 78,407,122 | |
Proceeds from Investments Sold | $ 27,122,545 |
8. INDEMNIFICATIONS
Under the Trust’s organizational documents, its officers and Trustees are indemnified against certain liability arising out of the performance of their duties to the Trust. Additionally, in the normal course of business, the Trust enters into contracts with service providers that may contain general indemnification clauses, which may permit indemnification to the extent permissible under applicable law. The Trust’s maximum exposure under these arrangements is unknown, as this would involve future claims that may be made against the Trust that have not yet occurred.
9. RECENT ACCOUNTING PRONOUNCEMENT
In May 2015, the Financial Accounting Standards Board issued Accounting Standards Update (“ASU”) 2015-07, “Disclosures for Investments in Certain Entities that Calculate Net Asset Value Per Share (or its Equivalent).” This is an update to Accounting Standards Codification Topic 820, Fair Value Measurement. ASU 2015-07 removes the requirement to categorize within the fair value hierarchy investments for which fair value is measured at net asset value per share (or its equivalent) using the practical expedient. ASU 2015-17 is effective for annual reporting periods beginning on or after December 15, 2015, and interim periods within those annual periods, with retrospective application for all periods presented. The Fund is currently evaluating the impact ASU 2015-07 will have on the Fund’s financial statements and disclosures.
18 | www.aspenfuturesfund.com |
Table of Contents
| Aspen Managed Futures Strategy Fund | Additional Information | |
| October 31, 2015 (Unaudited) |
1. FUND HOLDINGS
The Fund files its complete schedule of portfolio holdings with the Securities and Exchange Commission (the “SEC”) for the first and third quarters of each fiscal year on Form N-Q within 60 days after the end of the period. Copies of the Fund’s Form N-Q are available without charge on the SEC website at http://www.sec.gov. You may also review and copy the Form N-Q at the SEC’s Public Reference Room in Washington, DC. For more information about the operation of the Public Reference Room, please call the SEC at 1-800-SEC-0330.
2. FUND PROXY VOTING POLICIES, PROCEDURES AND SUMMARIES
The Fund’s policies and procedures used in determining how to vote proxies and information regarding how the Fund voted proxies relating to portfolio securities during the most recent prior 12-month period ending June 30 are available without charge, (1) upon request, by calling (toll-free) 855-845-9444 and (2) on the SEC’s website at http://www.sec.gov.
| Semi-Annual Report | October 31, 2015 | 19 |
Table of Contents
Table of Contents
Table of Contents
| ||||
| ||||
| 1 | ||||||||
| 4 | ||||||||
| 6 | ||||||||
| 7 | ||||||||
| 18 | ||||||||
| 19 | ||||||||
| 20 | ||||||||
| 23 | ||||||||
| 24 | ||||||||
| 30 | ||||||||
| 33 | ||||||||
Disciplined Growth Investors’ goal is to communicate clearly and transparently with our clients and mutual fund shareholders. It is mutually beneficial when our shareholders understand how we invest, what we are currently thinking and forecasting, and the specific investment decisions we have made. Our views and opinions regarding the investment prospects of our portfolio holdings and Funds are “forward looking statements” which may or may not be accurate over the long term. While we believe we have a reasonable basis for these forecasts and have confidence in our investment team’s views, actual results may differ materially from those we anticipate. Information provided in this report should not be considered a recommendation to purchase or sell any particular security.
You can identify forward looking statements as those including words such as “believe”, “expect”, “anticipate”, “forecast”, and similar statement. We cannot assure future performance. These forward-looking statements are made only as-of the date of this report. Following the publication of this report, we will not update any of the forward-looking statements included here.
Past performance does not guarantee future results. Fund prices fluctuate as the underlying assets have exposure to market fluctuations and other risks, as described in the Fund’s prospectus. Please visit www.dgifund.com or call 1.855.DGI.FUND to obtain current performance information and for the current prospectus and statement of additional information. This material must be preceded or accompanied by a prospectus. Please read the prospectus carefully before investing. |
| |||||||
Table of Contents
The Disciplined Growth Investors Fund | Shareholder Letter | |
| October 31, 2015 (Unaudited) | ||
October 31, 2015
Dear Shareholders,
As of October 31, 2015, The Disciplined Growth Investors Fund (the “DGI Fund”) had $114.0 million in assets in 362 shareholder accounts. The average portfolio size is slightly above $300,000. Our decision to keep the Fund direct-only appears to be paying off; we believe it keeps the total shareholder cost reasonable and provides the same experience to all shareholders.
We believe a stable shareholder base is a key to the Fund’s continued success and are encouraged by the loyalty Fund shareholders have shown through the Fund’s first four-plus years. We hope to find many more shareholders like you; loyal, purposeful, and engaged.
Performance
Since our last letter to you six months ago, the DGI Fund has decreased 3.40%. The equity portion of the portfolio has decreased 4.5% and the fixed income portion has decreased 0.4%. Since inception in August of 2011, your Fund has returned 13.04% on an annualized basis.
Market Outlook
In the last six months, the US stock market experienced a sharp decline followed by positive results in October. The S&P 500 index fell by 12% between July 20 and August 25. Was the market decline a correction (typically a decline of 10-20%) or the beginning of a bear market, a decline of more than 20%?
The evidence suggests the market underwent a correction and not the beginning of a bear market. A little perspective might be helpful here. Market corrections tend to correct minor issues, such as pockets of overvaluation. The two other types of market declines could be categorized as severe and cyclical bear markets. Severe bear markets (≈50% declines) help correct major issues, primarily extreme overvaluation and/or cataclysmic economic dislocation. In our opinion these two reasons were the proximate causes of the 2000-2002 and 2008-2009 severe bear markets, respectively. Ordinary or cyclical bear markets (20+% declines) tend to occur more frequently and are focused around the U.S. Federal Reserve’s (the “Fed”) policy and recessions.
Prior to this market decline the stock market was exhibiting minor, not catastrophic issues. In our last commentary, we noted that one of the unsettling issues was the narrowness of the market, i.e., only a few, overvalued stocks were leading the advance. The biotech1 group stands out as a prime example. The Russell Mid Cap Growth2 Index biotech group increased 28.5% and the pharmaceuticals group1 increased by 19.2% from the first of this year through the end of June.
| 1 | Biotech and pharmaceuticals are sub-sectors of the Russell Mid Cap Growth index within the larger health care sector of stocks. A stock’s inclusion in a specific sector may be determined by its product sales in a sector (relative to its overall sales), its profits from a sector relative to total profits, or other similar measures. |
| 2 | The Russell Mid Cap Growth Index is an index provided by Russell Investments representing the 201st to 1000th largest publicly-traded companies in its index weighted to give what Russell considers growth stocks a larger representation in the index versus what it considers value stocks. Investors cannot invest directly in an index; index-like investments can be accessed through passive index funds which seek to mimic index performance. |
Semi-Annual Report | October 31, 2015 |
1 |
Table of Contents
The Disciplined Growth Investors Fund | Shareholder Letter | |
| October 31, 2015 (Unaudited) | ||
The biotech group corrected sharply since their peak in mid-June. From that peak through the end of October, biotech stocks in the Russell Mid Cap Growth Index declined 16.7%. The prime reason they appreciated earlier this year is because the stocks kept going up. Yes, you read that last sentence correctly. They went up because they were going up. Once they stop going up speculators tend to abandon them, because even after the correction the stocks are still overvalued.
In the last quarterly report to you we noted a few other stocks leading the market this year were overvalued. One was Tesla3. In mid-July the stock peaked at over $280 per share, for a gain of 27% on the year to that point. Since then the stock has declined by 26.7% and is now down 7.0% for the year (through 10/31/15). By our analysis, the stock remains extremely overvalued even after the price decline.
The general investment environment also suggests the market is correcting versus entering a bear market. We believe we can prudently rule out the probability of a severe bear market. We have had five severe bear markets during the last 100 years, two in the 1930’s, one in the 1970’s and two from 2000-2010. The cleansing process from two severe bear markets in one decade tends to do two things: 1) force all market participants to stress-test their portfolios not once but twice and 2) leave all market participants with a heightened sense of fear and dread about what might come next. Therefore they act so cautiously so as to forestall another severe bear market.
What about a cyclical bear market? These types of bear markets are centered on normal cyclical recessions that cause temporary declines in earnings. We believe the U.S. economy is currently underperforming its potential; growth is sluggish. The Fed has not tightened and the yield curve is not inverted. This set of conditions suggests the U.S. will continue to achieve slow growth. Further, the 2016 national elections are 13 months away. If the election leads to tax and regulatory reform then we believe the U.S. economy is likely to achieve far better performance beginning in 2017.
There are still troubling economic soft spots around the world, which could produce a recession. China is trying to change its economy. We believe the economic reporting there reflects corruption and restricts us to a generalized impression of the progress in China. Europe is stagnant and trying to cope with a growing flood of refugees. The Mideast is a conflagration. The price of oil has been falling, which is pressuring the budgets of many OPEC4 governments.
The breakdown of world order is also worrying. Russia has become more aggressive; China is trying to exert its dominance in Asia. The chaos in the Mideast appears to be increasing. The decline in oil prices is highly favorable in the long run but increases the financial pressures on Russia and nearly all OPEC governments who are spending heavily to placate their populations. Europe may be facing a refugee crisis. For investors the question is whether this disorder will affect economic growth. We do not believe we can prudently link world issues to the stock market with sufficient confidence to alter our investment posture. We will continue to watch world events, and worry.
| 3 | The DGI Fund does not currently hold Tesla stock nor has it owned Tesla stock in the past. Current and future holdings are subject to risk. |
| 4 | OPEC stands for the Organization of Petroleum Exporting Countries. It is a 13-country cartel formed in 1960. Its constituents are located in the Middle East, Africa, and South America. |
2 |
1-855-DGI-FUND (344-3863) | www.DGIfund.com |
Table of Contents
The Disciplined Growth Investors Fund | Shareholder Letter | |
| October 31, 2015 (Unaudited) | ||
We have been continuing our efforts to improve the portfolio posture with new investments and additions to existing holdings. We are continuing to find unique and potentially highly profitable ideas. The work is slow and painstaking.
Your Fund’s investment posture reflects our view that the 2008-09 bear market “cleared the decks” for stocks to achieve a multi-year period of excellent performance. The fact of negative performance results during the first nine months of this year has not diminished our assessment that stocks offer the best source of risk-adjusted return over the next seven years.
Sincerely,
Frederick K. Martin, CFA
Chief Investment Officer
Disciplined Growth Investors, Inc.
ALPS Distributors, Inc. is the distributor for The Disciplined Growth Investors Fund.
The Fund is subject to investment risks, including possible loss of the principal amount invested and therefore is not suitable for all investors. The Fund may not achieve its objectives.
Diversification does not ensure a profit or guarantee against loss.
The views of the author and information discussed in this commentary are as of the date of publication, are subject to change, and may not reflect the writer’s current views. The views expressed are those of the author only, and represent an assessment of market conditions at a specific point in time, are opinions only and should not be relied upon as investment advice regarding a particular investment or markets in general. Such information does not constitute a recommendation to buy or sell specific securities or investment vehicles. It should not be assumed that any investment will be profitable or will equal the performance of the Fund or any securities or any sectors mentioned herein. The subject matter contained in this letter has been derived from several sources believed to be reliable and accurate at the time of compilation. Disciplined Growth Investors, Inc. nor the Fund accepts any liability for losses either direct or consequential caused by the use of this information.
Fred Martin is a registered representative of ALPS Distributors, Inc.
Semi-Annual Report | October 31, 2015 |
3 |
Table of Contents
The Disciplined Growth Investors Fund | Performance Update | |
| October 31, 2015 (Unaudited) | ||
Cumulative Total Return Performance (for the period ended October 31, 2015)
| 1 month | Quarter | 6 month | YTD | 1 Year | 3 Year | Since Inception* | ||||||||
Disciplined Growth Investors Fund | 2.54% | -2.35% | -3.40% | -2.92% | 1.11% | 10.87% | 13.04% | |||||||
S&P 500® Total Return Index(1) | 8.44% | -0.63% | 0.77% | 2.70% | 5.20% | 16.20% | 16.87% |
| * | Fund Inception date of August 12, 2011 |
| (1) | The S&P 500® Total Return Index is an unmanaged index of 500 common stocks chosen for market size, liquidity and industry group representation. It is a market-value weighted index. The Index is not actively managed and does not reflect any deductions for fees, expenses or taxes. An investor may not invest directly in the Index. |
The returns shown above do not reflect the deductions of taxes a shareholder would pay on Fund distributions or redemptions of Fund shares.
Returns less than one year are cumulative.
Performance data quoted represents past performance. Past performance does not guarantee future results. Investment return and principal value of an investment will fluctuate so that an investor’s shares, when sold or redeemed, may be worth more or less than the original cost. Current performance data may be higher or lower than actual data quoted. For the most current month-end performance data please call 1.855.DGI.FUND.
4 |
1-855-DGI-FUND (344-3863) | www.DGIfund.com |
Table of Contents
The Disciplined Growth Investors Fund | Performance Update | |
| October 31, 2015 (Unaudited) | ||
Growth of $10,000 Investment in the Fund (for the period ended October 31, 2015)

The chart represents historical performance of a hypothetical investment of $10,000 in the Fund since inception. Past performance does not guarantee future results. This chart does not reflect the deduction of taxes that a shareholder would pay on Fund distributions or the redemption of Fund shares.
Investing in the Fund is subject to investment risks, including possible loss of the principal amount invested.
Industry Sector Allocation (as a % of Net Assets)* | ||||
Technology | 24.40% | |||
Consumer Discretionary | 19.41% | |||
Producer Durables | 9.75% | |||
Health Care | 8.74% | |||
Energy | 2.67% | |||
Financial Services | 3.68% | |||
Asset/Mortgage Backed Securities | 0.12% | |||
Corporate Bond | 22.98% | |||
Foreign Government Bonds | 0.25% | |||
Government & Agency Obligations | 0.10% | |||
Other Assets in Excess of Liabilities | 7.90% | |||
Top Ten Holdings (as a % of Net Assets)* | ||||
TJX Cos., Inc. | 3.93% | |||
Edwards Lifesciences Corp. | 3.77% | |||
Middleby Corp. | 3.54% | |||
Intuit, Inc. | 3.40% | |||
L Brands, Inc. | 3.28% | |||
Royal Caribbean Cruises Ltd. | 2.45% | |||
FactSet Research Systems, Inc. | 2.35% | |||
Open Text Corp. | 2.33% | |||
Autodesk, Inc. | 2.05% | |||
Akamai Technologies, Inc. | 1.97% | |||
Top Ten Holdings | 29.07% | |||
* Holdings are subject to change, and may not reflect the current or future position of the portfolio.
Semi-Annual Report | October 31, 2015 |
5 |
Table of Contents
The Disciplined Growth Investors Fund | Disclosure of Fund Expenses | |
| October 31, 2015 (Unaudited) | ||
As a shareholder of a Fund, you incur two types of costs: direct costs, such as short-term redemption fees and wire fees, balance fees, and indirect costs, including management fees, and other fund operating expenses. This example is intended to help you understand your indirect costs, also referred to as “ongoing costs” (in dollars), of investing in the Fund and to compare these costs with the ongoing costs of investing in other mutual funds.
This example is based on an investment of $1,000 invested at the beginning of the period and held for the entire six-month period of May 1, 2015 through October 31, 2015.
Actual Expenses The first line of the table below provides information about actual account values and actual expenses. You may use the information in this line, together with the amount you invested at the beginning of the period, to estimate the expenses that you paid over the period. Simply divide your account value by $1,000 (for example, an $8,600 account value divided by $1,000 = 8.6), then multiply the result by the number in the first line under the heading “Expenses Paid During Period” to estimate the expenses you paid on your account during this period.
Hypothetical Example for Comparison Purposes The second line of the table provides information about hypothetical account values and hypothetical expenses based on the Fund’s actual expense ratio and an assumed rate of return of 5% per year before expenses, which is not the Fund’s actual return. The hypothetical account values and expenses may not be used to estimate the actual ending account balance or expenses you paid for the period. You may use this information to compare ongoing costs of investing in the Fund and other funds. To do so, compare this 5% hypothetical example with the 5% hypothetical examples that appear in the shareholder reports of other funds.
Please note that the expenses shown in the table are meant to highlight your ongoing costs only and do not reflect any direct costs, such as wire fees or low balance fees. Therefore, the second line of the table is useful in comparing ongoing costs only and will not help you determine the relative total costs of owning different funds. In addition, if these direct costs were included, your costs would be higher.
Beginning Account 5/1/2015 | Ending Account Value 10/31/2015 | Expense Ratio(a) | Expenses Paid 10/31/2015(b) | |||||||||||||||||
Actual | $ 1,000.00 | $ 966.00 | 0.78 | % | $ 3.85 | |||||||||||||||
Hypothetical (5% return before expenses) | $ 1,000.00 | $ 1,021.22 | 0.78 | % | $ 3.96 | |||||||||||||||
| (a) | The Fund’s expense ratios have been annualized based on the Fund’s most recent fiscal half-year expenses. |
| (b) | Expenses are equal to the Fund’s annualized expense ratio, multiplied by the average account value over the period, multiplied by the number of days in the most recent fiscal half-year (184)/366 (to reflect the half-year period). |
6 |
1-855-DGI-FUND (344-3863) | www.DGIfund.com |
Table of Contents
The Disciplined Growth Investors Fund | Portfolio of Investments | |
| October 31, 2015 (Unaudited) | ||
| Shares | Value (Note 2) | |||||||
| ||||||||
COMMON STOCKS (68.65%) | ||||||||
CONSUMER DISCRETIONARY (19.41%) | ||||||||
Auto & Auto Parts (1.41%) | ||||||||
Gentex Corp. | 97,600 | $ | 1,599,664 | |||||
|
| |||||||
Consumer Products (4.24%) | ||||||||
Ethan Allen Interiors, Inc. | 47,569 | 1,294,352 | ||||||
Garmin Ltd. | 34,563 | 1,225,950 | ||||||
Ralph Lauren Corp. | 9,806 | 1,086,211 | ||||||
Select Comfort Corp.(a) | 57,886 | 1,227,183 | ||||||
|
| |||||||
| 4,833,696 | ||||||||
|
| |||||||
Leisure (4.00%) | ||||||||
Cheesecake Factory, Inc. | 15,250 | 735,050 | ||||||
Royal Caribbean Cruises Ltd. | 28,400 | 2,793,140 | ||||||
TripAdvisor, Inc.(a) | 12,300 | 1,030,494 | ||||||
|
| |||||||
| 4,558,684 | ||||||||
|
| |||||||
Retail (9.00%) | ||||||||
Cabela’s, Inc.(a) | 36,600 | 1,433,622 | ||||||
L Brands, Inc. | 38,900 | 3,733,622 | ||||||
TJX Cos., Inc. | 61,125 | 4,473,738 | ||||||
Urban Outfitters, Inc.(a) | 21,300 | 609,180 | ||||||
|
| |||||||
| 10,250,162 | ||||||||
|
| |||||||
Textiles, Apparel & Luxury Goods (0.76%) | ||||||||
Tumi Holdings, Inc.(a) | 53,825 | 862,815 | ||||||
|
| |||||||
TOTAL CONSUMER DISCRETIONARY | 22,105,021 | |||||||
|
| |||||||
ENERGY (2.67%) | ||||||||
Crude Producers (0.48%) | ||||||||
Southwestern Energy Co.(a) | 49,100 | 542,064 | ||||||
|
| |||||||
Energy Equipment & Services (0.75%) | ||||||||
Noble Corp. PLC | 63,657 | 857,460 | ||||||
|
| |||||||
Oil & Gas Services (0.84%) | ||||||||
Core Laboratories NV | 8,200 | 953,906 | ||||||
|
| |||||||
Semi-Annual Report | October 31, 2015 |
7 |
Table of Contents
The Disciplined Growth Investors Fund | Portfolio of Investments | |
| October 31, 2015 (Unaudited) | ||
| Shares | Value (Note 2) | |||||||
| ||||||||
ENERGY (continued) | ||||||||
Oil, Gas & Consumable Fuels (0.60%) | ||||||||
Ultra Petroleum Corp.(a) | 125,125 | $ | 685,685 | |||||
|
| |||||||
TOTAL ENERGY | 3,039,115 | |||||||
|
| |||||||
FINANCIAL SERVICES (3.68%) | ||||||||
Banks (0.54%) | ||||||||
TCF Financial Corp. | 40,375 | 621,371 | ||||||
|
| |||||||
Consumer Finance & Credit Services (2.35%) | ||||||||
FactSet Research Systems, Inc. | 15,269 | 2,673,907 | ||||||
|
| |||||||
Investment Banking & Brokerage (0.79%) | ||||||||
E*Trade Financial Corp.(a) | 31,646 | 902,228 | ||||||
|
| |||||||
TOTAL FINANCIAL SERVICES | 4,197,506 | |||||||
|
| |||||||
HEALTH CARE (8.74%) | ||||||||
Biotechnology (1.09%) | ||||||||
Myriad Genetics, Inc.(a) | 30,625 | 1,236,331 | ||||||
|
| |||||||
Medical Equipment & Services (6.55%) | ||||||||
Edwards Lifesciences Corp.(a) | 27,325 | 4,294,124 | ||||||
Intuitive Surgical, Inc.(a) | 3,762 | 1,868,209 | ||||||
Varian Medical Systems, Inc.(a) | 16,500 | 1,295,745 | ||||||
|
| |||||||
| 7,458,078 | ||||||||
|
| |||||||
Medical Specialties (1.10%) | ||||||||
Align Technology, Inc.(a) | 19,200 | 1,256,832 | ||||||
|
| |||||||
TOTAL HEALTH CARE | 9,951,241 | |||||||
|
| |||||||
PRODUCER DURABLES (9.75%) | ||||||||
Computers (0.55%) | ||||||||
IHS, Inc. - Class A(a) | 5,225 | 624,596 | ||||||
|
| |||||||
Machinery (3.54%) | ||||||||
Middleby Corp.(a) | 34,454 | 4,029,051 | ||||||
|
| |||||||
Machinery-Diversified (0.66%) | ||||||||
Graco, Inc. | 10,225 | 750,515 | ||||||
|
| |||||||
8 |
1-855-DGI-FUND (344-3863) | www.DGIfund.com |
Table of Contents
The Disciplined Growth Investors Fund | Portfolio of Investments | |
| October 31, 2015 (Unaudited) | ||
| Shares | Value (Note 2) | |||||||
| ||||||||
PRODUCER DURABLES (continued) | ||||||||
Professional Services (1.27%) | ||||||||
CEB, Inc. | 19,425 | $ | 1,452,213 | |||||
|
| |||||||
Software (0.63%) | ||||||||
Paychex, Inc. | 13,825 | 713,094 | ||||||
|
| |||||||
Transportation & Freight (3.10%) | ||||||||
JetBlue Airways Corp.(a) | 85,750 | 2,130,030 | ||||||
Landstar System, Inc. | 22,225 | 1,401,064 | ||||||
|
| |||||||
| 3,531,094 | ||||||||
|
| |||||||
TOTAL PRODUCER DURABLES | 11,100,563 | |||||||
|
| |||||||
TECHNOLOGY (24.40%) | ||||||||
Computer Technology (1.12%) | ||||||||
Super Micro Computer, Inc.(a) | 45,400 | 1,280,734 | ||||||
|
| |||||||
Electronics (6.03%) | ||||||||
ARM Holdings PLC - Sponsored ADR | 20,637 | 978,813 | ||||||
Microchip Technology, Inc. | 21,800 | 1,052,722 | ||||||
Open Text Corp. | 57,112 | 2,649,997 | ||||||
Plexus Corp.(a) | 63,025 | 2,181,925 | ||||||
|
| |||||||
| 6,863,457 | ||||||||
|
| |||||||
Information Technology (11.27%) | ||||||||
Akamai Technologies, Inc.(a) | 36,825 | 2,239,696 | ||||||
Autodesk, Inc.(a) | 42,300 | 2,334,537 | ||||||
Dolby Laboratories, Inc. - Class A | 16,350 | 566,855 | ||||||
Intuit, Inc. | 39,725 | 3,870,407 | ||||||
Seagate Technology PLC | 53,097 | 2,020,872 | ||||||
Yahoo!, Inc.(a) | 50,600 | 1,802,372 | ||||||
|
| |||||||
| 12,834,739 | ||||||||
|
| |||||||
Semiconductors (1.76%) | ||||||||
Power Integrations, Inc. | 17,150 | 867,962 | ||||||
Synaptics, Inc.(a) | 13,400 | 1,140,206 | ||||||
|
| |||||||
| 2,008,168 | ||||||||
|
| |||||||
Software (1.52%) | ||||||||
Qlik Technologies, Inc.(a) | 33,300 | 1,044,621 | ||||||
RealPage, Inc.(a) | 40,300 | 681,070 | ||||||
|
| |||||||
| 1,725,691 | ||||||||
|
| |||||||
Semi-Annual Report | October 31, 2015 |
9 |
Table of Contents
The Disciplined Growth Investors Fund | Portfolio of Investments | |
| October 31, 2015 (Unaudited) | ||
| Shares | Value (Note 2) | |||||||
| ||||||||
TECHNOLOGY (continued) | ||||||||
Telecommunications (2.70%) | ||||||||
Plantronics, Inc. | 30,100 | $ | 1,613,962 | |||||
Ubiquiti Networks, Inc. | 30,100 | 878,318 | ||||||
ViaSat, Inc.(a) | 8,744 | 576,754 | ||||||
|
| |||||||
| 3,069,034 | ||||||||
|
| |||||||
TOTAL TECHNOLOGY | 27,781,823 | |||||||
|
| |||||||
TOTAL COMMON STOCKS (Cost $ 56,733,190) | 78,175,269 | |||||||
|
| |||||||
| Principal Amount | Value (Note 2) | |||||||
| ||||||||
ASSET/MORTGAGE BACKED SECURITIES (0.12%) | ||||||||
Government National Mortgage Association, Series 2005-93 | ||||||||
5.500% 12/20/2034 | $ | 129,687 | 134,019 | |||||
|
| |||||||
TOTAL ASSET/MORTGAGE BACKED SECURITIES (Cost $138,724) | 134,019 | |||||||
|
| |||||||
CORPORATE BONDS (22.98%) | ||||||||
BASIC MATERIALS (0.65%) | ||||||||
Chemicals (0.30%) | ||||||||
Lubrizol Corp. | ||||||||
8.875% 02/01/2019 | 285,000 | 345,381 | ||||||
|
| |||||||
Iron/Steel (0.35%) | ||||||||
Nucor Corp. | ||||||||
5.750% 12/01/2017 | 369,000 | 396,246 | ||||||
|
| |||||||
TOTAL BASIC MATERIALS | 741,627 | |||||||
|
| |||||||
COMMUNICATIONS (2.48%) | ||||||||
Media (1.67%) | ||||||||
21st Century Fox America, Inc. | ||||||||
6.900% 03/01/2019 | 317,000 | 363,449 | ||||||
Comcast Cable Communications Holdings, Inc. | ||||||||
9.455% 11/15/2022 | 263,000 | 366,011 | ||||||
Comcast Corp. | ||||||||
5.150% 03/01/2020 | 715,000 | 805,297 | ||||||
10 |
1-855-DGI-FUND (344-3863) | www.DGIfund.com |
Table of Contents
The Disciplined Growth Investors Fund | Portfolio of Investments | |
| October 31, 2015 (Unaudited) | ||
| Principal Amount | Value (Note 2) | |||||||
| ||||||||
Media (continued) | ||||||||
Viacom, Inc. | ||||||||
2.500% 09/01/2018 | $ | 364,000 | $ | 366,374 | ||||
|
| |||||||
| 1,901,131 | ||||||||
|
| |||||||
Telecommunications (0.81%) | ||||||||
AT&T, Inc. | ||||||||
2.450% 06/30/2020 | 510,000 | 506,125 | ||||||
AT&T, Inc. | ||||||||
5.500% 02/01/2018 | 7,000 | 7,583 | ||||||
Verizon Communications, Inc. | ||||||||
4.500% 09/15/2020 | 371,000 | 403,063 | ||||||
|
| |||||||
| 916,771 | ||||||||
|
| |||||||
TOTAL COMMUNICATIONS | 2,817,902 | |||||||
|
| |||||||
CONSUMER, CYCLICAL (1.31%) | ||||||||
Retail (1.31%) | ||||||||
Advance Auto Parts, Inc. | ||||||||
5.750% 05/01/2020 | 365,000 | 402,236 | ||||||
CVS Health Corp. | ||||||||
4.125% 05/15/2021 | 348,000 | 373,071 | ||||||
McDonald’s Corp. | ||||||||
6.300% 03/01/2038 | 284,000 | 340,811 | ||||||
Wal-Mart Stores, Inc. | ||||||||
6.200% 04/15/2038 | 297,000 | 377,508 | ||||||
|
| |||||||
TOTAL CONSUMER, CYCLICAL | 1,493,626 | |||||||
|
| |||||||
CONSUMER, NON-CYCLICAL (2.39%) | ||||||||
Beverages (1.06%) | ||||||||
Anheuser-Busch InBev Worldwide, Inc. | ||||||||
2.500% 07/15/2022 | 373,000 | 354,944 | ||||||
Diageo Capital PLC | ||||||||
5.750% 10/23/2017 | 453,000 | 491,087 | ||||||
Pepsi Bottling Group, Inc., Series B | ||||||||
7.000% 03/01/2029 | 269,000 | 364,325 | ||||||
|
| |||||||
| 1,210,356 | ||||||||
|
| |||||||
Commercial Services (0.33%) | ||||||||
Total System Services, Inc. | ||||||||
2.375% 06/01/2018 | 380,000 | 380,003 | ||||||
|
| |||||||
Semi-Annual Report | October 31, 2015 |
11 |
Table of Contents
The Disciplined Growth Investors Fund | Portfolio of Investments | |
| October 31, 2015 (Unaudited) | ||
| Principal Amount | Value (Note 2) | |||||||
| ||||||||
Food (0.33%) | ||||||||
Unilever Capital Corp. | ||||||||
4.800% 02/15/2019 | $ | 338,000 | $ | 371,614 | ||||
|
| |||||||
Healthcare-Services (0.35%) | ||||||||
UnitedHealth Group, Inc. | ||||||||
2.700% 07/15/2020 | 390,000 | 400,100 | ||||||
|
| |||||||
Pharmaceuticals (0.32%) | ||||||||
Johnson & Johnson | ||||||||
5.850% 07/15/2038 | 283,000 | 363,728 | ||||||
|
| |||||||
TOTAL CONSUMER, NON-CYCLICAL | 2,725,801 | |||||||
|
| |||||||
ENERGY (2.76%) | ||||||||
Oil & Gas (0.59%) | ||||||||
ConocoPhillips Holding Co. | ||||||||
6.950% 04/15/2029 | 282,000 | 352,019 | ||||||
Noble Energy, Inc. | ||||||||
8.250% 03/01/2019 | 272,000 | 317,126 | ||||||
|
| |||||||
| 669,145 | ||||||||
|
| |||||||
Pipelines (2.17%) | ||||||||
DCP Midstream Operating LP | ||||||||
3.875% 03/15/2023 | 380,000 | 323,612 | ||||||
Energy Transfer Partners LP | ||||||||
9.700% 03/15/2019 | 299,000 | 354,285 | ||||||
Enterprise Products Operating LLC | ||||||||
5.200% 09/01/2020 | 331,000 | 364,854 | ||||||
Kinder Morgan Energy Partners LP | ||||||||
9.000% 02/01/2019 | 299,000 | 345,560 | ||||||
ONEOK Partners LP | ||||||||
3.200% 09/15/2018 | 419,000 | 420,674 | ||||||
Plains All American Pipeline LP / PAA Finance Corp. | ||||||||
8.750% 05/01/2019 | 298,000 | 353,513 | ||||||
TransCanada PipeLines Ltd. | ||||||||
7.250% 08/15/2038 | 249,000 | 313,430 | ||||||
|
| |||||||
| 2,475,928 | ||||||||
|
| |||||||
TOTAL ENERGY | 3,145,073 | |||||||
|
| |||||||
12 |
1-855-DGI-FUND (344-3863) | www.DGIfund.com |
Table of Contents
The Disciplined Growth Investors Fund | Portfolio of Investments | |
| October 31, 2015 (Unaudited) | ||
| Principal Amount | Value (Note 2) | |||||||
| ||||||||
FINANCIAL (3.26%) | ||||||||
Banks (1.15%) | ||||||||
Bank of America Corp. | ||||||||
5.650% 05/01/2018 | $ | 340,000 | $ | 370,106 | ||||
JPMorgan Chase & Co. | ||||||||
4.400% 07/22/2020 | 370,000 | 398,837 | ||||||
Royal Bank of Scotland Group PLC, Series 1 | ||||||||
9.118% Perpetual Maturity (b) | 3,000 | 3,036 | ||||||
Wachovia Corp. | ||||||||
5.750% 06/15/2017 | 500,000 | 535,220 | ||||||
|
| |||||||
| 1,307,199 | ||||||||
|
| |||||||
Diversified Financial Services (1.13%) | ||||||||
American Express Co. | ||||||||
7.000% 03/19/2018 | 395,000 | 443,683 | ||||||
General Electric Capital Corp. | ||||||||
5.875% 01/14/2038 | 310,000 | 383,625 | ||||||
National Rural Utilities Cooperative Finance Corp. | ||||||||
10.375% 11/01/2018 | 373,000 | 463,054 | ||||||
|
| |||||||
| 1,290,362 | ||||||||
|
| |||||||
Insurance (0.66%) | ||||||||
American International Group, Inc. | ||||||||
6.400% 12/15/2020 | 340,000 | 401,991 | ||||||
MetLife, Inc., Series A | ||||||||
6.817% 08/15/2018 | 305,000 | 346,209 | ||||||
|
| |||||||
| 748,200 | ||||||||
|
| |||||||
Real Estate Investment Trusts (0.32%) | ||||||||
Health Care REIT, Inc. | ||||||||
2.250% 03/15/2018 | 365,000 | 366,382 | ||||||
|
| |||||||
TOTAL FINANCIAL | 3,712,143 | |||||||
|
| |||||||
GOVERNMENT (0.35%) | ||||||||
Multi-National (0.35%) | ||||||||
Corporacion Andina de Fomento | ||||||||
8.125% 06/04/2019 | 330,000 | 396,660 | ||||||
Corporacion Andina de Fomento | ||||||||
5.750% 01/12/2017 | 1,000 | 1,054 | ||||||
|
| |||||||
| 397,714 | ||||||||
|
| |||||||
TOTAL GOVERNMENT | 397,714 | |||||||
|
| |||||||
Semi-Annual Report | October 31, 2015 |
13 |
Table of Contents
The Disciplined Growth Investors Fund | Portfolio of Investments | |
| October 31, 2015 (Unaudited) | ||
| Principal Amount | Value (Note 2) | |||||||
| ||||||||
INDUSTRIAL (2.90%) | ||||||||
Aerospace/Defense (0.64%) | ||||||||
Lockheed Martin Corp. | ||||||||
4.250% 11/15/2019 | $ | 345,000 | $ | 373,075 | ||||
Rockwell Collins, Inc. | ||||||||
3.700% 12/15/2023 | 340,000 | 354,625 | ||||||
|
| |||||||
| 727,700 | ||||||||
|
| |||||||
Electrical Components & Equipment (0.32%) | ||||||||
Emerson Electric Co. | ||||||||
5.000% 04/15/2019 | 335,000 | 369,834 | ||||||
|
| |||||||
Electronics (0.28%) | ||||||||
Corning, Inc. | ||||||||
6.625% 05/15/2019 | 286,000 | 324,005 | ||||||
|
| |||||||
Engineering & Construction (0.33%) | ||||||||
Fluor Corp. | ||||||||
3.375% 09/15/2021 | 358,000 | 370,351 | ||||||
|
| |||||||
Environmental Control (0.35%) | ||||||||
Republic Services, Inc. | ||||||||
5.500% 09/15/2019 | 358,000 | 398,401 | ||||||
|
| |||||||
Miscellaneous Manufacturing (0.33%) | ||||||||
Tyco Electronics Group SA | ||||||||
3.500% 02/03/2022 | 364,000 | 372,681 | ||||||
|
| |||||||
Transportation (0.65%) | ||||||||
CSX Corp. | ||||||||
7.375% 02/01/2019 | 311,000 | 361,213 | ||||||
United Parcel Service, Inc. | ||||||||
6.200% 01/15/2038 | 293,000 | 382,459 | ||||||
|
| |||||||
| 743,672 | ||||||||
|
| |||||||
TOTAL INDUSTRIAL | 3,306,644 | |||||||
|
| |||||||
UTILITIES (6.88%) | ||||||||
Electric (6.18%) | ||||||||
Ameren Illinois Co. | ||||||||
9.750% 11/15/2018 | 351,000 | 429,781 | ||||||
Arizona Public Service Co. | ||||||||
8.750% 03/01/2019 | 297,000 | 358,185 | ||||||
14 |
1-855-DGI-FUND (344-3863) | www.DGIfund.com |
Table of Contents
The Disciplined Growth Investors Fund | Portfolio of Investments | |
| October 31, 2015 (Unaudited) | ||
| Principal Amount | Value (Note 2) | |||||||
| ||||||||
Electric (continued) | ||||||||
CMS Energy Corp. | ||||||||
5.050% 03/15/2022 | $ | 319,000 | $ | 354,493 | ||||
Commonwealth Edison Co. | ||||||||
4.000% 08/01/2020 | 330,000 | 353,513 | ||||||
Consolidated Edison Co. of New York, Inc. | ||||||||
7.125% 12/01/2018 | 310,000 | 358,577 | ||||||
Edison International | ||||||||
3.750% 09/15/2017 | 321,000 | 333,499 | ||||||
Georgia Power Co. | ||||||||
5.400% 06/01/2018 | 286,000 | 313,366 | ||||||
Interstate Power & Light Co. | ||||||||
3.650% 09/01/2020 | 347,000 | 366,958 | ||||||
ITC Holdings Corp. | ||||||||
4.050% 07/01/2023 | 388,000 | 402,026 | ||||||
Jersey Central Power & Light Co. | ||||||||
7.350% 02/01/2019 | 450,000 | 509,131 | ||||||
Nevada Power Co. | ||||||||
7.125% 03/15/2019 | 300,000 | 347,848 | ||||||
Oncor Electric Delivery Co. LLC | ||||||||
7.000% 09/01/2022 | 330,000 | 401,686 | ||||||
PacifiCorp | ||||||||
5.650% 07/15/2018 | 17,000 | 18,759 | ||||||
PPL Capital Funding, Inc. | ||||||||
3.500% 12/01/2022 | 529,000 | 535,488 | ||||||
PSEG Power LLC | ||||||||
2.450% 11/15/2018 | 373,000 | 375,031 | ||||||
PSEG Power LLC | ||||||||
5.320% 09/15/2016 | 440,000 | 455,101 | ||||||
Puget Energy, Inc. | ||||||||
5.625% 07/15/2022 | 337,000 | 381,355 | ||||||
TECO Finance, Inc. | ||||||||
6.572% 11/01/2017 | 317,000 | 345,901 | ||||||
Wisconsin Electric Power Co. | ||||||||
2.950% 09/15/2021 | 385,000 | 392,952 | ||||||
|
| |||||||
| 7,033,650 | ||||||||
|
| |||||||
Gas (0.70%) | ||||||||
CenterPoint Energy Resources Corp. | ||||||||
6.000% 05/15/2018 | 300,000 | 328,977 | ||||||
Semi-Annual Report | October 31, 2015 |
15 |
Table of Contents
The Disciplined Growth Investors Fund | Portfolio of Investments | |
| October 31, 2015 (Unaudited) | ||
| Principal Amount | Value (Note 2) | |||||||||||
| ||||||||||||
Gas (continued) | ||||||||||||
Sempra Energy | ||||||||||||
6.500% 06/01/2016 | $ | 455,000 | $ | 469,325 | ||||||||
|
| |||||||||||
| 798,302 | ||||||||||||
|
| |||||||||||
TOTAL UTILITIES | 7,831,952 | |||||||||||
|
| |||||||||||
TOTAL CORPORATE BONDS (Cost $26,217,337) | 26,172,482 | |||||||||||
|
| |||||||||||
FOREIGN GOVERNMENT BONDS (0.25%) | ||||||||||||
Province of Quebec Canada, Series NN | ||||||||||||
7.125% 02/09/2024 | 216,000 | 281,475 | ||||||||||
|
| |||||||||||
TOTAL FOREIGN GOVERNMENT BONDS (Cost $277,514) | 281,475 | |||||||||||
|
| |||||||||||
GOVERNMENT & AGENCY OBLIGATIONS (0.10%) | ||||||||||||
U.S. Treasury Bonds | ||||||||||||
6.500% 11/15/2026 | 28,000 | 39,790 | ||||||||||
|
| |||||||||||
U.S. Treasury Notes | ||||||||||||
5.125% 05/15/2016 | 20,000 | 20,514 | ||||||||||
U.S. Treasury Notes | ||||||||||||
4.500% 02/15/2016 | 38,000 | 38,474 | ||||||||||
U.S. Treasury Notes | ||||||||||||
4.500% 11/15/2015 | 16,000 | 16,026 | ||||||||||
|
| |||||||||||
TOTAL GOVERNMENT & AGENCY OBLIGATIONS (Cost $114,147) | 114,804 | |||||||||||
|
| |||||||||||
| Yield | Shares | Value (Note 2) | ||||||||||
| ||||||||||||
SHORT TERM INVESTMENTS (7.74%) | ||||||||||||
MONEY MARKET FUND (2.65%) | ||||||||||||
Fidelity Institutional Money Market Government Portfolio - Class I | 0.01%(c) | 3,013,809 | 3,013,809 | |||||||||
|
| |||||||||||
U.S. TREASURY BILLS (5.09%) | ||||||||||||
U.S. Treasury Bill, 12/10/2015 | 0.14%(d) | 5,800,000 | 5,799,884 | |||||||||
|
| |||||||||||
TOTAL SHORT TERM INVESTMENTS (Cost $8,812,938) | 8,813,693 | |||||||||||
|
| |||||||||||
16 |
1-855-DGI-FUND (344-3863) | www.DGIfund.com |
Table of Contents
The Disciplined Growth Investors Fund | Portfolio of Investments | |
| October 31, 2015 (Unaudited) | ||
TOTAL INVESTMENTS (99.84%) (Cost $92,293,850) | $ | 113,691,742 | ||
Other Assets In Excess Of Liabilities (0.16%) | 183,797 | |||
|
| |||
NET ASSETS (100.00%) | $ | 113,875,539 | ||
|
| |||
|
| |||
| (a) | Non-Income Producing Security. |
| (b) | This security has no contractual maturity date, is not redeemable and contractually pays an indefinite stream of interest. |
| (c) | Represents the 7-day yield. |
| (d) | Rate shown represents the bond equivalent yield to maturity at date of purchase. |
Common Abbreviations:
ADR - American Depositary Receipt.
LLC - Limited Liability Company.
LP - Limited Partnership.
Ltd. - Limited.
NV - Naamloze Vennootschap is the Dutch term for limited liability company.
PLC - Public Limited Company.
REIT - Real Estate Investment Trust.
| SA - | Generally designated corporations in various countries, mostly those employing civil law. This translates literally in all languages mentioned as anonymous company. |
Holdings are subject to change.
For Fund compliance purposes, the Fund’s industry classifications refer to any one or more of the industry sub-classifications used by one or more widely recognized market indexes or ratings group indexes, and/or as defined by Fund management. This definition may not apply for purposes of this report, which may combine industry sub-classifications for reporting ease. Industries are shown as a percent of net assets.
See Notes to Financial Statements.
Semi-Annual Report | October 31, 2015 |
17 |
Table of Contents
The Disciplined Growth Investors Fund | Statement of Assets and Liabilities | |
| October 31, 2015 (Unaudited) | ||
| ||||||
ASSETS | ||||||
Investments, at value | $ | 113,691,742 | ||||
Receivable for shares sold | 3,561 | |||||
Dividends and interest receivable | 391,380 | |||||
| ||||||
Total assets | 114,086,683 | |||||
| ||||||
LIABILITIES | ||||||
Payable for investments purchased | 34,281 | |||||
Payable for shares redeemed | 29,868 | |||||
Payable to adviser | 146,995 | |||||
| ||||||
Total liabilities | 211,144 | |||||
| ||||||
NET ASSETS | $ | 113,875,539 | ||||
| ||||||
| ||||||
NET ASSETS CONSIST OF |
| |||||
Paid-in capital (Note 5) | $ | 90,150,020 | ||||
Accumulated net investment income | 54,614 | |||||
Accumulated net realized gain on investments | 2,273,013 | |||||
Net unrealized appreciation on investments | 21,397,892 | |||||
| ||||||
NET ASSETS | $ | 113,875,539 | ||||
| ||||||
| ||||||
INVESTMENTS, AT COST | $ | 92,293,850 | ||||
PRICING OF SHARES | ||||||
| Net Asset Value, offering and redemption price per share | $ | 16.14 | ||||
| Shares of beneficial interest outstanding | 7,053,330 | |||||
See Notes to Financial Statements.
18 |
1-855-DGI-FUND (344-3863) | www.DGIfund.com |
Table of Contents
The Disciplined Growth Investors Fund | Statement of Operations | |
For the Six Months Ended October 31, 2015 (Unaudited) | ||||||
| ||||||
INVESTMENT INCOME | ||||||
Dividends | $ | 377,364 | ||||
Foreign taxes withheld | (3,036) | |||||
Interest | 346,293 | |||||
| ||||||
Total investment income | 720,621 | |||||
| ||||||
EXPENSES | ||||||
Investment advisory fees (Note 6) | 446,263 | |||||
| ||||||
Total expenses | 446,263 | |||||
| ||||||
NET INVESTMENT INCOME | 274,358 | |||||
| ||||||
REALIZED AND UNREALIZED LOSS ON INVESTMENTS | ||||||
Net realized loss on investments | (184,643) | |||||
Net change in unrealized depreciation on investments | (4,063,427) | |||||
| ||||||
NET REALIZED AND UNREALIZED LOSS ON INVESTMENTS | (4,248,070) | |||||
| ||||||
NET DECREASE IN NET ASSETS RESULTING FROM OPERATIONS | $ | (3,973,712) | ||||
| ||||||
| ||||||
See Notes to Financial Statements.
Semi-Annual Report | October 31, 2015 |
19 |
Table of Contents
The Disciplined Growth Investors Fund | Statements of Changes in Net Assets | |
For the Six Months Ended October 31, 2015 (Unaudited) | For the Year Ended April 30, 2015 | |||||||||||
| ||||||||||||
OPERATIONS | ||||||||||||
Net investment income | $ | 274,358 | $ | 601,292 | ||||||||
Net realized gain/(loss) on investments | (184,643) | 2,893,527 | ||||||||||
Net change in unrealized appreciation/(depreciation) on investments | (4,063,427) | 8,397,596 | ||||||||||
| ||||||||||||
Net increase/(decrease) in net assets resulting from operations | (3,973,712) | 11,892,415 | ||||||||||
| ||||||||||||
DISTRIBUTIONS (Note 3) | ||||||||||||
From net investment income | (282,818) | (550,583) | ||||||||||
From net realized gains on investments | – | (709,544) | ||||||||||
| ||||||||||||
Net decrease in net assets from distributions | (282,818) | (1,260,127) | ||||||||||
| ||||||||||||
CAPITAL SHARE TRANSACTIONS (Note 5) | ||||||||||||
Proceeds from sales of shares | 14,107,830 | 27,552,615 | ||||||||||
Issued to shareholders in reinvestment of distributions | 280,447 | 1,251,789 | ||||||||||
Cost of shares redeemed, net of redemption fees | (9,598,529) | (12,834,981) | ||||||||||
| ||||||||||||
Net increase from capital share transactions | 4,789,748 | 15,969,423 | ||||||||||
| ||||||||||||
Net increase in net assets | 533,218 | 26,601,711 | ||||||||||
| ||||||||||||
NET ASSETS | ||||||||||||
Beginning of period | 113,342,321 | 86,740,610 | ||||||||||
| ||||||||||||
End of period* | $ | 113,875,539 | $ | 113,342,321 | ||||||||
| ||||||||||||
| ||||||||||||
| *Including accumulated net investment income of: | $ | 54,614 | $ | 63,074 | ||||||||
OTHER INFORMATION | ||||||||||||
Share Transactions | ||||||||||||
Issued | 846,400 | 1,694,271 | ||||||||||
Issued to shareholders in reinvestment of distributions | 16,987 | 75,504 | ||||||||||
Redeemed | (575,499) | (779,232) | ||||||||||
| ||||||||||||
Net increase in share transactions | 287,888 | 990,543 | ||||||||||
| ||||||||||||
| ||||||||||||
See Notes to Financial Statements.
20 |
1-855-DGI-FUND (344-3863) | www.DGIfund.com |
Table of Contents
Page Intentionally Left Blank
Table of Contents
The Disciplined Growth Investors Fund | ||
| ||
NET ASSET VALUE, BEGINNING OF PERIOD | ||
INCOME FROM OPERATIONS | ||
Net investment income(a) | ||
Net realized and unrealized gain/(loss) on investments | ||
| ||
Total from investment operations | ||
| ||
DISTRIBUTIONS | ||
From net investment income | ||
From net realized gain on investments | ||
| ||
Total distributions | ||
| ||
INCREASE/(DECREASE) IN NET ASSET VALUE | ||
| ||
NET ASSET VALUE, END OF PERIOD | ||
| ||
TOTAL RETURN | ||
RATIOS AND SUPPLEMENTAL DATA | ||
Net assets, end of period (000’s) | ||
RATIOS TO AVERAGE NET ASSETS | ||
Expenses | ||
Net investment income | ||
PORTFOLIO TURNOVER RATE | ||
| (a) | Per share numbers have been calculated using the average shares method. |
| (b) | Not annualized. |
| (c) | Annualized. |
See Notes to Financial Statements.
22 |
1-855-DGI-FUND (344-3863) | www.DGIfund.com |
Table of Contents
| Financial Highlights | ||
| For a share outstanding during the periods presented | ||
For the Six Months Ended October 31, 2015 (Unaudited) | For the Year Ended April 30, 2015 | For the Year Ended April 30, 2014 | For the Year Ended April 30, 2013 | For the Period August 12, 2011 (Inception) to April 30, 2012 | ||||||||||||
| ||||||||||||||||
| $ 16.75 | $ | 15.02 | $ | 13.17 | $ | 12.13 | $ 10.00 | |||||||||
| 0.04 | 0.10 | 0.07 | 0.11 | 0.05 | ||||||||||||
| (0.61) | 1.83 | 1.90 | 1.09 | 2.11 | ||||||||||||
| ||||||||||||||||
| (0.57) | 1.93 | 1.97 | 1.20 | 2.16 | ||||||||||||
| ||||||||||||||||
| (0.04) | (0.09) | (0.07) | (0.11) | (0.03) | ||||||||||||
| – | (0.11) | (0.05) | (0.05) | – | ||||||||||||
| ||||||||||||||||
| (0.04) | (0.20) | (0.12) | (0.16) | (0.03) | ||||||||||||
| ||||||||||||||||
| (0.61) | 1.73 | 1.85 | 1.04 | 2.13 | ||||||||||||
| ||||||||||||||||
| $ 16.14 | $ | 16.75 | $ | 15.02 | $ | 13.17 | $ 12.13 | |||||||||
| ||||||||||||||||
| (3.40%)(b) | 12.87% | 15.02% | 9.93% | 21.65%(b) | ||||||||||||
| $ 113,876 | $ | 113,342 | $ | 86,741 | $ | 66,967 | $ 35,678 | |||||||||
| 0.78%(c) | 0.78% | 0.78% | 0.78% | 0.77%(c) | ||||||||||||
| 0.48%(c) | 0.61% | 0.47% | 0.90% | 0.60%(c) | ||||||||||||
| 9%(b) | 14% | 10% | 10% | 6%(b) | ||||||||||||
Semi-Annual Report | October 31, 2015 |
23 |
Table of Contents
The Disciplined Growth Investors Fund | Notes to Financial Statements | |
| October 31, 2015 (Unaudited) | ||
1. ORGANIZATION
Financial Investors Trust (the “Trust”), a Delaware statutory trust, is an open-end management investment company registered under the Investment Company Act of 1940, as amended (“1940 Act”). As of October 31, 2015, the Trust had 34 registered funds. This semi-annual report describes the Disciplined Growth Investors Fund (the “Fund”). The Fund seeks long-term capital growth and as a secondary objective, modest income with reasonable risk.
2. SIGNIFICANT ACCOUNTING POLICIES
The accompanying financial statements were prepared in accordance with accounting principles generally accepted in the United States of America (“U.S. GAAP”). The preparation of financial statements in conformity with U.S. GAAP requires management to make certain estimates and assumptions that affect the reported amounts of assets and liabilities and disclosures of contingent assets and liabilities at the date of the financial statements and the reported amounts of revenue and expenses during the period. Actual results could differ from those estimates. The Fund is considered an investment company for financial reporting purposes under U.S. GAAP. The following is a summary of significant accounting policies consistently followed by the Fund in preparation of their financial statements.
Investment Valuation: The Fund generally values its securities based on market prices determined at the close of regular trading on the New York Stock Exchange (“NYSE”), normally 4:00 p.m. Eastern Time, on each day the NYSE is open for trading.
For equity securities and mutual funds that are traded on an exchange, the market price is usually the closing sale or official closing price on that exchange. In the case of equity securities not traded on an exchange, or if such closing prices are not otherwise available, the securities are valued at the mean of the most recent bid and ask prices on such day. Redeemable securities issued by open-end registered investment companies are valued at the investment company’s applicable net asset value, with the exception of exchange-traded open-end investment companies, which are priced as equity securities.
The market price for debt obligations is generally the price supplied by an independent third-party pricing service approved by the Board of Trustees (the “Board”), which may use a matrix, formula or other objective method that takes into consideration quotations from dealers, market transactions in comparable investments, market indices and yield curves. If vendors are unable to supply a price, or if the price supplied is deemed to be unreliable, the market price may be determined using quotations received from one or more broker–dealers that make a market in the security. Short–term debt obligations that will mature in 60 days or less are valued at amortized cost, unless it is determined that using this method would not reflect an investment’s fair value.
When such prices or quotations are not available, or when the Disciplined Growth Investors, Inc. (the “Adviser”) believes that they are unreliable, securities may be priced using fair value procedures approved by the Board.
24 |
1-855-DGI-FUND (344-3863) | www.DGIfund.com |
Table of Contents
The Disciplined Growth Investors Fund | Notes to Financial Statements | |
| October 31, 2015 (Unaudited) | ||
Fair Value Measurements: The Fund discloses the classification of its fair value measurements following a three-tier hierarchy based on the inputs used to measure fair value. Inputs refer broadly to the assumptions that market participants would use in pricing the asset or liability, including assumptions about risk. Inputs may be observable or unobservable. Observable inputs reflect the assumptions market participants would use in pricing the asset or liability that are developed based on market data obtained from sources independent of the reporting entity. Unobservable inputs reflect the reporting entity’s own assumptions about the assumptions market participants would use in pricing the asset or liability that are developed based on the best information available.
Various inputs are used in determining the value of the Fund’s investments as of the end of the reporting period. When inputs used fall into different levels of the fair value hierarchy, the level in the hierarchy within which the fair value measurement falls is determined based on the lowest level input that is significant to the fair value measurement in its entirety. The designated input levels are not necessarily an indication of the risk or liquidity associated with these investments. These inputs are categorized in the following hierarchy under applicable financial accounting standards:
Level 1 – | Unadjusted quoted prices in active markets for identical investments, unrestricted assets or liabilities that the Fund has the ability to access at the measurement date; | |
Level 2 – | Quoted prices which are not active, quoted prices for similar assets or liabilities in active markets or inputs other than quoted prices that are observable (either directly or indirectly) for substantially the full term of the asset or liability; and | |
Level 3 – | Significant unobservable prices or inputs (including the Fund’s own assumptions in determining the fair value of investments) where there is little or no market activity for the asset or liability at the measurement date. | |
The following is a summary of each input used to value the Fund as of October 31, 2015:
| Investments in Securities at Value | Level 1 - Unadjusted Quoted Prices | Level 2 - Other Significant Observable Inputs | Level 3 - Significant Unobservable Inputs | Total | ||||||||||||
| ||||||||||||||||
Common Stocks(a) | $ | 78,175,269 | $ | – | $ | – | $ | 78,175,269 | ||||||||
Asset/Mortgage Backed Securities | – | 134,019 | – | 134,019 | ||||||||||||
Corporate Bonds | – | 26,172,482 | – | 26,172,482 | ||||||||||||
Foreign Government Bonds | – | 281,475 | – | 281,475 | ||||||||||||
Government & Agency Obligations | – | 114,804 | – | 114,804 | ||||||||||||
Short Term Investments | ||||||||||||||||
Money Market Fund | 3,013,809 | – | – | 3,013,809 | ||||||||||||
U.S. Treasury Bills | – | 5,799,884 | – | 5,799,884 | ||||||||||||
| ||||||||||||||||
TOTAL | $ | 81,189,078 | $ | 32,502,664 | $ | – | $ | 113,691,742 | ||||||||
| ||||||||||||||||
| (a) | For detailed descriptions of the underlying industries, see the accompanying Portfolio of Investments. |
Semi-Annual Report | October 31, 2015 |
25 |
Table of Contents
The Disciplined Growth Investors Fund | Notes to Financial Statements | |
| October 31, 2015 (Unaudited) | ||
The Fund recognizes transfers between levels as of the end of the period. For the six months October 31, 2015, the Fund did not have any transfers between Level 1 and Level 2 securities. For the six months ended October 31, 2015, the Fund did not have any securities that used unobservable inputs (Level 3) in determining fair value.
Investment Transactions and Investment Income: Investment transactions are accounted for on the date the investments are purchased or sold (trade date). Realized gains and losses from investment transactions are reported on an identified cost basis. Interest income, which includes accretion of discounts, is accrued and recorded as earned. Dividend income is recognized on the ex-dividend date or for certain foreign securities, as soon as information is available to the Fund.
Trust Expenses: Some expenses of the Trust can be directly attributed to the Fund. Expenses which cannot be directly attributed to the Fund are apportioned among all funds in the Trust based on average net assets of each fund.
Fund Expenses: Expenses that are specific to the Fund are charged directly to the Fund.
Federal Income Taxes: The Fund complies with the requirements under Subchapter M of the Internal Revenue Code of 1986, as amended, applicable to regulated investment companies and intends to distribute substantially all of their net taxable income and net capital gains, if any, each year so that it will not be subject to excise tax on undistributed income and gains. The Fund is not subject to income taxes to the extent such distributions are made.
As of and during the six months ended October 31, 2015, the Fund did not have a liability for any unrecognized tax benefits. The Fund files U.S. federal, state, and local tax returns as required. The Fund’s tax returns are subject to examination by the relevant tax authorities until expiration of the applicable statute of limitations, which is generally three years after the filing of the tax return for federal purposes and four years for most state returns. Tax returns for open years have incorporated no uncertain tax positions that require a provision for income taxes.
Distributions to Shareholders: The Fund normally pays dividends, if any, quarterly and distributes capital gains, if any, on an annual basis. Income dividend distributions are derived from interest and other income the Fund receives from its investments, including short term capital gains. Long term capital gain distributions are derived from gains realized when the Fund sells a security it has owned for more than a year. The Fund may make additional distributions and dividends at other times if the portfolio manager believes doing so may be necessary for the Fund to avoid or reduce taxes.
26 |
1-855-DGI-FUND (344-3863) | www.DGIfund.com |
Table of Contents
The Disciplined Growth Investors Fund | Notes to Financial Statements | |
| October 31, 2015 (Unaudited) | ||
3. TAX BASIS INFORMATION
Tax Basis of Investments: As of October 31, 2015, the aggregate cost of investments, gross unrealized appreciation/ (depreciation) and net unrealized appreciation for Federal tax purposes was as follows:
| Disciplined Growth Investors Fund | ||||
| ||||
Gross appreciation (excess of value over tax cost) | $ | 25,564,653 | ||
Gross depreciation (excess of tax cost over value) | (4,166,815) | |||
| ||||
Net unrealized appreciation | $ | 21,397,838 | ||
| ||||
Cost of investments for income tax purposes | $ | 92,293,904 | ||
| ||||
Tax Basis of Distributions to Shareholders: The character of distributions made during the year from net investment income or net realized gains may differ from its ultimate characterization for federal income tax purposes. Also, due to the timing of dividend distributions, the fiscal year in which amounts are distributed may differ from the fiscal year in which the income or realized gain was recorded by the Fund.
The tax character of distributions paid during the year ended April 30, 2015, were as follows:
| Ordinary Income | Long-Term Capital Gain | |||||||
| ||||||||
The Disciplined Growth Investors Fund | $ | 576,515 | $ | 683,612 | ||||
The amounts and characteristics of tax basis distributions and composition of distributable earnings/(accumulated losses) are finalized at fiscal year end. Accordingly, tax basis balances have not been determined as of October 31, 2015.
4. SECURITIES TRANSACTIONS
During the six months ended October 31, 2015, equity holdings, asset/mortgage backed securities, fixed income securities and U.S. Treasury Notes were transferred in-kind. The intent of the transfers was to save on equity transaction costs both for the new shareholders at the institution they transferred from and for the Fund on the addition of assets. The assets of two separate accounts were transferred-in-kind into the Fund in the amount of $4,093,519.
Semi-Annual Report | October 31, 2015 |
27 |
Table of Contents
The Disciplined Growth Investors Fund | Notes to Financial Statements | |
| October 31, 2015 (Unaudited) | ||
The cost of purchases and proceeds from sales of securities (excluding short-term securities, transfers-in-kind, and U.S. Government Obligations) during the six months ended October 31, 2015, were as follows:
| Fund | Purchases of Securities | Proceeds From Sales of Securities | ||||||
| ||||||||
The Disciplined Growth Investors Fund | $ | 9,460,622 | $ | 9,520,556 | ||||
5. SHARES OF BENEFICIAL INTEREST
The capitalization of the Trust consists of an unlimited number of shares of beneficial interest with no par value per share. Holders of the shares of the Fund of the Trust have one vote for each share held and a proportionate fraction of a vote for each fractional share. All shares issued and outstanding are fully paid and are transferable and redeemable at the option of the shareholder. Purchasers of the share do not have any obligation to make payments to the Trust or its creditors solely by reason of the purchasers’ ownership of the shares. Shares have no pre-emptive rights.
Shares redeemed within 90 days of purchase may incur a 2% short-term redemption fee deducted from the redemption amount. For the six months ended October 31, 2015, and year ended April 30, 2015, the Fund did not receive any redemption fees. Effective September 1, 2015, the Fund no longer imposes redemption fees.
6. MANAGEMENT AND RELATED-PARTY TRANSACTIONS
The Adviser, subject to the authority of the Board, is responsible for the overall management and administration of the Fund’s business affairs. The Adviser manages the investments of the Fund in accordance with the Fund’s investment objective, policies and limitations and investment guidelines established jointly by the Adviser and the Trustees. Pursuant to the Advisory Agreement, the Fund pays the Adviser a unitary management fee for the services and facilities it provides payable on a monthly basis at the annual rate of 0.78% of the Fund’s average daily net assets.
Out of the unitary management fee, the Adviser pays substantially all expenses of the Fund, including the cost of transfer agency, custody, fund administration, distribution fees or expenses, legal, audit and other services, except for interest expenses, brokerage expenses, taxes and extraordinary expenses not incurred in the ordinary course of the Fund’s business. Also included are Trustee fees which were $1,600 for the six months ended October 31, 2015.
Fund Administrator Fees and Expenses
ALPS Fund Services, Inc. (“ALPS”) serves as administrator to the Fund. Pursuant to an Administration Agreement, ALPS provides operational services to the Fund including, but not limited to, fund accounting and fund administration and generally assists in the Fund’s operations. Officers of the Trust are employees of ALPS. The Fund’s administration fee is accrued on a daily basis and paid monthly. The Administrator is also reimbursed for certain out-of-pocket expenses. The administrative fee and out-of-pocket expenses are included in the unitary management fee paid to the Adviser.
28 |
1-855-DGI-FUND (344-3863) | www.DGIfund.com |
Table of Contents
The Disciplined Growth Investors Fund | Notes to Financial Statements | |
| October 31, 2015 (Unaudited) | ||
Transfer Agent
ALPS serves as transfer, dividend paying and shareholder servicing agent for the Fund. ALPS receives an annual minimum fee, a fee based upon the number of shareholder accounts, and is also reimbursed by the Fund for certain out-of-pocket expenses. The fee is included in the unitary management fee paid to the Adviser.
Compliance Services
ALPS provides services that assist the Trust’s chief compliance officer in monitoring and testing the policies and procedures of the Trust in conjunction with requirements under Rule 38a-1 under the 1940 Act and receives an annual base fee. ALPS is reimbursed for certain out-of-pocket expenses. The fee is included in the unitary management fee paid to the Adviser.
Principal Financial Officer
ALPS receives an annual fee for providing principal financial officer services to the Fund. The fee is included in the unitary management fee paid to the Adviser.
Distributor
ALPS Distributors, Inc. (“ADI” or the “Distributor”) (an affiliate of ALPS) acts as the distributor of the Fund’s shares pursuant to a Distribution Agreement with the Trust. Shares are sold on a continuous basis by ADI as agent for the Fund, and ADI has agreed to use its best efforts to solicit orders for the sale of the Fund’s shares, although it is not obliged to sell any particular amount of shares. ADI is not entitled to any compensation for its services as Distributor. ADI is registered as a broker-dealer with the U.S. Securities and Exchange Commission.
7. INDEMNIFICATIONS
Under the Trust’s organizational documents, its officers and Trustees are indemnified against certain liability arising out of the performance of their duties to the Trust. Additionally, in the normal course of business, the Trust enters into contracts with service providers that may contain general indemnification clauses, which may permit indemnification to the extent permissible under applicable law. The Trust’s maximum exposure under these arrangements is unknown, as this would involve future claims that may be made against the Trust that have not yet occurred.
8. RECENT ACCOUNTING PRONOUNCEMENT
In May 2015, the Financial Accounting Standards Board issued Accounting Standards Update (“ASU”) 2015-07, “Disclosures for Investments in Certain Entities that Calculate Net Asset Value Per Share (or its Equivalent).” This is an update to Accounting Standards Codification Topic 820, Fair Value Measurement. ASU 2015-07 removes the requirement to categorize within the fair value hierarchy investments for which fair value is measured at net asset value per share (or its equivalent) using the practical expedient. ASU 2015-17 is effective for annual reporting periods beginning on or after December 15, 2015, and interim periods within those annual periods, with retrospective application for all periods presented. The Fund is currently evaluating the impact ASU 2015-07 will have on the Fund’s financial statements and disclosures.
Semi-Annual Report | October 31, 2015 |
29 |
Table of Contents
The Disciplined Growth Investors Fund | Disclosure Regarding Approval of Fund Advisory Agreements | |
| October 31, 2015 (Unaudited) | ||
On June 9-10, 2015, the Trustees met in person to discuss, among other things, the approval of the investment advisory agreement between Financial Investors Trust (the “Trust”) and Disciplined Growth Investors, Inc. (the “Adviser”) (the “Investment Advisory Agreement”), in accordance with Section 15(c) of the 1940 Act. In renewing and approving the Investment Advisory Agreement with the Adviser, the Trustees, including the Independent Trustees, considered the following factors with respect to the Disciplined Growth Investors Fund (the “Fund”):
Investment Advisory Fee Rate. The Trustees reviewed and considered the contractual annual unitary fee to be paid by the Trust, on behalf of the Fund, to the Adviser of 0.78% of the Fund’s daily average net assets, in light of the extent and quality of the advisory services to be provided by the Adviser to the Fund. The Board received and considered information including a comparison of the Fund’s contractual and actual advisory fees and overall expenses with those of funds in the relevant peer expense group of funds provided by an independent provider of investment company data (the “Data Provider”).
Total Expense Ratio. The Trustees noted that the Adviser fee arrangement was a unitary fee and determined that the contractual total expense ratio of 0.78% for the Fund was generally below the median for others within the Fund’s peer group and universe.
Nature, Extent and Quality of the Services under the Advisory Agreement. The Trustees received and considered information regarding the nature, extent and quality of services provided to the Fund under the Advisory Agreement. The Trustees reviewed certain background materials supplied by the Adviser in its presentation, including its Form ADV.
The Trustees reviewed and considered the Adviser’s investment advisory personnel, its history as an asset manager, its performance and the amount of assets currently under management by the Adviser. The Trustees also reviewed the research and decision-making processes utilized by the Adviser, including the methods adopted to seek to achieve compliance with the investment objectives, policies and restrictions of the Fund.
The Trustees considered the background and experience of the Adviser’s management in connection with the Fund, including reviewing the qualifications, backgrounds and responsibilities of the management team primarily responsible for the day-to-day portfolio management of the Fund and the extent of the resources devoted to research and analysis of actual and potential investments.
The Trustees also reviewed the accompanying compliance-related materials and further noted that they have received reports on these services and compliance issues at each regular Board meeting throughout the year related to the services rendered by the Adviser with respect to the Fund.
Performance: The Trustees reviewed performance information for the Fund for the 3-month, 1-year and 3-year periods ended March 31, 2015. That review included a comparison of the Fund’s performance to the performance of a group of comparable funds selected by the Data Provider. The Trustees noted the comparable performance of the Fund compared against funds identified by the Data Provider, specifically that the Fund’s performance exceeded that of the peer group average for the 1- and 3-year periods. The Trustees also considered the Adviser’s discussion of the Fund’s underlying portfolio diversification categories, its top contributors and top detractors, as well as the Adviser’s performance and reputation generally and its investment techniques, risk management controls and decision-making processes.
30 |
1-855-DGI-FUND (344-3863) | www.DGIfund.com |
Table of Contents
The Disciplined Growth Investors Fund | Disclosure Regarding Approval of Fund Advisory Agreements | |
| October 31, 2015 (Unaudited) | ||
Comparable Accounts: The Trustees considered information provided by the Adviser regarding its standard fee schedule for similarly managed separate accounts, and the corresponding rates applicable at different asset levels.
Profitability: The Trustees received and reviewed a profitability analysis prepared by the Adviser based on the fees payable under the Advisory Agreement. The Board then reviewed the Adviser’s financial statements in order to analyze the financial condition and stability and profitability of the adviser.
Economies of Scale. The Trustees considered whether economies of scale in the provision of services to the Fund will be passed along to the shareholders under the proposed agreements.
Other Benefits to the Adviser. The Trustees reviewed and considered any other benefits derived or to be derived by the Adviser from its relationship with the Fund, including whether soft dollar arrangements were used.
The Board summarized its deliberations with respect to the Investment Advisory Agreement with the Adviser. In selecting the Adviser and approving the investment advisory agreement and fees under such agreement, the Trustees concluded that no single factor reviewed by the Trustees was identified by the Trustees to be determinative as the principal factor in whether to approve the investment advisory agreement. Further, the Independent Trustees were advised by separate independent legal counsel throughout the process. The Trustees, including all of the Independent Trustees, concluded that:
| • | the investment advisory fee was a unitary fee; |
| • | the contractual total expense ratio of 0.78% for the Fund was generally below the median within the Fund’s peer group and universe; |
| • | the nature, extent and quality of services rendered by the Adviser under the Advisory Agreement were adequate; |
| • | the performance of the Fund was generally comparable to, or in certain cases better than, the performance of the funds in its Data Provider peer group; |
| • | bearing in mind the limitations of comparing different types of managed accounts and the different levels of service typically associated with such accounts, the fee structures applicable to the Adviser’s other clients employing a comparable strategy were not indicative of any unreasonableness with respect to the advisory fees proposed to be payable by the Fund; |
| • | the profit, if any, realized by the Adviser in connection with the operation of the Fund is fair to the Trust, especially in light of the unitary fee arrangement; and |
| • | there were no material economies of scale or other benefits accruing to the Adviser in connection with its relationship with the Fund. |
After reviewing the information received, the Trustees requested supplemental information and the Adviser provided materials in response. The Board determined that, given the totality of the information provided with respect to the Investment Advisory Agreement, the Board had received sufficient information to approve the Investment Advisory Agreement.
Semi-Annual Report | October 31, 2015 |
31 |
Table of Contents
The Disciplined Growth Investors Fund | Disclosure Regarding Approval of Fund Advisory Agreements | |
| October 31, 2015 (Unaudited) | ||
Based on the Trustees’ deliberations and their evaluation of the information described above, the Trustees, including all of the Independent Trustees, concluded that the Adviser’s compensation for investment advisory services is consistent with the best interests of the Fund and its shareholders.
32 |
1-855-DGI-FUND (344-3863) | www.DGIfund.com |
Table of Contents
The Disciplined Growth Investors Fund | Additional Information | |
| October 31, 2015 (Unaudited) | ||
1. FUND HOLDINGS
The Fund files its complete schedule of portfolio holdings with the Securities and Exchange Commission (the “SEC”) for the first and third quarters of each fiscal year on Form N-Q within 60 days after the end of the period. Copies of the Fund’s Form N-Q are available without charge on the SEC website at http://www.sec.gov. You may also review and copy the Form N-Q at the SEC’s Public Reference Room in Washington, DC. For more information about the operation of the Public Reference Room, please call the SEC at 1-800-SEC-0330.
2. FUND PROXY VOTING POLICIES, PROCEDURES AND SUMMARIES
The Fund’s policies and procedures used in determining how to vote proxies and information regarding how the Fund voted proxies relating to portfolio securities during the most recent prior 12-month period ending June 30 are available without charge, (1) upon request, by calling (toll-free) 855-DGI-Fund and (2) on the SEC’s website at http://www.sec.gov.
Semi-Annual Report | October 31, 2015 |
33 |
Table of Contents

Table of Contents
Table of Contents
| 1 | ||||
| 6 | ||||
| 10 | ||||
| 14 | ||||
| 18 | ||||
| 20 | ||||
| 22 | ||||
| 24 | ||||
| 26 | ||||
| 28 | ||||
| 29 | ||||
| 30 | ||||
| 32 | ||||
| 34 | ||||
| 35 | ||||
| 36 | ||||
| 40 | ||||
| 44 | ||||
| 48 | ||||
| 52 | ||||
| 60 | ||||
Table of Contents
| Emerald Growth Fund | Manager Commentary | |
October 31, 2015 (Unaudited) |
October 31, 2015
Dear Shareholders:
Investment Results
The performance of the Emerald Growth Fund’s Class A shares (without sales load), for the six months ended October 31, 2015, declined by -1.60%, outpacing the Russell 2000® Growth Index(1) which declined by -3.47%.
Macroeconomic occurrences during the three month period from June through September marked a major inflection point for the market. During that period the market built the wall of worry brick by brick with concerns over slowing global growth at the foundation. The abrupt devaluation of the Chinese Yuan was viewed as a panicked response to a rapidly weakening economy by Chinese leadership. This perceived fire drill by the government was heightened as the government’s decision to stem the decline in the market through various market interventions back-fired undermining confidence further. With the Brazilian and Russian economies already in recessionary territory, fears of a redo of the 1998 currency crisis quickly changed the risk structure of the market place. Concerns over the growth contagion were further stoked by the Federal Reserve’s decision not to raise rates in September, citing global economic developments as a source of concern. While these concerns have abated in recent weeks as economic data points from across the globe have seemingly stabilized and the Federal Reserve’s rhetoric has again shifted toward being more hawkish, we believe that questions around the sustainability of global economic growth remained at the forefront of investor concerns.
Investment Analysis
On a relative basis, Emerald Growth Fund managed to weather the storm reasonably well, outpacing the index for the quarter. Relative outperformance was broad-based, driven by a combination of the portfolio’s relative positioning and solid stock selection within the financial services, healthcare, utility and consumer discretionary sectors which offset underperformance within the producer durables sector.
The financial services sector was the largest contributor to return on a relative basis driven by both the portfolio’s relative overweight position and stock selection within the banking, consumer lending and commercial finance industries. Performance within the healthcare sector also contributed positively to return, driven by a combination of the portfolio’s relative underweight position and stock selection within the pharmaceutical and biotechnology industries.
The portfolio also achieved a positive, albeit more modest, contribution to return within the consumer discretionary and utilities sectors. The aforementioned was partially offset by relative underperformance within the producer durables sector. At the industry level, holdings within the aerospace, air transport, construction and scientific instrument industries detracted from performance.
Exiting October 2015, the portfolio held the largest active exposures to the financial services and technology sectors. Thoughts on those sectors and other areas of notable opportunity/ portfolio exposure are highlighted below:
The financial services sector remained the portfolio’s largest relative overweight position, with the greatest concentration of the exposure falling within the banking industry. While uncertainty regarding the timing of the next Federal Reserve rate increase created ongoing volatility in the direction of treasury yields and the performance of bank stocks, Emerald remains optimistic about opportunities within the industry. Our optimism continued to be predicated on our expectation that our portfolio companies can continue to grow earnings at a competitive pace, driven by loan growth, ongoing good asset quality and stable net interest margin. Further, we believe that ongoing consolidation within the industry can remain a tailwind.
Emerald has also maintained the portfolio’s relative overweight position to the technology sector. Although the sector has come under pressure related primarily to concerns over international growth, we continued to be optimistic regarding the outlook for the holdings in the portfolio. According to an October 1, 2015 Chief Information Officer Survey released by Morgan Stanley, spending in overall information technology is expected to accelerate, with the most notable acceleration in software, in which spending is now anticipated to grow at 5.5% up from 4.9% in the prior survey. The top spending priorities included cloud computing, security and business intelligence/analytics, all areas of emphasis for the Emerald portfolio. In addition to software, communications and systems applications are also poised to grow 3.9% with the bulk of those expenditures focused on network security and VoIP capabilities, also areas of emphasis within the portfolio. We believe this survey remains supportive of the secular trends and portfolio positioning from an enterprise spending perspective. On the consumer side of the technology sector, we believe mobile gaming, 4K television, the connected home and in-car infotainment, can be secular themes that accelerate as the year progresses.
The improvement in non-residential construction also remained a key theme within the portfolio. Recent data points have remained encouraging and we believe the improvement in non-residential construction that began during 2014 has continued, as fundamentals outside of the energy patch continued to look attractive. More recently we became positive on the outlook for residential construction and have added to positions in
Semi-Annual Report | October 31, 2015 |
1 |
Table of Contents
| Emerald Growth Fund | Manager Commentary | |
October 31, 2015 (Unaudited) |
companies poised to benefit from the resurgence in housing. The portfolio’s exposure to both non-residential and residential construction spanned sectors with exposures reflected in holdings within the producer durables and materials sectors, with investments in the engineering and construction, building materials and glass industries.
In regards to the healthcare sector, the third calendar quarter was the first quarter in recent memory that the sector has materially lagged the market overall. Concerns surrounding the future of drug pricing and the ability to sustain pricing power resurfaced in a meaningful way during the quarter magnifying the downside move from the broad market correction. This move weighed particularly hard on pharmaceutical and biotechnology stocks given their strong year-to-date performance. From an industry perspective pricing concerns are not new, but Hillary Clinton seemed intent on making drug pricing one of her key election issues. This means that the headline risk could linger for quite some time. At the end of the reporting period, we had little exposure to stocks that were solely dependent upon price increases for growth. Emerald continued to instead focus on those companies that are developing innovative therapeutics that can command premium pricing and can demonstrate that they are cost neutral or even save the system money. Therefore, despite the heightened focus on pricing we continued to believe that successful execution can be rewarded as has been the case on a year-to-date basis. The portfolio held an underweight position in the healthcare sector exiting the third quarter.
Market Outlook:
The U.S. may not have started the fire, in the words of Billy Joel, but domestically we were certainly feeling the heat as slowing emerging market growth weighed on global growth. While we believe developed markets, and the U.S. in particular, are likely to continue upon their growth paths, the slowdown in emerging markets and the impact to the U.S. manufacturing and export base is yet another factor gating the rate of domestic growth.
A prime example of the impact of the weakness in emerging markets is Caterpillar. The company’s shares retraced meaningfully during September as a result of a massive of revenue shortfall which missed consensus expectations by $1 billion on a $49 billion estimate. The company mentioned in its press release that at this pace, 2015 could be the first time in Caterpillar’s 90-year history that it had declining sales four years in a row. At the same time the company announced a sizeable restructuring initiative including the total permanent workforce reduction of more than 10,000 workers driven in management’s words by “recent, current and expected market conditions”. As evidenced by Caterpillar’s commentary and further supported by the slowing ISM Manufacturing Index (from the Institute of Supply Management) and decline in August real exports we did not believe there was any doubt that slowing emerging market growth was weighing on manufacturing in the U.S. To what magnitude the U.S. will slow appears to be the big question, and honestly is difficult to assess. From an export perspective, China is estimated to represent approximately 7% of U.S. exports, which is relatively small and manageable when considered in isolation. The bigger question, however, is how a slowing China (and to what magnitude China slows) in conjunction with a weak Brazil and weak Russia, impacts exports and demand from the rest of the world. This analysis is only further complicated by the relative strength or weakness in the U.S. dollar.
Interestingly, while the export outlook has dimmed, the import picture still looked encouraging with real merchandise imports rising 3.1% sequentially and 6.8% year over year in August, implying domestic demand remained strong. September auto sales reaching a 7-year high at 18.2 million SAAR (Seasonally Adjusted Annual Rate) and the upside surprise to the Conference Board Consumer Confidence Index, in the face of heightened market volatility was both encouraging and supportive of the outlook for consumption growth. Construction spending data has similarly remained encouraging. For the month of August, which is the most recent data that we have, construction spending rose 13.7% year over year, with private construction spending rising 16.5% and public spending increasing 7% year over year. Total residential spending increased 16.4% and non-residential spending increased 12.3%. While the durability of growth in both consumption and construction remain in question in the face of a weakening outlook for manufacturing, we continue to believe that the U.S. can remain an area of strength in the global growth malaise. That being said, Emerald believes that the ongoing reassessment of the Federal Reserve’s next step and the rate of domestic economic growth are likely to continue to be a point of volatility between now and year end.
As always, Emerald remains focused on utilizing its fundamental bottom-up research process to seek to identify the best growth opportunities within the small capitalization universe.
2 |
www.emeraldmutualfunds.com |
Table of Contents
| Emerald Growth Fund | Manager Commentary | |
October 31, 2015 (Unaudited) |
Top Contributors | Top Detractors | |||
LendingTree, Inc. | Spirit Airlines, Inc. | |||
Imperva, Inc. | Cepheid | |||
Bank of the Ozarks, Inc. | Astronics Corporation | |||
Depomed, Inc. | Glu Mobile Inc. | |||
Walker & Dunlop, Inc. | Roadrunner Transportation Systems Inc. | |||
Sincerely, | ||||
 |  |  | ||
Kenneth G. Mertz II, CFA | Stacey L. Sears | Joseph W. Garner | ||
Chief Investment Officer | Portfolio Manager | Portfolio Manager | ||
Portfolio Manager | ||||
Emerald Mutual Fund Advisers Trust
The views of the author and information discussed in this commentary are as of the date of publication, are subject to change, and may not reflect the writer’s current views. The views expressed are those of the author only, and represent an assessment of market conditions at a specific point in time, are opinions only and should not be relied upon as investment advice regarding a particular investment or markets in general. Such information does not constitute a recommendation to buy or sell specific securities or investment vehicles. It should not be assumed that any investment will be profitable or will equal the performance of the Fund or any securities or any sectors mentioned in this letter. The subject matter contained in this letter has been derived from several sources believed to be reliable and accurate at the time of compilation. Neither Emerald Mutual Fund Advisors Trust nor the Fund accepts any liability for losses either direct or consequential caused by the use of this information.
The Emerald Growth Fund is distributed by ALPS Distributors, Inc.
Diversification does not ensure a profit or guarantee against a loss.
The Fund is subject to investment risks, including possible loss of the principal amount invested and therefore is not suitable for all investors. The Fund may not achieve its objectives.
| (1) | The Russell 2000® Growth Index measures the performance of the small-cap growth segment of the U.S. equity universe. It includes those Russell 2000® Index companies with higher price-to-value ratios and higher forecasted growth values. The Index is not actively managed and does not reflect any deductions for fees, expenses or taxes. An investor may not invest directly into the Index. |
Semi-Annual Report | October 31, 2015 |
3 |
Table of Contents
| Emerald Growth Fund | Manager Commentary | |
October 31, 2015 (Unaudited) |
TOP TEN HOLDINGS (as a % of Net Assets)*
|
| |||||
EPAM Systems, Inc. | 2.39 | % | ||||
Bank of the Ozarks, Inc. | 2.19 | % | ||||
Apogee Enterprises, Inc. | 2.04 | % | ||||
MicroStrategy, Inc., Class A | 1.95 | % | ||||
Vonage Holdings Corp. | 1.75 | % | ||||
Imperva, Inc. | 1.73 | % | ||||
PrivateBancorp, Inc. | 1.63 | % | ||||
Acadia Healthcare Co., Inc. | 1.61 | % | ||||
Veeva Systems, Inc., Class A | 1.57 | % | ||||
Jack in the Box, Inc. | 1.57 | % | ||||
Top Ten Holdings | 18.43 | % | ||||
INDUSTRY SECTOR ALLOCATION (as a % of Net Assets)
|
| |||||
Technology | 24.10 | % | ||||
Financial Services | 18.19 | % | ||||
Health Care | 17.82 | % | ||||
Consumer Discretionary | 17.43 | % | ||||
Producer Durables | 6.81 | % | ||||
Materials & Processing | 6.25 | % | ||||
Utilities | 2.84 | % | ||||
Energy | 0.74 | % | ||||
Cash, Cash Equivalents, | 5.82 | % | ||||
* Holdings are subject to change, and may not reflect the current or future position of the portfolio.
|
| |||||
GROWTH OF $10,000 INVESTMENT IN THE FUND (for the period ended October 31, 2015)
Comparison of change in value of a $10,000 investment (includes applicable sales loads)
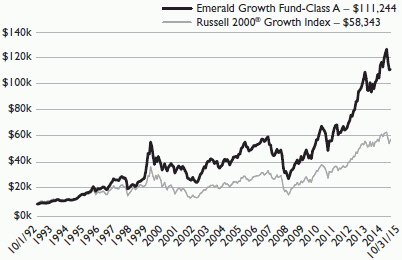
The chart represents historical performance of a hypothetical investment of $10,000 in the Fund since inception. Past performance does not guarantee future results. This chart does not reflect the deduction of taxes that a shareholder would pay on Fund distributions or the redemption of Fund shares.
AVERAGE ANNUAL TOTAL RETURN (for the period ended October 31, 2015)
| Since | Expense Ratio | |||||||||||||||||
| 1 Year | 3 Year | 5 Year | 10 Year | Inception1 | Gross2 | Net2 | ||||||||||||
Class A (NAV) | 9.76% | 19.41% | 16.58% | 9.60% | 11.24% | 1.29% | 1.29% | |||||||||||
Class A (MOP) | 4.54% | 17.49% | 15.45% | 9.07% | 11.00% | 1.29% | 1.29% | |||||||||||
Russell 2000® | 3.52% | 16.16% | 13.56% | 8.67% | 7.94% | |||||||||||||
Class C (NAV) | 9.05% | 18.64% | 15.83% | 8.95% | 5.52% | 1.94% | 1.94% | |||||||||||
Class C (CDSC) | 8.05% | 18.64% | 15.83% | 8.95% | 5.52% | 1.94% | 1.94% | |||||||||||
Russell 2000® | 3.52% | 16.16% | 13.56% | 8.67% | 4.16% | |||||||||||||
Investor Class | 9.79% | 19.38% | – | – | 11.72% | 1.34% | 1.34% | |||||||||||
Russell 2000® | 3.52% | 16.16% | – | – | 9.54% | |||||||||||||
Institutional Class | 10.07% | 19.77% | 16.92% | – | 16.66% | 0.99% | 0.99% | |||||||||||
Russell 2000® | 3.52% | 16.16% | 13.56% | – | 14.73% | |||||||||||||
The performance quoted represents past performance, does not guarantee future results and current performance may be lower or higher than the data quoted. The investment return and principal value of an investment will fluctuate so that shares, when redeemed, may be worth more or less than their original cost. Performance data current to the most recent month end may be obtained at www.emeraldmutualfunds.com.
Performance shown for periods prior to March 16, 2012, reflects the performance of the Forward Growth Fund, a series of Forward Funds (as a result of a reorganization of the Forward Growth Fund into the Emerald Growth Fund).
4 |
www.emeraldmutualfunds.com |
Table of Contents
| Emerald Growth Fund | Manager Commentary | |
October 31, 2015 (Unaudited) |
| ||||
Maximum Offering Price (MOP) for Class A shares includes the Fund’s maximum sales charge of 4.75%. Performance shown at NAV does not include these sales charges and would have been lower had it been taken into account.
A Contingent Deferred Sales Charge (CDSC) of 1.00% may apply to Class C shares redeemed within the first 12 months after a purchase.
| 1 | Inception Dates - Class A: 10/01/1992, Class C: 07/01/2000, Class Institutional: 10/21/2008, Class Investor: 05/01/2011 |
| 2 | Emerald Mutual Fund Advisers Trust (“Emerald” or the “Adviser”) has agreed contractually to waive a portion of its fees and reimburse other expenses until August 31, 2016 in amounts necessary to limit the Fund’s operating expenses (exclusive of Acquired Fund Fees and Expenses, brokerage expenses, interest expenses, taxes and extraordinary expense) for Class A, Class C, Institutional Class, and Investor Class shares to an annual rate (as percentage of the Fund’s average daily net assets) of 1.29%, 1.94%, 0.99% and 1.34% respectively. The Adviser will be permitted to recover, on a class-by-class basis, expenses it has borne through the agreement described above to the extent that the Fund’s expenses in later periods fall below the annual rates set forth in the relevant agreement. The Fund will not be obligated to pay any such deferred fees and expenses more than three years after the year(s) in which the fees and expense were incurred. The Adviser may not discontinue this waiver prior to August 31, 2016, without the approval by the Fund’s Board of Trustees. Ratios as of the Prospectus dated August 31, 2015 and may differ from the ratios presented in the Financial Highlights. |
| † | The Russell 2000® Growth Index measures the performance of the small-cap growth segment of the U.S. equity universe. It includes those Russell 2000® Index companies with higher price-to-value ratios and higher forecasted growth values. The Index is not actively managed and does not reflect any deduction for fees, expenses or taxes. An Investor may not invest directly into the Index. |
Important Risks
Investing in smaller companies generally will present greater investment risks, including: greater price volatility, greater sensitivity to changing economic conditions and less liquidity than the securities of larger, more mature companies.
Semi-Annual Report | October 31, 2015 |
5 |
Table of Contents
| Emerald Small Cap Value Fund | Manager Commentary | |
October 31, 2015 (Unaudited) |
October 31, 2015
Dear Shareholders:
Investment Results
The performance of the Emerald Small Cap Value Fund’s (the “Fund”) Investor Class, for the six months ended October 31, 2015, reflected a loss of -1.57% outpacing the Russell 2000® Value Index(1) which was down -4.83%.
Below average U.S. economic growth has persisted since the end of the recession in mid-2009. Concerns about the vulnerability of the “recovery” to exogenous shocks have weighed heavily on the minds of investors in the past year. Events such as the potential Greek exit from the European Union (EU) during the summer, Chinese currency devaluation in August, geopolitical instability in the Middle East, and overall economic slowdown in emerging markets, have contributed to heightened volatility in the stock market.
The risk-off trade in equities caused investors to gravitate to higher quality holdings. In the small cap value universe, the best performing stocks were those that possess both positive earnings trends and high levels of financial productivity as measured by a healthy Rate of Return (ROE).
In the third calendar quarter of 2015, the market experienced a significant correction, with the Russell 2000® Value Index declining -10.73%. In contrast, the Fund’s Investor Class was only -7.57%, owing to strong stock selection, and highlighting a key strategy of the Fund which is to limit the Fund’s downside exposure during market declines.
Investment Analysis
The Fund outperformed its benchmark for the trailing 6-month period ended October 31, 2015. At the sector level relative outperformance was driven by stock selection within the financial services, utilities and energy sectors. Outperformance was modestly offset by relative underperformance within the producer durables and healthcare sectors.
The financial services sector, which makes up over 42% of the benchmark, represented the largest source of relative outperformance for the portfolio, driven by relative outperformance within the banking and insurance industries. The portfolio benefited from an increase to overall banks exposure earlier in the year, and then a trim to these positions as valuation became stretched towards the end of the year.
The portfolio also experienced a significant positive contribution to return within the utilities sector, due to outsized exposure to telecommunications companies. The rapid adoption of unified communications as a service (UCAAS) is a trend we identified early on. Companies of all sizes look to put their communications infrastructure on the cloud to become more efficient in a cost effective manner. However, this outperformance was partially offset by relative underperformance within the producer durables. Stock selection within producer durables weighed on relative performance as holdings within the commercial services underperformed relative to expectations. In addition, the portfolio’s relative underweight to the benchmark in the energy and materials sectors contributed to outperformance, as commodity prices declined throughout the year and global growth outlook was revised lower.
Exiting October 2015, the portfolio had the largest relative active exposures to the technology and consumer discretionary sectors. The technology sector was an area of emphasis within the portfolio driven by a broad set of opportunities including semiconductor capital equipment for advanced nodes and 3-D design, touch technology and security for mobile devices, and “big data” management. An additional area of focus was the financial services sector in general and the banking industry in particular. Following the recent “disappointment” regarding the Federal Reserve’s postponement of interest rates “lift-off”, banks in general have underperformed the broader market. However, bank holdings in the Fund were still delivering strong loan growth, had good asset quality, stabilized their net interest margin, and were seeing an increased amount of merger and acquisition activity in their regions. Therefore, the portfolio continued to have meaningful allocation to the banking industry. The portfolio also had exposure to the resurging non-residential construction market, through holdings in the producer durables sector. With that said, the Fund’s investment process and portfolio construction is not based on following specific themes, but rather done through a rigorous bottom up fundamental analysis, focused on high quality companies that generate ample amount of free cash flow to fund operations and growth capital.
Market Outlook
We believe the risk/reward in the equity markets has improved as the markets have overshot what underlying economic fundamentals would otherwise suggest. While it is true industrial trends have remained generally downbeat, other sectors of the economy are showing robust signs of growth. Because consumer balance sheets have been significantly redressed since the financial crisis of 2008, auto and home sales have seen meaningful upticks in demand recently. According to Bloomberg, U.S. new car sales for October registered a seasonally adjusted annual rate (SAAR) of 18.23 million. This is the highest monthly SAAR since 2005 and the second straight month it has exceeded 18 million, something not seen in 15 years. According to CoreLogic, home prices in September have increased by 6.9% year-over-year.
6 |
www.emeraldmutualfunds.com |
Table of Contents
| Emerald Small Cap Value Fund | Manager Commentary | |
October 31, 2015 (Unaudited) |
With both consumer and small business confidence trending well, we believe loan demand and spending by both economic constituencies may expand in the quarters ahead. We believe these factors combined with recent Job Openings and Labor Turnover (JOLTS) data showing job openings overtaking labor turnover, suggest the Federal Reserve may soon raise interest rates confident that wage inflation is inevitable. We have written before that the advent of increasing rates should not be viewed negatively; witness the markets’ negative reaction recently when the Federal Reserve decided to not initiate its first rate hike in nearly a decade.
Top Contributors | Top Detractors | |||
Premiere Global Services, Inc. | CAI International, Inc. | |||
Argo Group International Holdings, Ltd. | Everi Holdings, Inc. | |||
Gray Television, Inc. | Xcerra Corporation | |||
Great Western Bancorp, Inc. | Interval Leisure Group, Inc. | |||
First Merchants Corporation | Iconix Brand Group, Inc. | |||
Sincerely, | ||||
 |  | |||
Richard A. Giesen, Jr. | Ori Elan | |||
Managing Director – Value Equity Strategies | Vice President | |||
Portfolio Manager | Portfolio Manager | |||
Emerald Mutual Fund Advisers Trust | ||||
The views of the author and information discussed in this commentary are as of the date of publication, are subject to change, and may not reflect the writer’s current views. The views expressed are those of the author only, and represent an assessment of market conditions at a specific point in time, are opinions only and should not be relied upon as investment advice regarding a particular investment or markets in general. Such information does not constitute a recommendation to buy or sell specific securities or investment vehicles. It should not be assumed that any investment will be profitable or will equal the performance of the Fund or any securities or any sectors mentioned in this letter. The subject matter contained in this letter has been derived from several sources believed to be reliable and accurate at the time of compilation. Neither Emerald Mutual Fund Advisors Trust nor the Fund accepts any liability for losses either direct or consequential caused by the use of this information.
The Emerald Small Cap Value Fund is distributed by ALPS Distributors, Inc.
Diversification does not assure a profit or protect against a loss.
The Fund is subject to investment risks, including possible loss of the principal amount invested and therefore is not suitable for all investors. The Fund may not achieve its objectives.
| (1) | The Russell 2000® Value Index measures the performance of small-cap value segment of the U.S. equity universe. It includes those Russell 2000 companies with lower price-to-book ratios and lower forecasted growth values. The Russell 2000® Value Index is constructed to provide a comprehensive and unbiased barometer for the small-cap value segment. The Index is completely reconstituted annually to ensure larger stocks do not distort the performance and characteristics of the true small-cap opportunity set and that the represented companies continue to reflect value characteristics. The Index is not actively managed and does not reflect any deductions for fees, expenses or taxes. An investor may not invest directly into the Index. |
Semi-Annual Report | October 31, 2015 |
7 |
Table of Contents
| Emerald Small Cap Value Fund | Manager Commentary | |
October 31, 2015 (Unaudited) |
| TOP TEN HOLDINGS | ||||||
| (as a % of Net Assets)*
| ||||||
Argo Group International | 3.51 | % | ||||
CyrusOne, Inc., REIT | 3.19 | % | ||||
Microsemi Corp. | 2.95 | % | ||||
Carriage Services, Inc. | 2.94 | % | ||||
Synaptics, Inc. | 2.93 | % | ||||
First Merchants Corp. | 2.88 | % | ||||
Cedar Realty Trust, Inc., | 2.76 | % | ||||
Gray Television, Inc. | 2.71 | % | ||||
Employers Holdings, Inc. | 2.69 | % | ||||
Everi Holdings, Inc. | 2.64 | % | ||||
Top Ten Holdings | 29.20 | % | ||||
INDUSTRY SECTOR ALLOCATION (as a % of Net Assets)
|
| |||||
Financial Services | 41.38 | % | ||||
Technology | 15.14 | % | ||||
Producer Durables | 13.72 | % | ||||
Consumer Discretionary | 13.02 | % | ||||
Utilities | 6.86 | % | ||||
Energy | 2.19 | % | ||||
Health Care | 1.65 | % | ||||
Materials & Processing | 1.01 | % | ||||
Cash, Cash Equivalents, | 5.03 | % | ||||
* Holdings are subject to change, and may not reflect the current or future position of the portfolio.
|
| |||||
GROWTH OF $10,000 INVESTMENT IN THE FUND (for the period ended October 31, 2015)
Comparison of change in value of a $10,000 investment (includes applicable sales loads)
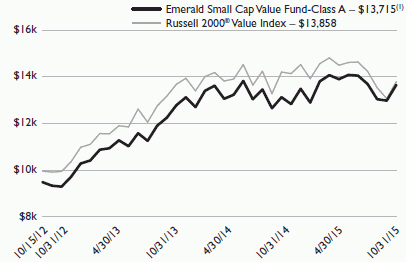
The chart represents historical performance of a hypothetical investment of $10,000 in the Fund since inception. Past performance does not guarantee future results. This chart does not reflect the deduction of taxes that a shareholder would pay on Fund distributions or the redemption of Fund shares.
AVERAGE ANNUAL TOTAL RETURN (for the period ended October 31, 2015)(2)
| Since | Expense Ratio | |||||||||
| 1 Year | 3 Years | Inception | Gross(3)(4) | Net(3)(4) | ||||||
Class A (NAV) | 4.04% | 13.54% | 12.73% | 1.62% | 1.35% | |||||
Class A (MOP) | -0.90% | 11.72% | 10.94% | 1.62% | 1.35% | |||||
Russell 2000® Value Index(5) | -2.88% | 11.65% | 11.31% | |||||||
Class C (NAV) | 3.36% | 12.81% | 12.00% | 2.27% | 2.00% | |||||
Class C (CDSC) | 2.36% | 12.81% | 12.00% | 2.27% | 2.00% | |||||
Russell 2000® Value Index(5) | -2.88% | 11.65% | 11.31% | |||||||
Investor Class | 4.32% | 13.69% | 12.92% | 1.52% | 1.25% | |||||
Russell 2000® Value Index(5) | -2.88% | 11.65% | 11.31% | |||||||
Institutional Class | 4.43% | 13.95% | 13.13% | 1.27% | 1.00% | |||||
Russell 2000® Value Index(5) | -2.88% | 11.65% | 11.31% | |||||||
The performance quoted represents past performance, does not guarantee future results and current performance may be lower or higher than the data quoted. The investment return and principal value of an investment will fluctuate so that shares, when redeemed, may be worth more or less than their original cost. Performance data current to the most recent month end may be obtained at www.emeraldmutualfunds.com.
Maximum Offering Price (MOP) for Class A shares includes the Fund’s maximum sales charge of 4.75%. Performance shown at NAV does not include these sales charges and would have been lower had it been taken into account.
A Contingent Deferred Sales Charge (CDSC) of 1.00% may apply to Class C shares redeemed within the first 12 months after a purchase.
8 |
www.emeraldmutualfunds.com |
Table of Contents
| Emerald Small Cap Value Fund | Manager Commentary | |
October 31, 2015 (Unaudited) |
| ||||
| (1) | As of June 26, 2015, the Emerald Small Cap Value Fund was reorganized as a successor to the Elessar Small Cap Value Fund (the Predecessor Fund), a series of Elessar Investment Trust. The performance shown for periods prior to June 26, 2015 reflects the performance of the Predecessor Fund’s Institutional Class and Investor Class shares. The Predecessor Fund did not offer Class A or Class C shares. The performance shown for class A and C shares prior to June 30, 2015 reflect the historical performance of the Predecessor Fund’s Institutional and Investor Shares since inception on October 15, 2012, calculated using the fees and expenses of Class A and C shares, respectively. |
| (2) | Commencement Dates - Class A: 06/30/2015, Class C: 06/30/2015, Class Institutional: 10/15/2012, Class Investor:10/15/2012 |
| (3) | Emerald Mutual Fund Advisers Trust (“Emerald” or the “Adviser”) has agreed contractually to waive a portion of its fees and reimburse other expenses until August 31, 2016 in amounts necessary to limit the Fund’s operating expenses (exclusive of Acquired Fund Fees and Expenses, brokerage expenses, interest expenses, taxes and extraordinary expense) for Class A, Class C, Institutional Class, and Investor Class shares to an annual rate (as percentage of the Fund’s average daily net assets) of 1.35%, 2.00%, 1.00% and 1.25% respectively. The Adviser will be permitted to recover, on a class-by-class basis, expenses it has borne through the agreement described above (the “Expense Agreement”) to the extent that the Fund’s expenses in later periods fall below the annual rates set forth in the Expense Agreement. The Fund will not be obligated to pay any such deferred fees and expenses more than three years after the year(s) in which the fees and expenses were incurred. The Adviser may not discontinue this waiver prior to August 31, 2016, without the approval by the Fund’s Board of Trustees. |
| (4) | The total annual fund operating expenses shown is as stated in the fund’s prospectus current as of the date of this report. The prospectus may vary from the expense ratio shown elsewhere in this report as the ratio’s per the prospectus are based on estimated future expenses as of the date of the prospectus. |
| (5) | The Russell 2000® Value Index measures the performance of small-cap value segment of the U.S. equity universe. It includes those Russell 2000 companies with lower price-to-book ratios and lower forecasted growth values. The Russell 2000® Value Index is constructed to provide a comprehensive and unbiased barometer for the small-cap value segment. The Index is completely reconstituted annually to ensure larger stocks do not distort the performance and characteristics of the true small-cap opportunity set and that the represented companies continue to reflect value characteristics. The Index is not actively managed and does not reflect any deductions for fees, expenses or taxes. An investor may not invest directly into the Index. |
Important Risks
Investing in smaller companies generally will present greater investment risks, including: greater price volatility, greater sensitivity to changing economic conditions and less liquidity than the securities of larger, more mature companies.
Semi-Annual Report | October 31, 2015 |
9 |
Table of Contents
| Emerald Insights Fund | Manager Commentary | |
October 31, 2015 (Unaudited) |
October 31, 2015
Dear Shareholders:
Investment Results
The performance of the Emerald Insights Fund’s Class A shares (without sales load), for the last six months reflected a negative return of -4.01%, trailing the Russell Midcap® Growth Index(1) benchmark by 1.37%. Performance for the period was driven by outperformance in technology, materials and processing, and producer durables; and underperformance in healthcare, energy, consumer discretionary and financial services.
Investment Analysis
Market performance was mixed over the past six months, with growth stock returns leading value for the first half of our reporting period, and value outpacing growth for the second half. Investor sentiment began to change as general manufacturing statistics showed signs of deterioration and the tailwind from lower energy prices failed to materialize. Offsetting this weakness during the third quarter was strength in the automobile, housing, nonresidential construction, and overall consumer spending and income segments, coupled with continued employment growth. As the summer progressed, job growth decelerated and a variety of production indices grew weaker. Finally, the lackluster domestic conditions, coupled with concerns about China and emerging market economies led the Federal Reserve (the “Fed”) to postpone raising the federal funds rate. The lack of Fed movement served to confuse the market and created a risk-averse atmosphere which pervaded the October quarter. Healthcare stocks, while materially outpacing the index for most of the last six months, saw a significant reversal, starting on September 21, 2015, with a tweet from Democratic presidential candidate Hillary Clinton criticizing price gouging by a small specialty pharma company, Turing Pharmaceuticals, and the next day unveiling her plan that would aim to limit drug prices. This sudden, but not surprising, attention to prescription drug prices as well as an economic growth scare emanating from China and a number of stressed emerging markets, and finally uncertainty about the Fed’s interest-rate policy led to a general decline in the price of higher multiple stocks and many of the year-to-date winners held in our portfolio. Correlations also climbed during the latter part of the period and have continued to rise through quarter-end. Additionally, small and mid-cap stocks lagged versus their large-cap brethren.
Market Outlook
The Fund was overweight in Technology, Energy and Materials companies at the end of our reporting period, given our thinking that tech growth rates versus valuations were very attractive at these levels, and that energy and materials were getting close to a bottom given relatively strong global demand for energy, and for materials like aggregates and paint related chemicals. We continued to underweight Consumer Staples, given growth rates that simply didn’t support stretched valuations. We were underweight, REITs, but added to exposure in a faster growing multifamily REIT focused in on properties in the Sun Belt and a grocery anchored community and neighborhood shopping center REIT. We remained overweight in banks as we still think the Fed may act to raise rates in the next few months and have a generally favorable view of the current lending environment. While we were equal weight healthcare, we still maintained an overweight to the biotechs as we did not see a way for the U.S. healthcare system to control drug pricing without a major legislative overhaul – which we think may be unlikely, regardless of who is in the White House. Our healthcare related names, for the most part, were not dependent on price increases for growth.
Given the recent decline in growth equities and the underperformance of growth versus value across all market cap ranges, it is no surprise that we were relatively more bullish about growth than we have been for some time. Liquidity was still strong for most industries; the yield curve was reasonably steep; innovation was strong; the Chinese economy seemed to be bottoming; and growth valuations were very attractive. According to J.P. Morgan Asset Management, mid-cap growth equities are trading at only 83.5% of their 20 year average P/E ratio as of September 30, 2015 – one of the lower levels we have seen over the past several years. We are cognizant, however, that the Fed could act too vigorously to raise rates and exacerbate an already fragile economy struggling with wider corporate bond spreads and relatively anemic growth.
We are willing to be patient with our holdings as the market pullback has allowed us to deploy some cash into some of our favorite, highest conviction “beaten up” positions. Fundamental investing can be, at times, frustrating as you must wait for affirmation of your investment thesis on individual names in the face of macro related changes in sentiment. However, we continue to believe our dedicated team of analysts and portfolio managers will continue to provide unique and valuable insights to our shareholders.
10 |
www.emeraldmutualfunds.com |
Table of Contents
| Emerald Insights Fund | Manager Commentary | |
October 31, 2015 (Unaudited) |
Top Five Contributors | Top Five Detractors | |||
SolarWinds, Inc. (SWI) | Akorn, Inc. (AKRX) | |||
Proofpoint, Inc. (PFPT) | Bluebird Bio, Inc (BLUE) | |||
Depomed, Inc. (DEPO) | Cepheid (CPHD) | |||
Royal Caribbean Cruises, Ltd.(RCL) | Affiliated Managers Group, Inc. (AMG) | |||
Southwest Airlines Co. (LUV) | Gulfport Energy Corp.(GPOR) | |||
Sincerely, | ||||
|
|
| ||
David A. Volpe, CFA | Joseph W. Garner | Stephen L. Amsterdam | ||
Deputy Chief Investment Officer | Associate Portfolio Manager | Associate Portfolio Manager | ||
Portfolio Manager | ||||
Emerald Mutual Fund Advisers Trust | ||||


The views of the author and information discussed in this commentary are as of the date of publication, are subject to change, and may not reflect the writer’s current views. The views expressed are those of author only, and represent an assessment of market conditions at a specific point in time, are opinions only and should not be relied upon as investment advice regarding a particular investment or markets in general. Such information does not constitute a recommendation to buy or sell specific securities or investment vehicles. It should not be assumed that any investment will be profitable or will equal the performance of the Fund or any securities or any sectors mentioned in this letter. The subject matter contained in this letter has been derived from several sources believed to be reliable and accurate at the time of compilation. Neither Emerald Mutual Fund Advisors Trust nor the Fund accepts any liability for losses either direct or consequential caused by the use of this information.
The Emerald Insights Fund is distributed by ALPS Distributors, Inc.
Diversification does not assure a profit or protect against a loss.
The Fund is subject to investment risks, including possible loss of the principal amount invested and therefore is not suitable for all investors. The Fund may not achieve its objectives.
| (1) | The Russell Midcap® Growth Index measures the performance of the mid-cap growth segment of the U.S. equity universe. It includes those Russell Midcap Index companies with higher price-to-book ratios and higher forecasted growth values. As of June 30, 2015, the Russell Midcap® Growth Index included securities issued by companies that ranged in size between $1.8 billion and $28.1 billion. The Index is not actively managed and does not reflect any deductions for fees, expenses or taxes. An investor may not invest directly into the Index. |
Semi-Annual Report | October 31, 2015 |
11 |
Table of Contents
| Emerald Insights Fund | Manager Commentary | |
October 31, 2015 (Unaudited) |
TOP TEN HOLDINGS (as a % of Net Assets)*
| ||||||
Southwest Airlines Co. | 2.85 | % | ||||
Wabtec Corp. | 2.27 | % | ||||
Whirlpool Corp. | 2.07 | % | ||||
Affiliated Managers Group, Inc. | 2.05 | % | ||||
IMAX Corp. | 1.97 | % | ||||
Jarden Corp. | 1.96 | % | ||||
Harman International Industries, Inc. | 1.74 | % | ||||
Alliance Data Systems Corp. | 1.70 | % | ||||
Skyworks Solutions, Inc. | 1.68 | % | ||||
Middleby Corp. | 1.66 | % | ||||
Top Ten Holdings | 19.95 | % | ||||
INDUSTRY SECTOR ALLOCATION (as a % of Net Assets)
|
| |||||
Consumer Discretionary | 26.26 | % | ||||
Technology | 18.63 | % | ||||
Financial Services | 12.48 | % | ||||
Health Care | 11.01 | % | ||||
Producer Durables | 10.13 | % | ||||
Materials & Processing | 6.63 | % | ||||
Consumer Staples | 3.37 | % | ||||
Energy | 1.91 | % | ||||
Utilities | 0.31 | % | ||||
Cash, Cash Equivalents, | 9.27 | % | ||||
* Holdings are subject to change, and may not reflect the current or future position of the portfolio.
|
| |||||
GROWTH OF $10,000 INVESTMENT IN THE FUND (for the period ended October 31, 2015)
Comparison of change in value of a $10,000 investment (includes applicable sales loads)
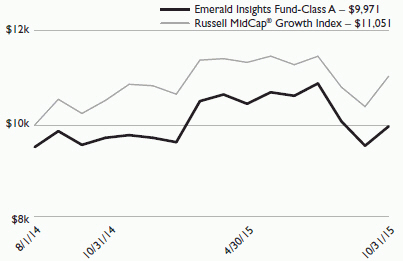
The chart represents historical performance of a hypothetical investment of $10,000 in the Fund since inception. Past performance does not guarantee future results. This chart does not reflect the deduction of taxes that a shareholder would pay on Fund distributions or the redemption of Fund shares.
AVERAGE ANNUAL TOTAL RETURN (for the period ended October 31, 2015)
| Expense Ratio | ||||||||||||||
| 1 Year | Since Inception1 | Gross2 | Net2 | |||||||||||
Class A (NAV) | 2.55% | 3.74% | 2.60% | 1.38% | ||||||||||
Class A (MOP) | -2.33% | -0.23% | 2.60% | 1.38% | ||||||||||
Russell MidCap® Growth Index† | 4.94% | 8.33% | ||||||||||||
Class C (NAV) | 1.77% | 2.95% | 7.28% | 2.03% | ||||||||||
Class C (CDSC) | 0.77% | 2.95% | 7.28% | 2.03% | ||||||||||
Russell MidCap® Growth Index† | 4.94% | 8.33% | ||||||||||||
Investor Class | 2.45% | 3.59% | 2.99% | 1.43% | ||||||||||
Russell MidCap® Growth Index† | 4.94% | 8.33% | ||||||||||||
Institutional Class | 2.74% | 3.90% | 4.69% | 1.08% | ||||||||||
Russell MidCap® Growth Index† | 4.94% | 8.33% | ||||||||||||
The performance quoted represents past performance, does not guarantee future results and current performance may be lower or higher than the data quoted. The investment return and principal value of an investment will fluctuate so that shares, when redeemed, may be worth more or less than their original cost. Performance data current to the most recent month end may be obtained at www.emeraldmutualfunds.com.
Maximum Offering Price (MOP) for Class A shares includes the Fund’s maximum sales charge of 4.75%. Performance shown at NAV does not include these sales charges and would have been lower had it been taken into account.
A Contingent Deferred Sales Charge (CDSC) of 1.00% may apply to Class C shares redeemed within the first 12 months after a purchase.
| 1 | Inception Date – August 1, 2014. |
12 |
www.emeraldmutualfunds.com |
Table of Contents
| Emerald Insights Fund | Manager Commentary | |
October 31, 2015 (Unaudited) |
| ||||
| 2 | Emerald Mutual Fund Advisers Trust (“Emerald” or the “Adviser”) has agreed contractually to waive a portion of its fees and reimburse other expenses until August 31, 2016 in amounts necessary to limit the Fund’s operating expenses (exclusive of Acquired Fund Fees and Expenses, brokerage expenses, interest expenses, taxes and extraordinary expense) for Class A, Class C, Institutional Class, and Investor Class shares to an annual rate (as percentage of the Fund’s average daily net assets) of 1.35%, 2.00%, 1.05% and 1.40% respectively. The Adviser will be permitted to recover, on a class-by-class basis, expenses it has borne through the agreement described above to the extent that the Fund’s expenses in later periods fall below the annual rates set forth in the relevant agreement. The Fund will not be obligated to pay any such deferred fees and expenses more than three years after the year(s) in which the fees and expense were incurred. The Adviser may not discontinue this waiver prior to August 31, 2016, without the approval by the Fund’s Board of Trustees. Ratios as of the Prospectus dated August 31, 2015 and may differ from the ratios presented in the Financial Highlights. |
| † | The Russell Midcap® Growth Index measures the performance of the mid-cap growth segment of the U.S. equity universe. It includes those Russell Midcap Index companies with higher price-to-book ratios and higher forecasted growth values. As of June 30, 2015, the Russell Midcap Growth Index included securities issued by companies that ranged in size between $1.8 billion and $28.1 billion. The Index is not actively managed and does not reflect any deductions for fees, expenses or taxes. An investor may not invest directly into the Index. |
Important Risks
Investing in smaller companies generally will present greater investment risks, including: greater price volatility, greater sensitivity to changing economic conditions and less liquidity than the securities of larger, more mature companies.
Semi-Annual Report | October 31, 2015 |
13 |
Table of Contents
| Emerald Banking and Finance Fund | Manager Commentary | |
October 31, 2015 (Unaudited) |
October 31, 2015
Dear Shareholder:
Investment Results
The Emerald Bank & Finance Fund-Class A outperformed the Russell 2000® Index(1) (the “Index”) for the six months ended October 31, 2015, returning +12.17% vs. -4.12% for the Index, though performing slightly less than the Russell 2000® Financial Services TR Index(2) which returned 2.43%. During the six months ended October 31, 2015, the SNL Small Cap U.S. Bank & Thrift Index(3) gained 8.24% versus a 0.77% gain delivered by the Standard & Poor’s 500 Index(4) and a loss of -4.83% for the Russell 2000 Value Index(5).
Interest rates, signs of increased loan growth, energy exposure and mergers and acquisitions all remained key drivers for banks as we ended the reporting period. For many banks, the first two concerns went hand-in-hand as bank net interest margins have troughed but certainly were not increasing considerably. Therefore, banks were looking to loan growth to offset the negative impact of low rates and depressed margins.
If indeed we see a rate increase in the fourth quarter of 2015, we believe the rise in interest rates may be gradual. As a result, while community banks may potentially see some net interest margin relief in 2016, banks may continue to need solid loan growth to drive profits.
Investment Analysis
Loan growth for U.S. commercial banks with less than $10 billion in assets slowed in the third quarter of 2015. An SNL Financial analysis looked at regulatory filings for these banks and overall, median third quarter loan growth was 1.63%, compared to the second quarter, and 6.54%, compared to the year-ago period. If we were to focus on banks between $1 billion and $10 billion in assets we saw slightly better loan growth with third quarter median loan growth of 2.22% and year-over-year loan growth of 11.18%. As a result we have seen the market rewarding banks with higher earnings multiples as they achieve the $1 billion asset mark and continue to grow towards $10 billion. We believed that plenty of opportunities existed to invest in community banks that were growing loans by greater than 15% year-over-year. This loan growth was being driven primarily by taking market share from larger regional banks.
As community banks continued to deliver better loan growth rates than their large cap peers we remained focused on the profitability of these loans as well as the quality of the loans. During the third quarter earnings season, most community bank executives continued to report that credit quality remained strong and while they saw competition on pricing they had not experienced deterioration in credit quality. In fact, the only concerns that we have seen have been focused around energy related loans.
On the energy front, credit issues have cropped up on banks in Texas and other energy producing regions. While we have not seen a great deal of losses nor do we believe there will be a large amount of losses, we have seen increased loan-loss reserves to guard against a prolonged slump in oil prices. Such prices started to fall in the summer of 2014 and, aside from modest recoveries at different points, they remain depressed. Oil prices have recently traded between $40 to $45 dollars per barrel, less than half of the level that they were at in early 2014.
Market Outlook
We believe that the recent testimony from Federal Reserve (the “Fed”) Chair Janet Yellen has created more uncertainty about a fourth quarter 2015 rate hike. Uncertainty in the market about the Fed moving away from near-zero rates for the first time in years we believe may lead us into a trading range until the December 2015 meeting. As we have noted in the past, most banks that we meet with claim to be asset sensitive to some degree and thus may be well positioned for a rising rate environment. The “wild card” in our opinion will be deposits. The cost of deposits have been at historically low rates for a prolonged period of time and no one really knows what will happen as rates rise from such a low base. The cost of money market demand and other savings accounts hovered near zero in the quarter ended September 30th 2015, according to an SNL Financial analysis of regulatory data. Deposit costs started trending down in 2008 after the financial crisis and have remained low since then. With many consumers taking a conservative stance after the financial crisis with their money and often deciding to place excess cash in the bank rather than invest it in low rate yielding investment products, most banks have had little trouble amassing deposits at relatively little expense. While nobody knows for sure when the rate environment will shift, some banks are now bracing for change in the year ahead and are mindful that depositors’ willingness to move their money around may increase when rates rise. We believe that banks should be taking some short term pain and paying a bit more to lock in longer term funding at these historically low rates. While a steepening yield curve can be a positive catalyst for bank stocks, particularly if it is a precursor to stronger economic activity, we believe an increase in short-term rates will be more beneficial to revenue and EPS (earnings per share) growth. The one-month and three-month LIBOR rates, which are tied to banks’ variable rate commercial and industrial (C&I) loans, have remained essentially flat since the end of 2013 and are near absolute lows (LIBOR rates are benchmark rates that some of the world’s leading banks charge each other for short-term loans. LIBOR stands for London Interbank Offered Rate). We believe these short term rates are highly correlated with the effective Fed Fund rate. With the consensus and our expectations for an initial increase in the Fed Funds rate in the fourth quarter of 2015, we believe one and three-month LIBOR rates may begin to rise in the fourth quarter of 2015 as well, potentially leading to increased earnings growth for the bank sector.
14 |
www.emeraldmutualfunds.com |
Table of Contents
| Emerald Banking and Finance Fund | Manager Commentary | |
October 31, 2015 (Unaudited) |
We believe that the market remains in the early stages of a long term recovery in bank stocks and remain confident in our expectations for improved fundamentals and continued consolidation amongst the small-to-mid capitalization bank and thrift stocks. Our focus remains on seeking companies capable of producing above average organic growth, relatively stable net interest margins, and improving earnings power aided by lower efficiency ratios, with potential for accretive mergers & acquisitions activity, as we deploy Emerald’s 10-Step research process to seek out companies in this market environment that is poised for the potential of higher short-term interest rates.
Top Five Contributors to Return Included | Top Five Detractors to Return Included | |
LendingTree, Inc. | Silvercrest Asset Management Group, Inc. Class A | |
Bank of the Ozarks, Inc. | East West Bancorp, Inc. | |
FCB Financial Holdings, Inc. Class A | SVB Financial Group | |
Eagle Bancorp, Inc. | Live Oak Bancshares, Inc. | |
Ameris Bancorp | BofI HOLDING, INC. | |
Sincerely, | ||
|
| |
Kenneth G. Mertz II, CFA | Steven E. Russell, Esq. | |
Chief Investment Officer | Portfolio Manager | |
Portfolio Manager | ||
Emerald Mutual Fund Advisers Trust | ||


The views of the author and information discussed in this commentary are as of the date of publication, are subject to change, and may not reflect the writer’s current views. The views expressed are those of the author only, and represent an assessment of market conditions at a specific point in time, are opinions only and should not be relied upon as investment advice regarding a particular investment or markets in general. Such information does not constitute a recommendation to buy or sell specific securities or investment vehicles. It should not be assumed that any investment will be profitable or will equal the performance of the Fund or any securities or any sectors mentioned in this letter. The subject matter contained in this letter has been derived from several sources believed to be reliable and accurate at the time of compilation. Neither Emerald Mutual Fund Advisors Trust nor the Fund accepts any liability for losses either direct or consequential caused by the use of this information.
The Emerald Banking and Finance Fund is distributed by ALPS Distributors, Inc.
Diversification does not assure a profit or protect against a loss.
The Fund is subject to investment risks, including possible loss of the principal amount invested and therefore is not suitable for all investors. The Fund may not achieve its objectives.
| (1) | Russell 2000® Index measures the performance of the small-cap segment of the U.S. equity universe. The Russell 2000® Index is a subset of the Russell 3000® Index representing approximately 10% of the total market capitalization of that index. It includes approximately 2000 of the smallest securities based on a combination of their market cap and current index membership. The Index is not actively managed and does not reflect any deduction of fees, expenses or taxes. An investor may not invest directly into the Index. |
| (2) | Russell 2000® Financial Services TR Index – is comprised of the smallest financial services companies in the Russell 3000 Index. The Index is not actively managed and does not reflect any deductions for fees, expense, or taxes. An investor may not invest directly in the Index. |
| (3) | SNL Small Cap Bank & Thrift Index: Includes all publicly traded (NYSE, NYSE MKT, NASDAQ, OTC) Banks and Thrifts in SNL’s coverage universe with $250M to $1B Total Common Market Capitalization as of most recent pricing data. Source: SNL Financial, data as of May 19, 2015. |
| (4) | Standard & Poor’s 500® Index is an unmanaged index of 500 common stocks chosen for the market size, liquidity and industry group representation. It is a market-value weighted index. The Index is not actively managed and does not reflect any deduction for fees, expenses or taxes. An investor may not invest directly into the Index. |
| (5) | The Russell 2000® Value Index measures the performance of small-cap value segment of the U.S. equity universe. It includes those Russell 2000 companies with lower price-to-book ratios and lower forecasted growth values. The Russell 2000® Value Index is constructed to provide a comprehensive and unbiased barometer for the small-cap value segment. The Index is completely reconstituted annually to ensure larger stocks do not distort the performance and characteristics of the true small-cap opportunity set and that the represented companies continue to reflect value characteristics. The Index is not actively managed and does not reflect any deductions for fees, expenses or taxes. An investor may not invest directly into the Index. |
Semi-Annual Report | October 31, 2015 |
15 |
Table of Contents
| Emerald Banking and Finance Fund | Manager Commentary | |
October 31, 2015 (Unaudited) |
| TOP TEN HOLDINGS (as a % of Net Assets)*
| ||||||
Bank of the Ozarks, Inc. | 3.71 | % | ||||
PacWest Bancorp | 3.39 | % | ||||
SVB Financial Group | 3.12 | % | ||||
Signature Bank | 2.87 | % | ||||
BankUnited, Inc. | 2.80 | % | ||||
LendingTree, Inc. | 2.66 | % | ||||
Ameris Bancorp | 2.55 | % | ||||
PrivateBancorp, Inc. | 2.48 | % | ||||
Home BancShares, Inc. | 2.40 | % | ||||
Eagle Bancorp, Inc. | 2.22 | % | ||||
Top Ten Holdings | 28.20 | % | ||||
INDUSTRY SECTOR ALLOCATION (as a % of Net Assets)
|
| |||||
Banks: Diversified | 70.38 | % | ||||
Banks: Savings, Thrift | 7.62 | % | ||||
Commercial Banks | 4.03 | % | ||||
Consumer Lending | 3.77 | % | ||||
Insurance: Property-Casualty | 3.39 | % | ||||
Diversified Financial Services | 2.97 | % | ||||
Commercial Services: Rental & Leasing | 1.39 | % | ||||
Real Estate Investment Trusts (REITs) | 1.15 | % | ||||
Securities Brokerage | 1.03 | % | ||||
Insurance | 0.52 | % | ||||
Financial Data & Services | 0.34 | % | ||||
Real Estate Management | 0.28 | % | ||||
Commercial Finance | 0.16 | % | ||||
Cash, Cash Equivalents, | 2.97 | % | ||||
* Holdings are subject to change, and may not reflect the current or future position of the portfolio.
|
| |||||
GROWTH OF $10,000 INVESTMENT IN THE FUND (for the period ended October 31, 2015)
Comparison of change in value of a $10,000 investment (includes applicable sales loads)
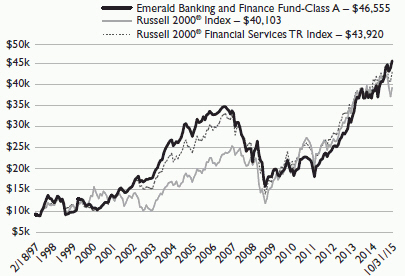
The chart represents historical performance of a hypothetical investment of $10,000 in the Fund since inception. Past performance does not guarantee future results. This chart does not reflect the deduction of taxes that a shareholder would pay on Fund distributions or the redemption of Fund shares.
AVERAGE ANNUAL TOTAL RETURN (for the period ended October 31, 2015)
| Since | Expense Ratio | |||||||||||||||||||||||||||
| 1 Year | 3 Year | 5 Year | 10 Year | Inception1 | Gross2 | Net2 | ||||||||||||||||||||||
Class A (NAV) | 18.10% | 21.21% | 17.94% | 3.79% | 8.86% | 1.60% | 1.60% | |||||||||||||||||||||
Class A (MOP) | 12.48% | 19.26% | 16.79% | 3.28% | 8.57% | 1.60% | 1.60% | |||||||||||||||||||||
Russell 2000® Index† | 0.34% | 13.90% | 12.06% | 7.47% | 7.71% | |||||||||||||||||||||||
Russell 2000® Financial Services TR Index†† | 4.31% | 14.57% | 13.49% | 4.77% | 8.23% | |||||||||||||||||||||||
Class C (NAV) | 17.35% | 20.44% | 17.20% | 3.14% | 9.08% | 2.25% | 2.25% | |||||||||||||||||||||
Class C (CDSC) | 16.35% | 20.44% | 17.20% | 3.14% | 9.08% | 2.25% | 2.25% | |||||||||||||||||||||
Russell 2000® Index† | 0.34% | 13.90% | 12.06% | 7.47% | 6.82% | |||||||||||||||||||||||
Russell 2000® Financial Services TR Index†† | 4.31% | 14.57% | 13.49% | 4.77% | 9.25% | |||||||||||||||||||||||
Investor Class | 18.14% | 21.23% | 16.92% | – | 13.97% | 1.65% | 1.65% | |||||||||||||||||||||
Russell 2000® Index† | 0.34% | 13.90% | 12.06% | – | 11.48% | |||||||||||||||||||||||
Russell 2000® Financial Services TR Index†† | 4.31% | 14.57% | 13.49% | – | 11.91% | |||||||||||||||||||||||
Institutional Class | 18.49% | 21.62% | – | – | 20.15% | 1.30% | 1.30% | |||||||||||||||||||||
Russell 2000® Index† | 0.34% | 13.90% | – | – | 10.96% | |||||||||||||||||||||||
Russell 2000® Financial Services TR Index†† | 4.31% | 14.57% | – | – | 13.58% | |||||||||||||||||||||||
The performance quoted represents past performance, does not guarantee future results and
16 |
www.emeraldmutualfunds.com |
Table of Contents
| Emerald Banking and Finance Fund | Manager Commentary | |
October 31, 2015 (Unaudited) |
| ||||
current performance may be lower or higher than the data quoted. The investment return and principal value of an investment will fluctuate so that shares, when redeemed, may be worth more or less than their original cost. Performance data current to the most recent month end may be obtained at www.emeraldmutualfunds.com.
Performance shown for periods prior to March 16, 2012, reflects the performance of the Forward Banking & Finance Fund, a series of Forward Funds (as a result of a reorganization of the Forward Banking & Finance Fund into the Emerald Banking & Finance Fund).
Maximum Offering Price (MOP) for Class A shares includes the Fund’s maximum sales charge of 4.75%. Performance shown at NAV does not include these sales charges and would have been lower had it been taken into account.
A Contingent Deferred Sales Charge (CDSC) of 1.00% may apply to Class C shares redeemed within the first 12 months after a purchase.
| 1 | Inception Dates - Class A: 02/18/1997, Class C: 07/01/2000, Class Institutional: 03/19/2012, Class Investor: 03/16/2010 |
| 2 | Emerald Mutual Fund Advisers Trust (“Emerald” or the “Adviser”) has agreed contractually to waive a portion of its fees and reimburse other expenses until August 31, 2016 in amounts necessary to limit the Fund’s operating expenses (exclusive of Acquired Fund Fees and Expenses, brokerage expenses, interest expenses, taxes and extraordinary expense) for Class A, Class C, Institutional Class, and Investor Class shares to an annual rate (as percentage of the Fund’s average daily net assets) of 1.84%, 2.49%, 1.54% and 1.89% respectively. The Adviser will be permitted to recover, on a class-by-class basis, expenses it has borne through the agreement described above to the extent that the Fund’s expenses in later periods fall below the annual rates set forth in the relevant agreement. The Fund will not be obligated to pay any such deferred fees and expenses more than three years after the year(s) in which the fees and expense were incurred. The Adviser may not discontinue this waiver prior to August 31, 2016, without the approval by the Fund’s Board of Trustees. Ratios as of the Prospectus dated August 31, 2015 and may differ from the ratios presented in the Financial Highlights. |
| † | The Russell 2000® Index measures the performance of the small-cap segment of the U.S. equity universe. The Russell 2000® is a subset of the Russell 3000® Index representing approximately 10% of the total market capitalization of that index. It includes approximately 2000 of the smallest securities based on a combination of their market cap and current index membership. The index is not actively managed and does not reflect any deductions for fees, expenses or taxes. An investor may not invest directly into an index. |
| †† | The Russell 2000® Financial Services TR Index is comprised of the smallest financial services companies in the Russell 3000 Index. The Index is not actively managed and does not reflect any deductions for fees, expense, or taxes. An investor may not invest directly in the Index. |
Important Risks
A fund that concentrates in a particular industry will involve a greater degree of risk than a fund with a more diversified portfolio. Investing in smaller companies generally will present greater investment risks, including: greater price volatility, greater sensitivity to changing economic conditions and less liquidity than the securities of larger, more mature companies.
| Semi-Annual Report | October 31, 2015 | 17 |
Table of Contents
| Emerald Funds | Disclosure of Fund Expenses | |
October 31, 2015 (Unaudited) |
As a shareholder of the Funds, you incur two types of costs: (1) transaction costs, including applicable sales charges (loads); and (2) ongoing costs, including management fees, distribution and service (12b-1) fees, shareholder services fees and other Fund expenses. This example is intended to help you understand your ongoing costs (in dollars) of investing in the Funds and to compare these costs with the ongoing costs of investing in other mutual funds. The example is based on an investment of $1,000 invested at the beginning of the (six-month) period and held for the entire period May 1, 2015 through October 31, 2015.
Actual Expenses
The first line for each share class of each Fund in the table provides information about actual account values and actual expenses. You may use this information, together with the amount you invested, to estimate the expenses that you paid over the period. Simply divide your account value by $1,000 (for example, an $8,600 account value divided by $1,000 = 8.6), then multiply the result by the number in the applicable line under the heading entitled “Expenses Paid During Period” to estimate the expenses you paid on your account during this period.
Hypothetical Example For Comparison Purposes
The second line for each share class of each Fund in the table below provides information about hypothetical account values and hypothetical expenses based on the Fund’s actual expense ratio and an assumed rate of return of 5% per year before expenses, which is not the Fund’s actual return. The hypothetical account values and expenses may not be used to estimate the actual ending account balance or expenses you paid for the period. You may use this information to compare the ongoing costs of investing in the Funds and other funds. To do so, compare this 5% hypothetical example with the 5% hypothetical examples that appear in the shareholder reports of other funds.
Please note that the expenses shown in the table below are meant to highlight your ongoing costs only and do not reflect any transactional costs, such as sales charges (loads), redemption fees or exchange fees. Therefore, the second line for each share class of each Fund within the table is useful in comparing ongoing costs only, and will not help you determine the relative total costs of owning different funds. If these transactional costs were included, your costs would have been higher.
| Emerald Growth Fund | Beginning Account Value 05/01/15 | Ending Account Value 10/31/15 | Expense Ratio(a) | Expense Paid During Period 5/01/15 - 10/31/15(b) | ||||
Class A | ||||||||
Actual | $ 1,000.00 | $ 984.50 | 1.20% | $ 5.99 | ||||
Hypothetical (5% return before expenses) | $ 1,000.00 | $ 1,019.10 | 1.20% | $ 6.09 | ||||
Class C | ||||||||
Actual | $ 1,000.00 | $ 981.70 | 1.84% | $ 9.17 | ||||
Hypothetical (5% return before expenses) | $ 1,000.00 | $ 1,015.89 | 1.84% | $ 9.32 | ||||
Institutional Class | ||||||||
Actual | $ 1,000.00 | $ 986.40 | 0.91% | $ 4.54 | ||||
Hypothetical (5% return before expenses) | $ 1,000.00 | $ 1,020.56 | 0.91% | $ 4.62 | ||||
Investor Class | ||||||||
Actual | $ 1,000.00 | $ 984.00 | 1.21% | $ 6.03 | ||||
Hypothetical (5% return before expenses) | $ 1,000.00 | $ 1,019.05 | 1.21% | $ 6.14 | ||||
Emerald Small Cap Value Fund(c) | ||||||||
Class A | ||||||||
Actual(d) | $ 1,000.00 | $ 1,052.00 | 1.35% | $ 1.17 | ||||
Hypothetical (5% return before expenses) | $ 1,000.00 | $ 1,018.35 | 1.35% | $ 6.85 | ||||
Class C | ||||||||
Actual(d) | $ 1,000.00 | $ 1,051.30 | 2.00% | $ 1.74 | ||||
Hypothetical (5% return before expenses) | $ 1,000.00 | $ 1,015.08 | 2.00% | $ 10.13 | ||||
18 |
www.emeraldmutualfunds.com |
Table of Contents
| Emerald Funds | Disclosure of Fund Expenses | |
October 31, 2015 (Unaudited) |
Institutional Class | ||||||||
Actual | $ 1,000.00 | $ 1,052.70 | 1.00% | $ 0.87 | ||||
Hypothetical (5% return before expenses) | $ 1,000.00 | $ 1,020.11 | 1.00% | $ 5.08 | ||||
Investor Class | ||||||||
Actual | $ 1,000.00 | $ 1,052.10 | 1.25% | $ 1.09 | ||||
Hypothetical (5% return before expenses) | $ 1,000.00 | $ 1,018.85 | 1.25% | $ 6.34 | ||||
Emerald Insights Fund | ||||||||
Class A | ||||||||
Actual | $ 1,000.00 | $ 953.60 | 1.35% | $ 6.63 | ||||
Hypothetical (5% return before expenses) | $ 1,000.00 | $ 1,018.35 | 1.35% | $ 6.85 | ||||
Class C | ||||||||
Actual | $ 1,000.00 | $ 949.60 | 2.00% | $ 9.80 | ||||
Hypothetical (5% return before expenses) | $ 1,000.00 | $ 1,015.08 | 2.00% | $ 10.13 | ||||
Institutional Class | ||||||||
Actual | $ 1,000.00 | $ 954.50 | 1.05% | $ 5.16 | ||||
Hypothetical (5% return before expenses) | $ 1,000.00 | $ 1,019.86 | 1.05% | $ 5.33 | ||||
Investor Class | ||||||||
Actual | $ 1,000.00 | $ 953.50 | 1.40% | $ 6.87 | ||||
Hypothetical (5% return before expenses) | $ 1,000.00 | $ 1,018.10 | 1.40% | $ 7.10 | ||||
Emerald Banking and Finance Fund | ||||||||
Class A | ||||||||
Actual | $ 1,000.00 | $ 1,121.70 | 1.48% | $ 7.89 | ||||
Hypothetical (5% return before expenses) | $ 1,000.00 | $ 1,017.70 | 1.48% | $ 7.51 | ||||
Class C | ||||||||
Actual | $ 1,000.00 | $ 1,118.40 | 2.13% | $ 11.34 | ||||
Hypothetical (5% return before expenses) | $ 1,000.00 | $ 1,014.43 | 2.13% | $ 10.79 | ||||
Institutional Class | ||||||||
Actual | $ 1,000.00 | $ 1,123.20 | 1.18% | $ 6.30 | ||||
Hypothetical (5% return before expenses) | $ 1,000.00 | $ 1,019.20 | 1.18% | $ 5.99 | ||||
Investor Class | ||||||||
Actual | $ 1,000.00 | $ 1,121.20 | 1.53% | $ 8.16 | ||||
Hypothetical (5% return before expenses) | $ 1,000.00 | $ 1,017.44 | 1.53% | $ 7.76 |
| (a) | The Fund’s expense ratios have been based on the Fund’s most recent fiscal half-year expenses. |
| (b) | Expenses are equal to the Fund’s annualized expense ratio multiplied by the average account value over the period, multiplied by the number of days in the most recent fiscal half-year (184)/366 (to reflect the half-year period). |
| (c) | Emerald Small Cap Value Fund changed its fiscal year end from September 30 to April 30. For the purposes of calculating the “Actual” figures, actual number of days from the last annual through October 31, 2015 were used (31 days). |
| (d) | Shares commenced operations on June 30, 2015. |
Semi-Annual Report | October 31, 2015 |
19 |
Table of Contents
| Emerald Growth Fund | Schedule of Investments | |
October 31, 2015 (Unaudited) |
| Value | ||||||||
| Shares | (Note 2) | |||||||
| COMMON STOCKS: 94.18% |
| ||||||
| Consumer Discretionary: 17.43% |
| ||||||
| 588,350 | American Eagle Outfitters, Inc. | $8,989,988 | ||||||
| 189,052 | Burlington Stores, Inc.(a) | 9,089,620 | ||||||
| 1,035,130 | Chegg, Inc.(a) | 7,142,397 | ||||||
| 132,625 | Chuy’s Holdings, Inc.(a) | 3,608,726 | ||||||
| 262,887 | Dave & Busters Entertainment, | 10,142,180 | ||||||
| 198,786 | Diversified Restaurant Holdings, | 594,370 | ||||||
| 245,034 | Five Below, Inc.(a) | 8,414,468 | ||||||
| 85,000 | Hemisphere Media Group, Inc.(a) | 1,150,050 | ||||||
| 191,810 | HomeAway, Inc.(a) | 6,053,524 | ||||||
| 345,565 | Interface, Inc. | 6,755,796 | ||||||
| 171,959 | Jack in the Box, Inc. | 12,816,104 | ||||||
| 198,347 | Kona Grill, Inc.(a) | 2,727,271 | ||||||
| 172,306 | Malibu Boats, Inc., Class A(a) | 2,448,468 | ||||||
| 129,894 | Marcus Corp. | 2,687,507 | ||||||
| 288,904 | MarineMax, Inc.(a) | 4,564,683 | ||||||
| 90,422 | Matthews International Corp., Class A | 5,220,062 | ||||||
| 219,283 | Ollie’s Bargain Outlet Holdings, | 3,475,635 | ||||||
| 237,189 | Planet Fitness, Inc., Class A(a) | 3,875,668 | ||||||
| 157,901 | Red Robin Gourmet Burgers, Inc.(a) | 11,825,206 | ||||||
| 205,600 | Rentrak Corp.(a) | 11,345,008 | ||||||
| 422,378 | Sequential Brands Group, Inc.(a) | 5,283,949 | ||||||
| 230,083 | Steven Madden Ltd.(a) | 8,018,393 | ||||||
| 244,594 | Tile Shop Holdings, Inc.(a) | 3,549,059 | ||||||
| 382,958 | Tilly’s, Inc., Class A(a) | 2,791,764 | ||||||
| 142,569,896 | ||||||||
| Energy: 0.74% | |||||||
| 539,220 | Synergy Resources Corp.(a) | 6,033,872 | ||||||
| Financial Services: 18.19% | |||||||
| 144,617 | American Campus Communities, Inc., REIT | 5,867,112 | ||||||
| 210,510 | American Farmland Co., REIT(a) | 1,515,672 | ||||||
| 85,327 | Ameris Bancorp | 2,687,800 | ||||||
| 136,623 | Atlas Financial Holdings, Inc.(a) | 2,598,569 | ||||||
| 357,955 | Bank of the Ozarks, Inc. | 17,904,909 | ||||||
| 84,276 | Bofl Holding, Inc.(a) | 6,742,923 | ||||||
| 87,000 | California Republic Bancorp(a) | 2,573,460 | ||||||
| 133,257 | CoBiz Financial, Inc. | 1,660,382 | ||||||
| 260,318 | ConnectOne Bancorp, Inc. | 4,646,676 | ||||||
| 140,253 | Customers Bancorp, Inc.(a) | 3,856,958 | ||||||
| 91,370 | Education Realty Trust, Inc., REIT | 3,281,097 | ||||||
| 252,184 | FCB Financial Holdings, Inc., Class A(a) | 8,967,663 | ||||||
| 117,790 | First Choice Bank(a) | 1,825,745 | ||||||
| 67,715 | First Foundation, Inc.(a) | 1,608,231 | ||||||
| 209,364 | First NBC Bank Holdings Co.(a) | 7,786,247 | ||||||
| 148,203 | Howard Bancorp, Inc.(a) | 1,870,322 | ||||||
| 99,000 | LendingTree, Inc.(a) | 12,014,640 | ||||||
| 389,256 | Live Oak Bancshares, Inc. | 5,581,931 | ||||||
| Value | ||||||||
| Shares | (Note 2) | |||||||
| Financial Services (continued) | |||||||
| 137,942 | Marcus & Millichap, Inc.(a) | $6,010,133 | ||||||
| 69,496 | National Commerce Corp.(a) | 1,745,045 | ||||||
| 221,590 | Opus Bank | 8,254,228 | ||||||
| 207,444 | Pacific Premier Bancorp, Inc.(a) | 4,428,929 | ||||||
| 110,974 | Pinnacle Financial Partners, Inc. | 5,839,452 | ||||||
| 319,586 | PrivateBancorp, Inc. | 13,368,282 | ||||||
| 18,257 | South State Corp. | 1,414,918 | ||||||
| 302,545 | Virtu Financial, Inc., Class A | 7,321,589 | ||||||
| 255,425 | Walker & Dunlop, Inc.(a) | 7,409,879 | ||||||
| 148,782,792 | ||||||||
| Health Care: 17.82% | |||||||
| 49,300 | Abaxis, Inc. | 2,475,353 | ||||||
| 213,921 | Acadia Healthcare Co., Inc.(a) | 13,136,889 | ||||||
| 214,748 | Adamas Pharma, Inc.(a) | 3,169,680 | ||||||
| 41,970 | Aimmune Therapeutics, Inc.(a) | 631,649 | ||||||
| 71,209 | Akebia Therapeutics, Inc.(a) | 635,184 | ||||||
| 866,952 | Amicus Therapeutics, Inc.(a) | 6,502,140 | ||||||
| 409,198 | AtriCure, Inc.(a) | 7,580,393 | ||||||
| 45,523 | Bluebird Bio, Inc.(a) | 3,511,189 | ||||||
| 107,239 | Cantel Medical Corp. | 6,357,128 | ||||||
| 104,100 | Chimerix, Inc.(a) | 4,078,638 | ||||||
| 98,517 | Conformis, Inc.(a) | 1,927,978 | ||||||
| 153,100 | Corindus Vascular Robotics, Inc.(a) | 489,920 | ||||||
| 91,873 | Corium International, Inc.(a) | 637,599 | ||||||
| 324,057 | Imprivata, Inc.(a) | 3,496,575 | ||||||
| 80,587 | Inogen, Inc.(a) | 3,444,288 | ||||||
| 293,780 | Insmed, Inc.(a) | 5,828,595 | ||||||
| 21,896 | Intercept Pharmaceuticals, Inc.(a) | 3,442,051 | ||||||
| 160,852 | Intrexon Corp.(a) | 5,404,627 | ||||||
| 413,596 | K2M Group Holdings, Inc.(a) | 7,548,127 | ||||||
| 232,380 | MacroGenics, Inc.(a) | 7,220,047 | ||||||
| 197,812 | Neos Therapeutics, Inc.(a) | 2,801,018 | ||||||
| 156,640 | Neurocrine Biosciences, Inc.(a) | 7,689,458 | ||||||
| 10,010 | Penumbra, Inc.(a) | 370,670 | ||||||
| 156,304 | Pieris Pharmaceuticals, Inc.(a) | 248,523 | ||||||
| 114,314 | Portola Pharm, Inc.(a) | 5,442,490 | ||||||
| 92,592 | Presbia PLC(a) | 419,442 | ||||||
| 84,813 | PTC Therapeutics, Inc.(a) | 2,109,299 | ||||||
| 194,655 | Relypsa, Inc.(a) | 3,112,533 | ||||||
| 208,702 | Teladoc, Inc.(a) | 4,105,168 | ||||||
| 505,742 | Veeva Systems, Inc., Class A(a) | 12,830,675 | ||||||
| 137,530 | WellCare Health Plan, Inc.(a) | 12,185,158 | ||||||
| 246,447 | ZIOPHARM Oncology, Inc.(a) | 2,807,031 | ||||||
| 62,372 | ZS Pharma, Inc.(a) | 4,054,804 | ||||||
| 145,694,319 | ||||||||
| Materials & Processing: 6.25% | |||||||
| 336,784 | Apogee Enterprises, Inc. | 16,680,911 | ||||||
| 277,518 | Headwaters, Inc.(a) | 5,702,995 | ||||||
| 295,522 | Installed Building Products, Inc.(a) | 6,545,812 | ||||||
| 115,040 | Milacron Holdings Corp.(a) | 1,963,733 | ||||||
20 |
www.emeraldmutualfunds.com |
Table of Contents
| Emerald Growth Fund | Schedule of Investments | |
October 31, 2015 (Unaudited) |
| Value | ||||||
| Shares | (Note 2) | |||||
Materials & Processing (continued) |
| |||||
370,042 | PGT, Inc.(a) | $4,462,707 | ||||
256,335 | Ply Gem Holdings, Inc.(a) | 3,029,880 | ||||
324,888 | Trex Co., Inc.(a) | 12,693,374 | ||||
| 51,079,412 | ||||||
Producer Durables: 6.81% |
| |||||
338,845 | Alarm.com Holdings, Inc.(a) | 4,286,389 | ||||
11,315 | Astronics Corp.(a) | 427,820 | ||||
175,299 | FARO Technologies, Inc.(a) | 5,923,353 | ||||
262,373 | Kforce, Inc. | 7,375,305 | ||||
196,962 | Knoll, Inc. | 4,577,397 | ||||
317,066 | Korn/Ferry International | 11,531,690 | ||||
152,219 | Spirit Airlines, Inc.(a) | 5,650,369 | ||||
102,405 | Tennant Co. | 5,931,298 | ||||
398,642 | Tutor Perini Corp.(a) | 6,689,213 | ||||
92,229 | Virgin America, Inc.(a) | 3,284,275 | ||||
| 55,677,109 | ||||||
Technology: 24.10% |
| |||||
138,049 | Applied Optoelectronics, Inc.(a) | 2,846,570 | ||||
369,284 | ARC Doc. Solutions, Inc.(a) | 2,296,947 | ||||
103,324 | Cavium, Inc.(a) | 7,330,838 | ||||
235,890 | ChannelAdvisor Corp.(a) | 2,056,961 | ||||
287,172 | Ciena Corp.(a) | 6,932,332 | ||||
219,464 | Cornerstone OnDemand, Inc.(a) | 6,913,116 | ||||
253,201 | EPAM Systems, Inc.(a) | 19,585,097 | ||||
210,508 | Everyday Health, Inc.(a) | 1,978,775 | ||||
308,309 | Gigamon, Inc.(a) | 8,086,945 | ||||
1,406,380 | Glu Mobile, Inc.(a) | 5,794,286 | ||||
386,824 | GTT Communications, Inc.(a) | 7,241,345 | ||||
171,969 | Guidewire Software, Inc.(a) | 10,013,755 | ||||
200,250 | Imperva, Inc.(a) | 14,141,655 | ||||
206,270 | Inovalon Holdings, Inc., Class A(a) | 4,754,524 | ||||
152,934 | Inphi Corp.(a) | 4,552,845 | ||||
92,285 | IPG Photonics Corp.(a) | 7,624,587 | ||||
74,218 | M/A-COM Technology Solutions Holdings, Inc.(a) | 2,504,115 | ||||
237,147 | Microsemi Corp.(a) | 8,539,664 | ||||
92,459 | MicroStrategy, Inc., Class A(a) | 15,909,420 | ||||
289,610 | Model N, Inc.(a) | 2,925,061 | ||||
292,850 | Pixelworks, Inc.(a) | 966,405 | ||||
180,950 | Proofpoint, Inc.(a) | 12,746,118 | ||||
323,327 | Qlik Technologies, Inc.(a) | 10,142,768 | ||||
221,228 | Reis, Inc. | 5,384,690 | ||||
374,030 | Sigma Designs, Inc.(a) | 3,295,204 | ||||
244,540 | Super Micro Computer, Inc.(a) | 6,898,473 | ||||
38,790 | Synaptics, Inc.(a) | 3,300,641 | ||||
256,860 | Synchronoss Technologies, Inc.(a) | 9,036,335 | ||||
448,877 | Telenav, Inc.(a) | 3,231,914 | ||||
| 197,031,386 | ||||||
| Value | ||||||
| Shares | (Note 2) | |||||
Utilities: 2.84% |
| |||||
840,124 | 8x8, Inc.(a) | $8,955,722 | ||||
2,356,935 | Vonage Holdings Corp.(a) | 14,306,595 | ||||
| 23,262,317 | ||||||
Total Common Stocks (Cost $732,212,178) | 770,131,103 | |||||
WARRANTS: 0.00% |
| |||||
41,894 | Magnum Hunter Resources Corp., Strike Price $8.50 (Expiring 04/15/16) | 0 | ||||
Total Warrants (Cost $0) | 0 | |||||
SHORT TERM INVESTMENTS: 3.17% |
| |||||
25,930,470 | Dreyfus Government Cash Management Fund - Institutional Class | 25,930,470 | ||||
Total Short Term Investments (Cost $25,930,470) | 25,930,470 | |||||
Total Investments: 97.35% (Cost $758,142,648) | 796,061,573 | |||||
Other Assets In Excess Of Liabilities: 2.65% | 21,646,345 | |||||
Net Assets: 100.00% | $ | 817,707,918 | ||||
| (a) | Non-income producing security. |
Investment Abbreviations:
Ltd. - Limited.
PLC - Public limited company.
REIT - Real Estate Investment Trust.
Holdings are subject to change.
For Fund compliance purposes, the Fund’s industry classifications refer to any one or more of the industry sub-classifications used by one or more widely recognized market indexes or ratings group indexes, and/or as defined by Fund management. This definition may not apply for purposes of this report, which may combine industry sub-classifications for reporting ease. Industries are shown as a percentage of net assets.
See Notes to Financial Statements.
Semi-Annual Report | October 31, 2015 |
21 |
Table of Contents
| Emerald Small Cap Value Fund | Schedule of Investments | |
October 31, 2015 (Unaudited) |
| Value | ||||||
| Shares | (Note 2) | |||||
COMMON STOCKS: 94.97% |
| |||||
Consumer Discretionary: 13.02% |
| |||||
24,487 | Carriage Services, Inc. | $526,716 | ||||
30,580 | Gray Television, Inc.(a) | 485,916 | ||||
18,945 | Iconix Brand Group, Inc.(a) | 290,237 | ||||
22,019 | Interval Leisure Group, Inc. | 388,635 | ||||
14,802 | Party City Holdco, Inc.(a) | 234,316 | ||||
32,080 | Stoneridge, Inc.(a) | 407,095 | ||||
| 2,332,915 | ||||||
Energy: 2.19% |
| |||||
8,182 | Superior Energy Services, Inc. | 115,857 | ||||
24,652 | Synergy Resources Corp.(a) | 275,856 | ||||
| 391,713 | ||||||
Financial Services: 41.38% |
| |||||
10,066 | Argo Group International Holdings Ltd. | 629,327 | ||||
70,860 | Cedar Realty Trust, Inc., REIT | 495,311 | ||||
16,834 | Corporate Office Properties Trust, REIT | 387,182 | ||||
16,179 | CyrusOne, Inc., REIT | 570,796 | ||||
6,386 | Eagle Bancorp, Inc.(a) | 303,974 | ||||
18,235 | Employers Holdings, Inc. | 482,680 | ||||
101,246 | Everi Holdings, Inc.(a) | 473,831 | ||||
15,962 | First Financial Bancorp | 307,747 | ||||
19,693 | First Merchants Corp. | 516,548 | ||||
19,131 | Flushing Financial Corp. | 402,516 | ||||
15,590 | Great Western Bancorp, Inc. | 440,573 | ||||
5,268 | IBERIABANK Corp. | 319,399 | ||||
14,624 | Live Oak Bancshares, Inc. | 209,708 | ||||
11,688 | Opus Bank | 435,378 | ||||
22,333 | Provident Financial Services, Inc. | 453,807 | ||||
26,165 | Ramco-Gershenson Properties Trust, REIT | 439,572 | ||||
32,738 | Real Industry, Inc.(a) | 311,011 | ||||
22,152 | Wilshire Bancorp, Inc. | 236,805 | ||||
| 7,416,165 | ||||||
Health Care: 1.65% |
| |||||
5,535 | Magellan Health, Inc.(a) | 295,569 | ||||
Materials & Processing: 1.01% |
| |||||
16,755 | Mercer International, Inc. | 180,954 | ||||
Producer Durables: 13.72% |
| |||||
10,582 | Ducommun, Inc.(a) | 228,994 | ||||
8,977 | EMCOR Group, Inc. | 433,410 | ||||
5,168 | EnerSys | 315,196 | ||||
9,433 | Generac Holdings, Inc.(a) | 297,706 | ||||
16,460 | MasTec, Inc.(a) | 276,034 | ||||
3,922 | Regal Beloit Corp. | 250,185 | ||||
13,428 | Viad Corp. | 404,317 | ||||
| Value | ||||||
| Shares | (Note 2) | |||||
Producer Durables (continued) |
| |||||
21,154 | Wabash National Corp.(a) | $253,213 | ||||
| 2,459,055 | ||||||
Technology: 15.14% |
| |||||
11,353 | ARRIS Group, Inc.(a) | 320,836 | ||||
14,668 | Microsemi Corp.(a) | 528,195 | ||||
4,822 | NICE Systems Ltd., Sponsored ADR | 298,096 | ||||
22,904 | Perficient, Inc.(a) | 382,954 | ||||
20,179 | Rudolph Technologies, Inc.(a) | 258,089 | ||||
6,172 | Synaptics, Inc.(a) | 525,175 | ||||
57,481 | Xcerra Corp.(a) | 398,919 | ||||
| 2,712,264 | ||||||
Utilities: 6.86% |
| |||||
11,386 | Great Plains Energy, Inc. | 313,115 | ||||
18,234 | Premiere Global Services, Inc.(a) | 249,441 | ||||
68,416 | Vonage Holdings Corp.(a) | 415,285 | ||||
10,522 | West Corp. | 250,529 | ||||
| 1,228,370 | ||||||
Total Common Stocks (Cost $15,059,302) | 17,017,005 | |||||
SHORT TERM INVESTMENTS: 5.43% |
| |||||
972,360 | Dreyfus Government Cash Management Fund - Institutional Class | 972,360 | ||||
Total Short Term Investments (Cost $972,360) | 972,360 | |||||
Total Investments: 100.40% (Cost $16,031,662) | 17,989,365 | |||||
Liabilities In Excess Of Other | (72,470 | ) | ||||
Net Assets: 100.00% | $17,916,895 | |||||
| (a) | Non-income producing security. |
Investment Abbreviations:
ADR - American Depositary Receipt.
Ltd. - Limited.
REIT - Real Estate Investment Trust.
Holdings are subject to change.
22 |
www.emeraldmutualfunds.com |
Table of Contents
| Emerald Small Cap Value Fund | Schedule of Investments | |
October 31, 2015 (Unaudited) |
For Fund compliance purposes, the Fund’s industry classifications refer to any one or more of the industry sub-classifications used by one or more widely recognized market indexes or ratings group indexes, and/or as defined by Fund management. This definition may not apply for purposes of this report, which may combine industry sub-classifications for reporting ease. Industries are shown as a percentage of net assets.
See Notes to Financial Statements.
Semi-Annual Report | October 31, 2015 |
23 |
Table of Contents
| Emerald Insights Fund | Schedule of Investments | |
October 31, 2015 (Unaudited) |
| Shares | Value (Note 2) | |||||
COMMON STOCKS: 89.43% |
| |||||
Consumer Discretionary: 26.26% |
| |||||
| 3,673 | Avis Budget Group, Inc.(a) | $183,430 | ||||
| 3,378 | Brunswick Corp. | 181,770 | ||||
| 2,025 | Dollar General Corp. | 137,234 | ||||
| 2,873 | Foot Locker, Inc. | 194,646 | ||||
| 2,158 | Harman International Industries, Inc. | 237,294 | ||||
| 8,672 | Hilton Worldwide Holdings, Inc. | 216,713 | ||||
| 1,425 | HomeAway, Inc.(a) | 44,973 | ||||
| 7,005 | IMAX Corp.(a) | 268,922 | ||||
| 2,524 | Jack in the Box, Inc. | 188,114 | ||||
| 5,977 | Jarden Corp.(a) | 267,770 | ||||
| 5,684 | Lions Gate Entertainment Corp. | 221,505 | ||||
| 2,361 | McGraw Hill Financial, Inc. | 218,723 | ||||
| 5,935 | Oasis Petroleum, Inc.(a) | 69,024 | ||||
| 977 | Polaris Industries, Inc. | 109,756 | ||||
| 2,097 | Ross Stores, Inc. | 106,066 | ||||
| 1,939 | Royal Caribbean Cruises Ltd. | 190,701 | ||||
| 1,146 | Signet Jewelers Ltd. | 172,977 | ||||
| 415 | Ulta Salon Cosmetics & Fragrance, Inc.(a) | 72,193 | ||||
| 2,258 | Under Armour, Inc., Class A(a) | 214,691 | ||||
| 1,763 | Whirlpool Corp. | 282,327 | ||||
|
| 3,578,829
|
| ||||
Consumer Staples: 3.37% |
| |||||
| 2,990 | Hain Celestial Group, Inc.(a) | 149,051 | ||||
| 877 | Mead Johnson Nutrition Co. | 71,914 | ||||
| 1,039 | Monster Beverage Corp.(a) | 141,636 | ||||
| 2,368 | WhiteWave Foods Co.(a) | 97,041 | ||||
|
| 459,642
|
| ||||
Energy: 1.91% |
| |||||
| 1,979 | Diamondback Energy, Inc.(a) | 146,129 | ||||
| 1,151 | EQT Corp. | 76,047 | ||||
| 1,143 | SM Energy Co. | 38,119 | ||||
|
| 260,295
|
| ||||
Financial Services: 11.18% |
| |||||
| 1,552 | Affiliated Managers Group, Inc.(a) | 279,764 | ||||
| 778 | Alliance Data Systems Corp.(a) | 231,307 | ||||
| 1,741 | BankUnited, Inc. | 64,730 | ||||
| 5,295 | Brixmor Property Group, Inc., REIT | 135,658 | ||||
| 2,323 | Mid-America Apartment Communities, Inc., REIT | 197,896 | ||||
| 3,776 | PacWest Bancorp | 170,071 | ||||
| 3,167 | SEI Investments Co. | 164,114 | ||||
| 751 | Signature Bank(a) | 111,839 | ||||
| 1,383 | SVB Financial Group(a) | 168,823 | ||||
|
| 1,524,202
|
| ||||
Health Care: 11.01% |
| |||||
| 1,261 | Acadia Healthcare Co., Inc.(a) | 77,438 | ||||
| Shares | Value (Note 2) | |||||
Health Care (continued) |
| |||||
| 7,801 | Akorn, Inc.(a) | $208,599 | ||||
| 1,963 | Alnylam Pharmaceuticals, Inc.(a) | 168,720 | ||||
| 7,402 | Amicus Therapeutics, Inc.(a) | 55,515 | ||||
| 1,540 | Bluebird Bio, Inc.(a) | 118,780 | ||||
| 2,755 | Cepheid(a) | 92,017 | ||||
| 644 | Intercept Pharmaceuticals, Inc.(a) | 101,237 | ||||
| 6,266 | Intrexon Corp.(a) | 210,538 | ||||
| 2,019 | Medivation, Inc.(a) | 84,919 | ||||
| 2,112 | PTC Therapeutics, Inc.(a) | 52,525 | ||||
| 6,688 | Veeva Systems, Inc., Class A(a) | 169,675 | ||||
| 1,705 | WellCare Health Plan, Inc.(a) | 151,063 | ||||
| 901 | ZIOPHARM Oncology, Inc.(a) | 10,262 | ||||
|
| 1,501,288
|
| ||||
Materials & Processing: 6.63% |
| |||||
| 768 | Acuity Brands, Inc. | 167,885 | ||||
| 1,523 | Eagle Materials, Inc. | 100,564 | ||||
| 802 | Martin Marietta Materials, Inc. | 124,430 | ||||
| 5,934 | Masco Corp. | 172,086 | ||||
| 1,930 | PPG Industries, Inc. | 201,222 | ||||
| 1,426 | Vulcan Materials Co. | 137,723 | ||||
|
| 903,910
|
| ||||
Producer Durables: 10.13% |
| |||||
| 4,124 | JetBlue Airways Corp.(a) | 102,440 | ||||
| 5,372 | Korn/Ferry International | 195,380 | ||||
| 1,938 | Middleby Corp.(a) | 226,630 | ||||
| 949 | Snap-on, Inc. | 157,429 | ||||
| 8,407 | Southwest Airlines Co. | 389,160 | ||||
| 3,741 | Wabtec Corp. | 310,017 | ||||
|
| 1,381,056
|
| ||||
Technology: 18.63% |
| |||||
| 2,978 | Activision Blizzard, Inc. | 103,515 | ||||
| 1,194 | Avago Technologies Ltd. | 147,017 | ||||
| 1,067 | Cavium, Inc.(a) | 75,704 | ||||
| 2,609 | EPAM Systems, Inc.(a) | 201,806 | ||||
| 4,796 | Fitbit, Inc., Class A(a) | 194,430 | ||||
| 4,313 | Fortinet, Inc.(a) | 148,195 | ||||
| 1,587 | Intuit, Inc. | 154,621 | ||||
| 1,389 | IPG Photonics Corp.(a) | 114,759 | ||||
| 775 | Lam Research Corp. | 59,357 | ||||
| 633 | LinkedIn Corp., Class A(a) | 152,471 | ||||
| 8,961 | ON Semiconductor Corp.(a) | 98,571 | ||||
| 922 | Palo Alto Networks, Inc.(a) | 148,442 | ||||
| 3,807 | PayPal Holdings, Inc.(a) | 137,090 | ||||
| 3,022 | Proofpoint, Inc.(a) | 212,870 | ||||
| 1,783 | SBA Communications Corp., Class A(a) | 212,213 | ||||
| 1,831 | ServiceNow, Inc.(a) | 149,501 | ||||
| 2,966 | Skyworks Solutions, Inc. | 229,094 | ||||
| 2,539,656 | ||||||
24 |
www.emeraldmutualfunds.com |
Table of Contents
| Emerald Insights Fund | Schedule of Investments | |
October 31, 2015 (Unaudited) |
| Shares | Value (Note 2) | |||||
Utilities: 0.31% |
| |||||
| 1,495 | Exelon Corp. | $41,740 | ||||
Total Common Stocks (Cost $11,777,505) | 12,190,618 | |||||
MASTER LIMITED PARTNERSHIPS: 1.30% |
| |||||
Financial Services: 1.30% |
| |||||
| 3,812 | Lazard Ltd., Class A | 176,571 | ||||
Total Master Limited Partnerships (Cost $201,777) | 176,571 | |||||
SHORT TERM INVESTMENTS: 8.19% |
| |||||
| 1,116,944 | Dreyfus Government Cash Management Fund - Institutional Class | 1,116,944 | ||||
Total Short Term Investments (Cost $1,116,944) | 1,116,944 | |||||
Total Investments: 98.92% (Cost $13,096,226) | 13,484,133 | |||||
Other Assets In Excess Of Liabilities: 1.08% | 147,630 | |||||
Net Assets: 100.00% | $13,631,763 | |||||
| (a) | Non-income producing security. |
Investment Abbreviations:
Ltd. - Limited.
REIT - Real Estate Investment Trust.
Holdings are subject to change.
For Fund compliance purposes, the Fund’s industry classifications refer to any one or more of the industry sub-classifications used by one or more widely recognized market indexes or ratings group indexes, and/or as defined by Fund management. This definition may not apply for purposes of this report, which may combine industry sub-classifications for reporting ease. Industries are shown as a percentage of net assets.
See Notes to Financial Statements.
Semi-Annual Report | October 31, 2015 |
25 |
Table of Contents
| Emerald Banking and Finance Fund | Schedule of Investments | |
October 31, 2015 (Unaudited) |
| Shares | Value (Note 2) | |||||
COMMON STOCKS: 97.03% |
| |||||
Financial Services: 95.64% |
| |||||
Banks: Diversified: 70.38% |
| |||||
| 113,100 | Alerus Financial Corp. | $2,239,380 | ||||
| 30,639 | American Business Bank(a) | 929,894 | ||||
| 228,492 | Ameris Bancorp | 7,197,498 | ||||
| 186,602 | Bancorp, Inc.(a) | 1,343,534 | ||||
| 54,028 | BancorpSouth, Inc. | 1,346,918 | ||||
| 209,296 | Bank of the Ozarks, Inc. | 10,468,986 | ||||
| 212,773 | BankUnited, Inc. | 7,910,900 | ||||
| 133,495 | BNC Bancorp | 2,996,963 | ||||
| 35,105 | Bofl Holding, Inc.(a) | 2,808,751 | ||||
| 162,177 | Bridge Bancorp, Inc. | 4,656,102 | ||||
| 24,757 | Bryn Mawr Bank Corp. | 721,171 | ||||
| 160,489 | California Republic Bancorp(a) | 4,747,265 | ||||
| 230,393 | CenterState Banks, Inc. | 3,359,130 | ||||
| 85,579 | CoBiz Financial, Inc. | 1,066,314 | ||||
| 31,763 | CommunityOne Bancorp(a) | 411,013 | ||||
| 190,470 | ConnectOne Bancorp, Inc. | 3,399,889 | ||||
| 922 | Consumers Bancorp, Inc. | 16,665 | ||||
| 94,170 | CU Bancorp(a) | 2,271,380 | ||||
| 190,303 | Customers Bancorp, Inc.(a) | 5,233,332 | ||||
| 131,668 | Eagle Bancorp, Inc.(a) | 6,267,397 | ||||
| 87,680 | East West Bancorp, Inc. | 3,541,395 | ||||
| 51,445 | Everbank Financial Corp. | 887,941 | ||||
| 86,853 | Farmers National Banc Corp. | 716,537 | ||||
| 58,890 | First Business Financial Services, Inc. | 1,451,639 | ||||
| 142,037 | First Foundation, Inc.(a) | 3,373,379 | ||||
| 149,550 | First NBC Bank Holdings Co.(a) | 5,561,765 | ||||
| 39,225 | First of Long Island Corp. | 1,089,278 | ||||
| 3,596 | First Virginia Community Bank(a) | 60,593 | ||||
| 11,100 | Freedom Bank of Virginia(a) | 88,356 | ||||
| 115,782 | Great Western Bancorp, Inc. | 3,271,999 | ||||
| 22,506 | Guaranty Bancorp | 370,899 | ||||
| 85,252 | Heartland Financial USA, Inc. | 3,140,684 | ||||
| 157,946 | Home BancShares, Inc. | 6,779,042 | ||||
| 16,003 | HopFed Bancorp, Inc. | 188,675 | ||||
| 114,296 | Howard Bancorp, Inc.(a) | 1,442,416 | ||||
| 11,890 | IBERIABANK Corp. | 720,891 | ||||
| 15,250 | Independent Bank Corp. | 712,785 | ||||
| 50,000 | Independent Bank Corporation | 724,000 | ||||
| 44,370 | Independent Bank Group, Inc. | 1,728,212 | ||||
| 67,294 | Investors Bancorp, Inc. | 841,848 | ||||
| 54,120 | John Marshall Bank(a) | 821,271 | ||||
| 180,060 | Live Oak Bancshares, Inc. | 2,582,060 | ||||
| 141,177 | MainStreet Bank(a) | 1,524,712 | ||||
| 247,664 | Malvern Bancorp, Inc.(a) | 3,925,474 | ||||
| 87,881 | Mercantile Bank Corp. | 1,938,655 | ||||
| 45,870 | Meridian Bancorp, Inc. | 644,015 | ||||
| 210,309 | National Commerce Corp.(a) | 5,280,859 | ||||
| 224 | Oak Valley Bancorp | 2,200 | ||||
| 73,738 | Old Line Bancshares, Inc. | 1,264,607 | ||||
| 138,001 | Opus Bank | 5,140,537 | ||||
| Shares | Value (Note 2) | |||||
Banks: Diversified (continued) |
| |||||
| 169,325 | Pacific Premier Bancorp, Inc.(a) | $3,615,089 | ||||
| 212,422 | PacWest Bancorp | 9,567,487 | ||||
| 63,580 | Peoples Bancorp, Inc. | 1,218,193 | ||||
| 102,662 | Pinnacle Financial Partners, Inc. | 5,402,074 | ||||
| 167,140 | PrivateBancorp, Inc. | 6,991,466 | ||||
| 30,000 | QCR Holdings, Inc. | 683,400 | ||||
| 78,565 | Renasant Corp. | 2,720,706 | ||||
| 481,505 | Royal Bancshares of Pennsylvania, Inc., Class A(a) | 1,006,345 | ||||
| 128,065 | ServisFirst Bancshares, Inc. | 5,427,395 | ||||
| 54,452 | Signature Bank(a) | 8,108,992 | ||||
| 66,236 | Simmons First National Corp., | 3,413,803 | ||||
| 46,032 | Southern First Bancshares, Inc.(a) | 1,054,133 | ||||
| 20,598 | Southern National Bancorp of VA, Inc. | 234,817 | ||||
| 39,735 | Sun Bancorp, Inc.(a) | 795,097 | ||||
| 72,089 | SVB Financial Group(a) | 8,799,904 | ||||
| 48,499 | Talmer Bancorp, Inc., Class A | 815,753 | ||||
| 25,430 | Texas Capital Bancshares, Inc.(a) | 1,403,736 | ||||
| 87,675 | WashingtonFirst Bankshares, Inc. | 1,628,125 | ||||
| 42,992 | West Town Bank & Trust(a) | 932,926 | ||||
| 155,294 | Western Alliance Bancorp(a) | 5,551,761 | ||||
|
| 198,580,408
|
| ||||
Banks: Savings, Thrift & Mortgage Lending: 7.62% |
| |||||
| 225,594 | Atlantic Coast Financial Corp.(a) | 1,380,635 | ||||
| 170,950 | Avenue Financial Holdings, Inc.(a) | 2,384,753 | ||||
| 36,138 | Elmira Savings Bank | 692,404 | ||||
| 157,210 | First Choice Bank(a) | 2,436,755 | ||||
| 119,500 | First Resource Bank | 791,688 | ||||
| 12,500 | Flushing Financial Corp. | 263,000 | ||||
| 103,401 | Heritage Financial Corp. | 1,904,646 | ||||
| 11,680 | Home Bancorp, Inc. | 296,438 | ||||
| 18,520 | Home Federal Bancorp, Inc. | 434,294 | ||||
| 134,226 | LegacyTexas Financial Group, Inc. | 3,852,286 | ||||
| 36,429 | Mackinac Financial Corp. | 375,947 | ||||
| 159,583 | Sterling Bancorp | 2,455,982 | ||||
| 49,746 | Sunshine Bancorp, Inc.(a) | 684,008 | ||||
| 30,890 | Sussex Bancorp | 402,497 | ||||
| 99,386 | WSFS Financial Corp. | 3,157,493 | ||||
|
| 21,512,826
|
| ||||
Commercial Banks: 4.03% |
| |||||
| 15,000 | County Bancorp, Inc. | 274,950 | ||||
| 561,112 | First Security Group, Inc.(a) | 1,313,002 | ||||
| 146,082 | Franklin Financial Network, Inc.(a) | 3,916,458 | ||||
| 107,712 | Investar Holdings Corp. | 1,700,773 | ||||
| 44,200 | Seacoast Commerce Banc | 718,250 | ||||
| 89,567 | Stonegate Bank | 2,795,386 | ||||
| 39,610 | Triumph Bancorp, Inc.(a) | 661,091 | ||||
| 11,379,910 | ||||||
26 |
www.emeraldmutualfunds.com |
Table of Contents
| Emerald Banking and Finance Fund | Schedule of Investments | |
October 31, 2015 (Unaudited) |
| Shares | Value (Note 2) | |||||
Commercial Finance & Mortgage Companies: 0.16% |
| |||||
| 32,000 | Ladder Capital Corp., REIT
|
| $456,320
|
| ||
Consumer Lending: 3.77% |
| |||||
| 241,368 | Enova International, Inc.(a) | 3,137,784 | ||||
| 61,839 | LendingTree, Inc.(a) | 7,504,781 | ||||
|
| 10,642,565
|
| ||||
Diversified Financial Services: 2.97% |
| |||||
| 153,814 | FCB Financial Holdings, Inc., Class A(a) | 5,469,626 | ||||
| 14,430 | Greenhill & Co., Inc. | 372,582 | ||||
| 82,423 | MidWestOne Financial Group, Inc. | 2,525,441 | ||||
|
| 8,367,649
|
| ||||
Financial Data & Services: 0.34% |
| |||||
| 5,000 | Black Knight Financial Services, Inc., Class A(a) | 180,150 | ||||
| 15,022 | Cass Information Systems, Inc. | 783,548 | ||||
|
| 963,698
|
| ||||
Insurance: 0.52% |
| |||||
| 50,000 | James River Group Holdings Ltd.
|
| 1,471,500
|
| ||
Insurance: Property-Casualty: 3.39% |
| |||||
| 64,570 | AmTrust Financial Services, Inc. | 4,404,965 | ||||
| 30,000 | Atlas Financial Holdings, Inc.(a) | 570,600 | ||||
| 296,069 | Conifer Holdings, Inc.(a) | 2,830,420 | ||||
| 40,000 | Federated National Holdings Co. | 1,231,400 | ||||
| 31,441 | United Insurance Holdings Corp. | 519,405 | ||||
|
| 9,556,790
|
| ||||
Real Estate Investment Trusts (REITs): 1.15% |
| |||||
| 70,240 | American Farmland Co., REIT(a) | 505,728 | ||||
| 53,830 | Diamond Resorts International, | 1,530,925 | ||||
| 45,660 | Farmland Partners, Inc., REIT | 468,472 | ||||
| 92,800 | Independence Realty Trust, | 727,552 | ||||
|
| 3,232,677
|
| ||||
Real Estate Management & Development: 0.28% |
| |||||
| 18,140 | Marcus & Millichap, Inc.(a)
|
| 790,360
|
| ||
Securities Brokerage & Services: 1.03% |
| |||||
| 119,996 | Virtu Financial, Inc., Class A
|
| 2,903,903
|
| ||
Producer Durables: 1.39% |
| |||||
Commercial Services: Rental & Leasing: 1.39% |
| |||||
| 221,689 | Marlin Business Services Corp. | 3,915,028 | ||||
Total Common Stocks (Cost $218,727,037) | 273,773,634 | |||||
| Shares | Value (Note 2) | |||||
SHORT TERM INVESTMENTS: 5.18% |
| |||||
| 14,623,042 | Dreyfus Government Cash Management Fund - Institutional Class | $14,623,042 | ||||
Total Short Term Investments (Cost $14,623,042) | 14,623,042 | |||||
Total Investments: 102.21% (Cost $233,350,079) | 288,396,676 | |||||
Liabilities In Excess Of Other | (6,240,652 | ) | ||||
Net Assets: 100.00% | $282,156,024 | |||||
| (a) | Non-income producing security. |
Investment Abbreviations:
Ltd. - Limited.
REIT - Real Estate Investment Trust.
Holdings are subject to change.
For Fund compliance purposes, the Fund’s industry classifications refer to any one or more of the industry sub-classifications used by one or more widely recognized market indexes or ratings group indexes, and/or as defined by Fund management. This definition may not apply for purposes of this report, which may combine industry sub-classifications for reporting ease. Industries are shown as a percentage of net assets.
See Notes to Financial Statements.
Semi-Annual Report | October 31, 2015 |
27 |
Table of Contents
| Emerald Funds | Statements of Assets and Liabilities | |
October 31, 2015 (Unaudited) |
Emerald Growth Fund | Emerald Small Cap Value Fund | Emerald Insights Fund | Emerald Banking and Finance Fund | |||||||||||||||
ASSETS: | ||||||||||||||||||
Investments, at value | $ | 796,061,573 | $ | 17,989,365 | $ | 13,484,133 | $ | 288,396,676 | ||||||||||
Cash | 2,075,546 | – | – | 1,304,768 | ||||||||||||||
Receivable for investments sold | 13,912,165 | – | 285,942 | – | ||||||||||||||
Receivable for shares sold | 38,250,195 | – | 94,800 | 2,320,881 | ||||||||||||||
Receivable due from advisor | – | 302 | – | – | ||||||||||||||
Interest and dividends receivable | 102,887 | 658 | 2,998 | 64,052 | ||||||||||||||
Other assets | 55,822 | 20,432 | 6,035 | 751,320 | ||||||||||||||
|
|
|
|
|
|
|
| |||||||||||
Total Assets | 850,458,188 | 18,010,757 | 13,873,908 | 292,837,697 | ||||||||||||||
|
|
|
|
|
|
|
| |||||||||||
LIABILITIES: | ||||||||||||||||||
Payable for investments purchased | 19,309,016 | 54,049 | 210,951 | 9,953,853 | ||||||||||||||
Payable for shares redeemed | 12,656,896 | – | – | 293,784 | ||||||||||||||
Investment advisory fees payable | 414,000 | – | 3,594 | 203,922 | ||||||||||||||
Payable to fund accounting and administration | 63,826 | 2,945 | 2,653 | 22,544 | ||||||||||||||
Payable for distribution and service fees | 228,140 | 104 | 4,649 | 156,729 | ||||||||||||||
Payable for trustee fees and expenses | 2,149 | 53 | 45 | 862 | ||||||||||||||
Payable for transfer agency fees | 20,397 | 4,653 | 4,744 | 14,555 | ||||||||||||||
Payable for chief compliance officer fee | 6,550 | 212 | 146 | 2,513 | ||||||||||||||
Payable for principal financial officer fee | 1,171 | 35 | 26 | 452 | ||||||||||||||
Payable for professional fees | 14,399 | 27,895 | 13,153 | 13,610 | ||||||||||||||
Accrued expenses and other liabilities | 33,726 | 3,916 | 2,184 | 18,849 | ||||||||||||||
|
|
|
|
|
|
|
| |||||||||||
Total Liabilities | 32,750,270 | 93,862 | 242,145 | 10,681,673 | ||||||||||||||
|
|
|
|
|
|
|
| |||||||||||
NET ASSETS | $ | 817,707,918 | $ | 17,916,895 | $ | 13,631,763 | $ | 282,156,024 | ||||||||||
|
|
|
|
|
|
|
| |||||||||||
NET ASSETS CONSIST OF: | ||||||||||||||||||
Paid-in capital (Note 5) | $ | 769,250,387 | $ | 16,824,285 | $ | 13,757,056 | $ | 229,805,031 | ||||||||||
Accumulated net investment income/(loss) | (2,904,693) | 68,446 | (44,030) | (463,004) | ||||||||||||||
Accumulated net realized gain/(loss) on investments | 13,443,299 | (933,539) | (469,170) | (2,232,600) | ||||||||||||||
Net unrealized appreciation on investments | 37,918,925 | 1,957,703 | 387,907 | 55,046,597 | ||||||||||||||
|
|
|
|
|
|
|
| |||||||||||
NET ASSETS | $ | 817,707,918 | $ | 17,916,895 | $ | 13,631,763 | $ | 282,156,024 | ||||||||||
|
|
|
|
|
|
|
| |||||||||||
INVESTMENTS, AT COST | $ | 758,142,648 | $ | 16,031,662 | $ | 13,096,226 | $ | 233,350,079 | ||||||||||
PRICING OF SHARES | ||||||||||||||||||
Class A: (a) | ||||||||||||||||||
Net Asset Value, offering and redemption price per share | $ | 19.71 | $ | 13.36 | $ | 10.47 | $ | 32.36 | ||||||||||
Net Assets | $ | 296,280,563 | $ | 14,605 | $ | 12,201,550 | $ | 117,550,124 | ||||||||||
Shares of beneficial interest outstanding | 15,032,362 | 1,093 | 1,165,020 | 3,632,370 | ||||||||||||||
Maximum offering price per share (NAV/.9525, based on maximum sales charge of 4.75% of the offering price) | $ | 20.69 | $ | 14.03 | $ | 10.99 | $ | 33.97 | ||||||||||
Class C: (a) | ||||||||||||||||||
Net Asset Value, offering and redemption price per share | $ | 17.16 | $ | 13.33 | $ | 10.37 | $ | 29.29 | ||||||||||
Net Assets | $ | 39,401,527 | $ | 14,573 | $ | 102,153 | $ | 46,595,264 | ||||||||||
Shares of beneficial interest outstanding | 2,296,319 | 1,093 | 9,849 | 1,591,092 | ||||||||||||||
Institutional Class: | ||||||||||||||||||
Net Asset Value, offering and redemption price per share | $ | 20.26 | $ | 13.38 | $ | 10.49 | $ | 32.74 | ||||||||||
Net Assets | $ | 353,802,065 | $ | 17,006,120 | $ | 363,047 | $ | 47,312,025 | ||||||||||
Shares of beneficial interest outstanding | 17,465,559 | 1,271,092 | 34,603 | 1,444,973 | ||||||||||||||
Investor Class: | ||||||||||||||||||
Net Asset Value, offering and redemption price per share | $ | 19.65 | $ | 13.34 | $ | 10.45 | $ | 30.99 | ||||||||||
Net Assets | $ | 128,223,763 | $ | 881,597 | $ | 965,013 | $ | 70,698,611 | ||||||||||
Shares of beneficial interest outstanding | 6,525,063 | 66,078 | 92,343 | 2,281,214 | ||||||||||||||
| (a) | Redemption price per share may be reduced for any applicable contingent deferred sales charge. For a description of a possible sales charge, please see the Funds’ Prospectus. |
See Notes to Financial Statements.
28 |
www.emeraldmutualfunds.com |
Table of Contents
| Emerald Funds | Statements of Operations | |
For the Six Months or Period Ended October 31, 2015 (Unaudited) |
Emerald Growth Fund | Emerald Small Cap Value Fund(a) | Emerald Insights Fund | Emerald Banking and Finance Fund | |||||||||||||||
INVESTMENT INCOME: | ||||||||||||||||||
Dividends | $ | 1,044,386 | $ | 1,393 | $ | 36,141 | $ | 1,346,832 | ||||||||||
Foreign taxes withheld | – | – | (178) | – | ||||||||||||||
|
|
|
|
|
|
|
| |||||||||||
Total Investment Income | 1,044,386 | 1,393 | 35,963 | 1,346,832 | ||||||||||||||
|
|
|
|
|
|
|
| |||||||||||
EXPENSES: | ||||||||||||||||||
Investment advisory fee (Note 6) | 1,919,466 | 10,983 | 37,696 | 933,350 | ||||||||||||||
Recoupment of previously waived fees | 134,517 | – | – | – | ||||||||||||||
Administration fee | 153,461 | 1,194 | 4,643 | 54,909 | ||||||||||||||
Custodian fee | 19,254 | 424 | 2,476 | 7,695 | ||||||||||||||
Professional fees | 13,493 | 2,619 | 9,234 | 10,717 | ||||||||||||||
Transfer agent fee | 73,235 | 2,315 | 14,794 | 46,285 | ||||||||||||||
Trustee fees and expenses | 5,694 | 53 | 106 | 2,069 | ||||||||||||||
Registration/filing fees | 54,801 | 2,633 | 5,078 | 30,993 | ||||||||||||||
Reports to shareholder and printing fees | 17,290 | 103 | 392 | 9,202 | ||||||||||||||
Distribution and service fees | ||||||||||||||||||
Class A | 361,559 | 4 | 15,534 | 136,944 | ||||||||||||||
Class C | 129,639 | 12 | 202 | 196,325 | ||||||||||||||
Institutional Class | 69,297 | – | 81 | 8,589 | ||||||||||||||
Investor Class | 116,346 | 88 | 1,624 | 88,731 | ||||||||||||||
Chief compliance officer fee | 19,767 | 106 | 382 | 7,240 | ||||||||||||||
Principal financial officer fee | 3,561 | 18 | 69 | 1,308 | ||||||||||||||
Other | 10,277 | 504 | 2,626 | 6,138 | ||||||||||||||
|
|
|
|
|
|
|
| |||||||||||
Total expenses before waiver | 3,101,657 | 21,056 | 94,937 | 1,540,495 | ||||||||||||||
Less fees waived/reimbursed by investment adviser (Note 6) | – | (6,308) | (27,236) | – | ||||||||||||||
|
|
|
|
|
|
|
| |||||||||||
Total Net Expenses | 3,101,657 | 14,748 | 67,701 | 1,540,495 | ||||||||||||||
|
|
|
|
|
|
|
| |||||||||||
NET INVESTMENT LOSS: | (2,057,271) | (13,355) | (31,738) | (193,663) | ||||||||||||||
|
|
|
|
|
|
|
| |||||||||||
REALIZED AND UNREALIZED GAIN/(LOSS) ON INVESTMENTS | ||||||||||||||||||
Net realized gain/(loss) on investments | (8,416,409) | 63,565 | (327,715) | 1,071,039 | ||||||||||||||
Net change in unrealized appreciation/(depreciation) on investments | (29,820,802) | 823,302 | (281,544) | 18,855,812 | ||||||||||||||
|
|
|
|
|
|
|
| |||||||||||
NET REALIZED AND UNREALIZED GAIN/(LOSS) ON INVESTMENTS | (38,237,211) | 886,867 | (609,259) | 19,926,851 | ||||||||||||||
|
|
|
|
|
|
|
| |||||||||||
NET INCREASE/(DECREASE) IN NET ASSETS RESULTING FROM OPERATIONS | $ | (40,294,482) | $ | 873,512 | $ | (640,997) | $ | 19,733,188 | ||||||||||
|
|
|
|
|
|
|
| |||||||||||
| (a) | Effective March 3, 2015 the Board approved changing the fiscal year-end of the Fund from September 30 to April 30. See Notes to Financial Statements. |
See Notes to Financial Statements.
Semi-Annual Report | October 31, 2015 |
29 |
Table of Contents
| Emerald Growth Fund | Statements of Changes in Net Assets | |
For the Six Months Ended October 31, 2015 (Unaudited) | Year Ended April 30, 2015 | |||||||||
OPERATIONS: | ||||||||||
Net investment loss | $ | (2,057,271) | $ | (2,204,019) | ||||||
Net realized gain/(loss) on investments | (8,416,409) | 26,045,665 | ||||||||
Net change in unrealized appreciation/(depreciation) on investments | (29,820,802) | 22,664,902 | ||||||||
|
|
|
| |||||||
Net increase/(decrease) in net assets resulting from operations | (40,294,482) | 46,506,548 | ||||||||
|
|
|
| |||||||
DISTRIBUTIONS TO SHAREHOLDERS (NOTE 3): | ||||||||||
From net realized gains on investments | ||||||||||
Class A | – | (7,114,290) | ||||||||
Class C | – | (872,458) | ||||||||
Institutional Class | – | (10,131,634) | ||||||||
Investor Class
|
| –
|
|
| (1,055,047)
|
| ||||
|
|
|
| |||||||
Net decrease in net assets from distributions | – | (19,173,429) | ||||||||
|
|
|
| |||||||
SHARE TRANSACTIONS (NOTE 5): | ||||||||||
Class A | ||||||||||
Proceeds from sale of shares | 215,862,303 | 53,012,811 | ||||||||
Issued to shareholders in reinvestment of distributions | – | 6,449,784 | ||||||||
Cost of shares redeemed | (30,591,917) | (23,205,808) | ||||||||
|
|
|
| |||||||
Net increase from share transactions | 185,270,386 | 36,256,787 | ||||||||
|
|
|
| |||||||
Class C | ||||||||||
Proceeds from sale of shares | 27,074,891 | 5,349,541 | ||||||||
Issued to shareholders in reinvestment of distributions | – | 745,415 | ||||||||
Cost of shares redeemed | (996,545) | (3,205,852) | ||||||||
|
|
|
| |||||||
Net increase from share transactions | 26,078,346 | 2,889,104 | ||||||||
|
|
|
| |||||||
Institutional Class | ||||||||||
Proceeds from sale of shares | 244,835,762 | 44,366,418 | ||||||||
Issued to shareholders in reinvestment of distributions | – | 9,651,464 | ||||||||
Cost of shares redeemed | (46,306,241) | (29,629,924) | ||||||||
|
|
|
| |||||||
Net increase from share transactions | 198,529,521 | 24,387,958 | ||||||||
|
|
|
| |||||||
Investor Class | ||||||||||
Proceeds from sale of shares | 126,517,683 | 18,821,238 | ||||||||
Issued to shareholders in reinvestment of distributions | – | 761,358 | ||||||||
Cost of shares redeemed | (15,272,994) | (13,424,866) | ||||||||
|
|
|
| |||||||
Net increase from share transactions | 111,244,689 | 6,157,730 | ||||||||
|
|
|
| |||||||
Net increase in net assets | $ | 480,828,460 | $ | 97,024,698 | ||||||
|
|
|
| |||||||
NET ASSETS: | ||||||||||
Beginning of period | 336,879,458 | 239,854,760 | ||||||||
|
|
|
| |||||||
End of period (including accumulated net investment loss of $(2,904,693) and $(847,422)) | $ | 817,707,918 | $ | 336,879,458 | ||||||
|
|
|
| |||||||
30 |
www.emeraldmutualfunds.com |
Table of Contents
| Emerald Growth Fund | Statements of Changes in Net Assets | |
For the Six Months Ended October 31, 2015 (Unaudited) | Year Ended April 30, 2015 | |||||||||
Other Information: | ||||||||||
SHARE TRANSACTIONS: | ||||||||||
Class A | ||||||||||
Sold | 10,308,476 | 2,761,491 | ||||||||
Distributions reinvested | – | 341,078 | ||||||||
Redeemed | (1,461,777) | (1,218,757) | ||||||||
|
|
|
| |||||||
Net increase in shares outstanding | 8,846,699 | 1,883,812 | ||||||||
|
|
|
| |||||||
Class C | ||||||||||
Sold | 1,468,835 | 306,048 | ||||||||
Distributions reinvested | – | 45,040 | ||||||||
Redeemed | (54,957) | (193,449) | ||||||||
|
|
|
| |||||||
Net increase in shares outstanding | 1,413,878 | 157,639 | ||||||||
|
|
|
| |||||||
Institutional Class | ||||||||||
Sold | 11,214,621 | 2,257,859 | ||||||||
Distributions reinvested | – | 498,012 | ||||||||
Redeemed | (2,225,818) | (1,548,603) | ||||||||
|
|
|
| |||||||
Net increase in shares outstanding | 8,988,803 | 1,207,268 | ||||||||
|
|
|
| |||||||
Investor Class | ||||||||||
Sold | 6,100,651 | 977,034 | ||||||||
Distributions reinvested | – | 40,390 | ||||||||
Redeemed | (753,312) | (718,235) | ||||||||
|
|
|
| |||||||
Net increase in shares outstanding | 5,347,339 | 299,189 | ||||||||
|
|
|
| |||||||
See Notes to Financial Statements.
Semi-Annual Report | October 31, 2015 |
31 |
Table of Contents
| Emerald Small Cap Value Fund | Statements of Changes in Net Assets | |
For the Period Ended October 31, 2015 (Unaudited) (a) | Year Ended September 30, 2015 | |||||||||
OPERATIONS: | ||||||||||
Net investment income/(loss) | $ | (13,355) | $ | 81,815 | ||||||
Net realized gain/(loss) on investments | 63,565 | (997,104) | ||||||||
Net change in unrealized appreciation on investments
|
| 823,302
|
|
| 1,168,742
|
| ||||
|
|
|
| |||||||
Net increase in net assets resulting from operations | 873,512 | 253,453 | ||||||||
|
|
|
| |||||||
DISTRIBUTIONS TO SHAREHOLDERS (NOTE 3): | ||||||||||
From net investment income | ||||||||||
Institutional Class | – | (76,689) | ||||||||
Investor Class | – | (1,619) | ||||||||
From net realized gains on investments | ||||||||||
Class A | – | (405) | ||||||||
Class C | – | (405) | ||||||||
Institutional Class | – | (505,155) | ||||||||
Investor Class
|
| –
|
|
| (11,254)
|
| ||||
|
|
|
| |||||||
Net decrease in net assets from distributions | – | (595,527) | ||||||||
|
|
|
| |||||||
SHARE TRANSACTIONS (NOTE 5): | ||||||||||
Class A | ||||||||||
Proceeds from sale of shares | – | 15,000 | ||||||||
Issued to shareholders in reinvestment of distributions | – | 405 | ||||||||
|
|
|
| |||||||
Net increase from share transactions | – | 15,405 | ||||||||
|
|
|
| |||||||
Class C | ||||||||||
Proceeds from sale of shares | – | 15,000 | ||||||||
Issued to shareholders in reinvestment of distributions | – | 405 | ||||||||
|
|
|
| |||||||
Net increase from share transactions | – | 15,405 | ||||||||
|
|
|
| |||||||
Institutional Class | ||||||||||
Proceeds from sale of shares | 77,439 | 3,861,703 | ||||||||
Issued to shareholders in reinvestment of distributions | – | 483,048 | ||||||||
Cost of shares redeemed | (433,174) | (11,838,177) | ||||||||
|
|
|
| |||||||
Net decrease from share transactions | (355,735) | (7,493,426) | ||||||||
|
|
|
| |||||||
Investor Class | ||||||||||
Proceeds from sale of shares | 464,916 | 83,181 | ||||||||
Issued to shareholders in reinvestment of distributions | – | 12,813 | ||||||||
Cost of shares redeemed | – | (173,977) | ||||||||
|
|
|
| |||||||
Net increase/(decrease) from share transactions | 464,916 | (77,983) | ||||||||
|
|
|
| |||||||
Net increase/(decrease) in net assets | $ | 982,693 | $ | (7,882,673) | ||||||
|
|
|
| |||||||
NET ASSETS: | ||||||||||
Beginning of period | 16,934,202 | 24,816,875 | ||||||||
|
|
|
| |||||||
End of period (including accumulated net investment income of $68,446 and $81,801) | $ | 17,916,895 | $ | 16,934,202 | ||||||
|
|
|
| |||||||
32 |
www.emeraldmutualfunds.com |
Table of Contents
| Emerald Small Cap Value Fund | Statements of Changes in Net Assets | |
For the Period Ended October 31, 2015 (Unaudited) (a) | Year Ended September 30, 2015 | |||||||||
Other Information: | ||||||||||
SHARE TRANSACTIONS: | ||||||||||
Class A | ||||||||||
Sold | – | 1,063 | ||||||||
Distributions reinvested | – | 30 | ||||||||
|
|
|
| |||||||
Net increase in shares outstanding | – | �� | 1,093 | |||||||
|
|
|
| |||||||
Class C | ||||||||||
Sold | – | 1,063 | ||||||||
Distributions reinvested | – | 30 | ||||||||
|
|
|
| |||||||
Net increase in shares outstanding | – | 1,093 | ||||||||
|
|
|
| |||||||
Institutional Class | ||||||||||
Sold | 5,792 | 289,259 | ||||||||
Distributions reinvested | – | 36,038 | ||||||||
Redeemed | (33,045) | (934,159) | ||||||||
|
|
|
| |||||||
Net decrease in shares outstanding | (27,253) | (608,862) | ||||||||
|
|
|
| |||||||
Investor Class | ||||||||||
Sold | 34,596 | 6,169 | ||||||||
Distributions reinvested | – | 959 | ||||||||
Redeemed | – | (12,883) | ||||||||
|
|
|
| |||||||
Net increase/(decrease) in shares outstanding | 34,596 | (5,755) | ||||||||
|
|
|
| |||||||
| (a) | Effective March 3, 2015 the Board approved changing the fiscal year-end of the Fund from September 30 to April 30. |
See Notes to Financial Statements.
Semi-Annual Report | October 31, 2015 |
33 |
Table of Contents
| Emerald Insights Fund | Statements of Changes in Net Assets | |
For the Six Months Ended October 31, 2015 (Unaudited) | For the Period August 1, 2014 (Inception) to | |||||||||
OPERATIONS: | ||||||||||
Net investment loss | $ | (31,738) | $ | (23,625) | ||||||
Net realized loss on investments | (327,715) | (143,101) | ||||||||
Net change in unrealized appreciation/(depreciation) on investments | (281,544) | 669,451 | ||||||||
|
|
|
| |||||||
Net increase/(decrease) in net assets resulting from operations | (640,997) | 502,725 | ||||||||
|
|
|
| |||||||
SHARE TRANSACTIONS (NOTE 5): | ||||||||||
Class A | ||||||||||
Proceeds from sale of shares | 6,522,181 | 6,101,597 | ||||||||
Cost of shares redeemed | (263,433) | (82,206) | ||||||||
|
|
|
| |||||||
Net increase from share transactions | 6,258,748 | 6,019,391 | ||||||||
|
|
|
| |||||||
Class C | ||||||||||
Proceeds from sale of shares | 84,233 | 24,453 | ||||||||
Cost of shares redeemed | (7,964) | – | ||||||||
|
|
|
| |||||||
Net increase from share transactions | 76,269 | 24,453 | ||||||||
|
|
|
| |||||||
Institutional Class | ||||||||||
Proceeds from sale of shares | 99,033 | 265,616 | ||||||||
|
|
|
| |||||||
Net increase from share transactions | 99,033 | 265,616 | ||||||||
|
|
|
| |||||||
Investor Class | ||||||||||
Proceeds from sale of shares | 720,976 | 434,000 | ||||||||
Cost of shares redeemed | (128,451) | – | ||||||||
|
|
|
| |||||||
Net increase from share transactions | 592,525 | 434,000 | ||||||||
|
|
|
| |||||||
Net increase in net assets | $ | 6,385,578 | $ | 7,246,185 | ||||||
|
|
|
| |||||||
NET ASSETS: | ||||||||||
Beginning of period | 7,246,185 | – | ||||||||
|
|
|
| |||||||
End of period (including accumulated net investment loss of $(44,030) and $(12,292)) | $ | 13,631,763 | $ | 7,246,185 | ||||||
|
|
|
| |||||||
Other Information: | ||||||||||
SHARE TRANSACTIONS: | ||||||||||
Class A | ||||||||||
Sold | 598,114 | 599,167 | ||||||||
Redeemed | (24,472) | (7,789) | ||||||||
|
|
|
| |||||||
Net increase in shares outstanding | 573,642 | 591,378 | ||||||||
|
|
|
| |||||||
Class C | ||||||||||
Sold | 8,169 | 2,457 | ||||||||
Redeemed | (777) | – | ||||||||
|
|
|
| |||||||
Net increase in shares outstanding | 7,392 | 2,457 | ||||||||
|
|
|
| |||||||
Institutional Class | ||||||||||
Sold | 9,228 | 25,375 | ||||||||
|
|
|
| |||||||
Net increase in shares outstanding | 9,228 | 25,375 | ||||||||
|
|
|
| |||||||
Investor Class | ||||||||||
Sold | 64,144 | 40,827 | ||||||||
Redeemed | (12,628) | – | ||||||||
|
|
|
| |||||||
Net increase in shares outstanding | 51,516 | 40,827 | ||||||||
|
|
|
| |||||||
See Notes to Financial Statements.
34 |
www.emeraldmutualfunds.com |
Table of Contents
| Emerald Banking and Finance Fund | Statements of Changes in Net Assets | |
For the Six Months Ended October 31, 2015 (Unaudited) | Year Ended April 30, 2015 | |||||||||
OPERATIONS: | ||||||||||
Net investment loss | $ | (193,663) | $ | (820,224) | ||||||
Net realized gain on investments | 1,071,039 | 2,239,110 | ||||||||
Net change in unrealized appreciation on investments | 18,855,812 | 10,618,634 | ||||||||
|
|
|
| |||||||
Net increase in net assets resulting from operations | 19,733,188 | 12,037,520 | ||||||||
|
|
|
| |||||||
SHARE TRANSACTIONS (NOTE 5): | ||||||||||
Class A | ||||||||||
Proceeds from sale of shares | 70,698,637 | 8,943,302 | ||||||||
Cost of shares redeemed | (9,555,194) | (13,656,116) | ||||||||
|
|
|
| |||||||
Net increase/(decrease) from share transactions | 61,143,443 | (4,712,814) | ||||||||
|
|
|
| |||||||
Class C | ||||||||||
Proceeds from sale of shares | 12,128,500 | 4,050,687 | ||||||||
Cost of shares redeemed | (1,469,388) | (3,175,681) | ||||||||
|
|
|
| |||||||
Net increase from share transactions | 10,659,112 | 875,006 | ||||||||
|
|
|
| |||||||
Institutional Class | ||||||||||
Proceeds from sale of shares | 26,340,572 | 3,363,492 | ||||||||
Cost of shares redeemed | (6,237,863) | (4,043,673) | ||||||||
|
|
|
| |||||||
Net increase/(decrease) from share transactions | 20,102,709 | (680,181) | ||||||||
|
|
|
| |||||||
Investor Class | ||||||||||
Proceeds from sale of shares | 47,019,385 | 12,918,507 | ||||||||
Cost of shares redeemed | (8,108,963) | (6,971,664) | ||||||||
|
|
|
| |||||||
Net increase from share transactions | 38,910,422 | 5,946,843 | ||||||||
|
|
|
| |||||||
Net increase in net assets | $ | 150,548,874 | $ | 13,466,374 | ||||||
|
|
|
| |||||||
NET ASSETS: | ||||||||||
Beginning of period | 131,607,150 | 118,140,776 | ||||||||
|
|
|
| |||||||
End of period (including accumulated net investment loss of $(463,004) and $(269,341)) | $ | 282,156,024 | $ | 131,607,150 | ||||||
|
|
|
| |||||||
Other Information: | ||||||||||
SHARE TRANSACTIONS: | ||||||||||
Class A | ||||||||||
Sold | 2,256,897 | 327,474 | ||||||||
Redeemed | (308,108) | (506,169) | ||||||||
|
|
|
| |||||||
Net increase/(decrease) in shares outstanding | 1,948,789 | (178,695) | ||||||||
|
|
|
| |||||||
Class C | ||||||||||
Sold | 427,211 | 162,947 | ||||||||
Redeemed | (52,565) | (129,546) | ||||||||
|
|
|
| |||||||
Net increase in shares outstanding | 374,646 | 33,401 | ||||||||
|
|
|
| |||||||
Institutional Class | ||||||||||
Sold | 832,499 | 122,773 | ||||||||
Redeemed | (201,648) | (147,805) | ||||||||
|
|
|
| |||||||
Net increase/(decrease) in shares outstanding | 630,851 | (25,032) | ||||||||
|
|
|
| |||||||
Investor Class | ||||||||||
Sold | 1,561,637 | 496,076 | ||||||||
Redeemed | (273,061) | (272,502) | ||||||||
|
|
|
| |||||||
Net increase in shares outstanding | 1,288,576 | 223,574 | ||||||||
|
|
|
| |||||||
See Notes to Financial Statements.
Semi-Annual Report | October 31, 2015 |
35 |
Table of Contents
| Emerald Growth Fund | Financial Highlights | |
For a share outstanding throughout the periods presented |
| CLASS A | ||||||||||||||||||||||||||||||
For the Six Months Ended October 31, 2015 (Unaudited) | Year Ended April 30, 2015 | Year Ended April 30, 2014 | Year Ended April 30, 2013 | For the Period January 1, 2012 to | Year Ended December 31, 2011 | |||||||||||||||||||||||||
NET ASSET VALUE, BEGINNING OF PERIOD | $ | 20.02 | $ | 18.11 | $ | 15.60 | $ | 16.20 | $ | 13.37 | $ | 13.57 | ||||||||||||||||||
INCOME/(LOSS) FROM OPERATIONS: | ||||||||||||||||||||||||||||||
Net investment loss(c) | (0.09) | (0.18) | (0.21) | (0.15) | (0.05) | (0.14) | ||||||||||||||||||||||||
Net realized and unrealized gain/(loss) on investments | (0.22) | 3.43 | 4.33 | 1.40 | 2.88 | (0.06) | ||||||||||||||||||||||||
|
|
|
|
|
|
|
|
|
|
|
| |||||||||||||||||||
Total from Investment Operations | (0.31) | 3.25 | 4.12 | 1.25 | 2.83 | (0.20) | ||||||||||||||||||||||||
|
|
|
|
|
|
|
|
|
|
|
| |||||||||||||||||||
LESS DISTRIBUTIONS: | ||||||||||||||||||||||||||||||
From capital gains | – | (1.34) | (1.61) | (1.85) | – | – | ||||||||||||||||||||||||
|
|
|
|
|
|
|
|
|
|
|
| |||||||||||||||||||
Total Distributions | – | (1.34) | (1.61) | (1.85) | – | – | ||||||||||||||||||||||||
|
|
|
|
|
|
|
|
|
|
|
| |||||||||||||||||||
NET INCREASE/(DECREASE) IN NET ASSET VALUE | (0.31) | 1.91 | 2.51 | (0.60) | 2.83 | (0.20) | ||||||||||||||||||||||||
|
|
|
|
|
|
|
|
|
|
|
| |||||||||||||||||||
NET ASSET VALUE, END OF PERIOD | $ | 19.71 | $ | 20.02 | $ | 18.11 | $ | 15.60 | $ | 16.20 | $ | 13.37 | ||||||||||||||||||
|
|
|
|
|
|
|
|
|
|
|
| |||||||||||||||||||
TOTAL RETURN(d) | (1.55)% | (e) | 18.38 | % | 26.01 | % | 9.14 | % | 21.17% | (e) | (1.47) | % | ||||||||||||||||||
RATIOS/SUPPLEMENTAL DATA: | ||||||||||||||||||||||||||||||
Net Assets, End of Period (000s) | $ | 296,281 | $ | 123,828 | $ | 77,900 | $ | 46,605 | $ | 41,991 | $ | 37,008 | ||||||||||||||||||
RATIOS TO AVERAGE NET ASSETS: | ||||||||||||||||||||||||||||||
Net Investment loss | (0.83)% | (f) | (0.93) | % | (1.12) | % | (1.01) | % | (1.02)% | (f) | (1.03) | % | ||||||||||||||||||
Operating expenses excluding reimbursement/waiver | 1.20% | (f) | 1.29 | % | 1.31 | % | 1.38 | % | 1.36% | (f) | 1.36 | % | ||||||||||||||||||
Operating expenses including reimbursement/waiver | 1.20% | (f) | 1.29 | % | 1.29 | % | 1.29 | % | 1.29% | (f) | 1.29 | % | ||||||||||||||||||
PORTFOLIO TURNOVER RATE | 25 % | (e) | 68 | % | 70 | % | 78 | % | 28% | (e) | 75 | % | ||||||||||||||||||
| (a) | Prior to its March 16, 2012 reorganization with and into the Emerald Growth Fund, the Fund was known as the Forward Growth Fund. |
| (b) | Effective March 13, 2012 the Board approved changing the fiscal year-end of the Fund from December 31 to April 30. |
| (c) | Per share amounts are based upon average shares outstanding. |
| (d) | Total return does not reflect the effect of sales charges. |
| (e) | Not Annualized. |
| (f) | Annualized. |
See Notes to Financial Statements.
36 |
www.emeraldmutualfunds.com |
Table of Contents
| Emerald Growth Fund | Financial Highlights | |
For a share outstanding throughout the periods presented |
| CLASS C | ||||||||||||||||||||||||||||||
For the Six Months Ended October 31, 2015 (Unaudited) | Year Ended April 30, 2015 | Year Ended April 30, 2014 | Year Ended April 30, 2013 | For the Period January 1, 2012 to | Year Ended December 31, 2011 | |||||||||||||||||||||||||
NET ASSET VALUE, BEGINNING OF PERIOD | $ | 17.48 | $ | 16.07 | $ | 14.07 | $ | 14.89 | $ | 12.31 | $ | 12.58 | ||||||||||||||||||
INCOME/(LOSS) FROM OPERATIONS: | ||||||||||||||||||||||||||||||
Net investment loss(c) | (0.14) | (0.27) | (0.30) | (0.23) | (0.08) | (0.22) | ||||||||||||||||||||||||
Net realized and unrealized gain/(loss) on investments | (0.18) | 3.02 | 3.91 | 1.26 | 2.66 | (0.05) | ||||||||||||||||||||||||
|
|
|
|
|
|
|
|
|
|
|
| |||||||||||||||||||
Total from Investment Operations | (0.32) | 2.75 | 3.61 | 1.03 | 2.58 | (0.27) | ||||||||||||||||||||||||
|
|
|
|
|
|
|
|
|
|
|
| |||||||||||||||||||
LESS DISTRIBUTIONS: | ||||||||||||||||||||||||||||||
From capital gains | – | (1.34) | (1.61) | (1.85) | – | – | ||||||||||||||||||||||||
|
|
|
|
|
|
|
|
|
|
|
| |||||||||||||||||||
Total Distributions | – | (1.34) | (1.61) | (1.85) | – | – | ||||||||||||||||||||||||
|
|
|
|
|
|
|
|
|
|
|
| |||||||||||||||||||
NET INCREASE/(DECREASE) IN NET ASSET VALUE | (0.32) | 1.41 | 2.00 | (0.82) | 2.58 | (0.27) | ||||||||||||||||||||||||
|
|
|
|
|
|
|
|
|
|
|
| |||||||||||||||||||
NET ASSET VALUE, END OF PERIOD | $ | 17.16 | $ | 17.48 | $ | 16.07 | $ | 14.07 | $ | 14.89 | $ | 12.31 | ||||||||||||||||||
|
|
|
|
|
|
|
|
|
|
|
| |||||||||||||||||||
TOTAL RETURN(d) | (1.83)% | (e) | 17.58 | % | 25.19 | % | 8.43 | % | 20.96% | (e) | (2.15) | % | ||||||||||||||||||
RATIOS/SUPPLEMENTAL DATA: | ||||||||||||||||||||||||||||||
Net Assets, End of Period (000s) | $ | 39,402 | $ | 15,427 | $ | 11,645 | $ | 4,946 | $ | 3,026 | $ | 2,743 | ||||||||||||||||||
RATIOS TO AVERAGE NET ASSETS: | ||||||||||||||||||||||||||||||
Net Investment loss | (1.48)% | (f) | (1.58) | % | (1.77) | % | (1.65) | % | (1.67)% | (f) | (1.68) | % | ||||||||||||||||||
Operating expenses excluding reimbursement/waiver | 1.84% | (f) | 1.94 | % | 1.96 | % | 2.03 | % | 2.01% | (f) | 2.01 | % | ||||||||||||||||||
Operating expenses including reimbursement/waiver | 1.84% | (f) | 1.94 | % | 1.94 | % | 1.94 | % | 1.94% | (f) | 1.94 | % | ||||||||||||||||||
PORTFOLIO TURNOVER RATE | 25 % | (e) | 68 | % | 70 | % | 78 | % | 28% | (e) | 75 | % | ||||||||||||||||||
| (a) | Prior to its March 16, 2012 reorganization with and into the Emerald Growth Fund, the Fund was known as the Forward Growth Fund. |
| (b) | Effective March 13, 2012 the Board approved changing the fiscal year-end of the Fund from December 31 to April 30. |
| (c) | Per share amounts are based upon average shares outstanding. |
| (d) | Total return does not reflect the effect of sales charges. |
| (e) | Not Annualized. |
| (f) | Annualized. |
See Notes to Financial Statements.
Semi-Annual Report | October 31, 2015 |
37 |
Table of Contents
| Emerald Growth Fund | Financial Highlights | |
For a share outstanding throughout the periods presented |
| INSTITUTIONAL CLASS | ||||||||||||||||||||||||||||||
For the Six Months Ended October 31, 2015 (Unaudited) | Year Ended April 30, 2015 | Year Ended April 30, 2014 | Year Ended April 30, 2013 | For the Period January 1, 2012 to | Year Ended December 31, 2011 | |||||||||||||||||||||||||
NET ASSET VALUE, BEGINNING OF PERIOD | $ | 20.54 | $ | 18.49 | $ | 15.86 | $ | 16.39 | $ | 13.51 | $ | 13.67 | ||||||||||||||||||
INCOME/(LOSS) FROM OPERATIONS: | ||||||||||||||||||||||||||||||
Net investment loss(c) | (0.06) | (0.12) | (0.16) | (0.11) | (0.04) | (0.10) | ||||||||||||||||||||||||
Net realized and unrealized gain/(loss) on investments | (0.22) | 3.51 | 4.40 | 1.43 | 2.92 | (0.06) | ||||||||||||||||||||||||
|
|
|
|
|
|
|
|
|
|
|
| |||||||||||||||||||
Total from Investment Operations | (0.28) | 3.39 | 4.24 | 1.32 | 2.88 | (0.16) | ||||||||||||||||||||||||
|
|
|
|
|
|
|
|
|
|
|
| |||||||||||||||||||
LESS DISTRIBUTIONS: | ||||||||||||||||||||||||||||||
From capital gains | – | (1.34) | (1.61) | (1.85) | – | – | ||||||||||||||||||||||||
|
|
|
|
|
|
|
|
|
|
|
| |||||||||||||||||||
Total Distributions | – | (1.34) | (1.61) | (1.85) | – | – | ||||||||||||||||||||||||
|
|
|
|
|
|
|
|
|
|
|
| |||||||||||||||||||
NET INCREASE/(DECREASE) IN NET ASSET VALUE | (0.28) | 2.05 | 2.63 | (0.53) | 2.88 | (0.16) | ||||||||||||||||||||||||
|
|
|
|
|
|
|
|
|
|
|
| |||||||||||||||||||
NET ASSET VALUE, END OF PERIOD | $ | 20.26 | $ | 20.54 | $ | 18.49 | $ | 15.86 | $ | 16.39 | $ | 13.51 | ||||||||||||||||||
|
|
|
|
|
|
|
|
|
|
|
| |||||||||||||||||||
TOTAL RETURN | (1.36)% | (d) | 18.77 | % | 26.35 | % | 9.47 | % | 21.32% | (d) | (1.17) | % | ||||||||||||||||||
RATIOS/SUPPLEMENTAL DATA: | ||||||||||||||||||||||||||||||
Net Assets, End of Period (000s) | $ | 353,802 | $ | 174,107 | $ | 134,440 | $ | 86,238 | $ | 83,149 | $ | 64,930 | ||||||||||||||||||
RATIOS TO AVERAGE NET ASSETS: | ||||||||||||||||||||||||||||||
Net Investment loss | (0.54)% | (e) | (0.63) | % | (0.82) | % | (0.71) | % | (0.72)% | (e) | (0.72) | % | ||||||||||||||||||
Operating expenses excluding reimbursement/waiver | 0.91% | (e) | 0.99 | % | 1.00 | % | 1.08 | % | 1.06% | (e) | 1.06 | % | ||||||||||||||||||
Operating expenses including reimbursement/waiver | 0.91% | (e) | 0.99 | % | 0.99 | % | 0.99 | % | 0.99% | (e) | 0.99 | % | ||||||||||||||||||
PORTFOLIO TURNOVER RATE | 25 % | (d) | 68 | % | 70 | % | 78 | % | 28% | (d) | 75 | % | ||||||||||||||||||
| (a) | Prior to its March 16, 2012 reorganization with and into the Emerald Growth Fund, the Fund was known as the Forward Growth Fund. |
| (b) | Effective March 13, 2012 the Board approved changing the fiscal year-end of the Fund from December 31 to April 30. |
| (c) | Per share amounts are based upon average shares outstanding. |
| (d) | Not Annualized. |
| (e) | Annualized. |
See Notes to Financial Statements.
38 |
www.emeraldmutualfunds.com |
Table of Contents
| Emerald Growth Fund | Financial Highlights | |
For a share outstanding throughout the periods presented |
| INVESTOR CLASS | ||||||||||||||||||||||||||||||
For the Six Months Ended October 31, 2015 (Unaudited) | Year Ended April 30, 2015 | Year Ended April 30, 2014 | Year Ended April 30, 2013 | For the Period January 1, 2012 to | Period Ended December 31, 2011(c) | |||||||||||||||||||||||||
NET ASSET VALUE, BEGINNING OF PERIOD | $ | 19.97 | $ | 18.06 | $ | 15.57 | $ | 16.18 | $ | 13.35 | $ | 15.74 | ||||||||||||||||||
INCOME/(LOSS) FROM OPERATIONS: | ||||||||||||||||||||||||||||||
Net investment loss(d) | (0.09) | (0.17) | (0.23) | (0.16) | (0.05) | (0.09) | ||||||||||||||||||||||||
Net realized and unrealized gain/(loss) on investments | (0.23) | 3.42 | 4.33 | 1.40 | 2.88 | (2.30) | ||||||||||||||||||||||||
|
|
|
|
|
|
|
|
|
|
|
| |||||||||||||||||||
Total from Investment Operations | (0.32) | 3.25 | 4.10 | 1.24 | 2.83 | (2.39) | ||||||||||||||||||||||||
|
|
|
|
|
|
|
|
|
|
|
| |||||||||||||||||||
LESS DISTRIBUTIONS: | ||||||||||||||||||||||||||||||
From capital gains | – | (1.34) | (1.61) | (1.85) | – | – | ||||||||||||||||||||||||
|
|
|
|
|
|
|
|
|
|
|
| |||||||||||||||||||
Total Distributions | – | (1.34) | (1.61) | (1.85) | – | – | ||||||||||||||||||||||||
|
|
|
|
|
|
|
|
|
|
|
| |||||||||||||||||||
NET INCREASE/(DECREASE) IN NET ASSET VALUE | (0.32) | 1.91 | 2.49 | (0.61) | 2.83 | (2.39) | ||||||||||||||||||||||||
|
|
|
|
|
|
|
|
|
|
|
| |||||||||||||||||||
NET ASSET VALUE, END OF PERIOD | $ | 19.65 | $ | 19.97 | $ | 18.06 | $ | 15.57 | $ | 16.18 | $ | 13.35 | ||||||||||||||||||
|
|
|
|
|
|
|
|
|
|
|
| |||||||||||||||||||
TOTAL RETURN | (1.60)% | (e) | 18.44 | % | 25.93 | % | 9.08 | % | 21.20% | (e) | (15.18)% | (e) | ||||||||||||||||||
RATIOS/SUPPLEMENTAL DATA: | ||||||||||||||||||||||||||||||
Net Assets, End of Period (000s) | $ | 128,224 | $ | 23,517 | $ | 15,870 | $ | 1,842 | $ | 1,085 | $ | 879 | ||||||||||||||||||
RATIOS TO AVERAGE NET ASSETS: | ||||||||||||||||||||||||||||||
Net Investment loss | (0.87)% | (f) | (0.91) | % | (1.18) | % | (1.05) | % | (1.07)% | (f) | (1.00)% | (f) | ||||||||||||||||||
Operating expenses excluding reimbursement/waiver | 1.21% | (f) | 1.27 | % | 1.34 | % | 1.43 | % | 1.41% | (f) | 1.43% | (f) | ||||||||||||||||||
Operating expenses including reimbursement/waiver | 1.21% | (f) | 1.27 | % | 1.34 | % | 1.34 | % | 1.34% | (f) | 1.34% | (f) | ||||||||||||||||||
PORTFOLIO TURNOVER RATE | 25 % | (e) | 68 | % | 70 | % | 78 | % | 28% | (e) | 75% | (g) | ||||||||||||||||||
| (a) | Prior to its March 16, 2012 reorganization with and into the Emerald Growth Fund, the Fund was known as the Forward Growth Fund. |
| (b) | Effective March 13, 2012 the Board approved changing the fiscal year-end of the Fund from December 31 to April 30. |
| (c) | The Fund began offering Investor Class shares on May 2, 2011. |
| (d) | Per share amounts are based upon average shares outstanding. |
| (e) | Not Annualized. |
| (f) | Annualized. |
| (g) | Portfolio turnover is calculated at the Fund level and represents the year ended December 31, 2011. |
See Notes to Financial Statements.
Semi-Annual Report | October 31, 2015 |
39 |
Table of Contents
| Emerald Small Cap Value Fund | Financial Highlights | |
For a share outstanding throughout the periods presented |
| CLASS A | ||||||||||||||||
For the Period Ended October 31, 2015 | Period Ended | |||||||||||||||
| (Unaudited)(a) | September 30, 2015(b) | |||||||||||||||
NET ASSET VALUE, BEGINNING OF PERIOD | $ | 12.70 | $ | 14.12 | ||||||||||||
INCOME/(LOSS) FROM OPERATIONS: | ||||||||||||||||
Net investment loss(c) | (0.01) | (0.01) | ||||||||||||||
Net realized and unrealized gain/(loss) on investments | 0.67 | (1.03) | ||||||||||||||
|
|
|
| |||||||||||||
Total from Investment Operations | 0.66 | (1.04) | ||||||||||||||
|
|
|
| |||||||||||||
LESS DISTRIBUTIONS: | ||||||||||||||||
From capital gains | – | (0.38) | ||||||||||||||
|
|
|
| |||||||||||||
Total Distributions | – | (0.38) | ||||||||||||||
|
|
|
| |||||||||||||
NET INCREASE/(DECREASE) IN NET ASSET VALUE | 0.66 | (1.42) | ||||||||||||||
|
|
|
| |||||||||||||
NET ASSET VALUE, END OF PERIOD | $ | 13.36 | $ | 12.70 | ||||||||||||
|
|
|
| |||||||||||||
TOTAL RETURN | 5.20% | (d) | (7.49 | )% | ||||||||||||
RATIOS/SUPPLEMENTAL DATA: | ||||||||||||||||
Net Assets, End of Period (000s) | $ | 15 | $ | 14 | ||||||||||||
RATIOS TO AVERAGE NET ASSETS: | ||||||||||||||||
Net Investment loss | (1.25)% | (e) | (0.24)% | (e) | ||||||||||||
Operating expenses excluding reimbursement/waiver | 1.78% | (e) | 2.16% | (e) | ||||||||||||
Operating expenses including reimbursement/waiver | 1.35% | (e) | 1.35% | (e) | ||||||||||||
PORTFOLIO TURNOVER RATE | 3 % | (d) | 69%(d) | (f) | ||||||||||||
| (a) | Effective March 3, 2015 the Board approved changing the fiscal year-end of the Fund from September 30 to April 30. |
| (b) | Class A commenced operations on June 30, 2015. |
| (c) | Per share amounts are based upon average shares outstanding. |
| (d) | Not Annualized. |
| (e) | Annualized. |
| (f) | Portfolio turnover rate is calculated at the Fund level and represents the year ended September 30, 2015. |
See Notes to Financial Statements.
40 |
www.emeraldmutualfunds.com |
Table of Contents
| Emerald Small Cap Value Fund | Financial Highlights | |
For a share outstanding throughout the periods presented |
| CLASS C | ||||||||||
For the Period Ended October 31, 2015 | Period Ended September 30, 2015(b) | |||||||||
NET ASSET VALUE, BEGINNING OF PERIOD | $ | 12.68 | $ | 14.12 | ||||||
INCOME/(LOSS) FROM OPERATIONS: | ||||||||||
Net investment loss(c) | (0.02) | (0.03) | ||||||||
Net realized and unrealized gain/(loss) on investments | 0.67 | (1.03) | ||||||||
|
|
|
| |||||||
Total from Investment Operations | 0.65 | (1.06) | ||||||||
|
|
|
| |||||||
LESS DISTRIBUTIONS: | ||||||||||
From capital gains | – | (0.38) | ||||||||
|
|
|
| |||||||
Total Distributions | – | (0.38) | ||||||||
|
|
|
| |||||||
NET INCREASE/(DECREASE) IN NET ASSET VALUE | 0.65 | (1.44) | ||||||||
|
|
|
| |||||||
NET ASSET VALUE, END OF PERIOD | $ | 13.33 | $ | 12.68 | ||||||
|
|
|
| |||||||
TOTAL RETURN | 5.13% | (d) | (7 .63) | % | ||||||
RATIOS/SUPPLEMENTAL DATA: | ||||||||||
Net Assets, End of Period (000s) | $ | 15 | $ | 14 | ||||||
RATIOS TO AVERAGE NET ASSETS: | ||||||||||
Net Investment loss | (1.90)% | (e) | (0.89)% | (e) | ||||||
Operating expenses excluding reimbursement/waiver | 2.43% | (e) | 2.81% | (e) | ||||||
Operating expenses including reimbursement/waiver | 2.00% | (e) | 2.00% | (e) | ||||||
PORTFOLIO TURNOVER RATE | 3 % | (d) | 69%(d) | (f) | ||||||
| (a) | Effective March 3, 2015 the Board approved changing the fiscal year-end of the Fund from September 30 to April 30. |
| (b) | Class C commenced operations on June 30, 2015. |
| (c) | Per share amounts are based upon average shares outstanding. |
| (d) | Not Annualized. |
| (e) | Annualized. |
| (f) | Portfolio turnover rate is calculated at the Fund level and represents the year ended September 30, 2015. |
See Notes to Financial Statements.
Semi-Annual Report | October 31, 2015 |
41 |
Table of Contents
| Emerald Small Cap Value Fund | Financial Highlights | |
For a share outstanding throughout the periods presented |
| INSTITUTIONAL CLASS | ||||||||||||||||||||
| For the | ||||||||||||||||||||
| Six Months Ended | ||||||||||||||||||||
| October 31, 2015 | Year Ended | Year Ended | Period Ended | |||||||||||||||||
| (Unaudited)(a) | September 30, 2015(b) | September 30, 2014 | September 30, 2013(c) | |||||||||||||||||
NET ASSET VALUE, BEGINNING OF PERIOD | $ | 12.71 | $ | 12.76 | $ | 12.56 | $ | 10.00 | ||||||||||||
INCOME FROM OPERATIONS: | ||||||||||||||||||||
Net investment income/(loss)(d) | (0.01) | 0.06 | 0.09 | 0.05 | ||||||||||||||||
Net realized and unrealized gain on investments | 0.68 | 0.33 | 0.76 | 2.54 | ||||||||||||||||
|
|
|
|
|
|
|
| |||||||||||||
Total from Investment Operations | 0.67 | 0.39 | 0.85 | 2.59 | ||||||||||||||||
|
|
|
|
|
|
|
| |||||||||||||
LESS DISTRIBUTIONS: | ||||||||||||||||||||
From investment income | – | (0.06) | (0.01) | (0.03) | ||||||||||||||||
From capital gains | – | (0.38) | (0.64) | – | ||||||||||||||||
|
|
|
|
|
|
|
| |||||||||||||
Total Distributions | – | (0.44) | (0.65) | (0.03) | ||||||||||||||||
|
|
|
|
|
|
|
| |||||||||||||
NET INCREASE/(DECREASE) IN NET ASSET VALUE | 0.67 | (0.05) | 0.20 | 2.56 | ||||||||||||||||
|
|
|
|
|
|
|
| |||||||||||||
NET ASSET VALUE, END OF PERIOD | $ | 13.38 | $ | 12.71 | $ | 12.76 | $ | 12.56 | ||||||||||||
|
|
|
|
|
|
|
| |||||||||||||
TOTAL RETURN | 5.27% | (e) | 2.93 | % | 6.64 | % | 25.99 | % | ||||||||||||
SUPPLEMENTAL DATA: | ||||||||||||||||||||
Net Assets, End of Period (000s) | $ | 17,006 | $ | 16,507 | $ | 24,343 | $ | 8,442 | ||||||||||||
RATIOS TO AVERAGE NET ASSETS: | ||||||||||||||||||||
Net Investment income/(loss) | (0.90)% | (f) | 0.45 | % | 0.65 | % | 0.48% | (f) | ||||||||||||
Operating expenses excluding reimbursement/waiver | 1.43% | (f) | 1.43 | % | 1.29 | % | 1.95% | (f) | ||||||||||||
Operating expenses including reimbursement/waiver | 1.00% | (f) | 1.00 | % | 1.00 | % | 1.00% | (f) | ||||||||||||
PORTFOLIO TURNOVER RATE | 3% | (e) | 69 | % | 49 | % | 67% | (e) | ||||||||||||
| (a) | Effective March 3, 2015 the Board approved changing the fiscal year-end of the Fund from September 30 to April 30. |
| (b) | Prior to its June 26, 2015 reorganization with and into the Emerald Small Cap Value Fund, the Fund was known as the Elessar Small Cap Value Fund. |
| (c) | For the period October 15, 2012 (commencement of investment operations) through September 30, 2013. |
| (d) | Per share amounts are based upon average shares outstanding. |
| (e) | Not Annualized. |
| (f) | Annualized. |
See Notes to Financial Statements.
42 |
www.emeraldmutualfunds.com |
Table of Contents
| Emerald Small Cap Value Fund | Financial Highlights | |
For a share outstanding throughout the periods presented |
| INVESTOR CLASS | ||||||||||||||||||||
| For the | ||||||||||||||||||||
| Six Months Ended | ||||||||||||||||||||
| October 31, 2015 | Year Ended | Year Ended | Period Ended | |||||||||||||||||
| (Unaudited)(a) | September 30, 2015(b) | September 30, 2014 | September 30, 2013(c) | |||||||||||||||||
NET ASSET VALUE, BEGINNING OF PERIOD | $ | 12.68 | $ | 12.73 | $ | 12.54 | $ | 10.00 | ||||||||||||
INCOME FROM OPERATIONS: | ||||||||||||||||||||
Net investment income/(loss)(d) | (0.01) | 0.03 | 0.07 | 0.02 | ||||||||||||||||
Net realized and unrealized gain on investments | 0.67 | 0.35 | 0.76 | 2.54 | ||||||||||||||||
|
|
|
|
|
|
|
| |||||||||||||
Total from Investment Operations | 0.66 | 0.38 | 0.83 | 2.56 | ||||||||||||||||
|
|
|
|
|
|
|
| |||||||||||||
LESS DISTRIBUTIONS: | ||||||||||||||||||||
From investment income | – | (0.05) | – | (0.02) | ||||||||||||||||
From capital gains | – | (0.38) | (0.64) | – | ||||||||||||||||
|
|
|
|
|
|
|
| |||||||||||||
Total Distributions | – | (0.43) | (0.64) | (0.02) | ||||||||||||||||
|
|
|
|
|
|
|
| |||||||||||||
NET INCREASE/(DECREASE) IN NET ASSET VALUE | 0.66 | (0.05) | 0.19 | 2.54 | ||||||||||||||||
|
|
|
|
|
|
|
| |||||||||||||
NET ASSET VALUE, END OF PERIOD | $ | 13.34 | $ | 12.68 | $ | 12.73 | $ | 12.54 | ||||||||||||
|
|
|
|
|
|
|
| |||||||||||||
TOTAL RETURN | 5.21% | (e) | 2.82 | % | 6.46 | % | 25.69 | % | ||||||||||||
SUPPLEMENTAL DATA: | ||||||||||||||||||||
Net Assets, End of Period (000s) | $ | 882 | $ | 399 | $ | 474 | $ | 271 | ||||||||||||
RATIOS TO AVERAGE NET ASSETS: | ||||||||||||||||||||
Net Investment income/(loss) | (1.15)% | (f) | 0.22 | % | 0.52 | % | 0.16%(f) | |||||||||||||
Operating expenses excluding reimbursement/waiver | 1.79% | (f) | 1.67 | % | 1.56 | % | 2.49% | (f) | ||||||||||||
Operating expenses including reimbursement/waiver | 1.25% | (f) | 1.25 | % | 1.25 | % | 1.25% | (f) | ||||||||||||
PORTFOLIO TURNOVER RATE | 3% | (e) | 69 | % | 49 | % | 67% | (e) | ||||||||||||
| (a) | Effective March 3, 2015 the Board approved changing the fiscal year-end of the Fund from September 30 to April 30. |
| (b) | Prior to its June 26, 2015 reorganization with and into the Emerald Small Cap Value Fund, the Fund was known as the Elessar Small Cap Value Fund. |
| (c) | For the period October 15, 2012 (commencement of investment operations) through September 30, 2013. |
| (d) | Per share amounts are based upon average shares outstanding. |
| (e) | Not Annualized. |
| (f) | Annualized. |
See Notes to Financial Statements.
Semi-Annual Report | October 31, 2015 |
43 |
Table of Contents
| Emerald Insights Fund | Financial Highlights | |
For a share outstanding throughout the period presented |
| CLASS A | ||||||||||
| For the Six Months Ended October 31, 2015 (Unaudited) | For the Period August 1, 2014 (Inception) to April 30, 2015 | |||||||||
NET ASSET VALUE, BEGINNING OF PERIOD | $ | 10.98 | $ | 10.00 | ||||||
INCOME FROM OPERATIONS: | ||||||||||
Net investment loss(a) | (0.03) | (0.05) | ||||||||
Net realized and unrealized gain/(loss) on investments | (0.48) | 1.03 | ||||||||
|
|
|
| |||||||
Total from Investment Operations | (0.51) | 0.98 | ||||||||
|
|
|
| |||||||
NET INCREASE/(DECREASE) IN NET ASSET VALUE | (0.51) | 0.98 | ||||||||
|
|
|
| |||||||
NET ASSET VALUE, END OF PERIOD | $ | 10.47 | $ | 10.98 | ||||||
|
|
|
| |||||||
TOTAL RETURN(b) | (4.64%)(c) | 9.80%(c) | ||||||||
RATIOS/SUPPLEMENTAL DATA: | ||||||||||
Net Assets, End of Period (000s) | $ | 12,202 | $ | 6,493 | ||||||
RATIOS TO AVERAGE NET ASSETS: | ||||||||||
Net Investment loss | (0.63%)(d) | (0.66%) (d) | ||||||||
Operating expenses excluding reimbursement/waiver | 1.89%(d) | 2.57%(d)(e) | ||||||||
Operating expenses including reimbursement/waiver | 1.35%(d) | 1.35%(d)(e) | ||||||||
PORTFOLIO TURNOVER RATE | 65%(c) | 88%(c) | ||||||||
| (a) | Per share amounts are based upon average shares outstanding. |
| (b) | Total return does not reflect the effect of sales charges. |
| (c) | Not Annualized. |
| (d) | Annualized. |
| (e) | Expense ratios before reductions for startup costs may not be representative of longer term operating periods. |
See Notes to Financial Statements.
44 |
www.emeraldmutualfunds.com |
Table of Contents
| Emerald Insights Fund | Financial Highlights | |
For a share outstanding throughout the period presented |
| CLASS C | ||||||||||
| For the Six Months Ended October 31, 2015 (Unaudited) | For the Period August 1, 2014 (Inception) to April 30, 2015 | |||||||||
NET ASSET VALUE, BEGINNING OF PERIOD | $ | 10.92 | $ | 10.00 | ||||||
INCOME FROM OPERATIONS: | ||||||||||
Net investment loss(a) | (0.07) | (0.10) | ||||||||
Net realized and unrealized gain/(loss) on investments | (0.48) | 1.02 | ||||||||
|
|
|
| |||||||
Total from Investment Operations | (0.55) | 0.92 | ||||||||
|
|
|
| |||||||
NET INCREASE/(DECREASE) IN NET ASSET VALUE | (0.55) | 0.92 | ||||||||
|
|
|
| |||||||
NET ASSET VALUE, END OF PERIOD | $ | 10.37 | $ | 10.92 | ||||||
�� |
|
|
| |||||||
TOTAL RETURN(b) | (5.04%)(c) | 9.20%(c) | ||||||||
RATIOS/SUPPLEMENTAL DATA: | ||||||||||
Net Assets, End of Period (000s) | $ | 102 | $ | 27 | ||||||
RATIOS TO AVERAGE NET ASSETS: | ||||||||||
Net Investment loss | (1.33%)(d) | (1.34%)(d) | ||||||||
Operating expenses excluding reimbursement/waiver | 2.55%(d) | 7.25%(d)(e) | ||||||||
Operating expenses including reimbursement/waiver | 2.00%(d) | 2.00%(d)(e) | ||||||||
PORTFOLIO TURNOVER RATE | 65%(c) | 88%(c) | ||||||||
| (a) | Per share amounts are based upon average shares outstanding. |
| (b) | Total return does not reflect the effect of sales charges. |
| (c) | Not Annualized. |
| (d) | Annualized. |
| (e) | Expense ratios before reductions for startup costs may not be representative of longer term operating periods. |
See Notes to Financial Statements.
Semi-Annual Report | October 31, 2015 |
45 |
Table of Contents
| Emerald Insights Fund | Financial Highlights | |
For a share outstanding throughout the period presented |
| INSTITUTIONAL CLASS | ||||||||||
| For the Six Months Ended October 31, 2015 (Unaudited) | For the Period August 1, 2014 (Inception) to April 30, 2015 | |||||||||
NET ASSET VALUE, BEGINNING OF PERIOD | $ | 10.99 | $ | 10.00 | ||||||
INCOME FROM OPERATIONS: | ||||||||||
Net investment loss(a) | (0.02) | (0.03) | ||||||||
Net realized and unrealized gain/(loss) on investments | (0.48) | 1.02 | ||||||||
|
|
|
| |||||||
Total from Investment Operations | (0.50) | 0.99 | ||||||||
|
|
|
| |||||||
NET INCREASE/(DECREASE) IN NET ASSET VALUE | (0.50) | 0.99 | ||||||||
|
|
|
| |||||||
NET ASSET VALUE, END OF PERIOD | $ | 10.49 | $ | 10.99 | ||||||
|
|
|
| |||||||
TOTAL RETURN | (4.55%)(b) | 9.90%(b) | ||||||||
RATIOS/SUPPLEMENTAL DATA: | ||||||||||
Net Assets, End of Period (000s) | $ | 363 | $ | 279 | ||||||
RATIOS TO AVERAGE NET ASSETS: | ||||||||||
Net Investment loss | (0.31%)(c) | (0.34%)(c) | ||||||||
Operating expenses excluding reimbursement/waiver | 1.60%(c) | 4.66%(c)(d) | ||||||||
Operating expenses including reimbursement/waiver | 1.05%(c) | 1.05%(c)(d) | ||||||||
PORTFOLIO TURNOVER RATE | 65%(b) | 88%(b) | ||||||||
| (a) | Per share amounts are based upon average shares outstanding. |
| (b) | Not Annualized. |
| (c) | Annualized. |
| (d) | Expense ratios before reductions for startup costs may not be representative of longer term operating periods. |
See Notes to Financial Statements.
46 |
www.emeraldmutualfunds.com |
Table of Contents
| Emerald Insights Fund | Financial Highlights | |
For a share outstanding throughout the period presented |
| INVESTOR CLASS | ||||||||||
| For the Six Months Ended October 31, 2015 (Unaudited) | For the Period August 1, 2014 (Inception) to April 30, 2015 | |||||||||
NET ASSET VALUE, BEGINNING OF PERIOD | $ | 10.96 | $ | 10.00 | ||||||
INCOME FROM OPERATIONS: | ||||||||||
Net investment loss(a) | (0.04) | (0.05) | ||||||||
Net realized and unrealized gain/(loss) on investments | (0.47) | 1.01 | ||||||||
|
|
|
| |||||||
Total from Investment Operations | (0.51) | 0.96 | ||||||||
|
|
|
| |||||||
NET INCREASE/(DECREASE) IN NET ASSET VALUE | (0.51) | 0.96 | ||||||||
|
|
|
| |||||||
NET ASSET VALUE, END OF PERIOD | $ | 10.45 | $ | 10.96 | ||||||
|
|
|
| |||||||
TOTAL RETURN | (4.65%)(b) | 9.60%(b) | ||||||||
RATIOS/SUPPLEMENTAL DATA: | ||||||||||
Net Assets, End of Period (000s) | $ | 965 | $ | 448 | ||||||
RATIOS TO AVERAGE NET ASSETS: | ||||||||||
Net Investment loss | (0.69%)(c) | (0.67%)(c) | ||||||||
Operating expenses excluding reimbursement/waiver | 1.95%(c) | 2.96%(c)(d) | ||||||||
Operating expenses including reimbursement/waiver | 1.40%(c) | 1.40%(c)(d) | ||||||||
PORTFOLIO TURNOVER RATE | 65%(b) | 88%(b) | ||||||||
| (a) | Per share amounts are based upon average shares outstanding. |
| (b) | Not Annualized. |
| (c) | Annualized. |
| (d) | Expense ratios before reductions for startup costs may not be representative of longer term operating periods. |
See Notes to Financial Statements.
Semi-Annual Report | October 31, 2015 |
47 |
Table of Contents
| Emerald Banking and Finance Fund | Financial Highlights | |
For a share outstanding throughout the periods presented |
| CLASS A | ||||||||||||||||||||||||||||||
| For the | ||||||||||||||||||||||||||||||
| Six Months Ended | For the Period | |||||||||||||||||||||||||||||
| October 31, 2015 | Year Ended | Year Ended | Year Ended | January 1, 2012 to | Year Ended | |||||||||||||||||||||||||
| (Unaudited) | April 30, 2015 | April 30, 2014 | April 30, 2013 | April 30, 2012(a)(b) | December 31, 2011 | |||||||||||||||||||||||||
NET ASSET VALUE, BEGINNING OF PERIOD | $ | 28.85 | $ | 26.11 | $ | 20.08 | $ | 16.96 | $ | 15.16 | $ | 15.89 | ||||||||||||||||||
INCOME/(LOSS) FROM OPERATIONS:(c) | ||||||||||||||||||||||||||||||
Net investment loss(d) | (0.02) | (0.16) | (0.13) | (0.01) | (0.01) | (0.03) | ||||||||||||||||||||||||
Net realized and unrealized gain/(loss) on investments | 3.53 | 2.90 | 6.16 | 3.13 | 1.81 | (0.70) | ||||||||||||||||||||||||
|
|
|
|
|
|
|
|
|
|
|
| |||||||||||||||||||
Total from Investment Operations | 3.51 | 2.74 | 6.03 | 3.12 | 1.80 | (0.73) | ||||||||||||||||||||||||
|
|
|
|
|
|
|
|
|
|
|
| |||||||||||||||||||
NET INCREASE/(DECREASE) IN NET ASSET VALUE | 3.51 | 2.74 | 6.03 | 3.12 | 1.80 | (0.73) | ||||||||||||||||||||||||
|
|
|
|
|
|
|
|
|
|
|
| |||||||||||||||||||
NET ASSET VALUE, END OF PERIOD | $ | 32.36 | $ | 28.85 | $ | 26.11 | $ | 20.08 | $ | 16.96 | $ | 15.16 | ||||||||||||||||||
|
|
|
|
|
|
|
|
|
|
|
| |||||||||||||||||||
TOTAL RETURN(e) | 12.17% | (f) | 10.49 | % | 30.03 | % | 18.40 | % | 11.87% | (f) | (4.59) | % | ||||||||||||||||||
RATIOS/SUPPLEMENTAL DATA: | ||||||||||||||||||||||||||||||
Net Assets, End of Period (000s) | $ | 117,550 | $ | 48,575 | $ | 48,622 | $ | 25,496 | $ | 21,363 | $ | 20,412 | ||||||||||||||||||
RATIOS TO AVERAGE NET ASSETS: | ||||||||||||||||||||||||||||||
Net Investment loss | (0.10)% | (g) | (0.58) | % | (0.53) | % | (0.06) | % | (0.24)% | (g) | (0.22) | % | ||||||||||||||||||
Operating expenses excluding reimbursement/waiver | 1.48% | (g) | 1.60 | % | 1.72 | % | 1.88 | % | 1.96% | (g) | 1.90 | % | ||||||||||||||||||
Operating expenses including reimbursement/waiver | 1.48% | (g) | 1.60 | % | 1.72 | % | 1.84 | % | 1.85% | (g) | n | /a | ||||||||||||||||||
PORTFOLIO TURNOVER RATE | 4% | (f) | 33 | % | 34 | % | 53 | % | 9% | (f) | 27 | % | ||||||||||||||||||
| (a) | Prior to its March 16, 2012 reorganization with and into the Emerald Banking and Finance Fund, the Fund was known as the Forward Banking and Finance Fund. |
| (b) | Effective March 13, 2012 the Board approved changing the fiscal year-end of the Fund from December 31 to April 30. |
| (c) | The amount shown for a share outstanding throughout the period may not correlate with the Statement of Operations for the period due to the timing of sales and redemptions of Fund shares in relation to income earned and/or fluctuating market value of the investments of the Fund. |
| (d) | Per share amounts are based upon average shares outstanding. |
| (e) | Total return does not reflect the effect of sales charges. |
| (f) | Not Annualized. |
| (g) | Annualized. |
See Notes to Financial Statements.
48 |
www.emeraldmutualfunds.com |
Table of Contents
| Emerald Banking and Finance Fund | Financial Highlights | |
For a share outstanding throughout the periods presented |
| CLASS C | ||||||||||||||||||||||||||||||
| For the Six Months Ended October 31, 2015 (Unaudited) | Year Ended April 30, 2015 | Year Ended April 30, 2014 | Year Ended April 30, 2013 | For the Period April 30, 2012(a)(b) | Year Ended December 31, 2011 | |||||||||||||||||||||||||
NET ASSET VALUE, BEGINNING OF PERIOD | $ | 26.19 | $ | 23.86 | $ | 18.46 | $ | 15.70 | $ | 14.06 | $ | 14.82 | ||||||||||||||||||
INCOME/(LOSS) FROM OPERATIONS:(c) | ||||||||||||||||||||||||||||||
Net investment loss(d) | (0.11) | (0.30) | (0.26) | (0.11) | (0.04) | (0.11) | ||||||||||||||||||||||||
Net realized and unrealized gain/(loss) on investments | 3.21 | 2.63 | 5.66 | 2.87 | 1.68 | (0.65) | ||||||||||||||||||||||||
|
|
|
|
|
|
|
|
|
|
|
| |||||||||||||||||||
Total from Investment Operations | 3.10 | 2.33 | 5.40 | 2.76 | 1.64 | (0.76 | ) | |||||||||||||||||||||||
|
|
|
|
|
|
|
|
|
|
|
| |||||||||||||||||||
NET INCREASE/(DECREASE) IN NET ASSET VALUE | 3.10 | 2.33 | 5.40 | 2.76 | 1.64 | (0.76) | ||||||||||||||||||||||||
|
|
|
|
|
|
|
|
|
|
|
| |||||||||||||||||||
NET ASSET VALUE, END OF PERIOD | $ | 29.29 | $ | 26.19 | $ | 23.86 | $ | 18.46 | $ | 15.70 | $ | 14.06 | ||||||||||||||||||
|
|
|
|
|
|
|
|
|
|
|
| |||||||||||||||||||
TOTAL RETURN(e) | 11.84% | (f) | 9.77 | % | 29.25 | % | 17.58 | % | 11.66% | (f) | (5.13) | % | ||||||||||||||||||
RATIOS/SUPPLEMENTAL DATA: | ||||||||||||||||||||||||||||||
Net Assets, End of Period (000s) | $ | 46,595 | $ | 31,862 | $ | 28,222 | $ | 17,705 | $ | 14,690 | $ | 13,675 | ||||||||||||||||||
RATIOS TO AVERAGE NET ASSETS: | ||||||||||||||||||||||||||||||
Net Investment loss | (0.79)% | (g) | (1.23) | % | (1.18) | % | (0.68) | % | (0.82)% | (g) | (0.77) | % | ||||||||||||||||||
Operating expenses excluding reimbursement/waiver | 2.13% | (g) | 2.25 | % | 2.38 | % | 2.54 | % | 2.55% | (g) | 2.45 | % | ||||||||||||||||||
Operating expenses including reimbursement/waiver | 2.13% | (g) | 2.25 | % | 2.38 | % | 2.49 | % | 2.44% | (g) | n | /a | ||||||||||||||||||
PORTFOLIO TURNOVER RATE | 4% | (f) | 33 | % | 34 | % | 53 | % | 9% | (f) | 27 | % | ||||||||||||||||||
| (a) | Prior to its March 16, 2012 reorganization with and into the Emerald Banking and Finance Fund, the Fund was known as the Forward Banking and Finance Fund. |
| (b) | Effective March 13, 2012 the Board approved changing the fiscal year-end of the Fund from December 31 to April 30. |
| (c) | The amount shown for a share outstanding throughout the period may not correlate with the Statement of Operations for the period due to the timing of sales and redemptions of Fund shares in relation to income earned and/or fluctuating market value of the investments of the Fund. |
| (d) | Per share amounts are based upon average shares outstanding. |
| (e) | Total return does not reflect the effect of sales charges. |
| (f) | Not Annualized. |
| (g) | Annualized. |
See Notes to Financial Statements.
Semi-Annual Report | October 31, 2015 |
49 |
Table of Contents
| Emerald Banking and Finance Fund | Financial Highlights | |
For a share outstanding throughout the periods presented |
| INSTITUTIONAL CLASS | |||||||||||||||||||||||||
For the Six Months Ended October 31, 2015 (Unaudited) | Year Ended April 30, 2015 | Year Ended April 30, 2014 | Year Ended April 30, 2013 | For the Period March 16, 2012 to April 30, 2012(a) | |||||||||||||||||||||
NET ASSET VALUE, BEGINNING OF PERIOD | $ | 29.15 | $ | 26.29 | $ | 20.15 | $ | 16.96 | $ | 16.85 | |||||||||||||||
INCOME/(LOSS) FROM OPERATIONS: | |||||||||||||||||||||||||
Net investment income/(loss)(b) | 0.03 | (0.07) | (0.06) | 0.01 | (0.01) | ||||||||||||||||||||
Net realized and unrealized gain on investments | 3.56 | 2.93 | 6.20 | 3.18 | 0.12 | ||||||||||||||||||||
|
|
|
|
|
|
|
|
|
| ||||||||||||||||
Total from Investment Operations | 3.59 | 2.86 | 6.14 | 3.19 | 0.11 | ||||||||||||||||||||
|
|
|
|
|
|
|
|
|
| ||||||||||||||||
NET INCREASE IN NET ASSET VALUE | 3.59 | 2.86 | 6.14 | 3.19 | 0.11 | ||||||||||||||||||||
|
|
|
|
|
|
|
|
|
| ||||||||||||||||
NET ASSET VALUE, END OF PERIOD | $ | 32.74 | $ | 29.15 | $ | 26.29 | $ | 20.15 | $ | 16.96 | |||||||||||||||
|
|
|
|
|
|
|
|
|
| ||||||||||||||||
TOTAL RETURN | 12.32% | (c) | 10.88 | % | 30.47 | % | 18.81 | % | 0.65% | (c) | |||||||||||||||
RATIOS/SUPPLEMENTAL DATA: | |||||||||||||||||||||||||
Net Assets, End of Period (000s) | $ | 47,312 | $ | 23,730 | $ | 22,062 | $ | 4,321 | $ | 8 | |||||||||||||||
RATIOS TO AVERAGE NET ASSETS: | |||||||||||||||||||||||||
Net Investment income/(loss) | 0.19% | (d) | (0.25) | % | (0.23) | % | 0.06 | % | (0.27)% | (d) | |||||||||||||||
Operating expenses excluding reimbursement/waiver | 1.18% | (d) | 1.27 | % | 1.37 | % | 1.62 | % | 1.83% | (d) | |||||||||||||||
Operating expenses including reimbursement/waiver | 1.18% | (d) | 1.27 | % | 1.37 | % | 1.54 | % | 1.53% | (d) | |||||||||||||||
PORTFOLIO TURNOVER RATE | 4% | (c) | 33 | % | 34 | % | 53 | % | 9%(c) | (e) | |||||||||||||||
| (a) | The Fund began offering Institutional Class shares on March 16, 2012. |
| (b) | Per share amounts are based upon average shares outstanding. |
| (c) | Not Annualized. |
| (d) | Annualized. |
| (e) | Portfolio turnover rate is calculated at the Fund level and represents the period ended April 30, 2012. |
See Notes to Financial Statements.
50 |
www.emeraldmutualfunds.com |
Table of Contents
| Emerald Banking and Finance Fund | Financial Highlights | |
For a share outstanding throughout the periods presented |
| INVESTOR CLASS | ||||||||||||||||||||||||||||||
For the Six Months Ended | Year Ended April 30, 2015 | Year Ended April 30, 2014 | Year Ended April 30, 2013 | For the Period January 1, 2012 to April 30, 2012(a)(b) | Year Ended December 31, 2011 | |||||||||||||||||||||||||
NET ASSET VALUE, BEGINNING OF PERIOD | $ | 27.64 | $ | 25.01 | $ | 19.23 | $ | 16.25 | $ | 14.50 | $ | 15.14 | ||||||||||||||||||
INCOME/(LOSS) FROM OPERATIONS:(c) | ||||||||||||||||||||||||||||||
Net investment income/(loss)(d) | (0.02) | (0.15) | (0.12) | (0.01) | (0.00) | (e) | 0.07 | |||||||||||||||||||||||
Net realized and unrealized gain/(loss) on investments | 3.37 | 2.78 | 5.90 | 2.99 | 1.75 | (0.71) | ||||||||||||||||||||||||
|
|
|
|
|
|
|
|
|
|
|
| |||||||||||||||||||
Total from Investment Operations | 3.35 | 2.63 | 5.78 | 2.98 | 1.75 | (0.64) | ||||||||||||||||||||||||
|
|
|
|
|
|
|
|
|
|
|
| |||||||||||||||||||
NET INCREASE/(DECREASE) IN NET ASSET VALUE | 3.35 | 2.63 | 5.78 | 2.98 | 1.75 | (0.64) | ||||||||||||||||||||||||
|
|
|
|
|
|
|
|
|
|
|
| |||||||||||||||||||
NET ASSET VALUE, END OF PERIOD | $ | 30.99 | $ | 27.64 | $ | 25.01 | $ | 19.23 | $ | 16.25 | $ | 14.50 | ||||||||||||||||||
|
|
|
|
|
|
|
|
|
|
|
| |||||||||||||||||||
TOTAL RETURN | 12.12% | (f) | 10.52 | % | 30.06 | % | 18.34 | % | 12.07% | (f) | (4.23) | % | ||||||||||||||||||
RATIOS/SUPPLEMENTAL DATA: | ||||||||||||||||||||||||||||||
Net Assets, End of Period (000s) | $ | 70,699 | $ | 27,440 | $ | 19,235 | $ | 6,255 | $ | 69 | 3 | $ | 136 | |||||||||||||||||
RATIOS TO AVERAGE NET ASSETS: | ||||||||||||||||||||||||||||||
Net Investment income/(loss) | (0.15)% | (g) | (0.56) | % | (0.53) | % | (0.08) | % | (0.07)% | (g) | 0.47 | % | ||||||||||||||||||
Operating expenses excluding reimbursement/waiver | 1.53% | (g) | 1.58 | % | 1.69 | % | 1.94 | % | 1.88% | (g) | 1.48 | % | ||||||||||||||||||
Operating expenses including reimbursement/waiver | 1.53% | (g) | 1.58 | % | 1.69 | % | 1.89 | % | 1.72% | (g) | n | /a | ||||||||||||||||||
PORTFOLIO TURNOVER RATE | 4% | (f) | 33 | % | 34 | % | 53 | % | 9% | (f) | 27 | % | ||||||||||||||||||
| (a) | Prior to its March 16, 2012 reorganization with and into the Emerald Banking and Finance Fund, the Fund was known as the Forward Banking and Finance Fund. |
| (b) | Effective March 13, 2012 the Board approved changing the fiscal year-end of the Fund from December 31 to April 30. |
| (c) | The amount shown for a share outstanding throughout the period may not correlate with the Statement of Operations for the period due to the timing of sales and redemptions of Fund shares in relation to income earned and/or fluctuating market value of the investments of the Fund. |
| (d) | Per share amounts are based upon average shares outstanding. |
| (e) | Less than $0.005 per share. |
| (f) | Not Annualized. |
| (g) | Annualized. |
See Notes to Financial Statements.
Semi-Annual Report | October 31, 2015 |
51 |
Table of Contents
| Emerald Funds | Notes to Financial Statements | |
October 31, 2015 (Unaudited) |
1. ORGANIZATION
Financial Investors Trust (the “Trust”), a Delaware statutory trust, is an open-end management investment company registered under the Investment Company Act of 1940, as amended (the “1940 Act”). As of October 31, 2015, the Trust had 34 registered funds. This semi-annual report describes the Emerald Growth Fund, Emerald Small Cap Value Fund, Emerald Insights Fund, and Emerald Banking and Finance Fund (each a “Fund” and collectively, the “Funds”). Prior to March 16, 2012, the Emerald Banking and Finance Fund was known as the Forward Banking and Finance Fund and the Emerald Growth Fund was known as the Forward Growth Fund. Effective March 13, 2012, the Board of Trustees (the “Board”) approved changing the fiscal year end of the Funds from December 31 to April 30. The Emerald Small Cap Value Fund is a successor to a previously operational fund which was a series of Elessar Funds Investment Trust, a Delaware statutory trust, and was organized into a series of the Trust effective as of the close of business on June 26, 2015. Effective March 3, 2015, the Board approved changing the fiscal year end of the Emerald Small Cap Value Fund from September 30 to April 30.
The Emerald Growth Fund and Emerald Insights Fund seek to achieve long-term growth through capital appreciation. The Emerald Small Cap Value Fund seeks long-term capital appreciation. The Emerald Banking and Finance Fund seeks to achieve long term growth through capital appreciation with income as a secondary objective.
2. SIGNIFICANT ACCOUNTING POLICIES
The accompanying financial statements were prepared in accordance with accounting principles generally accepted in the United States of America (“U.S. GAAP”). The preparation of financial statements in conformity with U.S. GAAP requires management to make certain estimates and assumptions that affect the reported amounts of assets and liabilities and disclosures of contingent assets and liabilities at the date of the financial statements and the reported amounts of revenue and expenses during the period. Actual results could differ from those estimates. The Funds are considered an investment company for financial reporting purposes under U.S. GAAP. The following is a summary of significant accounting policies consistently followed by the Funds in preparation of their financial statements.
Investment Valuation: The Funds generally value their securities based on market prices determined at the close of regular trading on the New York Stock Exchange (“NYSE”), normally, 4:00 p.m. Eastern time, on each business day the NYSE is open for trading.
For equity securities and mutual funds that are traded on an exchange, the market price is usually the closing sale or official closing price on that exchange. In the case of equity securities not traded on an exchange, or if such closing prices are not otherwise available, the securities are valued at the mean of the most recent bid and ask prices on such day. Redeemable securities issued by open-end registered investment companies are valued at the investment company’s applicable net asset value.
The market price for debt obligations is generally the price supplied by an independent third-party pricing service approved by the Board of Trustees (the “Board”), which may use a matrix, formula or other objective method that takes into consideration quotations from dealers, market transactions in comparable investments, market indices and yield curves. If vendors are unable to supply a price, or if the price supplied is deemed to be unreliable, the market price may be determined using quotations received from one or more brokers–dealers that make a market in the security. Short–term debt obligations that will mature in 60 days or less are valued at amortized cost, unless it is determined that using this method would not reflect an investment’s fair value. Investments in non-exchange traded funds are fair valued at their respective net asset values.
Equity securities that are primarily traded on foreign securities exchanges are valued at the preceding closing values of such securities on their respective exchanges, except when an occurrence subsequent to the time a value was so established is likely to have changed such value. In such an event, the fair values of those securities are determined in good faith through consideration of other factors in accordance with procedures established by and under the general supervision of the Board.
When such prices or quotations are not available, or when Emerald Mutual Fund Advisers Trust, (the “Adviser”), believes that they are unreliable, securities may be priced using fair value procedures approved by the Board.
Fair Value Measurements: A three-tier hierarchy has been established to classify fair value measurements for disclosure purposes. Inputs refer broadly to the assumptions that market participants would use in pricing the asset or liability, including assumptions about risk. Inputs may be observable or unobservable. Observable inputs are inputs that reflect the assumptions market participants would use in pricing the asset or liability that are developed based on market data obtained from sources independent of the reporting entity. Unobservable inputs are inputs that reflect the reporting entity’s own assumptions about the assumptions market participants would use in pricing the asset or liability that are developed based on the best information available. Various inputs are used in determining the value of each Fund’s investments as of the reporting period end. The designated input levels are not necessarily an indication of the risk or liquidity associated with these investments. These inputs are categorized in the following hierarchy under applicable financial accounting standards:
52 |
www.emeraldmutualfunds.com |
Table of Contents
| Emerald Funds | Notes to Financial Statements | |
October 31, 2015 (Unaudited) |
Level 1 – | Unadjusted quoted prices in active markets for identical investments, unrestricted assets or liabilities that the Funds have the ability to access at the measurement date; | |||
Level 2 – | Quoted prices which are not active, quoted prices for similar assets or liabilities in active markets or inputs other than quoted prices that are observable (either directly or indirectly) for substantially the full term of the asset or liability; and | |||
Level 3 – | Significant unobservable prices or inputs (including the Funds’ own assumptions in determining the fair value of investments) where there is little or no market activity for the asset or liability at the measurement date. | |||
The following is a summary of each input used to value the Funds as of October 31, 2015:
| Level 3 - | ||||||||||||||||
| Level 2 - | Significant | |||||||||||||||
| Level 1 - | Other Significant | Unobservable | ||||||||||||||
| Investments in Securities at Value | Quoted Prices | Observable Inputs | Inputs | Total | ||||||||||||
Emerald Growth Fund | ||||||||||||||||
Common Stocks(a) | $ | 770,131,103 | $ | – | $ | – | $ | 770,131,103 | ||||||||
Warrants | – | 0 | – | 0 | ||||||||||||
Short Term Investments | 25,930,470 | – | – | 25,930,470 | ||||||||||||
TOTAL | $ | 796,061,573 | $ | 0 | $ | – | $ | 796,061,573 | ||||||||
| Level 3 - | ||||||||||||||||
| Level 2 - | Significant | |||||||||||||||
| Level 1 - | Other Significant | Unobservable | ||||||||||||||
| Investments in Securities at Value | Quoted Prices | Observable Inputs | Inputs | Total | ||||||||||||
Emerald Small Cap Value Fund | ||||||||||||||||
Common Stocks(a) | $ | 17,017,005 | $ | – | $ | – | $ | 17,017,005 | ||||||||
Short Term Investments | 972,360 | – | – | 972,360 | ||||||||||||
TOTAL | $ | 17,989,365 | $ | – | $ | – | $ | 17,989,365 | ||||||||
| Level 3 - | ||||||||||||||||
| Level 2 - | Significant | |||||||||||||||
| Level 1 - | Other Significant | Unobservable | ||||||||||||||
| Investments in Securities at Value | Quoted Prices | Observable Inputs | Inputs | Total | ||||||||||||
Emerald Insights Fund | ||||||||||||||||
Common Stocks(a) | $ | 12,190,618 | $ | – | $ | – | $ | 12,190,618 | ||||||||
Master Limited Partnerships(a) | 176,571 | – | – | 176,571 | ||||||||||||
Short Term Investments | 1,116,944 | – | – | 1,116,944 | ||||||||||||
TOTAL | $ | 13,484,133 | $ | – | $ | – | $ | 13,484,133 | ||||||||
| Level 3 - | ||||||||||||||||
| Level 2 - | Significant | |||||||||||||||
| Level 1 - | Other Significant | Unobservable | ||||||||||||||
| Investments in Securities at Value | Quoted Prices | Observable Inputs | Inputs | Total | ||||||||||||
Emerald Banking and Finance Fund | ||||||||||||||||
Common Stocks(a) | $ | 273,773,634 | $ | – | $ | – | $ | 273,773,634 | ||||||||
Short Term Investments | 14,623,042 | – | – | 14,623,042 | ||||||||||||
TOTAL | $ | 288,396,676 | $ | – | $ | – | $ | 288,396,676 | ||||||||
| (a) | For detailed descriptions of sector and industry, see the accompanying Schedule of Investments. |
Semi-Annual Report | October 31, 2015 |
53 |
Table of Contents
| Emerald Funds | Notes to Financial Statements | |
October 31, 2015 (Unaudited) |
The Funds recognize transfers between levels as of the end of the period. For the six months or period ended October 31, 2015, the Funds had the following transfers between Level 1 and Level 2 securities.
| Level 1 | Level 2 | |||||||||||||||
| Emerald Growth Fund | Transfer In | Transfers (Out) | Transfer In | Transfers (Out) | ||||||||||||
Common Stocks | $ | 2,573,460 | $ | – | $ | – | $ | (2,573,460) | ||||||||
Total | $ | 2,573,460 | $ | – | $ | – | $ | (2,573,460) | ||||||||
| Level 1 | Level 2 | |||||||||||||||
| Emerald Banking and Finance Fund | Transfer In | Transfers (Out) | Transfer In | Transfers (Out) | ||||||||||||
Common Stocks | $ | 7,218,536 | $ | – | $ | – | $ | (7,218,536) | ||||||||
Total | $ | 7,218,536 | $ | – | $ | – | $ | (7,218,536) | ||||||||
The above transfers from Level 1 to Level 2 were due to the Funds’ lack of a closing market price. For the six months or period ended October 31, 2015, the Emerald Small Cap Value Fund and Emerald Insights Fund did not have any transfers between Level 1 and Level 2 securities.
For the six months or period ended October 31, 2015, the Funds did not have any securities that used significant unobservable inputs (Level 3) in determining fair value.
Investment Transactions and Investment Income: Investment transactions are accounted for on the date the investments are purchased or sold (trade date). Realized gains and losses from investment transactions are reported on an identified cost basis, which is the same basis the Funds use for federal income tax purposes. Interest income, which includes accretion of discounts, is accrued and recorded as earned. Dividend income is recognized on the ex-dividend date or for certain foreign securities, as soon as information is available to the Funds. All of the realized and unrealized gains and losses and net investment income, are allocated daily to each class in proportion to its average daily net assets.
Real Estate Investment Trusts (“REITs”): The Funds may invest a portion of their assets in REITs and are subject to certain risks associated with direct investment in REITs. REITs may be affected by changes in the value of their underlying properties and by defaults by borrowers or tenants. REITs depend generally on their ability to generate cash flow to make distributions to shareowners, and certain REITs have self-liquidation provisions by which mortgages held may be paid in full and distributions of capital returns may be made at any time. In addition, the performance of a REIT may be affected by its failure to qualify for tax-free pass-through of income under the Internal Revenue Code of 1986, as amended (the “Code”), or its failure to maintain exemption from registration under the 1940 Act.
Trust Expenses: Some expenses of the Trust can be directly attributed to the Funds. Expenses which cannot be directly attributed to the Funds are apportioned among all funds in the Trust based on average net assets of each fund.
Fund and Class Expenses: Expenses that are specific to a Fund or class of shares of a Fund, including distribution fees (Rule 12b-1 fees) and shareholder servicing fees, are charged directly to that Fund or share class. All expenses of a Fund, other than class specific expenses, are allocated daily to each class in proportion to its average daily net assets. Expenses that are common to the Funds generally are allocated among the Funds in proportion to their average daily net assets.
Federal Income Taxes: Each Fund complies with the requirements under Subchapter M of the Internal Revenue Code of 1986, as amended, applicable to regulated investment companies and intends to distribute substantially all of its net taxable income and net capital gains, if any, each year so that the Funds will not be subject to excise tax on undistributed income and gains. The Funds are not subject to income taxes to the extent such distributions are made.
As of and during the six months or period ended October 31, 2015, the Funds did not have a liability for any unrecognized tax benefits. The Funds file U.S. federal, state, and local tax returns as required. The Funds’ tax returns are subject to examination by the relevant tax authorities until expiration of the applicable statute of limitations, which is generally three years after the filing of the tax return for federal purposes and four years for most state returns. Tax returns for open years have incorporated no uncertain tax positions that require a provision for income taxes.
Distributions to Shareholders: Each Fund, except the Emerald Small Cap Value Fund, normally pays dividends and distributes capital gains, if any, on an annual basis. The Emerald Small Cap Value Fund normally pays dividends, if any, on a quarterly basis. The Emerald Small Cap Value Fund generally distributes capital gains, if any, on an annual basis. Income dividend distributions are derived from interest and other income each Fund receives from its investments, including short-term capital gains. Long term capital gain distributions are derived from gains realized when each Fund sells a security it
54 |
www.emeraldmutualfunds.com |
Table of Contents
| Emerald Funds | Notes to Financial Statements | |
October 31, 2015 (Unaudited) |
has owned for more than a year. Each Fund may make additional distributions and dividends at other times if the portfolio manager believes doing so may be necessary for each Fund to avoid or reduce taxes.
3. TAX BASIS INFORMATION
Tax Basis of Investments: As of October 31, 2015, the aggregate cost of investments, gross unrealized appreciation/(depreciation) and net unrealized appreciation/(depreciation) for Federal tax purposes was as follows:
| Gross Appreciation | Gross Depreciation | |||||||||||||||||||
| (excess of value over tax | (excess of tax cost over | Net Unrealized | Cost of Investments for | |||||||||||||||||
| cost) | value) | Appreciation | Income Tax Purposes | |||||||||||||||||
Emerald Growth Fund | $ | 98,036,369 | $ | (62,116,928) | $ | 35,919,441 | $ | 760,142,132 | ||||||||||||
Emerald Small Cap Value Fund | 2,720,480 | (804,626) | 1,915,854 | 16,073,511 | ||||||||||||||||
Emerald Insights Fund | 941,772 | (691,103) | 250,669 | 13,233,464 | ||||||||||||||||
Emerald Banking and Finance Fund | 60,370,829 | (5,346,676) | 55,024,153 | 233,372,523 | ||||||||||||||||
Tax Basis of Distributions to Shareholders: The character of distributions made during the year from net investment income or net realized gains may differ from its ultimate characterization for federal income tax purposes. Also, due to the timing of dividend distributions, the fiscal year in which amounts are distributed may differ from the fiscal year in which the income or realized gain were recorded by each Fund.
The tax character of distributions paid by the Funds for the fiscal year or period ended April 30, 2015, were as follows:
| Ordinary Income | Long-Term Capital Gain | |||||||
Emerald Growth Fund | $ | 7,294,238 | $ | 11,879,191 | ||||
Emerald Insights Fund | – | – | ||||||
Emerald Banking and Finance Fund | – | – | ||||||
The tax character of distributions paid by the Funds for the fiscal year ended September 30, 2015, were as follows:
| Ordinary Income | Long-Term Capital Gain | |||||||
Emerald Small Cap Value Fund | $ | 179,711 | $ | 415,816 | ||||
The tax character of distributions paid by the six months and or period ended October 31, 2015, the Funds did not make any distributions.
4. SECURITIES TRANSACTIONS
The cost of purchases and proceeds from sales of securities (excluding short-term securities) during the six months or period ended October 31, 2015, was as follows:
| Cost of Investments | Proceeds from | |||||||
| Funds | Purchased | Investments Sold | ||||||
Emerald Growth Fund | $ | 617,128,301 | $ | 134,488,559 | ||||
Emerald Small Cap Value Fund | 593,379 | 647,225 | ||||||
Emerald Insights Fund | 12,147,869 | 6,067,676 | ||||||
Emerald Banking and Finance Fund | 130,892,613 | 7,489,197 | ||||||
5. SHARES OF BENEFICIAL INTEREST
The capitalization of the Trust consists of an unlimited number of shares of beneficial interest with no par value per share. Holders of the shares of the Funds of the Trust have one vote for each share held and a proportionate fraction of a vote for each fractional share. All shares issued and outstanding are fully paid and are transferable and redeemable at the option of the shareholder. Purchasers of the shares do not have any obligation to make payments to the Trust or its creditors (other than the purchase price for the shares) or make contributions to the Trust or its creditors solely by reason of the purchaser’ ownership of the shares. Shares have no pre-emptive rights.
6. MANAGEMENT AND RELATED-PARTY TRANSACTIONS
The Adviser, subject to the authority of the Board, is responsible for the overall management and administration of the Funds’ business affairs. The Adviser manages the investments of the Funds in accordance with the Funds’ investment objective, policies and limitations and investment
Semi-Annual Report | October 31, 2015 |
55 |
Table of Contents
| Emerald Funds | Notes to Financial Statements | |
October 31, 2015 (Unaudited) |
guidelines established jointly by the Adviser and the Trustees. Pursuant to the Advisory Agreement, the Funds pay the Adviser fees for the services and facilities it provides payable on a monthly basis at the annual rate set forth below of the Funds’ average daily net assets.
Emerald Growth Fund | ||||
| Average Total Net Assets | Contractual Fee | |||
Up to and including $250M | 0.75% | |||
Over $250M and including $500M | 0.65% | |||
Over $500M and including $750M | 0.55% | |||
Over $750M | 0.45% | |||
Emerald Small Cap Value Fund | ||||
| Average Total Net Assets | Contractual Fee | |||
Up to and including $250M | 0.75% | |||
Over $250M and including $500M | 0.65% | |||
Over $500M and including $750M | 0.55% | |||
Over $750M | 0.45% | |||
Emerald Insights Fund | ||||
| Average Total Net Assets | Contractual Fee | |||
Up to and including $250M | 0.75% | |||
Over $250M and including $500M | 0.65% | |||
Over $500M and including $750M | 0.55% | |||
Over $750M | 0.45% | |||
Emerald Banking and Finance Fund | ||||
| Average Total Net Assets | Contractual Fee | |||
Up to and including $100M | 1.00% | |||
Over $100M | 0.90% | |||
The Adviser has contractually agreed to limit the total amount of “Management Fees” and “Other Expenses” that it is entitled to receive from each Fund through August 31, 2016, with respect to the Funds’ different classes, to the extent the Total Annual Fund Operating Expenses of a Fund (exclusive of acquired fund fees and expenses, brokerage expenses, interest expense, taxes and extraordinary expenses) exceed the annual rates (as a percentage of each Funds average daily net assets) set forth on the tables below. The Adviser will reduce the fee payable with respect to such Fund to the extent of such excess, and/or shall reimburse the Fund (or class) by the amount of such excess. The waiver or reimbursement shall be allocated to each class of the Fund in the same manner as the underlying expenses or fees were allocated. Pursuant to the expense limitation agreement between the Adviser and the Trust, each Fund will reimburse the Adviser for any contractual fee waivers and expense reimbursements made by the Adviser, provided that any such reimbursements made by each Fund to the Adviser will not cause the Funds’ expense limitation to exceed expense limitations in existence at the time the expense was incurred, or at the time of the reimbursement, whichever is lower, and the reimbursement is made within three years after the end of the fiscal year in which fees or expenses were incurred.
| Emerald Growth Fund | ||||||
| Class A | Class C | Institutional Class | Investor Class | |||
1.29% | 1.94% | 0.99% | 1.34% | |||
| Emerald Small Cap Value Fund | ||||||
| Class A | Class C | Institutional Class | Investor Class | |||
1.35% | 2.00% | 1.00% | 1.25% | |||
| Emerald Insights Fund | ||||||
| Class A | Class C | Institutional Class | Investor Class | |||
1.35% | 2.00% | 1.05% | 1.40% | |||
56 |
www.emeraldmutualfunds.com |
Table of Contents
| Emerald Funds | Notes to Financial Statements | |
October 31, 2015 (Unaudited) |
| Emerald Banking and Finance Fund | ||||||
| Class A | Class C | Institutional Class | Investor Class | |||
1.84% | 2.49% | 1.54% | 1.89% |
For the six months or period ended October 31, 2015, the fee waivers and/or reimbursements were as follows:
| Fund | Fees Waived/Reimbursed By Adviser | Recoupment of Past Waived Fees By Adviser | ||||||||
Emerald Growth Fund | ||||||||||
Class A | $ – | $ 49,069 | ||||||||
Class C | – | 4,473 | ||||||||
Institutional Class | – | 80,974 | ||||||||
Investor Class | – | – | ||||||||
Emerald Small Cap Value Fund | ||||||||||
Class A | $ 5 | $ – | ||||||||
Class C | 5 | – | ||||||||
Institutional Class | 6,107 | – | ||||||||
Investor Class | 190 | – | ||||||||
Emerald Insights Fund | ||||||||||
Class A | $ 24,011 | $ – | ||||||||
Class C | 110 | – | ||||||||
Institutional Class | 897 | – | ||||||||
Investor Class | 2,217 | – | ||||||||
Emerald Banking and Finance Fund | ||||||||||
Class A | $ – | $ – | ||||||||
Class C | – | – | ||||||||
Institutional Class | – | – | ||||||||
Investor Class | – | – | ||||||||
As of April 30, 2015, the balances of recoupable expenses for each Fund were as follows:
| Fund | Expires 2016 | Expires 2017 | Expires 2018 | Total | ||||||||||||
Emerald Growth Fund | ||||||||||||||||
Class A | $ | 37,509 | $ | 11,560 | $ | – | $ | 49,069 | ||||||||
Class C | 3,001 | 1,471 | – | 4,472 | ||||||||||||
Institutional Class | 64,286 | 16,688 | – | 80,974 | ||||||||||||
Investor Class | – | – | – | – | ||||||||||||
Emerald Insights Fund | ||||||||||||||||
Class A | $ | – | $ | – | $ | 41,382 | $ | 41,382 | ||||||||
Class C | – | – | 921 | 921 | ||||||||||||
Institutional Class | – | – | 3,464 | 3,464 | ||||||||||||
Investor Class | – | – | 1,872 | 1,872 | ||||||||||||
Emerald Banking and Finance Fund | ||||||||||||||||
Class A | $ | – | $ | – | $ | – | $ | – | ||||||||
Class C | – | – | – | – | ||||||||||||
Institutional Class | – | – | – | – | ||||||||||||
Investor Class | – | – | – | – | ||||||||||||
As of September 30, 2015, the balances of recoupable expenses for the Emerald Small Cap Value Fund were as follows:
| Fund | Expires 2016 | Expires 2017 | Expires 2018 | Total | ||||||||||||
Emerald Small Cap Value Fund | ||||||||||||||||
Class A | $ | 30 | $ | – | $ | – | $ | 30 | ||||||||
Class C | 30 | – | – | 30 | ||||||||||||
Institutional Class | 37,563 | – | – | 37,563 | ||||||||||||
Investor Class | 852 | – | – | 852 | ||||||||||||
Semi-Annual Report | October 31, 2015 |
57 |
Table of Contents
| Emerald Funds | Notes to Financial Statements | |
October 31, 2015 (Unaudited) |
The Funds will not be obligated to pay any such deferred fees and expenses more than three years after the year(s) in which the fees and expense were incurred.
Distributor: ALPS Distributors, Inc. (“ADI” or the “Distributor”) (an affiliate of ALPS Fund Services Inc. (“ALPS”)) acts as the distributor of the Funds’ shares pursuant to a Distribution Agreement with the Trust. Shares are sold on a continuous basis by ADI as agent for the Funds, and ADI has agreed to use its best efforts to solicit orders for the sale of Funds’ shares, although it is not obliged to sell any particular amount of shares. ADI is not entitled to any compensation for its services as Distributor. ADI is registered as a broker-dealer with the U.S. Securities and Exchange Commission.
Each Fund has adopted a separate Distribution and Services Plan (each a “Plan” and collectively, the “Plans”) pursuant to Rule 12b-1 of the 1940 Act. The Plans allow each Fund, as applicable, to use each Fund’s assets to pay fees in connection with the distribution and marketing of the Funds’ shares and/or the provision of shareholder services to the Funds’ shareholders. The Plan permits payment for services in connection with the administration of plans or programs that use shares of each Fund as their funding medium and for related expenses. The Plans permit each Fund to make total payments at an annual rate of up to 0.35%, 0.75% and 0.25% of the average daily net asset value of Class A, Class C and Investor Class, respectively. Because these fees are paid out of the Funds’ assets on an ongoing basis, over time they will increase the cost of an investment in the Funds, and Plan fees may cost an investor more than other types of sales charges.
Each Fund, except the Emerald Small Cap Value Fund, has adopted a Shareholder Services Plan (a “Shareholder Services Plan”) with respect to Class C, Institutional Class and Investor Class shares. Under the Shareholder Services Plan, each Fund is authorized to pay banks and their affiliates and other institutions, including broker-dealers and Fund affiliates (“Participating Organizations”), an aggregate fee in an amount not to exceed on an annual basis 0.25%, 0.05% and 0.15% of the average daily net asset value of Class C, Institutional Class and Investor Class, respectively, of the Funds attributable to or held in the name of a Participating Organizations for its clients as compensation for providing services pursuant to an agreement with a Participating Organizations. Any amount of such payment not paid to Participating Organizations during the Funds’ fiscal year for such service activities shall be reimbursed to the Funds as soon as practicable after the end of the fiscal year. Shareholder Services Plan fees are included with distribution and service fees on the Statements of Operations.
Effective June 26, 2015, the Emerald Small Cap Value Fund has adopted a Shareholder Services Plan (the “Plan”) with respect to its Class C shares. Under the Plan, the Emerald Small Cap Value Fund is authorized to pay banks and their affiliates and other institutions, including broker-dealers and Emerald Small Cap Value Fund affiliates (“Participating Organizations”), an aggregate fee in an amount not to exceed on an annual basis 0.25% of the average daily net asset value of Class C shares of the Emerald Small Cap Value Fund attributable to or held in the name of a Participating Organizations for its clients as compensation for providing shareholder service activities, which do not include distribution services pursuant to an agreement with a Participating Organizations. Any amount of such payment not paid to the Participating Organizations during the Fund’s fiscal year for such service activities shall be reimbursed to the Emerald Small Cap Value Fund as soon as practicable after the end of the fiscal year. Plan fees are included with distribution and service fees on the Statements of Operations.
Fund Administrator Fees and Expenses: ALPS Fund Services, Inc. (“ALPS”) serves as administrator to the Funds and the Funds have agreed to pay expenses incurred in connection with their administrative activities. Pursuant to an Administration Agreement, ALPS provides operational services to the Funds including, but not limited to, fund accounting and fund administration and generally assist in the Funds’ operations. Officers of the Trust are employees of ALPS. The Funds’ administration fee is accrued on a daily basis and paid monthly. Administration fees paid by the Funds for the six months or period ended October 31, 2015 are disclosed in the Statements of Operations.
The Administrator is also reimbursed by the Funds for certain out-of-pocket expenses.
Transfer Agent: ALPS serves as transfer, dividend paying and shareholder servicing agent for the Funds. ALPS receives an annual minimum fee, a fee based upon the number of shareholder accounts, and is also reimbursed by the Funds for certain out-of-pocket expenses.
Compliance Services: ALPS provides services that assist the Trust’s chief compliance officer in monitoring and testing the policies and procedures of the Trust in conjunction with requirements under Rule 38a-1 under the 1940 Act and receives an annual base fee. ALPS is reimbursed for certain out-of-pocket expenses by the Funds.
Principal Financial Officer: ALPS receives an annual fee for providing principal financial officer services to the Funds.
58 |
www.emeraldmutualfunds.com |
Table of Contents
| Emerald Funds | Notes to Financial Statements | |
October 31, 2015 (Unaudited) |
7. INDEMNIFICATIONS
Under the Trust’s organizational documents, its officers and Trustees are indemnified against certain liability arising out of the performance of their duties to the Trust. Additionally, in the normal course of business, the Trust enters into contracts with service providers that may contain general indemnification clauses, which may permit indemnification to the extent permissible under applicable law. The Trust’s maximum exposure under these arrangements is unknown, as this would involve future claims that may be made against the Trust that have not yet occurred.
8. RECENT ACCOUNTING PRONOUNCEMENT
In May 2015, the Financial Accounting Standards Board issued Accounting Standards Update (“ASU”) 2015-07, “Disclosures for Investments in Certain Entities that Calculate Net Asset Value Per Share (or its Equivalent).” This is an update to Accounting Standards Codification Topic 820, Fair Value Measurement. ASU 2015-07 removes the requirement to categorize within the fair value hierarchy investments for which fair value is measured at net asset value per share (or its equivalent) using the practical expedient. ASU 2015-17 is effective for annual reporting periods beginning on or after December 15, 2015, and interim periods within those annual periods, with retrospective application for all periods presented. The Funds are currently evaluating the impact ASU 2015-07 will have on the Funds’ financial statements and disclosures.
Semi-Annual Report | October 31, 2015 |
59 |
Table of Contents
| Emerald Funds | Additional Information | |
October 31, 2015 (Unaudited) |
1. FUND HOLDINGS
The Funds file their complete schedule of portfolio holdings with the Securities and Exchange Commission (the “SEC”) for the first and third quarters of each fiscal year on Form N-Q within 60 days after the end of the period. Copies of the Funds’ Form N-Q are available without charge on the SEC website at http://www.sec.gov. You may also review and copy the Form N-Q at the SEC’s Public Reference Room in Washington, DC. For more information about the operation of the Public Reference Room, please call the SEC at 1-800-SEC-0330.
2. FUND PROXY VOTING POLICIES, PROCEDURES AND SUMMARIES
Each Fund’s policies and procedures used in determining how to vote proxies and information regarding how the Funds voted proxies relating to portfolio securities during the most recent prior 12-month period ending June 30 are available without charge, (1) upon request, by calling (toll-free) (855) 828-9909 and (2) on the SEC’s website at http://www.sec.gov.
60 |
www.emeraldmutualfunds.com |
Table of Contents

Table of Contents
Table of Contents

TABLE OF CONTENTS
| 1 | ||||
| ||||
| 5 | ||||
| ||||
| 19 | ||||
| ||||
| 21 | ||||
| 25 | ||||
| 28 | ||||
| 33 | ||||
| 40 | ||||
| 43 | ||||
| 48 | ||||
| ||||
| 51 | ||||
| ||||
| 53 | ||||
| ||||
| 55 | ||||
| 56 | ||||
| 57 | ||||
| 58 | ||||
| 59 | ||||
| 60 | ||||
| 61 | ||||
| ||||
| 62 | ||||
| 64 | ||||
| 65 | ||||
| 67 | ||||
| 69 | ||||
| 71 | ||||
| 73 | ||||
| ||||
| 75 | ||||
| ||||
| 91 | ||||
| ||||
| 95 | ||||
| ||||
Table of Contents
| Grandeur Peak Funds® | Shareholder Letter | |
October 31, 2015 (Unaudited) |
| ||||
Robert Gardiner, CFA | Blake Walker | |||
CEO & Portfolio Manager | CIO & Portfolio Manager | |||

Dear Fellow Shareholders,
Around the end of May investors became very concerned with China’s leadership, who had been pumping up the Chinese markets in an attempt to support consumer sentiment and economic growth. The government’s triple action of cutting interest rates, reducing bank reserves, and devaluing the currency signaled to the market that the Chinese economy was probably slowing more than the official figures indicated. Investors panicked and markets across the globe suffered their worst quarterly return since the third quarter of 2011.
As you’ve heard us say before, we actually welcome some market volatility. In the long run, stock price volatility is good for us because it presents opportunities. Our team’s ability to hold conviction in a panicky market is born from a systematic and repeatable process which, we believe, over our careers has shown its worth. It stems from our ability to find what we believe to be financially sound, high-quality companies with sustainable competitive advantages and headroom to grow. These are companies with good management teams that we think can often gain market share and take advantage of weaker market environments.
With the market events in China triggering market declines across the globe, we suffered a broad-based sell-off across our portfolio holdings, but particularly in many of the emerging markets (EM) where countries are dealing with a variety of macro challenges including weak consumer sentiment, inflation, deficits, and political uncertainty. Many EM countries depend heavily on commodity and oil exports, so weaker commodity prices are hurting these economies and exacerbating government budgeting problems.
India, Indonesia, Thailand, and Malaysia are dealing with political unrest where promised spending and important reforms by new governments have been delayed. Brazil, where we have most of our Latin American exposure, fell victim to the market selloff and is dealing with their own political crisis. The Brazilian Real dropped more than 40% vs. the US Dollar (USD) to a 13-year low, compounding weak stock performance for USD-based investors. And lost in the EM headlines was the re-emergence of the saga in Greece.
We have also seen big moves in foreign exchange rates, specifically in the Turkish Lira, South African Rand, Euro, Chinese RMB, Indonesian Rupiah, and the aforementioned Brazilian Real. The strength of the US Dollar puts pressure on EM companies that have a high percentage of their operating costs in USD (commodities and many raw materials are often priced in USD). Meanwhile, many of these emerging market companies are not in a position to be able to pass on these costs immediately to customers due to fragile economies and weak consumer purchasing power.
So what are we doing in this environment? The same thing we do in any environment: fundamental company analysis. While we cannot control the markets, we can try to find good companies that we believe will weather the storms. No doubt, the global economy is still in a fragile state. We don’t attempt to time the market; instead, we see market corrections as a time to upgrade our portfolios by moving into our favorite high-quality names as their prices become more attractive. We’ve been travelling and talking to companies in the countries that have been hit hardest, and we are more excited by the opportunities now than we have been in recent quarters, but we are moving cautiously as we don’t anticipate a quick macro-economic rebound in many of these countries. Longer-term, we are still big believers that living standards will continue to rise in many EM countries despite the current bumps that are slowing progress. Our goal is to stick with prudent management teams who are good stewards of capital and who we believe can adapt and even thrive in this environment.
Semi-Annual Report | October 31, 2015 |
1 |
Table of Contents
| Grandeur Peak Funds® | Shareholder Letter | |
October 31, 2015 (Unaudited) |
Notes from the Road
The following are Spencer Stewarts’s notes from his recent visit to Pakistan:
A few days before my trip to Pakistan I was very excited. But my fiancée was very worried. She’d spent the morning scanning the Internet for all relevant information about Pakistan. The “No Travel Warning” she’d found on the U.S. Dept. of State website redoubled her bewilderment with my excitement. But I showed her a report that the British government had posted that I interpreted as only a “mild warning” for certain neighborhoods within Pakistan. Nonetheless, her trepidation had been effective and my bravado weakened; I vowed to adhere to her strict travel guidelines while in Pakistan. Not the US government’s, but hers.
Fast forward past the flights from SLC to NYC (redeye), NYC to Dubai, Dubai to Karachi and there I stood on Pakistani soil with my colleague, Jonathan Fulton. As we walk out of the airport, it’s clear we are getting stares. We are surprised to find nothing chaotic about the scene as I’d expected after travels to India and Bangladesh. The placidness is unsettling. The unexpected peace allows my mind to quickly assert all blame for the stares to Jonathan. While we are the only two Caucasians to be seen, it’s clear to me Jonathan’s hulking 6’3” height, blonde hair, blue-eyes and booming voice are blowing our cover. I like to think of myself as more of a chameleon at 5’8.75”. With a local broker as guide, we traverse the hundred yard gauntlet dividing the airport exit and our car without incident.
The thirty-minute drive from airport to hotel is relatively uneventful. Traffic is smooth. The roads are in decent shape. The occasional cow in the bed of a truck or sedan filled with goats wasn’t something you see every day, but still not as shocking as the families of five riding on a single motorcycle commonly seen in India. But as we near the Movenpick hotel the visible security presence becomes more pronounced. Two thorough security checks are required to breach the very high walls (topped with razor wire) surrounding the hotel and a third is required to access the building interiors. The compound feel of the hotel is escalating my internal threat-ometer to red from orange.
The hotel is clean but dated. The lobby is bustling with an eclectic and international bunch and I no longer feel out of place. I make some quick deductions and conclude that 95% of the purposeful looking business-types rubbing shoulders in that lobby have a higher net worth than me. With that quick and unscientific analysis the threat risk drops to a sunflower yellow and I’m feeling good.
Finally up in my mildew scented room I open the balcony drapes. The sliding door is welded shut and the street view is impeded by wire mesh. Threat risk back to orange…
After an attempted power nap I’m shaved, showered and heading out the door within ninety minutes of arrival. The evening is set with an atypical meeting schedule with a group of men I’m calling the Pakistani Boosters Club. We begin with a powwow involving the heads of the Pakistani Central Bank and the Director of Monetary Policy. The meeting is then followed by a dinner with President of the Karachi Stock Exchange and the Minister of the Board of investment.
The theme is clear and resounding from all. This time is different…Times have changed…NOW is the time to pay attention to Pakistan! It’s rare for any of our team to spend an hour let alone an entire evening meeting with public officials, yet I am grateful for the opportunity. Pakistan from my predominantly U.S. news-fed Western perception may be the most foreign place I’ve been. The locals seem to realize this, so casting a new light on the country is critical. Typically we can pull the most significant and relevant political, fiscal, regulatory and country-specific data from the bottom up, so this top down experience was unique. This night was spent analyzing a country as opposed to a company.
Why did inflation spike to 25% back in ‘08? Why is inflation now coming in at less than 2% today? What is the relationship between the military and the Prime Minister? Why has the benchmark lending rate dropped 350 basis points in twelve months and now sits at a multi-decade low? Will the Balance of Payments always be in the red? Will the recovery last? Did the government know Osama Bin Laden was hiding right under their nose?
All the answers revolve around security and energy in one form or another. The 2013 election marks the first successful power transition via democratic election since the country achieved independence back in 1947. The election is a big deal and provides a track record… of one. But even the short period of stability has led to a more aligned military, better security and a real fight against terrorists as the country seeks stability and Foreign Direct Investment (FDI). The reprieve that collapsing oil prices have offered is further enhancing the likelihood of structural and enduring change. With regard to FDI the China Pakistan Economic Corridor (CPEC) enters the conversation repeatedly. The CPEC is no small thing and can add major fuel to the economic fire. The Gross Domestic Products (GDP) of Pakistan is roughly $250b USD, and within the next two to three years the Chinese have slated somewhere between $40 - $50b of direct investments into Pakistan power and infrastructure. All else being equal, the Chinese investment could lift GDP by 15 - 20%, driving a GDP growth rate well in excess of the ~4% level Pakistan has delivered for the past few years. I feel the excitement and see the economic figures which ground the investment case. With the stock market up three fold since 2012 it’s clear that others see the opportunity as well. So with optimism sloshing through my jetlagged mind we start to call it a night.
2 |
1.855.377.7325 | www.GrandeurPeakGlobal.com |
Table of Contents
| Grandeur Peak Funds® | Shareholder Letter | |
October 31, 2015 (Unaudited) |
But wait, Osama Bin Laden. That’s one question I don’t want to leave hanging. The general view is that yes, the Pakistan military absolutely knew right where Osama was hiding. Throughout the search period the US government was injecting >$1b annually into the Pakistan anti-terrorism budgets so what motivation was there to turn in their golden goose? It’s a tough answer to swallow and a troubling reality, but I see how it makes perfect sense. Perfect sense to the Pakistan military that is.
The next morning comes slowly, but too soon, with jetlag always pinching much needed sleep the first couple of nights. Due to security concerns — I later find to be unofficial — almost all the meetings are set to take place within the hotel confines. The docket isn’t perfect but includes a nice mix of conglomerates that are able to provide insight into many industries. Although the info is relevant it doesn’t help us on our quest to find a great little company with great management. Midway through the third meeting our broker pulls me out for one of the two offsite meetings they’ve buttoned down. Unaware of the side meeting Jonathan begrudgingly stays behind to better understand why this particular bank has high non-performing loans. He’ll only be lucky if I don’t make it back alive.
Heading out into the busy Karachi streets I’m once again excited. Not only for the meeting with Atlas Batteries, but for the drive through this perilous land. As we drive across town I’m once again surprised at the relative cleanliness and order. When I ask where the slums are, our broker points out some fairly run-down apartment complexes, I would have expected something quite worse. The most exciting part of the ride is when we pass a number of lots filled with hundreds of goats. Eid al-Adha (EID) or the “Feast of the Sacrifice” is upon us and the broker compares the goat lots to our Christmas tree lots in the U.S. The lots are not the norm but a seasonal installment, providing convenient goat access for city folk. I probe a bit more. The goats are to be sacrificed and the meat to be shared in thirds with family, the less fortunate, and friends. The celebration is one of immediate goodwill and I respect it.
We arrive at the grungy looking Atlas building and soon find out that the rough exterior is disguising a modern and newly renovated interior. The paint is fresh and the air is cool and pleasant. I’m thrilled because on paper this barely $100 million market cap company appears to be a buy candidate. It’s been growing like a weed, is incredibly profitable and considering the valuation appears undiscovered. We take a seat in the tiny but comfortable conference room and the CFO soon arrives. He offers me coffee and I decline but ask him what’s appropriate. He tells me that accepting the coffee is the right thing to do, so I change my order.
The CFO isn’t accustomed to meeting with investors, so with no agenda we jump right into Q&A. They share the market nearly equally between Exide and one other local competitor. They don’t have any technology advantage but someday they may invest into a very expensive plant that can manufacture a hybrid battery that will require much less maintenance. It’s too early for the company to make the investment, because price remains the only driver of consumer behavior, and how difficult is it to add water to a battery once a month anyway? I ask myself the same question as I think about our disposable-loving nation. The phenomenal growth rate and margins we’ve seen in the past will not continue, he says. At this point I’m ready to commend him on his remarkable ability to talk me out of investing.
So why have things been going so well? With the substandard electrical grid in Pakistan people have turned to heavy-duty truck batteries for use as backup power in their homes. From what he hears and reads, massive grid and power generation investments driven in a large part by the China Pakistan Economic Corridor (CPEC) will eliminate the home-use opportunity within a matter of years. I understand his concern but don’t entirely swallow his pessimism. But without a handle on the Pakistani psyche, or experience dealing with local business owners I can’t generalize the people as optimists, realists or cynics. From experience I do know that more often than not, the best operators under-promise and over-deliver and that consistently great companies continue to be great. I’m left a little deflated. An uninspiring meeting such as this tends to push a company to the back burner or lead to more work and given the size and liquidity, Atlas will likely end up on the backburner.
Back in the car I request we take an alternate route to the hotel. The detour runs along the beach and through a very early stage and very high-end military owned housing development. The landscape is barren and the few lonely mansions that slowly appear from the dusty horizon look completely out of place. There are high walls and sand surrounding each one, there is no landscaping to be seen. These houses look as if they are decaying remnants of the past, but I’m assured by the broker that they are fresh. I wonder if this place will look like California in 30 years. I wonder if this place can ever look like California. The answer comes almost immediately. A mall seems to appear from thin air. The mall houses one of the largest movie multiplex in Pakistan and I’m told that nearly every show is sold out. There is a Subway Sandwich restaurant inside.
As we head back to the hotel I’m told that there really is no security threat in Karachi. The meetings are held in the hotel partially for convenience but mostly because it’s less expensive than hiring a security team for every foreign investor that comes to the country. The broker is surprised I didn’t request a security detail. At the same time I figure he would have offered one if it truly was a concern. Yes, there are five murders a day within Karachi, but I’m reassured that they are almost entirely motivated by political or sectarian ideals. I’m told the rate has been dropping rapidly and things are much better than they once were. I wonder if a single generation can change the country’s wild course. I wonder if the multiplex and the Subway have anything to do with it.
Semi-Annual Report | October 31, 2015 |
3 |
Table of Contents
| Grandeur Peak Funds® | Shareholder Letter | |
October 31, 2015 (Unaudited) |
Business Update
We launched the two Stalwarts Funds on September 1st and the Global Micro Cap Fund on October 20th. The Micro Cap Fund closed the same day it opened in order to keep the assets around $25M and allow us complete freedom in our search for interesting micro-cap companies across the globe. Meanwhile, we hope the Stalwarts funds will remain open for a long time. We are not aggressively marketing these small/mid-cap funds (SMID-cap); instead we envision them providing desired access for existing clients and selective new relationships, while helping us to become even better global investors.
It’s always a little hair-raising to launch a new fund amidst a gyrating market. In general we feel like we’re off to a good start in an environment that is affording us some better buying opportunities.
As always, feel free to reach out with any questions or concerns. We appreciate our relationship with you and continue to work hard on your behalf.
Sincerely,
Robert Gardiner, CFA | Blake Walker | |||
Chief Executive Officer & Portfolio Manager | Chief Investment Officer & Portfolio Manager | |||
The objective of all Grandeur Peak Funds is long-term growth of capital.
RISKS: Mutual fund investing involves risks and loss of principal is possible. Investing in small and micro-cap funds will be more volatile and loss of principal could be greater than investing in large cap or more diversified funds. Investing in foreign securities entails special risks, such as currency fluctuations and political uncertainties, which are described in more detail in the prospectus. Investments in emerging markets are subject to the same risks as other foreign securities and may be subject to greater risks than investments in foreign countries with more established economies and securities markets.
An investor should consider investment objectives, risks, charges, and expenses carefully before investing. To obtain a Grandeur Peak Funds prospectus, containing this and other information, visit www.grandeurpeakglobal.com or call 1-855-377-PEAK (7325). Please read it carefully before investing.
The views of the author and information discussed in this commentary are as of the date of publication, are subject to change, and may not reflect the writer's current views. The views expressed are those of the author only, and represent an assessment of market conditions at a specific point in time, are opinions only and should not be relied upon as investment advice regarding a particular investment or markets in general. Such information does not constitute a recommendation to buy or sell specific securities or investment vehicles. It should not be assumed that any investment will be profitable or will equal the performance of the Funds or any securities or any sectors mentioned herein. The subject matter contained herein has been derived from several sources believed to be reliable and accurate at the time of compilation. Grandeur Peak Global Advisors, LLC nor the Funds accept any liability for losses either direct or consequential caused by the use of this information. Past performance does not guarantee future results.
CFA® is trademark owned by CFA Institute.
ALPS Distributors, Inc. is the Distributor for the Grandeur Peak Funds.
The Funds are subject to investment risks, including possible loss of the principal amount invested and therefore are not suitable for all investors. The Funds may not achieve their objectives.
Diversification does not ensure a profit or guarantee against loss.
Basis point – A commonly used expression for describing 1/100th of 1%.
4 |
1.855.377.7325 | www.GrandeurPeakGlobal.com |
Table of Contents
| Grandeur Peak Emerging Markets Opportunities Fund | Performance Update | |
October 31, 2015 (Unaudited) |
Cumulative Total Return Performance for the periods ended October 31, 2015
| Expense Ratio | ||||||||||
| Since | ||||||||||
| 6 Months | 1 Year | Inception(a) | Gross | Net(b) | ||||||
Grandeur Peak Emerging Markets Opportunities | -11.56% | -5.98% | 2.30% | 1.82% | 1.82% | |||||
Grandeur Peak Emerging Markets Opportunities | -11.37% | -5.73% | 2.55% | 1.57% | 1.57% | |||||
Russell Emerging Markets Small Cap Index(c) | -15.33% | -10.15% | -2.39% | |||||||
| (a) | Fund inception date of December 16, 2013. |
| (b) | Grandeur Peak Global Advisors, LLC (the “Adviser”), has agreed to waive and/or reimburse fees or expenses in order to limit Total Annual Fund Operating Expenses After Fee Waiver/Expense Reimbursement (excluding acquired fund fees and expenses, brokerage expenses, interest expenses, taxes and extraordinary expenses) to 1.95% of the Fund’s average daily net assets for the Investor Class and 1.70% of the Fund’s average daily net assets for the Institutional Class. This agreement is in effect through August 31, 2016. The Fund may have to repay some of these waivers and reimbursements to the Adviser in the following three years. This agreement may not be terminated or modified prior to this date except with the approval of the Fund’s Board of Trustees. Ratios as of the Prospectus dated August 31, 2015 and may differ from the ratios presented in the Financial Highlights. |
| (c) | The Russell Emerging Markets Small Cap Index seeks to measure the performance of the small-cap equity universe of emerging countries. The Index is not actively managed and does not reflect any deductions for fees, expense, or taxes. An investor may not invest directly in the Index. |
Returns for periods greater than 1 year are annualized.
The returns shown above do not reflect the deduction of taxes a shareholder would pay on Fund distributions or redemption of Fund shares. Performance data quoted represents past performance. Past performance does not guarantee future results. Investment return and principal value of an investment will fluctuate so that an investor’s shares, when sold or redeemed, may be worth more or less than the original cost. The Fund imposes a 2.00% redemption fee on shares held for less than 60 days. Current performance data may be higher or lower than actual data quoted. For the most current month-end performance data, please call 1-855-377-PEAK (7325).
Growth of $10,000 for the period ended October 31, 2015
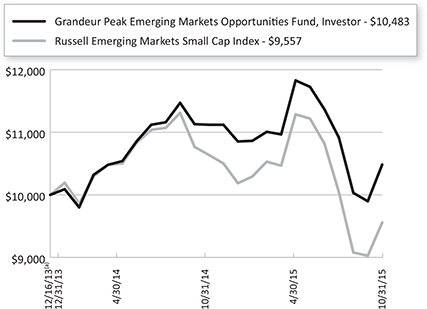
Semi-Annual Report | October 31, 2015 |
5 |
Table of Contents
| Grandeur Peak Emerging Markets Opportunities Fund | Performance Update | |
October 31, 2015 (Unaudited) |
The graphs shown above represent a hypothetical investment of $10,000 in the Fund’s Investor Class shares for the period from inception to October 31, 2015. All returns reflect reinvested dividends, but do not reflect the deduction of taxes that an investor would pay on distributions or redemptions.
The Fund also offers Institutional Class shares, performance for which is not reflected in the graphs above. The performance of Institutional Class shares may be higher or lower than the performance of the Investor Class shares shown in the graphs above based upon differences in fees paid by shareholders investing in the Investor Class shares and Institutional Class shares.
Regional Allocation (as a % of Net Assets)* | ||||||
Asia ex Japan | 71.3% | |||||
Africa/Middle East | 6.8% | |||||
Latin America | 6.0% | |||||
Europe | 4.0% | |||||
North America | 3.4% | |||||
Cash, Cash Equivalents, & Other Net Assets | 8.5% | |||||
Total | 100.0% | |||||
Industry Sector Allocation (as a % of Net Assets)* | ||||||
Financials | 23.5% | |||||
Consumer | 20.4% | |||||
Industrials | 18.2% | |||||
Technology | 15.9% | |||||
Health Care | 8.2% | |||||
Energy & Materials | 4.1% | |||||
Funds | 1.2% | |||||
Cash, Cash Equivalents, & Other Net Assets | 8.5% | |||||
Total | 100.0% | |||||
Top 10 Holdings (as a % of Net Assets)* | ||||||
Man Wah Holdings, Ltd. | 3.0% | |||||
Value Partners Group, Ltd. | 2.2% | |||||
China Medical System Holdings, Ltd. | 1.8% | |||||
Blue Label Telecoms, Ltd. | 1.4% | |||||
Bank of Georgia Holdings PLC | 1.4% | |||||
Credito Real SAB de CV SOFOM ER | 1.3% | |||||
Sporton International, Inc. | 1.2% | |||||
Market Vectors Vietnam ETF | 1.2% | |||||
Silergy Corp. | 1.1% | |||||
Security Bank Corp. | 1.1% | |||||
Total | 15.7% | |||||
| * | Holdings are subject to change, and may not reflect the current or future position of the portfolio. |
6 |
1.855.377.7325 | www.GrandeurPeakGlobal.com |
Table of Contents
| Grandeur Peak Global Micro Cap Fund | Performance Update | |
October 31, 2015 (Unaudited) |
Cumulative Total Return Performance for the periods ended October 31, 2015
| Expense Ratio | ||||||||||
| Since | ||||||||||
| Inception(a) | Gross | Net(b) | ||||||||
Grandeur Peak Global MicroCap – Institutional (GPMCX) | -1.00% | 2.30 | % | 2.00% | ||||||
Russell Global Small Cap Index(c) | -0.16% | |||||||||
| (a) | Fund inception date of October 20, 2015. |
| (b) | Grandeur Peak Global Advisors, LLC (the “Adviser”), has agreed to waive and/or reimburse fees or expenses in order to limit Total Annual Fund Operating Expenses After Fee Waiver/Expense Reimbursement (excluding acquired fund fees and expenses, brokerage expenses, interest expenses, taxes and extraordinary expenses) to 2.00% of the Fund’s average daily net assets for the Institutional Class. This agreement is in effect through August 31, 2016. The Fund may have to repay some of these waivers and reimbursements to the Adviser in the following three years. This agreement may not be terminated or modified prior to this date except with the approval of the Fund’s Board of Trustees. Ratios as of the Prospectus dated June 29, 2015 and may differ from the ratios presented in the Financial Highlights. |
| (c) | The Russell Global Small Cap Index seeks to measure the performance of the small-cap segment of the global equity universe. The Index is not actively managed and does not reflect any deductions for fees, expenses, or taxes. An investor may not invest directly in the Index. |
Returns for periods greater than 1 year are annualized.
The returns shown above do not reflect the deduction of taxes a shareholder would pay on Fund distributions or redemption of Fund shares.
Performance data quoted represents past performance. Past performance does not guarantee future results. Investment return and principal value of an investment will fluctuate so that an investor’s shares, when sold or redeemed, may be worth more or less than the original cost. The Fund imposes a 2.00% redemption fee on shares held for less than 60 days. Current performance data may be higher or lower than actual data quoted. For the most current month-end performance data, please call 1-855-377-PEAK (7325).
Growth of $10,000 for the period ended October 31, 2015
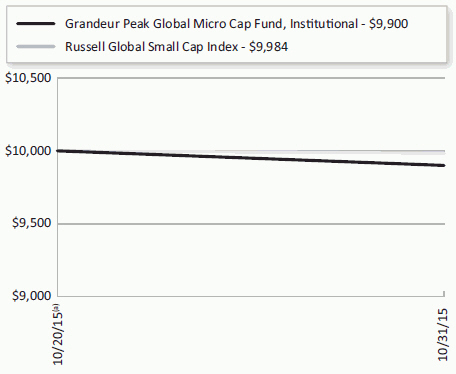
The graphs shown above represent a hypothetical investment of $10,000 in the Fund’s Institutional Class shares for the period from inception to October 31, 2015. All returns reflect reinvested dividends, but do not reflect the deduction of taxes that an investor would pay on distributions or redemptions.
Semi-Annual Report | October 31, 2015 |
7 |
Table of Contents
| Grandeur Peak Global Micro Cap Fund | Performance Update | |
October 31, 2015 (Unaudited) |
Regional Allocation (as a % of Net Assets)* | ||||||
Asia ex Japan | 18.8% | |||||
Europe | 13.2% | |||||
North America | 10.7% | |||||
Japan | 9.3% | |||||
Africa/Middle East | 2.0% | |||||
Australia/New Zealand | 1.5% | |||||
Latin America | 0.7% | |||||
Cash, Cash Equivalents, & Other Net Assets | 43.8% | |||||
Total | 100.0% | |||||
Industry Sector Allocation (as a % of Net Assets)* | ||||||
Consumer | 12.9% | |||||
Technology | 11.8% | |||||
Industrials | 11.0% | |||||
Financials | 9.5% | |||||
Health Care | 8.6% | |||||
Energy & Materials | 2.4% | |||||
Cash, Cash Equivalents, & Other Net Assets | 43.8% | |||||
Total | 100.0% | |||||
Top 10 Holdings (as a % of Net Assets)* | ||||||
Syuppin Co., Ltd. | 1.6% | |||||
Hard Off Corp. Co., Ltd. | 1.5% | |||||
Oxford Immunotec Global PLC | 1.4% | |||||
Ananda Development PCL | 1.3% | |||||
Cipher Pharmaceuticals, Inc. | 1.0% | |||||
Kolte-Patil Developers, Ltd. | 1.0% | |||||
Infotel SA | 0.9% | |||||
GCA Savvian Corp. | 0.9% | |||||
Malibu Boats, Inc., Class A | 0.9% | |||||
SoluCom | 0.8% | |||||
Total | 11.3% | |||||
| * | Holdings are subject to change, and may not reflect the current or future position of the portfolio. |
8 |
1.855.377.7325 | www.GrandeurPeakGlobal.com |
Table of Contents
| Grandeur Peak Global Opportunities Fund | Performance Update | |
October 31, 2015 (Unaudited) |
Cumulative Total Return Performance for the periods ended October 31, 2015
| Expense Ratio | ||||||||||||
| Since | ||||||||||||
| 6 Months | 1 Year | 3 Years | Inception(a) | Gross | Net(b) | |||||||
Grandeur Peak Global Opportunities Fund – Investor (GPGOX) | -6.41% | 1.81% | 14.87% | 16.08% | 1.63% | 1.63% | ||||||
Grandeur Peak Global Opportunities Fund –Institutional (GPGIX) | -6.65% | 1.99% | 15.21% | 16.46% | 1.38% | 1.38% | ||||||
Russell Global Small Cap Index(c) | -6.32% | -0.40% | 9.40% | 10.08% | ||||||||
Russell Global Index(d) | -4.59% | 0.56% | 10.77% | 11.40% | ||||||||
| (a) | Fund inception date of October 17, 2011. |
| (b) | Grandeur Peak Global Advisors, LLC (the “Adviser”), has agreed to waive and/or reimburse fees or expenses in order to limit Total Annual Fund Operating Expenses After Fee Waiver/Expense Reimbursement (excluding acquired fund fees and expenses, brokerage expenses, interest expenses, taxes and extraordinary expenses) to 1.75% of the Fund’s average daily net assets for the Investor Class and 1.50% of the Fund’s average daily net assets for the Institutional Class. This agreement is in effect through August 31, 2016. The Fund may have to repay some of these waivers and reimbursements to the Adviser in the following three years. This agreement may not be terminated or modified prior to this date except with the approval of the Fund’s Board of Trustees. Ratios as of the Prospectus dated August 31, 2015 and may differ from the ratios presented in the Financial Highlights. |
| (c) | The Russell Global Small Cap Index seeks to measure the performance of the small-cap segment of the global equity universe. The Index is not actively managed and does not reflect any deductions for fees, expense, or taxes. An investor may not invest directly in the Index. |
| (d) | The Russell Global Index seeks to measure the performance of the global equity universe. The Index is not actively managed and does not reflect any deductions for fees, expense, or taxes. An investor may not invest directly in the Index. |
Returns for periods greater than 1 year are annualized.
The returns shown above do not reflect the deduction of taxes a shareholder would pay on Fund distributions or redemption of Fund shares.
Performance data quoted represents past performance. Past performance does not guarantee future results. Investment return and principal value of an investment will fluctuate so that an investor’s shares, when sold or redeemed, may be worth more or less than the original cost. The Fund imposes a 2.00% redemption fee on shares held for less than 60 days. Current performance data may be higher or lower than actual data quoted. For the most current month-end performance data, please call 1-855-377-PEAK (7325).
Growth of $10,000 for the period ended October 31, 2015
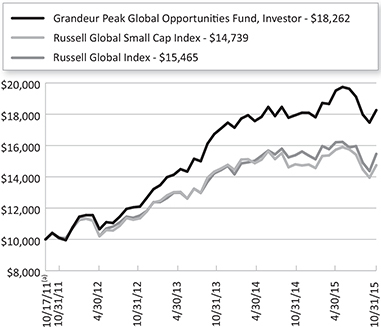
Semi-Annual Report | October 31, 2015 |
9 |
Table of Contents
| Grandeur Peak Global Opportunities Fund | Performance Update | |
October 31, 2015 (Unaudited) |
The graphs shown above represent a hypothetical investment of $10,000 in the Fund’s Investor Class shares for the period from inception to October 31, 2015. All returns reflect reinvested dividends, but do not reflect the deduction of taxes that an investor would pay on distributions or redemptions.
The Fund also offers Institutional Class shares, performance for which is not reflected in the graphs above. The performance of Institutional Class shares may be higher or lower than the performance of the Investor Class shares shown in the graphs above based upon differences in fees paid by shareholders investing in the Investor Class shares and Institutional Class shares.
Regional Allocation (as a % of Net Assets)* | ||||||
North America | 33.2% | |||||
Asia ex Japan | 30.3% | |||||
Europe | 23.3% | |||||
Japan | 6.2% | |||||
Latin America | 3.2% | |||||
Africa/Middle East | 2.3% | |||||
Australia/New Zealand | 1.2% | |||||
Cash, Cash Equivalents, & Other Net Assets | 0.3% | |||||
Total | 100.0% | |||||
Industry Sector Allocation (as a % of Net Assets)* | ||||||
Financials | 24.2% | |||||
Industrials | 22.5% | |||||
Technology | 20.3% | |||||
Consumer | 17.3% | |||||
Health Care | 12.7% | |||||
Energy & Materials | 2.7% | |||||
Cash, Cash Equivalents, & Other Net Assets | 0.3% | |||||
Total | 100.0% | |||||
Top 10 Holdings (as a % of Net Assets)* | ||||||
First Republic Bank | 2.5% | |||||
Man Wah Holdings, Ltd. | 2.4% | |||||
Clinigen Group PLC | 2.1% | |||||
Power Integrations, Inc. | 1.6% | |||||
Knight Transportation, Inc. | 1.5% | |||||
Melexis NV | 1.2% | |||||
RPS Group PLC | 1.2% | |||||
Palfinger AG | 1.2% | |||||
Inphi Corp. | 1.1% | |||||
Value Partners Group, Ltd. | 1.0% | |||||
Total | 15.8% | |||||
| * | Holdings are subject to change, and may not reflect the current or future position of the portfolio. |
10 |
1.855.377.7325 | www.GrandeurPeakGlobal.com |
Table of Contents
| Grandeur Peak Global Reach Fund | Performance Update | |
October 31, 2015 (Unaudited) |
Cumulative Total Return Performance for the periods ended October 31, 2015
| Expense Ratio | ||||||||||
| 6 Months | 1 Year | Since Inception(a) | Gross | Net(b) | ||||||
Grandeur Peak Global Reach Fund – Investor (GPROX) | -8.21% | -0.43% | 10.91% | 1.59% | 1.59% | |||||
Grandeur Peak Global Reach Fund – Institutional (GPRIX) | -8.13% | -0.22% | 11.14% | 1.34% | 1.34% | |||||
Russell Global Small Cap Index(c) | -6.32% | -0.40% | 5.65% | |||||||
Russell Global Index(d) | -4.59% | 0.56% | 7.85% | |||||||
| (a) | Fund inception date of June 19, 2013. |
| (b) | Grandeur Peak Global Advisors, LLC (the “Adviser”), has agreed to waive and/or reimburse fees or expenses in order to limit Total Annual Fund Operating Expenses After Fee Waiver/Expense Reimbursement (excluding acquired fund fees and expenses, brokerage expenses, interest expenses, taxes and extraordinary expenses) to 1.60% of the Fund’s average daily net assets for the Investor Class and 1.35% of the Fund’s average daily net assets for the Institutional Class. This agreement is in effect through August 31, 2016. The Fund may have to repay some of these waivers and reimbursements to the Adviser in the following three years. This agreement may not be terminated or modified prior to this date except with the approval of the Fund’s Board of Trustees. Ratios as of the Prospectus dated August 31, 2015 and may differ from the ratios presented in the Financial Highlights. |
| (c) | The Russell Global Small Cap Index seeks to measure the performance of the small-cap segment of the global equity universe. The Index is not actively managed and does not reflect any deductions for fees, expense, or taxes. An investor may not invest directly in the Index. |
| (d) | The Russell Global Index seeks to measure the performance of the global equity universe. The Index is not actively managed and does not reflect any deductions for fees, expense, or taxes. An investor may not invest directly in the Index. |
Returns for periods greater than 1 year are annualized.
The returns shown above do not reflect the deduction of taxes a shareholder would pay on Fund distributions or redemption of Fund shares.
Performance data quoted represents past performance. Past performance does not guarantee future results. Investment return and principal value of an investment will fluctuate so that an investor’s shares, when sold or redeemed, may be worth more or less than the original cost. The Fund imposes a 2.00% redemption fee on shares held for less than 60 days. Current performance data may be higher or lower than actual data quoted. For the most current month-end performance data, please call 1-855-377-PEAK (7325).
Growth of $10,000 for the period ended October 31, 2015
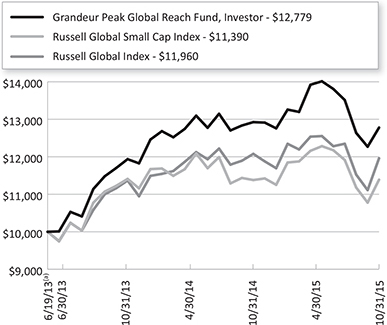
Semi-Annual Report | October 31, 2015 |
11 |
Table of Contents
| Grandeur Peak Global Reach Fund | Performance Update | |
October 31, 2015 (Unaudited) |
The graphs shown above represent a hypothetical investment of $10,000 in the Fund’s Investor Class shares for the period from inception to October 31, 2015. All returns reflect reinvested dividends, but do not reflect the deduction of taxes that an investor would pay on distributions or redemptions.
The Fund also offers Institutional Class shares, performance for which is not reflected in the graphs above. The performance of Institutional Class shares may be higher or lower than the performance of the Investor Class shares shown in the graphs above based upon differences in fees paid by shareholders investing in the Investor Class shares and Institutional Class shares.
Regional Allocation (as a % of Net Assets)* | ||||||
Asia ex Japan | 35.5% | |||||
North America | 27.2% | |||||
Europe | 21.5% | |||||
Japan | 5.9% | |||||
Africa/Middle East | 4.9% | |||||
Latin America | 2.9% | |||||
Australia/New Zealand | 2.2% | |||||
Cash, Cash Equivalents, & Other Net Assets | -0.1% | |||||
Total | 100.0% | |||||
Industry Sector Allocation (as a % of Net Assets)* | ||||||
Consumer | 24.4% | |||||
Financials | 22.4% | |||||
Technology | 19.7% | |||||
Industrials | 19.0% | |||||
Health Care | 11.1% | |||||
Energy & Materials | 3.1% | |||||
Communications | 0.4% | |||||
Cash, Cash Equivalents, & Other Net Assets | -0.1% | |||||
Total | 100.0% | |||||
Top 10 Holdings (as a % of Net Assets)* | ||||||
Man Wah Holdings, Ltd. | 2.2% | |||||
First Republic Bank | 2.0% | |||||
Clinigen Group PLC | 1.2% | |||||
China Medical System Holdings, Ltd. | 1.1% | |||||
WNS Holdings, Ltd., ADR | 1.1% | |||||
Inphi Corp. | 1.0% | |||||
Skandiabanken ASA | 0.9% | |||||
Value Partners Group, Ltd. | 0.9% | |||||
Roadrunner Transportation Systems, Inc. | 0.9% | |||||
Selamat Sempurna Tbk PT | 0.8% | |||||
Total | 12.1% | |||||
| * | Holdings are subject to change, and may not reflect the current or future position of the portfolio. |
12 |
1.855.377.7325 | www.GrandeurPeakGlobal.com |
Table of Contents
| Grandeur Peak Global Stalwarts Fund | Performance Update | |
October 31, 2015 (Unaudited) |
Cumulative Total Return Performance for the periods ended October 31, 2015
| Expense Ratio | ||||||
| Since Inception(a) | Gross | Net(b) | ||||
Grandeur Peak Global Stalwarts – Investor (GGSOX) | 5.10% | 1.60% | 1.35% | |||
Grandeur Peak Global Stalwarts – Institutional (GGSYX) | 5.10% | 1.35% | 1.10% | |||
Russell Global SMID Cap Index(c) | 4.72% | |||||
Russell Global Index(d) | 6.54% | |||||
| (a) | Fund inception date of September 1, 2015. |
| (b) | Grandeur Peak Global Advisors, LLC (the “Adviser”), has agreed to waive and/or reimburse fees or expenses in order to limit Total Annual Fund Operating Expenses After Fee Waiver/Expense Reimbursement (excluding acquired fund fees and expenses, brokerage expenses, interest expenses, taxes and extraordinary expenses) to 1.35% of the Fund’s average daily net assets for the Investor Class and 1.10% of the Fund’s average daily net assets for the Institutional Class. This agreement is in effect through August 31, 2016. The Fund may have to repay some of these waivers and reimbursements to the Adviser in the following three years. This agreement may not be terminated or modified prior to this date except with the approval of the Fund’s Board of Trustees. Ratios as of the Prospectus dated June 29, 2015 and may differ from the ratios presented in the Financial Highlights. |
| (c) | The Russell Global SMid Cap Index is designed to measure the performance of small- and mid-cap (SMid) securities and all capitalization securities respectively of issuers located in countries throughout the world representing developed and emerging markets. The Index is not actively managed and does not reflect any deductions for fees, expenses, or taxes. An investor may not invest directly in the Index. |
| (d) | The Russell Global Index seeks to measure the performance of the global equity universe. The index is not actively managed and does not reflect any deductions for fees, expenses, or taxes. An investor may not invest directly in the Index. |
Returns for periods greater than 1 year are annualized.
The returns shown above do not reflect the deduction of taxes a shareholder would pay on Fund distributions or redemption of Fund shares.
Performance data quoted represents past performance. Past performance does not guarantee future results. Investment return and principal value of an investment will fluctuate so that an investor’s shares, when sold or redeemed, may be worth more or less than the original cost. The Fund imposes a 2.00% redemption fee on shares held for less than 60 days. Current performance data may be higher or lower than actual data quoted. For the most current month-end performance data, please call 1-855-377-PEAK (7325).
Growth of $10,000 for the period ended October 31, 2015
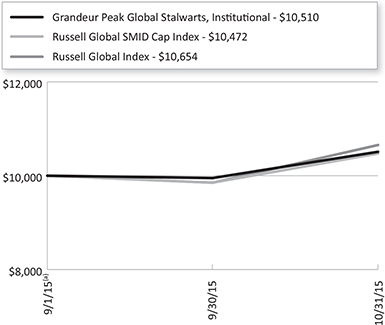
Semi-Annual Report | October 31, 2015 |
13 |
Table of Contents
| Grandeur Peak Global Stalwarts Fund | Performance Update | |
October 31, 2015 (Unaudited) |
The graphs shown above represent a hypothetical investment of $10,000 in the Fund’s Investor Class shares for the period from inception to October 31, 2015. All returns reflect reinvested dividends, but do not reflect the deduction of taxes that an investor would pay on distributions or redemptions.
The Fund also offers Institutional Class shares, performance for which is not reflected in the graphs above. The performance of Institutional Class shares may be higher or lower than the performance of the Investor Class shares shown in the graphs above based upon differences in fees paid by shareholders investing in the Investor Class shares and Institutional Class shares.
Regional Allocation (as a % of Net Assets)* | ||||||
North America | 37.5% | |||||
Asia ex Japan | 22.4% | |||||
Europe | 21.7% | |||||
Japan | 6.7% | |||||
Latin America | 2.9% | |||||
Africa/Middle East | 1.1% | |||||
Australia/New Zealand | 0.7% | |||||
Cash, Cash Equivalents, & Other Net Assets | 7.0% | |||||
Total | 100.0% | |||||
Industry Sector Allocation (as a % of Net Assets)* | ||||||
Financials | 28.0% | |||||
Industrials | 24.7% | |||||
Technology | 18.4% | |||||
Consumer | 12.3% | |||||
Health Care | 7.7% | |||||
Energy & Materials | 1.9% | |||||
Cash, Cash Equivalents, & Other Net Assets | 7.0% | |||||
Total | 100.0% | |||||
Top 10 Holdings (as a % of Net Assets)* | ||||||
MISUMI Group, Inc. | 2.9% | |||||
Knight Transportation, Inc. | 2.6% | |||||
First Republic Bank | 2.4% | |||||
Value Partners Group, Ltd. | 2.4% | |||||
Microchip Technology, Inc. | 2.0% | |||||
Power Integrations, Inc. | 1.8% | |||||
TransForce, Inc. | 1.8% | |||||
Amsurg Corp. | 1.7% | |||||
Diploma PLC | 1.6% | |||||
Man Wah Holdings, Ltd. | 1.5% | |||||
Total | 20.7% | |||||
| * | Holdings are subject to change, and may not reflect the current or future position of the portfolio. |
14 |
1.855.377.7325 | www.GrandeurPeakGlobal.com |
Table of Contents
| Grandeur Peak International Opportunities Fund | Performance Update | |
October 31, 2015 (Unaudited) |
Cumulative Total Return Performance for the periods ended October 31, 2015
| Expense Ratio | ||||||||||||||||||||||||
| 6 Months | 1 Year | 3 Years | Since Inception(a) | Gross | Net(b) | |||||||||||||||||||
Grandeur Peak International Opportunities Fund – | -7.60% | -1.19% | 13.48% | 15.04% | 1.63% | 1.63% | ||||||||||||||||||
Grandeur Peak International Opportunities Fund – | -7.58% | -1.02% | 13.59% | 15.24% | 1.38% | 1.38% | ||||||||||||||||||
Russell Global ex-U.S. Small Cap Index(c) | -7.78% | -0.90% | 6.65% | 7.01% | ||||||||||||||||||||
| (a) | Fund inception date of October 17, 2011. |
| (b) | Grandeur Peak Global Advisors, LLC (the “Adviser”),has agreed to waive and/or reimburse fees or expenses in order to limit Total Annual Fund Operating Expenses After Fee Waiver/Expense Reimbursement (excluding acquired fund fees and expenses, brokerage expenses, interest expenses, taxes and extraordinary expenses) to 1.75% of the Fund’s average daily net assets for the Investor Class and 1.50% of the Fund’s average daily net assets for the Institutional Class. This agreement is in effect through August 31, 2016. The Fund may have to repay some of these waivers and reimbursements to the Adviser in the following three years. This agreement may not be terminated or modified prior to this date except with the approval of the Fund’s Board of Trustees. Ratios as of the Prospectus dated August 31, 2015 and may differ from the ratios presented in the Financial Highlights. |
| (c) | The Russell Global ex-U.S. Small Cap Index seeks to measure the performance of the small-cap segment of the global equity universe, excluding companies assigned to the United States. The Index is not actively managed and does not reflect any deductions for fees, expense, or taxes. An investor may not invest directly in the Index. |
Returns for periods greater than 1 year are annualized.
The returns shown above do not reflect the deduction of taxes a shareholder would pay on Fund distributions or redemption of Fund shares.
Performance data quoted represents past performance. Past performance does not guarantee future results. Investment return and principal value of an investment will fluctuate so that an investor’s shares, when sold or redeemed, may be worth more or less than the original cost. The Fund imposes a 2.00% redemption fee on shares held for less than 60 days. Current performance data may be higher or lower than actual data quoted. For the most current month-end performance data, please call 1-855-377-PEAK (7325).
Growth of $10,000 for the period ended October 31, 2015
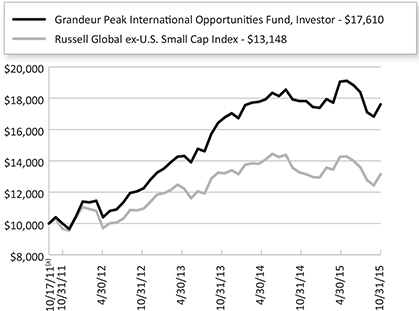
Semi-Annual Report | October 31, 2015 |
15 |
Table of Contents
| Grandeur Peak International Opportunities Fund | Performance Update | |
October 31, 2015 (Unaudited) |
The graphs shown above represent a hypothetical investment of $10,000 in the Fund’s Investor Class shares for the period from inception to October 31, 2015. All returns reflect reinvested dividends, but do not reflect the deduction of taxes that an investor would pay on distributions or redemptions.
The Fund also offers Institutional Class shares, performance for which is not reflected in the graphs above. The performance of Institutional Class shares may be higher or lower than the performance of the Investor Class shares shown in the graphs above based upon differences in fees paid by shareholders investing in the Investor Class shares and Institutional Class shares.
Regional Allocation (as a % of Net Assets)* | ||||||
Asia ex Japan | 38.8% | |||||
Europe | 32.8% | |||||
Japan | 10.0% | |||||
North America | 5.4% | |||||
Latin America | 3.9% | |||||
Africa/Middle East | 3.9% | |||||
Australia/New Zealand | 1.1% | |||||
Cash, Cash Equivalents, & Other Net Assets | 4.1% | |||||
Total | 100.0% | |||||
Industry Sector Allocation (as a % of Net Assets)* | ||||||
Industrials | 23.0% | |||||
Financials | 22.9% | |||||
Consumer | 16.7% | |||||
Technology | 16.2% | |||||
Health Care | 12.7% | |||||
Energy & Materials | 3.8% | |||||
Cash, Cash Equivalents, & Other Net Assets | 4.7% | |||||
Total | 100.0% | |||||
Top 10 Holdings (as a % of Net Assets)* | ||||||
Man Wah Holdings, Ltd. | 2.4% | |||||
Clinigen Group PLC | 2.4% | |||||
Value Partners Group, Ltd. | 1.3% | |||||
EMIS Group PLC | 1.3% | |||||
IG Group Holdings PLC | 1.3% | |||||
China Medical System Holdings, Ltd. | 1.2% | |||||
RPS Group PLC | 1.2% | |||||
Sporton International, Inc. | 1.1% | |||||
Melexis NV | 1.1% | |||||
VZ Holding AG | 1.1% | |||||
Total | 14.4% | |||||
| * | Holdings are subject to change, and may not reflect the current or future position of the portfolio. |
16 |
1.855.377.7325 | www.GrandeurPeakGlobal.com |
Table of Contents
| Grandeur Peak International Stalwarts Fund | Performance Update | |
October 31, 2015 (Unaudited) |
Cumulative Total Return Performance for the periods ended October 31, 2015
| Expense Ratio | ||||||
Since Inception(a) | Gross | Net(b) | ||||
Grandeur Peak International Stalwarts – Investor | 6.60% | 1.53% | 1.35% | |||
Grandeur Peak International Stalwarts – Institutional | 6.60% | 1.28% | 1.10% | |||
Russell Global ex-U.S. SMID Cap Index(c) | 5.10% | |||||
Russell Global ex-U.S. Small Cap Index(d) | 4.75% | |||||
| (a) | Fund inception date of September 1, 2015. |
| (b) | Grandeur Peak Global Advisors, LLC (the “Adviser”), has agreed to waive and/or reimburse fees or expenses in order to limit Total Annual Fund Operating Expenses After Fee Waiver/Expense Reimbursement (excluding acquired fund fees and expenses, brokerage expenses, interest expenses, taxes and extraordinary expenses) to 1.35% of the Fund’s average daily net assets for the Investor Class and 1.10% of the Fund’s average daily net assets for the Institutional Class. This agreement is in effect through August 31, 2016. The Fund may have to repay some of these waivers and reimbursements to the Adviser in the following three years. This agreement may not be terminated or modified prior to this date except with the approval of the Fund’s Board of Trustees. Ratios as of the Prospectus dated June 29, 2015 and may differ from the ratios presented in the Financial Highlights. |
| (c) | The Russell Global ex-US SMID Cap Index is constructed to provide a comprehensive and unbiased barometer for the small- and mid-cap (SMid) segments excluding companies assigned to the United States. The Russell Global ex-US SMid Cap Index is reconstituted annually to accurately reflect the changes in the market over time. The Index is not actively managed and does not reflect any deductions for fees, expenses, or taxes. An investor may not invest directly in the Index. |
| (d) | The Russell Global ex-U.S. Small Cap Index is designed to measure the performance of small capitalization securities outside of the U.S. The Index is not actively managed and does not reflect any deductions for fees, expenses, or taxes. An investor may not invest directly in the Index. |
Returns for periods greater than 1 year are annualized.
The returns shown above do not reflect the deduction of taxes a shareholder would pay on Fund distributions or redemption of Fund shares.
Performance data quoted represents past performance. Past performance does not guarantee future results. Investment return and principal value of an investment will fluctuate so that an investor’s shares, when sold or redeemed, may be worth more or less than the original cost. The Fund imposes a 2.00% redemption fee on shares held for less than 60 days. Current performance data may be higher or lower than actual data quoted. For the most current month-end performance data, please call 1-855-377-PEAK (7325).
Growth of $10,000 for the period ended October 31, 2015
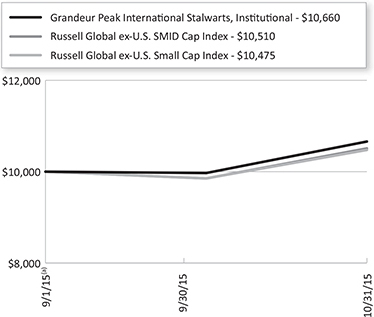
Semi-Annual Report | October 31, 2015 |
17 |
Table of Contents
| Grandeur Peak International Stalwarts Fund | Performance Update | |
October 31, 2015 (Unaudited) |
The graphs shown above represent a hypothetical investment of $10,000 in the Fund’s Investor Class shares for the period from inception to October 31, 2015. All returns reflect reinvested dividends, but do not reflect the deduction of taxes that an investor would pay on distributions or redemptions.
The Fund also offers Institutional Class shares, performance for which is not reflected in the graphs above. The performance of Institutional Class shares may be higher or lower than the performance of the Investor Class shares shown in the graphs above based upon differences in fees paid by shareholders investing in the Investor Class shares and Institutional Class shares.
Regional Allocation (as a % of Net Assets)* | ||||||
Europe | 33.3% | |||||
Asia ex Japan | 31.8% | |||||
North America | 9.6% | |||||
Japan | 9.0% | |||||
Latin America | 4.4% | |||||
Africa/Middle East | 1.5% | |||||
Australia/New Zealand | 1.1% | |||||
Cash, Cash Equivalents, & Other Net Assets | 9.3% | |||||
Total | 100.0% | |||||
Industry Sector Allocation (as a % of Net Assets)* | ||||||
Financials | 29.6% | |||||
Industrials | 22.3% | |||||
Technology | 15.6% | |||||
Consumer | 13.7% | |||||
Health Care | 6.4% | |||||
Energy & Materials | 3.1% | |||||
Cash, Cash Equivalents, & Other Net Assets | 9.3% | |||||
Total | 100.0% | |||||
Top 10 Holdings (as a % of Net Assets)* | ||||||
MISUMI Group, Inc. | 3.4% | |||||
Value Partners Group, Ltd. | 2.4% | |||||
TransForce, Inc. | 2.3% | |||||
CyberAgent, Inc. | 2.3% | |||||
Indutrade AB | 2.2% | |||||
Man Wah Holdings, Ltd. | 2.1% | |||||
Stantec, Inc. | 2.0% | |||||
China Medical System Holdings, Ltd. | 1.9% | |||||
Aalberts Industries NV | 1.8% | |||||
Diploma PLC | 1.8% | |||||
Total | 22.2% | |||||
| * | Holdings are subject to change, and may not reflect the current or future position of the portfolio. |
18 |
1.855.377.7325 | www.GrandeurPeakGlobal.com |
Table of Contents
| Grandeur Peak Funds® | Disclosure of Fund Expenses | |
October 31, 2015 (Unaudited) |
As a shareholder of a Fund, you incur two types of costs: direct costs, such as short-term redemption fees and wire fees, and indirect costs, including management fees, and other fund operating expenses. This example is intended to help you understand your indirect costs, also referred to as “ongoing costs” (in dollars), of investing in the Fund and to compare these costs with the ongoing costs of investing in other mutual funds.
This example is based on an investment of $1,000 invested at the beginning of the period and held for the entire six-month period of May 1, 2015 through of October 31, 2015.
Actual Expenses The first line of the table below provides information about actual account values and actual expenses. You may use the information in this line, together with the amount you invested at the beginning of the period, to estimate the expenses that you paid over the period. Simply divide your account value by $1,000 (for example, an $8,600 account value divided by $1,000 = 8.6), then multiply the result by the number in the first line under the heading “Expenses Paid During Period” to estimate the expenses you paid on your account during this period.
Hypothetical Example for Comparison Purposes The second line of the table provides information about hypothetical account values and hypothetical expenses based on the Fund’s actual expense ratio and an assumed rate of return of 5% per year before expenses, which is not the Fund’s actual return. The hypothetical account values and expenses may not be used to estimate the actual ending account balance or expenses you paid for the period. You may use this information to compare ongoing costs of investing in the Fund and other funds. To do so, compare this 5% hypothetical example with the 5% hypothetical examples that appear in the shareholder reports of other funds.
Please note that the expenses shown in the table are meant to highlight your ongoing costs only and do not reflect any direct costs, such as wire fees or low balance fees. Therefore, the second line of the table is useful in comparing ongoing costs only and will not help you determine the relative total costs of owning different funds. In addition, if these direct costs were included, your costs would be higher.
Beginning Account Value May 1, 2015 | Ending Account Value October 31, 2015 | Expense Ratio(a) | Expenses Paid During period May 1, 2015 - October 31, 2015(b) | |||||||||||||||||
Grandeur Peak Emerging Markets Opportunities Fund | ||||||||||||||||||||
Investor Class | ||||||||||||||||||||
Actual | $ 1,000.00 | $ 884.40 | 1.76% | $ 8.34 | ||||||||||||||||
Hypothetical (5% return before expenses) | $ 1,000.00 | $ 1,016.29 | 1.76% | $ 8.92 | ||||||||||||||||
Institutional Class | ||||||||||||||||||||
Actual | $ 1,000.00 | $ 886.30 | 1.55% | $ 7.35 | ||||||||||||||||
Hypothetical (5% return before expenses) | $ 1,000.00 | $ 1,017.34 | 1.55% | $ 7.86 | ||||||||||||||||
Grandeur Peak Global Micro Cap Fund | ||||||||||||||||||||
Institutional Class(c) | ||||||||||||||||||||
Actual | $ 1,000.00 | $ 990.00 | 2.00% | $ 0.60 | ||||||||||||||||
Hypothetical (5% return before expenses) | $ 1,000.00 | $ 1,015.08 | 2.00% | $ 10.13 | ||||||||||||||||
Grandeur Peak Global Opportunities Fund | ||||||||||||||||||||
Investor Class | ||||||||||||||||||||
Actual | $ 1,000.00 | $ 935.90 | 1.61% | $ 7.83 | ||||||||||||||||
Hypothetical (5% return before expenses) | $ 1,000.00 | $ 1,017.04 | 1.61% | $ 8.16 | ||||||||||||||||
Institutional Class | ||||||||||||||||||||
Actual | $ 1,000.00 | $ 933.50 | 1.38% | $ 6.71 | ||||||||||||||||
Hypothetical (5% return before expenses) | $ 1,000.00 | $ 1,018.20 | 1.38% | $ 7.00 | ||||||||||||||||
Grandeur Peak Global Reach Fund | ||||||||||||||||||||
Investor Class | ||||||||||||||||||||
Actual | $ 1,000.00 | $ 917.90 | 1.60% | $ 7.71 | ||||||||||||||||
Hypothetical (5% return before expenses) | $ 1,000.00 | $ 1,017.09 | 1.60% | $ 8.11 | ||||||||||||||||
Institutional Class | ||||||||||||||||||||
Actual | $ 1,000.00 | $ 918.70 | 1.35% | $ 6.51 | ||||||||||||||||
Hypothetical (5% return before expenses) | $ 1,000.00 | $ 1,018.35 | 1.35% | $ 6.85 | ||||||||||||||||
Grandeur Peak Global Stalwarts Fund | ||||||||||||||||||||
Investor Class(d) | ||||||||||||||||||||
Actual | $ 1,000.00 | $ 1,051.00 | 1.35% | $ 2.27 | ||||||||||||||||
Hypothetical (5% return before expenses) | $ 1,000.00 | $ 1,018.35 | 1.35% | $ 6.85 | ||||||||||||||||
Institutional Class(d) | ||||||||||||||||||||
Actual | $ 1,000.00 | $ 1,051.00 | 1.10% | $ 1.85 | ||||||||||||||||
Hypothetical (5% return before expenses) | $ 1,000.00 | $ 1,019.61 | 1.10% | $ 5.58 | ||||||||||||||||
Semi-Annual Report | October 31, 2015 |
19 |
Table of Contents
| Grandeur Peak Funds® | Disclosure of Fund Expenses | |
October 31, 2015 (Unaudited) |
Grandeur Peak International Opportunities Fund | ||||||||
Investor Class | ||||||||
Actual | $ 1,000.00 | $ 924.00 | 1.62% | $ 7.83 | ||||
Hypothetical (5% return before expenses) | $ 1,000.00 | $ 1,016.99 | 1.62% | $ 8.21 | ||||
Institutional Class | ||||||||
Actual | $ 1,000.00 | $ 924.20 | 1.38% | $ 6.67 | ||||
Hypothetical (5% return before expenses) | $ 1,000.00 | $ 1,018.20 | 1.38% | $ 7.00 | ||||
Grandeur Peak International Stalwarts Fund | ||||||||
Investor Class(d) | ||||||||
Actual | $ 1,000.00 | $ 1,066.00 | 1.35% | $ 2.29 | ||||
Hypothetical (5% return before expenses) | $ 1,000.00 | $ 1,018.35 | 1.35% | $ 6.85 | ||||
Institutional Class(d) | ||||||||
Actual | $ 1,000.00 | $ 1,066.00 | 1.10% | $ 1.86 | ||||
Hypothetical (5% return before expenses) | $ 1,000.00 | $ 1,019.61 | 1.10% | $ 5.58 | ||||
| (a) | The Fund's expense ratios have been annualized based on the Fund's most recent fiscal half-year expenses. |
| (b) | Expenses are equal to the Fund's annualized expense ratio multiplied by the average account value over the period, multiplied by the number of days in the most recent fiscal half-year 184/366 (to reflect the half-year period). |
| (c) | The Grandeur Peak Global Micro Cap Fund's inception date is October 20, 2015. Actual expenses on this Fund are equal to the Fund's annualized expense ratio multiplied by the average account value over the period, multiplied by the number of days since the Fund launched (11), then divided by 365. |
| (d) | The Grandeur Peak Global Stalwarts Fund's and the Grandeur Peak International Stalwarts Fund's inception date is September 1, 2015. Actual expenses on these Funds are equal to the Funds' annualized expense ratio multiplied by the average account value over the period, multiplied by the number of days since the Funds launched (60), then divided by 365. |
20 |
1.855.377.7325 | www.GrandeurPeakGlobal.com |
Table of Contents
| Grandeur Peak Emerging Markets Opportunities Fund | Portfolio of Investments | |
October 31, 2015 (Unaudited) |
| Shares | Value (Note 2) | |||||||
| ||||||||
COMMON STOCKS (89.68%) |
| |||||||
Bangladesh (0.94%) | ||||||||
Islami Bank Bangladesh, Ltd. | 5,158,765 | $ | 1,862,897 | |||||
Olympic Industries, Ltd. | 510,300 | 1,879,483 | ||||||
|
| |||||||
| 3,742,380 | ||||||||
|
| |||||||
Brazil (3.17%) | ||||||||
CETIP SA - Mercados Organizados | 358,774 | 3,172,315 | ||||||
Even Construtora e Incorporadora SA | 640,700 | 664,532 | ||||||
FPC Par Corretora de Seguros SA | 407,400 | 1,139,839 | ||||||
Localiza Rent a Car SA | 141,900 | 956,658 | ||||||
M Dias Branco SA | 122,700 | 2,223,938 �� | ||||||
Mills Estruturas e Servicos de Engenharia SA(a) | 294,300 | 341,877 | ||||||
Odontoprev SA | 750,200 | 1,921,919 | ||||||
Valid Solucoes e Servicos de Seguranca em Meios de Pagamento e Identificacao SA | 193,500 | 2,197,136 | ||||||
|
| |||||||
| 12,618,214 | ||||||||
|
| |||||||
China (14.99%) | ||||||||
51job, Inc., ADR(a) | 57,850 | 1,955,908 | ||||||
AAC Technologies Holdings, Inc. | 292,000 | 1,861,120 | ||||||
Airtac International Group | 230,500 | 1,199,948 | ||||||
BBI Life Sciences Corp.(b) | 7,402,000 | 1,919,596 | ||||||
China Lesso Group Holdings, Ltd. | 5,246,000 | 4,270,929 | ||||||
China Medical System Holdings, Ltd. | 5,173,000 | 7,141,525 | ||||||
China Pioneer Pharma Holdings, Ltd. | 2,208,000 | 965,747 | ||||||
China South City Holdings, Ltd. | 9,345,000 | 2,242,626 | ||||||
Consun Pharmaceutical Group, Ltd. | 1,990,000 | 1,170,800 | ||||||
Dongpeng Holdings Co., Ltd. | 4,444,000 | 1,662,787 | ||||||
Far East Horizon, Ltd. | 2,994,500 | 2,499,731 | ||||||
Goldpac Group, Ltd. | 2,748,000 | 1,428,849 | ||||||
Le Saunda Holdings, Ltd. | 2,341,400 | 625,332 | ||||||
Man Wah Holdings, Ltd. | 10,496,400 | 12,025,912 | ||||||
Mindray Medical International, Ltd., ADR | 53,050 | 1,272,139 | ||||||
Minth Group, Ltd. | 1,238,000 | 2,571,646 | ||||||
Noah Holdings, Ltd., | ||||||||
Sponsored ADR(a) | 105,974 | 2,969,391 | ||||||
| Shares | Value (Note 2) | |||||||
| ||||||||
China (continued) | ||||||||
O2Micro International, Ltd., ADR(a) | 542,425 | $ | 949,244 | |||||
Shandong Weigao Group Medical Polymer Co., Ltd., Class H | 1,846,000 | 1,281,382 | ||||||
Sihuan Pharmaceutical Holdings Group, Ltd.(c) | 2,563,000 | 869,699 | ||||||
Technovator International, Ltd.(a) | 2,317,000 | 1,458,850 | ||||||
Tsui Wah Holdings, Ltd. | 2,899,000 | 654,562 | ||||||
Vitasoy International Holdings, Ltd. | 1,101,900 | 1,836,832 | ||||||
WuXi PharmaTech Cayman, Inc., ADR(a) | 94,308 | 4,215,568 | ||||||
Xiabuxiabu Catering Management China Holdings Co., Ltd.(b)(d) | 1,188,500 | 582,703 | ||||||
|
| |||||||
| 59,632,826 | ||||||||
|
| |||||||
Colombia (2.19%) | ||||||||
Bolsa de Valores de Colombia | 384,090,414 | 2,187,605 | ||||||
Gran Tierra Energy, | 1,214,300 | 2,914,320 | ||||||
Parex Resources, Inc.(a) | 478,431 | 3,592,989 | ||||||
|
| |||||||
| 8,694,914 | ||||||||
|
| |||||||
Georgia (1.37%) | ||||||||
Bank of Georgia | 177,097 | 5,460,261 | ||||||
|
| |||||||
Greece (0.45%) | ||||||||
Sarantis SA | 223,934 | 1,809,931 | ||||||
|
| |||||||
Hong Kong (3.57%) | ||||||||
International Housewares Retail Co., Ltd. | 8,196,000 | 1,713,096 | ||||||
Jiashili Group, Ltd.(b) | 452,000 | 219,859 | ||||||
Samsonite International SA | 388,000 | 1,148,892 | ||||||
Sinosoft Technology Group, Ltd. | 3,852,000 | 2,196,712 | ||||||
Value Partners Group, Ltd. | 8,371,800 | 8,932,829 | ||||||
|
| |||||||
| 14,211,388 | ||||||||
|
| |||||||
India (13.82%) | ||||||||
AIA Engineering, Ltd. | 81,250 | 1,192,608 | ||||||
Ajanta Pharma, Ltd. | 86,230 | 2,044,606 | ||||||
Allcargo Logistics, Ltd. | 256,500 | 1,225,092 | ||||||
Bajaj Finance, Ltd. | 19,600 | 1,566,425 | ||||||
City Union Bank, Ltd. | 1,189,500 | 1,636,484 | ||||||
Credit Analysis & Research, Ltd. | 156,990 | 3,122,502 | ||||||
Cyient, Ltd. | 360,095 | 2,958,956 | ||||||
See Notes to Financial Statements.
Semi-Annual Report | October 31, 2015 |
21 |
Table of Contents
| Grandeur Peak Emerging Markets Opportunities Fund | Portfolio of Investments | |
October 31, 2015 (Unaudited) |
| Shares | Value (Note 2) | |||||||
| ||||||||
India (continued) |
| |||||||
Dewan Housing Finance Corp., Ltd. | 1,202,000 | $ | 4,135,123 | |||||
Eros International Media, Ltd.(a) | 153,000 | 648,222 | ||||||
Glenmark Pharmaceuticals, Ltd. | 74,700 | 1,133,446 | ||||||
Hinduja Global Solutions, Ltd. | 194,500 | 1,401,787 | ||||||
IFGL Refractories, Ltd. | 359,956 | 607,868 | ||||||
Indiabulls Housing Finance, Ltd. | 281,000 | 3,098,547 | ||||||
Infinite Computer Solutions India, Ltd.(a) | 480,000 | 1,397,873 | ||||||
Jammu & Kashmir Bank, Ltd. | 1,731,699 | 2,204,872 | ||||||
Kaveri Seed Co., Ltd. | 107,500 | 831,359 | ||||||
Kolte-Patil Developers, Ltd. | 1,272,739 | 3,392,932 | ||||||
Kovai Medical Center and Hospital | 16,348 | 227,726 | ||||||
KPIT Technologies, Ltd. | 774,780 | 1,622,005 | ||||||
MBL Infrastructures, Ltd. | 683,500 | 2,195,003 | ||||||
MT Educare, Ltd. | 865,731 | 1,818,373 | ||||||
PC Jeweller, Ltd. | 124,500 | 850,418 | ||||||
PI Industries, Ltd. | 94,675 | 968,410 | ||||||
Poly Medicure, Ltd. | 91,722 | 480,823 | ||||||
Somany Ceramics, Ltd. | 80,760 | 401,544 | ||||||
Supreme Industries, Ltd. | 5,000 | 48,210 | ||||||
Time Technoplast, Ltd. | 4,012,600 | 3,441,828 | ||||||
UFO Moviez India, Ltd.(a) | 133,456 | 1,123,077 | ||||||
Vaibhav Global, Ltd. | 275,434 | 2,041,360 | ||||||
Vardhman Textiles, Ltd. | 111,719 | 1,240,629 | ||||||
Vesuvius India, Ltd. | 171,200 | 1,843,652 | ||||||
WNS Holdings, Ltd., ADR(a) | 120,150 | 4,093,510 | ||||||
|
| |||||||
| 54,995,270 | ||||||||
|
| |||||||
Indonesia (4.77%) | ||||||||
Arwana Citramulia Tbk PT | 21,820,200 | 696,652 | ||||||
Astra Graphia Tbk PT | 8,442,500 | 1,045,482 | ||||||
Bank Negara Indonesia Persero Tbk PT | 9,365,000 | 3,253,375 | ||||||
Bank Tabungan Pensiunan Nasional Tbk PT(a) | 4,985,000 | 952,386 | ||||||
Bekasi Fajar Industrial Estate Tbk PT | 56,350,600 | 1,568,554 | ||||||
Express Transindo Utama Tbk PT(a) | 9,051,500 | 151,437 | ||||||
Lippo Cikarang Tbk PT(a) | 2,072,500 | 1,211,324 | ||||||
Panin Sekuritas Tbk PT | 6,082,500 | 1,506,460 | ||||||
Petra Foods, Ltd. | 841,400 | 1,453,486 | ||||||
Selamat Sempurna Tbk PT | 9,608,100 | 3,443,122 | ||||||
Tempo Scan Pacific Tbk PT | 17,950,700 | 2,229,493 | ||||||
| Shares | Value (Note 2) | |||||||
| ||||||||
Indonesia (continued) | ||||||||
Ultrajaya Milk Industry & Trading Co. Tbk PT(a) | 5,042,900 | $ | 1,470,961 | |||||
|
| |||||||
| 18,982,732 | ||||||||
|
| |||||||
Jersey (0.12%) | ||||||||
Integrated Diagnostics Holdings PLC(a)(b)(d) | 84,700 | 466,697 | ||||||
�� |
| |||||||
Luxembourg (0.38%) | ||||||||
Globant SA(a) | 43,462 | 1,502,481 | ||||||
|
| |||||||
Malaysia (3.85%) | ||||||||
7-Eleven Malaysia Holdings Bhd | 4,332,000 | 1,431,899 | ||||||
AEON Credit Service M Bhd | 639,300 | 1,904,804 | ||||||
Berjaya Auto Bhd | 3,821,600 | 1,868,101 | ||||||
Berjaya Food Bhd | 1,679,084 | 977,121 | ||||||
CB Industrial Product Holding Bhd | 3,838,800 | 1,769,279 | ||||||
GHL Systems Bhd(a) | 717,700 | 182,098 | ||||||
Kossan Rubber Industries | 1,026,800 | 1,947,956 | ||||||
My EG Services Bhd | 3,242,800 | 2,234,331 | ||||||
Nirvana Asia, Ltd.(b)(d) | 5,280,000 | 1,573,659 | ||||||
Uzma Bhd | 2,790,300 | 1,428,925 | ||||||
|
| |||||||
| 15,318,173 | ||||||||
|
| |||||||
Mexico (1.72%) | ||||||||
Banregio Grupo Financiero SAB de CV | 324,400 | 1,736,517 | ||||||
Credito Real SAB de CV SOFOM ER | 2,159,751 | 5,099,365 | ||||||
|
| |||||||
| 6,835,882 | ||||||||
|
| |||||||
Oman (0.23%) | ||||||||
Al Anwar Ceramic Tiles Co. | 1,015,026 | 901,659 | ||||||
|
| |||||||
Philippines (5.24%) | ||||||||
Concepcion Industrial Corp. | 3,372,660 | 3,349,609 | ||||||
Metropolitan Bank & Trust Co. | 957,990 | 1,740,219 | ||||||
Pepsi-Cola Products Philippines, Inc. | 42,513,000 | 3,813,639 | ||||||
Puregold Price Club, Inc. | 3,704,100 | 2,848,090 | ||||||
Robinsons Land Corp. | 3,948,600 | 2,580,674 | ||||||
Robinsons Retail Holdings, Inc. | 1,320,000 | 2,168,048 | ||||||
Security Bank Corp. | 1,429,600 | 4,338,876 | ||||||
|
| |||||||
| 20,839,155 | ||||||||
|
| |||||||
Poland (1.40%) | ||||||||
KRUK SA | 57,157 | 2,720,776 | ||||||
Wawel SA | 3,914 | 1,099,953 | ||||||
See Notes to Financial Statements.
22 |
1.855.377.7325 | www.GrandeurPeakGlobal.com |
Table of Contents
| Grandeur Peak Emerging Markets Opportunities Fund | Portfolio of Investments | |
October 31, 2015 (Unaudited) |
| Shares | Value (Note 2) | |||||||
| ||||||||
Poland (continued) | ||||||||
Work Service SA | 432,107 | $ | 1,733,192 | |||||
|
| |||||||
| 5,553,921 | ||||||||
|
| |||||||
Russia (0.29%) | ||||||||
MD Medical Group Investments PLC, GDR(b) | 218,300 | 1,146,075 | ||||||
|
| |||||||
South Africa (6.45%) | ||||||||
ARB Holdings, Ltd. | 1,134,108 | 441,711 | ||||||
Blue Label Telecoms, Ltd. | 6,516,023 | 5,485,344 | ||||||
Cartrack Holdings, Ltd. | 2,627,200 | 2,059,767 | ||||||
Clicks Group, Ltd. | 305,400 | 2,231,082 | ||||||
Comair, Ltd. | 6,720,142 | 1,553,902 | ||||||
EOH Holdings, Ltd. | 188,124 | 2,079,845 | ||||||
Interwaste Holdings, Ltd.(a) | 15,918,682 | 1,380,332 | ||||||
Invicta Holdings, Ltd. | 320,282 | 1,411,750 | ||||||
Italtile, Ltd. | 1,502,579 | 1,335,481 | ||||||
MiX Telematics, Ltd., Sponsored ADR | 218,036 | 1,227,543 | ||||||
OneLogix Group, Ltd. | 2,142,622 | 758,642 | ||||||
Super Group, Ltd.(a) | 771,280 | 1,814,645 | ||||||
Transaction Capital, Ltd. | 5,046,140 | 3,883,329 | ||||||
|
| |||||||
| 25,663,373 | ||||||||
|
| |||||||
South Korea (5.90%) | ||||||||
DGB Financial Group, Inc. | 317,000 | 2,947,415 | ||||||
Hy-Lok Corp. | 142,037 | 3,974,370 | ||||||
Interpark Holdings Corp. | 249,000 | 2,555,414 | ||||||
ISC Co., Ltd. | 129,037 | 2,897,546 | ||||||
Koh Young Technology, Inc. | 25,244 | 736,251 | ||||||
Kolao Holdings | 139,500 | 1,664,138 | ||||||
LF Corp. | 45,760 | 1,270,386 | ||||||
Samchuly Bicycle Co., Ltd. | 60,000 | 981,536 | ||||||
Solueta Co., Ltd.(a) | 144,000 | 943,538 | ||||||
TechWing, Inc. | 88,500 | 770,071 | ||||||
Vitzrocell Co., Ltd. | 286,587 | 3,594,749 | ||||||
Wins Co., Ltd. | 102,412 | 1,149,839 | ||||||
|
| |||||||
| 23,485,253 | ||||||||
|
| |||||||
Spain (0.28%) | ||||||||
Atento SA(a) | 107,200 | 1,104,160 | ||||||
|
| |||||||
Sri Lanka (2.03%) | ||||||||
Hatton National Bank PLC | 986,400 | 1,523,937 | ||||||
Hemas Holdings PLC | 3,337,031 | 1,934,511 | ||||||
The Lanka Hospital Corp. PLC | 1,640,200 | 593,985 | ||||||
Royal Ceramics Lanka PLC | 3,593,775 | 2,852,506 | ||||||
Sampath Bank PLC | 640,486 | 1,166,542 | ||||||
|
| |||||||
| 8,071,481 | ||||||||
|
| |||||||
| Shares | Value (Note 2) | |||||||
| ||||||||
Taiwan (12.06%) | ||||||||
ASPEED Technology, Inc. | 271,929 | $ | 3,019,711 | |||||
Chipbond Technology Corp. | 578,000 | 826,134 | ||||||
Cleanaway Co., Ltd. | 348,000 | 1,715,157 | ||||||
Cub Elecparts, Inc. | 252,002 | 3,174,914 | ||||||
Dr Wu Skincare Co., Ltd. | 178,000 | 1,206,278 | ||||||
DYNACOLOR, Inc. | 783,000 | 1,271,092 | ||||||
Elan Microelectronics Corp. | 1,020,000 | 1,131,116 | ||||||
I Yuan Precision Ind Co., Ltd. | 142,000 | 505,214 | ||||||
Materials Analysis Technology, Inc. | 503,000 | 952,901 | ||||||
Novatek Microelectronics Corp. | 610,000 | 2,085,727 | ||||||
On-Bright Electronics, Inc. | 302,900 | 1,590,847 | ||||||
Pacific Hospital Supply Co., Ltd. | 599,000 | 1,249,166 | ||||||
Polytronics Technology Corp. | 1,340,000 | 2,600,459 | ||||||
Richtek Technology Corp. | 132,486 | 773,364 | ||||||
Silergy Corp. | 430,422 | 4,408,499 | ||||||
Sinmag Equipment Corp. | 891,133 | 3,115,610 | ||||||
Sitronix Technology Corp. | 486,000 | 1,366,821 | ||||||
Solidwizard Technology Co., Ltd. | 588,000 | 1,865,603 | ||||||
Sporton International, Inc. | 818,534 | 4,967,154 | ||||||
Test Research, Inc. | 1,871,000 | 3,290,899 | ||||||
Topoint Technology Co., Ltd. | 1,218,000 | 994,255 | ||||||
TSC Auto ID Technology Co., Ltd. | 202,400 | 1,577,378 | ||||||
UDE Corp. | 1,920,000 | 2,356,862 | ||||||
Voltronic Power Technology Corp. | 150,425 | 1,927,605 | ||||||
|
| |||||||
| 47,972,766 | ||||||||
|
| |||||||
Thailand (1.13%) | ||||||||
Ananda Development PCL | 21,209,000 | 2,480,620 | ||||||
Jubilee Enterprise PCL | 1,255,200 | 719,929 | ||||||
Premier Marketing PCL | 4,566,900 | 1,309,689 | ||||||
|
| |||||||
| 4,510,238 | ||||||||
|
| |||||||
Turkey (1.44%) | ||||||||
Albaraka Turk Katilim | ||||||||
Bankasi AS | 2,072,290 | 988,023 | ||||||
EGE Seramik Sanayi ve Ticaret AS | 1,312,061 | 1,768,677 | ||||||
Is Girisim Sermayesi Yatirim Ortakligi AS | 904,559 | 530,561 | ||||||
Pinar SUT Mamulleri Sanayii AS | 283,846 | 1,854,725 | ||||||
See Notes to Financial Statements.
Semi-Annual Report | October 31, 2015 |
23 |
Table of Contents
| Grandeur Peak Emerging Markets Opportunities Fund | Portfolio of Investments | |
October 31, 2015 (Unaudited) |
| Shares | Value (Note 2) | |||||||
Turkey (continued) | ||||||||
TAV Havalimanlari Holding AS | 77,100 | $ | 605,608 | |||||
|
| |||||||
| 5,747,594 | ||||||||
|
| |||||||
United Arab Emirates (0.17%) | ||||||||
Aramex PJSC | 815,015 | 685,651 | ||||||
|
| |||||||
United States (0.51%) | ||||||||
First Cash Financial Services, Inc.(a) | 53,650 | 2,046,748 | ||||||
|
| |||||||
Vietnam (1.21%) | ||||||||
DHG Pharmaceutical JSC | 45,000 | 143,046 | ||||||
Japan Vietnam Medical Instrument JSC(a) | 923,000 | 223,152 | ||||||
PetroVietnam Drilling and Well Services JSC | 1,092,500 | 1,800,004 | ||||||
Vietnam Dairy Products JSC | 341,779 | 1,805,642 | ||||||
Vietnam Sun Corp. | 596,216 | 846,189 | ||||||
|
| |||||||
| 4,818,033 | ||||||||
|
| |||||||
TOTAL COMMON STOCKS (Cost $373,700,290) |
| 356,817,256 | ||||||
|
| |||||||
PREFERRED STOCKS (0.60%) |
| |||||||
Brazil (0.60%) | ||||||||
Banco ABC Brasil SA | 395,190 | 871,016 | ||||||
Banco Daycoval SA | 662,137 | 1,510,885 | ||||||
|
| |||||||
| 2,381,901 | ||||||||
|
| |||||||
TOTAL PREFERRED STOCKS (Cost $4,284,999) |
| 2,381,901 | ||||||
|
| |||||||
EXCHANGE-TRADED FUNDS (1.19%) |
| |||||||
United States (1.19%) | ||||||||
Market Vectors Vietnam ETF | 278,125 | 4,717,000 | ||||||
TOTAL EXCHANGE-TRADED FUNDS (Cost $5,035,591) |
| 4,717,000 | ||||||
|
| |||||||
TOTAL INVESTMENTS (91.47%) (Cost $383,020,880) |
| $ | 363,916,157 | |||||
Assets In Excess Of Other |
| 33,939,349 | ||||||
|
| |||||||
NET ASSETS (100.00%) | $ | 397,855,506 | ||||||
|
| |||||||
| (a) | Non-Income Producing Security. |
| (b) | Security was purchased pursuant to Regulation S under the Securities Act of 1933, which exempts securities offered and sold outside of the United States from registration. Such security cannot be sold in the United States without either an effective registration statement filed pursuant to the Securities Act of 1933, or pursuant to an exemption from registration. The security has been deemed liquid under guidelines approved by the Fund's Board of Trustees. As of October 31, 2015, the aggregate market value of those securities was $5,908,589, representing 1.49% of net assets. |
| (c) | Fair valued security under the procedures approved by the Fund's Board of Trustees. |
| (d) | Security exempt from registration under Rule 144A of the Securities Act of 1933. These securities may be resold in the ordinary course of business in transactions exempt from registration, normally to qualified institutional buyers. As of October 31, 2015, these securities had a total aggregate market value of $2,623,059, representing 0.66% of net assets. |
Common Abbreviations:
ADR - American Depositary Receipt.
AS - Anonim Sirketi is the Turkish term for joint stock company.
Bhd - Berhad is the Malaysian term for public limited company.
ER - Regulated Entity.
ETF - Exchange Traded Fund.
GDR - Global Depositary Receipt.
JSC - Joint Stock Company.
Ltd. - Limited.
PCL - Public Company Limited.
PJSC - Public Joint Stock Company.
PLC - Public Limited Company.
SA - Generally designates corporations in various countries, mostly those employing the civil law.
SAB de CV - A variable capital company.
SOFOM - Sociedad financiera de objeto multiple is the Spanish term for a multiple purpose financial institution.
Tbk PT - Terbuka Perseroan Terbatas is an Indonesian term for a limited liability company.
Holdings are subject to change, and may not reflect the current or future position of the portfolio.
For Fund compliance purposes, the Fund's geographical classifications refer to any one or more of the country sub-classifications used by one or more widely recognized market indexes or ratings group indexes, and/or as defined by Fund management. This definition may not apply for purposes of this report, which may combine sub-classifications for reporting ease. Geographical regions are shown as a percentage of net assets.
See Notes to Financial Statements.
24 |
1.855.377.7325 | www.GrandeurPeakGlobal.com |
Table of Contents
| Grandeur Peak Global Micro Cap Fund | Portfolio of Investments | |
October 31, 2015 (Unaudited) |
| Shares | Value (Note 2) | |||||||
COMMON STOCKS (56.25%) | ||||||||
Australia (1.52%) | ||||||||
Austbrokers Holdings, Ltd. | 18,200 | $ | 121,867 | |||||
Beacon Lighting Group, Ltd. | 69,600 | 89,337 | ||||||
CTI Logistics, Ltd. | 35,000 | 30,949 | ||||||
LifeHealthcare Group, Ltd. | 18,000 | 39,534 | ||||||
Lycopodium, Ltd. | 59,600 | 52,276 | ||||||
Medical Developments International, Ltd.(a) | 18,000 | 42,358 | ||||||
Reject Shop, Ltd. | 4,408 | 36,149 | ||||||
|
| |||||||
| 412,470 | ||||||||
|
| |||||||
Brazil (0.47%) | ||||||||
FPC Par Corretora de Seguros SA | 45,700 | 127,861 | ||||||
|
| |||||||
Britain (3.15%) | ||||||||
AB Dynamics PLC | 20,800 | 83,851 | ||||||
Bioventix PLC | 5,152 | 87,961 | ||||||
City of London Investment Group PLC | 12,100 | 63,235 | ||||||
dotdigital group PLC | 144,000 | 92,126 | ||||||
IDOX PLC | 92,000 | 60,631 | ||||||
Oxford Immunotec Global PLC(a) | 30,275 | 379,649 | ||||||
Sprue Aegis PLC | 17,600 | 84,788 | ||||||
|
| |||||||
| 852,241 | ||||||||
|
| |||||||
Canada (1.38%) | ||||||||
Biosyent, Inc.(a) | 1,700 | 9,114 | ||||||
Cipher Pharmaceuticals, | 63,200 | 260,997 | ||||||
Delphi Energy Corp.(a) | 76,500 | 42,708 | ||||||
Halogen Software, Inc.(a) | 8,900 | 60,236 | ||||||
|
| |||||||
| 373,055 | ||||||||
|
| |||||||
China (0.99%) | ||||||||
BBI Life Sciences Corp.(b) | 454,500 | 117,868 | ||||||
Le Saunda Holdings, Ltd. | 313,000 | 83,595 | ||||||
O2Micro International, Ltd., ADR(a) | 37,550 | 65,712 | ||||||
|
| |||||||
| 267,175 | ||||||||
|
| |||||||
Colombia (0.19%) | ||||||||
Bolsa de Valores de Colombia | 9,000,000 | 51,260 | ||||||
|
| |||||||
Denmark (0.31%) | ||||||||
GronlandsBANKEN A/S | 952 | 85,342 | ||||||
|
| |||||||
France (4.07%) | ||||||||
1000mercis | 700 | 28,673 | ||||||
ARGAN SA, REIT | 3,800 | 86,164 | ||||||
| Shares | Value (Note 2) | |||||||
France (continued) | ||||||||
Esker SA | 3,800 | $ | 127,199 | |||||
Infotel SA | 7,600 | 256,905 | ||||||
Medicrea International(a) | 13,810 | 111,618 | ||||||
MGI Digital Graphic Technology(a) | 2,700 | 87,053 | ||||||
Neurones | 4,600 | 86,195 | ||||||
SoluCom | 3,600 | 223,669 | ||||||
Thermador Groupe | 1,000 | 93,470 | ||||||
|
| |||||||
| 1,100,946 | ||||||||
|
| |||||||
Germany (0.95%) | ||||||||
First Sensor AG(a) | 7,100 | 88,342 | ||||||
Nexus AG | 4,500 | 80,956 | ||||||
Softing AG | 6,700 | 86,718 | ||||||
|
| |||||||
| 256,016 | ||||||||
|
| |||||||
Greece (0.04%) | ||||||||
Sarantis SA | 1,478 | 11,946 | ||||||
|
| |||||||
Hong Kong (0.63%) | ||||||||
International Housewares Retail Co., Ltd. | 815,000 | 170,348 | ||||||
|
| |||||||
India (4.16%) | ||||||||
IFGL Refractories, Ltd. | 36,000 | 60,794 | ||||||
Igarashi Motors India, Ltd. | 7,500 | 70,575 | ||||||
Kolte-Patil Developers, Ltd. | 96,500 | 257,255 | ||||||
Kovai Medical Center and Hospital | 7,418 | 103,332 | ||||||
MBL Infrastructures, Ltd. | 20,000 | 64,228 | ||||||
MT Educare, Ltd. | 40,000 | 84,016 | ||||||
Poly Medicure, Ltd. | 3,155 | 16,539 | ||||||
Somany Ceramics, Ltd. | 7,533 | 37,455 | ||||||
Tata Investment Corp., Ltd. | 12,200 | 103,246 | ||||||
Time Technoplast, Ltd. | 256,000 | 219,585 | ||||||
UFO Moviez India, Ltd.(a) | 10,500 | 88,361 | ||||||
Vesuvius India, Ltd. | 2,000 | 21,538 | ||||||
|
| |||||||
| 1,126,924 | ||||||||
|
| |||||||
Indonesia (1.98%) | ||||||||
Arwana Citramulia Tbk PT | 1,672,600 | 53,401 | ||||||
Astra Graphia Tbk PT | 1,029,700 | 127,513 | ||||||
Bekasi Fajar Industrial Estate Tbk PT | 2,910,700 | 81,021 | ||||||
BFI Finance Indonesia Tbk PT | 435,000 | 80,326 | ||||||
Lippo Cikarang Tbk PT(a) | 102,300 | 59,792 | ||||||
Panin Sekuritas Tbk PT | 6,000 | 1,486 | ||||||
Selamat Sempurna Tbk PT | 371,100 | 132,986 | ||||||
|
| |||||||
| 536,525 | ||||||||
|
| |||||||
See Notes to Financial Statements.
Semi-Annual Report | October 31, 2015 |
25 |
Table of Contents
| Grandeur Peak Global Micro Cap Fund | Portfolio of Investments | |
October 31, 2015 (Unaudited) |
| Shares | Value (Note 2) | |||||||
Ireland (0.80%) | ||||||||
Irish Residential Properties PLC, REIT | 175,200 | $ | 215,778 | |||||
|
| |||||||
Israel (0.62%) | ||||||||
Hamlet Israel-Canada, Ltd. | 4,500 | 34,891 | ||||||
Silicom, Ltd. | 4,000 | 132,480 | ||||||
|
| |||||||
| 167,371 | ||||||||
|
| |||||||
Japan (9.28%) | ||||||||
AIT Corp. | 18,900 | 177,927 | ||||||
Amiyaki Tei Co., Ltd. | 3,200 | 114,030 | ||||||
Anest Iwata Corp. | 27,300 | 193,885 | ||||||
AP Company Co., Ltd.(a) | 9,500 | 120,689 | ||||||
ARCLAND SERVICE Co., Ltd. | 1,300 | 52,142 | ||||||
Central Automotive Products, Ltd. | 11,000 | 80,128 | ||||||
CMIC Holdings Co., Ltd. | 10,100 | 126,302 | ||||||
Future Architect, Inc. | 21,000 | 115,207 | ||||||
GCA Savvian Corp. | 21,100 | 248,996 | ||||||
Hard Off Corp. Co., Ltd. | 32,000 | 406,795 | ||||||
JCU Corp. | 3,300 | 117,730 | ||||||
Monogatari Corp. | 1,300 | 55,590 | ||||||
Naigai Trans Line, Ltd. | 8,600 | 81,460 | ||||||
Prestige International, Inc. | 18,100 | 177,895 | ||||||
Syuppin Co., Ltd. | 50,900 | 442,059 | ||||||
|
| |||||||
| 2,510,835 | ||||||||
|
| |||||||
Malaysia (0.67%) | ||||||||
AEON Credit Service M Bhd | 11,000 | 32,775 | ||||||
Berjaya Food Bhd | 133,300 | 77,572 | ||||||
Uzma Bhd | 137,000 | 70,158 | ||||||
|
| |||||||
| 180,505 | ||||||||
|
| |||||||
Norway (0.91%) | ||||||||
Medistim ASA | 12,862 | 67,816 | ||||||
Multiconsult ASA(a)(b)(c) | 8,300 | 93,533 | ||||||
Zalaris ASA | 19,500 | 84,915 | ||||||
|
| |||||||
| 246,264 | ||||||||
|
| |||||||
Philippines (0.66%) | ||||||||
Concepcion Industrial Corp. | 97,900 | 97,231 | ||||||
Pepsi-Cola Products Philippines, Inc. | 908,000 | 81,452 | ||||||
|
| |||||||
| 178,683 | ||||||||
|
| |||||||
Singapore (0.89%) | ||||||||
CSE Global, Ltd. | 171,600 | 60,634 | ||||||
Riverstone Holdings, Ltd. | 126,400 | 179,553 | ||||||
|
| |||||||
| 240,187 | ||||||||
|
| |||||||
South Africa (1.38%) | ||||||||
ARB Holdings, Ltd. | 128,000 | 49,853 | ||||||
| Shares | Value (Note 2) | |||||||
South Africa (continued) | ||||||||
Cartrack Holdings, Ltd. | 38,921 | $ | 30,515 | |||||
Interwaste Holdings, Ltd.(a) | 800,000 | 69,369 | ||||||
MiX Telematics, Ltd., Sponsored ADR | 16,175 | 91,065 | ||||||
OneLogix Group, Ltd. | 155,000 | 54,881 | ||||||
Transaction Capital, Ltd. | 100,000 | 76,957 | ||||||
|
| |||||||
| 372,640 | ||||||||
|
| |||||||
South Korea (1.84%) | ||||||||
Hy-Lok Corp. | 6,250 | 174,883 | ||||||
ISC Co., Ltd. | 8,000 | 179,641 | ||||||
Vitzrocell Co., Ltd. | 5,100 | 63,971 | ||||||
Wins Co., Ltd. | 7,100 | 79,716 | ||||||
|
| |||||||
| 498,211 | ||||||||
|
| |||||||
Sri Lanka (0.69%) | ||||||||
Royal Ceramics Lanka PLC | 96,800 | 76,833 | ||||||
Sampath Bank PLC | 60,300 | 109,827 | ||||||
|
| |||||||
| 186,660 | ||||||||
|
| |||||||
Sweden (3.00%) | ||||||||
Bufab Holding AB | 16,100 | 84,612 | ||||||
HIQ International AB | 15,000 | 85,152 | ||||||
Moberg Pharma AB(a) | 26,900 | 166,875 | ||||||
Odd Molly International AB | 16,726 | 84,378 | ||||||
Opus Group AB | 168,000 | 110,118 | ||||||
Tethys Oil AB | 10,900 | 67,299 | ||||||
Vitec Software Group AB, Class B | 6,100 | 214,197 | ||||||
|
| |||||||
| 812,631 | ||||||||
|
| |||||||
Taiwan (3.96%) | ||||||||
ASPEED Technology, Inc. | 16,000 | 177,676 | ||||||
Dr Wu Skincare Co., Ltd. | 12,000 | 81,322 | ||||||
I Yuan Precision Ind Co., Ltd. | 14,000 | 49,810 | ||||||
On-Bright Electronics, Inc. | 33,000 | 173,318 | ||||||
Pacific Hospital Supply Co., Ltd. | 53,000 | 110,527 | ||||||
Sinmag Equipment Corp. | 25,000 | 87,406 | ||||||
Sitronix Technology Corp. | 41,000 | 115,308 | ||||||
TSC Auto ID Technology Co., Ltd. | 11,000 | 85,727 | ||||||
Tung Thih Electronic Co., Ltd. | 8,000 | 65,920 | ||||||
UDE Corp. | 103,000 | 126,436 | ||||||
|
| |||||||
| 1,073,450 | ||||||||
|
| |||||||
Thailand (1.39%) | ||||||||
Ananda Development PCL | 2,971,000 | 347,490 | ||||||
Premier Marketing PCL | 100,000 | 28,678 | ||||||
|
| |||||||
| 376,168 | ||||||||
|
| |||||||
See Notes to Financial Statements.
26 |
1.855.377.7325 | www.GrandeurPeakGlobal.com |
Table of Contents
| Grandeur Peak Global Micro Cap Fund | Portfolio of Investments | |
October 31, 2015 (Unaudited) |
| Shares | Value (Note 2) | |||||||
Turkey (1.01%) | ||||||||
EGE Seramik Sanayi ve Ticaret AS | 140,000 | $ | 188,722 | |||||
Pinar SUT Mamulleri Sanayii AS | 12,800 | 83,639 | ||||||
|
| |||||||
| 272,361 | ||||||||
|
| |||||||
United States (9.31%) | ||||||||
Alliance Fiber Optic Products, Inc. | 6,800 | 92,548 | ||||||
Aratana Therapeutics, Inc.(a) | 9,500 | 66,405 | ||||||
Bank of Marin Bancorp | 2,348 | 124,867 | ||||||
BioDelivery Sciences International, Inc.(a) | 24,325 | 130,868 | ||||||
Chase Corp. | 1,450 | 64,394 | ||||||
CRA International, Inc.(a) | 2,600 | 60,840 | ||||||
Enphase Energy, Inc.(a) | 37,250 | 134,100 | ||||||
Escalade, Inc. | 7,100 | 105,293 | ||||||
FormFactor, Inc.(a) | 11,400 | 93,936 | ||||||
Hennessy Advisors, Inc. | 2,475 | 69,052 | ||||||
Hingham Institution for Savings | 745 | 94,920 | ||||||
LGI Homes, Inc.(a) | 3,100 | 86,893 | ||||||
Malibu Boats, Inc., Class A(a) | 16,650 | 236,597 | ||||||
Manitex International, | 19,200 | 123,072 | ||||||
Mastech Holdings, Inc.(a) | 10,900 | 87,745 | ||||||
MCBC Holdings, Inc.(a) | 9,975 | 131,371 | ||||||
Misonix, Inc.(a) | 12,104 | 134,839 | ||||||
OTC Markets Group, Inc., Class A | 9,400 | 129,626 | ||||||
Reis, Inc. | 3,800 | 92,492 | ||||||
Sportsman's Warehouse Holdings, Inc.(a) | 12,460 | 134,070 | ||||||
STAAR Surgical Co.(a) | 10,200 | 83,130 | ||||||
Transcat, Inc.(a) | 4,165 | 40,067 | ||||||
Veracyte, Inc.(a) | 31,350 | 204,089 | ||||||
|
| |||||||
| 2,521,214 | ||||||||
|
| |||||||
TOTAL COMMON STOCKS (Cost $ 15,401,397) | 15,225,067 | |||||||
|
| |||||||
TOTAL INVESTMENTS (56.25%) (Cost $ 15,401,397) |
| $ | 15,225,067 | |||||
Assets In Excess Of Other |
| 11,843,767 | ||||||
|
| |||||||
NET ASSETS (100.00%) | $ | 27,068,834 | ||||||
|
| |||||||
| (a) | Non-Income Producing Security. |
| (b) | Security was purchased pursuant to Regulation S under the Securities Act of 1933, which exempts securities offered and sold outside of the United States from registration. Such security cannot be sold in the United States without either an effective registration statement filed pursuant to the Securities Act of 1933, or pursuant to an exemption from registration. The security has been deemed liquid under guidelines approved by the Fund's Board of Trustees. As of October 31, 2015, the aggregate market value of those securities was $211,401, representing 0.78% of net assets. |
| (c) | Security exempt from registration under Rule 144A of the Securities Act of 1933. These securities may be resold in the ordinary course of business in transactions exempt from registration, normally to qualified institutional buyers. As of October 31, 2015, these securities had a total aggregate market value of $93,533, representing 0.35% of net assets. |
Common Abbreviations:
AB - Aktiebolag is the Swedish equivalent of the term corporation.
ADR - American Depositary Receipt.
AG - Aktiengesellschaft is a German term that refers to a corporation that is limited by shares, i.e., owned by shareholders.
A/S - Aktieselskab is the Danish term for a stock-based corporation.
AS - Anonim Sirketi is the Turkish term for joint stock company.
ASA - Allmennaksjeselskap is the Norwegian term for a public limited company.
Bhd - Berhad is the Malaysian term for public limited company.
Ltd. - Limited.
PCL - Public Company Limited.
PLC - Public Limited Company.
REIT - Real Estate Investment Trust.
SA - Generally designates corporations in various countries, mostly those employing the civil law.
Tbk PT - Terbuka Perseroan Terbatas is an Indonesian term for a limited liability company.
Holdings are subject to change, and may not reflect the current or future position of the portfolio.
For Fund compliance purposes, the Fund's geographical classifications refer to any one or more of the country sub-classifications used by one or more widely recognized market indexes or ratings group indexes, and/or as defined by Fund management. This definition may not apply for purposes of this report, which may combine sub-classifications for reporting ease. Geographical regions are shown as a percentage of net assets.
See Notes to Financial Statements.
| Semi-Annual Report | October 31, 2015 | 27 |
Table of Contents
| Grandeur Peak Global Opportunities Fund | Portfolio of Investments | |
October 31, 2015 (Unaudited) |
| Shares | Value (Note 2) | |||||||
COMMON STOCKS (99.29%) | ||||||||
Australia (1.19%) | ||||||||
Countplus, Ltd. | 176,797 | $ | 119,770 | |||||
CTI Logistics, Ltd. | 1,454,886 | 1,286,474 | ||||||
Magellan Financial Group, Ltd. | 263,264 | 4,229,637 | ||||||
Reject Shop, Ltd. | 253,278 | 2,077,044 | ||||||
|
| |||||||
| 7,712,925 | ||||||||
|
| |||||||
Austria (1.15%) | ||||||||
Palfinger AG | 265,966 | 7,481,372 | ||||||
|
| |||||||
Belgium (1.21%) | ||||||||
Melexis NV | 160,770 | 7,840,671 | ||||||
|
| |||||||
Brazil (1.54%) | ||||||||
CETIP SA - Mercados Organizados | 488,971 | 4,323,531 | ||||||
FPC Par Corretora de Seguros SA | 440,200 | 1,231,608 | ||||||
M Dias Branco SA | 62,700 | 1,136,438 | ||||||
Odontoprev SA | 295,600 | 757,290 | ||||||
Tegma Gestao Logistica | 385,700 | 360,042 | ||||||
Valid Solucoes e Servicos de Seguranca em Meios de Pagamento e Identificacao SA | 196,100 | 2,226,658 | ||||||
|
| |||||||
| 10,035,567 | ||||||||
|
| |||||||
Britain (7.01%) | ||||||||
Abcam PLC | 339,553 | 3,145,967 | ||||||
Bovis Homes Group PLC | 79,186 | 1,251,251 | ||||||
Cambian Group PLC | 571,706 | 1,427,776 | ||||||
Clinigen Group PLC | 1,397,376 | 13,603,755 | ||||||
Diploma PLC | 169,900 | 1,680,205 | ||||||
EMIS Group PLC | 378,117 | 6,254,579 | ||||||
IG Group Holdings PLC | 394,048 | 4,589,399 | ||||||
On the Beach Group | 339,900 | 1,097,760 | ||||||
Oxford Immunotec Global PLC(a) | 160,580 | 2,013,673 | ||||||
RPS Group PLC | 2,071,939 | 7,506,146 | ||||||
Ultra Electronics Holdings PLC | 116,650 | 3,026,502 | ||||||
|
| |||||||
| 45,597,013 | ||||||||
|
| |||||||
Canada (2.29%) | ||||||||
Biosyent, Inc.(a) | 138,800 | 744,102 | ||||||
Cipher Pharmaceuticals, | 646,000 | 2,667,788 | ||||||
Halogen Software, Inc.(a) | 74,900 | 506,932 | ||||||
Home Capital Group, Inc. | 196,528 | 4,786,951 | ||||||
Richelieu Hardware, Ltd. | 73,555 | 3,866,194 | ||||||
| Shares | Value (Note 2) | |||||||
Canada (continued) | ||||||||
Stantec, Inc. | 93,228 | $ | 2,339,969 | |||||
|
| |||||||
| 14,911,936 | ||||||||
|
| |||||||
Chile (0.20%) | ||||||||
Banco de Chile | 12,411,000 | 1,313,335 | ||||||
|
| |||||||
China (7.14%) | ||||||||
BBI Life Sciences Corp.(c) | 8,235,500 | 2,135,751 | ||||||
China Lesso Group Holdings, Ltd. | 1,711,000 | 1,392,977 | ||||||
China Medical System Holdings, Ltd. | 4,594,000 | 6,342,193 | ||||||
Consun Pharmaceutical Group, Ltd. | 1,448,000 | 851,919 | ||||||
Dongpeng Holdings Co., Ltd. | 5,533,000 | 2,070,253 | ||||||
Far East Horizon, Ltd. | 2,863,000 | 2,389,958 | ||||||
Goldpac Group, Ltd. | 993,000 | 516,320 | ||||||
Le Saunda Holdings, Ltd. | 3,978,920 | 1,062,674 | ||||||
Man Wah Holdings, Ltd. | 13,380,800 | 15,330,620 | ||||||
Mindray Medical International, Ltd., ADR | 40,100 | �� | 961,598 | |||||
Noah Holdings, Ltd., Sponsored ADR(a) | 66,350 | 1,859,127 | ||||||
O2Micro International, Ltd., ADR(a) | 905,240 | 1,584,170 | ||||||
Sihuan Pharmaceutical Holdings Group, Ltd.(d) | 4,043,000 | 1,371,905 | ||||||
Tao Heung Holdings, Ltd. | 1,861,300 | 588,365 | ||||||
Tsui Wah Holdings, Ltd. | 5,823,400 | 1,314,860 | ||||||
Vitasoy International Holdings, Ltd. | 1,135,483 | 1,892,814 | ||||||
WuXi PharmaTech Cayman, Inc., ADR(a) | 81,575 | 3,646,403 | ||||||
Xiabuxiabu Catering Management China Holdings Co., Ltd.(b)(c) | 2,313,000 | 1,134,028 | ||||||
|
| |||||||
| 46,445,935 | ||||||||
|
| |||||||
Colombia (1.11%) | ||||||||
Gran Tierra Energy, Inc.(a) | 1,420,000 | 3,408,000 | ||||||
Parex Resources, Inc.(a) | 507,300 | 3,809,794 | ||||||
|
| |||||||
| 7,217,794 | ||||||||
|
| |||||||
Denmark (0.09%) | ||||||||
Topdanmark A/S(a) | 22,752 | 605,839 | ||||||
|
| |||||||
France (1.85%) | ||||||||
Alten SA | 17,853 | 926,633 | ||||||
ARGAN SA, REIT | 8,988 | 203,801 | ||||||
Esker SA | 30,047 | 1,005,774 | ||||||
Infotel SA | 34,520 | 1,166,888 | ||||||
See Notes to Financial Statements.
28 |
1.855.377.7325 | www.GrandeurPeakGlobal.com |
Table of Contents
| Grandeur Peak Global Opportunities Fund | Portfolio of Investments | |
October 31, 2015 (Unaudited) |
| Shares | Value (Note 2) | |||||||
France (continued) | ||||||||
Medicrea International(a) | 167,370 | $ | 1,352,756 | |||||
MGI Digital Graphic Technology(a) | 44,650 | 1,439,594 | ||||||
Neurones | 45,508 | 852,731 | ||||||
Prodware | 169,935 | 1,244,548 | ||||||
SoluCom | 40,021 | 2,486,514 | ||||||
Thermador Groupe | 14,678 | 1,371,957 | ||||||
|
| |||||||
| 12,051,196 | ||||||||
|
| |||||||
Georgia (0.82%) | ||||||||
Bank of Georgia Holdings PLC | 172,400 | 5,315,443 | ||||||
|
| |||||||
Germany (2.91%) | ||||||||
Bertrandt AG | 37,219 | 4,367,005 | ||||||
Nexus AG | 130,892 | 2,354,784 | ||||||
Norma Group SE | 43,068 | 2,210,042 | ||||||
PATRIZIA Immobilien AG(a) | 159,722 | 4,393,593 | ||||||
Softing AG | 75,599 | 978,469 | ||||||
Wirecard AG | 88,785 | 4,589,214 | ||||||
|
| |||||||
| 18,893,107 | ||||||||
|
| |||||||
Hong Kong (1.75%) | ||||||||
International Housewares Retail Co., Ltd. | 10,697,000 | 2,235,845 | ||||||
Samsonite International SA | 578,000 | 1,711,494 | ||||||
Sinosoft Technology Group, Ltd. | 1,110,000 | 633,009 | ||||||
Value Partners Group, Ltd. | 6,368,000 | 6,794,746 | ||||||
|
| |||||||
| 11,375,094 | ||||||||
|
| |||||||
India (7.72%) | ||||||||
AIA Engineering, Ltd. | 38,400 | 563,645 | ||||||
Ajanta Pharma, Ltd. | 168,167 | 3,987,420 | ||||||
Bajaj Finance, Ltd. | 34,475 | 2,755,230 | ||||||
City Union Bank, Ltd. | 1,356,267 | 1,865,918 | ||||||
Credit Analysis & Research, Ltd. | 137,200 | 2,728,883 | ||||||
Cyient, Ltd. | 359,116 | 2,950,912 | ||||||
Dewan Housing Finance Corp., Ltd. | 660,000 | 2,270,533 | ||||||
Eros International Media, Ltd.(a) | 97,000 | 410,964 | ||||||
Hinduja Global Solutions, Ltd. | 297,900 | 2,147,005 | ||||||
Indiabulls Housing Finance, Ltd. | 292,000 | 3,219,842 | ||||||
Jammu & Kashmir Bank, Ltd. | 1,140,500 | 1,452,133 | ||||||
Kolte-Patil Developers, Ltd. | 710,097 | 1,893,012 | ||||||
KPIT Technologies, Ltd. | 781,850 | 1,636,806 | ||||||
MBL Infrastructures, Ltd. | 430,000 | 1,380,909 | ||||||
| Shares | Value (Note 2) | |||||||
India (continued) | ||||||||
MT Educare, Ltd. | 587,689 | $ | 1,234,376 | |||||
PC Jeweller, Ltd. | 233,421 | 1,594,421 | ||||||
Persistent Systems, Ltd. | 118,200 | 1,167,258 | ||||||
Poly Medicure, Ltd. | 37,068 | 194,317 | ||||||
Supreme Industries, Ltd. | 177,644 | 1,712,826 | ||||||
Tata Investment Corp., Ltd. | 191,137 | 1,617,549 | ||||||
Time Technoplast, Ltd. | 1,804,205 | 1,547,566 | ||||||
UFO Moviez India, | 151,057 | 1,271,195 | ||||||
Vaibhav Global, Ltd. | 204,557 | 1,516,060 | ||||||
Vesuvius India, Ltd. | 53,365 | 574,688 | ||||||
WNS Holdings, Ltd., ADR(a) | 181,975 | 6,199,888 | ||||||
Yes Bank, Ltd. | 202,000 | 2,345,203 | ||||||
|
| |||||||
| 50,238,559 | ||||||||
|
| |||||||
Indonesia (2.96%) | ||||||||
Arwana Citramulia Tbk PT | 48,263,300 | 1,540,899 | ||||||
Astra Graphia Tbk PT | 9,349,400 | 1,157,789 | ||||||
Bank Negara Indonesia Persero Tbk PT | 7,019,500 | 2,438,555 | ||||||
Bank Rakyat Indonesia Persero Tbk PT | 2,251,000 | 1,730,906 | ||||||
Bank Tabungan Pensiunan Nasional Tbk PT(a) | 2,139,100 | 408,676 | ||||||
Panin Sekuritas Tbk PT | 4,960,800 | 1,228,647 | ||||||
Petra Foods, Ltd. | 1,572,400 | 2,716,260 | ||||||
Selamat Sempurna Tbk PT | 14,442,000 | 5,175,380 | ||||||
Tempo Scan Pacific Tbk PT | 15,553,000 | 1,931,697 | ||||||
Ultrajaya Milk Industry & Trading Co. Tbk | 3,254,500 | 949,303 | ||||||
|
| |||||||
| 19,278,112 | ||||||||
|
| |||||||
Ireland (0.72%) | ||||||||
Beazley PLC | 436,900 | �� | 2,448,940 | |||||
Irish Residential Properties PLC, REIT | 1,797,346 | 2,213,626 | ||||||
|
| |||||||
| 4,662,566 | ||||||||
|
| |||||||
Israel (0.09%) | ||||||||
Hamlet Israel-Canada, Ltd. | 75,283 | 583,717 | ||||||
|
| |||||||
Italy (0.56%) | ||||||||
Brembo SpA | 81,802 | 3,606,240 | ||||||
|
| |||||||
Japan (6.16%) | ||||||||
AIT Corp. | 341,700 | 3,216,799 | ||||||
Amiyaki Tei Co., Ltd. | 26,800 | 955,001 | ||||||
Anest Iwata Corp. | 225,900 | 1,604,345 | ||||||
AP Company Co., Ltd.(a) | 83,400 | 1,059,519 | ||||||
ARCLAND SERVICE Co., Ltd. | 30,800 | 1,235,369 | ||||||
Benefit One, Inc. | 44,200 | 780,194 | ||||||
CMIC Holdings Co., Ltd. | 132,620 | 1,658,437 | ||||||
Descente, Ltd. | 146,900 | 1,895,445 | ||||||
See Notes to Financial Statements.
Semi-Annual Report | October 31, 2015 |
29 |
Table of Contents
| Grandeur Peak Global Opportunities Fund | Portfolio of Investments | |
October 31, 2015 (Unaudited) |
| Shares | Value (Note 2) | |||||||
Japan (continued) | ||||||||
Future Architect, Inc. | 297,100 | $ | 1,629,901 | |||||
GCA Savvian Corp. | 299,900 | 3,539,054 | ||||||
Hard Off Corp. Co., Ltd. | 177,100 | 2,251,358 | ||||||
JCU Corp. | 53,200 | 1,897,953 | ||||||
MISUMI Group, Inc. | 155,000 | 2,041,062 | ||||||
Monogatari Corp. | 53,300 | 2,279,175 | ||||||
Naigai Trans Line, Ltd. | 44,300 | 419,615 | ||||||
Prestige International, Inc. | 262,900 | 2,583,901 | ||||||
SK Kaken Co., Ltd. | 25,000 | 2,444,684 | ||||||
Syuppin Co., Ltd. | 222,100 | 1,928,904 | ||||||
Trancom Co., Ltd. | 137,370 | 6,648,221 | ||||||
|
| |||||||
| 40,068,937 | ||||||||
|
| |||||||
Jersey (0.11%) | ||||||||
Integrated Diagnostics Holdings PLC(a)(b)(c) | 131,600 | 725,116 | ||||||
|
| |||||||
Luxembourg (0.77%) | ||||||||
Grand City Properties SA | 65,900 | 1,316,000 | ||||||
L'Occitane International SA | 1,843,753 | 3,720,524 | ||||||
|
| |||||||
| 5,036,524 | ||||||||
|
| |||||||
Malaysia (1.22%) | ||||||||
AEON Credit Service M Bhd | 571,480 | 1,702,734 | ||||||
Berjaya Auto Bhd | 5,111,400 | 2,498,589 | ||||||
Berjaya Food Bhd | 640,500 | 372,730 | ||||||
Kossan Rubber Industries | 940,000 | 1,783,287 | ||||||
My EG Services Bhd | 2,328,200 | 1,604,160 | ||||||
|
| |||||||
| 7,961,500 | ||||||||
|
| |||||||
Mexico (0.84%) | ||||||||
Banregio Grupo Financiero SAB de CV | 383,034 | 2,050,386 | ||||||
Credito Real SAB de CV SOFOM ER | 1,451,843 | 3,427,931 | ||||||
|
| |||||||
| 5,478,317 | ||||||||
|
| |||||||
Netherlands (0.69%) | ||||||||
Aalberts Industries NV | 97,522 | 3,170,553 | ||||||
Arcadis NV | 51,721 | 1,305,282 | ||||||
|
| |||||||
| 4,475,835 | ||||||||
|
| |||||||
Norway (1.07%) | ||||||||
Medistim ASA | 152,700 | 805,127 | ||||||
Skandiabanken | 761,300 | 4,121,552 | ||||||
SpareBank 1 SMN | 216,900 | 1,359,335 | ||||||
Zalaris ASA | 158,444 | 689,961 | ||||||
|
| |||||||
| 6,975,975 | ||||||||
|
| |||||||
Philippines (1.07%) | ||||||||
Pepsi-Cola Products Philippines, Inc. | 29,394,900 | 2,636,877 | ||||||
| Shares | Value (Note 2) | |||||||
Philippines (continued) | ||||||||
Security Bank Corp. | 1,419,640 | $ | 4,308,647 | |||||
|
| |||||||
| 6,945,524 | ||||||||
|
| |||||||
Poland (0.17%) | ||||||||
Wawel SA | 3,856 | 1,083,653 | ||||||
|
| |||||||
Singapore (0.65%) | ||||||||
CSE Global, Ltd. | 4,531,250 | 1,601,091 | ||||||
Riverstone Holdings, Ltd. | 1,864,600 | 2,648,693 | ||||||
|
| |||||||
| 4,249,784 | ||||||||
|
| |||||||
South Africa (2.06%) | ||||||||
Blue Label Telecoms, Ltd. | 1,012,400 | 852,262 | ||||||
Cartrack Holdings, Ltd. | 4,257,400 | 3,337,871 | ||||||
Clicks Group, Ltd. | 347,649 | 2,539,729 | ||||||
EOH Holdings, Ltd. | 167,000 | 1,846,304 | ||||||
Italtile, Ltd. | 1,177,166 | 1,046,256 | ||||||
MiX Telematics, Ltd., Sponsored ADR | 127,000 | 715,010 | ||||||
Super Group, Ltd.(a) | 1,309,307 | 3,080,500 | ||||||
|
| |||||||
| 13,417,932 | ||||||||
|
| |||||||
South Korea (1.91%) | ||||||||
Hy-Lok Corp. | 228,907 | 6,405,099 | ||||||
ISC Co., Ltd. | 157,814 | 3,543,738 | ||||||
Koh Young Technology, Inc. | 47,281 | 1,378,969 | ||||||
KONA I Co., Ltd. | 34,980 | 1,124,527 | ||||||
|
| |||||||
| 12,452,333 | ||||||||
|
| |||||||
Sweden (2.81%) | ||||||||
AddTech AB, Class B | 208,827 | 2,969,782 | ||||||
Beijer Alma AB | 95,000 | 2,201,661 | ||||||
Bufab Holding AB | 448,300 | 2,356,008 | ||||||
HIQ International AB | 107,868 | 612,345 | ||||||
Indutrade AB | 75,000 | 3,581,649 | ||||||
Moberg Pharma AB(a) | 245,880 | 1,525,319 | ||||||
Nibe Industrier AB, Class B | 95,100 | 3,062,194 | ||||||
Opus Group AB | 1,671,640 | 1,095,702 | ||||||
Sweco AB, Class B | 58,800 | 860,298 | ||||||
|
| |||||||
| 18,264,958 | ||||||||
|
| |||||||
Switzerland (1.31%) | ||||||||
Luxoft Holding, Inc.(a) | 29,425 | 1,960,882 | ||||||
VZ Holding AG | 20,975 | 6,535,788 | ||||||
|
| |||||||
| 8,496,670 | ||||||||
|
| |||||||
Taiwan (5.00%) | ||||||||
ASPEED Technology, Inc. | 261,237 | 2,900,979 | ||||||
Cub Elecparts, Inc. | 315,948 | 3,980,555 | ||||||
Novatek Microelectronics Corp. | 602,000 | 2,058,373 | ||||||
On-Bright Electronics, Inc. | 464,900 | 2,441,679 | ||||||
See Notes to Financial Statements.
30 |
1.855.377.7325 | www.GrandeurPeakGlobal.com |
Table of Contents
| Grandeur Peak Global Opportunities Fund | Portfolio of Investments | |
October 31, 2015 (Unaudited) |
| Shares | Value (Note 2) | |||||||
Taiwan (continued) | ||||||||
Polytronics Technology Corp. | 1,898,200 | $ | 3,683,725 | |||||
Silergy Corp. | 424,852 | 4,351,450 | ||||||
Sinmag Equipment Corp. | 240,842 | 842,040 | ||||||
Sporton International, Inc. | 813,803 | 4,938,444 | ||||||
Test Research, Inc. | 746,708 | 1,313,384 | ||||||
TSC Auto ID Technology Co., Ltd. | 145,200 | 1,131,597 | ||||||
UDE Corp. | 1,619,000 | 1,987,375 | ||||||
Voltronic Power Technology Corp. | 224,210 | 2,873,115 | ||||||
|
| |||||||
| 32,502,716 | ||||||||
|
| |||||||
Thailand (0.58%) | ||||||||
Ananda Development PCL | 13,412,000 | 1,568,677 | ||||||
Premier Marketing PCL | 7,758,000 | 2,224,829 | ||||||
|
| |||||||
| 3,793,506 | ||||||||
|
| |||||||
Turkey (0.20%) | ||||||||
EGE Seramik Sanayi ve Ticaret AS | 952,000 | 1,283,309 | ||||||
|
| |||||||
United Arab Emirates (0.13%) |
| |||||||
Aramex PJSC(a) | 988,170 | 831,322 | ||||||
|
| |||||||
United States (30.07%) | ||||||||
Abaxis, Inc. | 22,805 | 1,145,039 | ||||||
Alamo Group, Inc. | 27,000 | 1,266,840 | ||||||
Amsurg Corp.(a) | 51,730 | 3,625,756 | ||||||
Aratana Therapeutics, Inc.(a) | 56,125 | 392,314 | ||||||
BioDelivery Sciences International, Inc.(a) | 415,675 | | 2,236,331 | | ||||
Cardiovascular Systems, Inc.(a) | 97,375 | 1,334,037 | ||||||
Cempra, Inc.(a) | 72,875 | 1,617,825 | ||||||
CRA International, | 79,694 | 1,864,840 | ||||||
Diamond Hill Investment Group, Inc. | 32,250 | 6,451,612 | ||||||
DXP Enterprises, Inc.(a) | 32,075 | 970,589 | ||||||
Enphase Energy, Inc.(a) | 351,200 | 1,264,320 | ||||||
EPAM Systems, Inc.(a) | 67,625 | 5,230,794 | ||||||
Escalade, Inc. | 79,764 | 1,182,900 | ||||||
ExlService Holdings, Inc.(a) | 63,100 | 2,792,806 | ||||||
Fastenal Co. | 44,225 | 1,731,851 | ||||||
First Cash Financial Services, Inc.(a) | 69,650 | | 2,657,147 | | ||||
First Republic Bank | 250,000 | 16,327,500 | ||||||
FormFactor, Inc.(a) | 209,475 | 1,726,074 | ||||||
Fresh Market, Inc.(a) | 187,800 | 4,679,976 | ||||||
Genpact, Ltd.(a) | 106,300 | 2,634,114 | ||||||
Gentex Corp. | 126,825 | 2,078,662 | ||||||
| Shares | Value (Note 2) | |||||||
United States (continued) | ||||||||
Grand Canyon Education, Inc.(a) | 52,750 | $ | 2,192,290 | |||||
Hennessy Advisors, Inc. | 49,599 | 1,383,812 | ||||||
Hibbett Sports, Inc.(a) | 56,450 | 1,928,332 | ||||||
Home BancShares, Inc. | 101,050 | 4,337,066 | ||||||
Horizon Global Corp.(a) | 71,755 | 630,726 | ||||||
Inphi Corp.(a) | 238,375 | 7,096,424 | ||||||
IPC Healthcare, Inc.(a) | 10,525 | 826,213 | ||||||
Jones Energy, Inc., Class A(a) | 80,340 | 412,948 | ||||||
K2M Group Holdings, | 97,600 | 1,781,200 | ||||||
Knight Transportation, | 378,720 | 9,627,062 | ||||||
LGI Homes, Inc.(a) | 100,426 | 2,814,941 | ||||||
Littelfuse, Inc. | 15,075 | 1,506,445 | ||||||
Malibu Boats, Inc., Class A(a) | 197,250 | 2,802,923 | ||||||
Manitex International, | 221,355 | 1,418,886 | ||||||
MarketAxess Holdings, | 53,475 | 5,417,552 | ||||||
MaxLinear, Inc., | 144,400 | 1,877,200 | ||||||
MEDNAX, Inc.(a) | 48,850 | 3,442,460 | ||||||
Microchip Technology, Inc. | 60,520 | 2,922,511 | ||||||
MSC Industrial Direct Co., Inc., Class A | 26,425 | 1,658,697 | ||||||
Navigant Consulting, Inc.(a) | 114,160 | 1,963,552 | ||||||
NorthStar Asset Management Group, Inc. | 178,925 | 2,617,673 | ||||||
NorthStar Realty Finance Corp., REIT | 355,300 | 4,267,153 | ||||||
Perficient, Inc.(a) | 100,700 | 1,683,704 | ||||||
Power Integrations, Inc. | 205,900 | 10,420,599 | ||||||
PRA Group, Inc.(a) | 59,025 | 3,234,570 | ||||||
Resources Connection, Inc. | 293,415 | 5,266,799 | ||||||
Roadrunner Transportation Systems, Inc.(a) | 604,900 | 6,436,136 | ||||||
Signature Bank(a) | 23,350 | 3,477,282 | ||||||
Silicon Laboratories, | 97,640 | 4,879,071 | ||||||
Spirit Airlines, Inc.(a) | 50,450 | 1,872,704 | ||||||
Sportsman's Warehouse Holdings, Inc.(a) | 310,250 | 3,338,290 | ||||||
Sprouts Farmers Market, Inc.(a) | 28,475 | 580,321 | ||||||
STAAR Surgical Co.(a) | 454,575 | 3,704,786 | ||||||
SVB Financial Group(a) | 16,600 | 2,026,362 | ||||||
Synaptics, Inc.(a) | 24,325 | 2,069,814 | ||||||
Syntel, Inc.(a) | 82,000 | 3,857,280 | ||||||
Transcat, Inc.(a) | 14,102 | 135,661 | ||||||
TriMas Corp.(a) | 119,700 | 2,395,197 | ||||||
Tumi Holdings, Inc.(a) | 85,800 | 1,375,374 | ||||||
Universal Truckload Services, Inc. | 297,332 | 4,751,365 | ||||||
Veracyte, Inc.(a) | 198,373 | 1,291,408 | ||||||
Virtusa Corp.(a) | 71,750 | 4,120,603 | ||||||
See Notes to Financial Statements.
Semi-Annual Report | October 31, 2015 |
31 |
Table of Contents
| Grandeur Peak Global Opportunities Fund | Portfolio of Investments | |
October 31, 2015 (Unaudited) |
| Shares | Value (Note 2) | |||||||
United States (continued) | ||||||||
Vitamin Shoppe, Inc.(a) | 88,900 | $ | 2,550,541 | |||||
|
| |||||||
| 195,605,260 | ||||||||
|
| |||||||
Vietnam (0.16%) | ||||||||
DHG Pharmaceutical JSC | 72,440 | 230,272 | ||||||
Vietnam Dairy Products JSC | 152,000 | 803,027 | ||||||
|
| |||||||
| 1,033,299 | ||||||||
|
| |||||||
TOTAL COMMON STOCKS (Cost $577,337,889) |
| 645,848,891 | ||||||
|
| |||||||
PREFERRED STOCKS (0.38%) |
| |||||||
Brazil (0.38%) | ||||||||
Banco ABC Brasil SA | 15,586 | 34,352 | ||||||
Banco Daycoval SA | 1,078,400 | 2,460,728 | ||||||
|
| |||||||
| 2,495,080 | ||||||||
|
| |||||||
TOTAL PREFERRED STOCKS (Cost $5,185,970) |
| 2,495,080 | ||||||
|
| |||||||
TOTAL INVESTMENTS (99.67%) (Cost $582,523,859) |
| $ | 648,343,971 | |||||
Assets In Excess Of Other |
| 2,142,499 | ||||||
|
| |||||||
| NET ASSETS (100.00%) | $ | 650,486,470 | ||||||
|
| |||||||
| (a) | Non-Income Producing Security. |
| (b) | Security exempt from registration under Rule 144A of the Securities Act of 1933. These securities may be resold in the ordinary course of business in transactions exempt from registration, normally to qualified institutional buyers. As of October 31, 2015, these securities had a total aggregate market value of $7,078,456, representing 1.09% of net assets. |
| (c) | Security was purchased pursuant to Regulation S under the Securities Act of 1933, which exempts securities offered and sold outside of the United States from registration. Such security cannot be sold in the United States without either an effective registration statement filed pursuant to the Securities Act of 1933, or pursuant to an exemption from registration. The security has been deemed liquid under guidelines approved by the Fund's Board of Trustees. As of October 31, 2015, the aggregate market value of those securities was $9,214,207, representing 1.42% of net assets. |
| (d) | Fair valued security under the procedures approved by the Fund's Board of Trustees. |
Common Abbreviations:
AB - Aktiebolag is the Swedish equivalent of the term corporation.
ADR - American Depositary Receipt.
AG - Aktiengesellschaft is a German term that refers to a corporation that is limited by shares, i.e., owned by shareholders.
A/S - Aktieselskab is the Danish term for a stock-based corporation.
AS - Anonim Sirketi is the Turkish term for joint stock company.
ASA - Allmennaksjeselskap is the Norwegian term for a public limited company.
Bhd - Berhad is the Malaysian term for public limited company.
ER - Regulated Entity.
JSC - Joint Stock Company.
Ltd. - Limited.
NV - Naamloze Vennootschap is the Dutch term for a public limited liability corporation.
PCL - Public Company Limited.
PJSC - Public Joint Stock Company.
PLC - Public Limited Company.
REIT - Real Estate Investment Trust.
SA - Generally designates corporations in various countries, mostly those employing the civil law.
SAB de CV - A variable capital company.
SE - A European Company which can operate on a Europe-wide basis and be governed by community law directly applicable in all member states.
SOFOM - Sociedad financiera de objeto multiple is the Spanish term for a multiple purpose financial institution.
SpA - Societa per Azione.
Tbk PT - Terbuka Perseroan Terbatas is an Indonesian term for a limited liability company.
Holdings are subject to change, and may not reflect the current or future position of the portfolio.
For Fund compliance purposes, the Fund's geographical classifications refer to any one or more of the country sub-classifications used by one or more widely recognized market indexes or ratings group indexes, and/or as defined by Fund management. This definition may not apply for purposes of this report, which may combine sub-classifications for reporting ease. Geographical regions are shown as a percentage of net assets.
See Notes to Financial Statements.
32 |
1.855.377.7325 | www.GrandeurPeakGlobal.com |
Table of Contents
| Grandeur Peak Global Reach Fund | Portfolio of Investments | |
October 31, 2015 (Unaudited) |
| Shares | Value (Note 2) | |||||||
COMMON STOCKS (99.55%) |
| |||||||
Australia (1.89%) | ||||||||
Austbrokers Holdings, Ltd. | 127,702 | $ | 855,094 | |||||
Beacon Lighting Group, Ltd. | 545,100 | 699,679 | ||||||
Countplus, Ltd. | 807,288 | 546,893 | ||||||
CTI Logistics, Ltd. | 312,888 | 276,669 | ||||||
LifeHealthcare Group, Ltd. | 140,900 | 309,466 | ||||||
Magellan Financial Group, Ltd. | 95,664 | 1,536,951 | ||||||
Reject Shop, Ltd. | 195,595 | 1,604,006 | ||||||
|
| |||||||
| 5,828,758 | ||||||||
|
| |||||||
Austria (0.36%) | ||||||||
Palfinger AG | 39,848 | 1,120,887 | ||||||
|
| |||||||
Belgium (0.26%) | ||||||||
Melexis NV | 16,185 | 789,334 | ||||||
|
| |||||||
Brazil (1.32%) | ||||||||
CETIP SA - Mercados Organizados | 145,790 | 1,289,090 | ||||||
FPC Par Corretora de Seguros SA | 224,200 | 627,275 | ||||||
M Dias Branco SA | 46,200 | 837,375 | ||||||
Mills Estruturas e Servicos de Engenharia SA(a) | 76,700 | 89,099 | ||||||
Odontoprev SA | 283,300 | 725,779 | ||||||
Tegma Gestao Logistica | 181,400 | 169,333 | ||||||
Valid Solucoes e Servicos de Seguranca em Meios de Pagamento e Identificacao SA | 30,100 | 341,777 | ||||||
|
| |||||||
| 4,079,728 | ||||||||
|
| |||||||
Britain (6.54%) | ||||||||
AB Dynamics PLC | 191,800 | 773,201 | ||||||
Abcam PLC | 174,089 | 1,612,939 | ||||||
Arrow Global Group PLC | 244,100 | 936,999 | ||||||
Bioventix PLC | 22,900 | 390,977 | ||||||
Bovis Homes Group PLC | 27,074 | 427,808 | ||||||
Cambian Group PLC | 371,100 | 926,783 | ||||||
Clinigen Group PLC | 374,430 | 3,645,156 | ||||||
Diploma PLC | 47,700 | 471,723 | ||||||
dotdigital group PLC | 1,901,856 | 1,216,740 | ||||||
EMIS Group PLC | 38,896 | 643,394 | ||||||
Exova Group PLC | 128,000 | 293,521 | ||||||
Gamma Communications PLC | 186,125 | 1,101,814 | ||||||
IDOX PLC | 768,700 | 506,600 | ||||||
IG Group Holdings PLC | 139,443 | 1,624,065 | ||||||
Koovs PLC(a) | 326,300 | 186,119 | ||||||
On the Beach Group PLC(a)(b)(c) | 81,700 | 263,863 | ||||||
| Shares | Value (Note 2) | |||||||
Britain (continued) | ||||||||
Oxford Immunotec Global PLC(a) | 77,025 | $ | 965,894 | |||||
RPS Group PLC | 166,299 | 602,462 | ||||||
Sprue Aegis PLC | 149,400 | 719,735 | ||||||
Telit Communications PLC(a) | 232,900 | 894,007 | ||||||
Topps Tiles PLC | 373,695 | 838,209 | ||||||
Ultra Electronics Holdings PLC | 10,750 | 278,911 | ||||||
Victrex PLC | 23,600 | 673,063 | ||||||
WANdisco PLC(a) | 100,245 | 197,036 | ||||||
|
| |||||||
| 20,191,019 | ||||||||
|
| |||||||
British Virgin Islands (0.10%) |
| |||||||
SafeCharge International Group, Ltd. | 76,000 | 312,822 | ||||||
|
| |||||||
Canada (1.99%) | ||||||||
Bankers Petroleum, Ltd.(a) | 179,806 | 302,519 | ||||||
Biosyent, Inc.(a) | 14,800 | 79,342 | ||||||
Cipher Pharmaceuticals, Inc.(a) | 278,400 | 1,149,710 | ||||||
Delphi Energy Corp.(a) | 411,600 | 229,786 | ||||||
DIRTT Environmental Solutions(a) | 66,100 | 349,810 | ||||||
Halogen Software, Inc.(a) | 11,995 | 81,184 | ||||||
Home Capital Group, Inc. | 83,109 | 2,024,336 | ||||||
Stantec, Inc. | 33,820 | 848,862 | ||||||
TransForce, Inc. | 54,596 | 1,068,037 | ||||||
|
| |||||||
| 6,133,586 | ||||||||
|
| |||||||
Chile (0.22%) | ||||||||
Banco de Chile | 6,420,048 | 679,371 | ||||||
|
| |||||||
China (7.84%) | ||||||||
51job, Inc., ADR(a) | 9,900 | 334,719 | ||||||
AAC Technologies Holdings, Inc. | 78,000 | 497,149 | ||||||
BBI Life Sciences Corp.(c) | 4,218,000 | 1,093,874 | ||||||
China Lesso Group Holdings, Ltd. | 2,356,000 | 1,918,092 | ||||||
China Medical System Holdings, Ltd. | 2,534,000 | 3,498,284 | ||||||
China South City Holdings, Ltd. | 2,505,000 | 601,153 | ||||||
Consun Pharmaceutical Group, Ltd. | 641,000 | 377,127 | ||||||
Dongpeng Holdings Co., Ltd. | 2,408,000 | 900,988 | ||||||
Goldpac Group, Ltd. | 382,000 | 198,625 | ||||||
Le Saunda Holdings, Ltd. | 2,433,200 | 649,850 | ||||||
Man Wah Holdings, Ltd. | 5,834,600 | 6,684,805 | ||||||
See Notes to Financial Statements.
Semi-Annual Report | October 31, 2015 |
33 |
Table of Contents
| Grandeur Peak Global Reach Fund | Portfolio of Investments | |
October 31, 2015 (Unaudited) |
| Shares | Value (Note 2) | |||||||
China (continued) | ||||||||
Mindray Medical International, Ltd., ADR | 19,725 | $ | 473,005 | |||||
Noah Holdings, Ltd., Sponsored ADR(a) | 19,275 | 540,085 | ||||||
O2Micro International, Ltd., ADR(a) | 317,894 | 556,315 | ||||||
Shandong Weigao Group Medical Polymer Co., Ltd., Class H | 855,000 | 593,490 | ||||||
Sihuan Pharmaceutical Holdings Group, Ltd.(d) | 1,097,000 | 372,243 | ||||||
Technovator International, Ltd.(a) | 813,000 | 511,888 | ||||||
Tsui Wah Holdings, Ltd. | 2,957,000 | 667,658 | ||||||
Vitasoy International Holdings, Ltd. | 922,000 | 1,536,944 | ||||||
WuXi PharmaTech Cayman, Inc., ADR(a) | 38,010 | 1,699,047 | ||||||
Xiabuxiabu Catering Management China Holdings Co., Ltd.(b)(c) | 988,000 | 484,401 | ||||||
|
| |||||||
| 24,189,742 | ||||||||
|
| |||||||
Colombia (0.77%) | ||||||||
Gran Tierra Energy, | 523,050 | 1,255,320 | ||||||
Parex Resources, Inc.(a) | 149,261 | 1,120,941 | ||||||
|
| |||||||
| 2,376,261 | ||||||||
|
| |||||||
Denmark (0.55%) | ||||||||
Ringkjoebing Landbobank A/S | 4,307 | 921,430 | ||||||
Topdanmark A/S(a) | 29,272 | 779,453 | ||||||
|
| |||||||
| 1,700,883 | ||||||||
|
| |||||||
Finland (0.28%) | ||||||||
Aktia Bank OYJ | 72,700 | 876,992 | ||||||
|
| |||||||
France (2.16%) | ||||||||
1000mercis | 4,350 | 178,185 | ||||||
Akka Technologies | 16,594 | 458,015 | ||||||
Alten SA | 15,200 | 788,933 | ||||||
Ausy(a) | 16,438 | 687,974 | ||||||
Esker SA | 26,009 | 870,608 | ||||||
Infotel SA | 21,960 | 742,319 | ||||||
Medicrea International(a) | 86,569 | 699,688 | ||||||
MGI Digital Graphic Technology(a) | 20,119 | 648,672 | ||||||
Neurones | 19,682 | 368,802 | ||||||
Prodware | 56,904 | 416,746 | ||||||
SoluCom | 10,233 | 635,779 | ||||||
| Shares | Value (Note 2) | |||||||
France (continued) | ||||||||
Thermador Groupe | 1,943 | $ | 181,613 | |||||
|
| |||||||
| 6,677,334 | ||||||||
|
| |||||||
Georgia (0.59%) | ||||||||
Bank of Georgia Holdings | 59,400 | 1,831,423 | ||||||
|
| |||||||
Germany (2.41%) | ||||||||
Bertrandt AG | 5,377 | 630,898 | ||||||
CANCOM SE | 17,400 | 683,559 | ||||||
Elmos Semiconductor AG | 36,653 | 544,124 | ||||||
ElringKlinger AG | 38,814 | 869,216 | ||||||
First Sensor AG(a) | 84,919 | 1,056,609 | ||||||
Nexus AG | 39,685 | 713,944 | ||||||
Norma Group SE | 15,160 | 777,938 | ||||||
PATRIZIA Immobilien | 44,638 | 1,227,891 | ||||||
Wirecard AG | 18,096 | 935,365 | ||||||
|
| |||||||
| 7,439,544 | ||||||||
|
| |||||||
Greece (0.30%) | ||||||||
Sarantis SA | 114,898 | 928,655 | ||||||
|
| |||||||
Hong Kong (2.34%) | ||||||||
International Housewares Retail Co., Ltd. | 7,762,000 | 1,622,383 | ||||||
Samsonite International SA | 722,400 | 2,139,070 | ||||||
Sinosoft Technology Group, Ltd. | 1,225,000 | 698,591 | ||||||
Value Partners Group, Ltd. | 2,583,000 | 2,756,098 | ||||||
|
| |||||||
| 7,216,142 | ||||||||
|
| |||||||
India (8.08%) | ||||||||
AIA Engineering, Ltd. | 41,000 | 601,808 | ||||||
Ajanta Pharma, Ltd. | 20,418 | 484,133 | ||||||
Bajaj Finance, Ltd. | 14,400 | 1,150,843 | ||||||
City Union Bank, Ltd. | 669,400 | 920,944 | ||||||
Container Corp. of India, Ltd. | 13,600 | 275,798 | ||||||
Credit Analysis & Research, Ltd. | 41,800 | 831,394 | ||||||
Cyient, Ltd. | 146,700 | 1,205,457 | ||||||
Dewan Housing Finance Corp., Ltd. | 314,800 | 1,082,976 | ||||||
Eros International Media, Ltd.(a) | 44,328 | 187,806 | ||||||
Glenmark Pharmaceuticals, Ltd. | 42,400 | 643,348 | ||||||
Hinduja Global Solutions, Ltd. | 111,289 | 802,074 | ||||||
IFGL Refractories, Ltd. | 108,100 | 182,552 | ||||||
Igarashi Motors India, Ltd. | 64,087 | 603,062 | ||||||
See Notes to Financial Statements.
34 |
1.855.377.7325 | www.GrandeurPeakGlobal.com |
Table of Contents
| Grandeur Peak Global Reach Fund | Portfolio of Investments | |
October 31, 2015 (Unaudited) |
| Shares | Value (Note 2) | |||||||
India (continued) | ||||||||
Indiabulls Housing Finance, Ltd. | 84,278 | $ | 929,321 | |||||
Inox Wind, Ltd.(a) | 154,698 | 939,859 | ||||||
Jammu & Kashmir Bank, Ltd. | 574,500 | 731,478 | ||||||
Kolte-Patil Developers, Ltd. | 337,200 | 898,925 | ||||||
Kovai Medical Center and Hospital | 4,000 | 55,720 | ||||||
La Opala RG, Ltd. | 74,505 | 621,170 | ||||||
MBL Infrastructures, Ltd. | 329,406 | 1,057,860 | ||||||
MT Educare, Ltd. | 738,717 | 1,551,594 | ||||||
Persistent Systems, Ltd. | 35,132 | 346,938 | ||||||
PI Industries, Ltd. | 45,500 | 465,410 | ||||||
Poly Medicure, Ltd. | 81,374 | 426,577 | ||||||
Sintex Industries, Ltd. | 355,000 | 548,975 | ||||||
Somany Ceramics, Ltd. | 35,762 | 177,811 | ||||||
Supreme Industries, Ltd. | 45,000 | 433,885 | ||||||
Time Technoplast, Ltd. | 896,073 | 768,611 | ||||||
UFO Moviez India, Ltd.(a) | 71,483 | 601,553 | ||||||
Vaibhav Global, Ltd. | 102,142 | 757,018 | ||||||
Vesuvius India, Ltd. | 24,830 | 267,394 | ||||||
WNS Holdings, Ltd., ADR(a) | 95,125 | 3,240,909 | ||||||
Yes Bank, Ltd. | 98,000 | 1,137,772 | ||||||
|
| |||||||
| 24,930,975 | ||||||||
|
| |||||||
Indonesia (2.98%) | ||||||||
Astra Graphia Tbk PT | 847,000 | 104,889 | ||||||
Bank Negara Indonesia Persero Tbk PT | 3,492,000 | 1,213,111 | ||||||
Bank Rakyat Indonesia Persero Tbk PT | 1,106,500 | 850,843 | ||||||
Bank Tabungan Pensiunan Nasional Tbk PT(a) | 1,961,900 | 374,822 | ||||||
Bekasi Fajar Industrial Estate Tbk PT | 22,956,500 | 639,008 | ||||||
Panin Sekuritas Tbk PT | 2,425,000 | 600,603 | ||||||
Petra Foods, Ltd. | 1,017,500 | 1,757,692 | ||||||
Selamat Sempurna Tbk PT | 7,197,200 | 2,579,161 | ||||||
Tempo Scan Pacific Tbk PT | 5,739,800 | 712,888 | ||||||
Ultrajaya Milk Industry & Trading Co. Tbk PT(a) | 1,251,500 | 365,049 | ||||||
|
| |||||||
| 9,198,066 | ||||||||
|
| |||||||
Ireland (0.56%) | ||||||||
Irish Residential Properties PLC, REIT | 1,406,640 | 1,732,430 | ||||||
|
| |||||||
Israel (1.37%) | ||||||||
Caesarstone Sdot-Yam, Ltd. | 7,115 | 252,653 | ||||||
Hamlet Israel-Canada, Ltd. | 124,669 | 966,639 | ||||||
Sarine Technologies, Ltd. | 311,000 | 346,320 | ||||||
Silicom, Ltd. | 23,449 | 776,631 | ||||||
| Shares | Value (Note 2) | |||||||
Israel (continued) | ||||||||
Wix.com, Ltd.(a) | 85,525 | $ | 1,891,813 | |||||
|
| |||||||
| 4,234,056 | ||||||||
|
| |||||||
Italy (0.53%) | ||||||||
Brembo SpA | 37,105 | 1,635,773 | ||||||
|
| |||||||
Japan (5.92%) | ||||||||
AIT Corp. | 70,200 | 660,870 | ||||||
Amiyaki Tei Co., Ltd. | 16,400 | 584,404 | ||||||
Anest Iwata Corp. | 156,700 | 1,112,885 | ||||||
AP Company Co., Ltd.(a) | 91,900 | 1,167,504 | ||||||
Central Automotive Products, Ltd. | 90,000 | 655,590 | ||||||
CMIC Holdings Co., Ltd. | 42,400 | 530,220 | ||||||
CyberAgent, Inc. | 7,500 | 310,765 | ||||||
Daikokutenbussan Co., Ltd. | 3,600 | 124,107 | ||||||
Descente, Ltd. | 47,900 | 618,052 | ||||||
Future Architect, Inc. | 140,900 | 772,982 | ||||||
GCA Savvian Corp. | 100,200 | 1,182,438 | ||||||
Hard Off Corp. Co., Ltd. | 195,300 | 2,482,723 | ||||||
JCU Corp. | 15,800 | 563,678 | ||||||
MISUMI Group, Inc. | 54,100 | 712,397 | ||||||
Monogatari Corp. | 16,900 | 722,665 | ||||||
Naigai Trans Line, Ltd. | 15,200 | 143,976 | ||||||
Prestige International, Inc. | 53,900 | 529,754 | ||||||
Quick Co., Ltd. | 17,000 | 122,425 | ||||||
Sawai Pharmaceutical Co., Ltd. | 13,100 | 843,515 | ||||||
SK Kaken Co., Ltd. | 6,000 | 586,724 | ||||||
Syuppin Co., Ltd. | 179,900 | 1,562,403 | ||||||
TPR Co., Ltd. | 46,300 | 1,143,016 | ||||||
Trancom Co., Ltd. | 15,400 | 745,305 | ||||||
Trust Tech, Inc. | 5,700 | 108,124 | ||||||
World Holdings Co., Ltd. | 19,000 | 274,285 | ||||||
|
| |||||||
| 18,260,807 | ||||||||
|
| |||||||
Jersey (0.11%) | ||||||||
Integrated Diagnostics Holdings PLC(a)(b)(c) | 62,700 | 345,477 | ||||||
|
| |||||||
Luxembourg (1.02%) | ||||||||
Globant SA(a) | 27,988 | 967,545 | ||||||
Grand City Properties SA | 39,700 | 792,795 | ||||||
L'Occitane International SA | 689,000 | 1,390,339 | ||||||
|
| |||||||
| 3,150,679 | ||||||||
|
| |||||||
Malaysia (1.50%) | ||||||||
7-Eleven Malaysia Holdings Bhd | 2,119,600 | 700,613 | ||||||
AEON Credit Service M Bhd | 241,800 | 720,447 | ||||||
Berjaya Auto Bhd | 3,150,800 | 1,540,195 | ||||||
Berjaya Food Bhd | 1,669,300 | 971,427 | ||||||
See Notes to Financial Statements.
Semi-Annual Report | October 31, 2015 |
35 |
Table of Contents
| Grandeur Peak Global Reach Fund | Portfolio of Investments | |
October 31, 2015 (Unaudited) |
| Shares | Value (Note 2) | |||||||
Malaysia (continued) | ||||||||
CB Industrial Product Holding Bhd | 876,633 | $ | 404,035 | |||||
Uzma Bhd | 556,000 | 284,730 | ||||||
|
| |||||||
| 4,621,447 | ||||||||
|
| |||||||
Mexico (0.78%) | ||||||||
Banregio Grupo Financiero SAB de CV | 139,557 | 747,051 | ||||||
Credito Real SAB de CV SOFOM ER | 700,035 | 1,652,845 | ||||||
|
| |||||||
| 2,399,896 | ||||||||
|
| |||||||
Netherlands (0.79%) | ||||||||
Aalberts Industries NV | 65,582 | 2,132,147 | ||||||
Arcadis NV | 12,200 | 307,891 | ||||||
|
| |||||||
| 2,440,038 | ||||||||
|
| |||||||
New Zealand (0.31%) | ||||||||
Trilogy International, Ltd. | 801,257 | 954,925 | ||||||
|
| |||||||
Norway (1.74%) | ||||||||
Medistim ASA | 75,150 | 396,236 | ||||||
Multiconsult ASA(a)(b)(c) | 26,300 | 296,375 | ||||||
RenoNorden ASA | 66,800 | 302,680 | ||||||
Skandiabanken ASA(a)(b)(c) | 516,700 | 2,797,328 | ||||||
SpareBank 1 SMN | 155,100 | 972,028 | ||||||
Zalaris ASA | 138,000 | 600,936 | ||||||
|
| |||||||
| 5,365,583 | ||||||||
|
| |||||||
Philippines (1.56%) | ||||||||
Concepcion Industrial Corp. | 594,600 | 590,536 | ||||||
Pepsi-Cola Products Philippines, Inc. | 18,617,100 | 1,670,052 | ||||||
Puregold Price Club, Inc. | 922,700 | 709,466 | ||||||
Robinsons Land Corp. | 970,300 | 634,156 | ||||||
Security Bank Corp. | 400,700 | 1,216,135 | ||||||
|
| |||||||
| 4,820,345 | ||||||||
|
| |||||||
Poland (0.65%) | ||||||||
KRUK SA | 13,535 | 644,290 | ||||||
Wawel SA | 3,062 | 860,515 | ||||||
Work Service SA | 122,000 | 489,345 | ||||||
|
| |||||||
| 1,994,150 | ||||||||
|
| |||||||
Russia (0.02%) | ||||||||
MD Medical Group Investments PLC, GDR(c) | 11,855 | 62,239 | ||||||
|
| |||||||
Singapore (0.46%) | ||||||||
CSE Global, Ltd. | 1,958,000 | 691,848 | ||||||
Riverstone Holdings, Ltd. | 191,400 | 271,887 | ||||||
| Shares | Value (Note 2) | |||||||
Singapore (continued) | ||||||||
Super Group, Ltd. | 734,000 | $ | 471,554 | |||||
|
| |||||||
| 1,435,289 | ||||||||
|
| |||||||
South Africa (3.56%) | ||||||||
ARB Holdings, Ltd. | 1,473,866 | 574,040 | ||||||
Blue Label Telecoms, Ltd. | 1,589,100 | 1,337,742 | ||||||
Cartrack Holdings, Ltd. | 1,975,900 | 1,549,138 | ||||||
Clicks Group, Ltd. | 173,700 | 1,268,955 | ||||||
Comair, Ltd. | 2,556,226 | 591,078 | ||||||
EOH Holdings, Ltd. | 52,600 | 581,530 | ||||||
Interwaste Holdings, Ltd.(a) | 10,371,624 | 899,339 | ||||||
Invicta Holdings, Ltd. | 143,688 | 633,353 | ||||||
Italtile, Ltd. | 921,472 | 818,997 | ||||||
MiX Telematics, Ltd., Sponsored ADR | 95,929 | 540,080 | ||||||
OneLogix Group, Ltd. | 945,253 | 334,687 | ||||||
Super Group, Ltd.(a) | 449,700 | 1,058,041 | ||||||
Transaction Capital, Ltd. | 1,061,100 | 816,585 | ||||||
|
| |||||||
| 11,003,565 | ||||||||
|
| |||||||
South Korea (2.97%) | ||||||||
Bluecom Co., Ltd. | 38,500 | 428,885 | ||||||
DGB Financial Group, Inc. | 156,500 | 1,455,112 | ||||||
Duk San Neolux Co., Ltd.(a) | 16,642 | 334,285 | ||||||
Hy-Lok Corp. | 49,340 | 1,380,594 | ||||||
Interpark Holdings Corp. | 103,500 | 1,062,190 | ||||||
ISC Co., Ltd. | 69,151 | 1,552,796 | ||||||
Koh Young Technology, Inc. | 13,143 | 383,321 | ||||||
Solueta Co., Ltd.(a) | 57,000 | 373,484 | ||||||
TechWing, Inc. | 71,000 | 617,797 | ||||||
Vitzrocell Co., Ltd. | 105,375 | 1,321,751 | ||||||
Wins Co., Ltd. | 22,000 | 247,007 | ||||||
|
| |||||||
| 9,157,222 | ||||||||
|
| |||||||
Spain (0.00%)(e) | ||||||||
Let's GOWEX SA(a)(d) | 10,700 | 1 | ||||||
|
| |||||||
Sri Lanka (0.69%) | ||||||||
Hemas Holdings PLC | 1,654,561 | 959,166 | ||||||
Royal Ceramics Lanka PLC | 1,460,600 | 1,159,329 | ||||||
|
| |||||||
| 2,118,495 | ||||||||
|
| |||||||
Sweden (1.50%) | ||||||||
AddTech AB, Class B | 10,700 | 152,168 | ||||||
B&B Tools AB, Class B | 25,538 | 333,291 | ||||||
Bufab Holding AB | 131,150 | 689,249 | ||||||
HIQ International AB | 90,026 | 511,059 | ||||||
Indutrade AB | 7,400 | 353,389 | ||||||
Moberg Pharma AB(a) | 111,100 | 689,210 | ||||||
Odd Molly International AB | 64,088 | 323,307 | ||||||
Opus Group AB | 894,618 | 586,391 | ||||||
Sweco AB, Class B | 11,500 | 168,256 | ||||||
See Notes to Financial Statements.
36 |
1.855.377.7325 | www.GrandeurPeakGlobal.com |
Table of Contents
| Grandeur Peak Global Reach Fund | Portfolio of Investments | |
October 31, 2015 (Unaudited) |
| Shares | Value (Note 2) | |||||||
Sweden (continued) | ||||||||
Tethys Oil AB | 58,600 | $ | 361,811 | |||||
Vitec Software Group AB, Class B | 13,500 | 474,042 | ||||||
|
| |||||||
| 4,642,173 | ||||||||
|
| |||||||
Switzerland (1.01%) | ||||||||
Baloise Holding AG | 5,700 | 684,496 | ||||||
Luxoft Holding, Inc.(a) | 8,525 | 568,106 | ||||||
VZ Holding AG | 5,950 | 1,854,014 | ||||||
|
| |||||||
| 3,106,616 | ||||||||
|
| |||||||
Taiwan (5.13%) | ||||||||
ASPEED Technology, Inc. | 86,771 | 963,573 | ||||||
Chailease Holding Co., Ltd. | 387,000 | 742,683 | ||||||
Chipbond Technology Corp. | 162,000 | 231,546 | ||||||
Cub Elecparts, Inc. | 146,510 | 1,845,845 | ||||||
Dr Wu Skincare Co., Ltd. | 161,000 | 1,091,072 | ||||||
DYNACOLOR, Inc. | 239,000 | 387,983 | ||||||
Godex International Co., Ltd. | 181,650 | 414,068 | ||||||
I Yuan Precision Ind Co., Ltd. | 110,000 | 391,363 | ||||||
Novatek Microelectronics Corp. | 206,000 | 704,360 | ||||||
On-Bright Electronics, Inc. | 135,000 | 709,027 | ||||||
Pacific Hospital Supply Co., Ltd. | 278,000 | 579,747 | ||||||
Polytronics Technology Corp. | 348,000 | 675,343 | ||||||
Richtek Technology Corp. | 12,485 | 72,879 | ||||||
Silergy Corp. | 130,925 | 1,340,970 | ||||||
Sinmag Equipment Corp. | 194,371 | 679,567 | ||||||
Sitronix Technology Corp. | 109,000 | 306,550 | ||||||
Solidwizard Technology Co., Ltd. | 74,000 | 234,787 | ||||||
Sporton International, Inc. | 278,630 | 1,690,825 | ||||||
Test Research, Inc. | 488,440 | 859,116 | ||||||
TSC Auto ID Technology Co., Ltd. | 63,600 | 495,658 | ||||||
Tung Thih Electronic Co., Ltd. | 88,000 | 725,122 | ||||||
UDE Corp. | 552,000 | 677,598 | ||||||
|
| |||||||
| 15,819,682 | ||||||||
|
| |||||||
Thailand (0.65%) | ||||||||
Ananda Development PCL | 8,100,100 | 947,393 | ||||||
Jubilee Enterprise PCL | 131,700 | 75,538 | ||||||
Premier Marketing PCL | 3,478,100 | 997,445 | ||||||
|
| |||||||
| 2,020,376 | ||||||||
|
| |||||||
Turkey (0.57%) | ||||||||
EGE Seramik Sanayi ve Ticaret AS | 662,900 | 893,598 | ||||||
| Shares | Value (Note 2) | |||||||
Turkey (continued) | ||||||||
Pinar SUT Mamulleri Sanayii AS | 132,600 | $ | 866,444 | |||||
|
| |||||||
| 1,760,042 | ||||||||
|
| |||||||
United States (24.40%) | ||||||||
2U, Inc.(a) | 17,800 | 373,444 | ||||||
Abaxis, Inc. | 5,575 | 279,921 | ||||||
Alamo Group, Inc. | 13,253 | 621,831 | ||||||
Alliance Fiber Optic Products, Inc. | 57,300 | 779,853 | ||||||
Amsurg Corp.(a) | 20,537 | 1,439,438 | ||||||
Aratana Therapeutics, | 78,675 | 549,938 | ||||||
BioDelivery Sciences International, Inc.(a) | 187,975 | 1,011,305 | ||||||
Cempra, Inc.(a) | 19,550 | 434,010 | ||||||
Chase Corp. | 8,050 | 357,500 | ||||||
CRA International, Inc.(a) | 10,450 | 244,530 | ||||||
Demandware, Inc.(a) | 7,100 | 402,570 | ||||||
Diamond Hill Investment Group, Inc. | 5,650 | 1,130,282 | ||||||
DXP Enterprises, Inc.(a) | 22,000 | 665,720 | ||||||
Enphase Energy, Inc.(a) | 140,400 | 505,440 | ||||||
EPAM Systems, Inc.(a) | 9,300 | 719,355 | ||||||
ePlus, Inc.(a) | 12,800 | 1,080,576 | ||||||
Escalade, Inc. | 86,744 | 1,286,414 | ||||||
Evolent Health, Inc., Class A(a) | 20,100 | 258,285 | ||||||
ExlService Holdings, | 20,700 | 916,182 | ||||||
Fastenal Co. | 16,125 | 631,455 | ||||||
First Cash Financial Services, Inc.(a) | 21,150 | 806,872 | ||||||
First Republic Bank | 94,050 | 6,142,405 | ||||||
FormFactor, Inc.(a) | 83,099 | 684,736 | ||||||
Fresh Market, Inc.(a) | 67,874 | 1,691,420 | ||||||
Genesee & Wyoming, Inc., Class A(a) | 4,575 | 306,983 | ||||||
Genpact, Ltd.(a) | 23,575 | 584,188 | ||||||
Gentex Corp. | 50,375 | 825,646 | ||||||
Geospace Technologies Corp.(a) | 10,260 | 157,594 | ||||||
Hennessy Advisors, Inc. | 25,050 | 698,895 | ||||||
Hibbett Sports, Inc.(a) | 13,400 | 457,744 | ||||||
Home BancShares, Inc. | 40,175 | 1,724,311 | ||||||
Horizon Global Corp.(a) | 32,240 | 283,390 | ||||||
Inphi Corp.(a) | 102,600 | 3,054,402 | ||||||
IPC Healthcare, Inc.(a) | 9,800 | 769,300 | ||||||
Jones Energy, Inc., Class A(a) | 56,525 | 290,539 | ||||||
K2M Group Holdings, | 27,975 | 510,544 | ||||||
Knight Transportation, Inc. | 37,800 | 960,876 | ||||||
LGI Homes, Inc.(a) | 35,375 | 991,561 | ||||||
Littelfuse, Inc. | 5,325 | 532,127 | ||||||
Malibu Boats, Inc., Class A(a) | 85,750 | 1,218,508 | ||||||
See Notes to Financial Statements.
Semi-Annual Report | October 31, 2015 |
37 |
Table of Contents
| Grandeur Peak Global Reach Fund | Portfolio of Investments | |
October 31, 2015 (Unaudited) |
| Shares | Value (Note 2) | |||||||
United States (continued) | ||||||||
Manitex International, Inc.(a) | 47,677 | $ | 305,610 | |||||
Marin Software, Inc.(a) | 96,400 | 345,112 | ||||||
MarketAxess Holdings, Inc. | 9,005 | 912,297 | ||||||
Mastech Holdings, Inc.(a) | 69,747 | 561,463 | ||||||
MaxLinear, Inc., Class A(a) | 87,150 | 1,132,950 | ||||||
MCBC Holdings, Inc.(a) | 34,475 | 454,036 | ||||||
MEDNAX, Inc.(a) | 15,125 | 1,065,859 | ||||||
Microchip Technology, Inc. | 13,775 | 665,195 | ||||||
Misonix, Inc.(a) | 38,545 | 429,391 | ||||||
MSC Industrial Direct Co., Inc., Class A | 12,950 | 812,872 | ||||||
Navigant Consulting, Inc.(a) | 23,800 | 409,360 | ||||||
NorthStar Asset Management Group, Inc. | 49,975 | 731,134 | ||||||
NorthStar Realty Finance Corp., REIT | 139,825 | 1,679,298 | ||||||
NxStage Medical, Inc.(a) | 68,800 | 1,149,648 | ||||||
Palo Alto Networks, Inc.(a) | 2,300 | 370,300 | ||||||
Patrick Industries, Inc.(a) | 23,375 | 948,558 | ||||||
Paycom Software, Inc.(a) | 9,725 | 369,647 | ||||||
Perficient, Inc.(a) | 28,025 | 468,578 | ||||||
Power Integrations, Inc. | 36,440 | 1,844,228 | ||||||
PRA Group, Inc.(a) | 17,250 | 945,300 | ||||||
Proto Labs, Inc.(a) | 10,275 | 666,231 | ||||||
Quanta Services, Inc.(a) | 39,700 | 798,367 | ||||||
RealPage, Inc.(a) | 15,975 | 269,978 | ||||||
Reis, Inc. | 17,200 | 418,648 | ||||||
Resources Connection, Inc. | 33,700 | 604,915 | ||||||
Roadrunner Transportation Systems, Inc.(a) | 249,850 | 2,658,404 | ||||||
Signature Bank(a) | 13,350 | 1,988,082 | ||||||
Silicon Laboratories, Inc.(a) | 22,500 | 1,124,325 | ||||||
Spirit Airlines, Inc.(a) | 7,325 | 271,904 | ||||||
Sportsman's Warehouse Holdings, Inc.(a) | 111,400 | 1,198,664 | ||||||
Sprouts Farmers Market, Inc.(a) | 34,875 | 710,753 | ||||||
STAAR Surgical Co.(a) | 57,611 | 469,530 | ||||||
SVB Financial Group(a) | 5,925 | 723,265 | ||||||
Swift Transportation Co.(a) | 30,575 | 477,887 | ||||||
Synaptics, Inc.(a) | 17,200 | 1,463,548 | ||||||
Syntel, Inc.(a) | 14,175 | 666,792 | ||||||
Textura Corp.(a) | 20,250 | 594,540 | ||||||
Transcat, Inc.(a) | 197,402 | 1,899,007 | ||||||
TriMas Corp.(a) | 58,825 | 1,177,088 | ||||||
TubeMogul, Inc.(a) | 57,420 | 686,169 | ||||||
Tumi Holdings, Inc.(a) | 40,875 | 655,226 | ||||||
Universal Truckload Services, Inc. | 52,200 | 834,156 | ||||||
Veracyte, Inc.(a) | 88,438 | 575,731 | ||||||
| Shares | Value (Note 2) | |||||||
United States (continued) | ||||||||
Virtusa Corp.(a) | 8,300 | $ | 476,669 | |||||
Vitamin Shoppe, Inc.(a) | 50,025 | 1,435,217 | ||||||
WW Grainger, Inc. | 2,275 | 477,750 | ||||||
|
| |||||||
| 75,303,772 | ||||||||
|
| |||||||
Vietnam (0.77%) | ||||||||
Binh Minh Plastics JSC | 70,930 | 409,660 | ||||||
DHG Pharmaceutical JSC | 101,666 | 323,176 | ||||||
PetroVietnam Drilling and Well Services JSC | 269,330 | 443,749 | ||||||
Traphaco JSC | 89,000 | 330,729 | ||||||
Vietnam Dairy Products JSC | 117,163 | 618,980 | ||||||
Vietnam Sun Corp. | 177,998 | 252,626 | ||||||
|
| |||||||
| 2,378,920 | ||||||||
|
| |||||||
TOTAL COMMON STOCKS (Cost $310,793,169) | 307,265,520 | |||||||
|
| |||||||
PREFERRED STOCKS (0.55%) | ||||||||
Brazil (0.46%) | ||||||||
Banco ABC Brasil SA | 4,026 | 8,873 | ||||||
Banco Daycoval SA | 267,200 | 609,706 | ||||||
Itau Unibanco Holding SA | 115,100 | 790,006 | ||||||
|
| |||||||
| 1,408,585 | ||||||||
|
| |||||||
Colombia (0.09%) | ||||||||
Bancolombia SA | 33,027 | 286,378 | ||||||
|
| |||||||
TOTAL PREFERRED STOCKS (Cost $2,153,584) |
| 1,694,963 | ||||||
| �� |
|
| ||||||
TOTAL INVESTMENTS (100.10%) (Cost $312,946,753) |
| $ | 308,960,483 | |||||
Liabilities In Excess Of Other |
| (316,403) | ||||||
|
| |||||||
| NET ASSETS (100.00%) | $ | 308,644,080 | ||||||
|
| |||||||
| (a) | Non-Income Producing Security. |
| (b) | Security exempt from registration under Rule 144A of the Securities Act of 1933. These securities may be resold in the ordinary course of business in transactions exempt from registration, normally to qualified institutional buyers. As of October 31, 2015, these securities had a total aggregate market value of $4,187,444, representing 1.36% of net assets. |
See Notes to Financial Statements.
38 |
1.855.377.7325 | www.GrandeurPeakGlobal.com |
Table of Contents
| Grandeur Peak Global Reach Fund | Portfolio of Investments | |
October 31, 2015 (Unaudited) |
| (c) | Security was purchased pursuant to Regulation S under the Securities Act of 1933, which exempts securities offered and sold outside of the United States from registration. Such security cannot be sold in the United States without either an effective registration statement filed pursuant to the Securities Act of 1933, or pursuant to an exemption from registration. The security has been deemed liquid under guidelines approved by the Fund's Board of Trustees. As of October 31, 2015, the aggregate market value of those securities was $5,343,557, representing 1.73% of net assets. |
| (d) | Fair valued security under the procedures approved by the Fund's Board of Trustees. |
| (e) | Less than 0.005%. |
Common Abbreviations:
AB - Aktiebolag is the Swedish equivalent of the term corporation.
ADR - American Depositary Receipt.
AG - Aktiengesellschaft is a German term that refers to a corporation that is limited by shares, i.e., owned by shareholders.
A/S - Aktieselskab is the Danish term for a stock-based corporation.
AS - Anonim Sirketi is the Turkish term for joint stock company.
ASA - Allmennaksjeselskap is the Norwegian term for a public limited company.
Bhd - Berhad is the Malaysian term for public limited company.
ER - Regulated Entity.
GDR - Global Depositary Receipt.
JSC - Joint Stock Company.
Ltd. - Limited.
NV - Naamloze Vennootschap is the Dutch term for a public limited liability corporation.
OYJ - Osakeyhtio is the Finnish equivalent of a public limited company.
PCL - Public Company Limited.
PLC - Public Limited Company.
REIT - Real Estate Investment Trust.
SA - Generally designates corporations in various countries, mostly those employing the civil law.
SAB de CV - A variable capital company.
SE - A European Company which can operate on a Europe-wide basis and be governed by community law directly applicable in all member states.
SOFOM - Sociedad financiera de objeto multiple is the Spanish term for a multiple purpose financial institution.
SpA - Societa per Azione.
Tbk PT - Terbuka Perseroan Terbatas is an Indonesian term for a limited liability company.
Holdings are subject to change, and may not reflect the current or future position of the portfolio.
For Fund compliance purposes, the Fund's geographical classifications refer to any one or more of the country sub-classifications used by one or more widely recognized market indexes or ratings group indexes, and/or as defined by Fund management. This definition may not apply for purposes of this report, which may combine sub-classifications for reporting ease. Geographical regions are shown as a percentage of net assets.
See Notes to Financial Statements.
Semi-Annual Report | October 31, 2015 |
39 |
Table of Contents
| Grandeur Peak Global Stalwarts Fund | Portfolio of Investments | |
October 31, 2015 (Unaudited) |
| Shares | Value (Note 2) | |||||||
COMMON STOCKS (91.87%) | ||||||||
Australia (0.65%) | ||||||||
Magellan Financial Group, Ltd. | 6,585 | $ | 105,795 | |||||
|
| |||||||
Belgium (0.75%) | ||||||||
Melexis NV | 2,485 | 121,192 | ||||||
|
| |||||||
Brazil (1.10%) | ||||||||
CETIP SA - Mercados Organizados | 14,525 | 128,431 | ||||||
M Dias Branco SA | 2,725 | 49,391 | ||||||
|
| |||||||
| 177,822 | ||||||||
|
| |||||||
Britain (5.98%) | ||||||||
Abcam PLC | 6,125 | 56,748 | ||||||
Bovis Homes Group PLC | 4,975 | 78,612 | ||||||
Diploma PLC | 26,750 | 264,541 | ||||||
Halma PLC | 6,825 | 80,331 | ||||||
IG Group Holdings PLC | 13,975 | 162,764 | ||||||
Ultra Electronics Holdings PLC | 6,375 | 165,401 | ||||||
Victrex PLC | 5,475 | 156,145 | ||||||
|
| |||||||
| 964,542 | ||||||||
|
| |||||||
Canada (4.04%) | ||||||||
Home Capital Group, Inc. | 5,003 | 121,861 | ||||||
Stantec, Inc. | 9,673 | 242,787 | ||||||
TransForce, Inc. | 14,673 | 287,041 | ||||||
|
| |||||||
| 651,689 | ||||||||
|
| |||||||
Chile (0.72%) | ||||||||
Banco de Chile | 1,093,000 | 115,661 | ||||||
|
| |||||||
China (6.03%) | ||||||||
AAC Technologies Holdings, Inc. | 12,900 | 82,221 | ||||||
China Lesso Group Holdings, Ltd. | 89,500 | 72,865 | ||||||
China Medical System Holdings, Ltd. | 162,000 | 223,647 | ||||||
China South City Holdings, Ltd. | 256,000 | 61,435 | ||||||
Man Wah Holdings, Ltd. | 214,100 | 245,298 | ||||||
Mindray Medical International, Ltd., ADR | 2,325 | 55,754 | ||||||
Shandong Weigao Group Medical Polymer Co., Ltd., Class H | 80,000 | 55,531 | ||||||
Vitasoy International Holdings, Ltd. | 73,500 | 122,522 | ||||||
| Shares | Value (Note 2) | |||||||
China (continued) | ||||||||
WuXi PharmaTech Cayman, Inc., ADR(a) | 1,200 | $ | 53,640 | |||||
|
| |||||||
| 972,913 | ||||||||
|
| |||||||
Denmark (0.78%) | ||||||||
Topdanmark A/S(a) | 4,715 | 125,551 | ||||||
|
| |||||||
France (0.98%) | ||||||||
Alten SA | 3,057 | 158,669 | ||||||
|
| |||||||
Germany (2.33%) | ||||||||
Bertrandt AG | 875 | 102,666 | ||||||
Norma Group SE | 1,590 | 81,591 | ||||||
PATRIZIA Immobilien | 2,685 | 73,858 | ||||||
Wirecard AG | 2,300 | 118,885 | ||||||
|
| |||||||
| 377,000 | ||||||||
|
| |||||||
Hong Kong (3.29%) | ||||||||
Samsonite International SA | 49,500 | 146,573 | ||||||
Value Partners Group, Ltd. | 359,900 | 384,018 | ||||||
|
| |||||||
| 530,591 | ||||||||
|
| |||||||
India (4.84%) | ||||||||
AIA Engineering, Ltd. | 8,200 | 120,362 | ||||||
Ajanta Pharma, Ltd. | 2,275 | 53,943 | ||||||
Bajaj Finance, Ltd. | 1,300 | 103,895 | ||||||
Glenmark Pharmaceuticals, Ltd. | 3,700 | 56,141 | ||||||
Indiabulls Housing Finance, Ltd. | 6,800 | 74,983 | ||||||
WNS Holdings, Ltd., | 5,750 | 195,902 | ||||||
Yes Bank, Ltd. | 15,200 | 176,471 | ||||||
|
| |||||||
| 781,697 | ||||||||
|
| |||||||
Indonesia (2.18%) | ||||||||
Bank Negara Indonesia Persero Tbk PT | 399,000 | 138,612 | ||||||
Bank Rakyat Indonesia Persero Tbk PT | 174,600 | 134,259 | ||||||
Petra Foods, Ltd. | 45,500 | 78,599 | ||||||
|
| |||||||
| 351,470 | ||||||||
|
| |||||||
Israel (0.35%) | ||||||||
Caesarstone Sdot-Yam, Ltd. | 1,575 | 55,928 | ||||||
|
| |||||||
Italy (1.06%) | ||||||||
Brembo SpA | 3,883 | 171,182 | ||||||
|
| |||||||
Japan (6.70%) | ||||||||
Century Tokyo Leasing Corp. | 3,600 | 123,361 | ||||||
CyberAgent, Inc. | 5,900 | 244,469 | ||||||
See Notes to Financial Statements.
40 |
1.855.377.7325 | www.GrandeurPeakGlobal.com |
Table of Contents
| Grandeur Peak Global Stalwarts Fund | Portfolio of Investments | |
October 31, 2015 (Unaudited) |
| Shares | Value (Note 2) | |||||||
Japan (continued) | ||||||||
MISUMI Group, Inc. | 35,400 | $ | 466,152 | |||||
Sawai Pharmaceutical Co., Ltd. | 2,600 | 167,415 | ||||||
Suruga Bank, Ltd. | 4,000 | 79,490 | ||||||
|
| |||||||
| 1,080,887 | ||||||||
|
| |||||||
Luxembourg (1.70%) | ||||||||
Grand City Properties SA | 6,100 | 121,815 | ||||||
L'Occitane International SA | 75,400 | 152,150 | ||||||
|
| |||||||
| 273,965 | ||||||||
|
| |||||||
Mexico (0.79%) | ||||||||
Banregio Grupo Financiero SAB de CV | 23,800 | 127,402 | ||||||
Netherlands (2.04%) | ||||||||
Aalberts Industries NV | 6,295 | 204,658 | ||||||
Arcadis NV | 4,911 | 123,939 | ||||||
|
| |||||||
| 328,597 | ||||||||
|
| |||||||
Norway (0.26%) | ||||||||
TGS Nopec Geophysical Co. ASA | 2,150 | 42,384 | ||||||
|
| |||||||
Philippines (2.42%) | ||||||||
Puregold Price Club, Inc. | 204,000 | 156,856 | ||||||
Robinsons Retail Holdings, Inc. | 70,900 | 116,451 | ||||||
Security Bank Corp. | 38,800 | 117,759 | ||||||
|
| |||||||
| 391,066 | ||||||||
|
| |||||||
South Africa (0.71%) | ||||||||
EOH Holdings, Ltd. | 10,350 | 114,427 | ||||||
|
| |||||||
South Korea (0.73%) | ||||||||
DGB Financial Group, Inc. | 12,700 | 118,082 | ||||||
|
| |||||||
Sweden (3.71%) | ||||||||
Hexpol AB | 11,912 | 116,003 | ||||||
Indutrade AB | 5,125 | 244,746 | ||||||
Nibe Industrier AB, Class B | 3,727 | 120,009 | ||||||
Svenska Handelsbanken AB, Class A | 8,700 | 118,328 | ||||||
Sweco AB, Class B | 29 | 424 | ||||||
|
| |||||||
| 599,510 | ||||||||
|
| |||||||
Switzerland (2.14%) | ||||||||
Baloise Holding AG | 1,465 | 175,927 | ||||||
Luxoft Holding, Inc.(a) | 1,250 | 83,300 | ||||||
| Shares | Value (Note 2) | |||||||
Switzerland (continued) | ||||||||
VZ Holding AG | 275 | $ | 85,690 | |||||
|
| |||||||
| 344,917 | ||||||||
|
| |||||||
Taiwan (2.93%) | ||||||||
Catcher Technology Co., Ltd. | 16,000 | 157,716 | ||||||
Chailease Holding Co., Ltd. | 40,000 | 76,763 | ||||||
Largan Precision Co., Ltd. | 2,000 | 156,175 | ||||||
Novatek Microelectronics Corp. | 24,000 | 82,061 | ||||||
|
| |||||||
| 472,715 | ||||||||
|
| |||||||
United States (32.66%) | ||||||||
Amsurg Corp.(a) | 4,000 | 280,360 | ||||||
Carter's, Inc. | 875 | 79,520 | ||||||
Demandware, Inc.(a) | 1,025 | 58,117 | ||||||
EPAM Systems, Inc.(a) | 1,575 | 121,826 | ||||||
Fastenal Co. | 5,050 | 197,758 | ||||||
First Republic Bank | 5,950 | 388,594 | ||||||
Fresh Market, Inc.(a) | 3,000 | 74,760 | ||||||
Genesee & Wyoming, Inc., Class A(a) | 1,425 | 95,617 | ||||||
Genpact, Ltd.(a) | 4,850 | 120,183 | ||||||
Gentex Corp. | 9,950 | 163,080 | ||||||
Home BancShares, Inc. | 1,675 | 71,891 | ||||||
Knight Transportation, Inc. | 16,325 | 414,981 | ||||||
Littelfuse, Inc. | 1,275 | 127,411 | ||||||
MarketAxess Holdings, Inc. | 1,325 | 134,236 | ||||||
MEDNAX, Inc.(a) | 3,425 | 241,360 | ||||||
Microchip Technology, Inc. | 6,775 | 327,165 | ||||||
MSC Industrial Direct Co., Inc., Class A | 1,775 | 111,417 | ||||||
NorthStar Asset Management Group, Inc. | 4,625 | 67,664 | ||||||
NorthStar Realty Finance Corp., REIT | 17,225 | 206,872 | ||||||
Palo Alto Networks, Inc.(a) | 350 | 56,350 | ||||||
Paycom Software, Inc.(a) | 1,625 | 61,766 | ||||||
Power Integrations, Inc. | 5,700 | 288,477 | ||||||
PRA Group, Inc.(a) | 2,925 | 160,290 | ||||||
Proto Labs, Inc.(a) | 1,825 | 118,333 | ||||||
Quanta Services, Inc.(a) | 8,150 | 163,897 | ||||||
SEI Investments Co. | 1,825 | 94,572 | ||||||
Signature Bank(a) | 775 | 115,413 | ||||||
Silicon Laboratories, Inc.(a) | 3,300 | 164,901 | ||||||
Skechers USA, Inc., | 1,575 | 49,140 | ||||||
Spirit Airlines, Inc.(a) | 5,725 | 212,512 | ||||||
Sprouts Farmers Market, Inc.(a) | 2,625 | 53,498 | ||||||
SVB Financial Group(a) | 325 | 39,673 | ||||||
Synaptics, Inc.(a) | 1,925 | 163,798 | ||||||
See Notes to Financial Statements.
Semi-Annual Report | October 31, 2015 |
41 |
Table of Contents
| Grandeur Peak Global Stalwarts Fund | Portfolio of Investments | |
October 31, 2015 (Unaudited) |
| Shares | Value (Note 2) | |||||||
United States (continued) | ||||||||
Syntel, Inc.(a) | 1,675 | $ | 78,792 | |||||
Virtusa Corp.(a) | 950 | 54,559 | ||||||
WW Grainger, Inc. | 535 | 112,350 | ||||||
|
| |||||||
| 5,271,133 | ||||||||
|
| |||||||
| TOTAL COMMON STOCKS (Cost $14,372,929) | 14,826,787 | |||||||
|
| |||||||
| PREFERRED STOCKS (1.10%) | ||||||||
Brazil (0.79%) | ||||||||
Itau Unibanco Holding SA | 18,450 | 126,634 | ||||||
|
| |||||||
Colombia (0.31%) | ||||||||
Bancolombia SA | 5,800 | 50,292 | ||||||
|
| |||||||
| TOTAL PREFERRED STOCKS (Cost $177,824) | 176,926 | |||||||
|
| |||||||
TOTAL INVESTMENTS (92.97%) (Cost $14,550,753) |
| $ | 15,003,713 | |||||
Assets In Excess Of Other | 1,134,065 | |||||||
|
| |||||||
| NET ASSETS (100.00%) | $ | 16,137,778 | ||||||
|
| |||||||
| (a) | Non-Income Producing Security. |
Common Abbreviations:
AB - Aktiebolag is the Swedish equivalent of the term corporation.
ADR - American Depositary Receipt.
AG - Aktiengesellschaft is a German term that refers to a corporation that is limited by shares, i.e., owned by shareholders.
A/S - Aktieselskab is the Danish term for a stock-based corporation.
ASA - Allmennaksjeselskap is the Norwegian term for a public limited company.
Ltd. - Limited.
NV - Naamloze Vennootschap is the Dutch term for a public limited liability corporation.
PLC - Public Limited Company.
REIT - Real Estate Investment Trust.
SA - Generally designates corporations in various countries, mostly those employing the civil law.
SAB de CV - A variable capital company.
SE - A European Company which can operate on a Europe-wide basis and be governed by community law directly applicable in all member states.
SpA - Societa per Azione.
Tbk PT - Terbuka Perseroan Terbatas is an Indonesian term for a limited liability company.
Holdings are subject to change, and may not reflect the current or future position of the portfolio.
For Fund compliance purposes, the Fund's geographical classifications refer to any one or more of the country sub-classifications used by one or more widely recognized market indexes or ratings group indexes, and/or as defined by Fund management. This definition may not apply for purposes of this report, which may combine sub-classifications for reporting ease. Geographical regions are shown as a percentage of net assets.
See Notes to Financial Statements.
42 |
1.855.377.7325 | www.GrandeurPeakGlobal.com |
Table of Contents
| Grandeur Peak International Opportunities Fund | Portfolio of Investments | |
October 31, 2015 (Unaudited) |
| Shares | Value (Note 2) | |||||||
COMMON STOCKS (94.71%) |
| |||||||
Australia (1.08%) | ||||||||
Countplus, Ltd. | 122,193 | $ | 82,779 | |||||
CTI Logistics, Ltd. | 1,484,490 | 1,312,651 | ||||||
Magellan Financial Group, Ltd. | 297,900 | 4,786,104 | ||||||
Medical Developments International, Ltd.(a) | 653,338 | 1,537,454 | ||||||
Reject Shop, Ltd. | 62,531 | 512,795 | ||||||
|
| |||||||
| 8,231,783 | ||||||||
|
| |||||||
Austria (1.07%) | ||||||||
Palfinger AG | 288,740 | 8,121,983 | ||||||
|
| |||||||
Belgium (1.08%) | ||||||||
Melexis NV | 168,684 | 8,226,633 | ||||||
|
| |||||||
Brazil (2.19%) | ||||||||
CETIP SA - Mercados Organizados | 649,714 | 5,744,836 | ||||||
FPC Par Corretora de Seguros SA | 646,500 | 1,808,802 | ||||||
Localiza Rent a Car SA | 187,400 | 1,263,409 | ||||||
M Dias Branco SA | 161,900 | 2,934,439 | ||||||
Odontoprev SA | 501,000 | 1,283,499 | ||||||
Tegma Gestao Logistica | 560,644 | 523,348 | ||||||
Valid Solucoes e Servicos de Seguranca em Meios de Pagamento e Identificacao SA | 270,100 | 3,066,907 | ||||||
|
| |||||||
| 16,625,240 | ||||||||
|
| |||||||
Britain (10.83%) | ||||||||
Abcam PLC | 543,066 | 5,031,521 | ||||||
Advanced Medical Solutions Group PLC | 927,769 | 2,345,610 | ||||||
Arrow Global Group PLC | 1,422,000 | 5,458,472 | ||||||
Bovis Homes Group PLC | 225,351 | 3,560,865 | ||||||
Cambian Group PLC | 1,022,200 | 2,552,837 | ||||||
Clinigen Group PLC | 1,866,973 | 18,175,383 | ||||||
Diploma PLC | 460,400 | 4,553,068 | ||||||
EMIS Group PLC | 587,200 | 9,713,102 | ||||||
Exova Group PLC | 464,000 | 1,064,013 | ||||||
IG Group Holdings PLC | 833,365 | 9,706,036 | ||||||
On the Beach Group PLC(a)(b)(c) | 815,500 | 2,633,784 | ||||||
Oxford Immunotec Global PLC(a) | 205,130 | 2,572,330 | ||||||
RPS Group PLC | 2,413,011 | 8,741,769 | ||||||
Tracsis PLC | 253,100 | 1,691,428 | ||||||
| Shares | Value (Note 2) | |||||||
Britain (continued) | ||||||||
Ultra Electronics Holdings PLC | 167,000 | $ | 4,332,841 | |||||
|
| |||||||
| 82,133,059 | ||||||||
|
| |||||||
British Virgin Islands (0.10%) |
| |||||||
SafeCharge International Group, Ltd. | 188,100 | 774,234 | ||||||
|
| |||||||
Canada (3.23%) | ||||||||
Biosyent, Inc.(a) | 37,900 | 203,181 | ||||||
Cipher Pharmaceuticals, Inc.(a) | 789,800 | 3,261,640 | ||||||
Delphi Energy Corp.(a) | 1,057,100 | 590,152 | ||||||
DIRTT Environmental Solutions(a) | 345,500 | 1,828,434 | ||||||
Halogen Software, Inc.(a) | 136,700 | 925,203 | ||||||
Home Capital Group, Inc. | 236,460 | 5,759,598 | ||||||
Richelieu Hardware, Ltd. | 87,350 | 4,591,286 | ||||||
Stantec, Inc. | 158,352 | 3,974,543 | ||||||
TransForce, Inc. | 171,500 | 3,354,978 | ||||||
|
| |||||||
| 24,489,015 | ||||||||
|
| |||||||
China (9.51%) | ||||||||
BBI Life Sciences Corp.(c) | 10,186,500 | 2,641,714 | ||||||
China Lesso Group Holdings, Ltd. | 5,289,000 | 4,305,936 | ||||||
China Medical System Holdings, Ltd. | 6,852,000 | 9,459,448 | ||||||
China Pioneer Pharma Holdings, Ltd. | 857,000 | 374,839 | ||||||
China South City Holdings, Ltd. | 8,121,000 | 1,948,889 | ||||||
Consun Pharmaceutical Group, Ltd. | 2,275,000 | 1,338,477 | ||||||
Dongpeng Holdings Co., Ltd. | 8,743,000 | 3,271,321 | ||||||
Far East Horizon, Ltd. | 5,657,000 | 4,722,317 | ||||||
Goldpac Group, Ltd. | 3,711,000 | 1,929,571 | ||||||
Le Saunda Holdings, Ltd. | 6,169,680 | 1,647,774 | ||||||
Man Wah Holdings, Ltd. | 15,933,200 | 18,254,950 | ||||||
Mindray Medical International, Ltd., ADR | 86,550 | 2,075,469 | ||||||
Minth Group, Ltd. | 1,665,000 | 3,458,635 | ||||||
Noah Holdings, Ltd., Sponsored ADR(a) | 65,400 | 1,832,508 | ||||||
O2Micro International, Ltd., ADR(a) | 1,030,316 | 1,803,053 | ||||||
Sihuan Pharmaceutical Holdings Group, Ltd.(d) | 3,287,000 | 1,115,373 | ||||||
Tao Heung Holdings, Ltd. | 2,203,700 | 696,600 | ||||||
Vitasoy International Holdings, Ltd. | 2,163,338 | 3,606,215 | ||||||
See Notes to Financial Statements.
Semi-Annual Report | October 31, 2015 | 43 |
Table of Contents
| Grandeur Peak International Opportunities Fund | Portfolio of Investments | |
October 31, 2015 (Unaudited) |
| Shares | Value (Note 2) | |||||||
China (continued) | ||||||||
WuXi PharmaTech Cayman, Inc., | 148,550 | $ | 6,640,185 | |||||
Xiabuxiabu Catering Management China Holdings Co., | 2,004,500 | 982,776 | ||||||
|
| |||||||
| 72,106,050 | ||||||||
|
| |||||||
Colombia (1.08%) | ||||||||
Gran Tierra Energy, | 1,662,637 | 3,990,329 | ||||||
Parex Resources, | 560,345 | 4,208,158 | ||||||
|
| |||||||
| 8,198,487 | ||||||||
|
| |||||||
Denmark (0.39%) | ||||||||
Ringkjoebing Landbobank A/S | 13,763 | 2,944,424 | ||||||
|
| |||||||
Finland (0.46%) | ||||||||
Aktia Bank OYJ | 288,873 | 3,484,722 | ||||||
|
| |||||||
France (2.84%) | ||||||||
Alten SA | 72,700 | 3,773,384 | ||||||
ARGAN SA, REIT | 90,350 | 2,048,667 | ||||||
Esker SA | 75,800 | 2,537,280 | ||||||
Infotel SA | 45,900 | 1,551,569 | ||||||
Medicrea International(a) | 193,596 | 1,564,726 | ||||||
MGI Digital Graphic | ||||||||
Technology(a) | 71,550 | 2,306,897 | ||||||
Neurones | 79,220 | 1,484,428 | ||||||
Prodware | 268,000 | 1,962,744 | ||||||
SoluCom | 44,377 | 2,757,154 | ||||||
Thermador Groupe | 16,307 | 1,524,220 | ||||||
|
| |||||||
| 21,511,069 | ||||||||
|
| |||||||
Georgia (1.00%) | ||||||||
Bank of Georgia Holdings PLC | 245,711 | 7,575,770 | ||||||
|
| |||||||
Germany (4.07%) | ||||||||
Bertrandt AG | 45,304 | 5,315,640 | ||||||
CANCOM SE | 93,300 | 3,665,291 | ||||||
First Sensor AG(a) | 211,764 | 2,634,883 | ||||||
Nexus AG | 275,316 | 4,953,012 | ||||||
Norma Group SE | 48,103 | 2,468,414 | ||||||
PATRIZIA Immobilien AG(a) | 206,659 | 5,684,725 | ||||||
Softing AG | 96,691 | 1,251,460 | ||||||
Wirecard AG | 95,411 | 4,931,705 | ||||||
|
| |||||||
| 30,905,130 | ||||||||
|
| |||||||
Hong Kong (2.12%) | ||||||||
International Housewares Retail Co., Ltd. | 10,854,000 | 2,268,661 | ||||||
Samsonite International SA | 709,000 | 2,099,392 | ||||||
| Shares | Value (Note 2) | |||||||
Hong Kong (continued) | ||||||||
Sinosoft Technology Group, Ltd. | 3,132,000 | $ | 1,786,112 | |||||
Value Partners Group, Ltd. | 9,313,000 | 9,937,103 | ||||||
|
| |||||||
| 16,091,268 | ||||||||
|
| |||||||
India (7.15%) | ||||||||
AIA Engineering, Ltd. | 131,924 | 1,936,413 | ||||||
Ajanta Pharma, Ltd. | 153,805 | 3,646,881 | ||||||
Bajaj Finance, Ltd. | 38,226 | 3,055,009 | ||||||
City Union Bank, Ltd. | 1,976,565 | 2,719,308 | ||||||
Credit Analysis & Research, Ltd. | 161,600 | 3,214,194 | ||||||
Cyient, Ltd. | 434,267 | 3,568,439 | ||||||
Dewan Housing Finance Corp., Ltd. | 1,033,000 | 3,553,729 | ||||||
Glenmark Pharmaceuticals, Ltd. | 123,600 | 1,875,421 | ||||||
Hinduja Global Solutions, Ltd. | 340,600 | 2,454,749 | ||||||
Indiabulls Housing Finance, Ltd. | 225,000 | 2,481,043 | ||||||
Jammu & Kashmir Bank, Ltd. | 1,821,000 | 2,318,574 | ||||||
Kolte-Patil Developers, Ltd. | 816,794 | 2,177,451 | ||||||
KPIT Technologies, Ltd. | 916,321 | 1,918,321 | ||||||
MBL Infrastructures, Ltd. | 502,000 | 1,612,131 | ||||||
PC Jeweller, Ltd. | 249,500 | 1,704,252 | ||||||
Poly Medicure, Ltd. | 23,242 | 121,839 | ||||||
Supreme Industries, Ltd. | 198,834 | 1,917,138 | ||||||
Time Technoplast, Ltd. | 4,384,100 | 3,760,484 | ||||||
UFO Moviez India, Ltd.(a) | 134,758 | 1,134,033 | ||||||
Vaibhav Global, Ltd. | 260,500 | 1,930,678 | ||||||
WNS Holdings, Ltd., ADR(a) | 209,750 | 7,146,182 | ||||||
|
| |||||||
| 54,246,269 | ||||||||
|
| |||||||
Indonesia (3.12%) | ||||||||
Astra Graphia Tbk PT | 10,792,000 | 1,336,434 | ||||||
Bank Negara Indonesia Persero Tbk PT | 10,245,000 | 3,559,085 | ||||||
Bank Tabungan Pensiunan Nasional Tbk PT(a) | 2,566,200 | 490,273 | ||||||
Bekasi Fajar Industrial Estate Tbk PT | 65,215,500 | 1,815,314 | ||||||
Express Transindo Utama Tbk PT(a) | 22,620,500 | 378,454 | ||||||
Lippo Cikarang Tbk PT(a) | 1,334,000 | 779,689 | ||||||
Panin Sekuritas Tbk PT | 7,994,000 | 1,979,884 | ||||||
Petra Foods, Ltd. | 1,854,600 | 3,203,749 | ||||||
Selamat Sempurna Tbk PT | 16,888,700 | 6,052,170 | ||||||
Tempo Scan Pacific Tbk PT | 19,383,500 | 2,407,448 | ||||||
See Notes to Financial Statements.
44 |
1.855.377.7325 | www.GrandeurPeakGlobal.com |
Table of Contents
| Grandeur Peak International Opportunities Fund | Portfolio of Investments | |
October 31, 2015 (Unaudited) |
| Value | ||||||||
| Shares | (Note 2) | |||||||
| ||||||||
Indonesia (continued) | ||||||||
Ultrajaya Milk Industry & Trading Co. Tbk PT(a) | 5,739,500 | $ | 1,674,152 | |||||
|
| |||||||
| 23,676,652 | ||||||||
|
| |||||||
Ireland (1.52%) | ||||||||
Beazley PLC | 624,500 | 3,500,487 | ||||||
Irish Residential Properties PLC, REIT | 6,533,476 | 8,046,684 | ||||||
|
| |||||||
| 11,547,171 | ||||||||
|
| |||||||
Israel (0.49%) | ||||||||
Sarine Technologies, Ltd. | 1,358,600 | 1,512,896 | ||||||
Wix.com, Ltd.(a) | 99,150 | 2,193,198 | ||||||
|
| |||||||
| 3,706,094 | ||||||||
|
| |||||||
Italy (0.37%) | ||||||||
Brembo SpA | 62,900 | 2,772,945 | ||||||
|
| |||||||
Japan (10.03%) | ||||||||
AIT Corp. | 465,700 | 4,384,148 | ||||||
Anest Iwata Corp. | 636,600 | 4,521,142 | ||||||
AP Company Co., Ltd.(a) | 162,300 | 2,061,870 | ||||||
ARCLAND SERVICE Co., Ltd. | 34,300 | 1,375,752 | ||||||
Benefit One, Inc. | 60,200 | 1,062,617 | ||||||
CMIC Holdings Co., Ltd. | 214,955 | 2,688,051 | ||||||
CyberAgent, Inc. | 106,500 | 4,412,862 | ||||||
Daikokutenbussan Co., Ltd. | 2,500 | 86,185 | ||||||
Descente, Ltd. | 168,100 | 2,168,987 | ||||||
Future Architect, Inc. | 602,600 | 3,305,885 | ||||||
GCA Savvian Corp. | 539,800 | 6,370,060 | ||||||
Hard Off Corp. Co., Ltd. | 289,300 | 3,677,685 | ||||||
JCU Corp. | 104,800 | 3,738,825 | ||||||
MISUMI Group, Inc. | 554,700 | 7,304,370 | ||||||
Monogatari Corp. | 73,200 | 3,130,123 | ||||||
Prestige International, Inc. | 490,900 | 4,824,790 | ||||||
Quick Co., Ltd. | 127,300 | 916,746 | ||||||
Sawai Pharmaceutical Co., Ltd. | 45,000 | 2,897,572 | ||||||
SK Kaken Co., Ltd. | 31,000 | 3,031,408 | ||||||
Sun Frontier Fudousan Co., Ltd. | 137,300 | 1,117,333 | ||||||
Syuppin Co., Ltd. | 289,600 | 2,515,131 | ||||||
Trancom Co., Ltd. | 168,990 | 8,178,517 | ||||||
Trust Tech, Inc. | 29,800 | 565,279 | ||||||
World Holdings Co., Ltd. | 120,000 | 1,732,328 | ||||||
|
| |||||||
| 76,067,666 | ||||||||
|
| |||||||
Jersey (0.11%) | ||||||||
Integrated Diagnostics Holdings PLC(a)(b)(c) | 154,200 | 849,642 | ||||||
|
| |||||||
| Value | ||||||||
| Shares | (Note 2) | |||||||
| ||||||||
Luxembourg (0.69%) | ||||||||
L'Occitane International SA | 2,596,212 | $ | 5,238,918 | |||||
|
| |||||||
Malaysia (2.53%) | ||||||||
7-Eleven Malaysia Holdings Bhd | 4,674,000 | 1,544,944 | ||||||
AEON Credit Service M Bhd | 777,840 | 2,317,587 | ||||||
Berjaya Auto Bhd | 5,845,000 | 2,857,193 | ||||||
Berjaya Food Bhd | 1,798,016 | 1,046,331 | ||||||
CB Industrial Product Holding Bhd | 3,120,600 | 1,438,265 | ||||||
Kossan Rubber Industries | 1,194,000 | 2,265,154 | ||||||
My EG Services Bhd | 4,416,800 | 3,043,233 | ||||||
Nirvana Asia, Ltd.(b)(c) | 7,888,000 | 2,350,951 | ||||||
Uzma Bhd | 4,529,800 | 2,319,730 | ||||||
|
| |||||||
| 19,183,388 | ||||||||
|
| |||||||
Mexico (1.24%) | ||||||||
Banregio Grupo Financiero SAB de CV | 495,165 | 2,650,625 | ||||||
Credito Real SAB de CV SOFOM ER | 2,857,924 | 6,747,813 | ||||||
|
| |||||||
| 9,398,438 | ||||||||
|
| |||||||
Netherlands (1.21%) | ||||||||
Aalberts Industries NV | 222,697 | 7,240,138 | ||||||
Arcadis NV | 77,800 | 1,963,437 | ||||||
|
| |||||||
| 9,203,575 | ||||||||
|
| |||||||
Norway (1.77%) | ||||||||
Medistim ASA | 420,559 | 2,217,441 | ||||||
Skandiabanken ASA(a)(b)(c) | 1,268,200 | 6,865,825 | ||||||
SpareBank 1 SMN | 568,100 | 3,560,341 | ||||||
Zalaris ASA | 188,200 | 819,537 | ||||||
|
| |||||||
| 13,463,144 | ||||||||
|
| |||||||
Oman (0.25%) | ||||||||
Al Anwar Ceramic Tiles Co. | 2,135,760 | 1,897,221 | ||||||
|
| |||||||
Philippines (1.89%) | ||||||||
Concepcion Industrial Corp. | 1,967,000 | 1,953,556 | ||||||
Pepsi-Cola Products Philippines, Inc. | 41,391,500 | 3,713,035 | ||||||
Puregold Price Club, Inc. | 3,909,000 | 3,005,639 | ||||||
Security Bank Corp. | 1,856,760 | 5,635,318 | ||||||
|
| |||||||
| 14,307,548 | ||||||||
|
| |||||||
Russia (0.11%) | ||||||||
MD Medical Group Investments PLC, GDR(c) | 157,000 | 824,250 | ||||||
|
| |||||||
See Notes to Financial Statements.
Semi-Annual Report | October 31, 2015 |
45 |
Table of Contents
| Grandeur Peak International Opportunities Fund | Portfolio of Investments | |
October 31, 2015 (Unaudited) |
| Value | ||||||||
| Shares | (Note 2) | |||||||
| ||||||||
Singapore (1.13%) | ||||||||
ARA Asset Management, Ltd. | 2,255,212 | $ | 2,269,862 | |||||
CSE Global, Ltd. | 5,921,055 | 2,092,171 | ||||||
Riverstone Holdings, Ltd. | 2,940,000 | 4,176,315 | ||||||
|
| |||||||
| 8,538,348 | ||||||||
|
| |||||||
South Africa (2.94%) | ||||||||
Blue Label Telecoms, Ltd. | 4,517,800 | 3,803,192 | ||||||
Cartrack Holdings, Ltd. | 4,849,500 | 3,802,086 | ||||||
Clicks Group, Ltd. | 273,485 | 1,997,929 | ||||||
EOH Holdings, Ltd. | 301,756 | 3,336,127 | ||||||
Italtile, Ltd. | 3,988,625 | 3,545,060 | ||||||
MiX Telematics, Ltd., Sponsored ADR | 164,500 | 926,135 | ||||||
OneLogix Group, Ltd. | 2,450,980 | 867,823 | ||||||
Super Group, Ltd.(a) | 1,556,097 | 3,661,140 | ||||||
Transaction Capital, Ltd. | 503,772 | 387,685 | ||||||
|
| |||||||
| 22,327,177 | ||||||||
|
| |||||||
South Korea (3.78%) | ||||||||
DGB Financial Group, Inc. | 475,500 | 4,421,122 | ||||||
Duk San Neolux Co., Ltd.(a) | 39,634 | 796,122 | ||||||
Hy-Lok Corp. | 273,291 | 7,647,018 | ||||||
Interpark Holdings Corp. | 358,000 | 3,674,049 | ||||||
ISC Co., Ltd. | 228,553 | 5,132,193 | ||||||
Koh Young Technology, Inc. | 73,383 | 2,140,243 | ||||||
Kolao Holdings | 173,500 | 2,069,734 | ||||||
Vitzrocell Co., Ltd. | 221,726 | 2,781,178 | ||||||
|
| |||||||
| 28,661,659 | ||||||||
|
| |||||||
Sweden (3.83%) | ||||||||
AddTech AB, Class B | 401,313 | 5,707,174 | ||||||
Beijer Alma AB | 110,100 | 2,551,609 | ||||||
Bufab Holding AB | 836,000 | 4,393,537 | ||||||
HIQ International AB | 253,096 | 1,436,775 | ||||||
Indutrade AB | 81,850 | 3,908,773 | ||||||
Moberg Pharma AB(a) | 371,800 | 2,306,465 | ||||||
Nibe Industrier AB, Class B | 150,081 | 4,832,568 | ||||||
Odd Molly International AB | 72,938 | 367,953 | ||||||
Opus Group AB | 3,980,568 | 2,609,124 | ||||||
Tethys Oil AB | 146,000 | 901,440 | ||||||
|
| |||||||
| 29,015,418 | ||||||||
|
| |||||||
Switzerland (1.45%) | ||||||||
Luxoft Holding, Inc.(a) | 41,175 | 2,743,902 | ||||||
VZ Holding AG | 26,380 | 8,219,981 | ||||||
|
| |||||||
| 10,963,883 | ||||||||
|
| |||||||
Taiwan (6.68%) | ||||||||
ASPEED Technology, Inc. | 266,958 | 2,964,510 | ||||||
Cleanaway Co., Ltd. | 476,000 | 2,346,019 | ||||||
Cub Elecparts, Inc. | 433,981 | 5,467,625 | ||||||
| Value | ||||||||
| Shares | (Note 2) | |||||||
| ||||||||
Taiwan (continued) | ||||||||
Novatek Microelectronics Corp. | 791,000 | $ | 2,704,607 | |||||
On-Bright Electronics, Inc. | 372,000 | 1,953,763 | ||||||
Polytronics Technology Corp. | 2,550,300 | 4,949,217 | ||||||
Richtek Technology Corp. | 274,485 | 1,602,258 | ||||||
Silergy Corp. | 605,199 | 6,198,613 | ||||||
Sinmag Equipment Corp. | 678,810 | 2,373,279 | ||||||
Sporton International, Inc. | 1,431,507 | 8,686,891 | ||||||
Test Research, Inc. | 2,114,252 | 3,718,755 | ||||||
TSC Auto ID Technology Co., Ltd. | 454,100 | 3,538,968 | ||||||
UDE Corp. | 1,601,000 | 1,965,279 | ||||||
Voltronic Power Technology Corp. | 172,836 | 2,214,788 | ||||||
|
| |||||||
| 50,684,572 | ||||||||
|
| |||||||
Thailand (0.81%) | ||||||||
Ananda Development PCL | 26,514,800 | 3,101,190 | ||||||
Premier Marketing PCL | 10,552,000 | 3,026,088 | ||||||
|
| |||||||
| 6,127,278 | ||||||||
|
| |||||||
United Arab Emirates (0.19%) | ||||||||
Aramex PJSC | 1,750,150 | 1,472,356 | ||||||
|
| |||||||
United States (0.34%) | ||||||||
First Cash Financial Services, Inc.(a) | 67,025 | 2,557,004 | ||||||
|
| |||||||
Vietnam (0.03%) | ||||||||
DHG Pharmaceutical JSC | 65,000 | 206,622 | ||||||
|
| |||||||
TOTAL COMMON STOCKS (Cost $658,872,185) | 718,356,105 | |||||||
|
| |||||||
PREFERRED STOCKS (0.63%) | ||||||||
Brazil (0.63%) | ||||||||
Banco ABC Brasil SA | 616,160 | 1,358,043 | ||||||
Banco Daycoval SA | 1,481,400 | 3,380,306 | ||||||
|
| |||||||
| 4,738,349 | ||||||||
|
| |||||||
TOTAL PREFERRED STOCKS (Cost $9,892,704) | 4,738,349 | |||||||
|
| |||||||
See Notes to Financial Statements.
46 |
1.855.377.7325 | www.GrandeurPeakGlobal.com |
Table of Contents
| Grandeur Peak International Opportunities Fund | Portfolio of Investments | |
October 31, 2015 (Unaudited) |
| Value | ||||||||
| Shares | (Note 2) | |||||||
| ||||||||
EXCHANGE-TRADED FUNDS (0.58%) |
| |||||||
United States (0.58%) | ||||||||
Market Vectors Vietnam ETF | 261,070 | $ | 4,427,747 | |||||
TOTAL EXCHANGE-TRADED FUNDS (Cost $ 4,752,050) |
| 4,427,747 | ||||||
|
| |||||||
TOTAL INVESTMENTS (95.92%) (Cost $ 673,516,939) |
| $ | 727,522,201 | |||||
Assets In Excess Of Other |
| 30,961,544 | ||||||
|
| |||||||
NET ASSETS (100.00%) | $ | 758,483,745 | ||||||
|
| |||||||
| (a) | Non-Income Producing Security. |
| (b) | Security exempt from registration under Rule 144A of the Securities Act of 1933. These securities may be resold in the ordinary course of business in transactions exempt from registration, normally to qualified institutional buyers. As of October 31, 2015, these securities had a total aggregate market value of $13,682,978, representing 1.80% of net assets. |
| (c) | Security was purchased pursuant to Regulation S under the Securities Act of 1933, which exempts securities offered and sold outside of the United States from registration. Such security cannot be sold in the United States without either an effective registration statement filed pursuant to the Securities Act of 1933, or pursuant to an exemption from registration. The security has been deemed liquid under guidelines approved by the Fund's Board of Trustees. As of October 31, 2015, the aggregate market value of those securities was $17,148,942, representing 2.26% of net assets. |
| (d) | Fair valued security under the procedures approved by the Fund's Board of Trustees. |
Common Abbreviations:
AB - Aktiebolag is the Swedish equivalent of the term corporation.
ADR - American Depositary Receipt.
AG - Aktiengesellschaft is a German term that refers to a corporation that is limited by shares, i.e., owned by shareholders.
A/S - Aktieselskab is the Danish term for a stock-based corporation.
ASA - Allmennaksjeselskap is the Norwegian term for a public limited company.
Bhd - Berhad is the Malaysian term for public limited company.
ER - Regulated Entity.
ETF - Exchange Traded Fund.
GDR - Global Depositary Receipt.
JSC - Joint Stock Company. Ltd. - Limited.
NV - Naamloze Vennootschap is the Dutch term for a public limited liability corporation.
OYJ - Osakeyhtio is the Finnish equivalent of a public limited company.
PCL - Public Company Limited.
PJSC - Public Joint Stock Company.
PLC - Public Limited Company.
REIT - Real Estate Investment Trust.
SA - Generally designates corporations in various countries, mostly those employing the civil law.
SAB de CV - A variable capital company.
SE - A European Company which can operate on a Europe-wide basis and be governed by community law directly applicable in all member states.
SOFOM - Sociedad financiera de objeto multiple is the Spanish term for a multiple purpose financial institution.
SpA - Societa per Azione.
Tbk
PT - Terbuka Perseroan Terbatas is an Indonesian term for a limited liability company.
Holdings are subject to change, and may not reflect the current or future position of the portfolio.
For Fund compliance purposes, the Fund's geographical classifications refer to any one or more of the country sub-classifications used by one or more widely recognized market indexes or ratings group indexes, and/or as defined by Fund management. This definition may not apply for purposes of this report, which may combine sub-classifications for reporting ease. Geographical regions are shown as a percentage of net assets.
See Notes to Financial Statements.
Semi-Annual Report | October 31, 2015 |
47 |
Table of Contents
| Grandeur Peak International Stalwarts Fund | Portfolio of Investments | |
October 31, 2015 (Unaudited) |
| Value | ||||||||
| Shares | (Note 2) | |||||||
| ||||||||
COMMON STOCKS (88.99%) | ||||||||
Australia (1.12%) | ||||||||
Magellan Financial Group, Ltd. | 12,375 | $ | 198,818 | |||||
|
| |||||||
Belgium (1.24%) | ||||||||
Melexis NV | 4,481 | 218,536 | ||||||
|
| |||||||
Brazil (1.61%) | ||||||||
CETIP SA - Mercados Organizados | 23,000 | 203,368 | ||||||
M Dias Branco SA | 4,475 | 81,110 | ||||||
|
| |||||||
| 284,478 | ||||||||
|
| |||||||
Britain (8.34%) | ||||||||
Abcam PLC | 10,050 | 93,113 | ||||||
Bovis Homes Group PLC | 8,400 | 132,732 | ||||||
Diploma PLC | 31,700 | 313,493 | ||||||
Halma PLC | 11,475 | 135,062 | ||||||
IG Group Holdings PLC | 22,800 | 265,547 | ||||||
Ultra Electronics Holdings PLC | 10,250 | 265,938 | ||||||
Victrex PLC | 9,400 | 268,085 | ||||||
|
| |||||||
| 1,473,970 | ||||||||
|
| |||||||
Canada (5.56%) | ||||||||
Home Capital Group, Inc. | 9,154 | 222,969 | ||||||
Stantec, Inc. | 14,044 | 352,496 | ||||||
TransForce, Inc. | 20,822 | 407,332 | ||||||
|
| |||||||
| 982,797 | ||||||||
|
| |||||||
Chile (1.12%) | ||||||||
Banco de Chile | 1,870,650 | 197,953 | ||||||
|
| |||||||
China (9.08%) | ||||||||
AAC Technologies Holdings, Inc. | 23,000 | 146,595 | ||||||
China Lesso Group Holdings, Ltd. | 181,000 | 147,358 | ||||||
China Medical System Holdings, Ltd. | 245,600 | 339,060 | ||||||
China South City Holdings, Ltd. | 475,000 | 113,991 | ||||||
Man Wah Holdings, Ltd. | 326,800 | 374,421 | ||||||
Mindray Medical International, Ltd., ADR | 3,625 | 86,927 | ||||||
Shandong Weigao Group Medical | 125,300 | 86,976 | ||||||
Vitasoy International Holdings, Ltd. | 131,000 | 218,373 | ||||||
| Value | ||||||||
| Shares | (Note 2) | |||||||
| ||||||||
China (continued) | ||||||||
WuXi PharmaTech Cayman, Inc., ADR(a) | 2,025 | $ | 90,517 | |||||
|
| |||||||
| 1,604,218 | ||||||||
|
| |||||||
Denmark (1.28%) | ||||||||
Topdanmark A/S(a) | 8,505 | 226,471 | ||||||
|
| |||||||
France (1.50%) | ||||||||
Alten SA | 5,100 | 264,708 | ||||||
|
| |||||||
Germany (4.43%) | ||||||||
Bertrandt AG | 1,875 | 219,999 | ||||||
Norma Group SE | 3,200 | 164,209 | ||||||
PATRIZIA Immobilien AG(a) | 6,500 | 178,800 | ||||||
Wirecard AG | 4,250 | 219,678 | ||||||
|
| |||||||
| 782,686 | ||||||||
|
| |||||||
Hong Kong (3.46%) | ||||||||
Samsonite International SA | 62,160 | 184,059 | ||||||
Value Partners Group, Ltd. | 400,000 | 426,806 | ||||||
|
| |||||||
| 610,865 | ||||||||
|
| |||||||
India (6.06%) | ||||||||
AIA Engineering, Ltd. | 11,900 | 174,671 | ||||||
Ajanta Pharma, Ltd. | 3,700 | 87,731 | ||||||
Bajaj Finance, Ltd. | 1,725 | 137,861 | ||||||
Glenmark Pharmaceuticals, Ltd. | 4,700 | 71,315 | ||||||
Indiabulls Housing Finance, Ltd. | 11,200 | 123,501 | ||||||
WNS Holdings, Ltd., ADR(a) | 7,425 | 252,970 | ||||||
Yes Bank, Ltd. | 19,150 | 222,330 | ||||||
|
| |||||||
| 1,070,379 | ||||||||
|
| |||||||
Indonesia (3.47%) | ||||||||
Bank Negara Indonesia Persero Tbk PT | 696,200 | 241,858 | ||||||
Bank Rakyat Indonesia Persero Tbk PT | 317,500 | 244,142 | ||||||
Petra Foods, Ltd. | 73,600 | 127,141 | ||||||
|
| |||||||
| 613,141 | ||||||||
|
| |||||||
Ireland (0.56%) | ||||||||
Beazley PLC | 17,700 | 99,213 | ||||||
|
| |||||||
Israel (0.49%) | ||||||||
Caesarstone Sdot-Yam, Ltd. | 2,450 | 86,999 | ||||||
|
| |||||||
Italy (1.54%) | ||||||||
Brembo SpA | 6,167 | 271,872 | ||||||
|
| |||||||
See Notes to Financial Statements.
48 |
1.855.377.7325 | www.GrandeurPeakGlobal.com |
Table of Contents
| Grandeur Peak International Stalwarts Fund | Portfolio of Investments | |
October 31, 2015 (Unaudited) |
| Value | ||||||||
| Shares | (Note 2) | |||||||
| ||||||||
Japan (9.00%) | ||||||||
Century Tokyo Leasing Corp. | 5,500 | $ | 188,469 | |||||
CyberAgent, Inc. | 9,600 | 397,779 | ||||||
MISUMI Group, Inc. | 45,600 | 600,467 | ||||||
Sawai Pharmaceutical Co., Ltd. | 4,200 | 270,440 | ||||||
Suruga Bank, Ltd. | 6,700 | 133,145 | ||||||
|
| |||||||
| 1,590,300 | ||||||||
|
| |||||||
Luxembourg (2.37%) | ||||||||
Grand City Properties SA | 11,200 | 223,660 | ||||||
L'Occitane International SA | 97,000 | 195,737 | ||||||
|
| |||||||
| 419,397 | ||||||||
|
| |||||||
Mexico (1.27%) | ||||||||
Banregio Grupo Financiero SAB de CV | 42,050 | 225,094 | ||||||
|
| |||||||
Netherlands (3.04%) | ||||||||
Aalberts Industries NV | 9,658 | 313,993 | ||||||
Arcadis NV | 8,817 | 222,514 | ||||||
|
| |||||||
| 536,507 | ||||||||
|
| |||||||
Norway (0.36%) | ||||||||
TGS Nopec Geophysical Co. ASA | 3,250 | 64,069 | ||||||
|
| |||||||
Philippines (3.67%) | ||||||||
Puregold Price Club, Inc. | 342,200 | 263,118 | ||||||
Robinsons Retail Holdings, Inc. | 106,320 | 174,627 | ||||||
Security Bank Corp. | 69,200 | 210,024 | ||||||
|
| |||||||
| 647,769 | ||||||||
|
| |||||||
South Africa (1.01%) | ||||||||
EOH Holdings, Ltd. | 16,200 | 179,103 | ||||||
|
| |||||||
South Korea (1.01%) | ||||||||
DGB Financial Group, Inc. | 19,250 | 178,983 | ||||||
|
| |||||||
Sweden (5.84%) | ||||||||
Hexpol AB | 21,325 | 207,670 | ||||||
Indutrade AB | 8,250 | 393,982 | ||||||
Nibe Industrier AB, Class B | 6,200 | 199,638 | ||||||
Svenska Handelsbanken AB, Class A | 10,800 | 146,890 | ||||||
Sweco AB, Class B | 5,700 | 83,396 | ||||||
|
| |||||||
| 1,031,576 | ||||||||
|
| |||||||
Switzerland (2.75%) | ||||||||
Baloise Holding AG | 1,850 | 222,161 | ||||||
Luxoft Holding, Inc.(a) | 1,975 | 131,614 | ||||||
| Value | ||||||||
| Shares | (Note 2) | |||||||
| ||||||||
Switzerland (continued) | ||||||||
VZ Holding AG | 425 | $ | 132,430 | |||||
|
| |||||||
| 486,205 | ||||||||
|
| |||||||
Taiwan (5.02%) | ||||||||
Catcher Technology Co., Ltd. | 27,000 | 266,145 | ||||||
Chailease Holding Co., Ltd. | 93,000 | 178,474 | ||||||
Largan Precision Co., Ltd. | 4,000 | 312,351 | ||||||
Novatek Microelectronics Corp. | 38,000 | 129,931 | ||||||
|
| |||||||
| 886,901 | ||||||||
|
| |||||||
United States (2.79%) | ||||||||
EPAM Systems, Inc.(a) | 2,325 | 179,839 | ||||||
Genpact, Ltd.(a) | 7,225 | 179,035 | ||||||
Syntel, Inc.(a) | 2,850 | 134,064 | ||||||
|
| |||||||
| 492,938 | ||||||||
|
| |||||||
TOTAL COMMON STOCKS (Cost $14,947,469) |
| 15,725,946 | ||||||
|
| |||||||
PREFERRED STOCKS (1.72%) | ||||||||
Brazil (1.27%) | ||||||||
Itau Unibanco Holding SA | 32,700 | 224,441 | ||||||
|
| |||||||
Colombia (0.45%) | ||||||||
Bancolombia SA | 9,071 | 78,655 | ||||||
|
| |||||||
TOTAL PREFERRED STOCKS (Cost $303,224) |
| 303,096 | ||||||
|
| |||||||
TOTAL INVESTMENTS (90.71%) (Cost $15,250,693) |
| $ | 16,029,042 | |||||
Assets In Excess Of Other |
| 1,642,104 | ||||||
|
| |||||||
NET ASSETS (100.00%) |
| $ | 17,671,146 | |||||
|
| |||||||
| (a) | Non-Income Producing Security. |
See Notes to Financial Statements.
Semi-Annual Report | October 31, 2015 |
49 |
Table of Contents
| Grandeur Peak International Stalwarts Fund | Portfolio of Investments | |
October 31, 2015 (Unaudited) |
Common Abbreviations:
AB - Aktiebolag is the Swedish equivalent of the term corporation.
ADR - American Depositary Receipt.
AG - Aktiengesellschaft is a German term that refers to a corporation that is limited by shares, i.e., owned by shareholders.
A/S - Aktieselskab is the Danish term for a stock-based corporation.
ASA - Allmennaksjeselskap is the Norwegian term for a public limited company.
Ltd. - Limited.
NV - Naamloze Vennootschap is the Dutch term for a public limited liability corporation.
PLC - Public Limited Company.
SA - Generally designates corporations in various countries, mostly those employing the civil law.
SAB de CV - A variable capital company.
SE - A European Company which can operate on a Europe-wide basis and be governed by community law directly applicable in all member states.
SpA - Societa per Azione.
Tbk PT - Terbuka Perseroan Terbatas is an Indonesian term for a limited liability company.
Holdings are subject to change, and may not reflect the current or future position of the portfolio.
For Fund compliance purposes, the Fund's geographical classifications refer to any one or more of the country sub-classifications used by one or more widely recognized market indexes or ratings group indexes, and/or as defined by Fund management. This definition may not apply for purposes of this report, which may combine sub-classifications for reporting ease. Geographical regions are shown as a percentage of net assets.
See Notes to Financial Statements.
50 |
1.855.377.7325 | www.GrandeurPeakGlobal.com |
Table of Contents
| Grandeur Peak Funds® | Statements of Assets and Liabilities | |
October 31, 2015 (Unaudited) |
| Grandeur Peak Emerging Markets Opportunities Fund | Grandeur Peak Global Micro Cap Fund | Grandeur Peak Global Opportunities Fund | Grandeur Peak Global Reach Fund | |||||||||||||||||||||||||
| ||||||||||||||||||||||||||||
ASSETS | ||||||||||||||||||||||||||||
Investments, at value (Cost - see below) | $ | 363,916,157 | $ | 15,225,067 | $ | 648,343,971 | $ | 308,960,483 | ||||||||||||||||||||
Cash | 34,552,507 | 12,746,563 | 3,704,110 | 661,462 | ||||||||||||||||||||||||
Foreign cash, at value | 1,597,228 | 344,797 | 620,467 | 672,990 | ||||||||||||||||||||||||
Dividends and interest receivable | 136,422 | 384 | 552,750 | 204,372 | ||||||||||||||||||||||||
Receivable for investments sold | 731,475 | – | 5,401,572 | 3,850,037 | ||||||||||||||||||||||||
Receivable for fund shares subscribed | 138,481 | 1,710,093 | 135,643 | 79,220 | ||||||||||||||||||||||||
Receivable due from advisor | – | 411 | – | – | ||||||||||||||||||||||||
Prepaid and other assets | 11,693 | – | 23,492 | 18,881 | ||||||||||||||||||||||||
| ||||||||||||||||||||||||||||
Total assets | 401,083,963 | 30,027,315 | 658,782,005 | 314,447,445 | ||||||||||||||||||||||||
| ||||||||||||||||||||||||||||
LIABILITIES | ||||||||||||||||||||||||||||
Payable for investments purchased | 2,391,381 | 2,938,498 | 7,242,279 | 4,813,359 | ||||||||||||||||||||||||
Foreign capital gains tax | 114,232 | – | 32,634 | – | ||||||||||||||||||||||||
Payable for fund shares redeemed | 1,900 | 9,800 | 49,177 | 487,386 | ||||||||||||||||||||||||
Advisory fees payable | 453,674 | 2,917 | 690,884 | 306,178 | ||||||||||||||||||||||||
Administration fees payable | 31,543 | 774 | 48,210 | 32,787 | ||||||||||||||||||||||||
Custodian fees payable | 151,909 | 1,912 | 112,778 | 90,546 | ||||||||||||||||||||||||
Payable for trustee fees and expenses | 3,447 | 19 | 5,456 | 2,614 | ||||||||||||||||||||||||
Payable for chief compliance officer fee | 1,373 | 15 | 2,199 | 1,057 | ||||||||||||||||||||||||
Payable for principal financial officer fees | 330 | 3 | 527 | 254 | ||||||||||||||||||||||||
Distribution and service fees payable | 5,884 | – | 38,591 | 15,966 | ||||||||||||||||||||||||
Payable for transfer agency fees | 7,002 | 1,574 | 17,767 | 13,048 | ||||||||||||||||||||||||
Accrued expenses and other liabilities | 65,782 | 2,969 | 55,033 | 40,170 | ||||||||||||||||||||||||
| ||||||||||||||||||||||||||||
Total liabilities | 3,228,457 | 2,958,481 | 8,295,535 | 5,803,365 | ||||||||||||||||||||||||
| ||||||||||||||||||||||||||||
NET ASSETS | $ | 397,855,506 | $ | 27,068,834 | $ | 650,486,470 | $ | 308,644,080 | ||||||||||||||||||||
| ||||||||||||||||||||||||||||
NET ASSETS CONSISTS OF | ||||||||||||||||||||||||||||
Paid-in capital (Note 5) | $ | 407,960,737 | $ | 27,262,361 | $ | 534,653,633 | $ | 301,484,009 | ||||||||||||||||||||
Accumulated net investment income/(loss) | 1,769,051 | (9,285) | 1,115,522 | 843,363 | ||||||||||||||||||||||||
Accumulated net realized gain/(loss) on investments and foreign currency transactions | 7,344,895 | (6,981) | 48,963,352 | 10,308,223 | ||||||||||||||||||||||||
Net unrealized appreciation/(depreciation) on investments and translation of assets and liabilities in foreign currencies | (19,219,177) | (177,261) | 65,753,963 | (3,991,515) | ||||||||||||||||||||||||
| ||||||||||||||||||||||||||||
NET ASSETS | $ | 397,855,506 | $ | 27,068,834 | $ | 650,486,470 | $ | 308,644,080 | ||||||||||||||||||||
| ||||||||||||||||||||||||||||
INVESTMENTS, AT COST | $ | 383,020,880 | $ | 15,401,397 | $ | 582,523,859 | $ | 312,946,753 | ||||||||||||||||||||
PRICING OF SHARES | ||||||||||||||||||||||||||||
Investor Class | ||||||||||||||||||||||||||||
Net Assets | $ | 27,674,995 | $ | – | $ | 181,538,204 | $ | 74,339,648 | ||||||||||||||||||||
Net Asset Value, offering and redemption price per share | $ | 10.18 | $ | – | $ | 3.21 | $ | 12.53 | ||||||||||||||||||||
Shares of beneficial interest outstanding | 2,717,971 | – | 56,614,649 | 5,933,457 | ||||||||||||||||||||||||
Institutional Class | ||||||||||||||||||||||||||||
Net Assets | $ | 370,180,511 | $ | 27,068,834 | $ | 468,948,266 | $ | 234,304,432 | ||||||||||||||||||||
Net Asset Value, offering and redemption price per share | $ | 10.21 | $ | 9.90 | $ | 3.23 | $ | 12.55 | ||||||||||||||||||||
Shares of beneficial interest outstanding | 36,267,615 | 2,733,759 | 144,968,722 | 18,668,897 | ||||||||||||||||||||||||
See Notes to Financial Statements.
Semi-Annual Report | October 31, 2015 |
51 |
Table of Contents
| Grandeur Peak Funds® | Statements of Assets and Liabilities | |
October 31, 2015 (Unaudited) |
| Grandeur Peak Global Stalwarts Fund | Grandeur Peak International Opportunities Fund | Grandeur Peak International Stalwarts Fund | ||||||||||||||||||
| ||||||||||||||||||||
ASSETS | ||||||||||||||||||||
Investments, at value (Cost - see below) | $ | 15,003,713 | $ | 727,522,201 | $ | 16,029,042 | ||||||||||||||
Cash | 1,669,180 | 33,575,041 | 3,065,159 | |||||||||||||||||
Foreign cash, at value | 129,687 | 1,585,295 | 176,447 | |||||||||||||||||
Dividends and interest receivable | 6,725 | 779,148 | 10,609 | |||||||||||||||||
Receivable for investments sold | 76,383 | 4,085,795 | 62,790 | |||||||||||||||||
Receivable for fund shares subscribed | 163,247 | 42,835 | 103,000 | |||||||||||||||||
Receivable due from advisor | 11,937 | – | 6,795 | |||||||||||||||||
Prepaid and other assets | 392 | 23,431 | 390 | |||||||||||||||||
| ||||||||||||||||||||
Total assets | 17,061,264 | 767,613,746 | 19,454,232 | |||||||||||||||||
| ||||||||||||||||||||
LIABILITIES | ||||||||||||||||||||
Payable for investments purchased | 875,958 | 7,921,650 | 1,742,767 | |||||||||||||||||
Foreign capital gains tax | – | – | – | |||||||||||||||||
Payable for fund shares redeemed | – | 70,295 | – | |||||||||||||||||
Advisory fees payable | 82 | 821,586 | 8 | |||||||||||||||||
Administration fees payable | 3,594 | 56,063 | 3,790 | |||||||||||||||||
Custodian fees payable | 22,177 | 149,750 | 15,496 | |||||||||||||||||
Payable for trustee fees and expenses | 23 | 5,969 | 46 | |||||||||||||||||
Payable for chief compliance officer fee | 16 | 2,429 | 32 | |||||||||||||||||
Payable for principal financial officer fees | 4 | 581 | 7 | |||||||||||||||||
Distribution and service fees payable | 1,307 | 30,643 | 516 | |||||||||||||||||
Payable for transfer agency fees | 6,316 | 12,996 | 6,379 | |||||||||||||||||
Accrued expenses and other liabilities | 14,009 | 58,039 | 14,045 | |||||||||||||||||
| ||||||||||||||||||||
Total liabilities | 923,486 | 9,130,001 | 1,783,086 | |||||||||||||||||
| ||||||||||||||||||||
NET ASSETS | $ | 16,137,778 | $ | 758,483,745 | $ | 17,671,146 | ||||||||||||||
| ||||||||||||||||||||
NET ASSETS CONSISTS OF | ||||||||||||||||||||
Paid-in capital (Note 5) | $ | 15,682,832 | $ | 670,490,483 | $ | 16,901,478 | ||||||||||||||
Accumulated net investment income/(loss) | (8) | 3,582,852 | 7,118 | |||||||||||||||||
Accumulated net realized gain/(loss) on investments and foreign currency transactions | 2,262 | 30,450,115 | (14,835) | |||||||||||||||||
Net unrealized appreciation on investments and translation of assets and liabilities in foreign currencies | 452,692 | 53,960,295 | 777,385 | |||||||||||||||||
| ||||||||||||||||||||
NET ASSETS | $ | 16,137,778 | $ | 758,483,745 | $ | 17,671,146 | ||||||||||||||
| ||||||||||||||||||||
INVESTMENTS, AT COST | $ | 14,550,753 | $ | 673,516,939 | $ | 15,250,693 | ||||||||||||||
PRICING OF SHARES | ||||||||||||||||||||
Investor Class | ||||||||||||||||||||
Net Assets | $ | 9,029,717 | $ | 127,282,628 | $ | 3,084,232 | ||||||||||||||
Net Asset Value, offering and redemption price per share | $ | 10.51 | $ | 3.16 | $ | 10.66 | ||||||||||||||
Shares of beneficial interest outstanding | 859,014 | 40,325,689 | 289,400 | |||||||||||||||||
Institutional Class | ||||||||||||||||||||
Net Assets | $ | 7,108,061 | $ | 631,201,117 | $ | 14,586,914 | ||||||||||||||
Net Asset Value, offering and redemption price per share | $ | 10.51 | $ | 3.17 | $ | 10.66 | ||||||||||||||
Shares of beneficial interest outstanding | 676,047 | 199,078,261 | 1,368,545 | |||||||||||||||||
See Notes to Financial Statements.
52 |
1.855.377.7325 | www.GrandeurPeakGlobal.com |
Table of Contents
| Grandeur Peak Funds® | Statements of Operations | |
For the Six Months or Period Ended October 31, 2015 (Unaudited) |
Grandeur Peak | Grandeur Peak | Grandeur Peak | Grandeur Peak Global Reach Fund | |||||||||||||||||||||||||
| ||||||||||||||||||||||||||||
INVESTMENT INCOME | ||||||||||||||||||||||||||||
Dividends | $ | 7,185,846 | $ | 487 | $ | 7,441,641 | $ | 3,677,516 | ||||||||||||||||||||
Interest | 13 | – | – | 99 | ||||||||||||||||||||||||
Foreign taxes withheld | (706,922) | – | (622,520) | (295,050) | ||||||||||||||||||||||||
| ||||||||||||||||||||||||||||
Total investment income | 6,478,937 | 487 | 6,819,121 | 3,382,565 | ||||||||||||||||||||||||
| ||||||||||||||||||||||||||||
EXPENSES | ||||||||||||||||||||||||||||
Investment advisor fees (Note 6) | 2,871,598 | 7,328 | 4,347,738 | 1,831,085 | ||||||||||||||||||||||||
Recoupment of previously waived fees (Note 6) | – | – | – | 100,400 | ||||||||||||||||||||||||
Administrative fees | 81,380 | 774 | 128,074 | 72,094 | ||||||||||||||||||||||||
Distribution and service fees - Investor Class | 36,336 | – | 222,535 | 95,880 | ||||||||||||||||||||||||
Transfer agent fees | 19,582 | 1,574 | 44,415 | 33,472 | ||||||||||||||||||||||||
Professional fees | 29,735 | 1,145 | 23,023 | 17,825 | ||||||||||||||||||||||||
Printing fees | 7,945 | 38 | 22,587 | 10,627 | ||||||||||||||||||||||||
Registration fees | 20,382 | 144 | 16,397 | 19,785 | ||||||||||||||||||||||||
Custodian fees | 244,505 | 1,912 | 181,340 | 155,101 | ||||||||||||||||||||||||
Trustee fees and expenses | 6,380 | 19 | 10,214 | 4,932 | ||||||||||||||||||||||||
Chief compliance officer fees | 3,976 | 15 | 6,392 | 3,063 | ||||||||||||||||||||||||
Principal financial officer fees | 963 | 3 | 1,547 | 742 | ||||||||||||||||||||||||
Offering costs | – | 1,446 | – | – | ||||||||||||||||||||||||
Other expenses | 8,058 | 197 | 11,614 | 6,118 | ||||||||||||||||||||||||
| ||||||||||||||||||||||||||||
Total expenses | 3,330,840 | 14,595 | 5,015,876 | 2,351,124 | ||||||||||||||||||||||||
Less fees waived/reimbursed by investment advisor (Note 6) | – | (4,823) | – | – | ||||||||||||||||||||||||
| ||||||||||||||||||||||||||||
NET INVESTMENT INCOME/(LOSS) | 3,148,097 | (9,285) | 1,803,245 | 1,031,441 | ||||||||||||||||||||||||
| ||||||||||||||||||||||||||||
REALIZED AND UNREALIZED GAIN/(LOSS) ON INVESTMENTS | ||||||||||||||||||||||||||||
Net realized gain on investments | 1,776,733 | – | 16,848,191 | 2,466,575 | ||||||||||||||||||||||||
Net realized loss on foreign currency transactions | (238,636) | (6,981) | (133,009) | (111,440) | ||||||||||||||||||||||||
Net change in unrealized depreciation on investments (net of foreign capital gains tax of $114,232, $–, $32,634 and $–, respectively) | (58,287,626) | (176,330) | (66,097,080) | (31,885,739) | ||||||||||||||||||||||||
Net change in unrealized depreciation on translation of assets and liabilities in foreign currencies | (13,155) | (931) | (26,381) | (19,434) | ||||||||||||||||||||||||
| ||||||||||||||||||||||||||||
NET REALIZED AND UNREALIZED LOSS ON INVESTMENTS AND FOREIGN CURRENCY TRANSACTIONS | (56,762,684) | (184,242) | (49,408,279) | (29,550,038) | ||||||||||||||||||||||||
| ||||||||||||||||||||||||||||
NET DECREASE IN NET ASSETS RESULTING FROM OPERATIONS | $ | (53,614,587) | $ | (193,527) | $ | (47,605,034) | $ | (28,518,597) | ||||||||||||||||||||
| ||||||||||||||||||||||||||||
| (a) | Represents the period October 20, 2015 (inception) to October 31, 2015. |
See Notes to Financial Statements.
Semi-Annual Report | October 31, 2015 |
53 |
Table of Contents
| Grandeur Peak Funds® | Statements of Operations | |
For the Six Months or Period Ended October 31, 2015 (Unaudited) |
| Grandeur Peak Global Stalwarts Fund(a) | Grandeur Peak International Opportunities Fund | Grandeur Peak International Stalwarts Fund(a) | ||||||||||||||||||||
| ||||||||||||||||||||||
INVESTMENT INCOME | ||||||||||||||||||||||
Dividends | $ | 18,873 | $ | 10,572,662 | $ | 32,619 | ||||||||||||||||
Interest | – | 211 | 3 | |||||||||||||||||||
Foreign taxes withheld | (1,947) | (999,322) | (3,763) | |||||||||||||||||||
| ||||||||||||||||||||||
Total investment income | 16,926 | 9,573,551 | 28,859 | |||||||||||||||||||
| ||||||||||||||||||||||
EXPENSES | ||||||||||||||||||||||
Investment advisor fees (Note 6) | 11,083 | 5,090,765 | 15,299 | |||||||||||||||||||
Recoupment of previously waived fees (Note 6) | – | – | – | |||||||||||||||||||
Administrative fees | 3,594 | 148,988 | 3,790 | |||||||||||||||||||
Distribution and service fees - Investor Class | 1,695 | 191,904 | 704 | |||||||||||||||||||
Transfer agent fees | 6,316 | 33,415 | 6,379 | |||||||||||||||||||
Professional fees | 4,901 | 26,077 | 4,912 | |||||||||||||||||||
Printing fees | 37 | 16,118 | 50 | |||||||||||||||||||
Registration fees | 89 | 16,155 | 98 | |||||||||||||||||||
Custodian fees | 22,177 | 252,016 | 15,496 | |||||||||||||||||||
Trustee fees and expenses | 23 | 11,758 | 47 | |||||||||||||||||||
Chief compliance officer fees | 16 | 7,334 | 32 | |||||||||||||||||||
Principal financial officer fees | 4 | 1,774 | 7 | |||||||||||||||||||
Offering costs | 7,885 | – | 7,885 | |||||||||||||||||||
Other expenses | 1,148 | 13,121 | 1,152 | |||||||||||||||||||
| ||||||||||||||||||||||
Total expenses | 58,968 | 5,809,425 | 55,851 | |||||||||||||||||||
Less fees waived/reimbursed by investment advisor (Note 6) | (42,034) | – | (34,110) | |||||||||||||||||||
| ||||||||||||||||||||||
NET INVESTMENT INCOME/(LOSS) | (8) | 3,764,126 | 7,118 | |||||||||||||||||||
| ||||||||||||||||||||||
REALIZED AND UNREALIZED GAIN/(LOSS) ON INVESTMENTS | ||||||||||||||||||||||
Net realized gain/(loss) on investments | 3,739 | (179,199) | (13,728) | |||||||||||||||||||
Net realized loss on foreign currency transactions | (1,477) | (208,207) | (1,107) | |||||||||||||||||||
Net change in unrealized appreciation/(depreciation) on investments (net of foreign capital gains tax of $–, $– and $–, respectively) | 452,960 | (68,014,788) | 778,349 | |||||||||||||||||||
Net change in unrealized depreciation on translation of assets and liabilities in foreign currencies | (268) | (159,840) | (964) | |||||||||||||||||||
| ||||||||||||||||||||||
NET REALIZED AND UNREALIZED GAIN/(LOSS) ON INVESTMENTS AND FOREIGN CURRENCY TRANSACTIONS | 454,954 | (68,562,034) | 762,550 | |||||||||||||||||||
| ||||||||||||||||||||||
NET INCREASE/(DECREASE) IN NET ASSETS RESULTING FROM OPERATIONS | $ | 454,946 | $ | (64,797,908) | $ | 769,668 | ||||||||||||||||
| ||||||||||||||||||||||
| (a) | Represents the period September 1, 2015 (inception) to October 31, 2015. |
See Notes to Financial Statements.
54 |
1.855.377.7325 | www.GrandeurPeakGlobal.com |
Table of Contents
| Grandeur Peak Emerging Markets Opportunities Fund | Statements of Changes in Net Assets |
| For the Six Months Ended October 31, 2015 (Unaudited) | For the Year Ended April 30, 2015 | |||||||
| ||||||||
OPERATIONS | ||||||||
Net investment income | $ | 3,148,097 | $ | 1,653,817 | ||||
Net realized gain on investments and foreign currency transactions | 1,538,097 | 12,553,431 | ||||||
Net change in unrealized appreciation/(depreciation) on investments and foreign currency translations | (58,300,781) | 29,470,012 | ||||||
| ||||||||
Net increase/(decrease) in net assets resulting from operations | (53,614,587) | 43,677,260 | ||||||
| ||||||||
DISTRIBUTIONS TO SHAREHOLDERS (NOTE 3) | ||||||||
Net investment income | ||||||||
Investor Class | – | (54,833) | ||||||
Institutional Class | – | (1,137,527) | ||||||
Net realized gains on investments | ||||||||
Investor Class | – | (924,569) | ||||||
Institutional Class | – | (8,862,626) | ||||||
| ||||||||
Net decrease in net assets from distributions | – | (10,979,555) | ||||||
| ||||||||
CAPITAL SHARE TRANSACTIONS (NOTE 5) | ||||||||
Investor Class | ||||||||
Proceeds from sales of shares | 946,823 | 18,678,785 | ||||||
Distributions reinvested | – | 967,793 | ||||||
Cost of shares redeemed | (8,607,603) | (10,477,031) | ||||||
Redemption fees | – | 723 | ||||||
| ||||||||
Net increase/(decrease) from capital shares transactions | (7,660,780) | 9,170,270 | ||||||
| ||||||||
Institutional Class | ||||||||
Proceeds from sales of shares | 6,637,745 | 142,994,927 | ||||||
Distributions reinvested | – | 9,195,374 | ||||||
Cost of shares redeemed | (15,452,240) | (9,885,549) | ||||||
Redemption fees | 398 | 1,347 | ||||||
| ||||||||
Net increase/(decrease) from capital shares transactions | (8,814,097) | 142,306,099 | ||||||
| ||||||||
Net increase/(decrease) in net assets | (70,089,464) | 184,174,074 | ||||||
| ||||||||
NET ASSETS | ||||||||
Beginning of period | 467,944,970 | 283,770,896 | ||||||
| ||||||||
End of period* | $ | 397,855,506 | $ | 467,944,970 | ||||
| ||||||||
*Including accumulated net investment income/(loss) of: | $ | 1,769,051 | $ | (1,379,046) | ||||
OTHER INFORMATION | ||||||||
Shares Transactions | ||||||||
Investor Class | ||||||||
Issued | 89,183 | 1,678,743 | ||||||
Issued to shareholders in reinvestment of distributions | – | 92,083 | ||||||
Redeemed | (838,056) | (959,085) | ||||||
| ||||||||
Net increase/(decrease) in share transactions | (748,873) | 811,741 | ||||||
| ||||||||
Institutional Class | ||||||||
Issued | 630,924 | 12,912,043 | ||||||
Issued to shareholders in reinvestment of distributions | – | 874,085 | ||||||
Redeemed | (1,509,616) | (914,887) | ||||||
| ||||||||
Net increase/(decrease) in share transactions | (878,692) | 12,871,241 | ||||||
| ||||||||
See Notes to Financial Statements.
Semi-Annual Report | October 31, 2015 |
55 |
Table of Contents
| Grandeur Peak Global Micro Cap Fund | Changes in Net Assets |
| For the Period October 20, 2015 (Inception) to October 31, 2015 (Unaudited) | ||||
| ||||
OPERATIONS | ||||
Net investment loss | $ | (9,285) | ||
Net realized loss on investments and foreign currency transactions | (6,981) | |||
Net change in unrealized depreciation on investments and foreign currency translations | (177,261) | |||
| ||||
Net decrease in net assets resulting from operations | (193,527) | |||
| ||||
CAPITAL SHARE TRANSACTIONS (NOTE 5) | ||||
Institutional Class | ||||
Proceeds from sales of shares | 27,272,814 | |||
Cost of shares redeemed | (10,666) | |||
Redemption fees | 213 | |||
| ||||
Net increase from capital shares transactions | 27,262,361 | |||
| ||||
Net increase in net assets | 27,068,834 | |||
| ||||
NET ASSETS | ||||
Beginning of period | – | |||
| ||||
End of period* | $ | 27,068,834 | ||
| ||||
*Including accumulated net investment loss of: | $ | (9,285) | ||
OTHER INFORMATION | ||||
Shares Transactions | ||||
Institutional Class | ||||
Issued | 2,734,836 | |||
Redeemed | (1,077) | |||
| ||||
Net increase in share transactions | 2,733,759 | |||
| ||||
See Notes to Financial Statements.
56 |
1.855.377.7325 | www.GrandeurPeakGlobal.com |
Table of Contents
| Grandeur Peak Global Opportunities Fund | Statements of Changes in Net Assets |
For the Six Months Ended | For the Year Ended April 30, 2015 | |||||||
| ||||||||
OPERATIONS | ||||||||
Net investment income | $ | 1,803,245 | $ | 1,998,221 | ||||
Net realized gain on investments and foreign currency transactions | 16,715,182 | 64,188,443 | ||||||
Net change in unrealized appreciation/(depreciation) on investments and foreign currency translations | (66,123,461) | 8,724,491 | ||||||
| ||||||||
Net increase/(decrease) in net assets resulting from operations | (47,605,034) | 74,911,155 | ||||||
| ||||||||
DISTRIBUTIONS TO SHAREHOLDERS (NOTE 3) | ||||||||
Net investment income | ||||||||
Investor Class | – | (418,468) | ||||||
Institutional Class | – | (1,900,259) | ||||||
Net realized gains on investments | ||||||||
Investor Class | – | (12,966,230) | ||||||
Institutional Class | – | (32,097,504) | ||||||
| ||||||||
Net decrease in net assets from distributions | – | (47,382,461) | ||||||
| ||||||||
CAPITAL SHARE TRANSACTIONS (NOTE 5) | ||||||||
Investor Class | ||||||||
Proceeds from sales of shares | 5,986,881 | 12,505,211 | ||||||
Distributions reinvested | – | 12,613,027 | ||||||
Cost of shares redeemed | (12,635,878) | (47,705,840) | ||||||
Redemption fees | 409 | 1,678 | ||||||
| ||||||||
Net decrease from capital shares transactions | (6,648,588) | (22,585,924) | ||||||
| ||||||||
Institutional Class | ||||||||
Proceeds from sales of shares | 7,881,604 | 35,606,279 | ||||||
Distributions reinvested | – | 32,205,349 | ||||||
Cost of shares redeemed | (30,998,168) | (54,015,246) | ||||||
Redemption fees | 50 | 1,133 | ||||||
| ||||||||
Net increase/(decrease) from capital shares transactions | (23,116,514) | 13,797,515 | ||||||
| ||||||||
Net increase/(decrease) in net assets | (77,370,136) | 18,740,285 | ||||||
| ||||||||
NET ASSETS | ||||||||
Beginning of period | 727,856,606 | 709,116,321 | ||||||
| ||||||||
End of period* | $ | 650,486,470 | $ | 727,856,606 | ||||
| ||||||||
*Including accumulated net investment income/(loss) of: | $ | 1,115,522 | $ | (687,723) | ||||
OTHER INFORMATION | ||||||||
Shares Transactions | ||||||||
Investor Class | ||||||||
Issued | 1,806,675 | 3,751,583 | ||||||
Issued to shareholders in reinvestment of distributions | – | 3,966,361 | ||||||
Redeemed | (3,867,820) | (14,276,987) | ||||||
| ||||||||
Net decrease in share transactions | (2,061,145) | (6,559,043) | ||||||
| ||||||||
Institutional Class | ||||||||
Issued | 2,398,325 | 10,612,822 | ||||||
Issued to shareholders in reinvestment of distributions | – | 10,064,172 | ||||||
Redeemed | (9,582,552) | (16,204,159) | ||||||
| ||||||||
Net increase/(decrease) in share transactions | (7,184,227) | 4,472,835 | ||||||
| ||||||||
See Notes to Financial Statements.
Semi-Annual Report | October 31, 2015 |
57 |
Table of Contents
| Grandeur Peak Global Reach Fund | Statements of Changes in Net Assets |
| For the | ||||||||
| Six Months Ended | For the | |||||||
| October 31, 2015 | Year Ended | |||||||
| (Unaudited) | April 30, 2015 | |||||||
OPERATIONS | ||||||||
Net investment income | $ | 1,031,441 | $ | 458,861 | ||||
Net realized gain on investments and foreign currency transactions | 2,355,135 | 10,206,381 | ||||||
Net change in unrealized appreciation/(depreciation) on investments and foreign currency translations | (31,905,173) | 20,804,164 | ||||||
Net increase/(decrease) in net assets resulting from operations | (28,518,597) | 31,469,406 | ||||||
DISTRIBUTIONS TO SHAREHOLDERS (NOTE 3) | ||||||||
Net investment income | ||||||||
Investor Class | – | (39,255) | ||||||
Institutional Class | – | (429,550) | ||||||
Net realized gains on investments | ||||||||
Investor Class | – | (920,561) | ||||||
Institutional Class | – | (2,653,424) | ||||||
Net decrease in net assets from distributions | – | (4,042,790) | ||||||
CAPITAL SHARE TRANSACTIONS (NOTE 5) | ||||||||
Investor Class | ||||||||
Proceeds from sales of shares | 4,910,357 | 50,078,072 | ||||||
Distributions reinvested | – | 913,417 | ||||||
Cost of shares redeemed | (10,646,627) | (16,658,848) | ||||||
Redemption fees | 66 | 11,400 | ||||||
Net increase/(decrease) from capital shares transactions | (5,736,204) | 34,344,041 | ||||||
Institutional Class | ||||||||
Proceeds from sales of shares | 7,588,877 | 163,642,642 | ||||||
Distributions reinvested | – | 2,839,814 | ||||||
Cost of shares redeemed | (12,284,055) | (15,137,030) | ||||||
Redemption fees | 773 | 3,537 | ||||||
Net increase/(decrease) from capital shares transactions | (4,694,405) | 151,348,963 | ||||||
Net increase/(decrease) in net assets | (38,949,206) | 213,119,620 | ||||||
NET ASSETS | ||||||||
Beginning of period | 347,593,286 | 134,473,666 | ||||||
End of period* | $ | 308,644,080 | $ | 347,593,286 | ||||
*Including accumulated net investment income/(loss) of: | $ | 843,363 | $ | (188,078) | ||||
OTHER INFORMATION | ||||||||
Shares Transactions | ||||||||
Investor Class | ||||||||
Issued | 371,818 | 3,913,617 | ||||||
Issued to shareholders in reinvestment of distributions | – | 72,379 | ||||||
Redeemed | (836,008) | (1,303,058) | ||||||
Net increase/(decrease) in share transactions | (464,190) | 2,682,938 | ||||||
Institutional Class | ||||||||
Issued | 583,322 | 12,894,402 | ||||||
Issued to shareholders in reinvestment of distributions | – | 225,203 | ||||||
Redeemed | (965,436) | (1,179,712) | ||||||
Net increase/(decrease) in share transactions | (382,114) | 11,939,893 | ||||||
See Notes to Financial Statements.
58 |
1.855.377.7325 | www.GrandeurPeakGlobal.com |
Table of Contents
| Grandeur Peak Global Stalwarts Fund | Statement of Changes in Net Assets |
| For the Period | ||||
| September 1, 2015 | ||||
| (Inception) to | ||||
| October 31, 2015 | ||||
| (Unaudited) | ||||
OPERATIONS | ||||
Net investment loss | $ | (8) | ||
Net realized gain on investments and foreign currency transactions | 2,262 | |||
Net change in unrealized appreciation on investments and foreign currency translations | 452,692 | |||
Net increase in net assets resulting from operations | 454,946 | |||
CAPITAL SHARE TRANSACTIONS (NOTE 5) | ||||
Investor Class | ||||
Proceeds from sales of shares | 8,853,505 | |||
Cost of shares redeemed | (27,253) | |||
Redemption fees | 324 | |||
Net increase from capital shares transactions | 8,826,576 | |||
Institutional Class | ||||
Proceeds from sales of shares | 6,856,874 | |||
Cost of shares redeemed | (618) | |||
Net increase from capital shares transactions | 6,856,256 | |||
Net increase in net assets | 16,137,778 | |||
NET ASSETS | ||||
Beginning of period | – | |||
End of period* | $ | 16,137,778 | ||
*Including accumulated net investment loss of: | $ | (8) | ||
OTHER INFORMATION | ||||
Shares Transactions | ||||
Investor Class | ||||
Issued | 861,594 | |||
Redeemed | (2,580) | |||
Net increase in share transactions | 859,014 | |||
Institutional Class | ||||
Issued | 676,105 | |||
Redeemed | (58) | |||
Net increase in share transactions | 676,047 | |||
See Notes to Financial Statements.
Semi-Annual Report | October 31, 2015 |
59 |
Table of Contents
| Grandeur Peak International Opportunities Fund | Statements of Changes in Net Assets |
| For the | ||||||||
| Six Months Ended | For the | |||||||
| October 31, 2015 | Year Ended | |||||||
| (Unaudited) | April 30, 2015 | |||||||
OPERATIONS | ||||||||
Net investment income | $ | 3,764,126 | $ | 4,559,749 | ||||
Net realized gain/(loss) on investments and foreign currency transactions | (387,406) | 62,562,011 | ||||||
Net change in unrealized depreciation on investments and foreign currency translations | (68,174,628) | (7,154,588) | ||||||
Net increase/(decrease) in net assets resulting from operations | (64,797,908) | 59,967,172 | ||||||
DISTRIBUTIONS TO SHAREHOLDERS (NOTE 3) | ||||||||
Net investment income | ||||||||
Investor Class | – | (519,202) | ||||||
Institutional Class | – | (3,324,759) | ||||||
Net realized gains on investments | ||||||||
Investor Class | – | (9,145,192) | ||||||
Institutional Class | – | (39,074,979) | ||||||
Net decrease in net assets from distributions | – | (52,064,132) | ||||||
CAPITAL SHARE TRANSACTIONS (NOTE 5) | ||||||||
Investor Class | ||||||||
Proceeds from sales of shares | 17,217,990 | 27,042,166 | ||||||
Distributions reinvested | – | 9,427,674 | ||||||
Cost of shares redeemed | (50,938,005) | (18,351,671) | ||||||
Redemption fees | 5,087 | 293 | ||||||
Net increase/(decrease) from capital shares transactions | (33,714,928) | 18,118,462 | ||||||
Institutional Class | ||||||||
Proceeds from sales of shares | 19,011,857 | 25,311,158 | ||||||
Distributions reinvested | – | 36,728,280 | ||||||
Cost of shares redeemed | (18,223,307) | (43,279,215) | ||||||
Redemption fees | 2,199 | 1,597 | ||||||
Net increase from capital shares transactions | 790,749 | 18,761,820 | ||||||
Net increase/(decrease) in net assets | (97,722,087) | 44,783,322 | ||||||
NET ASSETS | ||||||||
Beginning of period | 856,205,832 | 811,422,510 | ||||||
End of period* | $ | 758,483,745 | $ | 856,205,832 | ||||
*Including accumulated net investment income/(loss) of: | $ | 3,582,852 | $ | (181,274) | ||||
OTHER INFORMATION | ||||||||
Shares Transactions | ||||||||
Investor Class | ||||||||
Issued | 5,330,624 | 8,289,054 | ||||||
Issued to shareholders in reinvestment of distributions | – | 3,021,690 | ||||||
Redeemed | (15,841,578) | (5,468,291) | ||||||
Net increase/(decrease) in share transactions | (10,510,954) | 5,842,453 | ||||||
Institutional Class | ||||||||
Issued | 5,905,114 | 7,532,407 | ||||||
Issued to shareholders in reinvestment of distributions | – | 11,734,275 | ||||||
Redeemed | (5,638,598) | (13,091,622) | ||||||
Net increase in share transactions | 266,516 | 6,175,060 | ||||||
See Notes to Financial Statements.
60 |
1.855.377.7325 | www.GrandeurPeakGlobal.com |
Table of Contents
| Grandeur Peak International Stalwarts Fund | Statement of Changes in Net Assets |
| For the Period | ||||
| September 1, 2015 | ||||
| (Inception) to | ||||
| October 31, 2015 | ||||
| (Unaudited) | ||||
OPERATIONS | ||||
Net investment income | $ | 7,118 | ||
Net realized loss on investments and foreign currency transactions | (14,835) | |||
Net change in unrealized appreciation on investments and foreign currency translations | 777,385 | |||
Net increase in net assets resulting from operations | 769,668 | |||
CAPITAL SHARE TRANSACTIONS (NOTE 5) | ||||
Investor Class | ||||
Proceeds from sales of shares | 3,019,618 | |||
Cost of shares redeemed | (35,328) | |||
Redemption fees | 200 | |||
Net increase from capital shares transactions | 2,984,490 | |||
Institutional Class | ||||
Proceeds from sales of shares | 13,920,774 | |||
Cost of shares redeemed | (3,786) | |||
Net increase from capital shares transactions | 13,916,988 | |||
Net increase in net assets | 17,671,146 | |||
NET ASSETS | ||||
Beginning of period | – | |||
End of period* | $ | 17,671,146 | ||
*Including accumulated net investment income of: | $ | 7,118 | ||
OTHER INFORMATION | ||||
Shares Transactions | ||||
Investor Class | ||||
Issued | 292,672 | |||
Redeemed | (3,272) | |||
Net increase in share transactions | 289,400 | |||
Institutional Class | ||||
Issued | 1,368,902 | |||
Redeemed | (357) | |||
Net increase in share transactions | 1,368,545 | |||
See Notes to Financial Statements.
Semi-Annual Report | October 31, 2015 |
61 |
Table of Contents
| Grandeur Peak Emerging Markets Opportunities Fund | Financial Highlights | |
For a Share Outstanding Throughout the Periods Presented | ||
| Investor Class | For the Six Months Ended October 31, 2015 | Year Ended April 30, 2015 | For the Period 2013 (Inception) to April 30, 2014 | |||||||||||||||||||||
| ||||||||||||||||||||||||
NET ASSET VALUE, BEGINNING OF PERIOD | $ | 11.51 | $ | 10.53 | $ | 10.00 | ||||||||||||||||||
INCOME FROM INVESTMENT OPERATIONS | ||||||||||||||||||||||||
Net investment income/(loss)(a) | 0.07 | 0.02 | (0.05) | |||||||||||||||||||||
Net realized and unrealized gain/(loss) on investments | (1.40) | 1.22 | 0.58 | |||||||||||||||||||||
Total income/(loss) from investment operations | (1.33) | 1.24 | 0.53 | |||||||||||||||||||||
DISTRIBUTIONS | ||||||||||||||||||||||||
From net investment income | – | (0.01) | – | |||||||||||||||||||||
From net realized gain on investments | – | (0.25) | – | |||||||||||||||||||||
Total distributions | – | (0.26) | – | |||||||||||||||||||||
REDEMPTION FEES ADDED TO PAID-IN CAPITAL | – | 0.00 | (b) | 0.00 | (b) | |||||||||||||||||||
INCREASE/DECREASE IN NET ASSET VALUE | (1.33) | 0.98 | 0.53 | |||||||||||||||||||||
NET ASSET VALUE, END OF PERIOD | $ | 10.18 | $ | 11.51 | $ | 10.53 | ||||||||||||||||||
| ||||||||||||||||||||||||
TOTAL RETURN | (11.56)% | (c) | 12.06 | % | 5.30% | (c) | ||||||||||||||||||
RATIOS AND SUPPLEMENTAL DATA | ||||||||||||||||||||||||
Net assets, end of period (in 000s) | $ | 27,675 | $ | 39,896 | $ | 27,952 | ||||||||||||||||||
RATIOS TO AVERAGE NET ASSETS | ||||||||||||||||||||||||
Expenses (excluding fees waived/reimbursed by investment advisor) | 1.76% | (d) | 1.82 | % | 2.01% | (d)(e) | ||||||||||||||||||
Expenses (including fees waived/reimbursed by investment advisor) | 1.76% | (d) | 1.82 | % | 1.95% | (d)(e) | ||||||||||||||||||
Net investment income/(loss) | 1.37% | (d) | 0.22 | % | (0.55)% | (d) | ||||||||||||||||||
PORTFOLIO TURNOVER RATE | 21% | (c) | 53 | % | 26% | (c) | ||||||||||||||||||
| (a) | Per share numbers have been calculated using the average shares method. |
| (b) | Less than $0.005 or ($0.005) per share. |
| (c) | Not Annualized. |
| (d) | Annualized. |
| (e) | Expense ratios during startup periods may not be representative of longer term operating periods. |
See Notes to Financial Statements.
62 |
1.855.377.7325 | www.GrandeurPeakGlobal.com |
Table of Contents
| Grandeur Peak Emerging Markets Opportunities Fund | Financial Highlights | |
For a Share Outstanding Throughout the Periods Presented | ||
| Institutional Class | For the Six Months Ended October 31, 2015 | Year Ended April 30, 2015 | For the Period 2013 (Inception) to April 30, 2014 | |||||||||||||||||||||
| ||||||||||||||||||||||||
NET ASSET VALUE, BEGINNING OF PERIOD | $ | 11.52 | $ | 10.54 | $ | 10.00 | ||||||||||||||||||
INCOME FROM INVESTMENT OPERATIONS | ||||||||||||||||||||||||
Net investment income/(loss)(a) | 0.08 | 0.05 | (0.03) | |||||||||||||||||||||
Net realized and unrealized gain/(loss) on investments | (1.39) | 1.21 | 0.57 | |||||||||||||||||||||
Total income/(loss) from investment operations | (1.31) | 1.26 | 0.54 | |||||||||||||||||||||
DISTRIBUTIONS | ||||||||||||||||||||||||
From net investment income | – | (0.03) | – | |||||||||||||||||||||
From net realized gain on investments | – | (0.25) | – | |||||||||||||||||||||
Total distributions | – | (0.28) | – | |||||||||||||||||||||
REDEMPTION FEES ADDED TO PAID-IN CAPITAL | 0.00 | (b) | 0.00 | (b) | 0.00 | (b) | ||||||||||||||||||
INCREASE/DECREASE IN NET ASSET VALUE | (1.31) | 0.98 | 0.54 | |||||||||||||||||||||
NET ASSET VALUE, END OF PERIOD | $ | 10.21 | $ | 11.52 | $ | 10.54 | ||||||||||||||||||
| ||||||||||||||||||||||||
TOTAL RETURN | (11.37)% | (c) | 12.22% | 5.40% | (c) | |||||||||||||||||||
RATIOS AND SUPPLEMENTAL DATA | ||||||||||||||||||||||||
Net assets, end of period (in 000s) | $ | 370,181 | $ | 428,048 | $ | 255,819 | ||||||||||||||||||
RATIOS TO AVERAGE NET ASSETS | ||||||||||||||||||||||||
Expenses (excluding fees waived/reimbursed by investment advisor) | 1.55% | (d) | 1.58% | 1.76% | (d)(e) | |||||||||||||||||||
Expenses (including fees waived/reimbursed by investment advisor) | 1.55% | (d) | 1.58% | 1.70% | (d)(e) | |||||||||||||||||||
Net investment income/(loss) | 1.49% | (d) | 0.43% | (0.37)% | (d) | |||||||||||||||||||
PORTFOLIO TURNOVER RATE | 21% | (c) | 53% | 26% | (c) | |||||||||||||||||||
| (a) | Per share numbers have been calculated using the average shares method. |
| (b) | Less than $0.005 or ($0.005) per share. |
| (c) | Not Annualized. |
| (d) | Annualized. |
| (e) | Expense ratios during startup periods may not be representative of longer term operating periods. |
See Notes to Financial Statements.
Semi-Annual Report | October 31, 2015 |
63 |
Table of Contents
| Grandeur Peak Global Micro Cap Fund | Financial Highlights | |
For a Share Outstanding Throughout the Periods Presented |
| Institutional Class | For the Period October 20, 2015 (Inception) to October 31, 2015 (Unaudited) | |||||||
| ||||||||
NET ASSET VALUE, BEGINNING OF PERIOD | $ | 10.00 | ||||||
INCOME FROM INVESTMENT OPERATIONS | ||||||||
Net investment loss(a) | (0.01) | |||||||
Net realized and unrealized loss on investments | (0.09) | |||||||
Total loss from investment operations | (0.10) | |||||||
REDEMPTION FEES ADDED TO PAID-IN CAPITAL | 0.00 | (b) | ||||||
DECREASE IN NET ASSET VALUE | (0.10) | |||||||
NET ASSET VALUE, END OF PERIOD | $ | 9.90 | ||||||
| ||||||||
TOTAL RETURN | (1.00)% | (c) | ||||||
RATIOS AND SUPPLEMENTAL DATA | ||||||||
Net assets, end of period (in 000s) | $ | 27,069 | ||||||
RATIOS TO AVERAGE NET ASSETS | ||||||||
Expenses (excluding fees waived/ reimbursed by investment advisor) | 2.99% | (d)(e) | ||||||
Expenses (including fees waived/ reimbursed by investment advisor) | 2.00% | (d)(e) | ||||||
Net investment loss | (1.90)% | (d) | ||||||
PORTFOLIO TURNOVER RATE | 0% | (c) | ||||||
| (a) | Per share numbers have been calculated using the average shares method. |
| (b) | Less than $0.005 or ($0.005) per share. |
| (c) | Not Annualized. |
| (d) | Annualized. |
| (e) | Expense ratios during startup periods may not be representative of longer term operating periods. |
See Notes to Financial Statements.
64 |
1.855.377.7325 | www.GrandeurPeakGlobal.com |
Table of Contents
| Grandeur Peak Global Opportunities Fund | Financial Highlights | |
For a Share Outstanding Throughout the Periods Presented |
| For the | ||||||||||||||||||||
| Six Months | For the Period | |||||||||||||||||||
| Ended | October 17, 2011 | |||||||||||||||||||
| October 31, 2015 | Year Ended | Year Ended | Year Ended | (Inception) to | ||||||||||||||||
| Investor Class | (Unaudited) | April 30, 2015 | April 30, 2014 | April 30, 2013 | April 30, 2012 | |||||||||||||||
NET ASSET VALUE, BEGINNING OF PERIOD | $ | 3.43 | $ | 3.31 | $ | 2.77 | $ | 2.31 | $ | 2.00 | ||||||||||
INCOME FROM INVESTMENT OPERATIONS | ||||||||||||||||||||
Net investment income/(loss)(a) | 0.01 | 0.00 | (b) | (0.00) | (b) | 0.00 | (b) | (0.00) | (b) | |||||||||||
Net realized and unrealized gain/(loss) on investments | (0.23) | 0.35 | 0.67 | 0.51 | 0.31 | |||||||||||||||
Total income/(loss) from investment operations | (0.22) | 0.35 | 0.67 | 0.51 | 0.31 | |||||||||||||||
DISTRIBUTIONS | ||||||||||||||||||||
From net investment income | – | (0.01) | – | (0.01) | – | |||||||||||||||
From net realized gain on investments | – | (0.22) | (0.13) | (0.04) | – | |||||||||||||||
Total distributions | – | (0.23) | (0.13) | (0.05) | – | |||||||||||||||
REDEMPTION FEES ADDED TO PAID-IN CAPITAL | 0.00 | (b) | 0.00 | (b) | 0.00 | (b) | 0.00 | (b) | 0.00 | (b) | ||||||||||
INCREASE/DECREASE IN NET ASSET VALUE | (0.22) | 0.12 | 0.54 | 0.46 | 0.31 | |||||||||||||||
NET ASSET VALUE, END OF PERIOD | $ | 3.21 | $ | 3.43 | $ | 3.31 | $ | 2.77 | $ | 2.31 | ||||||||||
TOTAL RETURN | (6.41)% | (c) | 11.09% | 24.31% | 22.34% | 15.50% | (c) | |||||||||||||
RATIOS AND SUPPLEMENTAL DATA | ||||||||||||||||||||
Net assets, end of period (in 000s) | $ | 181,538 | $ | 201,462 | $ | 216,247 | $ | 132,384 | $ | 73,154 | ||||||||||
RATIOS TO AVERAGE NET ASSETS | ||||||||||||||||||||
Expenses (excluding fees waived/ reimbursed by investment advisor) | 1.61% | (d) | 1.62% | 1.68% | 1.76% | 2.30% | (d) | |||||||||||||
Expenses (including fees waived/ reimbursed by investment advisor) | 1.61% | (d) | 1.62% | 1.68% | 1.75% | 1.75% | (d) | |||||||||||||
Net investment income/(loss) | 0.35% | (d) | 0.12% | (0.15)% | 0.19% | (0.04)% | (d) | |||||||||||||
PORTFOLIO TURNOVER RATE | 18% | (c) | 37% | 38% | 35% | 42% | (c) | |||||||||||||
| (a) | Per share numbers have been calculated using the average shares method. |
| (b) | Less than $0.005 or ($0.005) per share. |
| (c) | Not Annualized. |
| (d) | Annualized. |
See Notes to Financial Statements.
Semi-Annual Report | October 31, 2015 |
65 |
Table of Contents
| Grandeur Peak Global Opportunities Fund | Financial Highlights | |
For a Share Outstanding Throughout the Periods Presented |
| For the | ||||||||||||||||||||
| Six Months | For the Period | |||||||||||||||||||
| Ended | October 17, 2011 | |||||||||||||||||||
| October 31, 2015 | Year Ended | Year Ended | Year Ended | (Inception) to | ||||||||||||||||
| Institutional Class | (Unaudited) | April 30, 2015 | April 30, 2014 | April 30, 2013 | April 30, 2012 | |||||||||||||||
NET ASSET VALUE, BEGINNING OF PERIOD | $ | 3.46 | $ | 3.34 | $ | 2.79 | $ | 2.32 | $ | 2.00 | ||||||||||
INCOME FROM INVESTMENT OPERATIONS | ||||||||||||||||||||
Net investment income(a) | 0.01 | 0.01 | 0.00 | (b) | 0.01 | 0.00 | (b) | |||||||||||||
Net realized and unrealized gain/(loss) on investments | (0.24) | 0.34 | 0.68 | 0.52 | 0.32 | |||||||||||||||
Total income/(loss) from investment operations | (0.23) | 0.35 | 0.68 | 0.53 | 0.32 | |||||||||||||||
DISTRIBUTIONS | ||||||||||||||||||||
From net investment income | – | (0.01) | (0.00) | (b) | (0.02) | – | ||||||||||||||
From net realized gain on investments | – | (0.22) | (0.13) | (0.04) | – | |||||||||||||||
Total distributions | – | (0.23) | (0.13) | (0.06) | – | |||||||||||||||
REDEMPTION FEES ADDED TO PAID-IN CAPITAL | 0.00 | (b) | 0.00 | (b) | 0.00 | (b) | 0.00 | (b) | 0.00 | (b) | ||||||||||
INCREASE/DECREASE IN NET ASSET VALUE | (0.23) | 0.12 | 0.55 | 0.47 | 0.32 | |||||||||||||||
NET ASSET VALUE, END OF PERIOD | $ | 3.23 | $ | 3.46 | $ | 3.34 | $ | 2.79 | $ | 2.32 | ||||||||||
TOTAL RETURN | (6.65)% | (c) | 11.20% | 24.67% | 22.86% | 16.00% | (c) | |||||||||||||
RATIOS AND SUPPLEMENTAL DATA | ||||||||||||||||||||
Net assets, end of period (in 000s) | $ | 468,948 | $ | 526,394 | $ | 492,869 | $ | 217,953 | $ | 77,737 | ||||||||||
RATIOS TO AVERAGE NET ASSETS | ||||||||||||||||||||
Expenses (excluding fees waived/reimbursed by investment advisor) | 1.38% | (d) | 1.38% | 1.44% | 1.51% | 2.03% | (d) | |||||||||||||
Expenses (including fees waived/reimbursed by investment advisor) | 1.38% | (d) | 1.38% | 1.44% | 1.50% | 1.50% | (d) | |||||||||||||
Net investment income | 0.58% | (d) | 0.35% | 0.08% | 0.37% | 0.40% | (d) | |||||||||||||
PORTFOLIO TURNOVER RATE | 18% | (c) | 37% | 38% | 35% | 42% | (c) | |||||||||||||
| (a) | Per share numbers have been calculated using the average shares method. |
| (b) | Less than $0.005 or ($0.005) per share. |
| (c) | Not Annualized. |
| (d) | Annualized. |
See Notes to Financial Statements.
66 |
1.855.377.7325 | www.GrandeurPeakGlobal.com |
Table of Contents
| Grandeur Peak Global Reach Fund | Financial Highlights | |
For a Share Outstanding Throughout the Periods Presented |
| For the | ||||||||||||
| Six Months | For the Period | |||||||||||
| Ended | June 19, 2013 | |||||||||||
| October 31, 2015 | Year Ended | (Inception) to | ||||||||||
| Investor Class | (Unaudited) | April 30, 2015 | April 30, 2014 | |||||||||
NET ASSET VALUE, BEGINNING OF PERIOD | $ | 13.65 | $ | 12.43 | $ | 10.00 | ||||||
INCOME FROM INVESTMENT OPERATIONS | ||||||||||||
Net investment income/(loss)(a) | 0.03 | 0.00 | (b) | (0.02) | ||||||||
Net realized and unrealized gain/(loss) on investments | (1.15) | 1.37 | 2.54 | |||||||||
Total income/(loss) from investment operations | (1.12) | 1.37 | 2.52 | |||||||||
DISTRIBUTIONS | ||||||||||||
From net investment income | – | (0.01) | (0.02) | |||||||||
From net realized gain on investments | – | (0.14) | (0.08) | |||||||||
Total distributions | – | (0.15) | (0.10) | |||||||||
REDEMPTION FEES ADDED TO PAID-IN CAPITAL | 0.00 | (b) | 0.00 | (b) | 0.01 | |||||||
INCREASE/DECREASE IN NET ASSET VALUE | (1.12) | 1.22 | 2.43 | |||||||||
NET ASSET VALUE, END OF PERIOD | $ | 12.53 | $ | 13.65 | $ | 12.43 | ||||||
TOTAL RETURN | (8.21)% | (c) | 11.09% | 25.31% | (c) | |||||||
RATIOS AND SUPPLEMENTAL DATA | ||||||||||||
Net assets, end of period (in 000s) | $ | 74,340 | $ | 87,354 | $ | 46,163 | ||||||
RATIOS TO AVERAGE NET ASSETS | ||||||||||||
Expenses (excluding fees waived/reimbursed by investment advisor) | 1.60% | (d) | 1.60% | 1.91% | (d)(e) | |||||||
Expenses (including fees waived/reimbursed by investment advisor) | 1.60% | (d) | 1.60% | 1.60% | (d)(e) | |||||||
Net investment income/(loss) | 0.44% | (d) | 0.03% | (0.17)% | (d) | |||||||
PORTFOLIO TURNOVER RATE | 26% | (c) | 46% | 39% | (c) | |||||||
| (a) | Per share numbers have been calculated using the average shares method. |
| (b) | Less than $0.005 or ($0.005) per share. |
| (c) | Not Annualized. |
| (d) | Annualized. |
| (e) | Expense ratios during startup periods may not be representative of longer term operating periods. |
See Notes to Financial Statements.
Semi-Annual Report | October 31, 2015 |
67 |
Table of Contents
| Grandeur Peak Global Reach Fund | Financial Highlights | |
For a Share Outstanding Throughout the Periods Presented |
| Institutional Class | For the Six Months Ended October 31, 2015 (Unaudited) | Year Ended April 30, 2015 | For the Period April 30, 2014 | |||||||||
NET ASSET VALUE, BEGINNING OF PERIOD | $ | 13.66 | $ | 12.42 | $ | 10.00 | ||||||
INCOME FROM INVESTMENT OPERATIONS | ||||||||||||
Net investment income(a) | 0.04 | 0.03 | 0.02 | |||||||||
Net realized and unrealized gain/(loss) on investments | (1.15) | 1.37 | 2.52 | |||||||||
Total income/(loss) from investment operations | (1.11) | 1.40 | 2.54 | |||||||||
DISTRIBUTIONS | ||||||||||||
From net investment income | – | (0.02) | (0.04) | |||||||||
From net realized gain on investments | – | (0.14) | (0.08) | |||||||||
Total distributions | – | (0.16) | (0.12) | |||||||||
REDEMPTION FEES ADDED TO PAID-IN CAPITAL | 0.00(b) | 0.00(b) | 0.00(b) | |||||||||
INCREASE/DECREASE IN NET ASSET VALUE | (1.11) | 1.24 | 2.42 | |||||||||
NET ASSET VALUE, END OF PERIOD | $ | 12.55 | $ | 13.66 | $ | 12.42 | ||||||
TOTAL RETURN | (8.13)%(c) | 11.41% | 25.45%(c) | |||||||||
RATIOS AND SUPPLEMENTAL DATA | ||||||||||||
Net assets, end of period (in 000s) | $ | 234,304 | $ | 260,239 | $ | 88,311 | ||||||
RATIOS TO AVERAGE NET ASSETS | ||||||||||||
Expenses (excluding fees waived/reimbursed by investment advisor) | 1.35%(d) | 1.35% | 1.75%(d)(e) | |||||||||
Expenses (including fees waived/reimbursed by investment advisor) | 1.35%(d) | 1.35% | 1.35%(d)(e) | |||||||||
Net investment income | 0.68%(d) | 0.23% | 0.21%(d) | |||||||||
PORTFOLIO TURNOVER RATE | 26%(c) | 46% | 39%(c) | |||||||||
| (a) | Per share numbers have been calculated using the average shares method. |
| (b) | Less than $0.005 or ($0.005) per share. |
| (c) | Not Annualized. |
| (d) | Annualized. |
| (e) | Expense ratios during startup periods may not be representative of longer term operating periods. |
See Notes to Financial Statements.
68 |
1.855.377.7325 | www.GrandeurPeakGlobal.com |
Table of Contents
| Grandeur Peak Global Stalwarts Fund | Financial Highlights | |
For a Share Outstanding Throughout the Periods Presented |
| Investor Class | For the Period September 1, 2015 (Inception) to October 31, 2015 (Unaudited) | |||
NET ASSET VALUE, BEGINNING OF PERIOD | $ | 10.00 | ||
INCOME FROM INVESTMENT OPERATIONS | ||||
Net investment loss(a) | (0.00)(b) | (c) | ||
Net realized and unrealized gain on investments | 0.51 | |||
Total income from investment operations | 0.51 | |||
REDEMPTION FEES ADDED TO PAID-IN CAPITAL | 0.00(b) | |||
INCREASE IN NET ASSET VALUE | 0.51 | |||
NET ASSET VALUE, END OF PERIOD | $ | 10.51 | ||
TOTAL RETURN | 5.10%(d) | |||
RATIOS AND SUPPLEMENTAL DATA | ||||
Net assets, end of period (in 000s) | $ | 9,030 | ||
RATIOS TO AVERAGE NET ASSETS | ||||
Expenses (excluding fees waived/ reimbursed by investment advisor) | 4.21%(e)(f) | |||
Expenses (including fees waived/ reimbursed by investment advisor) | 1.35%(e)(f) | |||
Net investment loss | (0.13)%(e) | |||
PORTFOLIO TURNOVER RATE | 4%(d) | |||
| (a) | Per share numbers have been calculated using the average shares method. |
| (b) | Less than $0.005 or ($0.005) per share. |
| (c) | The amount shown for a share outstanding throughout the period may not correlate with the Statement of Operations for the period due to the timing of sales and redemptions of Fund shares in relation to income earned and/or fluctuating market value of the investments of the Fund. |
| (d) | Not Annualized. |
| (e) | Annualized. |
| (f) | Expense ratios during startup periods may not be representative of longer term operating periods. |
See Notes to Financial Statements.
Semi-Annual Report | October 31, 2015 |
69 |
Table of Contents
| Grandeur Peak Global Stalwarts Fund | Financial Highlights | |
For a Share Outstanding Throughout the Periods Presented |
| Institutional Class | For the Period September 1, 2015 (Inception) to October 31, 2015 (Unaudited) | |||
NET ASSET VALUE, BEGINNING OF PERIOD | $ | 10.00 | ||
INCOME FROM INVESTMENT OPERATIONS | ||||
Net investment income(a) | 0.00(b) | |||
Net realized and unrealized gain on investments | 0.51 | |||
Total income from investment operations | 0.51 | |||
REDEMPTION FEES ADDED TO PAID-IN CAPITAL | – | |||
INCREASE IN NET ASSET VALUE | 0.51 | |||
NET ASSET VALUE, END OF PERIOD | $ | 10.51 | ||
TOTAL RETURN | 5.10%(c) | |||
RATIOS AND SUPPLEMENTAL DATA | ||||
Net assets, end of period (in 000s) | $ | 7,108 | ||
RATIOS TO AVERAGE NET ASSETS | ||||
Expenses (excluding fees waived/ reimbursed by investment advisor) | 4.30%(d)(e) | |||
Expenses (including fees waived/ reimbursed by investment advisor) | 1.10%(d)(e) | |||
Net investment income | 0.13%(d) | |||
PORTFOLIO TURNOVER RATE | 4%(c) | |||
| (a) | Per share numbers have been calculated using the average shares method. |
| (b) | Less than $0.005 or ($0.005) per share. |
| (c) | Not Annualized. |
| (d) | Annualized. |
| (e) | Expense ratios during startup periods may not be representative of longer term operating periods. |
See Notes to Financial Statements.
70 |
1.855.377.7325 | www.GrandeurPeakGlobal.com |
Table of Contents
| Grandeur Peak International Opportunities Fund | Financial Highlights | |
For a Share Outstanding Throughout the Periods Presented |
| Investor Class | For the Six Months Ended October 31, 2015 (Unaudited) | Year Ended April 30, 2015 | Year Ended April 30, 2014 | Year Ended April 30, 2013 | For the Period October 17, 2011 (Inception) to April 30, 2012 | |||||||||||||||
NET ASSET VALUE, BEGINNING OF PERIOD | $ | 3.42 | $ | 3.41 | $ | 2.83 | $ | 2.29 | $ | 2.00 | ||||||||||
INCOME FROM INVESTMENT OPERATIONS | ||||||||||||||||||||
Net investment income(a) | 0.01 | 0.01 | 0.01 | 0.01 | 0.00(b) | |||||||||||||||
Net realized and unrealized gain/(loss) on investments | (0.27) | 0.21 | 0.68 | 0.55 | 0.29 | |||||||||||||||
Total income/(loss) from investment operations | (0.26) | 0.22 | 0.69 | 0.56 | 0.29 | |||||||||||||||
DISTRIBUTIONS | ||||||||||||||||||||
From net investment income | – | (0.01) | (0.02) | (0.01) | – | |||||||||||||||
From net realized gain on investments | – | (0.20) | (0.09) | (0.01) | – | |||||||||||||||
Total distributions | – | (0.21) | (0.11) | (0.02) | – | |||||||||||||||
REDEMPTION FEES ADDED TO PAID-IN CAPITAL | 0.00(b) | 0.00(b) | 0.00(b) | 0.00(b) | 0.00(b) | |||||||||||||||
INCREASE/DECREASE IN NET ASSET VALUE | (0.26) | 0.01 | 0.58 | 0.54 | 0.29 | |||||||||||||||
NET ASSET VALUE, END OF PERIOD | $ | 3.16 | $ | 3.42 | $ | 3.41 | $ | 2.83 | $ | 2.29 | ||||||||||
TOTAL RETURN | (7.60)%(c) | 7.25% | 24.59% | 24.57% | 14.50%(c) | |||||||||||||||
RATIOS AND SUPPLEMENTAL DATA | ||||||||||||||||||||
Net assets, end of period (in 000s) | $ | 127,283 | $ | 173,842 | $ | 153,296 | $ | 96,550 | $ | 9,274 | ||||||||||
RATIOS TO AVERAGE NET ASSETS | ||||||||||||||||||||
Expenses (excluding fees waived/ reimbursed by investment advisor) | 1.62%(d) | 1.62% | 1.73% | 1.88% | 2.94%(d) | |||||||||||||||
Expenses (including fees waived/ reimbursed by investment advisor) | 1.62%(d) | 1.62% | 1.73% | 1.75% | 1.75%(d) | |||||||||||||||
Net investment income | 0.74%(d) | 0.37% | 0.20% | 0.26% | 0.33%(d) | |||||||||||||||
PORTFOLIO TURNOVER RATE | 20%(c) | 36% | 37% | 52% | 24%(c) | |||||||||||||||
| (a) | Per share numbers have been calculated using the average shares method. |
| (b) | Less than $0.005 or ($0.005) per share. |
| (c) | Not Annualized. |
| (d) | Annualized. |
See Notes to Financial Statements.
Semi-Annual Report | October 31, 2015 |
71 |
Table of Contents
| Grandeur Peak International Opportunities Fund | Financial Highlights | |
For a Share Outstanding Throughout the Periods Presented |
| Institutional Class | For the Six Months Ended October 31, 2015 | Year Ended April 30, 2015 | Year Ended April 30, 2014 | Year Ended April 30, 2013 | For the Period October 17, 2011 (Inception) to April 30, 2012 | |||||||||||||||
NET ASSET VALUE, BEGINNING OF PERIOD | $ | 3.43 | $ | 3.42 | $ | 2.84 | $ | 2.29 | $ | 2.00 | ||||||||||
INCOME FROM INVESTMENT OPERATIONS | ||||||||||||||||||||
Net investment income(a) | 0.02 | 0.02 | 0.01 | 0.01 | 0.01 | |||||||||||||||
Net realized and unrealized gain/(loss) on investments | (0.28) | 0.21 | 0.69 | 0.57 | 0.28 | |||||||||||||||
Total income/(loss) from investment operations | (0.26) | 0.23 | 0.70 | 0.58 | 0.29 | |||||||||||||||
DISTRIBUTIONS | ||||||||||||||||||||
From net investment income | – | (0.02) | (0.03) | (0.02) | – | |||||||||||||||
From net realized gain on investments | – | (0.20) | (0.09) | (0.01) | – | |||||||||||||||
Total distributions | – | (0.22) | (0.12) | (0.03) | – | |||||||||||||||
REDEMPTION FEES ADDED TO PAID-IN CAPITAL | 0.00(b) | 0.00(b) | 0.00(b) | 0.00(b) | 0.00(b) | |||||||||||||||
INCREASE/DECREASE IN NET ASSET VALUE | (0.26) | 0.01 | 0.58 | 0.55 | 0.29 | |||||||||||||||
NET ASSET VALUE, END OF PERIOD | $ | 3.17 | $ | 3.43 | $ | 3.42 | $ | 2.84 | $ | 2.29 | ||||||||||
TOTAL RETURN | (7.58)%(c) | 7.41% | 24.70% | 25.11% | 14.50%(c) | |||||||||||||||
RATIOS AND SUPPLEMENTAL DATA | ||||||||||||||||||||
Net assets, end of period (in 000s) | $ | 631,201 | $ | 682,364 | $ | 658,127 | $ | 250,962 | $ | 55,458 | ||||||||||
RATIOS TO AVERAGE NET ASSETS | ||||||||||||||||||||
Expenses (excluding fees waived/reimbursed by investment advisor) | 1.38%(d) | 1.38% | 1.46% | 1.59% | 2.50%(d) | |||||||||||||||
Expenses (including fees waived/reimbursed by investment advisor) | 1.38%(d) | 1.38% | 1.46% | 1.50% | 1.50%(d) | |||||||||||||||
Net investment income | 0.97%(d) | 0.61% | 0.42% | 0.51% | 0.56%(d) | |||||||||||||||
PORTFOLIO TURNOVER RATE | 20%(c) | 36% | 37% | 52% | 24%(c) | |||||||||||||||
| (a) | Per share numbers have been calculated using the average shares method. |
| (b) | Less than $0.005 or ($0.005) per share. |
| (c) | Not Annualized. |
| (d) | Annualized. |
See Notes to Financial Statements.
72 |
1.855.377.7325 | www.GrandeurPeakGlobal.com |
Table of Contents
| Grandeur Peak International Stalwarts Fund | Financial Highlights | |
For a Share Outstanding Throughout the Periods Presented |
| Investor Class | For the Period September 1, 2015 October 31, 2015 | |||
NET ASSET VALUE, BEGINNING OF PERIOD | $ | 10.00 | ||
INCOME FROM INVESTMENT OPERATIONS | ||||
Net investment income(a) | 0.00(b) | |||
Net realized and unrealized gain on investments | 0.66 | |||
Total income from investment operations | 0.66 | |||
REDEMPTION FEES ADDED TO PAID-IN CAPITAL | 0.00(b) | |||
INCREASE IN NET ASSET VALUE | 0.66 | |||
NET ASSET VALUE, END OF PERIOD | $ | 10.66 | ||
TOTAL RETURN | 6.60%(c) | |||
RATIOS AND SUPPLEMENTAL DATA | ||||
Net assets, end of period (in 000s) | $ | 3,084 | ||
RATIOS TO AVERAGE NET ASSETS | ||||
Expenses (excluding fees waived/ reimbursed by investment advisor) | 3.02%(d)(e) | |||
Expenses (including fees waived/ reimbursed by investment advisor) | 1.35%(d)(e) | |||
Net investment income | 0.12%(d) | |||
PORTFOLIO TURNOVER RATE | 7%(c) | |||
| (a) | Per share numbers have been calculated using the average shares method. |
| (b) | Less than $0.005 or ($0.005) per share. |
| (c) | Not Annualized. |
| (d) | Annualized. |
| (e) | Expense ratios during startup periods may not be representative of longer term operating periods. |
See Notes to Financial Statements.
Semi-Annual Report | October 31, 2015 |
73 |
Table of Contents
| Grandeur Peak International Stalwarts Fund | Financial Highlights | |
For a Share Outstanding Throughout the Periods Presented |
| Institutional Class | For the Period September 1, 2015 (Inception) to October 31, 2015 (Unaudited) | |||
NET ASSET VALUE, BEGINNING OF PERIOD | $ | 10.00 | ||
INCOME FROM INVESTMENT OPERATIONS | ||||
Net investment income(a) | 0.01 | |||
Net realized and unrealized gain on investments | 0.65 | |||
Total income from investment operations | 0.66 | |||
REDEMPTION FEES ADDED TO PAID-IN CAPITAL | – | |||
INCREASE IN NET ASSET VALUE | 0.66 | |||
NET ASSET VALUE, END OF PERIOD | $ | 10.66 | ||
TOTAL RETURN | 6.60%(b) | |||
RATIOS AND SUPPLEMENTAL DATA | ||||
Net assets, end of period (in 000s) | $ | 14,587 | ||
RATIOS TO AVERAGE NET ASSETS | ||||
Expenses (excluding fees waived/ reimbursed by investment advisor) | 2.90%(c)(d) | |||
Expenses (including fees waived/ reimbursed by investment advisor) | 1.10%(c)(d) | |||
Net investment income | 0.42%(c) | |||
PORTFOLIO TURNOVER RATE | 7%(b) | |||
| (a) | Per share numbers have been calculated using the average shares method. |
| (b) | Not Annualized. |
| (c) | Annualized. |
| (d) | Expense ratios during startup periods may not be representative of longer term operating periods. |
See Notes to Financial Statements.
74 |
1.855.377.7325 | www.GrandeurPeakGlobal.com |
Table of Contents
| Grandeur Peak Funds® | Notes to Financial Statements | |
October 31, 2015 (Unaudited) |
1. ORGANIZATION
Financial Investors Trust (the “Trust”), a Delaware statutory trust, is an open-end management investment company registered under the Investment Company Act of 1940, as amended (“1940 Act”). As of October 31, 2015, the Trust had 34 registered funds. This semi-annual report describes the Grandeur Peak Emerging Markets Opportunities Fund, Grandeur Peak Global Micro Cap Fund, Grandeur Peak Global Opportunities Fund, Grandeur Peak Global Reach Fund, Grandeur Peak Global Stalwarts Fund, Grandeur Peak International Opportunities Fund, and Grandeur Peak International Stalwarts Fund (individually a “Fund” and collectively, the “Funds”). The Funds seek long-term growth of capital. The Funds offer Investor Class (except the Grandeur Peak Global Micro Cap Fund) and Institutional Class shares. The Grandeur Peak Global Opportunities Fund and Grandeur Peak International Opportunities Fund were each previously a non-diversified investment company for the diversification purposes of 1940 Act. As a result of operating in a diversified manner for the past three years, the Funds are now deemed to be diversified under the Investment Company Act of 1940. Neither Fund may resume operating in a non-diversified manner without first obtaining shareholder approval.
2. SIGNIFICANT ACCOUNTING POLICIES
The accompanying financial statements were prepared in accordance with accounting principles generally accepted in the United States of America (“U.S. GAAP”). The preparation of financial statements in conformity with U.S. GAAP requires management to make certain estimates and assumptions that affect the reported amounts of assets and liabilities and disclosures of contingent assets and liabilities at the date of the financial statements and the reported amounts of revenue and expenses during the period. Actual results could differ from those estimates. The Funds are considered an investment company for financial reporting purposes under U.S. GAAP. The following is a summary of significant accounting policies consistently followed by the Funds in preparation of their financial statements.
Investment Valuation: The Funds generally value their securities based on market prices determined at the close of regular trading on the New York Stock Exchange (“NYSE”), normally 4:00 p.m. Eastern Time, on each day the NYSE is open for trading.
For equity securities and mutual funds that are traded on an exchange, the market price is usually the closing sale or official closing price on that exchange. In the case of equity securities not traded on an exchange, or if such closing prices are not otherwise available, the securities are valued at the mean of the most recent bid and ask prices on such day. Redeemable securities issued by open-end registered investment companies are valued at the investment company’s applicable net asset value.
Equity securities that are primarily traded on foreign securities exchanges are valued at the closing values of such securities on their respective foreign exchanges, except when an event occurs subsequent to the close of the foreign exchange and the close of the NYSE that was likely to have changed such value. In such an event, the fair value of those securities are determined in good faith through consideration of other factors in accordance with procedures established by and under the general supervision of the Board of Trustees (the “Board”). The Funds will use a fair valuation model provided by an independent pricing service, which is intended to reflect fair value when a security’s value or a meaningful portion of each Fund’s portfolio is believed to have been materially affected by a valuation event that has occurred between the close of the exchange or market on which the security is traded and the close of the regular trading day on the NYSE. The Funds’ valuation procedures set forth certain triggers which instruct when to use the fair valuation model.
Forward currency exchange contracts have a market value determined by the prevailing foreign currency exchange daily rates and current foreign currency exchange forward rates. The foreign currency exchange forward rates are calculated using an automated system that estimates rates on the basis of the current day foreign currency exchange rates and forward foreign currency exchange rates supplied by a pricing service.
When such prices or quotations are not available, or when Grandeur Peak Global Advisors, LLC (the “Adviser”) believes that they are unreliable, securities may be priced using fair value procedures approved by the Board.
Fair Value Measurements: The Funds disclose the classification of their fair value measurements following a three-tier hierarchy based on the inputs used to measure fair value. Inputs refer broadly to the assumptions that market participants would use in pricing the asset or liability, including assumptions about risk. Inputs may be observable or unobservable. Observable inputs reflect the assumptions market participants would use in pricing the asset or liability that are developed based on market data obtained from sources independent of the reporting entity. Unobservable inputs reflect the reporting entity’s own assumptions about the assumptions market participants would use in pricing the asset or liability that are developed based on the best information available.
Various inputs are used in determining the value of the Funds’ investments as of the end of the reporting period. When inputs used fall into different levels of the fair value hierarchy, the level in the hierarchy within which the fair value measurement falls is determined based on the lowest level input that is significant to the fair value measurement in its entirety. The designated input levels are not necessarily an indication
Semi-Annual Report | October 31, 2015 |
75 |
Table of Contents
| Grandeur Peak Funds® | Notes to Financial Statements | |
October 31, 2015 (Unaudited) |
of the risk or liquidity associated with these investments. These inputs are categorized in the following hierarchy under applicable financial accounting standards:
Level 1 – Unadjusted quoted prices in active markets for identical investments, unrestricted assets or liabilities that the Funds have the ability to access at the measurement date;
Level 2 – Quoted prices which are not active, quoted prices for similar assets or liabilities in active markets or inputs other than quoted prices that are observable (either directly or indirectly) for substantially the full term of the asset or liability; and
Level 3 – Significant unobservable prices or inputs (including the Funds’ own assumptions in determining the fair value of investments) where there is little or no market activity for the asset or liability at the measurement date.
The following is a summary of each Fund’s investments in the fair value hierarchy as of October 31, 2015:
| Investments in Securities at Value | Level 1 - Quoted and Unadjusted | Level 2 - Other Significant Observable Inputs | Level 3 - Significant Inputs | Total | ||||||||||||||||||||||||
| ||||||||||||||||||||||||||||
Grandeur Peak Emerging Markets Opportunities Fund | ||||||||||||||||||||||||||||
Common Stocks | ||||||||||||||||||||||||||||
Bangladesh | $ | 3,742,380 | $ | – | $ | – | $ | 3,742,380 | ||||||||||||||||||||
Brazil | 12,618,214 | – | – | 12,618,214 | ||||||||||||||||||||||||
China | 58,763,127 | – | 869,699 | 59,632,826 | ||||||||||||||||||||||||
Colombia | 8,694,914 | – | – | 8,694,914 | ||||||||||||||||||||||||
Georgia | 5,460,261 | – | – | 5,460,261 | ||||||||||||||||||||||||
Greece | 1,809,931 | – | – | 1,809,931 | ||||||||||||||||||||||||
Hong Kong | 14,211,388 | – | – | 14,211,388 | ||||||||||||||||||||||||
India | 54,995,270 | – | – | 54,995,270 | ||||||||||||||||||||||||
Indonesia | 18,982,732 | – | – | 18,982,732 | ||||||||||||||||||||||||
Jersey | 466,697 | – | – | 466,697 | ||||||||||||||||||||||||
Luxembourg | 1,502,481 | – | – | 1,502,481 | ||||||||||||||||||||||||
Malaysia | 15,318,173 | – | – | 15,318,173 | ||||||||||||||||||||||||
Mexico | 6,835,882 | – | – | 6,835,882 | ||||||||||||||||||||||||
Oman | 901,659 | – | – | 901,659 | ||||||||||||||||||||||||
Philippines | 20,839,155 | – | – | 20,839,155 | ||||||||||||||||||||||||
Poland | 5,553,921 | – | – | 5,553,921 | ||||||||||||||||||||||||
Russia | 1,146,075 | – | – | 1,146,075 | ||||||||||||||||||||||||
South Africa | 25,663,373 | – | – | 25,663,373 | ||||||||||||||||||||||||
South Korea | 23,485,253 | – | – | 23,485,253 | ||||||||||||||||||||||||
Spain | 1,104,160 | – | – | 1,104,160 | ||||||||||||||||||||||||
Sri Lanka | 8,071,481 | – | – | 8,071,481 | ||||||||||||||||||||||||
Taiwan | 47,972,766 | – | – | 47,972,766 | ||||||||||||||||||||||||
Thailand | 4,510,238 | – | – | 4,510,238 | ||||||||||||||||||||||||
Turkey | 5,747,594 | – | – | 5,747,594 | ||||||||||||||||||||||||
United Arab Emirates | 685,651 | – | – | 685,651 | ||||||||||||||||||||||||
United States | 2,046,748 | – | – | 2,046,748 | ||||||||||||||||||||||||
Vietnam | 4,818,033 | – | – | 4,818,033 | ||||||||||||||||||||||||
Preferred Stocks | ||||||||||||||||||||||||||||
Brazil | 2,381,901 | – | – | 2,381,901 | ||||||||||||||||||||||||
Exchange-Traded Funds | ||||||||||||||||||||||||||||
United States | 4,717,000 | – | – | 4,717,000 | ||||||||||||||||||||||||
| ||||||||||||||||||||||||||||
Total | $ | 363,046,458 | $ | – | $ | 869,699 | $ | 363,916,157 | ||||||||||||||||||||
| ||||||||||||||||||||||||||||
76 |
1.855.377.7325 | www.GrandeurPeakGlobal.com |
Table of Contents
| Grandeur Peak Funds® | Notes to Financial Statements | |
October 31, 2015 (Unaudited) |
| Investments in Securities at Value | Level 1 - Quoted and Unadjusted | Level 2 - Other Significant Observable Inputs | Level 3 - Significant Inputs | Total | ||||||||||||
| ||||||||||||||||
Grandeur Peak Global Micro Cap Fund |
| |||||||||||||||
Common Stocks | ||||||||||||||||
Australia | $ | 412,470 | $ | – | $ | – | $ | 412,470 | ||||||||
Brazil | 127,861 | – | – | 127,861 | ||||||||||||
Britain | 852,241 | – | – | 852,241 | ||||||||||||
Canada | 373,055 | – | – | 373,055 | ||||||||||||
China | 267,175 | – | – | 267,175 | ||||||||||||
Colombia | 51,260 | – | – | 51,260 | ||||||||||||
Denmark | 85,342 | – | – | 85,342 | ||||||||||||
France | 1,100,946 | – | – | 1,100,946 | ||||||||||||
Germany | 256,016 | – | – | 256,016 | ||||||||||||
Greece | 11,946 | – | – | 11,946 | ||||||||||||
Hong Kong | 170,348 | – | – | 170,348 | ||||||||||||
India | 1,126,924 | – | – | 1,126,924 | ||||||||||||
Indonesia | 536,525 | – | – | 536,525 | ||||||||||||
Ireland | 215,778 | – | – | 215,778 | ||||||||||||
Israel | 167,371 | – | – | 167,371 | ||||||||||||
Japan | 2,510,835 | – | – | 2,510,835 | ||||||||||||
Malaysia | 180,505 | – | – | 180,505 | ||||||||||||
Norway | 246,264 | – | – | 246,264 | ||||||||||||
Philippines | 178,683 | – | – | 178,683 | ||||||||||||
Singapore | 240,187 | – | – | 240,187 | ||||||||||||
South Africa | 372,640 | – | – | 372,640 | ||||||||||||
South Korea | 498,211 | – | – | 498,211 | ||||||||||||
Sri Lanka | 186,660 | – | – | 186,660 | ||||||||||||
Sweden | 812,631 | – | – | 812,631 | ||||||||||||
Taiwan | 1,073,450 | – | – | 1,073,450 | ||||||||||||
Thailand | 376,168 | – | – | 376,168 | ||||||||||||
Turkey | 272,361 | – | – | 272,361 | ||||||||||||
United States | 2,521,214 | – | – | 2,521,214 | ||||||||||||
| ||||||||||||||||
Total | $ | 15,225,067 | $ | – | $ | – | $ | 15,225,067 | ||||||||
| ||||||||||||||||
Semi-Annual Report | October 31, 2015 |
77 |
Table of Contents
| Grandeur Peak Funds® | Notes to Financial Statements | |
October 31, 2015 (Unaudited) |
| Investments in Securities at Value | Level 1 - Quoted and Unadjusted | Level 2 - Other Significant Observable Inputs | Level 3 - Significant Unobservable Inputs | Total | ||||||||||||
| ||||||||||||||||
Grandeur Peak Global Opportunities Fund | ||||||||||||||||
Common Stocks | ||||||||||||||||
Australia | $ | 7,712,925 | $ | – | $ | – | $ | 7,712,925 | ||||||||
Austria | 7,481,372 | – | – | 7,481,372 | ||||||||||||
Belgium | 7,840,671 | – | – | 7,840,671 | ||||||||||||
Brazil | 10,035,567 | – | – | 10,035,567 | ||||||||||||
Britain | 45,597,013 | – | – | 45,597,013 | ||||||||||||
Canada | 14,911,936 | – | – | 14,911,936 | ||||||||||||
Chile | 1,313,335 | – | – | 1,313,335 | ||||||||||||
China | 45,074,030 | – | 1,371,905 | 46,445,935 | ||||||||||||
Colombia | 7,217,794 | – | – | 7,217,794 | ||||||||||||
Denmark | 605,839 | – | – | 605,839 | ||||||||||||
France | 12,051,196 | – | – | 12,051,196 | ||||||||||||
Georgia | 5,315,443 | – | – | 5,315,443 | ||||||||||||
Germany | 18,893,107 | – | – | 18,893,107 | ||||||||||||
Hong Kong | 11,375,094 | – | – | 11,375,094 | ||||||||||||
India | 50,238,559 | – | – | 50,238,559 | ||||||||||||
Indonesia | 19,278,112 | – | – | 19,278,112 | ||||||||||||
Ireland | 4,662,566 | – | – | 4,662,566 | ||||||||||||
Israel | 583,717 | – | – | 583,717 | ||||||||||||
Italy | 3,606,240 | – | – | 3,606,240 | ||||||||||||
Japan | 40,068,937 | – | – | 40,068,937 | ||||||||||||
Jersey | 725,116 | – | – | 725,116 | ||||||||||||
Luxembourg | 5,036,524 | – | – | 5,036,524 | ||||||||||||
Malaysia | 7,961,500 | – | – | 7,961,500 | ||||||||||||
Mexico | 5,478,317 | – | – | 5,478,317 | ||||||||||||
Netherlands | 4,475,835 | – | – | 4,475,835 | ||||||||||||
Norway | 2,854,423 | 4,121,552 | – | 6,975,975 | ||||||||||||
Philippines | 6,945,524 | – | – | 6,945,524 | ||||||||||||
Poland | 1,083,653 | – | – | 1,083,653 | ||||||||||||
Singapore | 4,249,784 | – | – | 4,249,784 | ||||||||||||
South Africa | 13,417,932 | – | – | 13,417,932 | ||||||||||||
South Korea | 12,452,333 | – | – | 12,452,333 | ||||||||||||
Sweden | 18,264,958 | – | – | 18,264,958 | ||||||||||||
Switzerland | 8,496,670 | – | – | 8,496,670 | ||||||||||||
Taiwan | 32,502,716 | – | – | 32,502,716 | ||||||||||||
Thailand | 3,793,506 | – | – | 3,793,506 | ||||||||||||
Turkey | 1,283,309 | – | – | 1,283,309 | ||||||||||||
United Arab Emirates | 831,322 | – | – | 831,322 | ||||||||||||
United States | 195,605,260 | – | – | 195,605,260 | ||||||||||||
Vietnam | 1,033,299 | – | – | 1,033,299 | ||||||||||||
Preferred Stocks | ||||||||||||||||
Brazil | 2,495,080 | – | – | 2,495,080 | ||||||||||||
| ||||||||||||||||
Total | $ | 642,850,514 | $ | 4,121,552 | $ | 1,371,905 | $ | 648,343,971 | ||||||||
| ||||||||||||||||
78 |
1.855.377.7325 | www.GrandeurPeakGlobal.com |
Table of Contents
| Grandeur Peak Funds® | Notes to Financial Statements | |
October 31, 2015 (Unaudited) |
| Investments in Securities at Value | Level 1 - Quoted and Unadjusted | Level 2 - Other Significant | Level 3 - Significant Unobservable Inputs | Total | ||||||||||||
| ||||||||||||||||
Grandeur Peak Global Reach Fund | ||||||||||||||||
Common Stocks | ||||||||||||||||
Australia | $ | 5,828,758 | $ | – | $ | – | $ | 5,828,758 | ||||||||
Austria | 1,120,887 | – | – | 1,120,887 | ||||||||||||
Belgium | 789,334 | – | – | 789,334 | ||||||||||||
Brazil | 4,079,728 | – | – | 4,079,728 | ||||||||||||
Britain | 20,503,841 | – | – | 20,503,841 | ||||||||||||
Canada | 6,133,586 | – | – | 6,133,586 | ||||||||||||
Chile | 679,371 | – | – | 679,371 | ||||||||||||
China | 23,817,499 | – | 372,243 | 24,189,742 | ||||||||||||
Colombia | 2,376,261 | – | – | 2,376,261 | ||||||||||||
Denmark | 1,700,883 | – | – | 1,700,883 | ||||||||||||
Egypt | 345,477 | – | – | 345,477 | ||||||||||||
Finland | 876,992 | – | – | 876,992 | ||||||||||||
France | 6,677,334 | – | – | 6,677,334 | ||||||||||||
Georgia | 1,831,423 | – | – | 1,831,423 | ||||||||||||
Germany | 7,439,544 | – | – | 7,439,544 | ||||||||||||
Greece | 928,655 | – | – | 928,655 | ||||||||||||
Hong Kong | 7,216,142 | – | – | 7,216,142 | ||||||||||||
India | 24,930,975 | – | – | 24,930,975 | ||||||||||||
Indonesia | 9,198,066 | – | – | 9,198,066 | ||||||||||||
Ireland | 1,732,430 | – | – | 1,732,430 | ||||||||||||
Israel | 4,234,056 | – | – | 4,234,056 | ||||||||||||
Italy | 1,635,773 | – | – | 1,635,773 | ||||||||||||
Japan | 18,260,807 | – | – | 18,260,807 | ||||||||||||
Luxembourg | 3,150,679 | – | – | 3,150,679 | ||||||||||||
Malaysia | 4,621,447 | – | – | 4,621,447 | ||||||||||||
Mexico | 2,399,896 | – | – | 2,399,896 | ||||||||||||
Netherlands | 2,440,038 | – | – | 2,440,038 | ||||||||||||
New Zealand | 954,925 | – | – | 954,925 | ||||||||||||
Norway | 2,568,255 | 2,797,328 | – | 5,365,583 | ||||||||||||
Philippines | 4,820,345 | – | – | 4,820,345 | ||||||||||||
Poland | 1,994,150 | – | – | 1,994,150 | ||||||||||||
Russia | 62,239 | – | – | 62,239 | ||||||||||||
Singapore | 1,435,289 | – | – | 1,435,289 | ||||||||||||
South Africa | 11,003,565 | – | – | 11,003,565 | ||||||||||||
South Korea | 9,157,222 | – | – | 9,157,222 | ||||||||||||
Spain | – | – | 1 | 1 | ||||||||||||
Sri Lanka | 2,118,495 | – | – | 2,118,495 | ||||||||||||
Sweden | 4,642,173 | – | – | 4,642,173 | ||||||||||||
Switzerland | 3,106,616 | – | – | 3,106,616 | ||||||||||||
Taiwan | 15,819,682 | – | – | 15,819,682 | ||||||||||||
Thailand | 2,020,376 | – | – | 2,020,376 | ||||||||||||
Turkey | 1,760,042 | – | – | 1,760,042 | ||||||||||||
United States | 75,303,772 | – | – | 75,303,772 | ||||||||||||
Vietnam | 2,378,920 | – | – | 2,378,920 | ||||||||||||
Preferred Stocks | ||||||||||||||||
Brazil | 1,408,585 | – | – | 1,408,585 | ||||||||||||
Colombia | 286,378 | – | – | 286,378 | ||||||||||||
| ||||||||||||||||
Total | $ | 305,790,911 | $ | 2,797,328 | $ | 372,244 | $ | 308,960,483 | ||||||||
| ||||||||||||||||
Semi-Annual Report | October 31, 2015 |
79 |
Table of Contents
| Grandeur Peak Funds® | Notes to Financial Statements | |
October 31, 2015 (Unaudited) |
| Investments in Securities at Value | Level 1 - Quoted and Unadjusted | Level 2 - Other Significant Observable Inputs | Level 3 - Significant Unobservable Inputs | Total | ||||||||||||
| ||||||||||||||||
Grandeur Peak Global Stalwarts Fund | ||||||||||||||||
Common Stocks | ||||||||||||||||
Australia | $ | 105,795 | $ | – | $ | – | $ | 105,795 | ||||||||
Belgium | 121,192 | – | – | 121,192 | ||||||||||||
Brazil | 177,822 | – | – | 177,822 | ||||||||||||
Britain | 964,542 | – | – | 964,542 | ||||||||||||
Canada | 651,689 | – | – | 651,689 | ||||||||||||
Chile | 115,661 | – | – | 115,661 | ||||||||||||
China | 972,913 | – | – | 972,913 | ||||||||||||
Denmark | 125,551 | – | – | 125,551 | ||||||||||||
France | 158,669 | – | – | 158,669 | ||||||||||||
Germany | 377,000 | – | – | 377,000 | ||||||||||||
Hong Kong | 530,591 | – | – | 530,591 | ||||||||||||
India | 781,697 | – | – | 781,697 | ||||||||||||
Indonesia | 351,470 | – | – | 351,470 | ||||||||||||
Israel | 55,928 | – | – | 55,928 | ||||||||||||
Italy | 171,182 | – | – | 171,182 | ||||||||||||
Japan | 1,080,887 | – | – | 1,080,887 | ||||||||||||
Luxembourg | 273,965 | – | – | 273,965 | ||||||||||||
Mexico | 127,402 | – | – | 127,402 | ||||||||||||
Netherlands | 328,597 | – | – | 328,597 | ||||||||||||
Norway | 42,384 | – | – | 42,384 | ||||||||||||
Philippines | 391,066 | – | – | 391,066 | ||||||||||||
South Africa | 114,427 | – | – | 114,427 | ||||||||||||
South Korea | 118,082 | – | – | 118,082 | ||||||||||||
Sweden | 599,510 | – | – | 599,510 | ||||||||||||
Switzerland | 344,917 | – | – | 344,917 | ||||||||||||
Taiwan | 472,715 | – | – | 472,715 | ||||||||||||
United States | 5,271,133 | – | – | 5,271,133 | ||||||||||||
Preferred Stocks | ||||||||||||||||
Brazil | 126,634 | – | – | 126,634 | ||||||||||||
Colombia | 50,292 | – | – | 50,292 | ||||||||||||
| ||||||||||||||||
Total | $ | 15,003,713 | $ | – | $ | – | $ | 15,003,713 | ||||||||
| ||||||||||||||||
80 |
1.855.377.7325 | www.GrandeurPeakGlobal.com |
Table of Contents
| Grandeur Peak Funds® | Notes to Financial Statements | |
October 31, 2015 (Unaudited) |
| Investments in Securities at Value | Level 1 - Quoted and Unadjusted | Level 2 - Other Significant Observable Inputs | Level 3 - Significant Unobservable Inputs | Total | ||||||||||||
| ||||||||||||||||
Grandeur Peak International Opportunities Fund |
| |||||||||||||||
Common Stocks | ||||||||||||||||
Australia | $ | 8,231,783 | $ | – | $ | – | $ | 8,231,783 | ||||||||
Austria | 8,121,983 | – | – | 8,121,983 | ||||||||||||
Belgium | 8,226,633 | – | – | 8,226,633 | ||||||||||||
Brazil | 16,625,240 | – | – | 16,625,240 | ||||||||||||
Britain | 82,133,059 | – | – | 82,133,059 | ||||||||||||
British Virgin Islands | 774,234 | – | – | 774,234 | ||||||||||||
Canada | 24,489,015 | – | – | 24,489,015 | ||||||||||||
China | 70,990,677 | – | 1,115,373 | 72,106,050 | ||||||||||||
Colombia | 8,198,487 | – | – | 8,198,487 | ||||||||||||
Denmark | 2,944,424 | – | – | 2,944,424 | ||||||||||||
Finland | 3,484,722 | – | – | 3,484,722 | ||||||||||||
France | 21,511,069 | – | – | 21,511,069 | ||||||||||||
Georgia | 7,575,770 | – | – | 7,575,770 | ||||||||||||
Germany | 30,905,130 | – | – | 30,905,130 | ||||||||||||
Hong Kong | 16,091,268 | – | – | 16,091,268 | ||||||||||||
India | 54,246,269 | – | – | 54,246,269 | ||||||||||||
Indonesia | 23,676,652 | – | – | 23,676,652 | ||||||||||||
Ireland | 11,547,171 | – | – | 11,547,171 | ||||||||||||
Israel | 3,706,094 | – | – | 3,706,094 | ||||||||||||
Italy | 2,772,945 | – | – | 2,772,945 | ||||||||||||
Japan | 76,067,666 | – | – | 76,067,666 | ||||||||||||
Jersey | 849,642 | – | – | 849,642 | ||||||||||||
Luxembourg | 5,238,918 | – | – | 5,238,918 | ||||||||||||
Malaysia | 19,183,388 | – | – | 19,183,388 | ||||||||||||
Mexico | 9,398,438 | – | – | 9,398,438 | ||||||||||||
Netherlands | 9,203,575 | – | – | 9,203,575 | ||||||||||||
Norway | 6,597,319 | 6,865,825 | – | 13,463,144 | ||||||||||||
Oman | 1,897,221 | – | – | 1,897,221 | ||||||||||||
Philippines | 14,307,548 | – | – | 14,307,548 | ||||||||||||
Russia | 824,250 | – | – | 824,250 | ||||||||||||
Singapore | 8,538,348 | – | – | 8,538,348 | ||||||||||||
South Africa | 22,327,177 | – | – | 22,327,177 | ||||||||||||
South Korea | 28,661,659 | – | – | 28,661,659 | ||||||||||||
Sweden | 29,015,418 | – | – | 29,015,418 | ||||||||||||
Switzerland | 10,963,883 | – | – | 10,963,883 | ||||||||||||
Taiwan | 50,684,572 | – | – | 50,684,572 | ||||||||||||
Thailand | 6,127,278 | – | – | 6,127,278 | ||||||||||||
United Arab Emirates | 1,472,356 | – | – | 1,472,356 | ||||||||||||
United States | 2,557,004 | – | – | 2,557,004 | ||||||||||||
Vietnam | 206,622 | – | – | 206,622 | ||||||||||||
Preferred Stocks | ||||||||||||||||
Brazil | 4,738,349 | – | – | 4,738,349 | ||||||||||||
Exchange-Traded Funds | ||||||||||||||||
United States | 4,427,747 | – | – | 4,427,747 | ||||||||||||
| ||||||||||||||||
Total | $ | 719,541,003 | $ | 6,865,825 | $ | 1,115,373 | $ | 727,522,201 | ||||||||
| ||||||||||||||||
Semi-Annual Report | October 31, 2015 |
81 |
Table of Contents
| Grandeur Peak Funds® | Notes to Financial Statements | |
October 31, 2015 (Unaudited) |
| Investments in Securities at Value | Level 1 - Quoted and Unadjusted | Level 2 - Other Significant Observable Inputs | Level 3 - Significant Unobservable Inputs | Total | ||||||||||||
| ||||||||||||||||
Grandeur Peak International Stalwarts Fund |
| |||||||||||||||
Common Stocks | ||||||||||||||||
Australia | $ | 198,818 | $ | – | $ | – | $ | 198,818 | ||||||||
Belgium | 218,536 | – | – | 218,536 | ||||||||||||
Brazil | 284,478 | – | – | 284,478 | ||||||||||||
Britain | 1,473,970 | – | – | 1,473,970 | ||||||||||||
Canada | 982,797 | – | – | 982,797 | ||||||||||||
Chile | 197,953 | – | – | 197,953 | ||||||||||||
China | 1,604,218 | – | – | 1,604,218 | ||||||||||||
Denmark | 226,471 | – | – | 226,471 | ||||||||||||
France | 264,708 | – | – | 264,708 | ||||||||||||
Germany | 782,686 | – | – | 782,686 | ||||||||||||
Hong Kong | 610,865 | – | – | 610,865 | ||||||||||||
India | 1,070,379 | – | – | 1,070,379 | ||||||||||||
Indonesia | 613,141 | – | – | 613,141 | ||||||||||||
Ireland | 99,213 | – | – | 99,213 | ||||||||||||
Israel | 86,999 | – | – | 86,999 | ||||||||||||
Italy | 271,872 | – | – | 271,872 | ||||||||||||
Japan | 1,590,300 | – | – | 1,590,300 | ||||||||||||
Luxembourg | 419,397 | – | – | 419,397 | ||||||||||||
Mexico | 225,094 | – | – | 225,094 | ||||||||||||
Netherlands | 536,507 | – | – | 536,507 | ||||||||||||
Norway | 64,069 | – | – | 64,069 | ||||||||||||
Philippines | 647,769 | – | – | 647,769 | ||||||||||||
South Africa | 179,103 | – | – | 179,103 | ||||||||||||
South Korea | 178,983 | – | – | 178,983 | ||||||||||||
Sweden | 1,031,576 | – | – | 1,031,576 | ||||||||||||
Switzerland | 486,205 | – | – | 486,205 | ||||||||||||
Taiwan | 886,901 | – | – | 886,901 | ||||||||||||
United States | 492,938 | – | – | 492,938 | ||||||||||||
Preferred Stocks | ||||||||||||||||
Brazil | 224,441 | – | – | 224,441 | ||||||||||||
Colombia | 78,655 | – | – | 78,655 | ||||||||||||
| ||||||||||||||||
Total | $ | 16,029,042 | $ | – | $ | – | $ | 16,029,042 | ||||||||
| ||||||||||||||||
82 |
1.855.377.7325 | www.GrandeurPeakGlobal.com |
Table of Contents
| Grandeur Peak Funds® | Notes to Financial Statements | |
October 31, 2015 (Unaudited) |
The Funds recognize transfers between levels as of the end of the period. For the six months or period ended October 31, 2015, the Funds had the following transfers between Level 1 and Level 2 securities. The most frequent, although not exclusive, cause of common stocks to be transferred between level 1 and 2 is due to whether the foreign securities in the Funds are fair value priced on the last day of the period (i.e. when the S&P 500 moves +/- 1% on the day, the foreign securities are re-priced as of 4:00pm EST based on a historic pricing algorithm performed by a third-party service).
The Grandeur Peak Emerging Markets Opportunities Fund had the following transfers out of Levels 1 and 2 at October 31, 2015:
| Level 1 - Quoted and Unadjusted Prices | Level 2 - Other Significant Observable Inputs | |||||||||||||||
| Transfers In | Transfers (Out) | Transfers In | Transfers (Out) | |||||||||||||
Common Stocks | $ 212,412,431 | $ – | $ – | $ (212,412,341) | ||||||||||||
Total | $ 212,412,431 | $ – | $ – | $ (212,412,341) | ||||||||||||
The Grandeur Peak Global Opportunities Fund had the following transfers out of Levels 1 and 2 at October 31, 2015: | ||||||||||||||||
| Level 1 - Quoted and Unadjusted Prices | Level 2 - Other Significant Observable Inputs | |||||||||||||||
| Transfers In | Transfers (Out) | Transfers In | Transfers (Out) | |||||||||||||
Common Stocks | $ 273,961,063 | $ – | $ – | $ (273,961,063) | ||||||||||||
Total | $ 273,961,063 | $ – | $ – | $ (273,961,063) | ||||||||||||
The Grandeur Peak Global Reach Fund had the following transfers out of Levels 1 and 2 at October 31, 2015: | ||||||||||||||||
| Level 1 - Quoted and Unadjusted Prices | Level 2 - Other Significant Observable Inputs | |||||||||||||||
| Transfers In | Transfers (Out) | Transfers In | Transfers (Out) | |||||||||||||
Common Stocks | $ 123,265,094 | $ – | $ – | $ (123,265,094) | ||||||||||||
Total | $ 123,265,094 | $ – | $ – | $ (123,265,094) | ||||||||||||
The Grandeur Peak International Opportunities Fund had the following transfers out of Levels 1 and 2 at October 31, 2015: | ||||||||||||||||
| Level 1 - Quoted and Unadjusted Prices | Level 2 - Other Significant Observable Inputs | |||||||||||||||
| Transfers In | Transfers (Out) | Transfers In | Transfers (Out) | |||||||||||||
Common Stocks | $ 432,868,645 | $ – | $ – | $ (432,868,645) | ||||||||||||
Total | $ 432,868,645 | $ – | $ – | $ (432,868,645) | ||||||||||||
The following is a reconciliation of the investments in which significant unobservable inputs (Level 3) were used in determining fair value:
| Grandeur Peak Emerging Markets Opportunities Fund | Common Stocks | Total | ||||||
|
| |||||||
Balance as of April 30, 2015 | $ | 1,654,510 | $ | 1,654,510 | ||||
Accrued Discount/Premium | – | – | ||||||
Return of Capital | – | – | ||||||
Realized Gain/(Loss) | (41,730) | (41,730) | ||||||
Change in Unrealized Appreciation/(Depreciation) | (717,461) | (717,461) | ||||||
Purchases | – | – | ||||||
Sales Proceeds | (25,620) | (25,620) | ||||||
Transfer into Level 3 | – | – | ||||||
Transfer out of Level 3 | – | – | ||||||
|
| |||||||
Balance as of October 31, 2015 | $ | 869,699 | $ | 869,699 | ||||
|
| |||||||
Net change in unrealized Appreciation/(Depreciation) included in the Statement of Operations attributable to Level 3 investments held at October 31, 2015 | $ | (734,129) | $ | (734,129) | ||||
Semi-Annual Report | October 31, 2015 |
83 |
Table of Contents
| Grandeur Peak Funds® | Notes to Financial Statements | |
October 31, 2015 (Unaudited) |
| Grandeur Peak Global Opportunities Fund | Common Stocks | Total | ||||||
|
| |||||||
Balance as of April 30, 2015 | $ | 2,538,049 | $ | 2,538,049 | ||||
Accrued Discount/Premium | – | – | ||||||
Return of Capital | – | – | ||||||
Realized Gain/(Loss) | (6,162) | (6,162) | ||||||
Change in Unrealized Appreciation/(Depreciation) | (1,155,891) | (1,155,891) | ||||||
Purchases | – | – | ||||||
Sales Proceeds | (4,091) | (4,091) | ||||||
Transfer into Level 3 | – | – | ||||||
Transfer out of Level 3 | – | – | ||||||
|
| |||||||
Balance as of October 31, 2015 | $ | 1,371,905 | $ | 1,371,905 | ||||
|
| |||||||
Net change in unrealized Appreciation/(Depreciation) included in the Statement of Operations attributable to Level 3 investments held at October 31, 2015 | $ | (1,158,051) | $ | (1,158,051) | ||||
| Grandeur Peak Global Reach Fund | Common Stocks | Total | ||||||
|
| |||||||
Balance as of April 30, 2015 | $ | 706,018 | $ | 706,018 | ||||
Accrued Discount/Premium | – | – | ||||||
Return of Capital | – | – | ||||||
Realized Gain/(Loss) | (15,969) | (15,969) | ||||||
Change in Unrealized Appreciation/(Depreciation) | (307,919) | (307,919) | ||||||
Purchases | – | – | ||||||
Sales Proceeds | (9,886) | (9,886) | ||||||
Transfer into Level 3 | – | – | ||||||
Transfer out of Level 3 | – | – | ||||||
|
| |||||||
Balance as of October 31, 2015 | $ | 372,244 | $ | 372,244 | ||||
|
| |||||||
Net change in unrealized Appreciation/(Depreciation) included in the Statement of Operations attributable to Level 3 investments held at October 31, 2015 | $ | (314,218) | $ | (314,218) | ||||
| Grandeur Peak International Opportunities Fund | Common Stocks | Total | ||||||
|
| |||||||
Balance as of April 30, 2015 | $ | 2,070,865 | $ | 2,070,865 | ||||
Accrued Discount/Premium | – | – | ||||||
Return of Capital | – | – | ||||||
Realized Gain/(Loss) | (10,722) | (10,722) | ||||||
Change in Unrealized Appreciation/(Depreciation) | (937,701) | (937,701) | ||||||
Purchases | – | – | ||||||
Sales Proceeds | (7,069) | (7,069) | ||||||
Transfer into Level 3 | – | – | ||||||
Transfer out of Level 3 | – | – | ||||||
|
| |||||||
Balance as of October 31, 2015 | $ | 1,115,373 | $ | 1,115,373 | ||||
|
| |||||||
Net change in unrealized Appreciation/(Depreciation) included in the Statement of Operations attributable to Level 3 investments held at October 31, 2015 | $ | (941,507) | $ | (941,507) | ||||
Net change in unrealized appreciation/depreciation on Level 3 securities is included on the Statements of Assets and Liabilities under Net unrealized appreciation on investments and translation of assets and liabilities in foreign currencies. Due to the lack of a market to trade a newly acquired security, a price was unobtainable and was transferred to a level 3 security for all Funds.
84 |
1.855.377.7325 | www.GrandeurPeakGlobal.com |
Table of Contents
| Grandeur Peak Funds® | Notes to Financial Statements | |
October 31, 2015 (Unaudited) |
The table below provided additional information about the Level 3 Fair Value Measurements as of October 31, 2015:
Quantitative Information about Level 3 Fair Value Measurements
Grandeur Peak Emerging Markets Opportunities Fund
| Asset Class | Fair Value (USD) at 10/31/15 | Valuation Technique | Unobservable Inputs(a) | Value | ||||
| Foreign Common Stock | $869,699 | Discount on last quoted exchange price | Discount | 40.3% | ||||
| Grandeur Peak Global Opportunities Fund | ||||||||
| Asset Class | Fair Value (USD) at 10/31/15 | Valuation Technique | Unobservable Inputs(a) | Value | ||||
Foreign Common Stock | $1,371,905 | Discount on last quoted exchange price | Discount | 40.3% | ||||
| Grandeur Peak Global Reach Fund | ||||||||
| Asset Class | Fair Value (USD) at 10/31/15 | Valuation Technique | Unobservable Inputs(a) | Value | ||||
Foreign Common Stock | $372,243 | Discount on last quoted exchange price | Discount | 40.3% | ||||
| Grandeur Peak International Opportunities Fund | ||||||||
| Asset Class | Fair Value (USD) at 10/31/15 | Valuation Technique | Unobservable Inputs(a) | Value | ||||
Foreign Common Stock | $1,115,373 | Discount on last quoted exchange price | Discount | 40.3% | ||||
(a) A change to the unobservable input may result in a significant change to the value of the investment as follows: | ||||||||
| Unobservable Input | Impact to Value if Input Increases | Impact to Value if Input Decreases | ||||||
Discount | Decrease | Increase | ||||||
Investment Transactions and Investment Income: Investment transactions are accounted for on the date the investments are purchased or sold (trade date). Realized gains and losses from investment transactions are reported on an identified cost basis. Interest income, which includes accretion of discounts and amortization of premiums, is accrued and recorded as earned. Dividend income is recognized on the ex-dividend date or for certain foreign securities, as soon as information is available to the Funds. All of the realized and unrealized gains and losses and net investment income, are allocated daily to each class in proportion to its average daily net assets.
Cash Management Transactions: The Funds subscribe to the Brown Brothers Harriman & Co. (“BBH”) Cash Management Service (“CMS”), whereby cash balances are automatically swept into overnight offshore demand deposits with either the BBH Grand Cayman branch or a branch of a pre-approved commercial bank. This fully automated program allows the Funds to earn interest on cash balances. Excess cash with deposit institutions domiciled outside of the U.S. are subject to sovereign actions in the jurisdiction of the deposit institution including, but not limited to, freeze, seizure or diminution. Cash balances in the BBH CMS are included on the Statements of Assets and Liabilities under Cash and Foreign Cash, at Value. As of October 31, 2015, the Funds had the following cash balances participating in the BBH CMS:
| Fund | ||||||
Grandeur Peak Emerging Markets Opportunities Fund | $ | 35,290,539 | ||||
Grandeur Peak Global Micro Cap Fund | 11,373,331 | |||||
Grandeur Peak Global Opportunities Fund | 2,920,151 | |||||
Grandeur Peak Global Reach Fund | 617,009 | |||||
Grandeur Peak Global Stalwarts Fund | 1,979,916 | |||||
Grandeur Peak International Stalwarts Fund | 1,342,336 | |||||
Grandeur Peak International Opportunities Fund | 49,090,714 | |||||
Semi-Annual Report | October 31, 2015 |
85 |
Table of Contents
| Grandeur Peak Funds® | Notes to Financial Statements | |
October 31, 2015 (Unaudited) |
As of October 31, 2015, the Funds had the following foreign cash balances participating in the BBH CMS (cost and value of foreign cash balances are equal):
| Fund | ||||||
Grandeur Peak Emerging Markets Opportunities Fund | $ | 32 | ||||
Grandeur Peak Global Micro Cap Fund | 10,821 | |||||
Grandeur Peak Global Opportunities Fund | 28,004 | |||||
Grandeur Peak Global Reach Fund | 341,427 | |||||
Grandeur Peak Global Stalwarts Fund | 9,007 | |||||
Grandeur Peak International Stalwarts Fund | – | |||||
Grandeur Peak International Opportunities Fund | 3,039,556 | |||||
Foreign Securities: The Funds may directly purchase securities of foreign issuers. Investing in securities of foreign issuers involves special risks not typically associated with investing in securities of U.S. issuers. The risks include possible reevaluation of currencies, the inability to repatriate foreign currency, less complete financial information about companies and possible future adverse political and economic developments. Moreover, securities of many foreign issuers and their markets may be less liquid and their prices more volatile than those of securities of comparable U.S. issuers.
Foreign Currency Translation: The books and records of the Funds are maintained in U.S. dollars. Investment valuations and other assets and liabilities initially expressed in foreign currencies are converted each business day into U.S. dollars based upon current exchange rates. Prevailing foreign exchange rates may generally be obtained at the close of the NYSE (normally, 4:00 p.m. Eastern Time). The portion of realized and unrealized gains or losses on investments due to fluctuations in foreign currency exchange rates is not separately disclosed and is included in realized and unrealized gains or losses on investments, when applicable.
Foreign Currency Spot Contracts: The Funds may enter into foreign currency spot contracts to facilitate transactions in foreign securities or to convert foreign currency receipts into U.S. dollars. A foreign currency spot contract is an agreement between two parties to buy and sell currencies at the current market rate, for settlement generally within two business days. The U.S. dollar value of the contracts is determined using current currency exchange rates supplied by a pricing service.
The contract is marked-to-market daily for settlements beyond one day and any change in market value is recorded as an unrealized gain or loss. When the contract is closed, a realized gain or loss is recorded equal to the difference between the value on the open and close date. Losses may arise from changes in the value of the foreign currency, or if the counterparties do not perform under the contract’s terms. The maximum potential loss from such contracts is the aggregate face value in U.S. dollars at the time the contract was opened.
Trust Expenses: Some expenses of the Trust can be directly attributed to the Funds. Expenses which cannot be directly attributed to the Funds are apportioned among all funds in the Trust based on average net assets of each fund.
Fund and Class Expenses: Expenses that are specific to a Fund or class of shares of a Fund, including distribution fees (Rule 12b-1 fees), are charged directly to that Fund or share class. Expenses that are common to all Funds generally are allocated among the Funds in proportion to their average daily net assets.
Offering Costs: Offering costs, including costs of printing initial prospectuses, legal and registration fees, are being amortized over twelve months from the inception date of the Funds. Amounts amortized during the period ended October 31, 2015 for the Grandeur Peak Micro Cap Fund, Grandeur Peak Global Stalwarts Fund, and Grandeur Peak International Stalwarts Fund are shown on the Fund’s Statement of Operations. As of October 31, 2015, the Grandeur Peak Emerging Markets Opportunities Fund, Grandeur Peak Global Opportunities Fund, Grandeur Peak Global Reach Fund, and Grandeur Peak International Opportunities Fund fully amortized all offering costs.
Federal Income Taxes: The Funds comply with the requirements under Subchapter M of the Internal Revenue Code of 1986, as amended, applicable to regulated investment companies and intend to distribute substantially all of their net taxable income and net capital gains, if any, each year so that it will not be subject to excise tax on undistributed income and gains. The Funds are not subject to income taxes to the extent such distributions are made.
As of and during the year ended April 30, 2015, the Grandeur Peak Emerging Markets Opportunities Fund, the Grandeur Peak Global Opportunities Fund, the Grandeur Peak Global Reach Fund, and the Grandeur Peak International Opportunities Fund had a liability for unrecognized capital gains tax in the amount of $598,797, $725,970, $411,508, and $730,034 respectively. The Funds file U.S. federal, state, and local tax returns as required. The Funds’ tax returns are subject to examination by the relevant tax authorities until expiration of the applicable statute of limitations, which is
86 |
1.855.377.7325 | www.GrandeurPeakGlobal.com |
Table of Contents
| Grandeur Peak Funds® | Notes to Financial Statements | |
October 31, 2015 (Unaudited) |
generally three years after the filing of the tax return for federal purposes and four years for most state returns. Tax returns for open years have incorporated no uncertain tax positions that require a provision for income taxes.
Distributions to Shareholders: Each Fund normally pays dividends and distributes capital gains, if any, on an annual basis. Income dividend distributions are derived from interest and other income each Fund receives from their investments, including short term capital gains. Long term capital gain distributions are derived from gains realized when each Fund sells a security it has owned for more than a year. Each Fund may make additional distributions and dividends at other times if the portfolio manager believes doing so may be necessary for each Fund to avoid or reduce taxes. The Funds intend to pass through foreign tax credits to shareholders.
3. TAX BASIS INFORMATION
Tax Basis of Investments: As of October 31, 2015, the aggregate cost of investments, gross unrealized appreciation/(depreciation) and net unrealized appreciation for Federal tax purposes was as follows:
| Gross Appreciation | Gross Depreciation | Cost of Investments | ||||||||||||||
| (excess of value | (excess of tax cost | Net Unrealized | for Income Tax | |||||||||||||
| over tax cost) | over value) | Appreciation/(Depreciation) | Purposes | |||||||||||||
Grandeur Peak Emerging Markets Opportunities Fund | $ | 43,178,185 | $ | (63,075,761 | ) | $ | (19,897,576 | ) | $ | 383,813,733 | ||||||
Grandeur Peak Global Micro Cap Fund | 201,413 | (377,743 | ) | (176,330 | ) | 15,401,397 | ||||||||||
Grandeur Peak Global Opportunities Fund | 147,814,808 | (82,109,513) | 65,705,295 | 582,638,676 | ||||||||||||
Grandeur Peak Global Reach Fund | 40,797,738 | (45,365,063 | ) | (4,567,325 | ) | 313,527,808 | ||||||||||
Grandeur Peak Global Stalwarts Fund | 768,414 | (321,169 | ) | 447,245 | 14,556,468 | |||||||||||
Grandeur Peak International Opportunities Fund | 141,599,074 | (87,714,257 | ) | 53,884,817 | 673,637,384 | |||||||||||
Grandeur Peak International Stalwarts Fund | 949,147 | (174,360 | ) | 774,787 | 15,254,255 | |||||||||||
Tax Basis of Distributions to Shareholders: The character of distributions made during the year from net investment income or net realized gains may differ from its ultimate characterization for federal income tax purposes. Also, due to the timing of dividend distributions, the fiscal year in which amounts are distributed may differ from the fiscal year in which the income or realized gain were recorded by the Funds.
The tax character of distributions paid by the Funds for the fiscal year and or period ended April 30, 2015 were as follows:
| Ordinary Income | Long-Term Capital Gain | |||||||
Grandeur Peak Emerging Markets Opportunities Fund | $ | 10,934,864 | $ | 44,691 | ||||
Grandeur Peak Global Opportunities Fund | 9,456,832 | 37,925,629 | ||||||
Grandeur Peak Global Reach Fund | 3,157,372 | 885,418 | ||||||
Grandeur Peak International Opportunities Fund | 19,542,293 | 32,521,839 | ||||||
During the six months or period ended October 31, 2015, the Funds did not make any distributions.
4. SECURITIES TRANSACTIONS
The cost of purchases and proceeds from sales of securities (excluding short term securities) during the six months or period ended October 31, 2015 were as follows:
| Proceeds From Sales of | ||||||||
| Fund | Purchases of Securities | Securities | ||||||
Grandeur Peak Emerging Markets Opportunities Fund | $ | 80,505,976 | $ | 83,198,212 | ||||
Grandeur Peak Global Micro Cap Fund | 15,401,396 | – | ||||||
Grandeur Peak Global Opportunities Fund | 122,944,904 | 144,612,514 | ||||||
Grandeur Peak Global Reach Fund | 84,482,786 | 85,835,069 | ||||||
Grandeur Peak Global Stalwarts Fund | 15,000,580 | 453,572 | ||||||
Grandeur Peak International Opportunities Fund | 156,959,309 | 149,261,873 | ||||||
Grandeur Peak International Stalwarts Fund | 16,194,243 | 929,833 | ||||||
Semi-Annual Report | October 31, 2015 |
87 |
Table of Contents
| Grandeur Peak Funds® | Notes to Financial Statements | |
October 31, 2015 (Unaudited) |
5. SHARES OF BENEFICIAL INTEREST
The capitalization of the Trust consists of an unlimited number of shares of beneficial interest with no par value per share. Holders of the shares of the Funds of the Trust have one vote for each share held and a proportionate fraction of a vote for each fractional share. All shares issued and outstanding are fully paid and are transferable and redeemable at the option of the shareholder. Purchasers of the shares do not have any obligation to make payments to the Trust or its creditors (other than the purchase price for the shares) or make contributions to the Trust or its creditors solely by reason of the purchasers’ ownership of the shares. Shares have no pre-emptive rights.
Shares redeemed within 60 days of purchase may incur a 2% short-term redemption fee deducted from the redemption amount. For the six months or period ended October 31, 2015 and the year ended April 30, 2015, the redemption fees charged by the Funds are presented in the Statements of Changes in Net Assets.
6. MANAGEMENT AND RELATED-PARTY TRANSACTIONS
The Adviser, subject to the authority of the Board, is responsible for the overall management and administration of the Funds’ business affairs. The Adviser manages the investments of the Funds in accordance with the Funds’ investment objective, policies and limitations and investment guidelines established jointly by the Adviser and the Trustees. Pursuant to the Advisory Agreement, (the “Advisory Agreement”), each Fund pays the Adviser an annual management fee based on each Fund’s average daily net assets. The management fee is paid on a monthly basis. The following table reflects the Funds’ advisory fee rates.
| Fund | Advisory Fee | |
Grandeur Peak Emerging Markets Opportunities Fund | 1.35% | |
Grandeur Peak Global Micro Cap Fund | 1.50% | |
Grandeur Peak Global Opportunities Fund | 1.25% | |
Grandeur Peak Global Reach Fund | 1.10% | |
Grandeur Peak Global Stalwarts Fund | 0.80% | |
Grandeur Peak International Opportunities Fund | 1.25% | |
Grandeur Peak International Stalwarts Fund | 0.80% |
With respect to the Grandeur Peak Global Opportunities Fund and the Grandeur Peak International Opportunities Fund, the Adviser has contractually agreed to limit certain of each Fund’s expenses to 1.75% of the Fund’s average daily net assets in the Investor Class shares and 1.50% of the Fund’s average daily net assets in the Institutional Class shares until August 31, 2016. With respect to the Grandeur Peak Emerging Markets Opportunities Fund, the Adviser has contractually agreed to limit certain of the Fund’s expenses to 1.95% of the Fund’s average daily net assets in the Investor Class shares and 1.70% of the Fund’s average daily net assets in the Institutional Class shares until August 31, 2016. With respect to the Grandeur Peak Global Reach Fund, the Adviser has contractually agreed to limit certain of the Fund’s expenses to 1.60% of the Fund’s average daily net assets in the Investor Class shares and 1.35% of the Fund’s average daily net assets in the Institutional Class shares until August 31, 2016. With respect to the Grandeur Peak Global Micro Cap Fund, the Adviser has contractually agreed to limit certain of the Fund’s expenses to 2.25% of the Fund’s average daily net assets in the Investor Class shares and 2.00% of the Fund’s average daily net assets in the Institutional Class shares until August 31, 2016. With respect to the Grandeur Peak Global Stalwarts Fund and the Grandeur Peak International Stalwarts Fund, the Adviser has contractually agreed to limit certain of the Fund’s expenses to 1.35% of the Fund’s average daily net assets in the Investor Class shares and 1.10% of the Fund’s average daily net assets in the Institutional Class shares until August 31, 2016. Pursuant to these agreements, each Fund will reimburse the Adviser for any fee waivers and expense reimbursements made by the Adviser, provided that any such reimbursements made by the Funds to the Adviser will not cause the Funds’ expense limitation to exceed expense limitations in existence at the time the expense was incurred, or at the time of the reimbursement, whichever is lower, and the reimbursement is made within three years after the expenses were incurred.
88 |
1.855.377.7325 | www.GrandeurPeakGlobal.com |
Table of Contents
| Grandeur Peak Funds® | Notes to Financial Statements | |
October 31, 2015 (Unaudited) |
For the six months or period ended October 31, 2015, the fee waivers and/or reimbursements were as follows:
| Fund | Fees Waived/Reimbursed By Adviser | Recoupment of Previously Waived Fees By Adviser | Total | |||||||||
Grandeur Peak Emerging Markets Opportunities Fund | ||||||||||||
Investor Class | $ | – | $ | – | $ | – | ||||||
Institutional Class | – | – | – | |||||||||
Grandeur Peak Global Micro Cap Fund | ||||||||||||
Investor Class | $ | – | $ | – | $ | – | ||||||
Institutional Class | 4,823 | – | 4,823 | |||||||||
Grandeur Peak Global Opportunities Fund | ||||||||||||
Investor Class | $ | – | $ | – | $ | – | ||||||
Institutional Class | – | – | – | |||||||||
Grandeur Peak Global Reach Fund | ||||||||||||
Investor Class | $ | – | $ | 31,335 | $ | 31,335 | ||||||
Institutional Class | – | 69,065 | 69,065 | |||||||||
Grandeur Peak Global Stalwarts Fund | ||||||||||||
Investor Class | $ | 19,396 | $ | – | $ | 19,396 | ||||||
Institutional Class | 22,638 | – | 22,638 | |||||||||
Grandeur Peak International Opportunities Fund | ||||||||||||
Investor Class | $ | – | $ | – | $ | – | ||||||
Institutional Class | – | – | – | |||||||||
Grandeur Peak International Stalwarts Fund | ||||||||||||
Investor Class | $ | 4,705 | $ | – | $ | 4,705 | ||||||
Institutional Class | 29,405 | – | 29,405 | |||||||||
As of April 30, 2015, the balances of recoupable expenses for each Fund were as follows:
|
| |||||||||||
| Expires | ||||||||||||
| Fund | 2017 | Total | ||||||||||
Grandeur Peak Emerging Markets Opportunities Fund | ||||||||||||
Investor Class | $ | – | $ | – | ||||||||
Institutional Class | – | – | ||||||||||
Grandeur Peak Global Opportunities Fund | ||||||||||||
Investor Class | $ | – | $ | – | ||||||||
Institutional Class | – | – | ||||||||||
Grandeur Peak Global Reach Fund | ||||||||||||
Investor Class | $ | 45,810 | $ | 45,810 | ||||||||
Institutional Class | 98,313 | 98,313 | ||||||||||
Grandeur Peak International Opportunities Fund | ||||||||||||
Investor Class | $ | – | $ | – | ||||||||
Institutional Class | – | – | ||||||||||
Administrator Fees and Expenses
ALPS Fund Services, Inc. (“ALPS”) serves as administrator to the Funds and the Funds have agreed to pay expenses incurred in connection with their administrative activities. Pursuant to an Administration Agreement, ALPS provides operational services to the Funds including, but not limited to, fund accounting and fund administration and generally assists in the Funds’ operations. Officers of the Trust are employees of ALPS. The Funds’ administration fee is accrued on a daily basis and paid monthly. Administration fees paid by the Funds for the six months or period ended October
31, 2015 are disclosed in the Statements of Operations.
ALPS is reimbursed by the Fund for certain out-of-pocket expenses.
Transfer Agent
ALPS serves as transfer, dividend paying and shareholder servicing agent for the Funds. ALPS receives an annual minimum fee, a fee based upon the number of shareholder accounts, and is also reimbursed by the Funds for certain out-of-pocket expenses.
Semi-Annual Report | October 31, 2015 |
89 |
Table of Contents
| Grandeur Peak Funds® | Notes to Financial Statements | |
October 31, 2015 (Unaudited) |
Compliance Services
ALPS provides services that assist the Trust’s chief compliance officer in monitoring and testing the policies and procedures of the Trust in conjunction with requirements under Rule 38a-1 under the 1940 Act and receives an annual base fee. ALPS is reimbursed for certain out-of-pocket expenses by the Funds.
Principal Financial Officer
ALPS receives an annual fee for providing principal financial officer services to the Funds.
Distributor: ALPS Distributors, Inc. (“ADI” or the “Distributor”) (an affiliate of ALPS) acts as the distributor of the Funds’ shares pursuant to a Distribution Agreement with the Trust. Shares are sold on a continuous basis by ADI as agent for the Funds, and ADI has agreed to use its best efforts to solicit orders for the sale of each Fund’s shares, although it is not obliged to sell any particular amount of shares. ADI is not entitled to any compensation for its services as Distributor. ADI is registered as a broker-dealer with the U.S. Securities and Exchange Commission.
Each Fund has adopted a Distribution and Services (Rule 12b-1) Plan pursuant to Rule 12b-1 of the 1940 Act (the “Plan”) for its Investor Class shares. The Plan allows the Funds to use Investor Class assets to pay fees in connection with the distribution and marketing of Investor Class shares and/or the provision of shareholder services to Investor Class shareholders. The Plan permits payment for services in connection with the administration of plans or programs that use Investor Class shares of each Fund as their funding medium and for related expenses. The Plan permits the Funds to make total payments at an annual rate of up to 0.25% of each Fund’s average daily net assets attributable to its Investor Class shares. The expenses of the Plan are reflected as distribution and service fees in the Statements of Operations.
7. INDEMNIFICATIONS
Under the Trust’s organizational documents, its officers and Trustees are indemnified against certain liability arising out of the performance of their duties to the Trust. Additionally, in the normal course of business, the Trust enters into contracts with service providers that may contain general indemnification clauses, which may permit indemnification to the extent permissible under applicable law. The Trust’s maximum exposure under these arrangements is unknown, as this would involve future claims that may be made against the Trust that have not yet occurred.
8. RECENT ACCOUNTING PRONOUNCEMENT
In May 2015, the Financial Accounting Standards Board issued Accounting Standards Update (“ASU”) 2015-07, “Disclosures for Investments in Certain Entities that Calculate Net Asset Value Per Share (or its Equivalent).” This is an update to Accounting Standards Codification Topic 820, Fair Value Measurement. ASU 2015-07 removes the requirement to categorize within the fair value hierarchy investments for which fair value is measured at net asset value per share (or its equivalent) using the practical expedient. ASU 2015-17 is effective for annual reporting periods beginning on or after December 15, 2015, and interim periods within those annual periods, with retrospective application for all periods presented. The Funds are currently evaluating the impact ASU 2015-07 will have on the Funds’ financial statements and disclosures.
90 |
1.855.377.7325 | www.GrandeurPeakGlobal.com |
Table of Contents
Grandeur Peak Funds® | Disclosure Regarding Approval of Fund Advisory Agreement | |
October 31, 2015 (Unaudited) |
GRANDEUR PEAK GLOBAL STALWARTS FUND, GRANDEUR PEAK INTERNATIONAL STALWARTS FUND
AND GRANDEUR PEAK GLOBAL MICRO CAP FUND
On June 9-10, 2015, the Trustees met in person to discuss, among other things, the approval of the investment advisory agreement between Financial Investors Trust (the “Trust”) and Grandeur Peak Global Advisors, LLC (“Grandeur Peak”) (the “Investment Advisory Agreement”), in accordance with Section 15(c) of the 1940 Act. The Independent Trustees met with independent legal counsel during executive session and discussed the Investment Advisory Agreement and other related materials.
In approving the Investment Advisory Agreement with Grandeur Peak, the Trustees, including the Independent Trustees, considered the following factors with respect to the Grandeur Peak Global Stalwarts Fund, Grandeur Peak International Stalwarts Fund and Grandeur Peak Global Micro Cap Funds (the “New Grandeur Peak Funds”):
Investment Advisory Fee Rate: The Trustees reviewed and considered the contractual annual advisory fee to be paid by the Trust, on behalf of the New Grandeur Peak Funds, to Grandeur Peak of 0.80% of daily average net assets for each of the Grandeur Peak Global Stalwarts Fund and Grandeur Peak International Stalwarts Fund and 1.50% of daily average net assets for the Grandeur Peak Global Micro Cap Fund, in light of the extent and quality of the advisory services to be provided by Grandeur Peak to the New Grandeur Peak Funds. The Board received and considered information including a comparison of each New Grandeur Peak Fund’s contractual and actual advisory fees and overall expenses with those of funds in the relevant peer expense group of funds provided by an independent provider of investment company data. The Trustees noted that the investment advisory fee rate was generally below, and in some cases significantly below, the peer group fee and the universe fee for the Grandeur Peak Global Stalwarts Fund and Grandeur Peak International Stalwarts Fund, and significantly above such medians for the Grandeur Peak Global Micro Cap Fund.
Total Expense Ratios: Based on such information, the Trustees further reviewed and considered the total expense ratios (after waivers, subject to certain exclusions), of 1.10%, 1.10% and 2.00% for each of the Grandeur Peak Global Stalwarts Fund, Grandeur Peak International Stalwarts Fund and Grandeur Peak Global Micro Cap Fund, respectively, taking into account the contractual fee waiver in place until August 2017. The Trustees noted that the total expense ratios (after waivers) were generally below the peer group total expense ratio and the universe total expense ratio for the Grandeur Peak Global Stalwarts Fund and the Grandeur Peak International Stalwarts Fund, and significantly above such medians for the Grandeur Peak Global Micro Cap Fund.
Nature, Extent and Quality of the Services under the Investment Advisory Agreement: The Trustees received and considered information regarding the nature, extent and quality of services to be provided to the New Grandeur Peak Funds under the Investment Advisory Agreement. The Trustees reviewed certain background materials supplied by Grandeur Peak in its presentation, including its Form ADV, financial statements and compliance policies and procedures.
The Trustees reviewed and considered Grandeur Peak’s investment advisory personnel, their history as asset managers and the amount of assets currently under management by Grandeur Peak. The Trustees also reviewed the research and decision-making processes utilized by Grandeur Peak, including the methods adopted to seek to achieve compliance with the investment objectives, policies and restrictions of the New Grandeur Peak Funds.
The Trustees considered the background and experience of Grandeur Peak’s management in connection with the New Grandeur Peak Funds, including reviewing the qualifications, backgrounds and responsibilities of the management team primarily responsible for the day-to-day portfolio management of the New Grandeur Peak Funds and the extent of the resources devoted to research and analysis of actual and potential investments.
The Trustees also reviewed, among other things, Grandeur Peak’s codes of ethics.
Performance: The Trustees noted that since the New Grandeur Peak Funds has not yet begun operations, there is no fund performance to be reviewed or analyzed at this time. The Trustees also considered the limitations on the comparability of performance information for certain related funds and accounts. The Trustees considered Grandeur Peak’s reputation generally and its investment techniques, risk management controls and decision-making processes.
Comparable Accounts: The Trustees considered information provided by Grandeur Peak indicating that there were no comparable accounts.
Profitability: The Trustees received and considered information on the profitability of the Grandeur Peak Funds to Grandeur Peak, as well as projected profitability analysis prepared by Grandeur Peak based on the fees payable under the respective Investment Advisory Agreement for the New Grandeur Peak Funds, with the exception of the Grandeur Peak Global Micro Cap Fund, which was not anticipated to launch until 2016. The
Semi-Annual Report | October 31, 2015 |
91 |
Table of Contents
Grandeur Peak Funds® | Disclosure Regarding Approval of Fund Advisory Agreement | |
October 31, 2015 (Unaudited) |
Trustees considered the profits, if any, anticipated to be realized by Grandeur Peak in connection with the operation of the New Grandeur Peak Funds. To the extent indicated by Grandeur Peak that the New Grandeur Peak Funds would not be immediately profitable, the Board recognized the commitment to be made by Grandeur Peak to each the Fund. The Board then reviewed and discussed Grandeur Peak’s financial statements in order to analyze the financial condition and stability and profitability of Grandeur Peak.
Economies of Scale: The Trustees considered whether economies of scale in the provision of services to the New Grandeur Peak Funds will be passed along to the shareholders under the proposed agreements.
Other Benefits to the Advisers: The Trustees reviewed and considered any other incidental benefits derived or to be derived by Grandeur Peak from its relationship with the New Grandeur Peak Funds, including whether soft dollar arrangements were used.
The Board summarized its deliberations with respect to the Investment Advisory Agreement with Grandeur Peak. In selecting Grandeur Peak, and the fees charged under the Investment Advisory Agreement, the Trustees concluded that no single factor reviewed by the Trustees was identified by the Trustees to be determinative as the principal factor in whether to approve the Investment Advisory Agreement. Further, the Independent Trustees were advised by independent legal counsel throughout the process. The Trustees, including all of the Independent Trustees, concluded that:
| • | the Trustees noted that the investment advisory fee rate was generally below, and in some cases significantly below, the peer group fee and the universe fee for the Grandeur Peak Global Stalwarts Fund and Grandeur Peak International Stalwarts Fund, and significantly above such medians for the Grandeur Peak Global Micro Cap Fund; |
| • | the Trustees noted that the total expense ratios (after waivers) were generally below the peer group total expense ratio and the universe total expense ratio for the Grandeur Peak Global Stalwarts Fund and the Grandeur Peak International Stalwarts Fund, and significantly above such medians for the Grandeur Peak Global Micro Cap Fund; |
| • | the terms of the proposed fee waiver and expense limitation agreement between the Trust, on behalf of the New Grandeur Peak Funds, and Grandeur Peak, were not unreasonable; |
| • | the nature, extent and quality of services to be rendered by Grandeur Peak under the Investment Advisory Agreement are adequate; |
| • | there was no performance history for the New Grandeur Peak Funds for the Board to consider; |
| • | there were no comparable accounts managed by Grandeur Peak; |
| • | there was no historical profitability for the adviser with respect to the New Grandeur Peak Funds for the Board to consider; and |
| • | there were no material economies of scale or other incidental benefits accruing to Grandeur Peak in connection with their relationship with the New Grandeur Peak Funds, at this time. |
Based on the Trustees’ deliberations and their evaluation of the information described above, the Trustees, including all of the Independent Trustees, concluded that Grandeur Peak’s compensation for investment advisory services is consistent with the best interests of the New Grandeur Peak Funds and its shareholders.
Grandeur Peak Global Opportunities Fund, Grandeur Peak International Opportunities Fund, Grandeur Peak Emerging Markets Opportunities Fund and Grandeur Peak Global Reach Fund
On September 15, 2015, the Trustees met in person to discuss, among other things, the renewal of the investment advisory agreement between the Trust and Grandeur Peak (the “Investment Advisory Agreement”), in accordance with Section 15(c) of the 1940 Act. The Independent Trustees met with independent legal counsel during executive session and discussed the Investment Advisory Agreement and other related materials.
In renewing and approving the Investment Advisory Agreement with Grandeur Peak, the Trustees, including the Independent Trustees, considered the following factors with respect to the Grandeur Peak Global Opportunities Fund, Grandeur Peak International Opportunities Fund, Grandeur Peak Emerging Markets Opportunities Fund and Grandeur Peak Global Reach Fund (the “Reviewed Grandeur Peak Funds”):
Investment Advisory Fee Rate: The Trustees reviewed and considered the contractual annual advisory fee to be paid by the Trust, on behalf of the Reviewed Grandeur Peak Funds to Grandeur Peak of 1.25% of each of the Grandeur Peak Global Opportunities Fund’s, Grandeur Peak Emerging Markets Opportunities Fund’s and Grandeur Peak International Opportunities Fund’s daily average net assets and 1.10% of the Grandeur Peak Global Reach Fund’s daily average net assets, in light of the extent and quality of the advisory services provided by Grandeur Peak to the Reviewed Grandeur Peak Funds.
The Board received and considered information including a comparison of each of the Reviewed Grandeur Peak Fund’s contractual and actual advisory fees and overall expenses with those of funds in the expense groups and universes of funds provided by an independent provider of investment company data and by Grandeur Peak. The Trustees noted that the investment advisory fee rate was above the median peer group fee and the median universe fee for each class of each Reviewed Grandeur Peak Fund.
92 |
1.855.377.7325 | www.GrandeurPeakGlobal.com |
Table of Contents
Grandeur Peak Funds® | Disclosure Regarding Approval of Fund Advisory Agreement | |
October 31, 2015 (Unaudited) |
Total Expense Ratios: Based on such information, the Trustees further reviewed and considered the total expense ratios (after waivers, subject to certain exclusions) of 1.38% for the Institutional Class and 1.62% for the Investor Class of each of the Grandeur Peak International Opportunities Fund and the Grandeur Peak Global Opportunities Fund, 1.58% for the Institutional Class and 1.82% for the Investor Class of the Grandeur Peak Emerging Markets Opportunities Fund and 1.35% for the Institutional Class and 1.60% for the Investor Class of the Grandeur Peak Global Reach Fund. The Trustees noted that the total expense ratios (after waivers) were above the median peer group total expense ratios and the median universe total expense ratios for each class of each Reviewed Grandeur Peak Fund.
Nature, Extent and Quality of the Services under the Investment Advisory Agreement: The Trustees received and considered information regarding the nature, extent and quality of services to be provided to the Reviewed Grandeur Peak Funds under the Investment Advisory Agreement. The Trustees reviewed certain background materials supplied by Grandeur Peak in its presentation, including its Form ADV.
The Trustees reviewed and considered Grandeur Peak’s investment advisory personnel, its history as an asset manager and its performance and the amount of assets currently under management by Grandeur Peak and its affiliated entities. The Trustees also reviewed the research and decision-making processes utilized by Grandeur Peak, including the methods adopted to seek to achieve compliance with the investment objectives, policies and restrictions of the Reviewed Grandeur Peak Funds.
The Trustees considered the background and experience of Grandeur Peak’s management in connection with the Reviewed Grandeur Peak Funds, including reviewing the qualifications, backgrounds and responsibilities of the management team primarily responsible for the day-to-day portfolio management of the Reviewed Grandeur Peak Funds and the extent of the resources devoted to research and analysis of actual and potential investments.
The Trustees also reviewed, among other things, Grandeur Peak’s insider trading policies and procedures and its Code of Ethics.
Performance: The Trustees reviewed performance information for each of the Reviewed Grandeur Peak Funds for the three-month, 1-year and 3–year, if applicable, periods ended June 30, 2015. That review included a comparison of each Reviewed Grandeur Peak Fund’s performance to the performance of a group of comparable funds selected by an independent provider of investment company data. The Trustees noted the performance of each Reviewed Grandeur Peak Fund was generally above its respective peer universe median for the most recent 1-year period and, with respect to the International Opportunities Fund and the Global Opportunities Fund, above the respective peer universe median for the most recent 3-year period. The Trustees also considered Grandeur Peak’s discussion of each Reviewed Grandeur Peak Fund’s underlying portfolio diversification categories, its top contributors and top detractors, as well as Grandeur Peak’s performance and reputation generally and its investment techniques, risk management controls and decision-making processes.
Comparable Accounts: The Trustees noted certain information provided by Grandeur Peak regarding fees charged to its limited partnership utilizing a strategy similar to that employed by the Grandeur Peak Global Opportunities Fund.
Profitability: The Trustees received and considered a retrospective and projected profitability analysis prepared by Grandeur Peak based on the fees payable under the Investment Advisory Agreement with respect to each Reviewed Grandeur Peak Fund. The Trustees considered the profits, if any, anticipated to be realized by Grandeur Peak in connection with the operation of each Reviewed Grandeur Peak Fund. The Board then reviewed Grandeur Peak’s unaudited calendar year 2011-2014 financial statements and a projection for 2015 in order to analyze the financial condition and stability and profitability of Grandeur Peak.
Economies of Scale: The Trustees considered whether economies of scale in the provision of services to the Reviewed Grandeur Peak Funds will be passed along to the shareholders under the proposed agreements.
Other Benefits to the Adviser: The Trustees reviewed and considered any other incidental benefits derived or to be derived by Grandeur Peak from its relationship with the Reviewed Grandeur Peak Funds, including whether soft dollar arrangements were used.
In renewing Grandeur Peak as the Reviewed Grandeur Peak Funds’ investment adviser and renewing the Investment Advisory Agreement and the fees charged under the Investment Advisory Agreement, the Trustees concluded that no single factor reviewed by the Trustees was identified by the Trustees to be determinative as the principal factor in whether to renew the Investment Advisory Agreement. Further, the Independent Trustees were advised by separate independent legal counsel throughout the process. The Trustees, including all of the Independent Trustees, concluded that:
| • | the investment advisory fee rate was above the median peer group fee and the median universe fee for each class of each Reviewed Grandeur Peak Fund; |
Semi-Annual Report | October 31, 2015 |
93 |
Table of Contents
Grandeur Peak Funds® | Disclosure Regarding Approval of Fund Advisory Agreement | |
October 31, 2015 (Unaudited) |
| • | the total expense ratio (after waivers) was above the median peer group fee and the median universe fee for each class of each Reviewed Grandeur Peak Fund; |
| • | the nature, extent and quality of services to be rendered by Grandeur Peak under the Investment Advisory Agreement with respect to the Reviewed Grandeur Peak Funds were adequate; |
| • | the performance of each class of each Reviewed Grandeur Peak Fund was generally above the median performance of the funds in its respective peer universe for the most recent 1-year period, and, with respect to the International Opportunities Fund and the Global Opportunities Fund, above the respective peer universe median for the most recent 3-year period; |
| • | bearing in mind the limitations of comparing different types of managed accounts and the different levels of service typically associated with such accounts, the fee structures applicable to Grandeur Peak’s other clients employing a comparable strategy to one or more of the Reviewed Grandeur Peak Funds were not indicative of any unreasonableness with respect to the advisory fees proposed to be payable by the Reviewed Grandeur Peak Funds; |
| • | the profit, if any, realized by Grandeur Peak in connection with the operation of the Reviewed Grandeur Peak Funds is not unreasonable; and |
| • | there were no material economies of scale or other incidental benefits accruing to Grandeur Peak in connection with its relationship with the Grandeur Peak Funds. |
After reviewing the information received, the Trustees requested supplemental information and the Adviser provided materials in response. The Board determined that, given the totality of the information provided with respect to the Investment Advisory Agreement, the Board had received sufficient information to approve the Investment Advisory Agreement.
Based on the Trustees’ deliberations and their evaluation of the information described above, the Trustees, including all of the Independent Trustees, concluded that Grandeur Peak’s compensation for investment advisory services is consistent with the best interests of the Reviewed Grandeur Peak Funds and their shareholders.
94 |
1.855.377.7325 | www.GrandeurPeakGlobal.com |
Table of Contents
| Grandeur Peak Funds® | Additional Information | |
October 31, 2015 (Unaudited) |
1. FUND HOLDINGS
The Funds file their complete schedule of portfolio holdings with the Securities and Exchange Commission (the “SEC”) for the first and third quarters of each fiscal year on Form N-Q within 60 days after the end of the period. Copies of the Funds’ Form N-Q are available without charge on the SEC website at http://www.sec.gov. You may also review and copy the Form N-Q at the SEC’s Public Reference Room in Washington, DC. For more information about the operation of the Public Reference Room, please call the SEC at 1-800-SEC-0330.
2. FUND PROXY VOTING POLICIES, PROCEDURES AND SUMMARIES
The Funds’ policies and procedures used in determining how to vote proxies and information regarding how the Funds voted proxies relating to portfolio securities during the most recent prior 12-month period ending June 30 are available without charge, (1) upon request, by calling (toll-free) 855-377-PEAK(7325) and (2) on the SEC’s website at http://www.sec.gov.
Semi-Annual Report | October 31, 2015 |
95 |
Table of Contents

Contact Us
| Mail: | Grandeur Peak Funds, P.O. Box 13664, Denver, CO 80201 | E-Mail: | grandeurpeakglobal@alpsinc.com | |||
| Phone: | 1.855.377.PEAK (7325) | Web: | www.GrandeurPeakGlobal.com | |||
Table of Contents
Table of Contents
| 1 | ||||
| 4 | ||||
| 7 | ||||
| 10 | ||||
| 11 | ||||
| 13 | ||||
| 14 | ||||
| 15 | ||||
| 16 | ||||
| 17 | ||||
| 18 | ||||
| 20 | ||||
| 22 | ||||
| 30 | ||||
| 33 | ||||
Table of Contents
Pathway Advisors Funds | Shareholder Letter | |
| October 31, 2015 (Unaudited) |
November 24, 2015
Dear Shareholder:
Below is a table of our year-to-date and one year performance as of 10/31/15. We’ve also included the annualized since inception return through the same period
| Calendar | ||||||
| Year-To-Date | 1 Year | Since Inception | ||||
Pathway Advisors Conservative | -1.14% | 1.19% | 3.04% | |||
Pathway Advisors Aggressive Growth | -2.20% | 2.42% | 8.21% |
The performance data quoted represents past performance. Past performance does not guarantee future results. The investment return and principal value of an investment will fluctuate so that an Investor’s shares, when redeemed, may not be worth more or less than their original cost and current performance may be lower or higher than the performance quoted. To obtain the most recent month-end performance data, please call 1-888-288-1121 or visit www.pathwayadvisorsfunds.com.
Hanson McClain, Inc. (the “Adviser”) has agreed contractually to limit the amount of the Fund’s total annual expenses, exclusive of Acquired Fund Fees and Expenses, brokerage expenses, interest expenses, taxes and extraordinary expenses, to 1.88% of the Fund’s average daily net assets. This agreement is in effect through August 31, 2016. The Adviser will be permitted to recover expenses it has borne through the agreement described above to the extent that the Fund’s expenses in later periods fall below the annual rates set forth in the relevant agreement. The Fund will not be obligated to pay any such deferred fees and expenses more than three years after the end of the fiscal year in which the fees and expense were deferred. The Adviser may not discontinue this waiver without the approval by the Fund’s Board of Trustees.
The divergence of central bank policy has continued since our last shareholder letter. The US dollar index has remained near multi-year highs against other currencies while energy prices have held near multi-year lows. The European Central Bank and the Bank of Japan continue to print money à la quantitative easing while the Federal Reserve continues to look forward to raising rates. With the Fed opting to not increase rates at all thus far and with there being some uncertainty of raising rates in December as well, it is possible that we may not see any rate increases until next year and even these are not certain.
In late August, while stocks in China were in a steep sell-off, the Chinese central bank, in order to stay competitive with other Asian currencies, devalued the Yuan. This along with concerns about slowing economic growth in countries like China saw global equity prices quickly fall sharply. While domestic equities have remarkably recovered roughly all of the losses from August and September, international developed market equities are still well below the highs set in May. Emerging markets equities started seeing drawdowns in May and while they have rallied well off their August and September lows, they are still 21% below the high set on April 28th on a price basis. They are down roughly 9.5% for the year through the end of October on a total return basis. High yield bonds have also struggled in this environment as fearful investors fled the asset class on concerns of increasing default rates for credit risky energy issuers. Yields between high yield bonds and treasuries, also known as credit spreads, went from 423 basis points, in early June, to a multi-year high of 653 basis points, in early October. Spreads compressed to 560 basis points by the end of October while the equity markets also surged more than 10% during the period. As of this
Semi-Annual Report | October 31, 2015 |
1 |
Table of Contents
| Shareholder Letter | ||
| October 31, 2015 (Unaudited) |
writing, spreads are at 603 basis points. We anticipate that as the profit cycle continues to slow down, short-term borrowing rates head higher, and news of some credit defaults hits the news, spreads in this space will stay high or perhaps move higher. This irrational fear that is akin to “the baby going out with the bath water” can be a good place for patient active managers to add excess returns, especially if the highest quality bonds are trading at or above par and with duration for many issues now being higher than the yield-to-maturity.
We believe that, while markets have recovered nicely in the past month and a half, there are still plenty of risks that have been masked by complacency and the perception that central bankers will keep asset prices afloat at all cost. We suspect that as long as inflation, particularly wage growth, stays anemic and as long as interest rate risk continues to offset macroeconomic risks, investors will likely continue to embrace richer valuations, growth will likely continue to outperform value, and rates will likely stay low. Should this environment change significantly, we believe that there is some risk for both bonds (high quality and low quality) and stocks, especially those with weaker balance sheets, to both go down together. This could be very painful for investors in portfolios with stocks and bonds, as correlations between the two could increase dramatically. We are neither predicting that this bleak environment will soon be on the horizon nor is one of a high probability outcome, but we do believe that diversification still is essential when it comes to using both domestic and international assets, active and passive strategies, and traditional and alternative investment strategies. As we draw near to the close of the 7th year of an almost uninterrupted bull market in equities (and even longer for bonds), as the Fed prepares to raise interest rates for the first time in 7 years, as profit margins wane from their multi-year highs, and as we prepare for a new President (and possibly new policies) in a highly bifurcated political arena, we believe it is prudent to be defensive and prepared for asset classes to mean revert. We wish everyone a safe and happy holiday season and we are continually grateful for your confidence and trust.
Sincerely,
David Schauer
Chief Investment Officer
Hanson McClain, Inc.
The views of the author and information discussed in this commentary are as of the date of publication, are subject to change, and may not reflect the writer’s current views. The views expressed are those of the author only, and represent an assessment of market conditions at a specific point in time, are opinions only and should not be relied upon as investment advice regarding a particular investment or markets in general. Such information does not constitute a recommendation to buy or sell specific securities or investment vehicles. It should not be assumed that any investment will be profitable or will equal the performance of the portfolios or any securities or any sectors mentioned in this letter. The subject matter contained in this letter has been derived from several sources believed to be reliable and accurate at the time of compilation. Neither Hanson McClain, Inc. nor the Funds accept any liability for losses either direct or consequential caused by the use of this information.
The Pathway Advisors Aggressive Growth Fund invests in underlying funds that use investment techniques and financial instruments that may be considered aggressive, including the use of futures contracts, options on futures contracts, securities and indices, forward contracts, swap agreements and similar instruments, exposes an underlying fund to potentially dramatic changes (losses) in the value of certain of its portfolio holdings.
2 |
www.pathwayadvisorsfunds.com |
Table of Contents
Pathway Advisors Funds | Shareholder Letter | |
| October 31, 2015 (Unaudited) |
The Pathway Advisor Conservative Fund invests in underlying funds that invest long or short in fixed-income securities which subjects the Fund to additional risks that include credit risk, interest risk, maturity risk, investment-grade securities risk, municipal securities risk and prepayment risk. These risks could affect the value of a particular investment by the Fund, possibly causing the Fund’s share price and total return to be reduced and fluctuate more than other types of investments.
The Pathway Advisors Funds are distributed by ALPS Distributors, Inc.
The Pathway Advisors Funds are subject to investment risks, including possible loss of the principal amount invested and therefore are not suitable for all investors. The Funds may not achieve their objectives.
Diversification does not assure a profit or protect against a loss.
Quantitative Easing – An unconventional monetary policy in which a central bank purchases government securities or other securities from the market in order to lower interest rates and increase the money supply.
Duration – A measure of the sensitivity of the price (the value of principal) of a fixed-income investment to a change in interest rates. Duration is expressed as a number of years. Rising interest rates mean falling bond prices, while declining interest rates mean rising bond prices.
Yield to Maturity - The internal rate of return (IRR, overall interest rate) earned by an investor who buys the bond today at the market price, assuming that the bond will be held until maturity, and that all coupon and principal payments will be made on schedule.
Basis point – A commonly used expression for describing 1/100th of 1%.
Semi-Annual Report | October 31, 2015 |
3 |
Table of Contents
| Performance Update | ||
| October 31, 2015 (Unaudited) |
Cumulative Total Return for the period ended October 31, 2015
| Calendar YTD | One Year | Three Years | Since Inception* | |||||
Pathway Advisors Conservative Fund | -1.14% | -1.19% | 2.69% | 3.04% | ||||
S&P 500® Total Return Index1 | 2.70% | 5.20% | 16.20% | 15.72% | ||||
Barclays Capital U.S. Aggregate Bond Index2 | 1.14% | 1.96% | 1.65% | 1.66% | ||||
Russell 2000® Index3 | -2.53% | 0.34% | 13.90% | 14.05% |
| * | Fund inception date of July 30, 2012. |
The returns shown above do not reflect the deduction of taxes a shareholder would pay on Fund distributions or redemption of Fund shares.
Performance data quoted represents past performance. Past performance does not guarantee future results. Investment return and principal value of an investment will fluctuate so that an investor’s shares, when sold or redeemed, may be worth more or less than the original cost. Current performance data may be higher or lower than actual data quoted. For the most current month-end performance data, please call 1-888-288-1121 or visit www.pathwayadvisorsfunds.com.
| 1 | The S&P 500® Total Return Index is an unmanaged index of 500 common stocks chosen for the market size, liquidity and industry group representation. It is a market-value weighted index. The Index is not actively managed and does not reflect any deduction for fees, expenses or taxes. An investor may not invest directly into the Index. |
| 2 | The Barclays Capital U.S. Aggregate Bond Index is a market capitalization-weighted index, meaning the securities in the index are weighted according to the market size of each bond type. Most U.S. traded investment grade bonds are represented. Municipal bonds, and Treasury Inflation-Protected Securities are excluded, due to tax treatment issues. The Index includes Treasury securities, Government agency bonds, Mortgage-backed bonds, Corporate bonds, and a small amount of foreign bonds traded in U.S. The Index is not actively managed and does not reflect any deduction for fees, expenses or taxes. An investor may not invest directly into the Index. |
| 3 | The Russell 2000® Index measures the performance of the small-cap segment of the U.S. equity universe. The Russell 2000® Index is a subset of the Russell 3000® Index representing approximately 10% of the total market capitalization of that index. It includes approximately 2000 of the smallest securities based on a combination of their market cap and current index membership. The Index is not actively managed and does not reflect any deduction for fees, expenses or taxes. An investor may not invest directly into the Index. |
4 |
www.pathwayadvisorsfunds.com |
Table of Contents
Pathway Advisors Conservative Fund | Performance Update | |
| October 31, 2015 (Unaudited) |
Growth of $10,000 for the period ended October 31, 2015
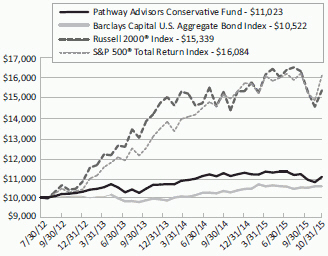
The graphs shown above represent a hypothetical investment of $10,000 in the Fund’s Investor Class shares for the period from inception to 10/31/15. All returns reflect reinvested dividends, but do not reflect the deduction of taxes that an investor would pay on distributions or redemptions.
Semi-Annual Report | October 31, 2015 |
5 |
Table of Contents
Pathway Advisors Conservative Fund | Performance Update | |
| October 31, 2015 (Unaudited) |
| Top Ten Long Holdings | (as a % of Net Assets)* | |
DoubleLine Total Return Bond Fund - Class I | 13.81% | |
iShares® Core U.S. Aggregate Bond ETF | 13.79% | |
Vanguard® Total Stock Market ETF | 11.29% | |
Metropolitan West Total Return Bond Fund - Class I | 7.88% | |
Goldman Sachs Strategic Income Fund - Institutional Class | 6.06% | |
Vanguard® Wellington Fund - Class Admiral | 5.93% | |
Templeton Global Bond Fund - Advisor Class | 5.88% | |
Vanguard® S&P 500® ETF | 4.82% | |
Putnam Capital Spectrum Fund - Class Y | 4.00% | |
Loomis Sayles Bond Fund - Institutional Class | 3.97% | |
Top Ten Holdings | 77.43% |
Portfolio Allocation (as a % of Net Assets as of October 31, 2015)*
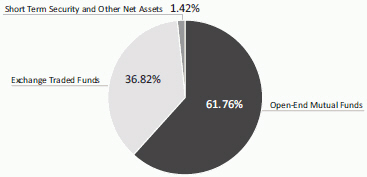
| * | Holdings are subject to change, and may not reflect the current or future position of the portfolio. |
6 |
www.pathwayadvisorsfunds.com |
Table of Contents
| Performance Update | ||
| October 31, 2015 (Unaudited) |
Cumulative Total Return for the period ended October 31, 2015
| Calendar YTD | One Year | Three Years | Since Inception* | |||||
Pathway Advisors Aggressive Growth Fund | -2.20% | -2.42% | 7.66% | 8.21% | ||||
MSCI EAFE® Index1 | 2.13% | -0.07% | 8.02% | 9.51% | ||||
S&P 500® Total Return Index2 | 2.70% | 5.20% | 16.20% | 15.72% | ||||
Russell 2000® Index3 | -2.53% | 0.34% | 13.90% | 14.05% |
| * | Fund inception date of July 30, 2012. |
The returns shown above do not reflect the deduction of taxes a shareholder would pay on Fund distributions or redemption of Fund shares.
Performance data quoted represents past performance. Past performance does not guarantee future results. Investment return and principal value of an investment will fluctuate so that an investor’s shares, when sold or redeemed, may be worth more or less than the original cost. Current performance data may be higher or lower than actual data quoted. For the most current month-end performance data, please call 1-888-288-1121 or visit www.pathwayadvisorsfunds.com.
| 1 | MSCI EAFE® Index (Europe, Australasia, Far East) is a free float-adjusted market capitalization weighted index designed to measure developed market equity performance. The MSCI EAFE® Index is composed of companies representative of the market structure of Developed Market countries. The index includes reinvestment of dividends, net of foreign withholding taxes. The Index is not actively managed and does not reflect any deduction for fees, expenses or taxes. An investor may not invest directly into the Index. |
| 2 | The S&P 500® Total Return Index is an unmanaged index of 500 common stocks chosen for the market size, liquidity and industry group representation. It is a market-value weighted index. The Index is not actively managed and does not reflect any deduction for fees, expenses or taxes. An investor may not invest directly into the Index. |
| 3 | The Russell 2000® Index measures the performance of the small-cap segment of the U.S. equity universe. The Russell 2000® Index is a subset of the Russell 3000® Index representing approximately 10% of the total market capitalization of that index. It includes approximately 2000 of the smallest securities based on a combination of their market cap and current index membership. The Index is not actively managed and does not reflect any deduction for fees, expenses or taxes. An investor may not invest directly into the Index. |
Source: MSCI. MSCI makes no express or implied warranties or representations and shall have no liability whatsoever with respect to any MSCI data contained herein. The MSCI data may not be further redistributed or used to create indices or financial products. This report is not approved or produced by MSCI.
Semi-Annual Report | October 31, 2015 |
7 |
Table of Contents
Pathway Advisors Aggressive Growth Fund | Performance Update | |
| October 31, 2015 (Unaudited) |
Growth of $10,000 for the period ended October 31, 2015
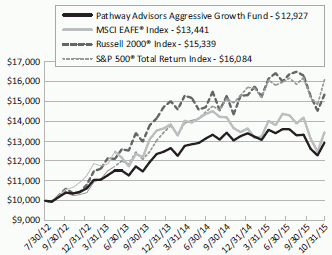
The graphs shown above represent a hypothetical investment of $10,000 in the Fund’s Investor Class shares for the period from inception 10/31/15. All returns reflect reinvested dividends, but do not reflect the deduction of taxes that an investor would pay on distributions or redemptions.
8 |
www.pathwayadvisorsfunds.com |
Table of Contents
Pathway Advisors Aggressive Growth Fund | Performance Update | |
| October 31, 2015 (Unaudited) |
| Top Ten Long Holdings | (as a % of Net Assets)* | |
Vanguard® Total Stock Market ETF | 23.52% | |
Vanguard® Total International Stock ETF | 11.90% | |
Vanguard® S&P 500® ETF | 10.04% | |
Vanguard® Global Minimum Volatility Fund - Class Admiral | 10.02% | |
DoubleLine Total Return Bond Fund - Class I | 9.78% | |
Putnam Capital Spectrum Fund - Class Y | 4.02% | |
Deutsche Global Infrastructure Fund - Institutional Class | 3.92% | |
Vanguard® FTSE Emerging Markets ETF | 3.84% | |
Vanguard® High Dividend Yield ETF | 3.66% | |
Akre Focus Fund - Institutional Class | 3.15% | |
Top Ten Holdings | 83.85% |
Portfolio Allocation (as a % of Net Assets as of October 31, 2015)*
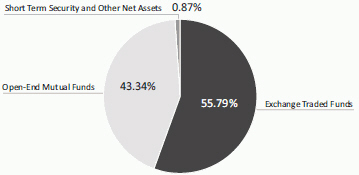
| * | Holdings are subject to change, and may not reflect the current or future position of the portfolio. |
Semi-Annual Report | October 31, 2015 |
9 |
Table of Contents
Pathway Advisors Funds | Disclosure of Fund Expenses | |
| October 31, 2015 (Unaudited) |
As a shareholder of a Fund, you incur two types of costs: direct costs, such as short-term redemption fees and wire fees, and indirect costs, including management fees, and other fund operating expenses. This example is intended to help you understand your indirect costs, also referred to as “ongoing costs” (in dollars), of investing in the Fund and to compare these costs with the ongoing costs of investing in other mutual funds.
This example is based on an investment of $1,000 invested at the beginning of the period and held for the entire six-month period of May 1, 2015 through October 31, 2015.
Actual Expenses The first line of the table below provides information about actual account values and actual expenses. You may use the information in this line, together with the amount you invested at the beginning of the period, to estimate the expenses that you paid over the period. Simply divide your account value by $1,000 (for example, an $8,600 account value divided by $1,000 = 8.6), then multiply the result by the number in the first line under the heading “Expenses Paid During Period” to estimate the expenses you paid on your account during this period.
Hypothetical Example for Comparison Purposes The second line of the table provides information about hypothetical account values and hypothetical expenses based on the Fund’s actual expense ratio and an assumed rate of return of 5% per year before expenses, which is not the Fund’s actual return. The hypothetical account values and expenses may not be used to estimate the actual ending account balance or expenses you paid for the period. You may use this information to compare ongoing costs of investing in the Fund and other funds. To do so, compare this 5% hypothetical example with the 5% hypothetical examples that appear in the shareholder reports of other funds.
Please note that the expenses shown in the table are meant to highlight your ongoing costs only and do not reflect any direct costs, such as wire fees or low balance fees. Therefore, the second line of the table is useful in comparing ongoing costs only and will not help you determine the relative total costs of owning different funds. In addition, if these direct costs were included, your costs would be higher.
| Expenses Paid | ||||||||
| Beginning | Ending | During Period | ||||||
| Account Value | Account Value | Expense | 05/01/15- | |||||
| 05/01/15 | 10/31/15 | Ratio(a) | 10/31/15(b) | |||||
Pathway Advisors Conservative Fund | ||||||||
Actual | $ 1,000.00 | $ 976.50 | 1.88% | $ 9.34 | ||||
Hypothetical | ||||||||
(5% return before expenses) | $ 1,000.00 | $ 1,015.69 | 1.88% | $ 9.53 | ||||
Pathway Advisors Aggressive Growth Fund | ||||||||
Actual | $ 1,000.00 | $ 950.70 | 1.88% | $ 9.22 | ||||
Hypothetical | ||||||||
(5% return before expenses) | $ 1,000.00 | $ 1,015.69 | 1.88% | $ 9.53 | ||||
| (a) | Annualized, based on the Funds’ most recent fiscal half year expenses. |
| (b) | Expenses are equal to the Fund’s annualized expense ratio multiplied by the average account value over the period, multiplied by the number of days in the most recent fiscal half-year (184)/366 (to reflect the half-year period). |
10 |
www.pathwayadvisorsfunds.com |
Table of Contents
| Portfolio of Investments | ||
| October 31, 2015 (Unaudited) |
| Value | ||||||||||||
| Description | Shares | (Note 2) | ||||||||||
| ||||||||||||
EXCHANGE TRADED FUNDS (36.82%) | ||||||||||||
iShares® Core U.S. Aggregate Bond ETF | 39,745 | $ | 4,350,091 | |||||||||
Schwab U.S. TIPs ETF™(a) | 16,500 | 888,360 | ||||||||||
Vanguard® FTSE Emerging Markets ETF | 18,455 | 642,972 | ||||||||||
Vanguard® S&P 500® ETF | 7,986 | 1,521,812 | ||||||||||
Vanguard® Total International Stock ETF | 13,783 | 649,041 | ||||||||||
Vanguard® Total Stock Market ETF | 33,434 | 3,561,724 | ||||||||||
|
| |||||||||||
TOTAL EXCHANGE TRADED FUNDS (Cost $11,774,216) | 11,614,000 | |||||||||||
| ||||||||||||
OPEN-END MUTUAL FUNDS (61.76%) | ||||||||||||
Catalyst Hedged Futures Strategy Fund - Class I | 69,053 | 760,274 | ||||||||||
Deutsche Global Infrastructure Fund - Institutional Class |
| 46,835 | 634,609 | |||||||||
DoubleLine Total Return Bond Fund - Class I | 400,418 | 4,356,546 | ||||||||||
Goldman Sachs Strategic Income Fund - Institutional Class |
| 192,666 | 1,911,247 | |||||||||
Hartford World Bond Fund - Class Y | 118,981 | 1,248,107 | ||||||||||
Loomis Sayles Bond Fund - Institutional Class | 89,417 | 1,250,950 | ||||||||||
Metropolitan West Total Return Bond Fund - Class I |
| 229,656 | 2,484,878 | |||||||||
Osterweis Strategic Income Fund - Class I | 111,503 | 1,239,917 | ||||||||||
PIMCO All Asset All Authority Fund - Institutional Class |
| 73,716 | 603,736 | |||||||||
Putnam Capital Spectrum Fund - Class Y | 34,112 | 1,262,148 | ||||||||||
Templeton Global Bond Fund - Advisor Class | 158,201 | 1,854,114 | ||||||||||
Vanguard® Wellington Fund - Class Admiral | 27,796 | 1,870,678 | ||||||||||
|
| |||||||||||
TOTAL OPEN-END MUTUAL FUNDS (Cost $20,003,141) | 19,477,204 | |||||||||||
| ||||||||||||
| 7-Day | Value | |||||||||||
| Yield | Shares | (Note 2) | ||||||||||
| ||||||||||||
SHORT TERM INVESTMENTS (0.04%) | ||||||||||||
Dreyfus Cash Management, Institutional Shares | 0.059 | % | 13,804 | 13,804 | ||||||||
|
| |||||||||||
TOTAL SHORT TERM INVESTMENTS (Cost $13,804) | 13,804 | |||||||||||
| ||||||||||||
TOTAL INVESTMENTS (98.62%) (Cost $31,791,161) | $ | 31,105,008 | ||||||||||
Other Assets In Excess Of Liabilities (1.38%) | 436,798 | |||||||||||
| ||||||||||||
NET ASSETS (100.00%) | $ | 31,541,806 | ||||||||||
| ||||||||||||
| (a) | Non-income producing security. |
Semi-Annual Report | October 31, 2015 |
11 |
Table of Contents
Pathway Advisors Conservative Fund | Portfolio of Investments | |
| October 31, 2015 (Unaudited) |
Common Abbreviations:
ETF - Exchange Traded Fund.
FTSE - Financial Times and Stock Exchange.
PIMCO - Pacific Investment Management Company, LLC.
S&P - Standard & Poor’s.
TIPS - Treasury Inflation Protected Securities.
Holdings are subject to change.
See Notes to Financial Statements.
12 |
www.pathwayadvisorsfunds.com |
Table of Contents
| Portfolio of Investments | ||
| October 31, 2015 (Unaudited) |
| Value | ||||||||||||
| Description | Shares | (Note 2) | ||||||||||
| ||||||||||||
EXCHANGE TRADED FUNDS (55.79%) | ||||||||||||
iShares® MSCI Emerging Markets Minimum Volatility ETF | 20,000 | $ | 1,046,800 | |||||||||
Vanguard® FTSE Emerging Markets ETF | 40,836 | 1,422,726 | ||||||||||
Vanguard® High Dividend Yield ETF | 20,000 | 1,358,400 | ||||||||||
Vanguard® S&P 500® ETF | 19,540 | 3,723,542 | ||||||||||
Vanguard® Total International Stock ETF | 93,724 | 4,413,463 | ||||||||||
Vanguard® Total Stock Market ETF | 81,887 | 8,723,423 | ||||||||||
|
| |||||||||||
TOTAL EXCHANGE TRADED FUNDS (Cost $21,083,113) | 20,688,354 | |||||||||||
| ||||||||||||
OPEN-END MUTUAL FUNDS (43.34%) | ||||||||||||
361 Managed Futures Fund - Class I | 32,103 | 362,119 | ||||||||||
Akre Focus Fund - Institutional Class |
| 49,393 | 1,168,156 | |||||||||
Boston Partners Long/Short Equity Fund - Institutional Class | 18,574 | 376,300 | ||||||||||
Catalyst Hedged Futures Strategy Fund - Class I |
| 83,711 | 921,659 | |||||||||
Deutsche Global Infrastructure Fund - Institutional Class | 107,162 | 1,452,045 | ||||||||||
DoubleLine Total Return Bond Fund - Class I | 333,458 | 3,628,027 | ||||||||||
LoCorr Market Trend Fund - Class I |
| 30,738 | 371,004 | |||||||||
Osterweis Strategic Income Fund - Class I | 68,593 | 762,755 | ||||||||||
PIMCO All Asset All Authority Fund - Institutional Class |
| 85,956 | 703,979 | |||||||||
Principal MidCap Fund - Institutional Class | 49,631 | 1,122,150 | ||||||||||
Putnam Capital Spectrum Fund - Class Y | 40,248 | 1,489,194 | ||||||||||
Vanguard® Global Minimum Volatility Fund - Class Admiral | 157,299 | 3,715,395 | ||||||||||
|
| |||||||||||
TOTAL OPEN-END MUTUAL FUNDS (Cost $16,410,789) | 16,072,783 | |||||||||||
| ||||||||||||
| 7-Day | Value | |||||||||||
| Yield | Shares | (Note 2) | ||||||||||
| ||||||||||||
SHORT TERM INVESTMENTS (0.62%) | ||||||||||||
Dreyfus Cash Management, Institutional Shares | 0.059 | % | 230,802 | 230,802 | ||||||||
|
| |||||||||||
TOTAL SHORT TERM INVESTMENTS (Cost $230,802) | 230,802 | |||||||||||
| ||||||||||||
TOTAL INVESTMENTS (99.75%) (Cost $37,724,704) | $ | 36,991,939 | ||||||||||
Other Assets In Excess Of Liabilities (0.25%) | 91,547 | |||||||||||
| ||||||||||||
NET ASSETS (100.00%) | $ | 37,083,486 | ||||||||||
| ||||||||||||
Common Abbreviations:
ETF - Exchange Traded Fund.
FTSE - Financial Times and Stock Exchange.
MSCI - Morgan Stanley Capital International.
PIMCO - Pacific Investment Management Company, LLC.
S&P - Standard & Poor’s.
Holdings are subject to change.
See Notes to Financial Statements.
Semi-Annual Report | October 31, 2015 |
13 |
Table of Contents
Pathway Advisors Funds | Statements of Assets and Liabilities | |
| October 31, 2015 (Unaudited) |
| Pathway Advisors | ||||||||
| Pathway Advisors | Aggressive Growth | |||||||
| Conservative Fund | Fund | |||||||
|
| |||||||
ASSETS | ||||||||
Investments, at value | $ 31,105,008 | $ | 36,991,939 | |||||
Cash | 4,804 | – | ||||||
Receivable for investments sold | 309,581 | – | ||||||
Receivable for shares sold | 201,863 | 201,863 | ||||||
Dividends receivable | 22,539 | 12,156 | ||||||
Other assets | 13,022 | 11,187 | ||||||
| ||||||||
Total assets | 31,656,817 | 37,217,145 | ||||||
| ||||||||
LIABILITIES | ||||||||
Investment advisory fees payable | 30,305 | 42,639 | ||||||
Distributions and service fees payable | 26,284 | 30,094 | ||||||
Payable for shares redeemed | 31,707 | 31,707 | ||||||
Payable for trustee fees and expenses | 37 | 103 | ||||||
Payable for chief compliance officer fees | 1,581 | 2,066 | ||||||
Payable for principal financial officer fees | 378 | 494 | ||||||
Payable for administration fees | 7,935 | 9,157 | ||||||
Payable for transfer agency fees | 4,760 | 5,179 | ||||||
Payable for professional fees | 9,102 | 9,009 | ||||||
Payable for custody fees | 306 | 266 | ||||||
Payable for reports to shareholders | 753 | 1,098 | ||||||
Accrued expenses and other liabilities | 1,863 | 1,847 | ||||||
| ||||||||
Total liabilities | 115,011 | 133,659 | ||||||
| ||||||||
NET ASSETS | $ 31,541,806 | $ | 37,083,486 | |||||
| ||||||||
NET ASSETS CONSIST OF | ||||||||
Paid-in capital (Note 5) | $ 32,001,099 | $ | 38,029,071 | |||||
Accumulated net investment income | 114,787 | 62,265 | ||||||
Accumulated net realized gain/(loss) on investments | 112,073 | (275,085) | ||||||
Net unrealized depreciation on investments | (686,153) | (732,765) | ||||||
| ||||||||
NET ASSETS | $ 31,541,806 | $ | 37,083,486 | |||||
| ||||||||
INVESTMENTS, AT COST | $ 31,791,161 | $ | 37,724,704 | |||||
| ||||||||
PRICING OF SHARES | ||||||||
Net Asset Value, offering and redemption price per share | $10.41 | $ | 11.56 | |||||
Net Assets | $ 31,541,806 | $ | 37,083,486 | |||||
Shares of beneficial interest outstanding (unlimited number of shares, no par value common stock authorized) | 3,029,467 | 3,207,138 | ||||||
See Notes to Financial Statements.
14 |
www.pathwayadvisorsfunds.com |
Table of Contents
Pathway Advisors Funds | Statements of Operations | |
| For the Six Months Ended October 31, 2015 (Unaudited) |
| Pathway | Pathway | |||||||
| Advisors | Advisors | |||||||
| Conservative | Aggressive | |||||||
| Fund | Growth Fund | |||||||
|
| |||||||
INVESTMENT INCOME | ||||||||
Dividends from other investment companies | $ 402,725 | $ | 455,902 | |||||
| ||||||||
Total investment income | 402,725 | 455,902 | ||||||
| ||||||||
EXPENSES | ||||||||
Investment advisory fees (Note 6) | 160,566 | 189,956 | ||||||
Recoupment of previously waived fees | – | 4,943 | ||||||
Administration fees | 46,793 | 55,169 | ||||||
Transfer agency fees | 21,109 | 22,318 | ||||||
Distribution and service fees | 48,349 | 44,540 | ||||||
Professional fees | 9,355 | 9,807 | ||||||
Custody fees | 2,674 | 2,640 | ||||||
Reports to shareholders | 1,224 | 1,491 | ||||||
Trustee fees and expenses | 402 | 501 | ||||||
Registration fees | 10,497 | 9,316 | ||||||
Chief compliance officer fees | 9,361 | 11,297 | ||||||
Principal financial officer fees | 2,279 | 2,746 | ||||||
Other | 2,842 | 2,392 | ||||||
| ||||||||
Total expenses before waivers | 315,451 | 357,116 | ||||||
Less fees waived/reimbursed by investment advisor | (13,586) | – | ||||||
| ||||||||
Total net expenses | 301,865 | 357,116 | ||||||
| ||||||||
NET INVESTMENT INCOME | 100,860 | 98,786 | ||||||
| ||||||||
Net realized gain/(loss) on investments | 13,190 | (442,315) | ||||||
Net change in unrealized depreciation on investments | (894,556) | (1,629,956) | ||||||
| ||||||||
NET REALIZED AND UNREALIZED LOSS ON INVESTMENTS | (881,366) | (2,072,271) | ||||||
| ||||||||
NET DECREASE IN NET ASSETS RESULTING FROM OPERATIONS | $ (780,506) | $ (1,973,485) | ||||||
| ||||||||
See Notes to Financial Statements.
Semi-Annual Report | October 31, 2015 |
15 |
Table of Contents
Conservative Fund | Statements of Changes in Net Assets |
| Six Months Ended | For the | |||||||
| October 31, 2015 | Year Ended | |||||||
| (Unaudited) | April 30, 2015 | |||||||
| ||||||||
OPERATIONS | ||||||||
Net investment income | $ | 100,860 | $ | 105,099 | ||||
Net realized gain on investments | 13,190 | 177,216 | ||||||
Net realized capital gain distributions from other investment companies | – | 33,763 | ||||||
Net change in unrealized appreciation/(depreciation) on investments | (894,556) | 70,829 | ||||||
| ||||||||
Net increase/(decrease) in net assets resulting from operations | (780,506) | 386,907 | ||||||
| ||||||||
DISTRIBUTIONS (NOTE 3) | ||||||||
Net investment income | – | (107,965) | ||||||
Net realized gains on investments | – | (122,319) | ||||||
| ||||||||
Net decrease in net assets from distributions | – | (230,284) | ||||||
| ||||||||
BENEFICIAL INTEREST TRANSACTIONS (NOTE 5) | ||||||||
Shares sold | 3,526,070 | 29,628,281 | ||||||
Dividends reinvested | – | 230,284 | ||||||
Shares redeemed | (3,551,501) | (3,090,468) | ||||||
| ||||||||
Net increase/(decrease) in net assets derived from beneficial interest transactions | (25,431) | 26,768,097 | ||||||
| ||||||||
Net increase/(decrease) in net assets | (805,937) | 26,924,720 | ||||||
NET ASSETS: | ||||||||
Beginning of period | 32,347,743 | 5,423,023 | ||||||
| ||||||||
End of period* | $ | 31,541,806 | $ | 32,347,743 | ||||
| ||||||||
* Includes accumulated net investment income of: | $ | 114,787 | $ | 13,927 | ||||
See Notes to Financial Statements.
16 |
www.pathwayadvisorsfunds.com |
Table of Contents
Aggressive Growth Fund | Statements of Changes in Net Assets |
| Six Months Ended | For the | |||||||
| October 31, 2015 | Year Ended | |||||||
| (Unaudited) | April 30, 2015 | |||||||
| ||||||||
OPERATIONS | ||||||||
Net investment income | $ | 98,786 | $ | 103,324 | ||||
Net realized gain/(loss) on investments | (442,315) | 1,154,117 | ||||||
Net realized capital gain distributions from other investment companies | – | 74,206 | ||||||
Net change in unrealized depreciation on investments | (1,629,956) | (115,782) | ||||||
| ||||||||
Net increase/(decrease) in net assets resulting from operations | (1,973,485) | 1,215,865 | ||||||
| ||||||||
DISTRIBUTIONS (NOTE 3) | ||||||||
Net investment income | – | (150,330) | ||||||
Net realized gains on investments | – | (1,134,772) | ||||||
| ||||||||
Net decrease in net assets from distributions | – | (1,285,102) | ||||||
| ||||||||
BENEFICIAL INTEREST TRANSACTIONS (NOTE 5) | ||||||||
Shares sold | 3,643,679 | 31,104,559 | ||||||
Dividends reinvested | – | 1,285,089 | ||||||
Shares redeemed | (3,957,208) | (9,573,718) | ||||||
| ||||||||
Net increase/(decrease) in net assets derived from beneficial interest transactions | (313,529) | 22,815,930 | ||||||
| ||||||||
Net increase/(decrease) in net assets | (2,287,014) | 22,746,693 | ||||||
NET ASSETS: | ||||||||
Beginning of period | 39,370,500 | 16,623,807 | ||||||
| ||||||||
End of period* | $ | 37,083,486 | $ | 39,370,500 | ||||
| ||||||||
* Includes accumulated net investment income/(loss) of: | $ | 62,265 | $ | (36,521) | ||||
See Notes to Financial Statements.
Semi-Annual Report | October 31, 2015 |
17 |
Table of Contents
| Financial Highlights | ||
| For a share outstanding throughout the periods presented. |
| For the Six | ||||||||||||||||
| Months Ended | ||||||||||||||||
| October 31, | For the Year | For the Year | For the Period | |||||||||||||
| 2015 | Ended | Ended | Ended | |||||||||||||
| (Unaudited) | April 30, 2015 | April 30, 2014 | April 30, 2013(a) | |||||||||||||
| ||||||||||||||||
NET ASSET VALUE, BEGINNING OF PERIOD | $ | 10.66 | $ | 10.61 | $ | 10.51 | $ | 10.00 | ||||||||
INCOME FROM OPERATIONS | ||||||||||||||||
Net investment income(b) | 0.03 | 0.12 | 0.16 | 0.14 | ||||||||||||
Net realized and unrealized gain/(loss) on investments | (0.28) | 0.23 | 0.10 | 0.52 | ||||||||||||
Total from Investment | ||||||||||||||||
|
|
|
|
|
|
|
| |||||||||
Operations | (0.25) | 0.35 | 0.26 | 0.66 | ||||||||||||
|
|
|
|
|
|
|
| |||||||||
LESS DISTRIBUTIONS | ||||||||||||||||
Net investment income | – | (0.14) | (0.13) | (0.13) | ||||||||||||
Net realized gain on investments | – | (0.16) | (0.03) | (0.02) | ||||||||||||
|
|
|
|
|
|
|
| |||||||||
Total Distributions | – | (0.30) | (0.16) | (0.15) | ||||||||||||
|
|
|
|
|
|
|
| |||||||||
NET INCREASE/(DECREASE) IN NET ASSET VALUE | (0.25) | 0.05 | 0.10 | 0.51 | ||||||||||||
|
|
|
|
|
|
|
| |||||||||
NET ASSET VALUE, END OF PERIOD | $ | 10.41 | $ | 10.66 | $ | 10.61 | $ | 10.51 | ||||||||
|
|
|
|
|
|
|
| |||||||||
TOTAL RETURN(c) | (2.35%) | 3.28% | 2.53% | 6.59% | ||||||||||||
RATIOS/SUPPLEMENTAL DATA | ||||||||||||||||
Net assets, End of Period (000s) | $ | 31,542 | $ | 32,348 | $ | 5,423 | $ | 1,364 | ||||||||
RATIOS TO AVERAGE NET ASSETS: | ||||||||||||||||
Operating Expenses: | ||||||||||||||||
Excluding reimbursement/waiver(d) | 1.96%(e) | 2.65% | 4.84% | 49.62%(e)(f) | ||||||||||||
Including reimbursement/waiver(d) | 1.88%(e) | 1.88% | 1.91%(g) | 1.98%(e)(f) | ||||||||||||
Net investment income including reimbursement/waiver(d) | 0.63%(e) | 1.10% | 1.57% | 1.83%(e) | ||||||||||||
PORTFOLIO TURNOVER RATE | 6%(h) | 50% | 38% | 18%(h) | ||||||||||||
18 |
www.pathwayadvisorsfunds.com |
Table of Contents
Pathway Advisors Conservative Fund | Financial Highlights | |
| For a share outstanding throughout the periods presented. |
| (a) | The Fund commenced operations on July 31, 2012. |
| (b) | Calculated using the average shares method. |
| (c) | Total investment return is calculated assuming a purchase of a common share at the opening of the first day and a sale at closing on the last day of each period reported. Dividends and distributions, if any, are assumed for purposes of this calculation to be reinvested at prices obtained under the Fund’s dividend reinvestment plan. Total returns would have been lower had certain expenses not been waived during the period. Total investment returns do not reflect brokerage commissions, if any, and are not annualized. |
| (d) | The ratios exclude the impact of expenses of the underlying funds in which the Fund invests as represented in the Portfolio of Investments. |
| (e) | Annualized. |
| (f) | Expense ratios before reductions for startup periods may not be representative of longer term operating periods. |
| (g) | Contractual expense limitation changed from 1.98% to 1.88% effective October 1, 2013. |
| (h) | Not Annualized. |
See Notes to Financial Statements.
Semi-Annual Report | October 31, 2015 |
19 |
Table of Contents
| Financial Highlights | ||
| For a share outstanding throughout the periods presented. |
| For the Six | ||||||||||||||||
| Months Ended | ||||||||||||||||
| October 31, | For the Year | For the Year | For the Period | |||||||||||||
| 2015 | Ended | Ended | Ended | |||||||||||||
| (Unaudited) | April 30, 2015 | April 30, 2014 | April 30, 2013(a) | |||||||||||||
| ||||||||||||||||
NET ASSET VALUE, BEGINNING OF PERIOD | $ | 12.16 | $ | 12.65 | $ | 11.40 | $ | 10.00 | ||||||||
INCOME FROM OPERATIONS | ||||||||||||||||
Net investment income(b) | 0.03 | 0.07 | 0.10 | 0.03 | ||||||||||||
Net realized and unrealized gain/(loss) on investments | (0.63) | 0.58 | 1.27 | 1.47 | ||||||||||||
Total from Investment | ||||||||||||||||
|
|
|
|
|
|
|
| |||||||||
Operations | (0.60) | 0.65 | 1.37 | 1.50 | ||||||||||||
|
|
|
|
|
|
|
| |||||||||
LESS DISTRIBUTIONS | ||||||||||||||||
Net investment income | – | (0.13) | (0.09) | (0.08) | ||||||||||||
Net realized gain on investments | – | (1.01) | (0.03) | (0.02) | ||||||||||||
|
|
|
|
|
|
|
| |||||||||
Total Distributions | – | (1.14) | (0.12) | (0.10) | ||||||||||||
|
|
|
|
|
|
|
| |||||||||
NET INCREASE/(DECREASE) IN NET ASSET VALUE | (0.60) | (0.49) | 1.25 | 1.40 | ||||||||||||
|
|
|
|
|
|
|
| |||||||||
NET ASSET VALUE, END OF PERIOD | $ | 11.56 | $ | 12.16 | $ | 12.65 | $ | 11.40 | ||||||||
|
|
|
|
|
|
|
| |||||||||
TOTAL RETURN(c) | (4.93%) | 5.41% | 12.05% | 15.14% | ||||||||||||
RATIOS/SUPPLEMENTAL DATA | ||||||||||||||||
Net assets, End of Period (000s) | $ | 37,083 | $ | 39,371 | $ | 16,624 | $ | 1,579 | ||||||||
RATIOS TO AVERAGE NET ASSETS: | ||||||||||||||||
Operating Expenses: | ||||||||||||||||
Excluding reimbursement/waiver(d) | 1.88%(e) | 2.29% | 3.16% | 44.74%(e)(f) | ||||||||||||
Including reimbursement/waiver(d) | 1.88%(e) | 1.88% | 1.90%(g) | 1.98%(e)(f) | ||||||||||||
Net investment income including reimbursement/waiver(d) | 0.52%(e) | 0.58% | 0.85% | 0.39%(e) | ||||||||||||
PORTFOLIO TURNOVER RATE | 23%(h) | 65% | 18% | 31%(h) | ||||||||||||
20 |
www.pathwayadvisorsfunds.com |
Table of Contents
Pathway Advisors Aggressive Growth Fund | Financial Highlights | |
| For a share outstanding throughout the periods presented. |
| (a) | The Fund commenced operations on July 31, 2012. |
| (b) | Calculated using the average shares method. |
| (c) | Total investment return is calculated assuming a purchase of a common share at the opening of the first day and a sale at closing on the last day of each period reported. Dividends and distributions, if any, are assumed for purposes of this calculation to be reinvested at prices obtained under the Fund’s dividend reinvestment plan. Total returns would have been lower had certain expenses not been waived during the period. Total investment returns do not reflect brokerage commissions, if any, and are not annualized. |
| (d) | The ratios exclude the impact of expenses of the underlying funds in which the Fund invests as represented in the Portfolio of Investments. |
| (e) | Annualized. |
| (f) | Expense ratios before reductions for startup periods may not be representative of longer term operating periods. |
| (g) | Contractual expense limitation changed from 1.98% to 1.88% effective October 1, 2013. |
| (h) | Not Annualized. |
See Notes to Financial Statements.
Semi-Annual Report | October 31, 2015 |
21 |
Table of Contents
Pathway Advisors Funds | Notes to Financial Statements | |
| October 31, 2015 (Unaudited) |
1. ORGANIZATION
Financial Investors Trust (the “Trust”), a Delaware statutory trust, is an open-end management investment company registered under the Investment Company Act of 1940, as amended (“1940 Act”). As of October 31, 2015, the Trust has 34 registered funds. This semi-annual report describes Pathway Advisors Conservative Fund and Pathway Advisors Aggressive Growth Fund (individually a “Fund” and collectively, the “Funds”). The Pathway Advisors Conservative Fund seeks total return through a primary emphasis on income with a secondary emphasis on growth of capital. The Pathway Advisors Aggressive Growth Fund seeks total return through a primary emphasis on growth with a secondary emphasis on income.
2. SIGNIFICANT ACCOUNTING POLICIES
The accompanying financial statements were prepared in accordance with accounting principles generally accepted in the United States of America (“U.S. GAAP”). The preparation of financial statements in conformity with U.S. GAAP requires management to make certain estimates and assumptions that affect the reported amounts of assets and liabilities and disclosures of contingent assets and liabilities at the date of the financial statements and the reported amounts of revenue and expenses during the period. Actual results could differ from those estimates. The Funds are considered an investment company for financial reporting purposes under U.S. GAAP. The following is a summary of significant accounting policies consistently followed by the Funds in preparation of their financial statements.
Investment Valuation: The Funds generally value their securities based on market prices determined at the close of regular trading on the New York Stock Exchange (“NYSE”), normally 4:00 p.m. Eastern Time, on each day the NYSE is open for trading.
For equity securities and mutual funds that are traded on an exchange, the market price is usually the closing sale or official closing price on that exchange. In the case of equity securities not traded on an exchange, or if such closing prices are not otherwise available, the securities are valued at the mean of the most recent bid and ask prices on such day. Redeemable securities issued by open-end registered investment companies are valued at the investment company’s applicable net asset value, with the exception of exchange-traded open-end investment companies, which are priced as equity securities.
The market price for debt obligations is generally the price supplied by an independent third-party pricing service approved by the Board of Trustees (the “Board”), which may use a matrix, formula or other objective method that takes into consideration quotations from dealers, market transactions in comparable investments, market indices and yield curves. If vendors are unable to supply a price, or if the price supplied is deemed to be unreliable, the market price may be determined using quotations received from one or more broker-dealers that make a market in the security. Short–term debt obligations that will mature in 60 days or less are valued at amortized cost, unless it is determined that using this method would not reflect an investment’s fair value.
When such prices or quotations are not available, or when Hanson McClain, Inc. (the “Adviser”) believes that they are unreliable, securities may be priced using fair value procedures approved by the Board.
22 |
www.pathwayadvisorsfunds.com |
Table of Contents
Pathway Advisors Funds | Notes to Financial Statements | |
| October 31, 2015 (Unaudited) |
Fair Value Measurements: The Funds disclose the classification of their fair value measurements following a three-tier hierarchy based on the inputs used to measure fair value. Inputs refer broadly to the assumptions that market participants would use in pricing the asset or liability, including assumptions about risk. Inputs may be observable or unobservable. Observable inputs reflect the assumptions market participants would use in pricing the asset or liability that are developed based on market data obtained from sources independent of the reporting entity. Unobservable inputs reflect the reporting entity’s own assumptions about the assumptions market participants would use in pricing the asset or liability that are developed based on the best information available.
Various inputs are used in determining the value of the Funds’ investments as of the end of the reporting period. When inputs used fall into different levels of the fair value hierarchy, the level in the hierarchy within which the fair value measurement falls is determined based on the lowest level input that is significant to the fair value measurement in its entirety. The designated input levels are not necessarily an indication of the risk or liquidity associated with these investments. These inputs are categorized in the following hierarchy under applicable financial accounting standards:
Level 1 – | Unadjusted quoted prices in active markets for identical investments, unrestricted assets or liabilities that the Funds have the ability to access at the measurement date; | |
Level 2 – | Quoted prices which are not active, quoted prices for similar assets or liabilities in active markets or inputs other than quoted prices that are observable (either directly or indirectly) for substantially the full term of the asset or liability; and | |
Level 3 – | Significant unobservable prices or inputs (including the Funds’ own assumptions in determining the fair value of investments) where there is little or no market activity for the asset or liability at the measurement date. | |
The following is a summary of the inputs used to value the Funds’ investments as of October 31, 2015:
Pathway Advisors Conservative Fund
| Level 2 - | ||||||||||||||||
| Other | Level 3 - | |||||||||||||||
| Significant | Significant | |||||||||||||||
| Investments in Securities at | Level 1 - | Observable | Unobservable | |||||||||||||
| Value | Quoted Prices | Inputs | Inputs | Total | ||||||||||||
| ||||||||||||||||
Exchange Traded Funds | $ | 11,614,000 | $ | – | $ | – | $ | 11,614,000 | ||||||||
Open-End Mutual Funds | 19,477,204 | – | – | 19,477,204 | ||||||||||||
Short Term Investments | 13,804 | – | – | 13,804 | ||||||||||||
| ||||||||||||||||
Total | $ | 31,105,008 | $ | – | $ | – | $ | 31,105,008 | ||||||||
| ||||||||||||||||
Semi-Annual Report | October 31, 2015 |
23 |
Table of Contents
Pathway Advisors Funds | Notes to Financial Statements | |
| October 31, 2015 (Unaudited) |
Pathway Advisors Aggressive Growth Fund
| Level 2 - | ||||||||||||||||
| Other | Level 3 - | |||||||||||||||
| Significant | Significant | |||||||||||||||
| Investments in Securities at | Level 1 - | Observable | Unobservable | |||||||||||||
| Value | Quoted Prices | Inputs | Inputs | Total | ||||||||||||
| ||||||||||||||||
Exchange Traded Funds | $ | 20,688,354 | $ | – | $ | – | $ | 20,688,354 | ||||||||
Open-End Mutual Funds | 16,072,783 | – | – | 16,072,783 | ||||||||||||
Short Term Investments | 230,802 | – | – | 230,802 | ||||||||||||
| ||||||||||||||||
Total | $ | 36,991,939 | $ | – | $ | – | $ | 36,991,939 | ||||||||
| ||||||||||||||||
The Funds recognize transfers between levels as of the end of the period. For the six months ended October 31, 2015, the Funds did not have any transfers between Level 1 and Level 2 securities. For the six months ended October 31, 2015, the Funds did not have any securities that used significant unobservable inputs (Level 3) in determining fair value.
Investment Transactions and Investment Income: Investment transactions are accounted for on the date the investments are purchased or sold (trade date basis). Net realized gains and losses from investment transactions are reported on an identified cost basis. Interest income, which includes accretion of discounts and amortization of premiums, is accrued and recorded as earned. Dividend income is recognized on the ex-dividend date or for certain foreign securities, as soon as information is available to the Funds.
Trust Expenses: Some expenses of the Trust can be directly attributed to the Funds. Expenses which cannot be directly attributed to the Funds are apportioned among all funds in the Trust based on average net assets of each fund.
Fund Expenses: Expenses that are specific to a Fund are charged directly to that Fund.
Federal Income Taxes: The Funds comply with the requirements under Subchapter M of the Internal Revenue Code of 1986, as amended, applicable to regulated investment companies and intend to distribute substantially all of their net taxable income and net capital gains, if any, each year, so that it will not be subject to excise tax on undistributed income and gains. The Funds are not subject to income taxes to the extent such distributions are made.
As of and during the six months ended October 31, 2015, the Funds did not have a liability for any unrecognized tax benefits. The Funds file U.S. federal, state, and local tax returns as required. The Funds’ tax returns are subject to examination by the relevant tax authorities until expiration of the applicable statute of limitations, which is generally three years after the filing of the tax return for federal purposes and four years for most state returns. Tax returns for open years have incorporated no uncertain tax positions that require a provision for income taxes.
Distributions to Shareholders: Each Fund normally pays dividends and distributes capital gains, if any, on an annual basis. Income dividend distributions are derived from interest and other income each Fund receives from its investments, including short-term capital gains. Long term capital gain distributions are derived from gains realized when each Fund sells a security it has
24 |
www.pathwayadvisorsfunds.com |
Table of Contents
Pathway Advisors Funds | Notes to Financial Statements | |
| October 31, 2015 (Unaudited) |
owned for more than a year. Each Fund may make additional distributions and dividends at other times if the portfolio manager believes doing so may be necessary for each Fund to avoid or reduce taxes.
3. TAX BASIS INFORMATION
Tax Basis of Investments: As of October 31, 2015, the costs of investments for federal income tax purposes and accumulated net unrealized appreciation/(depreciation) on investments were as follows:
| Gross | Gross | Cost of | ||||||||||||||
| Appreciation | Depreciation | Investments for | ||||||||||||||
| (excess of value | (excess of tax | Net Unrealized | Income Tax | |||||||||||||
| over tax cost) | cost over value) | Appreciation | Purposes | |||||||||||||
| ||||||||||||||||
Pathway Advisors Conservative Fund | $ | 35,386 | $ | (771,985 | ) | $ | (736,599 | ) | $ | 31,841,607 | ||||||
Pathway Advisors Aggressive Growth Fund | 332,791 | (1,096,295 | ) | (763,504 | ) | 37,755,443 | ||||||||||
Tax Basis of Distributions to Shareholders: The character of distributions made during the period from net investment income or net realized gains may differ from its ultimate characterization for federal income tax purposes. Also, due to the timing of dividend distributions, the fiscal year in which amounts are distributed may differ from the fiscal year in which the income or realized gain were recorded by the Funds.
The tax character of distributions paid by the Funds for the year ended April 30, 2015, were as follows:
| Long-Term Capital | ||||||||
| Ordinary Income | Gain | |||||||
| ||||||||
Pathway Advisors Conservative Fund | $ | 156,882 | $ | 73,402 | ||||
Pathway Advisors Aggressive Growth Fund | 576,858 | 708,244 | ||||||
The amounts and characteristics of tax basis distributions and composition of distributable earnings/(accumulated losses) are finalized at fiscal year-end. Accordingly, tax basis balances have not been determined as of October 31, 2015.
4. SECURITIES TRANSACTIONS
Purchases and sales of securities (excluding short-term securities) during the six months ended October 31, 2015, were as follows:
| Purchases of | Proceeds From Sales | |||||||
| Fund | Securities | of Securities | ||||||
| ||||||||
Pathway Advisors Conservative Fund | $ | 2,023,987 | $ 2,248,514 | |||||
Pathway Advisors Aggressive Growth Fund | 8,696,212 | 8,996,255 | ||||||
Semi-Annual Report | October 31, 2015 |
25 |
Table of Contents
Pathway Advisors Funds | Notes to Financial Statements | |
| October 31, 2015 (Unaudited) |
5. BENEFICIAL SHARE TRANSACTIONS
The capitalization of the Trust consists of an unlimited number of shares of beneficial interest with no par value per share. Holders of the shares of the Funds of the Trust have one vote for each share held and a proportionate fraction of a vote for each fractional share. All shares issued and outstanding are fully paid and are transferable and redeemable at the option of the shareholder. Purchasers of the shares do not have any obligation to make payments to the Trust or its creditors (other than the purchase price for the shares) or make contributions to the Trust or its creditors solely by reason of the purchasers’ ownership of the shares. Shares have no pre-emptive rights.
Transactions in shares of capital stock:
Pathway Advisors Conservative Fund
| For the Six Months | ||||||||
| Ended October 31, | For the Year Ended | |||||||
| 2015 | April 30, 2015 | |||||||
| ||||||||
Common Shares Outstanding - Beginning of Period | 3,033,100 | 510,894 | ||||||
Common Shares Sold | 336,003 | 2,789,052 | ||||||
Common Shares Issued as Reinvestment of Dividends | – | 21,828 | ||||||
Common Shares Redeemed | (339,636) | (288,674) | ||||||
| ||||||||
Common Shares Outstanding - End of Period | 3,029,467 | 3,033,100 | ||||||
| ||||||||
Pathway Advisors Aggressive Growth Fund
| For the Six Months | ||||||||
| Ended October 31, | For the Year Ended | |||||||
| 2015 | April 30, 2015 | |||||||
| ||||||||
Common Shares Outstanding - Beginning of Period | 3,236,511 | 1,314,394 | ||||||
Common Shares Sold | 308,727 | 2,567,170 | ||||||
Common Shares Issued as Reinvestment of Dividends | – | 108,082 | ||||||
Common Shares Redeemed | (338,100) | (753,135) | ||||||
| ||||||||
Common Shares Outstanding - End of Period | 3,207,138 | 3,236,511 | ||||||
| ||||||||
6. MANAGEMENT AND RELATED PARTY TRANSACTIONS
Investment Advisory
The Adviser, subject to the authority of the Board, is responsible for the overall management and administration of the Funds’ business affairs. The Adviser manages the investments of the Funds in accordance with the Funds’ investment objective, policies and limitations and investment guidelines established jointly by the Adviser and the Board. Pursuant to the Investment Advisory Agreement (“Advisory Agreement”), the Adviser is entitled to an investment advisory fee, computed daily and payable monthly of 1.00% of the average daily net assets for each Fund.
The Adviser has agreed contractually to limit the amount of each Fund’s total annual expenses, exclusive of acquired fund fees and expenses, brokerage expenses, interest expenses, taxes and extraordinary expenses, to 1.88% of each Fund’s average daily net assets. This agreement is in effect through August 31, 2016. The Adviser will be permitted to recover expenses it has borne through the
26 |
www.pathwayadvisorsfunds.com |
Table of Contents
Pathway Advisors Funds | Notes to Financial Statements | |
| October 31, 2015 (Unaudited) |
agreement described above to the extent that the Funds’ expenses in later periods fall below the annual rates set forth in the relevant agreement. The Funds will not be obligated to pay any such deferred fees and expenses more than three years after the end of the fiscal year in which the fees and expense were deferred. The Adviser may not discontinue this waiver without the approval by the Funds’ Board.
For the six months ended October 31, 2015, the fee waivers and/or reimbursements were as follows:
Fees Waived/ Reimbursed By | Recoupment of Past Waived Fees By Adviser | Total | ||||||||||
Pathway Advisors Conservative Fund | $ | 13,586 | $ | – | $ | 13,586 | ||||||
Pathway Advisors Aggressive Growth Fund | – | 4,943 | 4,943 | |||||||||
As of October 31, 2015, the balances of recoupable expenses for each Fund were as follows:
| Fund | Expires 2016 | Expires 2017 | Expires 2018 | Total | ||||||||||||
Pathway Advisors Conservative Fund | $ | 153,925 | $ | 97,471 | $ | 73,567 | $ | 324,963 | ||||||||
Pathway Advisors Aggressive Growth Fund | 167,248 | 120,826 | 72,255 | 360,329 | ||||||||||||
Fund Administrator Fees and Expenses
ALPS Fund Services, Inc. (“ALPS”) serves as administrator to the Funds and the Funds have agreed to pay expenses incurred in connection with their administrative activities. Pursuant to an Administration Agreement, ALPS provides operational services to the Funds including, but not limited to, fund accounting and fund administration and generally assists in the Funds’ operations. Officers of the Trust are employees of ALPS. The Funds’ administration fee is accrued on a daily basis and paid monthly. Administration fees paid by the Funds for the six months ended October 31, 2015 are disclosed in the Statements of Operations.
ALPS is reimbursed by the Funds for certain out of pocket expenses.
Transfer Agent
ALPS serves as transfer, dividend paying and shareholder servicing agent for the Funds. ALPS receives an annual minimum fee, a fee based upon the number of shareholder accounts, and is also reimbursed by each Fund for certain out-of-pocket expenses.
Compliance Services
ALPS provides services that assist the Trust’s chief compliance officer in monitoring and testing the policies and procedures of the Trust in conjunction with requirements under Rule 38a-1 under the 1940 Act and receives an annual base fee. ALPS is reimbursed for certain out-of-pocket expenses by the Funds.
Principal Financial Officer
ALPS receives an annual fee for providing principal financial officer services to the Funds.
Semi-Annual Report | October 31, 2015 |
27 |
Table of Contents
Pathway Advisors Funds | Notes to Financial Statements | |
| October 31, 2015 (Unaudited) |
Distributor
ALPS Distributors, Inc. (“ADI” or the “Distributor”) (an affiliate of ALPS) acts as the distributor of the Funds’ shares pursuant to a Distribution Agreement with the Trust. Shares are sold on a continuous basis by ADI as agent for the Funds, and ADI has agreed to use its best efforts to solicit orders for the sale of the Funds’ shares, although it is not obliged to sell any particular amount of shares. ADI is not entitled to any compensation for its services as Distributor. ADI is registered as a broker-dealer with the U.S. Securities and Exchange Commission.
Each Fund has adopted a separate Distribution and Services Plan (each a “Plan” and collectively, the “Plans”) pursuant to Rule 12b-1 of the 1940 Act. The Plans allow each Fund, as applicable, to use each Fund’s assets to pay fees in connection with the distribution and marketing of the Funds’ shares and/or the provision of shareholder services to the Funds’ shareholders. The Plan permits payment for services in connection with the administration of plans or programs that use shares of each Fund as their funding medium and for related expenses. The Plans permit each Fund to make total payments at an annual rate of up to 0.25% of each Funds’ average daily net assets. Because these fees are paid out of the Funds’ assets on an ongoing basis, over time they will increase the cost of an investment in the Funds, and Plan fees may cost an investor more than other types of sales charges.
Each Fund has adopted a Shareholder Services Plan (a “Shareholder Services Plan”) with respect to its shares. Under the Shareholder Services Plan, each Fund is authorized to pay banks and their affiliates and other institutions, including broker-dealers and Fund affiliates (“Participating Organizations”), an aggregate fee in an amount not to exceed on an annual basis 0.15% of the average daily net asset value of shares of the Funds attributable to or held in the name of a Participating Organization for its clients as compensation for providing services pursuant to an agreement with a Participating Organization. Any amount of such payment not paid to the Participating Organizations during the Funds’ fiscal year for such service activities shall be reimbursed to the Funds as soon as practicable after the end of the fiscal year. Shareholder Services Plan fees are included within “Distribution and service fees” on the Statement of Operations.
7. INDEMNIFICATIONS
Under the Trust’s organizational documents, its officers and Trustees are indemnified against certain liability arising out of the performance of their duties to the Trust. Additionally, in the normal course of business, the Trust enters into contracts with service providers that may contain general indemnification clauses, which may permit indemnification to the extent permissible under applicable laws. The Trust’s maximum exposure under these arrangements is unknown, as this would involve future claims that may be made against the Trust that have not yet occurred.
9. RECENT ACCOUNTING PRONOUNCEMENT
In May 2015, the Financial Accounting Standards Board issued Accounting Standards Update (“ASU”) 2015-07, “Disclosures for Investments in Certain Entities that Calculate Net Asset Value Per Share (or its Equivalent).” This is an update to Accounting Standards Codification Topic 820, Fair Value Measurement. ASU 2015-07 removes the requirement to categorize within the fair value hierarchy investments for which fair value is measured at net asset value per share (or its equivalent) using the practical expedient. ASU 2015-17 is effective for annual reporting periods
28 |
www.pathwayadvisorsfunds.com |
Table of Contents
Pathway Advisors Funds | Notes to Financial Statements | |
| October 31, 2015 (Unaudited) |
beginning on or after December 15, 2015, and interim periods within those annual periods, with retrospective application for all periods presented. The Funds are currently evaluating the impact ASU 2015-07 will have on the Funds’ financial statements and disclosures.
Semi-Annual Report | October 31, 2015 |
29 |
Table of Contents
Pathway Advisors Funds | Disclosure Regarding Approval of Fund Advisory Agreement | |
| October 31, 2015 (Unaudited) |
On June 10, 2015, the Trustees met in person to discuss, among other things, the approval of the investment advisory agreement between Financial Investors Trust (the “Trust”) and Highland Associates, Inc. (the “Adviser”) (the “Investment Advisory Agreement”), in accordance with Section 15(c) of the 1940 Act. The Independent Trustees met with independent legal counsel during executive session and discussed the Investment Advisory Agreement and other related materials.
In renewing and approving the Investment Advisory Agreement with the Adviser, the Trustees, including the Independent Trustees, considered the following factors with respect to Pathway Advisors Conservative Fund and Pathway Advisors Aggressive Growth Fund (the “Pathway Advisors Funds”):
Investment Advisory Fee Rate: The Trustees reviewed and considered the contractual annual advisory fee to be paid by the Trust, on behalf of the Pathway Advisors Funds, to the Adviser of 1.00% of each of the Pathway Advisors Funds’ daily average net assets, in light of the extent and quality of the advisory services provided by the Adviser to the Pathway Advisors Funds. The Board received and considered information including a comparison of the Pathway Advisors Funds’ contractual and actual advisory fees and overall expenses with those of funds in the relevant peer expense group of funds provided by an independent provider of investment company data (the “Data Provider”). The Trustees noted that the investment advisory fee rate was above the peer group fee and the universe fee for each Pathway Advisors Fund.
Total Expense Ratios: Based on such information, the Trustees further reviewed and considered the total expense ratios (after waivers, subject to certain exclusions) of 1.88% for each Pathway Advisors Fund, taking into account the contractual fee waivers in place through August 2016. The Trustees noted that the total expense ratio (after waivers) was above the peer group fee and the universe fee for each Pathway Advisors Fund.
Nature, Extent and Quality of the Services under the Investment Advisory Agreement: The Trustees received and considered information regarding the nature, extent and quality of services to be provided to the Pathway Advisors Funds under the Investment Advisory Agreement. The Trustees reviewed certain background materials supplied by the Adviser in its presentation, including its Form ADV.
The Trustees reviewed and considered the Adviser’s investment advisory personnel, its history as an asset manager and its performance and the amount of assets currently under management by the Adviser and its affiliated entities. The Trustees also reviewed the research and decision-making processes utilized by the Adviser, including the methods adopted to seek to achieve compliance with the investment objectives, policies and restrictions of the Pathway Advisors Funds.
The Trustees considered the background and experience of the Adviser’s management in connection with the Pathway Advisors Funds, including reviewing the qualifications, backgrounds and responsibilities of the management team primarily responsible for the day-to-day portfolio management of the Pathway Advisors Funds and the extent of the resources devoted to research and analysis of actual and potential investments.
30 |
www.pathwayadvisorsfunds.com |
Table of Contents
Pathway Advisors Funds | Disclosure Regarding Approval of Fund Advisory Agreement | |
| October 31, 2015 (Unaudited) |
The Trustees also reviewed, among other things, the Adviser’s insider trading policies and procedures and its Code of Ethics.
Performance: The Trustees reviewed performance information for each of the Pathway Advisors Funds for the 3-month and 1-year periods ended March 31, 2015. That review included a comparison of each Pathway Advisors Fund’s performance to the performance of a group of comparable funds selected by the Data Provider. The Trustees noted the performance of each Pathway Advisors Fund was generally below the respective peer universe median for the most recent 3-month period and the 1-year period. The Trustees also considered the Adviser’s discussion of each Pathway Advisors Fund’s underlying portfolio diversification categories, its top contributors and top detractors, as well as the Adviser’s performance and reputation generally and its investment techniques, risk management controls and decision-making processes.
Comparable Accounts: The Trustees considered information provided by the Adviser indicating that there were no comparable accounts.
Profitability: The Trustees received and considered a profitability analysis prepared by the Adviser based on the fees payable under the Investment Advisory Agreement. The Trustees considered the profits, if any, anticipated to be realized by the Adviser in connection with the operation of each Pathway Advisors Fund. The Board then reviewed the Adviser’s financial statements in order to analyze the financial condition and stability and profitability of the adviser.
Economies of Scale: The Trustees considered whether economies of scale in the provision of services to the Pathway Advisors Funds will be passed along to the shareholders under the proposed agreements.
Other Benefits to the Adviser: The Trustees reviewed and considered any other incidental benefits derived or to be derived by the Adviser from its relationship with the Pathway Advisors Funds, including whether soft dollar arrangements were used.
In selecting the Adviser of the Pathway Advisors Funds and approving the Investment Advisory Agreement and the fees charged under the Investment Advisory Agreement, the Trustees concluded that no single factor reviewed by the Trustees was identified by the Trustees to be determinative as the principal factor in whether to approve the Investment Advisory Agreement. Further, the Independent Trustees were advised by separate independent legal counsel throughout the process. The Trustees, including all of the Independent Trustees, concluded that:
| ● | the investment advisory fee rate was above the peer group fee and the universe fee for each Pathway Advisors Fund; |
| ● | the total expense ratio (after waivers) was above the peer group fee and the universe fee for each Pathway Advisors Fund; |
| ● | the nature, extent and quality of services to be rendered by the Adviser under the Investment Advisory Agreement were adequate; |
| ● | the performance of each Pathway Advisors Fund was below, but generally within an acceptable range, of the performance of the funds in its respective peer universe provided the Data Provider; |
| ● | there were no comparable accounts managed by the Adviser; |
Semi-Annual Report | October 31, 2015 |
31 |
Table of Contents
Pathway Advisors Funds | Disclosure Regarding Approval of Fund Advisory Agreement | |
| October 31, 2015 (Unaudited) |
| ● | the profit, if any, realized by the Adviser in connection with the operation of the Pathway Advisors Funds is not unreasonable to the Pathway Advisors Funds; and |
| ● | there were no material economies of scale or other incidental benefits accruing to the Adviser in connection with its relationship with the Pathway Advisors Funds. |
After reviewing the information received, the Trustees requested supplemental information and the Adviser provided materials in response. The Board determined that, given the totality of the information provided with respect to the Investment Advisory Agreement, the Board had received sufficient information to approve the Investment Advisory Agreement.
Based on the Trustees’ deliberations and their evaluation of the information described above, the Trustees, including all of the Independent Trustees, concluded that the Adviser’s compensation for investment advisory services is consistent with the best interests of the Pathway Advisors Funds and their shareholders.
32 |
www.pathwayadvisorsfunds.com |
Table of Contents
Pathway Advisors Funds | Additional Information | |
| October 31, 2015 (Unaudited) |
1. FUND HOLDINGS
The Funds file their complete schedule of portfolio holdings with the Securities and Exchange Commission (the “SEC”) for the first and third quarters of each fiscal year on Form N-Q within 60 days after the end of the period. Copies of the Funds’ Form N-Q are available without charge on the SEC website at http://www.sec.gov. You may also review and copy the Form N-Q at the SEC’s Public Reference Room in Washington, DC. For more information about the operation of the Public Reference Room, please call the SEC at 1-800-SEC-0330.
2. FUND PROXY VOTING POLICIES, PROCEDURES AND SUMMARIES
The Funds’ policies and procedures used in determining how to vote proxies and information regarding how the Fund voted proxies relating to portfolio securities during the most recent prior 12-month period ending June 30 are available without charge, (1) upon request, by calling (toll-free) 888-288-1121 and (2) on the SEC’s website at http://www.sec.gov.
Semi-Annual Report | October 31, 2015 |
33 |
Table of Contents
Table of Contents
Table of Contents
| PAGE | ||
| 1 | ||
| 5 | ||
| 6 | ||
| 7 | ||
| 8 | ||
| 10 | ||
| 50 | ||
| 52 | ||
| 53 | ||
| 55 | ||
| 57 | ||
| 58 | ||
| 69 | ||
Table of Contents
| Redmont Funds | Shareholder Letter | |
October 31, 2015 (Unaudited) |
Introduction:
October 31, 2015
The Funds performed well during the past six months relative to the HFRX Global Index. The absolute performance was driven by the Long/Short allocation and relative performance was driven by the Opportunistic allocations. The Tactical allocation performed in-line with the benchmark.
Tactical Managers – two of the Tactical managers contributed positively due to relative performance versus the allocation benchmark. Pinebridge and FPA performed as expected while Morgan Stanley Multi-Asset significantly underperformed the benchmark.
Long/Short Managers – all four managers performed very well, beating their respective benchmarks. Dalton, Boston Partners & Impala had positive performance during the period contributing a bulk of the absolute fund performance. In Fund I, Boston Partners was removed and reinvested in Dalton & Impala. We are evaluating the managers within this allocation and will provide additional updates if anything changes.
Opportunistic Managers – AQR Multi-Strategy had the best absolute performance in the fund. AQR Risk Parity lost money during the period, and Stadion was a slight detractor through August. Weiss Alpha Balanced Risk replaced the allocation to Stadion on September 1st, adding modestly to performance since its inception.
Please see our fact sheet for a more detailed listing of performance and allocations.
REDMONT RESOLUTE FUND I
Table 1 notes the performance for Fund I as of quarter end under standard reporting (since inception) as well as of October 31st.
Table 1 i. ii. iii. iv. v.
Performance (amounts greater than one year are annualized)
| Standardized Performance Data | Non-Standardized Performance Data | |||||||||||||||||||||||||||||
| Redmont Resolute Fund I | as of September 30, 2015 | as of October 31, 2015 | ||||||||||||||||||||||||||||
| Year-to-Date | 1-Year | Since Inception (12/30/11) | Year-to-Date | 1-Year | Since Inception (12/30/11) | |||||||||||||||||||||||||
Resolute Fund I - I Class | -2.91 | % | -2.06 | % | 1.79 | % | -0.38 | % | 0.41 | % | 2.43 | % | ||||||||||||||||||
Resolute Fund I - A Class | -0.95 | % | -0.14 | % | 2.00 | % | 1.52 | % | 2.26 | % | 2.61 | % | ||||||||||||||||||
Load Adjusted | -6.38 | % | -5.62 | % | 0.48 | % | -4.04 | % | -3.36 | % | 1.11 | % | ||||||||||||||||||
HFRX Global Hedge Fund Index | 3.05 | % | -4.74 | % | 1.69 | % | -1.63 | % | -2.05 | % | 2.03 | % | ||||||||||||||||||
S&P 500® Total Return Index | -5.29 | % | -0.61 | % | 14.34 | % | 2.70 | % | 5.20 | % | 16.43 | % | ||||||||||||||||||
Morningstar Multi-Alternative Universe | -2.63 | % | -1.93 | % | 1.54 | % | -1.20 | % | -0.66 | % | 1.89 | % | ||||||||||||||||||
| Gross Expense | Less Expense | Net Expense | ||||||||||||||||||||||||||||
| Ratio | Waivers | Ratio | Net Ratio ex Dividend & Short Expense | |||||||||||||||||||||||||||
Resolute Fund I - I Class | 6.18 | % | -3.72 | % | 2.46 | % | 2.35 | % | ||||||||||||||||||||||
Resolute Fund I - A Class | 6.61 | % | -3.73 | % | 2.88 | % | 2.77 | % | ||||||||||||||||||||||
This performance analysis section shows the fund’s historical performance. Past performance is not indicative of future results. Investment return and value of shares will fluctuate. Upon redemption, shares may be worth more or less than their original cost. The current performance may be higher or lower than the quoted performance. Call 1-855-268-2242 or visit www.redmontfunds.com for the most recent month end performance results. The Fund has a redemption fee of 2.00% for shares redeemed within the first 90 days of purchase. Maximum Offering Price (MOP) for Class A includes the Fund’s maximum sales charge of 5.50%. Performance shown at NAV does not include these sales charges and would have been lower had it been taken into account.
Note: “Non-Standardized” performance includes month-end periods other than quarter-end. Examples include April, May, July, August, etc.
| Semi-Annual Report | October 31, 2015 | 1 |
Table of Contents
| Redmont Funds | Shareholder Letter | |
October 31, 2015 (Unaudited) |
REDMONT RESOLUTE FUND II
Table 2 notes the performance for Fund II as of quarter end under standard reporting (since inception) as well as of October 31st.
Table 2 i. ii. iii. iv. vi.
Performance (amounts greater than one year are annualized)
| Standardized Performance Data | Non-Standardized Performance Data | |||||||||||||||||||||||||||||
| Redmont Resolute Fund II | as of September 30, 2015 | as of October 31, 2015 | ||||||||||||||||||||||||||||
| Since Inception | Since Inception | |||||||||||||||||||||||||||||
| Year-to-Date | 1-Year | (12/30/11) | Year-to-Date | 1-Year | (12/30/11) | |||||||||||||||||||||||||
Resolute Fund II - I Class | -2.51% | -0.96% | 3.65% | 0.27% | 1.51% | 4.33% | ||||||||||||||||||||||||
HFRX Global Hedge Fund Index | 3.05% | -4.74% | 1.69% | -1.63% | -2.05% | 2.03% | ||||||||||||||||||||||||
S&P 500® Total Return Index | -5.29% | -0.61% | 14.34% | 2.70% | 5.20% | 16.43% | ||||||||||||||||||||||||
Morningstar Multi-Alternative Universe | -2.63% | -1.93% | 1.54% | -1.20% | -0.66% | 1.89% | ||||||||||||||||||||||||
| Gross Expense | Less Expense | Net Expense | ||||||||||||||||||||||||||||
| Ratio | Waivers | Ratio | Net Ratio ex Dividend & Short Expense | |||||||||||||||||||||||||||
Resolute Fund II - I Class | 2.53% | -1.35% | 1.18% | 1.08% | ||||||||||||||||||||||||||
This performance analysis section shows the fund’s historical performance. Past performance is not indicative of future results. Investment return and value of shares will fluctuate. Upon redemption, shares may be worth more or less than their original cost. The current performance may be higher or lower than the quoted performance. Call 1-855-268-2242 or visit www.redmontfunds.com for the most recent month end performance results. The Fund has a redemption fee of 2.00% for shares redeemed within the first 90 days of purchase. Performance shown at NAV does not include these sales charges and would have been lower had it been taken into account.
Note: “Non-Standardized” performance includes month-end periods other than quarter-end. Examples include April, May, July, August, etc.
Portfolio Changes:
The overall allocation has remained unchanged during 2015 but we have made several manager changes as we continue to identify unique strategies that add value to the portfolio. Within the Long/Short allocation in Fund I, Boston Partners was removed due to manager operational constraints. Proceeds were reinvested in Dalton & Impala for the time being. This change did not affect Fund II. Within the Opportunistic allocation in Fund I & II, Stadion was replaced by Weiss Alpha Balanced Strategy. This move is expected to improve risk-adjusted performance.
Closing:
We seek to add value both in our allocation and manager selection decisions. The changes outlined above should continue to provide additional value going forward. We appreciate your investment in our Redmont Resolute Funds, please feel free to contact us with any questions.
Sincerely,

R. Scott Graham, CFA & Michael T. Lytle, CFA
Portfolio Managers vii.
2 |
www.redmontfunds.com |
Table of Contents
| Redmont Funds | Shareholder Letter | |
October 31, 2015 (Unaudited) |
Underlying Allocation Weights & Performance:
The current allocation remained roughly unchanged during the six months ending October 31, 2015. Figure 1 lists the long-term target asset allocation for the Funds as well as the allocation for Fund I and Fund II as of October 31, 2015.
Figure 1
| Long-Term | Fund I | Fund II | ||
| Target Asset Allocation | October 31, 2015 Allocation | October 31, 2015 Allocation | ||
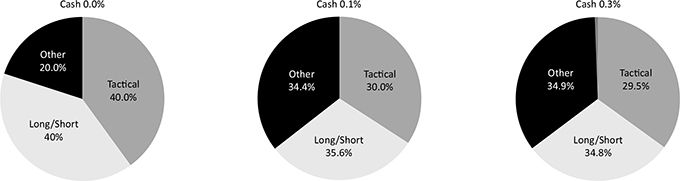 | ||||
Holdings and allocations subject to change, and may not reflect the current or future position of the portfolio.
| Semi-Annual Report | October 31, 2015 | 3 |
Table of Contents
| Redmont Funds | Shareholder Letter | |
October 31, 2015 (Unaudited) |
Each Fund’s investment objectives, risks, charges and expenses must be considered before investing. The prospectus contains this and other important information about each investment company, and may be obtained by calling 1-855-268-2242 or by visiting www.redmontfunds.com. Read it carefully before investing.
The views of the author and information discussed in this commentary are as of the date of publication, are subject to change, and may not reflect the writer’s current views. The views expressed are those of the author only, and represent an assessment of market conditions at a specific point in time, are opinions only and should not be relied upon as investment advice regarding a particular investment or markets in general. Such information does not constitute a recommendation to buy or sell specific securities or investment vehicles. It should not be assumed that any investment will be profitable or will equal the performance of the portfolios or any securities or any sectors mentioned in this letter. The subject matter contained in this letter has been derived from several sources believed to be reliable and accurate at the time of compilation. Neither Highland Associates, Inc. nor the Funds accept any liability for losses either direct or consequential caused by the use of this information.
RISKS:
The Funds are structured with an Underlying Investment Strategy. This strategy adopts the risks of investments in Other Investment Companies. These risks include, but are not limited to higher expenses, allocation risk, underlying fund risk, transparency risk, and underlying fund managed portfolio risk. Investments which focus on alternative strategies are subject to increased risk and loss of principal and are not suitable for all investors. Swap Risk involves swap agreements and are subject to counterparty default risk and may not perform as intended. Derivatives Risk involves the exercise of skill and judgment. Derivatives may expire worthless or not perform as expected. Equity risk may cause the value of the securities held by the Funds to fall due to general market and economic conditions, perceptions regarding the industries in which the issuers of securities held by the Fund participate, or factors relating to specific companies in which the Fund invest.
The Funds’ investments in non-U.S. issuers may be even more volatile and may present more risks than investments in U.S. issuers.
Commodity Risk may subject the Funds to greater volatility than traditional investments because of global supply and demand, changes in interest rates, commodity index volatility, and factors affecting a particular industry or commodity. Commodity-linked investments may not move in the same direction and to the same extent as the underlying commodities.
| i. | Source: Factset |
| ii. | The HFRX Global Index is designed to be representative of the overall composition of the hedge fund universe, and includes convertible arbitrage, distressed securities, equity hedge, equity market neutral, event driven, macro, merger arbitrage, and relative value strategies. Investors cannot invest directly in an index. |
| iii. | The S&P 500 Total Return Index is an unmanaged index of 500 common stocks chosen for market size, liquidity, and industry group representation. It is a market-value weighted index. The S&P 500 Index figures do not reflect any fees, expenses, or taxes. Investors cannot invest directly in this index. |
| iv. | The Morningstar Multi-Alternative Universe is designed to represent the exposure to alternative investment tactics. Funds in this category have the majority of their assets exposed to alternative strategies. An investor’s exposure to different tactics may change slightly over time in response to market movements. Funds in this category include both funds with static allocations to alternative strategies and funds tactically allocating among alternative strategies and asset classes. The gross short exposure is greater than 20%. |
| v. | Highland Associates, Inc. (the “Adviser”) has agreed, with respect to each share class of the Redmont Resolute Fund I, contractually to waive a portion of its Management Fee and/or reimburse Fund expenses in two ways. First, the Adviser will waive the portion of its 1.50% Management Fee and/or reimburse the Fund (or share class, as applicable) by an amount equal to any amount over the total of (i) 0.50% plus (ii) any subadvisory fees paid by the Adviser (“Sub-Advisory Fees”). Second, and after the fee waiver and/or expense reimbursement described above has been applied, to the extent the Fund’s total annual expenses (exclusive of Distribution and Service (12b-1) Fees, Swap Fees and Expenses, Shareholder Services Fees, Acquired Fund Fees and Expenses, Sub-Advisory Fees, brokerage expenses, interest expense, taxes and extraordinary expenses) exceed 1.40% of the Fund’s average daily net assets, the Adviser has contractually agreed to also either reduce the fee payable by the amount of such excess, and/or to reimburse the Fund (or share class, as applicable) by the amount of such excess. This agreement is in effect through August 31, 2017. The Adviser will be permitted to recover expenses it has borne through the agreement to limit total annual expenses for each share class to 1.40% of the Fund’s average daily net assets, on a class-by-class basis, to the extent that the Fund’s expenses in later periods fall below the annual rates set forth in the relevant agreement. The Fund will not be obligated to pay any such deferred fees and expenses more than three years after the end of the fiscal year in which the fees and expense were deferred. The Adviser may not discontinue this agreement to waive fees and/or reimburse expenses without the approval by the Fund’s Board of Trustees. |
| vi. | Highland Associates, Inc. has agreed to waive the portion of its 1.50% Management Fee in excess of any sub-advisory fees paid by the Adviser to sub-advisors in connection with the Redmont Resolute Fund II. This agreement is in effect through August 31, 2017. The Adviser may not discontinue this agreement to waive fees without the approval by the Fund’s Board of Trustees. |
| vii. | R. Scott Graham and Michael T. Lytle are registered representatives of ALPS Distributors, Inc. CFA Institute Marks are trademarks owned by the CFA Institute. |
ALPS Distributors, Inc. is the distributor for the Redmont Funds. R. Scott Graham and Michael T. Lytle are registered representatives of ALPS Distributors, Inc. CFA Institute Marks are trademarks owned by the CFA Institute.
4 |
www.redmontfunds.com |
Table of Contents
| Redmont Resolute Fund I | Performance Update | |
October 31, 2015 (Unaudited) |
Performance (for the period ended October 31, 2015)
Redmont Resolute Fund I
Cumulative Total Return (for the period ended October 31, 2015) | Year-to-Date | 1 Year | 3 Year | Since Inception* | ||||||||||||||||
Class A (NAV)(a) | 1.52 | % | 2.26 | % | 3.21 | % | 2.61 | % | ||||||||||||
Class A (LOAD) | -4.04 | % | -3.36 | % | 1.30 | % | 1.11 | % | ||||||||||||
Class I (NAV) | -0.38 | % | 0.41 | % | 2.88 | % | 2.43 | % | ||||||||||||
HFRX Global Hedge Fund Index(b) | -1.63 | % | -2.05 | % | 1.88 | % | 2.03 | % | ||||||||||||
S&P 500® Total Return Index(c) | 2.70 | % | 5.20 | % | 16.20 | % | 16.43 | % | ||||||||||||
Dow Jones U.S. Select Dividend Index(d) | -0.40 | % | 2.03 | % | 14.02 | % | 13.82 | % | ||||||||||||
| * | Fund inception date of 12/30/11. |
| (a) | Net Asset Value (NAV) is the share price without sales charges. |
| (b) | The HFRX Global Hedge Fund Index is designed to be representative of the overall composition of the hedge fund universe, and includes convertible arbitrage, distressed securities, equity hedge, equity market neutral, event driven, macro, merger arbitrage, and relative value strategies. The index is not actively managed and does not reflect any deduction of fees, expenses or taxes. An investor may not invest directly in an index. |
| (c) | The S&P 500® Total Return Index is the Standard & Poor’s composite index of 500 stocks, a widely recognized, unmanaged index of common stock prices. The index is not actively managed and does not reflect any deduction of fees, expenses or taxes. An investor may not invest directly in an index. |
| (d) | The Dow Jones U.S. Select Dividend Index represents the country’s top stocks by dividend yield, selected annually and subject to screening and buffering criteria. The index is not actively managed and does not reflect any deductions of fees, expenses or taxes. An investor may not invest directly in an index. |
Performance data quoted represents past performance. Past performance does not guarantee future results. Investment return and principal value of an investment will fluctuate so that an investor’s shares, when sold or redeemed, may be worth more or less than the original cost. Current performance data may be higher or lower than actual data quoted. For the most current month-end performance data please call 1-855-268-2242.
The table does not reflect the deduction of taxes that a shareholder would pay on Fund distributions or the redemption of Fund shares.
Performance of $10,000 Initial Investment (for the period ended October 31, 2015)
Comparison of change in value of a $10,000 investment (includes applicable sales loads)
Top Ten Holdings* (for the period ended October 31, 2015) | ||||||||
As a percentage of Net Assets | ||||||||
PIMCO Short-Term Fund, | 23.92% | |||||||
FPA Crescent Fund | 9.77% | |||||||
Morgan Stanley Institutional Fund, Inc. - Multi-Asset Portfolio, Class I | 9.12% | |||||||
AQR Multi Strategy Alternative Fund, Class I | 5.70% | |||||||
AQR Risk Parity Fund, Class I | 5.57% | |||||||
iShares® MSCI Japan ETF | 2.01% | |||||||
iShares® MSCI EMU ETF | 1.83% | |||||||
Diamond Hill Long-Short Fund, Class Y | 1.81% | |||||||
PowerShares® Senior Loan Portfolio | 1.06% | |||||||
iShares® Russell 2000 ETF | 0.90% | |||||||
Top Ten Holdings | 61.69% | |||||||
* Holdings are subject to change, and may not reflect the current or future position of the portfolio. | ||||||||
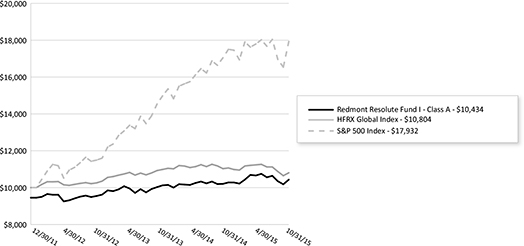
The chart represents historical performance of a hypothetical investment of $10,000 in the Fund since inception. Past performance does not guarantee future results. This chart does not reflect the deduction of taxes that a shareholder would pay on Fund distributions or the redemption of Fund shares.
| Semi-Annual Report | October 31, 2015 | 5 |
Table of Contents
| Redmont Resolute Fund II | Performance Update | |
October 31, 2015 (Unaudited) |
Performance (for the period ended October 31, 2015)
Redmont Resolute Fund II
Cumulative Total Return (for the period ended October 31, 2015) | Year-to-Date | 1 Year | 3 Year | Since Inception* | ||||||||||||||||
Class I (NAV) | 0.27 | % | 1.51 | % | 4.37 | % | 4.33 | % | ||||||||||||
HFRX Global Hedge Fund Index(a) | -1.63 | % | -2.05 | % | 1.88 | % | 2.03 | % | ||||||||||||
S&P 500® Total Return Index(b) | 2.70 | % | 5.20 | % | 16.20 | % | 16.43 | % | ||||||||||||
Dow Jones U.S. Select Dividend Index(c) | -0.40 | % | 2.03 | % | 14.02 | % | 13.82 | % | ||||||||||||
| * | Fund inception date of 12/30/11. |
| (a) | The HFRX Global Hedge Fund Index is designed to be representative of the overall composition of the hedge fund universe and includes convertible arbitrage, distressed securities, equity hedge, equity market neutral, event driven, macro, merger arbitrage and relative value strategies. The index is not actively managed and does not reflect any deduction of fees, expenses or taxes. An investor may not invest directly in an index. |
| (b) | The S&P 500® Total Return Index is the Standard & Poor’s composite index of 500 stocks, a widely recognized, unmanaged index of common stock prices. The index is not actively managed and does not reflect any deduction of fees, expenses or taxes. An investor may not invest directly in an index. |
| (c) | The Dow Jones U.S. Select Dividend Index represents the country’s top stocks by dividend yield, selected annually and subject to screening and buffering criteria. The index is not actively managed and does not reflect any deductions of fees, expenses or taxes. An investor may not invest directly in an index. |
Performance data quoted represents past performance. Past performance does not guarantee future results. Investment return and principal value of an investment will fluctuate so that an investor’s shares, when sold or redeemed, may be worth more or less than the original cost. Current performance data may be higher or lower than actual data quoted. For the most current month-end performance data please call 1-855-268-2242.
The table does not reflect the deduction of taxes that a shareholder would pay on Fund distributions or the redemption of Fund shares.
Performance of $10,000 Initial Investment (for the period ended October 31, 2015)
Comparison of change in value of a $10,000 investment
Top Ten Holdings* (for the period ended October 31, 2015) | ||||||||
As a percentage of Net Assets |
| |||||||
PIMCO Short-Term Fund, Institutional Class | 16.78% | |||||||
AQR Multi Strategy Alternative Fund, Class I | 10.22% | |||||||
FPA Crescent Fund | 10.05% | |||||||
Morgan Stanley Institutional Fund, Inc. - Multi-Asset Portfolio, Class I | 9.46% | |||||||
Diamond Hill Long-Short Fund, Class Y | 8.65% | |||||||
AQR Risk Parity Fund, Class I | 8.53% | |||||||
Nuveen Symphony Floating Rate Income Fund, Class I | 0.84% | |||||||
Microsoft Corp. | 0.20% | |||||||
Exxon Mobil Corp. | 0.15% | |||||||
Oracle Corp. | 0.11% | |||||||
Top Ten Holdings | 64.99% | |||||||
* Holdings are subject to change, and may not reflect the current or future position of the portfolio. | ||||||||
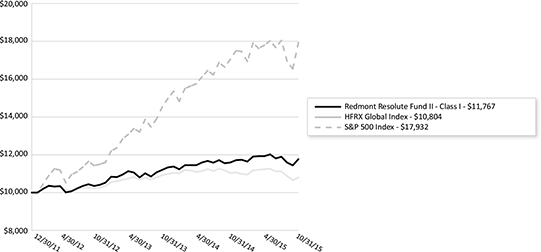
The chart represents historical performance of a hypothetical investment of $10,000 in the Fund since inception. Past performance does not guarantee future results. This chart does not reflect the deduction of taxes that a shareholder would pay on Fund distributions or the redemption of Fund shares.
6 |
www.redmontfunds.com |
Table of Contents
| Redmont Funds | Disclosure of Fund Expenses | |
October 31, 2015 (Unaudited) |
As a shareholder of the Funds, you incur two types of costs: (1) transaction costs, including applicable sales charges (loads), redemption fees, wire fees and low balance fees; and (2) ongoing costs, including management fees, distribution and service (12b-1) fees, shareholder services fees and other Fund expenses. This example is intended to help you understand your indirect costs, also referred to as “ongoing costs” (in dollars), of investing in the Fund and to compare these costs with the ongoing costs of investing in other mutual funds.
This example is based on an investment of $1,000 invested at the beginning of the period and held for the six-month period of May 1, 2015 through October 31, 2015.
Actual Expenses The first line of the table below provides information about actual account values and actual expenses. You may use the information in this line, together with the amount you invested at the beginning of the period, to estimate the expenses that you paid over the period. Simply divide your account value by $1,000 (for example, an $8,600 account value divided by $1,000 = 8.6), then multiply the result by the number in the first line under the heading “Expenses Paid During Period” to estimate the expenses you paid on your account during this period.
Hypothetical Example for Comparison Purposes The second line of the table provides information about hypothetical account values and hypothetical expenses based on the Fund’s actual expense ratio and an assumed rate of return of 5% per year before expenses, which is not the Fund’s actual return. The hypothetical account values and expenses may not be used to estimate the actual ending account balance or expenses you paid for the period. You may use this information to compare ongoing costs of investing in the Fund and other funds. To do so, compare this 5% hypothetical example with the 5% hypothetical examples that appear in the shareholder reports of other funds.
Please note that the expenses shown in the table are meant to highlight your ongoing costs only and do not reflect any transactional costs, such as applicable sales charges (loads), redemption fees, wire fees and low balance fees. Therefore, the second line of the table is useful in comparing ongoing costs only and will not help you determine the relative total costs of owning different funds. In addition, if these transaction costs were included, your costs would be higher.
| BEGINNING | ENDING | EXPENSES PAID | ||||||||||||||||||
| ACCOUNT VALUE | ACCOUNT VALUE | EXPENSE | DURING PERIOD | |||||||||||||||||
| 05/01/15 | 10/31/15 | RATIO(a) | 05/01/15-10/31/15(b) | |||||||||||||||||
Redmont Resolute Fund I | ||||||||||||||||||||
Class A | ||||||||||||||||||||
Actual | $ | 1,000.00 | $ | 978.90 | 2.12 | % | $ | 10.55 | ||||||||||||
Hypothetical (5% return before expenses)
| $
| 1,000.00
|
| $
| 1,014.48
|
|
| 2.12
| %
| $
| 10.74
|
| ||||||||
Class I | ||||||||||||||||||||
Actual | $ | 1,000.00 | $ | 981.50 | 1.72 | % | $ | 8.57 | ||||||||||||
Hypothetical (5% return before expenses) | $ | 1,000.00 | $ | 1,016.49 | 1.72 | % | $ | 8.72 | ||||||||||||
Redmont Resolute Fund II | ||||||||||||||||||||
Class I | ||||||||||||||||||||
Actual | $ | 1,000.00 | $ | 986.70 | 0.36 | % | $ | 1.80 | ||||||||||||
Hypothetical (5% return before expenses) | $ | 1,000.00 | $ | 1,023.33 | 0.36 | % | $ | 1.83 | ||||||||||||
| (a) | Annualized, based on the Fund’s most recent fiscal half year expenses. |
| (b) | Expenses are equal to the Fund’s annualized expense ratio multiplied by the average account value over the period, multiplied by the number of days in the most recent fiscal half-year (184)/366 (to reflect the half-year period). |
Semi-Annual Report | October 31, 2015 |
7 |
Table of Contents
| Redmont Resolute Fund I | Schedule of Investments | |
October 31, 2015 (Unaudited) |
| Value | ||||||||
| Description | Shares | (Note 2) | ||||||
| ||||||||
EXCHANGE TRADED FUNDS (10.62%) | ||||||||
iShares® Europe ETF | 532 | $ | 22,466 | |||||
iShares® iBoxx $ Investment Grade Corporate Bond ETF | 191 | 22,236 | ||||||
iShares® MSCI EMU ETF | 1,432 | 52,769 | ||||||
iShares® MSCI India ETF | 603 | 17,173 | ||||||
iShares® MSCI Japan ETF | 4,706 | 57,978 | ||||||
iShares® MSCI Mexico Capped ETF | 208 | 11,382 | ||||||
iShares® MSCI United Kingdom ETF | 7 | 122 | ||||||
iShares® Russell 1000 Value ETF | 98 | 9,828 | ||||||
iShares® Russell 2000 ETF | 225 | 25,952 | ||||||
PowerShares® DB Commodity Index Tracking Fund(a) | 428 | 6,506 | ||||||
PowerShares® Senior Loan Portfolio | 1,336 | 30,728 | ||||||
SPDR® Barclays High Yield Bond ETF | 267 | 9,737 | ||||||
SPDR® S&P 500® ETF Trust | 120 | 24,952 | ||||||
Vanguard Total International Bond ETF | 283 | 15,050 | ||||||
|
| |||||||
| 306,879 | ||||||||
|
| |||||||
TOTAL EXCHANGE TRADED FUNDS (Cost $303,929) | 306,879 | |||||||
| ||||||||
OPEN-END MUTUAL FUNDS (55.88%) | ||||||||
AQR Multi Strategy Alternative Fund, Class I | 15,636 | 164,649 | ||||||
AQR Risk Parity Fund, Class I | 16,387 | 160,921 | ||||||
Diamond Hill Long-Short Fund, Class Y(a) | 2,156 | 52,362 | ||||||
FPA Crescent Fund | 8,464 | 282,536 | ||||||
Morgan Stanley Institutional Fund, Inc. - Multi-Asset Portfolio, Class I | 25,522 | 263,642 | ||||||
PIMCO Short-Term Fund, Institutional Class | 70,773 | 691,453 | ||||||
|
| |||||||
| 1,615,563 | ||||||||
|
| |||||||
TOTAL OPEN-END MUTUAL FUNDS (Cost $1,593,574) | 1,615,563 | |||||||
| ||||||||
| Description | Principal Amount/ Shares | Value (Note 2) | ||||||
| ||||||||
SHORT TERM INVESTMENTS (16.90%) | ||||||||
MONEY MARKET FUNDS (16.73%) | ||||||||
Dreyfus Treasury Cash Management Fund, Institutional Class, 7-day yield, | 483,570 | 483,570 | ||||||
|
| |||||||
U.S. TREASURY BILLS (0.17%) | ||||||||
0.208%, 03/31/2016(b)(c) | 5,000 | 4,997 | ||||||
|
| |||||||
TOTAL SHORT TERM INVESTMENTS (Cost $488,566) | 488,567 | |||||||
| ||||||||
TOTAL INVESTMENTS (83.40%) (Cost $2,386,069) | $ | 2,411,009 | ||||||
SEGREGATED CASH WITH BROKERS (17.40%)(d) | 503,001 | |||||||
LIABILITIES IN EXCESS OF OTHER ASSETS (-0.80%) | (23,001) | |||||||
| ||||||||
NET ASSETS (100.00%) | $ | 2,891,009 | ||||||
| ||||||||
See Notes to Financial Statements.
8 |
www.redmontfunds.com |
Table of Contents
| Redmont Resolute Fund I | Schedule of Investments | |
October 31, 2015 (Unaudited) |
| (a) | Non-income producing security. |
| (b) | Security position either entirely or partially held in a segregated account as collateral for futures contracts and total return swap contracts. Aggregate total market value of $4,997. |
| (c) | Rate shown represents the bond equivalent yield to maturity at date of purchase. |
| (d) | Includes cash which is being held as collateral for total return swap contracts. |
FUTURES CONTRACTS
At October 31, 2015, the Fund had outstanding futures contracts:
| Description | Position | Contracts | Expiration Date | Underlying Face Amount at Value | Unrealized Appreciation | |||||||||
| ||||||||||||||
Foreign Currency Contracts | ||||||||||||||
Euro FX Currency Future | Short | 1 | 12/15/2015 | $ | (137,613 | ) | $ | 2,562 | ||||||
|
| |||||||||||||
| $ | (137,613 | ) | $ | 2,562 | ||||||||||
|
| |||||||||||||
TOTAL RETURN SWAP CONTRACTS*
| Counterparty | Reference Obligation | Notional Amount | Rate Paid by the Fund | Termination Date | Unrealized Appreciation | |||||
| ||||||||||
Morgan Stanley | Impala Segregated Portfolio(a) | $ 522,912 | 1-Month LIBOR BBA | 03/20/2019 | $ (964) | |||||
Morgan Stanley | Melchior Segregated Portfolio(b) | 460,228 | 1-Month LIBOR BBA | 03/20/2019 | (362) | |||||
Morgan Stanley | WABR Cayman Company Limited(c) | 674,272 | 1-Month LIBOR BBA | 09/01/2020 | (632) | |||||
|
| |||||||||
| $ 1,657,412 | $ (1,958) | |||||||||
|
| |||||||||
| * | The Fund receives payments based on any positive return of the Reference Obligation less the rate paid by the Fund. The Fund makes payments on any negative return of such Reference Obligation plus the rate paid by the Fund. |
| (a) | European equity long/short strategy that employs a flexible, low-net strategy (0% to 50%), and long exposure will vary between 60% and 100%. The portfolio is primarily comprised of large and mid-cap stocks listed on European exchanges. |
| (b) | Global equity long/short strategy that uses a long-biased strategy that is focused on cyclical sectors. The strategy has a net exposure that ranges between 50% and 80%, and long exposure varies between 80% and 100%. The strategy is comprised of large cap stocks listed on exchanges of developed and emerging market countries. |
| (c) | Weiss Alpha Balanced Risk incorporates an absolute return oriented approach within a risk parity framework. Active absolute return strategies include fundamental long/short equity, credit relative value, discretionary macro, and equity market neutral strategies. The strategy also maintains a passive risk weighted allocation to equities and fixed income, but each of the three allocations is equally risk weighted subject to a 40% limit on the absolute return allocation. Gross equity long exposure will typically be 140% or less, and net equity exposure will vary between 5% and 35%. |
Common Abbreviations:
AQR - AQR Capital Management LLC.
BBA - British Bankers Association.
DB - Deutsche Bank.
EMU - European Economic and Monetary Union.
ETF - Exchange Traded Fund.
FPA - First Pacific Advisors LLC.
FX - Foreign Exchange.
LIBOR - London Interbank Offered Rate.
MSCI - Morgan Stanley Capital International.
PIMCO - Pacific Investment Management Company.
S&P - Standard & Poor’s.
SPDR - Standard & Poor’s Depositary Receipt.
See Notes to Financial Statements.
| Semi-Annual Report | October 31, 2015 | 9 |
Table of Contents
| Redmont Resolute Fund II | Schedule of Investments | |
October 31, 2015 (Unaudited) |
| Description | Shares | Value (Note 2) | ||||||
| ||||||||
COMMON STOCKS (13.79%) | ||||||||
ADVERTISING (0.07%) | ||||||||
Omnicom Group, Inc.(a) | 6,092 | $ | 456,412 | |||||
The Interpublic Group of Companies, Inc. | 704 | 16,143 | ||||||
|
| |||||||
| 472,555 | ||||||||
|
| |||||||
AEROSPACE & DEFENSE (0.53%) | ||||||||
Airbus Group SE | 2,702 | 188,259 | ||||||
Cubic Corp. | 2,944 | 132,038 | ||||||
General Dynamics Corp. | 3,714 | 551,826 | ||||||
Harris Corp.(a) | 6,161 | 487,520 | ||||||
IHI Corp. | 7,000 | 19,955 | ||||||
L-3 Communications Holdings, Inc. | 122 | 15,421 | ||||||
Lockheed Martin Corp.(a) | 3,227 | 709,392 | ||||||
Northrop Grumman Corp.(a) | 3,106 | 583,152 | ||||||
Raytheon Co.(a) | 3,605 | 423,227 | ||||||
Safran SA | 1,272 | 96,668 | ||||||
The Boeing Co. | 819 | 121,269 | ||||||
United Technologies Corp.(a) | 3,401 | 334,692 | ||||||
|
| |||||||
| 3,663,419 | ||||||||
|
| |||||||
AGRICULTURE (0.11%) | ||||||||
Archer-Daniels-Midland Co. | 2,141 | 97,758 | ||||||
British American Tobacco PLC | 2,254 | 134,109 | ||||||
Bunge, Ltd. | 83 | 6,056 | ||||||
Imperial Tobacco Group PLC | 3,636 | 196,128 | ||||||
Japan Tobacco, Inc. | 1,400 | 48,856 | ||||||
Philip Morris International, Inc. | 1,983 | 175,297 | ||||||
Reynolds American, Inc. | 2,601 | 125,680 | ||||||
|
| |||||||
| 783,884 | ||||||||
|
| |||||||
AIRLINES (0.08%) | ||||||||
American Airlines Group, Inc. | 738 | 34,110 | ||||||
Delta Air Lines, Inc. | 9,630 | 489,589 | ||||||
Southwest Airlines Co. | 586 | 27,126 | ||||||
United Continental Holdings, Inc.(b) | 370 | 22,315 | ||||||
|
| |||||||
| 573,140 | ||||||||
|
| |||||||
APPAREL (0.04%) | ||||||||
adidas AG | 1,684 | 151,015 | ||||||
Christian Dior SE | 334 | 65,780 | ||||||
NIKE, Inc., Class B | 683 | 89,494 | ||||||
|
| |||||||
| 306,289 | ||||||||
|
| |||||||
AUTO MANUFACTURERS (0.20%) | ||||||||
Daihatsu Motors Co., Ltd. | 3,800 | 46,921 | ||||||
Fiat Chrysler Auto NV(b) | 3,983 | 58,778 | ||||||
Fuji Heavy Industries, Ltd. | 5,100 | 199,824 | ||||||
Honda Motor Co., Ltd. | 6,500 | 217,834 | ||||||
Isuzu Motors, Ltd. | 5,900 | 69,503 | ||||||
Mazda Motor Corp. | 5,000 | 99,631 | ||||||
Mitsubishi Motors Corp. | 4,200 | 37,590 | ||||||
PACCAR, Inc. | 729 | 38,382 | ||||||
See Notes to Financial Statements.
10 |
www.redmontfunds.com |
Table of Contents
| Redmont Resolute Fund II | Schedule of Investments | |
October 31, 2015 (Unaudited) |
| Description | Shares | Value (Note 2) | ||||||
| ||||||||
AUTO MANUFACTURERS (0.20%) (continued) | ||||||||
Suzuki Motor Corp. | 3,700 | $ | 122,342 | |||||
Toyota Motor Corp. | 8,700 | 538,496 | ||||||
|
| |||||||
| 1,429,301 | ||||||||
|
| |||||||
AUTO PARTS & EQUIPMENT (0.19%) | ||||||||
Bridgestone Corp. | 4,400 | 163,209 | ||||||
Continental AG | 677 | 162,814 | ||||||
Delphi Automotive PLC | 1,184 | 98,497 | ||||||
GKN PLC | 5,447 | 24,117 | ||||||
JTEKT Corp. | 2,000 | 34,839 | ||||||
Lear Corp. | 2,118 | 264,877 | ||||||
NGK Insulators, Ltd. | 3,000 | 65,534 | ||||||
NHK Spring Co., Ltd. | 10,100 | 103,871 | ||||||
Tenneco, Inc.(b) | 6,299 | 356,460 | ||||||
The Goodyear Tire & Rubber Co. | 92 | 3,021 | ||||||
Toyoda Gosei Co., Ltd. | 1,500 | 34,781 | ||||||
|
| |||||||
| 1,312,020 | ||||||||
|
| |||||||
BANKS (1.41%) | ||||||||
Banco Santander SA | 41,183 | 230,963 | ||||||
Bank of America Corp.(a) | 21,215 | 355,988 | ||||||
Barclays PLC | 53,645 | 191,862 | ||||||
BB&T Corp.(a) | 14,882 | 552,866 | ||||||
BNP Paribas SA | 3,412 | 207,336 | ||||||
Capital One Financial Corp.(a) | 8,524 | 672,544 | ||||||
Citigroup, Inc.(a) | 17,779 | 945,309 | ||||||
Citizens Financial Group, Inc. | 9,457 | 229,805 | ||||||
Comerica, Inc. | 1,262 | 54,771 | ||||||
Commerzbank AG(b) | 11,789 | 129,767 | ||||||
Cullen/Frost Bankers, Inc. | 308 | 21,080 | ||||||
Danske Bank A/S | 4,920 | 135,289 | ||||||
DnB ASA | 5,890 | 75,005 | ||||||
East West Bancorp, Inc. | 502 | 20,276 | ||||||
Fifth Third Bancorp(a) | 31,808 | 605,942 | ||||||
First Horizon National Corp. | 1,382 | 19,597 | ||||||
Fukuoka Financial Group, Inc. | 1,000 | 5,312 | ||||||
Hokuhoku Financial Group, Inc. | 51,000 | 114,113 | ||||||
HSBC Holdings PLC | 13,407 | 104,912 | ||||||
Huntington Bancshares, Inc.(a) | 24,039 | 263,708 | ||||||
Intesa Sanpaolo SpA RSP | 37,031 | 118,336 | ||||||
Investec PLC | 1,557 | 13,010 | ||||||
JPMorgan Chase & Co.(a) | 13,001 | 835,314 | ||||||
KBC Groep NV | 2,125 | 129,456 | ||||||
Mitsubishi UFJ Financial Group, Inc. | 65,500 | 429,140 | ||||||
Mizuho Financial Group, Inc. | 87,600 | 181,705 | ||||||
Morgan Stanley | 7,386 | 243,516 | ||||||
Popular, Inc. | 669 | 19,782 | ||||||
Regions Financial Corp.(a) | 31,832 | 297,629 | ||||||
Royal Bank of Scotland Group PLC(b) | 26,136 | 127,965 | ||||||
State Street Corp.(a) | 3,517 | 242,673 | ||||||
Sumitomo Mitsui Financial Group, Inc. | 2,300 | 92,633 | ||||||
SunTrust Banks, Inc.(a) | 6,748 | 280,177 | ||||||
See Notes to Financial Statements.
| Semi-Annual Report | October 31, 2015 | 11 |
Table of Contents
| Redmont Resolute Fund II | Schedule of Investments | |
October 31, 2015 (Unaudited) |
| Description | Shares | Value (Note 2) | ||||||
| ||||||||
BANKS (1.41%) (continued) | ||||||||
The Bank of Yokohama, Ltd. | 21,000 | $ | 132,140 | |||||
The Chiba Bank, Ltd. | 9,000 | 66,230 | ||||||
The Chugoku Bank, Ltd. | 1,900 | 27,161 | ||||||
The Goldman Sachs Group, Inc.(a) | 2,256 | 423,000 | ||||||
The Iyo Bank, Ltd. | 3,100 | 33,628 | ||||||
The PNC Financial Services Group, Inc.(a) | 2,982 | 269,155 | ||||||
Wells Fargo & Co.(a) | 16,794 | 909,227 | ||||||
|
| |||||||
| 9,808,322 | ||||||||
|
| |||||||
BEVERAGES (0.14%) | ||||||||
Anheuser-Busch InBev NV | 128 | 15,300 | ||||||
Asahi Group Holdings, Ltd. | 4,600 | 142,837 | ||||||
Carlsberg A/S, Class B | 1,630 | 133,623 | ||||||
Coca-Cola Enterprises, Inc. | 514 | 26,389 | ||||||
Constellation Brands, Inc., Class A(a) | 1,435 | 193,438 | ||||||
Heineken Holding NV | 1,735 | 139,143 | ||||||
Kirin Holdings Co., Ltd. | 5,100 | 72,736 | ||||||
PepsiCo, Inc. | 1,867 | 190,789 | ||||||
The Coca-Cola Co. | 2,090 | 88,512 | ||||||
|
| |||||||
| 1,002,767 | ||||||||
|
| |||||||
BIOTECHNOLOGY (0.14%) | ||||||||
Amgen, Inc. | 1,317 | 208,323 | ||||||
Biogen, Inc.(b) | 102 | 29,632 | ||||||
Celgene Corp.(b) | 609 | 74,730 | ||||||
Gilead Sciences, Inc. | 6,330 | 684,463 | ||||||
|
| |||||||
| 997,148 | ||||||||
|
| |||||||
BUILDING MATERIALS (0.09%) | ||||||||
Asahi Glass Co., Ltd. | 9,000 | 51,985 | ||||||
Daikin Industries, Ltd. | 2,600 | 168,923 | ||||||
LafargeHolcim, Ltd. | 2,742 | 154,653 | ||||||
Masco Corp. | 9,680 | 280,720 | ||||||
|
| |||||||
| 656,281 | ||||||||
|
| |||||||
CHEMICALS (0.31%) | ||||||||
Air Water, Inc. | 2,000 | 32,999 | ||||||
BASF SE | 2,819 | 231,037 | ||||||
CF Industries Holdings, Inc. | 439 | 22,288 | ||||||
Daicel Corp. | 7,500 | 99,942 | ||||||
EI du Pont de Nemours & Co. | 1,777 | 112,662 | ||||||
EMS-Chemie Holding AG | 303 | 128,287 | ||||||
Hitachi Chemical Co., Ltd. | 1,900 | 30,420 | ||||||
Kaneka Corp. | 3,000 | 26,800 | ||||||
Kuraray Co., Ltd. | 2,000 | 24,861 | ||||||
LyondellBasell Industries NV, Class A | 1,207 | 112,142 | ||||||
Mitsui Chemicals, Inc. | 9,000 | 34,383 | ||||||
PPG Industries, Inc. | 3,324 | 346,560 | ||||||
Praxair, Inc. | 20 | 2,222 | ||||||
Shin-Etsu Chemical Co., Ltd. | 3,500 | 209,820 | ||||||
The Dow Chemical Co. | 2,010 | 103,857 | ||||||
The Mosaic Co. | 8,912 | 301,137 | ||||||
See Notes to Financial Statements.
12 |
www.redmontfunds.com |
Table of Contents
| Redmont Resolute Fund II | Schedule of Investments | |
October 31, 2015 (Unaudited) |
| Description | Shares | Value (Note 2) | ||||||
| ||||||||
CHEMICALS (0.31%) (continued) | ||||||||
The Valspar Corp. | 3,860 | $ | 312,467 | |||||
|
| |||||||
| 2,131,884 | ||||||||
|
| |||||||
COAL (0.00%)(c) | ||||||||
Cloud Peak Energy, Inc.(b) | 6,097 | 18,108 | ||||||
|
| |||||||
COMMERCIAL SERVICES (0.56%) | ||||||||
Abertis Infraestructuras SA | 796 | 13,226 | ||||||
Adecco SA | 1,819 | 135,443 | ||||||
Aggreko PLC | 564 | 7,960 | ||||||
Benesse Holdings, Inc. | 2,200 | 59,344 | ||||||
Civeo Corp. | 10,114 | 18,812 | ||||||
Dai Nippon Printing Co., Ltd. | 11,000 | 114,676 | ||||||
Equifax, Inc.(a) | 4,484 | 477,860 | ||||||
EVERTEC, Inc. | 6,467 | 117,958 | ||||||
Global Payments, Inc. | 1,152 | 157,144 | ||||||
H&R Block, Inc. | 10,924 | 407,028 | ||||||
ISS A/S | 3,676 | 129,374 | ||||||
ManpowerGroup, Inc.(a) | 5,139 | 471,657 | ||||||
MasterCard, Inc., Class A | 355 | 35,141 | ||||||
Moody’s Corp.(a) | 3,551 | 341,464 | ||||||
New Oriental Education & Technology Group, Inc., Sponsored ADR | 6,974 | 191,855 | ||||||
PayPal Holdings, Inc.(b) | 972 | 35,002 | ||||||
Robert Half International, Inc.(a) | 6,151 | 323,912 | ||||||
Secom Co., Ltd. | 1,400 | 94,173 | ||||||
The Western Union Co. | 969 | 18,653 | ||||||
Total System Services, Inc. | 5,390 | 282,706 | ||||||
Towers Watson & Co., Class A(a) | 3,558 | 439,627 | ||||||
United Rentals, Inc.(b) | 72 | 5,390 | ||||||
|
| |||||||
| 3,878,405 | ||||||||
|
| |||||||
COMPUTERS (0.59%) | ||||||||
Accenture PLC, Class A | 1,519 | 162,837 | ||||||
Amdocs, Ltd.(a) | 6,005 | 357,718 | ||||||
Apple, Inc. | 9,675 | 1,156,162 | ||||||
Brocade Communications Systems, Inc.(a) | 43,905 | 457,490 | ||||||
Computer Sciences Corp. | 531 | 35,359 | ||||||
EMC Corp.(a) | 20,391 | 534,652 | ||||||
Fortinet, Inc.(b) | 463 | 15,909 | ||||||
Hewlett-Packard Co. | 17,071 | 460,234 | ||||||
International Business Machines Corp. | 1,408 | 197,233 | ||||||
Itochu Techno-Solutions Corp. | 4,900 | 108,014 | ||||||
NetApp, Inc. | 748 | 25,432 | ||||||
Seagate Technology PLC | 3,372 | 128,338 | ||||||
Western Digital Corp.(a) | 6,704 | 447,961 | ||||||
|
| |||||||
| 4,087,339 | ||||||||
|
| |||||||
CONTAINERS & PACKAGING (0.07%) | ||||||||
WestRock Co. | 9,037 | 485,829 | ||||||
|
| |||||||
See Notes to Financial Statements.
| Semi-Annual Report | October 31, 2015 | 13 |
Table of Contents
| Redmont Resolute Fund II | Schedule of Investments | |
October 31, 2015 (Unaudited) |
| Description | Shares | Value (Note 2) | ||||||
| ||||||||
COSMETICS & PERSONAL CARE (0.06%) | ||||||||
Beiersdorf AG | 293 | $ | 27,847 | |||||
Colgate-Palmolive Co. | 413 | 27,403 | ||||||
Kao Corp. | 2,000 | 103,406 | ||||||
Svenska Cellulosa AB SCA, Class B | 3,991 | 117,718 | ||||||
The Procter & Gamble Co. | 1,955 | 149,323 | ||||||
|
| |||||||
| 425,697 | ||||||||
|
| |||||||
DISTRIBUTION & WHOLESALE (0.10%) | ||||||||
Arrow Electronics, Inc.(a)(b) | 6,588 | 362,274 | ||||||
Fossil Group, Inc.(b) | 95 | 5,169 | ||||||
ITOCHU Corp. | 15,100 | 190,705 | ||||||
Marubeni Corp. | 18,000 | 104,775 | ||||||
Mitsubishi Corp. | 200 | 3,667 | ||||||
|
| |||||||
| 666,590 | ||||||||
|
| |||||||
DIVERSIFIED FINANCIAL SERVICES (0.52%) | ||||||||
Aberdeen Asset Management PLC | 24,600 | 131,480 | ||||||
AEON Financial Service Co., Ltd. | 1,300 | 32,804 | ||||||
Affiliated Managers Group, Inc.(b) | 157 | 28,301 | ||||||
Alliance Data Systems Corp.(b) | 878 | 261,038 | ||||||
Ally Financial, Inc.(b) | 15,584 | 310,433 | ||||||
Ameriprise Financial, Inc. | 1,334 | 153,890 | ||||||
BlackRock, Inc. | 90 | 31,677 | ||||||
CME Group, Inc. | 947 | 89,463 | ||||||
Credit Saison Co., Ltd. | 1,800 | 37,307 | ||||||
Daiwa Securities Group, Inc. | 20,000 | 137,913 | ||||||
Discover Financial Services(a) | 10,925 | 614,204 | ||||||
Eaton Vance Corp. | 404 | 14,589 | ||||||
Intercontinental Exchange, Inc. | 90 | 22,716 | ||||||
Lazard LP, Class A | 392 | 18,157 | ||||||
Legg Mason, Inc. | 1,800 | 80,550 | ||||||
Navient Corp. | 18,579 | 245,057 | ||||||
Nomura Holdings, Inc. | 10,200 | 64,715 | ||||||
ORIX Corp. | 3,800 | 56,101 | ||||||
Partners Group Holding AG | 205 | 74,248 | ||||||
Raymond James Financial, Inc.(a) | 4,394 | 242,153 | ||||||
SLM Corp.(b) | 33,912 | 239,419 | ||||||
T Rowe Price Group, Inc. | 280 | 21,174 | ||||||
TD Ameritrade Holding Corp.(a) | 6,468 | 222,952 | ||||||
The Charles Schwab Corp.(a) | 7,265 | 221,728 | ||||||
The NASDAQ OMX Group, Inc. | 1,978 | 114,506 | ||||||
Visa, Inc., Class A | 2,058 | 159,660 | ||||||
|
| |||||||
| 3,626,235 | ||||||||
|
| |||||||
ELECTRIC (0.24%) | ||||||||
AES Corp. | 29,637 | 324,525 | ||||||
Calpine Corp.(b) | 1,364 | 21,156 | ||||||
Chubu Electric Power Co., Inc. | 6,200 | 96,054 | ||||||
Consolidated Edison, Inc. | 296 | 19,462 | ||||||
Duke Energy Corp. | 558 | 39,880 | ||||||
E.ON SE | 14,309 | 151,008 | ||||||
Edison International | 456 | 27,597 | ||||||
See Notes to Financial Statements.
14 |
www.redmontfunds.com |
Table of Contents
| Redmont Resolute Fund II | Schedule of Investments | |
October 31, 2015 (Unaudited) |
| Description | Shares | Value (Note 2) | ||||||
| ||||||||
ELECTRIC (0.24%) (continued) | ||||||||
EDP - Energias de Portugal SA | 34,789 | $ | 128,845 | |||||
Electric Power Development Co., Ltd. | 1,300 | 43,146 | ||||||
Electricite de France SA | 2,636 | 49,089 | ||||||
Endesa SA | 1,067 | 23,760 | ||||||
Enel SpA | 11,786 | 54,382 | ||||||
Engie SA | 6,505 | 114,130 | ||||||
Entergy Corp. | 217 | 14,791 | ||||||
Exelon Corp. | 4,785 | 133,597 | ||||||
FirstEnergy Corp. | 49 | 1,529 | ||||||
Iberdrola SA | 24,738 | 176,739 | ||||||
MDU Resources Group, Inc. | 550 | 10,373 | ||||||
NRG Energy, Inc. | 3,957 | 51,006 | ||||||
PG&E Corp. | 72 | 3,845 | ||||||
Public Service Enterprise Group, Inc. | 103 | 4,253 | ||||||
RWE AG | 895 | 12,455 | ||||||
The Chugoku Electric Power Co., Inc. | 8,100 | 123,108 | ||||||
The Kansai Electric Power Co., Inc.(b) | 3,200 | 41,316 | ||||||
Tohoku Electric Power Co., Inc. | 2,600 | 36,801 | ||||||
|
| |||||||
| 1,702,847 | ||||||||
|
| |||||||
ELECTRICAL COMPONENTS & EQUIPMENT (0.04%) | ||||||||
Brother Industries, Ltd. | 1,500 | 19,367 | ||||||
Casio Computer Co., Ltd. | 3,500 | 66,479 | ||||||
Emerson Electric Co. | 1,670 | 78,874 | ||||||
Hitachi, Ltd. | 15,000 | 87,375 | ||||||
|
| |||||||
| 252,095 | ||||||||
|
| |||||||
ELECTRONICS (0.36%) | ||||||||
Agilent Technologies, Inc. | 1,686 | 63,663 | ||||||
Avnet, Inc. | 7,144 | 324,552 | ||||||
Corning, Inc. | 1,775 | 33,015 | ||||||
Flextronics International, Ltd.(a)(b) | 41,919 | 477,457 | ||||||
Hirose Elect Co., Ltd. | 700 | 85,622 | ||||||
Hitachi High-Technologies Corp. | 2,400 | 65,136 | ||||||
Honeywell International, Inc.(a) | 2,914 | 300,958 | ||||||
Hoya Corp. | 4,400 | 183,373 | ||||||
Ibiden Co., Ltd. | 1,000 | 13,906 | ||||||
Jabil Circuit, Inc.(a) | 26,524 | 609,521 | ||||||
Minebea Co., Ltd. | 7,000 | 78,081 | ||||||
Murata Manufacturing Co., Ltd. | 1,300 | 186,969 | ||||||
TE Connectivity, Ltd. | 1,450 | 93,438 | ||||||
|
| |||||||
| 2,515,691 | ||||||||
|
| |||||||
ENGINEERING & CONSTRUCTION (0.05%) | ||||||||
ACS Actividades de Construccion y Servicios SA | 3,606 | 122,707 | ||||||
Bouygues SA | 3,331 | 126,243 | ||||||
Jacobs Engineering Group, Inc.(b) | 462 | 18,545 | ||||||
Japan Airport Terminal Co., Ltd. | 800 | 43,756 | ||||||
Obayashi Corp. | 1,000 | 8,817 | ||||||
|
| |||||||
| 320,068 | ||||||||
|
| |||||||
See Notes to Financial Statements.
| Semi-Annual Report | October 31, 2015 | 15 |
Table of Contents
| Redmont Resolute Fund II | Schedule of Investments | |
October 31, 2015 (Unaudited) |
| Description | Shares | Value (Note 2) | ||||||
| ||||||||
ENTERTAINMENT (0.04%) | ||||||||
Six Flags Entertainment Corp. | 4,090 | $ | 212,844 | |||||
William Hill PLC | 20,614 | 100,770 | ||||||
|
| |||||||
| 313,614 | ||||||||
|
| |||||||
FOOD (0.18%) | ||||||||
Associated British Foods PLC | 1,883 | 100,293 | ||||||
Carrefour SA | 966 | 31,517 | ||||||
General Mills, Inc. | 2,020 | 117,382 | ||||||
Ingredion, Inc. | 88 | 8,365 | ||||||
Koninklijke Ahold NV | 7,166 | 145,939 | ||||||
METRO AG | 2,326 | 71,695 | ||||||
Nestle SA | 3,167 | 242,223 | ||||||
Nissin Foods Holdings Co., Ltd. | 2,200 | 102,279 | ||||||
Pilgrim’s Pride Corp. | 206 | 3,912 | ||||||
Seven & I Holdings Co., Ltd. | 1,600 | 73,072 | ||||||
The Kraft Heinz Co. | 388 | 30,253 | ||||||
The Kroger Co. | 1,257 | 47,515 | ||||||
Tyson Foods, Inc., Class A(a) | 5,634 | 249,924 | ||||||
|
| |||||||
| 1,224,369 | ||||||||
|
| |||||||
FOOD SERVICE (0.02%) | ||||||||
Compass Group PLC | 9,793 | 168,934 | ||||||
|
| |||||||
FOREST PRODUCTS & PAPER (0.03%) | ||||||||
International Paper Co. | 922 | 39,360 | ||||||
Mondi PLC | 1,952 | 45,259 | ||||||
UPM-Kymmene OYJ | 7,032 | 131,843 | ||||||
|
| |||||||
| 216,462 | ||||||||
|
| |||||||
GAS (0.00%)(c) | ||||||||
National Fuel Gas Co. | 165 | 8,667 | ||||||
UGI Corp. | 259 | 9,498 | ||||||
|
| |||||||
| 18,165 | ||||||||
|
| |||||||
HAND & MACHINE TOOLS (0.14%) | ||||||||
Fuji Electric Holdings Co., Ltd. | 27,000 | 121,497 | ||||||
Makita Corp. | 1,300 | 71,857 | ||||||
Schindler Holding AG | 775 | 126,076 | ||||||
Schindler Holding AG, Participation Certificates | 823 | 133,718 | ||||||
SMC Corp. | 200 | 51,944 | ||||||
Stanley Black & Decker, Inc.(a) | 4,735 | 501,815 | ||||||
|
| |||||||
| 1,006,907 | ||||||||
|
| |||||||
HEALTHCARE - PRODUCTS (0.17%) | ||||||||
Hologic, Inc.(b) | 295 | 11,464 | ||||||
Intuitive Surgical, Inc.(b) | 38 | 18,871 | ||||||
Medtronic PLC | 3,337 | 246,671 | ||||||
QIAGEN NV(b) | 3,581 | 86,869 | ||||||
St Jude Medical, Inc. | 5,796 | 369,843 | ||||||
Varian Medical Systems, Inc.(b) | 626 | 49,160 | ||||||
See Notes to Financial Statements.
16 |
www.redmontfunds.com |
Table of Contents
| Redmont Resolute Fund II | Schedule of Investments | |
October 31, 2015 (Unaudited) |
| Description | Shares | Value (Note 2) | ||||||
| ||||||||
HEALTHCARE - PRODUCTS (0.17%) (continued) | ||||||||
Zimmer Biomet Holdings, Inc.(a) | 3,657 | $ | 382,412 | |||||
|
| |||||||
| 1,165,290 | ||||||||
|
| |||||||
HEALTHCARE - SERVICES (0.25%) | ||||||||
Aetna, Inc. | 295 | 33,860 | ||||||
Anthem, Inc. | 2,889 | 402,004 | ||||||
Centene Corp.(b) | 27 | 1,606 | ||||||
Cigna Corp. | 2,596 | 347,968 | ||||||
HCA Holdings, Inc.(b) | 199 | 13,689 | ||||||
Health Net, Inc.(b) | 59 | 3,791 | ||||||
ICON PLC(b) | 3,570 | 228,016 | ||||||
Laboratory Corp. of America Holdings(b) | 3,061 | 375,707 | ||||||
Quest Diagnostics, Inc. | 3,272 | 222,333 | ||||||
UnitedHealth Group, Inc. | 762 | 89,748 | ||||||
Universal Health Services, Inc., Class B | 63 | 7,692 | ||||||
|
| |||||||
| 1,726,414 | ||||||||
|
| |||||||
HOME BUILDERS (0.04%) | ||||||||
Barratt Developments PLC | 12,137 | 114,602 | ||||||
Daiwa House Industry Co., Ltd. | 2,200 | 58,268 | ||||||
Iida Group Holdings Co., Ltd. | 6,600 | 124,813 | ||||||
|
| |||||||
| 297,683 | ||||||||
|
| |||||||
HOME FURNISHINGS (0.04%) | ||||||||
Leggett & Platt, Inc. | 562 | 25,307 | ||||||
Panasonic Corp. | 18,100 | 215,244 | ||||||
Sony Corp. | 900 | 25,955 | ||||||
|
| |||||||
| 266,506 | ||||||||
|
| |||||||
HOUSEHOLD PRODUCTS & WARES (0.02%) | ||||||||
Henkel AG & Co. KGaA | 1,458 | 134,692 | ||||||
|
| |||||||
HOUSEWARES (0.16%) | ||||||||
Avery Dennison Corp.(a) | 8,111 | 526,972 | ||||||
Kimberly-Clark Corp. | 290 | 34,716 | ||||||
Newell Rubbermaid, Inc.(a) | 11,370 | 482,429 | ||||||
The Clorox Co. | 324 | 39,508 | ||||||
|
| |||||||
| 1,083,625 | ||||||||
|
| |||||||
INSURANCE (0.91%) | ||||||||
ACE, Ltd.(a) | 4,199 | 476,754 | ||||||
Admiral Group PLC | 386 | 9,598 | ||||||
Aflac, Inc. | 1,449 | 92,374 | ||||||
Alleghany Corp.(b) | 571 | 283,370 | ||||||
Allianz SE | 1,355 | 237,436 | ||||||
American International Group, Inc. | 6,216 | 391,981 | ||||||
AmTrust Financial Services, Inc. | 313 | 21,353 | ||||||
Aon PLC | 4,617 | 430,812 | ||||||
Aviva PLC | 18,462 | 138,321 | ||||||
AXA SA | 4,883 | 130,615 | ||||||
Baloise Holding AG | 1,081 | 129,814 | ||||||
See Notes to Financial Statements.
| Semi-Annual Report | October 31, 2015 | 17 |
Table of Contents
| Redmont Resolute Fund II | Schedule of Investments | |
October 31, 2015 (Unaudited) |
| Description | Shares | Value (Note 2) | ||||||
| ||||||||
INSURANCE (0.91%) (continued) | ||||||||
Berkshire Hathaway, Inc., Class B(a)(b) | 3,501 | $ | 476,206 | |||||
Everest Re Group, Ltd. | 123 | 21,890 | ||||||
Legal & General Group PLC | 38,485 | 155,204 | ||||||
Marsh & McLennan Cos., Inc. | 428 | 23,857 | ||||||
MetLife, Inc.(a) | 5,774 | 290,894 | ||||||
MS&AD Insurance Group Holdings, Inc. | 2,100 | 62,511 | ||||||
Principal Financial Group, Inc. | 134 | 6,721 | ||||||
Prudential Financial, Inc. | 1,531 | 126,308 | ||||||
Swiss Re AG | 1,835 | 170,607 | ||||||
The Allstate Corp.(a) | 7,919 | 490,028 | ||||||
The Dai-ichi Life Insurance Co., Ltd. | 9,100 | 159,497 | ||||||
The Progressive Corp. | 3,191 | 105,718 | ||||||
The Travelers Companies, Inc.(a) | 2,875 | 324,559 | ||||||
Tokio Marine Holdings, Inc. | 5,100 | 198,303 | ||||||
Unum Group | 10,419 | 361,018 | ||||||
Validus Holdings, Ltd. | 2,951 | 130,729 | ||||||
Voya Financial, Inc. | 366 | 14,849 | ||||||
WR Berkley Corp. | 6,187 | 345,420 | ||||||
XL Group PLC(a) | 12,600 | 479,808 | ||||||
Zurich Insurance Group AG | 139 | 36,745 | ||||||
|
| |||||||
| 6,323,300 | ||||||||
|
| |||||||
INTERNET (0.42%) | ||||||||
Alphabet, Inc., Class A | 635 | 468,243 | ||||||
Alphabet, Inc., Class C | 261 | 185,521 | ||||||
Amazon.com, Inc.(b) | 300 | 187,770 | ||||||
Baidu, Inc., Sponsored ADR(b) | 1,134 | 212,591 | ||||||
CDW Corp. | 10,480 | 468,351 | ||||||
eBay, Inc.(a)(b) | 14,668 | 409,237 | ||||||
Expedia, Inc.(a) | 2,065 | 281,459 | ||||||
F5 Networks, Inc.(b) | 643 | 70,859 | ||||||
Facebook, Inc., Class A(b) | 1,476 | 150,508 | ||||||
IAC/InterActiveCorp | 2,883 | 193,190 | ||||||
Kakaku.com, Inc. | 1,700 | 32,036 | ||||||
Netflix, Inc.(b) | 53 | 5,744 | ||||||
Nexon Co., Ltd. | 4,300 | 60,151 | ||||||
Phoenix New Media, Ltd., ADR(b) | 12,074 | 58,559 | ||||||
Qihoo 360 Technology Co., Ltd., ADR(b) | 1,846 | 105,388 | ||||||
Symantec Corp. | 1,063 | 21,898 | ||||||
The Priceline Group, Inc.(b) | 16 | 23,268 | ||||||
|
| |||||||
| 2,934,773 | ||||||||
|
| |||||||
INVESTMENT COMPANIES (0.04%) | ||||||||
EXOR SpA | 2,652 | 131,670 | ||||||
Investor AB, Class B | 3,845 | 142,845 | ||||||
|
| |||||||
| 274,515 | ||||||||
|
| |||||||
IRON & STEEL (0.03%) | ||||||||
Hitachi Metals, Ltd. | 300 | 3,428 | ||||||
JFE Holdings, Inc. | 2,500 | 39,695 | ||||||
Kobe Steel, Ltd. | 44,000 | 56,153 | ||||||
See Notes to Financial Statements.
18 |
www.redmontfunds.com |
Table of Contents
| Redmont Resolute Fund II | Schedule of Investments | |
October 31, 2015 (Unaudited) |
| Description | Shares | Value (Note 2) | ||||||
| ||||||||
IRON & STEEL (0.03%) (continued) | ||||||||
Nippon Steel & Sumitomo Metal Corp. | 4,200 | $ | 86,005 | |||||
|
| |||||||
| 185,281 | ||||||||
|
| |||||||
LEISURE TIME (0.02%) | ||||||||
Carnival Corp. | 351 | 18,982 | ||||||
Carnival PLC | 1,884 | 105,051 | ||||||
|
| |||||||
| 124,033 | ||||||||
|
| |||||||
LODGING (0.00%)(c) | ||||||||
Wyndham Worldwide Corp. | 173 | 14,074 | ||||||
|
| |||||||
MACHINERY - CONSTRUCTION & MINING (0.04%) | ||||||||
ABB, Ltd. | 9,475 | 178,870 | ||||||
Caterpillar, Inc. | 12 | 876 | ||||||
Hitachi Construction Machinery Co., Ltd. | 6,900 | 107,614 | ||||||
|
| |||||||
| 287,360 | ||||||||
|
| |||||||
MACHINERY - DIVERSIFIED (0.06%) | ||||||||
Deere & Co. | 564 | 43,992 | ||||||
FANUC Corp. | 100 | 17,863 | ||||||
Hollysys Automation Technologies, Ltd. | 4,845 | 103,635 | ||||||
Kawasaki Heavy Industries, Ltd. | 29,000 | 117,519 | ||||||
Rockwell Automation, Inc. | 407 | 44,428 | ||||||
Roper Technologies, Inc. | 18 | 3,354 | ||||||
Sumitomo Heavy Industries, Ltd. | 13,000 | 59,252 | ||||||
Xylem, Inc. | 180 | 6,554 | ||||||
|
| |||||||
| 396,597 | ||||||||
|
| |||||||
MEDIA (0.53%) | ||||||||
CBS Corp., Class B(a) | 4,203 | 195,524 | ||||||
Comcast Corp., Class A(a) | 13,084 | 819,320 | ||||||
Discovery Communications, Inc., Class C(b) | 348 | 9,577 | ||||||
Liberty Broadband Corp., Class C(a)(b) | 2,092 | 112,487 | ||||||
Liberty Global PLC LiLAC, Class C(b) | 597 | 23,080 | ||||||
Liberty Global PLC, Class C(b) | 14,894 | 635,080 | ||||||
Liberty Media Corp., Class C(a)(b) | 4,741 | 185,610 | ||||||
News Corp., Class A | 430 | 6,622 | ||||||
Starz, Class A(b) | 4,568 | 153,074 | ||||||
TEGNA, Inc. | 8,801 | 237,979 | ||||||
The Walt Disney Co. | 1,024 | 116,470 | ||||||
Time Warner Cable, Inc. | 491 | 92,995 | ||||||
Time Warner, Inc. | 3,333 | 251,108 | ||||||
Time, Inc.(a) | 5,818 | 108,099 | ||||||
Twenty-First Century Fox, Inc., Class A | 10,849 | 332,956 | ||||||
Viacom, Inc., Class B(a) | 5,639 | 278,059 | ||||||
Vivendi SA | 6,580 | 158,570 | ||||||
|
| |||||||
| 3,716,610 | ||||||||
|
| |||||||
See Notes to Financial Statements.
| Semi-Annual Report | October 31, 2015 | 19 |
Table of Contents
| Redmont Resolute Fund II | Schedule of Investments | |
October 31, 2015 (Unaudited) |
| Description | Shares | Value (Note 2) | ||||||
| ||||||||
MINING (0.02%) | ||||||||
Barrick Gold Corp. | 17,409 | $ | 133,875 | |||||
|
| |||||||
MISCELLANEOUS MANUFACTURING (0.33%) | ||||||||
3M Co. | 1,166 | 183,307 | ||||||
Danaher Corp.(a) | 5,639 | 526,175 | ||||||
Dover Corp. | 1,183 | 76,221 | ||||||
FUJIFILM Holdings Corp. | 4,400 | 176,919 | ||||||
General Electric Co. | 4,189 | 121,146 | ||||||
Illinois Tool Works, Inc. | 1,132 | 104,076 | ||||||
Ingersoll-Rand PLC(a) | 9,456 | 560,363 | ||||||
Nikon Corp. | 3,300 | 42,990 | ||||||
Parker-Hannifin Corp. | 446 | 46,696 | ||||||
Pentair PLC | 87 | 4,865 | ||||||
Textron, Inc.(a) | 11,043 | 465,683 | ||||||
|
| |||||||
| 2,308,441 | ||||||||
|
| |||||||
OFFICE & BUSINESS EQUIPMENT (0.03%) | ||||||||
Canon, Inc. | 7,200 | 217,187 | ||||||
Pitney Bowes, Inc. | 581 | 11,998 | ||||||
|
| |||||||
| 229,185 | ||||||||
|
| |||||||
OIL & GAS (1.10%) | ||||||||
Anadarko Petroleum Corp. | 4,862 | 325,170 | ||||||
Apache Corp. | 141 | 6,645 | ||||||
BP PLC | 46,784 | 278,680 | ||||||
Canadian Natural Resources, Ltd.(a) | 9,061 | 210,396 | ||||||
Chevron Corp. | 1,903 | 172,945 | ||||||
CVR Energy, Inc. | 478 | 21,252 | ||||||
Diamondback Energy, Inc.(b) | 8,958 | 661,459 | ||||||
Energen Corp.(a) | 8,206 | 477,179 | ||||||
EOG Resources, Inc. | 5,990 | 514,241 | ||||||
EP Energy Corp., Class A(b) | 2,996 | 16,508 | ||||||
EQT Corp. | 2,180 | 144,033 | ||||||
Exxon Mobil Corp.(a) | 12,085 | 999,913 | ||||||
Galp Energia SGPS SA | 7,285 | 78,804 | ||||||
Hess Corp. | 315 | 17,706 | ||||||
Idemitsu Kosan Co., Ltd. | 3,300 | 54,394 | ||||||
Inpex Corp. | 12,900 | 123,527 | ||||||
Kosmos Energy, Ltd.(b) | 17,696 | 120,687 | ||||||
Marathon Oil Corp. | 3,516 | 64,624 | ||||||
Marathon Petroleum Corp. | 7,805 | 404,299 | ||||||
Murphy Oil Corp. | 845 | 24,023 | ||||||
Neste OYJ | 5,043 | 123,055 | ||||||
Occidental Petroleum Corp. | 6,963 | 519,022 | ||||||
Parsley Energy, Inc., Class A(a)(b) | 36,778 | 652,074 | ||||||
Phillips 66(a) | 6,988 | 622,281 | ||||||
QEP Resources, Inc. | 13,480 | 208,401 | ||||||
Rice Energy, Inc.(a)(b) | 7,749 | 118,250 | ||||||
Royal Dutch Shell PLC, Class A | 1,288 | 33,556 | ||||||
RSP Permian, Inc.(b) | 14,954 | 410,039 | ||||||
Tesoro Corp. | 777 | 83,085 | ||||||
See Notes to Financial Statements.
20 |
www.redmontfunds.com |
Table of Contents
| Redmont Resolute Fund II | Schedule of Investments | |
October 31, 2015 (Unaudited) |
| Description | Shares | Value (Note 2) | ||||||
| ||||||||
OIL & GAS (1.10%) (continued) | ||||||||
TOTAL SA | 815 | $ | 39,563 | |||||
Transocean, Ltd. | 1,346 | 21,307 | ||||||
Valero Energy Corp. | 1,492 | 98,353 | ||||||
WPX Energy, Inc.(b) | 2,445 | 16,773 | ||||||
|
| |||||||
| 7,662,244 | ||||||||
|
| |||||||
OIL & GAS SERVICES (0.05%) | ||||||||
Amec Foster Wheeler PLC | 4,029 | 44,161 | ||||||
Baker Hughes, Inc. | 1,427 | 75,174 | ||||||
Bristow Group, Inc. | 3,114 | 108,149 | ||||||
Cameron International Corp.(b) | 433 | 29,448 | ||||||
Halliburton Co. | 112 | 4,299 | ||||||
Schlumberger, Ltd. | 1,273 | 99,498 | ||||||
|
| |||||||
| 360,729 | ||||||||
|
| |||||||
PACKAGING & CONTAINERS (0.27%) | ||||||||
Ball Corp. | 67 | 4,589 | ||||||
Berry Plastics Group, Inc.(b) | 11,290 | 378,215 | ||||||
Crown Holdings, Inc.(a)(b) | 8,676 | 460,175 | ||||||
Graphic Packaging Holding Co.(a) | 46,416 | 657,251 | ||||||
Packaging Corp. of America | 5,245 | 359,020 | ||||||
|
| |||||||
| 1,859,250 | ||||||||
|
| |||||||
PHARMACEUTICALS (1.00%) | ||||||||
Abbott Laboratories | 440 | 19,712 | ||||||
AbbVie, Inc. | 5,452 | 324,667 | ||||||
Alfresa Holdings Corp. | 6,300 | 121,802 | ||||||
AmerisourceBergen Corp. | 722 | 69,680 | ||||||
AstraZeneca PLC | 1,738 | 111,205 | ||||||
Baxalta, Inc. | 437 | 15,059 | ||||||
Bayer AG | 2,149 | 286,768 | ||||||
Cardinal Health, Inc.(a) | 5,100 | 419,220 | ||||||
Chugai Pharmaceutical Co., Ltd. | 2,400 | 77,766 | ||||||
Daiichi Sankyo Co., Ltd. | 8,100 | 160,060 | ||||||
Eisai Co., Ltd. | 1,800 | 113,486 | ||||||
Endo International PLC(b) | 2,064 | 123,819 | ||||||
Express Scripts Holding Co.(a)(b) | 6,617 | 571,576 | ||||||
GlaxoSmithKline PLC | 1,238 | 26,814 | ||||||
Johnson & Johnson | 8,739 | 882,901 | ||||||
McKesson Corp.(a) | 2,197 | 392,824 | ||||||
Medipal Holdings Corp. | 2,200 | 38,724 | ||||||
Merck & Co., Inc. | 10,413 | 569,175 | ||||||
Novartis AG | 2,017 | 183,345 | ||||||
Novartis AG, Sponsored ADR | 3,250 | 293,898 | ||||||
Novo Nordisk A/S, Class B | 4,942 | 262,535 | ||||||
Ono Pharmaceutical Co., Ltd. | 400 | 55,291 | ||||||
Orion OYJ, Class B | 3,050 | 109,070 | ||||||
Pfizer, Inc. | 23,665 | 800,350 | ||||||
Roche Holding AG | 581 | 157,704 | ||||||
Sanofi | 502 | 50,703 | ||||||
Shire PLC | 2,617 | 198,693 | ||||||
Sumitomo Dainippon Pharma Co., Ltd. | 10,000 | 111,295 | ||||||
See Notes to Financial Statements.
| Semi-Annual Report | October 31, 2015 | 21 |
Table of Contents
| Redmont Resolute Fund II | Schedule of Investments | |
October 31, 2015 (Unaudited) |
| Description | Shares | Value (Note 2) | ||||||
| ||||||||
PHARMACEUTICALS (1.00%) (continued) | ||||||||
Takeda Pharmaceutical Co., Ltd. | 700 | $ | 34,400 | |||||
Teva Pharmaceutical Industries, Ltd., Sponsored ADR | 5,965 | 353,068 | ||||||
UCB SA | 453 | 39,214 | ||||||
|
| |||||||
| 6,974,824 | ||||||||
|
| |||||||
REAL ESTATE (0.05%) | ||||||||
CBRE Group, Inc., Class A(b) | 794 | 29,600 | ||||||
Daito Trust Construction Co., Ltd. | 1,300 | 141,560 | ||||||
Hulic Co., Ltd. | 1,500 | 14,121 | ||||||
Mitsubishi Estate Co., Ltd. | 8,000 | 172,835 | ||||||
|
| |||||||
| 358,116 | ||||||||
|
| |||||||
REAL ESTATE INVESTMENT TRUSTS (0.13%) | ||||||||
American Homes 4 Rent, Class A | 6,064 | 100,056 | ||||||
American Residential Properties, Inc. | 4,934 | 81,756 | ||||||
Boston Properties, Inc.(a) | 864 | 108,734 | ||||||
Brixmor Property Group, Inc. | 445 | 11,401 | ||||||
Digital Realty Trust, Inc. | 305 | 22,558 | ||||||
Equity Residential | 665 | 51,418 | ||||||
General Growth Properties, Inc. | 811 | 23,478 | ||||||
Hospitality Properties Trust | 57 | 1,530 | ||||||
Host Hotels & Resorts, Inc. | 11,378 | 197,181 | ||||||
Japan Retail Fund Investment Corp. | 13 | 25,274 | ||||||
LaSalle Hotel Properties | 1,893 | 55,673 | ||||||
Public Storage | 273 | 62,643 | ||||||
Sunstone Hotel Investors, Inc. | 6,318 | 91,358 | ||||||
Vornado Realty Trust | 423 | 42,533 | ||||||
|
| |||||||
| 875,593 | ||||||||
|
| |||||||
RETAIL (0.40%) | ||||||||
Aeon Co., Ltd. | 4,200 | 62,615 | ||||||
Best Buy Co., Inc. | 501 | 17,550 | ||||||
Chipotle Mexican Grill, Inc.(b) | 17 | 10,884 | ||||||
CVS Health Corp.(a) | 4,227 | 417,543 | ||||||
Darden Restaurants, Inc. | 58 | 3,590 | ||||||
Dollar General Corp. | 290 | 19,653 | ||||||
FamilyMart Co., Ltd. | 2,100 | 86,405 | ||||||
GameStop Corp., Class A | 89 | 4,100 | ||||||
J Front Retailing Co., Ltd. | 6,900 | 114,476 | ||||||
Liberty Interactive Corp. QVC Group, Class A(b) | 771 | 21,102 | ||||||
Lowe’s Companies, Inc. | 4,574 | 337,698 | ||||||
Macy’s, Inc.(a) | 4,565 | 232,724 | ||||||
Marks & Spencer Group PLC | 10,878 | 86,028 | ||||||
Office Depot, Inc.(b) | 18,944 | 144,353 | ||||||
O’Reilly Automotive, Inc.(b) | 403 | 111,333 | ||||||
Pandora A/S | 1,130 | 130,372 | ||||||
PVH Corp. | 448 | 40,746 | ||||||
Shimamura Co., Ltd. | 300 | 33,985 | ||||||
Staples, Inc. | 784 | 10,184 | ||||||
Starbucks Corp. | 2,792 | 174,695 | ||||||
Target Corp. | 5,105 | 394,004 | ||||||
The Gap, Inc. | 1,739 | 47,336 | ||||||
See Notes to Financial Statements.
22 |
www.redmontfunds.com |
Table of Contents
| Redmont Resolute Fund II | Schedule of Investments | |
October 31, 2015 (Unaudited) |
| Description | Shares | Value (Note 2) | ||||||
| ||||||||
RETAIL (0.40%) (continued) | ||||||||
The Home Depot, Inc. | 672 | $ | 83,086 | |||||
The TJX Companies, Inc. | 94 | 6,880 | ||||||
Wal-Mart Stores, Inc. | 3,554 | 203,431 | ||||||
|
| |||||||
| 2,794,773 | ||||||||
|
| |||||||
SAVINGS & LOANS (0.02%) | ||||||||
Investors Bancorp, Inc. | 10,892 | 136,259 | ||||||
|
| |||||||
SEMICONDUCTORS (0.26%) | ||||||||
Analog Devices, Inc. | 670 | 40,280 | ||||||
ARM Holdings PLC | 9,406 | 148,628 | ||||||
ASML Holding NV | 461 | 42,892 | ||||||
Avago Technologies, Ltd. | 4,187 | 515,545 | ||||||
Intel Corp. | 1,749 | 59,221 | ||||||
Micron Technology, Inc.(b) | 120 | 1,987 | ||||||
NVIDIA Corp. | 450 | 12,767 | ||||||
ON Semiconductor Corp.(a)(b) | 35,324 | 388,564 | ||||||
Skyworks Solutions, Inc. | 72 | 5,561 | ||||||
Texas Instruments, Inc.(a) | 10,616 | 602,140 | ||||||
Xilinx, Inc. | 243 | 11,572 | ||||||
|
| |||||||
| 1,829,157 | ||||||||
|
| |||||||
SHIPBUILDING (0.05%) | ||||||||
Huntington Ingalls Industries, Inc.(a) | 3,118 | 373,973 | ||||||
|
| |||||||
SOFTWARE (0.49%) | ||||||||
Activision Blizzard, Inc.(a) | 10,250 | 356,290 | ||||||
Amadeus IT Holding SA, Class A | 3,266 | 139,205 | ||||||
Citrix Systems, Inc.(b) | 440 | 36,124 | ||||||
COLOPL, Inc.(b) | 300 | 4,940 | ||||||
Electronic Arts, Inc.(b) | 2,043 | 147,239 | ||||||
Fidelity National Information Services, Inc. | 4,367 | 318,442 | ||||||
Intuit, Inc. | 581 | 56,607 | ||||||
Microsoft Corp.(a) | 25,960 | 1,366,534 | ||||||
NetEase, Inc., ADR(a) | 1,603 | 231,681 | ||||||
Oracle Corp.(a) | 18,577 | 721,531 | ||||||
Red Hat, Inc.(b) | 53 | 4,193 | ||||||
salesforce.com, Inc.(b) | 159 | 12,356 | ||||||
The Dun & Bradstreet Corp. | 163 | 18,561 | ||||||
|
| |||||||
| 3,413,703 | ||||||||
|
| |||||||
TELECOMMUNICATIONS (0.44%) | ||||||||
AT&T, Inc. | 1,078 | 36,124 | ||||||
BT Group PLC | 29,412 | 210,838 | ||||||
CenturyLink, Inc. | 2,605 | 73,487 | ||||||
Cisco Systems, Inc.(a) | 15,511 | 447,492 | ||||||
Deutsche Telekom AG | 11,593 | 216,784 | ||||||
Eutelsat Communications SA | 3,747 | 123,653 | ||||||
Hikari Tsushin, Inc. | 900 | 68,990 | ||||||
Juniper Networks, Inc. | 315 | 9,888 | ||||||
See Notes to Financial Statements.
| Semi-Annual Report | October 31, 2015 | 23 |
Table of Contents
| Redmont Resolute Fund II | Schedule of Investments | |
October 31, 2015 (Unaudited) |
| Description | Shares | Value (Note 2) | ||||||
| ||||||||
TELECOMMUNICATIONS (0.44%) (continued) | ||||||||
KDDI Corp. | 9,400 | $ | 229,489 | |||||
Level 3 Communications, Inc.(b) | 362 | 18,444 | ||||||
Motorola Solutions, Inc.(a) | 3,991 | 279,250 | ||||||
Nippon Telegraph & Telephone Corp. | 4,500 | 167,291 | ||||||
NTT DOCOMO, Inc. | 10,500 | 205,136 | ||||||
Orange SA | 3,952 | 69,685 | ||||||
Proximus SADP | 2,648 | 91,768 | ||||||
SoftBank Corp. | 1,600 | 90,124 | ||||||
Swisscom AG | 261 | 134,665 | ||||||
Verizon Communications, Inc. | 12,556 | 588,625 | ||||||
Vodafone Group PLC | 4,596 | 15,180 | ||||||
|
| |||||||
| 3,076,913 | ||||||||
|
| |||||||
TEXTILES (0.00%)(c) | ||||||||
Mohawk Industries, Inc.(b) | 42 | 8,211 | ||||||
|
| |||||||
TOYS, GAMES & HOBBIES (0.00%)(c) | ||||||||
Hasbro, Inc. | 204 | 15,673 | ||||||
|
| |||||||
TRANSPORTATION (0.11%) | ||||||||
AP Moeller-Maersk A/S, Class B | 81 | 119,428 | ||||||
Central Japan Railway Co. | 1,200 | 220,767 | ||||||
CH Robinson Worldwide, Inc. | 244 | 16,929 | ||||||
DSV A/S | 734 | 29,761 | ||||||
East Japan Railway Co. | 100 | 9,588 | ||||||
Hankyu Hanshin Holdings | 21,000 | 137,656 | ||||||
Kamigumi Co., Ltd. | 4,000 | 34,673 | ||||||
Nippon Express Co., Ltd. | 11,000 | 57,156 | ||||||
Nippon Yusen Kabushiki Kaisha | 12,000 | 31,623 | ||||||
Union Pacific Corp. | 262 | 23,410 | ||||||
United Parcel Service, Inc., Class B | 1,146 | 118,061 | ||||||
|
| |||||||
| 799,052 | ||||||||
|
| |||||||
TOTAL COMMON STOCKS (Cost $87,265,186) | 96,205,089 | |||||||
| ||||||||
EXCHANGE TRADED FUNDS (0.13%) | ||||||||
iShares® Europe ETF | 1,234 | 52,112 | ||||||
iShares® MSCI Japan ETF | 3,654 | 45,017 | ||||||
iShares® Russell 1000 Value ETF | 478 | 47,939 | ||||||
PowerShares® DB Commodity Index Tracking Fund(b) | 44,576 | 677,555 | ||||||
SPDR® S&P 500® ETF Trust | 426 | 88,578 | ||||||
|
| |||||||
| 911,201 | ||||||||
|
| |||||||
TOTAL EXCHANGE TRADED FUNDS (Cost $913,646) | 911,201 | |||||||
| ||||||||
See Notes to Financial Statements.
24 |
www.redmontfunds.com |
Table of Contents
| Redmont Resolute Fund II | Schedule of Investments | |
October 31, 2015 (Unaudited) |
| Description | Shares | Value (Note 2) | ||||||
| ||||||||
EXCHANGE TRADED FUNDS (0.13%) (continued) | ||||||||
LIMITED PARTNERSHIPS (0.01%) | ||||||||
OIL & GAS (0.01%) | ||||||||
Viper Energy Partners LP | 5,852 | $ | 94,802 | |||||
|
| |||||||
TOTAL LIMITED PARTNERSHIPS (Cost $122,912) | 94,802 | |||||||
| ||||||||
OPEN-END MUTUAL FUNDS (64.54%) | ||||||||
AQR Multi Strategy Alternative Fund, Class I | 6,767,030 | 71,256,824 | ||||||
AQR Risk Parity Fund, Class I | 6,061,810 | 59,526,973 | ||||||
Diamond Hill Long-Short Fund, Class Y(b) | 2,484,721 | 60,353,870 | ||||||
FPA Crescent Fund | 2,100,235 | 70,105,847 | ||||||
Morgan Stanley Institutional Fund, Inc. - Multi-Asset Portfolio, Class I | 6,386,953 | 65,977,229 | ||||||
Nuveen Symphony Floating Rate Income Fund, Class I | 297,220 | 5,861,171 | ||||||
PIMCO Short-Term Fund, Institutional Class | 11,981,188 | 117,056,210 | ||||||
|
| |||||||
| 450,138,124 | ||||||||
|
| |||||||
TOTAL OPEN-END MUTUAL FUNDS (Cost $441,038,774) | 450,138,124 | |||||||
| ||||||||
PREFERRED STOCKS (0.02%) | ||||||||
HOUSEHOLD PRODUCTS & WARES (0.02%) | ||||||||
Henkel AG & Co. KGaA | 1,391 | 150,973 | ||||||
|
| |||||||
TOTAL PREFERRED STOCKS (Cost $163,867) | 150,973 | |||||||
| ||||||||
| Description | Principal Amount | Value (Note 2) | ||||||
| ||||||||
ASSET-BACKED SECURITIES (0.16%) | ||||||||
Honda Auto Receivables Owner Trust 2015-3 A2 | ||||||||
0.92%, 11/20/2017 | $ | 660,000 | 660,202 | |||||
Hyundai Auto Lease Securitization Trust 2015-A A1 | ||||||||
0.28%, 03/15/2016(d) | 45,478 | 45,479 | ||||||
Nissan Auto Receivables Owner Trust 2015-A A1 | ||||||||
0.35%, 04/15/2016 | 143,339 | 143,321 | ||||||
Toyota Auto Receivables Owner Trust 2015-A A2 | ||||||||
0.71%, 07/17/2017 | 272,000 | 272,025 | ||||||
|
| |||||||
| 1,121,027 | ||||||||
|
| |||||||
TOTAL ASSET-BACKED SECURITIES (Cost $1,120,807) | 1,121,027 | |||||||
| ||||||||
See Notes to Financial Statements.
| Semi-Annual Report | October 31, 2015 | 25 |
Table of Contents
| Redmont Resolute Fund II | Schedule of Investments | |
October 31, 2015 (Unaudited) |
| Description | Principal Amount | Value (Note 2) | ||||||||||
| ||||||||||||
CONTINGENT CONVERTIBLE SECURITIES (0.03%) | ||||||||||||
BANKS (0.03%) | ||||||||||||
Credit Agricole SA | ||||||||||||
7.88%, Perpetual Maturity(d)(e)(f) | $ | 200,000 | $ | 205,725 | ||||||||
|
| |||||||||||
TOTAL CONTINGENT CONVERTIBLE SECURITIES (Cost $213,250) | 205,725 | |||||||||||
| ||||||||||||
CORPORATE BONDS (1.87%) | ||||||||||||
ADVERTISING (0.01%) | ||||||||||||
The Interpublic Group of Companies, Inc. | ||||||||||||
4.20%, 04/15/2024 | 36,000 | 35,989 | ||||||||||
|
| |||||||||||
AEROSPACE & DEFENSE (0.04%) | ||||||||||||
BAE Systems Holdings, Inc. | ||||||||||||
3.80%, 10/07/2024(d) | 45,000 | 45,620 | ||||||||||
4.75%, 10/07/2044(d) | 19,000 | 18,891 | ||||||||||
Harris Corp. | ||||||||||||
4.85%, 04/27/2035 | 34,000 | 33,175 | ||||||||||
5.05%, 04/27/2045 | 32,000 | 31,505 | ||||||||||
L-3 Communications Corp. | ||||||||||||
3.95%, 05/28/2024 | 10,000 | 9,568 | ||||||||||
Moog, Inc. | ||||||||||||
5.25%, 12/01/2022(d) | 20,000 | 20,475 | ||||||||||
Orbital ATK, Inc. | ||||||||||||
5.50%, 10/01/2023(d) | 17,000 | 17,786 | ||||||||||
The Boeing Co. | ||||||||||||
0.95%, 05/15/2018 | 86,000 | 85,141 | ||||||||||
2.20%, 10/30/2022 | 27,000 | 26,432 | ||||||||||
|
| |||||||||||
| 288,593 | ||||||||||||
|
| |||||||||||
AIRLINES (0.01%) | ||||||||||||
Allegiant Travel Co. | ||||||||||||
5.50%, 07/15/2019 | 20,000 | 20,520 | ||||||||||
United Airlines 2013-1 Class B Pass Through Trust | ||||||||||||
5.38%, 08/15/2021 | 27,289 | 28,244 | ||||||||||
|
| |||||||||||
| 48,764 | ||||||||||||
|
| |||||||||||
APPAREL (0.00%)(c) | ||||||||||||
NIKE, Inc. | ||||||||||||
3.88%, 11/01/2045 | 26,000 | 25,505 | ||||||||||
|
| |||||||||||
AUTO MANUFACTURERS (0.05%) | ||||||||||||
American Honda Finance Corp. | ||||||||||||
1.20%, 07/14/2017 | 153,000 | 152,600 | ||||||||||
Hyundia Capital America | ||||||||||||
2.40%, 10/30/2018(d) | 71,000 | 71,068 | ||||||||||
Paccar Financial Corp. | ||||||||||||
2.20%, 09/15/2019 | 93,000 | 93,448 | ||||||||||
See Notes to Financial Statements.
| 26 |
www.redmontfunds.com |
Table of Contents
| Redmont Resolute Fund II | Schedule of Investments | |
October 31, 2015 (Unaudited) |
| Description | Principal Amount | Value (Note 2) | ||||||||||||
| ||||||||||||||
AUTO MANUFACTURERS (0.05%) (continued) | ||||||||||||||
Toyota Motor Credit Corp. | ||||||||||||||
1.55%, 07/13/2018 | $ | 23,000 | $ | 23,080 | ||||||||||
|
| |||||||||||||
| 340,196 | ||||||||||||||
|
| |||||||||||||
BANKS (0.48%) | ||||||||||||||
Abbey National Treasury Services PLC | ||||||||||||||
1.38%, 03/13/2017 | 46,000 | 46,040 | ||||||||||||
Bank of America Corp. | ||||||||||||||
2.63%, 10/19/2020 | 21,000 | 20,944 | ||||||||||||
4.25%, 10/22/2026 | 104,000 | 104,593 | ||||||||||||
7.25%, 10/15/2025 | 7,000 | 8,596 | ||||||||||||
Bank of America Corp., Series L | ||||||||||||||
2.60%, 01/15/2019 | 103,000 | 104,308 | ||||||||||||
3.95%, 04/21/2025 | 35,000 | 34,521 | ||||||||||||
BNP Paribas SA | ||||||||||||||
7.38%, Perpetual Maturity(d)(e)(f) | 225,000 | 233,156 | ||||||||||||
Capital One Financial Corp. | ||||||||||||||
4.20%, 10/29/2025 | 24,000 | 24,059 | ||||||||||||
Capital One Financial Corp., Series E | ||||||||||||||
5.50%, Perpetual Maturity(e)(f) | 19,000 | 19,083 | ||||||||||||
Citigroup, Inc. | ||||||||||||||
3.88%, 03/26/2025 | 19,000 | 18,584 | ||||||||||||
4.40%, 06/10/2025 | 158,000 | 160,678 | ||||||||||||
4.45%, 09/29/2027 | 31,000 | 31,168 | ||||||||||||
6.00%, 10/31/2033 | 20,000 | 22,845 | ||||||||||||
Credit Suisse New York | ||||||||||||||
1.70%, 04/27/2018 | 38,000 | 37,893 | ||||||||||||
Deutsche Bank AG London | ||||||||||||||
1.88%, 02/13/2018 | 125,000 | 124,632 | ||||||||||||
Fifth Third Bancorp, Series J | ||||||||||||||
4.90%, Perpetual Maturity(e)(f) | 80,000 | 75,800 | ||||||||||||
First Horizon National Corp. | ||||||||||||||
3.50%, 12/15/2020 | 87,000 | 86,823 | ||||||||||||
HSBC Holdings PLC | ||||||||||||||
5.63%, Perpetual Maturity(e)(f) | 210,000 | 210,131 | ||||||||||||
JPMorgan Chase & Co. | ||||||||||||||
3.25%, 09/23/2022 | 124,000 | 125,351 | ||||||||||||
4.95%, 06/01/2045 | 19,000 | 19,316 | ||||||||||||
JPMorgan Chase & Co., Series U | ||||||||||||||
6.13%, Perpetual Maturity(e)(f) | 19,000 | 19,428 | ||||||||||||
Lloyds Bank PLC | ||||||||||||||
6.50%, 09/14/2020(d) | 100,000 | 115,539 | ||||||||||||
Lloyds Banking Group PLC | ||||||||||||||
7.50%, Perpetual Maturity(e)(f) | 205,000 | 218,325 | ||||||||||||
Morgan Stanley | ||||||||||||||
1.88%, 01/05/2018 | 32,000 | 32,180 | ||||||||||||
2.80%, 06/16/2020 | 21,000 | 21,196 | ||||||||||||
4.10%, 05/22/2023 | 150,000 | 152,716 | ||||||||||||
4.75%, 03/22/2017 | 63,000 | 65,847 | ||||||||||||
5.00%, 11/24/2025 | 33,000 | 35,396 | ||||||||||||
Nordea Bank AB | ||||||||||||||
5.50%, Perpetual Maturity(d)(e)(f) | 215,000 | 211,668 | ||||||||||||
See Notes to Financial Statements.
| Semi-Annual Report | October 31, 2015 | 27 |
Table of Contents
| Redmont Resolute Fund II | Schedule of Investments | |
October 31, 2015 (Unaudited) |
| Description | Principal Amount | Value (Note 2) | ||||||||||||
| ||||||||||||||
BANKS (0.48%) (continued) | ||||||||||||||
Regions Financial Corp. | ||||||||||||||
7.38%, 12/10/2037 | $ | 111,000 | $ | 141,601 | ||||||||||
Standard Chartered PLC | ||||||||||||||
6.50%, Perpetual Maturity(d)(e)(f) | 215,000 | 212,645 | ||||||||||||
The Bank of New York Mellon Corp., Series E | ||||||||||||||
4.95%, Perpetual Maturity(e)(f) | 36,000 | 36,045 | ||||||||||||
The Goldman Sachs Group, Inc. | ||||||||||||||
4.25%, 10/21/2025 | 76,000 | 76,507 | ||||||||||||
4.75%, 10/21/2045 | 13,000 | 13,234 | ||||||||||||
5.15%, 05/22/2045 | 14,000 | 14,123 | ||||||||||||
6.13%, 02/15/2033 | 43,000 | 51,801 | ||||||||||||
6.75%, 10/01/2037 | 123,000 | 148,830 | ||||||||||||
The Goldman Sachs Group, Inc., Series M | ||||||||||||||
5.38%, Perpetual Maturity(e)(f) | 20,000 | 19,825 | ||||||||||||
Wells Fargo & Co. | ||||||||||||||
1.40%, 09/08/2017 | 160,000 | 160,357 | ||||||||||||
4.30%, 07/22/2027 | 30,000 | 31,016 | ||||||||||||
Wells Fargo & Co., Series U | ||||||||||||||
5.88%, Perpetual Maturity(e)(f) | 33,000 | 34,945 | ||||||||||||
Wells Fargo Capital X | ||||||||||||||
5.95%, 12/15/2036 | 28,000 | 28,406 | ||||||||||||
|
| |||||||||||||
| 3,350,151 | ||||||||||||||
|
| |||||||||||||
BEVERAGES (0.02%) | ||||||||||||||
Anheuser-Busch InBev Worldwide, Inc. | ||||||||||||||
1.38%, 07/15/2017 | 78,000 | 77,750 | ||||||||||||
Diageo Capital PLC | ||||||||||||||
5.75%, 10/23/2017 | 49,000 | 53,120 | ||||||||||||
|
| |||||||||||||
| 130,870 | ||||||||||||||
|
| |||||||||||||
BIOTECHNOLOGY (0.02%) | ||||||||||||||
Biogen, Inc. | ||||||||||||||
4.05%, 09/15/2025 | 28,000 | 28,368 | ||||||||||||
5.20%, 09/15/2045 | 28,000 | 28,377 | ||||||||||||
Celgene Corp. | ||||||||||||||
5.00%, 08/15/2045 | 30,000 | 30,248 | ||||||||||||
Gilead Sciences, Inc. | ||||||||||||||
4.75%, 03/01/2046 | 19,000 | 19,290 | ||||||||||||
|
| |||||||||||||
| 106,283 | ||||||||||||||
|
| |||||||||||||
BUILDING MATERIALS (0.00%)(c) | ||||||||||||||
Building Materials Corp. of America | ||||||||||||||
6.00%, 10/15/2025(d) | 5,000 | 5,337 | ||||||||||||
|
| |||||||||||||
CHEMICALS (0.02%) | ||||||||||||||
Airgas, Inc. | ||||||||||||||
3.05%, 08/01/2020 | 12,000 | 12,156 | ||||||||||||
Lubrizol Corp. | ||||||||||||||
6.50%, 10/01/2034 | 24,000 | 30,541 | ||||||||||||
NOVA Chemicals Corp. | ||||||||||||||
5.00%, 05/01/2025(d) | 20,000 | 20,050 | ||||||||||||
See Notes to Financial Statements.
28 |
www.redmontfunds.com |
Table of Contents
| Redmont Resolute Fund II | Schedule of Investments | |
October 31, 2015 (Unaudited) |
| Description | Principal Amount | Value (Note 2) | ||||||||||||
| ||||||||||||||
CHEMICALS (0.02%) (continued) | ||||||||||||||
RPM International, Inc. | ||||||||||||||
5.25%, 06/01/2045 | $ | 57,000 | $ | 53,847 | ||||||||||
The Sherwin-Williams Co. | ||||||||||||||
4.55%, 08/01/2045 | 15,000 | 15,782 | ||||||||||||
The Valspar Corp. | ||||||||||||||
3.95%, 01/15/2026 | 15,000 | 15,203 | ||||||||||||
Tronox Finance LLC | ||||||||||||||
7.50%, 03/15/2022(d) | 25,000 | 17,750 | ||||||||||||
|
| |||||||||||||
| 165,329 | ||||||||||||||
|
| |||||||||||||
COMMERCIAL SERVICES (0.02%) | ||||||||||||||
Automatic Data Processing, Inc. | ||||||||||||||
2.25%, 09/15/2020 | 17,000 | 17,156 | ||||||||||||
Global Cash Access, Inc. | ||||||||||||||
10.00%, 01/15/2022(d) | 25,000 | 23,187 | ||||||||||||
Great Lakes Dredge & Dock Corp. | ||||||||||||||
7.38%, 02/01/2019 | 20,000 | 19,500 | ||||||||||||
Harland Clarke Holdings Corp. | ||||||||||||||
6.88%, 03/01/2020(d) | 25,000 | 22,688 | ||||||||||||
President and Fellows of Harvard College | ||||||||||||||
3.62%, 10/01/2037 | 34,000 | 33,104 | ||||||||||||
United Rentals North | ||||||||||||||
5.50%, 07/15/2025 | 20,000 | 20,025 | ||||||||||||
|
| |||||||||||||
| 135,660 | ||||||||||||||
|
| |||||||||||||
COMPUTERS (0.04%) | ||||||||||||||
Apple, Inc. | ||||||||||||||
2.85%, 05/06/2021 | 50,000 | 51,539 | ||||||||||||
3.45%, 02/09/2045 | 8,000 | 6,929 | ||||||||||||
Hewlett-Packard Co. | ||||||||||||||
4.90%, 10/15/2025(d) | 33,000 | 32,686 | ||||||||||||
6.00%, 09/15/2041 | 101,000 | 97,534 | ||||||||||||
6.20%, 10/15/2035(d) | 38,000 | 37,455 | ||||||||||||
6.35%, 10/15/2045(d) | 35,000 | 34,130 | ||||||||||||
|
| |||||||||||||
| 260,273 | ||||||||||||||
|
| |||||||||||||
CONTAINERS & PACKAGING (0.00%)(c) | ||||||||||||||
Brambles USA, Inc. | ||||||||||||||
4.13%, 10/23/2025(d) | 14,000 | 14,098 | ||||||||||||
Crown Cork & Seal Co., Inc. | ||||||||||||||
7.38%, 12/15/2026 | 15,000 | 16,444 | ||||||||||||
|
| |||||||||||||
| 30,542 | ||||||||||||||
|
| |||||||||||||
DISTRIBUTION & WHOLESALE (0.00%)(c) | ||||||||||||||
H&E Equipment Services, Inc. | ||||||||||||||
7.00%, 09/01/2022 | 20,000 | 20,400 | ||||||||||||
|
| |||||||||||||
DIVERSIFIED FINANCIAL SERVICES (0.11%) | ||||||||||||||
Ally Financial, Inc. | ||||||||||||||
5.13%, 09/30/2024 | 20,000 | 21,149 | ||||||||||||
See Notes to Financial Statements.
| Semi-Annual Report | October 31, 2015 | 29 |
Table of Contents
| Redmont Resolute Fund II | Schedule of Investments | |
October 31, 2015 (Unaudited) |
| Description | Principal Amount | Value (Note 2) | ||||||||||||
| ||||||||||||||
DIVERSIFIED FINANCIAL SERVICES (0.11%) (continued) | ||||||||||||||
American Express Credit Corp. | ||||||||||||||
2.38%, 05/26/2020 | $ | 37,000 | $ | 36,982 | ||||||||||
Credit Acceptance Corp. | ||||||||||||||
7.38%, 03/15/2023(d) | 30,000 | 31,125 | ||||||||||||
Discover Financial Services | ||||||||||||||
3.75%, 03/04/2025 | 38,000 | 37,068 | ||||||||||||
Enova International, Inc. | ||||||||||||||
9.75%, 06/01/2021 | 35,000 | 29,837 | ||||||||||||
General Electric Capital Corp. | ||||||||||||||
1.25%, 05/15/2017 | 89,000 | 89,311 | ||||||||||||
5.88%, 01/14/2038 | 56,000 | 69,300 | ||||||||||||
National Rural Utilities Cooperative Finance Corp. | ||||||||||||||
0.95%, 04/24/2017 | 19,000 | 18,996 | ||||||||||||
1.10%, 01/27/2017 | 59,000 | 59,123 | ||||||||||||
1.90%, 11/01/2015 | 150,000 | 150,000 | ||||||||||||
2.00%, 01/27/2020 | 38,000 | 37,490 | ||||||||||||
2.30%, 11/01/2020 | 17,000 | 16,971 | ||||||||||||
3.25%, 11/01/2025 | 18,000 | 18,087 | ||||||||||||
4.75%, 04/30/2043(f) | 64,000 | 63,808 | ||||||||||||
Quicken Loans, Inc. | ||||||||||||||
5.75%, 05/01/2025(d) | 30,000 | 29,888 | ||||||||||||
Synchrony Financial | ||||||||||||||
4.25%, 08/15/2024 | 54,000 | 54,316 | ||||||||||||
TD Ameritrade Holding Corp. | ||||||||||||||
2.95%, 04/01/2022 | 25,000 | 24,928 | ||||||||||||
|
| |||||||||||||
| 788,379 | ||||||||||||||
|
| |||||||||||||
ELECTRIC (0.11%) | ||||||||||||||
AES Corp. | ||||||||||||||
5.50%, 03/15/2024 | 30,000 | 28,500 | ||||||||||||
Arizona Public Service Co. | ||||||||||||||
2.20%, 01/15/2020 | 20,000 | 19,918 | ||||||||||||
Dominion Resources, Inc. | ||||||||||||||
5.75%, 10/01/2054(f) | 31,000 | 32,162 | ||||||||||||
Dynegy, Inc. | ||||||||||||||
7.38%, 11/01/2022 | 10,000 | 10,111 | ||||||||||||
Electricite de France SA | ||||||||||||||
2.35%, 10/13/2020(d) | 98,000 | 97,036 | ||||||||||||
3.63%, 10/13/2025(d) | 18,000 | 17,976 | ||||||||||||
4.95%, 10/13/2045(d) | 39,000 | 38,833 | ||||||||||||
Entergy Arkansas, Inc. | ||||||||||||||
4.95%, 12/15/2044 | 25,000 | 24,536 | ||||||||||||
Entergy Louisiana LLC | ||||||||||||||
4.95%, 01/15/2045 | 23,000 | 23,189 | ||||||||||||
Exelon Corp. | ||||||||||||||
4.95%, 06/15/2035 | 16,000 | 16,283 | ||||||||||||
5.10%, 06/15/2035 | 16,000 | 16,550 | ||||||||||||
Exelon Generation Co. LLC | ||||||||||||||
2.95%, 01/15/2020 | 26,000 | 26,131 | ||||||||||||
FirstEnergy Corp., Series C | ||||||||||||||
7.38%, 11/15/2031 | 74,000 | 88,595 | ||||||||||||
See Notes to Financial Statements.
30 |
www.redmontfunds.com |
Table of Contents
| Redmont Resolute Fund II | Schedule of Investments | |
October 31, 2015 (Unaudited) |
| Description | Principal Amount | Value (Note 2) | ||||||||||||
| ||||||||||||||
ELECTRIC (0.11%) (continued) | ||||||||||||||
Georgia Power Co. | ||||||||||||||
3.00%, 04/15/2016 | $ | 22,000 | $ | 22,222 | ||||||||||
Hydro-Quebec | ||||||||||||||
1.38%, 06/19/2017 | 95,000 | 95,635 | ||||||||||||
Louisville Gas & Electric Co. | ||||||||||||||
4.38%, 10/01/2045 | 4,000 | 4,161 | ||||||||||||
NRG Energy, Inc. | ||||||||||||||
6.25%, 07/15/2022 | 20,000 | 18,600 | ||||||||||||
South Carolina Electric & Gas Co. | ||||||||||||||
5.10%, 06/01/2065 | 20,000 | 21,224 | ||||||||||||
Talen Energy Supply LLC | ||||||||||||||
6.50%, 06/01/2025(d) | 20,000 | 17,775 | ||||||||||||
Terraform Global Operating LLC | ||||||||||||||
9.75%, 08/15/2022(d) | 10,000 | 9,000 | ||||||||||||
The Southern Co. | ||||||||||||||
1.30%, 08/15/2017 | 119,000 | 118,477 | ||||||||||||
Trans-Allegheny Interstate Line Co. | ||||||||||||||
3.85%, 06/01/2025(d) | 20,000 | 20,104 | ||||||||||||
|
| |||||||||||||
| 767,018 | ||||||||||||||
|
| |||||||||||||
ELECTRICAL COMPONENTS & EQUIPMENT (0.01%) | ||||||||||||||
Belden, Inc. | ||||||||||||||
5.25%, 07/15/2024(d) | 15,000 | 14,325 | ||||||||||||
EnerSys | ||||||||||||||
5.00%, 04/30/2023(d) | 20,000 | 20,350 | ||||||||||||
General Cable Corp. | ||||||||||||||
5.75%, 10/01/2022 | 20,000 | 17,300 | ||||||||||||
|
| |||||||||||||
| 51,975 | ||||||||||||||
|
| |||||||||||||
ELECTRONICS (0.01%) | ||||||||||||||
Corning, Inc. | ||||||||||||||
1.50%, 05/08/2018 | 23,000 | 22,745 | ||||||||||||
2.90%, 05/15/2022 | 23,000 | 22,400 | ||||||||||||
Flextronics International, Ltd. | ||||||||||||||
4.75%, 06/15/2025(d) | 11,000 | 10,753 | ||||||||||||
|
| |||||||||||||
| 55,898 | ||||||||||||||
|
| |||||||||||||
ENERGY & ALTERNATE SOURCES (0.00%)(c) | ||||||||||||||
TerraForm Power Operating LLC | ||||||||||||||
5.88%, 02/01/2023(d) | 25,000 | 23,188 | ||||||||||||
|
| |||||||||||||
ENGINEERING & CONSTRUCTION (0.00%)(c) | ||||||||||||||
Weekley Homes LLC | ||||||||||||||
6.00%, 02/01/2023 | 20,000 | 19,300 | ||||||||||||
|
| |||||||||||||
ENTERTAINMENT (0.01%) | ||||||||||||||
International Game Technology | ||||||||||||||
7.50%, 06/15/2019 | 25,000 | 26,938 | ||||||||||||
Scientific Games International, Inc. | ||||||||||||||
7.00%, 01/01/2022(d) | 25,000 | 25,375 | ||||||||||||
See Notes to Financial Statements.
| Semi-Annual Report | October 31, 2015 | 31 |
Table of Contents
| Redmont Resolute Fund II | Schedule of Investments | |
October 31, 2015 (Unaudited) |
| Description | Principal Amount | Value (Note 2) | ||||||||||||
| ||||||||||||||
ENTERTAINMENT (0.01%) (continued) | ||||||||||||||
WMG Acquisition Corp. | ||||||||||||||
6.00%, 01/15/2021(d) | $ | 25,000 | $ | 25,875 | ||||||||||
|
|
| ||||||||||||
| 78,188 | ||||||||||||||
|
|
| ||||||||||||
FOOD (0.01%) | ||||||||||||||
Dean Foods Co. | ||||||||||||||
6.50%, 03/15/2023(d) | 15,000 | 15,862 | ||||||||||||
JBS USA LLC / JBS USA Finance, Inc. | ||||||||||||||
5.88%, 07/15/2024(d) | 25,000 | 24,563 | ||||||||||||
SUPERVALU, Inc. | ||||||||||||||
7.75%, 11/15/2022 | 15,000 | 14,831 | ||||||||||||
|
|
| ||||||||||||
| 55,256 | ||||||||||||||
|
|
| ||||||||||||
FOREST PRODUCTS & PAPER (0.05%) | ||||||||||||||
Cascades, Inc. | ||||||||||||||
5.75%, 07/15/2023(d) | 30,000 | 28,875 | ||||||||||||
Clearwater Paper Corp. | ||||||||||||||
4.50%, 02/01/2023 | 10,000 | 9,600 | ||||||||||||
Domtar Corp. | ||||||||||||||
6.75%, 02/15/2044 | 46,000 | 46,505 | ||||||||||||
Georgia-Pacific LLC | ||||||||||||||
3.60%, 03/01/2025(d) | 131,000 | 131,069 | ||||||||||||
3.73%, 07/15/2023(d) | 87,000 | 88,907 | ||||||||||||
5.40%, 11/01/2020(d) | 52,000 | 57,873 | ||||||||||||
PH Glatfelter Co. | ||||||||||||||
5.38%, 10/15/2020 | 10,000 | 10,150 | ||||||||||||
|
|
| ||||||||||||
| 372,979 | ||||||||||||||
|
|
| ||||||||||||
GAS (0.01%) | ||||||||||||||
Dominion Gas Holdings LLC | ||||||||||||||
4.80%, 11/01/2043 | 34,000 | 33,228 | ||||||||||||
|
| |||||||||||||
HAND & MACHINE TOOLS (0.01%) | ||||||||||||||
Stanley Black & Decker, Inc. | ||||||||||||||
5.75%, 12/15/2053(f) | 83,000 | 88,188 | ||||||||||||
|
| |||||||||||||
HEALTHCARE - PRODUCTS (0.01%) | ||||||||||||||
Danaher Corp. | ||||||||||||||
3.35%, 09/15/2025 | 25,000 | 25,639 | ||||||||||||
4.38%, 09/15/2045 | 14,000 | 14,612 | ||||||||||||
Greatbatch, Ltd. | ||||||||||||||
9.13%, 11/01/2023(d) | 10,000 | 10,213 | ||||||||||||
Sterigenics-Nordion Holdings LLC | ||||||||||||||
6.50%, 05/15/2023(d) | 20,000 | 20,175 | ||||||||||||
Universal Hospital Services, Inc. | ||||||||||||||
7.63%, 08/15/2020 | 15,000 | 14,381 | ||||||||||||
|
|
| ||||||||||||
| 85,020 | ||||||||||||||
|
|
| ||||||||||||
See Notes to Financial Statements.
32 |
www.redmontfunds.com |
Table of Contents
| Redmont Resolute Fund II | Schedule of Investments | |
October 31, 2015 (Unaudited) |
| Description | Principal Amount | Value (Note 2) | ||||||||||||
| ||||||||||||||
HEALTHCARE - SERVICES (0.07%) | ||||||||||||||
DaVita HealthCare Partners, Inc. | ||||||||||||||
5.13%, 07/15/2024 | $ | 30,000 | $ | 30,562 | ||||||||||
HCA, Inc. | ||||||||||||||
5.38%, 02/01/2025 | 30,000 | 30,900 | ||||||||||||
Laboratory Corp. of America Holdings | ||||||||||||||
3.20%, 02/01/2022 | 10,000 | 9,890 | ||||||||||||
3.60%, 02/01/2025 | 33,000 | 32,192 | ||||||||||||
4.70%, 02/01/2045 | 17,000 | 15,704 | ||||||||||||
Roche Holdings, Inc. | ||||||||||||||
1.35%, 09/29/2017(d) | 300,000 | 301,225 | ||||||||||||
UnitedHealth Group, Inc. | ||||||||||||||
1.40%, 12/15/2017 | 28,000 | 28,065 | ||||||||||||
3.35%, 07/15/2022 | 21,000 | 21,785 | ||||||||||||
|
| |||||||||||||
| 470,323 | ||||||||||||||
|
| |||||||||||||
HOLDING COMPANIES - DIVERSIFIED (0.01%) | ||||||||||||||
MUFG Americas Holdings Corp. | ||||||||||||||
1.63%, 02/09/2018 | 18,000 | 17,970 | ||||||||||||
Opal Acquisition, Inc. | ||||||||||||||
8.88%, 12/15/2021(d) | 20,000 | 17,850 | ||||||||||||
| �� |
|
| ||||||||||||
| 35,820 | ||||||||||||||
|
| |||||||||||||
HOME BUILDERS (0.00%)(c) | ||||||||||||||
Mattamy Group Corp. | ||||||||||||||
6.50%, 11/15/2020(d) | 10,000 | 9,894 | ||||||||||||
|
| |||||||||||||
HOUSEHOLD PRODUCTS & WARES (0.00%)(c) | ||||||||||||||
Kimberly-Clark Corp. | ||||||||||||||
1.85%, 03/01/2020 | 12,000 | 11,920 | ||||||||||||
|
| |||||||||||||
INSURANCE (0.08%) | ||||||||||||||
ACE INA Holdings, Inc. | ||||||||||||||
4.35%, 11/03/2045 | 18,000 | 18,324 | ||||||||||||
Allied World Assurance Co. Holdings, Ltd. | ||||||||||||||
4.35%, 10/29/2025 | 27,000 | 26,907 | ||||||||||||
American International Group, Inc. | ||||||||||||||
3.88%, 01/15/2035 | 86,000 | 80,925 | ||||||||||||
Assurant, Inc. | ||||||||||||||
6.75%, 02/15/2034 | 98,000 | 116,492 | ||||||||||||
Massachusetts Mutual Life Insurance Co. | ||||||||||||||
4.50%, 04/15/2065(d) | 24,000 | 22,281 | ||||||||||||
New York Life Global Funding | ||||||||||||||
1.65%, 05/15/2017(d) | 104,000 | 104,765 | ||||||||||||
Pacific LifeCorp. | ||||||||||||||
6.00%, 02/10/2020(d) | 51,000 | 57,645 | ||||||||||||
Prudential Financial, Inc. | ||||||||||||||
5.38%, 05/15/2045(f) | 13,000 | 13,081 | ||||||||||||
5.63%, 06/15/2043(f) | 81,000 | 84,969 | ||||||||||||
See Notes to Financial Statements.
| Semi-Annual Report | October 31, 2015 | 33 |
Table of Contents
| Redmont Resolute Fund II | Schedule of Investments | |
October 31, 2015 (Unaudited) |
| Description | Principal Amount | Value (Note 2) | ||||||||||||
| ||||||||||||||
INSURANCE (0.08%) (continued) | ||||||||||||||
XLIT, Ltd. | ||||||||||||||
4.45%, 03/31/2025 | $ | 19,000 | $ | 19,041 | ||||||||||
5.50%, 03/31/2045 | 43,000 | 41,096 | ||||||||||||
|
| |||||||||||||
| 585,526 | ||||||||||||||
|
| |||||||||||||
INTERNET (0.01%) | ||||||||||||||
Cogent Communications Group, Inc. | ||||||||||||||
5.38%, 03/01/2022(d) | 25,000 | 24,750 | ||||||||||||
Netflix, Inc. | ||||||||||||||
5.88%, 02/15/2025(d) | 25,000 | 26,563 | ||||||||||||
|
| |||||||||||||
| 51,313 | ||||||||||||||
|
| |||||||||||||
IRON & STEEL (0.01%) | ||||||||||||||
AK Steel Corp. | ||||||||||||||
8.75%, 12/01/2018 | 10,000 | 9,673 | ||||||||||||
Allegheny Technologies, Inc. | ||||||||||||||
5.95%, 01/15/2021 | 23,000 | 20,355 | ||||||||||||
ArcelorMittal | ||||||||||||||
7.00%, 02/25/2022 | 20,000 | 19,100 | ||||||||||||
Steel Dynamics, Inc. | ||||||||||||||
5.13%, 10/01/2021 | 20,000 | 19,950 | ||||||||||||
|
| |||||||||||||
| 69,078 | ||||||||||||||
|
| |||||||||||||
LEISURE TIME (0.00%)(c) | ||||||||||||||
Viking Cruises, Ltd. | ||||||||||||||
6.25%, 05/15/2025(d) | 25,000 | 24,688 | ||||||||||||
|
| |||||||||||||
LODGING (0.02%) | ||||||||||||||
Caesars Entertainment Resort Properties LLC | ||||||||||||||
8.00%, 10/01/2020 | 25,000 | 24,937 | ||||||||||||
Golden Nugget Escrow, Inc. | ||||||||||||||
8.50%, 12/01/2021(d) | 25,000 | 26,000 | ||||||||||||
Interval Acquisition Corp. | ||||||||||||||
5.63%, 04/15/2023(d) | 25,000 | 25,750 | ||||||||||||
MGM Resorts International | ||||||||||||||
6.00%, 03/15/2023 | 25,000 | 25,563 | ||||||||||||
Quapaw Downstream Development Authority of the Quapaw Tribe of Oklahoma | ||||||||||||||
10.50%, 07/01/2019(d) | 25,000 | 26,000 | ||||||||||||
|
| |||||||||||||
| 128,250 | ||||||||||||||
|
| |||||||||||||
MACHINERY - DIVERSIFIED (0.04%) | ||||||||||||||
ATS Automation Tooling Systems, Inc. | ||||||||||||||
6.50%, 06/15/2023(d) | 7,000 | 7,192 | ||||||||||||
John Deere Capital Corp. | ||||||||||||||
0.43%, 02/25/2016(f) | 120,000 | 120,025 | ||||||||||||
1.13%, 06/12/2017 | 81,000 | 81,045 | ||||||||||||
1.55%, 12/15/2017 | 85,000 | 85,529 | ||||||||||||
|
| |||||||||||||
| 293,791 | ||||||||||||||
|
| |||||||||||||
See Notes to Financial Statements.
34 |
www.redmontfunds.com |
Table of Contents
| Redmont Resolute Fund II | Schedule of Investments | |
October 31, 2015 (Unaudited) |
| Description | Principal Amount | Value (Note 2) | ||||||||||||
| ||||||||||||||
MEDIA (0.05%) | ||||||||||||||
21st Century Fox America, Inc. | ||||||||||||||
4.75%, 09/15/2044 | $ | 11,000 | $ | 11,101 | ||||||||||
4.95%, 10/15/2045(d) | 13,000 | 13,370 | ||||||||||||
Cable One, Inc. | ||||||||||||||
5.75%, 06/15/2022(d) | 24,000 | 24,660 | ||||||||||||
CCO Safari II LLC | ||||||||||||||
3.58%, 07/23/2020(d) | 41,000 | 41,324 | ||||||||||||
6.38%, 10/23/2035(d) | 18,000 | 18,599 | ||||||||||||
6.48%, 10/23/2045(d) | 19,000 | 19,751 | ||||||||||||
Clear Channel Worldwide Holdings, Inc. | ||||||||||||||
6.50%, 11/15/2022 | 25,000 | 25,844 | ||||||||||||
Expo Event Transco, Inc. | ||||||||||||||
9.00%, 06/15/2021(d) | 25,000 | 25,125 | ||||||||||||
Lee Enterprises, Inc. | ||||||||||||||
9.50%, 03/15/2022(d) | 25,000 | 23,875 | ||||||||||||
Sirius XM Radio, Inc. | ||||||||||||||
5.38%, 04/15/2025(d) | 25,000 | 25,656 | ||||||||||||
The McClatchy Co. | ||||||||||||||
9.00%, 12/15/2022 | 30,000 | 29,062 | ||||||||||||
The Walt Disney Co. | ||||||||||||||
1.50%, 09/17/2018 | 30,000 | 30,138 | ||||||||||||
Time, Inc. | ||||||||||||||
5.75%, 04/15/2022(d) | 25,000 | 25,125 | ||||||||||||
Viacom, Inc. | ||||||||||||||
3.88%, 04/01/2024 | 12,000 | 11,404 | ||||||||||||
4.85%, 12/15/2034 | 17,000 | 14,719 | ||||||||||||
5.25%, 04/01/2044 | 34,000 | 29,681 | ||||||||||||
|
| |||||||||||||
| 369,434 | ||||||||||||||
|
| |||||||||||||
METAL FABRICATE & HARDWARE (0.01%) | ||||||||||||||
Valmont Industries, Inc. | ||||||||||||||
5.25%, 10/01/2054 | 60,000 | 52,609 | ||||||||||||
|
| |||||||||||||
MINING (0.02%) | ||||||||||||||
Anglo American Capital PLC | ||||||||||||||
4.88%, 05/14/2025(d) | 16,000 | 12,820 | ||||||||||||
FMG Resources August 2006 Pty., Ltd. | ||||||||||||||
9.75%, 03/01/2022(d) | 25,000 | 24,938 | ||||||||||||
Freeport-McMoRan, Inc. | ||||||||||||||
2.30%, 11/14/2017 | 24,000 | 22,650 | ||||||||||||
Goldcorp, Inc. | ||||||||||||||
5.45%, 06/09/2044 | 46,000 | 42,624 | ||||||||||||
Kinross Gold Corp. | ||||||||||||||
5.95%, 03/15/2024 | 25,000 | 20,568 | ||||||||||||
Teck Resources, Ltd. | ||||||||||||||
2.50%, 02/01/2018 | 29,000 | 24,976 | ||||||||||||
|
| |||||||||||||
| 148,576 | ||||||||||||||
|
| |||||||||||||
MISCELLANEOUS MANUFACTURING (0.03%) | ||||||||||||||
General Electric Co. | ||||||||||||||
2.70%, 10/09/2022 | 52,000 | 52,111 | ||||||||||||
See Notes to Financial Statements.
| Semi-Annual Report | October 31, 2015 | 35 |
Table of Contents
| Redmont Resolute Fund II | Schedule of Investments | |
October 31, 2015 (Unaudited) |
| Description | Principal Amount | Value (Note 2) | ||||||||||||
| ||||||||||||||
MISCELLANEOUS MANUFACTURING (0.03%) (continued) | ||||||||||||||
Ingersoll-Rand Global Holding Co., Ltd. | ||||||||||||||
5.75%, 06/15/2043 | $ | 84,000 | $ | 92,818 | ||||||||||
Ingersoll-Rand Luxembourg Finance SA | ||||||||||||||
4.65%, 11/01/2044 | 14,000 | 13,400 | ||||||||||||
Trinity Industries, Inc. | ||||||||||||||
4.55%, 10/01/2024 | 27,000 | 25,722 | ||||||||||||
|
| |||||||||||||
| 184,051 | ||||||||||||||
|
| |||||||||||||
OIL & GAS (0.11%) | ||||||||||||||
Anadarko Finance Co., Series B | ||||||||||||||
7.50%, 05/01/2031 | 20,000 | 24,747 | ||||||||||||
Anadarko Petroleum Corp. | ||||||||||||||
6.45%, 09/15/2036 | 114,000 | 128,755 | ||||||||||||
Baytex Energy Corp. | ||||||||||||||
5.63%, 06/01/2024(d) | 15,000 | 12,450 | ||||||||||||
BP Capital Markets PLC | ||||||||||||||
3.54%, 11/04/2024 | 22,000 | 22,353 | ||||||||||||
4.74%, 03/11/2021 | 30,000 | 33,354 | ||||||||||||
Carrizo Oil & Gas, Inc. | ||||||||||||||
6.25%, 04/15/2023 | 14,000 | 13,387 | ||||||||||||
Chevron Corp. | ||||||||||||||
1.37%, 03/02/2018 | 40,000 | 40,126 | ||||||||||||
1.96%, 03/03/2020 | 22,000 | 22,021 | ||||||||||||
ConocoPhillips Co. | ||||||||||||||
1.50%, 05/15/2018 | 16,000 | 15,993 | ||||||||||||
EP Energy LLC / Everest Acquisition Finance, Inc. | ||||||||||||||
6.38%, 06/15/2023 | 15,000 | 11,475 | ||||||||||||
Exxon Mobil Corp. | ||||||||||||||
1.31%, 03/06/2018 | 41,000 | 41,212 | ||||||||||||
Halcon Resources Corp. | ||||||||||||||
8.63%, 02/01/2020(d) | 15,000 | 12,994 | ||||||||||||
Hess Corp. | ||||||||||||||
5.60%, 02/15/2041 | 25,000 | 24,584 | ||||||||||||
7.88%, 10/01/2029 | 32,000 | 38,308 | ||||||||||||
Hilcorp Energy I LP / Hilcorp Finance Co. | ||||||||||||||
5.00%, 12/01/2024(d) | 15,000 | 13,650 | ||||||||||||
Marathon Oil Corp. | ||||||||||||||
6.60%, 10/01/2037 | 28,000 | 28,796 | ||||||||||||
MEG Energy Corp. | ||||||||||||||
6.38%, 01/30/2023(d) | 20,000 | 17,050 | ||||||||||||
Murphy Oil USA, Inc. | ||||||||||||||
6.00%, 08/15/2023 | 20,000 | 21,200 | ||||||||||||
Newfield Exploration Co. | ||||||||||||||
5.38%, 01/01/2026 | 10,000 | 9,550 | ||||||||||||
Noble Energy, Inc. | ||||||||||||||
3.90%, 11/15/2024 | 20,000 | 19,081 | ||||||||||||
5.05%, 11/15/2044 | 69,000 | 63,213 | ||||||||||||
Oasis Petroleum, Inc. | ||||||||||||||
6.88%, 03/15/2022 | 20,000 | 17,200 | ||||||||||||
Petroleos Mexicanos | ||||||||||||||
5.50%, 06/27/2044 | 12,000 | 10,286 | ||||||||||||
See Notes to Financial Statements.
36 |
www.redmontfunds.com |
Table of Contents
| Redmont Resolute Fund II | Schedule of Investments | |
October 31, 2015 (Unaudited) |
| Description | Principal Amount | Value (Note 2) | ||||||||||||
| ||||||||||||||
OIL & GAS (0.11%) (continued) | ||||||||||||||
Sanchez Energy Corp. | ||||||||||||||
6.13%, 01/15/2023 | $ | 20,000 | $ | 14,600 | ||||||||||
Shell International Finance BV | ||||||||||||||
2.13%, 05/11/2020 | 30,000 | 30,096 | ||||||||||||
SM Energy Co. | ||||||||||||||
5.63%, 06/01/2025 | 5,000 | 4,575 | ||||||||||||
Southwestern Energy Co. | ||||||||||||||
3.30%, 01/23/2018 | 10,000 | 9,821 | ||||||||||||
4.95%, 01/23/2025 | 35,000 | 30,601 | ||||||||||||
Talisman Energy, Inc. | ||||||||||||||
5.50%, 05/15/2042 | 63,000 | 46,167 | ||||||||||||
|
| |||||||||||||
| 777,645 | ||||||||||||||
|
| |||||||||||||
OIL & GAS SERVICES (0.01%) | ||||||||||||||
Freeport-McMoran Oil & Gas LLC / FCX Oil & Gas, Inc. | ||||||||||||||
6.63%, 05/01/2021 | 35,000 | 31,675 | ||||||||||||
|
| |||||||||||||
PACKAGING & CONTAINERS (0.00%)(c) | ||||||||||||||
Sealed Air Corp. | ||||||||||||||
5.13%, 12/01/2024(d) | 2,000 | 2,065 | ||||||||||||
|
| |||||||||||||
PHARMACEUTICALS (0.02%) | ||||||||||||||
Actavis Funding SCS | ||||||||||||||
4.75%, 03/15/2045 | 14,000 | 13,515 | ||||||||||||
Baxalta, Inc. | ||||||||||||||
3.60%, 06/23/2022(d) | 29,000 | 29,401 | ||||||||||||
4.00%, 06/23/2025(d) | 16,000 | 16,126 | ||||||||||||
Forest Laboratories LLC | ||||||||||||||
4.88%, 02/15/2021(d) | 65,000 | 70,410 | ||||||||||||
Mylan, Inc. | ||||||||||||||
5.40%, 11/29/2043 | 18,000 | 17,532 | ||||||||||||
Valeant Pharmaceuticals International, Inc. | ||||||||||||||
5.88%, 05/15/2023(d) | 15,000 | 12,675 | ||||||||||||
|
| |||||||||||||
| 159,659 | ||||||||||||||
|
| |||||||||||||
PIPELINES (0.05%) | ||||||||||||||
Columbia Pipeline Group, Inc. | ||||||||||||||
2.45%, 06/01/2018(d) | 8,000 | 8,017 | ||||||||||||
4.50%, 06/01/2025(d) | 29,000 | 27,972 | ||||||||||||
El Paso Pipeline Partners Operating Co., LLC | ||||||||||||||
6.50%, 04/01/2020 | 92,000 | 100,165 | ||||||||||||
Energy Transfer Equity LP | ||||||||||||||
7.50%, 10/15/2020 | 25,000 | 27,005 | ||||||||||||
Energy Transfer Partners LP | ||||||||||||||
4.90%, 03/15/2035 | 38,000 | 30,960 | ||||||||||||
5.15%, 03/15/2045 | 15,000 | 12,024 | ||||||||||||
Genesis Energy LP | ||||||||||||||
5.63%, 06/15/2024 | 20,000 | 17,775 | ||||||||||||
Kinder Morgan, Inc. | ||||||||||||||
5.00%, 02/15/2021(d) | 57,000 | 57,761 | ||||||||||||
See Notes to Financial Statements.
| Semi-Annual Report | October 31, 2015 | 37 |
Table of Contents
| Redmont Resolute Fund II | Schedule of Investments | |
October 31, 2015 (Unaudited) |
| Description | Principal Amount | Value (Note 2) | ||||||||||||
| ||||||||||||||
PIPELINES (0.05%) (continued) | ||||||||||||||
Tesoro Logistics LP | ||||||||||||||
6.13%, 10/15/2021 | $ | 20,000 | $ | 20,900 | ||||||||||
TransCanada Trust | ||||||||||||||
5.63%, 05/20/2075(f) | 16,000 | 15,390 | ||||||||||||
Williams Partners LP | ||||||||||||||
4.00%, 09/15/2025 | 15,000 | 12,796 | ||||||||||||
|
| |||||||||||||
| 330,765 | ||||||||||||||
|
| |||||||||||||
REAL ESTATE (0.02%) | ||||||||||||||
American Campus Communities Operating Partnership LP | ||||||||||||||
4.13%, 07/01/2024 | 40,000 | 40,036 | ||||||||||||
Greystar Real Estate Partners LLC | ||||||||||||||
8.25%, 12/01/2022(d) | 25,000 | 26,437 | ||||||||||||
Kennedy-Wilson, Inc. | ||||||||||||||
5.88%, 04/01/2024 | 20,000 | 19,875 | ||||||||||||
Prologis LP | ||||||||||||||
3.75%, 11/01/2025 | 24,000 | 23,878 | ||||||||||||
|
| |||||||||||||
| 110,226 | ||||||||||||||
|
| |||||||||||||
REAL ESTATE INVESTMENT TRUSTS (0.03%) | ||||||||||||||
Communications Sales & Leasing, Inc. | ||||||||||||||
6.00%, 04/15/2023(d) | 25,000 | 24,375 | ||||||||||||
CTR Partnership LP | ||||||||||||||
5.88%, 06/01/2021 | 9,000 | 9,275 | ||||||||||||
DuPont Fabros Technology LP | ||||||||||||||
5.63%, 06/15/2023 | 25,000 | 25,750 | ||||||||||||
National Retail Properties, Inc. | ||||||||||||||
4.00%, 11/15/2025 | 12,000 | 11,971 | ||||||||||||
Omega Healthcare Investors, Inc. | ||||||||||||||
4.50%, 04/01/2027(d) | 43,000 | 41,120 | ||||||||||||
4.95%, 04/01/2024 | 49,000 | 49,919 | ||||||||||||
5.25%, 01/15/2026(d) | 48,000 | 49,655 | ||||||||||||
|
| |||||||||||||
| 212,065 | ||||||||||||||
|
| |||||||||||||
RETAIL (0.03%) | ||||||||||||||
AutoNation, Inc. | ||||||||||||||
4.50%, 10/01/2025 | 20,000 | 20,531 | ||||||||||||
Conn’s, Inc. | ||||||||||||||
7.25%, 07/15/2022 | 10,000 | 9,600 | ||||||||||||
Costco Wholesale Corp. | ||||||||||||||
2.25%, 02/15/2022 | 42,000 | 41,377 | ||||||||||||
CVS Pass-Through Trust | ||||||||||||||
5.93%, 01/10/2034(d) | 34,466 | 38,534 | ||||||||||||
Dollar General Corp. | ||||||||||||||
4.13%, 07/15/2017 | 59,000 | 60,541 | ||||||||||||
Kohls Corp. | ||||||||||||||
5.55%, 07/17/2045 | 21,000 | 20,375 | ||||||||||||
PF Chang’s China Bistro, Inc. | ||||||||||||||
10.25%, 06/30/2020(d) | 15,000 | 14,025 | ||||||||||||
|
| |||||||||||||
| 204,983 | ||||||||||||||
|
| |||||||||||||
See Notes to Financial Statements.
38 |
www.redmontfunds.com |
Table of Contents
| Redmont Resolute Fund II | Schedule of Investments | |
October 31, 2015 (Unaudited) |
| Description | Principal Amount | Value (Note 2) | ||||||||||
| ||||||||||||
SAVINGS & LOANS (0.05%) | ||||||||||||
Astoria Financial Corp. | ||||||||||||
5.00%, 06/19/2017 | $ | 97,000 | $ | 101,213 | ||||||||
First Niagara Financial Group, Inc. | ||||||||||||
6.75%, 03/19/2020 | 166,000 | 187,379 | ||||||||||
7.25%, 12/15/2021 | 37,000 | 44,159 | ||||||||||
|
| |||||||||||
| 332,751 | ||||||||||||
|
| |||||||||||
SEMICONDUCTORS (0.01%) | ||||||||||||
Intel Corp. | ||||||||||||
1.35%, 12/15/2017 | 71,000 | 71,345 | ||||||||||
Micron Technology, Inc. | ||||||||||||
5.63%, 01/15/2026(d) | 25,000 | 23,562 | ||||||||||
|
| |||||||||||
| 94,907 | ||||||||||||
|
| |||||||||||
SOFTWARE (0.03%) | ||||||||||||
Fidelity National Information Services, Inc. | ||||||||||||
5.00%, 10/15/2025 | 15,000 | 15,050 | ||||||||||
First Data Corp. | ||||||||||||
5.38%, 08/15/2023(d) | 20,000 | 20,625 | ||||||||||
7.00%, 12/01/2023(d) | 5,000 | 5,112 | ||||||||||
Infor US, Inc. | ||||||||||||
5.75%, 08/15/2020(d) | 25,000 | 25,563 | ||||||||||
Microsoft Corp. | ||||||||||||
1.30%, 11/03/2018 | 29,000 | 28,998 | ||||||||||
4.45%, 11/03/2045 | 26,000 | 26,517 | ||||||||||
Oracle Corp. | ||||||||||||
2.80%, 07/08/2021 | 56,000 | 56,973 | ||||||||||
3.90%, 05/15/2035 | 22,000 | 21,010 | ||||||||||
|
| |||||||||||
| 199,848 | ||||||||||||
|
| |||||||||||
TELECOMMUNICATIONS (0.10%) | ||||||||||||
AT&T, Inc. | ||||||||||||
3.00%, 06/30/2022 | 74,000 | 72,711 | ||||||||||
4.35%, 06/15/2045 | 39,000 | 33,941 | ||||||||||
4.50%, 05/15/2035 | 51,000 | 47,901 | ||||||||||
4.75%, 05/15/2046 | 19,000 | 17,626 | ||||||||||
5.80%, 02/15/2019 | 18,000 | 20,037 | ||||||||||
CenturyLink, Inc. | ||||||||||||
5.63%, 04/01/2025 | 25,000 | 22,531 | ||||||||||
CISCO Systems, Inc. | ||||||||||||
2.13%, 03/01/2019 | 66,000 | 66,926 | ||||||||||
Frontier Communications Corp. | ||||||||||||
11.00%, 09/15/2025(d) | 40,000 | 42,025 | ||||||||||
Hughes Satellite Systems Corp. | ||||||||||||
7.63%, 06/15/2021 | 25,000 | 27,344 | ||||||||||
Intelsat Jackson Holdings SA | ||||||||||||
7.50%, 04/01/2021 | 25,000 | 22,687 | ||||||||||
Sprint Communications, Inc. | ||||||||||||
7.00%, 03/01/2020(d) | 25,000 | 26,344 | ||||||||||
Sprint Corp. | ||||||||||||
7.63%, 02/15/2025 | 45,000 | 40,050 | ||||||||||
See Notes to Financial Statements.
| Semi-Annual Report | October 31, 2015 | 39 |
Table of Contents
| Redmont Resolute Fund II | Schedule of Investments | |
October 31, 2015 (Unaudited) |
| Description | Principal Amount | Value (Note 2) | ||||||||||||||||
TELECOMMUNICATIONS (0.10%) (continued) | ||||||||||||||||||
T-Mobile USA, Inc. | ||||||||||||||||||
6.50%, 01/15/2024 | $ | 40,000 | $ | 40,700 | ||||||||||||||
Verizon Communications, Inc. | ||||||||||||||||||
4.40%, 11/01/2034 | 8,000 | 7,550 | ||||||||||||||||
4.52%, 09/15/2048 | 80,000 | 72,248 | ||||||||||||||||
4.67%, 03/15/2055 | 49,000 | 43,295 | ||||||||||||||||
4.86%, 08/21/2046 | 88,000 | 84,673 | ||||||||||||||||
6.40%, 09/15/2033 | 5,000 | 5,792 | ||||||||||||||||
|
| |||||||||||||||||
| 694,381 | ||||||||||||||||||
|
| |||||||||||||||||
TRANSPORTATION (0.01%) | ||||||||||||||||||
Canadian Pacific Railway Co. | ||||||||||||||||||
6.13%, 09/15/2115 | 31,000 | 33,562 | ||||||||||||||||
Union Pacific Corp. | ||||||||||||||||||
3.88%, 02/01/2055 | 23,000 | 20,331 | ||||||||||||||||
|
| |||||||||||||||||
| 53,893 | ||||||||||||||||||
|
| |||||||||||||||||
TRUCKING & LEASING (0.00%)(c) | ||||||||||||||||||
Penske Truck Leasing Co. LP / PTL Finance Corp. | ||||||||||||||||||
3.05%, 01/09/2020(d) | 12,000 | 12,001 | ||||||||||||||||
3.38%, 02/01/2022(d) | 14,000 | 13,689 | ||||||||||||||||
|
| |||||||||||||||||
| 25,690 | ||||||||||||||||||
|
| |||||||||||||||||
TOTAL CORPORATE BONDS (Cost $13,241,420) | 13,028,335 | |||||||||||||||||
| ||||||||||||||||||
| Description | Currency | Principal Amount | Value (Note 2) | |||||||||||||||
FOREIGN GOVERNMENT BONDS (0.01%) | ||||||||||||||||||
Mexico Government International Bond | ||||||||||||||||||
4.75%, 03/08/2044 | USD | 89,000 | 84,772 | |||||||||||||||
|
| |||||||||||||||||
TOTAL FOREIGN GOVERNMENT BONDS (Cost $90,964) | 84,772 | |||||||||||||||||
| ||||||||||||||||||
GOVERNMENT BONDS (0.19%) | ||||||||||||||||||
Tennessee Valley Authority | ||||||||||||||||||
1.75%, 10/15/2018 | 43,000 | 43,597 | ||||||||||||||||
|
| |||||||||||||||||
U.S. Treasury Bonds | ||||||||||||||||||
2.00%, 08/15/2025 | 7,000 | 6,911 | ||||||||||||||||
2.50%, 02/15/2045 | 66,000 | 60,222 | ||||||||||||||||
3.00%, 05/15/2045 | 19,000 | 19,258 | ||||||||||||||||
3.13%, 11/15/2041 | 79,000 | 82,919 | ||||||||||||||||
3.13%, 08/15/2044 | 96,000 | 99,753 | ||||||||||||||||
4.50%, 02/15/2036 | 50,000 | 65,067 | ||||||||||||||||
5.25%, 11/15/2028 | 69,000 | 91,367 | ||||||||||||||||
|
| |||||||||||||||||
| 425,497 | ||||||||||||||||||
|
| |||||||||||||||||
See Notes to Financial Statements.
40 |
www.redmontfunds.com |
Table of Contents
| Redmont Resolute Fund II | Schedule of Investments | |
October 31, 2015 (Unaudited) |
| Description | Currency | Principal Amount | Value (Note 2) | |||||||||||||
U.S. Treasury Inflation Indexed Notes | ||||||||||||||||
0.13%, 04/15/2018 | $ | 154,650 | $ | 154,838 | ||||||||||||
|
| |||||||||||||||
U.S. Treasury Notes | ||||||||||||||||
1.38%, 03/31/2020 | 36,000 | 35,886 | ||||||||||||||
1.38%, 04/30/2020 | 41,000 | 40,847 | ||||||||||||||
1.38%, 09/30/2020 | 129,000 | 128,159 | ||||||||||||||
1.88%, 08/31/2022 | 80,000 | 80,004 | ||||||||||||||
2.00%, 07/31/2022 | 16,000 | 16,136 | ||||||||||||||
2.00%, 02/15/2025 | 207,000 | 204,712 | ||||||||||||||
2.13%, 05/15/2025 | 104,000 | 103,839 | ||||||||||||||
2.25%, 11/15/2024 | 97,000 | 98,086 | ||||||||||||||
|
| |||||||||||||||
| 707,669 | ||||||||||||||||
|
| |||||||||||||||
TOTAL GOVERNMENT BONDS (Cost $1,329,764) | 1,331,601 | |||||||||||||||
| ||||||||||||||||
| Description | Principal Amount/ Shares | Value (Note 2) | ||||||||||||||
SHORT TERM INVESTMENTS (7.91%) | ||||||||||||||||
MONEY MARKET FUNDS (7.36%) | ||||||||||||||||
Dreyfus Treasury Cash Management Fund, Institutional Class, 7-day yield, 0.010% | 51,320,643 | 51,320,643 | ||||||||||||||
|
| |||||||||||||||
U.S. TREASURY BILLS (0.55%) | ||||||||||||||||
0.180%, 02/04/2016(g) | 763,000 | 762,803 | ||||||||||||||
0.188%, 03/31/2016(a)(g) | 3,065,000 | 3,062,781 | ||||||||||||||
|
| |||||||||||||||
| 3,825,584 | ||||||||||||||||
|
| |||||||||||||||
TOTAL SHORT TERM INVESTMENTS (Cost $55,145,863) | 55,146,227 | |||||||||||||||
| ||||||||||||||||
TOTAL INVESTMENTS (88.66%) (Cost $600,646,453) | $ | 618,417,876 | ||||||||||||||
SEGREGATED CASH WITH BROKERS (15.38%)(h) | 107,288,333 | |||||||||||||||
SECURITIES SOLD SHORT (-3.93%) (Proceeds $27,289,643) | (27,413,436) | |||||||||||||||
LIABILITIES IN EXCESS OF OTHER ASSETS (-0.11%) | (773,997) | |||||||||||||||
| ||||||||||||||||
NET ASSETS (100.00%) | $ | 697,518,776 | ||||||||||||||
| ||||||||||||||||
SCHEDULE OF SECURITIES SOLD SHORT
| Description | Shares | Value (Note 2) | ||||||
COMMON STOCKS (-3.92%) | ||||||||
APPAREL (-0.05%) | ||||||||
Deckers Outdoor Corp. | (2,580 | ) | $ (143,603 | ) | ||||
Under Armour, Inc., Class A | (2,065 | ) | (196,340 | ) | ||||
|
| |||||||
| (339,943 | ) | |||||||
|
| |||||||
See Notes to Financial Statements.
| Semi-Annual Report | October 31, 2015 | 41 |
Table of Contents
| Redmont Resolute Fund II | Schedule of Investments | |
October 31, 2015 (Unaudited) |
| Description | Shares | Value (Note 2) | ||||||
AUTO MANUFACTURERS (-0.02%) | ||||||||
Tesla Motors, Inc. | (604 | ) | $ (124,986) | |||||
|
| |||||||
AUTO PARTS & EQUIPMENT (-0.08%) | ||||||||
Autoliv, Inc. | (2,472 | ) | (299,706) | |||||
Dorman Products, Inc. | (3,696 | ) | (172,529) | |||||
Mobileye NV | (2,514 | ) | (114,437) | |||||
|
| |||||||
| (586,672) | ||||||||
|
| |||||||
BANKS (-0.39%) | ||||||||
BancorpSouth, Inc. | (6,465 | ) | (161,172) | |||||
Bank of Hawaii Corp. | (1,951 | ) | (127,751) | |||||
Bank of the Ozarks, Inc. | (2,387 | ) | (119,398) | |||||
Community Bank System, Inc. | (4,308 | ) | (175,594) | |||||
Cullen/Frost Bankers, Inc. | (2,124 | ) | (145,367) | |||||
CVB Financial Corp. | (10,855 | ) | (189,420) | |||||
First Financial Bankshares, Inc. | (5,802 | ) | (192,975) | |||||
Glacier Bancorp, Inc. | (5,852 | ) | (160,111) | |||||
HDFC Bank, Ltd., ADR | (2,078 | ) | (127,049) | |||||
Home BancShares, Inc. | (2,352 | ) | (100,948) | |||||
MB Financial, Inc. | (3,601 | ) | (116,096) | |||||
PacWest Bancorp | (3,353 | ) | (151,019) | |||||
Texas Capital Bancshares, Inc. | (1,352 | ) | (74,630) | |||||
Trustmark Corp. | (5,162 | ) | (124,043) | |||||
UMB Financial Corp. | (2,124 | ) | (104,246) | |||||
United Bankshares, Inc. | (6,296 | ) | (249,007) | |||||
Valley National Bancorp | (20,880 | ) | (219,240) | |||||
Westamerica Bancorporation | (4,345 | ) | (192,092) | |||||
|
| |||||||
| (2,730,158) | ||||||||
|
| |||||||
BEVERAGES (-0.02%) | ||||||||
The Boston Beer Co., Inc., Class A | (504 | ) | (110,673) | |||||
|
| |||||||
BIOTECHNOLOGY (-0.08%) | ||||||||
Achillion Pharmaceuticals, Inc. | (9,700 | ) | (75,854) | |||||
Alexion Pharmaceuticals, Inc. | (379 | ) | (66,704) | |||||
Illumina, Inc. | (801 | ) | (114,767) | |||||
Intrexon Corp. | (2,178 | ) | (73,181) | |||||
Kite Pharma, Inc. | (1,384 | ) | (94,181) | |||||
The Medicines Co. | (3,674 | ) | (125,798) | |||||
|
| |||||||
| (550,485) | ||||||||
|
| |||||||
BUILDING MATERIALS (-0.05%) | ||||||||
Fortune Brands Home & Security, Inc. | (3,217 | ) | (168,346) | |||||
Trex Co., Inc. | (1,820 | ) | (71,107) | |||||
USG Corp. | (4,912 | ) | (115,776) | |||||
|
| |||||||
| (355,229) | ||||||||
|
| |||||||
CHEMICALS (-0.08%) | ||||||||
Axalta Coating Systems, Ltd. | (8,099 | ) | (223,775) | |||||
International Flavors & Fragrances, Inc. | (1,460 | ) | (169,448) | |||||
NewMarket Corp. | (441 | ) | (173,639) | |||||
|
| |||||||
| (566,862) | ||||||||
|
| |||||||
COMMERCIAL SERVICES (-0.14%) | ||||||||
Aramark | (6,650 | ) | (201,827) | |||||
Cimpress NV | (1,747 | ) | (137,838) | |||||
Monro Muffler Brake, Inc. | (4,215 | ) | (312,627) | |||||
See Notes to Financial Statements.
42 |
www.redmontfunds.com |
Table of Contents
| Redmont Resolute Fund II | Schedule of Investments | |
October 31, 2015 (Unaudited) |
| Description | Shares | Value (Note 2) | ||||||
COMMERCIAL SERVICES (-0.14%) (continued) | ||||||||
Nord Anglia Education, Inc. | (6,361 | ) | $ (124,676) | |||||
Rollins, Inc. | (7,217 | ) | (193,560) | |||||
|
| |||||||
| (970,528) | ||||||||
|
| |||||||
COMPUTERS (-0.22%) | ||||||||
3D Systems Corp. | (12,463 | ) | (125,378) | |||||
Electronics for Imaging, Inc. | (5,037 | ) | (233,918) | |||||
Infosys, Ltd., Sponsored ADR | (18,271 | ) | (331,801) | |||||
Unisys Corp. | (13,156 | ) | (176,291) | |||||
VeriFone Systems, Inc. | (8,724 | ) | (262,941) | |||||
Wipro, Ltd., ADR | (30,797 | ) | (381,267) | |||||
|
| |||||||
| (1,511,596) | ||||||||
|
| |||||||
COSMETICS & PERSONAL CARE (-0.03%) | ||||||||
Colgate-Palmolive Co. | (3,086 | ) | (204,756) | |||||
|
| |||||||
DISTRIBUTION & WHOLESALE (-0.05%) | ||||||||
LKQ Corp. | (6,911 | ) | (204,635) | |||||
WW Grainger, Inc. | (569 | ) | (119,490) | |||||
|
| |||||||
| (324,125) | ||||||||
|
| |||||||
DIVERSIFIED FINANCIAL SERVICES (-0.12%) | ||||||||
Credit Acceptance Corp. | (407 | ) | (76,960) | |||||
Eaton Vance Corp. | (5,631 | ) | (203,335) | |||||
Financial Engines, Inc. | (5,492 | ) | (176,623) | |||||
LPL Financial Holdings, Inc. | (5,401 | ) | (230,082) | |||||
WisdomTree Investments, Inc. | (9,048 | ) | (173,993) | |||||
|
| |||||||
| (860,993) | ||||||||
|
| |||||||
ELECTRIC (-0.03%) | ||||||||
Ormat Technologies, Inc. | (5,129 | ) | (193,466) | |||||
|
| |||||||
ELECTRONICS (-0.11%) | ||||||||
Itron, Inc. | (10,328 | ) | (379,347) | |||||
National Instruments Corp. | (13,608 | ) | (414,636) | |||||
|
| |||||||
| (793,983) | ||||||||
|
| |||||||
ENTERTAINMENT (-0.04%) | ||||||||
DreamWorks Animation SKG, Inc., Class A | (6,519 | ) | (131,945) | |||||
Regal Entertainment Group, Class A | (8,453 | ) | (163,819) | |||||
|
| |||||||
| (295,764) | ||||||||
|
| |||||||
FOOD (-0.17%) | ||||||||
B&G Foods, Inc. | (6,802 | ) | (246,845) | |||||
McCormick & Co., Inc. | (2,890 | ) | (242,702) | |||||
Mondelez International, Inc., Class A | (5,776 | ) | (266,620) | |||||
Snyder’s-Lance, Inc. | (1,243 | ) | (44,176) | |||||
The Hain Celestial Group, Inc. | (3,514 | ) | (175,173) | |||||
TreeHouse Foods, Inc. | (2,502 | ) | (214,271) | |||||
|
| |||||||
| (1,189,787) | ||||||||
|
| |||||||
HEALTHCARE - PRODUCTS (-0.12%) | ||||||||
Henry Schein, Inc. | (1,045 | ) | (158,537) | |||||
IDEXX Laboratories, Inc. | (2,772 | ) | (190,215) | |||||
Sirona Dental Systems, Inc. | (1,539 | ) | (167,951) | |||||
West Pharmaceutical Services, Inc. | (4,816 | ) | (289,008) | |||||
|
| |||||||
| (805,711) | ||||||||
|
| |||||||
See Notes to Financial Statements.
| Semi-Annual Report | October 31, 2015 | 43 |
Table of Contents
| Redmont Resolute Fund II | Schedule of Investments | |
October 31, 2015 (Unaudited) |
| Description | Shares | Value (Note 2) | ||||||
HOME FURNISHINGS (-0.03%) | ||||||||
Leggett & Platt, Inc. | (4,069 | ) | $ (183,227) | |||||
|
| |||||||
HOUSEWARES (-0.05%) | ||||||||
The Clorox Co. | (1,337 | ) | (163,034) | |||||
Tumi Holdings, Inc. | (11,581 | ) | (185,643) | |||||
|
| |||||||
| (348,677) | ||||||||
|
| |||||||
INTERNET (-0.15%) | ||||||||
Cogent Communications Holdings, Inc. | (5,622 | ) | (172,708) | |||||
FireEye, Inc. | (8,871 | ) | (231,977) | |||||
HomeAway, Inc. | (4,895 | ) | (154,486) | |||||
LinkedIn Corp., Class A | (715 | ) | (172,222) | |||||
Netflix, Inc. | (836 | ) | (90,606) | |||||
Wayfair, Inc., Class A | (5,915 | ) | (250,027) | |||||
|
| |||||||
| (1,072,026) | ||||||||
|
| |||||||
IRON & STEEL (-0.02%) | ||||||||
Vale SA, Sponsored ADR | (31,948 | ) | (139,293) | |||||
|
| |||||||
LEISURE TIME (-0.03%) | ||||||||
Qunar Cayman Islands, Ltd., ADR | (3,671 | ) | (178,190) | |||||
|
| |||||||
MACHINERY - DIVERSIFIED (-0.08%) | ||||||||
CNH Industrial NV | (16,281 | ) | (110,548) | |||||
Deere & Co. | (2,882 | ) | (224,796) | |||||
Wabtec Corp. | (2,889 | ) | (239,411) | |||||
|
| |||||||
| (574,755) | ||||||||
|
| |||||||
MEDIA (0.00%)(i) | ||||||||
Media General, Inc. | (431 | ) | (6,405) | |||||
|
| |||||||
METAL FABRICATE & HARDWARE (-0.01%) | ||||||||
Sun Hydraulics Corp. | (3,140 | ) | (91,971) | |||||
|
| |||||||
MINING (-0.01%) | ||||||||
Goldcorp, Inc. | (4,819 | ) | (61,780) | |||||
Teck Resources, Ltd., Class B | (6,550 | ) | (38,448) | |||||
|
| |||||||
| (100,228) | ||||||||
|
| |||||||
MISCELLANEOUS MANUFACTURING (-0.07%) | ||||||||
Proto Labs, Inc. | (5,868 | ) | (380,481) | |||||
Raven Industries, Inc. | (4,650 | ) | (84,677) | |||||
|
| |||||||
| (465,158) | ||||||||
|
| |||||||
OIL & GAS (-0.23%) | ||||||||
Cabot Oil & Gas Corp. | (8,476 | ) | (184,014) | |||||
Chevron Corp. | (2,498 | ) | (227,018) | |||||
Continental Resources, Inc. | (3,642 | ) | (123,500) | |||||
CVR Energy, Inc. | (2,441 | ) | (108,527) | |||||
Diamond Offshore Drilling, Inc. | (9,693 | ) | (192,697) | |||||
Helmerich & Payne, Inc. | (2,256 | ) | (126,945) | |||||
Hess Corp. | (2,705 | ) | (152,048) | |||||
Matador Resources Co. | (6,242 | ) | (160,482) | |||||
Noble Energy, Inc. | (6,078 | ) | (217,835) | |||||
Oasis Petroleum, Inc. | (10,458 | ) | (121,627) | |||||
|
| |||||||
| (1,614,693) | ||||||||
|
| |||||||
See Notes to Financial Statements.
44 |
www.redmontfunds.com |
Table of Contents
| Redmont Resolute Fund II | Schedule of Investments | |
October 31, 2015 (Unaudited) |
| Description | Shares | Value (Note 2) | ||||||
PHARMACEUTICALS (-0.04%) | ||||||||
Dexcom, Inc. | (1,828 | ) | $ (152,309) | |||||
OPKO Health, Inc. | (12,109 | ) | (114,430) | |||||
|
| |||||||
| (266,739) | ||||||||
|
| |||||||
PIPELINES (-0.02%) | ||||||||
Spectra Energy Corp. | (4,587 | ) | (131,051) | |||||
|
| |||||||
REAL ESTATE INVESTMENT TRUSTS (-0.18%) | ||||||||
Equinix, Inc. | (1,107 | ) | (328,425) | |||||
HCP, Inc. | (2,809 | ) | (104,495) | |||||
Health Care REIT, Inc. | (1,414 | ) | (91,726) | |||||
Iron Mountain, Inc. | (5,976 | ) | (183,105) | |||||
Omega Healthcare Investors, Inc. | (1,996 | ) | (68,902) | |||||
Plum Creek Timber Co., Inc. | (5,057 | ) | (206,022) | |||||
Realty Income Corp. | (5,379 | ) | (266,045) | |||||
|
| |||||||
| (1,248,720) | ||||||||
|
| |||||||
RETAIL (-0.34%) | ||||||||
Bob Evans Farms, Inc. | (5,056 | ) | (218,773) | |||||
Buffalo Wild Wings, Inc. | (1,294 | ) | (199,625) | |||||
CarMax, Inc. | (3,282 | ) | (193,671) | |||||
Chipotle Mexican Grill, Inc. | (307 | ) | (196,551) | |||||
Dollar Tree, Inc. | (2,447 | ) | (160,254) | |||||
Kate Spade & Co. | (7,593 | ) | (136,446) | |||||
lululemon athletica, Inc. | (2,759 | ) | (135,660) | |||||
Nordstrom, Inc. | (1,848 | ) | (120,508) | |||||
PriceSmart, Inc. | (2,584 | ) | (222,172) | |||||
Texas Roadhouse, Inc. | (7,399 | ) | (254,156) | |||||
The Cheesecake Factory, Inc. | (2,264 | ) | (109,125) | |||||
The Wendy’s Co. | (27,322 | ) | (250,269) | |||||
Tiffany & Co. | (2,031 | ) | (167,436) | |||||
|
| |||||||
| (2,364,646) | ||||||||
|
| |||||||
SAVINGS & LOANS (-0.03%) | ||||||||
New York Community Bancorp, Inc. | (11,904 | ) | (196,654) | |||||
|
| |||||||
SEMICONDUCTORS (-0.02%) | ||||||||
Ambarella, Inc. | (1,567 | ) | (77,473) | |||||
Cirrus Logic, Inc. | (2,621 | ) | (80,805) | |||||
InvenSense, Inc. | (848 | ) | (10,108) | |||||
|
| |||||||
| (168,386) | ||||||||
|
| |||||||
SOFTWARE (-0.50%) | ||||||||
Acxiom Corp. | (8,943 | ) | (197,819) | |||||
Aspen Technology, Inc. | (7,228 | ) | (299,167) | |||||
athenahealth, Inc. | (1,938 | ) | (295,448) | |||||
Blackbaud, Inc. | (4,856 | ) | (304,423) | |||||
Cerner Corp. | (1,776 | ) | (117,731) | |||||
Guidewire Software, Inc. | (3,612 | ) | (210,327) | |||||
Medidata Solutions, Inc. | (6,585 | ) | (283,155) | |||||
NetSuite, Inc. | (4,162 | ) | (354,061) | |||||
Proofpoint, Inc. | (5,170 | ) | (364,175) | |||||
Rackspace Hosting, Inc. | (8,398 | ) | (217,088) | |||||
Synchronoss Technologies, Inc. | (3,178 | ) | (111,802) | |||||
Veeva Systems, Inc., Class A | (9,168 | ) | (232,592) | |||||
Verint Systems, Inc. | (4,146 | ) | (197,267) | |||||
See Notes to Financial Statements.
| Semi-Annual Report | October 31, 2015 | 45 |
Table of Contents
| Redmont Resolute Fund II | Schedule of Investments | |
October 31, 2015 (Unaudited) |
| Description | Shares | Value (Note 2) | ||||||||||||
SOFTWARE (-0.50%) (continued) | ||||||||||||||
Workday, Inc., Class A | (3,817 | ) | $ | (301,428) | ||||||||||
|
| |||||||||||||
| (3,486,483) | ||||||||||||||
|
| |||||||||||||
STORAGE & WAREHOUSING (-0.02%) | ||||||||||||||
Mobile Mini, Inc. | (4,119 | ) | (141,035) | |||||||||||
|
| |||||||||||||
TELECOMMUNICATIONS (-0.21%) | ||||||||||||||
Arista Networks, Inc. | (3,287 | ) | (212,044) | |||||||||||
CenturyLink, Inc. | (5,242 | ) | (147,877) | |||||||||||
Ciena Corp. | (4,362 | ) | (105,299) | |||||||||||
Finisar Corp. | (15,200 | ) | (172,824) | |||||||||||
Frontier Communications Corp. | (29,840 | ) | (153,378) | |||||||||||
Sprint Corp. | (58,073 | ) | (274,685) | |||||||||||
Telefonica SA, Sponsored ADR | (14,252 | ) | (187,699) | |||||||||||
Ubiquiti Networks, Inc. | (897 | ) | (26,174) | |||||||||||
ViaSat, Inc. | (2,798 | ) | (184,556) | |||||||||||
|
| |||||||||||||
| (1,464,536) | ||||||||||||||
|
| |||||||||||||
TOYS, GAMES & HOBBIES (-0.03%) | ||||||||||||||
Mattel, Inc. | (7,893 | ) | (194,010) | |||||||||||
|
| |||||||||||||
TRANSPORTATION (-0.05%) | ||||||||||||||
Heartland Express, Inc. | (6,978 | ) | (131,396) | |||||||||||
JB Hunt Transport Services, Inc. | (1,353 | ) | (103,328) | |||||||||||
Old Dominion Freight Line, Inc. | (959 | ) | (59,400) | |||||||||||
Ryder System, Inc. | (929 | ) | (66,684) | |||||||||||
|
| |||||||||||||
| (360,808) | ||||||||||||||
|
| |||||||||||||
TOTAL COMMON STOCKS (Proceeds $27,187,438) | (27,313,408) | |||||||||||||
| ||||||||||||||
LIMITED PARTNERSHIPS (-0.01%) | ||||||||||||||
PIPELINES (-0.01%) | ||||||||||||||
EQT Midstream Partners LP | (1,351 | ) | (100,028) | |||||||||||
|
| |||||||||||||
TOTAL LIMITED PARTNERSHIPS (Proceeds $102,204) | (100,028) | |||||||||||||
| ||||||||||||||
TOTAL SECURITIES SOLD SHORT (Proceeds $27,289,643) | $ | (27,413,436) | ||||||||||||
| ||||||||||||||
SCHEDULE OF WRITTEN OPTIONS | ||||||||||||||
| Description | Number of Contracts | Exercise Price | Maturity Date | Value (Note 2) | ||||||||||
| ||||||||||||||
WRITTEN OPTIONS | ||||||||||||||
Call Options | ||||||||||||||
Anadarko Petroleum Corp. | (48) | $ | 80.00 | 01/15/2016 | $ | (3,648) | ||||||||
Diamondback Energy, Inc. | (32) | 70.00 | 12/18/2015 | (22,720) | ||||||||||
Diamondback Energy, Inc. | (31) | 60.00 | 12/18/2015 | (46,500) | ||||||||||
Diamondback Energy, Inc. | (21) | 70.00 | 01/15/2016 | (16,695) | ||||||||||
EOG Resources, Inc. | (25) | 85.00 | 01/15/2016 | (13,600) | ||||||||||
EOG Resources, Inc. | (36) | 80.00 | 01/15/2016 | (30,600) | ||||||||||
See Notes to Financial Statements.
46 |
www.redmontfunds.com |
Table of Contents
| Redmont Resolute Fund II | Schedule of Investments | |
October 31, 2015 (Unaudited) |
| Description | Number of Contracts | Exercise Price | Maturity Date | Value (Note 2) | ||||||||||
WRITTEN OPTIONS (continued) | ||||||||||||||
Call Options (continued) | ||||||||||||||
Exxon Mobil Corp. | (17) | $ 70.00 | 01/15/2016 | $ | (22,355) | |||||||||
Exxon Mobil Corp. | (70) | 80.00 | 01/15/2016 | (30,450) | ||||||||||
Marathon Petroleum Corp. | (50) | 55.00 | 01/15/2016 | (8,500) | ||||||||||
Occidental Petroleum Corp. | (46) | 75.00 | 01/15/2016 | (14,490) | ||||||||||
Phillips 66 | (18) | 75.00 | 01/15/2016 | (27,900) | ||||||||||
Phillips 66 | (46) | 70.00 | 01/15/2016 | (94,300) | ||||||||||
|
| |||||||||||||
TOTAL WRITTEN OPTIONS (Proceeds $193,730) | $ | (331,758) | ||||||||||||
|
| |||||||||||||
| (a) | Security position either entirely or partially held in a segregated account as collateral for securities sold short, written options, futures contracts, and total return swap contracts. Aggregate total market value of $24,009,977. |
| (b) | Non-income producing security. |
| (c) | Less than 0.005%. |
| (d) | Security exempt from registration under rule 144A of the securities act of 1933. This security may be resold in transactions exempt from registration, normally to qualified institutional buyers. At period end, the market value of those securities was $3,738,057, representing 0.54% of the Fund’s net assets. |
| (e) | This security has no contractual maturity date, is not redeemable and contractually pays an indefinite stream of interest. |
| (f) | The rate shown on floating or adjustable rate securities represents the coupon rate at period end. |
| (g) | Rate shown represents the bond equivalent yield to maturity at date of purchase. |
| (h) | Includes cash which is being held as collateral for securities sold short, written options, and total return swap contracts. |
| (i) | Less than (0.005)%. |
FUTURES CONTRACTS
At October 31, 2015, the Fund had outstanding futures contracts:
| Description | Position | Contracts | Expiration Date | Underlying Face Amount at Value | Unrealized Appreciation | |||||||||||
| ||||||||||||||||
Commodity Contracts | ||||||||||||||||
Corn Future | Long | 8 | 12/15/2015 | $ | 152,896 | $ | 882 | |||||||||
WTI Crude Future | Long | 5 | 11/23/2015 | 232,950 | 16,773 | |||||||||||
Equity Contracts | ||||||||||||||||
Euro STOXX 50® Index Future | Long | 157 | 12/21/2015 | 5,875,113 | 349,244 | |||||||||||
Mexican Bolsa Index Future | Long | 92 | 12/21/2015 | 2,478,037 | 64,919 | |||||||||||
Russell 2000® E-Mini Future | Long | 49 | 12/21/2015 | 5,675,670 | 71,059 | |||||||||||
Tokyo Price Index Future | Long | 12 | 12/11/2015 | 1,549,847 | 55,486 | |||||||||||
Fixed Income Contracts | ||||||||||||||||
Australian 10 Year Bond Future | Long | 2 | 12/16/2015 | 138,855 | 133 | |||||||||||
Australian 3 Year Bond Future | Long | 2 | 12/16/2015 | 140,096 | 80 | |||||||||||
Euro-BTP Future | Long | 17 | 12/09/2015 | 2,597,352 | 90,452 | |||||||||||
Euro-OAT Future | Long | 8 | 12/09/2015 | 1,348,171 | 29,722 | |||||||||||
Long Gilt Future | Long | 2 | 12/30/2015 | 363,045 | 674 | |||||||||||
Short Gilt Future | Long | 2 | 12/30/2015 | 321,052 | 397 | |||||||||||
U.S. 5 Year Treasury Note Future | Short | 23 | 01/04/2016 | (2,754,779) | 845 | |||||||||||
Foreign Currency Contracts | ||||||||||||||||
Euro FX Currency Future | Short | 43 | 12/15/2015 | (5,917,359) | 110,170 | |||||||||||
Japanese Yen Currency Future | Short | 135 | 12/15/2015 | (13,986,000) | 26,559 | |||||||||||
Swiss Franc Currency Future | Short | 18 | 12/15/2015 | (2,279,484) | 38,306 | |||||||||||
|
| |||||||||||||||
| $ | (4,064,538) | $ | 855,701 | |||||||||||||
|
| |||||||||||||||
See Notes to Financial Statements.
| Semi-Annual Report | October 31, 2015 | 47 |
Table of Contents
| Redmont Resolute Fund II | Schedule of Investments | |
October 31, 2015 (Unaudited) |
| Description | Position | Contracts | Expiration Date | Underlying Face Amount at Value | Unrealized Depreciation | |||||||||||
| ||||||||||||||||
Commodity Contracts | ||||||||||||||||
Copper Future | Long | 2 | 12/30/2015 | $ | 115,876 | $ | (2,379) | |||||||||
Gold 100 Oz. Future | Long | 1 | 12/30/2015 | 114,140 | (2,509) | |||||||||||
Live Cattle Future | Long | 1 | 01/04/2016 | 56,690 | (182) | |||||||||||
Sugar No. 11 (World) Future | Long | 3 | 03/01/2016 | 48,786 | (132) | |||||||||||
Equity Contracts | ||||||||||||||||
E-Mini S&P 500® Future | Short | 79 | 12/21/2015 | (8,191,115) | (470,040) | |||||||||||
FTSE® 100 Index Future | Short | 13 | 12/21/2015 | (1,266,572) | (41,010) | |||||||||||
SGX CNX Nifty Index Future | Long | 237 | 11/27/2015 | 3,828,498 | (73,341) | |||||||||||
Fixed Income Contracts | ||||||||||||||||
Canadian 10 Year Bond Future | Long | 4 | 12/21/2015 | 429,795 | (10,318) | |||||||||||
Canadian 5 Year Bond Future | Long | 2 | 12/21/2015 | 188,865 | (1,779) | |||||||||||
Euro-BOBL Future | Short | 9 | 12/09/2015 | (1,280,851) | (8,031) | |||||||||||
U.S. 10 Year Treasury Note Future | Short | 46 | 12/22/2015 | (5,873,602) | (14,840) | |||||||||||
U.S. Treasury Long Bond Future | Short | 4 | 12/22/2015 | (625,752) | (4,290) | |||||||||||
Foreign Currency Contracts | ||||||||||||||||
British Pound Currency Future | Short | 37 | 12/15/2015 | (3,566,319) | (15,152) | |||||||||||
|
| |||||||||||||||
| $ | (16,021,561) | $ | (644,003) | |||||||||||||
|
| |||||||||||||||
TOTAL RETURN SWAP CONTRACTS*
| Counterparty | Reference Obligation | Notional Amount | Rate Paid by the Fund | Termination Date | Unrealized Appreciation | |||||||||
| ||||||||||||||
Morgan Stanley | Impala Segregated Portfolio(a) | $ | 61,353,798 | 1-Month LIBOR BBA | 03/20/2019 | $ | (113,094) | |||||||
Morgan Stanley | Melchior Segregated Portfolio(b) | 58,541,640 | 1-Month LIBOR BBA | 03/20/2019 | (45,996) | |||||||||
Morgan Stanley | WABR Cayman Company Limited(c) | 111,704,401 | 1-Month LIBOR BBA | 09/01/2020 | (104,761) | |||||||||
|
|
|
| |||||||||||
| $ | 231,599,839 | $ | (263,851) | |||||||||||
|
|
|
| |||||||||||
| * | The Fund receives payments based on any positive return of the Reference Obligation less the rate paid by the Fund. The Fund makes payments on any negative return of such Reference Obligation plus the rate paid by the Fund. |
| (a) | European equity long/short strategy that employs a flexible, low-net strategy (0% to 50%), and long exposure will vary between 60% and 100%. The portfolio is primarily comprised of large and mid-cap stocks listed on European exchanges. |
| (b) | Global equity long/short strategy that uses a long-biased strategy that is focused on cyclical sectors. The strategy has a net exposure that ranges between 50% and 80%, and long exposure varies between 80% and 100%. The strategy is comprised of large cap stocks listed on exchanges of developed and emerging market countries. |
| (c) | Weiss Alpha Balanced Risk incorporates an absolute return oriented approach within a risk parity framework. Active absolute return strategies include fundamental long/short equity, credit relative value, discretionary macro, and equity market neutral strategies. The strategy also maintains a passive risk weighted allocation to equities and fixed income, but each of the three allocations is equally risk weighted subject to a 40% limit on the absolute return allocation. Gross equity long exposure will typically be 140% or less, and net equity exposure will vary between 5% and 35%. |
Common Abbreviations:
AB - Aktiebolag is the Swedish equivalent of the term corporation.
ADR - American Depositary Receipt.
AG - Aktiengesellschaft is a German term that refers to a corporation that is limited by shares, i.e., owned by shareholders.
AQR - AQR Capital Management LLC.
A/S - Aktieselskab is the Danish term for Joint Stock Company.
ASA - Allmennaksjeselskap is the Norwegian term for public limited company.
BBA - British Bankers Association.
BOBL - Bundesobligationen is the German word for a German government security issued with a 5 year maturity.
Bolsa - The Spanish term for stock exchange.
BTP - Bonds offered by the government of Italy.
BV - Besloten Vennootschap is the Dutch term for private limited liability company.
CNX Nifty - The National Stock Exchange of India’s benchmark stock market index for Indian equity market.
DB - Deutsche Bank.
ETF - Exchange Traded Fund.
See Notes to Financial Statements.
48 |
www.redmontfunds.com |
Table of Contents
| Redmont Resolute Fund II | Schedule of Investments | |
October 31, 2015 (Unaudited) |
FPA - First Pacific Advisors LLC.
FTSE - Financial Times and the London Stock Exchange.
FX - Foreign Exchange.
KGaA - Kommanditgesellschaft Auf Aktien is the German term for a partnership limited by shares.
LIBOR - London Interbank Offered Rate.
LLC - Limited Liability Company.
LP - Limited Partnership.
Ltd. - Limited.
MSCI - Morgan Stanley Capital International.
NV - Naamloze Vennootschap is the Dutch term for a public limited liability corporation.
OAT - Obligations Assimilables du Tresor is the French term for Long-term French government bonds.
OYJ - Osakeyhtio is the Finnish equivalent of a public limited company.
PIMCO - Pacific Investment Management Company.
PLC - Public Limited Company.
REIT - Real Estate Investment Trust.
RSP - Risparmio non voting shares.
S&P - Standard & Poor’s.
SA - Generally designates corporations in various countries, mostly those employing the civil law.
SCS - Societe en Commandite Simple is the French term for limited partnership.
SE - SE Regulation. A European company which can operate on a Europe-wide basis and be governed by Community law directly applicable in all Member States.
SGPS - Sociedade Gestora de Participacoes Sociais is the Portuguese term for holding company.
SGX - Singapore Exchange.
SpA - Societa per Azione.
SPDR - Standard & Poor’s Depositary Receipt.
STOXX 50 - A stock index representing 50 of the largest companies in Europe based on market capitalization.
See Notes to Financial Statements.
| Semi-Annual Report | October 31, 2015 | 49 |
Table of Contents
| Redmont Funds | Statements of Assets and Liabilities | |
October 31, 2015 (Unaudited) |
| Redmont Resolute | Redmont Resolute | |||||||
| Fund I | Fund II | |||||||
| ||||||||
ASSETS | ||||||||
Investments, at value | $ | 2,411,009 | $ | 618,417,876 | ||||
Deposits with brokers for securities sold short and written options | 5,701 | 26,594,187 | ||||||
Deposits with brokers for total return swap contracts | 497,300 | 80,694,146 | ||||||
Foreign currency, at value (Cost $– and $14,646, respectively) | – | 14,333 | ||||||
Receivable for investments sold | – | 1,510,775 | ||||||
Variation margin receivable | 350 | 81,423 | ||||||
Receivable due from adviser | 7,645 | – | ||||||
Receivable for dividends | 950 | 460,950 | ||||||
Other assets | 7,752 | 7,214 | ||||||
| ||||||||
Total assets | 2,930,707 | 727,780,904 | ||||||
| ||||||||
LIABILITIES | ||||||||
Securities sold short (Proceeds $– and $27,289,643, respectively) | – | 27,413,436 | ||||||
Written options, at value (Premiums received $– and $193,730, respectively) | – | 331,758 | ||||||
Unrealized depreciation on total return swap contracts | 1,958 | 263,851 | ||||||
Investment advisory fees payable | – | 374,965 | ||||||
Distributions and service fees payable | 192 | N/A | ||||||
Payable for dividend expense on securities sold short | 98 | 28,542 | ||||||
Payable for interest expense on total return swap contracts | 144 | 20,173 | ||||||
Payable for investments purchased | – | 1,641,326 | ||||||
Trustee fees and expenses payable | 31 | 5,278 | ||||||
Chief compliance officer fee payable | 47 | 8,178 | ||||||
Principal financial officer fees payable | 13 | 1,681 | ||||||
Administration fees payable | 6,110 | 86,243 | ||||||
Transfer agent fees payable | 10,248 | 8,555 | ||||||
Professional fees payable | 10,412 | 30,609 | ||||||
Custody fees payable | 6,978 | 30,801 | ||||||
Accrued expenses and other liabilities | 3,467 | 16,732 | ||||||
| ||||||||
Total liabilities | 39,698 | 30,262,128 | ||||||
| ||||||||
NET ASSETS | $ | 2,891,009 | $ | 697,518,776 | ||||
| ||||||||
NET ASSETS CONSIST OF | ||||||||
Paid-in capital (Note 6) | $ | 2,719,766 | $ | 667,134,681 | ||||
Accumulated net income/(loss) | (2,954) | 6,876,976 | ||||||
Accumulated net realized gain on investments, securities sold short, written options, futures contracts, total return swap contracts, and foreign currency transactions | 148,653 | 6,050,245 | ||||||
Net unrealized appreciation on investments, securities sold short, written options, futures contracts, total return swap contracts, and translation of assets and liabilities in foreign currency transactions | 25,544 | 17,456,874 | ||||||
| ||||||||
NET ASSETS | $ | 2,891,009 | $ | 697,518,776 | ||||
| ||||||||
INVESTMENTS, AT COST | $ | 2,386,069 | $ | 600,646,453 | ||||
| ||||||||
See Notes to Financial Statements.
50 |
www.redmontfunds.com |
Table of Contents
| Redmont Funds | Statements of Assets and Liabilities | |
October 31, 2015 (Unaudited) |
| Redmont Resolute | Redmont Resolute | |||||||
| Fund I | Fund II | |||||||
| ||||||||
PRICING OF SHARES | ||||||||
Class A: | ||||||||
Net Asset Value, offering and redemption price per share(a) | $ | 10.68 | N/A | |||||
Net Assets | $ | 463,888 | N/A | |||||
Shares of beneficial interest outstanding (unlimited number of shares, no par value common stock authorized) | 43,424 | N/A | ||||||
Maximum offering price per share ((NAV/0.9450), based on maximum sales charge of 5.50% of the offering price) | $ | 11.30 | N/A | |||||
Class I: | ||||||||
Net Asset Value, offering and redemption price per share | $ | 10.60 | $ | 11.17 | ||||
Net Assets | $ | 2,427,121 | $ | 697,518,776 | ||||
Shares of beneficial interest outstanding (unlimited number of shares, no par value common stock authorized) | 229,073 | 62,426,960 | ||||||
| (a) | Redemption price per share may be reduced for any applicable contingent deferred sales charge. For a description of a possible sales charge, please see the Fund’s Prospectus. |
See Notes to Financial Statements.
| Semi-Annual Report | October 31, 2015 | 51 |
Table of Contents
| Redmont Funds | Statements of Operations | |
For the Six Months Ended October 31, 2015 (Unaudited) |
Redmont Resolute Fund I | Redmont Resolute Fund II | |||||||
| ||||||||
INVESTMENT INCOME | ||||||||
Dividends | $ | 16,740 | $ | 3,027,901 | ||||
Interest | 3 | 298,153 | ||||||
Foreign taxes withheld | (13) | (35,803) | ||||||
| ||||||||
Total investment income | 16,730 | 3,290,251 | ||||||
| ||||||||
EXPENSES | ||||||||
Investment advisory fees (Note 7) | 22,535 | 5,111,804 | ||||||
Broker fees and charges on securities sold short | 460 | 80,944 | ||||||
Administration fees | 6,972 | 194,254 | ||||||
Transfer agency fees | 23,746 | 20,085 | ||||||
Distribution and service fees | ||||||||
Class A | 855 | N/A | ||||||
Professional fees | 6,904 | 26,051 | ||||||
Custody fees | 13,853 | 58,310 | ||||||
Reports to shareholders and printing fees | 197 | 5,837 | ||||||
Trustee fees and expenses | 45 | 9,720 | ||||||
Registration/filing fees | 14,631 | 1,667 | ||||||
Chief compliance officer fees | 116 | 24,314 | ||||||
Principal financial officer fees | 27 | 5,000 | ||||||
Dividend expense on securities sold short | 1,255 | 219,756 | ||||||
Other | 1,953 | 11,580 | ||||||
| ||||||||
Total expenses before waivers | 93,549 | 5,769,322 | ||||||
Less fees waived/reimbursed by investment adviser (Note 7) | ||||||||
Class A | (9,552) | N/A | ||||||
Class I | (57,326) | (4,546,532) | ||||||
| ||||||||
Total net expenses | 26,671 | 1,222,790 | ||||||
| ||||||||
NET INVESTMENT INCOME/(LOSS) | (9,941) | 2,067,461 | ||||||
| ||||||||
Net realized gain on investments | 68,877 | 1,868,866 | ||||||
Net realized gain on securities sold short | 4,646 | 435,840 | ||||||
Net realized gain on written options | – | 76,814 | ||||||
Net realized loss on futures contracts | (7,988) | (1,720,894) | ||||||
Net realized loss on total return swap contracts | (7,693) | (2,231,023) | ||||||
Net realized gain/(loss) on foreign currency transactions | 5 | (7,569) | ||||||
Net change in unrealized depreciation on investments | (133,371) | (13,309,955) | ||||||
Net change in unrealized appreciation on securities sold short | 9,909 | 1,442,622 | ||||||
Net change in unrealized depreciation on written options | – | (122,795) | ||||||
Net change in unrealized appreciation on futures contracts | 11,572 | 1,305,689 | ||||||
Net change in unrealized appreciation on total return swap contracts | 6,721 | 1,490,940 | ||||||
Net change in unrealized depreciation on translation of assets and liabilities in foreign currency transactions | – | (1,881) | ||||||
| ||||||||
NET REALIZED AND UNREALIZED LOSS ON INVESTMENTS | (47,322) | (10,773,346) | ||||||
| ||||||||
NET DECREASE IN NET ASSETS RESULTING FROM OPERATIONS | $ | (57,263) | $ | (8,705,885) | ||||
| ||||||||
See Notes to Financial Statements.
52 |
www.redmontfunds.com |
Table of Contents
| Redmont Funds | Statements of Changes in Net Assets | |
| Redmont Resolute Fund I | ||||||||
| Six Months Ended October 31, 2015 (Unaudited) | For the Year Ended April 30, 2015 | ||||||
OPERATIONS | ||||||||
Net investment loss | $ | (9,941) | $ | (11,389) | ||||
Net realized gain on investments, securities sold short, futures contracts, total return swap contracts, and foreign currency transactions | 57,847 | 207,151 | ||||||
Net realized gain distributions from other investment companies | – | 13,702 | ||||||
Net change in unrealized depreciation on investments, securities sold short, futures contracts, and total return swap contracts. | (105,169) | (88,022) | ||||||
| ||||||||
Net increase/(decrease) in net assets resulting from operations | (57,263) | 121,442 | ||||||
| ||||||||
DISTRIBUTIONS (NOTE 4) | ||||||||
Net investment income | ||||||||
Class I | – | (2,014) | ||||||
Net realized gains on investments | ||||||||
Class A | – | (19,271) | ||||||
Class I | – | (62,548) | ||||||
| ||||||||
Net decrease in net assets from distributions | – | (83,833) | ||||||
| ||||||||
BENEFICIAL INTEREST TRANSACTIONS (NOTE 6) | ||||||||
Shares sold | ||||||||
Class A | 105,000 | 828,298 | ||||||
Class I | 494,026 | 187,065 | ||||||
Dividends reinvested | ||||||||
Class A | – | 19,271 | ||||||
Class I | – | 64,562 | ||||||
Shares redeemed, net of redemption fees | ||||||||
Class A | (31,968) | (541,265) | ||||||
Class I | (779,993) | (1,687,672) | ||||||
| ||||||||
Net decrease in net assets derived from beneficial interest transactions | (212,935) | (1,129,741) | ||||||
| ||||||||
Net decrease in Net Assets | (270,198) | (1,092,132) | ||||||
NET ASSETS: | ||||||||
Beginning of period | 3,161,207 | 4,253,339 | ||||||
| ||||||||
End of period* | $ | 2,891,009 | $ | 3,161,207 | ||||
| ||||||||
* Includes accumulated net investment income/(loss) of: | $ | (2,954) | $ | 6,987 | ||||
See Notes to Financial Statements.
| Semi-Annual Report | October 31, 2015 | 53 |
Table of Contents
| Redmont Funds | Statements of Changes in Net Assets | |
| Redmont Resolute Fund II | ||||||||
| Six Months Ended October 31, 2015 (Unaudited) | For the Year Ended April 30, 2015 | ||||||
OPERATIONS | ||||||||
Net investment income | $ | 2,067,461 | $ | 11,793,052 | ||||
Net realized gain/(loss) on investments, securities sold short, written options, futures contracts, total return swap contracts, and foreign currency transactions | (1,577,966) | 19,405,734 | ||||||
Net realized gain distributions from other investment companies | – | 3,191,369 | ||||||
Net change in unrealized depreciation on investments, securities sold short, written options, futures contracts, total return swap contracts, and translation of assets and liabilities in foreign currency transactions | (9,195,380) | (7,606,167) | ||||||
| ||||||||
Net increase/(decrease) in net assets resulting from operations | (8,705,885) | 26,783,988 | ||||||
| ||||||||
DISTRIBUTIONS (NOTE 4) | ||||||||
Net investment income | ||||||||
Class I | – | (14,088,339) | ||||||
Net realized gains on investments | ||||||||
Class I | – | (4,443,526) | ||||||
| ||||||||
Net decrease in net assets from distributions | – | (18,531,865) | ||||||
| ||||||||
BENEFICIAL INTEREST TRANSACTIONS (NOTE 6) | ||||||||
Shares sold | ||||||||
Class I | 31,947,841 | 97,459,393 | ||||||
Dividends reinvested | ||||||||
Class I | – | 18,500,507 | ||||||
Shares redeemed, net of redemption fees | ||||||||
Class I | (14,988,703) | (39,895,825) | ||||||
| ||||||||
Net increase in net assets derived from beneficial interest transactions | 16,959,138 | 76,064,075 | ||||||
| ||||||||
Net increase in Net Assets | 8,253,253 | 84,316,198 | ||||||
NET ASSETS: | ||||||||
Beginning of period | 689,265,523 | 604,949,325 | ||||||
| ||||||||
End of period* | $ | 697,518,776 | $ | 689,265,523 | ||||
| ||||||||
* Includes accumulated net investment income of: | $ | 6,876,976 | $ | 4,809,515 | ||||
See Notes to Financial Statements.
54 |
www.redmontfunds.com |
Table of Contents
| Redmont Resolute Fund I | Financial Highlights | |
For a share outstanding throughout the periods presented |
| Class A | ||||||||||||||||||||
| For the | ||||||||||||||||||||
| Six Months Ended | For the | For the | For the | For the | ||||||||||||||||
| October 31, 2015 | Year Ended | Year Ended | Year Ended | Period Ended | ||||||||||||||||
| (Unaudited) | April 30, 2015 | April 30, 2014 | April 30, 2013 | April 30, 2012(a) | ||||||||||||||||
| ||||||||||||||||||||
NET ASSET VALUE, BEGINNING OF PERIOD | $ | 10.91 | $ | 10.61 | $ | 10.63 | $ | 10.17 | $ | 10.00 | ||||||||||
INCOME/(LOSS) FROM OPERATIONS | ||||||||||||||||||||
Net investment loss(b) | (0.06) | (0.18) | (0.10) | (0.04) | (0.07) | |||||||||||||||
Net realized and unrealized gain/(loss) on investments | (0.17) | 0.39 | 0.17 | 0.52 | 0.24 | |||||||||||||||
|
|
|
|
|
|
|
|
|
| |||||||||||
Total from Investment Operations | (0.23) | 0.21 | 0.07 | 0.48 | 0.17 | |||||||||||||||
|
|
|
|
|
|
|
|
|
| |||||||||||
LESS DISTRIBUTIONS | ||||||||||||||||||||
Net investment income | – | – | – | (0.03) | – | |||||||||||||||
Net realized gain on investments | – | (0.23) | (0.09) | (0.00)(c) | – | |||||||||||||||
|
|
|
|
|
|
|
|
|
| |||||||||||
Total Distributions | – | (0.23) | (0.09) | (0.03) | – | |||||||||||||||
|
|
|
|
|
|
|
|
|
| |||||||||||
REDEMPTION FEES ADDED TO PAID IN CAPITAL | – | 0.32 | – | 0.01 | – | |||||||||||||||
|
|
|
|
|
|
|
|
|
| |||||||||||
NET INCREASE/(DECREASE) IN NET ASSET VALUE | (0.23) | 0.30 | (0.02) | 0.46 | 0.17 | |||||||||||||||
|
|
|
|
|
|
|
|
|
| |||||||||||
NET ASSET VALUE, END OF PERIOD | $ | 10.68 | $ | 10.91 | $ | 10.61 | $ | 10.63 | $ | 10.17 | ||||||||||
|
|
|
|
|
|
|
|
|
| |||||||||||
TOTAL RETURN(d) | (2.11) | % | 5.05 | % | 0.70 | % | 4.81 | % | 1.70 | % | ||||||||||
RATIOS/SUPPLEMENTAL DATA | ||||||||||||||||||||
Net assets, End of Period (000s) | $ | 464 | $ | 401 | $ | 104 | $ | 21 | $ | 1 | ||||||||||
RATIOS TO AVERAGE NET ASSETS: | ||||||||||||||||||||
Operating expenses excluding reimbursement/waiver(e) | 6.55%(f) | (g) | 5.81% | (g) | 5.38% | (g) | 6.47 | % | 689.76% | (f) | ||||||||||
Operating expenses including reimbursement/waiver(e) | 2.12%(f) | (g) | 2.08% | (g) | 2.08% | (g) | 2.30 | % | 2.30% | (f) | ||||||||||
Net investment loss including reimbursement/waiver(e) | (1.07)% | (f) | (1.66)% | (0.99)% | (0.38) | % | (2.21)% | (f) | ||||||||||||
PORTFOLIO TURNOVER RATE | 16% | (h) | 83% | 91% | 25 | % | 13% | (h) | ||||||||||||
| (a) | The Fund’s inception was December 30, 2011. |
| (b) | Calculated using the average shares method. |
| (c) | Less than $0.005 per share. |
| (d) | Total investment return is calculated assuming a purchase of a common share at the opening of the first day and a sale at closing on the last day of each period reported. Dividends and distributions, if any, are assumed for purposes of this calculation to be reinvested at prices obtained under the Fund’s dividend reinvestment plan. Total returns would have been lower had certain expenses not been waived during the period. Total investment returns do not reflect brokerage commissions, if any, and are not annualized. |
| (e) | The ratios exclude the impact of expenses of the underlying funds in which the Fund invests as represented in the Schedule of Investments. |
| (f) | Annualized. |
| (g) | Dividend and interest expense on securities sold short totaled 0.11% (annualized), 0.11%, and 0.08% of average net assets for the six months ended October 31, 2015 and the years ended April 30, 2015 and 2014, respectively. |
| (h) | Not Annualized. |
See Notes to Financial Statements.
| Semi-Annual Report | October 31, 2015 | 55 |
Table of Contents
| Redmont Resolute Fund I | Financial Highlights | |
For a share outstanding throughout the periods presented |
| Class I | ||||||||||||||||||||
| For the | ||||||||||||||||||||
| Six Months Ended | For the | For the | For the | For the | ||||||||||||||||
| October 31, 2015 | Year Ended | Year Ended | Year Ended | Period Ended | ||||||||||||||||
| (Unaudited) | April 30, 2015 | April 30, 2014 | April 30, 2013 | April 30, 2012(a) | ||||||||||||||||
| ||||||||||||||||||||
NET ASSET VALUE, BEGINNING OF PERIOD | $ | 10.80 | $ | 10.70 | $ | 10.65 | $ | 10.18 | $ | 10.00 | ||||||||||
INCOME/(LOSS) FROM OPERATIONS | ||||||||||||||||||||
Net investment loss(b) | (0.03) | (0.02) | (0.04) | (0.02) | (0.06) | |||||||||||||||
Net realized and unrealized gain/(loss) on investments | (0.17) | 0.36 | 0.18 | 0.52 | 0.24 | |||||||||||||||
|
|
|
|
|
|
|
|
|
| |||||||||||
Total from Investment Operations | (0.20) | 0.34 | 0.14 | 0.50 | 0.18 | |||||||||||||||
|
|
|
|
|
|
|
|
|
| |||||||||||
LESS DISTRIBUTIONS | ||||||||||||||||||||
Net investment income | – | (0.01) | – | (0.03) | – | |||||||||||||||
Net realized gain on investments | – | (0.23) | (0.09) | (0.00)(c) | – | |||||||||||||||
|
|
|
|
|
|
|
|
|
| |||||||||||
Total Distributions | – | (0.24) | (0.09) | (0.03) | – | |||||||||||||||
|
|
|
|
|
|
|
|
|
| |||||||||||
REDEMPTION FEES ADDED TO PAID IN CAPITAL | – | 0.00(c) | – | – | – | |||||||||||||||
|
|
|
|
|
|
|
|
|
| |||||||||||
NET INCREASE/(DECREASE) IN NET ASSET VALUE | (0.20) | 0.10 | 0.05 | 0.47 | 0.18 | |||||||||||||||
|
|
|
|
|
|
|
|
|
| |||||||||||
NET ASSET VALUE, END OF PERIOD | $ | 10.60 | $ | 10.80 | $ | 10.70 | $ | 10.65 | $ | 10.18 | ||||||||||
|
|
|
|
|
|
|
|
|
| |||||||||||
TOTAL RETURN(d) | (1.85) | % | 3.16 | % | 1.36 | % | 4.96 | % | 1.80 | % | ||||||||||
RATIOS/SUPPLEMENTAL DATA | ||||||||||||||||||||
Net assets, End of Period (000s) | $ | 2,427 | $ | 2,760 | $ | 4,149 | $ | 3,195 | $ | 951 | ||||||||||
RATIOS TO AVERAGE NET ASSETS: | ||||||||||||||||||||
Operating expenses excluding reimbursement/waiver(e) | 6.17%(f) | (g) | 5.38% | (g) | 4.85% | (g) | 5.87 | % | 19.86% | (f) | ||||||||||
Operating expenses including reimbursement/waiver(e) | 1.72%(f) | (g) | 1.66% | (g) | 1.73% | (g) | 1.90 | % | 1.90% | (f) | ||||||||||
Net investment loss including reimbursement/waiver(e) | (0.59)% | (f) | (0.19)% | (0.35)% | (0.23) | % | (1.78)% | (f) | ||||||||||||
PORTFOLIO TURNOVER RATE | 16% | (h) | 83% | 91% | 25 | % | 13% | (h) | ||||||||||||
| (a) | The Fund’s inception was December 30, 2011. |
| (b) | Calculated using the average shares method. |
| (c) | Less than $0.005 per share. |
| (d) | Total investment return is calculated assuming a purchase of a common share at the opening of the first day and a sale at closing on the last day of each period reported. Dividends and distributions, if any, are assumed for purposes of this calculation to be reinvested at prices obtained under the Fund’s dividend reinvestment plan. Total returns would have been lower had certain expenses not been waived during the period. Total investment returns do not reflect brokerage commissions, if any, and are not annualized. |
| (e) | The ratios exclude the impact of expenses of the underlying funds in which the Fund invests as represented in the Schedule of Investments. |
| (f) | Annualized. |
| (g) | Dividend and interest expense on securities sold short totaled 0.11% (annualized), 0.11%, and 0.08% of average net assets for the six months ended October 31, 2015 and the years ended April 30, 2015 and 2014, respectively. |
| (h) | Not Annualized. |
See Notes to Financial Statements.
56 |
www.redmontfunds.com |
Table of Contents
| Redmont Resolute Fund II | Financial Highlights | |
For a share outstanding throughout the periods presented |
| Class I | ||||||||||||||||||||
| For the | ||||||||||||||||||||
| Six Months Ended | For the | For the | For the | For the | ||||||||||||||||
| October 31, 2015 | Year Ended | Year Ended | Year Ended | Period Ended | ||||||||||||||||
| (Unaudited) | April 30, 2015 | April 30, 2014 | April 30, 2013 | April 30, 2012(a) | ||||||||||||||||
| ||||||||||||||||||||
NET ASSET VALUE, BEGINNING OF PERIOD | $ | 11.32 | $ | 11.18 | $ | 11.05 | $ | 10.34 | $ | 10.00 | ||||||||||
INCOME/(LOSS) FROM OPERATIONS | ||||||||||||||||||||
Net investment income/(loss)(b) | 0.03 | 0.20 | 0.13 | 0.11 | (0.03) | |||||||||||||||
Net realized and unrealized gain/(loss) on investments | (0.18) | 0.26 | 0.19 | 0.68 | 0.37 | |||||||||||||||
|
|
|
|
|
|
|
|
|
| |||||||||||
Total from Investment Operations | (0.15) | 0.46 | 0.32 | 0.79 | 0.34 | |||||||||||||||
|
|
|
|
|
|
|
|
|
| |||||||||||
LESS DISTRIBUTIONS | ||||||||||||||||||||
Net investment income | – | (0.24) | (0.11) | (0.08) | – | |||||||||||||||
Net realized gain on investments | – | (0.08) | (0.08) | – | – | |||||||||||||||
|
|
|
|
|
|
|
|
|
| |||||||||||
Total Distributions | – | (0.32) | (0.19) | (0.08) | – | |||||||||||||||
|
|
|
|
|
|
|
|
|
| |||||||||||
NET INCREASE/(DECREASE) IN NET ASSET VALUE | (0.15) | 0.14 | 0.13 | 0.71 | 0.34 | |||||||||||||||
|
|
|
|
|
|
|
|
|
| |||||||||||
NET ASSET VALUE, END OF PERIOD | $ | 11.17 | $ | 11.32 | $ | 11.18 | $ | 11.05 | $ | 10.34 | ||||||||||
|
|
|
|
|
|
|
|
|
| |||||||||||
TOTAL RETURN(c) | (1.33) | % | 4.16 | % | 2.85 | % | 7.65 | % | 3.40 | % | ||||||||||
RATIOS/SUPPLEMENTAL DATA | ||||||||||||||||||||
Net assets, End of Period (000s) | $ | 697,519 | $ | 689,266 | $ | 604,949 | $ | 446,319 | $ | 78,498 | ||||||||||
RATIOS TO AVERAGE NET ASSETS: | ||||||||||||||||||||
Operating expenses excluding reimbursement/waiver(d) | 1.69%(e) | (f) | 1.68% | (f) | 1.69% | (f) | 1.32 | % | 1.63% | (e) | ||||||||||
Operating expenses including reimbursement/waiver(d) | 0.36%(e) | (f) | 0.33% | (f) | 0.29% | (f) | 0.22 | % | 1.13% | (e) | ||||||||||
Net investment income/(loss) | 0.61% | (e) | 1.79% | 1.19% | 1.08 | % | (0.97)% | (e) | ||||||||||||
PORTFOLIO TURNOVER RATE | 11% | (g) | 54% | 114% | 51 | % | 18% | (g) | ||||||||||||
| (a) | The Fund’s inception was December 30, 2011. |
| (b) | Calculated using the average shares method. |
| (c) | Total investment return is calculated assuming a purchase of a common share at the opening of the first day and a sale at closing on the last day of each period reported. Dividends and distributions, if any, are assumed for purposes of this calculation to be reinvested at prices obtained under the Fund’s dividend reinvestment plan. Total returns would have been lower had certain expenses not been waived during the period. Total investment returns do not reflect brokerage commissions, if any, and are not annualized. |
| (d) | The ratios exclude the impact of expenses of the underlying funds in which the Fund invests as represented in the Schedule of Investments. |
| (e) | Annualized. |
| (f) | Dividend and interest expense on securities sold short totaled 0.09% (annualized), 0.10%, and 0.08% of average net assets for the six months ended October 31, 2015 and the years ended April 30, 2015 and 2014, respectively. |
| (g) | Not Annualized. |
See Notes to Financial Statements.
| Semi-Annual Report | October 31, 2015 | 57 |
Table of Contents
| Redmont Funds | Notes to Financial Statements | |
October 31, 2015 (Unaudited) |
1. ORGANIZATION
Financial Investors Trust (the “Trust”), a Delaware statutory trust, is an open-end management investment company registered under the Investment Company Act of 1940, as amended (“1940 Act”). As of October 31, 2015, the Trust has 34 registered funds. This semi-annual report describes the Redmont Resolute Fund I and Redmont Resolute Fund II (each a “Fund” and collectively, the “Funds”). The Funds seek to provide long-term total return with reduced volatility and reduced correlation to the conventional stock and bond markets. The Redmont Resolute Fund I offers Class A and Class I shares and the Redmont Resolute Fund II offers Class I shares.
2. SIGNIFICANT ACCOUNTING POLICIES
The accompanying financial statements were prepared in accordance with accounting principles generally accepted in the United States of America (“U.S. GAAP”). The preparation of financial statements in conformity with U.S. GAAP requires management to make certain estimates and assumptions that affect the reported amounts of assets and liabilities and disclosures of contingent assets and liabilities at the date of the financial statements and the reported amounts of revenue and expenses during the period. Actual results could differ from those estimates. The Funds are considered an investment company for financial reporting purposes under U.S. GAAP. The following is a summary of significant accounting policies consistently followed by the Funds in preparation of their financial statements.
Investment Valuation: The Funds generally value their securities based on market prices determined at the close of regular trading on the New York Stock Exchange (“NYSE”), normally 4:00 p.m. Eastern Time, on each day the NYSE is open for trading.
For equity securities and mutual funds that are traded on an exchange, the market price is usually the closing sale or official closing price on that exchange. In the case of equity securities not traded on an exchange, or if such closing prices are not otherwise available, the securities are valued at the mean of the most recent bid and ask prices on such day. Redeemable securities issued by open-end registered investment companies are valued at the investment company’s applicable net asset value, with the exception of exchange-traded open-end investment companies, which are priced as equity securities.
The market price for debt obligations is generally the price supplied by an independent third-party pricing service approved by the Board of Trustees (the “Board”), which may use a matrix, formula or other objective method that takes into consideration quotations from dealers, market transactions in comparable investments, market indices and yield curves. If vendors are unable to supply a price, or if the price supplied is deemed to be unreliable, the market price may be determined using quotations received from one or more brokers–dealers that make a market in the security. Short–term debt obligations that will mature in 60 days or less are valued at amortized cost, unless it is determined that using this method would not reflect an investment’s fair value.
Futures contracts that are listed or traded on a national securities exchange, commodities exchange, contract market or comparable over the counter market, and that are freely transferrable, are valued at their closing settlement price on the exchange on which they are primarily traded or based upon the current settlement price for a like instrument acquired on the day on which the instrument is being valued. A settlement price may not be used if the market makes a limit move with respect to a particular commodity. Over-the-counter swap contracts for which market quotations are readily available are valued based on quotes received from independent pricing services or one or more dealers that make markets in such securities. Options contracts listed for trading on a securities exchange or board of trade are valued at the last quoted sales price or, in the absence of a sale at the mean of the last bid and asked price.
When such prices or quotations are not available, or when Highland Associates, Inc. (the “Adviser”) believes that they are unreliable, securities may be priced using fair value procedures approved by the Board.
Fair Value Measurements: The Funds disclose the classification of their fair value measurements following a three-tier hierarchy based on the inputs used to measure fair value. Inputs refer broadly to the assumptions that market participants would use in pricing the asset or liability, including assumptions about risk. Inputs may be observable or unobservable. Observable inputs reflect the assumptions market participants would use in pricing the asset or liability that are developed based on market data obtained from sources independent of the reporting entity. Unobservable inputs reflect the reporting entity’s own assumptions about the assumptions market participants would use in pricing the asset or liability that are developed based on the best information available.
58 |
www.redmontfunds.com |
Table of Contents
| Redmont Funds | Notes to Financial Statements | |
October 31, 2015 (Unaudited) |
Various inputs are used in determining the value of the Funds’ investments as of the end of the reporting period. When inputs used fall into different levels of the fair value hierarchy, the level in the hierarchy within which the fair value measurement falls is determined based on the lowest level input that is significant to the fair value measurement in its entirety. The designated input levels are not necessarily an indication of the risk or liquidity associated with these investments. These inputs are categorized in the following hierarchy under applicable financial accounting standards:
Level 1 – | Unadjusted quoted prices in active markets for identical investments, unrestricted assets or liabilities that the Funds have the ability to access at the measurement date; | |
Level 2 – | Quoted prices which are not active, quoted prices for similar assets or liabilities in active markets or inputs other than quoted prices that are observable (either directly or indirectly) for substantially the full term of the asset or liability; and | |
Level 3 – | Significant unobservable prices or inputs (including the Funds’ own assumptions in determining the fair value of investments) where there is little or no market activity for the asset or liability at the measurement date. | |
The following is a summary of the inputs used to value the Funds’ investments as of October 31, 2015:
Redmont Resolute Fund I | ||||||||||||||||
| Investments in Securities at Value | Level 1 - Quoted Prices | Level 2 - Other Significant Observable Inputs | Level 3 - Unobservable Inputs | Total | ||||||||||||
| ||||||||||||||||
Exchange Traded Funds | $ | 306,879 | $ | – | $ | – | $ | 306,879 | ||||||||
Open-End Mutual Funds | 1,615,563 | – | – | 1,615,563 | ||||||||||||
Short Term Investments | ||||||||||||||||
Money Market Funds | 483,570 | – | – | 483,570 | ||||||||||||
U.S. Treasury Bills | – | 4,997 | – | 4,997 | ||||||||||||
| ||||||||||||||||
Total | $ | 2,406,012 | $ | 4,997 | $ | – | $ | 2,411,009 | ||||||||
| ||||||||||||||||
Other Financial Instruments | ||||||||||||||||
| ||||||||||||||||
Assets: | ||||||||||||||||
Futures Contracts | $ | 2,562 | $ | – | $ | – | $ | 2,562 | ||||||||
Liabilities: | ||||||||||||||||
Total Return Swap Contracts | – | (1,958 | ) | – | (1,958) | |||||||||||
| ||||||||||||||||
Total | $ | 2,562 | $ | (1,958 | ) | $ | – | $ | 604 | |||||||
| ||||||||||||||||
Redmont Resolute Fund II | ||||||||||||||||
| Investments in Securities at Value | Level 1 - Quoted Prices | Level 2 - Other Significant Observable Inputs | Level 3 - Unobservable Inputs | Total | ||||||||||||
| ||||||||||||||||
Common Stocks | $ | 96,205,089 | $ | – | $ | – | $ | 96,205,089 | ||||||||
Exchange Traded Funds | 911,201 | – | – | 911,201 | ||||||||||||
Limited Partnerships | 94,802 | – | – | 94,802 | ||||||||||||
Open-End Mutual Funds | 450,138,124 | – | – | 450,138,124 | ||||||||||||
Preferred Stocks | 150,973 | – | – | 150,973 | ||||||||||||
Asset-Backed Securities | – | 1,121,027 | – | 1,121,027 | ||||||||||||
Contingent Convertible Securities | – | 205,725 | – | 205,725 | ||||||||||||
Corporate Bonds | – | 13,028,335 | – | 13,028,335 | ||||||||||||
Foreign Government Bonds | – | 84,772 | – | 84,772 | ||||||||||||
Government Bonds | – | 1,331,601 | – | 1,331,601 | ||||||||||||
Short Term Investments | ||||||||||||||||
Money Market Funds | 51,320,643 | – | – | 51,320,643 | ||||||||||||
U.S. Treasury Bills | – | 3,825,584 | – | 3,825,584 | ||||||||||||
| ||||||||||||||||
Total | $ | 598,820,832 | $ | 19,597,044 | $ | – | $ | 618,417,876 | ||||||||
| ||||||||||||||||
Other Financial Instruments | ||||||||||||||||
| ||||||||||||||||
Assets: | ||||||||||||||||
Futures Contracts | $ | 855,701 | $ | – | $ | – | $ | 855,701 | ||||||||
| Semi-Annual Report | October 31, 2015 | 59 |
Table of Contents
| Redmont Funds | Notes to Financial Statements | |
October 31, 2015 (Unaudited) |
Liabilities: | ||||||||||||||||
Common Stocks Sold Short | (27,313,408 | ) | – | – | (27,313,408) | |||||||||||
Limited Partnerships | (100,028 | ) | – | – | (100,028) | |||||||||||
Written Options | (331,758 | ) | – | – | (331,758) | |||||||||||
Futures Contracts | (644,003 | ) | – | – | (644,003) | |||||||||||
Total Return Swap Contracts | – | (263,851 | ) | – | (263,851) | |||||||||||
| ||||||||||||||||
Total | $ | (27,533,496 | ) | $ | (263,851 | ) | $ | – | $ | (27,797,347) | ||||||
| ||||||||||||||||
| * | For detailed descriptions, see the accompanying Schedule of Investments. |
The Funds recognize transfers between levels as of the end of the period. For the six months ended October 31, 2015, the Funds did not have any transfers between Level 1 and Level 2 securities. There were no Level 3 securities held during the period.
Trust Expenses: Some expenses of the Trust can be directly attributed to the Funds. Expenses which cannot be directly attributed to the Funds are apportioned among all funds in the Trust based on average net assets of each fund.
Fund and Class Expenses: Expenses that are specific to a Fund or class of shares of a Fund, including distribution fees (Rule 12b-1 fees) and shareholder servicing fees, are charged directly to that Fund or share class. Expenses that are common to all Funds generally are allocated among the Funds in proportion to their average daily net assets.
Federal Income Taxes: The Funds comply with the requirements under Subchapter M of the Internal Revenue Code of 1986, as amended, applicable to regulated investment companies and intend to distribute substantially all of their net taxable income and net capital gains, if any, each year so that the Funds will not be subject to excise tax on undistributed income and gains. The Funds are not subject to income taxes to the extent such distributions are made.
As of and during the six months ended October 31, 2015, the Funds did not have a liability for any unrecognized tax benefits. The Funds file U.S. federal, state, and local tax returns as required. The Funds’ tax returns are subject to examination by the relevant tax authorities until expiration of the applicable statute of limitations, which is generally three years after the filing of the tax return for federal purposes and four years for most state returns. Tax returns for open years have incorporated no uncertain tax positions that require a provision for income taxes.
Investment Transactions and Investment Income: Investment transactions are accounted for on the date the investments are purchased or sold (trade date basis). Net realized gains and losses from investment transactions are reported on an identified cost basis. Interest income, which includes accretion of discounts and amortization of premiums, is accrued and recorded as earned. Dividend income is recognized on the ex-dividend date or for certain foreign securities, as soon as information is available to the Funds. All of the realized and unrealized gains and losses and net investment income, are allocated daily to each class in proportion its average daily net assets.
Short Sales: Each Fund may make short sales of securities consistent with its strategies. A short sale is a transaction in which a Fund sells a security it does not own in anticipation that the market price of that security will decline.
When a Fund makes a short sale, it must borrow the security sold short and deliver it to the broker dealer through which it made the short sale as collateral for its obligation to deliver the security upon conclusion of the sale. The Fund may have to pay a fee to borrow particular securities and is often obligated to pay over any accrued interest and dividends on such borrowed securities.
If the price of the security sold short increases between the time of the short sale and the time that a Fund replaces the borrowed security, the Fund will incur a loss; conversely, if the price declines, the Fund will realize a capital gain. Any gain will be decreased, and any loss increased, by the transaction costs described above. The successful use of short selling may be adversely affected by imperfect correlation between movements in the price of the security sold short and the securities being hedged.
To the extent that a Fund engages in short sales, it will provide collateral to the broker-dealer and (except in the case of short sales “against the box”) will maintain additional asset coverage in the form of segregated or “earmarked” assets determined to be liquid in accordance with procedures established by the Board and that is equal to the current market value of the securities sold short, or will ensure that such positions are covered by “offsetting” positions, until the Fund replaces the borrowed security. A short sale is “against the box” to the extent that the Fund contemporaneously owns, or has the right to obtain at no added cost, securities identical to those sold short. Each Fund may engage in short selling to the extent permitted by the federal securities laws and rules and interpretations thereunder. To the extent a Fund engages in short selling in foreign (non-U.S.) jurisdictions, the Fund will do so to the extent permitted by the laws and regulations of such jurisdiction.
60 |
www.redmontfunds.com |
Table of Contents
| Redmont Funds | Notes to Financial Statements | |
October 31, 2015 (Unaudited) |
Distributions to Shareholders: Each Fund normally pays dividends and distributes capital gains, if any, on an annual basis. Income dividend distributions are derived from interest and other income each Fund receives from their investments, including distributions of short term capital gains. Capital gain distributions are derived from gains realized when each Fund sells a security it has owned for more than a year. Each Fund may make additional distributions and dividends at other times if its portfolio manager or managers believe doing so may be necessary for each Fund to avoid or reduce taxes.
3. DERIVATIVE INSTRUMENTS
Swap Contracts: Each Fund may enter into swap transactions for hedging purposes or to seek to increase total return. At the present time, the Funds primarily enter into swap transactions for the purpose of increasing total return. Risks may arise as a result of the failure of the counterparty to the swap contract to comply with the terms of the swap contract. The loss incurred by the failure of a counterparty is generally limited to the net payment to be received by the Funds and/or the termination value at the end of the contract.
Therefore, the Funds consider the creditworthiness of each counterparty to a contract in evaluating potential credit risk. Additionally, risks may arise from unanticipated movements in interest rates or in the value of the underlying reference asset or index. Entering into these agreements involves, to varying degrees, market risk, liquidity risk and elements of credit, legal and documentation risk that are not directly reflected in the amounts recognized in the Statements of Assets and Liabilities.
Each Fund invests in total return swaps to obtain exposure to a security or market without owning such security or investing directly in that market or to transfer the risk/return of one market (e.g., fixed income) to another market (e.g., equity) (equity risk and/or interest rate risk). Total return swaps are agreements in which there is an exchange of cash flows whereby one party commits to make payments based on the total return (coupons plus capital gains/losses) of an underlying instrument in exchange for fixed or floating rate interest payments. To the extent the total return of the instrument or index underlying the transaction exceeds or falls short of the offsetting interest rate obligation, the Fund will receive a payment from or make a payment to the counterparty. Swap agreements held at October 31, 2015 are disclosed in the Schedule of Investments.
International Swaps and Derivatives Association, Inc. Master Agreements (“ISDA Master Agreements”) govern OTC financial derivative transactions entered into by the Funds and those counterparties. The ISDA Master Agreements maintain provisions for general obligations, representations, agreements, collateral and events of default or termination. Events of termination include conditions that may entitle counterparties to elect to terminate early and cause settlement of all outstanding transactions under the applicable ISDA Master Agreement. Any election to early terminate could be material to the financial statements.
The number of swap contracts held at October 31, 2015 is representative of the swap contract activity for the six months ended October 31, 2015.
Option Contracts: Each Fund may enter into options transactions for hedging purposes and for non-hedging purposes such as seeking to enhance return. Each Fund may write covered put and call options on any stocks or stock indices, currencies traded on domestic and foreign securities exchanges, or futures contracts on stock indices, interest rates and currencies traded on domestic and, to the extent permitted by the CFTC, foreign exchanges. A call option on an asset written by a Fund obligates the Fund to sell the specified asset to the holder (purchaser) at a stated price (the exercise price) if the option is exercised before a specified date (the expiration date). A put option on an asset written by a Fund obligates the Fund to buy the specified asset from the purchaser at the exercise price if the option is exercised before the expiration date. Premiums received when writing options are recorded as liabilities and are subsequently adjusted to the current value of the options written. Premiums received from writing options that expire are treated as realized gains. Premiums received from writing options, which are either exercised or closed, are offset against the proceeds received or amount paid on the transaction to determine realized gains or losses which are recorded on the Statement of Operations.
Written option activity for the six months ended October 31, 2015 was as follows:
Redmont Resolute Fund II | ||||||||||||
| Written Call Options | ||||||||||||
| Contracts | Premiums | |||||||||||
Outstanding, April 30, 2015 | (181) | $ | 72,275 | |||||||||
Written | (649) | 269,006 | ||||||||||
Covered | 295 | (103,354 | ) | |||||||||
Exercised | 38 | (23,654 | ) | |||||||||
Expired | 57 | (20,543 | ) | |||||||||
Outstanding, October 31, 2015 | (440) | $ | 193,730 | |||||||||
| Semi-Annual Report | October 31, 2015 | 61 |
Table of Contents
| Redmont Funds | Notes to Financial Statements | |
October 31, 2015 (Unaudited) |
Futures: Each Fund may enter into futures contracts for hedging purposes. A futures contract represents a commitment for the future purchase or sale of an asset at a specified price on a specified date. Upon entering into a futures contract, the Fund is required to deposit an initial margin with the broker in an amount equal to a certain percentage of the contract amount. The Fund receives from or pays to the broker, on a daily basis, an amount of cash equal to the daily fluctuation in value of the contract. Such receipts or payments are known as “variation margin,” and are recorded by the Fund as unrealized gains or losses. When the futures contract is closed, the Fund records a gain or loss equal to the difference between the value of the contract at the time it was opened and the value at the time it was closed.
A Fund’s potential losses from the use of futures extend beyond its initial investment in such contracts. The use of futures contracts involves, to varying degrees, elements of market risk in excess of the amount recognized in the Statements of Assets and Liabilities. The predominant risk is that the movement of a futures contract’s price may result in a loss, which could render a Fund’s hedging strategy unsuccessful. There is minimal counterparty credit risk since futures contracts are exchange traded and the exchange’s clearinghouse, as counterparty to all exchange traded futures, guarantees the futures against default.
Risk Exposure: The following tables disclose the amounts related to each Fund’s use of derivative instruments.
The effect of derivatives instruments on the Statements of Assets and Liabilities as of October 31, 2015:
| Risk Exposure | Asset Derivatives Statements of Assets and Liabilities Location | Fair Value | Liability Derivatives Statements of Assets and Liabilities Location | Fair Value | ||||||||
| ||||||||||||
Redmont Resolute Fund I | ||||||||||||
Equity Contracts (Total Return Swap Contracts) | Unrealized appreciation on | $ | – | Unrealized depreciation on | $ | 1,958 | ||||||
total return swap contracts | total return swap contracts | |||||||||||
Futures Contracts* | Unrealized appreciation on futures contracts | 2,562 | (a) | Unrealized depreciation on futures contracts | – | |||||||
| ||||||||||||
Total | $ | 2,562 | $ | 1,958 | ||||||||
| ||||||||||||
* Risk Exposure to Fund | ||||||||||||
Foreign Currency | $ | 2,562 | $ | – | ||||||||
| Risk Exposure | Asset Derivatives Statements of Assets and Liabilities Location | Fair Value | Liability Derivatives Statements of Assets and Liabilities Location | Fair Value | ||||||||
| ||||||||||||
Redmont Resolute Fund II | ||||||||||||
Equity Contracts (Total Return Swap Contracts) | Unrealized appreciation on | $ | – | Unrealized depreciation on | $ | 263,851 | ||||||
total return swap contracts | total return swap contracts | |||||||||||
Equity Contracts (Written Options) | N/A | N/A | Written options, at value | 331,758 | ||||||||
Futures Contracts* | Unrealized appreciation on futures contracts | 855,701 | (a) | Unrealized depreciation on futures contracts | 644,003(a) | |||||||
| ||||||||||||
Total | $ | 855,701 | $ | 1,239,612 | ||||||||
| ||||||||||||
* Risk Exposure to Fund | ||||||||||||
Commodity Contracts | $ | 17,655 | $ | 5,202 | ||||||||
Equity Contracts | 540,708 | 584,391 | ||||||||||
Fixed Income Contracts | 122,303 | 39,258 | ||||||||||
Foreign Currency | 175,035 | 15,152 | ||||||||||
|
| |||||||||||
| $ | 855,701 | $ | 644,003 | |||||||||
|
| |||||||||||
| (a) | Reflects cumulative unrealized appreciation (depreciation) of futures contracts as reported in the Schedule of Investments. The value reflected on the accompanying Statement of Assets and Liabilities is only the unsettled variation margin receivable as of October 31, 2015. |
62 |
www.redmontfunds.com |
Table of Contents
| Redmont Funds | Notes to Financial Statements | |
October 31, 2015 (Unaudited) |
The effect of derivatives instruments on the Statements of Operations for the six months ended October 31, 2015:
| Risk Exposure | Statement of Operations Location | Realized Gain on Derivatives Recognized in Income | Change in Unrealized (Depreciation) on Derivatives Recognized in Income | |||||||
| ||||||||||
Redmont Resolute Fund I | ||||||||||
Equity Contracts | Net realized loss on total return swap contracts/Net change in unrealized appreciation on total return swap contracts | $ | (7,693 | ) | $ | 6,721 | ||||
Futures Contracts* | Net realized loss on futures contracts/Net change in unrealized appreciation on futures contracts | (7,988 | ) | 11,572 | ||||||
| ||||||||||
Total | $ | (15,681 | ) | $ | 18,293 | |||||
| ||||||||||
* Risk Exposure to Fund | ||||||||||
Foreign Currency Contracts | $ | (7,988 | ) | $ | 11,572 | |||||
|
| |||||||||
| $ | (7,988 | ) | $ | 11,572 | ||||||
| ||||||||||
Redmont Resolute Fund II | ||||||||||
Equity Contracts | Net realized loss on total return swap contracts/Net change in unrealized appreciation on total return swap contracts | $ | (2,231,023) | $ | 1,490,940 | |||||
Equity Contracts | Net realized gain on purchased options/Net change in unrealized appreciation/(depreciation) on purchased options | 20,543 | – | |||||||
Equity Contracts | Net realized gain on written options/Net change in unrealized depreciation on written options | 76,814 | (122,795) | |||||||
Futures Contracts* | Net realized loss on futures contracts/Net change in unrealized appreciation on futures contracts | (1,720,894 | ) | 1,305,689 | ||||||
| ||||||||||
Total | $ | (3,875,103 | ) | $ | 2,673,834 | |||||
| ||||||||||
*Risk Exposure to Fund | ||||||||||
Commodity Contracts | $ | – | $ | 12,453 | ||||||
Equity Contracts | (906,167 | ) | 187,067 | |||||||
Fixed Income Contracts | (107,425 | ) | 112,573 | |||||||
Foreign Currency Contracts | (707,302 | ) | 993,596 | |||||||
|
| |||||||||
| $ | (1,720,894 | ) | $ | 1,305,689 | ||||||
| ||||||||||
| Semi-Annual Report | October 31, 2015 | 63 |
Table of Contents
| Redmont Funds | Notes to Financial Statements | |
October 31, 2015 (Unaudited) |
Volume of Derivative Instruments for the Funds during the six months ended October 31, 2015 was as follows:
| Derivative Type | Unit of Measurement | Monthly Average | ||||||
| ||||||||
Redmont I | ||||||||
Equity Swap Contracts | Notional Quantity | 1,339,469 | ||||||
Futures Contracts | Contracts | (1 | ) | |||||
| Derivative Type | Unit of Measurement | Monthly Average | ||||||
| ||||||||
Redmont II | ||||||||
Equity Swap Contracts | Notional Quantity | 230,586,303 | ||||||
Futures Contracts | Contracts | 159 | ||||||
Written Option Contracts | Contracts | (322 | ) | |||||
Certain derivative contracts and repurchase agreements are executed under either standardized netting agreements or, for exchange-traded derivatives, the relevant contracts for a particular exchange which contain enforceable netting provisions. A derivative netting arrangement creates an enforceable right of set-off that becomes effective, and affects the realization of settlement on individual assets, liabilities and collateral amounts, only following a specified event of default or early termination. Default events may include the failure to make payments or deliver securities timely, material adverse changes in financial condition or insolvency, the breach of minimum regulatory capital requirements, or loss of license, charter or other legal authorization necessary to perform under the contract.
The following table presents financial instruments that are subject to enforceable netting arrangements or other similar agreements as of October 31, 2015:
Redmont Resolute Fund I
Offsetting of Derivatives Liabilities
Gross Amounts Not Offset in the Statement of Financial Position | ||||||||||||||||||||||
|
| |||||||||||||||||||||
| Description | Gross Amounts of Recognized Liabilities | Gross Amounts Offset in the Statement of Financial Position | Net Amounts Financial Position | Financial Instruments Available for Offset(a) | Cash Collateral Pledged(a) | Net Payable Amount | ||||||||||||||||
| ||||||||||||||||||||||
Total Return Swap Contracts | $ | 1,958 | $ | 1,958 | $ | – | $ | 1,958 | $ | – | ||||||||||||
| ||||||||||||||||||||||
Total | $ | 1,958 | $ | 1,958 | $ | – | $ | 1,958 | $ | – | ||||||||||||
| ||||||||||||||||||||||
Redmont Resolute Fund II | ||||||||||||||||||||||
Offsetting of Derivatives Liabilities |
| |||||||||||||||||||||
Gross Amounts Not Offset in the Statement of Financial Position | ||||||||||||||||||||||
|
| |||||||||||||||||||||
| Description | Gross Amounts of Recognized Liabilities | Gross Amounts Offset in the Statement of Financial Position | Net Amounts Financial Position | Financial Instruments Available for Offset(a) | Cash Collateral Pledged(a) | Net Payable Amount | ||||||||||||||||
| ||||||||||||||||||||||
Total Return Swap Contracts | $ | 263,851 | $ | 263,851 | $ | – | $ | (263,851 | ) | $ | – | |||||||||||
| ||||||||||||||||||||||
Total | $ | 263,851 | $ | 263,851 | $ | – | $ | (263,851 | ) | $ | – | |||||||||||
| ||||||||||||||||||||||
| (a) | These amounts are limited to the derivative asset/liability balance and, accordingly, do not include excess collateral received/pledged. |
64 |
www.redmontfunds.com |
Table of Contents
| Redmont Funds | Notes to Financial Statements | |
October 31, 2015 (Unaudited) |
4. TAX BASIS INFORMATION
Tax Basis of Investments: As of October 31, 2015, the aggregate cost of investments, gross unrealized appreciation/(depreciation) and net unrealized appreciation for Federal tax purposes were as follows:
| Gross Appreciation (excess of value over tax cost) | Gross Depreciation (excess of tax cost over value) | Cost of Investments for Income Tax Purposes | Net Unrealized Appreciation | |||||||||||||
| ||||||||||||||||
Redmont Resolute Fund I | $ | 72,549 | $ | (51,406) | $ | 2,389,866 | $ | 21,143 | ||||||||
Redmont Resolute Fund II | 35,354,506 | (19,255,783) | 602,319,153 | 16,098,723 | ||||||||||||
Tax Basis of Distributions to Shareholders: The character of distributions made during the year from net investment income or net realized gains may differ from its ultimate characterization for federal income tax purposes. Also, due to the timing of dividend distributions, the fiscal year in which amounts are distributed may differ from the fiscal year in which the income or realized gain were recorded by the Funds.
The tax character of distributions paid by the Funds for the fiscal year ended April 30, 2015, were as follows:
| Ordinary Income | Long-Term Capital Gains | |||||||
| ||||||||
Redmont Resolute Fund I | $ | 20,460 | $ | 63,373 | ||||
Redmont Resolute Fund II | 14,088,339 | 4,443,526 | ||||||
The amounts and characteristics of tax basis distributions and composition of distributable earnings/(accumulated losses) are finalized at fiscal year-end. Accordingly, tax basis balances have not been determined as of October 31, 2015.
5. SECURITIES TRANSACTIONS
Purchases and sales of securities, excluding short-term securities and U.S. Government Obligations during the six months ended October 31, 2015 were as follows:
| Fund | Purchases of Securities | Proceeds From Sales of Securities | ||||||
| ||||||||
Redmont Resolute Fund I | $ | 371,188 | $ | 810,740 | ||||
Redmont Resolute Fund II | 89,374,378 | 57,542,213 | ||||||
Purchases and sales of U.S. Government Obligations during the six months ended October 31, 2015 were as follows:
| Fund | Purchases of Securities | Proceeds From Sales of Securities | ||||||
| ||||||||
Redmont Resolute Fund I | $ | – | $ | – | ||||
Redmont Resolute Fund II | 893,856 | 942,893 | ||||||
6. BENEFICIAL SHARE TRANSACTIONS
The capitalization of the Trust consists of an unlimited number of shares of beneficial interest with no par value per share. Holders of the shares of the Funds of the Trust have one vote for each share held and a proportionate fraction of a vote for each fractional share. All shares issued and outstanding are fully paid and are transferable and redeemable at the option of the shareholder. Purchasers of the shares do not have any obligation to make payments to the Trust or its creditors (other than the purchase price for the shares) or make contributions to the Trust or its creditors solely by reason of the purchasers’ ownership of the shares. Shares have no pre-emptive rights.
| Semi-Annual Report | October 31, 2015 | 65 |
Table of Contents
| Redmont Funds | Notes to Financial Statements | |
October 31, 2015 (Unaudited) |
Transactions in common shares were as follows:
Redmont Resolute Fund I
| Class A: | For the Six Months Ended October 31, 2015 (Unaudited) | For the Year Ended | ||||||
| ||||||||
Common Shares Outstanding - Beginning of Period | 36,772 | 9,794 | ||||||
Common Shares Sold | 9,635 | 76,910 | ||||||
Common Shares Issued as Reinvestment of Dividends | – | 1,832 | ||||||
Common Shares Redeemed | (2,983 | ) | (51,764) | |||||
| ||||||||
Common Shares Outstanding - End of Period | 43,424 | 36,772 | ||||||
| ||||||||
| Class I: | For the Six Months Ended October 31, 2015 (Unaudited) | For the Year Ended | ||||||
| ||||||||
Common Shares Outstanding - Beginning of Period | 255,492 | 387,727 | ||||||
Common Shares Sold | 45,881 | 17,365 | ||||||
Common Shares Issued as Reinvestment of Dividends | – | 6,068 | ||||||
Common Shares Redeemed | (72,300 | ) | (155,668) | |||||
| ||||||||
Common Shares Outstanding - End of Period | 229,073 | 255,492 | ||||||
| ||||||||
Redmont Resolute Fund II | ||||||||
| Class I: | For the Six Months Ended October 31, 2015 (Unaudited) | For the Year Ended | ||||||
| ||||||||
Common Shares Outstanding - Beginning of Period | 60,903,896 | 54,134,098 | ||||||
Common Shares Sold | 2,850,503 | 8,615,477 | ||||||
Common Shares Issued as Reinvestment of Dividends | – | 1,660,728 | ||||||
Common Shares Redeemed | (1,327,439 | ) | (3,506,407) | |||||
| ||||||||
Common Shares Outstanding - End of Period | 62,426,960 | 60,903,896 | ||||||
| ||||||||
Shares redeemed within 30 days of purchase may incur a 2% short-term redemption fee deducted from the redemption amount. Redemption fees are reflected in the “Shares redeemed, net of redemption fees” in the Statements of Changes in Net Assets. For the six months ended October 31, 2015 and the year ended April 30, 2015, the Funds retained fees as follows:
| Fund | For the Six Months Ended October 31, 2015 (Unaudited) | For the Year Ended April 30, 2015 | ||||||
Redmont Resolute Fund I | $ | – | $ | 10,019 | ||||
Redmont Resolute Fund II | – | – | ||||||
7. MANAGEMENT AND RELATED PARTY TRANSACTIONS
Investment Advisory
The Adviser, subject to the authority of the Board, is responsible for the overall management and administration of the Funds’ business affairs. Pursuant to the Investment Advisory Agreement (the “Advisory Agreement”), the Adviser is entitled to an investment advisory fee, computed daily and payable monthly of 1.50% of the average daily net assets for each Fund.
The Adviser entered into an Investment Sub-Advisory Agreement with Robeco Investment Management, Inc. (“Robeco”) and with Pinebridge Investments LLC (“Pinebridge). The Investment Sub-Advisory Agreements are in accordance with the Funds’ investment objective, policies and limitations and investment guidelines established jointly by the Adviser and the Board. The Adviser determines the allocation of each Fund’s assets among Robeco, Pinebridge and other open-end investment companies. The Funds are not required to invest with any minimum number of
66 |
www.redmontfunds.com |
Table of Contents
| Redmont Funds | Notes to Financial Statements | |
October 31, 2015 (Unaudited) |
sub-advisers or open-end investment companies, and do not have minimum or maximum limitations with respect to allocations of assets to Robeco and Prinebridge (collectively the “Sub-Advisors”), investment strategy or market sector. Highland may change the allocation of each of the Fund’s assets among the available investment options, and may add or remove sub-advisers, at any time. The Sub-Advisors are responsible for the day-to-day management of its allocated portion of Fund assets. Highland has ultimate responsibility, subject to the oversight of the Board of the Funds, to oversee the Sub-Advisors, and to recommend their hiring, termination and replacement.
Pursuant to the each Investment Sub-Advisory Agreement, the Adviser pays the Sub-Advisors an annual sub-advisory management fee which is based on each Fund’s average quarterly market value of the assets managed by the Sub-Advisors. The Adviser is required to pay all fees due to Sub-Advisors out of the management fee the Adviser receives from each Fund. The following table reflects the Funds’ contractual sub-advisory fee rates.
| Sub-Advisers | Average Daily Market Value of the Fund | Contractual Sub-Advisory Fee | ||
| First $50 Million | 0.55% | |||
Pinebridge Investments LLC | Over $50 Million | 0.50% | ||
| First $50 Million | 1.25% | |||
Robeco Investment Management, Inc. | Over $50 Million | 1.00% |
The Adviser has agreed, with respect to Redmont Resolute Fund I’s Class A and Class I shares, to contractually to waive the portion of its 1.50% Management Fee in excess of the sum of 0.50% plus any sub-advisory fees paid by the Adviser to the Sub-Advisors, and/or reimburse the Fund (or class, as applicable) by the amount of such excess. In addition, after giving effect to the foregoing fee waiver and/or expense reimbursement, the Adviser has contractually agreed to limit the amount of the Fund’s total annual expenses (exclusive of Distribution and Service (Rule 12b-1) Fees, shareholder services fees, swap fees and expenses, acquired fund fees and expenses, sub-advisory fees, brokerage expenses, interest expense, taxes and extraordinary expenses) to 1.40% of the average daily net assets. The agreement is in effect through August 31, 2017. Pursuant to this agreement, the Fund will reimburse the Adviser for any fee waivers and expense reimbursements made by the Adviser, provided that any such reimbursements made by the Fund to the Adviser will not cause the Fund’s expense limitation to exceed expense limitations in existence at the time the expense was incurred, or at the time of the reimbursement, whichever is lower, and the reimbursement is made within three years after the expenses were incurred.
The Adviser has agreed, with respect to the Redmont Resolute Fund II Class I shares, to waive the portion of its 1.50% Management Fee in excess of any sub-advisory fees paid by the Adviser to Sub-Advisors. This agreement is in effect through August 31, 2017.
For the six months ended October 31, 2015, the fee waivers and/or reimbursements were as follows:
Fees Waived/Reimbursed By Adviser | Recoupment of Previously Waived Fees By Adviser | |||||
Redmont Resolute Fund I - Class A | $ (9,552) | $ | – | |||
Redmont Resolute Fund I - Class I | (57,326) | – | ||||
Redmont Resolute Fund II - Class I | (4,546,532) | – | ||||
As of October 31, 2015, the balances of recoupable expenses for each Fund were as follows:
| Expires 2016 | Expires 2017 | Expires 2018 | Total | |||||||||||||
Redmont Resolute Fund I - Class A | $ | 2,377 | $ | 801 | $ | 9,323 | $ | 12,501 | ||||||||
Redmont Resolute Fund I - Class I | 61,265 | 83,109 | 92,586 | 236,960 | ||||||||||||
Administrator Fees and Expenses
ALPS Fund Services, Inc. (“ALPS”) serves as administrator to the Funds and the Funds have agreed to pay expenses incurred in connection with their administrative activities. Pursuant to an Administration Agreement, ALPS provides operational services to the Funds including, but not limited to, fund accounting and fund administration and generally assists in the Funds’ operations. Officers of the Trust are employees of ALPS. The Funds’ administration fee is accrued on a daily basis and paid monthly. Administration fees paid by the Funds for the year ended October 31, 2015 are disclosed in the Statements of Operations.
ALPS is reimbursed by the Fund for certain out-of-pocket expenses.
| Semi-Annual Report | October 31, 2015 | 67 |
Table of Contents
| Redmont Funds | Notes to Financial Statements | |
October 31, 2015 (Unaudited) |
Transfer Agent
ALPS serves as transfer, dividend paying and shareholder servicing agent for the Funds. ALPS receives an annual minimum fee, a fee based upon the number of shareholder accounts, and is also reimbursed by the Funds for certain out-of-pocket expenses.
Compliance Services
ALPS provides services that assist the Trust’s chief compliance officer in monitoring and testing the policies and procedures of the Trust in conjunction with requirements under Rule 38a-1 under the 1940 Act and receives an annual base fee. ALPS is reimbursed for certain out-of-pocket expenses by the Funds.
Principal Financial Officer
ALPS receives an annual fee for providing principal financial officer services to the Funds.
Distributor
ALPS Distributors, Inc. (“ADI” or the “Distributor”) (an affiliate of ALPS) acts as the distributor of the Funds’ shares pursuant to a Distribution Agreement with the Trust. Shares are sold on a continuous basis by ADI as agent for the Funds, and ADI has agreed to use its best efforts to solicit orders for the sale of Funds’ shares, although it is not obliged to sell any particular amount of shares. ADI is not entitled to any compensation for its services as Distributor. ADI is registered as a broker-dealer with the U.S. Securities and Exchange Commission.
The Redmont Resolute Fund I has adopted a Distribution and Services Plan (the “Plan”) pursuant to Rule 12b-1 of the 1940 Act for Class A shares. The Plan allows the Fund to use Class A assets to pay fees in connection with the distribution and marketing of Class A shares and/or the provision of shareholder services to Class A shareholders. The Plan permits payment for services in connection with the administration of plans or programs that use Class A shares of the Fund, if any, as their funding medium and for related expenses. The Plan permits the Fund to make total payments at an annual rate of up to 0.25% of the Fund’s average daily net assets attributable to its Class A shares. Because these fees are paid out of the Fund’s Class A assets, if any, on an ongoing basis, over time they will increase the cost of an investment in Class A shares, if any, and Plan fees may cost an investor more than other types of sales charges.
The Redmont Resolute Fund I has adopted a shareholder services plan (“Shareholder Services Plan”) for Class A shares. Under the Shareholder Services Plan the Fund is authorized to pay banks and their affiliates and other institutions, including broker-dealers and Fund affiliates (“Participating Organizations”), an aggregate fee in an amount not to exceed on an annual basis 0.15% for Class A shares of the average daily net asset value of the Class A shares, respectively, attributable to or held in the name of a Participating Organizations for its clients as compensation for providing shareholder service activities, which do not include distribution services, pursuant to an agreement with a Participating Organizations. Shareholder Services plan fees are included with distribution and service fees on the Statements of Operations.
8. INDEMNIFICATIONS
Under the Trust’s organizational documents, its officers and Trustees are indemnified against certain liability arising out of the performance of their duties to the Trust. Additionally, in the normal course of business, the Trust enters into contracts with service providers that may contain general indemnification clauses which may permit indemnification to the extent permissible under applicable law. The Trust’s maximum exposure under these arrangements is unknown, as this would involve future claims that may be made against the Trust that have not yet occurred.
9. RECENT ACCOUNTING PRONOUNCEMENT
In May 2015, the Financial Accounting Standards Board issued Accounting Standards Update (“ASU”) 2015-07, “Disclosures for Investments in Certain Entities that Calculate Net Asset Value Per Share (or its Equivalent).” This is an update to Accounting Standards Codification Topic 820, Fair Value Measurement. ASU 2015-07 removes the requirement to categorize within the fair value hierarchy investments for which fair value is measured at net asset value per share (or its equivalent) using the practical expedient. ASU 2015-17 is effective for annual reporting periods beginning on or after December 15, 2015, and interim periods within those annual periods, with retrospective application for all periods presented. The Funds are currently evaluating the impact ASU 2015-07 will have on the Funds’ financial statements and disclosures.
10. SUBSEQUENT EVENT
The Board, based upon the recommendation of the Adviser, has determined to close and liquidate the Redmont Resolute Fund I. The Board concluded that it would be in the best interests of the Redmont Resolute Fund I and its shareholders that the Redmont Resolute Fund I be closed and liquidated as a series of the Trust effective as of the close of business on January 29, 2016.
68 |
www.redmontfunds.com |
Table of Contents
| Redmont Funds | Additional Information | |
October 31, 2015 (Unaudited) |
1. FUND HOLDINGS
The Funds file their complete schedule of portfolio holdings with the Securities and Exchange Commission (the “SEC”) for the first and third quarters of each fiscal year on Form N-Q within 60 days after the end of the period. Copies of the Funds’ Form N-Q are available without charge on the SEC website at http:// www.sec.gov. You may also review and copy the Form N-Q at the SEC’s Public Reference Room in Washington, D.C. For more information about the operation of the Public Reference Room, please call the SEC at 1-800-SEC-0330.
2. FUND PROXY VOTING POLICIES, PROCEDURES AND SUMMARIES
Fund policies and procedures used in determining how to vote proxies and information regarding how each of the Funds voted proxies relating to portfolio securities during the most recent prior 12-month period ending June 30 are available without charge, (1) upon request, by calling (toll-free) (866) 759-5679 and (2) on the SEC’s website at http://www.sec.gov.
| Semi-Annual Report | October 31, 2015 | 69 |
Table of Contents

Table of Contents
Table of Contents
| 1 | |||
| 10 | |||
| 16 | |||
| 17 | |||
Statement of Assets and Liabilities
| 23 | |||
| 24 | |||
Statements of Changes in Net Assets
| 25 | |||
| 28 | |||
| 32 | |||
| 40 | |||
Table of Contents
Seafarer Overseas Growth and Income Fund | Letter to Shareholders | |
| October 31, 2015 |
LETTER TO SHAREHOLDERS
November 16, 2015
Dear Fellow Shareholders,
I am pleased to address you again on behalf of the Seafarer Overseas Growth and Income Fund. This report addresses the first half of the Fund’s fiscal year (May 1, 2015 to October 31, 2015).
During the semi-annual period, the Fund declined -12.77%, while the Fund’s benchmark, the MSCI Emerging Markets Total Return Index, fell -17.55%.1 By way of broader comparison, the S&P 500 Index rose 0.77%.
The Fund began the fiscal year with a net asset value of $12.66 per share. In June, the Fund paid a semi-annual distribution of $0.060 per share. That payment brought the cumulative distribution per share, as measured from the Fund’s inception,2 to $1.091. The Fund finished the semi-annual period with a value of $10.99 per share.3
Performance Review
Two main events impacted performance during the fiscal half-year: severe weakness among most emerging market currencies, precipitated by the downgrade in Brazil’s sovereign bond rating to “junk” status, and a sharp stock market correction in China.
In a portfolio review published in early 2015,4 I wrote that I expected weakness in emerging market currencies to continue, but to moderate:
Looking forward, Seafarer’s analysis and my instinct both suggest that most of the currency “pain” is in the past. Certainly, the [negative] conditions [that have caused currencies to decline versus the U.S. dollar] still exist, and consequently the [downward] trend may continue for some time. How long I do not know. Yet it is difficult to underestimate the magnitude of the adjustment that has already taken place.
My prediction was terribly wrong. Rather than moderate, the weakness in most currencies escalated. From May 1st to October 31st, the Brazilian Real fell 22% versus the U.S. dollar; the Malaysian Ringgit was off 17%; the Turkish Lira dropped 8%; the Mexican Peso was down 7%; and the Indonesian Rupiah declined 5%.5 Even the Renminbi, China’s currency – notoriously stable, and occasionally strong over the past decade – depreciated about 2% during the semi-annual period as the Chinese government materially altered the mechanism that sets the currency’s value versus the dollar.
The Brazilian Real’s decline was spurred by the downgrade of the country’s sovereign debt to a level equivalent to “junk.” For the past four years, the country has been saddled with poor economic and fiscal policy under the Rousseff administration. President Rousseff has signaled her willingness to revise policies and introduce greater fiscal discipline. However, her political support has deteriorated to such an extent that she can find no allies in the Brazilian legislature. The resulting gridlock, combined with the fiscal shortfall, led at least one major rating agency to move Brazil’s bonds into “junk status.”
While the Real suffered the most acute loss, many currencies were weak during the period. The overall impact on the Fund was pronounced: I estimate that just under half of the Fund’s drop during the six-month period was due to currency depreciation. The benchmark suffered as well, as over one third of the index’s losses were due to currency effects.
Apart from currencies, the other major source of weakness was China. The country’s stock markets collapsed from June to August, undermining both the index and the Fund. In the spring of 2015, I had some sense that China’s stock market might experience a correction (see the video China’s Emergence, In Context on the Seafarer website, from June 20156). I did not have definitive knowledge as to when the correction might occur – the aforementioned video was recorded only a week before the sell-off began in earnest – yet I had recognized conditions that appeared sufficiently extreme as to warrant caution.
Semi-Annual Report | October 31, 2015 |
1 |
Table of Contents
Seafarer Overseas Growth and Income Fund | Letter to Shareholders | |
| October 31, 2015 |
I thought the best precaution was to ensure that the Fund’s China-related holdings had “defensive valuations.” By “defensive,” I mean security valuations low enough as to be reasonably confident that such securities might avoid full participation in a market-wide sell-off; and also valuations that feature current yields that could prove attractive in the event of a decline (and thereby offer a second line of “defense” against a potential correction). At the same time, I believed it paramount to avoid Chinese stocks that had been caught up in the chaotic surge that characterized the second quarter. I thought such stock gains would prove unsustainable, as they appeared to be financed by retail investors reliant on excessive amounts of margin finance.
Unfortunately, my notion of “defensive” valuations proved faulty. The Fund held eight China-linked securities – seven stocks listed on the Hong Kong Stock Exchange, plus one bond – all denominated in Hong Kong dollars. All the stocks fell in unison with the sell-off in Chinese stocks that took place over the summer. The Fund’s holdings in China marginally outperformed the benchmark’s China holdings during the semi-annual period (17.6% decline for the Fund, versus 22.4% for the index). Nonetheless, that result was bitterly disappointing, particularly as China’s stock markets seemed devoid of any “defensive” haven – or at least I found none. The Fund’s China-related losses accounted for a bit more than one quarter of the Fund’s decline during the period.
The Fund’s outperformance versus the benchmark during the fiscal half-year was mainly due to security selection in China, where the Fund owned two small caps that avoided the brunt of the market’s losses (Texwinca, a textile company, and Pico Far East, a media firm); to security selection in Malaysia (Hartalega, a disposable glove maker); and to security selection in South Korea (Samsung Electronics, a technology giant that announced a share buyback).
Death of the Emerging Markets
The Seafarer Overseas Growth and Income Fund launched on February 15th, 2012. The intervening 45 months have been very problematic for the developing world. Between the Fund’s inception and October 31st of this year, the Fund’s benchmark index declined -10.64%, measured cumulatively. The S&P 500 rose 67.42% over the same period.
Over the past four years, the emerging markets have been beset by numerous challenges. Nearly all countries have suffered from decelerating economic growth; most have incurred severe currency weakness; several have experienced some form of credit or financial shock; and some have been shaken by political strife and instability. The poor performance of emerging market stocks in combination with such challenges has led a number of analysts to declare the “death” of the emerging markets as an asset class.7 Other analysts have questioned whether the asset class ever made sense in the first place: it seems little more than a haphazard collection of countries with weak governance and which are prone to boom-and-bust cycles. The fleeting gains that these markets produce are nearly always wrecked by episodic currency crises. Even long-term investors struggle to produce gains, and many understandably wonder whether “emerging markets” have any place in their portfolio whatsoever.
To be candid: though I established Seafarer based on the sincere belief that the developing world has much to offer long-term investors, the past four years have given me pause. The going has been rough. While the Fund has produced gains and outperformed its benchmark since inception, its performance has been choppy, well below that of the S&P, and by no means immune to the conditions described above. I still perceive the potential of these markets. However, I acknowledge that it is very fair to question whether these markets are “dead,” and it is necessary that I address this question directly.
An Incoherent Group
Before I provide a view on the future viability of the asset class, I would like to first summarize and respond to the main arguments regarding its demise. One of the most prevalent views today is that the asset class is outdated and nonsensical: it represents an overbroad range of countries that, after three decades of evolution, have little in common. The complaint recognizes that the markets have disparate scale, growth models, economic cycles, and political structures. Proponents of this argument question whether such dissimilar markets can ever perform in tandem, and thereby constitute a coherent asset class.
2 |
(855) 732-9220 | seafarerfunds.com |
Table of Contents
Seafarer Overseas Growth and Income Fund | Letter to Shareholders | |
| October 31, 2015 |
I agree entirely with this view, with one important caveat: based on the same logic, the asset class never made sense in the first place. Lumping together China with Malaysia, India with South Korea, Poland with Russia was always a questionable proposition. There has never been much to unite these markets in the first place; yet careful observers could see even thirty years ago that some markets were clearly more important in terms of their potential scale and economic heft than others. Personally, I think the “emerging markets” were melded into one class some thirty years ago only because all were alien and small in the eyes of most Western investors. They formed a motley group of castoffs; but Modern Portfolio Theory (or “MPT,” an asset allocation framework developed by Dr. Harry Markowitz) demanded they be slotted somewhere. Thus an ill-formed asset class was born. Today, the economic structure and scale of a few of these markets (especially China) vastly eclipses the rest, making the differences within the class too large to ignore – ironically giving rise to the now prevalent, three-decade-late-dollar-short view that the asset class “doesn’t make sense.”
China-Plus
The recognition that China’s potential is unique among the emerging markets leads to the second common critique: the traditional notion of “emerging markets” is outdated, as it fails to recognize China’s prominence. A modern version would recast the asset class as “China-Plus.”8 The underlying idea is that China’s fortunes dominate the rest of the developing world to such great extent that all other countries should be relegated to an adjunct position (denoted as a “plus”) within a China-centric portfolio. Essentially, a long-term investment in the emerging markets must strive to get China “right” with a majority allocation (e.g., perhaps 75% or more of the portfolio); everything else worth owning in the developing world can be safely relegated to the remainder (e.g., 25%).
I have strong sympathies with this argument, too. For the majority of my career, I was an Asia specialist for this very reason. I have long believed that China’s scale and potential for sustainable growth distinguished it from the rest of the developing world. At every opportunity, I have derided the “BRIC” concept,9 as I believe catchy acronyms are a poor substitute for an investment strategy. However, the BRIC concept has one thing to recommend it: it elevates certain markets – including China – above the rest. BRIC reminds investors that some markets possess greater potential, and therefore should figure more prominently in portfolio construction (even as I question why Brazil and Russia made the list).
Why, then, do I not run a China-centric fund? There are two reasons. First: both my heart and my mind tell me that the 2.9 billion people that live in the developing world outside China cannot be “safely relegated” to the residual 25%. Growth, progress and wealth creation can occur anywhere, against the grain. Second: China’s rise is not a foregone conclusion. I believe that in order for China to reach its full potential – the sort of potential that would validate a “China-Plus” approach – the country must introduce economic reforms that would ultimately unseat the communist party. I do not believe there is any other way. This is the core, unspoken question that gnaws at the heart of any “China-Plus” strategy: will the party let go of China, so that the nation might emerge, and rise above the rest? I do not know, and no one does, except perhaps in the core of the central politburo. I can state sincerely that, at least so far, the party has not shied from such reforms, but the hardest work is yet to come.
Always Emerging, Never Emerged
This leads to a third objection against the asset class: do any of these emerging markets ever emerge, anyway? They seem trapped in a never-ending boom-bust cycle, from which none escape to attain development. There are many versions of this argument. One version is that the developing world is nothing more than a cluster of unstable economies highly dependent on commodity prices for growth. When commodity prices collapse, so too does the developing world.10 Another version rests on the idea that the developing world suffers from graft and poor governance, such that “success [leads] to arrogance and complacency – and the next downturn.”11 Effectively, the developing world is saddled with weak social and government institutions, and its economies lurch from one political crisis or corruption scandal to the next. A third version (and the most important, in my view) focuses on the currencies: perhaps the countries make some progress, and their securities markets might occasionally rise; but ultimately their currencies collapse versus the U.S. dollar, undermining any notion of wealth creation for the local citizen and the foreign investor alike.
Semi-Annual Report | October 31, 2015 |
3 |
Table of Contents
Seafarer Overseas Growth and Income Fund | Letter to Shareholders | |
| October 31, 2015 |
I think the first and second versions of this argument are largely hogwash. I do not disagree with the observation that resource industries are prominent in the developing world, or that most emerging market countries suffer from poor governance. I disagree with the timeframe implicit in such judgments: these views mistake cyclical downturns for structural failure. The analysts that advance such arguments are the impatient denizens of Wall Street, and they lack any sense of the time and effort required to produce progress in the real world. They fail to recognize that living standards have improved considerably (in some cases immensely) across most of the emerging markets during the past thirty years.
I completely concur with the third version of the argument, though. I think the emerging markets’ progress, as measured in U.S. dollar terms, has been interrupted by major currency crises with distressing regularity. During my education and career, I have lived through three such crises. I have come to believe that, unless a government holds absolute power such that it can ignore the will of its people, the very act of socio-economic development obliges a country to adopt fiscal and monetary policies that are inflationary relative to those of the U.S. dollar. This consigns most emerging market currencies to a state of routine “slippage” versus the dollar, sometimes punctuated by sharp crises. So far, the emerging markets appear unable to escape from this cycle, and they may never do so. I will return to this topic below.
Decouple or Bust
A fourth argument follows from the third: even if the developing world “emerges” (i.e., attains wealth and the many other characteristics of the developed world), do these markets ever “decouple?” Investors have declared the asset class as-good-as-dead because it has not performed according to their expectations. Those expectations rested on a tenuous assumption, namely that emerging market stocks would somehow both grow and behave in a counter-cyclical (non-correlated) manner relative to stocks in the developed world.
I think the notion of decoupling was always misplaced, or at least so poorly defined that it was bound to give rise to frustration. The notion of decoupling is too complicated for me to address properly in this letter. However, I can state one idea briefly: the notion of development-driven growth is incompatible with the notion of non-correlated returns. Simply put, the developing world has grown explicitly because it has coupled with the rest of the world, not the opposite.
Thirty years ago, nearly every corner of the developing world was poor, with isolated markets and broken economies. The progress that has followed since has occurred because selected countries adopted policies that promoted openness, competition, deregulation, and trade. The potential of the emerging markets was unlocked via integration; the growth that ensued occurred because the markets coupled with the rest of the world. To expect the emerging markets to offer differentiated performance during an acute crisis is to ignore what made them investable, and growth-oriented in the first place.
“Decoupled” (uncorrelated) markets still exist today – in financial parlance, they are mostly known as “frontier” markets – but they are the same small, poor and isolated economies that were prevalent in the emerging world thirty years ago. Only when they “couple” will they “emerge.” In so doing, their economies and financial markets will assuredly become more correlated with the rest of the world.
U.S. Multinationals Are All You Need
The fifth and final argument is an older one, and it has a chief proponent, the estimable Jack Bogle, founder and former CEO of Vanguard. Bogle believes the emerging market asset class is redundant. He argues that large, U.S.-based multinationals have expanded overseas, and that many derive significant revenues and profits from the developing world. Bogle suggests that indirect exposure is sufficient for most investors, not least because it can be achieved through U.S. companies that exhibit better transparency and governance than their emerging market counterparts.
4 |
(855) 732-9220 | seafarerfunds.com |
Table of Contents
Seafarer Overseas Growth and Income Fund | Letter to Shareholders | |
| October 31, 2015 |
The last bit of that argument holds some truth, but it mostly smacks of “home market bias.” There is plenty of evidence that North America companies are not immune to accounting and governance scandals. By contrast, the former part of the argument cannot be dismissed. At the outset of my career, very few multinationals had a material presence in Asia (I worked there as a consultant). Companies gave lip service to the idea of international expansion, but few had material revenues or profits derived from the developing world.
Much is different today. U.S. companies have expanded into the emerging markets, and Bogle’s argument deserves attention. Still, my experience suggests that multinationals are present mostly in large, well-established sectors. Few operate in the nascent industries that drive much of the markets’ marginal growth. For example: domestic firms seem to control most service industries, presumably because they are closer to customers, and they know regulatory standards better. Bogle has made the same argument for decades. It now holds more truth than it once did. Yet his U.S.-centric prescription underestimates the breadth and depth of the emerging markets – and I do not believe it renders the asset class redundant, not by a long shot.
The Emerging Markets Are Dead; Long Live The Emerging Markets
Each of the preceding arguments is flawed, but each holds an element of critical truth. Obviously, I do not think the asset class is “dead.” Yet the traditional notion of the asset class is outmoded, and I recognize the need to develop a new definition that accounts for such truths. In my opinion, three criticisms of the asset class carry particular weight:
| 1. | the emerging markets have little in common, except that all suffer from weak domestic institutions and dysfunctional local markets; |
| 2. | currencies pose a constant threat to economic development and investors’ returns; and |
| 3. | traditional notions of the asset class belie China’s prominence. |
I will address each item in turn.
Defined by Dysfunction
It may seem counterintuitive, but I believe the first item is an answer unto itself. Analysts point to little that unites the emerging markets, but nearly everyone decries the prevalence of flawed institutions and faulty local markets. I posit that this complaint is central to the very definition of the asset class. The only thing that unites these markets is their shortcomings, and therefore the definition should rest upon such flaws.
Traditionally, investors have used a wide range of measures to delineate what was, and was not, an “emerging market” (e.g., income per capita, growth rates, technology adoption). I propose that a revised definition concentrate on the status of local markets and social institutions – especially the presence (or absence) of well-formed capital markets. As an investor, I believe the depth, breadth and liquidity of capital markets influences the propensity for liquidity shocks and credit crunches. Liquidity and credit shocks tend to beget economic disruptions. For better or worse, I believe the frequency and severity of such disruptions are central to the very nature of what it means to be an “emerging market.”
This sounds awful: an emerging market is defined by its failings rather than its potential. Again, it may seem counterintuitive, but I believe that a developing country’s shortcomings are precisely what give rise to its raw potential for growth. Countries grow in a sustainable manner when they raise their productivity. A developing country that struggles with economic or financial shortcomings ironically has greater room to demonstrate progress, as it has the potential to grow from a low base. Obviously, economic instability and severe cycles are undesirable for everyone, especially for the residents of the developing world. Yet as an investor, one must recognize that the potential for an emerging market is not derived from its present state, flawed and cyclical as it may be. Rather, the potential is derived from the capacity to one day escape that state, address structural flaws, make economic progress, and move onward. The pace of change may seem glacial at times, but institutions do develop; capital markets do deepen, and grow more liquid; and economic shocks lessen in severity and frequency.
Semi-Annual Report | October 31, 2015 |
5 |
Table of Contents
Seafarer Overseas Growth and Income Fund | Letter to Shareholders | |
| October 31, 2015 |
All of this represents progress; it is manifest in growth and rising stock prices. Savvy investors can capitalize on the volatility and mispriced securities that inevitably accompany an economic shock – indeed, the exacerbated volatility is what gives long-term investors the chance to capture excess returns. More importantly, though, patient investors must embrace the idea that “emerging markets” are severely flawed by definition. It is precisely those flaws that produce the potential for growth and returns that make the securities worth owning in the first place.
The Currency Conundrum
As discussed above, the threat of currency loss poses a constant threat to the asset class. I do not believe that most economies can successfully “emerge” without adopting monetary and fiscal polices that are generally “looser” than those of the U.S. dollar. This means that most emerging market currencies have an embedded “inflationary” bias and will weaken versus the dollar over time. This condition may manifest itself in ordinary, modest depreciation; or it might manifest itself in extraordinary volatility and loss – a currency crisis.
Unfortunately, I do not know of a productive means to avoid currency risk. Instead, any serious emerging market investor must embrace currency risk and manage it. The cost of hedging all currencies, all the time, exceeds the benefit. Hedging costs are practical only if one can predict which currency will fall next, and to what extent – and such prediction is beyond the reach of most mortals (certainly, it is beyond me). There is one bit of happy news. I have estimated the long-term cost of currency risk (see the video Currency Risk, in Context on the Seafarer website12). Provided that a long-term investor owns a well-diversified basket of equities, the expected cost of currency risk is a small fraction of the expected benefit from owning emerging market equities.
Still, I do not know how currency risk can ever be resolved. The emerging markets are, by definition, stuck with weak institutions and poorly formed capital markets. However, in order to grow, these countries must invest in physical and social infrastructure at very large scale. Obviously, large-scale investment requires substantial capital, but stunted capital markets mean that the developing world faces a constant deficit. This makes the emerging markets structurally dependent on foreign borrowing, usually from U.S. dollar-based creditors. This sort of borrowing is so well known in academic circles that it has an analytical name: researchers call it “original sin.” As discussed above, the developing world is prone to follow “inflationary” currency policies. Unfortunately, dollar-based borrowing combined with weak currency policies mean that developing countries naturally veer toward currency weakness (or outright collapse). If pressed, I can imagine only one long-shot scenario that might arrest this depressing cycle: the emerging markets must discover a new currency that could act as an alternate source of long-term funding, and thereby move beyond the dollar.
China’s Prominence
This brings me directly to China, and its special role within the developing world. China casts an outsized shadow over the economic cycle of the emerging markets; indeed, China’s economy now impacts the global economic cycle. This is especially evident in markets for resources, commodities, and energy: when China is expanding, prices in these markets are firm; when China’s economy is soft, so too are prices. The vagaries of China’s domestic credit cycle and the ulterior motives of its large, state-owned enterprises create distortions in global markets.
Today, the idea that China dominates the fortunes of the emerging markets is incontrovertible. Yet only four years ago, this was not widely recognized. Certainly, everyone at that time recognized China’s impact on commodity prices. Yet it seemed to me that most analysts were firmly in the thrall of a resource super-cycle, in which China played only a marginal, swing-price role.13 Hindsight suggests that China’s role in underpinning the cycle was far greater than most understood; and accordingly, the up-cycle that emerging markets enjoyed between 2005 and 2011 was far more dependent on China than most believed. I would go so far as to say that, without China, much of the rest of the growth would not have happened.
China’s economic heft gives it great power, and the ability to influence the economic cycles of other nations. Whether China will use its power in an ethical fashion is open to serious debate. For now, I only wish to note that China’s power is tangible, the leadership is aware of it, and China will likely employ its power more directly in the future.
6 |
(855) 732-9220 | seafarerfunds.com |
Table of Contents
Seafarer Overseas Growth and Income Fund | Letter to Shareholders | |
| October 31, 2015 |
One likely ramification is that China will promote use of its currency by encouraging its trading partners within the developing world to use the currency extensively for trade and capital investment. Within the next decade, I would not be surprised if China pushes its trading partners to pay for their imports from China exclusively in Renminbi. Likewise, China might offer discounted prices on its capital equipment (e.g., industrial machinery) and other exports, provided the trading partners pay in Renminbi. I expect that China’s banks would be happy to extend long-term Renminbi loans, or arrange “Panda” bond issues, in order to fund purchases of capital goods.14
Lastly, I would not be surprised if China made a firm request that commodity producers – oil, iron ore, copper, and perhaps gold – quote their output in Renminbi, not just U.S. dollars. I imagine that in order to foster a new double-quote standard, China will offer a Renminbi quote that stands at a reasonable premium over the dollar quote. Given the depressed state of most commodity markets, I imagine that the price premium will quickly overcome any concerns that producers have regarding the adoption of the Renminbi.
The Future of the Asset Class
So, what do I think of the future of the emerging markets asset class? In order for it to remain relevant, it must be redefined. I believe the new definition must encompass the following four characteristics:
| 1. | Global investors will define the emerging markets by their dysfunctions, rather than thematic overlays or spurious growth narratives. Investors will recognize that the formative and haphazard state of emerging markets may be what induces their volatility, but it also gives rise to their growth potential, and therefore it is the source of their return. The growth that draws investors to the asset class derives from the fact that these markets are emerging from a low base – they have much room to grow, but only because they are doing so from humble (and often problematic) beginnings. Personally, I believe the scope for such growth is still very compelling. In addition, investors drawn to active management will recognize that the markets’ heightened volatility induces mis-pricings with greater frequency, and therefore may generate the opportunity to produce excess returns. |
| 2. | Currency risk will remain a central feature of the asset class. Investors will recognize that the very act of development, combined with the emerging markets’ structural capital deficit, naturally begets currency weakness versus the U.S dollar. Savvy investors will recognize that currency risk does not “come out in the wash,” but rather imposes a structural drag on returns. However, thoughtful investors will recognize that the expected cost of this drag does not outweigh the expected benefit from investing in the growth potential of the developing world. Accordingly, long-term investors will seek to actively manage currency risk – by hedging, if it ever becomes cost-effective (it is not so at present) – or by careful diversification otherwise. |
| 3. | Short of a catastrophic event,15 China will gain further prominence as a political and economic force within the developing world. Accordingly, China will comprise a much larger portion of all international benchmark indices in the next decade. I do not know whether China will occupy 75% or more of the emerging market asset class (today, the MSCI Emerging Market Index has a 28% weighting in China); but I am thoroughly convinced that China’s allocation will be a great deal larger than it is now. Critics question whether, in the interim, the economy will face a depression or outright collapse. Their concerns are relevant, and I do not dismiss the risk that China faces a financial or economic shock. At the same time, this concern ignores two simple truths: that China’s economy is already very large, and its underlying markets are making steady progress toward liberalization and deregulation. There is only one way I can interpret those two basic facts over the long term: in the coming decades, China’s economy will be much larger than it is today, regardless of whether or not it experiences a “hard landing” along the way. Investors that concur must seek means to gain greater exposure to China over the long-term. |
Semi-Annual Report | October 31, 2015 |
7 |
Table of Contents
Seafarer Overseas Growth and Income Fund | Letter to Shareholders | |
| October 31, 2015 |
| 4. | As China continues to liberalize its economy, the country will simultaneously push for the internationalization of the Renminbi, first and foremost within the developing world. In so doing, China may inadvertently provide a means by which the emerging markets can avoid U.S. dollar-driven “original sin.” Emerging market companies are likely to discover that the rate cycles that govern the Renminbi are naturally synchronized with their own domestic cycles. Borrowers are likely to prefer the Renminbi as a funding currency if they perceive lower “slippage” costs versus the dollar. If China makes the Renminbi freely and easily traded around the world, there is an outside chance that the emerging markets will move beyond the dollar, and escape the currency risk that has shackled their progress in the past. |
Announcements
I am pleased to report that Seafarer Capital Partners, the Fund’s adviser, continues to invest in its team and resources in order to better serve your Fund.
During the past six months, Seafarer introduced two new members to its team: Martin Fawzy and Kevin Jo. Martin is Seafarer’s dedicated compliance professional; he now occupies the role of Assistant Chief Compliance Officer. Kevin Jo joined as an Operations Analyst. He contributes to the firm’s trading and settlement functions. We welcome both Martin and Kevin to the firm.
Over the past six months, the Fund’s scale has grown considerably. At the end of the preceding fiscal year, on April 30, 2015, net assets totaled $183 million. Six months later, on October 31, net assets had risen to $700 million, representing approximately 283% growth. In conjunction with this growth in assets, Seafarer is pleased to deliver lower costs to the Fund’s shareholders. As of September 1, 2015, Seafarer reduced the contractual cap on expenses for the Investor share class from 1.25% to 1.15% (the Institutional class remains unchanged, at 1.05%). In addition, Seafarer has extended the contractual cap for twenty-four months (the prior cap was for twelve months), with the intent to renew the same obligation for the foreseeable future.
The Fund’s current scale may afford it additional economic benefits. Seafarer Capital Partners has imposed a contractual cap on expenses since the Fund’s inception. In order to implement the cap, through much of the Fund’s existence Seafarer waived all or part of its management fee, and during certain periods it directly subsidized the Fund. The cap ensured that, even if the Fund’s net assets were small, net expenses would not exceed the contractual commitment – regardless of the actual level of gross expenses, which might have been considerably higher than the limit imposed by the cap.
While no assurances can be made regarding the Fund’s future, at the Fund’s current size, we estimate that gross expenses will naturally fall below the current contractual cap. Seafarer has sought to implement an efficient cost structure for the Fund, particularly with respect to administrative and custodial costs. The Fund’s current scale should reveal a portion of those efficiencies. Seafarer’s goal is to reduce costs over time, and with scale. In the future, Seafarer believes that the Fund’s natural economies of scale will do more to lower costs sustainably than would revisions to the existing expense caps.
Thank you for entrusting us with your capital. We are, as always, honored to serve as your investment adviser in the emerging markets.
Sincerely,
Andrew Foster
Chief Investment Officer
Seafarer Capital Partners, LLC
The MSCI Emerging Markets Total Return Index, Standard (Large+Mid Cap) Core, Gross (dividends reinvested), USD is a free float-adjusted market capitalization index designed to measure equity market performance of emerging markets. Index code: GDUEEGF. It is not possible to invest directly in this or any index.
The S&P 500 Total Return Index is a stock market index based on the market capitalizations of 500 large companies with common stock listed on the NYSE or NASDAQ. It is not possible to invest directly in this or any index.
8 |
(855) 732-9220 | seafarerfunds.com |
Table of Contents
Seafarer Overseas Growth and Income Fund | Letter to Shareholders | |
| October 31, 2015 |
The views of the author and information discussed in this commentary are as of the date of publication, are subject to change, and may not reflect the writer’s current views. The views expressed are those of the author only, and represent an assessment of market conditions at a specific point in time, are opinions only and should not be relied upon as investment advice regarding a particular investment or markets in general. Such information does not constitute a recommendation to buy or sell specific securities or investment vehicles. It should not be assumed that any investment will be profitable or will equal the performance of the portfolios or any securities or any sectors mentioned herein. The subject matter contained herein has been derived from several sources believed to be reliable and accurate at the time of compilation. Neither Seafarer Capital Partners, LLC, nor the Fund accepts any liability for losses either direct or consequential caused by the use of this information.
Information on the Seafarer website is provided for textual reference only, and is not incorporated by reference into this letter or report.
The Fund is subject to investment risks, including possible loss of the principal amount invested and therefore is not suitable for all investors. The Fund may not achieve its objectives.
Diversification does not ensure a profit or guarantee against loss.
| 1 | References to the “Fund” pertain to the Fund’s Institutional share class (ticker: SIGIX). The Investor share class (ticker: SFGIX) declined -12.80% during the semi-annual period. |
| 2 | The Fund’s inception date is February 15, 2012. |
| 3 | The Fund’s Investor share class began the fiscal year with a net asset value of $12.64 per share; it paid a semi-annual distribution of $0.059 per share in June; and it finished the semi-annual period with a value of $10.97 per share. |
| 4 | The Portfolio Review for the fourth quarter of 2014 is available at: www.seafarerfunds.com/fund/portfolio-review/2014/12/Q4 |
| 5 | Sources: Bloomberg and Seafarer. |
| 6 | The “China’s Emergence, In Context” video is available at www.seafarerfunds.com/video/2015/06/chinas-emergence-in-context |
| 7 | See, for instance, John Paul Smith as quoted in the article by James Kynge and Jonathan Wheatley, “Emerging Markets: Redrawing the World Map,” Financial Times, 3 August 2015. |
| 8 | Ajay Kapur, “The GEMs Inquirer – Emerging Markets: A Falling Knife,” Merrill Lynch, 29 July 2015. |
| 9 | “BRIC” is an acronym that refers to the four largest emerging market countries – Brazil, Russia, India, and China. |
| 10 | Ruchir Sharma, “The Emerging Market Comedown,” The Wall Street Journal, 21 January 2014. Mr. Sharma comments that “many emerging markets rely heavily on commodities for the bulk of their exports, and they grow at catch-up speeds—at a rate faster than the world’s leading economy—only when commodity prices are rising.” |
| 11 | Ruchir Sharma, “The Ever-Emerging Markets,” Foreign Affairs, January / February 2014. |
| 12 | The “Currency Risk, In Context” video is available at www.seafarerfunds.com/video/2015/03/currency-risk-in-context |
| 13 | See, for instance, Jeremy Grantham, “Time to Wake Up: Days of Abundant Resources and Falling Prices Are Over Forever,” GMO, April 2011. |
| 14 | A “Panda bond” is a Renminbi-denominated bond issued by a company of non-Chinese origin, usually sold within China. |
| 15 | By “catastrophic event,” I am primarily imagining a scenario in which China went to war with another global power. |
Semi-Annual Report | October 31, 2015 |
9 |
Table of Contents
Seafarer Overseas Growth and Income Fund | Portfolio Review | |
| October 31, 2015 |
Seafarer Overseas Growth and Income Fund Performance
| Since | Net | |||||||||
| Total Return | Inception* - | Expense | ||||||||
| (As of October 31, 2015) | 1 Year | 3 Years | Annualized | Ratio** | ||||||
Investor Class (SFGIX) | -4.03% | 3.36% | 5.14% | 1.15% | ||||||
Institutional Class (SIGIX) | -3.92% | 3.52% | 5.27% | 1.05% | ||||||
MSCI Emerging Markets Total Return Index^ | -14.22% | -2.53% | -2.99% | |||||||
Gross expense ratio: 1.25% for Investor Class; 1.15% for Institutional Class. Ratios as of the Prospectus dated August 31, 2015**
All performance is in U.S. dollars with gross (pre-tax) dividends and/or distributions reinvested. The performance data quoted represents past performance and does not guarantee future results. Future returns may be lower or higher. The investment return and principal value will fluctuate so that an investor’s shares, when redeemed, may be worth more or less than the original cost. Shares of the Fund redeemed or exchanged within 90 days of purchase are subject to a 2% redemption fee. Performance does not reflect this fee, which if deducted would reduce an individual’s return. To obtain the Fund’s most recent month-end performance, visit seafarerfunds.com or call (855) 732-9220.
| * | Inception Date: February 15, 2012. |
| ** | Seafarer Capital Partners, LLC has agreed contractually to waive and/or reimburse fees or expenses in order to limit Total Annual Fund Operating Expenses After Fee Waiver/Expense Reimbursements (excluding brokerage expenses, interest expenses, taxes and extraordinary expenses) to 1.15% and 1.05% of the Fund’s average daily net assets for the Investor and Institutional share classes, respectively. This agreement is in effect through August 31, 2017. |
| ^ | The MSCI Emerging Markets Total Return Index, Standard (Large+Mid Cap) Core, Gross (dividends reinvested), USD is a free float-adjusted market capitalization index designed to measure equity market performance of emerging markets. Index code: GDUEEGF. The index is not actively managed and does not reflect any deductions for fees, expense or taxes. An investor may not invest directly in an index. |
10 |
(855) 732-9220 | seafarerfunds.com |
Table of Contents
Seafarer Overseas Growth and Income Fund | Portfolio Review | |
| October 31, 2015 |
Performance of a $10,000 Investment Since Inception
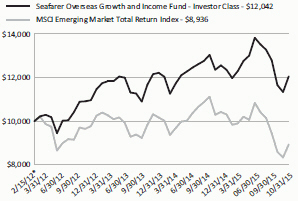
* Inception Date: February 15, 2012.
The chart shown above represents historical performance of a hypothetical investment of $10,000 in the Fund’s Investor Class shares for the period from inception to October 31, 2015. All returns reflect reinvested dividends and/or distributions, but do not reflect the deduction of taxes that an investor would pay on distributions or redemptions.
The Fund also offers Institutional Class shares, performance for which is not reflected in the chart above. The performance of Institutional Class shares may be higher or lower than the performance of the Investor Class shares shown above based upon differences in fees paid by shareholders investing in the Investor Class shares and Institutional Class shares.
Investment Objective
The Fund seeks to provide long-term capital appreciation along with some current income. The Fund seeks to mitigate adverse volatility in returns as a secondary objective.
Strategy
The Fund invests primarily in the securities of companies located in developing countries. The Fund invests in several asset classes including dividend-paying common stocks, preferred stocks, convertible bonds, and fixed-income securities.
The Fund seeks to offer investors a relatively stable means of participating in a portion of developing countries’ growth prospects, while providing some downside protection compared to a portfolio that invests only in the common stocks of those countries.
Semi-Annual Report | October 31, 2015 |
11 |
Table of Contents
Seafarer Overseas Growth and Income Fund | Portfolio Review | |
| October 31, 2015 |
Fund Characteristics
Inception Date | February 15, 2012 | |||||
Net Assets | $700.1M | |||||
Portfolio Turnover1 | 0% |
| Investor Class | Institutional Class | |||||||||||
Ticker | SFGIX | SIGIX | ||||||||||
NAV | $10.97 | $10.99 | ||||||||||
30-Day SEC Yield | 2.22% | 2.32% | ||||||||||
Fund Distribution Yield | 1.63% | 1.73% | ||||||||||
Net Expense Ratio | 1.15% | 1.05% | ||||||||||
Redemption Fee (within 90 calendar days) | 2.00% | 2.00% | ||||||||||
Minimum Initial Investment | $2,500 | $100,000 | ||||||||||
Minimum Initial Investment - Automatic Investment Plan | $1,500 | $100,000 | ||||||||||
Minimum Initial Investment - Retirement Account | $1,000 | $100,000 | ||||||||||
Underlying Portfolio Holdings
Number of Holdings | 45 | |||||
% of Net Assets in Top 10 Holdings | 38% | |||||
Weighted Average Market Cap | $23.0B | |||||
Market Cap of Portfolio Median Dollar | $3.7B | |||||
Gross Portfolio Yield2 | 3.6% | |||||
Price / Book Value2 | 1.6 | |||||
Price / Earnings2,3 | 12.5 | |||||
Earnings Per Share Growth2,3 | 11% |
| 1 | For the six months ended October 31, 2015. Portfolio Turnover is for a period less than one year and is not annualized. |
| 2 | Calculated as a harmonic average of the underlying portfolio holdings. |
| 3 | Based on consensus earnings estimates for next year. Excludes securities for which consensus earnings estimates are not available. |
30-Day SEC Yield: a standard yield calculation developed by the Securities and Exchange Commission (SEC). It represents net investment income earned by the Fund over a 30-day period, expressed as an annual percentage rate based on the Fund’s share price at the end of the 30-day period. The 30-Day Yield should be regarded as an estimate of the Fund’s rate of investment income, and it may not equal the Fund’s actual income distribution rate.
Fund Distribution Yield: a measure of the sum of the Fund’s income distributions during the trailing 380 days divided by the previous month’s NAV (adjusted upward for any capital gains distributed over the same time period).
Gross Portfolio Yield: gross yield for the underlying portfolio, estimated based on the dividend yield for common and preferred stocks and yield to maturity for bonds. This measure of yield does not account for offsetting Fund expenses and other costs, and consequently it should not be construed as the yield that an investor in the Fund would receive.
Price / Book Value: the value of a company’s common shares, divided by the company’s book value.
Price / Earnings: the market price of a company’s common shares divided by the earnings per common share as forecast for next year.
Earnings Per Share (EPS) Growth: forecast growth rate of earnings per common share next year, expressed as a percentage.
Past performance does not guarantee future results.
Sources: ALPS Fund Services, Inc., Bloomberg, Seafarer.
12 |
(855) 732-9220 | seafarerfunds.com |
Table of Contents
Seafarer Overseas Growth and Income Fund | Portfolio Review | |
| October 31, 2015 |
Top 10 Holdings
| Holding | Sector | Country | Issuer Mkt Cap ($B) | Yield1 | Price / Book | Price / Earnings2 | EPS Growth2 | ||||||||||||||||||||||
Samsung Electronics Co. Ltd., Pfd. | Information Technology | South Korea | $177.1 | 1.9 | % | 0.9 | 8 | 3% | |||||||||||||||||||||
Bank Pekao SA | Financials | Poland | $10.2 | 6.7 | % | 1.8 | 15 | 4% | |||||||||||||||||||||
Banco Bradesco SA | Financials | Brazil | $29.2 | 5.3 | % | 1.2 | 6 | 0% | |||||||||||||||||||||
Infosys, Ltd. ADR | Information Technology | India | $42.0 | 1.9 | % | 4.7 | 19 | 9% | |||||||||||||||||||||
Singapore Telecommunications Ltd. | Telecom. Services | Singapore | $45.2 | 4.4 | % | 2.5 | 15 | 7% | |||||||||||||||||||||
Hang Lung Properties, Ltd. | Financials | China / Hong Kong | $11.2 | 3.9 | % | 0.7 | 14 | -3% | |||||||||||||||||||||
Astra International Tbk PT | Consumer Discretionary | Indonesia | $17.2 | 3.7 | % | 2.4 | 12 | 10% | |||||||||||||||||||||
Sanlam, Ltd. | Financials | South Africa | $9.9 | 3.6 | % | 3.0 | 13 | 13% | |||||||||||||||||||||
Texwinca Holdings, Ltd. | Consumer Discretionary | China / Hong Kong | $1.3 | 7.4 | % | 1.7 | 10 | 13% | |||||||||||||||||||||
Valid Solucoes | Industrials | Brazil | $0.8 | 1.7 | % | 3.9 | 14 | 26% | |||||||||||||||||||||
Cumulative Weight of Top 10 Holdings: | 38 | % | ||
Total Number of Holdings: | 45 |
| 1 | Yield = dividend yield for common and preferred stocks and yield to maturity for bonds. |
| 2 | Based on consensus earnings estimates for next year. |
Portfolio holdings are subject to change and may not reflect the current or future position of the portfolio.
Sources: ALPS Fund Services, Inc., Bloomberg, Seafarer.
Semi-Annual Report | October 31, 2015 |
13 |
Table of Contents
Seafarer Overseas Growth and Income Fund | Portfolio Review | |
| October 31, 2015 |
Portfolio Composition
| Region/Country | % Net Assets | ||||
East & South Asia | 53 | ||||
China / Hong Kong | 18 | ||||
India | 8 | ||||
Indonesia | 4 | ||||
Japan | 2 | ||||
Malaysia | 1 | ||||
Singapore | 7 | ||||
South Korea | 9 | ||||
Taiwan | 3 | ||||
Vietnam | 2 | ||||
Eastern Europe | 13 | ||||
Poland | 8 | ||||
Turkey | 5 | ||||
Latin America | 22 | ||||
Brazil | 15 | ||||
Mexico | 8 | ||||
Middle East & Africa | 4 | ||||
South Africa | 4 | ||||
Cash and Other Assets, Less Liabilities | 8 | ||||
Total | 100 | ||||
| Asset Class | % Net Assets | ||||
Common Stock | 71 | ||||
Preferred Stock | 11 | ||||
ADR | 5 | ||||
Foreign Currency Government Bond | 2 | ||||
Foreign Currency Convertible Bond | 2 | ||||
Foreign Currency Corporate Bond | 1 | ||||
USD Convertible Bond | 0 | ||||
Cash and Other Assets, Less Liabilities | 8 | ||||
Total | 100 | ||||
| Market Capitalization of Issuer | % Net Assets | ||||
Large Cap (over $10 billion) | 37 | ||||
Mid Cap ($1 - $10 billion) | 39 | ||||
Small Cap (under $1 billion) | 14 | ||||
Not Applicable | 2 | ||||
Cash and Other Assets, Less Liabilities | 8 | ||||
Total | 100 | ||||
| Sector | % Net Assets | ||||
Consumer Discretionary | 14 | ||||
Consumer Staples | 4 | ||||
Energy | – | ||||
Financials* | 22 | ||||
Government | 2 | ||||
Health Care | 10 | ||||
Industrials | 8 | ||||
Information Technology | 20 | ||||
Materials | 4 | ||||
Telecommunication Services | 5 | ||||
Utilities | 2 | ||||
Cash and Other Assets, Less Liabilities | 8 | ||||
Total | 100 | ||||
| * | The Fund’s holdings in the Financials sector include property-related stocks, which are classified within the “Financials sector” according to the Global Industry Classification Standard (GICS) methodology utilized herein. Property-related holdings comprised 4% of the Fund’s net assets as of October 31, 2015. |
Due to rounding, percentage values may not sum to 100%. Values less than 0.5% may be rounded to 0%.
14 |
(855) 732-9220 | seafarerfunds.com |
Table of Contents
Seafarer Overseas Growth and Income Fund | Portfolio Review | |
| October 31, 2015 |
Top 5 Performance Contributors and Detractors
For the six months ended October 31, 2015
| Contributors | % Net Assets1 | ||||||
Infosys, Ltd. ADR | 4.1 | ||||||
Bao Viet Holdings | 1.0 | ||||||
Samsung Electronics Co. Ltd., Pfd. | 4.9 | ||||||
Iochpe-Maxion SA | 1.2 | ||||||
Grupo Herdez SAB de CV | 1.8 | ||||||
| Detractors | % Net Assets1 | ||||||
Valid Solucoes | 2.8 | ||||||
Sanlam, Ltd. | 3.4 | ||||||
Cia Vale do Rio Doce, Pfd. | 1.7 | ||||||
Hang Lung Properties, Ltd. | 4.0 | ||||||
Banco Bradesco SA | 4.1 | ||||||
| 1 | As of end of period. |
Source: Bloomberg.
Semi-Annual Report | October 31, 2015 |
15 |
Table of Contents
Seafarer Overseas Growth and Income Fund | Disclosure of Fund Expenses | |
| October 31, 2015 |
As a shareholder of the Fund you will incur two types of costs: (1) transaction costs, including applicable redemption fees; and (2) ongoing costs, including management fees and other Fund expenses. The following examples are intended to help you understand your ongoing costs (in dollars) of investing in the Fund and to compare these costs with the ongoing costs of investing in other mutual funds. The examples are based on an investment of $1,000 invested on May 1, 2015 and held until October 31, 2015.
Actual Expenses. The first line of each table below provides information about actual account values and actual expenses. You may use the information in this line, together with the amount you invested, to estimate the expenses that you paid over the period. Simply divide your account value by $1,000 (for example, an $8,600 account value divided by $1,000 = 8.6), then multiply the result by the number in the first line under the heading “Expenses Paid During Period” to estimate the expenses you paid on your account during this period.
Hypothetical Example for Comparison Purposes. The second line of the table below provides information about hypothetical account values and hypothetical expenses based on the Fund’s actual expense ratio and an assumed rate of return of 5% per year before expenses, which is not the Fund’s actual return. The hypothetical account values and expenses may not be used to estimate the actual ending account balance or expenses you paid for the period. You may use this information to compare the ongoing costs of investing in the Fund and other mutual funds. To do so, compare this 5% hypothetical example with the 5% hypothetical examples that appear in the shareholder reports of the other funds. The expenses shown in the table are meant to highlight ongoing Fund costs only and do not reflect transaction fees, such as redemption fees or exchange fees. Therefore, the second line of each table below is useful in comparing ongoing costs only, and may not help you determine the relative total costs of owning different funds. In addition, if these transactional costs were included, your costs would have been higher.
| Beginning | Ending | Expenses Paid | ||||||||
| Account Value | Account Value | Expense | During Period | |||||||
| 05/01/15 | 10/31/15 | Ratio(a) | 05/01/15 - 10/31/15(b) | |||||||
Investor Class | ||||||||||
Actual | $ 1,000.00 | $ 872.00 | 1.20% | $ 5.65 | ||||||
Hypothetical (5% return before expenses) | $ 1,000.00 | $ 1,019.10 | 1.20% | $ 6.09 | ||||||
Institutional Class | ||||||||||
Actual | $ 1,000.00 | $ 872.30 | 1.05% | $ 4.94 | ||||||
Hypothetical (5% return before expenses) | $ 1,000.00 | $ 1,019.86 | 1.05% | $ 5.33 |
| (a) | Annualized, based on the Fund’s most recent fiscal half year expenses. |
| (b) | Expenses are equal to the Fund’s annualized expense ratio multiplied by the average account value over the period, multiplied by the number of days in the most recent fiscal half-year (184)/366 (to reflect the half-year period). |
16 |
(855) 732-9220 | seafarerfunds.com |
Table of Contents
Seafarer Overseas Growth and Income Fund | Portfolio of Investments | |
| October 31, 2015 (Unaudited) |
| Currency | Shares | Value | ||||||||
| ||||||||||
COMMON STOCKS (75.7%) | ||||||||||
Brazil (8.2%) | ||||||||||
Valid Solucoes e Servicos de Seguranca em Meios de Pagamento e Identificacao SA | BRL | 1,705,000 | $ | 19,359,777 | ||||||
Odontoprev SA | BRL | 6,750,000 | 17,292,658 | |||||||
TOTVS SA | BRL | 1,386,700 | 12,286,510 | |||||||
Iochpe-Maxion SA | BRL | 2,000,000 | 8,297,572 | |||||||
|
| |||||||||
Total Brazil | 57,236,517 | |||||||||
|
| |||||||||
China / Hong Kong (15.9%) | ||||||||||
Hang Lung Properties, Ltd. | HKD | 11,550,000 | 28,260,805 | |||||||
Texwinca Holdings, Ltd. | HKD | 20,976,000 | 20,413,448 | |||||||
Xinhua Winshare Publishing and Media Co., Ltd., Class H | HKD | 21,380,000 | 17,978,347 | |||||||
Shandong Weigao Group Medical Polymer Co., Ltd., Class H | HKD | 23,998,000 | 16,569,776 | |||||||
Greatview Aseptic Packaging Co., Ltd. | HKD | 30,300,000 | 14,224,581 | |||||||
Pico Far East Holdings, Ltd. | HKD | 36,838,000 | 9,791,020 | |||||||
Digital China Holdings, Ltd. | HKD | 4,299,000 | 4,386,011 | |||||||
|
| |||||||||
Total China / Hong Kong | 111,623,988 | |||||||||
|
| |||||||||
India (7.9%) | ||||||||||
Infosys, Ltd., ADR | USD | 1,570,000 | 28,511,200 | |||||||
Sun Pharma Advanced Research Co., Ltd.(a) | INR | 2,580,786 | 15,220,789 | |||||||
Balkrishna Industries, Ltd. | INR | 1,165,000 | 11,641,574 | |||||||
|
| |||||||||
Total India | 55,373,563 | |||||||||
|
| |||||||||
Indonesia (3.6%) | ||||||||||
Astra International Tbk PT | IDR | 58,000,000 | 24,932,961 | |||||||
|
| |||||||||
Total Indonesia | 24,932,961 | |||||||||
|
| |||||||||
Japan (2.4%) | ||||||||||
Hisamitsu Pharmaceutical Co., Inc. | JPY | 432,000 | 16,744,284 | |||||||
|
| |||||||||
Total Japan | 16,744,284 | |||||||||
|
| |||||||||
Semi-Annual Report | October 31, 2015 |
17 |
Table of Contents
Seafarer Overseas Growth and Income Fund | Portfolio of Investments | |
| October 31, 2015 (Unaudited) |
| Currency | Shares | Value | ||||||||
| ||||||||||
Malaysia (0.8%) | ||||||||||
Hartalega Holdings Bhd | MYR | 4,550,000 | $ | 5,518,040 | ||||||
|
| |||||||||
Total Malaysia | 5,518,040 | |||||||||
|
| |||||||||
Mexico (6.4%) | ||||||||||
Bolsa Mexicana de Valores SAB de CV | MXN | 9,800,000 | 16,375,062 | |||||||
Grupo Financiero Banorte SAB de CV | MXN | 3,050,000 | 16,328,536 | |||||||
Grupo Herdez SAB de CV | MXN | 4,400,000 | 12,229,474 | |||||||
|
| |||||||||
Total Mexico | 44,933,072 | |||||||||
|
| |||||||||
Poland (8.1%) | ||||||||||
Bank Pekao SA | PLN | 785,000 | 30,526,764 | |||||||
Asseco Poland SA | PLN | 903,011 | 13,329,076 | |||||||
PGE SA | PLN | 3,375,000 | 12,562,545 | |||||||
|
| |||||||||
Total Poland | 56,418,385 | |||||||||
|
| |||||||||
Singapore (6.2%) | ||||||||||
Singapore Telecommunications, Ltd. | SGD | 10,030,000 | 28,497,772 | |||||||
SIA Engineering Co., Ltd. | SGD | 5,150,000 | 14,645,348 | |||||||
|
| |||||||||
Total Singapore | 43,143,120 | |||||||||
|
| |||||||||
South Africa (3.9%) | ||||||||||
Sanlam, Ltd. | ZAR | 5,300,000 | 23,943,963 | |||||||
EOH Holdings, Ltd. | ZAR | 305,000 | 3,367,933 | |||||||
|
| |||||||||
Total South Africa | 27,311,896 | |||||||||
|
| |||||||||
South Korea (3.8%) | ||||||||||
Dongsuh Co., Inc. | KRW | 551,473 | 16,307,199 | |||||||
Sindoh Co., Ltd. | KRW | 200,000 | 10,683,742 | |||||||
|
| |||||||||
Total South Korea | 26,990,941 | |||||||||
|
| |||||||||
Taiwan (2.8%) | ||||||||||
Taiwan Semiconductor Manufacturing Co., Ltd. | TWD | 3,700,000 | 15,590,575 | |||||||
18 |
(855) 732-9220 | seafarerfunds.com |
Table of Contents
Seafarer Overseas Growth and Income Fund | Portfolio of Investments | |
| October 31, 2015 (Unaudited) |
| Currency | Shares | Value | ||||||||
| ||||||||||
Taiwan (continued) | ||||||||||
Taiwan Semiconductor Manufacturing Co., Ltd., ADR | USD | 200,000 | $ | 4,392,000 | ||||||
|
| |||||||||
Total Taiwan | 19,982,575 | |||||||||
|
| |||||||||
Turkey (4.2%) | ||||||||||
Aselsan Elektronik Sanayi Ve Ticaret AS | TRY | 3,050,000 | 14,580,780 | |||||||
Arcelik AS | TRY | 2,675,000 | 14,577,595 | |||||||
|
| |||||||||
Total Turkey | 29,158,375 | |||||||||
|
| |||||||||
Vietnam (1.5%) | ||||||||||
Bao Viet Holdings | VND | 2,500,000 | 6,799,504 | |||||||
Nam Long Investment Corp. | VND | 3,150,000 | 3,003,962 | |||||||
Vietnam National Reinsurance Corp. | VND | 815,790 | 840,061 | |||||||
|
| |||||||||
Total Vietnam | 10,643,527 | |||||||||
|
| |||||||||
TOTAL COMMON STOCKS (Cost $555,309,646) | 530,011,244 | |||||||||
| ||||||||||
PREFERRED STOCKS (10.6%) | ||||||||||
Brazil (5.8%) | ||||||||||
Banco Bradesco SA, ADR | USD | 5,250,000 | 28,560,000 | |||||||
Vale SA | BRL | 3,300,000 | 12,005,290 | |||||||
|
| |||||||||
Total Brazil | 40,565,290 | |||||||||
|
| |||||||||
South Korea (4.8%) | ||||||||||
Samsung Electronics Co., Ltd. | KRW | 32,500 | 33,945,586 | |||||||
|
| |||||||||
Total South Korea | 33,945,586 | |||||||||
|
| |||||||||
TOTAL PREFERRED STOCKS (Cost $83,949,133) | 74,510,876 | |||||||||
| ||||||||||
Semi-Annual Report | October 31, 2015 |
19 |
Table of Contents
Seafarer Overseas Growth and Income Fund | Portfolio of Investments | |
| October 31, 2015 (Unaudited) |
| Currency | Rate | Maturity Date | Principal Amount | Value | ||||||||||
| ||||||||||||||
FOREIGN CURRENCY CONVERTIBLE BONDS (1.8%) | ||||||||||||||
China / Hong Kong (1.8%) | ||||||||||||||
ASM Pacific Technology, Ltd. | HKD | 2.00% | 03/28/19 | 100,000,000 | $ | 12,886,099 | ||||||||
|
| |||||||||||||
Total China / Hong Kong | 12,886,099 | |||||||||||||
|
| |||||||||||||
TOTAL FOREIGN CURRENCY CONVERTIBLE BONDS (Cost $13,390,434) | 12,886,099 | |||||||||||||
| ||||||||||||||
FOREIGN CURRENCY CORPORATE BONDS (1.2%) | ||||||||||||||
Mexico (1.2%) | ||||||||||||||
America Movil SAB de CV | MXN | 7.13% | 12/09/24 | 137,710,000 | 8,257,031 | |||||||||
|
| |||||||||||||
Total Mexico | 8,257,031 | |||||||||||||
|
| |||||||||||||
TOTAL FOREIGN CURRENCY CORPORATE BONDS (Cost $8,064,472) | 8,257,031 | |||||||||||||
| ||||||||||||||
FOREIGN CURRENCY GOVERNMENT BONDS (2.2%) | ||||||||||||||
Brazil (0.6%) | ||||||||||||||
Brazilian Government International Bond | BRL | 10.25% | 01/10/28 | 20,000,000 | 4,358,818 | |||||||||
|
| |||||||||||||
Total Brazil | 4,358,818 | |||||||||||||
|
| |||||||||||||
Indonesia (0.7%) | ||||||||||||||
Indonesia Treasury Bond, Series FR70 | IDR | 8.38% | 03/15/24 | 70,000,000,000 | 5,000,775 | |||||||||
|
| |||||||||||||
Total Indonesia | 5,000,775 | |||||||||||||
|
| |||||||||||||
Turkey (0.9%) | ||||||||||||||
Turkey Government Bond | TRY | 8.80% | 09/27/23 | 18,000,000 | 5,887,014 | |||||||||
|
| |||||||||||||
Total Turkey | 5,887,014 | |||||||||||||
|
| |||||||||||||
TOTAL FOREIGN CURRENCY GOVERNMENT BONDS (Cost $17,876,490) | 15,246,607 | |||||||||||||
| ||||||||||||||
20 |
(855) 732-9220 | seafarerfunds.com |
Table of Contents
Seafarer Overseas Growth and Income Fund | Portfolio of Investments | |
October 31, 2015 (Unaudited)
|
| Currency | Rate | Maturity Date | Principal Amount | Value | ||||||||||||
| ||||||||||||||||
USD CONVERTIBLE BONDS (0.4%) | ||||||||||||||||
Singapore (0.4%) | ||||||||||||||||
Olam International, Ltd. | USD | 6.00% | 10/15/16 | $ | 2,500,000 | $ | 2,559,375 | |||||||||
|
| |||||||||||||||
Total Singapore | 2,559,375 | |||||||||||||||
|
| |||||||||||||||
TOTAL USD CONVERTIBLE BONDS (Cost $2,563,958) | 2,559,375 | |||||||||||||||
| ||||||||||||||||
TOTAL INVESTMENTS (Cost $681,154,133) (91.9%) | $ | 643,471,232 | ||||||||||||||
Cash and Other Assets, Less Liabilities (8.1%) | 56,610,774 | |||||||||||||||
| ||||||||||||||||
NET ASSETS (100.0%) | $ | 700,082,006 | ||||||||||||||
| ||||||||||||||||
| (a) | Non-income producing security. |
Certain securities were fair valued in accordance with procedures established by the Fund’s Board of Trustees (Note 2).
Currency Abbreviations | ||||
BRL | - | Brazil Real | ||
HKD | - | Hong Kong Dollar | ||
IDR | - | Indonesia Rupiah | ||
INR | - | India Rupee | ||
JPY | - | Japan Yen | ||
KRW | - | South Korea Won | ||
MXN | - | Mexico Peso | ||
MYR | - | Malaysia Ringgit | ||
PLN | - | Poland Zloty | ||
SGD | - | Singapore Dollar | ||
TRY | - | Turkey Lira | ||
TWD | - | Taiwan New Dollar | ||
USD | - | United States Dollar | ||
VND | - | Vietnam Dong | ||
ZAR | - | South Africa Rand | ||
Semi-Annual Report | October 31, 2015 |
21 |
Table of Contents
Seafarer Overseas Growth and Income Fund | Portfolio of Investments | |
| October 31, 2015 (Unaudited) |
Common Abbreviations: | ||||
ADR | - | American Depositary Receipt. | ||
AS | - | Andonim Sirketi, Joint Stock Company in Turkey. | ||
Bhd | - | Berhad, Public Limited Company in Malaysia. | ||
Ltd. | - | Limited. | ||
SA | - | Generally designates corporations in various countries, mostly those employing the civil law. This translates literally in all languages mentioned as anonymous company. | ||
SAB de CV | - | A variable capital company. | ||
Tbk PT | - | Terbuka is the Indonesian term for limited liability company. | ||
Holdings are subject to change.
For Fund compliance purposes, the Fund’s geographical classifications refer to any one or more of the sub-classifications used by one or more widely recognized market indexes or ratings group indexes, and/or as defined by Fund management. This definition may not apply for purposes of this report, which may combine sub-classifications for reporting ease. Geographical regions are shown as a percentage of net assets.
See Accompanying Notes to Financial Statements.
22 |
(855) 732-9220 | seafarerfunds.com |
Table of Contents
Seafarer Overseas Growth and Income Fund | Statement of Assets and Liabilities | |
| October 31, 2015 |
ASSETS: | ||||
Investments, at value | $ | 643,471,232 | ||
Cash | 58,305,357 | |||
Foreign currency, at value (Cost $8,940,164) | 8,900,539 | |||
Receivable for shares sold | 4,767,987 | |||
Interest and dividends receivable | 1,243,600 | |||
Prepaid expenses and other assets | 16,841 | |||
| ||||
Total Assets | 716,705,556 | |||
| ||||
LIABILITIES: | ||||
Payable for investments purchased | 15,683,617 | |||
Administrative fees payable | 50,632 | |||
Shareholder service plan fees payable | 70,267 | |||
Payable for shares redeemed | 272,301 | |||
Investment advisory fees payable | 472,147 | |||
Trustee fees and expenses payable | 1,043 | |||
Audit and tax fees payable | 13,492 | |||
Accrued expenses and other liabilities | 60,051 | |||
| ||||
Total Liabilities | 16,623,550 | |||
| ||||
NET ASSETS | $ | 700,082,006 | ||
| ||||
NET ASSETS CONSIST OF: | ||||
Paid-in capital (Note 5) | $ | 734,678,316 | ||
Accumulated net investment income | 2,333,508 | |||
Accumulated net realized gain on investments and foreign currency transactions | 788,026 | |||
Net unrealized depreciation on investments and translation of assets and liabilities in foreign currencies | (37,717,844) | |||
| ||||
NET ASSETS | $ | 700,082,006 | ||
| ||||
INVESTMENTS, AT COST | $ | 681,154,133 | ||
PRICING OF SHARES | ||||
Investor Class: | ||||
Net Asset Value, offering and redemption price per share | $ | 10.97 | ||
Net Assets | $ | 354,473,583 | ||
Shares of beneficial interest outstanding | 32,309,333 | |||
Institutional Class: | ||||
Net Asset Value, offering and redemption price per share | $ | 10.99 | ||
Net Assets | $ | 345,608,423 | ||
Shares of beneficial interest outstanding | 31,438,118 | |||
See Accompanying Notes to Financial Statements.
Semi-Annual Report | October 31, 2015 |
23 |
Table of Contents
Seafarer Overseas Growth and Income Fund | Statement of Operations | |
| For the Six Months Ended October 31, 2015 (Unaudited) |
INVESTMENT INCOME: | ||||||
Dividends | $ | 6,725,938 | ||||
Foreign taxes withheld on dividends | (440,319) | |||||
Interest and other income | 574,814 | |||||
| ||||||
Total investment income | 6,860,433 | |||||
| ||||||
EXPENSES: | ||||||
Investment advisory fees (Note 6) | 1,620,427 | |||||
Administrative and transfer agency fees | 148,003 | |||||
Trustee fees and expenses | 3,829 | |||||
Registration/filing fees | 28,370 | |||||
Shareholder service plan fees | ||||||
Investor Class | 145,499 | |||||
Institutional Class | 43,728 | |||||
Recoupment of previously waived fees | ||||||
Investor Class | 168,622 | |||||
Institutional Class | 130,424 | |||||
Legal fees | 5,558 | |||||
Audit fees | 9,523 | |||||
Reports to shareholders and printing fees | 7,470 | |||||
Custody fees | 108,308 | |||||
Miscellaneous | 5,019 | |||||
| ||||||
Total expenses | 2,424,780 | |||||
| ||||||
NET INVESTMENT INCOME: | 4,435,653 | |||||
| ||||||
Net realized loss on investments | (246,485) | |||||
Net realized loss on foreign currency transactions | (337,894) | |||||
Net change in unrealized depreciation on investments (net of foreign capital gains tax of $(233,737)) | (52,179,116) | |||||
Net change in unrealized depreciation on translation of assets and liabilities in foreign currency transactions | (29,995) | |||||
| ||||||
NET REALIZED AND UNREALIZED LOSS ON INVESTMENTS AND FOREIGN CURRENCY TRANSLATIONS | (52,793,490) | |||||
| ||||||
NET DECREASE IN NET ASSETS RESULTING FROM OPERATIONS | $ | (48,357,837) | ||||
| ||||||
See Accompanying Notes to Financial Statements.
24 |
(855) 732-9220 | seafarerfunds.com |
Table of Contents
Seafarer Overseas Growth and Income Fund | Statements of Changes in Net Assets | |
For the Six Months Ended October 31, 2015 | Year Ended April 30, 2015 | |||||||
OPERATIONS: | ||||||||
Net investment income | $ | 4,435,653 | $ | 1,478,828 | ||||
Net realized gain/(loss) on investments and foreign currency transactions | (584,379) | 3,072,569 | ||||||
Net change in unrealized appreciation/(depreciation) on investments and foreign currency translations | (52,209,111) | 11,219,064 | ||||||
| ||||||||
Net increase/(decrease) in net assets resulting from operations | (48,357,837) | 15,770,461 | ||||||
| ||||||||
DISTRIBUTIONS TO SHAREHOLDERS (NOTE 3): | ||||||||
From net investment income | ||||||||
Investor Class | $ | (755,708) | $ | (553,066) | ||||
Institutional Class | (901,823) | (1,354,908) | ||||||
From net realized gains on investments | ||||||||
Investor Class | – | (462,598) | ||||||
Institutional Class | – | (1,176,662) | ||||||
| ||||||||
Net decrease in net assets from distributions | (1,657,531) | (3,547,234) | ||||||
| ||||||||
BENEFICIAL INTEREST TRANSACTIONS (NOTE 5): | ||||||||
Shares sold | ||||||||
Investor Class | $ | 350,293,945 | $ | 35,017,066 | ||||
Institutional Class | 264,423,656 | 82,647,370 | ||||||
Dividends reinvested | ||||||||
Investor Class | 750,504 | 1,000,415 | ||||||
Institutional Class | 663,284 | 2,292,073 | ||||||
Shares Redeemed, net of redemption fees | ||||||||
Investor Class | (27,587,591) | (12,562,924) | ||||||
Institutional Class | (21,703,261) | (11,165,061) | ||||||
| ||||||||
Net increase in net assets derived from beneficial interest transactions | 566,840,537 | 97,228,939 | ||||||
| ||||||||
Net increase in net assets | $ | 516,825,169 | $ | 109,452,166 | ||||
NET ASSETS: | ||||||||
Beginning of period | $ | 183,256,837 | $ | 73,804,671 | ||||
| ||||||||
End of period (including accumulated net investment income/(loss) of $2,333,508 and ($444,614), respectively) | $ | 700,082,006 | $ | 183,256,837 | ||||
| ||||||||
Semi-Annual Report | October 31, 2015 |
25 |
Table of Contents
Seafarer Overseas Growth and Income Fund | Statements of Changes in Net Assets | |
For the Six Months Ended October 31, 2015 | Year Ended April 30, 2015 | |||||||
Other Information: | ||||||||
SHARE TRANSACTIONS: | ||||||||
Investor Class | ||||||||
Sold | 30,507,718 | 2,904,763 | ||||||
Distributions reinvested | 61,266 | 90,196 | ||||||
Redeemed | (2,496,042) | (1,105,772) | ||||||
| ||||||||
Net increase in shares outstanding | 28,072,942 | 1,889,187 | ||||||
| ||||||||
Institutional Class | ||||||||
Sold | 23,122,778 | 6,996,213 | ||||||
Distributions reinvested | 54,057 | 206,966 | ||||||
Redeemed | (1,987,749) | (977,140) | ||||||
| ||||||||
Net increase in shares outstanding | 21,189,086 | 6,226,039 | ||||||
| ||||||||
See Accompanying Notes to Financial Statements.
26 |
(855) 732-9220 | seafarerfunds.com |
Table of Contents
Intentionally Left Blank
Table of Contents
| For a share outstanding through the periods presented |
Investor Class |
NET ASSET VALUE, BEGINNING OF PERIOD |
INCOME FROM OPERATIONS: |
Net investment income(a) |
Net realized and unrealized gain/(loss) on investments |
|
Total from investment operations |
|
LESS DISTRIBUTIONS: |
From net investment income |
From net realized gains on investments |
|
Total distributions |
|
REDEMPTION FEES ADDED TO PAID IN CAPITAL |
|
NET INCREASE/(DECREASE) IN NET ASSET VALUE |
|
NET ASSET VALUE, END OF PERIOD |
|
TOTAL RETURN(d) |
SUPPLEMENTAL DATA: |
Net assets, end of period (in 000s) |
RATIOS TO AVERAGE NET ASSETS: |
Operating expenses excluding reimbursement/waiver |
Operating expenses including reimbursement/waiver |
Net investment income including reimbursement/waiver |
PORTFOLIO TURNOVER RATE(g) |
| (a) | Calculated using the average shares method. |
| (b) | Less than $(0.005) per share. |
| (c) | Less than $0.005 per share. |
| (d) | Total returns are for the period indicated and have not been annualized. Total returns would have been lower had certain expenses not been waived during the period. Returns shown do not reflect the deduction of taxes that a shareholder would pay on Fund distributions or the redemption of Fund shares. |
| (e) | Annualized. |
| (f) | Effective September 1, 2015, the Adviser agreed to limit expenses to 1.15%. Prior to September 1, 2015, the Adviser agreed to limit expenses to 1.25% for the period September 1, 2014 through August 31, 2015. Prior to September 1, 2014, the Adviser agreed to limit expenses to 1.40%. |
| (g) | Portfolio turnover rate for periods less than one full year have not been annualized. |
| (h) | Less than 0.5%. |
See Accompanying Notes to Financial Statements.
28 |
(855) 732-9220 | seafarerfunds.com |
Table of Contents
| Seafarer Overseas Growth and Income Fund | ||
For the Six Months Ended October 31, 2015 (Unaudited) | Year Ended April 30, 2015 | Year Ended April 30, 2014 | Year Ended April 30, 2013 | For the Period April 30, 2012 | ||||||||||||||
| $ | 12.64 | $ | 11.58 | $ | 11.91 | $ | 10.18 | $ | 10.00 | |||||||||
| 0.10 | 0.14 | 0.19 | 0.10 | 0.05 | ||||||||||||||
| (1.71) | 1.26 | 0.02 | 1.74 | 0.13 | ||||||||||||||
|
| |||||||||||||||||
| (1.61) | 1.40 | 0.21 | 1.84 | 0.18 | ||||||||||||||
|
| |||||||||||||||||
| (0.06) | (0.19) | (0.26) | (0.11) | – | ||||||||||||||
| – | (0.15) | (0.28) | (0.00) | (b) | – | |||||||||||||
|
| |||||||||||||||||
| (0.06) | (0.34) | (0.54) | (0.11) | – | ||||||||||||||
|
| |||||||||||||||||
| 0.00 | (c) | 0.00 | (c) | 0.00 | (c) | 0.00 | (c) | – | ||||||||||
|
| |||||||||||||||||
| (1.67) | 1.06 | (0.33) | 1.73 | 0.18 | ||||||||||||||
|
| |||||||||||||||||
| $ | 10.97 | $ | 12.64 | $ | 11.58 | $ | 11.91 | $ | 10.18 | |||||||||
|
| |||||||||||||||||
| (12.80%) | 12.55% | 1.93% | 18.24% | 1.80% | ||||||||||||||
| $ | 354,474 | $ | 53,543 | $ | 27,181 | $ | 26,348 | $ | 1,443 | |||||||||
| 1.20% | (e) | 1.30% | 1.78% | 2.82% | 18.96%(e) | |||||||||||||
| 1.20% | (e)(f) | 1.30% | (f) | 1.40% | 1.49% | 1.60%(e) | ||||||||||||
| 1.83% | (e) | 1.19% | 1.66% | 0.90% | 2.61%(e) | |||||||||||||
| 0% | (h) | 28% | 51% | 39% | 5% | |||||||||||||
Semi-Annual Report | October 31, 2015 |
29 |
Table of Contents
Financial Highlights | ||
| For a share outstanding through the periods presented |
Institutional Class |
NET ASSET VALUE, BEGINNING OF PERIOD |
INCOME FROM OPERATIONS: |
Net investment income(a) |
Net realized and unrealized gain/(loss) on investments |
|
Total from investment operations |
|
LESS DISTRIBUTIONS: |
From net investment income |
From net realized gains on investments |
|
Total distributions |
|
REDEMPTION FEES ADDED TO PAID IN CAPITAL |
|
NET INCREASE/(DECREASE) IN NET ASSET VALUE |
|
NET ASSET VALUE, END OF PERIOD |
|
TOTAL RETURN(d) |
SUPPLEMENTAL DATA: |
Net assets, end of period (in 000s) |
RATIOS TO AVERAGE NET ASSETS: |
Operating expenses excluding reimbursement/waiver |
Operating expenses including reimbursement/waiver |
Net investment income including reimbursement/waiver |
PORTFOLIO TURNOVER RATE(g) |
| (a) | Calculated using the average shares method. |
| (b) | Less than $(0.005) per share. |
| (c) | Less than $0.005 per share. |
| (d) | Total returns are for the period indicated and have not been annualized. Total returns would have been lower had certain expenses not been waived during the period. Returns shown do not reflect the deduction of taxes that a shareholder would pay on Fund distributions or the redemption of Fund shares. |
| (e) | Annualized. |
| (f) | Effective September 1, 2014 the Adviser agreed to limit expenses to 1.05%. Prior to September 1, 2014, the Adviser agreed to limit expenses to 1.25%. |
| (g) | Portfolio turnover rate for periods less than one full year have not been annualized. |
| (h) | Less than 0.5%. |
See Accompanying Notes to Financial Statements.
30 |
(855) 732-9220 | seafarerfunds.com |
Table of Contents
| Seafarer Overseas Growth and Income Fund | ||
For the Six Months Ended October 31, 2015 (Unaudited) | Year Ended April 30, 2015 | Year Ended April 30, 2014 | Year Ended April 30, 2013 | For the Period February 15, 2012 (Inception) to April 30, 2012 | ||||||||||||||
| $ | 12.66 | $ | 11.59 | $ | 11.91 | $ | 10.18 | $ | 10.00 | |||||||||
| 0.13 | 0.15 | 0.21 | 0.14 | 0.04 | ||||||||||||||
| (1.74) | 1.28 | 0.02 | 1.71 | 0.14 | ||||||||||||||
|
| |||||||||||||||||
| (1.61) | 1.43 | 0.23 | 1.85 | 0.18 | ||||||||||||||
|
| |||||||||||||||||
| (0.06) | (0.21) | (0.27) | (0.12) | – | ||||||||||||||
| – | (0.15) | (0.28) | (0.00) | (b) | – | |||||||||||||
|
| |||||||||||||||||
| (0.06) | (0.36) | (0.55) | (0.12) | – | ||||||||||||||
|
| |||||||||||||||||
| 0.00 | (c) | 0.00 | (c) | 0.00 | (c) | 0.00 | (c) | – | ||||||||||
|
| |||||||||||||||||
| (1.67) | 1.07 | (0.32) | 1.73 | 0.18 | ||||||||||||||
|
| |||||||||||||||||
| $ | 10.99 | $ | 12.66 | $ | 11.59 | $ | 11.91 | $ | 10.18 | |||||||||
|
| |||||||||||||||||
| (12.77%) | 12.76% | 2.12% | 18.33% | 1.80% | ||||||||||||||
| $ | 345,608 | $ | 129,714 | $ | 46,624 | $ | 11,486 | $ | 1,346 | |||||||||
| 1.05% | (e) | 1.18% | 1.61% | 2.88% | 21.65%(e) | |||||||||||||
| 1.05% | (e) | 1.10% | (f) | 1.25% | 1.35% | 1.45%(e) | ||||||||||||
| 2.26% | (e) | 1.30% | 1.89% | 1.28% | 2.00%(e) | |||||||||||||
| 0% | (h) | 28% | 51% | 39% | 5% ’ | |||||||||||||
Semi-Annual Report | October 31, 2015 |
31 |
Table of Contents
Seafarer Overseas Growth and Income Fund | Notes to Financial Statements | |
| October 31, 2015 (Unaudited) |
1. ORGANIZATION
Financial Investors Trust (the “Trust”), a Delaware statutory trust, is an open-end management investment company registered under the Investment Company Act of 1940, as amended (“1940 Act”). As of October 31, 2015, the Trust had 34 registered funds. This semi-annual report describes the Seafarer Overseas Growth and Income Fund (the “Fund”). The Fund seeks to provide long-term capital appreciation along with some current income; it also seeks to mitigate adverse volatility in returns as a secondary objective. The Fund offers Investor Class and Institutional Class shares.
2. SIGNIFICANT ACCOUNTING POLICIES
The accompanying financial statements were prepared in accordance with accounting principles generally accepted in the United States of America (“U.S. GAAP”). The preparation of financial statements in conformity with U.S. GAAP requires management to make certain estimates and assumptions that affect the reported amounts of assets and liabilities and disclosures of contingent assets and liabilities at the date of the financial statements and the reported amounts of revenue and expenses during the period. Actual results could differ from those estimates. The Fund is considered an investment company for financial reporting purposes under U.S. GAAP. The following is a summary of significant accounting policies consistently followed by the Fund in preparation of its financial statements.
Investment Valuation: The Fund generally values its securities based on market prices determined at the close of regular trading on the New York Stock Exchange (“NYSE”), normally 4:00 p.m. Eastern Time, on each day the NYSE is open for trading.
For equity securities and mutual funds that are traded on an exchange, the market price is usually the closing sale or official closing price on that exchange. In the case of equity securities not traded on an exchange, or if such closing prices are not otherwise available, the securities are valued at the mean of the most recent bid and ask prices on such day. Redeemable securities issued by open-end registered investment companies are valued at the investment company’s applicable net asset value, with the exception of exchange-traded open-end investment companies, which are priced as equity securities.
Equity securities that are primarily traded on foreign securities exchanges are valued at the closing values of such securities on their respective foreign exchanges, except when an event occurs subsequent to the close of the foreign exchange but before the close of the NYSE, such that the securities’ value would likely change. In such an event, the fair values of those securities are determined in good faith through consideration of other factors in accordance with procedures established by and under the general supervision of the Board of Trustees (the “Board”). The Fund will use a fair valuation model provided by an independent pricing service, which is intended to reflect fair value when a security’s value or a meaningful portion of the Fund’s portfolio is believed to have been materially affected by a valuation event that has occurred between the close of the exchange or market on which the security is traded and the close of the regular trading day on the NYSE. The Fund’s valuation procedures set forth certain triggers that inform the Fund when to use the fair valuation model.
The market price for debt obligations is generally the price supplied by an independent third-party pricing service approved by the Board which may use a matrix, formula or other objective method that takes into consideration quotations from dealers, market transactions in comparable investments, market indices and yield curves. If vendors are unable to supply a price, or if the price supplied is deemed to be unreliable, the market price may be determined using quotations received from one or more broker–dealers that make a market in the security. Short–term debt obligations that will mature in 60 days or less are valued at amortized cost, unless it is determined that using this method would not reflect an investment’s fair value.
32 |
(855) 732-9220 | seafarerfunds.com |
Table of Contents
Seafarer Overseas Growth and Income Fund | Notes to Financial Statements | |
| October 31, 2015 (Unaudited) |
Forward currency exchange contracts have a market value determined by the prevailing foreign currency exchange daily rates and current foreign currency exchange forward rates. The foreign currency exchange forward rates are calculated using an automated system that estimates rates on the basis of the current day foreign currency exchange rates and forward foreign currency exchange rates supplied by a pricing service.
When such prices or quotations are not available, or when Seafarer Capital Partners, LLC (the “Adviser”) believes that they are unreliable, securities may be priced using fair value procedures approved by the Board.
Certain foreign countries impose a tax on capital gains which is accrued by the Fund based on unrealized appreciation, if any, on affected securities. The tax is paid when the gain is realized.
Fair Value Measurements: The Fund discloses the classification of its fair value measurements following a three-tier hierarchy based on the inputs used to measure fair value. Inputs refer broadly to the assumptions that market participants would use in pricing the asset or liability, including assumptions about risk. Inputs may be observable or unobservable. Observable inputs reflect the assumptions market participants would use in pricing the asset or liability. Such inputs are developed based on market data obtained from sources independent of the reporting entity. Unobservable inputs reflect the reporting entity’s own assumptions about the assumptions market participants would use in pricing the asset or liability, which are developed based on the information available and the reporting entity’s best efforts to interpret such information.
Various inputs are used in determining the value of the Fund’s investments as of the end of the reporting period. When inputs used fall into different levels of the fair value hierarchy, the level in the hierarchy within which the fair value measurement falls is determined based on the lowest level input that is significant to the fair value measurement in its entirety. The designated input levels are not necessarily an indication of the risk or liquidity associated with these investments. These inputs are categorized in the following hierarchy under applicable financial accounting standards:
Level 1 – | Unadjusted quoted prices in active markets for identical investments, unrestricted assets or liabilities that a Fund has the ability to access at the measurement date; | |
Level 2 – | Quoted prices which are not active, quoted prices for similar assets or liabilities in active markets or inputs other than quoted prices that are observable (either directly or indirectly) for substantially the full term of the asset or liability; and | |
Level 3 – | Significant unobservable prices or inputs (including the Fund’s own assumptions in determining the fair value of investments) where there is little or no market activity for the asset or liability at the measurement date. | |
Semi-Annual Report | October 31, 2015 |
33 |
Table of Contents
Seafarer Overseas Growth and Income Fund | Notes to Financial Statements | |
| October 31, 2015 (Unaudited) |
The following is a summary of each input used to value the Fund as of October 31, 2015:
Investments in Securities at Value(a) | Level 1 - Quoted Prices | Level 2 - Other Significant | Level 3 - Significant | Total | ||||||||||||
| ||||||||||||||||
Common Stocks | ||||||||||||||||
Brazil | $ | 57,236,517 | $ | – | $ | – | $ | 57,236,517 | ||||||||
China / Hong Kong | 9,791,020 | 101,832,968 | – | 111,623,988 | ||||||||||||
India | 28,511,200 | 26,862,363 | – | 55,373,563 | ||||||||||||
Indonesia | – | 24,932,961 | – | 24,932,961 | ||||||||||||
Japan | – | 16,744,284 | – | 16,744,284 | ||||||||||||
Malaysia | 5,518,040 | – | – | 5,518,040 | ||||||||||||
Mexico | 44,933,072 | – | – | 44,933,072 | ||||||||||||
Poland | – | 56,418,385 | – | 56,418,385 | ||||||||||||
Singapore | – | 43,143,120 | – | 43,143,120 | ||||||||||||
South Africa | – | 27,311,896 | – | 27,311,896 | ||||||||||||
South Korea | 10,683,742 | 16,307,199 | – | 26,990,941 | ||||||||||||
Taiwan | 4,392,000 | 15,590,575 | – | 19,982,575 | ||||||||||||
Turkey | – | 29,158,375 | – | 29,158,375 | ||||||||||||
Vietnam | 3,844,023 | 6,799,504 | – | 10,643,527 | ||||||||||||
Preferred Stocks | ||||||||||||||||
Brazil | 40,565,290 | – | – | 40,565,290 | ||||||||||||
South Korea | – | 33,945,586 | – | 33,945,586 | ||||||||||||
Foreign Currency | ||||||||||||||||
Convertible Bonds | – | 12,886,099 | – | 12,886,099 | ||||||||||||
Foreign Currency | ||||||||||||||||
Corporate Bonds | – | 8,257,031 | – | 8,257,031 | ||||||||||||
Foreign Currency | ||||||||||||||||
Government Bonds | – | 15,246,607 | – | 15,246,607 | ||||||||||||
USD Convertible Bonds | – | 2,559,375 | – | 2,559,375 | ||||||||||||
| ||||||||||||||||
Total | $ | 205,474,904 | $ | 437,996,328 | $ | – | $ | 643,471,232 | ||||||||
| ||||||||||||||||
| (a) | For detailed descriptions of countries, see the accompanying Portfolio of Investments. |
The Fund recognizes transfers between levels as of the end of the period. For the six months ended October 31, 2015, the Fund did not have any securities that used significant unobservable inputs (Level 3) in determining fair value.
34 |
(855) 732-9220 | seafarerfunds.com |
Table of Contents
Seafarer Overseas Growth and Income Fund | Notes to Financial Statements | |
| October 31, 2015 (Unaudited) |
Security amounts the Fund transferred between Levels 1 and 2 at October 31, 2015 were as follows:
| Seafarer Overseas | Level 1 | Level 2 | ||||||||||||||
Growth and Income Fund | Transfers In | Transfers (Out) | Transfers In | Transfers (Out) | ||||||||||||
| ||||||||||||||||
Common Stocks | $ | 5,518,040 | $ | (18,441,078 | ) | $ | 18,441,078 | $ | (5,518,040) | |||||||
| ||||||||||||||||
Total | $ | 5,518,040 | $ | (18,441,078 | ) | $ | 18,441,078 | $ | (5,518,040) | |||||||
| ||||||||||||||||
The above transfers were due to the Fund utilizing a fair value evaluation service with respect to international securities with an earlier market closing than the Fund’s net asset value computation cutoff. When events trigger the use of the fair value evaluation service on a reporting date, it results in certain securities transferring from a Level 1 to a Level 2.
Investment Transactions and Investment Income: Investment transactions are accounted for on the date the investments are purchased or sold (trade date). Realized gains and losses from investment transactions are reported on an identified cost basis. Interest income, which includes accretion of discounts and amortization of premiums, is accrued and recorded as earned. Dividend income is recognized on the ex-dividend date or for certain foreign securities, as soon as information is available to the Fund. All of the realized and unrealized gains and losses and net investment income are allocated daily to each class in proportion to its average daily net assets.
Concentration of Credit Risk: The Fund places its cash with one banking institution, which is insured by Federal Deposit Insurance Corporation (FDIC). The FDIC limit is $250,000. At various times throughout the year, the amount on deposit may exceed the FDIC limit and subject the Fund to a credit risk. The Fund does not believe that such deposits are subject to any unusual risk associated with investment activities.
Foreign Securities: The Fund may directly purchase securities of foreign issuers. Investing in securities of foreign issuers involves special risks not typically associated with investing in securities of U.S. issuers. The risks include possible reevaluation of currencies, the inability to repatriate foreign currency, less complete financial information about companies and possible future adverse political and economic developments. Moreover, securities of many foreign issuers and their markets may be less liquid and their prices more volatile than those of securities of comparable U.S. issuers.
Foreign Currency Translation: The books and records of the Fund are maintained in U.S. dollars. Investment valuations and other assets and liabilities initially expressed in foreign currencies are converted each business day into U.S. dollars based upon current exchange rates. Prevailing foreign exchange rates may generally be obtained at the close of the NYSE (normally, 4:00 p.m. Eastern time). The portion of realized and unrealized gains or losses on investments due to fluctuations in foreign currency exchange rates is not separately disclosed and is included in realized and unrealized gains or losses on investments, when applicable.
Foreign Currency Spot Contracts: The Fund may enter into foreign currency spot contracts to facilitate transactions in foreign securities or to convert foreign currency receipts into U.S. dollars. A foreign currency spot contract is an agreement between two parties to buy and sell currencies at the current market rate, for settlement generally within two business days. The U.S. dollar value of the contracts is determined using current currency exchange rates supplied by a pricing service. The contract is marked-to-market daily for settlements beyond one day and any change in market value is recorded as an unrealized gain or loss. When the contract is closed, the Fund records a realized gain
Semi-Annual Report | October 31, 2015 |
35 |
Table of Contents
Seafarer Overseas Growth and Income Fund | Notes to Financial Statements | |
| October 31, 2015 (Unaudited) |
or loss equal to the difference between the value on the open and close date. Losses may arise from changes in the value of the foreign currency, or if the counterparties do not perform under the contract’s terms. The maximum potential loss from such contracts is the aggregate face value in U.S. dollars at the time the contract was opened.
Trust Expenses: Some expenses of the Trust can be directly attributed to the Fund. Expenses which cannot be directly attributed to the Fund are apportioned among all funds in the Trust based on average net assets of each fund.
Fund and Class Expenses: Expenses that are specific to the Fund or class of shares of the Fund, including shareholder servicing fees, are charged directly to the Fund or share class. All expenses of the Fund, other than class specific expenses, are allocated daily to each class in proportion to its average daily net assets.
Federal Income Taxes: The Fund complies with the requirements under Subchapter M of the Internal Revenue Code of 1986, as amended, applicable to regulated investment companies and intends to distribute substantially all of its net taxable income and net capital gains, if any, each year so that it will not be subject to excise tax on undistributed income and gains. The Fund is not subject to income taxes to the extent such distributions are made.
As of and during the six months ended October 31, 2015, the Fund did not have a liability for any unrecognized tax benefits. The Fund files U.S. federal, state, and local tax returns as required. The Fund’s tax returns are subject to examination by the relevant tax authorities until expiration of the applicable statute of limitations, which is generally three years after the filing of the tax return for federal purposes and four years for most state returns. Tax returns for open years have incorporated no uncertain tax positions that require a provision for income taxes.
Distributions to Shareholders: The Fund normally pays dividends from net investment income, if any, on a semi-annual basis. The Fund normally distributes capital gains, if any, on an annual basis. Income dividend distributions are derived from interest and other income the Fund receives from its investments, including short term capital gains. Long term capital gain distributions are derived from gains realized when the Fund sells a security it has owned for more than one year. The Fund may make additional distributions and dividends at other times if the Adviser believes doing so may be necessary for the Fund to avoid or reduce taxes.
3. TAX BASIS INFORMATION
Tax Basis of Investments: As of October 31, 2015, the aggregate cost of investments, gross unrealized appreciation/ (depreciation) and net unrealized appreciation for Federal tax purposes were as follows:
| Cost of Investments | Gross Appreciation | Gross Unrealized Depreciation | Net Unrealized Appreciation | |||||||||||||
| ||||||||||||||||
Seafarer Overseas Growth and Income Fund | $ | 681,617,820 | $ | 29,853,331 | $ | (67,999,919 | ) | $ | (38,146,588 | ) | ||||||
Tax Basis of Distributions to Shareholders: The character of distributions made during the year from net investment income or net realized gains may differ from its ultimate characterization for federal income tax purposes. Also, due to the timing of dividend distributions, the fiscal year in which amounts are distributed may differ from the fiscal year in which the income or realized gain is recorded by the Fund.
36 |
(855) 732-9220 | seafarerfunds.com |
Table of Contents
Seafarer Overseas Growth and Income Fund | Notes to Financial Statements | |
| October 31, 2015 (Unaudited) |
The tax character of distributions paid by the Fund for the fiscal year ended April 30, 2015, were as follows:
| Ordinary Income | Long-Term Capital Gain | |||||||
| ||||||||
Seafarer Overseas Growth and Income Fund | $ | 1,973,654 | $ | 1,573,580 | ||||
The amounts and characteristics of tax basis distributions and composition of distributable earnings/(accumulated losses) are finalized at fiscal year-end. Accordingly, tax basis balances have not been determined as of October 31, 2015.
4. SECURITIES TRANSACTIONS
The cost of purchases and proceeds from sales of securities excluding short term securities during the six months ended October 31, 2015, were as follows:
| Purchases of Securities | Proceeds From Sales of Securities | |||||
| ||||||
Seafarer Overseas Growth and Income Fund | $ | 519,300,972 | $1,106,421 | |||
5. SHARES OF BENEFICIAL INTEREST
The capitalization of the Trust consists of an unlimited number of shares of beneficial interest with no par value per share. Holders of the shares of the Fund of the Trust have one vote for each share held and a proportionate fraction of a vote for each fractional share. All shares issued and outstanding are fully paid and are transferable and redeemable at the option of the shareholder. Purchasers of the shares do not have any obligation to make payments to the Trust or its creditors solely by reason of the purchasers’ ownership of the shares. Shares have no pre-emptive rights.
Shares redeemed within 90 days of purchase may incur a 2% short-term redemption fee deducted from the redemption amount. The redemption fee is reflected in the “Shares redeemed, net of redemption fees” in the Statements of Changes in Net Assets. During the six months ended October 31, 2015, and the year ended April 30, 2015, the Fund retained the following redemption fees:
| Fund | For the Six Months Ended October 31, 2015 (Unaudited) | For the Year ended April 30, 2015 | ||
| ||||
Seafarer Overseas Growth and Income Fund | ||||
| ||||
Investor Class | $ 78,580 | $ 10,091 | ||
| ||||
Institutional Class | $ 62,721 | $ 6,959 | ||
| ||||
Semi-Annual Report | October 31, 2015 |
37 |
Table of Contents
Seafarer Overseas Growth and Income Fund | Notes to Financial Statements | |
| October 31, 2015 (Unaudited) |
6. MANAGEMENT AND RELATED-PARTY TRANSACTIONS
The Adviser, subject to the authority of the Board, is responsible for the overall management and administration of the Fund’s business affairs. The Adviser manages the investments of the Fund in accordance with the Fund’s investment objective, policies, limitations and investment guidelines established jointly by the Adviser and the Trustees. Pursuant to the advisory agreement with the Trust, the Adviser is entitled to investment advisory fees, computed daily and payable monthly at an annual rate of 0.75% of the average daily net assets of the Fund.
Effective September 1, 2014, the Adviser contractually agreed to limit certain Fund expenses (excluding brokerage expenses, interest expenses, taxes and extraordinary expenses), to 1.25% and 1.05% of the Fund’s average daily net assets in the Investor and Institutional share classes, respectively, through August 31, 2015. Effective September 1, 2015, the Adviser contractually agreed to limit such Fund expenses to 1.15% and 1.05% of the Fund’s average daily net assets in the Investor and Institutional share classes, respectively, through August 31, 2017, at which point this agreement may be extended further. The Fund may have to repay some of these waivers and reimbursements to the Adviser in the following three years. Pursuant to the expense limitation agreement between the Adviser and the Trust, the Fund will reimburse the Adviser for any contractual fee waivers and expense reimbursements made by the Adviser, provided that any such reimbursements made by the Fund to the Adviser will not cause the Fund’s expense limitation to exceed expense limitations in existence at the time the expense was incurred, or at the time of the reimbursement, whichever is lower, and the reimbursement is made within three years after the end of the fiscal year in which fees or expenses were incurred. As of the date of this report, the Adviser has recouped waived revenues but has declined to seek reimbursement for subsidized expenses.
As of October 31, 2015, the balances of recoupable expenses for each class were as follows:
| Fund | Expires 2016 | Expires 2017 | Expires 2018 | Total | ||||||||||||
| ||||||||||||||||
Seafarer Overseas Growth and Income Fund | ||||||||||||||||
| ||||||||||||||||
Investor Class | $ | 111,471 | $ | 89,143 | $ | – | $ | 200,614 | ||||||||
| ||||||||||||||||
Institutional Class | 42,281 | 66,379 | 67,938 | 176,598 | ||||||||||||
| ||||||||||||||||
Fund Administrator Fees and Expenses
ALPS Fund Services, Inc. (“ALPS” and the “Administrator”) (an affiliate of ALPS Distributors, Inc.) provides administrative, fund accounting and other services to the Fund under the Administration, Bookkeeping and Pricing Services Agreement with the Trust. Under this Agreement, ALPS is paid fees by the Fund, accrued on a daily basis and paid on a monthly basis following the end of the month, based on the greater of (a) an annual total fee of $151,120 (subject to an annual cost of living increase), or (b) the following fee schedule:
| Average Total Net Assets | Contractual Fee | |
| ||
Between $0-$500M | 0.05% | |
$500M-$1B | 0.03% | |
Above $1B | 0.02% | |
The Administrator is also reimbursed by the Fund for certain out-of-pocket expenses.
Transfer Agent
ALPS serves as transfer, dividend paying and shareholder servicing agent for the Fund (“Transfer Agent”). ALPS is compensated based upon a $26,420 annual base fee for the Fund, and annually $9 per direct open account and $7 per open account through NSCC. The Transfer Agent is also reimbursed by the Fund for certain out-of-pocket expenses.
38 |
(855) 732-9220 | seafarerfunds.com |
Table of Contents
Seafarer Overseas Growth and Income Fund | Notes to Financial Statements | |
| October 31, 2015 (Unaudited) |
Compliance Services
ALPS provides services that assist the Trust’s chief compliance officer in monitoring and testing the policies and procedures of the Trust in conjunction with requirements under Rule 38a-1 under the 1940 Act under the Chief Compliance Officer Services Agreement with the Trust. Under this Agreement, the Adviser pays ALPS an annual base fee of $31,704 and reimburses ALPS for certain out-of-pocket expenses.
Principal Financial Officer
ALPS provides principal financial officer services to the Fund under the Principal Financial Officer Services Agreement with the Trust. Under this Agreement, the Adviser pays ALPS an annual base fee of $10,000 and reimburses ALPS for certain out-of-pocket expenses.
Distributor
ALPS Distributors, Inc. (“ADI” or the “Distributor”) (an affiliate of ALPS) acts as the distributor of the Fund’s shares pursuant to the Distribution Agreement with the Trust. Under a side letter agreement, the Adviser pays ADI an annual base fee of $12,000 for the distribution services. The Adviser also reimburses ADI for certain out-of-pocket expenses. Shares are sold on a continuous basis by ADI as agent for the Fund, and ADI has agreed to use its best efforts to solicit orders for the sale of the Fund’s shares, although it is not obliged to sell any particular amount of shares. ADI is registered as a broker-dealer with the U.S. Securities and Exchange Commission.
Shareholder Service Plan for Investor Class and Institutional Class Shares
The Fund has adopted a shareholder service plan (a “Service Plan”) for each of its share classes. Under the Service Plan, the Fund is authorized to enter into shareholder service agreements with investment advisors, financial institutions and other service providers (“Participating Organizations”) to maintain and provide certain administrative and servicing functions in relation to the accounts of shareholders. The Service Plan will cause the Fund to pay an aggregate fee, not to exceed on an annual basis 0.15% and 0.05% of the average daily net asset value of the Investor and Institutional share classes, respectively. Such payment will be made on assets attributable to or held in the name of a Participating Organizations, on behalf of its clients as compensation for providing service activities pursuant to an agreement with a Participating Organizations. Any amount of such payment not paid to the Participating Organizations during the Fund’s fiscal year for such service activities shall be reimbursed to the Fund as soon as practicable after the end of the fiscal year.
7. INDEMNIFICATIONS
Under the Trust’s organizational documents, its officers and Trustees are indemnified against certain liability arising out of the performance of their duties to the Trust. Additionally, in the normal course of business, the Trust enters into contracts with service providers that may contain general indemnification clauses, which may permit indemnification to the extent permissible under the applicable law. The Trust’s maximum exposure under these arrangements is unknown, as this would involve future claims that may be made against the Trust that have not yet occurred.
8. RECENT ACCOUNTING PRONOUNCEMENT
In May 2015, the Financial Accounting Standards Board issued Accounting Standards Update (“ASU”) 2015-07, “Disclosures for Investments in Certain Entities that Calculate Net Asset Value Per Share (or its Equivalent).” This is an update to Accounting Standards Codification Topic 820, Fair Value Measurement. ASU 2015-07 removes the requirement to categorize within the fair value hierarchy investments for which fair value is measured at net asset value per share (or its equivalent) using the practical expedient. ASU 2015-17 is effective for annual reporting periods beginning on or after December 15, 2015, and interim periods within those annual periods, with retrospective application for all periods presented. The Fund is currently evaluating the impact ASU 2015-07 will have on the Fund’s financial statements and disclosures.
Semi-Annual Report | October 31, 2015 |
39 |
Table of Contents
| Additional Information | ||
| October 31, 2015 (Unaudited) |
1. FUND HOLDINGS
The Fund files its complete schedule of portfolio holdings with the Securities and Exchange Commission (the “SEC”) for the first and third quarters of each fiscal year on Form N-Q within 60 days after the end of the period. Copies of the Fund’s Form N-Q are available without charge on the SEC website at http://www.sec.gov. You may also review and copy the Form N-Q at the SEC’s Public Reference Room in Washington, D.C. For more information about the operation of the Public Reference Room, please call the SEC at 1-800-SEC-0330.
2. FUND PROXY VOTING POLICIES, PROCEDURES AND SUMMARIES
The Fund’s policies and procedures used in determining how to vote proxies and information regarding how the Fund voted proxies relating to portfolio securities during the most recent prior 12-month period ending June 30 are available without charge, (1) upon request, by calling toll-free (855) 732-9220 and (2) on the SEC’s website at http://www.sec.gov.
40 |
(855) 732-9220 | seafarerfunds.com |
Table of Contents

Table of Contents
Table of Contents
| Table of Contents | ||
| October 31, 2015 |
| 1 | ||||
| 6 | ||||
| 7 | ||||
| 11 | ||||
| 12 | ||||
| 13 | ||||
| 15 | ||||
| 16 | ||||
| 22 | ||||
| 25 | ||||
Table of Contents
| Stonebridge Small-Cap Growth Fund | Letter to Shareholders | |
| October 31, 2015 (Unaudited) | ||
November 12, 2015
OVERVIEW
As discussed in our last letter to shareholders, our economic outlook was predicated on our belief that the slowdown in U.S. economic growth during the first quarter of 2015 was due to an unusually cold winter and that the U.S. economy would snap-back and normalize. Gross Domestic Product (GDP) growth in the U.S. did surge in the second quarter and then moderated in the third quarter. We expect more of the same going forward; uneven GDP growth as a result of volatile commodity prices and foreign exchange rates. Yet, the overall U.S. economy continues to improve. Employers in the U.S. are hiring, the labor participation rate is improving, real wages are higher and oil prices are lower. As such, we remain constructive about the outlook for economic growth in the U.S. for the remainder of this year and next year. For small growth companies, the domestic economic outlook and interest rates are key barometers.
Concerning interest rates, we believe it is likely the Federal Reserve will raise the Federal Funds rate in December. While this would be a significant change in policy, we do not expect any repercussions in the short-term. We believe the Federal Reserve will proceed slowly and non-consecutively. As such, we think short-term rates will rise and the yield curve will flatten as opposed to a shift across the entire yield curve. Further, we anticipate that the continued easing in Europe, China and Japan will likely keep a lid on long-term interest rates in the U.S. as overseas monies flow into U.S. bonds.
With regards to the global economic outlook, capital markets across the world experienced significant volatility during the second half of the third quarter. In mid-August, the Chinese government devalued its currency leading to the first significant correction of the global equity markets in years. Subsequently, the Chinese government lowered its expectation for domestic growth in China and has since lowered interest rates. Emerging markets fared the worst as a weaker Chinese currency makes its exports to developed markets more competitive. Fortunately, demand from China for U.S. goods is very limited and so while the contagion effect can occur in the short-term, the consequence to the U.S. economy should be insignificant.
As a result of our sanguine outlook for the U.S. economy, the Fund has significantly increased its exposure to consumer discretionary stocks and industrial stocks. Further, the Fund has taken advantage of interesting investment opportunities in the health care sector due to industry specific concerns regarding drug prices. The Fund’s strategic repositioning to these sectors has already paid dividends to the Fund’s performance. Since the end of the third quarter (September 30, 2015), the Fund has seen an improvement in its performance versus its benchmark, the Russell 2000® Growth Index1.
| Semi-Annual Report | October 31, 2015 | 1 | |
Table of Contents
| Stonebridge Small-Cap Growth Fund | Letter to Shareholders | |
| October 31, 2015 (Unaudited) | ||
STONEBRIDGE SMALL-CAP GROWTH FUND
For the six months ending October 31, 2015, the Stonebridge Small-Cap Growth Fund fell by 12.20%. Most of this short-fall occurred in August and September as a result of the correction in the global equity markets. As mentioned earlier, the Fund has added to its consumer discretionary and industrial exposure while reducing its technology exposure. Regarding technology, the Fund had a large position in technology at the end of the fiscal year (April 30, 2015). Several investments performed well over the ensuing period, exceeding the adviser’s price targets and so the Fund realized some profits and reinvested the proceeds into new opportunities in the consumer discretionary and industrial sectors. However, the technology sector currently remains one of the largest economic sector for the Fund’s investments and a key focus for the Fund.
Stonebridge Small-Cap Growth Fund (SBSGX) Sector Allocation
as a Percent of Net Assets as of October 31, 2015*

* These allocations may not reflect the current or future position of the portfolio.
2 | Stonebridge Small-Cap Growth Fund | |
Table of Contents
| Stonebridge Small-Cap Growth Fund | Letter to Shareholders | |
| October 31, 2015 (Unaudited) | ||
Change in value of a $10,000 investment in Stonebridge Small-Cap
Growth Fund (SBSGX) vs. the Russell 2000® Growth Index and
the S&P 500® Total Return Index from October 31, 2005 to October 31, 2015
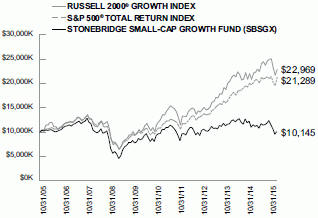
Average Annual Total Returns for the Years Ended October 31, 2015
| 1 Year | 5 Years | 10 Years | ||||||||||
Stonebridge Small-Cap Growth Fund (SBSGX) | -11.92% | 0.92% | 0.14% | |||||||||
Russell 2000® Growth Index(1) | 3.52% | 13.56% | 8.67% | |||||||||
S&P 500® Total Return Index(2) | 5.20% | 14.33% | 7.85% | |||||||||
Average annual total returns reflect reinvestment of all dividends and capital gains distributions, any fee waivers in effect and any expense reimbursements. Without the fee waivers and expense reimbursements, the total return figures would be lower. Past performance is not indicative of future results and current performance may be lower or higher than the performance quoted. Investment return and principal value will fluctuate and shares, when redeemed, may be worth more or less than their original cost. The total returns shown do not reflect the deduction of taxes that a shareholder would pay on fund distributions or the redemption of fund shares. To obtain the most recent month-end performance, please call the Fund’s toll-free number at 1-800-639-3935.
Effective as of the close of business February 15, 2013, Stonebridge Small-Cap Growth Fund (SBAGX) (the “Acquired Fund”) and Stonebridge Institutional Small-Cap Growth Fund (SBSCX) (the “Acquiring Fund”), each a series of Stonebridge Funds Trust were reorganized into a newly created fund, which is named the Stonebridge Small-Cap Growth Fund (SBSGX) (the “Fund”), under the Financial Investors Trust. The Fund’s performance for periods prior to the close of business February 15, 2013 is that of the Acquiring Fund.
| Semi-Annual Report | October 31, 2015 | 3 | |
Table of Contents
| Stonebridge Small-Cap Growth Fund | Letter to Shareholders | |
| October 31, 2015 (Unaudited) | ||
Stonebridge Capital Management, Inc. (the “Adviser”) has contractually agreed to limit the amount of the Fund’s Total Annual Fund Operating Expenses, exclusive of brokerage expenses, interest expenses, taxes and extraordinary expenses, to an annual rate of 1.96% of the Fund’s average daily net assets. This agreement is in effect through August 31, 2016. The Adviser will be permitted to recover expenses it has borne through the agreement described above to the extent that the Fund’s expenses in later periods fall below the annual rates set forth in the relevant agreement. The Fund will not be obligated to pay any such deferred fees and expenses more than three years after the end of the fiscal year in which the fees and expenses were deferred. The Adviser may not discontinue the waiver without the approval by the Fund’s Board of Trustees.
As of the Prospectus dated August 31, 2015, the gross annual expense ratio for the Stonebridge Small-Cap Growth Fund was 2.12%. At October 31, 2015, the Fund’s gross annual expense ratio was 2.28% and the Fund’s annual net expense ratio was 2.20%.
CONCLUSION
In managing the Fund in accordance with its strategy, we seek to identify strong businesses that we believe exhibit competitive advantages, growing market share, and healthy balance sheets, and that are poised to rapidly grow earnings in excess of market expectations. We are positioning the Fund toward those businesses and economic sectors that we believe contain the best opportunities for future growth and investment returns. Although we are most excited about the outlook for consumer discretionary, health care, industrial and technology companies, we believe that we will continue to find opportunities for the Fund across sectors that can deliver solid performance results for shareholders.
Sincerely,
Richard C. Barrett, CFA
Matthew W. Markatos, CFA
Portfolio Managers
Stonebridge Capital Management, Inc.
Performance quoted above represents past performance. Past Performance does not guarantee future results.
The views of the author and information discussed in this commentary are as of the date of publication, are subject to change, and may not reflect the writer’s current views. The views expressed are those of the author only, and represent an assessment of market conditions at a specific point in time, are opinions only and should not be relied upon as investment advice regarding a particular investment or markets in general. Such information does not constitute a recommendation to buy or sell specific securities or investment vehicles. It should not be assumed that any investment will be profitable or will equal the performance of the portfolios or any securities or any sectors mentioned in this letter. The subject matter contained in this letter has been derived from several sources believed to be reliable and accurate at the time of compilation. Neither Stonebridge Capital Management, Inc. nor the Fund accepts any liability for losses either direct or consequential caused by the use of this information.
The Stonebridge Small-Cap Growth Fund is distributed by ALPS Distributors, Inc.
The Fund is subject to investment risks, including possible loss of the principal amount invested and therefore is not suitable for all investors. The Fund may not achieve its objectives.
Diversification does not ensure a profit or guarantee against loss.
4 | Stonebridge Small-Cap Growth Fund | |
Table of Contents
| Stonebridge Small-Cap Growth Fund | Letter to Shareholders | |
| October 31, 2015 (Unaudited) | ||
DEFINITIONS:
| (1) | The Russell 2000® Growth Index is an unmanaged index that measures the performance of those Russell 2000® Index companies with higher price-to-book ratios and higher forecasted growth values. The Russell 2000® Index measures the performance of the 2,000 smallest companies in the Russell 3000® Index, which measures the performance of the 3,000 largest U.S. companies in terms of market capitalization. The Russell 2000® Growth Index is constructed to provide a comprehensive and unbiased barometer of the small-cap growth market. This is a total return index which reflects the reinvestment of income dividends and capital gain distributions, if any, but does not reflect fees, brokerage commissions, or other expenses of investing. The Index is not actively managed and does not reflect any deductions for fees, expenses or taxes. An investor may not invest directly in the Index. |
| (2) | The S&P 500® Total Return Index is an unmanaged index of 500 common stocks chosen for the market size, liquidity and industry group representation. It is a market-value weighted index. The Index is not actively managed and does not reflect any deduction for fees, expenses or taxes. An investor may not invest directly into the Index. |
Yield Curve - A line that plots the interest rates, at a set point in time, of bonds having equal credit quality, but differing maturity dates. The most frequently reported yield curve compares the three-month, two-year, five-year and 30-year U.S. Treasury debt. This yield curve is used as a benchmark for other debt in the market, such as mortgage rates or bank lending rates. The curve is also used to predict changes in economic output and growth.
| Semi-Annual Report | October 31, 2015 | 5 | |
Table of Contents
| Stonebridge Small-Cap Growth Fund | Disclosure of Fund Expenses | |
| October 31, 2015 (Unaudited) | ||
As a shareholder of a Fund, you incur two types of costs: (1) transaction costs (such as the 2% fee on redemption of Fund shares made within 30 days of purchase); and (2) ongoing costs, including management fees and other Fund expenses. The following examples are intended to help you understand your ongoing costs (in dollars) of investing in a Fund and to compare these costs with the ongoing costs of investing in other mutual funds. The examples are based on an investment of $1,000 invested on May 1, 2015 and held until October 31, 2015.
Actual Return — The first line of the following tables provides information about actual account values and actual expenses. You may use the information in this line, together with the amount you invested, to estimate the expenses that you paid over the period. Simply divide your account value by $1,000 (for example, an $8,600 account value divided by $1,000 = 8.6), then multiply the result by the number in the first line under the heading “Expense Paid During Period” to estimate the expenses you paid on your account during this period.
Hypothetical 5% Return — The second line of the following tables provides information about hypothetical account values and hypothetical expenses based on each Fund’s actual expense ratio and an assumed rate of return of 5% per year before expenses, which is not the Fund’s actual return. The hypothetical account values and expenses may not be used to estimate the actual ending account balance or expenses you paid for the period. You may use this information to compare the ongoing costs of investing in a Fund and other mutual funds. To do so, compare this 5% hypothetical example with the 5% hypothetical examples that appear in the shareholder reports of the other funds.
The expenses shown in the table are meant to highlight ongoing Fund costs only and do not reflect transaction fees, such as redemption fees. Therefore, the second line of the table is useful in comparing ongoing costs only, and may not help you determine the relative total costs of owning different funds. If the transaction fees were included, your costs would be higher.
Stonebridge Small-Cap Growth Fund
Beginning Account Value at 5/01/15 | Ending Account Value at 10/31/15 | Expense Ratio(1) | Expense Paid During Period 5/01/15 to 10/31/15(2) | |||||||||||||||||
Actual Fund Return | $ 1,000.00 | $ | 878.00 | 2.20 | % | $ 10.39 | ||||||||||||||
Hypothetical Fund Return (5% return before expenses) | $ 1,000.00 | $ | 1,014.08 | 2.20 | % | $ 11.14 | ||||||||||||||
| (1) | The Fund’s expense ratios have been annualized based on the Fund’s most recent fiscal half-year expenses. |
| (2) | Expenses are equal to the Fund’s annualized expense ratio multiplied by the average account value over the period, multiplied by the number of days in the most recent fiscal half-year (184)/366 (to reflect the half-year period). |
6 | Stonebridge Small-Cap Growth Fund | |
Table of Contents
| Stonebridge Small-Cap Growth Fund | Statement of Investments | |
| October 31, 2015 (Unaudited) | ||
| Shares | Market Value | |||||||
COMMON STOCKS (99.39%) | ||||||||
CONSUMER DISCRETIONARY - (16.18%) | ||||||||
Hotels, Restaurants & Leisure (6.11%) | ||||||||
Belmond Ltd. - Class A** | 34,000 | $ | 365,160 | |||||
El Pollo Loco Holdings, Inc.** | 14,000 | 160,720 | ||||||
Interval Leisure Group, Inc. | 18,000 | 317,700 | ||||||
|
| |||||||
| 843,580 | ||||||||
|
| |||||||
Household Durables (3.39%) | ||||||||
TRI Pointe Group, Inc.** | 36,000 | 467,280 | ||||||
|
| |||||||
Media (2.11%) | ||||||||
MDC Partners, Inc. - Class A | 14,000 | 290,920 | ||||||
|
| |||||||
Specialty Retail (4.57%) | ||||||||
Select Comfort Corp.** | 11,500 | 243,800 | ||||||
Vitamin Shoppe, Inc.** | 13,500 | 387,315 | ||||||
|
| |||||||
| 631,115 | ||||||||
|
| |||||||
TOTAL CONSUMER DISCRETIONARY | 2,232,895 | |||||||
|
| |||||||
CONSUMER STAPLES - (2.25%) | ||||||||
Food & Staples Retailing (2.25%) | ||||||||
The Chefs’ Warehouse, Inc.** | 20,500 | 310,575 | ||||||
|
| |||||||
TOTAL CONSUMER STAPLES | 310,575 | |||||||
|
| |||||||
ENERGY - (9.89%) | ||||||||
Energy Equipment & Services (3.63%) | ||||||||
Superior Energy Services, Inc. | 17,500 | 247,800 | ||||||
US Silica Holdings, Inc. | 14,000 | 252,840 | ||||||
|
| |||||||
| 500,640 | ||||||||
|
| |||||||
Oil, Gas & Consumable Fuels (6.26%) | ||||||||
Denbury Resources, Inc. | 67,500 | 238,950 | ||||||
Sanchez Energy Corp.** | 42,000 | 249,900 | ||||||
Synergy Resources Corp.** | 33,500 | 374,865 | ||||||
|
| |||||||
| 863,715 | ||||||||
|
| |||||||
TOTAL ENERGY | 1,364,355 | |||||||
|
| |||||||
FINANCIALS - (3.26%) | ||||||||
Capital Markets (2.25%) | ||||||||
Fifth Street Asset Management, Inc. | 53,000 | 310,580 | ||||||
|
| |||||||
| See Notes to Financial Statements. | ||
| Semi-Annual Report | October 31, 2015 | 7 | |
Table of Contents
| Stonebridge Small-Cap Growth Fund | Statement of Investments | |
| October 31, 2015 (Unaudited) | ||
| Shares | Market Value | |||||||
FINANCIALS (continued) | ||||||||
Thrifts & Mortgage Finance (1.01%) | ||||||||
BofI Holding, Inc.** | 1,750 | $ | 140,018 | |||||
|
| |||||||
TOTAL FINANCIALS | 450,598 | |||||||
|
| |||||||
HEALTH CARE - (21.06%) | ||||||||
Biotechnology (12.16%) | ||||||||
ACADIA Pharmaceuticals, Inc.** | 8,500 | 295,970 | ||||||
Cepheid** | 6,500 | 217,100 | ||||||
Exact Sciences Corp.** | 38,000 | 316,540 | ||||||
Genomic Health, Inc.** | 26,000 | 543,920 | ||||||
PTC Therapeutics, Inc.** | 12,250 | 304,657 | ||||||
|
| |||||||
| 1,678,187 | ||||||||
|
| |||||||
Health Care Equipment & Supplies (6.46%) | ||||||||
Tandem Diabetes Care, Inc.** | 53,040 | 481,073 | ||||||
Trinity Biotech PLC - Sponsored ADR | 36,500 | 409,895 | ||||||
|
| |||||||
| 890,968 | ||||||||
|
| |||||||
Life Sciences Tools & Services (2.44%) | ||||||||
Luminex Corp.** | 18,500 | 336,700 | ||||||
|
| |||||||
TOTAL HEALTH CARE | 2,905,855 | |||||||
|
| |||||||
INDUSTRIALS - (17.76%) | ||||||||
Commercial Services & Supplies (2.91%) | ||||||||
Performant Financial Corp.** | 50,000 | 115,500 | ||||||
Ritchie Bros. Auctioneers, Inc. | 11,000 | 285,670 | ||||||
|
| |||||||
| 401,170 | ||||||||
|
| |||||||
Construction & Engineering (3.40%) | ||||||||
Aegion Corp.** | 10,000 | 192,900 | ||||||
KBR, Inc. | 15,000 | 276,600 | ||||||
|
| |||||||
| 469,500 | ||||||||
|
| |||||||
Machinery (4.74%) | ||||||||
Chart Industries, Inc.** | 6,750 | 116,033 | ||||||
Energy Recovery, Inc.** | 10,000 | 71,700 | ||||||
Woodward, Inc. | 10,250 | 466,375 | ||||||
|
| |||||||
| 654,108 | ||||||||
|
| |||||||
See Notes to Financial Statements. | ||
8 | Stonebridge Small-Cap Growth Fund | |
Table of Contents
| Stonebridge Small-Cap Growth Fund | Statement of Investments | |
| October 31, 2015 (Unaudited) | ||
| Shares | Market Value | |||||||
INDUSTRIALS (continued) | ||||||||
Professional Services (6.71%) | ||||||||
Mistras Group, Inc.** | 12,000 | $ | 227,040 | |||||
The Advisory Board Co.** | 7,750 | 339,682 | ||||||
WageWorks, Inc.** | 7,500 | 360,150 | ||||||
|
| |||||||
| 926,872 | ||||||||
|
| |||||||
TOTAL INDUSTRIALS | 2,451,650 | |||||||
|
| |||||||
INFORMATION TECHNOLOGY - (20.90%) | ||||||||
Communications Equipment (0.82%) | ||||||||
Ruckus Wireless, Inc.** | 10,000 | 112,800 | ||||||
|
| |||||||
Electronic Equipment, Instruments & Components (1.18%) | ||||||||
MicroVision, Inc.** | 55,000 | 162,250 | ||||||
|
| |||||||
Internet Software & Services (7.06%) | ||||||||
Bazaarvoice, Inc.** | 55,000 | 243,650 | ||||||
Cornerstone OnDemand, Inc.** | 13,500 | 425,250 | ||||||
Marin Software, Inc.** | 25,055 | 89,697 | ||||||
SPS Commerce, Inc.** | 3,000 | 215,460 | ||||||
|
| |||||||
| 974,057 | ||||||||
|
| |||||||
Semiconductors & Semiconductor Equipment (3.41%) | ||||||||
Applied Micro Circuits Corp.** | 53,000 | 343,440 | ||||||
SunEdison, Inc.** | 17,500 | 127,750 | ||||||
|
| |||||||
| 471,190 | ||||||||
|
| |||||||
Software (5.89%) | ||||||||
Callidus Software, Inc.** | 20,500 | 356,085 | ||||||
Jive Software, Inc.** | 30,000 | 146,100 | ||||||
MobileIron, Inc.** | 32,000 | 123,520 | ||||||
Tangoe, Inc.** | 22,693 | 187,898 | ||||||
|
| |||||||
| 813,603 | ||||||||
|
| |||||||
Technology Hardware, Storage & Peripherals (2.54%) | ||||||||
Nimble Storage, Inc.** | 15,500 | 350,300 | ||||||
|
| |||||||
TOTAL INFORMATION TECHNOLOGY | 2,884,200 | |||||||
|
| |||||||
MATERIALS - (1.44%) | ||||||||
Chemicals (1.44%) | ||||||||
Intrepid Potash, Inc.** | 51,500 | 198,790 | ||||||
|
| |||||||
TOTAL MATERIALS | 198,790 | |||||||
|
| |||||||
| See Notes to Financial Statements. | ||
| Semi-Annual Report | October 31, 2015 | 9 | |
Table of Contents
| Stonebridge Small-Cap Growth Fund | Statement of Investments | |
| October 31, 2015 (Unaudited) | ||
| Shares | Market Value | |||||||
TELECOMMUNICATION SERVICES - (6.65%) | ||||||||
Diversified Telecommunication Services (6.65%) | ||||||||
8x8, Inc.** | 35,000 | $ | 373,100 | |||||
Cogent Communications Holdings, Inc. | 17,750 | 545,280 | ||||||
|
| |||||||
TOTAL TELECOMMUNICATION SERVICES | 918,380 | |||||||
|
| |||||||
TOTAL COMMON STOCKS (Cost $15,299,063) | 13,717,298 | |||||||
|
| |||||||
MONEY MARKET MUTUAL FUNDS (0.71%) | ||||||||
Fidelity® Institutional Money Market | 98,476 | 98,476 | ||||||
|
| |||||||
TOTAL MONEY MARKET MUTUAL FUNDS (Cost $98,476) | 98,476 | |||||||
|
| |||||||
TOTAL INVESTMENTS (100.10%) (Cost $15,397,539) | $ | 13,815,774 | ||||||
LIABILITIES IN EXCESS OF OTHER ASSETS (-0.10%) | (14,451) | |||||||
|
| |||||||
NET ASSETS (100.00%) | $ | 13,801,323 | ||||||
|
| |||||||
| ** | Non-Income Producing Security. |
Common Abbreviations:
ADR - American Depositary Receipt.
Ltd. - Limited.
PLC - Public Limited Company.
Holdings are subject to change.
For Fund compliance purposes, the Fund’s industry classifications refer to any one or more of the industry sub-classifications used by one or more widely recognized market indexes or ratings group indexes, and/or as defined by Fund management. This definition may not apply for purposes of this report, which may combine industry sub-classifications for reporting ease. Industries are shown as a percentage of net assets.
See Notes to Financial Statements. | ||
10 | Stonebridge Small-Cap Growth Fund | |
Table of Contents
| Stonebridge Small-Cap Growth Fund | Statement of Assets and Liabilities | |
| October 31, 2015 (Unaudited) | ||
ASSETS: | ||||
Investments, at value | $ | 13,815,774 | ||
Receivable for investments sold | 312,136 | |||
Dividends receivable | 1,401 | |||
Prepaid and other assets | 18,446 | |||
|
| |||
Total assets | 14,147,757 | |||
|
| |||
LIABILITIES: | ||||
Payable for investments purchased | 286,224 | |||
Advisory fees payable | 2,889 | |||
Administration and fund accounting fees payable | 14,573 | |||
Payable for transfer agent fees | 16,410 | |||
Payable for professional fees | 12,252 | |||
Payable for trustee fees and expenses | 152 | |||
Payable for chief compliance officer fees | 3,575 | |||
Accrued expenses and other liabilities | 10,359 | |||
|
| |||
Total liabilities | 346,434 | |||
|
| |||
Net Assets | $ | 13,801,323 | ||
|
| |||
COMPOSITION OF NET ASSETS: | ||||
Paid-in capital (Note 5) | $ | 16,130,263 | ||
Accumulated net investment loss | (191,263) | |||
Accumulated net realized loss on investments | (555,912) | |||
Net unrealized depreciation in value of investments | (1,581,765) | |||
|
| |||
Net Assets | $ | 13,801,323 | ||
|
| |||
NET ASSET VALUE PER SHARE: | ||||
Net Assets | $ | 13,801,323 | ||
Shares outstanding | 1,881,499 | |||
Net asset value and redemption price per share* | $ | 7.34 | ||
|
| |||
Investments, at cost | $ | 15,397,539 | ||
|
| |||
| * | A charge of 2% is imposed on the redemption proceeds of shares held 30 days or less (Note 5). |
| See Notes to Financial Statements. | ||
| Semi-Annual Report | October 31, 2015 | 11 | |
Table of Contents
| Stonebridge Small-Cap Growth Fund | Statement of Operations | |
| For the Six Months Ended October 31, 2015 (Unaudited) | ||
INCOME: | ||||
Dividends | $ | 72,265 | ||
Foreign taxes withheld on dividends | (1,696) | |||
|
| |||
Total Income | 70,569 | |||
|
| |||
EXPENSES: | ||||
Investment advisory fees (Note 6) | 59,165 | |||
Administration fees | 39,956 | |||
Transfer agent fees | 36,302 | |||
Fund accounting fees and expenses | 1,830 | |||
Custodian fees | 2,513 | |||
Professional fees | 12,791 | |||
Printing fees | 2,783 | |||
Registration fees | 7,713 | |||
Trustee fees and expenses | 232 | |||
Chief compliance officer fees | 10,620 | |||
Insurance | 101 | |||
Other | 5,510 | |||
|
| |||
Total Expenses | 179,516 | |||
|
| |||
Less fees waived/reimbursed by investment advisor (Note 6) | (6,016) | |||
Net Expenses | 173,500 | |||
|
| |||
Net Investment Loss | (102,931) | |||
|
| |||
REALIZED AND UNREALIZED GAIN/(LOSS) ON INVESTMENTS: | ||||
Net realized gain on investments | 56,785 | |||
Change in net unrealized depreciation of investments | (1,908,873) | |||
|
| |||
Net Realized and Unrealized Loss on Investments | (1,852,088) | |||
|
| |||
Net Decrease in Net Assets Resulting From Operations | $ | (1,955,019) | ||
|
| |||
See Notes to Financial Statements. | ||
12 | Stonebridge Small-Cap Growth Fund | |
Table of Contents
| Stonebridge Small-Cap Growth Fund | Statements of Changes in Net Assets |
For the Six Months Ended | For the Year Ended April 30, 2015 | |||||||
| ||||||||
OPERATIONS: | ||||||||
Net investment loss | $ | (102,931) | $ | (298,479) | ||||
Net realized gain/(loss) on investments | 56,785 | (505,161) | ||||||
Change in net unrealized appreciation/(depreciation) of investments | (1,908,873) | 110,963 | ||||||
|
| |||||||
Decrease in Net Assets Resulting from Operations | (1,955,019) | (692,677) | ||||||
|
| |||||||
DISTRIBUTIONS (Note 3): | ||||||||
From net realized gains | – | (1,202,412) | ||||||
|
| |||||||
Total distributions | – | (1,202,412) | ||||||
|
| |||||||
CAPITAL SHARE TRANSACTIONS (NOTE 5): | ||||||||
Net decrease in shareholder activity derived from beneficial interest transactions, net of redemption fees | (621,455) | (431,599) | ||||||
|
| |||||||
NET DECREASE IN NET ASSETS | (2,576,474) | (2,326,688) | ||||||
NET ASSETS: | ||||||||
Beginning of period | 16,377,797 | 18,704,485 | ||||||
|
| |||||||
End of period* | $ | 13,801,323 | $ | 16,377,797 | ||||
|
| |||||||
* Includes accumulated net investment loss of: | $ | (191,263) | $ | (88,332) | ||||
| See Notes to Financial Statements. | ||
| Semi-Annual Report | October 31, 2015 | 13 | |
Table of Contents
| Stonebridge Small-Cap Growth Fund | ||
| For a share outstanding through the periods presented | ||
| ||
PER SHARE DATA | ||
| Net asset value, beginning of year | ||
| INCOME/(LOSS) FROM INVESTMENT OPERATIONS: | ||
| Net investment loss | ||
| Net realized and unrealized gain/(loss) on investments | ||
| Total Income/(Loss) from Investment Operations | ||
| DISTRIBUTIONS TO SHAREHOLDERS: | ||
| From net realized gain on investments | ||
| Total Distributions to Shareholders | ||
| Net Increase/(Decrease) in Net Asset Value | ||
| Net asset value, end of year | ||
| Total Return | ||
| Ratios & Supplemental Data: | ||
| Net assets, end of year (in 000s) | ||
| Ratios to average net assets: | ||
Expenses (excluding fee waivers) | ||
Expenses (including fee waivers) | ||
Net investment loss (including fee waivers) | ||
| Portfolio Turnover Rate(6) | ||
| (1) | The Fund’s fiscal year end changed from October 31st to April 30th. See Note 1. |
| (2) | Calculated using the average shares method. |
| (3) | Total return not annualized for periods less than one full year. |
| (4) | Annualized. |
| (5) | Effective October 1, 2015, the Adviser contractually agreed to limit expenses to 1.96%. |
| (6) | Portfolio turnover rate for periods less than one full year have not been annualized. |
See Notes to Financial Statements. | ||
14 | Stonebridge Small-Cap Growth Fund | |
Table of Contents
| Financial Highlights | ||
Six Months Ended October 31, 2015 (Unaudited) | Year Ended April 30, 2015 | Year Ended April 30, 2014 | Six Months Ended April 30, 2013(1) | Year Ended October 31, 2012 | Year Ended October 31, 2011 | |||||||||||||||||
|
| |||||||||||||||||||||
| $8.36 | $9.42 | $8.74 | $8.42 | $7.90 | $7.91 | |||||||||||||||||
|
| |||||||||||||||||||||
| (0.05)(2) | (0.15)(2) | (0.20)(2) | (0.15)(2) | (0.30) | (0.26) | |||||||||||||||||
| (0.97) | (0.27) | 1.26 | 0.47 | 0.82 | 0.25 | |||||||||||||||||
|
| |||||||||||||||||||||
| (1.02) | (0.42) | 1.06 | 0.32 | 0.52 | (0.01) | |||||||||||||||||
|
| |||||||||||||||||||||
| – | (0.64) | (0.38) | – | – | – | |||||||||||||||||
|
| |||||||||||||||||||||
| – | (0.64) | (0.38) | – | – | – | |||||||||||||||||
|
| |||||||||||||||||||||
| (1.02) | (1.06) | 0.68 | 0.32 | 0.52 | (0.01) | |||||||||||||||||
|
| |||||||||||||||||||||
| $7.34 | $8.36 | $9.42 | $8.74 | $8.42 | $7.90 | |||||||||||||||||
|
| |||||||||||||||||||||
| (12.20)%(3) | (3.83)% | 12.20% | 3.80%(3) | 6.58% | (0.13)% | |||||||||||||||||
|
| |||||||||||||||||||||
| $13,801 | $16,378 | $18,704 | $17,842 | $12,673 | $12,457 | |||||||||||||||||
|
| |||||||||||||||||||||
| 2.28% | N/A | N/A | N/A | N/A | N/A | |||||||||||||||||
|
| |||||||||||||||||||||
| 2.20%(4)(5) | 2.12% | 2.25% | 3.86%(4) | 3.89% | 3.36% | |||||||||||||||||
|
| |||||||||||||||||||||
| (1.30)%(4) | (1.73)% | (2.09)% | (3.52)%(4) | (3.58)% | (2.96)% | |||||||||||||||||
|
| |||||||||||||||||||||
| 76% | 138% | 152% | 89% | 222% | 195% | |||||||||||||||||
|
| |||||||||||||||||||||
| Semi-Annual Report | October 31, 2015 | 15 | |
Table of Contents
| Stonebridge Small-Cap Growth Fund | Notes to Financial Statements | |
| October 31, 2015 (Unaudited) | ||
1. ORGANIZATION
Financial Investors Trust (the “Trust”), a Delaware statutory trust, is an open-end management investment company registered under the Investment Company Act of 1940, as amended (“1940 Act”). As of October 31, 2015, the Trust had 34 registered funds. This semi-annual report describes the Stonebridge Small-Cap Growth Fund (prior to the close of business on February 15, 2013 known as the Stonebridge Institutional Small-Cap Growth Fund) (the “Fund”). The Fund seeks long-term growth of capital.
The Fund is a successor to a previously operational fund which was a series of the Stonebridge Funds Trust, a Delaware statutory trust, and was organized into a series of the Trust effective as of the close of business on February 15, 2013. As a result, the Fund’s fiscal year end changed from October 31 to April 30.
2. SIGNIFICANT ACCOUNTING POLICIES
The accompanying financial statements were prepared in accordance with accounting principles generally accepted in the United States of America (“U.S. GAAP”). The preparation of financial statements in conformity with U.S. GAAP requires management to make certain estimates and assumptions that affect the reported amounts of assets and liabilities and disclosures of contingent assets and liabilities at the date of the financial statements and the reported amounts of revenue and expenses during the period. Actual results could differ from those estimates. The Fund is considered an investment company for financial reporting purposes under U.S. GAAP. The following is a summary of significant accounting policies consistently followed by the Fund in preparation of its financial statements.
Investment Valuation: The Fund generally values its securities based on market prices determined at the close of regular trading on the New York Stock Exchange (“NYSE”), normally 4:00 p.m. Eastern Time, on each day the NYSE is open for trading.
For equity securities and mutual funds that are traded on an exchange, the market price is usually the closing sale or official closing price on that exchange. In the case of equity securities not traded on an exchange, or if such closing prices are not otherwise available, the securities are valued at the mean of the most recent bid and ask prices on such day. Redeemable securities issued by open-end registered investment companies are valued at the investment company’s applicable net asset value, with the exception of exchange-traded open-end investment companies, which are priced as equity securities.
The market price for debt obligations is generally the price supplied by an independent third-party pricing service approved by the Board of Trustees (the “Board”), which may use a matrix, formula or other objective method that takes into consideration quotations from dealers, market transactions in comparable investments, market indices and yield curves. If vendors are unable to supply a price, or if the price supplied is deemed to be unreliable, the market price may be determined using quotations received from one or more broker-dealers that make a market in the security. Short–term debt obligations that will mature in 60 days or less are valued at amortized cost, unless it is determined that using this method would not reflect an investment’s fair value. Investments in non-exchange traded funds are fair valued at their respective net asset values.
16 | Stonebridge Small-Cap Growth Fund | |
Table of Contents
| Stonebridge Small-Cap Growth Fund | Notes to Financial Statements | |
| October 31, 2015 (Unaudited) | ||
When such prices or quotations are not available, or when Stonebridge Capital Management, Inc. (the “Adviser”) believes that they are unreliable, securities may be priced using fair value procedures approved by the Board.
Fair Value Measurements: The Fund discloses the classification of its fair value measurements following a three-tier hierarchy based on the inputs used to measure fair value. Inputs refer broadly to the assumptions that market participants would use in pricing the asset or liability, including assumptions about risk. Inputs may be observable or unobservable. Observable inputs reflect the assumptions market participants would use in pricing the asset or liability that are developed based on market data obtained from sources independent of the reporting entity.
Unobservable inputs reflect the reporting entity’s own assumptions about the assumptions market participants would use in pricing the asset or liability that are developed based on the best information available.
Various inputs are used in determining the value of the Fund’s investments as of the end of the reporting period. When inputs used fall into different levels of the fair value hierarchy, the level in the hierarchy within which the fair value measurement falls is determined based on the lowest level input that is significant to the fair value measurement in its entirety. The designated input levels are not necessarily an indication of the risk or liquidity associated with these investments. These inputs are categorized in the following hierarchy under applicable financial accounting standards:
Level 1 | – | Unadjusted quoted prices in active markets for identical investments, unrestricted assets or liabilities that the Fund has the ability to access at the measurement date; | ||
Level 2 | – | Quoted prices which are not active, quoted prices for similar assets or liabilities in active markets or inputs other than quoted prices that are observable (either directly or indirectly) for substantially the full term of the asset or liability; and | ||
Level 3 | – | Significant unobservable prices or inputs (including the Fund’s own assumptions in determining the fair value of investments) where there is little or no market activity for the asset or liability at the measurement date. | ||
The following is a summary of each input used to value the Fund as of October 31, 2015:
| Valuation Inputs | ||||||||||||||||||||
|
| |||||||||||||||||||
| Investments in Securities at Value | Level 1 | Level 2 | Level 3 | Total | ||||||||||||||||
| ||||||||||||||||||||
Common Stocks* | $ | 13,717,298 | $ | – | $ | – | $ | 13,717,298 | ||||||||||||
Money Market Mutual Funds | 98,476 | – | – | 98,476 | ||||||||||||||||
| ||||||||||||||||||||
Total | $ | 13,815,774 | $ | – | $ | – | $ | 13,815,774 | ||||||||||||
| ||||||||||||||||||||
| * | For detailed descriptions, see the accompanying Statement of Investments. |
The Fund recognizes transfers between levels as of the end of the period. For the six months ended October 31, 2015, the Fund did not have any transfers between Level 1 and Level 2 securities. For the six months ended October 31, 2015, the Fund did not have any securities that used significant unobservable inputs (Level 3) in determining fair value.
| Semi-Annual Report | October 31, 2015 | 17 | |
Table of Contents
| Stonebridge Small-Cap Growth Fund | Notes to Financial Statements | |
| October 31, 2015 (Unaudited) | ||
Investment Transactions and Investment Income: Investment transactions are accounted for on the date the investments are purchased or sold (trade date). Realized gains and losses from investment transactions are reported on an identified cost basis. Interest income, which includes accretion of discounts, is accrued and recorded as earned. Dividend income is recognized on the ex-dividend date or for certain foreign securities, as soon as information is available to the Fund.
Trust Expenses: Some expenses of the Trust can be directly attributed to the Fund. Expenses which cannot be directly attributed to the Fund are apportioned among all funds in the Trust based on average net assets of each fund.
Fund Expenses: Expenses that are specific to the Fund are charged directly to the Fund.
Federal Income Taxes: The Fund complies with the requirements under Subchapter M of the Internal Revenue Code of 1986, as amended (the “Code”), applicable to regulated investment companies and intends to distribute substantially all of their net taxable income and net capital gains, if any, each year so that it will not be subject to excise tax on undistributed income and gains. The Fund is not subject to income taxes to the extent such distributions are made.
As of and during the six months ended October 31, 2015, the Fund did not have a liability for any unrecognized tax benefits. The Fund files U.S. federal, state, and local tax returns as required. The Fund’s tax returns are subject to examination by the relevant tax authorities until expiration of the applicable statute of limitations, which is generally three years after the filing of the tax return for federal purposes and four years for most state returns. Tax returns for open years have incorporated no uncertain tax positions that require a provision for income taxes.
Distributions to Shareholders: The Fund normally pays dividends and distributes capital gains, if any, on an annual basis. Income dividend distributions are derived from interest and other income the Fund receives from its investments, including short term capital gains. Long term capital gain distributions are derived from gains realized when the Fund sells a security it has owned for more than a year. The Fund may make additional distributions and dividends at other times if the portfolio manager believes doing so may be necessary for the Fund to avoid or reduce taxes.
3. TAX BASIS INFORMATION
Tax Basis of Investments: As of October 31, 2015, the aggregate cost of investments, gross unrealized appreciation/(depreciation) and net unrealized appreciation for Federal tax purposes was as follows:
Gross appreciation (excess of value over tax cost) | $ | 914,857 | ||||
Gross depreciation (excess of tax cost over value) | (2,496,622) | |||||
| ||||||
Net unrealized depreciation | $ | (1,581,765) | ||||
| ||||||
Cost of investments for income tax purposes | $ | 15,397,539 | ||||
| ||||||
Tax Basis of Distributions to Shareholders: The character of distributions made during the year from net investment income or net realized gains may differ from its ultimate characterization for federal income tax purposes. Also, due to the timing of dividend distributions, the fiscal year in which amounts are distributed may differ from the fiscal year in which the income or realized gain was recorded by the Fund.
18 | Stonebridge Small-Cap Growth Fund | |
Table of Contents
| Stonebridge Small-Cap Growth Fund | Notes to Financial Statements | |
| October 31, 2015 (Unaudited) | ||
The tax character of distributions paid during the year ended April 30, 2015, were as follows:
| Ordinary Income | Long-Term Capital Gain | |||||||
The Stonebridge Small-Cap Growth Fund | $ | 962,886 | $ | 239,526 | ||||
The amounts and characteristics of tax basis distributions and composition of distributable earnings/(accumulated losses) are finalized at fiscal year-end. Accordingly, tax basis balances have not been determined as of October 31, 2015.
4. SECURITIES TRANSACTIONS
The cost of purchases and proceeds from sales of securities (excluding short-term securities) during the six months ended October 31, 2015, was as follows:
| Purchases | Sales | |||||||||
Stonebridge Small-Cap Growth Fund | $ | 11,544,406 | $ | 12,114,506 | ||||||
5. SHARES OF BENEFICIAL INTEREST
The capitalization of the Trust consists of an unlimited number of shares of beneficial interest with no par value per share. Holders of the shares of the Fund of the Trust have one vote for each share held and a proportionate fraction of a vote for each fractional share. All shares issued and outstanding are fully paid and are transferable and redeemable at the option of the shareholder. Purchasers of the shares do not have any obligation to make payments to the Trust or its creditors (other than the purchase price for the shares) or make contributions to the Trust or its creditors solely by reason of the purchasers’ ownership of the shares. Shares have no pre-emptive rights.
| Six Months Ended October 31, 2015 Shares | Six Months Ended October 31, 2015 Amount | Year Ended April 30, 2015 Shares | Year Ended April 30, 2015 Amount | |||||||||||||||
| ||||||||||||||||||
Shares sold | 8,224 | $ | 69,871 | 22,272 | $ | 193,865 | ||||||||||||
Shares issued in reinvestment of dividends | – | – | 154,444 | 1,179,954 | ||||||||||||||
| ||||||||||||||||||
Total | 8,224 | 69,871 | 176,716 | 1,373,819 | ||||||||||||||
| ||||||||||||||||||
Less shares redeemed, net of redemption fees | (84,624) | (691,326) | (204,934) | (1,805,418) | ||||||||||||||
| ||||||||||||||||||
Net Decrease | (76,400) | $ | (621,455) | (28,218) | $ | (431,599) | ||||||||||||
| ||||||||||||||||||
Shares redeemed within 30 days of purchase will incur a 2% short-term redemption fee deducted from the redemption amount. Redemption fees are reflected in the “Net increase/(decrease) in shareholder activity derived from beneficial interest transactions, net of redemption fees” in the Statements of Changes in Net Assets.
For the six months ended October 31, 2015, and the year ended April 30, 2015 the Fund did not receive any redemption fees.
| Semi-Annual Report | October 31, 2015 | 19 | |
Table of Contents
| Stonebridge Small-Cap Growth Fund | Notes to Financial Statements | |
| October 31, 2015 (Unaudited) | ||
6. MANAGEMENT AND RELATED-PARTY TRANSACTIONS
The Trust has entered into an advisory agreement with the Adviser with respect to the Fund. The advisory agreement has been approved by the Board and shareholders. Pursuant to the advisory agreement with the Trust, the Adviser is entitled to investment advisory fees, computed daily and payable monthly at an annual rate of 0.75% of the average daily net assets of the Fund.
The Adviser has contractually agreed to limit the amount of the Fund’s Total Annual Fund Operating Expenses, exclusive of brokerage expenses, interest expenses, taxes and extraordinary expenses, to an annual rate of 1.96% of the Fund’s average daily net assets. This agreement is in effect through August 31, 2016. The Adviser will be permitted to recover expenses it has borne through the agreement described above to the extent that the Fund’s expenses in later periods fall below the annual rates set forth in the relevant agreement. The Fund will not be obligated to pay any such deferred fees and expenses more than three years after the end of the fiscal year in which the fees and expenses were deferred. The Adviser may not discontinue the waiver without the approval by the Fund’s Board.
For the six months ended October 31, 2015, the fee waivers and/or reimbursements were as follows:
| Fees Waived/ Reimbursed By Adviser | ||||
Stonebridge Small-Cap Growth Fund | $ 6,016 |
Fund Accounting Fees and Expenses
ALPS Fund Services, Inc. (“ALPS”) serves as administrator to the Fund and the Fund has agreed to pay expenses incurred in connection with their administrative activities. Pursuant to an Administration Agreement, ALPS provides operational services to the Fund including, but not limited to fund accounting and fund administration and generally assists in the Fund’s operations. Officers of the Trust are employees of ALPS. The Fund’s administration fee is accrued on a daily basis and paid monthly. Administration fees paid by the Fund for the six months ended October 31, 2015 are disclosed in the Statement of Operations.
ALPS is reimbursed by the Fund for certain out-of-pocket expenses.
Transfer Agent
ALPS serves as transfer, dividend paying and shareholder servicing agent for the Fund. ALPS receives an annual minimum fee, a fee based upon the number of shareholder accounts, and is also reimbursed by the Fund for certain out-of-pocket expenses.
Compliance Services
ALPS provides services that assist the Trust’s chief compliance officer in monitoring and testing the policies and procedures of the Trust in conjunction with requirements under Rule 38a-1 under the 1940 Act and receives an annual base fee. ALPS is reimbursed for certain out-of-pocket expenses by the Fund.
Principal Financial Officer
ALPS receives an annual fee for providing principal financial officer services to the Fund.
20 | Stonebridge Small-Cap Growth Fund | |
Table of Contents
| Stonebridge Small-Cap Growth Fund | Notes to Financial Statements | |
| October 31, 2015 (Unaudited) | ||
Distributor
ALPS Distributors, Inc. (“ADI” or the “Distributor”) (an affiliate of ALPS) acts as the distributor of the Fund’s shares pursuant to a Distribution Agreement with the Trust. Shares are sold on a continuous basis by ADI as agent for the Fund, and ADI has agreed to use its best efforts to solicit orders for the sale of the Fund’s shares, although it is not obliged to sell any particular amount of shares. ADI is not entitled to any compensation for its services as Distributor. ADI is registered as a broker-dealer with the U.S. Securities and Exchange Commission.
7. INDEMNIFICATIONS
Under the Trust’s organizational documents, its officers and Trustees are indemnified against certain liability arising out of the performance of their duties to the Trust. Additionally, in the normal course of business, the Trust enters into contracts with service providers that may contain general indemnification clauses, which may permit indemnification to the extent permissible under applicable law. The Trust’s maximum exposure under these arrangements is unknown, as this would involve future claims that may be made against the Trust that have not yet occurred.
8. RECENT ACCOUNTING PRONOUNCEMENT
In May 2015, the Financial Accounting Standards Board issued Accounting Standards Update (“ASU”) 2015-07, “Disclosures for Investments in Certain Entities that Calculate Net Asset Value Per Share (or its Equivalent).” This is an update to Accounting Standards Codification Topic 820, Fair Value Measurement. ASU 2015-07 removes the requirement to categorize within the fair value hierarchy investments for which fair value is measured at net asset value per share (or its equivalent) using the practical expedient. ASU 2015-17 is effective for annual reporting periods beginning on or after December 15, 2015, and interim periods within those annual periods, with retrospective application for all periods presented. The Fund is currently evaluating the impact ASU 2015-07 will have on the Fund’s financial statements and disclosures.
| Semi-Annual Report | October 31, 2015 | 21 | |
Table of Contents
| Stonebridge Small-Cap Growth Fund | Disclosure Regarding Approval of Fund Advisory Agreement | |
| October 31, 2015 (Unaudited) | ||
On September 15, 2015, the Trustees met in person to discuss, among other things, the approval of the investment advisory agreement between Financial Investors Trust (the “Trust”) and Stonebridge Capital Management, Inc. (the “Adviser”) (the “Investment Advisory Agreement”), in accordance with Section 15(c) of the 1940 Act. The Independent Trustees met with independent legal counsel during executive session and discussed the Investment Advisory Agreement and other related materials.
In renewing and approving the Investment Advisory Agreement with the Adviser, the Trustees, including the Independent Trustees, considered the following factors with respect to Stonebridge Small-Cap Growth Fund (the “Fund”):
Investment Advisory Fee Rate: The Trustees reviewed and considered the contractual annual advisory fee to be paid by the Trust, on behalf of the Fund to the Adviser of 0.75% of the Fund’s daily average net assets, in light of the extent and quality of the advisory services provided by the Adviser to the Fund. The Board received and considered information including a comparison of the Fund’s contractual and actual advisory fees and overall expenses with those of funds in the peer expense group and universe of funds provided by an independent provider of investment company data (the “Data Provider”). The Trustees noted that the investment advisory fee rate was below both the median peer group fee and the median universe fee for the Fund.
Total Expense Ratios: Based on such information, the Trustees further reviewed and considered the total expense ratio of 2.12% for the Fund. The Trustees noted that the total expense ratio was substantially above the median peer group total expense ratio and the median universe total expense ratio for the Fund. The Trustees also considered the Adviser’s proposal to enter into a contractual arrangement with the Trust pursuant to which the Adviser would waive a portion of its fees and/or reimburse expenses in amounts necessary to limit the Fund’s total expense ratio, exclusive of certain expenses, to 1.96% for a certain period.
Nature, Extent and Quality of the Services under the Investment Advisory Agreement: The Trustees received and considered information regarding the nature, extent and quality of services to be provided to the Fund under the Investment Advisory Agreement. The Trustees reviewed certain background materials supplied by the Adviser in its presentation, including its Form ADV. The Trustees also reviewed and considered supplemental information provided by the Adviser relating to, among other things, its management of the predecessor fund to the Fund.
The Trustees reviewed and considered the Adviser’s investment advisory personnel, its history as an asset manager and its performance and the amount of assets currently under management by the Adviser and its affiliated entities. The Trustees also reviewed the research and decision-making processes utilized by the Adviser, including the methods adopted to seek to achieve compliance with the investment objectives, policies and restrictions of the Fund.
The Trustees considered the background and experience of the Adviser’s management in connection with the Fund, including reviewing the qualifications, backgrounds and responsibilities of the management team primarily responsible for the day-to-day portfolio management of the Fund and the extent of the resources devoted to research and analysis of actual and potential investments.
The Trustees also reviewed, among other things, the Adviser’s insider trading policies and procedures and its Code of Ethics.
22 | Stonebridge Small-Cap Growth Fund | |
Table of Contents
| Stonebridge Small-Cap Growth Fund | Disclosure Regarding Approval of Fund Advisory Agreement | |
| October 31, 2015 (Unaudited) | ||
Performance: The Trustees reviewed performance information for the Fund for the 3 month, 1-year, 3-year and 5-year periods ended June 30, 2015. That review included a comparison of the Fund’s performance to the performance of a group of comparable funds selected by the Data Provider. The Trustees noted the performance of the Fund was above the peer universe median for the most recent 3-month period and significantly below the peer universe median for the 1-year, 3-year and 5-year periods. The Trustees also considered the Adviser’s discussion of the Fund’s underlying portfolio diversification categories, its top contributors and top detractors, as well as the Adviser’s performance and reputation generally and its investment techniques, risk management controls and decision-making processes.
Comparable Accounts: The Trustees considered the Adviser’s statements indicating that there were no comparable accounts.
Profitability: The Trustees received and considered a retrospective and projected profitability analysis prepared by the Adviser based on the fees payable under the Investment Advisory Agreement. The Trustees considered the profits, if any, anticipated to be realized by the Adviser in connection with the operation of the Fund. The Board then reviewed the Adviser’s most recent year-end financial statements (unaudited) for the period ended December 31, 2014 and profit and loss statement for January through June 2015 in order to analyze the financial condition and stability and profitability of the adviser.
Economies of Scale: The Trustees considered whether economies of scale in the provision of services to the Fund will be passed along to the shareholders under the proposed agreements.
Other Benefits to the Adviser: The Trustees reviewed and considered any other incidental benefits derived or to be derived by the Adviser from its relationship with the Fund, including whether soft dollar arrangements were used.
In selecting the Adviser as the Fund’s investment adviser and approving the Investment Advisory Agreement and the fees charged under the Investment Advisory Agreement, the Trustees concluded that no single factor reviewed by the Trustees was identified by the Trustees to be determinative as the principal factor in whether to approve the Investment Advisory Agreement. Further, the Independent Trustees were advised by separate independent legal counsel throughout the process. The Trustees, including all of the Independent Trustees, concluded that:
| • | the investment advisory fee rate was below the median peer group fee and the median universe fee for the Fund; |
| • | the total expense ratio was substantially above the median peer group fee and the median universe fee for the Fund; |
| • | the Adviser proposed to enter into a contractual arrangement with the Trust pursuant to which the Adviser would waive a portion of its fees and/or reimburse expenses in amounts necessary to limit the Fund’s total expense ratio, exclusive of certain expenses, to 1.96% for a certain period; |
| • | the nature, extent and quality of services to be rendered by the Adviser under the Investment Advisory Agreement were adequate; |
| • | the performance of the Fund was significantly below its Data Provider peer universe median for the 1-year, 3-year and 5-year periods, but showed improving performance relative to the peer universe median in more recent periods; |
| Semi-Annual Report | October 31, 2015 | 23 | |
Table of Contents
| Stonebridge Small-Cap Growth Fund | Disclosure Regarding Approval of Fund Advisory Agreement | |
| October 31, 2015 (Unaudited) | ||
| • | there were no comparable accounts managed by the Adviser; |
| • | the profit, if any, realized by the Adviser in connection with the operation of the Fund is not unreasonable to the Fund; and |
| • | there were no material economies of scale or other incidental benefits accruing to the Adviser in connection with its relationship with the Fund. |
After reviewing the information received, the Trustees requested supplemental information and the Adviser provided materials in response. The Board determined that, given the totality of the information provided with respect to the Investment Advisory Agreement, the Board had received sufficient information to approve the Investment Advisory Agreement.
Based on the Trustees’ deliberations and their evaluation of the information described above, the Trustees, including all of the Independent Trustees, concluded that the Adviser’s compensation for investment advisory services is consistent with the best interests of the Fund and its shareholders.
24 | Stonebridge Small-Cap Growth Fund | |
Table of Contents
| Stonebridge Small-Cap Growth Fund | Additional Information | |
| October 31, 2015 (Unaudited) | ||
1. FUND HOLDINGS
The Fund files its complete schedule of portfolio holdings with the Securities and Exchange Commission (the “SEC”) for the first and third quarters of each fiscal year on Form N-Q within 60 days after the end of the period. Copies of the Fund’s Form N-Q are available without charge on the SEC website at http://www.sec.gov. You may also review and copy the Form N-Q at the SEC’s Public Reference Room in Washington, DC. For more information about the operation of the Public Reference Room, please call the SEC at 1-800-SEC-0330.
2. FUND PROXY VOTING POLICIES, PROCEDURES AND SUMMARIES
The Fund’s policies and procedures used in determining how to vote proxies and information regarding how the Fund voted proxies relating to portfolio securities during the most recent prior 12-month period ending June 30 are available without charge, (1) upon request, by calling (toll-free) 800-639-3935 and (2) on the SEC’s website at http://www.sec.gov.
| Semi-Annual Report | October 31, 2015 | 25 | |
Table of Contents

Table of Contents
Table of Contents
CONTENTS | PAGE | |
| 1 | ||
| 7 | ||
| 10 | ||
| 9 | ||
| 12 | ||
| 13 | ||
| 16 | ||
| 20 | ||
| 21 | ||
| 22 | ||
| 23 | ||
| 25 | ||
| 27 | ||
| 28 | ||
| 36 | ||
| www.vulcanvaluepartners.com |
Table of Contents
| ||
| ||
October 31, 2015 (Unaudited) | ||
PORTFOLIO REVIEW
General
For the six months ended October 31, 2015, Vulcan Value Partners Fund returned -6.06% and the Vulcan Value Partners Small Cap Fund returned -5.16%. We experienced meaningful volatility during the last half of the six month period ending October 31, 2015 for the first time in several years. While it did not last as long as we would have liked, we took full advantage of it while it did last. We materially re-positioned the funds into positions of greater concentration in businesses that were more deeply discounted. We paid a price in terms of poor short-term performance but believe we mitigated risk and improved our long-term prospects. As you know, we place no weight on short-term results, good or bad, and neither should you. In fact, we have and will continue to willingly make decisions that negatively impact short-term performance when we think we can mitigate risk and improve our long-term returns. We encourage you to place more weight on our longer term historical results and a great deal of weight on our long-term prospects.
We entered the last half of the period ending October 31, 2015 with the portfolios defensively positioned. In our second quarter letter we wrote:
“[I]n the current environment our investment discipline results in us having smaller position sizes in our diversified portfolios, which increases liquidity and enables us to respond quickly to better opportunities, should they present themselves.
Unfortunately, we believe near term compounding prospects are below average. Valuation levels are higher than they have been in many years. Applying a consistent valuation methodology, many of the companies we do not own are trading above our estimate of fair value. The companies we do own trade at an estimated discount, but the discounts available to us are not as great as we would like. Moreover, a sluggish global economy, combined with a very strong dollar is causing value growth to be below average for many companies we follow. Volatility continues to be very low, which reduces the number of potential investment opportunities available to us.”
What stayed the same and what changed? Well, the global economy remains weak. In fact, our bottom up work suggests the global economy is weaker than the top down macroeconomists say it is. What did change was an increasing recognition of this fact in the markets which resulted in a spike of volatility around the world. We used our liquidity to take larger stakes in fantastic businesses at deeper discounts to our estimates of fair value than have been available in quite some time. As a result, we materially improved our estimated margin of safety by lowering our price to value ratios, and we became more concentrated in these more discounted businesses. In the Large Cap Fund, we went from owning 35 companies to 30. Estimated price to value ratios improved to the lower 60’s from the high 70’s at the beginning of the year. In the Small Cap Fund, we went from holding 17% cash (because limit orders we were using were not being filled) to being fully invested. Estimated price to value ratios improved to the upper 60’s.
We were able to improve our margin of safety because we limit ourselves to only owning businesses we believe have inherently stable values. When prices fall and estimated values remain firm, we are able to take advantage of stock price volatility. We exited more fully valued companies in which we had smaller position sizes – our “winners” – and used the proceeds to buy larger stakes in more discounted businesses – our “losers.” Our performance during the period would have been better if we had not done so. We believe our prospects over the next five years would be worse if we had not done so. We will always choose the long-term over the short-term.
Semi-Annual Report | October 31, 2015 |
1 |
Table of Contents
Shareholder Letter
| ||
| ||
October 31, 2015 (Unaudited) | ||
If volatility continues, and we hope it does, expect more periods of poor performance. If we successfully execute our investment discipline, we believe these painful periods ultimately will result in superior long-term results. You are an important part of enabling us to execute. Your patient capital and shared long-term time horizon allows us to buy competitively entrenched business at what we believe are absurd valuation levels because sellers are worried about short-term results.
An example is instructive: We own several businesses that are experiencing changes to their business models that are holding back short-term results but should, in our view, lead to better long-term returns. The most prominent example is Oracle, which we own in the Large Cap Fund. Oracle and SAP dominate the global enterprise software market. This market is evolving from onsite delivery of software solutions to cloud- based delivery. For the foreseeable future, we expect the market to be a hybrid, whereby some solutions reside in the enterprise and some are delivered through the cloud. Oracle and SAP are the only companies able to deliver comprehensive enterprise solutions onsite or through the cloud or in combination, and Oracle is ahead of SAP in this transition. Oracle’s cloud business grew 34% in their most recent quarter, and it is accelerating. Their results exceeded their own expectations and are well ahead of ours. Ironically, the faster the cloud grows, the more pressure it puts on short-term results because cloud products do not have an upfront license fee, while enterprise products do. Our research shows cloud-based products are more profitable over time. Perhaps as soon as next year, the revenue mix-shift to faster growing cloud products should overwhelm the reduction in less valuable, one-time, upfront license fees. Next year is too long for Wall Street to wait, and Oracle’s stock has been one of our worst performers, down nearly 14% so far this year. Meanwhile, we enjoy a $14B free cash flow coupon that is being used to repurchase discounted stock. With a stable value and improving long-term prospects, Oracle is our largest position firm wide.
In the discussion that follows, we generally define material contributors and detractors as companies having a greater than 1% impact on the portfolio.
Vulcan Value Partners Fund Review:
We bought three new positions during the second quarter and sold twelve positions.
There were no material contributors to performance, and there were three material detractors to performance during the period. Material detractors include Aberdeen Asset Management, National Oilwell Varco, and Fossil Group.
Aberdeen Asset Management is one of the leading asset managers in the world and has global reach on a scale few others in the industry can rival. Based in the U.K., the company has exposure to emerging markets, which hurt its short-term results. Moreover, Aberdeen has been disciplined about closing existing funds to new investors, which has hurt its short-term results but we believe is good for its long-term prospects.
2 |
www.vulcanvaluepartners.com |
Table of Contents
Shareholder Letter
| ||
| ||
October 31, 2015 (Unaudited) | ||
National Oilwell Varco is the leading provider of offshore drilling platforms, and its products are used on virtually every well in the world – both onshore and offshore. Regardless of the price of oil, producers simply cannot produce output without using National Oilwell Varco’s products. The company is producing strong free cash flow in the current downturn and is using its free cash flow to repurchase deeply discounted stock. We started purchasing National Oilwell Varco after oil dropped to $50 per barrel. It is one of the few companies in the energy sector that qualifies for investment at Vulcan Value Partners.
Fossil Group is the largest lifestyle watch company in the world. It is a preferred partner for brands such as Michael Kors because Fossil Group has global scale in both manufacturing and distribution. In addition, Fossil Group sells its own brands, such as Fossil and Skagen. We knew 2015 would be a tough year for the company due to the strong dollar and investments to expand into wearables. Looking beyond 2015, we believe Fossil is very well positioned to add additional partners to its portfolio of brands and expand its addressable market by partnering with Intel and Google to produce fashion-oriented wearables. In the meantime, Fossil Group is producing strong free cash flow and using it to repurchase its discounted stock.
Purchases include Honeywell International, Swiss Re, and Unilever. Both Honeywell and Unilever are companies that we have owned and/or followed for many years. Their estimated values have compounded at a consistent rate and are stable. They are well managed, have strong balance sheets, and are trading at a discount to our estimate of intrinsic worth, thereby providing a margin of safety.
Swiss RE is one of the largest reinsurance companies in the world. It has been in business 152 years. It was a conservatively managed, well-run company but made disastrous capital allocation decisions just before the financial crisis. Swiss RE’s former CEO had an investment banking background. Just prior to the financial crisis he steered the company’s investment portfolio into riskier commercial mortgage-backed securities (CMBS) and began insuring credit default swaps. As the financial crisis hit, Swiss RE took heavy losses on both the asset and liability sides of its balance sheet. Importantly, the core reinsurance business never skipped a beat. Swiss RE was forced to go to Berkshire Hathaway, hat in hand, and recapitalize on very attractive terms to Berkshire Hathaway and on onerous terms for Swiss RE. Why would we even look at such a company? New management has returned Swiss RE to its conservative past. Capital allocation has been excellent since then with Berkshire Hathaway’s expensive capital paid off. The investment portfolio has been reinvested primarily in highly-rated, government- backed debt. Underwriting results, which always remained profitable, continue to be good. Swiss RE is not a turnaround. It has turned around already, but the market does not believe it and neither did we until we did our due diligence.
Sales included Emerson Electric, Intercontinental Hotels Group, Louis Vuitton Moet Hennessy, MSCI Inc, Partners Re, Precision Castparts, Sabre Corporation, Chubb, Nasdaq Inc., Scripps Network Interactive, Colgate-Palmolive, and Unilever.
Intercontinental Hotels Group deserves special mention. It was an excellent investment for us but had reached our estimate of intrinsic worth. As mentioned, we will not own anything at our estimate of fair value because we have no margin of safety in terms of price compared to estimated value. We believe Intercontinental Hotels Group, led by CEO Richard Solomons, did an especially good job intelligently allocating capital while we owned it, selling assets at fantastic prices and repurchasing discounted stock. We are grateful for the hard work and intelligent decisions made by their management team, which benefited our own results.
Semi-Annual Report | October 31, 2015 |
3 |
Table of Contents
Shareholder Letter
| ||
| ||
October 31, 2015 (Unaudited) | ||
Chubb was also an outstanding investment for us. Its estimated value compounded steadily while we owned it, and its price appreciated more. During the third quarter, ACE, Ltd. bid for the company at almost exactly our estimate of intrinsic worth, and we sold our entire position to increase our stakes in more discounted companies. Nasdaq was another company that worked out very well for us. We sold it very close to our estimate of fair value to increase our stakes in more discounted companies. We lost money on Scripps Interactive Networks. On a standalone basis, there was no reason to sell it. However, within the context of the portfolio, we had the opportunity to reallocate capital to substantially more discounted companies, so we sold it to do so. Colgate-Palmolive and Unilever were also a smaller positions that we sold and redeployed capital to increase our stakes in more discounted companies.
We are pleased with the changes we were able to make during the second half of the period to mitigate risk and improve our long-term prospects. In the second quarter letter we wrote, “We hope to experience more stock price volatility in the coming months but, of course, we cannot control what Mr. Market decides to do.” Well, we got the volatility we were hoping for. We were ready and took full advantage of it. We would prefer to see more of it. Short-term volatility creates opportunity for long-term investors.
Vulcan Value Partners Small Cap Fund Review:
In our second quarter letter we wrote:
“In Small Cap, we have sold a number of positions at our estimate of fair value but have been unable to redeploy capital back into replacements at prices that provide us with a margin of safety. Consequently, cash levels are rising, and price to value ratios in the companies we do own are not as low as in Large Cap. Our investment philosophy tends to keep us fully invested most of the time. However, at extremes, cash levels can rise. We will not compromise on quality, and we will not pay fair value for anything. We size positions according to our estimated discount. The larger the discount, the larger the position size and vice versa. When discounts are not available then cash levels will rise as a residual. The last time cash levels began to rise in Small Cap was 2007. Cash levels are roughly half the level they were in 2007, but they are headed higher as this letter is being written. We all know what happened in 2008.
We encourage our Small Cap Partners to reduce their small cap exposure in general and with us if they have better alternatives. At the very least, we strongly ask you to not add to your Small Cap allocation with us. There will be a day when we write the opposite of what we are writing today. We look forward to writing that letter, but for the time being, we believe Small Cap risks are rising and potential returns are falling.”
In August, cash levels peaked at 17% before volatility spiked in August. We use limit orders to buy and sell. The sales were easy. The buys were difficult until August. We ended the period fully invested.
We bought ten new positions during the period and sold twelve positions.
There were no material contributors to performance, and there were two material detractors to performance during the period. Material detractors include Nu Skin Enterprises and Fossil Group.
4 |
www.vulcanvaluepartners.com |
Table of Contents
Shareholder Letter
| ||
| ||
October 31, 2015 (Unaudited) | ||
Nu Skin returned approximately -28% in the period. It was up 38.8% in the first quarter when it was our largest position. Following our investment discipline, we reduced our weight in Nu Skin prior to its stock price decline because its price had risen faster than its estimated value in the first quarter of this year. We still have a significant stake in Nu Skin and are optimistic that its estimated value will compound at double digit rates over the next five years.
Fossil Group is the largest lifestyle watch company in the world. It is a preferred partner for brands such as Michael Kors because Fossil Group has global scale in both manufacturing and distribution. In addition, Fossil Group sells its own brands, such as Fossil and Skagen. We knew 2015 would be a tough year for the company due to the strong dollar and investments to expand into wearables. Looking beyond 2015, we believe Fossil is very well positioned to add additional partners to its portfolio of brands and expand its addressable market by partnering with Intel and Google to produce fashion-oriented wearables. In the meantime, Fossil Group is producing strong free cash flow and using it to repurchase its discounted stock.
New purchases include Cohen & Steers, Herman Miller, Jack Henry & Associates, Lincoln Electric, Savills PLC, Timkin Company, Concentric AB, Core Laboratories, Crane Company, and Thermon Group.
Concentric AB makes engine and hydraulic products used in medium and heavy-duty diesel engines. Their products tend to have long life cycles and are critical components where quality is more important than price. Core Laboratories provides products that are critical for the exploration and production of oil and gas. Regardless of commodity prices, E&P companies have to use Core Laboratories’ products, so it enjoys strong pricing power. Crane Company makes aerospace and fluid handling products. Its brakes are on virtually every Boeing aircraft in production. Thermon Group makes products used to monitor temperatures in pipelines. Its products are used in energy transportation, manufacturing, refining, and by utilities. Similar to Core Laboratories, its products are needed regardless of end market commodity prices.
We have owned Lincoln Electric and Jack Henry & Associates before. Both meet our quality criteria and have compounded their estimated values since we sold them. They are not as discounted as they were when we originally purchased them, but they are among the most discounted companies we could find that meet our quality standards. One new purchase, Cohen and Steers, was also sold shortly after we bought it. We simply could not execute on the trading desk and buy a meaningful stake at prices that we found attractive.
We sold Cohen & Steers, Exponent, KMG Chemicals, Rovi Corporation, Core Laboratories, Herman Miller, Jack Henry & Associates, Chemed, MSCI Inc., Omnicell, ProAssurance, and Sabre Corp.
Cohen and Steers is explained above. Exponent and KMG Chemicals reached our estimate of fair value, so we sold them. Rovi’s competitive position declined due to adverse legal rulings related to their patent portfolio. Subsequent to our sale, Rovi’s stock price has declined over 18%.
Chemed, MSCI, Omnicall, Proassurance and Sabre all were excellent investments or us, and all were sold at or very near our estimate of fair value. We used the proceeds from these sales to redeploy capital into more discounted companies with larger margins of safety.
Semi-Annual Report | October 31, 2015 |
5 |
Table of Contents
Shareholder Letter
| ||
| ||
October 31, 2015 (Unaudited) | ||
We are pleased with the changes we were able to make during the period to mitigate risk and improve our long-term prospects. Estimated price to value ratios have improved, and we are fully invested. We no longer feel that we need to tell you that we “encourage our Small Cap Partners to reduce their small cap exposure in general and with us if they have better alternatives.” However, we believe our opportunity set remains more attractive in Large Cap than in Small Cap. Things have improved materially, but we would not encourage you to increase your small cap exposure with us or anyone else unless valuation levels continue to improve.
Closing
We have been wanting to see more volatility for a long time. We got it in the second half of the period and took advantage of it. As you know, everyone at Vulcan Value Partners is required to invest in publicly traded equities exclusively through Vulcan. From this perspective, we feel that the poor performance we endured was a small price to pay for the material improvement in margin of safety and enhanced prospective long-term returns. Future periods may be more painful. As long as our price to value ratios are improving more than the decline in stock prices, our long-term prospects are improving. We thank you for your patient capital, long-term time horizon, and confidence in us.
C.T. Fitzpatrick
Chief Executive Officer
Vulcan Value Partners, LLC
Please see page 7 and 10 for 1 year and inception to date returns for the Vulcan Value Partners Fund and Vulcan Value Partners Small Cap Fund, respectively.
Margin of Safety is a favorable difference between the price of a company’s shares and the estimated intrinsic value of those shares.
The views of the author and information discussed in this commentary are as of the date of publication, are subject to change, and may not reflect the writer’s current views. The views expressed are those of the author only, and represent an assessment of market conditions at a specific point in time, are opinions only and should not be relied upon as investment advice regarding a particular investment or markets in general. Such information does not constitute a recommendation to buy or sell specific securities or investment vehicles. It should not be assumed that any investment will be profitable or will equal the performance of the Funds or any securities or any sectors mentioned in this letter. The subject matter contained in this letter has been derived from several sources believed to be reliable and accurate at the time of compilation. Neither Vulcan Value Partners, LLC nor the Funds accept any liability for losses either direct or consequential caused by the use of this information.
The Funds are subject to investment risks, including possible loss of the principal amount invested and therefore are not suitable for all investors. The Funds may not achieve their objectives.
Diversification does not assure a profit or protect against loss.
The primary and secondary benchmark indexes are not actively managed and do not reflect any deductions for fees, expenses or taxes. An investor may not invest directly in an index.
The Funds are distributed by ALPS Distributors, Inc.
6 |
www.vulcanvaluepartners.com |
Table of Contents
| ||
| ||
October 31, 2015 (Unaudited) | ||
Average Annual Total Returns (as of 10/31/15)
| Since | Expense Ratios | |||||||||||||
| 1 Year | 3 Year | 5 Year | Inception* | Total | Net** | |||||||||
| ||||||||||||||
Vulcan Value Partners Fund | 0.24% | 15.78% | 14.77% | 13.75% | 1.08% | 1.08% | ||||||||
S&P 500® Total Return Index*** | 5.20% | 16.20% | 14.33% | 13.42% | ||||||||||
Russell 1000® Value Index*** | 0.53% | 14.52% | 13.26% | 12.49% | ||||||||||
Performance data quoted represents past performance. Past performance does not guarantee future results. Investment return and principal value of an investment will fluctuate so that an investor’s shares, when sold or redeemed, may be worth more or less than the original cost. The Fund imposes a 2.00% redemption fee on shares held for less than 90 days. Current performance data may be higher or lower than actual data quoted. For the most current month-end performance data, please call 1-877-421-5078.
The table does not reflect the deduction of taxes that a shareholder would pay on Fund distributions or the redemption of Fund shares.
Subject to investment risks, including possible loss of the principal amount invested.
* | Fund inception date of 12/30/09. |
** | Vulcan Value Partners, LLC (“Vulcan” or the “Adviser”) has given a contractual agreement to the Fund that to the extent the Total Annual Fund Operating Expenses (as defined in Item 3 of Form N-1A) with respect to the Fund (exclusive of Acquired Fund Fees and Expenses (if any), brokerage expenses, interest expense, taxes and extraordinary expenses) (“Designated Annual Fund Operating Expenses”) exceed 1.25% of the Fund’s average daily net assets for a particular fiscal year of the Fund, the Adviser will reduce the Management Fee and/or Other Expenses otherwise payable to the Adviser with respect to the Fund for the fiscal year by an amount equal to such excess, and/or the Adviser shall reimburse the Fund by the amount of such excess. This agreement is in effect through August 31, 2016. Without this agreement, expenses could be higher. If the Adviser foregoes any fees and/or reimburses the Fund pursuant to this letter agreement with respect to a particular fiscal year, then the Adviser shall be entitled to recover from the Fund the amount foregone or reimbursed to the extent Designated Annual Fund Operating Expenses are less than 1.25% of the Fund’s average daily net assets if within three years after the expenses were incurred. Ratios as of the Prospectus dated August 31, 2015 and may differ from the ratio disclosed in the Financial Highlights. |
*** | Indices are not actively managed and do not reflect any deduction for fees, expenses or taxes. An investor may not invest directly in an index. |
Semi-Annual Report | October 31, 2015 |
7 |
Table of Contents
Fund Overview
| ||
| ||
October 31, 2015 (Unaudited) | ||
Performance of $10,000 Initial Investment (for the period ended October 31, 2015)
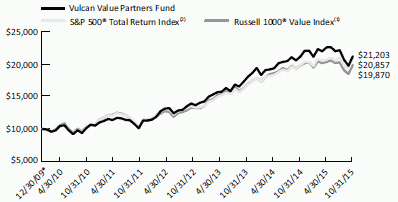
The chart above represents historical performance of a hypothetical investment of $10,000 in the Fund since inception. Past performance does not guarantee future results. This chart does not reflect the deduction of taxes that a shareholder would pay on Fund distributions or the redemption of Fund shares.
* | Fund inception date of 12/30/09. |
(1) | The Russell 1000® Value Index measures the performance of the large-cap value segment of the U.S. equity universe. It includes those Russell 1000® companies with lower price-to-book ratios and lower expected growth values. The index is not actively managed and does not reflect any deductions for fees, expense or taxes. An investor may not invest directly in an index. |
(2) | The S&P 500® Total Return Index is an unmanaged index of 500 common stocks chosen for market size, liquidity and industry group representation. It is a market-value weighted index. The index is not actively managed and does not reflect any deductions for fees, expense or taxes. An investor may not invest directly in an index. |
Investing in the Fund is subject to investment risks, including possible loss of the principal amount invested.
Industry Allocation (as a % of Net Assets)*
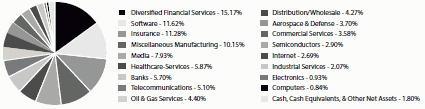
* | Holdings are subject to change, and may not reflect the current or future position of the portfolio. |
8 |
www.vulcanvaluepartners.com |
Table of Contents
| ||
| ||
October 31, 2015 (Unaudited) | ||
As a shareholder of the Vulcan Value Partners Fund (the “Fund”), you will incur two types of costs: (1) transaction costs, including applicable redemption fees; and (2) ongoing costs, including management fees and other Fund expenses. The following examples are intended to help you understand your ongoing costs (in dollars) of investing in the Fund and to compare these costs with the ongoing costs of investing in other mutual funds. The examples are based on an investment of $1,000 invested on May 1, 2015 and held until October 31, 2015.
Actual Expenses. The first line of each table below provides information about actual account values and actual expenses. You may use the information in this line, together with the amount you invested, to estimate the expenses that you paid over the period. Simply divide your account value by $1,000 (for example, an $8,600 account value divided by $1,000 = 8.6), then multiply the result by the number in the first line under the heading “Expenses Paid During Period” to estimate the expenses you paid on your account during this period.
Hypothetical Example for Comparison Purposes. The second line of the table below provides information about hypothetical account values and hypothetical expenses based on the Fund’s actual expense ratio and an assumed rate of return of 5% per year before expenses, which is not the Fund’s actual return. The hypothetical account values and expenses may not be used to estimate the actual ending account balance or expenses you paid for the period. You may use this information to compare the ongoing costs of investing in the Fund and other mutual funds. To do so, compare this 5% hypothetical example with the 5% hypothetical examples that appear in the shareholder reports of the other funds. The expenses shown in the table are meant to highlight ongoing Fund costs only and do not reflect transaction fees, such as redemption fees or exchange fees. Therefore, the second line of each table below is useful in comparing ongoing costs only, and may not help you determine the relative total costs of owning different funds. In addition, if these transactional costs were included, your costs would have been higher.
| Beginning Account | Ending Account | Expenses Paid | ||||||
| Value | Value | Expense | During period | |||||
| 5/1/15 | 10/31/15 | Ratio(a) | 5/1/15 - 10/31/15(b) | |||||
| ||||||||
Actual | $ 1,000.00 | $ 939.40 | 1.07% | $ 5.22 | ||||
Hypothetical (5% return before expenses) | $ 1,000.00 | $ 1,019.76 | 1.07% | $ 5.43 | ||||
(a) | The Fund’s expense ratios have been annualized based on the Fund’s most recent fiscal half-year expenses. |
(b) | Expenses are equal to the Fund’s annualized expense ratio multiplied by the average account value over the period, multiplied by the number of days in the most recent fiscal half-year (184)/366 (to reflect the half-year period). |
Semi-Annual Report | October 31, 2015 |
9 |
Table of Contents
Fund Overview
| ||
| ||
October 31, 2015 (Unaudited) | ||
VULCAN VALUE PARTNERS SMALL CAP FUND
Average Annual Total Returns (as of 10/31/15)
| Since | Expense Ratios | |||||||||||||||||||||||
| 1 Year | 3 Year | 5 Year | Inception* | Total | Net** | |||||||||||||||||||
| ||||||||||||||||||||||||
Vulcan Value Partners Small Cap Fund | 0.62% | 13.89% | 14.54% | 15.23% | 1.26% | 1.25% | ||||||||||||||||||
Russell 2000® Value Index*** | -2.88% | 11.65% | 10.53% | 10.84% | ||||||||||||||||||||
Russell 2000® Index*** | 0.34% | 13.90% | 12.06% | 12.44% | ||||||||||||||||||||
Performance data quoted represents past performance. Past performance does not guarantee future results. Investment return and principal value of an investment will fluctuate so that an investor’s shares, when sold or redeemed, may be worth more or less than the original cost. The Fund imposes a 2.00% redemption fee on shares held for less than 90 days. Current performance data may be higher or lower than actual data quoted. For the most current month-end performance data, please call 1-877-421-5078.
The table does not reflect the deduction of taxes that a shareholder would pay on Fund distributions or the redemption of Fund shares.
Subject to investment risks, including possible loss of the principal amount invested.
* | Fund inception date of 12/30/09. |
** | Vulcan Value Partners, LLC (“Vulcan” or the “Adviser”) has given a contractual agreement to the Fund that to the extent the Total Annual Fund Operating Expenses (as defined in Item 3 of Form N-1A) with respect to the Fund (exclusive of Acquired Fund Fees and Expenses (if any), brokerage expenses, interest expense, taxes and extraordinary expenses) (“Designated Annual Fund Operating Expenses”) exceed 1.25% of such Fund’s average daily net assets for a particular fiscal year of the Fund, the Adviser will reduce the Management Fee and/or Other Expenses otherwise payable to the Adviser with respect to the Fund for such fiscal year by an amount equal to such excess, and/or the Adviser shall reimburse the Fund by the amount of such excess. This agreement is in effect through August 31, 2016. Without this agreement, expenses could be higher. If the Adviser foregoes any fees and/or reimburses the Fund pursuant to this letter agreement with respect to a particular fiscal year, then the Adviser shall be entitled to recover from the Fund the amount foregone or reimbursed to the extent Designated Annual Fund Operating Expenses are less than 1.25% of the Fund’s average daily net assets if within three years after the expenses were incurred. Ratios as of the Prospectus dated August 31, 2015 and may differ from the ratio disclosed in the Financial Highlights. |
*** | Indices are not actively managed and do not reflect any deduction for fees, expenses or taxes. An investor may not invest directly in an index. |
10 |
www.vulcanvaluepartners.com |
Table of Contents
Fund Overview
| ||
| ||
October 31, 2015 (Unaudited) | ||
Performance of $10,000 Initial Investment (for the period ended October 31, 2015)
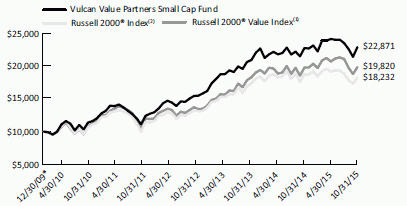
The chart above represents historical performance of a hypothetical investment of $10,000 in the Fund since inception. Past performance does not guarantee future results. This chart does not reflect the deduction of taxes that a shareholder would pay on Fund distributions or the redemption of Fund shares.
* | Fund inception date of 12/30/09. |
(1) | The Russell 2000® Value Index measures the performance of small-cap value segment of the U.S. equity universe. It includes those Russell 2000® companies with lower price-to-book ratios and lower forecasted growth values. The index is not actively managed and does not reflect any deductions for fees, expense or taxes. An investor may not invest directly in an index. |
(2) | The Russell 2000® Index measures the performance of the small-cap segment of the U.S. equity universe. The Russell 2000® Index is a subset of the Russell 3000® Index representing approximately 8% of the total market capitalization of that index. It includes approximately 2,000 of the smallest securities based on a combination of their market cap and current index membership. The index is not actively managed and does not reflect any deductions for fees, expense or taxes. An investor may not invest directly in an index. |
Investing in the Fund is subject to investment risks, including possible loss of the principal amount invested.
Industry Allocation (as a % of Net Assets)*
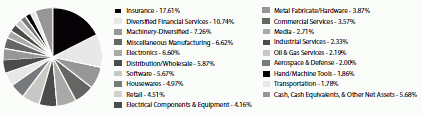
* | Holdings are subject to change, and may not reflect the current or future position of the portfolio. |
Semi-Annual Report | October 31, 2015 |
11 |
Table of Contents
Disclosure of Fund Expenses
| ||
| ||
October 31, 2015 (Unaudited) | ||
As a shareholder of the Vulcan Value Partners Small Cap Fund (the “Fund”), you will incur two types of costs: (1) transaction costs, including applicable redemption fees; and (2) ongoing costs, including management fees and other Fund expenses. The following examples are intended to help you understand your ongoing costs (in dollars) of investing in the Fund and to compare these costs with the ongoing costs of investing in other mutual funds. The examples are based on an investment of $1,000 invested on May 1, 2015 and held until October 31, 2015.
Actual Expenses. The first line of each table below provides information about actual account values and actual expenses. You may use the information in this line, together with the amount you invested, to estimate the expenses that you paid over the period. Simply divide your account value by $1,000 (for example, an $8,600 account value divided by $1,000 = 8.6), then multiply the result by the number in the first line under the heading “Expenses Paid During Period” to estimate the expenses you paid on your account during this period.
Hypothetical Example for Comparison Purposes. The second line of the table below provides information about hypothetical account values and hypothetical expenses based on the Fund’s actual expense ratio and an assumed rate of return of 5% per year before expenses, which is not the Fund’s actual return. The hypothetical account values and expenses may not be used to estimate the actual ending account balance or expenses you paid for the period. You may use this information to compare the ongoing costs of investing in the Fund and other mutual funds. To do so, compare this 5% hypothetical example with the 5% hypothetical examples that appear in the shareholder reports of the other funds. The expenses shown in the table are meant to highlight ongoing Fund costs only and do not reflect transaction fees, such as redemption fees or exchange fees. Therefore, the second line of each table below is useful in comparing ongoing costs only, and may not help you determine the relative total costs of owning different funds. In addition, if these transactional costs were included, your costs would have been higher.
Vulcan Value Partners Small Cap Fund
| Beginning Account | Ending Account | Expenses Paid | ||||||
| Value | Value | Expense | During period | |||||
| 5/1/15 | 10/31/15 | Ratio(a) | 5/1/15 - 10/31/15(b) | |||||
| ||||||||
Actual | $ 1,000.00 | $ 948.40 | 1.25% | $ 6.12 | ||||
Hypothetical (5% return before expenses) | $ 1,000.00 | $ 1,018.85 | 1.25% | $ 6.34 | ||||
(a) | The Fund’s expense ratios have been annualized based on the Fund’s most recent fiscal half-year expenses. |
(b) | Expenses are equal to the Fund’s annualized expense ratio multiplied by the average account value over the period, multiplied by the number of days in the most recent fiscal half-year (184)/366 (to reflect the half-year period). |
12 |
www.vulcanvaluepartners.com |
Table of Contents
|
| |
October 31, 2015 (Unaudited) |
| Value | ||||||||
Shares
| (Note 2) | |||||||
COMMON STOCKS (98.20%) | ||||||||
Communications (15.72%) | ||||||||
Internet (2.69%) | ||||||||
F5 Networks, Inc.(a) | 447,639 | $ | 49,329,818 | |||||
|
| |||||||
Media (7.93%) | ||||||||
Discovery Communications, Inc., Class C(a) | 3,277,278 | 90,190,690 | ||||||
Time Warner, Inc. | 381,434 | 28,737,238 | ||||||
Walt Disney Co. | 233,020 | 26,503,695 | ||||||
|
| |||||||
| 145,431,623 | ||||||||
|
| |||||||
Telecommunications (5.10%) | ||||||||
Cisco Systems, Inc. | 2,419,831 | 69,812,124 | ||||||
Verizon Communications, Inc. | 502,552 | 23,559,638 | ||||||
|
| |||||||
| 93,371,762 | ||||||||
|
| |||||||
TOTAL COMMUNICATIONS | 288,133,203 | |||||||
|
| |||||||
Consumer, Cyclical (4.27%) | ||||||||
Distribution/Wholesale (4.27%) | ||||||||
Fossil Group, Inc.(a) | 1,437,950 | 78,238,859 | ||||||
|
| |||||||
TOTAL CONSUMER, CYCLICAL | 78,238,859 | |||||||
|
| |||||||
Consumer, Non-cyclical (9.45%) | ||||||||
Commercial Services (3.58%) | ||||||||
Mastercard, Inc., Class A | 663,666 | 65,696,297 | ||||||
|
| |||||||
Healthcare-Services (5.87%) | ||||||||
Aetna, Inc. | 484,727 | 55,636,965 | ||||||
Anthem, Inc. | 372,981 | 51,900,306 | ||||||
|
| |||||||
| 107,537,271 | ||||||||
|
| |||||||
TOTAL CONSUMER, NON-CYCLICAL | 173,233,568 | |||||||
|
| |||||||
Energy (4.40%) | ||||||||
Oil & Gas Services (4.40%) | ||||||||
National Oilwell Varco, Inc. | 2,144,189 | 80,707,274 | ||||||
|
| |||||||
TOTAL ENERGY | 80,707,274 | |||||||
|
| |||||||
Financial (32.15%) | ||||||||
Banks (5.70%) | ||||||||
Bank of New York Mellon Corp. | 1,090,318 | 45,411,745 | ||||||
Semi-Annual Report | October 31, 2015 |
13 |
Table of Contents
Statement of Investments
| Vulcan Value Partners Fund
| |
| ||
October 31, 2015 (Unaudited) | ||
| Value | ||||||||
| Shares | (Note 2) | |||||||
| ||||||||
Financial (continued) | ||||||||
Banks (continued) | ||||||||
State Street Corp. | 856,626 | $ | 59,107,194 | |||||
|
| |||||||
| 104,518,939 | ||||||||
|
| |||||||
Diversified Financial Services (15.17%) | ||||||||
Aberdeen Asset Management PLC | 14,973,509 | 80,029,407 | ||||||
Franklin Resources, Inc. | 2,287,379 | 93,233,568 | ||||||
T. Rowe Price Group, Inc. | 550,649 | 41,640,077 | ||||||
Visa, Inc., Class A | 815,682 | 63,280,610 | ||||||
|
| |||||||
| 278,183,662 | ||||||||
|
| |||||||
Insurance (11.28%) | ||||||||
Axis Capital Holdings, Ltd. | 1,177,738 | 63,597,852 | ||||||
Everest Re Group, Ltd. | 295,167 | 52,530,871 | ||||||
Swiss Re AG | 974,310 | 90,585,350 | ||||||
|
| |||||||
| 206,714,073 | ||||||||
|
| |||||||
TOTAL FINANCIAL | 589,416,674 | |||||||
|
| |||||||
Industrial (16.85%) | ||||||||
Aerospace & Defense (3.70%) | ||||||||
Boeing Co. | 458,295 | 67,859,741 | ||||||
|
| |||||||
Electronics (0.93%) | ||||||||
Honeywell International, Inc. | 165,621 | 17,105,337 | ||||||
|
| |||||||
Industrial Services (2.07%) | ||||||||
MSC Industrial Direct Co., Inc., Class A | 603,596 | 37,887,721 | ||||||
|
| |||||||
Miscellaneous Manufacturing (10.15%) | ||||||||
Dover Corp. | 797,064 | 51,354,833 | ||||||
Parker-Hannifin Corp. | 1,286,218 | 134,667,025 | ||||||
|
| |||||||
| 186,021,858 | ||||||||
|
| |||||||
TOTAL INDUSTRIAL | 308,874,657 | |||||||
|
| |||||||
Technology (15.36%) | ||||||||
Computers (0.84%) | ||||||||
Apple, Inc. | 128,629 | 15,371,166 | ||||||
|
| |||||||
Semiconductors (2.90%) | ||||||||
QUALCOMM, Inc. | 893,905 | 53,115,835 | ||||||
|
| |||||||
14 |
www.vulcanvaluepartners.com |
Table of Contents
Vulcan Value Partners Fund
|
Statement of Investments | |
| ||
October 31, 2015 (Unaudited) | ||
| Value | ||||||||||||
| Shares | (Note 2) | |||||||||||
| ||||||||||||
Technology (continued) | ||||||||||||
Software (11.62%) | ||||||||||||
Check Point Software Technologies, Ltd.(a) | 230,350 | $ | 19,565,929 | |||||||||
Microsoft Corp. | 849,195 | 44,701,625 | ||||||||||
Oracle Corp. | 3,831,554 | 148,817,557 | ||||||||||
|
| |||||||||||
| 213,085,111 | ||||||||||||
|
| |||||||||||
TOTAL TECHNOLOGY | 281,572,112 | |||||||||||
|
| |||||||||||
TOTAL COMMON STOCKS (Cost $1,735,707,786) | 1,800,176,347 | |||||||||||
| ||||||||||||
| 7-Day | Value | |||||||||||
| Yield | Shares | (Note 2) | ||||||||||
| ||||||||||||
SHORT TERM INVESTMENTS (1.99%) | ||||||||||||
Money Market Fund (1.99%) | ||||||||||||
Dreyfus Treasury Prime Cash Management Fund, Institutional Shares | 0.010% | 36,454,548 | 36,454,548 | |||||||||
|
| |||||||||||
TOTAL SHORT TERM INVESTMENTS (Cost $36,454,548) | 36,454,548 | |||||||||||
| ||||||||||||
TOTAL INVESTMENTS (100.19%) (Cost $1,772,162,334) | $ | 1,836,630,895 | ||||||||||
Liabilities In Excess Of Other Assets (-0.19%) | (3,476,267) | |||||||||||
| ||||||||||||
NET ASSETS (100.00%)
| $
| 1,833,154,628
|
| |||||||||
| ||||||||||||
| ||||||||||||
(a) | Non-Income Producing Security. |
Common Abbreviations:
AG - Aktiengesellschaft is a German term that refers to a corporation that is limited by shares, i.e., owned by shareholders.
Ltd. - Limited.
PLC - Public Limited Company.
Holdings are subject to change.
For Fund compliance purposes, the Fund’s industry classifications refer to any one or more of the industry sub-classifications used by one or more widely recognized market indexes or ratings group indexes, and/or as defined by Fund management. This definition may not apply for purposes of this report, which may combine industry sub-classifications for reporting ease. Industries are shown as a percentage of net assets.
See Accompanying Notes to Financial Statements.
Semi-Annual Report | October 31, 2015 |
15 |
Table of Contents
Statement of Investments
| ||
| ||
October 31, 2015 (Unaudited) | ||
| Value | ||||||||
| Shares | (Note 2) | |||||||
COMMON STOCKS (94.32%) | ||||||||
Communications (2.71%) | ||||||||
Media (2.71%) | ||||||||
SAI Global, Ltd. | 9,680,569 | $ | 30,305,105 | |||||
|
| |||||||
TOTAL COMMUNICATIONS | 30,305,105 | |||||||
|
| |||||||
Consumer, Cyclical (15.35%) | ||||||||
Distribution/Wholesale (5.87%) | ||||||||
Fossil Group, Inc.(a) | 1,206,506 | 65,645,991 | ||||||
|
| |||||||
Housewares (4.97%) | ||||||||
Tupperware Brands Corp. | 945,629 | 55,669,179 | ||||||
|
| |||||||
Retail (4.51%) | ||||||||
Nu Skin Enterprises, Inc., Class A | 1,321,569 | 50,497,152 | ||||||
|
| |||||||
TOTAL CONSUMER, CYCLICAL | 171,812,322 | |||||||
|
| |||||||
Consumer, Non-cyclical (3.57%) | ||||||||
Commercial Services (3.57%) | ||||||||
Navigant Consulting, Inc.(a) | 1,399,209 | 24,066,395 | ||||||
Savills PLC | 1,129,941 | 15,955,977 | ||||||
|
| |||||||
| 40,022,372 | ||||||||
|
| |||||||
TOTAL CONSUMER, NON-CYCLICAL | 40,022,372 | |||||||
|
| |||||||
Energy (2.19%) | ||||||||
Oil & Gas Services (2.19%) | ||||||||
Thermon Group Holdings, Inc.(a) | 1,220,186 | 24,537,941 | ||||||
|
| |||||||
TOTAL ENERGY | 24,537,941 | |||||||
|
| |||||||
Financial (28.35%) | ||||||||
Diversified Financial Services (10.74%) | ||||||||
Ashmore Group PLC | 12,590,122 | 52,404,173 | ||||||
Eaton Vance Corp. | 769,099 | 27,772,165 | ||||||
NASDAQ, Inc. | 65,362 | 3,783,806 | ||||||
Virtus Investment Partners, Inc. | 310,250 | 36,311,660 | ||||||
|
| |||||||
| 120,271,804 | ||||||||
|
| |||||||
Insurance (17.61%) | ||||||||
Aspen Insurance Holdings, Ltd. | 944,263 | 45,900,625 | ||||||
Axis Capital Holdings, Ltd. | 829,325 | 44,783,550 | ||||||
16 |
www.vulcanvaluepartners.com |
Table of Contents
Vulcan Value Partners Small Cap Fund
| Statement of Investments
| |
| ||
October 31, 2015 (Unaudited) | ||
| Value | ||||||||
| Shares | (Note 2) | |||||||
Financial (continued) | ||||||||
Insurance (continued) | ||||||||
Everest Re Group, Ltd. | 165,386 | $ | 29,433,746 | |||||
Navigators Group, Inc.(a) | 650,369 | 55,508,994 | ||||||
Safety Insurance Group, Inc. | 371,931 | 21,553,402 | ||||||
|
| |||||||
| 197,180,317 | ||||||||
|
| |||||||
TOTAL FINANCIAL | 317,452,121 | |||||||
|
| |||||||
Industrial (36.48%) | ||||||||
Aerospace & Defense (2.00%) | ||||||||
Curtiss-Wright Corp. | 321,271 | 22,347,611 | ||||||
|
| |||||||
Electrical Components & Equipment (4.16%) | ||||||||
EnerSys | 763,606 | 46,572,330 | ||||||
|
| |||||||
Electronics (6.60%) | ||||||||
Ituran Location and Control, Ltd. | 1,360,860 | 27,761,544 | ||||||
Woodward, Inc. | 1,014,050 | 46,139,275 | ||||||
|
| |||||||
| 73,900,819 | ||||||||
|
| |||||||
Hand/Machine Tools (1.86%) | ||||||||
Lincoln Electric Holdings, Inc. | 347,610 | 20,790,554 | ||||||
|
| |||||||
Industrial Services (2.33%) | ||||||||
MSC Industrial Direct Co., Inc., Class A | 415,546 | 26,083,822 | ||||||
|
| |||||||
Machinery-Diversified (7.26%) | ||||||||
Concentric AB | 1,916,666 | 22,153,644 | ||||||
Graco, Inc. | 122,076 | 8,960,379 | ||||||
Lindsay Corp. | 443,673 | 30,072,156 | ||||||
Nordson Corp. | 281,780 | 20,074,007 | ||||||
|
| |||||||
| 81,260,186 | ||||||||
|
| |||||||
Metal Fabricate/Hardware (3.87%) | ||||||||
Timken Co. | 1,372,547 | 43,372,485 | ||||||
|
| |||||||
Miscellaneous Manufacturing (6.62%) | ||||||||
Actuant Corp., Class A | 1,211,330 | 27,618,324 | ||||||
Crane Co. | 410,812 | 21,625,144 | ||||||
Donaldson Co., Inc. | 823,513 | 24,870,092 | ||||||
|
| |||||||
| 74,113,560 | ||||||||
|
| |||||||
Semi-Annual Report | October 31, 2015 |
17 |
Table of Contents
Statement of Investments
| Vulcan Value Partners Small Cap Fund
| |
| ||
October 31, 2015 (Unaudited) | ||
| Value | ||||||||||||
| Shares | (Note 2) | |||||||||||
Industrial (continued) | ||||||||||||
Transportation (1.78%) | ||||||||||||
Forward Air Corp. | 439,643 | $ | 19,942,207 | |||||||||
|
| |||||||||||
TOTAL INDUSTRIAL | 408,383,574 | |||||||||||
|
| |||||||||||
Technology (5.67%) | ||||||||||||
Software (5.67%) | ||||||||||||
ACI Worldwide, Inc.(a) | 2,649,644 | 63,458,974 | ||||||||||
|
| |||||||||||
TOTAL TECHNOLOGY | 63,458,974 | |||||||||||
|
| |||||||||||
TOTAL COMMON STOCKS (Cost $1,063,322,765) | 1,055,972,409 | |||||||||||
| ||||||||||||
| 7-Day | Value | |||||||||||
| Yield | Shares | (Note 2) | ||||||||||
| ||||||||||||
SHORT TERM INVESTMENTS (4.40%) | ||||||||||||
Money Market Fund (4.40%) | ||||||||||||
Dreyfus Treasury Prime Cash Management Fund, Institutional Shares | 0.010 | % | 49,202,179 | 49,202,179 | ||||||||
|
| |||||||||||
TOTAL SHORT TERM INVESTMENTS (Cost $49,202,179) | 49,202,179 | |||||||||||
| ||||||||||||
TOTAL INVESTMENTS (98.72%) (Cost $1,112,524,944) | $ | 1,105,174,588 | ||||||||||
Other Assets In Excess Of Liabilities (1.28%) | 14,361,950 | |||||||||||
| ||||||||||||
NET ASSETS (100.00%) | $ | 1,119,536,538 | ||||||||||
| ||||||||||||
| ||||||||||||
(a) | Non-Income Producing Security. |
18 |
www.vulcanvaluepartners.com |
Table of Contents
Vulcan Value Partners Small Cap Fund
| Statement of Investments
| |
| ||
October 31, 2015 (Unaudited) | ||
Common Abbreviations:
AB - Aktiebolag is the Swedish equivalent of the term corporation.
Ltd. - Limited.
PLC - Public Limited Company.
Holdings are subject to change.
For Fund compliance purposes, the Fund’s industry classifications refer to any one or more of the industry sub-classifications used by one or more widely recognized market indexes or ratings group indexes, and/or as defined by Fund management. This definition may not apply for purposes of this report, which may combine industry sub-classifications for reporting ease. Industries are shown as a percentage of net assets.
See Accompanying Notes to Financial Statements.
| ||
Semi-Annual Report | October 31, 2015 |
19 | |
Table of Contents
Statements of Assets and Liabilities
| ||
| ||
October 31, 2015 (Unaudited) | ||
| Vulcan Value Partners | Vulcan Value Partners | |||||||
| Fund | Small Cap Fund | |||||||
| ||||||||
ASSETS: | ||||||||
Investments, at value | $ | 1,836,630,895 | $ | 1,105,174,588 | ||||
Cash | 3,505,759 | – | ||||||
Receivable for investments sold | – | 7,873,601 | ||||||
Receivable for shares sold | 368,242 | 8,152,410 | ||||||
Dividends receivable | 575,846 | 398,591 | ||||||
Other assets | 40,749 | 16,838 | ||||||
| ||||||||
Total assets | 1,841,121,491 | 1,121,616,028 | ||||||
| ||||||||
LIABILITIES: | ||||||||
Payable to custodian | – | 10,984 | ||||||
Payable for investments purchased | 4,525,685 | – | ||||||
Payable for shares redeemed | 1,706,385 | 777,902 | ||||||
Payable to adviser | 1,516,300 | 1,080,078 | ||||||
Payable for administration fees | 80,391 | 50,301 | ||||||
Payable for transfer agency fees | 46,594 | 80,406 | ||||||
Payable for professional fees | 18,632 | 17,373 | ||||||
Payable for trustee fees and expenses | 12,897 | 8,486 | ||||||
Accrued expenses and other liabilities | 59,979 | 53,960 | ||||||
| ||||||||
Total liabilities | 7,966,863 | 2,079,490 | ||||||
| ||||||||
NET ASSETS | $ | 1,833,154,628 | $ | 1,119,536,538 | ||||
| ||||||||
NET ASSETS CONSIST OF: | ||||||||
Paid-in capital (Note 5) | $ | 1,650,765,512 | $ | 1,068,557,917 | ||||
Accumulated net investment income | 9,476,880 | 425,034 | ||||||
Accumulated net realized gain on investments | 108,443,675 | 57,903,943 | ||||||
Net unrealized appreciation/(depreciation) in value of investments | 64,468,561 | (7,350,356) | ||||||
| ||||||||
NET ASSETS | $ | 1,833,154,628 | $ | 1,119,536,538 | ||||
| ||||||||
INVESTMENTS, AT COST | $ | 1,772,162,334 | $ | 1,112,524,944 | ||||
PRICING OF SHARES: | ||||||||
Net Asset Value, offering and redemption price per share | $ | 18.76 | $ | 17.65 | ||||
Shares of beneficial interest outstanding (unlimited number of shares, no par value | 97,735,907 | 63,413,431 | ||||||
See Accompanying Notes to Financial Statements.
20 |
www.vulcanvaluepartners.com |
Table of Contents
| Statements of Operations | ||
For the Six Months Ended October 31, 2015 (Unaudited)
|
| Vulcan Value Partners | Vulcan Value Partners | |||||||
| Fund | Small Cap Fund | |||||||
| ||||||||
INVESTMENT INCOME: | ||||||||
Dividends | $ | 15,993,684 | $ | 7,591,316 | ||||
Foreign taxes withheld | (106,249) | (128,888) | ||||||
| ||||||||
Total investment income | 15,887,435 | 7,462,428 | ||||||
| ||||||||
EXPENSES: | ||||||||
Investment advisory fees (Note 6) | 9,018,121 | 6,474,403 | ||||||
Administrative fees | 243,833 | 152,748 | ||||||
Transfer agency fees | 142,267 | 238,071 | ||||||
Professional fees | 23,023 | 18,323 | ||||||
Custodian fees | 103,981 | 62,040 | ||||||
Trustee fees and expenses | 25,347 | 16,021 | ||||||
Recoupment of previously waived fees | – | 24,808 | ||||||
Other | 75,828 | 50,980 | ||||||
| ||||||||
Total net expenses | 9,632,400 | 7,037,394 | ||||||
| ||||||||
NET INVESTMENT INCOME | 6,255,035 | 425,034 | ||||||
| ||||||||
Net realized gain on investments | 48,722,291 | 41,432,180 | ||||||
Net change in unrealized depreciation of investments | (167,680,211) | (100,634,515) | ||||||
| ||||||||
NET REALIZED AND UNREALIZED LOSS ON INVESTMENTS | (118,957,920) | (59,202,335) | ||||||
| ||||||||
NET DECREASE IN NET ASSETS RESULTING FROM OPERATIONS | $ | (112,702,885) | $ | (58,777,301) | ||||
| ||||||||
See Accompanying Notes to Financial Statements.
Semi-Annual Report | October 31, 2015 |
21 |
Table of Contents
| Vulcan Value Partners Fund | ||
| ||
For the Six Months Ended | For the | |||||||
| October 31, 2015 | Year Ended | |||||||
| (Unaudited) | April 30, 2015 | |||||||
| ||||||||
OPERATIONS: | ||||||||
Net investment income | $ | 6,255,035 | $ | 14,655,614 | ||||
Net realized gain on investments and foreign currency transactions | 48,722,291 | 98,001,413 | ||||||
Net change in unrealized appreciation/(depreciation) on investments | (167,680,211) | 79,272,468 | ||||||
| ||||||||
Net increase/(decrease) in net assets resulting from operations | (112,702,885) | 191,929,495 | ||||||
| ||||||||
DISTRIBUTIONS TO SHAREHOLDERS (Note 3): | ||||||||
From net investment income | – | (12,786,089) | ||||||
From net realized gains on investments | – | (68,848,994) | ||||||
| ||||||||
Net decrease in net assets from distributions | – | (81,635,083) | ||||||
| ||||||||
SHARE TRANSACTIONS (Note 5): | ||||||||
Proceeds from sales of shares | 343,809,508 | 787,552,477 | ||||||
Issued to shareholders in reinvestment of distributions | – | 66,389,769 | ||||||
Cost of shares redeemed, net of redemption fees | (168,056,362) | (123,961,345) | ||||||
| ||||||||
Net increase from share transactions | 175,753,146 | 729,980,901 | ||||||
| ||||||||
Net increase in net assets | 63,050,261 | 840,275,313 | ||||||
| ||||||||
NET ASSETS: | ||||||||
Beginning of year | 1,770,104,367 | 929,829,054 | ||||||
| ||||||||
End of period* | $ | 1,833,154,628 | $ | 1,770,104,367 | ||||
| ||||||||
*Includes accumulated net investment income of: | $ | 9,476,880 | $ | 3,221,845 | ||||
See Accompanying Notes to Financial Statements.
22 |
www.vulcanvaluepartners.com |
Table of Contents
Vulcan Value Partners Small Cap Fund Statements of Changes in Net Assets
| ||
| ||
| For the Six | ||||||||
| Months Ended | For the | |||||||
| October 31, 2015 | Year Ended | |||||||
| (Unaudited) | April 30, 2015 | |||||||
OPERATIONS: | ||||||||
Net investment income | $ | 425,034 | $ | 5,831,901 | ||||
Net realized gain on investments | 41,432,180 | 75,800,547 | ||||||
Net change in unrealized appreciation/(depreciation) on investments | (100,634,515) | 22,946,461 | ||||||
Net increase/(decrease) in net assets resulting from operations | (58,777,301) | 104,578,909 | ||||||
DISTRIBUTIONS TO SHAREHOLDERS (Note 3): | ||||||||
From net investment income | – | (5,724,213) | ||||||
From net realized gains on investments | – | (94,956,634) | ||||||
Net decrease in net assets from distributions | – | (100,680,847) | ||||||
SHARE TRANSACTIONS (Note 5): | ||||||||
Proceeds from sales of shares | 139,903,340 | 286,238,909 | ||||||
Issued to shareholders in reinvestment of distributions | – | 84,059,577 | ||||||
Cost of shares redeemed, net of redemption fees | (94,711,861) | (307,320,451) | ||||||
Net increase from share transactions | 45,191,479 | 62,978,035 | ||||||
Net increase/(decrease) in net assets | (13,585,822) | 66,876,097 | ||||||
NET ASSETS: | ||||||||
Beginning of year | 1,133,122,360 | 1,066,246,263 | ||||||
End of period* | $ | 1,119,536,538 | $ | 1,133,122,360 | ||||
*Includes accumulated net investment income/(loss) of: | $ | 425,034 | $ | – | ||||
See Accompanying Notes to Financial Statements. | ||
Semi-Annual Report | October 31, 2015 |
23 |
Table of Contents
| ||
| ||
For a share outstanding throughout the years presented. | ||
|
NET ASSET VALUE, BEGINNING OF PERIOD |
INCOME/(LOSS) FROM OPERATIONS: |
Net investment income(a) |
Net realized and unrealized gain/(loss) on investments |
Total from investment operations |
LESS DISTRIBUTIONS TO SHAREHOLDERS: |
From net investment income |
From net realized gains on investments |
Total distributions |
Redemption fees added to paid-in capital |
Increase/(decrease) in net asset value |
NET ASSET VALUE, END OF PERIOD |
|
Total return |
RATIOS AND SUPPLEMENTAL DATA: |
Net assets, end of period (000’s) |
Ratio of expenses to average net assets without fee waivers/reimbursements |
Ratio of expenses to average net assets including fee waivers/reimbursements |
Net investment income to average net assets including fee waivers/reimbursements |
Portfolio turnover rate |
(a) | Per share numbers have been calculated using the average shares method. |
(b) | Less than $0.005 per share. |
(c) | Not annualized. |
(d) | Annualized. |
See Accompanying Notes to Financial Statements.
24 |
www.vulcanvaluepartners.com |
Table of Contents
| ||
| ||
For the Six Months Ended | For the Year Ended April 30, | For the Year Ended April 30, | For the Year Ended April 30, | For the Year Ended April 30, | For the Year Ended April 30, | |||||
$ 19.97 | $ 18.20 | $ 15.28 | $ 13.03 | $ 11.66 | $ 10.57 | |||||
0.07 | 0.22 | 0.14 | 0.15 | 0.02 | 0.01 | |||||
(1.28) | 2.77 | 3.33 | 2.35 | 1.45 | 1.13 | |||||
(1.21) | 2.99 | 3.47 | 2.50 | 1.47 | 1.14 | |||||
– | (0.17) | (0.11) | (0.12) | (0.01) | (0.01) | |||||
– | (1.05) | (0.44) | (0.13) | (0.09) | (0.04) | |||||
– | (1.22) | (0.55) | (0.25) | (0.10) | (0.05) | |||||
0.00(b) | 0.00(b) | 0.00(b) | 0.00(b) | 0.00(b) | 0.00(b) | |||||
(1.21) | 1.77 | 2.92 | 2.25 | 1.37 | 1.09 | |||||
$ 18.76 | $ 19.97 | $18.20 | $15.28 | $13.03 | $11.66 | |||||
| ||||||||||
(6.06%)(c) | 16.61% | 22.84% | 19.33% | 12.73% | 10.82% | |||||
$ 1,833,155 | $ 1,770,104 | $ 929,829 | $ 447,297 | $ 125,087 | $ 48,757 | |||||
1.07%(d) | 1.08% | 1.09% | 1.18% | 1.51% | 2.01% | |||||
1.07%(d) | 1.08% | 1.09% | 1.18% | 1.50% | 1.50% | |||||
0.69%(d) | 1.12% | 0.80% | 1.06% | 0.16% | 0.07% | |||||
43%(c) | 64% | 56% | 24% | 49% | 44% | |||||
Semi-Annual Report | October 31, 2015 |
25 |
Table of Contents
Financial Highlights
| ||
| ||
For a share outstanding throughout the years presented. | ||
|
NET ASSET VALUE, BEGINNING OF PERIOD |
INCOME/(LOSS) FROM OPERATIONS: |
Net investment income/(loss)(a) |
Net realized and unrealized gain/(loss) on investments |
Total from investment operations |
LESS DISTRIBUTIONS TO SHAREHOLDERS: |
From net investment income |
From net realized gains on investments |
Total distributions |
Redemption fees added to paid-in capital |
Increase/(decrease) in net asset value |
NET ASSET VALUE, END OF PERIOD |
|
Total return |
RATIOS AND SUPPLEMENTAL DATA: |
Net assets, end of period (000’s) |
Ratio of expenses to average net assets without fee waivers/reimbursements |
Ratio of expenses to average net assets including fee waivers/reimbursements |
Net investment income/(loss) to average net assets including fee waivers/reimbursements |
Portfolio turnover rate |
(a) Per | share numbers have been calculated using the average shares method. |
(b) Less | than $0.005 per share. |
(c) Not | annualized. |
(d) Annualized. |
See Accompanying Notes to Financial Statements.
26 |
www.vulcanvaluepartners.com |
Table of Contents
Vulcan Value Partners Small Cap Fund
| ||
| ||
For the Six Months Ended 2015 (Unaudited) | For the Year Ended April 30, 2015 | For the Year Ended April 30, 2014 | For the Year Ended April 30, 2013 | For the Year Ended April 30, 2012 | For the Year Ended April 30, 2011 | |||||
$ 18.61 | $ 18.74 | $ 16.97 | $ 13.18 | $ 13.72 | $ 11.60 | |||||
0.01 | 0.10 | (0.01) | 0.03 | 0.02 | (0.09) | |||||
(0.97) | 1.77 | 2.76 | 3.91 | 0.17 | 2.55 | |||||
(0.96) | 1.87 | 2.75 | 3.94 | 0.19 | 2.46 | |||||
– | (0.11) | – | (0.06) | – | – | |||||
– | (1.89) | (0.98) | (0.09) | (0.73) | (0.34) | |||||
– | (2.00) | (0.98) | (0.15) | (0.73) | (0.34) | |||||
0.00(b) | 0.00(b) | 0.00(b) | 0.00(b) | 0.00(b) | 0.00(b) | |||||
(0.96) | (0.13) | 1.77 | 3.79 | (0.54) | 2.12 | |||||
$ 17.65 | $ 18.61 | $ 18.74 | $ 16.97 | $ 13.18 | $ 13.72 | |||||
| ||||||||||
(5.16%)(c) | 10.74% | 16.11% | 30.07% | 2.10% | 21.75% | |||||
$ 1,119,537 | $ 1,133,122 | $1,066,246 | $ 425,152 | $ 40,103 | $ 36,363 | |||||
1.25%(d) | 1.26% | 1.30% | 1.38% | 1.86% | 2.50% | |||||
1.25%(d) | 1.25% | 1.25% | 1.28% | 1.50% | 1.50% | |||||
0.08%(d) | 0.56% | (0.05%) | 0.21% | 0.15% | (0.71%) | |||||
45%(c) | 73% | 70% | 57% | 57% | 60% | |||||
Semi-Annual Report | October 31, 2015 |
27 |
Table of Contents
| ||
| ||
October 31, 2015 (Unaudited) | ||
1. ORGANIZATION
Financial Investors Trust (the “Trust”) is organized as a Delaware statutory trust and is registered as an open-end management investment company under the Investment Company Act of 1940, as amended (“1940 Act”). As of October 31, 2015, the Trust had 34 registered funds. This semi-annual report describes the Vulcan Value Partners Fund and Vulcan Value Partners Small Cap Fund (each a “Fund” and collectively, the “Funds”). The Funds seek to achieve long-term capital appreciation. The Funds are classified as a non-diversified investment company for purpose of the 1940 Act.
2. SIGNIFICANT ACCOUNTING POLICIES
The accompanying financial statements were prepared in accordance with accounting principles generally accepted in the United States of America (“U.S. GAAP”). The preparation of financial statements in conformity with U.S. GAAP requires management to make certain estimates and assumptions that affect the reported amounts of assets and liabilities and disclosures of contingent assets and liabilities at the date of the financial statements and the reported amounts of revenue and expenses during the period. Actual results could differ from those estimates. The Funds are considered an investment company for financial reporting purposes under U.S. GAAP. The following is a summary of significant accounting policies consistently followed by the Funds in preparation of their financial statements.
Investment Valuation: The Funds generally value their securities based on market prices determined at the close of regular trading on the New York Stock Exchange (“NYSE”), normally 4:00 p.m. Eastern Time, on each day the NYSE is open for trading.
For equity securities and mutual funds that are traded on an exchange, the market price is usually the closing sale or official closing price on that exchange. In the case of equity securities not traded on an exchange, or if such closing prices are not otherwise available, the securities are valued at the mean of the most recent bid and ask prices on such day. Redeemable securities issued by open-end registered investment companies are valued at the investment company’s applicable net asset value.
The market price for debt obligations is generally the price supplied by an independent third-party pricing service approved by the Board of Trustees (the “Board”), which may use a matrix, formula or other objective method that takes into consideration quotations from dealers, market transactions in comparable investments, market indices and yield curves. If vendors are unable to supply a price, or if the price supplied is deemed to be unreliable, the market price may be determined using quotations received from one or more broker–dealers that make a market in the security. Short-term debt obligations that will mature in 60 days or less are valued at amortized cost, unless it is determined that using this method would not reflect an investment’s fair value.
When such prices or quotations are not available, or when Vulcan Value Partners, LLC (“Vulcan” or the “Adviser”) believes that they are unreliable, securities may be priced using fair value procedures approved by the Board.
28 |
www.vulcanvaluepartners.com |
Table of Contents
Notes to Financial Statements | ||
| ||
October 31, 2015 (Unaudited) | ||
Fair Value Measurements: A three-tier hierarchy has been established to classify fair value measurements for disclosure purposes. Inputs refer broadly to the assumptions that market participants would use in pricing the asset or liability, including assumptions about risk. Inputs may be observable or unobservable. Observable inputs are inputs that reflect the assumptions market participants would use in pricing the asset or liability that are developed based on market data obtained from sources independent of the reporting entity. Unobservable inputs are inputs that reflect the reporting entity’s own assumptions about the assumptions market participants would use in pricing the asset or liability that are developed based on the best information available. Various inputs are used in determining the value of each Fund’s investments as of the reporting period end. The designated input levels are not necessarily an indication of the risk or liquidity associated with these investments. These inputs are categorized in the following hierarchy under applicable financial accounting standards:
Level 1 – | Unadjusted quoted prices in active markets for identical investments, unrestricted assets or liabilities that the Funds have the ability to | |
Level 2 – | Quoted prices which are not active, quoted prices for similar assets or liabilities in active markets or inputs other than quoted prices | |
Level 3 – | Significant unobservable prices or inputs (including the Funds’ own assumptions in determining the fair value of investments) where |
The following is a summary of each input used to value each Fund’s investments as of October 31, 2015.
Vulcan Value Partners Fund:
Investments in Securities at Value | Level 1 - Unadjusted Quoted Prices | Level 2 - Other Significant Observable Inputs | Level 3 - Significant Unobservable Inputs | Total | ||||||||||||
| ||||||||||||||||
Common Stocks(a) | $ | 1,800,176,347 | $ | – | $ | – | $ | 1,800,176,347 | ||||||||
Short Term Investments | 36,454,548 | – | – | 36,454,548 | ||||||||||||
| ||||||||||||||||
TOTAL | $ | 1,836,630,895 | $ | – | $ | – | $ | 1,836,630,895 | ||||||||
| ||||||||||||||||
Vulcan Value Partners Small Cap Fund: | ||||||||||||||||
Investments in Securities at Value | Level 1 - Unadjusted Quoted Prices | Level 2 - Other Significant Observable Inputs | Level 3 - Significant Unobservable Inputs | Total | ||||||||||||
| ||||||||||||||||
Common Stocks(a) | $ | 1,055,972,409 | $ | – | $ | – | $ | 1,055,972,409 | ||||||||
Short Term Investments | 49,202,179 | – | – | 49,202,179 | ||||||||||||
| ||||||||||||||||
TOTAL | $ | 1,105,174,588 | $ | – | $ | – | $ | 1,105,174,588 | ||||||||
| ||||||||||||||||
(a) | For detailed descriptions, see the accompanying Statements of Investments. |
Semi-Annual Report | October 31, 2015 |
29 |
Table of Contents
Notes to Financial Statements
| ||
| ||
October 31, 2015 (Unaudited) | ||
The Funds recognize transfers between levels as of the end of period. For the six months ended October 31, 2015, the Funds did have transfers between Level 1 and Level 2. For the six months ended October 31, 2015, the Funds did not have any securities that used significant unobservable inputs (Level 3) in determining fair value.
| Level 1 | Level 2 | |||||||||||||||
| Transfer In | Transfers (Out) | Transfer In | Transfers (Out) | |||||||||||||
| ||||||||||||||||
Common Stocks | $ | 82,709,278 | $ | – | $ | – | $ (82,709,278) | |||||||||
| ||||||||||||||||
Total | $ | 82,709,278 | $ | – | $ | – | $ (82,709,278) | |||||||||
| ||||||||||||||||
Investment Transactions and Investment Income: Investment transactions are accounted for on the date the investments are purchased or sold (trade date). Realized gains and losses from investment transactions are reported on an identified cost basis, which is the same basis the Funds use for federal income tax purposes. Interest income, which includes accretion of discounts and amortization of premiums, is accrued and recorded as earned. Dividend income is recognized on the ex-dividend date or for certain foreign securities, as soon as information is available to the Funds. All of the realized and unrealized gains and losses and net investment income, are allocated daily to each class in proportion to its average daily net assets.
Foreign Securities: The Funds may directly purchase securities of foreign issuers. Investing in securities of foreign issuers involves special risks not typically associated with investing in securities of U.S. issuers. The risks include possible reevaluation of currencies, the inability to repatriate foreign currency, less complete financial information about companies and possible future adverse political and economic developments. Moreover, securities of many foreign issuers and their markets may be less liquid and their prices more volatile than those of securities of comparable U.S. issuers.
Foreign Currency Translation: The books and records of the Fund are maintained in U.S. dollars. Investment valuations and other assets and liabilities initially expressed in foreign currencies are converted each business day into U.S. dollars based upon current exchange rates. Prevailing foreign exchange rates may generally be obtained at the close of the NYSE (normally, 4:00 p.m. Eastern Time). The portion of realized and unrealized gains or losses on investments due to fluctuations in foreign currency exchange rates is not separately disclosed and is included in realized and unrealized gains or losses on investments, when applicable.
Trust Expenses: Some expenses of the Trust can be directly attributed to the Funds. Expenses which cannot be directly attributed are apportioned among all funds in the Trust based on average net assets of each fund.
Fund Expenses: Expenses that are specific to a Fund are charged directly to that Fund.
Federal Income Taxes: Each Fund complies with the requirements under Subchapter M of the Internal Revenue Code of 1986, as amended, applicable to regulated investment companies and intends to distribute substantially all of its net taxable income and net capital gains, if any, each year so that it will not be subject to excise tax on undistributed income and gains. The Funds are not subject to income taxes to the extent such distributions are made.
30 |
www.vulcanvaluepartners.com |
Table of Contents
Notes to Financial Statements | ||
| ||
October 31, 2015 (Unaudited) | ||
As of and during the six months ended October 31, 2015, the Funds did not have a liability for any unrecognized tax benefits. The Funds file U.S. federal, state, and local tax returns as required. The Fund’s tax returns are subject to examination by the relevant tax authorities until expiration of the applicable statute of limitations, which is generally three years after the filing of the tax return for federal purposes and four years for most state returns. Tax returns for open years have incorporated no uncertain tax positions that require a provision for income taxes.
Distributions to Shareholders: Each Fund normally pays dividends and distributes capital gains, if any, on an annual basis. Income dividend distributions are derived from interest and other income each Fund receives from its investments, including short-term capital gains. Long term capital gain distributions are derived from gains realized when each Fund sells a security it has owned for more than a year. Each Fund may make additional distributions and dividends at other times if the portfolio manager believes doing so may be necessary for each Fund to avoid or reduce taxes.
3. TAX BASIS INFORMATION:
Tax Basis of Investments: As of October 31, 2015, the aggregate cost of investments, gross unrealized appreciation/ (depreciation) and net unrealized appreciation for federal tax purposes was as follows:
| Vulcan Value Partners Fund | Vulcan Value Partners Small Cap Fund | |||||||
| ||||||||
Gross appreciation | $ | 191,946,443 | $ | 81,919,300 | ||||
Gross depreciation | (138,437,206) | (94,758,191) | ||||||
| ||||||||
Net unrealized appreciation | $ | 53,509,237 | $ | (12,838,891) | ||||
| ||||||||
Cost of investments for income tax purposes | $ | 1,783,121,658 | $ | 1,118,013,479 | ||||
| ||||||||
Tax Basis of Distributions to Shareholders: The character of distributions made during the year from net investment income or net realized gains may differ from its ultimate characterization for federal income tax purposes. Also, due to the timing of dividend distributions, the fiscal year in which amounts are distributed may differ from the fiscal year in which the income or realized gain were recorded by each Fund.
The tax character of distributions paid by the Funds for the fiscal year ended April 30, 2015 were as follows:
| Ordinary Income | Long-Term Capital Gain | |||||||
| ||||||||
2015 | ||||||||
Vulcan Value Partners Fund | $ | 48,380,968 | $ | 33,254,115 | ||||
Vulcan Value Partners Small Cap Fund | 64,217,648 | 36,463,199 | ||||||
Semi-Annual Report | October 31, 2015 |
31 |
Table of Contents
Notes to Financial Statements
| ||
| ||
October 31, 2015 (Unaudited) | ||
The amounts and characteristics of tax basis distributions and composition of distributable earnings/(accumulated losses) are finalized at fiscal year-end. Accordingly, tax basis balances have not been determined as of October 31, 2015.
4. SECURITIES TRANSACTIONS
The cost of purchases and proceeds from sales of securities (excluding short-term securities) during the six months ended October 31, 2015 were as follows:
| Proceeds From | ||||||||
Fund | Purchase of Securities | Sales of Securities | ||||||
| ||||||||
Vulcan Value Partners Fund | $ | 906,751,133 | $ | 755,697,044 | ||||
Vulcan Value Partners Small Cap Fund | 558,740,725 | 451,621,040 | ||||||
5. CAPITAL SHARE TRANSACTIONS
The capitalization of the Trust consists of an unlimited number of shares of beneficial interest with no par value per share. Holders of the shares of the Funds of the Trust have one vote for each share held and a proportionate fraction of a vote for each fractional share. All shares issued and outstanding are fully paid and are transferable and redeemable at the option of the shareholder. Purchasers of the shares do not have any obligation to make payments to the Trust or its creditors (other than the purchase price for the shares) or make contributions to the Trust or its creditors solely by reason of the purchasers’ ownership of the shares. Shares have no pre-emptive rights.
Shares redeemed within 90 days of purchase may incur a 2% short-term redemption fee deducted from the redemption amount. The Vulcan Value Partners Fund and the Vulcan Value Partners Small Cap Fund retained $52,673 and $5,509, respectively, for the six months ended October 31, 2015, and $22,469 and $17,712, respectively, for the year ended April 30, 2015, which is reflected in the “Cost of shares redeemed, net of redemption fees” in the Statements of Changes in Net Assets.
Transactions in shares of capital stock for the dates listed below were as follows:
Vulcan Value Partners Fund
| For the Six | ||||||||
| Months Ended | ||||||||
| October 31, 2015 | For the Year Ended | |||||||
| (Unaudited) | April 30, 2015 | |||||||
| ||||||||
Shares Sold | 18,055,503 | 40,549,413 | ||||||
Shares Issued in Reinvestment of Dividends | – | 3,392,456 | ||||||
Less Shares Redeemed | (8,957,278) | (6,399,329) | ||||||
| ||||||||
Net Increase | 9,098,225 | 37,542,540 | ||||||
| ||||||||
32 |
www.vulcanvaluepartners.com |
Table of Contents
Notes to Financial Statements | ||
| ||
October 31, 2015 (Unaudited) | ||
Vulcan Value Partners Small Cap Fund
| For the Six | ||||||||
| Months Ended | ||||||||
| October 31, 2015 | For the Year Ended | |||||||
| (Unaudited) | April 30, 2015 | |||||||
| ||||||||
Shares Sold | 7,895,524 | 15,540,687 | ||||||
Shares Issued in Reinvestment of Dividends | – | 4,815,937 | ||||||
Less Shares Redeemed | (5,361,757) | (16,362,540) | ||||||
| ||||||||
Net Increase | 2,533,767 | 3,994,084 | ||||||
| ||||||||
6. MANAGEMENT AND RELATED-PARTY TRANSACTIONS
The Adviser, subject to the authority of the Board, is responsible for the overall management and administration of the Funds’ business affairs. Vulcan manages the investments of the Funds in accordance with each Fund’s investment objective, policies and limitations and investment guidelines established jointly by the Adviser and the Board. Pursuant to the Investment Advisory Agreement (the “Advisory Agreement”), the Funds pay Vulcan an annual management fee of 1.00% and 1.15% for Vulcan Value Partners Fund and Vulcan Value Partners Small Cap Fund, respectively, based on each Fund’s average daily net assets.
Vulcan has contractually agreed with the Funds to limit the amount of each Fund’s total annual expenses (exclusive of brokerage expenses, interest expense, taxes and extraordinary expenses) to 1.25% of each Fund’s average daily net assets. This agreement is in effect through August 31, 2016 and is reevaluated on an annual basis. Without this agreement, expenses could be higher. The Adviser is permitted to recover expenses it has borne through the agreement described above to the extent that each Fund’s expenses in later periods fall below the annual rates set forth in the relevant agreement. If the Adviser foregoes any fees and/or reimburses the Funds pursuant to this agreement with respect to a particular fiscal year, then the Adviser shall be entitled to recover from the Funds the amount forgone or reimbursed to the extent annual fund operating expenses are less than 1.25% of the Funds’ average daily net assets during any fiscal year following such fiscal year.
Pursuant to the expense limitation agreement between the Adviser and the Trust, each Fund will reimburse the Adviser for any contractual fee waivers and expense reimbursements made by the Adviser, provided that any such reimbursements made by each Fund to the Adviser will not cause the Funds’ expense limitation to exceed expense limitations in existence at the time the expense was incurred, or at the time of the reimbursement, whichever is lower, and the reimbursement is made within three years after the end of the fiscal year in which fees or expenses were incurred.
For the six months ended October 31, 2015, the fee waivers and/or reimbursements were as follows:
| Fees | Recoupment of | |||||||||
| Waived/Reimbursed | Previously Waived Fees | |||||||||
Fund | By Adviser | by Adviser | ||||||||
Vulcan Value Partners Fund | $ – | $ – | ||||||||
Vulcan Value Partners Small Cap Fund | – | 24,808 | ||||||||
Semi-Annual Report | October 31, 2015 |
33 |
Table of Contents
Notes to Financial Statements
| ||
| ||
October 31, 2015 (Unaudited) | ||
As of October 31, 2015, the balances of recoupable expenses for each Fund were as follows:
Fund | Expires 2016 | Expires 2017 | Expires 2018 | Total | ||||||||||||
| ||||||||||||||||
Vulcan Value Partners Fund | $ | – | $ | – | $ | – | $ | – | ||||||||
Vulcan Value Partners Small Cap Fund | 161,158 | 400,224 | 79,989 | 641,371 | ||||||||||||
Fund Administrator Fees and Expenses: ALPS Fund Services, Inc. (“ALPS”) serves as administrator to the Funds and the Funds have agreed to pay expenses incurred in connection with its administrative activities. Pursuant to an Administrative Agreement, ALPS provides operational services to the Funds including, but not limited to fund accounting and fund administration and generally assist in each Fund’s operations. Officers of the Trust are employees of ALPS. The Funds’ administration fee is accrued on a daily basis and paid monthly. Administration fees paid by the Funds for the six months ended October 31, 2015 are disclosed in the Statements of Operations.
ALPS is reimbursed by the Funds for certain out-of-pocket expenses.
Transfer Agent: ALPS serves as transfer, dividend paying and shareholder servicing agent for the Funds. ALPS receives an annual minimum fee, a fee based upon the number of shareholder accounts, and is also reimbursed by the Funds for certain out-of-pocket expenses.
Compliance Services: ALPS provides services that assist the Trust’s chief compliance officer in monitoring and testing the policies and procedures of the Trust in conjunction with requirements under Rule 38a-1 under the 1940 Act and receives an annual base fee. ALPS is reimbursed for certain out-of-pocket expenses by the Funds. Vulcan pays this fee on behalf of the Funds.
Principal Financial Officer: ALPS Fund Services, Inc. (“ALPS” and the “Administrator”) (an affiliate of ADI) receives an annual fee for providing principal financial officer services to the Funds. Vulcan pays this fee on behalf of the Funds.
Distributor: ALPS Distributors, Inc. (“ADI” or the “Distributor”) (an affiliate of ALPS Fund Services, Inc.) acts as the distributor of each Fund’s shares pursuant to a Distribution Agreement with the Trust. Shares are sold on a continuous basis by ADI as agent for the Funds, and ADI has agreed to use its best efforts to solicit orders for the sale of each Fund’s shares, although it is not obliged to sell any particular amount of shares. ADI is not entitled to any compensation for its services as Distributor. ADI is registered as a broker-dealer with the U.S. Securities and Exchange Commission.
7. INDEMNIFICATIONS
Under the Trust’s organizational documents, its Officers and Trustees are indemnified against certain liability arising out of the performance of their duties to the Trust. Additionally, in the normal course of business, the Trust enters into contracts with service providers that may contain general indemnification clauses which may permit indemnification to the extent permissible under applicable law. The Trust’s maximum exposure under these arrangements is unknown, as this would involve future claims that may be made against the Trust that have not yet occurred.
34 |
www.vulcanvaluepartners.com |
Table of Contents
Notes to Financial Statements | ||
| ||
October 31, 2015 (Unaudited) | ||
8. RECENT ACCOUNTING PRONOUNCEMENT
In May 2015, the Financial Accounting Standards Board issued Accounting Standards Update (“ASU”) 2015-07, “Disclosures for Investments in Certain Entities that Calculate Net Asset Value Per Share (or its Equivalent).” This is an update to Accounting Standards Codification Topic 820, Fair Value Measurement. ASU 2015-07 removes the requirement to categorize within the fair value hierarchy investments for which fair value is measured at net asset value per share (or its equivalent) using the practical expedient. ASU 2015-17 is effective for annual reporting periods beginning on or after December 15, 2015, and interim periods within those annual periods, with retrospective application for all periods presented. The Funds are currently evaluating the impact ASU 2015-07 will have on the Funds’ financial statements and disclosures.
Semi-Annual Report | October 31, 2015 |
35 |
Table of Contents
| ||
| ||
October 31, 2015 (Unaudited) | ||
1. FUND HOLDINGS
The Fund files its complete schedule of portfolio holdings with the Securities and Exchange Commission (the “SEC”) for the first and third quarters of each fiscal year on Form N-Q within 60 days after the end of the period. Copies of the Fund’s Form N-Q are available without charge on the SEC website at http://www.sec.gov. You may also review and copy the Form N-Q at the SEC’s Public Reference Room in Washington, DC. For more information about the operation of the Public Reference Room, please call the SEC at 1-800-SEC-0330.
2. FUND PROXY VOTING POLICIES, PROCEDURES AND SUMMARIES
The Fund’s policies and procedures used in determining how to vote proxies and information regarding how the Fund voted proxies relating to portfolio securities during the most recent prior 12-month period ending June 30 are available without charge, (1) upon request, by calling (toll-free) (866)-759-5679 and (2) on the SEC’s website at http://www.sec.gov.
36 |
www.vulcanvaluepartners.com |
Table of Contents

Table of Contents
| Item 2. | Code of Ethics. |
Not applicable to this Report.
| Item 3. | Audit Committee Financial Expert. |
Not applicable to this Report.
| Item 4. | Principal Accountant Fees and Services. |
Not applicable to this Report.
| Item 5. | Audit Committee of Listed Registrants. |
Not applicable to the Registrant.
| Item 6. | Investments. |
| (a) | Schedule of Investments is included as part of the Reports to Stockholders filed under Item 1 of this Form N-CSR. |
| (b) | Not applicable. |
| Item 7. | Disclosure of Proxy Voting Policies and Procedures for Closed-End Management Investment Companies. |
Not applicable to the Registrant.
| Item 8. | Portfolio Managers of Closed-End Management Investment Companies. |
Not applicable to the Registrant.
Table of Contents
| Item 9. | Purchases of Equity Securities by Closed-End Management Investment Company and Affiliated Purchasers. |
Not applicable to the Registrant.
| Item 10. | Submission of Matters to a Vote of Security Holders. |
There have been no material changes to the procedures by which shareholders may recommend nominees to the Registrant’s Board of Trustees, where those changes were implemented after the Registrant last provided disclosure in response to the requirements of Item 407(c)(2)(iv) of Regulation S-K, or this Item.
| Item 11. | Controls and Procedures. |
| (a) | The Registrant’s principal executive officer and principal financial officer have concluded that the Registrant’s disclosure controls and procedures (as defined in Rule 30a-3(c) under the Investment Company Act of 1940, as amended) are effective based on their evaluation of these controls and procedures as of a date within 90 days of the filing date of this report. |
| (b) | There was no change in the Registrant’s internal control over financial reporting (as defined in Rule 30a-3(d) under the Investment Company Act of 1940, as amended) that occurred during the second fiscal quarter of the period covered by this report that has materially affected, or is reasonably likely to materially affect, the Registrant’s internal control over financial reporting. |
| Item 12. | Exhibits. |
| (a)(1) | Not applicable to this Report. |
| (a)(2) | The certifications required by Rule 30a-2(a) of the Investment Company Act of 1940, as amended, and Section 302 of the Sarbanes-Oxley Act of 2002 are attached hereto as Exhibit 99.Cert. |
| (a)(3) | Not applicable to the Registrant. |
| (b) | The certifications by the Registrant’s principal executive officer and principal financial officer, as required by Rule 30a-2(b) of the Investment Company Act of 1940, as amended, and Section 906 of the Sarbanes-Oxley Act of 2002 are attached hereto as Exhibit 99.906Cert. |
Table of Contents
SIGNATURES
Pursuant to the requirements of the Securities Exchange Act of 1934 and the Investment Company Act of 1940, the Registrant has duly caused this report to be signed on its behalf by the undersigned, thereunto duly authorized.
FINANCIAL INVESTORS TRUST
| By: | /s/ Edmund J. Burke | |
| Edmund J. Burke (Principal Executive Officer) | ||
| President | ||
| Date: | January 8, 2016 | |
Pursuant to the requirements of the Securities Exchange Act of 1934 and the Investment Company Act of 1940, this report has been signed below by the following persons on behalf of the Registrant and in the capacities and on the dates indicated.
FINANCIAL INVESTORS TRUST
| By: | /s/ Edmund J. Burke | |
| Edmund J. Burke (Principal Executive Officer) | ||
| President | ||
| Date: | January 8, 2016 | |
| By: | /s/ Kimberly R. Storms | |
| Kimberly R. Storms (Principal Financial Officer) | ||
| Treasurer | ||
| Date: | January 8, 2016 | |