UNITED STATES
SECURITIES AND EXCHANGE COMMISSION
Washington, D.C. 20549
FORM N-CSR
CERTIFIED SHAREHOLDER REPORT OF REGISTERED
MANAGEMENT INVESTMENT COMPANIES
Investment Company Act file number: 811-8194
FINANCIAL INVESTORS TRUST
(exact name of Registrant as specified in charter)
1290 Broadway, Suite 1100, Denver, Colorado 80203
(Address of principal executive offices) (Zip code)
David T. Buhler, Secretary
Financial Investors Trust
1290 Broadway, Suite 1100
Denver, Colorado 80203
(Name and address of agent for service)
Registrant’s telephone number, including area code: 303-623-2577
Date of fiscal year end: October 31
Date of reporting period: November 1, 2014 – April 30, 2015
| Item 1. | Reports to Stockholders. |
table of
CONTENTS
CONTENTS
| Disclosure of Fund Expenses | 1 | |
| ALPS | Alerian MLP Infrastructure Index Fund | ||
| Management Commentary | 5 | |
| Performance Update | 6 | |
| Statement of Investments | 8 | |
| Statement of Assets and Liabilities | 9 | |
| Statement of Operations | 10 | |
| Statements of Changes in Net Assets | 11 | |
| Financial Highlights | 12 | |
| ALPS | CoreCommodity Management | ||
CompleteCommodities® Strategy Fund | ||
| Management Commentary | 16 | |
| Performance Update | 18 | |
| Consolidated Statement of Investments | 20 | |
| Consolidated Statement of Assets and Liabilities | 27 | |
| Consolidated Statement of Operations | 29 | |
| Consolidated Statements of Changes in Net Assets | 30 | |
| Consolidated Financial Highlights | 31 | |
| ALPS | Kotak India Growth Fund | ||
| Management Commentary | 34 | |
| Performance Update | 36 | |
| Consolidated Statement of Investments | 38 | |
| Consolidated Statement of Assets and Liabilities | 40 | |
| Consolidated Statement of Operations | 41 | |
| Consolidated Statements of Changes in Net Assets | 42 | |
| Consolidated Financial Highlights | 43 | |
| ALPS | Red Rocks Listed Private Equity Fund | ||
| Management Commentary | 46 | |
| Performance Update | 48 | |
| Statement of Investments | 51 | |
| Statement of Assets and Liabilities | 53 | |
| Statement of Operations | 54 | |
| Statements of Changes in Net Assets | 55 | |
| Financial Highlights | 56 | |
| ALPS | Sterling ETF Tactical Rotation Fund | ||
| Management Commentary | 60 | |
| Performance Update | 61 | |
| Statement of Investments | 63 | |
| Statement of Assets and Liabilities | 64 | |
| Statement of Operations | 65 | |
| Statements of Changes in Net Assets | 66 | |
| Financial Highlights | 67 | |
| ALPS | Westport Resources Hedged High Income Fund | ||
| Management Commentary | 70 | |
| Performance Update | 71 | |
| Statement of Investments | 73 | |
| Statement of Assets and Liabilities | 81 | |
| Statement of Operations | 82 | |
| Statements of Changes in Net Assets | 83 | |
| Financial Highlights | 84 | |
| ALPS | WMC Research Value Fund | ||
| Management Commentary | 87 | |
| Performance Update | 89 | |
| Statement of Investments | 91 | |
| Statement of Assets and Liabilities | 95 | |
| Statement of Operations | 96 | |
| Statements of Changes in Net Assets | 97 | |
| Financial Highlights | 98 | |
| Clough China Fund | ||
| Management Commentary | 101 | |
| Performance Update | 104 | |
| Statement of Investments | 106 | |
| Statement of Assets and Liabilities | 110 | |
| Statement of Operations | 111 | |
| Statements of Changes in Net Assets | 112 | |
| Financial Highlights | 113 | |
| RiverFront Global Allocation Series | ||
| Management Commentary | 116 | |
| Performance Update | 118 | |
| Statements of Investments | 128 | |
| Statements of Assets and Liabilities | 138 | |
| Statements of Operations | 140 | |
| Statements of Changes in Net Assets | 141 | |
| Financial Highlights | 146 | |
| Notes to Financial Statements | 163 | |
| Additional Information | 194 |
www.alpsfunds.com
| Disclosure of Fund Expenses | |
| April 30, 2015 (Unaudited) |
Examples. As a shareholder of the Funds, you will incur two types of costs: (1) transaction costs, including applicable sales charges (loads) and redemption fees; and (2) ongoing costs, including management fees, distribution and service (12b-1) fees, shareholder service fees and other Fund expenses. The following examples are intended to help you understand your ongoing costs (in dollars) of investing in the Funds and to compare these costs with the ongoing costs of investing in other mutual funds. The examples are based on an investment of $1,000 invested on November 1, 2014 and held until April 30, 2015.
Actual Expenses. The first line under each class in the following table provides information about actual account values and actual expenses. You may use the information in this line, together with the amount you invested, to estimate the expenses that you paid over the period. Simply divide your account value by $1,000 (for example, an $8,600 account value divided by $1,000 = 8.6), then multiply the result by the number in the first line under the heading “Expenses Paid During Period November 1, 2014 – April 30, 2015” to estimate the expenses you paid on your account during this period.
Hypothetical Example for Comparison Purposes. The second line under each class in the following table provides information about hypothetical account values and hypothetical expenses based on the Fund’s actual expense ratio and an assumed rate of return of 5% per year before expenses, which is not the Fund’s actual return. The hypothetical account values and expenses may not be used to estimate the actual ending account balance or expenses you paid for the period. You may use this information to compare the ongoing costs of investing in the Funds and other mutual funds. To do so, compare these 5% hypothetical examples with the 5% hypothetical examples that appear in the shareholder reports of the other funds.
Please note that the expenses shown in the table are meant to highlight your ongoing costs only and do not reflect any transactional costs, such as sales charges or redemption fees. Therefore, the second line under each class in the following table is useful in comparing ongoing costs only, and will not help you determine the relative total costs of owning different funds. In addition, if these transactional costs were included, your costs would have been higher.
1 | April 30, 2015
| Disclosure of Fund Expenses | |
| April 30, 2015 (Unaudited) |
Beginning Account Value November 1, 2014 | Ending Account Value April 30, 2015 | Expense Ratio(a) | Expenses Paid During Period November 1, 2014 - April 30, 2015(b) | ||||||||||
| ALPS | Alerian MLP Infrastructure Index Fund | |||||||||||||
| Class A | |||||||||||||
| Actual | $ | 1,000.00 | $ | 956.10 | 1.24 | % | $ | 6.01 | |||||
| Hypothetical (5% return before expenses) | $ | 1,000.00 | $ | 1,018.65 | 1.24 | % | $ | 6.21 | |||||
| Class C | |||||||||||||
| Actual | $ | 1,000.00 | $ | 954.00 | 1.85 | % | $ | 8.96 | |||||
| Hypothetical (5% return before expenses) | $ | 1,000.00 | $ | 1,015.62 | 1.85 | % | $ | 9.25 | |||||
| Class I | |||||||||||||
| Actual | $ | 1,000.00 | $ | 957.20 | 0.85 | % | $ | 4.12 | |||||
| Hypothetical (5% return before expenses) | $ | 1,000.00 | $ | 1,020.58 | 0.85 | % | $ | 4.26 | |||||
ALPS | CoreCommodity Management CompleteCommodities® Strategy Fund(c) | |||||||||||||
| Class A | |||||||||||||
| Actual | $ | 1,000.00 | $ | 889.10 | 1.45 | % | $ | 6.79 | |||||
| Hypothetical (5% return before expenses) | $ | 1,000.00 | $ | 1,017.60 | 1.45 | % | $ | 7.25 | |||||
| Class C | |||||||||||||
| Actual | $ | 1,000.00 | $ | 887.10 | 2.05 | % | $ | 9.59 | |||||
| Hypothetical (5% return before expenses) | $ | 1,000.00 | $ | 1,014.63 | 2.05 | % | $ | 10.24 | |||||
| Class I | |||||||||||||
| Actual | $ | 1,000.00 | $ | 890.90 | 1.15 | % | $ | 5.39 | |||||
| Hypothetical (5% return before expenses) | $ | 1,000.00 | $ | 1,019.09 | 1.15 | % | $ | 5.76 | |||||
ALPS | Kotak India Growth Fund(d) | |||||||||||||
| Class A | |||||||||||||
| Actual | $ | 1,000.00 | $ | 1,003.70 | 1.92 | % | $ | 9.54 | |||||
| Hypothetical (5% return before expenses) | $ | 1,000.00 | $ | 1,015.27 | 1.92 | % | $ | 9.59 | |||||
| Class C | |||||||||||||
| Actual | $ | 1,000.00 | $ | 1,000.30 | 2.60 | % | $ | 12.90 | |||||
| Hypothetical (5% return before expenses) | $ | 1,000.00 | $ | 1,011.90 | 2.60 | % | $ | 12.97 | |||||
| Class I | |||||||||||||
| Actual | $ | 1,000.00 | $ | 1,007.10 | 1.60 | % | $ | 7.96 | |||||
| Hypothetical (5% return before expenses) | $ | 1,000.00 | $ | 1,016.86 | 1.60 | % | $ | 8.00 | |||||
| ALPS | Red Rocks Listed Private Equity Fund | |||||||||||||
| Class A | |||||||||||||
| Actual | $ | 1,000.00 | $ | 1,105.40 | 1.53 | % | $ | 7.99 | |||||
| Hypothetical (5% return before expenses) | $ | 1,000.00 | $ | 1,017.21 | 1.53 | % | $ | 7.65 | |||||
| Class C | |||||||||||||
| Actual | $ | 1,000.00 | $ | 1,101.10 | 2.12 | % | $ | 11.04 | |||||
| Hypothetical (5% return before expenses) | $ | 1,000.00 | $ | 1,014.28 | 2.12 | % | $ | 10.59 | |||||
| Class I | |||||||||||||
| Actual | $ | 1,000.00 | $ | 1,108.00 | 1.16 | % | $ | 6.06 | |||||
| Hypothetical (5% return before expenses) | $ | 1,000.00 | $ | 1,019.04 | 1.16 | % | $ | 5.81 | |||||
| Class R | |||||||||||||
| Actual | $ | 1,000.00 | $ | 1,104.70 | 1.58 | % | $ | 8.25 | |||||
| Hypothetical (5% return before expenses) | $ | 1,000.00 | $ | 1,016.96 | 1.58 | % | $ | 7.90 | |||||
| ALPS | Sterling ETF Tactical Rotation Fund | |||||||||||||
| Class A | |||||||||||||
| Actual | $ | 1,000.00 | $ | 1,008.70 | 1.54 | % | $ | 7.67 | |||||
| Hypothetical (5% return before expenses) | $ | 1,000.00 | $ | 1,017.16 | 1.54 | % | $ | 7.70 | |||||
| Class C | |||||||||||||
| Actual | $ | 1,000.00 | $ | 1,005.80 | 2.15 | % | $ | 10.69 | |||||
| Hypothetical (5% return before expenses) | $ | 1,000.00 | $ | 1,014.13 | 2.15 | % | $ | 10.74 | |||||
| Class I | |||||||||||||
| Actual | $ | 1,000.00 | $ | 1,012.40 | 1.15 | % | $ | 5.74 | |||||
| Hypothetical (5% return before expenses) | $ | 1,000.00 | $ | 1,019.09 | 1.15 | % | $ | 5.76 | |||||
2 | April 30, 2015
| Disclosure of Fund Expenses | |
| April 30, 2015 (Unaudited) |
Beginning Account Value November 1, 2014 | Ending Account Value April 30, 2015 | Expense Ratio(a) | Expenses Paid During Period November 1, 2014 - April 30, 2015(b) | ||||||||||
| ALPS | Westport Resources Hedged High Income Fund | |||||||||||||
| Class A | |||||||||||||
| Actual | $ | 1,000.00 | $ | 1,004.50 | 2.39 | % | $ | 11.88 | |||||
| Hypothetical (5% return before expenses) | $ | 1,000.00 | $ | 1,012.94 | 2.39 | % | $ | 11.93 | |||||
| Class C | |||||||||||||
| Actual | $ | 1,000.00 | $ | 1,002.60 | 2.99 | % | $ | 14.85 | |||||
| Hypothetical (5% return before expenses) | $ | 1,000.00 | $ | 1,009.97 | 2.99 | % | $ | 14.90 | |||||
| Class I | |||||||||||||
| Actual | $ | 1,000.00 | $ | 1,007.50 | 1.99 | % | $ | 9.91 | |||||
| Hypothetical (5% return before expenses) | $ | 1,000.00 | $ | 1,014.93 | 1.99 | % | $ | 9.94 | |||||
ALPS | WMC Research Value Fund(e) | |||||||||||||
| Class A | |||||||||||||
| Actual | $ | 1,000.00 | $ | 1,043.50 | 1.40 | % | $ | 7.09 | |||||
| Hypothetical (5% return before expenses) | $ | 1,000.00 | $ | 1,017.85 | 1.40 | % | $ | 7.00 | |||||
| Class C | |||||||||||||
| Actual | $ | 1,000.00 | $ | 1,040.30 | 2.15 | % | $ | 10.88 | |||||
| Hypothetical (5% return before expenses) | $ | 1,000.00 | $ | 1,014.13 | 2.15 | % | $ | 10.74 | |||||
| Class I | |||||||||||||
| Actual | $ | 1,000.00 | $ | 1,045.20 | 1.15 | % | $ | 5.83 | |||||
| Hypothetical (5% return before expenses) | $ | 1,000.00 | $ | 1,019.09 | 1.15 | % | $ | 5.76 | |||||
| Clough China Fund | |||||||||||||
| Class A | |||||||||||||
| Actual | $ | 1,000.00 | $ | 1,219.90 | 1.95 | % | $ | 10.73 | |||||
| Hypothetical (5% return before expenses) | $ | 1,000.00 | $ | 1,015.12 | 1.95 | % | $ | 9.74 | |||||
| Class C | |||||||||||||
| Actual | $ | 1,000.00 | $ | 1,215.00 | 2.70 | % | $ | 14.83 | |||||
| Hypothetical (5% return before expenses) | $ | 1,000.00 | $ | 1,011.41 | 2.70 | % | $ | 13.47 | |||||
| Class I | |||||||||||||
| Actual | $ | 1,000.00 | $ | 1,221.40 | 1.70 | % | $ | 9.36 | |||||
| Hypothetical (5% return before expenses) | $ | 1,000.00 | $ | 1,016.36 | 1.70 | % | $ | 8.50 | |||||
| RiverFront Conservative Income Builder Fund | |||||||||||||
| Class A | |||||||||||||
| Actual | $ | 1,000.00 | $ | 1,020.90 | 1.15 | % | $ | 5.76 | |||||
| Hypothetical (5% return before expenses) | $ | 1,000.00 | $ | 1,019.09 | 1.15 | % | $ | 5.76 | |||||
| Class C | |||||||||||||
| Actual | $ | 1,000.00 | $ | 1,016.10 | 1.90 | % | $ | 9.50 | |||||
| Hypothetical (5% return before expenses) | $ | 1,000.00 | $ | 1,015.37 | 1.90 | % | $ | 9.49 | |||||
| Class I | |||||||||||||
| Actual | $ | 1,000.00 | $ | 1,021.10 | 0.90 | % | $ | 4.51 | |||||
| Hypothetical (5% return before expenses) | $ | 1,000.00 | $ | 1,020.33 | 0.90 | % | $ | 4.51 | |||||
| RiverFront Dynamic Equity Income Fund | |||||||||||||
| Class A | |||||||||||||
| Actual | $ | 1,000.00 | $ | 1,059.00 | 1.15 | % | $ | 5.87 | |||||
| Hypothetical (5% return before expenses) | $ | 1,000.00 | $ | 1,019.09 | 1.15 | % | $ | 5.76 | |||||
| Class C | |||||||||||||
| Actual | $ | 1,000.00 | $ | 1,055.10 | 1.90 | % | $ | 9.68 | |||||
| Hypothetical (5% return before expenses) | $ | 1,000.00 | $ | 1,015.37 | 1.90 | % | $ | 9.49 | |||||
| Class I | |||||||||||||
| Actual | $ | 1,000.00 | $ | 1,059.80 | 0.90 | % | $ | 4.60 | |||||
| Hypothetical (5% return before expenses) | $ | 1,000.00 | $ | 1,020.33 | 0.90 | % | $ | 4.51 | |||||
3 | April 30, 2015
| Disclosure of Fund Expenses | |
| April 30, 2015 (Unaudited) |
| Beginning Account Value November 1, 2014 | Ending Account Value April 30, 2015 | Expense Ratio(a) | Expenses Paid During Period November 1, 2014 - April 30, 2015(b) | ||||||||||
| RiverFront Global Allocation Fund | |||||||||||||
| Class A | |||||||||||||
| Actual | $ | 1,000.00 | $ | 1,064.60 | 1.15 | % | $ | 5.89 | |||||
| Hypothetical (5% return before expenses) | $ | 1,000.00 | $ | 1,019.09 | 1.15 | % | $ | 5.76 | |||||
| Class C | |||||||||||||
| Actual | $ | 1,000.00 | $ | 1,060.80 | 1.90 | % | $ | 9.71 | |||||
| Hypothetical (5% return before expenses) | $ | 1,000.00 | $ | 1,015.37 | 1.90 | % | $ | 9.49 | |||||
| Class I | |||||||||||||
| Actual | $ | 1,000.00 | $ | 1,065.70 | 0.90 | % | $ | 4.61 | |||||
| Hypothetical (5% return before expenses) | $ | 1,000.00 | $ | 1,020.33 | 0.90 | % | $ | 4.51 | |||||
| RiverFront Global Growth Fund | |||||||||||||
| Class A | |||||||||||||
| Actual | $ | 1,000.00 | $ | 1,071.50 | 1.15 | % | $ | 5.91 | |||||
| Hypothetical (5% return before expenses) | $ | 1,000.00 | $ | 1,019.09 | 1.15 | % | $ | 5.76 | |||||
| Class C | |||||||||||||
| Actual | $ | 1,000.00 | $ | 1,067.70 | 1.90 | % | $ | 9.74 | |||||
| Hypothetical (5% return before expenses) | $ | 1,000.00 | $ | 1,015.37 | 1.90 | % | $ | 9.49 | |||||
| Class I | |||||||||||||
| Actual | $ | 1,000.00 | $ | 1,072.30 | 0.90 | % | $ | 4.62 | |||||
| Hypothetical (5% return before expenses) | $ | 1,000.00 | $ | 1,020.33 | 0.90 | % | $ | 4.51 | |||||
| Class L | |||||||||||||
| Actual | $ | 1,000.00 | $ | 1,073.20 | 0.90 | % | $ | 4.63 | |||||
| Hypothetical (5% return before expenses) | $ | 1,000.00 | $ | 1,020.33 | 0.90 | % | $ | 4.51 | |||||
| Investor Class | |||||||||||||
| Actual | $ | 1,000.00 | $ | 1,071.20 | 1.15 | % | $ | 5.91 | |||||
| Hypothetical (5% return before expenses) | $ | 1,000.00 | $ | 1,019.09 | 1.15 | % | $ | 5.76 | |||||
| RiverFront Moderate Growth & Income Fund | |||||||||||||
| Class A | |||||||||||||
| Actual | $ | 1,000.00 | $ | 1,036.90 | 1.15 | % | $ | 5.81 | |||||
| Hypothetical (5% return before expenses) | $ | 1,000.00 | $ | 1,019.09 | 1.15 | % | $ | 5.76 | |||||
| Class C | |||||||||||||
| Actual | $ | 1,000.00 | $ | 1,033.40 | 1.90 | % | $ | 9.58 | |||||
| Hypothetical (5% return before expenses) | $ | 1,000.00 | $ | 1,015.37 | 1.90 | % | $ | 9.49 | |||||
| Class I | |||||||||||||
| Actual | $ | 1,000.00 | $ | 1,038.90 | 0.90 | % | $ | 4.55 | |||||
| Hypothetical (5% return before expenses) | $ | 1,000.00 | $ | 1,020.33 | 0.90 | % | $ | 4.51 | |||||
(a) | Annualized, based on the Fund's most recent fiscal half year expenses. |
(b) | Expenses are equal to the Fund's annualized expense ratio multiplied by the average account value over the period, multiplied by the number of days in the most recent fiscal half year (181), divided by 365. |
(c) | Includes expenses of the CoreCommodity Management Cayman Commodity Fund Ltd. (wholly-owned subsidiary), exclusive of the subsidiary's management fee. |
(d) | Includes expenses of the Kotak Mauritius Portfolio (wholly-owned subsidiary). |
(e) | Prior to February 28, 2015, the ALPS | WMC Research Value Fund was known as the ALPS | WMC Disciplined Value Fund. |
4 | April 30, 2015
| ALPS | Alerian MLP Infrastructure Index Fund | |
| Management Commentary | April 30, 2015 (Unaudited) |
During the six-month period of November 1, 2014 to April 30, 2015 the Alerian MLP Infrastructure Index Fund’s (“Fund”) Class A shares delivered a net return of -4.39% at Net Asset Value. Class A delivered a net return of -9.65% at MOP, Class C was -5.54% with CDSC, and Class I was -4.28%. This compares to the Fund’s index, the Alerian MLP Infrastructure Index (“AMZI”), which returned -8.36% on a price-return and -5.99% on a total-return basis. The difference in performance between the AMZI and the Fund is primarily attributable to the Fund’s operating expenses and the impact of the Fund’s C Corporation tax election.
During the period, the Fund paid a distribution of $0.182 on February 19, representing a 1.1% increase compared to the previous quarter and a 4.6% increase compared to the previous year.
Top contributors to the AMZI during the period include NuStar Energy (NS), TC Pipelines (TCP), Buckeye Partners (BPL), and Western Gas Partners (WES). The majority of the master limited partnerships (MLPs) in the AMZI generated negative returns during the period, including Targa Resource Partners (NGLS), DCP Midstream (DPM), and Williams Partners (WPZ). During the period, Williams Partners (WPZ)* was removed from the AMZI due to its merger with Access Midstream Partners (ACMP), Atlas Pipeline Partners (APL) was removed from the AMZI due to its merger with Targa Resource Partners (NGLS), and Regency Energy Partners (RGP) was removed from the AMZI due to its merger with Energy Transfer Partners (ETP).
The energy markets continued to experience a downward slide during the six-month period ending April 30. West Texas Intermediate (WTI) oil prices fell 46% from $80.53/barrel at the end of October to a low of $43.39/barrel on March 17. Since March however, oil prices have somewhat recovered and found support around the $50-55/barrel range during April, representing a net 30% decline for the six-month period. Directionally, the AMZI performed similarly to oil prices during the period, falling 15.6% from the end of October until mid-March, followed by a seven-week streak of positive returns for a total decline of 8.4% for the six-month period. Despite weak long-term historical correlations to commodity prices, MLPs exhibited a strong correlation to crude prices during the period.
While equity price volatility may persist until crude oil prices stabilize, long-term fundamentals for the energy infrastructure industry still remain intact. Throughout the period, MLPs continued to announce organic projects backed with successful long-term binding commitments. These projects include a new crude oil pipeline from the Permian Basin to the Gulf Coast, a new pipeline moving natural gas liquids (NGLs) from Northwest Louisiana to Mont Belvieu, Texas, and additional pipeline infrastructure in the Northeast to meet increased demand for natural gas and relieve congestion in the current infrastructure grid. In addition, 15 of the 22 MLPs in the AMZI increased their distribution during the first calendar quarter of 2015 and the remaining 7 MLPs maintained their distribution.
Recent comments from the White House in April outlining the need to modernize the current US energy infrastructure grid in order to better support the increasing domestic supply of energy re sources should bode well for energy infrastructure MLPs in the AMZI. With billions of dollars of infrastructure opportunities over the next few decades, we believe that MLPs continue to represent a compelling potential investment opportunity for investors seeking after-tax yield and access to real assets.
| * | After the merger completion, Access Midstream Partners changed its name to Williams Partners and ticker from “ACMP” to “WPZ”. |
The views and information discussed in this commentary are as of the date of publication, are subject to change, and may not reflect the writer’s current views. The views expressed represent an assessment of market conditions at a specific point in time, are opinions only and should not be relied upon as investment advice regarding a particular investment or markets in general. Such information does not constitute a recommendation to buy or sell specific securities or investment vehicles. It should not be assumed that any investment will be profitable or will equal the performance of the fund(s) or any securities or any sectors mentioned in this letter. The subject matter contained in this letter has been derived from several sources believed to be reliable and accurate at the time of compilation. Neither ALPS Advisors, Inc., Alerian, nor the Fund accept any liability for losses either direct or consequential caused by the use of this information.
5 | April 30, 2015
| ALPS | Alerian MLP Infrastructure Index Fund | |
| Performance Update | April 30, 2015 (Unaudited) |
Performance of $10,000 Initial Investment (as of April 30, 2015)
Comparison of change in value of a $10,000 investment (includes maximum sales charges of 5.50%)
Comparison of change in value of a $10,000 investment (includes maximum sales charges of 5.50%)
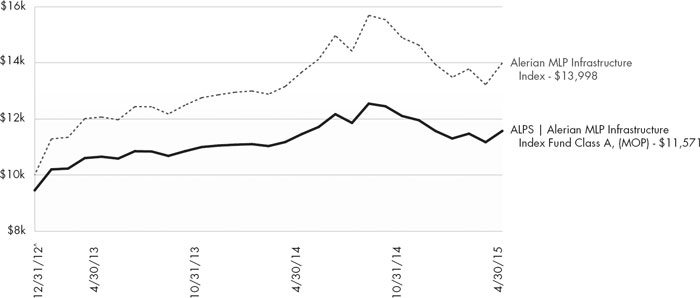
The chart above represents historical performance of a hypothetical investment of $10,000 in the Fund since inception. Past performance does not guarantee future results. This chart does not reflect the deduction of taxes that a shareholder would pay on Fund distributions or the redemption of Fund shares.
Average Annual Total Returns (as of April 30, 2015)
| 6 Month | 1 Year | Since Inception^ | Total Expense Ratio* | What You Pay*,** | |||||||||
| Class A (NAV) | -4.39% | 0.98 | % | 9.07 | % | 2.22% | 1.25% | ||||||
| Class A (MOP) | -9.65% | -4.55 | % | 6.47 | % | ||||||||
| Class C (NAV) | -4.60% | 0.52 | % | 8.62 | % | 2.82% | 1.85% | ||||||
| Class C (CDSC) | -5.54% | -0.43 | % | 8.62 | % | ||||||||
| Class I | -4.28% | 1.25 | % | 9.28 | % | 1.81% | 0.85% | ||||||
Alerian MLP Infrastructure Index1 | -5.99% | 2.39 | % | 15.54 | % | ||||||||
Performance data quoted represents past performance. Past performance does not guarantee future results. Investment return and principal value of an investment will fluctuate so that an investor’s shares, when sold or redeemed, may be worth more or less than the original cost. Current performance data may be higher or lower than actual data quoted. For the most current month-end performance data please call 1-866-759-5679.
Maximum Offering Price (MOP) for Class A shares includes the Fund’s maximum sales charge of 5.50%. Performance shown at NAV does not include these sales charges and would have been lower had it been taken into account. If you invest $1 million or more, either as a lump sum or through the Fund’s accumulation or letter of intent programs, you can purchase Class A shares without an initial sales charge (load). A Contingent Deferred Sales Charge (“CDSC”) of 1.00% may apply to Class C shares redeemed within the first 12 months after a purchase, and on Class A shares redeemed within the first 18 months after a purchase in excess of $1 million.
Performance less than 1 year is cumulative.
6 | April 30, 2015
| ALPS | Alerian MLP Infrastructure Index Fund | |
| Performance Update | April 30, 2015 (Unaudited) |
1 | Alerian MLP Infrastructure Index is comprised of 25 midstream energy Master Limited Partnerships. The index is not actively managed and does not reflect any deductions for fees, expenses or taxes. An investor may not invest directly in an index. |
^ | Fund inception date of December 31, 2012. |
| * | Excludes deferred income tax expense of 4.49% for Class A, 4.27% for Class C, and 4.63% for Class I. |
| ** | What You Pay reflects the Advisor’s and Sub-Advisor’s decision to contractually limit expenses through February 29, 2016. Please see the prospectus for additional information. |
Investments in securities of MLPs involve risks that differ from an investment in common stock. MLPs are controlled by their general partners, which generally have conflicts of interest and limited fiduciary duties to the MLP, which may permit the general partner to favor its own interests over the MLPs. The benefit you are expected to derive from the Fund’s investment in MLPs depends largely on the MLPs being treated as partnerships for federal income tax purposes. As a partnership, an MLP has no federal income tax liability at the entity level. Therefore, treatment of one or more MLPs as a corporation for federal income tax purposes could affect the Fund’s ability to meet its investment objective and would reduce the amount of cash available to pay or distribute to you. Legislative, judicial, or administrative changes and differing interpretations, possibly on a retroactive basis, could negatively impact the value of an investment in MLPs and therefore the value of your investment in the Fund.
The table does not reflect the deduction of taxes that a shareholder would pay on Fund distributions or the redemption of Fund shares.
This Fund is not suitable for all investors and is subject to investment risks, including possible loss of the principal amount invested.
There is no guarantee that the Fund will continue to hold any one particular security or stay invested in any one particular company. The composition of the Fund’s top holdings is subject to change. Performance figures are historical and reflect the change in share price, reinvested distributions, changes in net asset value, sales charges and capital gains distributions, if any.
Not FDIC Insured – No Bank Guarantee – May Lose Value
Top Ten Holdings (as a % of Net Assets) †
| Enterprise Products Partners LP | 10.07 | % | ||
| Energy Transfer Partners LP | 7.75 | % | ||
| Magellan Midstream Partners LP | 7.57 | % | ||
| Williams Partners LP | 7.33 | % | ||
| Plains All American Pipeline LP | 7.31 | % | ||
| MarkWest Energy Partners LP | 7.27 | % | ||
| Sunoco Logistics Partners LP | 4.87 | % | ||
| Buckeye Partners LP | 4.83 | % | ||
| Targa Resources Partners LP | 4.78 | % | ||
| ONEOK Partners LP | 4.71 | % | ||
| Top Ten Holdings | 66.49 | % | ||
† | Holdings are subject to change. Table presents approximate values only. |
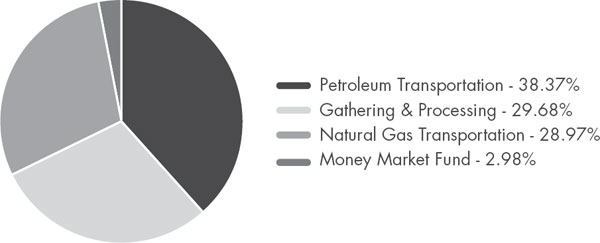
Industry Sector Allocation (as a % of Total Investments)
7 | April 30, 2015
| ALPS | Alerian MLP Infrastructure Index Fund | |
| Statement of Investments | April 30, 2015 (Unaudited) |
| Shares | Value (Note 2) | |||||||
| MASTER LIMITED PARTNERSHIPS (100.04%) | ||||||||
| Gathering & Processing (30.60%) | ||||||||
| Pipelines (30.60%) | ||||||||
| Crestwood Midstream Partners LP | 40,953 | $ | 649,924 | |||||
| DCP Midstream Partners LP | 24,399 | 995,479 | ||||||
| EnLink Midstream Partners LP | 28,505 | 733,434 | ||||||
| MarkWest Energy Partners LP | 37,221 | 2,510,929 | ||||||
| Targa Resources Partners LP | 36,333 | 1,650,972 | ||||||
| Western Gas Partners LP | 20,521 | 1,495,776 | ||||||
| Williams Partners LP | 51,221 | 2,530,317 | ||||||
| 10,566,831 | ||||||||
| TOTAL GATHERING & PROCESSING | 10,566,831 | |||||||
| Natural Gas Transportation (29.87%) | ||||||||
| Pipelines (29.87%) | ||||||||
| Energy Transfer Partners LP | 46,312 | 2,675,928 | ||||||
| Enterprise Products Partners LP | 101,514 | 3,476,854 | ||||||
| EQT Midstream Partners LP | 10,479 | 924,248 | ||||||
| ONEOK Partners LP | 38,804 | 1,627,828 | ||||||
| Spectra Energy Partners LP | 14,170 | 767,730 | ||||||
| TC PipeLines LP | 12,386 | 843,239 | ||||||
| 10,315,827 | ||||||||
| TOTAL NATURAL GAS TRANSPORTATION | 10,315,827 | |||||||
| Petroleum Transportation (39.57%) | ||||||||
| Pipelines (39.57%) | ||||||||
| Buckeye Partners LP | 20,460 | 1,669,127 | ||||||
| Enbridge Energy Partners LP | 43,133 | 1,601,959 | ||||||
| Genesis Energy LP | 21,297 | 1,058,674 | ||||||
| Magellan Midstream Partners LP | 31,302 | 2,613,717 | ||||||
| NGL Energy Partners LP | 19,649 | 574,930 | ||||||
| NuStar Energy LP | 17,269 | 1,160,131 | ||||||
| Plains All American Pipeline LP | 50,409 | 2,525,995 | ||||||
| Sunoco Logistics Partners LP | 37,947 | 1,683,329 | ||||||
| Tesoro Logistics LP | 13,827 | 774,727 | ||||||
| 13,662,589 | ||||||||
| TOTAL PETROLEUM TRANSPORTATION | 13,662,589 | |||||||
| TOTAL MASTER LIMITED PARTNERSHIPS (Cost $32,607,698) | 34,545,247 | |||||||
7-Day Yield | Shares | Value (Note 2) | ||||||||||
| SHORT TERM INVESTMENTS (3.07%) | ||||||||||||
| Money Market Fund (3.07%) | ||||||||||||
| Morgan Stanley Institutional Liquidity Fund - Prime Portfolio | 0.077 | % | 1,060,633 | $ | 1,060,633 | |||||||
| TOTAL SHORT TERM INVESTMENTS (Cost $1,060,633) | 1,060,633 | |||||||||||
| TOTAL INVESTMENTS (103.11%) (Cost $33,668,331) | $ | 35,605,880 | ||||||||||
| Liabilities In Excess Of Other Assets (-3.11%) | (1,074,060 | ) | ||||||||||
| NET ASSETS (100.00%) | $ | 34,531,820 | ||||||||||
Common Abbreviations:
LP - Limited Partnerships.
For Fund compliance purposes, the Fund’s industry classifications refer to any one or more of the industry sub-classifications used by one or more widely recognized market indexes or ratings group indexes, and/or as defined by Fund management. This definition may not apply for purposes of this report, which may combine industry sub-classifications for reporting ease. Industries are shown as a percent of net assets.
See Notes to Financial Statements.
8 | April 30, 2015
| ALPS | Alerian MLP Infrastructure Index Fund | |
| Statement of Assets and Liabilities | April 30, 2015 (Unaudited) |
| ASSETS | ||||
| Investments, at value | $ | 35,605,880 | ||
| Receivable for investments sold | 1,654,948 | |||
| Receivable for shares sold | 455,103 | |||
| Dividends receivable | 192,904 | |||
| Income tax receivable | 3,139 | |||
| Prepaid expenses and other assets | 25,366 | |||
| Total Assets | 37,937,340 | |||
| LIABILITIES | ||||
| Payable for investments purchased | 2,689,874 | |||
| Deferred tax liability | 451,821 | |||
| Franchise tax payable | 2,660 | |||
| Payable for shares redeemed | 201,553 | |||
| Investment advisory fees payable | 4,803 | |||
| Administration and transfer agency fees payable | 3,568 | |||
| Distribution and services fees payable | 16,095 | |||
| Trustees’ fees and expenses payable | 95 | |||
| Professional fee payable | 18,080 | |||
| Accrued expenses and other liabilities | 16,971 | |||
| Total Liabilities | 3,405,520 | |||
| NET ASSETS | $ | 34,531,820 | ||
| NET ASSETS CONSIST OF | ||||
| Paid-in capital | $ | 34,072,835 | ||
| Accumulated net investment loss, net of deferred income taxes | (285,799 | ) | ||
| Accumulated net realized loss on investments, net of deferred income taxes | (503,354 | ) | ||
| Net unrealized appreciation on investments, net of deferred income taxes | 1,248,138 | |||
| NET ASSETS | $ | 34,531,820 | ||
| INVESTMENTS, AT COST | $ | 33,668,331 | ||
| PRICING OF SHARES | ||||
| Class A: | ||||
| Net Asset Value, offering and redemption price per share | $ | 10.64 | ||
| Net Assets | $ | 17,093,294 | ||
| Shares of beneficial interest outstanding (unlimited number of shares, no par value common stock authorized) | 1,607,267 | |||
| Maximum offering price per share ((NAV/0.9450), based on maximum sales charge of 5.50% of the offering price) | $ | 11.26 | ||
| Class C: | ||||
Net Asset Value, offering and redemption price per share(a) | $ | 10.53 | ||
| Net Assets | $ | 10,321,364 | ||
| Shares of beneficial interest outstanding (unlimited number of shares, no par value common stock authorized) | 979,815 | |||
| Class I: | ||||
| Net Asset Value, offering and redemption price per share | $ | 10.69 | ||
| Net Assets | $ | 7,117,162 | ||
| Shares of beneficial interest outstanding (unlimited number of shares, no par value common stock authorized) | 665,822 | |||
(a) | Redemption price per share may be reduced for any applicable contingent deferred sales charge. For a description of a possible sales charge, please see the Fund’s Prospectus. |
See Notes to Financial Statements.
9 | April 30, 2015
| ALPS | Alerian MLP Infrastructure Index Fund | |
| Statement of Operations | For the Six Months Ended April 30, 2015 (Unaudited) |
| INVESTMENT INCOME | ||||
| Dividends | $ | 101 | ||
| Distributions from master limited partnerships | 689,641 | |||
| Less return of capital distributions | (689,641 | ) | ||
| Total Investment Income | 101 | |||
| EXPENSES | ||||
| Investment advisory fees | 99,288 | |||
| Administrative fees | 14,868 | |||
| Transfer agency fees | 488 | |||
| Distribution and service fees | ||||
| Class A | 24,479 | |||
| Class C | 45,170 | |||
| Professional fees | 44,640 | |||
| Reports to shareholders and printing fees | 1,619 | |||
| State registration fees | 21,444 | |||
| SEC registration fees | 521 | |||
| Insurance fees | 143 | |||
| Custody fees | 7,943 | |||
| Trustees’ fees and expenses | 327 | |||
| Miscellaneous expenses | 8,892 | |||
| Total Expenses | 269,822 | |||
| Less fees waived/reimbursed by investment advisor (Note 8) | ||||
| Class A | (35,672 | ) | ||
| Class C | (25,325 | ) | ||
| Class I | (18,612 | ) | ||
| Net Expenses | 190,213 | |||
| Net Investment Loss, Before Income Taxes | (190,112 | ) | ||
| Deferred income tax benefit | 41,621 | |||
| Deferred income tax benefit - Class A | 9,136 | |||
| Deferred income tax benefit - Class C | 16,261 | |||
| Net Investment Loss, Net of Income Taxes | (123,094 | ) | ||
| REALIZED AND UNREALIZED GAIN/(LOSS) | ||||
| Net realized loss on investments, before income taxes | (137,362 | ) | ||
| Deferred income tax benefit | 48,730 | |||
| Net Realized Loss on investments, Net of Income Taxes | (88,632 | ) | ||
| Net change in unrealized appreciation on investment, before deferred income taxes | (1,528,380 | ) | ||
| Deferred income tax expense | 552,396 | |||
| Net Change in Unrealized Appreciation on Investments | (975,984 | ) | ||
| NET REALIZED AND UNREALIZED GAIN ON INVESTMENTS, NET OF INCOME TAXES | (1,064,616 | ) | ||
| NET INCREASE IN NET ASSETS RESULTING FROM OPERATIONS | $ | (1,187,710 | ) | |
See Notes to Financial Statements.
10 | April 30, 2015
| ALPS | Alerian MLP Infrastructure Index Fund |
| Statements of Changes in Net Assets |
For the Six Months Ended April 30, 2015 (Unaudited) | For the Fiscal Period Ended October 31, 2014(a) | |||||||
| OPERATIONS | ||||||||
| Net investment loss, net of income taxes | $ | (123,094 | ) | $ | (84,514 | ) | ||
| Net realized gain/(loss) on investments, net of income taxes | (88,632 | ) | 3,372 | |||||
| Net change in unrealized appreciation/(depreciation) on investments, net of deferred income taxes | (975,984 | ) | 902,714 | |||||
| Net Increase/(Decrease) in Net AssetsResulting from Operations | (1,187,710 | ) | 821,572 | |||||
| DISTRIBUTIONS | ||||||||
| Dividends to shareholders from net investment income | ||||||||
| Class A | (24,107 | ) | (26,390 | ) | ||||
| Class C | (18,360 | ) | (32,401 | ) | ||||
| Class I | (11,722 | ) | (36,117 | ) | ||||
| Dividends to shareholders from tax return of capital | ||||||||
| Class A | (187,466 | ) | (422,657 | ) | ||||
| Class C | (142,772 | ) | (205,706 | ) | ||||
| Class I | (91,157 | ) | (200,052 | ) | ||||
| Net Decrease in Net Assets from Distributions | (475,584 | ) | (923,323 | ) | ||||
| BENEFICIAL INTEREST TRANSACTIONS (NOTE 6) | ||||||||
| Shares sold | ||||||||
| Class A | 8,318,067 | 3,317,091 | ||||||
| Class C | 5,402,989 | 3,457,848 | ||||||
| Class I | 4,163,046 | 5,196,869 | ||||||
| Dividends reinvested | ||||||||
| Class A | 199,739 | 427,003 | ||||||
| Class C | 160,017 | 178,058 | ||||||
| Class I | 102,150 | 219,273 | ||||||
| Shares redeemed | ||||||||
| Class A | (1,318,423 | ) | (1,375,093 | ) | ||||
| Class C | (1,484,998 | ) | (245,100 | ) | ||||
| Class I | (3,396,938 | ) | (184,339 | ) | ||||
| Net Increase in Net Assets Derived from Beneficial Interest Transactions | 12,145,649 | 10,991,610 | ||||||
| Net increase in net assets | 10,482,355 | 10,889,859 | ||||||
| NET ASSETS | ||||||||
| Beginning of period | 24,049,465 | 13,159,606 | ||||||
| End of period * | $ | 34,531,820 | $ | 24,049,465 | ||||
| *Including accumulated net investment loss, net of deferred income taxes, of: | $ | (285,799 | ) | $ | (162,705 | ) | ||
(a) | Effective May 1, 2014, the Board approved changing the fiscal year-end of the Funds from April 30 to October 31. |
See Notes to Financial Statements.
11 | April 30, 2015
| ALPS | Alerian MLP Infrastructure Index Fund – Class A |
| Financial Highlights |
Selected data for a share of beneficial interest outstanding throughout the periods indicated:
| For the Period | ||||||||||||||||
| For the Six | For the Fiscal | January 2, 2013 | ||||||||||||||
| Months Ended | Period Ended | For the Year | (Commencement) | |||||||||||||
| April 30, 2015 | October 31, | Ended | to | |||||||||||||
| (Unaudited) | 2014(a) | April 30, 2014 | April 30, 2013 | |||||||||||||
| Net asset value, beginning of period | $ | 11.32 | $ | 11.23 | $ | 11.10 | $ | 10.00 | ||||||||
| INCOME/(LOSS) FROM INVESTMENT OPERATIONS: | ||||||||||||||||
Net investment loss(b) | (0.04 | ) | (0.05 | ) | (0.09 | ) | (0.03 | ) | ||||||||
| Net realized and unrealized gain/(loss) | (0.46 | ) | 0.67 | 0.90 | 1.29 | |||||||||||
| Total from investment operations | (0.50 | ) | 0.62 | 0.81 | 1.26 | |||||||||||
| DISTRIBUTIONS: | ||||||||||||||||
| From net investment income | (0.02 | ) | (0.03 | ) | (0.36 | ) | – | |||||||||
| From tax return of capital | (0.16 | ) | (0.50 | ) | (0.32 | ) | (0.16 | ) | ||||||||
| Total distributions | (0.18 | ) | (0.53 | ) | (0.68 | ) | (0.16 | ) | ||||||||
| Net increase/(decrease) in net asset value | (0.68 | ) | 0.09 | 0.13 | 1.10 | |||||||||||
| Net asset value, end of period | $ | 10.64 | $ | 11.32 | $ | 11.23 | $ | 11.10 | ||||||||
TOTAL RETURN(c) | (4.39 | )% | 5.61 | % | 7.59 | % | 12.68 | % | ||||||||
| RATIOS/SUPPLEMENTAL DATA: | ||||||||||||||||
| Net assets, end of period (000s) | $ | 17,093 | $ | 10,619 | $ | 8,223 | $ | 928 | ||||||||
| Ratio of expenses to average net assets before waivers, franchise tax expense and income tax expense/benefit | 1.80 | %(d) | 2.20 | %(d) | 3.09 | % | 5.51 | %(d)(e) | ||||||||
| Ratio of expense waivers to average net assets | (0.56 | %)(d) | (0.97 | %)(d) | (1.84 | %) | (4.26 | %)(d)(e) | ||||||||
| Ratio of expenses to average net assets net of waivers before franchise tax expense and income tax expense/benefit | 1.24 | %(d)(f) | 1.23 | %(d)(f) | 1.25 | % | 1.25 | %(d)(e) | ||||||||
Ratio of franchise tax expense and deferred income tax expense to average net assets(g) | 4.68 | %(d) | 4.49 | %(d) | 5.38 | % | 20.55 | %(d) | ||||||||
| Ratio of total expenses to average net assets | 5.92 | %(d) | 5.72 | %(d) | 6.63 | % | 21.80 | %(d) | ||||||||
| Ratio of investment loss to average net assets before waivers, franchise tax expense and income tax expense/benefit | (1.80 | %)(d) | (2.20% | )(d) | (3.09 | %) | (5.51 | %)(d)(e) | ||||||||
| Ratio of expense waivers to average net assets | (0.56 | %)(d) | (0.97 | %)(d) | (1.84 | %) | (4.26 | %)(d)(e) | ||||||||
| Ratio of investment loss to average net assets net of waivers before franchise tax expense and income tax expense/benefit | (1.24 | %)(d)(f) | (1.23 | %)(d)(f) | (1.25 | %) | (1.25% | )(d)(e) | ||||||||
Ratio of franchise tax expense and deferred income tax benefit to average net assets(h) | 0.44 | %(d) | 0.43 | %(d) | 0.43 | % | 0.40 | %(d) | ||||||||
| Ratio of net investment loss to average net assets | (0.80 | %)(d) | (0.80 | %)(d) | (0.82 | %) | (0.85 | %)(d) | ||||||||
Portfolio turnover rate(i) | 35 | % | 7 | % | 63 | % | 3 | % | ||||||||
See Notes to Financial Statements.
12 | April 30, 2015
| ALPS | Alerian MLP Infrastructure Index Fund – Class A |
| Financial Highlights |
Selected data for a share of beneficial interest outstanding throughout the periods indicated:
(a) | Effective May 1, 2014, the Board approved changing the fiscal year-end of the Funds from April 30 to October 31. |
(b) | Calculated using the average shares method. |
(c) | Total returns are for the period indicated and have not been annualized. Total returns would have been lower had certain expenses not been waived during the period. Returns shown do not reflect the deduction of taxes that a shareholder would pay on Fund distributions or the redemption of Fund shares. Returns shown exclude any applicable sales charges. |
(d) | Annualized. |
(e) | Expense ratios before reductions for startup periods may not be representative of longer term operating periods. |
(f) | According to the Fund’s shareholder services plan with respect to the Fund’s Class A shares, any amount of such payment not paid during the Fund’s fiscal year for such service activities shall be reimbursed to the Fund as soon as practical after the end of the fiscal year. Fees were reimbursed to the Fund during the period ended April 30, 2015 and October 31, 2014, for the prior fiscal year in the amount of 0.01% and 0.02% of average net assets of Class A shares respectively. |
(g) | Deferred income tax expense estimate for the ratio calculation is derived from the net investment loss, and realized and unrealized gains/losses. |
(h) | Deferred income tax benefit for the ratio calculation is derived from net investment loss only. |
(i) | Portfolio turnover rate for periods less than one full year have not been annualized. |
See Notes to Financial Statements.
13 | April 30, 2015
| ALPS | Alerian MLP Infrastructure Index Fund – Class C |
| Financial Highlights |
Selected data for a share of beneficial interest outstanding throughout the periods indicated:
| For the Period | ||||||||||||||||
| For the Six | For the Fiscal | January 2, 2013 | ||||||||||||||
| Months Ended | Period Ended | For the Year | (Commencement) | |||||||||||||
| April 30, 2015 | October 31, | Ended | to | |||||||||||||
| (Unaudited) | 2014(a) | April 30, 2014 | April 30, 2013 | |||||||||||||
| Net asset value, beginning of period | $ | 11.23 | $ | 11.17 | $ | 11.09 | $ | 10.00 | ||||||||
| INCOME/(LOSS) FROM INVESTMENT OPERATIONS: | ||||||||||||||||
Net investment loss(b) | (0.06 | ) | (0.07 | ) | (0.13 | ) | (0.05 | ) | ||||||||
| Net realized and unrealized gain/(loss) | (0.46 | ) | 0.66 | 0.89 | 1.30 | |||||||||||
| Total from investment operations | (0.52 | ) | 0.59 | 0.76 | 1.25 | |||||||||||
| DISTRIBUTIONS: | ||||||||||||||||
| From net investment income | (0.02 | ) | (0.08 | ) | (0.35 | ) | – | |||||||||
| From tax return of capital | (0.16 | ) | (0.45 | ) | (0.33 | ) | (0.16 | ) | ||||||||
| Total distributions | (0.18 | ) | (0.53 | ) | (0.68 | ) | (0.16 | ) | ||||||||
| Net increase/(decrease) in net asset value | (0.70 | ) | 0.06 | 0.08 | 1.09 | |||||||||||
| Net asset value, end of period | $ | 10.53 | $ | 11.23 | $ | 11.17 | $ | 11.09 | ||||||||
TOTAL RETURN(c) | (4.60 | )% | 5.37 | % | 7.13 | % | 12.58 | % | ||||||||
| RATIOS/SUPPLEMENTAL DATA: | ||||||||||||||||
| Net assets, end of period (000s) | $ | 10,321 | $ | 6,773 | $ | 3,429 | $ | 563 | ||||||||
| Ratio of expenses to average net assets before waivers, franchise tax expense and income tax expense/benefit | 2.41 | %(d) | 2.82 | %(d) | 3.71 | % | 7.01 | %(d)(e) | ||||||||
| Ratio of expense waivers to average net assets | (0.56 | %)(d) | (0.97 | %)(d) | (1.86 | %) | (5.16 | %)(d)(e) | ||||||||
| Ratio of expenses to average net assets net of waivers before franchise tax expense and income tax expense/benefit | 1.85 | %(d) | 1.85 | %(d) | 1.85 | % | 1.85 | %(d)(e) | ||||||||
Ratio of franchise tax expense and deferred income tax expense to average net assets(f) | 4.89 | %(d) | 4.27 | %(d) | 5.16 | % | 20.55 | %(d) | ||||||||
| Ratio of total expenses to average net assets | 6.74 | %(d) | 6.12 | %(d) | 7.01 | % | 22.40 | %(d) | ||||||||
| Ratio of investment loss to average net assets before waivers,franchise tax expense and income tax expense/benefit | (2.41 | %)(d) | (2.82 | %)(d) | (3.71 | %) | (7.01 | %)(d)(e) | ||||||||
| Ratio of expense waivers to average net assets | (0.56 | %)(d) | (0.97 | %)(d) | (1.86 | %) | (5.16 | %)(d)(e) | ||||||||
| Ratio of investment loss to average net assets net of waivers before franchise tax expense and income tax expense/benefit | (1.85 | %)(d) | (1.85 | %)(d) | (1.85 | %) | (1.85 | %)(d)(e) | ||||||||
Ratio of franchise tax expense and deferred income tax benefit to average net assets(g) | 0.65 | %(d) | 0.65 | %(d) | 0.65 | % | 0.40 | %(d) | ||||||||
| Ratio of net investment loss to average net assets | (1.20 | %)(d) | (1.20 | %)(d) | (1.20 | %) | (1.45 | %)(d) | ||||||||
Portfolio turnover rate(h) | 35 | % | 7 | % | 63 | % | 3 | % | ||||||||
(a) | Effective May 1, 2014, the Board approved changing the fiscal year-end of the Funds from April 30 to October 31. |
(b) | Calculated using the average shares method. |
(c) | Total returns are for the period indicated and have not been annualized. Total returns would have been lower had certain expenses not been waived during the period. Returns shown do not reflect the deduction of taxes that a shareholder would pay on Fund distributions or the redemption of Fund shares. Returns shown exclude any applicable sales charges. |
(d) | Annualized. |
(e) | Expense ratios before reductions for startup periods may not be representative of longer term operating periods. |
(f) | Deferred income tax expense estimate for the ratio calculation is derived from the net investment loss, and realized and unrealized gains/losses. |
(g) | Deferred income tax benefit for the ratio calculation is derived from net investment loss only. |
(h) | Portfolio turnover rate for periods less than one full year have not been annualized. |
See Notes to Financial Statements.
14 | April 30, 2015
| ALPS | Alerian MLP Infrastructure Index Fund – Class I |
| Financial Highlights |
Selected data for a share of beneficial interest outstanding throughout the periods indicated:
| For the Period | ||||||||||||||||
| For the Six | For the Fiscal | January 2, 2013 | ||||||||||||||
| Months Ended | Period Ended | For the Year | (Commencement) | |||||||||||||
| April 30, 2015 | October 31, | Ended | to | |||||||||||||
| (Unaudited) | 2014(a) | April 30, 2014 | April 30, 2013 | |||||||||||||
| Net asset value, beginning of period | $ | 11.36 | $ | 11.25 | $ | 11.11 | $ | 10.00 | ||||||||
| INCOME/(LOSS) FROM INVESTMENT OPERATIONS: | ||||||||||||||||
Net investment loss(b) | (0.03 | ) | (0.03 | ) | (0.06 | ) | (0.02 | ) | ||||||||
| Net realized and unrealized gain/(loss) | (0.46 | ) | 0.67 | 0.88 | 1.29 | |||||||||||
| Total from investment operations | (0.49 | ) | 0.64 | 0.82 | 1.27 | |||||||||||
| DISTRIBUTIONS: | ||||||||||||||||
| From net investment income | (0.02 | ) | (0.04 | ) | (0.27 | ) | – | |||||||||
| From tax return of capital | (0.16 | ) | (0.49 | ) | (0.41 | ) | (0.16 | ) | ||||||||
| Total distributions | (0.18 | ) | (0.53 | ) | (0.68 | ) | (0.16 | ) | ||||||||
| Net increase/(decrease) in net asset value | (0.67 | ) | 0.11 | 0.14 | 1.11 | |||||||||||
| Net asset value, end of period | $ | 10.69 | $ | 11.36 | $ | 11.25 | $ | 11.11 | ||||||||
TOTAL RETURN(c) | (4.28 | )% | 5.78 | % | 7.68 | % | 12.78 | % | ||||||||
| RATIOS/SUPPLEMENTAL DATA: | ||||||||||||||||
| Net assets, end of period (000s) | $ | 7,117 | $ | 6,658 | $ | 1,507 | $ | 2,256 | ||||||||
| Ratio of expenses to average net assets before waivers, franchise tax expense and income tax expense/benefit | 1.41 | %(d) | 1.81 | %(d) | 3.03 | % | 6.01 | %(d)(e) | ||||||||
| Ratio of expense waivers to average net assets | (0.56 | %)(d) | (0.96 | %)(d) | (2.18 | %) | (5.16 | )%(d)(e) | ||||||||
| Ratio of expenses to average net assets net of waivers before franchise tax expense and income tax expense/benefit | 0.85 | %(d) | 0.85 | %(d) | 0.85 | % | 0.85 | %(d)(e) | ||||||||
Ratio of franchise tax expense and deferred income tax expense to average net assets(f) | 4.53 | %(d) | 4.63 | %(d) | 5.53 | % | 20.55 | %(d) | ||||||||
| Ratio of total expenses to average net assets | 5.38 | %(d) | 5.48 | %(d) | 6.38 | % | 21.40 | %(d) | ||||||||
| Ratio of investment loss to average net assets before waivers,franchise tax expense and income tax expense/benefit | (1.41 | %)(d) | (1.81 | %)(d) | (3.03 | %) | (6.01 | %)(d)(e) | ||||||||
| Ratio of expense waivers to average net assets | (0.56 | %)(d) | (0.96 | %)(d) | (2.18 | %) | (5.16 | %)(d)(e) | ||||||||
| Ratio of investment loss to average net assets net of waivers before franchise tax expense and income tax expense/benefit | (0.85 | %)(d) | (0.85 | %)(d) | (0.85 | %) | (0.85 | %)(d)(e) | ||||||||
| Ratio of franchise tax expense and deferred income tax benefit to | ||||||||||||||||
average net assets(g) | 0.29 | %(d) | 0.28 | %(d) | 0.29 | % | 0.40 | %(d) | ||||||||
| Ratio of net investment loss to average net assets | (0.56 | %)(d) | (0.57% | )(d) | (0.56 | %) | (0.45 | %)(d) | ||||||||
Portfolio turnover rate(h) | 35 | % | 7 | % | 63 | % | 3 | % | ||||||||
(a) | Effective May 1, 2014, the Board approved changing the fiscal year-end of the Funds from April 30 to October 31. |
(b) | Calculated using the average shares method. |
(c) | Total returns are for the period indicated and have not been annualized. Total returns would have been lower had certain expenses not been waived during the period. Returns shown do not reflect the deduction of taxes that a shareholder would pay on Fund distributions or the redemption of Fund shares. |
(d) | Annualized. |
(e) | Expense ratios before reductions for startup periods may not be representative of longer term operating periods. |
(f) | Deferred income tax expense estimate for the ratio calculation is derived from the net investment loss, and realized and unrealized gains/losses. |
(g) | Deferred income tax benefit for the ratio calculation is derived from net investment loss only. |
(h) | Portfolio turnover rate for periods less than one full year have not been annualized. |
See Notes to Financial Statements.
15 | April 30, 2015
| ALPS | CoreCommodity Management | |
CompleteCommodities® Strategy Fund | |
| Management Commentary | April 30, 2015 (Unaudited) |
Commodity prices for the six month period ending April 30, 2015 were lower: Spot commodity prices, as measured by the diversified Bloomberg Commodity Spot Index (BCOMSP), were down, -8.69% during this period. Commodity equities, evaluated against the Standard & Poor’s Global Natural Resources Total Return Index (SPGNRUN), were modestly lower, -1.39% for the period. The ALPS CoreCommodity Management CompleteCommodities® Strategy Fund (JCRIX) delivered a net negative total return of -10.91% for the period (JCRAX was -11.09% and JCRCX was down -11.29%). The Bloomberg Commodity Total Return Index (BCOMTR) declined-11.87% during the same period.
The ALPS CoreCommodity CompleteCommodities® Strategy Fund aspires to deliver returns close to spot commodity results. Spot commodity prices are essentially uninvestable. For the six months ending April 30, 2015, the ALPS CoreCommodity CompleteCommodities® Strategy Fund (“I” Shares—JCRIX) underperformed spot commodity returns Bloomberg Commodity Spot Index (BCOMSP) by 222 basis points after fees. The Fund employs a strategy that combines an actively managed portfolio of commodity futures related exposure (collateralized by Treasury Inflation Protected Securities – TIPS), commodity equities, and physical commodity Exchange-Traded Funds. The Fund maintains a well-diversified exposure to all sectors of the commodity markets without leverage. While the exact composition of the Fund changes from time to time in response to structural and value opportunities identified by the Fund Policy Committee, the Fund allocated approximately 66% of its assets toward commodity futures related investments and approximately 34% of its assets in commodity equities on average throughout the year. The Fund was about 99% invested by the end of April.
With a few exceptions, commodity prices were under price pressure for the six month period ending in April 30, 2015. Disappointing global growth rates may have contributed to the underperformance of commodity prices generally. The strength of the US Dollar likely created additional headwinds for commodity prices. Since most commodities are traded in US currency, commodity prices tend to move inversely to USD fluctuations. For the six month period we are examining, the USD climbed by approximately +8%, accounting for substantially all of the losses suffered by the BCOMSP Spot Index.
Energy prices were particularly weak during the 6-month period ending April 30, 2015. West Texas Intermediate (WTI) crude oil, the US marker crude, fell by -24.62%. Natural gas dropped even more, down -28.97%. Technological advances in drilling and gathering techniques increased supplies primarily in North America. Underwhelming global growth kept energy demand at a slower pace. A significant oversupply situation ensued and prices declined substantially to reflect the balance shift.
Additionally, many agricultural prices were also pressured lower. Political and economic stress in South America, specifically in Brazil and Argentina, pushed local currencies lower. Farmers were encouraged to sell their crops to monetize their assets and to receive foreign currency. Coffee, sugar, and orange juice prices were down -26.89%, -17.83%, and -16.96% respectively. Favorable early weather patterns supported early planting and optimistic outlooks for wheat and soybean supplies. Wheat prices fell by -10.99% while soybeans declined by -6.98%.
Base metals prices were also influenced by the move in the US Dollar, but generally did not lose as much as the Dollar appreciated. Copper prices edged down by -5.27%. Aluminum was off by -6.93% and Nickel dropped by -11.56%.
Precious metals benefited from the announcement by the ECB (European Central Bank) to pursue an aggressive low interest rate campaign through quantitative easing. The measures were perceived as a highly stimulative attempt to lower the value of the Euro and to manage the level of European interest rates to the downside. Gold managed a modest gain of +0.92% and silver added +0.11%. Considering the magnitude of the US Dollar’s advance, the performance of precious metals was positive.
{The Fund’s top equity holdings at the end of April 2015 included Sanderson Farms (SAFM) -10.60 YTD, Monsanto (MON) -4.61% YTD, CF Industries (CF) +5.48% YTD, Mosaic (MOS) -3.61% YTD, Pilgrim’s Pride (PPC) -24.67% YTD, FMC Corp (FMC) +4.00% YTD, AGCO Corporation (AGCO) +13.96% YTD, CNOOC Ltd-ADR +26.44% YTD, Hormel Foods Corp (HRL) +4.32% YTD, and K+S Ag (SDF GR)+27.58% YTD}
US Treasuries and/or U.S. Treasury Inflation Protected Bonds or TIPS are held by the Fund to invest excess cash and as collateral for commodity futures related investments held in our Cayman Island subsidiary. Nominal yield on the US Treasury benchmark 10-year note stood at 2.25% in the beginning of November 2014. It had declined to 2.03%, at the end of April. 10 year rates dipped to 1.64% in mid-March as the effects of European Central Bank policies to purchase European Union debt through quantitative easing spread globally to other bond rates. Despite the efforts by the Federal Reserve and other central banks to maintain historically low interest rates, we believe we may be nearing the end of what has been a significant multi-year rally in US treasury prices. As a result, we continue to invest in TIPS with limited duration exposure along with short-dated US Treasury Bills. At the end of April, our weighted average maturity was approximately 1.15 years in our TIPS portion of the collateral.
We strongly believe that the long term fundamental drivers of commodity demand and ultimately higher prices are still in place. The recent underperformance of commodity prices relative to the Standard and Poor’s 500 Index (S&P) may be a temporary phenomenon. Population growth is likely to remain unabated regardless of the economic environment in the US and Europe. A billion more people will probably be added to the world population over the next decade. The trend of wealth distribution to the developing world as those economies grow at rapid rates relative to the slow or negative growth occurring in the developed countries is likely contributing to ever increasing demand for raw materials and food. Incremental gains in disposable income in the developing nations have led to competition for the commodities needed for more complex and costly lifestyles. In a world with limited supplies of food, fuel, building materials, and other necessities of life, price may become the ultimate allocator. Additionally, the aggressively accommodative central bank monetary policies recently announced coupled with measures already in place globally are likely to make commodities and other real assets more attractive over time as currencies, including the US Dollar, may decline in value.
Satch Chada
Co-Portfolio Manager
Robert Hyman
Co-Portfolio Manager
16 | April 30, 2015
| ALPS | CoreCommodity Management | |
CompleteCommodities® Strategy Fund | |
| Management Commentary | April 30, 2015 (Unaudited) |
Standard & Poor’s 500 Index is a composite index of 500 stocks, a widely recognized, unmanaged index of common stock prices. An investor may not invest directly in an index.
The views and information discussed in this commentary are as of the date of publication, are subject to change, and may not reflect the writer’s current views. The views expressed represent an assessment of market conditions at a specific point in time, are opinions only and should not be relied upon as investment advice regarding a particular investment or markets in general. Such information does not constitute a recommendation to buy or sell specific securities or investment vehicles. It should not be assumed that any investment will be profitable or will equal the performance of the fund(s) or any securities or any sectors mentioned in this letter. The subject matter contained in this letter has been derived from several sources believed to be reliable and accurate at the time of compilation. Neither the Fund nor CoreCommodity Management, LLC accepts any liability for losses either direct or consequential caused by the use of this information.
Diversification cannot guarantee gain or prevent losses.
17 | April 30, 2015
| ALPS | CoreCommodity Management | |
CompleteCommodities® Strategy Fund | |
| Performance Update | April 30, 2015 (Unaudited) |
Performance of $10,000 Initial Investment (as of April 30, 2015)
Comparison of change in value of a $10,000 investment (includes maximum sales charges of 5.50%)
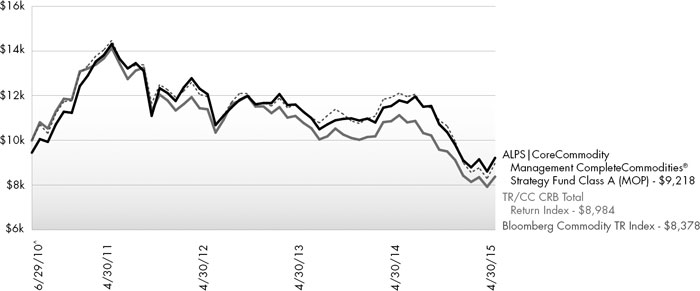
The chart above represents historical performance of a hypothetical investment of $10,000 in the Fund since inception. Past performance does not guarantee future results. This chart does not reflect the deduction of taxes that a shareholder would pay on Fund distributions or the redemption of Fund shares.
Average Annual Total Returns (as of April 30, 2015)
| 6 Month | 1 Year | 3 Year | Since Inception^ | Total Expense Ratio | What You Pay* | |
| Class A (NAV) | -11.09% | -21.80% | -8.58% | -0.52% | 1.46% | 1.45% |
| Class A (MOP) | -16.01% | -26.09% | -10.29% | -1.67% | ||
| Class C (NAV) | -11.29% | -22.22% | -9.12% | -1.07% | 2.07% | 2.05% |
| Class C (CDSC) | -12.18% | -23.00% | -9.12% | -1.07% | ||
| Class I | -10.91% | -21.49% | -8.31% | -0.22% | 1.16% | 1.15% |
TR/CC CRB Total Return Index1 | -15.61% | -25.84% | -9.09% | -2.19% | ||
Bloomberg Commodity TR Index1 | -11.87% | -24.69% | -9.73% | -3.59% |
Performance data quoted represents past performance. Past performance does not guarantee future results. Investment return and principal value of an investment will fluctuate so that an investor’s shares, when sold or redeemed, may be worth more or less than the original cost. Current performance data may be higher or lower than actual data quoted. For the most current month-end performance data, please call 1-866-759-5679.
Maximum Offering Price (MOP) for Class A shares includes the Fund’s maximum sales charge of 5.50%. Performance shown at NAV does not include these sales charges and would have been lower had it been taken into account. If you invest $1 million or more, either as a lump sum or through the Fund’s accumulation or letter of intent programs, you can purchase Class A shares without an initial sales charge (load). A Contingent Deferred Sales Charge (“CDSC”) of 1.00% may apply to Class C shares redeemed within the first 12 months after a purchase, and on Class A shares redeemed within the first 18 months after a purchase in excess of $1 million. The Fund imposes a 2.00% redemption fee on shares held for less than 30 days.
Performance less than 1 year is cumulative.
18 | April 30, 2015
| ALPS | CoreCommodity Management | |
CompleteCommodities® Strategy Fund | |
| Performance Update | April 30, 2015 (Unaudited) |
| 1 | Thomson Reuters/CC CRB Total Return Index and the Bloomberg Commodity TR Index (formerly the Dow Jones-UBS Commodity Index) are unmanaged indices used as a measurement of change in commodity market conditions based on the performance of a basket of different commodities. Each index is composed of a different basket of commodities, a different weighting of the commodities in the basket, and a different re-balancing schedule. The indices are not actively managed and do not reflect any deduction for fees, expenses or taxes. An investor may not invest directly in an index. |
| ^ | Fund Inception date of June 29, 2010. |
| * | What You Pay reflects the Advisor’s decision to contractually limit expenses through February 29, 2016. Please see the prospectus for additional information. |
Investments in securities of MLPs involve risks that differ from an investment in common stock. MLPs are controlled by their general partners, which generally have conflicts of interest and limited fiduciary duties to the MLP, which may permit the general partner to favor its own interests over the MLPs. The benefit you are expected to derive from the Fund’s investment in MLPs depends largely on the MLPs being treated as partnerships for federal income tax purposes. As a partnership, an MLP has no federal income tax liability at the entity level. Therefore, treatment of one or more MLPs as a corporation for federal income tax purposes could affect the Fund’s ability to meet its investment objective and would reduce the amount of cash available to pay or distribute to you. Legislative, judicial, or administrative changes and differing interpretations, possibly on a retroactive basis, could negatively impact the value of an investment in MLPs and therefore the value of your investment in the Fund.
Investing in commodity-related securities involves risk and considerations not present when investing in more conventional securities. The Fund may be more susceptible to high volatility of commodity markets.
Derivatives generally are more sensitive to changes in economic or market conditions than other types of investments; this could result in losses that significantly exceed the Fund’s original investment.
The table does not reflect the deduction of taxes that a shareholder would pay on Fund distributions or the redemption of Fund shares.
This Fund is not suitable for all investors, and is subject to investment risks, including possible loss of the principal amount invested.
There is no guarantee that the Fund will continue to hold any one particular security or stay invested in any one particular company. The composition of the Fund’s top holdings is subject to change. Performance figures are historical and reflect the change in share price, reinvested distributions, changes in net asset value, sales charges and capital gains distributions, if any.
Not FDIC Insured – No Bank Guarantee – May Lose Value
Asset Type Allocation (as a % of Net Assets) †
| Government Bonds | 50.55% |
| Common Stocks | 33.56% |
| Commodity-Linked Notes | 0.91% |
| Master Limited Partnerships | 0.43% |
| Purchased Options | 0.12% |
| Short Term Investments and Other Assets | 14.43% |
| Total | 100.00% |
| † | Holdings are subject to change. Table presents approximate values only. |
19 | April 30, 2015
| ALPS | CoreCommodity Management | |
CompleteCommodities® Strategy Fund | |
| Consolidated Statement of Investments | April 30, 2015 (Unaudited) |
| Value | ||||||||
| Shares | (Note 2) | |||||||
| COMMON STOCKS (33.56%) | ||||||||
| Argentina (0.19%) | ||||||||
| YPF SA, Sponsored ADR | 27,285 | $ | 833,284 | |||||
| Australia (1.17%) | ||||||||
| BHP Billiton, Ltd. | 68,819 | 1,741,084 | ||||||
| Caltex Australia, Ltd. | 14,292 | 400,712 | ||||||
| Fortescue Metals Group, Ltd. | 31,313 | 53,772 | ||||||
| GrainCorp, Ltd., Class A | 41,007 | 321,588 | ||||||
| Iluka Resources, Ltd. | 60,429 | 390,215 | ||||||
| Incitec Pivot, Ltd. | 188,051 | 593,769 | ||||||
Newcrest Mining, Ltd.(a) | 28,587 | 326,893 | ||||||
| Nufarm, Ltd. | 36,328 | 209,574 | ||||||
| Orica, Ltd. | 38,628 | 617,479 | ||||||
Regis Resources, Ltd. (a) | 206,540 | 205,124 | ||||||
| Sandfire Resources NL | 41,755 | 162,571 | ||||||
| Woodside Petroleum, Ltd. | 9,366 | 259,783 | ||||||
| 5,282,564 | ||||||||
| Austria (0.19%) | ||||||||
| OMV AG | 10,960 | 366,116 | ||||||
| Voestalpine AG | 11,421 | 479,877 | ||||||
| 845,993 | ||||||||
| Bermuda (0.17%) | ||||||||
Kosmos Energy, Ltd.(a) | 50,884 | 497,646 | ||||||
| Nabors Industries, Ltd. | 11,916 | 198,997 | ||||||
| Seadrill, Ltd. | 4,179 | 54,703 | ||||||
| 751,346 | ||||||||
| Brazil (0.55%) | ||||||||
| Cia de Saneamento Basico do Estado de Sao Paulo, ADR | 77,481 | 456,363 | ||||||
| Cia Siderurgica Nacional SA, Sponsored ADR | 1,580 | 4,250 | ||||||
| Gerdau SA, Sponsored ADR | 190,337 | 639,533 | ||||||
Petroleo Brasileiro SA, Sponsored ADR(a) | 35,152 | 333,944 | ||||||
| Vale SA, Sponsored ADR | 136,571 | 1,048,865 | ||||||
| 2,482,955 | ||||||||
| Canada (4.59%) | ||||||||
| Agnico‐Eagle Mines, Ltd. | 15,403 | 466,652 | ||||||
| Alamos Gold, Inc. | 61,800 | 427,196 | ||||||
| ARC Resources, Ltd. | 6,787 | 138,890 | ||||||
Argonaut Gold, Inc.(a) | 14,775 | 24,860 | ||||||
| AuRico Gold, Inc. | 67,852 | 236,803 | ||||||
B2Gold Corp.(a) | 168,500 | 263,958 | ||||||
| Barrick Gold Corp. | 59,330 | 772,477 | ||||||
| Cameco Corp. | 12,079 | 212,349 | ||||||
| Canadian Natural Resources, Ltd. | 5,741 | 190,888 | ||||||
| Canadian Oil Sands, Ltd. | 169,108 | 1,837,552 | ||||||
| Cenovus Energy, Inc. | 74,429 | 1,402,214 | ||||||
| Centerra Gold, Inc. | 78,900 | 408,070 | ||||||
| Crescent Point Energy Corp. | 10,981 | 286,789 | ||||||
Detour Gold Corp.(a) | 16,587 | 175,287 | ||||||
| Value | ||||||||
| Shares | (Note 2) | |||||||
| Canada (continued) | ||||||||
| Eldorado Gold Corp. | 65,346 | $ | 324,116 | |||||
| Encana Corp. | 81,800 | 1,162,378 | ||||||
Endeavour Silver Corp.(a) | 18,980 | 38,340 | ||||||
| First Quantum Minerals, Ltd. | 44,647 | 683,860 | ||||||
| Franco‐Nevada Corp. | 9,227 | 478,235 | ||||||
| Goldcorp, Inc. | 31,061 | 584,879 | ||||||
| HudBay Minerals, Inc. | 23,000 | 227,426 | ||||||
| Husky Energy, Inc. | 10,586 | 236,726 | ||||||
IAMGOLD Corp.(a) | 456 | 1,021 | ||||||
| Imperial Oil, Ltd. | 25,209 | 1,111,160 | ||||||
Kinross Gold Corp.(a) | 140,786 | 342,110 | ||||||
Lundin Mining Corp.(a) | 37,100 | 184,501 | ||||||
| Maple Leaf Foods, Inc. | 10,500 | 201,471 | ||||||
MEG Energy Corp.(a) | 5,900 | 113,794 | ||||||
New Gold, Inc.(a) | 69,617 | 235,305 | ||||||
| Osisko Gold Royalties, Ltd. | 2,569 | 34,431 | ||||||
| Pacific Rubiales Energy Corp. | 228,700 | 773,391 | ||||||
| Pan American Silver Corp. | 49,160 | 468,003 | ||||||
| Peyto Exploration & Development Corp. | 13,600 | 395,319 | ||||||
| Potash Corp. of Saskatchewan, Inc. | 20,852 | 680,609 | ||||||
Primero Mining Corp.(a) | 37,900 | 139,789 | ||||||
Sandstorm Gold, Ltd.(a) | 39,467 | 141,292 | ||||||
SEMAFO, Inc.(a) | 110,100 | 338,559 | ||||||
Silver Standard Resources, Inc.(a) | 44,960 | 244,807 | ||||||
| Silver Wheaton Corp. | 29,773 | 587,719 | ||||||
| SunCoke Energy, Inc. | 16,171 | 283,478 | ||||||
| Suncor Energy, Inc. | 52,160 | 1,699,026 | ||||||
| Tahoe Resources, Inc. | 6,600 | 93,270 | ||||||
| Teck Resources, Ltd., Class B | 64,472 | 977,556 | ||||||
| TransCanada Corp. | 7,142 | 331,498 | ||||||
Turquoise Hill Resources, Ltd.(a) | 81,758 | 340,113 | ||||||
| Yamana Gold, Inc. | 92,948 | 355,068 | ||||||
| 20,653,235 | ||||||||
| Chile (0.12%) | ||||||||
| Sociedad Quimica y Minera de Chile SA, Sponsored ADR | 25,642 | 560,021 | ||||||
| China (1.24%) | ||||||||
| China Petroleum & Chemical Corp., ADR | 464 | 43,834 | ||||||
| China Petroleum & Chemical Corp., Class H | 400,358 | 375,018 | ||||||
| China Shenhua Energy Co., Ltd., Class H | 95,369 | 247,942 | ||||||
| CNOOC, Ltd. | 250,001 | 423,842 | ||||||
| CNOOC, Ltd., Sponsored ADR | 18,859 | 3,229,604 | ||||||
| Jiangxi Copper Co., Ltd., Class H | 50,082 | 103,905 | ||||||
| PetroChina Co., Ltd., ADR | 4,087 | 526,896 | ||||||
| PetroChina Co., Ltd., Class H | 330,045 | 424,131 | ||||||
| Zijin Mining Group Co., Ltd., Class H | 560,331 | 216,164 | ||||||
| 5,591,336 | ||||||||
20 | April 30, 2015
| ALPS | CoreCommodity Management | |
CompleteCommodities® Strategy Fund | |
| Consolidated Statement of Investments | April 30, 2015 (Unaudited) |
| Value | ||||||||
| Shares | (Note 2) | |||||||
| Colombia (0.19%) | ||||||||
| Ecopetrol SA, Sponsored ADR | 50,903 | $ | 871,459 | |||||
| Denmark (0.06%) | ||||||||
| FLSmidth & Co. A/S | 6,011 | 257,549 | ||||||
| Finland (0.30%) | ||||||||
| Kemira OYJ | 10,739 | 126,250 | ||||||
| Neste Oil OYJ | 19,790 | 539,086 | ||||||
Outokumpu OYJ (a) | 61,518 | 373,699 | ||||||
| Outotec OYJ | 43,438 | 304,840 | ||||||
| 1,343,875 | ||||||||
| France (0.17%) | ||||||||
| TOTAL SA | 4,886 | 266,000 | ||||||
| TOTAL SA, Sponsored ADR | 9,057 | 489,984 | ||||||
| 755,984 | ||||||||
| Germany (0.66%) | ||||||||
| Aurubis AG | 639 | 40,704 | ||||||
| K+S AG | 78,161 | 2,573,213 | ||||||
| Salzgitter AG | 10,429 | 358,918 | ||||||
| 2,972,835 | ||||||||
| India (0.08%) | ||||||||
Reliance Industries, Ltd., Sponsored GDR(b) | 8,852 | 238,119 | ||||||
| Sesa Sterlite, Ltd., ADR | 9,014 | 118,444 | ||||||
| 356,563 | ||||||||
| Israel (0.06%) | ||||||||
| The Israel Corp., Ltd. | 785 | 289,476 | ||||||
| Italy (0.14%) | ||||||||
| Eni SpA, Sponsored ADR | �� | 16,393 | 629,983 | |||||
| Japan (1.60%) | ||||||||
| Hitachi Metals, Ltd. | 50,000 | 787,688 | ||||||
| Idemitsu Kosan Co., Ltd. | 25,931 | 504,721 | ||||||
| Inpex Corp. | 106,133 | 1,342,218 | ||||||
| Iseki & Co., Ltd. | 20,907 | 43,600 | ||||||
| JFE Holdings, Inc. | 12,600 | 285,980 | ||||||
| Kubota Corp. | 18,000 | 282,890 | ||||||
| Kurita Water Industries, Ltd. | 10,616 | 277,403 | ||||||
| Maruichi Steel Tube, Ltd. | 20,000 | 510,050 | ||||||
| Nihon Nohyaku Co., Ltd. | 16,100 | 170,169 | ||||||
| Nihon Trim Co., Ltd. | 4,101 | 127,426 | ||||||
| Nippon Steel & Sumitomo Metal Corp. | 208,342 | 546,156 | ||||||
| Nisshin Steel Co., Ltd. | 29,000 | 390,067 | ||||||
| Osaka Titanium Technologies Co., Ltd. | 8,500 | 184,167 | ||||||
| Showa Shell Sekiyu KK | 44,500 | 431,583 | ||||||
| Sumitomo Forestry Co., Ltd. | 15,159 | 176,982 | ||||||
| Sumitomo Metal Mining Co., Ltd. | 26,000 | 384,883 | ||||||
| Tokyo Steel Manufacturing Co., Ltd. | 37,000 | 258,442 | ||||||
| Value | ||||||||
| Shares | (Note 2) | |||||||
| Japan (continued) | ||||||||
| TonenGeneral Sekiyu KK | 36,000 | $ | 346,432 | |||||
| Yamato Kogyo Co., Ltd. | 6,700 | 158,859 | ||||||
| 7,209,716 | ||||||||
| Jersey (0.11%) | ||||||||
| Randgold Resources, Ltd., ADR | 6,784 | 516,737 | ||||||
| Luxembourg (0.35%) | ||||||||
APERAM SA (a) | 13,273 | 508,511 | ||||||
| ArcelorMittal | 13,316 | 142,297 | ||||||
| ArcelorMittal SA | 13,635 | 145,758 | ||||||
| Subsea 7 SA | 63,173 | 701,810 | ||||||
| Tenaris SA, ADR | 2,743 | 84,347 | ||||||
| 1,582,723 | ||||||||
| Mexico (0.34%) | ||||||||
| Grupo Mexico SAB de CV, Series B | 424,283 | 1,311,123 | ||||||
| Industrias Penoles SAB de CV | 13,107 | 222,124 | ||||||
| 1,533,247 | ||||||||
| Netherlands (0.06%) | ||||||||
| Royal Dutch Shell PLC, Class A, | ||||||||
| Sponsored ADR | 4,503 | 285,625 | ||||||
| Norway (0.63%) | ||||||||
| Marine Harvest ASA | 75,761 | 926,173 | ||||||
| Norsk Hydro ASA | 104,109 | 492,083 | ||||||
| Statoil ASA | 48,474 | 1,023,595 | ||||||
| Yara International ASA | 7,649 | 392,522 | ||||||
| 2,834,373 | ||||||||
| Peru (0.18%) | ||||||||
| Cia de Minas Buenaventura SAA, ADR | 71,096 | 794,853 | ||||||
| Singapore (0.25%) | ||||||||
| Golden Agri‐Resources, Ltd. | 893,758 | 283,690 | ||||||
Kenon Holdings, Ltd.(a) | 5,495 | 118,990 | ||||||
| Olam International, Ltd. | 46,254 | 70,612 | ||||||
| Wilmar International, Ltd. | 257,061 | 633,327 | ||||||
| 1,106,619 | ||||||||
| South Africa (0.58%) | ||||||||
Anglo Platinum, Ltd. (a) | 5,831 | 160,354 | ||||||
| AngloGold Ashanti, Ltd., ADR | 77,918 | 882,811 | ||||||
| Gold Fields, Ltd., Sponsored ADR | 60,039 | 274,378 | ||||||
Harmony Gold Mining Co., Ltd., Sponsored ADR(a) | 38,989 | 75,639 | ||||||
Impala Platinum Holdings, Ltd. (a) | 39,295 | 218,007 | ||||||
| Kumba Iron Ore, Ltd. | 1,186 | 15,967 | ||||||
| Sasol, Ltd. | 24,099 | 973,643 | ||||||
| Sibanye Gold, Ltd., Sponsored ADR | 2,515 | 23,767 | ||||||
| 2,624,566 | ||||||||
21 | April 30, 2015
| ALPS | CoreCommodity Management | |
CompleteCommodities® Strategy Fund | |
| Consolidated Statement of Investments | April 30, 2015 (Unaudited) |
| Value | ||||||||
| Shares | (Note 2) | |||||||
| South Korea (0.04%) | ||||||||
| POSCO, Sponsored ADR | 2,859 | $ | 168,910 | |||||
| Spain (0.03%) | ||||||||
| Acerinox SA | 10,270 | 150,604 | ||||||
| Sweden (0.33%) | ||||||||
| Boliden AB | 7,842 | 171,175 | ||||||
| Holmen AB, B Shares | 11,000 | 364,319 | ||||||
Lundin Petroleum AB (a) | 16,470 | 266,813 | ||||||
SSAB AB, A Shares (a) | 41,117 | 249,169 | ||||||
| Svenska Cellulosa AB SCA, Class B | 16,465 | 417,683 | ||||||
| 1,469,159 | ||||||||
| Switzerland (0.45%) | ||||||||
| Glencore PLC | 28,003 | 133,360 | ||||||
| Noble Corp. PLC | 9,174 | 158,802 | ||||||
| Syngenta AG | 3,828 | 1,290,019 | ||||||
| Transocean, Ltd. | 8,890 | 167,310 | ||||||
Weatherford International, Ltd.(a) | 20,498 | 298,246 | ||||||
| 2,047,737 | ||||||||
| United Kingdom (0.86%) | ||||||||
| Anglo American PLC | 6,469 | 109,726 | ||||||
| Antofagasta PLC | 13,306 | 159,619 | ||||||
| BG Group PLC | 23,065 | 418,662 | ||||||
| BHP Billiton PLC, ADR | 3,227 | 155,864 | ||||||
| BP PLC, Sponsored ADR | 21,309 | 919,697 | ||||||
| CNH Industrial N.V. | 36,636 | 319,466 | ||||||
| Fresnillo PLC | 14,550 | 160,695 | ||||||
Kazakhmys PLC (a) | 11,431 | 45,814 | ||||||
Lonmin PLC (a) | 32,588 | 72,083 | ||||||
| Rio Tinto PLC, Sponsored ADR | 20,930 | 937,455 | ||||||
| Severn Trent PLC | 9,330 | 304,333 | ||||||
| United Utilities Group PLC | 16,752 | 249,686 | ||||||
| 3,853,100 | ||||||||
| United States (17.87%) | ||||||||
| AGCO Corp. | 63,210 | 3,255,947 | ||||||
| Allegheny Technologies, Inc. | 5,767 | 196,020 | ||||||
Allied Nevada Gold Corp.(a) | 28,885 | 4,330 | ||||||
| American States Water Co. | 5,263 | 202,047 | ||||||
| American Vanguard Corp. | 9,167 | 100,012 | ||||||
| American Water Works Co., Inc. | 3,695 | 201,451 | ||||||
| The Andersons, Inc. | 6,430 | 274,497 | ||||||
| Apache Corp. | 4,465 | 305,406 | ||||||
| Aqua America, Inc. | 14,536 | 389,856 | ||||||
| Archer‐Daniels‐Midland Co. | 13,777 | 673,420 | ||||||
| Baker Hughes, Inc. | 3,155 | 215,991 | ||||||
| Calgon Carbon Corp. | 5,034 | 111,704 | ||||||
| California Resources Corp. | 5,559 | 51,699 | ||||||
| California Water Service Group | 7,154 | 170,766 | ||||||
| Cal‐Maine Foods, Inc. | 13,156 | 588,205 | ||||||
Cameron International Corp.(a) | 12,267 | 672,477 | ||||||
| Carpenter Technology Corp. | 5,307 | 229,528 | ||||||
Carrizo Oil & Gas, Inc. (a) | 1,829 | 101,930 | ||||||
| Value | ||||||||
| Shares | (Note 2) | |||||||
| United States (continued) | ||||||||
Century Aluminum Co. (a) | 6,417 | $ | 82,715 | |||||
| CF Industries Holdings, Inc. | 15,453 | 4,442,274 | ||||||
| Chesapeake Energy Corp. | 17,429 | 274,855 | ||||||
| Chevron Corp. | 8,502 | 944,232 | ||||||
| Cimarex Energy Co. | 3,872 | 481,677 | ||||||
| Civeo Corp. | 14,255 | 66,571 | ||||||
| Cliffs Natural Resources, Inc. | 7,741 | 45,982 | ||||||
Coeur Mining, Inc.(a) | 22,697 | 118,478 | ||||||
| Commercial Metals Co. | 24,641 | 409,041 | ||||||
| ConocoPhillips | 1,680 | 114,106 | ||||||
Continental Resources, Inc.(a) | 27,814 | 1,463,851 | ||||||
| Core Laboratories N.V. | 7,491 | 983,418 | ||||||
| CST Brands, Inc. | 2,472 | 103,107 | ||||||
| CVR Energy, Inc. | 12,494 | 500,260 | ||||||
Darling Ingredients, Inc. (a) | 11,542 | 157,664 | ||||||
| Deere & Co. | 12,525 | 1,133,763 | ||||||
| Delek US Holdings, Inc. | 3,432 | 126,709 | ||||||
| Devon Energy Corp. | 7,198 | 490,976 | ||||||
| Diamond Offshore Drilling, Inc. | 3,190 | 106,769 | ||||||
Dresser‐Rand Group, Inc.(a) | 6,704 | 554,220 | ||||||
Dril‐Quip, Inc.(a) | 13,390 | 1,067,451 | ||||||
| Energen Corp. | 7,526 | 535,625 | ||||||
| Ensco PLC, Class A | 9,480 | 258,614 | ||||||
| EOG Resources, Inc. | 4,853 | 480,204 | ||||||
EP Energy Corp., Class A (a) | 25,747 | 380,283 | ||||||
| EQT Corp. | 3,493 | 314,160 | ||||||
| Exxon Mobil Corp. | 15,417 | 1,346,983 | ||||||
First Majestic Silver Corp.(a) | 40,390 | 196,699 | ||||||
| FMC Corp. | 55,828 | 3,311,159 | ||||||
FMC Technologies, Inc.(a) | 6,853 | 302,217 | ||||||
| Freeport‐McMoRan, Inc. | 6,163 | 143,413 | ||||||
| Halliburton Co. | 564 | 27,608 | ||||||
| Harsco Corp. | 21,983 | 353,487 | ||||||
| Hecla Mining Co. | 101,198 | 305,618 | ||||||
Helix Energy Solutions Group, Inc. (a) | 33,598 | 553,695 | ||||||
| Helmerich & Payne, Inc. | 18,279 | 1,425,214 | ||||||
| Hess Corp. | 11,310 | 869,739 | ||||||
| HollyFrontier Corp. | 28,340 | 1,099,025 | ||||||
| Hormel Foods Corp. | 46,987 | 2,553,743 | ||||||
| Ingredion, Inc. | 9,393 | 745,804 | ||||||
Intrepid Potash, Inc. (a) | 32,370 | 405,596 | ||||||
| Joy Global, Inc. | 29,912 | 1,275,448 | ||||||
| Kaiser Aluminum Corp. | 1,761 | 141,532 | ||||||
| Kinder Morgan, Inc. | 5,763 | 247,521 | ||||||
| Lindsay Corp. | 4,274 | 338,458 | ||||||
| Marathon Oil Corp. | 41,699 | 1,296,839 | ||||||
| Marathon Petroleum Corp. | 14,249 | 1,404,524 | ||||||
McEwen Mining, Inc.(a) | 29,851 | 29,851 | ||||||
| Monsanto Co. | 41,591 | 4,739,710 | ||||||
| The Mosaic Co. | 91,935 | 4,045,140 | ||||||
| Murphy Oil Corp. | 7,071 | 336,650 | ||||||
| National Oilwell Varco, Inc. | 4,787 | 260,461 | ||||||
Newfield Exploration Co.(a) | 8,554 | 335,659 | ||||||
| Newmont Mining Corp. | 84 | 2,225 | ||||||
| Noble Energy, Inc. | 4,222 | 214,140 | ||||||
22 | April 30, 2015
| ALPS | CoreCommodity Management | |
CompleteCommodities® Strategy Fund | |
| Consolidated Statement of Investments | April 30, 2015 (Unaudited) |
| Value | ||||||||
| Shares | (Note 2) | |||||||
| United States (continued) | ||||||||
NOW, Inc.(a) | 1,643 | $ | 39,268 | |||||
| Nucor Corp. | 7,634 | 372,997 | ||||||
| Occidental Petroleum Corp. | 12,166 | 974,497 | ||||||
| Oceaneering International, Inc. | 24,046 | 1,325,175 | ||||||
Oil States International, Inc. (a) | 10,174 | 484,181 | ||||||
| Paragon Offshore PLC | 3,058 | 5,535 | ||||||
| Patterson‐UTI Energy, Inc. | 22,816 | 509,938 | ||||||
| PBF Energy, Inc., Class A | 20,977 | 595,327 | ||||||
| Peabody Energy Corp. | 7,370 | 34,860 | ||||||
| Phillips 66 | 10,779 | 854,882 | ||||||
| Pilgrim’s Pride Corp. | 147,025 | 3,631,517 | ||||||
| Pioneer Natural Resources Co. | 2,078 | 359,037 | ||||||
| Plum Creek Timber Co., Inc. REIT | 4,614 | 194,711 | ||||||
| Potash Corp. REIT | 7,200 | 265,752 | ||||||
| Rayonier Advanced Materials, Inc. | 4,357 | 72,805 | ||||||
| Rayonier, Inc. REIT | 56,505 | 1,445,963 | ||||||
| Reliance Steel & Aluminum Co. | 16,902 | 1,093,897 | ||||||
| Royal Gold, Inc. | 2,115 | 136,481 | ||||||
| RPC, Inc. | 100,043 | 1,591,684 | ||||||
| Sanderson Farms, Inc. | 68,104 | 5,115,972 | ||||||
| Schlumberger, Ltd. | 10,293 | 973,821 | ||||||
Seventy Seven Energy, Inc.(a) | 592 | 3,001 | ||||||
| SM Energy Co. | 11,797 | 683,872 | ||||||
| Southern Copper Corp. | 53,486 | 1,742,574 | ||||||
Southwestern Energy Co.(a) | 12,696 | 355,869 | ||||||
| Spectra Energy Corp. | 5,869 | 218,620 | ||||||
| Steel Dynamics, Inc. | 17,923 | 396,636 | ||||||
Stillwater Mining Co. (a) | 112 | 1,504 | ||||||
| Superior Energy Services, Inc. | 13,527 | 344,939 | ||||||
| Tesoro Corp. | 6,441 | 552,831 | ||||||
| United States Steel Corp. | 6,929 | 166,435 | ||||||
| Valero Energy Corp. | 17,574 | 999,961 | ||||||
| Walter Energy, Inc. | 68,768 | 34,886 | ||||||
| Western Refining, Inc. | 24,410 | 1,075,261 | ||||||
| Weyerhaeuser Co. REIT | 22,259 | 701,381 | ||||||
Whiting Petroleum Corp.(a) | 2,961 | 112,252 | ||||||
| The Williams Co., Inc. | 7,776 | 398,053 | ||||||
| World Fuel Services Corp. | 8,104 | 449,772 | ||||||
| Worthington Industries, Inc. | 15,573 | 420,938 | ||||||
| 80,427,534 | ||||||||
TOTAL COMMON STOCKS (Cost $159,999,690) | 151,083,961 | |||||||
| MASTER LIMITED PARTNERSHIPS (0.43%) | ||||||||
| United States (0.43%) | ||||||||
| Buckeye Partners LP | 977 | 79,704 | ||||||
| CVR Partners LP | 7,942 | 115,636 | ||||||
| CVR Refining LP | 24,412 | 525,834 | ||||||
| Energy Transfer Partners LP | 2,591 | 149,708 | ||||||
| Enterprise Products Partners LP | 10,676 | 365,653 | ||||||
| Magellan Midstream Partners LP | 2,054 | 171,509 | ||||||
| MarkWest Energy Partners LP | 1,427 | 96,265 | ||||||
| Northern Tier Energy LP | 4,983 | 126,369 | ||||||
| Plains All American Pipeline LP | 3,090 | 154,840 | ||||||
| Value | ||||||||
| Shares | (Note 2) | |||||||
| United States (continued) | ||||||||
| Rentech Nitrogen Partners LP | 7,631 | $ | 114,923 | |||||
| Williams Partners LP | 1,242 | 61,355 | ||||||
| 1,961,796 | ||||||||
TOTAL MASTER LIMITED PARTNERSHIPS (Cost $1,980,879) | 1,961,796 | |||||||
| Principal | Value | |||||||
| Amount | (Note 2) | |||||||
| COMMODITY‐LINKED NOTES (0.91%) | ||||||||
Bank of America Corp., Commodity‐Linked Note Linked to the Merrill Lynch Commodity Index eXtra J‐Series F3 Total Return Index, 0.000%, 2/9/16(c) | $ | 4,100,000 | $ | 4,110,520 | ||||
TOTAL COMMODITY‐LINKED NOTES (Cost $4,100,000) | 4,110,520 | |||||||
| GOVERNMENT BONDS (50.55%) | ||||||||
| U.S. Treasury Bonds (50.55%) | ||||||||
| United States Treasury Inflation Indexed Bonds | ||||||||
| 1.875%, 7/15/15 | 8,747,560 | 8,858,269 | ||||||
| 2.000%, 1/15/16 | 20,988,310 | 21,517,929 | ||||||
0.125%, 4/15/16(d) | 78,679,760 | 79,675,531 | ||||||
| 2.500%, 7/15/16 | 2,149,885 | 2,259,564 | ||||||
| 0.875%, 11/30/16 | 25,000,000 | 25,164,050 | ||||||
2.375%, 1/15/17(d) | 10,182,900 | 10,798,650 | ||||||
| 1.000%, 3/31/17 | 36,000,000 | 36,298,116 | ||||||
0.125%, 4/15/17(d) | 14,982,415 | 15,307,818 | ||||||
2.625%, 7/15/17(d) | 14,437,590 | 15,695,234 | ||||||
| 1.625%, 1/15/18 | 11,202,500 | 11,966,544 | ||||||
| 227,541,705 | ||||||||
TOTAL GOVERNMENT BONDS (Cost $227,967,038) | 227,541,705 | |||||||
| Expiration | Exercise | Number of | Value | ||||||||||
| Date | Price | Contracts | (Note 2) | ||||||||||
| PURCHASED OPTIONS (0.12%) | |||||||||||||
| Purchased Call Options (0.11%) | |||||||||||||
| WTI Crude Future: | |||||||||||||
| 11/17/15 | $ | 80.00 | 500 | $ | 450,000 | ||||||||
| 11/17/15 | 100.00 | 225 | 40,500 | ||||||||||
| 490,500 | |||||||||||||
Total Purchased Call Options (Cost $1,373,465) | 490,500 | ||||||||||||
| Purchased Put Options (0.01%) | |||||||||||||
| WIT Crude Future: | |||||||||||||
| 6/17/15 | 45.00 | 200 | 28,000 | ||||||||||
23 | April 30, 2015
| ALPS | CoreCommodity Management | |
CompleteCommodities® Strategy Fund | |
| Consolidated Statement of Investments | April 30, 2015 (Unaudited) |
| Expiration | Exercise | Number of | Value | ||||||||||
| Date | Price | Contracts | (Note 2) | ||||||||||
| Purchased Put Options (continued) | |||||||||||||
SPDR® S&P 500® ETF Trust: | |||||||||||||
| 6/19/15 | $ | 185.00 | 300 | $ | 14,400 | ||||||||
| Total Purchased Put Options (Cost $604,237) | 42,400 | ||||||||||||
| TOTAL PURCHASED OPTIONS (Cost $1,977,702) | 532,900 | ||||||||||||
| 7-Day | Value | |||||||||||
| Yield | Shares | (Note 2) | ||||||||||
| SHORT TERM INVESTMENTS (6.42%) | ||||||||||||
| Money Market Fund (6.42%) | ||||||||||||
| Dreyfus Treasury Prime Cash Management Fund, Institutional Shares | 0.00005% | 28,903,172 | $ | 28,903,172 | ||||||||
TOTAL SHORT TERM INVESTMENTS (Cost $28,903,172) | 28,903,172 | |||||||||||
TOTAL INVESTMENTS (91.99%) (Cost $424,928,481) | $ | 414,134,054 | ||||||||||
Other Assets In Excess Of Liabilities (8.01%)(e) | 36,038,444 | |||||||||||
NET ASSETS ‐ 100.00% | $ | 450,172,498 | ||||||||||
(a) | Non-Income Producing Security. |
(b) | Security exempt from registration under rule 144A of the securities act of 1933. This Security may be ressold in transactions exempt from registration, normally to qualified institutional buyers. As of April 30, 2015, the market value of those securities was 238,119 representing 0.05% of the Fund’s net assets. |
(c) | Floating or variable rate security. Interest rate disclosed is that which is in effect at April 30, 2015. |
(d) | Security, or portion of security, is being held as collateral for total return swap contracts, futures contracts and written options aggregating a total market value of $30,362,478. |
(e) | Includes cash which is being held as collateral for total return swap contracts, future contracts and written options in the amount of $17,405,125. |
| Common Abbreviations: |
| A/S - Aktieselskab is the Danish equivalent for the term Stock Company. |
| AB - Aktiebolag is the Swedish equivalent of the term corporation. |
| ADR - American Depositary Receipt. |
| AG - Aktiengesellschaft is a German term that refers to a corporation that is limited by shares, i.e., owned by shareholders. |
| ASA - Allmennaksjeselskap is the Norwegian term for public limited company. |
| GDR - Global Depositary Receipt. |
| KK - Kabushiki Kaisha is the Japanese equivalent for the term Stock Company. |
| Ltd. - Limited. |
| LP - Limited Partnership. |
| N.V. - Naamloze vennootschap is the Dutch term for a public limited liability corporation. |
| OYJ - Osakeyhtio is the Finnish equivalent of a public limited company. |
| PLC - Public Limited Co. |
| REIT - Real Estate Investment Trust. |
| SA - Generally designated corporations in various countries, mostly those employing the civil law. |
| SAA - Sociedad Anonima Abierta is the Peruvian term used for companies with 20 or more shareholders. |
| SAB de CV - A variable capital company. |
| SCA - Societe en commandite pe actiuni is the Romanian term for limited liability partnership. |
| SpA - Societa per Azione. |
| For Fund compliance purposes, the Fund’s industry and geographical classifications refer to any one or more of the industry sub-classifications used by one or more widely recognized market indexes or ratings group indexes, and/or as defined by Fund management. This definition may not apply for purposes of this report, which may combine sub-classifications for reporting ease. Industries and regions are shown as a percent of net assets. |
| See Notes to Financial Statements. |
24 | April 30, 2015
| ALPS | CoreCommodity Management | |
CompleteCommodities® Strategy Fund | |
| Consolidated Statement of Investments | April 30, 2015 (Unaudited) |
SCHEDULE OF WRITTEN OPTIONS | Expiration Date | Exercise Price | Contracts | Value (Note 2) | ||||||||||
| Written Call Options | ||||||||||||||
| WTI Crude Future: | ||||||||||||||
| 11/17/15 | $ | 49.00 | (100 | ) | $ | (1,545,000 | ) | |||||||
| 11/17/15 | 90.00 | (500 | ) | (180,000 | ) | |||||||||
| 11/17/15 | 100.00 | (225 | ) | (40,500 | ) | |||||||||
| TOTAL WRITTEN CALL OPTIONS | ||||||||||||||
| (Premiums received $1,688,514) | (1,765,500 | ) | ||||||||||||
| Written Put Options | ||||||||||||||
| WIT Crude Future | 6/17/15 | 40.00 | (200 | ) | (10,000 | ) | ||||||||
| WTI Crude Future | 11/17/15 | 70.00 | (100 | ) | (965,000 | ) | ||||||||
| TOTAL WRITTEN PUT OPTIONS | ||||||||||||||
| (Premiums received $502,729) | (975,000 | ) | ||||||||||||
| TOTAL WRITTEN OPTIONS | ||||||||||||||
| (Premiums received $2,191,243) | $ | (2,740,500 | ) | |||||||||||
| FUTURES CONTRACTS | ||||||||||||||
| Expiration | Value | Unrealized | ||||||||||||
| Description | Position | Contracts | Date | (Note 2) | Appreciation | |||||||||
| Brent Crude Future | Long | 265 | 5/15/15 | $ | 17,696,700 | $ | 2,207,530 | |||||||
| Platinum Future | Long | 50 | 7/30/15 | 2,851,000 | 4,855 | |||||||||
| Silver Future | Long | 25 | 7/30/15 | 2,019,125 | 24,077 | |||||||||
| Soybean Meal Future | Long | 50 | 7/15/15 | 1,580,500 | 8,920 | |||||||||
| Sugar #11 (World) | Long | 140 | 7/01/15 | 2,066,624 | 30,719 | |||||||||
| Wheat Future | Long | 40 | 7/15/15 | 94,800,000 | 1,946 | |||||||||
| $ | 27,161,949 | $ | 2,278,047 | |||||||||||
| Expiration | Value | Unrealized | ||||||||||||
| Description | Position | Contracts | Date | (Note 2) | Depreciation | |||||||||
| Copper Future | Short | (34) | 7/30/15 | $ | (2,453,525 | ) | $ | (101,147 | ) | |||||
| Copper Future | Short | (20) | 9/29/15 | (1,443,000 | ) | (81,167 | ) | |||||||
| Gold 100 Oz Future | Long | 8 | 6/27/15 | 945,920 | (2,587 | ) | ||||||||
| WTI Crude Future | Short | (177) | 5/19/15 | (10,554,510 | ) | (1,132,330 | ) | |||||||
| WTI Crude Future | Short | (67) | 6/20/15 | (4,067,570 | ) | (257,338 | ) | |||||||
| $ | (17,572,685 | ) | $ | (1,574,569 | ) | |||||||||
See Notes to Financial Statements.
25 | April 30, 2015
| ALPS | CoreCommodity Management | |
CompleteCommodities® Strategy Fund | |
| Consolidated Statement of Investments | April 30, 2015 (Unaudited) |
TOTAL RETURN SWAP CONTRACTS(a)
| Notional | Floating Rate/Fixed | Termination | Unrealized | |||||||||||||||
| Swap Counterparty | Reference Obligation | Dollars | Amount Paid by Fund | Date | Appreciation | |||||||||||||
| UBS | CRB 3m Fwd TR Index* | $ | 21,463,836 | USB3MTA + 40 bps** | 11/30/15 | $ | 1,476,481 | |||||||||||
| Citigroup | CRB 3m Fwd TR Index* | 62,718,936 | USB3MTA + 27 bps** | 09/18/15 | 4,314,389 | |||||||||||||
| Societe Generale | CRB 3m Fwd TR Index* | 104,482,226 | USB3MTA + 35 bps** | 11/30/15 | 7,187,255 | |||||||||||||
| Bank of America - Merrill Lynch | CRB 3m Fwd TR Index* | 59,654,338 | USB3MTA + 35 bps** | 06/30/15 | 4,103,577 | |||||||||||||
| Bank of America - Merrill Lynch | LME Copper Future | 3,418,200 | N/A | 05/20/15 | 392,100 | |||||||||||||
| Bank of America - Merrill Lynch | ML Aluminum GA6 | 4,479,410 | USB3MTA + 10 bps** | 06/30/15 | 320,435 | |||||||||||||
| Bank of America - Merrill Lynch | ML eXtra Copper GA6 | 4,577,066 | USB3MTA + 10 bps** | 06/30/15 | 247,285 | |||||||||||||
| Bank of America - Merrill Lynch | ML eXtra Coffee GA6 | 3,276,510 | USB3MTA + 10 bps** | 06/30/15 | 21,822 | |||||||||||||
| $ | 18,063,344 | |||||||||||||||||
| Floating Rate/Fixed | ||||||||||||||||||
| Notional | Amount Received by | Termination | Unrealized | |||||||||||||||
| Swap Counterparty | Reference Obligation | Dollars | Fund | Date | Appreciation | |||||||||||||
| Bank of America - Merrill Lynch | MLCS Silver J- F3 | $ | (532,405 | ) | USB3MTA** | 06/30/15 | $ | 15,410 | ||||||||||
| $ | 15,410 | |||||||||||||||||
| Total Appreciation | $ | 18,078,754 | ||||||||||||||||
| Notional | Floating Rate/Fixed | Termination | Unrealized | |||||||||||||||
| Swap Counterparty | Reference Obligation | Dollars | Amount Paid by Fund | Date | Depreciation | |||||||||||||
| Bank of America - Merrill Lynch | ML eXtra Silver GA6 | $ | 535,217 | USB3MTA + 10 bps** | 06/30/15 | $ | (15,135 | ) | ||||||||||
| $ | (15,135 | ) | ||||||||||||||||
| Floating Rate/Fixed | ||||||||||||||||||
| Notional | Amount Received by | Termination | Unrealized | |||||||||||||||
| Swap Counterparty | Reference Obligation | Dollars | Fund | Date | Depreciation | |||||||||||||
| Bank of America - Merrill Lynch | MLCS Copper J- F3 | $ | (4,576,811 | ) | USB3MTA** | 06/30/15 | $ | (239,581 | ) | |||||||||
| Bank of America - Merrill Lynch | MLCS Coffee J- F3 | (3,172,804 | ) | USB3MTA** | 06/30/15 | (22,869 | ) | |||||||||||
| Bank of America - Merrill Lynch | MLCX Aluminum J- F3 | (4,408,245 | ) | USB3MTA** | 06/30/15 | (322,123 | ) | |||||||||||
| $ | (584,573 | ) | ||||||||||||||||
| Total Depreciation | $ | (599,708 | ) | |||||||||||||||
(a) | The Fund receives payments based on any positive return of the Reference Obligation less the rate paid by the Fund. The Fund makes payments on any negative return of such Reference Obligations plus the rate paid by the fund |
| * | CRB - Commodity Research Bureau |
| ** | United States Auction Results 3 Month Treasury Bill High Discount |
See Notes to Financial Statements.
26 | April 30, 2015
| ALPS | CoreCommodity Management | |
CompleteCommodities® Strategy Fund | |
| Consolidated Statement of Assets and Liabilities | April 30, 2015 (Unaudited) |
| ASSETS | ||||
| Investments, at value | $ | 414,134,054 | ||
| Foreign currency, at value (Cost $6,149) | 6,141 | |||
| Unrealized appreciation on total return swap contracts | 18,078,754 | |||
| Receivable for investments sold | 644,663 | |||
| Receivable for shares sold | 785,993 | |||
| Receivable for variation margin | 2,278,047 | |||
| Cash collateral pledged for written options (Note 3) | 1,075,064 | |||
| Cash collateral pledged for futures contracts (Note 3) | 12,768,361 | |||
| Cash collateral pledged for total return swap contracts (Note 3) | 3,561,700 | |||
| Receivable from broker for futures contracts | 2,560,591 | |||
| Dividends and interest receivable | 857,913 | |||
| Prepaid expenses and other assets | 15,298 | |||
| Total Assets | 456,766,579 | |||
| LIABILITIES | ||||
| Written options, at value (premiums received $2,191,243) | 2,740,500 | |||
| Payable for variation margin | 1,574,569 | |||
| Payable due to broker for total return swap contracts | 74,495 | |||
| Payable for shares redeemed | 799,780 | |||
| Payable due to custodian - overdraft | 356,844 | |||
| Unrealized depreciation on total return swap contracts | 599,708 | |||
| Investment advisory fees payable | 310,088 | |||
| Administration and transferagency fees payable | 56,292 | |||
| Distribution and services fees payable | 26,640 | |||
| Trustees’ fees and expenses payable | 117 | |||
| Professional fees payable | 31,319 | |||
| Accrued expenses and other liabilities | 23,729 | |||
| Total Liabilities | 6,594,081 | |||
| NET ASSETS | $ | 450,172,498 | ||
| NET ASSETS CONSIST OF | ||||
| Paid- in capital | $ | 529,810,010 | ||
| Accumulated net investment loss | (4,459,788 | ) | ||
| Accumulated net realized loss on investments, written options, futures contracts, total return swap contracts and foreign currency transactions | (82,036,197 | ) | ||
| Net unrealized appreciation on investments, written options, futures contracts, total return swap contracts and translation of assets and liabilitiesdenominated in foreign currencies | 6,858,473 | |||
| NET ASSETS | $ | 450,172,498 | ||
| INVESTMENTS, AT COST | $ | 424,928,481 | ||
See Notes to Financial Statements.
27 | April 30, 2015
| ALPS | CoreCommodity Management | |
CompleteCommodities® Strategy Fund | |
| Consolidated Statement of Assets and Liabilities | April 30, 2015 (Unaudited) |
| PRICING OF SHARES | ||||
| Class A: | ||||
| Net Asset Value, offering and redemption price per share | $ | 8.50 | ||
| Net Assets | $ | 37,979,140 | ||
| Shares of beneficial interest outstanding (unlimited number of shares, no par value common stock authorized) | 4,466,754 | |||
| Maximum offering price per share ((NAV/0.9450), based on maximum sales charge of 5.50% of the offering price) | $ | 8.99 | ||
| Class C: | ||||
Net Asset Value, offering and redemption price per share(a) | $ | 8.33 | ||
| Net Assets | $ | 9,352,239 | ||
| Shares of beneficial interest outstanding (unlimited number of shares, no par value common stock authorized) | 1,123,173 | |||
| Class I: | ||||
| Net Asset Value, offering and redemption price per share | $ | 8.48 | ||
| Net Assets | $ | 402,841,119 | ||
| Shares of beneficial interest outstanding (unlimited number of shares, no par value common stock authorized) | 47,486,145 | |||
(a) | Redemption price per share may be reduced for any applicable contingent deferred sales charge. For a description of a possible sales charge, please see the Fund’s Prospectus. |
See Notes to Financial Statements.
28 | April 30, 2015
| ALPS | CoreCommodity Management | |
CompleteCommodities® Strategy Fund | |
| Consolidated Statement of Operations | For the Six Months Ended April 30, 2015 (Unaudited) |
| INVESTMENT INCOME | ||||
| Dividends | $ | 1,687,737 | ||
| Foreign taxes withheld on dividends | (96,048 | ) | ||
| Interest and other income, net of premium amortization and accretion of discount | (3,549,187 | ) | ||
| Total Investment Income | (1,957,498 | ) | ||
| EXPENSES | ||||
| Investment advisory fees | 1,720,765 | |||
| Administrative fees | 239,897 | |||
| Transfer agency fees | 52,043 | |||
| Distribution and service fees | ||||
| Class A | 72,416 | |||
| Class C | 49,429 | |||
| Professional fees | 36,890 | |||
| Networking fees | ||||
| Class I | 142,590 | |||
| Reports to shareholders and printing fees | 23,538 | |||
| State registration fees | 30,723 | |||
| SEC registration fees | 112 | |||
| Insurance fees | 2,794 | |||
| Custody fees | 21,467 | |||
| Trustees’ fees and expenses | 10,936 | |||
| Repayment of previously waived fees | ||||
| Class I | 14,914 | |||
| Miscellaneous expenses | 11,013 | |||
| Total Expenses | 2,429,527 | |||
| Less fees waived/reimbursed by investment advisor (Note 8) | ||||
| Class A | (2,108 | ) | ||
| Class C | (527 | ) | ||
| Net Expenses | 2,426,892 | |||
| Net Investment Loss | (4,384,390 | ) | ||
| Net realized loss on investments | (8,217,512 | ) | ||
| Net realized gain on written options | 867,361 | |||
| Net realized loss on futures contracts | (1,771,373 | ) | ||
| Net realized loss on total return swap contracts | (62,311,991 | ) | ||
| Net realized loss on foreign currency transactions | (1,014,330 | ) | ||
| Net change in unrealized appreciation on investments | 5,420,041 | |||
| Net change in unrealized depreciation on written options | (796,778 | ) | ||
| Net change in unrealized appreciation on futures contracts | 1,860,901 | |||
| Net change in unrealized appreciation on total return swap contracts | 23,561,010 | |||
| Net change in unrealized appreciation on translation of assets and liabilities denominated in foreign currencies | 25,551 | |||
| NET REALIZED AND UNREALIZED LOSS ON INVESTMENTS | (42,377,120 | ) | ||
| NET DECREASE IN NET ASSETS RESULTING FROM OPERATIONS | $ | (46,761,510 | ) | |
See Notes to Financial Statements.
29 | April 30, 2015
| ALPS | CoreCommodity Management |
CompleteCommodities® Strategy Fund |
| Consolidated Statements of Changes in Net Assets |
| For the Six Months | For the Fiscal Period | |||||||
| Ended April 30, 2015 | Ended October 31, | |||||||
| (Unaudited) | 2014(a) | |||||||
| OPERATIONS | ||||||||
| Net investment loss | $ | (4,384,390 | ) | $ | (225,381 | ) | ||
| Net realized loss on investments, written options, futures contracts, total return swap contracts and foreign currency transactions | (72,447,845 | ) | (21,185,447 | ) | ||||
| Net change in unrealized appreciation/(depreciation) on investments, written options, futures contracts, total return swap contracts and translation of assets and liabilities denominated in foreign currencies | 30,070,725 | (36,830,011 | ) | |||||
| Net Decrease in Net Assets Resulting from Operations | (46,761,510 | ) | (58,240,840 | ) | ||||
| DISTRIBUTIONS | ||||||||
| Dividends to shareholders from net investment income | ||||||||
| Class I | (1,912,471 | ) | – | |||||
| Net Decrease in Net Assets from Distributions | (1,912,471 | ) | – | |||||
| BENEFICIAL INTEREST TRANSACTIONS (NOTE 6) | ||||||||
| Shares sold | ||||||||
| Class A | 11,338,982 | 21,322,142 | ||||||
| Class C | 1,562,618 | 3,307,759 | ||||||
| Class I | 205,989,998 | 225,598,695 | ||||||
| Dividends reinvested | ||||||||
| Class I | 1,791,360 | – | ||||||
| Shares redeemed, net of redemption fees | ||||||||
| Class A | (9,017,537 | ) | (86,135,268 | ) | ||||
| Class C | (3,357,267 | ) | (3,037,985 | ) | ||||
| Class I | (155,584,649 | ) | (49,542,035 | ) | ||||
| Net Increase in Net Assets Derived from Beneficial Interest Transactions | 52,723,505 | 111,513,308 | ||||||
| Net increase in net assets | 4,049,524 | 53,272,468 | ||||||
| NET ASSETS | ||||||||
| Beginning of period | 446,122,974 | 392,850,506 | ||||||
| End of period * | $ | 450,172,498 | $ | 446,122,974 | ||||
| *Including accumulated net investment income/(loss) of: | $ | (4,459,788 | ) | $ | 1,837,073 | |||
(a) | Effective May 1, 2014, the Board approved changing the fiscal year-end of the Funds from April 30 to October 31. |
See Notes to Financial Statements.
30 | April 30, 2015
| ALPS | CoreCommodity Management |
CompleteCommodities® Strategy Fund – Class A |
| Consolidated Financial Highlights |
| Selected data for a share of beneficial interest outstanding throughout the periods indicated: |
| For the | ||||||||||||||||||||||||
| For the Six | For the | Period | ||||||||||||||||||||||
| Months | Fiscal | June 29, | ||||||||||||||||||||||
| Ended | Period | For the Year | For the Year | For the Year | 2010 | |||||||||||||||||||
| April 30, | Ended | Ended | Ended | Ended | (Inception) | |||||||||||||||||||
| 2015 | October 31, | April 30, | April 30, | April 30, | to April 30, | |||||||||||||||||||
(Unaudited)(a) | 2014(a)(b) | 2014(a) | 2013(a)(c) | 2012(a) | 2011(a) | |||||||||||||||||||
| Net asset value, beginning of period | $ | 9.56 | $ | 10.87 | $ | 10.40 | $ | 11.18 | $ | 14.28 | $ | 10.00 | ||||||||||||
| INCOME/(LOSS) FROM INVESTMENT OPERATIONS: | ||||||||||||||||||||||||
Net investment income/(loss)(d) | (0.10 | ) | 0.00 | (e) | (0.06 | ) | (0.03 | ) | 0.04 | 0.12 | ||||||||||||||
| Net realized and unrealized gain/(loss) | (0.96 | ) | (1.31 | ) | 0.53 | (0.69 | ) | (2.29 | ) | 4.87 | ||||||||||||||
| Total from investment operations | (1.06 | ) | (1.31 | ) | 0.47 | (0.72 | ) | (2.25 | ) | 4.99 | ||||||||||||||
| DISTRIBUTIONS: | ||||||||||||||||||||||||
| From net investment income | – | – | – | – | (0.83 | ) | (0.71 | ) | ||||||||||||||||
| From net realized gains | – | – | – | – | (0.02 | ) | – | |||||||||||||||||
| Tax return of capital | – | – | – | (0.06 | ) | – | – | |||||||||||||||||
| Total distributions | – | – | – | (0.06 | ) | (0.85 | ) | (0.71 | ) | |||||||||||||||
| REDEMPTION FEES ADDED TO PAID- IN CAPITAL (NOTE 6) | 0.00 | (e) | 0.00 | (e) | 0.00 | (e) | 0.00 | (e) | 0.00 | (e) | 0.00 | (e) | ||||||||||||
| Net increase/(decrease) in net asset value | (1.06 | ) | (1.31 | ) | 0.47 | (0.78 | ) | (3.10 | ) | 4.28 | ||||||||||||||
| Net asset value, end of period | $ | 8.50 | $ | 9.56 | $ | 10.87 | $ | 10.40 | $ | 11.18 | $ | 14.28 | ||||||||||||
TOTAL RETURN(f) | (11.09 | )% | (12.05 | )% | 4.52 | % | (6.44 | )% | (15.77 | )% | 51.41 | % | ||||||||||||
| RATIOS/SUPPLEMENTAL DATA: | ||||||||||||||||||||||||
| Net assets, end of period (000s) | $ | 37,979 | $ | 39,971 | $ | 112,562 | $ | 104,234 | $ | 85,805 | $ | 37,060 | ||||||||||||
| Ratio of expenses to average net assets excluding fee waivers and reimbursements | 1.46 | %(g) | 1.46 | %(g) | 1.50 | % | 1.50 | % | 1.64 | % | 2.59 | %(g) | ||||||||||||
| Ratio of expenses to average net assets including fee waivers and reimbursements | 1.45 | %(g) | 1.45 | %(g) | 1.45 | % | 1.40 | %(h) | 1.45 | % | 1.45 | %(g) | ||||||||||||
| Ratio of net investment income/(loss) to average net assets | (2.46 | )%(g) | 0.09 | %(g) | (0.60 | )% | (0.30 | )% | 0.36 | % | 1.08 | %(g) | ||||||||||||
Portfolio turnover rate(i) | 29 | % | 12 | % | 28 | % | 117 | % | 264 | % | 59 | % | ||||||||||||
(a) | Per share amounts and ratios to average net assets include income and expenses of the CoreCommodity Management Cayman Commodity Fund Ltd. (wholly-owned subsidiary). |
(b) | Effective May 1, 2014, the Board approved changing the fiscal year-end of the Funds from April 30 to October 31. |
(c) | Prior to April 30, 2013 the ALPS | CoreCommodity Management CompleteCommodities® Strategy Fund was known as the Jefferies Asset Management Commodity Strategy Allocation Fund. |
(d) | Calculated using the average shares method. |
(e) | Less than $0.005 per share. |
(f) | Total returns are for the period indicated and have not been annualized. Total returns would have been lower had certain expenses not been waived during the period. Returns shown do not reflect the deduction of taxes that a shareholder would pay on Fund distributions or the redemption of Fund shares. Returns shown exclude any applicable sales charges. |
(g) | Annualized. |
(h) | According to the Fund’s shareholder services plan with respect to the Fund’s Class A shares, any amount of such payment not paid during the Fund’s fiscal year for such service activities shall be reimbursed to the Fund as soon as practical after the end of the fiscal year. Fees were reimbursed to the Fund during the year ended April 30, 2013, for the prior fiscal year in the amount of 0.05% of average net assets of Class A shares. |
(i) | Portfolio turnover rate for periods less than one full year have not been annualized. |
See Notes to Financial Statements.
31 | April 30, 2015
| ALPS | CoreCommodity Management |
CompleteCommodities® Strategy Fund – Class C |
| Consolidated Financial Highlights |
| Selected data for a share of beneficial interest outstanding throughout the periods indicated: |
| For the | ||||||||||||||||||||||||
| For the Six | For the | Period | ||||||||||||||||||||||
| Months | Fiscal | June 29, | ||||||||||||||||||||||
| Ended | Period | For the Year | For the Year | For the Year | 2010 | |||||||||||||||||||
| April 30, | Ended | Ended | Ended | Ended | (Inception) | |||||||||||||||||||
| 2015 | October 31, | April 30, | April 30, | April 30, | to April 30, | |||||||||||||||||||
(Unaudited)(a) | 2014(a)(b) | 2014(a) | 2013(a)(c) | 2012(a) | 2011(a) | |||||||||||||||||||
| Net asset value, beginning of period | $ | 9.39 | $ | 10.71 | $ | 10.31 | $ | 11.15 | $ | 14.19 | $ | 10.00 | ||||||||||||
| INCOME/(LOSS) FROM INVESTMENT OPERATIONS: | ||||||||||||||||||||||||
Net investment income/(loss)(d) | (0.13 | ) | (0.04 | ) | (0.12 | ) | (0.10 | ) | (0.05 | ) | 0.08 | |||||||||||||
| Net realized and unrealized gain/(loss) | (0.93 | ) | (1.28 | ) | 0.52 | (0.69 | ) | (2.26 | ) | 4.87 | ||||||||||||||
| Total from investment operations | (1.06 | ) | (1.32 | ) | 0.40 | (0.79 | ) | (2.31 | ) | 4.95 | ||||||||||||||
| DISTRIBUTIONS: | ||||||||||||||||||||||||
| From net investment income | – | – | – | – | (0.71 | ) | (0.76 | ) | ||||||||||||||||
| From net realized gains | – | – | – | – | (0.02 | ) | – | |||||||||||||||||
| Tax return of capital | – | – | – | (0.05 | ) | – | – | |||||||||||||||||
| Total distributions | – | – | – | (0.05 | ) | (0.73 | ) | (0.76 | ) | |||||||||||||||
| REDEMPTION FEES ADDED TO PAID- IN CAPITAL (NOTE 6) | 0.00 | (e) | 0.00 | (e) | 0.00 | (e) | 0.00 | (e) | 0.00 | (e) | 0.00 | (e) | ||||||||||||
| Net increase/(decrease) in net asset value | (1.06 | ) | (1.32 | ) | 0.40 | (0.84 | ) | (3.04 | ) | 4.19 | ||||||||||||||
| Net asset value, end of period | $ | 8.33 | $ | 9.39 | $ | 10.71 | $ | 10.31 | $ | 11.15 | $ | 14.19 | ||||||||||||
TOTAL RETURN(f) | (11.29 | )% | (12.32 | )% | 3.88 | % | (7.10 | )% | (16.26 | )% | 50.90 | % | ||||||||||||
| RATIOS/SUPPLEMENTAL DATA: | ||||||||||||||||||||||||
| Net assets, end of period (000s) | $ | 9,352 | $ | 12,534 | $ | 13,996 | $ | 19,444 | $ | 18,095 | $ | 7,352 | ||||||||||||
| Ratio of expenses to average net assets excluding fee waivers and reimbursements | 2.06 | %(g) | 2.07 | %(g) | 2.10 | % | 2.14 | % | 2.24 | % | 4.00 | %(g) | ||||||||||||
| Ratio of expenses to average net assets including fee waivers and reimbursements | 2.05 | %(g) | 2.05 | %(g) | 2.05 | % | 2.05 | % | 2.05 | % | 2.05 | %(g) | ||||||||||||
| Ratio of net investment income/(loss) to average net assets | (3.03 | )%(g) | (0.82 | )%(g) | (1.16 | )% | (0.92 | )% | (0.42 | )% | 0.72 | %(g) | ||||||||||||
Portfolio turnover rate(h) | 29 | % | 12 | % | 28 | % | 117 | % | 264 | % | 59 | % | ||||||||||||
(a) | Per share amounts and ratios to average net assets include income and expenses of the CoreCommodity Management Cayman Commodity Fund Ltd. (wholly-owned subsidiary). |
(b) | Effective May 1, 2014, the Board approved changing the fiscal year-end of the Funds from April 30 to October 31. |
(c) | Prior to April 30, 2013 the ALPS | CoreCommodity Management CompleteCommodities® Strategy Fund was known as the Jefferies Asset Management Commodity Strategy Allocation Fund. |
(d) | Calculated using the average shares method. |
(e) | Less than $0.005 per share. |
(f) | Total returns are for the period indicated and have not been annualized. Total returns would have been lower had certain expenses not been waived during the period. Returns shown do not reflect the deduction of taxes that a shareholder would pay on Fund distributions or the redemption of Fund shares. Returns shown exclude any applicable sales charges. |
(g) | Annualized. |
(h) | Portfolio turnover rate for periods less than one full year have not been annualized. |
See Notes to Financial Statements.
32 | April 30, 2015
| ALPS | CoreCommodity Management |
CompleteCommodities® Strategy Fund – Class I |
| Consolidated Financial Highlights |
| Selected data for a share of beneficial interest outstanding throughout the periods indicated: |
| For the | ||||||||||||||||||||||||
| For the Six | For the | Period | ||||||||||||||||||||||
| Months | Fiscal | June 29, | ||||||||||||||||||||||
| Ended | Period | For the Year | For the Year | For the Year | 2010 | |||||||||||||||||||
| April 30, | Ended | Ended | Ended | Ended | (Inception) | |||||||||||||||||||
| 2015 | October 31, | April 30, | April 30, | April 30, | to April 30, | |||||||||||||||||||
(Unaudited)(a) | 2014(a)(b) | 2014(a) | 2013(a)(c) | 2012(a) | 2011(a) | |||||||||||||||||||
| Net asset value, beginning of period | $ | 9.57 | $ | 10.87 | $ | 10.37 | $ | 11.12 | $ | 14.25 | $ | 10.00 | ||||||||||||
| INCOME/(LOSS) FROM INVESTMENT OPERATIONS: | ||||||||||||||||||||||||
Net investment income/(loss)(d) | (0.09 | ) | (0.01 | ) | (0.03 | ) | (0.00 | )(e) | 0.10 | 0.13 | ||||||||||||||
| Net realized and unrealized gain/(loss) | (0.95 | ) | (1.29 | ) | 0.53 | (0.69 | ) | (2.32 | ) | 4.89 | ||||||||||||||
| Total from investment operations | (1.04 | ) | (1.30 | ) | 0.50 | (0.69 | ) | (2.22 | ) | 5.02 | ||||||||||||||
| DISTRIBUTIONS: | ||||||||||||||||||||||||
| From net investment income | (0.05 | ) | – | – | – | (0.89 | ) | (0.77 | ) | |||||||||||||||
| From net realized gains | – | – | �� | – | – | (0.02 | ) | – | ||||||||||||||||
| Tax return of capital | – | – | – | (0.06 | ) | – | – | |||||||||||||||||
| Total distributions | (0.05 | ) | – | – | (0.06 | ) | (0.91 | ) | (0.77 | ) | ||||||||||||||
| REDEMPTION FEES ADDED TO PAID- IN CAPITAL (NOTE 6) | 0.00 | (e) | 0.00 | (e) | 0.00 | (e) | 0.00 | (e) | 0.00 | (e) | 0.00 | (e) | ||||||||||||
| Net increase/(decrease) in net asset value | (1.09 | ) | (1.30 | ) | 0.50 | (0.75 | ) | (3.13 | ) | 4.25 | ||||||||||||||
| Net asset value, end of period | $ | 8.48 | $ | 9.57 | $ | 10.87 | $ | 10.37 | $ | 11.12 | $ | 14.25 | ||||||||||||
TOTAL RETURN(f) | (10.91 | )% | (11.96 | )% | 4.82 | % | (6.16 | )% | (15.53 | )% | 51.74 | % | ||||||||||||
| RATIOS/SUPPLEMENTAL DATA: | ||||||||||||||||||||||||
| Net assets, end of period (000s) | $ | 402,841 | $ | 393,618 | $ | 266,293 | $ | 187,146 | $ | 83,497 | $ | 73,630 | ||||||||||||
| Ratio of expenses to average net assets excluding fee waivers and reimbursements | 1.15 | %(g) | 1.16 | %(g) | 1.16 | % | 1.17 | % | 1.33 | % | 2.04 | %(g) | ||||||||||||
| Ratio of expenses to average net assets including fee waivers and reimbursements | 1.15 | %(g) | 1.15 | %(g) | 1.15 | % | 1.15 | % | 1.15 | % | 1.15 | %(g) | ||||||||||||
| Ratio of net investment income/(loss) to average net assets | (2.11 | )%(g) | (0.12 | )%(g) | (0.26 | )% | (0.02 | )% | 0.82 | % | 1.19 | %(g) | ||||||||||||
Portfolio turnover rate(h) | 29 | % | 12 | % | 28 | % | 117 | % | 264 | % | 59 | % | ||||||||||||
(a) | Per share amounts and ratios to average net assets include income and expenses of the CoreCommodity Management Cayman Commodity Fund Ltd. (wholly-owned subsidiary). |
(b) | Effective May 1, 2014, the Board approved changing the fiscal year-end of the Funds from April 30 to October 31. |
(c) | Prior to April 30, 2013 the ALPS | CoreCommodity Management CompleteCommodities® Strategy Fund was known as the Jefferies Asset Management Commodity Strategy Allocation Fund. |
(d) | Calculated using the average shares method. |
(e) | Less than $0.005 per share. |
(f) | Total returns are for the period indicated and have not been annualized. Total returns would have been lower had certain expenses not been waived during the period. Returns shown do not reflect the deduction of taxes that a shareholder would pay on Fund distributions or the redemption of Fund shares. |
(g) | Annualized. |
(h) | Portfolio turnover rate for periods less than one full year have not been annualized. |
See Notes to Financial Statements.
33 | April 30, 2015
| ALPS | Kotak India Growth Fund | |
| Management Commentary | April 30, 2015 (Unaudited) |
Performance
ALPS | Kotak India Growth Fund (the “Fund”) was launched on February 14, 2011. During the 6 month period ended April 30, 2015 (hereinafter also referred to as “the period”), the Fund’s Class A Shares, INDAX, delivered a total return of 0.45% at Net Asset Value (NAV), Class C, INFCX, delivered 0.03% at NAV, and Class I, INDIX, delivered 0.71%. The fund outperformed the benchmark CNX 500 Index (“CNX 500”) which returned -2.31% during the period without taking into account sales charges for Class A and C Shares.
The period saw consolidation of the equity markets after a sharp rise in the previous six months post the landslide victory of the Mr. Narendra Modi’s Bharatiya Janata Party (BJP) led National Democratic Alliance (NDA).
The period also saw a significant collapse of commodity prices, particularly oil. India being a large oil importer is seeing positive impact of this fall on its trade deficit, inflation and currency.
After reaching its all-time high, the equity markets have consolidated in recent months. The new government under Mr. Narendra Modi has a pro-development and pro-reform agenda. The economy in the previous few years had seen worries emerging on multiple fronts. A general slowdown in the economy led by weak investment cycle, rising inflation and widening current account deficit impacting the currency, and high subsidies particularly oil subsidies had led to deterioration of the fiscal deficit. The mandate for Mr. Modi has been for change and reviving the economic growth.
In the first year of its five year mandate, the government has embarked many changes. One of the big priorities of the new government is to make India a preferred destination for investments. Manufacturing, under the mantra of “Make in India” is a key agenda. As part of this agenda, there are many policy changes that have already been put in place or are under various stages of implementation. Investment levels in many restricted sectors have been further liberalized. Foreign investment limit in insurance has been increased from 26% to 49%, in defense to 49%, up to 100% in many areas of railways. In addition, there has been big focus on improving efficiencies and speeding up the clearance mechanism for investments. Many projects which have seen inordinate delays on the backs of regulatory bottlenecks like environment clearance have seen significant progress. In addition, there has been a beginning in easing up the tight labour regulations. In all, an all-round effort towards “ease of doing business” in India is being embarked upon. Towards this effort significant tax changes are underway. India is moving towards a uniform Goods and Services Tax (GST) regime. While the legislation is yet to be cleared, the government is targeting to implement Uniform GST by 1 April, 2016. This in addition to improving the tax net and thus improving tax to GDP (Gross Domestic Product) will go a long way in making India a homogenous economy where movement of goods and services will be eased thus improving investment climate.
In addition, there was a big change in the coal mining industry and a new legislation is in place which allows for the first time commercial mining of coal by the private sector. A new minerals bill now mandates auction of key minerals thus improving transparency and efficiency in this core segment of the economy.
The government has also started a big push towards reducing the subsidies and targeting them better. Diesel fuel has been deregulated and government has started direct benefit transfer on cooking gas subsidy. With this reduction in subsidy, the government is spending more towards infrastructure build. Budgetary support towards roads is 2.5X of last fiscal and towards railways is 1.5x of
last fiscal.
last fiscal.
In addition to these changes, though politically sensitive, a major legislation of land acquisition is being pursued. This in our view can remove a big bottleneck in the investment cycle revival and infrastructure development. In all a comprehensives set of reforms and policy measures have been taken or are under consideration to revive the investment cycle and improve the overall economy.
During the period we also saw meaningful improvement in other macro factors namely inflation and current account deficit, both benefitting from the fall in the commodity price. Consumer inflation (the Consumer Price Index) has been around 5% and wholesale inflation (the Wholesale Price Index) is now trending in negative territory with April API at -2.65%. With inflation now trending lower than the central bank (the Reserve Bank of India, or “RBI”) trajectory, the RBI has had two 25 basis point (“bps”) rate cuts in the 2015 calendar year so far.
While the political change and the macro improvement have been positive, economic growth is yet to pick up thus far. Corporate earnings have also been sluggish in the past two quarters. Some part of the weakness is clearly attributable to lack of earnings for the commodity producers but overall we have seen weak revenue growth leading to disappointing profit growth. While commodity price decline has hurt the profits of commodity producers, we see a meaningful margin benefit to accrue to sectors like autos and auto ancillaries, consumers both durables and staples, and capital good. The interest rate cycle change also bodes well for corporate earnings in coming quarters. However, the key to corporate earnings remains an uptick in overall economy and that we see only from second half of the current fiscal.
One of the prime reasons for the weaker than expected economic growth in the last few months has been a lack of government spending to rein in the fiscal deficit for year ending Mar 2015 to 4.1% of GDP. We see this changing from here on. Budgetary allocation in Finance bill 2015-16 has seen meaningful allocation increases to government spending in segments like roads and railways in particular. We expect heightened activity in these segments from here on and this could well prove to be the required trigger to kick-start the economic uptick and the investment cycle. Two other areas where large scale investment is potentially visible but the impact will be felt more in the medium term are Defense and Nuclear Energy.
34 | April 30, 2015
| ALPS | Kotak India Growth Fund | |
| Management Commentary | April 30, 2015 (Unaudited) |
During Mr. Modi’s recent trips, India has recently signed up for arrangements on nuclear fuel from Australia and Canada increasing visibility of large scale nuclear power investments in India. However, private investment still remains weak. In our view, public spending will lead the investment cycle and private investment will follow towards the second half of the current fiscal.
Portfolio Composition
The portfolio continues to be positioned in a way as to benefit from a revival in the economy and improving macroeconomic tailwinds from the four broad investment themes in India – consumption led by favorable demographics, financial services, infrastructure and outsourcing. The fund mandate is flexible to invest across the spectrum of market capitalizations in order to take advantage of any opportunistic mispricing arising from market conditions, valuation differential, earnings growth or liquidity flows.
For the six month period ending April 30, 2015, Cement & Cement Products (650 basis points “bps”), Paints (130 bps) and Construction (130 bps) are the largest over weights compared to benchmark, while Oil & Gas (360bps), Utilities (233bps), Telecom (157 bps) are the largest underweights in the portfolio as against the benchmark. In terms of market capitalization focus, as of 30 April, 2015, the fund is invested 71.44% in large caps, 20.96% in midcaps and 5.48% in small caps. Over the last 12 months, exposure to midcap and small cap companies has remained in the range of 23%-27% of the fund.
Outlook
In the last six months, there has been a recalibration of expectations from the Modi government. One year after, while there is an all-round effort to kick start the economy and also to curb corruption, things could have done a faster pace. Exuberance has given way to guarded optimism. While we are confident that key legislation, the GST and Land acquisition bills, will be passed in the next session of the parliament, these are facing some political headwinds. On the back of slow economic uptick, the last two quarter earnings as earlier highlighted has also been muted and as a result Indian equity markets though at times volatile have consolidated in the period.
After this period of consolidation, markets are trading at around 16.5X one year forward Price to Earnings (PE) and 14.2X year ending March 2017. Our bottom up estimates suggests a higher teen earnings growth over the next 12-24 months and is in sync with our top down view of economic growth picking up from here on. Indian economy is poised to be amongst the fastest growing economy in the world and with corporate earnings at a cusp of uptick, Indian equity markets after this period of consolidation is now at a reasonable valuation. The benefit of the changes put in place by the new government and the overall benefit of soft commodity prices to the economy and the consumer will start showing through in the economy from here. Further with inflation likely to remain benign, we see room for accommodative monetary policy. Though there are some risks in the near term, namely, sharp uptick in oil prices, weak monsoon and its impact on both food inflation and rural economy, possible reversal of global equity flows as and when the US interest rate cycle turns and weak corporate earnings. However, one should use this phase of consolidation in the market to increase exposure in Indian equities.
Nitin Jain – Portfolio Manager
Important Notice
Investments in India are subject to a number of risks including, but not limited to, risk of losing some or all of the capital invested, high market volatility, variable market liquidity, geopolitical risks (including political instability), exchange rate fluctuations (between the currency of the fund’s share class and the Indian Rupee), changes in tax regime and restrictions on investment activities of foreign investors.
Basis Point – a unit that is equal to 1/100th of 1% and is used to denote the change in a financial instrument.
The views and information discussed in this commentary are as of the date of publication, are subject to change, and may not reflect the writer’s current views. The views expressed represent an assessment of market conditions at a specific point in time, are opinions only and should not be relied upon as investment advice regarding a particular investment or markets in general. Such information does not constitute a recommendation to buy or sell specific securities or investment vehicles. It should not be assumed that any investment will be profitable or will equal the performance of the fund or any securities or any sectors mentioned in this letter. The subject matter contained in this letter has been derived from several sources believed to be reliable and accurate at the time of compilation. Neither the Fund nor Kotak Mahindra (UK) Limited accepts any liability for losses either direct or consequential caused by the use of this information.
35 | April 30, 2015
| ALPS | Kotak India Growth Fund | |
| Performance Update | April 30, 2015 (Unaudited) |
Performance of $10,000 Initial Investment (as of April 30, 2015)
Comparison of change in value of a $10,000 investment (includes maximum sales charges of 5.50%)
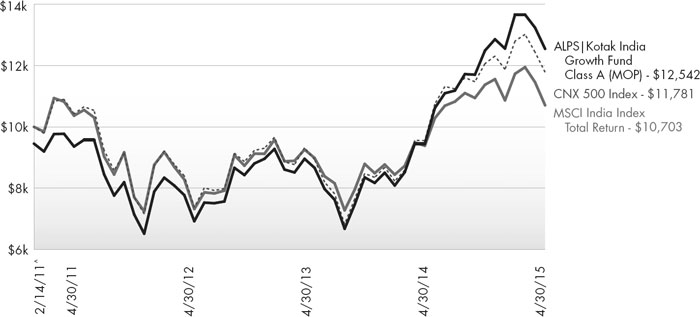
The chart above represents historical performance of a hypothetical investment of $10,000 in the Fund since inception. Past performance does not guarantee future results. This chart does not reflect the deduction of taxes that a shareholder would pay on Fund distributions or the redemption of Fund shares.
Average Annual Total Returns (as of April 30, 2015)
| 6 Month | 1 Year | 3 Year | Since Inception^ | Total Expense Ratio | What You Pay* | |
| Class A (NAV) | 0.45% | 32.73% | 17.28% | 6.96% | 5.02% | 2.00% |
| Class A (MOP) | -5.08% | 25.45% | 15.08% | 5.53% | ||
| Class C (NAV) | 0.03% | 31.88% | 16.49% | 6.23% | 5.57% | 2.60% |
| Class C (CDSC) | -0.93% | 30.88% | 16.49% | 6.23% | ||
| Class I | 0.71% | 33.31% | 17.72% | 7.33% | 4.49% | 1.60% |
CNX 500 Index1 | -2.31% | 23.30% | 11.93% | 3.97% | ||
MSCI India Index Total Return2 | -5.88% | 14.06% | 8.91% | 1.63% |
Performance data quoted represents past performance. Past performance does not guarantee future results. Investment return and principal value of an investment will fluctuate so that an investor’s shares, when sold or redeemed, may be worth more or less than the original cost. Current performance data may be higher or lower than actual data quoted. For the most current month-end performance data, please call 1-877-256-8445.
Maximum Offering Price (MOP) for Class A shares includes the Fund’s maximum sales charge of 5.50%. Performance shown at NAV does not include these sales charges and would have been lower had it been taken into account. If you invest $1 million or more, either as a lump sum or through the Fund’s accumulation or letter of intent programs, you can purchase Class A shares without an initial sales charge (load). A Contingent Deferred Sales Charge (“CDSC”) of 1.00% may apply to Class C shares redeemed within the first 12 months after a purchase, and on Class A shares redeemed within the first 18 months after a purchase in excess of $1 million. The Fund imposes a 2.00% redemption fee on shares held for less than 30 days.
Performance less than 1 year is cumulative.
36 | April 30, 2015
| ALPS | Kotak India Growth Fund | |
| Performance Update | April 30, 2015 (Unaudited) |
Investing in the Fund is subject to investment risks, including possible loss of the principal amount invested. Derivatives generally are more sensitive to changes in economic or market conditions than other types of investments; this could result in losses that significantly exceed the funds original investment.
| 1 | CNX 500 Index - India’s first broad based benchmark of the Indian capital market. The CNX 500 companies are disaggregated into 72 industry indices. Industry weightages in the index reflect the industry weightages in the market. The index is not actively managed and does not reflect any deduction for fees, expenses or taxes. An investor may not invest directly in an index. |
| 2 | MSCI India Index - designed to measure the performance of the large and mid cap segments of the Indian market. With 64 constituents, the index covers approximately 85% of the Indian equity universe. |
| ^ | Fund inception date of February 14, 2011. |
| * | What You Pay reflects the Advisor’s and Sub-Advisor’s decision to contractually limit expenses through February 29, 2016. Please see the prospectus for additional information. |
The table does not reflect the deduction of taxes that a shareholder would pay on Fund distributions or the redemption of Fund shares.
This Fund is not suitable for all investors and is subject to investment risks, including possible loss of the principal amount invested.
There is no guarantee that the Fund will continue to hold any one particular security or stay invested in any one particular company. The composition of the Fund’s top holdings is subject to change. Performance figures are historical and reflect the change in share price, reinvested distributions, changes in net asset value, sales charges and capital gains distributions, if any.
Not FDIC Insured – No Bank Guarantee – May Lose Value
Investing in India involves risk and considerations not present when investing in more established securities markets. The Fund may be more susceptible to economic, market, political and local risks of the region than a fund that is more geographically diversified. Investments in India are subject to a number of risks including, but not limited to, risk of losing some or all of the capital invested, high market volatility, variable market liquidity, geopolitical risks (including political instability), exchange rate fluctuations (between the currency of the fund’s share class and the Indian Rupee), changes in tax regime and restrictions on investment activities of foreign investors.
Top Ten Holdings (as a % of Net Assets) †
| Infosys, Ltd. | 4.78% |
| Axis Bank, Ltd. | 4.52% |
| ICICI Bank, Ltd. | 4.32% |
| HDFC Bank, Ltd. | 4.30% |
| Tata Consultancy Services, Ltd. | 4.14% |
| ITC, Ltd. | 4.03% |
| Larsen & Toubro, Ltd. | 3.35% |
| Housing Development Finance Corp. | 3.19% |
| State Bank of India | 2.89% |
| Sun Pharmaceutical Industries, Ltd. | 2.88% |
| Top Ten Holdings | 38.40% |
| † | Holdings are subject to change. Table presents approximate values only. |
Industry Sector Allocation (as a % of Net Assets)
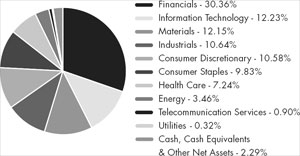
37 | April 30, 2015
| ALPS | Kotak India Growth Fund | |
| Consolidated Statement of Investments | April 30, 2015 (Unaudited) |
| Value | ||||||||
| Shares | (Note 2) | |||||||
| COMMON STOCKS (97.71%) | ||||||||
| Consumer Discretionary (10.58%) | ||||||||
| Auto Components (2.83%) | ||||||||
| Motherson Sumi Systems, Ltd. | 32,000 | $ | 253,292 | |||||
| MRF, Ltd. | 415 | 239,259 | ||||||
| 492,551 | ||||||||
| Automobiles (6.20%) | ||||||||
| Maruti Suzuki India, Ltd. | 6,974 | 408,703 | ||||||
| Tata Motors, Ltd., Class A | 91,894 | 449,030 | ||||||
| TVS Motor Co., Ltd. | 59,900 | 221,764 | ||||||
| 1,079,497 | ||||||||
| Media (1.55%) | ||||||||
Dish TV India, Ltd.(a) | 229,000 | 270,942 | ||||||
| TOTAL CONSUMER DISCRETIONARY | 1,842,990 | |||||||
| Consumer Staples (9.83%) | ||||||||
| Beverages (2.64%) | ||||||||
| United Breweries, Ltd. | 13,300 | 194,799 | ||||||
United Spirits, Ltd.(a) | 5,050 | 264,595 | ||||||
| 459,394 | ||||||||
| Food Products (2.34%) | ||||||||
| Britannia Industries, Ltd. | 10,000 | 345,553 | ||||||
| Nestle India, Ltd. | 600 | 62,018 | ||||||
| 407,571 | ||||||||
| Household Products (0.82%) | ||||||||
| Jyothy Laboratories, Ltd. | 36,500 | 142,629 | ||||||
| Tobacco (4.03%) | ||||||||
| ITC, Ltd. | 138,500 | 701,915 | ||||||
| TOTAL CONSUMER STAPLES | 1,711,509 | |||||||
| Energy (3.46%) | ||||||||
| Oil, Gas & Consumable Fuels (3.46%) | ||||||||
| Hindustan Petroleum Corp., Ltd. | 29,700 | 291,837 | ||||||
| Reliance Industries, Ltd. | 22,959 | 311,386 | ||||||
| 603,223 | ||||||||
| TOTAL ENERGY | 603,223 | |||||||
| Financials (30.36%) | ||||||||
| Commercial Banks (21.57%) | ||||||||
| Axis Bank, Ltd. | 88,264 | 787,913 | ||||||
| Bank of Baroda | 93,240 | 247,721 | ||||||
| HDFC Bank, Ltd. | 48,033 | 748,188 | ||||||
| ICICI Bank, Ltd. | 144,000 | 752,306 | ||||||
| IndusInd Bank, Ltd. | 26,547 | 344,004 | ||||||
| Value | ||||||||
| Shares | (Note 2) | |||||||
| Commercial Banks (continued) | ||||||||
| State Bank of India | 118,640 | $ | 502,873 | |||||
| Yes Bank, Ltd. | 28,400 | 374,625 | ||||||
| 3,757,630 | ||||||||
| Consumer Finance (2.27%) | ||||||||
| Shriram Transport Finance Co., Ltd. | 14,000 | 213,665 | ||||||
SKS Microfinance, Ltd.(a) | 24,500 | 181,036 | ||||||
| 394,701 | ||||||||
| Diversified Financial Services (0.94%) | ||||||||
| Multi Commodity Exchange of | ||||||||
| India, Ltd. | 10,000 | 164,327 | ||||||
| Insurance (1.21%) | ||||||||
| MAX India, Ltd. | 31,300 | 210,788 | ||||||
| Real Estate Management & Development (1.18%) | ||||||||
| The Phoenix Mills, Ltd. | 36,000 | 206,455 | ||||||
| Thrifts & Mortgage Finance (3.19%) | ||||||||
| Housing Development Finance Corp. | 30,200 | 555,472 | ||||||
| TOTAL FINANCIALS | 5,289,373 | |||||||
| Health Care (7.24%) | ||||||||
| Pharmaceuticals (7.24%) | ||||||||
| Cadila Healthcare, Ltd. | 7,100 | 190,235 | ||||||
| Cipla, Ltd. | 25,220 | 252,066 | ||||||
| Lupin, Ltd. | 11,400 | 317,693 | ||||||
| Sun Pharmaceutical Industries, Ltd. | 34,000 | 501,829 | ||||||
| 1,261,823 | ||||||||
| TOTAL HEALTH CARE | 1,261,823 | |||||||
| Industrials (10.64%) | ||||||||
| Construction & Engineering (4.65%) | ||||||||
| Larsen & Toubro, Ltd. | 22,799 | 583,954 | ||||||
| MBL Infrastructures, Ltd. | 25,200 | 226,125 | ||||||
| 810,079 | ||||||||
| Electrical Equipment (3.41%) | ||||||||
| Amara Raja Batteries, Ltd. | 18,540 | 231,561 | ||||||
| Crompton Greaves, Ltd. | 60,000 | 158,895 | ||||||
| Finolex Cables, Ltd. | 48,200 | 203,514 | ||||||
| 593,970 | ||||||||
| Machinery (1.66%) | ||||||||
| Thermax, Ltd. | 9,300 | 143,589 | ||||||
38 | April 30, 2015
| ALPS | Kotak India Growth Fund | |
| Consolidated Statement of Investments | April 30, 2015 (Unaudited) |
| Value | ||||||||
| Shares | (Note 2) | |||||||
| Machinery (continued) | ||||||||
| Timken India, Ltd. | 15,663 | $ | 145,883 | |||||
| 289,472 | ||||||||
| Transportation Infrastructure (0.92%) | ||||||||
| IL&FS Transportation Networks, Ltd. | 60,343 | 159,878 | ||||||
| TOTAL INDUSTRIALS | 1,853,399 | |||||||
| Information Technology (12.23%) | ||||||||
| IT Services (12.23%) | ||||||||
| HCL Technologies, Ltd. | 20,900 | 289,750 | ||||||
| Infosys, Ltd. | 27,300 | 833,325 | ||||||
| Tata Consultancy Services, Ltd. | 18,598 | 721,403 | ||||||
| Tech Mahindra, Ltd. | 29,176 | 285,421 | ||||||
| 2,129,899 | ||||||||
| TOTAL INFORMATION TECHNOLOGY | 2,129,899 | |||||||
| Materials (12.15%) | ||||||||
| Chemicals (3.00%) | ||||||||
| Akzo Nobel India, Ltd. | 8,966 | 197,461 | ||||||
| Berger Paints India, Ltd. | 59,000 | 195,066 | ||||||
| Coromandel International, Ltd. | 6,257 | 22,574 | ||||||
| Supreme Industries, Ltd. | 10,035 | 107,886 | ||||||
| 522,987 | ||||||||
| Construction Materials (9.15%) | ||||||||
| ACC, Ltd. | 10,960 | 246,980 | ||||||
| Century Textiles & Industries, Ltd. | 20,841 | 239,338 | ||||||
| JK Cement, Ltd. | 30,205 | 306,446 | ||||||
| Orient Cement, Ltd. | 59,974 | 160,220 | ||||||
| The Ramco Cements, Ltd. | 51,317 | 246,954 | ||||||
| Shree Cement, Ltd. | 1,147 | 183,646 | ||||||
| Ultratech Cement, Ltd. | 4,983 | 209,399 | ||||||
| 1,592,983 | ||||||||
| TOTAL MATERIALS | 2,115,970 | |||||||
| Telecommunication Services (0.90%) | ||||||||
| Diversified Telecommunication (0.90%) | ||||||||
| Tata Communications, Ltd. | 22,970 | 157,173 | ||||||
Wireless Telecommunication Services (0.00%)(b) | ||||||||
| Bharti Airtel, Ltd. | 50 | 300 | ||||||
| TOTAL TELECOMMUNICATION SERVICES | 157,473 | |||||||
| Value | ||||||||
| Shares | (Note 2) | |||||||
| Utilities (0.32%) | ||||||||
| Independent Power and Renewable Energy Producers (0.32%) | ||||||||
| PTC India, Ltd. | 49,135 | $ | 55,864 | |||||
| TOTAL UTILITIES | 55,864 | |||||||
| TOTAL COMMON STOCKS (Cost $15,652,369) | 17,021,523 | |||||||
| TOTAL INVESTMENTS (97.71%) (Cost $15,652,369) | $ | 17,021,523 | ||||||
| Other Assets In Excess Of Liabilities (2.29%) | 399,327 | |||||||
| NET ASSETS (100.00%) | $ | 17,420,850 | ||||||
| (a) | Non-Income Producing Security. (b) Less than 0.005%. |
| (b) | Less than 0.005%. |
Common Abbreviations:
Ltd. - Limited.
For Fund compliance purposes, the Fund’s industry classifications refer to any one or more of the industry sub-classifications used by one or more widely recognized market indexes or ratings group indexes, and/or as defined by Fund management. This definition may not apply for purposes of this report, which may combine industry sub-classifications for reporting ease. Industries are shown as a percent of net assets.
See Notes to Financial Statements.
39 | April 30, 2015
| ALPS | Kotak India Growth Fund | |
| Consolidated Statement of Assets and Liabilities | April 30, 2015 (Unaudited) |
| ASSETS | ||||
| Investments, at value | $ | 17,021,523 | ||
| Foreign currency, at value (Cost $436,519) | 435,078 | |||
| Receivable for investments sold | 5,156,178 | |||
| Receivable for shares sold | 112,495 | |||
| Dividends receivable | 1,545 | |||
| Receivable due from advisor | 3,016 | |||
| Prepaid expenses and other assets | 22,837 | |||
| Total Assets | 22,752,672 | |||
| LIABILITIES | ||||
| Payable for investments purchased | 433 | |||
| Payable for shares redeemed | 2,653,096 | |||
| Payable due to custodian - overdraft | 2,570,899 | |||
| Administration and transfer agency fees payable | 25,538 | |||
| Distribution and services fees payable | 6,049 | |||
| Trustees’ fees and expenses payable | 2,031 | |||
| Professional fees payable | 39,967 | |||
| Accrued expenses and other liabilities | 33,809 | |||
| Total Liabilities | 5,331,822 | |||
| NET ASSETS | $ | 17,420,850 | ||
| NET ASSETS CONSIST OF | ||||
| Paid-in capital | $ | 14,861,392 | ||
| Accumulated net investment loss | (280,870 | ) | ||
| Accumulated net realized gain on investments and foreign currency transactions | 1,488,494 | |||
| Net unrealized appreciation on investments and translation of assets and liabilities denominated in foreign currencies | 1,351,834 | |||
| NET ASSETS | $ | 17,420,850 | ||
| INVESTMENTS, AT COST | $ | 15,652,369 | ||
| PRICING OF SHARES | ||||
| Class A: | ||||
| Net Asset Value, offering and redemption price per share | $ | 12.71 | ||
| Net Assets | $ | 6,245,997 | ||
| Shares of beneficial interest outstanding (unlimited number of shares, no par value common stock authorized) | 491,434 | |||
| Maximum offering price per share ((NAV/0.9450), based on maximum sales charge of 5.50% of the offering price) | $ | 13.45 | ||
| Class C: | ||||
Net Asset Value, offering and redemption price per share(a) | $ | 12.40 | ||
| Net Assets | $ | 1,902,504 | ||
| Shares of beneficial interest outstanding (unlimited number of shares, no par value common stock authorized) | 153,390 | |||
| Class I: | ||||
| Net Asset Value, offering and redemption price per share | $ | 12.88 | ||
| Net Assets | $ | 9,272,349 | ||
| Shares of beneficial interest outstanding (unlimited number of shares, no par value common stock authorized) | 719,976 | |||
| (a) | Redemption price per share may be reduced for any applicable contingent deferred sales charge. For a description of a possible sales charge, please see the Fund’s Prospectus. |
See Notes to Financial Statements.
40 | April 30, 2015
| ALPS | Kotak India Growth Fund | |
| Consolidated Statement of Operations | For the Six Months Ended April 30, 2015 (Unaudited) |
| INVESTMENT INCOME | ||||
| Dividends | $ | 13,260 | ||
| Total Investment Income | 13,260 | |||
| EXPENSES | ||||
| Investment advisory fees | 121,486 | |||
| Administrative fees | 71,817 | |||
| Transfer agency fees | 610 | |||
| Distribution and service fees | ||||
| Class A | 10,512 | |||
| Class C | 9,552 | |||
| Professional fees | 20,962 | |||
| Reports to shareholders and printing fees | 3,727 | |||
| State registration fees | 21,525 | |||
| SEC registration fees | 181 | |||
| Insurance fees | 1,483 | |||
| Custody fees | 40,501 | |||
| Trustees’ fees and expenses | 2,186 | |||
| Miscellaneous expenses | 12,389 | |||
| Total Expenses | 316,931 | |||
| Less fees waived/reimbursed by investment advisor (Note 8) | ||||
| Class A | (47,607 | ) | ||
| Class C | (13,899 | ) | ||
| Class I | (79,860 | ) | ||
| Net Expenses | 175,565 | |||
| Net Investment Loss | (162,305 | ) | ||
| Net realized gain on investments | 1,775,684 | |||
| Net realized loss on foreign currency transactions | (29,245 | ) | ||
| Net change in unrealized depreciation on investments | (1,772,378 | ) | ||
| Net change in unrealized depreciation on translation of assets and liabilities denominated in foreign currencies | (17,066 | ) | ||
| NET REALIZED AND UNREALIZED LOSS ON INVESTMENTS | (43,005 | ) | ||
| NET DECREASE IN NET ASSETS RESULTING FROM OPERATIONS | $ | (205,310 | ) | |
See Notes to Financial Statements.
41 | April 30, 2015
| ALPS | Kotak India Growth Fund |
| Consolidated Statements of Changes in Net Assets |
| For the Six Months | For the Fiscal Period | |||||||
| Ended April 30, 2015 | Ended October 31, | |||||||
| (Unaudited) | 2014(a) | |||||||
| OPERATIONS | ||||||||
| Net investment income/(loss) | $ | (162,305 | ) | $ | 15,803 | |||
| Net realized gain on investments and foreign currency transactions | 1,746,439 | 804,742 | ||||||
| Net change in unrealized appreciation/(depreciation) on investments and translation of assets and liabilities denominated in foreign currencies | (1,789,444 | ) | 2,192,910 | |||||
| Net Increase/(Decrease) in Net Assets Resulting from Operations | (205,310 | ) | 3,013,455 | |||||
| DISTRIBUTIONS | ||||||||
| Dividends to shareholders from net investment income | ||||||||
| Class A | (79,832 | ) | – | |||||
| Class C | (13,012 | ) | – | |||||
| Class I | (89,196 | ) | – | |||||
| Dividends to shareholders from net realized gains | ||||||||
| Class A | (174,473 | ) | – | |||||
| Class C | (45,295 | ) | – | |||||
| Class I | (266,183 | ) | – | |||||
| Net Decrease in Net Assets from Distributions | (667,991 | ) | – | |||||
| BENEFICIAL INTEREST TRANSACTIONS (NOTE 6) | ||||||||
| Shares sold | ||||||||
| Class A | 2,804,365 | 2,894,035 | ||||||
| Class C | 892,705 | 545,448 | ||||||
| Class I | 4,279,090 | 6,266,320 | ||||||
| Dividends reinvested | ||||||||
| Class A | 225,432 | – | ||||||
| Class C | 55,484 | – | ||||||
| Class I | 348,314 | – | ||||||
| Shares redeemed, net of redemption fees | ||||||||
| Class A | (2,085,423 | ) | (3,972,790 | ) | ||||
| Class C | (473,969 | ) | (211,571 | ) | ||||
| Class I | (3,739,477 | ) | (577,957 | ) | ||||
| Net Increase in Net Assets Derived from Beneficial Interest Transactions | 2,306,521 | 4,943,485 | ||||||
| Net increase in net assets | 1,433,220 | 7,956,940 | ||||||
| NET ASSETS | ||||||||
| Beginning of period | 15,987,630 | 8,030,690 | ||||||
| End of period * | $ | 17,420,850 | $ | 15,987,630 | ||||
| *Including accumulated net investment income/(loss) of: | $ | (280,870 | ) | $ | 63,475 | |||
| (a) | Effective May 1, 2014, the Board approved changing the fiscal year-end of the Funds from April 30 to October 31. |
See Notes to Financial Statements.
42 | April 30, 2015
| ALPS | Kotak India Growth Fund – Class A |
| Consolidated Financial Highlights |
Selected data for a share of beneficial interest outstanding throughout the periods indicated:
| For the | ||||||||||||||||||||||||
| For the | Period | |||||||||||||||||||||||
| For the Six | Fiscal | February 14, | ||||||||||||||||||||||
| Months | Period | For the Year | For the Year | For the Year | 2011 | |||||||||||||||||||
| Ended April | Ended | Ended | Ended | Ended | (Inception) | |||||||||||||||||||
| 30, 2015 | October 31, | April 30, | April 30, | April 30, | to April 30, | |||||||||||||||||||
(Unaudited)(a) | 2014(a)(b) | 2014(a) | 2013(a) | 2012(a) | 2011(a) | |||||||||||||||||||
| Net asset value, beginning of period | $ | 13.20 | $ | 9.99 | $ | 9.47 | $ | 8.22 | $ | 10.35 | $ | 10.00 | ||||||||||||
| INCOME/(LOSS) FROM INVESTMENT OPERATIONS: | ||||||||||||||||||||||||
Net investment income/(loss)(c) | (0.12 | ) | 0.01 | (0.02 | ) | (0.07 | ) | (0.08 | ) | (0.04 | ) | |||||||||||||
| Net realized and unrealized gain/(loss) | 0.18 | 3.20 | 0.54 | 1.32 | (2.04 | ) | 0.39 | |||||||||||||||||
| Total from investment operations | 0.06 | 3.21 | 0.52 | 1.25 | (2.12 | ) | 0.35 | |||||||||||||||||
| DISTRIBUTIONS: | ||||||||||||||||||||||||
| From net investment income | (0.17 | ) | – | – | – | – | – | |||||||||||||||||
| From net realized gains | (0.38 | ) | – | – | – | (0.01 | ) | – | ||||||||||||||||
| Total distributions | (0.55 | ) | – | – | – | (0.01 | ) | – | ||||||||||||||||
| REDEMPTION FEES ADDED TO PAID-IN CAPITAL (NOTE 6) | 0.00 | (d) | 0.00 | (d) | 0.00 | (d) | 0.00 | (d) | 0.00 | (d) | 0.00 | (d) | ||||||||||||
| Net increase/(decrease) in net asset value | (0.49 | ) | 3.21 | 0.52 | 1.25 | (2.13 | ) | 0.35 | ||||||||||||||||
| Net asset value, end of period | $ | 12.71 | $ | 13.20 | $ | 9.99 | $ | 9.47 | $ | 8.22 | $ | 10.35 | ||||||||||||
TOTAL RETURN(e) | 0.45 | % | 32.13 | % | 5.49 | % | 15.21 | % | (20.44 | )% | 3.40 | % | ||||||||||||
| RATIOS/SUPPLEMENTAL DATA: | ||||||||||||||||||||||||
| Net assets, end of period (000s) | $ | 6,246 | $ | 5,536 | $ | 5,211 | $ | 4,681 | $ | 2,404 | $ | 935 | ||||||||||||
| Ratio of expenses to average net assets excluding fee waivers and reimbursements | 3.39 | %(f) | 4.92 | %(f) | 6.51 | % | 7.99 | % | 12.42 | % | 69.96 | %(f) | ||||||||||||
| Ratio of expenses to average net assets including fee waivers and reimbursements | 1.92 | %(f)(g) | 1.90 | %(f)(g) | 1.88 | %(g) | 2.00 | % | 2.00 | % | 2.00 | %(f) | ||||||||||||
| Ratio of net investment income/(loss) to average net assets | (1.79 | )%(f) | 0.19 | %(f) | (0.27 | )% | (0.82 | )% | (0.89 | )% | (1.82 | )%(f) | ||||||||||||
Portfolio turnover rate(h) | 41 | % | 28 | % | 65 | % | 93 | % | 114 | % | 9 | % | ||||||||||||
| (a) | Per share amounts and ratios to average net assets include income and expenses of the Kotak Mauritius Portfolio (wholly-owned subsidiary). |
(b) | Effective May 1, 2014, the Board approved changing the fiscal year-end of the Funds from April 30 to October 31. |
| (c) | Calculated using the average shares method. |
(d) | Less than $0.005 per share. |
| (e) | Total returns are for the period indicated and have not been annualized. Total returns would have been lower had certain expenses not been waived during the period. Returns shown do not reflect the deduction of taxes that a shareholder would pay on Fund distributions or the redemption of Fund shares. Returns shown exclude any applicable sales charges. |
| (f) | Annualized. |
| (g) | According to the Fund’s shareholder services plan with respect to the Fund’s Class A shares, any amount of such payment not paid during the Fund’s fiscal year for such service activities shall be reimbursed to the Fund as soon as practical after the end of the fiscal year. Fees were reimbursed to the Fund during the period ended April 30, 2015, for the prior fiscal year in the amount of 0.08% (annualized) of average net assets of Class A shares, during the period ended October 31, 2014, for the prior fiscal year in the amount of 0.10% (annualized) of average net assets of Class A shares and during the year ended April 30, 2014, for the prior fiscal year in the amount of 0.12% of average net assets of Class A shares. |
| (h) | Portfolio turnover rate for periods less than one full year have not been annualized. |
See Notes to Financial Statements.
43 | April 30, 2015
| ALPS | Kotak India Growth Fund – Class C |
| Consolidated Financial Highlights |
Selected data for a share of beneficial interest outstanding throughout the periods indicated:
| For the | ||||||||||||||||||||||||
| For the | Period | |||||||||||||||||||||||
| For the Six | Fiscal | February 14, | ||||||||||||||||||||||
| Months | Period | For the Year | For the Year | For the Year | 2011 | |||||||||||||||||||
| Ended April | Ended | Ended | Ended | Ended | (Inception) | |||||||||||||||||||
| 30, 2015 | October 31, | April 30, | April 30, | April 30, | to April 30, | |||||||||||||||||||
(Unaudited)(a) | 2014(a)(b) | 2014(a) | 2013(a) | 2012(a) | 2011(a) | |||||||||||||||||||
| Net asset value, beginning of period | $ | 12.88 | $ | 9.77 | $ | 9.34 | $ | 8.15 | $ | 10.32 | $ | 10.00 | ||||||||||||
| INCOME/(LOSS) FROM INVESTMENT OPERATIONS: | ||||||||||||||||||||||||
Net investment loss(c) | (0.16 | ) | (0.03 | ) | (0.09 | ) | (0.12 | ) | (0.13 | ) | (0.05 | ) | ||||||||||||
| Net realized and unrealized gain/(loss) | 0.17 | 3.14 | 0.52 | 1.31 | (2.03 | ) | 0.37 | |||||||||||||||||
| Total from investment operations | 0.01 | 3.11 | 0.43 | 1.19 | (2.16 | ) | 0.32 | |||||||||||||||||
| DISTRIBUTIONS: | ||||||||||||||||||||||||
| From net investment income | (0.11 | ) | – | – | – | – | – | |||||||||||||||||
| From net realized gains | (0.38 | ) | – | – | – | (0.01 | ) | – | ||||||||||||||||
| Total distributions | (0.49 | ) | – | – | – | (0.01 | ) | – | ||||||||||||||||
| REDEMPTION FEES ADDED TO PAID-IN CAPITAL (NOTE 6) | – | 0.00 | (d) | – | – | 0.00 | (d) | – | ||||||||||||||||
| Net increase/(decrease) in net asset value | (0.48 | ) | 3.11 | 0.43 | 1.19 | (2.17 | ) | 0.32 | ||||||||||||||||
| Net asset value, end of period | $ | 12.40 | $ | 12.88 | $ | 9.77 | $ | 9.34 | $ | 8.15 | $ | 10.32 | ||||||||||||
TOTAL RETURN(e) | 0.03 | % | 31.83 | % | 4.60 | % | 14.60 | % | (20.97 | )% | 3.20 | % | ||||||||||||
| RATIOS/SUPPLEMENTAL DATA: | ||||||||||||||||||||||||
| Net assets, end of period (000s) | $ | 1,903 | $ | 1,497 | $ | 875 | $ | 924 | $ | 435 | $ | 466 | ||||||||||||
| Ratio of expenses to average net assets excluding fee waivers and reimbursements | 4.06 | %(f) | 5.57 | %(f) | 7.26 | % | 8.54 | % | 13.39 | % | 69.64 | %(f) | ||||||||||||
| Ratio of expenses to average net assets including fee waivers and reimbursements | 2.60 | %(f) | 2.60 | %(f) | 2.60 | % | 2.60 | % | 2.60 | % | 2.60 | %(f) | ||||||||||||
| Ratio of net investment loss to average net assets | (2.46 | )%(f) | (0.50 | )%(f) | (1.00 | )% | (1.42 | )% | (1.49 | )% | (2.42 | )%(f) | ||||||||||||
Portfolio turnover rate(g) | 41 | % | 28 | % | 65 | % | 93 | % | 114 | % | 9 | % | ||||||||||||
| (a) | Per share amounts and ratios to average net assets include income and expenses of the Kotak Mauritius Portfolio (wholly-owned subsidiary). |
| (b) | Effective May 1, 2014, the Board approved changing the fiscal year-end of the Funds from April 30 to October 31. |
| (c) | Calculated using the average shares method. |
| (d) | Less than $0.005 per share. |
| (e) | Total returns are for the period indicated and have not been annualized. Total returns would have been lower had certain expenses not been waived during the period. Returns shown do not reflect the deduction of taxes that a shareholder would pay on Fund distributions or the redemption of Fund shares. Returns shown exclude any applicable sales charges. |
| (f) | Annualized. |
| (g) | Portfolio turnover rate for periods less than one full year have not been annualized. |
See Notes to Financial Statements.
44 | April 30, 2015
| ALPS | Kotak India Growth Fund – Class I |
| Consolidated Financial Highlights |
Selected data for a share of beneficial interest outstanding throughout the periods indicated:
| For the | ||||||||||||||||||||||||
| For the | Period | |||||||||||||||||||||||
| For the Six | Fiscal | February 14, | ||||||||||||||||||||||
| Months | Period | For the Year | For the Year | For the Year | 2011 | |||||||||||||||||||
| Ended April | Ended | Ended | Ended | Ended | (Inception) | |||||||||||||||||||
| 30, 2015 | October 31, | April 30, | April 30, | April 30, | to April 30, | |||||||||||||||||||
(Unaudited)(a) | 2014(a)(b) | 2014(a) | 2013(a) | 2012(a) | 2011(a) | |||||||||||||||||||
| Net asset value, beginning of period | $ | 13.29 | $ | 10.04 | $ | 9.55 | $ | 8.25 | $ | 10.34 | $ | 10.00 | ||||||||||||
| INCOME/(LOSS) FROM INVESTMENT OPERATIONS: | ||||||||||||||||||||||||
Net investment income/(loss)(c) | (0.10 | ) | 0.03 | 0.00 | (d) | (0.04 | ) | (0.04 | ) | (0.03 | ) | |||||||||||||
| Net realized and unrealized gain/(loss) | 0.19 | 3.22 | 0.54 | 1.34 | (2.04 | ) | 0.37 | |||||||||||||||||
| Total from investment operations | 0.09 | 3.25 | 0.54 | 1.30 | (2.08 | ) | 0.34 | |||||||||||||||||
| DISTRIBUTIONS: | ||||||||||||||||||||||||
| From net investment income | (0.13 | ) | – | (0.05 | ) | – | – | – | ||||||||||||||||
| From net realized gains | (0.38 | ) | – | – | – | (0.01 | ) | – | ||||||||||||||||
| Total distributions | (0.51 | ) | – | (0.05 | ) | – | (0.01 | ) | – | |||||||||||||||
| REDEMPTION FEES ADDED TO PAID-IN CAPITAL (NOTE 6) | 0.01 | 0.00 | (d) | – | 0.00 | (d) | 0.00 | (d) | – | |||||||||||||||
| Net increase/(decrease) in net asset value | (0.41 | ) | 3.25 | 0.49 | 1.30 | (2.09 | ) | 0.34 | ||||||||||||||||
| Net asset value, end of period | $ | 12.88 | $ | 13.29 | $ | 10.04 | $ | 9.55 | $ | 8.25 | $ | 10.34 | ||||||||||||
TOTAL RETURN(e) | 0.71 | % | 32.37 | % | 5.70 | % | 15.76 | % | (20.23 | )% | 3.50 | % | ||||||||||||
| RATIOS/SUPPLEMENTAL DATA: | ||||||||||||||||||||||||
| Net assets, end of period (000s) | $ | 9,272 | $ | 8,955 | $ | 1,945 | $ | 2,149 | $ | 1,609 | $ | 568 | ||||||||||||
| Ratio of expenses to average net assets excluding fee waivers and reimbursements | 3.05 | %(f) | 4.49 | %(f) | 6.28 | % | 7.65 | % | 12.05 | % | 96.67 | %(f) | ||||||||||||
| Ratio of expenses to average net assets including fee waivers and reimbursements | 1.60 | %(f) | 1.60 | %(f) | 1.60 | % | 1.60 | % | 1.60 | % | 1.60 | %(f) | ||||||||||||
| Ratio of net investment income/(loss) to average net assets | (1.46 | )%(f) | 0.50 | %(f) | 0.00 | %(g) | (0.42 | )% | (0.49 | )% | (1.36 | )%(f) | ||||||||||||
Portfolio turnover rate(h) | 41 | % | 28 | % | 65 | % | 93 | % | 114 | % | 9 | % | ||||||||||||
| (a) | Per share amounts and ratios to average net assets include income and expenses of the Kotak Mauritius Portfolio (wholly-owned subsidiary). |
| (b) | Effective May 1, 2014, the Board approved changing the fiscal year-end of the Funds from April 30 to October 31. |
| (c) | Calculated using the average shares method. |
(d) | Less than $0.005 per share. |
| (e) | Total returns are for the period indicated and have not been annualized. Total returns would have been lower had certain expenses not been waived during the period. Returns shown do not reflect the deduction of taxes that a shareholder would pay on Fund distributions or the redemption of Fund shares. |
| (f) | Annualized. |
| (g) | Less than 0.005% |
| (h) | Portfolio turnover rate for periods less than one full year have not been annualized. |
See Notes to Financial Statements.
45 | April 30, 2015
| ALPS | Red Rocks Listed Private Equity Fund | |
| Management Commentary | April 30, 2015 (Unaudited) |
Overview
The Return of Volatility
During the latter part of 2014, the capital markets and private equity world were relatively steady with little drama being reflected in prices. Since that time things have gotten more interesting: the US Dollar which had been strengthening in early 2014 accelerated and got even stronger versus most major currencies; global interest rates continued their downward trend with some countries now posting negative returns (government bonds in Denmark, Sweden, Switzerland, France, and Germany all have negative effective rates*); the US equity markets continued their upward price trend; most global equity markets improved, if only slightly; commodity prices softened; and energy (in particular crude oil) prices collapsed. While several of these are correlated, one of the common observations has been volatility returning with a capital V.
Private equity has been affected in a number of ways: while EBITDA (Earnings Before Interest, Taxes, Depreciation and Amortization) multiples continue to rise and earnings continue to improve, volatility in the capital markets has not had an adverse impact on the pricing of Listed Private Equity (LPE) vehicles. The pricing of LPE securities is about the same. In looking at the leading benchmark index, the Global Listed Private Equity Index (the only 1940 Act compliant Index with the largest AUM (Assets Under Management) in a tracking exchange traded fund), over the past few months, volatility has been 10.15% versus 10.03% for the periods April 30, 2014 – October 31, 2014 and October 31, 2014 – April 30, 2015, respectively, or a 1% decrease in volatility for the two measurement periods.
Contrast a 1% decrease in LPE volatility to the broader equity markets. The Morgan Stanley All World Index experienced significantly more volatility: 8.33% versus 10.19% for the periods April 30, 2014 – October 31, 2014 and October 31, 2014 – April 30, 2015, respectively, or a 22% increase in volatility for the two measurement periods. The Morgan Stanley All World Index was actually, albeit very slightly, more volatile than the Global Listed Private Equity Index over the same period. That’s something we’re not use to seeing and we believe that it is significant.
At the same time, certain things didn’t change much from a private equity perspective: exit opportunities of existing portfolio companies, either through an outright or partial sale, are as strong as ever, organic revenue growth in existing portfolio companies continues, albeit at a tepid pace and investors (institutional and retail) continue to pour capital into the asset class. The result: private equity managers are posting very good returns from past investments yet are challenged to find new companies in which to invest at (what they consider to be) reasonable valuations.
No one ever said that the job of a private equity manager was easy.
Portfolio Review
The Fund’s I Shares Class returned 10.80% net of fees, (Class A delivered a net return of 4.53% at MOP), compared with 5.38%, 13.29% and 9.99% for the MSCI World Index, the Red Rocks Global Listed Private Equity Index and the S&P Listed Private Equity Index, respectively, for the 6-month period ending April 30, 2015.
During the period, we exited AP Alternative Assets L.P., Better Capital PCC LTD, Capital Southwest Corporation, Intermediate Capital Group PLC and Melrose Industries PLC., while we added Ares Management L.P. and Graphite Enterprise Trust PLC to the Fund. Montauk Energy Holdings was acquired by a corporate action and disposed of during the period.
At the end of the period the Fund held 34 holdings in some of the top performing private equity funds/firms from around the globe. We believe that finding, researching and analyzing these investments is what Red Rocks Capital does best; it is partly intellectual curiosity and partly competitive. It’s why we come to work excited. And with that, our objective remains a constant: to assemble the best global portfolio of listed private equity companies for the benefit of our shareholders.
Net contributors to performance for the quarter included:
| · | The Blackstone Group LP |
| · | Aurelius AG |
| · | 3I Group PLC |
Net detractors to performance for the quarter included:
| · | Grand Parade Investments LTD |
| · | IP Group PLC |
| · | Standard Life European Private Equity |
Outlook
Our outlook hasn’t changed much over the last several months: tepid global GDP (Gross Domestic Product) coupled with historically low interest rates and increasingly volatile capital markets makes for a challenging world in which to invest. Fortunately private equity managers are fairly adept. They adapt better than most. We believe that will translate into strong, long-term returns.
Valuation multiples continue to look full in most industry sectors (energy and related services being the possible exception). That has not stopped private equity firms from producing positive results. Yes, growth continues to be hard to come by. However, we believe private equity has a knack for growing company revenues even in the face of tepid GDP growth.
The above is why more investors have been committing an increasing amount of capital to the asset class.
As always, we appreciate your continued support and interest in Red Rocks and the Listed Private Equity strategy.
Adam Goldman
Co-Portfolio Manager
46 | April 30, 2015
| ALPS | Red Rocks Listed Private Equity Fund | |
| Management Commentary | April 30, 2015 (Unaudited) |
| * | Bloomberg, March 15, 2015 |
Morgan Stanley All World Index is a market-capitalization-weighted index maintained by Morgan Stanley Capital International (MSCI) and designed to provide a broad measure of stock performance throughout the world, including both developed and emerging markets.
The views and information discussed in this commentary are as of the date of publication, are subject to change, and may not reflect the writer’s current views. The views expressed represent an assessment of market conditions at a specific point in time, are opinions only and should not be relied upon as investment advice regarding a particular investment or markets in general. Such information does not constitute a recommendation to buy or sell specific securities or investment vehicles. It should not be assumed that any investment will be profitable or will equal the performance of the fund(s) or any securities or any sectors mentioned in this letter. The subject matter contained in this letter has been derived from several sources believed to be reliable and accurate at the time of compilation. Neither the Fund nor Red Rocks Capital LLC accepts any liability for losses either direct or consequential caused by the use of this information.
Diversification cannot guarantee gain or prevent losses.
47 | April 30, 2015
| ALPS | Red Rocks Listed Private Equity Fund | |
| Performance Update | April 30, 2015 (Unaudited) |
Performance of $10,000 Initial Investment (as of April 30, 2015)
Comparison of change in value of a $10,000 investment (includes maximum sales charges of 5.50%)
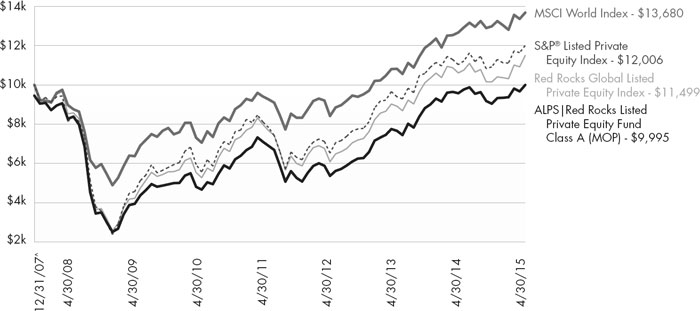
The chart above represents historical performance of a hypothetical investment of $10,000 in the Fund since inception. Past performance does not guarantee future results. This chart does not reflect the deduction of taxes that a shareholder would pay on Fund distributions or the redemption of Fund shares.
Average Annual Total Returns (as of April 30, 2015)
| 6 Month | 1 Year | 3 Year | 5 Year | Since Inception^ | Total Expense Ratio | What You Pay* | |||||||||||
| Class A (NAV) | 10.54 | % | 4.38 | % | 19.32% | 12.70% | 0.76 | % | 2.35% | 2.35% | |||||||
| Class A (MOP) | 4.53 | % | -1.39 | % | 17.11% | 11.44% | -0.01 | % | |||||||||
| Class C (NAV) | 10.11 | % | 3.66 | % | 18.50% | 11.80% | -0.03 | % | 2.85% | 2.85% | |||||||
| Class C (CDSC) | 9.11 | % | 2.66 | % | 18.50% | 11.80% | -0.03 | % | |||||||||
| Class I (NAV) | 10.80 | % | 4.82 | % | 19.72% | 13.01% | 1.07 | % | 1.95% | 1.95% | |||||||
| Class R | 10.47 | % | 4.42 | % | 19.41% | 12.55% | 0.52 | % | 2.33% | 2.33% | |||||||
MSCI World Index1 | 5.38 | % | 7.99 | % | 14.12% | 11.13% | 4.37 | % | |||||||||
Red Rocks Global Listed Private Equity Index2 | 13.29 | % | 8.40 | % | 19.34% | 12.87% | 1.92 | % | |||||||||
S&P® LPE Total Return Index3 | 9.99 | % | 8.85 | % | 19.04% | 11.94% | 2.53 | % | |||||||||
Performance data quoted represents past performance. Past performance does not guarantee future results. Investment return and principal value of an investment will fluctuate so that an investor’s shares, when sold or redeemed, may be worth more or less than the original cost. Current performance data may be higher or lower than actual data quoted. For the most current month-end performance data, please call 1-866-759-5679.
Maximum Offering Price (MOP) for Class A shares includes the Fund’s maximum sales charge of 5.50%. Performance shown at NAV does not include these sales charges and would have been lower had it been taken into account. If you invest $1 million or more, either as a lump sum or through the Fund’s accumulation or letter of intent programs, you can purchase Class A shares without an initial sales charge (load). A Contingent Deferred Sales Charge (“CDSC”) of 1.00% may apply to Class C shares redeemed within the first 12 months after a purchase, and on Class A shares redeemed within the first 18 months after a purchase in excess of $1 million. The Fund imposes a 2.00% redemption fee on shares held for less than 90 days.
Performance less than 1 year is cumulative.
48 | April 30, 2015
| ALPS | Red Rocks Listed Private Equity Fund | |
| Performance Update | April 30, 2015 (Unaudited) |
Performance shown for Class C shares prior to June 30, 2010 reflects the historical performance of the Fund’s Class A shares, calculated using the fees and expenses of Class C shares.
| 1 | MSCI World Index: Morgan Stanley Capital International’s market capitalization weighted index is composed of companies representative of the market structure of 22 developed market countries in North America, Europe and the Asia/Pacific Region. The index is not actively managed and does not reflect any deduction for fees, expenses or taxes. An investor may not invest directly in an index. |
| 2 | The Red Rocks Global Listed Private Equity Index replaced the S&P Listed Private Equity Index as the Fund’s secondary index effective March 12, 2014. The Red Rocks Global Listed Private Equity Index includes securities, ADRs and GDRs of 40 to 75 private equity companies, including business development companies, master limited partnerships and other vehicles whose principal business is to invest in, lend capital to or provide services to privately held companies. The Red Rocks Global Listed Private Equity Index is managed by the Fund’s Sub-Advisor. The Advisor and Sub-Advisor made this recommendation to the Board because the new index more closely aligns to the Fund’s investment strategies and investment restrictions. Information on both indices will be shown for a one-year transition period. An investor may not invest directly in an index. |
| 3 | S&P® Listed Private Equity Index: The S&P® Listed Private Equity Index is comprised of 30 leading listed private equity companies that meet size, liquidity, exposure, and activity requirements. The index is designed to provide tradable exposure to the leading publicly listed companies in the private equity space. The index is not actively managed and does not reflect any deduction for fees, expenses or taxes. An investor may not invest directly in an index. |
| ^ | Fund inception date of December 31, 2007. |
| * | What You Pay reflects the Advisor’s and Sub-Advisor’s decision to contractually limit expenses through February 29, 2016 and Acquired Fund Fees and Expenses of 0.70%. Please see the current prospectus for additional information. |
The table does not reflect the deduction of taxes that a shareholder would pay on Fund distributions or the redemption of Fund shares.
Listed Private Equity Companies are subject to various risks depending on their underlying investments, which could include, but are not limited to, additional liquidity risk, industry risk, non-U.S. security risk, currency risk, credit risk, managed portfolio risk and derivatives risk (derivatives risk is the risk that the value of the Listed Private Equity Companies’ derivative investments will fall because of pricing difficulties or lack of correlation with the underlying investment).
There are inherent risks in investing in private equity companies, which encompass financial institutions or vehicles whose principal business is to invest in and lend capital to privately held companies. Generally, little public information exists for private and thinly traded companies, and there is a risk that investors may not be able to make a fully informed investment decision.
Listed Private Equity Companies may have relatively concentrated investment portfolios, consisting of a relatively small number of holdings. A consequence of this limited number of investments is that the aggregate returns realized may be adversely impacted by the poor performance of a small number of investments, or even a single investment, particularly if a company experiences the need to write down the value of an investment.
Certain of the Fund’s investments may be exposed to liquidity risk due to low trading volume, lack of a market maker or legal restrictions limiting the ability of the Fund to sell particular securities at an advantageous price and/or time. As a result, these securities may be more difficult to value. Foreign investing involves special risks, such as currency fluctuations and political uncertainty. The Fund invests in derivatives and is subject to the risk that the value of those derivative investments will fall because of pricing difficulties or lack of correlation with the underlying investment.
There is no guarantee that the Fund will continue to hold any one particular security or stay invested in any one particular company. The composition of the Fund’s top holdings is subject to change. Performance figures are historical and reflect the change in share price, reinvested distributions, changes in net asset value, sales charges and capital gains distributions, if any.
Not FDIC Insured – No Bank Guarantee – May Lose Value
49 | April 30, 2015
| ALPS | Red Rocks Listed Private Equity Fund | |
| Performance Update | April 30, 2015 (Unaudited) |
Top Ten Holdings (as a % of Net Assets) †
| HarbourVest Global Private Equity, Ltd. | 6.18 | % | ||
| The Blackstone Group LP | 5.92 | % | ||
| Aurelius AG | 5.38 | % | ||
| The Carlyle Group LP | 5.03 | % | ||
| 3i Group PLC | 4.86 | % | ||
| Eurazeo SA | 4.75 | % | ||
| Onex Corp. | 4.51 | % | ||
| KKR & Co. LP | 4.16 | % | ||
| Brookfield Asset Management, Inc., Class A | 4.14 | % | ||
| Ackermans & van Haaren N.V. | 3.91 | % | ||
| Top Ten Holdings | 48.84 | % |
| † | Holdings are subject to change. Table presents indicative values only. |
Industry Sector Allocation (as a % of Net Assets)
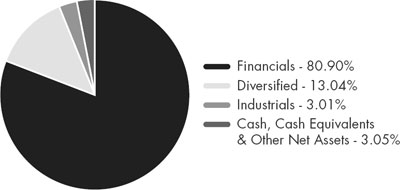
50 | April 30, 2015
| ALPS | Red Rocks Listed Private Equity Fund | |
| Statement of Investments | April 30, 2015 (Unaudited) |
| Shares | Value (Note 2) | |||||||
CLOSED‐END FUNDS (10.11%) | ||||||||
| Graphite Enterprise Trust PLC | 397,168 | $ | 3,523,798 | |||||
| HBM Healthcare Investments AG, Class A | 106,592 | 11,939,401 | ||||||
| HgCapital Trust PLC | 909,569 | 14,939,234 | ||||||
Oakley Capital Investments, Ltd.(a) | 3,990,546 | 10,229,578 | ||||||
Pantheon International Participations PLC, Ordinary Shares(a) | 270,208 | 5,392,007 | ||||||
Pantheon International Participations PLC, Redeemable Shares(a) | 357,700 | 7,055,552 | ||||||
| 53,079,570 | ||||||||
TOTAL CLOSED‐END FUNDS (Cost $47,511,710) | 53,079,570 | |||||||
| COMMON STOCKS (86.84%) | ||||||||
| Diversified (13.04%) | ||||||||
Holding Companies‐Diversified Operations (13.04%) | ||||||||
| Ackermans & van Haaren N.V. | 167,532 | 20,504,348 | ||||||
| Remgro, Ltd. | 423,397 | 9,420,883 | ||||||
| Schouw & Co. | 371,599 | 19,056,789 | ||||||
| Wendel SA | 158,106 | 19,457,212 | ||||||
| 68,439,232 | ||||||||
| TOTAL DIVERSIFIED | 68,439,232 | |||||||
| Financials (70.79%) | ||||||||
| Diversified Financial Services (16.92%) | ||||||||
| Apollo Global Management LLC, Class A | 243,371 | 5,563,461 | ||||||
| Ares Management LP | 216,423 | 3,919,421 | ||||||
| The Blackstone Group LP | 758,226 | 31,056,937 | ||||||
| The Carlyle Group LP | 873,950 | 26,384,550 | ||||||
| KKR & Co. LP | 970,093 | 21,836,793 | ||||||
| 88,761,162 | ||||||||
| Investment Companies (34.83%) | ||||||||
| 3i Group PLC | 3,282,180 | 25,518,242 | ||||||
| Altamir | 1,058,991 | 13,484,257 | ||||||
| Ares Capital Corp. | 433,139 | 7,372,026 | ||||||
| Aurelius AG | 584,721 | 28,221,969 | ||||||
| Eurazeo SA | 347,322 | 24,924,291 | ||||||
| Grand Parade Investments, Ltd. | 7,668,174 | 4,241,386 | ||||||
| Hosken Consolidated Investments, Ltd. | 840,890 | 11,037,509 | ||||||
| Investor AB, B Shares | 391,693 | 15,990,443 | ||||||
IP Group PLC(a) | 2,920,755 | 8,832,228 | ||||||
| Shares | Value (Note 2) | |||||||
| Investment Companies (continued) | ||||||||
| mutares AG | 23,648 | $ | 2,602,209 | |||||
| Onex Corp. | 392,914 | 23,659,513 | ||||||
SVG Capital PLC(a) | 2,205,642 | 16,901,238 | ||||||
| 182,785,311 | ||||||||
| Private Equity (14.90%) | ||||||||
| Castle Private Equity, Ltd. | 409,181 | 6,249,884 | ||||||
Electra Private Equity PLC(a) | 312,297 | 14,961,340 | ||||||
| HarbourVest Global Private Equity, Ltd. | 2,450,321 | 32,405,495 | ||||||
Riverstone Energy, Ltd.(a) | 789,397 | 12,614,067 | ||||||
| Standard Life European Private Equity Trust PLC, Ordinary Shares | 3,803,199 | 11,967,731 | ||||||
| 78,198,517 | ||||||||
| Real Estate (4.14%) | ||||||||
| Brookfield Asset Management, Inc., Class A | 403,636 | 21,735,799 | ||||||
| TOTAL FINANCIALS | 371,480,789 | |||||||
| Industrials (3.01%) | ||||||||
| Miscellaneous Manufacturers (3.01%) | ||||||||
| Danaher Corp. | 192,808 | 15,787,119 | ||||||
| TOTAL INDUSTRIALS | 15,787,119 | |||||||
| TOTAL COMMON STOCKS (Cost $373,774,600) | 455,707,140 | |||||||
7-Day Yield | Shares | Value (Note 2) | ||||||||||
| SHORT TERM INVESTMENTS (2.89%) | ||||||||||||
| Money Market Fund (2.89%) | ||||||||||||
Morgan Stanley Institutional Liquidity Fund ‐ Prime Portfolio | 0.078 | % | 15,151,192 | 15,151,192 | ||||||||
| TOTAL SHORT TERM INVESTMENTS (Cost $15,151,192) | 15,151,192 | |||||||||||
| TOTAL INVESTMENTS (99.84%) (Cost $436,437,502) | $ | 523,937,902 | ||||||||||
| Other Assets In Excess Of Liabilities (0.16%) | 832,831 | |||||||||||
| NET ASSETS (100.00%) | $ | 524,770,733 | ||||||||||
51 | April 30, 2015
| ALPS | Red Rocks Listed Private Equity Fund | |
| Statement of Investments | April 30, 2015 (Unaudited) |
| (a) | Non-Income Producing Security. |
Common Abbreviations:
| AB - | Aktiebolag is the Swedish equivalent of the term corporation. |
| AG - | Aktiengesellschaft is a German term that refers to a corporation that is limited by shares, i.e., owned by shareholders. |
| LLC - | Limited Liability Company. |
| LP - | Limited Partnership. |
| Ltd. - | Limited. |
| N.V. - | Naamloze Vennootschap is the Dutch term for a public limited liability corporation. |
| PLC - | Public Limited Company. |
| SA - | Generally designates corporations in various countries, mostly those employing the civil law. |
For Fund compliance purposes, the Fund’s industry classifications refer to any one or more of the industry sub-classifications used by one or more widely recognized market indexes or ratings group indexes, and/or as defined by Fund management. This definition may not apply for purposes of this report, which may combine industry sub-classifications for reporting ease. Industries are shown as a percent of net assets.
See Notes to Financial Statements.
52 | April 30, 2015
| ALPS | Red Rocks Listed Private Equity Fund | |
| Statement of Assets and Liabilities | April 30, 2015 (Unaudited) |
| ASSETS | ||||
| Investments, at value | $ | 523,937,902 | ||
| Foreign currency, at value (Cost $1,396,159) | 1,422,245 | |||
| Receivable for investments sold | 2,219,943 | |||
| Receivable for shares sold | 1,214,193 | |||
| Dividends receivable | 1,902,510 | |||
| Prepaid expenses and other assets | 29,724 | |||
| Total Assets | 530,726,517 | |||
| LIABILITIES | ||||
| Payable for investments purchased | 4,892,289 | |||
| Payable for shares redeemed | 327,339 | |||
| Investment advisory fees payable | 360,896 | |||
| Administration and transfer agency fees payable | 87,234 | |||
| Distribution and services fees payable | 177,057 | |||
| Trustees’ fees and expenses payable | 2,345 | |||
| Professional fees payable | 20,223 | |||
| Custody fees payable | 19,953 | |||
| Accrued expenses and other liabilities | 68,448 | |||
| Total Liabilities | 5,955,784 | |||
| NET ASSETS | $ | 524,770,733 | ||
| NET ASSETS CONSIST OF | ||||
Paid‐in capital | $ | 448,224,836 | ||
| Accumulated net investment loss | (28,204,999 | ) | ||
| Accumulated net realized gain on investments and foreign currency transactions | 17,235,444 | |||
| Net unrealized appreciation on investments and translation of assets and liabilities denominated in foreign currencies | 87,515,452 | |||
| NET ASSETS | $ | 524,770,733 | ||
| INVESTMENTS, AT COST | $ | 436,437,502 | ||
| PRICING OF SHARES | ||||
| Class A: | ||||
| Net Asset Value, offering and redemption price per share | $ | 7.05 | ||
| Net Assets | $ | 223,475,552 | ||
| Shares of beneficial interest outstanding (unlimited number of shares, no par value common stock authorized) | 31,714,416 | |||
| Maximum offering price per share ((NAV/0.9450), based on maximum sales charge of 5.50% of the offering price) | $ | 7.46 | ||
| Class C: | ||||
Net Asset Value, offering and redemption price per share(a) | $ | 6.84 | ||
| Net Assets | $ | 18,645,253 | ||
| Shares of beneficial interest outstanding (unlimited number of shares, no par value common stock authorized) | 2,725,387 | |||
| Class I: | ||||
| Net Asset Value, offering and redemption price per share | $ | 7.12 | ||
| Net Assets | $ | 280,913,021 | ||
| Shares of beneficial interest outstanding (unlimited number of shares, no par value common stock authorized) | 39,471,256 | |||
| Class R: | ||||
| Net Asset Value, offering and redemption price per share | $ | 6.22 | ||
| Net Assets | $ | 1,736,907 | ||
| Shares of beneficial interest outstanding (unlimited number of shares, no par value common stock authorized) | 279,310 | |||
| (a) | Redemption price per share may be reduced for any applicable contingent deferred sales charge. For a description of a possible sales charge, please see the Fund’s Prospectus. |
See Notes to Financial Statements.
53 | April 30, 2015
| ALPS | Red Rocks Listed Private Equity Fund | |
| Statement of Operations | For the Six Months Ended April 30, 2015 (Unaudited) |
| INVESTMENT INCOME | ||||
| Dividends | $ | 4,544,141 | ||
| Foreign taxes withheld on dividends | (244,441 | ) | ||
| Total Investment Income | 4,299,700 | |||
| EXPENSES | ||||
| Investment advisory fees | 2,046,179 | |||
| Administrative fees | 194,545 | |||
| Transfer agency fees | 146,294 | |||
| Distribution and service fees | ||||
| Class A | 422,193 | |||
| Class C | 87,811 | |||
| Class R | 3,141 | |||
| Professional fees | 22,996 | |||
| Networking fees | ||||
| Class A | 15,053 | |||
| Class C | 5,488 | |||
| Class I | 119,343 | |||
| Class R | 109 | |||
| Reports to shareholders and printing fees | 31,513 | |||
| State registration fees | 38,312 | |||
| Insurance fees | 2,959 | |||
| Custody fees | 43,112 | |||
| Trustees’ fees and expenses | 5,993 | |||
| Repayment of previously waived fees | ||||
| Class A | 58,221 | |||
| Class I | 14,669 | |||
| Miscellaneous expenses | 9,247 | |||
| Total Expenses | 3,267,178 | |||
| Net Investment Income | 1,032,522 | |||
| Net realized gain on investments | 18,372,441 | |||
| Net realized loss on foreign currency transactions | (4,005,714 | ) | ||
| Net change in unrealized appreciation on investments | 33,697,956 | |||
| Net change in unrealized appreciation on translation of assets and liabilities denominated in foreign currencies | 28,975 | |||
| NET REALIZED AND UNREALIZED GAIN ON INVESTMENTS | 48,093,658 | |||
| NET INCREASE IN NET ASSETS RESULTING FROM OPERATIONS | $ | 49,126,180 | ||
See Notes to Financial Statements.
54 | April 30, 2015
| ALPS | Red Rocks Listed Private Equity Fund | |
| Statements of Changes in Net Assets |
For the Six Months Ended April 30, 2015 (Unaudited) | For the Fiscal Period Ended October 31, 2014(a) | |||||||
| OPERATIONS | ||||||||
| Net investment income | $ | 1,032,522 | $ | 1,777,483 | ||||
| Net realized gain on investments and foreign currency transactions | 14,366,727 | 9,109,785 | ||||||
| Net realized gain distributions from other investment companies | – | 7,133 | ||||||
| Net change in unrealized appreciation/(depreciation) on investments and translation of assets and liabilities denominated in foreign currencies | 33,726,931 | (39,532,683 | ) | |||||
| Net Increase/(Decrease) in Net Assets Resulting from Operations | 49,126,180 | (28,638,282 | ) | |||||
| DISTRIBUTIONS | ||||||||
| Dividends to shareholders from net investment income | ||||||||
| Class A | (6,752,313 | ) | – | |||||
| Class C | (542,478 | ) | – | |||||
| Class I | (8,146,943 | ) | – | |||||
| Class R | (38,485 | ) | – | |||||
| Dividends to shareholders from net realized gains | ||||||||
| Class A | (640,746 | ) | – | |||||
| Class C | (55,244 | ) | – | |||||
| Class I | (732,422 | ) | – | |||||
| Class R | (3,531 | ) | – | |||||
| Net Decrease in Net Assets from Distributions | (16,912,162 | ) | – | |||||
| BENEFICIAL INTEREST TRANSACTIONS (NOTE 6) | ||||||||
| Shares sold | ||||||||
| Class A | 36,038,825 | 61,140,590 | ||||||
| Class C | 1,880,114 | 7,348,056 | ||||||
| Class I | 71,068,549 | 99,388,072 | ||||||
| Class R | 950,857 | 453,224 | ||||||
| Dividends reinvested | ||||||||
| Class A | 6,738,832 | – | ||||||
| Class C | 407,086 | – | ||||||
| Class I | 4,333,215 | – | ||||||
| Class R | 40,534 | – | ||||||
| Shares redeemed, net of redemption fees | ||||||||
| Class A | (37,117,274 | ) | (50,641,540 | ) | ||||
| Class C | (1,947,894 | ) | (1,176,895 | ) | ||||
| Class I | (61,059,799 | ) | (36,901,005 | ) | ||||
| Class R | (212,118 | ) | (78,846 | ) | ||||
| Net Increase in Net Assets Derived from Beneficial Interest Transactions | 21,120,927 | 79,531,656 | ||||||
| Net increase in net assets | 53,334,945 | 50,893,374 | ||||||
| NET ASSETS | ||||||||
| Beginning of period | 471,435,788 | 420,542,414 | ||||||
| End of period * | $ | 524,770,733 | $ | 471,435,788 | ||||
| *Including accumulated net investment loss of: | $ | (28,204,999 | ) | $ | (13,757,302 | ) | ||
| (a) | Effective May 1, 2014, the Board approved changing the fiscal year-end of the Funds from April 30 to October 31. |
See Notes to Financial Statements.
55 | April 30, 2015
| ALPS | Red Rocks Listed Private Equity Fund – Class A |
| Financial Highlights |
| Selected data for a share of beneficial interest outstanding throughout the periods indicated: |
For the Six Months Ended April 30, 2015 (Unaudited) | For the Fiscal Period Ended October 31, 2014(a) | For the Year Ended April 30, 2014 | For the Year Ended April 30, 2013 | For the Year Ended April 30, 2012 | For the Year Ended April 30, 2011 | |||||||||||||||||||
| Net asset value, beginning of period | $ | 6.61 | $ | 7.00 | $ | 6.05 | $ | 4.67 | $ | 6.44 | $ | 5.17 | ||||||||||||
| INCOME/(LOSS) FROM INVESTMENT OPERATIONS: | ||||||||||||||||||||||||
Net investment income(b) | 0.01 | 0.02 | 0.03 | 0.08 | 0.07 | 0.04 | ||||||||||||||||||
| Net realized and unrealized gain/(loss) | 0.67 | (0.41 | ) | 1.37 | 1.39 | (1.41 | ) | 1.61 | ||||||||||||||||
| Total from investment operations | 0.68 | (0.39 | ) | 1.40 | 1.47 | (1.34 | ) | 1.65 | ||||||||||||||||
| DISTRIBUTIONS: | ||||||||||||||||||||||||
| From net investment income | (0.22 | ) | – | (0.45 | ) | (0.09 | ) | (0.43 | ) | (0.38 | ) | |||||||||||||
| From net realized gains | (0.02 | ) | – | – | – | – | – | |||||||||||||||||
| Total distributions | (0.24 | ) | – | (0.45 | ) | (0.09 | ) | (0.43 | ) | (0.38 | ) | |||||||||||||
| REDEMPTION FEES ADDED TO PAID-IN CAPITAL (NOTE 6) | 0.00 | (c) | 0.00 | (c) | 0.00 | (c) | 0.00 | (c) | 0.00 | (c) | 0.00 | (c) | ||||||||||||
| Net increase/(decrease) in net asset value | 0.44 | (0.39 | ) | 0.95 | 1.38 | (1.77 | ) | 1.27 | ||||||||||||||||
| Net asset value, end of period | $ | 7.05 | $ | 6.61 | $ | 7.00 | $ | 6.05 | $ | 4.67 | $ | 6.44 | ||||||||||||
TOTAL RETURN(d) | 10.54 | % | (5.57 | )% | 23.54 | % | 31.75 | % | (19.68 | )% | 33.22 | % | ||||||||||||
| RATIOS/SUPPLEMENTAL DATA: | ||||||||||||||||||||||||
| Net assets, end of period (000s) | $ | 223,476 | $ | 203,996 | $ | 205,727 | $ | 105,488 | $ | 85,807 | $ | 124,874 | ||||||||||||
Ratio of expenses to average net assets excluding fee waivers and reimbursements(e) | 1.53 | %(f) | 1.59 | %(f) | 1.64 | % | 1.53 | % | 1.71 | % | 1.70 | % | ||||||||||||
Ratio of expenses to average net assets including fee waivers and reimbursements(e) | 1.53 | %(f) | 1.59 | %(f)(g) | 1.64 | %(g) | 1.51 | %(h) | 1.50 | % | 1.50 | % | ||||||||||||
Ratio of net investment income to average net assets(e) | 0.27 | %(f) | 0.71 | %(f) | 0.46 | % | 1.54 | % | 1.34 | % | 0.67 | % | ||||||||||||
Portfolio turnover rate(i) | 18 | % | 11 | % | 40 | % | 32 | % | 72 | % | 43 | % | ||||||||||||
(a) | Effective May 1, 2014, the Board approved changing the fiscal year-end of the Funds from April 30 to October 31. |
| (b) | Calculated using the average shares method. |
(c) | Less than $0.005 per share. |
(d) | Total returns are for the period indicated and have not been annualized. Total returns would have been lower had certain expenses not been waived during the period. Returns shown do not reflect the deduction of taxes that a shareholder would pay on Fund distributions or the redemption of Fund shares. Returns shown exclude any applicable sales charges. |
(e) | The ratios exclude the impact of expenses of the underlying funds in which the Fund invests as represented in the Statement of Investments. |
| (f) | Annualized. |
(g) | According to the Fund’s shareholder services plan with respect to the Fund’s Class A shares, any amount of such payment not paid during the Fund’s fiscal year for such service activities shall be reimbursed to the Fund as soon as practical after the end of the fiscal year. Fees were reimbursed to the Fund during the period ended October 31, 2014, for the prior fiscal year in the amount of 0.06% (annualized) of average net assets of Class A shares and during the year ended April 30, 2014, for the prior fiscal year in the amount of 0.01% of average net assets of Class A shares. |
(h) | Contractual expense limitation changed from 1.50% to 1.65% effective September 1, 2012. |
| (i) | Portfolio turnover rate for periods less than one full year have not been annualized. |
See Notes to Financial Statements.
56 | April 30, 2015
| ALPS | Red Rocks Listed Private Equity Fund – Class C |
| Financial Highlights |
| Selected data for a share of beneficial interest outstanding throughout the periods indicated: |
For the Six Months Ended April 30, 2015 (Unaudited) | For the Fiscal Period Ended October 31, 2014(a) | For the Year Ended April 30, 2014 | For the Year Ended April 30, 2013 | For the Year Ended April 30, 2012 | For the Period July 2, 2010 (Incpetion)to April 30, 2011 | |||||||||||||||||||
| Net asset value, beginning of period | $ | 6.43 | $ | 6.83 | $ | 5.92 | $ | 4.59 | $ | 6.37 | $ | 4.39 | ||||||||||||
| INCOME/(LOSS) FROM INVESTMENT OPERATIONS: | ||||||||||||||||||||||||
Net investment income/(loss)(b) | (0.01 | ) | (0.00 | )(c) | (0.00 | )(c) | 0.04 | 0.03 | (0.01 | ) | ||||||||||||||
| Net realized and unrealized gain/(loss) | 0.64 | (0.40 | ) | 1.33 | 1.35 | (1.39 | ) | 2.36 | ||||||||||||||||
| Total from investment operations | 0.63 | (0.40 | ) | 1.33 | 1.39 | (1.36 | ) | 2.35 | ||||||||||||||||
| DISTRIBUTIONS: | ||||||||||||||||||||||||
| From net investment income | (0.20 | ) | – | (0.42 | ) | (0.06 | ) | (0.42 | ) | (0.37 | ) | |||||||||||||
| From net realized gains | (0.02 | ) | – | – | – | – | – | |||||||||||||||||
| Total distributions | (0.22 | ) | – | (0.42 | ) | (0.06 | ) | (0.42 | ) | (0.37 | ) | |||||||||||||
REDEMPTION FEES ADDED TO PAID‐IN CAPITAL (NOTE 6) | 0.00 | (c) | 0.00 | (c) | 0.00 | (c) | 0.00 | (c) | 0.00 | (c) | 0.00 | (c) | ||||||||||||
| Net increase/(decrease) in net asset value | 0.41 | (0.40 | ) | 0.91 | 1.33 | (1.78 | ) | 1.98 | ||||||||||||||||
| Net asset value, end of period | $ | 6.84 | $ | 6.43 | $ | 6.83 | $ | 5.92 | $ | 4.59 | $ | 6.37 | ||||||||||||
TOTAL RETURN(d) | 10.11 | % | (5.86 | )% | 22.97 | % | 30.55 | % | (20.33 | )% | 55.32 | % | ||||||||||||
| RATIOS/SUPPLEMENTAL DATA: | ||||||||||||||||||||||||
| Net assets, end of period (000s) | $ | 18,645 | $ | 17,193 | $ | 12,200 | $ | 4,417 | $ | 2,838 | $ | 2,566 | ||||||||||||
Ratio of expenses to average net assets excluding fee waivers and reimbursements(e) | 2.12 | %(f) | 2.15 | %(f) | 2.20 | % | 2.25 | % | 2.37 | % | 2.31 | %(f) | ||||||||||||
Ratio of expenses to average net assets including fee waivers and reimbursements(e) | 2.12 | %(f) | 2.15 | %(f) | 2.20 | % | 2.25 | % | 2.25 | % | 2.25 | %(f) | ||||||||||||
Ratio of net investment income/(loss) to average net assets(e) | (0.34 | )%(f) | (0.13 | )%(f) | (0.04 | )% | 0.79 | % | 0.59 | % | (0.19 | )%(f) | ||||||||||||
Portfolio turnover rate(g) | 18 | % | 11 | % | 40 | % | 32 | % | 72 | % | 43 | %(h) | ||||||||||||
(a) | Effective May 1, 2014, the Board approved changing the fiscal year-end of the Funds from April 30 to October 31. |
(b) | Calculated using the average shares method. |
(c) | Less than $0.005 per share. |
(d) | Total returns are for the period indicated and have not been annualized. Total returns would have been lower had certain expenses not been waived during the period. Returns shown do not reflect the deduction of taxes that a shareholder would pay on Fund distributions or the redemption of Fund shares. Returns shown exclude any applicable sales charges. |
(e) | The ratios exclude the impact of expenses of the underlying funds in which the Fund invests as represented in the Statement of Investments. |
(f) | Annualized. |
(g) | Portfolio turnover rate for periods less than one full year have not been annualized. |
(h) | Portfolio turnover rate is calculated at the Fund Level and represents the year ended April 30, 2011. |
See Notes to Financial Statements.
57 | April 30, 2015
| ALPS | Red Rocks Listed Private Equity Fund – Class I |
| Financial Highlights |
| Selected data for a share of beneficial interest outstanding throughout the periods indicated: |
For the Six Months Ended April 30, 2015 (Unaudited) | For the Fiscal Period Ended October 31, 2014(a) | For the Year Ended April 30, 2014 | For the Year Ended April 30, 2013 | For the Year Ended April 30, 2012 | For the Year Ended April 30, 2011 | |||||||||||||||||||
| Net asset value, beginning of period | $ | 6.67 | $ | 7.05 | $ | 6.08 | $ | 4.69 | $ | 6.47 | $ | 5.19 | ||||||||||||
| INCOME/(LOSS) FROM INVESTMENT OPERATIONS: | ||||||||||||||||||||||||
Net investment income(b) | 0.02 | 0.03 | 0.06 | 0.12 | 0.08 | 0.05 | ||||||||||||||||||
| Net realized and unrealized gain/(loss) | 0.68 | (0.41 | ) | 1.37 | 1.36 | (1.42 | ) | 1.62 | ||||||||||||||||
| Total from investment operations | 0.70 | (0.38 | ) | 1.43 | 1.48 | (1.34 | ) | 1.67 | ||||||||||||||||
| DISTRIBUTIONS: | ||||||||||||||||||||||||
| From net investment income | (0.23 | ) | – | (0.46 | ) | (0.09 | ) | (0.44 | ) | (0.39 | ) | |||||||||||||
| From net realized gains | (0.02 | ) | – | – | – | – | – | |||||||||||||||||
| Total distributions | (0.25 | ) | – | (0.46 | ) | (0.09 | ) | (0.44 | ) | (0.39 | ) | |||||||||||||
REDEMPTION FEES ADDED TO PAID‐IN CAPITAL (NOTE 6) | 0.00 | (c) | 0.00 | (c) | 0.00 | (c) | 0.00 | (c) | 0.00 | (c) | 0.00 | (c) | ||||||||||||
| Net increase/(decrease) in net asset value | 0.45 | (0.38 | ) | 0.97 | 1.39 | (1.78 | ) | 1.28 | ||||||||||||||||
| Net asset value, end of period | $ | 7.12 | $ | 6.67 | $ | 7.05 | $ | 6.08 | $ | 4.69 | $ | 6.47 | ||||||||||||
TOTAL RETURN(d) | 10.80 | % | (5.39 | )% | 24.02 | % | 31.99 | % | (19.52 | )% | 33.47 | % | ||||||||||||
| RATIOS/SUPPLEMENTAL DATA: | ||||||||||||||||||||||||
| Net assets, end of period (000s) | $ | 280,913 | $ | 249,375 | $ | 202,076 | $ | 137,856 | $ | 77,750 | $ | 66,854 | ||||||||||||
Ratio of expenses to average net assets excluding fee waivers and reimbursements(e) | 1.16 | %(f) | 1.25 | %(f) | 1.25 | % | 1.27 | % | 1.41 | % | 1.36 | % | ||||||||||||
Ratio of expenses to average net assets including fee waivers and reimbursements(e) | 1.16 | %(f) | 1.25 | %(f) | 1.25 | % | 1.25 | % | 1.25 | % | 1.25 | % | ||||||||||||
Ratio of net investment income to average net assets(e) | 0.62 | %(f) | 0.85 | %(f) | 0.91 | % | 2.27 | % | 1.60 | % | 0.91 | % | ||||||||||||
Portfolio turnover rate(g) | 18 | % | 11 | % | 40 | % | 32 | % | 72 | % | 43 | % | ||||||||||||
(a) | Effective May 1, 2014, the Board approved changing the fiscal year-end of the Funds from April 30 to October 31. |
(b) | Calculated using the average shares method. |
(c) | Less than $0.005 per share. |
(d) | Total returns are for the period indicated and have not been annualized. Total returns would have been lower had certain expenses not been waived during the period. Returns shown do not reflect the deduction of taxes that a shareholder would pay on Fund distributions or the redemption of Fund shares. |
(e) | The ratios exclude the impact of expenses of the underlying funds in which the Fund invests as represented in the Statement of Investments. |
(f) | Annualized. |
(g) | Portfolio turnover rate for periods less than one full year have not been annualized. |
See Notes to Financial Statements.
58 | April 30, 2015
| ALPS | Red Rocks Listed Private Equity Fund – Class R |
| Financial Highlights |
| Selected data for a share of beneficial interest outstanding throughout the periods indicated: |
For the Six Months Ended April 30, 2015 (Unaudited) | For the Fiscal Period Ended October 31, 2014(a) | For the Year Ended April 30, 2014 | For the Year Ended April 30, 2013 | For the Year Ended April 30, 2012 | For the Year Ended April 30, 2011 | |||||||||||||||||||
| Net asset value, beginning of period | $ | 5.87 | $ | 6.21 | $ | 5.41 | $ | 4.17 | $ | 5.82 | $ | 4.73 | ||||||||||||
| INCOME/(LOSS) FROM INVESTMENT OPERATIONS: | ||||||||||||||||||||||||
Net investment income(b) | 0.01 | 0.01 | 0.02 | 0.08 | 0.05 | 0.03 | ||||||||||||||||||
| Net realized and unrealized gain/(loss) | 0.59 | (0.36 | ) | 1.22 | 1.24 | (1.27 | ) | 1.43 | ||||||||||||||||
| Total from investment operations | 0.60 | (0.35 | ) | 1.24 | 1.32 | (1.22 | ) | 1.46 | ||||||||||||||||
| DISTRIBUTIONS: | ||||||||||||||||||||||||
| From net investment income | (0.23 | ) | – | (0.44 | ) | (0.08 | ) | (0.43 | ) | (0.37 | ) | |||||||||||||
| From net realized gains | (0.02 | ) | – | – | – | – | – | |||||||||||||||||
| Total distributions | (0.25 | ) | – | (0.44 | ) | (0.08 | ) | (0.43 | ) | (0.37 | ) | |||||||||||||
REDEMPTION FEES ADDED TO PAID‐IN CAPITAL (NOTE 6) | 0.00 | (c) | 0.01 | – | – | – | – | |||||||||||||||||
| Net increase/(decrease) in net asset value | 0.35 | (0.34 | ) | 0.80 | 1.24 | (1.65 | ) | 1.09 | ||||||||||||||||
| Net asset value, end of period | $ | 6.22 | $ | 5.87 | $ | 6.21 | $ | 5.41 | $ | 4.17 | $ | 5.82 | ||||||||||||
TOTAL RETURN(d) | 10.47 | % | (5.48 | )% | 23.50 | % | 32.05 | % | (19.93 | )% | 32.47 | % | ||||||||||||
| RATIOS/SUPPLEMENTAL DATA: | ||||||||||||||||||||||||
| Net assets, end of period (000s) | $ | 1,737 | $ | 872 | $ | 540 | $ | 191 | $ | 46 | $ | 125 | ||||||||||||
Ratio of expenses to average net assets excluding fee waivers and reimbursements(e) | 1.58 | %(f) | 1.63 | %(f) | 1.72 | % | 1.85 | % | 1.89 | % | 1.87 | % | ||||||||||||
Ratio of expenses to average net assets including fee waivers and reimbursements(e) | 1.58 | %(f) | 1.63 | %(f) | 1.72 | % | 1.75 | % | 1.75 | % | 1.75 | % | ||||||||||||
Ratio of net investment income to average net assets(e) | 0.35 | %(f) | 0.46 | %(f) | 0.36 | % | 1.80 | % | 1.10 | % | 0.66 | % | ||||||||||||
Portfolio turnover rate(g) | 18 | % | 11 | % | 40 | % | 32 | % | 72 | % | 43 | % | ||||||||||||
(a) | Effective May 1, 2014, the Board approved changing the fiscal year-end of the Funds from April 30 to October 31. |
(b) | Calculated using the average shares method. |
(c) | Less than ($0.005) per share. |
(d) | Total returns are for the period indicated and have not been annualized. Total returns would have been lower had certain expenses not been waived during the period. Returns shown do not reflect the deduction of taxes that a shareholder would pay on Fund distributions or the redemption of Fund shares. |
(e) | The ratios exclude the impact of expenses of the underlying funds in which the Fund invests as represented in the Statement of Investments. |
(f) | Annualized. |
(g) | Portfolio turnover rate for periods less than one full year have not been annualized. |
See Notes to Financial Statements.
59 | April 30, 2015
| ALPS | Sterling ETF Tactical Rotation Fund | |
| Management Commentary | April 30, 2015 (Unaudited) |
The ALPS | Sterling ETF Tactical Rotation Fund experienced slight underperformance against its Morningstar Global Allocation Index benchmark during the previous six months. Class I Shares of the Fund (ETRIX) posted a +1.14% gain during the period while the Global Allocation benchmark was +2.59%. The underperformance was a result of missing the beginning leg of the international equity markets strong 2015 start as well as lack of leadership among the remaining asset classes that ETRIX rotates between.
Sterling Global Strategies believes new trends have developed and will be able to capitalize on those trends. They are also excited about commodities as a potential performance enhancer during the second half of 2015.
Mark W. Eicker
Chief Investment Officer
The views and information discussed in this commentary are as of the date of publication, are subject to change, and may not reflect the writer’s current views. The views expressed represent an assessment of market conditions at a specific point in time, are opinions only and should not be relied upon as investment advice regarding a particular investment or markets in general. Such information does not constitute a recommendation to buy or sell specific securities or investment vehicles. It should not be assumed that any investment will be profitable or will equal the performance of the fund(s) or any securities or any sectors mentioned in this letter. The subject matter contained in this letter has been derived from several sources believed to be reliable and accurate at the time of compilation. Neither the Fund nor Sterling Global Strategies accepts any liability for losses either direct or consequential caused by the use of this information.
60 | April 30, 2015
| ALPS | Sterling ETF Tactical Rotation Fund | |
| Performance Update | April 30, 2015 (Unaudited) |
Performance of $10,000 Initial Investment (as of April 30, 2015)
Comparison of change in value of a $10,000 investment (includes maximum sales charges of 5.50%)
Comparison of change in value of a $10,000 investment (includes maximum sales charges of 5.50%)
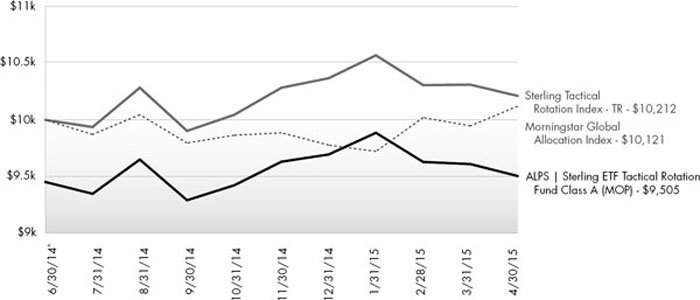
The chart above represents historical performance of a hypothetical investment of $10,000 in the Fund since inception. Past performance does not guarantee future results. This chart does not reflect the deduction of taxes that a shareholder would pay on Fund distributions or the redemption of Fund shares.
Average Annual Total Returns (as of April 30, 2015)
| 3 Month | 6 Month | Since Inception^ | Total Expense Ratio | What You Pay* | |
| Class A (NAV) | -3.85% | 0.87% | 0.56% | 1.85% | 1.75% |
| Class A (MOP) | -9.10% | -4.68% | -4.95% | ||
| Class C (NAV) | -3.96% | 0.58% | 0.08% | 2.45% | 2.35% |
| Class C (CDSC) | -4.92% | -0.42% | -0.91% | ||
| Class I (NAV) | -3.56% | 1.14% | 1.03% | 1.45% | 1.35% |
Morningstar Global Allocation Index1 | 4.10% | 2.59% | 1.21% | ||
Sterling Tactical Rotation Index TR2 | -3.39% | 1.66% | 2.12% |
Performance data quoted represents past performance. Past performance does not guarantee future results. Investment return and principal value of an investment will fluctuate so that an investor’s shares, when sold or redeemed, may be worth more or less than the original cost. Current performance data may be higher or lower than actual data quoted. The Fund imposes a 2.00% redemption fee on shares held for less than 30 days. Performance shown does not include the redemption fee, which if reflected would reduce the performance quoted. For the most current month-end performance data, please call 1-866-759-5679.
Maximum Offering Price (MOP) for Class A shares includes the Fund’s maximum sales charge of 5.50%. CDSC performance for Class C shares includes a 1% contingent deferred sales charge (CDSC) on C shares redeemed within 12 months of purchase. Performance shown at NAV does not include these sales charges and would have been lower had it been taken into account.
Performance less than 1 year is cumulative.
1 | Morningstar Global Allocation Index: seeks to provide both capital appreciation and income by investing across three areas: global equities, global bonds, and cash. An investor may not invest directly in an index. |
2 | The Sterling Tactical Rotation Index - seeks to provide absolute returns during any market cycle or condition by employing an equally weighted strategic rotation model, trading between commodities, REITs, bonds, international and domestic equities. An investor may not invest directly in an index. |
| ^ | Fund inception date of June 30, 2014. |
61 | April 30, 2015
| ALPS | Sterling ETF Tactical Rotation Fund | |
| Performance Update | April 30, 2015 (Unaudited) |
| * | What You Pay reflects the Advisor’s decision to contractually limit expenses through February 29, 2016 and estimated Acquired Fund Fees and Expenses of 0.20%. Please see the prospectus for additional information. |
This Fund is not suitable for all investors. The Fund is “non-diversified” and will generally be more volatile than diversified funds.
Investments in small and mid-cap companies generally will experience greater price volatility. International and Emerging markets are riskier than more developed markets because they tend to develop unevenly and may never fully develop. Prices of fixed income securities generally increase when interest rates decline and decrease when interest rates increase and may cause losses. Real estate investments are subject to specific risks, such as risks related to general and local economic conditions and risks related to individual properties.
The Fund invests in Exchange Traded Funds (“ETFs”) and the Fund could lose money by investing in an ETF if the prices of the securities owned by the ETF go down. The Fund’s shareholders will indirectly incur the fees and expenses charged by the underlying ETFs held by the Fund, in addition to the expense charged by the Fund.
Commodities and futures generally are volatile and involve a high degree of risk. This fund enters into a short sale by selling a security it has borrowed. If the market price of a security increases after the Fund borrows the security, the Fund will suffer a potentially unlimited loss when it replaces the borrowed security at the higher price. The use of derivatives exposes the Fund to additional risks including increased volatility, lack of liquidity, and possible losses greater than the Fund’s initial investment as well as increased transaction.
There is no guarantee that the Fund will continue to hold any one particular security or stay invested in any one particular company. The composition of the Fund’s top holdings is subject to change. Performance figures are historical and reflect the change in share price, reinvested distributions, changes in net asset value, sales charges and capital gains distributions, if any.
The ALPS | Sterling ETF Tactical Rotation Fund is new and has limited operating history.
Not FDIC Insured – No Bank Guarantee – May Lose Value
Portfolio Composition (as a % of Net Assets) *
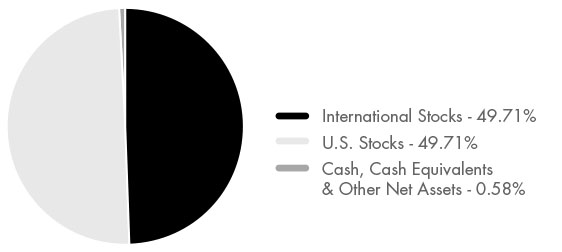
| * | Holdings are subject to change. |
62 | April 30, 2015
| ALPS | Sterling ETF Tactical Rotation Fund | |
| Statement of Investments | April 30, 2015 (Unaudited) |
| Shares | Value (Note 2) | |||||||
| EXCHANGE TRADED FUNDS (99.42%) | ||||||||
iShares® MSCI EAFE ETF | 211,718 | $ | 14,081,363 | |||||
SPDR® S&P 500® ETF Trust | 67,530 | 14,081,356 | ||||||
| 28,162,719 | ||||||||
| TOTAL EXCHANGE TRADED FUNDS (Cost $27,849,039) | 28,162,719 | |||||||
7-Day Yield | Shares | Value (Note 2) | ||||||||||
| SHORT TERM INVESTMENTS (0.33%) | ||||||||||||
| Money Market Fund (0.33%) | ||||||||||||
| Morgan Stanley Institutional Liquidity Fund, Prime Portfolio | 0.077 | % | 93,075 | 93,075 | ||||||||
| TOTAL SHORT TERM INVESTMENTS (Cost $93,075) | 93,075 | |||||||||||
| TOTAL INVESTMENTS (99.75%) (Cost $27,942,114) | $ | 28,255,794 | ||||||||||
| Other Assets In Excess Of Liabilities (0.25%) | 70,795 | |||||||||||
| NET ASSETS (100.00%) | $ | 28,326,589 | ||||||||||
Common Abbreviations:
EAFE - Europe, Australia, and Far East.
ETF - Exchange Traded Fund.
EAFE - Europe, Australia, and Far East.
ETF - Exchange Traded Fund.
MSCI - Morgan Stanley Capital International.
S&P - Standard and Poor’s.
S&P - Standard and Poor’s.
SPDR - Standard and Poor’s Depositary Receipt.
For Fund compliance purposes, the Fund’s industry classifications refer to any one or more of the industry sub-classifications used by one or more widely recognized market indexes or ratings group indexes, and/or as defined by Fund management. This definition may not apply for purposes of this report, which may combine industry sub-classifications for reporting ease. Industries are shown as a percent of net assets.
See Notes to Financial Statements.
63 | April 30, 2015
| ALPS | Sterling ETF Tactical Rotation Fund | |
| Statement of Assets and Liabilities | April 30, 2015 (Unaudited) |
| ASSETS | ||||
| Investments, at value | $ | 28,255,794 | ||
| Receivable for investments sold | 13,989,281 | |||
| Receivable for shares sold | 183,601 | |||
| Dividends and interest receivable | 19 | |||
| Deferred offering costs | 11,893 | |||
| Prepaid expenses and other assets | 19,307 | |||
| Total Assets | 42,459,895 | |||
| LIABILITIES | ||||
| Payable for investments purchased | 14,082,031 | |||
| Payable for shares redeemed | 11,519 | |||
| Investment advisory fees payable | 7,222 | |||
| Administration and transfer agency fees payable | 8,635 | |||
| Distribution and services fees payable | 10,135 | |||
| Trustees’ fees and expenses payable | 6 | |||
| Professional fees payable | 8,304 | |||
| Accrued expenses and other liabilities | 5,454 | |||
| Total Liabilities | 14,133,306 | |||
| NET ASSETS | $ | 28,326,589 | ||
| NET ASSETS CONSIST OF | ||||
| Paid-in capital | $ | 28,634,252 | ||
| Accumulated net investment income | 17,247 | |||
| Accumulated net realized loss on investments | (638,590 | ) | ||
| Net unrealized appreciation on investments | 313,680 | |||
| NET ASSETS | $ | 28,326,589 | ||
| INVESTMENTS, AT COST | $ | 27,942,114 | ||
| PRICING OF SHARES | ||||
| Class A: | ||||
| Net Asset Value, offering and redemption price per share | $ | 9.99 | ||
| Net Assets | $ | 14,415,883 | ||
| Shares of beneficial interest outstanding (unlimited number of shares, no par value common stock authorized) | 1,442,649 | |||
| Maximum offering price per share ((NAV/0.9450), based on maximum sales charge of 5.50% of the offering price) | $ | 10.57 | ||
| Class C: | ||||
Net Asset Value, offering and redemption price per share(a) | $ | 9.95 | ||
| Net Assets | $ | 1,417,229 | ||
| Shares of beneficial interest outstanding (unlimited number of shares, no par value common stock authorized) | 142,458 | |||
| Class I: | ||||
| Net Asset Value, offering and redemption price per share | $ | 10.03 | ||
| Net Assets | $ | 12,493,477 | ||
| Shares of beneficial interest outstanding (unlimited number of shares, no par value common stock authorized) | 1,245,410 | |||
(a) | Redemption price per share may be reduced for any applicable contingent deferred sales charge. For a description of a possible sales charge, please see the Fund’s Prospectus. |
See Notes to Financial Statements.
64 | April 30, 2015
| ALPS | Sterling ETF Tactical Rotation Fund | |
| Statement of Operations | For the Six Months Ended April 30, 2015 (Unaudited) |
| INVESTMENT INCOME | ||||
| Dividends | $ | 276,935 | ||
| Total Investment Income | 276,935 | |||
| EXPENSES | ||||
| Investment advisory fees | 105,107 | |||
| Administrative fees | 49,975 | |||
| Transfer agency fees | 457 | |||
| Distribution and service fees | ||||
| Class A | 22,236 | |||
| Class C | 4,539 | |||
| Professional fees | 4,864 | |||
| Networking fees | ||||
| Class A | 16 | |||
| Class C | 4 | |||
| Class I | 2,232 | |||
| Reports to shareholders and printing fees | 1,410 | |||
| State registration fees | 7,600 | |||
| SEC registration fees | 498 | |||
| Insurance fees | 35 | |||
| Custody fees | 1,767 | |||
| Trustees’ fees and expenses | 250 | |||
| Offering costs | 35,573 | |||
| Miscellaneous expenses | 6,344 | |||
| Total Expenses | 242,907 | |||
| Less fees waived/reimbursed by investment advisor (Note 8) | ||||
| Class A | (43,174 | ) | ||
| Class C | (3,538 | ) | ||
| Class I | (42,185 | ) | ||
| Net Expenses | 154,010 | |||
| Net Investment Income | 122,925 | |||
| Net realized loss on investments | (489,856 | ) | ||
| Net change in unrealized appreciation on investments | 74,381 | |||
| NET REALIZED AND UNREALIZED LOSS ON INVESTMENTS | (415,475 | ) | ||
| NET DECREASE IN NET ASSETS RESULTING FROM OPERATIONS | $ | (292,550 | ) | |
See Notes to Financial Statements.
65 | April 30, 2015
| ALPS | Sterling ETF Tactical Rotation Fund |
| Statements of Changes in Net Assets |
| For the Period | ||||||||
| For the Six Months | July 1, 2014 | |||||||
| Ended April 30, 2015 | (Commencement) to | |||||||
| (Unaudited) | October 31, 2014 | |||||||
| OPERATIONS | ||||||||
| Net investment income | $ | 122,925 | $ | 13,776 | ||||
| Net realized loss on investments | (489,856 | ) | (148,734 | ) | ||||
| Net change in unrealized appreciation on investments | 74,381 | 239,299 | ||||||
| Net Increase/(Decrease) in Net Assets Resulting from Operations | (292,550 | ) | 104,341 | |||||
| DISTRIBUTIONS | ||||||||
| Dividends to shareholders from net investment income | ||||||||
| Class A | (55,630 | ) | – | |||||
| Class C | (4,086 | ) | – | |||||
| Class I | (67,213 | ) | – | |||||
| Net Decrease in Net Assets from Distributions | (126,929 | ) | – | |||||
| BENEFICIAL INTEREST TRANSACTIONS (NOTE 6) | ||||||||
| Shares sold | ||||||||
| Class A | 12,845,669 | 5,280,333 | ||||||
| Class C | 1,150,986 | 540,462 | ||||||
| Class I | 7,093,410 | 7,423,186 | ||||||
| Dividends reinvested | ||||||||
| Class A | 50,265 | – | ||||||
| Class C | 3,473 | – | ||||||
| Class I | 56,161 | – | ||||||
| Shares redeemed, net of redemption fees | ||||||||
| Class A | (3,429,665 | ) | (85,902 | ) | ||||
| Class C | (243,912 | ) | (8,249 | ) | ||||
| Class I | (1,912,049 | ) | (122,441 | ) | ||||
| Net Increase in Net Assets Derived from Beneficial Interest Transactions | 15,614,338 | 13,027,389 | ||||||
| Net increase in net assets | 15,194,859 | 13,131,730 | ||||||
| NET ASSETS | ||||||||
| Beginning of period | 13,131,730 | – | ||||||
| End of period * | $ | 28,326,589 | $ | 13,131,730 | ||||
| * Including accumulated net investment income of: | $ | 17,247 | $ | 20,797 | ||||
See Notes to Financial Statements.
66 | April 30, 2015
| ALPS | Sterling ETF Tactical Rotation Fund – Class A |
| Financial Highlights |
Selected data for a share of beneficial interest outstanding throughout the periods indicated:
| For the | For the Period | |||||||
| Six Months | July 1, 2014 | |||||||
| Ended | (Commencement) | |||||||
| April 30, 2015 | to | |||||||
| (Unaudited) | October 31, 2014 | |||||||
| Net asset value, beginning of period | $ | 9.97 | $ | 10.00 | ||||
| INCOME FROM INVESTMENT OPERATIONS: | ||||||||
Net investment income(a) | 0.04 | 0.02 | ||||||
| Net realized and unrealized gain/(loss) | 0.05 | (0.05 | ) | |||||
| Total from investment operations | 0.09 | (0.03 | ) | |||||
| DISTRIBUTIONS: | ||||||||
| From net investment income | (0.07 | ) | – | |||||
| Total distributions | (0.07 | ) | – | |||||
| REDEMPTION FEES ADDED TO PAID‐IN CAPITAL (NOTE 6) | 0.00 | (b) | 0.00 | (b) | ||||
| Net increase/(decrease) in net asset value | 0.02 | (0.03 | ) | |||||
| Net asset value, end of period | $ | 9.99 | $ | 9.97 | ||||
TOTAL RETURN(c) | 0.87 | % | (0.30 | )% | ||||
| RATIOS/SUPPLEMENTAL DATA: | ||||||||
| Net assets, end of period (000s) | $ | 14,416 | $ | 5,262 | ||||
| Ratio of expenses to average net assets excluding fee waivers and reimbursements | 2.31 | %(d) | 5.01 | %(d) | ||||
| Ratio of expenses to average net assets including fee waivers and reimbursements | 1.54 | %(d)(e) | 1.55 | %(d) | ||||
| Ratio of net investment income to average net assets | 0.88 | %(d) | 0.67 | %(d) | ||||
Portfolio turnover rate(f) | 188 | % | 181 | % | ||||
(a) | Calculated using the average shares method. |
(b) | Less than $0.005 per share. |
(c) | Total returns are for the period indicated and have not been annualized. Total returns would have been lower had certain expenses not been waived during the period. Returns shown do not reflect the deduction of taxes that a shareholder would pay on Fund distributions or the redemption of Fund shares. Returns shown exclude any applicable sales charges. |
(d) | Annualized. |
(e) | According to the Fund’s shareholder services plan with respect to the Fund’s Class A shares, any amount of such payment not paid during the Fund’s fiscal year for such service activities shall be reimbursed to the Fund as soon as practical after the end of the fiscal year. Fees were reimbursed to the Fund during the period ended April 30, 2015, for the prior fiscal year in the amount of 0.01% (annualized) of average net assets of Class A shares |
| (f) | Portfolio turnover rate for periods less than one full year have not been annualized. |
See Notes to Financial Statements.
67 | April 30, 2015
| ALPS | Sterling ETF Tactical Rotation Fund – Class C |
| Financial Highlights |
Selected data for a share of beneficial interest outstanding throughout the periods indicated:
| For the | For the Period | |||||||
| Six Months | July 1, 2014 | |||||||
| Ended | (Commencement) | |||||||
| April 30, 2015 | to | |||||||
| (Unaudited) | October 31, 2014 | |||||||
| Net asset value, beginning of period | $ | 9.95 | $ | 10.00 | ||||
| INCOME FROM INVESTMENT OPERATIONS: | ||||||||
Net investment income(a) | 0.01 | – | ||||||
| Net realized and unrealized gain/(loss) | 0.05 | (0.05 | ) | |||||
| Total from investment operations | 0.06 | (0.05 | ) | |||||
| DISTRIBUTIONS: | ||||||||
| From net investment income | (0.06 | ) | – | |||||
| Total distributions | (0.06 | ) | – | |||||
| Net (decrease) in net asset value | – | (0.05 | ) | |||||
| Net asset value, end of period | $ | 9.95 | $ | 9.95 | ||||
TOTAL RETURN(b) | 0.58 | % | (0.50 | )% | ||||
| RATIOS/SUPPLEMENTAL DATA: | ||||||||
| Net assets, end of period (000s) | $ | 1,417 | $ | 530 | ||||
| Ratio of expenses to average net assets excluding fee waivers and reimbursements | 2.93 | %(c) | 9.70 | %(c) | ||||
| Ratio of expenses to average net assets including fee waivers and reimbursements | 2.15 | %(c) | 2.15 | %(c) | ||||
| Ratio of net investment income to average net assets | 0.28 | %(c) | 0.12 | %(c) | ||||
Portfolio turnover rate(d) | 188 | % | 181 | % | ||||
(a) | Calculated using the average shares method. |
(b) | Total returns are for the period indicated and have not been annualized. Total returns would have been lower had certain expenses not been waived during the period. Returns shown do not reflect the deduction of taxes that a shareholder would pay on Fund distributions or the redemption of Fund shares. Returns shown exclude any applicable sales charges. |
(c) | Annualized. |
(d) | Portfolio turnover rate for periods less than one full year have not been annualized. |
See Notes to Financial Statements.
68 | April 30, 2015
| ALPS | Sterling ETF Tactical Rotation Fund – Class I |
| Financial Highlights |
Selected data for a share of beneficial interest outstanding throughout the periods indicated:
| For the | For the Period | |||||||
| Six Months | July 1, 2014 | |||||||
| Ended | (Commencement) | |||||||
| April 30, 2015 | to | |||||||
| (Unaudited) | October 31, 2014 | |||||||
| Net asset value, beginning of period | $ | 9.98 | $ | 10.00 | ||||
| INCOME FROM INVESTMENT OPERATIONS: | ||||||||
Net investment income(a) | 0.07 | 0.03 | ||||||
| Net realized and unrealized gain/(loss) | 0.06 | (0.05 | ) | |||||
| Total from investment operations | 0.13 | (0.02 | ) | |||||
| DISTRIBUTIONS: | ||||||||
| From net investment income | (0.08 | ) | – | |||||
| Total distributions | (0.08 | ) | – | |||||
| REDEMPTION FEES ADDED TO PAID‐IN CAPITAL (NOTE 6) | 0.00 | (b) | – | |||||
| Net increase/(decrease) in net asset value | 0.05 | (0.02 | ) | |||||
| Net asset value, end of period | $ | 10.03 | $ | 9.98 | ||||
TOTAL RETURN(c) | 1.24 | % | (0.20 | )% | ||||
| RATIOS/SUPPLEMENTAL DATA: | ||||||||
| Net assets, end of period (000s) | $ | 12,493 | $ | 7,340 | ||||
| Ratio of expenses to average net assets excluding fee waivers and reimbursements | 2.00 | %(d) | 5.93 | %(d) | ||||
| Ratio of expenses to average net assets including fee waivers and reimbursements | 1.15 | %(d) | 1.15 | %(d) | ||||
| Ratio of net investment income to average net assets | 1.45 | %(d) | 0.94 | %(d) | ||||
Portfolio turnover rate(e) | 188 | % | 181 | % | ||||
(a) | Calculated using the average shares method. |
(b) | Less than $0.005 per share. |
(c) | Total returns are for the period indicated and have not been annualized. Total returns would have been lower had certain expenses not been waived during the period. Returns shown do not reflect the deduction of taxes that a shareholder would pay on Fund distributions or the redemption of Fund shares. |
(d) | Annualized. |
(e) | Portfolio turnover rate for periods less than one full year have not been annualized. |
See Notes to Financial Statements.
69 | April 30, 2015
| ALPS | Westport Resources Hedged High Income Fund | |
| Management Commentary | April 30, 2015 (Unaudited) |
Portfolio Review – April, 2015
The ALPS | Westport Resources Hedged High Income Fund’s Class I Shares returned 0.96% for the month, 2.12% year to date (YTD), and 0.75% for the last six months, net of fees. The Fund outperformed the Morningstar Non-Traditional Bond Universe benchmark (+0.39%) for the month, (+1.27%) YTD, and (+0.57%) for six months. These results place the Fund in the top quartile of the Universe for the current year in what has been a choppy market for interest rate moves.
The Fund is invested in three sub-strategies: the Senior Loan Floating Rate Strategy, the Short Duration High Yield (HY) Strategy, and the Relative Value Long/Short Debt Strategy. Fund assets are allocated approximately one-third to each sub-strategy.
Two of the three strategies had positive performance for the month, year to date, and six-month periods. The Short Duration High Yield also has had a positive contribution for the current year, but shows a slight loss for the six month period. Before taking into account fees and expenses, the Senior Loan Floating Rate Strategy returned 3.41%, the Short Duration High Yield Strategy lost 0.23%, and the Relative Value Long/Short Debt Strategy gained 2.28% for the six month period. These compared to their respective benchmarks of the Credit Suisse Leverage Loan index which was up 2.33%, the PIMCO 0-5 Year HY ETF (Exchange-Traded Fund) up 0.65%, and the Barclays U.S. Aggregate Bond Index which was up 2.06% for six months.
We continue to believe that the three complementary strategies work well as a core diversified fixed income portfolio allocation.
Outlook
Recent mixed U.S. data, including some negative surprises, may keep the Federal Reserve (the “Fed”) more reserved about their planned moves to policy normalization. Inflation expectations are beginning to show signs of picking up despite the lower Consumer Price Index and Gross Domestic Product growth seen in the last few quarters; which contrasts with the Fed’s perception that they will remain data-dependent before they engage in any sort of rate hike. This scenario is expected to keep interest rates range bound. Volatility is likely to persist given the uncertainty around this expected shift in monetary policy, as well as the influences of the unsettled state of the energy markets. For this reason we constructed a fund that avoids interest rate timing and focuses rather on strategic positioning, looking to take advantage of the continued reshaping of the yield curve and the risk-adjusted yield advantage of a multi-strategy approach. Finally, fundamental credit research-driven security selection should prove an important source of value added in more volatile markets.
Current Positioning Themes:
Macro and Rates:
| · | The FOMC wants to normalize U.S. monetary policy and momentum has shifted from “when” to how they will initiate their plan of action. |
| · | Eurozone government bonds are expensive relative to U.S. Treasuries. |
| · | Modest net long duration, short intermediate swap spreads, and a flatter yield curve. |
Corporate Credit:
| · | Credit spread volatility means wider equilibrium spreads. |
| · | U.S Investment Grade and High Yield spreads offer value relative to many global alternatives. |
| · | Market technicals (supply and demand) will influence market pricing. |
| · | High Yield Energy sector remains a source of market volatility. |
| · | Credit fundamentals continue to slowly deteriorate, but are not yet problematic. |
| · | Default rates in HY market are very low as many maturities extended in low rate environment. |
| · | Corporate Earnings- more about the second half of earnings season with U.S. dollar strength dominating headline numbers. |
Securitized Credit:
| · | Securitized credit offers an attractive alternative to higher-yielding corporate credit. |
| · | U.S. housing recovery cycle is trailing the U.S. business/default cycle. |
| · | Will look to add subordinated CMBS (commercial mortgage-backed security) exposure on relative underperformance to RMBS (residential mortgage-backed securities). |
Mark R. Tonucci, Co-Portfolio Manager
Michael E. Portnoy, Co-Portfolio Manager
The views and information discussed in this commentary are as of the date of publication, are subject to change, and may not reflect the writer's current views. The views expressed represent an assessment of market conditions at a specific point in time, are opinions only and should not be relied upon as investment advice regarding a particular investment or markets in general. Such information does not constitute a recommendation to buy or sell specific securities or investment vehicles. It should not be assumed that any investment will be profitable or will equal the performance of the fund(s) or any securities or any sectors mentioned in this letter. The subject matter contained in this letter has been derived from several sources believed to be reliable and accurate at the time of compilation. Neither ALPS Advisors, Inc., Westport Resources Management, Inc. nor the Fund accepts any liability for losses either direct or consequential caused by the use of this information.
The Credit Suisse Leverage Loan Index is an index designed to mirror the investable universe of the US-denominated leveraged loan market.
The PIMCO 0-5 Year High Yield Corporate Bond Index Exchange-Traded Fund is a short term-high yield index which tracks the BofA Merrill Lynch 0-5 Year US High Yield Constrained Index, towards achievement of the yield, volatility level, and low or negative correlations with other asset classes inherent in short maturity high yield. The BofA Merrill Lynch 0-5 Year US High Yield Constrained Index is an unmanaged index comprised of U.S. dollar denominated below investment grade corporate debt securities publicly issued in the U.S. domestic market with remaining maturities of less than 5 years.
70 | April 30, 2015
| ALPS | Westport Resources Hedged High Income Fund | |
| Performance Update | April 30, 2015 (Unaudited) |
Performance of $10,000 Initial Investment (as of April 30, 2015)
Comparison of change in value of a $10,000 investment (includes maximum sales charges of 5.50%)
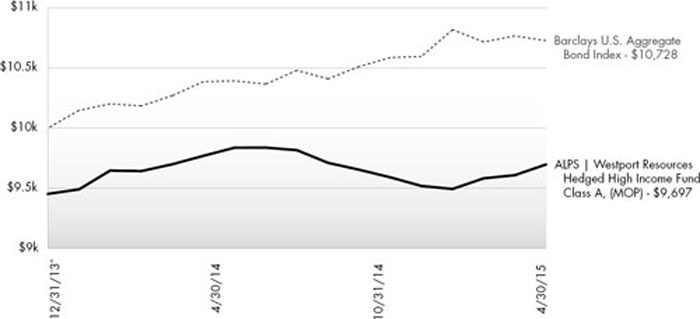
The chart above represents historical performance of a hypothetical investment of $10,000 in the Fund since inception. Past performance does not guarantee future results. This chart does not reflect the deduction of taxes that a shareholder would pay on Fund distributions or the redemption of Fund shares.
Average Annual Total Returns (as of April 30, 2015)
| 6 Month | 1 Year | Since Inception^ | Total Expense Ratio | What You Pay* | |
| Class A (NAV) | 0.45% | -0.02% | 1.95% | 3.64% | 2.39% |
| Class A (MOP) | -5.04% | -5.50% | -2.29% | ||
| Class C (NAV) | 0.26% | -0.62% | 1.33% | 4.25% | 2.99% |
| Class C (CDSC) | -0.71% | -1.56% | 1.33% | ||
| Class I | 0.75% | 0.38% | 2.36% | 3.39% | 1.99% |
Barclays U.S. Aggregate Bond Index1 | 2.06% | 4.46% | 5.43% |
Performance data quoted represents past performance. Past performance does not guarantee future results. Investment return and principal value of an investment will fluctuate so that an investor's shares, when sold or redeemed, may be worth more or less than the original cost. Current performance data may be higher or lower than actual data quoted. For the most current month-end performance data, please call 1-866-759-5679.
Maximum Offering Price (MOP) for Class A shares includes the Fund’s maximum sales charge of 5.50%. Performance shown at NAV does not include these sales charges and would have been lower had it been taken into account. If you invest $1 million or more, either as a lump sum or through the Fund’s accumulation or letter of intent programs, you can purchase Class A shares without an initial sales charge (load). A Contingent Deferred Sales Charge (“CDSC”) of 1.00% may apply to Class C shares redeemed within the first 12 months after a purchase, and on Class A shares redeemed within the first 18 months after a purchase in excess of $1 million.
Performance less than 1 year is cumulative.
71 | April 30, 2015
| ALPS | Westport Resources Hedged High Income Fund | |
| Performance Update | April 30, 2015 (Unaudited) |
| 1 | The Barclays U.S. Aggregate Bond Index is a broad-based benchmark that measures the investment grade, U.S. dollar-denominated, fixed-rate taxable bond market, including Treasuries, government-related and corporate securities, MBS (agency fixed-rate and hybrid ARM passthroughs), ABS, and CMBS. The index is not actively managed and does not reflect any deductions for fees, expenses or taxes. An investor may not invest directly in an index. |
| ^ | Fund inception date of December 31, 2013. |
| * | What You Pay reflects the Advisor’s decision to contractually limit expenses through February 29, 2016. Please see the prospectus for additional information. |
There is no guarantee that the Fund will continue to hold any one particular security or stay invested in any one particular company. The composition of the Fund's top holdings is subject to change. Performance figures are historical and reflect the change in share price, reinvested distributions, changes in net asset value, sales charges and capital gains distributions, if any.
Not FDIC Insured – No Bank Guarantee – May Lose Value
Derivatives generally are more sensitive to changes in economic or market conditions than other types of investments; this could result in losses that significantly exceed the Fund's original investment.
All investments involve risks, including possible loss of principal. The risks associated with higher-yielding, lower-rated securities include higher risk of default and loss of principal. Changes in the financial strength of a bond issuer or in a bond’s credit rating may affect its value. In addition, interest rate movements will affect the fund’s share price and yield. Credit risk refers to the possibility the bond issuer will not be able to make principal and interest payments. Bond prices generally move in the opposite direction of interest rates. Thus, as the prices of bonds in the fund adjust to a rise in interest rates, the fund’s share price may decline. These and other risk considerations are discussed in the fund’s prospectus. The principal on mortgage or asset-backed securities normally may be prepaid at any time, which will reduce the yield and market value of those securities. US obligations are supported by varying degrees of credit but generally are not backed by the full faith and credit of the US government. Investments in non-investment-grade debt securities (“high yield” or “junk” bonds) may be subject to greater market fluctuations and risk of default or loss of income and principal than securities in higher rating categories.
Senior-secured and second lien loans and bonds: Assets pledged as security for these loans and bonds would first be made available to senior lenders before other investors’ demands were met when settling a bankruptcy.
The Fund is not required to invest with any minimum number of sub-advisors, and does not have minimum or maximum limitations with respect to the allocations of the assets to any sub-advisor or investment option.
Top Ten Holdings (as a % of Net Assets) †
| Broadview Networks Holdings, Inc., Sec. Notes | 2.39 | % | ||
| Marine Acquisition Corp., Term Loan | 2.29 | % | ||
| Creditcorp, Sec. Notes | 2.25 | % | ||
| TeleCommunication Systems, Inc., Conv. Sr. Unsec. Notes | 2.19 | % | ||
| ION Geophysical Corp., Second Lien Notes | 2.18 | % | ||
| American Gilsonite Co., Second Lien Notes | 2.17 | % | ||
| Boardriders SA, Sr. Unsec. Notes | 2.05 | % | ||
| Global Investments Group Finance Ltd., Sr. Unsec. Notes | 2.04 | % | ||
| Neebo, Inc., Sec. Notes | 1.78 | % | ||
ProShares UltraShort Russell 2000® | 1.73 | % | ||
| Top Ten Holdings | 21.07 | % |
| † | Holdings are subject to change. Table presents indicative values only. |
Portfolio Composition (as a % of Net Assets)
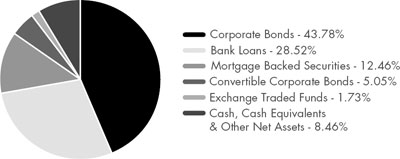
72 | April 30, 2015
| ALPS | Westport Resources Hedged High Income Fund | |
| Statement of Investments | April 30, 2015 (Unaudited) |
| Value | ||||||||
| Shares | (Note 2) | |||||||
| EXCHANGE TRADED FUNDS (1.73%) | ||||||||
ProShares UltraShort Russell 2000®(a) | 9,380 | $ | 349,780 | |||||
| TOTAL EXCHANGE TRADED FUNDS (Cost $389,827) | 349,780 | |||||||
| Principal | Value | |||||||
| Amount | (Note 2) | |||||||
BANK LOANS (28.52%)(b) | ||||||||
| Basic Materials (0.39%) | ||||||||
| Tensar Corp., First Lien Term Loan | ||||||||
| 5.750% 07/09/2021 | $ | 84,575 | 78,892 | |||||
| Communications (4.44%) | ||||||||
| ABG Intermediate Holdings LLC, First Lien Term Loan | ||||||||
| 5.500% 05/27/2021 | 250 | 252 | ||||||
| Answers Corporation, First Lien Term Loan | ||||||||
| 6.250% 10/01/2021 | 61,845 | 59,423 | ||||||
| Auction.com, A-2 Term Loan | ||||||||
| 4.440% 02/28/2017 | 2,964 | 2,949 | ||||||
| Auction.com, A-4 Term Loan | ||||||||
| 4.440% 02/28/2017 | 51,036 | 50,781 | ||||||
| Block Communications, Incremental Term B Loan | ||||||||
| 4.250% 11/07/2021 | 58,678 | 59,246 | ||||||
| ConvergeOne Holdings Corp., First Lien Initial Term Loan | ||||||||
| 6.000% 06/17/2020 | 50,618 | 50,713 | ||||||
| Encompass Digital Media, Inc., Second Lien Tranche B Term Loan | ||||||||
| 8.750% 06/06/2022 | 100,000 | 100,500 | ||||||
| Extreme Reach, Inc., Second Lien Initial Term Loan | ||||||||
| 10.500% 01/22/2021 | 160,000 | 160,400 | ||||||
| iParadigms Holdings LLC, First Lien Initial Term Loan | ||||||||
| 5.000% 07/30/2021 | 19,845 | 19,919 | ||||||
| MediArena Acquisition BV, (fka AP NMT Acquisition BV), First Lien Term B Loan | ||||||||
| 6.750% 08/13/2021 | 98,505 | 98,456 | ||||||
| Miller Heiman, Inc., Term Loan | ||||||||
| 6.750% 09/30/2019 | 34,560 | 33,566 | ||||||
| NextGen Networks Pty. Ltd. (Nextgen Finance LLC), Term B Loan | ||||||||
| 5.000% 05/31/2021 | 99,250 | 96,603 | ||||||
| Presidio, Inc., Term Loan | ||||||||
| 6.250% 02/02/2022 | 26,000 | 26,260 | ||||||
| Principal | Value | |||||||
| Amount | (Note 2) | |||||||
| Communications (continued) | ||||||||
| RentPath LLC, Term Loan | ||||||||
| 6.250% 12/17/2021 | $ | 38,873 | $ | 39,358 | ||||
| TCH-2 Holdings LLC (TravelClick, Inc.), First Lien Initial Term Loan | ||||||||
| 5.500% 05/06/2021 | 99,269 | 99,187 | ||||||
| Total Communications | 897,613 | |||||||
| Consumer, Cyclical (6.21%) | ||||||||
| Amaya Holdings BV, First Lien Initial Term B Loan | ||||||||
| 5.000% 08/01/2021 | 111,440 | 111,754 | ||||||
| AMF Bowling Centers, Inc., Term B Loan | ||||||||
| 7.250% 09/18/2021 | 41,790 | 42,103 | ||||||
| BDF Acquisition Corp., Initial Term Loan | ||||||||
| 5.250% 02/12/2021 | 124,063 | 123,520 | ||||||
| BDF Acquisition Corp., Second Lien Initial Term Loan | ||||||||
| 9.000% 02/12/2022 | 23,000 | 22,080 | ||||||
| Caesars Entertainment Operating Company, Inc. (fka Harrah’s Operating Company, Inc.) Term B-7 Loan | ||||||||
| 11.500% 01/28/2018 | 199,000 | 183,357 | ||||||
| Deluxe Entertainment Services Group, Inc., Initial Term Loan | ||||||||
| 6.500% 02/28/2020 | 93,854 | 90,100 | ||||||
| Fitness International LLC, Term B Loan | ||||||||
| 5.500% 07/01/2020 | 75,365 | 71,715 | ||||||
| GOBP Holdings, Inc., First Lien Initial Term Loan | ||||||||
| 5.750% 10/21/2021 | 28,000 | 28,350 | ||||||
| Great Wolf Resorts, Inc., Term B Loan | ||||||||
| 5.750% 08/06/2020 | 53,727 | 53,827 | ||||||
| GST AutoLeather, Inc., Commitment Term B Loan | ||||||||
| 6.500% 07/10/2020 | 99,500 | 99,002 | ||||||
| Hercules Achievement, Inc. (aka Varsity Brands, Inc.), First Lien Initial Term Loan | ||||||||
| 6.000% 12/10/2021 | 7,968 | 8,079 | ||||||
| MPG Holdco I, Inc., Initial Term Loan | ||||||||
| 4.250% 10/20/2021 | 81,563 | 81,736 | ||||||
| Twin River Management Group, Inc. (fka BLB Management Services, Inc.), Closing Date Term Loan | ||||||||
| 5.250% 07/10/2020 | 239,048 | 239,764 | ||||||
73 | April 30, 2015
| ALPS | Westport Resources Hedged High Income Fund | |
| Statement of Investments | April 30, 2015 (Unaudited) |
| Principal | Value | |||||||
| Amount | (Note 2) | |||||||
| Consumer, Cyclical (continued) | ||||||||
| World Triathlon Corp., Initial Term Loan | ||||||||
| 5.250% 06/25/2021 | $ | 99,250 | $ | 99,829 | ||||
| Total Consumer, Cyclical | 1,255,216 | |||||||
| Consumer, Non-cyclical (5.83%) | ||||||||
| Academi Holdings LLC (ERSM (International) Ltd.), First Lien Term Loan | ||||||||
| 6.250% 07/25/2019 | 40,700 | 40,497 | ||||||
| Accuvant Finance LLC, Initial Term Loan | ||||||||
| 6.250% 01/28/2022 | 74,000 | 74,601 | ||||||
| Candy Intermediate Holdings, Inc., Initial Term Loan | ||||||||
| 7.500% 06/18/2018 | 15,959 | 15,979 | ||||||
| Central Security, First Lien Initial Term Loan | ||||||||
| 6.250% 10/06/2020 | 46,883 | 46,941 | ||||||
| CPI Buyer, First Lien Initial Term Loan | ||||||||
| 5.500% 08/16/2021 | 36,815 | 36,907 | ||||||
| Global Cash Access, Inc., Term B Loan | ||||||||
| 6.250% 12/18/2020 | 21,890 | 22,198 | ||||||
| Global Knowledge Training LLC, First Lien Term Loan | ||||||||
| 6.500% 01/20/2021 | 18,953 | 19,047 | ||||||
| Marine Acquisition Corp., Term Loan | ||||||||
| 5.250% 01/30/2021 | 458,929 | 462,084 | ||||||
| Mister Car Wash Holdings, Inc., Term Loan | ||||||||
| 5.000% 08/20/2021 | 41,685 | 41,928 | ||||||
| Navex Global, Inc., First Lien Term Loan | ||||||||
| 5.750% 11/19/2021 | 4,000 | 4,010 | ||||||
| Navex Global, Inc., Second Lien Term Loan | ||||||||
| 9.750% 11/18/2022 | 46,000 | 45,770 | ||||||
| Sun Products Corp. (fka Huish Detergents, Inc.), Tranche B Term Loan | ||||||||
| 5.500% 03/23/2020 | 97,800 | 94,517 | ||||||
| Therakos, Inc., First Lien Term Loan | ||||||||
| 7.000% 12/27/2017 | 26,313 | 26,181 | ||||||
| Vestcom International, Inc. (fka Vector Investment Holdings, Inc.), Second Lien Term Loan | ||||||||
| 8.750% 09/30/2022 | 88,000 | 87,120 | ||||||
| Vestcom International, Inc. (fka Vector Investment Holdings, Inc.), Term Loan | ||||||||
| 5.250% 09/30/2021 | 115,935 | 116,225 | ||||||
| Principal | Value | |||||||
| Amount | (Note 2) | |||||||
| Consumer, Non-cyclical (continued) | ||||||||
| Wyle Services Corp., Term Loan | ||||||||
| 5.000% 05/23/2021 | $ | 44,448 | $ | 44,559 | ||||
| Total Consumer, Non-cyclical | 1,178,564 | |||||||
| Diversified (2.19%) | ||||||||
| Emerald 2 Ltd., Facility B1 Loan | ||||||||
| 5.000% 05/14/2021 | 100,000 | 98,625 | ||||||
| Koosharem LLC, Term Loan | ||||||||
| 7.500% 05/15/2020 | 57,855 | 57,674 | ||||||
| US LBM Holdings LLC, Initial Term Loan | ||||||||
| 8.000% 05/02/2020 | 286,618 | 286,618 | ||||||
| Total Diversified | 442,917 | |||||||
| Energy (0.26%) | ||||||||
| Expro Financial Services, S.a.r.l., Initial Term Loan | ||||||||
| 5.750% 09/02/2021 | 44,775 | 40,034 | ||||||
| Preferred Proppants LLC, Term Loan | ||||||||
| 6.750% 07/27/2020 | 13,878 | 11,483 | ||||||
| Total Energy | 51,517 | |||||||
| Financials (4.01%) | ||||||||
| Aptean, Inc., First Lien Term Loan | ||||||||
| 5.250% 02/26/2020 | 99,000 | 97,762 | ||||||
| Asurion LLC (fka Asurion Corp.), Incremental Tranche B-1 Term Loan | ||||||||
| 5.000% 05/24/2019 | 146,982 | 148,019 | ||||||
| Bats Global Markets, Inc., Incremental B-2 Term Loan | ||||||||
| 5.750% 01/31/2020 | 11,639 | 11,763 | ||||||
| DTZ US Borrower LLC, Second Lien Initial Term Loan | ||||||||
| 9.250% 11/04/2022 | 38,000 | 38,522 | ||||||
| DTZ US Borrower LLC, Term Loan | ||||||||
| 5.500% 11/04/2021 | 39,900 | 40,382 | ||||||
| IG Investments Holdings LLC, Term B Loan | ||||||||
| 6.000% 10/31/2021 | 49,872 | 50,174 | ||||||
| Liquidnet Holdings, Inc., Term Loan | ||||||||
| 7.750% 05/22/2019 | 96,250 | 93,844 | ||||||
| LTCG Holdings Corp., Initial Term Loan | ||||||||
| 6.000% 06/06/2020 | 76,250 | 68,816 | ||||||
| NXT Capital, Inc. (NXT Capital LLC), Facility Term Loan | ||||||||
| 6.250% 09/04/2018 | 98,995 | 99,490 | ||||||
| RCS Capital Corp., First Lien Term Loan | ||||||||
| 6.500% 04/29/2019 | 102,342 | 100,967 | ||||||
74 | April 30, 2015
| ALPS | Westport Resources Hedged High Income Fund | |
| Statement of Investments | April 30, 2015 (Unaudited) |
| Principal | Value | |||||||
| Amount | (Note 2) | |||||||
| Financials (continued) | ||||||||
| Walter Investment Management Corp., Tranche B Term Loan | ||||||||
| 4.750% 12/18/2020 | $ | 61,843 | $ | 59,273 | ||||
| Total Financials | 809,012 | |||||||
| Industrials (2.58%) | ||||||||
| C.H.I. Overhead Doors, Inc., First Lien Term Loan | ||||||||
| 5.500% 03/18/2019 | 46,987 | 47,075 | ||||||
| Distribution International, Inc., Term Loan | ||||||||
| 6.000% 12/15/2021 | 33,000 | 33,206 | ||||||
| Dynacast International LLC, Term Loan | ||||||||
| 5.250% 01/28/2022 | 25,000 | 25,354 | ||||||
| Mirion Technologies (GDS), Inc. (fka Global Dosimetry Solutions, Inc.), Term Loan | ||||||||
| 5.750% 03/31/2022 | 29,000 | 29,190 | ||||||
| NN, Inc., Loan | ||||||||
| 6.000% 08/27/2021 | 36,009 | 36,294 | ||||||
| NVLX Acquisition LLC, Second Lien Closing Date Term Loan | ||||||||
| 9.750% 06/05/2022 | 51,000 | 51,638 | ||||||
| Pelican Products, Inc., Second Lien Term Loan | ||||||||
| 9.250% 04/09/2021 | 150,000 | 149,438 | ||||||
| Quality Home Brands Holdings LLC, First Lien Initial Term Loan | ||||||||
| 7.750% 12/17/2018 | 49,375 | 49,560 | ||||||
| U.S. Farathane LLC, Initial Term Loan | ||||||||
| 6.750% 12/23/2021 | 45,288 | 45,910 | ||||||
| U.S. Shipping Corp. (fka U.S. Shipping Partners LP), Tranche B-1 Term Loan | ||||||||
| 5.500% 04/30/2018 | 53,617 | 53,528 | ||||||
| Total Industrials | 521,193 | |||||||
| Technology (2.61%) | ||||||||
| Novetta LLC, Initial Term Loan | ||||||||
| 6.000% 10/02/2020 | 50,745 | 50,745 | ||||||
| P2 Lower Acquisition LLC, First Lien Initial Term Loan | ||||||||
| 5.500% 10/22/2020 | 89,565 | 89,901 | ||||||
| QBS Holding Company, Term Loan | ||||||||
| 5.750% 08/07/2021 | 199,500 | 196,009 | ||||||
| Regit Eins GmbH (TV Borrower US LLC), First Lien Dollar Term Loan | ||||||||
| 6.000% 01/08/2021 | 99,500 | 98,692 | ||||||
| Principal | Value | |||||||
| Amount | (Note 2) | |||||||
| Technology (continued) | ||||||||
| Stratus Technologies Bermuda Ltd. (Stratus Technologies, Inc.), Inc., Initial Term Loan | ||||||||
| 6.000% 04/28/2021 | $ | 22,988 | $ | 22,959 | ||||
| Vencore, Inc. (fka SI Organization, Inc.), First Lien Initial Term Loan | ||||||||
| 5.750% 11/23/2019 | 68,970 | 69,539 | ||||||
| Total Technology | 527,845 | |||||||
| TOTAL BANK LOANS (Cost $5,743,625) | 5,762,769 | |||||||
| CONVERTIBLE CORPORATE BONDS (5.05%) | ||||||||
| Communications (3.44%) | ||||||||
| Alaska Communications Systems Group, Inc., Conv. Sub. Notes | ||||||||
| 6.250% 05/01/2018 | 250,000 | 251,407 | ||||||
| TeleCommunication Systems, Inc., Conv. Sr. Unsec. Notes | ||||||||
| 7.750% 06/30/2018 | 450,000 | 443,250 | ||||||
| Total Communications | 694,657 | |||||||
| Financials (1.61%) | ||||||||
| Pinetree Capital Ltd., Conv. Sub. Notes | ||||||||
| 10.000% 05/31/2016 | 450,000 | 326,357 | ||||||
| TOTAL CONVERTIBLE CORPORATE BONDS (Cost $1,053,458) | 1,021,014 | |||||||
| CORPORATE BONDS (43.78%) | ||||||||
| Basic Materials (3.01%) | ||||||||
| American Gilsonite Co., Second Lien Notes | ||||||||
11.500% 09/01/2017 (c) | 500,000 | 437,500 | ||||||
| Eco Services Operations LLC/Eco Finance Corp., Sr. Unsec. Notes | ||||||||
8.500% 11/01/2022 (c) | 26,000 | 26,650 | ||||||
| FMG Resources August 2006 Pty Ltd., Sec. Notes | ||||||||
9.750% 03/01/2022 (c) | 40,000 | 41,400 | ||||||
| Ryerson, Inc. / Joseph T. Ryerson & Son Inc., First Lien Notes | ||||||||
| 9.000% 10/15/2017 | 100,000 | 101,945 | ||||||
| Total Basic Materials | 607,495 | |||||||
| Communications (5.33%) | ||||||||
| Broadview Networks Holdings, Inc., Sec. Notes | ||||||||
| 10.500% 11/15/2017 | 500,000 | 482,500 | ||||||
| iHeartCommunications, Inc., First Lien Notes | ||||||||
| 9.000% 12/15/2019 | 75,000 | 74,437 | ||||||
75 | April 30, 2015
| ALPS | Westport Resources Hedged High Income Fund | |
| Statement of Investments | April 30, 2015 (Unaudited) |
| Principal | Value | |||||||
| Amount | (Note 2) | |||||||
| Communications (continued) | ||||||||
| Interactive Network, Inc. / FriendFinder Networks, Inc., First Lien Notes | ||||||||
| 14.000% 12/20/2018 | $ | 240,504 | $ | 182,783 | ||||
| Sprint Communications, Inc., Sr. Unsec. Notes | ||||||||
| 7.000% 08/15/2020 | 125,000 | 127,188 | ||||||
| Visant Corp., Sr. Unsec. Notes | ||||||||
| 10.000% 10/01/2017 | 100,000 | 87,750 | ||||||
| Windstream Corp., Sr. Unsec. Notes | ||||||||
| 7.750% 10/01/2021 | 125,000 | 123,438 | ||||||
| Total Communications | 1,078,096 | |||||||
| Consumer, Cyclical (7.66%) | ||||||||
| Boardriders SA, Sr. Unsec. Notes, Series REGS | ||||||||
8.875% 12/15/2017 (d) | 390,000 | 414,921 | ||||||
| Bon-Ton Department Stores, Inc., Second Lien Notes | ||||||||
| 10.625% 07/15/2017 | 115,000 | 115,000 | ||||||
| Caesars Entertainment Operating Co., Inc., Sr. Unsec. Notes | ||||||||
10.750% 02/01/2016 (e) | 250,000 | 63,750 | ||||||
| K Hovnanian Enterprises, Inc., Sr. Unsec. Notes | ||||||||
8.000% 11/01/2019 (c) | 55,000 | 53,625 | ||||||
| KB Home, Sr. Unsec. Notes | ||||||||
| 8.000% 03/15/2020 | 100,000 | 111,000 | ||||||
| MGM Resorts International, Sr. Unsec. Notes | ||||||||
| 5.250% 03/31/2020 | 100,000 | 102,750 | ||||||
| Neebo, Inc., Sec. Notes | ||||||||
15.000% 06/30/2016 (c) | 346,500 | 360,360 | ||||||
| Tunica-Biloxi Gaming Authority, Sr. Unsec. Notes | ||||||||
9.000% 11/15/2015 (c) | 400,000 | 222,000 | ||||||
| United Airlines 2014-1 Class B Pass Through Trust, Second Lien Notes, Series B | ||||||||
| 4.750% 04/11/2022 | 100,000 | 103,750 | ||||||
| Total Consumer, Cyclical | 1,547,156 | |||||||
| Consumer, Non-cyclical (2.74%) | ||||||||
| American Achievement Corp., Second Lien Notes | ||||||||
10.875% 04/15/2016 (c) | 170,000 | 169,150 | ||||||
| Carolina Beverage Group LLC / Carolina Beverage Group Finance, Inc., Sec. Notes | ||||||||
10.625% 08/01/2018 (c) | 103,000 | 100,940 | ||||||
| DJO Finco, Inc. / DJO Finance LLC / DJO Finance Corp., Second Lien Notes | ||||||||
8.125% 06/15/2021 (c) | 100,000 | 101,750 | ||||||
| Principal | Value | |||||||
| Amount | (Note 2) | |||||||
| Consumer, Non-cyclical (continued) | ||||||||
| HJ Heinz Co., Second Lien Notes | ||||||||
4.875% 02/15/2025 (c) | $ | 70,000 | $ | 76,615 | ||||
| JLL / Delta Dutch Pledgeco BV, PIK Sr. Unsec. Notes | ||||||||
8.750% 05/01/2020 (c)(f) | 75,000 | 75,797 | ||||||
| Lantheus Medical Imaging, Inc., Sr. Unsec. Notes | ||||||||
| 9.750% 05/15/2017 | 30,000 | 29,587 | ||||||
| Total Consumer, Non-cyclical | 553,839 | |||||||
| Energy (6.69%) | ||||||||
| Antero Resources Corp., Sr. Unsec. Notes | ||||||||
| 5.125% 12/01/2022 | 100,000 | 100,500 | ||||||
| CrownRock LP / CrownRock Finance, Inc., Sr. Unsec.Notes | ||||||||
7.750% 02/15/2023 (c) | 75,000 | 79,875 | ||||||
| DCP Midstream LLC, Sr. Unsec. Notes | ||||||||
5.350% 03/15/2020 (c) | 40,000 | 39,709 | ||||||
| Diamond Offshore Drilling, Inc., Sr. Unsec. Notes | ||||||||
| 4.875% 11/01/2043 | 50,000 | 42,709 | ||||||
| Endeavor Energy Resources LP / EER Finance, Inc., Sr. Unsec. Notes | ||||||||
8.125% 09/15/2023 (c) | 65,000 | 67,762 | ||||||
| EV Energy Partners LP / EV Energy Finance Corp., Sr. Unsec. Notes | ||||||||
| 8.000% 04/15/2019 | 35,000 | 34,125 | ||||||
| ION Geophysical Corp., Second Lien Notes | ||||||||
| 8.125% 05/15/2018 | 560,000 | 439,600 | ||||||
| Kinder Morgan Energy Partners LP, Sr. Unsec. Notes | ||||||||
| 5.400% 09/01/2044 | 100,000 | 98,717 | ||||||
| Murray Energy Corp., Sec. Notes | ||||||||
11.250% 04/15/2021 (c) | 65,000 | 66,300 | ||||||
| Newfield Exploration Co., Sr. Unsec. Notes | ||||||||
| 5.375% 01/01/2026 | 20,000 | 20,900 | ||||||
| Pioneer Energy Services Corp., Sr. Unsec. Notes | ||||||||
| 6.125% 03/15/2022 | 100,000 | 77,000 | ||||||
| Polarcus Ltd., Sr. Unsec. Notes | ||||||||
8.000% 06/07/2018 (c) | 400,000 | 142,000 | ||||||
| Sunoco LP / Sunoco Finance Corp., Sr. Unsec. Notes | ||||||||
6.375% 04/01/2023 (c) | 35,000 | 36,575 | ||||||
| United Refining Co., First Lien Notes | ||||||||
| 10.500% 02/28/2018 | 100,000 | 106,210 | ||||||
| Total Energy | 1,351,982 | |||||||
76 | April 30, 2015
| ALPS | Westport Resources Hedged High Income Fund | |
| Statement of Investments | April 30, 2015 (Unaudited) |
| Principal | Value | |||||||
| Amount | (Note 2) | |||||||
| Financials (9.05%) | ||||||||
| Aircastle Ltd., Sr. Unsec. Notes | ||||||||
| 5.500% 02/15/2022 | $ | 35,000 | $ | 37,450 | ||||
| Ally Financial, Inc., Sr. Unsec. Notes | ||||||||
| 3.750% 11/18/2019 | 130,000 | 129,623 | ||||||
| Communications Sales & Leasing, Inc., First Lien Notes | ||||||||
6.000% 04/15/2023 (c) | 27,000 | 27,176 | ||||||
| Creditcorp, Sec. Notes | ||||||||
12.000% 07/15/2018 (c) | 510,000 | 453,900 | ||||||
| Fly Leasing Ltd., Sr. Unsec. Notes | ||||||||
| 6.375% 10/15/2021 | 200,000 | 201,500 | ||||||
| Global Investments Group Finance Ltd., Sr. Unsec. Notes | ||||||||
11.000% 09/24/2017 (c) | 400,000 | 412,000 | ||||||
| Goldman Sachs Group, Inc., Jr. Sub. Notes, Series M | ||||||||
5.375% Perpetual Maturity (b)(g) | 70,000 | 70,017 | ||||||
| Goldman Sachs Group, Inc., Jr. Sub. Notes, Series L | ||||||||
5.700% Perpetual Maturity (b)(g) | 100,000 | 100,875 | ||||||
| Greystar Real Estate Partners LLC, Sec. Notes | ||||||||
8.250% 12/01/2022 (c) | 55,000 | 58,437 | ||||||
| JPMorgan Chase & Co., Jr. Sub. Notes, Series V | ||||||||
5.000% Perpetual Maturity (b)(g) | 50,000 | 49,250 | ||||||
| KKR Group Finance Co. III LLC, Sr. Unsec. Notes | ||||||||
5.125% 06/01/2044 (c) | 75,000 | 76,554 | ||||||
| Morgan Stanley, Jr. Sub. Notes, Series J | ||||||||
5.550% Perpetual Maturity (b)(g) | 45,000 | 45,338 | ||||||
| RHP Hotel Properties LP / RHP Finance Corp., Sr. Unsec. Notes | ||||||||
5.000% 04/15/2023 (c) | 60,000 | 61,050 | ||||||
| Wells Fargo & Co., Jr. Sub. Notes, Series S | ||||||||
5.900% Perpetual Maturity (b)(g) | 100,000 | 105,000 | ||||||
| Total Financials | 1,828,170 | |||||||
| Industrials (6.62%) | ||||||||
| American Piping Products, Inc., Second Lien Notes | ||||||||
12.875% 11/15/2017 (c) | 30,000 | 29,550 | ||||||
| Principal | Value | |||||||
| Amount | (Note 2) | |||||||
| Industrials (continued) | ||||||||
| CNH Industrial Capital LLC, Sr. Unsec. Notes | ||||||||
3.375% 07/15/2019 (c) | $ | 85,000 | $ | 83,725 | ||||
| Congoleum Corp., PIK First Lien Notes | ||||||||
9.000% 12/31/2017 (f)(h) | 350,000 | 262,500 | ||||||
| CTP Transportation Products LLC / CTP Finance, Inc., Sec. Notes | ||||||||
8.250% 12/15/2019 (c) | 100,000 | 106,500 | ||||||
| Dispensing Dynamics International, Sec. Notes | ||||||||
12.500% 01/01/2018 (c) | 115,000 | 121,612 | ||||||
| Euramax International, Inc., First Lien Notes | ||||||||
| 9.500% 04/01/2016 | 34,000 | 32,470 | ||||||
| Kratos Defense & Security Solutions, Inc., First Lien Notes | ||||||||
| 7.000% 05/15/2019 | 50,000 | 44,750 | ||||||
| NCI Building Systems, Inc., Sr. Unsec. Notes | ||||||||
8.250% 01/15/2023 (c) | 80,000 | 85,200 | ||||||
| NCSG Crane & Heavy Haul Services, Second Lien Notes | ||||||||
9.500% 08/15/2019 (c) | 190,000 | 128,725 | ||||||
| Optimas OE Solutions Holding LLC / Optimas OE Solutions, Inc., Sec. Notes | ||||||||
8.625% 06/01/2021 (c) | 55,000 | 56,375 | ||||||
| Tempel Steel Co., Sec. Notes | ||||||||
12.000% 08/15/2016 (c) | 368,000 | 314,640 | ||||||
| Vulcan Materials Co., Sr. Unsec. Notes | ||||||||
| 4.500% 04/01/2025 | 70,000 | 71,400 | ||||||
| Total Industrials | 1,337,447 | |||||||
| Technology (2.68%) | ||||||||
| DynCorp International, Inc., Sr. Unsec. Notes | ||||||||
| 10.375% 07/01/2017 | 325,000 | 279,500 | ||||||
| First Data Corp., Sr. Unsec. Notes | ||||||||
| 12.625% 01/15/2021 | 150,000 | 177,450 | ||||||
| MSCI, Inc., Sr. Unsec. Notes | ||||||||
5.250% 11/15/2024 (c) | 20,000 | 20,850 | ||||||
| Seagate HDD Cayman, Sr. Unsec. Notes | ||||||||
5.750% 12/01/2034 (c) | 60,000 | 63,675 | ||||||
| Total Technology | 541,475 | |||||||
| TOTAL CORPORATE BONDS (Cost $9,887,350) | 8,845,660 | |||||||
77 | April 30, 2015
| ALPS | Westport Resources Hedged High Income Fund | |
| Statement of Investments | April 30, 2015 (Unaudited) |
| Principal | Value | |||||||
| Amount | (Note 2) | |||||||
| MORTGAGE BACKED SECURITIES (12.46%) | ||||||||
| American Homes 4 Rent, Series 2014-SFR1 | ||||||||
3.500% 06/17/2016 (b)(c) | $ | 150,000 | $ | 148,868 | ||||
| American Homes 4 Rent, Series 2014-SFR2 | ||||||||
6.231% 10/17/2024 (c) | 100,000 | 108,966 | ||||||
| American Residential Properties Trust, Series 2014-SFR1 | ||||||||
4.082% 09/17/2016 (b)(c) | 100,000 | 101,898 | �� | |||||
4.588% 09/17/2016 (b)(c) | 100,000 | 101,312 | ||||||
| Invitation Homes Trust, Series 2013-SFR1 | ||||||||
2.900% 12/17/2015 (b)(c) | 100,000 | 99,799 | ||||||
| Invitation Homes Trust, Series 2014-SFR2 | ||||||||
3.572% 09/17/2016 (b)(c) | 100,000 | 101,235 | ||||||
| Citigroup Commercial Mortgage Trust, Series 2014-GC25 | ||||||||
3.548% 10/10/2024 (c) | 100,000 | 85,551 | ||||||
| Colony American Homes, Series 2014-1A | ||||||||
3.050% 05/17/2017 (b)(c) | 125,000 | 125,045 | ||||||
| COMM Mortgage Trust, Series 2014-CR17 | ||||||||
4.800% 05/10/2024 (b)(c) | 207,000 | 204,413 | ||||||
| Countrywide Alternative Loan Trust, Series 2006-6CB | ||||||||
| 5.750% 05/25/2036 | 268,877 | 223,181 | ||||||
| Fannie Mae Connecticut Avenue Securities, Series 2014-C03 | ||||||||
3.181% 07/25/2024 (b) | 100,000 | 95,928 | ||||||
| Fannie Mae Connecticut Avenue Securities, Series 2014-C02 | ||||||||
2.770% 05/25/2024 (b) | 50,000 | 46,679 | ||||||
| Freddie Mac Structured Agency Credit Risk Debt Notes, Series 2014-DN4 | ||||||||
4.705% 10/25/2024 (b) | 250,000 | 261,733 | ||||||
| Freddie Mac Structured Agency Credit Risk Debt Notes, Series 2014-DN1 | ||||||||
4.681% 02/25/2024 (b) | 250,000 | 264,336 | ||||||
| Invitation Homes Trust, Series 2014-SFR1 | ||||||||
3.912% 06/17/2016 (b)(c) | 200,000 | 201,534 | ||||||
| Morgan Stanley Bank of America Merrill Lynch Trust, Series 2014-C16 | ||||||||
4.758% 06/15/2024 (b)(c) | 100,000 | 97,830 | ||||||
| Popular ABS Mortgage Pass-Through Trust, Series 2005-6 | ||||||||
5.680% 01/25/2036 (b) | 42,740 | 40,710 | ||||||
| Principal | Value | |||||||
| Amount | (Note 2) | |||||||
| Wells Fargo Commercial Mortgage Trust, Series 2015-C27 | ||||||||
3.768% 03/15/2025 (c) | $ | 100,000 | $ | 87,204 | ||||
| WFRBS Commercial Mortgage Trust, Series 2014-LC14 | ||||||||
4.586% 02/15/2024 (b)(c) | 125,000 | 120,015 | ||||||
| TOTAL MORTGAGE BACKED SECURITIES (Cost $2,417,313) | 2,516,237 | |||||||
| SHORT TERM SECURITIES (0.25%) | ||||||||
| Government (0.25%) | ||||||||
| U.S. Treasury Bills Discounted Notes, | ||||||||
09/24/2015(i)(j) 0.034% | 50,000 | 49,995 | ||||||
| TOTAL GOVERNMENT | 49,995 | |||||||
| TOTAL SHORT TERM SECURITIES (Cost $49,976) | 49,995 | |||||||
| TOTAL INVESTMENTS (91.79%) (Cost $19,541,549) | $ | 18,545,455 | ||||||
| Other Assets In Excess Of Liabilities (8.21%) | 1,658,292 | (k) | ||||||
| NET ASSETS (100.00%) | $ | 20,203,747 | ||||||
| (a) | Non-Income Producing Security. |
| (b) | Floating or variable rate security. Interest rate disclosed is that which is in effect at April 30, 2015. |
| (c) | Security exempt from registration under Rule 144A of the Securities Act of 1933. These securities have been deemed liquid under procedures approved by the Fund’s Board of Trustees and may normally be sold to qualified institutional buyers in transactions exempt from registration. Total market value of Rule 144A securities amounts to $5,781,647, which represents approximately 28.62% of net assets as of April 30, 2015. |
| (d) | Securities were purchased pursuant to Regulation S under the Securities Act of 1933, which exempts securities offered and sold outside of the United States from registration. Such securities cannot be sold in the United States without either an effective registration statement filed pursuant to the Securities Act of 1933, or pursuant to an exemption from registration. These securities have been deemed liquid under guidelines approved by the Fund’s Board of Trustees. As of April 30, 2015 the aggregate market value of those securities was $414,921, representing 2.05% of net assets. |
| (e) | Security is in default and therefore is non-income producing. |
| (f) | Payment in-kind security. |
| (g) | This security has no contractual maturity date, is not redeemable and contractually pays an indefinite stream of interest. |
78 | April 30, 2015
| ALPS | Westport Resources Hedged High Income Fund | |
| Statement of Investments | April 30, 2015 (Unaudited) |
| (h) | Fair valued security under the procedures approved by the Fund’s Board of Trustees. |
| (i) | All or a portion of the security is pledged as collateral on futures. The aggregate market value of the collateralized securities totals $49,995 as of April 30, 2015. See Note 3 in Notes to Financial Statements. |
(j) Rate shown represents the bond equivalent yield to maturity at date of purchase.
| (k) | Portion of Assets in Excess of Liabilities is held as collateral for futures contracts and credit default swap contracts in the amount of $190,241. See Note 3 in the Notes to Financial Statements. |
Common Abbreviations:
aka - Also known as.
BV - Besloten Vennootschap is the Dutch term for private limited liability company.
Conv. - Convertible. fka - Formerly known as.
GmbH - Gesellschaft mit beschränkter Haftungis the German term for limited liability company.
Jr. Sub. - Junior Subordinated.
LLC - Limited Liability Company.
LP - Limited Partnership.
Ltd. - Limited.
PIK - Payment in-kind. Pty. - Proprietary.
SA - Generally designates corporations in various countries, mostly those employing the civil law.
Sec. - Secured.
Sr. Unsec. - Senior Unsecured.
Sub. - Subordinated.
For Fund compliance purposes, the Fund’s industry classifications refer to any one or more of the industry sub-classifications used by one or more widely recognized market indexes or ratings group indexes, and/or as defined by Fund management. This definition may not apply for purposes of this report, which may combine industry sub-classifications for reporting ease. Industries are shown as a percent of net assets.
79 | April 30, 2015
| ALPS | Westport Resources Hedged High Income Fund | |
| Statement of Investments | April 30, 2015 (Unaudited) |
FUTURES CONTRACTS
| Expiration | Value | Unrealized | ||||||||||||
| Description | Position | Contracts | Date | (Note 2) | Appreciation | |||||||||
| Euro - Bund Future | Short | (5) | 06/09/15 | $ | (783,500 | ) | $ | 7,738 | ||||||
| $ | (783,500 | ) | $ | 7,738 | ||||||||||
| Expiration | Value | Unrealized | ||||||||||||
| Description | Position | Contracts | Date | (Note 2) | Depreciation | |||||||||
| 10 Year USD Deliverable Interest Rate Swap Future | Short | (9) | 06/16/15 | $ | (947,953 | ) | $ | (19,319 | ) | |||||
| 5 Year USD Deliverable Interest Rate Swap Future | Short | (15) | 06/16/15 | (1,542,891 | ) | (24,177 | ) | |||||||
| CME Ultra Long Term U.S. Treasury Bond Future | Long | 1 | 06/22/15 | 164,500 | (4,128 | ) | ||||||||
| U.S. 10 Year Treasury Note Future | Long | 19 | 06/22/15 | 2,439,125 | (2,986 | ) | ||||||||
| U.S. 5 Year Treasury Note Future | Short | (25) | 07/01/15 | (3,003,320 | ) | (24,572 | ) | |||||||
| $ | (2,890,539 | ) | $ | (75,182 | ) | |||||||||
CREDIT DEFAULT SWAP CONTRACTS
| Buy Credit | Notional | Rate Received | Termination | Upfront | Unrealized | |||||||||||||
| Referenced Obligation | Protection | Amount | by Fund | Date | Payment Paid | Depreciation | ||||||||||||
| CDX North American High | ||||||||||||||||||
| Centrally cleared swap | Yield Index Series 23 | Buy | $ 980,000 | 5.00% | 12/20/19 | $ | (53,400 | ) | $ | (27,745 | ) | |||||||
| TOTAL | $ | (53,400 | ) | $ | (27,745 | ) | ||||||||||||
OUTSTANDING FORWARD FOREIGN CURRENCY CONTRACTS
| Unrealized | ||||||||||
| Foreign | Contracted | Purchase/Sale | Settlement | Current | Appreciation/ | |||||
| Counterparty | Currency | Amount* | Contract | Date | Value | (Depreciation) | ||||
| State Street Bank & | ||||||||||
| Trust Co. | CAD | 160,000 | Sale | 06/04/15 | $ | 132,550 | $ | 424 | ||
| $ | 424 | |||||||||
| State Street Bank & | ||||||||||
| Trust Co. | EUR | 185,000 | Sale | 06/04/15 | $ | 207,825 | $ | (2,456 | ) | |
| $ | (2,456 | ) | ||||||||
See Notes to Financial Statements.
80 | April 30, 2015
| ALPS | Westport Resources Hedged High Income Fund | |
| Statement of Assets and Liabilities | April 30, 2015 (Unaudited) |
| ASSETS | ||||
| Investments, at value | $ | 18,545,455 | ||
| Cash | 1,367,835 | |||
| Unrealized appreciation on forward foreign currency contracts | 424 | |||
| Receivable for investments sold | 276,491 | |||
| Receivable for variation margin | 7,738 | |||
| Cash collateral pledged for futures contracts (Note 3) | 77,123 | |||
| Cash collateral pledged for credit default swap contracts (Note 3) | 113,118 | |||
| Interest receivable | 338,811 | |||
| Prepaid expenses and other assets | 39,178 | |||
| Total Assets | 20,766,173 | |||
| LIABILITIES | ||||
| Payable for investments purchased | 331,200 | |||
| Payable for variation margin | 75,182 | |||
| Payable due to broker for credit default swap contracts | 53,400 | |||
| Unrealized depreciation on credit default swap contracts | 27,745 | |||
| Unrealized depreciation on forward foreign currency contracts | 2,456 | |||
| Investment advisory fees payable | 15,718 | |||
| Administration and transfer agency fees payable | 6,529 | |||
| Distribution and services fees payable | 6,335 | |||
| Professional fees payable | 15,907 | |||
| Accrued expenses and other liabilities | 27,954 | |||
| Total Liabilities | 562,426 | |||
| NET ASSETS | $ | 20,203,747 | ||
| NET ASSETS CONSIST OF | ||||
| Paid-in capital | $ | 21,377,932 | ||
| Accumulated net investment loss | (2,750 | ) | ||
| Accumulated net realized loss on investments, futures contracts, credit default swap contracts and foreign currency transactions | (78,200 | ) | ||
| Net unrealized depreciation on investments, futures contracts, credit default swap contracts and translation of assets and liabilities denominated in foreign currencies and forward foreign currency contracts | (1,093,235 | ) | ||
| NET ASSETS | $ | 20,203,747 | ||
| INVESTMENTS, AT COST | $ | 19,541,549 | ||
| PRICING OF SHARES | ||||
| Class A: | ||||
| Net Asset Value, offering and redemption price per share | $ | 9.57 | ||
| Net Assets | $ | 2,971,542 | ||
| Shares of beneficial interest outstanding (unlimited number of shares, no par value common stock authorized) | 310,485 | |||
| Maximum offering price per share ((NAV/0.9450), based on maximum sales charge of 5.50% of the offering price) | $ | 10.13 | ||
| Class C: | ||||
Net Asset Value, offering and redemption price per share(a) | $ | 9.57 | ||
| Net Assets | $ | 1,092,619 | ||
| Shares of beneficial interest outstanding (unlimited number of shares, no par value common stock authorized) | 114,194 | |||
| Class I: | ||||
| Net Asset Value, offering and redemption price per share | $ | 9.57 | ||
| Net Assets | $ | 16,139,586 | ||
| Shares of beneficial interest outstanding (unlimited number of shares, no par value common stock authorized) | 1,686,811 | |||
| (a) | Redemption price per share may be reduced for any applicable contingent deferred sales charge. For a description of a possible sales charge, please see the Fund’s Prospectus. |
See Notes to Financial Statements.
81 | April 30, 2015
| ALPS | Westport Resources Hedged High Income Fund | |
| Statement of Operations | For the Six Months Ended April 30, 2015 (Unaudited) |
| INVESTMENT INCOME | ||||
| Interest and other income | $ | 904,963 | ||
| Total Investment Income | 904,963 | |||
| EXPENSES | ||||
| Investment advisory fees | 239,039 | |||
| Administrative fees | 32,574 | |||
| Transfer agency fees | 363 | |||
| Distribution and service fees | ||||
| Class A | 7,031 | |||
| Class C | 6,404 | |||
| Professional fees | 11,619 | |||
| Networking fees | ||||
| Class I | 8,579 | |||
| Reports to shareholders and printing fees | 3,828 | |||
| State registration fees | 18,201 | |||
| SEC registration fees | 967 | |||
| Insurance fees | 164 | |||
| Custody fees | 8,378 | |||
| Trustees’ fees and expenses | 358 | |||
| Offering costs | 12,451 | |||
| Miscellaneous expenses | 13,504 | |||
| Total Expenses | 363,460 | |||
| Less fees waived/reimbursed by investment advisor (Note 8) | ||||
| Class A | (19,563 | ) | ||
| Class C | (7,176 | ) | ||
| Class I | (104,842 | ) | ||
| Net Expenses | 231,879 | |||
| Net Investment Income | 673,084 | |||
| Net realized loss on investments | (36,205 | ) | ||
| Net realized loss on futures contracts | (70,160 | ) | ||
| Net realized gain on credit default swap | 1,015 | |||
| Net realized loss on foreign currency transactions | (1,532 | ) | ||
| Net change in unrealized depreciation on investments | (437,405 | ) | ||
| Net change in unrealized depreciation on futures contracts | (38,661 | ) | ||
| Net change in unrealized depreciation on credit default swap | (17,071 | ) | ||
| Net change in unrealized depreciation on translation of assets and liabilities denominated in foreign currencies and forward foreign currency contracts | (868 | ) | ||
| NET REALIZED AND UNREALIZED LOSS ON INVESTMENTS | (600,887 | ) | ||
| NET INCREASE IN NET ASSETS RESULTING FROM OPERATIONS | $ | 72,197 | ||
See Notes to Financial Statements.
82 | April 30, 2015
| ALPS | Westport Resources Hedged High Income Fund | |
| Statements of Changes in Net Assets |
| For the Period | ||||||||
| For the Six Months | January 1, 2014 | |||||||
| Ended April 30, 2015 | (Commencement) to | |||||||
| (Unaudited) | October 31, 2014 | |||||||
| OPERATIONS | ||||||||
| Net investment income | $ | 673,084 | $ | 774,512 | ||||
| Net realized gain/(loss) on investments, futures contracts and foreign currency transactions | (106,882 | ) | 138,936 | |||||
| Net change in unrealized depreciation on investments, futures contracts and translation of assets and liabilities denominated in foreign currencies and forward foreign currency contracts | (494,005 | ) | (599,230 | ) | ||||
| Net Increase in Net Assets Resulting from Operations | 72,197 | 314,218 | ||||||
| DISTRIBUTIONS | ||||||||
| Dividends to shareholders from net investment income | ||||||||
| Class A | (103,604 | ) | (126,416 | ) | ||||
| Class C | (34,048 | ) | (45,997 | ) | ||||
| Class I | (548,856 | ) | (661,379 | ) | ||||
| Dividends to shareholders from net realized gains | ||||||||
| Class A | (17,220 | ) | – | |||||
| Class C | (5,789 | ) | – | |||||
| Class I | (82,396 | ) | – | |||||
| Net Decrease in Net Assets from Distributions | (791,913 | ) | (833,792 | ) | ||||
| BENEFICIAL INTEREST TRANSACTIONS (NOTE 6) | ||||||||
| Shares sold | ||||||||
| Class A | 101,155 | 4,376,893 | ||||||
| Class C | – | 1,732,540 | ||||||
| Class I | 1,006,715 | 20,102,463 | ||||||
| Dividends reinvested | ||||||||
| Class A | 104,982 | 84,424 | ||||||
| Class C | 39,837 | 33,245 | ||||||
| Class I | 621,587 | 450,245 | ||||||
| Shares redeemed | ||||||||
| Class A | (1,309,097 | ) | (176,024 | ) | ||||
| Class C | (493,396 | ) | (142,172 | ) | ||||
| Class I | (3,840,217 | ) | (1,250,143 | ) | ||||
| Net Increase/(Decrease) in Net Assets Derived from Beneficial Interest Transactions | (3,768,434 | ) | 25,211,471 | |||||
| Net increase/(decrease) in net assets | (4,488,150 | ) | 24,691,897 | |||||
| NET ASSETS | ||||||||
| Beginning of period | 24,691,897 | – | ||||||
| End of period * | $ | 20,203,747 | $ | 24,691,897 | ||||
| *Including accumulated net investment income/(loss) of: | $ | (2,750 | ) | $ | 10,674 | |||
See Notes to Financial Statements.
83 | April 30, 2015
| ALPS | Westport Resources Hedged High Income Fund – Class A | |
| Financial Highlights |
Selected data for a share of beneficial interest outstanding throughout the periods indicated:
| For the Period | ||||||||
| For the Six | January 1, 2014 | |||||||
| Months Ended | (Commencement) | |||||||
| April 30, 2015 | to | |||||||
| (Unaudited) | October 31, 2014 | |||||||
| Net asset value, beginning of period | $ | 9.86 | $ | 10.00 | ||||
| INCOME FROM INVESTMENT OPERATIONS: | ||||||||
Net investment income(a) | 0.28 | 0.36 | ||||||
| Net realized and unrealized loss | (0.24 | ) | (0.14 | ) | ||||
| Total from investment operations | 0.04 | 0.22 | ||||||
| DISTRIBUTIONS: | ||||||||
| From net investment income | (0.29 | ) | (0.36 | ) | ||||
| From net realized gains | (0.04 | ) | – | |||||
| Total distributions | (0.33 | ) | (0.36 | ) | ||||
| Net (decrease) in net asset value | (0.29 | ) | (0.14 | ) | ||||
| Net asset value, end of period | $ | 9.57 | $ | 9.86 | ||||
TOTAL RETURN(b) | 0.45 | % | 2.13 | % | ||||
| RATIOS/SUPPLEMENTAL DATA: | ||||||||
| Net assets, end of period (000s) | $ | 2,972 | $ | 4,190 | ||||
| Ratio of expenses to average net assets excluding fee waivers and reimbursements | 3.50 | %(c) | 3.64 | %(c)(d) | ||||
| Ratio of expenses to average net assets including fee waivers and reimbursements | 2.39 | %(c) | 2.39 | %(c)(d) | ||||
| Ratio of net investment income to average net assets | 5.81 | %(c) | 4.33 | %(c)(d) | ||||
Portfolio turnover rate(e) | 38 | % | 108 | % | ||||
| (a) | Calculated using the average shares method. |
| (b) | Total returns are for the period indicated and have not been annualized. Total returns would have been lower had certain expenses not been waived during the period. Returns shown do not reflect the deduction of taxes that a shareholder would pay on Fund distributions or the redemption of Fund shares. Returns shown exclude any applicable sales charges. |
| (c) | Annualized. |
| (d) | Expense ratios before reductions for startup periods may not be representative of longer term operating periods. |
| (e) | Portfolio turnover rate for periods less than one full year have not been annualized. |
See Notes to Financial Statements.
84 | April 30, 2015
| ALPS | Westport Resources Hedged High Income Fund – Class C | |
| Financial Highlights |
Selected data for a share of beneficial interest outstanding throughout the periods indicated:
| For the Period | ||||||||
| For the Six | January 1, 2014 | |||||||
| Months Ended | (Commencement) | |||||||
| April 30, 2015 | to | |||||||
| (Unaudited) | October 31, 2014 | |||||||
| Net asset value, beginning of period | $ | 9.85 | $ | 10.00 | ||||
| INCOME FROM INVESTMENT OPERATIONS: | ||||||||
Net investment income(a) | 0.25 | 0.31 | ||||||
| Net realized and unrealized loss | (0.23 | ) | (0.16 | ) | ||||
| Total from investment operations | 0.02 | 0.15 | ||||||
| DISTRIBUTIONS: | ||||||||
| From net investment income | (0.26 | ) | (0.30 | ) | ||||
| From net realized gains | (0.04 | ) | – | |||||
| Total distributions | (0.30 | ) | (0.30 | ) | ||||
| Net (decrease) in net asset value | (0.28 | ) | (0.15 | ) | ||||
| Net asset value, end of period | $ | 9.57 | $ | 9.85 | ||||
TOTAL RETURN(b) | 0.26 | % | 1.51 | % | ||||
| RATIOS/SUPPLEMENTAL DATA: | ||||||||
| Net assets, end of period (000s) | $ | 1,093 | $ | 1,587 | ||||
| Ratio of expenses to average net assets excluding fee waivers and reimbursements | 4.11 | %(c) | 4.25 | %(c)(d) | ||||
| Ratio of expenses to average net assets including fee waivers and reimbursements | 2.99 | %(c) | 2.99 | %(c)(d) | ||||
| Ratio of net investment income to average net assets | 5.26 | %(c) | 3.70 | %(c)(d) | ||||
Portfolio turnover rate(e) | 38 | % | 108 | % | ||||
| (a) | Calculated using the average shares method. |
| (b) | Total returns are for the period indicated and have not been annualized. Total returns would have been lower had certain expenses not been waived during the period. Returns shown do not reflect the deduction of taxes that a shareholder would pay on Fund distributions or the redemption of Fund shares. Returns shown exclude any applicable sales charges. |
| (c) | Annualized. |
| (d) | Expense ratios before reductions for startup periods may not be representative of longer term operating periods. |
| (e) | Portfolio turnover rate for periods less than one full year have not been annualized. |
See Notes to Financial Statements.
85 | April 30, 2015
| ALPS | Westport Resources Hedged High Income Fund – Class I | |
| Financial Highlights |
Selected data for a share of beneficial interest outstanding throughout the periods indicated:
| For the Period | ||||||||
| For the Six | January 1, 2014 | |||||||
| Months Ended | (Commencement) | |||||||
| April 30, 2015 | to | |||||||
| (Unaudited) | October 31, 2014 | |||||||
| Net asset value, beginning of period | $ | 9.85 | $ | 10.00 | ||||
| INCOME FROM INVESTMENT OPERATIONS: | ||||||||
Net investment income(a) | 0.30 | 0.38 | ||||||
| Net realized and unrealized loss | (0.24 | ) | (0.14 | ) | ||||
| Total from investment operations | 0.06 | 0.24 | ||||||
| DISTRIBUTIONS: | ||||||||
| From net investment income | (0.30 | ) | (0.39 | ) | ||||
| From net realized gains | (0.04 | ) | – | |||||
| Total distributions | (0.34 | ) | (0.39 | ) | ||||
| Net (decrease) in net asset value | (0.28 | ) | (0.15 | ) | ||||
| Net asset value, end of period | $ | 9.57 | $ | 9.85 | ||||
TOTAL RETURN(b) | 0.75 | % | 2.38 | % | ||||
| RATIOS/SUPPLEMENTAL DATA: | ||||||||
| Net assets, end of period (000s) | $ | 16,140 | $ | 18,915 | ||||
| Ratio of expenses to average net assets excluding fee waivers and reimbursements | 3.21 | %(c) | 3.39 | %(c)(d) | ||||
| Ratio of expenses to average net assets including fee waivers and reimbursements | 1.99 | %(c) | 1.99 | %(c)(d) | ||||
| Ratio of net investment income to average net assets | 6.26 | %(c) | 4.59 | %(c)(d) | ||||
Portfolio turnover rate(e) | 38 | % | 108 | % | ||||
| (a) | Calculated using the average shares method. |
| (b) | Total returns are for the period indicated and have not been annualized. Total returns would have been lower had certain expenses not been waived during the period. Returns shown do not reflect the deduction of taxes that a shareholder would pay on Fund distributions or the redemption of Fund shares. |
| (c) | Annualized. |
| (d) | Expense ratios before reductions for startup periods may not be representative of longer term operating periods. |
| (e) | Portfolio turnover rate for periods less than one full year have not been annualized. |
See Notes to Financial Statements.
86 | April 30, 2015
| ALPS | WMC Research Value Fund | |
| Management Commentary | April 30, 2015 (Unaudited) |
Market Commentary
US equities rose for the period, notwithstanding significant volatility. The S&P 500 Index finished 2014 with strong gains, retreated briefly, but then reached new all-time highs on March 2 and April 24. The period began strong with stocks rallying in early November on the heels of positive economic and corporate data points, including a solid corporate earnings season and news that Republicans took control of the US Senate. Stocks pulled back slightly near month-end, led by weakness in the energy sector associated with the significant decline in oil prices. In December, US stocks began to rally again but ultimately fell 1.4% during the final two trading days of the year to end the month in the red. Stocks continued to fall in January, which was the worst monthly return for US stocks in a year. Despite a positive overall scorecard, earnings sentiment was fairly negative among many investors, in part due to currency headwinds and some accompanying high-profile earnings guidance disappointments. Equities rebounded in February, posting their best monthly gain since October 2011. The market pulled back again in early March as soft manufacturing data, potential currency- and oil-related earnings headwinds, and valuation concerns weighed on investors’ minds. However, risk appetites increased after the March 18 Federal Open Market Committee statement underlined the US Federal Reserve’s hesitation to raise rates as US domestic inflation remains subdued and other major central banks have an easing bias. This, as well as a positive earnings season, helped drive stronger returns in April allowing US stocks to end the period with modest gains. Returns varied noticeably by market-cap, as small- and mid-cap stocks outperformed large-cap stocks.
Within the Russell 1000 Value Index, eight of ten sectors posted positive returns during the period, with the consumer discretionary and health care sectors gaining the most. Energy and utilities were the only two sectors that posted negative returns during the period.
Fund Review
The Fund outperformed its benchmark for the period, on a gross of fee basis, posting positive relative results in six out of ten broad market sectors. Overall, stock selection was additive relative to the Russell 1000 Value Index, as decisions in consumer staples, energy, financials, and information technology more than offset weak stock selection in consumer discretionary and industrials.
Top contributors to relative performance included Dollar Tree (consumer discretionary), Lowe’s (consumer discretionary), and Equifax (industrials). Our position in Dollar Tree, a US-based discount retailer, contributed to relative performance as the company reported third quarter earnings that beat analyst estimates. We eliminated our position in Dollar Tree during the period. Lowe’s, US-based home improvement retailer, saw its shares rise after the company reported better-than-expected third quarter earnings results and raised full-year guidance. Our position in Equifax, a consumer credit reporting agency, contributed to relative performance as shares rose during the period after the company reported fourth quarter earnings that were in-line with analyst estimates, while the company’s revenues increased on a year over year basis. The company also provided encouraging guidance for the first quarter, which was viewed favorably by investors.
Detractors from relative performance for the period included Halliburton (energy), Microsoft (information technology), and Chevron (energy). Shares of Halliburton, a global oilfield services company, fell during the period amid the precipitous drop in oil prices, which will likely impact demand for Halliburton’s services. However, we believe Halliburton’s large exposure to North America positions the company well relative to others in the industry. We also think the company will benefit from the Baker Hughes acquisition. Therefore, we continue to own the stock. Shares of Microsoft, a US-based developer of a range of software products and services, declined after the company reported earnings that were slightly below estimates and showed that profits were undercut by its Nokia business segment, weak PC sales, and FX headwinds. Chevron, a US-based integrated oil and gas company, underperformed as declining oil prices have had a major negative effect on the stock. Not owning Pfizer, a large US pharmaceutical company that had strong performance over the period, also detracted from relative performance during the period.
Strategy and Outlook
The portfolio takes predominantly a bottom-up approach to investing, with value-added primarily from stock selection. As a result, we maintain industry neutrality in relation to the benchmark and do not take sector bets. At the security level, however, we do take active positions which reflect our outlook for a specific company.
Several of our top overweight positions at the end of the period were within the financials sector. Our team recently visited the Division of Banking Supervision and Regulation at the Fed and believes that US banks will continue to be held to a higher standard than most of the rest of the world. The good news is that US bank balance sheets are already very strong given post-crisis capital raises. We are focused on profitable regional banks, and also see opportunities with megabanks that trade at a steep discount to their regional counterparts particularly those that would likely benefit from eventual steepening in the yield curve.
One of the top overweights within financials at the end of the period was Citigroup, a global diversified financial services holding company who offers its consumers a wide range of financial products and services. We believe that over time, the company could achieve considerable returns on tangible equity (ROTE) by shedding non-core assets and improving its operating structure.
Another top overweight was Santander Consumer. Santander Consumer is a specialized consumer finance company focused on vehicle finance and other unsecured consumer lending products. Although regulatory headwinds still subsist on the business, we believe recent stabilization of credit quality should enable the company to resume earnings growth and maintain a positive outlook on this stock. We believe the business model will become less capital intensive and returns on investment will improve. Lastly, we find the company’s valuation to be compelling.
87 | April 30, 2015
| ALPS | WMC Research Value Fund | |
| Management Commentary | April 30, 2015 (Unaudited) |
Within the information technology sector, corporate spending on storage, security, software and networking remains strong in the US. While cyclical spending improves, we continue to look for opportunities amid secular shifts towards internet cloud based software solutions and greater monetization of mobile platforms. Among individual holdings in this sector, we have a positive view on Apple. Apple is a designer, manufacturer, and marketer of mobile communication and media devices. We were overweight Apple at the end of the period as we believe the market underestimates the strength of the company’s product cycle which we expect should have a positive effect on margins as an increasing number of users of other phones switch to Apple products.
Effective February 28, 2014 the Fund’s Board approved the transition from Wellington Management’s Disciplined US Value strategy to their Research Value strategy. Similar to Disciplined US Value, the Research Value approach seeks to achieve long-term total return in excess of the Russell 1000 Value Index by investing primarily in value oriented equity securities of US companies, emphasizing those with above-average potential for capital appreciation. The Research Value approach employs fundamental, bottom-up security analysis.
The Research Value portfolio consists of multiple subportfolios, each of which is actively managed by one or more of Wellington Management’s Global Industry Analysts. The allocation of assets to the subportfolios corresponds to the relative weights of the analysts’ coverage universes within the index. In addition, individual analysts have developed investment frameworks that have proven most relevant to their particular philosophy, process, and industry. Thus, the portfolio combines a blend of investment disciplines, which we believe diversifies investment style risk. The portfolio is rebalanced regularly to maintain industry weights that are close to the index and to maintain style diversification.
Cheryl M. Duckworth, CFA
Senior Managing Director and Associate Director, Global Industry Research
Mark Mandel, CFA
Senior Managing Director and Director, Global Industry Research
The views and information discussed in this commentary are as of the date of publication, are subject to change, and may not reflect the writer’s current views. The views expressed represent an assessment of market conditions at a specific point in time, are opinions only and should not be relied upon as investment advice regarding a particular investment or markets in general. Such information does not constitute a recommendation to buy or sell specific securities or investment vehicles. It should not be assumed that any investment will be profitable or will equal the performance of the fund(s) or any securities or any sectors mentioned in this letter. The subject matter contained in this letter has been derived from several sources believed to be reliable and accurate at the time of compilation. Neither the Fund nor Wellington Management Company, LLP accepts any liability for losses either direct or consequential caused by the use of this information.
Diversification cannot guarantee gain or prevent losses.
88 | April 30, 2015
| ALPS | WMC Research Value Fund | |
| Performance Update | April 30, 2015 (Unaudited) |
Performance of $10,000 Initial Investment (as of April 30, 2015)
Comparison of change in value of a $10,000 investment (includes maximum sales charges of 5.50%)
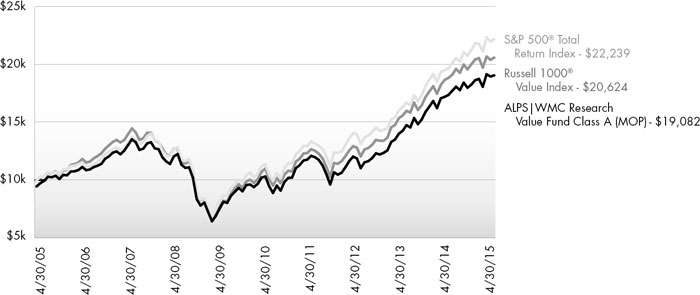
The chart above represents historical performance of a hypothetical investment of $10,000 in the Fund since inception. Past performance does not guarantee future results. This chart does not reflect the deduction of taxes that a shareholder would pay on Fund distributions or the redemption of Fund shares.
Average Annual Total Returns (as of April 30, 2015)
| 6 Month | 1 Year | 5 Year | 10 Year | Total Expense Ratio | What You Pay* | |
| Class A (NAV) | 4.35% | 9.78% | 13.09% | 7.28% | 1.48% | 1.40% |
| Class A (MOP) | -1.39% | 3.77% | 11.82% | 6.67% | ||
| Class C (NAV) | 4.03% | 8.97% | 12.28% | 6.49% | 2.24% | 2.15% |
| Class C (CDSC) | 3.10% | 7.99% | 12.28% | 6.49% | ||
| Class I | 4.52% | 10.07% | 13.38% | 7.50% | 1.23% | 1.15% |
Russell 1000® Value Index1 | 2.89% | 9.31% | 13.39% | 7.51% | ||
S&P 500® Total Return Index2 | 4.40% | 12.98% | 14.33% | 8.32% |
Performance data quoted represents past performance. Past performance does not guarantee future results. Investment return and principal value of an investment will fluctuate so that an investor’s shares, when sold or redeemed, may be worth more or less than the original cost. Current performance data may be higher or lower than actual data quoted. For the most current month-end performance data, please call 1-866-759-5679.
Maximum Offering Price (MOP) for Class A shares includes the Fund’s maximum sales charge of 5.50%. Performance shown at NAV does not include these sales charges and would have been lower had it been taken into account. If you invest $1 million or more, either as a lump sum or through the Fund’s accumulation or letter of intent programs, you can purchase Class A shares without an initial sales charge (load). A Contingent Deferred Sales Charge (“CDSC”) of 1.00% may apply to Class C shares redeemed within the first 12 months after a purchase, and on Class A shares redeemed within the first 18 months after a purchase in excess of $1 million.
Performance less than 1 year is cumulative.
89 | April 30, 2015
| ALPS | WMC Research Value Fund | |
| Performance Update | April 30, 2015 (Unaudited) |
Performance shown for Class C shares prior to June 30, 2010 reflects the historical performance of the Fund’s Class A shares, calculated using the fees and expenses of Class C shares.
Effective February 28, 2014 the Fund changed its name from the ALPS | WMC Disciplined Value Fund to the ALPS | WMC Research Value Fund.
The performance shown for the ALPS | WMC Research Value Fund (the “Fund”) for periods prior to August 29, 2009, reflects the performance of the Activa Mutual Funds Trust – Activa Value Fund (as result of a prior reorganization of Activa Mutual Funds Trust – Activa Value Fund into the Fund).
| 1 | The Russell 1000® Value Index measures the performance of those Russell 1000® companies with lower price-to-book ratios and lower forecasted growth values. The index is not actively managed and does not reflect any deduction for fees, expenses or taxes. An investor may not invest directly in an index. |
| 2 | The S&P 500® Index is the Standard & Poor’s composite index of 500 stocks, a widely recognized, unmanaged index of common stock prices. The index is not actively managed and does not reflect any deduction for fees, expenses or taxes. An investor may not invest directly in an index. |
| * | What You Pay reflects the Advisor’s decision to contractually limit expenses through February 29, 2016. Please see the prospectus for additional information. |
The table does not reflect the deduction of taxes that a shareholder would pay on Fund distributions or the redemption of Fund shares.
There is no guarantee that the Fund will continue to hold any one particular security or stay invested in any one particular company. The composition of the Fund’s top holdings is subject to change. Performance figures are historical and reflect the change in share price, reinvested distributions, changes in net asset value, sales charges and capital gains distributions, if any.
Not FDIC Insured – No Bank Guarantee – May Lose Value
Top Ten Holdings (as a % of Net Assets) †
| Wells Fargo & Co. | 3.63% |
| Citigroup, Inc. | 3.38% |
| Cisco Systems, Inc. | 2.03% |
| American International Group, Inc. | 2.01% |
| Merck & Co., Inc. | 2.01% |
| Medtronic PLC | 1.98% |
| The PNC Financial Services Group, Inc. | 1.92% |
| Mondelez International, Inc., Class A | 1.84% |
| Exxon Mobil Corp. | 1.70% |
| Chevron Corp. | 1.68% |
| Top Ten Holdings | 22.18% |
| † | Holdings are subject to change. Table presents indicative values only. |
Industry Sector Allocation (as a % of Net Assets)
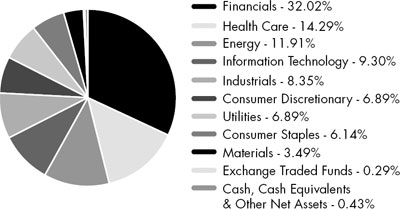
90 | April 30, 2015
| ALPS | WMC Research Value Fund | |
| Statement of Investments | April 30, 2015 (Unaudited) |
| Shares | Value (Note 2) | |||||||
| COMMON STOCKS (99.28%) | ||||||||
| Consumer Discretionary (6.89%) | ||||||||
| Automobiles & Components (0.59%) | ||||||||
| Harley‐Davidson, Inc. | 10,965 | $ | 616,343 | |||||
| Consumer Durables & Apparel (0.24%) | ||||||||
| Arctic Cat, Inc. | 6,910 | 245,236 | ||||||
| Consumer Services (0.75%) | ||||||||
| Las Vegas Sands Corp. | 4,680 | 247,478 | ||||||
Norwegian Cruise Line Holdings, Ltd.(a) | 11,050 | 536,036 | ||||||
| 783,514 | ||||||||
| Media (2.78%) | ||||||||
| Comcast Corp., Class A | 16,670 | 962,859 | ||||||
DreamWorks Animation SKG, Inc., Class A(a) | 6,480 | 168,869 | ||||||
| The Interpublic Group of | ||||||||
| Companies., Inc. | 17,920 | 373,453 | ||||||
Markit, Ltd.(a) | 9,620 | 246,753 | ||||||
| Twenty‐First Century Fox, Inc., Class A | 22,233 | 757,700 | ||||||
| The Walt Disney Co. | 3,460 | 376,171 | ||||||
| 2,885,805 | ||||||||
| Retailing (2.53%) | ||||||||
| Advance Auto Parts, Inc. | 6,846 | 978,978 | ||||||
| CST Brands, Inc. | 6,200 | 258,602 | ||||||
| DSW, Inc., Class A | 5,690 | 206,377 | ||||||
Liberty Interactive Corp., Class A(a) | 7,270 | 209,085 | ||||||
| Lowe’s Companies., Inc. | 14,198 | 977,674 | ||||||
| 2,630,716 | ||||||||
| TOTAL CONSUMER DISCRETIONARY | 7,161,614 | |||||||
| Consumer Staples (6.14%) | ||||||||
| Food & Staples Retailing (1.72%) | ||||||||
| CVS Health Corp. | 13,865 | 1,376,656 | ||||||
| Walgreens Boots Alliance, Inc. | 4,960 | 411,333 | ||||||
| 1,787,989 | ||||||||
| Food Beverage & Tobacco (2.78%) | ||||||||
| Anheuser‐Busch InBev N.V., Sponsored ADR | 2,155 | 258,686 | ||||||
| Mondelez International, Inc., Class A | 49,769 | 1,909,636 | ||||||
Post Holdings, Inc.(a) | 11,505 | 540,045 | ||||||
TreeHouse Foods, Inc.(a) | 2,230 | 181,210 | ||||||
| 2,889,577 | ||||||||
| Shares | Value (Note 2) | |||||||
| Household & Personal Products (1.64%) | ||||||||
| Avon Products, Inc. | 52,175 | $ | 426,270 | |||||
| Coty, Inc., Class A | 24,409 | 583,619 | ||||||
The Estee Lauder Companies., Inc., Class A | 6,622 | 538,302 | ||||||
| Nu Skin Enterprises, Inc., Class A | 2,730 | 154,382 | ||||||
| 1,702,573 | ||||||||
| TOTAL CONSUMER STAPLES | 6,380,139 | |||||||
| Energy (11.91%) | ||||||||
| Energy (11.91%) | ||||||||
| Anadarko Petroleum Corp. | 9,900 | 931,590 | ||||||
| Chevron Corp. | 15,692 | 1,742,754 | ||||||
Cobalt International Energy, Inc.(a) | 90,195 | 965,087 | ||||||
| CONSOL Energy, Inc. | 8,980 | 291,670 | ||||||
| Enbridge, Inc. | 3,040 | 159,083 | ||||||
| EOG Resources, Inc. | 8,814 | 872,145 | ||||||
| Exxon Mobil Corp. | 20,238 | 1,768,194 | ||||||
| Halliburton Co. | 4,793 | 234,617 | ||||||
| Hess Corp. | 6,750 | 519,075 | ||||||
| Kinder Morgan, Inc. | 5,210 | 223,770 | ||||||
| Marathon Oil Corp. | 15,272 | 474,959 | ||||||
Patterson‐UTI Energy, Inc. | 12,500 | 279,375 | ||||||
| Pioneer Natural Resources Co. | 5,180 | 895,000 | ||||||
| RPC, Inc. | 2,650 | 42,162 | ||||||
| Seadrill, Ltd. | 4,090 | 53,538 | ||||||
Southwestern Energy Co.(a) | 18,300 | 512,949 | ||||||
| Tesco Corp. | 11,740 | 150,976 | ||||||
| TransCanada Corp. | 15,080 | 700,014 | ||||||
| Valero Energy Corp. | 15,840 | 901,296 | ||||||
Whiting Petroleum Corp.(a) | 12,100 | 458,711 | ||||||
| The Williams Companies., Inc. | 3,920 | 200,665 | ||||||
| TOTAL ENERGY | 12,377,630 | |||||||
| Financials (32.02%) | ||||||||
| Banks (11.46%) | ||||||||
| Citigroup, Inc. | 65,905 | 3,514,055 | ||||||
| Citizens Financial Group, Inc. | 34,400 | 896,120 | ||||||
| Fifth Third Bancorp | 56,860 | 1,137,200 | ||||||
| M&T Bank Corp. | 4,890 | 585,186 | ||||||
| The PNC Financial Services Group, Inc. | 21,790 | 1,998,797 | ||||||
| Wells Fargo & Co. | 68,420 | 3,769,942 | ||||||
| 11,901,300 | ||||||||
| Diversified Financials (5.95%) | ||||||||
| Ameriprise Financial, Inc. | 6,913 | 866,061 | ||||||
| BlackRock, Inc. | 2,180 | 793,389 | ||||||
| Invesco, Ltd. | 10,020 | 415,028 | ||||||
| Janus Capital Group, Inc. | 12,130 | 217,127 | ||||||
91 | April 30, 2015
| ALPS | WMC Research Value Fund | |
| Statement of Investments | April 30, 2015 (Unaudited) |
| Shares | Value (Note 2) | |||||||
| Diversified Financials (continued) | ||||||||
| Legg Mason, Inc. | 6,850 | $ | 360,652 | |||||
| MSCI, Inc. | 3,120 | 190,913 | ||||||
| Northern Trust Corp. | 11,290 | 825,864 | ||||||
| Raymond James Financial, Inc. | 5,530 | 312,611 | ||||||
| Santander Consumer USA Holdings, Inc. | 69,130 | 1,706,820 | ||||||
| TD Ameritrade Holding Corp. | 4,090 | 148,262 | ||||||
UBS Group AG(a) | 8,650 | 173,606 | ||||||
| WisdomTree Investments, Inc. | 9,160 | 174,406 | ||||||
| 6,184,739 | ||||||||
| Insurance (9.28%) | ||||||||
| The Allstate Corp. | 10,800 | 752,328 | ||||||
| American International Group, Inc. | 37,120 | 2,089,485 | ||||||
| Assured Guaranty, Ltd. | 56,960 | 1,480,390 | ||||||
| The Hartford Financial Services Group, Inc. | 25,950 | 1,057,982 | ||||||
| Marsh & McLennan Companies., Inc. | 22,960 | 1,289,434 | ||||||
| Principal Financial Group, Inc. | 16,910 | 864,439 | ||||||
| Prudential Financial, Inc. | 9,124 | 744,518 | ||||||
| XL Group PLC | 36,790 | 1,364,173 | ||||||
| 9,642,749 | ||||||||
| Real Estate (5.33%) | ||||||||
| American Tower Corp. | 2,410 | 227,817 | ||||||
| AvalonBay Communities, Inc. | 5,840 | 959,746 | ||||||
| Douglas Emmett, Inc. | 10,160 | 289,560 | ||||||
| Essex Property Trust, Inc. | 1,875 | 416,156 | ||||||
| Federal Realty Investment Trust | 4,814 | 643,487 | ||||||
Forest City Enterprises, Inc., Class A(a) | 32,473 | 771,558 | ||||||
| Health Care REIT, Inc. | 8,220 | 592,004 | ||||||
| InfraREIT, Inc. | 1,790 | 55,830 | ||||||
| MFA Financial, Inc. | 29,610 | 230,070 | ||||||
| Paramount Group, Inc. | 15,210 | 278,647 | ||||||
| Public Storage | 950 | 178,515 | ||||||
| SL Green Realty Corp. | 7,310 | 894,452 | ||||||
| 5,537,842 | ||||||||
| TOTAL FINANCIALS | 33,266,630 | |||||||
| Health Care (14.29%) | ||||||||
| Health Care Equipment & Services (8.85%) | ||||||||
| Abbott Laboratories | 11,350 | 526,867 | ||||||
| Aetna, Inc. | 3,202 | 342,198 | ||||||
Boston Scientific Corp.(a) | 57,090 | 1,017,344 | ||||||
| Cigna Corp. | 4,730 | 589,547 | ||||||
HCA Holdings, Inc.(a) | 11,220 | 830,392 | ||||||
| McKesson Corp. | 2,741 | 612,339 | ||||||
| Medtronic PLC | 27,700 | 2,062,265 | ||||||
| St Jude Medical, Inc. | 11,900 | 833,595 | ||||||
| Stryker Corp. | 6,428 | 592,919 | ||||||
| UnitedHealth Group, Inc. | 10,500 | 1,169,700 | ||||||
| Shares | Value (Note 2) | |||||||
| Health Care Equipment & Services (continued) | ||||||||
| Zimmer Holdings, Inc. | 5,641 | $ | 619,607 | |||||
| 9,196,773 | ||||||||
| Pharmaceuticals, Biotechnology & Life Sciences (5.44%) | ||||||||
Actavis PLC(a) | 4,441 | 1,256,181 | ||||||
Alkermes PLC(a) | 4,260 | 235,876 | ||||||
Alnylam Pharmaceuticals, Inc.(a) | 3,810 | 388,125 | ||||||
Bristol‐Myers Squibb Co. | 26,354 | 1,679,541 | ||||||
| Merck & Co., Inc. | 35,072 | 2,088,888 | ||||||
| 5,648,611 | ||||||||
| TOTAL HEALTH CARE | 14,845,384 | |||||||
| Industrials (8.35%) | ||||||||
| Capital Goods (5.50%) | ||||||||
AECOM(a) | 4,830 | 152,435 | ||||||
| Caterpillar, Inc. | 340 | 29,539 | ||||||
| Danaher Corp. | 11,870 | 971,915 | ||||||
| Eaton Corp. PLC | 5,540 | 380,764 | ||||||
| General Dynamics Corp. | 3,997 | 548,868 | ||||||
| General Electric Co. | 23,150 | 626,902 | ||||||
| Honeywell International, Inc. | 2,555 | 257,851 | ||||||
| Illinois Tool Works, Inc. | 3,870 | 362,155 | ||||||
| Lockheed Martin Corp. | 1,840 | 343,344 | ||||||
| Luxfer Holdings PLC, ADR | 36 | 463 | ||||||
| Pentair PLC | 4,260 | 264,759 | ||||||
| Raytheon Co. | 2,961 | 307,944 | ||||||
| Textron, Inc. | 3,660 | 160,967 | ||||||
| United Technologies Corp. | 8,582 | 976,202 | ||||||
WESCO International, Inc.(a) | 4,560 | 328,958 | ||||||
| 5,713,066 | ||||||||
| Commercial & Professional Services (1.48%) | ||||||||
| Equifax, Inc. | 2,889 | 280,031 | ||||||
Huron Consulting Group, Inc.(a) | 1,530 | 92,749 | ||||||
| ManpowerGroup, Inc. | 4,870 | 415,557 | ||||||
| Nielsen N.V. | 16,778 | 754,003 | ||||||
| 1,542,340 | ||||||||
| Transportation (1.37%) | ||||||||
| Celadon Group, Inc. | 2,190 | 56,589 | ||||||
| CSX Corp. | 11,040 | 398,434 | ||||||
| FedEx Corp. | 1,840 | 312,009 | ||||||
| Kansas City Southern | 450 | 46,120 | ||||||
| Knight Transportation, Inc. | 1,930 | 55,777 | ||||||
| Landstar System, Inc. | 3,310 | 206,246 | ||||||
United Continental Holdings, Inc.(a) | 5,840 | 348,882 | ||||||
| 1,424,057 | ||||||||
| TOTAL INDUSTRIALS | 8,679,463 | |||||||
92 | April 30, 2015
| ALPS | WMC Research Value Fund | |
| Statement of Investments | April 30, 2015 (Unaudited) |
| Shares | Value (Note 2) | |||||||
| Information Technology (9.30%) | ||||||||
| Semiconductors & Semiconductor Equipment (3.01%) | ||||||||
| Analog Devices, Inc. | 1,500 | $ | 92,760 | |||||
| Applied Materials, Inc. | 11,740 | 232,334 | ||||||
First Solar, Inc.(a) | 6,100 | 363,987 | ||||||
Freescale Semiconductor, Ltd.(a) | 15,740 | 615,277 | ||||||
| Intel Corp. | 47,974 | 1,561,554 | ||||||
SunEdison Semiconductor, Ltd.(a) | 3,440 | 76,815 | ||||||
SunPower Corp.(a) | 5,840 | 187,990 | ||||||
| 3,130,717 | ||||||||
| Software & Services (2.08%) | ||||||||
| Accenture PLC, Class A | 1,374 | 127,301 | ||||||
Genpact, Ltd.(a) | 14,370 | 314,128 | ||||||
| Global Payments, Inc. | 1,580 | 158,443 | ||||||
Google, Inc., Class A(a) | 1,630 | 894,495 | ||||||
HomeAway, Inc.(a) | 1,400 | 39,130 | ||||||
| Microsoft Corp. | 9,483 | 461,253 | ||||||
VeriFone Systems, Inc.(a) | 4,555 | 162,932 | ||||||
| 2,157,682 | ||||||||
| Technology Hardware & Equipment (4.21%) | ||||||||
| Apple, Inc. | 11,422 | 1,429,463 | ||||||
Arista Networks, Inc.(a) | 3,130 | 200,351 | ||||||
Arrow Electronics, Inc.(a) | 1,400 | 83,594 | ||||||
| Cisco Systems, Inc. | 73,320 | 2,113,816 | ||||||
Hewlett‐Packard Co. | 7,600 | 250,572 | ||||||
| Western Digital Corp. | 3,070 | 300,062 | ||||||
| 4,377,858 | ||||||||
| TOTAL INFORMATION TECHNOLOGY | 9,666,257 | |||||||
| Materials (3.49%) | ||||||||
| Materials (3.49%) | ||||||||
| Ball Corp. | 3,900 | 286,299 | ||||||
Boise Cascade Co. (a) | 5,700 | 197,790 | ||||||
| Cabot Corp. | 5,070 | 216,692 | ||||||
| Celanese Corp., Series A | 5,100 | 338,436 | ||||||
| CRH PLC, Sponsored ADR | 6,270 | 175,246 | ||||||
Crown Holdings, Inc.(a) | 4,995 | 271,029 | ||||||
| The Dow Chemical Co. | 7,693 | 392,343 | ||||||
| International Paper Co. | 8,790 | 472,199 | ||||||
| LyondellBasell Industries N.V., Class A | 2,580 | 267,082 | ||||||
| Martin Marietta Materials, Inc. | 140 | 19,971 | ||||||
| The Mosaic Co. | 6,100 | 268,400 | ||||||
| Nucor Corp. | 1,980 | 96,743 | ||||||
Owens‐Illinois, Inc. (a) | 5,150 | 123,136 | ||||||
| Reliance Steel & Aluminum Co. | 3,920 | 253,702 | ||||||
The Sherwin‐Williams Co. | 800 | 222,400 | ||||||
| Shares | Value (Note 2) | ||||||||
| Materials (continued) | |||||||||
| Vulcan Materials Co. | 250 | $ | 21,380 | ||||||
| TOTAL MATERIALS | 3,622,848 | ||||||||
| Utilities (6.89%) | |||||||||
| Utilities (6.89%) | |||||||||
| Ameren Corp. | 8,850 | 362,319 | |||||||
| American Electric Power Co., Inc. | 2,817 | 160,203 | |||||||
| American Water Works Co., Inc. | 6,370 | 347,292 | |||||||
| Dominion Resources, Inc. | 6,255 | 448,358 | |||||||
| DTE Energy Co. | 5,290 | 421,243 | |||||||
| Duke Energy Corp. | 11,350 | 880,419 | |||||||
| Edison International | 7,340 | 447,300 | |||||||
| Exelon Corp. | 12,520 | 425,930 | |||||||
| FirstEnergy Corp. | 1,880 | 67,511 | |||||||
| ITC Holdings Corp. | 5,870 | 211,320 | |||||||
| NextEra Energy, Inc. | 12,207 | 1,232,053 | |||||||
| NRG Energy, Inc. | 5,895 | 148,790 | |||||||
| PG&E Corp. | 9,357 | 495,172 | |||||||
| Pinnacle West Capital Corp. | 5,850 | 358,020 | |||||||
| Public Service Enterprise Group, Inc. | 3,780 | 157,021 | |||||||
| UGI Corp. | 28,580 | 994,870 | |||||||
| TOTAL UTILITIES | 7,157,821 | ||||||||
| TOTAL COMMON STOCKS (Cost $90,866,090) | 103,157,786 | ||||||||
| EXCHANGE TRADED FUNDS (0.29%) | |||||||||
iShares® Russell 1000® Value ETF | 2,890 | 300,531 | |||||||
| TOTAL EXCHANGE TRADED FUNDS (Cost $306,081) | 300,531 | ||||||||
7-Day Yield | Shares | Value (Note 2) | |||||||
| SHORT TERM INVESTMENTS (0.06%) | |||||||||
| Money Market Fund (0.06%) | |||||||||
Morgan Stanley Institutional Liquidity Fund ‐ Prime Portfolio | 0.077% | 60,491 | 60,491 | ||||||
| TOTAL SHORT TERM INVESTMENTS (Cost $60,491) | 60,491 | ||||||||
93 | April 30, 2015
| ALPS | WMC Research Value Fund | |
| Statement of Investments | April 30, 2015 (Unaudited) |
Value (Note 2) | ||||
| TOTAL INVESTMENTS (99.63%) (Cost $91,232,662) | $ | 103,518,808 | ||
| Other Assets In Excess Of Liabilities (0.37%) | 383,170 | |||
| NET ASSETS (100.00%) | $ | 103,901,978 | ||
| (a) | Non-Income Producing Security. |
Common Abbreviations:
| ADR - | American Depositary Receipt. |
| AG - | Aktiengesellschaft is a German term that refers to a corporation that is limited by shares, i.e., owned by shareholders. |
| ETF - | Exchange Traded Fund. |
| Ltd. - | Limited. |
| N.V. - | Naamloze Vennootschap is the Dutch term for a public limited liability corporation. |
| PLC - | Public Limited Company. |
| REIT - | Real Estate Investment Trust. |
For Fund compliance purposes, the Fund’s industry classifications refer to any one or more of the industry sub-classifications used by one or more widely recognized market indexes or ratings group indexes, and/or as defined by Fund management. This definition may not apply for purposes of this report, which may combine industry sub-classifications for reporting ease. Industries are shown as a percent of net assets.
See Notes to Financial Statements.
94 | April 30, 2015
| ALPS | WMC Research Value Fund | |
| Statement of Assets and Liabilities | April 30, 2015 (Unaudited) |
| ASSETS | ||||
| Investments, at value | $ | 103,518,808 | ||
| Receivable for investments sold | 674,982 | |||
| Dividends receivable | 66,857 | |||
| Prepaid expenses and other assets | 22,274 | |||
| Total Assets | 104,282,921 | |||
| LIABILITIES | ||||
| Payable for investments purchased | 202,982 | |||
| Payable for shares redeemed | 47,521 | |||
Payable due to custodian ‐ overdraft | 1,163 | |||
| Investment advisory fees payable | 75,424 | |||
| Administration and transfer agency fees payable | 19,366 | |||
| Distribution and services fees payable | 13,606 | |||
| Trustees’ fees and expenses payable | 27 | |||
| Professional fees payable | 10,046 | |||
| Accrued expenses and other liabilities | 10,808 | |||
| Total Liabilities | 380,943 | |||
| NET ASSETS | $ | 103,901,978 | ||
| NET ASSETS CONSIST OF | ||||
Paid‐in capital | $ | 69,880,545 | ||
| Accumulated net investment income | 101,198 | |||
| Accumulated net realized gain on investments | 21,634,089 | |||
| Net unrealized appreciation on investments | 12,286,146 | |||
| NET ASSETS | $ | 103,901,978 | ||
| INVESTMENTS, AT COST | $ | 91,232,662 | ||
| PRICING OF SHARES | ||||
| Class A: | ||||
| Net Asset Value, offering and redemption price per share | $ | 11.77 | ||
| Net Assets | $ | 59,046,913 | ||
| Shares of beneficial interest outstanding (unlimited number of shares, no par value common stock authorized) | 5,014,684 | |||
| Maximum offering price per share ((NAV/0.9450), based on maximum sales charge of 5.50% of the offering price) | $ | 12.46 | ||
| Class C: | ||||
Net Asset Value, offering and redemption price per share(a) | $ | 11.56 | ||
| Net Assets | $ | 1,622,553 | ||
| Shares of beneficial interest outstanding (unlimited number of shares, no par value common stock authorized) | 140,364 | |||
| Class I: | ||||
| Net Asset Value, offering and redemption price per share | $ | 11.94 | ||
| Net Assets | $ | 43,232,512 | ||
| Shares of beneficial interest outstanding (unlimited number of shares, no par value common stock authorized) | 3,621,989 | |||
| (a) | Redemption price per share may be reduced for any applicable contingent deferred sales charge. For a description of a possible sales charge, please see the Fund’s Prospectus. |
See Notes to Financial Statements.
95 | April 30, 2015
| ALPS | WMC Research Value Fund | |
| Statement of Operations | For the Six Months Ended April 30, 2015 (Unaudited) |
| INVESTMENT INCOME | ||||
| Dividends | $ | 1,075,530 | ||
| Foreign taxes withheld on dividends | (3,340) | |||
| Total Investment Income | 1,072,190 | |||
| EXPENSES | ||||
| Investment advisory fees | 496,795 | |||
| Administrative fees | 80,503 | |||
| Transfer agency fees | 9,591 | |||
| Distribution and service fees | ||||
| Class A | 74,359 | |||
| Class C | 5,424 | |||
| Professional fees | 12,222 | |||
| Reports to shareholders and printing fees | 5,610 | |||
| State registration fees | 22,841 | |||
| SEC registration fees | 439 | |||
| Insurance fees | 611 | |||
| Custody fees | 3,364 | |||
| Trustees’ fees and expenses | 858 | |||
| Miscellaneous expenses | 5,594 | |||
| Total Expenses | 718,211 | |||
| Less fees waived/reimbursed by investment advisor (Note 8) | ||||
| Class A | (20,997) | |||
| Class C | (502) | |||
| Class I | (15,546) | |||
| Net Expenses | 681,166 | |||
| Net Investment Income | 391,024 | |||
| Net realized gain on investments | 25,607,503 | |||
| Net change in unrealized depreciation on investments | (21,486,731) | |||
| NET REALIZED AND UNREALIZED GAIN ON INVESTMENTS | 4,120,772 | |||
| NET INCREASE IN NET ASSETS RESULTING FROM OPERATIONS | $ | 4,511,796 | ||
See Notes to Financial Statements.
96 | April 30, 2015
| ALPS | WMC Research Value Fund | |
| Statements of Changes in Net Assets |
For the Six Months Ended April 30, 2015 (Unaudited)(a) | For the Fiscal Period Ended October 31, 2014(b) | |||||||
| OPERATIONS | ||||||||
| Net investment income | $ | 391,024 | $ | 310,060 | ||||
| Net realized gain on investments | 25,607,503 | 5,958,826 | ||||||
| Net change in unrealized depreciation on investments | (21,486,731 | ) | (874,500 | ) | ||||
| Net Increase in Net Assets Resulting from Operations | 4,511,796 | 5,394,386 | ||||||
| DISTRIBUTIONS | ||||||||
| Dividends to shareholders from net investment income | ||||||||
| Class A | (280,500 | ) | – | |||||
| Class C | (1,366 | ) | – | |||||
| Class I | (222,337 | ) | – | |||||
| Dividends to shareholders from net realized gains | ||||||||
| Class A | (5,704,627 | ) | – | |||||
| Class C | (35,924 | ) | – | |||||
| Class I | (4,142,646 | ) | – | |||||
| Net Decrease in Net Assets from Distributions | (10,387,400 | ) | – | |||||
| BENEFICIAL INTEREST TRANSACTIONS (NOTE 6) | ||||||||
| Shares sold | ||||||||
| Class A | 1,535,905 | 154,740 | ||||||
| Class C | 1,453,306 | 114,228 | ||||||
| Class I | 2,035,690 | 1,715,713 | ||||||
| Dividends reinvested | ||||||||
| Class A | 5,488,048 | – | ||||||
| Class C | 19,609 | – | ||||||
| Class I | 4,362,161 | – | ||||||
| Shares redeemed | ||||||||
| Class A | (4,142,907 | ) | (2,625,164 | ) | ||||
| Class C | (101,968 | ) | – | |||||
| Class I | (4,259,042 | ) | (5,297,693 | ) | ||||
| Net Increase/(Decrease) in Net Assets Derived from Beneficial Interest Transactions | 6,390,802 | (5,938,176 | ) | |||||
| Net increase/(decrease) in net assets | 515,198 | (543,790 | ) | |||||
| NET ASSETS | ||||||||
| Beginning of period | 103,386,780 | 103,930,570 | ||||||
| End of period * | $ | 103,901,978 | $ | 103,386,780 | ||||
| *Including accumulated net investment income of: | $ | 101,198 | $ | 214,377 | ||||
| (a) | Prior to February 28, 2015, the ALPS | WMC Research Value Fund was known as the ALPS | WMC Disciplined Value Fund. |
| (b) | Effective May 1, 2014, the Board approved changing the fiscal year-end of the Funds from April 30 to October 31. |
See Notes to Financial Statements.
97 | April 30, 2015
| ALPS | WMC Research Value Fund – Class A | |
| Financial Highlights |
Selected data for a share of beneficial interest outstanding throughout the periods indicated:
For the Six Months Ended April 30, 2015 (Unaudited)(a) | For the Fiscal Period Ended October 31, 2014(b) | For the Year Ended April 30, 2014 | For the Year Ended April 30, 2013(c) | For the Year Ended April 30, 2012 | For the Year Ended April 30, 2011(d) | |||||||||||||||||||
| Net asset value, beginning of period | $ | 12.54 | $ | 11.92 | $ | 10.01 | $ | 8.42 | $ | 8.64 | $ | 7.43 | ||||||||||||
| INCOME/(LOSS) FROM INVESTMENT OPERATIONS: | ||||||||||||||||||||||||
Net investment income(e) | 0.04 | 0.03 | 0.06 | 0.08 | 0.06 | 0.06 | ||||||||||||||||||
| Net realized and unrealized gain/(loss) | 0.45 | 0.59 | 2.09 | 1.61 | (0.23 | ) | 1.22 | |||||||||||||||||
| Total from investment operations | 0.49 | 0.62 | 2.15 | 1.69 | (0.17 | ) | 1.28 | |||||||||||||||||
| DISTRIBUTIONS: | ||||||||||||||||||||||||
| From net investment income | (0.06 | ) | – | (0.11 | ) | (0.10 | ) | (0.05 | ) | (0.07 | ) | |||||||||||||
| From net realized gains | (1.20 | ) | – | (0.13 | ) | – | – | – | ||||||||||||||||
| Total distributions | (1.26 | ) | – | (0.24 | ) | (0.10 | ) | (0.05 | ) | (0.07 | ) | |||||||||||||
| �� | ||||||||||||||||||||||||
| Net increase/(decrease) in net asset value | (0.77 | ) | 0.62 | 1.91 | 1.59 | (0.22 | ) | 1.21 | ||||||||||||||||
| Net asset value, end of period | $ | 11.77 | $ | 12.54 | $ | 11.92 | $ | 10.01 | $ | 8.42 | $ | 8.64 | ||||||||||||
TOTAL RETURN(f) | 4.35 | % | 5.20 | % | 21.70 | % | 20.17 | % | (1.81 | )% | 17.34 | % | ||||||||||||
| RATIOS/SUPPLEMENTAL DATA: | ||||||||||||||||||||||||
| Net assets, end of period (000s) | $ | 59,047 | $ | 59,628 | $ | 59,069 | $ | 50,142 | $ | 44,989 | $ | 48,899 | ||||||||||||
| Ratio of expenses to average net assets excluding fee waivers and reimbursements | 1.47 | %(g) | 1.48 | %(g) | 1.47 | % | 1.51 | % | 1.58 | % | 1.71 | % | ||||||||||||
| Ratio of expenses to average net assets including fee waivers and reimbursements | 1.40 | %(g) | 1.40 | %(g) | 1.40 | % | 1.40 | % | 1.40 | % | 1.40 | % | ||||||||||||
| Ratio of net investment income to average net assets | 0.65 | %(g) | 0.48 | %(g) | 0.52 | % | 0.95 | % | 0.83 | % | 0.77 | % | ||||||||||||
Portfolio turnover rate(h) | 75 | % | 13 | % | 19 | % | 34 | % | 46 | % | 44 | % | ||||||||||||
| (a) | Prior to February 28, 2015, the ALPS | WMC Research Value Fund was known as the ALPS | WMC Disciplined Value Fund. |
| (b) | Effective May 1, 2014, the Board approved changing the fiscal year-end of the Funds from April 30 to October 31. |
| (c) | Prior to August 31, 2012, the ALPS | WMC Disciplined Value Fund was known as the ALPS | WMC Value Intersection Fund. |
| (d) | Prior to August 31, 2010, the ALPS | WMC Value Intersection Fund was known as the Activa Value Fund (as a result of the reorganization of Activa Mutual Funds Trust - Activa Value Fund into the fund). |
| (e) | Calculated using the average shares method. |
| (f) | Total returns are for the period indicated and have not been annualized. Total returns would have been lower had certain expenses not been waived during the period. Returns shown do not reflect the deduction of taxes that a shareholder would pay on Fund distributions or the redemption of Fund shares. Returns shown exclude any applicable sales charges. |
| (g) | Annualized. |
| (h) | Portfolio turnover rate for periods less than one full year have not been annualized. |
See Notes to Financial Statements.
98 | April 30, 2015
| ALPS | WMC Research Value Fund – Class C | |
| Financial Highlights |
Selected data for a share of beneficial interest outstanding throughout the periods indicated:
For the Six Months Ended April 30, 2015 (Unaudited)(a) | For the Fiscal Period Ended October 31, 2014(b) | For the Year Ended April 30, 2014 | For the Year Ended April 30, 2013(c) | For the Year Ended April 30, 2012 | For the Period July 2, 2010 (Incpetion)to April 30, 2011(d) | |||||||||||||||||||
| Net asset value, beginning of period | $ | 12.36 | $ | 11.80 | $ | 9.93 | $ | 8.39 | $ | 8.62 | $ | 6.40 | ||||||||||||
| INCOME/(LOSS) FROM INVESTMENT OPERATIONS: | ||||||||||||||||||||||||
Net investment income/(loss)(e) | (0.01 | ) | (0.02 | ) | (0.02 | ) | 0.02 | (0.01 | ) | (0.01 | ) | |||||||||||||
| Net realized and unrealized gain/(loss) | 0.46 | 0.58 | 2.08 | 1.57 | (0.20 | ) | 2.27 | |||||||||||||||||
| Total from investment operations | 0.45 | 0.56 | 2.06 | 1.59 | (0.21 | ) | 2.26 | |||||||||||||||||
| DISTRIBUTIONS: | ||||||||||||||||||||||||
| From net investment income | (0.05 | ) | – | (0.06 | ) | (0.05 | ) | (0.02 | ) | (0.04 | ) | |||||||||||||
| From net realized gains | (1.20 | ) | – | (0.13 | ) | – | – | – | ||||||||||||||||
| Total distributions | (1.25 | ) | – | (0.19 | ) | (0.05 | ) | (0.02 | ) | (0.04 | ) | |||||||||||||
| Net increase/(decrease) in net asset value | (0.80 | ) | 0.56 | 1.87 | 1.54 | (0.23 | ) | 2.22 | ||||||||||||||||
| Net asset value, end of period | $ | 11.56 | $ | 12.36 | $ | 11.80 | $ | 9.93 | $ | 8.39 | $ | 8.62 | ||||||||||||
TOTAL RETURN(f) | 4.03 | % | 4.75 | % | 20.97 | % | 19.07 | % | (2.45 | )% | 35.44 | % | ||||||||||||
| RATIOS/SUPPLEMENTAL DATA: | ||||||||||||||||||||||||
| Net assets, end of period (000s) | $ | 1,623 | $ | 257 | $ | 133 | $ | 100 | $ | 79 | $ | 14 | ||||||||||||
| Ratio of expenses to average net assets excluding fee waivers and reimbursements | 2.24 | %(g) | 2.24 | %(g) | 2.22 | % | 2.26 | % | 2.38 | % | 2.49 | %(g) | ||||||||||||
| Ratio of expenses to average net assets including fee waivers and reimbursements | 2.15 | %(g) | 2.15 | %(g) | 2.15 | % | 2.15 | % | 2.15 | % | 2.15 | %(g) | ||||||||||||
| Ratio of net investment income/(loss) to average net assets | (0.14 | )%(g) | (0.30 | )%(g) | (0.23 | )% | 0.19 | % | (0.16 | )% | (0.09 | )%(g) | ||||||||||||
Portfolio turnover rate(h) | 75 | % | 13 | % | 19 | % | 34 | % | 46 | % | 44 | %(i) | ||||||||||||
| (a) | Prior to February 28, 2015, the ALPS | WMC Research Value Fund was known as the ALPS | WMC Disciplined Value Fund. |
| (b) | Effective May 1, 2014, the Board approved changing the fiscal year-end of the Funds from April 30 to October 31. |
| (c) | Prior to August 31, 2012, the ALPS | WMC Disciplined Value Fund was known as the ALPS | WMC Value Intersection Fund. |
| (d) | Prior to August 31, 2010, the ALPS | WMC Value Intersection Fund was known as the Activa Value Fund (as a result of the reorganization of Activa Mutual Funds Trust - Activa Value Fund into the fund). |
| (e) | Calculated using the average shares method. |
| (f) | Total returns are for the period indicated and have not been annualized. Total returns would have been lower had certain expenses not been waived during the period. Returns shown do not reflect the deduction of taxes that a shareholder would pay on Fund distributions or the redemption of Fund shares. Returns shown exclude any applicable sales charges. |
| (g) | Annualized. |
| (h) | Portfolio turnover rate for periods less than one full year have not been annualized. |
| (i) | Portfolio turnover rate is calculated at the Fund Level and represents the year ended April 30, 2011. |
See Notes to Financial Statements.
99 | April 30, 2015
| ALPS | WMC Research Value Fund – Class I | |
| Financial Highlights |
Selected data for a share of beneficial interest outstanding throughout the periods indicated:
For the Six Months Ended April 30, 2015 (Unaudited)(a) | For the Fiscal Period Ended October 31, 2014(b) | For the Year Ended April 30, 2014 | For the Year Ended April 30, 2013(c) | For the Year Ended April 30, 2012 | For the Year Ended April 30, 2011(d) | |||||||||||||||||||
| Net asset value, beginning of period | $ | 12.69 | $ | 12.05 | $ | 10.10 | $ | 8.49 | $ | 8.71 | $ | 7.48 | ||||||||||||
| INCOME/(LOSS) FROM INVESTMENT OPERATIONS: | ||||||||||||||||||||||||
Net investment income(e) | 0.05 | 0.05 | 0.09 | 0.11 | 0.09 | 0.07 | ||||||||||||||||||
| Net realized and unrealized gain/(loss) | 0.46 | 0.59 | 2.12 | 1.61 | (0.24 | ) | 1.24 | |||||||||||||||||
| Total from investment operations | 0.51 | 0.64 | 2.21 | 1.72 | (0.15 | ) | 1.31 | |||||||||||||||||
| DISTRIBUTIONS: | ||||||||||||||||||||||||
| From net investment income | (0.06 | ) | – | (0.13 | ) | (0.11 | ) | (0.07 | ) | (0.08 | ) | |||||||||||||
| From net realized gains | (1.20 | ) | – | (0.13 | ) | – | – | – | ||||||||||||||||
| Total distributions | (1.26 | ) | – | (0.26 | ) | (0.11 | ) | (0.07 | ) | (0.08 | ) | |||||||||||||
| Net increase/(decrease) in net asset value | (0.75 | ) | 0.64 | 1.95 | 1.61 | (0.22 | ) | 1.23 | ||||||||||||||||
| Net asset value, end of period | $ | 11.94 | $ | 12.69 | $ | 12.05 | $ | 10.10 | $ | 8.49 | $ | 8.71 | ||||||||||||
TOTAL RETURN(f) | 4.52 | % | 5.31 | % | 22.11 | % | 20.43 | % | (1.62 | )% | 17.67 | % | ||||||||||||
| RATIOS/SUPPLEMENTAL DATA: | ||||||||||||||||||||||||
| Net assets, end of period (000s) | $ | 43,233 | $ | 43,502 | $ | 44,729 | $ | 39,417 | $ | 34,636 | $ | 29,251 | ||||||||||||
| Ratio of expenses to average net assets excluding fee waivers and reimbursements | 1.22 | %(g) | 1.23 | %(g) | 1.22 | % | 1.26 | % | 1.33 | % | 1.46 | % | ||||||||||||
| Ratio of expenses to average net assets including fee waivers and reimbursements | 1.15 | %(g) | 1.15 | %(g) | 1.15 | % | 1.15 | % | 1.15 | % | 1.15 | % | ||||||||||||
| Ratio of net investment income to average net assets | 0.90 | %(g) | 0.74 | %(g) | 0.77 | % | 1.20 | % | 1.08 | % | 0.95 | % | ||||||||||||
Portfolio turnover rate(h) | 75 | % | 13 | % | 19 | % | 34 | % | 46 | % | 44 | % | ||||||||||||
| (a) | Prior to February 28, 2015, the ALPS | WMC Research Value Fund was known as the ALPS | WMC Disciplined Value Fund. |
| (b) | Effective May 1, 2014, the Board approved changing the fiscal year-end of the Funds from April 30 to October 31. |
| (c) | Prior to August 31, 2012, the ALPS | WMC Disciplined Value Fund was known as the ALPS | WMC Value Intersection Fund. |
| (d) | Prior to August 31, 2010, the ALPS | WMC Value Intersection Fund was known as the Activa Value Fund (as a result of the reorganization of Activa Mutual Funds Trust - Activa Value Fund into the fund). |
| (e) | Calculated using the average shares method. |
| (f) | Total returns are for the period indicated and have not been annualized. Total returns would have been lower had certain expenses not been waived during the period. Returns shown do not reflect the deduction of taxes that a shareholder would pay on Fund distributions or the redemption of Fund shares. |
| (g) | Annualized. |
| (h) | Portfolio turnover rate for periods less than one full year have not been annualized. |
See Notes to Financial Statements.
100 | April 30, 2015
| Clough China Fund | |
| Management Commentary | April 30, 2015 (Unaudited) |
The Clough China Fund Class A NAV gained 21.99% for the six month period ending April 30, 2015 and 38.36% for the one year period ending April 30, 2015 while the MSCI China index soared 29.61% and 48.06%, respectively, as China was one of the best performing markets in the world during the past year.
Chinese equities emerged from a long sleep of some seven to eight years and promptly jumped to levels not reached since their previous record high in 2007. The spectacular revival took place with heavy trading volume mostly over the last 6 months, from November 2014 to April 2015. In a way this has been a very “classic” rally since it is liquidity driven. It has also been typically Chinese, by the surprising violence and speed of the move and the dramatic change in investor sentiment as economic reforms encouraged flows into equity markets. Therefore and to paraphrase official vocabulary, it is a rally “with Chinese characteristics”.
Liquidity came from the combination of a shift in the People’s Bank of China (PBoC) monetary policy stance from a “neutral” stance to active easing with the first interest rate cut on November 21st and a strong inflow from Mainland China into Hong Kong-listed Chinese equities (known as H shares).
Mainland Chinese investors first began buying H-shares in Hong Kong after the launch of the Hong Kong – Shanghai Connect system in November. This program initially involved only Mainland retail investors with more than Renminbi (“Rmb”) 500,000 (about USD 81,000) in their brokerage accounts. The system was expanded on March 27th, when Chinese mutual funds were allowed to participate and Chinese individual investors were authorized to open up to 20 accounts at brokerage houses from only one before. These measures were clearly designed to encourage investors to invest in the cheaper H-share market and relieve some upside pressure to China’s strong domestic market. The inflows have been so significant that the Hong Kong Monetary Authority (HKMA) has had to intervene several times in foreign exchange markets to buy the U.S. dollar (and sell the Hong Kong dollar) in order to maintain the Hong Kong currency within the limits of its USD peg.
Mainland Chinese investors were attracted to Hong Kong at least partially because Hong Kong listed stocks were trading at a very large discount (around 40%) to their counterparts listed in Shanghai and Shenzhen. They also found that the Hong Kong exchange was rich with listed companies in sectors not well represented in the mainland markets, such as renewable energy, environmental services, internet and pharmaceuticals. Anecdotally it appeared that much of the investor interest has been in those high growth segments.
The November rate cut (40 basis points1 or “bps”) proved to be only the beginning of China’s monetary easing cycle as the government intensified efforts to prevent economic growth from slowing further. Indeed, the PBoC decided a second rate cut (25 bps) at the end of February 2015 and a third one (25 bps again) on May 11th. In the meantime, the commercial banks’ required reserve ratio (RRR) was trimmed twice, once in February and again in April 2015 with additional RRR cuts targeted for qualified banks with high exposure to rural regions. At the same time, the government announced new measures which were seen as the start of a “de-risking” process of the financial system. For instance, the PBoC recapitalized two policy banks, the China Development Bank and the Export- Import Bank, with $62 billion, with funds taken from China’s massive $3.7 trillion foreign exchange reserves. To further tackle the issue of local government debts, the Ministry of Finance allowed a swap of $160 billion of high rate local government debts for lower cost bonds and declared that local government debts were now qualified as collateral for the Central Bank’s open market operations and interbank borrowings.
On the macro economic front, China’s economic growth remained stuck around 7% – an area that obviously fails to excite international investors. GDP (Gross Domestic Product) increased 7.4% for the full year 2014, which was slightly above consensus, though then slowed to 7% in the first quarter of 2015. The slowdown in retail sales growth – to 10.6% in the first quarter – and in fixed asset investment – to 12% on the first four months of this year from about 16% last year - though not dramatic, lacked any sign of rebound. But the paradox was that weak economic data raised anticipation of further monetary and fiscal policy easing measures from Beijing. Indeed, bad news was good news for investors as liquidity conditions remained strong.
Portfolio Composition
Unlike recent years when small to mid-sized companies tended to drive fund performance, nine out of ten of our major positive contributors to performance were very large stocks. Index heavyweights such as China Mobile and the two largest commercial banks – China Construction Bank and Industrial and Commercial Bank of China – were the three largest contributors.
China Mobile is the largest telecom operator in China. Its share price surged in 2014 as subscriber demand for 4G mobile services accelerated earlier and more significantly than expected allowing market share gains from its two smaller competitors. China Mobile’s 4G network is the world’s largest. The project to establish a shared Tower company for the three operators – offering savings in capital expenditure – and cuts in handset subsidies also contributed to the share price rebound. Investors looked past weaker earnings and a dividend cut to focus on new positive developments with 4G growth offering an improved earnings and cash flow outlook in the coming years. The stock also attracted strong inflows under the Shanghai – Hong Kong Connect system when Mainland investors looked for cheap blue chip names to invest. China Mobile is not listed on domestic exchanges.
101 | April 30, 2015
| Clough China Fund | |
| Management Commentary | April 30, 2015 (Unaudited) |
China Construction Bank (CCB) and Industrial and Commercial Bank of China (ICBC) are generally considered to be China’s most solid and best quality banks. Their management style is rather conservative. Even if their earnings growth recently slowed down from 10 - 11% in 2013 to 5 - 6% last year and about 2% in the first quarter of 2015, their capitalization ratios remain comfortable, above 12% and both banks are earning ROEs (Return On Equity2) of between 17 and 18%, which are much higher than comparable large banks in the Western economies. We believe strong balance sheets and higher earnings base will help these banks withstand the gradual increase in non-performing loans we expect in the sector. Importantly, recent government moves to swap local government debts into municipal bond-like structures with central government credit support will reduce the risks on banks’ balance sheet as it will turn high credit risk assets into low risk assets. The recent larger than expected 100 bps cut in the RRR on April 19, which released Rmb 1.3 trillion (equivalent to $210 billion) of liquidity, is a positive for banks. These two banks have been distributing about one-third of their profits to shareholders, which give their shares relatively high dividend yields3, above 6% before the rally, around 5% currently. All these factors explain their strong performance and valuations remain reasonable in our opinion with the share priced at just 1.1x book value. As we expect the easing policy to continue in the coming months, this should support the sector re-rating.
On the other hand, three portfolio holdings which generated the highest individual returns on an absolute percentage basis were CSR Corp. Ltd. and China Railway Construction, two stocks related to the growth in railway construction and equipment, and CT Environmental, a specialist in waste water treatment and the treatment of hazardous wastes.
Among major detractors were Sands China, the Macau casino operator, which suffered alongside a general slump in gaming revenues due to the impact of Beijing’s anti-corruption efforts. Sands China is no longer in the portfolio. Auto maker BYD Co. was also a major detractor, though in recent months the shares have recovered strongly. BYD refocused its business towards batteries and “new energy vehicles” (NEV), mainly electric cars in the last few years. It currently holds a market leading 25% market share in pure electric vehicles and plug-in hybrids. NEVs are well supported by the government policy to curb pollution, as electric vehicles are eligible for generous government subsidies that work to reduce selling prices by 30 to 60%. BYD management expects to almost triple its revenue from NEV, which should account for more than 50% of total sales. BYD remains among your Fund’s holdings as we see it as one of the biggest beneficiaries of China’s electric vehicle and environmental clean-up policies.
Outlook
While it looks like many international investors remain more concerned than convinced by the rally in Chinese equities, with even short interest going up lately (source: CICC. Portfolio & Quant Strategy, May 20, 2015), we dare to be contrarian. We believe in further market upside going forward and we are not short of reasons to support our positive stance.
We believe liquidity conditions will continue to support equities. We expect more interest rate cuts and further reductions in the bank RRR in the coming months. The RRR is still too high at 18.5% and inflation remains low giving the PBoC room to reduce debt costs. The government also has leeway to relax the fiscal policy. In the first quarter of 2015, fiscal spending rebounded to 7.8% from a slight decline in the fourth quarter of last year. More spending is being allocated to infrastructure projects. While fixed asset investment (FAI) increased only 12% in the first four months of 2015, FAI in railway infrastructure gained 20.2% and FAI in railway equipment rose 45.7%. Rail is not the only sector that will benefit from a more expansionary fiscal policy. Investments in energy conservation and environmental protection are also on the rise. Measures to reduce water pollution and increase natural gas usage have been announced. Collective spending to improve the environment should translate into Rmb 20 trillion ($3.2 trillion) of investments over 2014 - 2023, or a 14.4% average growth rate over 10 years. (Source: HSBC Global Research, China. May 19, 2015). China has upside potential in this area as its investments in environmental protection only amounted to 1.6% of GDP in 2012, as compared to 2.5% - 3% for developed countries.
The Chinese bull market has been welcomed, if not encouraged by Beijing as it works to help the economic rebalancing and reform agenda. Plans to reform the State Owned Enterprises (SOEs), which includes reducing the number of Central SOEs from 112 to 40 are designed to enhance the efficiency of these groups, through mixed ownership reform, employee shareholding, change in the Board compensation system, and asset restructuring, among other things. It has already started, with four pilot programs now under way for six pilot central SOEs (source: CICC, SOE Reform series (6): Central SOE reforms and restructuring. April 30, 2015). More State owned firms will be privatized via stock market listings. Reforms like these create investment opportunities and in many ways, government policy creates a roadmap to help investors find potentially lucrative opportunities.
Among the new powerful investment themes we are focusing are research efforts are two others: The One Belt One Road (OBOR) action plan and the “Made in China 2025” strategy which were recently outlined in documents issued by the State Council. The initiative to create a new “Silk Road” (One Belt One Road) by land and by sea, aims to link developed Europe and East Asia (Credit Suisse, Asian Daily, March 30, 2015). Companies involved in transportation infrastructure, construction and international ports management as well as their massive domestic supply chains will be involved. The “Made in China 2025” plan is similar to the Industry 4.0 presented by the German government in 2013 and targets to build a high end manufacturing sector with a focus on ten key areas, among which include: new information technology, numerical control tools and robots, high end railway equipment and new energy vehicles. (source: Barclay’s China comments May 20, 2015). We logically anticipate the companies involved in these different businesses to benefit and there are plenty of publicly listed beneficiaries in these sectors in Hong Kong.
While the stock market remains strong we do expect to see the mainland authorities, including market regulators and supervisory bodies to continue to discourage excessive speculation. Indeed we have seen periodic tightening of margin financing and brokerage firm leverage ratios as an attempt to “lean into the wind” as Beijing actively seeks to avoid a stock market bubble. We find this both healthy and prudent. While tighter policy directed towards stocks could increase volatility, it improves the chances for a longer up-cycle in Chinese stocks.
102 | April 30, 2015
| Clough China Fund | |
| Management Commentary | April 30, 2015 (Unaudited) |
While Chinese economic growth is likely to continue to decelerate, by no means should we consider this a crisis situation. The service sector is booming. It contributed 63.7% to nominal GDP growth in 2014, up from 42.9% in 2010. Service industries have also added an average of 9 million jobs per year since 2008 against 5 million from the manufacturing and construction sectors. China is transforming. Since 2008, the private health market size has increased four times and China’s movie box office revenue has jumped 8.3 times. Over the last seven years, internet e-commerce has been multiplied 54 times! (source: Credit Suisse China Economic Outlook . March 2015).
The recovery of Chinese equity markets and the substantial opening of China’s markets via programs like the Hong Kong–Shanghai Connect system and the now pending Hong Kong– Shenzhen Connect system are expected to lead to further internationalization of the Chinese currency. It is increasingly likely that Chinese equities, including A-shares4 listed on mainland exchanges, are going to become a more significant weighting in most Emerging Market and global benchmark indices. We expect in coming years that this will lead to increased interest in (and demand for) Chinese stocks. We expect the Clough China Fund to be a major beneficiary of these tailwinds and will continue to focus on identifying the most attractive Chinese companies and themes in which to invest.
Francoise Vappereau, Co-Portfolio Manager
Eric Brock, Co-Portfolio Manager
| 1 | A basis point is a unit that is equal to 1/100th of 1% and is used to denote the change in a financial instrument. |
| 2 | Return on equity is the amount of net income returned as a percentage of shareholder equity. |
| 3 | Dividend Yield is a financial ratio that shows how much a company pays out in dividends each year relative to its share price. |
| 4 | A-Shares are shares in mainland China-based companies that trade on Chinese stock exchanges such as the Shanghai Stock Exchange and the Shenzhen Stock Exchange. |
Investments in international and emerging markets securities include exposure to risks such as currency fluctuations, foreign taxes and regulations, and the potential for illiquid markets and political instability.
The views and information discussed in this commentary are as of the date of publication, are subject to change, and may not reflect the writer's current views. The views expressed represent an assessment of market conditions at a specific point in time, are opinions only and should not be relied upon as investment advice regarding a particular investment or markets in general. Such information does not constitute a recommendation to buy or sell specific securities or investment vehicles. It should not be assumed that any investment will be profitable or will equal the performance of the fund(s) or any securities or any sectors mentioned in this letter. The subject matter contained in this letter has been derived from several sources believed to be reliable and accurate at the time of compilation. Neither Clough Capital Partners, LP nor the Fund accepts any liability for losses either direct or consequential caused by the use of this information.
103 | April 30, 2015
| Clough China Fund | |
| Performance Update | April 30, 2015 (Unaudited) |
Performance of $10,000 Initial Investment (as of April 30, 2015)
Comparison of change in value of a $10,000 investment (includes maximum sales charges of 5.50%)
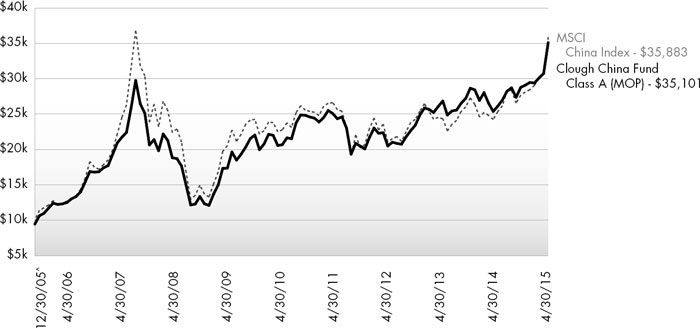
The chart above represents historical performance of a hypothetical investment of $10,000 in the Fund since inception. Past performance does not guarantee future results. This chart does not reflect the deduction of taxes that a shareholder would pay on Fund distributions or the redemption of Fund shares.
Average Annual Total Returns (as of April 30, 2015)
| 6 Month | 1 Year | 3 Year | 5 Year | Since Inception^ | Total Expense Ratio | What You Pay* | |
| Class A (NAV) | 21.99% | 38.36% | 16.20% | 9.80% | 15.10% | 2.06% | 1.95% |
| Class A (MOP) | 15.27% | 30.73% | 14.04% | 8.56% | 14.40% | ||
| Class C (NAV) | 21.50% | 37.28% | 15.30% | 8.96% | 14.24% | 2.87% | 2.70% |
| Class C (CDSC) | 20.50% | 36.28% | 15.30% | 8.96% | 14.24% | ||
Class I 1 | 22.14% | 38.69% | 16.52% | 10.12% | 15.57% | 1.82% | 1.70% |
MSCI China Index2 | 29.61% | 48.06% | 15.03% | 8.56% | 14.67% |
Performance data quoted represents past performance. Past performance does not guarantee future results. Investment return and principal value of an investment will fluctuate so that an investor’s shares, when sold or redeemed, may be worth more or less than the original cost. Current performance data may be higher or lower than actual data quoted. For the most current month-end performance data, please call 1-877-256-8445.
Maximum Offering Price (MOP) for Class A shares includes the Fund’s maximum sales charge of 5.50%. Performance shown at NAV does not include these sales charges and would have been lower had it been taken into account. If you invest $1 million or more, either as a lump sum or through the Fund’s accumulation or letter of intent programs, you can purchase Class A shares without an initial sales charge (load). A Contingent Deferred Sales Charge (“CDSC”) of 1.00% may apply to Class C shares redeemed within the first 12 months after a purchase, and on Class A shares redeemed within the first 18 months after a purchase in excess of $1 million. The Fund imposes a 2.00% redemption fee on shares held for less than 30 days.
Performance less than 1 year is cumulative.
The performance shown for the Clough China Fund for periods prior to January 15, 2010, reflects the performance of the Old Mutual China Fund, a series of Old Mutual Funds I (as a result of a prior reorganization of the Old Mutual China Fund into the Clough China Fund).
| 1 | Prior to close of business on January 15, 2010, Class I was known as Institutional Class of the Old Mutual China Fund. |
104 | April 30, 2015
| Clough China Fund | |
| Performance Update | April 30, 2015 (Unaudited) |
| 2 | The Morgan Stanley Capital International (“MSCI”) China Index is constructed according to the MSCI Global Investable Market Index (GIMI) family. The MSCI China Index is part of the MSCI Emerging Markets Index. The index is not actively managed and does not reflect any deduction for fees, expenses or taxes. An investor may not invest directly in an index. |
| ^ | Fund Inception date of December 30, 2005. |
| * | What You Pay reflects the Advisor’s decision to contractually limit expenses through February 29, 2016. Please see the prospectus for additional information. |
The table does not reflect the deduction of taxes that a shareholder would pay on Fund distributions or the redemption of Fund shares.
This Fund is not suitable for all investors and is subject to investment risks, including possible loss of the principal amount invested.
There is no guarantee that the Fund will continue to hold any one particular security or stay invested in any one particular company. The composition of the Fund's top holdings is subject to change. Performance figures are historical and reflect the change in share price, reinvested distributions, changes in net asset value, sales charges and capital gains distributions, if any.
Not FDIC Insured – No Bank Guarantee – May Lose Value
Investing in the Fund is subject to investment risks, including possible loss of the principal amount invested.
Investing in China, Hong Kong and Taiwan involves risk and considerations not present when investing in more established securities markets. The Fund may be more susceptible to the economic, market, political and local risks of these regions than a fund that is more geographically diversified.
Top Ten Holdings (as a % of Net Assets) †
| Tencent Holdings, Ltd. | 9.14% |
| China Mobile, Ltd. | 7.10% |
| China Construction Bank Corp., Class H | 5.79% |
| Industrial & Commercial Bank of China, Ltd., Class H | 4.99% |
| Bank of China, Ltd., Class H | 4.27% |
| Hong Kong Exchanges and Clearing, Ltd. | 3.44% |
| China Life Insurance Co., Ltd., Class H | 3.28% |
| Ping An Insurance Group Co. of China, Ltd., Class H | 3.05% |
| China Petroleum & Chemical Corp., Class H | 3.03% |
| CNOOC, Ltd. | 2.87% |
| Top Ten Holdings | 46.96% |
† Holdings are subject to change. Table presents indicative values only. Excludes cash & cash equivalents.
Industry Sector Allocation (as a % of Net Assets)
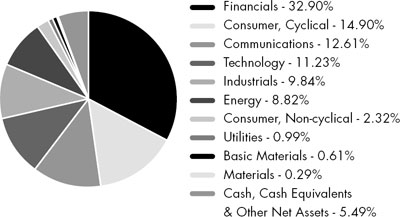
105 | April 30, 2015
| Clough China Fund | |
| Statement of Investments | April 30, 2015 (Unaudited) |
| Shares | Value (Note 2) | |||||||
| COMMON STOCKS (86.27%) | ||||||||
| Communications (12.61%) | ||||||||
| Telecommunications (12.61%) | ||||||||
| China Communications Services Corp., Ltd., Class H | 1,900,000 | $ | 1,070,738 | |||||
| China Fiber Optic Network System Group, Ltd. | 4,132,000 | 1,499,480 | ||||||
| China Mobile, Ltd. | 585,000 | 8,355,722 | ||||||
| China Telecom Corp., Ltd., Class H | 1,600,000 | 1,185,293 | ||||||
| China Unicom Hong Kong, Ltd. | 572,000 | 1,074,290 | ||||||
| ZTE Corp., Class H | 487,600 | 1,640,772 | ||||||
| 14,826,295 | ||||||||
| TOTAL COMMUNICATIONS | 14,826,295 | |||||||
| Consumer, Cyclical (9.51%) | ||||||||
| Apparel (2.30%) | ||||||||
| Best Pacific International Holdings, Ltd. | 1,114,000 | 501,981 | ||||||
| Peak Sport Products Co., Ltd. | 2,059,000 | 698,077 | ||||||
| Shenzhou International Group Holdings, Ltd. | 192,000 | 903,019 | ||||||
| Stella International Holdings, Ltd. | 225,000 | 608,294 | ||||||
| 2,711,371 | ||||||||
| Auto Manufacturers (2.46%) | ||||||||
BAIC Motor Corp., Ltd., Class H(a) | 837,500 | 1,239,199 | ||||||
| Chongqing Changan Automobile Co., Ltd., Class B | 66,070 | 216,785 | ||||||
| Great Wall Motor Co., Ltd., Class H | 189,000 | 1,434,053 | ||||||
| 2,890,037 | ||||||||
| Auto Parts & Equipment (0.40%) | ||||||||
Fuyao Glass Industry Group Co., Ltd., Class H(a)(b) | 186,000 | 466,527 | ||||||
| Home Furnishings (0.64%) | ||||||||
| Skyworth Digital Holdings, Ltd. | 844,000 | 751,870 | ||||||
| Lodging (0.76%) | ||||||||
| Shanghai Jin Jiang International | ||||||||
| Hotels Group Co., Ltd. | 1,760,000 | 892,829 | ||||||
| Retail (1.54%) | ||||||||
| Man Wah Holdings, Ltd. | 1,396,712 | 1,812,197 | ||||||
| Shares | Value (Note 2) | |||||||
| Textiles (1.41%) | ||||||||
| Pacific Textile Holdings, Ltd. | 1,200,000 | $ | 1,663,257 | |||||
| TOTAL CONSUMER, CYCLICAL | 11,188,088 | |||||||
| Consumer, Non-Cyclical (1.66%) | ||||||||
| Pharmaceuticals (1.66%) | ||||||||
| Sinopharm Group Co., Ltd., Class H | 412,000 | 1,956,918 | ||||||
| TOTAL CONSUMER, NON-CYCLICAL | 1,956,918 | |||||||
| Energy (8.82%) | ||||||||
| Oil & Gas (8.37%) | ||||||||
| China Petroleum & Chemical Corp., Class H | 3,782,000 | 3,569,325 | ||||||
| CNOOC, Ltd. | 1,980,000 | 3,376,320 | ||||||
| PetroChina Co., Ltd., Class H | 2,244,000 | 2,894,231 | ||||||
| 9,839,876 | ||||||||
| Oil & Gas Services (0.45%) | ||||||||
| Sinopec Kantons Holdings, Ltd. | 592,000 | 535,036 | ||||||
| TOTAL ENERGY | 10,374,912 | |||||||
| Financials (32.59%) | ||||||||
| Banks (18.36%) | ||||||||
| Agricultural Bank of China, Ltd., Class H | 1,699,000 | 956,504 | ||||||
| Bank of China, Ltd., Class H | 7,334,437 | 5,025,582 | ||||||
| BOC Hong Kong Holdings, Ltd. | 258,000 | 1,000,709 | ||||||
| China Construction Bank Corp., Class H | 7,015,080 | 6,809,782 | ||||||
| China Merchants Bank Co., Ltd., Class H | 642,000 | 1,927,055 | ||||||
| Industrial & Commercial Bank of China, Ltd., Class H | 6,768,967 | 5,871,814 | ||||||
| 21,591,446 | ||||||||
| Diversified Financial Services (3.44%) | ||||||||
| Hong Kong Exchanges and Clearing, Ltd. | 106,300 | 4,052,184 | ||||||
| Insurance (7.17%) | ||||||||
| China Life Insurance Co., Ltd., Class H | 795,000 | 3,858,361 | ||||||
China Taiping Insurance Holdings Co., Ltd.(a) | 264,600 | 983,017 | ||||||
| Ping An Insurance Group Co. of China, Ltd., Class H | 251,000 | 3,589,612 | ||||||
| 8,430,990 | ||||||||
106 | April 30, 2015
| Clough China Fund | |
| Statement of Investments | April 30, 2015 (Unaudited) |
| Shares | Value (Note 2) | |||||||
| Real Estate (3.62%) | ||||||||
| China Overseas Land & Investment, Ltd. | 418,000 | $ | 1,741,130 | |||||
| China Resources Land, Ltd. | 388,000 | 1,407,745 | ||||||
| Greenland Hong Kong Holdings, Ltd. | 433,000 | 441,617 | ||||||
| Poly Property Group Co., Ltd. | 1,047,000 | 670,821 | ||||||
| 4,261,313 | ||||||||
| TOTAL FINANCIALS | 38,335,933 | |||||||
| Industrials (8.57%) | ||||||||
| Electrical Components & Equipment (1.73%) | ||||||||
| Xinjiang Goldwind Science & Technology Co., Ltd. | 383,600 | 891,225 | ||||||
| Zhuzhou CSR Times Electric Co., Ltd., Class H | 135,000 | 1,147,918 | ||||||
| 2,039,143 | ||||||||
| Electronics (0.39%) | ||||||||
IMAX Corp.(a) | 12,200 | 455,792 | ||||||
| Engineering & Construction (2.66%) | ||||||||
| China Communications Construction Co., Ltd., Class H | 768,000 | 1,396,881 | ||||||
| China Railway Construction Corp., Ltd., Class H | 306,000 | 610,999 | ||||||
| China State Construction International Holdings, Ltd. | 582,000 | 1,121,703 | ||||||
| 3,129,583 | ||||||||
| Environmental Control (2.07%) | ||||||||
| China Everbright International, Ltd. | 228,000 | 425,164 | ||||||
China Everbright Water, Ltd.(a) | 1,368,300 | 1,155,981 | ||||||
| CT Environmental Group, Ltd. | 608,760 | 852,872 | ||||||
| 2,434,017 | ||||||||
| Transportation Infrastructure (1.72%) | ||||||||
| China Merchants Holdings International Co., Ltd. | 268,000 | 1,215,828 | ||||||
| Cosco International Holdings, Ltd. | 1,382,000 | 807,293 | ||||||
| 2,023,121 | ||||||||
| TOTAL INDUSTRIALS | 10,081,656 | |||||||
| Shares | Value (Note 2) | |||||||
| Materials (0.29%) | ||||||||
| Building Products (0.29%) | ||||||||
| West China Cement, Ltd. | 1,996,000 | $ | 341,082 | |||||
| TOTAL MATERIALS | 341,082 | |||||||
| Technology (11.23%) | ||||||||
| Computers (1.40%) | ||||||||
| Lenovo Group, Ltd. | 956,000 | 1,643,909 | ||||||
| Electrical Equipment & Instruments (0.69%) | ||||||||
| Byd Co., Ltd., Class H | 134,000 | 809,543 | ||||||
| Internet (9.14%) | ||||||||
| Tencent Holdings, Ltd. | 520,800 | 10,748,729 | ||||||
| TOTAL TECHNOLOGY | 13,202,181 | |||||||
| Utilities (0.99%) | ||||||||
| Electric (0.99%) | ||||||||
CGN Power Co., Ltd., Class H(a)(b) | 2,079,000 | 1,163,343 | ||||||
| TOTAL UTILITIES | 1,163,343 | |||||||
| TOTAL COMMON STOCKS (Cost $75,689,894) | 101,470,408 | |||||||
| PARTICIPATION NOTES (8.24%) | ||||||||
| Basic Materials (0.61%) | ||||||||
| Iron & Steel (0.61%) | ||||||||
Baoshan Iron & Steel Co., Ltd., Class A (Loan Participation Notes issued by Morgan Stanley Asia Products), expiring 12/07/15(a) | 496,123 | 717,444 | ||||||
| TOTAL BASIC MATERIALS | 717,444 | |||||||
| Consumer, Cyclical (5.39%) | ||||||||
| Apparel (0.66%) | ||||||||
Zhejiang Semir Garment Co., Ltd., Class A (Loan Participation Notes issued by Morgan Stanley Asia Products), expiring 03/20/17(a) | 176,600 | 772,696 | ||||||
107 | April 30, 2015
| Clough China Fund | |
| Statement of Investments | April 30, 2015 (Unaudited) |
| Shares | Value (Note 2) | |||||||
| Auto Manufacturers (1.64%) | ||||||||
Chongqing Changan Automobile Co., Ltd., Class A (Loan Participation Notes issued by Morgan Stanley Asia Products), expiring 02/04/16(a) | 252,000 | $ | 1,023,800 | |||||
Zhengzhou Yutong Bus Co., Ltd., Class A (Loan Participation Notes issued by Morgan Stanley Asia Products), expiring 11/18/15(a) | 183,660 | 906,638 | ||||||
| 1,930,438 | ||||||||
| Auto Parts & Equipment (0.48%) | ||||||||
Fuyao Glass Industry Group Co., Ltd., Class A (Loan Participation Notes issued by Morgan Stanley Asia Products), expiring 03/16/17(a) | 223,100 | 562,524 | ||||||
| Entertainment (0.51%) | ||||||||
Huayi Brothers Media Corp., Class A (Loan Participation Notes issued by Morgan Stanley Asia Products), expiring 04/10/17(a) | 107,100 | 604,151 | ||||||
| Home Furnishings (1.61%) | ||||||||
Hangzhou Robam Appliances Co., Ltd., Class A (Loan Participation Notes issued by Morgan Stanley Asia Products), expiring 03/03/16(a) | 89,900 | 721,052 | ||||||
Qingdao Haier Co., Ltd., Class A (Loan Participation Notes issued by Morgan Stanley Asia Products), expiring 11/27/15(a) | 268,100 | 1,171,758 | ||||||
| 1,892,810 | ||||||||
| Shares | Value (Note 2) | |||||||
| Housewares (0.49%) | ||||||||
Zhejiang Supor Cookware Co., Ltd., Class A (Loan Participation Notes issued by Morgan Stanley Asia Products), expiring 03/03/16(a) | 138,300 | $ | 573,018 | |||||
| TOTAL CONSUMER, CYCLICAL | 6,335,637 | |||||||
| Consumer, Non-Cyclical (0.66%) | ||||||||
| Beverages (0.66%) | ||||||||
Kweichow Moutai Co., Ltd., Class A (Loan Participation Notes issued by Morgan Stanley Asia Products), expiring 12/09/15(a) | 19,100 | 776,681 | ||||||
| TOTAL CONSUMER, NON-CYCLICAL | 776,681 | |||||||
| Financials (0.31%) | ||||||||
| Diversified Financial Services (0.31%) | ||||||||
Citic Securities Co., Ltd., Class A (Loan Participation Notes issued by Morgan Stanley Asia Products), expiring 02/11/16(a) | 66,300 | 367,262 | ||||||
| TOTAL FINANCIALS | 367,262 | |||||||
| Industrials (1.27%) | ||||||||
| Engineering & Construction (0.77%) | ||||||||
Shanghai International Airport Co., Ltd., Class A (Loan Participation Notes issued by Morgan Stanley Asia Products), expiring 11/18/15(a) | 204,465 | 910,769 | ||||||
| Machinery - Diversified (0.50%) | ||||||||
Shanghai Mechanical & Electrical Industry Co., Ltd., Class A (Loan Participation Notes issued by Morgan Stanly Asia Products), expiring 02/16/16(a) | 111,300 | 588,721 | ||||||
| TOTAL INDUSTRIALS | 1,499,490 | |||||||
| TOTAL PARTICIPATION NOTES (Cost $7,941,686) | 9,696,514 | |||||||
108 | April 30, 2015
| Clough China Fund | |
| Statement of Investments | April 30, 2015 (Unaudited) |
7-Day Yield | Shares | Value (Note 2) | ||||||||||
| SHORT TERM INVESTMENTS (3.12%) | ||||||||||||
| Money Market Fund (3.12%) | ||||||||||||
| Morgan Stanley Institutional Liquidity Funds - Prime Portfolio | 0.078 | % | 3,665,560 | $ | 3,665,560 | |||||||
| TOTAL SHORT TERM INVESTMENTS (Cost $3,665,560) | 3,665,560 | |||||||||||
Value (Note 2) | ||||||||||||
| TOTAL INVESTMENTS (97.63%) (Cost $87,297,140) | $ | 114,832,482 | ||||||||||
| Other Assets In Excess Of Liabilities (2.37%) | 2,787,395 | |||||||||||
| NET ASSETS (100.00%) | $ | 117,619,877 | ||||||||||
(a) Non-Income Producing Security.
(b) Security exempt from registration under Rule 144A of the Securities Act of 1933. This security may be resold in transactions exempt from registration, normally to qualified institutional buyers. As of April 30, 2015, the aggregate market value of those securities was $1,629,870, representing 1.39% of net assets.
Common Abbreviations:
Ltd. - Limited.
For Fund compliance purposes, the Fund’s industry classifications refer to any one or more of the industry sub-classifications used by one or more widely recognized market indexes or ratings group indexes, and/or as defined by Fund management. This definition may not apply for purposes of this report, which may combine industry sub-classifications for reporting ease. Industries are shown as a percent of net assets.
See Notes to Financial Statements.
109 | April 30, 2015
| Clough China Fund | |
| Statement of Assets and Liabilities | April 30, 2015 (Unaudited) |
| ASSETS | ||||
| Investments, at value | $ | 114,832,482 | ||
| Foreign currency, at value (Cost $3,305,807) | 3,305,701 | |||
| Receivable for investments sold | 676,451 | |||
| Receivable for shares sold | 1,570,054 | |||
| Dividends receivable | 14,612 | |||
| Prepaid expenses and other assets | 16,531 | |||
| Total Assets | 120,415,831 | |||
| LIABILITIES | ||||
| Payable for investments purchased | 2,537,615 | |||
| Payable for shares redeemed | 54,526 | |||
| Investment advisory fees payable | 114,359 | |||
| Administration and transfer agency fees payable | 20,079 | |||
| Distribution and services fees payable | 18,121 | |||
| Trustees’ fees and expenses payable | 409 | |||
| Professional fees payable | 22,020 | |||
| Accrued expenses and other liabilities | 28,825 | |||
| Total Liabilities | 2,795,954 | |||
| NET ASSETS | $ | 117,619,877 | ||
| NET ASSETS CONSIST OF | ||||
| Paid-in capital | $ | 86,802,242 | ||
| Accumulated net investment loss | (650,777 | ) | ||
| Accumulated net realized gain on investments and foreign currency transactions | 3,932,280 | |||
| Net unrealized appreciation on investments and translation of assets and liabilities denominated in foreign currencies | 27,536,132 | |||
| NET ASSETS | $ | 117,619,877 | ||
| INVESTMENTS, AT COST | $ | 87,297,140 | ||
| PRICING OF SHARES | ||||
| Class A: | ||||
| Net Asset Value, offering and redemption price per share | $ | 27.48 | ||
| Net Assets | $ | 36,906,967 | ||
| Shares of beneficial interest outstanding (unlimited number of shares, no par value common stock authorized) | 1,343,143 | |||
| Maximum offering price per share ((NAV/0.9450), based on maximum sales charge of 5.50% of the offering price) | $ | 29.08 | ||
| Class C: | ||||
Net Asset Value, offering and redemption price per share(a) | $ | 26.29 | ||
| Net Assets | $ | 13,973,811 | ||
| Shares of beneficial interest outstanding (unlimited number of shares, no par value common stock authorized) | 531,442 | |||
| Class I: | ||||
| Net Asset Value, offering and redemption price per share | $ | 28.05 | ||
| Net Assets | $ | 66,739,099 | ||
| Shares of beneficial interest outstanding (unlimited number of shares, no par value common stock authorized) | 2,379,610 | |||
(a) Redemption price per share may be reduced for any applicable contingent deferred sales charge. For a description of a possible sales charge, please see the Fund’s Prospectus.
See Notes to Financial Statements.
110 | April 30, 2015
| Clough China Fund | |
| Statement of Operations | For the Six Months Ended April 30, 2015 (Unaudited) |
| INVESTMENT INCOME | ||||
| Dividends | $ | 227,289 | ||
| Foreign taxes withheld on dividends | (2,695 | ) | ||
| Total Investment Income | 224,594 | |||
| EXPENSES | ||||
| Investment advisory fees | 577,857 | |||
| Administrative fees | 72,517 | |||
| Transfer agency fees | 2,299 | |||
| Distribution and service fees | ||||
| Class A | 39,051 | |||
| Class C | 58,833 | |||
| Professional fees | 25,334 | |||
| Networking fees | ||||
| Class A | 4,941 | |||
| Class C | 4,811 | |||
| Class I | 7,761 | |||
| Reports to shareholders and printing fees | 5,833 | |||
| State registration fees | 20,643 | |||
| SEC registration fees | 5 | |||
| Insurance fees | 488 | |||
| Custody fees | 19,237 | |||
| Trustees’ fees and expenses | 1,076 | |||
| Miscellaneous expenses | 7,153 | |||
| Total Expenses | 847,839 | |||
| Less fees waived/reimbursed by investment advisor (Note 8) | ||||
| Class A | (6,579 | ) | ||
| Class C | (5,423 | ) | ||
| Class I | (10,281 | ) | ||
| Net Expenses | 825,556 | |||
| Net Investment Loss | (600,962 | ) | ||
| Net realized gain on investments | 5,577,653 | |||
| Net realized gain on foreign currency transactions | 7,262 | |||
| Net change in unrealized appreciation on investments | 13,019,083 | |||
| Net change in unrealized depreciation on translation of assets and liabilities denominated in foreign currencies | (2,220 | ) | ||
| NET REALIZED AND UNREALIZED GAIN ON INVESTMENTS | 18,601,778 | |||
| NET INCREASE IN NET ASSETS RESULTING FROM OPERATIONS | $ | 18,000,816 | ||
See Notes to Financial Statements.
111 | April 30, 2015
| Clough China Fund |
| Statements of Changes in Net Assets |
For the Six Months Ended April 30, 2015 (Unaudited) | For the Fiscal Period Ended October 31, 2014(a) | |||||||
| OPERATIONS | ||||||||
| Net investment income/(loss) | $ | (600,962 | ) | $ | 1,526,148 | |||
| Net realized gain on investments and foreign currency transactions | 5,584,915 | 2,049,534 | ||||||
| Net change in unrealized appreciation on investments and translation of assets and liabilities denominated in foreign currencies | 13,016,863 | 6,054,295 | ||||||
| Net Increase in Net Assets Resulting from Operations | 18,000,816 | 9,629,977 | ||||||
| DISTRIBUTIONS | ||||||||
| Dividends to shareholders from net investment income | ||||||||
| Class A | (646,688 | ) | – | |||||
| Class C | (212,498 | ) | – | |||||
| Class I | (889,808 | ) | – | |||||
| Dividends to shareholders from net realized gains | ||||||||
| Class A | (599,361 | ) | – | |||||
| Class C | (236,066 | ) | – | |||||
| Class I | (777,420 | ) | – | |||||
| Net Decrease in Net Assets from Distributions | (3,361,841 | ) | – | |||||
| BENEFICIAL INTEREST TRANSACTIONS (NOTE 6) | ||||||||
| Shares sold | ||||||||
| Class A | 3,606,791 | 3,360,623 | ||||||
| Class C | 1,527,819 | 896,076 | ||||||
| Class I | 22,931,489 | 8,345,000 | ||||||
| Dividends reinvested | ||||||||
| Class A | 858,834 | – | ||||||
| Class C | 247,634 | – | ||||||
| Class I | 1,031,976 | – | ||||||
| Shares redeemed, net of redemption fees | ||||||||
| Class A | (3,384,725 | ) | (7,865,957 | ) | ||||
| Class C | (1,337,543 | ) | (1,541,832 | ) | ||||
| Class I | (4,519,889 | ) | (6,269,825 | ) | ||||
| Net Increase/(Decrease) in Net Assets Derived from Beneficial Interest Transactions | 20,962,386 | (3,075,915 | ) | |||||
| Net increase in net assets | 35,601,361 | 6,554,062 | ||||||
| NET ASSETS | ||||||||
| Beginning of period | 82,018,516 | 75,464,454 | ||||||
| End of period * | $ | 117,619,877 | $ | 82,018,516 | ||||
| *Including accumulated net investment income/(loss) of: | $ | (650,777 | ) | $ | 1,699,179 | |||
(a) Effective May 1, 2014, the Board approved changing the fiscal year-end of the Funds from April 30 to October 31.
See Notes to Financial Statements.
112 | April 30, 2015
| Clough China Fund – Class A |
| Financial Highlights |
Selected data for a share of beneficial interest outstanding throughout the periods indicated:
| For the Six | For the | |||||||||||||||||||||||
| Months | Fiscal | |||||||||||||||||||||||
| Ended | Period | For the Year | For the Year | For the Year | For the Year | |||||||||||||||||||
| April 30, | Ended | Ended | Ended | Ended | Ended | |||||||||||||||||||
| 2015 | October 31, | April 30, | April 30, | April 30, | April 30, | |||||||||||||||||||
| (Unaudited) | 2014(a) | 2014 | 2013 | 2012 | 2011 | |||||||||||||||||||
| Net asset value, beginning of period | $ | 23.50 | $ | 20.72 | $ | 21.45 | $ | 18.43 | $ | 21.02 | $ | 18.21 | ||||||||||||
| INCOME/(LOSS) FROM INVESTMENT OPERATIONS: | ||||||||||||||||||||||||
Net investment income/(loss)(b) | (0.17 | ) | 0.45 | 0.12 | 0.15 | 0.02 | (0.04 | ) | ||||||||||||||||
| Net realized and unrealized gain/(loss) | 5.11 | 2.33 | (0.69 | ) | 2.90 | (2.61 | ) | 2.94 | ||||||||||||||||
| Total from investment operations | 4.94 | 2.78 | (0.57 | ) | 3.05 | (2.59 | ) | 2.90 | ||||||||||||||||
| DISTRIBUTIONS: | ||||||||||||||||||||||||
| From net investment income | (0.50 | ) | – | (0.17 | ) | (0.03 | ) | – | (0.09 | ) | ||||||||||||||
| From net realized gains | (0.46 | ) | – | – | – | – | – | |||||||||||||||||
| Total distributions | (0.96 | ) | – | (0.17 | ) | (0.03 | ) | – | (0.09 | ) | ||||||||||||||
| REDEMPTION FEES ADDED TO PAID-IN CAPITAL (NOTE 6) | 0.00 | (c) | 0.00 | (c) | 0.01 | 0.00 | (c) | 0.00 | (c) | 0.00 | (b)(c) | |||||||||||||
| Net increase/(decrease) in net asset value | 3.98 | 2.78 | (0.73 | ) | 3.02 | (2.59 | ) | 2.81 | ||||||||||||||||
| Net asset value, end of period | $ | 27.48 | $ | 23.50 | $ | 20.72 | $ | 21.45 | $ | 18.43 | $ | 21.02 | ||||||||||||
TOTAL RETURN(d) | 21.99 | % | 13.42 | % | (2.69 | )% | 16.54 | % | (12.32 | )% | 16.00 | % | ||||||||||||
| RATIOS/SUPPLEMENTAL DATA: | ||||||||||||||||||||||||
| Net assets, end of period (000s) | $ | 36,907 | $ | 30,526 | $ | 31,164 | $ | 32,709 | $ | 30,542 | $ | 44,616 | ||||||||||||
| Ratio of expenses to average net assets excluding fee waivers and reimbursements | 1.99 | %(e) | 2.06 | %(e) | 2.06 | % | 2.14 | % | 2.08 | % | 2.07 | % | ||||||||||||
| Ratio of expenses to average net assets including fee waivers and reimbursements | 1.95 | %(e) | 1.95 | %(e) | 1.95 | % | 1.95 | % | 1.95 | % | 1.89 | %(f) | ||||||||||||
| Ratio of net investment income/(loss) to average net assets | (1.43 | )%(e) | 3.96 | %(e) | 0.55 | % | 0.78 | % | 0.13 | % | (0.22 | )% | ||||||||||||
Portfolio turnover rate(g) | 89 | % | 76 | % | 232 | % | 221 | % | 174 | % | 170 | % | ||||||||||||
(a) Effective May 1, 2014, the Board approved changing the fiscal year-end of the Funds from April 30 to October 31.
(b) Calculated using the average shares method.
(c) Less than $0.005 per share.
(d) Total returns are for the period indicated and have not been annualized. Total returns would have been lower had certain expenses not been waived during the period. Returns shown do not reflect the deduction of taxes that a shareholder would pay on Fund distributions or the redemption of Fund shares. Returns shown exclude any applicable sales charges.
(e) Annualized.
(f) Contractual expense limitation changed from 1.85% to 1.95% effective January 1, 2011.
(g) Portfolio turnover rate for periods less than one full year have not been annualized.
See Notes to Financial Statements.
113 | April 30, 2015
| Clough China Fund – Class C |
| Financial Highlights |
Selected data for a share of beneficial interest outstanding throughout the periods indicated:
| For the Six | For the | |||||||||||||||||||||||
| Months | Fiscal | |||||||||||||||||||||||
| Ended | Period | For the Year | For the Year | For the Year | For the Year | |||||||||||||||||||
| April 30, | Ended | Ended | Ended | Ended | Ended | |||||||||||||||||||
| 2015 | October 31, | April 30, | April 30, | April 30, | April 30, | |||||||||||||||||||
| (Unaudited) | 2014(a) | 2014 | 2013 | 2012 | 2011 | |||||||||||||||||||
| Net asset value, beginning of period | $ | 22.53 | $ | 19.94 | $ | 20.71 | $ | 17.90 | $ | 20.58 | $ | 17.89 | ||||||||||||
| INCOME/(LOSS) FROM INVESTMENT OPERATIONS: | ||||||||||||||||||||||||
Net investment income/(loss)(b) | (0.25 | ) | 0.33 | (0.02 | ) | 0.01 | (0.11 | ) | (0.21 | ) | ||||||||||||||
| Net realized and unrealized gain/(loss) | 4.89 | 2.26 | (0.68 | ) | 2.80 | (2.57 | ) | 2.90 | ||||||||||||||||
| Total from investment operations | 4.64 | 2.59 | (0.70 | ) | 2.81 | (2.68 | ) | 2.69 | ||||||||||||||||
| DISTRIBUTIONS: | ||||||||||||||||||||||||
| From net investment income | (0.42 | ) | – | (0.07 | ) | – | – | (0.00 | )(c) | |||||||||||||||
| From net realized gains | (0.46 | ) | – | – | – | – | – | |||||||||||||||||
| Total distributions | (0.88 | ) | – | (0.07 | ) | – | – | (0.00 | )(c) | |||||||||||||||
| REDEMPTION FEES ADDED TO PAID-IN CAPITAL (NOTE 6) | 0.00 | (c) | 0.00 | (c) | 0.00 | (c) | 0.00 | (c) | 0.00 | (c) | 0.00 | (c) | ||||||||||||
| Net increase/(decrease) in net asset value | 3.76 | 2.59 | (0.77 | ) | 2.81 | (2.68 | ) | 2.69 | ||||||||||||||||
| Net asset value, end of period | $ | 26.29 | $ | 22.53 | $ | 19.94 | $ | 20.71 | $ | 17.90 | $ | 20.58 | ||||||||||||
TOTAL RETURN(d) | 21.50 | % | 12.99 | % | (3.43 | )% | 15.70 | % | (13.02 | )% | 15.13 | % | ||||||||||||
| RATIOS/SUPPLEMENTAL DATA: | ||||||||||||||||||||||||
| Net assets, end of period (000s) | $ | 13,974 | $ | 11,575 | $ | 10,866 | $ | 12,251 | $ | 11,674 | $ | 16,848 | ||||||||||||
| Ratio of expenses to average net assets excluding fee waivers and reimbursements | 2.79 | %(e) | 2.87 | %(e) | 2.86 | % | 2.94 | % | 2.88 | % | 2.86 | % | ||||||||||||
| Ratio of expenses to average net assets including fee waivers and reimbursements | 2.70 | %(e) | 2.70 | %(e) | 2.70 | % | 2.70 | % | 2.70 | % | 2.70 | % | ||||||||||||
| Ratio of net investment income/(loss) to average net assets | (2.18 | )%(e) | 3.08 | %(e) | (0.09 | )% | 0.07 | % | (0.62 | )% | (1.10 | )% | ||||||||||||
Portfolio turnover rate(f) | 89 | % | 76 | % | 232 | % | 221 | % | 174 | % | 170 | % | ||||||||||||
(a) Effective May 1, 2014, the Board approved changing the fiscal year-end of the Funds from April 30 to October 31.
(b) Calculated using the average shares method.
(c) Less than $0.005 and ($0.005) per share.
(d) Total returns are for the period indicated and have not been annualized. Total returns would have been lower had certain expenses not been waived during the period. Returns shown do not reflect the deduction of taxes that a shareholder would pay on Fund distributions or the redemption of Fund shares. Returns shown exclude any applicable sales charges.
(e) Annualized.
(f) Portfolio turnover rate for periods less than one full year have not been annualized.
See Notes to Financial Statements.
114 | April 30, 2015
| Clough China Fund – Class I |
| Financial Highlights |
Selected data for a share of beneficial interest outstanding throughout the periods indicated:
| For the Six | For the | |||||||||||||||||||||||
| Months | Fiscal | |||||||||||||||||||||||
| Ended | Period | For the Year | For the Year | For the Year | For the Year | |||||||||||||||||||
| April 30, | Ended | Ended | Ended | Ended | Ended | |||||||||||||||||||
| 2015 | October 31, | April 30, | April 30, | April 30, | April 30, | |||||||||||||||||||
| (Unaudited) | 2014(a) | 2014 | 2013 | 2012 | 2011 | |||||||||||||||||||
| Net asset value, beginning of period | $ | 23.97 | $ | 21.11 | $ | 21.82 | $ | 18.71 | $ | 21.30 | $ | 18.41 | ||||||||||||
| INCOME/(LOSS) FROM INVESTMENT OPERATIONS: | ||||||||||||||||||||||||
Net investment income/(loss)(b) | (0.14 | ) | 0.45 | 0.19 | 0.13 | 0.06 | (0.01 | ) | ||||||||||||||||
| Net realized and unrealized gain/(loss) | 5.21 | 2.41 | (0.69 | ) | 3.02 | (2.65 | ) | 3.03 | ||||||||||||||||
| Total from investment operations | 5.07 | 2.86 | (0.50 | ) | 3.15 | (2.59 | ) | 3.02 | ||||||||||||||||
| DISTRIBUTIONS: | ||||||||||||||||||||||||
| From net investment income | (0.53 | ) | – | (0.21 | ) | (0.06 | ) | – | (0.13 | ) | ||||||||||||||
| From net realized gains | (0.46 | ) | – | – | – | – | – | |||||||||||||||||
| Total distributions | (0.99 | ) | – | (0.21 | ) | (0.06 | ) | – | (0.13 | ) | ||||||||||||||
| REDEMPTION FEES ADDED TO PAID-IN CAPITAL (NOTE 6) | 0.00 | (c) | 0.00 | (c) | 0.00 | (c) | 0.02 | 0.00 | (c) | 0.00 | (c) | |||||||||||||
| Net increase/(decrease) in net asset value | 4.08 | 2.86 | (0.71 | ) | 3.11 | (2.59 | ) | 2.89 | ||||||||||||||||
| Net asset value, end of period | $ | 28.05 | $ | 23.97 | $ | 21.11 | $ | 21.82 | $ | 18.71 | $ | 21.30 | ||||||||||||
TOTAL RETURN(d) | 22.14 | % | 13.55 | % | (2.41 | )% | 16.95 | % | (12.16 | )% | 16.45 | % | ||||||||||||
| RATIOS/SUPPLEMENTAL DATA: | ||||||||||||||||||||||||
| Net assets, end of period (000s) | $ | 66,739 | $ | 39,917 | $ | 33,435 | $ | 25,972 | $ | 28,868 | $ | 41,054 | ||||||||||||
| Ratio of expenses to average net assets excluding fee waivers and reimbursements | 1.75 | %(e) | 1.82 | %(e) | 1.81 | % | 1.94 | % | 1.85 | % | 1.85 | % | ||||||||||||
| Ratio of expenses to average net assets including fee waivers and reimbursements | 1.70 | %(e) | 1.70 | %(e) | 1.70 | % | 1.70 | % | 1.70 | % | 1.53 | %(f) | ||||||||||||
| Ratio of net investment income/(loss) to average net assets | (1.17 | )%(e) | 3.89 | %(e) | 0.83 | % | 0.69 | % | 0.33 | % | (0.03 | )% | ||||||||||||
Portfolio turnover rate(g) | 89 | % | 76 | % | 232 | % | 221 | % | 174 | % | 170 | % | ||||||||||||
(a) Effective May 1, 2014, the Board approved changing the fiscal year-end of the Funds from April 30 to October 31. (b) Calculated using the average shares method.
(c) Less than $0.005 per share.
(d) Total returns are for the period indicated and have not been annualized. Total returns would have been lower had certain expenses not been waived during the period. Returns shown do not reflect the deduction of taxes that a shareholder would pay on Fund distributions or the redemption of Fund shares.
(e) Annualized.
(f) Contractual expense limitation changed from 1.40% to 1.70% effective January 1, 2011.
(g) Portfolio turnover rate for periods less than one full year have not been annualized.
See Notes to Financial Statements.
115 | April 30, 2015
| RiverFront Global Allocation Series | |
| Management Commentary | April 30, 2015 (Unaudited) |
Six Month Review:
The last several months of 2014 proved difficult for our strategy positioning as oil prices plunged, high yield spreads widened, and Treasury yields fell to the lows of the year while Europe continued to struggle with deflation pressures. These simultaneous market movements made for a tough finish to the year for our funds as we underperformed the benchmark due to holdings in Master Limited Partnerships (MLPS), short high yield, and Europe; while not holding any Treasuries. Additionally, the Federal Reserve decided to end Quantitative Easing (QE), which set the stage for the long anticipated rate hikes.
As we transitioned into 2015, the first several months became the first act of a currency story that we believe will play out over the next year as the European Central Bank (ECB) gets Quantitative Easing (QE) up and fully running, the Federal Reserve (Fed) begins to raise interest rates, and the Bank of Japan (BOJ) slows the rate of Yen depreciation. The ECB’s announcement of €60 billion per month purchase program of covered bonds, sovereign debt, and asset backed securities caused the Euro to depreciate relative to the dollar over the period. With the US economy showing signs of strength with the unemployment rate falling to 5.5% and the Fed removing “patient” from its commentary, higher interest rates were expected which caused further dollar strength. RiverFront responded to the ECB announcement by making a currency hedged investment in Europe with the goal of allowing our US investors to receive the return of the local European market without experiencing the effect of the depreciating Euro in dollar terms. Additionally, we continued to hold hedged investments in Japan as the Yen neared its December 2014 low of ¥121.46.
Looking ahead to the rest of the year, we believe that there will be further depreciation of the Euro and that it will reach parity with the dollar as the ECB increases its balance sheet through QE. Additionally, we believe that the Yen will be range bound in the ¥120-¥125 range. Broadly speaking, we will continue to favor international markets relative to domestic US. The US benefitted from QE over the last 3 years and now Europe and Japan are in the early to middle innings of QE, respectively. Therefore, it is our belief that international markets will follow a similar path to what the US experienced and outperform in the near term.
Performance Discussion:
In discussing the performance for the RiverFront funds, it’s important to keep in mind their global allocation mandate. All of the RiverFront offerings have exposure to multi-cap, global equities; our balanced funds have the addition of fixed income. The table below illustrates the disparity of returns across the major indices during the most recent quarter, which resulted in varying degrees of relative performance when compared to the traditional single index, mutual fund benchmark.
| Benchmark Indexes* | 6 Month Returns** |
| S&P 500 Total Return | 4.40% |
| S&P 1000 Total Return | 5.82% |
| MSCI EAFE (Net) | 6.81% |
| MSCI Emerging Markets (Net) | 3.92% |
| MSCI All Country World Index (Net) | 4.97% |
| Barclays US Aggregate | 2.06% |
| Barclays US Treasury Index | 2.07% |
| Barclays US Short Treasury Index (1-3M) | 0.01% |
Data as of 4/30/2015
| * | For index definitions see footnotes at the end of the Management Commentary and below the performance data on the following pages. |
| ** | For a complete presentation of RiverFront Mutual Fund and relevant benchmark performance, please refer to the Performance Update on the following pages. |
Growth Funds
Positive Contributors:
| · | We continued to focus our international allocations to ETFs that hedged our currency exposure – both the Euro and the Yen – actually adding to the size of those positions over the six month period. This exposure contributed positively to performance across all strategies. |
Security selection in multiple asset classes contributed positively. For example:
| · | Within US equity, we benefitted from positive security selection in areas such as media, homebuilders, large cap pharma and materials. |
| · | Within financials, the allocation to REITs contributed positively. |
| · | Within emerging markets, our country focus in areas of emerging Asia rather than Latin America impacted fund performance positively. |
The underweight to traditional fixed income contributed positively in Dynamic Equity Income and Global Allocation.
Performance Detractors:
| · | Within domestic equities, Energy detracted from performance. It was the worst performing US sector during the quarter and we were overweight relative to the ACWI based equity benchmark for the growth funds. Additionally, we were tilted towards some of the smaller cap equipment and drilling companies which had poor relative performance during the quarter. |
| · | MLPs continued to underperform due to the correlation with depressed oil prices. |
116 | April 30, 2015
| RiverFront Global Allocation Series | |
| Management Commentary | April 30, 2015 (Unaudited) |
Balanced Funds
Positive Contributors:
We continued to focus our international allocations to ETFs that hedged our currency exposure – both the Euro and the Yen – actually adding to the size of those positions over the six month period. This exposure contributed positively to performance across all strategies.
Security selection in multiple asset classes contributed positively. For example:
| · | Within US equity, we had a focus on REITs within financials and we were underweight banks and insurance. |
| · | Within emerging markets, our country focus in areas of emerging Asia rather than Latin America was a positive contributor. |
| · | Within fixed income, the funds benefitted from positive selection within high yield. |
Performance Detractors:
Our tactical trade into intermediate US Treasuries hit our risk management trigger following stronger US employment data which sent yields higher.
MLPs continued to lag on a relative basis due to depressed oil prices.
Past performance is no guarantee of future results. Dividends are not guaranteed and are subject to change or elimination. Investments in international and emerging markets securities include exposure to risks such as currency fluctuations, foreign taxes and regulations, and the potential for illiquid markets and political instability.
The views and information discussed in this commentary are as of the date of publication, are subject to change, and may not reflect the writer’s current views. The views expressed represent an assessment of market conditions at a specific point in time, are opinions only and should not be relied upon as investment advice regarding a particular investment or markets in general. Such information does not constitute a recommendation to buy or sell specific securities or investment vehicles. It should not be assumed that any investment will be profitable or will equal the performance of the fund(s) or any securities or any sectors mentioned in this letter. The subject matter contained in this letter has been derived from several sources believed to be reliable and accurate at the time of compilation. Neither the Fund(s) nor RiverFront Investment Group, LLC accepts any liability for losses either direct or consequential caused by the use of this information.
The S&P 1000® Index combines the S&P MidCap 400® and the S&P SmallCap 600® to form an investable benchmark for the mid- to small-cap segment of the U.S. equity market.
The MSCI EAFE Index is recognized as the pre-eminent benchmark in the United States to measure international equity performance. It comprises the MSCI country indices that represent developed markets outside of North America: Europe, Australasia and the Far East.
The MSCI Emerging Markets Index is a free float-adjusted market capitalization index that is designed to measure equity market performance in the global emerging markets.
The Barclays U.S. Treasury Index includes public obligations of the U.S. Treasury, excluding Treasury bills and certain special issues, such as state and local government series bonds (SLGs) and U.S. Treasury TIPS.
The Barclays U.S. Short Treasury Index is composed of bonds of investment grade with a maturity between one and three years.
An investor may not invest directly in an index.
Diversification cannot guarantee gain or prevent losses.
117 | April 30, 2015
| RiverFront Conservative Income Builder Fund | |
| Performance Update | April 30, 2015 (Unaudited) |
Performance of $10,000 Initial Investment (as of April 30, 2015)
Comparison of change in value of a $10,000 investment (includes maximum sales charges of 5.50%)
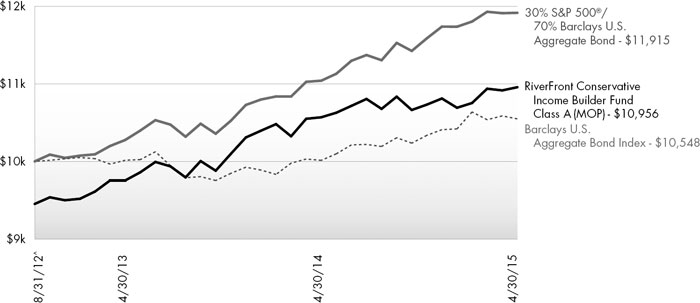
The chart above represents historical performance of a hypothetical investment of $10,000 in the Fund since inception. Past performance does not guarantee future results. This chart does not reflect the deduction of taxes that a shareholder would pay on Fund distributions or the redemption of Fund shares.
Average Annual Total Returns (as of April 30, 2015)
| 6 Month | 1 Year | Since Inception^ | Total Expense Ratio | What You Pay* | |
| Class A (NAV) | 2.09% | 3.09% | 5.70% | 2.71% | 1.47% |
| Class A (MOP) | -3.51% | -2.58% | 3.49% | ||
| Class C (NAV) | 1.61% | 2.31% | 4.91% | 3.46% | 2.22% |
| Class C (CDSC) | 0.63% | 1.32% | 4.91% | ||
| Class I | 2.11% | 3.33% | 5.95% | 2.44% | 1.22% |
Barclays U.S. Aggregate Bond Index1 | 2.06% | 4.46% | 2.02% | ||
30% S&P 500® and 70% Barclays U.S. Aggregate Bond1,2 | 2.84% | 7.05% | 6.80% |
Performance data quoted represents past performance. Past performance does not guarantee future results. Investment return and principal value of an investment will fluctuate so that an investor’s shares, when sold or redeemed, may be worth more or less than the original cost. Current performance data may be higher or lower than actual data quoted. For the most current month-end performance data, please call 1-866-759-5679.
Maximum Offering Price (MOP) for Class A shares includes the Fund’s maximum sales charge of 5.50%. Performance shown at NAV does not include these sales charges and would have been lower had it been taken into account. If you invest $1 million or more, either as a lump sum or through the Fund’s accumulation or letter of intent programs, you can purchase Class A shares without an initial sales charge (load). A Contingent Deferred Sales Charge (“CDSC”) of 1.00% may apply to Class C shares redeemed within the first 12 months after a purchase, and on Class A shares redeemed within the first 18 months after a purchase in excess of $1 million.
Performance less than 1 year is cumulative.
118 | April 30, 2015
| RiverFront Conservative Income Builder Fund | |
| Performance Update | April 30, 2015 (Unaudited) |
| 1 | The Barclays U.S. Aggregate Bond Index is a broad-based benchmark that measures the investment grade, U.S. dollar-denominated, fixed-rate taxable bond market, including Treasuries, government-related and corporate securities, MBS (agency fixed-rate and hybrid ARM passthroughs), ABS, and CMBS. The index is not actively managed and does not reflect any deductions for fees, expenses or taxes. An investor may not invest directly in an index. |
| 2 | The S&P 500® Index is the Standard & Poor’s composite index of 500 stocks, a widely recognized, unmanaged index of common stock prices. |
^ | Fund inception date of August 31, 2012. |
| * | What You Pay reflects the Advisor’s and Sub-Advisor’s decision to contractually limit expenses through February 29, 2016. Please see the prospectus for additional information. |
Investments in securities of MLPs involve risks that differ from an investment in common stock. MLPs are controlled by their general partners, which generally have conflicts of interest and limited fiduciary duties to the MLP, which may permit the general partner to favor its own interests over the MLPs. The benefit you are expected to derive from the Fund’s investment in MLPs depends largely on the MLPs being treated as partnerships for federal income tax purposes. As a partnership, an MLP has no federal income tax liability at the entity level. Therefore, treatment of one or more MLPs as a corporation for federal income tax purposes could affect the Fund’s ability to meet its investment objective and would reduce the amount of cash available to pay or distribute to you. Legislative, judicial, or administrative changes and differing interpretations, possibly on a retroactive basis, could negatively impact the value of an investment in MLPs and therefore the value of your investment in the Fund.
The table does not reflect the deduction of taxes that a shareholder would pay on Fund distributions or the redemption of Fund shares.
This Fund is not suitable for all investors. Subject to investment risks, including possible loss of the principal amount invested.
There is no guarantee that the Fund will continue to hold any one particular security or stay invested in any one particular company. The composition of the Fund’s top holdings is subject to change. Performance figures are historical and reflect the change in share price, reinvested distributions, changes in net asset value, sales charges and capital gains distributions, if any.
Not FDIC Insured – No Bank Guarantee – May Lose Value
Top Ten Holdings (as a % of Net Assets) †
SPDR® Barclays Short Term Corporate Bond ETF | 18.67% |
iShares® Barclays 1-3 Year Credit Bond ETF | 14.94% |
| RiverFront Strategic Income Fund | 10.63% |
SPDR® Barclays Short Term High Yield Bond ETF | 10.18% |
WisdomTree® LargeCap Dividend Fund | 10.16% |
| Deutsche X-trackers MSCI EAFE Hedged Equity ETF | 5.92% |
WisdomTree® Europe Hedged Equity Fund | 4.12% |
WisdomTree® Japan Hedged Equity Fund | 3.92% |
| PIMCO 0-5 Year High Yield Corporate Bond Index ETF | 3.54% |
PowerShares® S&P 500® High Dividend Portfolio | 2.27% |
| Top Ten Holdings | 84.35% |
| † | Holdings are subject to change. Table presents indicative values only. Excludes cash & cash equivalents. |
Portfolio Composition (as a % of Net Assets)

119 | April 30, 2015
| RiverFront Dynamic Equity Income Fund | |
| Performance Update | April 30, 2015 (Unaudited) |
Performance of $10,000 Initial Investment (as of April 30, 2015)
Comparison of change in value of a $10,000 investment (includes maximum sales charges of 5.50%)
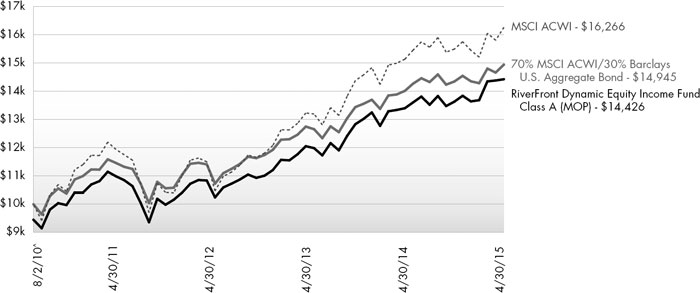
The chart above represents historical performance of a hypothetical investment of $10,000 in the Fund since inception. Past performance does not guarantee future results. This chart does not reflect the deduction of taxes that a shareholder would pay on Fund distributions or the redemption of Fund shares.
Average Annual Total Returns (as of April 30, 2015)
| 6 Month | 1 Year | 3 Years | Since Inception^ | Total Expense Ratio | What You Pay* | |
| Class A (NAV) | 5.90% | 7.66% | 10.00% | 9.33% | 1.78% | 1.54% |
| Class A (MOP) | 0.09% | 1.77% | 7.95% | 8.03% | ||
| Class C (NAV) | 5.51% | 6.89% | 9.20% | 8.51% | 2.54% | 2.29% |
| Class C (CDSC) | 4.51% | 5.89% | 9.20% | 8.51% | ||
| Class I | 5.98% | 7.97% | 10.27% | 9.59% | 1.54% | 1.29% |
MSCI All Country World Index1 | 4.97% | 7.46% | 12.24% | 10.80% | ||
70% MSCI ACWI and 30% Barclays U.S. Aggregate Bond1,2 | 4.17% | 6.64% | 9.40% | 8.84% |
Performance data quoted represents past performance. Past performance does not guarantee future results. Investment return and principal value of an investment will fluctuate so that an investor’s shares, when sold or redeemed, may be worth more or less than the original cost. Current performance data may be higher or lower than actual data quoted. For the most current month-end performance data, please call 1-866-759-5679.
Maximum Offering Price (MOP) for Class A shares includes the Fund’s maximum sales charge of 5.50%. Performance shown at NAV does not include these sales charges and would have been lower had it been taken into account. If you invest $1 million or more, either as a lump sum or through the Fund’s accumulation or letter of intent programs, you can purchase Class A shares without an initial sales charge (load). A Contingent Deferred Sales Charge (“CDSC”) of 1.00% may apply to Class C shares redeemed within the first 12 months after a purchase, and on Class A shares redeemed within the first 18 months after a purchase in excess of $1 million.
Performance less than 1 year is cumulative.
120 | April 30, 2015
| RiverFront Dynamic Equity Income Fund | |
| Performance Update | April 30, 2015 (Unaudited) |
| 1 | The MSCI ACWI (All Country World Index) is a free float-adjusted market capitalization weighted index that is designed to measure the equity market performance of developed and emerging markets. The MSCI ACWI consists of 45 country indices comprising 24 developed and 21 emerging market country indices. The index includes reinvestment of dividends, net of foreign withholding taxes. The index is not actively managed and does not reflect any deductions for fees, expenses or taxes. An investor may not invest directly in an index. |
| 2 | The Barclays U.S. Aggregate Bond Index is a broad-based benchmark that measures the investment grade, U.S. dollar-denominated, fixed-rate taxable bond market, including Treasuries, government-related and corporate securities, MBS (agency fixed-rate and hybrid ARM passthroughs), ABS, and CMBS. The index is not actively managed and does not reflect any deductions for fees, expenses or taxes. An investor may not invest directly in an index. |
| ^ | Fund inception date of August 2, 2010. |
| * | What You Pay reflects the Advisor’s and Sub-Advisor’s decision to contractually limit expenses through February 29, 2016. Please see the prospectus for additional information. |
Investments in securities of MLPs involve risks that differ from an investment in common stock. MLPs are controlled by their general partners, which generally have conflicts of interest and limited fiduciary duties to the MLP, which may permit the general partner to favor its own interests over the MLPs. The benefit you are expected to derive from the Fund’s investment in MLPs depends largely on the MLPs being treated as partnerships for federal income tax purposes. As a partnership, an MLP has no federal income tax liability at the entity level. Therefore, treatment of one or more MLPs as a corporation for federal income tax purposes could affect the Fund’s ability to meet its investment objective and would reduce the amount of cash available to pay or distribute to you. Legislative, judicial, or administrative changes and differing interpretations, possibly on a retroactive basis, could negatively impact the value of an investment in MLPs and therefore the value of your investment in the Fund.
The table does not reflect the deduction of taxes that a shareholder would pay on Fund distributions or the redemption of Fund shares.
This Fund is not suitable for all investors. Subject to investment risks, including possible loss of the principal amount invested.
There is no guarantee that the Fund will continue to hold any one particular security or stay invested in any one particular company. The composition of the Fund’s top holdings is subject to change. Performance figures are historical and reflect the change in share price, reinvested distributions, changes in net asset value, sales charges and capital gains distributions, if any.
Not FDIC Insured – No Bank Guarantee – May Lose Value
Top Ten Holdings (as a % of Net Assets) †
WisdomTree® Europe Hedged Equity Fund | 18.00% |
| RiverFront Strategic Income Fund | 8.28% |
PowerShares® S&P 500® High Dividend Portfolio | 7.79% |
WisdomTree® Japan Hedged Equity Fund | 6.85% |
| Deutsche X-trackers MSCI EAFE Hedged Equity ETF | 5.46% |
SPDR® Barclays Short Term High Yield Bond ETF | 5.32% |
iShares® MSCI All Country Asia ex Japan ETF | 4.13% |
iShares® Currency Hedged MSCI Germany ETF | 3.68% |
iShares® MSCI Japan Index ETF | 3.56% |
Consumer Staples Select Sector SPDR® Fund | 3.00% |
| Top Ten Holdings | 66.07% |
| † | Holdings are subject to change. Table presents indicative values only. Excludes cash & cash equivalents. |
Portfolio Composition (as a % of Net Assets)
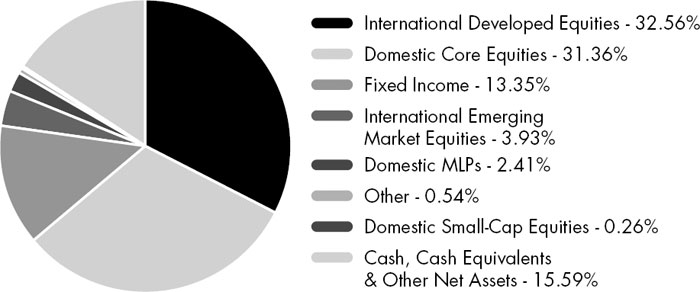
121 | April 30, 2015
| RiverFront Global Allocation Fund | |
| Performance Update | April 30, 2015 (Unaudited) |
Comparison of change in value of a $10,000 investment (includes maximum sales charges of 5.50%)
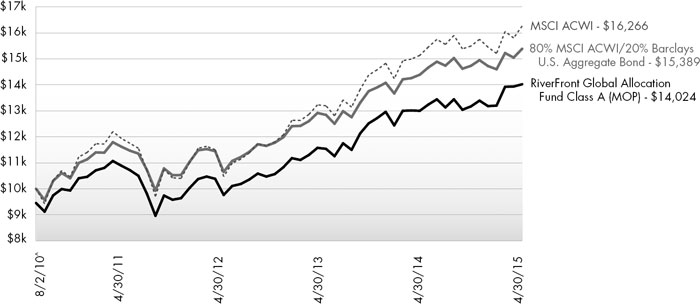
The chart above represents historical performance of a hypothetical investment of $10,000 in the Fund since inception. Past performance does not guarantee future results. This chart does not reflect the deduction of taxes that a shareholder would pay on Fund distributions or the redemption of Fund shares.
Average Annual Total Returns (as of April 30, 2015)
| 6 Month | 1 Year | 3 Years | Since Inception^ | Total Expense Ratio | What You Pay* | |
| Class A (NAV) | 6.46% | 7.85% | 10.53% | 8.68% | 1.89% | 1.54% |
| Class A (MOP) | 0.64% | 1.96% | 8.47% | 7.39% | ||
| Class C (NAV) | 6.08% | 7.07% | 9.70% | 7.88% | 2.64% | 2.29% |
| Class C (CDSC) | 5.10% | 6.09% | 9.70% | 7.88% | ||
| Class I | 6.57% | 7.99% | 10.76% | 8.91% | 1.65% | 1.29% |
MSCI All Country World Index1 | 4.97% | 7.46% | 12.24% | 10.80% | ||
80% MSCI ACWI and 20% Barclays U.S. Aggregate Bond1,2 | 4.44% | 6.92% | 10.35% | 9.51% |
Performance data quoted represents past performance. Past performance does not guarantee future results. Investment return and principal value of an investment will fluctuate so that an investor’s shares, when sold or redeemed, may be worth more or less than the original cost. Current performance data may be higher or lower than actual data quoted. For the most current month-end performance data, please call 1-866-759-5679.
Maximum Offering Price (MOP) for Class A shares includes the Fund’s maximum sales charge of 5.50%. Performance shown at NAV does not include these sales charges and would have been lower had it been taken into account. If you invest $1 million or more, either as a lump sum or through the Fund’s accumulation or letter of intent programs, you can purchase Class A shares without an initial sales charge (load). A Contingent Deferred Sales Charge (“CDSC”) of 1.00% may apply to Class C shares redeemed within the first 12 months after a purchase, and on Class A shares redeemed within the first 18 months after a purchase in excess of $1 million.
Performance less than 1 year is cumulative.
122 | April 30, 2015
| RiverFront Global Allocation Fund | |
| Performance Update | April 30, 2015 (Unaudited) |
| 1 | The MSCI ACWI (All Country World Index) is a free float-adjusted market capitalization weighted index that is designed to measure the equity market performance of developed and emerging markets. The MSCI ACWI consists of 45 country indices comprising 24 developed and 21 emerging market country indices. The index includes reinvestment of dividends, net of foreign withholding taxes. The index is not actively managed and does not reflect any deductions for fees, expenses or taxes. An investor may not invest directly in an index. |
| 2 | The Barclays U.S. Aggregate Bond Index is a broad-based benchmark that measures the investment grade, U.S. dollar-denominated, fixed-rate taxable bond market, including Treasuries, government-related and corporate securities, MBS (agency fixed-rate and hybrid ARM passthroughs), ABS, and CMBS. The index is not actively managed and does not reflect any deductions for fees, expenses or taxes. An investor may not invest directly in an index. |
| ^ | Fund inception date of August 2, 2010. |
| * | What You Pay reflects the Advisor’s and Sub-Advisor’s decision to contractually limit expenses through February 29, 2016. Please see the prospectus for additional information. |
Investments in securities of MLPs involve risks that differ from an investment in common stock. MLPs are controlled by their general partners, which generally have conflicts of interest and limited fiduciary duties to the MLP, which may permit the general partner to favor its own interests over the MLPs. The benefit you are expected to derive from the Fund’s investment in MLPs depends largely on the MLPs being treated as partnerships for federal income tax purposes. As a partnership, an MLP has no federal income tax liability at the entity level. Therefore, treatment of one or more MLPs as a corporation for federal income tax purposes could affect the Fund’s ability to meet its investment objective and would reduce the amount of cash available to pay or distribute to you. Legislative, judicial, or administrative changes and differing interpretations, possibly on a retroactive basis, could negatively impact the value of an investment in MLPs and therefore the value of your investment in the Fund.
The table does not reflect the deduction of taxes that a shareholder would pay on Fund distributions or the redemption of Fund shares.
This Fund is not suitable for all investors. Subject to investment risks, including possible loss of the principal amount invested.
There is no guarantee that the Fund will continue to hold any one particular security or stay invested in any one particular company. The composition of the Fund’s top holdings is subject to change. Performance figures are historical and reflect the change in share price, reinvested distributions, changes in net asset value, sales charges and capital gains distributions, if any.
Not FDIC Insured – No Bank Guarantee – May Lose Value
Top Ten Holdings (as a % of Net Assets) †
WisdomTree® Europe Hedged Equity Fund | 18.72% |
WisdomTree® Japan Hedged Equity Fund | 6.96% |
iShares® MSCI All Country Asia ex Japan ETF | 5.78% |
| RiverFront Strategic Income Fund | 5.63% |
WisdomTree® LargeCap Dividend Fund | 5.54% |
| Deutsche X-trackers MSCI EAFE Hedged Equity ETF | 4.73% |
iShares® MSCI Japan Index ETF | 4.40% |
SPDR® Morgan Stanley Technology ETF | 4.22% |
iShares® Currency Hedged MSCI Germany ETF | 3.72% |
Vanguard® FTSE Developed Markets ETF | 3.69% |
| Top Ten Holdings | 63.39% |
| † | Holdings are subject to change. Table presents indicative values only. Excludes cash & cash equivalents. |
Portfolio Composition (as a % of Net Assets)
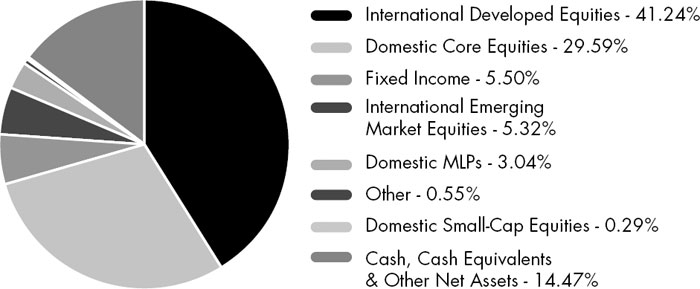
123 | April 30, 2015
| RiverFront Global Growth Fund | |
| Performance Update | April 30, 2015 (Unaudited) |
Performance of $10,000 Initial Investment (as of April 30, 2015)
Comparison of change in value of a $10,000 investment (includes maximum sales charges of 5.50%)
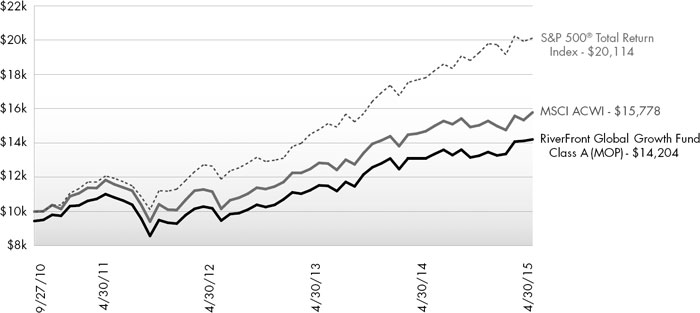
The chart above represents historical performance of a hypothetical investment of $10,000 in the Fund since inception. Past performance does not guarantee future results. This chart does not reflect the deduction of taxes that a shareholder would pay on Fund distributions or the redemption of Fund shares.
Average Annual Total Returns (as of April 30, 2015)
| 6 Month | 1 Year | 3 Years | 5 Years | Since Inception^ | Total Expense Ratio | What You Pay* | |
| Class A (NAV) | 7.15% | 8.42% | 11.71% | 8.13% | 11.90% | 1.78% | 1.55% |
| Class A (MOP) | 1.25% | 2.44% | 9.62% | 8.13% | 11.90% | ||
| Class C (NAV) | 6.77% | 7.63% | 10.90% | 7.34% | 11.08% | 2.53% | 2.30% |
| Class C (CDSC) | 5.82% | 6.66% | 10.90% | 7.34% | 11.08% | ||
| Class I | 7.23% | 8.70% | 12.00% | 8.40% | 12.19% | 1.76% | 1.30% |
Class L1 | 7.32% | 8.73% | 12.02% | 8.39% | 12.18% | 1.42% | 1.30% |
| Investor Class | 7.12% | 8.39% | 11.73% | 8.12% | 11.88% | 1.78% | 1.55% |
MSCI All Country World Index2 | 4.97% | 7.46% | 12.24% | 9.58% | 13.68% | ||
S&P 500® Total Return Index3 | 4.40% | 12.98% | 16.73% | 14.33% | 15.52% |
Performance data quoted represents past performance. Past performance does not guarantee future results. Investment return and principal value of an investment will fluctuate so that an investor’s shares, when sold or redeemed, may be worth more or less than the original cost. Current performance data may be higher or lower than actual data quoted. For the most current month-end performance data, please call 1-866-759-5679.
Maximum Offering Price (MOP) for Class A shares includes the Fund’s maximum sales charge of 5.50%. Performance shown at NAV does not include these sales charges and would have been lower had it been taken into account. If you invest $1 million or more, either as a lump sum or through the Fund’s accumulation or letter of intent programs, you can purchase Class A shares without an initial sales charge (load). A Contingent Deferred Sales Charge (“CDSC”) of 1.00% may apply to Class C shares redeemed within the first 12 months after a purchase, and on Class A shares redeemed within the first 18 months after a purchase in excess of $1 million.
Performance less than 1 year is cumulative.
124 | April 30, 2015
| RiverFront Global Growth Fund | |
| Performance Update | April 30, 2015 (Unaudited) |
| 1 | Prior to close of business on September 24, 2010, Class L was known as Institutional Class of the Baird Funds, Inc. - RiverFront Long-Term Growth Fund. |
| 2 | The MSCI ACWI (All Country World Index) is a free float-adjusted market capitalization weighted index that is designed to measure the equity market performance of developed and emerging markets. The MSCI ACWI consists of 45 country indices comprising 24 developed and 21 emerging market country indices. The index includes reinvestment of dividends, net of foreign withholding taxes. The index is not actively managed and does not reflect any deductions for fees, expenses or taxes. An investor may not invest directly in an index. |
| 3 | S&P 500® Total Return Index is the Standard & Poor’s composite index of 500 stocks, a widely recognized, unmanaged index of common stock prices. The index is not actively managed and does not reflect any deduction for fees, expenses or taxes. An investor may not invest directly in an index. |
| ^ | Fund inception date of October 28, 2008. |
| * | What You Pay reflects the Advisor’s and Sub-Advisor’s decision to contractually limit expenses through February 29, 2016. Please see the prospectus for additional information. |
The Class A, C, I and L shares performance shown for periods prior to September 27, 2010 reflects the performance of the Baird Funds, Inc. – RiverFront Long-Term Growth Fund’s Institutional Class shares (as result of the reorganization of the Baird Funds, Inc. – RiverFront Long-Term Growth Fund into the Fund).
The Investor Class performance shown for periods prior to September 27, 2010 reflects the performance of the Baird Funds, Inc. – RiverFront Long-Term Growth Fund’s Investor Class shares (as result of the reorganization of the Baird Funds, Inc. – RiverFront Long-Term Growth Fund into the Fund).
Investments in securities of MLPs involve risks that differ from an investment in common stock. MLPs are controlled by their general partners, which generally have conflicts of interest and limited fiduciary duties to the MLP, which may permit the general partner to favor its own interests over the MLPs. The benefit you are expected to derive from the Fund’s investment in MLPs depends largely on the MLPs being treated as partnerships for federal income tax purposes. As a partnership, an MLP has no federal income tax liability at the entity level. Therefore, treatment of one or more MLPs as a corporation for federal income tax purposes could affect the Fund’s ability to meet its investment objective and would reduce the amount of cash available to pay or distribute to you. Legislative, judicial, or administrative changes and differing interpretations, possibly on a retroactive basis, could negatively impact the value of an investment in MLPs and therefore the value of your investment in the Fund.
The table does not reflect the deduction of taxes that a shareholder would pay on Fund distributions or the redemption of Fund shares.
This Fund is not suitable for all investors. Subject to investment risks, including possible loss of the principal amount invested.
There is no guarantee that the Fund will continue to hold any one particular security or stay invested in any one particular company. The composition of the Fund’s top holdings is subject to change. Performance figures are historical and reflect the change in share price, reinvested distributions, changes in net asset value, sales charges and capital gains distributions, if any.
Not FDIC Insured – No Bank Guarantee – May Lose Value
Top Ten Holdings (as a % of Net Assets) †
WisdomTree® Europe Hedged Equity Fund | 21.41% |
WisdomTree® Japan Hedged Equity Fund | 7.67% |
iShares® MSCI All Country Asia ex Japan ETF | 7.08% |
| Deutsche X-trackers MSCI EAFE Hedged Equity ETF | 6.07% |
iShares® MSCI Japan Index ETF | 5.08% |
Vanguard® FTSE Developed Markets ETF | 3.85% |
iShares® Currency Hedged MSCI Germany ETF | 3.61% |
SPDR® Morgan Stanley Technology ETF | 3.55% |
iShares® Dow Jones U.S. Energy Sector Index Fund | 2.91% |
iShares® MSCI United Kingdom ETF | 2.26% |
| Top Ten Holdings | 63.49% |
| † | Holdings are subject to change. Table presents indicative values only. Excludes cash & cash equivalents. |
Portfolio Composition (as a % of Net Assets)
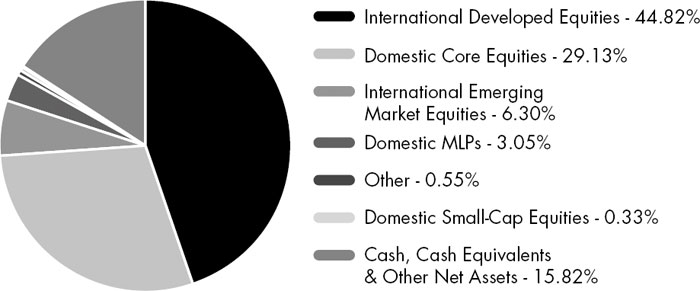
125 | April 30, 2015
| RiverFront Moderate Growth & Income Fund | |
| Performance Update | April 30, 2015 (Unaudited) |
Comparison of change in value of a $10,000 investment (includes maximum sales charges of 5.50%)
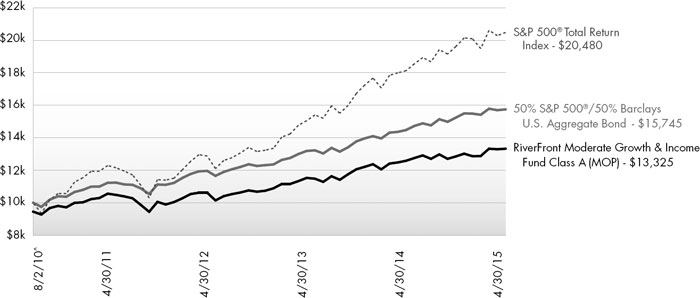
The chart above represents historical performance of a hypothetical investment of $10,000 in the Fund since inception. Past performance does not guarantee future results. This chart does not reflect the deduction of taxes that a shareholder would pay on Fund distributions or the redemption of Fund shares.
Average Annual Total Returns (as of April 30, 2015)
| 6 Month | 1 Year | 3 Years | Since Inception^ | Total Expense Ratio | What You Pay* | |
| Class A (NAV) | 3.69% | 5.89% | 7.87% | 7.51% | 1.66% | 1.50% |
| Class A (MOP) | -2.03% | 0.05% | 5.85% | 6.24% | ||
| Class C (NAV) | 3.34% | 5.14% | 7.09% | 6.72% | 2.42% | 2.25% |
| Class C (CDSC) | 2.36% | 4.16% | 7.09% | 6.72% | ||
| Class I | 3.89% | 6.23% | 8.19% | 7.79% | 1.42% | 1.25% |
S&P 500® Total Return Index1 | 4.40% | 12.98% | 16.73% | 16.32% | ||
50% S&P 500® and 50% Barclays U.S. Aggregate Bond1,2 | 3.32% | 8.77% | 9.60% | 10.04% |
Performance data quoted represents past performance. Past performance does not guarantee future results. Investment return and principal value of an investment will fluctuate so that an investor’s shares, when sold or redeemed, may be worth more or less than the original cost. Current performance data may be higher or lower than actual data quoted. For the most current month-end performance data, please call 1-866-759-5679.
Maximum Offering Price (MOP) for Class A shares includes the Fund’s maximum sales charge of 5.50%. Performance shown at NAV does not include these sales charges and would have been lower had it been taken into account. If you invest $1 million or more, either as a lump sum or through the Fund’s accumulation or letter of intent programs, you can purchase Class A shares without an initial sales charge (load). A Contingent Deferred Sales Charge (“CDSC”) of 1.00% may apply to Class C shares redeemed within the first 12 months after a purchase, and on Class A shares redeemed within the first 18 months after a purchase in excess of $1 million.
Performance less than 1 year is cumulative.
126 | April 30, 2015
| RiverFront Moderate Growth & Income Fund | |
| Performance Update | April 30, 2015 (Unaudited) |
| 1 | S&P 500® Total Return Index is the Standard & Poor’s composite index of 500 stocks, a widely recognized, unmanaged index of common stock prices. The index is not actively managed and does not reflect any deduction for fees, expenses or taxes. An investor may not invest directly in an index. |
| 2 | The Barclays U.S. Aggregate Bond Index is a broad-based benchmark that measures the investment grade, U.S. dollar-denominated, fixed-rate taxable bond market, including Treasuries, government-related and corporate securities, MBS (agency fixed-rate and hybrid ARM passthroughs), ABS, and CMBS. The index is not actively managed and does not reflect any deductions for fees, expenses or taxes. An investor may not invest directly in an index. |
| ^ | Fund inception date of August 2, 2010. |
| * | What You Pay reflects the Advisor’s and Sub-Advisor’s decision to contractually limit expenses through February 29, 2016. Please see the prospectus for additional information. |
Investments in securities of MLPs involve risks that differ from an investment in common stock. MLPs are controlled by their general partners, which generally have conflicts of interest and limited fiduciary duties to the MLP, which may permit the general partner to favor its own interests over the MLPs. The benefit you are expected to derive from the Fund’s investment in MLPs depends largely on the MLPs being treated as partnerships for federal income tax purposes. As a partnership, an MLP has no federal income tax liability at the entity level. Therefore, treatment of one or more MLPs as a corporation for federal income tax purposes could affect the Fund’s ability to meet its investment objective and would reduce the amount of cash available to pay or distribute to you. Legislative, judicial, or administrative changes and differing interpretations, possibly on a retroactive basis, could negatively impact the value of an investment in MLPs and therefore the value of your investment in the Fund.
The table does not reflect the deduction of taxes that a shareholder would pay on Fund distributions or the redemption of Fund shares.
This Fund is not suitable for all investors. Subject to investment risks, including possible loss of the principal amount invested.
There is no guarantee that the Fund will continue to hold any one particular security or stay invested in any one particular company. The composition of the Fund’s top holdings is subject to change. Performance figures are historical and reflect the change in share price, reinvested distributions, changes in net asset value, sales charges and capital gains distributions, if any.
Not FDIC Insured – No Bank Guarantee – May Lose Value
Top Ten Holdings (as a % of Net Assets) †
| RiverFront Strategic Income Fund | 10.57% |
WisdomTree® Europe Hedged Equity Fund | 10.24% |
SPDR® Barclays Short Term Corporate Bond ETF | 10.05% |
SPDR® Barclays Short Term High Yield Bond ETF | 7.87% |
PowerShares® S&P 500® High Dividend Portfolio | 7.00% |
WisdomTree® LargeCap Dividend Fund | 6.71% |
| PIMCO 0-5 Year High Yield Corporate Bond Index ETF | 6.08% |
| Deutsche X-trackers MSCI EAFE Hedged Equity ETF | 5.80% |
WisdomTree® Japan Hedged Equity Fund | 4.29% |
Consumer Staples Select Sector SPDR® Fund | 2.98% |
| Top Ten Holdings | 71.59% |
| † | Holdings are subject to change. Table presents indicative values only. Excludes cash & cash equivalents. |
Portfolio Composition (as a % of Net Assets)
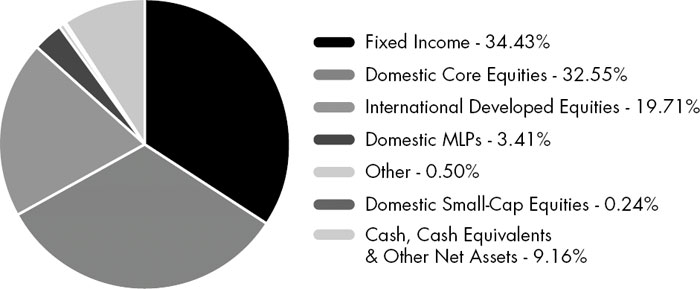
127 | April 30, 2015
| RiverFront Conservative Income Builder Fund | |
| Statement of Investments | April 30, 2015 (Unaudited) |
| Value | ||||||||
| Shares | (Note 2) | |||||||
| COMMON STOCKS (0.50%) | ||||||||
| Energy (0.50%) | ||||||||
| Pipelines (0.50%) | ||||||||
| Kinder Morgan, Inc. | 943 | $ | 40,502 | |||||
| TOTAL ENERGY | 40,502 | |||||||
| TOTAL COMMON STOCKS (Cost $37,950) | 40,502 | |||||||
| EXCHANGE TRADED FUNDS (94.88%) | ||||||||
| Debt (57.96%) | ||||||||
iShares® Barclays 1-3 Year Credit Bond ETF | 11,350 | 1,197,879 | ||||||
| PIMCO 0-5 Year High Yield Corporate Bond Index ETF | 2,790 | 283,603 | ||||||
RiverFront Strategic Income Fund(a) | 33,696 | 852,172 | ||||||
SPDR® Barclays Short Term Corporate Bond ETF | 48,756 | 1,496,809 | ||||||
SPDR® Barclays Short Term High Yield Bond ETF | 27,809 | 815,916 | ||||||
| 4,646,379 | ||||||||
| Equity (36.92%) | ||||||||
Consumer Discretionary Select Sector SPDR® Fund | 538 | 40,517 | ||||||
Consumer Staples Select Sector SPDR® Fund | 1,581 | 76,473 | ||||||
| Deutsche X-trackers MSCI EAFE Hedged Equity ETF | 15,714 | 474,406 | ||||||
| Global X MLP & Energy Infrastructure ETF | 6,575 | 127,621 | ||||||
iShares® Currency Hedged MSCI Germany ETF | 5,486 | 148,561 | ||||||
iShares® Dow Jones U.S. Energy Sector Index Fund | 1,531 | 71,329 | ||||||
iShares® MSCI Japan Index ETF | 9,313 | 119,765 | ||||||
PowerShares® Aerospace & Defense Portfolio | 1,554 | 55,478 | ||||||
PowerShares® KBW Bank Portfolio | 1,192 | 45,165 | ||||||
PowerShares® S&P 500® Ex-Rate Sensitive Low Volatility Portfolio(b) | 1,625 | 40,029 | ||||||
PowerShares® S&P 500® High Dividend Portfolio | 5,552 | 182,161 | ||||||
SPDR® Morgan Stanley Technology ETF | 574 | 59,271 | ||||||
WisdomTree® Europe Hedged Equity Fund | 5,146 | 330,682 | ||||||
WisdomTree® Japan Hedged Equity Fund | 5,577 | 314,654 | ||||||
| Shares | Value (Note 2) | |||||||
| Equity (continued) | ||||||||
WisdomTree® Japan SmallCap Dividend Fund | 1,075 | $ | 59,308 | |||||
WisdomTree® LargeCap Dividend Fund | 10,959 | 814,254 | ||||||
| 2,959,674 | ||||||||
| TOTAL EXCHANGE TRADED FUNDS (Cost $7,470,868) | 7,606,053 | |||||||
| EXCHANGE TRADED NOTES (1.02%) | ||||||||
| Equity (1.02%) | ||||||||
| Barclays ETN+ Select MLP ETNs | 2,658 | 81,574 | ||||||
| TOTAL EXCHANGE TRADED NOTES (Cost $73,198) | 81,574 | |||||||
7-Day Yield | Shares | Value (Note 2) | ||||||||||
| SHORT TERM INVESTMENTS (2.89%) | ||||||||||||
| Money Market Fund (2.89%) | ||||||||||||
| Morgan Stanley Institutional Liquidity Fund - Prime Portfolio | 0.078 | % | 231,918 | 231,918 | ||||||||
| TOTAL SHORT TERM INVESTMENTS (Cost $231,918) | 231,918 | |||||||||||
| TOTAL INVESTMENTS (99.29%) (Cost $7,813,934) | $ | 7,960,047 | ||||||||||
| Other Assets In Excess Of Liabilities (0.71%) | 56,856 | |||||||||||
| NET ASSETS (100.00%) | $ | 8,016,903 | ||||||||||
(a) | Affiliated Company. See Note 7 in Notes to Financial Statements. |
(b) | Non-Income Producing Security. |
128 | April 30, 2015
| RiverFront Conservative Income Builder Fund | |
| Statement of Investments | April 30, 2015 (Unaudited) |
| Common Abbreviations: |
| EAFE - Europe, Australia, and Far East. |
| ETF - Exchange Traded Fund. |
| ETN - Exchange Traded Note. |
| KBW- Keefe, Bruyette, & Woods. |
| MLP - Master Limited Partnership. |
| MSCI - Morgan Stanley Capital International. |
| PIMCO - Pacific Investment Management Company. |
| S&P - Standard and Poor’s. |
| SPDR - Standard and Poor's Depositary Receipt. |
| For Fund compliance purposes, the Fund’s industry classifications refer to any one or more of the industry sub-classifications used by one or more widely recognized market indexes or ratings group indexes, and/or as defined by Fund management. This definition may not apply for purposes of this report, which may combine industry sub-classifications for reporting ease. Industries are shown as a percent of net assets. |
See Notes to Financial Statements.
129 | April 30, 2015
| RiverFront Dynamic Equity Income Fund | |
| Statement of Investments | April 30, 2015 (Unaudited) |
| Value | ||||||||
| Shares | (Note 2) | |||||||
| COMMON STOCKS (6.70%) | ||||||||
| Basic Materials (0.83%) | ||||||||
| Forest Products & Paper (0.83%) | ||||||||
| International Paper Co. | 11,422 | $ | 613,590 | |||||
| TOTAL BASIC MATERIALS | 613,590 | |||||||
| Communications (0.84%) | ||||||||
| Media (0.84%) | ||||||||
| CBS Corp. Class B | 9,955 | 618,504 | ||||||
| TOTAL COMMUNICATIONS | 618,504 | |||||||
| Consumer, Cyclical (0.98%) | ||||||||
| Retail (0.98%) | ||||||||
| CVS Health Corp. | 7,271 | 721,937 | ||||||
| TOTAL CONSUMER, CYCLICAL | 721,937 | |||||||
| Consumer, Non-Cyclical (2.49%) | ||||||||
| Pharmaceuticals (2.49%) | ||||||||
| Abbott Laboratories | 12,320 | 571,894 | ||||||
| Bristol-Myers Squibb Co. | 10,979 | 699,692 | ||||||
| Pfizer, Inc. | 16,662 | 565,342 | ||||||
| 1,836,928 | ||||||||
| TOTAL CONSUMER, NON-CYCLICAL | 1,836,928 | |||||||
| Energy (0.79%) | ||||||||
| Pipelines (0.79%) | ||||||||
| Kinder Morgan, Inc. | 13,511 | 580,297 | ||||||
| TOTAL ENERGY | 580,297 | |||||||
| Technology (0.77%) | ||||||||
| Software (0.77%) | ||||||||
| Oracle Corp. | 13,072 | 570,201 | ||||||
| TOTAL TECHNOLOGY | 570,201 | |||||||
| TOTAL COMMON STOCKS (Cost $4,301,094) | 4,941,457 | |||||||
| EXCHANGE TRADED FUNDS (87.84%) | ||||||||
| Debt (13.60%) | ||||||||
RiverFront Strategic Income Fund(a) | 241,396 | 6,104,905 | ||||||
| Value | �� | |||||||
| Shares | (Note 2) | |||||||
| Debt (continued) | ||||||||
SPDR® Barclays Short Term High Yield Bond ETF | 133,736 | $ | 3,923,814 | |||||
| 10,028,719 | ||||||||
| Equity (74.24%) | ||||||||
Consumer Staples Select Sector SPDR® Fund | 45,760 | 2,213,411 | ||||||
| Deutsche X-trackers MSCI EAFE Hedged Equity ETF | 133,392 | 4,027,105 | ||||||
| Global X FTSE Nordic Region ETF | 13,528 | 328,460 | ||||||
| Global X MLP & Energy Infrastructure ETF | 100,748 | 1,955,519 | ||||||
iShares® Asia 50 ETF | 20,654 | 1,108,913 | ||||||
iShares® Currency Hedged MSCI Germany ETF | 100,356 | 2,717,640 | ||||||
iShares® Dow Jones U.S. Energy Sector Index Fund | 30,365 | 1,414,705 | ||||||
iShares® MSCI All Country Asia ex Japan ETF | 44,714 | 3,045,471 | ||||||
iShares® MSCI Australia ETF | 57,237 | 1,334,767 | ||||||
iShares® MSCI Japan Index ETF | 204,481 | 2,629,626 | ||||||
iShares® MSCI United Kingdom ETF | 50,225 | 964,822 | ||||||
iShares® U.S. Home Construction ETF | 26,373 | 683,588 | ||||||
PowerShares® Aerospace & Defense Portfolio | 20,241 | 722,604 | ||||||
PowerShares® KBW Bank Portfolio | 43,097 | 1,632,945 | ||||||
PowerShares® S&P 500® Ex-Rate Sensitive Low Volatility Portfolio(b) | 14,896 | 366,942 | ||||||
PowerShares® S&P 500® High Dividend Portfolio | 175,049 | 5,743,358 | ||||||
SPDR® Morgan Stanley Technology ETF | 16,222 | 1,675,084 | ||||||
Vanguard® Information Technology ETF | 3,370 | 363,589 | ||||||
Vanguard® Telecommunication Services ETF | 8,935 | 800,933 | ||||||
WisdomTree® Europe Hedged Equity Fund | 206,663 | 13,280,164 | ||||||
WisdomTree® Japan Hedged Equity Fund | 89,573 | 5,053,709 | ||||||
WisdomTree® Japan SmallCap Dividend Fund | 12,235 | 675,005 | ||||||
130 | April 30, 2015
| RiverFront Dynamic Equity Income Fund | |
| Statement of Investments | April 30, 2015 (Unaudited) |
| Value | ||||||||
| Shares | (Note 2) | |||||||
| Equity (continued) | ||||||||
WisdomTree® LargeCap Dividend Fund | 27,382 | $ | 2,034,483 | |||||
| 54,772,843 | ||||||||
| TOTAL EXCHANGE TRADED FUNDS (Cost $60,662,896) | 64,801,562 | |||||||
| EXCHANGE TRADED NOTES (1.30%) | ||||||||
| Equity (1.30%) | ||||||||
| Barclays ETN+ Select MLP ETNs | 31,416 | 964,157 | ||||||
| TOTAL EXCHANGE TRADED NOTES (Cost $871,448) | 964,157 | |||||||
| 7-Day | Value | |||||||||||
| Yield | Shares | (Note 2) | ||||||||||
| SHORT TERM INVESTMENTS (4.68%) | ||||||||||||
| Money Market Fund (4.68%) | ||||||||||||
| Morgan Stanley Institutional Liquidity Fund -Prime Portfolio | 0.078 | % | 3,453,507 | 3,453,507 | ||||||||
| TOTAL SHORT TERM INVESTMENTS (Cost $3,453,507) | 3,453,507 | |||||||||||
| TOTAL INVESTMENTS (100.52%) (Cost $69,288,945) | $ | 74,160,683 | ||||||||||
| Liabilities In Excess Of Other Assets (-0.52%) | (386,339 | ) | ||||||||||
| NET ASSETS (100.00%) | $ | 73,774,344 | ||||||||||
| (a) | Affiliated Company. See Note 7 in Notes to Financial Statements. |
| (b) | Non-Income Producing Security. |
Common Abbreviations:
EAFE - Europe, Australia, and Far East.
ETF - Exchange Traded Fund.
ETF - Exchange Traded Fund.
ETN - Exchange Traded Note.
FTSE - Financial Times and the London Stock Exchange.
MLP - Master Limited Partnership.
MLP - Master Limited Partnership.
MSCI - Morgan Stanley Capital International.
S&P - Standard and Poor’s.
S&P - Standard and Poor’s.
SPDR - Standard and Poor's Depositary Receipt.
For Fund compliance purposes, the Fund’s industry classifications refer to any one or more of the industry sub-classifications used by one or more widely recognized market indexes or ratings group indexes, and/or as defined by Fund management. This definition may not apply for purposes of this report, which may combine industry sub-classifications for reporting ease. Industries are shown as a percent of net assets.
See Notes to Financial Statements.
131 | April 30, 2015
| RiverFront Global Allocation Fund | |
| Statement of Investments | April 30, 2015 (Unaudited) |
| Shares | Value (Note 2) | |||||||
| COMMON STOCKS (6.27%) | ||||||||
| Basic Materials (0.75%) | ||||||||
| Forest Products & Paper (0.75%) | ||||||||
| International Paper Co. | 5,748 | $ | 308,783 | |||||
| TOTAL BASIC MATERIALS | 308,783 | |||||||
| Communications (0.84%) | ||||||||
| Media (0.84%) | ||||||||
| CBS Corp. Class B | 5,533 | 343,765 | ||||||
| TOTAL COMMUNICATIONS | 343,765 | |||||||
| Consumer, Cyclical (0.85%) | ||||||||
| Retail (0.85%) | ||||||||
| CVS Health Corp. | 3,525 | 349,997 | ||||||
| TOTAL CONSUMER, CYCLICAL | 349,997 | |||||||
Consumer, Non‐Cyclical (2.35%) | ||||||||
| Pharmaceuticals (2.35%) | ||||||||
| Abbott Laboratories | 6,064 | 281,491 | ||||||
Bristol‐Myers Squibb Co. | 5,757 | 366,893 | ||||||
| Pfizer, Inc. | 9,291 | 315,244 | ||||||
| 963,628 | ||||||||
TOTAL CONSUMER, NON‐CYCLICAL | 963,628 | |||||||
| Energy (0.76%) | ||||||||
| Pipelines (0.76%) | ||||||||
| Kinder Morgan, Inc. | 7,280 | 312,676 | ||||||
| TOTAL ENERGY | 312,676 | |||||||
| Technology (0.72%) | ||||||||
| Software (0.72%) | ||||||||
| Oracle Corp. | 6,802 | 296,703 | ||||||
| TOTAL TECHNOLOGY | 296,703 | |||||||
| TOTAL COMMON STOCKS (Cost $2,265,533) | 2,575,552 | |||||||
| EXCHANGE TRADED FUNDS (88.60%) | ||||||||
| Debt (5.62%) | ||||||||
RiverFront Strategic Income Fund(a) | 91,345 | 2,310,115 | ||||||
| Equity (82.98%) | ||||||||
Deutsche X‐trackers MSCI EAFE Hedged Equity ETF | 64,409 | 1,944,508 | ||||||
| Shares | Value (Note 2) | |||||||
| Equity (continued) | ||||||||
| Financial Select Sector SPDR® Fund | 38,103 | $ | 919,425 | |||||
| First Trust NYSE Arca Biotechnology Index Fund | 4,556 | 508,040 | ||||||
| Global X FTSE Nordic Region ETF | 7,542 | 183,120 | ||||||
| Global X MLP & Energy Infrastructure ETF | 35,215 | 683,523 | ||||||
iShares® Asia 50 ETF | 11,634 | 624,630 | ||||||
iShares® Currency Hedged MSCI Germany ETF | 56,413 | 1,527,664 | ||||||
iShares® Dow Jones U.S. Energy Sector Index Fund | 16,241 | 756,668 | ||||||
iShares® MSCI All Country Asia ex Japan ETF | 34,865 | 2,374,655 | ||||||
iShares® MSCI Australia ETF | 32,459 | 756,944 | ||||||
iShares® MSCI EAFE ETF | 8,202 | 545,515 | ||||||
iShares® MSCI Japan Index ETF | 140,420 | 1,805,801 | ||||||
iShares® MSCI Switzerland Capped ETF | 11,997 | 414,376 | ||||||
iShares® MSCI United Kingdom ETF | 63,295 | 1,215,897 | ||||||
iShares® U.S. Consumer Goods ETF | 5,476 | 576,020 | ||||||
iShares® U.S. Home Construction ETF | 30,534 | 791,441 | ||||||
PowerShares® Aerospace & Defense Portfolio | 9,899 | 353,394 | ||||||
PowerShares® KBW Bank Portfolio | 14,677 | 556,112 | ||||||
PowerShares® S&P 500® Ex‐ Rate Sensitive Low Volatility Portfolio(b) | 8,237 | 202,907 | ||||||
PowerShares® S&P 500® High Dividend Portfolio | 16,788 | 550,814 | ||||||
SPDR® Morgan Stanley Technology ETF | 16,789 | 1,733,632 | ||||||
Vanguard® FTSE Developed Markets ETF | 36,677 | 1,517,328 | ||||||
Vanguard® Telecommunication Services ETF | 3,707 | 332,296 | ||||||
WisdomTree® Europe Hedged Equity Fund | 119,669 | 7,689,930 | ||||||
WisdomTree® Japan Hedged Equity Fund | 50,638 | 2,856,996 | ||||||
WisdomTree® Japan SmallCap Dividend Fund | 6,895 | 380,397 | ||||||
WisdomTree® LargeCap Dividend Fund | 30,626 | 2,275,512 | ||||||
| 34,077,545 | ||||||||
| TOTAL EXCHANGE TRADED FUNDS (Cost $33,418,781) | 36,387,660 | |||||||
132 | April 30, 2015
| RiverFront Global Allocation Fund | |
| Statement of Investments | April 30, 2015 (Unaudited) |
| Shares | Value (Note 2) | |||||||
| EXCHANGE TRADED NOTES (2.03%) | ||||||||
| Equity (2.03%) | ||||||||
| Barclays ETN+ Select MLP ETNs | 27,113 | $ | 832,098 | |||||
| TOTAL EXCHANGE TRADED NOTES (Cost $780,143) | 832,098 | |||||||
7-Day Yield | Shares | Value (Note 2) | ||||||||||
| SHORT TERM INVESTMENTS (3.11%) | ||||||||||||
| Money Market Fund (3.11%) | ||||||||||||
| Morgan Stanley | ||||||||||||
Institutional Liquidity Fund ‐ Prime Portfolio | 0.078 | % | 1,276,038 | 1,276,038 | ||||||||
| TOTAL SHORT TERM INVESTMENTS (Cost $1,276,038) | 1,276,038 | |||||||||||
| TOTAL INVESTMENTS (100.01%) (Cost $37,740,495) | $ | 41,071,348 | ||||||||||
Liabilities In Excess Of Other Assets (‐0.01%) | (2,893 | ) | ||||||||||
| NET ASSETS (100.00%) | $ | 41,068,455 | ||||||||||
| (a) | Affiliated Company. See Note 7 in Notes to Financial Statements. |
| (b) | Non-Income Producing Security. |
| Common Abbreviations: |
| EAFE - Europe, Australia, and Far East. |
| ETN - Exchange Traded Note. |
| ETF - Exchange Traded Fund. |
| FTSE - Financial Times and the London Stock Exchange. |
| KBW- Keefe, Bruyette, & Woods. |
| MLP - Master Limited Partnership. |
| MSCI - Morgan Stanley Capital International. |
| NYSE - New York Stock Exchange |
| S&P - Standard and Poor’s. |
| SPDR - Standard and Poor’s Depositary Receipt. |
For Fund compliance purposes, the Fund's industry classifications refer to any one or more of the industry sub-classifications used by one or more widely recognized market indexes or ratings group indexes, and/or as defined by Fund management. This definition may not apply for purposes of this report, which may combine industry sub-classifications for reporting ease. Industries are shown as a percent of net assets.
See Notes to Financial Statements.
133 | April 30, 2015
| RiverFront Global Growth Fund | |
| Statement of Investments | April 30, 2015 (Unaudited) |
| Shares | Value (Note 2) | |||||||
| COMMON STOCKS (6.56%) | ||||||||
| Basic Materials (0.74%) | ||||||||
| Forest Products & Paper (0.74%) | ||||||||
| International Paper Co. | 11,509 | $ | 618,264 | |||||
| TOTAL BASIC MATERIALS | 618,264 | |||||||
| Communications (0.83%) | ||||||||
| Media (0.83%) | ||||||||
| CBS Corp. Class B | 11,031 | 685,356 | ||||||
| TOTAL COMMUNICATIONS | 685,356 | |||||||
| Consumer, Cyclical (0.98%) | ||||||||
| Retail (0.98%) | ||||||||
| CVS Health Corp. | 8,221 | 816,263 | ||||||
| TOTAL CONSUMER, CYCLICAL | 816,263 | |||||||
Consumer, Non‐Cyclical (2.48%) | ||||||||
| Pharmaceuticals (2.48%) | ||||||||
| Abbott Laboratories | 14,050 | 652,201 | ||||||
Bristol‐Myers Squibb Co. | 12,456 | 793,821 | ||||||
| Pfizer, Inc. | 18,136 | 615,354 | ||||||
| 2,061,376 | ||||||||
TOTAL CONSUMER, NON‐CYCLICAL | 2,061,376 | |||||||
| Energy (0.74%) | ||||||||
| Pipelines (0.74%) | ||||||||
| Kinder Morgan, Inc. | 14,228 | 611,093 | ||||||
| TOTAL ENERGY | 611,093 | |||||||
| Technology (0.79%) | ||||||||
| Software (0.79%) | ||||||||
| Oracle Corp. | 15,052 | 656,568 | ||||||
| TOTAL TECHNOLOGY | 656,568 | |||||||
| TOTAL COMMON STOCKS (Cost $4,712,344) | 5,448,920 | |||||||
| EXCHANGE TRADED FUNDS (87.54%) | ||||||||
| Equity (87.54%) | ||||||||
Consumer Staples Select Sector SPDR® Fund | 28,583 | 1,382,560 | ||||||
Deutsche X‐trackers MSCI EAFE Hedged Equity ETF | 166,966 | 5,040,704 | ||||||
Financial Select Sector SPDR® Fund | 59,254 | 1,429,799 | ||||||
| Shares | Value (Note 2) | |||||||
| Equity (continued) | ||||||||
| First Trust NYSE Arca Biotechnology Index Fund | 9,970 | $ | 1,111,755 | |||||
| Global X FTSE Nordic Region ETF | 14,949 | 362,962 | ||||||
| Global X MLP & Energy Infrastructure ETF | 78,973 | 1,532,866 | ||||||
iShares® Asia 50 ETF | 22,912 | 1,230,145 | ||||||
iShares® Currency Hedged MSCI Germany ETF | 110,635 | 2,995,996 | ||||||
iShares® Dow Jones U.S. Energy Sector Index Fund | 51,799 | 2,413,315 | ||||||
iShares® MSCI All Country Asia ex Japan ETF | 86,287 | 5,877,008 | ||||||
iShares® MSCI Australia ETF | 64,083 | 1,494,416 | ||||||
iShares® MSCI Japan Index ETF | 328,092 | 4,219,263 | ||||||
iShares® MSCI Pacific ex Japan ETF | 15,776 | 746,520 | ||||||
iShares® MSCI Switzerland Capped ETF | 23,226 | 802,226 | ||||||
iShares® MSCI United Kingdom ETF | 97,639 | 1,875,645 | ||||||
iShares® U.S. Consumer Goods ETF | 8,784 | 923,989 | ||||||
iShares® U.S. Home Construction ETF | 62,743 | 1,626,299 | ||||||
PowerShares® Aerospace & Defense Portfolio | 26,170 | 934,269 | ||||||
PowerShares® KBW Bank Portfolio | 41,871 | 1,586,492 | ||||||
PowerShares® S&P 500® Ex‐ Rate Sensitive Low Volatility Portfolio(a) | 16,602 | 408,967 | ||||||
PowerShares® S&P 500® High Dividend Portfolio | 39,209 | 1,286,447 | ||||||
SPDR® Morgan Stanley Technology ETF | 28,564 | 2,949,519 | ||||||
Vanguard® FTSE Developed Markets ETF | 77,193 | 3,193,474 | ||||||
Vanguard® Information Technology ETF | 6,051 | 652,842 | ||||||
Vanguard® Telecommunication Services ETF | 8,786 | 787,577 | ||||||
WisdomTree® Europe Hedged Equity Fund | 276,704 | 17,780,999 | ||||||
WisdomTree® Japan Hedged Equity Fund | 112,861 | 6,367,618 | ||||||
WisdomTree® Japan SmallCap Dividend Fund | 13,209 | 728,740 | ||||||
134 | April 30, 2015
| RiverFront Global Growth Fund | |
| Statement of Investments | April 30, 2015 (Unaudited) |
| Shares | Value (Note 2) | |||||||
| Equity (continued) | ||||||||
WisdomTree® LargeCap Dividend Fund | 12,655 | $ | 940,266 | |||||
| 72,682,678 | ||||||||
| TOTAL EXCHANGE TRADED FUNDS (Cost $65,028,792) | 72,682,678 | |||||||
| EXCHANGE TRADED NOTES (2.00%) | ||||||||
| Equity (2.00%) | ||||||||
| Barclays ETN+ Select MLP ETNs | 53,998 | 1,657,198 | ||||||
| TOTAL EXCHANGE TRADED NOTES (Cost $1,554,128) | 1,657,198 | |||||||
7-Day Yield | Shares | Value (Note 2) | ||||||||||
| SHORT TERM INVESTMENTS (3.08%) | ||||||||||||
| Money Market Fund (3.08%) | ||||||||||||
Morgan Stanley Institutional Liquidity Fund ‐ Prime Portfolio | 0.078 | % | 2,559,750 | 2,559,750 | ||||||||
| TOTAL SHORT TERM INVESTMENTS (Cost $2,559,750) | 2,559,750 | |||||||||||
| TOTAL INVESTMENTS (99.18%) (Cost $73,855,014) | $ | 82,348,546 | ||||||||||
| Other Assets In Excess Of Liabilities (0.82%) | 683,577 | |||||||||||
| NET ASSETS (100.00%) | $ | 83,032,123 | ||||||||||
| (a) | Non-Income Producing Security. |
| Common Abbreviations: |
| EAFE - Europe, Australia, and Far East. |
| ETN - Exchange Traded Note. |
| ETF - Exchange Traded Fund. |
| FTSE - Financial Times and the London Stock Exchange. |
| KBW- Keefe, Bruyette, & Woods. |
| MLP - Master Limited Partnership. |
| MSCI - Morgan Stanley Capital International. |
| NYSE - New York Stock Exchange. |
| S&P - Standard and Poor’s. |
| SPDR - Standard and Poor’s Depositary Receipt. |
For Fund compliance purposes, the Fund's industry classifications refer to any one or more of the industry sub-classifications used by one or more widely recognized market indexes or ratings group indexes, and/or as defined by Fund management. This definition may not apply for purposes of this report, which may combine industry sub-classifications for reporting ease. Industries are shown as a percent of net assets.
See Notes to Financial Statements.
135 | April 30, 2015
| RiverFront Moderate Growth & Income Fund | |
| Statement of Investments | April 30, 2015 (Unaudited) |
| Shares | Value (Note 2) | |||||||
| COMMON STOCKS (6.51%) | ||||||||
| Basic Materials (0.78%) | ||||||||
| Forest Products & Paper (0.78%) | ||||||||
| International Paper Co. | 20,853 | $ | 1,120,223 | |||||
| TOTAL BASIC MATERIALS | 1,120,223 | |||||||
| Communications (0.76%) | ||||||||
| Media (0.76%) | ||||||||
| CBS Corp. Class B | 17,577 | 1,092,059 | ||||||
| TOTAL COMMUNICATIONS | 1,092,059 | |||||||
| Consumer, Cyclical (1.01%) | ||||||||
| Retail (1.01%) | ||||||||
| CVS Health Corp. | 14,522 | 1,441,890 | ||||||
| TOTAL CONSUMER, CYCLICAL | 1,441,890 | |||||||
Consumer, Non‐Cyclical (2.43%) | ||||||||
| Pharmaceuticals (2.43%) | ||||||||
| Abbott Laboratories | 24,928 | 1,157,158 | ||||||
Bristol‐Myers Squibb Co. | 21,053 | 1,341,708 | ||||||
| Pfizer, Inc. | 29,420 | 998,220 | ||||||
| 3,497,086 | ||||||||
TOTAL CONSUMER, NON‐CYCLICAL | 3,497,086 | |||||||
| Energy (0.77%) | ||||||||
| Pipelines (0.77%) | ||||||||
| Kinder Morgan, Inc. | 25,821 | 1,109,012 | ||||||
| TOTAL ENERGY | 1,109,012 | |||||||
| Technology (0.76%) | ||||||||
| Software (0.76%) | ||||||||
| Oracle Corp. | 25,134 | 1,096,345 | ||||||
| TOTAL TECHNOLOGY | 1,096,345 | |||||||
| TOTAL COMMON STOCKS (Cost $8,041,518) | 9,356,615 | |||||||
| EXCHANGE TRADED FUNDS (88.00%) | ||||||||
| Debt (34.56%) | ||||||||
| PIMCO 0-5 Year High Yield Corporate Bond Index ETF | 86,017 | 8,743,628 | ||||||
RiverFront Strategic Income Fund(a) | 600,817 | 15,194,662 | ||||||
SPDR® Barclays Short Term Corporate Bond ETF | 470,393 | 14,441,065 | ||||||
| Shares | Value (Note 2) | |||||||
| Debt (continued) | ||||||||
SPDR® Barclays Short Term High Yield Bond ETF | 385,405 | $ | 11,307,783 | |||||
| 49,687,138 | ||||||||
| Equity (53.44%) | ||||||||
Consumer Staples Select Sector SPDR® Fund | 88,626 | 4,286,840 | ||||||
Deutsche X‐trackers MSCI EAFE Hedged Equity ETF | 276,102 | 8,335,519 | ||||||
| Global X MLP & Energy Infrastructure ETF | 158,629 | 3,078,989 | ||||||
iShares® Currency Hedged MSCI Germany ETF | 99,196 | 2,686,228 | ||||||
iShares® Dow Jones U.S. Energy Sector Index Fund | 41,446 | 1,930,969 | ||||||
iShares® MSCI Japan Index ETF | 316,306 | 4,067,695 | ||||||
iShares® U.S. Home Construction ETF | 42,893 | 1,111,786 | ||||||
PowerShares® Aerospace & Defense Portfolio | 33,013 | 1,178,564 | ||||||
PowerShares® KBW Bank Portfolio | 68,545 | 2,597,170 | ||||||
PowerShares® S&P 500® Ex-Rate Sensitive Low Volatility Portfolio(b) | 28,617 | 704,940 | ||||||
PowerShares® S&P 500® High Dividend Portfolio | 306,634 | 10,060,661 | ||||||
SPDR® Morgan Stanley Technology ETF | 36,337 | 3,752,159 | ||||||
Vanguard® Telecommunication Services ETF | 16,398 | 1,469,917 | ||||||
WisdomTree® Europe Hedged Equity Fund | 228,969 | 14,713,548 | ||||||
WisdomTree® Japan Hedged Equity Fund | 109,321 | 6,167,891 | ||||||
WisdomTree® Japan SmallCap Dividend Fund | 18,717 | 1,032,617 | ||||||
WisdomTree® LargeCap Dividend Fund | 129,772 | 9,642,059 | ||||||
| 76,817,552 | ||||||||
| TOTAL EXCHANGE TRADED FUNDS (Cost $120,466,977) | 126,504,690 | |||||||
| EXCHANGE TRADED NOTES (2.34%) | ||||||||
| Equity (2.34%) | ||||||||
| Barclays ETN+ Select MLP ETNs | 109,629 | 3,364,514 | ||||||
| TOTAL EXCHANGE TRADED NOTES (Cost $2,984,764) | 3,364,514 | |||||||
136 | April 30, 2015
| RiverFront Moderate Growth & Income Fund | |
| Statement of Investments | April 30, 2015 (Unaudited) |
7-Day Yield | Shares | Value (Note 2) | |||||||
| SHORT TERM INVESTMENTS (2.88%) | |||||||||
| Money Market Fund (2.88%) | |||||||||
| Morgan Stanley Institutional Liquidity Fund - Prime Portfolio | 0.078 | % | 4,137,391 | $ | 4,137,391 | ||||
| TOTAL SHORT TERM INVESTMENTS (Cost $4,137,391) | 4,137,391 | ||||||||
| TOTAL INVESTMENTS (99.73%) (Cost $135,630,650) | $ | 143,363,210 | |||||||
| Other Assets In Excess Of Liabilities (0.27%) | 384,501 | ||||||||
| NET ASSETS (100.00%) | $ | 143,747,711 | |||||||
(a) | Affiliated Company. See Note 7 in Notes to Financial Statements. |
(b) | Non-Income Producing Security. |
| Common Abbreviations: |
| EAFE - Europe, Australia, and Far East. |
| ETF - Exchange Traded Fund. |
| ETN - Exchange Traded Note. |
| KBW- Keefe, Bruyette, & Woods. |
| MLP - Master Limited Partnership. |
| MSCI - Morgan Stanley Capital International. |
| PIMCO - Pacific Investment Management Company. |
| S&P - Standard and Poor’s. |
| SPDR - Standard and Poor’s Depositary Receipt. |
For Fund compliance purposes, the Fund’s industry classifications refer to any one or more of the industry sub-classifications used by one or more widely recognized market indexes or ratings group indexes, and/or as defined by Fund management. This definition may not apply for purposes of this report, which may combine industry sub-classifications for reporting ease. Industries are shown as a percent of net assets.
See Notes to Financial Statements.
137 | April 30, 2015
| RiverFront Global Allocation Series | |
| Statements of Assets and Liabilities | April 30, 2015 (Unaudited) |
RiverFront Conservative Income Builder Fund | RiverFront Dynamic Equity Income Fund | RiverFront Global Allocation Fund | RiverFront Global Growth Fund | RiverFront Moderate Growth & Income Fund | ||||||||||||||||
| ASSETS | ||||||||||||||||||||
| Investments, at value | $ | 7,107,875 | $ | 68,055,778 | $ | 38,761,233 | $ | 82,348,546 | $ | 128,168,548 | ||||||||||
| Investments in affiliates, at value | 852,172 | 6,104,905 | 2,310,115 | – | 15,194,662 | |||||||||||||||
| Receivable for shares sold | 61,169 | 158,836 | 31,730 | 937,560 | 521,662 | |||||||||||||||
| Dividends and interest receivable | 1,525 | 16,246 | 8,248 | 17,832 | 64,149 | |||||||||||||||
| Prepaid expenses and other assets | 11,842 | 12,924 | 11,029 | 23,250 | 12,366 | |||||||||||||||
| Total Assets | 8,034,583 | 74,348,689 | 41,122,355 | 83,327,188 | 143,961,387 | |||||||||||||||
| LIABILITIES | ||||||||||||||||||||
| Payable for shares redeemed | – | 478,317 | – | 219,477 | 32,019 | |||||||||||||||
| Investment advisory fees payable | – | 40,785 | 19,614 | 43,932 | 83,586 | |||||||||||||||
| Administration and transfer agency fees payable | 761 | 8,606 | 5,063 | 9,503 | 16,117 | |||||||||||||||
| Distribution and services fees payable | 4,284 | 31,474 | 15,069 | 16,055 | 63,174 | |||||||||||||||
| Trustees’ fees and expenses payable | 33 | 53 | 171 | 367 | 379 | |||||||||||||||
| Professional fees payable | 10,541 | 10,627 | 9,605 | 4,208 | 11,017 | |||||||||||||||
| Custody fees payable | 461 | 1,343 | 656 | 1,029 | 1,049 | |||||||||||||||
| Printing fees payable | – | 501 | 1,495 | – | 3,585 | |||||||||||||||
| Accrued expenses and other liabilities | 1,600 | 2,639 | 2,227 | 494 | 2,750 | |||||||||||||||
| Total Liabilities | 17,680 | 574,345 | 53,900 | 295,065 | 213,676 | |||||||||||||||
| NET ASSETS | $ | 8,016,903 | $ | 73,774,344 | $ | 41,068,455 | $ | 83,032,123 | $ | 143,747,711 | ||||||||||
| NET ASSETS CONSIST OF | ||||||||||||||||||||
| Paid-in capital | $ | 7,790,324 | $ | 66,630,182 | $ | 37,036,972 | $ | 73,088,026 | $ | 133,055,277 | ||||||||||
| Accumulated net investment income | 43,341 | 484,243 | 217,612 | 539,475 | 734,226 | |||||||||||||||
| Accumulated net realized gain on investments | 37,125 | 1,788,181 | 483,018 | 911,090 | 2,225,648 | |||||||||||||||
| Net unrealized appreciation in value on investments | 146,113 | 4,871,738 | 3,330,853 | 8,493,532 | 7,732,560 | |||||||||||||||
| NET ASSETS | $ | 8,016,903 | $ | 73,774,344 | $ | 41,068,455 | $ | 83,032,123 | $ | 143,747,711 | ||||||||||
| INVESTMENTS, AT COST | $ | 6,968,957 | $ | 63,220,149 | $ | 35,445,827 | $ | 73,855,014 | $ | 120,533,702 | ||||||||||
| INVESTMENTS IN AFFILIATES, AT COST | $ | 844,977 | $ | 6,068,796 | $ | 2,294,668 | $ | – | $ | 15,096,948 | ||||||||||
See Notes to Financial Statements.
138 | April 30, 2015
| RiverFront Global Allocation Series | |
Statements of Assets and Liabilities (continued) | April 30, 2015 (Unaudited) |
| RiverFront | RiverFront | RiverFront | ||||||||||||||||||
| Conservative | Dynamic Equity | RiverFront | RiverFront | Moderate Growth | ||||||||||||||||
| Income Builder | Income | Global Allocation | Global Growth | & Income | ||||||||||||||||
| Fund | Fund | Fund | Fund | Fund | ||||||||||||||||
| PRICING OF SHARES | ||||||||||||||||||||
| Class A: | ||||||||||||||||||||
| Net Asset Value, offering and redemption price per share | $ | 10.69 | $ | 13.24 | $ | 12.83 | $ | 14.75 | $ | 11.82 | ||||||||||
| Net Assets | $ | 1,285,874 | $ | 18,071,900 | $ | 9,572,018 | $ | 17,407,766 | $ | 27,238,582 | ||||||||||
| Shares of beneficial interest outstanding (unlimited number of shares, no par value common stock authorized) | 120,290 | 1,364,826 | 746,303 | 1,180,027 | 2,303,742 | |||||||||||||||
| Maximum offering price per share ((NAV/0.9450), based on maximum sales charge of 5.50% of the offering price) | $ | 11.31 | $ | 14.01 | $ | 13.58 | $ | 15.61 | $ | 12.51 | ||||||||||
| Class C: | ||||||||||||||||||||
Net Asset Value, offering and redemption price per share(a) | $ | 10.61 | $ | 13.07 | $ | 12.65 | $ | 14.51 | $ | 11.76 | ||||||||||
| Net Assets | $ | 4,757,344 | $ | 33,478,004 | $ | 16,028,480 | $ | 12,938,100 | $ | 69,865,832 | ||||||||||
| Shares of beneficial interest outstanding (unlimited number of shares, no par value common stock authorized) | 448,318 | 2,562,014 | 1,267,522 | 891,887 | 5,940,105 | |||||||||||||||
| Class I: | ||||||||||||||||||||
| Net Asset Value, offering and redemption price per share | $ | 10.51 | $ | 13.16 | $ | 12.59 | $ | 14.82 | $ | 11.82 | ||||||||||
| Net Assets | $ | 1,973,685 | $ | 22,224,440 | $ | 15,467,957 | $ | 17,081,861 | $ | 46,643,297 | ||||||||||
| Shares of beneficial interest outstanding (unlimited number of shares, no par value common stock authorized) | 187,781 | 1,688,526 | 1,228,310 | 1,152,697 | 3,947,740 | |||||||||||||||
| Class L: | ||||||||||||||||||||
| Net Asset Value, offering and redemption price per share | N/A | N/A | N/A | $ | 14.80 | N/A | ||||||||||||||
| Net Assets | N/A | N/A | N/A | $ | 27,747,442 | N/A | ||||||||||||||
| Shares of beneficial interest outstanding (unlimited number of shares, no par value common stock authorized) | N/A | N/A | N/A | 1,875,057 | N/A | |||||||||||||||
| Investor Class: | ||||||||||||||||||||
| Net Asset Value, offering and redemption price per share | N/A | N/A | N/A | $ | 14.67 | N/A | ||||||||||||||
| Net Assets | N/A | N/A | N/A | $ | 7,856,954 | N/A | ||||||||||||||
| Shares of beneficial interest outstanding (unlimited number of shares, no par value common stock authorized) | N/A | N/A | N/A | 535,442 | N/A | |||||||||||||||
| (a) | Redemption price per share may be reduced for any applicable contingent deferred sales charge. For a description of a possible sales charge, please see the Fund’s Prospectus. |
See Notes to Financial Statements.
139 | April 30, 2015
| RiverFront Global Allocation Series | |
| Statements of Operations | For the Six Months Ended April 30, 2015 (Unaudited) |
| RiverFront | RiverFront | RiverFront | ||||||||||||||||||
| Conservative | Dynamic Equity | RiverFront | RiverFront | Moderate Growth | ||||||||||||||||
| Income Builder | Income | Global Allocation | Global Growth | & Income | ||||||||||||||||
| Fund | Fund | Fund | Fund | Fund | ||||||||||||||||
| INVESTMENT INCOME | ||||||||||||||||||||
| Dividends | $ | 159,138 | $ | 1,621,783 | $ | 824,760 | $ | 1,800,588 | $ | 2,779,542 | ||||||||||
| Dividends from affiliated securities | 14,983 | 79,293 | 19,297 | – | 233,644 | |||||||||||||||
| Total Investment Income | 174,121 | 1,701,076 | 844,057 | 1,800,588 | 3,013,186 | |||||||||||||||
| EXPENSES | ||||||||||||||||||||
| Investment advisory fees | 35,272 | 298,000 | 156,827 | 321,211 | 590,396 | |||||||||||||||
| Administrative fees | 4,833 | 36,843 | 19,914 | 39,867 | 72,288 | |||||||||||||||
| Transfer agency fees | 422 | 2,587 | 1,530 | 2,279 | 4,383 | |||||||||||||||
| Distribution and service fees | ||||||||||||||||||||
| Class A | 1,550 | 21,698 | 10,504 | 21,318 | 34,054 | |||||||||||||||
| Class C | 24,415 | 157,883 | 74,867 | 59,149 | 335,436 | |||||||||||||||
| Investor Class | – | – | – | 9,632 | – | |||||||||||||||
| Professional fees | 8,389 | 9,408 | 7,876 | 8,042 | 10,829 | |||||||||||||||
| Reports to shareholders and printing fees | 344 | 3,561 | 2,907 | 3,428 | 7,236 | |||||||||||||||
| State registration fees | 20,597 | 22,924 | 21,402 | 33,036 | 24,358 | |||||||||||||||
| Insurance fees | 52 | 418 | 217 | 449 | 814 | |||||||||||||||
| Custody fees | 1,607 | 2,979 | 1,828 | 3,054 | 3,792 | |||||||||||||||
| Trustees’ fees and expenses | 107 | 601 | 456 | 932 | 1,469 | |||||||||||||||
| Miscellaneous expenses | 3,931 | 6,427 | 5,432 | 8,327 | 9,121 | |||||||||||||||
| Total Expenses | 101,519 | 563,329 | 303,760 | 510,724 | 1,094,176 | |||||||||||||||
| Less fees waived/reimbursed by investment advisor (Note 8) | ||||||||||||||||||||
| Class A | (5,753 | ) | (16,901 | ) | (11,923 | ) | (18,050 | ) | (19,449 | ) | ||||||||||
| Class C | (22,535 | ) | (30,763 | ) | (21,206 | ) | (12,612 | ) | (47,986 | ) | ||||||||||
| Class I | (9,919 | ) | (20,555 | ) | (19,208 | ) | (14,999 | ) | (32,127 | ) | ||||||||||
| Class L | – | – | – | (26,684 | ) | – | ||||||||||||||
| Investor Class | – | – | – | (8,172 | ) | – | ||||||||||||||
| Net Expenses | 63,312 | 495,110 | 251,423 | 430,207 | 994,614 | |||||||||||||||
| Net Investment Income | 110,809 | 1,205,966 | 592,634 | 1,370,381 | 2,018,572 | |||||||||||||||
| Net realized gain on investments | 44,378 | 1,834,305 | 487,866 | 946,935 | 2,230,143 | |||||||||||||||
| Net realized loss on investments - affiliated securities | (2,957 | ) | – | – | – | (4,363 | ) | |||||||||||||
| Net change in unrealized appreciation/(depreciation) on investments | (3,071 | ) | 836,617 | 1,125,142 | 2,928,434 | 679,691 | ||||||||||||||
| NET REALIZED AND UNREALIZED GAIN ON INVESTMENTS | 38,350 | 2,670,922 | 1,613,008 | 3,875,369 | 2,905,471 | |||||||||||||||
| NET INCREASE IN NET ASSETS RESULTING FROM OPERATIONS | $ | 149,159 | $ | 3,876,888 | $ | 2,205,642 | $ | 5,245,750 | $ | 4,924,043 | ||||||||||
See Notes to Financial Statements.
140 | April 30, 2015
| RiverFront Conservative Income Builder Fund |
| Statements of Changes in Net Assets |
For the Six Months Ended | For the Fiscal Period Ended | |||||||
| April 30, 2015 | October 31, 2014(a) | |||||||
| OPERATIONS | ||||||||
| Net investment income | $ | 110,809 | $ | 29,975 | ||||
| Net realized gain on investments | 44,378 | 110,437 | ||||||
Net realized loss on investments ‐ affiliated securities | (2,957 | ) | (42 | ) | ||||
| Net change in unrealized depreciation on investments | (3,071 | ) | (67,675 | ) | ||||
| Net Increase in Net Assets Resulting from Operations | 149,159 | 72,695 | ||||||
| DISTRIBUTIONS | ||||||||
| Dividends to shareholders from net investment income | ||||||||
| Class A | (12,065 | ) | (7,517 | ) | ||||
| Class C | (35,142 | ) | (14,233 | ) | ||||
| Class I | (21,882 | ) | (13,957 | ) | ||||
| Dividends to shareholders from net realized gains | ||||||||
| Class A | (33,682 | ) | – | |||||
| Class C | (128,451 | ) | – | |||||
| Class I | (53,269 | ) | – | |||||
| Net Decrease in Net Assets from Distributions | (284,491 | ) | (35,707 | ) | ||||
| BENEFICIAL INTEREST TRANSACTIONS (NOTE 6) | ||||||||
| Shares sold | ||||||||
| Class A | 494,765 | 224,208 | ||||||
| Class C | 627,688 | 1,216,347 | ||||||
| Class I | 511,467 | 1,817,467 | ||||||
| Dividends reinvested | ||||||||
| Class A | 20,748 | 3,697 | ||||||
| Class C | 139,954 | 12,819 | ||||||
| Class I | 66,023 | 13,270 | ||||||
| Shares redeemed | ||||||||
| Class A | (299,882 | ) | (244,851 | ) | ||||
| Class C | (950,792 | ) | (336,045 | ) | ||||
| Class I | (1,397,609 | ) | (392,394 | ) | ||||
| Net Increase/(Decrease) in Net Assets Derived from Beneficial Interest Transactions | (787,638 | ) | 2,314,518 | |||||
| Net increase/(decrease) in net assets | (922,970 | ) | 2,351,506 | |||||
| NET ASSETS | ||||||||
| Beginning of period | 8,939,873 | 6,588,367 | ||||||
| End of period * | $ | 8,016,903 | $ | 8,939,873 | ||||
| *Including accumulated net investment income of: | $ | 43,341 | $ | 1,621 | ||||
(a) | Effective May 1, 2014, the Board approved changing the fiscal year-end of the Funds from April 30 to October 31. |
See Notes to Financial Statements.
141 | April 30, 2015
| RiverFront Dynamic Equity Income Fund |
| Statements of Changes in Net Assets |
For the Six Months Ended | For the Fiscal Period Ended | |||||||
| April 30, 2015 | October 31, 2014(a) | |||||||
| OPERATIONS | ||||||||
| Net investment income | $ | 1,205,966 | $ | 354,835 | ||||
| Net realized gain on investments | 1,834,305 | 495,747 | ||||||
Net realized loss on investments ‐ affiliated securities | – | (2,968 | ) | |||||
| Net change in unrealized appreciation on investments | 836,617 | 59,792 | ||||||
| Net Increase in Net Assets Resulting from Operations | 3,876,888 | 907,406 | ||||||
| DISTRIBUTIONS | ||||||||
| Dividends to shareholders from net investment income | ||||||||
| Class A | (194,756 | ) | (111,022 | ) | ||||
| Class C | (301,894 | ) | (86,202 | ) | ||||
| Class I | (239,141 | ) | (158,721 | ) | ||||
| Dividends to shareholders from net realized gains | ||||||||
| Class A | (621,662 | ) | – | |||||
| Class C | (1,103,238 | ) | – | |||||
| Class I | (746,196 | ) | – | |||||
| Net Decrease in Net Assets from Distributions | (3,206,887 | ) | (355,945 | ) | ||||
| BENEFICIAL INTEREST TRANSACTIONS (NOTE 6) | ||||||||
| Shares sold | ||||||||
| Class A | 2,699,067 | 3,938,297 | ||||||
| Class C | 5,026,089 | 7,076,964 | ||||||
| Class I | 3,614,967 | 3,502,112 | ||||||
| Dividends reinvested | ||||||||
| Class A | 769,625 | 102,697 | ||||||
| Class C | 1,313,215 | 79,328 | ||||||
| Class I | 876,597 | 138,648 | ||||||
| Shares redeemed | ||||||||
| Class A | (2,797,478 | ) | (2,263,648 | ) | ||||
| Class C | (3,327,532 | ) | (3,022,626 | ) | ||||
| Class I | (3,511,747 | ) | (1,075,996 | ) | ||||
| Net Increase in Net Assets Derived from Beneficial Interest Transactions | 4,662,803 | 8,475,776 | ||||||
| Net increase in net assets | 5,332,804 | 9,027,237 | ||||||
| NET ASSETS | ||||||||
| Beginning of period | 68,441,540 | 59,414,303 | ||||||
| End of period * | $ | 73,774,344 | $ | 68,441,540 | ||||
| *Including accumulated net investment income of: | $ | 484,243 | $ | 14,068 | ||||
(a) | Effective May 1, 2014, the Board approved changing the fiscal year-end of the Funds from April 30 to October 31. |
See Notes to Financial Statements.
142 | April 30, 2015
| RiverFront Global Allocation Fund |
| Statements of Changes in Net Assets |
For the Six Months Ended | For the Fiscal Period Ended | |||||||
| April 30, 2015 | October 31, 2014(a) | |||||||
| OPERATIONS | ||||||||
| Net investment income | $ | 592,634 | $ | 166,583 | ||||
| Net realized gain on investments | 487,866 | 1,047,052 | ||||||
Net realized loss on investments ‐ affiliated securities | – | (14,540 | ) | |||||
| Net change in unrealized appreciation/(depreciation) on investments | 1,125,142 | (814,242 | ) | |||||
| Net Increase in Net Assets Resulting from Operations | 2,205,642 | 384,853 | ||||||
| DISTRIBUTIONS | ||||||||
| Dividends to shareholders from net investment income | ||||||||
| Class A | (135,563 | ) | – | |||||
| Class C | (171,705 | ) | – | |||||
| Class I | (234,337 | ) | – | |||||
| Dividends to shareholders from net realized gains | ||||||||
| Class A | (560,595 | ) | – | |||||
| Class C | (1,028,926 | ) | – | |||||
| Class I | (892,615 | ) | – | |||||
| Net Decrease in Net Assets from Distributions | (3,023,741 | ) | – | |||||
| BENEFICIAL INTEREST TRANSACTIONS (NOTE 6) | ||||||||
| Shares sold | ||||||||
| Class A | 1,590,461 | 704,281 | ||||||
| Class C | 2,423,680 | 1,706,825 | ||||||
| Class I | 3,287,273 | 3,218,570 | ||||||
| Dividends reinvested | ||||||||
| Class A | 673,030 | – | ||||||
| Class C | 1,146,839 | – | ||||||
| Class I | 1,105,082 | – | ||||||
| Shares redeemed | ||||||||
| Class A | (869,520 | ) | (1,557,221 | ) | ||||
| Class C | (1,952,422 | ) | (1,700,105 | ) | ||||
| Class I | (1,542,645 | ) | (975,931 | ) | ||||
| Net Increase in Net Assets Derived from Beneficial Interest Transactions | 5,861,778 | 1,396,419 | ||||||
| Net increase in net assets | 5,043,679 | 1,781,272 | ||||||
| NET ASSETS | ||||||||
| Beginning of period | 36,024,776 | 34,243,504 | ||||||
| End of period * | $ | 41,068,455 | $ | 36,024,776 | ||||
| *Including accumulated net investment income of: | $ | 217,612 | $ | 166,583 | ||||
(a) | Effective May 1, 2014, the Board approved changing the fiscal year-end of the Funds from April 30 to October 31. |
See Notes to Financial Statements.
143 | April 30, 2015
| RiverFront Global Growth Fund |
| Statements of Changes in Net Assets |
For the Six Months Ended April 30, 2015 | For the Fiscal Period Ended October 31, 2014(a) | |||||||
| OPERATIONS | ||||||||
| Net investment income | $ | 1,370,381 | $ | 422,375 | ||||
| Net realized gain on investments | 946,935 | 3,579,076 | ||||||
| Net change in unrealized appreciation/(depreciation) on investments | 2,928,434 | (3,270,391 | ) | |||||
| Net Increase in Net Assets Resulting from Operations | 5,245,750 | 731,060 | ||||||
| DISTRIBUTIONS | ||||||||
| Dividends to shareholders from net investment income | ||||||||
| Class A | (284,353 | ) | – | |||||
| Class C | (141,577 | ) | – | |||||
| Class I | (243,129 | ) | – | |||||
| Class L | (453,248 | ) | – | |||||
| Investor Class | (133,236 | ) | – | |||||
| Dividends to shareholders from net realized gains | ||||||||
| Class A | (1,555,258 | ) | – | |||||
| Class C | (1,081,235 | ) | – | |||||
| Class I | (1,217,027 | ) | – | |||||
| Class L | (2,207,236 | ) | – | |||||
| Investor Class | (716,298 | ) | – | |||||
| Net Decrease in Net Assets from Distributions | (8,032,597 | ) | – | |||||
| BENEFICIAL INTEREST TRANSACTIONS (NOTE 6) | ||||||||
| Shares sold | ||||||||
| Class A | 3,016,931 | 4,307,345 | ||||||
| Class C | 2,148,124 | 1,088,318 | ||||||
| Class I | 5,180,344 | 2,214,171 | ||||||
| Class L | 3,789,489 | 1,420,447 | ||||||
| Investor Class | 233,086 | 66,568 | ||||||
| Dividends reinvested | ||||||||
| Class A | 1,781,625 | – | ||||||
| Class C | 1,193,814 | – | ||||||
| Class I | 1,360,312 | – | ||||||
| Class L | 2,618,006 | – | ||||||
| Investor Class | 762,580 | – | ||||||
| Shares redeemed | ||||||||
| Class A | (3,438,730 | ) | (4,115,225 | ) | ||||
| Class C | (1,367,127 | ) | (1,282,840 | ) | ||||
| Class I | (2,323,518 | ) | (852,301 | ) | ||||
| Class L | (2,168,857 | ) | (2,447,309 | ) | ||||
| Investor Class | (585,499 | ) | (760,465 | ) | ||||
| Net Increase/(Decrease) in Net Assets Derived from Beneficial Interest Transactions | 12,200,580 | (361,291 | ) | |||||
| Net increase in net assets | 9,413,733 | 369,769 | ||||||
| NET ASSETS | ||||||||
| Beginning of period | 73,618,390 | 73,248,621 | ||||||
| End of period * | $ | 83,032,123 | $ | 73,618,390 | ||||
| *Including accumulated net investment income of: | $ | 539,475 | $ | 424,637 | ||||
(a) | Effective May 1, 2014, the Board approved changing the fiscal year-end of the Funds from April 30 to October 31. |
144 | April 30, 2015
| RiverFront Moderate Growth & Income Fund |
| Statements of Changes in Net Assets |
For the Six Months Ended April 30, 2015 | For the Fiscal Period Ended October 31, 2014(a) | |||||||
| OPERATIONS | ||||||||
| Net investment income | $ | 2,018,572 | $ | 849,869 | ||||
| Net realized gain on investments | 2,230,143 | 3,635,670 | ||||||
| Net realized loss on investments ‐ affiliated securities | (4,363 | ) | – | |||||
| Net change in unrealized appreciation/(depreciation) on investments | 679,691 | (1,889,311 | ) | |||||
| Net Increase in Net Assets Resulting from Operations | 4,924,043 | 2,596,228 | ||||||
| DISTRIBUTIONS | ||||||||
| Dividends to shareholders from net investment income | ||||||||
| Class A | (293,198 | ) | (220,828 | ) | ||||
| Class C | (519,310 | ) | (267,118 | ) | ||||
| Class I | (521,526 | ) | (373,018 | ) | ||||
| Dividends to shareholders from net realized gains | ||||||||
| Class A | (1,452,046 | ) | – | |||||
| Class C | (3,504,595 | ) | – | |||||
| Class I | (2,361,505 | ) | – | |||||
| Net Decrease in Net Assets from Distributions | (8,652,180 | ) | (860,964 | ) | ||||
| BENEFICIAL INTEREST TRANSACTIONS (NOTE 6) | ||||||||
| Shares sold | ||||||||
| Class A | 2,574,879 | 4,201,326 | ||||||
| Class C | 7,855,495 | 7,712,589 | ||||||
| Class I | 9,039,716 | 6,525,980 | ||||||
| Dividends reinvested | ||||||||
| Class A | 1,580,412 | 187,752 | ||||||
| Class C | 3,570,702 | 220,912 | ||||||
| Class I | 2,610,717 | 325,977 | ||||||
| Shares redeemed | ||||||||
| Class A | (3,778,805 | ) | (8,283,862 | ) | ||||
| Class C | (6,210,721 | ) | (5,318,273 | ) | ||||
| Class I | (5,891,054 | ) | (3,079,334 | ) | ||||
| Net Increase in Net Assets Derived from Beneficial Interest Transactions | 11,351,341 | 2,493,067 | ||||||
| Net increase in net assets | 7,623,204 | 4,228,331 | ||||||
| NET ASSETS | ||||||||
| Beginning of period | 136,124,507 | 131,896,176 | ||||||
| End of period * | $ | 143,747,711 | $ | 136,124,507 | ||||
| *Including accumulated net investment income of: | $ | 734,226 | $ | 49,688 | ||||
(a) | Effective May 1, 2014, the Board approved changing the fiscal year-end of the Funds from April 30 to October 31. |
145 | April 30, 2015
| RiverFront Conservative Income Builder Fund – Class A |
| Financial Highlights |
| Selected data for a share of beneficial interest outstanding throughout the periods indicated: |
For the Six Months Ended April 30, 2015 (Unaudited) | For the Fiscal Period Ended October 31, 2014(a) | For the Year Ended April 30, 2014 | For the Period September 4, 2012 (Commencement) to April 30, 2013 | |||||||||||||
| Net asset value, beginning of period | $ | 10.86 | $ | 10.83 | $ | 10.48 | $ | 10.00 | ||||||||
| INCOME FROM INVESTMENT OPERATIONS: | ||||||||||||||||
Net investment income(b) | 0.16 | 0.07 | 0.13 | 0.09 | ||||||||||||
| Net realized and unrealized gain | 0.06 | 0.04 | 0.53 | 0.48 | ||||||||||||
| Total from investment operations | 0.22 | 0.11 | 0.66 | 0.57 | ||||||||||||
| DISTRIBUTIONS: | ||||||||||||||||
| From net investment income | (0.10 | ) | (0.08 | ) | (0.12 | ) | (0.09 | ) | ||||||||
| From net realized gains | (0.29 | ) | – | (0.19 | ) | – | ||||||||||
| Total distributions | (0.39 | ) | (0.08 | ) | (0.31 | ) | (0.09 | ) | ||||||||
| Net increase/(decrease) in net asset value | (0.17 | ) | 0.03 | 0.35 | 0.48 | |||||||||||
| Net asset value, end of period | $ | 10.69 | $ | 10.86 | $ | 10.83 | $ | 10.48 | ||||||||
TOTAL RETURN(c) | 2.09 | % | 0.98 | % | 6.35 | % | 5.72 | % | ||||||||
| RATIOS/SUPPLEMENTAL DATA: | ||||||||||||||||
| Net assets, end of period (000s) | $ | 1,286 | $ | 1,089 | $ | 1,101 | $ | 607 | ||||||||
| Ratio of expenses to average net assets excluding fee waivers and reimbursements | 2.08 | %(d) | 2.39 | %(d) | 2.94 | % | 5.65 | %(d)(e) | ||||||||
| Ratio of expenses to average net assets including fee waivers and reimbursements | 1.15 | %(d) | 1.15 | %(d) | 1.15 | % | 1.15 | %(d)(e) | ||||||||
| Ratio of net investment income to average net assets | 3.01 | %(d) | 1.22 | %(d) | 1.27 | % | 1.37 | %(d)(e) | ||||||||
Portfolio turnover rate(f) | 120 | % | 34 | % | 125 | % | 73 | % | ||||||||
(a) | Effective May 1, 2014, the Board approved changing the fiscal year-end of the Funds from April 30 to October 31. |
(b) | Calculated using the average shares method. |
(c) | Total returns are for the period indicated and have not been annualized. Total returns would have been lower had certain expenses not been waived during the period. Returns shown do not reflect the deduction of taxes that a shareholder would pay on Fund distributions or the redemption of Fund shares. Returns shown exclude any applicable sales charges. |
(d) | Annualized. |
(e) | Expense ratios before reductions for startup periods may not be representative of longer term operating periods. |
(f) | Portfolio turnover rate for periods less than one full year have not been annualized. |
See Notes to Financial Statements.
146 | April 30, 2015
| RiverFront Conservative Income Builder Fund – Class C |
| Financial Highlights |
| Selected data for a share of beneficial interest outstanding throughout the periods indicated: |
| For the Period | ||||||||||||||||
| September 4, | ||||||||||||||||
| For the Six | For the Fiscal | 2012 | ||||||||||||||
| Months Ended | Period Ended | For the Year | (Commencement) | |||||||||||||
| April 30, 2015 | October 31, | Ended | to | |||||||||||||
| (Unaudited) | 2014(a) | April 30, 2014 | April 30, 2013 | |||||||||||||
| Net asset value, beginning of period | $ | 10.81 | $ | 10.77 | $ | 10.51 | $ | 10.00 | ||||||||
| INCOME FROM INVESTMENT OPERATIONS: | ||||||||||||||||
Net investment income(b) | 0.12 | 0.03 | 0.06 | 0.06 | ||||||||||||
| Net realized and unrealized gain | 0.05 | 0.04 | 0.51 | 0.47 | ||||||||||||
| Total from investment operations | 0.17 | 0.07 | 0.57 | 0.53 | ||||||||||||
| DISTRIBUTIONS: | ||||||||||||||||
| From net investment income | (0.08 | ) | (0.03 | ) | (0.12 | ) | (0.02 | ) | ||||||||
| From net realized gains | (0.29 | ) | – | (0.19 | ) | – | ||||||||||
| Total distributions | (0.37 | ) | (0.03 | ) | (0.31 | ) | (0.02 | ) | ||||||||
| Net increase/(decrease) in net asset value | (0.20 | ) | 0.04 | 0.26 | 0.51 | |||||||||||
| Net asset value, end of period | $ | 10.61 | $ | 10.81 | $ | 10.77 | $ | 10.51 | ||||||||
TOTAL RETURN(c) | 1.61 | % | 0.68 | % | 5.49 | % | 5.29 | % | ||||||||
| RATIOS/SUPPLEMENTAL DATA: | ||||||||||||||||
| Net assets, end of period (000s) | $ | 4,757 | $ | 5,021 | $ | 4,106 | $ | 2,264 | ||||||||
| Ratio of expenses to average net assets excluding fee waivers and reimbursements | 2.82 | %(d) | 3.14 | %(d) | 3.73 | % | 6.53 | %(d)(e) | ||||||||
| Ratio of expenses to average net assets including fee waivers and reimbursements | 1.90 | %(d) | 1.90 | %(d) | 1.90 | % | 1.90 | %(d)(e) | ||||||||
| Ratio of net investment income to average net assets | 2.36 | %(d) | 0.47 | %(d) | 0.53 | % | 0.90 | %(d)(e) | ||||||||
Portfolio turnover rate(f) | 120 | % | 34 | % | 125 | % | 73 | % | ||||||||
(a) | Effective May 1, 2014, the Board approved changing the fiscal year-end of the Funds from April 30 to October 31. | |
(b) | Calculated using the average shares method. | |
(c) | Total returns are for the period indicated and have not been annualized. Total returns would have been lower had certain expenses not been waived during the period. Returns shown do not reflect the deduction of taxes that a shareholder would pay on Fund distributions or the redemption of Fund shares. Returns shown exclude any applicable sales charges. | |
(d) | Annualized. | |
(e) | Expense ratios before reductions for startup periods may not be representative of longer term operating periods. | |
(f) | Portfolio turnover rate for periods less than one full year have not been annualized. | |
See Notes to Financial Statements.
147 | April 30, 2015
| RiverFront Conservative Income Builder Fund – Class I |
| Financial Highlights |
| Selected data for a share of beneficial interest outstanding throughout the periods indicated: |
For the Six Months Ended April 30, 2015 (Unaudited) | For the Fiscal Period Ended October 31, 2014(a) | For the Year Ended April 30, 2014 | For the Period September 4, 2012 (Commencement) to April 30, 2013 | |||||||||||||
| Net asset value, beginning of period | $ | 10.70 | $ | 10.66 | $ | 10.29 | $ | 10.00 | ||||||||
| INCOME FROM INVESTMENT OPERATIONS: | ||||||||||||||||
Net investment income(b) | 0.17 | 0.07 | 0.15 | 0.12 | ||||||||||||
| Net realized and unrealized gain | 0.05 | 0.06 | 0.51 | 0.46 | ||||||||||||
| Total from investment operations | 0.22 | 0.13 | 0.66 | 0.58 | ||||||||||||
| DISTRIBUTIONS: | ||||||||||||||||
| From net investment income | (0.12 | ) | (0.09 | ) | (0.10 | ) | (0.29 | ) | ||||||||
| From net realized gains | (0.29 | ) | – | (0.19 | ) | – | ||||||||||
| Total distributions | (0.41 | ) | (0.09 | ) | (0.29 | ) | (0.29 | ) | ||||||||
| Net increase/(decrease) in net asset value | (0.19 | ) | 0.04 | 0.37 | 0.29 | |||||||||||
| Net asset value, end of period | $ | 10.51 | $ | 10.70 | $ | 10.66 | $ | 10.29 | ||||||||
TOTAL RETURN(c) | 2.11 | % | 1.19 | % | 6.53 | % | 5.95 | % | ||||||||
| RATIOS/SUPPLEMENTAL DATA: | ||||||||||||||||
| Net assets, end of period (000s) | $ | 1,974 | $ | 2,830 | $ | 1,381 | $ | 715 | ||||||||
| Ratio of expenses to average net assets excluding fee waivers and reimbursements | 1.81 | %(d) | 2.12 | %(d) | 2.66 | % | 7.74 | %(d)(e) | ||||||||
| Ratio of expenses to average net assets including fee waivers and reimbursements | 0.90 | %(d) | 0.90 | %(d) | 0.90 | % | 0.90 | %(d)(e) | ||||||||
| Ratio of net investment income to average net assets | 3.16 | %(d) | 1.34 | %(d) | 1.49 | % | 1.84 | %(d)(e) | ||||||||
Portfolio turnover rate(f) | 120 | % | 34 | % | 125 | % | 73 | % | ||||||||
(a) | Effective May 1, 2014, the Board approved changing the fiscal year-end of the Funds from April 30 to October 31. |
(b) | Calculated using the average shares method. |
(c) | Total returns are for the period indicated and have not been annualized. Total returns would have been lower had certain expenses not been waived during the period. Returns shown do not reflect the deduction of taxes that a shareholder would pay on Fund distributions or the redemption of Fund shares. |
(d) | Annualized. |
(e) | Expense ratios before reductions for startup periods may not be representative of longer term operating periods. |
(f) | Portfolio turnover rate for periods less than one full year have not been annualized. |
See Notes to Financial Statements.
148 | April 30, 2015
| RiverFront Dynamic Equity Income Fund – Class A |
| Financial Highlights |
| Selected data for a share of beneficial interest outstanding throughout the periods indicated: |
For the Six Months Ended April 30, 2015 (Unaudited) | For the Fiscal Period Ended October 31, 2014(a) | For the Year Ended April 30, 2014 | For the Year Ended April 30, 2013 | For the Year Ended April 30, 2012(b) | For the Period August 2, 2010 (Inception) to April 30, 2011 | |||||||||||||||||||
| Net asset value, beginning of period | $ | 13.10 | $ | 12.97 | $ | 12.24 | $ | 11.24 | $ | 11.73 | $ | 10.00 | ||||||||||||
| INCOME/(LOSS) FROM INVESTMENT OPERATIONS: | ||||||||||||||||||||||||
Net investment income(c) | 0.25 | 0.09 | 0.17 | 0.25 | 0.16 | 0.12 | ||||||||||||||||||
| Net realized and unrealized gain/(loss) | 0.49 | 0.13 | 1.17 | 0.99 | (0.49 | ) | 1.67 | |||||||||||||||||
| Total from investment operations | 0.74 | 0.22 | 1.34 | 1.24 | (0.33 | ) | 1.79 | |||||||||||||||||
| DISTRIBUTIONS: | ||||||||||||||||||||||||
| From net investment income | (0.14 | ) | (0.09 | ) | (0.17 | ) | (0.24 | ) | (0.15 | ) | (0.06 | ) | ||||||||||||
| From net realized gains | (0.46 | ) | – | (0.44 | ) | – | – | (0.00 | )(d) | |||||||||||||||
| Tax return of capital | – | – | – | – | (0.01 | ) | (0.00 | )(d) | ||||||||||||||||
| Total distributions | (0.60 | ) | (0.09 | ) | (0.61 | ) | (0.24 | ) | (0.16 | ) | (0.06 | ) | ||||||||||||
| Net increase/(decrease) in net asset value | 0.14 | 0.13 | 0.73 | 1.00 | (0.49 | ) | 1.73 | |||||||||||||||||
| Net asset value, end of period | $ | 13.24 | $ | 13.10 | $ | 12.97 | $ | 12.24 | $ | 11.24 | $ | 11.73 | ||||||||||||
TOTAL RETURN(e) | 5.90 | % | 1.66 | % | 11.15 | % | 11.22 | % | (2.80 | )% | 17.99 | % | ||||||||||||
| RATIOS/SUPPLEMENTAL DATA: | ||||||||||||||||||||||||
| Net assets, end of period (000s) | $ | 18,072 | $ | 17,275 | $ | 15,374 | $ | 8,087 | $ | 7,114 | $ | 5,723 | ||||||||||||
| Ratio of expenses to average net assets excluding fee waivers and reimbursements | 1.34 | %(f) | 1.39 | %(f) | 1.42 | % | 1.58 | % | 1.73 | % | 2.17 | %(f) | ||||||||||||
| Ratio of expenses to average net assets including fee waivers and reimbursements | 1.15 | %(f) | 1.15 | %(f) | 1.15 | % | 1.20 | %(g) | 1.30 | % | 1.30 | %(f) | ||||||||||||
| Ratio of net investment income to average net assets | 3.80 | %(f) | 1.33 | %(f) | 1.38 | % | 2.17 | % | 1.50 | % | 1.48 | %(f) | ||||||||||||
Portfolio turnover rate(h) | 47 | % | 45 | % | 99 | % | 136 | % | 133 | % | 66 | % | ||||||||||||
(a) | Effective May 1, 2014, the Board approved changing the fiscal year-end of the Funds from April 30 to October 31. |
(b) | Prior to January 1, 2012, the RiverFront Dynamic Equity Income Fund was known as the RiverFront Long-Term Growth & Income Fund. |
(c) | Calculated using the average shares method. |
(d) | Less than ($0.005) per share. |
(e) | Total returns are for the period indicated and have not been annualized. Total returns would have been lower had certain expenses not been waived during the period. Returns shown do not reflect the deduction of taxes that a shareholder would pay on Fund distributions or the redemption of Fund shares. Returns shown exclude any applicable sales charges. |
(f) | Annualized. |
(g) | Contractual expense limitation change from 1.30% to 1.15% effective September 1, 2012. |
(h) | Portfolio turnover rate for periods less than one full year have not been annualized. |
See Notes to Financial Statements.
149 | April 30, 2015
| RiverFront Dynamic Equity Income Fund – Class C |
| Financial Highlights |
| Selected data for a share of beneficial interest outstanding throughout the periods indicated: |
For the Six Months Ended April 30, 2015 (Unaudited) | For the Fiscal Period Ended October 31, 2014(a) | For the Year Ended April 30, 2014 | For the Year Ended April 30, 2013 | For the Year Ended April 30, 2012(b) | For the Period August 2, 2010 (Inception) to April 30, 2011 | |||||||||||||||||||
| Net asset value, beginning of period | $ | 12.97 | $ | 12.84 | $ | 12.13 | $ | 11.14 | $ | 11.67 | $ | 10.00 | ||||||||||||
| INCOME/(LOSS) FROM INVESTMENT OPERATIONS: | ||||||||||||||||||||||||
Net investment income(c) | 0.19 | 0.04 | 0.08 | 0.16 | 0.09 | 0.05 | ||||||||||||||||||
| Net realized and unrealized gain/(loss) | 0.49 | 0.13 | 1.15 | 0.98 | (0.51 | ) | 1.67 | |||||||||||||||||
| Total from investment operations | 0.68 | 0.17 | 1.23 | 1.14 | (0.42 | ) | 1.72 | |||||||||||||||||
| DISTRIBUTIONS: | ||||||||||||||||||||||||
| From net investment income | (0.12 | ) | (0.04 | ) | (0.08 | ) | (0.15 | ) | (0.10 | ) | (0.05 | ) | ||||||||||||
| From net realized gains | (0.46 | ) | – | (0.44 | ) | – | – | (0.00 | )(d) | |||||||||||||||
| Tax return of capital | – | – | – | – | (0.01 | ) | (0.00 | )(d) | ||||||||||||||||
| Total distributions | (0.58 | ) | (0.04 | ) | (0.52 | ) | (0.15 | ) | (0.11 | ) | (0.05 | ) | ||||||||||||
| Net increase/(decrease) in net asset value | 0.10 | 0.13 | 0.71 | 0.99 | (0.53 | ) | 1.67 | |||||||||||||||||
| Net asset value, end of period | $ | 13.07 | $ | 12.97 | $ | 12.84 | $ | 12.13 | $ | 11.14 | $ | 11.67 | ||||||||||||
TOTAL RETURN(e) | 5.51 | % | 1.30 | % | 10.34 | % | 10.41 | % | (3.60 | )% | 17.32 | % | ||||||||||||
| RATIOS/SUPPLEMENTAL DATA: | ||||||||||||||||||||||||
| Net assets, end of period (000s) | $ | 33,478 | $ | 30,170 | $ | 25,787 | $ | 16,070 | $ | 13,729 | $ | 9,223 | ||||||||||||
| Ratio of expenses to average net assets excluding fee waivers and reimbursements | 2.09 | %(f) | 2.15 | %(f) | 2.18 | % | 2.33 | % | 2.49 | % | 3.10 | %(f) | ||||||||||||
| Ratio of expenses to average net assets including fee waivers and reimbursements | 1.90 | %(f) | 1.90 | %(f) | 1.90 | % | 1.95 | %(g) | 2.05 | % | 2.05 | %(f) | ||||||||||||
| Ratio of net investment income to average net assets | 2.91 | %(f) | 0.60 | %(f) | 0.61 | % | 1.44 | % | 0.84 | % | 0.65 | %(f) | ||||||||||||
Portfolio turnover rate(h) | 47 | % | 45 | % | 99 | % | 136 | % | 133 | % | 66 | % | ||||||||||||
(a) | Effective May 1, 2014, the Board approved changing the fiscal year-end of the Funds from April 30 to October 31. | |
(b) | Prior to January 1, 2012, the RiverFront Dynamic Equity Income Fund was known as the RiverFront Long-Term Growth & Income Fund. | |
(c) | Calculated using the average shares method. | |
(d) | Less than ($0.005) per share. | |
(e) | Total returns are for the period indicated and have not been annualized. Total returns would have been lower had certain expenses not been waived during the period. Returns shown do not reflect the deduction of taxes that a shareholder would pay on Fund distributions or the redemption of Fund shares. Returns shown exclude any applicable sales charges. | |
(f) | Annualized. | |
(g) | Contractual expense limitation change from 2.05% to 1.90% effective September 1, 2012. | |
(h) | Portfolio turnover rate for periods less than one full year have not been annualized. | |
See Notes to Financial Statements.
150 | April 30, 2015
| RiverFront Dynamic Equity Income Fund – Class I |
| Financial Highlights |
| Selected data for a share of beneficial interest outstanding throughout the periods indicated: |
For the Six Months Ended April 30, 2015 (Unaudited) | For the Fiscal Period Ended October 31, 2014(a) | For the Year Ended April 30, 2014 | For the Year Ended April 30, 2013 | For the Year Ended April 30, 2012(b) | For the Period August 2, 2010 (Inception) to April 30, 2011 | |||||||||||||||||||
| Net asset value, beginning of period | $ | 13.02 | $ | 12.88 | $ | 12.16 | $ | 11.17 | $ | 11.64 | $ | 10.00 | ||||||||||||
| INCOME/(LOSS) FROM INVESTMENT OPERATIONS: | ||||||||||||||||||||||||
Net investment income(c) | 0.25 | 0.10 | 0.20 | 0.27 | 0.20 | 0.12 | ||||||||||||||||||
| Net realized and unrealized gain/(loss) | 0.49 | 0.14 | 1.16 | 0.99 | (0.50 | ) | 1.68 | |||||||||||||||||
| Total from investment operations | 0.74 | 0.24 | 1.36 | 1.26 | (0.30 | ) | 1.80 | |||||||||||||||||
| DISTRIBUTIONS: | ||||||||||||||||||||||||
| From net investment income | (0.14 | ) | (0.10 | ) | (0.20 | ) | (0.27 | ) | (0.16 | ) | (0.15 | ) | ||||||||||||
| From net realized gains | (0.46 | ) | – | (0.44 | ) | – | – | (0.00 | )(d) | |||||||||||||||
| Tax return of capital | – | – | – | – | (0.01 | ) | (0.01 | ) | ||||||||||||||||
| Total distributions | (0.60 | ) | (0.10 | ) | (0.64 | ) | (0.27 | ) | (0.17 | ) | (0.16 | ) | ||||||||||||
| Net increase/(decrease) in net asset value | 0.14 | 0.14 | 0.72 | 0.99 | (0.47 | ) | 1.64 | |||||||||||||||||
| Net asset value, end of period | $ | 13.16 | $ | 13.02 | $ | 12.88 | $ | 12.16 | $ | 11.17 | $ | 11.64 | ||||||||||||
TOTAL RETURN(e) | 5.98 | % | 1.88 | % | 11.40 | % | 11.47 | % | (2.58 | )% | 18.21 | % | ||||||||||||
| RATIOS/SUPPLEMENTAL DATA: | ||||||||||||||||||||||||
| Net assets, end of period (000s) | $ | 22,224 | $ | 20,997 | $ | 18,254 | $ | 10,460 | $ | 6,897 | $ | 3,301 | ||||||||||||
| Ratio of expenses to average net assets excluding fee waivers and reimbursements | 1.09 | %(f) | 1.15 | %(f) | 1.17 | % | 1.33 | % | 1.49 | % | 2.44 | %(f) | ||||||||||||
| Ratio of expenses to average net assets including fee waivers and reimbursements | 0.90 | %(f) | 0.90 | %(f) | 0.90 | % | 0.95 | %(g) | 1.05 | % | 1.05 | %(f) | ||||||||||||
| Ratio of net investment income to average net assets | 3.94 | %(f) | 1.57 | %(f) | 1.61 | % | 2.36 | % | 1.88 | % | 1.49 | %(f) | ||||||||||||
Portfolio turnover rate(h) | 47 | % | 45 | % | 99 | % | 136 | % | 133 | % | 66 | % | ||||||||||||
(a) | Effective May 1, 2014, the Board approved changing the fiscal year-end of the Funds from April 30 to October 31. |
(b) | Prior to January 1, 2012, the RiverFront Dynamic Equity Income Fund was known as the RiverFront Long-Term Growth & Income Fund. |
(c) | Calculated using the average shares method. |
(d) | Less than ($0.005) per share. |
(e) | Total returns are for the period indicated and have not been annualized. Total returns would have been lower had certain expenses not been waived during the period. Returns shown do not reflect the deduction of taxes that a shareholder would pay on Fund distributions or the redemption of Fund shares. |
(f) | Annualized. |
(g) | Contractual expense limitation change from 1.05% to 0.90% effective September 1, 2012. |
(h) | Portfolio turnover rate for periods less than one full year have not been annualized. |
See Notes to Financial Statements.
151 | April 30, 2015
| RiverFront Global Allocation Fund – Class A |
| Financial Highlights |
| Selected data for a share of beneficial interest outstanding throughout the periods indicated: |
For the Six Months Ended April 30, 2015 (Unaudited) | For the Fiscal Period Ended October 31, 2014(a) | For the Year Ended April 30, 2014 | For the Year Ended April 30, 2013 | For the Year Ended April 30, 2012(b) | For the Period August 2, 2010 (Inception) to April 30, 2011 | ||||||||||||||
| Net asset value, beginning of period | $ | 13.14 | $ | 12.97 | $ | 11.93 | $ | 10.86 | $ | 11.66 | $ | 10.00 | |||||||
| INCOME/(LOSS) FROM INVESTMENT OPERATIONS: | |||||||||||||||||||
Net investment income(c) | 0.22 | 0.08 | 0.10 | 0.15 | 0.12 | 0.10 | |||||||||||||
| Net realized and unrealized gain/(loss) | 0.57 | 0.09 | 1.36 | 1.08 | (0.84 | ) | 1.61 | ||||||||||||
| Total from investment operations | 0.79 | 0.17 | 1.46 | 1.23 | (0.72 | ) | 1.71 | ||||||||||||
| DISTRIBUTIONS: | |||||||||||||||||||
| From net investment income | (0.21 | ) | – | (0.09 | ) | (0.16 | ) | (0.07 | ) | (0.05 | ) | ||||||||
| From net realized gains | (0.89 | ) | – | (0.33 | ) | – | (0.01 | ) | – | ||||||||||
| Total distributions | (1.10 | ) | – | (0.42 | ) | (0.16 | ) | (0.08 | ) | (0.05 | ) | ||||||||
| Net increase/(decrease) in net asset value | (0.31 | ) | 0.17 | 1.04 | 1.07 | (0.80 | ) | 1.66 | |||||||||||
| Net asset value, end of period | $ | 12.83 | $ | 13.14 | $ | 12.97 | $ | 11.93 | $ | 10.86 | $ | 11.66 | |||||||
TOTAL RETURN(d) | 6.46 | % | 1.31 | % | 12.32 | % | 11.47 | % | (6.18 | )% | 17.12 | % | |||||||
| RATIOS/SUPPLEMENTAL DATA: | |||||||||||||||||||
| Net assets, end of period (000s) | $ | 9,572 | $ | 8,372 | $ | 9,098 | $ | 8,244 | $ | 5,791 | $ | 4,686 | |||||||
| Ratio of expenses to average net assets excluding fee waivers and reimbursements | 1.43 | %(e) | 1.50 | %(e) | 1.51 | % | 1.68 | % | 1.80 | % | 3.00 | %(e) | |||||||
| Ratio of expenses to average net assets including fee waivers and reimbursements | 1.15 | %(e) | 1.15 | %(e) | 1.15 | % | 1.19 | %(f) | 1.30 | % | 1.30 | %(e) | |||||||
| Ratio of net investment income to average net assets | 3.44 | %(e) | 1.21 | %(e) | 0.83 | % | 1.32 | % | 1.10 | % | 1.16 | %(e) | |||||||
Portfolio turnover rate(g) | 42 | % | 47 | % | 95 | % | 113 | % | 163 | % | 77 | % | |||||||
(a) | Effective May 1, 2014, the Board approved changing the fiscal year-end of the Funds from April 30 to October 31. |
(b) | Prior to January 1, 2012, the RiverFront Global Allocation Fund was known as the RiverFront Moderate Growth Fund. |
(c) | Calculated using the average shares method. |
(d) | Total returns are for the period indicated and have not been annualized. Total returns would have been lower had certain expenses not been waived during the period. Returns shown do not reflect the deduction of taxes that a shareholder would pay on Fund distributions or the redemption of Fund shares. Returns shown exclude any applicable sales charges. |
(e) | Annualized. |
(f) | Contractual expense limitation change from 1.30% to 1.15% effective September 1, 2012. |
(g) | Portfolio turnover rate for periods less than one full year have not been annualized. |
See Notes to Financial Statements.
152 | April 30, 2015
| RiverFront Global Allocation Fund – Class C |
| Financial Highlights |
| Selected data for a share of beneficial interest outstanding throughout the periods indicated: |
For the Six Months Ended April 30, 2015 (Unaudited) | For the Fiscal Period Ended October 31, 2014(a) | For the Year Ended April 30, 2014 | For the Year Ended April 30, 2013 | For the Year Ended April 30, 2012(b) | For the Period August 2, 2010 (Inception) to April 30, 2011 | ||||||||||||||
| Net asset value, beginning of period | $ | 12.95 | $ | 12.83 | $ | 11.84 | $ | 10.81 | $ | 11.64 | $ | 10.00 | |||||||
| INCOME/(LOSS) FROM INVESTMENT OPERATIONS: | |||||||||||||||||||
Net investment income(c) | 0.17 | 0.03 | 0.01 | 0.07 | 0.02 | 0.00 | (d) | ||||||||||||
| Net realized and unrealized gain/(loss) | 0.56 | 0.09 | 1.34 | 1.07 | (0.82 | ) | 1.65 | ||||||||||||
| Total from investment operations | 0.73 | 0.12 | 1.35 | 1.14 | (0.80 | ) | 1.65 | ||||||||||||
| DISTRIBUTIONS: | |||||||||||||||||||
| From net investment income | (0.14 | ) | – | (0.03 | ) | (0.11 | ) | (0.02 | ) | (0.01 | ) | ||||||||
| From net realized gains | (0.89 | ) | – | (0.33 | ) | – | (0.01 | ) | – | ||||||||||
| Total distributions | (1.03 | ) | – | (0.36 | ) | (0.11 | ) | (0.03 | ) | (0.01 | ) | ||||||||
| Net increase/(decrease) in net asset value | (0.30 | ) | 0.12 | 0.99 | 1.03 | (0.83 | ) | 1.64 | |||||||||||
| Net asset value, end of period | $ | 12.65 | $ | 12.95 | $ | 12.83 | $ | 11.84 | $ | 10.81 | $ | 11.64 | |||||||
TOTAL RETURN(e) | 6.08 | % | 0.94 | % | 11.48 | % | 10.59 | % | (6.86 | )% | 16.52 | % | |||||||
| RATIOS/SUPPLEMENTAL DATA: | |||||||||||||||||||
| Net assets, end of period (000s) | $ | 16,028 | $ | 14,758 | $ | 14,624 | $ | 9,686 | $ | 9,891 | $ | 8,926 | |||||||
| Ratio of expenses to average net assets excluding fee waivers and reimbursements | 2.18 | %(f) | 2.25 | %(f) | 2.26 | % | 2.44 | % | 2.58 | % | 3.21 | %(f) | |||||||
| Ratio of expenses to average net assets including fee waivers and reimbursements | 1.90 | %(f) | 1.90 | %(f) | 1.90 | % | 1.95 | %(g) | 2.05 | % | 2.05 | %(f) | |||||||
| Ratio of net investment income to average net assets | 2.74 | %(f) | 0.40 | %(f) | 0.05 | % | 0.66 | % | 0.17 | % | 0.04 | %(f) | |||||||
Portfolio turnover rate(h) | 42 | % | 47 | % | 95 | % | 113 | % | 163 | % | 77 | % | |||||||
(a) | Effective May 1, 2014, the Board approved changing the fiscal year-end of the Funds from April 30 to October 31. |
(b) | Prior to January 1, 2012, the RiverFront Global Allocation Fund was known as the RiverFront Moderate Growth Fund. |
(c) | Calculated using the average shares method. |
(d) | Less than $0.005 per share. |
(e) | Total returns are for the period indicated and have not been annualized. Total returns would have been lower had certain expenses not been waived during the period. Returns shown do not reflect the deduction of taxes that a shareholder would pay on Fund distributions or the redemption of Fund shares. Returns shown exclude any applicable sales charges. |
(f) | Annualized. |
(g) | Contractual expense limitation change from 2.05% to 1.90% effective September 1, 2012. |
(h) | Portfolio turnover rate for periods less than one full year have not been annualized. |
See Notes to Financial Statements.
153 | April 30, 2015
| RiverFront Global Allocation Fund – Class I |
| Financial Highlights |
| Selected data for a share of beneficial interest outstanding throughout the periods indicated: |
| For the | |||||||||||||||||||
| For the Six | For the | Period | |||||||||||||||||
| Months | Fiscal | August 2, | |||||||||||||||||
| Ended | Period | For the Year | For the Year | For the Year | 2010 | ||||||||||||||
| April 30, | Ended | Ended | Ended | Ended | (Inception) | ||||||||||||||
| 2015 | October 31, | April 30, | April 30, | April 30, | to April 30, | ||||||||||||||
| (Unaudited) | 2014(a) | 2014 | 2013 | 2012(b) | 2011 | ||||||||||||||
| Net asset value, beginning of period | $ | 12.92 | $ | 12.75 | $ | 11.72 | $ | 10.66 | $ | 11.42 | $ | 10.00 | |||||||
| INCOME/(LOSS) FROM INVESTMENT OPERATIONS: | |||||||||||||||||||
Net investment income(c) | 0.22 | 0.09 | 0.13 | 0.17 | 0.13 | 0.08 | |||||||||||||
| Net realized and unrealized gain/(loss) | 0.56 | 0.08 | 1.34 | 1.07 | (0.80 | ) | 1.62 | ||||||||||||
| Total from investment operations | 0.78 | 0.17 | 1.47 | 1.24 | (0.67 | ) | 1.70 | ||||||||||||
| DISTRIBUTIONS: | |||||||||||||||||||
| From net investment income | (0.22 | ) | – | (0.11 | ) | (0.18 | ) | (0.08 | ) | (0.28 | ) | ||||||||
| From net realized gains | (0.89 | ) | – | (0.33 | ) | – | (0.01 | ) | – | ||||||||||
| Total distributions | (1.11 | ) | – | (0.44 | ) | (0.18 | ) | (0.09 | ) | (0.28 | ) | ||||||||
| Net increase/(decrease) in net asset value | (0.33 | ) | 0.17 | 1.03 | 1.06 | (0.76 | ) | 1.42 | |||||||||||
| Net asset value, end of period | $ | 12.59 | $ | 12.92 | $ | 12.75 | $ | 11.72 | $ | 10.66 | $ | 11.42 | |||||||
TOTAL RETURN(d) | 6.57 | % | 1.33 | % | 12.61 | % | 11.73 | % | (5.86 | )% | 17.20 | % | |||||||
| RATIOS/SUPPLEMENTAL DATA: | |||||||||||||||||||
| Net assets, end of period (000s) | $ | 15,468 | $ | 12,895 | $ | 10,521 | $ | 6,675 | $ | 3,496 | $ | 1,905 | |||||||
| Ratio of expenses to average net assets excluding fee waivers and reimbursements | 1.18 | %(e) | 1.26 | %(e) | 1.26 | % | 1.43 | % | 1.55 | % | 4.68 | %(e) | |||||||
| Ratio of expenses to average net assets including fee waivers and reimbursements | 0.90 | %(e) | 0.90 | %(e) | 0.90 | % | 0.94 | %(f) | 1.05 | % | 1.05 | %(e) | |||||||
| Ratio of net investment income to average net assets | 3.59 | %(e) | 1.41 | %(e) | 1.07 | % | 1.52 | % | 1.28 | % | 0.98 | %(e) | |||||||
Portfolio turnover rate(g) | 42 | % | 47 | % | 95 | % | 113 | % | 163 | % | 77 | % | |||||||
(a) | Effective May 1, 2014, the Board approved changing the fiscal year-end of the Funds from April 30 to October 31. |
(b) | Prior to January 1, 2012, the RiverFront Global Allocation Fund was known as the RiverFront Moderate Growth Fund. |
(c) | Calculated using the average shares method. |
(d) | Total returns are for the period indicated and have not been annualized. Total returns would have been lower had certain expenses not been waived during the period. Returns shown do not reflect the deduction of taxes that a shareholder would pay on Fund distributions or the redemption of Fund shares. |
(e) | Annualized. |
(f) | Contractual expense limitation change from 1.05% to 0.90% effective September 1, 2012. |
(g) | Portfolio turnover rate for periods less than one full year have not been annualized. |
See Notes to Financial Statements.
154 | April 30, 2015
| RiverFront Global Growth Fund – Class A |
| Financial Highlights |
| Selected data for a share of beneficial interest outstanding throughout the periods indicated: |
| For the | |||||||||||||||||||
| For the Six | Fiscal | For the | |||||||||||||||||
| Months | Period | For the Year | For the Year | For the Year | Fiscal | ||||||||||||||
| Ended April | Ended | Ended | Ended | Ended | Period | ||||||||||||||
| 30, 2015 | October 31, | April 30, | April 30, | April 30, | Ended April | ||||||||||||||
| (Unaudited) | 2014(a) | 2014 | 2013 | 2012(b) | 30, 2011(c) | ||||||||||||||
| Net asset value, beginning of period | $ | 15.44 | $ | 15.26 | $ | 14.89 | $ | 13.37 | $ | 15.65 | $ | 14.66 | |||||||
| INCOME/(LOSS) FROM INVESTMENT OPERATIONS: | |||||||||||||||||||
Net investment income(d) | 0.27 | 0.08 | 0.12 | 0.17 | 0.14 | 0.00 | (e) | ||||||||||||
| Net realized and unrealized gain/(loss) | 0.73 | 0.10 | 1.88 | 1.57 | (1.41 | ) | 0.99 | ||||||||||||
| Total from investment operations | 1.00 | 0.18 | 2.00 | 1.74 | (1.27 | ) | 0.99 | ||||||||||||
| DISTRIBUTIONS: | |||||||||||||||||||
| From net investment income | (0.25 | ) | – | (0.12 | ) | (0.22 | ) | (0.14 | ) | – | |||||||||
| From net realized gains | (1.44 | ) | – | (1.51 | ) | – | (0.87 | ) | – | ||||||||||
| Total distributions | (1.69 | ) | – | (1.63 | ) | (0.22 | ) | (1.01 | ) | – | |||||||||
| Net increase/(decrease) in net asset value | (0.69 | ) | 0.18 | 0.37 | 1.52 | (2.28 | ) | 0.99 | |||||||||||
| Net asset value, end of period | $ | 14.75 | $ | 15.44 | $ | 15.26 | $ | 14.89 | $ | 13.37 | $ | 15.65 | |||||||
TOTAL RETURN(f) | 7.15 | % | 1.18 | % | 13.66 | % | 13.14 | % | (7.51 | )% | 6.75 | % | |||||||
| RATIOS/SUPPLEMENTAL DATA: | |||||||||||||||||||
| Net assets, end of period (000s) | $ | 17,408 | $ | 16,694 | $ | 16,440 | $ | 8,525 | $ | 5,241 | $ | 12,307 | |||||||
| Ratio of expenses to average net assets excluding fee waivers and reimbursements | 1.36 | %(g) | 1.38 | %(g) | 1.40 | % | 1.49 | % | 1.52 | % | 1.58 | %(g) | |||||||
Ratio of expenses to average net assets including fee waivers and reimbursements(h) | 1.15 | %(g) | 1.15 | %(g) | 1.15 | % | 0.98 | % | 0.92 | % | 0.81 | %(g) | |||||||
| Ratio of net investment income to average net assets | 3.69 | %(g) | 1.08 | %(g) | 0.76 | % | 1.23 | % | 0.99 | % | 0.06 | %(g) | |||||||
Portfolio turnover rate(i) | 41 | % | 48 | % | 85 | % | 113 | % | 119 | % | 34 | % | |||||||
(a) | Effective May 1, 2014, the Board approved changing the fiscal year-end of the Funds from April 30 to October 31. |
(b) | Prior to January 1, 2012, the RiverFront Global Growth Fund was known as the RiverFront Long-Term Growth Fund. |
(c) | Effective March 8, 2011, the Board approved changing the fiscal year-end of the Fund from December 31 to April 30. |
(d) | Calculated using the average shares method. |
(e) | Less than $0.005 per share. |
(f) | Total returns are for the period indicated and have not been annualized. Total returns would have been lower had certain expenses not been waived during the period. Returns shown do not reflect the deduction of taxes that a shareholder would pay on Fund distributions or the redemption of Fund shares. Returns shown exclude any applicable sales charges. |
(g) | Annualized. |
(h) | Prior to January 1, 2013, all acquired fund fees were reimbursed. |
(i) | Portfolio turnover rate for periods less than one full year have not been annualized. |
See Notes to Financial Statements.
155 | April 30, 2015
| RiverFront Global Growth Fund – Class C |
| Financial Highlights |
| Selected data for a share of beneficial interest outstanding throughout the periods indicated: |
| For the | |||||||||||||||||||
| For the Six | Fiscal | For the | |||||||||||||||||
| Months | Period | For the Year | For the Year | For the Year | Fiscal | ||||||||||||||
| Ended April | Ended | Ended | Ended | Ended | Period | ||||||||||||||
| 30, 2015 | October 31, | April 30, | April 30, | April 30, | Ended April | ||||||||||||||
| (Unaudited) | 2014(a) | 2014 | 2013 | 2012(b) | 30, 2011(c) | ||||||||||||||
| Net asset value, beginning of period | $ | 15.19 | $ | 15.07 | $ | 14.76 | $ | 13.29 | $ | 15.60 | $ | 14.63 | |||||||
| INCOME/(LOSS) FROM INVESTMENT OPERATIONS: | |||||||||||||||||||
Net investment income/(loss)(d) | 0.21 | 0.03 | 0.01 | 0.08 | 0.05 | (0.04 | ) | ||||||||||||
| Net realized and unrealized gain/(loss) | 0.72 | 0.09 | 1.86 | 1.54 | (1.42 | ) | 1.01 | ||||||||||||
| Total from investment operations | 0.93 | 0.12 | 1.87 | 1.62 | (1.37 | ) | 0.97 | ||||||||||||
| DISTRIBUTIONS: | |||||||||||||||||||
| From net investment income | (0.17 | ) | – | (0.05 | ) | (0.15 | ) | (0.07 | ) | – | |||||||||
| From net realized gains | (1.44 | ) | – | (1.51 | ) | – | (0.87 | ) | – | ||||||||||
| Total distributions | (1.61 | ) | – | (1.56 | ) | (0.15 | ) | (0.94 | ) | – | |||||||||
| Net increase/(decrease) in net asset value | (0.68 | ) | 0.12 | 0.31 | 1.47 | (2.31 | ) | 0.97 | |||||||||||
| Net asset value, end of period | $ | 14.51 | $ | 15.19 | $ | 15.07 | $ | 14.76 | $ | 13.29 | $ | 15.60 | |||||||
TOTAL RETURN(e) | 6.77 | % | 0.80 | % | 12.84 | % | 12.31 | % | (8.22 | )% | 6.63 | % | |||||||
| RATIOS/SUPPLEMENTAL DATA: | |||||||||||||||||||
| Net assets, end of period (000s) | $ | 12,938 | $ | 11,420 | $ | 11,511 | $ | 7,182 | $ | 6,808 | $ | 6,156 | |||||||
| Ratio of expenses to average net assets excluding fee waivers and reimbursements | 2.11 | %(f) | 2.13 | %(f) | 2.15 | % | 2.25 | % | 2.29 | % | 2.33 | %(f) | |||||||
Ratio of expenses to average net assets including fee waivers and reimbursements(g) | 1.90 | %(f) | 1.90 | %(f) | 1.90 | % | 1.73 | % | 1.67 | % | 1.55 | %(f) | |||||||
| Ratio of net investment income/(loss) to average net assets | 2.88 | %(f) | 0.38 | %(f) | 0.07 | % | 0.57 | % | 0.34 | % | (0.72 | )%(f) | |||||||
Portfolio turnover rate(h) | 41 | % | 48 | % | 85 | % | 113 | % | 119 | % | 34 | % | |||||||
(a) | Effective May 1, 2014, the Board approved changing the fiscal year-end of the Funds from April 30 to October 31. |
(b) | Prior to January 1, 2012, the RiverFront Global Growth Fund was known as the RiverFront Long-Term Growth Fund. |
(c) | Effective March 8, 2011, the Board approved changing the fiscal year-end of the Fund from December 31 to April 30. |
(d) | Calculated using the average shares method. |
(e) | Total returns are for the period indicated and have not been annualized. Total returns would have been lower had certain expenses not been waived during the period. Returns shown do not reflect the deduction of taxes that a shareholder would pay on Fund distributions or the redemption of Fund shares. Returns shown exclude any applicable sales charges. |
(f) | Annualized. |
(g) | Prior to January 1, 2013, all acquired fund fees were reimbursed. |
(h) | Portfolio turnover rate for periods less than one full year have not been annualized. |
See Notes to Financial Statements.
156 | April 30, 2015
| RiverFront Global Growth Fund – Class I |
| Financial Highlights |
| Selected data for a share of beneficial interest outstanding throughout the periods indicated: |
For the Six Months Ended April 30, 2015 (Unaudited) | For the Fiscal Period Ended October 31, 2014(a) | For the Year Ended April 30, 2014 | For the Year Ended April 30, 2013 | For the Year Ended April 30, 2012(b) | For the Fiscal Period Ended April 30, 2011(c) | |||||||||||||||||||
| Net asset value, beginning of period | $ | 15.52 | $ | 15.32 | $ | 14.92 | $ | 13.40 | $ | 15.67 | $ | 14.65 | ||||||||||||
| INCOME/(LOSS) FROM INVESTMENT OPERATIONS: | ||||||||||||||||||||||||
Net investment income(d) | 0.28 | 0.10 | 0.17 | 0.20 | 0.19 | 0.01 | ||||||||||||||||||
| Net realized and unrealized gain/(loss) | 0.74 | 0.10 | 1.89 | 1.57 | (1.51 | ) | 1.01 | |||||||||||||||||
| Total from investment operations | 1.02 | 0.20 | 2.06 | 1.77 | (1.32 | ) | 1.02 | |||||||||||||||||
| DISTRIBUTIONS: | ||||||||||||||||||||||||
| From net investment income | (0.28 | ) | – | (0.15 | ) | (0.25 | ) | (0.16 | ) | – | ||||||||||||||
| From net realized gains | (1.44 | ) | – | (1.51 | ) | – | (0.79 | ) | – | |||||||||||||||
| Total distributions | (1.72 | ) | – | (1.66 | ) | (0.25 | ) | (0.95 | ) | – | ||||||||||||||
| Net increase/(decrease) in net asset value | (0.70 | ) | 0.20 | 0.40 | 1.52 | (2.27 | ) | 1.02 | ||||||||||||||||
| Net asset value, end of period | $ | 14.82 | $ | 15.52 | $ | 15.32 | $ | 14.92 | $ | 13.40 | $ | 15.67 | ||||||||||||
TOTAL RETURN(e) | 7.23 | % | 1.31 | % | 14.01 | % | 13.36 | % | (7.31 | )% | 7.04 | % | ||||||||||||
| RATIOS/SUPPLEMENTAL DATA: | ||||||||||||||||||||||||
| Net assets, end of period (000s) | $ | 17,082 | $ | 13,343 | $ | 11,845 | $ | 7,769 | $ | 6,022 | $ | 4,508 | ||||||||||||
| Ratio of expenses to average net assets excluding fee waivers and reimbursements | 1.12 | %(f) | 1.36 | %(f) | 1.16 | % | 1.25 | % | 1.30 | % | 1.30 | %(f) | ||||||||||||
Ratio of expenses to average net assets including fee waivers and reimbursements(g) | 0.90 | %(f) | 0.90 | %(f) | 0.90 | % | 0.73 | % | 0.67 | % | 0.61 | %(f) | ||||||||||||
| Ratio of net investment income to average net assets | 3.77 | %(f) | 1.32 | %(f) | 1.13 | % | 1.45 | % | 1.44 | % | 0.23 | %(f) | ||||||||||||
Portfolio turnover rate(h) | 41 | % | 48 | % | 85 | % | 113 | % | 119 | % | 34 | % | ||||||||||||
(a) | Effective May 1, 2014, the Board approved changing the fiscal year-end of the Funds from April 30 to October 31. |
(b) | Prior to January 1, 2012, the RiverFront Global Growth Fund was known as the RiverFront Long-Term Growth Fund. |
(c) | Effective March 8, 2011, the Board approved changing the fiscal year-end of the Fund from December 31 to April 30. |
(d) | Calculated using the average shares method. |
(e) | Total returns are for the period indicated and have not been annualized. Total returns would have been lower had certain expenses not been waived during the period. Returns shown do not reflect the deduction of taxes that a shareholder would pay on Fund distributions or the redemption of Fund shares. |
(f) | Annualized. |
(g) | Prior to January 1, 2013, all acquired fund fees were reimbursed. |
(h) | Portfolio turnover rate for periods less than one full year have not been annualized. |
See Notes to Financial Statements.
157 | April 30, 2015
| RiverFront Global Growth Fund – Class L |
| Financial Highlights |
| Selected data for a share of beneficial interest outstanding throughout the periods indicated: |
For the Six Months Ended April 30, 2015 (Unaudited) | For the Fiscal Period Ended October 31, 2014(a) | For the Year Ended April 30, 2014 | For the Year Ended April 30, 2013 | For the Year Ended April 30, 2012(b) | For the Fiscal Period Ended April 30, 2011(c) | |||||||||||||||||||
| Net asset value, beginning of period | $ | 15.49 | $ | 15.29 | $ | 14.90 | $ | 13.37 | $ | 15.65 | $ | 14.63 | ||||||||||||
| INCOME/(LOSS) FROM INVESTMENT OPERATIONS: | ||||||||||||||||||||||||
Net investment income(d) | 0.28 | 0.11 | 0.17 | 0.22 | 0.17 | 0.01 | ||||||||||||||||||
| Net realized and unrealized gain/(loss) | 0.75 | 0.09 | 1.88 | 1.56 | (1.41 | ) | 1.01 | |||||||||||||||||
| Total from investment operations | 1.03 | 0.20 | 2.05 | 1.78 | (1.24 | ) | 1.02 | |||||||||||||||||
| DISTRIBUTIONS: | ||||||||||||||||||||||||
| From net investment income | (0.28 | ) | – | (0.15 | ) | (0.25 | ) | (0.14 | ) | – | ||||||||||||||
| From net realized gains | (1.44 | ) | – | (1.51 | ) | – | (0.87 | ) | – | |||||||||||||||
| Total distributions | (1.72 | ) | – | (1.66 | ) | (0.25 | ) | (1.04 | ) | – | ||||||||||||||
| Net increase/(decrease) in net asset value | (0.69 | ) | 0.20 | 0.39 | 1.53 | (2.28 | ) | 1.02 | ||||||||||||||||
| Net asset value, end of period | $ | 14.80 | $ | 15.49 | $ | 15.29 | $ | 14.90 | $ | 13.37 | $ | 15.65 | ||||||||||||
TOTAL RETURN(e) | 7.32 | % | 1.31 | % | 13.98 | % | 13.43 | % | (7.31 | )% | 6.97 | % | ||||||||||||
| RATIOS/SUPPLEMENTAL DATA: | ||||||||||||||||||||||||
| Net assets, end of period (000s) | $ | 27,747 | $ | 24,400 | $ | 25,092 | $ | 23,454 | $ | 24,765 | $ | 42,977 | ||||||||||||
| Ratio of expenses to average net assets excluding fee waivers and reimbursements | 1.11 | %(f) | 1.02 | %(f) | 1.15 | % | 1.25 | % | 1.08 | % | 1.28 | %(f) | ||||||||||||
Ratio of expenses to average net assets including fee waivers and reimbursements (includes acquired fund fee reimbursements)(g) | 0.90 | %(f) | 0.90 | %(f) | 0.90 | % | 0.73 | % | 0.67 | % | 0.64 | %(f) | ||||||||||||
| Ratio of expenses to average net assets including fee waivers and reimbursements (excludes acquired fund fee reimbursements) | 0.90 | %(f) | 0.90 | %(f) | 0.90 | % | 0.90 | % | 0.90 | % | 0.90 | %(f) | ||||||||||||
| Ratio of net investment income to average net assets | 3.81 | %(f) | 1.37 | %(f) | 1.11 | % | 1.59 | % | 1.26 | % | 0.19 | %(f) | ||||||||||||
Portfolio turnover rate(h) | 41 | % | 48 | % | 85 | % | 113 | % | 119 | % | 34 | % | ||||||||||||
(a) | Effective May 1, 2014, the Board approved changing the fiscal year-end of the Funds from April 30 to October 31. |
(b) | Prior to January 1, 2012, the RiverFront Global Growth Fund was known as the RiverFront Long-Term Growth Fund. |
(c) | Effective March 8, 2011, the Board approved changing the fiscal year-end of the Fund from December 31 to April 30. |
(d) | Calculated using the average shares method. |
(e) | Total returns are for the period indicated and have not been annualized. Total returns would have been lower had certain expenses not been waived during the period. Returns shown do not reflect the deduction of taxes that a shareholder would pay on Fund distributions or the redemption of Fund shares. |
(f) | Annualized. |
(g) | Prior to January 1, 2013, all acquired fund fees were reimbursed. |
(h) | Portfolio turnover rate for periods less than one full year have not been annualized. |
See Notes to Financial Statements.
158 | April 30, 2015
| RiverFront Global Growth Fund – Investor Class |
| Financial Highlights |
| Selected data for a share of beneficial interest outstanding throughout the periods indicated: |
For the Six Months Ended April 30, 2015 (Unaudited) | For the Fiscal Period Ended October 31, 2014(a) | For the Year Ended April 30, 2014 | For the Year Ended April 30, 2013 | For the Year Ended April 30, 2012(b) | For the Fiscal Period Ended April 30, 2011(c) | |||||||||||||||||||
| Net asset value, beginning of period | $ | 15.37 | $ | 15.19 | $ | 14.82 | $ | 13.32 | $ | 15.59 | $ | 14.59 | ||||||||||||
| INCOME/(LOSS) FROM INVESTMENT OPERATIONS: | ||||||||||||||||||||||||
Net investment income(d) | 0.27 | 0.09 | 0.13 | 0.18 | 0.13 | 0.00 | (e) | |||||||||||||||||
| Net realized and unrealized gain/(loss) | 0.72 | 0.09 | 1.87 | 1.54 | (1.39 | ) | 1.00 | |||||||||||||||||
| Total from investment operations | 0.99 | 0.18 | 2.00 | 1.72 | (1.26 | ) | 1.00 | |||||||||||||||||
| DISTRIBUTIONS: | ||||||||||||||||||||||||
| From net investment income | (0.25 | ) | – | (0.12 | ) | (0.22 | ) | (0.14 | ) | – | ||||||||||||||
| From net realized gains | (1.44 | ) | – | (1.51 | ) | – | (0.87 | ) | – | |||||||||||||||
| Total distributions | (1.69 | ) | – | (1.63 | ) | (0.22 | ) | (1.01 | ) | – | ||||||||||||||
| Net increase/(decrease) in net asset value | (0.70 | ) | 0.18 | 0.37 | 1.50 | (2.27 | ) | 1.00 | ||||||||||||||||
| Net asset value, end of period | $ | 14.67 | $ | 15.37 | $ | 15.19 | $ | 14.82 | $ | 13.32 | $ | 15.59 | ||||||||||||
TOTAL RETURN(f) | 7.12 | % | 1.18 | % | 13.73 | % | 13.07 | % | (7.47 | )% | 6.79 | % | ||||||||||||
| RATIOS/SUPPLEMENTAL DATA: | ||||||||||||||||||||||||
| Net assets, end of period (000s) | $ | 7,857 | $ | 7,762 | $ | 8,361 | $ | 9,174 | $ | 10,133 | $ | 21,270 | ||||||||||||
| Ratio of expenses to average net assets excluding fee waivers and reimbursements | 1.36 | %(g) | 1.38 | %(g) | 1.41 | % | 1.50 | % | 1.93 | % | 1.53 | %(g) | ||||||||||||
Ratio of expenses to average net assets including fee waivers and reimbursements (includes acquired fund fee reimbursements)(h) | 1.15 | %(g) | 1.15 | %(g) | 1.15 | % | 0.98 | % | 0.92 | % | 0.89 | %(g) | ||||||||||||
| Ratio of expenses to average net assets including fee waivers and reimbursements (excludes acquired fund fee reimbursements) | 1.15 | %(g) | 1.15 | %(g) | 1.15 | % | 1.15 | % | 1.15 | % | 1.15 | %(g) | ||||||||||||
| Ratio of net investment income/(loss) to average net assets | 3.75 | %(g) | 1.14 | %(g) | 0.85 | % | 1.36 | % | 0.97 | % | (0.08 | )%(g) | ||||||||||||
Portfolio turnover rate(i) | 41 | % | 48 | % | 85 | % | 113 | % | 119 | % | 34 | % | ||||||||||||
(a) | Effective May 1, 2014, the Board approved changing the fiscal year-end of the Funds from April 30 to October 31. |
(b) | Prior to January 1, 2012, the RiverFront Global Growth Fund was known as the RiverFront Long-Term Growth Fund. |
(c) | Effective March 8, 2011, the Board approved changing the fiscal year-end of the Fund from December 31 to April 30. |
(d) | Calculated using the average shares method. |
(e) | Less than $0.005 per share. |
(f) | Total returns are for the period indicated and have not been annualized. Total returns would have been lower had certain expenses not been waived during the period. Returns shown do not reflect the deduction of taxes that a shareholder would pay on Fund distributions or the redemption of Fund shares. |
(g) | Annualized. |
(h) | Prior to January 1, 2013, all acquired fund fees were reimbursed. |
(i) | Portfolio turnover rate for periods less than one full year have not been annualized. |
See Notes to Financial Statements.
159 | April 30, 2015
| RiverFront Moderate Growth & Income Fund – Class A |
| Financial Highlights |
| Selected data for a share of beneficial interest outstanding throughout the periods indicated: |
For the Six Months Ended April 30, 2015 (Unaudited) | For the Fiscal Period Ended October 31, 2014(a) | For the Year Ended April 30, 2014 | For the Year Ended April 30, 2013 | For the Year Ended April 30, 2012 | For the Period August 2, 2010 (Inception) to April 30, 2011 | |||||||||||||||||||
| Net asset value, beginning of period | $ | 12.15 | $ | 11.99 | $ | 11.66 | $ | 10.96 | $ | 11.08 | $ | 10.00 | ||||||||||||
| INCOME/(LOSS) FROM INVESTMENT OPERATIONS: | ||||||||||||||||||||||||
Net investment income(b) | 0.19 | 0.09 | 0.16 | 0.24 | 0.17 | 0.15 | ||||||||||||||||||
| Net realized and unrealized gain/(loss) | 0.24 | 0.16 | 0.89 | 0.69 | (0.12 | ) | 1.01 | |||||||||||||||||
| Total from investment operations | 0.43 | 0.25 | 1.05 | 0.93 | 0.05 | 1.16 | ||||||||||||||||||
| DISTRIBUTIONS: | ||||||||||||||||||||||||
| From net investment income | (0.12 | ) | (0.09 | ) | (0.16 | ) | (0.23 | ) | (0.17 | ) | (0.08 | ) | ||||||||||||
| From net realized gains | (0.64 | ) | – | (0.56 | ) | – | – | (0.00 | )(c) | |||||||||||||||
| Tax return of capital | – | – | – | – | (0.00 | )(c) | – | |||||||||||||||||
| Total distributions | (0.76 | ) | (0.09 | ) | (0.72 | ) | (0.23 | ) | (0.17 | ) | (0.08 | ) | ||||||||||||
| Net increase/(decrease) in net asset value | (0.33 | ) | 0.16 | 0.33 | 0.70 | (0.12 | ) | 1.08 | ||||||||||||||||
| Net asset value, end of period | $ | 11.82 | $ | 12.15 | $ | 11.99 | $ | 11.66 | $ | 10.96 | $ | 11.08 | ||||||||||||
TOTAL RETURN(d) | 3.69 | % | 2.12 | % | 9.16 | % | 8.59 | % | 0.55 | % | 11.70 | % | ||||||||||||
| RATIOS/SUPPLEMENTAL DATA: | ||||||||||||||||||||||||
| Net assets, end of period (000s) | $ | 27,239 | $ | 27,598 | $ | 31,033 | $ | 29,066 | $ | 20,754 | $ | 12,148 | ||||||||||||
| Ratio of expenses to average net assets excluding fee waivers and reimbursements | 1.29 | %(e) | 1.31 | %(e) | 1.32 | % | 1.40 | % | 1.50 | % | 1.64 | %(e) | ||||||||||||
| Ratio of expenses to average net assets including fee waivers and reimbursements | 1.15 | %(e) | 1.15 | %(e) | 1.15 | % | 1.19 | %(f) | 1.30 | % | 1.30 | %(e) | ||||||||||||
| Ratio of net investment income to average net assets | 3.23 | %(e) | 1.54 | %(e) | 1.35 | % | 2.17 | % | 1.65 | % | 1.89 | %(e) | ||||||||||||
Portfolio turnover rate(g) | 65 | % | 42 | % | 98 | % | 108 | % | 128 | % | 69 | % | ||||||||||||
(a) | Effective May 1, 2014, the Board approved changing the fiscal year-end of the Funds from April 30 to October 31. |
(b) | Calculated using the average shares method. |
(c) | Less than ($0.005) per share. |
(d) | Total returns are for the period indicated and have not been annualized. Total returns would have been lower had certain expenses not been waived during the period. Returns shown do not reflect the deduction of taxes that a shareholder would pay on Fund distributions or the redemption of Fund shares. Returns shown exclude any applicable sales charges. |
(e) | Annualized. |
(f) | Contractual expense limitation change from 1.30% to 1.15% effective September 1, 2012. |
(g) | Portfolio turnover rate for periods less than one full year have not been annualized. |
See Notes to Financial Statements.
160 | April 30, 2015
| RiverFront Moderate Growth & Income Fund – Class C |
| Financial Highlights |
| Selected data for a share of beneficial interest outstanding throughout the periods indicated: |
For the Six Months Ended April 30, 2015 (Unaudited) | For the Fiscal Period Ended October 31, 2014(a) | For the Year Ended April 30, 2014 | For the Year Ended April 30, 2013 | For the Year Ended April 30, 2012 | For the Period August 2, 2010 (Inception) to April 30, 2011 | |||||||||||||||||||
| Net asset value, beginning of period | $ | 12.10 | $ | 11.94 | $ | 11.62 | $ | 10.92 | $ | 11.06 | $ | 10.00 | ||||||||||||
| INCOME/(LOSS) FROM INVESTMENT OPERATIONS: | ||||||||||||||||||||||||
Net investment income(b) | 0.14 | 0.05 | 0.07 | 0.16 | 0.09 | 0.10 | ||||||||||||||||||
| Net realized and unrealized gain/(loss) | 0.25 | 0.16 | 0.89 | 0.68 | (0.13 | ) | 1.02 | |||||||||||||||||
| Total from investment operations | 0.39 | 0.21 | 0.96 | 0.84 | (0.04 | ) | 1.12 | |||||||||||||||||
| DISTRIBUTIONS: | ||||||||||||||||||||||||
| From net investment income | (0.09 | ) | (0.05 | ) | (0.08 | ) | (0.14 | ) | (0.10 | ) | (0.06 | ) | ||||||||||||
| From net realized gains | (0.64 | ) | – | (0.56 | ) | – | – | (0.00 | )(c) | |||||||||||||||
| Tax return of capital | – | – | – | – | (0.00 | )(c) | – | |||||||||||||||||
| Total distributions | (0.73 | ) | (0.05 | ) | (0.64 | ) | (0.14 | ) | (0.10 | ) | (0.06 | ) | ||||||||||||
| Net increase/(decrease) in net asset value | (0.34 | ) | 0.16 | 0.32 | 0.70 | (0.14 | ) | 1.06 | ||||||||||||||||
| Net asset value, end of period | $ | 11.76 | $ | 12.10 | $ | 11.94 | $ | 11.62 | $ | 10.92 | $ | 11.06 | ||||||||||||
TOTAL RETURN(d) | 3.34 | % | 1.75 | % | 8.33 | % | 7.83 | % | (0.37 | )% | 11.24 | % | ||||||||||||
| RATIOS/SUPPLEMENTAL DATA: | ||||||||||||||||||||||||
| Net assets, end of period (000s) | $ | 69,866 | $ | 66,445 | $ | 63,031 | $ | 52,579 | $ | 39,015 | $ | 24,061 | ||||||||||||
| Ratio of expenses to average net assets excluding fee waivers and reimbursements | 2.04 | %(e) | 2.07 | %(e) | 2.07 | % | 2.15 | % | 2.25 | % | 2.54 | %(e) | ||||||||||||
| Ratio of expenses to average net assets including fee waivers and reimbursements | 1.90 | %(e) | 1.90 | %(e) | 1.90 | % | 1.95 | %(f) | 2.05 | % | 2.05 | %(e) | ||||||||||||
| Ratio of net investment income to average net assets | 2.41 | %(e) | 0.77 | %(e) | 0.59 | % | 1.43 | % | 0.88 | % | 1.22 | %(e) | ||||||||||||
Portfolio turnover rate(g) | 65 | % | 42 | % | 98 | % | 108 | % | 128 | % | 69 | % | ||||||||||||
(a) | Effective May 1, 2014, the Board approved changing the fiscal year-end of the Funds from April 30 to October 31. |
(b) | Calculated using the average shares method. |
(c) | Less than ($0.005) per share. |
(d) | Total returns are for the period indicated and have not been annualized. Total returns would have been lower had certain expenses not been waived during the period. Returns shown do not reflect the deduction of taxes that a shareholder would pay on Fund distributions or the redemption of Fund shares. Returns shown exclude any applicable sales charges. |
(e) | Annualized. |
(f) | Contractual expense limitation change from 2.05% to 1.90% effective September 1, 2012. |
(g) | Portfolio turnover rate for periods less than one full year have not been annualized. |
See Notes to Financial Statements.
161 | April 30, 2015
| RiverFront Moderate Growth & Income Fund – Class I |
| Financial Highlights |
| Selected data for a share of beneficial interest outstanding throughout the periods indicated: |
For the Six Months Ended April 30, 2015 (Unaudited) | For the Fiscal Period Ended October 31, 2014(a) | For the Year Ended April 30, 2014 | For the Year Ended April 30, 2013 | For the Year Ended April 30, 2012 | For the Period August 2, 2010 (Inception) to April 30, 2011 | |||||||||||||||||||
| Net asset value, beginning of period | $ | 12.14 | $ | 11.98 | $ | 11.65 | $ | 10.94 | $ | 11.07 | $ | 10.00 | ||||||||||||
| INCOME/(LOSS) FROM INVESTMENT OPERATIONS: | ||||||||||||||||||||||||
Net investment income(b) | 0.20 | 0.11 | 0.19 | 0.26 | 0.20 | 0.17 | ||||||||||||||||||
| Net realized and unrealized gain/(loss) | 0.25 | 0.16 | 0.89 | 0.70 | (0.13 | ) | 1.01 | |||||||||||||||||
| Total from investment operations | 0.45 | 0.27 | 1.08 | 0.96 | 0.07 | 1.18 | ||||||||||||||||||
| DISTRIBUTIONS: | ||||||||||||||||||||||||
| From net investment income | (0.13 | ) | (0.11 | ) | (0.19 | ) | (0.25 | ) | (0.19 | ) | (0.11 | ) | ||||||||||||
| From net realized gains | (0.64 | ) | – | (0.56 | ) | – | – | (0.00 | )(c) | |||||||||||||||
| Tax return of capital | – | – | – | – | (0.01 | ) | – | |||||||||||||||||
| Total distributions | (0.77 | ) | (0.11 | ) | (0.75 | ) | (0.25 | ) | (0.20 | ) | (0.11 | ) | ||||||||||||
| Net increase/(decrease) in net asset value | (0.32 | ) | 0.16 | 0.33 | 0.71 | (0.13 | ) | 1.07 | ||||||||||||||||
| Net asset value, end of period | $ | 11.82 | $ | 12.14 | $ | 11.98 | $ | 11.65 | $ | 10.94 | $ | 11.07 | ||||||||||||
TOTAL RETURN(d) | 3.89 | % | 2.25 | % | 9.43 | % | 8.94 | % | 0.71 | % | 11.92 | % | ||||||||||||
| RATIOS/SUPPLEMENTAL DATA: | ||||||||||||||||||||||||
| Net assets, end of period (000s) | $ | 46,643 | $ | 42,081 | $ | 37,832 | $ | 25,898 | $ | 12,880 | $ | 7,535 | ||||||||||||
| Ratio of expenses to average net assets excluding fee waivers and reimbursements | 1.04 | %(e) | 1.07 | %(e) | 1.07 | % | 1.15 | % | 1.26 | % | 1.55 | %(e) | ||||||||||||
| Ratio of expenses to average net assets including fee waivers and reimbursements | 0.90 | %(e) | 0.90 | %(e) | 0.90 | % | 0.94 | %(f) | 1.05 | % | 1.05 | %(e) | ||||||||||||
| Ratio of net investment income to average net assets | 3.46 | %(e) | 1.77 | %(e) | 1.59 | % | 2.39 | % | 1.91 | % | 2.16 | %(e) | ||||||||||||
Portfolio turnover rate(g) | 65 | % | 42 | % | 98 | % | 108 | % | 128 | % | 69 | % | ||||||||||||
(a) | Effective May 1, 2014, the Board approved changing the fiscal year-end of the Funds from April 30 to October 31. |
(b) | Calculated using the average shares method. |
(c) | Less than ($0.005) per share. |
(d) | Total returns are for the period indicated and have not been annualized. Total returns would have been lower had certain expenses not been waived during the period. Returns shown do not reflect the deduction of taxes that a shareholder would pay on Fund distributions or the redemption of Fund shares. |
(e) | Annualized. |
(f) | Contractual expense limitation change from 1.05% to 0.90% effective September 1, 2012. |
(g) | Portfolio turnover rate for periods less than one full year have not been annualized. |
See Notes to Financial Statements.
162 | April 30, 2015
| Notes to Financial Statements | |
| April 30, 2015 (Unaudited) |
| 1. Organization |
Financial Investors Trust (the “Trust”), a Delaware statutory trust, is an open-end management investment company registered under the Investment Company Act of 1940, as amended (“1940 Act”). As of April 30, 2015, the Trust had 30 registered funds. This semi-annual report includes the financial statements and financial highlights of the following 13 funds: ALPS | Alerian MLP Infrastructure Index Fund, ALPS | CoreCommodity Management CompleteCommodities® Strategy Fund, ALPS | Kotak India Growth Fund, ALPS | Red Rocks Listed Private Equity Fund, ALPS | Sterling ETF Tactical Rotation Fund, ALPS | Westport Resources Hedged High Income Fund, ALPS | WMC Research Value Fund (formerly the ALPS|WMC Disciplined Value Fund), Clough China Fund, RiverFront Conservative Income Builder Fund, RiverFront Dynamic Equity Income Fund, RiverFront Global Allocation Fund, RiverFront Global Growth Fund and RiverFront Moderate Growth & Income Fund (each, a “Fund” and collectively, the “Funds”).
ALPS | Alerian MLP Infrastructure Index Fund seeks investment results that correspond (before fees and expenses) generally to the price and yield performance of its underlying index, the Alerian MLP Infrastructure Index. The ALPS | CoreCommodity Management CompleteCommodities® Strategy Fund seeks to maximize real returns (returns after inflation), consistent with prudent investment management. ALPS | Kotak India Growth Fund’s investment goal is long-term capital appreciation. ALPS | Red Rocks Listed Private Equity Fund seeks to maximize total return, which consists of appreciation on its investments and a variable income stream. ALPS | Sterling ETF Tactical Rotation Fund seeks investment results that correspond (before fees and expenses) generally to the performance of the Sterling Tactical Rotation Index. ALPS | Westport Resources Hedged High Income Fund seeks to provide high current income. The Fund’s secondary investment objective is to seek capital preservation, with the potential for capital appreciation. ALPS | WMC Research Value Fund seeks long-term capital appreciation: dividend income may be a factor in portfolio selection but is secondary to the Fund’s principal objective. The Clough China Fund seeks to provide investors with long-term capital appreciation. The RiverFront Conservative Income Builder Fund seeks to provide current income and potential for that income to grow over time. The RiverFront Dynamic Equity Income Fund seeks to achieve long-term growth and income through a combination of capital appreciation and rising dividend payments that exceed the average yield on global stocks generally. The RiverFront Global Allocation Fund seeks to provide high total investment return through a fully managed investment policy utilizing United States and foreign equity securities, debt and money market securities, the combination of which will be varied from time to time both with respect to types of securities and markets in response to changing market and economic trends. Total investment return means the combination of capital appreciation and investment income. The RiverFront Global Growth Fund seeks to achieve long-term capital appreciation through a fully managed investment policy utilizing United States and foreign equity securities, debt and money market securities, the combination of which will be varied from time to time both with respect to types of securities and markets in response to changing market and economic trends. The RiverFront Moderate Growth & Income Fund has two primary investment objectives: (1) seeks to provide a level of current income that exceeds the average yield on U.S. stocks in general and (2) to provide a growing stream of income over the years. The Funds secondary objective is to provide growth of capital.
The classes of each Fund differ principally in the applicable distribution and shareholder service fees. Shareholders of each class also bear certain expenses that pertain to that particular class. All shareholders bear the common expenses of the Fund and earn income and realized gains/losses from the Fund pro rata based on the average daily net assets of each class, without distinction between share classes. Dividends to shareholders are determined separately for each class based on income and expenses allocable to each class. Realized gain distributions to shareholders are allocated to each class pro rata based on the shares outstanding of each class on the date of distribution. Differences in per share dividend rates generally result from differences in separate class expenses, including distribution and shareholder service fees, if applicable.
Basis of Consolidation for the ALPS | CoreCommodity Management CompleteCommodities® Strategy Fund
CoreCommodity Management Cayman Commodity Fund Ltd. (the “Subsidiary”), a Cayman Islands exempted company, was incorporated on April 23, 2010 and is a wholly owned subsidiary of the ALPS | CoreCommodity Management CompleteCommodities® Strategy Fund (the “CoreCommodity Fund”). The Subsidiary acts as an investment vehicle for the CoreCommodity Fund in order to effect certain commodity-related investments on behalf of the CoreCommodity Fund. CoreCommodity Fund is the sole shareholder of the Subsidiary pursuant to a subscription agreement dated as of June 14, 2010, and it is intended that the CoreCommodity Fund will remain the sole shareholder and will continue to wholly own and control the Subsidiary. Under the Articles of Association of the Subsidiary, shares issued by the Subsidiary confer upon a shareholder the right to vote at general meetings of the Subsidiary and certain rights in connection with any winding-up or repayment of capital, as well as the right to participate in the profits or assets of the Subsidiary. The CoreCommodity Fund may invest up to 25% of its total assets in shares of the Subsidiary. As a wholly owned subsidiary of the CoreCommodity Fund, the financial statements of the Subsidiary are included in the consolidated financial statements and financial highlights of the CoreCommodity Fund. All investments held by the Subsidiary are disclosed in the accounts of the CoreCommodity Fund. As of April 30, 2015, net assets of the CoreCommodity Fund were $450,172,498, of which $94,791,596 or 21.06%, represented the CoreCommodity Fund’s ownership of all issued shares and voting rights of the Subsidiary.
Basis of Consolidation for the ALPS | Kotak India Growth Fund
ALPS | Kotak India Growth Fund, (the “Kotak Fund”) invests in the equity securities of Indian companies through its wholly owned, collective investment vehicle, the India Premier Equity Portfolio (the “Portfolio”). The Portfolio is registered with and regulated by the Mauritius Financial Services Commission. The Portfolio was formed for the purpose of facilitating the Kotak Fund’s purchase of securities of a wide selection of Indian companies, consistent with the Kotak Fund’s investment strategies. The Portfolio is a private company limited by shares incorporated under the Mauritius Companies Act 2001. As a wholly owned subsidiary of the Kotak Fund, financial statements of the Portfolio are included in the consolidated financial statements and financial highlights of the Kotak Fund. All investments held by the Portfolio are disclosed in the accounts of the Kotak Fund.
163 | April 30, 2015
| Notes to Financial Statements | |
| April 30, 2015 (Unaudited) |
The Portfolio established residency in Mauritius allowing the Kotak Fund to receive the beneficial tax treatment under the Treaty between India and Mauritius. If the benefits of the Treaty are denied or if the Portfolio is held to have a permanent establishment in India, gains derived by the Portfolio due to the sale of securities, may be subject to taxation in India. India’s Finance Act of 2012 had introduced legislation on General Anti-Avoidance Rules (“GAAR”) into the Act which contains treaty override provisions. The GAAR may be used by the Indian tax authorities to declare any arrangement whose main purpose or one of the main purposes is to obtain a tax benefit, as an “impermissible avoidance arrangement.” Originally, GAAR was to be effective from April 1, 2012; however, subsequent to the 2013 amendments introduced to the Finance Act, GAAR had been deferred until April 1, 2015. In the 2015 budget presentation, the Finance Minister (India) announced that the implementation of GAAR will be delayed by two years.
| 2. SIGNIFICANT ACCOUNTING POLICIES |
The following is a summary of significant accounting policies consistently followed by each Fund in the preparation of its financial statements. Each Fund is considered an investment company for financial reporting purposes, the following policies are in conformity with accounting principles generally accepted in the United States of America for investment companies (“U.S. GAAP”). The preparation of financial statements in conformity with U.S. GAAP requires management to make certain estimates and assumptions that affect the reported amounts of assets and liabilities and disclosures of contingent assets and liabilities at the date of the financial statements and the reported amounts of revenue and expenses during the period. Actual results could differ from those estimates. The following is a summary of significant accounting policies consistently followed by the Funds and subsidiaries, as applicable, in preparation of their financial statements.
Investment Valuation: The Funds generally value their securities based on market prices determined at the close of regular trading on the New York Stock Exchange (“NYSE”), normally 4:00 p.m. Eastern Time, on each day the NYSE is open for trading. For equity securities and mutual funds that are traded on an exchange, the market price is usually the closing sale or official closing price on that exchange.
The market price for debt obligations is generally the price supplied by an independent third-party pricing service approved by the Board, which may use a matrix, formula or other objective method that takes into consideration quotations from dealers, market transactions in comparable investments, market indices and yield curves. If vendors are unable to supply a price, or if the price supplied is deemed to be unreliable, the market price may be determined using quotations received from one or more brokers-dealers that make a market in the security. Short-term debt obligations that will mature in 60 days or less are valued at amortized cost; unless it is determined that using this method would not reflect an investment’s fair value. Investments in non-exchange traded funds are fair valued at their respective net asset values.
Futures contracts that are listed or traded on a national securities exchange, commodities exchange, contract market or comparable over the counter market, and that are freely transferable, are valued at their closing settlement price on the exchange on which they are primarily traded or based upon the current settlement price for a like instrument acquired on the day on which the instrument is being valued. A settlement price may not be used if the market makes a limit move with respect to a particular commodity. Over-the-counter swap contracts for which market quotations are readily available are valued based on quotes received from independent pricing services or one or more dealers that make markets in such securities.
Equity securities that are primarily traded on foreign securities exchanges are valued at the closing values of such securities on their respective foreign exchanges, except when an event occurs subsequent to the close of the foreign exchange and the close of the NYSE that was likely to have changed such value. In such an event, the fair value of those securities are determined in good faith through consideration of other factors in accordance with procedures established by and under the general supervision of the Board. The Funds will use a fair valuation model provided by an independent pricing service, which is intended to reflect fair value when a security’s value or a meaningful portion of the Fund’s portfolio is believed to have been materially affected by an valuation event that has occurred between the close of the exchange or market on which the security is traded and the close of the regular trading day on the NYSE.
Forward currency exchange contracts have a market value determined by the prevailing foreign currency exchange daily rates and current foreign currency exchange forward rates. The foreign currency exchange forward rates are calculated using an automated system that estimates rates on the basis of the current day foreign currency exchange rates and forward foreign currency exchange rates supplied by a pricing service. Foreign exchange rates and forward foreign currency exchange rates may generally be obtained at the close of the NYSE, normally 4:00 p.m. Eastern Time.
When such prices or quotations are not available, or when the Fair Value Committee appointed by the Board believes that they are unreliable, securities may be priced using fair value procedures approved by the Board.
164 | April 30, 2015
| Notes to Financial Statements | |
| April 30, 2015 (Unaudited) |
Fair Value Measurements: The Funds disclose the classification of their fair value measurements following a three-tier hierarchy based on the inputs used to measure fair value. Inputs refer broadly to the assumptions that market participants would use in pricing the asset or liability, including assumptions about risk. Inputs may be observable or unobservable. Observable inputs reflect the assumptions market participants would use in pricing the asset or liability that are developed based on market data obtained from sources independent of the reporting entity. Unobservable inputs reflect the reporting entity’s own assumptions about the assumptions market participants would use in pricing the asset or liability that are developed based on the best information available.
Various inputs are used in determining the value of each Fund’s investments as of the end of the reporting period. When inputs used fall into different levels of the fair value hierarchy, the level in the hierarchy within which the fair value measurement falls is determined based on the lowest level input that is significant to the fair value measurement in its entirety. The designated input levels are not necessarily an indication of the risk or liquidity associated with these investments. These inputs are categorized in the following hierarchy under applicable financial accounting standards:
| Level 1 – | Unadjusted quoted prices in active markets for identical investments, unrestricted assets or liabilities that a Fund has the ability to access at the measurement date; |
| Level 2 – | Quoted prices which are not active, quoted prices for similar assets or liabilities in active markets or inputs other than quoted prices that are observable (either directly or indirectly) for substantially the full term of the asset or liability; and |
| Level 3 – | Significant unobservable prices or inputs (including the Fund’s own assumptions in determining the fair value of investments) where there is little or no market activity for the asset or liability at the measurement date. |
The following is a summary of each Fund’s investments/financial instruments in the fair value hierarchy as of April 30, 2015:
| Level 1 - Unadjusted | Level 2 - Other Significant | Level 3 - Significant | ||||||||||||||
| Investments in Securities at Value | Quoted Prices | Observable Inputs | Unobservable Inputs | Total | ||||||||||||
| ALPS | Alerian MLP Infrastructure Index Fund | ||||||||||||||||
Master Limited Partnerships(a) | $ | 34,545,247 | $ | – | $ | – | $ | 34,545,247 | ||||||||
| Short Term Investments | 1,060,633 | – | – | 1,060,633 | ||||||||||||
| Total | $ | 35,605,880 | $ | – | $ | – | $ | 35,605,880 | ||||||||
| Level 1 - Unadjusted | Level 2 - Other Significant | Level 3 - Significant | ||||||||||||||
| Investments in Securities at Value | Quoted Prices | Observable Inputs | Unobservable Inputs | Total | ||||||||||||
ALPS | CoreCommodity Management CompleteCommodities® Strategy Fund | ||||||||||||||||
Common Stocks(a) | $ | 151,083,961 | $ | – | $ | – | $ | 151,083,961 | ||||||||
Master Limited Partnerships(a) | 1,961,796 | – | – | 1,961,796 | ||||||||||||
| Commodity‐Linked Notes | – | 4,110,520 | – | 4,110,520 | ||||||||||||
| Government Bonds | – | 227,541,705 | – | 227,541,705 | ||||||||||||
| Purchased Options | 532,900 | – | – | 532,900 | ||||||||||||
| Short Term Investments | 28,903,172 | – | – | 28,903,172 | ||||||||||||
| Total | $ | 182,481,829 | $ | 231,652,225 | $ | – | $ | 414,134,054 | ||||||||
| Other Financial Instruments | ||||||||||||||||
| Assets | ||||||||||||||||
| Futures Contracts | $ | 2,278,047 | $ | – | $ | – | $ | 2,278,047 | ||||||||
| Total Return Swap Contracts | – | 18,078,754 | – | 18,078,754 | ||||||||||||
| Liabilities | ||||||||||||||||
| Written Options | (2,740,500 | ) | – | – | (2,740,500 | ) | ||||||||||
| Futures Contracts | (1,574,569 | ) | – | – | (1,574,569 | ) | ||||||||||
| Total Return Swap Contracts | – | (599,708 | ) | – | (599,708 | ) | ||||||||||
| Total | $ | (2,037,022 | ) | $ | 17,479,046 | $ | – | $ | 15,442,022 | |||||||
165 | April 30, 2015
| Notes to Financial Statements | |
| April 30, 2015 (Unaudited) |
| Level 1 - Unadjusted | Level 2 - Other Significant | Level 3 - Significant | ||||||||||||||
| Investments in Securities at Value | Quoted Prices | Observable Inputs | Unobservable Inputs | Total | ||||||||||||
| ALPS | Kotak India Growth Fund | ||||||||||||||||
| Common Stocks | ||||||||||||||||
| Consumer Discretionary | $ | – | $ | 1,842,990 | $ | – | $ | 1,842,990 | ||||||||
| Consumer Staples | – | 1,711,509 | – | 1,711,509 | ||||||||||||
| Energy | – | 603,223 | – | 603,223 | ||||||||||||
| Financials | 206,455 | 5,082,918 | – | 5,289,373 | ||||||||||||
| Health Care | 190,235 | 1,071,588 | – | 1,261,823 | ||||||||||||
| Industrials | 143,589 | 1,709,810 | – | 1,853,399 | ||||||||||||
| Information Technology | 1,296,574 | 833,325 | – | 2,129,899 | ||||||||||||
| Materials | 107,886 | 2,008,084 | – | 2,115,970 | ||||||||||||
| Telecommunication Services | – | 157,473 | – | 157,473 | ||||||||||||
| Utilities | – | 55,864 | – | 55,864 | ||||||||||||
| Total | $ | 1,944,739 | $ | 15,076,784 | $ | – | $ | 17,021,523 | ||||||||
| Level 1 - Unadjusted | Level 2 - Other Significant | Level 3 - Significant | ||||||||||||||
| Investments in Securities at Value | Quoted Prices | Observable Inputs | Unobservable Inputs | Total | ||||||||||||
| ALPS | Red Rocks Listed Private Equity Fund | ||||||||||||||||
| Closed‐End Funds | $ | 53,079,570 | $ | – | $ | – | $ | 53,079,570 | ||||||||
Common Stocks(a) | 455,707,140 | – | – | 455,707,140 | ||||||||||||
| Short Term Investments | 15,151,192 | – | – | 15,151,192 | ||||||||||||
| Total | $ | 523,937,902 | $ | – | $ | – | $ | 523,937,902 | ||||||||
| Level 1 - Unadjusted | Level 2 - Other Significant | Level 3 - Significant | ||||||||||||||
| Investments in Securities at Value | Quoted Prices | Observable Inputs | Unobservable Inputs | Total | ||||||||||||
| ALPS | Sterling ETF Tactical Rotation Fund | ||||||||||||||||
| Exchange Traded Funds | $ | 28,162,719 | $ | – | $ | – | $ | 28,162,719 | ||||||||
| Short Term Investments | 93,075 | – | – | 93,075 | ||||||||||||
| Total | $ | 28,255,794 | $ | – | $ | – | $ | 28,255,794 | ||||||||
166 | April 30, 2015
| Notes to Financial Statements | |
| April 30, 2015 (Unaudited) |
| Level 1 - Unadjusted | Level 2 - Other Significant | Level 3 - Significant | ||||||||||||||
| Investments in Securities at Value | Quoted Prices | Observable Inputs | Unobservable Inputs | Total | ||||||||||||
| ALPS | Westport Resources Hedged High Income Fund | ||||||||||||||||
| Exchange Traded Funds | $ | 349,780 | $ | – | $ | – | $ | 349,780 | ||||||||
Bank Loans(a) | – | 5,762,769 | – | 5,762,769 | ||||||||||||
Convertible Corporate Bonds(a) | – | 1,021,014 | – | 1,021,014 | ||||||||||||
| Corporate Bonds | ||||||||||||||||
| Basic Materials | – | 607,495 | – | 607,495 | ||||||||||||
| Communications | – | 1,078,096 | – | 1,078,096 | ||||||||||||
| Consumer, Cyclical | – | 1,547,156 | – | 1,547,156 | ||||||||||||
| Consumer, Non-cyclical | – | 553,839 | – | 553,839 | ||||||||||||
| Energy | – | 1,351,982 | – | 1,351,982 | ||||||||||||
| Financials | – | 1,828,170 | – | 1,828,170 | ||||||||||||
| Industrials | – | 1,074,947 | 262,500 | 1,337,447 | ||||||||||||
| Technology | – | 541,475 | – | 541,475 | ||||||||||||
| Mortgage Backed Securities | – | 2,516,237 | – | 2,516,237 | ||||||||||||
| Short Term Securities | – | 49,995 | – | 49,995 | ||||||||||||
| Total | $ | 349,780 | $ | 17,933,175 | $ | 262,500 | $ | 18,545,455 | ||||||||
| Other Financial Instruments | ||||||||||||||||
| Assets | ||||||||||||||||
| Futures Contracts | $ | 7,738 | $ | – | $ | – | $ | 7,738 | ||||||||
| Forward Foreign Currency Contracts | – | 424 | – | 424 | ||||||||||||
| Liabilities | ||||||||||||||||
| Futures Contracts | (75,182 | ) | – | – | (75,182 | ) | ||||||||||
| Credit Default Swap Contracts | – | (27,745 | ) | – | (27,745 | ) | ||||||||||
| Forward Foreign Currency Contracts | – | (2,456 | ) | – | (2,456 | ) | ||||||||||
| Total | $ | (67,444 | ) | $ | (29,777 | ) | $ | – | $ | (97,221 | ) | |||||
| Level 1 - Unadjusted | Level 2 - Other Significant | Level 3 - Significant | ||||||||||||||
| Investments in Securities at Value | Quoted Prices | Observable Inputs | Unobservable Inputs | Total | ||||||||||||
| ALPS | WMC Research Value Fund | ||||||||||||||||
Common Stocks(a) | $ | 103,157,786 | $ | – | $ | – | $ | 103,157,786 | ||||||||
| Exchange Traded Funds | 300,531 | – | – | 300,531 | ||||||||||||
| Short Term Investments | 60,491 | – | – | 60,491 | ||||||||||||
| Total | $ | 103,518,808 | $ | – | $ | – | $ | 103,518,808 | ||||||||
| Level 1 - Unadjusted | Level 2 - Other Significant | Level 3 - Significant | ||||||||||||||
| Investments in Securities at Value | Quoted Prices | Observable Inputs | Unobservable Inputs | Total | ||||||||||||
| Clough China Fund | ||||||||||||||||
| Common Stocks | ||||||||||||||||
| Communications | $ | – | $ | 14,826,295 | $ | – | $ | 14,826,295 | ||||||||
| Consumer, Cyclical | 466,527 | 10,721,561 | – | 11,188,088 | ||||||||||||
| Consumer, Non-Cyclical | – | 1,956,918 | – | 1,956,918 | ||||||||||||
| Energy | – | 10,374,912 | – | 10,374,912 | ||||||||||||
| Financials | – | 38,335,933 | – | 38,335,933 | ||||||||||||
| Industrials | 455,792 | 9,625,864 | – | 10,081,656 | ||||||||||||
| Materials | – | 341,082 | – | 341,082 | ||||||||||||
| Technology | – | 13,202,181 | – | 13,202,181 | ||||||||||||
| Utilities | – | 1,163,343 | – | 1,163,343 | ||||||||||||
Participation Notes(a) | – | 9,696,514 | – | 9,696,514 | ||||||||||||
| Short Term Investments | 3,665,560 | – | – | 3,665,560 | ||||||||||||
| Total | $ | 4,587,879 | $ | 110,244,603 | $ | – | $ | 114,832,482 | ||||||||
167 | April 30, 2015
| Notes to Financial Statements | |
| April 30, 2015 (Unaudited) |
| Level 1 - Unadjusted | Level 2 - Other Significant | Level 3 - Significant | ||||||||||||||
| Investments in Securities at Value | Quoted Prices | Observable Inputs | Unobservable Inputs | Total | ||||||||||||
| RiverFront Conservative Income Builder Fund | ||||||||||||||||
Common Stocks(a) | $ | 40,502 | $ | – | $ | – | $ | 40,502 | ||||||||
Exchange Traded Funds(a) | 7,606,053 | – | – | 7,606,053 | ||||||||||||
Exchange Traded Notes(a) | 81,574 | – | – | 81,574 | ||||||||||||
| Short Term Investments | 231,918 | – | – | 231,918 | ||||||||||||
| Total | $ | 7,960,047 | $ | – | $ | – | $ | 7,960,047 | ||||||||
| Level 1 - Unadjusted | Level 2 - Other Significant | Level 3 - Significant | ||||||||||||||
| Investments in Securities at Value | Quoted Prices | Observable Inputs | Unobservable Inputs | Total | ||||||||||||
| RiverFront Dynamic Equity Income Fund | ||||||||||||||||
Common Stocks(a) | $ | 4,941,457 | $ | – | $ | – | $ | 4,941,457 | ||||||||
Exchange Traded Funds(a) | 64,801,562 | – | – | 64,801,562 | ||||||||||||
Exchange Traded Notes(a) | 964,157 | – | – | 964,157 | ||||||||||||
| Short Term Investments | 3,453,507 | – | – | 3,453,507 | ||||||||||||
| Total | $ | 74,160,683 | $ | – | $ | – | $ | 74,160,683 | ||||||||
| Level 1 - Unadjusted | Level 2 - Other Significant | Level 3 - Significant | ||||||||||||||
| Investments in Securities at Value | Quoted Prices | Observable Inputs | Unobservable Inputs | Total | ||||||||||||
| RiverFront Global Allocation Fund | ||||||||||||||||
Common Stocks(a) | $ | 2,575,552 | $ | – | $ | – | $ | 2,575,552 | ||||||||
Exchange Traded Funds(a) | 36,387,660 | – | – | 36,387,660 | ||||||||||||
Exchange Traded Notes(a) | 832,098 | – | – | 832,098 | ||||||||||||
| Short Term Investments | 1,276,038 | – | – | 1,276,038 | ||||||||||||
| Total | $ | 41,071,348 | $ | – | $ | – | $ | 41,071,348 | ||||||||
| Level 1 - Unadjusted | Level 2 - Other Significant | Level 3 - Significant | ||||||||||||||
| Investments in Securities at Value | Quoted Prices | Observable Inputs | Unobservable Inputs | Total | ||||||||||||
| RiverFront Global Growth Fund | ||||||||||||||||
Common Stocks(a) | $ | 5,448,920 | $ | – | $ | – | $ | 5,448,920 | ||||||||
Exchange Traded Funds(a) | 72,682,678 | – | – | 72,682,678 | ||||||||||||
Exchange Traded Notes(a) | 1,657,198 | – | – | 1,657,198 | ||||||||||||
| Short Term Investments | 2,559,750 | – | – | 2,559,750 | ||||||||||||
| Total | $ | 82,348,546 | $ | – | $ | – | $ | 82,348,546 | ||||||||
| Level 1 - Unadjusted | Level 2 - Other Significant | Level 3 - Significant | ||||||||||||||
| Investments in Securities at Value | Quoted Prices | Observable Inputs | Unobservable Inputs | Total | ||||||||||||
| RiverFront Moderate Growth & Income Fund | ||||||||||||||||
Common Stocks(a) | $ | 9,356,615 | $ | – | $ | – | $ | 9,356,615 | ||||||||
Exchange Traded Funds(a) | 126,504,690 | – | – | 126,504,690 | ||||||||||||
Exchange Traded Notes(a) | 3,364,514 | – | – | 3,364,514 | ||||||||||||
| Short Term Investments | 4,137,391 | – | – | 4,137,391 | ||||||||||||
| Total | $ | 143,363,210 | $ | – | $ | – | $ | 143,363,210 | ||||||||
| (a) | For detailed descriptions of country, sector and/or industry, see the accompanying Statement of Investments or Consolidated Statement of Investments. |
The Funds recognize transfers between levels as of the end of the period. For the Six-Month Period Ended April 30, 2015, the Funds did not have any transfers between Level 1 and Level 2 securities, except the Clough China Fund and ALPS | Kotak India Growth Fund. The Clough China Fund and ALPS | Kotak India Growth Fund utilize a fair value evaluation service with respect to international securities with an earlier market closing than the Funds’ net asset value computation cutoff. When events trigger the use of the fair value evaluation service on a reporting period date, it results in certain securities transferring from a Level 1 to a Level 2 classification. The transfer amount disclosed in the table below represents the value of the securities as of April 30, 2015 transferred in/(out) of Level 1 and Level 2 during the reporting period that were also held as of October 31, 2014.
168 | April 30, 2015
| Notes to Financial Statements | |
| April 30, 2015 (Unaudited) |
The Clough China Fund had the following transfers between Levels 1 and 2 at April 30, 2015:
| Level 1 - Quoted and Unadjusted Prices | Level 2 - Other Significant Observable Inputs | |||||||||||||||
| Transfers In | Transfers (Out) | Transfers In | Transfers (Out) | |||||||||||||
| Common Stocks | $ | – | $ | (2,165,238 | ) | $ | 2,165,238 | $ | – | |||||||
| Total | $ | – | $ | (2,165,238 | ) | $ | 2,165,238 | $ | – | |||||||
The ALPS | Kotak India Growth Fund had the following transfers between Levels 1 and 2 at April 30, 2015:
| Level 1 - Quoted and Unadjusted Prices | Level 2 - Other Significant Observable Inputs | |||||||||||||||
| Transfers In | Transfers (Out) | Transfers In | Transfers (Out) | |||||||||||||
| Common Stocks | $ | 1,296,574 | $ | (1,299,462 | ) | $ | 1,299,462 | $ | (1,296,574 | ) | ||||||
| Total | $ | 1,296,574 | $ | (1,299,462 | ) | $ | 1,299,462 | $ | (1,296,574 | ) | ||||||
The changes of the fair value of investments for which the Funds have used Level 3 inputs to determine the fair value are as follows:
Investments in Securities | Balance as of October 31, 2014 | Accrued discount/ premium | Realized Gain/(Loss) | Change in Unrealized Appreciation/ (Depreciation) | Purchases | Sales Proceeds | Transfer into Level 3 | Transfer out of Level 3 | Balance as of April 30, 2015 | Net change in unrealized appreciation/ (depreciation) included in the Statements of Operations attributable to Level 3 investments held at April 30, 2015 | ||||||||||||||||||||||||||||||
| ALPS|Westport Resources Hedged High Income Fund | ||||||||||||||||||||||||||||||||||||||||
| Corporate Bonds | $ | 262,500 | $ | 6,875 | $ | – | $ | (6,875 | ) | $ | – | $ | – | $ | – | $ | – | $ | 262,500 | $ | (6,875 | ) | ||||||||||||||||||
| Total | $ | 262,500 | $ | 6,875 | $ | – | $ | (6,875 | ) | $ | – | $ | – | $ | – | $ | – | $ | 262,500 | $ | (6,875 | ) | ||||||||||||||||||
Information about Level 3 fair value measurements as of April 30, 2015:
| Fair Value | Valuation Technique | Unobservable Input | ||||
| ALPS|Westport Resources Hedged High Income Fund | ||||||
| Assets | ||||||
| Corporate Bonds | $ | 262,500 | Broker | Broker Quote | ||
Offering Costs: The ALPS | Sterling ETF Tactical Rotation Fund and ALPS | Westport Resources Hedged High Income Fund incurred offering costs during the Six-Month Period Ended April 30, 2015. These offering costs, including fees for printing initial prospectuses, legal, and registration fees, are being amortized over the first twelve months from the inception date of each Fund. Amounts amortized through April 30, 2015 are shown on each Fund’s Statement of Operations.
Fund and Class Expenses: Some expenses of the Trust can be directly attributed to a Fund or a specific share class of a Fund. Expenses which cannot be directly attributed are apportioned among all Funds in the Trust based on average net assets of each share class within a Fund.
Federal Income Taxes: The Funds, except for ALPS | Alerian MLP Infrastructure Index Fund, comply with the requirements under Subchapter M of the Internal Revenue Code of 1986, as amended (the “Code”) applicable to regulated investment companies and intend to distribute substantially all of their net taxable income and net capital gains, if any, each year. Those Funds are not subject to income taxes to the extent such distributions are made.
169 | April 30, 2015
| Notes to Financial Statements | |
| April 30, 2015 (Unaudited) |
The ALPS | Alerian MLP Infrastructure Index Fund is taxed as a regular corporation (or so-called subchapter “C” corporation) for federal income tax purposes, and will be subject to tax on its taxable income at rates applicable to corporations. Currently, the maximum marginal regular federal income tax rate for a corporation is 35 percent, but the Fund expects to pay federal income tax at a rate of 34 percent. The ALPS | Alerian MLP Infrastructure Index Fund may be subject to a 20 percent federal alternative minimum tax on its federal alternative taxable income to the extent that its alternative minimum tax exceeds its regular federal income tax. This differs from most investment companies, which elect to be treated as “regulated investment companies” under the Code in order to avoid paying entity level income taxes. Under current law, the ALPS | Alerian MLP Infrastructure Index Fund is not eligible to elect treatment as a regulated investment company due to its investments, primarily in Master Limited Partnerships (“MLPs”) invested in energy assets. As a result, the ALPS | Alerian MLP Infrastructure Index Fund will be obligated to pay applicable federal and state corporate income taxes on its taxable income as opposed to most other investment companies which are not so obligated. As discussed below, the ALPS | Alerian MLP Infrastructure Index Fund expects that a portion of the distributions it receives from MLPs may be treated as a tax-deferred return of capital, thus reducing the Fund’s current tax liability. However, the amount of taxes currently paid by the ALPS | Alerian MLP Infrastructure Index Fund will vary depending on the amount of income and gains derived from investments and/or sales of MLP interests and such taxes will reduce the return from an investment in the Fund. See further disclosure regarding MLPs below.
As of and during the Six-Month Period Ended April 30, 2015, the Funds, except the ALPS | Alerian MLP Infrastructure Index Fund, did not have a liability for any unrecognized tax benefits. The Funds file U.S. federal, state, and local tax returns as required. The Funds’ tax returns are subject to examination by the relevant tax authorities until expiration of the applicable statute of limitations which is generally three years after the filing of the tax return, but may extend to four years in certain jurisdictions. Tax returns for open years have incorporated no uncertain tax positions that require a provision for income taxes.
Distributions to Shareholders: Each Fund, except the ALPS | CoreCommodity Management CompleteCommodities® Strategy Fund, RiverFront Conservative Income Builder Fund, RiverFront Dynamic Equity Income Fund, and RiverFront Moderate Growth & Income Fund normally pays dividends and distributes capital gains, if any, on an annual basis. The ALPS | CoreCommodity Management CompleteCommodities® Strategy Fund, RiverFront Conservative Income Builder Fund, RiverFront Dynamic Equity Income Fund, and RiverFront Moderate Growth & Income Fund pay dividends, if any, on a quarterly basis and distribute capital gains annually. Income dividend distributions are derived from interest and other income the Fund receives from its investments, including distributions of short-term capital gains. Capital gain distributions are derived from gains realized when the Fund sells a security it has owned for more than a year. Each Fund may make additional distributions and dividends at other times if its portfolio manager or managers believe doing so may be necessary for the Fund to avoid or reduce taxes.
Distributions received from the ALPS | Alerian MLP Infrastructure Index Fund’s investments in MLPs generally are comprised of income and return of capital. The Fund records investment income and return of capital based on estimates made at the time such distributions are received. Such estimates are based on historical information available from each MLP and other industry sources. These estimates may subsequently be revised based on information received from MLPs after their tax reporting periods are concluded. Return of capital distributions are not taxable income to the shareholder, but reduce the investor’s tax basis in the investor’s Fund shares. Such a reduction in tax basis will result in larger taxable gains and/or lower tax losses on a subsequent sale of Fund shares. Shareholders who periodically receive the payment of dividends or other distributions consisting of a return of capital may be under the impression that they are receiving net profits from the Fund when, in fact, they are not. Shareholders should not assume that the source of the distributions is from the net profits of the Fund.
Commodity-Linked Notes: The ALPS | CoreCommodity Management CompleteCommodities® Strategy Fund may invest in commodity-linked notes which are derivative instruments that have characteristics of a debt security and of a commodity-linked derivative. A commodity-linked note typically provides for interest payments and a principal payment at maturity linked to the price movement of the underlying commodity, commodity index or commodity futures or option contract. Commodity-linked notes may be principal protected, partially protected, or offer no principal protection. The value of these notes will rise and fall in response to changes in the underlying commodity or related index or investment. These notes are often leveraged, increasing the volatility of each note’s value relative to the change in the underlying linked index. Commodity index-linked investments may be more volatile and less liquid than the underlying index and their value may be affected by the performance of the commodities as well as other factors, including liquidity, quality, maturity and other economic variables. Commodity-linked notes are typically issued by a bank or other financial institution and are sometimes referred to as structured notes because the terms of the notes may be structured by the issuer and the purchaser of the notes to accommodate the specific investment requirements of the purchaser.
Investment Transactions and Investment Income: Investment transactions are accounted for on the date the investments are purchased or sold (trade date basis). Net realized gains and losses from investment transactions are reported on an identified cost basis. Interest income, which includes accretion of discounts and amortization of premiums, is accrued and recorded as earned. Dividend income is recognized on the ex-dividend date or for certain foreign securities, as soon as information is available to each Fund.
Foreign Securities: Each Fund may directly purchase securities of foreign issuers. Investing in securities of foreign issuers involves special risks not typically associated with investing in securities of U.S. issuers. The risks include possible reevaluation of currencies, the inability to repatriate foreign currency, less complete financial information about companies and possible future adverse political and economic developments.
Moreover, securities of many foreign issuers and their markets may be less liquid and their prices more volatile than those of securities of comparable U.S. issuers.
170 | April 30, 2015
| Notes to Financial Statements | |
| April 30, 2015 (Unaudited) |
Foreign Currency Translation: The books and records of the Funds are maintained in U.S. dollars. Investment valuations and other assets and liabilities initially expressed in foreign currencies are converted each business day into U.S. dollars based upon current exchange rates. The portion of realized and unrealized gains or losses on investments due to fluctuations in foreign currency exchange rates is not separately disclosed and is included in realized and unrealized gains or losses on investments, when applicable.
Foreign Currency Spot Contracts: The Funds may enter into foreign currency spot contracts to facilitate transactions in foreign securities or to convert foreign currency receipts into U.S. dollars. A foreign currency spot contract is an agreement between two parties to buy and sell currencies at the current market rate, for settlement generally within two business days. The U.S. dollar value of the contracts is determined using current currency exchange rates supplied by a pricing service. The contract is marked‐to‐market daily for settlements beyond one day and any change in market value is recorded as an unrealized gain or loss. When the contract is closed, the Fund records a realized gain or loss equal to the difference between the value on the open and close date. Losses may arise from changes in the value of the foreign currency, or if the counterparties do not perform under the contract’s terms. The maximum potential loss from such contracts is the aggregate face value in U.S. dollars at the time the contract was opened.
Real Estate Investment Trusts (“REITs”): The Funds may invest a portion of their assets in REITs and are subject to certain risks associated with direct investment in REITs. REITs may be affected by changes in the value of their underlying properties and by defaults by borrowers or tenants. REITs depend generally on their ability to generate cash flow to make distributions to shareowners, and certain REITs have self‐liquidation provisions by which mortgages held may be paid in full and distributions of capital returns may be made at any time. In addition, the performance of a REIT may be affected by its failure to qualify for tax‐free pass‐through of income under the Internal Revenue Code of 1986, as amended (the “Code”), or its failure to maintain exemption from registration under the 1940 Act.
Treasury Inflation Protected‐Securities: The Funds may invest in treasury inflation protected securities (“TIPS”), including structured bonds in which the principal amount is adjusted daily to keep pace with inflation, as measured by the U.S. Consumer Pricing Index for Urban Consumers. The adjustments to principal due to inflation/deflation are reflected as increases/decreases to interest income with a corresponding adjustment to cost. Such adjustments may have a significant impact on a Fund’s distributions and may result in a return of capital to shareholders. The repayment of the original bond principal upon maturity is guaranteed by the full faith and credit of the U.S. Government.
Loan Participations and Assignments: Certain Funds may invest in loan participations and assignments. The Fund considers loan participations and assignments to be investments in debt securities. Loan participations typically will result in the Fund having a contractual relationship only with the lender, not with the borrower. The Fund will have the right to receive payments of principal, interest and any fees to which it is entitled only from the lender selling the participation and only upon receipt by the lender of the payments from the borrower. Under a loan participation, the Fund generally will have no right to enforce compliance by the borrower with the terms of the loan agreement relating to the loan, nor any rights of set‐off against the borrower, and the Fund may not benefit directly from any collateral supporting the loan in which it has purchased the participation. As a result, the Fund will assume the credit risk of both the borrower and the lender that is selling the participation. In the event of the insolvency of the lender selling a participation, the Fund may be treated as a general creditor of the lender and may not benefit from any set‐off between the lender and the borrower. When the Fund purchases assignments of loans from lenders, the Fund will acquire direct rights against the borrower on the loan, except that under certain circumstances such rights may be more limited than those held by the assigning lender.
Master Limited Partnerships: MLPs are publicly traded partnerships engaged in the transportation, storage and processing of minerals and natural resources. By confining their operations to these specific activities, their interests, or units, are able to trade on public securities exchanges exactly like the shares of a corporation, without entity level taxation. To qualify as a MLP and to not be taxed as a corporation, a partnership must receive at least 90% of its income from qualifying sources as set forth in Section 7704(d) of the Code. These qualifying sources include natural resource based activities such as the processing, transportation and storage of mineral or natural resources. MLPs generally have two classes of owners, the general partner and limited partners. The general partner of an MLP is typically owned by a major energy company, an investment fund, the direct management of the MLP, or is an entity owned by one or more of such parties. The general partner may be structured as a private or publicly traded corporation or other entity. The general partner typically controls the operations and management of the MLP through an up to 2% equity interest in the MLP plus, in many cases, ownership of common units and subordinated units. Limited partners typically own the remainder of the partnership, through ownership of common units, and have a limited role in the partnership’s operations and management. MLPs are typically structured such that common units and general partner interests have first priority to receive quarterly cash distributions up to an established minimum amount (“minimum quarterly distributions” or “MQD”). Common and general partner interests also accrue arrearages in distributions to the extent the MQD is not paid. Once common and general partner interests have been paid, subordinated units receive distributions of up to the MQD; however, subordinated units do not accrue arrearages. Distributable cash in excess of the MQD is paid to both common and subordinated units and is distributed to both common and subordinated units generally on a pro rata basis. The general partner is also eligible to receive incentive distributions if the general partner operates the business in a manner which results in distributions paid per common unit surpassing specified target levels. As the general partner increases cash distributions to the limited partners, the general partner receives an increasingly higher percentage of the incremental cash distributions.
171 | April 30, 2015
| Notes to Financial Statements | |
| April 30, 2015 (Unaudited) |
| 3. | DERIVATIVE INSTRUMENTS |
As a part of their investment strategy, the ALPS | CoreCommodity Management CompleteCommodities® Strategy Fund, ALPS | Kotak India Growth Fund and ALPS | Westport Resources Hedged High Income Fund are permitted to enter in various types of derivatives contracts. The other funds including ALPS | Alerian MLP Infrastructure Index Fund, ALPS | Red Rocks Listed Private Equity Fund, ALPS|Sterling ETF Tactical Rotation Fund, ALPS | WMC Research Value Fund, Clough China Fund, RiverFront Conservative Income Builder Fund, RiverFront Dynamic Equity Income Fund, RiverFront Global Allocation Fund, RiverFront Global Growth Fund and RiverFront Moderate Growth & Income Fund may invest to a lesser extent in derivatives contracts. In doing so, the Funds will employ strategies in differing combinations to permit them to increase, decrease, or change the level or types of exposure to market factors. Central to those strategies are features inherent in derivatives that make them more attractive for this purpose than equity or debt securities; they require little or no initial cash investment, they can focus exposure on only certain selected risk factors, and they may not require the ultimate receipt or delivery of the underlying security (or securities) to the contract. This may allow the Funds to pursue their objectives more quickly and efficiently than if they were to make direct purchases or sales of securities capable of affecting a similar response to market factors.
Cash collateral that has been pledged to cover derivative obligations of the Funds and cash collateral received from the counterparty, if any, is reported separately on the Statements of Assets and Liabilities as cash pledged as collateral and cash received as collateral, respectively. Non‐cash collateral pledged by the Funds, if any, is noted in the Statements of Investments.
Risk of Investing in Derivatives: The Funds’ use of derivatives can result in losses due to unanticipated changes in the market risk factors and the overall market. In instances where the Funds are using derivatives to decrease, or hedge, exposures to market risk factors for securities held by the Funds, there are also risks that those derivatives may not perform as expected resulting in losses for the combined or hedged positions.
Derivatives may have little or no initial cash investment relative to their market value exposure and therefore can produce significant gains or losses in excess of their cost. This use of embedded leverage allows the Fund to increase its market value exposure relative to its net assets and can substantially increase the volatility of the Funds’ performance.
Additional associated risks from investing in derivatives also exist and potentially could have significant effects on the valuation of the derivative and the Funds. Typically, the associated risks are not the risks that the Funds are attempting to increase or decrease exposure to, per their investment objectives, but are the additional risks from investing in derivatives.
Examples of these associated risks are liquidity risk, which is the risk that the Funds will not be able to sell or close out the derivative in a timely manner, and counterparty credit risk, which is the risk that the counterparty will not fulfill its obligation to the Funds. In addition, use of derivatives may increase or decrease exposure to the following risk factors:
Equity Risk: Equity risk relates to the change in value of equity securities as they relate to increases or decreases in the general market. Associated risks can be different for each type of derivative and are discussed by each derivative type in the notes that follow.
Commodity Risk: Exposure to the commodities markets may subject the Funds to greater volatility than investments in traditional securities. Prices of various commodities may also be affected by factors, such as drought, floods, weather, livestock disease, embargoes, tariffs and other regulatory developments, which are unpredictable. The prices of commodities can also fluctuate widely due to supply and demand disruptions in major producing or consuming regions.
Foreign Currency Risk: Currency trading involves significant risks, including market risk, interest rate risk, country risk, counterparty credit risk and short sale risk. Market risk results from the price movement of foreign currency values in response to shifting market supply and demand. Interest rate risk arises whenever a country changes its stated interest rate target associated with its currency. Country risk arises because virtually every country has interfered with international transactions in its currency.
Interest Rate Risk: Interest rate risk is the risk that fixed income securities will decline in value because of changes in interest rates. As nominal interest rates rise, the value of fixed income securities held by the Funds are likely to decrease. Securities with longer durations tend to be more sensitive to changes in interest rates, and are usually more volatile than securities.
172 | April 30, 2015
| Notes to Financial Statements | |
| April 30, 2015 (Unaudited) |
Swap Contracts: Each Fund may enter into swap transactions for hedging purposes or to seek to increase total return. At the present time, the CoreCommodity Fund primarily enters into swap transactions for the purpose of increasing total return and the ALPS Westport Hedged High Income Fund for hedging purposes. Swap agreements may be executed in a multilateral or other trade facility program, such as a registered exchange (“centrally cleared swaps”) or may be privately negotiated in the over‐the counter market. The duration of a swap agreement typically ranges from a few weeks to more than one year. In a centrally cleared swap, immediately following execution of the swap agreement, the swap agreement is novated to a central counterparty (the “CCP”) and the Fund’s counterparty on the swap agreement becomes the CCP. Risks may arise as a result of the failure of the counterparty to the swap contract to comply with the terms of the swap contract. The loss incurred by the failure of a counterparty is generally limited to the net payment to be received by the Funds and/or the termination value at the end of the contract. Therefore, the Funds consider the creditworthiness of each counterparty to a contract in evaluating potential credit risk. Although centrally cleared swaps typically present less counterparty risk than non‐centrally cleared swaps, a Fund that has entered into centrally cleared swaps is subject to the risk of the failure of the CCP.
Additionally, risks may arise from unanticipated movements in interest rates or in the value of the underlying reference asset or index. Entering into these agreements involves, to varying degrees, market risk, liquidity risk and elements of credit, legal and documentation risk that are not directly reflected in the amounts recognized in the Statements of Assets and Liabilities.
The Funds may pay or receive cash as collateral on these contracts which may be recorded as an asset and/or liability. The Funds must set aside liquid assets, or engage in other appropriate measures, to cover its obligations under these contracts. Swaps are marked to market daily using either pricing vendor quotations, counterparty prices or model prices and the change in value, if any, is recorded as an unrealized gain or loss. Upfront payments made and/or received by the Funds are recorded as an asset and/or liability and realized gains or losses are recognized ratably over the contract’s term/event, with the exception of forward starting interest rate swaps, whose realized gains or losses are recognized ratably from the effective start date. Periodic payments received or made on swap contracts are recorded as realized gains or losses. Gains or losses are realized upon termination of a swap contract and are recorded on the Statement of Operations.
Total return swaps are agreements in which there is an exchange of cash flows whereby one party commits to make payments based on the total return (coupons plus capital gains/losses) of an underlying instrument in exchange for fixed or floating rate interest payments. To the extent the total return of the instrument or index underlying the transaction exceeds or falls short of the offsetting interest rate obligation, the Fund will receive a payment from or make a payment to the counterparty. Credit default swaps are a type of swap agreement in which the protection “buyer” is generally obligated to pay the protection “seller” an upfront and/ or a periodic stream of payments over the term of the contract provided that no credit event, such as a default, on a reference obligation has occurred. Credit default swaps (“CDS”) are typically two‐party financial contracts that transfer credit exposure between the two parties. Under a typical CDS, one party (the “seller”) receives pre‐determined periodic payments from the other party (the “buyer”). The seller agrees to make compensating specific payments to the buyer if a negative credit event occurs, such as the bankruptcy or default by the issuer of the underlying debt instrument. Swap agreements held at April 30, 2015 are disclosed after the Statement of Investments.
The number of swap contracts held at April 30, 2015 is representative of the swap contract activity for the Six‐Month Period Ended April 30, 2015.
Futures: Each Fund may invest in futures contracts in accordance with their investment objectives. Each Fund does so for a variety of reasons including for cash management, hedging or non‐hedging purposes in an attempt to achieve the Fund’s investment objective. A futures contract provides for the future sale by one party and purchase by another party of a specified quantity of the security or other financial instrument at a specified price and time. A futures contract on an index is an agreement pursuant to which two parties agree to take or make delivery of an amount of cash equal to the difference between the value of the index at the close of the last trading day of the contract and the price at which the index contract was originally written. Futures transactions may result in losses in excess of the amount invested in the futures contract. There can be no guarantee that there will be a correlation between price movements in the hedging vehicle and in the portfolio securities being hedged. An incorrect correlation could result in a loss on both the hedged securities in a Fund and the hedging vehicle so that the portfolio return might have been greater had hedging not been attempted. There can be no assurance that a liquid market will exist at a time when a Fund seeks to close out a futures contract or a futures option position. Lack of a liquid market for any reason may prevent a Fund from liquidating an unfavorable position, and the Fund would remain obligated to meet margin requirements until the position is closed. In addition, a Fund could be exposed to risk if the counterparties to the contracts are unable to meet the terms of their contracts. With exchange traded futures, there is minimal counterparty credit risk to the Funds since futures are exchange traded and the exchange’s clearinghouse, as counterparty to all exchange traded futures, guarantees the futures against default.
When a purchase or sale of a futures contract is made by a Fund, the Fund is required to deposit with its custodian (or broker, if legally permitted) a specified amount of liquid assets (“initial margin”). The margin required for a futures contract is set by the exchange on which the contract is traded and may be modified during the term of the contract. The initial margin is in the nature of a performance bond or good faith deposit on the futures contract that is returned to a Fund upon termination of the contract, assuming all contractual obligations have been satisfied. Each day a Fund may pay or receive cash, called “variation margin,” equal to the daily change in value of the futures contract. Such payments or receipts are recorded for financial statement purposes as unrealized gains or losses by a Fund. Variation margin does not represent a borrowing or loan by a Fund but is instead a settlement between a Fund and the broker of the amount one would owe the other if the futures contract expired. When the contract is closed, a Fund records a realized gain or loss equal to the difference between the value of the contract at the time it was opened and the value at the time it was closed.
173 | April 30, 2015
| Notes to Financial Statements | |
| April 30, 2015 (Unaudited) |
For the the ALPS | CoreCommodity Fund the number of futures contracts held at April 30, 2015 is representative of futures contracts activity during the Six‐Month Period Ended April 30, 2015. The average futures contract amounts for the ALPS | Westport Resources Fund during the same period ended April 30, 2015 was 181.
Option Contracts: Each Fund may enter into options transactions for hedging purposes and for non‐hedging purposes such as seeking to enhance return. Each Fund may write covered put and call options on any stocks or stock indices, currencies traded on domestic and foreign securities exchanges, or futures contracts on stock indices, interest rates and currencies traded on domestic and, to the extent permitted by the CFTC, foreign exchanges. A call option on an asset written by a Fund obligates the Fund to sell the specified asset to the holder (purchaser) at a stated price (the exercise price) if the option is exercised before a specified date (the expiration date). A put option on an asset written by a Fund obligates the Fund to buy the specified asset from the purchaser at the exercise price if the option is exercised before the expiration date. Premiums received when writing options are recorded as liabilities and are subsequently adjusted to the current value of the options written. Premiums received from writing options that expire are treated as realized gains. Premiums received from writing options, which are either exercised or closed, are offset against the proceeds received or amount paid on the transaction to determine realized gains or losses which are recorded on the Statement of Operations.
The Funds had the following transactions in written covered call/put options during the Period Ended April 30, 2015:
| Number of Contracts | Premiums Received | |||||||
ALPS | CoreCommodity Management CompleteCommodities® Strategy Fund | ||||||||
| Options Outstanding, at the beginning of the period | (536 | ) | $ | 1,186,481 | ||||
| Options written | (1,465 | ) | 2,829,321 | |||||
| Options closed | 773 | (1,684,563 | ) | |||||
| Options exercised | – | – | ||||||
| Options expired | 103 | (139,996 | ) | |||||
| Options Outstanding, at April 30, 2015 | (1,125 | ) | $ | 2,191,243 | ||||
Derivatives Instruments: The following tables disclose the amounts related to each Fund’s use of derivative instruments.
The effect of derivatives instruments on the Statement of Assets and Liabilities as of April 30, 2015:
| Risk Exposure | Asset Location | Fair Value | Liability Location | Fair Value | ||||||||||||
ALPS | CoreCommodity Management CompleteCommodities® Strategy Fund(a) | ||||||||||||||||
| Equity Contracts (Purchased Options) | Investments, at value | $ | 532,900 | N/A | $ | N/A | ||||||||||
| Equity Contracts (Written Options) | N/A | N/A | Written options, at value | 2,740,500 | ||||||||||||
| Commodity Contracts (Futures Contracts) | Receivable for variation margin(b) | 2,278,047 | Payable for variation margin (b) | 1,574,569 | ||||||||||||
| Commodity Contracts (Total Return Swap Contracts) | Unrealized appreciation on total return swap contracts | 18,078,754 | Unrealized depreciation on total return swap contracts | 599,708 | ||||||||||||
| Total | $ | 20,889,701 | $ | 4,914,777 | ||||||||||||
| ALPS | Westport Resources Hedged High Income Fund | ||||||||||||||||
| Interest Rate Contracts (Futures Contracts) | Receivable for variation margin | $ | 7,738 | Payable for variation margin | $ | 75,182 | ||||||||||
| Interest Rate Contracts (Credit Defualt Swap Contracts) | Unrealized appreciation on credit default swap contracts | N/A | Unrealized depreciation on credit default swap contracts | 27,745 | ||||||||||||
| Foreign Exchange Rate Contracts (Forward Foreign Currency Contracts) | Unrealized appreciation on forward foreign currency contracts | 424 | Unrealized depreciation on forward foreign currency contracts | 2,456 | ||||||||||||
| Total | $ | 8,162 | $ | 105,383 | ||||||||||||
(a) | The ALPS | CoreCommodity Management CompleteCommodities® Strategy Fund consolidates the statements of assets and liabilities. |
(b) | Includes cumulative appreciation (depreciation) of futures contracts as reported in the consolidated statement of investments. |
174 | April 30, 2015
| Notes to Financial Statements | |
| April 30, 2015 (Unaudited) |
The effect of derivatives instruments on the Statement of Operations for the Period Ended April 30, 2015:
| Change in Unrealized | |||||||||
Realized Gain/(Loss) | Appreciation/ (Depreciation) | ||||||||
on Derivatives Recognized | on Derivatives Recognized in | ||||||||
| Risk Exposure | Statement of Operations Location | in Income | Income | ||||||
ALPS | CoreCommodity Management CompleteCommodities® Strategy Fund(a) | |||||||||
| Equity Contracts (Purchased Options) | Net realized loss on investments/Net change in unrealized appreciation on investments | $ | (815,571 | ) | $ | (1,035,270 | ) | ||
| Equity Contracts (Written Options) | |||||||||
| Net realized gain on written options/Net change in unrealized (depreciation) on written options | 867,361 | (796,778 | ) | ||||||
| Futures Contracts* | Net realized loss on futures contracts/Net change in unrealized appreciation on futures contracts | (1,771,373 | ) | 1,860,901 | |||||
| Commodity Contracts (Total Return Swap Contracts) | Net realized loss on total return swap contracts/Net change in unrealized appreciation on total return swap contracts | (62,311,991 | ) | 23,561,010 | |||||
| Total | $ | (64,031,574 | ) | $ | 23,589,863 | ||||
| *Risk Exposure to Fund | |||||||||
| Commodity Contracts | $ | (1,390,546 | ) | $ | 1,860,901 | ||||
| Equity Contracts | (380,827 | ) | – | ||||||
| $ | (1,771,373 | ) | $ | 1,860,901 | |||||
| ALPS | Westport Resources Hedged High Income Fund | |||||||||
| Interest Rate Contracts (Futures Contracts) | Net realized loss on futures contracts/Net change in unrealized depreciation on futures contracts | $ | (70,160 | ) | $ | (38,661 | ) | ||
| Interest Rate Contracts (Credit Defualt Swap Contracts) | Net realized gain on credit defualt swap contracts/Net change in unrealized depreciation on credit default swap contracts | 1,015 | (17,071 | ) | |||||
| Foreign Exchange Rate Contracts (Forward Foreign Currency Contracts) | Net realized loss on foreign currency transactions/Net change in unrealized depreciation on translation of assets and liabilities denominated in foreign currencies and forward foreign currency contracts | N/A | N/A | ||||||
| Total | $ | (69,145 | ) | $ | (55,732 | ) | |||
(a) | The ALPS | CoreCommodity Management CompleteCommodities® Strategy Fund consolidates the statements of operations. |
175 | April 30, 2015
| Notes to Financial Statements | |
| April 30, 2015 (Unaudited) |
Certain derivative contracts are executed under either standardized netting agreements or, for exchange‐traded derivatives, the relevant contracts for a particular exchange which contain enforceable netting provisions. A derivative netting arrangement creates an enforceable right of set‐off that becomes effective, and affects the realization of settlement on individual assets, liabilities and collateral amounts, only following a specified event of default or early termination. Default events may include the failure to make payments or deliver securities timely, material adverse changes in financial condition or insolvency, the breach of minimum regulatory capital requirements, or loss of license, charter or other legal authorization necessary to perform under the contract.
The following table presents financial instruments that are subject to enforceable netting arrangements or other similar agreements as of April 30, 2015:
| Offsetting of Derivatives Asset | ||||||||||||||||||||||||
| April 30, 2015 | ||||||||||||||||||||||||
| Gross Amounts Not | ||||||||||||||||||||||||
| Offset in the | ||||||||||||||||||||||||
| Statement of | ||||||||||||||||||||||||
| Financial Position | ||||||||||||||||||||||||
| Gross Amounts | ||||||||||||||||||||||||
| Offset in the | Net Amounts | |||||||||||||||||||||||
| Statement of | Presented in the | |||||||||||||||||||||||
| Gross Amounts of | Assets and | Statement of Assets | Financial | Cash Collateral | ||||||||||||||||||||
| Description | Recognized Assets | Liabilities | and Liabilities | Instruments(a) | Received(a) | Net Amount | ||||||||||||||||||
| ALPS | CoreCommodity Management CompleteCommodities® Strategy Fund | ||||||||||||||||||||||||
| Total Return Swap Contracts | $ | 18,078,754 | $ | – | $ | 18,078,754 | $ | (599,708 | ) | $ | – | $ | 17,479,046 | |||||||||||
| Total | $ | 18,078,754 | $ | – | $ | 18,078,754 | $ | (599,708 | ) | $ | – | $ | 17,479,046 | |||||||||||
| Offsetting of Derivatives Liability | ||||||||||||||||||||||||
| April 30, 2015 | ||||||||||||||||||||||||
| Gross Amounts Not | ||||||||||||||||||||||||
| Offset in the | ||||||||||||||||||||||||
| Statement of | ||||||||||||||||||||||||
| Financial Position | ||||||||||||||||||||||||
| Gross Amounts | ||||||||||||||||||||||||
| Offset in the | Net Amounts | |||||||||||||||||||||||
| Gross Amounts of | Statement of | Presented in the | ||||||||||||||||||||||
| Recognized | Assets and | Statement of Assets | Financial | Cash Collateral | ||||||||||||||||||||
| Description | Liabilities | Liabilities | and Liabilities | Instruments(a) | Pledged(a) | Net Amount | ||||||||||||||||||
| ALPS | CoreCommodity Management CompleteCommodities® Strategy Fund | ||||||||||||||||||||||||
| Total Return Swap Contracts | $ | 599,708 | $ | – | $ | 599,708 | $ | (599,708 | ) | $ | – | $ | – | |||||||||||
| Total | $ | 599,708 | $ | – | $ | 599,708 | $ | (599,708 | ) | $ | – | $ | – | |||||||||||
(a) | These amounts are limited to the derivative asset/liability balance and, accordingly, do not include excess collateral received/pledged. |
| 4. | TAX BASIS INFORMATION |
Tax Basis of Distributions to Shareholders: The character of distributions made during the year from net investment income or net realized gains may differ from its ultimate characterization for federal income tax purposes. Also, due to the timing of dividend distributions, the fiscal year in which amounts are distributed may differ from the fiscal year in which the income or realized gain were recorded by a Fund. The amounts and characteristics of tax basis distributions and composition of distributable earnings/(accumulated losses) are finalized at fiscal year‐end. Accordingly, tax basis balances have not been determined as of April 30, 2015.
The tax character of distributions paid by the Funds for the Fiscal Periods Ended October 31, 2014 were as follows:
| Fund | Ordinary Income | Long-Term Capital Gain | Return of Capital | |||||||||
| ALPS | Alerian MLP Infrastructure Index Fund | $ | 94,908 | $ | – | $ | 828,416 | ||||||
ALPS | CoreCommodity Management CompleteCommodities® Strategy Fund | – | – | – | |||||||||
| ALPS | Kotak India Growth Fund | – | – | – | |||||||||
| ALPS | Red Rocks Listed Private Equity Fund | – | – | – | |||||||||
176 | April 30, 2015
| Notes to Financial Statements | |
| April 30, 2015 (Unaudited) |
| Fund | Ordinary Income | Long-Term Capital Gain | Return of Capital | |||||||||
| ALPS | Sterling ETF Tactical Rotation Fund | $ | – | $ | – | $ | – | ||||||
| ALPS | Westport Resources Hedged High Income Fund | 833,792 | – | – | |||||||||
| ALPS | WMC Research Value Fund | – | – | – | |||||||||
| Clough China Fund | – | – | – | |||||||||
| RiverFront Conservative Income Builder Fund | 35,707 | – | – | |||||||||
| RiverFront Dynamic Equity Income Fund | 355,945 | – | – | |||||||||
| RiverFront Global Allocation Fund | – | – | – | |||||||||
| RiverFront Global Growth Fund | – | – | – | |||||||||
| RiverFront Moderate Growth & Income Fund | 860,964 | – | – | |||||||||
Capital Losses: As of October 31, 2014 the following Funds had capital loss carryforwards which may reduce the Funds’ taxable income arising from future net realized gains on investments, if any, to the extent permitted by the Code and thus may reduce the amount of the distributions to shareholders which would otherwise be necessary to relieve the Funds of any liability for federal tax.
Under the recently enacted Regulated Investment Company Modernization Act of 2010, capital losses incurred by each fund in tax years beginning after December 22, 2010 will not be subject to expiration. In addition, such losses must be utilized prior to the losses incurred in the years preceding enactment.
Capital loss carryovers utilized during the Fiscal Period Ended October 31, 2014, were:
| Fund | Amount | |||
| ALPS | Kotak India Growth Fund | $ | 147,278 | ||
Post-Enactment Capital Losses*:
Capital losses deferred to next tax year were as follows:
| Fund | Short-Term | Long-Term | ||||||
ALPS | CoreCommodity Management CompleteCommodities® Strategy Fund | $ | 5,494,259 | $ | 2,670,859 | ||||
| ALPS | Red Rocks Listed Private Equity Fund | 35,975 | – | ||||||
| ALPS | Sterling ETF Tactical Rotation Fund | 148,421 | – | ||||||
| * | Post-Enactment Capital Losses arise in fiscal years beginning after December 22, 2010, and exclude any election for late year capital loss (during the period November 1st to December 31st) deferred for the current fiscal year. As a result of the enactment of the Regulated Investment Company Act of 2010, pre-enactment capital loss carryforwards may be more likely to expire unused. Additionally, post-enactment capital losses that are carried forward will retain their character as either short-term or long-term losses rather than being considered all short-term as under previous law. |
Unrealized Appreciation and Depreciation on Investments: As of April 30, 2015, the costs of investments for federal income tax purposes and accumulated net unrealized appreciation/(depreciation) on investments were as follows:
| Gross | Gross | |||||||||||||||||||
| Appreciation | Depreciation | Net Appreciation of | Cost of Investments | |||||||||||||||||
| (excess of value | (excess of tax | Foreign Currency | Net Unrealized | for Income Tax | ||||||||||||||||
| Fund | over tax cost) | cost over value) | and Derivatives | Appreciation | Purposes | |||||||||||||||
| ALPS | Alerian MLP Infrastructure Index Fund | $ | 2,414,782 | $ | (426,136 | ) | $ | – | $ | 1,988,646 | $ | 33,617,234 | |||||||||
ALPS | CoreCommodity Management CompleteCommodities® Strategy Fund | 13,987,853 | (26,617,796 | ) | – | (12,629,943 | ) | 426,763,997 | |||||||||||||
| ALPS | Kotak India Growth Fund | 1,948,343 | (817,805 | ) | – | 1,130,538 | 15,890,985 | ||||||||||||||
| ALPS | Red Rocks Listed Private Equity Fund | 67,245,254 | (7,709,381 | ) | – | 59,535,873 | 464,402,029 | ||||||||||||||
| ALPS | Sterling ETF Tactical Rotation Fund | 309,021 | (675 | ) | – | 308,346 | 27,947,448 | ||||||||||||||
| ALPS | Westport Resources Hedged High Income Fund | 294,269 | (1,298,740 | ) | – | (1,004,471 | ) | 19,549,926 | |||||||||||||
| ALPS | WMC Research Value Fund | 14,188,046 | (1,916,060 | ) | – | 12,271,986 | 91,246,822 | ||||||||||||||
| Clough China Fund | 26,582,883 | (651,434 | ) | – | 25,931,449 | 88,901,033 | ||||||||||||||
177 | April 30, 2015
| Notes to Financial Statements | |
| April 30, 2015 (Unaudited) |
| Fund | Gross Appreciation (excess of value over tax cost) | Gross Depreciation (excess of tax cost over value) | Net Appreciation of Foreign Currency and Derivatives | Net Unrealized Appreciation | Cost of Investments for Income Tax Purposes | |||||||||||||||
| RiverFront Conservative Income Builder Fund | $ | 188,124 | $ | (45,933 | ) | $ | – | $ | 142,191 | $ | 7,817,856 | |||||||||
| RiverFront Dynamic Equity Income Fund | 5,407,973 | (556,119 | ) | – | 4,851,854 | 69,308,829 | ||||||||||||||
| RiverFront Global Allocation Fund | 3,561,255 | (234,078 | ) | – | 3,327,177 | 37,744,171 | ||||||||||||||
| RiverFront Global Growth Fund | 8,909,286 | (446,868 | ) | – | 8,462,418 | 73,886,128 | ||||||||||||||
| RiverFront Moderate Growth & Income Fund | 8,648,902 | (916,342 | ) | – | 7,732,560 | 135,630,650 | ||||||||||||||
Deferred Tax Liability for ALPS | Alerian MLP Infrastructure Index Fund
Since the ALPS | Alerian MLP Infrastructure Index Fund will be subject to taxation on its taxable income, the NAV of Fund shares will also be reduced by the accrual of any deferred tax liabilities. The Index however is calculated without any adjustments for taxes. As a result, the Fund’s after tax performance could differ significantly from the Index even if the pretax performance of the Fund and the performance of the Index are closely correlated.
Cash distributions from MLPs to the ALPS | Alerian MLP Infrastructure Index Fund that exceed such Fund’s allocable share of such MLP’s net taxable income are considered a tax-deferred return of capital that will reduce the Fund’s adjusted tax basis in the equity securities of the MLP. These reductions in such Fund’s adjusted tax basis in the MLP equity securities will increase the amount of gain (or decrease the amount of loss) recognized by the Fund on a subsequent sale of the securities. The Fund will accrue deferred income taxes for any future tax liability associated with (i) that portion of MLP distributions considered to be a tax-deferred return of capital as well as (ii) capital appreciation of its investments. Upon the sale of an MLP security, the Fund may be liable for previously deferred taxes. The Fund will rely to some extent on information provided by the MLPs, which is not necessarily timely, to estimate deferred tax liability for purposes of financial statement reporting and determining the NAV. From time to time, ALPS Advisors, Inc. will modify the estimates or assumptions related to the Fund’s deferred tax liability as new information becomes available. The Fund will generally compute deferred income taxes based on the marginal regular federal income tax rate applicable to corporations and an assumed rate attributable to state taxes.
The Fund’s income tax expense/(benefit) consists of the following:
| April 30, 2015 | Current | Deferred | Total | |||||||||
| Federal | $ | – | $ | (631,293 | ) | $ | (631,293 | ) | ||||
| State | – | (36,851 | ) | (36,851 | ) | |||||||
| Total tax expense | $ | – | $ | (668,144 | ) | $ | (668,144 | ) | ||||
| October 31, 2014 | Current | Deferred | Total | |||||||||
| Federal | $ | 6,396 | $ | 421,789 | $ | 428,185 | ||||||
| State | 262 | 19,945 | 20,207 | |||||||||
| Total tax expense | $ | 6,658 | $ | 441,734 | $ | 448,392 | ||||||
Deferred income taxes reflect the net tax effect of temporary differences between the carrying amounts of assets and liabilities for financial reporting and tax purposes.
Components of the Fund’s deferred tax assets and liabilities are as follows:
| As of April 30, 2015 | ||||
| Non-current Deferred tax assets: | ||||
| Net Operating Loss Carryforward | $ | 262,508 | ||
| Other | 1,584 | |||
| Less Non-current Deferred tax liabilities: | ||||
| Net unrealized gain on investment securities | (715,913 | ) | ||
| Other | – | |||
| Net Deferred tax liability | $ | (451,821 | ) | |
178 | April 30, 2015
| Notes to Financial Statements | |
| April 30, 2015 (Unaudited) |
| As of October 31, 2014 | ||||
| Non-current Deferred tax assets: | ||||
| Net Operating Loss Carryforward | $ | – | ||
| Other | – | |||
| Less Non-current Deferred tax liabilities: | ||||
| Net unrealized gain on investment securities | (1,121,336 | ) | ||
| Other | 1,370 | |||
| Net Deferred tax liability | $ | (1,119,966 | ) | |
Although the Fund currently has a net deferred tax liability, it reviews the recoverability of its deferred tax assets based upon the weight of available evidence. When assessing the recoverability of its deferred tax assets, significant weight was given to the effects of potential future realized and unrealized gains on investments and the period over which these deferred tax assets can be realized. Currently, any capital losses that may be generated by the Fund in the future are eligible to be carried back up to three years and can be carried forward for five years to offset capital gains recognized by the fund in those years. Net operating losses that may be generated by the Fund in the future are eligible to be carried back up to two years and can be carried forward for 20 years to offset income generated by the Fund in those years.
Based upon the Fund’s assessment, it has determined that it is more likely than not that its deferred tax assets will be realized through future taxable income of the appropriate character. Accordingly, no valuation allowance has been established for the Fund’s deferred tax assets. The Fund will continue to assess the need for a valuation allowance in the future. Significant declines in the fair value of its portfolio of investments may change the Fund’s assessment of the recoverability of these assets and may result in the recording of a valuation allowance against all or a portion of the Fund’s gross deferred tax assets.
Total income tax benefit (current and deferred) differs from the amount computed by applying the federal statutory income tax rate of 34% to net investment and realized and unrealized gain/(losses) on investment before taxes as follows:
| For the Fiscal Period Ended | ||||
| April 30, 2015 | ||||
| Income tax expense at statutory rate | $ | (630,990 | ) | |
| State income taxes (net of federal benefit) | (35,980 | ) | ||
| Permanent differences, net | (4,381 | ) | ||
| Change in estimated state referral rate | 285 | |||
| Other | 2,922 | |||
| Net income tax expense | $ | (668,144 | ) | |
| For the Fiscal Period Ended | ||||
| October 31, 2014 | ||||
| Income tax expense at statutory rate | $ | 431,788 | ||
| State income taxes (net of federal benefit) | 24,966 | |||
| Permanent differences, net | – | |||
| Change in estimated state referral rate | (5,005 | ) | ||
| Other | (3,357 | ) | ||
| Net income tax expense | $ | 448,392 | ||
179 | April 30, 2015
| Notes to Financial Statements | |
| April 30, 2015 (Unaudited) |
The following is a tabular reconciliation of the total amounts of unrecognized tax benefits:
| April 30, 2015 | ||||
| Unrecognized tax benefit - Beginning | $ | – | ||
| Gross increases - tax positions in prior period | – | |||
| Gross decreases - tax positions in prior period | – | |||
| Gross increases - tax positions in current period | – | |||
| Settlement | – | |||
| Lapse of statute of limitations | – | |||
| Net income tax expense | $ | – | ||
| October 31, 2014 | ||||
| Unrecognized tax benefit - Beginning | $ | – | ||
| Gross increases - tax positions in prior period | – | |||
| Gross decreases - tax positions in prior period | – | |||
| Gross increases - tax positions in current period | – | |||
| Settlement | – | |||
| Lapse of statute of limitations | – | |||
| Net income tax expense | $ | – |
The Fund recognizes interest accrued related to unrecognized tax benefits and penalties as income tax expense. The Fund had no accrued penalties or interest for the Period Ended April 30, 2015.
The Fund recognizes the tax benefits of uncertain tax positions only where the position is “more likely than not” to be sustained assuming examination by tax authorities. Management has analyzed the Fund’s tax positions, and has concluded that no liability for unrecognized tax benefits should be recorded related to uncertain tax positions taken on U.S. tax returns and state tax returns filed since inception of the fund. No U.S. federal or state income tax returns are currently under examination. The Fund’s initial tax year will be for the period ended October 31, 2013 and this period remains subject to examination by tax authorities in the United States. Due to the nature of the Fund’s investments, the Fund may be required to file income tax returns in several states. The Fund is not aware of any tax positions for which it is reasonably possible that the total amounts of unrecognized tax benefits will change materially in the next 12 months.
| 5. SECURITIES TRANSACTIONS |
| Purchases and sales of securities, excluding short-term securities and U.S. Government Obligations during the Six-Month Period Ended April 30, 2015 were as follows: |
| Purchases | Proceeds from | |||||||
| Fund | of Securities | Sales of Securities | ||||||
| ALPS | Alerian MLP Infrastructure Index Fund | $ | 22,339,337 | $ | 10,025,663 | ||||
ALPS | CoreCommodity Management CompleteCommodities® Strategy Fund(a) | 64,034,631 | 57,351,636 | ||||||
ALPS | Kotak India Growth Fund(b) | 9,287,811 | 7,484,133 | ||||||
| ALPS | Red Rocks Listed Private Equity Fund | 85,355,496 | 88,773,606 | ||||||
| ALPS | Sterling ETF Tactical Rotation Fund | 56,876,637 | 41,294,644 | ||||||
| ALPS | Westport Resources Hedged High Income Fund | 7,559,058 | 12,136,494 | ||||||
| ALPS | WMC Research Value Fund | 77,299,735 | 79,784,411 | ||||||
| Clough China Fund | 90,745,041 | 72,774,920 | ||||||
| RiverFront Conservative Income Builder Fund | 9,730,063 | 10,536,451 | ||||||
| RiverFront Dynamic Equity Income Fund | 33,287,538 | 31,841,233 | ||||||
| RiverFront Global Allocation Fund | 17,913,518 | 15,061,240 | ||||||
| RiverFront Global Growth Fund | 32,627,356 | 30,326,669 | ||||||
| RiverFront Moderate Growth & Income Fund | 89,093,211 | 87,936,339 | ||||||
180 | April 30, 2015
| Notes to Financial Statements | |
| April 30, 2015 (Unaudited) |
Purchases and sales of U.S. Government Obligations during the Six-Month Period Ended April 30, 2015 were as follows:
| Fund | Purchases of Securities | Proceeds from Sales of Securities | ||||||
ALPS | CoreCommodity Management CompleteCommodities® Strategy Fund | $ | 61,284,453 | $ | 46,634,580 | ||||
| (a) | Purchases and sales for ALPS | CoreCommodity Management CompleteCommodities® Strategy Fund are consolidated and include the balances of CoreCommodity Management Cayman Commodity Fund, Ltd. (wholly owned subsidiary). |
| (b) | Purchases and sales for ALPS | Kotak India Growth Fund are consolidated and include the balances of Kotak Mauritius Portfolio (wholly owned subsidiary). |
| 6. BENEFICIAL INTEREST TRANSACTIONS |
Shares redeemed within 90 days of purchase for ALPS | Red Rocks Listed Private Equity Fund and 30 days of purchase for ALPS | CoreCommodity Management CompleteCommodities® Strategy Fund, ALPS | Kotak India Growth Fund, and Clough China Fund, may incur a 2% short-term redemption fee deducted from the redemption amount. In addition, shares redeemed within 30 days of purchase for the ALPS | Sterling ETF Tactical Rotation Fund may incur a 1% short-term redemption fee. The ALPS | Alerian MLP Infrastructure Index Fund, ALPS | Westport Resources Hedged High Income Fund, ALPS | WMC Research Value Fund, RiverFront Conservative Income Builder Fund, RiverFront Dynamic Equity Income Fund, RiverFront Global Allocation Fund, RiverFront Global Growth Fund, and RiverFront Moderate Growth & Income Fund shares do not incur redemption fees. |
For the Six-Month Period Ended April 30, 2015, the amounts listed below were retained by the Funds. These amounts are reflected in “Shares redeemed” in the Statements of Changes in Net Assets.
| Redemption Fee Retained | ||||||||||||
| For the | ||||||||||||
| Six Months Ended | For the Fiscal | |||||||||||
| April 30, 2015 | Periods Ended | For the Year Ended | ||||||||||
| Fund | (Unaudited) | October 31, 2014 | April 30, 2014 | |||||||||
ALPS | CoreCommodity Management CompleteCommodities® Strategy Fund - Class A | $ | 107 | $ | 2,815 | $ | 28,999 | ||||||
ALPS | CoreCommodity Management CompleteCommodities® Strategy Fund - Class C | 106 | 19 | 55 | |||||||||
ALPS | CoreCommodity Management CompleteCommodities® Strategy Fund - Class I | 66,267 | 5,450 | 15,328 | |||||||||
| ALPS | Kotak India Growth Fund - Class A | 910 | 346 | 1,100 | |||||||||
| ALPS | Kotak India Growth Fund - Class C | – | 142 | – | |||||||||
| ALPS | Kotak India Growth Fund - Class I | 8,759 | 402 | – | |||||||||
| ALPS | Red Rocks Listed Private Equity Fund - Class A | 6,520 | 23,046 | 15,705 | |||||||||
| ALPS | Red Rocks Listed Private Equity Fund - Class C | 4,834 | 1,464 | 472 | |||||||||
| ALPS | Red Rocks Listed Private Equity Fund - Class I | 43,202 | 37,095 | 46,273 | |||||||||
| ALPS | Red Rocks Listed Private Equity Fund - Class R | 60 | 1,022 | – | |||||||||
| ALPS | Sterling ETF Tactical Rotation Fund - Class A | 118 | 98 | – | |||||||||
| ALPS | Sterling ETF Tactical Rotation Fund - Class I | 98 | – | – | |||||||||
| Clough China Fund - Class A | 196 | 1,558 | 9,336 | |||||||||
| Clough China Fund - Class C | 59 | 12 | 145 | |||||||||
| Clough China Fund - Class I | 7,979 | 905 | 7,776 | |||||||||
181 | April 30, 2015
| Notes to Financial Statements | |
| April 30, 2015 (Unaudited) |
Transactions in shares of capital stock were as follows:
| ALPS | Alerian MLP Infrastructure Index Fund | ||||||||
| For the | ||||||||
| Six Months Ended | For the Fiscal Period | |||||||
| April 30, 2015 | Ended October 31, | |||||||
| (Unaudited) | 2014(a) | |||||||
| Class A | ||||||||
| Shares sold | 774,190 | 288,018 | ||||||
| Dividends reinvested | 18,914 | 37,693 | ||||||
| Shares redeemed | (124,074 | ) | (119,831 | ) | ||||
| Net increase in shares outstanding | 669,030 | 205,880 | ||||||
| Class C | ||||||||
| Shares sold | 501,829 | 301,736 | ||||||
| Dividends reinvested | 15,283 | 15,834 | ||||||
| Shares redeemed | (140,148 | ) | (21,671 | ) | ||||
| Net increase in shares outstanding | 376,964 | 295,899 | ||||||
| Class I | ||||||||
| Shares sold | 387,940 | 448,719 | ||||||
| Dividends reinvested | 9,628 | 19,256 | ||||||
| Shares redeemed | (317,774 | ) | (15,903 | ) | ||||
| Net increase in shares outstanding | 79,794 | 452,072 | ||||||
| ALPS | CoreCommodity Management | ||||||||
| CompleteCommodities® Strategy Fund | ||||||||
| For the | ||||||||
| Six Months Ended | For the Fiscal Period | |||||||
| April 30, 2015 | Ended October 31, | |||||||
| (Unaudited) | 2014(a) | |||||||
| Class A | ||||||||
| Shares sold | 1,341,940 | 2,009,784 | ||||||
| Dividends reinvested | – | – | ||||||
| Shares redeemed | (1,057,111 | ) | (8,184,764 | ) | ||||
| Net increase/(decrease) in shares outstanding | 284,829 | (6,174,980 | ) | |||||
| Class C | ||||||||
| Shares sold | 185,151 | 325,208 | ||||||
| Dividends reinvested | – | – | ||||||
| Shares redeemed | (396,952 | ) | (297,385 | ) | ||||
| Net increase/(decrease) in shares outstanding | (211,801 | ) | 27,823 | |||||
| Class I | ||||||||
| Shares sold | 24,427,604 | 21,543,668 | ||||||
| Dividends reinvested | 209,271 | – | ||||||
| Shares redeemed | (18,276,933 | ) | (4,926,582 | ) | ||||
| Net increase in shares outstanding | 6,359,942 | 16,617,086 | ||||||
182 | April 30, 2015
| Notes to Financial Statements | |
| April 30, 2015 (Unaudited) |
| ALPS | Kotak India Growth Fund | ||||||||
For the Six Months Ended April 30, 2015 (Unaudited) | For the Fiscal Period Ended October 31, 2014(a) | |||||||
| Class A | ||||||||
| Shares sold | 207,115 | 237,553 | ||||||
| Dividends reinvested | 17,640 | – | ||||||
| Shares redeemed | (152,547 | ) | (339,968 | ) | ||||
| Net increase/(decrease) in shares outstanding | 72,208 | (102,415 | ) | |||||
| Class C | ||||||||
| Shares sold | 68,445 | 46,251 | ||||||
| Dividends reinvested | 4,439 | – | ||||||
| Shares redeemed | (35,765 | ) | (19,484 | ) | ||||
| Net increase in shares outstanding | 37,119 | 26,767 | ||||||
| Class I | ||||||||
| Shares sold | 308,692 | 526,457 | ||||||
| Dividends reinvested | 26,938 | – | ||||||
| Shares redeemed | (289,305 | ) | (46,610 | ) | ||||
| Net increase in shares outstanding | 46,325 | 479,847 | ||||||
| ALPS | Red Rocks Listed Private Equity Fund | ||||||||
For the Six Months Ended April 30, 2015 (Unaudited) | For the Fiscal Period Ended October 31, 2014(a) | |||||||
| Class A | ||||||||
| Shares sold | 5,335,672 | 8,719,848 | ||||||
| Dividends reinvested | 1,028,829 | – | ||||||
| Shares redeemed | (5,504,044 | ) | (7,255,050 | ) | ||||
| Net increase in shares outstanding | 860,457 | 1,464,798 | ||||||
| Class C | ||||||||
| Shares sold | 286,546 | 1,066,330 | ||||||
| Dividends reinvested | 63,807 | – | ||||||
| Shares redeemed | (298,943 | ) | (179,224 | ) | ||||
| Net increase in shares outstanding | 51,410 | 887,106 | ||||||
| Class I | ||||||||
| Shares sold | 10,459,068 | 14,082,200 | ||||||
| Dividends reinvested | 655,554 | – | ||||||
| Shares redeemed | (9,008,178 | ) | (5,365,813 | ) | ||||
| Net increase in shares outstanding | 2,106,444 | 8,716,387 | ||||||
| Class R | ||||||||
| Shares sold | 158,904 | 75,154 | ||||||
| Dividends reinvested | 7,001 | – | ||||||
| Shares redeemed | (35,042 | ) | (13,616 | ) | ||||
| Net increase in shares outstanding | 130,863 | 61,538 | ||||||
183 | April 30, 2015
| Notes to Financial Statements | |
| April 30, 2015 (Unaudited) |
| ALPS | Sterling ETF Tactical Rotation Fund | ||||||||
For the Six Months Ended April 30, 2015 (Unaudited) | For the Period July 1, 2014 (Commencement) to October 31, 2014 | |||||||
| Class A | ||||||||
| Shares sold | 1,249,537 | 536,342 | ||||||
| Dividends reinvested | 4,852 | – | ||||||
| Shares redeemed | (339,363 | ) | (8,719 | ) | ||||
| Net increase in shares outstanding | 915,026 | 527,623 | ||||||
| Class C | ||||||||
| Shares sold | 112,617 | 54,102 | ||||||
| Dividends reinvested | 336 | – | ||||||
| Shares redeemed | (23,781 | ) | (816 | ) | ||||
| Net increase in shares outstanding | 89,172 | 53,286 | ||||||
| Class I | ||||||||
| Shares sold | 692,869 | 747,556 | ||||||
| Dividends reinvested | 5,411 | – | ||||||
| Shares redeemed | (188,006 | ) | (12,420 | ) | ||||
| Net increase in shares outstanding | 510,274 | 735,136 | ||||||
| ALPS | Westport Resources Hedged High Income Fund | ||||||||
For the Six Months Ended April 30, 2015 (Unaudited) | For the Period January 1, 2014 (Commencement) to October 31, 2014 | |||||||
| Class A | ||||||||
| Shares sold | 10,357 | 434,199 | ||||||
| Dividends reinvested | 10,998 | 8,382 | ||||||
| Shares redeemed | (136,023 | ) | (17,428 | ) | ||||
| Net increase/(decrease) in shares outstanding | (114,668 | ) | 425,153 | |||||
| Class C | ||||||||
| Shares sold | – | 171,830 | ||||||
| Dividends reinvested | 4,175 | 3,301 | ||||||
| Shares redeemed | (51,074 | ) | (14,038 | ) | ||||
| Net increase/(decrease) in shares outstanding | (46,899 | ) | 161,093 | |||||
| Class I | ||||||||
| Shares sold | 103,875 | 1,999,490 | ||||||
| Dividends reinvested | 65,153 | 44,725 | ||||||
| Shares redeemed | (401,913 | ) | (124,519 | ) | ||||
| Net increase/(decrease) in shares outstanding | (232,885 | ) | 1,919,696 | |||||
184 | April 30, 2015
| Notes to Financial Statements | |
| April 30, 2015 (Unaudited) |
| ALPS | WMC Research Value Fund | ||||||||
For the Six Months Ended April 30, 2015 (Unaudited) | For the Fiscal Period Ended October 31, 2014(a) | |||||||
| Class A | ||||||||
| Shares sold | 130,943 | 12,637 | ||||||
| Dividends reinvested | 485,238 | – | ||||||
| Shares redeemed | (355,925 | ) | (212,255 | ) | ||||
| Net increase/(decrease) in shares outstanding | 260,256 | (199,618 | ) | |||||
| Class C | ||||||||
| Shares sold | 126,712 | 9,584 | ||||||
| Dividends reinvested | 1,762 | – | ||||||
| Shares redeemed | (8,925 | ) | – | |||||
| Net increase in shares outstanding | 119,549 | 9,584 | ||||||
| Class I | ||||||||
| Shares sold | 168,023 | 139,366 | ||||||
| Dividends reinvested | 380,975 | – | ||||||
| Shares redeemed | (355,800 | ) | (423,706 | ) | ||||
| Net increase/(decrease) in shares outstanding | 193,198 | (284,340 | ) | |||||
| Clough China Fund | ||||||||
For the Six Months Ended April 30, 2015 (Unaudited) | For the Fiscal Period Ended October 31, 2014(a) | |||||||
| Class A | ||||||||
| Shares sold | 147,134 | 146,054 | ||||||
| Dividends reinvested | 38,495 | – | ||||||
| Shares redeemed | (141,425 | ) | (351,151 | ) | ||||
| Net increase/(decrease) in shares outstanding | 44,204 | (205,097 | ) | |||||
| Class C | ||||||||
| Shares sold | 63,783 | 40,370 | ||||||
| Dividends reinvested | 11,566 | – | ||||||
| Shares redeemed | (57,740 | ) | (71,486 | ) | ||||
| Net increase/(decrease) in shares outstanding | 17,609 | (31,116 | ) | |||||
| Class I | ||||||||
| Shares sold | 857,892 | 356,849 | ||||||
| Dividends reinvested | 45,342 | – | ||||||
| Shares redeemed | (188,943 | ) | (275,489 | ) | ||||
| Net increase in shares outstanding | 714,291 | 81,360 | ||||||
185 | April 30, 2015
| Notes to Financial Statements | |
| April 30, 2015 (Unaudited) |
| RiverFront Conservative Income Builder Fund | ||||||||
For the Six Months Ended April 30, 2015 (Unaudited) | For the Fiscal Period Ended October 31, 2014(a) | |||||||
| Class A | ||||||||
| Shares sold | 46,145 | 20,788 | ||||||
| Dividends reinvested | 1,964 | 339 | ||||||
| Shares redeemed | (28,048 | ) | (22,586 | ) | ||||
| Net increase/(decrease) in shares outstanding | 20,061 | (1,459 | ) | |||||
| Class C | ||||||||
| Shares sold | 59,339 | 113,010 | ||||||
| Dividends reinvested | 13,331 | 1,180 | ||||||
| Shares redeemed | (89,056 | ) | (30,896 | ) | ||||
| Net increase/(decrease) in shares outstanding | (16,386 | ) | 83,294 | |||||
| Class I | ||||||||
| Shares sold | 48,716 | 170,292 | ||||||
| Dividends reinvested | 6,355 | 1,236 | ||||||
| Shares redeemed | (131,822 | ) | (36,589 | ) | ||||
| Net increase/(decrease) in shares outstanding | (76,751 | ) | 134,939 | |||||
| RiverFront Dynamic Equity Income Fund | ||||||||
For the Six Months Ended April 30, 2015 (Unaudited) | For the Fiscal Period Ended October 31, 2014(a) | |||||||
| Class A | ||||||||
| Shares sold | 205,672 | 298,200 | ||||||
| Dividends reinvested | 60,473 | 7,788 | ||||||
| Shares redeemed | (219,492 | ) | (173,465 | ) | ||||
| Net increase in shares outstanding | 46,653 | 132,523 | ||||||
| Class C | ||||||||
| Shares sold | 389,828 | 543,597 | ||||||
| Dividends reinvested | 104,344 | 6,068 | ||||||
| Shares redeemed | (257,863 | ) | (232,754 | ) | ||||
| Net increase in shares outstanding | 236,309 | 316,911 | ||||||
| Class I | ||||||||
| Shares sold | 280,009 | 268,460 | ||||||
| Dividends reinvested | 69,333 | 10,588 | ||||||
| Shares redeemed | (273,765 | ) | (83,369 | ) | ||||
| Net increase in shares outstanding | 75,577 | 195,679 | ||||||
186 | April 30, 2015
| Notes to Financial Statements | |
| April 30, 2015 (Unaudited) |
| RiverFront Global Allocation Fund | ||||||||
For the Six Months Ended April 30, 2015 (Unaudited) | For the Fiscal Period Ended October 31, 2014(a) | |||||||
| Class A | ||||||||
| Shares sold | 123,283 | 53,535 | ||||||
| Dividends reinvested | 54,813 | – | ||||||
| Shares redeemed | (69,048 | ) | (117,670 | ) | ||||
| Net increase/(decrease) in shares outstanding | 109,048 | (64,135 | ) | |||||
| Class C | ||||||||
| Shares sold | 191,779 | 131,314 | ||||||
| Dividends reinvested | 94,535 | – | ||||||
| Shares redeemed | (158,476 | ) | (131,094 | ) | ||||
| Net increase in shares outstanding | 127,838 | 220 | ||||||
| Class I | ||||||||
| Shares sold | 261,969 | 247,340 | ||||||
| Dividends reinvested | 91,727 | – | ||||||
| Shares redeemed | (123,266 | ) | (74,901 | ) | ||||
| Net increase in shares outstanding | 230,430 | 172,439 | ||||||
| RiverFront Global Growth Fund | ||||||||
For the Six Months Ended April 30, 2015 (Unaudited) | For the Fiscal Period Ended October 31, 2014(a) | |||||||
| Class A | ||||||||
| Shares sold | 204,588 | 274,216 | ||||||
| Dividends reinvested | 126,977 | – | ||||||
| Shares redeemed | (232,798 | ) | (270,395 | ) | ||||
| Net increase in shares outstanding | 98,767 | 3,821 | ||||||
| Class C | ||||||||
| Shares sold | 148,351 | 71,276 | ||||||
| Dividends reinvested | 86,361 | – | ||||||
| Shares redeemed | (94,800 | ) | (83,298 | ) | ||||
| Net increase/(decrease) in shares outstanding | 139,912 | (12,022 | ) | |||||
| Class I | ||||||||
| Shares sold | 356,335 | 141,152 | ||||||
| Dividends reinvested | 96,480 | – | ||||||
| Shares redeemed | (159,942 | ) | (54,618 | ) | ||||
| Net increase in shares outstanding | 292,873 | 86,534 | ||||||
| Class L | ||||||||
| Shares sold | 261,554 | 91,284 | ||||||
| Dividends reinvested | 186,091 | – | ||||||
| Shares redeemed | (147,812 | ) | (157,229 | ) | ||||
| Net increase/(decrease) in shares outstanding | 299,833 | (65,945 | ) | |||||
| Investor Class | ||||||||
| Shares sold | 16,282 | 4,306 | ||||||
| Dividends reinvested | 54,628 | – | ||||||
| Shares redeemed | (40,593 | ) | (49,732 | ) | ||||
| Net increase/(decrease) in shares outstanding | 30,317 | (45,426 | ) | |||||
187 | April 30, 2015
| Notes to Financial Statements | |
| April 30, 2015 (Unaudited) |
| RiverFront Moderate Growth & Income Fund | ||||||||
For the Six Months Ended April 30, 2015 (Unaudited) | For the Fiscal Period Ended October 31, 2014(a) | |||||||
| Class A | ||||||||
| Shares sold | 216,849 | 346,863 | ||||||
| Dividends reinvested | 135,959 | 15,435 | ||||||
| Shares redeemed | (320,857 | ) | (679,187 | ) | ||||
| Net increase/(decrease) in shares outstanding | 31,951 | (316,889 | ) | |||||
| Class C | ||||||||
| Shares sold | 664,726 | 637,442 | ||||||
| Dividends reinvested | 308,974 | 18,215 | ||||||
| Shares redeemed | (525,360 | ) | (442,477 | ) | ||||
| Net increase in shares outstanding | 448,340 | 213,180 | ||||||
| Class I | ||||||||
| Shares sold | 758,304 | 536,778 | ||||||
| Dividends reinvested | 224,750 | 26,841 | ||||||
| Shares redeemed | (502,592 | ) | (255,089 | ) | ||||
| Net increase in shares outstanding | 480,462 | 308,530 | ||||||
| (a) | Effective May 1, 2014, the Board approved changing the fiscal year-end of the Funds from April 30 to October 31. |
| 7. AFFILIATED COMPANIES |
Funds may invest in certain securities that are considered securities issued by affiliated companies. As defined by the Investment Company Act of 1940, an affiliated person, including an affiliated company, is one in which a Fund owns 5% or more of the outstanding voting securities, or a company which is under common ownership or control with the Fund. The purchases, sales, dividend income, capital gains, return of capital distributions received, shares and value of investments in affiliated companies for the six months ended April 30, 2015 were as follows:
RiverFront Conservative Income Builder
| Security Name | Share Balance November 1, 2014 | Purchases | Sales | Share Balance April 30, 2015 | Dividend Income | Realized Loss | Market Value April 30, 2015 | |||||||||||||||||||||
| RiverFront Strategic Income Fund | 34,106 | 5,826 | 6,236 | 33,696 | $ | 14,983 | $ | (2,957 | ) | $ | 852,172 | |||||||||||||||||
| $ | 14,983 | $ | (2,957 | ) | $ | 852,172 | ||||||||||||||||||||||
RiverFront Dynamic Equity Income Fund
| Security Name | Share Balance November 1, 2014 | Purchases | Sales | Share Balance April 30, 2015 | Dividend Income | Realized Loss | Market Value April 30, 2015 | |||||||||||||||||||||
| RiverFront Strategic Income Fund | 142,382 | 99,014 | – | 241,396 | $ | 79,293 | $ | – | $ | 6,104,905 | ||||||||||||||||||
| $ | 79,293 | $ | – | $ | 6,104,905 | |||||||||||||||||||||||
RiverFront Global Allocation Fund
| Security Name | Share Balance November 1, 2014 | Purchases | Sales | Share Balance April 30, 2015 | Dividend Income | Realized Loss | Market Value April 30, 2015 | |||||||||||||||||||||
| RiverFront Strategic Income Fund | 18,764 | 72,581 | – | 91,345 | $ | 19,297 | $ | – | $ | 2,310,115 | ||||||||||||||||||
| $ | 19,297 | $ | – | $ | 2,310,115 | |||||||||||||||||||||||
188 | April 30, 2015
| Notes to Financial Statements | |
| April 30, 2015 (Unaudited) |
RiverFront Moderate Growth & Income Fund
| Share | Share | Market | ||||||||||||||||||||||||||
| Balance | Balance | Value | ||||||||||||||||||||||||||
| November 1, | April 30, | Dividend | Realized | April 30, | ||||||||||||||||||||||||
| Security Name | 2014 | Purchases | Sales | 2015 | Income | Loss | 2015 | |||||||||||||||||||||
| RiverFront Strategic Income Fund | 489,954 | 120,906 | 10,043 | 600,817 | $ | 233,644 | $ | (4,363 | ) | $ | 15,194,662 | |||||||||||||||||
| $ | 233,644 | $ | (4,363 | ) | $ | 15,194,662 | ||||||||||||||||||||||
| 8. MANAGEMENT AND RELATED-PARTY TRANSACTIONS |
ALPS Advisors, Inc. (“AAI”), subject to the authority of the Board, is responsible for the overall management of the Funds listed below. AAI has delegated daily management of the Funds listed below to the corresponding Sub-Advisor(s) listed in the table below. Each Sub-Advisor manages the investments of the Fund in accordance with its investment objective, policies and limitations and investment guidelines established jointly by AAI and the Board.
| Fund | Sub-Advisor(s) |
| ALPS | CoreCommodity Management CompleteCommodities® Strategy Fund | CoreCommodity Management, LLC |
| ALPS | Kotak India Growth Fund | Kotak Mahindra (UK) Limited |
| ALPS | Red Rocks Listed Private Equity Fund | Red Rocks Capital LLC |
| ALPS | Sterling ETF Tactical Rotation Fund | Sterling Global Strategies LLC |
| ALPS | WMC Research Value Fund | Wellington Management Company, LLP |
| Clough China Fund | Clough Capital Partners, LP |
| RiverFront Conservative Income Builder Fund | RiverFront Investment Group, LLC |
| RiverFront Dynamic Equity Income Fund | RiverFront Investment Group, LLC |
| RiverFront Global Allocation Fund | RiverFront Investment Group, LLC |
| RiverFront Global Growth Fund | RiverFront Investment Group, LLC |
| RiverFront Moderate Growth & Income Fund | RiverFront Investment Group, LLC |
AAI and Westport Resources Management, Inc. (“Westport Resources”) (“collectively the “Westport Co-Advisors”), subject to the authority of the Board, serve as co-investment advisors for the ALPS | Westport Resources Hedged High Income Fund (the “Westport Fund”). AAI provides fund administration services and other portfolio support services and compliance monitoring for the We Fund. WestportResources manages the Fund’s investment program and selects, subject to the approval of the Board, sub-advisors to the Fund. Westport Resources and the Trust have entered into sub-advisory agreements with respect to the Fund with three Sub-Advisors (the “Westport Sub-Advisors”), Concise Capital Management, LP, Amundi Smith Breeden LLC, and Sound Point Capital Management, L.P., to manage a portion of the Fund’s assets.
Pursuant to the Investment Advisory Agreement (the “Advisory Agreement”), the Funds listed below pay AAI an annual management fee which is based on each Fund’s average daily net assets. The management fee is paid on a monthly basis. The following table reflects the Funds’ contractual management fee rates (expressed as an annual rate).
| Fund | Contractual Management Fee |
| ALPS | Alerian MLP Infrastructure Index Fund | 0.70% |
| ALPS | CoreCommodity Management CompleteCommodities® Strategy Fund | 0.85% |
| ALPS | Kotak India Growth Fund | 1.25% |
| ALPS | Red Rocks Listed Private Equity Fund | 0.85% |
| ALPS | Sterling ETF Tactical Rotation Fund | 0.95% |
| ALPS | WMC Research Value Fund | 0.95%(a) |
| Clough China Fund | 1.35% |
| RiverFront Conservative Income Builder Fund | 0.85% |
| RiverFront Dynamic Equity Income Fund | 0.85% |
| RiverFront Global Allocation Fund | 0.85% |
189 | April 30, 2015
| Notes to Financial Statements |
| April 30, 2015 (Unaudited) |
| Fund | Contractual Management Fee |
| RiverFront Global Growth Fund | 0.85% |
| RiverFront Moderate Growth & Income Fund | 0.85% |
(a) | The contractual management fee is 0.95% for the first $250 million of net assets, 0.85% for the next $250 million of net assets, and 0.75% for net assets in excess of $500 million. |
Pursuant to the Investment Advisory Agreement between the Westport Fund and AAI, the Westport Fund pays AAI an annual management fee of the greater of (i) 0.20%, based on the Westport Fund’s average daily net assets, or (ii) $150,000. Pursuant to the Investment Advisory Agreement between the Westport Fund and Westport Resources, the Westport Fund pays Westport Resources an annual management fee of 1.50% based on the Westport Fund’s average daily net assets. The management fee for each Advisory Agreement is paid on a monthly basis. The Westport Sub-Advisors will be engaged to manage the investments of the Westport Fund according to the its investment objective, policies and limitations and any investment guidelines established by the Westport Co-Advisors and the Board. Westport Resources will pay the Westport Sub-Advisors out of the advisory fee paid to it pursuant to the Westport Resources Advisory Agreement.
Pursuant to an Investment Sub-advisory Agreement, AAI pays the Sub-Advisors of the Funds listed below an annual sub-advisory management fee which is based on each Fund’s average daily assets. AAI is required to pay all fees due to each Sub-Advisor out of the management fee AAI receives from each Fund listed below. The following table reflects the Funds’ contractual sub-advisory fee rates.
| Fund | Average Daily Net Assets of the Fund | Contractual Sub-Advisory Fee | ||
ALPS | CoreCommodity Management CompleteCommodities® Strategy Fund | All Asset Levels | 0.75% | ||
| ALPS | Kotak India Growth Fund | First $50 Million | 1.15% | ||
| Over $50 Million | 1.05% | |||
| ALPS | Red Rocks Listed Private Equity Fund | All Asset Levels | 0.57% | ||
| ALPS | Sterling ETF Tactical Rotation Fund | All Asset Levels | 0.60% | ||
| ALPS | WMC Research Value Fund | First $250 Million | 0.50% | ||
| $250 Million - $500 Million | 0.40% | |||
| Over $500 Million | 0.30% | |||
| Clough China Fund | All Asset Levels | 0.90% | ||
| RiverFront Conservative Income Builder Fund | All Asset Levels | 0.60% | ||
| RiverFront Dynamic Equity Income Fund | All Asset Levels | 0.60% | ||
| RiverFront Global Allocation Fund | All Asset Levels | 0.60% | ||
| RiverFront Global Growth Fund | All Asset Levels | 0.60% | ||
| RiverFront Moderate Growth & Income Fund | All Asset Levels | 0.60% |
The Advisor(s) and each Sub-Advisor have contractually agreed to limit the amount of each Fund’s total annual expenses, exclusive of distribution and service (12b-1) fees (except Clough China Class A and Class C shares), shareholder service fees (except Clough China Class A shares and Class C shares), acquired fund fees and expenses, brokerage expenses, interest expense, taxes and extraordinary expenses, that exceed the following annual rates below. These agreements are reevaluated on an annual basis based on the terms disclosed below.
| Fund | Class A | Class C | Class I | Class Inv | Class L | Class R | Term of Expense Limit Agreement | |||||||
| ALPS | Alerian MLP Infrastructure Index Fund | 0.85% | 0.85% | 0.85% | N/A | N/A | N/A | 9/1/2014 ‐ 2/29/2016 | |||||||
ALPS | CoreCommodity Management CompleteCommodities® Strategy Fund | 1.05% | 1.05% | 1.15% | N/A | N/A | N/A | 9/11/2013 ‐ 9/11/2015 | |||||||
| ALPS | Kotak India Growth Fund | 1.60% | 1.60% | 1.60% | N/A | N/A | N/A | 9/1/2014 ‐ 8/31/2015 | |||||||
| ALPS | Red Rocks Listed Private Equity Fund | 1.25% | 1.25% | 1.25% | N/A | N/A | 1.25% | 9/1/2014 ‐ 8/31/2015 | |||||||
| ALPS | Sterling ETF Tactical Rotation Fund | 1.15% | 1.15% | 1.15% | N/A | N/A | N/A | 6/30/2014 - 2/29/2016 | |||||||
ALPS | Westport Resources Hedged High Income Fund | 1.99% | 1.99% | 1.99% | N/A | N/A | N/A | 12/19/2013 ‐ 8/31/2015 | |||||||
| ALPS | WMC Research Value Fund | 1.15% | 1.15% | 1.15% | N/A | N/A | N/A | 9/1/2014 ‐ 8/31/2015 | |||||||
| Clough China Fund | 1.95% | 2.70% | 1.70% | N/A | N/A | N/A | 9/1/2014 ‐ 8/31/2015 | |||||||
| RiverFront Conservative Income Builder Fund | 0.90% | 0.90% | 0.90% | N/A | N/A | N/A | 9/1/2014 ‐ 8/31/2015 |
190 | April 30, 2015
| Notes to Financial Statements |
| April 30, 2015 (Unaudited) |
| Fund | Class A | Class C | Class I | Class Inv | Class L | Class R | Term of Expense Limit Agreement | |||||||
| RiverFront Dynamic Equity Income Fund | 0.90% | 0.90% | 0.90% | N/A | N/A | N/A | 9/1/2014 ‐ 8/31/2015 | |||||||
| RiverFront Global Allocation Fund | 0.90% | 0.90% | 0.90% | N/A | N/A | N/A | 9/1/2014 ‐ 8/31/2015 | |||||||
| RiverFront Global Growth Fund | 0.90% | 0.90% | 0.90% | 0.90% | 0.90% | N/A | 9/1/2014 ‐ 8/31/2015 | |||||||
| RiverFront Moderate Growth & Income Fund | 0.90% | 0.90% | 0.90% | N/A | N/A | N/A | 9/1/2014 ‐ 8/31/2015 |
The Advisor(s) and each Sub-Advisor are permitted to recover expenses they have waived or reimbursed, on a class-by-class basis, through the agreements described above to the extent that expenses in later periods fall below the annual limits set forth in these agreements. Clough China Fund is not obligated to pay any such waived or reimbursed fees and expenses more than one year after the end of the fiscal year in which the fees or expenses were waived or reimbursed. The ALPS | Alerian MLP Infrastructure Index Fund, ALPS | CoreCommodity Management CompleteCommodities® Strategy Fund, ALPS | Kotak India Growth Fund, ALPS | Red Rocks Listed Private Equity Fund, ALPS | Sterling ETF Tactical Rotation Fund, ALPS | Westport Resources Hedged High Income, ALPS | WMC Research Value Fund, RiverFront Conservative Income Builder Fund, RiverFront Global Growth Fund, RiverFront Dynamic Equity Income Fund, RiverFront Global Allocation Fund and RiverFront Moderate Growth & Income Fund are not obligated to pay any such waived or reimbursed fees and expenses more than three years after the end of the fiscal year in which the fees or expenses were waived or reimbursed. At April 30, 2015, the Advisor(s) and Sub-Advisor may seek reimbursement of previously waived and reimbursed fees as follows:
| Fund | Expires 10/31/15 | Expires 4/30/16 | Expires 10/31/16 | Expires 4/30/17 | Expires 10/31/17 | Expires 10/31/18 | Total | ||||||||||||||
| ALPS | Alerian MLP Infrastructure Index Fund - Class A | $ | N/A | $ | 9,499 | $ | N/A | $ | 95,994 | $ | 48,763 | $ | 35,672 | $ | 189,928 | |||||||
| ALPS | Alerian MLP Infrastructure Index Fund - Class C | N/A | 9,045 | N/A | 28,674 | 24,506 | 25,325 | 87,550 | ||||||||||||||
| ALPS | Alerian MLP Infrastructure Index Fund - Class I | N/A | 36,196 | N/A | 38,321 | 23,256 | 18,612 | 116,385 | ||||||||||||||
ALPS | CoreCommodity Management CompleteCommodities® Strategy Fund - Class A | N/A | 91,338 | N/A | 55,147 | 5,093 | 2,108 | 153,686 | ||||||||||||||
ALPS | CoreCommodity Management CompleteCommodities® Strategy Fund - Class C | N/A | 17,117 | N/A | 9,066 | 1,738 | 527 | 28,448 | ||||||||||||||
ALPS | CoreCommodity Management CompleteCommodities® Strategy Fund - Class I | N/A | 21,636 | N/A | 30,311 | 11,487 | N/A | 63,434 | ||||||||||||||
| ALPS | Kotak India Growth Fund - Class A | N/A | 188,194 | N/A | 198,350 | 81,178 | 47,607 | 515,329 | ||||||||||||||
| ALPS | Kotak India Growth Fund - Class C | N/A | 37,562 | N/A | 38,130 | 16,958 | 13,899 | 106,549 | ||||||||||||||
| ALPS | Kotak India Growth Fund - Class I | N/A | 121,202 | N/A | 87,957 | 78,795 | 79,860 | 367,814 | ||||||||||||||
| ALPS | Red Rocks Listed Private Equity Fund - Class A | N/A | N/A | N/A | N/A | N/A | N/A | N/A | ||||||||||||||
| ALPS | Red Rocks Listed Private Equity Fund - Class C | N/A | N/A | N/A | N/A | N/A | N/A | N/A | ||||||||||||||
| ALPS | Red Rocks Listed Private Equity Fund - Class I | N/A | N/A | N/A | N/A | N/A | N/A | N/A | ||||||||||||||
| ALPS | Red Rocks Listed Private Equity Fund - Class R | N/A | N/A | N/A | N/A | N/A | N/A | N/A | ||||||||||||||
| ALPS | Sterling ETF Tactical Rotation Fund - Class A | N/A | N/A | N/A | N/A | 15,562 | 43,174 | 58,736 | ||||||||||||||
| ALPS | Sterling ETF Tactical Rotation Fund - Class C | N/A | N/A | N/A | N/A | 7,752 | 3,538 | 11,290 | ||||||||||||||
| ALPS | Sterling ETF Tactical Rotation Fund - Class I | N/A | N/A | N/A | N/A | 53,715 | 42,185 | 95,900 | ||||||||||||||
| ALPS | Westport Resources Hedged High Income Fund - Class A | N/A | N/A | N/A | N/A | 33,823 | 19,563 | 53,386 | ||||||||||||||
| ALPS | Westport Resources Hedged High Income Fund - Class C | N/A | N/A | N/A | N/A | 14,345 | 7,176 | 21,521 | ||||||||||||||
| ALPS | Westport Resources Hedged High Income Fund - Class I | N/A | N/A | N/A | N/A | 188,185 | 104,842 | 293,027 |
191 | April 30, 2015
| Notes to Financial Statements | |
| April 30, 2015 (Unaudited) |
| Expires | Expires | Expires | Expires | Expires | Expires | |||||||||||||||||
| Fund | 10/31/15 | 4/30/16 | 10/31/16 | 4/30/17 | 10/31/17 | 10/31/18 | Total | |||||||||||||||
| ALPS | WMC Disciplined Value Fund - Class A | $ | N/A | $ | 50,013 | $ | N/A | $ | 39,957 | $ | 25,559 $ | 20,997 | $ | 136,526 | |||||||||
| ALPS | WMC Disciplined Value Fund - Class C | N/A | 90 | N/A | 81 | 74 | 502 | 747 | |||||||||||||||
| ALPS | WMC Disciplined Value Fund - Class I | N/A | 36,903 | N/A | 31,790 | 18,931 | 15,546 | 103,170 | |||||||||||||||
| Clough China Fund - Class A | 17,210 | N/A | 6,579 | N/A | N/A | N/A | 23,789 | |||||||||||||||
| Clough China Fund - Class C | 9,617 | N/A | 5,423 | N/A | N/A | N/A | 15,040 | |||||||||||||||
| Clough China Fund - Class I | 22,406 | N/A | 10,281 | N/A | N/A | N/A | 32,687 | |||||||||||||||
| RiverFront Conservative Income Builder | ||||||||||||||||||||||
| Fund - Class A | N/A | 6,224 | N/A | 14,608 | 6,814 | 5,753 | 33,399 | |||||||||||||||
| RiverFront Conservative Income Builder | ||||||||||||||||||||||
| Fund - Class C | N/A | 38,763 | N/A | 50,536 | 28,317 | 22,535 | 140,151 | |||||||||||||||
| RiverFront Conservative Income Builder | ||||||||||||||||||||||
| Fund - Class I | N/A | 21,584 | N/A | 23,541 | 11,336 | 9,919 | 66,380 | |||||||||||||||
| RiverFront Dynamic Equity Income Fund - Class A | N/A | 25,434 | N/A | 28,302 | 20,436 | 16,901 | 91,073 | |||||||||||||||
| RiverFront Dynamic Equity Income Fund - Class C | N/A | 54,152 | N/A | 55,724 | 35,936 | 30,763 | 176,575 | |||||||||||||||
| RiverFront Dynamic Equity Income Fund - Class I | N/A | 29,280 | N/A | 39,925 | 24,440 | 20,555 | 114,200 | |||||||||||||||
| RiverFront Global Allocation Fund - Class A | N/A | 32,881 | N/A | 31,141 | 15,480 | 11,923 | 91,425 | |||||||||||||||
| RiverFront Global Allocation Fund - Class C | N/A | 44,218 | N/A | 41,816 | 26,510 | 21,206 | 133,750 | |||||||||||||||
| RiverFront Global Allocation Fund - Class I | N/A | 21,009 | N/A | 30,843 | 21,125 | 19,208 | 92,185 | |||||||||||||||
| RiverFront Global Growth Fund - Class A | N/A | 22,444 | N/A | 28,381 | 20,675 | 18,050 | 89,550 | |||||||||||||||
| RiverFront Global Growth Fund - Class C | N/A | 23,097 | N/A | 22,962 | 13,878 | 12,612 | 72,549 | |||||||||||||||
| RiverFront Global Growth Fund - Class I | N/A | 18,595 | N/A | 27,339 | 29,599 | 14,999 | 90,532 | |||||||||||||||
| RiverFront Global Growth Fund - Class L | N/A | 78,131 | N/A | 60,282 | 15,078 | 26,684 | 180,175 | |||||||||||||||
| RiverFront Global Growth Fund - Investor Class | N/A | 31,778 | N/A | 22,272 | 9,650 | 8,172 | 71,872 | |||||||||||||||
| RiverFront Moderate Growth & Income Fund | N/A | 49,603 | N/A | 52,042 | 25,024 | 19,449 | 146,118 | |||||||||||||||
| RiverFront Moderate Growth & Income Fund | N/A | 92,197 | N/A | 96,176 | 54,689 | 47,986 | 291,048 | |||||||||||||||
| RiverFront Moderate Growth & Income Fund | N/A | 38,570 | N/A | 55,830 | 33,901 | 32,127 | 160,428 | |||||||||||||||
ALPS Portfolio Solutions Distributor, Inc. (the “Distributor”) acts as the distributor of the Funds’ shares pursuant to a Distribution Agreement with the Trust. Shares are sold on a continuous basis by the Distributor, as agent for the Funds, and the Distributor has agreed to use its best efforts to solicit orders for the sale of Funds’ shares, although it is not obliged to sell any particular amount of shares. The Distributor is not entitled to any compensation for its services. The Distributor is registered as a broker-dealer with the Securities and Exchange Commission. The Funds’ Distributor is also the distributor of the Select Sector SPDR exchange traded funds (the “Underlying Sector ETFs”). As required by exemptive relief obtained by the Underlying Sector ETFs, the Advisor(s) will reimburse any applicable Fund an amount equal to the distribution fee received by the Distributor from the Underlying Sector ETFs attributable to such Fund’s investment in the Underlying Sector ETFs, for so long as the Distributor acts as distributor to such Fund and the Underlying Sector ETFs.
Each Fund has adopted a Distribution and Services Plan (the “Plan”) pursuant to Rule 12b-1 of the 1940 Act for the Class A, Class C, Class R (ALPS | Red Rocks Listed Private Equity Fund only), and Investor Class (RiverFront Global Growth Fund only) shares. The Plan allows a Fund to use Class A, Class C, Class R and Investor Class assets to pay fees in connection with the distribution and marketing of Class A, Class C, Class R and Investor Class shares and/or the provision of shareholder services to Class A, Class C, Class R and Investor Class shareholders. The Plan permits payment for services in connection with the administration of plans or programs that use Class A, Class C, Class R and Investor Class shares of a Fund, if any, as their funding medium and for related expenses. The Plan permits a Fund to make total payments at an annual rate of up to 0.25% of a Fund’s average daily net assets attributable to its Class A and Investor Class shares, 0.75% of a Fund’s average daily net assets attributable to its Class C shares and 0.50% of the ALPS | Red Rocks Listed Private Equity Fund’s average daily net assets attributable to its Class R shares.
Because these fees are paid out of a Fund’s Class A, Class C, Class R and Investor Class assets, if any, on an ongoing basis, over time they will increase the cost of an investment in Class A, Class C, Class R and Investor Class shares, if any, and Plan fees may cost an investor more than other types of sales charges.
192 | April 30, 2015
| Notes to Financial Statements | |
| April 30, 2015 (Unaudited) |
The ALPS | Alerian MLP Infrastructure Index Fund Class A and Class C shares, ALPS | Kotak India Growth Fund Class A and Class C shares, ALPS | Red Rocks Listed Private Equity Fund Class A and Class C shares, ALPS | Sterling ETF Tactical Rotation Fund Class A and Class C shares, ALPS | Westport Resources Hedged High Income Fund Class A and Class C shares, ALPS | WMC Research Value Fund Class C shares, Clough China Fund Class A and Class C shares, ALPS | CoreCommodity Management CompleteCommodities® Strategy Fund Class A and Class C shares, RiverFront Conservative Income Builder Fund Class C shares, RiverFront Dynamic Equity Income Fund Class C shares, RiverFront Global Allocation Fund Class C shares, RiverFront Global Growth Fund Class C Shares, and the RiverFront Moderate Growth & Income Fund Class C shares have adopted a shareholder services plan (“Shareholder Services Plan”). Under the Shareholder Services Plan for each Fund, the Funds are authorized to pay banks and their affiliates and other institutions, including broker-dealers and Fund affiliates (“Participating Organizations”), an aggregate fee in an amount not to exceed on an annual basis 0.15% for ALPS | Alerian MLP Infrastructure Index Fund Class A shares, ALPS | CoreCommodity Management CompleteCommodities® Strategy Fund Class A shares, ALPS | Kotak India Growth Fund Class A shares, ALPS | Red Rocks Listed Private Equity Fund Class A shares, ALPS | Sterling ETF Tactical Rotation Fund Class A shares, and ALPS | Westport Resources Hedged High Income Fund Class A shares, and not to exceed 0.25% for the ALPS | Alerian MLP Infrastructure Index Fund Class C shares, ALPS | CoreCommodity Management CompleteCommodities® Strategy Fund Class C shares, ALPS | Kotak India Growth Fund Class C shares, ALPS Real Asset Income Fund Class C shares, ALPS | Red Rocks Listed Private Equity Fund Class C shares, ALPS | Sterling ETF Tactical Rotation Fund Class C shares, ALPS | Westport Resources Hedged High Income Fund Class C shares, ALPS | WMC Research Value Fund Class C shares, Clough China Fund Class C shares, RiverFront Conservative Income Builder Fund Class C shares, RiverFront Dynamic Equity Income Fund Class C shares, RiverFront Global Allocation Fund Class C shares, RiverFront Global Growth Fund Class C Shares, and the RiverFront Moderate Growth & Income Fund Class C shares of the average daily net asset value of the Class A shares and Class C shares, respectively, attributable to or held in the name of a Participating Organization for its clients as compensation for providing shareholder service activities, which do not include distribution services, pursuant to an agreement with a Participating Organization. Shareholder Services plan fees are included with distribution and service fees on the Statements of Operations.
Certain intermediaries may charge networking, omnibus account or other administrative fees with respect to transactions in shares of each Fund. Transactions may be processed through the National Securities Clearing Corporation or similar systems or processed on a manual basis. These fees generally are paid by the Fund to the Distributor, which uses such fees to reimburse intermediaries. In the event an intermediary receiving payments from the Distributor on behalf of the Fund converts from a networking structure to an omnibus account structure or otherwise experiences increased costs, fees borne by the Fund may increase. Networking fees are shown in the Statements of Operations, if applicable to
the Fund.
the Fund.
ALPS Fund Services, Inc. (“ALPS”) serves as administrator to the Funds and the Funds have agreed to pay expenses incurred in connection with their administrative activities. Pursuant to an Administrative Agreement, ALPS provides operational services to the Funds including, but not limited to, fund accounting and fund administration and generally assists in the Funds’ operations. Officers of the Trust are employees of ALPS. The Funds’ administration fee is accrued on a daily basis and paid monthly. Administration fees paid by the Funds for the six months ended April 30, 2015 are disclosed in the Statement of Operations.
ALPS is reimbursed by the Fund for certain out‐of‐pocket expenses.
| 9. | INDEMNIFICATIONS |
Under the Trust’s organizational documents, its officers and Trustees are indemnified against certain liability arising out of the performance of their duties to the Trust. Additionally, in the normal course of business, the Trust enters into contracts with service providers that may contain general indemnification clauses which may permit indemnification to the extent permissible under applicable law. The Trust’s maximum exposure under these arrangements is unknown, as this would involve future claims that may be made against the Trust that have not yet occurred.
193 | April 30, 2015
| Additional Information |
| April 30, 2015 (Unaudited) |
| 1. FUND HOLDINGS |
The Funds file their complete schedule of portfolio holdings with the Securities and Exchange Commission (the “SEC”) for the first and third quarters of each fiscal year on Form N-Q within 60 days after the end of the period. Copies of the Funds’ Form N-Q are available without charge on the SEC website at http:// www.sec.gov. You may also review and copy the Form N-Q at the SEC’s Public Reference Room in Washington, D.C. For more information about the operation of the Public Reference Room, please call the SEC at 1-800-SEC-0330.
| 2. FUND PROXY VOTING POLICIES, PROCEDURES AND SUMMARIES |
Fund policies and procedures used in determining how to vote proxies and information regarding how each of the Funds voted proxies relating to portfolio securities during the most recent prior 12-month period ending June 30 are available without charge, (1) upon request, by calling (toll-free) (866) 759-5679 and (2) on the SEC’s website at http://www.sec.gov.
| 3. DISCLOSURE REGARDING APPROVAL OF FUND ADVISORY AND SUB-ADVISORY AGREEMENTS |
Transaction Approval – ALPS | Red Rocks Listed Private Equity Fund
On April 6, 2015, Red Rocks Capital LLC (“Red Rocks”), the sub-adviser to the ALPS/Red Rocks Listed Private Equity Fund (the “Fund”), entered into an agreement pursuant to which it is expected to become a wholly-owned subsidiary of ALPS Advisors, Inc. (“ALPS Advisors”) (the “Transaction”). At a meeting held on April 22, 2015, the Trustees discussed with Red Rocks its general plans and intentions regarding the Fund. The Board also inquired about the plans for, and anticipated roles and responsibilities of, the employees and officers of Red Rocks in connection with the Transaction, including the anticipated senior management structure. The Independent Trustees met to consider ALPS Advisors’ and Red Rocks’ recommendations as to the approval of the new Investment Sub-Advisory Agreement for the Fund required as a result of the Transaction (the “New Agreement”), to take effect upon consummation of the Transaction.
In considering the New Agreement, the Trustees also requested, and received, information from both Red Rocks and ALPS Advisors regarding anticipated effects assuming completion of the Transaction. The Board also inquired about the plans for, and anticipated roles and responsibilities of, the employees and officers of Red Rocks in connection with the Transaction, including the anticipated senior management structure.
Based on its evaluation, the Board unanimously concluded that the terms of the New Agreement were reasonable and fair and that its approval was in the best interests of the Fund and its Shareholders.
In voting to approve the New Agreement, the Board did not identify any single factor as all-important or controlling. The following summary does not identify all the matters considered by the Board, but provides a summary of the principal matters it considered. The Board considered whether the New Agreement would be in the best interests of the Fund and its Shareholders, based on: (i) the nature, extent and quality of the services to be provided under the New Agreement; (ii) the investment performance of the Fund; (iii) the expenses borne by the Fund (including management fees and other expenses), the fees indirectly charged by Red Rocks to the Fund and to its other clients, and projected profits to be realized by Red Rocks and its affiliates from their relationships with the Fund; (iv) the fact that economies of scale may be realized as the Fund grows and whether fee levels will reflect economies of scale for the benefit of Shareholders; (v) potential fall-out benefits to Red Rocks from its relationships with the Fund; and (vi) other general information about Red Rocks. The following is a summary of the Board’s consideration and conclusions regarding
these matters.
these matters.
Nature, Extent and Quality of the Services Provided
The Board received and considered information regarding the nature, extent and quality of services provided to the Fund under the New Agreement. The Trustees reviewed certain background materials supplied by Red Rocks, including their Form ADV.
The Board reviewed and considered Red Rocks’ investment advisory personnel, its history as an asset manager, its performance and the amount of assets currently under management by Red Rocks, and reviewed the qualifications, backgrounds and responsibilities of the management team primarily responsible for the day-to-day portfolio management of the Fund and the extent of the resources devoted to research and analysis of actual and potential investments. The Board also reviewed the research and decision-making processes utilized by Red Rocks, including the methods adopted to seek to achieve compliance with the investment objectives, policies and restrictions of the Fund.
The Board also reviewed certain compliance-related materials and noted that they have received reports on advisory services and compliance matters from Red Rocks at each regular Board meeting throughout the year.
Investment Performance
The Board reviewed performance information for the Fund for the 1-year, 3-year and 5-year periods ended March 31, 2015. The review included a comparison of the Fund’s performance to the performance of a group of comparable funds selected by an independent provider of research data. The Trustees noted that the Fund had favorable performance for each of these periods when compared against its peer universe average as identified by the independent provider of research data. The Board also considered Red Rocks’ performance and reputation generally and its investment techniques, risk management controls and decision-making processes.
194 | April 30, 2015
| Additional Information |
| April 30, 2015 (Unaudited) |
Fees and Expenses
The Board reviewed and considered (a) the contractual annual advisory fee rate to be paid by the Trust, on behalf of the Fund, to ALPS Advisors and (b) the contractual sub-advisory fee rate to be paid by ALPS Advisors to Red Rocks, in light of the extent and quality of the advisory services provided by ALPS Advisors and Red Rocks to the Fund. The Board also considered fees charged by Red Rocks to comparable accounts.
Based on such information, the Board further determined that the contractual annual advisory fees, inclusive of the sub-advisory fees to be paid by ALPS Advisors to Red Rocks, and taking into account the contractual fee waivers in place, are generally lower than the peer universe median or within an acceptable range of the peer universe median. The Board also determined that the Fund’s total expenses, on a class-by-class basis, were generally lower than the peer universe median, or within an acceptable range thereof.
Projected Profitability and Costs of Services to Red Rocks
The Trustees received and considered a projected profitability analysis prepared by Red Rocks based on the fees payable under the New Agreement, and also considered information regarding the financial condition of Red Rocks. The Trustees also received information from ALPS Advisors regarding the anticipated effects of the Transaction on its projected profitability. In assessing the projected profitability analysis, the Board noted that the Fund’s total fees and expenses were within an acceptable range of the median expenses of comparable funds identified by the independent provider of investment company data.
Extent of Economies of Scale as the Fund Grows and Whether Fee Levels Reflect Economies of Scale
The Trustees considered whether economies of scale in the provision of services to the Fund were being passed along to the shareholders. The Trustees also considered whether any fall-out benefits or any other direct or indirect benefits would accrue to Red Rocks from its relationship with the Fund. The Board also reviewed and considered any other benefits derived or to be derived by Red Rocks from its relationship with the Fund, including soft dollar arrangements.
Based on its evaluation of the aforementioned considerations, the Board unanimously voted to approve the New Agreement, and to recommend to the Shareholders of the Fund that they approve the New Agreement.
Standard Renewal – ALPS | Red Rocks Listed Private Equity Fund
On April 22, 2015, the Trustees met in person to discuss, among other things, the approval of the investment sub-advisory agreement among the Trust, ALPS Advisors, Inc. and Red Rocks Capital LLC (“Red Rocks”) (the “Sub-Advisory Agreement”), in accordance with Section 15(c) of the 1940 Act. The Independent Trustees met with independent legal counsel during executive session and discussed the Sub-Advisory Agreement and other related materials.
In renewing and approving the Sub-Advisory Agreement with Red Rocks, the Trustees, including the Independent Trustees, considered the following factors with respect to the ALPS/Red Rocks Listed Private Equity Fund (the “Fund”):
In voting to approve the Sub-Advisory Agreement, the Board did not identify any single factor as all-important or controlling. The following summary does not identify all the matters considered by the Board, but provides a summary of the principal matters it considered. The Board considered whether the Sub-Advisory Agreement would be in the best interests of the Fund and its Shareholders, based on: (i) the nature, extent and quality of the services to be provided under the Sub-Advisory Agreement; (ii) the investment performance of the Fund; (iii) the expenses borne by the Fund (including management fees and other expenses), the fees indirectly charged by Red Rocks to the Fund and to its other clients, and projected profits to be realized by Red Rocks and its affiliates from their relationships with the Fund; (iv) the fact that economies of scale may be realized as the Fund grows and whether fee levels will reflect economies of scale for the benefit of Shareholders; (v) potential fall-out benefits to Red Rocks from its relationships with the Fund; and (vi) other general information about Red Rocks. The following is a summary of the Board’s consideration and conclusions regarding these matters.
Nature, Extent and Quality of the Services Provided
The Board received and considered information regarding the nature, extent and quality of services provided to the Fund under the Sub-Advisory Agreement. The Trustees reviewed certain background materials supplied by Red Rocks, including their Form ADV.
The Board reviewed and considered Red Rocks’ investment advisory personnel, its history as an asset manager, its performance and the amount of assets currently under management by Red Rocks, and reviewed the qualifications, backgrounds and responsibilities of the management team primarily responsible for the day-to-day portfolio management of the Fund and the extent of the resources devoted to research and analysis of actual and potential investments. The Board also reviewed the research and decision-making processes utilized by Red Rocks, including the methods adopted to seek to achieve compliance with the investment objectives, policies and restrictions of the Fund.
195 | April 30, 2015
| Additional Information |
| April 30, 2015 (Unaudited) |
The Board also reviewed certain compliance-related materials and noted that they have received reports on advisory services and compliance matters from Red Rocks at each regular Board meeting throughout the year.
Investment Performance
The Board reviewed performance information for the Fund for the 1-year, 3-year and 5-year periods ended March 31, 2015. The review included a comparison of the Fund’s performance to the performance of a group of comparable funds selected by an independent provider of research data. The Trustees noted that the Fund had favorable performance for each of these periods when compared against its peer universe average as identified by the independent provider of research data. The Board also considered Red Rocks’ performance and reputation generally and its investment techniques, risk management controls and decision-making processes.
Fees and Expenses
The Board reviewed and considered (a) the contractual annual advisory fee rate to be paid by the Trust, on behalf of the Fund, to ALPS Advisors and (b) the contractual sub-advisory fee rate to be paid by ALPS Advisors to Red Rocks, in light of the extent and quality of the advisory services provided by ALPS Advisors and Red Rocks to the Fund. The Board also considered fees charged by Red Rocks to comparable accounts.
Based on such information, the Board further determined that the contractual annual advisory fees, inclusive of the sub-advisory fees to be paid by ALPS Advisors to Red Rocks, and taking into account the contractual fee waivers in place, are generally lower than the peer universe median or within an acceptable range of the peer universe median. The Board also determined that the Fund’s total expenses, on a class-by-class basis, were generally lower than the peer universe median, or within an acceptable range thereof.
Projected Profitability and Costs of Services to Red Rocks
The Trustees received and considered a historical and projected profitability analysis prepared by Red Rocks based on the fees payable under the Sub-Advisory Agreement, and also considered information regarding the financial condition of Red Rocks. In assessing the profitability analysis, the Board noted that the Fund’s total fees and expenses were within an acceptable range of the median expenses of comparable funds identified by the independent provider of investment company data.
Extent of Economies of Scale as the Fund Grows and Whether Fee Levels Reflect Economies of Scale
The Trustees considered whether economies of scale in the provision of services to the Fund were being passed along to the shareholders. The Trustees also considered whether any fall-out benefits or any other direct or indirect benefits would accrue to Red Rocks from its relationship with the Fund. The Board also reviewed and considered any other benefits derived or to be derived by Red Rocks from its relationship with the Fund, including soft dollar arrangements.
Based on its evaluation of the aforementioned considerations, the Board unanimously voted to approve the Sub-Advisory Agreement, and to recommend to the Shareholders of the Fund that they approve the Sub-Advisory Agreement.
196 | April 30, 2015
| Item 2. | Code of Ethics. |
Not applicable to this Report.
| Item 3. | Audit Committee Financial Expert. |
Not applicable to this Report.
| Item 4. | Principal Accountant Fees and Services. |
Not applicable to this Report.
| Item 5. | Audit Committee of Listed Registrants. |
Not applicable to Registrant.
| Item 6. | Investments. |
| (a) | Schedule of Investments is included as part of the Reports to Stockholders filed under Item 1 of this Form N-CSR. |
| (b) | Not applicable. |
| Item 7. | Disclosure of Proxy Voting Policies and Procedures for Closed-End Management Investment Companies. |
Not applicable to Registrant.
| Item 8. | Portfolio Managers of Closed-End Management Investment Companies. |
Not applicable to Registrant.
| Item 9. | Purchases of Equity Securities by Closed-End Management Investment Company and Affiliated Purchasers. |
Not applicable to Registrant.
| Item 10. | Submission of Matters to a Vote of Security Holders. |
There have been no material changes to the procedures by which shareholders may recommend nominees to the Registrant’s Board of Trustees, where those changes were implemented after the Registrant last provided disclosure in response to the requirements of Item 407(c)(2)(iv) of Regulation S-K, or this Item.
| Item 11. | Controls and Procedures. |
| (a) | The Registrant’s principal executive officer and principal financial officer have concluded that the Registrant’s disclosure controls and procedures (as defined in Rule 30a-3(c) under the Investment Company Act of 1940, as amended) are effective based on their evaluation of these controls and procedures as of a date within 90 days of the filing date of this report. |
| (b) | There was no change in the Registrant’s internal control over financial reporting (as defined in Rule 30a-3(d) under the Investment Company Act of 1940, as amended) that occurred during the second fiscal quarter of the period covered by this report that has materially affected, or is reasonably likely to materially affect, the Registrant’s internal control over financial reporting. |
| Item 12. | Exhibits. |
| (a)(1) | Not applicable to this Report. |
| (a)(2) | The certifications required by Rule 30a-2(a) of the Investment Company Act of 1940, as amended, and Section 302 of the Sarbanes-Oxley Act of 2002 are attached hereto as Exhibit 99.Cert. |
| (a)(3) | Not applicable to Registrant. |
| (b) | The certifications by the Registrant’s principal executive officer and principal financial officer, as required by Rule 30a-2(b) of the Investment Company Act of 1940, as amended, and Section 906 of the Sarbanes-Oxley Act of 2002 are attached hereto as Exhibit 99.906Cert. |
SIGNATURES
Pursuant to the requirements of the Securities Exchange Act of 1934 and the Investment Company Act of 1940, the Registrant has duly caused this report to be signed on its behalf by the undersigned, thereunto duly authorized.
| FINANCIAL INVESTORS TRUST | ||
| By: | /s/ Edmund J. Burke | |
| Edmund J. Burke (Principal Executive Officer) | ||
| President | ||
| Date: | July 2, 2015 | |
Pursuant to the requirements of the Securities Exchange Act of 1934 and the Investment Company Act of 1940, this report has been signed below by the following persons on behalf of the Registrant and in the capacities and on the dates indicated.
| FINANCIAL INVESTORS TRUST | |||
| By: | /s/ Edmund J. Burke | ||
| Edmund J. Burke (Principal Executive Officer) | |||
| President | |||
| Date: | July 2, 2015 | ||
| By: | /s/ Kimberly R. Storms | ||
| Kimberly R. Storms (Principal Financial Officer) | |||
| Treasurer | |||
| Date: | July 2, 2015 | ||