UNITED STATES
SECURITIES AND EXCHANGE COMMISSION
Washington, D.C. 20549
FORM N-CSR
CERTIFIED SHAREHOLDER REPORT OF REGISTERED
MANAGEMENT INVESTMENT COMPANIES
Investment Company Act file number: 811-8194
FINANCIAL INVESTORS TRUST
(exact name of Registrant as specified in charter)
1290 Broadway, Suite 1100, Denver, Colorado 80203
(Address of principal executive offices) (Zip code)
David T. Buhler, Secretary
Financial Investors Trust
1290 Broadway, Suite 1100
Denver, Colorado 80203
(Name and address of agent for service)
Registrant’s telephone number, including area code: 303-623-2577
Date of fiscal year end: October 31
Date of reporting period: October 31, 2013 – April 30, 2014
Item 1. Reports to Stockholders.

April 30, 2014

ALPS Real Asset Income Fund
ALPS | Westport Resources Hedged High Income Fund
An ALPS Advisors Solution

Table of Contents April 30, 2014 |
| 1 | ||||
ALPS Real Asset Income Fund | ||||
| 2 | ||||
| 4 | ||||
| 7 | ||||
| 8 | ||||
| 9 | ||||
| 10 | ||||
ALPS | Westport Resources Hedged High Income Fund | ||||
| 13 | ||||
| 14 | ||||
| 16 | ||||
| 21 | ||||
| 22 | ||||
| 23 | ||||
| 24 | ||||
| 27 | ||||
| 37 | ||||
| April 30, 2014 (Unaudited) |
Examples. As a shareholder of the Funds, you will incur two types of costs: (1) transaction costs, including applicable sales charges (loads); and (2) ongoing costs, including management fees, distribution and service (12b-1) fees, shareholder service fees and other Fund expenses. The following examples are intended to help you understand your ongoing costs (in dollars) of investing in the Funds and to compare these costs with the ongoing costs of investing in other mutual funds. The examples are based on an investment of $1,000 invested on November 1, 2013 and held until April 30, 2014.
Actual Expenses. The first line under each class in the table below provides information about actual account values and actual expenses. You may use the information in this line, together with the amount you invested, to estimate the expenses that you paid over the period. Simply divide your account value by $1,000 (for example, an $8,600 account value divided by $1,000 = 8.6), then multiply the result by the number in the first line under the heading “Expenses Paid During Period November 1, 2013 – April 30, 2014” to estimate the expenses you paid on your account during this period.
Hypothetical Example for Comparison Purposes. The second line under each class in the table below provides information about hypothetical account values and hypothetical expenses based on the Fund’s actual expense ratio and an assumed rate of return of 5% per year before expenses, which is not the Fund’s actual return. The hypothetical account values and expenses may not be used to estimate the actual ending account balance or expenses you paid for the period. You may use this information to compare the ongoing costs of investing in the Funds and other mutual funds. To do so, compare these 5% hypothetical examples with the 5% hypothetical examples that appear in the shareholder reports of the other funds.
Please note that the expenses shown in the table are meant to highlight your ongoing costs only and do not reflect any transactional costs, such as sales charges or redemption fees. Therefore, the second line under each class in the table below is useful in comparing ongoing costs only, and will not help you determine the relative total costs of owning different funds. In addition, if these transactional costs were included, your costs would have been higher.
Beginning Account Value November 1, 2013 | Ending Account Value April 30, 2014 | Expense Ratio(a) | Expenses Paid During Period November 1, 2013 - April 30, 2014(b) | |||||||||||||||||
ALPS Real Asset Income Fund(c) |
| |||||||||||||||||||
Class A(d) | ||||||||||||||||||||
Actual | $ | 1,000.00 | $ | 1,093.50 | 1.40 | % | $ | 6.10 | ||||||||||||
Hypothetical (5% return before expenses) | $ | 1,000.00 | $ | 1,017.85 | 1.40 | % | $ | 7.00 | ||||||||||||
Class C(d) | ||||||||||||||||||||
Actual | $ | 1,000.00 | $ | 1,091.30 | 2.00 | % | $ | 8.71 | ||||||||||||
Hypothetical (5% return before expenses) | $ | 1,000.00 | $ | 1,014.88 | 2.00 | % | $ | 9.99 | ||||||||||||
Class I(d) | ||||||||||||||||||||
Actual | $ | 1,000.00 | $ | 1,095.30 | 1.00 | % | $ | 4.36 | ||||||||||||
Hypothetical (5% return before expenses) | $ | 1,000.00 | $ | 1,019.84 | 1.00 | % | $ | 5.01 | ||||||||||||
ALPS | Westport Resources Hedged High Income Fund |
| |||||||||||||||||||
Class A(e) | ||||||||||||||||||||
Actual | $ | 1,000.00 | $ | 1,027.20 | 2.39 | % | $ | 7.96 | ||||||||||||
Hypothetical (5% return before expenses) | $ | 1,000.00 | $ | 1,012.94 | 2.39 | % | $ | 11.93 | ||||||||||||
Class C(e) | ||||||||||||||||||||
Actual | $ | 1,000.00 | $ | 1,024.10 | 2.99 | % | $ | 9.95 | ||||||||||||
Hypothetical (5% return before expenses) | $ | 1,000.00 | $ | 1,009.97 | 2.99 | % | $ | 14.90 | ||||||||||||
Class I(e) | ||||||||||||||||||||
Actual | $ | 1,000.00 | $ | 1,027.60 | 1.99 | % | $ | 6.63 | ||||||||||||
Hypothetical (5% return before expenses) | $ | 1,000.00 | $ | 1,014.93 | 1.99 | % | $ | 9.94 | ||||||||||||
| (a) | Annualized, based on the Fund’s most recent fiscal half year expenses. |
| (b) | Expenses are equal to the Fund’s annualized expense ratio multiplied by the average account value over the period, multiplied by the number of days in the most recent fiscal half year (181), divided by 365. |
| (c) | Includes expenses of the ALPS Real Asset Income Fund (Cayman) Ltd. (wholly-owned subsidiary), exclusive of the subsidiary’s management fee. |
| (d) | ALPS Real Asset Income Fund commenced operations on November 30, 2013. For purposes of calculating the “Actual” figures, actual number of days from commencement of operations through April 30, 2014 were used (152 days). |
| (e) | ALPS | Westport Resources Hedged High Income Fund commenced operations on January 1, 2014. For purposes of calculating the “Actual” figures, actual number of days from commencement of operations through April 30, 2014 were used (120 days). |
1 | April 30, 2014
ALPS Real Asset Income Fund | ||
| April 30, 2014 (Unaudited) |
Performance of $10,000 Initial Investment (as of April 30, 2014)
Comparison of change in value of a $10,000 investment (includes maximum sales charges of 5.50%)
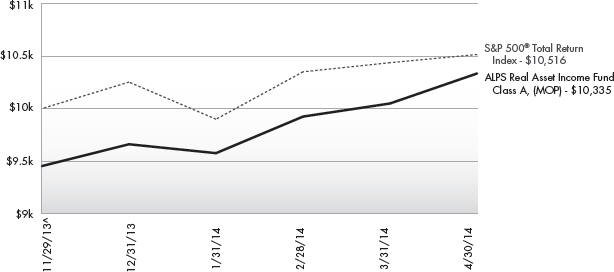
The chart above represents historical performance of a hypothetical investment of $10,000 in the Fund since inception. Past performance does not guarantee future results. This chart does not reflect the deduction of taxes that a shareholder would pay on Fund distributions or the redemption of Fund shares.
Average Annual Total Returns (as of April 30, 2014)
| 3 Month1 | Since Inception ^ | Total Expense Ratio | What You Pay * | |||||
Class A (NAV) | 7.94% | 9.35% | ||||||
Class A (MOP) | 2.00% | 3.35% | 1.54% | 1.40% | ||||
Class C (NAV) | 7.84% | 9.13% | ||||||
Class C (CDSC) | 6.84% | 8.13% | 2.14% | 2.00% | ||||
Class I | 8.02% | 9.53% | 1.14% | 1.00% | ||||
S&P 500® Total Return Index2 | 6.23% | 5.16% |
Performance data quoted represents past performance. Past performance does not guarantee future results. Investment return and principal value of an investment will fluctuate so that an investor’s shares, when sold or redeemed, may be worth more or less than the original cost. Current performance data may be higher or lower than actual data quoted. For the most current month-end performance data, please call
1-866-759-5679.
Maximum Offering Price (MOP) for Class A shares includes the Fund’s maximum sales charge of 5.50%. Performance shown at NAV does not include these sales charges and would have been lower had it been taken into account. If you invest $1 million or more, either as a lump sum or through the Fund’s accumulation or letter of intent programs, you can purchase Class A shares without an initial sales charge (load). A Contingent Deferred Sales Charge (“CDSC”) of 1.00% may apply to Class C shares redeemed within the first 12 months after a purchase, and on Class A shares redeemed within the first 18 months after a purchase in excess of $1 million.
| 1 | Performance less than 1 year is cumulative. |
| 2 | The S&P 500® Index is the Standard & Poor’s composite index of 500 stocks, a widely recognized, unmanaged index of common stock prices. The index is not actively managed and does not reflect any deduction for fees, expenses or taxes. An investor may not invest directly in an index. |
| ^ | Fund inception date of November 29, 2013. |
| * | What You Pay reflects the Advisor’s decision to contractually limit expenses through February 28, 2015. Please see the prospectus for additional information. |
2 | April 30, 2014
ALPS Real Asset Income Fund | ||
Performance Update | April 30, 2014 (Unaudited) |
There is no guarantee that the Fund will continue to hold any one particular security or stay invested in any one particular company. The composition of the Fund’s top holdings is subject to change. Performance figures are historical and reflect the change in share price, reinvested distributions, changes in net asset value, sales charges and capital gains distributions, if any.
Not FDIC Insured – No Bank Guarantee – May Lose Value
Derivatives generally are more sensitive to changes in economic or market conditions than other types of investments; this could result in losses that significantly exceed the Fund’s original investment.
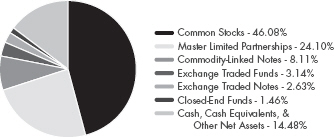
Top Ten Holdings (as a % of Net Assets) †
| ||||
UBS AG Commodity-Linked Note Linked to the Thomson Reuter/Jefferies CRB 3 Month Forward Index | 4.06 | % | ||
Bank of America Corp., Commodity-Linked Note Linked to the Merrill Lynch Commodity Index eXtra J-Series F3 Total Return Index | 4.05 | % | ||
PowerShares DB Commodity Index Tracking Fund | 3.14 | % | ||
ELEMENTS Linked to the Rogers International Commodity Index - Total Return | 2.63 | % | ||
Enterprise Products Partners LP | 2.38 | % | ||
Kinder Morgan Energy Partners LP | 2.19 | % | ||
TransCanada Corp. | 1.99 | % | ||
Westshore Terminals Investment Corp. | 1.98 | % | ||
Snam SpA | 1.92 | % | ||
Atlantia SpA | 1.90 | % | ||
Top Ten Holdings | 26.24 | % | ||
† Holdings are subject to change. Table presents indicative values only.
Portfolio Composition (as a % of Net Assets)
3 | April 30, 2014
ALPS Real Asset Income Fund | ||
| April 30, 2014 (Unaudited) |
| Shares | Value (Note 2) | |||||||
| ||||||||
CLOSED-END FUNDS (1.46%) | ||||||||
HICL Infrastructure Co. Ltd. | 10,600 | $ | 24,376 | |||||
International Public Partnerships Ltd. | 11,000 | 23,680 | ||||||
|
| |||||||
| 48,056 | ||||||||
|
| |||||||
TOTAL CLOSED-END FUNDS (Cost $44,721) | 48,056 | |||||||
|
| |||||||
COMMON STOCKS (46.08%) | ||||||||
Basic Materials (5.49%) | ||||||||
Chemicals (3.21%) | ||||||||
CF Industries Holdings, Inc. | 137 | 33,588 | ||||||
Monsanto Co. | 164 | 18,155 | ||||||
The Mosaic Co. | 443 | 22,168 | ||||||
Potash Corp. of Saskatchewan, Inc. | 867 | 31,351 | ||||||
|
| |||||||
| 105,262 | ||||||||
|
| |||||||
Iron/Steel (0.65%) | ||||||||
Carpenter Technology Corp. | 63 | 3,956 | ||||||
Gerdau SA, ADR | 691 | 4,153 | ||||||
Steel Dynamics, Inc. | 133 | 2,430 | ||||||
Vale SA, ADR | 828 | 10,946 | ||||||
|
| |||||||
| 21,485 | ||||||||
|
| |||||||
Mining (1.63%) | ||||||||
Goldcorp, Inc. | 862 | 21,309 | ||||||
Kinross Gold Corp.(a) | 3,189 | 12,947 | ||||||
Rio Tinto PLC, ADR | 166 | 9,012 | ||||||
Southern Copper Corp. | 336 | 10,127 | ||||||
|
| |||||||
| 53,395 | ||||||||
|
| |||||||
TOTAL BASIC MATERIALS | 180,142 | |||||||
|
| |||||||
Communications (2.75%) | ||||||||
Telecommunications (2.75%) | ||||||||
Eutelsat Communications SA | 1,100 | 37,740 | ||||||
SES SA | 1,400 | 52,723 | ||||||
|
| |||||||
| 90,463 | ||||||||
|
| |||||||
TOTAL COMMUNICATIONS | 90,463 | |||||||
|
| |||||||
Consumer, Cyclical (1.98%) | ||||||||
Storage/Warehousing (1.98%) | ||||||||
Westshore Terminals Investment Corp. | 2,000 | 64,997 | ||||||
|
| |||||||
TOTAL CONSUMER, CYCLICAL | 64,997 | |||||||
|
| |||||||
| Shares | Value (Note 2) | |||||||
Consumer, Non-Cyclical (5.74%) |
| |||||||
Commercial Services (4.82%) |
| |||||||
Atlantia SpA | 2,400 | $ | 62,431 | |||||
Jiangsu Expressway Co. Ltd., Class H | 42,900 | 48,306 | ||||||
Zhejiang Expressway Co. Ltd., Class H | 54,900 | 47,515 | ||||||
|
| |||||||
| 158,252 | ||||||||
|
| |||||||
Food (0.92%) | ||||||||
Tyson Foods, Inc., | 722 | 30,302 | ||||||
|
| |||||||
TOTAL CONSUMER, NON-CYCLICAL |
| 188,554 | ||||||
|
| |||||||
Energy (13.55%) | ||||||||
Energy-Alternate Sources (2.55%) |
| |||||||
Pattern Energy Group, Inc. | 1,300 | 34,840 | ||||||
TransAlta Renewables, Inc. | 4,800 | 48,830 | ||||||
|
| |||||||
| 83,670 | ||||||||
|
| |||||||
Oil & Gas (5.22%) | ||||||||
Chevron Corp. | 133 | 16,694 | ||||||
ConocoPhillips | 243 | 18,057 | ||||||
Eni SpA, ADR | 377 | 19,468 | ||||||
HollyFrontier Corp. | 114 | 5,995 | ||||||
Marathon Oil Corp. | 537 | 19,413 | ||||||
Marathon Petroleum Corp. | 314 | 29,186 | ||||||
Murphy Oil Corp. | 383 | 24,294 | ||||||
Occidental Petroleum Corp. | 185 | 17,714 | ||||||
Valero Energy Corp. | 362 | 20,696 | ||||||
|
| |||||||
| 171,517 | ||||||||
|
| |||||||
Pipelines (5.78%) | ||||||||
Inter Pipeline Ltd. | 1,400 | 38,064 | ||||||
Spectra Energy Corp. | 900 | 35,739 | ||||||
TransCanada Corp. | 1,400 | 65,245 | ||||||
The Williams Cos, Inc. | 1,200 | 50,604 | ||||||
|
| |||||||
| 189,652 | ||||||||
|
| |||||||
TOTAL ENERGY | 444,839 | |||||||
|
| |||||||
Industrials (3.96%) | ||||||||
Engineering & Construction (2.29%) |
| |||||||
Ferrovial SA | 1,700 | 37,736 | ||||||
Sydney Airport | 9,600 | 37,635 | ||||||
|
| |||||||
| 75,371 | ||||||||
|
| |||||||
Machinery-Construction & Mining (0.28%) |
| |||||||
Joy Global, Inc. | 150 | 9,057 | ||||||
|
| |||||||
4 | April 30, 2014
ALPS Real Asset Income Fund | ||
Consolidated Statement of Investments | April 30, 2014 (Unaudited) |
| Shares | Value (Note 2) | |||||||
| ||||||||
Machinery-Diversified (0.26%) |
| |||||||
AGCO Corp. | 152 | $ | 8,467 | |||||
|
| |||||||
Transportation (1.13%) | ||||||||
Hutchison Port Holdings Trust | 54,400 | 36,992 | ||||||
|
| |||||||
TOTAL INDUSTRIALS | 129,887 | |||||||
|
| |||||||
Utilities (12.61%) | ||||||||
Electric (5.27%) | ||||||||
DUET Group | 11,900 | 23,989 | ||||||
PG&E Corp. | 800 | 36,464 | ||||||
SP AusNet | 19,600 | 25,492 | ||||||
Spark Infrastructure Group | 15,200 | 24,923 | ||||||
Terna Rete Elettrica Nazionale SpA | 11,500 | 62,223 | ||||||
|
| |||||||
| 173,091 | ||||||||
|
| |||||||
Gas (5.03%) | ||||||||
Hong Kong & China Gas Co. Ltd. | 16,100 | 37,130 | ||||||
Keyera Corp. | 400 | 26,605 | ||||||
National Grid PLC | 2,700 | 38,315 | ||||||
Snam SpA | 10,500 | 63,105 | ||||||
|
| |||||||
| 165,155 | ||||||||
|
| |||||||
Water (2.31%) | ||||||||
Pennon Group PLC | 2,000 | 25,579 | ||||||
Severn Trent PLC | 800 | 24,921 | ||||||
United Utilities Group PLC | 1,900 | 25,535 | ||||||
|
| |||||||
| 76,035 | ||||||||
|
| |||||||
TOTAL UTILITIES | 414,281 | |||||||
|
| |||||||
TOTAL COMMON STOCKS (Cost $1,393,118) | 1,513,163 | |||||||
|
| |||||||
EXCHANGE TRADED FUNDS (3.14%) |
| |||||||
PowerShares DB Commodity Index Tracking Fund(a) | 3,900 | 102,999 | ||||||
|
| |||||||
TOTAL EXCHANGE TRADED FUNDS (Cost $99,456) |
| 102,999 | ||||||
|
| |||||||
EXCHANGE TRADED NOTES (2.63%) |
| |||||||
ELEMENTS Linked to the Rogers International Commodity | 10,000 | 86,400 | ||||||
|
| |||||||
TOTAL EXCHANGE TRADED NOTES (Cost $80,542) |
| 86,400 | ||||||
|
| |||||||
| Shares | Value (Note 2) | |||||||
| ||||||||
MASTER LIMITED PARTNERSHIPS (24.10%) |
| |||||||
Energy (24.10%) | ||||||||
Pipelines (24.10%) | ||||||||
Access Midstream Partners LP | 426 | $ | 25,283 | |||||
Atlas Pipeline Partners LP | 349 | 11,301 | ||||||
Buckeye Partners LP | 492 | 37,495 | ||||||
Crestwood Midstream Partners LP | 661 | 15,362 | ||||||
DCP Midstream Partners LP | 391 | 20,918 | ||||||
El Paso Pipeline Partners LP | 596 | 19,400 | ||||||
Enbridge Energy Partners LP | 973 | 29,151 | ||||||
Energy Transfer Partners LP | 960 | 52,982 | ||||||
EnLink Midstream Partners LP | 428 | 12,622 | ||||||
Enterprise Products Partners LP | 1,068 | 78,103 | ||||||
Genesis Energy LP | 343 | 19,009 | ||||||
Kinder Morgan Energy Partners LP | 954 | 71,913 | ||||||
Magellan Midstream Partners LP | 765 | 56,771 | ||||||
MarkWest Energy Partners LP | 723 | 45,795 | ||||||
NuStar Energy LP | 305 | 17,800 | ||||||
ONEOK Partners LP | 652 | 37,157 | ||||||
Plains All American Pipeline LP | 988 | 55,130 | ||||||
Regency Energy Partners LP | 1,310 | 35,684 | ||||||
Spectra Energy Partners LP | 219 | 11,925 | ||||||
Sunoco Logistics Partners LP | 329 | 29,926 | ||||||
Targa Resources Partners LP | 464 | 27,473 | ||||||
TC PipeLines LP | 212 | 11,244 | ||||||
Tesoro Logistics LP | 165 | 10,544 | ||||||
Western Gas Partners LP | 313 | 21,284 | ||||||
Williams Partners LP | 721 | 37,189 | ||||||
|
| |||||||
| 791,461 | ||||||||
|
| |||||||
TOTAL ENERGY | 791,461 | |||||||
|
| |||||||
TOTAL MASTER LIMITED PARTNERSHIPS (Cost $746,966) |
| 791,461 | ||||||
|
| |||||||
| Principal Amount | Value (Note 2) | |||||||
| ||||||||
COMMODITY-LINKED NOTES (8.11%) |
| |||||||
Bank of America Corp., Commodity-Linked Note Linked to the Merrill Lynch Commodity Index eXtra J-Series F3 Total Return Index, 0.00%, Series 5 01/09/2015(b) | $ | 100,000 | 132,894 | |||||
5 | April 30, 2014
ALPS Real Asset Income Fund | ||
Consolidated Statement of Investments | April 30, 2014 (Unaudited) |
| Principal Amount | Value (Note 2) | |||||||||||
| ||||||||||||
UBS AG Commodity-Linked Note Linked to the Thomson Reuter/Jefferies CRB 3 Month Forward Index, 0.00% |
| $ | 100,000 | $ | 133,370 | |||||||
|
| |||||||||||
TOTAL COMMODITY-LINKED NOTES (Cost $200,000) |
| 266,264 | ||||||||||
|
| |||||||||||
| 7-Day Yield | Shares | Value (Note 2) | ||||||||||
| ||||||||||||
SHORT TERM INVESTMENTS (5.85%) |
| |||||||||||
Money Market Funds (5.85%) |
| |||||||||||
Morgan Stanley Institutional Liquidity Fund, Prime Portfolio | 0.055 | % | 9,877 | 9,876 | ||||||||
Dreyfus Treasury Prime Institutional Fund | 0.000 | %(c) | 182,422 | 182,422 | ||||||||
|
| |||||||||||
TOTAL SHORT TERM INVESTMENTS (Cost $192,298) |
| 192,298 | ||||||||||
|
| |||||||||||
TOTAL INVESTMENTS (91.37%) (Cost $2,757,101) |
| $ | 3,000,641 | |||||||||
SEGREGATED CASH (4.53%)(d) |
| 148,701 | ||||||||||
Other Assets In Excess Of Liabilities (4.10%) |
| 134,750 | ||||||||||
|
| |||||||||||
NET ASSETS (100.00%) |
| $ | 3,284,092 | |||||||||
|
| |||||||||||
SCHEDULE OF WRITTEN OPTIONS | Expiration Date | Exercise Price | Contracts | Value | ||||||||||||
| ||||||||||||||||
Written Call Options |
| |||||||||||||||
SPDR® Gold Shares | 05/2/2014 | 125.50 | (1 | ) | $ | (27 | ) | |||||||||
|
| |||||||||||||||
TOTAL WRITTEN CALL OPTIONS |
| |||||||||||||||
(Premiums received $112) |
| (27 | ) | |||||||||||||
|
| |||||||||||||||
| (a) | Non-Income Producing Security. |
| (b) | Floating or variable rate security. Interest rate disclosed is that which is in effect at April 30, 2014. |
| (c) | Less than 0.005%. |
| (d) | Cash is being held as collateral for written options. |
Common Abbreviations:
ADR - American Depositary Receipt.
LP - Limited Partnership.
Ltd. - Limited.
PLC - Public Limited Company.
SA - Generally designates corporations in various countries,
mostly those employing the civil law.
SpA - Societa’ Per Azioni is an Italian shared company.
SPDR - Standard and Poor’s Depositary Receipt.
For Fund compliance purposes, the Fund’s industry classifications refer to any one or more of the industry sub-classifications used by one or more widely recognized market indexes or ratings group indexes, and/or as defined by Fund management. This definition may not apply for purposes of this report, which may combine industry sub-classifications for reporting ease. Industries are shown as a percent of net assets.
See Notes to Financial Statements.
6 | April 30, 2014
ALPS Real Asset Income Fund | ||
| Consolidated Statement of Assets and Liabilities | April 30, 2014 (Unaudited) |
ASSETS | ||||
Investments, at value | $ | 3,000,641 | ||
Cash | 475 | |||
Foreign currency, at value (Cost $4,988) | 5,003 | |||
Receivable for investments sold | 83,637 | |||
Deposit with broker for written options | 148,701 | |||
Dividends receivable | 6,756 | |||
Receivable due from advisor | 24,203 | |||
Prepaid offering costs | 45,431 | |||
Prepaid expenses and other assets | 4,061 | |||
| ||||
Total Assets | 3,318,908 | |||
| ||||
LIABILITIES | ||||
Written options, at value (premiums received $112) | 27 | |||
Administration and transfer agency fees payable | 13,745 | |||
Distribution and services fees payable | 876 | |||
Professional fees payable | 13,939 | |||
Accrued expenses and other liabilities | 6,229 | |||
| ||||
Total Liabilities | 34,816 | |||
| ||||
NET ASSETS | $ | 3,284,092 | ||
| ||||
NET ASSETS CONSIST OF | ||||
Paid-in capital | $ | 3,036,486 | ||
Accumulated net investment loss | (14,772 | ) | ||
Accumulated net realized gain on investments, written options, securities sold short and foreign currency transactions | 18,703 | |||
Net unrealized appreciation on investments, written options and translation of assets and liabilities denominated in foreign currencies | 243,675 | |||
| ||||
NET ASSETS | $ | 3,284,092 | ||
| ||||
INVESTMENTS, AT COST | $ | 2,757,101 | ||
| ||||
PRICING OF SHARES | ||||
Class A: | ||||
Net Asset Value, offering and redemption price per share(a) | $ | 10.82 | ||
Net Assets | $ | 547,822 | ||
Shares of beneficial interest outstanding (unlimited number of shares, no par value common stock authorized) | 50,624 | |||
Maximum offering price per share ((NAV/0.9450), based on maximum sales charge of 5.50% of the offering price) | $ | 11.45 | ||
Class C: | ||||
Net Asset Value, offering and redemption price per share(a) | $ | 10.82 | ||
Net Assets | $ | 545,437 | ||
Shares of beneficial interest outstanding (unlimited number of shares, no par value common stock authorized) | 50,431 | |||
Class I: | ||||
Net Asset Value, offering and redemption price per share | $ | 10.82 | ||
Net Assets | $ | 2,190,833 | ||
Shares of beneficial interest outstanding (unlimited number of shares, no par value common stock authorized) | 202,459 | |||
| (a) | Redemption price per share may be reduced for any applicable contingent deferred sales charge. For a description of a possible sales charge, please see the Fund’s Prospectus. |
See Notes to Financial Statements.
7 | April 30, 2014
ALPS Real Asset Income Fund | ||
| For the Period Ended April 30, 2014 (Unaudited) |
INVESTMENT INCOME | ||||
Dividends | $ | 38,518 | ||
Foreign taxes withheld on dividends | (1,816 | ) | ||
| ||||
Total Investment Income | 36,702 | |||
| ||||
EXPENSES | ||||
Investment advisory fees | 10,336 | |||
Administrative and transfer agency fees | 64,873 | |||
Distribution and service fees | ||||
Class A | 862 | |||
Class C | 2,150 | |||
Professional fees | 14,558 | |||
Networking fees | ||||
Class I | 862 | |||
Reports to shareholders and printing fees | 3,415 | |||
State registration fees | 883 | |||
SEC registration fees | 10 | |||
Custody fees | 10,368 | |||
Trustees’ fees and expenses | 2,842 | |||
Offering costs | 28,905 | |||
Miscellaneous expenses | 5,225 | |||
| ||||
Total Expenses | 145,289 | |||
| ||||
Less fees waived/reimbursed by investment advisor (Note 7) | ||||
Class A | (21,429 | ) | ||
Class C | (21,378 | ) | ||
Class I | (86,548 | ) | ||
| ||||
Net Expenses | 15,934 | |||
| ||||
Net Investment Income | 20,768 | |||
| ||||
Net realized gain on investments | 19,664 | |||
Net realized gain on written options | 825 | |||
Net realized loss on securities sold short | (1,754 | ) | ||
Net realized loss on foreign currency transactions | (32 | ) | ||
Net change in unrealized appreciation on investments | 243,540 | |||
Net change in unrealized appreciation on written options | 85 | |||
Net change in unrealized appreciation on translation of assets and liabilities denominated in foreign currencies | 50 | |||
| ||||
NET REALIZED AND UNREALIZED GAIN ON INVESTMENTS | 262,378 | |||
| ||||
NET INCREASE IN NET ASSETS RESULTING FROM OPERATIONS | $ | 283,146 | ||
| ||||
See Notes to Financial Statements.
8 | April 30, 2014
ALPS Real Asset Income Fund | ||
For the Period November 30, 2013 (Commencement) to April 30, 2014 (Unaudited) | ||||
| ||||
OPERATIONS | ||||
Net investment income | $ | 20,768 | ||
Net realized gain on investments, written options, securities sold short and foreign currency transactions | 18,703 | |||
Net change in unrealized appreciation on investments, written options and translation of assets and liabilities denominated in foreign currencies | 243,675 | |||
| ||||
Net Increase in Net Assets Resulting from Operations | 283,146 | |||
| ||||
DISTRIBUTIONS | ||||
Dividends to shareholders from net investment income | ||||
Class A | (5,516 | ) | ||
Class C | (4,480 | ) | ||
Class I | (25,544 | ) | ||
| ||||
Net Decrease in Net Assets from Distributions | (35,540 | ) | ||
| ||||
BENEFICIAL INTEREST TRANSACTIONS (NOTE 6) | ||||
Shares sold | ||||
Class A | 500,966 | |||
Class C | 500,030 | |||
Class I | 2,000,030 | |||
Dividends reinvested | ||||
Class A | 5,516 | |||
Class C | 4,480 | |||
Class I | 25,544 | |||
Shares redeemed | ||||
Class A | (20 | ) | ||
Class C | (30 | ) | ||
Class I | (30 | ) | ||
| ||||
Net Increase in Net Assets Derived from Beneficial Interest Transactions | 3,036,486 | |||
| ||||
Net increase in net assets | 3,284,092 | |||
NET ASSETS | ||||
Beginning of period | – | |||
| ||||
End of period * | $ | 3,284,092 | ||
| ||||
*Including accumulated net investment loss of: | $ | (14,772 | ) | |
See Notes to Financial Statements.
9 | April 30, 2014
ALPS Real Asset Income Fund – Class A | ||
Selected data for a share of beneficial interest outstanding throughout the period indicated: |
For the Period November 30, 2013 (Commencement) to April 30, 2014 (Unaudited) | ||||||
Net asset value, beginning of period | $10.00 | |||||
INCOME FROM INVESTMENT OPERATIONS: | ||||||
Net investment income(a) | 0.06 | |||||
Net realized and unrealized gain | 0.87 | |||||
Total from investment operations | 0.93 | |||||
DISTRIBUTIONS: | ||||||
From net investment income | (0.11) | |||||
Total distributions | (0.11) | |||||
Net increase in net asset value | 0.82 | |||||
Net asset value, end of period | $10.82 | |||||
TOTAL RETURN(b) | 9.35% | |||||
RATIOS/SUPPLEMENTAL DATA: | ||||||
Net assets, end of period (000s) | $548 | |||||
Ratio of expenses to average net assets excluding fee waivers and reimbursements | 11.34%(c)(d) | |||||
Ratio of expenses to average net assets including fee waivers and reimbursements | 1.40%(c)(d) | |||||
Ratio of net investment income to average net assets | 1.44%(c)(d) | |||||
Portfolio turnover rate(e) | 8% | |||||
| (a) | Calculated using the average shares method. |
| (b) | Total returns are for the period indicated and have not been annualized. Total returns would have been lower had certain expenses not been waived during the period. Returns shown do not reflect the deduction of taxes that a shareholder would pay on Fund distributions or the redemption of Fund shares. Returns shown exclude any applicable sales charges. |
| (c) | Annualized. |
| (d) | Expense ratios before reductions for startup periods may not be representative of longer term operating periods. |
| (e) | Portfolio turnover rate for periods less than one full year have not been annualized. |
See Notes to Financial Statements.
10 | April 30, 2014
ALPS Real Asset Income Fund – Class C | ||
Consolidated Financial Highlights | ||
Selected data for a share of beneficial interest outstanding throughout the period indicated: | ||
| For the Period November 30, 2013 (Commencement) to April 30, 2014 (Unaudited) | ||
Net asset value, beginning of period | $10.00 | |
INCOME FROM INVESTMENT OPERATIONS: | ||
Net investment income(a) | 0.04 | |
Net realized and unrealized gain | 0.87 | |
Total from investment operations | 0.91 | |
DISTRIBUTIONS: | ||
From net investment income | (0.09) | |
Total distributions | (0.09) | |
Net increase in net asset value | 0.82 | |
Net asset value, end of period | $10.82 | |
TOTAL RETURN(b) | 9.13% | |
RATIOS/SUPPLEMENTAL DATA: | ||
Net assets, end of period (000s) | $545 | |
Ratio of expenses to average net assets excluding fee waivers and reimbursements | 11.94%(c)(d) | |
Ratio of expenses to average net assets including fee waivers and reimbursements | 2.00%(c)(d) | |
Ratio of net investment income to average net assets | 0.84%(c)(d) | |
Portfolio turnover rate(e) | 8% | |
| (a) | Calculated using the average shares method. |
| (b) | Total returns are for the period indicated and have not been annualized. Total returns would have been lower had certain expenses not been waived during the period. Returns shown do not reflect the deduction of taxes that a shareholder would pay on Fund distributions or the redemption of Fund shares. Returns shown exclude any applicable sales charges. |
| (c) | Annualized. |
| (d) | Expense ratios before reductions for startup periods may not be representative of longer term operating periods. |
| (e) | Portfolio turnover rate for periods less than one full year have not been annualized. |
See Notes to Financial Statements.
11 | April 30, 2014
ALPS Real Asset Income Fund – Class I | ||
Consolidated Financial Highlights | ||
Selected data for a share of beneficial interest outstanding throughout the period indicated: | ||
| For the Period November 30, 2013 (Commencement) to April 30, 2014 (Unaudited) | ||||
Net asset value, beginning of period | $10.00 | |||
INCOME FROM INVESTMENT OPERATIONS: | ||||
Net investment income(a) | 0.08 | |||
Net realized and unrealized gain | 0.87 | |||
Total from investment operations | 0.95 | |||
DISTRIBUTIONS: | ||||
From net investment income | (0.13 | ) | ||
Total distributions | (0.13 | ) | ||
Net increase in net asset value | 0.82 | |||
Net asset value, end of period | $10.82 | |||
TOTAL RETURN(b) | 9.53% | |||
RATIOS/SUPPLEMENTAL DATA: | ||||
Net assets, end of period (000s) | $2,191 | |||
Ratio of expenses to average net assets excluding fee waivers and reimbursements | 11.04% | (c)(d) | ||
Ratio of expenses to average net assets including fee waivers and reimbursements | 1.00% | (c)(d) | ||
Ratio of net investment income to average net assets | 1.84% | (c)(d) | ||
Portfolio turnover rate(e) | 8% | |||
| (a) | Calculated using the average shares method. |
| (b) | Total returns are for the period indicated and have not been annualized. Total returns would have been lower had certain expenses not been waived during the period. Returns shown do not reflect the deduction of taxes that a shareholder would pay on Fund distributions or the redemption of Fund shares. |
| (c) | Annualized. |
| (d) | Expense ratios before reductions for startup periods may not be representative of longer term operating periods. |
| (e) | Portfolio turnover rate for periods less than one full year have not been annualized. |
See Notes to Financial Statements.
12 | April 30, 2014
| April 30, 2014 (Unaudited) | ||
Portfolio Review
The Fund’s I Share Class returned 0.63% for the month, 2.76% YTD (year to date), net of fees. The Fund outperformed the Morningstar Non-Traditional Bond Universe by 0.29% for the month, and has outperformed this benchmark by 1.52% YTD. The Barclays Capital U.S. Aggregate Bond Index gained 0.84% for the month and had a YTD return of 2.70%.
The Fund is invested in three sub-strategies: the Senior Loan Floating Rate Strategy, the Short Duration High Yield Strategy, and the Relative Value Long/Short Debt Strategy. Fund assets are allocated approximately one-third to each sub-strategy.
All three strategies had positive performance for the month and year to date. The Relative Value Long/Short Debt Strategy was the biggest contributor to performance for the period.
Outlook
Domestic economic growth is thawing from the severe winter. Consensus macro forecast call for mid-three percent real Gross Domestic Product (GDP) growth during the second half of 2014. The Eurozone’s modest economic recovery continues to gain traction. China’s economic growth path and policy actions are event wildcards. Managers will be watching capital market volatility around shifting central bank policies and reaction. While geopolitical tensions maintain a modest undercurrent of uncertainty, domestic macro data readings signal that the economy is indeed thawing from extreme winter weather. A strong U.S. durable goods orders report served as an example while also pointing to a much needed jump-start in business spending. As noted in earlier outlooks, higher capital spending levels are an important ingredient to additional domestic economic growth. Upcoming data will help to validate if the recent burst in economic activity is simply weather-related catch-up or something more sustainable. Managers believe the latter and are comfortable with our mid-three percent real GDP growth forecast during the 2 second half of 2014. On a micro level, nearly two-thirds of S&P 500 constituents had reported first quarter earnings by the end of April. To date, corporate operating results (earnings and revenues) have generally outperformed recently lowered expectations. Revenue growth and business spending will be two of the more important items to watch during the last half of the year.
Current Positioning Themes
Macro and Rates:
| • | The U.S. monetary policy reaction function has been reset with the market beginning to question “low for long” commitment. Short swap spread positioning offers a potential flight-to-quality hedge. |
Corporate Credit:
| • | Valuations offer moderate compensation but can be supported by credit fundamentals, economic growth expectations, and liquidity conditions. |
| • | “Not too hot, not too cold”…stable economic growth is an important element for continued spread performance. |
| • | Near-term corporate refinancing risk is lower than prior to global financial crisis. |
| • | Focus on selection opportunities. |
| • | Leveraged loans offer limited upside due to minimal call protection. |
| • | Watch capital spending growth in 2014. |
Securitized Credit:
| • | Securitized credit offers an attractive surrogate to higher-yielding corporate credit. |
| • | Opportunities in new issue securitization (agency credit risk transfer and single family rental) and legacy non-agency Residential Mortgage-Backed Security (RMBS) cash flows that should benefit from a continued housing recovery and better underwriting quality. |
| • | Looking for selective opportunities in lower-rated new issue Commercial Mortgage-Backed Securities (CMBS) and legacy structures that may benefit from continued Commercial Real Estate (CRE) recovery. |
| 1 | The Nontraditional Bond category contains funds that pursue strategies divergent in one or more ways from conventional practice in the broader bond-fund universe. Many funds in this group describe themselves as “absolute return” portfolios, which seek to avoid losses and produce returns uncorrelated with the overall bond market; they employ a variety of methods to achieve those aims. Another large subset are self-described “unconstrained” portfolios that have more flexibility to invest tactically across a wide swath of individual sectors, including high-yield and foreign debt, and typically with very large allocations. Funds in the latter group typically have broad freedom to manage interest-rate sensitivity, but attempt to tactically manage those exposures in order to minimize volatility. The category is also home to a subset of portfolios that attempt to minimize volatility by maintaining short or ultra-short duration portfolios, but explicitly court significant credit and foreign bond market risk in order to generate high returns. Funds within this category often will use credit default swaps and other fixed income derivatives to a significant level within their portfolios. |
©2014 Morningstar. All Rights Reserved.
| 2 | The S&P 500 is the Standard and Poor’s composite index of 500 stocks. |
The views and information discussed in this commentary are as of the date of publication, are subject to change, and may not reflect the writer’s current views. The views expressed represent an assessment of market conditions at a specific point in time, are opinions only and should not be relied upon as investment advice regarding a particular investment or markets in general. Such information does not constitute a recommendation to buy or sell specific securities or investment vehicles. It should not be assumed that any investment will be profitable or will equal the performance of the fund(s) or any securities or any sectors mentioned herein. The subject matter contained herein has been derived from several sources believed to be reliable and accurate at the time of compilation. The Advisors do not accept any liability for losses either direct or consequential caused by the use of this information.
13 | April 30, 2014
ALPS | Westport Resources Hedged High Income Fund | ||
| April 30, 2014 (Unaudited) | ||
Performance of $10,000 Initial Investment (as of April 30, 2014)
Comparison of change in value of a $10,000 investment (includes maximum sales charges of 5.50%)
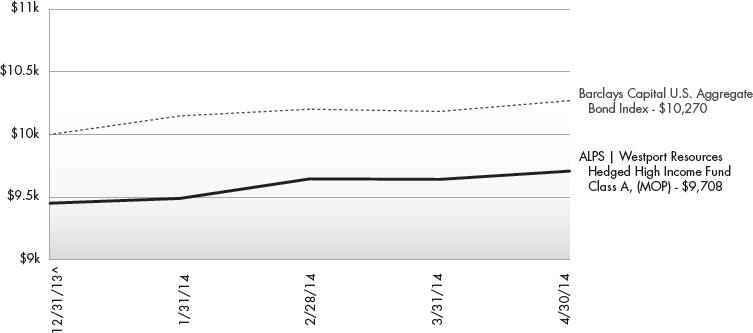
The chart above represents historical performance of a hypothetical investment of $10,000 in the Fund since inception. Past performance does not guarantee future results. This chart does not reflect the deduction of taxes that a shareholder would pay on Fund distributions or the redemption of Fund shares.
Average Annual Total Returns (as of April 30, 2014)
| 3 Month1 | Since Inception ^ | Total Expense Ratio | What You Pay * | |||||
Class A (NAV) | 2.21% | 2.72% | ||||||
Class A (MOP) | -3.38% | -2.92% | 2.45% | 2.39% | ||||
Class C (NAV) | 2.10% | 2.41% | ||||||
Class C (CDSC) | 1.10% | 1.41% | 3.05% | 2.99% | ||||
Class I | 2.35% | 2.76% | 2.05% | 1.99% | ||||
Barclays Capital U.S. Aggregate Bond Index2 | 1.21% | 2.70% |
Performance data quoted represents past performance. Past performance does not guarantee future results. Investment return and principal value of an investment will fluctuate so that an investor’s shares, when sold or redeemed, may be worth more or less than the original cost. Current performance data may be higher or lower than actual data quoted. For the most current month-end performance data, please call 1-866-759-5679.
Maximum Offering Price (MOP) for Class A shares includes the Fund’s maximum sales charge of 5.50%. Performance shown at NAV does not include these sales charges and would have been lower had it been taken into account. If you invest $1 million or more, either as a lump sum or through the Fund’s accumulation or letter of intent programs, you can purchase Class A shares without an initial sales charge (load). A Contingent Deferred Sales Charge (“CDSC”) of 1.00% may apply to Class C shares redeemed within the first 12 months after a purchase, and on Class A shares redeemed within the first 18 months after a purchase in excess of $1 million.
| 1 | Performance less than 1 year is cumulative. |
| 2 | The Barclays Capital U.S. Aggregate Bond Index is a broad-based benchmark that measures the investment grade, U.S. dollar-denominated, fixed-rate taxable bond market, including Treasuries, government-related and corporate securities, MBS (agency fixed-rate and hybrid ARM passthroughs), ABS, and CMBS. The index is not actively managed and does not reflect any deductions for fees, expenses or taxes. An investor may not invest directly in an index. |
14 | April 30, 2014
ALPS | Westport Resources Hedged High Income Fund | ||
Performance Update | April 30, 2014 (Unaudited) | |
| ^ | Fund inception date of December 31, 2013. |
| * | What You Pay reflects the Advisor’s decision to contractually limit expenses through August 31, 2015. Please see the prospectus for additional information. |
There is no guarantee that the Fund will continue to hold any one particular security or stay invested in any one particular company. The composition of the Fund’s top holdings is subject to change. Performance figures are historical and reflect the change in share price, reinvested distributions, changes in net asset value, sales charges and capital gains distributions, if any.
Not FDIC Insured – No Bank Guarantee – May Lose Value
Derivatives generally are more sensitive to changes in economic or market conditions than other types of investments; this could result in losses that significantly exceed the Fund’s original investment.
All investments involve risks, including possible loss of principal. The risks associated with higher-yielding, lower-rated securities include higher risk of default and loss of principal. Changes in the financial strength of a bond issuer or in a bond’s credit rating may affect its value. In addition, interest rate movements will affect the fund’s share price and yield. Credit risk refers to the possibility the bond issuer will not be able to make principal and interest payments. Bond prices generally move in the opposite direction of interest rates. Thus, as the prices of bonds in the fund adjust to a rise in interest rates, the fund’s share price may decline. These and other risk considerations are discussed in the fund’s prospectus. The principal on mortgage or asset-backed securities normally may be prepaid at any time, which will reduce the yield and market value of those securities. US obligations are supported by varying degrees of credit but generally are not backed by the full faith and credit of the US government. Investments in non-investment-grade debt securities (“high yield” or “junk” bonds) may be subject to greater market fluctuations and risk of default or loss of income and principal than securities in higher rating categories.
Senior-secured and second lien loans and bonds: Assets pledged as security for these loans and bonds would first be made available to senior lenders before other investors’ demands were met when settling a bankruptcy.
The Fund is not required to invest with any minimum number of sub-advisers, and does not have minimum or maximum limitations with respect to the allocations of the assets to any sub-adviser or investment option.
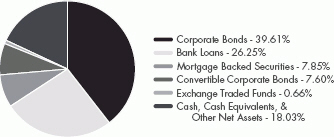
Top Ten Holdings (as a % of Net Assets) †
Hutchinson Technology, Inc., Conv. Sr. Unsec. Notes | 2.70% | |||||
ION Geophysical Corp., 2nd Lien Notes | 2.63% | |||||
Stratus Technologies Bermuda Ltd. / Stratus Technologies, Inc., 1st Lien Notes | 2.61% | |||||
Extreme Reach, Inc., First Lien Initial Term Loan | 2.35% | |||||
Marine Acquisition Corp., Term Loan | 2.34% | |||||
Broadview Networks Holdings, Inc., Sec. Notes | 2.27% | |||||
Colt Defense LLC / Colt Finance Corp., Sr. Unsec. Notes | 1.87% | |||||
Dell International LLC, Term B Loan | 1.85% | |||||
Global Investments Group Finance Ltd., Sr. Unsec. Notes | 1.83% | |||||
Black Elk Energy Offshore Operations LLC, 2nd Lien Notes | 1.78% | |||||
Top Ten Holdings | 22.23% |
† Holdings are subject to change. Table presents indicative values only.
Portfolio Composition (as a % of Net Assets)
15 | April 30, 2014
ALPS | Westport Resources Hedged High Income Fund | ||
| April 30, 2014 (Unaudited) | ||
| Shares | Value (Note 2) | |||||||
EXCHANGE TRADED FUNDS (0.66%) |
| |||||||
ProShares UltraShort Russell2000(a) | 2,900 | $ | 142,390 | |||||
|
| |||||||
TOTAL EXCHANGE TRADED FUNDS | ||||||||
(Cost $139,431) | 142,390 | |||||||
|
| |||||||
| Principal Amount | Value (Note 2) | |||||||
BANK LOANS (26.25%) | ||||||||
Accellent, Inc., First Lien Initial Term Loan | ||||||||
4.500% 03/12/2021 | $ | 50,000 | 49,719 | |||||
Aegis Toxicology Sciences Corp., First Lien Initial Term Loan | ||||||||
5.500% 02/24/2021 | 100,000 | 100,625 | ||||||
Allied Security Holdings LLC, Second Lien Closing Date Term Loan | ||||||||
8.000% 08/13/2021 | 5,082 | 5,103 | ||||||
Allied Security Holdings LLC, Second Lien Delayed Draw Term Loan | ||||||||
L+3.50% 08/13/2021 (b) | 1,918 | 1,926 | ||||||
Aptean, Inc., First Lien Term Loan | ||||||||
5.250% 02/26/2020 | 100,000 | 100,125 | ||||||
Aricent Technologies, Second Lien Term Loan | ||||||||
9.500% 04/14/2022 | 100,000 | 100,063 | ||||||
Asurion LLC (fka Asurion Corp.), Incremental Tranche B-1 Term Loan | ||||||||
L+3.75% 05/24/2019 (b) | 149,743 | 150,097 | ||||||
Asurion LLC (fka Asurion Corp.), Second Lien Term Loan | ||||||||
8.500% 03/03/2021 | 150,000 | 154,312 | ||||||
BRG Sports, Inc. (fka Easton-Bell Sports, Inc.), First Lien Term Loan | ||||||||
L+5.50% 04/15/2021 (b) | 150,000 | 150,375 | ||||||
BRG Sports, Inc. (fka Easton-Bell Sports, Inc.), Second Lien Term Loan | ||||||||
L+9.25% 04/15/2022 (b) | 150,000 | 150,750 | ||||||
C.H.I. Overhead Doors, Inc., First Lien Term Loan | ||||||||
5.500% 03/18/2019 | 49,864 | 50,051 | ||||||
Capital Safety North America Holdings, Inc. (fka Hupah Finance, Inc.), Second Lien Initial Loan | ||||||||
L+5.50% 03/28/2022 (b) | 250,000 | 251,750 | ||||||
| Principal Amount | Value (Note 2) | |||||||
Ceva Group PLC (fka Louis No.1 PLC/TNT Logistics), Pre- Funded Loan | ||||||||
L+5.50% 03/19/2021 (b) | $ | 7,896 | $ | 7,850 | ||||
Ceva Intercompany BV, Dutch BV Term Loan | ||||||||
L+5.50% 03/19/2021 (b) | 8,327 | 8,278 | ||||||
Ceva Logistics Canada (fka as TNT Canada), Canadian Term Loan | ||||||||
L+5.50% 03/19/2021 (b) | 1,436 | 1,427 | ||||||
Ceva Logistics U.S. Holdings, Inc. (fka Louis U.S. Holdco, Inc.), U.S. Term Loan | ||||||||
L+5.50% 03/19/2021 (b) | 11,485 | 11,418 | ||||||
Checkout Holdings Corp., First Lien Term B Loan | ||||||||
L+3.50% 04/09/2021 (b) | 150,000 | 149,569 | ||||||
Checkout Holdings Corp., Second Lien Initial Term Loan | ||||||||
7.750% 04/11/2022 | 150,000 | 148,875 | ||||||
Clover Technologies Group LLC (Clover Holdings, Inc.), Term Loan | ||||||||
L+4.50% 04/17/2020 (b) | 250,000 | 249,250 | ||||||
Dell International LLC, Term B Loan | ||||||||
L+3.50% 04/29/2020 (b) | 398,750 | 398,477 | ||||||
Deluxe Entertainment Services Group, Inc., Initial Term Loan | ||||||||
6.500% 02/28/2020 | 100,000 | 100,609 | ||||||
Diamond Resorts Corp., Term Loan | ||||||||
L+4.50% 04/23/2021 (b) | 22,000 | 22,028 | ||||||
Extreme Reach, Inc., First Lien Initial Term Loan | ||||||||
L+5.75% 01/24/2020 (b) | 500,000 | 507,500 | ||||||
Extreme Reach, Inc., Second Lien Initial Term Loan | ||||||||
L+9.50% 01/22/2021 (b) | 160,000 | 161,800 | ||||||
Flexera Software LLC (fka Flexera Software, Inc.), Second Lien Term Loan | ||||||||
8.000% 04/02/2021 | 15,000 | 15,075 | ||||||
Intertrust Group BV, Second Lien Facility 2 Loan | ||||||||
L+7.00% 04/11/2022 (b) | 150,000 | 150,688 | ||||||
iQor U.S., Inc., First Lien Term B Loan | ||||||||
L+5.00% 04/01/2021 (b) | 46,000 | 44,102 | ||||||
Jazz Pharmaceuticals, Inc., Tranche 2 Term Loan | ||||||||
3.250% 06/12/2018 | 1,250 | 1,251 | ||||||
16 | April 30, 2014
| ALPS | Westport Resources Hedged High Income Fund | ||
| Statement of Investments | April 30, 2014 (Unaudited) | |
| Principal Amount | Value (Note 2) | |||||||
| ||||||||
Lineage Logistics LLC, Term Loan | ||||||||
4.500% 04/07/2021 | $ | 19,000 | $ | 18,739 | ||||
Marine Acquisition Corp., Term Loan | ||||||||
L+4.25% 01/30/2021 (b) | 500,000 | 504,375 | ||||||
Millennium Laboratories LLC, Tranche B Term Loan | ||||||||
5.250% 04/16/2021 | 19,000 | 18,960 | ||||||
NXT Capital, Inc. (NXT Capital LLC), Facility Term Loan | ||||||||
L+5.25% 09/04/2018 (b) | 100,000 | 101,000 | ||||||
Pelican Products, Inc., Second Lien Term Loan | ||||||||
L+8.25% 04/09/2021 (b) | 150,000 | 152,250 | ||||||
PeroxyChem LLC, Initial Term Loan | ||||||||
7.500% 02/13/2020 | 19,000 | 19,190 | ||||||
Pier 1 Imports, Inc., Initial Term Loan | ||||||||
L+3.50% 04/30/2021 (b) | 18,000 | 18,023 | ||||||
Quad/Graphics, Inc., Term B Loan | ||||||||
L+3.25% 04/28/2021 (b) | 30,000 | 29,775 | ||||||
Quality Home Brands Holdings LLC, First Lien Initial Term Loan | ||||||||
7.750% 12/17/2018 | 49,875 | 50,415 | ||||||
Renaissance Learning, Inc., Second Lien Initial Term Loan | ||||||||
8.000% 04/11/2022 | 100,000 | 99,958 | ||||||
Signode Industrial Group Lux SA (Signode Industrial Group U.S., Inc.), Initial Term B Loan | ||||||||
L+3.00% 05/01/2021 (b) | 200,000 | 199,025 | ||||||
Stadium Management Group, First Lien Term Loan | ||||||||
4.500% 02/27/2020 | 99,750 | 99,875 | ||||||
Stratus Technologies, Inc., Term Loan | ||||||||
L+5.00% 04/23/2021 (b) | 27,000 | 26,848 | ||||||
Sun Products Corp. (fka Huish Detergents, Inc.), Tranche B Term Loan | ||||||||
L+4.25% 03/23/2020 (b) | 100,000 | 97,187 | ||||||
Sungard Availability Services Capital, Inc., Tranche B Term Loan | ||||||||
6.000% 03/29/2019 | 250,000 | 249,137 | ||||||
TelX Group, Inc., First Lien Initial Term Loan | ||||||||
4.500% 04/09/2020 | 100,000 | 99,937 | ||||||
TelX Group, Inc., Second Lien Initial Term Loan | ||||||||
7.500% 04/09/2021 | 100,000 | 100,719 | ||||||
| Principal Amount | Value (Note 2) | |||||||
| ||||||||
Twin River Management Group, Inc. (fka BLB Management Services, Inc.), Term B Loan | ||||||||
L+4.25% 04/10/2021 (b) | $ | 250,000 | $ | 250,938 | ||||
US LBM Holdings LLC, Term Loan | ||||||||
L+6.25% 04/24/2020 (b) | 250,000 | 248,750 | ||||||
YP LLC, Term Loan | ||||||||
8.000% 06/04/2018 | 6,645 | 6,717 | ||||||
YPSO Holding SA, Term B Loan | ||||||||
L+3.75% 04/23/2020 (b) | 11,933 | 11,931 | ||||||
YPSO Holding SA, Term B2 Loan | ||||||||
L+3.75% 04/23/2020 (b) | 10,323 | 10,322 | ||||||
|
| |||||||
TOTAL BANK LOANS | ||||||||
(Cost $5,589,713) | 5,657,164 | |||||||
|
| |||||||
CONVERTIBLE CORPORATE BONDS (7.60%) |
| |||||||
Communications (3.33%) | ||||||||
Alaska Communications Systems Group, Inc., Conv. Sr. Sub. Notes | ||||||||
6.250% 05/01/2018 (c) | 440,000 | 374,000 | ||||||
Central European Media Enterprises Ltd., Conv. Sec. Notes | ||||||||
5.000% 11/15/2015 | 350,000 | 343,000 | ||||||
|
| |||||||
Total Communications | 717,000 | |||||||
|
| |||||||
Financials (1.57%) | ||||||||
DFC Global Corp., Conv. Sr. Unsec. Notes | ||||||||
3.250% 04/15/2017 | 350,000 | 338,188 | ||||||
|
| |||||||
Technology (2.70%) | ||||||||
Hutchinson Technology, Inc., Conv. Sr. Unsec. Notes | ||||||||
8.500% 01/15/2026 | 600,000 | 582,000 | ||||||
|
| |||||||
TOTAL CONVERTIBLE CORPORATE BONDS |
| |||||||
(Cost $1,616,238) | 1,637,188 | |||||||
|
| |||||||
CORPORATE BONDS (39.61%) |
| |||||||
Communications (8.28%) | ||||||||
Broadview Networks Holdings, Inc., Sec. Notes | ||||||||
10.500% 11/15/2017 | 500,000 | 488,750 | ||||||
CenturyLink, Inc., Sr. Unsec. Notes Series V | ||||||||
5.625% 04/01/2020 | 250,000 | 264,062 | ||||||
17 | April 30, 2014
| ALPS | Westport Resources Hedged High Income Fund | ||
| Statement of Investments | April 30, 2014 (Unaudited) | |
| Principal Amount | Value (Note 2) | |||||||
| ||||||||
Communications (continued) |
| |||||||
Clear Channel Communications, Inc., 1st Lien Notes | ||||||||
9.000% 12/15/2019 | $ | 150,000 | $ | 160,500 | ||||
Interactive Network, Inc. / FriendFinder Networks, Inc., Sec. Notes | ||||||||
14.000% 12/20/2018 | 250,000 | 260,000 | ||||||
Sprint Communications, Inc., Sr. Unsec. Notes | ||||||||
7.000% 08/15/2020 | 225,000 | 245,813 | ||||||
Visant Corp., Sr. Unsec. Notes | ||||||||
10.000% 10/01/2017 | 100,000 | 94,500 | ||||||
Windstream Corp., Sr. Unsec. Notes | ||||||||
7.750% 10/01/2021 | 250,000 | 271,875 | ||||||
|
| |||||||
Total Communications | 1,785,500 | |||||||
|
| |||||||
Consumer, Cyclical (4.86%) | ||||||||
Caesars Entertainment Operating Co., Inc., Sr. Unsec. Notes | ||||||||
10.750% 02/01/2016 | 250,000 | 223,750 | ||||||
KB Home, Sr. Unsec. Notes | ||||||||
8.000% 03/15/2020 | 200,000 | 227,500 | ||||||
MGM Resorts International, Sr. Unsec. Notes | ||||||||
5.250% 03/31/2020 | 250,000 | 257,600 | ||||||
Neebo, Inc., Sec. Notes | ||||||||
15.000% 06/30/2016 (c) | 71,500 | 73,287 | ||||||
Pinnacle Entertainment, Inc., Sr. Sub. Notes | ||||||||
7.750% 04/01/2022 | 150,000 | 163,500 | ||||||
United Airlines 2014-1 Class B Pass Through Trust, 2nd Lien Notes, Series B | ||||||||
4.750% 04/11/2022 | 100,000 | 100,938 | ||||||
|
| |||||||
Total Consumer, Cyclical |
| 1,046,575 | ||||||
|
| |||||||
Consumer, Non-cyclical (2.48%) |
| |||||||
The ADT Corp., Sr. Unsec. Notes | ||||||||
4.125% 06/15/2023 | 250,000 | 225,625 | ||||||
TreeHouse Foods, Inc., Sr. Unsec. Notes | ||||||||
4.875% 03/15/2022 | 100,000 | 101,500 | ||||||
United Rentals North America, Inc., Sr. Unsec. Notes | ||||||||
5.750% 11/15/2024 | 200,000 | 207,750 | ||||||
|
| |||||||
Total Consumer, Non-cyclical |
| 534,875 | ||||||
|
| |||||||
| Principal Amount | Value (Note 2) | |||||||
| ||||||||
Diversified (0.12%) | ||||||||
FCC Holdings, Inc., Sr. Unsec. Notes | ||||||||
13.000% 12/15/2015 (c) | $ | 25,250 | $ | 25,755 | ||||
|
| |||||||
Energy (6.07%) | ||||||||
Black Elk Energy Offshore Operations LLC, 2nd Lien Notes | ||||||||
13.750% 12/01/2015 | 400,000 | 384,000 | ||||||
Denbury Resources, Inc., Sr. Sub. Notes | ||||||||
4.625% 07/15/2023 | 200,000 | 191,250 | ||||||
ION Geophysical Corp., 2nd Lien Notes | ||||||||
8.125% 05/15/2018 (c) | 600,000 | 567,000 | ||||||
Petrobras Global Finance BV, Sr. Unsec. Notes | ||||||||
6.250% 03/17/2024 | 60,000 | 63,149 | ||||||
Pioneer Energy Services Corp., Sr. Unsec. Notes | ||||||||
6.125% 03/15/2022 (c) | 100,000 | 102,750 | ||||||
|
| |||||||
Total Energy | 1,308,149 | |||||||
|
| |||||||
Financials (5.97%) | ||||||||
Ares Capital Corp., Sr. Unsec. Notes | ||||||||
4.875% 11/30/2018 | 250,000 | 260,914 | ||||||
Global Investments Group Finance Ltd., Sr. Unsec. Notes | ||||||||
11.000% 09/24/2017 | 400,000 | 395,000 | ||||||
Goldman Sachs Group, Inc., Jr. Sub. Notes, Series L | ||||||||
5.700% Perpetual Maturity (d) | 200,000 | 205,241 | ||||||
Hunt Cos, Inc., Sec. Notes | ||||||||
9.625% 03/01/2021 (c) | 16,000 | 16,600 | ||||||
Sumitomo Mitsui Financial Group, Inc., Sub. Notes | ||||||||
4.436% 04/02/2024 (c) | 200,000 | 204,142 | ||||||
Wells Fargo & Co., Jr. Sub. Notes, Series S | ||||||||
5.900% Perpetual Maturity (d) | 200,000 | 205,420 | ||||||
|
| |||||||
Total Financials | 1,287,317 | |||||||
|
| |||||||
Industrials (6.21%) | ||||||||
American Piping Products, Inc., 2nd Lien Notes | ||||||||
12.875% 11/15/2017 (c) | 250,000 | 268,125 | ||||||
Colt Defense LLC / Colt Finance Corp., Sr. Unsec. Notes | ||||||||
8.750% 11/15/2017 | 450,000 | 402,750 | ||||||
18 | April 30, 2014
| ALPS | Westport Resources Hedged High Income Fund | ||
Statement of Investments | April 30, 2014 (Unaudited) | |
| Principal Amount | Value (Note 2) | |||||||||
| ||||||||||
Industrials (continued) | ||||||||||
Congoleum Corp., PIK 1st Lien Notes | ||||||||||
9.000% 12/31/2017 (e) | $ | 350,000 | $ | 282,187 | ||||||
Euramax International, Inc., 1st Lien Notes | ||||||||||
9.500% 04/01/2016 | 34,000 | 34,255 | ||||||||
Horizon Lines LLC, 1st Lien Notes | ||||||||||
11.000% 10/15/2016 | 348,000 | 350,610 | ||||||||
|
| |||||||||
Total Industrials | 1,337,927 | |||||||||
|
| |||||||||
Technology (5.62%) | ||||||||||
First Data Corp., Sr. Unsec. Notes | ||||||||||
12.625% 01/15/2021 | 250,000 | 301,250 | ||||||||
Jazz Technologies, Inc., Sr. Unsec. Notes | ||||||||||
8.000% 06/30/2015 | 350,000 | 346,500 | ||||||||
Stratus Technologies Bermuda Ltd. / Stratus Technologies, Inc., 1st Lien Notes | ||||||||||
12.000% 03/29/2015 | 500,000 | 563,125 | ||||||||
|
| |||||||||
Total Technology | 1,210,875 | |||||||||
|
| |||||||||
TOTAL CORPORATE BONDS | ||||||||||
(Cost $8,340,381) | 8,536,973 | |||||||||
|
| |||||||||
MORTGAGE BACKED SECURITIES (7.85%) |
| |||||||||
Bear Stearns Commercial Mortgage Securities Trust, Series 2007-PW17 | ||||||||||
5.888% 09/11/2017 (f) | 200,000 | 200,290 | ||||||||
Colony American Homes, Series 2014-1A | ||||||||||
3.050% 05/17/2017 (c)(f) | 225,000 | 219,660 | ||||||||
Commercial Mortgage Pass Through Certificates, Series 2014-CR17 | ||||||||||
4.959% 05/10/2024 (c)(f) | 207,000 | 191,591 | ||||||||
Countrywide Alternative Loan Trust, Series 2006-6CB | ||||||||||
5.750% 05/25/2036 (f) | 306,526 | 221,473 | ||||||||
Freddie Mac Structured Agency Credit Risk Debt Notes, Series – | ||||||||||
3.754% 04/25/2024 (f) | 250,000 | 258,296 | ||||||||
4.652% 02/25/2024 (f) | 250,000 | 276,731 | ||||||||
Merrill Lynch Mortgage Trust, Series 2006-C2 | ||||||||||
5.802% 08/12/2043 (f) | 175,000 | 177,756 | ||||||||
Popular ABS Mortgage Pass- Through Trust, Series 2005-6 | ||||||||||
4.536% 01/25/2036 (f) | 49,071 | 44,432 | ||||||||
| Principal Amount | Value (Note 2) | |||||||||
| ||||||||||
Residential Accredit Loans, Inc., Series 2006-QS5 | ||||||||||
6.000% 05/25/2036 | $ | 122,053 | $ | 102,883 | ||||||
|
| |||||||||
TOTAL MORTGAGE BACKED SECURITIES |
| |||||||||
(Cost $1,648,444) | 1,693,112 | |||||||||
|
| |||||||||
Yield | Principal Amount | Value (Note 2) | ||||||||
| ||||||||||
SHORT TERM INVESTMENTS (0.23%) |
| |||||||||
Government (0.23%) |
| |||||||||
United States Treasury Bill Discounted Notes, | ||||||||||
10/16/2014(g)(h) | 0.058% | 50,000 | 49,991 | |||||||
|
| |||||||||
TOTAL SHORT TERM INVESTMENTS |
| |||||||||
(Cost $49,987) | 49,991 | |||||||||
|
| |||||||||
TOTAL INVESTMENTS (82.20%) |
| |||||||||
(Cost $17,384,194) |
| $ | 17,716,818 | |||||||
Other Assets In Excess Of Liabilities (17.80%) |
| 3,835,068 | ||||||||
|
| |||||||||
NET ASSETS (100.00%) |
| $ | 21,551,886 | |||||||
|
| |||||||||
| (a) | Non-Income Producing Security. |
| (b) | All or a portion of this position has not settled as of April 30, 2014. The interest rate shown represents the stated spread over the London Interbank Offered Rate (“LIBOR” or “L”) or the applicable LIBOR floor; the Fund will not accrue interest until the settlement date, at which point LIBOR will be established. |
| (c) | Security exempt from registration under Rule 144A of the Securities Act of 1933. These securities have been deemed liquid under procedures approved by the Fund’s Board of Trustees and may normally be sold to qualified institutional buyers in transactions exempt from registration. Total market value of Rule 144A securities amounts to $2,042,910, which represents approximately 9.48% of net assets as of April 30, 2014. |
| (d) | This security has no contractual maturity date, is not redeemable and contractually pays an indefinite stream of interest. |
| (e) | Payment in-kind security. |
| (f) | Floating or variable rate security. Interest rate disclosed is that which is in effect at April 30, 2014. |
| (g) | All or a portion of the security is pledged as collateral on futures. The aggregate market value of the collateralized securities totals $49,991 as of April 30, 2014. See Note 3 in Notes to Financial Statements. |
| (h) | Rate shown represents the bond equivalent yield to maturity at date of purchase. |
19 | April 30, 2014
| ALPS | Westport Resources Hedged High Income Fund | ||
Statement of Investments | April 30, 2014 (Unaudited) | |
Common Abbreviations:
BV - Besloten Vennootschap is the Dutch term for private limited liability company.
Conv. - Convertible.
fka - Formerly known as.
Jr. Sub. - Jr Subordinated.
LLC - Limited Liability Company.
Ltd. - Limited.
PIK - Payment in-kind.
PLC - Public Limited Company.
SA - Generally designates corporations in various countries, mostly those employing the civil law.
Sec. - Secured.
Sr. Sub. - Sr Subordinated.
Sr. Unsec. - Sr Unsecured.
Sub. - Subordinated.
For Fund compliance purposes, the Fund’s industry classifications refer to any one or more of the industry sub-classifications used by one or more widely recognized market indexes or ratings group indexes, and/or as defined by Fund management. This definition may not apply for purposes of this report, which may combine industry sub-classifications for reporting ease. Industries are shown as a percent of net assets.
FUTURES CONTRACTS
| Description | Position | Contracts | Expiration Date | Value (Note 2) | Unrealized Appreciation | |||||||||
U.S. 5 Year Note Future | Short | (16) | 7/01/14 | $ | (1,911,250 | ) | $ | 6,460 | ||||||
|
| |||||||||||||
| $ | (1,911,250 | ) | $ | 6,460 | ||||||||||
|
| |||||||||||||
| Description | Position | Contracts | Expiration Date | Value (Note 2) | Unrealized Depreciation | |||||||||
10 Year USD Interest Rate Swap Future | Short | (4) | 6/17/14 | $ | (402,938 | ) | $ | (2,604 | ) | |||||
U.S. 10 Year Note Future | Short | (3) | 6/20/14 | (373,266 | ) | (648 | ) | |||||||
USD Interest Rate Swap 5 Year Primary Future | Short | (3) | 6/17/14 | (305,297 | ) | (757 | ) | |||||||
|
| |||||||||||||
| $ | (1,081,500 | ) | $ | (4,009 | ) | |||||||||
|
| |||||||||||||
See Notes to Financial Statements.
20 | April 30, 2014
| ALPS | Westport Resources Hedged High Income Fund | ||
| April 30, 2014 (Unaudited) | ||
ASSETS | ||||
Investments, at value | $ | 17,716,818 | ||
Cash | 3,608,599 | |||
Receivable for investments sold | 2,543,339 | |||
Receivable for shares sold | 516,787 | |||
Receivable for variation margin | 6,460 | |||
Interest receivable | 262,052 | |||
Prepaid offering costs | 48,756 | |||
Prepaid expenses and other assets | 6,373 | |||
| ||||
Total Assets | 24,709,184 | |||
| ||||
LIABILITIES | ||||
Payable for investments purchased | 3,091,292 | |||
Payable for variation margin | 4,009 | |||
Payable due to broker for futures contracts | 10,982 | |||
Investment advisory fees payable | 9,751 | |||
Administration and transfer agency fees payable | 5,670 | |||
Distribution and services fees payable | 2,708 | |||
Trustees’ fees and expenses payable | 1,498 | |||
Professional fees payable | 16,502 | |||
Accrued expenses and other liabilities | 14,886 | |||
| ||||
Total Liabilities | 3,157,298 | |||
| ||||
NET ASSETS | $ | 21,551,886 | ||
| ||||
NET ASSETS CONSIST OF | ||||
Paid-in capital | $ | 21,268,093 | ||
Accumulated net investment income | 2,845 | |||
Accumulated net realized loss on investments and futures contracts | (54,127 | ) | ||
Net unrealized appreciation on investments and futures contracts | 335,075 | |||
| ||||
NET ASSETS | $ | 21,551,886 | ||
| ||||
INVESTMENTS, AT COST | $ | 17,384,194 | ||
| ||||
PRICING OF SHARES | ||||
Class A: | ||||
Net Asset Value, offering and redemption price per share(a) | $ | 10.18 | ||
Net Assets | $ | 3,599,853 | ||
Shares of beneficial interest outstanding (unlimited number of shares, no par value common stock authorized) | 353,785 | |||
Maximum offering price per share ((NAV/0.9450), based on maximum sales charge of 5.50% of the offering price) | $ | 10.77 | ||
Class C: | ||||
Net Asset Value, offering and redemption price per share(a) | $ | 10.17 | ||
Net Assets | $ | 1,428,618 | ||
Shares of beneficial interest outstanding (unlimited number of shares, no par value common stock authorized) | 140,441 | |||
Class I: | ||||
Net Asset Value, offering and redemption price per share | $ | 10.17 | ||
Net Assets | $ | 16,523,415 | ||
Shares of beneficial interest outstanding (unlimited number of shares, no par value common stock authorized) | 1,624,265 | |||
| (a) | Redemption price per share may be reduced for any applicable contingent deferred sales charge. For a description of a possible sales charge, please see the Fund’s Prospectus. |
See Notes to Financial Statements.
21 | April 30, 2014
ALPS | Westport Resources Hedged High Income Fund | ||
| For the Period Ended April 30, 2014 (Unaudited) | ||
INVESTMENT INCOME | ||||
Interest and other income | $ | 295,994 | ||
Total Investment Income | 295,994 | |||
EXPENSES | ||||
Investment advisory fees | 130,177 | |||
Administrative and transfer agency fees | 18,536 | |||
Distribution and service fees | ||||
Class A | 2,889 | |||
Class C | 3,247 | |||
Professional fees | 16,516 | |||
Networking fees | ||||
Class I | 4,344 | |||
Reports to shareholders and printing fees | 2,775 | |||
State registration fees | 1,693 | |||
SEC registration fees | 46 | |||
Custody fees | 9,616 | |||
Trustees’ fees and expenses | 1,609 | |||
Offering costs | 23,151 | |||
Miscellaneous expenses | 3,265 | |||
Total Expenses | 217,864 | |||
Less fees waived/reimbursed by investment advisor (Note 7) | ||||
Class A | (13,323) | |||
Class C | (5,878) | |||
Class I | (85,250) | |||
Net Expenses | 113,413 | |||
Net Investment Income | 182,581 | |||
Net realized loss on investments | (49,659) | |||
Net realized loss on futures contracts | (4,468) | |||
Net change in unrealized appreciation on investments | 332,624 | |||
Net change in unrealized appreciation on futures contracts | 2,451 | |||
NET REALIZED AND UNREALIZED GAIN ON INVESTMENTS | 280,948 | |||
NET INCREASE IN NET ASSETS RESULTING FROM OPERATIONS | $ | 463,529 | ||
See Notes to Financial Statements.
22 | April 30, 2014
ALPS | Westport Resources Hedged High Income Fund | ||
For the Period January 1, 2014 (Commencement) to April 30, 2014 (Unaudited) | ||||
OPERATIONS | ||||
Net investment income | $ | 182,581 | ||
Net realized loss on investments and futures contracts | (54,127 | ) | ||
Net change in unrealized appreciation on investments and futures contracts | 335,075 | |||
Net Increase in Net Assets Resulting from Operations | 463,529 | |||
DISTRIBUTIONS | ||||
Dividends to shareholders from net investment income | ||||
Class A | (21,831 | ) | ||
Class C | (8,456 | ) | ||
Class I | (149,449 | ) | ||
Net Decrease in Net Assets from Distributions | (179,736 | ) | ||
BENEFICIAL INTEREST TRANSACTIONS (NOTE 6) | ||||
Shares sold | ||||
Class A | 3,555,566 | |||
Class C | 1,470,040 | |||
Class I | 16,640,704 | |||
Dividends reinvested | ||||
Class A | 4,231 | |||
Class C | 1,140 | |||
Class I | 18,142 | |||
Shares redeemed | ||||
Class A | (40 | ) | ||
Class C | (58,040 | ) | ||
Class I | (363,650 | ) | ||
Net Increase in Net Assets Derived from Beneficial Interest Transactions | 21,268,093 | |||
Net increase in net assets | 21,551,886 | |||
NET ASSETS | ||||
Beginning of period | – | |||
End of period * | $ | 21,551,886 | ||
*Including accumulated net investment income of: | $ | 2,845 | ||
See Notes to Financial Statements.
23 | April 30, 2014
ALPS | Westport Resources Hedged High Income Fund – Class A | ||
Selected data for a share of beneficial interest outstanding throughout the period indicated: | ||
For the Period April 30, 2014 | ||
Net asset value, beginning of period | $10.00 | |
INCOME FROM INVESTMENT OPERATIONS: | ||
Net investment income(a) | 0.11 | |
Net realized and unrealized gain | 0.16 | |
Total from investment operations | 0.27 | |
DISTRIBUTIONS: | ||
From net investment income | (0.09) | |
Total distributions | (0.09) | |
Net increase in net asset value | 0.18 | |
Net asset value, end of period | $10.18 | |
TOTAL RETURN(b) | 2.72% | |
RATIOS/SUPPLEMENTAL DATA: | ||
Net assets, end of period (000s) | $3,600 | |
Ratio of expenses to average net assets excluding fee waivers and reimbursements | 4.23%(c)(d) | |
Ratio of expenses to average net assets including fee waivers and reimbursements | 2.39%(c)(d) | |
Ratio of net investment income to average net assets | 3.23%(c)(d) | |
Portfolio turnover rate(e) | 48% | |
| (a) | Calculated using the average shares method. |
| (b) | Total returns are for the period indicated and have not been annualized. Total returns would have been lower had certain expenses not been waived during the period. Returns shown do not reflect the deduction of taxes that a shareholder would pay on Fund distributions or the redemption of Fund shares. Returns shown exclude any applicable sales charges. |
| (c) | Annualized. |
| (d) | Expense ratios before reductions for startup periods may not be representative of longer term operating periods. |
| (e) | Portfolio turnover rate for periods less than one full year have not been annualized. |
See Notes to Financial Statements.
24 | April 30, 2014
ALPS | Westport Resources Hedged High Income Fund – Class C | ||
Financial Highlights Selected data for a share of beneficial interest outstanding throughout the period indicated: | ||
For the Period January 1, 2014 (Commencement) to April 30, 2014 (Unaudited) | ||
Net asset value, beginning of period | $10.00 | |
INCOME FROM INVESTMENT OPERATIONS: | ||
Net investment income(a) | 0.09 | |
Net realized and unrealized gain | 0.15 | |
Total from investment operations | 0.24 | |
DISTRIBUTIONS: | ||
From net investment income | (0.07) | |
Total distributions | (0.07) | |
Net increase in net asset value | 0.17 | |
Net asset value, end of period | $10.17 | |
TOTAL RETURN(b) | 2.41% | |
RATIOS/SUPPLEMENTAL DATA: | ||
Net assets, end of period (000s) | $1,429 | |
Ratio of expenses to average net assets excluding fee waivers and reimbursements | 4.80%(c)(d) | |
Ratio of expenses to average net assets including fee waivers and reimbursements | 2.99%(c)(d) | |
Ratio of net investment income to average net assets | 2.67%(c)(d) | |
Portfolio turnover rate(e) | 48% | |
| (a) | Calculated using the average shares method. |
| (b) | Total returns are for the period indicated and have not been annualized. Total returns would have been lower had certain expenses not been waived during the period. Returns shown do not reflect the deduction of taxes that a shareholder would pay on Fund distributions or the redemption of Fund shares. Returns shown exclude any applicable sales charges. |
| (c) | Annualized. |
| (d) | Expense ratios before reductions for startup periods may not be representative of longer term operating periods. |
| (e) | Portfolio turnover rate for periods less than one full year have not been annualized. |
See Notes to Financial Statements.
25 | April 30, 2014
ALPS | Westport Resources Hedged High Income Fund – Class I | ||
Financial Highlights Selected data for a share of beneficial interest outstanding throughout the period indicated: | ||
For the Period January 1, 2014 (Commencement) to April 30, 2014 (Unaudited) | ||
Net asset value, beginning of period | $10.00 | |
INCOME FROM INVESTMENT OPERATIONS: | ||
Net investment income(a) | 0.11 | |
Net realized and unrealized gain | 0.17 | |
Total from investment operations | 0.28 | |
DISTRIBUTIONS: | ||
From net investment income | (0.11) | |
Total distributions | (0.11) | |
Net increase in net asset value | 0.17 | |
Net asset value, end of period | $10.17 | |
TOTAL RETURN(b) | 2.76% | |
RATIOS/SUPPLEMENTAL DATA: | ||
Net assets, end of period (000s) | $16,523 | |
Ratio of expenses to average net assets excluding fee waivers and reimbursements | 3.95%(c)(d) | |
Ratio of expenses to average net assets including fee waivers and reimbursements | 1.99%(c)(d) | |
Ratio of net investment income to average net assets | 3.47%(c)(d) | |
Portfolio turnover rate(e) | 48% | |
| (a) | Calculated using the average shares method. |
| (b) | Total returns are for the period indicated and have not been annualized. Total returns would have been lower had certain expenses not been waived during the period. Returns shown do not reflect the deduction of taxes that a shareholder would pay on Fund distributions or the redemption of Fund shares. |
| (c) | Annualized. |
| (d) | Expense ratios before reductions for startup periods may not be representative of longer term operating periods. |
| (e) | Portfolio turnover rate for periods less than one full year have not been annualized. |
See Notes to Financial Statements.
26 | April 30, 2014
| Notes to Financial Statements | ||
| April 30, 2014 (Unaudited) |
1. ORGANIZATION
Financial Investors Trust (the “Trust”), a Delaware statutory trust, is an open-end management investment company registered under the Investment Company Act of 1940, as amended (“1940 Act”). As of April 30, 2014, the Trust had 30 registered funds. This semi-annual report describes the following funds: ALPS Real Asset Income Fund and ALPS | Westport Resources Hedged High Income Fund (each, a “Fund” and collectively, the “Funds”). ALPS Real Asset Income Fund seeks to provide a high level of current income and long-term capital appreciation. The ALPS | Westport Resources Hedged High Income Fund seeks to provide high current income. The Fund’s secondary investment objective is to seek capital preservation, with the potential for capital appreciation.
The classes of each fund differ principally in the applicable distribution and shareholder service fees. Shareholders of each class also bear certain expenses that pertain to that particular class. All shareholders bear the common expenses of the Fund and earn income and realized gains/losses from the Fund pro rata based on the average daily net assets of each class, without distinction between share classes. Dividends to shareholders are determined separately for each class based on income and expenses allocable to each class. Realized gain distributions to shareholders are allocated to each class pro rata based on the shares outstanding of each class on the date of distribution. Differences in per share dividend rates generally result from differences in separate class expenses, including distribution and shareholder service fees, if applicable.
Basis of Consolidation for the ALPS Real Asset Income Fund
ALPS Real Asset Income Fund (Cayman) Ltd. (the “Subsidiary”), a Cayman Islands exempted company, was incorporated on May 23, 2013 and is a wholly owned subsidiary of the ALPS Real Asset Income Fund (the “Real Asset Income Fund”). The Subsidiary acts as an investment vehicle for the Real Asset Income Fund in order to effect certain commodity-related investments on behalf of the Real Asset Income Fund. The Real Asset Income Fund is the sole shareholder of the Subsidiary pursuant to a subscription agreement dated as of November 25, 2013, and it is intended that the Real Asset Income Fund will remain the sole shareholder and will continue to wholly own and control the Subsidiary. Under the Articles of Association of the Subsidiary, shares issued by the Subsidiary confer upon a shareholder the right to vote at general meetings of the Subsidiary and certain rights in connection with any winding-up or repayment of capital, as well as the right to participate in the profits or assets of the Subsidiary. The Real Asset Income Fund may invest up to 25% of its total assets in shares of the Subsidiary. As a wholly owned subsidiary of the Real Assets Income Fund, the statement of investments the Subsidiary is included in the consolidated statement of investments of the Real Asset Income Fund. All investments held by the Subsidiary are disclosed in the accounts of the Real Asset Income Fund. As of April 30, 2014, net assets of the Real Asset Income Fund were $3,284,092, of which $610,907, or 18.60%, represented the Real Asset Income’s ownership of all issued shares and voting rights of the Subsidiary.
2. SIGNIFICANT ACCOUNTING POLICIES
The accompanying financial statements were prepared in accordance with accounting principles generally accepted in the United States of America (“U.S. GAAP”). The preparation of financial statements in conformity with U.S. GAAP requires management to make certain estimates and assumptions that affect the reported amounts of assets and liabilities and disclosures of contingent assets and liabilities at the date of the financial statements and the reported amounts of revenue and expenses during the period. Actual results could differ from those estimates. The following is a summary of significant accounting policies consistently followed by the Funds and subsidiaries, as applicable, in preparation of their financial statements.
Investment Valuation: The Funds generally value their securities based on market prices determined at the close of regular trading on the New York Stock Exchange (“NYSE”), normally 4:00 p.m. Eastern Time, on each day the NYSE is open for trading.
For equity securities and mutual funds that are traded on an exchange, the market price is usually the closing sale or official closing price on that exchange. In the case of equity securities not traded on an exchange, or if such closing prices are not otherwise available, the securities are valued at the mean of the most recent bid and ask prices on such day.
The market price for debt obligations is generally the price supplied by an independent third-party pricing service approved by the Board of Trustees (the “Board”), which may use a matrix, formula or other objective method that takes into consideration quotations from dealers, market transactions in comparable investments, market indices and yield curves. If vendors are unable to supply a price, or if the price supplied is deemed to be unreliable, the market price may be determined using quotations received from one or more brokers–dealers that make a market in the security. Short–term debt obligations that will mature in 60 days or less are valued at amortized cost; unless it is determined that using this method would not reflect an investment’s fair value. Investments in non-exchange traded funds are fair valued at their respective net asset values.
Futures contracts that are listed or traded on a national securities exchange, commodities exchange, contract market or comparable over the counter market, and that are freely transferable, are valued at their closing settlement price on the exchange on which they are primarily traded or based upon the current settlement price for a like instrument acquired on the day on which the instrument is being valued. A settlement price may not be used if the market makes a limit move with respect to a particular commodity. Over-the-counter swap contracts for which market quotations are readily available are valued based on quotes received from independent pricing services or one or more dealers that make markets in such securities.
27 | April 30, 2014
| Notes to Financial Statements | ||
| April 30, 2014 (Unaudited) |
Equity securities that are primarily traded on foreign securities exchanges are valued at the closing values of such securities on their respective foreign exchanges, except when an event occurs subsequent to the close of the foreign exchange and the close of the NYSE that was likely to have changed such value. In such an event, the fair value of those securities is determined in good faith through consideration of other factors in accordance with procedures established by and under the general supervision of the Board. The Funds will use a fair valuation model provided by an independent pricing service, which is intended to reflect fair value when a security’s value or a meaningful portion of the Fund’s portfolio is believed to have been materially affected by an valuation event that has occurred between the close of the exchange or market on which the security is traded and the close of the regular trading day on the NYSE. The Funds’ valuation procedures set forth certain triggers which instruct when to use the fair valuation model.
Forward currency exchange contracts have a market value determined by the prevailing foreign currency exchange daily rates and current foreign currency exchange forward rates. The foreign currency exchange forward rates are calculated using an automated system that estimates rates on the basis of the current day foreign currency exchange rates and forward foreign currency exchange rates supplied by a pricing service. Foreign exchange rates and forward foreign currency exchange rates may generally be obtained at the close of the NYSE, normally 4:00 p.m. Eastern Time.
When such prices or quotations are not available, or when the Fair Value Committee appointed by the Board believes that they are unreliable, securities may be priced using fair value procedures approved by the Board.
Fair Value Measurements: The Funds disclose the classification of their fair value measurements following a three-tier hierarchy based on the inputs used to measure fair value. Inputs refer broadly to the assumptions that market participants would use in pricing the asset or liability, including assumptions about risk. Inputs may be observable or unobservable. Observable inputs reflect the assumptions market participants would use in pricing the asset or liability that are developed based on market data obtained from sources independent of the reporting entity. Unobservable inputs reflect the reporting entity’s own assumptions about the assumptions market participants would use in pricing the asset or liability that are developed based on the best information available.
Various inputs are used in determining the value of each Fund’s investments as of the end of the reporting period. When inputs used fall into different levels of the fair value hierarchy, the level in the hierarchy within which the fair value measurement falls is determined based on the lowest level input that is significant to the fair value measurement in its entirety. The designated input levels are not necessarily an indication of the risk or liquidity associated with these investments. These inputs are categorized in the following hierarchy under applicable financial accounting standards:
Level 1 – | Unadjusted quoted prices in active markets for identical investments, unrestricted assets or liabilities that a Fund has the ability to access at the measurement date; | |
Level 2 – | Quoted prices which are not active, quoted prices for similar assets or liabilities in active markets or inputs other than quoted prices that are observable (either directly or indirectly) for substantially the full term of the asset or liability; and | |
Level 3 – | Significant unobservable prices or inputs (including the Fund’s own assumptions in determining the fair value of investments) where there is little or no market activity for the asset or liability at the measurement date. | |
28 | April 30, 2014
| Notes to Financial Statements | ||
| April 30, 2014 (Unaudited) |
The following is a summary of each Fund’s investments/financial instruments in the fair value hierarchy as of April 30, 2014:
| Investments in Securities at Value | Level 1 - Unadjusted Quoted Prices | Level 2 - Other Significant Observable Inputs | Level 3 - Significant Unobservable Inputs | Total | ||||||||||||
| ||||||||||||||||
ALPS Real Asset Income Fund |
| |||||||||||||||
Closed-End Funds | $ | 48,056 | $ | – | $ | – | $ | 48,056 | ||||||||
Common Stocks(a) | 1,513,163 | – | – | 1,513,163 | ||||||||||||
Exchange Traded Funds | 102,999 | – | – | 102,999 | ||||||||||||
Exchange Traded Notes | 86,400 | – | – | 86,400 | ||||||||||||
Master Limited Partnerships(a) | 791,461 | – | – | 791,461 | ||||||||||||
Commodity-Linked Notes | – | 266,264 | – | 266,264 | ||||||||||||
Short Term Investments | 192,298 | – | – | 192,298 | ||||||||||||
| ||||||||||||||||
Total | $ | 2,734,377 | $ | 266,264 | $ | – | $ | 3,000,641 | ||||||||
| ||||||||||||||||
| ||||||||||||||||
Other Financial Instruments | ||||||||||||||||
| ||||||||||||||||
Liabilities | ||||||||||||||||
Written Call Options | $ | (27) | $ | – | $ | – | $ | (27) | ||||||||
| ||||||||||||||||
Total | $ | (27) | $ | – | $ | – | $ | (27) | ||||||||
| ||||||||||||||||
| ||||||||||||||||
| Investments in Securities at Value | Level 1 - Unadjusted Quoted Prices | Level 2 - Other Significant Observable Inputs | Level 3 - Significant Unobservable Inputs | Total | ||||||||||||
| ||||||||||||||||
ALPS | Westport Resources Hedged High Income Fund |
| |||||||||||||||
Exchange Traded Funds | $ | 142,390 | $ | – | $ | – | $ | 142,390 | ||||||||
Bank Loans | – | 5,657,164 | – | 5,657,164 | ||||||||||||
Convertible Corporate Bonds(a) | – | 1,637,188 | – | 1,637,188 | ||||||||||||
Corporate Bonds(a) | – | 8,536,973 | – | 8,536,973 | ||||||||||||
Mortgage Backed Securities | – | 1,693,112 | – | 1,693,112 | ||||||||||||
Short Term Investments | – | 49,991 | – | 49,991 | ||||||||||||
| ||||||||||||||||
Total | $ | 142,390 | $ | 17,574,428 | $ | – | $ | 17,716,818 | ||||||||
| ||||||||||||||||
| ||||||||||||||||
Other Financial Instruments | ||||||||||||||||
| ||||||||||||||||
Assets | ||||||||||||||||
Futures Contracts | $ | 6,460 | $ | – | $ | – | $ | 6,460 | ||||||||
Liabilities | ||||||||||||||||
Futures Contracts | (4,009) | – | – | (4,009) | ||||||||||||
| ||||||||||||||||
Total | $ | 2,451 | $ | – | $ | – | $ | 2,451 | ||||||||
| ||||||||||||||||
| ||||||||||||||||
| (a) | For detailed descriptions of country, sector and/or industry, see the accompanying Statement of Investments. |
The Funds recognize transfers between levels as of the end of the period. For the period ended April 30, 2014, the Funds did not have any transfers between Level 1 and Level 2 securities. The Funds did not have any securities that used significant unobservable inputs (Level 3) in determining fair value.
Fund and Class Expenses: Some expenses of the Trust can be directly attributed to a Fund or a specific share class of a Fund. Expenses which cannot be directly attributed are apportioned among all Funds in the Trust based on average net assets of each share class within a Fund.
Federal Income Taxes: The Funds comply with the requirements under Subchapter M of the Internal Revenue Code of 1986 applicable to regulated investment companies and intend to distribute substantially all of their net taxable income and net capital gains, if any, each year. The Funds are not subject to income taxes to the extent such distributions are made.
As of and during the period ended April 30, 2014, the Funds did not have a liability for any unrecognized tax benefits. The Funds file U.S. federal, state, and local tax returns as required. The Funds’ tax returns are subject to examination by the relevant tax authorities until expiration of the applicable statute of limitations which is generally three years after the filing of the tax return, but may extend to four years in certain jurisdictions. Tax returns for open years have incorporated no uncertain tax positions that require a provision for income taxes.
Commodity-Linked Notes: The ALPS Real Asset Income Fund may invest in commodity-linked notes which are derivative instrument with characteristics of a debt security and of a commodity-linked derivative. A commodity-linked note typically provides for interest payments and a
29 | April 30, 2014
Notes to Financial Statements | ||
| April 30, 2014 (Unaudited) |
principal payment at maturity linked to the price movement of the underlying commodity, commodity index or commodity futures or option contract. Commodity-linked notes may be principal protected, partially protected, or offer no principal protection. The value of these notes will rise and fall in response to changes in the underlying commodity or related index or investment. These notes are often leveraged, increasing the volatility of each note’s value relative to the change in the underlying linked index. Commodity index-linked investments may be more volatile and less liquid than the underlying index and their value may be affected by the performance of the commodities as well as other factors, including liquidity, quality, maturity and other economic variables. Commodity-linked notes are typically issued by a bank or other financial institution and are sometimes referred to as structured notes because the terms of the notes may be structured by the issuer and the purchaser of the notes to accommodate the specific investment requirements of the purchaser.
Investment Transactions and Investment Income: Investment transactions are accounted for on the date the investments are purchased or sold (trade date basis). Net realized gains and losses from investment transactions are reported on an identified cost basis. Interest income, which includes accretion of discounts and amortization of premiums, is accrued and recorded as earned. Dividend income is recognized on the ex-dividend date or for certain foreign securities, as soon as information is available to each Fund.
Foreign Securities: The Funds may directly purchase securities of foreign issuers. Investing in securities of foreign issuers involves special risks not typically associated with investing in securities of U.S. issuers. The risks include possible reevaluation of currencies, the inability to repatriate foreign currency, less complete financial information about companies and possible future adverse political and economic developments.
Moreover, securities of many foreign issuers and their markets may be less liquid and their prices more volatile than those of securities of comparable U.S. issuers.
Foreign Currency Translation: The books and records of the Funds are maintained in U.S. dollars. Investment valuations and other assets and liabilities initially expressed in foreign currencies are converted each business day into U.S. dollars based upon current exchange rates. The portion of realized and unrealized gains or losses on investments due to fluctuations in foreign currency exchange rates is not separately disclosed and is included in realized and unrealized gains or losses on investments, when applicable.
Foreign Currency Spot Contracts: The Funds may enter into foreign currency spot contracts to facilitate transactions in foreign securities or to convert foreign currency receipts into U.S. dollars. A foreign currency spot contract is an agreement between two parties to buy and sell currencies at the current market rate, for settlement generally within two business days. The U.S. dollar value of the contracts is determined using current currency exchange rates supplied by a pricing service. The contract is marked-to-market daily for settlements beyond one day and any change in market value is recorded as an unrealized gain or loss. When the contract is closed, the Fund records a realized gain or loss equal to the difference between the value on the open and close date. Losses may arise from changes in the value of the foreign currency, or if the counterparties do not perform under the contract’s terms. The maximum potential loss from such contracts is the aggregate face value in U.S. dollars at the time the contract was opened.
Master Limited Partnerships: MLPs are publicly traded partnerships engaged in the transportation, storage and processing of minerals and natural resources. By confining their operations to these specific activities, their interests, or units, are able to trade on public securities exchanges exactly like the shares of a corporation, without entity level taxation. Of the seventy MLPs eligible for inclusion in the Index, approximately two-thirds trade on the NYSE and the rest trade on the NASDAQ. To qualify as a MLP and to not be taxed as a corporation, a partnership must receive at least 90% of its income from qualifying sources as set forth in Section 7704(d) of the Internal Revenue Code of 1986, as amended (the “Code”). These qualifying sources include natural resource based activities such as the processing, transportation and storage of mineral or natural resources. MLPs generally have two classes of owners, the general partner and limited partners. The general partner of an MLP is typically owned by a major energy company, an investment fund, the direct management of the MLP, or is an entity owned by one or more of such parties. The general partner may be structured as a private or publicly traded corporation or other entity. The general partner typically controls the operations and management of the MLP through an up to 2% equity interest in the MLP plus, in many cases, ownership of common units and subordinated units. Limited partners typically own the remainder of the partnership, through ownership of common units, and have a limited role in the partnership’s operations and management. MLPs are typically structured such that common units and general partner interests have first priority to receive quarterly cash distributions up to an established minimum amount (“minimum quarterly distributions” or “MQD”). Common and general partner interests also accrue arrearages in distributions to the extent the MQD is not paid. Once common and general partner interests have been paid, subordinated units receive distributions of up to the MQD; however, subordinated units do not accrue arrearages. Distributable cash in excess of the MQD is paid to both common and subordinated units and is distributed to both common and subordinated units generally on a pro rata basis. The general partner is also eligible to receive incentive distributions if the general partner operates the business in a manner which results in distributions paid per common unit surpassing specified target levels. As the general partner increases cash distributions to the limited partners, the general partner receives an increasingly higher percentage of the incremental cash distributions.
30 | April 30, 2014
Notes to Financial Statements | ||
| April 30, 2014 (Unaudited) |
3. DERIVATIVE INSTRUMENTS
As a part of their investment strategy, ALPS Real Asset Income Fund and ALPS | Westport Resources Hedged High Income Fund are permitted to purchase investment securities and are also allowed to enter into various types of derivatives contracts. In doing so, the Funds will employ strategies in differing combinations to permit them to increase, decrease, or change the level or types of exposure to market factors. Central to those strategies are features inherent in derivatives that make them more attractive for this purpose than equity or debt securities; they require little or no initial cash investment, they can focus exposure on only certain selected risk factors, and they may not require the ultimate receipt or delivery of the underlying security (or securities) to the contract. This may allow the Funds to pursue their objectives more quickly and efficiently than if they were to make direct purchases or sales of securities capable of affecting a similar response to market factors.
Risk of Investing in Derivatives: The Funds’ use of derivatives can result in losses due to unanticipated changes in the market risk factors and the overall market. In instances where the Funds are using derivatives to decrease, or hedge, exposures to market risk factors for securities held by the Funds, there are also risks that those derivatives may not perform as expected resulting in losses for the combined or hedged positions.
Derivatives may have little or no initial cash investment relative to their market value exposure and therefore can produce significant gains or losses in excess of their cost. This use of embedded leverage allows a Fund to increase its market value exposure relative to its net assets and can substantially increase the volatility of the Funds’ performance.
Additional associated risks from investing in derivatives also exist and potentially could have significant effects on the valuation of the derivative and the Funds. Typically, the associated risks are not the risks that the Funds are attempting to increase or decrease exposure to, per their investment objectives, but are the additional risks from investing in derivatives.
Examples of these associated risks are liquidity risk, which is the risk that the Funds will not be able to sell or close out the derivative in a timely manner, and counterparty credit risk, which is the risk that the counterparty will not fulfill its obligation to the Funds. In addition, use of derivatives may increase or decrease exposure to the following risk factors:
Equity Risk: Equity risk relates to the change in value of equity securities as they relate to increases or decreases in the general market. Associated risks can be different for each type of derivative and are discussed by each derivative type in the notes that follow.
Commodity Risk: Exposure to the commodities markets may subject the Fund to greater volatility than investments in traditional securities. Prices of various commodities may also be affected by factors, such as drought, floods, weather, livestock disease, embargoes, tariffs and other regulatory developments, which are unpredictable. The prices of commodities can also fluctuate widely due to supply and demand disruptions in major producing or consuming regions.
Foreign Currency Risk: Currency trading involves significant risks, including market risk, interest rate risk, country risk, counterparty credit risk and short sale risk. Market risk results from the price movement of foreign currency values in response to shifting market supply and demand. Interest rate risk arises whenever a country changes its stated interest rate target associated with its currency. Country risk arises because virtually every country has interfered with international transactions in its currency.
Interest Rate Risk: Interest rate risk is the risk that fixed income securities will decline in value because of changes in interest rates. As nominal interest rates rise, the value of fixed income securities held by the Fund are likely to decrease. Securities with longer durations tend to be more sensitive to changes in interest rates, and are usually more volatile than securities.
Futures: Certain Funds may invest in futures contracts in accordance with their investment objectives. Each Fund does so for a variety of reasons including for cash management, hedging or non-hedging purposes in an attempt to achieve investment returns consistent with the Fund’s investment objective. A futures contract provides for the future sale by one party and purchase by another party of a specified quantity of the security or other financial instrument at a specified price and time. A futures contract on an index is an agreement pursuant to which two parties agree to take or make delivery of an amount of cash equal to the difference between the value of the index at the close of the last trading day of the contract and the price at which the index contract was originally written. Futures transactions may result in losses in excess of the amount invested in the futures contract. There can be no guarantee that there will be a correlation between price movements in the hedging vehicle and in the portfolio securities being hedged. An incorrect correlation could result in a loss on both the hedged securities in a Fund and the hedging vehicle so that the portfolio return might have been greater had hedging not been attempted. There can be no assurance that a liquid market will exist at a time when a Fund seeks to close out a futures contract or a futures option position. Lack of a liquid market for any reason may prevent a Fund from liquidating an unfavorable position, and the Fund would remain obligated to meet margin requirements until the position is closed. In addition, a Fund could be exposed to risk if the counterparties to the contracts are unable to meet the terms of their contracts. With exchange traded futures, there is minimal counterparty credit risk to the Funds since futures are exchange traded and the exchange’s clearinghouse, as counterparty to all exchange traded futures, guarantees the futures against default.
31 | April 30, 2014
Notes to Financial Statements | ||
| April 30, 2014 (Unaudited) |
When a purchase or sale of a futures contract is made by a Fund, the Fund is required to deposit with its custodian (or broker, if legally permitted) a specified amount of liquid assets (“initial margin”). The margin required for a futures contract is set by the exchange on which the contract is traded and may be modified during the term of the contract. The initial margin is in the nature of a performance bond or good faith deposit on the futures contract that is returned to a Fund upon termination of the contract, assuming all contractual obligations have been satisfied. Each day a Fund may pay or receive cash, called “variation margin,” equal to the daily change in value of the futures contract. Such payments or receipts are recorded for financial statement purposes as unrealized gains or losses by a Fund. Variation margin does not represent a borrowing or loan by a Fund but is instead a settlement between a Fund and the broker of the amount one would owe the other if the futures contract expired. When the contract is closed, a Fund records a realized gain or loss equal to the difference between the value of the contract at the time it was opened and the value at the time it was closed. As of April 30, 2014, the ALPS | Westport Resources Hedged High Income Fund had futures contracts outstanding with a net unrealized appreciation of $2,451. The number of futures contracts held at April 30, 2014 is representative of futures contracts activity during the period ended April 30, 2014.
Option Contracts: Each Fund may enter into options transactions for hedging purposes and for non-hedging purposes such as seeking to enhance return. Each Fund may write covered put and call options on any stocks or stock indices, currencies traded on domestic and foreign securities exchanges, or futures contracts on stock indices, interest rates and currencies traded on domestic and, to the extent permitted by the CFTC, foreign exchanges. A call option on an asset written by a Fund obligates the Fund to sell the specified asset to the holder (purchaser) at a stated price (the exercise price) if the option is exercised before a specified date (the expiration date). A put option on an asset written by a Fund obligates the Fund to buy the specified asset from the purchaser at the exercise price if the option is exercised before the expiration date. Premiums received when writing options are recorded as liabilities and are subsequently adjusted to the current value of the options written. Premiums received from writing options that expire are treated as realized gains. Premiums received from writing options, which are either exercised or closed, are offset against the proceeds received or amount paid on the transaction to determine realized gains or losses.
The ALPS Real Asset Income Fund had the following transactions in written covered call/put options during the six months ended April 30, 2014:
| Number of Contracts | Premiums | |||||
| ||||||
Options Outstanding, at the beginning of the period | – | $ | – | |||
Options written | (31) | 2,059 | ||||
Options closed | 13 | (845) | ||||
Options exercised | 2 | (277) | ||||
Options expired | 15 | (825) | ||||
| ||||||
Options Outstanding, at April 30, 2014 | (1) | $ | 112 | |||
| ||||||
Derivative Instruments: The following tables disclose the amounts related to each Fund’s use of derivative instruments.
The effect of derivative instruments on the Statement of Assets and Liabilities as of April 30, 2014:
| Risk Exposure | Asset Location | Fair Value | Liability Location | Fair Value | ||||||||
| ||||||||||||
ALPS Real Asset Income Fund | ||||||||||||
Equity Contracts (Written Options) | N/A | N/A | Written options, at value | $ | 27 | |||||||
| ||||||||||||
Total | N/A | $ | 27 | |||||||||
| ||||||||||||
| ALPS | Westport Resources Hedged High Income Fund | ||||||||||||
Futures Contracts* | Receivable for variation margin | $ | 6,460 | Payable for variation margin | $ | 4,009 | ||||||
| ||||||||||||
Total | $ | 6,460 | $ | 4,009 | ||||||||
| ||||||||||||
| * Risk Exposure to Fund | ||||||||||||
| Fixed Income Contracts | $ | 6,460 | $ | 4,009 | ||||||||
|
| |||||||||||
| $ | 6,460 | $ | 4,009 | |||||||||
|
| |||||||||||
32 | April 30, 2014
Notes to Financial Statements | ||
| April 30, 2014 (Unaudited) |
The effect of derivative instruments on the Statement of Operations for the period ended April 30, 2014:
| Risk Exposure | Statement of Operations Location | Realized Gain/(Loss) Recognized in Income | Change in Unrealized Gain/(Loss) on Derivatives Recognized in Income | |||||||
ALPS Real Asset Income Fund | ||||||||||
Equity Contracts | Net realized gain on written options/Net change in unrealized appreciation on written options | $ | 825 | $ | 85 | |||||
Securities Sold Short | Net realized loss on securities sold short | (1,754 | ) | N/A | ||||||
Total | $ | (929 | ) | $ | 85 | |||||
ALPS | Westport Resources Hedged High Income Fund | ||||||||||
Futures Contracts* | Net realized loss on futures contracts/Net change in unrealized appreciation on futures contracts | $ | (4,468 | ) | $ | 2,451 | ||||
Total | $ | (4,468 | ) | $ | 2,451 | |||||
| *Risk Exposure to Fund | ||||||||||
| Fixed Income Contracts | $ | (4,468 | ) | $ | 2,451 | |||||
|
| |||||||||
| $ | (4,468 | ) | $ | 2,451 | ||||||
|
| |||||||||
4. TAX BASIS INFORMATION
Tax Basis of Distributions to Shareholders: The character of distributions made during the period from net investment income or net realized gains may differ from its ultimate characterization for federal income tax purposes. Also, due to the timing of dividend distributions, the fiscal year in which amounts are distributed may differ from the fiscal year in which the income or realized gain were recorded by a Fund. The amounts and characteristics of tax basis distributions and composition of distributable earnings/(accumulated losses) are finalized at fiscal year-end.
Unrealized Appreciation and Depreciation on Investments: As of April 30, 2014, the costs of investments for federal income tax purposes and accumulated net unrealized appreciation/(depreciation) on investments were as follows:
| Fund | Gross Appreciation (excess of value over tax cost) | Gross Depreciation (excess of tax cost over value) | Net Unrealized Appreciation/ (Depreciation) | Cost of Investments for Income Tax Purposes | ||||||||||||
ALPS Real Asset Income Fund | $ | 292,355 | $ | (34,957 | ) | $ | 257,398 | $ | 2,743,243 | |||||||
ALPS | Westport Resources Hedged High Income Fund | 372,179 | (39,555 | ) | 332,624 | 17,384,194 | |||||||||||
5. SECURITIES TRANSACTIONS
Purchases and sales of securities, excluding short-term securities, during the period ended April 30, 2014 were as follows:
| Fund | Purchases of Securities | Proceeds from Sales of Securities | ||||||
ALPS Real Asset Income Fund | $ | 2,760,876 | $ | 215,737 | ||||
ALPS | Westport Resources Hedged High Income Fund | 24,883,271 | 7,531,969 | ||||||
33 | April 30, 2014
Notes to Financial Statements | ||
| April 30, 2014 (Unaudited) |
6. BENEFICIAL INTEREST TRANSACTIONS
The capitalization of the Trust consists of an unlimited number of shares of beneficial interest with no par value per share. Holders of the shares of the Fund have one vote for each share held and a proportionate fraction of a vote for each fractional share. All shares issued and outstanding are fully paid and are non-assessable, transferable and redeemable at the option of the shareholder. Shares have no pre-emptive rights.
| ALPS Real Asset Income Fund | ALPS | Westport Resources Hedged High Income Fund | |||||
For the Period to April 30, 2014 | For the Period January 1, 2014 (Commencement) to April 30, 2014 | |||||
Class A | ||||||
Shares sold | 50,095 | 353,371 | ||||
Dividends reinvested | 531 | 418 | ||||
Shares redeemed | (2) | (4) | ||||
Net increase in shares outstanding | 50,624 | 353,785 | ||||
Class C | ||||||
Shares sold | 50,003 | 146,038 | ||||
Dividends reinvested | 431 | 113 | ||||
Shares redeemed | (3) | (5,710) | ||||
Net increase in shares outstanding | 50,431 | 140,441 | ||||
Class I | ||||||
Shares sold | 200,003 | 1,658,759 | ||||
Dividends reinvested | 2,459 | 1,793 | ||||
Shares redeemed | (3) | (36,287) | ||||
Net increase in shares outstanding | 202,459 | 1,624,265 | ||||
7. MANAGEMENT AND RELATED PARTY TRANSACTIONS
ALPS Advisors, Inc. (“AAI” or “Advisor”), subject to the authority of the Board, is responsible for the overall management and administration of the ALPS Real Asset Income Fund’s business affairs. AAI has delegated daily management of the ALPS Real Asset Income Fund to RREEF America LLC with respect to the Global Infrastructure Strategy, and CoreCommodity Management, LLC with respect to the Commodity Strategy (the “Sub-Advisors”). Each Sub-Advisor manages the investments of the Fund in accordance with its investment objective, policies and limitations and investment guidelines established jointly by the Advisor and the Board.
ALPS Advisors and Westport Resources Management, Inc., subject to the authority of the Board, serve as the ALPS | Westport Resources Hedged High Income Fund’s co-investment advisors. ALPS Advisors provides fund administration services and other portfolio support services and compliance monitoring for the Fund. Westport Resources manages the Fund’s investment program and selects, subject to the approval of the Fund’s Board of Trustees, sub-advisors to the Fund. Westport Resources and the Trust have entered into sub-advisory agreements with respect to the Fund with three Sub-Advisors, Concise Capital Management, LP, Amundi Smith Breeden LLC, and Sound Point Capital Management, L.P., one or more of which may be selected from time to time by Westport Resources, to manage a portion of the Fund’s assets.
Pursuant to the Investment Advisory Agreement, the ALPS Real Asset Income Fund pays the Advisor an annual management fee of 0.80% based on the Fund’s average daily net assets. The management fee is paid on a monthly basis. Pursuant to an Investment Sub-advisory Agreement with RREEF, the Advisor pays RREEF an annual sub-advisory management fee of 0.55% based on the Fund’s average daily net assets allocated to RREEF. Pursuant to an Investment Sub-advisory Agreement with CoreCommodity, the Advisor pays CoreCommodity an annual sub-advisory management fee of 0.65% based on the Fund’s average daily net assets allocated to CoreCommodity. Each sub-advisory management fee is paid on a monthly basis. The Advisor is required to pay all fees due to the Sub-advisors out of the management fee the Advisor receives from the Fund.
Pursuant to the Investment Advisory Agreement between the ALPS | Westport Resources Hedged High Income Fund and ALPS Advisors, the Fund pays ALPS Advisors an annual management fee of the greater of (i) 0.20%, based on the Fund’s average daily net assets, or (ii) $150,000. Pursuant to the Investment Advisory Agreement between the Fund and Westport Resources, the Fund pays Westport Resources an annual management fee of 1.50% based on the Fund’s average daily net assets. The management fee for each Advisory Agreement is paid on a monthly basis. The Sub-Advisors will be engaged to manage the investments of the Fund according to the Fund’s investment objective, policies and limitations and any investment guidelines established by the Co-Advisors and the Board of Trustees. Westport Resources will pay the Sub-Advisors out of the advisory fee paid to it pursuant to the Westport Resources Advisory Agreement.
34 | April 30, 2014
Notes to Financial Statements | ||
| April 30, 2014 (Unaudited) |
The Advisor(s) have contractually agreed to limit the amount of each Fund’s total annual expenses, exclusive of distribution and service (12b-1) fees, shareholder service fees, acquired fund fees and expenses, brokerage expenses, interest expense, taxes and extraordinary expenses that exceed 1.00% and 1.99% for the ALPS Real Asset Income Fund and the ALPS | Westport Resources Hedged High Income Fund, respectively. This agreement is in effect through February 28, 2015 for the ALPS Real Asset Income Fund and August 31, 2015 for the ALPS | Westport Resources Hedged High Income Fund. These agreements are reevaluated on an annual basis and may not be discontinued without approval by the Trust’s Board of Trustees.
The Advisor(s) are permitted to recover expenses they have waived or reimbursed, on a class-by-class basis, through the agreements described above to the extent that expenses in later periods fall below the annual limits set forth in these agreements. The Funds will not be obligated to pay any such fees and expenses more than three years after the end of the fiscal year in which the fees or expenses were waived or reimbursed.
For the period ended April 30, 2014, the fee waivers and/or reimbursements were as follows:
| Fund | Fees Waived/Reimbursed by Advisor(s) | ||||
ALPS Real Asset Income Fund - Class A | $ 21,429 | ||||
ALPS Real Asset Income Fund - Class C | 21,378 | ||||
ALPS Real Asset Income Fund - Class I | 86,548 | ||||
ALPS | Westport Resources Hedged High Income Fund - Class A | 13,323 | ||||
ALPS | Westport Resources Hedged High Income Fund - Class C | 5,878 | ||||
ALPS | Westport Resources Hedged High Income Fund - Class I | 85,250 | ||||
As of April 30, 2014, the balances of recoupable expenses were as follows: | |||||
Fund | Expires 2017 | ||||
ALPS Real Asset Income Fund - Class A | $ 21,429 | ||||
ALPS Real Asset Income Fund - Class C | 21,378 | ||||
ALPS Real Asset Income Fund - Class I | 86,548 | ||||
ALPS | Westport Resources Hedged High Income Fund - Class A | 13,323 | ||||
ALPS | Westport Resources Hedged High Income Fund - Class C | 5,878 | ||||
ALPS | Westport Resources Hedged High Income Fund - Class I | 85,250 | ||||
ALPS Portfolio Solutions Distributor, Inc. (the “Distributor”) acts as the distributor of the Funds’ shares pursuant to a Distribution Agreement with the Trust. Prior to April 30, 2014, the Distributor was ALPS Distributors, Inc. Shares are sold on a continuous basis by the Distributor, as agent for the Funds, and the Distributor has agreed to use its best efforts to solicit orders for the sale of Funds’ shares, although it is not obliged to sell any particular amount of shares. The Distributor is not entitled to any compensation for its services. The Distributor is registered as a broker-dealer with the Securities and Exchange Commission. The Funds’ Distributor is also the distributor of the Select Sector SPDR exchange traded funds (the “Underlying Sector ETFs”). As required by exemptive relief obtained by the Underlying Sector ETFs, the Advisor will reimburse any applicable Fund an amount equal to the distribution fee received by the Distributor from the Underlying Sector ETFs attributable to such Fund’s investment in the Underlying Sector ETFs, for so long as the Distributor acts as distributor to such Fund and the Underlying Sector ETFs.
Each Fund has adopted a Distribution and Services Plan (the “Plan”) pursuant to Rule 12b-1 of the 1940 Act for the Class A and Class C shares. The Plan allows a Fund to use Class A and/or Class C assets to pay fees in connection with the distribution and marketing of Class A or Class C shares and/or the provision of shareholder services to Class A and/or Class C shareholders. The Plan permits payment for services in connection with the administration of plans or programs that use Class A and/or Class C shares of a Fund, if any, as their funding medium and for related expenses. The Plan permits a Fund to make total payments at an annual rate of up to 0.25% of a Fund’s average daily net assets attributable to its Class A shares, 0.75% of a Fund’s average daily net assets attributable to its Class C shares. Because these fees are paid out of a Fund’s Class A or Class C assets on an ongoing basis, over time they will increase the cost of an investment in Class A and Class C shares and Plan fees may cost an investor more than other types of sales charges.
The Funds have adopted a shareholder services plan (“Shareholder Services Plan”) with respect to the Funds’ Class A Shares and Class C shares. Under the Shareholder Services Plan for each Fund, the Funds are authorized to pay banks and their affiliates and other institutions, including broker-dealers and Fund affiliates (“Participating Organizations”), an aggregate fee in an amount not to exceed on an annual basis 0.15% for Class A shares and not to exceed 0.25% of Class C Shares of the average daily net asset value of the Class A shares and Class C shares, respectively, attributable to or held in the name of a Participating Organization for its clients as compensation for providing shareholder service activities, which do not include distribution services, pursuant to an agreement with a Participating Organization. Shareholder Services plan fees are included with distribution and service fees on the Statements of Operations.
35 | April 30, 2014
Notes to Financial Statements | ||
| April 30, 2014 (Unaudited) |
Certain intermediaries may charge networking, omnibus account or other administrative fees with respect to transactions in shares of each Fund. Transactions may be processed through the National Securities Clearing Corporation or similar systems or processed on a manual basis. These fees are paid by the Fund to the Distributor, which uses such fees to reimburse intermediaries. In the event an intermediary receiving payments from the Distributor on behalf of the Fund converts from a networking structure to an omnibus account structure or otherwise experiences increased costs, fees borne by the Fund may increase. Networking fees are shown in the Statements of Operations, if applicable to the Fund.
ALPS Fund Services, Inc. (“ALPS”) serves as administrator to the Funds and the Funds have agreed to pay expenses incurred in connection with their administrative activities. Pursuant to an Administrative Agreement, ALPS provides operational services to the Funds including, but not limited to fund accounting and fund administration and generally assists in the Funds’ operations.
The Annual Administrative Fee is based on each Fund’s average daily net assets and will be billed monthly, at the following:
| Fund | Average Daily Net Assets of the Fund | Annual Administrative Fee | |||||
ALPS Real Asset Income Fund | All Asset Levels | 0.05%* | |||||
ALPS | Westport Resources Hedged High Income Fund | All Asset Levels | 0.10%** | |||||
| * | Subject to a minimum annual fee of $100,000; $50,000 of which to the Sub-advisers. |
| ** | Subject to a minimum annual fee of $50,000. |
8. INDEMNIFICATIONS
Under the Trust’s organizational documents, its officers and Trustees are indemnified against certain liability arising out of the performance of their duties to the Trust. Additionally, in the normal course of business, the Trust enters into contracts with service providers that may contain general indemnification clauses which may permit indemnification to the extent permissible under applicable law. The Trust’s maximum exposure under these arrangements is unknown, as this would involve future claims that may be made against the Trust that have not yet occurred.
9. NEW ACCOUNTING PRONOUNCEMENTS
In June 2013, the Financial Accounting Standards Board (the “FASB”) issued Accounting Standards Update (“ASU”) No. 2013-08, Financial Services- Investment Companies (Topic 946): Amendments to the Scope, Measurement, and Disclosure Requirements. The FASB standard identifies characteristics a company must assess to determine whether it is considered an investment company for financial reporting purposes. This ASU is effective for fiscal years beginning after December 15, 2013. The Fund believes the adoption of this ASU will not have a material impact on its financial statements.
36 | April 30, 2014
| April 30, 2014 (Unaudited) |
PROXY VOTING POLICIES AND PROCEDURES
A description of the Fund’s proxy voting policies and procedures used in determining how to vote for proxies and information regarding how the Fund voted proxies related to portfolio securities during the most recent 12-month period ended June 30th is available without charge, (1) on the Securities and Exchange Commission’s (“SEC”) website at http://www.sec.gov; (2) upon request, by calling (toll-free) 1-866-513-5856; and (3) on the Trust’s website located at http://www.alpsfunds.com.
PORTFOLIO HOLDINGS
The Trust will file its complete schedule of portfolio holdings with the SEC for the first and third quarters of each fiscal year on Form N-Q. The Trust’s Form N-Q will be available (1) on the SEC’s website at http://www.sec.gov; (2) by calling (toll-free) 1-866-513-5856; (3) on the Trust’s website located at http://www.alpsfunds.com; and (4) for review and copying at the SEC’s Public Reference Room (“PRR”) in Washington D.C. Information regarding the operation of the PRR may be obtained by calling (toll-free) 1-800-732-0330.
DISCLOSURE REGARDING APPROVAL OF FUND ADVISORY AND SUB-ADVISORY AGREEMENTS
ALPS Real Asset Income Fund
On June 11, 2013, the Trustees met in person to discuss, among other things, the approval of the investment advisory agreement between the Trust and ALPS Advisors, Inc. (“ALPS Advisors”) (the “ALPS Advisory Agreement”), the investment sub-advisory agreement among the Trust, ALPS Advisors and CoreCommodity Management, LLC (“CoreCommodity”) (the “CoreCommodity Sub-Advisory Agreement”), and the investment sub-advisory agreement among the Trust, ALPS Advisors and RREEF America LLC (“RREEF”) (the “RREEF Sub-Advisory Agreement”), in accordance with Section 15(c) of the 1940 Act. The Independent Trustees met with independent legal counsel during executive session and discussed the ALPS Advisory Agreement, the CoreCommodity Sub-Advisory Agreement, the RREEF Sub-Advisory Agreement and other related materials.
In renewing and approving the ALPS Advisory Agreement with ALPS Advisors, the CoreCommodity Sub-Advisory Agreement with CoreCommodity, and the RREEF Sub-Advisory Agreement with RREEF, the Trustees, including the Independent Trustees, considered the following factors with respect to the ALPS Real Asset Income Fund:
Investment Advisory Fee Rate: The Trustees reviewed and considered the contractual annual advisory fee to be paid (a) by the Trust, on behalf of the ALPS Real Asset Income Fund, to ALPS Advisors of 0.80% of the ALPS Real Asset Income Fund’s daily average net assets, and (b) the contractual annual sub-advisory fee to be paid by ALPS Advisors to CoreCommodity and RREEF of 0.65% and 0.55%, respectively, of the ALPS Real Asset Income Fund’s daily average net assets allocated to each, in light of the extent and quality of the advisory services to be provided by each to the ALPS Real Asset Income Fund.
The Trustees considered the information they received comparing the ALPS Real Asset Income Fund’s contractual annual advisory fee and overall expenses with those of funds in both the relevant expense group and universe of funds provided by an independent provider of investment company data.
Based on such information, the Trustees determined that the contractual annual advisory fee of 0.80% and the total expense ratio of 1.00% for the ALPS Real Asset Income Fund, taking into account the contractual fee waiver in place, is comparable to others within the ALPS Real Asset Income Fund’s anticipated peer universe.
Nature, Extent and Quality of the Services under the Investment Advisory Agreement and Sub-Advisory Agreement: The Trustees received and considered information regarding the nature, extent and quality of services to be provided to the ALPS Real Asset Income Fund under the ALPS Investment Advisory Agreement and each of the Sub-Advisory Agreements. The Trustees reviewed certain background materials supplied by ALPS Advisors, CoreCommodity and RREEF in their presentation, including their Forms ADV.
The Trustees reviewed and considered ALPS Advisors’, CoreCommodity’s and RREEF’s investment advisory personnel, their history as asset managers and their performance and the amount of assets currently under management by each. The Trustees also reviewed the research and decision-making processes utilized by ALPS Advisors, CoreCommodity and RREEF, including the methods adopted to seek to achieve compliance with the investment objectives, policies and restrictions of the ALPS Real Asset Income Fund.
The Trustees considered the background and experience of ALPS Advisors’, CoreCommodity’s and RREEF’s management in connection with the ALPS Real Asset Income Fund, including reviewing the qualifications, backgrounds and responsibilities of the management team primarily responsible for the day-to-day portfolio management of the ALPS Real Asset Income Fund and the extent of the resources devoted to research and analysis of actual and potential investments.
The Trustees also reviewed, among other things, each of ALPS Advisors’, CoreCommodity’s and RREEF’s Code of Ethics.
37 | April 30, 2014
Additional Information | ||
| April 30, 2014 (Unaudited) |
Performance: The Trustees noted that since the ALPS Real Asset Income Fund has not yet begun operations, there is no fund performance to be reviewed or analyzed at this time. The Trustees also considered the limitations on the comparability of performance information for certain related funds and accounts. The Trustees considered ALPS Advisors’, CoreCommodity’s and RREEF’s reputation generally and their investment techniques, risk management controls and decision-making processes.
The Adviser’s Profitability: The Trustees received and considered a projected profitability analysis prepared by ALPS Advisors, CoreCommodity and RREEF based on the fees payable under the ALPS Investment Advisory Agreement and each of the Sub-Advisory Agreements, as applicable. The Trustees considered the profits, if any, anticipated to be realized by ALPS Advisors, CoreCommodity and RREEF in connection with the operation of the ALPS Real Asset Income Fund. The Board then reviewed and discussed ALPS Advisors’, CoreCommodity’s and RREEF’s financial statements in order to analyze the financial condition and stability and profitability of each adviser.
Economies of Scale: The Trustees considered whether economies of scale in the provision of services to the ALPS Real Asset Income Fund will be passed along to the shareholders under the proposed agreements.
Other Benefits to the Advisers: The Trustees reviewed and considered any other incidental benefits derived or to be derived by ALPS Advisors, CoreCommodity and RREEF from their relationship with the ALPS Real Asset Income Fund, including soft dollar arrangements.
The Board summarized its deliberations with respect to the Investment Advisory Agreement with ALPS Advisors and the Sub-Advisory Agreements with CoreCommodity and RREEF. In selecting ALPS Advisors, CoreCommodity and RREEF, and the fees charged under the Investment Advisory Agreement and Sub-Advisory Agreements, the Trustees concluded that no single factor reviewed by the Trustees was identified by the Trustees to be determinative as the principal factor in whether to approve the Investment Advisory Agreement or Sub-Advisory Agreements. Further, the Independent Trustees were advised by separate independent legal counsel throughout the process. The Trustees, including all of the Independent Trustees, concluded that:
| • | the investment advisory fees to be received by ALPS Advisors and the projected total expense ratios with respect to the ALPS Real Asset Income Fund were comparable to others within the Fund’s peer universe, taking into account the contractual fee waiver; |
| • | the nature, extent and quality of services to be rendered by ALPS Advisors under the Investment Advisory Agreement and CoreCommodity and RREEF under the respective Sub-Advisory Agreements were adequate; |
| • | there was no performance history for the ALPS Real Asset Income Fund for the Board to consider; |
| • | the terms of the proposed fee waiver and expense limitation agreement between the Trust, on behalf of the ALPS Real Asset Income Fund, and ALPS Advisors, were not unreasonable; |
| • | the profit, if any, anticipated to be realized by ALPS Advisors, CoreCommodity or RREEF in connection with the operation of the ALPS Real Asset Income Fund is not unreasonable to the Fund; and |
| • | there were no material economies of scale or other incidental benefits accruing to ALPS Advisors, CoreCommodity or RREEF in connection with their relationship with the ALPS Real Asset Income Fund. |
Based on the Trustees’ deliberations and their evaluation of the information described above, the Trustees, including all of the Independent Trustees, concluded that ALPS Advisors’, CoreCommodity’s and RREEF’s compensation for investment advisory services is consistent with the best interests of the ALPS Real Asset Income Fund and its shareholders.
ALPS | Westport Resources Hedged High Income Fund
On December 10, 2013, the Trustees met in person to discuss, among other things, the approval of the investment advisory agreement between the Trust and ALPS Advisors, Inc. (“ALPS Advisors”) (“ALPS Investment Advisory Agreement”), the investment advisory agreement between the Trust and Westport Resources Management, Inc. (“Westport”) (“Westport Investment Advisory Agreement), the investment sub-advisory agreement among the Trust, Westport and Concise Capital Management, LP (“Concise”), the investment sub-advisory agreement among the Trust, Westport and Sound Point Capital Management, L.P. (“Sound Point”), and the investment sub-advisory agreement among the Trust, Westport and Amundi Smith Breeden, LLC (“Smith Breeden”) (collectively, the “Sub-Advisory Agreements” and each a “Sub-Advisory Agreement”), in accordance with Section 15(c) of the 1940 Act. The Independent Trustees met with independent legal counsel during executive session and discussed each of the ALPS and Westport Investment Advisory Agreements, and each Sub-Advisory Agreement with Concise, Sound Point and Smith Breeden, and other related materials.
38 | April 30, 2014
Additional Information | ||
| April 30, 2014 (Unaudited) |
In approving each of the ALPS and Westport Investment Advisory Agreements, and each Sub-Advisory Agreement with Concise, Sound Point and Smith Breeden, the Trustees, including the Independent Trustees, considered the following factors with respect to the ALPS/Westport Resources Hedged High Income Fund (the “Hedged High Income Fund” or the “Fund”):
Investment Advisory Fee Rate: The Trustees reviewed and considered the contractual annual advisory fee to be paid (a) by the Trust, on behalf of the Hedged High Income Fund, to ALPS Advisors of the greater of (i) 0.20% of the Hedged High Income Fund’s daily average net assets and (ii) $150,000, (b) by the Trust, on behalf of the Hedged High Income Fund, to Westport of 1.50% of the Hedged High Income Fund’s daily average net assets, and (c) the contractual annual sub-advisory fees to be paid by Westport to Concise, Sound Point and Smith Breeden based on the Hedged High Income Fund’s daily average net assets allocated to each, in light of the extent and quality of the advisory services to be provided by each to the Hedged High Income Fund.
The Trustees considered the information they received comparing the Hedged High Income Fund’s contractual annual advisory fees and overall expenses with those of funds in both the relevant expense group and universe of funds provided by an independent provider of investment company data.
Based on such information, the Trustees determined that the contractual annual advisory fee of (i) the greater of 0.20% of the Hedged High Income Fund’s daily average net assets and (ii) $150,000, with respect to ALPS Advisors, 1.50% of the Hedged High Income Fund’s daily average net assets with respect to Westport, and total expenses of 1.99% for each share class taking into account the contractual fee waiver in place between the Trust and Westport, subject to certain exclusions, is within an acceptable range of mutual funds within the Hedged High Income Fund’s anticipated peer universe, especially those alternative fixed-income funds using a similar multi-manager structure.
Nature, Extent and Quality of the Services under the Investment Advisory Agreements and Sub-Advisory Agreements: The Trustees received and considered information regarding the nature, extent and quality of services to be provided to the Hedged High Income Fund under the Investment Advisory Agreements and Sub-Advisory Agreements. The Trustees reviewed certain background materials supplied by ALPS Advisors, Westport, Concise, Sound Point and Smith Breeden in their presentations, including their Form ADVs, financial statements and compliance policies and procedures.
The Trustees reviewed and considered ALPS Advisors’, Westport’s, Concise’s, Sound Point’s and Smith Breeden’s investment advisory personnel, their history as asset managers and the amount of assets currently under management by each. The Trustees also reviewed the research and decision-making processes utilized by ALPS Advisors, Westport, Concise, Sound Point and Smith Breeden, including the methods adopted to seek to achieve compliance with the investment objectives, policies and restrictions of the Hedged High Income Fund.
The Trustees considered the background and experience of ALPS Advisors’, Westport’s, Concise’s, Sound Point’s and Smith Breeden’s management in connection with the Hedged High Income Fund, including reviewing the qualifications, backgrounds and responsibilities of the management team primarily responsible for the day-to-day portfolio management of the Hedged High Income Fund and the extent of the resources devoted to research and analysis of actual and potential investments.
The Trustees also reviewed, among other things, each of ALPS Advisors’, Westport’s, Concise’s, Sound Point’s and Smith Breeden’s Code of Ethics.
Performance: The Trustees noted that since the Hedged High Income Fund has not yet begun operations, there is no fund performance to be reviewed or analyzed at this time. The Trustees also considered the limitations on the comparability of performance information for certain related funds and accounts. The Trustees considered ALPS Advisors’, Westport’s, Concise’s, Sound Point’s and Smith Breeden’s reputation generally and their investment techniques, risk management controls and decision-making processes.
The Adviser’s Profitability: The Trustees received and considered a projected profitability analysis prepared by each of ALPS Advisors, Westport, Concise, Sound Point and Smith Breeden based on the fees payable under the respective Investment Advisory Agreements and Sub-Advisory Agreements, as applicable. The Trustees considered the profits, if any, anticipated to be realized by ALPS Advisors, Westport, Concise, Sound Point and Smith Breeden in connection with the operation of the Hedged High Income Fund. To the extent indicated by an Adviser or Sub-Adviser that the Hedged High Income Fund would not be immediately profitable, the Board recognized the commitment made by each to the Fund. The Board then reviewed and discussed ALPS Advisors’, Westport’s, Concise’s, Sound Point’s and Smith Breeden’s financial statements in order to analyze the financial condition and stability and profitability of each adviser.
Economies of Scale: The Trustees considered whether economies of scale in the provision of services to the Hedged High Income Fund will be passed along to the shareholders under the proposed agreements.
Other Benefits to the Advisers: The Trustees reviewed and considered any other incidental benefits derived or to be derived by ALPS Advisors, Westport, Concise, Sound Point and Smith Breeden from their relationship with the Hedged High Income Fund, including soft dollar arrangements.
The Board summarized its deliberations with respect to the ALPS and Westport Investment Advisory Agreements, and the Sub-Advisory Agreements with Concise, Sound Point and Smith Breeden. In selecting ALPS Advisors, Westport, Concise, Sound Point and Smith Breeden, and the
39 | April 30, 2014
Additional Information | ||
| April 30, 2014 (Unaudited) |
fees charged under the respective Investment Advisory Agreements and Sub-Advisory Agreements, the Trustees concluded that no single factor reviewed by the Trustees was identified by the Trustees to be determinative as the principal factor in whether to approve each of the Investment Advisory Agreements or Sub-Advisory Agreements. Further, the Independent Trustees were advised by independent legal counsel throughout the process. The Trustees, including all of the Independent Trustees, concluded that:
| • | the investment advisory fees to be received by ALPS Advisors and Westport, and the projected total expense ratios with respect to the Hedged High Income Fund after taking into account contractual fee waivers, were within an acceptable range of others within the Fund’s peer universe, bearing in mind that the sub-advisory fees were to be paid by Westport to the sub-advisers and not paid directly by the Fund; |
| • | the nature, extent and quality of services to be rendered by ALPS Advisors and Westport under their respective Investment Advisory Agreements, and Concise, Sound Point and Smith Breeden under their respective Sub-Advisory Agreements, were adequate; |
| • | there was no performance history for the Hedged High Income Fund for the Board to consider; |
| • | the terms of the proposed fee waiver and expense limitation agreement between the Trust, on behalf of the Hedged High Income Fund, and Westport, were not unreasonable; |
| • | there was no historical profitability for the advisers and the sub-advisors with respect to the Fund for the Board to consider; and |
| • | there were no material economies of scale or other incidental benefits accruing to ALPS Advisors, Westport, Concise, Sound Point and Smith Breeden in connection with their relationship with the Hedged High Income Fund, at this time. |
Based on the Trustees’ deliberations and their evaluation of the information described above, the Trustees, including all of the Independent Trustees, concluded that ALPS Advisors’, Westport’s, Concise’s, Sound Point’s and Smith Breeden’s compensation for investment advisory services is consistent with the best interests of the Hedged High Income Fund and its shareholders.
40 | April 30, 2014
SEMI-ANNUAL REPORT | April 30, 2014
| ||||||
The Management Commentaries included in this shareholder report contain certain forward-looking statements about the factors that may affect the performance of the Funds in the future. These statements are based on Fund management’s predictions and expectations concerning certain future events and their expected impact on the Funds, such as performance of the economy as a whole and of specific industry sectors, changes in the levels of interest rates, the impact of developing world events, and other factors that may influence the future performance of the Funds. Management believes these forward-looking statements to be reasonable, although they are inherently uncertain and difficult to predict. Actual events may cause adjustments in portfolio management strategies from those currently expected to be employed.
Must be accompanied or preceded by a prospectus. Investors are reminded to read the prospectus carefully before investing.
| ||||||
ALPS Portfolio Solutions Distributor, Inc., distributor.
| APS000135
| |||||
Item 2. Code of Ethics.
Not applicable to this Report.
Item 3. Audit Committee Financial Expert.
Not applicable to this Report.
Item 4. Principal Accountant Fees and Services.
Not applicable to this Report.
Item 5. Audit Committee of Listed Registrants.
Not applicable to Registrant.
Item 6. Investments.
| (a) | Schedule of Investments is included as part of the Reports to Stockholders filed under Item 1 of this Form N-CSR. |
| (b) | Not applicable. |
Item 7. Disclosure of Proxy Voting Policies and Procedures for Closed-End Management Investment
Companies.
Not applicable to Registrant.
Item 8. Portfolio Managers of Closed-End Management Investment Companies.
Not applicable to Registrant.
Item 9. Purchases of Equity Securities by Closed-End Management Investment Company and Affiliated
Purchasers.
Not applicable to Registrant.
Item 10. Submission of Matters to a Vote of Security Holders.
There have been no material changes to the procedures by which shareholders may recommend nominees to the Registrant’s Board of Trustees, where those changes were implemented after the Registrant last provided disclosure in response to the requirements of Item 407(c)(2)(iv) of Regulation S-K, or this Item.
Item 11. Controls and Procedures.
| (a) | The Registrant’s principal executive officer and principal financial officer have concluded that the Registrant’s disclosure controls and procedures (as defined in Rule 30a-3(c) under the Investment Company Act of 1940, as amended) are effective based on their evaluation of these controls and procedures as of a date within 90 days of the filing date of this report. |
| (b) | There was no change in the Registrant’s internal control over financial reporting (as defined in Rule 30a-3(d) under the Investment Company Act of 1940, as amended) that occurred during the second fiscal quarter of the period covered by this report that has materially affected, or is reasonably likely to materially affect, the Registrant’s internal control over financial reporting. |
Item 12. Exhibits.
| (a)(1) | Not applicable to this Report. |
| (a)(2) | The certifications required by Rule 30a-2(a) of the Investment Company Act of 1940, as amended, and Section 302 of the Sarbanes-Oxley Act of 2002 are attached hereto as Exhibit 99.Cert. |
| (a)(3) | Not applicable to Registrant. |
| (b) | The certifications by the Registrant’s principal executive officer and principal financial officer, as required by Rule 30a-2(b) of the Investment Company Act of 1940, as amended, and Section 906 of the Sarbanes-Oxley Act of 2002 are attached hereto as Exhibit 99.906Cert. |
SIGNATURES
Pursuant to the requirements of the Securities Exchange Act of 1934 and the Investment Company Act of 1940, the Registrant has duly caused this report to be signed on its behalf by the undersigned, thereunto duly authorized.
FINANCIAL INVESTORS TRUST
| By: | /s/ Edmund J. Burke | |
Edmund J. Burke (Principal Executive Officer) President | ||
| Date: | July 7, 2014 | |
Pursuant to the requirements of the Securities Exchange Act of 1934 and the Investment Company Act of 1940, this report has been signed below by the following persons on behalf of the Registrant and in the capacities and on the dates indicated.
FINANCIAL INVESTORS TRUST
| By: | /s/ Edmund J. Burke | |
Edmund J. Burke (Principal Executive Officer) President | ||
| Date: | July 7, 2014 | |
| By: | /s/ Kimberly R. Storms | |
Kimberly R. Storms (Principal Financial Officer) Treasurer | ||
| Date: | July 7, 2014 | |