UNITED STATES
SECURITIES AND EXCHANGE COMMISSION
Washington, D.C. 20549
FORM N-CSR
CERTIFIED SHAREHOLDER REPORT OF REGISTERED
MANAGEMENT INVESTMENT COMPANIES
Investment Company Act file number: 811-08194
FINANCIAL INVESTORS TRUST
(Exact name of Registrant as specified in charter)
1290 Broadway, Suite 1100, Denver, Colorado 80203
(Address of principal executive offices) (Zip code)
Karen Gilomen, Esq., Secretary
Financial Investors Trust
1290 Broadway, Suite 1100
Denver, Colorado 80203
(Name and address of agent for service)
Registrant’s telephone number, including area code: 303-623-2577
Date of fiscal year end: April 30
Date of reporting period: May 1, 2016 – October 31, 2016
Item 1. Reports to Stockholders.

TABLE OF CONTENTS
| PAGE | |
| Manager Commentary | 1 |
| Performance Update | 3 |
| Consolidated Disclosure of Fund Expenses | 5 |
| Consolidated Schedule of Investments | 6 |
| Consolidated Statement of Assets & Liabilities | 8 |
| Consolidated Statement of Operations | 9 |
| Consolidated Statements of Changes in Net Assets | 10 |
| Consolidated Financial Highlights | 11 |
| Notes to Consolidated Financial Statements | 13 |
| Additional Information | 20 |
| Aspen Managed Futures Strategy Fund | Manager Commentary |
| October 31, 2016 (Unaudited) |
October 31, 2016
Performance Results
For the six‐month period ending October 31, 2016, the Class I shares of the Aspen Managed Futures Strategy Fund (the “Fund”) posted a return of ‐3.45%. Per its mandate, the Fund maintained tight correlation(1) to the Aspen Managed Futures Beta Index (“Aspen MFBI” or the “Index”)(2). The Index uses a combination of trend and counter‐trend algorithms to determine exposures to 23 futures markets. In following the Index, the Fund can take long or short positions in each of the eligible markets. A long position in a futures market will profit if the price of the futures contract rises, whereas a short position will profit if the price of the futures contract falls.
The BTOP50 Index(3), a managed futures benchmark, returned ‐4.01% over the same period. It is important to note that there are substantive differences between the Fund and the Index in terms of construction. There were no significant changes to the Fund strategy during this period.
Explanation of Fund Performance
The Fund returned ‐2.45% in May. A surprise rate cut by the Reserve Bank of Australia was a factor in the monthly loss. The cut drove down the Australian dollar, causing losses in long AUD positions in the Index’s Trend and Counter‐Trend models.
The month of June provided a gain of +3.18% for the Fund. The majority of that return occurred on a single day, June 24, the first day of market reaction to the surprise results of the UK’s “Brexit”(4) vote to leave European Union. The Aspen MFBI’s futures positioning around Brexit arose from the crosswinds of pre‐Brexit market moves. Because the vote was a rare, point‐in‐time volatility‐inducing event that everyone could see coming in advance, volatility naturally spiked in advance in the weeks preceding the vote—which led to a Broad Risk Indicator‐driven increase in the Trend/Counter‐Trend ratio in the Index. Risk assets, particularly European issues, declined—which led to net short risk exposures in the Trend model. However, concerns notwithstanding, at no point prior to the actual vote tally did markets predict a greater than 50% probability of a UK “Leave” vote. In particular, over the course of the week of the actual vote, the market’s movements reflected increasing confidence that the “Remain” side would win. This resulted in Index positioning that, while risk‐off overall, was not positioned strongly short risk assets, but was decidedly long fixed income. In aggregate, that positioning enabled the Fund to capture a gain of about +2% on June 24. Remarkably, it took only about a week for global equity markets, including those in the UK itself, to recover their Brexit losses. Typically a “V‐bottom” bounce of that nature is problematic for a trend‐following model such as the one tracked by the Fund, but in this case, the Fund was actually able to profit during the market rebound as well as the initial market drop. The primary reason for this was the fact that the Fund’s long fixed income positions continued to post profits, as the post‐Brexit rebound was apparently driven in part by speculation of further easing, which in turn benefitted sovereign bonds as well as equity markets.
After the craziness of Brexit, the markets settled into a quieter mode for the remainder of the reporting period. A trendless, low‐volatility backdrop created difficult conditions for the Index’s trend model, but it benefitted the Index’s risk‐on counter‐trend model. Trend attribution was negative and counter‐trend attribution was positive in each of the remaining four months of the period—a pattern that previously had not occurred for more than two consecutive months. Because the Index is always primarily trend‐following, this pattern led to losses for the Fund in all four months (July: ‐0.50%, August: ‐0.78%, September: ‐1.01%, October: ‐1.93%). However, the boost provided by the counter‐trend sub‐model kept losses over the entire period relatively modest—i.e., the losses over the entire four‐month period were only about 100 basis points(5) greater than the gains in June alone.
At the end of October, heading toward the U.S. presidential election, the most notable development in the Fund was the adoption of net short fixed income futures positioning for the first time all year, in response to rising global interest rates over the last couple months of the reporting period.
Outlook
On September 9th, the bears appeared to be running the table. Investors were concerned that a month of central bank announcements would lead to a market pullback. In addition, concerns about the end of easy money, sky‐high equity valuations and lack of economic growth in Europe seemed to confirm traders’ worst suspicions, as the S&P 500® Total Return Index(6) fell over 2.5% that day. However, in the weeks that followed, the markets were able to shake off the gloom. So what gives?
Apparently, those arguments just weren’t enough to end the 7 ½ ‐ year bull market. News of the improving domestic economy was certainly a plus, along with less hawkish news from the European Central Bank and the Federal Reserve (“Fed”). And with interest rates so low, the current high valuation of stocks seem not to be enough of a catalyst to push the markets lower.
A deeper dive into the third quarter’s market performance gives some indication of the larger concerns among investors. The weakness during the period of the so‐called bond proxy sectors (utilities, real estate, and consumer staples) was mainly due to worries about rising rates. Likewise, weakness in U.S. exporters and multinationals signals skepticism around a global economic upswing.
| Semi-Annual Report | October 31, 2016 | 1 |
| Aspen Managed Futures Strategy Fund | Manager Commentary |
| October 31, 2016 (Unaudited) |
These concerns are not new, of course. But it should be noted that even if the Fed does raise rates in December, it is in our view likely to be only 25 basis points. That would still leave rates extremely low. As has been the case for the last several years, we believe the market will continue to fall in anticipation of bad news, only to recover when the worst‐case scenario doesn’t come to fruition.
Donald Trump’s surprise victory in the U.S. presidential race ranks with Brexit as one of the most stunning events of the year. Besides showing clients the value of discipline for staying in the market even after nine consecutive down sessions, Wednesday’s market action after the election also contains some interesting clues about the potential direction of markets as we approach year‐end.
The most important observation is stock prices rising in the face of higher rates. The 10‐year note yield has climbed from 1.89% before the election to 2.30%, and equity markets have also risen during that period. Have we finally reached a point where rallies are not entirely dependent on dovish Fed action? That may be the case. Last month’s release of third quarter Gross Domestic Product numbers showing 2.90% growth was certainly encouraging.
We feel that it is also positive to see the yield curve finally steepening (i.e., long‐term rates rising more than short‐term rates). A move such as this should be a boon for bank stocks, making it easier for banks to profit from lending activity.
Sincerely,
Bryan R. Fisher
William Ware Bush
Bryan R. Fisher
William Ware Bush
Performance data quoted represents past performance. Past performance does not guarantee future results. Investment return and principal value of an investment will fluctuate so that an investor’s shares, when sold or redeemed, may be worth more or less than the original cost. Current performance data may be higher or lower than actual data quoted. For the most current month-end performance data please call 1-855-845-9444.
The views of Aspen Partners, Ltd. and information discussed in this commentary are as of the date of publication, are subject to change, and may not reflect the writers’ current views. The views expressed are those of the Fund’s adviser only, and represent an assessment of market conditions at a specific point in time, are opinions only and should not be relied upon as investment advice regarding a particular investment or markets in general. Such information does not constitute a recommendation to buy or sell specific securities or investment vehicles. It should not be assumed that any investment will be profitable or will equal the performance of the portfolios or any securities or any sectors mentioned in this letter. The subject matter contained in this letter has been derived from several sources believed to be reliable and accurate at the time of compilation. Neither Aspen Partners Ltd. nor the Fund accepts any liability for losses either direct or consequential caused by the use of this information.
The Aspen Managed Futures Strategy Fund is distributed by ALPS Distributors, Inc.
The Fund is subject to investment risks, including possible loss of the principal amount invested and therefore is not suitable for all investors. The Fund may not achieve its objectives.
Diversification does not eliminate the risk of experiencing investment losses.
| (1) | Correlation - a statistical measure of how two securities or portfolios move in relation to each other. |
| (2) | Aspen Managed Futures Beta Index (Aspen MFBI) is constructed using a quantitative, rules-based model designed to replicate the trend-following and counter-trend exposure of futures markets by allocating assets to liquid futures contracts of certain financial and commodities futures markets. The Index therefore seeks to reflect the performance of strategies and exposures common to a broad universe of futures markets, i.e., managed futures beta. |
| (3) | Barclay BTOP50 Index is an index of the largest investable CTA programs as measured by assets under management. The index is not actively managed and does not reflect any deduction for fees, expenses or taxes. An investor may not invest directly into the Index. |
| (4) | Brexit is an abbreviation for "British exit," which refers to the June 23, 2016, referendum whereby British citizens voted to exit the European Union. The referendum roiled global markets, including currencies, causing the British pound to fall to its lowest level in decades. |
| (5) | Basis point is a common unit of measure fir interest rates and other percentages in finance. One basis point is equal to 1/100th of 1% or 0.01%(.0001). |
| (6) | The S&P 500® Total Return Index is an unmanaged index of 500 common stocks chosen for market size, liquidity and industry group representation. It is a market-value weighted index. The Index is not actively managed and does not reflect any deductions for fees, expenses or taxes. An investor may not invest directly in the Index. |
| 2 | www.aspenfuturesfund.com |
| Aspen Managed Futures Strategy Fund | Performance Update |
| October 31, 2016 (Unaudited) |
Cumulative Total Return Performance as of October 31, 2016
| Aspen Managed Futures Strategy Fund | 6 Months | Calendar Year-to-Date | 1 Year | 3 Year | 5 Year | Since Inception* | Expense Ratios | |
| Total | Net(1) | |||||||
Aspen Managed Futures Strategy Fund ‐ Class A (NAV)(2) | ‐3.28% | ‐4.47% | ‐3.49% | 1.23% | 0.19% | ‐0.97% | 1.61% | 1.61% |
Aspen Managed Futures Strategy Fund ‐ Class A (MOP)(3) | ‐8.57% | ‐9.73% | ‐8.77% | ‐0.65% | ‐0.94% | ‐2.03% | 1.61% | 1.61% |
| Aspen Managed Futures Strategy Fund ‐ Class I | ‐3.45% | ‐4.73% | ‐3.51% | 1.52% | 0.50% | ‐0.66% | 1.23% | 1.23% |
SG CTA Index(4) | ‐3.33% | ‐1.65% | ‐0.40% | 5.18% | 2.13% | 1.14% | ||
Aspen Managed Futures Beta Index(5) | ‐2.76% | ‐3.35% | ‐1.95% | 3.30% | 2.35% | 1.27% | ||
Performance data quoted represents past performance. Past performance does not guarantee future results. Investment return and principal value of an investment will fluctuate so that an investor’s shares, when sold or redeemed, may be worth more or less than the original cost. Current performance data may be higher or lower than actual data quoted. For the most current month-end performance data, please call 1-855-845-9444.
The table does not reflect the deduction of taxes that a shareholder would pay on Fund distributions or the redemption of Fund shares.
Subject to investment risks, including possible loss of the principal amount invested.
Returns for periods greater than 1 year are annualized.
| * | Fund Inception date of August 2, 2011. |
| (1) | Aspen Partners, Ltd. (the “Adviser”) has agreed to waive and/or reimburse fees or expenses in order to limit total annual Fund operating expenses after fee waiver/expense reimbursements (excluding distribution and service (12b-1) fees, shareholder services fees, acquired fund fees and expenses, brokerage expenses, interest expenses, taxes and extraordinary expenses) to 1.55% of the Fund’s average daily net assets. This agreement (the “Expense Agreement”) is in effect through August 31, 2017. The Adviser will be permitted to recover, on a class-by-class basis, expenses it has borne through the Expense Agreement to the extent that the Fund’s expenses in later periods fall below the expense cap in effect at the time of waiver or reimbursement. Notwithstanding the foregoing, the Fund will not be obligated to pay any such deferred fees and expenses more than three years after the end of the fiscal year in which the fees and expenses were deferred. The Expense Agreement may not be terminated or modified prior to August 31, 2017 except with the approval of the Fund’s Board of Trustees |
| (2) | Net Asset Value (NAV) is the share price without sales charges. |
| (3) | Maximum Offering Price (MOP) includes sales charges. Class A returns include effects of the Fund’s maximum sales charge of 5.50%. |
| (4) | The SG CTA Index (formerly, the Newedge CTA Index) provides the market with a reliable daily performance benchmark of major commodity trading advisors (CTAs). The SG CTA Index calculates the daily rate of return for a pool of CTAs selected from the larger managers that are open to new investment. Selection of the pool of qualified CTAs used in construction of the Index will be conducted annually, with re-balancing on January 1st of each year. A committee of industry professionals has been established to monitor the methodology of the index on a regular basis. The Index is not actively managed and does not reflect any deduction for fees, expenses or taxes. An investor cannot invest directly in the Index. |
| (5) | Aspen Managed Futures Beta Index – The Managed Futures Beta Index is constructed using a quantitative, rules-based model designed to replicate the trend-following and counter-trend exposure of futures markets by allocating assets to liquid futures contracts of certain financial and commodities futures markets. The Index therefore seeks to reflect the performance of strategies and exposures common to a broad universe of futures markets, i.e., managed futures beta. The index is not actively managed and does not reflect any deductions for fees, expense or taxes. An investor may not invest directly in an index. |
Portfolio Composition as of October 31, 2016
As a percentage of Net Assets^
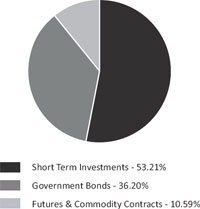
^ | Holdings subject to change, and may not reflect the current or future position of the portfolio. |
| Semi-Annual Report | October 31, 2016 | 3 |
| Aspen Managed Futures Strategy Fund | Performance Update |
| October 31, 2016 (Unaudited) |
Performance of $10,000 Initial Investment (as of October 31, 2016)
Comparison of change in value of a $10,000 investment (includes applicable sales loads)
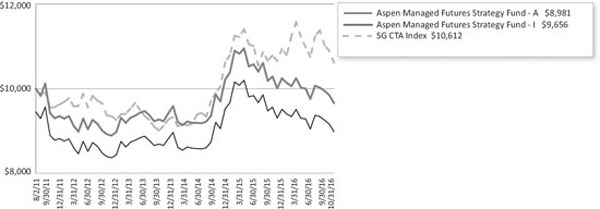
The chart above represents historical performance of a hypothetical investment of $10,000 in the Fund since inception. Past performance does not guarantee future results. This chart does not reflect the deduction of taxes that a shareholder would pay on Fund distributions or the redemption of Fund shares.
Investing in the Fund is subject to investment risks, including possible loss of the principal amount invested.
| 4 | www.aspenfuturesfund.com |
| Aspen Managed Futures Strategy Fund | Consolidated Disclosure of Fund Expenses |
| October 31, 2016 (Unaudited) |
As a shareholder of the Fund, you incur two types of costs: transaction costs, including sales charges (loads) on purchase payments, reinvested dividends, or other distributions; redemption fees; and exchange fees; and (2) ongoing costs, including management fees; distribution and/or service (12b‐1) fees; shareholder servicing fees; and other fund operating expenses. This example is intended to help you understand your ongoing costs (in dollars), of investing in the Fund and to compare these costs with the ongoing costs of investing in other mutual funds.
This example is based on an investment of $1,000 invested at the beginning of the period and held for the entire six‐month period of May 1, 2016 through October 31, 2016.
Actual Expenses The first line of the table below provides information about actual account values and actual expenses. You may use the information in this line, together with the amount you invested, to estimate the expenses that you paid over the period. Simply divide your account value by $1,000 (for example, an $8,600 account value divided by $1,000 = 8.6), then multiply the result by the number in the first line under the heading “Expenses Paid During Period” to estimate the expenses you paid on your account during this period.
Hypothetical Example for Comparison Purposes The second line of the table below provides information about hypothetical account values and hypothetical expenses based on the Fund’s actual expense ratio and an assumed rate of return of 5% per year before expenses, which is not the Fund’s actual return. The hypothetical account values and expenses may not be used to estimate the actual ending account balance or expenses you paid for the period. You may use this information to compare the ongoing costs of investing in the Fund and other funds. To do so, compare this 5% hypothetical example with the 5% hypothetical examples that appear in the shareholder reports of other mutual funds.
Please note that the expenses shown in the table are meant to highlight your ongoing costs only and do not reflect any transactional costs, such as applicable sales charges (loads), redemption fees, or exchange fees. Therefore, the second line of the table is useful in comparing ongoing costs only and will not help you determine the relative total costs of owning different funds. In addition, if these transactional costs were included, your costs would have been higher.
Beginning Account Value 5/1/16 | Ending Account Value 10/31/16 | Expense Ratio(a) | Expenses Paid During period 5/1/16 - 10/31/16(b) | |
| Class A | ||||
| Actual | $1,000.00 | $967.20 | 1.03% | $5.11 |
| Hypothetical (5% return before expenses) | $1,000.00 | $1,020.01 | 1.03% | $5.24 |
| Class I | ||||
| Actual | $1,000.00 | $965.50 | 1.24% | $6.14 |
| Hypothetical (5% return before expenses) | $1,000.00 | $1,018.95 | 1.24% | $6.31 |
| (a) | The Fund's expense ratios have been based on the Fund's most recent fiscal half-year expenses. |
| (b) | Expenses are equal to the Fund's annualized expense ratio multiplied by the average account value over the period, multiplied by the number of days in the most recent fiscal half-year (184)/365 (to reflect the half-year period). |
| Semi-Annual Report | October 31, 2016 | 5 |
| Aspen Managed Futures Strategy Fund | Consolidated Schedule of Investments |
October 31, 2016 (Unaudited)
| Principal Amount/Shares | Value (Note 2) | |||||||
| GOVERNMENT BONDS (36.20%) | ||||||||
| U.S. TREASURY NOTES (36.20%) | ||||||||
| 0.500%, 11/30/2016 | $ | 9,047,000 | $ | 9,049,325 | ||||
| 0.500%, 01/31/2017 | 8,010,000 | 8,014,446 | ||||||
| 0.500%, 03/31/2017 | 15,014,000 | 15,019,855 | ||||||
| 0.625%, 05/31/2017 | 10,065,000 | 10,070,304 | ||||||
| 0.625%, 07/31/2017 | 19,823,000 | 19,822,604 | ||||||
| 0.625%, 08/31/2017 | 5,045,000 | 5,043,522 | ||||||
| 1.000%, 09/15/2017 | 5,000,000 | 5,014,160 | ||||||
| 0.625%, 09/30/2017 | 6,050,000 | 6,046,812 | ||||||
| 0.750%, 10/31/2017 | 7,134,000 | 7,137,481 | ||||||
| 0.625%, 11/30/2017 | 5,135,000 | 5,129,783 | ||||||
| TOTAL GOVERNMENT BONDS (Cost $90,305,637) | 90,348,292 | |||||||
| SHORT TERM INVESTMENTS (53.21%) | ||||||||
| MONEY MARKET FUND (3.89%) | ||||||||
| Dreyfus Treasury & Agency Cash Management Fund ‐ Institutional Shares, 7‐day yield, 0.207% | 9,713,818 | 9,713,818 | ||||||
| U.S. TREASURY BILLS (49.32%) | ||||||||
0.496%, 11/10/2016(a) | 10,000,000 | 9,998,747 | ||||||
0.563%, 12/08/2016(a) | 13,350,000 | 13,344,080 | ||||||
0.565%, 01/05/2017(a) | 10,500,000 | 10,495,096 | ||||||
0.397%, 02/02/2017(a) | 10,400,000 | 10,390,806 | ||||||
0.510%, 03/30/2017(a) | 8,500,000 | 8,486,630 | ||||||
0.570%, 04/27/2017(a) | 5,600,000 | 5,586,510 | ||||||
0.492%, 05/25/2017(a) | 10,500,000 | 10,471,818 | ||||||
0.429%, 06/22/2017(a) | 13,350,000 | 13,307,227 | ||||||
0.402%, 07/20/2017(a) | 10,000,000 | 9,961,480 | ||||||
0.557%, 08/17/2017(a) | 14,000,000 | 13,938,190 | ||||||
0.528%, 09/14/2017(a) | 7,800,000 | 7,759,822 | ||||||
0.631%, 10/12/2017(a) | 9,400,000 | 9,342,989 | ||||||
| 123,083,395 | ||||||||
| TOTAL SHORT TERM INVESTMENTS (Cost $132,796,920) | 132,797,213 | |||||||
TOTAL INVESTMENTS (89.41%) (Cost $223,102,557) | $ | 223,145,505 | ||||||
| Other Assets In Excess Of Liabilities (10.59%) | 26,424,761 | (b) | ||||||
| NET ASSETS (100.00%) | $ | 249,570,266 | ||||||
| (a) | Rate shown represents the bond equivalent yield to maturity at date of purchase. |
| (b) | Includes cash which is being held as collateral for futures contracts. |
See Notes to Consolidated Financial Statements.
| 6 | www.aspenfuturesfund.com |
| Aspen Managed Futures Strategy Fund | Consolidated Schedule of Investments |
October 31, 2016 (Unaudited)
FUTURES CONTRACTS
At October 31, 2016, the Fund had outstanding futures contracts:
| Description | Position | Contracts | Expiration Date | Underlying Face Amount at Value | Unrealized Appreciation | ||||||||
| Equity Contracts | |||||||||||||
Euro STOXX 50® Index Future | Long | 311 | 12/16/2016 | $ | 10,422,952 | $ | 13,715 | ||||||
FTSE® 100 Index Future | Long | 182 | 12/16/2016 | 15,435,603 | 291,652 | ||||||||
| Nikkei 225 Index Future | Long | 121 | 12/08/2016 | 10,539,100 | 248,471 | ||||||||
| Foreign Currency Contracts | |||||||||||||
| Canadian Dollar Currency Future | Short | 519 | 12/20/2016 | (38,678,475 | ) | 336,881 | |||||||
| Euro FX Currency Future | Short | 401 | 12/19/2016 | (55,072,338 | ) | 258,953 | |||||||
| Japanese Yen Currency Future | Short | 110 | 12/19/2016 | (13,125,063 | ) | 48,443 | |||||||
| New Zealand Dollar Currency Future | Long | 227 | 12/19/2016 | 16,194,180 | 182,217 | ||||||||
| Swiss Franc Currency Future | Short | 129 | 12/19/2016 | (16,321,725 | ) | 4,516 | |||||||
| Interest Rate Contracts | |||||||||||||
| Canadian 10 Year Bond Future | Short | 129 | 12/19/2016 | (13,908,879 | ) | 71,375 | |||||||
| Euro‐Bund Future | Short | 80 | 12/08/2016 | (14,241,773 | ) | 77,981 | |||||||
| Long Gilt Future | Short | 91 | 12/28/2016 | (13,960,878 | ) | 83,035 | |||||||
| U.S. 10 Year Note Future | Short | 110 | 12/20/2016 | (14,258,750 | ) | 19,099 | |||||||
| $ | (126,976,046 | ) | $ | 1,636,338 | |||||||||
| Description | Position | Contracts | Expiration Date | Underlying Face Amount at Value | Unrealized Depreciation | ||||||||
| Commodity Contracts | |||||||||||||
Copper Future(a) | Short | 57 | 12/28/2016 | $ | (3,142,125 | ) | $ | (145,058 | ) | ||||
Corn Future(a) | Short | 170 | 12/14/2016 | (3,015,375 | ) | (187,618 | ) | ||||||
Gold 100 Oz. Future(a) | Short | 23 | 12/28/2016 | (2,928,130 | ) | (42,654 | ) | ||||||
New York Harbor ULSD Future(a) | Long | 136 | 11/30/2016 | 8,590,277 | (363,149 | ) | |||||||
Silver Future(a) | Long | 34 | 12/28/2016 | 3,025,320 | (161,094 | ) | |||||||
Soybean Future(a) | Long | 61 | 01/13/2017 | 3,085,838 | (28,439 | ) | |||||||
Sugar No. 11 (World) Future(a) | Long | 352 | 02/28/2017 | 8,503,757 | (819,696 | ) | |||||||
WTI Crude Future(a) | Long | 182 | 11/21/2016 | 8,528,520 | (689,304 | ) | |||||||
| Equity Contracts | |||||||||||||
S&P 500® E‐Mini Future | Long | 49 | 12/16/2016 | 5,194,245 | (44,116 | ) | |||||||
| Foreign Currency Contracts | |||||||||||||
| Australian Dollar Currency Future | Long | 723 | 12/19/2016 | 54,890,160 | (174,409 | ) | |||||||
| $ | 82,732,487 | $ | (2,655,537 | ) | |||||||||
Common Abbreviations:
FTSE - Financial Times and the London Stock Exchange
S&P - Standard and Poor's
ULSD - Ultra Low Sulfur Diesel
(a) | Owned by an entity that is owned by the Fund and is consolidated as described in Note 1 of the Notes to the Consolidated Financial Statements. |
For Fund compliance purposes, the Fund's industry classifications refer to any one or more of the industry sub-classifications used by one or more widely recognized market indexes or ratings group indexes, and/or as defined by Fund management. This definition may not apply for purposes of this report, which may combine industry sub-classifications for reporting ease. Industries are shown as a percentage of net assets.
See Notes to Consolidated Financial Statements.
| Semi-Annual Report | October 31, 2016 | 7 |
| Aspen Managed Futures Strategy Fund | Consolidated Statement of Assets & Liabilities |
October 31, 2016 (Unaudited)
| ASSETS: | ||||
| Investments, at value | $ | 223,145,505 | ||
| Cash | 3,351,619 | |||
| Deposit with broker for futures contracts (Note 3) | 28,948,750 | |||
| Receivable for shares sold | 18,951 | |||
| Variation margin receivable | 44,556 | |||
| Interest receivable | 126,841 | |||
| Prepaid and other assets | 36,108 | |||
| Total assets | 255,672,330 | |||
| LIABILITIES: | ||||
| Foreign cash due to broker for futures contracts (Note 3)(Cost $4,931,226) | 4,842,728 | |||
| Payable to advisor | 161,054 | |||
| Variation margin payable | 878,756 | |||
| Payable for shares redeemed | 31,300 | |||
| Payable for administration fees | 19,522 | |||
| Payable for distribution and service fees | ||||
| Class A | 22,993 | |||
| Payable for transfer agency fees | 9,434 | |||
| Delegated transfer agent equivalent services fees | ||||
| Class A | 2,100 | |||
| Class I | 40,633 | |||
| Payable for trustee fees and expenses | 7,503 | |||
| Payable for professional fees | 18,877 | |||
| Payable for chief compliance officer fees | 3,083 | |||
| Payable for principal financial officer fees | 854 | |||
| Payable for licensing fees | 53,684 | |||
| Accrued expenses and other liabilities | 9,543 | |||
| Total liabilities | 6,102,064 | |||
| NET ASSETS | $ | 249,570,266 | ||
| NET ASSETS CONSIST OF: | ||||
| Paid‐in capital (Note 5) | $ | 272,349,786 | ||
| Accumulated net investment income | 1,192,248 | |||
| Accumulated net realized loss | (23,084,015 | ) | ||
| Net unrealized depreciation | (887,753 | ) | ||
| NET ASSETS | $ | 249,570,266 | ||
| INVESTMENTS, AT COST | $ | 223,102,557 | ||
| PRICING OF SHARES: | ||||
| Class A: | ||||
| Net Asset Value, offering and redemption price per share | $ | 8.54 | ||
| Net Assets | $ | 7,242,638 | ||
| Shares of beneficial interest outstanding | 848,419 | |||
| Maximum offering price per share (NAV/0.9450), based on maximum sales charge of 5.50% of the offering price | $ | 9.04 | ||
| Class I: | ||||
| Net Asset Value, offering and redemption price per share | $ | 8.67 | ||
| Net Assets | $ | 242,327,628 | ||
| Shares of beneficial interest outstanding | 27,960,915 | |||
See Notes to Consolidated Financial Statements.
| 8 | www.aspenfuturesfund.com |
| Aspen Managed Futures Strategy Fund | Consolidated Statement of Operations |
For the Six Months Ended October 31, 2016 (Unaudited)
| INVESTMENT INCOME: | ||||
| Interest | $ | 608,303 | ||
| Dividends | 9,768 | |||
| Total investment income | 618,071 | |||
| EXPENSES: | ||||
| Investment advisory fees (Note 6) | 1,000,139 | |||
| Investment advisory fees ‐ subsidiary (Note 6) | 92,487 | |||
| Administrative fees | 109,756 | |||
| Transfer agency fees | 35,834 | |||
| Delegated transfer agent equivalent services fees | ||||
| Class A | 2,795 | |||
| Class I | 77,595 | |||
| Professional fees | 22,140 | |||
| Custodian fees | 6,273 | |||
| Trustee fees and expenses | 9,684 | |||
| Principal financial officer fees | 2,520 | |||
| Chief compliance officer fees | 17,554 | |||
| Licensing fees | 333,380 | |||
| Other | 26,107 | |||
| Total expenses before waiver/reimbursement | 1,736,264 | |||
| Waiver of investment advisory fees ‐ subsidiary (Note 6) | (92,487 | ) | ||
| Total net expenses | 1,643,777 | |||
| NET INVESTMENT LOSS | (1,025,706 | ) | ||
| Net realized gain on investments | 1,601 | |||
| Net realized loss on futures contracts | (2,559,565 | ) | ||
| Net realized gain on foreign currency transactions | 163,180 | |||
| Total net realized loss | (2,394,784 | ) | ||
| Net change in unrealized depreciation of investments | (51,839 | ) | ||
| Net change in unrealized depreciation on futures contracts | (6,139,116 | ) | ||
| Net change in unrealized appreciation on translation of assets and liabilities denominated in foreign currency transactions | 129,199 | |||
| Net change in unrealized depreciation | (6,061,756 | ) | ||
| NET REALIZED AND UNREALIZED LOSS ON INVESTMENTS | (8,456,540 | ) | ||
| NET DECREASE IN NET ASSETS RESULTING FROM OPERATIONS | $ | (9,482,246 | ) | |
See Notes to Consolidated Financial Statements.
| Semi-Annual Report | October 31, 2016 | 9 |
| Aspen Managed Futures Strategy Fund | Consolidated Statements of Changes in Net Assets |
For the Six Months Ended October 31, 2016 (Unaudited) | For the Year Ended April 30, 2016 | |||||||
| OPERATIONS: | ||||||||
| Net investment loss | $ | (1,025,706 | ) | $ | (2,786,624 | ) | ||
| Net realized loss | (2,394,784 | ) | (22,047,854 | ) | ||||
| Net change in unrealized appreciation/(depreciation) | (6,061,756 | ) | 9,897,802 | |||||
| Net decrease in net assets resulting from operations | (9,482,246 | ) | (14,936,676 | ) | ||||
| DISTRIBUTIONS TO SHAREHOLDERS (Note 4): | ||||||||
| From net investment income | ||||||||
| Class A | – | (290,384 | ) | |||||
| Class I | – | (4,854,577 | ) | |||||
| From net realized gains on investments | ||||||||
| Class A | – | (1,080,184 | ) | |||||
| Class I | – | (15,329,525 | ) | |||||
| Net decrease in net assets from distributions | – | (21,554,670 | ) | |||||
| SHARE TRANSACTIONS (Note 5): | ||||||||
| Class A | ||||||||
| Proceeds from sales of shares | 4,207,015 | 17,757,620 | ||||||
| Distributions reinvested | – | 1,314,015 | ||||||
| Cost of shares redeemed | (16,345,074 | ) | (20,727,211 | ) | ||||
| Redemption fees | 2,269 | 5,100 | ||||||
| Class I | ||||||||
| Proceeds from sales of shares | 26,346,180 | 83,806,547 | ||||||
| Distributions reinvested | – | 16,756,950 | ||||||
| Cost of shares redeemed | (39,438,757 | ) | (44,568,213 | ) | ||||
| Redemption fees | 477 | 2,041 | ||||||
| Net increase/(decrease) from share transactions | (25,227,890 | ) | 54,346,849 | |||||
| Net increase/(decrease) in net assets | (34,710,136 | ) | 17,855,503 | |||||
| NET ASSETS: | ||||||||
| Beginning of period | 284,280,402 | 266,424,899 | ||||||
| End of period* | $ | 249,570,266 | $ | 284,280,402 | ||||
| *Includes accumulated net investment income of: | $ | 1,192,248 | $ | 2,217,954 | ||||
| Other Information: | ||||||||
| SHARE TRANSACTIONS: | ||||||||
| Class A | ||||||||
| Sold | 481,951 | 1,836,531 | ||||||
| Distributions reinvested | – | 146,490 | ||||||
| Redeemed | (1,863,492 | ) | (2,134,823 | ) | ||||
| Net decrease in shares outstanding | (1,381,541 | ) | (151,802 | ) | ||||
| Class I | ||||||||
| Sold | 2,947,888 | 8,468,843 | ||||||
| Distributions reinvested | – | 1,837,385 | ||||||
| Redeemed | (4,438,176 | ) | (4,699,475 | ) | ||||
| Net increase/(decrease) in shares outstanding | (1,490,288 | ) | 5,606,753 | |||||
See Notes to Consolidated Financial Statements.
| 10 | www.aspenfuturesfund.com |
| Aspen Managed Futures Strategy Fund – Class A | Consolidated Financial Highlights |
For a share outstanding throughout the periods presented.
For the Six Months Ended October 31, 2016 (Unaudited)(a) | For the Year Ended April 30, 2016 (a) | For the Year Ended April 30, 2015 (a) | For the Year Ended April 30, 2014 (a) | For the Year Ended April 30, 2013 (a) | For the Period August 2, 2011 (Inception) to April 30, 2012 (a) | |||||||||||||||||||
| NET ASSET VALUE, BEGINNING OF PERIOD | $ | 8.83 | $ | 10.01 | $ | 8.97 | $ | 9.29 | $ | 8.95 | $ | 10.00 | ||||||||||||
| INCOME/(LOSS) FROM OPERATIONS: | ||||||||||||||||||||||||
Net investment loss(b) | (0.02 | ) | (0.12 | ) | (0.14 | ) | (0.16 | ) | (0.16 | ) | (0.13 | ) | ||||||||||||
| Net realized and unrealized gain/(loss) on investments | (0.27 | ) | (0.39 | ) | 1.39 | (0.05 | ) | 0.50 | (0.92 | ) | ||||||||||||||
| Total from investment operations | (0.29 | ) | (0.51 | ) | 1.25 | (0.21 | ) | 0.34 | (1.05 | ) | ||||||||||||||
| LESS DISTRIBUTIONS: | ||||||||||||||||||||||||
| From net investment income | – | (0.14 | ) | – | – | – | – | |||||||||||||||||
| Distributions from net realized gain on investments | – | (0.53 | ) | (0.21 | ) | (0.12 | ) | – | – | |||||||||||||||
| Total distributions | – | (0.67 | ) | (0.21 | ) | (0.12 | ) | – | – | |||||||||||||||
| REDEMPTION FEES ADDED TO PAID IN CAPITAL | 0.00 | (c) | 0.00 | (c) | 0.00 | (c) | 0.01 | 0.00 | (c) | – | ||||||||||||||
| INCREASE/(DECREASE) IN NET ASSET VALUE | (0.29 | ) | (1.18 | ) | 1.04 | (0.32 | ) | 0.34 | (1.05 | ) | ||||||||||||||
| NET ASSET VALUE, END OF PERIOD | $ | 8.54 | $ | 8.83 | $ | 10.01 | $ | 8.97 | $ | 9.29 | $ | 8.95 | ||||||||||||
TOTAL RETURN(d) | (3.28 | %)(e) | (5.20 | %) | 14.00 | % | (2.15 | %) | 3.80 | % | (10.50 | %)(e) | ||||||||||||
| RATIOS AND SUPPLEMENTAL DATA: | ||||||||||||||||||||||||
| Net assets, end of period (000's) | $ | 7,243 | $ | 19,682 | $ | 23,850 | $ | 12,914 | $ | 3,350 | $ | 1,254 | ||||||||||||
| RATIOS TO AVERAGE NET ASSETS: | ||||||||||||||||||||||||
| Operating expenses excluding fee waivers/reimbursements | 1.03 | %(f)(g) | 1.56 | %(g) | 1.64 | % | 1.83 | % | 1.80 | % | 2.53 | %(f) | ||||||||||||
| Operating expenses including fee waivers/reimbursements | 1.03 | %(f) | 1.56 | % | 1.64 | % | 1.83 | % | 1.80 | % | 1.80 | %(f) | ||||||||||||
| Net investment loss including fee waivers/reimbursements | (0.56 | %)(f) | (1.24 | %) | (1.50 | %) | (1.72 | %) | (1.75 | %) | (1.79 | %)(f) | ||||||||||||
| PORTFOLIO TURNOVER RATE | 12 | %(e) | 58 | % | 38 | % | 90 | % | 0 | % | 0 | %(e) | ||||||||||||
| (a) | Per share amounts and ratios to average net assets include income and expenses of the Aspen Futures Fund Ltd. (subsidiary), exclusive of the subsidiary's management fee. |
| (b) | Per share numbers have been calculated using the average shares method. |
| (c) | Less than $0.005 per share. |
| (d) | Total return does not reflect the effect of sales charges. |
| (e) | Not annualized. |
| (f) | Annualized. |
| (g) | The ratio of operating expenses excluding fee waiver/reimbursements to average net assets is calculated excluding the waived Subsidiary management fee (see Note 6 for additional detail). The ratio inclusive of that fee would be 1.10% and 1.64% for the six months ended October 31, 2016 and the year ended April 30, 2016, respectively. |
See Notes to Consolidated Financial Statements.
| Semi-Annual Report | October 31, 2016 | 11 |
| Aspen Managed Futures Strategy Fund – Class I | Consolidated Financial Highlights |
For a share outstanding throughout the periods presented.
For the Six Months Ended October 31, 2016 (Unaudited)(a) | For the Year Ended April 30, 2016 (a) | For the Year Ended April 30, 2015 (a) | For the Year Ended April 30, 2014 (a) | For the Year Ended April 30, 2013 (a) | For the Period August 2, 2011 (Inception) to April 30, 2012 (a) | |||||||||||||||||||
| NET ASSET VALUE, BEGINNING OF PERIOD | $ | 8.98 | $ | 10.17 | $ | 9.07 | $ | 9.36 | $ | 8.98 | $ | 10.00 | ||||||||||||
| INCOME/(LOSS) FROM OPERATIONS: | ||||||||||||||||||||||||
Net investment loss(b) | (0.03 | ) | (0.09 | ) | (0.11 | ) | (0.11 | ) | (0.11 | ) | (0.11 | ) | ||||||||||||
| Net realized and unrealized gain/(loss) on investments | (0.28 | ) | (0.40 | ) | 1.42 | (0.06 | ) | 0.49 | (0.91 | ) | ||||||||||||||
| Total from investment operations | (0.31 | ) | (0.49 | ) | 1.31 | (0.17 | ) | 0.38 | (1.02 | ) | ||||||||||||||
| LESS DISTRIBUTIONS: | ||||||||||||||||||||||||
| From net investment income | – | (0.17 | ) | – | – | – | – | |||||||||||||||||
| Distributions from net realized gain on investments | – | (0.53 | ) | (0.21 | ) | (0.12 | ) | – | – | |||||||||||||||
| Total distributions | – | (0.70 | ) | (0.21 | ) | (0.12 | ) | – | – | |||||||||||||||
| REDEMPTION FEES ADDED TO PAID IN CAPITAL | 0.00 | (c) | 0.00 | (c) | 0.00 | (c) | 0.00 | (c) | 0.00 | (c) | 0.00 | (c) | ||||||||||||
| INCREASE/(DECREASE) IN NET ASSET VALUE | (0.31 | ) | (1.19 | ) | 1.10 | (0.29 | ) | 0.38 | (1.02 | ) | ||||||||||||||
| NET ASSET VALUE, END OF PERIOD | $ | 8.67 | $ | 8.98 | $ | 10.17 | $ | 9.07 | $ | 9.36 | $ | 8.98 | ||||||||||||
| TOTAL RETURN | (3.45 | %)(d) | (4.97 | %) | 14.51 | % | (1.81 | %) | 4.23 | % | (10.20 | %)(d) | ||||||||||||
| RATIOS AND SUPPLEMENTAL DATA: | ||||||||||||||||||||||||
| Net assets, end of period (000's) | $ | 242,328 | $ | 264,598 | $ | 242,575 | $ | 167,258 | $ | 120,769 | $ | 90,450 | ||||||||||||
| RATIOS TO AVERAGE NET ASSETS: | ||||||||||||||||||||||||
| Operating expenses excluding fee waivers/reimbursements | 1.24 | %(e)(f) | 1.22 | %(f) | 1.25 | % | 1.30 | % | 1.25 | % | 1.75 | %(e) | ||||||||||||
| Operating expenses including fee | ||||||||||||||||||||||||
| waivers/reimbursements | 1.24 | %(e) | 1.22 | % | 1.25 | % | 1.30 | % | 1.25 | % | 1.55 | %(e) | ||||||||||||
| Net investment loss including fee | ||||||||||||||||||||||||
| waivers/reimbursements | (0.78 | %)(e) | (0.94 | %) | (1.11 | %) | (1.20 | %) | (1.20 | %) | (1.54 | %)(e) | ||||||||||||
| PORTFOLIO TURNOVER RATE | 12 | %(d) | 58 | % | 38 | % | 90 | % | 0 | % | 0 | %(d) | ||||||||||||
| (a) | Per share amounts and ratios to average net assets include income and expenses of the Aspen Futures Fund Ltd. (subsidiary), exclusive of the subsidiary's management fee. |
| (b) | Per share numbers have been calculated using the average shares method. |
| (c) | Less than $0.005 per share. |
| (d) | Not annualized. |
| (e) | Annualized. |
| (f) | The ratio of operating expenses excluding fee waiver/reimbursements to average net assets is calculated excluding the waived Subsidiary management fee (see Note 6 for additional detail). The ratio inclusive of that fee would be 1.31% and 1.30% for the six months ended October 31, 2016 and the year ended April 30, 2016, respectively. |
See Notes to Consolidated Financial Statements.
| 12 | www.aspenfuturesfund.com |
| Aspen Managed Futures Strategy Fund | Notes to Consolidated Financial Statements |
October 31, 2016 (Unaudited)
1. ORGANIZATION
Financial Investors Trust (the “Trust”), a Delaware statutory trust, is an open‐end management investment company registered under the Investment Company Act of 1940, as amended (“1940 Act”). The Trust consists of multiple separate portfolios or series. . This semi‐annual report describes the Aspen Managed Futures Strategy Fund (the “Fund”). The Fund seeks investment results that replicate as closely as possible, before fees and expenses, the price and yield performance of the Aspen Managed Futures Beta Index (the “MFBI” or “Index”). The Aspen Managed Futures Strategy Fund offers Class A and Class I shares.
Basis of Consolidation for the Aspen Futures Fund, Ltd.
Aspen Futures Fund, Ltd. (the “Subsidiary”), a Cayman Islands exempted company, is a wholly owned subsidiary of the Fund. The Subsidiary’s investment objective is designed to enhance the ability of the Fund to obtain exposure to equities, financial, currency and commodities markets consistent with the limits of the U.S. federal tax law requirements applicable to registered investment companies. The Subsidiary is subject to substantially the same investment policies and investment restrictions as the Fund. The Subsidiary acts as an investment vehicle for the Fund in order to effect certain commodity‐related investments on behalf of the Fund. Investments in the Subsidiary are expected to provide the Fund with exposure to the commodity markets within the limitations of Subchapter M of the Internal Revenue Code of 1986, as amended (the “Code”), and recent IRS revenue rulings, as discussed below under “Federal Income Taxes”. The Fund is the sole shareholder of the Subsidiary pursuant to a subscription agreement dated as of August 2, 2011, and it is intended that the Fund will remain the sole shareholder and will continue to control the Subsidiary. Under the Articles of Association of the Subsidiary, shares issued by the Subsidiary confer upon a shareholder the right to wholly own and vote at general meetings of the Subsidiary and certain rights in connection with any winding‐up or repayment of capital, as well as the right to participate in the profits or assets of the Subsidiary. The Fund may invest up to 25% of its total assets in shares of the Subsidiary. As a wholly owned subsidiary of the Fund, all assets and liabilities, income and expenses of the Subsidiary are consolidated in the financial statements and financial highlights of the Fund. All investments held by the Subsidiary are disclosed in the accounts of the Fund. As of October 31, 2016, net assets of the Fund were $249,570,266, of which $20,524,355 or 8.22%, represented the Fund’s ownership of all issued shares and voting rights of the Subsidiary.
2. SIGNIFICANT ACCOUNTING POLICIES
The accompanying financial statements were prepared in accordance with accounting principles generally accepted in the United States of America (“U.S. GAAP”). The preparation of financial statements in conformity with U.S. GAAP requires management to make certain estimates and assumptions that affect the reported amounts of assets and liabilities and disclosures of contingent assets and liabilities at the date of the financial statements and the reported amounts of revenue and expenses during the period. Actual results could differ from those estimates. The Fund is considered an investment company for financial reporting purposes under U.S. GAAP. The following is a summary of significant accounting policies consistently followed by the Fund and Subsidiary in preparation of the financial statements.
Investment Valuation: The Fund generally values its securities based on market prices determined at the close of regular trading on the New York Stock Exchange (“NYSE”), normally 4:00 p.m. Eastern Time, on each day the NYSE is open for trading.
For equity securities and mutual funds that are traded on an exchange, the market price is usually the closing sale or official closing price on that exchange. In the case of equity securities not traded on an exchange, or if such closing prices are not otherwise available, the securities are valued at the mean of the most recent bid and ask prices on such day. Redeemable securities issued by open‐end registered investment companies are valued at the investment company’s applicable net asset value, with the exception of exchange‐traded open‐end investment companies, which are priced as equity securities.
The market price for debt obligations is generally the price supplied by an independent third‐party pricing service approved by the Board of Trustees (the “Board”), which may use a matrix, formula or other objective method that takes into consideration quotations from dealers, market transactions in comparable investments, market indices and yield curves. If vendors are unable to supply a price, or if the price supplied is deemed to be unreliable, the market price may be determined using quotations received from one or more brokers–dealers that make a market in the security.
Futures contracts that are listed or traded on a national securities exchange, commodities exchange, contract market or comparable over‐the‐counter market, and that are freely transferable, are valued at their closing settlement price on the exchange on which they are primarily traded or based upon the current settlement price for a like instrument acquired on the day on which the instrument is being valued. A settlement price may not be used if the market makes a limit move with respect to a particular commodity.
Forward currency exchange contracts have a fair value determined by the prevailing foreign currency exchange daily rates and current foreign currency exchange forward rates. The foreign currency exchange forward rates are calculated using an automated system that estimates rates on the basis of the current day foreign currency exchange rates and forward foreign currency exchange rates supplied by a pricing service.
| Semi-Annual Report | October 31, 2016 | 13 |
| Aspen Managed Futures Strategy Fund | Notes to Consolidated Financial Statements |
October 31, 2016 (Unaudited)
Investment securities that are primarily traded on foreign securities exchanges are valued at the preceding closing values of such securities on their respective exchanges, except when an occurrence subsequent to the time a value was so established is likely to have changed such value. In such an event, the fair value of those securities are determined in good faith through consideration of other factors in accordance with procedures established by and under the general supervision of the Board.
When such prices or quotations are not available, or when Aspen Partners, Ltd. (the “Adviser”) believes that they are unreliable, securities may be priced using fair value procedures approved by the Board.
Fair Value Measurements: The Fund discloses the classification of its fair value measurements following a three‐tier hierarchy based on the inputs used to measure fair value. Inputs refer broadly to the assumptions that market participants would use in pricing the asset or liability, including assumptions about risk. Inputs may be observable or unobservable. Observable inputs reflect the assumptions market participants would use in pricing the asset or liability that are developed based on market data obtained from sources independent of the reporting entity. Unobservable inputs reflect the reporting entity’s own assumptions about the assumptions market participants would use in pricing the asset or liability that are developed based on the best information available.
Various inputs are used in determining the value of the Fund’s investments as of the end of the reporting period. When inputs used fall into different levels of the fair value hierarchy, the level in the hierarchy within which the fair value measurement falls is determined based on the lowest level input that is significant to the fair value measurement in its entirety. The designated input levels are not necessarily an indication of the risk or liquidity associated with these investments. These inputs are categorized in the following hierarchy under applicable financial accounting standards:
| Level 1 – | Unadjusted quoted prices in active markets for identical investments, unrestricted assets or liabilities that the Fund has the ability to access at the measurement date; |
| Level 2 – | Quoted prices which are not active, quoted prices for similar assets or liabilities in active markets or inputs other than quoted prices that are observable (either directly or indirectly) for substantially the full term of the asset or liability; and |
| Level 3 – | Significant unobservable prices or inputs (including the Fund’s own assumptions in determining the fair value of investments) where there is little or no market activity for the asset or liability at the measurement date. |
The following is a summary of each input used to value the Fund as of October 31, 2016:
| Investments in Securities at Value | Level 1 - Quoted Prices | Level 2 - Other Significant Observable Inputs | Level 3 - Significant Unobservable Inputs | Total | ||||||||||||
| Government Bonds | $ | – | $ | 90,348,292 | $ | – | $ | 90,348,292 | ||||||||
| Short Term Investments | ||||||||||||||||
| Money Market Fund | 9,713,818 | – | – | 9,713,818 | ||||||||||||
| U.S. Treasury Bills | – | 123,083,395 | – | 123,083,395 | ||||||||||||
| TOTAL | $ | 9,713,818 | $ | 213,431,687 | $ | – | $ | 223,145,505 | ||||||||
| Other Financial Instruments | ||||||||||||||||
| Assets: | ||||||||||||||||
| Futures Contracts | ||||||||||||||||
| Equity Contracts | $ | 553,838 | $ | – | $ | – | $ | 553,838 | ||||||||
| Foreign Currency Contracts | 831,010 | – | – | 831,010 | ||||||||||||
| Interest Rate Contracts | 251,490 | – | – | 251,490 | ||||||||||||
| Liabilities: | ||||||||||||||||
| Futures Contracts | ||||||||||||||||
| Commodity Contracts | (2,437,012 | ) | – | – | (2,437,012 | ) | ||||||||||
| Equity Contracts | (44,116 | ) | – | – | (44,116 | ) | ||||||||||
| Foreign Currency Contracts | (174,409 | ) | – | – | (174,409 | ) | ||||||||||
| TOTAL | $ | (1,019,199 | ) | $ | – | $ | – | $ | (1,019,199 | ) | ||||||
The Fund recognizes transfers between levels as of the end of the period. For the six months ended October 31, 2016, the Fund did not have any transfers between Level 1 and Level 2 securities. For the six months ended October 31, 2016, the Fund did not have any securities that used significant unobservable inputs (Level 3) in determining fair value.
| 14 | www.aspenfuturesfund.com |
| Aspen Managed Futures Strategy Fund | Notes to Consolidated Financial Statements |
October 31, 2016 (Unaudited)
Investment Transactions and Investment Income: Investment transactions are accounted for on the date the investments are purchased or sold (trade date). Realized gains and losses from investment transactions are reported on an identified cost basis, which is the same basis the Fund uses for federal income tax purposes. Interest income, which includes accretion of discounts, is accrued and recorded as earned. Dividend income is recognized on the ex‐dividend date or for certain foreign securities, as soon as information is available to the Fund. All of the realized and unrealized gains and losses and net investment income, are allocated daily to each class in proportion to its average daily net assets.
Foreign Securities: The Fund may directly purchase securities of foreign issuers. Investing in securities of foreign issuers involves special risks not typically associated with investing in securities of U.S. issuers. The risks include possible reevaluation of currencies, the inability to repatriate foreign currency, less complete financial information about companies and possible future adverse political and economic developments. Moreover, securities of many foreign issuers and their markets may be less liquid and their prices more volatile than those of securities of comparable U.S. issuers.
Foreign Currency Translation: The books and records of the Fund are maintained in U.S. dollars. Investment valuations and other assets and liabilities initially expressed in foreign currencies are converted each business day into U.S. dollars based upon current exchange rates. Prevailing foreign exchange rates may generally be obtained at the close of the NYSE (normally, 4:00 p.m. Eastern Time). The portion of realized and unrealized gains or losses on investments due to fluctuations in foreign currency exchange rates is not separately disclosed and is included in realized and unrealized gains or losses on investments, when applicable.
Foreign Currency Spot Contracts: The Fund may enter into foreign currency spot contracts to facilitate transactions in foreign securities or to convert foreign currency receipts into U.S. dollars. A foreign currency spot contract is an agreement between two parties to buy and sell currencies at the current market rate, for settlement generally within two business days. The U.S. dollar value of the contracts is determined using current currency exchange rates supplied by a pricing service. The contract is marked‐to‐market daily for settlements beyond one day and any change in market value is recorded as an unrealized gain or loss. When the contract is closed, the Fund records a realized gain or loss equal to the difference between the value on the open and close date. Losses may arise from changes in the value of the foreign currency, or if the counterparties do not perform under the contract’s terms. The maximum potential loss from such contracts is the aggregate face value in U.S. dollars at the time the contract was opened.
Trust Expenses: Some expenses of the Trust can be directly attributed to the Fund. Expenses which cannot be directly attributed to the Fund are apportioned among all funds in the Trust based on average net assets of each fund.
Fund and Class Expenses: Expenses that are specific to a class of shares of the Fund, including distribution fees (Rule 12b‐1 fees) and shareholder servicing fees, are charged directly to that share class. All expenses of the Fund, other than class specific expenses, are allocated daily to each class in proportion to its average daily net assets.
Federal Income Taxes: The Fund complies with the requirements under Subchapter M of the Internal Revenue Code of 1986, as amended, applicable to regulated investment companies and intends to distribute substantially all of their net taxable income and net capital gains, if any, each year so that it will not be subject to excise tax on distributed income and gains. The Fund is not subject to income taxes to the extent such distributions are made.
As of and during the six months ended October 31, 2016, the Fund did not have a liability for any unrecognized tax benefits. The Fund files U.S. federal, state, and local tax returns as required. The Fund’s tax returns are subject to examination by the relevant tax authorities until expiration of the applicable statute of limitations, which is generally three years after the filing of the tax return for federal purposes and four years for most state returns. Tax returns for open years have incorporated no uncertain tax positions that require a provision for income taxes.
Distributions to Shareholders: The Fund normally pays dividends and distributes capital gains, if any, on an annual basis. Income dividend distributions are derived from interest and other income the Fund receives from its investments, including short term capital gains. Long term capital gains distributions are derived from gains realized when the Fund sells a security it has owned for more than a year. The Fund may make additional distributions and dividends at other times if the portfolio manager believes doing so may be necessary for the Fund to avoid or reduce taxes.
3. DERIVATIVE INSTRUMENTS
The Fund uses derivatives (including futures) to pursue its investment objective. The Fund’s use of derivative instruments involves risks different from, or possibly greater than, the risks associated with investing directly in securities and other traditional investments. These risks may include (i) the risk that the counterparty to a derivative transaction may not fulfill its contractual obligations, (ii) risk of mispricing or improper valuation, and (iii) the risk that changes in the value of the derivative may not correlate perfectly with the underlying asset, rate or index. These risks could cause
| Semi-Annual Report | October 31, 2016 | 15 |
| Aspen Managed Futures Strategy Fund | Notes to Consolidated Financial Statements |
October 31, 2016 (Unaudited)
the Fund to lose more than the principal amount invested. In addition, investments in derivatives involve leverage, which means a small percentage of assets invested in derivatives can have a disproportionately large impact on the Fund.
The Fund’s use of derivatives can result in losses due to unanticipated changes in the market risk factors and the overall market. In instances where the Fund is using derivatives to decrease, or hedge, exposures to market risk factors for securities held by the Fund, there are also risks that those derivatives may not perform as expected resulting in losses for the combined or hedged positions. Derivatives may have little or no initial cash investment relative to their market value exposure and therefore can produce significant gains or losses in excess of their cost. This use of embedded leverage allows the Fund to increase its market value exposure relative to its net assets and can substantially increase the volatility of the Fund’s performance.
In addition, use of derivatives may increase or decrease exposure to the following risk factors:
| • | Equity Risk: Equity risk relates to the change in value of equity securities as they relate to increases or decreases in the general market. |
| • | Interest Rate Risk: When the Fund invests in fixed‐income securities or derivatives, the value of an investment in the Fund will fluctuate with changes in interest rates. Typically, a rise in interest rates causes a decline in the value of fixed‐income securities or derivatives owned by the Fund. In general, the market price of debt securities with longer maturities will increase or decrease more in response to changes in interest rates than shorter‐term securities. Other risk factors include credit risk (the debtor may default) and prepayment risk (the debtor may pay its obligation early, reducing the amount of interest payments). |
| • | Foreign Currency Risk: Currency trading involves significant risks, including market risk, interest rate risk, country risk, counterparty credit risk and short sale risk. Market risk results from the price movement of foreign currency values in response to shifting market supply and demand. Interest rate risk arises whenever a country changes its stated interest rate target associated with its currency. Country risk arises because virtually every country may interfer with international transactions in its currency. Counterparty credit risk arises when the counterparty will not fulfill its obligations to the Fund. Short sale risk arises from the sale of a security that is not owned, or any sale that is completed by the delivery of a security borrowed. |
| • | Commodity Risk: Exposure to the commodities markets may subject the Fund to greater volatility than investments in traditional securities. Commodity prices are influenced by unfavorable weather, animal and plant disease, geologic and environmental factors, as well as changes in government regulation such as tariffs, embargoes or burdensome production rules and restrictions. |
Futures: The Fund and the Subsidiary may enter into futures contracts. Futures contracts are agreements between two parties to buy and sell a particular commodity, instrument or index for a specified price on a specified future date. When the Fund or the Subsidiary enters into a futures contract, it is required to deposit with (or for the benefit of) its broker an amount of cash or short‐term high‐quality securities as “initial margin”. The margin requirements are set by the exchange on which the contract is traded and may be modified during the term of the contract. The initial margin is in the nature of a performance bond or good faith deposit on the futures contract that is returned to the Fund upon termination of the contract, assuming all contractual obligations have been satisfied. As the value of the contract changes, the value of the futures contract position increases or declines. Subsequent payments, known as “variation margin”, are made or received by the Fund or the Subsidiary each day, depending on the price fluctuations in the fair value of the contract and the value of cash or securities on deposit with the broker. Such payments or receipts are recorded for financial statement purposes as unrealized gains or losses by the Fund. Variation margin does not represent a borrowing or loan by the Fund but is instead a settlement between the Fund and the broker of the amount one would owe the other if the futures contract expired. When the contract is closed, the Fund records a realized gain or loss equal to the difference between the value of the contract at the time it was opened and the value at the time it was closed. When the Fund or the Subsidiary enters into a futures contract certain risks may arise, such as illiquidity in the futures market, which may limit the Fund’s or the Subsidiary’s ability to close out a futures contract prior to settlement date, and unanticipated movements in the value of securities, commodities or interest rates. Futures contracts are exchange‐traded. Exchange‐traded futures are standardized contracts and are settled through a clearing house with fulfillment supported by the credit of the exchange. Therefore, counterparty credit risk to the Fund and the Subsidiary is reduced. With exchange traded futures, there is minimal counterparty credit risk to the Funds since futures are exchange traded and the exchange’s clearinghouse, as a counterparty to all exchange traded futures, guarantees the futures against default.
| 16 | www.aspenfuturesfund.com |
| Aspen Managed Futures Strategy Fund | Notes to Consolidated Financial Statements |
October 31, 2016 (Unaudited)
Consolidated Balance Sheet – Fair Value of Derivative Instruments as of October 31, 2016
| Risk Exposure | Asset Derivatives Balance Sheet Location | Fair Value | Liabilities Derivatives Balance Sheet Location | Fair Value | ||||||
| Futures Contracts | Unrealized appreciation on futures contracts(a) | $ | 1,636,338 | Unrealized depreciation on futures contracts (a) | $ | 2,655,537 | ||||
| $ | 1,636,338 | $ | 2,655,537 | |||||||
| Risk Exposure to Fund | ||||||||||
| Commodity Contracts | $ | – | $ | 2,437,012 | ||||||
| Equity Contracts | 553,838 | 44,116 | ||||||||
| Foreign Currency Contracts | 831,010 | 174,409 | ||||||||
| Interest Rate Contracts | 251,490 | – | ||||||||
| $ | 1,636,338 | $ | 2,655,537 | |||||||
| (a) | Represents cumulative appreciation/(depreciation) of futures contracts as reported in the Consolidated Statement of Investments. Only the current day’s net variation margin is reported within the Consolidated Statement of Assets and Liabilities. |
Consolidated Statement of Operations – The effect of Derivative Instruments for the six months ended October 31, 2016:
| Derivatives Instruments | Location of Gain/(Loss) on Derivatives Recognized in Income | Realized Gain/ (Loss) on Derivatives Recognized in Income | Change in Unrealized Appreciation/(Depreciation) on Derivatives Recognized in Income | ||||||
| Futures Contracts | Net realized loss on futures contracts/Net change in unrealized depreciation on futures contracts | $ | (2,559,565 | ) | $ | (6,139,116 | ) | ||
| $ | (2,559,565 | ) | $ | (6,139,116 | ) | ||||
| Risk Exposure to Fund | |||||||||
| Commodity Contracts | $ | 824,954 | $ | (3,948,875 | ) | ||||
| Equity Contracts | (6,923,613 | ) | 1,123,509 | ||||||
| Foreign Currency Contracts | 1,523,088 | (4,122,371 | ) | ||||||
| Interest Rate Contracts | 2,016,006 | 808,621 | |||||||
| $ | (2,559,565 | ) | $ | (6,139,116 | ) | ||||
The average number of net futures contracts held by the fund during the period was 1,962.
4. TAX BASIS INFORMATION
Tax Basis of Investments: As of October 31, 2016, the aggregate cost of investments, gross unrealized appreciation/(depreciation) and net unrealized appreciation for Federal tax purposes was as follows:
| Cost of Investments | Gross Appreciation (excess of value over tax cost) | Gross Depreciation (excess of tax cost over value) | Net Appreciation on Investments | |||||||||||||
| Aspen Managed Futures Strategy Fund | $ | 223,102,557 | $ | 60,337 | $ | (17,389 | ) | $ | 42,948 | |||||||
Tax Basis of Distributions to Shareholders: Distributions are determined in accordance with federal income tax regulations, which differ from GAAP, and, therefore, may differ significantly in amount or character from net investment income and realized gains for financial reporting purposes. Financial reporting records are adjusted for permanent book/tax differences to reflect tax character but are not adjusted for temporary differences.
The tax character of distributions paid during the year ending April 30, 2016 were as follows:
| Ordinary Income | Long-Term Capital Gain | |||||||
| Aspen Managed Futures Strategy Fund | $ | 13,114,807 | $ | 8,439,863 | ||||
| Semi-Annual Report | October 31, 2016 | 17 |
| Aspen Managed Futures Strategy Fund | Notes to Consolidated Financial Statements |
October 31, 2016 (Unaudited)
The amounts and characteristics of tax basis distributions and composition of distributable earnings/(accumulated losses) are finalized at fiscal year-end. Accordingly, tax basis balances have not been determined as of October 31, 2016.
5. SHARES OF BENEFICIAL INTEREST
The capitalization of the Trust consists of an unlimited number of shares of beneficial interest with no par value per share. Holders of the shares of the Fund of the Trust have one vote for each share held and a proportionate fraction of a vote for each fractional share. All shares issued and outstanding are fully paid and are transferable and redeemable at the option of the shareholder. Purchasers of the shares do not have any obligation to make payments to the Trust or its creditors solely by reason of the purchasers’ ownership of the shares. Shares have no pre-emptive rights.
Fund shares redeemed within 30 days of purchase may incur a 2% short-term redemption fee deducted from the redemption amount. The amount of redemption fees received during the period are presented in the Consolidated Statement of Changes in Net Assets.
6. MANAGEMENT AND RELATED-PARTY TRANSACTIONS
The Adviser, subject to the authority of the Board, is responsible for the overall management and administration of the Fund’s business affairs. The Adviser manages the investments of the Fund in accordance with the Fund’s investment objective, policies and limitations and investment guidelines established jointly by the Adviser and the Board. Pursuant to the Investment Advisory Agreement, (the “Advisory Agreement”), the Fund will pay the Adviser an annual management fee of 0.75%, based on the Fund’s average daily net assets. The management fee is paid on a monthly basis.
The Subsidiary has entered into a separate advisory agreement (the “Subsidiary Advisory Agreement”) with the Adviser for the management of the Subsidiary’s portfolio pursuant to which the Subsidiary is obligated to pay the Adviser a management fee at the same rate that the Fund pays the Adviser for investment advisory services provided to the Fund. The Adviser has agreed to waive the advisory fee it receives from the Fund in an amount equal to the management fee paid by the Subsidiary. This waiver may not be terminated or modified without the consent of the Board. This agreement may not be terminated or modified prior to this date except with the approval of the Board. For the period ended October 31, 2016, this amount equaled $92,487 and is disclosed in the Consolidated Statement of Operations. These waivers are not subject to reimbursement/recoupment.
The Adviser has contractually agreed to limit the Fund’s total annual fund operating expenses (exclusive of distribution and service (12b-1) fees, shareholder services fees, acquired fund fees and expenses, brokerage expenses, interest expense, taxes and extraordinary expenses) to 1.55% of the Fund’s average daily net assets for each of Class A and Class I Shares. This agreement (the “Expense Agreement”) is in effect from September 1, 2016 through August 31, 2017. The prior Expense Agreement was in effect from April 1, 2013 through August 31, 2016. The Adviser will be permitted to recover, on a class-by-class basis, expenses it has borne through the Expense Agreement to the extent that the Fund’s expenses in later periods fall below the expense cap in effect at the time of waiver or reimbursement. Notwithstanding the foregoing, the Fund will not be obligated to pay any such fees and expenses more than three years after the end of the fiscal year in which the fees or expenses were foregone or reimbursed. The Adviser may not discontinue or modify this waiver prior to August 31, 2017 without the approval by the Fund’s Board of Trustees.
Fund Administrator Fees and Expenses
ALPS Fund Services, Inc. (“ALPS”) serves as administrator to the Fund and the Fund has agreed to pay expenses incurred in connection with its administrative activities. Pursuant to an Administration Agreement, ALPS provides operational services to the Fund including, but not limited to, fund accounting and fund administration and generally assist in the Fund’s operations. Officers of the Trust are employees of ALPS. The Fund’s administration fee is accrued on a daily basis and paid monthly. Administration fees paid by the Fund for the six months ended October 31, 2016 are disclosed in the Consolidated Statement of Operations.
ALPS is reimbursed by the Fund for certain out-of-pocket expenses.
Transfer Agent
ALPS serves as transfer, dividend paying and shareholder servicing agent for the Fund. ALPS receives an annual minimum fee, a fee based upon the number of shareholder accounts, and is also reimbursed by the Fund for certain out-of-pocket expenses. Transfer agent fees paid by the Fund for the six months ended October 31, 2016 are disclosed in the Consolidated Statement of Operations.
Compliance Services
ALPS provides services that assist the Trust’s chief compliance officer in monitoring and testing the policies and procedures of the Trust in conjunction with requirements under Rule 38a-1 under the 1940 Act and receives an annual base fee. ALPS is reimbursed for certain out-of-pocket expenses by the Fund. Compliance service fees paid by the Fund for the six months ended October 31, 2016 are disclosed in the Consolidated Statement of Operations.
| 18 | www.aspenfuturesfund.com |
| Aspen Managed Futures Strategy Fund | Notes to Consolidated Financial Statements |
October 31, 2016 (Unaudited)
Principal Financial Officer
ALPS receives an annual fee for providing principal financial officer services to the Fund. Principal financial officer fees paid by the Fund for the six months ended October 31, 2016 are disclosed in the Consolidated Statement of Operations.
Distributor
ALPS Distributors, Inc. (“ADI” or the “Distributor”) (an affiliate of ALPS) acts as the distributor of the Fund’s shares pursuant to a Distribution Agreement with the Trust. Shares are sold on a continuous basis by ADI as agent for the Fund, and ADI has agreed to use its best efforts to solicit orders for the sale of the Fund’s shares, although it is not obliged to sell any particular amount of shares. ADI is not entitled to any compensation for its services as Distributor. ADI is registered as a broker-dealer with the U.S. Securities and Exchange Commission.
The Fund has adopted a plan of distribution for Class A shares pursuant to Rule 12b-1 under the 1940 Act (the “Plan”). The Plan allows the Fund to use Class A assets to pay fees in connection with the distribution and marketing of Class A shares and/or the provision of shareholder services to Class A shareholders. The Plan permits payment for services in connection with the administration of plans or programs that use Class A shares as their funding medium and for related expenses. The recipients of such payments may include the Distributor, other affiliates of the Adviser, broker-dealers, financial institutions, plan sponsors and administrators and other financial intermediaries through which investors may purchase shares of the Fund. The Plan permits the Fund to use its Class A assets to make total payments at an annual rate of up to 0.25% of the Fund’s average daily net assets attributable to its Class A shares. The expenses of the plan are reflected as distribution and service fees in the Consolidated Statement of Operations.
The Fund has adopted a shareholder service plan (a “Shareholder Services Plan”) for Class A shares. Under the Shareholder Services Plan the Fund is authorized to compensate certain financial intermediaries, including broker-dealers and Fund affiliates, which may include the Distributor, Adviser and/or the transfer agent (“Participating Organizations”), an aggregate fee in an amount not to exceed on an annual basis 0.15% for Class A shares of the average daily net asset value of the Class A shares attributable to or held in the name of a Participating Organizations for its clients as compensation for providing shareholder service activities, which do not include distribution services, pursuant to an agreement with a Participating Organizations. Any amount of such payment not paid to the Participating Organizations during the Fund’s fiscal year for such service activities shall be reimbursed to the Fund. Shareholder Services Plan fees are included with distribution and service fees on the Consolidated Statement of Operations.
Certain intermediaries may charge networking, omnibus account or other administrative fees with respect to transactions in shares of the Fund. Transactions may be processed through the National Securities Clearing Corporation (“NSCC”) or similar systems or processed on a manual basis. These fees are paid by the Fund to the Distributor, which uses such fees to reimburse intermediaries. In the event an intermediary receiving payments from the Distributor on behalf of the Fund converts from a networking structure to an omnibus account structure or otherwise experiences increased costs, fees borne by the Fund may increase. Fees paid by the Fund for the six months ended October 31, 2016 are disclosed in the Consolidated Statement of Operations as Delegated Transfer Agent Equivalent Services.
Index Licensing Services
The Fund has adopted an Index Licensing Agreement with Quantitative Equity Strategies, LLC (“QES”) and the Adviser, joint owners of the Index, pursuant to which the Fund pays QES a monthly annualized licensing fee of 0.25%, based on the Fund’s average daily net assets for the right to use the Index in connection with the Fund.
7. SECURITIES TRANSACTIONS
The cost of purchases and proceeds from sales of U.S. Government securities (excluding short-term securities) during the six months ended October 31, 2016 were as follows:
| Aspen Managed Futures Strategy Fund | ||||
| Cost of Investments Purchased | $ | 17,279,475 | ||
| Proceeds from Investments Sold | $ | 84,383,518 | ||
8. INDEMNIFICATIONS
Under the Trust’s organizational documents, its officers and Trustees are indemnified against certain liability arising out of the performance of their duties to the Trust. Additionally, in the normal course of business, the Trust enters into contracts with service providers that may contain general indemnification clauses, which may permit indemnification to the extent permissible under applicable law. The Trust’s maximum exposure under these arrangements is unknown, as this would involve future claims that may be made against the Trust that have not yet occurred.
| Semi-Annual Report | October 31, 2016 | 19 |
| Aspen Managed Futures Strategy Fund | Additional Information |
October 31, 2016 (Unaudited)
1. FUND HOLDINGS
The Fund files its complete schedule of portfolio holdings with the Securities and Exchange Commission (the “SEC”) for the first and third quarters of each fiscal year on Form N-Q within 60 days after the end of the period. Copies of the Fund’s Form N-Q are available without charge on the SEC website at http://www.sec.gov. You may also review and copy the Form N-Q at the SEC’s Public Reference Room in Washington, DC. For more information about the operation of the Public Reference Room, please call the SEC at 1-800-SEC-0330.
2. FUND PROXY VOTING POLICIES, PROCEDURES AND SUMMARIES
The Fund’s policies and procedures used in determining how to vote proxies and information regarding how the Fund voted proxies relating to portfolio securities during the most recent prior 12-month period ending June 30 are available without charge, (1) upon request, by calling (toll-free) 855-845-9444 and (2) on the SEC’s website at http://www.sec.gov.
| 20 | www.aspenfuturesfund.com |


Table of Contents
| Shareholder Letter | 1 |
| Performance Update | 4 |
| Disclosure of Fund Expenses | 6 |
| Portfolio of Investments | 7 |
| Statement of Assets and Liabilities | 18 |
| Statement of Operations | 19 |
| Statements of Changes in Net Assets | 20 |
| Financial Highlights | 22 |
| Notes to Financial Statements | 24 |
| Additional Information | 30 |
| Disclosure Regarding Approval of Fund Advisory Agreements | 31 |
Disciplined Growth Investors’ goal is to communicate clearly and transparently with our clients and mutual fund shareholders. It is mutually beneficial when our shareholders understand how we invest, what we are currently thinking and forecasting, and the specific investment decisions we have made. Our views and opinions regarding the investment prospects of our portfolio holdings and Funds are “forward looking statements” which may or may not be accurate over the long term. While we believe we have a reasonable basis for these forecasts and have confidence in our investment team’s views, actual results may differ materially from those we anticipate. Information provided in this report should not be considered a recommendation to purchase or sell any particular security.
You can identify forward looking statements as those including words such as “believe”, “expect”, “anticipate”, “forecast”, and similar statement. We cannot assure future performance. These forward-looking statements are made only as-of the date of this report. Following the publication of this report, we will not update any of the forward-looking statements included here.
Past performance does not guarantee future results. Fund prices fluctuate as the underlying assets have exposure to market fluctuations and other risks, as described in the Fund’s prospectus. Please visit www.dgifund.com or call 855-344-3863 to obtain current performance information and for the current prospectus and statement of additional information. This material must be preceded or accompanied by a prospectus. Please read the prospectus carefully before investing.
| The Disciplined Growth Investors Fund | Shareholder Letter |
October 31, 2016 (Unaudited)
As of October 31, 2016, The Disciplined Growth Investors Fund had total assets of $136.7 million.
During the past six months, The DGI Fund experienced appreciation of 5.68%. Equities have returned 7.8% in this period while fixed income securities have returned 1.9%. Since inception, The DGI Fund has returned 11.89% on an annualized basis (5 years, 2 months).
The recent appreciation was broadly based: 35 portfolio equities increased in price and 17 declined. Broad participation is a reliable sign of a healthy market.
This appreciation occurred in spite of lackluster economic progress, pervasive discomfort with the two leading U.S. presidential candidates, numerous terrorist attacks around the world, social unrest in the United States, and continued wars in the Middle East.
Portfolio Asset Mix
The portfolio currently holds 69.2% stocks and 30.8% bonds and cash. A list of holdings is included as part of this annual report and is available on the Fund’s website at www.dgifund.com.
Portfolio Turnover & Transactions
The DGI Fund’s turnover for the last six months was 5.1%. This is in‐line with the Fund’s historical longer term levels of turnover.
In the last six months, we added one new stock to The DGI Fund, Proto Labs, Inc. (NASDAQ: PRLB). Proto Labs is a quick‐turn manufacturer of custom parts for prototyping and short‐run manufacturing. The company's manufacturing services include CNC (Computer Numerical Control) machining, injection molding and additive manufacturing. Low‐volume manufacturing has historically been an underserved and fragmented market due to the inefficiencies inherent in the quotation, equipment set‐up and non‐recurring engineering processes required to produce custom parts. Proto Labs's operating model not only eliminates many of those inefficiencies, it does it at a time when speed, cost and flexibility in product design and development are increasing in competitive importance for its customers. Proto Labs eliminates most of the time‐consuming and expensive labor conventionally required to quote and manufacture parts in low volumes via its proprietary software that was purposefully designed to automatically analyze part geometry, provide a final quote & generate the required tool path to manufacture the part. Rare are operating models that generate the types of operating profit margins and return on invested capital (ROIC) that Proto Labs has posted, combined with little requirement for incremental capital and labor to accommodate growth. Proto Labs has maintained these margin and return metrics while approximately tripling revenues over the past five years to about $300 million. Its balance sheet is solid as well, with $176 million of cash and marketable securities and no debt.
One company, IHS Inc., underwent a merger. It merged with Markit, becoming IHS Markit (NASDAQ: INFO). We did not make any transactions in the Fund’s position in INFO around this merger.
We made no sell decisions over the past six months, though three Fund holdings were acquired by competitors during the period. QLIK Technology was acquired by Thoma Bravo, Tumi Holdings was acquired by Samsonite, and Arm Holdings was acquired by Softbank. All three acquisitions were all‐cash transactions.
| Semi-Annual Report | October 31, 2016 | 1 |
| The Disciplined Growth Investors Fund | Shareholder Letter |
October 31, 2016 (Unaudited)
Market & Portfolio Commentary
Sometimes the reasons for a short‐term market move can be easily identified, such as the selloff after the Brexit1 vote. More often we can only guess at the reasons for the move. The appreciation the last six months is one of those times.
The most obvious possibility is that the long‐term investment position of the portfolio is sound. (We spent a lot of time and effort in 2014 and 2015 restructuring the portfolio for the next seven years.) We believe the portfolio companies are uniformly good companies making excellent progress towards their goals. Their stocks are priced to yield a return in excess of our 12% hurdle rate2 over the next seven years, according to our research and investment models.
With a favorable backdrop for stocks it has not been uncommon to witness the broad stock market put on a burst of appreciation. Historically, stocks have earned their superior return over bonds in a series of compressed time frames; that is, the excess return from stocks is confined to about 10% of the trading days.
We are also struck by the superior performance of small company stocks. If we were to hazard a guess as to why small stocks have performed so well, we would point to several possible factors. Their strong performance might signal increased odds for corporate tax reform. A cut in the tax rate for corporations would favor the smaller companies, who do not have lobbyists helping to write the tax code and pay higher rates than the large and very large companies. The mid‐sized companies the portfolio holds would benefit more from tax reform than the large companies and less than smaller companies. Second, the level of IPO activity has been sharply reduced for the last decade. This is favorable for the relative performance of small company stocks. Third, with sluggish economic growth, those companies with excellent growth prospects might be favored. Lastly, earlier this year the RUST stocks (real estate investment trusts “Reits”, utilities, consumer staples, and telecomm services) were leaders; many are fully valued or overvalued. Investors may be shifting from dividend payers to growth companies.
Our comments here reflect on market conditions prior to the November 8, 2016 US Presidential Election. We are assessing market implications of the election and will update you in due course.
Sincerely,
Frederick K. Martin, CFA
Chief Investment Officer
Chief Investment Officer
Disciplined Growth Investors, Inc.
| 2 | 1-855-DGI-FUND (344-3863) | www.DGIfund.com |
| The Disciplined Growth Investors Fund | Shareholder Letter |
October 31, 2016 (Unaudited)
The views of Disciplined Growth Investors, Inc. and information discussed in this commentary are as of the date of publication, are subject to change, and may not reflect the writers’ current views. The views expressed are those of the Fund’s adviser only, and represent an assessment of market conditions at a specific point in time, are opinions only and should not be relied upon as investment advice regarding a particular investment or markets in general. Such information does not constitute a recommendation to buy or sell specific securities or investment vehicles. It should not be assumed that any investment will be profitable or will equal the performance of the portfolios or any securities or any sectors mentioned in this letter. The subject matter contained in this letter has been derived from several sources believed to be reliable and accurate at the time of compilation. Neither Disciplined Growth Investors, Inc. nor the Fund accepts any liability for losses either direct or consequential caused by the use of this information.
The Fund is distributed by ALPS Distributors, Inc.
The Fund is subject to investment risks, including possible loss of the principal amount invested and therefore is not suitable for all investors. The Fund may not achieve its objectives.
Diversification does not eliminate the risk of experiencing investment losses.
| (1) | Brexit is an abbreviation for “British exit,” which refers to the June 23, 2016, referendum whereby British citizens voted to exit the European Union. The referendum roiled global markets, including currencies, causing the British pound to fall to its lowest level in decades. |
| (2) | Hurdle rate refers to the minimum expected return a potential investment candidate must clear before we will make an investment. In the case of The DGI Fund the hurdle rate for stocks is 12%. This is an annualized rate of expected return over the next seven years. Existing holdings may show an expected return figure above or below the hurdle rate over the course of our long term ownership. |
| Semi-Annual Report | October 31, 2016 | 3 |
| The Disciplined Growth Investors Fund | Performance Update |
October 31, 2016 (Unaudited)
Cumulative Total Return Performance (for the period ended October 31, 2016)
| 6 month | YTD | 1 Year | 3 Year | 5 Year | Since Inception* | |
| The Disciplined Growth Investors Fund | 5.68% | 9.07% | 7.16% | 7.14% | 10.54% | 11.89% |
S&P 500® Total Return Index(1) | 4.06% | 5.87% | 4.51% | 8.84% | 13.57% | 14.39% |
Performance data quoted represents past performance. Past performance does not guarantee future results. Investment return and principal value of an investment will fluctuate so that an investor’s shares, when sold or redeemed, may be worth more or less than the original cost. Current performance data may be higher or lower than actual data quoted. For the most current month-end performance data please call 1.855.DGI.FUND.
The table does not reflect the deductions of taxes a shareholder would pay on Fund distributions or redemptions of Fund shares.
Subject to investment risks, including possible loss of the principal amount invested.
Returns for periods greater than 1 year are annualized.
| * | Fund Inception date of August 12, 2011. |
| (1) | The S&P 500® Total Return Index is an unmanaged index of 500 common stocks chosen for market size, liquidity and industry group representation. It is a market-value weighted index. The Index is not actively managed and does not reflect any deductions for fees, expenses or taxes. An investor may not invest directly in the Index. |
| 4 | 1-855-DGI-FUND (344-3863) | www.DGIfund.com |
| The Disciplined Growth Investors Fund | Performance Update |
October 31, 2016 (Unaudited)
Growth of $10,000 Investment in the Fund (for the period ended October 31, 2016)
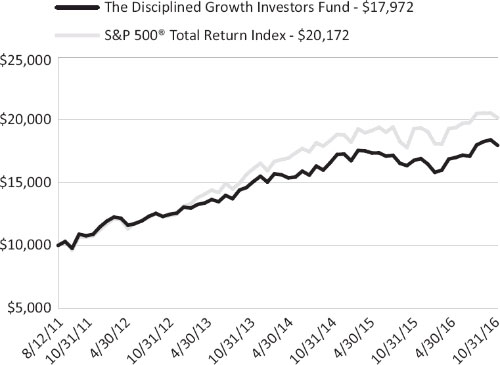
The chart above represents historical performance of a hypothetical investment of $10,000 in the Fund since inception. Past performance does not guarantee future results. This chart does not reflect the deduction of taxes that a shareholder would pay on Fund distributions or the redemption of Fund shares.
Investing in the Fund is subject to investment risks, including possible loss of the principal amount invested.
Industry Sector Allocation
(as a % of Net Assets)*
| Health Care | 9.51% |
| Consumer Discretionary | 17.37% |
| Technology | 27.66% |
| Producer Durables | 7.91% |
| Financial Services | 3.18% |
| Energy | 2.92% |
| Consumer, Non-cyclical | 0.57% |
| Industrials | 0.11% |
| Asset/Mortgage Backed Securities | 0.04% |
| Corporate Bond | 21.14% |
| Foreign Government Bonds | 0.30% |
| Short Term & Other Net Assets | 9.22% |
Top Ten Holdings
(as a % of Net Assets)*
| Edwards Lifesciences Corp. | 4.28% |
| TJX Cos., Inc. | 3.67% |
| Intuit, Inc. | 3.49% |
| Middleby Corp. | 3.23% |
| Open Text Corp. | 3.02% |
| Autodesk, Inc. | 2.50% |
| Plexus Corp. | 2.41% |
| Akamai Technologies, Inc. | 2.27% |
| L Brands, Inc. | 2.22% |
| Plantronics, Inc. | 2.18% |
| Top Ten Holdings |
| * | Holdings are subject to change, and may not reflect the current or future position of the portfolio. |
| Semi-Annual Report | October 31, 2016 | 5 |
| The Disciplined Growth Investors Fund | Disclosure of Fund Expenses |
October 31, 2016 (Unaudited)
As a shareholder of the Fund, you incur two types of costs: (1) transaction costs, including sales charges (loads) on purchase payments, reinvested dividends, or other distributions; redemption fees; and exchange fees; and (2) ongoing costs, including management fees; distribution and/or service (12b-1) fees; and other fund operating expenses. This example is intended to help you understand your ongoing costs (in dollars), of investing in the Fund and to compare these costs with the ongoing costs of investing in other mutual funds.
This example is based on an investment of $1,000 invested at the beginning of the period and held for the entire six-month period of May 1, 2016 through October 31, 2016.
Actual Expenses The first line of the table below provides information about actual account values and actual expenses. You may use the information in this line, together with the amount you invested, to estimate the expenses that you paid over the period. Simply divide your account value by $1,000 (for example, an $8,600 account value divided by $1,000 = 8.6), then multiply the result by the number in the first line under the heading “Expenses Paid During Period” to estimate the expenses you paid on your account during this period.
Hypothetical Example for Comparison Purposes The second line of the table below provides information about hypothetical account values and hypothetical expenses based on the Fund’s actual expense ratio and an assumed rate of return of 5% per year before expenses, which is not the Fund’s actual return. The hypothetical account values and expenses may not be used to estimate the actual ending account balance or expenses you paid for the period. You may use this information to compare the ongoing costs of investing in the Fund and other mutual funds. To do so, compare this 5% hypothetical example with the 5% hypothetical examples that appear in the shareholder reports of the other funds.
Please note that the expenses shown in the table are meant to highlight your ongoing costs only and do not reflect transactional costs, such as sales charges (loads), redemption fees or exchange fees. Therefore, the second line of the table is useful in comparing ongoing costs only and will not help you determine the relative total costs of owning different funds. In addition, if these transactional costs were included, your costs would have been higher.
Beginning Account Value 5/1/2016 | Ending Account Value 10/31/2016 | Expense Ratio(a) | Expenses Paid During period 5/1/2016 - 10/31/2016(b) | |
| Actual | $1,000.00 | $1,056.80 | 0.78% | $4.04 |
| Hypothetical (5% return before expenses) | $1,000.00 | $1,021.27 | 0.78% | $3.97 |
| (a) | The Fund's expense ratios have been annualized based on the Fund's most recent fiscal half-year expenses. |
| (b) | Expenses are equal to the Fund's annualized expense ratio, multiplied by the average account value over the period, multiplied by the number of days in the most recent fiscal half-year (184)/365 (to reflect the half-year period). |
| 6 | 1-855-DGI-FUND (344-3863) | www.DGIfund.com |
| The Disciplined Growth Investors Fund | Portfolio of Investments |
October 31, 2016 (Unaudited)
| Shares | Value (Note 2) | |||||||
| COMMON STOCKS (69.23%) | ||||||||
| CONSUMER DISCRETIONARY (17.37%) | ||||||||
| Auto & Auto Parts (1.48%) | ||||||||
| Gentex Corp. | 119,325 | $ | 2,017,786 | |||||
| Consumer Products (4.45%) | ||||||||
| Ethan Allen Interiors, Inc. | 55,894 | 1,715,946 | ||||||
| Garmin Ltd. | 40,975 | 1,981,551 | ||||||
| Ralph Lauren Corp. | 10,956 | 1,074,783 | ||||||
Select Comfort Corp.(a) | 68,336 | 1,311,368 | ||||||
| 6,083,648 | ||||||||
| Leisure (3.10%) | ||||||||
| Cheesecake Factory, Inc. | 17,887 | 951,410 | ||||||
| Royal Caribbean Cruises Ltd. | 31,338 | 2,408,952 | ||||||
TripAdvisor, Inc.(a) | 13,600 | 876,928 | ||||||
| 4,237,290 | ||||||||
| Retail (8.34%) | ||||||||
Cabela's, Inc.(a) | 40,850 | 2,516,769 | ||||||
| L Brands, Inc. | 42,022 | 3,033,568 | ||||||
| TJX Cos., Inc. | 67,975 | 5,013,156 | ||||||
Urban Outfitters, Inc.(a) | 24,925 | 833,741 | ||||||
| 11,397,234 | ||||||||
| TOTAL CONSUMER DISCRETIONARY | 23,735,958 | |||||||
| CONSUMER, NON-CYCLICAL (0.57%) | ||||||||
| Commercial Services (0.57%) | ||||||||
IHS Markit Ltd.(a) | 21,025 | 773,510 | ||||||
| TOTAL CONSUMER, NON-CYCLICAL | 773,510 | |||||||
| ENERGY (2.92%) | ||||||||
| Crude Producers (0.95%) | ||||||||
Southwestern Energy Co.(a) | 124,950 | 1,298,231 | ||||||
| Oil & Gas Services (0.65%) | ||||||||
| Core Laboratories NV | 9,200 | 892,124 | ||||||
| Semi-Annual Report | October 31, 2016 | 7 |
| The Disciplined Growth Investors Fund | Portfolio of Investments |
October 31, 2016 (Unaudited)
| Shares | Value (Note 2) | |||||||
| ENERGY (continued) | ||||||||
| Oil, Gas & Consumable Fuels (1.32%) | ||||||||
Ultra Petroleum Corp.(a) | 281,388 | $ | 1,798,069 | |||||
| TOTAL ENERGY | 3,988,424 | |||||||
| FINANCIAL SERVICES (3.18%) | ||||||||
| Banks (0.52%) | ||||||||
| TCF Financial Corp. | 49,975 | 714,643 | ||||||
| Consumer Finance & Credit Services (1.93%) | ||||||||
| FactSet Research Systems, Inc. | 17,031 | 2,635,036 | ||||||
| Investment Banking & Brokerage (0.73%) | ||||||||
E*Trade Financial Corp.(a) | 35,628 | 1,003,284 | ||||||
| TOTAL FINANCIAL SERVICES | 4,352,963 | |||||||
| HEALTH CARE (9.51%) | ||||||||
| Biotechnology (0.48%) | ||||||||
Myriad Genetics, Inc.(a) | 33,100 | 652,401 | ||||||
| Medical Equipment & Services (7.68%) | ||||||||
Edwards Lifesciences Corp.(a) | 61,500 | 5,856,030 | ||||||
Intuitive Surgical, Inc.(a) | 4,049 | 2,721,252 | ||||||
Varian Medical Systems, Inc.(a) | 21,188 | 1,922,387 | ||||||
| 10,499,669 | ||||||||
| Medical Specialties (1.35%) | ||||||||
Align Technology, Inc.(a) | 21,525 | 1,849,428 | ||||||
| TOTAL HEALTH CARE | 13,001,498 | |||||||
| INDUSTRIALS (0.11%) | ||||||||
| Industrial Goods & Services (0.11%) | ||||||||
Proto Labs, Inc.(a) | 3,400 | 151,980 | ||||||
| TOTAL INDUSTRIALS | 151,980 | |||||||
| PRODUCER DURABLES (7.91%) | ||||||||
| Machinery (3.23%) | ||||||||
Middleby Corp.(a) | 39,341 | 4,410,520 | ||||||
| 8 | 1-855-DGI-FUND (344-3863) | www.DGIfund.com |
| The Disciplined Growth Investors Fund | Portfolio of Investments |
October 31, 2016 (Unaudited)
| Shares | Value (Note 2) | |||||||
| PRODUCER DURABLES (continued) | ||||||||
| Machinery-Diversified (0.64%) | ||||||||
| Graco, Inc. | 11,600 | $ | 868,840 | |||||
| Professional Services (0.80%) | ||||||||
| CEB, Inc. | 22,550 | 1,097,057 | ||||||
| Software (0.63%) | ||||||||
| Paychex, Inc. | 15,600 | 861,120 | ||||||
| Transportation & Freight (2.61%) | ||||||||
JetBlue Airways Corp.(a) | 96,625 | 1,689,005 | ||||||
| Landstar System, Inc. | 26,462 | 1,882,771 | ||||||
| 3,571,776 | ||||||||
| TOTAL PRODUCER DURABLES | 10,809,313 | |||||||
| TECHNOLOGY (27.66%) | ||||||||
| Computer Technology (0.87%) | ||||||||
Super Micro Computer, Inc.(a) | 50,225 | 1,190,332 | ||||||
| Electronics (6.51%) | ||||||||
| Microchip Technology, Inc. | 24,400 | 1,477,420 | ||||||
| Open Text Corp. | 66,487 | 4,127,513 | ||||||
Plexus Corp.(a) | 71,988 | 3,297,770 | ||||||
| 8,902,703 | ||||||||
| Information Technology (12.27%) | ||||||||
Akamai Technologies, Inc.(a) | 44,700 | 3,105,309 | ||||||
Autodesk, Inc.(a) | 47,350 | 3,422,458 | ||||||
| Dolby Laboratories, Inc. - Class A | 20,175 | 960,128 | ||||||
| Intuit, Inc. | 43,875 | 4,770,968 | ||||||
| Seagate Technology PLC | 61,265 | 2,102,002 | ||||||
Yahoo!, Inc.(a) | 58,025 | 2,410,939 | ||||||
| 16,771,804 | ||||||||
| Semiconductors (1.99%) | ||||||||
| Power Integrations, Inc. | 30,175 | 1,944,779 | ||||||
Synaptics, Inc.(a) | 14,975 | 780,497 | ||||||
| 2,725,276 | ||||||||
| Semi-Annual Report | October 31, 2016 | 9 |
| The Disciplined Growth Investors Fund | Portfolio of Investments |
October 31, 2016 (Unaudited)
| Shares | Value (Note 2) | |||||||
| TECHNOLOGY (continued) | ||||||||
| Software (1.98%) | ||||||||
| Cognex Corp. | 26,625 | $ | 1,373,850 | |||||
Medidata Solutions, Inc.(a) | 3,050 | 146,369 | ||||||
RealPage, Inc.(a) | 43,400 | 1,180,480 | ||||||
| 2,700,699 | ||||||||
| Telecommunications (4.04%) | ||||||||
| Plantronics, Inc. | 57,588 | 2,977,876 | ||||||
Ubiquiti Networks, Inc.(a) | 33,475 | 1,755,094 | ||||||
ViaSat, Inc.(a) | 11,183 | 790,191 | ||||||
| 5,523,161 | ||||||||
| TOTAL TECHNOLOGY | 37,813,975 | |||||||
TOTAL COMMON STOCKS (Cost $66,514,925) | 94,627,621 | |||||||
| Principal Amount | Value (Note 2) | |||||||
| ASSET/MORTGAGE BACKED SECURITIES (0.04%) | ||||||||
| Government National Mortgage Association, Series 2005-93 | ||||||||
| 5.500% 12/20/2034 | $ | 51,071 | 51,785 | |||||
| TOTAL ASSET/MORTGAGE BACKED SECURITIES (Cost $53,993) | 51,785 | |||||||
| CORPORATE BONDS (21.13%) | ||||||||
| BASIC MATERIALS (0.31%) | ||||||||
Iron/Steel (0.31%) | ||||||||
| Nucor Corp. | ||||||||
| 5.750% 12/01/2017 | 406,000 | 423,850 | ||||||
| TOTAL BASIC MATERIALS | 423,850 | |||||||
| COMMUNICATIONS (2.25%) | ||||||||
Media (1.53%) | ||||||||
| 21st Century Fox America, Inc. | ||||||||
| 6.900% 03/01/2019 | 372,000 | 415,728 | ||||||
| Comcast Cable Communications Holdings, Inc. | ||||||||
| 9.455% 11/15/2022 | 307,000 | 428,641 | ||||||
| 10 | 1-855-DGI-FUND (344-3863) | www.DGIfund.com |
| The Disciplined Growth Investors Fund | Portfolio of Investments |
October 31, 2016 (Unaudited)
| Principal Amount | Value (Note 2) | |||||||
| Media (continued) | ||||||||
| Comcast Corp. | ||||||||
| 5.150% 03/01/2020 | $ | 715,000 | $ | 795,804 | ||||
| Viacom, Inc. | ||||||||
| 3.125% 06/15/2022 | 445,000 | 452,267 | ||||||
| 2,092,440 | ||||||||
Telecommunications (0.72%) | ||||||||
| AT&T, Inc. | ||||||||
| 4.450% 04/01/2024 | 502,000 | 543,772 | ||||||
| AT&T, Inc. | ||||||||
| 5.500% 02/01/2018 | 7,000 | 7,331 | ||||||
| Verizon Communications, Inc. | ||||||||
| 5.150% 09/15/2023 | 380,000 | 434,630 | ||||||
| 985,733 | ||||||||
| TOTAL COMMUNICATIONS | 3,078,173 | |||||||
| CONSUMER, CYCLICAL (1.70%) | ||||||||
Airlines (0.42%) | ||||||||
| Southwest Airlines Co. | ||||||||
| 2.650% 11/05/2020 | 557,000 | 570,274 | ||||||
Retail (1.28%) | ||||||||
| Advance Auto Parts, Inc. | ||||||||
| 5.750% 05/01/2020 | 388,000 | 425,789 | ||||||
| CVS Health Corp. | ||||||||
| 5.000% 12/01/2024 | 450,000 | 514,468 | ||||||
| McDonald's Corp. | ||||||||
| 6.300% 03/01/2038 | 292,000 | 377,816 | ||||||
| Wal-Mart Stores, Inc. | ||||||||
| 6.200% 04/15/2038 | 316,000 | 439,167 | ||||||
| 1,757,240 | ||||||||
| TOTAL CONSUMER, CYCLICAL | 2,327,514 | |||||||
| CONSUMER, NON-CYCLICAL (1.63%) | ||||||||
Beverages (0.66%) | ||||||||
| Anheuser-Busch InBev Worldwide, Inc. | ||||||||
| 2.500% 07/15/2022 | 443,000 | 448,577 | ||||||
| Pepsi Bottling Group, Inc., Series B | ||||||||
| 7.000% 03/01/2029 | 318,000 | 454,708 | ||||||
| 903,285 | ||||||||
| Semi-Annual Report | October 31, 2016 | 11 |
| The Disciplined Growth Investors Fund | Portfolio of Investments |
October 31, 2016 (Unaudited)
| Principal Amount | Value (Note 2) | |||||||
Commercial Services (0.32%) | ||||||||
| Total System Services, Inc. | ||||||||
| 2.375% 06/01/2018 | $ | 431,000 | $ | 433,973 | ||||
Healthcare-Services (0.31%) | ||||||||
| UnitedHealth Group, Inc. | ||||||||
| 3.350% 07/15/2022 | 406,000 | 432,341 | ||||||
Pharmaceuticals (0.34%) | ||||||||
| Johnson & Johnson | ||||||||
| 5.850% 07/15/2038 | 330,000 | 462,569 | ||||||
| TOTAL CONSUMER, NON-CYCLICAL | 2,232,168 | |||||||
| ENERGY (2.46%) | ||||||||
Oil & Gas (0.53%) | ||||||||
| Conoco Funding Co. | ||||||||
| 7.250% 10/15/2031 | 311,000 | 403,922 | ||||||
| Noble Energy, Inc. | ||||||||
| 8.250% 03/01/2019 | 289,000 | 329,069 | ||||||
| 732,991 | ||||||||
Pipelines (1.93%) | ||||||||
| Energy Transfer Partners LP | ||||||||
| 9.700% 03/15/2019 | 374,000 | 433,369 | ||||||
| Enterprise Products Operating LLC | ||||||||
| 5.200% 09/01/2020 | 408,000 | 455,030 | ||||||
| MarkWest Energy Partners LP / MarkWest Energy Finance Corp. | ||||||||
| 4.500% 07/15/2023 | 448,000 | 461,642 | ||||||
| MPLX LP | ||||||||
| 4.000% 02/15/2025 | 455,000 | 450,736 | ||||||
| ONEOK Partners LP | ||||||||
| 3.200% 09/15/2018 | 440,000 | 452,026 | ||||||
| TransCanada PipeLines Ltd. | ||||||||
| 7.250% 08/15/2038 | 269,000 | 381,388 | ||||||
| 2,634,191 | ||||||||
| TOTAL ENERGY | 3,367,182 | |||||||
| 12 | 1-855-DGI-FUND (344-3863) | www.DGIfund.com |
| The Disciplined Growth Investors Fund | Portfolio of Investments |
October 31, 2016 (Unaudited)
| Principal Amount | Value (Note 2) | |||||||
| FINANCIAL (3.53%) | ||||||||
Banks (1.64%) | ||||||||
| Bank of America Corp. | ||||||||
| 5.625% 07/01/2020 | $ | 379,000 | $ | 424,590 | ||||
| JPMorgan Chase & Co. | ||||||||
| 4.400% 07/22/2020 | 394,000 | 426,041 | ||||||
| Royal Bank of Scotland Group PLC, Series 1 | ||||||||
9.118% Perpetual Maturity (b) | 3,000 | 3,042 | ||||||
| US Bancorp | ||||||||
| 2.950% 07/15/2022 | 411,000 | 426,523 | ||||||
| Wachovia Corp. | ||||||||
| 5.750% 06/15/2017 | 500,000 | 513,667 | ||||||
| Wells Fargo & Co. | ||||||||
| 2.100% 07/26/2021 | 450,000 | 448,093 | ||||||
| 2,241,956 | ||||||||
Diversified Financial Services (0.97%) | ||||||||
| American Express Co. | ||||||||
| 7.000% 03/19/2018 | 414,000 | 445,235 | ||||||
| General Electric Capital Corp. | ||||||||
| 5.875% 01/14/2038 | 331,000 | 434,948 | ||||||
| National Rural Utilities Cooperative Finance Corp. | ||||||||
| 10.375% 11/01/2018 | 381,000 | 447,345 | ||||||
| 1,327,528 | ||||||||
Insurance (0.63%) | ||||||||
| American International Group, Inc. | ||||||||
| 4.875% 06/01/2022 | 390,000 | 436,151 | ||||||
| MetLife, Inc., Series A | ||||||||
| 6.817% 08/15/2018 | 383,000 | 418,316 | ||||||
| 854,467 | ||||||||
Real Estate Investment Trusts (0.29%) | ||||||||
| Welltower, Inc. | ||||||||
| 2.250% 03/15/2018 | 391,000 | 394,577 | ||||||
| TOTAL FINANCIAL | 4,818,528 | |||||||
| GOVERNMENT (0.29%) | ||||||||
Multi-National (0.29%) | ||||||||
| Corporacion Andina de Fomento | ||||||||
| 8.125% 06/04/2019 | 343,000 | 397,348 | ||||||
| Semi-Annual Report | October 31, 2016 | 13 |
| The Disciplined Growth Investors Fund | Portfolio of Investments |
October 31, 2016 (Unaudited)
| Principal Amount | Value (Note 2) | |||||||
| Multi-National (continued) | ||||||||
| Corporacion Andina de Fomento | ||||||||
| 5.750% 01/12/2017 | $ | 1,000 | $ | 1,010 | ||||
| 398,358 | ||||||||
| TOTAL GOVERNMENT | 398,358 | |||||||
| INDUSTRIAL (3.07%) | ||||||||
Aerospace/Defense (0.61%) | ||||||||
| Lockheed Martin Corp. | ||||||||
| 4.250% 11/15/2019 | 367,000 | 396,208 | ||||||
| Rockwell Collins, Inc. | ||||||||
| 3.700% 12/15/2023 | 408,000 | 432,684 | ||||||
| 828,892 | ||||||||
Electrical Components & Equipment (0.28%) | ||||||||
| Emerson Electric Co. | ||||||||
| 5.000% 04/15/2019 | 356,000 | 385,586 | ||||||
Electronics (0.31%) | ||||||||
| Corning, Inc. | ||||||||
| 6.625% 05/15/2019 | 377,000 | 420,121 | ||||||
Engineering & Construction (0.32%) | ||||||||
| Fluor Corp. | ||||||||
| 3.375% 09/15/2021 | 416,000 | 441,222 | ||||||
Environmental Control (0.30%) | ||||||||
| Republic Services, Inc. | ||||||||
| 5.500% 09/15/2019 | 376,000 | 416,194 | ||||||
Miscellaneous Manufacturing (0.32%) | ||||||||
| Tyco Electronics Group SA | ||||||||
| 3.500% 02/03/2022 | 409,000 | 433,063 | ||||||
Transportation (0.93%) | ||||||||
| Burlington North SF LLC | ||||||||
| 4.700% 10/01/2019 | 390,000 | 426,719 | ||||||
| CSX Corp. | ||||||||
| 7.375% 02/01/2019 | 367,000 | 413,498 | ||||||
| 14 | 1-855-DGI-FUND (344-3863) | www.DGIfund.com |
| The Disciplined Growth Investors Fund | Portfolio of Investments |
October 31, 2016 (Unaudited)
| Principal Amount | Value (Note 2) | |||||||
| Transportation (continued) | ||||||||
| United Parcel Service, Inc. | ||||||||
| 6.200% 01/15/2038 | $ | 311,000 | $ | 432,303 | ||||
| 1,272,520 | ||||||||
| TOTAL INDUSTRIAL | 4,197,598 | |||||||
| UTILITIES (5.89%) | ||||||||
Electric (5.32%) | ||||||||
| Ameren Illinois Co. | ||||||||
| 9.750% 11/15/2018 | 370,000 | 430,350 | ||||||
| Arizona Public Service Co. | ||||||||
| 8.750% 03/01/2019 | 370,000 | 430,371 | ||||||
| CMS Energy Corp. | ||||||||
| 5.050% 03/15/2022 | 367,000 | 415,614 | ||||||
| Commonwealth Edison Co. | ||||||||
| 4.000% 08/01/2020 | 353,000 | 379,994 | ||||||
| Consolidated Edison Co. of New York, Inc. | ||||||||
| 7.125% 12/01/2018 | 331,000 | 369,406 | ||||||
| Edison International | ||||||||
| 3.750% 09/15/2017 | 413,000 | 421,502 | ||||||
| Interstate Power & Light Co. | ||||||||
| 3.650% 09/01/2020 | 370,000 | 390,992 | ||||||
| ITC Holdings Corp. | ||||||||
| 4.050% 07/01/2023 | 413,000 | 439,470 | ||||||
| Jersey Central Power & Light Co. | ||||||||
| 7.350% 02/01/2019 | 469,000 | 521,659 | ||||||
| Nevada Power Co. | ||||||||
| 7.125% 03/15/2019 | 316,000 | 357,023 | ||||||
| Oncor Electric Delivery Co. LLC | ||||||||
| 7.000% 09/01/2022 | 351,000 | 442,874 | ||||||
| PacifiCorp | ||||||||
| 5.650% 07/15/2018 | 17,000 | 18,241 | ||||||
| PPL Capital Funding, Inc. | ||||||||
| 3.500% 12/01/2022 | 549,000 | 579,284 | ||||||
| PSEG Power LLC | ||||||||
| 5.125% 04/15/2020 | 387,000 | 421,576 | ||||||
| Puget Energy, Inc. | ||||||||
| 5.625% 07/15/2022 | 362,000 | 413,404 | ||||||
| Southern Power Co., Series 15B | ||||||||
| 2.375% 06/01/2020 | 445,000 | 450,777 | ||||||
| TECO Finance, Inc. | ||||||||
| 6.572% 11/01/2017 | 338,000 | 354,330 | ||||||
| Semi-Annual Report | October 31, 2016 | 15 |
| The Disciplined Growth Investors Fund | Portfolio of Investments |
October 31, 2016 (Unaudited)
| Principal Amount | Value (Note 2) | |||||||
| Electric (continued) | ||||||||
| Wisconsin Electric Power Co. | ||||||||
| 2.950% 09/15/2021 | $ | 408,000 | $ | 428,226 | ||||
| 7,265,093 | ||||||||
Gas (0.57%) | ||||||||
| CenterPoint Energy Resources Corp. | ||||||||
| 4.500% 01/15/2021 | 305,000 | 327,281 | ||||||
| Sempra Energy | ||||||||
| 2.875% 10/01/2022 | 440,000 | 452,015 | ||||||
| 779,296 | ||||||||
| TOTAL UTILITIES | 8,044,389 | |||||||
| TOTAL CORPORATE BONDS (Cost $28,289,046) | 28,887,760 | |||||||
| FOREIGN GOVERNMENT BONDS (0.30%) | ||||||||
| Province of Quebec Canada, Series NN | ||||||||
| 7.125% 02/09/2024 | 320,000 | 415,071 | ||||||
| TOTAL FOREIGN GOVERNMENT BONDS (Cost $406,283) | 415,071 | |||||||
| GOVERNMENT & AGENCY OBLIGATIONS (0.07%) | ||||||||
| U.S. Treasury Bonds | ||||||||
| 6.500% 11/15/2026 | 62,000 | 88,625 | ||||||
| TOTAL GOVERNMENT & AGENCY OBLIGATIONS (Cost $88,037) | 88,625 | |||||||
| Yield | Shares | Value (Note 2) | ||||||||||
| SHORT TERM INVESTMENTS (9.13%) | ||||||||||||
| MONEY MARKET FUND (1.49%) | ||||||||||||
| Fidelity Institutional Money Market Government Portfolio - Class I | 0.27 | %(c) | 2,030,440 | 2,030,440 | ||||||||
| 16 | 1-855-DGI-FUND (344-3863) | www.DGIfund.com |
| The Disciplined Growth Investors Fund | Portfolio of Investments |
October 31, 2016 (Unaudited)
| Yield | Shares | Value (Note 2) | ||||||||||
| SHORT TERM INVESTMENTS (continued) | ||||||||||||
| U.S. TREASURY BILLS (7.64%) | ||||||||||||
| U.S. Treasury Bill, 07/20/2017 | 0.48 | %(d) | 3,000,000 | $ | 2,988,444 | |||||||
| U.S. Treasury Bill, 09/14/2017 | 0.57 | %(d) | 7,494,000 | 7,455,399 | ||||||||
| 10,443,843 | ||||||||||||
| TOTAL SHORT TERM INVESTMENTS (Cost $12,476,110) | 12,474,283 | |||||||||||
TOTAL INVESTMENTS (99.90%) (Cost $107,828,394) | $ | 136,545,145 | ||||||||||
| Other Assets In Excess Of Liabilities (0.10%) | 138,480 | |||||||||||
| NET ASSETS (100.00%) | $ | 136,683,625 | ||||||||||
(a) | Non-Income Producing Security. |
(b) | This security has no contractual maturity date, is not redeemable and contractually pays an indefinite stream of interest. |
(c) | Represents the 7-day yield. |
(d) | Rate shown represents the bond equivalent yield to maturity at date of purchase. |
For Fund compliance purposes, the Fund's industry classifications refer to any one or more of the industry sub-classifications used by one or more widely recognized market indexes or ratings group indexes, and/or as defined by Fund management. This definition may not apply for purposes of this report, which may combine industry sub-classifications for reporting ease. Industries are shown as a percent of net assets.
See Notes to Financial Statements.
| Semi-Annual Report | October 31, 2016 | 17 |
| The Disciplined Growth Investors Fund | Statement of Assets and Liabilities |
October 31, 2016 (Unaudited)
| ASSETS | ||||
| Investments, at value | $ | 136,545,145 | ||
| Dividends and interest receivable | 381,324 | |||
| Total assets | 136,926,469 | |||
| LIABILITIES | ||||
| Payable for investments purchased | 151,167 | |||
| Payable to adviser | 91,677 | |||
| Total liabilities | 242,844 | |||
| NET ASSETS | $ | 136,683,625 | ||
| NET ASSETS CONSIST OF | ||||
| Paid‐in capital (Note 5) | $ | 107,496,145 | ||
| Accumulated net investment income | 52,713 | |||
| Accumulated net realized gain | 418,016 | |||
| Net unrealized appreciation | 28,716,751 | |||
| NET ASSETS | $ | 136,683,625 | ||
| INVESTMENTS, AT COST | $ | 107,828,394 | ||
| PRICING OF SHARES | ||||
| Net Asset Value, offering and redemption price per share | $ | 16.82 | ||
| Shares of beneficial interest outstanding | 8,126,395 | |||
See Notes to Financial Statements.
| 18 | 1-855-DGI-FUND (344-3863) | www.DGIfund.com |
| The Disciplined Growth Investors Fund | Statement of Operations |
For the Six Months Ended October 31, 2016 (Unaudited) | ||||
| INVESTMENT INCOME | ||||
| Dividends | $ | 476,997 | ||
| Foreign taxes withheld | (6,536 | ) | ||
| Interest | 416,283 | |||
| Total investment income | 886,744 | |||
| EXPENSES | ||||
| Investment advisory fees (Note 6) | 513,027 | |||
| Total expenses | 513,027 | |||
| NET INVESTMENT INCOME | 373,717 | |||
| REALIZED AND UNREALIZED GAIN ON INVESTMENTS | ||||
| Net realized gain on investments | 1,469,575 | |||
| Net change in unrealized appreciation on investments | 5,195,535 | |||
| NET REALIZED AND UNREALIZED GAIN ON INVESTMENTS | 6,665,110 | |||
| NET INCREASE IN NET ASSETS RESULTING FROM OPERATIONS | $ | 7,038,827 | ||
See Notes to Financial Statements.
| Semi-Annual Report | October 31, 2016 | 19 |
| The Disciplined Growth Investors Fund | Statements of Changes in Net Assets |
For the Six Months Ended October 31, 2016 (Unaudited) | For the Year Ended April 30, 2016 | |||||||
| OPERATIONS | ||||||||
| Net investment income | $ | 373,717 | $ | 671,062 | ||||
| Net realized gain/(loss) | 1,469,575 | (1,044,969 | ) | |||||
| Net change in unrealized appreciation/(depreciation) | 5,195,535 | (1,940,103 | ) | |||||
| Net increase/(decrease) in net assets resulting from operations | 7,038,827 | (2,314,010 | ) | |||||
| DISTRIBUTIONS (Note 3) | ||||||||
| From net investment income | (352,623 | ) | (709,053 | ) | ||||
| From net realized gains on investments | – | (2,457,710 | ) | |||||
| Net decrease in net assets from distributions | (352,623 | ) | (3,166,763 | ) | ||||
| CAPITAL SHARE TRANSACTIONS (Note 5) | ||||||||
| Proceeds from sales of shares | 22,910,438 | 22,263,652 | ||||||
| Issued to shareholders in reinvestment of distributions | 349,771 | 3,149,642 | ||||||
| Cost of shares redeemed, net of redemption fees | (13,119,671 | ) | (13,417,959 | ) | ||||
| Net increase from capital share transactions | 10,140,538 | 11,995,335 | ||||||
| Net increase in net assets | 16,826,742 | 6,514,562 | ||||||
| NET ASSETS | ||||||||
| Beginning of period | 119,856,883 | 113,342,321 | ||||||
| End of period* | $ | 136,683,625 | $ | 119,856,883 | ||||
| *Including accumulated net investment income of: | $ | 52,713 | $ | 31,619 | ||||
| OTHER INFORMATION | ||||||||
| Share Transactions | ||||||||
| Issued | 1,365,247 | 1,367,464 | ||||||
| Issued to shareholders in reinvestment of distributions | 21,220 | 202,387 | ||||||
| Redeemed | (770,301 | ) | (825,064 | ) | ||||
| Net increase in share transactions | 616,166 | 744,787 | ||||||
See Notes to Financial Statements.
| 20 | 1-855-DGI-FUND (344-3863) | www.DGIfund.com |
Intentionally Left Blank
The Disciplined Growth Investors Fund
| NET ASSET VALUE, BEGINNING OF PERIOD |
| INCOME FROM OPERATIONS |
Net investment income(a) |
| Net realized and unrealized gain/(loss) on investments |
| Total from investment operations |
| DISTRIBUTIONS |
| From net investment income |
| From net realized gain on investments |
| Total distributions |
| REDEMPTION FEES ADDED TO PAID‐IN CAPITAL |
| INCREASE/(DECREASE) IN NET ASSET VALUE |
| NET ASSET VALUE, END OF PERIOD |
| TOTAL RETURN |
| RATIOS AND SUPPLEMENTAL DATA |
| Net assets, end of period (000’s) |
| RATIOS TO AVERAGE NET ASSETS |
| Expenses |
| Net investment income |
| PORTFOLIO TURNOVER RATE |
| (a) | Per share numbers have been calculated using the average shares method. |
| (b) | Not annualized. |
| (c) | Annualized. |
See Notes to Financial Statements.
| 22 | 1-855-DGI-FUND (344-3863) | www.DGIfund.com |
| Financial Highlights |
| For a share outstanding during the periods presented |
For the Six Months Ended October 31, 2016 (Unaudited) | For the Year Ended April 30, 2016 | For the Year Ended April 30, 2015 | For the Year Ended April 30, 2014 | For the Year Ended April 30, 2013 | For the Period August 12, 2011 (Inception) to April 30, 2012 | |||||||||||||||||
| $ | 15.96 | $ | 16.75 | $ | 15.02 | $ | 13.17 | $ | 12.13 | $ | 10.00 | |||||||||||
| 0.05 | 0.09 | 0.10 | 0.07 | 0.11 | 0.05 | |||||||||||||||||
| 0.86 | (0.44 | ) | 1.83 | 1.90 | 1.09 | 2.11 | ||||||||||||||||
| 0.91 | (0.35 | ) | 1.93 | 1.97 | 1.20 | 2.16 | ||||||||||||||||
| (0.05 | ) | (0.10 | ) | (0.09 | ) | (0.07 | ) | (0.11 | ) | (0.03 | ) | |||||||||||
| – | (0.34 | ) | (0.11 | ) | (0.05 | ) | (0.05 | ) | – | |||||||||||||
| (0.05 | ) | (0.44 | ) | (0.20 | ) | (0.12 | ) | (0.16 | ) | (0.03 | ) | |||||||||||
| – | – | – | – | – | – | |||||||||||||||||
| 0.86 | (0.79 | ) | 1.73 | 1.85 | 1.04 | 2.13 | ||||||||||||||||
| $ | 16.82 | $ | 15.96 | $ | 16.75 | $ | 15.02 | $ | 13.17 | $ | 12.13 | |||||||||||
| 5.68 | %(b) | (2.05 | %) | 12.87 | % | 15.02 | % | 9.93 | % | 21.65 | %(b) | |||||||||||
| $ | 136,684 | $ | 119,857 | $ | 113,342 | $ | 86,741 | $ | 66,967 | $ | 35,678 | |||||||||||
| 0.78 | %(c) | 0.78 | % | 0.78 | % | 0.78 | % | 0.78 | % | 0.77 | %(c) | |||||||||||
| 0.57 | %(c) | 0.59 | % | 0.61 | % | 0.47 | % | 0.90 | % | 0.60 | %(c) | |||||||||||
| 5 | %(b) | 13 | % | 14 | % | 10 | % | 10 | % | 6 | %(b) | |||||||||||
| Semi-Annual Report | October 31, 2016 | 23 |
| The Disciplined Growth Investors Fund | Notes to Financial Statements |
October 31, 2016 (Unaudited)
1. ORGANIZATION
Financial Investors Trust (the “Trust”), a Delaware statutory trust, is an open‐end management investment company registered under the Investment Company Act of 1940, as amended (“1940 Act”). The Trust consists of multiple separate portfolios or series. This semi‐annual report describes The Disciplined Growth Investors Fund (the “Fund”). The Fund seeks long‐term capital growth and as a secondary objective, modest income with reasonable risk.
2. SIGNIFICANT ACCOUNTING POLICIES
The accompanying financial statements were prepared in accordance with accounting principles generally accepted in the United States of America (“U.S. GAAP”). The preparation of financial statements in conformity with U.S. GAAP requires management to make certain estimates and assumptions that affect the reported amounts of assets and liabilities and disclosures of contingent assets and liabilities at the date of the financial statements and the reported amounts of revenue and expenses during the period. Actual results could differ from those estimates. The Fund is considered an investment company for financial reporting purposes under U.S. GAAP. The following is a summary of significant accounting policies consistently followed by the Fund in preparation of their financial statements.
Investment Valuation: The Fund generally values its securities based on market prices determined at the close of regular trading on the New York Stock Exchange (“NYSE”), normally 4:00 p.m. Eastern Time, on each day the NYSE is open for trading.
For equity securities and mutual funds that are traded on an exchange, the market price is usually the closing sale or official closing price on that exchange. In the case of equity securities not traded on an exchange, or if such closing prices are not otherwise available, the securities are valued at the mean of the most recent bid and ask prices on such day. Redeemable securities issued by open‐end registered investment companies are valued at the investment company’s applicable net asset value, with the exception of exchange‐traded open‐end investment companies, which are priced as equity securities.
The market price for debt obligations is generally the price supplied by an independent third‐party pricing service approved by the Board of Trustees (the “Board”), which may use a matrix, formula or other objective method that takes into consideration quotations from dealers, market transactions in comparable investments, market indices and yield curves. If vendors are unable to supply a price, or if the price supplied is deemed to be unreliable, the market price may be determined using quotations received from one or more broker–dealers that make a market in the security. Fixed‐income obligations, excluding municipal securities, having a remaining maturity of greater than 60 days, are typically valued at the mean between the evaluated bid and ask prices formulated by an independent pricing service. Corporate Bonds, U.S. Government & Agency, and U.S. Treasury Bonds & Notes are valued using market models that consider trade data, quotations from dealers and active market makers, relevant yield curve and spread data, creditworthiness, trade data or market information on comparable securities, and other relevant security specific information. Mortgage‐related and asset‐backed securities are valued based on models that consider trade data, prepayment and default projections, benchmark yield and spread data and estimated cash flows of each tranche of the issuer. Publicly traded foreign government debt securities are
| 24 | 1-855-DGI-FUND (344-3863) | www.DGIfund.com |
| The Disciplined Growth Investors Fund | Notes to Financial Statements |
October 31, 2016 (Unaudited)
typically traded internationally in the over‐the‐counter market and are valued at the mean between the bid and asked prices as of the close of business of that market.
When such prices or quotations are not available, or when Disciplined Growth Investors, Inc. (the “Adviser”) believes that they are unreliable, securities may be priced using fair value procedures approved by the Board.
Fair Value Measurements: The Fund discloses the classification of its fair value measurements following a three‐tier hierarchy based on the inputs used to measure fair value. Inputs refer broadly to the assumptions that market participants would use in pricing the asset or liability, including assumptions about risk. Inputs may be observable or unobservable. Observable inputs reflect the assumptions market participants would use in pricing the asset or liability that are developed based on market data obtained from sources independent of the reporting entity. Unobservable inputs reflect the reporting entity’s own assumptions about the assumptions market participants would use in pricing the asset or liability that are developed based on the best information available.
Various inputs are used in determining the value of the Fund’s investments as of the end of the reporting period. When inputs used fall into different levels of the fair value hierarchy, the level in the hierarchy within which the fair value measurement falls is determined based on the lowest level input that is significant to the fair value measurement in its entirety. The designated input levels are not necessarily an indication of the risk or liquidity associated with these investments. These inputs are categorized in the following hierarchy under applicable financial accounting standards:
| Level 1 – | Unadjusted quoted prices in active markets for identical investments, unrestricted assets or liabilities that the Fund has the ability to access at the measurement date; |
| Level 2 – | Quoted prices which are not active, quoted prices for similar assets or liabilities in active markets or inputs other than quoted prices that are observable (either directly or indirectly) for substantially the full term of the asset or liability; and |
| Level 3 – | Significant unobservable prices or inputs (including the Fund’s own assumptions in determining the fair value of investments) where there is little or no market activity for the asset or liability at the measurement date. |
| Semi-Annual Report | October 31, 2016 | 25 |
| The Disciplined Growth Investors Fund | Notes to Financial Statements |
October 31, 2016 (Unaudited)
The following is a summary of each input used to value the Fund as of October 31, 2016:
| Investments in Securities at Value | Level 1 - Unadjusted Quoted Prices | Level 2 - Other Significant Observable Inputs | Level 3 - Significant Unobservable Inputs | Total | ||||||||||||
Common Stocks(a) | $ | 94,627,621 | $ | – | $ | – | $ | 94,627,621 | ||||||||
| Asset/Mortgage Backed Securities | – | 51,785 | – | 51,785 | ||||||||||||
| Corporate Bonds | – | 28,887,760 | – | 28,887,760 | ||||||||||||
| Foreign Government Bonds | – | 415,071 | – | 415,071 | ||||||||||||
| Government & Agency Obligations | – | 88,625 | – | 88,625 | ||||||||||||
| Short Term Investments | ||||||||||||||||
| Money Market Fund | 2,030,440 | – | – | 2,030,440 | ||||||||||||
| U.S. Treasury Bills | – | 10,443,843 | – | 10,443,843 | ||||||||||||
| TOTAL | $ | 96,658,061 | $ | 39,887,084 | $ | – | $ | 136,545,145 | ||||||||
| (a) | For detailed descriptions of the underlying industries, see the accompanying Portfolio of Investments. |
The Fund recognizes transfers between levels as of the end of the period. For the six months ended October 31, 2016, the Fund did not have any transfers between Level 1 and Level 2 securities. For the six months ended October 31, 2016, the Fund did not have any securities that used unobservable inputs (Level 3) in determining fair value.
Investment Transactions and Investment Income: Investment transactions are accounted for on the date the investments are purchased or sold (trade date). Realized gains and losses from investment transactions are reported on an identified cost basis, which is the same basis the Fund uses for federal income tax purposes. Interest income, which includes accretion of discounts, is accrued and recorded as earned. Dividend income is recognized on the ex‐dividend date or for certain foreign securities, as soon as information is available to the Fund.
Trust Expenses: Some expenses of the Trust can be directly attributed to the Fund. Expenses which cannot be directly attributed to the Fund are apportioned among all funds in the Trust based on average net assets of each fund.
Fund Expenses: Expenses that are specific to the Fund are charged directly to the Fund.
Federal Income Taxes: The Fund complies with the requirements under Subchapter M of the Internal Revenue Code of 1986, as amended, applicable to regulated investment companies and intends to distribute substantially all of their net taxable income and net capital gains, if any, each year so that it will not be subject to excise tax on undistributed income and gains. The Fund is not subject to income taxes to the extent such distributions are made.
As of and during the six months ended October 31, 2016, the Fund did not have a liability for any unrecognized tax benefits. The Fund files U.S. federal, state, and local tax returns as required. The
| 26 | 1-855-DGI-FUND (344-3863) | www.DGIfund.com |
| The Disciplined Growth Investors Fund | Notes to Financial Statements |
October 31, 2016 (Unaudited)
Fund’s tax returns are subject to examination by the relevant tax authorities until expiration of the applicable statute of limitations, which is generally three years after the filing of the tax return for federal purposes and four years for most state returns. Tax returns for open years have incorporated no uncertain tax positions that require a provision for income taxes.
Distributions to Shareholders: The Fund normally pays dividends, if any, quarterly and distributes capital gains, if any, on an annual basis. Income dividend distributions are derived from dividends and other income the Fund receives from its investments, including short term capital gains. Long term capital gain distributions are derived from gains realized when the Fund sells a security it has owned for more than a year. The Fund may make additional distributions and dividends at other times if the portfolio manager believes doing so may be necessary for the Fund to avoid or reduce taxes.
3. TAX BASIS INFORMATION
Tax Basis of Investments: As of October 31, 2016, the aggregate cost of investments, gross unrealized appreciation/ (depreciation) and net unrealized appreciation for Federal tax purposes was as follows:
| Disciplined Growth Investors Fund | ||||
| Gross appreciation | ||||
| (excess of value over tax cost) | $ | 32,549,205 | ||
| Gross depreciation | ||||
| (excess of tax cost over value) | (3,832,508 | ) | ||
| Net unrealized appreciation | $ | 28,716,697 | ||
| Cost of investments for income tax purposes | $ | 107,828,450 | ||
Tax Basis of Distributions to Shareholders: The character of distributions made during the year from net investment income or net realized gains may differ from its ultimate characterization for federal income tax purposes. Also, due to the timing of dividend distributions, the fiscal year in which amounts are distributed may differ from the fiscal year in which the income or realized gain was recorded by the Fund.
The tax character of distributions paid during the year ended April 30, 2016, were as follows:
| Ordinary Income | Long-Term Capital Gain | |||||||
| The Disciplined Growth Investors Fund | $ | 921,941 | $ | 2,244,822 | ||||
The amounts and characteristics of tax basis distributions and composition of distributable earnings/(accumulated losses) are finalized at fiscal year end. Accordingly, tax basis balances have not been determined as of October 31, 2016.
| Semi-Annual Report | October 31, 2016 | 27 |
| The Disciplined Growth Investors Fund | Notes to Financial Statements |
October 31, 2016 (Unaudited)
4. SECURITIES TRANSACTIONS
During the six months ended October 31, 2016, equity holdings, asset/mortgage backed securities, fixed income securities and U.S. Treasury Bonds were transferred in‐kind. The intent of the transfers was to save on equity transaction costs both for the new shareholders at the institution they transferred from and for the Fund on the addition of assets. The assets of two separate accounts were transferred‐in‐kind into the Fund in the amount of $10,176,253.
The cost of purchases and proceeds from sales of securities (excluding short‐term securities, transfers‐in‐kind, and U.S. Government Obligations) during the six months ended October 31, 2016, were as follows:
| Fund | Purchases of Securities | Proceeds From Sales of Securities | ||||||
| The Disciplined Growth Investors Fund | $ | 6,215,333 | $ | 10,495,438 | ||||
Investment transactions in U.S. Government Obligations (excluding transfers‐in‐kind) during the six months ended October 31, 2016 were as follows:
| Fund | Purchases of Securities | Proceeds From Sales of Securities | ||||||
| The Disciplined Growth Investors Fund | $ | – | $ | 6,019,826 | ||||
5. SHARES OF BENEFICIAL INTEREST
The capitalization of the Trust consists of an unlimited number of shares of beneficial interest with no par value per share. Holders of the shares of the Fund of the Trust have one vote for each share held and a proportionate fraction of a vote for each fractional share. All shares issued and outstanding are fully paid and are transferable and redeemable at the option of the shareholder. Purchasers of the shares do not have any obligation to make payments to the Trust or its creditors (other than the purchase price for the shares or make contributions to the Trust or its creditors solely by reason of the purchasers’ ownership of the shares. Shares have no pre‐emptive rights.
Prior to September 1, 2015, shares redeemed within 90 days of purchase may have incurred a 2% short‐term redemption fee deducted from the redemption amount. Effective September 1, 2015, the Fund no longer imposes redemption fees. For the year ended April 30, 2016, the Fund did not receive any redemption fees.
6. MANAGEMENT AND RELATED‐PARTY TRANSACTIONS
The Adviser, subject to the authority of the Board, is responsible for the overall management and administration of the Fund’s business affairs. The Adviser manages the investments of the Fund in accordance with the Fund’s investment objective, policies and limitations and investment guidelines established jointly by the Adviser and the Trustees. Pursuant to the Advisory Agreement, the Fund pays the Adviser a unitary management fee for the services and facilities it provides payable on a monthly basis at the annual rate of 0.78% of the Fund’s average daily net assets. The management fee is paid on a monthly basis.
| 28 | 1-855-DGI-FUND (344-3863) | www.DGIfund.com |
| The Disciplined Growth Investors Fund | Notes to Financial Statements |
October 31, 2016 (Unaudited)
Out of the unitary management fee, the Adviser pays substantially all expenses of the Fund, including the cost of transfer agency, custody, fund administration, bookkeeping and pricing services, legal, audit and other services, except for interest expenses, brokerage expenses, taxes and extraordinary expenses not incurred in the ordinary course of the Fund’s business. Also included are Trustee fees which were $1,570 for the six months ended October 31, 2016.
Fund Administrator Fees and Expenses
ALPS Fund Services, Inc. (“ALPS”) serves as administrator to the Fund. Pursuant to an Administration Agreement, ALPS provides operational services to the Fund including, but not limited to, fund accounting and fund administration and generally assists in the Fund’s operations. Officers of the Trust are employees of ALPS. The Fund’s administration fee is accrued on a daily basis and paid monthly. The Administrator is also reimbursed for certain out‐of‐pocket expenses. The administrative fee and out‐of‐pocket expenses are included in the unitary management fee paid to the Adviser.
Transfer Agent
ALPS serves as transfer, dividend paying and shareholder servicing agent for the Fund. ALPS receives an annual minimum fee, a fee based upon the number of shareholder accounts, and is also reimbursed for certain out‐of‐pocket expenses. The fee and out‐of‐pocket expenses are included in the unitary management fee paid to the Adviser.
Compliance Services
ALPS provides services that assist the Trust’s chief compliance officer in monitoring and testing the policies and procedures of the Trust in conjunction with requirements under Rule 38a‐1 under the 1940 Act and receives an annual base fee. ALPS is reimbursed for certain out‐of‐pocket expenses. The fee and out‐of‐pocket expenses are included in the unitary management fee paid to the Adviser.
Principal Financial Officer
ALPS receives an annual fee for providing principal financial officer services to the Fund. The fee is included in the unitary management fee paid to the Adviser.
Distributor
ALPS Distributors, Inc. (“ADI” or the “Distributor”) (an affiliate of ALPS) acts as the distributor of the Fund’s shares pursuant to a Distribution Agreement with the Trust. Shares are sold on a continuous basis by ADI as agent for the Fund, and ADI has agreed to use its best efforts to solicit orders for the sale of the Fund’s shares, although it is not obliged to sell any particular amount of shares. ADI is not entitled to any compensation for its services as Distributor. ADI is registered as a broker‐dealer with the Securities and Exchange Commission.
7. INDEMNIFICATIONS
Under the Trust’s organizational documents, its officers and Trustees are indemnified against certain liability arising out of the performance of their duties to the Trust. Additionally, in the normal course of business, the Trust enters into contracts with service providers that may contain general indemnification clauses, which may permit indemnification to the extent permissible under applicable law. The Trust’s maximum exposure under these arrangements is unknown, as this would involve future claims that may be made against the Trust that have not yet occurred.
| Semi-Annual Report | October 31, 2016 | 29 |
| The Disciplined Growth Investors Fund | Additional Information |
October 31, 2016 (Unaudited)
1. FUND HOLDINGS
The Fund files its complete schedule of portfolio holdings with the Securities and Exchange Commission (the “SEC”) for the first and third quarters of each fiscal year on Form N-Q within 60 days after the end of the period. Copies of the Fund’s Form N-Q are available without charge on the SEC website at http://www.sec.gov. You may also review and copy the Form N-Q at the SEC’s Public Reference Room in Washington, DC. For more information about the operation of the Public Reference Room, please call the SEC at 1-800-SEC-0330.
2. FUND PROXY VOTING POLICIES, PROCEDURES AND SUMMARIES
The Fund’s policies and procedures used in determining how to vote proxies and information regarding how the Fund voted proxies relating to portfolio securities during the most recent prior 12-month period ending June 30 are available without charge, (1) upon request, by calling (toll‐free) 855‐DGI‐Fund and (2) on the SEC’s website at http://www.sec.gov.
| 30 | 1-855-DGI-FUND (344-3863) | www.DGIfund.com |
| Disclosure Regarding Approval of | |
| The Disciplined Growth Investors Fund | Fund Advisory Agreements |
October 31, 2016 (Unaudited)
On June 7‐8, 2016, the Trustees met in person to discuss, among other things, the approval of the investment advisory agreement between Financial Investors Trust (the “Trust”) and Disciplined Growth Investors, Inc. (the “Adviser”) (the “Investment Advisory Agreement”), in accordance with Section 15(c) of the 1940 Act. In renewing and approving the Investment Advisory Agreement with the Adviser, the Trustees, including the Independent Trustees, considered the following factors with respect to the Disciplined Growth Investors Fund (the “Fund”):
Investment Advisory Fee Rate: The Trustees reviewed and considered the contractual annual advisory fee paid by the Trust, on behalf of the Fund, to the Adviser of 0.78% of the Fund’s daily average net assets, in light of the extent and quality of the advisory services provided by the Adviser to the Fund. The Board received and considered information including a comparison of the Fund’s contractual and actual advisory fees and overall expenses with those funds in the peer groups and universes of funds provided by an independent provider of investment company data and by the Adviser (collectively, the “Data Provider”). The Trustees noted that the contractual advisory fee rates for the Fund were below the Data Provider peer group average and median contractual advisory fee rates.
Total Expense Ratio: The Trustees noted that the total expense ratio (after waivers) of 0.78% for the Fund was below the Data Provider’s peer group average and median total expense ratios (after waivers).
Nature, Extent and Quality of the Services under the Investment Advisory Agreement: The Trustees received and considered information regarding the nature, extent and quality of services to be provided to the Fund under the Investment Advisory Agreement. The Trustees reviewed certain background materials supplied by the Adviser in its presentation, including its Form ADV.
The Trustees reviewed and considered the Adviser’s investment advisory personnel, its history as an asset manager and its performance and the amount of assets currently under management by the Adviser and its affiliated entities. The Trustees also reviewed the research and decision‐making processes utilized by the Adviser, including the methods adopted to seek to achieve compliance with the investment objectives, policies and restrictions of the Fund.
The Trustees considered the background and experience of the Adviser’s management in connection with the Fund, including reviewing the qualifications, backgrounds and responsibilities of the management team primarily responsible for the day‐to‐day portfolio management of the Fund and the extent of the resources devoted to research and analysis of actual and potential investments.
The Trustees also reviewed, among other things, the Adviser’s insider trading policies and procedures and its Code of Ethics.
Performance: The Trustees reviewed performance information for the Fund for the three‐month, one‐year and three‐year periods ended March 31, 2016. That review included a comparison of the Fund’s performance to the performance of a group of comparable funds selected by the Data Provider. The Trustees noted the performance of the Fund was above its Data Provider peer group average and median performance for the three‐month and three‐year periods ended March 31, 2016. The Trustees noted the performance of the Fund was above its Data Provider peer group
| Semi-Annual Report | October 31, 2016 | 31 |
| Disclosure Regarding Approval of | |
| The Disciplined Growth Investors Fund | Fund Advisory Agreements |
October 31, 2016 (Unaudited)
average but below its Data Provider peer group median for the one‐year period ended March 31, 2016. The Trustees also considered the Adviser’s discussion of the Fund’s underlying portfolio diversification categories, its top contributors and top detractors, as well as the Adviser’s performance and reputation generally and its investment techniques, risk management controls and decision‐making processes.
Comparable Accounts: The Trustees noted certain information provided by the Adviser regarding fees charged to its other clients utilizing a strategy similar to that employed by the Fund.
Profitability: The Trustees received and considered a retrospective and projected profitability analysis prepared by the Adviser based on the fees payable under the Investment Advisory Agreement with respect to the Fund. The Trustees considered the profits, if any, anticipated to be realized by the Adviser in connection with the operation of the Fund. The Board then reviewed the Adviser’s audited calendar year 2014 and 2015 financial statements in order to analyze the financial condition and stability and profitability of the Adviser.
Economies of Scale: The Trustees considered whether economies of scale in the provision of services to the Fund will be passed along to the shareholders under the proposed agreements.
Other Benefits to the Adviser: The Trustees reviewed and considered any other incidental benefits derived or to be derived by the Adviser from its relationship with the Fund, including whether soft dollar arrangements were used.
In renewing the Adviser as the Fund’s investment adviser and renewing the Investment Advisory Agreement and the fees charged under the Investment Advisory Agreement, the Trustees concluded that no single factor reviewed by the Trustees was identified by the Trustees to be determinative as the principal factor in whether to renew the Investment Advisory Agreement. Further, the Independent Trustees were advised by separate independent legal counsel throughout the process. The Trustees, including all of the Independent Trustees, concluded that:
| ● | the Fund’s contractual advisory fee rate was below its Data Provider peer group average and median contractual advisory fee rates; |
| ● | the Fund’s total expense ratio (after waivers) was below its Data Provider peer group average and median total expense ratios (after waivers); |
| ● | the nature, extent and quality of services rendered by the Adviser under the Investment Advisory Agreement with respect to the Fund were adequate; |
| ● | the performance of the Fund was above its Data Provider peer group average and median performance for the three‐month and three‐year periods ended March 31, 2016 and above its Data Provider peer group average, but below its Data Provider peer group median for the one‐year period ended March 31, 2016; |
| ● | bearing in mind the limitations of comparing different types of managed accounts and the different levels of service typically associated with such accounts, the fee structures applicable to the Adviser’s other clients employing a comparable strategy to the Fund was not indicative of any unreasonableness with respect to the advisory fees proposed to be payable by the Fund; |
| 32 | 1-855-DGI-FUND (344-3863) | www.DGIfund.com |
| Disclosure Regarding Approval of | |
| The Disciplined Growth Investors Fund | Fund Advisory Agreements |
October 31, 2016 (Unaudited)
| ● | the profit realized by the Adviser in connection with the operation of the Fund is not unreasonable to the Fund; and |
| ● | there were no material economies of scale or other incidental benefits accruing to the Adviser in connection with its relationship with the Fund. |
During the review process, the Trustees noted certain instances where clarification or follow‐up was appropriate and others where the Trustees determined that further clarification or follow‐up was not necessary. In those instances where clarification or follow‐up was requested, the Board determined that in each case either information responsive to its requests had been provided, or where any request was outstanding in whole or in part, given the totality of the information provided, the Board had received sufficient information to approve the Investment Advisory Agreement with the Adviser.
Based on the Trustees’ deliberations and their evaluation of the information described above, the Trustees, including all of the Independent Trustees, concluded that the Adviser’s compensation for investment advisory services is consistent with the best interests of the Fund and its shareholders.
| Semi-Annual Report | October 31, 2016 | 33 |

TABLE OF CONTENTS
| Manager Commentary | |
| Emerald Growth Fund | 1 |
| Emerald Small Cap Value Fund | 6 |
| Emerald Insights Fund | 12 |
| Emerald Banking and Finance Fund | 16 |
| Disclosure of Fund Expenses | 22 |
| Schedule of Investments | |
| Emerald Growth Fund | 25 |
| Emerald Small Cap Value Fund | 27 |
| Emerald Insights Fund | 28 |
| Emerald Banking and Finance Fund | 30 |
| Statements of Assets and Liabilities | 32 |
| Statements of Operations | 33 |
| Statements of Changes of Net Assets | |
| Emerald Growth Fund | 34 |
| Emerald Small Cap Value Fund | 36 |
| Emerald Insights Fund | 38 |
| Emerald Banking and Finance Fund | 39 |
| Financial Highlights | |
| Emerald Growth Fund | 40 |
| Emerald Small Cap Value Fund | 44 |
| Emerald Insights Fund | 48 |
| Emerald Banking and Finance Fund | 52 |
| Notes to Financial Statements | 56 |
| Additional Information | 64 |
| Emerald Growth Fund | Manager Commentary |
October 31, 2016 (Unaudited)
October 31, 2016
Dear Shareholders:
Investment Results
The performance of the Emerald Growth Fund’s Class A shares (without sales load), for the six months ended October 31, 2016, advanced by 5.82% outperforming the Russell 2000® Growth Index(1) which appreciated by 4.71%.
Slowing global and domestic recession fears receded over the last six months as the market and Federal Reserve appear to be coalescing around lower for longer economic growth and a shallower trajectory of interest rate increases. There have been numerous periods of moderating quarter to quarter growth throughout the post‐recession economic recovery that revived recessionary concerns. In each instance these episodes of slow growth have been followed by a reacceleration in U.S. domestic growth from slow growth to moderate growth. The most recent episode of rising concern and slowing economic growth at the end of 2015 and into early 2016 has been met yet again with a return to moderate growth.
This backdrop proved favorable for small capitalization stocks, as measured by the Russell 2000® Growth Index, which gained 4.71% for the six month period, outpacing the larger capitalization peers, as the measured by the Russell 1000® Growth Index(2), which gained 3.70%.
Investment Analysis
On a relative basis, the Fund outpaced the benchmark for the trailing period as the positive contribution to return achieved in the healthcare, consumer discretionary and utilities sectors offset relative underperformance within financial services, producer durables and materials sectors.
The healthcare sector was the largest source of relative outperformance for the trailing period driven by a combination of stock selection and relative positioning within the services, biotech, and pharmaceuticals industries. Performance within the consumer discretionary and utilities sectors also contributed positively to relative performance as a result of the relative outperformance of holdings within the specialty retail, hotel, education and telecommunications services industries.
Relative outperformance in the aforementioned was partially offset by relative underperformance within the financial services, producer durables and materials sectors. Performance within the financial services sector was the largest detractor to return for the period, largely as a result of the Fund’s relative overweight and stock selection within the banking industry. Performance within the producer durables and materials sectors also detracted from relative performance as a result of the Fund’s relative underweight position to both sectors and stock selection within the back office support industry.
Exiting October 2016, the Fund’s largest active exposures were to the consumer discretionary, technology, utilities and financial services sectors. Thoughts on those sectors and other areas of notable opportunity/ portfolio exposure are highlighted below:
The Fund ended October with the largest relative overweight position to the consumer discretionary sector. The overweight is comprised of a diverse subset of companies across the industries, with the largest exposures within the specialty retail, restaurant, apparel, hotel, funeral, leisure time and broadcast industries. Emerald Mutual Fund Advisers Trust (or “Emerald”), the Fund’s investment adviser, believes that each of these companies is positioned to benefit from company specific initiatives and opportunities.
The technology sector also remains a key overweight position relative to the benchmark. The Fund’s portfolio has exposure to emerging trends in optical network infrastructure as significant technology transitions are underway to support increased bandwidth across multiple networks: within and between datacenters, and; within core and metro telecommunications networks, cable operators, and submarine. The next few years represent the first time in over a decade that these disparate networks are all undergoing shifts in technology and network architecture, which should bode well for optical suppliers, equipment manufacturers, and electronic component suppliers across the supply chain. The portfolio also remains exposed to software companies benefitting from strong secular growth in areas such as cybersecurity and digital marketing. More importantly, we believe both the software and semiconductor industries will continue to benefit from consolidation as both larger vendors and private equity groups continue their activity in the technology industry. Emerald continues to be optimistic regarding the growth prospects for the holdings in the portfolio.
| Semi-Annual Report | October 31, 2016 | 1 |
| Emerald Growth Fund | Manager Commentary |
October 31, 2016 (Unaudited)
The Fund’s portfolio also maintained an overweight position to the utilities sector. Emerald continues to believe that adoption of unified communications among mid‐market and enterprise customers is in the very early stages and that the segment will continue to expand, shifting market leadership from traditional telephony equipment providers to a new group of software/network centric companies.
Additionally, although the relative overweight to financial services has declined on an absolute basis, the portfolio remains overweight. The aggregate exposure is comprised of overweight positions to the banking, consumer lending, and real estate investment trust industries with the largest relative overweight position remaining in the banking industry. Emerald continues to believe that small capitalization banks are particularly well positioned to continue to gain market share from their larger capitalization peers and in that regard anticipates that holdings within the portfolio will generate loan growth of 10% or better this year.
Market Outlook:
After a challenging start to the calendar year, where global growth concerns and risk aversion weighed heavily on the market and small capitalization stocks, the outlook has become much more sanguine. As we look to the balance of 2016 and into 2017 Emerald believes that the outlook for small capitalization stocks, and more specifically small capitalization growth stocks, looks increasingly favorable. First, from an earnings perspective small capitalization stocks and particularly small capitalization growth stocks remain the greatest source of earnings growth in the domestic universe. In a recently released report from Lori Calvasina, Chief US Equity Strategist at Credit Suisse the 2016 consensus anticipated earnings growth of 5.5% for the S&P 500(3), 6.8% for the Russell Mid‐Cap(4) and 7.1% for the Russell 2000. The outlook for 2017 looks even more favorable with consensus anticipated earnings growth of 10.2% for the S&P 500, 10.4% for the Russell Mid‐Cap and 13.1% for the Russell 2000. Further we believe that small capitalization stocks, given the faster growth profile, look even more attractive when we consider the relative valuation of small capitalization stocks to their larger capitalization brethren. On a median last twelve months profits and earnings(5), excluding negative earnings companies, the Russell 2000 is as cheap as its been relative to the S&P 500 since 2003, according to a recent research report from Furey Research Partners. Taking this a step further, Dubravko Lakos‐Bujas Chief Strategist at J.P. Morgan argues that “low but stable economic growth with reduced risk of a recession should demand a premium for growth stocks”. Merger and acquisition activity, which is closing in on a new high in small caps, seemingly supports this valuation argument, as acquirers are continuing to find attractive opportunities to make accretive strategic acquisitions at double‐digit premiums to their public market valuations.
As we look forward, while optimistic regarding the outlook for small capitalization stocks, the market/economy is not without risk. Concerns include the pending change in U.S. political leadership, the durability of consumer spending and the direction and rhetoric of the Federal Reserve. Given this backdrop, we expect periods of heightened global volatility to continue adversely affecting the U.S. market. Offsetting these risks, Emerald’s research team continues to find innovators, consolidators, and market share gainers in our domestic universe
Top Contributors: | Top Detractors: | |
| Veeva Systems Inc. | Opus Bank | |
| Vonage Holdings Corp. | Red Robin Gourmet Burgers, Inc. | |
| Cepheid | Acadia Healthcare Company, Inc. | |
| Gigamon Inc. | Virtu Financial, Inc. | |
| Jack in the Box Inc. | Impax Laboratories | |
| Kenneth G. Mertz II, CFA | Stacey L. Sears | Joseph W. Garner |
| Chief Investment Officer | Portfolio Manager | Portfolio Manager |
| Portfolio Manager | ||
| Emerald Mutual Fund Advisers Trust |
Past performance does not guarantee future results. Fund prices fluctuate as the underlying assets have exposure to market fluctuations and other risks, as described in the Fund’s prospectus. Please visit www.emeraldmutualfunds.com to obtain current performance information and for the current prospectus and statement of additional information. This material must be preceded or accompanied by a prospectus. Please read the prospectus carefully before investing.
| 2 | www.emeraldmutualfunds.com |
| Emerald Growth Fund | Manager Commentary |
October 31, 2016 (Unaudited)
The views of Emerald Mutual Fund Advisors Trust and information discussed in this commentary are as of the date of publication, are subject to change, and may not reflect the writer's current views. The views expressed are those of the author only, and represent an assessment of market conditions at a specific point in time, are opinions only and should not be relied upon as investment advice regarding a particular investment or markets in general. Such information does not constitute a recommendation to buy or sell specific securities or investment vehicles. It should not be assumed that any investment will be profitable or will equal the performance of the Fund or any securities or any sectors mentioned in this letter. The subject matter contained in this letter has been derived from several sources believed to be reliable and accurate at the time of compilation. Neither Emerald Mutual Fund Advisors Trust nor the Fund accepts any liability for losses either direct or consequential caused by the use of this information.
The Emerald Growth Fund is distributed by ALPS Distributors, Inc.
The Fund is subject to investment risks, including possible loss of the principal amount invested and therefore is not suitable for all investors. The Fund may not achieve its objectives.
Diversification does not eliminate the risk of experiencing investment losses.
(1) | The Russell 2000® Growth Index measures the performance of the small-cap growth segment of the U.S. equity universe. It includes those Russell 2000® Index companies with higher price-to-value ratios and higher forecasted growth values. The Index is not actively managed and does not reflect any deductions for fees, expenses or taxes. An investor may not invest directly into the Index. |
(2) | The Russell 1000® Index is a stock market index that represents the highest-ranking 1,000 stocks in the Russell 3000 Index, which represents about 90% of the total market capitalization of that index. The Russell 1000® Index has a weighted average market capitalization of $81 billion; the median market capitalization is approximately $4.6 billion. The Index is not actively managed and does not reflect any deductions for fees, expenses or taxes. An investor may not invest directly into the Index. |
(3) | The S&P 500® Total Return Index is an unmanaged index of 500 common stocks chosen for market size, liquidity and industry group representation. It is a market-value weighted index. The Index is not actively managed and does not reflect any deductions for fees, expenses or taxes. An investor may not invest directly in the Index. |
(4) | Russell Midcap Index is a market capitalization weighted index representing the smallest 800 companies in the Russell 1000 Index. The Index is not actively managed and does not reflect any deductions for fees, expenses or taxes. An investor may not invest directly in the Index. |
(5) | Profits and earnings is an accounting term applicable to stockholders of closely held businesses. Profits and earnings are a company's net profits after deducting distributions to the stockholders. |
| Semi-Annual Report | October 31, 2016 | 3 |
| Emerald Growth Fund | Manager Commentary |
October 31, 2016 (Unaudited)
TOP TEN HOLDINGS
(as a % of Net Assets)*
| Veeva Systems, Inc., Class A | 2.64% |
| Vonage Holdings Corp. | 2.10% |
| 8x8, Inc. | 1.86% |
| Microsemi Corp. | 1.85% |
| Bank of the Ozarks, Inc. | 1.80% |
| MicroStrategy, Inc., Class A | 1.79% |
| Apogee Enterprises, Inc. | 1.75% |
| Installed Building Products, Inc. | 1.58% |
| EPAM Systems, Inc. | 1.52% |
| Trex Co., Inc. | 1.46% |
| Top Ten Holdings | 18.35% |
INDUSTRY SECTOR ALLOCATION
(as a % of Net Assets)
| Technology | 23.67% |
| Consumer Discretionary | 21.58% |
| Health Care | 17.37% |
| Financial Services | 13.19% |
| Materials & Processing | 7.84% |
| Producer Durables | 7.20% |
| Utilities | 4.75% |
| Energy | 1.88% |
| Cash, Cash Equivalents, & Other Net Assets | 2.52% |
| * | Holdings are subject to change, and may not reflect the current or future position of the portfolio. |
AVERAGE ANNUAL TOTAL RETURN (for the period ended October 31, 2016)
| 1 Year | 3 Year | 5 Year | 10 Year | Since Inception1 | Expense Ratio | ||
Gross2 | Net2 | ||||||
| Class A (NAV) | ‐3.56% | 3.90% | 13.37% | 7.40% | 10.58% | 1.16% | 1.16% |
| Class A (MOP) | ‐8.13% | 2.23% | 12.27% | 6.88% | 10.35% | 1.16% | 1.16% |
Russell 2000® Growth Index† | ‐0.49% | 3.70% | 11.34% | 6.92% | 7.58% | ||
| Class C (NAV) | ‐4.17% | 3.23% | 12.66% | 6.76% | 4.90% | 1.82% | 1.82% |
| Class C (CDSC) | ‐5.10% | 3.23% | 12.66% | 6.76% | 4.90% | 1.82% | 1.82% |
Russell 2000® Growth Index† | ‐0.49% | 3.70% | 11.34% | 6.92% | 3.87% | ||
| Investor Class | ‐3.62% | 3.87% | 13.35% | – | 8.76% | 1.23% | 1.23% |
Russell 2000® Growth Index† | ‐0.49% | 3.70% | 11.34% | – | 7.64% | ||
| Institutional Class | ‐3.22% | 4.22% | 13.73% | – | 13.98% | 0.86% | 0.86% |
Russell 2000® Growth Index† | ‐0.49% | 3.70% | 11.34% | – | 12.72% | ||
Performance quoted represents past performance, does not guarantee future results and current performance may be lower or higher than the data quoted. The investment return and principal value of an investment will fluctuate so that shares, when redeemed, may be worth more or less than their original cost. Performance data current to the most recent month end may be obtained at www.emeraldmutualfunds.com.
Performance shown for periods prior to March 16, 2012, reflects the performance of the Forward Growth Fund, a series of Forward Funds (as a result of a reorganization of the Forward Growth Fund into the Emerald Growth Fund).
The table does not reflect the deduction of taxes that a shareholder would pay on Fund distributions or the redemption of Fund shares.
Subject to investment risks, including possible loss of the principal amount invested.
Maximum Offering Price (MOP) for Class A shares includes the Fund's maximum sales charge of 4.75%. Performance shown at NAV does not include these sales charges and would have been lower had it been taken into account.
A Contingent Deferred Sales Charge (CDSC) of 1.00% may apply to Class C shares redeemed within the first 12 months after a purchase.
| 1 | Inception Dates - Class A: 10/01/1992, Class C: 07/01/2000, Class Institutional: 10/21/2008, Class Investor: 05/01/2011 |
| 2 | Emerald Mutual Fund Advisers Trust ("Emerald" or the "Adviser") has agreed contractually to waive a portion of its fees and reimburse other expenses until August 31, 2017 in amounts necessary to limit the Fund's operating expenses (exclusive of Acquired Fund Fees and Expenses, brokerage expenses, interest expenses, taxes and extraordinary expense) for Class A, Class C, Institutional Class, and Investor Class shares to an annual rate (as percentage of the Fund's average daily net assets) of 1.29%, 1.94%, 0.99% and 1.34% respectively. The Adviser will be permitted to recover, on a class-by-class basis, expenses it has borne through the agreement described above to the extent that the Fund's expenses in later periods fall below the annual rates set forth in the relevant agreement. The Fund will not be obligated to pay any such deferred fees and expenses more than three years after the year(s) in which the fees and expense were incurred. The Adviser may not discontinue this waiver prior to August 31, 2017, without the approval by the Fund's Board of Trustees. Ratios as of the Prospectus dated August 31, 2016 and may differ from the ratios presented in the Financial Highlights. |
| † | The Russell 2000® Growth Index measures the performance of the small-cap growth segment of the U.S. equity universe. It includes those Russell 2000® Index companies with higher price-to-value ratios and higher forecasted growth values. The Index is not actively managed and does not reflect any deduction for fees, expenses or taxes. An Investor may not invest directly into the Index. |
| 4 | www.emeraldmutualfunds.com |
| Emerald Growth Fund | Manager Commentary |
October 31, 2016 (Unaudited)
GROWTH OF $10,000 INVESTMENT IN THE FUND (for the period ended October 31, 2016)
Comparison of change in value of a $10,000 investment (includes applicable sales loads)
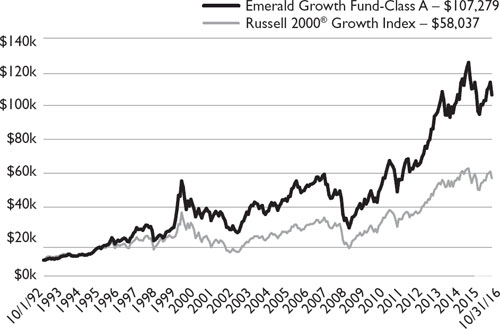
The chart represents historical performance of a hypothetical investment of $10,000 in the Fund since inception. Past performance does not guarantee future results. This chart does not reflect the deduction of taxes that a shareholder would pay on Fund distributions or the redemption of Fund shares.
Investing in the Fund is subject to investment risks, including possible loss of the principal amount invested.
| Semi-Annual Report | October 31, 2016 | 5 |
| Emerald Small Cap Value Fund | Manager Commentary |
October 31, 2016 (Unaudited)
October 31, 2016
Dear Shareholders:
Investment Results
The performance of the Emerald Small Cap Value Fund Investor Class, for the six months ended October 31, 2016, reflected a gain of 3.15% (without sales load) lagging the Russell 2000® Value Index(1) which was up 7.54%.
The market’s resilience in the face of several significant uncertainties was remarkable. First, macro environment challenges and mixed domestic economic data deterred the Fed from raising rates so far this year. However, from recent FOMC (Federal Open Market Committee) minutes, there seems to be a growing support for a rate hike, with several voting members anticipating an increase soon. The timing and trajectory of future rate hikes depends largely on the committee’s view of the labor market, and how much slack is still available there, as outlook on inflation remains cautious. The Fed is under great pressure to raise rates in December, and it could be a big surprise if they did not.
Second, the U.S. presidential election contributed to the uncertainty paralysis regarding capital decisions. According to the NFIB (National Federation of Independent Business), the percentage of businesses who believe it is “not a good time to expand” due to political climate has been climbing, now around 35%.
Third, we believe that unresolved international issues such as Brexit(2) and a slowing Chinese economy have been largely ignored by the market. The collapse of the British Pound, and the ongoing fiscal stimulus implemented by the ECB (European Central Bank) are not signs that things are getting better “across the pond”. Recent weak China trade data indicated a slowdown in foreign and domestic demand, while the credit to GDP (Gross Domestic Product) ratio is at record high(3).
While the market brushed off these concerns, earnings expectations have been lowered throughout the year. The largest downward revisions were in Energy and Materials, and with the exception of Technology, cyclical sectors have seen bigger estimates cuts than defensives.
U.S. small caps had a strong showing in the past twelve months, with the Russell 2000® Value Index topping the domestic equity market capitalization category charts. However, we believe the strong performance was driven primarily by low quality companies. Underwhelming macro‐economic data and geopolitical concerns were largely dismissed by investors and fueled the risk‐on trade.
Interestingly, the broad outperformance of low quality in the 3rd calendar quarter of 2016 was unusual as it resembled what investors would expect to see coming out of a major bear market trough. A low quality (low ROE, loss‐making, small size, low price, high valuation) outperformance throughout 2016 worked against quality‐focused active managers.
We believe that our underperformance during the period was mainly due to our discipline that largely excludes non‐earners and momentum stocks from consideration.
Investment Analysis
The Emerald Small Cap Value Fund (without sales load) underperformed its benchmark for the 6‐month period ended October 31, 2016. At the sector level, relative outperformance was driven by stock selection within the producer durables, and a relative underweight to the benchmark’s healthcare sector. Relative underperformance was experienced within the technology, financial services, and consumer discretionary sectors.
Negative stock selection in our technology holdings weighed on relative performance as holdings within the semiconductor and telecommunications equipment industries continued to face headwinds from slowing consumer demand for mobile and pc devices, as well as a pause in enterprise spending.
The Fund’s underperformance in the financial services sector was due to a slight lag of our bank holdings versus the benchmark, and a couple of non‐financial services companies, which are classified under that sector, that materially underperformed due to disappointing earnings reports. However, being close to benchmark’s weight in Real Estate Investment Trusts (REITs) and strong stock selection within that industry, contributed positive alpha to the fund.
A study by Merrill Lynch(4) shows that our small cap value peers are underweight banks by 600 basis points (bps)(5), and underweight REITs by 740 bps versus the Russell 2000 Value benchmark. In contrast, the Emerald small cap value fund is equal‐weighted banks and slightly over‐weighted REITS. Emerald’s portfolio management team has worked throughout the years (and at any point in the economic cycle) to identify and invest in banks that produce above average loan growth, possess strong balance sheet, have a high return on equity, and trade at discount to peers. Historically, the Fund’s portfolio had a higher exposure to the financials sector than peers, it has been a differentiating factor, and contributed significant alpha to our performance since inception.
| 6 | www.emeraldmutualfunds.com |
| Emerald Small Cap Value Fund | Manager Commentary |
October 31, 2016 (Unaudited)
In the past six months, we have increased the portfolio’s exposure to the producer durables and materials sectors as we see more tangible signs of the resurging residential and non‐residential construction market.
Financial services and technology are two sectors where absolute portfolio weightings decreased throughout the period. In each case, holdings that were trimmed or sold during this period had previously exceeded our predetermined price targets and, according to our sell discipline, exited the portfolio when the stock price declined by a given percentage amount from its earlier period high.
Market Outlook
With the presidential election behind us, we are hopeful that the removal of one major uncertainty will re‐ignite capital spending (in both public and private sectors), and shift the focus from political campaigning to implementing growth initiatives in Washington DC in the coming year. And, while it is too early to determine which sectors will benefit most by the policies of the incoming administration, we believe that cyclical industries such as banks (steepening yield curve), engineering and construction (infrastructure spending), and technology (cash repatriation), would outperform in the coming year.
Quality is still very cheap and when volatility moves higher, stocks with highest ROE and earners tend to outperform(6). And, as discussed in our previous newsletter, we believe that value is making a comeback.
We will continue to seek attractive investment opportunities for our clients by focusing on high‐quality companies identified and evaluated by our fundamental research and active portfolio management.
Top Contributors | Top Detractors | |
| Vonage Holdings Corp. | Real Industry, Inc. | |
| Viad Corp | Synaptics Incorporated | |
| Rudolph Technologies, Inc. | Gray Television, Inc. | |
| Microsemi Corporation | Opus Bank | |
| EMCOR Group, Inc. | MDC Partners Inc. Class A | |
| Sincerely, | ||
| Richard A. Giesen, Jr. | Ori Elan | |
Managing Director – Value Equity Strategies | Vice President | |
| Portfolio Manager | Portfolio Manager |
Emerald Mutual Fund Advisers Trust
Past performance does not guarantee future results. Fund prices fluctuate as the underlying assets have exposure to market fluctuations and other risks, as described in the Fund’s prospectus. Please visit www.emeraldmutualfunds.com to obtain current performance information and for the current prospectus and statement of additional information. This material must be preceded or accompanied by a prospectus. Please read the prospectus carefully before investing.
The views of Emerald Mutual Fund Advisors Trust and information discussed in this commentary are as of the date of publication, are subject to change, and may not reflect the writer's current views. The views expressed are those of the author only, and represent an assessment of market conditions at a specific point in time, are opinions only and should not be relied upon as investment advice regarding a particular investment or markets in general. Such information does not constitute a recommendation to buy or sell specific securities or investment vehicles. It should not be assumed that any investment will be profitable or will equal the performance of the Fund or any securities or any sectors mentioned in this letter. The subject matter contained in this letter has been derived from several sources believed to be reliable and accurate at the time of compilation. Neither Emerald Mutual Fund Advisors Trust nor the Fund accepts any liability for losses either direct or consequential caused by the use of this information.
The Emerald Small Cap Value Fund is distributed by ALPS Distributors, Inc.
The Fund is subject to investment risks, including possible loss of the principal amount invested and therefore is not suitable for all investors. The Fund may not achieve its objectives.
Diversification does not eliminate the risk of experiencing investment losses.
| Semi-Annual Report | October 31, 2016 | 7 |
| Emerald Small Cap Value Fund | Manager Commentary |
October 31, 2016 (Unaudited)
(1) | The Russell 2000® Value Index measures the performance of small-cap value segment of the U.S. equity universe. It includes those Russell 2000 companies with lower price-to-book ratios and lower forecasted growth values. The Russell 2000® Value Index is constructed to provide a comprehensive and unbiased barometer for the small-cap value segment. The Index is completely reconstituted annually to ensure larger stocks do not distort the performance and characteristics of the true small-cap opportunity set and that the represented companies continue to reflect value characteristics. The Index is not actively managed and does not reflect any deductions for fees, expenses or taxes. An investor may not invest directly into the Index. |
(2) | Brexit is an abbreviation for “British exit,” which refers to the June 23, 2016, referendum whereby British citizens voted to exit the European Union. The referendum roiled global markets, including currencies, causing the British pound to fall to its lowest level in decades. |
(3) | Stifel, Worth Noting, 13 October, 2016. |
(4) | Bank of America/Merrill Lynch, Active managers’ holdings update, 29 September, 2016. |
(5) | Basis point is a common unit of measure fir interest rates and other percentages in finance. One basis point is equal to 1/100th of 1% or 0.01%(.0001). |
(6) | Jefferies, Equity Strategy JEF'S SMID-Cap Perspectives—Thoughts & Observations, 06 October, 2016. |
| 8 | www.emeraldmutualfunds.com |
| Emerald Small Cap Value Fund | Manager Commentary |
October 31, 2016 (Unaudited)
| TOP TEN HOLDINGS | |
| (as a % of Net Assets)* | |
| Vonage Holdings Corp. | 3.69% |
| Viad Corp. | 3.55% |
| Microsemi Corp. | 3.49% |
| First Merchants Corp. | 3.14% |
| Great Western Bancorp, Inc. | 3.12% |
| ARRIS International PLC | 3.09% |
| EMCOR Group, Inc. | 3.07% |
| CyrusOne, Inc., REIT | 3.00% |
| Corporate Office Properties Trust, REIT | 2.92% |
| Mercer International, Inc. | 2.88% |
| Top Ten Holdings | 31.95% |
| INDUSTRY SECTOR ALLOCATION | |
| (as a % of Net Assets) | |
| Financial Services | 34.70% |
| Technology | 17.55% |
| Producer Durables | 14.46% |
| Consumer Discretionary | 14.43% |
| Materials & Processing | 7.56% |
| Utilities | 6.04% |
| Energy | 1.02% |
| Cash, Cash Equivalents, & Other Net Assets | 4.24% |
| * | Holdings are subject to change, and may not reflect the current or future position of the portfolio. |
AVERAGE ANNUAL TOTAL RETURN (for the period ended October 31, 2016)(1),(2) |
| 1 Year | 3 Years | Since Inception(2) | Expense Ratio | ||
Gross(3)(4) | Net(3)(4) | ||||
| Class A (NAV) | 0.77% | 3.97% | 9.65% | 2.12% | 1.36% |
| Class A (MOP) | ‐4.04% | 2.31% | 8.33% | 2.12% | 1.36% |
Russell 2000® Value Index(5) | 8.81% | 4.47% | 10.69% | ||
| Class C (NAV) | 0.00% | 3.25% | 8.90% | 2.77% | 2.01% |
| Class C (CDSC) | ‐1.00% | 3.25% | 8.90% | 2.77% | 2.01% |
Russell 2000® Value Index(5) | 8.81% | 4.47% | 10.69% | ||
| Investor Class | 0.80% | 4.08% | 9.79% | 2.02% | 1.26% |
Russell 2000® Value Index(5) | 8.81% | 4.47% | 10.69% | ||
| Institutional Class | 1.01% | 4.30% | 10.01% | 1.77% | 1.01% |
Russell 2000® Value Index(5) | 8.81% | 4.47% | 10.69% | ||
Performance quoted represents past performance, does not guarantee future results and current performance may be lower or higher than the data quoted. The investment return and principal value of an investment will fluctuate so that shares, when redeemed, may be worth more or less than their original cost. Performance data current to the most recent month end may be obtained at www.emeraldmutualfunds.com.
The table does not reflect the deduction of taxes that a shareholder would pay on Fund distributions or the redemption of Fund shares.
Subject to investment risks, including possible loss of the principal amount invested.
Maximum Offering Price (MOP) for Class A shares includes the Fund's maximum sales charge of 4.75%. Performance shown at NAV does not include these sales charges and would have been lower had it been taken into account.
A Contingent Deferred Sales Charge (CDSC) of 1.00% may apply to Class C shares redeemed within the first 12 months after a purchase.
(1) | As of June 26, 2015, the Emerald Small Cap Value Fund was reorganized as a successor to the Elessar Small Cap Value Fund (the Predecessor Fund), a series of Elessar Investment Trust. The performance shown for periods prior to June 26, 2015 reflects the performance of the Predecessor Fund's Institutional Class and Investor Class shares. The Predecessor Fund did not offer Class A or Class C shares. The performance shown for class A and C shares prior to June 30, 2015 reflect the historical performance of the Predecessor Fund’s Institutional and Investor Shares since inception on October 15, 2012, calculated using the fees and expenses of Class A and C shares, respectively. |
(2) | Commencement Dates - Class A: 06/30/2015, Class C: 06/30/2015, Class Institutional: 10/15/2012, Class Investor:10/15/2012 |
(3) | Emerald Mutual Fund Advisers Trust (“Emerald” or the “Adviser”) has agreed contractually to waive a portion of its fees and reimburse other expenses until August 31, 2017 in amounts necessary to limit the Fund’s operating expenses (exclusive of Acquired Fund Fees and Expenses, brokerage expenses, interest expenses, taxes and extraordinary expense) for Class A, Class C, Institutional Class, and Investor Class shares to an annual rate (as percentage of the Fund’s average daily net assets) of 1.35%, 2.00%, 1.00% and 1.25% respectively. The Adviser will be permitted to recover, on a class-by-class basis, expenses it has borne through the agreement described above to the extent that the Fund's expenses in later periods fall below the annual rates set forth in the relevant agreement. The Fund will not be obligated to pay any such deferred fees and expenses more than three years after the year(s) in which the fees and expense were incurred. The Adviser may not discontinue this waiver prior to August 31, 2017, without the approval by the Fund's Board of Trustees. Ratios as of the Prospectus dated August 31, 2017 and may differ from the ratios presented in the Financial Highlights. |
| Semi-Annual Report | October 31, 2016 | 9 |
| Emerald Small Cap Value Fund | Manager Commentary |
October 31, 2016 (Unaudited)
(4) | The total annual fund operating expenses shown is as stated in the fund’s prospectus current as of the date of this report. The prospectus may vary from the expense ratio shown elsewhere in this report as the ratio’s per the prospectus are based on estimated future expenses as of the date of the prospectus. |
(5) | The Russell 2000® Value Index measures the performance of small-cap value segment of the U.S. equity universe. It includes those Russell 2000 companies with lower price-to-book ratios and lower forecasted growth values. The Russell 2000® Value Index is constructed to provide a comprehensive and unbiased barometer for the small-cap value segment. The Index is completely reconstituted annually to ensure larger stocks do not distort the performance and characteristics of the true small-cap opportunity set and that the represented companies continue to reflect value characteristics. The Index is not actively managed and does not reflect any deductions for fees, expenses or taxes. An investor may not invest directly into the Index. |
Important Risks
Investing in smaller companies generally will present greater investment risks, including: greater price volatility, greater sensitivity to changing economic conditions and less liquidity than the securities of larger, more mature companies.
| 10 | www.emeraldmutualfunds.com |
| Emerald Small Cap Value Fund | Manager Commentary |
October 31, 2016 (Unaudited)
GROWTH OF $10,000 INVESTMENT IN THE FUND (for the period ended October 31, 2016)
Comparison of change in value of a $10,000 investment (includes applicable sales loads)
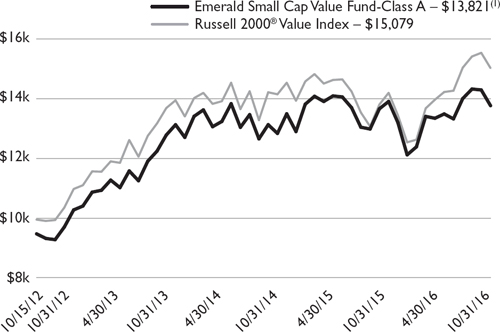
The chart represents historical performance of a hypothetical investment of $10,000 in the Fund since inception. Past performance does not guarantee future results. This chart does not reflect the deduction of taxes that a shareholder would pay on Fund distributions or the redemption of Fund shares.
Investing in the Fund is subject to investment risks, including possible loss of the principal amount invested.
| Semi-Annual Report | October 31, 2016 | 11 |
| Emerald Insights Fund | Manager Commentary |
October 31, 2016 (Unaudited)
October 31, 2016
Dear Shareholders:
Investment Results
The performance of the Emerald Insights Fund’s Class A shares (without sales load), for the past six months reflected a return of 3.20%, which was 1.23% greater than the Russell Midcap® Growth Index(1) benchmark return of 1.97%. Performance for the period was driven by outperformance in Healthcare, Technology, and Consumer; with underperformance in Producer Durables and Financial Services.
Investment Analysis
After a disappointing inaugural year - a period where investor sentiment was increasingly influenced by macroeconomic factors and political rhetoric which led to higher stock correlations(2) and is typically less attractive for fundamental investors, it was difficult as portfolio managers to remain steadfast in our process and not follow the crowd. It took experience and conviction to buck the trend and focus on the fundamentals as we saw them. Similarly, considering the strength of our Russell Mid Cap Growth benchmark, it took the same type of confidence in our research team and strategy to continue to position portfolios in higher growth, differentiated names, when the market was gravitating so strongly to low growth dividend payers, Real Estate Investment Trusts (REITs) and utilities. From a fundamental economic perspective, this reporting period saw less of an emphasis on macroeconomic factors that plagued the last 3-4 quarters and more of a focus on company fundamentals as investors rotated away from defensive and yield sectors into growthier groups. Overall, midcap growth stocks continued their move higher off the February lows as global growth concerns abated and the appetite for risk increased. Correlations declined, affording some tailwind to active managers vs. passive benchmarks. Risk, as a term, was less demonized during the summer months with smaller caps and higher beta areas such as Biotech leading. M&A (Mergers & Acquisitions) was also a major factor during the period, as our portfolio alone had three companies acquired at substantial premiums.
The domestic economy remained lackluster, with moderate employment growth offset by weak industrial and retail sales data, as well as a declining Leading Economic Index. The U.S. Dollar witnessed continued strength vs. the Euro and especially the British Pound, potentially pressuring those companies with international currency exposure.
Market Outlook
We remain believers that stock prices are most influenced by earnings and sales growth. Given our belief that growth valuations remain attractive (although they have increased), we think growth equities can outperform value in a slow growth economic environment. The Fund portfolio is made up of names that we believe may have significantly more earnings growth over the next 3-5 years than the Russell Midcap Growth benchmark. Volatility, which has been low recently, in our view likely will increase in future quarters. To combat this expected increase, we have increased the weighted average market capitalization of the Fund’s portfolio, which now stands roughly in-line with our benchmark. Other valuation metrics, such as Price/Cash Flow, Price/Sales, Price/Earnings, and Price/Book stand in line to modestly higher than the benchmark. As valuation metrics stand roughly in-line with the benchmark and the Fund’s portfolio is projected to grow EPS (earnings per share) at a substantially greater pace, we feel comfortable with our positioning and return prospects. We have not significantly changed the portfolio positioning from a sector perspective and continue to remain overweight Information Technology, Energy, and Banks. We also remain overweight in Materials, although we have reduced some exposure based on U.S. Dollar strength and some emerging concerns regarding the industrial manufacturing and commercial construction cycles. We remain underweight Healthcare – primarily within the equipment and services subsectors while remaining overweight Biotech. We also continue to underweight yield focused sectors such as Consumer Staples, REITs and Utilities due to what appear to be excessive valuations.
While there are certainly headwinds facing stocks in the near term, Emerald’s research team continues to find innovators, consolidators and market share gainers in our mid cap growth universe. Despite all of the talk surrounding passive management being superior to active, we main confident that in the mid cap growth space, inefficiencies abound and we have the research team and processes in place to identify and exploit these market and valuation opportunities.
| 12 | www.emeraldmutualfunds.com |
| Emerald Insights Fund | Manager Commentary |
October 31, 2016 (Unaudited)
Contributors | Detractors | |
| Cepheid | Signet Jewelers Limited | |
| Veeva Systems Inc Class A | Southwest Airlines Co. | |
| WhiteWave Foods Company | Alnylam Pharmaceuticals, Inc | |
| Proofpoint, Inc. | Affiliated Managers Group, Inc. | |
| Jack in the Box Inc. | Fitbit, Inc. Class A | |
| Sincerely, | ||
| David A. Volpe, CFA | Stephen L. Amsterdam | Joseph Hovorka |
| Deputy Chief Investment Officer | Associate Portfolio Manager | Associate Portfolio Manager |
| Portfolio Manager | ||
| Emerald Mutual Fund Advisers Trust |
Past performance does not guarantee future results. Fund prices fluctuate as the underlying assets have exposure to market fluctuations and other risks, as described in the Fund’s prospectus. Please visit www.emeraldmutualfunds.com to obtain current performance information and for the current prospectus and statement of additional information. This material must be preceded or accompanied by a prospectus. Please read the prospectus carefully before investing.
The views of Emerald Mutual Fund Advisors Trust and information discussed in this commentary are as of the date of publication, are subject to change, and may not reflect the writer's current views. The views expressed are those of the author only, and represent an assessment of market conditions at a specific point in time, are opinions only and should not be relied upon as investment advice regarding a particular investment or markets in general. Such information does not constitute a recommendation to buy or sell specific securities or investment vehicles. It should not be assumed that any investment will be profitable or will equal the performance of the Fund or any securities or any sectors mentioned in this letter. The subject matter contained in this letter has been derived from several sources believed to be reliable and accurate at the time of compilation. Neither Emerald Mutual Fund Advisors Trust nor the Fund accepts any liability for losses either direct or consequential caused by the use of this information.
Diversification does not eliminate the risk of experiencing investment losses.
The Emerald Insights Fund is distributed by ALPS Distributors, Inc.
The Fund is subject to investment risks, including possible loss of the principal amount invested and therefore is not suitable for all investors. The Fund may not achieve its objectives.
(1) | The Russell Midcap® Growth Index measures the performance of the mid-cap growth segment of the U.S. equity universe. It includes those Russell Midcap Index companies with higher price-to-book ratios and higher forecasted growth values. As of June 30, 2015, the Russell Midcap® Growth Index included securities issued by companies that ranged in size between $1.8 billion and $28.1 billion. The Index is not actively managed and does not reflect any deductions for fees, expenses or taxes. An investor may not invest directly into the Index. |
(2) | Correlation is a statistical measure of how an index moves in relation to another index or model portfolio. A correlation ranges from -1 to 1. A correlation of 1 means the two indexes have moved in lockstep with each other. A correlation of -1 means the two indexes have moved in exactly the opposite direction. |
| Semi-Annual Report | October 31, 2016 | 13 |
| Emerald Insights Fund | Manager Commentary |
October 31, 2016 (Unaudited)
TOP TEN HOLDINGS
(as a % of Net Assets)*
| S&P Global, Inc. | 2.33% |
| SVB Financial Group | 2.12% |
| Southwest Airlines Co. | 2.11% |
| IMAX Corp. | 2.11% |
| Wabtec Corp. | 2.05% |
| Middleby Corp. | 1.99% |
| Proofpoint, Inc. | 1.97% |
| Cinemark Holdings, Inc. | 1.96% |
| Veeva Systems, Inc., Class A | 1.93% |
| Palo Alto Networks, Inc. | 1.93% |
| Top Ten Holdings | 20.50% |
INDUSTRY SECTOR ALLOCATION
(as a % of Net Assets)
| Consumer Discretionary | 24.34% |
| Technology | 22.34% |
| Financial Services | 13.35% |
| Health Care | 11.60% |
| Producer Durables | 10.15% |
| Materials & Processing | 6.73% |
| Energy | 4.39% |
| Consumer Staples | 3.09% |
| Cash, Cash Equivalents, & Other Net Assets | 4.01% |
| * | Holdings are subject to change, and may not reflect the current or future position of the portfolio. |
AVERAGE ANNUAL TOTAL RETURN (for the period ended October 31, 2016)
| 1 Year | Since Inception1 | Expense Ratio | ||
Gross2 | Net2 | |||
| Class A (NAV) | -4.49% | 0.00% | 2.03% | 1.36% |
| Class A (MOP) | -9.01% | -2.15% | 2.03% | 1.36% |
Russell MidCap® Growth Index† | 0.40% | 4.73% | ||
| Class C (NAV) | -5.11% | -0.71% | 2.68% | 2.07% |
| Class C (CDSC) | -6.06% | -0.71% | 2.68% | 2.07% |
Russell MidCap® Growth Index† | 0.40% | 4.73% | ||
| Investor Class | -4.50% | -0.09% | 2.08% | 1.41% |
Russell MidCap® Growth Index† | 0.40% | 4.73% | ||
| Institutional Class | -4.10% | 0.27% | 1.73% | 1.06% |
Russell MidCap® Growth Index† | 0.40% | 4.73% | ||
The performance quoted represents past performance, does not guarantee future results and current performance may be lower or higher than the data quoted. The investment return and principal value of an investment will fluctuate so that shares, when redeemed, may be worth more or less than their original cost. Performance data current to the most recent month end may be obtained at www.emeraldmutualfunds.com.
The table does not reflect the deduction of taxes that a shareholder would pay on Fund distributions or the redemption of Fund shares.
Subject to investment risks, including possible loss of the principal amount invested.
Maximum Offering Price (MOP) for Class A shares includes the Fund's maximum sales charge of 4.75%. Performance shown at NAV does not include these sales charges and would have been lower had it been taken into account.
A Contingent Deferred Sales Charge (CDSC) of 1.00% may apply to Class C shares redeemed within the first 12 months after a purchase.
| 1 | Inception Date – August 1, 2014. |
| 2 | Emerald Mutual Fund Advisers Trust ("Emerald" or the "Adviser") has agreed contractually to waive a portion of its fees and reimburse other expenses until August 31, 2017 in amounts necessary to limit the Fund's operating expenses (exclusive of Acquired Fund Fees and Expenses, brokerage expenses, interest expenses, taxes and extraordinary expense) for Class A, Class C, Institutional Class, and Investor Class shares to an annual rate (as percentage of the Fund's average daily net assets) of 1.35%, 2.00%, 1.05% and 1.40% respectively. The Adviser will be permitted to recover, on a class-by-class basis, expenses it has borne through the agreement described above to the extent that the Fund's expenses in later periods fall below the annual rates set forth in the relevant agreement. The Fund will not be obligated to pay any such deferred fees and expenses more than three years after the year(s) in which the fees and expense were incurred. The Adviser may not discontinue this waiver prior to August 31, 2017, without the approval by the Fund's Board of Trustees. Ratios as of the Prospectus dated August 31, 2016 and may differ from the ratios presented in the Financial Highlights. |
| † | The Russell Midcap® Growth Index measures the performance of the mid-cap growth segment of the U.S. equity universe. It includes those Russell Midcap Index companies with higher price-to-book ratios and higher forecasted growth values. As of June 30, 2015, the Russell Midcap Growth Index included securities issued by companies that ranged in size between $1.8 billion and $28.1 billion. The Index is not actively managed and does not reflect any deductions for fees, expenses or taxes. An investor may not invest directly into the Index. |
Important Risks
Investing in smaller companies generally will present greater investment risks, including: greater price volatility, greater sensitivity to changing economic conditions and less liquidity than the securities of larger, more mature companies.
| 14 | www.emeraldmutualfunds.com |
| Emerald Insights Fund | Manager Commentary |
October 31, 2016 (Unaudited)
GROWTH OF $10,000 INVESTMENT IN THE FUND (for the period ended October 31, 2016)
Comparison of change in value of a $10,000 investment (includes applicable sales loads)
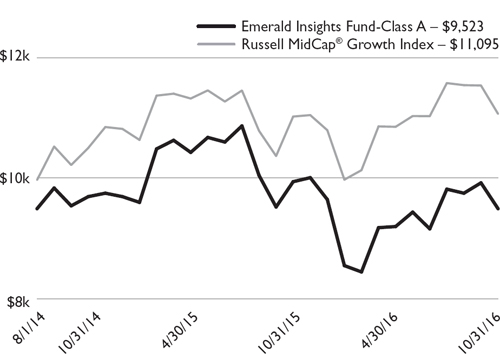
The chart represents historical performance of a hypothetical investment of $10,000 in the Fund since inception. Past performance does not guarantee future results. This chart does not reflect the deduction of taxes that a shareholder would pay on Fund distributions or the redemption of Fund shares.
Investing in the Fund is subject to investment risks, including possible loss of the principal amount invested.
| Semi-Annual Report | October 31, 2016 | 15 |
| Emerald Banking and Finance Fund | Manager Commentary |
| October 31, 2016 (Unaudited) |
October 31, 2016
Dear Shareholder:
Investment Results
The Emerald Bank & Finance Fund Class A shares (without sales load) underperformed the Russell 2000® Index(1) for the six months ended October 31, 2016, returning 3.55% vs. 6.13% for the Index. During the six months ended October 31, 2016, the Russell 2000 Financial Services TR Index(2) returned 7.92%, the SNL Small Cap U.S. Bank & Thrift Index(3) gained 8.86% versus a 4.06% gain delivered by the Standard & Poor’s 500 Index(4) and a gain of 7.54% for the Russell 2000® Value Index(5).
In our last Annual Report we stated that margins benefited modestly in the first quarter of 2016 from the Federal Reserve’s (FED) decision to finally begin raising short term rates in mid‐December 2015. Prior to the rate hike in December, LIBOR (London Interbank Offered Rate, are benchmark rates that some of the world’s leading banks charge each other for short‐term loans), began increasing the last week of November 2015, and continued climbing leading up to, and following, the increase in short term rates. We went on to state that we believed, that further rate increases will need to occur for margins to expand further. Subsequent to our last shareholder letter short term rates have yet to move higher and asset sensitive banks, which benefit from increases in short term rates, fell out of favor. As a result, our portfolio which is over‐weighted in asset sensitive banks underperformed.
The Fund’s performance also suffered from our decision not to invest in banks with energy exposure in their loan portfolio until we felt more certain that we had seen the peak of loan defaults that resulted from lower energy prices. We obviously showed an abundance of caution, in regard to energy exposed banks, and the market did not agree with us as banks with substantial energy loans have been some of the best performing banks in the second and third calendar quarters of 2016. Our caution, while warranted, contributed to our underperformance of the SNL Small Cap U.S. Bank and Thrift Index over the last six months.
We continue to have an overweight in assets sensitive banks, which is the result of being invested in banks that focus on commercial lending. Our position in these banks are not a play on trying to time interest rate increases but instead our preference for banks that have more of a commercial loan focus as they tend to be more growth oriented.
Investment Analysis
We believe that based on median return on average assets and net charge‐offs, community banks had a stronger third quarter than they did in 2015. We believe the banks in the Fund continued to generate superior loan growth, relatively stable NIMs (Net Interest Margins), stable expenses and abnormally low credit costs in general. It is our opinion that community banks that are below $10 billion in assets continue to produce the strongest earnings power and will continue to receive a higher trading multiple as a result of that superior earnings power. S&P Global Market Intelligence(6) analyzed banks and thrifts with less than $10 billion in assets for the quarter ended Sept. 30, based on GAAP filings, and ranked them by highest and lowest return on average assets. Out of those banks, those with assets between $5 billion and $10 billion had the strongest return on average assets, at a median of 1.08%, as well as the lowest net charge‐off on average loans at 0.06%, down from 0.10% in the year‐ago period. Banks in the $1 billion to $5 billion range saw a median return on average assets of 0.90%, and median net charge‐offs on average loans of 0.05%, down year over year. Banks with less than $1 billion in assets saw an increase in return on average assets, at a median of 0.78%. Their median net charge‐offs on average loans came in at 0.02%, down from the year‐ago period. We continue to believe that these banks are the beneficiary of taking market share from the larger regional banks. Additionally, banks with assets between $5 and $10 billion tend to have enough scale to absorb much of the regulatory burden as can be seen when we look at the difference in efficiency ratios.
Many of the smallest banks saw their efficiency ratios rise in the third quarter, as they continue to feel the pinch of regulatory costs and low interest rates. S&P Global Market Intelligence analyzed banks and thrifts with less than $10 billion in assets for the quarter ended Sept. 30, based on GAAP filings. Those with less than $1 billion in assets had the highest efficiency ratios, with a median of 72.69%, up year over year from 70.98%. The midsize community banks, those with $1 billion to $5 billion in assets, also saw a lower median third‐quarter efficiency ratio year over year. However, the largest community banks, those with $5 billion to $10 billion in assets, had the best median third‐quarter efficiency ratio among community banks, down year over year at 58.23%.
Market Outlook
Prior to the recent election, we have muddled through a slow growth economic expansion that has been the longest period of expansion on record. As a result, many felt that a recession is sure to be on the horizon. We do not share in this fear as we are not seeing signs of excesses typically associated with recessions such as an overheated job market, overinvestment, unmanageable debt and asset bubbles. Indeed, the job market has been strong, but even with unemployment rates at a low 5%, wage gains have been much weaker than prior to the financial crisis of 2008. As a result, inflation has stayed persistently below the Fed’s 2% target, despite the low rates and the Fed’s bond buying efforts. We believe that
| 16 | www.emeraldmutualfunds.com |
| Emerald Banking and Finance Fund | Manager Commentary |
| October 31, 2016 (Unaudited) |
coupled with muted wage gains, low inflation readings suggest that for all the jobs created over the past several years, the tight job market has not put the economy at risk of overheating.
We believe the low inflation, low rate environment has also led the Fed to view risk as asymmetric, with raising rates too soon far more dangerous than raising them too late. The central bank started out the year indicating that it was going to put through four quarter‐point rate increases. In March, the number fell to two and later to one and along with the reduced rate expectations we believe the Fed lost some degree of credibility in regard to their timing and projections for rate increases.
Then along came the election and President Elect Donald Trump pulled off one of the biggest upsets in election history and the investment expectations for banks changed significantly in our opinion. President Elect Trump has been outspoken about his criticism of the Fed’s failure to raise interest rates. Why is this criticism so important in our opinion? We believe that two twenty‐five basis points increases in the Fed rate would raise earnings estimates on average from 5% to 10% based on the asset sensitivity of the individual bank.
While on the campaign trail, President Elect Trump also expressed his desire to repeal the Dodd‐Frank Act, the post financial crisis regulatory overhaul that has subjected banks to more stringent rules and higher capital requirements. Trump’s transition team has floated a plan that would provide banks with an opportunity to free themselves from various regulations, such as stress testing, as long as they maintain capital levels equal to at least 10% of total assets and high ratings from their regulators. We believe such a provision would immediately help many small community banks that tend to be better capitalized than the large regionals and the money center banks.
We believe that with the potential of reduced regulatory expenses, lower corporate tax rates and several Fed rate hikes on the horizon, bank earnings growth rates have the potential for significant growth. As a result, we would expect that banks will trade at higher multiples as earning growth rates improve.
Our focus remains on seeking companies capable of producing above average organic growth, relatively stable net interest margins, and improving earnings power aided by lower efficiency ratios, with potential for accretive mergers & acquisitions activity, as we deploy Emerald’s 10‐Step research process to seek out companies in this market environment that is poised for the potential of higher short‐term interest rates.
Top Five Contributors to Return: | Top Five Detractors to Return: |
Meta Financial Group, Inc. SVB Financial Group Equity Bancshares, Inc. Class A National Commerce Corp. (Alabama) PrivateBancorp, Inc. | BankUnited, Inc. Bank of the Ozarks, Inc. First NBC Bank Holding Co. Signature Bank Opus Bank |
Kenneth G. Mertz II, CFA Chief Investment Officer Portfolio Manager | Steven E. Russell, Esq. Portfolio Manager |
| Emerald Mutual Fund Advisers Trust |
Past performance does not guarantee future results. Fund prices fluctuate as the underlying assets have exposure to market fluctuations and other risks, as described in the Fund’s prospectus. Please visit www.emeraldmutualfunds.com to obtain current performance information and for the current prospectus and statement of additional information.
The views of Emerald Mutual Fund Advisors Trust and information discussed in this commentary are as of the date of publication, are subject to change, and may not reflect the writer’s current views. The views expressed are those of the author only, and represent an assessment of market conditions at a specific point in time, are opinions only and should not be relied upon as investment advice regarding a particular investment or markets in general. Such information does not constitute a recommendation to buy or sell specific securities or investment vehicles. It should not be assumed that any investment will be profitable or will equal the performance of the Fund or any securities or any sectors mentioned in this letter. The subject matter contained in this letter has been derived from several sources believed to be reliable and accurate at the time of compilation. Neither Emerald Mutual Fund Advisors Trust nor the Fund accepts any liability for losses either direct or consequential caused by the use of this information.
Diversification does not eliminate the risk of experiencing investment losses.
| Semi-Annual Report | October 31, 2016 | 17 |
| Emerald Banking and Finance Fund | Manager Commentary |
| October 31, 2016 (Unaudited) |
The Emerald Banking and Finance Fund is distributed by ALPS Distributors, Inc.
The Fund is subject to investment risks, including possible loss of the principal amount invested and therefore is not suitable for all investors. The Fund may not achieve its objectives.
| (1) | Russell 2000® Index measures the performance of the small-cap segment of the U.S. equity universe. The Russell 2000® Index is a subset of the Russell 3000® Index representing approximately 10% of the total market capitalization of that index. It includes approximately 2000 of the smallest securities based on a combination of their market cap and current index membership. The Index is not actively managed and does not reflect any deduction of fees, expenses or taxes. An investor may not invest directly into the Index. |
| (2) | Russell 2000® Financial Services TR Index – is comprised of the smallest financial services companies in the Russell 3000 Index. The Index is not actively managed and does not reflect any deductions for fees, expense, or taxes. An investor may not invest directly in the Index. |
| (3) | SNL Small Cap Bank & Thrift Index: Includes all publicly traded (NYSE, NYSE Amex, NASDAQ, OTC BB, Pink Sheets) Banks and Thrifts in SNL’s coverage universe with $250M to $1B Total Common Market Capitalization as of most recent pricing data. Source: SNL Financial, data as of April 30, 2016. |
| (4) | Standard & Poor’s 500® Index is an unmanaged index of 500 common stocks chosen for the market size, liquidity and industry group representation. It is a market-value weighted index. The Index is not actively managed and does not reflect any deduction for fees, expenses or taxes. An investor may not invest directly into the Index. |
| (5) | The Russell 2000® Value Index measures the performance of small-cap value segment of the U.S. equity universe. It includes those Russell 2000 companies with lower price-to-book ratios and lower forecasted growth values. The Russell 2000® Value Index is constructed to provide a comprehensive and unbiased barometer for the small-cap value segment. The Index is completely reconstituted annually to ensure larger stocks do not distort the performance and characteristics of the true small-cap opportunity set and that the represented companies continue to reflect value characteristics. The Index is not actively managed and does not reflect any deductions for fees, expenses or taxes. An investor may not invest directly into the Index. |
| (6) | S&P Global Market Intelligence is a division of S&P Global (NYSE: SPGI), which provides essential intelligence for individuals, companies and governments to make decisions with confidence. |
| 18 | www.emeraldmutualfunds.com |
| Emerald Banking and Finance Fund | Manager Commentary |
| October 31, 2016 (Unaudited) |
| TOP TEN HOLDINGS | |
| (as a % of Net Assets)* | |
| SVB Financial Group | 4.63% |
| Bank of the Ozarks, Inc. | 3.95% |
| Home BancShares, Inc. | 3.22% |
| Meta Financial Group, Inc. | 3.01% |
| Signature Bank | 2.93% |
| Eagle Bancorp, Inc. | 2.81% |
FCB Financial Holdings, Inc., Class A | 2.42% |
| ServisFirst Bancshares, Inc. | 2.36% |
| Pinnacle Financial Partners, Inc. | 2.34% |
| National Commerce Corp. | 2.30% |
| Top Ten Holdings | 29.97% |
| INDUSTRY SECTOR ALLOCATION (as a % of Net Assets) | |
| Banks: Diversified | 77.92% |
| Banks: Savings, Thrift & Mortgage Lending | 10.76% |
| Real Estate Investment Trusts (REITs) | 2.54% |
| Commercial Banks | 2.12% |
| Consumer Lending | 1.80% |
| Insurance: Property‐Casualty | 1.39% |
| Insurance | 0.64% |
| Computer Services Software & Systems | 0.32% |
| Securities Brokerage & Services | 0.29% |
| Financial Data & Services | 0.26% |
| Diversified Financial Services | 0.26% |
| Real Estate Management & Development | 0.05% |
| Cash, Cash Equivalents, & Other Net Assets | 1.65% |
* | Holdings are subject to change, and may not reflect the current or future position of the portfolio. |
AVERAGE ANNUAL TOTAL RETURN (for the period ended October 31, 2016)
| 1 Year | 3 Year | 5 Year | 10 Year | Since Inception1 | Expense Ratio | ||
Gross2 | Net2 | ||||||
| Class A (NAV) | 0.06% | 10.67% | 17.14% | 2.92% | 8.39% | 1.49% | 1.49% |
| Class A (MOP) | ‐4.68% | 8.89% | 16.01% | 2.42% | 8.12% | 1.49% | 1.49% |
Russell 2000® Index† | 4.11% | 4.12% | 11.51% | 5.96% | 7.52% | ||
Russell 2000® | |||||||
| Financial Services | |||||||
TR Index†† | 8.21% | 8.16% | 14.60% | 3.74% | 8.23% | ||
| Class C (NAV) | ‐0.58% | 9.95% | 16.41% | 2.28% | 8.46% | 2.14% | 2.14% |
| Class C (CDSC) | ‐1.57% | 9.95% | 16.41% | 2.28% | 8.46% | 2.14% | 2.14% |
Russell 2000® Index† | 4.11% | 4.12% | 11.51% | 5.96% | 6.66% | ||
Russell 2000® | |||||||
| Financial Services | |||||||
TR Index†† | 8.21% | 8.16% | 14.60% | 3.74% | 9.19% | ||
| Investor Class | 0.00% | 10.65% | 17.18% | – | 11.75% | 1.54% | 1.54% |
Russell 2000® Index† | 4.11% | 4.12% | 11.51% | – | 10.33% | ||
Russell 2000® | |||||||
| Financial Services | |||||||
TR Index†† | 8.21% | 8.16% | 14.60% | – | 11.35% | ||
| Institutional Class | 0.37% | 11.01% | – | – | 15.56% | 1.19% | 1.19% |
Russell 2000® Index† | 4.11% | 4.12% | – | – | 9.44% | ||
Russell 2000® | |||||||
| Financial Services | |||||||
TR Index†† | 8.21% | 8.16% | – | – | 12.40% | ||
The performance quoted represents past performance, does not guarantee future results and current performance may be lower or higher than the data quoted. The investment return and principal value of an investment will fluctuate so that shares, when redeemed, may be worth more or less than their original cost. Performance data current to the most recent month end may be obtained at www.emeraldmutualfunds.com.
Performance shown for periods prior to March 16, 2012, reflects the performance of the Forward Banking & Finance Fund, a series of Forward Funds (as a result of a reorganization of the Forward Banking & Finance Fund into the Emerald Banking & Finance Fund).
The table does not reflect the deduction of taxes that a shareholder would pay on Fund distributions or the redemption of Fund shares.
Subject to investment risks, including possible loss of the principal amount invested.
Maximum Offering Price (MOP) for Class A shares includes the Fund’s maximum sales charge of 4.75%. Performance shown at NAV does not include these sales charges and would have been lower had it been taken into account.
A Contingent Deferred Sales Charge (CDSC) of 1.00% may apply to Class C shares redeemed within the first 12 months after a purchase.
1 | Inception Dates - Class A: 02/18/1997, Class C: 07/01/2000, Class Institutional: 03/19/2012, Class Investor: 03/16/2010 |
2 | Emerald Mutual Fund Advisers Trust ("Emerald" or the "Adviser") has agreed contractually to waive a portion of its fees and reimburse other expenses until August 31, 2017 in amounts necessary to limit the Fund’s operating expenses (exclusive of Acquired Fund Fees and Expenses, brokerage expenses, interest expenses, taxes and extraordinary expense) for Class A, Class C, Institutional Class, and Investor Class shares to an annual rate (as percentage of the Fund’s average daily net assets) of 1.84%, 2.49%, 1.54% and 1.89% respectively. The Adviser will be permitted to recover, on a class-by-class basis, expenses it has borne through the agreement described above to the extent that the Fund’s expenses in later periods fall below the annual rates set forth in the relevant agreement. The Fund will not be obligated to pay any such deferred fees and expenses more than three years after the year(s) in which the fees and expense were incurred. The Adviser may not discontinue this waiver prior to August 31, 2017, without the approval by the Fund’s Board of Trustees. Ratios as of the Prospectus dated August 31, 2016 and may differ from the ratios presented in the Financial Highlights. |
| Semi-Annual Report | October 31, 2016 | 19 |
| Emerald Banking and Finance Fund | Manager Commentary |
| October 31, 2016 (Unaudited) |
| † | The Russell 2000® Index measures the performance of the small-cap segment of the U.S. equity universe. The Russell 2000® is a subset of the Russell 3000® Index representing approximately 10% of the total market capitalization of that index. It includes approximately 2000 of the smallest securities based on a combination of their market cap and current index membership. The index is not actively managed and does not reflect any deductions for fees, expenses or taxes. An investor may not invest directly into an index. |
| †† | The Russell 2000® Financial Services TR Index is comprised of the smallest financial services companies in the Russell 3000 Index. The Index is not actively managed and does not reflect any deductions for fees, expense, or taxes. An investor may not invest directly in the Index. |
Important Risks
A fund that concentrates in a particular industry will involve a greater degree of risk than a fund with a more diversified portfolio. Investing in smaller companies generally will present greater investment risks, including: greater price volatility, greater sensitivity to changing economic conditions and less liquidity than the securities of larger, more mature companies.
| 20 | www.emeraldmutualfunds.com |
| Emerald Banking and Finance Fund | Manager Commentary |
| October 31, 2016 (Unaudited) |
GROWTH OF $10,000 INVESTMENT IN THE FUND (for the period ended October 31, 2016)
Comparison of change in value of a $10,000 investment (includes applicable sales loads)
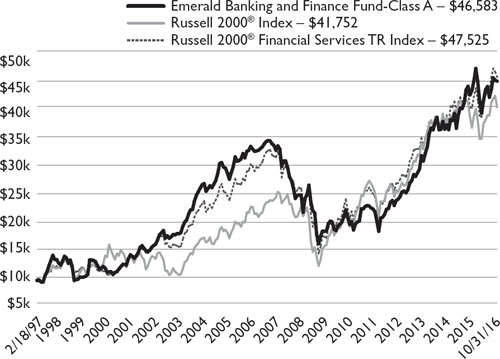
The chart represents historical performance of a hypothetical investment of $10,000 in the Fund since inception. Past performance does not guarantee future results. This chart does not reflect the deduction of taxes that a shareholder would pay on Fund distributions or the redemption of Fund shares.
Investing in the Fund is subject to investment risks, including possible loss of the principal amount invested.
| Semi-Annual Report | October 31, 2016 | 21 |
| Emerald Funds | Disclosure of Fund Expenses |
| October 31, 2016 (Unaudited) |
As a shareholder of the Funds, you incur two types of costs: (1) transaction costs, including applicable sales charges (loads); and (2) ongoing costs, including management fees, distribution and service (12b‐1) fees, shareholder services fees and other Fund expenses. This example is intended to help you understand your ongoing costs (in dollars) of investing in the Funds and to compare these costs with the ongoing costs of investing in other mutual funds. The example is based on an investment of $1,000 invested at the beginning of the (six‐month) period and held for the entire period May 1, 2016 through October 31, 2016.
Actual Expenses
The first line for each share class of the Fund in the table below provides information about actual account values and actual expenses. You may use this information, together with the amount you invested, to estimate the expenses that you paid over the period. Simply divide your account value by $1,000 (for example, an $8,600 account value divided by $1,000 = 8.6), then multiply the result by the number in the applicable line under the heading titled “Expenses Paid During Period” to estimate the expenses you paid on your account during this period.
Hypothetical Example For Comparison Purposes
The second line for each share class of each Fund in the table below provides information about hypothetical account values and hypothetical expenses based on the Fund’s actual expense ratio and an assumed rate of return of 5% per year before expenses, which is not the Fund’s actual return. The hypothetical account values and expenses may not be used to estimate the actual ending account balance or expenses you paid for the period. You may use this information to compare the ongoing costs of investing in the Funds and other funds. To do so, compare this 5% hypothetical example with the 5% hypothetical examples that appear in the shareholder reports of other mutual funds.
Please note that the expenses shown in the table below are meant to highlight your ongoing costs only and do not reflect any transactional costs, such as sales charges (loads), redemption fees or exchange fees. Therefore, the second line for each share class of the Fund within the table is useful in comparing ongoing costs only, and will not help you determine the relative total costs of owning different funds. If these transactional costs were included, your costs would have been higher.
| 22 | www.emeraldmutualfunds.com |
| Emerald Funds | Disclosure of Fund Expenses |
October 31, 2016 (Unaudited)
Beginning Account Value 05/01/16 | Ending Account Value 10/31/16 | Expense Ratio(a) | Expense Paid During Period 5/01/16 - 10/31/16(b) | |
| Emerald Growth Fund | ||||
| Class A | ||||
| Actual | $1,000.00 | $1,058.20 | 1.10% | $5.71 |
| Hypothetical (5% return before expenses) | $1,000.00 | $1,019.66 | 1.10% | $5.60 |
| Class C | ||||
| Actual | $1,000.00 | $1,055.50 | 1.75% | $9.07 |
| Hypothetical (5% return before expenses) | $1,000.00 | $1,016.38 | 1.75% | $8.89 |
| Institutional Class | ||||
| Actual | $1,000.00 | $1,060.40 | 0.79% | $4.10 |
| Hypothetical (5% return before expenses) | $1,000.00 | $1,021.22 | 0.79% | $4.02 |
| Investor Class | ||||
| Actual | $1,000.00 | $1,058.40 | 1.14% | $5.91 |
| Hypothetical (5% return before expenses) | $1,000.00 | $1,019.46 | 1.14% | $5.80 |
| Emerald Small Cap Value Fund | ||||
| Class A | ||||
| Actual | $1,000.00 | $1,031.50 | 1.35% | $6.91 |
| Hypothetical (5% return before expenses) | $1,000.00 | $1,018.40 | 1.35% | $6.87 |
| Class C | ||||
| Actual | $1,000.00 | $1,027.80 | 2.00% | $10.22 |
| Hypothetical (5% return before expenses) | $1,000.00 | $1,015.12 | 2.00% | $10.16 |
| Institutional Class | ||||
| Actual | $1,000.00 | $1,033.00 | 1.00% | $5.12 |
| Hypothetical (5% return before expenses) | $1,000.00 | $1,020.16 | 1.00% | $5.09 |
| Investor Class | ||||
| Actual | $1,000.00 | $1,031.60 | 1.25% | $6.40 |
| Hypothetical (5% return before expenses) | $1,000.00 | $1,018.90 | 1.25% | $6.36 |
| Emerald Insights Fund | ||||
| Class A | ||||
| Actual | $1,000.00 | $1,032.00 | 1.35% | $6.91 |
| Hypothetical (5% return before expenses) | $1,000.00 | $1,018.40 | 1.35% | $6.87 |
| Class C | ||||
| Actual | $1,000.00 | $1,029.30 | 2.00% | $10.23 |
| Hypothetical (5% return before expenses) | $1,000.00 | $1,015.12 | 2.00% | $10.16 |
| Institutional Class | ||||
| Actual | $1,000.00 | $1,033.90 | 1.05% | $5.38 |
| Hypothetical (5% return before expenses) | $1,000.00 | $1,019.91 | 1.05% | $5.35 |
| Investor Class | ||||
| Actual | $1,000.00 | $1,032.10 | 1.40% | $7.17 |
| Hypothetical (5% return before expenses) | $1,000.00 | $1,018.15 | 1.40% | $7.12 |
| Semi-Annual Report | October 31, 2016 | 23 |
| Emerald Funds | Disclosure of Fund Expenses |
October 31, 2016 (Unaudited)
| Emerald Banking and Finance Fund | ||||
| Class A | ||||
| Actual | $1,000.00 | $1,035.50 | 1.47% | $7.54 |
| Hypothetical (5% return before expenses) | $1,000.00 | $1,017.80 | 1.47% | $7.48 |
| Class C | ||||
| Actual | $1,000.00 | $1,032.30 | 2.12% | $10.86 |
| Hypothetical (5% return before expenses) | $1,000.00 | $1,014.52 | 2.12% | $10.76 |
| Institutional Class | ||||
| Actual | $1,000.00 | $1,036.90 | 1.17% | $6.01 |
| Hypothetical (5% return before expenses) | $1,000.00 | $1,019.31 | 1.17% | $5.96 |
| Investor Class | ||||
| Actual | $1,000.00 | $1,035.10 | 1.52% | $7.80 |
| Hypothetical (5% return before expenses) | $1,000.00 | $1,017.54 | 1.52% | $7.73 |
| (a) | The Fund's expense ratios have been based on the Fund's most recent fiscal half-year expenses. |
| (b) | Expenses are equal to the Fund's annualized expense ratio multiplied by the average account value over the period, multiplied by the number of days in the most recent fiscal half-year (184)/365 (to reflect the half-year period). |
| 24 | www.emeraldmutualfunds.com |
| Emerald Growth Fund | Schedule of Investments |
October 31, 2016 (Unaudited)
| Shares | Value (Note 2) | ||||||
| COMMON STOCKS: 97.48% | |||||||
| Consumer Discretionary: 21.58% | |||||||
| 558,780 | American Eagle Outfitters, Inc. | $ | 9,521,611 | ||||
| 173,712 | Burlington Stores, Inc.(a) | 13,017,977 | |||||
| 131,468 | Camping World Holdings, Inc., Class A(a) | 2,939,624 | |||||
| 1,299,906 | Chegg, Inc.(a) | 8,644,375 | |||||
| 80,951 | Churchill Downs, Inc. | 11,009,336 | |||||
| 132,625 | Chuy's Holdings, Inc.(a) | 3,766,550 | |||||
| 58,972 | Dave & Buster's Entertainment, Inc.(a) | 2,438,492 | |||||
| 275,020 | Fitbit, Inc., Class A(a) | 3,646,765 | |||||
| 223,492 | Five Below, Inc.(a) | 8,398,829 | |||||
| 52,760 | Hibbett Sports, Inc.(a) | 2,049,726 | |||||
| 180,510 | IMAX Corp.(a) | 5,460,428 | |||||
| 130,736 | Jack in the Box, Inc. | 12,253,885 | |||||
| 251,320 | Kate Spade & Co.(a) | 4,209,610 | |||||
| 410,040 | Kona Grill, Inc.(a) | 4,407,930 | |||||
| 304,623 | Marcus Corp. | 8,072,510 | |||||
| 293,353 | MarineMax, Inc.(a) | 5,852,392 | |||||
| 172,848 | Matthews International Corp., Class A | 10,353,595 | |||||
| 56,926 | Meritage Homes Corp.(a) | 1,761,860 | |||||
| 188,149 | Nexstar Broadcasting Group, Inc., Class A | 9,181,671 | |||||
| 313,522 | NutriSystem, Inc. | 9,938,647 | |||||
| 286,182 | Ollie's Bargain Outlet Holdings, Inc.(a) | 7,827,078 | |||||
| 513,550 | Penn National Gaming, Inc.(a) | 6,640,202 | |||||
| 340,589 | Planet Fitness, Inc., Class A(a) | 7,220,487 | |||||
| 55,628 | Red Robin Gourmet Burgers, Inc.(a) | 2,558,888 | |||||
| 858,984 | Sequential Brands Group, Inc.(a) | 6,184,685 | |||||
| 327,435 | Steven Madden Ltd.(a) | 10,936,329 | |||||
| 460,803 | Tile Shop Holdings, Inc.(a) | 7,810,611 | |||||
| 385,958 | Tilly's, Inc., Class A(a) | 3,581,690 | |||||
| 219,190 | Urban Outfitters, Inc.(a) | 7,331,906 | |||||
| 197,017,689 | |||||||
| Energy: 1.88% | |||||||
| 562,487 | Callon Petroleum Co.(a) | 7,306,706 | |||||
| 107,610 | Extraction Oil & Gas, Inc.(a) | 2,298,550 | |||||
| 141,571 | Matador Resources Co.(a) | 3,087,664 | |||||
| 204,082 | Rice Energy, Inc.(a) | 4,508,171 | |||||
| 17,201,091 | |||||||
| Financial Services: 13.19% | |||||||
| 74,807 | Atlas Financial Holdings, Inc.(a) | 1,282,940 | |||||
| 444,575 | Bank of the Ozarks, Inc. | 16,431,492 | |||||
| 567,894 | Bofl Holding, Inc.(a) | 10,579,865 | |||||
| 564,475 | CareTrust REIT, Inc. | 7,947,808 | |||||
| 162,924 | Customers Bancorp, Inc.(a) | 4,410,353 | |||||
| 87,396 | CyrusOne, Inc., REIT | 3,898,736 | |||||
| 181,782 | Education Realty Trust, Inc., REIT | 7,742,095 | |||||
| 243,527 | FCB Financial Holdings, Inc., Class A(a) | 9,083,557 | |||||
| 122,502 | First Choice Bank(a) | 1,929,406 | |||||
| Shares | Value (Note 2) | ||||||
| Financial Services (continued) | |||||||
| 235,810 | Global Medical REIT, Inc. | $ | 2,299,147 | ||||
| 148,203 | Howard Bancorp, Inc.(a) | 2,022,971 | |||||
| 142,835 | LendingTree, Inc.(a) | 11,405,375 | |||||
| 306,432 | Live Oak Bancshares, Inc. | 4,887,590 | |||||
| 189,520 | MedEquities Realty Trust, Inc., REIT(a) | 2,196,537 | |||||
| 144,926 | National Commerce Corp.(a) | 4,101,406 | |||||
| 405,180 | Opus Bank | 8,123,859 | |||||
| 278,556 | Pacific Premier Bancorp, Inc.(a) | 7,200,673 | |||||
| 251,198 | QTS Realty Trust, Inc., REIT, Class A | 11,545,060 | |||||
| 238,165 | Virtu Financial, Inc., Class A | 3,048,512 | |||||
| 9,694 | Walker & Dunlop, Inc.(a) | 233,335 | |||||
| 120,370,717 | |||||||
| Health Care: 17.37% | |||||||
| 345,958 | Adamas Pharmaceuticals, Inc.(a) | 4,753,463 | |||||
| 225,783 | Aimmune Therapeutics, Inc.(a) | 3,675,747 | |||||
| 258,633 | Albany Molecular Research, Inc.(a) | 4,032,088 | |||||
| 203,577 | Alder Biopharmaceuticals, Inc.(a) | 4,936,742 | |||||
| 689,848 | Amicus Therapeutics, Inc.(a) | 4,759,951 | |||||
| 196,562 | Applied Genetic Technologies Corp.(a) | 1,405,418 | |||||
| 280,917 | AtriCure, Inc.(a) | 5,123,926 | |||||
| 200,000 | AxoGen, Inc.(a) | 1,770,000 | |||||
| 189,624 | Bluebird Bio, Inc.(a) | 9,054,546 | |||||
| 75,003 | Cantel Medical Corp. | 5,342,464 | |||||
| 519,410 | Exelixis, Inc.(a) | 5,500,552 | |||||
| 516,842 | Insmed, Inc.(a) | 6,708,609 | |||||
| 214,722 | Integer Holdings Corp.(a) | 4,734,620 | |||||
| 37,682 | Intercept Pharmaceuticals, Inc.(a) | 4,662,771 | |||||
| 84,687 | Intrexon Corp.(a) | 2,210,331 | |||||
| 443,454 | K2M Group Holdings, Inc.(a) | 7,569,760 | |||||
| 198,252 | MacroGenics, Inc.(a) | 4,696,590 | |||||
| 338,454 | NantHealth, Inc.(a) | 4,443,901 | |||||
| 354,849 | NeoGenomics, Inc.(a) | 2,860,083 | |||||
| 143,921 | Neurocrine Biosciences, Inc.(a) | 6,299,422 | |||||
| 231,212 | Novan, Inc.(a) | 4,855,452 | |||||
| 44,793 | Omnicell, Inc.(a) | 1,461,372 | |||||
| 27,470 | Ophthotech Corp.(a) | 983,975 | |||||
| 413,878 | Portola Pharmaceuticals, Inc.(a) | 7,524,302 | |||||
| 119,301 | Reata Pharmaceuticals, Inc., Class A(a) | 2,700,975 | |||||
| 170,345 | Sarepta Therapeutics, Inc.(a) | 6,684,338 | |||||
| 129,090 | Tabula Rasa HealthCare, Inc.(a) | 1,512,935 | |||||
| 304,582 | Teladoc, Inc.(a) | 4,949,457 | |||||
| 157,118 | Ultragenyx Pharmaceutical, Inc.(a) | 9,268,391 | |||||
| 620,436 | Veeva Systems, Inc., Class A(a) | 24,103,939 | |||||
| 158,586,120 | |||||||
| Materials & Processing: 7.84% | |||||||
| 392,055 | Apogee Enterprises, Inc. | 15,976,241 | |||||
| 93,930 | Berry Plastics Group, Inc.(a) | 4,109,438 | |||||
| 292,710 | GMS, Inc.(a) | 6,082,514 | |||||
| 496,973 | Headwaters, Inc.(a) | 8,150,357 | |||||
| 435,435 | Installed Building Products, Inc.(a) | 14,391,127 | |||||
| Semi-Annual Report | October 31, 2016 | 25 |
| Emerald Growth Fund | Schedule of Investments |
October 31, 2016 (Unaudited)
| Shares | Value (Note 2) | ||||||
| Materials & Processing (continued) | |||||||
| 167,977 | Masonite International Corp.(a) | $ | 9,557,891 | ||||
| 247,598 | Trex Co., Inc.(a) | 13,323,248 | |||||
| 71,590,816 | |||||||
| Producer Durables: 7.20% | |||||||
| 40,000 | AquaVenture Holdings Ltd.(a) | 849,200 | |||||
| 47,752 | Blue Bird Corp.(a) | 704,342 | |||||
| 117,990 | Dycom Industries, Inc.(a) | 9,076,971 | |||||
| 196,763 | Generac Holdings, Inc.(a) | 7,494,703 | |||||
| 138,183 | KLX, Inc.(a) | 4,756,259 | |||||
| 336,190 | Knoll, Inc. | 7,275,152 | |||||
| 267,780 | Spirit Airlines, Inc.(a) | 12,834,695 | |||||
| 58,847 | Team, Inc.(a) | 1,809,545 | |||||
| 128,365 | Tennant Co. | 8,080,577 | |||||
| 77,323 | Tetra Tech, Inc. | 2,973,069 | |||||
| 517,342 | Tutor Perini Corp.(a) | 9,855,365 | |||||
| 65,709,878 | |||||||
| Technology: 23.67% | |||||||
| 308,061 | Alarm.com Holdings, Inc.(a) | 8,989,220 | |||||
| 222,080 | Applied Optoelectronics, Inc.(a) | 4,270,598 | |||||
| 24,280 | Apptio, Inc., Class A(a) | 479,044 | |||||
| 25,000 | Blackline, Inc.(a) | 568,750 | |||||
| 213,462 | Cavium, Inc.(a) | 12,049,930 | |||||
| 289,476 | ChannelAdvisor Corp.(a) | 3,184,236 | |||||
| 490,502 | Ciena Corp.(a) | 9,505,929 | |||||
| 228,629 | comScore, Inc.(a) | 6,582,229 | |||||
| 219,434 | Cornerstone OnDemand, Inc.(a) | 9,062,624 | |||||
| 62,740 | Ellie Mae, Inc.(a) | 6,643,539 | |||||
| 215,379 | EPAM Systems, Inc.(a) | 13,863,946 | |||||
| 129,515 | Gigamon, Inc.(a) | 7,162,179 | |||||
| 456,824 | GTT Communications, Inc.(a) | 10,278,540 | |||||
| 148,119 | Guidewire Software, Inc.(a) | 8,509,437 | |||||
| 101,327 | Imperva, Inc.(a) | 3,738,966 | |||||
| 50,834 | Inphi Corp.(a) | 1,885,941 | |||||
| 75,635 | IPG Photonics Corp.(a) | 7,337,351 | |||||
| 294,238 | Lumentum Holdings, Inc.(a) | 9,886,397 | |||||
| 144,239 | MACOM Technology Solutions Holdings, Inc.(a) | 5,302,226 | |||||
| 315,300 | Mercury Systems, Inc.(a) | 8,759,034 | |||||
| 401,917 | Microsemi Corp.(a) | 16,932,763 | |||||
| 83,938 | MicroStrategy, Inc., Class A(a) | 16,351,962 | |||||
| 311,360 | Model N, Inc.(a) | 3,207,008 | |||||
| 166,903 | Proofpoint, Inc.(a) | 13,081,857 | |||||
| 82,500 | Quantenna Communications, Inc.(a) | 1,235,850 | |||||
| 221,026 | Reis, Inc. | 4,343,161 | |||||
| 201,533 | Sigma Designs, Inc.(a) | 1,471,191 | |||||
| 74,132 | Synchronoss Technologies, Inc.(a) | 2,721,386 | |||||
| 209,160 | Take-Two Interactive Software, Inc.(a) | 9,284,612 | |||||
| 321,028 | Telenav, Inc.(a) | 1,749,603 | |||||
| 165,273 | Varonis Systems, Inc.(a) | 4,718,544 | |||||
| Shares | Value (Note 2) | ||||||
| Technology (continued) | |||||||
| 230,773 | Xactly Corp.(a) | $ | 2,976,972 | ||||
| 216,135,025 | |||||||
| Utilities: 4.75% | |||||||
| 1,192,146 | 8x8, Inc.(a) | 16,988,080 | |||||
| 195,143 | Cogent Communications Holdings, Inc. | 7,200,777 | |||||
| 2,790,105 | Vonage Holdings Corp.(a) | 19,140,120 | |||||
| 43,328,977 | |||||||
Total Common Stocks (Cost $821,851,889) | 889,940,313 | ||||||
| SHORT TERM INVESTMENTS: 2.04% | |||||||
| 18,587,093 | Dreyfus Government Cash Management Fund - Institutional Class 0.278% (7-Day Yield) | 18,587,093 | |||||
Total Short Term Investments (Cost $18,587,093) | 18,587,093 | ||||||
Total Investments: 99.52% (Cost $840,438,982) | 908,527,406 | ||||||
| Other Assets In Excess Of Liabilities: 0.48% | 4,408,303 | ||||||
| Net Assets: 100.00% | $ | 912,935,709 | |||||
| (a) | Non-income producing security. |
For Fund compliance purposes, the Fund's industry classifications refer to any one or more of the industry sub-classifications used by one or more widely recognized market indexes or ratings group indexes, and/or as defined by Fund management. This definition may not apply for purposes of this report, which may combine industry sub-classifications for reporting ease. Industries are shown as a percentage of net assets.
See Notes to Financial Statements.
| 26 | www.emeraldmutualfunds.com |
| Emerald Small Cap Value Fund | Schedule of Investments |
October 31, 2016 (Unaudited)
| Shares | Value (Note 2) | ||||||
| COMMON STOCKS: 95.77% | |||||||
| Consumer Discretionary: 14.43% | |||||||
| 3,812 | Big Lots, Inc. | $ | 165,441 | ||||
| 8,183 | Camping World Holdings, Inc., Class A(a) | 182,972 | |||||
| 19,614 | Carriage Services, Inc. | 463,675 | |||||
| 47,222 | Gray Television, Inc.(a) | 420,276 | |||||
| 21,268 | ILG, Inc. | 348,370 | |||||
| 14,591 | Viad Corp. | 605,526 | |||||
| 42,600 | ZAGG, Inc.(a) | 276,900 | |||||
| 2,463,160 | |||||||
| Energy: 1.02% | |||||||
| 42,366 | Jones Energy, Inc., Class A(a) | 173,701 | |||||
| Financial Services: 34.71% | |||||||
| 68,095 | Cedar Realty Trust, Inc., REIT | 461,003 | |||||
| 18,646 | Corporate Office Properties Trust, REIT | 497,662 | |||||
| 11,493 | CyrusOne, Inc., REIT | 512,703 | |||||
| 11,703 | Employers Holdings, Inc. | 366,889 | |||||
| 192,434 | Everi Holdings, Inc.(a) | 386,792 | |||||
| 18,443 | First Financial Bancorp | 396,525 | |||||
| 19,036 | First Merchants Corp. | 535,863 | |||||
| 16,531 | Great Western Bancorp, Inc. | 532,959 | |||||
| 16,980 | Live Oak Bancshares, Inc. | 270,831 | |||||
| 4,539 | Meta Financial Group, Inc. | 332,482 | |||||
| 12,687 | OceanFirst Financial Corp. | 262,367 | |||||
| 21,074 | Provident Financial Services, Inc. | 478,169 | |||||
| 25,316 | Ramco-Gershenson Properties Trust, REIT | 438,979 | |||||
| 3,692 | SVB Financial Group(a) | 451,421 | |||||
| 5,924,645 | |||||||
| Materials & Processing: 7.56% | |||||||
| 14,348 | Builders FirstSource, Inc.(a) | 138,745 | |||||
| 11,506 | Koppers Holdings, Inc.(a) | 376,822 | |||||
| 62,195 | Mercer International, Inc. | 491,340 | |||||
| 16,034 | NN, Inc. | 283,000 | |||||
| 1,289,907 | |||||||
| Producer Durables: 14.46% | |||||||
| 7,692 | Cubic Corp. | 328,448 | |||||
| 21,750 | Ducommun, Inc.(a) | 414,120 | |||||
| 8,679 | EMCOR Group, Inc. | 524,732 | |||||
| 12,039 | Generac Holdings, Inc.(a) | 458,566 | |||||
| 6,242 | ICF International, Inc.(a) | 289,629 | |||||
| 15,885 | MasTec, Inc.(a) | 453,517 | |||||
| 2,469,012 | |||||||
| Technology: 17.55% | |||||||
| 18,988 | ARRIS International PLC(a) | 527,487 | |||||
| 14,156 | Microsemi Corp.(a) | 596,392 | |||||
| 24,805 | Perficient, Inc.(a) | 461,621 | |||||
| 23,117 | Rudolph Technologies, Inc.(a) | 418,418 | |||||
| Shares | Value (Note 2) | ||||||
| Technology (continued) | |||||||
| 7,894 | Synaptics, Inc.(a) | $ | 411,435 | ||||
| 15,141 | Web.com Group, Inc.(a) | 243,770 | |||||
| 61,287 | Xcerra Corp.(a) | 337,691 | |||||
| 2,996,814 | |||||||
| Utilities: 6.04% | |||||||
| 91,792 | Vonage Holdings Corp.(a) | 629,693 | |||||
| 20,365 | West Corp. | 401,598 | |||||
| 1,031,291 | |||||||
Total Common Stocks (Cost $14,426,384) | 16,348,530 | ||||||
| SHORT TERM INVESTMENTS: 3.64% | |||||||
| 622,098 | Dreyfus Government Cash Management Fund - Institutional Class 0.278% (7-Day Yield) | 622,098 | |||||
Total Short Term Investments (Cost $622,098) | 622,098 | ||||||
Total Investments: 99.41% (Cost $15,048,482) | 16,970,628 | ||||||
| Other Assets In Excess Of Liabilities: 0.59% | 101,292 | ||||||
| Net Assets: 100.00% | $ | 17,071,920 | |||||
| (a) | Non-income producing security. |
For Fund compliance purposes, the Fund's industry classifications refer to any one or more of the industry sub-classifications used by one or more widely recognized market indexes or ratings group indexes, and/or as defined by Fund management. This definition may not apply for purposes of this report, which may combine industry sub-classifications for reporting ease. Industries are shown as a percentage of net assets.
See Notes to Financial Statements.
| Semi-Annual Report | October 31, 2016 | 27 |
| Emerald Insights Fund | Schedule of Investments |
October 31, 2016 (Unaudited)
| Shares | Value (Note 2) | ||||||
| COMMON STOCKS: 95.14% | |||||||
| Consumer Discretionary: 24.34% | |||||||
| 1,853 | Brunswick Corp. | $ | 80,605 | ||||
| 5,818 | Cinemark Holdings, Inc. | 231,556 | |||||
| 1,710 | Dick's Sporting Goods, Inc. | 95,162 | |||||
| 1,552 | Dollar General Corp. | 107,228 | |||||
| 12,216 | Fitbit, Inc., Class A(a) | 161,984 | |||||
| 1,616 | Five Below, Inc.(a) | 60,729 | |||||
| 3,205 | Foot Locker, Inc. | 213,998 | |||||
| 4,071 | Hilton Worldwide Holdings, Inc. | 92,005 | |||||
| 8,253 | IMAX Corp.(a) | 249,653 | |||||
| 1,612 | Jack in the Box, Inc. | 151,093 | |||||
| 5,548 | Kate Spade & Co.(a) | 92,929 | |||||
| 606 | Lululemon Athletica, Inc.(a) | 34,694 | |||||
| 7,105 | MGM Resorts International(a) | 185,938 | |||||
| 218 | O'Reilly Automotive, Inc.(a) | 57,648 | |||||
| 1,969 | Ross Stores, Inc. | 123,141 | |||||
| 830 | Royal Caribbean Cruises Ltd. | 63,802 | |||||
| 1,534 | Signet Jewelers Ltd. | 124,653 | |||||
| 3,775 | Six Flags Entertainment Corp. | 210,079 | |||||
| 1,870 | Thor Industries, Inc. | 148,310 | |||||
| 3,938 | Toll Brothers, Inc.(a) | 108,059 | |||||
| 569 | Ulta Salon Cosmetics & Fragrance, Inc.(a) | 138,460 | |||||
| 3,001 | Under Armour, Inc., Class A(a) | 93,331 | |||||
| 2,105 | Under Armour, Inc., Class C(a) | 54,435 | |||||
| 2,879,492 | |||||||
| Consumer Staples: 3.09% | |||||||
| 1,379 | ConAgra Foods, Inc. | 66,440 | |||||
| 2,347 | Hain Celestial Group, Inc.(a) | 85,360 | |||||
| 1,476 | Monster Beverage Corp.(a) | 213,046 | |||||
| 364,846 | |||||||
| Energy: 4.39% | |||||||
| 1,702 | Anadarko Petroleum Corp. | 101,167 | |||||
| 3,195 | Cabot Oil & Gas Corp. | 66,711 | |||||
| 1,755 | Diamondback Energy, Inc.(a) | 160,214 | |||||
| 2,690 | Extraction Oil & Gas, Inc.(a) | 57,458 | |||||
| 2,840 | Rice Energy, Inc.(a) | 62,736 | |||||
| 2,119 | SM Energy Co. | 71,262 | |||||
| 519,548 | |||||||
| Financial Services: 12.50% | |||||||
| 1,451 | Affiliated Managers Group, Inc.(a) | 192,490 | |||||
| 1,066 | Alliance Data Systems Corp.(a) | 217,965 | |||||
| 3,934 | Bank of the Ozarks, Inc. | 145,401 | |||||
| 3,469 | CubeSmart, REIT | 90,437 | |||||
| 322 | Equinix, Inc., REIT | 115,044 | |||||
| 684 | Mid-America Apartment Communities, Inc., REIT | 63,441 | |||||
| 2,156 | PacWest Bancorp | 93,549 | |||||
| 826 | PayPal Holdings, Inc.(a) | 34,411 | |||||
| 2,259 | S&P Global, Inc. | 275,259 | |||||
| Shares | Value (Note 2) | ||||||
| Financial Services (continued) | |||||||
| 2,053 | SVB Financial Group(a) | $ | 251,020 | ||||
| 1,479,017 | |||||||
| �� | |||||||
| Health Care: 11.60% | |||||||
| 1,711 | Abbott Laboratories | 67,140 | |||||
| 1,068 | Acadia Healthcare Co., Inc.(a) | 38,405 | |||||
| 2,179 | Alnylam Pharmaceuticals, Inc.(a) | 77,572 | |||||
| 2,960 | Bluebird Bio, Inc.(a) | 141,340 | |||||
| 5,281 | Catalent, Inc.(a) | 120,459 | |||||
| 575 | Edwards Lifesciences Corp.(a) | 54,751 | |||||
| 2,574 | Incyte Corp. Ltd.(a) | 223,861 | |||||
| 4,898 | Intrexon Corp.(a) | 127,838 | |||||
| 1,686 | Sarepta Therapeutics, Inc.(a) | 66,159 | |||||
| 1,608 | VCA, Inc.(a) | 98,828 | |||||
| 5,885 | Veeva Systems, Inc., Class A(a) | 228,632 | |||||
| 306 | WellCare Health Plans, Inc.(a) | 34,734 | |||||
| 754 | West Pharmaceutical Services, Inc. | 57,327 | |||||
| 332 | Zimmer Biomet Holdings, Inc. | 34,993 | |||||
| 1,372,039 | |||||||
| Materials & Processing: 6.73% | |||||||
| 562 | Acuity Brands, Inc. | 125,646 | |||||
| 3,321 | Axalta Coating Systems Ltd.(a) | 83,424 | |||||
| 2,660 | Berry Plastics Group, Inc.(a) | 116,375 | |||||
| 4,061 | Crown Holdings, Inc.(a) | 220,309 | |||||
| 2,967 | Masco Corp. | 91,621 | |||||
| 1,400 | Vulcan Materials Co. | 158,480 | |||||
| 795,855 | |||||||
| Producer Durables: 10.15% | |||||||
| 574 | Carlisle Cos., Inc. | 60,184 | |||||
| 2,460 | Dycom Industries, Inc.(a) | 189,248 | |||||
| 2,910 | Korn/Ferry International | 59,335 | |||||
| 2,101 | Middleby Corp.(a) | 235,543 | |||||
| 1,062 | Snap-on, Inc. | 163,654 | |||||
| 6,241 | Southwest Airlines Co. | 249,952 | |||||
| 3,142 | Wabtec Corp. | 242,908 | |||||
| 1,200,824 | |||||||
| Technology: 22.34% | |||||||
| 3,779 | Activision Blizzard, Inc. | 163,139 | |||||
| 7,045 | ARRIS International PLC(a) | 195,710 | |||||
| 1,119 | Broadcom Ltd. | 190,543 | |||||
| 2,931 | Cavium, Inc.(a) | 165,455 | |||||
| 1,424 | Electronic Arts, Inc.(a) | 111,812 | |||||
| 957 | Ellie Mae, Inc.(a) | 101,337 | |||||
| 1,861 | Intuit, Inc. | 202,365 | |||||
| 1,687 | NVIDIA Corp. | 120,047 | |||||
| 12,658 | ON Semiconductor Corp.(a) | 147,719 | |||||
| 1,484 | Palo Alto Networks, Inc.(a) | 228,284 | |||||
| 2,972 | Proofpoint, Inc.(a) | 232,945 | |||||
| 1,911 | SBA Communications Corp., Class A(a) | 216,478 | |||||
| 28 | www.emeraldmutualfunds.com |
| Emerald Insights Fund | Schedule of Investments |
October 31, 2016 (Unaudited)
| Shares | Value (Note 2) | ||||||
| Technology (continued) | |||||||
| 2,238 | ServiceNow, Inc.(a) | $ | 196,743 | ||||
| 2,727 | Skyworks Solutions, Inc. | 209,815 | |||||
| 6,320 | VeriFone Systems, Inc.(a) | 97,834 | |||||
| 22,339 | Zynga, Inc., Class A(a) | 62,773 | |||||
| 2,642,999 | |||||||
Total Common Stocks (Cost $10,707,372) | 11,254,620 | ||||||
| MASTER LIMITED PARTNERSHIPS: 0.85% | |||||||
| Financial Services: 0.85% | |||||||
| 2,750 | Lazard Ltd., Class A | 100,265 | |||||
Total Master Limited Partnerships (Cost $92,034) | 100,265 | ||||||
| SHORT TERM INVESTMENTS: 5.00% | |||||||
| 592,088 | Dreyfus Government Cash Management Fund - Institutional Class 0.278% (7-Day Yield) | 592,088 | |||||
Total Short Term Investments (Cost $592,088) | 592,088 | ||||||
Total Investments: 100.99% (Cost $11,391,494) | 11,946,973 | ||||||
| Liabilities In Excess Of Other Assets: (0.99)% | (117,438 | ) | |||||
| Net Assets: 100.00% | $ | 11,829,535 | |||||
(a) | Non-income producing security. |
For Fund compliance purposes, the Fund's industry classifications refer to any one or more of the industry sub-classifications used by one or more widely recognized market indexes or ratings group indexes, and/or as defined by Fund management. This definition may not apply for purposes of this report, which may combine industry sub-classifications for reporting ease. Industries are shown as a percentage of net assets.
See Notes to Financial Statements.
| Semi-Annual Report | October 31, 2016 | 29 |
| Emerald Banking and Finance Fund | Schedule of Investments |
October 31, 2016 (Unaudited)
| Shares | Value (Note 2) | ||||||
| COMMON STOCKS: 98.35% | |||||||
| Financial Services: 98.03% | |||||||
| Banks: Diversified: 77.92% | |||||||
| 100,000 | 1st Source Corp. | $ | 3,456,000 | ||||
| 55,280 | Access National Corp. | 1,302,950 | |||||
| 27,340 | Alerus Financial Corp. | 453,844 | |||||
| 53,798 | American Business Bank(a) | 1,566,867 | |||||
| 80,000 | American Riviera Bank(a) | 958,000 | |||||
| 171,237 | Ameris Bancorp | 6,215,903 | |||||
| 314,286 | Bank of the Ozarks, Inc. | 11,616,011 | |||||
| 171,605 | BNC Bancorp | 4,272,964 | |||||
| 225,409 | Bridge Bancorp, Inc. | 6,210,018 | |||||
| 125,000 | Capstar Financial Holdings, Inc.(a) | 2,125,000 | |||||
| 16,094 | Cardinal Financial Corp. | 422,950 | |||||
| 203,323 | CenterState Banks, Inc. | 3,798,074 | |||||
| 51,319 | Civista Bancshares, Inc. | 756,442 | |||||
| 30,402 | CNB Financial Corp. | 594,359 | |||||
| 17,052 | Commerce Union Bancshares, Inc. | 345,474 | |||||
| 167,349 | ConnectOne Bancorp, Inc. | 3,070,854 | |||||
| 922 | Consumers Bancorp, Inc. | 15,443 | |||||
| 32,124 | CU Bancorp(a) | 754,914 | |||||
| 190,303 | Customers Bancorp, Inc.(a) | 5,151,502 | |||||
| 167,748 | Eagle Bancorp, Inc.(a) | 8,244,814 | |||||
| 228,773 | Equity Bancshares, Inc., Class A(a) | 5,954,961 | |||||
| 86,853 | Farmers National Banc Corp. | 911,956 | |||||
| 191,017 | FCB Financial Holdings, Inc., Class A(a) | 7,124,934 | |||||
| 188,963 | First Bank(a) | 1,691,219 | |||||
| 36,040 | First Busey Corp. | 832,884 | |||||
| 119,800 | First Business Financial Services, Inc. | 2,258,230 | |||||
| 163,498 | First Choice Bank(a) | 2,575,093 | |||||
| 20,280 | First Financial Bankshares, Inc. | 734,136 | |||||
| 142,037 | First Foundation, Inc.(a) | 3,513,995 | |||||
| 38,966 | First of Long Island Corp. | 1,244,964 | |||||
| 170,772 | Franklin Financial Network, Inc.(a) | 5,567,167 | |||||
| 246,394 | Freedom Bank of Virginia(a) | 2,285,304 | |||||
| 63,620 | FVC Bankcorp, Inc.(a) | 1,047,821 | |||||
| 169,868 | Gold Coast Bank(a) | 1,810,793 | |||||
| 21,985 | Great Western Bancorp, Inc. | 708,796 | |||||
| 61,496 | Green Bancorp, Inc.(a) | 636,484 | |||||
| 22,506 | Guaranty Bancorp | 427,614 | |||||
| 138,670 | Heritage Commerce Corp. | 1,504,570 | |||||
| 440,592 | Home BancShares, Inc. | 9,477,134 | |||||
| 16,003 | HopFed Bancorp, Inc. | 182,114 | |||||
| 114,296 | Howard Bancorp, Inc.(a) | 1,560,140 | |||||
| 10,720 | IBERIABANK Corp. | 703,768 | |||||
| 15,250 | Independent Bank Corp. | 841,038 | |||||
| 50,000 | Independent Bank Corporation | 840,000 | |||||
| 15,731 | Independent Bank Group, Inc. | 759,807 | |||||
| 60,120 | John Marshall Bank(a) | 1,052,100 | |||||
| 65,781 | Lakeland Bancorp, Inc. | 930,801 | |||||
| 46,615 | Lakeland Financial Corp. | 1,717,297 | |||||
| 220,060 | Live Oak Bancshares, Inc. | 3,509,957 | |||||
| 44,420 | MainSource Financial Group, Inc. | 1,108,723 | |||||
| Shares | Value (Note 2) | ||||||
| Banks: Diversified (continued) | |||||||
| 259,003 | Malvern Bancorp, Inc.(a) | $ | 4,584,353 | ||||
| 30 | Mechanics Bank(a) | 945,000 | |||||
| 87,881 | Mercantile Bank Corp. | 2,418,485 | |||||
| 45,870 | Meridian Bancorp, Inc. | 731,627 | |||||
| 239,209 | National Commerce Corp.(a) | 6,769,615 | |||||
| 48,060 | Nicolet Bankshares, Inc.(a) | 1,862,806 | |||||
| 224 | Oak Valley Bancorp | 2,352 | |||||
| 87,388 | Old Line Bancshares, Inc. | 1,720,233 | |||||
| 31,762 | Opus Bank | 636,828 | |||||
| 60,410 | Pacific Mercantile Bancorp(a) | 338,296 | |||||
| 169,325 | Pacific Premier Bancorp, Inc.(a) | 4,377,051 | |||||
| 151,362 | PacWest Bancorp | 6,567,597 | |||||
| 75,493 | Paragon Commercial Corp.(a) | 2,908,745 | |||||
| 133,412 | Pinnacle Financial Partners, Inc. | 6,884,059 | |||||
| 32,250 | PrivateBancorp, Inc. | 1,458,990 | |||||
| 89,430 | Puget Sound Bancorp, Inc.(a) | 1,580,228 | |||||
| 44,800 | QCR Holdings, Inc. | 1,456,000 | |||||
| 45,042 | Renasant Corp. | 1,519,717 | |||||
| 481,505 | Royal Bancshares of Pennsylvania, Inc., Class A(a) | 1,251,913 | |||||
| 62,200 | Seacoast Commerce Banc Holdings | 1,034,075 | |||||
| 128,065 | ServisFirst Bancshares, Inc. | 6,933,439 | |||||
| 71,512 | Signature Bank(a) | 8,621,487 | |||||
| 66,236 | Simmons First National Corp., Class A | 3,268,747 | |||||
| 46,032 | Southern First Bancshares, Inc.(a) | 1,222,150 | |||||
| 20,598 | Southern National Bancorp of Virginia, Inc. | 270,246 | |||||
| 129,815 | Stonegate Bank | 4,496,792 | |||||
| 111,196 | SVB Financial Group(a) | 13,595,935 | |||||
| 25,740 | Texas Capital Bancshares, Inc.(a) | 1,526,382 | |||||
| 1,716 | The National Capital Bank of Washington(a) | 291,720 | |||||
| 39,610 | Triumph Bancorp, Inc.(a) | 736,746 | |||||
| 18,300 | United Bankshares, Inc. | 689,910 | |||||
| 68,750 | Unity Bancorp, Inc. | 845,625 | |||||
| 187,675 | WashingtonFirst Bankshares, Inc. | 4,588,654 | |||||
| 106,242 | West Town Bank & Trust(a) | 2,417,006 | |||||
| 108,804 | Western Alliance Bancorp(a) | 4,064,917 | |||||
| 55,594 | Yadkin Financial Corp. | 1,542,178 | |||||
| 229,006,087 | |||||||
| Banks: Savings, Thrift & Mortgage Lending: 10.76% | |||||||
| 225,594 | Atlantic Coast Financial Corp.(a) | 1,448,313 | |||||
| 105,020 | Bofl Holding, Inc.(a) | 1,956,523 | |||||
| 125,475 | First Resource Bank(a) | 920,986 | |||||
| 82,750 | Flushing Financial Corp. | 1,772,505 | |||||
| 103,401 | Heritage Financial Corp. | 1,902,578 | |||||
| 11,680 | Home Bancorp, Inc. | 335,333 | |||||
| 18,520 | Home Federal Bancorp, Inc. | 443,184 | |||||
| 44,970 | LegacyTexas Financial Group, Inc. | 1,538,424 | |||||
| 120,788 | Meta Financial Group, Inc. | 8,847,721 | |||||
| 182,919 | OceanFirst Financial Corp. | 3,782,765 | |||||
| 45,843 | Sterling Bancorp | 825,174 | |||||
| 30 | www.emeraldmutualfunds.com |
| Emerald Banking and Finance Fund | Schedule of Investments |
October 31, 2016 (Unaudited)
| Shares | Value (Note 2) | ||||||
| Banks: Savings, Thrift & Mortgage Lending (continued) | |||||||
| 49,746 | Sunshine Bancorp, Inc.(a) | $ | 718,581 | ||||
| 30,940 | Sussex Bancorp | 515,151 | |||||
| 40,000 | Waterstone Financial, Inc. | 678,000 | |||||
| 169,608 | WSFS Financial Corp. | 5,944,760 | |||||
| 31,629,998 | |||||||
| Commercial Banks: 2.12% | |||||||
| 30,814 | County Bancorp, Inc. | 607,036 | |||||
| 157,712 | Investar Holding Corp. | 2,562,820 | |||||
| 15,773 | Mid Penn Bancorp, Inc. | 291,800 | |||||
| 175,683 | Professional Holding Corp.(a) | 2,239,958 | |||||
| 30,517 | Veritex Holdings, Inc.(a) | 538,015 | |||||
| 6,239,629 | |||||||
| Consumer Lending: 1.80% | |||||||
| 66,381 | LendingTree, Inc.(a) | 5,300,523 | |||||
| Diversified Financial Services: 0.26% | |||||||
| 25,908 | MidWestOne Financial Group, Inc. | 753,405 | |||||
| Financial Data & Services: 0.26% | |||||||
| 21,920 | Blackhawk Network Holdings, Inc.(a) | 755,144 | |||||
| Insurance: 0.64% | |||||||
| 50,000 | James River Group Holdings Ltd. | 1,882,000 | |||||
| Insurance: Property-Casualty: 1.39% | |||||||
| 25,460 | Atlas Financial Holdings, Inc.(a) | 436,639 | |||||
| 40,000 | Federated National Holdings Co. | 716,400 | |||||
| 31,190 | Hilltop Holdings, Inc.(a) | 770,393 | |||||
| 47,570 | Kinsale Capital Group, Inc. | 1,144,058 | |||||
| 75,340 | NMI Holdings, Inc., Class A(a) | 576,351 | |||||
| 31,441 | United Insurance Holdings Corp. | 455,895 | |||||
| 4,099,736 | |||||||
| Real Estate Investment Trusts (REITs): 2.54% | |||||||
| 28,070 | American Campus Communities, Inc., REIT | 1,462,728 | |||||
| 49,360 | Education Realty Trust, Inc., REIT | 2,102,242 | |||||
| 92,800 | Independence Realty Trust, Inc., REIT | 773,024 | |||||
| 260,480 | MedEquities Realty Trust, Inc., REIT(a) | 3,018,963 | |||||
| 8,100 | Whitestone REIT | 107,730 | |||||
| 7,464,687 | |||||||
| Real Estate Management & Development: 0.05% | |||||||
| 5,740 | Marcus & Millichap, Inc.(a) | 134,488 | |||||
| Securities Brokerage & Services: 0.29% | |||||||
| 65,456 | Virtu Financial, Inc., Class A | 837,837 | |||||
| Shares | Value (Note 2) | ||||||
| Technology: 0.32% | |||||||
| Computer Services Software & Systems: 0.32% | |||||||
| 95,633 | Bankrate, Inc.(a) | $ | 745,938 | ||||
| 5,000 | Black Knight Financial Services, Inc., Class A(a) | 196,750 | |||||
| 942,688 | |||||||
Total Common Stocks (Cost $233,650,009) | 289,046,222 | ||||||
| SHORT TERM INVESTMENTS: 1.88% | |||||||
| 5,516,629 | Dreyfus Government Cash Management Fund - Institutional Class 0.278% (7-Day Yield) | 5,516,629 | |||||
Total Short Term Investments (Cost $5,516,629) | 5,516,629 | ||||||
Total Investments: 100.23% (Cost $239,166,638) | 294,562,851 | ||||||
| Liabilities In Excess Of Other Assets: (0.23)% | (671,082 | ) | |||||
| Net Assets: 100.00% | $ | 293,891,769 | |||||
(a) | Non-income producing security. |
For Fund compliance purposes, the Fund's industry classifications refer to any one or more of the industry sub-classifications used by one or more widely recognized market indexes or ratings group indexes, and/or as defined by Fund management. This definition may not apply for purposes of this report, which may combine industry sub-classifications for reporting ease. Industries are shown as a percentage of net assets.
See Notes to Financial Statements.
| Semi-Annual Report | October 31, 2016 | 31 |
| Emerald Funds | Statements of Assets and Liabilities |
October 31, 2016 (Unaudited)
Emerald Growth Fund | Emerald Small Cap Value Fund | Emerald Insights Fund | Emerald Banking and Finance Fund | |||||||||||||
| ASSETS: | ||||||||||||||||
| Investments, at value | $ | 908,527,406 | $ | 16,970,628 | $ | 11,946,973 | $ | 294,562,851 | ||||||||
| Receivable for investments sold | 10,115,316 | 263,217 | 53,018 | 1,120,539 | ||||||||||||
| Receivable for shares sold | 9,168,755 | 91,564 | – | 545,140 | ||||||||||||
| Interest and dividends receivable | 118,228 | 5 | 2,366 | 92,462 | ||||||||||||
| Other assets | 53,801 | 32,807 | 29,802 | 34,140 | ||||||||||||
| Total Assets | 927,983,506 | 17,358,221 | 12,032,159 | 296,355,132 | ||||||||||||
| LIABILITIES: | ||||||||||||||||
| Payable for investments purchased | 4,506,034 | 157,961 | 170,514 | 1,280,250 | ||||||||||||
| Payable for shares redeemed | 9,596,317 | 98,711 | 4,504 | 665,155 | ||||||||||||
| Investment advisory fees payable | 491,209 | 5,103 | 435 | 232,414 | ||||||||||||
| Payable to fund accounting and administration | 39,002 | 1,768 | 1,622 | 13,371 | ||||||||||||
| Payable for distribution and service fees | 296,575 | 1,025 | 4,744 | 209,085 | ||||||||||||
| Payable for trustee fees and expenses | 5,992 | 43 | 85 | 1,975 | ||||||||||||
| Payable for transfer agency fees | 43,896 | 2,259 | 2,764 | 23,653 | ||||||||||||
| Payable for chief compliance officer fee | 3,729 | 47 | 60 | 1,520 | ||||||||||||
| Payable for principal financial officer fee | 619 | 4 | 10 | 253 | ||||||||||||
| Payable for professional fees | 13,579 | 12,763 | 11,425 | 11,625 | ||||||||||||
| Accrued expenses and other liabilities | 50,845 | 6,617 | 6,461 | 24,062 | ||||||||||||
| Total Liabilities | 15,047,797 | 286,301 | 202,624 | 2,463,363 | ||||||||||||
| NET ASSETS | $ | 912,935,709 | $ | 17,071,920 | $ | 11,829,535 | $ | 293,891,769 | ||||||||
| NET ASSETS CONSIST OF: | ||||||||||||||||
| Paid‐in capital (Note 5) | $ | 909,380,377 | $ | 15,945,085 | $ | 12,456,001 | $ | 252,570,960 | ||||||||
| Accumulated net investment income/(loss) | (4,299,811 | ) | 25,785 | (59,682 | ) | (922,498 | ) | |||||||||
| Accumulated net realized loss | (60,233,281 | ) | (821,096 | ) | (1,122,263 | ) | (13,152,906 | ) | ||||||||
| Net unrealized appreciation | 68,088,424 | 1,922,146 | 555,479 | 55,396,213 | ||||||||||||
| NET ASSETS | $ | 912,935,709 | $ | 17,071,920 | $ | 11,829,535 | $ | 293,891,769 | ||||||||
| INVESTMENTS, AT COST | $ | 840,438,982 | $ | 15,048,482 | $ | 11,391,494 | $ | 239,166,638 | ||||||||
| PRICING OF SHARES | ||||||||||||||||
Class A: (a) | ||||||||||||||||
| Net Asset Value, offering and redemption price per share | $ | 18.54 | $ | 13.41 | $ | 10.00 | $ | 32.38 | ||||||||
| Net Assets | $ | 284,505,406 | $ | 451,282 | $ | 10,308,035 | $ | 97,610,207 | ||||||||
| Shares of beneficial interest outstanding | 15,341,539 | 33,663 | 1,030,373 | 3,014,954 | ||||||||||||
| Maximum offering price per share (NAV/.9525, based on maximum sales charge of 4.75% of the offering price) | $ | 19.47 | $ | 14.07 | $ | 10.50 | $ | 33.99 | ||||||||
Class C: (a) | ||||||||||||||||
| Net Asset Value, offering and redemption price per share | $ | 15.98 | $ | 13.30 | $ | 9.84 | $ | 29.11 | ||||||||
| Net Assets | $ | 36,892,579 | $ | 619,686 | $ | 98,364 | $ | 52,535,597 | ||||||||
| Shares of beneficial interest outstanding | 2,308,602 | 46,580 | 9,993 | 1,804,904 | ||||||||||||
| Institutional Class: | ||||||||||||||||
| Net Asset Value, offering and redemption price per share | $ | 19.13 | $ | 13.45 | $ | 10.06 | $ | 32.86 | ||||||||
| Net Assets | $ | 486,536,387 | $ | 14,506,210 | $ | 1,327,622 | $ | 63,758,195 | ||||||||
| Shares of beneficial interest outstanding | 25,427,628 | 1,078,401 | 131,988 | 1,940,224 | ||||||||||||
| Investor Class: | ||||||||||||||||
| Net Asset Value, offering and redemption price per share | $ | 18.48 | $ | 13.39 | $ | 9.98 | $ | 31.00 | ||||||||
| Net Assets | $ | 105,001,337 | $ | 1,494,742 | $ | 95,514 | $ | 79,987,770 | ||||||||
| Shares of beneficial interest outstanding | 5,681,748 | 111,622 | 9,573 | 2,580,146 | ||||||||||||
| (a) | Redemption price per share may be reduced for any applicable contingent deferred sales charge. For a description of a possible sales charge, please see the Funds' Prospectus. |
See Notes to Financial Statements
| 32 | www.emeraldmutualfunds.com |
| Emerald Funds | Statements of Operations |
For the Six Months or Period Ended October 31, 2016 (Unaudited)
Emerald Growth Fund | Emerald Small Cap Value Fund | Emerald Insights Fund | Emerald Banking and Finance Fund | |||||||||||||
| INVESTMENT INCOME: | ||||||||||||||||
| Dividends | 2,318,836 | 127,026 | 45,557 | 1,637,011 | ||||||||||||
| Foreign taxes withheld | – | (2,945 | ) | (58 | ) | – | ||||||||||
| Total Investment Income | 2,318,836 | 124,081 | 45,499 | 1,637,011 | ||||||||||||
| EXPENSES: | ||||||||||||||||
| Investment advisory fee (Note 6) | 2,911,529 | 64,818 | 48,377 | 1,371,739 | ||||||||||||
| Administration fee | 217,950 | 4,777 | 5,054 | 69,144 | ||||||||||||
| Custodian fee | 43,412 | 2,528 | 2,528 | 17,564 | ||||||||||||
| Professional fees | 21,732 | 8,741 | 9,073 | 15,111 | ||||||||||||
| Transfer agent fee | 162,438 | 14,627 | 16,705 | 83,005 | ||||||||||||
| Trustee fees and expenses | 13,514 | 216 | 189 | 4,416 | ||||||||||||
| Registration/filing fees | 98,679 | 23,651 | 21,158 | 47,761 | ||||||||||||
| Reports to shareholder and printing fees | 46,662 | 1,688 | 961 | 17,275 | ||||||||||||
| Distribution and service fees | ||||||||||||||||
| Class A | 563,253 | 686 | 19,649 | 181,074 | ||||||||||||
| Class C | 210,153 | 3,085 | 513 | 261,772 | ||||||||||||
| Institutional Class | 120,494 | – | 370 | 15,406 | ||||||||||||
| Investor Class | 224,151 | 2,240 | 182 | 152,360 | ||||||||||||
| Chief compliance officer fee | 22,448 | 385 | 314 | 7,209 | ||||||||||||
| Principal financial officer fee | 3,739 | 60 | 53 | 1,201 | ||||||||||||
| Other | 21,237 | 3,571 | 3,818 | 9,260 | ||||||||||||
| Total expenses before waiver | 4,681,391 | 131,073 | 128,944 | 2,254,297 | ||||||||||||
| Less fees waived/reimbursed by investment advisor (Note 6) | – | (38,626 | ) | (43,662 | ) | – | ||||||||||
| Total Net Expenses | 4,681,391 | 92,447 | 85,282 | 2,254,297 | ||||||||||||
| NET INVESTMENT INCOME/(LOSS): | (2,362,555 | ) | 31,634 | (39,783 | ) | (617,286 | ) | |||||||||
| REALIZED AND UNREALIZED GAIN/(LOSS) | ||||||||||||||||
| Net realized loss | (13,673,679 | ) | (29,532 | ) | (731 | ) | (402,918 | ) | ||||||||
| Net change in unrealized appreciation | 70,722,063 | 544,010 | 494,650 | 10,182,643 | ||||||||||||
| NET REALIZED AND UNREALIZED GAIN | 57,048,384 | 514,478 | 493,919 | 9,779,725 | ||||||||||||
| NET INCREASE IN NET ASSETS RESULTING FROM OPERATIONS | $ | 54,685,829 | $ | 546,112 | $ | 454,136 | $ | 9,162,439 | ||||||||
See Notes to Financial Statements.
| Semi-Annual Report | October 31, 2016 | 33 |
| Emerald Growth Fund | Statements of Changes in Net Assets |
For the Six Months Ended October 31, 2016 (Unaudited) | Year Ended April 30, 2016 | |||||||
| OPERATIONS: | ||||||||
| Net investment loss | $ | (2,362,555 | ) | $ | (5,189,508 | ) | ||
| Net realized loss | (13,673,679 | ) | (45,883,891 | ) | ||||
| Net change in unrealized appreciation/(depreciation) | 70,722,063 | (70,373,366 | ) | |||||
| Net increase/(decrease) in net assets resulting from operations | 54,685,829 | (121,446,765 | ) | |||||
| DISTRIBUTIONS TO SHAREHOLDERS (NOTE 3): | ||||||||
| From net realized gains | ||||||||
| Class A | – | (8,925,260 | ) | |||||
| Class C | – | (1,239,080 | ) | |||||
| Institutional Class | – | (9,080,768 | ) | |||||
| Investor Class | – | (3,291,011 | ) | |||||
| Net decrease in net assets from distributions | – | (22,536,119 | ) | |||||
| SHARE TRANSACTIONS (NOTE 5): | ||||||||
| Class A | ||||||||
| Proceeds from sale of shares | 26,317,301 | 381,182,773 | ||||||
| Issued to shareholders in reinvestment of distributions | – | 8,212,776 | ||||||
| Cost of shares redeemed | (85,708,646 | ) | (133,632,331 | ) | ||||
| Net increase/(decrease) from share transactions | (59,391,345 | ) | 255,763,218 | |||||
| Class C | ||||||||
| Proceeds from sale of shares | 357,636 | 38,113,416 | ||||||
| Issued to shareholders in reinvestment of distributions | – | 1,010,353 | ||||||
| Cost of shares redeemed | (7,999,419 | ) | (4,668,547 | ) | ||||
| Net increase/(decrease) from share transactions | (7,641,783 | ) | 34,455,222 | |||||
| Institutional Class | ||||||||
| Proceeds from sale of shares | 78,718,692 | 461,582,646 | ||||||
| Issued to shareholders in reinvestment of distributions | – | 8,228,820 | ||||||
| Cost of shares redeemed | (70,944,550 | ) | (133,394,758 | ) | ||||
| Net increase from share transactions | 7,774,142 | 336,416,708 | ||||||
| Investor Class | ||||||||
| Proceeds from sale of shares | 16,633,329 | 171,962,946 | ||||||
| Issued to shareholders in reinvestment of distributions | – | 2,169,384 | ||||||
| Cost of shares redeemed | (30,518,124 | ) | (62,270,391 | ) | ||||
| Net increase/(decrease) from share transactions | (13,884,795 | ) | 111,861,939 | |||||
| Net increase/(decrease) in net assets | $ | (18,457,952 | ) | $ | 594,514,203 | |||
| NET ASSETS: | ||||||||
| Beginning of period | 931,393,661 | 336,879,458 | ||||||
| End of period (including accumulated net investment loss of $(4,299,811) and $(1,937,256)) | $ | 912,935,709 | $ | 931,393,661 | ||||
| 34 | www.emeraldmutualfunds.com |
| Emerald Growth Fund | Statements of Changes in Net Assets |
For the Six Months Ended October 31, 2016 (Unaudited) | Year Ended April 30, 2016 | |||||||
| Other Information: | ||||||||
| SHARE TRANSACTIONS: | ||||||||
| Class A | ||||||||
| Sold | 1,415,759 | 19,174,156 | ||||||
| Distributions reinvested | – | 443,454 | ||||||
| Redeemed | (4,549,811 | ) | (7,327,683 | ) | ||||
| Net increase/(decrease) in shares outstanding | (3,134,052 | ) | 12,289,927 | |||||
| Class C | ||||||||
| Sold | 22,150 | 2,128,222 | ||||||
| Distributions reinvested | – | 62,950 | ||||||
| Redeemed | (492,051 | ) | (295,110 | ) | ||||
| Net increase/(decrease) in shares outstanding | (469,901 | ) | 1,896,062 | |||||
| Institutional Class | ||||||||
| Sold | 4,063,444 | 23,158,775 | ||||||
| Distributions reinvested | – | 431,732 | ||||||
| Redeemed | (3,750,736 | ) | (6,952,343 | ) | ||||
| Net increase in shares outstanding | 312,708 | 16,638,164 | ||||||
| Investor Class | ||||||||
| Sold | 892,478 | 8,581,157 | ||||||
| Distributions reinvested | – | 117,518 | ||||||
| Redeemed | (1,655,865 | ) | (3,431,264 | ) | ||||
| Net increase/(decrease) in shares outstanding | (763,387 | ) | 5,267,411 | |||||
See Notes to Financial Statements.
| Semi-Annual Report | October 31, 2016 | 35 |
| Emerald Small Cap Value Fund | Statements of Changes in Net Assets |
For the Six Months Ended October 31, 2016 (Unaudited) | For the Period October 1, 2015 to April 30, 2016(a) | Year Ended September 30, 2015 | ||||||||||
| OPERATIONS: | ||||||||||||
| Net investment income/(loss) | $ | 31,634 | $ | (9,086 | ) | $ | 81,815 | |||||
| Net realized gain/(loss) | (29,532 | ) | 205,540 | (997,104 | ) | |||||||
| Net change in unrealized appreciation | 544,010 | 243,735 | 1,168,742 | |||||||||
| Net increase in net assets resulting from operations | 546,112 | 440,189 | 253,453 | |||||||||
| DISTRIBUTIONS TO SHAREHOLDERS (NOTE 3): | ||||||||||||
| From net investment income | ||||||||||||
| Class A | – | (55 | ) | – | ||||||||
| Class C | – | (31 | ) | – | ||||||||
| Institutional Class | – | (78,137 | ) | (76,689 | ) | |||||||
| Investor Class | – | (3,585 | ) | (1,619 | ) | |||||||
| From net realized gains | ||||||||||||
| Class A | – | – | (405 | ) | ||||||||
| Class C | – | – | (405 | ) | ||||||||
| Institutional Class | – | – | (505,155 | ) | ||||||||
| Investor Class | – | – | (11,254 | ) | ||||||||
| Net decrease in net assets from distributions | – | (81,807 | ) | (595,527 | ) | |||||||
| SHARE TRANSACTIONS (NOTE 5): | ||||||||||||
Class A (b) | ||||||||||||
| Proceeds from sale of shares | 115,814 | 327,544 | 15,000 | |||||||||
| Issued to shareholders in reinvestment of distributions | – | 55 | 405 | |||||||||
| Cost of shares redeemed | (13,298 | ) | – | – | ||||||||
| Net increase from share transactions | 102,516 | 327,599 | 15,405 | |||||||||
Class C (c) | ||||||||||||
| Proceeds from sale of shares | 40,000 | 554,859 | 15,000 | |||||||||
| Issued to shareholders in reinvestment of distributions | – | 31 | 405 | |||||||||
| Cost of shares redeemed | (2,874 | ) | – | – | ||||||||
| Net increase from share transactions | 37,126 | 554,891 | 15,405 | |||||||||
| Institutional Class | ||||||||||||
| Proceeds from sale of shares | 511,904 | 631,324 | 3,861,703 | |||||||||
| Issued to shareholders in reinvestment of distributions | – | 64,940 | 483,048 | |||||||||
| Cost of shares redeemed | (153,555 | ) | (3,833,338 | ) | (11,838,177 | ) | ||||||
| Net increase/(decrease) from share transactions | 358,349 | (3,137,074 | ) | (7,493,426 | ) | |||||||
| Investor Class | ||||||||||||
| Proceeds from sale of shares | 156,862 | 1,660,183 | 83,181 | |||||||||
| Issued to shareholders in reinvestment of distributions | – | 3,585 | 12,813 | |||||||||
| Cost of shares redeemed | (672,054 | ) | (158,757 | ) | (173,977 | ) | ||||||
| Net increase/(decrease) from share transactions | (515,192 | ) | 1,505,011 | (77,983 | ) | |||||||
| Net increase/(decrease) in net assets | $ | 528,911 | $ | (391,193 | ) | $ | (7,882,673 | ) | ||||
| NET ASSETS: | ||||||||||||
| Beginning of period | 16,543,009 | 16,934,202 | 24,816,875 | |||||||||
| End of period (including accumulated net investment income/(loss) of $25,785, $(5,849) and $81,801) | $ | 17,071,920 | $ | 16,543,009 | $ | 16,934,202 | ||||||
| 36 | www.emeraldmutualfunds.com |
| Emerald Small Cap Value Fund | Statements of Changes in Net Assets |
For the Six Months Ended October 31, 2016 (Unaudited) | For the Period October 1, 2015 to April 30, 2016(a) | Year Ended September 30, 2015 | ||||||||||
| Other Information: | ||||||||||||
| SHARE TRANSACTIONS: | ||||||||||||
Class A (b) | ||||||||||||
| Sold | 8,523 | 25,051 | 1,063 | |||||||||
| Distributions reinvested | – | 4 | 30 | |||||||||
| Redeemed | (1,009 | ) | – | – | ||||||||
| Net increase in shares outstanding | 7,514 | 25,055 | 1,093 | |||||||||
Class C (c) | ||||||||||||
| Sold | 3,068 | 42,635 | 1,063 | |||||||||
| Distributions reinvested | – | 2 | 30 | |||||||||
| Redeemed | (218 | ) | – | – | ||||||||
| Net increase in shares outstanding | 2,850 | 42,637 | 1,093 | |||||||||
| Institutional Class | ||||||||||||
| Sold | 38,504 | 49,075 | 289,259 | |||||||||
| Distributions reinvested | – | 5,138 | 36,038 | |||||||||
| Redeemed | (11,480 | ) | (301,180 | ) | (934,159 | ) | ||||||
| Net increase/(decrease) in shares outstanding | 27,024 | (246,967 | ) | (608,862 | ) | |||||||
| Investor Class | ||||||||||||
| Sold | 11,855 | 132,087 | 6,169 | |||||||||
| Distributions reinvested | – | 284 | 959 | |||||||||
| Redeemed | (50,144 | ) | (13,942 | ) | (12,883 | ) | ||||||
| Net increase/(decrease) in shares outstanding | (38,289 | ) | 118,429 | (5,755 | ) | |||||||
| (a) | Effective March 3, 2015 the Board approved changing the fiscal year-end of the Fund from September 30 to April 30. |
| (b) | Class A commenced operations on June 30, 2015. |
| (c) | Class C commenced operations on June 30, 2015. |
| Semi-Annual Report | October 31, 2016 | 37 |
| Emerald Insights Fund | Statements of Changes in Net Assets |
For the Six Months Ended October 31, 2016 (Unaudited) | Year Ended April 30, 2016 | |||||||
| OPERATIONS: | ||||||||
| Net investment loss | $ | (39,783 | ) | $ | (60,421 | ) | ||
| Net realized loss | (731 | ) | (991,477 | ) | ||||
| Net change in unrealized appreciation/(depreciation) on investments | 494,650 | (608,622 | ) | |||||
| Net increase/(decrease) in net assets resulting from operations | 454,136 | (1,660,520 | ) | |||||
| SHARE TRANSACTIONS (NOTE 5): | ||||||||
| Class A | ||||||||
| Proceeds from sale of shares | 288,944 | 7,019,638 | ||||||
| Cost of shares redeemed | (1,767,739 | ) | (644,531 | ) | ||||
| Net increase/(decrease) from share transactions | (1,478,795 | ) | 6,375,107 | |||||
| Class C | ||||||||
| Proceeds from sale of shares | – | 90,586 | ||||||
| Cost of shares redeemed | (5,340 | ) | (7,964 | ) | ||||
| Net increase/(decrease) from share transactions | (5,340 | ) | 82,622 | |||||
| Institutional Class | ||||||||
| Proceeds from sale of shares | 47,178 | 1,476,544 | ||||||
| Cost of shares redeemed | (497,652 | ) | (108,493 | ) | ||||
| Net increase/(decrease) from share transactions | (450,474 | ) | 1,368,051 | |||||
| Investor Class | ||||||||
| Proceeds from sale of shares | 11,500 | 980,954 | ||||||
| Cost of shares redeemed | (4,700 | ) | (1,089,191 | ) | ||||
| Net increase/(decrease) from share transactions | 6,800 | (108,237 | ) | |||||
| Net increase/(decrease) in net assets | $ | (1,473,673 | ) | $ | 6,057,023 | |||
| NET ASSETS: | ||||||||
| Beginning of period | 13,303,208 | 7,246,185 | ||||||
| End of period (including accumulated net investment loss of $(59,682) and $(19,899)) | $ | 11,829,535 | $ | 13,303,208 | ||||
| Other Information: | ||||||||
| SHARE TRANSACTIONS: | ||||||||
| Class A | ||||||||
| Sold | 28,605 | 648,075 | ||||||
| Redeemed | (173,698 | ) | (63,986 | ) | ||||
| Net increase/(decrease) in shares outstanding | (145,093 | ) | 584,089 | |||||
| Class C | ||||||||
| Sold | – | 8,833 | ||||||
| Redeemed | (520 | ) | (777 | ) | ||||
| Net increase/(decrease) in shares outstanding | (520 | ) | 8,056 | |||||
| Institutional Class | ||||||||
| Sold | 4,829 | 163,820 | ||||||
| Redeemed | (50,555 | ) | (11,482 | ) | ||||
| Net increase/(decrease) in shares outstanding | (45,726 | ) | 152,338 | |||||
| Investor Class | ||||||||
| Sold | 1,157 | 89,665 | ||||||
| Redeemed | (484 | ) | (121,592 | ) | ||||
| Net increase/(decrease) in shares outstanding | 673 | (31,927 | ) | |||||
See Notes to Financial Statements.
| 38 | www.emeraldmutualfunds.com |
| Emerald Banking and Finance Fund | Statements of Changes in Net Assets |
For the Six Months Ended October 31, 2016 (Unaudited) | Year Ended April 30, 2016 | |||||||
| OPERATIONS: | ||||||||
| Net investment loss | $ | (617,286 | ) | $ | (703,999 | ) | ||
| Net realized loss | (402,918 | ) | (9,446,349 | ) | ||||
| Net change in unrealized appreciation | 10,182,643 | 9,022,785 | ||||||
| Net increase/(decrease) in net assets resulting from operations | 9,162,439 | (1,127,563 | ) | |||||
| SHARE TRANSACTIONS (NOTE 5): | ||||||||
| Class A | ||||||||
| Proceeds from sale of shares | 9,178,006 | 139,134,278 | ||||||
| Cost of shares redeemed | (25,493,074 | ) | (75,700,736 | ) | ||||
| Net increase/(decrease) from share transactions | (16,315,068 | ) | 63,433,542 | |||||
| Class C | ||||||||
| Proceeds from sale of shares | 3,905,230 | 23,271,396 | ||||||
| Cost of shares redeemed | (5,310,223 | ) | (4,636,338 | ) | ||||
| Net increase/(decrease) from share transactions | (1,404,993 | ) | 18,635,058 | |||||
| Institutional Class | ||||||||
| Proceeds from sale of shares | 8,816,571 | 56,443,883 | ||||||
| Cost of shares redeemed | (8,713,645 | ) | (19,778,965 | ) | ||||
| Net increase from share transactions | 102,926 | 36,664,918 | ||||||
| Investor Class | ||||||||
| Proceeds from sale of shares | 21,510,060 | 112,489,510 | ||||||
| Cost of shares redeemed | (24,188,679 | ) | (56,677,531 | ) | ||||
| Net increase/(decrease) from share transactions | (2,678,619 | ) | 55,811,979 | |||||
| Net increase/(decrease) in net assets | $ | (11,133,315 | ) | $ | 173,417,934 | |||
| NET ASSETS: | ||||||||
| Beginning of period | 305,025,084 | 131,607,150 | ||||||
| End of period (including accumulated net investment loss of $(922,498) and $(305,212)) | $ | 293,891,769 | $ | 305,025,084 | ||||
| Other Information: | ||||||||
| SHARE TRANSACTIONS: | ||||||||
| Class A | ||||||||
| Sold | 293,053 | 4,379,264 | ||||||
| Redeemed | (815,512 | ) | (2,525,433 | ) | ||||
| Net increase/(decrease) in shares outstanding | (522,459 | ) | 1,853,831 | |||||
| Class C | ||||||||
| Sold | 135,696 | 809,825 | ||||||
| Redeemed | (187,590 | ) | (169,473 | ) | ||||
| Net increase/(decrease) in shares outstanding | (51,894 | ) | 640,352 | |||||
| Institutional Class | ||||||||
| Sold | 275,917 | 1,770,911 | ||||||
| Redeemed | (281,398 | ) | (639,328 | ) | ||||
| Net increase/(decrease) in shares outstanding | (5,481 | ) | 1,131,583 | |||||
| Investor Class | ||||||||
| Sold | 706,589 | 3,679,872 | ||||||
| Redeemed | (811,315 | ) | (1,987,638 | ) | ||||
| Net increase/(decrease) in shares outstanding | (104,726 | ) | 1,692,234 | |||||
See Notes to Financial Statements.
| Semi-Annual Report | October 31, 2016 | 39 |
| Emerald Growth Fund | Financial Highlights |
For a share outstanding throughout the periods presented
| CLASS A | ||||||||||||||||||||||||||||
| For the Six Months Ended October 31, 2016 (Unaudited) | Year Ended April 30, 2016 | Year Ended April 30, 2015 | Year Ended April 30, 2014 | Year Ended April 30, 2013 | For the Period January 1, 2012 to April 30, 2012(a)(b) | Year Ended December 31, 2011 | ||||||||||||||||||||||
| NET ASSET VALUE, BEGINNING OF PERIOD | $ | 17.52 | $ | 20.02 | $ | 18.11 | $ | 15.60 | $ | 16.20 | $ | 13.37 | $ | 13.57 | ||||||||||||||
| INCOME/(LOSS) FROM OPERATIONS: | ||||||||||||||||||||||||||||
Net investment loss(c) | (0.06 | ) | (0.15 | ) | (0.18 | ) | (0.21 | ) | (0.15 | ) | (0.05 | ) | (0.14 | ) | ||||||||||||||
| Net realized and unrealized gain/(loss) on investments | 1.08 | (1.88 | ) | 3.43 | 4.33 | 1.40 | 2.88 | (0.06 | ) | |||||||||||||||||||
| Total from Investment Operations | 1.02 | (2.03 | ) | 3.25 | 4.12 | 1.25 | 2.83 | (0.20 | ) | |||||||||||||||||||
| LESS DISTRIBUTIONS: | ||||||||||||||||||||||||||||
| From capital gains | – | (0.47 | ) | (1.34 | ) | (1.61 | ) | (1.85 | ) | – | – | |||||||||||||||||
| Total Distributions | – | (0.47 | ) | (1.34 | ) | (1.61 | ) | (1.85 | ) | – | – | |||||||||||||||||
| NET INCREASE/(DECREASE) IN NET ASSET VALUE | 1.02 | (2.50 | ) | 1.91 | 2.51 | (0.60 | ) | 2.83 | (0.20 | ) | ||||||||||||||||||
| NET ASSET VALUE, END OF PERIOD | $ | 18.54 | $ | 17.52 | $ | 20.02 | $ | 18.11 | $ | 15.60 | $ | 16.20 | $ | 13.37 | ||||||||||||||
TOTAL RETURN(d) | 5.82 | %(e) | (10.28 | )% | 18.38 | % | 26.01 | % | 9.14 | % | 21.17 | %(e) | (1.47 | )% | ||||||||||||||
| RATIOS/SUPPLEMENTAL DATA: | ||||||||||||||||||||||||||||
| Net Assets, End of Period (000s) | $ | 284,505 | $ | 323,603 | $ | 123,828 | $ | 77,900 | $ | 46,605 | $ | 41,991 | $ | 37,008 | ||||||||||||||
| RATIOS TO AVERAGE NET ASSETS: | ||||||||||||||||||||||||||||
| Net Investment loss | (0.61 | )%(f) | (0.81 | )% | (0.93 | )% | (1.12 | )% | (1.01 | )% | (1.02 | )%(f) | (1.03 | )% | ||||||||||||||
| Operating expenses excluding reimbursement/waiver | 1.10 | %(f) | 1.17 | % | 1.29 | % | 1.31 | % | 1.38 | % | 1.36 | %(f) | 1.36 | % | ||||||||||||||
| Operating expenses including reimbursement/waiver | 1.10 | %(f) | 1.17 | % | 1.29 | % | 1.29 | % | 1.29 | % | 1.29 | %(f) | 1.29 | % | ||||||||||||||
| PORTFOLIO TURNOVER RATE | 30 | %(e) | 45 | % | 68 | % | 70 | % | 78 | % | 28 | %(e) | 75 | % | ||||||||||||||
| (a) | Prior to its March 16, 2012 reorganization with and into the Emerald Growth Fund, the Fund was known as the Forward Growth Fund. |
| (b) | Effective March 13, 2012 the Board approved changing the fiscal year-end of the Fund from December 31 to April 30. |
| (c) | Per share amounts are based upon average shares outstanding. |
| (d) | Total return does not reflect the effect of sales charges. |
| (e) | Not Annualized. |
| (f) | Annualized. |
See Notes to Financial Statements.
| 40 | www.emeraldmutualfunds.com |
| Emerald Growth Fund | Financial Highlights |
For a share outstanding throughout the periods presented
| CLASS C | ||||||||||||||||||||||||||||
| For the Six Months Ended October 31, 2016 (Unaudited) | Year Ended April 30, 2016 | Year Ended April 30, 2015 | Year Ended April 30, 2014 | Year Ended April 30, 2013 | For the Period January 1, 2012 to April 30, 2012(a)(b) | Year Ended December 31, 2011 | ||||||||||||||||||||||
| NET ASSET VALUE, BEGINNING OF PERIOD | $ | 15.14 | $ | 17.48 | $ | 16.07 | $ | 14.07 | $ | 14.89 | $ | 12.31 | $ | 12.58 | ||||||||||||||
| INCOME/(LOSS) FROM OPERATIONS: | ||||||||||||||||||||||||||||
Net investment loss(c) | (0.10 | ) | (0.24 | ) | (0.27 | ) | (0.30 | ) | (0.23 | ) | (0.08 | ) | (0.22 | ) | ||||||||||||||
| Net realized and unrealized gain/(loss) on investments | 0.94 | (1.63 | ) | 3.02 | 3.91 | 1.26 | 2.66 | (0.05 | ) | |||||||||||||||||||
| Total from Investment Operations | 0.84 | (1.87 | ) | 2.75 | 3.61 | 1.03 | 2.58 | (0.27 | ) | |||||||||||||||||||
| LESS DISTRIBUTIONS: | ||||||||||||||||||||||||||||
| From capital gains | – | (0.47 | ) | (1.34 | ) | (1.61 | ) | (1.85 | ) | – | – | |||||||||||||||||
| Total Distributions | – | (0.47 | ) | (1.34 | ) | (1.61 | ) | (1.85 | ) | – | – | |||||||||||||||||
| NET INCREASE/(DECREASE) IN NET ASSET VALUE | 0.84 | (2.34 | ) | 1.41 | 2.00 | (0.82 | ) | 2.58 | (0.27 | ) | ||||||||||||||||||
| NET ASSET VALUE, END OF PERIOD | $ | 15.98 | $ | 15.14 | $ | 17.48 | $ | 16.07 | $ | 14.07 | $ | 14.89 | $ | 12.31 | ||||||||||||||
TOTAL RETURN(d) | 5.55 | %(e) | (10.87 | )% | 17.58 | % | 25.19 | % | 8.43 | % | 20.96 | %(e) | (2.15 | )% | ||||||||||||||
| RATIOS/SUPPLEMENTAL DATA: | ||||||||||||||||||||||||||||
| Net Assets, End of Period (000s) | $ | 36,893 | $ | 42,075 | $ | 15,427 | $ | 11,645 | $ | 4,946 | $ | 3,026 | $ | 2,743 | ||||||||||||||
| RATIOS TO AVERAGE NET ASSETS: | ||||||||||||||||||||||||||||
| Net Investment loss | (1.26 | )%(f) | (1.46 | )% | (1.58 | )% | (1.77 | )% | (1.65 | )% | (1.67 | )%(f) | (1.68 | )% | ||||||||||||||
| Operating expenses excluding reimbursement/waiver | 1.75 | %(f) | 1.81 | % | 1.94 | % | 1.96 | % | 2.03 | % | 2.01 | %(f) | 2.01 | % | ||||||||||||||
| Operating expenses including reimbursement/waiver | 1.75 | %(f) | 1.81 | % | 1.94 | % | 1.94 | % | 1.94 | % | 1.94 | %(f) | 1.94 | % | ||||||||||||||
| PORTFOLIO TURNOVER RATE | 30 | %(e) | 45 | % | 68 | % | 70 | % | 78 | % | 28 | %(e) | 75 | % | ||||||||||||||
| (a) | Prior to its March 16, 2012 reorganization with and into the Emerald Growth Fund, the Fund was known as the Forward Growth Fund. |
| (b) | Effective March 13, 2012 the Board approved changing the fiscal year-end of the Fund from December 31 to April 30. |
| (c) | Per share amounts are based upon average shares outstanding. |
| (d) | Total return does not reflect the effect of sales charges. |
| (e) | Not Annualized. |
| (f) | Annualized. |
See Notes to Financial Statements.
| Semi-Annual Report | October 31, 2016 | 41 |
| Emerald Growth Fund | Financial Highlights |
For a share outstanding throughout the periods presented
| INSTITUTIONAL CLASS | ||||||||||||||||||||||||||||
| For the Six Months Ended October 31, 2016 (Unaudited) | Year Ended April 30, 2016 | Year Ended April 30, 2015 | Year Ended April 30, 2014 | Year Ended April 30, 2013 | For the Period January 1, 2012 to April 30, 2012(a)(b) | Year Ended December 31, 2011 | ||||||||||||||||||||||
| NET ASSET VALUE, BEGINNING OF PERIOD | $ | 18.04 | $ | 20.54 | $ | 18.49 | $ | 15.86 | $ | 16.39 | $ | 13.51 | $ | 13.67 | ||||||||||||||
| INCOME/(LOSS) FROM OPERATIONS: | ||||||||||||||||||||||||||||
Net investment loss(c) | (0.03 | ) | (0.10 | ) | (0.12 | ) | (0.16 | ) | (0.11 | ) | (0.04 | ) | (0.10 | ) | ||||||||||||||
| Net realized and unrealized gain/(loss) on investments | 1.12 | (1.93 | ) | 3.51 | 4.40 | 1.43 | 2.92 | (0.06 | ) | |||||||||||||||||||
| Total from Investment Operations | 1.09 | (2.03 | ) | 3.39 | 4.24 | 1.32 | 2.88 | (0.16 | ) | |||||||||||||||||||
| LESS DISTRIBUTIONS: | ||||||||||||||||||||||||||||
| From capital gains | – | (0.47 | ) | (1.34 | ) | (1.61 | ) | (1.85 | ) | – | – | |||||||||||||||||
| Total Distributions | – | (0.47 | ) | (1.34 | ) | (1.61 | ) | (1.85 | ) | – | – | |||||||||||||||||
| NET INCREASE/(DECREASE) IN NET ASSET VALUE | 1.09 | (2.50 | ) | 2.05 | 2.63 | (0.53 | ) | 2.88 | (0.16 | ) | ||||||||||||||||||
| NET ASSET VALUE, END OF PERIOD | $ | 19.13 | $ | 18.04 | $ | 20.54 | $ | 18.49 | $ | 15.86 | $ | 16.39 | $ | 13.51 | ||||||||||||||
| TOTAL RETURN | 6.04 | %(d) | (9.97 | )% | 18.77 | % | 26.35 | % | 9.47 | % | 21.32 | %(d) | (1.17 | )% | ||||||||||||||
| RATIOS/SUPPLEMENTAL DATA: | ||||||||||||||||||||||||||||
| Net Assets, End of Period (000s) | $ | 486,536 | $ | 453,190 | $ | 174,107 | $ | 134,440 | $ | 86,238 | $ | 83,149 | $ | 64,930 | ||||||||||||||
| RATIOS TO AVERAGE NET ASSETS: | ||||||||||||||||||||||||||||
| Net Investment loss | (0.31 | )%(e) | (0.51 | )% | (0.63 | )% | (0.82 | )% | (0.71 | )% | (0.72 | )%(e) | (0.72 | )% | ||||||||||||||
| Operating expenses excluding reimbursement/waiver | 0.79 | %(e) | 0.87 | % | 0.99 | % | 1.00 | % | 1.08 | % | 1.06 | %(e) | 1.06 | % | ||||||||||||||
| Operating expenses including reimbursement/waiver | 0.79 | %(e) | 0.87 | % | 0.99 | % | 0.99 | % | 0.99 | % | 0.99 | %(e) | 0.99 | % | ||||||||||||||
| PORTFOLIO TURNOVER RATE | 30 | %(d) | 45 | % | 68 | % | 70 | % | 78 | % | 28 | %(d) | 75 | % | ||||||||||||||
| (a) | Prior to its March 16, 2012 reorganization with and into the Emerald Growth Fund, the Fund was known as the Forward Growth Fund. |
| (b) | Effective March 13, 2012 the Board approved changing the fiscal year-end of the Fund from December 31 to April 30. |
| (c) | Per share amounts are based upon average shares outstanding. |
| (d) | Not Annualized. |
| (e) | Annualized. |
See Notes to Financial Statements.
| 42 | www.emeraldmutualfunds.com |
| Emerald Growth Fund | Financial Highlights |
For a share outstanding throughout the periods presented
| INVESTOR CLASS | ||||||||||||||||||||||||||||
| For the Six Months Ended October 31, 2016 (Unaudited) | Year Ended April 30, 2016 | Year Ended April 30, 2015 | Year Ended April 30, 2014 | Year Ended April 30, 2013 | For the Period January 1, 2012 to April 30, 2012(a)(b) | Period Ended December 31, 2011(c) | ||||||||||||||||||||||
| NET ASSET VALUE, BEGINNING OF PERIOD | $ | 17.46 | $ | 19.97 | $ | 18.06 | $ | 15.57 | $ | 16.18 | $ | 13.35 | $ | 15.74 | ||||||||||||||
| INCOME/(LOSS) FROM OPERATIONS: | ||||||||||||||||||||||||||||
Net investment loss(d) | (0.06 | ) | (0.16 | ) | (0.17 | ) | (0.23 | ) | (0.16 | ) | (0.05 | ) | (0.09 | ) | ||||||||||||||
| Net realized and unrealized gain/(loss) on investments | 1.08 | (1.88 | ) | 3.42 | 4.33 | 1.40 | 2.88 | (2.30 | ) | |||||||||||||||||||
| Total from Investment Operations | 1.02 | (2.04 | ) | 3.25 | 4.10 | 1.24 | 2.83 | (2.39 | ) | |||||||||||||||||||
| LESS DISTRIBUTIONS: | ||||||||||||||||||||||||||||
| From capital gains | – | (0.47 | ) | (1.34 | ) | (1.61 | ) | (1.85 | ) | – | – | |||||||||||||||||
| Total Distributions | – | (0.47 | ) | (1.34 | ) | (1.61 | ) | (1.85 | ) | – | – | |||||||||||||||||
| NET INCREASE/(DECREASE) IN NET ASSET VALUE | 1.02 | (2.51 | ) | 1.91 | 2.49 | (0.61 | ) | 2.83 | (2.39 | ) | ||||||||||||||||||
| NET ASSET VALUE, END OF PERIOD | $ | 18.48 | $ | 17.46 | $ | 19.97 | $ | 18.06 | $ | 15.57 | $ | 16.18 | $ | 13.35 | ||||||||||||||
| TOTAL RETURN | 5.84 | %(e) | (10.36 | )% | 18.44 | % | 25.93 | % | 9.08 | % | 21.20 | %(e) | (15.18 | )%(e) | ||||||||||||||
| RATIOS/SUPPLEMENTAL DATA: | ||||||||||||||||||||||||||||
| Net Assets, End of Period (000s) | $ | 105,001 | $ | 112,526 | $ | 23,517 | $ | 15,870 | $ | 1,842 | $ | 1,085 | $ | 879 | ||||||||||||||
| RATIOS TO AVERAGE NET ASSETS: | ||||||||||||||||||||||||||||
| Net Investment loss | (0.66 | )%(f) | (0.84 | )% | (0.91 | )% | (1.18 | )% | (1.05 | )% | (1.07 | )%(f) | (1.00 | )%(f) | ||||||||||||||
| Operating expenses excluding reimbursement/waiver | 1.14 | %(f) | 1.19 | % | 1.27 | % | 1.34 | % | 1.43 | % | 1.41 | %(f) | 1.43 | %(f) | ||||||||||||||
| Operating expenses including reimbursement/waiver | 1.14 | %(f) | 1.19 | % | 1.27 | % | 1.34 | % | 1.34 | % | 1.34 | %(f) | 1.34 | %(f) | ||||||||||||||
| PORTFOLIO TURNOVER RATE | 30 | %(e) | 45 | % | 68 | % | 70 | % | 78 | % | 28 | %(e) | 75 | %(g) | ||||||||||||||
| (a) | Prior to its March 16, 2012 reorganization with and into the Emerald Growth Fund, the Fund was known as the Forward Growth Fund. |
| (b) | Effective March 13, 2012 the Board approved changing the fiscal year-end of the Fund from December 31 to April 30. |
| (c) | The Fund began offering Investor Class shares on May 2, 2011. |
| (d) | Per share amounts are based upon average shares outstanding. |
| (e) | Not Annualized. |
| (f) | Annualized. |
| (g) | Portfolio turnover is calculated at the Fund level and represents the year ended December 31, 2011. |
See Notes to Financial Statements.
| Semi-Annual Report | October 31, 2016 | 43 |
| Emerald Small Cap Value Fund | Financial Highlights |
For a share outstanding throughout the periods presented
| CLASS A | ||||||||||||
For the Six Months Ended October 31, 2016 (Unaudited) | For the Period October 1, 2015 to April 30, 2016(a) | Period Ended September 30, 2015(b) | ||||||||||
| NET ASSET VALUE, BEGINNING OF PERIOD | $ | 13.00 | $ | 12.70 | $ | 14.12 | ||||||
| INCOME/(LOSS) FROM OPERATIONS: | ||||||||||||
Net investment income/(loss)(c) | 0.00 | (d) | (0.09 | ) | (0.01 | ) | ||||||
| Net realized and unrealized gain/(loss) on investments | 0.41 | 0.44 | (1.03 | ) | ||||||||
| Total from Investment Operations | 0.41 | 0.35 | (1.04 | ) | ||||||||
| LESS DISTRIBUTIONS: | ||||||||||||
| From investment income | – | (0.05 | ) | – | ||||||||
| From capital gains | – | – | (0.38 | ) | ||||||||
| Total Distributions | – | (0.05 | ) | (0.38 | ) | |||||||
| NET INCREASE/(DECREASE) IN NET ASSET VALUE | 0.41 | 0.30 | (1.42 | ) | ||||||||
| NET ASSET VALUE, END OF PERIOD | $ | 13.41 | $ | 13.00 | $ | 12.70 | ||||||
| TOTAL RETURN | 3.15 | %(e) | 2.77 | %(e) | (7.49 | )%(e) | ||||||
| RATIOS/SUPPLEMENTAL DATA: | ||||||||||||
| Net Assets, End of Period (000s) | $ | 451 | $ | 340 | $ | 14 | ||||||
| RATIOS TO AVERAGE NET ASSETS: | ||||||||||||
| Net Investment income/(loss) | 0.06 | %(f) | (1.13 | )%(f) | (0.24 | )%(f) | ||||||
| Operating expenses excluding reimbursement/waiver | 1.79 | %(f) | 2.69 | %(f) | 2.16 | %(f) | ||||||
| Operating expenses including reimbursement/waiver | 1.35 | %(f) | 1.35 | %(f) | 1.35 | %(f) | ||||||
| PORTFOLIO TURNOVER RATE | 26 | %(e) | 31 | %(e) | 69 | %(e)(g) | ||||||
| (a) | Effective March 3, 2015 the Board approved changing the fiscal year-end of the Fund from September 30 to April 30. |
| (b) | Class A commenced operations on June 30, 2015. |
| (c) | Per share amounts are based upon average shares outstanding. |
| (d) | Less than $0.005 per share. |
| (e) | Not Annualized. |
| (f) | Annualized. |
| (g) | Portfolio turnover rate is calculated at the Fund level and represents the year ended September 30, 2015. |
See Notes to Financial Statements.
| 44 | www.emeraldmutualfunds.com |
| Emerald Small Cap Value Fund | Financial Highlights |
For a share outstanding throughout the periods presented
| CLASS C | ||||||||||||
For the Six Months Ended October 31, 2016 (Unaudited) | For the Period October 1, 2015 to April 30, 2016(a) | Period Ended September 30, 2015(b) | ||||||||||
| NET ASSET VALUE, BEGINNING OF PERIOD | $ | 12.94 | $ | 12.68 | $ | 14.12 | ||||||
| INCOME/(LOSS) FROM OPERATIONS: | ||||||||||||
Net investment loss(c) | (0.04 | ) | (0.14 | ) | (0.03 | ) | ||||||
| Net realized and unrealized gain/(loss) on investments | 0.40 | 0.43 | (1.03 | ) | ||||||||
| Total from Investment Operations | 0.36 | 0.29 | (1.06 | ) | ||||||||
| LESS DISTRIBUTIONS: | ||||||||||||
| From investment income | – | (0.03 | ) | – | ||||||||
| From capital gains | – | – | (0.38 | ) | ||||||||
| Total Distributions | – | (0.03 | ) | (0.38 | ) | |||||||
| NET INCREASE/(DECREASE) IN NET ASSET VALUE | 0.36 | 0.26 | (1.44 | ) | ||||||||
| NET ASSET VALUE, END OF PERIOD | $ | 13.30 | $ | 12.94 | $ | 12.68 | ||||||
| TOTAL RETURN | 2.78 | %(d) | 2.28 | %(d) | (7.63 | )%(d) | ||||||
| RATIOS/SUPPLEMENTAL DATA: | ||||||||||||
| Net Assets, End of Period (000s) | $ | 620 | $ | 566 | $ | 14 | ||||||
| RATIOS TO AVERAGE NET ASSETS: | ||||||||||||
| Net Investment loss | (0.57 | )%(e) | (2.06 | )%(e) | (0.89 | )%(e) | ||||||
| Operating expenses excluding reimbursement/waiver | 2.45 | %(e) | 3.37 | %(e) | 2.81 | %(e) | ||||||
| Operating expenses including reimbursement/waiver | 2.00 | %(e) | 2.00 | %(e) | 2.00 | %(e) | ||||||
| PORTFOLIO TURNOVER RATE | 26 | %(d) | 31 | %(d) | 69 | %(d)(f) | ||||||
| (a) | Effective March 3, 2015 the Board approved changing the fiscal year-end of the Fund from September 30 to April 30. |
| (b) | Class C commenced operations on June 30, 2015. |
| (c) | Per share amounts are based upon average shares outstanding. |
| (d) | Not Annualized. |
| (e) | Annualized. |
| (f) | Portfolio turnover rate is calculated at the Fund level and represents the year ended September 30, 2015. |
See Notes to Financial Statements.
| Semi-Annual Report | October 31, 2016 | 45 |
| Emerald Small Cap Value Fund | Financial Highlights |
For a share outstanding throughout the periods presented
| INSTITUTIONAL CLASS | ||||||||||||||||||||
| For the Six Months Ended October 31, 2016 (Unaudited) | For the Period October 1, 2015 to April 30, 2016(a) | Year Ended September 30, 2015(b) | Year Ended September 30, 2014 | Period Ended September 30, 2013(c) | ||||||||||||||||
| NET ASSET VALUE, BEGINNING OF PERIOD | $ | 13.02 | $ | 12.71 | $ | 12.76 | $ | 12.56 | $ | 10.00 | ||||||||||
| INCOME FROM OPERATIONS: | ||||||||||||||||||||
Net investment income/(loss)(d) | 0.03 | (0.01 | ) | 0.06 | 0.09 | 0.05 | ||||||||||||||
| Net realized and unrealized gain on investments | 0.40 | 0.38 | 0.33 | 0.76 | 2.54 | |||||||||||||||
| Total from Investment Operations | 0.43 | 0.37 | 0.39 | 0.85 | 2.59 | |||||||||||||||
| LESS DISTRIBUTIONS: | ||||||||||||||||||||
| From investment income | – | (0.06 | ) | (0.06 | ) | (0.01 | ) | (0.03 | ) | |||||||||||
| From capital gains | – | – | (0.38 | ) | (0.64 | ) | – | |||||||||||||
| Total Distributions | – | (0.06 | ) | (0.44 | ) | (0.65 | ) | (0.03 | ) | |||||||||||
| NET INCREASE/(DECREASE) IN NET ASSET VALUE | 0.43 | 0.31 | (0.05 | ) | 0.20 | 2.56 | ||||||||||||||
| NET ASSET VALUE, END OF PERIOD | $ | 13.45 | $ | 13.02 | $ | 12.71 | $ | 12.76 | $ | 12.56 | ||||||||||
| TOTAL RETURN | 3.30 | %(e) | 2.94 | %(e) | 2.93 | % | 6.64 | % | 25.99 | %(e) | ||||||||||
| SUPPLEMENTAL DATA: | ||||||||||||||||||||
| Net Assets, End of Period (000s) | $ | 14,506 | $ | 13,691 | $ | 16,507 | $ | 24,343 | $ | 8,442 | ||||||||||
| RATIOS TO AVERAGE NET ASSETS: | ||||||||||||||||||||
| Net Investment income/(loss) | 0.43 | %(f) | (0.07 | )%(f) | 0.45 | % | 0.65 | % | 0.48 | %(f) | ||||||||||
| Operating expenses excluding reimbursement/waiver | 1.45 | %(f) | 1.75 | %(f) | 1.43 | % | 1.29 | % | 1.95 | %(f) | ||||||||||
| Operating expenses including reimbursement/waiver | 1.00 | %(f) | 1.00 | %(f) | 1.00 | % | 1.00 | % | 1.00 | %(f) | ||||||||||
| PORTFOLIO TURNOVER RATE | 26 | %(e) | 31 | %(e) | 69 | % | 49 | % | 67 | %(e) | ||||||||||
| (a) | Effective March 3, 2015 the Board approved changing the fiscal year-end of the Fund from September 30 to April 30. |
| (b) | Prior to its June 26, 2015 reorganization with and into the Emerald Small Cap Value Fund, the Fund was known as the Elessar Small Cap Value Fund. |
| (c) | For the period October 15, 2012 (commencement of investment operations) through September 30, 2013. |
| (d) | Per share amounts are based upon average shares outstanding. |
| (e) | Not Annualized. |
| (f) | Annualized. |
See Notes to Financial Statements.
| 46 | www.emeraldmutualfunds.com |
| Emerald Small Cap Value Fund | Financial Highlights |
For a share outstanding throughout the periods presented
| INVESTOR CLASS | ||||||||||||||||||||
| For the Six Months Ended October 31, 2016 (Unaudited) | For the Period October 1, 2015 to April 30, 2016(a) | Year Ended September 30, 2015(b) | Year Ended September 30, 2014 | Period Ended September 30, 2013(c) | ||||||||||||||||
| NET ASSET VALUE, BEGINNING OF PERIOD | $ | 12.98 | $ | 12.68 | $ | 12.73 | $ | 12.54 | $ | 10.00 | ||||||||||
| INCOME FROM OPERATIONS: | ||||||||||||||||||||
Net investment income/(loss)(d) | 0.01 | (0.02 | ) | 0.03 | 0.07 | 0.02 | ||||||||||||||
| Net realized and unrealized gain on investments | 0.40 | 0.37 | 0.35 | 0.76 | 2.54 | |||||||||||||||
| Total from Investment Operations | 0.41 | 0.35 | 0.38 | 0.83 | 2.56 | |||||||||||||||
| LESS DISTRIBUTIONS: | ||||||||||||||||||||
| From investment income | – | (0.05 | ) | (0.05 | ) | – | (0.02 | ) | ||||||||||||
| From capital gains | – | – | (0.38 | ) | (0.64 | ) | – | |||||||||||||
| Total Distributions | – | (0.05 | ) | (0.43 | ) | (0.64 | ) | (0.02 | ) | |||||||||||
| NET INCREASE/(DECREASE) IN NET ASSET VALUE | 0.41 | 0.30 | (0.05 | ) | 0.19 | 2.54 | ||||||||||||||
| NET ASSET VALUE, END OF PERIOD | $ | 13.39 | $ | 12.98 | $ | 12.68 | $ | 12.73 | $ | 12.54 | ||||||||||
| TOTAL RETURN | 3.16 | %(e) | 2.80 | %(e) | 2.82 | % | 6.46 | % | 25.69 | %(e) | ||||||||||
| SUPPLEMENTAL DATA: | ||||||||||||||||||||
| Net Assets, End of Period (000s) | $ | 1,495 | $ | 1,946 | $ | 399 | $ | 474 | $ | 271 | ||||||||||
| RATIOS TO AVERAGE NET ASSETS: | ||||||||||||||||||||
| Net Investment income/(loss) | 0.22 | %(f) | (0.25 | )%(f) | 0.22 | % | 0.52 | % | 0.16 | %(f) | ||||||||||
| Operating expenses excluding reimbursement/waiver | 1.70 | %(f) | 2.14 | %(f) | 1.67 | % | 1.56 | % | 2.49 | %(f) | ||||||||||
| Operating expenses including reimbursement/waiver | 1.25 | %(f) | 1.25 | %(f) | 1.25 | % | 1.25 | % | 1.25 | %(f) | ||||||||||
| PORTFOLIO TURNOVER RATE | 26 | %(e) | 31 | %(e) | 69 | % | 49 | % | 67 | %(e) | ||||||||||
| (a) | Effective March 3, 2015 the Board approved changing the fiscal year-end of the Fund from September 30 to April 30. |
| (b) | Prior to its June 26, 2015 reorganization with and into the Emerald Small Cap Value Fund, the Fund was known as the Elessar Small Cap Value Fund. |
| (c) | For the period October 15, 2012 (commencement of investment operations) through September 30, 2013. |
| (d) | Per share amounts are based upon average shares outstanding. |
| (e) | Not Annualized. |
| (f) | Annualized. |
See Notes to Financial Statements.
| Semi-Annual Report | October 31, 2016 | 47 |
| Emerald Insights Fund | Financial Highlights |
For a share outstanding throughout the period presented
| CLASS A | ||||||||||||
For the Six Months Ended October 31, 2016 (Unaudited) | Year Ended April 30, 2016 | For the Period August 1, 2014 (Inception) to April 30, 2015 | ||||||||||
| NET ASSET VALUE, BEGINNING OF PERIOD | $ | 9.69 | $ | 10.98 | $ | 10.00 | ||||||
| INCOME/(LOSS) FROM OPERATIONS: | ||||||||||||
Net investment loss(a) | (0.03 | ) | (0.05 | ) | (0.05 | ) | ||||||
| Net realized and unrealized gain/(loss) on investments | 0.34 | (1.24 | ) | 1.03 | ||||||||
| Total from Investment Operations | 0.31 | (1.29 | ) | 0.98 | ||||||||
| NET INCREASE/(DECREASE) IN NET ASSET VALUE | 0.31 | (1.29 | ) | 0.98 | ||||||||
| NET ASSET VALUE, END OF PERIOD | $ | 10.00 | $ | 9.69 | $ | 10.98 | ||||||
TOTAL RETURN(b) | 3.20 | %(c) | (11.75 | %) | 9.80 | %(c) | ||||||
| RATIOS/SUPPLEMENTAL DATA: | ||||||||||||
| Net Assets, End of Period (000s) | $ | 10,308 | $ | 11,388 | $ | 6,493 | ||||||
| RATIOS TO AVERAGE NET ASSETS: | ||||||||||||
| Net Investment loss | (0.65% | )(d) | (0.54 | %) | (0.66% | )(d) | ||||||
| Operating expenses excluding reimbursement/waiver | 2.03 | %(d) | 2.01 | % | 2.57 | %(d)(e) | ||||||
| Operating expenses including reimbursement/waiver | 1.35 | %(d) | 1.35 | % | 1.35 | %(d)(e) | ||||||
| PORTFOLIO TURNOVER RATE | 40 | %(c) | 99 | % | 88 | %(c) | ||||||
(a) | Per share amounts are based upon average shares outstanding. |
(b) | Total return does not reflect the effect of sales charges. |
(c) | Not Annualized. |
(d) | Annualized. |
(e) | Expense ratios before reductions for startup costs may not be representative of longer term operating periods. |
See Notes to Financial Statements.
| 48 | www.emeraldmutualfunds.com |
| Emerald Insights Fund | Financial Highlights |
For a share outstanding throughout the period presented
| CLASS C | ||||||||||||
For the Six Months Ended October 31, 2016 (Unaudited) | Year Ended April 30, 2016 | For the Period August 1, 2014 (Inception) to April 30, 2015 | ||||||||||
| NET ASSET VALUE, BEGINNING OF PERIOD | $ | 9.56 | $ | 10.92 | $ | 10.00 | ||||||
| INCOME/(LOSS) FROM OPERATIONS: | ||||||||||||
Net investment loss(a) | (0.06 | ) | (0.11 | ) | (0.10 | ) | ||||||
| Net realized and unrealized gain/(loss) on investments | 0.34 | (1.25 | ) | 1.02 | ||||||||
| Total from Investment Operations | 0.28 | (1.36 | ) | 0.92 | ||||||||
| NET INCREASE/(DECREASE) IN NET ASSET VALUE | 0.28 | (1.36 | ) | 0.92 | ||||||||
| NET ASSET VALUE, END OF PERIOD | $ | 9.84 | $ | 9.56 | $ | 10.92 | ||||||
TOTAL RETURN(b) | 2.93 | %(c) | (12.45 | %) | 9.20 | %(c) | ||||||
| RATIOS/SUPPLEMENTAL DATA: | ||||||||||||
| Net Assets, End of Period (000s) | $ | 98 | $ | 101 | $ | 27 | ||||||
| RATIOS TO AVERAGE NET ASSETS: | ||||||||||||
| Net Investment loss | (1.30 | %)(d) | (1.17 | %) | (1.34 | %)(d) | ||||||
| Operating expenses excluding reimbursement/waiver | 2.68 | %(d) | 2.70 | % | 7.25 | %(d)(e) | ||||||
| Operating expenses including reimbursement/waiver | 2.00 | %(d) | 2.00 | % | 2.00 | %(d)(e) | ||||||
| PORTFOLIO TURNOVER RATE | 40 | %(c) | 99 | % | 88 | %(c) | ||||||
(a) | Per share amounts are based upon average shares outstanding. |
(b) | Total return does not reflect the effect of sales charges. |
(c) | Not Annualized. |
(d) | Annualized. |
(e) | Expense ratios before reductions for startup costs may not be representative of longer term operating periods. |
See Notes to Financial Statements.
| Semi-Annual Report | October 31, 2016 | 49 |
| Emerald Insights Fund | Financial Highlights |
For a share outstanding throughout the period presented
| INSTITUTIONAL CLASS | ||||||||||||
For the Six Months Ended October 31, 2016 (Unaudited) | Year Ended April 30, 2016 | For the Period August 1, 2014 (Inception) to April 30, 2015 | ||||||||||
| NET ASSET VALUE, BEGINNING OF PERIOD | $ | 9.73 | $ | 10.99 | $ | 10.00 | ||||||
| INCOME/(LOSS) FROM OPERATIONS: | ||||||||||||
Net investment loss(a) | (0.02 | ) | (0.00 | )(b) | (0.03 | ) | ||||||
| Net realized and unrealized gain/(loss) on investments | 0.35 | (1.26 | ) | 1.02 | ||||||||
| Total from Investment Operations | 0.33 | (1.26 | ) | 0.99 | ||||||||
| NET INCREASE/(DECREASE) IN NET ASSET VALUE | 0.33 | (1.26 | ) | 0.99 | ||||||||
| NET ASSET VALUE, END OF PERIOD | $ | 10.06 | $ | 9.73 | $ | 10.99 | ||||||
| TOTAL RETURN | 3.39 | %(c) | (11.46 | %) | 9.90 | %(c) | ||||||
| RATIOS/SUPPLEMENTAL DATA: | ||||||||||||
| Net Assets, End of Period (000s) | $ | 1,328 | $ | 1,729 | $ | 279 | ||||||
| RATIOS TO AVERAGE NET ASSETS: | ||||||||||||
| Net Investment loss | (0.34 | %)(d) | (0.05 | %) | (0.34 | %)(d) | ||||||
| Operating expenses excluding reimbursement/waiver | 1.73 | %(d) | 1.90 | % | 4.66 | %(d)(e) | ||||||
| Operating expenses including reimbursement/waiver | 1.05 | %(d) | 1.05 | % | 1.05 | %(d)(e) | ||||||
| PORTFOLIO TURNOVER RATE | 40 | %(c) | 99 | % | 88 | %(c) | ||||||
(a) | Per share amounts are based upon average shares outstanding. |
(b) | Less than $0.005 per share. |
(c) | Not Annualized. |
(d) | Annualized. |
(e) | Expense ratios before reductions for startup costs may not be representative of longer term operating periods. |
See Notes to Financial Statements.
| 50 | www.emeraldmutualfunds.com |
| Emerald Insights Fund | Financial Highlights |
For a share outstanding throughout the period presented
| INVESTOR CLASS | ||||||||||||
For the Six Months Ended October 31, 2016 (Unaudited) | Year Ended April 30, 2016 | For the Period August 1, 2014 (Inception) to April 30, 2015 | ||||||||||
| NET ASSET VALUE, BEGINNING OF PERIOD | $ | 9.67 | $ | 10.96 | $ | 10.00 | ||||||
| INCOME/(LOSS) FROM OPERATIONS: | ||||||||||||
Net investment loss(a) | (0.04 | ) | (0.08 | ) | (0.05 | ) | ||||||
| Net realized and unrealized gain/(loss) on investments | 0.35 | (1.21 | ) | 1.01 | ||||||||
| Total from Investment Operations | 0.31 | (1.29 | ) | 0.96 | ||||||||
| NET INCREASE/(DECREASE) IN NET ASSET VALUE | 0.31 | (1.29 | ) | 0.96 | ||||||||
| NET ASSET VALUE, END OF PERIOD | $ | 9.98 | $ | 9.67 | $ | 10.96 | ||||||
| TOTAL RETURN | 3.21 | %(b) | (11.77 | %) | 9.60 | %(b) | ||||||
| RATIOS/SUPPLEMENTAL DATA: | ||||||||||||
| Net Assets, End of Period (000s) | $ | 96 | $ | 86 | $ | 448 | ||||||
| RATIOS TO AVERAGE NET ASSETS: | ||||||||||||
| Net Investment loss | (0.70 | %)(c) | (0.72 | %) | (0.67 | %)(c) | ||||||
| Operating expenses excluding reimbursement/waiver | 2.08 | %(c) | 1.91 | % | 2.96 | %(c)(d) | ||||||
| Operating expenses including reimbursement/waiver | 1.40 | %(c) | 1.40 | % | 1.40 | %(c)(d) | ||||||
| PORTFOLIO TURNOVER RATE | 40 | %(b) | 99 | % | 88 | %(b) | ||||||
(a) | Per share amounts are based upon average shares outstanding. |
(b) | Not Annualized. |
(c) | Annualized. |
(d) | Expense ratios before reductions for startup costs may not be representative of longer term operating periods. |
See Notes to Financial Statements.
| Semi-Annual Report | October 31, 2016 | 51 |
| Emerald Banking and Finance Fund | Financial Highlights |
For a share outstanding throughout the periods presented
| CLASS A | ||||||||||||||||||||||||||||
| For the Six Months Ended October 31, 2016 (Unaudited) | Year Ended April 30, 2016 | Year Ended April 30, 2015 | Year Ended April 30, 2014 | Year Ended April 30, 2013 | For the Period January 1, 2012 to April 30, 2012(a)(b) | Year Ended December 31, 2011 | ||||||||||||||||||||||
| NET ASSET VALUE, BEGINNING OF PERIOD | $ | 31.27 | $ | 28.85 | $ | 26.11 | $ | 20.08 | $ | 16.96 | $ | 15.16 | $ | 15.89 | ||||||||||||||
INCOME/(LOSS) FROM OPERATIONS:(c) | ||||||||||||||||||||||||||||
Net investment loss(d) | (0.06 | ) | (0.06 | ) | (0.16 | ) | (0.13 | ) | (0.01 | ) | (0.01 | ) | (0.03 | ) | ||||||||||||||
| Net realized and unrealized gain/(loss) on investments | 1.17 | 2.48 | �� | 2.90 | 6.16 | 3.13 | 1.81 | (0.70 | ) | |||||||||||||||||||
| Total from Investment Operations | 1.11 | 2.42 | 2.74 | 6.03 | 3.12 | 1.80 | (0.73 | ) | ||||||||||||||||||||
| NET INCREASE/(DECREASE) IN NET ASSET VALUE | 1.11 | 2.42 | 2.74 | 6.03 | 3.12 | 1.80 | (0.73 | ) | ||||||||||||||||||||
| NET ASSET VALUE, END OF PERIOD | $ | 32.38 | $ | 31.27 | $ | 28.85 | $ | 26.11 | $ | 20.08 | $ | 16.96 | $ | 15.16 | ||||||||||||||
TOTAL RETURN(e) | 3.55 | %(f) | 8.39 | % | 10.49 | % | 30.03 | % | 18.40 | % | 11.87 | %(f) | (4.59 | )% | ||||||||||||||
| RATIOS/SUPPLEMENTAL DATA: | ||||||||||||||||||||||||||||
| Net Assets, End of Period (000s) | $ | 97,610 | $ | 110,601 | $ | 48,575 | $ | 48,622 | $ | 25,496 | $ | 21,363 | $ | 20,412 | ||||||||||||||
| RATIOS TO AVERAGE NET ASSETS: | ||||||||||||||||||||||||||||
| Net Investment loss | (0.35 | )%(g) | (0.21 | )% | (0.58 | )% | (0.53 | )% | (0.06 | )% | (0.24 | )%(g) | (0.22 | )% | ||||||||||||||
| Operating expenses excluding reimbursement/waiver | 1.47 | %(g) | 1.48 | % | 1.60 | % | 1.72 | % | 1.88 | % | 1.96 | %(g) | 1.90 | % | ||||||||||||||
| Operating expenses including reimbursement/waiver | 1.47 | %(g) | 1.48 | % | 1.60 | % | 1.72 | % | 1.84 | % | 1.85 | %(g) | n/a | |||||||||||||||
| PORTFOLIO TURNOVER RATE | 15 | %(f) | 30 | % | 33 | % | 34 | % | 53 | % | 9 | %(f) | 27 | % | ||||||||||||||
(a) | Prior to its March 16, 2012 reorganization with and into the Emerald Banking and Finance Fund, the Fund was known as the Forward Banking and Finance Fund. |
(b) | Effective March 13, 2012 the Board approved changing the fiscal year-end of the Fund from December 31 to April 30. |
(c) | The amount shown for a share outstanding throughout the period may not correlate with the Statement of Operations for the period due to the timing of sales and redemptions of Fund shares in relation to income earned and/or fluctuating market value of the investments of the Fund. |
(d) | Per share amounts are based upon average shares outstanding. |
(e) | Total return does not reflect the effect of sales charges. |
(f) | Not Annualized. |
(g) | Annualized. |
See Notes to Financial Statements.
| 52 | www.emeraldmutualfunds.com |
| Emerald Banking and Finance Fund | Financial Highlights |
For a share outstanding throughout the periods presented
| CLASS C | ||||||||||||||||||||||||||||
| For the Six Months Ended October 31, 2016 (Unaudited) | Year Ended April 30, 2016 | Year Ended April 30, 2015 | Year Ended April 30, 2014 | Year Ended April 30, 2013 | For the Period January 1, 2012 to April 30, 2012(a)(b) | Year Ended December 31, 2011 | ||||||||||||||||||||||
| NET ASSET VALUE, BEGINNING OF PERIOD | $ | 28.20 | $ | 26.19 | $ | 23.86 | $ | 18.46 | $ | 15.70 | $ | 14.06 | $ | 14.82 | ||||||||||||||
INCOME/(LOSS) FROM OPERATIONS:(c) | ||||||||||||||||||||||||||||
Net investment loss(d) | (0.14 | ) | (0.24 | ) | (0.30 | ) | (0.26 | ) | (0.11 | ) | (0.04 | ) | (0.11 | ) | ||||||||||||||
| Net realized and unrealized gain/(loss) on investments | 1.05 | 2.25 | 2.63 | 5.66 | 2.87 | 1.68 | (0.65 | ) | ||||||||||||||||||||
| Total from Investment Operations | 0.91 | 2.01 | 2.33 | 5.40 | 2.76 | 1.64 | (0.76 | ) | ||||||||||||||||||||
| NET INCREASE/(DECREASE) IN NET ASSET VALUE | 0.91 | 2.01 | 2.33 | 5.40 | 2.76 | 1.64 | (0.76 | ) | ||||||||||||||||||||
| NET ASSET VALUE, END OF PERIOD | $ | 29.11 | $ | 28.20 | $ | 26.19 | $ | 23.86 | $ | 18.46 | $ | 15.70 | $ | 14.06 | ||||||||||||||
TOTAL RETURN(e) | 3.23 | %(f) | 7.67 | % | 9.77 | % | 29.25 | % | 17.58 | % | 11.66 | %(f) | (5.13 | )% | ||||||||||||||
| RATIOS/SUPPLEMENTAL DATA: | ||||||||||||||||||||||||||||
| Net Assets, End of Period (000s) | $ | 52,536 | $ | 52,366 | $ | 31,862 | $ | 28,222 | $ | 17,705 | $ | 14,690 | $ | 13,675 | ||||||||||||||
| RATIOS TO AVERAGE NET ASSETS: | ||||||||||||||||||||||||||||
| Net Investment loss | (1.01 | )%(g) | (0.87 | )% | (1.23 | )% | (1.18 | )% | (0.68 | )% | (0.82 | )%(g) | (0.77 | )% | ||||||||||||||
| Operating expenses excluding reimbursement/waiver | 2.12 | %(g) | 2.13 | % | 2.25 | % | 2.38 | % | 2.54 | % | 2.55 | %(g) | 2.45 | % | ||||||||||||||
| Operating expenses including reimbursement/waiver | 2.12 | %(g) | 2.13 | % | 2.25 | % | 2.38 | % | 2.49 | % | 2.44 | %(g) | n/a | |||||||||||||||
| PORTFOLIO TURNOVER RATE | 15 | %(f) | 30 | % | 33 | % | 34 | % | 53 | % | 9 | %(f) | 27 | % | ||||||||||||||
(a) | Prior to its March 16, 2012 reorganization with and into the Emerald Banking and Finance Fund, the Fund was known as the Forward Banking and Finance Fund. |
(b) | Effective March 13, 2012 the Board approved changing the fiscal year-end of the Fund from December 31 to April 30. |
(c) | The amount shown for a share outstanding throughout the period may not correlate with the Statement of Operations for the period due to the timing of sales and redemptions of Fund shares in relation to income earned and/or fluctuating market value of the investments of the Fund. |
(d) | Per share amounts are based upon average shares outstanding. |
(e) | Total return does not reflect the effect of sales charges. |
(f) | Not Annualized. |
(g) | Annualized. |
See Notes to Financial Statements.
| Semi-Annual Report | October 31, 2016 | 53 |
| Emerald Banking and Finance Fund | Financial Highlights |
For a share outstanding throughout the periods presented
| INSTITUTIONAL CLASS | ||||||||||||||||||||||||
| For the Six Months Ended October 31, 2016 (Unaudited) | Year Ended April 30, 2016 | Year Ended April 30, 2015 | Year Ended April 30, 2014 | Year Ended April 30, 2013 | For the Period March 16, 2012 to April 30, 2012(a) | |||||||||||||||||||
| NET ASSET VALUE, BEGINNING OF PERIOD | $ | 31.69 | $ | 29.15 | $ | 26.29 | $ | 20.15 | $ | 16.96 | $ | 16.85 | ||||||||||||
| INCOME/(LOSS) FROM OPERATIONS: | ||||||||||||||||||||||||
Net investment income/(loss)(b) | (0.01 | ) | 0.03 | (0.07 | ) | (0.06 | ) | 0.01 | (0.01 | ) | ||||||||||||||
| Net realized and unrealized gain on investments | 1.18 | 2.51 | 2.93 | 6.20 | 3.18 | 0.12 | ||||||||||||||||||
| Total from Investment Operations | 1.17 | 2.54 | 2.86 | 6.14 | 3.19 | 0.11 | ||||||||||||||||||
| NET INCREASE IN NET ASSET VALUE | 1.17 | 2.54 | 2.86 | 6.14 | 3.19 | 0.11 | ||||||||||||||||||
| NET ASSET VALUE, END OF PERIOD | $ | 32.86 | $ | 31.69 | $ | 29.15 | $ | 26.29 | $ | 20.15 | $ | 16.96 | ||||||||||||
| TOTAL RETURN | 3.69 | %(c) | 8.71 | % | 10.88 | % | 30.47 | % | 18.81 | % | 0.65 | %(c) | ||||||||||||
| RATIOS/SUPPLEMENTAL DATA: | ||||||||||||||||||||||||
| Net Assets, End of Period (000s) | $ | 63,758 | $ | 61,654 | $ | 23,730 | $ | 22,062 | $ | 4,321 | $ | 8 | ||||||||||||
| RATIOS TO AVERAGE NET ASSETS: | ||||||||||||||||||||||||
| Net Investment income/(loss) | (0.06 | )%(d) | 0.11 | % | (0.25 | )% | (0.23 | )% | 0.06 | % | (0.27 | )%(d) | ||||||||||||
| Operating expenses excluding reimbursement/waiver | 1.17 | %(d) | 1.15 | % | 1.27 | % | 1.37 | % | 1.62 | % | 1.83 | %(d) | ||||||||||||
| Operating expenses including reimbursement/waiver | 1.17 | %(d) | 1.15 | % | 1.27 | % | 1.37 | % | 1.54 | % | 1.53 | %(d) | ||||||||||||
| PORTFOLIO TURNOVER RATE | 15 | %(c) | 30 | % | 33 | % | 34 | % | 53 | % | 9 | %(c)(e) | ||||||||||||
(a) | The Fund began offering Institutional Class shares on March 16, 2012. |
(b) | Per share amounts are based upon average shares outstanding. |
(c) | Not Annualized. |
(d) | Annualized. |
(e) | Portfolio turnover rate is calculated at the Fund level and represents the period ended April 30, 2012. |
See Notes to Financial Statements.
| 54 | www.emeraldmutualfunds.com |
| Emerald Banking and Finance Fund | Financial Highlights |
For a share outstanding throughout the periods presented
| INVESTOR CLASS | ||||||||||||||||||||||||||||
| For the Six Months Ended October 31, 2016 (Unaudited) | Year Ended April 30, 2016 | Year Ended April 30, 2015 | Year Ended April 30, 2014 | Year Ended April 30, 2013 | For the Period January 1, 2012 to April 30, 2012(a)(b) | Year Ended December 31, 2011 | ||||||||||||||||||||||
| NET ASSET VALUE, BEGINNING OF PERIOD | $ | 29.95 | $ | 27.64 | $ | 25.01 | $ | 19.23 | $ | 16.25 | $ | 14.50 | $ | 15.14 | ||||||||||||||
INCOME/(LOSS) FROM OPERATIONS:(c) | ||||||||||||||||||||||||||||
Net investment income/(loss)(d) | (0.06 | ) | (0.07 | ) | (0.15 | ) | (0.12 | ) | (0.01 | ) | (0.00 | )(e) | 0.07 | |||||||||||||||
| Net realized and unrealized gain/(loss) on investments | 1.11 | 2.38 | 2.78 | 5.90 | 2.99 | 1.75 | (0.71 | ) | ||||||||||||||||||||
| Total from Investment Operations | 1.05 | 2.31 | 2.63 | 5.78 | 2.98 | 1.75 | (0.64 | ) | ||||||||||||||||||||
| NET INCREASE/(DECREASE) IN NET ASSET VALUE | 1.05 | 2.31 | 2.63 | 5.78 | 2.98 | 1.75 | (0.64 | ) | ||||||||||||||||||||
| NET ASSET VALUE, END OF PERIOD | $ | 31.00 | $ | 29.95 | $ | 27.64 | $ | 25.01 | $ | 19.23 | $ | 16.25 | $ | 14.50 | ||||||||||||||
| TOTAL RETURN | 3.51 | %(f) | 8.36 | % | 10.52 | % | 30.06 | % | 18 .34 | % | 12.07 | %(f) | (4.23 | )% | ||||||||||||||
| RATIOS/SUPPLEMENTAL DATA: | ||||||||||||||||||||||||||||
| Net Assets, End of Period (000s) | $ | 79,988 | $ | 80,404 | $ | 27,440 | $ | 19,235 | $ | 6,255 | $ | 693 | $ | 136 | ||||||||||||||
| RATIOS TO AVERAGE NET ASSETS: | ||||||||||||||||||||||||||||
| Net Investment income/(loss) | (0.40 | )%(g) | (0.23 | )% | (0.56 | )% | (0.53 | )% | (0.08 | )% | (0.07 | )%(g) | 0.47 | % | ||||||||||||||
| Operating expenses excluding reimbursement/waiver | 1.52 | %(g) | 1.48 | % | 1.58 | % | 1.69 | % | 1.94 | % | 1.88 | %(g) | 1.48 | % | ||||||||||||||
| Operating expenses including reimbursement/waiver | 1.52 | %(g) | 1.48 | % | 1.58 | % | 1.69 | % | 1.89 | % | 1.72 | %(g) | n/a | |||||||||||||||
| PORTFOLIO TURNOVER RATE | 15 | %(f) | 30 | % | 33 | % | 34 | % | 53 | % | 9 | %(f) | 27 | % | ||||||||||||||
(a) | Prior to its March 16, 2012 reorganization with and into the Emerald Banking and Finance Fund, the Fund was known as the Forward Banking and Finance Fund. |
(b) | Effective March 13, 2012 the Board approved changing the fiscal year-end of the Fund from December 31 to April 30. |
(c) | The amount shown for a share outstanding throughout the period may not correlate with the Statement of Operations for the period due to the timing of sales and redemptions of Fund shares in relation to income earned and/or fluctuating market value of the investments of the Fund. |
(d) | Per share amounts are based upon average shares outstanding. |
(e) | Less than $0.005 per share. |
(f) | Not Annualized. |
(g) | Annualized. |
See Notes to Financial Statements.
| Semi-Annual Report | October 31, 2016 | 55 |
| Emerald Funds | Notes to Financial Statements |
October 31, 2016 (Unaudited)
1. ORGANIZATION
Financial Investors Trust (the “Trust”), a Delaware statutory trust, is an open‐end management investment company registered under the Investment Company Act of 1940, as amended (the “1940 Act”). The Trust consists of multiple separate portfolios or series. This semi‐annual report describes the Emerald Growth Fund, Emerald Small Cap Value Fund, Emerald Insights Fund, and Emerald Banking and Finance Fund (each a “Fund” and collectively, the “Funds”). Prior to March 16, 2012, the Emerald Banking and Finance Fund was known as the Forward Banking and Finance Fund and the Emerald Growth Fund was known as the Forward Growth Fund. Effective March 13, 2012, the Board of Trustees (the “Board”) approved changing the fiscal year end of the Funds from December 31 to April 30. The Emerald Small Cap Value Fund is a successor to a previously operational fund which was a series of Elessar Funds Investment Trust, a Delaware statutory trust, and was organized into a series of the Trust effective as of the close of business on June 26, 2015. Effective March 3, 2015, the Board approved changing the fiscal year end of the Emerald Small Cap Value Fund from September 30 to April 30.
The Emerald Growth Fund and Emerald Insights Fund seek to achieve long‐term growth through capital appreciation. The Emerald Small Cap Value Fund seeks long‐term capital appreciation. The Emerald Banking and Finance Fund seeks to achieve long term growth through capital appreciation with income as a secondary objective.
2. SIGNIFICANT ACCOUNTING POLICIES
The accompanying financial statements were prepared in accordance with accounting principles generally accepted in the United States of America (“U.S. GAAP”). The preparation of financial statements in conformity with U.S. GAAP requires management to make certain estimates and assumptions that affect the reported amounts of assets and liabilities and disclosures of contingent assets and liabilities at the date of the financial statements and the reported amounts of revenue and expenses during the period. Actual results could differ from those estimates. The Funds are considered an investment company for financial reporting purposes under U.S. GAAP. The following is a summary of significant accounting policies consistently followed by the Funds in preparation of their financial statements.
Investment Valuation: The Funds generally value their securities based on market prices determined at the close of regular trading on the New York Stock Exchange (“NYSE”), normally, 4:00 p.m. Eastern time, on each business day the NYSE is open for trading.
For equity securities and mutual funds that are traded on an exchange, the market price is usually the closing sale or official closing price on that exchange. In the case of equity securities not traded on an exchange, or if such closing prices are not otherwise available, the securities are valued at the mean of the most recent bid and ask prices on such day. Redeemable securities issued by open‐end registered investment companies are valued at the investment company’s applicable net asset value, with the exception of exchange‐traded open‐end investment companies, which are priced as equity securities.
The market price for debt obligations is generally the price supplied by an independent third‐party pricing service approved by the Board of Trustees (the “Board”), which may use a matrix, formula or other objective method that takes into consideration quotations from dealers, market transactions in comparable investments, market indices and yield curves. If vendors are unable to supply a price, or if the price supplied is deemed to be unreliable, the market price may be determined using quotations received from one or more brokers–dealers that make a market in the security.
Equity securities that are primarily traded on foreign securities exchanges are valued at the preceding closing values of such securities on their respective exchanges, except when an occurrence subsequent to the time a value was so established is likely to have changed such value. In such an event, the fair values of those securities are determined in good faith through consideration of other factors in accordance with procedures established by and under the general supervision of the Board.
When such prices or quotations are not available, or when Emerald Mutual Fund Advisers Trust, (the “Adviser”), believes that they are unreliable, securities may be priced using fair value procedures approved by the Board.
Fair Value Measurements: A three‐tier hierarchy has been established to classify fair value measurements for disclosure purposes. Inputs refer broadly to the assumptions that market participants would use in pricing the asset or liability, including assumptions about risk. Inputs may be observable or unobservable. Observable inputs are inputs that reflect the assumptions market participants would use in pricing the asset or liability that are developed based on market data obtained from sources independent of the reporting entity. Unobservable inputs are inputs that reflect the reporting entity’s own assumptions about the assumptions market participants would use in pricing the asset or liability that are developed based on the best information available. Various inputs are used in determining the value of each Fund’s investments as of the reporting period end. The designated input levels are not necessarily an indication of the risk or liquidity associated with these investments.
| 56 | www.emeraldmutualfunds.com |
| Emerald Funds | Notes to Financial Statements |
October 31, 2016 (Unaudited)
These inputs are categorized in the following hierarchy under applicable financial accounting standards:
| Level 1 – | Unadjusted quoted prices in active markets for identical investments, unrestricted assets or liabilities that the Funds have the ability to access at the measurement date; |
| Level 2 – | Quoted prices which are not active, quoted prices for similar assets or liabilities in active markets or inputs other than quoted prices that are observable (either directly or indirectly) for substantially the full term of the asset or liability; and |
| Level 3 – | Significant unobservable prices or inputs (including the Funds’ own assumptions in determining the fair value of investments) where there is little or no market activity for the asset or liability at the measurement date. |
The following is a summary of each input used to value the Funds as of October 31, 2016:
| Investments in Securities at Value | Level 1 - Quoted Prices | Level 2 - Other Significant Observable Inputs | Level 3 - Significant Unobservable Inputs | Total | ||||||||||||
| Emerald Growth Fund | ||||||||||||||||
Common Stocks(a) | $ | 889,940,313 | $ | – | $ | – | $ | 889,940,313 | ||||||||
| Short Term Investments | 18,587,093 | – | – | 18,587,093 | ||||||||||||
| TOTAL | $ | 908,527,406 | $ | – | $ | – | $ | 908,527,406 | ||||||||
| Investments in Securities at Value | Level 1 - Quoted Prices | Level 2 - Other Significant Observable Inputs | Level 3 - Significant Unobservable Inputs | Total | ||||||||||||
| Emerald Small Cap Value Fund | ||||||||||||||||
Common Stocks(a) | $ | 16,348,530 | $ | – | $ | – | $ | 16,348,530 | ||||||||
| Short Term Investments | 622,098 | – | – | 622,098 | ||||||||||||
| TOTAL | $ | 16,970,628 | $ | – | $ | – | $ | 16,970,628 | ||||||||
| Investments in Securities at Value | Level 1 - Quoted Prices | Level 2 - Other Significant Observable Inputs | Level 3 - Significant Unobservable Inputs | Total | ||||||||||||
| Emerald Insights Fund | ||||||||||||||||
Common Stocks(a) | $ | 11,254,620 | $ | – | $ | – | $ | 11,254,620 | ||||||||
Master Limited Partnerships(a) | 100,265 | – | – | 100,265 | ||||||||||||
| Short Term Investments | 592,088 | – | – | 592,088 | ||||||||||||
| TOTAL | $ | 11,946,973 | $ | – | $ | – | $ | 11,946,973 | ||||||||
| Investments in Securities at Value | Level 1 - Quoted Prices | Level 2 - Other Significant Observable Inputs | Level 3 - Significant Unobservable Inputs | Total | ||||||||||||
| Emerald Banking and Finance Fund | ||||||||||||||||
| Common Stocks | ||||||||||||||||
| Commercial Banks | $ | 3,999,671 | $ | 2,239,958 | $ | – | $ | 6,239,629 | ||||||||
Other(a) | 282,806,593 | – | – | 282,806,593 | ||||||||||||
| Short Term Investments | 5,516,629 | – | – | 5,516,629 | ||||||||||||
| TOTAL | $ | 292,322,893 | $ | 2,239,958 | $ | – | $ | 294,562,851 | ||||||||
(a) | For detailed descriptions of sector and industry, see the accompanying Schedule of Investments. |
| Semi-Annual Report | October 31, 2016 | 57 |
| Emerald Funds | Notes to Financial Statements |
October 31, 2016 (Unaudited)
The Funds recognize transfers between levels as of the end of the period. For the six months ended October 31, 2016, the Fund had the following transfers between Level 1 and Level 2 securities.
| Level 1 | Level 2 | |||||||||||||||
| Emerald Banking and Finance Fund | Transfer In | Transfers (Out) | Transfer In | Transfers (Out) | ||||||||||||
| Common Stocks | $ | 2,285,304 | $ | – | $ | – | $ | (2,285,304 | ) | |||||||
| Total | $ | 2,285,304 | $ | – | $ | – | $ | (2,285,304 | ) | |||||||
The above transfers from Level 2 to Level 1 were due to the ability to obtain a closing market price within an active market for a security that previously had no market to trade. For the six months ended October 31, 2016, the Emerald Growth Fund, Emerald Small Cap Value Fund and Emerald Insights Fund did not have any transfers between Level 1 and Level 2 securities.
For the six months ended October 31, 2016, the Funds did not have any securities that used significant unobservable inputs (Level 3) in determining fair value.
Investment Transactions and Investment Income: Investment transactions are accounted for on the date the investments are purchased or sold (trade date). Realized gains and losses from investment transactions are reported on an identified cost basis, which is the same basis the Funds use for federal income tax purposes. Interest income, which includes accretion of discounts, is accrued and recorded as earned. Dividend income is recognized on the ex‐dividend date or for certain foreign securities, as soon as information is available to the Funds. All of the realized and unrealized gains and losses and net investment income, are allocated daily to each class in proportion to its average daily net assets.
Real Estate Investment Trusts (“REITs”): The Funds may invest a portion of their assets in REITs and are subject to certain risks associated with direct investment in REITs. REITs may be affected by changes in the value of their underlying properties and by defaults by borrowers or tenants. REITs depend generally on their ability to generate cash flow to make distributions to shareowners, and certain REITs have self‐liquidation provisions by which mortgages held may be paid in full and distributions of capital returns may be made at any time. In addition, the performance of a REIT may be affected by its failure to qualify for tax‐free pass‐through of income under the Internal Revenue Code of 1986, as amended (the “Code”), or its failure to maintain exemption from registration under the 1940 Act. A Fund’s investments in REITs may result in such Fund’s receipt of cash in excess of the REITs’ earnings. If the Fund receives such distributions all or a portion of these distributions will constitute a return of capital to such Fund. Receiving a return of capital distribution from REITs will reduce the amount of income available to be distributed to Fund shareholders. Income from REITs generally will not be eligible for treatment as qualified dividend income. As the final character of the distributions is not known until reported by the REITs on their 1099s, the Funds utilize an average of the prior year’s reallocation information as an estimate for the current year character of distributions.
Trust Expenses: Some expenses of the Trust can be directly attributed to the Funds. Expenses which cannot be directly attributed to the Funds are apportioned among all funds in the Trust based on average net assets of each fund.
Fund and Class Expenses: Expenses that are specific to a Fund or class of shares of a Fund, including distribution fees (Rule 12b‐1 fees) and shareholder servicing fees, are charged directly to that Fund or share class. All expenses of a Fund, other than class specific expenses, are allocated daily to each class in proportion to its average daily net assets. Expenses that are common to the Funds generally are allocated among the Funds in proportion to their average daily net assets.
Federal Income Taxes: Each Fund complies with the requirements under Subchapter M of the Internal Revenue Code of 1986, as amended, applicable to regulated investment companies and intends to distribute substantially all of its net taxable income and net capital gains, if any, each year so that the Funds will not be subject to excise tax on undistributed income and gains. The Funds are not subject to income taxes to the extent such distributions are made.
As of and during the six months ended October 31, 2016, the Funds did not have a liability for any unrecognized tax benefits. The Funds file U.S. federal, state, and local tax returns as required. The Funds’ tax returns are subject to examination by the relevant tax authorities until expiration of the applicable statute of limitations, which is generally three years after the filing of the tax return for federal purposes and four years for most state returns. Tax returns for open years have incorporated no uncertain tax positions that require a provision for income taxes.
Distributions to Shareholders: Each Fund normally pays dividends and distributes capital gains, if any, on an annual basis. Income dividend distributions are derived from dividends and other income each Fund receives from its investments, including short‐term capital gains. Long term capital gain distributions are derived from gains realized when each Fund sells a security it has owned for more than a year. Each Fund may make additional distributions and dividends at other times if the portfolio manager believes doing so may be necessary for each Fund to avoid or reduce taxes.
| 58 | www.emeraldmutualfunds.com |
| Emerald Funds | Notes to Financial Statements |
October 31, 2016 (Unaudited)
3. TAX BASIS INFORMATION
Tax Basis of Investments: As of October 31, 2016, the aggregate cost of investments, gross unrealized appreciation/(depreciation) and net unrealized appreciation/(depreciation) for Federal tax purposes was as follows:
| Gross Appreciation (excess of value over tax cost) | Gross Depreciation (excess of tax cost over value) | Net Unrealized Appreciation/(Depreciation) | Cost of Investments for Income Tax Purposes | |||||||||||||
| Emerald Growth Fund | $ | 134,144,622 | $ | (69,540,901 | ) | $ | 64,603,721 | $ | 843,923,685 | |||||||
| Emerald Small Cap Value Fund | 3,062,513 | (1,205,679 | ) | 1,856,834 | 15,113,794 | |||||||||||
| Emerald Insights Fund | 1,150,172 | (797,283 | ) | 352,889 | 11,594,084 | |||||||||||
| Emerald Banking and Finance Fund | 61,527,893 | (6,491,474 | ) | 55,036,419 | 239,526,432 | |||||||||||
Tax Basis of Distributions to Shareholders: The character of distributions made during the year from net investment income or net realized gains may differ from its ultimate characterization for federal income tax purposes. Also, due to the timing of dividend distributions, the fiscal year in which amounts are distributed may differ from the fiscal year in which the income or realized gain were recorded by each Fund.
The tax character of distributions paid by the Funds for the fiscal year or period ended April 30, 2016, were as follows:
| Ordinary Income | Long-Term Capital Gain | |||||||
| Emerald Growth Fund | $ | – | $ | 22,536,119 | ||||
| Emerald Small Cap Value Fund | 81,808 | – | ||||||
| Emerald Insights Fund | – | – | ||||||
| Emerald Banking and Finance Fund | – | – | ||||||
The amounts and characteristics of tax basis distributions and composition of distributable earnings/(accumulated losses) are finalized at fiscal year‐end. Accordingly, tax basis balances have not been determined as of October 31, 2016.
4. SECURITIES TRANSACTIONS
The cost of purchases and proceeds from sales of securities (excluding short‐term securities) during the six months or period ended October 31, 2016 was as follows:
| Funds | Cost of Investments Purchased | Proceeds from Investments Sold | ||||||
| Emerald Growth Fund | $ | 283,064,651 | $ | 359,538,914 | ||||
| Emerald Small Cap Value Fund | 4,335,592 | 4,239,026 | ||||||
| Emerald Insights Fund | 5,020,976 | 7,319,006 | ||||||
| Emerald Banking and Finance Fund | 42,936,097 | 67,293,430 | ||||||
| Semi-Annual Report | October 31, 2016 | 59 |
| Emerald Funds | Notes to Financial Statements |
October 31, 2016 (Unaudited)
5. SHARES OF BENEFICIAL INTEREST
The capitalization of the Trust consists of an unlimited number of shares of beneficial interest with no par value per share. Holders of the shares of the Funds of the Trust have one vote for each share held and a proportionate fraction of a vote for each fractional share. All shares issued and outstanding are fully paid and are transferable and redeemable at the option of the shareholder. Purchasers of the shares do not have any obligation to make payments to the Trust or its creditors (other than the purchase price for the shares) or make contributions to the Trust or its creditors solely by reason of the purchaser’s ownership of the shares. Shares have no pre‐emptive rights.
6. MANAGEMENT AND RELATED‐PARTY TRANSACTIONS
The Adviser, subject to the authority of the Board, is responsible for the overall management and administration of the Funds’ business affairs. The Adviser manages the investments of the Funds in accordance with the Funds’ investment objective, policies and limitations and investment guidelines established jointly by the Adviser and the Trustees. Pursuant to the Advisory Agreement, the Funds pay the Adviser fees for the services and facilities it provides payable on a monthly basis at the annual rate set forth below of the Funds’ average daily net assets. The management fee is paid on a monthly basis.
| Emerald Growth Fund | |
| Average Total Net Assets | Contractual Fee |
| Up to and including $250M | 0.75% |
| Over $250M and including $500M | 0.65% |
| Over $500M and including $750M | 0.55% |
| Over $750M | 0.45% |
| Emerald Small Cap Value Fund | |
| Average Total Net Assets | Contractual Fee |
| Up to and including $250M | 0.75% |
| Over $250M and including $500M | 0.65% |
| Over $500M and including $750M | 0.55% |
| Over $750M | 0.45% |
| Emerald Insights Fund | |
| Average Total Net Assets | Contractual Fee |
| Up to and including $250M | 0.75% |
| Over $250M and including $500M | 0.65% |
| Over $500M and including $750M | 0.55% |
| Over $750M | 0.45% |
| Emerald Banking and Finance Fund | |
| Average Total Net Assets | Contractual Fee |
| Up to and including $100M | 1.00% |
| Over $100M | 0.90% |
Adviser has contractually agreed to limit each Fund’s total annual operating expenses (exclusive of acquired fund fees and expenses, brokerage expenses, interest expenses, taxes and extraordinary expense) set forth in the preceding table for Class A, Class C, Institutional Class, and Investor Class shares to the annual rates (as percentages of a Fund’s average daily net assets. This agreement (the “Expense Agreement”) is in effect from September 1, 2016 through August 31, 2017 for all Funds except the Emerald Small Cap Value Fund. The Emerald Small Cap Value Fund’s agreement is in effect from June 26, 2015 through August 31, 2017. The prior Expense Agreement was in effect from September 1, 2015 through August 31, 2016 for all Funds except the Emerald Small Cap Value Fund. The Adviser will be permitted to recover, on a class‐by‐class basis, expenses it has borne through the expense agreement to the extent that a Fund’s expenses in later periods fall below the expense cap in effect at the time of the waiver or reimbursement. Notwithstanding the foregoing, the Funds will not be obligated to pay any such fees and expenses more than three years after the end of the fiscal year in which the fees or expenses were foregone or reimbursed. The Adviser may not discontinue this waiver, prior to August 31, 2017, without the approval by the Fund’s Board. Fees waived/reimbursed by the Adviser for the six month period ended October 31, 2016 are disclosed in the Statements of Operations.
| 60 | www.emeraldmutualfunds.com |
| Emerald Funds | Notes to Financial Statements |
October 31, 2016 (Unaudited)
| Emerald Growth Fund | |||
| Class A | Class C | Institutional Class | Investor Class |
| 1.29% | 1.94% | 0.99% | 1.34% |
| Emerald Small Cap Value Fund | |||
| Class A | Class C | Institutional Class | Investor Class |
| 1.35% | 2.00% | 1.00% | 1.25% |
| Emerald Insights Fund | |||
| Class A | Class C | Institutional Class | Investor Class |
| 1.35% | 2.00% | 1.05% | 1.40% |
| Emerald Banking and Finance Fund | |||
| Class A | Class C | Institutional Class | Investor Class |
| 1.84% | 2.49% | 1.54% | 1.89% |
For the six months ended October 31, 2016, the fee waivers and/or reimbursements were as follows:
| Fund | Fees Waived/ Reimbursed By Adviser | Recoupment of Past Waived Fees By Adviser | ||||||
| Emerald Growth Fund | ||||||||
| Class A | $ | – | $ | – | ||||
| Class C | – | – | ||||||
| Institutional Class | – | – | ||||||
| Investor Class | – | – | ||||||
| Emerald Small Cap Value Fund | ||||||||
| Class A | $ | 870 | $ | – | ||||
| Class C | 1,375 | – | ||||||
| Institutional Class | 32,361 | – | ||||||
| Investor Class | 4,020 | – | ||||||
| Emerald Insights Fund | ||||||||
| Class A | $ | 38,004 | $ | – | ||||
| Class C | 348 | – | ||||||
| Institutional Class | 5,001 | – | ||||||
| Investor Class | 309 | – | ||||||
| Emerald Banking and Finance Fund | ||||||||
| Class A | $ | – | $ | – | ||||
| Class C | – | – | ||||||
| Institutional Class | – | – | ||||||
| Investor Class | – | – | ||||||
| Semi-Annual Report | October 31, 2016 | 61 |
| Emerald Funds | Notes to Financial Statements |
October 31, 2016 (Unaudited)
As of October 31, 2016, the balances of recoupable expenses for each Fund were as follows:
| Fund | Expires 2017 | Expires 2018 | Expires 2019 | Total | ||||||||||||
| Emerald Growth Fund | ||||||||||||||||
| Class A | $ | – | $ | – | $ | – | $ | – | ||||||||
| Class C | – | – | – | – | ||||||||||||
| Institutional Class | – | – | – | – | ||||||||||||
| Investor Class | – | – | – | – | ||||||||||||
| Emerald Small Cap Value Fund | ||||||||||||||||
| Class A | $ | – | $ | 30 | $ | 256 | $ | 286 | ||||||||
| Class C | – | 30 | 617 | 647 | ||||||||||||
| Institutional Class | – | 37,563 | 64,181 | 101,744 | ||||||||||||
| Investor Class | – | 852 | 5,731 | 6,583 | ||||||||||||
| Emerald Insights Fund | ||||||||||||||||
| Class A | $ | – | $ | 41,382 | $ | 67,047 | $ | 108,429 | ||||||||
| Class C | – | 921 | 467 | 1,388 | ||||||||||||
| Institutional Class | – | 3,464 | 5,690 | 9,154 | ||||||||||||
| Investor Class | – | 1,872 | 3,372 | 5,244 | ||||||||||||
| Emerald Banking and Finance Fund | ||||||||||||||||
| Class A | $ | – | $ | – | $ | – | $ | – | ||||||||
| Class C | – | – | – | – | ||||||||||||
| Institutional Class | – | – | – | – | ||||||||||||
| Investor Class | – | – | – | – | ||||||||||||
Fund Administrator Fees and Expenses: ALPS Fund Services, Inc. (“ALPS”) serves as administrator to the Funds and the Funds have agreed to pay expenses incurred in connection with their administrative activities. Pursuant to an Administration Agreement, ALPS provides operational services to the Funds including, but not limited to, fund accounting and fund administration and generally assist in the Funds’ operations. Officers of the Trust are employees of ALPS. The Funds’ administration fee is accrued on a daily basis and paid monthly. Administration fees paid by the Funds for the six months ended October 31, 2016 are disclosed in the Statements of Operations.
The Administrator is also reimbursed by the Funds for certain out‐of‐pocket expenses.
Transfer Agent: ALPS serves as transfer, dividend paying and shareholder servicing agent for the Funds. ALPS receives an annual minimum fee, a fee based upon the number of shareholder accounts, and is also reimbursed by the Funds for certain out‐of‐pocket expenses. Transfer agent fees paid by the Funds for the six months ended October 31, 2016 are disclosed in the Statements of Operations.
Compliance Services: ALPS provides services that assist the Trust’s chief compliance officer in monitoring and testing the policies and procedures of the Trust in conjunction with requirements under Rule 38a‐1 under the 1940 Act and receives an annual base fee. ALPS is reimbursed for certain out‐of‐pocket expenses by the Funds. Compliance service fees paid by the Funds for the six months ended October 31, 2016 are disclosed in the Statements of Operations.
Principal Financial Officer: ALPS receives an annual fee for providing principal financial officer services to the Funds. Principal financial officer fees paid by the Fund for the six months ended October 31, 2016 are disclosed in the Statements of Operations.
Distributor: ALPS Distributors, Inc. (“ADI” or the “Distributor”) (an affiliate of ALPS Fund Services Inc. (“ALPS”)) acts as the distributor of the Funds’ shares pursuant to a Distribution Agreement with the Trust. Shares are sold on a continuous basis by ADI as agent for the Funds, and ADI has agreed to use its best efforts to solicit orders for the sale of Funds’ shares, although it is not obliged to sell any particular amount of shares. ADI is not entitled to any compensation for its services as Distributor. ADI is registered as a broker‐dealer with the U.S. Securities and Exchange Commission.
Each Fund has adopted a separate Distribution and Services Plan (each a “Plan” and collectively, the “Plans”) pursuant to Rule 12b‐1 of the 1940 Act. The Plans allow each Fund, as applicable, to use each Fund’s assets to pay fees in connection with the distribution and marketing of the Funds’ shares and/or the provision of shareholder services to the Funds’ shareholders. The Plan permits payment for services in connection with the administration of plans or programs that use shares of each Fund as their funding medium and for related expenses. The recipients of such payments may include other affiliates of the Adviser, broker‐dealers, financial institutions, plan sponsors and administrators and other financial intermediaries through which investors may purchase shares of the Fund. The Plans permit each Fund to make total payments at an annual rate of up to 0.35%, 0.75% and 0.25% of the average daily net asset value of Class A, Class C and Investor Class, respectively. Because these fees are paid
| 62 | www.emeraldmutualfunds.com |
| Emerald Funds | Notes to Financial Statements |
October 31, 2016 (Unaudited)
out of the Funds’ assets on an ongoing basis, over time they will increase the cost of an investment in the Funds, and Plan fees may cost an investor more than other types of sales charges.
Each Fund, except the Emerald Small Cap Value Fund, has adopted a Shareholder Services Plan (a “Shareholder Services Plan”) with respect to its Class C, Institutional Class and Investor Class shares. Under the Shareholder Services Plan, a Fund is authorized to compensate certain financial intermediaries, including broker‐dealers and Fund affiliates which may include the Distributor, Adviser and/or the transfer agent (the “Participating Organizations”), an aggregate fee in an amount not to exceed on an annual basis 0.25%, 0.05% and 0.15% of the average daily net asset value of Class C, Institutional Class and Investor Class, respectively, of the Funds attributable to or held in the name of the Participating Organizations pursuant to an agreement with such Participating Organizations (the “Agreement”). Each Agreement will set forth the non‐distribution related shareholder services to be performed by the Participating Organizations for the benefit of a Fund’s shareholders who have elected to have such Participating Organizations service their accounts. Any amount of such payment not paid to Participating Organizations during a Fund’s fiscal year for such service activities shall be reimbursed to the Fund as soon as practicable after the end of the fiscal year. Shareholder Services Plan fees are included with distribution and service fees on the Statements of Operations.
The Emerald Small Cap Value Fund has adopted a Shareholder Services Plan (the “Plan”) with respect to its Class C shares. Under the Plan, the Fund is authorized to pay banks and its affiliates and other institutions, including broker‐dealers and Fund affiliates which may include the Distributor, Adviser and/or the transfer agent (“Class C Participating Organizations”), an aggregate fee in an amount not to exceed on an annual basis 0.25% of the average daily net asset value of Class C shares of the Fund attributable to or held in the name of the Participating Organizations for its clients as compensation for providing shareholder service activities, which do not include distribution services pursuant to an agreement with Participating Organizations. Any amount of such payment not paid to the Participating Organizations during the Fund’s fiscal year for such service activities shall be reimbursed to the Fund as soon as practicable after the end of the fiscal year. Plan fees are included with distribution and service fees on the Statements of Operations.
7. INDEMNIFICATIONS
Under the Trust’s organizational documents, its officers and Trustees are indemnified against certain liability arising out of the performance of their duties to the Trust. Additionally, in the normal course of business, the Trust enters into contracts with service providers that may contain general indemnification clauses, which may permit indemnification to the extent permissible under applicable law. The Trust’s maximum exposure under these arrangements is unknown, as this would involve future claims that may be made against the Trust that have not yet occurred.
| Semi-Annual Report | October 31, 2016 | 63 |
| Emerald Funds | Additional Information |
October 31, 2016 (Unaudited)
1. FUND HOLDINGS
The Funds file their complete schedule of portfolio holdings with the Securities and Exchange Commission (the “SEC”) for the first and third quarters of each fiscal year on Form N‐Q within 60 days after the end of the period. Copies of the Funds’ Form N‐Q are available without charge on the SEC website at http://www.sec.gov. You may also review and copy the Form N‐Q at the SEC’s Public Reference Room in Washington, DC. For more information about the operation of the Public Reference Room, please call the SEC at 1‐800‐SEC‐0330.
2. FUND PROXY VOTING POLICIES, PROCEDURES AND SUMMARIES
Each Fund’s policies and procedures used in determining how to vote proxies and information regarding how the Funds voted proxies relating to portfolio securities during the most recent prior 12‐month period ending June 30 are available without charge, (1) upon request, by calling (toll‐free) (855) 828‐9909 and (2) on the SEC’s website at http://www.sec.gov.
| 64 | www.emeraldmutualfunds.com |


TABLE OF CONTENTS
| Shareholder Letter | 1 |
| Performance Update | 9 |
| Disclosure of Fund Expenses | 30 |
| Portfolio of Investments | |
| Grandeur Peak Emerging Markets Opportunities Fund | 32 |
| Grandeur Peak Global Micro Cap Fund | 36 |
| Grandeur Peak Global Opportunities Fund | 40 |
| Grandeur Peak Global Reach Fund | 45 |
| Grandeur Peak Global Stalwarts Fund | 51 |
| Grandeur Peak International Opportunities Fund | 54 |
| Grandeur Peak International Stalwarts Fund | 58 |
| Statements of Assets and Liabilities | 61 |
| Statements of Operations | 63 |
| Statements of Changes in Net Assets | |
| Grandeur Peak Emerging Markets Opportunities Fund | 65 |
| Grandeur Peak Global Micro Cap Fund | 66 |
| Grandeur Peak Global Opportunities Fund | 67 |
| Grandeur Peak Global Reach Fund | 68 |
| Grandeur Peak Global Stalwarts Fund | 69 |
| Grandeur Peak International Opportunities Fund | 70 |
| Grandeur Peak International Stalwarts Fund | 71 |
| Financial Highlights | |
| Grandeur Peak Emerging Markets Opportunities Fund | 72 |
| Grandeur Peak Global Micro Cap Fund | 74 |
| Grandeur Peak Global Opportunities Fund | 75 |
| Grandeur Peak Global Reach Fund | 77 |
| Grandeur Peak Global Stalwarts Fund | 79 |
| Grandeur Peak International Opportunities Fund | 81 |
| Grandeur Peak International Stalwarts Fund | 83 |
| Notes to Financial Statements | 85 |
| Disclosure Regarding Approval of Fund Advisory Agreement | 95 |
| Additional Information | 98 |
Grandeur Peak Funds® | Shareholder Letter |
October 31, 2016 (Unaudited)

Dear Fellow Investors,
If you read my recent annual CEO letter you can skip this portion of the report. We decided to use my letter as the introduction to the semi‐annual report this year to ensure that all shareholders have the opportunity to hear my recent thoughts and announcements.
As a firm, we made our sixth annual trek to the top of Grandeur Peak on October 7th. There, per tradition, we each shared a High and Low for the year.

These past five years have been a thrilling journey for our firm and for me personally, and I’d like to give you an overview of what we have accomplished and where our focus will be going forward.
| Semi-Annual Report | October 31, 2016 | 1 |
Grandeur Peak Funds® | Shareholder Letter |
October 31, 2016 (Unaudited)
First, however, I’d like to share with you two exciting announcements that I think set us up really well for the next five years and beyond. First, I’m pleased to announce that my partner Blake Walker will succeed me as Chief Executive Officer at Grandeur Peak as of January 1st. I will remain Chairman, but I will more fully focus my attention on the front line of stock picking and portfolio management. Second, we are extremely excited to announce the formation of a sister company, Rondure Global AdvisorsSM, which will be led by acclaimed portfolio manager Laura Geritz. I’ll provide more detail about these two announcements later in this letter.
My family has a tradition of sharing our Best and Worst from the day at the dinner table each night. It’s super exciting when one of our children lists multiple Bests and then says “I didn’t have a worst today.” That is a bit how I feel reflecting on our first five years at Grandeur Peak. We have a great list of Highs, but I’m harder pressed to find Lows (although there have been a few).
Today we have roughly $3 billion in assets under management (AUM), which is quite an achievement in so short a time. This is one of our Highs for sure, but this was a secondary goal for us. When I recently inquired internally if we should have a party when we hit $3B, no one was interested. We have a motto: “We don’t want to be big; we want to be great.” I still count our $3B AUM among our nice accomplishments, as we’ve not only been good investors but we’ve been successful entrepreneurs. Because of this, Grandeur Peak is in a solid financial position today, and we’ve been able to build a balance sheet for strategic investment when future opportunities arise and/or to weather a rainy day.
But again on a scale of 1 to 10, growth of our AUM is maybe a 3 for us. What is a 12 on that scale is performance for our clients. So let me share our performance Highs and Lows from our first five years.
My youngest son Sam is in his last season of high school soccer. He’s a terrific player. I’ve seen a lot of soccer over the years. Maria, my oldest daughter, and my three brothers played through high school as well. One of the fascinating aspects of soccer is that in any given game, either team can win. In one game earlier this fall, my son Sam had two beautiful shots on goal, one just missing and the other hitting the post. Two of his teammates hit the post as well. They just could not find the net. Their team completely dominated the game, but they played to a tie. Through the years I’ve also seen games won by our team which were not deserved, where an astute coach pulled the team aside and told the players he was disappointed in their play and that the win was lucky as opposed to earned. The score in a single soccer game simply does not tell the whole story.
I’ve learned this same lesson over three‐plus decades of investing. The results of any single year can be deceiving. You can be doing all the right things but have a tough year, or you can be making far too many mistakes and yet still have a good year. In 1998‐99 when the internet boom began, any company that added “.com” to their name seemed to see their stock price soar. While our team at Wasatch Advisors was a big believer in the internet, we thought the market reaction was crazy—bidding up companies that had no real business, only hype. We chose to avoid these names. Consequently, we lagged the markets as we stuck with our “boring” 15% growers. Many of our clients, and even board members, were frustrated that we weren’t chasing the dot‐com stocks. It was tough, but we were satisfied with how we were playing the game despite what the scoreboard portrayed. You may remember that in 2000‐01 the internet bubble burst, and many who had chased internet stocks were crushed, while we escaped unscathed.
In last year’s annual letter I expressed discouragement over mistakes I felt we were making as a team. While our performance for 2015 was reasonable, I felt we had not played the game as well as we should have. It would have been easy at year end to say “decent year,” but I did not feel that was an accurate reflection of how we’d done. We had made too many mistakes and had not reacted quickly enough to deteriorating fundamentals in some of our companies (especially in emerging markets), and we had let quality dip and not paid enough attention to weakening fundamental momentum. By not being willing to pay up for quality we had to re‐learn the age old lesson that you typically “get what you pay for.” Our strength of being value sensitive was a weakness for us last year and we were slow to recognize it. I’m reminded of a Buffet quote: “It's far better to buy a wonderful company at a fair price than a fair company at a wonderful price.” This was a Low on our five‐year journey.
In comparison, I feel we’ve had a really solid year in 2016. Investing, like soccer, is a mental game. Sometimes a team has to lose to learn the lessons that will make it better. Losing a game can expose a team’s weaknesses that it didn’t realize it had. A good team learns from those mistakes, adjusts, and becomes an even better team. Our team learned a lot from our mistakes in 2015. We’re more focused on balancing valuation with stronger momentum, while ensuring that quality comes first. I see it in our work. Some of our 2015 issues carried over into the first half of 2016, but as we progressed through the year I really feel that those 2015 mistakes are behind us. It’s not a simple fix since we have to be vigilant to capture good earnings growth in today’s lackluster global economy, but we are doing a better job finding quality, growing companies at good valuations with good momentum.
To be clear, the scoreboard is somewhat mixed this year. While we show up high in the rankings against our peer group, our absolute performance is roughly in line with most of our index benchmarks. But, the biggest factor keeping us from more impressive results relative to the benchmarks is that the market has been driven by strong performance from the Real Estate, Materials and Utilities sectors. We are significantly underweight in these three sectors, so this has been a noticeable headwind for us this year. We have good research coverage of these areas, but these sectors are
| 2 | 1.855.377.7325 | www.GrandeurPeakGlobal.com |
Grandeur Peak Funds® | Shareholder Letter |
October 31, 2016 (Unaudited)
simply not our bread and butter, and haven’t been over my career. Given how much Real Estate, Materials, and Utilities have outperformed, I honestly would have expected us to have had a lot tougher year. We’ve kept up because we’ve done well in our core areas.
While any given soccer game may be won by the inferior team, over a full season the best teams usually end up at the top. Last year, Sam’s high school team got off to a very slow start, winless in its four preseason games, but they were a solid team and by the end of the year they qualified and made a nice run at the state tournament.
Similarly, though our performance in a given year may not have been as good as we would like, I’m pleased to report that our five‐year performance for our clients has been outstanding. Our first two funds, Global Opportunities and International Opportunities, hit their five‐year mark on October 17th, and they have significantly outperformed their primary benchmarks by roughly 40 and 50 percentage points respectively over those five years (non‐annualized—see standardized performance in the Performance Update section). In addition, both funds were ranked in the top decile of their Morningstar peer group for the five years ending 10/31/16.
Our Global Reach Fund hit its three‐year mark this summer with similarly impressive numbers, outperforming its benchmark handily and landing in the top decile of its peer group as well. The Emerging Markets Opportunities Fund will reach its third anniversary next month. We won’t speculate on just where it will fall in the 3‐year rankings, but suffice it to say that it has also done quite well in what has been a tougher period for emerging markets.
We were also pleased to see our new Global Stalwarts and International Stalwarts Funds solidly outperform their benchmarks and peers in their first year, although we would be the first to say that one year is merely one game of a long season. Both Funds are in the top decile of their peer group for the 1‐year ending 10/31/16. You will recall that these two funds invest in companies with market caps above $1.5 billion. Because they invest in the more liquid names, there is more capacity in these funds. They currently are our only open funds, and we do not anticipate closing them anytime soon. We have not aggressively marketed these funds (and have no intention to do so), but we will also be vigilant to close them at the appropriate time. We are hoping to find a few institutional clients from Australasia and Europe for these strategies, as we believe having global clients will make us a better global firm.
Our new Global Micro Cap Fund hit its one year mark on October 20th. The performance was similarly in the top decile of its Morningstar category. Blake and I have very successfully focused on the micro‐cap space throughout our careers. The micro‐cap space is such an exciting segment because we can find fast‐growing, undiscovered companies before others do. We want Grandeur Peak to be known as the firm that looks under every tiny stone in every corner of the globe for gems. We want to be the first to find a great young company, and then own it for a decade as it hopefully blossoms into one of the best companies in the world.
Unfortunately, the micro‐cap space in the US is not as interesting as it once was because Sarbanes Oxley and other regulatory costs of being a publicly traded company have discouraged great US companies from going public as early. The good news is that we see an extremely rich universe of micro‐cap companies across the globe. The non‐US micro‐cap universe feels similar to where the US universe was in 1995 when I launched my first micro‐cap fund. It’s our intention to find these companies early, get to know them and then own them across each of our funds at the appropriate time. So, while the Grandeur Peak Global Micro Cap Fund will remain very small in assets, its greatest purpose is to be a “feeder” of ideas to our other funds.
| Semi-Annual Report | October 31, 2016 | 3 |
Grandeur Peak Funds® | Shareholder Letter |
October 31, 2016 (Unaudited)
Morningstar Rankings & Ratings as of 10/31/161
| Grandeur Peak Fund | 5-Year Ranking | 3-Year Ranking | 1-Year Ranking | Morningstar Category |
| Global Opportunities (GPGIX) | TOP 2% (11 of 737 funds) | TOP 12% (117 of 960 funds) | TOP 7% (81 of 1136 funds) | World Stock |
| Int’l Opportunities (GPIIX) | TOP 7% (8 of 109 funds) | TOP 11% (14 of 122 funds) | TOP 7% (9 of 130 funds) | Foreign Small/ Mid Growth |
| Global Reach (GPRIX) | ‐‐ | TOP 7% (60 of 960 funds) | TOP 4% (46 of 1136 funds) | World Stock |
| Emerging Markets (GPEIX) | ‐‐ | ‐‐ | TOP 30% (256 of 867 funds) | Diversified Emerging Markets |
| Global Stalwarts (GGSYX) | ‐‐ | ‐‐ | TOP 4% (38 of 1136 funds) | World Stock |
| Int’l Stalwarts (GISYX) | ‐‐ | ‐‐ | TOP 1% (5 of 859 funds) | Foreign Large Blend |
| Global Micro Cap (GPMCX) | ‐‐ | ‐‐ | TOP 3% (28 of 1136 funds) | World Stock |
Source: Morningstar Essentials. Rankings are based on total return. Ratings are based on risk-adjusted return. The World Stock and Diversified Emerging Markets categories are comprised of funds investing in any capitalization range. Data shows past performance. Past performance is not indicative of future performance.
In summary, we are very pleased with our five‐year performance. But past performance is past performance. Our goal in launching Grandeur Peak was not to make an early splash with good performance, raise assets, and coast into the sunset. Rather it was to build and create something truly unique and special that could sustain performance over the long‐term. To do this we have sought to build a world class TEAM and STRUCTURE, run a disciplined, enduring and ever‐improving investment PROCESS, and to be a company with an amazing CULTURE.
Team & Structure
One High has been the strength and support of the business side of our firm. Led by Eric Huefner (President/COO), Amy Hone (VP of Operations & Compliance), and Mark Siddoway (Head of Client Relations), we were fortunate to have a very experienced team when we started. We’ve added other talented people as well from places like Goldman Sachs and PIMCO. Our most recent hire was John Parker, Director of IT. John has actually been with us since our inception on an outsourced basis, but our increasing IT needs led us to ask John if he might close his own firm to join ours. John, who is a great cultural fit at Grandeur Peak, joined us full‐time in March. We believe IT systems are critically important for any world‐class investment manager, and John is a key addition for us.
Our first routine SEC exam was completed this spring and we feel very good about how it went. Feel free to contact Eric Huefner with questions. Our firm has a strong culture of compliance, and having our first SEC exam behind us is a confirming milestone.
It’s not a true Low, but we’ve been challenged to keep up on the trading team. Earlier this year, we moved one of our traders to research, which was a great move, but it didn’t help our trading desk. We’re currently looking for another trader. Meanwhile, Gerome Gregory, one of our lead traders, is living in Hong Kong for three months and enhancing our trading knowledge of Asia. Our commitment to sending team members off to strengthen our global understanding extends to all areas of the firm.
With the research team, we feel like we’ve built a “force to be reckoned with.” We held a client conference in June (another High this year!). There, a long‐time client pulled me aside and asked what I personally was up to, where I was spending my time, and if anything had changed in my life? Was I focused on growing assets under management at the expense of getting performance in the funds? Why were we launching new funds? He probed from every angle, focusing on where I individually was spending my time. He pushed me just like I push company management teams. It was fun to be on the other side of the questioning!
This client is very astute to be probing me on all these fronts. So many firms like ours, after achieving a modicum of success, have been lulled into doing things in the spirit of growth that compromise their ability to get performance. He wanted to make sure that I personally was focused on the right things, and rightfully so. Without going into the details of all my answers, I assured him that we remain squarely focused on performance and remain vigilant in limiting our assets investing in micro and small‐cap companies.
| 4 | 1.855.377.7325 | www.GrandeurPeakGlobal.com |
Grandeur Peak Funds® | Shareholder Letter |
October 31, 2016 (Unaudited)
I will have more to say about my focus going forward later in this letter, but the one thing I want all of our clients to know is that Grandeur Peak is NOT about me, and it never has been. Those who may think the success of Grandeur Peak is attributable to me are sorely wrong. Obviously I have played a role and it’s worth knowing what I’m working on, but it is even more important to understand the people, the structure, and the focus of the great team we have diligently assembled. They are the ones who have delivered the performance for Grandeur Peak clients.
We started Grandeur Peak in 2011 with 6 experienced research analysts. Today our team of analysts is 24 (18 full‐time, plus 6 part‐time college students). This feels like the right size for what we’re tackling. Eight of us are experienced analysts who formerly worked together at Wasatch Advisors. We have added three additional experienced analysts, one of whom, Liping Cai, is presently living in Shanghai. Mark Madsen was our most recent senior hire and former colleague, joining us on January 1st. He was recently promoted to be an Industry Portfolio Manager (PM) over Energy & Materials for the Global Reach Fund. Brad Barth was also recently promoted to be the Industry PM over Financials. Brad joined us last year from Goldman Sachs. All of our senior investment team are playing important roles as analysts, portfolio managers, and/or on the Director of Research team. We are very fortunate to have built such a cohesive and experienced team.
We have also been investing in our junior team since day one. This team has been built from within and is now contributing in a significant way. We’ve been aggressive in hiring and developing a next generation of analysts. We have six analysts who started with us as college interns who are now full‐time analysts, and another six associates who are still in college working at Grandeur Peak part‐time. We throw our young analysts right into the mix with us, and give them the same tools and experiences as anyone on the team. It’s perhaps not your typical college spring break to spend the week in Korea visiting twenty‐five companies, but our young analysts have thrived on such opportunities. In fact, Spencer Hackett, one of our recent graduates, just returned from living and working in Tokyo for five months.
Of course not all interns stay with us and become full‐time analysts, but our “build‐and‐promote‐from‐within” strategy is working very well. Ben Gardiner was the latest analyst to join us full‐time after graduating this spring with a Math degree, Magna Cum Laude, from the University of Utah. We also picked up a new analyst internally when we moved Juliette Douglas, a talented member of our trading and operations team, to Research this year as a member of the Technology team.
There is no more important title at Grandeur Peak than ANALYST. While Blake and I have had many titles since the inception of the firm, the most important one for both of us is ANALYST. This is the heart of our research process and there is nothing we are more focused on than developing our team to be great analysts.
Each of our analysts wears two to four different hats, depending on their experience and the size of their roles.
First and foremost, we are global industry analysts. Each of our six industry teams are now three analysts deep. The leader of each industry team serves as the Industry PM on the Global Reach Fund. When we launched the Reach Fund three years ago, it caused a little internal indigestion as we worked out the details of how the industries would manage the Fund but we are ecstatic about how this has played out. With real money to manage, these teams are very focused and we are seeing the benefits playing out across all of our portfolios.
The second hat each analyst wears is on a specific portfolio team (sometimes multiple portfolios). You’ve probably heard me say before that we don’t believe in a “star” portfolio manager system, nor do we believe in a committee system. We are trying to achieve a middle ground with true “team” management of the portfolios, facilitated by two lead PMs assisted by lead analysts and overseen by a Guardian PM(s). The guardian portfolio manager provides “high‐end consulting” to help ensure we are seeing the forest as well as the trees. Some of the most valuable help I’ve had over my career has been for another experienced PM to look over my shoulder and offer suggestions about what I wasn’t seeing from my vantage point deep in the forest.
At year end we will be making a few small tweaks to our portfolio manager assignments designed to help us achieve the best performance we can in each of our portfolios. Stay tuned.
The third hat most of our analysts wear is that of geography. Our geographic focus is designed to enhance our fundamental analysis by giving us a better feel for local nuances that may affect our investments and to ensure we have looked in every nook and cranny. This hat has been a work in progress since our inception. Until now our team has honestly not had the breadth and experience needed to develop the fully functioning geography focus that we envisioned. This has been a modest Low for our first five years. But with a team as large and deep as we are now, it is our plan to run our geography teams similar to the industry teams, with a lead PM and supporting analysts for each region. This will also help ensure we have multiple minds looking closely at every investment. We anticipate the geography teams having a small product of their own to manage as well. More to come on this in 2017.
There is a fourth hat which is the “Director of Research” (DOR) hat. Rob Green has been a key leader of this team since our founding. The Director of Research team keeps us focused on executing and improving our process, while the quantitative analysts on the DOR team spend their days
| Semi-Annual Report | October 31, 2016 | 5 |
Grandeur Peak Funds® | Shareholder Letter |
October 31, 2016 (Unaudited)
looking at numbers, screens, and our watch lists to find emerging opportunities. The quantitative team has been a valuable contributor, though we’ve only scratched the surface on what this team can do for us.
We love our team structure. We are well‐organized. We are focused. We are accountable. We have the waterfront covered from end to end and from multiple angles. This structure is what it takes to truly cover the globe, and it differentiates us from our competitors. Our team and structure have come together very nicely thanks to five years of significant work. Each of our analysts is good at finding great companies in hidden valleys, yet they also sit with a global view from the peak: “Grandeur Peak to Cache Valley” as I call it.2 That is what our structure allows us to do.
Process
We remain devout in our allegiance to our time‐tested process. In a nutshell, we screen and use fundamental research to find great small companies that we think are going to get big. We look for great management teams, a sustainable competitive advantage, headroom to grow, good business models, financial strength, and good corporate governance. We try to find these great companies before others do so that we pay reasonable prices for them.
We call these companies “Best‐In‐Class Growth companies” (BICGs). We like to find them as undiscovered gems in the earliest innings (micro‐cap companies), but we continue to own them in their “stalwart” years when they are somewhat recognized but still with a lot of good growth left. We also like to buy fallen angel BICGs. Some companies hit a bump in the road along their journey and the market will often focus on short‐term negatives instead of long‐term potential. A fallen angel BICG company that gets back on track can be a great investment.
You’ve heard me talk about how good I feel we are at the front end of our process. Screening, finding and touching these intriguing companies are real strengths of ours. We are very disciplined screeners and we are willing travelers to every corner of the earth to get to know them. In these five years we’ve touched over 6000 companies in 64 countries. On a scale of 1 to 10, I would give our team a 10 on the front end of the process.
I’ve also mentioned previously that we need to get better at the back end of the process. This has been somewhat of a Low for us—i.e. not making as much progress as we would like. The most important part of the back end of the process might best be articulated as “we aspire to know our companies better than anyone.” We’ve spent 2016 working intensively on taking our modeling to the next level. With so many different accounting issues across geographies and industries, we’ve spent considerable time with our earnings model methodology so that we have a standardized way to look at company results.
We have made other progress on the back end this year, but there is a plenty more to do, so it will remain an important focus in 2017. I would say we have moved from a 4 to a 6 on the back end. We have great momentum on this front and I hope we’ll be at an 8 or 9 by 2018. One great part of our culture is our academic mindset; we believe we must be right for the right reasons, and we understand we must constantly improve the process.
Culture
We created Grandeur Peak with the idea of building a unique investment firm. It was going to take the right individuals, organized in a new type of structure, with a unique culture, to become a world‐class global investment firm. As students of companies around the world we see time and again that great companies have unique cultures. We have been very thoughtful about our culture and how we continue to cultivate it.
You may have heard that as a firm we took an RV trip along the West Coast from Canada to Mexico this summer. We divided the entire firm into four teams, with each team spending a week visiting companies and clients along their section of the route. Over those four weeks we saw 75 companies and a number of clients. It was a chance for non‐research employees to experience part of the research process first‐hand, and for research analysts to meet with clients. We also pre‐arranged a local service project for each team to tackle. Yes, we slipped in some fun team‐building activities along the way as well (e.g. fly fishing in Montana, hiking in Banff, kayaking in the San Juan Islands, golfing at Bandon Dunes, running Hood to Coast in Oregon, screaming at Disneyland and baseball games, soaking in a Shakespeare play, being awed by the Grand Canyon, and such).
We flew spouses/significant others out on the weekends to participate with us. Our spouses are very much a part of the team at Grandeur Peak. We would not be where we are today without their undying support of the hard work and crazy hours of our team! We were particularly fortunate to have Amy’s husband, Chris Hone, take a month off from his job to drive the RV for us (on some harrowing roads). The trip concluded upon the RV’s triumphant return with an overnight family party in the mountains outside of Salt Lake.
The RV trip is a nice illustration of our culture. Robert Frost’s poem is important to us: We want to take the road less traveled. We work hard. We play hard. We like being together. Every member of our firm is highly valued. We like doing things differently. We love our companies. We appreciate our clients. We cherish the world we live in and we want to give back to the communities around us.
| 6 | 1.855.377.7325 | www.GrandeurPeakGlobal.com |
Grandeur Peak Funds® | Shareholder Letter |
| October 31, 2016 (Unaudited) |
CEO Transition
With our team, structure, process, and culture solidly in place, it feels like the right time in our evolution to pass the CEO baton to Blake and focus my talents elsewhere for the firm. It’s been rewarding to have had the experience of being a CEO. Leading a firm with such fantastic people and a clear mission has been a thrill, and winning the EY Entrepreneur of the Year award for Utah was gratifying, but there are two great reasons to now elevate Blake into the CEO role.
First, I think Blake will be a better CEO for the next decade than I would. In my 35 years of working in this business, Blake has been the best partner I’ve ever had, and I’ve had many great partners. He walks the talk. He’s unselfish and loyal. He’s smart, a visionary, can make tough decisions, and he will hold his ground on the core values of the company. He’s a great investor. Blake understands just how very fortunate we are, and he has been a key champion of our mandate to create something special for our clients and employees, and to share our success with our global community. His time is here.
Second, I think I will be more valuable over the next five years as an analyst, portfolio manager, and mentor. My passion has always been to be a front line general. I love to read annual reports, build earnings models and visit companies side‐by‐side with other analysts. That is where I think I have the greatest skill. I have plenty of energy left (I’m only 51), and I expect to be working at Grandeur Peak until they bury me. I love doing what we’re doing. I’m extremely passionate about our company, the next generation of employees, and delivering for our clients. I feel the best thing I can do is hand over the reins of CEO and spend my energy analyzing companies and building portfolios.
I have also been the co‐Director of Research. As mentioned, our Director of Research team is strong and functioning well. Effective January 1st, I will relinquish both the CEO and DOR roles. Rob Green (CFA, MSF), who has been my deputy Director of Research, will become the Director of Research. Randy Pearce (CFA, MBA) who has been the co‐Director of Research will step into Blake’s former role as Chief Investment Officer.
Randy and Rob have both been with us since the inception of Grandeur Peak. They too have worn many hats over the past five years, been great team players, and developed into nice leaders for the firm.
Randy has delivered strong performance for our clients as a global analyst, as the leader of the financials team (Randy picked our first huge winner, Magellan Financial, which is up 20x from where we first bought it five years ago) and as the lead portfolio manager of the two Stalwarts strategies. As CIO he will be focused on the big investment ideas and themes, making sure we’re seeing what’s on the horizon and taking advantage of opportunities while preparing against unnecessary risks. Randy is a great thinker and has the skills and background to lead us on this front.
Rob is the glue that holds us together and the grease that keeps our process humming at 120mph. He may have to bring a little of his military upbringing into his increased role as Director of Research, but Rob’s understanding of the team, the structure, and the process combined with his unselfishness, analytical abilities, and steadiness will make him a great DOR.
You’ll notice that Mark Madsen’s promotion to Industry PM on Energy & Materials will free some time up for Blake, and Brad Barth’s promotion to Industry PM on Finance similarly frees Randy up a bit. However, both Blake and Randy remain analysts first and foremost, and they will continue to wear their industry hats.
Rondure Global AdvisorsSM
Perhaps the most exciting announcement is the formation of a new joint venture with industry veteran Laura Geritz (CFA, MA). We worked with Laura for a number of years at Wasatch Advisors. She announced her departure from Wasatch earlier this year. When we learned of her decision to leave Wasatch we jumped at the chance to talk with her about the possibility of working together again. Just last week we jointly formed a new investment firm named Rondure Global Advisors.
Laura has a strong track record of performance for her clients. She played a key role as a lead portfolio manager on the Wasatch Emerging Markets Small Cap Fund, the Wasatch International Opportunities Fund, and as the founding PM on the Wasatch Frontier Emerging Small Countries Fund. Laura is a skilled investor who shares many of the same investment philosophies with us. She’s a bottom‐up stock picker doing fundamental analysis focused on quality companies. She’s globally minded and is known for her killer travel schedule because she believes she can understand a company after seeing it on its home turf.
Laura will be the CEO of Rondure Global Advisors and will launch her own products under that name. She will also hire her own research and client team. Grandeur Peak will provide the back‐office and trading support. Rondure will be co‐located in the same office with Grandeur Peak, where we will sit side‐by‐side and work collaboratively. Rondure’s products will be more complementary than competitive with our existing products. I would describe Rondure’s investment focus as more “core” as compared to Grandeur Peak’s “growth” bent, and Rondure will not impact our liquidity constrained products as the new firm will focus on companies above $1.5 billion market‐cap.
| Semi-Annual Report | October 31, 2016 | 7 |
Grandeur Peak Funds® | Shareholder Letter |
October 31, 2016 (Unaudited)
Grandeur Peak’s research team will remain focused on our own mission with minimal disruption, while benefitting from the wisdom and experience of a great investor. We’re thrilled to have Laura sitting with us and traveling with us. She brings a perspective that will help us see macro issues better, but what we’re most excited about is simply talking about individual companies with Laura and her team.
The Wrap
While we have enjoyed a number of Highs over the past five years, there remain several areas for improvement, and we are anxiously engaged in those efforts as we speak. We are thrilled to have delivered solid performance across our products, but most importantly, we are encouraged that we have built a Team, a Structure, a Process, and a Culture that we believe is the backbone for delivering for our clients for years into the future. While I am stepping down as CEO, I plan to help deliver these results for decades to come.
Finally, I am deeply grateful to you, our clients, who believed in us when we were a small team with just a few assets and a big idea. Thank you. Thank you all very much.
Sincerely,

Robert Gardiner
Chairman, CEO & Co‐Founder
Grandeur Peak Global Advisors
Grandeur Peak Global Advisors
An investor should consider investment objectives, risks, charges, and expenses carefully before investing. To obtain a Grandeur Peak Funds prospectus, containing this and other information, visit www.grandeurpeakglobal.com or call 1-855-377-PEAK (7325). Please read it carefully before investing.
The views of Grandeur Peak Global Advisors, LLC. and information discussed in this commentary are as of the date of publication, are subject to change, and may not reflect the writers’ current views. The views expressed are those of the Fund’s adviser only, and represent an assessment of market conditions at a specific point in time, are opinions only and should not be relied upon as investment advice regarding a particular investment or markets in general. Such information does not constitute a recommendation to buy or sell specific securities or investment vehicles. It should not be assumed that any investment will be profitable or will equal the performance of the portfolios or any securities or any sectors mentioned in this letter. The subject matter contained in this letter has been derived from several sources believed to be reliable and accurate at the time of compilation. Neither Grandeur Peak Global Advisors, LLC nor the Funds accept any liability for losses either direct or consequential caused by the use of this information.
The Funds are distributed by ALPS Distributors, Inc.
The Funds are subject to investment risks, including possible loss of the principal amount invested and therefore is not suitable for all investors. The Fund may not achieve its objectives.
Diversification does not eliminate the risk of experiencing investment losses.
CFA is a trademark owned by the CFA Institute.
The Sarbanes-Oxley Act of 2002 (SOX) is an act passed by U.S. Congress in 2002 to protect investors from the possibility of fraudulent accounting activities by corporations. The SOX Act mandated strict reforms to improve financial disclosures from corporations and prevent accounting fraud.
Wasatch Advisors and the Wasatch Funds are not affiliated with Grandeur Peak Global Advisors or Rondure Global Advisors. An investor should consider investment objectives, risks, charges and expenses carefully before investing. To obtain a Wasatch Funds prospectus, which contains this and other information, visit www.wasatchfunds.com or call 800.551.1700. Please read the prospectus carefully before investing.
The Morningstar percentile rank is the rank among its category peers, which rank is based on a comparison of a fund’s total return performance against its peers over a given time period. Past performance is no guarantee of future results.
| 1 | © 2016 Morningstar, Inc. All Rights Reserved. The information contained herein: (1) is proprietary to Morningstar; (2) may not be copied or distributed; and (3) is not warranted to be accurate, complete or timely. Neither Morningstar nor its content providers are responsible for any damages or losses arising from any use of this information. |
| 2 | Grandeur Peak and Cache Valley are both locations in Utah; “Cache” means “hidden” in French. |
| 8 | 1.855.377.7325 | www.GrandeurPeakGlobal.com |
| Grandeur Peak Emerging Markets Opportunities Fund | Performance Update |
October 31, 2016 (Unaudited)
Cumulative Total Return Performance for the periods ended October 31, 2016
| 6 Months | 1 Year | Since Inception(a) | Expense Ratio(b) | ||
| Gross | Net(c) | ||||
| Grandeur Peak Emerging Markets Opportunities Fund – Investor (GPEOX) | 10.18% | 10.10% | 4.95% | 1.81% | 1.81% |
| Grandeur Peak Emerging Markets Opportunities Fund – Institutional (GPEIX) | 10.36% | 10.27% | 5.17% | 1.56% | 1.56% |
Russell Emerging Markets Small Cap Index(d) | 5.53% | 5.89% | 0.42% | ||
Performance data quoted represents past performance. Past performance does not guarantee future results. Investment return and principal value of an investment will fluctuate so that an investor’s shares, when sold or redeemed, may be worth more or less than the original cost. The Fund imposes a 2.00% redemption fee on shares held for less than 60 days. Current performance data may be higher or lower than actual data quoted. For the most current month-end performance data, please call 1-855-377-PEAK (7325).
The table does not reflect the deduction of taxes a shareholder would pay on Fund distributions or redemption of Fund shares.
Subject to investment risks, including possible loss of the principal amount invested.
Returns for periods greater than 1 year are annualized.
| (a) | Fund inception date of December 16, 2013. |
| (b) | Ratios as of the Prospectus dated August 31, 2016 and may differ from the ratios presented in the Financial Highlights. |
| (c) | Grandeur Peak Global Advisors, LLC (the “Adviser”), has agreed to waive and/or reimburse fees or expenses in order to limit Total Annual Fund Operating Expenses After Fee Waiver/Expense Reimbursement (excluding acquired fund fees and expenses, brokerage expenses, interest expenses, taxes and extraordinary expenses) to 1.95% and 1.70% of the Fund’s average daily net assets for the Fund’s Investor Class Shares and Institutional Class Shares, respectively. This agreement (the “Expense Agreement”) is in effect through August 31, 2017. The Adviser will be permitted to recover, on a class- by-class basis, expenses it has borne through the Expense Agreement to the extent that a Fund’s expenses in later periods fall below the expense cap in effect at the time of waiver or reimbursement. Notwithstanding the foregoing, the Fund will not be obligated to pay any such deferred fees and expenses more than three years after the end of the fiscal year in which the fee and expenses was deferred. The Expense Agreement may not be terminated or modified prior to August 31, 2017 except with the approval of the Fund’s Board of Trustees. |
| (d) | The Russell Emerging Markets Small Cap Index seeks to measure the performance of the small-cap equity universe of emerging countries. The Index is not actively managed and does not reflect any deductions for fees, expense, or taxes. An investor may not invest directly in the Index. |
| Semi-Annual Report | October 31, 2016 | 9 |
| Grandeur Peak Emerging Markets Opportunities Fund | Performance Update |
October 31, 2016 (Unaudited)
Growth of $10,000 for the period ended October 31, 2016
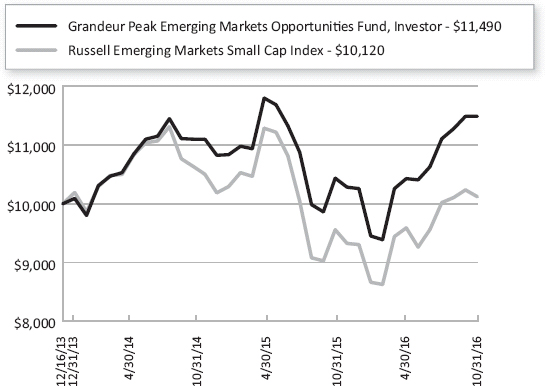
The chart shown above represent a hypothetical investment of $10,000 in the Fund’s Investor Class shares for the period from inception to October 31, 2016. All returns reflect reinvested dividends, but do not reflect the deduction of taxes that an investor would pay on distributions or redemptions.
Investing in the Fund is subject to investment risks, including possible loss of the principal amount invested.
The Fund also offers Institutional Class shares, performance for which is not reflected in the graphs above. The performance of Institutional Class shares may be higher or lower than the performance of the Investor Class shares shown in the graphs above based upon differences in fees paid by shareholders investing in the Investor Class shares and Institutional Class shares.
| 10 | 1.855.377.7325 | www.GrandeurPeakGlobal.com |
| Grandeur Peak Emerging Markets Opportunities Fund | Performance Update |
October 31, 2016 (Unaudited)
| Regional Allocation (as a % of Net Assets)* | |
| Asia ex Japan | 68.0% |
| Africa/Middle East | 10.7% |
| Latin America | 4.1% |
| Europe | 3.0% |
| North America | 2.8% |
| Asia Pacific | 0.4% |
| South America | 0.3% |
| Cash, Cash Equivalents, & Other Net Assets | 10.7% |
| Total | 100.0% |
| Industry Sector Allocation (as a % of Net Assets)* | |
| Financials | 21.6% |
| Consumer | 18.9% |
| Industrials | 17.3% |
| Technology | 17.0% |
| Health Care | 9.0% |
| Energy & Materials | 5.5% |
| Cash, Cash Equivalents, & Other Net Assets | 10.7% |
| Total | 100.0% |
| Top 10 Holdings (as a % of Net Assets)* | |
| Man Wah Holdings, Ltd. | 2.6% |
| Value Partners Group, Ltd. | 2.2% |
| China Medical System Holdings, Ltd. | 2.0% |
| Security Bank Corp. | 1.6% |
| Silergy Corp. | 1.5% |
| Bank Negara Indonesia Persero Tbk PT | 1.4% |
| Sporton International, Inc. | 1.4% |
| Time Technoplast, Ltd. | 1.4% |
| Sitronix Technology Corp. | 1.3% |
| Sinmag Equipment Corp. | 1.2% |
| Total | 16.6% |
| * | Holdings are subject to change, and may not reflect the current or future position of the portfolio. |
| Semi-Annual Report | October 31, 2016 | 11 |
| Grandeur Peak Global Micro Cap Fund | Performance Update |
October 31, 2016 (Unaudited)
Cumulative Total Return Performance for the periods ended October 31, 2016
| 6 Months | 1 Year | Since Inception(a) | Expense Ratio(b) | ||
| Gross | Net(c) | ||||
| Grandeur Peak Global MicroCap – Institutional (GPMCX) | 6.55% | 11.72% | 10.27% | 2.30% | 2.00% |
Russell Global Small Cap Index(d) | 4.40% | 5.51% | 5.18% | ||
Performance data quoted represents past performance. Past performance does not guarantee future results. Investment return and principal value of an investment will fluctuate so that an investor’s shares, when sold or redeemed, may be worth more or less than the original cost. The Fund imposes a 2.00% redemption fee on shares held for less than 60 days. Current performance data may be higher or lower than actual data quoted. For the most current month-end performance data, please call 1-855-377-PEAK (7325).
The table does not reflect the deduction of taxes a shareholder would pay on Fund distributions or redemption of Fund shares.
Subject to investment risks, including possible loss of the principal amount invested.
Returns for periods greater than 1 year are annualized.
(a) | Fund inception date of October 20, 2015. |
(b) | Ratios as of the Prospectus dated August 31, 2016 and may differ from the ratios presented in the Financial Highlights. |
(c) | Grandeur Peak Global Advisors, LLC (the “Adviser”), has agreed to waive and/or reimburse fees or expenses in order to limit Total Annual Fund Operating Expenses After Fee Waiver/Expense Reimbursement (excluding acquired fund fees and expenses, brokerage expenses, interest expenses, taxes and extraordinary expenses) to 2.00% of the Fund’s average daily net assets for the Fund’s Institutional Class Shares. This agreement is in effect through August 31, 2017. The Adviser will be permitted to recover, on a class-by-class basis, expenses it has borne through this agreement to the extent that a Fund’s expenses in later periods fall below the annual rates set forth in this agreement or in previous agreements. Notwithstanding the foregoing, the Fund will not be obligated to pay any such deferred fees and expenses more than three years after the end of the fiscal year in which the fee and expenses was deferred. This agreement may not be terminated or modified prior to August 31, 2017 except with the approval of the Fund’s Board of Trustees. |
(d) | The Russell Global Small Cap Index seeks to measure the performance of the small-cap segment of the global equity universe. The Index is not actively managed and does not reflect any deductions for fees, expenses, or taxes. An investor may not invest directly in the Index. |
| 12 | 1.855.377.7325 | www.GrandeurPeakGlobal.com |
| Grandeur Peak Global Micro Cap Fund | Performance Update |
October 31, 2016 (Unaudited)
Growth of $10,000 for the period ended October 31, 2016
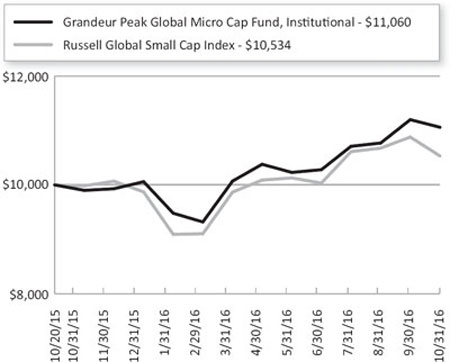
The chart shown above represent a hypothetical investment of $10,000 in the Fund’s Institutional Class shares for the period from inception to October 31, 2016. All returns reflect reinvested dividends, but do not reflect the deduction of taxes that an investor would pay on distributions or redemptions.
Investing in the Fund is subject to investment risks, including possible loss of the principal amount invested.
| Semi-Annual Report | October 31, 2016 | 13 |
| Grandeur Peak Global Micro Cap Fund | Performance Update |
October 31, 2016 (Unaudited)
| Regional Allocation (as a % of Net Assets)* | |
| Asia ex Japan | 30.5% |
| Europe | 23.6% |
| North America | 16.9% |
| Japan | 13.2% |
| Australia/New Zealand | 5.0% |
| Africa/Middle East | 2.9% |
| Latin America | 1.9% |
| Asia Pacific | 0.9% |
| Cash, Cash Equivalents, & Other Net Assets | 5.1% |
| Total | 100.0% |
| Industry Sector Allocation (as a % of Net Assets)* | |
| Financials | 21.3% |
| Consumer | 21.2% |
| Industrials | 17.7% |
| Technology | 16.8% |
| Health Care | 13.9% |
| Energy & Materials | 4.0% |
| Cash, Cash Equivalents, & Other Net Assets | 5.1% |
| Total | 100.0% |
| Top 10 Holdings (as a % of Net Assets)* | |
| Ananda Development PCL | 1.8% |
| Syuppin Co., Ltd. | 1.7% |
| M&A Capital Partners Co., Ltd. | 1.6% |
| Hard Off Corp. Co., Ltd. | 1.5% |
| Time Technoplast, Ltd. | 1.4% |
| Trilogy International, Ltd. | 1.3% |
| Infotel SA | 1.1% |
| On‐Bright Electronics, Inc. | 1.0% |
| Wavestone | 1.0% |
| Prestige International, Inc. | 1.0% |
| Total | 13.4% |
| * | Holdings are subject to change, and may not reflect the current or future position of the portfolio. |
| 14 | 1.855.377.7325 | www.GrandeurPeakGlobal.com |
| Grandeur Peak Global Opportunities Fund | Performance Update |
October 31, 2016 (Unaudited)
Cumulative Total Return Performance for the periods ended October 31, 2016
| 6 Months | 1 Year | 3 Years | 5 Years | Since Inception(a) | Expense Ratio(b) | ||
| Gross | Net(c) | ||||||
| Grandeur Peak Global Opportunities Fund – Investor (GPGOX) | 4.65% | 6.20% | 5.04% | 13.27% | 14.05% | 1.63% | 1.63% |
| Grandeur Peak Global Opportunities Fund – Institutional (GPGIX) | 4.95% | 6.34% | 5.29% | 13.60% | 14.38% | 1.38% | 1.38% |
Russell Global Small Cap Index(d) | 4.40% | 5.51% | 2.77% | 8.28% | 9.16% | ||
Russell Global Index(e) | 3.25% | 2.92% | 3.82% | 8.81% | 9.66% | ||
Performance data quoted represents past performance. Past performance does not guarantee future results. Investment return and principal value of an investment will fluctuate so that an investor’s shares, when sold or redeemed, may be worth more or less than the original cost. The Fund imposes a 2.00% redemption fee on shares held for less than 60 days. Current performance data may be higher or lower than actual data quoted. For the most current month-end performance data, please call 1-855-377-PEAK (7325).
The table does not reflect the deduction of taxes a shareholder would pay on Fund distributions or redemption of Fund shares.
Subject to investment risks, including possible loss of the principal amount invested.
Returns for periods greater than 1 year are annualized.
(a) | Fund inception date of October 17, 2011. |
(b) | Ratios as of the Prospectus dated August 31, 2016 and may differ from the ratios presented in the Financial Highlights. |
(c) | Grandeur Peak Global Advisors, LLC (the “Adviser”), has agreed to waive and/or reimburse fees or expenses in order to limit Total Annual Fund Operating Expenses After Fee Waiver/Expense Reimbursement (excluding acquired fund fees and expenses, brokerage expenses, interest expenses, taxes and extraordinary expenses) to 1.75% and 1.50% of the Fund’s average daily net assets for the Fund’s Investor Class Shares and Institutional Class Shares, respectively. This agreement (the “Expense Agreement”) is in effect through August 31, 2017. The Adviser will be permitted to recover, on a class- by-class basis, expenses it has borne the Expense Agreement to the extent that a Fund’s expenses in later periods fall below the expense cap in effect at the time of waiver or reimbursement. Notwithstanding the foregoing, the Fund will not be obligated to pay any such deferred fees and expenses more than three years after the end of the fiscal year in which the fee and expenses was deferred. The Expense Agreement may not be terminated or modified prior to August 31, 2017 except with the approval of the Fund’s Board of Trustees. |
(d) | The Russell Global Small Cap Index seeks to measure the performance of the small-cap segment of the global equity universe. The Index is not actively managed and does not reflect any deductions for fees, expense, or taxes. An investor may not invest directly in the Index. |
(e) | The Russell Global Index seeks to measure the performance of the global equity universe. The Index is not actively managed and does not reflect any deductions for fees, expense, or taxes. An investor may not invest directly in the Index. |
| Semi-Annual Report | October 31, 2016 | 15 |
| Grandeur Peak Global Opportunities Fund | Performance Update |
October 31, 2016 (Unaudited)
Growth of $10,000 for the period ended October 31, 2016
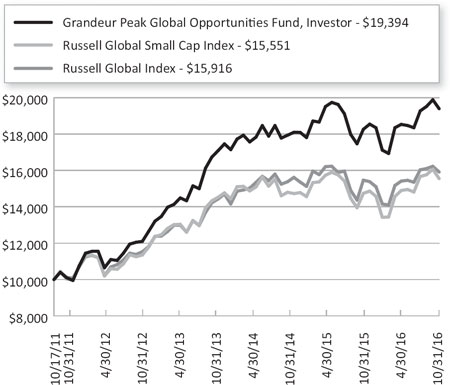
The chart shown above represent a hypothetical investment of $10,000 in the Fund’s Investor Class shares for the period from inception to October 31, 2016. All returns reflect reinvested dividends, but do not reflect the deduction of taxes that an investor would pay on distributions or redemptions.
Investing in the Fund is subject to investment risks, including possible loss of the principal amount invested.
The Fund also offers Institutional Class shares, performance for which is not reflected in the graphs above. The performance of Institutional Class shares may be higher or lower than the performance of the Investor Class shares shown in the graphs above based upon differences in fees paid by shareholders investing in the Investor Class shares and Institutional Class shares.
| 16 | 1.855.377.7325 | www.GrandeurPeakGlobal.com |
| Grandeur Peak Global Opportunities Fund | Performance Update |
October 31, 2016 (Unaudited)
| Regional Allocation (as a % of Net Assets)* | |
| North America | 28.9% |
| Asia ex Japan | 28.2% |
| Europe | 24.2% |
| Japan | 9.0% |
| Africa/Middle East | 3.0% |
| Australia/New Zealand | 2.8% |
| Latin America | 2.2% |
| Cash, Cash Equivalents, & Other Net Assets | 1.7% |
| Total | 100.0% |
| Industry Sector Allocation (as a % of Net Assets)* | |
| Financials | 24.4% |
| Technology | 20.4% |
| Consumer | 19.0% |
| Industrials | 18.9% |
| Health Care | 13.1% |
| Energy & Materials | 2.5% |
| Cash, Cash Equivalents, & Other Net Assets | 1.7% |
| Total | 100.0% |
| Top 10 Holdings (as a % of Net Assets)* | |
| Power Integrations, Inc. | 2.7% |
| Man Wah Holdings, Ltd. | 2.5% |
| First Republic Bank | 2.4% |
| Clinigen Group PLC | 2.1% |
| Knight Transportation, Inc. | 1.7% |
| Melexis NV | 1.4% |
| Palfinger AG | 1.2% |
| Trancom Co., Ltd. | 1.1% |
| MarketAxess Holdings, Inc. | 1.0% |
| VZ Holding AG | 0.9% |
| Total | 17.0% |
| * | Holdings are subject to change, and may not reflect the current or future position of the portfolio. |
| Semi-Annual Report | October 31, 2016 | 17 |
| Grandeur Peak Global Reach Fund | Performance Update |
October 31, 2016 (Unaudited)
Cumulative Total Return Performance for the periods ended October 31, 2016
| 6 Months | 1 Year | 3 Years | Since Inception(a) | Expense Ratio(b) | ||
| Gross | Net(c) | |||||
| Grandeur Peak Global Reach Fund – Investor (GPROX) | 5.20% | 7.21% | 6.07% | 9.80% | 1.55% | 1.55% |
| Grandeur Peak Global Reach Fund – Institutional (GPRIX) | 5.27% | 7.50% | 6.34% | 10.04% | 1.30% | 1.30% |
Russell Global Small Cap Index(d) | 4.40% | 5.51% | 2.77% | 5.61% | ||
Russell Global Index(e) | 3.25% | 2.92% | 3.82% | 6.36% | ||
Performance data quoted represents past performance. Past performance does not guarantee future results. Investment return and principal value of an investment will fluctuate so that an investor’s shares, when sold or redeemed, may be worth more or less than the original cost. The Fund imposes a 2.00% redemption fee on shares held for less than 60 days. Current performance data may be higher or lower than actual data quoted. For the most current month-end performance data, please call 1-855-377-PEAK (7325).
The table does not reflect the deduction of taxes a shareholder would pay on Fund distributions or redemption of Fund shares.
Subject to investment risks, including possible loss of the principal amount invested.
Returns for periods greater than 1 year are annualized.
(a) | Fund inception date of June 19, 2013. |
(b) | Ratios as of the Prospectus dated August 31, 2016 and may differ from the ratios presented in the Financial Highlights. |
(c) | Grandeur Peak Global Advisors, LLC (the “Adviser”), has agreed to waive and/or reimburse fees or expenses in order to limit Total Annual Fund Operating Expenses After Fee Waiver/Expense Reimbursement (excluding acquired fund fees and expenses, brokerage expenses, interest expenses, taxes and extraordinary expenses) to 1.60% and 1.35% of the Fund’s average daily net assets for the Fund’s Investor Class Shares and Institutional Class Shares, respectively. This agreement (the “Expense Agreement”) is in effect through August 31, 2017. The Adviser will be permitted to recover, on a class- by-class basis, expenses it has borne through the Expense Agreement to the extent that a Fund’s expenses in later periods fall below the expense cap in effect at the time of waiver or reimbursement. Notwithstanding the foregoing, the Fund will not be obligated to pay any such deferred fees and expenses more than three years after the end of the fiscal year in which the fee and expenses was deferred. The Expense Agreement may not be terminated or modified prior to August 31, 2017 except with the approval of the Fund’s Board of Trustees. |
(d) | The Russell Global Small Cap Index seeks to measure the performance of the small-cap segment of the global equity universe. The Index is not actively managed and does not reflect any deductions for fees, expense, or taxes. An investor may not invest directly in the Index. |
(e) | The Russell Global Index seeks to measure the performance of the global equity universe. The Index is not actively managed and does not reflect any deductions for fees, expense, or taxes. An investor may not invest directly in the Index. |
| 18 | 1.855.377.7325 | www.GrandeurPeakGlobal.com |
| Grandeur Peak Global Reach Fund | Performance Update |
October 31, 2016 (Unaudited)
Growth of $10,000 for the period ended October 31, 2016
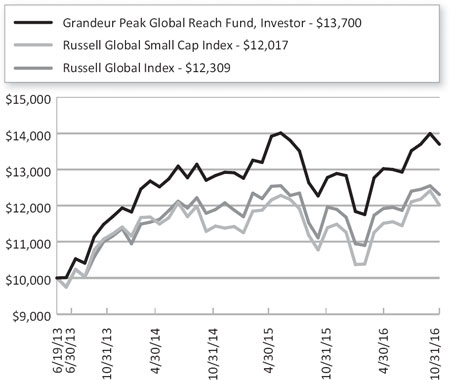
The chart shown above represent a hypothetical investment of $10,000 in the Fund’s Investor Class shares for the period from inception to October 31, 2016. All returns reflect reinvested dividends, but do not reflect the deduction of taxes that an investor would pay on distributions or redemptions.
Investing in the Fund is subject to investment risks, including possible loss of the principal amount invested.
The Fund also offers Institutional Class shares, performance for which is not reflected in the graphs above. The performance of Institutional Class shares may be higher or lower than the performance of the Investor Class shares shown in the graphs above based upon differences in fees paid by shareholders investing in the Investor Class shares and Institutional Class shares.
| Semi-Annual Report | October 31, 2016 | 19 |
| Grandeur Peak Global Reach Fund | Performance Update |
October 31, 2016 (Unaudited)
| Regional Allocation (as a % of Net Assets)* | |
| Asia ex Japan | 32.0% |
| North America | 26.2% |
| Europe | 22.6% |
| Japan | 6.9% |
| Africa/Middle East | 5.6% |
| Australia/New Zealand | 3.3% |
| Latin America | 2.1% |
| Cash, Cash Equivalents, & Other Net Assets | 1.3% |
| Total | 100.0% |
| Industry Sector Allocation (as a % of Net Assets)* | |
| Financials | 23.2% |
| Consumer | 22.6% |
| Industrials | 18.8% |
| Technology | 18.7% |
| Health Care | 11.9% |
| Energy & Materials | 3.5% |
| Cash, Cash Equivalents, & Other Net Assets | 1.3% |
| Total | 100.0% |
| Top 10 Holdings (as a % of Net Assets)* | |
| Man Wah Holdings, Ltd. | 2.1% |
| First Republic Bank | 2.0% |
| Clinigen Group PLC | 1.4% |
| Wix.com, Ltd. | 1.2% |
| Inphi Corp. | 1.0% |
| Skandiabanken ASA | 1.0% |
| Yes Bank, Ltd. | 1.0% |
| China Medical System Holdings, Ltd. | 0.9% |
| CBL Corp., Ltd. | 0.9% |
| Trilogy International, Ltd. | 0.9% |
| Total | 12.4% |
| * | Holdings are subject to change, and may not reflect the current or future position of the portfolio. |
| 20 | 1.855.377.7325 | www.GrandeurPeakGlobal.com |
| Grandeur Peak Global Stalwarts Fund | Performance Update |
October 31, 2016 (Unaudited)
Cumulative Total Return Performance for the periods ended October 31, 2016
| 6 Months | 1 Year | Since Inception(a) | Expense Ratio(b) | ||
| Gross | Net(c) | ||||
| Grandeur Peak Global Stalwarts – Investor (GGSOX) | 4.42% | 7.85% | 11.37% | 2.09% | 1.35% |
| Grandeur Peak Global Stalwarts – Institutional (GGSYX) | 4.60% | 8.24% | 11.71% | 1.84% | 1.10% |
Russell Global SMID Cap Index(d) | 3.00% | 4.59% | 8.13% | ||
Russell Global Index(e) | 3.25% | 2.92% | 8.23% | ||
Performance data quoted represents past performance. Past performance does not guarantee future results. Investment return and principal value of an investment will fluctuate so that an investor’s shares, when sold or redeemed, may be worth more or less than the original cost. The Fund imposes a 2.00% redemption fee on shares held for less than 60 days. Current performance data may be higher or lower than actual data quoted. For the most current month-end performance data, please call 1-855-377-PEAK (7325).
The table does not reflect the deduction of taxes a shareholder would pay on Fund distributions or redemption of Fund shares.
Subject to investment risks, including possible loss of the principal amount invested.
Returns for periods greater than 1 year are annualized.
(a) | Fund inception date of September 1, 2015. |
(b) | Ratios as of the Prospectus dated August 31, 2016 and may differ from the ratios presented in the Financial Highlights. |
(c) | Grandeur Peak Global Advisors, LLC (the “Adviser”), has agreed to waive and/or reimburse fees or expenses in order to limit Total Annual Fund Operating Expenses After Fee Waiver/Expense Reimbursement (excluding acquired fund fees and expenses, brokerage expenses, interest expenses, taxes and extraordinary expenses) to 1.35% and 1.10% of the Fund’s average daily net assets for the Fund’s Investor Class Shares and Institutional Class Shares, respectively. This agreement is in effect through August 31, 2017. The Adviser will be permitted to recover, on a class-by-class basis, expenses it has borne through this agreement to the extent that a Fund’s expenses in later periods fall below the annual rates set forth in this agreement or in previous agreements. Notwithstanding the foregoing, the Fund will not be obligated to pay any such deferred fees and expenses more than three years after the end of the fiscal year in which the fee and expenses was deferred. This agreement may not be terminated or modified prior to August 31, 2017 except with the approval of the Fund’s Board of Trustees. |
(d) | The Russell Global SMid Cap Index is designed to measure the performance of small- and mid-cap (SMid) securities and all capitalization securities respectively of issuers located in countries throughout the world representing developed and emerging markets. The Index is not actively managed and does not reflect any deductions for fees, expenses, or taxes. An investor may not invest directly in the Index. |
(e) | The Russell Global Index seeks to measure the performance of the global equity universe. The index is not actively managed and does not reflect any deductions for fees, expenses, or taxes. An investor may not invest directly in the Index. |
| Semi-Annual Report | October 31, 2016 | 21 |
| Grandeur Peak Global Stalwarts Fund | Performance Update |
October 31, 2016 (Unaudited)
Growth of $10,000 for the period ended October 31, 2016
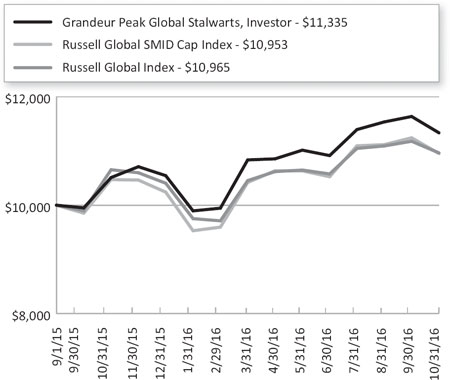
The graphs shown above represent a hypothetical investment of $10,000 in the Fund’s Investor Class shares for the period from inception to October 31, 2016. All returns reflect reinvested dividends, but do not reflect the deduction of taxes that an investor would pay on distributions or redemptions.
Investing in the Fund is subject to investment risks, including possible loss of the principal amount invested.
The Fund also offers Institutional Class shares, performance for which is not reflected in the graphs above. The performance of Institutional Class shares may be higher or lower than the performance of the Investor Class shares shown in the graphs above based upon differences in fees paid by shareholders investing in the Investor Class shares and Institutional Class shares.
| 22 | 1.855.377.7325 | www.GrandeurPeakGlobal.com |
| Grandeur Peak Global Stalwarts Fund | Performance Update |
October 31, 2016 (Unaudited)
| Regional Allocation (as a % of Net Assets)* | |
| North America | 37.8% |
| Europe | 22.5% |
| Asia ex Japan | 20.9% |
| Japan | 7.9% |
| Africa/Middle East | 1.8% |
| Asia Pacific | 1.7% |
| Latin America | 1.4% |
| Australia/New Zealand | 0.5% |
| Cash, Cash Equivalents, & Other Net Assets | 5.5% |
| Total | 100.0% |
| Industry Sector Allocation (as a % of Net Assets)* | |
| Financials | 26.7% |
| Consumer | 21.1% |
| Industrials | 18.7% |
| Technology | 17.6% |
| Health Care | 6.9% |
| Energy & Materials | 2.0% |
| Exchange Traded Funds | 1.5% |
| Cash, Cash Equivalents, & Other Net Assets | 5.5% |
| Total | 100.0% |
| Top 10 Holdings (as a % of Net Assets)* | |
| First Republic Bank | 2.7% |
| Power Integrations, Inc. | 2.5% |
| Man Wah Holdings, Ltd. | 2.4% |
| Nihon M&A Center, Inc. | 2.0% |
| MEDNAX, Inc. | 1.9% |
| Value Partners Group, Ltd. | 1.9% |
| Stantec, Inc. | 1.7% |
| Knight Transportation, Inc. | 1.7% |
| Yes Bank, Ltd. | 1.7% |
| TransForce, Inc. | 1.6% |
| Total | 20.1% |
| * | Holdings are subject to change, and may not reflect the current or future position of the portfolio. |
| Semi-Annual Report | October 31, 2016 | 23 |
| Grandeur Peak International Opportunities Fund | Performance Update |
October 31, 2016 (Unaudited)
Cumulative Total Return Performance for the periods ended October 31, 2016
| 6 Months | 1 Year | 3 Years | 5 Years | Since Inception(a) | Expense Ratio(b) | ||
| Gross | Net(c) | ||||||
| Grandeur Peak International Opportunities Fund – Investor (GPIOX) | 5.83% | 8.20% | 5.06% | 12.87% | 13.65% | 1.63% | 1.63% |
| Grandeur Peak International Opportunities Fund – Institutional (GPIIX) | 5.47% | 8.38% | 5.23% | 13.07% | 13.85% | 1.38% | 1.38% |
Russell Global ex-U.S. Small Cap Index(d) | 3.20% | 6.53% | 1.87% | 6.38% | 6.92% | ||
Performance data quoted represents past performance. Past performance does not guarantee future results. Investment return and principal value of an investment will fluctuate so that an investor’s shares, when sold or redeemed, may be worth more or less than the original cost. The Fund imposes a 2.00% redemption fee on shares held for less than 60 days. Current performance data may be higher or lower than actual data quoted. For the most current month-end performance data, please call 1-855-377-PEAK (7325).
The table does not reflect the deduction of taxes a shareholder would pay on Fund distributions or redemption of Fund shares.
Subject to investment risks, including possible loss of the principal amount invested.
Returns for periods greater than 1 year are annualized.
| (a) | Fund inception date of October 17, 2011. |
| (b) | Ratios as of the Prospectus dated August 31, 2016 and may differ from the ratios presented in the Financial Highlights. |
| (c) | Grandeur Peak Global Advisors, LLC (the “Adviser”), has agreed to waive and/or reimburse fees or expenses in order to limit Total Annual Fund Operating Expenses After Fee Waiver/Expense Reimbursements (excluding acquired fund fees and expenses, brokerage expenses, interest expenses, taxes and extraordinary expenses) to 1.75% and 1.50% of the Fund’s average daily net assets for the Fund’s Investor Class Shares and Institutional Class Shares, respectively. This agreement (the “Expense Agreement”) is in effect through August 31, 2017. The Adviser will be permitted to recover, on a class- by-class basis, expenses it has borne through the Expense Agreement to the extent that a Fund’s expenses in later periods fall below the expense cap in effect at the time of waiver or reimbursement. Notwithstanding the foregoing, the Funds will not be obligated to pay any such deferred fees and expenses more than three years after the end of the fiscal year in which the fee and expenses was deferred. The Expense Agreement may not be terminated or modified prior to August 31, 2017 except with the approval of the Fund’s Board of Trustees. |
| (d) | The Russell Global ex-U.S. Small Cap Index seeks to measure the performance of the small-cap segment of the global equity universe, excluding companies assigned to the United States. The Index is not actively managed and does not reflect any deductions for fees, expense, or taxes. An investor may not invest directly in the Index. |
| 24 | 1.855.377.7325 | www.GrandeurPeakGlobal.com |
| Grandeur Peak International Opportunities Fund | Performance Update |
October 31, 2016 (Unaudited)
Growth of $10,000 for the period ended October 31, 2016
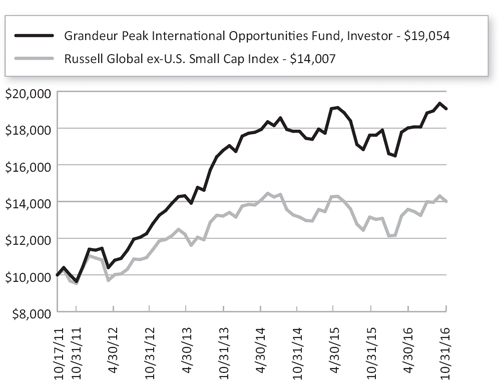
The chart shown above represent a hypothetical investment of $10,000 in the Fund’s Investor Class shares for the period from inception to October 31, 2016. All returns reflect reinvested dividends, but do not reflect the deduction of taxes that an investor would pay on distributions or redemptions.
Investing in the Fund is subject to investment risks, including possible loss of the principal amount invested.
The Fund also offers Institutional Class shares, performance for which is not reflected in the graphs above. The performance of Institutional Class shares may be higher or lower than the performance of the Investor Class shares shown in the graphs above based upon differences in fees paid by shareholders investing in the Investor Class shares and Institutional Class shares.
| Semi-Annual Report | October 31, 2016 | 25 |
| Grandeur Peak International Opportunities Fund | Performance Update |
October 31, 2016 (Unaudited)
| Regional Allocation (as a % of Net Assets)* | |
| Asia ex Japan | 35.0% |
| Europe | 28.1% |
| Japan | 12.2% |
| North America | 5.4% |
| Africa/Middle East | 5.1% |
| Australia/New Zealand | 3.3% |
| Latin America | 2.4% |
| Cash, Cash Equivalents, & Other Net Assets | 8.5% |
| Total | 100.0% |
| Industry Sector Allocation (as a % of Net Assets)* | |
| Financials | 23.3% |
| Industrials | 20.2% |
| Technology | 17.8% |
| Consumer | 15.2% |
| Health Care | 11.4% |
| Energy & Materials | 3.6% |
| Cash, Cash Equivalents, & Other Net Assets | 8.5% |
| Total | 100.0% |
| Top 10 Holdings (as a % of Net Assets)* | |
| Clinigen Group PLC | 2.2% |
| Man Wah Holdings, Ltd. | 2.1% |
| China Medical System Holdings, Ltd. | 1.2% |
| Security Bank Corp. | 1.2% |
| Value Partners Group, Ltd. | 1.1% |
| Alkem Laboratories, Ltd. | 1.1% |
| Irish Residential Properties PLC, REIT | 1.1% |
| Silergy Corp. | 1.0% |
| Sporton International, Inc. | 1.0% |
| M&A Capital Partners Co., Ltd. | 1.0% |
| Total | 13.0% |
| * | Holdings are subject to change, and may not reflect the current or future position of the portfolio. |
| 26 | 1.855.377.7325 | www.GrandeurPeakGlobal.com |
| Grandeur Peak International Stalwarts Fund | Performance Update |
October 31, 2016 (Unaudited)
Cumulative Total Return Performance for the periods ended October 31, 2016
| 6 Months | 1 Year | Since Inception(a) | Expense Ratio(b) | ||
| Gross | Net(c) | ||||
| Grandeur Peak International Stalwarts – Investor | 5.99% | 9.57% | 14.27% | 1.45% | 1.35% |
| Grandeur Peak International Stalwarts – Institutional | 6.07% | 9.80% | 14.47% | 1.20% | 1.10% |
Russell Global ex-U.S. SMID Cap Index(d) | 2.35% | 4.97% | 8.80% | ||
Russell Global ex-U.S. Small Cap Index(e) | 3.20% | 6.53% | 9.88% | ||
Performance data quoted represents past performance. Past performance does not guarantee future results. Investment return and principal value of an investment will fluctuate so that an investor’s shares, when sold or redeemed, may be worth more or less than the original cost. The Fund imposes a 2.00% redemption fee on shares held for less than 60 days. Current performance data may be higher or lower than actual data quoted. For the most current month-end performance data, please call 1-855-377-PEAK (7325).
The table does not reflect the deduction of taxes a shareholder would pay on Fund distributions or redemption of Fund shares.
Subject to investment risks, including possible loss of the principal amount invested.
Returns for periods greater than 1 year are annualized.s
(a) | Fund inception date of September 1, 2015. |
(b) | Ratios as of the Prospectus dated August 31, 2016 and may differ from the ratios presented in the Financial Highlights. |
(c) | Grandeur Peak Global Advisors, LLC (the “Adviser”), has agreed to waive and/or reimburse fees or expenses in order to limit Total Annual Fund Operating Expenses After Fee Waiver/Expense Reimbursement (excluding acquired fund fees and expenses, brokerage expenses, interest expenses, taxes and extraordinary expenses) to 1.35% and 1.10% of the Fund’s average daily net assets for the Fund’s Investor Class Shares and Institutional Class Shares, respectively. This agreement is in effect through August 31, 2017. The Adviser will be permitted to recover, on a class-by-class basis, expenses it has borne through this agreement to the extent that a Fund’s expenses in later periods fall below the annual rates set forth in this agreement or in previous agreements. Notwithstanding the foregoing, the Fund will not be obligated to pay any such deferred fees and expenses more than three years after the end of the fiscal year in which the fee and expenses was deferred. This agreement may not be terminated or modified prior to August 31, 2017 except with the approval of the Fund’s Board of Trustees. |
(d) | The Russell Global ex-US SMid Cap Index is constructed to provide a comprehensive and unbiased barometer for the small- and mid-cap (SMid) segments excluding companies assigned to the United States. The Russell Global ex-US SMid Cap Index is reconstituted annually to accurately reflect the changes in the market over time. The Index is not actively managed and does not reflect any deductions for fees, expenses, or taxes. An investor may not invest directly in the Index. |
(e) | The Russell Global ex-U.S. Small Cap Index is designed to measure the performance of small capitalization securities outside of the U.S. The Index is not actively managed and does not reflect any deductions for fees, expenses, or taxes. An investor may not invest directly in the Index. |
| Semi-Annual Report | October 31, 2016 | 27 |
| Grandeur Peak International Stalwarts Fund | Performance Update |
October 31, 2016 (Unaudited)
Growth of $10,000 for the period ended October 31, 2016
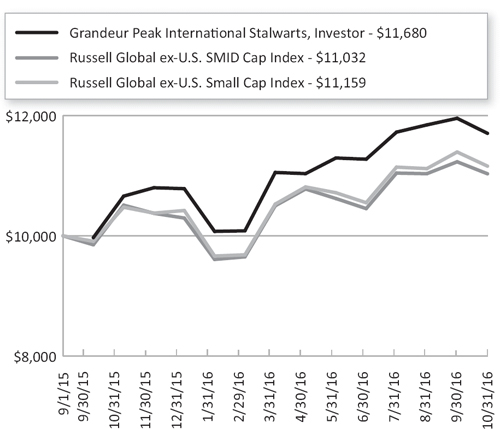
The chart shown above represent a hypothetical investment of $10,000 in the Fund’s Investor Class shares for the period from inception to October 31, 2016. All returns reflect reinvested dividends, but do not reflect the deduction of taxes that an investor would pay on distributions or redemptions.
Investing in the Fund is subject to investment risks, including possible loss of the principal amount invested.
The Fund also offers Institutional Class shares, performance for which is not reflected in the graphs above. The performance of Institutional Class shares may be higher or lower than the performance of the Investor Class shares shown in the graphs above based upon differences in fees paid by shareholders investing in the Investor Class shares and Institutional Class shares.
| 28 | 1.855.377.7325 | www.GrandeurPeakGlobal.com |
| Grandeur Peak International Stalwarts Fund | Performance Update |
October 31, 2016 (Unaudited)
| Regional Allocation (as a % of Net Assets)* | |
| Europe | 31.9% |
| Asia ex Japan | 27.6% |
| North America | 15.2% |
| Japan | 10.3% |
| Latin America | 2.6% |
| Africa/Middle East | 2.3% |
| Asia Pacific | 2.1% |
| Australia/New Zealand | 0.7% |
| Cash, Cash Equivalents, & Other Net Assets | 7.3% |
| Total | 100.0% |
| Industry Sector Allocation (as a % of Net Assets)* | |
| Financials | 27.3% |
| Industrials | 20.5% |
| Consumer | 19.7% |
| Technology | 14.5% |
| Health Care | 5.6% |
| Exchange Traded Funds | 2.9% |
| Energy & Materials | 2.2% |
| Cash, Cash Equivalents, & Other Net Assets | 7.3% |
| Total | 100.0% |
| Top 10 Holdings (as a % of Net Assets)* | |
| Man Wah Holdings, Ltd. | 2.6% |
| TransForce, Inc. | 2.4% |
| Nihon M&A Center, Inc. | 2.3% |
| Value Partners Group, Ltd. | 2.3% |
| Stantec, Inc. | 2.2% |
| MISUMI Group, Inc. | 2.1% |
| Brembo SpA | 2.0% |
| Aalberts Industries NV | 2.0% |
| Yes Bank, Ltd. | 2.0% |
| Ritchie Bros. Auctioneers, Inc. | 1.9% |
| Total | 21.8% |
| * | Holdings are subject to change, and may not reflect the current or future position of the portfolio. |
| Semi-Annual Report | October 31, 2016 | 29 |
Grandeur Peak Funds® | Disclosure of Fund Expenses |
October 31, 2016 (Unaudited)
As a shareholder of a Fund, you incur two types of costs: (1) transaction costs, including sales charges (loads) on purchase payments, reinvested dividends, or other distributions; redemption fees; and exchange fees; and (2) ongoing costs, including management fees; distribution and/or service (12b-1) fees; and other Fund expenses. This example is intended to help you understand your ongoing costs (in dollars) of investing in the Fund and to compare these costs with the ongoing costs of investing in other mutual funds.
This example is based on an investment of $1,000 invested at the beginning of the period and held for the entire six-month period of May 1, 2016 through of October 31, 2016.
Actual Expenses The first line of the table provides information about actual account values and actual expenses. You may use the information in this line, together with the amount you invested, to estimate the expenses that you paid over the period. Simply divide your account value by $1,000 (for example, an $8,600 account value divided by $1,000 = 8.6), then multiply the result by the number in the first line under the heading “Expenses Paid During Period” to estimate the expenses you paid on your account during this period.
Hypothetical Example for Comparison Purposes The second line of the table provides information about hypothetical account values and hypothetical expenses based on the Fund’s actual expense ratio and an assumed rate of return of 5% per year before expenses, which is not the Fund’s actual return. The hypothetical account values and expenses may not be used to estimate the actual ending account balance or expenses you paid for the period. You may use this information to compare the ongoing costs of investing in the Fund and other mutual funds. To do so, compare this 5% hypothetical example with the 5% hypothetical examples that appear in the shareholder reports of the other funds.
Please note that the expenses shown in the table are meant to highlight your ongoing costs only and do not reflect any transactional costs, such as redemption fees or exchange fees. Therefore, the second line of the table is useful in comparing ongoing costs only and will not help you determine the relative total costs of owning different funds. In addition, if these transactional costs were included, your costs would have been higher.
| 30 | 1.855.377.7325 | www.GrandeurPeakGlobal.com |
Grandeur Peak Funds® | Disclosure of Fund Expenses |
October 31, 2016 (Unaudited)
Beginning Account Value May 1, 2016 | Ending Account Value October 31, 2016 | Expense Ratio(a) | Expenses Paid During period May 1, 2016 - October 31, 2016(b) | |
| Grandeur Peak Emerging Markets Opportunities Fund | ||||
| Investor Class | ||||
| Actual | $1,000.00 | $1,101.80 | 1.75% | $9.27 |
| Hypothetical (5% return before expenses) | $1,000.00 | $1,016.38 | 1.75% | $8.89 |
| Institutional Class | ||||
| Actual | $1,000.00 | $1,103.60 | 1.55% | $8.22 |
| Hypothetical (5% return before expenses) | $1,000.00 | $1,017.39 | 1.55% | $7.88 |
| Grandeur Peak Global Micro Cap Fund | ||||
| Institutional Class | ||||
| Actual | $1,000.00 | $1,065.50 | 1.98% | $10.31 |
| Hypothetical (5% return before expenses) | $1,000.00 | $1,015.22 | 1.98% | $10.06 |
| Grandeur Peak Global Opportunities Fund | ||||
| Investor Class | ||||
| Actual | $1,000.00 | $1,046.50 | 1.60% | $8.25 |
| Hypothetical (5% return before expenses) | $1,000.00 | $1,017.14 | 1.60% | $8.13 |
| Institutional Class | ||||
| Actual | $1,000.00 | $1,049.50 | 1.37% | $7.08 |
| Hypothetical (5% return before expenses) | $1,000.00 | $1,018.30 | 1.37% | $6.97 |
| Grandeur Peak Global Reach Fund | ||||
| Investor Class | ||||
| Actual | $1,000.00 | $1,052.00 | 1.52% | $7.86 |
| Hypothetical (5% return before expenses) | $1,000.00 | $1,017.54 | 1.52% | $7.73 |
| Institutional Class | ||||
| Actual | $1,000.00 | $1,052.70 | 1.29% | $6.67 |
| Hypothetical (5% return before expenses) | $1,000.00 | $1,018.70 | 1.29% | $6.56 |
| Grandeur Peak Global Stalwarts Fund | ||||
| Investor Class | ||||
| Actual | $1,000.00 | $1,044.20 | 1.35% | $6.96 |
| Hypothetical (5% return before expenses) | $1,000.00 | $1,018.40 | 1.35% | $6.87 |
| Institutional Class | ||||
| Actual | $1,000.00 | $1,046.00 | 1.10% | $5.67 |
| Hypothetical (5% return before expenses) | $1,000.00 | $1,019.66 | 1.10% | $5.60 |
| Grandeur Peak International Opportunities Fund | ||||
| Investor Class | ||||
| Actual | $1,000.00 | $1,058.30 | 1.59% | $8.25 |
| Hypothetical (5% return before expenses) | $1,000.00 | $1,017.19 | 1.59% | $8.08 |
| Institutional Class | ||||
| Actual | $1,000.00 | $1,054.70 | 1.37% | $7.10 |
| Hypothetical (5% return before expenses) | $1,000.00 | $1,018.30 | 1.37% | $6.97 |
| Grandeur Peak International Stalwarts Fund | ||||
| Investor Class | ||||
| Actual | $1,000.00 | $1,059.90 | 1.30% | $6.75 |
| Hypothetical (5% return before expenses) | $1,000.00 | $1,018.65 | 1.30% | $6.61 |
| Institutional Class | ||||
| Actual | $1,000.00 | $1,060.70 | 1.06% | $5.51 |
| Hypothetical (5% return before expenses) | $1,000.00 | $1,019.86 | 1.06% | $5.40 |
(a) | The Fund's expense ratios have been annualized based on the Fund's most recent fiscal half-year expenses. |
(b) | Expenses are equal to the Fund's annualized expense ratio multiplied by the average account value over the period, multiplied by the number of days in the most recent fiscal half-year 184/365 (to reflect the half-year period). |
| Semi-Annual Report | October 31, 2016 | 31 |
| Grandeur Peak Emerging Markets Opportunities Fund | Portfolio of Investments |
October 31, 2016 (Unaudited)
| Shares | Value (Note 2) | |||||||
| COMMON STOCKS (89.29%) | ||||||||
| Argentina (0.20%) | ||||||||
Globant SA(a) | 18,287 | $ | 795,484 | |||||
| Bangladesh (0.54%) | ||||||||
| Olympic Industries, Ltd. | 259,657 | 998,808 | ||||||
| Shasha Denims, Ltd. | 2,136,956 | 1,148,638 | ||||||
| 2,147,446 | ||||||||
| Brazil (1.42%) | ||||||||
Atento SA(a) | 35,792 | 322,128 | ||||||
| FPC Par Corretora de Seguros SA | 561,100 | 2,652,568 | ||||||
| Valid Solucoes e Servicos de Seguranca em Meios de Pagamento e Identificacao SA | 285,800 | 2,685,195 | ||||||
| 5,659,891 | ||||||||
| Chile (0.29%) | ||||||||
| Forus SA | 325,019 | 1,171,067 | ||||||
| China (11.73%) | ||||||||
51job, Inc., ADR(a) | 47,000 | 1,598,000 | ||||||
| Airtac International Group | 119,500 | 952,365 | ||||||
BBI Life Sciences Corp.(b) | 9,244,000 | 2,598,387 | ||||||
| BrightKing Holdings, Ltd. | 100,000 | 200,903 | ||||||
| China Lesso Group Holdings, Ltd. | 3,641,000 | 2,671,286 | ||||||
| China Medical System Holdings, Ltd. | 5,190,000 | 8,110,682 | ||||||
Essex Bio‐technology, Ltd. | 4,521,000 | 1,999,475 | ||||||
| Man Wah Holdings, Ltd. | 15,277,400 | 10,144,814 | ||||||
| Minth Group, Ltd. | 550,000 | 1,957,308 | ||||||
O2Micro International, Ltd., ADR(a) | 542,425 | 949,244 | ||||||
On‐Bright Electronics, Inc. | 462,080 | 3,009,029 | ||||||
| Shandong Weigao Group Medical Polymer Co., Ltd., Class H | 1,846,000 | 1,204,397 | ||||||
Shanghai Haohai Biological Technology Co., Ltd., Class H(b)(c) | 390,800 | 1,864,420 | ||||||
| Sihuan Pharmaceutical Holdings Group, Ltd. | 3,440,000 | 825,009 | ||||||
| Silergy Corp. | 413,422 | 6,039,374 | ||||||
| Sinosoft Technology Group, Ltd. | 2,698,800 | 1,179,662 | ||||||
Xiabuxiabu Catering Management China Holdings Co., Ltd.(b)(c) | 2,174,500 | 1,317,785 | ||||||
| 46,622,140 | ||||||||
| Shares | Value (Note 2) | |||||||
| Colombia (2.02%) | ||||||||
| Bolsa de Valores de Colombia | 249,678,088 | $ | 1,486,387 | |||||
Gran Tierra Energy, Inc.(a) | 1,124,500 | 3,272,295 | ||||||
Parex Resources, Inc.(a) | 284,131 | 3,268,576 | ||||||
| 8,027,258 | ||||||||
| Egypt (0.22%) | ||||||||
Integrated Diagnostics Holdings PLC(b)(c) | 320,300 | 880,825 | ||||||
| Georgia (1.47%) | ||||||||
| BGEO Group PLC | 113,297 | 4,099,251 | ||||||
Georgia Healthcare Group PLC(a)(b)(c) | 402,225 | 1,742,826 | ||||||
| 5,842,077 | ||||||||
| Greece (0.62%) | ||||||||
| Sarantis SA | 223,934 | 2,468,069 | ||||||
| Hong Kong (3.28%) | ||||||||
| International Housewares Retail Co., Ltd. | 8,865,000 | 1,771,731 | ||||||
| Samsonite International SA | 231,000 | 726,757 | ||||||
| Value Partners Group, Ltd. | 8,940,800 | 8,553,969 | ||||||
| Vitasoy International Holdings, Ltd. | 940,900 | 1,967,804 | ||||||
| 13,020,261 | ||||||||
| India (16.12%) | ||||||||
Advanced Enzyme Technologies Ltd.(a)(b) | 15,500 | 493,675 | ||||||
| AIA Engineering, Ltd. | 81,250 | 1,572,773 | ||||||
| Alkem Laboratories, Ltd. | 184,037 | 4,496,866 | ||||||
| Bajaj Finance, Ltd. | 156,000 | 2,505,264 | ||||||
| City Union Bank, Ltd. | 1,309,500 | 2,924,422 | ||||||
| Control Print, Ltd. | 113,980 | 498,849 | ||||||
| Cyient, Ltd. | 411,095 | 3,013,357 | ||||||
| Dewan Housing Finance Corp., Ltd. | 332,000 | 1,631,006 | ||||||
Dilip Buildcon, Ltd.(a)(b)(c) | 456,165 | 1,626,612 | ||||||
| Divi's Laboratories, Ltd. | 94,500 | 1,811,003 | ||||||
Eros International Media, Ltd.(a) | 310,000 | 904,891 | ||||||
| Essel Propack, Ltd. | 502,000 | 1,811,850 | ||||||
| Hinduja Global Solutions, Ltd. | 194,500 | 1,629,704 | ||||||
ICICI Prudential Life Insurance Co., Ltd.(b)(c) | 45,167 | 208,703 | ||||||
| Indiabulls Housing Finance, Ltd. | 294,000 | 3,736,932 | ||||||
Infinite Computer Solutions India, Ltd.(a) | 529,500 | 1,917,051 | ||||||
See Notes to Financial Statements.
| 32 | 1.855.377.7325 | www.GrandeurPeakGlobal.com |
| Grandeur Peak Emerging Markets Opportunities Fund | Portfolio of Investments |
October 31, 2016 (Unaudited)
| Shares | Value (Note 2) | |||||||
| India (continued) | ||||||||
Inox Wind, Ltd.(a) | 589,500 | $ | 1,874,336 | |||||
Kellton Tech Solutions, Ltd.(a) | 382,033 | 704,730 | ||||||
Kolte‐Patil Developers, Ltd. | 1,202,415 | 2,284,690 | ||||||
| Kovai Medical Center and Hospital | 72,583 | 880,301 | ||||||
| KPIT Technologies, Ltd. | 824,858 | 1,769,851 | ||||||
| Kwality, Ltd. | 793,700 | 1,691,113 | ||||||
| MBL Infrastructures, Ltd. | 773,000 | 1,214,712 | ||||||
| MT Educare, Ltd. | 825,731 | 1,703,723 | ||||||
| Poly Medicure, Ltd. | 91,722 | 548,932 | ||||||
| Time Technoplast, Ltd. | 3,690,100 | 5,351,174 | ||||||
| UFO Moviez India, Ltd. | 113,382 | 788,232 | ||||||
Vaibhav Global, Ltd.(a) | 251,319 | 1,178,578 | ||||||
| Vakrangee Software, Ltd. | 643,500 | 2,429,511 | ||||||
| Vardhman Textiles, Ltd. | 25,219 | 432,000 | ||||||
| Vesuvius India, Ltd. | 171,200 | 2,985,455 | ||||||
WNS Holdings, Ltd., ADR(a) | 146,725 | 4,034,937 | ||||||
| Yes Bank, Ltd. | 179,000 | 3,409,996 | ||||||
| 64,065,229 | ||||||||
| Indonesia (7.18%) | ||||||||
| Arwana Citramulia Tbk PT | 34,009,700 | 1,589,969 | ||||||
| Astra Graphia Tbk PT | 8,442,500 | 1,300,538 | ||||||
| Bank Negara Indonesia Persero Tbk PT | 13,138,500 | 5,613,668 | ||||||
| Bekasi Fajar Industrial Estate Tbk PT | 56,350,600 | 1,347,439 | ||||||
| Delfi, Ltd. | 866,400 | 1,394,959 | ||||||
| Hexindo Adiperkasa Tbk PT | 1,833,800 | 473,629 | ||||||
| Indonesia Pondasi Raya Tbk PT | 15,760,000 | 1,588,320 | ||||||
| Link Net Tbk PT | 6,266,000 | 2,401,134 | ||||||
Lippo Cikarang Tbk PT(a) | 3,005,000 | 1,393,336 | ||||||
| Panin Sekuritas Tbk PT | 7,155,500 | 2,056,493 | ||||||
| Selamat Sempurna Tbk PT | 10,365,600 | 3,614,614 | ||||||
| Surya Toto Indonesia Tbk PT | 19,795,000 | 986,109 | ||||||
| Tempo Scan Pacific Tbk PT | 17,950,700 | 2,957,848 | ||||||
Ultrajaya Milk Industry & Trading Co. Tbk PT(a) | 5,042,900 | 1,835,820 | ||||||
| 28,553,876 | ||||||||
| Malaysia (3.21%) | ||||||||
7‐Eleven Malaysia Holdings Bhd, Class B | 1,999,200 | 829,227 | ||||||
| AEON Credit Service M Bhd | 631,100 | 2,217,500 | ||||||
| Berjaya Auto Bhd | 2,649,600 | 1,440,069 | ||||||
| Berjaya Food Bhd | 2,088,084 | 886,005 | ||||||
| CB Industrial Product Holding Bhd | 3,838,800 | 1,821,028 | ||||||
GHL Systems Bhd(a) | 717,700 | 143,711 | ||||||
| Kossan Rubber Industries | 1,555,600 | 2,503,051 | ||||||
| Shares | Value (Note 2) | |||||||
| Malaysia (continued) | ||||||||
| My EG Services Bhd | 5,041,600 | $ | 2,932,421 | |||||
| 12,773,012 | ||||||||
| Mexico (2.19%) | ||||||||
| Banregio Grupo Financiero SAB de CV | 367,200 | 2,406,878 | ||||||
| Credito Real SAB de CV SOFOM ER | 2,566,271 | 4,715,443 | ||||||
| Unifin Financiera SAB de CV SOFOM ENR | 532,600 | 1,576,582 | ||||||
| 8,698,903 | ||||||||
| Oman (0.70%) | ||||||||
| Al Anwar Ceramic Tiles Co. | 742,026 | 294,845 | ||||||
| Tethys Oil AB | 339,923 | 2,474,487 | ||||||
| 2,769,332 | ||||||||
| Pakistan (2.77%) | ||||||||
| Abbott Laboratories Pakistan, Ltd. | 113,300 | 867,588 | ||||||
| Akzo Nobel Pakistan, Ltd. | 422,000 | 840,134 | ||||||
| Bank Al Habib, Ltd. | 1,609,000 | 705,934 | ||||||
| Bata Pakistan, Ltd. | 11,160 | 432,929 | ||||||
| DG Khan Cement Co., Ltd. | 548,500 | 898,431 | ||||||
| Hum Network, Ltd. | 7,895,500 | 902,558 | ||||||
| Kohinoor Textile Mills, Ltd. | 1,939,451 | 1,649,829 | ||||||
| Meezan Bank, Ltd. | 2,317,500 | 1,157,644 | ||||||
| Pak Elektron, Ltd. | 1,732,500 | 1,096,368 | ||||||
| Shell Pakistan, Ltd. | 208,400 | 803,593 | ||||||
| Systems, Ltd. | 2,181,500 | 1,646,325 | ||||||
| 11,001,333 | ||||||||
| Peru (0.56%) | ||||||||
| Credicorp, Ltd. | 14,850 | 2,207,898 | ||||||
| Philippines (6.06%) | ||||||||
| Concepcion Industrial Corp. | 3,603,660 | 4,614,114 | ||||||
| Holcim Philippines, Inc. | 1,193,500 | 409,151 | ||||||
| Metro Retail Stores Group, Inc. | 29,784,000 | 2,915,507 | ||||||
Pepsi‐Cola Products Philippines, Inc. | 36,075,000 | 2,316,965 | ||||||
| Puregold Price Club, Inc. | 3,531,100 | 2,971,600 | ||||||
| Robinsons Land Corp. | 3,948,600 | 2,523,810 | ||||||
| Robinsons Retail Holdings, Inc. | 1,267,000 | 2,022,595 | ||||||
| Security Bank Corp. | 1,383,600 | 6,297,598 | ||||||
| 24,071,340 | ||||||||
| Poland (0.55%) | ||||||||
| PGS Software SA | 22,864 | 72,207 | ||||||
| Wawel SA | 3,914 | 866,951 | ||||||
See Notes to Financial Statements.
| Semi-Annual Report | October 31, 2016 | 33 |
| Grandeur Peak Emerging Markets Opportunities Fund | Portfolio of Investments |
October 31, 2016 (Unaudited)
| Shares | Value (Note 2) | |||||||
| Poland (continued) | ||||||||
Work Service SA(a) | 432,107 | $ | 1,239,075 | |||||
| 2,178,233 | ||||||||
| Russia (0.87%) | ||||||||
MD Medical Group Investments PLC, GDR(b) | 146,700 | 1,362,843 | ||||||
TCS Group Holding GDR PLC(b) | 231,400 | 2,094,170 | ||||||
| 3,457,013 | ||||||||
| South Africa (6.72%) | ||||||||
| ARB Holdings, Ltd. | 1,134,108 | 529,888 | ||||||
| Blue Label Telecoms, Ltd. | 1,960,723 | 2,966,441 | ||||||
| Cartrack Holdings, Ltd. | 2,627,200 | 2,143,261 | ||||||
| Clicks Group, Ltd. | 230,700 | 2,147,240 | ||||||
| Comair, Ltd. | 6,720,142 | 2,043,392 | ||||||
| EOH Holdings, Ltd. | 335,124 | 3,974,141 | ||||||
Interwaste Holdings, Ltd.(a) | 15,918,682 | 1,121,554 | ||||||
| Invicta Holdings, Ltd. | 320,282 | 1,320,677 | ||||||
| Italtile, Ltd. | 1,502,579 | 1,621,398 | ||||||
| MiX Telematics, Ltd., Sponsored ADR | 218,036 | 1,371,446 | ||||||
| Mr. Price Group, Ltd. | 109,200 | 1,244,923 | ||||||
OneLogix Group, Ltd.(a) | 2,142,622 | 478,301 | ||||||
Super Group, Ltd.(a) | 389,780 | 1,150,514 | ||||||
| Transaction Capital, Ltd. | 4,689,040 | 4,593,842 | ||||||
| 26,707,018 | ||||||||
| South Korea (4.53%) | ||||||||
| DGB Financial Group, Inc. | 241,000 | 2,021,936 | ||||||
Hy‐Lok Corp. | 157,743 | 3,143,142 | ||||||
| Interpark Holdings Corp. | 265,500 | 1,158,989 | ||||||
| ISC Co., Ltd. | 182,857 | 2,812,570 | ||||||
| Koh Young Technology, Inc. | 32,744 | 1,282,002 | ||||||
| Kolao Holdings | 181,000 | 1,392,004 | ||||||
| Mando Corp. | 6,500 | 1,525,235 | ||||||
| Vitzrocell Co., Ltd. | 404,141 | 3,832,143 | ||||||
| Wins Co., Ltd. | 82,912 | 836,909 | ||||||
| 18,004,930 | ||||||||
| Sri Lanka (2.29%) | ||||||||
| Hatton National Bank PLC | 1,002,391 | 1,532,391 | ||||||
| Hemas Holdings PLC | 3,804,326 | 2,752,284 | ||||||
| Lanka Hospital Corp. PLC | 1,640,200 | 781,840 | ||||||
| Royal Ceramics Lanka PLC | 3,593,775 | 2,891,543 | ||||||
| Sampath Bank PLC | 657,838 | 1,156,443 | ||||||
| 9,114,501 | ||||||||
| Switzerland (0.28%) | ||||||||
Wizz Air Holdings PLC(a)(b)(c) | 61,200 | 1,131,873 | ||||||
| Shares | Value (Note 2) | |||||||
| Taiwan (8.97%) | ||||||||
| ASPEED Technology, Inc. | 167,929 | $ | 2,421,221 | |||||
| Cub Elecparts, Inc. | 122,073 | 1,121,799 | ||||||
| Dr. Wu Skincare Co., Ltd. | 321,000 | 2,197,132 | ||||||
| I Yuan Precision Ind. Co., Ltd. | 307,000 | 1,162,529 | ||||||
| Materials Analysis Technology, Inc. | 1,191,000 | 3,011,703 | ||||||
| Novatek Microelectronics Corp. | 577,000 | 2,166,664 | ||||||
| Polytronics Technology Corp. | 646,000 | 1,228,234 | ||||||
| Sinmag Equipment Corp. | 1,038,133 | 4,868,690 | ||||||
| Sitronix Technology Corp. | 1,406,000 | 5,212,770 | ||||||
| Solidwizard Technology Co., Ltd. | 646,000 | 1,862,822 | ||||||
| Sporton International, Inc. | 1,153,978 | 5,521,688 | ||||||
| Test Research, Inc. | 1,990,000 | 2,522,380 | ||||||
| Topoint Technology Co., Ltd. | 1,391,000 | 877,158 | ||||||
| UDE Corp. | 1,524,000 | 1,482,589 | ||||||
| 35,657,379 | ||||||||
| Thailand (1.43%) | ||||||||
| Ananda Development PCL | 25,863,800 | 3,650,751 | ||||||
| Premier Marketing PCL | 4,566,900 | 1,207,053 | ||||||
Thaire Life Assurnce(a) | 2,868,000 | 811,292 | ||||||
| 5,669,096 | ||||||||
| Turkey (0.75%) | ||||||||
EGE Seramik Sanayi ve Ticaret AS(a) | 1,167,186 | 1,308,923 | ||||||
| Pinar SUT Mamulleri Sanayii AS | 335,346 | 1,671,176 | ||||||
| 2,980,099 | ||||||||
| United Arab Emirates (0.25%) | ||||||||
| Aramex PJSC | 1,018,125 | 981,272 | ||||||
| United States (0.64%) | ||||||||
| First Cash Financial Services, Inc. | 53,650 | 2,532,280 | ||||||
| Vietnam (1.43%) | ||||||||
| DHG Pharmaceutical JSC | 45,000 | 198,562 | ||||||
| FPT Corp. | 155,250 | 302,530 | ||||||
| Nui Nho Stone JSC | 245,660 | 1,021,245 | ||||||
PetroVietnam Drilling and Well Services JSC(a) | 1,092,500 | 1,186,808 | ||||||
See Notes to Financial Statements.
| 34 | 1.855.377.7325 | www.GrandeurPeakGlobal.com |
| Grandeur Peak Emerging Markets Opportunities Fund | Portfolio of Investments |
October 31, 2016 (Unaudited)
| Shares | Value (Note 2) | |||||||
| Vietnam (continued) | ||||||||
| Vietnam Dairy Products JSC | 467,506 | $ | 2,973,877 | |||||
| 5,683,022 | ||||||||
| TOTAL COMMON STOCKS | ||||||||
| (Cost $336,780,752) | 354,872,157 | |||||||
| RIGHTS (0.01%) | ||||||||
| Taiwan (0.01%) | ||||||||
Materials Analysis, Strike Price 71.50 TWD (expiring 11/17/16)(a) | 148,968 | 39,181 | ||||||
| TOTAL RIGHTS | ||||||||
| (Cost $0) | 39,181 | |||||||
| TOTAL INVESTMENTS (89.30%) | ||||||||
| (Cost $336,780,752) | $ | 354,911,338 | ||||||
| Other Assets In Excess Of Liabilities (10.70%) | 42,514,887 | |||||||
| NET ASSETS (100.00%) | $ | 397,426,225 | ||||||
(a) | Non-Income Producing Security. |
(b) | Security was purchased pursuant to Regulation S under the Securities Act of 1933, which exempts securities offered and sold outside of the United States from registration. Such security cannot be sold in the United States without either an effective registration statement filed pursuant to the Securities Act of 1933, or pursuant to an exemption from registration. The security has been deemed liquid under guidelines approved by the Fund's Board of Trustees. As of October 31, 2016, the aggregate market value of those securities was $15,322,119, representing 3.86% of net assets. |
(c) | Security exempt from registration under Rule 144A of the Securities Act of 1933. These securities may be resold in the ordinary course of business in transactions exempt from registration, normally to qualified institutional buyers. As of October 31, 2016, these securities had a total aggregate market value of $8,773,044, representing 2.21% of net assets. |
Currency Abbreviations:
TWD - New Taiwan Dollar
Holdings are subject to change, and may not reflect the current or future position of the portfolio.
For Fund compliance purposes, the Fund's geographical classifications refer to any one or more of the country sub-classifications used by one or more widely recognized market indexes or ratings group indexes, and/or as defined by Fund management. This definition may not apply for purposes of this report, which may combine sub-classifications for reporting ease. Geographical regions are shown as a percentage of net assets.
See Notes to Financial Statements.
| Semi-Annual Report | October 31, 2016 | 35 |
| Grandeur Peak Global Micro Cap Fund | Portfolio of Investments |
| October 31, 2016 (Unaudited) |
| Shares | Value (Note 2) | |||||||
| COMMON STOCKS (94.93%) | ||||||||
| Australia (2.61%) | ||||||||
| Beacon Lighting Group, Ltd. | 79,100 | $ | 101,991 | |||||
| CTI Logistics, Ltd. | 158,141 | 99,847 | ||||||
| Greencross, Ltd. | 46,500 | 246,900 | ||||||
| Lycopodium, Ltd. | 109,426 | 224,749 | ||||||
| Medical Developments International, Ltd. | 15,057 | 60,476 | ||||||
| Reject Shop, Ltd. | 21,835 | 124,076 | ||||||
| 858,039 | ||||||||
| Bangladesh (0.11%) | ||||||||
| Shasha Denims, Ltd. | 69,200 | 37,196 | ||||||
| Brazil (0.89%) | ||||||||
| FPC Par Corretora de Seguros SA | 61,700 | 291,683 | ||||||
| Britain (6.53%) | ||||||||
| AB Dynamics PLC | 32,300 | 182,851 | ||||||
| Arrow Global Group PLC | 45,919 | 168,474 | ||||||
| Bioventix PLC | 7,799 | 131,257 | ||||||
| City of London Investment Group PLC | 18,400 | 85,244 | ||||||
| Clinigen Group PLC | 18,900 | 171,189 | ||||||
| dotdigital group PLC | 215,000 | 137,501 | ||||||
| IDOX PLC | 92,000 | 69,676 | ||||||
| Morses Club PLC | 64,438 | 95,435 | ||||||
Motorpoint Group PLC(a)(b) | 36,300 | 61,759 | ||||||
On the Beach Group PLC(a)(b)(c) | 33,000 | 87,954 | ||||||
Oxford Immunotec Global PLC(a) | 25,394 | 326,567 | ||||||
Premier Asset Management Group PLC(a) | 106,200 | 170,286 | ||||||
| Premier Technical Services Group PLC | 76,800 | 70,033 | ||||||
| River & Mercantile Group PLC | 23,400 | 62,582 | ||||||
| S&U PLC | 3,000 | 89,046 | ||||||
| Sanne Group PLC | 17,913 | 115,109 | ||||||
| Tracsis PLC | 19,300 | 125,203 | ||||||
| 2,150,166 | ||||||||
| Canada (1.88%) | ||||||||
Biosyent, Inc.(a) | 40,193 | 254,708 | ||||||
Cipher Pharmaceuticals, Inc.(a) | 55,300 | 199,959 | ||||||
DIRTT Environmental Solutions(a) | 26,900 | 99,073 | ||||||
| Sandvine Corp. | 29,900 | 67,098 | ||||||
| 620,838 | ||||||||
| Shares | Value (Note 2) | |||||||
| China (2.94%) | ||||||||
BBI Life Sciences Corp.(b) | 716,000 | $ | 201,260 | |||||
| BrightKing Holdings, Ltd. | 20,000 | 40,181 | ||||||
| Essex Bio-technology, Ltd. | 220,000 | 97,298 | ||||||
O2Micro International, Ltd., ADR(a) | 96,300 | 168,525 | ||||||
| On-Bright Electronics, Inc. | 51,600 | 336,015 | ||||||
Xiabuxiabu Catering Management China Holdings Co., Ltd.(b)(c) | 206,500 | 125,143 | ||||||
| 968,422 | ||||||||
| Colombia (1.05%) | ||||||||
Amerisur Resources PLC(a) | 194,100 | 70,680 | ||||||
| Bolsa de Valores de Colombia | 20,370,422 | 121,269 | ||||||
Gran Tierra Energy, Inc.(a) | 52,375 | 152,411 | ||||||
| 344,360 | ||||||||
| France (5.44%) | ||||||||
| 1000mercis | 1,800 | 79,137 | ||||||
| Esker SA | 6,700 | 303,758 | ||||||
| Infotel SA | 8,700 | 352,411 | ||||||
Medicrea International(a) | 16,100 | 99,327 | ||||||
MGI Digital Graphic Technology(a) | 4,300 | 165,495 | ||||||
| Neurones | 7,600 | 187,715 | ||||||
| Tessi SA | 850 | 129,615 | ||||||
| Thermador Groupe | 1,614 | 139,527 | ||||||
| Wavestone | 3,737 | 335,444 | ||||||
| 1,792,429 | ||||||||
| Georgia (1.02%) | ||||||||
Georgia Healthcare Group PLC(a)(b)(c) | 40,300 | 174,618 | ||||||
TBC Bank Group PLC(a) | 10,300 | 162,507 | ||||||
| 337,125 | ||||||||
| Germany (1.63%) | ||||||||
| Nexus AG | 6,200 | 127,477 | ||||||
| publity AG | 6,900 | 233,370 | ||||||
| Softing AG | 13,235 | 177,250 | ||||||
| 538,097 | ||||||||
| Greece (0.89%) | ||||||||
| Sarantis SA | 26,700 | 294,272 | ||||||
| Greenland (0.42%) | ||||||||
| GronlandsBANKEN A/S | 1,552 | 138,576 | ||||||
| Hong Kong (1.26%) | ||||||||
| International Housewares Retail Co., Ltd. | 1,100,000 | 219,842 | ||||||
| See Notes to Financial Statements. |
| 36 | 1.855.377.7325 | www.GrandeurPeakGlobal.com |
| Grandeur Peak Global Micro Cap Fund | Portfolio of Investments |
| October 31, 2016 (Unaudited) |
| Shares | Value (Note 2) | |||||||
| Hong Kong (continued) | ||||||||
| TK Group Holdings, Ltd. | 718,000 | $ | 194,416 | |||||
| 414,258 | ||||||||
| India (8.32%) | ||||||||
| City Union Bank, Ltd. | 117,500 | 262,405 | ||||||
| Cyient, Ltd. | 10,140 | 74,327 | ||||||
Eros International Media, Ltd.(a) | 48,000 | 140,112 | ||||||
| Essel Propack, Ltd. | 31,522 | 113,771 | ||||||
| Igarashi Motors India, Ltd. | 18,000 | 217,742 | ||||||
| Kolte-Patil Developers, Ltd. | 87,578 | 166,405 | ||||||
| Kovai Medical Center and Hospital | 21,967 | 266,420 | ||||||
| KPIT Technologies, Ltd. | 36,000 | 77,243 | ||||||
| Kwality, Ltd. | 41,500 | 88,423 | ||||||
| MBL Infrastructures, Ltd. | 54,500 | 85,643 | ||||||
| MT Educare, Ltd. | 50,500 | 104,196 | ||||||
| Persistent Systems, Ltd. | 10,500 | 101,374 | ||||||
| Poly Medicure, Ltd. | 12,573 | 75,246 | ||||||
| Somany Ceramics, Ltd. | 13,033 | 128,815 | ||||||
| Tata Investment Corp., Ltd. | 18,400 | 161,942 | ||||||
| Time Technoplast, Ltd. | 328,000 | 475,647 | ||||||
| UFO Moviez India, Ltd. | 7,375 | 51,271 | ||||||
| Vesuvius India, Ltd. | 8,570 | 149,447 | ||||||
| 2,740,429 | ||||||||
| Indonesia (3.57%) | ||||||||
| Arwana Citramulia Tbk PT | 2,475,100 | 115,712 | ||||||
| Astra Graphia Tbk PT | 1,179,700 | 181,729 | ||||||
| Bekasi Fajar Industrial Estate Tbk PT | 2,910,700 | 69,600 | ||||||
| BFI Finance Indonesia Tbk PT | 746,000 | 194,390 | ||||||
| Hexindo Adiperkasa Tbk PT | 634,500 | 163,877 | ||||||
Lippo Cikarang Tbk PT(a) | 102,300 | 47,434 | ||||||
| Panin Sekuritas Tbk PT | 272,700 | 78,374 | ||||||
| Selamat Sempurna Tbk PT | 473,600 | 165,150 | ||||||
| Surya Toto Indonesia Tbk PT | 3,180,000 | 158,415 | ||||||
| 1,174,681 | ||||||||
| Ireland (0.95%) | ||||||||
| Irish Residential Properties PLC, REIT | 241,800 | 311,887 | ||||||
| Israel (0.29%) | ||||||||
Camtek, Ltd.(a) | 33,100 | 95,990 | ||||||
| Italy (0.40%) | ||||||||
Banca Sistema SpA(b)(c) | 50,715 | 133,057 | ||||||
| Japan (13.41%) | ||||||||
| AIT Corp. | 18,900 | 167,247 | ||||||
| Shares | Value (Note 2) | |||||||
| Japan (continued) | ||||||||
| Amiyaki Tei Co., Ltd. | 5,500 | $ | 203,228 | |||||
| Anest Iwata Corp. | 16,200 | 163,282 | ||||||
| Anshin Guarantor Service Co., Ltd. | 3,900 | 87,357 | ||||||
AP Company Co., Ltd.(a) | 9,500 | 64,227 | ||||||
| ARCLAND SERVICE Co., Ltd. | 4,000 | 118,814 | ||||||
| Central Automotive Products, Ltd. | 13,000 | 112,558 | ||||||
| CMIC Holdings Co., Ltd. | 13,300 | 197,845 | ||||||
| eGuarantee, Inc. | 9,800 | 261,470 | ||||||
| Encourage Technologies Co., Ltd. | 4,000 | 56,947 | ||||||
| Future Architect, Inc. | 41,000 | 273,672 | ||||||
| GCA Savvian Corp. | 33,600 | 251,511 | ||||||
| Hard Off Corp. Co., Ltd. | 44,400 | 487,312 | ||||||
| Interworks, Inc. | 6,800 | 74,050 | ||||||
M&A Capital Partners Co., Ltd.(a) | 21,200 | 521,358 | ||||||
| Monogatari Corp. | 1,300 | 59,812 | ||||||
| Naigai Trans Line, Ltd. | 10,800 | 105,662 | ||||||
| Prestige International, Inc. | 44,000 | 331,878 | ||||||
| Quick Co., Ltd. | 15,300 | 155,086 | ||||||
| Syuppin Co., Ltd. | 51,500 | 564,747 | ||||||
| Trancom Co., Ltd. | 2,700 | 157,309 | ||||||
| 4,415,372 | ||||||||
| Malaysia (1.12%) | ||||||||
| AEON Credit Service M Bhd | 45,800 | 160,928 | ||||||
| Berjaya Food Bhd | 201,300 | 85,415 | ||||||
| Health Management International, Ltd. | 298,800 | 123,493 | ||||||
| 369,836 | ||||||||
| Mexico (0.42%) | ||||||||
| Credito Real SAB de CV SOFOM ER | 75,700 | 139,096 | ||||||
| Netherlands (0.30%) | ||||||||
Shop Apotheke Europe NV(a)(c) | 3,100 | 98,347 | ||||||
| New Zealand (2.35%) | ||||||||
| CBL Corp., Ltd. | 75,436 | 203,370 | ||||||
| Restaurant Brands New Zealand, Ltd. | 39,920 | 150,727 | ||||||
| Trilogy International, Ltd. | 172,600 | 419,649 | ||||||
| 773,746 | ||||||||
| Norway (2.28%) | ||||||||
| Medistim ASA | 25,862 | 212,847 | ||||||
Multiconsult ASA(b)(c) | 19,400 | 254,758 | ||||||
| See Notes to Financial Statements. |
| Semi-Annual Report | October 31, 2016 | 37 |
| Grandeur Peak Global Micro Cap Fund | Portfolio of Investments |
| October 31, 2016 (Unaudited) |
| Shares | Value (Note 2) | |||||||
| Norway (continued) | ||||||||
Skandiabanken ASA(a)(b)(c) | 37,900 | $ | 282,105 | |||||
| 749,710 | ||||||||
| Oman (0.37%) | ||||||||
| Tethys Oil AB | 16,900 | 123,024 | ||||||
| Philippines (1.12%) | ||||||||
| Concepcion Industrial Corp. | 122,900 | 157,361 | ||||||
| Metro Retail Stores Group, Inc. | 1,105,000 | 108,167 | ||||||
| Pepsi-Cola Products Philippines, Inc. | 1,624,000 | 104,303 | ||||||
| 369,831 | ||||||||
| Poland (0.43%) | ||||||||
| PGS Software SA | 45,050 | 142,272 | ||||||
| Singapore (0.90%) | ||||||||
| CSE Global, Ltd. | 171,600 | 50,570 | ||||||
| Riverstone Holdings, Ltd. | 372,800 | 245,184 | ||||||
| 295,754 | ||||||||
| South Africa (2.24%) | ||||||||
| ARB Holdings, Ltd. | 400,143 | 186,959 | ||||||
| Cartrack Holdings, Ltd. | 178,400 | 145,538 | ||||||
| City Lodge Hotels, Ltd. | 7,300 | 78,924 | ||||||
| MiX Telematics, Ltd., Sponsored ADR | 23,575 | 148,287 | ||||||
| Transaction Capital, Ltd. | 181,107 | 177,430 | ||||||
| 737,138 | ||||||||
| South Korea (2.25%) | ||||||||
| Hy-Lok Corp. | 10,550 | 210,216 | ||||||
| InBody Co., Ltd. | 2,900 | 83,762 | ||||||
| ISC Co., Ltd. | 11,855 | 182,345 | ||||||
| Koh Young Technology, Inc. | 2,650 | 103,754 | ||||||
| Vitzrocell Co., Ltd. | 9,317 | 88,346 | ||||||
| Wins Co., Ltd. | 7,100 | 71,667 | ||||||
| 740,090 | ||||||||
| Sri Lanka (1.08%) | ||||||||
| Royal Ceramics Lanka PLC | 267,000 | 214,827 | ||||||
| Sampath Bank PLC | 80,421 | 141,376 | ||||||
| 356,203 | ||||||||
| Sweden (3.34%) | ||||||||
| Bufab Holding AB | 27,400 | 227,521 | ||||||
| HIQ International AB | 25,200 | 156,939 | ||||||
Moberg Pharma AB(a) | 50,900 | 276,136 | ||||||
| Odd Molly International AB | 34,826 | 163,100 | ||||||
| Shares | Value (Note 2) | |||||||
| Sweden (continued) | ||||||||
| Vitec Software Group AB, Class B | 35,500 | $ | 275,128 | |||||
| 1,098,824 | ||||||||
| Taiwan (4.82%) | ||||||||
| ASPEED Technology, Inc. | 14,000 | 201,854 | ||||||
| Dr. Wu Skincare Co., Ltd. | 44,100 | 301,849 | ||||||
| I Yuan Precision Ind. Co., Ltd. | 29,000 | 109,815 | ||||||
| Materials Analysis Technology, Inc. | 42,000 | 106,206 | ||||||
| Sinmag Equipment Corp. | 34,000 | 159,455 | ||||||
| Sitronix Technology Corp. | 66,000 | 244,696 | ||||||
| Solidwizard Technology Co., Ltd. | 49,000 | 141,298 | ||||||
| Sporton International, Inc. | 24,239 | 115,982 | ||||||
| Tung Thih Electronic Co., Ltd. | 10,000 | 146,399 | ||||||
| UDE Corp. | 60,000 | 58,370 | ||||||
| 1,585,924 | ||||||||
| Thailand (1.76%) | ||||||||
| Ananda Development PCL | 4,112,000 | 580,421 | ||||||
| Turkey (0.97%) | ||||||||
EGE Seramik Sanayi ve Ticaret AS(a) | 172,000 | 192,887 | ||||||
| Pinar SUT Mamulleri Sanayii AS | 25,500 | 127,078 | ||||||
| 319,965 | ||||||||
| United States (14.56%) | ||||||||
Aratana Therapeutics, Inc.(a) | 16,775 | 135,877 | ||||||
Atlas Financial Holdings, Inc.(a) | 7,600 | 130,340 | ||||||
| Bank of Marin Bancorp | 2,575 | 130,681 | ||||||
| BG Staffing, Inc. | 12,450 | 177,537 | ||||||
BioDelivery Sciences International, Inc.(a) | 32,550 | 74,865 | ||||||
| Chase Corp. | 1,125 | 76,894 | ||||||
| Diamond Hill Investment Group, Inc. | 900 | 163,809 | ||||||
Entellus Medical, Inc.(a) | 7,177 | 146,770 | ||||||
ePlus, Inc.(a) | 1,082 | 99,057 | ||||||
| Escalade, Inc. | 18,275 | 222,041 | ||||||
| Evolution Petroleum Corp. | 19,275 | 148,417 | ||||||
FormFactor, Inc.(a) | 5,975 | 53,626 | ||||||
Health Insurance Innovations, Inc., Class A(a) | 8,636 | 48,362 | ||||||
| Hennessy Advisors, Inc. | 2,584 | 74,626 | ||||||
Hibbett Sports, Inc.(a) | 4,220 | 163,947 | ||||||
| See Notes to Financial Statements. |
| 38 | 1.855.377.7325 | www.GrandeurPeakGlobal.com |
| Grandeur Peak Global Micro Cap Fund | Portfolio of Investments |
| October 31, 2016 (Unaudited) |
| Shares | Value (Note 2) | |||||||
| United States (continued) | ||||||||
| Hingham Institution for Savings | 1,715 | $ | 246,017 | |||||
Inphi Corp.(a) | 4,125 | 153,037 | ||||||
iRadimed Corp.(a) | 5,654 | 53,430 | ||||||
K2M Group Holdings, Inc.(a) | 5,450 | 93,031 | ||||||
| Kinsale Capital Group, Inc. | 1,000 | 24,050 | ||||||
| LeMaitre Vascular, Inc. | 8,750 | 183,225 | ||||||
LGI Homes, Inc.(a) | 3,600 | 107,136 | ||||||
Malibu Boats, Inc., Class A(a) | 16,536 | 242,583 | ||||||
Mastech Holdings, Inc.(a) | 3,541 | 26,186 | ||||||
| MCBC Holdings, Inc. | 12,925 | 143,984 | ||||||
| OTC Markets Group, Inc., Class A | 8,025 | 152,475 | ||||||
| Reis, Inc. | 4,375 | 85,969 | ||||||
| Seacoast Commerce Banc Holdings | 4,085 | 67,403 | ||||||
Sportsman's Warehouse Holdings, Inc.(a) | 30,960 | 284,832 | ||||||
STAAR Surgical Co.(a) | 15,175 | 128,229 | ||||||
Transcat, Inc.(a) | 15,166 | 159,243 | ||||||
Trecora Resources(a) | 16,100 | 165,025 | ||||||
TriMas Corp.(a) | 5,900 | 105,905 | ||||||
Vascular Solutions, Inc.(a) | 4,938 | 225,173 | ||||||
Veracyte, Inc.(a) | 41,750 | 303,105 | ||||||
| 4,796,887 | ||||||||
| Vietnam (1.01%) | ||||||||
| Binh Minh Plastics JSC | 20,000 | 180,800 | ||||||
| Traphaco JSC | 29,500 | 153,295 | ||||||
| 334,095 | ||||||||
TOTAL COMMON STOCKS (Cost $28,362,384) | 31,268,040 | |||||||
| RIGHTS (0.02%) | ||||||||
| New Zealand (0.01%) | ||||||||
Restaurant Brands NZ, Strike Price 4.70 NZD (expiring 11/09/16)(a) | 7,751 | 3,215 | ||||||
| Taiwan (0.01%) | ||||||||
Materials Analysis, Strike Price 71.50 TWD (expiring 11/17/16)(a) | 6,046 | 1,590 | ||||||
| TOTAL RIGHTS | ||||||||
| (Cost $0) | 4,805 | |||||||
TOTAL INVESTMENTS (94.95%) (Cost $28,362,384) | $ | 31,272,845 | ||
| Other Assets In Excess Of Liabilities (5.05%) | 1,664,041 | |||
| NET ASSETS (100.00%) | $ | 32,936,886 |
(a) | Non-Income Producing Security. |
(b) | Security was purchased pursuant to Regulation S under the Securities Act of 1933, which exempts securities offered and sold outside of the United States from registration. Such security cannot be sold in the United States without either an effective registration statement filed pursuant to the Securities Act of 1933, or pursuant to an exemption from registration. The security has been deemed liquid under guidelines approved by the Fund's Board of Trustees. As of October 31, 2016, the aggregate market value of those securities was $1,320,655, representing 4.01% of net assets. |
(c) | Security exempt from registration under Rule 144A of the Securities Act of 1933. These securities may be resold in the ordinary course of business in transactions exempt from registration, normally to qualified institutional buyers. As of October 31, 2016, these securities had a total aggregate market value of $1,155,982, representing 3.51% of net assets. |
Currency Abbreviations:
NZD - New Zealand Dollar
TWD - New Taiwan Dollar
Holdings are subject to change, and may not reflect the current or future position of the portfolio.
For Fund compliance purposes, the Fund's geographical classifications refer to any one or more of the country sub-classifications used by one or more widely recognized market indexes or ratings group indexes, and/or as defined by Fund management. This definition may not apply for purposes of this report, which may combine sub-classifications for reporting ease. Geographical regions are shown as a percentage of net assets.
| See Notes to Financial Statements. |
| Semi-Annual Report | October 31, 2016 | 39 |
| Grandeur Peak Global Opportunities Fund | Portfolio of Investments |
| October 31, 2016 (Unaudited) |
| Shares | Value (Note 2) | |||||||
| COMMON STOCKS (98.29%) | ||||||||
| Argentina (0.30%) | ||||||||
Globant SA(a) | 43,825 | $ | 1,906,388 | |||||
| Australia (1.54%) | ||||||||
| CTI Logistics, Ltd. | 1,502,587 | 948,705 | ||||||
| Greencross, Ltd. | 544,716 | 2,892,270 | ||||||
| Magellan Financial Group, Ltd. | 240,964 | 3,902,484 | ||||||
| Reject Shop, Ltd. | 346,971 | 1,971,638 | ||||||
| 9,715,097 | ||||||||
| Austria (1.23%) | ||||||||
| Palfinger AG | 255,283 | 7,734,541 | ||||||
| Belgium (1.39%) | ||||||||
| Melexis NV | 133,935 | 8,778,993 | ||||||
| Brazil (0.61%) | ||||||||
| FPC Par Corretora de Seguros SA | 440,200 | 2,081,021 | ||||||
| Valid Solucoes e Servicos de Seguranca em Meios de Pagamento e Identificacao SA | 190,100 | 1,786,058 | ||||||
| 3,867,079 | ||||||||
| Britain (7.28%) | ||||||||
| Abcam PLC | 213,853 | 2,279,897 | ||||||
| Alliance Pharma PLC | 631,130 | 349,558 | ||||||
| Arrow Global Group PLC | 851,517 | 3,124,167 | ||||||
| B&M European Value Retail SA | 487,700 | 1,400,433 | ||||||
| Clinigen Group PLC | 1,439,976 | 13,042,734 | ||||||
| Diploma PLC | 169,900 | 1,949,604 | ||||||
| EMIS Group PLC | 378,117 | 3,871,451 | ||||||
Motorpoint Group PLC(a)(b) | 740,200 | 1,259,347 | ||||||
On the Beach Group PLC(a)(b)(c) | 359,200 | 957,362 | ||||||
Oxford Immunotec Global PLC(a) | 233,505 | 3,002,874 | ||||||
| River & Mercantile Group PLC | 477,200 | 1,276,243 | ||||||
| RPS Group PLC | 1,687,239 | 3,495,320 | ||||||
| Sanne Group PLC | 506,450 | 3,254,450 | ||||||
| Secure Trust Bank PLC | 83,800 | 2,430,939 | ||||||
| Ted Baker PLC | 51,200 | 1,551,054 | ||||||
| Ultra Electronics Holdings PLC | 114,450 | 2,602,814 | ||||||
| 45,848,247 | ||||||||
| Canada (1.71%) | ||||||||
Biosyent, Inc.(a) | 228,700 | 1,449,303 | ||||||
| Shares | Value (Note 2) | |||||||
| Canada (continued) | ||||||||
Cipher Pharmaceuticals, Inc.(a) | 709,900 | $ | 2,566,924 | |||||
DIRTT Environmental Solutions(a) | 163,200 | 601,065 | ||||||
| Richelieu Hardware, Ltd. | 197,365 | 3,794,858 | ||||||
| Stantec, Inc. | 107,428 | 2,389,958 | ||||||
| 10,802,108 | ||||||||
| China (5.89%) | ||||||||
BBI Life Sciences Corp.(b) | 10,839,500 | 3,046,864 | ||||||
| China Medical System Holdings, Ltd. | 3,009,000 | 4,702,320 | ||||||
| Man Wah Holdings, Ltd. | 23,588,400 | 15,663,655 | ||||||
O2Micro International, Ltd., ADR(a) | 905,240 | 1,584,170 | ||||||
| On-Bright Electronics, Inc. | 793,080 | 5,164,476 | ||||||
| Silergy Corp. | 376,852 | 5,505,150 | ||||||
Xiabuxiabu Catering Management China Holdings Co., Ltd.(b)(c) | 2,362,000 | 1,431,414 | ||||||
| 37,098,049 | ||||||||
| Colombia (0.98%) | ||||||||
Amerisur Resources PLC(a) | 3,109,700 | 1,132,367 | ||||||
Gran Tierra Energy, Inc.(a) | 775,950 | 2,258,014 | ||||||
Parex Resources, Inc.(a) | 244,100 | 2,808,069 | ||||||
| 6,198,450 | ||||||||
| Egypt (0.06%) | ||||||||
Integrated Diagnostics Holdings PLC(b)(c) | 131,600 | 361,900 | ||||||
| France (2.12%) | ||||||||
| Alten SA | 17,853 | 1,276,035 | ||||||
| Esker SA | 30,047 | 1,362,243 | ||||||
| Infotel SA | 34,520 | 1,398,301 | ||||||
Medicrea International(a) | 167,370 | 1,032,565 | ||||||
MGI Digital Graphic Technology(a) | 43,650 | 1,679,963 | ||||||
| Neurones | 45,508 | 1,124,020 | ||||||
| Tessi SA | 8,710 | 1,328,175 | ||||||
| Thermador Groupe | 15,290 | 1,321,787 | ||||||
| Wavestone | 31,626 | 2,838,846 | ||||||
| 13,361,935 | ||||||||
| Georgia (0.78%) | ||||||||
| BGEO Group PLC | 135,200 | 4,891,734 | ||||||
| Germany (3.34%) | ||||||||
Aroundtown Property Holdings PLC(a) | 677,000 | 3,232,820 | ||||||
| Nexus AG | 129,290 | 2,658,314 | ||||||
| See Notes to Financial Statements. |
| 40 | 1.855.377.7325 | www.GrandeurPeakGlobal.com |
| Grandeur Peak Global Opportunities Fund | Portfolio of Investments |
| October 31, 2016 (Unaudited) |
| Shares | Value (Note 2) | |||||||
| Germany (continued) | ||||||||
| Norma Group SE | 76,768 | $ | 3,532,686 | |||||
PATRIZIA Immobilien AG(a) | 170,194 | 3,518,018 | ||||||
| publity AG | 90,700 | 3,067,627 | ||||||
| Softing AG | 100,854 | 1,350,693 | ||||||
| Wirecard AG | 77,685 | 3,685,320 | ||||||
| 21,045,478 | ||||||||
| Hong Kong (1.83%) | ||||||||
| International Housewares Retail Co., Ltd. | 11,549,000 | 2,308,147 | ||||||
| Samsonite International SA | 552,200 | 1,737,295 | ||||||
| Value Partners Group, Ltd. | 5,334,000 | 5,103,220 | ||||||
| Vitasoy International Holdings, Ltd. | 1,135,483 | 2,374,756 | ||||||
| 11,523,418 | ||||||||
| India (9.06%) | ||||||||
| AIA Engineering, Ltd. | 38,400 | 743,317 | ||||||
| Ajanta Pharma, Ltd. | 43,667 | 1,334,859 | ||||||
| Alkem Laboratories, Ltd. | 230,131 | 5,623,154 | ||||||
| Bajaj Finance, Ltd. | 302,750 | 4,861,978 | ||||||
| City Union Bank, Ltd. | 1,356,267 | 3,028,864 | ||||||
| Cyient, Ltd. | 359,116 | 2,632,347 | ||||||
| Divi's Laboratories, Ltd. | 275,500 | 5,279,697 | ||||||
Eros International Media, Ltd.(a) | 336,000 | 980,785 | ||||||
| Essel Propack, Ltd. | 186,695 | 673,831 | ||||||
| Hinduja Global Solutions, Ltd. | 226,600 | 1,898,668 | ||||||
| Indiabulls Housing Finance, Ltd. | 334,000 | 4,245,358 | ||||||
Kellton Tech Solutions, Ltd.(a) | 93,500 | 172,478 | ||||||
| Kolte-Patil Developers, Ltd. | 665,669 | 1,264,827 | ||||||
| Kovai Medical Center and Hospital | 9,041 | 109,651 | ||||||
| KPIT Technologies, Ltd. | 645,850 | 1,385,764 | ||||||
| MBL Infrastructures, Ltd. | 470,500 | 739,356 | ||||||
| MT Educare, Ltd. | 587,689 | 1,212,574 | ||||||
| Persistent Systems, Ltd. | 127,700 | 1,232,898 | ||||||
| Poly Medicure, Ltd. | 44,637 | 267,141 | ||||||
| Tata Investment Corp., Ltd. | 169,637 | 1,493,006 | ||||||
| Time Technoplast, Ltd. | 1,804,205 | 2,616,356 | ||||||
| UFO Moviez India, Ltd. | 134,815 | 937,234 | ||||||
Vaibhav Global, Ltd.(a) | 158,363 | 742,654 | ||||||
| Vakrangee Software, Ltd. | 633,000 | 2,389,868 | ||||||
| Vesuvius India, Ltd. | 53,365 | 930,600 | ||||||
WNS Holdings, Ltd., ADR(a) | 169,400 | 4,658,500 | ||||||
| Yes Bank, Ltd. | 295,500 | 5,629,351 | ||||||
| 57,085,116 | ||||||||
| Shares | Value (Note 2) | |||||||
| Indonesia (2.87%) | ||||||||
| Arwana Citramulia Tbk PT | 41,549,800 | $ | 1,942,472 | |||||
| Astra Graphia Tbk PT | 8,201,900 | 1,263,475 | ||||||
| Bank Rakyat Indonesia Persero Tbk PT | 2,251,000 | 2,104,706 | ||||||
| Delfi, Ltd. | 1,572,400 | 2,531,663 | ||||||
| Panin Sekuritas Tbk PT | 4,960,800 | 1,425,736 | ||||||
| Selamat Sempurna Tbk PT | 14,442,000 | 5,036,105 | ||||||
| Tempo Scan Pacific Tbk PT | 15,553,000 | 2,562,764 | ||||||
Ultrajaya Milk Industry & Trading Co. Tbk PT(a) | 3,254,500 | 1,184,770 | ||||||
| 18,051,691 | ||||||||
| Ireland (0.29%) | ||||||||
| Irish Residential Properties PLC, REIT | 1,396,146 | 1,800,828 | ||||||
| Israel (0.57%) | ||||||||
Wix.com, Ltd.(a) | 89,625 | 3,585,000 | ||||||
| Italy (0.76%) | ||||||||
| Brembo SpA | 77,308 | 4,777,893 | ||||||
| Japan (9.01%) | ||||||||
| AIT Corp. | 327,500 | 2,898,064 | ||||||
| Amiyaki Tei Co., Ltd. | 63,400 | 2,342,662 | ||||||
| Anest Iwata Corp. | 251,100 | 2,530,873 | ||||||
AP Company Co., Ltd.(a) | 83,400 | 563,847 | ||||||
| ARCLAND SERVICE Co., Ltd. | 61,600 | 1,829,732 | ||||||
| Century Tokyo Leasing Corp. | 42,100 | 1,487,370 | ||||||
| CMIC Holdings Co., Ltd. | 148,120 | 2,203,368 | ||||||
| CyberAgent, Inc. | 90,800 | 2,645,123 | ||||||
| eGuarantee, Inc. | 84,300 | 2,249,179 | ||||||
| Future Architect, Inc. | 411,800 | 2,748,737 | ||||||
| GCA Savvian Corp. | 389,000 | 2,911,843 | ||||||
| Hard Off Corp. Co., Ltd. | 264,700 | 2,905,213 | ||||||
M&A Capital Partners Co., Ltd.(a) | 143,000 | 3,516,706 | ||||||
| MISUMI Group, Inc. | 219,400 | 4,010,583 | ||||||
| Monogatari Corp. | 50,300 | 2,314,270 | ||||||
| Naigai Trans Line, Ltd. | 55,300 | 541,030 | ||||||
| Prestige International, Inc. | 555,800 | 4,192,217 | ||||||
| Sawai Pharmaceutical Co., Ltd. | 33,600 | 2,175,493 | ||||||
| SK Kaken Co., Ltd. | 22,000 | 2,292,934 | ||||||
| Suruga Bank, Ltd. | 67,500 | 1,650,973 | ||||||
| Syuppin Co., Ltd. | 197,500 | 2,165,777 | ||||||
| Trancom Co., Ltd. | 113,370 | 6,605,232 | ||||||
| 56,781,226 | ||||||||
| Luxembourg (0.95%) | ||||||||
| Grand City Properties SA | 116,300 | 2,043,332 | ||||||
| See Notes to Financial Statements. |
| Semi-Annual Report | October 31, 2016 | 41 |
| Grandeur Peak Global Opportunities Fund | Portfolio of Investments |
| October 31, 2016 (Unaudited) |
| Shares | Value (Note 2) | |||||||
| Luxembourg (continued) | ||||||||
| L'Occitane International SA | 1,897,753 | $ | 3,920,032 | |||||
| 5,963,364 | ||||||||
| Malaysia (0.71%) | ||||||||
| AEON Credit Service M Bhd | 559,480 | 1,965,849 | ||||||
| Berjaya Auto Bhd | 24,600 | 13,370 | ||||||
| My EG Services Bhd | 4,284,400 | 2,491,999 | ||||||
| 4,471,218 | ||||||||
| Mexico (0.85%) | ||||||||
| Banregio Grupo Financiero SAB de CV | 383,034 | 2,510,665 | ||||||
| Credito Real SAB de CV SOFOM ER | 1,537,649 | 2,825,382 | ||||||
| 5,336,047 | ||||||||
| Netherlands (0.57%) | ||||||||
| Aalberts Industries NV | 83,222 | 2,628,797 | ||||||
| Arcadis NV | 72,221 | 951,367 | ||||||
| 3,580,164 | ||||||||
| New Zealand (1.23%) | ||||||||
| CBL Corp., Ltd. | 661,082 | 1,782,229 | ||||||
| Restaurant Brands New Zealand, Ltd. | 855,000 | 3,228,247 | ||||||
| Trilogy International, Ltd. | 1,115,098 | 2,711,182 | ||||||
| 7,721,658 | ||||||||
| Norway (1.33%) | ||||||||
| Medistim ASA | 152,700 | 1,256,737 | ||||||
Multiconsult ASA(b)(c) | 113,000 | 1,483,900 | ||||||
Skandiabanken ASA(a)(b)(c) | 761,300 | 5,666,662 | ||||||
| 8,407,299 | ||||||||
| Oman (0.25%) | ||||||||
| Tethys Oil AB | 218,000 | 1,586,942 | ||||||
| Peru (0.25%) | ||||||||
| Credicorp, Ltd. | 10,625 | 1,579,725 | ||||||
| Philippines (1.67%) | ||||||||
| Concepcion Industrial Corp. | 1,126,700 | 1,442,623 | ||||||
| Metro Retail Stores Group, Inc. | 15,321,000 | 1,499,748 | ||||||
| Pepsi-Cola Products Philippines, Inc. | 29,394,900 | 1,887,927 | ||||||
| Security Bank Corp. | 1,244,640 | 5,665,107 | ||||||
| 10,495,405 | ||||||||
| Shares | Value (Note 2) | |||||||
| Poland (0.14%) | ||||||||
| Wawel SA | 3,856 | $ | 854,104 | |||||
| Singapore (0.60%) | ||||||||
| CSE Global, Ltd. | 4,531,250 | 1,335,355 | ||||||
| Riverstone Holdings, Ltd. | 3,729,200 | 2,452,627 | ||||||
| 3,787,982 | ||||||||
| South Africa (1.99%) | ||||||||
| Cartrack Holdings, Ltd. | 4,257,400 | 3,473,173 | ||||||
| City Lodge Hotels, Ltd. | 95,882 | 1,036,631 | ||||||
| Clicks Group, Ltd. | 246,349 | 2,292,893 | ||||||
| EOH Holdings, Ltd. | 167,000 | 1,980,406 | ||||||
| Italtile, Ltd. | 1,177,166 | 1,270,253 | ||||||
| MiX Telematics, Ltd., Sponsored ADR | 127,000 | 798,830 | ||||||
Super Group, Ltd.(a) | 567,307 | 1,674,521 | ||||||
| 12,526,707 | ||||||||
| South Korea (1.45%) | ||||||||
| Hy-Lok Corp. | 242,907 | 4,840,096 | ||||||
| ISC Co., Ltd. | 144,103 | 2,216,485 | ||||||
| Koh Young Technology, Inc. | 53,781 | 2,105,649 | ||||||
| 9,162,230 | ||||||||
| Sweden (2.53%) | ||||||||
| AddTech AB, Class B | 182,127 | 2,591,113 | ||||||
| Beijer Alma AB | 89,576 | 2,067,791 | ||||||
| Bufab Holding AB | 394,510 | 3,275,881 | ||||||
| HIQ International AB | 116,092 | 722,992 | ||||||
| Indutrade AB | 154,800 | 2,877,601 | ||||||
Moberg Pharma AB(a) | 329,880 | 1,789,620 | ||||||
| Nibe Industrier AB, Class B | 352,000 | 2,618,911 | ||||||
| 15,943,909 | ||||||||
| Switzerland (1.48%) | ||||||||
| Leonteq AG | 13,900 | 801,369 | ||||||
Luxoft Holding, Inc.(a) | 35,900 | 1,902,700 | ||||||
| VZ Holding AG | 19,575 | 5,796,044 | ||||||
Wizz Air Holdings PLC(a)(b)(c) | 43,700 | 808,216 | ||||||
| 9,308,329 | ||||||||
| Taiwan (2.75%) | ||||||||
| ASPEED Technology, Inc. | 183,237 | 2,641,934 | ||||||
| Cub Elecparts, Inc. | 292,473 | 2,687,702 | ||||||
| Dr. Wu Skincare Co., Ltd. | 92,500 | 633,130 | ||||||
| Novatek Microelectronics Corp. | 441,000 | 1,655,977 | ||||||
| Sinmag Equipment Corp. | 330,842 | 1,551,600 | ||||||
| Sporton International, Inc. | 725,990 | 3,473,802 | ||||||
| Tung Thih Electronic Co., Ltd. | 216,000 | 3,162,228 | ||||||
| See Notes to Financial Statements. |
| 42 | 1.855.377.7325 | www.GrandeurPeakGlobal.com |
| Grandeur Peak Global Opportunities Fund | Portfolio of Investments |
| October 31, 2016 (Unaudited) |
| Shares | Value (Note 2) | |||||||
| Taiwan (continued) | ||||||||
| UDE Corp. | 1,574,000 | $ | 1,531,230 | |||||
| 17,337,603 | ||||||||
| Thailand (0.79%) | ||||||||
| Ananda Development PCL | 23,099,000 | 3,260,492 | ||||||
| Premier Marketing PCL | 6,383,700 | 1,687,241 | ||||||
| 4,947,733 | ||||||||
| Turkey (0.16%) | ||||||||
EGE Seramik Sanayi ve Ticaret AS(a) | 928,419 | 1,041,162 | ||||||
| United Arab Emirates (0.18%) | ||||||||
| Aramex PJSC | 1,162,100 | 1,120,035 | ||||||
| United States (26.38%) | ||||||||
| Alamo Group, Inc. | 27,000 | 1,752,840 | ||||||
Aratana Therapeutics, Inc.(a) | 196,550 | 1,592,055 | ||||||
| Bank of the Ozarks, Inc. | 43,025 | 1,590,204 | ||||||
| BG Staffing, Inc. | 52,149 | 743,645 | ||||||
BioDelivery Sciences International, Inc.(a) | 488,325 | 1,123,147 | ||||||
Coupa Software, Inc.(a) | 550 | 13,750 | ||||||
| Diamond Hill Investment Group, Inc. | 30,334 | 5,521,091 | ||||||
Dril-Quip, Inc.(a) | 26,125 | 1,240,937 | ||||||
Entellus Medical, Inc.(a) | 8,275 | 169,224 | ||||||
EPAM Systems, Inc.(a) | 67,475 | 4,343,366 | ||||||
| Escalade, Inc. | 125,635 | 1,526,465 | ||||||
ExlService Holdings, Inc.(a) | 56,050 | 2,467,881 | ||||||
| Fastenal Co. | 44,500 | 1,734,610 | ||||||
| First Cash Financial Services, Inc. | 87,700 | 4,139,440 | ||||||
| First Republic Bank | 199,225 | 14,828,317 | ||||||
Genpact, Ltd.(a) | 89,025 | 2,046,685 | ||||||
| Gentex Corp. | 265,325 | 4,486,646 | ||||||
Health Insurance Innovations, Inc., Class A(a) | 67,475 | 377,860 | ||||||
Hibbett Sports, Inc.(a) | 57,750 | 2,243,587 | ||||||
| Hingham Institution for Savings | 14,600 | 2,094,370 | ||||||
| Home BancShares, Inc. | 173,800 | 3,738,438 | ||||||
Inphi Corp.(a) | 146,750 | 5,444,425 | ||||||
iRadimed Corp.(a) | 55,675 | 526,129 | ||||||
K2M Group Holdings, Inc.(a) | 107,875 | 1,841,426 | ||||||
| Knight Transportation, Inc. | 356,720 | 10,434,060 | ||||||
| LeMaitre Vascular, Inc. | 109,948 | 2,302,311 | ||||||
LGI Homes, Inc.(a) | 80,351 | 2,391,246 | ||||||
| Littelfuse, Inc. | 13,950 | 1,946,025 | ||||||
Malibu Boats, Inc., Class A(a) | 179,150 | 2,628,130 | ||||||
| MarketAxess Holdings, Inc. | 39,900 | 6,015,324 | ||||||
| Shares | Value (Note 2) | |||||||
| United States (continued) | ||||||||
MEDNAX, Inc.(a) | 88,375 | $ | 5,412,969 | |||||
| Microchip Technology, Inc. | 75,945 | 4,598,470 | ||||||
| MSC Industrial Direct Co., Inc., Class A | 41,875 | 3,048,500 | ||||||
Paycom Software, Inc.(a) | 61,800 | 3,196,914 | ||||||
| Power Integrations, Inc. | 267,500 | 17,240,375 | ||||||
PRA Group, Inc.(a) | 147,800 | 4,714,820 | ||||||
Signature Bank(a) | 27,400 | 3,303,344 | ||||||
Silicon Laboratories, Inc.(a) | 77,765 | 4,662,012 | ||||||
Spirit Airlines, Inc.(a) | 55,075 | 2,639,745 | ||||||
Sportsman's Warehouse Holdings, Inc.(a) | 593,350 | 5,458,820 | ||||||
Sprouts Farmers Market, Inc.(a) | 190,750 | 4,225,113 | ||||||
STAAR Surgical Co.(a) | 379,825 | 3,209,521 | ||||||
Trecora Resources(a) | 112,600 | 1,154,150 | ||||||
TriMas Corp.(a) | 156,500 | 2,809,175 | ||||||
| Universal Logistics Holdings, Inc. | 274,207 | 3,413,877 | ||||||
Vascular Solutions, Inc.(a) | 68,468 | 3,122,141 | ||||||
Veracyte, Inc.(a) | 241,448 | 1,752,912 | ||||||
Virtusa Corp.(a) | 47,425 | 898,230 | ||||||
| 166,164,722 | ||||||||
| Vietnam (0.41%) | ||||||||
| DHG Pharmaceutical JSC | 72,440 | 319,641 | ||||||
| Vietnam Dairy Products JSC | 358,800 | 2,282,381 | ||||||
| 2,602,022 | ||||||||
TOTAL COMMON STOCKS (Cost $514,701,780) | 619,153,531 | |||||||
| RIGHTS (0.01%) | ||||||||
| New Zealand (0.01%) | ||||||||
Restaurant Brands NZ, Strike Price 4.70 NZD (expiring 11/09/16)(a) | 166,019 | 68,858 | ||||||
| TOTAL RIGHTS (Cost $0) | 68,858 | |||||||
TOTAL INVESTMENTS (98.30%) (Cost $514,701,780) | $ | 619,222,389 | ||||||
| Other Assets In Excess Of Liabilities (1.70%) | 10,678,697 | |||||||
| NET ASSETS (100.00%) | $ | 629,901,086 | ||||||
| (a) | Non-Income Producing Security. |
| See Notes to Financial Statements. |
| Semi-Annual Report | October 31, 2016 | 43 |
| Grandeur Peak Global Opportunities Fund | Portfolio of Investments |
| October 31, 2016 (Unaudited) |
| (b) | Security was purchased pursuant to Regulation S under the Securities Act of 1933, which exempts securities offered and sold outside of the United States from registration. Such security cannot be sold in the United States without either an effective registration statement filed pursuant to the Securities Act of 1933, or pursuant to an exemption from registration. The security has been deemed liquid under guidelines approved by the Fund's Board of Trustees. As of October 31, 2016, the aggregate market value of those securities was $15,015,665, representing 2.38% of net assets. |
| (c) | Security exempt from registration under Rule 144A of the Securities Act of 1933. These securities may be resold in the ordinary course of business in transactions exempt from registration, normally to qualified institutional buyers. As of October 31, 2016, these securities had a total aggregate market value of $10,709,454, representing 1.70% of net assets. |
Currency Abbreviations:
NZD - New Zealand Dollar
Holdings are subject to change, and may not reflect the current or future position of the portfolio.
For Fund compliance purposes, the Fund's geographical classifications refer to any one or more of the country sub-classifications used by one or more widely recognized market indexes or ratings group indexes, and/or as defined by Fund management. This definition may not apply for purposes of this report, which may combine sub-classifications for reporting ease. Geographical regions are shown as a percentage of net assets.
| See Notes to Financial Statements. |
| 44 | 1.855.377.7325 | www.GrandeurPeakGlobal.com |
| Grandeur Peak Global Reach Fund | Portfolio of Investments |
October 31, 2016 (Unaudited)
| Shares | Value (Note 2) | |||||||
| COMMON STOCKS (98.42%) | ||||||||
| Argentina (0.31%) | ||||||||
Globant SA(a) | 20,613 | $ | 896,665 | |||||
| Australia (1.19%) | ||||||||
| Beacon Lighting Group, Ltd. | 477,900 | 616,198 | ||||||
| CTI Logistics, Ltd. | 323,146 | 204,028 | ||||||
| Greencross, Ltd. | 196,400 | 1,042,822 | ||||||
| Magellan Financial Group, Ltd. | 33,264 | 538,720 | ||||||
| Reject Shop, Ltd. | 176,275 | 1,001,670 | ||||||
| 3,403,438 | ||||||||
| Austria (0.41%) | ||||||||
| Palfinger AG | 39,148 | 1,186,102 | ||||||
| Belgium (0.28%) | ||||||||
| Melexis NV | 12,385 | 811,795 | ||||||
| Brazil (0.30%) | ||||||||
| FPC Par Corretora de Seguros SA | 122,100 | 577,221 | ||||||
| Valid Solucoes e Servicos de Seguranca em Meios de Pagamento e Identificacao SA | 30,100 | 282,800 | ||||||
| 860,021 | ||||||||
| Britain (6.91%) | ||||||||
| AB Dynamics PLC | 120,500 | 682,151 | ||||||
| Abcam PLC | 66,289 | 706,710 | ||||||
| Alliance Pharma PLC | 960,700 | 532,094 | ||||||
| Arrow Global Group PLC | 235,351 | 863,489 | ||||||
| B&M European Value Retail SA | 212,500 | 610,195 | ||||||
| Bioventix PLC | 15,800 | 265,914 | ||||||
| Clinigen Group PLC | 431,730 | 3,910,440 | ||||||
| Close Brothers Group PLC | 33,417 | 542,775 | ||||||
| Diploma PLC | 68,800 | 789,480 | ||||||
| dotdigital group PLC | 1,716,856 | 1,097,999 | ||||||
| EMIS Group PLC | 53,596 | 548,757 | ||||||
| Exova Group PLC | 128,000 | 329,011 | ||||||
Horizon Discovery Group PLC(a) | 155,300 | 245,213 | ||||||
| IDOX PLC | 550,000 | 416,543 | ||||||
Metro Bank PLC(a) | 18,100 | 613,456 | ||||||
| Morses Club PLC | 428,100 | 634,034 | ||||||
Motorpoint Group PLC(a)(b) | 171,000 | 290,933 | ||||||
On the Beach Group PLC(a)(b)(c) | 199,100 | 530,654 | ||||||
Oxford Immunotec Global PLC(a) | 78,675 | 1,011,760 | ||||||
| Shares | Value (Note 2) | |||||||
| Britain (continued) | ||||||||
| Premier Technical Services Group PLC | 640,000 | $ | 583,604 | |||||
| River & Mercantile Group PLC | 84,200 | 225,188 | ||||||
| RPS Group PLC | 166,299 | 344,508 | ||||||
| S&U PLC | 18,000 | 534,276 | ||||||
| Sanne Group PLC | 159,600 | 1,025,590 | ||||||
| Secure Trust Bank PLC | 19,200 | 556,969 | ||||||
| Softcat PLC | 160,000 | 634,522 | ||||||
| Topps Tiles PLC | 430,895 | 482,585 | ||||||
| Ultra Electronics Holdings PLC | 26,150 | 594,702 | ||||||
WANdisco PLC(a) | 100,245 | 176,074 | ||||||
| 19,779,626 | ||||||||
| Canada (2.10%) | ||||||||
Biosyent, Inc.(a) | 81,400 | 515,843 | ||||||
Cipher Pharmaceuticals, Inc.(a) | 238,700 | 863,114 | ||||||
DIRTT Environmental Solutions(a) | 427,300 | 1,573,743 | ||||||
| Ritchie Bros. Auctioneers, Inc. | 29,400 | 1,016,946 | ||||||
| Stantec, Inc. | 44,820 | 997,114 | ||||||
| TransForce, Inc. | 46,096 | 1,045,778 | ||||||
| 6,012,538 | ||||||||
| China (6.18%) | ||||||||
BBI Life Sciences Corp.(b) | 5,592,500 | 1,571,990 | ||||||
| BrightKing Holdings, Ltd. | 59,000 | 118,533 | ||||||
| China Lesso Group Holdings, Ltd. | 987,000 | 724,130 | ||||||
| China Medical System Holdings, Ltd. | 1,709,000 | 2,670,743 | ||||||
| Essex Bio‐technology, Ltd. | 1,321,000 | 584,231 | ||||||
| Man Wah Holdings, Ltd. | 8,973,600 | 5,958,835 | ||||||
O2Micro International, Ltd., ADR(a) | 317,894 | 556,315 | ||||||
| On‐Bright Electronics, Inc. | 206,400 | 1,344,061 | ||||||
| Shandong Weigao Group Medical Polymer Co., Ltd., Class H | 424,000 | 276,633 | ||||||
Shanghai Haohai Biological Technology Co., Ltd., Class H(b)(c) | 78,700 | 375,460 | ||||||
| Sihuan Pharmaceutical Holdings Group, Ltd. | 1,290,000 | 309,378 | ||||||
| Silergy Corp. | 126,925 | 1,854,153 | ||||||
| Sinosoft Technology Group, Ltd. | 1,256,400 | 549,180 | ||||||
See Notes to Financial Statements.
| Semi-Annual Report | October 31, 2016 | 45 |
| Grandeur Peak Global Reach Fund | Portfolio of Investments |
October 31, 2016 (Unaudited)
| Shares | Value (Note 2) | |||||||
| China (continued) | ||||||||
Xiabuxiabu Catering Management China Holdings Co., Ltd.(b)(c) | 1,312,000 | $ | 795,095 | |||||
| 17,688,737 | ||||||||
| Colombia (1.09%) | ||||||||
Amerisur Resources PLC(a) | 2,036,300 | 741,499 | ||||||
Gran Tierra Energy, Inc.(a) | 386,195 | 1,123,827 | ||||||
Parex Resources, Inc.(a) | 108,361 | 1,246,560 | ||||||
| 3,111,886 | ||||||||
| Denmark (0.20%) | ||||||||
| Ringkjoebing Landbobank A/S | 2,730 | 577,765 | ||||||
| Egypt (0.19%) | ||||||||
Integrated Diagnostics Holdings PLC(b)(c) | 201,400 | 553,850 | ||||||
| Finland (0.28%) | ||||||||
Ferratum OYJ(b) | 10,500 | 163,675 | ||||||
| Metso OYJ | 24,600 | 645,411 | ||||||
| 809,086 | ||||||||
| France (1.96%) | ||||||||
| Alten SA | 10,400 | 743,335 | ||||||
| Esker SA | 26,009 | 1,179,172 | ||||||
| Infotel SA | 21,960 | 889,533 | ||||||
Medicrea International(a) | 86,569 | 534,075 | ||||||
MGI Digital Graphic Technology(a) | 17,352 | 667,829 | ||||||
| Neurones | 17,282 | 426,855 | ||||||
| Thermador Groupe | 2,874 | 248,451 | ||||||
| Wavestone | 10,433 | 936,498 | ||||||
| 5,625,748 | ||||||||
| Georgia (0.95%) | ||||||||
| BGEO Group PLC | 37,000 | 1,338,714 | ||||||
| Georgia Healthcare Group | ||||||||
PLC(a)(b)(c) | 183,848 | 796,607 | ||||||
TBC Bank Group PLC(a) | 16,200 | 255,593 | ||||||
TBC Bank JSC, GDR(b) | 28,946 | 331,432 | ||||||
| 2,722,346 | ||||||||
| Germany (2.84%) | ||||||||
Aroundtown Property Holdings PLC(a) | 170,077 | 812,154 | ||||||
| CANCOM SE | 14,900 | 676,504 | ||||||
| GRENKE AG | 3,200 | 557,130 | ||||||
| Nexus AG | 42,185 | 867,360 | ||||||
| Norma Group SE | 36,860 | 1,696,212 | ||||||
PATRIZIA Immobilien AG(a) | 46,131 | 953,557 | ||||||
| Shares | Value (Note 2) | |||||||
| Germany (continued) | ||||||||
| publity AG | 38,300 | $ | 1,295,371 | |||||
| Wirecard AG | 26,896 | 1,275,927 | ||||||
| 8,134,215 | ||||||||
| Greece (0.46%) | ||||||||
| Sarantis SA | 119,670 | 1,318,932 | ||||||
| Hong Kong (2.27%) | ||||||||
| International Housewares Retail Co., Ltd. | 8,060,000 | 1,610,846 | ||||||
| Samsonite International SA | 264,900 | 833,411 | ||||||
| Value Partners Group, Ltd. | 2,393,000 | 2,289,465 | ||||||
| Vitasoy International Holdings, Ltd. | 847,000 | 1,771,421 | ||||||
| 6,505,143 | ||||||||
| India (8.47%) | ||||||||
Advanced Enzyme Technologies Ltd.(a)(b) | 24,000 | 764,400 | ||||||
| AIA Engineering, Ltd. | 38,000 | 735,574 | ||||||
| Alkem Laboratories, Ltd. | 39,482 | 964,726 | ||||||
| Bajaj Finance, Ltd. | 91,000 | 1,461,404 | ||||||
| Bajaj Finserv, Ltd. | 13,000 | 658,540 | ||||||
| City Union Bank, Ltd. | 691,900 | 1,545,176 | ||||||
| Control Print, Ltd. | 78,762 | 344,712 | ||||||
| Cyient, Ltd. | 168,200 | 1,232,918 | ||||||
| Divi's Laboratories, Ltd. | 31,000 | 594,086 | ||||||
Eros International Media, Ltd.(a) | 240,328 | 701,518 | ||||||
| Essel Propack, Ltd. | 242,042 | 873,593 | ||||||
| Hinduja Global Solutions, Ltd. | 95,289 | 798,421 | ||||||
ICICI Prudential Life Insurance Co., Ltd.(b)(c) | 9,437 | 43,605 | ||||||
| Igarashi Motors India, Ltd. | 70,087 | 847,825 | ||||||
| Indiabulls Housing Finance, Ltd. | 48,278 | 613,645 | ||||||
Inox Wind, Ltd.(a) | 194,698 | 619,049 | ||||||
Kellton Tech Solutions, Ltd.(a) | 141,634 | 261,270 | ||||||
| Kolte‐Patil Developers, Ltd. | 134,373 | 255,320 | ||||||
| Kovai Medical Center and Hospital | 17,822 | 216,149 | ||||||
| Kwality, Ltd. | 180,814 | 385,255 | ||||||
| MBL Infrastructures, Ltd. | 329,406 | 517,637 | ||||||
| MT Educare, Ltd. | 529,217 | 1,091,929 | ||||||
| Persistent Systems, Ltd. | 25,132 | 242,641 | ||||||
| Poly Medicure, Ltd. | 95,104 | 569,173 | ||||||
| Time Technoplast, Ltd. | 663,073 | 961,551 | ||||||
| UFO Moviez India, Ltd. | 70,483 | 489,998 | ||||||
Vaibhav Global, Ltd.(a) | 102,142 | 479,002 | ||||||
| Vakrangee Software, Ltd. | 116,000 | 437,954 | ||||||
See Notes to Financial Statements.
| 46 | 1.855.377.7325 | www.GrandeurPeakGlobal.com |
| Grandeur Peak Global Reach Fund | Portfolio of Investments |
October 31, 2016 (Unaudited)
| Shares | Value (Note 2) | |||||||
| India (continued) | ||||||||
| Vesuvius India, Ltd. | 34,043 | $ | 593,656 | |||||
WNS Holdings, Ltd., ADR(a) | 77,225 | 2,123,687 | ||||||
| Yes Bank, Ltd. | 149,000 | 2,838,488 | ||||||
| 24,262,902 | ||||||||
| Indonesia (3.02%) | ||||||||
| Astra Graphia Tbk PT | 1,942,500 | 299,236 | ||||||
| Bank Rakyat Indonesia Persero Tbk PT | 629,500 | 588,588 | ||||||
| Delfi, Ltd. | 1,017,500 | 1,638,239 | ||||||
| Hexindo Adiperkasa Tbk PT | 1,406,900 | 363,370 | ||||||
| Indonesia Pondasi Raya Tbk PT | 5,214,000 | 525,476 | ||||||
| Panin Sekuritas Tbk PT | 2,363,300 | 679,213 | ||||||
| Selamat Sempurna Tbk PT | 7,197,200 | 2,509,753 | ||||||
| Surya Toto Indonesia Tbk PT | 12,250,000 | 610,247 | ||||||
| Tempo Scan Pacific Tbk PT | 5,739,800 | 945,783 | ||||||
Ultrajaya Milk Industry & Trading Co. Tbk PT(a) | 1,368,700 | 498,262 | ||||||
| 8,658,167 | ||||||||
| Ireland (0.39%) | ||||||||
| Irish Residential Properties PLC, REIT | 874,377 | 1,127,821 | ||||||
| Israel (2.15%) | ||||||||
Caesarstone Sdot‐Yam, Ltd.(a) | 7,115 | 251,515 | ||||||
Camtek, Ltd.(a) | 133,475 | 387,078 | ||||||
Hamlet Israel‐Canada, Ltd.(a) | 54,496 | 640,377 | ||||||
| IDI Insurance Co., Ltd. | 11,553 | 573,690 | ||||||
Kornit Digital, Ltd.(a) | 95,126 | 979,798 | ||||||
Wix.com, Ltd.(a) | 83,175 | 3,327,000 | ||||||
| 6,159,458 | ||||||||
| Italy (1.14%) | ||||||||
Banca Sistema SpA(b)(c) | 246,097 | 645,665 | ||||||
| Brembo SpA | 35,717 | 2,207,430 | ||||||
| Telit Communications PLC | 133,100 | 419,505 | ||||||
| 3,272,600 | ||||||||
| Japan (6.82%) | ||||||||
| AIT Corp. | 70,200 | 621,203 | ||||||
| Amiyaki Tei Co., Ltd. | 28,500 | 1,053,090 | ||||||
| Anest Iwata Corp. | 72,700 | 732,754 | ||||||
| Anshin Guarantor Service Co., Ltd. | 27,700 | 620,457 | ||||||
AP Company Co., Ltd.(a) | 79,400 | 536,804 | ||||||
| CMIC Holdings Co., Ltd. | 50,000 | 743,778 | ||||||
| CyberAgent, Inc. | 17,000 | 495,232 | ||||||
| eGuarantee, Inc. | 21,200 | 565,630 | ||||||
| Shares | Value (Note 2) | |||||||
| Japan (continued) | ||||||||
| Encourage Technologies Co., Ltd. | 23,400 | $ | 333,138 | |||||
| Future Architect, Inc. | 139,900 | 933,823 | ||||||
| GCA Savvian Corp. | 118,700 | 888,524 | ||||||
| Hard Off Corp. Co., Ltd. | 213,000 | 2,337,780 | ||||||
| JCU Corp. | 7,800 | 316,849 | ||||||
M&A Capital Partners Co., Ltd.(a) | 64,200 | 1,578,829 | ||||||
| MISUMI Group, Inc. | 77,900 | 1,423,994 | ||||||
| Monogatari Corp. | 9,900 | 455,493 | ||||||
| Nihon M&A Center, Inc. | 20,400 | 664,308 | ||||||
| Prestige International, Inc. | 97,800 | 737,673 | ||||||
| Quick Co., Ltd. | 58,700 | 595,004 | ||||||
| Sawai Pharmaceutical Co., Ltd. | 15,300 | 990,627 | ||||||
| SK Kaken Co., Ltd. | 3,000 | 312,673 | ||||||
| Syuppin Co., Ltd. | 129,400 | 1,418,995 | ||||||
| Trancom Co., Ltd. | 9,300 | 541,842 | ||||||
| Trust Tech, Inc. | 42,000 | 646,000 | ||||||
| 19,544,500 | ||||||||
| Luxembourg (0.62%) | ||||||||
| Grand City Properties SA | 52,200 | 917,127 | ||||||
| L'Occitane International SA | 419,000 | 865,494 | ||||||
| 1,782,621 | ||||||||
| Malaysia (0.69%) | ||||||||
| AEON Credit Service M Bhd | 161,600 | 567,815 | ||||||
| Berjaya Auto Bhd | 955,800 | 519,481 | ||||||
| Berjaya Food Bhd | 1,084,300 | 460,085 | ||||||
| CB Industrial Product Holding Bhd | 876,633 | 415,852 | ||||||
| 1,963,233 | ||||||||
| Mexico (0.89%) | ||||||||
| Banregio Grupo Financiero SAB de CV | 92,157 | 604,060 | ||||||
| Credito Real SAB de CV SOFOM ER | 742,535 | 1,364,385 | ||||||
| Unifin Financiera SAB de CV SOFOM ENR | 195,650 | 579,155 | ||||||
| 2,547,600 | ||||||||
| Netherlands (0.90%) | ||||||||
| Aalberts Industries NV | 62,482 | 1,973,667 | ||||||
Shop Apotheke Europe NV(a)(c) | 18,700 | 593,257 | ||||||
| 2,566,924 | ||||||||
| New Zealand (2.15%) | ||||||||
| CBL Corp., Ltd. | 969,024 | 2,612,418 | ||||||
See Notes to Financial Statements.
| Semi-Annual Report | October 31, 2016 | 47 |
| Grandeur Peak Global Reach Fund | Portfolio of Investments |
October 31, 2016 (Unaudited)
| Shares | Value (Note 2) | |||||||
| New Zealand (continued) | ||||||||
| Restaurant Brands New Zealand, Ltd. | 275,000 | $ | 1,038,325 | |||||
| Trilogy International, Ltd. | 1,036,524 | 2,520,142 | ||||||
| 6,170,885 | ||||||||
| Norway (1.91%) | ||||||||
| Medistim ASA | 75,150 | 618,492 | ||||||
Multiconsult ASA(b)(c) | 63,000 | 827,307 | ||||||
Norwegian Finans Holding ASA(a) | 62,600 | 615,594 | ||||||
| Protector Forsikring ASA | 62,600 | 536,040 | ||||||
Skandiabanken ASA(a)(b)(c) | 385,200 | 2,867,199 | ||||||
| 5,464,632 | ||||||||
| Oman (0.35%) | ||||||||
| Tethys Oil AB | 137,900 | 1,003,850 | ||||||
| Pakistan (0.11%) | ||||||||
| Akzo Nobel Pakistan, Ltd. | 157,500 | 313,557 | ||||||
| Peru (0.19%) | ||||||||
| Credicorp, Ltd. | 3,700 | 550,116 | ||||||
| Philippines (1.98%) | ||||||||
| Concepcion Industrial Corp. | 956,600 | 1,224,827 | ||||||
| Holcim Philippines, Inc. | 874,000 | 299,621 | ||||||
| Metro Retail Stores Group, Inc. | 7,129,000 | 697,846 | ||||||
| Pepsi‐Cola Products Philippines, Inc. | 15,380,100 | 987,808 | ||||||
| Puregold Price Club, Inc. | 860,700 | 724,323 | ||||||
| Robinsons Land Corp. | 725,300 | 463,587 | ||||||
| Security Bank Corp. | 278,700 | 1,268,532 | ||||||
| 5,666,544 | ||||||||
| Poland (0.28%) | ||||||||
| PGS Software SA | 75,476 | 238,360 | ||||||
| Wawel SA | 2,541 | 562,832 | ||||||
| 801,192 | ||||||||
| Russia (0.32%) | ||||||||
MD Medical Group Investments PLC, GDR(b) | 11,855 | 110,133 | ||||||
TCS Group Holding GDR PLC(b) | 89,900 | 813,595 | ||||||
| 923,728 | ||||||||
| Singapore (0.35%) | ||||||||
| CSE Global, Ltd. | 1,694,000 | 499,220 | ||||||
| Shares | Value (Note 2) | |||||||
| Singapore (continued) | ||||||||
| Riverstone Holdings, Ltd. | 765,800 | $ | 503,653 | |||||
| 1,002,873 | ||||||||
| South Africa (2.80%) | ||||||||
| ARB Holdings, Ltd. | 2,093,266 | 978,035 | ||||||
| Blue Label Telecoms, Ltd. | 564,502 | 854,053 | ||||||
| Cartrack Holdings, Ltd. | 1,975,900 | 1,611,933 | ||||||
| City Lodge Hotels, Ltd. | 40,200 | 434,624 | ||||||
| Clicks Group, Ltd. | 81,600 | 759,492 | ||||||
| EOH Holdings, Ltd. | 47,700 | 565,661 | ||||||
Interwaste Holdings, Ltd.(a) | 5,043,434 | 355,336 | ||||||
| Italtile, Ltd. | 921,472 | 994,339 | ||||||
Super Group, Ltd.(a) | 286,800 | 846,548 | ||||||
| Transaction Capital, Ltd. | 643,600 | 630,533 | ||||||
| 8,030,554 | ||||||||
| South Korea (1.98%) | ||||||||
| Cell Biotech Co., Ltd. | 7,000 | 277,431 | ||||||
| Hanssem Co., Ltd. | 4,300 | 667,031 | ||||||
| Hy‐Lok Corp. | 46,840 | 933,320 | ||||||
| Interpark Holdings Corp. | 96,500 | 421,252 | ||||||
| ISC Co., Ltd. | 76,029 | 1,169,421 | ||||||
| Koh Young Technology, Inc. | 14,143 | 553,731 | ||||||
| Mando Corp. | 4,000 | 938,606 | ||||||
| Vitzrocell Co., Ltd. | 73,780 | 699,596 | ||||||
| 5,660,388 | ||||||||
Spain (0.00%)(d) | ||||||||
Let's GOWEX SA(a)(e)(f) | 10,700 | 1 | ||||||
| Sri Lanka (0.71%) | ||||||||
| Hemas Holdings PLC | 1,170,961 | 847,146 | ||||||
| Royal Ceramics Lanka PLC | 1,460,600 | 1,175,195 | ||||||
| 2,022,341 | ||||||||
| Sweden (1.61%) | ||||||||
| Bufab Holding AB | 102,150 | 848,220 | ||||||
| HIQ International AB | 90,026 | 560,660 | ||||||
| Indutrade AB | 36,300 | 674,786 | ||||||
Moberg Pharma AB(a) | 111,100 | 602,725 | ||||||
| Sweco AB, Class B | 41,300 | 828,090 | ||||||
TF Bank AB(a)(b) | 57,900 | 580,144 | ||||||
| Vitec Software Group AB, Class B | 67,500 | 523,131 | ||||||
| 4,617,756 | ||||||||
| Switzerland (1.44%) | ||||||||
| Leonteq AG | 8,100 | 466,985 | ||||||
Luxoft Holding, Inc.(a) | 13,575 | 719,475 | ||||||
| VZ Holding AG | 6,950 | 2,057,854 | ||||||
See Notes to Financial Statements.
| 48 | 1.855.377.7325 | www.GrandeurPeakGlobal.com |
| Grandeur Peak Global Reach Fund | Portfolio of Investments |
October 31, 2016 (Unaudited)
| Shares | Value (Note 2) | |||||||
| Switzerland (continued) | ||||||||
Wizz Air Holdings PLC(a)(b)(c) | 48,300 | $ | 893,292 | |||||
| 4,137,606 | ||||||||
| Taiwan (3.66%) | ||||||||
| ASPEED Technology, Inc. | 56,771 | 818,531 | ||||||
| Cub Elecparts, Inc. | 70,944 | 651,945 | ||||||
| Dr. Wu Skincare Co., Ltd. | 318,000 | 2,176,598 | ||||||
| I Yuan Precision Ind. Co., Ltd. | 132,000 | 499,850 | ||||||
| Novatek Microelectronics Corp. | 153,000 | 574,523 | ||||||
| Polytronics Technology Corp. | 145,000 | 275,687 | ||||||
| Sinmag Equipment Corp. | 169,371 | 794,325 | ||||||
| Sitronix Technology Corp. | 312,000 | 1,156,746 | ||||||
| Solidwizard Technology Co., Ltd. | 74,000 | 213,388 | ||||||
| Sporton International, Inc. | 274,346 | 1,312,723 | ||||||
| Test Research, Inc. | 488,440 | 619,111 | ||||||
| TSC Auto ID Technology Co., Ltd. | 34,600 | 252,175 | ||||||
| Tung Thih Electronic Co., Ltd. | 59,000 | 863,757 | ||||||
| UDE Corp. | 270,000 | 262,663 | ||||||
| 10,472,022 | ||||||||
| Thailand (0.67%) | ||||||||
| Ananda Development PCL | 6,517,100 | 919,908 | ||||||
| Premier Marketing PCL | 2,698,100 | 713,120 | ||||||
Thaire Life Assurnce(a) | 1,047,000 | 296,173 | ||||||
| 1,929,201 | ||||||||
| Turkey (0.40%) | ||||||||
EGE Seramik Sanayi ve Ticaret AS(a) | 436,800 | 489,843 | ||||||
| Pinar SUT Mamulleri Sanayii AS | 132,600 | 660,804 | ||||||
| 1,150,647 | ||||||||
| United States (23.26%) | ||||||||
| Alamo Group, Inc. | 11,753 | 763,005 | ||||||
Amsurg Corp.(a) | 7,112 | 424,942 | ||||||
| AmTrust Financial Services, Inc. | 22,650 | 597,733 | ||||||
Aratana Therapeutics, Inc.(a) | 71,300 | 577,530 | ||||||
Atlas Financial Holdings, Inc.(a) | 36,500 | 625,975 | ||||||
| Bank of the Ozarks, Inc. | 16,025 | 592,284 | ||||||
| BG Staffing, Inc. | 38,025 | 542,236 | ||||||
BioDelivery Sciences International, Inc.(a) | 260,900 | 600,070 | ||||||
BofI Holding, Inc.(a) | 26,025 | 484,846 | ||||||
| Shares | Value (Note 2) | |||||||
| United States (continued) | ||||||||
Coupa Software, Inc.(a) | 250 | $ | 6,250 | |||||
| Diamond Hill Investment Group, Inc. | 5,525 | 1,005,605 | ||||||
Edwards Lifesciences Corp.(a) | 2,975 | 283,279 | ||||||
Entellus Medical, Inc.(a) | 3,673 | 75,113 | ||||||
EPAM Systems, Inc.(a) | 15,125 | 973,596 | ||||||
ePlus, Inc.(a) | 12,896 | 1,180,629 | ||||||
| Escalade, Inc. | 102,102 | 1,240,539 | ||||||
Etsy, Inc.(a) | 51,675 | 670,741 | ||||||
Evolent Health, Inc., Class A(a) | 12,100 | 254,705 | ||||||
| Evolution Petroleum Corp. | 111,900 | 861,630 | ||||||
ExlService Holdings, Inc.(a) | 17,325 | 762,820 | ||||||
| Fastenal Co. | 35,450 | 1,381,841 | ||||||
| First Cash Financial Services, Inc. | 11,200 | 528,640 | ||||||
| First Republic Bank | 75,175 | 5,595,275 | ||||||
FormFactor, Inc.(a) | 26,924 | 241,643 | ||||||
Genesee & Wyoming, Inc., Class A(a) | 8,825 | 599,570 | ||||||
Genpact, Ltd.(a) | 23,575 | 541,989 | ||||||
| Gentex Corp. | 89,975 | 1,521,477 | ||||||
| Hennessy Advisors, Inc. | 16,426 | 474,383 | ||||||
Hibbett Sports, Inc.(a) | 15,325 | 595,376 | ||||||
| Hingham Institution for Savings | 4,250 | 609,662 | ||||||
| Home BancShares, Inc. | 26,075 | 560,873 | ||||||
INC Research Holdings, Inc., Class A(a) | 6,750 | 308,475 | ||||||
Inphi Corp.(a) | 80,300 | 2,979,130 | ||||||
K2M Group Holdings, Inc.(a) | 26,650 | 454,916 | ||||||
| Kinsale Capital Group, Inc. | 29,075 | 699,254 | ||||||
| Knight Transportation, Inc. | 38,500 | 1,126,125 | ||||||
| LeMaitre Vascular, Inc. | 27,643 | 578,844 | ||||||
LGI Homes, Inc.(a) | 21,650 | 644,304 | ||||||
| Littelfuse, Inc. | 4,800 | 669,600 | ||||||
Malibu Boats, Inc., Class A(a) | 65,844 | 965,931 | ||||||
| MarketAxess Holdings, Inc. | 8,430 | 1,270,907 | ||||||
MaxLinear, Inc., Class A(a) | 31,725 | 593,575 | ||||||
MEDNAX, Inc.(a) | 39,975 | 2,448,469 | ||||||
| Microchip Technology, Inc. | 14,250 | 862,838 | ||||||
| MSC Industrial Direct Co., Inc., Class A | 14,925 | 1,086,540 | ||||||
National Beverage Corp.(a) | 20,600 | 973,144 | ||||||
NV5 Global, Inc.(a) | 22,650 | 647,790 | ||||||
NxStage Medical, Inc.(a) | 42,750 | 972,135 | ||||||
| OTC Markets Group, Inc., Class A | 16,075 | 305,425 | ||||||
Palo Alto Networks, Inc.(a) | 4,175 | 642,240 | ||||||
Patrick Industries, Inc.(a) | 8,700 | 498,945 | ||||||
Paycom Software, Inc.(a) | 22,425 | 1,160,045 | ||||||
See Notes to Financial Statements.
| Semi-Annual Report | October 31, 2016 | 49 |
| Grandeur Peak Global Reach Fund | Portfolio of Investments |
October 31, 2016 (Unaudited)
| Shares | Value (Note 2) | |||||||
| United States (continued) | ||||||||
| Power Integrations, Inc. | 36,440 | $ | 2,348,558 | |||||
PRA Group, Inc.(a) | 45,625 | 1,455,438 | ||||||
Proto Labs, Inc.(a) | 24,050 | 1,075,035 | ||||||
Qualys, Inc.(a) | 23,825 | 887,481 | ||||||
Quanta Services, Inc.(a) | 33,150 | 953,063 | ||||||
| Reis, Inc. | 17,200 | 337,980 | ||||||
| Seacoast Commerce Banc Holdings | 15,641 | 258,077 | ||||||
| ServisFirst Bancshares, Inc. | 11,550 | 625,317 | ||||||
Signature Bank(a) | 4,975 | 599,786 | ||||||
Silicon Laboratories, Inc.(a) | 20,175 | 1,209,491 | ||||||
Spirit Airlines, Inc.(a) | 23,900 | 1,145,527 | ||||||
Sportsman's Warehouse Holdings, Inc.(a) | 139,175 | 1,280,410 | ||||||
Sprouts Farmers Market, Inc.(a) | 45,525 | 1,008,379 | ||||||
STAAR Surgical Co.(a) | 57,611 | 486,813 | ||||||
SVB Financial Group(a) | 5,525 | 675,542 | ||||||
Synaptics, Inc.(a) | 11,825 | 616,319 | ||||||
Transcat, Inc.(a) | 158,452 | 1,663,746 | ||||||
Trecora Resources(a) | 46,703 | 478,706 | ||||||
TriMas Corp.(a) | 63,025 | 1,131,299 | ||||||
TubeMogul, Inc.(a) | 57,420 | 419,166 | ||||||
Vascular Solutions, Inc.(a) | 19,121 | 871,918 | ||||||
Veracyte, Inc.(a) | 169,954 | 1,233,866 | ||||||
Virtusa Corp.(a) | 20,675 | 391,585 | ||||||
| WW Grainger, Inc. | 1,950 | 405,834 | ||||||
| 66,622,225 | ||||||||
| Vietnam (1.24%) | ||||||||
| Binh Minh Plastics JSC | 70,930 | 641,207 | ||||||
| DHG Pharmaceutical JSC | 101,666 | 448,600 | ||||||
| Nui Nho Stone JSC | 80,940 | 336,479 | ||||||
PetroVietnam Drilling and Well Services JSC(a) | 269,330 | 292,580 | ||||||
| Traphaco JSC | 78,380 | 407,297 | ||||||
| Vietnam Dairy Products JSC | 222,291 | 1,414,027 | ||||||
| 3,540,190 | ||||||||
TOTAL COMMON STOCKS (Cost $251,267,258) | 281,964,027 | |||||||
| PREFERRED STOCKS (0.23%) | ||||||||
| Brazil (0.23%) | ||||||||
| Itau Unibanco Holding SA | 54,010 | 651,098 | ||||||
TOTAL PREFERRED STOCKS (Cost $336,808) | 651,098 | |||||||
| Shares | Value (Note 2) | |||||||
| RIGHTS (0.01%) | ||||||||
| New Zealand (0.01%) | ||||||||
Restaurant Brands NZ, Strike Price 4.70 NZD (expiring 11/09/16)(a) | 53,398 | $ | 22,147 | |||||
| TOTAL RIGHTS (Cost $0) | 22,147 | |||||||
TOTAL INVESTMENTS (98.66%) (Cost $251,604,066) | $ | 282,637,272 | ||||||
| Other Assets In Excess Of Liabilities (1.34%) | 3,833,722 | |||||||
| NET ASSETS (100.00%) | $ | 286,470,994 | ||||||
| (a) | Non-Income Producing Security. |
| (b) | Security was purchased pursuant to Regulation S under the Securities Act of 1933, which exempts securities offered and sold outside of the United States from registration. Such security cannot be sold in the United States without either an effective registration statement filed pursuant to the Securities Act of 1933, or pursuant to an exemption from registration. The security has been deemed liquid under guidelines approved by the Fund's Board of Trustees. As of October 31, 2016, the aggregate market value of those securities was $12,955,035, representing 4.52% of net assets. |
| (c) | Security exempt from registration under Rule 144A of the Securities Act of 1933. These securities may be resold in the ordinary course of business in transactions exempt from registration, normally to qualified institutional buyers. As of October 31, 2016, these securities had a total aggregate market value of $8,921,991, representing 3.11% of net assets. |
| (d) | Less than 0.005%. |
| (e) | Security determined to be illiquid under the procedures approved by the Fund’s Board of Trustees. |
| (f) | Fair valued security under the procedures approved by the Fund's Board of Trustees. |
Currency Abbreviations:
NZD - New Zealand Dollar
NZD - New Zealand Dollar
Holdings are subject to change, and may not reflect the current or future position of the portfolio.
For Fund compliance purposes, the Fund's geographical classifications refer to any one or more of the country sub-classifications used by one or more widely recognized market indexes or ratings group indexes, and/or as defined by Fund management. This definition may not apply for purposes of this report, which may combine sub-classifications for reporting ease. Geographical regions are shown as a percentage of net assets.
See Notes to Financial Statements.
| 50 | 1.855.377.7325 | www.GrandeurPeakGlobal.com |
| Grandeur Peak Global Stalwarts Fund | Portfolio of Investments |
October 31, 2016 (Unaudited)
| Shares | Value (Note 2) | |||||||
| COMMON STOCKS (92.20%) | ||||||||
| Australia (0.52%) | ||||||||
| Magellan Financial Group, Ltd. | 22,685 | $ | 367,390 | |||||
| Belgium (0.78%) | ||||||||
| Melexis NV | 8,385 | 549,609 | ||||||
| Britain (4.77%) | ||||||||
| Abcam PLC | 22,625 | 241,206 | ||||||
| B&M European Value Retail SA | 238,800 | 685,715 | ||||||
| Close Brothers Group PLC | 14,500 | 235,516 | ||||||
| Diploma PLC | 66,550 | 763,662 | ||||||
Metro Bank PLC(a) | 7,400 | 250,805 | ||||||
| Ted Baker PLC | 22,100 | 669,498 | ||||||
| Ultra Electronics Holdings PLC | 23,375 | 531,593 | ||||||
| 3,377,995 | ||||||||
| Canada (5.86%) | ||||||||
| Crescent Point Energy Corp. | 29,689 | 353,488 | ||||||
| Gildan Activewear, Inc. | 17,660 | 453,580 | ||||||
| Home Capital Group, Inc. | 1,999 | 39,569 | ||||||
| Ritchie Bros. Auctioneers, Inc. | 29,250 | 1,011,757 | ||||||
| Stantec, Inc. | 53,599 | 1,192,421 | ||||||
| TransForce, Inc. | 48,373 | 1,097,436 | ||||||
| 4,148,251 | ||||||||
| China (4.67%) | ||||||||
| AAC Technologies Holdings, Inc. | 21,000 | 200,373 | ||||||
| China Lesso Group Holdings, Ltd. | 283,500 | 207,995 | ||||||
| China Medical System Holdings, Ltd. | 538,000 | 840,760 | ||||||
| Man Wah Holdings, Ltd. | 2,575,800 | 1,710,436 | ||||||
| Tencent Holdings, Ltd. | 13,000 | 344,966 | ||||||
| 3,304,530 | ||||||||
| Colombia (0.57%) | ||||||||
Parex Resources, Inc.(a) | 34,900 | 401,481 | ||||||
| Finland (0.34%) | ||||||||
| Metso OYJ | 9,086 | 238,382 | ||||||
| France (1.38%) | ||||||||
| Alten SA | 10,457 | 747,409 | ||||||
| BioMerieux | 1,600 | 233,250 | ||||||
| 980,659 | ||||||||
| Shares | Value (Note 2) | |||||||
| Georgia (0.61%) | ||||||||
| BGEO Group PLC | 12,000 | $ | 434,178 | |||||
| Germany (4.24%) | ||||||||
Aroundtown Property Holdings PLC(a) | 96,754 | 462,021 | ||||||
| CTS Eventim AG & Co. KGaA | 9,900 | 355,701 | ||||||
| GRENKE AG | 2,950 | 513,604 | ||||||
| Norma Group SE | 14,040 | 646,088 | ||||||
PATRIZIA Immobilien AG(a) | 25,986 | 537,147 | ||||||
| Wirecard AG | 10,350 | 490,997 | ||||||
| 3,005,558 | ||||||||
| Hong Kong (3.40%) | ||||||||
| Samsonite International SA | 133,500 | 420,009 | ||||||
| Value Partners Group, Ltd. | 1,375,900 | 1,316,370 | ||||||
| Vitasoy International Holdings, Ltd. | 321,500 | 672,387 | ||||||
| 2,408,766 | ||||||||
| India (6.36%) | ||||||||
| AIA Engineering, Ltd. | 22,575 | 436,989 | ||||||
| Ajanta Pharma, Ltd. | 8,875 | 271,300 | ||||||
| Alkem Laboratories, Ltd. | 19,324 | 472,174 | ||||||
| Bajaj Finance, Ltd. | 28,000 | 449,663 | ||||||
| Bajaj Finserv, Ltd. | 5,200 | 263,416 | ||||||
| Divi's Laboratories, Ltd. | 24,900 | 477,185 | ||||||
ICICI Prudential Life Insurance Co., Ltd.(b)(c) | 5,366 | 24,795 | ||||||
| Indiabulls Housing Finance, Ltd. | 21,200 | 269,466 | ||||||
WNS Holdings, Ltd., ADR(a) | 24,525 | 674,437 | ||||||
| Yes Bank, Ltd. | 61,200 | 1,165,876 | ||||||
| 4,505,301 | ||||||||
| Indonesia (1.15%) | ||||||||
| Bank Rakyat Indonesia Persero Tbk PT | 601,600 | 562,501 | ||||||
| Delfi, Ltd. | 156,500 | 251,975 | ||||||
| 814,476 | ||||||||
| Israel (0.45%) | ||||||||
Wix.com, Ltd.(a) | 7,975 | 319,000 | ||||||
| Italy (1.42%) | ||||||||
| Brembo SpA | 16,239 | 1,003,625 | ||||||
| Japan (8.66%) | ||||||||
| Century Tokyo Leasing Corp. | 14,800 | 522,876 | ||||||
| CyberAgent, Inc. | 24,400 | 710,804 | ||||||
| Dip Corp. | 19,100 | 507,779 | ||||||
| MISUMI Group, Inc. | 56,700 | 1,036,463 | ||||||
See Notes to Financial Statements.
| Semi-Annual Report | October 31, 2016 | 51 |
| Grandeur Peak Global Stalwarts Fund | Portfolio of Investments |
October 31, 2016 (Unaudited)
| Shares | Value (Note 2) | |||||||
| Japan (continued) | ||||||||
| MonotaRO Co., Ltd. | 13,700 | $ | 334,694 | |||||
| Nihon M&A Center, Inc. | 43,700 | 1,423,052 | ||||||
| Sawai Pharmaceutical Co., Ltd. | 9,000 | 582,722 | ||||||
| Seria Co., Ltd. | 7,400 | 585,678 | ||||||
| Suruga Bank, Ltd. | 17,600 | 430,476 | ||||||
| 6,134,544 | ||||||||
| Luxembourg (1.51%) | ||||||||
| Grand City Properties SA | 31,850 | 559,589 | ||||||
| L'Occitane International SA | 246,400 | 508,968 | ||||||
| 1,068,557 | ||||||||
| Mexico (0.71%) | ||||||||
| Banregio Grupo Financiero SAB de CV | 76,400 | 500,778 | ||||||
| Netherlands (1.70%) | ||||||||
| Aalberts Industries NV | 27,838 | 879,340 | ||||||
| Arcadis NV | 24,727 | 325,729 | ||||||
| 1,205,069 | ||||||||
| Philippines (3.00%) | ||||||||
| Puregold Price Club, Inc. | 788,000 | 663,142 | ||||||
| Robinsons Retail Holdings, Inc. | 413,900 | 660,735 | ||||||
| Security Bank Corp. | 176,300 | 802,448 | ||||||
| 2,126,325 | ||||||||
| South Africa (1.30%) | ||||||||
| EOH Holdings, Ltd. | 61,850 | 733,462 | ||||||
| Mr. Price Group, Ltd. | 16,300 | 185,826 | ||||||
| 919,288 | ||||||||
| South Korea (0.79%) | ||||||||
| LG Household & Health Care, Ltd. | 450 | 322,482 | ||||||
| Mando Corp. | 1,000 | 234,652 | ||||||
| 557,134 | ||||||||
| Sweden (3.02%) | ||||||||
| Hexpol AB | 55,562 | 456,755 | ||||||
| Indutrade AB | 31,325 | 582,305 | ||||||
| Nibe Industrier AB, Class B | 38,308 | 285,015 | ||||||
| Svenska Handelsbanken AB, Class A | 33,300 | 454,217 | ||||||
| Sweco AB, Class B | 17,900 | 358,906 | ||||||
| 2,137,198 | ||||||||
| Switzerland (2.77%) | ||||||||
| Baloise Holding AG | 3,940 | 484,960 | ||||||
| Leonteq AG | 5,000 | 288,262 | ||||||
| Shares | Value (Note 2) | |||||||
| Switzerland (continued) | ||||||||
Luxoft Holding, Inc.(a) | 6,925 | $ | 367,025 | |||||
| VZ Holding AG | 2,090 | 618,837 | ||||||
Wizz Air Holdings PLC(a)(b)(c) | 10,900 | 201,592 | ||||||
| 1,960,676 | ||||||||
| Taiwan (1.68%) | ||||||||
| Largan Precision Co., Ltd. | 5,000 | 591,777 | ||||||
| Novatek Microelectronics Corp. | 78,000 | 292,894 | ||||||
| Vanguard International Semiconductor Corp. | 148,000 | 302,026 | ||||||
| 1,186,697 | ||||||||
| United States (29.78%) | ||||||||
Amazon.com, Inc.(a) | 650 | 513,383 | ||||||
Amsurg Corp.(a) | 4,300 | 256,925 | ||||||
| AmTrust Financial Services, Inc. | 9,550 | 252,024 | ||||||
| Bank of the Ozarks, Inc. | 6,600 | 243,936 | ||||||
BofI Holding, Inc.(a) | 8,975 | 167,204 | ||||||
| Carter's, Inc. | 5,175 | 446,809 | ||||||
Dollar Tree, Inc.(a) | 5,800 | 438,190 | ||||||
Dril‐Quip, Inc.(a) | 4,600 | 218,500 | ||||||
Edwards Lifesciences Corp.(a) | 1,825 | 173,776 | ||||||
EPAM Systems, Inc.(a) | 10,975 | 706,461 | ||||||
Etsy, Inc.(a) | 31,550 | 409,519 | ||||||
| Fastenal Co. | 11,500 | 448,270 | ||||||
| First Cash Financial Services, Inc. | 9,500 | 448,400 | ||||||
| First Republic Bank | 25,250 | 1,879,357 | ||||||
Genesee & Wyoming, Inc., Class A(a) | 3,150 | 214,011 | ||||||
Genpact, Ltd.(a) | 18,825 | 432,787 | ||||||
| Gentex Corp. | 60,400 | 1,021,364 | ||||||
| Home BancShares, Inc. | 11,512 | 247,623 | ||||||
| Knight Transportation, Inc. | 40,175 | 1,175,119 | ||||||
| Littelfuse, Inc. | 4,000 | 558,000 | ||||||
LKQ Corp.(a) | 21,450 | 692,406 | ||||||
| MarketAxess Holdings, Inc. | 4,625 | 697,265 | ||||||
MEDNAX, Inc.(a) | 22,375 | 1,370,469 | ||||||
| Microchip Technology, Inc. | 14,550 | 881,002 | ||||||
| MSC Industrial Direct Co., Inc., Class A | 5,200 | 378,560 | ||||||
National Beverage Corp.(a) | 5,075 | 239,743 | ||||||
Palo Alto Networks, Inc.(a) | 2,825 | 434,570 | ||||||
Paycom Software, Inc.(a) | 9,225 | 477,209 | ||||||
| Power Integrations, Inc. | 26,875 | 1,732,094 | ||||||
PRA Group, Inc.(a) | 16,300 | 519,970 | ||||||
Proto Labs, Inc.(a) | 8,925 | 398,947 | ||||||
| SEI Investments Co. | 7,850 | 347,991 | ||||||
Signature Bank(a) | 2,800 | 337,568 | ||||||
See Notes to Financial Statements.
| 52 | 1.855.377.7325 | www.GrandeurPeakGlobal.com |
| Grandeur Peak Global Stalwarts Fund | Portfolio of Investments |
October 31, 2016 (Unaudited)
| Shares | Value (Note 2) | |||||||
| United States (continued) | ||||||||
Silicon Laboratories, Inc.(a) | 9,800 | $ | 587,510 | |||||
Spirit Airlines, Inc.(a) | 6,275 | 300,761 | ||||||
Sprouts Farmers Market, Inc.(a) | 24,950 | 552,643 | ||||||
SVB Financial Group(a) | 1,425 | 174,235 | ||||||
Tyler Technologies, Inc.(a) | 1,625 | 260,650 | ||||||
Virtusa Corp.(a) | 14,608 | 276,676 | ||||||
| WW Grainger, Inc. | 835 | 173,780 | ||||||
| 21,085,707 | ||||||||
| Vietnam (0.76%) | ||||||||
| Vietnam Dairy Products JSC | 84,184 | 535,507 | ||||||
TOTAL COMMON STOCKS (Cost $61,328,748) | 65,276,681 | |||||||
| PREFERRED STOCKS (0.86%) | ||||||||
| Brazil (0.86%) | ||||||||
| Itau Unibanco Holding SA | 50,545 | 609,327 | ||||||
TOTAL PREFERRED STOCKS (Cost $352,995) | 609,327 | |||||||
| EXCHANGE‐TRADED FUNDS (1.48%) | ||||||||
| WisdomTree Japan Hedged Equity Fund | 23,175 | 1,046,351 | ||||||
TOTAL EXCHANGE‐TRADED FUNDS (Cost $921,990) | 1,046,351 | |||||||
| TOTAL INVESTMENTS (94.54%) (Cost $62,603,733) | $ | 66,932,359 | ||||||
| Other Assets In Excess Of Liabilities (5.46%) | 3,864,860 | |||||||
| NET ASSETS (100.00%) | $ | 70,797,219 | ||||||
| (a) | Non-Income Producing Security. |
| (b) | Security exempt from registration under Rule 144A of the Securities Act of 1933. These securities may be resold in the ordinary course of business in transactions exempt from registration, normally to qualified institutional buyers. As of October 31, 2016, these securities had a total aggregate market value of $226,387, representing 0.32% of net assets. |
| (c) | Security was purchased pursuant to Regulation S under the Securities Act of 1933, which exempts securities offered and sold outside of the United States from registration. Such security cannot be sold in the United States without either an effective registration statement filed pursuant to the Securities Act of 1933, or pursuant to an exemption from registration. The security has been deemed liquid under guidelines approved by the Fund's Board of Trustees. As of October 31, 2016, the aggregate market value of those securities was $226,387, representing 0.32% of net assets. |
Holdings are subject to change, and may not reflect the current or future position of the portfolio.
For Fund compliance purposes, the Fund's geographical classifications refer to any one or more of the country sub-classifications used by one or more widely recognized market indexes or ratings group indexes, and/or as defined by Fund management. This definition may not apply for purposes of this report, which may combine sub-classifications for reporting ease. Geographical regions are shown as a percentage of net assets.
See Notes to Financial Statements.
| Semi-Annual Report | October 31, 2016 | 53 |
| Grandeur Peak International Opportunities Fund | Portfolio of Investments |
October 31, 2016 (Unaudited)
| Shares | Value (Note 2) | |||||||
| COMMON STOCKS (91.47%) | ||||||||
| Australia (1.83%) | ||||||||
| CTI Logistics, Ltd. | 1,533,161 | $ | 968,009 | |||||
| Greencross, Ltd. | 983,600 | 5,222,606 | ||||||
| Magellan Financial Group, Ltd. | 220,800 | 3,575,922 | ||||||
| Medical Developments International, Ltd. | 520,709 | 2,091,425 | ||||||
| Reject Shop, Ltd. | 222,431 | 1,263,948 | ||||||
| 13,121,910 | ||||||||
| Austria (0.96%) | ||||||||
| Palfinger AG | 226,240 | 6,854,599 | ||||||
| Belgium (0.80%) | ||||||||
| Melexis NV | 87,784 | 5,753,949 | ||||||
| Brazil (0.98%) | ||||||||
| FPC Par Corretora de Seguros SA | 789,000 | 3,729,953 | ||||||
| Valid Solucoes e Servicos de Seguranca em Meios de Pagamento e Identificacao SA | 347,700 | 3,266,768 | ||||||
| 6,996,721 | ||||||||
| Britain (7.78%) | ||||||||
| Abcam PLC | 294,566 | 3,140,382 | ||||||
| Alliance Pharma PLC | 3,193,134 | 1,768,550 | ||||||
| Arrow Global Group PLC | 1,660,300 | 6,091,545 | ||||||
| Clinigen Group PLC | 1,700,173 | 15,399,496 | ||||||
| Diploma PLC | 214,800 | 2,464,831 | ||||||
| EMIS Group PLC | 404,800 | 4,144,652 | ||||||
| Exova Group PLC | 587,400 | 1,509,854 | ||||||
Motorpoint Group PLC(a)(b) | 842,350 | 1,433,142 | ||||||
On the Beach Group PLC(a)(b)(c) | 639,200 | 1,703,635 | ||||||
Oxford Immunotec Global PLC(a) | 237,180 | 3,050,135 | ||||||
Purplebricks Group PLC(a) | 1,062,400 | 1,657,982 | ||||||
| River & Mercantile Group PLC | 625,400 | 1,672,596 | ||||||
| RPS Group PLC | 1,050,211 | 2,175,639 | ||||||
| Sanne Group PLC | 461,800 | 2,967,529 | ||||||
| Secure Trust Bank PLC | 95,300 | 2,764,540 | ||||||
| Tracsis PLC | 190,900 | 1,238,407 | ||||||
| Ultra Electronics Holdings PLC | 108,700 | 2,472,048 | ||||||
| 55,654,963 | ||||||||
| Canada (3.46%) | ||||||||
Biosyent, Inc.(a) | 336,000 | 2,129,278 | ||||||
| Shares | Value (Note 2) | |||||||
| Canada (continued) | ||||||||
Cipher Pharmaceuticals, Inc.(a) | 887,400 | $ | 3,208,745 | |||||
DIRTT Environmental Solutions(a) | 865,900 | 3,189,105 | ||||||
| Home Capital Group, Inc. | 111,542 | 2,207,888 | ||||||
| Richelieu Hardware, Ltd. | 229,350 | 4,409,853 | ||||||
| Sandvine Corp. | 857,700 | 1,924,757 | ||||||
| Stantec, Inc. | 158,352 | 3,522,869 | ||||||
| TransForce, Inc. | 185,500 | 4,208,428 | ||||||
| 24,800,923 | ||||||||
| China (6.80%) | ||||||||
BBI Life Sciences Corp.(b) | 11,509,500 | 3,235,194 | ||||||
| BrightKing Holdings, Ltd. | 146,000 | 293,318 | ||||||
| China Lesso Group Holdings, Ltd. | 4,668,000 | 3,424,763 | ||||||
| China Medical System Holdings, Ltd. | 5,683,000 | 8,881,119 | ||||||
| Man Wah Holdings, Ltd. | 22,361,200 | 14,848,744 | ||||||
| Minth Group, Ltd. | 714,000 | 2,540,942 | ||||||
O2Micro International, Ltd., ADR(a) | 1,030,316 | 1,803,053 | ||||||
| On‐Bright Electronics, Inc. | 636,000 | 4,141,583 | ||||||
| Sihuan Pharmaceutical Holdings Group, Ltd. | 3,237,000 | 776,324 | ||||||
| Silergy Corp. | 506,199 | 7,394,684 | ||||||
Xiabuxiabu Catering Management China Holdings Co., Ltd.(b)(c) | 2,196,500 | 1,331,118 | ||||||
| 48,670,842 | ||||||||
| Colombia (1.10%) | ||||||||
Gran Tierra Energy, Inc.(a) | 1,178,037 | 3,428,088 | ||||||
Parex Resources, Inc.(a) | 388,975 | 4,474,677 | ||||||
| 7,902,765 | ||||||||
| Denmark (0.41%) | ||||||||
| Ringkjoebing Landbobank A/S | 13,763 | 2,912,740 | ||||||
| Egypt (0.06%) | ||||||||
Integrated Diagnostics Holdings PLC(b)(c) | 154,200 | 424,050 | ||||||
| Finland (0.15%) | ||||||||
Ferratum OYJ(b) | 69,000 | 1,075,576 | ||||||
| France (3.31%) | ||||||||
| Alten SA | 51,300 | 3,666,643 | ||||||
| Esker SA | 106,960 | 4,849,254 | ||||||
| Infotel SA | 68,367 | 2,769,341 | ||||||
Medicrea International(a) | 193,596 | 1,194,363 | ||||||
See Notes to Financial Statements.
| 54 | 1.855.377.7325 | www.GrandeurPeakGlobal.com |
| Grandeur Peak International Opportunities Fund | Portfolio of Investments |
October 31, 2016 (Unaudited)
| Shares | Value (Note 2) | |||||||
| France (continued) | ||||||||
MGI Digital Graphic Technology(a) | 76,013 | $ | 2,925,522 | |||||
| Neurones | 71,320 | 1,761,560 | ||||||
| Tessi SA | 12,400 | 1,890,857 | ||||||
| Thermador Groupe | 16,987 | 1,468,489 | ||||||
| Wavestone | 35,572 | 3,193,051 | ||||||
| 23,719,080 | ||||||||
| Georgia (0.87%) | ||||||||
| BGEO Group PLC | 172,211 | 6,230,845 | ||||||
| Germany (4.16%) | ||||||||
Aroundtown Property Holdings PLC(a) | 778,500 | 3,717,504 | ||||||
| CANCOM SE | 70,600 | 3,205,448 | ||||||
| Nexus AG | 278,516 | 5,726,529 | ||||||
| Norma Group SE | 48,103 | 2,213,589 | ||||||
PATRIZIA Immobilien AG(a) | 169,904 | 3,512,024 | ||||||
| publity AG | 122,700 | 4,149,921 | ||||||
| Softing AG | 96,691 | 1,294,940 | ||||||
| Wirecard AG | 125,611 | 5,958,895 | ||||||
| 29,778,850 | ||||||||
| Hong Kong (1.97%) | ||||||||
| International Housewares Retail Co., Ltd. | 11,358,000 | 2,269,974 | ||||||
| Value Partners Group, Ltd. | 8,449,000 | 8,083,447 | ||||||
| Vitasoy International Holdings, Ltd. | 1,797,338 | 3,758,963 | ||||||
| 14,112,384 | ||||||||
| India (8.40%) | ||||||||
| AIA Engineering, Ltd. | 131,924 | 2,553,680 | ||||||
| Alkem Laboratories, Ltd. | 313,843 | 7,668,622 | ||||||
| Bajaj Finance, Ltd. | 297,260 | 4,773,812 | ||||||
| City Union Bank, Ltd. | 1,976,565 | 4,414,136 | ||||||
| Cyient, Ltd. | 434,267 | 3,183,209 | ||||||
| Divi's Laboratories, Ltd. | 133,500 | 2,558,401 | ||||||
| Essel Propack, Ltd. | 729,500 | 2,632,957 | ||||||
| Hinduja Global Solutions, Ltd. | 340,600 | 2,853,867 | ||||||
| Indiabulls Housing Finance, Ltd. | 314,000 | 3,991,145 | ||||||
Kellton Tech Solutions, Ltd.(a) | 106,000 | 195,537 | ||||||
| Kolte‐Patil Developers, Ltd. | 816,794 | 1,551,978 | ||||||
| KPIT Technologies, Ltd. | 640,821 | 1,374,973 | ||||||
| MBL Infrastructures, Ltd. | 580,500 | 912,212 | ||||||
| Time Technoplast, Ltd. | 4,384,100 | 6,357,574 | ||||||
| UFO Moviez India, Ltd. | 132,458 | 920,848 | ||||||
Vaibhav Global, Ltd.(a) | 258,200 | 1,210,847 | ||||||
| Vakrangee Software, Ltd. | 921,000 | 3,477,202 | ||||||
| Shares | Value (Note 2) | |||||||
| India (continued) | ||||||||
WNS Holdings, Ltd., ADR(a) | 194,875 | $ | 5,359,062 | |||||
| Yes Bank, Ltd. | 217,500 | 4,143,431 | ||||||
| 60,133,493 | ||||||||
| Indonesia (4.38%) | ||||||||
| Arwana Citramulia Tbk PT | 59,029,500 | 2,759,656 | ||||||
| Astra Graphia Tbk PT | 10,792,000 | 1,662,471 | ||||||
| Bank Negara Indonesia Persero Tbk PT | 9,878,000 | 4,220,559 | ||||||
| Bekasi Fajar Industrial Estate Tbk PT | 65,215,500 | 1,559,414 | ||||||
| Delfi, Ltd. | 1,445,600 | 2,327,507 | ||||||
| Indonesia Pondasi Raya Tbk PT | 19,831,500 | 1,998,653 | ||||||
| Link Net Tbk PT | 5,792,700 | 2,219,765 | ||||||
Lippo Cikarang Tbk PT(a) | 2,189,000 | 1,014,979 | ||||||
| Panin Sekuritas Tbk PT | 8,494,000 | 2,441,179 | ||||||
| Selamat Sempurna Tbk PT | 16,888,700 | 5,889,300 | ||||||
| Tempo Scan Pacific Tbk PT | 19,383,500 | 3,193,940 | ||||||
Ultrajaya Milk Industry & Trading Co. Tbk PT(a) | 5,739,500 | 2,089,410 | ||||||
| 31,376,833 | ||||||||
| Ireland (1.06%) | ||||||||
| Irish Residential Properties PLC, REIT | 5,867,176 | 7,567,815 | ||||||
| Israel (0.77%) | ||||||||
| Sarine Technologies, Ltd. | 1,358,600 | 1,591,747 | ||||||
Wix.com, Ltd.(a) | 98,450 | 3,938,000 | ||||||
| 5,529,747 | ||||||||
| Italy (0.83%) | ||||||||
Banca Sistema SpA(b)(c) | 1,071,907 | 2,812,280 | ||||||
| Brembo SpA | 50,284 | 3,107,719 | ||||||
| 5,919,999 | ||||||||
| Japan (12.22%) | ||||||||
| AIT Corp. | 465,700 | 4,121,003 | ||||||
| Amiyaki Tei Co., Ltd. | 53,000 | 1,958,377 | ||||||
| Anest Iwata Corp. | 360,900 | 3,637,564 | ||||||
| Anshin Guarantor Service Co., Ltd. | 125,000 | 2,799,895 | ||||||
AP Company Co., Ltd.(a) | 165,300 | 1,117,552 | ||||||
| ARCLAND SERVICE Co., Ltd. | 55,300 | 1,642,600 | ||||||
| CMIC Holdings Co., Ltd. | 181,955 | 2,706,683 | ||||||
| CyberAgent, Inc. | 180,600 | 5,261,114 | ||||||
| eGuarantee, Inc. | 191,300 | 5,104,009 | ||||||
| Future Architect, Inc. | 776,100 | 5,180,414 | ||||||
| GCA Savvian Corp. | 698,800 | 5,230,838 | ||||||
| Hard Off Corp. Co., Ltd. | 289,300 | 3,175,210 | ||||||
| JCU Corp. | 34,500 | 1,401,449 | ||||||
See Notes to Financial Statements.
| Semi-Annual Report | October 31, 2016 | 55 |
| Grandeur Peak International Opportunities Fund | Portfolio of Investments |
October 31, 2016 (Unaudited)
| Shares | Value (Note 2) | |||||||
| Japan (continued) | ||||||||
M&A Capital Partners Co., Ltd.(a) | 297,000 | $ | 7,303,929 | |||||
| MISUMI Group, Inc. | 318,500 | 5,822,108 | ||||||
| Monogatari Corp. | 41,500 | 1,909,388 | ||||||
| Prestige International, Inc. | 794,800 | 5,994,916 | ||||||
| Quick Co., Ltd. | 365,400 | 3,703,826 | ||||||
| Sawai Pharmaceutical Co., Ltd. | 58,500 | 3,787,689 | ||||||
| SK Kaken Co., Ltd. | 31,000 | 3,230,953 | ||||||
| Syuppin Co., Ltd. | 253,600 | 2,780,967 | ||||||
| Trancom Co., Ltd. | 104,590 | 6,093,686 | ||||||
| Trust Tech, Inc. | 227,600 | 3,500,704 | ||||||
| 87,464,874 | ||||||||
| Luxembourg (0.82%) | ||||||||
| Grand City Properties SA | 187,800 | 3,299,551 | ||||||
| L'Occitane International SA | 1,238,712 | 2,558,705 | ||||||
| 5,858,256 | ||||||||
| Malaysia (1.84%) | ||||||||
| 7‐Eleven Malaysia Holdings Bhd, Class B | 3,575,000 | 1,482,837 | ||||||
| AEON Credit Service M Bhd | 745,040 | 2,617,852 | ||||||
| Berjaya Auto Bhd | 4,720,000 | 2,565,340 | ||||||
| Berjaya Food Bhd | 2,056,016 | 872,398 | ||||||
| CB Industrial Product Holding Bhd | 3,120,200 | 1,480,142 | ||||||
| My EG Services Bhd | 7,147,600 | 4,157,364 | ||||||
| 13,175,933 | ||||||||
| Mexico (1.45%) | ||||||||
| Banregio Grupo Financiero SAB de CV | 560,065 | 3,671,047 | ||||||
| Credito Real SAB de CV SOFOM ER | 3,651,824 | 6,710,113 | ||||||
| 10,381,160 | ||||||||
| Netherlands (0.70%) | ||||||||
| Aalberts Industries NV | 116,497 | 3,679,880 | ||||||
| Arcadis NV | 101,360 | 1,335,215 | ||||||
| 5,015,095 | ||||||||
| New Zealand (1.42%) | ||||||||
| CBL Corp., Ltd. | 1,289,176 | 3,475,524 | ||||||
| Restaurant Brands New Zealand, Ltd. | 971,000 | 3,666,231 | ||||||
| Trilogy International, Ltd. | 1,257,385 | 3,057,130 | ||||||
| 10,198,885 | ||||||||
| Norway (1.71%) | ||||||||
| Medistim ASA | 420,559 | 3,461,244 | ||||||
Multiconsult ASA(b)(c) | 115,852 | 1,521,352 | ||||||
| Shares | Value (Note 2) | |||||||
| Norway (continued) | ||||||||
Skandiabanken ASA(a)(b)(c) | 979,400 | $ | 7,290,069 | |||||
| 12,272,665 | ||||||||
| Oman (0.59%) | ||||||||
| Al Anwar Ceramic Tiles Co. | 1,499,060 | 595,653 | ||||||
| Tethys Oil AB | 496,508 | 3,614,355 | ||||||
| 4,210,008 | ||||||||
| Peru (0.35%) | ||||||||
| Credicorp, Ltd. | 16,850 | 2,505,258 | ||||||
| Philippines (2.81%) | ||||||||
| Concepcion Industrial Corp. | 3,109,000 | 3,980,753 | ||||||
| Holcim Philippines, Inc. | 2,303,300 | 789,608 | ||||||
| Metro Retail Stores Group, Inc. | 28,329,000 | 2,773,080 | ||||||
| Pepsi‐Cola Products Philippines, Inc. | 34,685,500 | 2,227,723 | ||||||
| Puregold Price Club, Inc. | 2,465,000 | 2,074,423 | ||||||
| Security Bank Corp. | 1,823,760 | 8,301,031 | ||||||
| 20,146,618 | ||||||||
| Singapore (0.77%) | ||||||||
| CSE Global, Ltd. | 5,921,055 | 1,744,929 | ||||||
| Riverstone Holdings, Ltd. | 5,677,000 | 3,733,660 | ||||||
| 5,478,589 | ||||||||
| South Africa (3.43%) | ||||||||
| Blue Label Telecoms, Ltd. | 2,117,200 | 3,203,180 | ||||||
| Cartrack Holdings, Ltd. | 4,849,500 | 3,956,207 | ||||||
| Clicks Group, Ltd. | 273,485 | 2,545,462 | ||||||
| EOH Holdings, Ltd. | 349,156 | 4,140,543 | ||||||
| Italtile, Ltd. | 3,988,625 | 4,304,032 | ||||||
| MiX Telematics, Ltd., Sponsored ADR | 209,800 | 1,319,642 | ||||||
| Mr. Price Group, Ltd. | 163,800 | 1,867,384 | ||||||
OneLogix Group, Ltd.(a) | 2,450,980 | 547,136 | ||||||
Super Group, Ltd.(a) | 788,297 | 2,326,817 | ||||||
| Transaction Capital, Ltd. | 353,000 | 345,833 | ||||||
| 24,556,236 | ||||||||
| South Korea (2.47%) | ||||||||
| Hy‐Lok Corp. | 286,501 | 5,708,738 | ||||||
| Interpark Holdings Corp. | 358,000 | 1,562,779 | ||||||
| ISC Co., Ltd. | 273,285 | 4,203,466 | ||||||
| Koh Young Technology, Inc. | 44,883 | 1,757,272 | ||||||
| Kolao Holdings | 173,500 | 1,334,324 | ||||||
| Vitzrocell Co., Ltd. | 325,737 | 3,088,701 | ||||||
| 17,655,280 | ||||||||
| Sweden (3.03%) | ||||||||
| AddTech AB, Class B | 363,013 | 5,164,570 | ||||||
See Notes to Financial Statements.
| 56 | 1.855.377.7325 | www.GrandeurPeakGlobal.com |
| Grandeur Peak International Opportunities Fund | Portfolio of Investments |
October 31, 2016 (Unaudited)
| Shares | Value (Note 2) | |||||||
| Sweden (continued) | ||||||||
| Bufab Holding AB | 716,600 | $ | 5,950,411 | |||||
| HIQ International AB | 253,096 | 1,576,219 | ||||||
| Indutrade AB | 173,750 | 3,229,865 | ||||||
Moberg Pharma AB(a) | 457,200 | 2,480,340 | ||||||
| Odd Molly International AB | 72,938 | 341,588 | ||||||
| Opus Group AB | 3,980,568 | 2,930,728 | ||||||
| 21,673,721 | ||||||||
| Switzerland (1.53%) | ||||||||
| Leonteq AG | 26,800 | 1,545,086 | ||||||
Luxoft Holding, Inc.(a) | 47,500 | 2,517,500 | ||||||
| VZ Holding AG | 23,280 | 6,893,073 | ||||||
| 10,955,659 | ||||||||
| Taiwan (4.63%) | ||||||||
| ASPEED Technology, Inc. | 257,958 | 3,719,271 | ||||||
| Cub Elecparts, Inc. | 195,732 | 1,798,694 | ||||||
| Dr. Wu Skincare Co., Ltd. | 162,000 | 1,108,833 | ||||||
| Materials Analysis Technology, Inc. | 995,000 | 2,516,074 | ||||||
| Novatek Microelectronics Corp. | 739,000 | 2,774,982 | ||||||
| Polytronics Technology Corp. | 1,130,300 | 2,149,029 | ||||||
| Sinmag Equipment Corp. | 952,810 | 4,468,538 | ||||||
| Sitronix Technology Corp. | 841,000 | 3,118,023 | ||||||
| Sporton International, Inc. | 1,529,650 | 7,319,247 | ||||||
| Test Research, Inc. | 2,114,252 | 2,679,873 | ||||||
| UDE Corp. | 1,545,000 | 1,503,018 | ||||||
| 33,155,582 | ||||||||
| Thailand (0.84%) | ||||||||
| Ananda Development PCL | 26,514,800 | 3,742,642 | ||||||
| Premier Marketing PCL | 8,478,400 | 2,240,880 | ||||||
| 5,983,522 | ||||||||
| United Arab Emirates (0.25%) | ||||||||
| Aramex PJSC | 1,855,000 | 1,787,854 | ||||||
| United States (0.45%) | ||||||||
| First Cash Financial Services, Inc. | 68,475 | 3,232,020 | ||||||
| Vietnam (0.08%) | ||||||||
| DHG Pharmaceutical JSC | 126,000 | 555,974 | ||||||
TOTAL COMMON STOCKS (Cost $560,886,278) | 654,801,273 | |||||||
| Shares | Value (Note 2) | |||||||
| RIGHTS (0.02%) | ||||||||
| New Zealand (0.01%) | ||||||||
Restaurant Brands NZ, Strike Price 4.70 NZD (expiring 11/09/16)(a) | 188,544 | $ | 78,200 | |||||
| Taiwan (0.01%) | ||||||||
Materials Analysis, Strike Price 71.50 TWD (expiring 11/17/16)(a) | 124,785 | 32,820 | ||||||
TOTAL RIGHTS (Cost $0) | 111,020 | |||||||
TOTAL INVESTMENTS (91.49%) (Cost $560,886,278) | $ | 654,912,293 | ||||||
| Other Assets In Excess Of Liabilities (8.51%) | 60,909,789 | |||||||
| NET ASSETS (100.00%) | $ | 715,822,082 | ||||||
| (a) | Non-Income Producing Security. |
| (b) | Security was purchased pursuant to Regulation S under the Securities Act of 1933, which exempts securities offered and sold outside of the United States from registration. Such security cannot be sold in the United States without either an effective registration statement filed pursuant to the Securities Act of 1933, or pursuant to an exemption from registration. The security has been deemed liquid under guidelines approved by the Fund's Board of Trustees. As of October 31, 2016, the aggregate market value of those securities was $20,826,415, representing 2.91% of net assets. |
| (c) | Security exempt from registration under Rule 144A of the Securities Act of 1933. These securities may be resold in the ordinary course of business in transactions exempt from registration, normally to qualified institutional buyers. As of October 31, 2016, these securities had a total aggregate market value of $15,082,504, representing 2.11% of net assets. |
Currency Abbreviations:
NZD - New Zealand Dollar
TWD - New Taiwan Dollar
Holdings are subject to change, and may not reflect the current or future position of the portfolio.
For Fund compliance purposes, the Fund's geographical classifications refer to any one or more of the country sub-classifications used by one or more widely recognized market indexes or ratings group indexes, and/or as defined by Fund management. This definition may not apply for purposes of this report, which may combine sub-classifications for reporting ease. Geographical regions are shown as a percentage of net assets.
See Notes to Financial Statements.
| Semi-Annual Report | October 31, 2016 | 57 |
| Grandeur Peak International Stalwarts Fund | Portfolio of Investments |
October 31, 2016 (Unaudited)
| Shares | Value (Note 2) | |||||||
| COMMON STOCKS (88.55%) | ||||||||
| Australia (0.66%) | ||||||||
| Magellan Financial Group, Ltd. | 86,427 | $ | 1,399,711 | |||||
| Belgium (1.32%) | ||||||||
| Melexis NV | 42,761 | 2,802,841 | ||||||
| Britain (6.21%) | ||||||||
| Abcam PLC | 111,150 | 1,184,975 | ||||||
| B&M European Value Retail SA | 976,400 | 2,803,738 | ||||||
| Close Brothers Group PLC | 54,229 | 880,814 | ||||||
| Diploma PLC | 268,400 | 3,079,892 | ||||||
Metro Bank PLC(a) | 22,800 | 772,751 | ||||||
| Ted Baker PLC | 69,200 | 2,096,346 | ||||||
| Ultra Electronics Holdings PLC | 106,150 | 2,414,056 | ||||||
| 13,232,572 | ||||||||
| Canada (8.00%) | ||||||||
| Crescent Point Energy Corp. | 92,428 | 1,100,481 | ||||||
| Gildan Activewear, Inc. | 80,722 | 2,073,267 | ||||||
| Home Capital Group, Inc. | 6,263 | 123,971 | ||||||
| Ritchie Bros. Auctioneers, Inc. | 118,925 | 4,113,616 | ||||||
| Stantec, Inc. | 206,908 | 4,603,098 | ||||||
| TransForce, Inc. | 221,222 | 5,018,851 | ||||||
| 17,033,284 | ||||||||
| Chile (0.59%) | ||||||||
| Banco de Chile | 10,489,421 | 1,248,511 | ||||||
| China (5.75%) | ||||||||
| AAC Technologies Holdings, Inc. | 108,000 | 1,030,488 | ||||||
| China Lesso Group Holdings, Ltd. | 1,462,000 | 1,072,623 | ||||||
| China Medical System Holdings, Ltd. | 2,277,600 | 3,559,323 | ||||||
| Man Wah Holdings, Ltd. | 8,360,000 | 5,551,379 | ||||||
| Tencent Holdings, Ltd. | 39,000 | 1,034,898 | ||||||
| 12,248,711 | ||||||||
| Colombia (0.72%) | ||||||||
Parex Resources, Inc.(a) | 133,500 | 1,535,753 | ||||||
| Finland (0.48%) | ||||||||
| Metso OYJ | 38,626 | 1,013,401 | ||||||
| France (1.96%) | ||||||||
| Alten SA | 48,049 | 3,434,279 | ||||||
| Shares | Value (Note 2) | |||||||
| France (continued) | ||||||||
| BioMerieux | 5,100 | $ | 743,485 | |||||
| 4,177,764 | ||||||||
| Georgia (0.71%) | ||||||||
| BGEO Group PLC | 42,000 | 1,519,621 | ||||||
| Germany (5.89%) | ||||||||
Aroundtown Property Holdings PLC(a) | 441,737 | 2,109,389 | ||||||
| CTS Eventim AG & Co. KGaA | 38,850 | 1,395,856 | ||||||
| GRENKE AG | 12,000 | 2,089,238 | ||||||
| Norma Group SE | 55,250 | 2,542,477 | ||||||
PATRIZIA Immobilien AG(a) | 99,200 | 2,050,527 | ||||||
| Wirecard AG | 49,850 | 2,364,848 | ||||||
| 12,552,335 | ||||||||
| Hong Kong (4.42%) | ||||||||
| Samsonite International SA | 500,560 | 1,574,829 | ||||||
| Value Partners Group, Ltd. | 5,154,000 | 4,931,008 | ||||||
| Vitasoy International Holdings, Ltd. | 1,385,000 | 2,896,597 | ||||||
| 9,402,434 | ||||||||
| India (8.19%) | ||||||||
| AIA Engineering, Ltd. | 103,400 | 2,001,535 | ||||||
| Ajanta Pharma, Ltd. | 42,500 | 1,299,185 | ||||||
| Alkem Laboratories, Ltd. | 58,174 | 1,421,457 | ||||||
| Bajaj Finance, Ltd. | 123,250 | 1,979,319 | ||||||
| Bajaj Finserv, Ltd. | 20,300 | 1,028,336 | ||||||
| Divi's Laboratories, Ltd. | 67,000 | 1,283,992 | ||||||
ICICI Prudential Life Insurance Co., Ltd.(b)(c) | 13,308 | 61,492 | ||||||
| Indiabulls Housing Finance, Ltd. | 82,000 | 1,042,273 | ||||||
WNS Holdings, Ltd., ADR(a) | 114,820 | 3,157,550 | ||||||
| Yes Bank, Ltd. | 218,450 | 4,161,529 | ||||||
| 17,436,668 | ||||||||
| Indonesia (1.75%) | ||||||||
| Bank Rakyat Indonesia Persero Tbk PT | 2,874,000 | 2,687,216 | ||||||
| Delfi, Ltd. | 651,600 | 1,049,117 | ||||||
| 3,736,333 | ||||||||
| Israel (0.47%) | ||||||||
Wix.com, Ltd.(a) | 24,850 | 994,000 | ||||||
| Italy (2.00%) | ||||||||
| Brembo SpA | 68,884 | 4,257,261 | ||||||
See Notes to Financial Statements.
| 58 | 1.855.377.7325 | www.GrandeurPeakGlobal.com |
| Grandeur Peak International Stalwarts Fund | Portfolio of Investments |
October 31, 2016 (Unaudited)
| Shares | Value (Note 2) | |||||||
| Japan (11.16%) | ||||||||
| Century Tokyo Leasing Corp. | 47,100 | $ | 1,664,017 | |||||
| CyberAgent, Inc. | 108,900 | 3,172,399 | ||||||
| Dip Corp. | 68,500 | 1,821,093 | ||||||
| MISUMI Group, Inc. | 247,500 | 4,524,244 | ||||||
| MonotaRO Co., Ltd. | 64,900 | 1,585,523 | ||||||
| Nihon M&A Center, Inc. | 152,300 | 4,959,517 | ||||||
| Sawai Pharmaceutical Co., Ltd. | 38,100 | 2,466,854 | ||||||
| Seria Co., Ltd. | 24,500 | 1,939,067 | ||||||
| Suruga Bank, Ltd. | 66,600 | 1,628,960 | ||||||
| 23,761,674 | ||||||||
| Luxembourg (2.41%) | ||||||||
| Grand City Properties SA | 173,100 | 3,041,279 | ||||||
| L'Occitane International SA | 1,007,250 | 2,080,593 | ||||||
| 5,121,872 | ||||||||
| Mexico (1.35%) | ||||||||
| Banregio Grupo Financiero SAB de CV | 438,750 | 2,875,866 | ||||||
| Netherlands (2.56%) | ||||||||
| Aalberts Industries NV | 131,747 | 4,161,593 | ||||||
| Arcadis NV | 98,116 | 1,292,483 | ||||||
| 5,454,076 | ||||||||
| Philippines (4.11%) | ||||||||
| Puregold Price Club, Inc. | 3,592,200 | 3,023,019 | ||||||
| Robinsons Retail Holdings, Inc. | 1,522,320 | 2,430,179 | ||||||
| Security Bank Corp. | 727,200 | 3,309,926 | ||||||
| 8,763,124 | ||||||||
| South Africa (1.80%) | ||||||||
| EOH Holdings, Ltd. | 249,000 | 2,952,821 | ||||||
| Mr. Price Group, Ltd. | 77,000 | 877,830 | ||||||
| 3,830,651 | ||||||||
| South Korea (1.23%) | ||||||||
| LG Household & Health Care, Ltd. | 2,100 | 1,504,916 | ||||||
| Mando Corp. | 4,750 | 1,114,595 | ||||||
| 2,619,511 | ||||||||
| Sweden (4.53%) | ||||||||
| Hexpol AB | 239,625 | 1,969,869 | ||||||
| Indutrade AB | 139,550 | 2,594,116 | ||||||
| Nibe Industrier AB, Class B | 246,900 | 1,836,958 | ||||||
| Svenska Handelsbanken AB, Class A | 156,700 | 2,137,414 | ||||||
| Shares | Value (Note 2) | |||||||
| Sweden (continued) | ||||||||
| Sweco AB, Class B | 54,900 | $ | 1,100,778 | |||||
| 9,639,135 | ||||||||
| Switzerland (3.90%) | ||||||||
| Baloise Holding AG | 13,600 | 1,673,973 | ||||||
| Leonteq AG | 19,400 | 1,118,458 | ||||||
Luxoft Holding, Inc.(a) | 31,025 | 1,644,325 | ||||||
| VZ Holding AG | 10,889 | 3,224,169 | ||||||
Wizz Air Holdings PLC(a)(b)(c) | 35,000 | 647,313 | ||||||
| 8,308,238 | ||||||||
| Taiwan (2.48%) | ||||||||
| Largan Precision Co., Ltd. | 22,000 | 2,603,818 | ||||||
| Novatek Microelectronics Corp. | 367,000 | 1,378,103 | ||||||
| Vanguard International Semiconductor Corp. | 632,000 | 1,289,735 | ||||||
| 5,271,656 | ||||||||
| United States (2.94%) | ||||||||
EPAM Systems, Inc.(a) | 35,950 | 2,314,101 | ||||||
| First Cash Financial Services, Inc. | 40,125 | 1,893,900 | ||||||
Genpact, Ltd.(a) | 89,450 | 2,056,456 | ||||||
| 6,264,457 | ||||||||
| Vietnam (0.96%) | ||||||||
| Vietnam Dairy Products JSC | 322,844 | 2,053,660 | ||||||
TOTAL COMMON STOCKS (Cost $175,633,733) | 188,555,120 | |||||||
| PREFERRED STOCKS (1.25%) | ||||||||
| Brazil (1.25%) | ||||||||
| Itau Unibanco Holding SA | 220,330 | 2,656,109 | ||||||
TOTAL PREFERRED STOCKS (Cost $1,431,685) | 2,656,109 | |||||||
| EXCHANGE-TRADED FUNDS (2.86%) | ||||||||
iShares® MSCI EAFE ETF | 17,000 | 982,940 | ||||||
iShares® MSCI Emerging Markets ETF | 27,500 | 1,021,350 | ||||||
iShares® MSCI Japan ETF | 75,000 | 947,250 | ||||||
| WisdomTree Japan Hedged Equity Fund | 69,800 | 3,151,470 | ||||||
TOTAL EXCHANGE-TRADED FUNDS (Cost $5,792,754) | 6,103,010 | |||||||
See Notes to Financial Statements.
| Semi-Annual Report | October 31, 2016 | 59 |
| Grandeur Peak International Stalwarts Fund | Portfolio of Investments |
October 31, 2016 (Unaudited)
TOTAL INVESTMENTS (92.66%) (Cost $182,858,172) | $ | 197,314,239 | ||
| Other Assets In Excess Of Liabilities (7.34%) | 15,631,361 | |||
| NET ASSETS (100.00%) | $ | 212,945,600 |
| (a) | Non-Income Producing Security. |
| (b) | Security exempt from registration under Rule 144A of the Securities Act of 1933. These securities may be resold in the ordinary course of business in transactions exempt from registration, normally to qualified institutional buyers. As of October 31, 2016, these securities had a total aggregate market value of $708,805, representing 0.33% of net assets. |
| (c) | Security was purchased pursuant to Regulation S under the Securities Act of 1933, which exempts securities offered and sold outside of the United States from registration. Such security cannot be sold in the United States without either an effective registration statement filed pursuant to the Securities Act of 1933, or pursuant to an exemption from registration. The security has been deemed liquid under guidelines approved by the Fund's Board of Trustees. As of October 31, 2016, the aggregate market value of those securities was $708,805, representing 0.33% of net assets. |
Holdings are subject to change, and may not reflect the current or future position of the portfolio.
For Fund compliance purposes, the Fund's geographical classifications refer to any one or more of the country sub-classifications used by one or more widely recognized market indexes or ratings group indexes, and/or as defined by Fund management. This definition may not apply for purposes of this report, which may combine sub-classifications for reporting ease. Geographical regions are shown as a percentage of net assets.
See Notes to Financial Statements.
| 60 | 1.855.377.7325 | www.GrandeurPeakGlobal.com |
Grandeur Peak Funds® | Statements of Assets and Liabilities |
October 31, 2016 (Unaudited)
| Grandeur Peak Emerging Markets Opportunities Fund | Grandeur Peak Global Micro Cap Fund | Grandeur Peak Global Opportunities Fund | Grandeur Peak Global Reach Fund | |||||||||||||
| ASSETS | ||||||||||||||||
| Investments, at value (Cost ‐ see below) | $ | 354,911,338 | $ | 31,272,845 | $ | 619,222,389 | $ | 282,637,272 | ||||||||
| Cash | 39,909,746 | 1,300,586 | 11,318,960 | 3,516,636 | ||||||||||||
| Foreign cash, at value (Cost $3,438,805, $317,287, $237,178 and $1,056,729, respectively) | 3,454,686 | 318,899 | 238,269 | 1,060,046 | ||||||||||||
| Dividends and interest receivable | 201,807 | 31,328 | 611,095 | 248,264 | ||||||||||||
| Receivable for investments sold | 314,310 | 120,687 | 1,966,304 | 835,743 | ||||||||||||
| Receivable for fund shares subscribed | 5,588 | 21,060 | 109,958 | 98,379 | ||||||||||||
| Prepaid and other assets | 10,167 | 16,207 | 30,354 | 20,819 | ||||||||||||
| Total assets | 398,807,642 | 33,081,612 | 633,497,329 | 288,417,159 | ||||||||||||
| LIABILITIES | ||||||||||||||||
| Payable for investments purchased | 106,827 | 39,706 | 1,671,715 | 1,207,777 | ||||||||||||
| Foreign capital gains tax | 526,059 | 40,451 | 513,344 | 227,257 | ||||||||||||
| Payable for fund shares redeemed | 137,735 | – | 567,904 | 122,213 | ||||||||||||
| Advisory fees payable | 458,543 | 32,133 | 661,885 | 272,580 | ||||||||||||
| Administration fees payable | 16,388 | 708 | 25,450 | 17,059 | ||||||||||||
| Custodian fees payable | 96,435 | 21,533 | 71,745 | 56,052 | ||||||||||||
| Payable for trustee fees and expenses | 2,023 | 169 | 3,594 | 1,720 | ||||||||||||
| Payable for chief compliance officer fee | 795 | 64 | 1,479 | 719 | ||||||||||||
| Payable for principal financial officer fees | 138 | 10 | 264 | 129 | ||||||||||||
| Distribution and service fees payable | 4,128 | – | 36,918 | 13,941 | ||||||||||||
| Payable for transfer agency fees | 4,039 | 3,863 | 10,824 | 7,386 | ||||||||||||
| Accrued expenses and other liabilities | 28,307 | 6,089 | 31,121 | 19,332 | ||||||||||||
| Total liabilities | 1,381,417 | 144,726 | 3,596,243 | 1,946,165 | ||||||||||||
| NET ASSETS | $ | 397,426,225 | $ | 32,936,886 | $ | 629,901,086 | $ | 286,470,994 | ||||||||
| NET ASSETS CONSISTS OF | ||||||||||||||||
| Paid‐in capital (Note 5) | $ | 384,461,595 | $ | 29,636,198 | $ | 526,346,470 | $ | 271,240,456 | ||||||||
| Accumulated net investment income | 2,746,744 | 89,725 | 295,415 | 707,322 | ||||||||||||
| Accumulated net realized gain/(loss) | (7,402,367 | ) | 339,910 | (715,068 | ) | (16,279,723 | ) | |||||||||
| Net unrealized appreciation | 17,620,253 | 2,871,053 | 103,974,269 | 30,802,939 | ||||||||||||
| NET ASSETS | $ | 397,426,225 | $ | 32,936,886 | $ | 629,901,086 | $ | 286,470,994 | ||||||||
| INVESTMENTS, AT COST | $ | 336,780,752 | $ | 28,362,384 | $ | 514,701,780 | $ | 251,604,066 | ||||||||
| PRICING OF SHARES | ||||||||||||||||
| Investor Class | ||||||||||||||||
| Net Assets | $ | 18,631,225 | $ | – | $ | 170,709,074 | $ | 63,562,557 | ||||||||
| Net Asset Value, offering and redemption price per share | $ | 10.82 | $ | – | $ | 3.15 | $ | 12.95 | ||||||||
| Shares of beneficial interest outstanding | 1,721,421 | – | 54,184,206 | 4,906,837 | ||||||||||||
| Institutional Class | ||||||||||||||||
| Net Assets | $ | 378,795,000 | $ | 32,936,886 | $ | 459,192,012 | $ | 222,908,437 | ||||||||
| Net Asset Value, offering and redemption price per share | $ | 10.87 | $ | 11.06 | $ | 3.18 | $ | 12.98 | ||||||||
| Shares of beneficial interest outstanding | 34,838,576 | 2,978,629 | 144,298,916 | 17,168,704 | ||||||||||||
See Notes to Financial Statements.
| Semi-Annual Report | October 31, 2016 | 61 |
Grandeur Peak Funds® | Statements of Assets and Liabilities |
October 31, 2016 (Unaudited)
| Grandeur Peak Global Stalwarts Fund | Grandeur Peak International Opportunities Fund | Grandeur Peak International Stalwarts Fund | ||||||||||
| ASSETS | ||||||||||||
| Investments, at value (Cost ‐ see below) | $ | 66,932,359 | $ | 654,912,293 | $ | 197,314,239 | ||||||
| Cash | 4,107,473 | 61,829,951 | 15,372,627 | |||||||||
| Foreign cash, at value (Cost $369,303, $1,113,084 and $1,904,806, respectively) | 370,157 | 1,098,552 | 1,906,116 | |||||||||
| Dividends and interest receivable | 54,818 | 776,223 | 176,032 | |||||||||
| Receivable for investments sold | 69,799 | 1,312,569 | 211,578 | |||||||||
| Receivable for fund shares subscribed | 18,036 | 452,383 | 315,862 | |||||||||
| Prepaid and other assets | 27,865 | 29,857 | 30,202 | |||||||||
| Total assets | 71,580,507 | 720,411,828 | 215,326,656 | |||||||||
| LIABILITIES | ||||||||||||
| Payable for investments purchased | 582,536 | 2,818,269 | 1,529,925 | |||||||||
| Foreign capital gains tax | 104,769 | 773,190 | 623,329 | |||||||||
| Payable for fund shares redeemed | 3,058 | 71,852 | 29,490 | |||||||||
| Advisory fees payable | 50,065 | 739,321 | 143,069 | |||||||||
| Administration fees payable | 3,780 | 28,398 | 7,790 | |||||||||
| Custodian fees payable | 18,026 | 92,957 | 26,628 | |||||||||
| Payable for trustee fees and expenses | 45 | 4,155 | 703 | |||||||||
| Payable for chief compliance officer fee | 5 | 1,693 | 256 | |||||||||
| Payable for principal financial officer fees | 4 | 303 | 47 | |||||||||
| Distribution and service fees payable | 8,816 | 17,110 | 5,661 | |||||||||
| Payable for transfer agency fees | 4,151 | 7,260 | 3,627 | |||||||||
| Accrued expenses and other liabilities | 8,033 | 35,238 | 10,531 | |||||||||
| Total liabilities | 783,288 | 4,589,746 | 2,381,056 | |||||||||
| NET ASSETS | $ | 70,797,219 | $ | 715,822,082 | $ | 212,945,600 | ||||||
| NET ASSETS CONSISTS OF | ||||||||||||
| Paid‐in capital (Note 5) | $ | 66,782,646 | $ | 606,484,590 | $ | 199,813,347 | ||||||
| Accumulated net investment income | 141,645 | 2,710,679 | 1,121,751 | |||||||||
| Accumulated net realized gain/(loss) | (350,295 | ) | 13,433,266 | (1,817,113 | ) | |||||||
| Net unrealized appreciation | 4,223,223 | 93,193,547 | 13,827,615 | |||||||||
| NET ASSETS | $ | 70,797,219 | $ | 715,822,082 | $ | 212,945,600 | ||||||
| INVESTMENTS, AT COST | $ | 62,603,733 | $ | 560,886,278 | $ | 182,858,172 | ||||||
| PRICING OF SHARES | ||||||||||||
| Investor Class | ||||||||||||
| Net Assets | $ | 41,149,477 | $ | 79,620,862 | $ | 26,219,214 | ||||||
| Net Asset Value, offering and redemption price per share | $ | 11.33 | $ | 3.27 | $ | 11.68 | ||||||
| Shares of beneficial interest outstanding | 3,630,642 | 24,366,700 | 2,244,636 | |||||||||
| Institutional Class | ||||||||||||
| Net Assets | $ | 29,647,741 | $ | 636,201,220 | $ | 186,726,386 | ||||||
| Net Asset Value, offering and redemption price per share | $ | 11.37 | $ | 3.28 | $ | 11.70 | ||||||
| Shares of beneficial interest outstanding | 2,607,761 | 193,828,183 | 15,954,642 | |||||||||
See Notes to Financial Statements.
| 62 | 1.855.377.7325 | www.GrandeurPeakGlobal.com |
Grandeur Peak Funds® | Statements of Operations |
For the Six Months Ended October 31, 2016 (Unaudited)
| Grandeur Peak Emerging Markets Opportunities Fund | Grandeur Peak Global Micro Cap Fund | Grandeur Peak Global Opportunities Fund | Grandeur Peak Global Reach Fund | |||||||||||||
| INVESTMENT INCOME | ||||||||||||||||
| Dividends | $ | 5,409,159 | $ | 463,408 | $ | 5,932,795 | $ | 3,012,882 | ||||||||
| Interest | 1,588 | 9 | – | – | ||||||||||||
| Foreign taxes withheld | (560,266 | ) | (45,678 | ) | (444,963 | ) | (259,045 | ) | ||||||||
| Total investment income | 4,850,481 | 417,739 | 5,487,832 | 2,753,837 | ||||||||||||
| EXPENSES | ||||||||||||||||
| Investment advisor fees (Note 6) | 2,597,802 | 238,433 | 3,954,664 | 1,588,017 | ||||||||||||
| Administrative fees | 78,348 | 11,732 | 123,643 | 64,873 | ||||||||||||
| Distribution and service fees ‐ Investor Class | 20,339 | – | 203,062 | 75,952 | ||||||||||||
| Transfer agent fees | 19,384 | 19,137 | 41,544 | 31,776 | ||||||||||||
| Professional fees | 15,705 | 10,124 | 22,194 | 18,394 | ||||||||||||
| Printing fees | 6,462 | 1,373 | 17,277 | 9,905 | ||||||||||||
| Registration fees | 18,385 | 4,413 | 16,227 | 16,951 | ||||||||||||
| Custodian fees | 223,004 | 41,650 | 152,041 | 121,293 | ||||||||||||
| Trustee fees and expenses | 4,878 | 408 | 8,211 | 3,772 | ||||||||||||
| Chief compliance officer fees | 4,681 | 386 | 7,891 | 3,637 | ||||||||||||
| Principal financial officer fees | 845 | 68 | 1,430 | 659 | ||||||||||||
| Offering costs | – | 28,369 | – | – | ||||||||||||
| Other expenses | 9,419 | 3,071 | 13,321 | 8,515 | ||||||||||||
| Total expenses | 2,999,252 | 359,164 | 4,561,505 | 1,943,744 | ||||||||||||
| Less fees waived/reimbursed by investment advisor (Note 6) | – | (44,854 | ) | (35,775 | ) | – | ||||||||||
| NET INVESTMENT INCOME | 1,851,229 | 103,429 | 962,102 | 810,093 | ||||||||||||
| REALIZED AND UNREALIZED GAIN/(LOSS) ON INVESTMENTS | ||||||||||||||||
| Net realized gain/(loss) on investments | 6,128,744 | 427,520 | (544,166 | ) | (3,039,406 | ) | ||||||||||
| Net realized gain/(loss) on foreign currency transactions | (82,156 | ) | 376 | (51,811 | ) | (75,032 | ) | |||||||||
| Net change in unrealized appreciation on investments (net of foreign capital gains tax of $458,958, $40,451, $513,344 and $227,257, respectively) | 29,314,452 | 1,478,701 | 29,114,371 | 16,970,434 | ||||||||||||
| Net change in unrealized depreciation on translation of assets and liabilities in foreign currencies | (1,156 | ) | (3,303 | ) | (43,305 | ) | (15,641 | ) | ||||||||
| NET REALIZED AND UNREALIZED GAIN ON INVESTMENTS AND FOREIGN CURRENCY TRANSACTIONS | 35,359,884 | 1,903,294 | 28,475,089 | 13,840,355 | ||||||||||||
| NET INCREASE IN NET ASSETS RESULTING FROM OPERATIONS | $ | 37,211,113 | $ | 2,006,723 | $ | 29,437,191 | $ | 14,650,448 | ||||||||
See Notes to Financial Statements.
| Semi-Annual Report | October 31, 2016 | 63 |
Grandeur Peak Funds® | Statements of Operations |
For the Six Months Ended October 31, 2016 (Unaudited)
Grandeur Peak Global Stalwarts Fund | Grandeur Peak International Opportunities Fund | Grandeur Peak International Stalwarts Fund | ||||||||||
| INVESTMENT INCOME | ||||||||||||
| Dividends | $ | 398,441 | $ | 8,203,018 | $ | 1,528,801 | ||||||
| Interest | – | 258 | – | |||||||||
| Foreign taxes withheld | (28,987 | ) | (771,486 | ) | (139,313 | ) | ||||||
| Total investment income | 369,454 | 7,431,790 | 1,389,488 | |||||||||
| EXPENSES | ||||||||||||
| Investment advisor fees (Note 6) | 217,059 | 4,503,509 | 653,631 | |||||||||
| Recoupment of previously waived fees (Note 6) | – | – | 51,467 | |||||||||
| Administrative fees | 12,870 | 140,515 | 32,422 | |||||||||
| Distribution and service fees ‐ Investor Class | 38,104 | 90,894 | 31,235 | |||||||||
| Transfer agent fees | 22,814 | 31,695 | 19,162 | |||||||||
| Professional fees | 9,853 | 24,754 | 13,738 | |||||||||
| Printing fees | 1,885 | 12,439 | 2,454 | |||||||||
| Registration fees | 5,687 | 16,074 | 5,247 | |||||||||
| Custodian fees | 34,421 | 210,349 | 54,923 | |||||||||
| Trustee fees and expenses | 517 | 9,356 | 1,927 | |||||||||
| Chief compliance officer fees | 522 | 8,990 | 1,820 | |||||||||
| Principal financial officer fees | 98 | 1,629 | 331 | |||||||||
| Offering costs | 22,792 | – | 23,592 | |||||||||
| Other expenses | 3,550 | 14,816 | 4,278 | |||||||||
| Total expenses | 370,172 | 5,065,020 | 896,227 | |||||||||
| Less fees waived/reimbursed by investment advisor (Note 6) | (33,612 | ) | (57,110 | ) | – | |||||||
| NET INVESTMENT INCOME | 32,894 | 2,423,880 | 493,261 | |||||||||
| REALIZED AND UNREALIZED GAIN/(LOSS) ON INVESTMENTS | ||||||||||||
| Net realized gain on investments | 128,354 | 13,305,758 | 363,108 | |||||||||
| Net realized gain/(loss) on foreign currency transactions | (90,010 | ) | 1,361,923 | (319,290 | ) | |||||||
| Net change in unrealized appreciation on investments (net of foreign capital gains tax of $80,753, $773,190 and $490,847, respectively) | 1,942,146 | 22,825,261 | 7,087,888 | |||||||||
| Net change in unrealized depreciation on translation of assets and liabilities in foreign currencies | (3,744 | ) | (113,608 | ) | (23,569 | ) | ||||||
| NET REALIZED AND UNREALIZED GAIN ON INVESTMENTS AND FOREIGN CURRENCY TRANSACTIONS | 1,976,746 | 37,379,334 | 7,108,137 | |||||||||
| NET INCREASE IN NET ASSETS RESULTING FROM OPERATIONS | $ | 2,009,640 | $ | 39,803,214 | $ | 7,601,398 | ||||||
See Notes to Financial Statements.
| 64 | 1.855.377.7325 | www.GrandeurPeakGlobal.com |
| Grandeur Peak Emerging Markets Opportunities Fund | Statements of Changes in Net Assets |
For the Six Months Ended October 31, 2016 (Unaudited) | For the Year Ended April 30, 2016 | |||||||
| OPERATIONS | ||||||||
| Net investment income | $ | 1,851,229 | $ | 2,937,123 | ||||
| Net realized gain/(loss) | 6,046,588 | (6,742,695 | ) | |||||
| Net change in unrealized appreciation/(depreciation) | 29,313,296 | (50,774,647 | ) | |||||
| Net increase/(decrease) in net assets resulting from operations | 37,211,113 | (54,580,219 | ) | |||||
| DISTRIBUTIONS TO SHAREHOLDERS (NOTE 3) | ||||||||
| Net investment income | ||||||||
| Investor Class | – | – | ||||||
| Institutional Class | – | – | ||||||
| Net realized gains on investments | ||||||||
| Investor Class | – | (784,769 | ) | |||||
| Institutional Class | – | (12,306,838 | ) | |||||
| Net decrease in net assets from distributions | – | (13,091,607 | ) | |||||
| CAPITAL SHARE TRANSACTIONS (NOTE 5) | ||||||||
| Investor Class | ||||||||
| Proceeds from sales of shares | 156,660 | 1,471,368 | ||||||
| Distributions reinvested | – | 766,668 | ||||||
| Cost of shares redeemed | (4,038,147 | ) | (16,030,060 | ) | ||||
| Redemption fees | 1 | 2,624 | ||||||
| Net decrease from capital shares transactions | (3,881,486 | ) | (13,789,400 | ) | ||||
| Institutional Class | ||||||||
| Proceeds from sales of shares | 8,279,049 | 11,860,125 | ||||||
| Distributions reinvested | – | 11,059,498 | ||||||
| Cost of shares redeemed | (14,223,222 | ) | (39,363,942 | ) | ||||
| Redemption fees | 22 | 1,324 | ||||||
| Net decrease from capital shares transactions | (5,944,151 | ) | (16,442,995 | ) | ||||
| Net increase/(decrease) in net assets | 27,385,476 | (97,904,221 | ) | |||||
| NET ASSETS | ||||||||
| Beginning of period | 370,040,749 | 467,944,970 | ||||||
| End of period* | $ | 397,426,225 | $ | 370,040,749 | ||||
| *Including accumulated net investment income of: | $ | 2,746,744 | $ | 895,515 | ||||
| OTHER INFORMATION | ||||||||
| Shares Transactions | ||||||||
| Investor Class | ||||||||
| Issued | 15,163 | 144,484 | ||||||
| Issued to shareholders in reinvestment of distributions | – | 79,530 | ||||||
| Redeemed | (386,315 | ) | (1,598,285 | ) | ||||
| Net decrease in share transactions | (371,152 | ) | (1,374,271 | ) | ||||
| Institutional Class | ||||||||
| Issued | 786,832 | 1,186,242 | ||||||
| Issued to shareholders in reinvestment of distributions | – | 1,143,692 | ||||||
| Redeemed | (1,413,331 | ) | (4,011,166 | ) | ||||
| Net decrease in share transactions | (626,499 | ) | (1,681,232 | ) | ||||
See Notes to Financial Statements.
| Semi-Annual Report | October 31, 2016 | 65 |
| Grandeur Peak Global Micro Cap Fund | Statements of Changes in Net Assets |
For the Six Months Ended October 31, 2016 (Unaudited) | For the Period October 21, 2015 (Commencement of Operations) to April 30, 2016 | |||||||
| OPERATIONS | ||||||||
| Net investment income/(loss) | $ | 103,429 | $ | (59,607 | ) | |||
| Net realized gain/(loss) | 427,896 | (97,724 | ) | |||||
| Net change in unrealized appreciation | 1,475,398 | 1,395,655 | ||||||
| Net increase in net assets resulting from operations | 2,006,723 | 1,238,324 | ||||||
| CAPITAL SHARE TRANSACTIONS (NOTE 5) | ||||||||
| Institutional Class | ||||||||
| Proceeds from sales of shares | 1,259,762 | 31,071,815 | ||||||
| Cost of shares redeemed | (1,065,055 | ) | (1,575,834 | ) | ||||
| Redemption fees | 2 | 1,149 | ||||||
| Net increase from capital shares transactions | 194,709 | 29,497,130 | ||||||
| Net increase in net assets | 2,201,432 | 30,735,454 | ||||||
| NET ASSETS | ||||||||
| Beginning of period | 30,735,454 | – | ||||||
| End of period* | $ | 32,936,886 | $ | 30,735,454 | ||||
| *Including accumulated net investment income/(loss) of: | $ | 89,725 | $ | (13,704 | ) | |||
| OTHER INFORMATION | ||||||||
| Shares Transactions | ||||||||
| Institutional Class | ||||||||
| Issued | 118,333 | 3,118,442 | ||||||
| Redeemed | (99,572 | ) | (158,574 | ) | ||||
| Net increase in share transactions | 18,761 | 2,959,868 | ||||||
See Notes to Financial Statements.
| 66 | 1.855.377.7325 | www.GrandeurPeakGlobal.com |
| Grandeur Peak Global Opportunities Fund | Statements of Changes in Net Assets |
For the Six Months Ended October 31, 2016 (Unaudited) | For the Year Ended April 30, 2016 | |||||||
| OPERATIONS | ||||||||
| Net investment income | $ | 962,102 | $ | 1,497,876 | ||||
| Net realized gain/(loss) | (595,977 | ) | 16,758,288 | |||||
| Net change in unrealized appreciation/(depreciation) | 29,071,066 | (56,974,221 | ) | |||||
| Net increase/(decrease) in net assets resulting from operations | 29,437,191 | (38,718,057 | ) | |||||
| DISTRIBUTIONS TO SHAREHOLDERS (NOTE 3) | ||||||||
| Net investment income | ||||||||
| Investor Class | – | (109,124 | ) | |||||
| Institutional Class | – | (1,035,196 | ) | |||||
| Net realized gains on investments | ||||||||
| Investor Class | – | (13,697,007 | ) | |||||
| Institutional Class | – | (34,852,047 | ) | |||||
| Net decrease in net assets from distributions | – | (49,693,374 | ) | |||||
| CAPITAL SHARE TRANSACTIONS (NOTE 5) | ||||||||
| Investor Class | ||||||||
| Proceeds from sales of shares | 5,167,033 | 16,451,459 | ||||||
| Distributions reinvested | – | 13,160,455 | ||||||
| Cost of shares redeemed | (15,674,797 | ) | (33,495,791 | ) | ||||
| Redemption fees | 101 | 981 | ||||||
| Net decrease from capital shares transactions | (10,507,663 | ) | (3,882,896 | ) | ||||
| Institutional Class | ||||||||
| Proceeds from sales of shares | 19,469,260 | 21,799,233 | ||||||
| Distributions reinvested | – | 34,499,590 | ||||||
| Cost of shares redeemed | (33,688,004 | ) | �� | (66,675,634 | ) | |||
| Redemption fees | 4,171 | 663 | ||||||
| Net decrease from capital shares transactions | (14,214,573 | ) | (10,376,148 | ) | ||||
| Net increase/(decrease) in net assets | 4,714,955 | (102,670,475 | ) | |||||
| NET ASSETS | ||||||||
| Beginning of period | 625,186,131 | 727,856,606 | ||||||
| End of period* | $ | 629,901,086 | $ | 625,186,131 | ||||
| *Including accumulated net investment income/(loss) of: | $ | 295,415 | $ | (666,687 | ) | |||
| OTHER INFORMATION | ||||||||
| Shares Transactions | ||||||||
| Investor Class | ||||||||
| Issued | 1,676,929 | 5,378,903 | ||||||
| Issued to shareholders in reinvestment of distributions | – | 4,386,818 | ||||||
| Redeemed | (5,068,162 | ) | (10,866,076 | ) | ||||
| Net decrease in share transactions | (3,391,233 | ) | (1,100,355 | ) | ||||
| Institutional Class | ||||||||
| Issued | 6,254,829 | 7,034,568 | ||||||
| Issued to shareholders in reinvestment of distributions | – | 11,423,705 | ||||||
| Redeemed | (10,933,210 | ) | (21,633,925 | ) | ||||
| Net decrease in share transactions | (4,678,381 | ) | (3,175,652 | ) | ||||
See Notes to Financial Statements.
| Semi-Annual Report | October 31, 2016 | 67 |
| Grandeur Peak Global Reach Fund | Statements of Changes in Net Assets |
For the Six Months Ended October 31, 2016 (Unaudited) | For the Year Ended April 30, 2016 | |||||||
| OPERATIONS | ||||||||
| Net investment income | $ | 810,093 | $ | 866,968 | ||||
| Net realized loss | (3,114,438 | ) | (10,392,458 | ) | ||||
| Net change in unrealized appreciation/(depreciation) | 16,954,793 | (14,065,512 | ) | |||||
| Net increase/(decrease) in net assets resulting from operations | 14,650,448 | (23,591,002 | ) | |||||
| DISTRIBUTIONS TO SHAREHOLDERS (NOTE 3) | ||||||||
| Net investment income | ||||||||
| Investor Class | – | (31,050 | ) | |||||
| Institutional Class | – | (548,683 | ) | |||||
| Net realized gains on investments | ||||||||
| Investor Class | – | (2,531,840 | ) | |||||
| Institutional Class | – | (8,291,704 | ) | |||||
| Net decrease in net assets from distributions | – | (11,403,277 | ) | |||||
| CAPITAL SHARE TRANSACTIONS (NOTE 5) | ||||||||
| Investor Class | ||||||||
| Proceeds from sales of shares | 2,044,714 | 8,664,894 | ||||||
| Distributions reinvested | – | 2,432,032 | ||||||
| Cost of shares redeemed | (8,818,531 | ) | (22,513,189 | ) | ||||
| Redemption fees | 265 | 112 | ||||||
| Net decrease from capital shares transactions | (6,773,552 | ) | (11,416,151 | ) | ||||
| Institutional Class | ||||||||
| Proceeds from sales of shares | 5,722,267 | 14,482,195 | ||||||
| Distributions reinvested | – | 8,452,696 | ||||||
| Cost of shares redeemed | (15,871,507 | ) | (35,375,478 | ) | ||||
| Redemption fees | 5 | 1,064 | ||||||
| Net decrease from capital shares transactions | (10,149,235 | ) | (12,439,523 | ) | ||||
| Net decrease in net assets | (2,272,339 | ) | (58,849,953 | ) | ||||
| NET ASSETS | ||||||||
| Beginning of period | 288,743,333 | 347,593,286 | ||||||
| End of period* | $ | 286,470,994 | $ | 288,743,333 | ||||
| *Including accumulated net investment income/(loss) of: | $ | 707,322 | $ | (102,771 | ) | |||
| OTHER INFORMATION | ||||||||
| Shares Transactions | ||||||||
| Investor Class | ||||||||
| Issued | 163,186 | 687,256 | ||||||
| Issued to shareholders in reinvestment of distributions | – | 199,838 | ||||||
| Redeemed | (695,943 | ) | (1,845,147 | ) | ||||
| Net decrease in share transactions | (532,757 | ) | (958,053 | ) | ||||
| Institutional Class | ||||||||
| Issued | 444,522 | 1,168,635 | ||||||
| Issued to shareholders in reinvestment of distributions | – | 694,552 | ||||||
| Redeemed | (1,264,034 | ) | (2,925,982 | ) | ||||
| Net decrease in share transactions | (819,512 | ) | (1,062,795 | ) | ||||
See Notes to Financial Statements.
| 68 | 1.855.377.7325 | www.GrandeurPeakGlobal.com |
| Grandeur Peak Global Stalwarts Fund | Changes in Net Assets |
For the Six Months Ended October 31, 2016 (Unaudited) | For the Period September 2, 2015 (Commencement of Operations) to April 30, 2016 | |||||||
| OPERATIONS | ||||||||
| Net investment income | $ | 32,894 | $ | 16,435 | ||||
| Net realized gain/(loss) | 38,344 | (316,587 | ) | |||||
| Net change in unrealized appreciation | 1,938,402 | 2,284,821 | ||||||
| Net increase in net assets resulting from operations | 2,009,640 | 1,984,669 | ||||||
| DISTRIBUTIONS TO SHAREHOLDERS (NOTE 3) | ||||||||
| Net investment income | ||||||||
| Investor Class | – | (1,406 | ) | |||||
| Institutional Class | – | (1,599 | ) | |||||
| Net realized gains on investments | ||||||||
| Investor Class | – | (5,451 | ) | |||||
| Institutional Class | – | (4,017 | ) | |||||
| Net decrease in net assets from distributions | – | (12,473 | ) | |||||
| CAPITAL SHARE TRANSACTIONS (NOTE 5) | ||||||||
| Investor Class | ||||||||
| Proceeds from sales of shares | 23,485,758 | 19,927,627 | ||||||
| Distributions reinvested | – | 6,798 | ||||||
| Cost of shares redeemed | (2,484,558 | ) | (1,840,013 | ) | ||||
| Redemption fees | 237 | 756 | ||||||
| Net increase from capital shares transactions | 21,001,437 | 18,095,168 | ||||||
| Institutional Class | ||||||||
| Proceeds from sales of shares | 11,803,270 | 17,799,288 | ||||||
| Distributions reinvested | – | 5,140 | ||||||
| Cost of shares redeemed | (710,466 | ) | (1,178,526 | ) | ||||
| Redemption fees | – | 72 | ||||||
| Net increase from capital shares transactions | 11,092,804 | 16,625,974 | ||||||
| Net increase in net assets | 34,103,881 | 36,693,338 | ||||||
| NET ASSETS | ||||||||
| Beginning of period | 36,693,338 | – | ||||||
| End of period* | $ | 70,797,219 | $ | 36,693,338 | ||||
| *Including accumulated net investment income of: | $ | 141,645 | $ | 108,751 | ||||
| OTHER INFORMATION | ||||||||
| Shares Transactions | ||||||||
| Investor Class | ||||||||
| Issued | 2,085,915 | 1,940,844 | ||||||
| Issued to shareholders in reinvestment of distributions | – | 639 | ||||||
| Redeemed | (218,013 | ) | (178,743 | ) | ||||
| Net increase in share transactions | 1,867,902 | 1,762,740 | ||||||
| Institutional Class | ||||||||
| Issued | 1,055,246 | 1,727,174 | ||||||
| Issued to shareholders in reinvestment of distributions | – | 483 | ||||||
| Redeemed | (62,904 | ) | (112,238 | ) | ||||
| Net increase in share transactions | 992,342 | 1,615,419 | ||||||
See Notes to Financial Statements.
| Semi-Annual Report | October 31, 2016 | 69 |
| Grandeur Peak International Opportunities Fund | Statements of Changes in Net Assets |
For the Six Months Ended October 31, 2016 (Unaudited) | For the Year Ended April 30, 2016 | |||||||
| OPERATIONS | ||||||||
| Net investment income | $ | 2,423,880 | $ | 4,673,044 | ||||
| Net realized gain/(loss) | 14,667,681 | (1,400,622 | ) | |||||
| Net change in unrealized appreciation/(depreciation) | 22,711,653 | (51,653,029 | ) | |||||
| Net increase/(decrease) in net assets resulting from operations | 39,803,214 | (48,380,607 | ) | |||||
| DISTRIBUTIONS TO SHAREHOLDERS (NOTE 3) | ||||||||
| Net investment income | ||||||||
| Investor Class | – | (333,339 | ) | |||||
| Institutional Class | – | (2,890,960 | ) | |||||
| Net realized gains on investments | ||||||||
| Investor Class | – | (5,176,781 | ) | |||||
| Institutional Class | – | (25,904,418 | ) | |||||
| Net decrease in net assets from distributions | – | (34,305,498 | ) | |||||
| CAPITAL SHARE TRANSACTIONS (NOTE 5) | ||||||||
| Investor Class | ||||||||
| Proceeds from sales of shares | 11,516,601 | 22,706,144 | ||||||
| Distributions reinvested | – | 5,342,478 | ||||||
| Cost of shares redeemed | (59,476,591 | ) | (62,519,592 | ) | ||||
| Redemption fees | 173 | 5,300 | ||||||
| Net decrease from capital shares transactions | (47,959,817 | ) | (34,465,670 | ) | ||||
| Institutional Class | ||||||||
| Proceeds from sales of shares | 61,013,198 | 25,906,118 | ||||||
| Distributions reinvested | – | 25,634,915 | ||||||
| Cost of shares redeemed | (40,328,053 | ) | (87,311,199 | ) | ||||
| Redemption fees | 708 | 8,941 | ||||||
| Net increase/(decrease) from capital shares transactions | 20,685,853 | (35,761,225 | ) | |||||
| Net increase/(decrease) in net assets | 12,529,250 | (152,913,000 | ) | |||||
| NET ASSETS | ||||||||
| Beginning of period | 703,292,832 | 856,205,832 | ||||||
| End of period* | $ | 715,822,082 | $ | 703,292,832 | ||||
| *Including accumulated net investment income of: | $ | 2,710,679 | $ | 286,799 | ||||
| OTHER INFORMATION | ||||||||
| Shares Transactions | ||||||||
| Investor Class | ||||||||
| Issued | 3,630,496 | 7,180,441 | ||||||
| Issued to shareholders in reinvestment of distributions | – | 1,740,221 | ||||||
| Redeemed | (19,328,497 | ) | (19,692,604 | ) | ||||
| Net decrease in share transactions | (15,698,001 | ) | (10,771,942 | ) | ||||
| Institutional Class | ||||||||
| Issued | 19,764,003 | 8,230,251 | ||||||
| Issued to shareholders in reinvestment of distributions | – | 8,323,024 | ||||||
| Redeemed | (12,507,635 | ) | (28,793,205 | ) | ||||
| Net increase/(decrease) in share transactions | 7,256,368 | (12,239,930 | ) | |||||
See Notes to Financial Statements.
| 70 | 1.855.377.7325 | www.GrandeurPeakGlobal.com |
| Grandeur Peak International Stalwarts Fund | Statements of Changes in Net Assets |
For the Six Months Ended October 31, 2016 (Unaudited) | For the Period September 2, 2015 (Commencement of Operations) to April 30, 2016 | |||||||
| OPERATIONS | ||||||||
| Net investment income | $ | 493,261 | $ | 306,704 | ||||
| Net realized gain/(loss) | 43,818 | (1,541,441 | ) | |||||
| Net change in unrealized appreciation | 7,064,319 | 6,763,296 | ||||||
| Net increase in net assets resulting from operations | 7,601,398 | 5,528,559 | ||||||
| DISTRIBUTIONS TO SHAREHOLDERS (NOTE 3) | ||||||||
| Net investment income | ||||||||
| Institutional Class | – | (30,017 | ) | |||||
| Net decrease in net assets from distributions | – | (30,017 | ) | |||||
| CAPITAL SHARE TRANSACTIONS (NOTE 5) | ||||||||
| Investor Class | ||||||||
| Proceeds from sales of shares | 4,512,323 | 22,223,231 | ||||||
| Cost of shares redeemed | (1,714,945 | ) | (1,404,112 | ) | ||||
| Redemption fees | 125 | 1,506 | ||||||
| Net increase from capital shares transactions | 2,797,503 | 20,820,625 | ||||||
| Institutional Class | ||||||||
| Proceeds from sales of shares | 68,470,748 | 122,552,744 | ||||||
| Distributions reinvested | – | 29,459 | ||||||
| Cost of shares redeemed | (7,021,888 | ) | (7,803,828 | ) | ||||
| Redemption fees | – | 297 | ||||||
| Net increase from capital shares transactions | 61,448,860 | 114,778,672 | ||||||
| Net increase in net assets | 71,847,761 | 141,097,839 | ||||||
| NET ASSETS | ||||||||
| Beginning of period | 141,097,839 | – | ||||||
| End of period* | $ | 212,945,600 | $ | 141,097,839 | ||||
| *Including accumulated net investment income of: | $ | 1,121,751 | $ | 628,490 | ||||
| OTHER INFORMATION | ||||||||
| Shares Transactions | ||||||||
| Investor Class | ||||||||
| Issued | 391,553 | 2,133,944 | ||||||
| Redeemed | (145,929 | ) | (134,932 | ) | ||||
| Net increase in share transactions | 245,624 | 1,999,012 | ||||||
| Institutional Class | ||||||||
| Issued | 5,767,237 | 11,528,096 | ||||||
| Issued to shareholders in reinvestment of distributions | – | 2,720 | ||||||
| Redeemed | (610,204 | ) | (733,207 | ) | ||||
| Net increase in share transactions | 5,157,033 | 10,797,609 | ||||||
See Notes to Financial Statements.
| Semi-Annual Report | October 31, 2016 | 71 |
| Grandeur Peak Emerging Markets Opportunities Fund | Financial Highlights |
| For a Share Outstanding Throughout the Periods Presented |
| Investor Class | For the Six Months Ended October 31, 2016 (Unaudited) | Year Ended April 30, 2016 | Year Ended April 30, 2015 | For the Period December 16, 2013 (Inception) to April 30, 2014 | ||||||||||||
| NET ASSET VALUE, BEGINNING OF PERIOD | $ | 9.82 | $ | 11.51 | $ | 10.53 | $ | 10.00 | ||||||||
| INCOME FROM INVESTMENT OPERATIONS | ||||||||||||||||
Net investment income/(loss)(a) | 0.04 | 0.07 | 0.02 | (0.05 | ) | |||||||||||
| Net realized and unrealized gain/(loss) on investments | 0.96 | (1.41 | ) | 1.22 | 0.58 | |||||||||||
| Total income/(loss) from investment operations | 1.00 | (1.34 | ) | 1.24 | 0.53 | |||||||||||
| DISTRIBUTIONS | ||||||||||||||||
| From net investment income | – | – | (0.01 | ) | – | |||||||||||
| From net realized gain on investments | – | (0.35 | ) | (0.25 | ) | – | ||||||||||
| Total distributions | – | (0.35 | ) | (0.26 | ) | – | ||||||||||
| REDEMPTION FEES ADDED TO PAID-IN CAPITAL | 0.00 | (b) | 0.00 | (b) | 0.00 | (b) | 0.00 | (b) | ||||||||
| INCREASE/DECREASE IN NET ASSET VALUE | 1.00 | (1.69 | ) | 0.98 | 0.53 | |||||||||||
| NET ASSET VALUE, END OF PERIOD | $ | 10.82 | $ | 9.82 | $ | 11.51 | $ | 10.53 | ||||||||
| TOTAL RETURN | 10.18 | %(c) | (11.62 | )% | 12.06 | % | 5.30 | %(c) | ||||||||
| RATIOS AND SUPPLEMENTAL DATA | ||||||||||||||||
| Net assets, end of period (in 000s) | $ | 18,631 | $ | 20,548 | $ | 39,896 | $ | 27,952 | ||||||||
| RATIOS TO AVERAGE NET ASSETS | ||||||||||||||||
| Expenses (excluding fees waived/reimbursed by investment advisor) | 1.75 | %(d) | 1.77 | % | 1.82 | % | 2.01 | %(d)(e) | ||||||||
| Expenses (including fees waived/reimbursed by investment advisor) | 1.75 | %(d) | 1.77 | % | 1.82 | % | 1.95 | %(d)(e) | ||||||||
| Net investment income/(loss) | 0.81 | %(d) | 0.69 | % | 0.22 | % | (0.55 | )%(d) | ||||||||
| PORTFOLIO TURNOVER RATE | 14 | %(c) | 40 | % | 53 | % | 26 | %(c) | ||||||||
| (a) | Per share numbers have been calculated using the average shares method. |
| (b) | Less than $0.005 or ($0.005) per share. |
| (c) | Not Annualized. |
(d) | Annualized. |
| (e) | Expense ratios during startup periods may not be representative of longer term operating periods. |
| See Notes to Financial Statements. |
| 72 | 1.855.377.7325 | www.GrandeurPeakGlobal.com |
| Grandeur Peak Emerging Markets Opportunities Fund | Financial Highlights |
| For a Share Outstanding Throughout the Periods Presented |
| Institutional Class | For the Six Months Ended October 31, 2016 (Unaudited) | Year Ended April 30, 2016 | Year Ended April 30, 2015 | For the Period December 16, 2013 (Inception) to April 30, 2014 | ||||||||||||
| NET ASSET VALUE, BEGINNING OF PERIOD | $ | 9.85 | $ | 11.52 | $ | 10.54 | $ | 10.00 | ||||||||
| INCOME FROM INVESTMENT OPERATIONS | ||||||||||||||||
Net investment income/(loss)(a) | 0.05 | 0.08 | 0.05 | (0.03 | ) | |||||||||||
| Net realized and unrealized gain/(loss) on investments | 0.97 | (1.40 | ) | 1.21 | 0.57 | |||||||||||
| Total income/(loss) from investment operations | 1.02 | (1.32 | ) | 1.26 | 0.54 | |||||||||||
| DISTRIBUTIONS | ||||||||||||||||
| From net investment income | – | – | (0.03 | ) | – | |||||||||||
| From net realized gain on investments | – | (0.35 | ) | (0.25 | ) | �� | – | |||||||||
| Total distributions | – | (0.35 | ) | (0.28 | ) | – | ||||||||||
| REDEMPTION FEES ADDED TO PAID-IN CAPITAL | 0.00 | (b) | 0.00 | (b) | 0.00 | (b) | 0.00 | (b) | ||||||||
| INCREASE/DECREASE IN NET ASSET VALUE | 1.02 | (1.67 | ) | 0.98 | 0.54 | |||||||||||
| NET ASSET VALUE, END OF PERIOD | $ | 10.87 | $ | 9.85 | $ | 11.52 | $ | 10.54 | ||||||||
| TOTAL RETURN | 10.36 | %(c) | (11.44 | )% | 12.22 | % | 5.40 | %(c) | ||||||||
| RATIOS AND SUPPLEMENTAL DATA | ||||||||||||||||
| Net assets, end of period (in 000s) | $ | 378,795 | $ | 349,493 | $ | 428,048 | $ | 255,819 | ||||||||
| RATIOS TO AVERAGE NET ASSETS | ||||||||||||||||
| Expenses (excluding fees waived/reimbursed by investment advisor) | 1.55 | %(d) | 1.55 | % | 1.58 | % | 1.76 | %(d)(e) | ||||||||
| Expenses (including fees waived/reimbursed by investment advisor) | 1.55 | %(d) | 1.55 | % | 1.58 | % | 1.70 | %(d)(e) | ||||||||
| Net investment income/(loss) | 0.97 | %(d) | 0.75 | % | 0.43 | % | (0.37 | )%(d) | ||||||||
| PORTFOLIO TURNOVER RATE | 14 | %(c) | 40 | % | 53 | % | 26 | %(c) | ||||||||
| (a) | Per share numbers have been calculated using the average shares method. |
| (b) | Less than $0.005 or ($0.005) per share. |
| (c) | Not Annualized. |
| (d) | Annualized. |
| (e) | Expense ratios during startup periods may not be representative of longer term operating periods. |
| See Notes to Financial Statements. |
| Semi-Annual Report | October 31, 2016 | 73 |
| Grandeur Peak Global Micro Cap Fund | Financial Highlights |
| For a Share Outstanding Throughout the Periods Presented |
| Institutional Class | For the Six Months Ended October 31, 2016 (Unaudited) | For the Period October 21, 2015 (Commencement of Operations) to April 30, 2016 | ||||||
| NET ASSET VALUE, BEGINNING OF PERIOD | $ | 10.38 | $ | 10.00 | ||||
| INCOME FROM INVESTMENT OPERATIONS | ||||||||
Net investment income/(loss)(a) | 0.03 | (0.02 | ) | |||||
| Net realized and unrealized gain on investments | 0.65 | 0.40 | ||||||
| Total income from investment operations | 0.68 | 0.38 | ||||||
| REDEMPTION FEES ADDED TO PAID-IN CAPITAL | 0.00 | (b) | 0.00 | (b) | ||||
| INCREASE IN NET ASSET VALUE | 0.68 | 0.38 | ||||||
| NET ASSET VALUE, END OF PERIOD | $ | 11.06 | $ | 10.38 | ||||
| TOTAL RETURN | 6.55 | %(c) | 3.80 | %(c) | ||||
| RATIOS AND SUPPLEMENTAL DATA | ||||||||
| Net assets, end of period (in 000s) | $ | 32,937 | $ | 30,735 | ||||
| RATIOS TO AVERAGE NET ASSETS | ||||||||
| Expenses (excluding fees waived/ reimbursed by investment advisor) | 2.26 | %(d) | 2.30 | %(d)(e) | ||||
| Expenses (including fees waived/ reimbursed by investment advisor) | 1.98 | %(d) | 2.00 | %(d)(e) | ||||
| Net investment income/(loss) | 0.65 | %(d) | (0.41 | )%(d) | ||||
| PORTFOLIO TURNOVER RATE | 13 | %(c) | 8 | %(c) | ||||
| (a) | Per share numbers have been calculated using the average shares method. |
| (b) | Less than $0.005 or ($0.005) per share. |
| (c) | Not Annualized. |
| (d) | Annualized. |
| (e) | Expense ratios during startup periods may not be representative of longer term operating periods. |
| See Notes to Financial Statements. |
| 74 | 1.855.377.7325 | www.GrandeurPeakGlobal.com |
| Grandeur Peak Global Opportunities Fund | Financial Highlights |
| For a Share Outstanding Throughout the Periods Presented |
| Investor Class | For the Six Months Ended October 31, 2016 (Unaudited) | Year Ended April 30, 2016 | Year Ended April 30, 2015 | Year Ended April 30, 2014 | Year Ended April 30, 2013 | For the Period October 17, 2011 (Inception) to April 30, 2012 | ||||||||||||||||||
| NET ASSET VALUE, BEGINNING OF PERIOD | $ | 3.01 | $ | 3.43 | $ | 3.31 | $ | 2.77 | $ | 2.31 | $ | 2.00 | ||||||||||||
| INCOME FROM INVESTMENT OPERATIONS | ||||||||||||||||||||||||
Net investment income/(loss)(a) | 0.00 | (b) | 0.00 | (b) | 0.00 | (b) | (0.00 | )(b) | 0.00 | (b) | (0.00 | )(b) | ||||||||||||
| Net realized and unrealized gain/(loss) on investments | 0.14 | (0.18 | ) | 0.35 | 0.67 | 0.51 | 0.31 | |||||||||||||||||
| Total income/(loss) from investment operations | 0.14 | (0.18 | ) | 0.35 | 0.67 | 0.51 | 0.31 | |||||||||||||||||
| DISTRIBUTIONS | ||||||||||||||||||||||||
| From net investment income | – | (0.00 | )(b) | (0.01 | ) | – | (0.01 | ) | – | |||||||||||||||
| From net realized gain on investments | – | (0.24 | ) | (0.22 | ) | (0.13 | ) | (0.04 | ) | – | ||||||||||||||
| Total distributions | – | (0.24 | ) | (0.23 | ) | (0.13 | ) | (0.05 | ) | – | ||||||||||||||
| REDEMPTION FEES ADDED TO PAID-IN CAPITAL | 0.00 | (b) | 0.00 | (b) | 0.00 | (b) | 0.00 | (b) | 0.00 | (b) | 0.00 | (b) | ||||||||||||
| INCREASE/DECREASE IN NET ASSET VALUE | 0.14 | (0.42 | ) | 0.12 | 0.54 | 0.46 | 0.31 | |||||||||||||||||
| NET ASSET VALUE, END OF PERIOD | $ | 3.15 | $ | 3.01 | $ | 3.43 | $ | 3.31 | $ | 2.77 | $ | 2.31 | ||||||||||||
| TOTAL RETURN | 4.65 | %(c) | (5.03 | )% | 11.09 | % | 24.31 | % | 22.34 | % | 15.50 | %(c) | ||||||||||||
| RATIOS AND SUPPLEMENTAL DATA | ||||||||||||||||||||||||
| Net assets, end of period (in 000s) | $ | 170,709 | $ | 173,156 | $ | 201,462 | $ | 216,247 | $ | 132,384 | $ | 73,154 | ||||||||||||
| RATIOS TO AVERAGE NET ASSETS | ||||||||||||||||||||||||
| Expenses (excluding fees waived/reimbursed by investment advisor) | 1.61 | %(d) | 1.62 | % | 1.62 | % | 1.68 | % | 1.76 | % | 2.30 | %(d) | ||||||||||||
| Expenses (including fees waived/reimbursed by investment advisor) | 1.60 | %(d) | 1.62 | % | 1.62 | % | 1.68 | % | 1.75 | % | 1.75 | %(d) | ||||||||||||
| Net investment income/(loss) | 0.14 | %(d) | 0.06 | % | 0.12 | % | (0.15 | )% | 0.19 | % | (0.04 | )%(d) | ||||||||||||
| PORTFOLIO TURNOVER RATE | 14 | %(c) | 32 | % | 37 | % | 38 | % | 35 | % | 42 | %(c) | ||||||||||||
| (a) | Per share numbers have been calculated using the average shares method. |
| (b) | Less than $0.005 or ($0.005) per share. |
| (c) | Not Annualized. |
| (d) | Annualized. |
| See Notes to Financial Statements. |
| Semi-Annual Report | October 31, 2016 | 75 |
| Grandeur Peak Global Opportunities Fund | Financial Highlights |
| For a Share Outstanding Throughout the Periods Presented |
| Institutional Class | For the Six Months Ended October 31, 2016 (Unaudited) | Year Ended April 30, 2016 | Year Ended April 30, 2015 | Year Ended April 30, 2014 | Year Ended April 30, 2013 | For the Period October 17, 2011 (Inception) to April 30, 2012 | ||||||||||||||||||
| NET ASSET VALUE, BEGINNING OF PERIOD | $ | 3.03 | $ | 3.46 | $ | 3.34 | $ | 2.79 | $ | 2.32 | $ | 2.00 | ||||||||||||
| INCOME FROM INVESTMENT OPERATIONS | ||||||||||||||||||||||||
Net investment income(a) | 0.01 | 0.01 | 0.01 | 0.00 | (b) | 0.01 | 0.00 | (b) | ||||||||||||||||
| Net realized and unrealized gain/(loss) on investments | 0.14 | (0.19 | ) | 0.34 | 0.68 | 0.52 | 0.32 | |||||||||||||||||
| Total income/(loss) from investment operations | 0.15 | (0.18 | ) | 0.35 | 0.68 | 0.53 | 0.32 | |||||||||||||||||
| DISTRIBUTIONS | ||||||||||||||||||||||||
| From net investment income | – | (0.01 | ) | (0.01 | ) | (0.00 | )(b) | (0.02 | ) | – | ||||||||||||||
| From net realized gain on investments | – | (0.24 | ) | (0.22 | ) | (0.13 | ) | (0.04 | ) | – | ||||||||||||||
| Total distributions | – | (0.25 | ) | (0.23 | ) | (0.13 | ) | (0.06 | ) | – | ||||||||||||||
| REDEMPTION FEES ADDED TO PAID-IN CAPITAL | 0.00 | (b) | 0.00 | (b) | 0.00 | (b) | 0.00 | (b) | 0.00 | (b) | 0.00 | (b) | ||||||||||||
| INCREASE/DECREASE IN NET ASSET VALUE | 0.15 | (0.43 | ) | 0.12 | 0.55 | 0.47 | 0.32 | |||||||||||||||||
| NET ASSET VALUE, END OF PERIOD | $ | 3.18 | $ | 3.03 | $ | 3.46 | $ | 3.34 | $ | 2.79 | $ | 2.32 | ||||||||||||
| TOTAL RETURN | 4.95 | %(c) | (5.12 | )% | 11.20 | % | 24.67 | % | 22.86 | % | 16.00 | %(c) | ||||||||||||
| RATIOS AND SUPPLEMENTAL DATA | ||||||||||||||||||||||||
| Net assets, end of period (in 000s) | $ | 459,192 | $ | 452,030 | $ | 526,394 | $ | 492,869 | $ | 217,953 | $ | 77,737 | ||||||||||||
| RATIOS TO AVERAGE NET ASSETS | ||||||||||||||||||||||||
| Expenses (excluding fees waived/reimbursed by investment advisor) | 1.38 | %(d) | 1.38 | % | 1.38 | % | 1.44 | % | 1.51 | % | 2.03 | %(d) | ||||||||||||
| Expenses (including fees waived/reimbursed by investment advisor) | 1.37 | %(d) | 1.38 | % | 1.38 | % | 1.44 | % | 1.50 | % | 1.50 | %(d) | ||||||||||||
| Net investment income | 0.37 | %(d) | 0.30 | % | 0.35 | % | 0.08 | % | 0.37 | % | 0.40 | %(d) | ||||||||||||
| PORTFOLIO TURNOVER RATE | 14 | %(c) | 32 | % | 37 | % | 38 | % | 35 | % | 42 | %(c) | ||||||||||||
| (a) | Per share numbers have been calculated using the average shares method. |
| (b) | Less than $0.005 or ($0.005) per share. |
| (c) | Not Annualized. |
| (d) | Annualized. |
| See Notes to Financial Statements. |
| 76 | 1.855.377.7325 | www.GrandeurPeakGlobal.com |
| Grandeur Peak Global Reach Fund | Financial Highlights |
| For a Share Outstanding Throughout the Periods Presented |
| Investor Class | For the Six Months Ended October 31, 2016 (Unaudited) | Year Ended April 30, 2016 | Year Ended April 30, 2015 | For the Period June 19, 2013 (Inception) to April 30, 2014 | ||||||||||||
| NET ASSET VALUE, BEGINNING OF PERIOD | $ | 12.31 | $ | 13.65 | $ | 12.43 | $ | 10.00 | ||||||||
| INCOME FROM INVESTMENT OPERATIONS | ||||||||||||||||
Net investment income/(loss)(a) | 0.02 | 0.01 | 0.00 | (b) | (0.02 | ) | ||||||||||
| Net realized and unrealized gain/(loss) on investments | 0.62 | (0.89 | ) | 1.37 | 2.54 | |||||||||||
| Total income/(loss) from investment operations | 0.64 | (0.88 | ) | 1.37 | 2.52 | |||||||||||
| DISTRIBUTIONS | ||||||||||||||||
| From net investment income | – | (0.01 | ) | (0.01 | ) | (0.02 | ) | |||||||||
| From net realized gain on investments | – | (0.45 | ) | (0.14 | ) | (0.08 | ) | |||||||||
| Total distributions | – | (0.46 | ) | (0.15 | ) | (0.10 | ) | |||||||||
| REDEMPTION FEES ADDED TO PAID-IN CAPITAL | 0.00 | (b) | 0.00 | (b) | 0.00 | (b) | 0.01 | |||||||||
| INCREASE/DECREASE IN NET ASSET VALUE | 0.64 | (1.34 | ) | 1.22 | 2.43 | |||||||||||
| NET ASSET VALUE, END OF PERIOD | $ | 12.95 | $ | 12.31 | $ | 13.65 | $ | 12.43 | ||||||||
| TOTAL RETURN | 5.20 | %(c) | (6.45 | )% | 11.09 | % | 25.31 | %(c) | ||||||||
| RATIOS AND SUPPLEMENTAL DATA | ||||||||||||||||
| Net assets, end of period (in 000s) | $ | 63,563 | $ | 66,984 | $ | 87,354 | $ | 46,163 | ||||||||
| RATIOS TO AVERAGE NET ASSETS | ||||||||||||||||
| Expenses (excluding fees waived/reimbursed by investment advisor) | 1.52 | %(d) | 1.60 | % | 1.60 | % | 1.91 | %(d)(e) | ||||||||
| Expenses (including fees waived/reimbursed by investment advisor) | 1.52 | %(d) | 1.60 | % | 1.60 | % | 1.60 | %(d)(e) | ||||||||
| Net investment income/(loss) | 0.39 | %(d) | 0.10 | % | 0.03 | % | (0.17 | )%(d) | ||||||||
| PORTFOLIO TURNOVER RATE | 17 | %(c) | 46 | % | 46 | % | 39 | %(c) | ||||||||
| (a) | Per share numbers have been calculated using the average shares method. |
| (b) | Less than $0.005 or ($0.005) per share. |
| (c) | Not Annualized. |
| (d) | Annualized. |
| (e) | Expense ratios during startup periods may not be representative of longer term operating periods. |
| See Notes to Financial Statements. |
| Semi-Annual Report | October 31, 2016 | 77 |
| Grandeur Peak Global Reach Fund | Financial Highlights |
For a Share Outstanding Throughout the Periods Presented
| Institutional Class | For the Six Months Ended October 31, 2016 (Unaudited) | Year Ended April 30, 2016 | Year Ended April 30, 2015 | For the Period June 19, 2013 (Inception) to April 30, 2014 | ||||||||||||
| NET ASSET VALUE, BEGINNING OF PERIOD | $ | 12.33 | $ | 13.66 | $ | 12.42 | $ | 10.00 | ||||||||
| INCOME FROM INVESTMENT OPERATIONS | ||||||||||||||||
Net investment income(a) | 0.04 | 0.04 | 0.03 | 0.02 | ||||||||||||
| Net realized and unrealized gain/(loss) on investments | 0.61 | (0.89 | ) | 1.37 | 2.52 | |||||||||||
| Total income/(loss) from investment operations | 0.65 | (0.85 | ) | 1.40 | 2.54 | |||||||||||
| DISTRIBUTIONS | ||||||||||||||||
| From net investment income | – | (0.03 | ) | (0.02 | ) | (0.04 | ) | |||||||||
| From net realized gain on investments | – | (0.45 | ) | (0.14 | ) | (0.08 | ) | |||||||||
| Total distributions | – | (0.48 | ) | (0.16 | ) | (0.12 | ) | |||||||||
| REDEMPTION FEES ADDED TO PAID‐IN CAPITAL | 0.00 | (b) | 0.00 | (b) | 0.00 | (b) | 0.00 | (b) | ||||||||
| INCREASE/DECREASE IN NET ASSET VALUE | 0.65 | (1.33 | ) | 1.24 | 2.42 | |||||||||||
| NET ASSET VALUE, END OF PERIOD | $ | 12.98 | $ | 12.33 | $ | 13.66 | $ | 12.42 | ||||||||
| TOTAL RETURN | 5.27 | %(c) | (6.18 | )% | 11.41 | % | 25.45 | %(c) | ||||||||
| RATIOS AND SUPPLEMENTAL DATA | ||||||||||||||||
| Net assets, end of period (in 000s) | $ | 222,908 | $ | 221,759 | $ | 260,239 | $ | 88,311 | ||||||||
| RATIOS TO AVERAGE NET ASSETS | ||||||||||||||||
| Expenses (excluding fees waived/reimbursed by investment advisor) | 1.29 | %(d) | 1.35 | % | 1.35 | % | 1.75 | %(d)(e) | ||||||||
| Expenses (including fees waived/reimbursed by investment advisor) | 1.29 | %(d) | 1.35 | % | 1.35 | % | 1.35 | %(d)(e) | ||||||||
| Net investment income | 0.61 | %(d) | 0.34 | % | 0.23 | % | 0.21 | %(d) | ||||||||
| PORTFOLIO TURNOVER RATE | 17 | %(c) | 46 | % | 46 | % | 39 | %(c) | ||||||||
(a) | Per share numbers have been calculated using the average shares method. |
(b) | Less than $0.005 or ($0.005) per share. |
(c) | Not Annualized. |
(d) | Annualized. |
(e) | Expense ratios during startup periods may not be representative of longer term operating periods. |
See Notes to Financial Statements.
| 78 | 1.855.377.7325 | www.GrandeurPeakGlobal.com |
| Grandeur Peak Global Stalwarts Fund | Financial Highlights |
For a Share Outstanding Throughout the Periods Presented
| Investor Class | For the Six Months Ended October 31, 2016 (Unaudited) | For the Period September 2, 2015 (Commencement of Operations) to April 30, 2016 | ||||||
| NET ASSET VALUE, BEGINNING OF PERIOD | $ | 10.85 | $ | 10.00 | ||||
| INCOME FROM INVESTMENT OPERATIONS | ||||||||
Net investment income/(loss)(a) | (0.00 | )(b) | 0.00 | (b) | ||||
| Net realized and unrealized gain on investments | 0.48 | 0.85 | ||||||
| Total income from investment operations | 0.48 | 0.85 | ||||||
| DISTRIBUTIONS | ||||||||
| From net investment income | – | (0.00 | )(b) | |||||
| From net realized gain on investments | – | (0.00 | )(b) | |||||
| Total distributions | – | (0.00 | )(b) | |||||
| REDEMPTION FEES ADDED TO PAID‐IN CAPITAL | 0.00 | (b) | 0.00 | (b) | ||||
| INCREASE IN NET ASSET VALUE | 0.48 | 0.85 | ||||||
| NET ASSET VALUE, END OF PERIOD | $ | 11.33 | $ | 10.85 | ||||
| TOTAL RETURN | 4.42 | %(c) | 8.55 | %(c) | ||||
| RATIOS AND SUPPLEMENTAL DATA | ||||||||
| Net assets, end of period (in 000s) | $ | 41,149 | $ | 19,131 | ||||
| RATIOS TO AVERAGE NET ASSETS | ||||||||
| Expenses (excluding fees waived/ reimbursed by investment advisor) | 1.47 | %(d) | 2.06 | %(d)(e) | ||||
| Expenses (including fees waived/ reimbursed by investment advisor) | 1.35 | %(d) | 1.35 | %(d)(e) | ||||
| Net investment loss | (0.01 | )%(d) | 0.00 | %(d)(f) | ||||
| PORTFOLIO TURNOVER RATE | 15 | %(c) | 24 | %(c) | ||||
(a) | Per share numbers have been calculated using the average shares method. |
(b) | Less than $0.005 or ($0.005) per share. |
(c) | Not Annualized. |
(d) | Annualized. |
(e) | Expense ratios during startup periods may not be representative of longer term operating periods. |
(f) | Less than 0.005% of average net assets. |
See Notes to Financial Statements.
| Semi-Annual Report | October 31, 2016 | 79 |
| Grandeur Peak Global Stalwarts Fund | Financial Highlights |
For a Share Outstanding Throughout the Periods Presented
| Institutional Class | For the Six Months Ended October 31, 2016 (Unaudited) | For the Period September 2, 2015 (Commencement of Operations) to April 30, 2016 | ||||||
| NET ASSET VALUE, BEGINNING OF PERIOD | $ | 10.87 | $ | 10.00 | ||||
| INCOME FROM INVESTMENT OPERATIONS | ||||||||
Net investment income(a) | 0.02 | 0.02 | ||||||
| Net realized and unrealized gain on investments | 0.48 | 0.85 | ||||||
| Total income from investment operations | 0.50 | 0.87 | ||||||
| DISTRIBUTIONS | ||||||||
| From net investment income | – | (0.00 | )(b) | |||||
| From net realized gain on investments | – | (0.00 | )(b) | |||||
| Total distributions | – | (0.00 | )(b) | |||||
| REDEMPTION FEES ADDED TO PAID‐IN CAPITAL | – | 0.00 | (b) | |||||
| INCREASE IN NET ASSET VALUE | 0.50 | 0.87 | ||||||
| NET ASSET VALUE, END OF PERIOD | $ | 11.37 | $ | 10.87 | ||||
| TOTAL RETURN | 4.60 | %(c) | 8.76 | %(c) | ||||
| RATIOS AND SUPPLEMENTAL DATA | ||||||||
| Net assets, end of period (in 000s) | $ | 29,648 | $ | 17,562 | ||||
| RATIOS TO AVERAGE NET ASSETS | ||||||||
| Expenses (excluding fees waived/reimbursed by investment advisor) | 1.23 | %(d) | 1.86 | %(d)(e) | ||||
| Expenses (including fees waived/reimbursed by investment advisor) | 1.10 | %(d) | 1.10 | %(d)(e) | ||||
| Net investment income | 0.28 | %(d) | 0.22 | %(d) | ||||
| PORTFOLIO TURNOVER RATE | 15 | %(c) | 24 | %(c) | ||||
(a) | Per share numbers have been calculated using the average shares method. |
(b) | Less than $0.005 or ($0.005) per share. |
(c) | Not Annualized. |
(d) | Annualized. |
(e) | Expense ratios during startup periods may not be representative of longer term operating periods. |
See Notes to Financial Statements.
| 80 | 1.855.377.7325 | www.GrandeurPeakGlobal.com |
| Grandeur Peak International Opportunities Fund | Financial Highlights |
For a Share Outstanding Throughout the Periods Presented
| Investor Class | For the Six Months Ended October 31, 2016 (Unaudited) | Year Ended April 30, 2016 | Year Ended April 30, 2015 | Year Ended April 30, 2014 | Year Ended April 30, 2013 | For the Period October 17, 2011 (Inception) to April 30, 2012 | ||||||||||||||||||
| NET ASSET VALUE, BEGINNING OF PERIOD | $ | 3.09 | $ | 3.42 | $ | 3.41 | $ | 2.83 | $ | 2.29 | $ | 2.00 | ||||||||||||
| INCOME FROM INVESTMENT OPERATIONS | ||||||||||||||||||||||||
Net investment income(a) | 0.01 | 0.01 | 0.01 | 0.01 | 0.01 | 0.00 | (b) | |||||||||||||||||
| Net realized and unrealized gain/(loss) on investments | 0.17 | (0.20 | ) | 0.21 | 0.68 | 0.55 | 0.29 | |||||||||||||||||
| Total income/(loss) from investment operations | 0.18 | (0.19 | ) | 0.22 | 0.69 | 0.56 | 0.29 | |||||||||||||||||
| DISTRIBUTIONS | ||||||||||||||||||||||||
| From net investment income | – | (0.01 | ) | (0.01 | ) | (0.02 | ) | (0.01 | ) | – | ||||||||||||||
| From net realized gain on investments | – | (0.13 | ) | (0.20 | ) | (0.09 | ) | (0.01 | ) | – | ||||||||||||||
| Total distributions | – | (0.14 | ) | (0.21 | ) | (0.11 | ) | (0.02 | ) | – | ||||||||||||||
| REDEMPTION FEES ADDED TO PAID‐IN CAPITAL | 0.00 | (b) | 0.00 | (b) | 0.00 | (b) | 0.00 | (b) | 0.00 | (b) | 0.00 | (b) | ||||||||||||
| INCREASE/DECREASE IN NET ASSET VALUE | 0.18 | (0.33 | ) | 0.01 | 0.58 | 0.54 | 0.29 | |||||||||||||||||
| NET ASSET VALUE, END OF PERIOD | $ | 3.27 | $ | 3.09 | $ | 3.42 | $ | 3.41 | $ | 2.83 | $ | 2.29 | ||||||||||||
| TOTAL RETURN | 5.83 | %(c) | (5.53 | )% | 7.25 | % | 24.59 | % | 24.57 | % | 14.50 | %(c) | ||||||||||||
| RATIOS AND SUPPLEMENTAL DATA | ||||||||||||||||||||||||
| Net assets, end of period (in 000s) | $ | 79,621 | $ | 123,922 | $ | 173,842 | $ | 153,296 | $ | 96,550 | $ | 9,274 | ||||||||||||
| RATIOS TO AVERAGE NET ASSETS | ||||||||||||||||||||||||
| Expenses (excluding fees waived/ reimbursed by investment advisor) | 1.61 | %(d) | 1.62 | % | 1.62 | % | 1.73 | % | 1.88 | % | 2.94 | %(d) | ||||||||||||
| Expenses (including fees waived/ reimbursed by investment advisor) | 1.59 | %(d) | 1.62 | % | 1.62 | % | 1.73 | % | 1.75 | % | 1.75 | %(d) | ||||||||||||
| Net investment income | 0.42 | %(d) | 0.45 | % | 0.37 | % | 0.20 | % | 0.26 | % | 0.33 | %(d) | ||||||||||||
| PORTFOLIO TURNOVER RATE | 12 | %(c) | 34 | % | 36 | % | 37 | % | 52 | % | 24 | %(c) | ||||||||||||
(a) | Per share numbers have been calculated using the average shares method. |
(b) | Less than $0.005 or ($0.005) per share. |
(c) | Not Annualized. |
(d) | Annualized. |
See Notes to Financial Statements.
| Semi-Annual Report | October 31, 2016 | 81 |
| Grandeur Peak International Opportunities Fund | Financial Highlights |
For a Share Outstanding Throughout the Periods Presented
| Institutional Class | For the Six Months Ended October 31, 2016 (Unaudited) | Year Ended April 30, 2016 | Year Ended April 30, 2015 | Year Ended April 30, 2014 | Year Ended April 30, 2013 | For the Period October 17, 2011 (Inception) to April 30, 2012 | ||||||||||||||||||
| NET ASSET VALUE, BEGINNING OF PERIOD | $ | 3.11 | $ | 3.43 | $ | 3.42 | $ | 2.84 | $ | 2.29 | $ | 2.00 | ||||||||||||
| INCOME FROM INVESTMENT OPERATIONS | ||||||||||||||||||||||||
Net investment income(a) | 0.01 | 0.02 | 0.02 | 0.01 | 0.01 | 0.01 | ||||||||||||||||||
| Net realized and unrealized gain/(loss) on investments | 0.16 | (0.20 | ) | 0.21 | 0.69 | 0.57 | 0.28 | |||||||||||||||||
| Total income/(loss) from investment operations | 0.17 | (0.18 | ) | 0.23 | 0.70 | 0.58 | 0.29 | |||||||||||||||||
| DISTRIBUTIONS | ||||||||||||||||||||||||
| From net investment income | – | (0.01 | ) | (0.02 | ) | (0.03 | ) | (0.02 | ) | – | ||||||||||||||
| From net realized gain on investments | – | (0.13 | ) | (0.20 | ) | (0.09 | ) | (0.01 | ) | – | ||||||||||||||
| Total distributions | – | (0.14 | ) | (0.22 | ) | (0.12 | ) | (0.03 | ) | – | ||||||||||||||
| REDEMPTION FEES ADDED TO PAID‐IN CAPITAL | 0.00 | (b) | 0.00 | (b) | 0.00 | (b) | 0.00 | (b) | 0.00 | (b) | 0.00 | (b) | ||||||||||||
| INCREASE/DECREASE IN NET ASSET VALUE | 0.17 | (0.32 | ) | 0.01 | 0.58 | 0.55 | 0.29 | |||||||||||||||||
| NET ASSET VALUE, END OF PERIOD | $ | 3.28 | $ | 3.11 | $ | 3.43 | $ | 3.42 | $ | 2.84 | $ | 2.29 | ||||||||||||
| TOTAL RETURN | 5.47 | %(c) | (5.02 | )% | 7.41 | % | 24.70 | % | 25.11 | % | 14.50 | %(c) | ||||||||||||
| RATIOS AND SUPPLEMENTAL DATA | ||||||||||||||||||||||||
| Net assets, end of period (in 000s) | $ | 636,201 | $ | 579,371 | $ | 682,364 | $ | 658,127 | $ | 250,962 | $ | 55,458 | ||||||||||||
| RATIOS TO AVERAGE NET ASSETS | ||||||||||||||||||||||||
| Expenses (excluding fees waived/ reimbursed by investment advisor) | 1.38 | %(d) | 1.38 | % | 1.38 | % | 1.46 | % | 1.59 | % | 2.50 | %(d) | ||||||||||||
| Expenses (including fees waived/ reimbursed by investment advisor) | 1.37 | %(d) | 1.38 | % | 1.38 | % | 1.46 | % | 1.50 | % | 1.50 | %(d) | ||||||||||||
| Net investment income | 0.70 | %(d) | 0.65 | % | 0.61 | % | 0.42 | % | 0.51 | % | 0.56 | %(d) | ||||||||||||
| PORTFOLIO TURNOVER RATE | 12 | %(c) | 34 | % | 36 | % | 37 | % | 52 | % | 24 | %(c) | ||||||||||||
(a) | Per share numbers have been calculated using the average shares method. |
(b) | Less than $0.005 or ($0.005) per share. |
(c) | Not Annualized. |
(d) | Annualized. |
See Notes to Financial Statements.
| 82 | 1.855.377.7325 | www.GrandeurPeakGlobal.com |
| Grandeur Peak International Stalwarts Fund | Financial Highlights |
For a Share Outstanding Throughout the Periods Presented
| Investor Class | For the Six Months Ended October 31, 2016 (Unaudited) | For the Period September 2, 2015 (Commencement of Operations) to April 30, 2016 | ||||||
| NET ASSET VALUE, BEGINNING OF PERIOD | $ | 11.02 | $ | 10.00 | ||||
| INCOME FROM INVESTMENT OPERATIONS | ||||||||
Net investment income(a) | 0.02 | 0.03 | ||||||
| Net realized and unrealized gain on investments | 0.64 | 0.99 | ||||||
| Total income from investment operations | 0.66 | 1.02 | ||||||
| REDEMPTION FEES ADDED TO PAID‐IN CAPITAL | 0.00 | (b) | 0.00 | (b) | ||||
| INCREASE IN NET ASSET VALUE | 0.66 | 1.02 | ||||||
| NET ASSET VALUE, END OF PERIOD | $ | 11.68 | $ | 11.02 | ||||
| TOTAL RETURN | 5.99 | %(c) | 10.20 | %(c) | ||||
| RATIOS AND SUPPLEMENTAL DATA | ||||||||
| Net assets, end of period (in 000s) | $ | 26,219 | $ | 22,028 | ||||
| RATIOS TO AVERAGE NET ASSETS | ||||||||
| Expenses (excluding fees waived/ reimbursed by investment advisor) | 1.30 | %(d) | 1.45 | %(d)(e) | ||||
| Expenses (including fees waived/ reimbursed by investment advisor) | 1.30 | %(d) | 1.35 | %(d)(e) | ||||
| Net investment income | 0.42 | %(d) | 0.44 | %(d) | ||||
| PORTFOLIO TURNOVER RATE | 15 | %(c) | 59 | %(c) | ||||
(a) | Per share numbers have been calculated using the average shares method. |
(b) | Less than $0.005 or ($0.005) per share. |
(c) | Not Annualized. |
(d) | Annualized. |
(e) | Expense ratios during startup periods may not be representative of longer term operating periods. |
See Notes to Financial Statements.
| Semi-Annual Report | October 31, 2016 | 83 |
| Grandeur Peak International Stalwarts Fund | Financial Highlights |
For a Share Outstanding Throughout the Periods Presented
| Institutional Class | For the Six Months Ended October 31, 2016 (Unaudited) | For the Period September 2, 2015 (Commencement of Operations) to April 30, 2016 | ||||||
| NET ASSET VALUE, BEGINNING OF PERIOD | $ | 11.03 | $ | 10.00 | ||||
| INCOME FROM INVESTMENT OPERATIONS | ||||||||
Net investment income(a) | 0.04 | 0.04 | ||||||
| Net realized and unrealized gain on investments | 0.63 | 0.99 | ||||||
| Total income from investment operations | 0.67 | 1.03 | ||||||
| DISTRIBUTIONS | ||||||||
| From net investment income | – | (0.00 | )(b) | |||||
| Total distributions | – | (0.00 | )(b) | |||||
| REDEMPTION FEES ADDED TO PAID‐IN CAPITAL | – | 0.00 | (b) | |||||
| INCREASE IN NET ASSET VALUE | 0.67 | 1.03 | ||||||
| NET ASSET VALUE, END OF PERIOD | $ | 11.70 | $ | 11.03 | ||||
| TOTAL RETURN | 6.07 | %(c) | 10.34 | %(c) | ||||
| RATIOS AND SUPPLEMENTAL DATA | ||||||||
| Net assets, end of period (in 000s) | $ | 186,726 | $ | 119,070 | ||||
| RATIOS TO AVERAGE NET ASSETS | ||||||||
| Expenses (excluding fees waived/ reimbursed by investment advisor) | 1.06 | %(d) | 1.20 | %(d)(e) | ||||
| Expenses (including fees waived/ reimbursed by investment advisor) | 1.06 | %(d) | 1.10 | %(d)(e) | ||||
| Net investment income | 0.64 | %(d) | 0.60 | %(d) | ||||
| PORTFOLIO TURNOVER RATE | 15 | %(c) | 59 | %(c) | ||||
(a) | Per share numbers have been calculated using the average shares method. |
(b) | Less than $0.005 or ($0.005) per share. |
(c) | Not Annualized. |
(d) | Annualized. |
(e) | Expense ratios during startup periods may not be representative of longer term operating periods. |
See Notes to Financial Statements.
| 84 | 1.855.377.7325 | www.GrandeurPeakGlobal.com |
Grandeur Peak Funds® | Notes to Financial Statements |
| October 31, 2016 (Unaudited) |
1. ORGANIZATION
Financial Investors Trust (the “Trust”), a Delaware statutory trust, is an open‐end management investment company registered under the Investment Company Act of 1940, as amended (“1940 Act”). As of October 31, 2016, the Trust consists of multiple separate portfolios or series. This semi‐annual report describes the Grandeur Peak Emerging Markets Opportunities Fund, Grandeur Peak Global Micro Cap Fund, Grandeur Peak Global Opportunities Fund, Grandeur Peak Global Reach Fund, Grandeur Peak Global Stalwarts Fund, Grandeur Peak International Opportunities Fund, and Grandeur Peak International Stalwarts Fund (individually a “Fund” and collectively, the “Funds”). The Funds seek long‐term growth of capital. The Funds offer Investor Class (except the Grandeur Peak Global Micro Cap Fund) and Institutional Class shares.
2. SIGNIFICANT ACCOUNTING POLICIES
The accompanying financial statements were prepared in accordance with accounting principles generally accepted in the United States of America (“U.S. GAAP”). The preparation of financial statements in conformity with U.S. GAAP requires management to make certain estimates and assumptions that affect the reported amounts of assets and liabilities and disclosures of contingent assets and liabilities at the date of the financial statements and the reported amounts of revenue and expenses during the period. Actual results could differ from those estimates. The Funds are considered an investment company for financial reporting purposes under U.S. GAAP. The following is a summary of significant accounting policies consistently followed by the Funds in preparation of their financial statements.
Investment Valuation: The Funds generally value their securities based on market prices determined at the close of regular trading on the New York Stock Exchange (“NYSE”), normally 4:00 p.m. Eastern Time, on each day the NYSE is open for trading.
For equity securities and mutual funds that are traded on an exchange, the market price is usually the closing sale or official closing price on that exchange. In the case of equity securities not traded on an exchange, or if such closing prices are not otherwise available, the securities are valued at the mean of the most recent bid and ask prices on such day. Redeemable securities issued by open‐end registered investment companies are valued at the investment company’s applicable net asset value, with the exception of exchange‐traded open‐end investment companies, which are priced as equity securities.
Equity securities that are primarily traded on foreign securities exchanges are valued at the closing values of such securities on their respective foreign exchanges, except when an event occurs subsequent to the close of the foreign exchange and the close of the NYSE that was likely to have changed such value. In such an event, the fair value of those securities are determined in good faith through consideration of other factors in accordance with procedures established by and under the general supervision of the Board of Trustees (the “Board”). The Funds will use a fair valuation model provided by an independent pricing service, which is intended to reflect fair value when a security’s value or a meaningful portion of each Fund’s portfolio is believed to have been materially affected by a valuation event that has occurred between the close of the exchange or market on which the security is traded and the close of the regular trading day on the NYSE. The Funds’ valuation procedures set forth certain triggers which instruct when to use the fair valuation model.
Forward currency exchange contracts have a fair value determined by the prevailing foreign currency exchange daily rates and current foreign currency exchange forward rates. The foreign currency exchange forward rates are calculated using an automated system that estimates rates on the basis of the current day foreign currency exchange rates and forward foreign currency exchange rates supplied by a pricing service.
When such prices or quotations are not available, or when Grandeur Peak Global Advisors, LLC (the “Adviser”) believes that they are unreliable, securities may be priced using fair value procedures approved by the Board.
Fair Value Measurements: The Funds disclose the classification of their fair value measurements following a three‐tier hierarchy based on the inputs used to measure fair value. Inputs refer broadly to the assumptions that market participants would use in pricing the asset or liability, including assumptions about risk. Inputs may be observable or unobservable. Observable inputs reflect the assumptions market participants would use in pricing the asset or liability that are developed based on market data obtained from sources independent of the reporting entity. Unobservable inputs reflect the reporting entity’s own assumptions about the assumptions market participants would use in pricing the asset or liability that are developed based on the best information available.
| Semi-Annual Report | October 31, 2016 | 85 |
Grandeur Peak Funds® | Notes to Financial Statements |
| October 31, 2016 (Unaudited) |
Various inputs are used in determining the value of the Funds’ investments as of the end of the reporting period. When inputs used fall into different levels of the fair value hierarchy, the level in the hierarchy within which the fair value measurement falls is determined based on the lowest level input that is significant to the fair value measurement in its entirety. The designated input levels are not necessarily an indication of the risk or liquidity associated with these investments. These inputs are categorized in the following hierarchy under applicable financial accounting standards:
Level 1 – Unadjusted quoted prices in active markets for identical investments, unrestricted assets or liabilities that the Funds have the ability to access at the measurement date;
Level 2 – Quoted prices which are not active, quoted prices for similar assets or liabilities in active markets or inputs other than quoted prices that are observable (either directly or indirectly) for substantially the full term of the asset or liability; and
Level 3 – Significant unobservable prices or inputs (including the Funds’ own assumptions in determining the fair value of investments) where there is little or no market activity for the asset or liability at the measurement date.
The following is a summary of each Fund’s investments in the fair value hierarchy as of October 31, 2016:
| Investments in Securities at Value | Level 1 - Quoted and Unadjusted Prices | Level 2 - Other Significant Observable Inputs | Level 3 - Significant Unobservable Inputs | Total | ||||||||||||
| Grandeur Peak Emerging Markets Opportunities Fund | ||||||||||||||||
Common Stocks* | $ | 354,872,157 | $ | – | $ | – | $ | 354,872,157 | ||||||||
Rights* | – | 39,181 | – | 39,181 | ||||||||||||
| Total | $ | 354,872,157 | $ | 39,181 | $ | – | $ | 354,911,338 | ||||||||
| Investments in Securities at Value | Level 1 - Quoted and Unadjusted Prices | Level 2 - Other Significant Observable Inputs | Level 3 - Significant Unobservable Inputs | Total | ||||||||||||
| Grandeur Peak Global Micro Cap Fund | ||||||||||||||||
Common Stocks* | $ | 31,268,040 | $ | – | $ | – | $ | 31,268,040 | ||||||||
Rights* | – | 4,805 | – | 4,805 | ||||||||||||
| Total | $ | 31,268,040 | $ | 4,805 | $ | – | $ | 31,272,845 | ||||||||
| Investments in Securities at Value | Level 1 - Quoted and Unadjusted Prices | Level 2 - Other Significant Observable Inputs | Level 3 - Significant Unobservable Inputs | Total | ||||||||||||
| Grandeur Peak Global Opportunities Fund | ||||||||||||||||
Common Stocks* | $ | 619,153,531 | $ | – | $ | – | $ | 619,153,531 | ||||||||
Rights* | – | 68,858 | – | 68,858 | ||||||||||||
| Total | $ | 619,153,531 | $ | 68,858 | $ | – | $ | 619,222,389 | ||||||||
| Investments in Securities at Value | Level 1 - Quoted and Unadjusted Prices | Level 2 - Other Significant Observable Inputs | Level 3 - Significant Unobservable Inputs | Total | ||||||||||||
| Grandeur Peak Global Reach Fund | ||||||||||||||||
| Common Stocks | ||||||||||||||||
| Georgia | $ | 2,390,914 | $ | 331,432 | $ | – | $ | 2,722,346 | ||||||||
| Spain | – | – | 1 | 1 | ||||||||||||
Other* | 279,241,680 | – | – | 279,241,680 | ||||||||||||
Preferred Stocks* | $ | 651,098 | $ | – | $ | – | $ | 651,098 | ||||||||
Rights* | – | 22,147 | – | 22,147 | ||||||||||||
| Total | $ | 282,283,692 | $ | 353,579 | $ | 1 | $ | 282,637,272 | ||||||||
| 86 | 1.855.377.7325 | www.GrandeurPeakGlobal.com |
Grandeur Peak Funds® | Notes to Financial Statements |
| October 31, 2016 (Unaudited) |
| Investments in Securities at Value | Level 1 - Quoted and Unadjusted Prices | Level 2 - Other Significant Observable Inputs | Level 3 - Significant Unobservable Inputs | Total | ||||||||||||
| Grandeur Peak Global Stalwarts Fund | ||||||||||||||||
Common Stocks* | $ | 65,276,681 | $ | – | $ | – | $ | 65,276,681 | ||||||||
Preferred Stocks* | 609,327 | – | – | 609,327 | ||||||||||||
Exchange Traded Funds* | 1,046,351 | – | – | 1,046,351 | ||||||||||||
| Total | $ | 66,932,359 | $ | – | $ | – | $ | 66,932,359 | ||||||||
| Investments in Securities at Value | Level 1 - Quoted and Unadjusted Prices | Level 2 - Other Significant Observable Inputs | Level 3 - Significant Unobservable Inputs | Total | ||||||||||||
| Grandeur Peak International Opportunities Fund | ||||||||||||||||
Common Stocks* | $ | 654,801,273 | $ | – | $ | – | $ | 654,801,273 | ||||||||
Rights* | – | 111,020 | – | 111,020 | ||||||||||||
| Total | $ | 654,801,273 | $ | 111,020 | $ | – | $ | 654,912,293 | ||||||||
| Investments in Securities at Value | Level 1 - Quoted and Unadjusted Prices | Level 2 - Other Significant Observable Inputs | Level 3 - Significant Unobservable Inputs | Total | ||||||||||||
| Grandeur Peak International Stalwarts Fund | ||||||||||||||||
Common Stocks* | $ | 188,555,120 | $ | – | $ | – | $ | 188,555,120 | ||||||||
Preferred Stocks* | 2,656,109 | – | – | 2,656,109 | ||||||||||||
Exchange Traded Funds* | 6,103,010 | – | – | 6,103,010 | ||||||||||||
| Total | $ | 197,314,239 | $ | – | $ | – | $ | 197,314,239 | ||||||||
| * | For a detailed country breakdown, see the accompanying Portfolio of Investments. |
The Fund utilizes a fair value evaluation service with respect to international securities with an earlier market closing than the Fund’s net asset value computation cutoff. When events trigger the use of the fair value evaluation service on a reporting period date, it results in certain securities transferring from a Level 1 to a Level 2 classification. When the trigger is not met at a period end, it could result in securities transferring from a Level 2 to a Level 1 classification. The transfer amount disclosed in the table below represents the value of the securities as of October 31, 2016 transferred in/(out) of Level 1 and Level 2 during the reporting period that were also held as of April 30, 2016.
The Grandeur Peak Global Micro Cap Fund had the following transfers in Level 1 from Level and Level 2 at October 31, 2016:
Level 1 - Quoted and Unadjusted Prices | Level 2 - Other Significant Observable Inputs | |||||||||||||||
| Transfers In | Transfers (Out) | Transfers In | Transfers (Out) | |||||||||||||
| Common Stocks | $ | 95,435 | $ | – | $ | – | $ | (95,435 | ) | |||||||
| Total | $ | 95,435 | $ | – | $ | – | $ | (95,435 | ) | |||||||
The Grandeur Peak Global Opportunities Fund had the following transfers in Level 1 from Level and Level 2 at October 31, 2016:
Level 1 - Quoted and Unadjusted Prices | Level 2 - Other Significant Observable Inputs | |||||||||||||||
| Transfers In | Transfers (Out) | Transfers In | Transfers (Out) | |||||||||||||
| Common Stocks | $ | 634,034 | $ | – | $ | – | $ | (634,034 | ) | |||||||
| Total | $ | 634,034 | $ | – | $ | – | $ | (634,034 | ) | |||||||
| Semi-Annual Report | October 31, 2016 | 87 |
Grandeur Peak Funds® | Notes to Financial Statements |
| October 31, 2016 (Unaudited) |
The following is a reconciliation of the investments in which significant unobservable inputs (Level 3) were used in determining fair value:
| Grandeur Peak Global Reach Fund | Common Stocks | Total | ||||||
| Balance as of April 30, 2016 | $ | 1 | $ | 1 | ||||
| Accrued Discount/Premium | – | – | ||||||
| Return of Capital | – | – | ||||||
| Realized Gain/(Loss) | – | – | ||||||
| Change in Unrealized Appreciation/(Depreciation) | – | – | ||||||
| Purchases | – | – | ||||||
| Sales Proceeds | – | – | ||||||
| Transfer into Level 3 | – | – | ||||||
| Transfer out of Level 3 | – | – | ||||||
| Balance as of October 31, 2016 | $ | 1 | $ | 1 | ||||
| Net change in unrealized Appreciation/(Depreciation) included in the Statement of Operations attributable to Level 3 investments held at October 31, 2016 | $ | – | $ | – | ||||
Change in unrealized appreciation/depreciation on Level 3 securities is included on the Statements of Operations under Net change in unrealized appreciation/(depreciation) on investments. Realized gain (loss) on Level 3 securities is included on the Statements of Operations under Net realized gain/(loss) on investments. Due to the ability to obtain a closing market price within an active market for a security that previously had no market to trade, the security was transferred to level 1 for all Funds.
Investment Transactions and Investment Income: Investment transactions are accounted for on the date the investments are purchased or sold (trade date). Realized gains and losses from investment transactions are reported on an identified cost which is the same basis the Fund uses for federal income tax purposes. Interest income, which includes accretion of discounts and amortization of premiums, is accrued and recorded as earned. Dividend income is recognized on the ex‐dividend date or for certain foreign securities, as soon as information is available to the Funds. All of the realized and unrealized gains and losses and net investment income, are allocated daily to each class in proportion to its average daily net assets.
Cash Management Transactions: The Funds subscribe to the Brown Brothers Harriman & Co. (“BBH”) Cash Management Service (“CMS”), whereby cash balances are automatically swept into overnight offshore demand deposits with either the BBH Grand Cayman branch or a branch of a pre‐approved commercial bank. This fully automated program allows the Funds to earn interest on cash balances. Excess cash with deposit institutions domiciled outside of the U.S. are subject to sovereign actions in the jurisdiction of the deposit institution including, but not limited to, freeze, seizure or diminution. Cash balances in the BBH CMS are included on the Statements of Assets and Liabilities under Cash and Foreign Cash, at Value. As of October 31, 2016, the Funds had the following cash balances participating in the BBH CMS:
| Fund | ||||
| Grandeur Peak Emerging Markets Opportunities Fund | $ | 40,259,450 | ||
| Grandeur Peak Global Micro Cap Fund | 1,406,113 | |||
| Grandeur Peak Global Opportunities Fund | 12,135,233 | |||
| Grandeur Peak Global Reach Fund | 3,973,945 | |||
| Grandeur Peak Global Stalwarts Fund | 3,987,286 | |||
| Grandeur Peak International Opportunities Fund | 61,894,440 | |||
| Grandeur Peak International Stalwarts Fund | 15,243,967 | |||
As of October 31, 2016, the Funds had the following foreign cash balances participating in the BBH CMS (cost and value of foreign cash balances are equal):
| Fund | ||||
| Grandeur Peak Emerging Markets Opportunities Fund | $ | 1,907 | ||
| Grandeur Peak Global Micro Cap Fund | 1,318 | |||
| Grandeur Peak Global Opportunities Fund | 243,420 | |||
| Grandeur Peak Global Reach Fund | 301,985 | |||
| Grandeur Peak Global Stalwarts Fund | 16,978 | |||
| Grandeur Peak International Opportunities Fund | 690,766 | |||
| Grandeur Peak International Stalwarts Fund | 1,140,801 | |||
| 88 | 1.855.377.7325 | www.GrandeurPeakGlobal.com |
Grandeur Peak Funds® | Notes to Financial Statements |
| October 31, 2016 (Unaudited) |
Foreign Securities: The Funds may directly purchase securities of foreign issuers. Investing in securities of foreign issuers involves special risks not typically associated with investing in securities of U.S. issuers. The risks include possible reevaluation of currencies, the inability to repatriate foreign currency, less complete financial information about companies and possible future adverse political and economic developments. Moreover, securities of many foreign issuers and their markets may be less liquid and their prices more volatile than those of securities of comparable U.S. issuers.
Foreign Currency Translation: The books and records of the Funds are maintained in U.S. dollars. Investment valuations and other assets and liabilities initially expressed in foreign currencies are converted each business day into U.S. dollars based upon current exchange rates. Prevailing foreign exchange rates may generally be obtained at the close of the NYSE (normally, 4:00 p.m. Eastern Time). The portion of realized and unrealized gains or losses on investments due to fluctuations in foreign currency exchange rates is not separately disclosed and is included in realized and unrealized gains or losses on investments, when applicable.
Foreign Currency Spot Contracts: The Funds may enter into foreign currency spot contracts to facilitate transactions in foreign securities or to convert foreign currency receipts into U.S. dollars. A foreign currency spot contract is an agreement between two parties to buy and sell currencies at the current market rate, for settlement generally within two business days. The U.S. dollar value of the contracts is determined using current currency exchange rates supplied by a pricing service.
The contract is marked‐to‐market daily for settlements beyond one day and any change in market value is recorded as an unrealized gain or loss. When the contract is closed, a realized gain or loss is recorded equal to the difference between the value on the open and close date. Losses may arise from changes in the value of the foreign currency, or if the counterparties do not perform under the contract’s terms. The maximum potential loss from such contracts is the aggregate face value in U.S. dollars at the time the contract was opened.
Trust Expenses: Some expenses of the Trust can be directly attributed to the Funds. Expenses which cannot be directly attributed to the Funds are apportioned among all funds in the Trust based on average net assets of each fund.
Fund and Class Expenses: Expenses that are specific to a Fund or class of shares of a Fund, including distribution fees (Rule 12b‐1 fees), are charged directly to that Fund or share class. Expenses that are common to all Funds generally are allocated among the Funds in proportion to their average daily net assets.
Offering Costs: Offering costs, including costs of printing initial prospectuses, legal and registration fees, are being amortized over twelve months from the inception date of the Funds. Amounts amortized during the period ended October 31, 2016 for the Grandeur Peak Micro Cap Fund, Grandeur Peak Global Stalwarts Fund, and Grandeur Peak International Stalwarts Fund are shown on the Statements of Operations. As of October 31, 2016, the Grandeur Peak Emerging Markets Opportunities Fund, Grandeur Peak Global Opportunities Fund, Grandeur Peak Global Reach Fund, and Grandeur Peak International Opportunities Fund fully amortized all offering costs.
Federal Income Taxes: The Funds comply with the requirements under Subchapter M of the Internal Revenue Code of 1986, as amended, applicable to regulated investment companies and intend to distribute substantially all of their net taxable income and net capital gains, if any, each year so that it will not be subject to excise tax on undistributed income and gains. The Funds are not subject to income taxes to the extent such distributions are made.
As of and during the period ended October 31, 2016, the Funds had a liability for unrecognized capital gains tax. These amounts are disclosed as Foreign Capital Gains Tax on the Statements of Assets and Liabilities. The Funds file U.S. federal, state, and local tax returns as required. The Funds’ tax returns are subject to examination by the relevant tax authorities until expiration of the applicable statute of limitations, which is generally three years after the filing of the tax return for federal purposes and four years for most state returns. Tax returns for open years have incorporated no uncertain tax positions that require a provision for income taxes.
Distributions to Shareholders: Each Fund normally pays dividends and distributes capital gains, if any, on an annual basis. Income dividend distributions are derived from dividends and other income each Fund receives from their investments, including short term capital gains. Long term capital gain distributions are derived from gains realized when each Fund sells a security it has owned for more than a year. Each Fund may make additional distributions and dividends at other times if the portfolio manager believes doing so may be necessary for each Fund to avoid or reduce taxes. The Funds intend to pass through foreign tax credits to shareholders.
| Semi-Annual Report | October 31, 2016 | 89 |
Grandeur Peak Funds® | Notes to Financial Statements |
| October 31, 2016 (Unaudited) |
3. TAX BASIS INFORMATION
Tax Basis of Investments: As of October 31, 2016, the aggregate cost of investments, gross unrealized appreciation/(depreciation) and net unrealized appreciation for Federal tax purposes was as follows:
| Gross Appreciation (excess of value over tax cost) | Gross Depreciation (excess of tax cost over value) | Net Unrealized Appreciation/(Depreciation) | Cost of Investments for Income Tax Purposes | |||||||||||||
| Grandeur Peak Emerging Markets Opportunities Fund | $ | 61,153,718 | $ | (43,565,871 | ) | $ | 17,587,847 | $ | 337,323,491 | |||||||
| Grandeur Peak Global Micro Cap Fund | 4,770,533 | (1,862,448 | ) | 2,908,085 | 28,364,760 | |||||||||||
| Grandeur Peak Global Opportunities Fund | 161,121,854 | (56,668,918 | ) | 104,452,936 | 514,769,453 | |||||||||||
| Grandeur Peak Global Reach Fund | 56,143,905 | (25,404,511 | ) | 30,739,394 | 251,897,878 | |||||||||||
| Grandeur Peak Global Stalwarts Fund | 6,976,026 | (2,791,207 | ) | 4,184,819 | 62,747,540 | |||||||||||
| Grandeur Peak International Opportunities Fund | 153,295,250 | (59,327,564 | ) | 93,967,686 | 560,944,607 | |||||||||||
| Grandeur Peak International Stalwarts Fund | 22,804,589 | (8,808,041 | ) | 13,996,548 | 183,317,691 | |||||||||||
Tax Basis of Distributions to Shareholders: The character of distributions made during the year from net investment income or net realized gains may differ from its ultimate characterization for federal income tax purposes. Also, due to the timing of dividend distributions, the fiscal year in which amounts are distributed may differ from the fiscal year in which the income or realized gain were recorded by the Funds.
The tax character of distributions paid by the Funds for the fiscal year and or period ended April 30, 2016 were as follows:
| Ordinary Income | Long-Term Capital Gain | |||||||
| Grandeur Peak Emerging Markets Opportunities Fund | $ | 37 | $ | 13,091,570 | ||||
| Grandeur Peak Global Micro Cap Fund | – | – | ||||||
| Grandeur Peak Global Opportunities Fund | 4,220,786 | 45,472,588 | ||||||
| Grandeur Peak Global Reach Fund | 4,111,213 | 7,292,064 | ||||||
| Grandeur Peak Global Stalwarts Fund | 12,473 | – | ||||||
| Grandeur Peak International Opportunities Fund | 5,508,633 | 28,796,865 | ||||||
| Grandeur Peak International Stalwarts Fund | 30,017 | – | ||||||
The amounts and characteristics of tax basis distributions and composition of distributable earnings/(accumulated losses) are finalized at fiscal year end. Accordingly, tax basis balances have not been determined as of October 31, 2016.
4. SECURITIES TRANSACTIONS
The cost of purchases and proceeds from sales of securities (excluding short term securities) during the six months ended October 31, 2016 were as follows:
| Fund | Purchases of Securities | Proceeds From Sales of Securities | ||||||
| Grandeur Peak Emerging Markets Opportunities Fund | $ | 47,666,725 | $ | 69,283,972 | ||||
| Grandeur Peak Global Micro Cap Fund | 4,010,136 | 4,901,260 | ||||||
| Grandeur Peak Global Opportunities Fund | 83,893,371 | 105,972,083 | ||||||
| Grandeur Peak Global Reach Fund | 47,441,433 | 61,795,895 | ||||||
| Grandeur Peak Global Stalwarts Fund | 38,071,635 | 7,565,026 | ||||||
| Grandeur Peak International Opportunities Fund | 79,443,292 | 128,068,338 | ||||||
| Grandeur Peak International Stalwarts Fund | 81,045,217 | 22,972,719 | ||||||
5. SHARES OF BENEFICIAL INTEREST
The capitalization of the Trust consists of an unlimited number of shares of beneficial interest with no par value per share. Holders of the shares of the Funds of the Trust have one vote for each share held and a proportionate fraction of a vote for each fractional share. All shares issued and outstanding are fully paid and are transferable and redeemable at the option of the shareholder. Purchasers of the share do not have
| 90 | 1.855.377.7325 | www.GrandeurPeakGlobal.com |
Grandeur Peak Funds® | Notes to Financial Statements |
| October 31, 2016 (Unaudited) |
any obligation to make payments to the Trust or its creditors solely by reason of the purchasers’ ownership of the shares. Shares have no pre‐emptive rights.
Shares redeemed within 60 days of purchase may incur a 2% short‐term redemption fee deducted from the redemption amount. For the six months ended October 31, 2016 and the year ended April 30, 2016, the redemption fees charged by the Funds are presented in the Statements of Changes in Net Assets.
6. MANAGEMENT AND RELATED‐PARTY TRANSACTIONS
The Adviser, subject to the authority of the Board, is responsible for the overall management and administration of the Funds’ business affairs. The Adviser manages the investments of the Funds in accordance with the Funds’ investment objective, policies and limitations and investment guidelines established jointly by the Adviser and the Trustees. Pursuant to the Advisory Agreement, (the “Advisory Agreement”), each Fund pays the Adviser an annual management fee based on each Fund’s average daily net assets. The management fee is paid on a monthly basis. The following table reflects the Funds’ advisory fee rates.
| Fund | Advisory Fee |
| Grandeur Peak Emerging Markets Opportunities Fund | 1.35% |
| Grandeur Peak Global Micro Cap Fund | 1.50% |
| Grandeur Peak Global Opportunities Fund | 1.25% |
| Grandeur Peak Global Reach Fund | 1.10% |
| Grandeur Peak Global Stalwarts Fund | 0.80% |
| Grandeur Peak International Opportunities Fund | 1.25% |
| Grandeur Peak International Stalwarts Fund | 0.80% |
The Adviser has contractually agreed to limit certain of each Fund’s expenses. The following table reflects the Funds’ expense cap.
| Fund | Expense Cap | Term of Expense Limit Agreements |
| Grandeur Peak Emerging Markets Opportunities Fund | ||
| Investor Class | 1.95% | September 1, 2015 – August 31, 2016 / |
| Institutional Class | 1.70% | September 1, 2016 – August 31, 2017 |
| Grandeur Peak Global Micro Cap Fund | ||
| Institutional Class | 2.00% | June 29, 2015 – August 31, 2016 / September 1, 2016 – August 31, 2017 |
| Grandeur Peak Global Opportunities Fund | ||
| Investor Class | 1.75% | September 1, 2015 – August 31, 2016 / |
| Institutional Class | 1.50% | September 1, 2016 – August 31, 2017 |
| Grandeur Peak Global Reach Fund | ||
| Investor Class | 1.60% | September 1, 2015 – August 31, 2016 / |
| Institutional Class | 1.35% | September 1, 2016 – August 31, 2017 |
| Grandeur Peak Global Stalwarts Fund | ||
| Investor Class | 1.35% | June 29, 2015 – August 31, 2016 / |
| Institutional Class | 1.10% | September 1, 2016 – August 31, 2017 |
| Grandeur Peak International Opportunities Fund | ||
| Investor Class | 1.75% | September 1, 2015 – August 31, 2016 / |
| Institutional Class | 1.50% | September 1, 2016 – August 31, 2017 |
| Grandeur Peak International Stalwarts Fund | ||
| Investor Class | 1.35% | June 29, 2015 – August 31, 2016 / |
| Institutional Class | 1.10% | September 1, 2016 – August 31, 2017 |
Pursuant to these agreements, each Fund will reimburse the Adviser for any fee waivers and expense reimbursements made by the Adviser, provided that any such reimbursements made by the Funds to the Adviser will not cause the Funds’ expense limitation to exceed expense limitations in existence at the time the expense was incurred, or at the time of the reimbursement, whichever is lower, and the reimbursement is made within three years after the expenses were incurred. Fees waived/reimbursed by adviser for the six months ended October 31, 2016 are disclosed in the Statements of Operations.
| Semi-Annual Report | October 31, 2016 | 91 |
Grandeur Peak Funds® | Notes to Financial Statements |
| October 31, 2016 (Unaudited) |
In addition to the foregoing contractual arrangements, the Adviser has voluntarily agreed, effective September 1, 2016, to waive, with respect to the Grandeur Peak Global Opportunities Fund and the Grandeur Peak International Opportunities Fund only, annual management fees to the extent such fees exceed 1.10% on assets above $500 million (the annual management fee rate with respect to such funds will remain 1.25% on the first $500 million in assets). This voluntary arrangement may be terminated at any time by the Adviser.
For the six months ended October 31, 2016, the fee waivers/reimbursements and/or recoupments were as follows:
| Fund | Fees Waived/ Reimbursed By Adviser | Recoupment of Previously Waived Fees By Adviser | ||||||
| Grandeur Peak Emerging Markets Opportunities Fund | ||||||||
| Investor Class | $ | – | $ | – | ||||
| Institutional Class | – | – | ||||||
| Grandeur Peak Global Micro Cap Fund | ||||||||
| Institutional Class | $ | 44,853 | $ | – | ||||
| Grandeur Peak Global Opportunities Fund | ||||||||
| Investor Class | $ | 9,752 | $ | – | ||||
| Institutional Class | 26,023 | – | ||||||
| Grandeur Peak Global Reach Fund | ||||||||
| Investor Class | $ | – | $ | – | ||||
| Institutional Class | – | – | ||||||
| Grandeur Peak Global Stalwarts Fund | ||||||||
| Investor Class | $ | 17,817 | $ | – | ||||
| Institutional Class | 15,795 | – | ||||||
| Grandeur Peak International Opportunities Fund | ||||||||
| Investor Class | $ | 6,377 | $ | – | ||||
| Institutional Class | 50,733 | – | ||||||
| Grandeur Peak International Stalwarts Fund | ||||||||
| Investor Class | $ | – | $ | 7,314 | ||||
| Institutional Class | – | 44,153 | ||||||
| 92 | 1.855.377.7325 | www.GrandeurPeakGlobal.com |
Grandeur Peak Funds® | Notes to Financial Statements |
| October 31, 2016 (Unaudited) |
As of October 31, 2016, the balances of recoupable expenses for each Fund were as follows:
| Fund | Expires 2019 | Total | ||||||
| Grandeur Peak Emerging Markets Opportunities Fund | ||||||||
| Investor Class | $ | – | $ | – | ||||
| Institutional Class | – | – | ||||||
| Grandeur Peak Global Micro Cap Fund | ||||||||
| Institutional Class | $ | 44,561 | $ | 44,561 | ||||
| Grandeur Peak Global Opportunities Fund | ||||||||
| Investor Class | $ | – | $ | – | ||||
| Institutional Class | – | – | ||||||
| Grandeur Peak Global Reach Fund | ||||||||
| Investor Class | $ | – | $ | – | ||||
| Institutional Class | – | – | ||||||
| Grandeur Peak Global Stalwarts Fund | ||||||||
| Investor Class | $ | 56,762 | $ | 56,762 | ||||
| Institutional Class | 55,389 | 55,389 | ||||||
| Grandeur Peak International Opportunities Fund | ||||||||
| Investor Class | $ | – | $ | – | ||||
| Institutional Class | – | – | ||||||
| Grandeur Peak International Stalwarts Fund | ||||||||
| Investor Class | $ | 7,314 | $ | 7,314 | ||||
| Institutional Class | 44,153 | 44,153 | ||||||
Administrator Fees and Expenses
ALPS Fund Services, Inc. (“ALPS”) serves as administrator to the Funds and the Funds have agreed to pay expenses incurred in connection with their administrative activities. Pursuant to an Administration Agreement, ALPS provides operational services to the Funds including, but not limited to, fund accounting and fund administration and generally assists in the Funds’ operations. Officers of the Trust are employees of ALPS. The Funds’ administration fee is accrued on a daily basis and paid monthly. Administration fees paid by the Funds for the six months ended October 31, 2016 are disclosed in the Statements of Operations.
ALPS is reimbursed by the Fund for certain out‐of‐pocket expenses.
Transfer Agent
ALPS serves as transfer, dividend paying and shareholder servicing agent for the Funds. ALPS receives an annual minimum fee, a fee based upon the number of shareholder accounts, and is also reimbursed by the Funds for certain out‐of‐pocket expenses. Transfer agent fees paid by the Funds for the six months ended October 31, 2016 are disclosed in the Statements of Operations.
Compliance Services
ALPS provides services that assist the Trust’s chief compliance officer in monitoring and testing the policies and procedures of the Trust in conjunction with requirements under Rule 38a‐1 under the 1940 Act and receives an annual base fee. ALPS is reimbursed for certain out‐of‐pocket expenses by the Funds. Compliance service fees paid by the Funds for the six months ended October 31, 2016 are disclosed in the Statements of Operations.
Principal Financial Officer
ALPS receives an annual fee for providing principal financial officer services to the Funds. Principal financial officer fees paid by the Fund for the six months ended October 31, 2016 are disclosed in the Statements of Operations.
Distributor: ALPS Distributors, Inc. (“ADI” or the “Distributor”) (an affiliate of ALPS) acts as the distributor of the Funds’ shares pursuant to a Distribution Agreement with the Trust. Shares are sold on a continuous basis by ADI as agent for the Funds, and ADI has agreed to use its best efforts to solicit orders for the sale of each Fund’s shares, although it is not obliged to sell any particular amount of shares. ADI is not entitled to any compensation for its services as Distributor. ADI is registered as a broker‐dealer with the U.S. Securities and Exchange Commission.
| Semi-Annual Report | October 31, 2016 | 93 |
Grandeur Peak Funds® | Notes to Financial Statements |
| October 31, 2016 (Unaudited) |
Each Fund has adopted a Distribution and Services (Rule 12b‐1) Plan pursuant to Rule 12b‐1 of the 1940 Act (the “Plan”) for its Investor Class shares. The Plan allows the Funds to use Investor Class assets to pay fees in connection with the distribution and marketing of Investor Class shares and/or the provision of shareholder services to Investor Class shareholders. The Plan permits payment for services in connection with the administration of plans or programs that use Investor Class shares of each Fund as their funding medium and for related expenses. The recipients of such payments may include the Distributor, other affiliates of the Adviser, broker‐dealers, financial institutions, plan sponsors and administrators and other financial intermediaries through which investors may purchase shares of the Fund. The Plan permits the Funds to make total payments at an annual rate of up to 0.25% of each Fund’s average daily net assets attributable to its Investor Class shares. The expenses of the Plan are reflected as distribution and service fees in the Statements of Operations.
7. INDEMNIFICATIONS
Under the Trust’s organizational documents, its officers and Trustees are indemnified against certain liability arising out of the performance of their duties to the Trust. Additionally, in the normal course of business, the Trust enters into contracts with service providers that may contain general indemnification clauses, which may permit indemnification to the extent permissible under applicable law. The Trust’s maximum exposure under these arrangements is unknown, as this would involve future claims that may be made against the Trust that have not yet occurred.
| 94 | 1.855.377.7325 | www.GrandeurPeakGlobal.com |
| Disclosure Regarding Approval of | |
Grandeur Peak Funds® | Fund Advisory Agreement |
On September 13, 2016, the Trustees met in person to discuss, among other things, the renewal of the investment advisory agreement between the Trust and Grandeur Peak (the “Investment Advisory Agreement”), in accordance with Section 15(c) of the 1940 Act. The Independent Trustees met with independent legal counsel during executive session and discussed the Investment Advisory Agreement and other related materials. In renewing and approving the Investment Advisory Agreement with Grandeur Peak, the Trustees, including the Independent Trustees, considered the following factors with respect to the Grandeur Peak Global Opportunities Fund (“Global Opportunities Fund”), Grandeur Peak International Opportunities Fund (“Global International Fund”), Grandeur Peak Global Reach Fund (“Global Reach Fund”), Grandeur Peak Emerging Markets Opportunities Fund (“Emerging Markets Opportunities Fund”), Grandeur Peak Global Stalwarts Fund (“Global Stalwart Fund”), Grandeur Peak International Stalwarts Fund (“International Stalwart Fund”), and Grandeur Peak Global Micro Cap Fund (“Micro Cap Fund”) (collectively, the “Grandeur Peak Funds”):
Investment Advisory Fee Rate: The Trustees reviewed and considered the contractual annual advisory fee to be paid by the Trust, on behalf of the Grandeur Peak Funds to Grandeur Peak of 1.25% of each of the Global Opportunities Fund and Global International Fund daily average net assets, 1.10% of the Global Reach Fund daily average net assets, 1.35% of the Emerging Markets Opportunities Fund daily average net assets, 0.80% of each of the Global Stalwart Fund and International Stalwart Fund daily average net assets and 1.50% of the Micro Cap Fund daily average net assets, in light of the extent and quality of the advisory services provided by Grandeur Peak to the Grandeur Peak Funds.
The Board received and considered information including a comparison of the net and gross management fees and the gross advisory fee of each of the Grandeur Peak Funds with those of funds in the peer group and universe of funds provided by an independent provider of investment company data (the “Data Provider”). The Trustees noted that the net and gross management fees of the Investor Class, as applicable, and Institutional Class of each Grandeur Peak Fund was above its respective peer group and universe median, except for the Global Stalwart and International Stalwart Funds, which were below their respective peer group and universe median. The Trustees also noted that the gross advisory fee of the Investor Class, as applicable, and Institutional Class of each Grandeur Peak Fund was above its respective peer group average and median, except for the Institutional Class of the Micro Cap Fund and the Investor Class and the Institutional Class of the Global Stalwarts and International Stalwarts Funds, which were below their respective peer group average and median.
Total Expense Ratios: The Trustees further reviewed and considered the total net expense ratios (after waivers, subject to certain exclusions) of 1.38% for the Institutional Class and 1.62% for the Investor Class of each of the International Opportunities Fund and the Global Opportunities Fund, 1.55% for the Institutional Class and 1.77% for the Investor Class of the Emerging Markets Opportunities Fund, 1.35% for the Institutional Class and 1.60% for the Investor Class of the Global Reach Fund, 2.00% for the Institutional Class of the Micro Cap Fund and 1.35% for the Investor Class and 1.10% for the Institutional Class of each of the Global Stalwarts and International Stalwarts Funds. The Trustees noted that the total expense ratios (after waivers) of the Investor Class, as applicable, and Institutional Class of each Grandeur Peak Fund was generally above (and in some cases significantly above) the peer group median and average total expense ratios (after waivers), except that the total expense ratio (after waivers) of the Investor Class of the Emerging Markets Opportunities Fund and the International Stalwarts Fund were below the peer group median and average total expense ratios (after waivers).
Nature, Extent and Quality of the Services under the Investment Advisory Agreement: The Trustees received and considered information regarding the nature, extent and quality of services to be provided to the Grandeur Peak Funds under the Investment Advisory Agreement. The Trustees reviewed certain background materials supplied by Grandeur Peak in its presentation, including its Form ADV.
The Trustees reviewed and considered Grandeur Peak’s investment advisory personnel, its history as an asset manager and its performance and the amount of assets currently under management by Grandeur Peak and its affiliated entities. The Trustees also reviewed the research and decision‐making processes utilized by Grandeur Peak, including the methods adopted to seek to achieve compliance with the investment objectives, policies and restrictions of the Grandeur Peak Funds.
The Trustees considered the background and experience of Grandeur Peak’s management in connection with the Grandeur Peak Funds, including reviewing the qualifications, backgrounds and responsibilities of the management team primarily responsible for the day‐to‐day portfolio management of the Grandeur Peak Funds and the extent of the resources devoted to research and analysis of actual and potential investments.
The Trustees also reviewed, among other things, Grandeur Peak’s insider trading policies and procedures and its Code of Ethics.
Performance: The Trustees reviewed performance information for each of the Grandeur Peak Funds for the three‐month, 1‐year and 3–year periods, if applicable, ended June 30, 2016. That review included a comparison of each Grandeur Peak Fund’s performance to the performance of a group of comparable funds selected by the Data Provider. The Trustees noted that the performance of Investor Class, as applicable, and Institutional Class of each Grandeur Peak Fund was above the median performance of the funds in its respective peer performance universe for the most recent 3‐month, 1‐year and 3‐year period and since inception, as applicable, except that the Investor Class and Institutional Class of the Global Stalwarts Fund was below its respective peer performance universe for the most recent 3‐month period. The Trustees noted that the since inception performance of each of the Grandeur Peak Funds ranked in the top three of its respective peer performance universe, except the Investor Class of the Emerging Markets Opportunities Fund which ranked fourth in its peer performance universe.
| Semi-Annual Report | October 31, 2016 | 95 |
Grandeur Peak Funds® | Disclosure Regarding Approval of Fund Advisory Agreement |
The Trustees also considered Grandeur Peak’s discussion of each Grandeur Peak Fund’s underlying portfolio diversification categories, its top contributors and top detractors, as well as Grandeur Peak’s performance and reputation generally and its investment techniques, risk management controls and decision‐making processes.
Comparable Accounts: The Trustees considered certain information provided by Grandeur Peak regarding fees charged to its limited partnerships and separately managed accounts utilizing strategies similar to those employed by the Global Opportunities Fund and the Global International Fund, noting Grandeur Peak’s statements in the Grandeur Peak Book regarding differences in how often the accounts are priced, number of clientele, turnover of client assets, and operational structure.
Profitability: The Trustees received and considered a retrospective and projected profitability analysis prepared by Grandeur Peak based on the fees payable under the Investment Advisory Agreement with respect to each Grandeur Peak Fund. The Trustees considered the profits, if any, anticipated to be realized by Grandeur Peak in connection with the operation of each Grandeur Peak Fund. The Board then reviewed Grandeur Peak’s Income Statement and Balance Sheet for the calendar years 2011‐2015 and projections for 2016 in order to analyze the financial condition and stability and profitability of Grandeur Peak.
Economies of Scale: The Trustees considered whether economies of scale in the provision of services to the Grandeur Peak Funds will be passed along to the shareholders under the proposed agreements.
Other Benefits to the Adviser: The Trustees reviewed and considered any other incidental benefits derived or to be derived by Grandeur Peak from its relationship with the Grandeur Peak Funds, including whether soft dollar arrangements were used.
In renewing Grandeur Peak as the Grandeur Peak Funds’ investment adviser and renewing the Investment Advisory Agreement and the fees charged under the Investment Advisory Agreement, the Trustees concluded that no single factor reviewed by the Trustees was identified by the Trustees to be determinative as the principal factor in whether to renew the Investment Advisory Agreement. Further, the Independent Trustees were advised by separate independent legal counsel throughout the process. The Trustees, including all of the Independent Trustees, concluded that:
| • | the net and gross management fees of the Investor Class, as applicable, and Institutional Class of each Grandeur Peak Fund was above its respective peer group and universe median, except for the Global Stalwart and International Stalwart Funds, which were below their respective peer group and universe median; and the gross advisory fee of the Investor Class, as applicable, and Institutional Class of each Grandeur Peak Fund was above its respective peer group average and median, except for the Institutional Class of the Micro Cap Fund and the Investor Class and the Institutional Class of the Global Stalwarts and International Stalwarts Funds, which were below their respective peer group average and median; |
| • | the total expense ratios (after waivers) of the Investor Class, as applicable, and Institutional Class of each Grandeur Peak Fund was generally above (and in some cases significantly above) the peer group median and average total expense ratios (after waivers), except that the total expense ratio (after waivers) of the Investor Class of the Emerging Markets Opportunities Fund and the International Stalwarts Fund were below the peer group median and average total expense ratios (after waivers); |
| • | the nature, extent and quality of services to be rendered by Grandeur Peak under the Investment Advisory Agreement with respect to the Grandeur Peak Funds were adequate; |
| • | the performance of Investor Class, as applicable, and Institutional Class of each Grandeur Peak Fund was above the median performance of the funds in its respective peer performance universe for the most recent 3‐month, 1‐year and 3‐year period and since inception, as applicable, except that the Investor Class and Institutional Class of the Global Stalwarts Fund was below its respective peer performance universe for the most recent 3‐month period and the since inception performance of each of the Grandeur Peak Funds ranked in the top three of its respective peer performance universe, except the Investor Class of the Emerging Markets Opportunities Fund which ranked fourth in its peer performance universe; |
| • | bearing in mind the limitations of comparing different types of managed accounts and the different levels of service typically associated with such accounts, the fee structures applicable to Grandeur Peak’s other clients employing a comparable strategy to one or more of the Grandeur Peak Funds were not indicative of any unreasonableness with respect to the advisory fees proposed to be payable by the Grandeur Peak Funds; |
| • | the profit, if any, realized by Grandeur Peak in connection with the operation of the Grandeur Peak Funds is not unreasonable to the Grandeur Peak Funds; and |
| • | there were no material economies of scale or other incidental benefits accruing to Grandeur Peak in connection with its relationship with the Grandeur Peak Funds. |
| 96 | 1.855.377.7325 | www.GrandeurPeakGlobal.com |
| Disclosure Regarding Approval of | |
Grandeur Peak Funds® | Fund Advisory Agreement |
During the review process, the Trustees noted certain instances where clarification or follow‐up was appropriate and others where the Trustees determined that further clarification or follow‐up was not necessary. In those instances where clarification or follow‐up was requested, the Board determined that in each case either information responsive to its requests had been provided, or where any request was outstanding in whole or in part, given the totality of the information provided with respect to the Investment Advisory Agreement, the Board had received sufficient information to approve the Investment Advisory Agreement.
Based on the Trustees’ deliberations and their evaluation of the information described above, the Trustees, including all of the Independent Trustees, concluded that Grandeur Peak’s compensation for investment advisory services is consistent with the best interests of the Grandeur Peak Funds and their shareholders.
| Semi-Annual Report | October 31, 2016 | 97 |
Grandeur Peak Funds® | Additional Information |
| October 31, 2016 (Unaudited) |
1. FUND HOLDINGS
The Funds file their complete schedule of portfolio holdings with the Securities and Exchange Commission (the “SEC”) for the first and third quarters of each fiscal year on Form N-Q within 60 days after the end of the period. Copies of the Funds’ Form N-Q are available without charge on the SEC website at http://www.sec.gov. You may also review and copy the Form N-Q at the SEC’s Public Reference Room in Washington, DC. For more information about the operation of the Public Reference Room, please call the SEC at 1-800-SEC-0330.
2. FUND PROXY VOTING POLICIES, PROCEDURES AND SUMMARIES
The Funds’ policies and procedures used in determining how to vote proxies and information regarding how the Funds voted proxies relating to portfolio securities during the most recent prior 12-month period ending June 30 are available without charge, (1) upon request, by calling (toll‐free) 855‐377‐PEAK(7325) and (2) on the SEC’s website at http://www.sec.gov.
| 98 | 1.855.377.7325 | www.GrandeurPeakGlobal.com |

Contact Us
| Mail: | Grandeur Peak Funds, P.O. Box 13664, Denver, CO 80201 | E-Mail: | grandeurpeakglobal@alpsinc.com |
| Phone: | 1.855.377.PEAK (7325) | Web: | www.GrandeurPeakGlobal.com |

Table of Contents
| PAGE | |
| Shareholder Letter | 1 |
| Performance Update | 5 |
| Consolidated Disclosure of Fund Expenses | 7 |
| Consolidated Schedule of Investments | 8 |
| Consolidated Statement of Assets and Liabilities | 59 |
| Consolidated Statement of Operations | 60 |
| Consolidated Statements of Changes in Net Assets | 61 |
| Consolidated Financial Highlights | 62 |
| Notes to Consolidated Financial Statements | 63 |
| Additional Information | 73 |
| Redmont Resolute Fund | Shareholder Letter |
October 31, 2016 (Unaudited)
PERFORMANCE:
October 31, 2016
The Fund outperformed the HFRX Global Index by approximately 220 basis points(1) over the twelve months ending October 31, 2016. Redmont performed in line with the HFRX Global Index in September 2015 and October 2016, which were weaker months for equity performance. The Fund historically has strong up market capture with down market capture in line with the index. Since inception, the Fund has outperformed the HFRX Global Index by over 230 basis points annualized. This is due primarily to a higher level of net equity exposure than the benchmark which allowed us to be able to keep up with strong equity markets.
Relative to the S&P 500 Index, the Fund has performed as we expected - participating but trailing in strong up markets while generally protecting capital (not experiencing as negative a return as the index) and outperforming in negative markets, which was certainly the case in the two most recent months.
When compared to the peer group (Morningstar MultiAlternative Universe)(2), the Fund has outperformed the Universe over all time periods – by over 230 basis points during the past twelve months and 240 basis points annualized since inception. As with the HFRX Global Index, the Universe is very diverse and contains a number of market-neutral and other low net equity strategies that cause the average net equity exposure for the Universe to be considerably less than our Fund. So we anticipate outperforming the Universe in up markets and underperforming in down markets - recent performance has been consistent with our expectations.
Long/Short Managers – Long/Short equity managers performed well relative to the HFRX Equity Hedge Index which reacted to sharp declines in global equities and increased volatility due to geopolitical uncertainty during the period. Impala and Boston Partners Research Long/Short posted positive returns for the period.
Macro – Macro managers were a detractor during the past 12 months. Manager positions in Japan and Europe detracted during their respective market drawdowns. In the past month, this bucket of multi-asset strategy oriented managers was replaced with a systematic macro fund to take advantage of relative value differentials globally. This sector is a small allocation and is held as a risk-off return contributor.
Credit/GTAA – Tactical managers were a drag on performance. Similar to macro, global equity market corrections tended to hurt these managers during the period.
Relative Value – Performance exceeded the HFRX Relative Value benchmark. Weiss Alpha Balance Risk was the main contributor. Fixed income beta(3) and the increased tactical weight during a time of interest rate declines for the past year lead to relative outperformance. Equity risk and security selection also contributed to positive returns.
Event Driven Managers – The absolute return oriented manager AQR Multi-Strategy contributed on an absolute and relative basis during the period with allocations to arbitrage-style strategies aiding performance. Event driven dedicated manager PSAM was recently added to the portfolio.
| Semi-Annual Report | October 31, 2016 | 1 |
| Redmont Resolute Fund | Shareholder Letter |
October 31, 2016 (Unaudited)
REDMONT RESOLUTE FUND
Table 1 notes the performance for the Fund as of quarter end under standard reporting (since inception) as well as of October 31st.
Table 1 (2)(4)(5)(6)(7)
Performance (amounts greater than one year are annualized)
Standardized Performance Data as of September 30, 2016 | Standardized Performance Data as of October 31, 2016 | |||||||
| Year-to-Date | 1-Year | 3-Year | Since Inception (12/30/11) | Year-to-Date | 1-Year | 3-Year | Since Inception (12/30/11) | |
| Redmont Resolute Fund - I Class | 2.52% | 4.31% | 2.53% | 3.80% | 1.96% | 0.86% | 1.95% | 3.60% |
| Morningstar Multi-Alternative Universe | -3.30% | 0.79% | 0.73% | 1.02% | -1.34% | -1.51% | 0.07% | 0.82% |
| HFRX Global Index | 1.33% | 0.72% | -0.22% | 1.48% | 0.75% | -1.30% | -0.81% | 1.34% |
S&P 500® Index | 7.84% | 15.43% | 11.16% | 14.58% | 5.87% | 4.51% | 8.84% | 13.86% |
| Gross Expense Ratio | Less Expense Waivers | Net Expense Ratio | Net Ratio ex Dividend & Short Expense | |
| Redmont Resolute Fund - I Class | 2.40% | -1.27% | 1.13% | 1.05% |
Performance data quoted represents past performance. Past performance does not guarantee future results. Investment return and principal value of an investment will fluctuate so that an investor’s shares, when sold or redeemed, may be worth more or less than the original cost. Current performance data may be higher or lower than actual data quoted. For the most current month-end performance data please call 1-855-268-2242.
The Fund has a redemption fee of 2.00% for shares redeemed within the first 90 days of purchase. Performance shown at NAV does not include these sales charges and would have been lower had it been taken into account.
The Adviser has agreed to waive the portion of its 1.50% Management Fee in excess of any sub-advisory fees paid by the Adviser to sub-advisors in connection with the Fund (“Sub-Advisory Fees”). This agreement (the “Expense Agreement”) is in effect through August 31, 2017. The Adviser may not discontinue this agreement to waive fees prior to August 31, 2017 without the approval by the Fund’s Board of Trustees.
Net Ratio ex Dividend & Short Expense is the Net Expense Ratio less any Dividend and Interest Expense on Securities Sold Short
Portfolio Changes:
The overall allocation was adjusted since April 2016 to more closely reflect the asset allocation breakdown of the HFRX Global Hedge Fund Index and categorize investments with more specificity. Several manager changes were made over the past six months. AQR Risk Parity was removed from event driven and replaced by PSAM. Morgan Stanley Multi-Asset Portfolio was sold and Brevan Howard added in macro. Diamond Hill was replaced by Incline in the long/short equity bucket. Clinton was added to the relative value bucket. These changes were made on the basis of improved risk/return profile of the portfolio when back-tested and met our target net exposure for the portfolio.
Closing:
We continue to add value both in our allocation and manager selection decisions. The changes outlined above should continue to provide additional value going forward. We appreciate your investment in our Redmont Resolute Fund, please feel free to contact us with any questions
Sincerely,
 | |
R. Scott Graham, CFA & Michael T. Lytle, CFA | |
Portfolio Managers(7) |
2
| Redmont Resolute Fund | Shareholder Letter |
October 31, 2016 (Unaudited)
Underlying Allocation Weights & Performance:
The current allocation was modified during the past six months to reflect additional sub-asset classes. Opportunistic was broken out into relative value and event driven. Tactical was split into macro and credit/GTAA. Long/short equity remains unchanged. This allocation change more closely aligns with the construction of the HFRX Global Hedge Fu index.nd Figure 1 lists the long-term target asset allocation for the Fund as well as the allocation as of October 31, 2016.
Figure 1
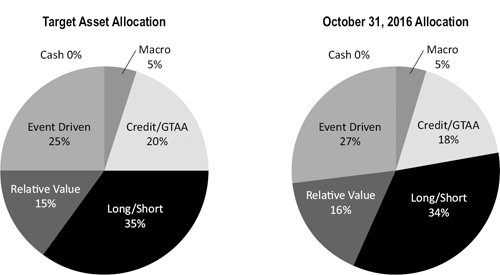
Holdings and allocations subject to change and may not reflect the current or future position of the portfolio.
| Semi-Annual Report | October 31, 2016 | 3 |
| Redmont Resolute Fund | Shareholder Letter |
October 31, 2016 (Unaudited)
IMPORTANT NOTES AND DISCLOSURES
Past performance does not guarantee future results.
Fund prices fluctuate as the underlying assets have exposure to market fluctuations and other risks, as described in the Fund’s prospectus. Please call 1-855-268-2242 to obtain current performance information and for the current prospectus and statement of additional information. This material must be preceded or accompanied by a prospectus. Please read the prospectus carefully before investing.
The views of Highland Associates, Inc. and information discussed in this commentary are as of the date of publication, are subject to change, and may not reflect the writers’ current views. The views expressed are those of the Fund’s adviser only, and represent an assessment of market conditions at a specific point in time, are opinions only and should not be relied upon as investment advice regarding a particular investment or markets in general. Such information does not constitute a recommendation to buy or sell specific securities or investment vehicles. It should not be assumed that any investment will be profitable or will equal the performance of the portfolios or any securities or any sectors mentioned in this letter. The subject matter contained in this letter has been derived from several sources believed to be reliable and accurate at the time of compilation. Neither Highland Associates, Inc. nor the Fund accepts any liability for losses either direct or consequential caused by the use of this information.
The Redmont Resolute Fund is distributed by ALPS Distributors, Inc.
The Fund is subject to investment risks, including possible loss of the principal amount invested and therefore is not suitable for all investors. The Fund may not achieve its objectives.
Diversification does not eliminate the risk of experiencing investment losses.
RISKS:
The Fund is structured with an Underlying Investment Strategy. This strategy adopts the risks of investments in Other Investment Companies. These risks include, but are not limited to higher expenses, allocation risk, underlying fund risk, transparency risk, and underlying fund managed portfolio risk. Investments which focus on alternative strategies are subject to increased risk and loss of principal and are not suitable for all investors. Swap Risk involves swap agreements and are subject to counterparty default risk and may not perform as intended. Derivatives Risk involves the exercise of skill and judgment. Derivatives may expire worthless or not perform as expected. Equity risk may cause the value of the securities held by the Fund to fall due to general market and economic conditions, perceptions regarding the industries in which the issuers of securities held by the Fund participate, or factors relating to specific companies in which the Fund invest.
The Fund’s investments in non-U.S. issuers may be even more volatile and may present more risks than investments in U.S. issuers.
Commodity Risk may subject the Funds to greater volatility than traditional investments because of global supply and demand, changes in interest rates, commodity index volatility, and factors affecting a particular industry or commodity. Commodity-linked investments may not move in the same direction and to the same extent as the underlying commodities.
| (1) | Basis point is a common unit of measure for interest rates and other percentages in finance. One basis point is equal to 1/100th of 1% or 0.01%(.0001). |
| (2) | The Morningstar Multi-Alternative Universe is designed to represent the exposure to alternative investment tactics. Funds in this category have the majority of their assets exposed to alternative strategies. An investor’s exposure to different tactics may change slightly over time in response to market movements. Funds in this category include both funds with static allocations to alternative strategies and funds tactically allocating among alternative strategies and asset classes. The gross short exposure is greater than 20%. |
| (3) | Beta is a measure of the volatility, or systematic risk, of a security or a portfolio in comparison to the market as a whole. Beta is used in the capital asset pricing model (CAPM), which calculates the expected return of an asset based on its beta and expected market returns. |
(4) | The S&P 500® Index is an unmanaged index of 500 common stocks chosen for market size, liquidity, and industry group representation. It is a market value weighted index. The S&P 500® Index figures do not reflect any fees, expenses, or taxes. Investors cannot invest directly in this index. |
(5) | The HFRX Global Index is designed to be representative of the overall composition of the hedge fund universe, and includes convertible arbitrage, distressed securities, equity hedge, equity market neutral, event driven, macro, merger arbitrage, and relative value strategies. The index returns are updated periodically and are subject to change. The returns were accurate as of the date of this publication. Investors cannot invest directly in an index. |
(6) | Highland Associates, Inc. has agreed to waive the portion of its 1.50% Management Fee in excess of any sub-advisory fees paid by the Adviser to sub-advisors in connection with the Redmont Resolute Fund. This agreement is in effect through August 31, 2017. The Adviser may not discontinue this agreement to waive fees without the approval by the Fund’s Board of Trustees. |
(7) | R. Scott Graham and Michael T. Lytle are registered representatives of ALPS Distributors, Inc. CFA Institute Marks are trademarks owned by the CFA Institute. |
4
| Redmont Resolute Fund | Performance Update |
October 31, 2016 (Unaudited)
Performance (for the period ended October 31, 2016)
Redmont Resolute Fund
| Cumulative Total Return | ||||||
| (for the period ended October 31, 2016) | Year-to-Date | 1 Year | 3 Year | Since Inception* | Gross(a) Ratio | Net(a) Ratio |
| Redmont Resolute Fund - Class I - NAV | 1.96% | 0.86% | 1.95% | 3.60% | 2.40% | 1.13% |
S&P 500® Index(b) | 5.87% | 4.51% | 8.84% | 13.86% | ||
Dow Jones U.S Select Dividend Index(c) | 14.92% | 13.49% | 10.33% | 13.75% | ||
HFRX Global Hedge Fund Index(d) | 0.75% | -1.30% | -0.81% | 1.34% |
Performance data quoted represents past performance. Past performance does not guarantee future results. Investment return and principal value of an investment will fluctuate so that an investor’s shares, when sold or redeemed, may be worth more or less than the original cost. Current performance data may be higher or lower than actual data quoted. For the most current month-end performance data please call 1-855-268-2242.
The Fund has a redemption fee of 2.00% for shares redeemed within the first 90 days of purchase. Performance shown at NAV does not include these sales charges and would have been lower had it been taken into account.
The Adviser has agreed to waive the portion of its 1.50% Management Fee in excess of any sub-advisory fees paid by the Adviser to sub-advisors in connection with the Fund (“Sub-Advisory Fees”). This agreement (the “Expense Agreement”) is in effect through August 31, 2017. The Adviser may not discontinue this agreement to waive fees prior to August 31, 2017 without the approval by the Fund’s Board of Trustees.
| * | Fund inception date of 12/30/11. |
(a) | Ratios as of the Prospectus dated August 31, 2016 and may differ from the ratios presented in the Financial Highlights. |
(b) | The S&P 500® Index is the Standard & Poor's composite index of 500 stocks, a widely recognized, unmanaged index of common stock prices. The index is not actively managed and does not reflect any deduction of fees, expenses or taxes. An investor may not invest directly in an index. |
(c) | The Dow Jones U.S. Select Dividend Index represents the country’s top stocks by dividend yield, selected annually and subject to screening and buffering criteria. The index is not actively managed and does not reflect any deductions of fees, expenses or taxes. An investor may not invest directly in an index. |
(d) | The HFRX Global Hedge Fund Index is designed to be representative of the overall composition of the hedge fund universe and includes convertible arbitrage, distressed securities, equity hedge, equity market neutral, event driven, macro, merger arbitrage and relative value strategies. The index returns are updated periodically and are subject to change. The returns were accurate as of the date of this publication. The index is not actively managed and does not reflect any deduction of fees, expenses or taxes. An investor may not invest directly in an index. |
The table does not reflect the deduction of taxes that a shareholder would pay on Fund distributions or the redemption of Fund shares.
Top Ten Holdings**
(for the period ended October 31, 2016)
As a percentage of Net Assets
| PIMCO Short-Term Fund, Institutional Class | 26.54% |
| AQR Multi Strategy Alternative Fund, Class I | 17.42% |
| Redmont Cayman Hldgs | 4.64% |
| FPA Crescent Fund | 4.00% |
| Dollar General Corp. | 0.65% |
| Yahoo!, Inc. | 0.62% |
| The Williams Cos., Inc. | 0.58% |
| Newell Brands, Inc. | 0.55% |
| ServiceMaster Global Holdings, Inc. | 0.54% |
| SS&C Technologies Holdings, Inc. | 0.54% |
| Top Ten Holdings |
| ** | Holdings are subject to change, and may not reflect the current or future position of the portfolio. |
| Semi-Annual Report | October 31, 2016 | 5 |
| Redmont Resolute Fund | Performance Update |
October 31, 2016 (Unaudited)
Performance of $10,000 Initial Investment (for the period ended October 31, 2016)
Comparison of change in value of a $10,000 investment
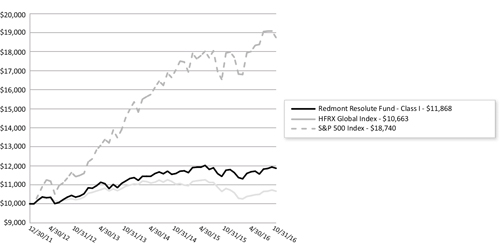
The chart represents historical performance of a hypothetical investment of $10,000 in the Fund since inception. Past performance does not guarantee future results. This chart does not reflect the deduction of taxes that a shareholder would pay on Fund distributions or the redemption of Fund shares.
Investing in the Fund is subject to investment risks, including possible loss of the principal amount invested.
6
| Redmont Resolute Fund | Consolidated Disclosure of Fund Expenses |
October 31, 2016 (Unaudited)
As a shareholder of the Fund, you incur two types of costs: (1) transaction costs, including applicable sales charges (loads), redemption fees; and (2) ongoing costs, including management fees, distribution and service (12b-1) fees, shareholder services fees and other Fund operating expenses. This example is intended to help you understand your ongoing costs (in dollars) of investing in the Fund and to compare these costs with the ongoing costs of investing in other mutual funds.
This example is based on an investment of $1,000 invested at the beginning of the period and held for the six-month period of May 1, 2016 to October 31, 2016.
Actual Expenses. The first line of the table below provides information about actual account values and actual expenses. You may use the information in this line, together with the amount you invested to estimate the expenses that you paid over the period. Simply divide your account value by $1,000 (for example, an $8,600 account value divided by $1,000 = 8.6), then multiply the result by the number in the first line of the table below under the heading titled “Expenses Paid During Period” to estimate the expenses you paid on your account during this period.
Hypothetical Example for Comparison Purposes. The second line of the table below provides information about hypothetical account values and hypothetical expenses based on the Fund’s actual expense ratio and an assumed rate of return of 5% per year before expenses, which is not the Fund’s actual return. The hypothetical account values and expenses may not be used to estimate the actual ending account balance or expenses you paid for the period. You may use this information to compare the ongoing costs of investing in the Fund and other mutual funds. To do so, compare this 5% hypothetical example with the 5% hypothetical examples that appear in the shareholder reports of the other funds.
Please note that the expenses shown in the table below are meant to highlight your ongoing costs only and do not reflect any transactional costs, such as applicable sales charges (loads), redemption fees, or exchange fees. Therefore, the second line of the table below is useful in comparing ongoing costs only and will not help you determine the relative total costs of owning different funds. In addition, if these transactional costs were included, your costs would have been higher.
| BEGINNING ACCOUNT VALUE 05/01/16 | ENDING ACCOUNT VALUE 10/31/16 | EXPENSE RATIO(a) | EXPENSES PAID DURING PERIOD 05/01/16-10/31/16(b) | |
| Redmont Resolute Fund | ||||
| Class I | ||||
| Actual | $1,000.00 | $1,015.80 | 0.30% | $1.52 |
| Hypothetical (5% return before expenses) | $1,000.00 | $1,023.69 | 0.30% | $1.53 |
| (a) | Annualized, based on the Fund's most recent fiscal half year expenses. |
| (b) | Expenses are equal to the Fund's annualized expense ratio multiplied by the average account value over the period, multiplied by the number of days in the most recent fiscal half-year (184)/365 (to reflect the half-year period). |
| Semi-Annual Report | October 31, 2016 | 7 |
| Redmont Resolute Fund | Consolidated Schedule of Investments |
October 31, 2016 (Unaudited)
| Description | Shares | Value (Note 2) | ||||||
| CLOSED END FUNDS (0.01%) | ||||||||
| Better Capital PCC, Ltd. | 3,153 | $ | 3,744 | |||||
| Electra Private Equity PLC | 695 | 36,622 | ||||||
| Goldman Sachs BDC, Inc. | 231 | 5,100 | ||||||
| HgCapital Trust PLC | 438 | 7,768 | ||||||
| Princess Private Equity Holding, Ltd. | 722 | 6,634 | ||||||
Riverstone Energy, Ltd.(a) | 41 | 624 | ||||||
| 60,492 | ||||||||
| TOTAL CLOSED END FUNDS (Cost $60,788) | 60,492 | |||||||
| COMMON STOCKS (22.97%) | ||||||||
ADVERTISING (0.11%) | ||||||||
Omnicom Group, Inc.(b) | 5,069 | 404,608 | ||||||
| The Interpublic Group of Companies, Inc. | 7,206 | 161,342 | ||||||
| 565,950 | ||||||||
AEROSPACE & DEFENSE (0.48%) | ||||||||
| BAE Systems PLC | 4,443 | 29,502 | ||||||
| Cobham PLC | 700 | 1,224 | ||||||
General Dynamics Corp.(b) | 2,596 | 391,321 | ||||||
Harris Corp.(b) | 4,574 | 408,047 | ||||||
IHI Corp.(a) | 10,000 | 26,414 | ||||||
| L‐3 Communications Holdings, Inc. | 598 | 81,890 | ||||||
Lockheed Martin Corp.(b) | 2,386 | 587,863 | ||||||
Northrop Grumman Corp.(b) | 1,208 | 276,632 | ||||||
Raytheon Co.(b) | 2,659 | 363,246 | ||||||
| Safran SA | 337 | 23,169 | ||||||
| The Boeing Co. | 402 | 57,257 | ||||||
United Technologies Corp.(b) | 2,843 | 290,555 | ||||||
| 2,537,120 | ||||||||
AGRICULTURE (0.15%) | ||||||||
| Altria Group, Inc. | 3,181 | 210,328 | ||||||
| Archer‐Daniels‐Midland Co. | 3,311 | 144,260 | ||||||
| British American Tobacco PLC | 1,476 | 84,758 | ||||||
| Gudang Garam Tbk PT | 25,300 | 131,658 | ||||||
| Hanjaya Mandala Sampoerna Tbk PT | 488,400 | 147,852 | ||||||
| Japan Tobacco, Inc. | 800 | 30,468 | ||||||
| Philip Morris International, Inc. | 189 | 18,227 | ||||||
| Swedish Match AB | 496 | 17,260 | ||||||
| 784,811 | ||||||||
AIRLINES (0.15%) | ||||||||
| Alaska Air Group, Inc. | 500 | 36,110 | ||||||
| American Airlines Group, Inc. | 1,444 | 58,626 | ||||||
| ANA Holdings, Inc. | 19,000 | 53,483 | ||||||
Delta Air Lines, Inc.(b) | 5,339 | 223,010 | ||||||
| Deutsche Lufthansa AG | 1,064 | 13,602 | ||||||
| easyJet PLC | 1,281 | 14,692 | ||||||
| Southwest Airlines Co. | 3,280 | 131,364 | ||||||
See Notes to Financial Statements.
8
| Redmont Resolute Fund | Consolidated Schedule of Investments |
October 31, 2016 (Unaudited)
| Description | Shares | Value (Note 2) | ||||||
AIRLINES (0.15%) (continued) | ||||||||
United Continental Holdings, Inc.(a) | 4,965 | $ | 279,182 | |||||
| 810,069 | ||||||||
APPAREL (0.05%) | ||||||||
| Asics Corp. | 300 | 6,414 | ||||||
| Christian Dior SE | 430 | 82,960 | ||||||
| Hanesbrands, Inc. | 5,445 | 139,936 | ||||||
| LVMH Moet Hennessy Louis Vuitton SE | 102 | 18,537 | ||||||
Michael Kors Holdings, Ltd.(a) | 50 | 2,539 | ||||||
| 250,386 | ||||||||
AUTO MANUFACTURERS (0.23%) | ||||||||
| Bayerische Motoren Werke AG | 156 | 13,592 | ||||||
| Daimler AG | 967 | 68,904 | ||||||
| Fuji Heavy Industries, Ltd. | 7,100 | 277,176 | ||||||
| Hino Motors, Ltd. | 500 | 5,459 | ||||||
| Honda Motor Co., Ltd. | 2,900 | 86,942 | ||||||
| Isuzu Motors, Ltd. | 14,100 | 174,721 | ||||||
| Mazda Motor Corp. | 9,500 | 156,491 | ||||||
| Mitsubishi Motors Corp. | 1,700 | 9,483 | ||||||
| PACCAR, Inc. | 773 | 42,453 | ||||||
| Suzuki Motor Corp. | 1,900 | 67,579 | ||||||
| Toyota Motor Corp. | 5,200 | 301,428 | ||||||
| 1,204,228 | ||||||||
AUTO PARTS & EQUIPMENT (0.16%) | ||||||||
| Bridgestone Corp. | 2,200 | 82,130 | ||||||
| Cie Generale des Etablissements Michelin | 115 | 12,451 | ||||||
| Denso Corp. | 1,100 | 47,883 | ||||||
| GKN PLC | 1,247 | 4,872 | ||||||
| JTEKT Corp. | 1,400 | 20,759 | ||||||
| Koito Manufacturing Co., Ltd. | 3,400 | 177,668 | ||||||
| Lear Corp. | 361 | 44,324 | ||||||
| NHK Spring Co., Ltd. | 200 | 1,888 | ||||||
| NOK Corp. | 100 | 2,248 | ||||||
| Nokian Renkaat OYJ | 140 | 4,698 | ||||||
Tenneco, Inc.(a) | 3,547 | 195,333 | ||||||
| The Goodyear Tire & Rubber Co. | 18 | 522 | ||||||
| Toyoda Gosei Co., Ltd. | 800 | 18,316 | ||||||
| Visteon Corp. | 3,200 | 225,952 | ||||||
| 839,044 | ||||||||
BANKS (1.61%) | ||||||||
| Agricultural Bank of China, Ltd., Class H | 6,000 | 2,530 | ||||||
| Banco Bilbao Vizcaya Argentaria SA | 8,615 | 62,209 | ||||||
| Banco de Sabadell SA | 7,426 | 9,937 | ||||||
| Bank Central Asia Tbk PT | 647,000 | 769,825 | ||||||
| Bank Mandiri Persero Tbk PT | 489,900 | 430,840 | ||||||
| Bank Negara Indonesia Persero Tbk PT | 391,500 | 167,276 | ||||||
Bank of America Corp.(b) | 20,986 | 346,269 | ||||||
| Bank of Montreal | 3,221 | 204,984 | ||||||
| Bank Rakyat Indonesia Persero Tbk PT | 582,500 | 544,643 | ||||||
See Notes to Financial Statements.
| Semi-Annual Report | October 31, 2016 | 9 |
| Redmont Resolute Fund | Consolidated Schedule of Investments |
October 31, 2016 (Unaudited)
| Description | Shares | Value (Note 2) | ||||||
BANKS (1.61%) (continued) | ||||||||
| Barclays Africa Group, Ltd. | 3,165 | $ | 36,702 | |||||
BB&T Corp.(b) | 4,781 | 187,415 | ||||||
| BNP Paribas SA | 856 | 49,652 | ||||||
Capital One Financial Corp.(b) | 4,691 | 347,322 | ||||||
| Chongqing Rural Commercial Bank Co., Ltd., Class H | 15,000 | 8,994 | ||||||
Citigroup, Inc.(b) | 10,789 | 530,279 | ||||||
| Citizens Financial Group, Inc. | 4,634 | 122,060 | ||||||
| Comerica, Inc. | 84 | 4,376 | ||||||
| Concordia Financial Group, Ltd. | 8,600 | 39,953 | ||||||
| Credit Agricole SA | 3,859 | 41,650 | ||||||
| Danske Bank A/S | 821 | 25,348 | ||||||
| DnB ASA | 1,370 | 19,815 | ||||||
| East West Bancorp, Inc. | 5,640 | 222,836 | ||||||
Fifth Third Bancorp(b) | 15,328 | 333,537 | ||||||
| First Republic Bank | 298 | 22,180 | ||||||
| FirstRand, Ltd. | 6,982 | 25,021 | ||||||
| Gentera SAB de CV | 36,100 | 71,203 | ||||||
| Grupo Financiero Banorte SAB de CV | 119,000 | 702,000 | ||||||
| Grupo Financiero Inbursa SAB de CV | 128,600 | 209,559 | ||||||
| Grupo Financiero Santander Mexico SAB de CV, Class B | 102,000 | 184,724 | ||||||
| HSBC Holdings PLC | 10,308 | 77,746 | ||||||
Huntington Bancshares, Inc.(b) | 18,660 | 197,796 | ||||||
| ICICI Bank, Ltd., Sponsored ADR | 17,380 | 144,080 | ||||||
| Intesa Sanpaolo SpA RSP | 2,615 | 5,649 | ||||||
| Japan Post Bank Co., Ltd. | 2,900 | 34,235 | ||||||
JPMorgan Chase & Co.(b) | 7,598 | 526,237 | ||||||
| Lloyds Banking Group PLC | 42,506 | 29,791 | ||||||
| M&T Bank Corp. | 44 | 5,400 | ||||||
| Mitsubishi UFJ Financial Group, Inc. | 35,000 | 181,758 | ||||||
| Mizuho Financial Group, Inc. | 11,500 | 19,421 | ||||||
| Morgan Stanley | 2,492 | 83,656 | ||||||
| Natixis SA | 2,165 | 10,944 | ||||||
| Nordea Bank AB | 1,704 | 17,913 | ||||||
| Regions Financial Corp. | 917 | 9,821 | ||||||
| Societe Generale SA | 1,354 | 52,855 | ||||||
State Street Corp.(b) | 1,882 | 132,135 | ||||||
| Sumitomo Mitsui Financial Group, Inc. | 3,400 | 118,434 | ||||||
| Sumitomo Mitsui Trust Holdings, Inc. | 3,300 | 111,710 | ||||||
SunTrust Banks, Inc.(b) | 4,520 | 204,440 | ||||||
| The Bank of Kyoto, Ltd. | 2,000 | 14,704 | ||||||
| The Chiba Bank, Ltd. | 13,000 | 80,576 | ||||||
| The Chugoku Bank, Ltd. | 1,700 | 22,857 | ||||||
The Goldman Sachs Group, Inc.(b) | 881 | 157,029 | ||||||
| The Hiroshima Bank, Ltd. | 4,000 | 17,164 | ||||||
| The Iyo Bank, Ltd. | 1,600 | 9,856 | ||||||
| U.S. Bancorp | 3,580 | 160,241 | ||||||
Wells Fargo & Co.(b) | 7,995 | 367,850 | ||||||
| 8,517,437 | ||||||||
BEVERAGES (0.46%) | ||||||||
| Anheuser‐Busch InBev NV | 454 | 52,106 | ||||||
| Arca Continental SAB de CV | 16,900 | 105,025 | ||||||
See Notes to Financial Statements.
10
| Redmont Resolute Fund | Consolidated Schedule of Investments |
October 31, 2016 (Unaudited)
| Description | Shares | Value (Note 2) | ||||||
BEVERAGES (0.46%) (continued) | ||||||||
| Asahi Group Holdings, Ltd. | 5,800 | $ | 207,455 | |||||
| Brown‐Forman Corp., Class B | 60 | 2,770 | ||||||
| Carlsberg A/S, Class B | 164 | 14,789 | ||||||
| Coca‐Cola European Partners PLC | 5,157 | 198,235 | ||||||
| Coca‐Cola Femsa SAB de CV, Class L | 27,700 | 207,988 | ||||||
| Coca‐Cola HBC AG | 2,004 | 43,318 | ||||||
Constellation Brands, Inc., Class A(b) | 994 | 166,117 | ||||||
| Diageo PLC | 1,984 | 52,927 | ||||||
| Dr. Pepper Snapple Group, Inc. | 2,250 | 197,528 | ||||||
| Fomento Economico Mexicano SAB de CV | 92,300 | 885,008 | ||||||
| Heineken Holding NV | 482 | 37,096 | ||||||
| Heineken NV | 76 | 6,261 | ||||||
Monster Beverage Corp.(a) | 11 | 1,588 | ||||||
| PepsiCo, Inc. | 2,447 | 262,318 | ||||||
| The Coca‐Cola Co. | 273 | 11,575 | ||||||
| 2,452,104 | ||||||||
BIOTECHNOLOGY (0.06%) | ||||||||
| Amgen, Inc. | 94 | 13,269 | ||||||
Biogen, Inc.(a) | 24 | 6,724 | ||||||
Celgene Corp.(a) | 820 | 83,788 | ||||||
Genmab A/S(a) | 7 | 1,155 | ||||||
Gilead Sciences, Inc.(b) | 3,186 | 234,585 | ||||||
Illumina, Inc.(a) | 4 | 545 | ||||||
Regeneron Pharmaceuticals, Inc.(a) | 5 | 1,725 | ||||||
| 341,791 | ||||||||
BUILDING MATERIALS (0.26%) | ||||||||
| Asahi Glass Co., Ltd. | 5,000 | 35,043 | ||||||
Cemex SAB de CV(a) | 662,000 | 572,652 | ||||||
| Cie de Saint‐Gobain | 782 | 34,720 | ||||||
Continental Building Products, Inc.(a) | 2,875 | 58,794 | ||||||
| Daikin Industries, Ltd. | 2,200 | 211,462 | ||||||
| Fortune Brands Home & Security, Inc. | 34 | 1,857 | ||||||
| Indocement Tunggal Prakarsa Tbk PT | 77,200 | 97,328 | ||||||
Masco Corp.(b) | 3,420 | 105,610 | ||||||
| Nichias Corp. | 12,000 | 106,990 | ||||||
| Rinnai Corp. | 500 | 48,155 | ||||||
| Semen Indonesia Persero Tbk PT | 155,600 | 117,463 | ||||||
| Taiheiyo Cement Corp. | 1,000 | 2,870 | ||||||
| 1,392,944 | ||||||||
CHEMICALS (0.36%) | ||||||||
| Air Water, Inc. | 1,000 | 18,757 | ||||||
| Akzo Nobel NV | 650 | 42,013 | ||||||
| Arkema SA | 188 | 17,827 | ||||||
| Asahi Kasei Corp. | 6,000 | 54,227 | ||||||
| BASF SE | 153 | 13,487 | ||||||
| Daicel Corp. | 12,000 | 158,368 | ||||||
| EI du Pont de Nemours & Co. | 513 | 35,289 | ||||||
EMS‐Chemie Holding AG(a) | 29 | 14,558 | ||||||
| Evonik Industries AG | 1,174 | 36,678 | ||||||
See Notes to Financial Statements.
| Semi-Annual Report | October 31, 2016 | 11 |
| Redmont Resolute Fund | Consolidated Schedule of Investments |
October 31, 2016 (Unaudited)
| Description | Shares | Value (Note 2) | ||||||
CHEMICALS (0.36%) (continued) | ||||||||
Ferro Corp.(a) | 8,670 | $ | 112,363 | |||||
| Givaudan SA, Registered Shares | 1 | 1,935 | ||||||
| Hitachi Chemical Co., Ltd. | 800 | 18,766 | ||||||
| Johnson Matthey PLC | 30 | 1,252 | ||||||
| Kuraray Co., Ltd. | 2,300 | 34,959 | ||||||
| Lonza Group AG | 310 | 58,520 | ||||||
| LyondellBasell Industries NV, Class A | 2,993 | 238,093 | ||||||
| Mexichem SA de CV | 41,900 | 100,133 | ||||||
| Mitsubishi Gas Chemical Co., Inc. | 500 | 7,714 | ||||||
| Mitsui Chemicals, Inc. | 4,000 | 19,758 | ||||||
| Monsanto Co. | 26 | 2,620 | ||||||
| PPG Industries, Inc. | 3,725 | 346,909 | ||||||
| Shin‐Etsu Chemical Co., Ltd. | 1,000 | 76,008 | ||||||
| Teijin, Ltd. | 600 | 11,632 | ||||||
| The Dow Chemical Co. | 1,438 | 77,379 | ||||||
| The Sherwin‐Williams Co. | 16 | 3,918 | ||||||
| The Valspar Corp. | 1,569 | 156,272 | ||||||
| Toray Industries, Inc. | 10,000 | 93,335 | ||||||
Versum Materials, Inc.(a) | 6,038 | 137,063 | ||||||
| 1,889,833 | ||||||||
COAL (0.02%) | ||||||||
| Adaro Energy Tbk PT | 755,500 | 91,774 | ||||||
COMMERCIAL SERVICES (1.19%) | ||||||||
| Abertis Infraestructuras SA | 2,325 | 34,519 | ||||||
| Adecco Group AG | 47 | 2,795 | ||||||
| Aggreko PLC | 313 | 3,071 | ||||||
| Benesse Holdings, Inc. | 500 | 13,126 | ||||||
| Edenred | 35 | 811 | ||||||
| EVERTEC, Inc. | 4,602 | 69,720 | ||||||
| GMO Payment Gateway, Inc. | 500 | 23,029 | ||||||
| ISS A/S | 230 | 9,043 | ||||||
| Jasa Marga Persero Tbk PT | 107,000 | 37,148 | ||||||
| KAR Auction Services, Inc. | 56,498 | 2,405,685 | ||||||
| Nielsen Holdings PLC | 5,376 | 242,028 | ||||||
OHL Mexico SAB de CV(a) | 20,900 | 24,526 | ||||||
| Outsourcing, Inc. | 1,400 | 53,266 | ||||||
| Park24 Co., Ltd. | 100 | 3,094 | ||||||
PayPal Holdings, Inc.(a) | 1,908 | 79,487 | ||||||
| Randstad Holding NV | 19 | 979 | ||||||
| Recruit Holdings Co., Ltd. | 2,900 | 116,697 | ||||||
| RELX NV | 809 | 13,654 | ||||||
Robert Half International, Inc.(b) | 1,813 | 67,842 | ||||||
| Secom Co., Ltd. | 100 | 7,231 | ||||||
| ServiceMaster Global Holdings, Inc. | 79,853 | 2,857,939 | ||||||
| Temp Holdings Co., Ltd. | 3,700 | 62,872 | ||||||
| The Western Union Co. | 2,286 | 45,880 | ||||||
| Total System Services, Inc. | 1,839 | 91,729 | ||||||
See Notes to Financial Statements.
12
| Redmont Resolute Fund | Consolidated Schedule of Investments |
October 31, 2016 (Unaudited)
| Description | Shares | Value (Note 2) | ||||||
COMMERCIAL SERVICES (1.19%) (continued) | ||||||||
United Rentals, Inc.(a) | 8 | $ | 605 | |||||
| 6,266,776 | ||||||||
COMPUTERS (0.51%) | ||||||||
| Accenture PLC, Class A | 23 | 2,673 | ||||||
Amdocs, Ltd.(b) | 4,614 | 269,688 | ||||||
| Apple, Inc. | 2,411 | 273,745 | ||||||
| Atos SE | 68 | 7,063 | ||||||
BayCurrent Consulting, Inc.(a) | 5,300 | 88,544 | ||||||
| Brocade Communications Systems, Inc. | 21,406 | 226,904 | ||||||
Cognizant Technology Solutions Corp., Class A(a) | 469 | 24,083 | ||||||
| Computer Sciences Corp. | 4,814 | 262,122 | ||||||
Dell Technologies, Inc. ‐ VMware Inc, Class V(a)(b) | 1,773 | 87,037 | ||||||
| Fujitsu, Ltd. | 23,000 | 136,658 | ||||||
| Hewlett Packard Enterprise Co. | 23,310 | 523,776 | ||||||
| Hewlett‐Packard Co. | 29,146 | 422,325 | ||||||
| International Business Machines Corp. | 20 | 3,074 | ||||||
Leidos Holdings, Inc.(b) | 6,131 | 254,866 | ||||||
| Nomura Research Institute, Ltd. | 300 | 10,427 | ||||||
| NTT Data Corp. | 600 | 31,010 | ||||||
| SCSK Corp. | 2,600 | 97,187 | ||||||
Teradata Corp.(a) | 69 | 1,860 | ||||||
| 2,723,042 | ||||||||
CONTAINERS & PACKAGING (0.04%) | ||||||||
WestRock Co.(b) | 4,795 | 221,481 | ||||||
COSMETICS & PERSONAL CARE (0.06%) | ||||||||
| Beiersdorf AG | 421 | 37,065 | ||||||
| Colgate‐Palmolive Co. | 161 | 11,489 | ||||||
| Kao Corp. | 2,600 | 134,004 | ||||||
| Kose Corp. | 300 | 27,434 | ||||||
| Pola Orbis Holdings, Inc. | 600 | 50,005 | ||||||
| The Procter & Gamble Co. | 767 | 66,575 | ||||||
| 326,572 | ||||||||
DISTRIBUTION & WHOLESALE (0.64%) | ||||||||
| AKR Corporindo Tbk PT | 93,300 | 50,769 | ||||||
Arrow Electronics, Inc.(a)(b) | 4,440 | 271,373 | ||||||
| Genuine Parts Co. | 79 | 7,157 | ||||||
| ITOCHU Corp. | 13,900 | 176,086 | ||||||
| LKQ Corp. | 86,815 | 2,802,388 | ||||||
| Marubeni Corp. | 12,100 | 63,771 | ||||||
| Mitsubishi Corp. | 200 | 4,369 | ||||||
| Sumitomo Corp. | 300 | 3,460 | ||||||
| 3,379,373 | ||||||||
DIVERSIFIED FINANCIAL SERVICES (0.50%) | ||||||||
| Aberdeen Asset Management PLC | 7,121 | 27,909 | ||||||
| AEON Financial Service Co., Ltd. | 2,100 | 37,066 | ||||||
Alliance Data Systems Corp.(a)(b) | 926 | 189,339 | ||||||
See Notes to Financial Statements.
| Semi-Annual Report | October 31, 2016 | 13 |
| Redmont Resolute Fund | Consolidated Schedule of Investments |
October 31, 2016 (Unaudited)
| Description | Shares | Value (Note 2) | ||||||
DIVERSIFIED FINANCIAL SERVICES (0.50%) (continued) | ||||||||
| Ally Financial, Inc. | 8,120 | $ | 146,728 | |||||
| American Express Co. | 3,901 | 259,105 | ||||||
| Ameriprise Financial, Inc. | 81 | 7,160 | ||||||
| BlackRock, Inc. | 3 | 1,024 | ||||||
Brait SE(a) | 2,944 | 19,561 | ||||||
| Capitec Bank Holdings, Ltd. | 191 | 9,703 | ||||||
| CME Group, Inc. | 58 | 5,806 | ||||||
CoreLogic, Inc.(a) | 1,834 | 78,055 | ||||||
| Daiwa Securities Group, Inc. | 11,000 | 65,841 | ||||||
Discover Financial Services(b) | 6,869 | 386,931 | ||||||
E*Trade Financial Corp.(a) | 1,715 | 48,294 | ||||||
| Federated Investors, Inc., Class B | 890 | 24,030 | ||||||
| Hargreaves Lansdown PLC | 736 | 10,450 | ||||||
| Intermediate Capital Group PLC | 1,731 | 12,829 | ||||||
| Invesco, Ltd. | 31 | 871 | ||||||
| Lazard, Ltd., Class A | 1,253 | 45,684 | ||||||
| MasterCard, Inc., Class A | 98 | 10,488 | ||||||
| Mebuki Financial Group, Inc. | 10,530 | 37,553 | ||||||
Navient Corp.(b) | 14,368 | 183,623 | ||||||
| Partners Group Holding AG | 120 | 60,755 | ||||||
Raymond James Financial, Inc.(b) | 2,422 | 145,611 | ||||||
SLM Corp.(a)(b) | 23,168 | 163,334 | ||||||
Synchrony Financial(b) | 9,754 | 278,867 | ||||||
| T Rowe Price Group, Inc. | 39 | 2,496 | ||||||
TD Ameritrade Holding Corp.(b) | 5,716 | 195,544 | ||||||
The Charles Schwab Corp.(b) | 6,468 | 205,036 | ||||||
| Visa, Inc., Class A | 14 | 1,155 | ||||||
| 2,660,848 | ||||||||
ELECTRIC (0.18%) | ||||||||
| AES Corp. | 20,482 | 241,073 | ||||||
| Ameren Corp. | 213 | 10,639 | ||||||
| Chubu Electric Power Co., Inc. | 4,400 | 64,802 | ||||||
| Duke Energy Corp. | 39 | 3,121 | ||||||
| E.ON SE | 2,020 | 14,795 | ||||||
| Edison International | 40 | 2,939 | ||||||
| EDP ‐ Energias de Portugal SA | 6,850 | 22,641 | ||||||
| Electric Power Development Co., Ltd. | 700 | 16,334 | ||||||
| Electricite de France SA | 543 | 6,086 | ||||||
| Endesa SA | 166 | 3,529 | ||||||
| Enel SpA | 42,160 | 181,422 | ||||||
| Engie SA | 5,809 | 83,760 | ||||||
| Entergy Corp. | 890 | 65,575 | ||||||
| Exelon Corp. | 1,653 | 56,318 | ||||||
| Fortum OYJ | 1,542 | 25,713 | ||||||
| Great Plains Energy, Inc. | 348 | 9,897 | ||||||
| NRG Energy, Inc. | 166 | 1,765 | ||||||
| Public Service Enterprise Group, Inc. | 626 | 26,342 | ||||||
| The Chugoku Electric Power Co., Inc. | 2,900 | 33,958 | ||||||
The Kansai Electric Power Co., Inc.(a) | 1,300 | 12,452 | ||||||
See Notes to Financial Statements.
14
| Redmont Resolute Fund | Consolidated Schedule of Investments |
October 31, 2016 (Unaudited)
| Description | Shares | Value (Note 2) | ||||||
ELECTRIC (0.18%) (continued) | ||||||||
| Tohoku Electric Power Co., Inc. | 4,100 | $ | 50,238 | |||||
| 933,399 | ||||||||
ELECTRICAL COMPONENTS & EQUIPMENT (0.15%) | ||||||||
AMETEK, Inc.(b) | 3,689 | 162,685 | ||||||
| Brother Industries, Ltd. | 600 | 11,042 | ||||||
| Casio Computer Co., Ltd. | 12,700 | 177,536 | ||||||
| Emerson Electric Co. | 1,192 | 60,410 | ||||||
| Hitachi, Ltd. | 15,000 | 79,985 | ||||||
| Nidec Corp. | 2,300 | 223,048 | ||||||
| W‐Scope Corp. | 2,900 | 51,988 | ||||||
| 766,694 | ||||||||
ELECTRONICS (0.37%) | ||||||||
| Alps Electric Co., Ltd. | 2,600 | 62,477 | ||||||
Avnet, Inc.(b) | 2,667 | 111,881 | ||||||
| Corning, Inc. | 221 | 5,019 | ||||||
Flextronics International, Ltd.(a)(b) | 27,942 | 396,497 | ||||||
Fortive Corp.(b) | 2,903 | 148,198 | ||||||
| Hirose Elect Co., Ltd. | 400 | 52,942 | ||||||
Honeywell International, Inc.(b) | 2,125 | 233,070 | ||||||
| Hoya Corp. | 1,800 | 75,265 | ||||||
Jabil Circuit, Inc.(b) | 14,829 | 316,451 | ||||||
| Keyence Corp. | 100 | 73,481 | ||||||
| Kyocera Corp. | 1,300 | 63,345 | ||||||
| Minebea Co., Ltd. | 1,000 | 10,241 | ||||||
| Murata Manufacturing Co., Ltd. | 1,100 | 153,876 | ||||||
| NEC Corp. | 8,000 | 21,436 | ||||||
| TE Connectivity, Ltd. | 3,869 | 243,244 | ||||||
| 1,967,423 | ||||||||
ENGINEERING & CONSTRUCTION (0.14%) | ||||||||
| Boskalis Westminster | 574 | 18,522 | ||||||
| Bouygues SA | 589 | 19,206 | ||||||
| Fluor Corp. | 2 | 104 | ||||||
| Grupo Aeroportuario del Pacifico SAB de CV, Class B | 15,100 | 145,879 | ||||||
| Grupo Aeroportuario del Sureste SAB de CV, Class B | 11,730 | 186,739 | ||||||
Jacobs Engineering Group, Inc.(a) | 31 | 1,599 | ||||||
| Kajima Corp. | 4,000 | 27,043 | ||||||
| Obayashi Corp. | 3,300 | 31,877 | ||||||
| Penta‐Ocean Construction Co., Ltd. | 11,700 | 69,841 | ||||||
| Promotora y Operadora de Infraestructura SAB de CV | 15,025 | 167,611 | ||||||
| Skanska AB, Class B | 830 | 18,030 | ||||||
| Taisei Corp. | 9,000 | 67,627 | ||||||
| 754,078 | ||||||||
ENTERTAINMENT (0.05%) | ||||||||
| Paddy Power Betfair PLC | 59 | 6,108 | ||||||
Six Flags Entertainment Corp.(b) | 4,333 | 241,131 | ||||||
| William Hill PLC | 3,376 | 12,223 | ||||||
| 259,462 | ||||||||
See Notes to Financial Statements.
| Semi-Annual Report | October 31, 2016 | 15 |
| Redmont Resolute Fund | Consolidated Schedule of Investments |
October 31, 2016 (Unaudited)
| Description | Shares | Value (Note 2) | ||||||
ENVIRONMENTAL CONTROL (0.00%)(c) | ||||||||
| Republic Services, Inc. | 95 | $ | 5,000 | |||||
FOOD (0.34%) | ||||||||
| Ajinomoto Co., Inc. | 7,700 | 171,556 | ||||||
| Campbell Soup Co. | 8 | 435 | ||||||
| Carrefour SA | 351 | 9,207 | ||||||
| Danone SA | 117 | 8,102 | ||||||
| General Mills, Inc. | 168 | 10,413 | ||||||
| Gruma SAB de CV, Class B | 8,955 | 124,482 | ||||||
| Grupo Bimbo SAB de CV, Class A | 88,400 | 238,340 | ||||||
| Grupo Lala SAB de CV | 19,800 | 36,822 | ||||||
| ICA Gruppen AB | 294 | 9,130 | ||||||
| Indofood CBP Sukses Makmur Tbk PT | 122,400 | 88,179 | ||||||
| Indofood Sukses Makmur Tbk PT | 230,400 | 150,092 | ||||||
| J Sainsbury PLC | 4,185 | 12,852 | ||||||
| Koninklijke Ahold Delhaize NV | 5,401 | 123,292 | ||||||
| MEIJI Holdings Co., Ltd. | 600 | 59,960 | ||||||
| METRO AG | 137 | 4,104 | ||||||
| Mondelez International, Inc., Class A | 1,794 | 80,622 | ||||||
| Morinaga & Co., Ltd. | 2,100 | 97,821 | ||||||
| Nestle SA | 1,637 | 118,695 | ||||||
| Nichirei Corp. | 4,500 | 98,651 | ||||||
Nomad Foods, Ltd.(a) | 12,551 | 154,252 | ||||||
| Pilgrim's Pride Corp. | 3,139 | 68,556 | ||||||
| Seven & I Holdings Co., Ltd. | 1,300 | 54,333 | ||||||
| Sysco Corp. | 101 | 4,860 | ||||||
| The Hershey Co. | 37 | 3,791 | ||||||
| The JM Smucker Co. | 6 | 788 | ||||||
| The Kroger Co. | 1,482 | 45,912 | ||||||
| Tyson Foods, Inc., Class A | 34 | 2,409 | ||||||
| 1,777,656 | ||||||||
FOOD SERVICE (0.01%) | ||||||||
| Compass Group PLC | 1,686 | 30,563 | ||||||
FOREST PRODUCTS & PAPER (0.02%) | ||||||||
| International Paper Co. | 66 | 2,972 | ||||||
| Mondi PLC | 1,005 | 19,633 | ||||||
| OJI Holdings Corp. | 4,000 | 16,973 | ||||||
| UPM‐Kymmene OYJ | 1,954 | 45,474 | ||||||
| 85,052 | ||||||||
GAS (0.04%) | ||||||||
| Centrica PLC | 8,843 | 23,185 | ||||||
| Enagas SA | 943 | 27,070 | ||||||
| Gas Natural SDG SA | 114 | 2,249 | ||||||
| Osaka Gas Co., Ltd. | 6,000 | 24,985 | ||||||
| Perusahaan Gas Negara Persero Tbk | 572,500 | 112,324 | ||||||
See Notes to Financial Statements.
16
| Redmont Resolute Fund | Consolidated Schedule of Investments |
October 31, 2016 (Unaudited)
| Description | Shares | Value (Note 2) | ||||||
GAS (0.04%) (continued) | ||||||||
| Snam SpA | 3,771 | $ | 19,878 | |||||
| 209,691 | ||||||||
HAND & MACHINE TOOLS (0.11%) | ||||||||
| Disco Corp. | 700 | 84,772 | ||||||
| Fuji Electric Holdings Co., Ltd. | 40,000 | 200,248 | ||||||
| SMC Corp. | 300 | 87,222 | ||||||
Stanley Black & Decker, Inc.(b) | 1,914 | 217,890 | ||||||
| 590,132 | ||||||||
HEALTHCARE ‐ PRODUCTS (0.14%) | ||||||||
| Abbott Laboratories | 41 | 1,609 | ||||||
| Baxter International, Inc. | 767 | 36,501 | ||||||
CYBERDYNE, Inc.(a) | 2,700 | 40,602 | ||||||
Edwards Lifesciences Corp.(a) | 44 | 4,190 | ||||||
Hologic, Inc.(a) | 4,166 | 150,018 | ||||||
Intuitive Surgical, Inc.(a) | 77 | 51,750 | ||||||
| Lifco AB, Class B | 416 | 10,529 | ||||||
| Medtronic PLC | 79 | 6,480 | ||||||
| Shimadzu Corp. | 11,000 | 160,379 | ||||||
| Thermo Fisher Scientific, Inc. | 6 | 882 | ||||||
| Topcon Corp. | 10,900 | 163,287 | ||||||
| Zimmer Biomet Holdings, Inc. | 921 | 97,073 | ||||||
| 723,300 | ||||||||
HEALTHCARE ‐ SERVICES (0.37%) | ||||||||
| Aetna, Inc. | 444 | 47,663 | ||||||
Anthem, Inc.(b) | 2,715 | 330,850 | ||||||
| Cigna Corp. | 2,449 | 291,015 | ||||||
DaVita, Inc.(a)(b) | 3,390 | 198,722 | ||||||
| Fresenius SE & Co., KGaA | 186 | 13,729 | ||||||
HCA Holdings, Inc.(a) | 474 | 36,275 | ||||||
Laboratory Corp. of America Holdings(a) | 2,347 | 294,173 | ||||||
| Miraca Holdings, Inc. | 300 | 14,532 | ||||||
PeptiDream, Inc.(a) | 1,200 | 62,020 | ||||||
| UnitedHealth Group, Inc. | 1,918 | 271,071 | ||||||
| Universal Health Services, Inc., Class B | 1,254 | 151,370 | ||||||
WellCare Health Plans, Inc.(a) | 2,000 | 227,020 | ||||||
| 1,938,440 | ||||||||
HOLDING COMPANIES ‐ DIVERSIFIED (0.08%) | ||||||||
| Ackermans & van Haaren NV | 158 | 21,950 | ||||||
| Alfa SAB de CV, Class A | 152,600 | 231,552 | ||||||
| Grupo Carso SAB de CV | 29,200 | 127,608 | ||||||
| Leucadia National Corp. | 1,414 | 26,399 | ||||||
| Schouw & Co. | 135 | 8,577 | ||||||
| Wendel SA | 217 | 24,965 | ||||||
| 441,051 | ||||||||
HOME BUILDERS (0.07%) | ||||||||
| Barratt Developments PLC | 2,497 | 13,866 | ||||||
| Berkeley Group Holdings PLC | 1,175 | 33,927 | ||||||
See Notes to Financial Statements.
| Semi-Annual Report | October 31, 2016 | 17 |
| Redmont Resolute Fund | Consolidated Schedule of Investments |
October 31, 2016 (Unaudited)
| Description | Shares | Value (Note 2) | ||||||
HOME BUILDERS (0.07%) (continued) | ||||||||
| Daiwa House Industry Co., Ltd. | 900 | $ | 24,768 | |||||
| DR Horton, Inc. | 41 | 1,182 | ||||||
| Iida Group Holdings Co., Ltd. | 3,000 | 58,043 | ||||||
| Persimmon PLC | 1,286 | 26,665 | ||||||
| PulteGroup, Inc. | 9,002 | 167,437 | ||||||
| Waskita Karya Persero Tbk PT | 249,300 | 50,059 | ||||||
| 375,947 | ||||||||
HOME FURNISHINGS (0.04%) | ||||||||
| Electrolux AB, Class B | 176 | 4,168 | ||||||
| Hoshizaki Electric Co., Ltd. | 300 | 27,119 | ||||||
| Leggett & Platt, Inc. | 63 | 2,890 | ||||||
| Sony Corp. | 4,300 | 137,812 | ||||||
Tempur Sealy International, Inc.(a) | 354 | 19,141 | ||||||
| Whirlpool Corp. | 18 | 2,697 | ||||||
| 193,827 | ||||||||
HOUSEHOLD PRODUCTS & WARES (0.09%) | ||||||||
| Henkel AG & Co. KGaA | 213 | 23,452 | ||||||
| Kimberly‐Clark de Mexico SAB de CV, Class A | 84,900 | 182,952 | ||||||
| Unilever Indonesia Tbk PT | 80,100 | 273,027 | ||||||
| 479,431 | ||||||||
HOUSEWARES (0.56%) | ||||||||
| Avery Dennison Corp. | 118 | 8,235 | ||||||
| Kimberly‐Clark Corp. | 411 | 47,023 | ||||||
Newell Brands, Inc.(b) | 60,017 | 2,882,016 | ||||||
| The Clorox Co. | 372 | 44,647 | ||||||
| 2,981,921 | ||||||||
INSURANCE (0.58%) | ||||||||
| Admiral Group PLC | 845 | 19,827 | ||||||
| Aflac, Inc. | 907 | 62,465 | ||||||
Alleghany Corp.(a) | 260 | 134,215 | ||||||
| Allianz SE | 917 | 142,942 | ||||||
| Allied World Assurance Co. Holdings AG | 319 | 13,711 | ||||||
| American International Group, Inc. | 2,059 | 127,040 | ||||||
| AmTrust Financial Services, Inc. | 1,677 | 44,256 | ||||||
| Aon PLC | 2,752 | 305,004 | ||||||
| Arthur J Gallagher & Co. | 122 | 5,884 | ||||||
| Aspen Insurance Holdings, Ltd. | 1,202 | 57,997 | ||||||
| Assicurazioni Generali SpA | 2,507 | 32,392 | ||||||
| Aviva PLC | 1,113 | 6,032 | ||||||
| AXA SA | 2,034 | 45,851 | ||||||
Berkshire Hathaway, Inc., Class B(a)(b) | 2,447 | 353,102 | ||||||
Chubb, Ltd.(b) | 2,116 | 268,732 | ||||||
| Cincinnati Financial Corp. | 41 | 2,902 | ||||||
| Direct Line Insurance Group PLC | 9,062 | 38,389 | ||||||
| Genworth MI Canada, Inc. | 300 | 6,515 | ||||||
| Japan Post Holdings Co., Ltd. | 600 | 7,655 | ||||||
| Legal & General Group PLC | 10,810 | 27,707 | ||||||
| Marsh & McLennan Cos., Inc. | 53 | 3,360 | ||||||
| See Notes to Financial Statements. |
| 18 |
| Redmont Resolute Fund | Consolidated Schedule of Investments |
October 31, 2016 (Unaudited)
| Description | Shares | Value (Note 2) | ||||||
INSURANCE (0.58%) (continued) | ||||||||
MetLife, Inc.(b) | 3,333 | $ | 156,518 | |||||
| MS&AD Insurance Group Holdings, Inc. | 9,000 | 267,932 | ||||||
| Muenchener Rueckversicherungs‐Gesellschaft AG in Muenchen | 141 | 27,335 | ||||||
| Principal Financial Group, Inc. | 15 | 819 | ||||||
| St. James's Place PLC | 417 | 4,823 | ||||||
| Swiss Re AG | 21 | 1,950 | ||||||
| T&D Holdings, Inc. | 6,600 | 79,991 | ||||||
The Allstate Corp.(b) | 4,091 | 277,779 | ||||||
| The Dai‐ichi Life Insurance Co., Ltd. | 3,800 | 55,839 | ||||||
| The Hanover Insurance Group, Inc. | 59 | 4,495 | ||||||
The Travelers Companies, Inc.(b) | 2,173 | 235,075 | ||||||
| Tokio Marine Holdings, Inc. | 4,400 | 174,078 | ||||||
| Unum Group | 2,708 | 95,863 | ||||||
| 3,088,475 | ||||||||
INTERNET (1.12%) | ||||||||
Alibaba Group Holding, Ltd., Sponsored ADR(a) | 2,203 | 224,023 | ||||||
Alphabet, Inc., Class A(a) | 590 | 477,841 | ||||||
Alphabet, Inc., Class C(a) | 93 | 72,962 | ||||||
Amazon.com, Inc.(a) | 35 | 27,644 | ||||||
Baidu, Inc., Sponsored ADR(a) | 1,090 | 192,777 | ||||||
CDW Corp.(b) | 6,691 | 300,493 | ||||||
eBay, Inc.(a)(b) | 11,113 | 316,832 | ||||||
F5 Networks, Inc.(a) | 233 | 32,203 | ||||||
Facebook, Inc., Class A(a) | 1,220 | 159,808 | ||||||
| GMO internet, Inc. | 5,000 | 66,988 | ||||||
| IAC/InterActiveCorp | 347 | 22,361 | ||||||
| Kakaku.com, Inc. | 8,600 | 144,741 | ||||||
| M3, Inc. | 1,400 | 42,719 | ||||||
| Mixi, Inc. | 300 | 11,056 | ||||||
Netflix, Inc.(a) | 1 | 125 | ||||||
| Nexon Co., Ltd. | 2,600 | 44,379 | ||||||
Rocket Internet SE(a)(d)(e) | 581 | 12,679 | ||||||
| SMS Co., Ltd. | 3,500 | 91,480 | ||||||
The Priceline Group, Inc.(a) | 95 | 140,052 | ||||||
VeriSign, Inc.(a) | 689 | 57,890 | ||||||
| Yahoo!, Inc. | 79,386 | 3,298,488 | ||||||
Yandex NV, Class A(a) | 2,294 | 45,169 | ||||||
YY, Inc., ADR(a) | 2,608 | 125,366 | ||||||
| 5,908,076 | ||||||||
INVESTMENT COMPANIES (0.04%) | ||||||||
American Capital, Ltd.(a) | 1,074 | 18,247 | ||||||
| Apollo Investment Corp. | 1,348 | 7,967 | ||||||
| Ares Capital Corp. | 1,381 | 21,129 | ||||||
| BlackRock Capital Investment Corp. | 520 | 3,910 | ||||||
| China Merchants China Direct Investments, Ltd. | 2,000 | 2,935 | ||||||
| Compass Diversified Holdings | 480 | 8,784 | ||||||
| Fifth Street Finance Corp. | 939 | 5,061 | ||||||
| FS Investment Corp. | 1,417 | 13,603 | ||||||
| Golub Capital BDC, Inc. | 317 | 5,611 | ||||||
| Main StreetCapital Corp. | 353 | 11,847 | ||||||
See Notes to Financial Statements.
| Semi-Annual Report | October 31, 2016 | 19 |
| Redmont Resolute Fund | Consolidated Schedule of Investments |
October 31, 2016 (Unaudited)
| Description | Shares | Value (Note 2) | ||||||
INVESTMENT COMPANIES (0.04%) (continued) | ||||||||
| Medley Capital Corp. | 394 | $ | 2,971 | |||||
| Melrose Industries PLC | 6,755 | 13,952 | ||||||
| New Mountain Finance Corp. | 387 | 5,147 | ||||||
| Pargesa Holding SA | 554 | 37,202 | ||||||
| PennantPark Investment Corp. | 469 | 3,532 | ||||||
| Prospect Capital Corp. | 1,925 | 15,188 | ||||||
| Solar Capital, Ltd. | 256 | 5,151 | ||||||
| TCP Capital Corp. | 318 | 5,085 | ||||||
| TPG Specialty Lending, Inc. | 342 | 6,129 | ||||||
| Triangle Capital Corp. | 243 | 4,670 | ||||||
| Zeder Investments, Ltd. | 13,226 | 6,543 | ||||||
| 204,664 | ||||||||
IRON & STEEL (0.12%) | ||||||||
ArcelorMittal(a) | 54 | 364 | ||||||
| Fosun International, Ltd. | 25,500 | 37,023 | ||||||
| Hitachi Metals, Ltd. | 100 | 1,251 | ||||||
| JFE Holdings, Inc. | 8,500 | 122,106 | ||||||
Kobe Steel, Ltd.(a) | 200 | 1,655 | ||||||
| Nucor Corp. | 1,031 | 50,364 | ||||||
| Steel Dynamics, Inc. | 15,260 | 419,040 | ||||||
| 631,803 | ||||||||
LEISURE TIME (0.05%) | ||||||||
| Brunswick Corp. | 3,535 | 153,773 | ||||||
| Carnival Corp. | 1,853 | 90,982 | ||||||
| Carnival PLC | 344 | 16,573 | ||||||
| 261,328 | ||||||||
LODGING (0.01%) | ||||||||
| Marriott International, Inc., Class A | 29 | 1,992 | ||||||
MGM Resorts International(a) | 2,122 | 55,533 | ||||||
| Wyndham Worldwide Corp. | 3 | 197 | ||||||
| 57,722 | ||||||||
MACHINERY ‐ CONSTRUCTION & MINING (0.06%) | ||||||||
| ABB, Ltd. | 2,540 | 52,363 | ||||||
| Atlas Copco AB, Class A | 1,023 | 30,014 | ||||||
| Atlas Copco AB, Class B | 1,107 | 28,949 | ||||||
| Caterpillar, Inc. | 60 | 5,008 | ||||||
| Hitachi Construction Machinery Co., Ltd. | 1,600 | 33,520 | ||||||
| United Tractors Tbk PT | 88,100 | 146,012 | ||||||
| 295,866 | ||||||||
MACHINERY ‐ DIVERSIFIED (0.14%) | ||||||||
| Amada Holdings Co., Ltd. | 100 | 1,142 | ||||||
| ANDRITZ AG | 440 | 23,016 | ||||||
| BWX Technologies, Inc. | 6,100 | 239,242 | ||||||
| Cummins, Inc. | 137 | 17,511 | ||||||
| Deere & Co. | 148 | 13,069 | ||||||
| Hexagon AB, Class B | 268 | 9,382 | ||||||
| Hollysys Automation Technologies, Ltd. | 3,474 | 69,167 | ||||||
| See Notes to Financial Statements. |
| 20 |
| Redmont Resolute Fund | Consolidated Schedule of Investments |
October 31, 2016 (Unaudited)
| Description | Shares | Value (Note 2) | ||||||
MACHINERY ‐ DIVERSIFIED (0.14%) (continued) | ||||||||
| Kawasaki Heavy Industries, Ltd. | 14,000 | $ | 40,984 | |||||
| Kone OYJ, Class B | 362 | 16,662 | ||||||
| Kubota Corp. | 7,000 | 113,107 | ||||||
| MAN SE | 179 | 18,306 | ||||||
| Nabtesco Corp. | 3,800 | 113,779 | ||||||
| Obara Group, Inc. | 900 | 38,877 | ||||||
| Rockwell Automation, Inc. | 46 | 5,507 | ||||||
| 719,751 | ||||||||
MEDIA (0.96%) | ||||||||
CBS Corp., Class B(b) | 2,157 | 122,129 | ||||||
Comcast Corp., Class A(b) | 6,104 | 377,349 | ||||||
Discovery Communications, Inc., Class C(a) | 196 | 4,921 | ||||||
| Global Mediacom Tbk PT | 372,600 | 24,273 | ||||||
| Grupo Televisa SAB | 116,500 | 572,361 | ||||||
| ITV PLC | 1,287,848 | 2,687,637 | ||||||
Liberty Broadband Corp., Class C(a)(b) | 1,063 | 70,849 | ||||||
Liberty Global PLC LiLAC, Class C(a) | 3,464 | 95,745 | ||||||
Liberty Global PLC, Class C(a) | 11,900 | 378,420 | ||||||
| Media Nusantara Citra Tbk PT | 262,200 | 42,200 | ||||||
| Pearson PLC | 657 | 6,092 | ||||||
| RTL Group SA | 329 | 25,787 | ||||||
| Scripps Networks Interactive, Inc., Class A | 2,663 | 171,391 | ||||||
| Surya Citra Media Tbk PT | 306,900 | 62,330 | ||||||
| The Walt Disney Co. | 628 | 58,209 | ||||||
| Time Warner, Inc. | 3,708 | 329,975 | ||||||
| Twenty‐First Century Fox, Inc., ClassA | 106 | 2,785 | ||||||
| Twenty‐First Century Fox, Inc., Class B | 65 | 1,715 | ||||||
| Vivendi SA | 2,339 | 47,296 | ||||||
| 5,081,464 | ||||||||
METAL FABRICATE & HARDWARE (0.01%) | ||||||||
| MISUMI Group, Inc. | 3,700 | 67,635 | ||||||
MINING (0.19%) | ||||||||
| Alcoa Corp. | 84 | 2,413 | ||||||
Anglo American PLC(a) | 155 | 2,146 | ||||||
| Barrick Gold Corp. | 13,228 | 232,693 | ||||||
| BHP Billiton PLC | 1,356 | 20,490 | ||||||
| Boliden AB | 217 | 5,029 | ||||||
| Freeport‐McMoRan, Inc. | 267 | 2,985 | ||||||
| Grupo Mexico SAB de CV, Class B | 194,300 | 476,986 | ||||||
| Industrias Penoles SAB de CV | 7,810 | 188,938 | ||||||
| Newmont Mining Corp. | 23 | 852 | ||||||
| Rio Tinto PLC | 853 | 29,646 | ||||||
| Sumitomo Metal Mining Co., Ltd. | 5,000 | 64,818 | ||||||
| Teck Resources, Ltd., Class B | 24 | 518 | ||||||
| 1,027,514 | ||||||||
MISCELLANEOUS MANUFACTURING (0.19%) | ||||||||
| 3M Co. | 314 | 51,904 | ||||||
| See Notes to Financial Statements. |
| Semi-Annual Report | October 31, 2016 | 21 |
| Redmont Resolute Fund | Consolidated Schedule of Investments |
October 31, 2016 (Unaudited)
| Description | Shares | Value (Note 2) | ||||||
MISCELLANEOUS MANUFACTURING (0.19%) (continued) | ||||||||
| Alfa Laval AB | 348 | $ | 5,001 | |||||
Danaher Corp.(b) | 3,367 | 264,478 | ||||||
| Dover Corp. | 43 | 2,876 | ||||||
| General Electric Co. | 2,535 | 73,769 | ||||||
Ingersoll‐Rand PLC(b) | 3,303 | 222,259 | ||||||
| Konica Minolta, Inc. | 100 | 897 | ||||||
| Nikon Corp. | 2,000 | 30,266 | ||||||
| Parker‐Hannifin Corp. | 17 | 2,087 | ||||||
| Siemens AG | 54 | 6,132 | ||||||
Textron, Inc.(b) | 8,658 | 347,013 | ||||||
| 1,006,682 | ||||||||
OFFICE & BUSINESS EQUIPMENT (0.02%) | ||||||||
| Canon, Inc. | 2,800 | 80,553 | ||||||
| Pitney Bowes, Inc. | 48 | 856 | ||||||
| Ricoh Co., Ltd. | 2,100 | 17,141 | ||||||
| Xerox Corp. | 393 | 3,840 | ||||||
| 102,390 | ||||||||
OIL & GAS (0.86%) | ||||||||
| Anadarko Petroleum Corp. | 6,113 | 363,357 | ||||||
| Apache Corp. | 57 | 3,390 | ||||||
| BP PLC | 14,874 | 88,061 | ||||||
Chesapeake Energy Corp.(a) | 235 | 1,295 | ||||||
| Chevron Corp. | 526 | 55,099 | ||||||
Concho Resources, Inc.(a) | 25 | 3,174 | ||||||
| ConocoPhillips Co. | 6,013 | 261,265 | ||||||
| DCC PLC | 202 | 16,479 | ||||||
| Devon Energy Corp. | 86 | 3,259 | ||||||
| Diamond Offshore Drilling, Inc. | 1,662 | 27,406 | ||||||
Diamondback Energy, Inc.(a) | 2,856 | 260,724 | ||||||
| Energen Corp. | 3,579 | 179,415 | ||||||
| Eni SpA | 2,324 | 33,701 | ||||||
| EOG Resources, Inc. | 21 | 1,899 | ||||||
| EQT Corp. | 3,898 | 257,268 | ||||||
| Exxon Mobil Corp. | 1,508 | 125,647 | ||||||
| Galp Energia SGPS SA | 166 | 2,251 | ||||||
Gulfport Energy Corp.(a) | 11,504 | 277,361 | ||||||
| Hess Corp. | 21 | 1,007 | ||||||
| Inpex Corp. | 10,000 | 93,983 | ||||||
| JX Holdings, Inc. | 400 | 1,586 | ||||||
Kosmos Energy, Ltd.(a) | 13,788 | 71,835 | ||||||
Laredo Petroleum, Inc.(a) | 3,288 | 39,193 | ||||||
| Marathon Oil Corp. | 14,260 | 187,947 | ||||||
| Marathon Petroleum Corp. | 8,253 | 359,748 | ||||||
| Murphy Oil Corp. | 38 | 983 | ||||||
| Nabors Industries, Ltd. | 3,532 | 42,031 | ||||||
Newfield Exploration Co.(a) | 5,957 | 241,795 | ||||||
| Noble Energy, Inc. | 1,551 | 53,463 | ||||||
| Occidental Petroleum Corp. | 5 | 365 | ||||||
Parsley Energy, Inc., Class A(a)(b) | 14,607 | 480,570 | ||||||
| Phillips 66 | 4,012 | 325,574 | ||||||
| See Notes to Financial Statements. |
| 22 |
| Redmont Resolute Fund | Consolidated Schedule of Investments |
October 31, 2016 (Unaudited)
| Description | Shares | Value (Note 2) | ||||||
OIL & GAS (0.86%) (continued) | ||||||||
| Pioneer Natural Resources Co. | 6 | $ | 1,074 | |||||
| QEP Resources, Inc. | 9,561 | 153,645 | ||||||
Rice Energy, Inc.(a)(b) | 5,949 | 131,413 | ||||||
| Rowan Cos. PLC, Class A | 672 | 8,917 | ||||||
| Royal Dutch Shell PLC, Class A | 3,042 | 75,902 | ||||||
| Royal Dutch Shell PLC, Class B | 466 | 12,064 | ||||||
RSP Permian, Inc.(a) | 3,500 | 126,350 | ||||||
Southwestern Energy Co.(a) | 16 | 166 | ||||||
| Statoil ASA | 2,634 | 43,165 | ||||||
| Tesoro Corp. | 49 | 4,164 | ||||||
| TOTAL SA | 312 | 14,974 | ||||||
Transocean, Ltd.(a) | 1,289 | 12,387 | ||||||
| Valero Energy Corp. | 1,550 | 91,822 | ||||||
| 4,537,174 | ||||||||
OIL & GAS SERVICES (0.48%) | ||||||||
| Baker Hughes, Inc. | 66 | 3,656 | ||||||
| China Petroleum & Chemical Corp., Class H | 76,000 | 55,367 | ||||||
Extraction Oil & Gas, Inc.(a) | 1,224 | 26,145 | ||||||
FMC Technologies, Inc.(a) | 13 | 419 | ||||||
| Halliburton Co. | 123 | 5,658 | ||||||
| National Oilwell Varco, Inc. | 83 | 2,664 | ||||||
| Range Resources Corp. | 1,001 | 33,824 | ||||||
| Schlumberger, Ltd. | 87 | 6,806 | ||||||
| Sunoco LP | 83,890 | 2,390,026 | ||||||
| 2,524,565 | ||||||||
PACKAGING & CONTAINERS (0.30%) | ||||||||
| Bemis Co., Inc. | 87 | 4,239 | ||||||
Berry Plastics Group, Inc.(a)(b) | 8,963 | 392,131 | ||||||
Crown Holdings, Inc.(a) | 3,753 | 203,600 | ||||||
Graphic Packaging Holding Co.(b) | 36,408 | 455,100 | ||||||
Packaging Corp. of America(b) | 2,059 | 169,868 | ||||||
| Sealed Air Corp. | 7,991 | 364,629 | ||||||
| 1,589,567 | ||||||||
PHARMACEUTICALS (0.61%) | ||||||||
AbbVie, Inc.(b) | 3,389 | 189,038 | ||||||
| Actelion, Ltd. | 88 | 12,717 | ||||||
| Alfresa Holdings Corp. | 1,700 | 36,020 | ||||||
Allergan PLC(a) | 28 | 5,850 | ||||||
| Astellas Pharma, Inc. | 800 | 11,897 | ||||||
| AstraZeneca PLC | 184 | 10,333 | ||||||
| Bayer AG | 597 | 59,172 | ||||||
| Bristol‐Myers Squibb Co. | 91 | 4,633 | ||||||
Cardinal Health, Inc.(b) | 2,307 | 158,468 | ||||||
| Chugai Pharmaceutical Co., Ltd. | 100 | 3,414 | ||||||
| CSPC Pharmaceutical Group, Ltd. | 18,000 | 18,660 | ||||||
| Daiichi Sankyo Co., Ltd. | 3,000 | 72,261 | ||||||
| Eisai Co., Ltd. | 1,100 | 70,257 | ||||||
Express Scripts Holding Co.(a)(b) | 4,358 | 293,729 | ||||||
| Galenica AG | 5 | 5,012 | ||||||
| See Notes to Financial Statements. |
| Semi-Annual Report | October 31, 2016 | 23 |
| Redmont Resolute Fund | Consolidated Schedule of Investments |
October 31, 2016 (Unaudited)
| Description | Shares | Value (Note 2) | ||||||
PHARMACEUTICALS (0.61%) (continued) | ||||||||
| GlaxoSmithKline PLC | 4,048 | $ | 80,193 | |||||
Herbalife, Ltd.(a) | 200 | 12,136 | ||||||
| Hikma Pharmaceuticals PLC | 109 | 2,340 | ||||||
| Johnson & Johnson | 4,312 | 500,149 | ||||||
| Kalbe Farma Tbk PT | 1,107,000 | 147,623 | ||||||
Mallinckrodt PLC(a) | 31 | 1,837 | ||||||
McKesson Corp.(b) | 1,765 | 224,455 | ||||||
| Merck & Co., Inc. | 7,634 | 448,269 | ||||||
| Novartis AG | 592 | 42,117 | ||||||
| Novartis AG, Sponsored ADR | 1,558 | 110,649 | ||||||
| Novo Nordisk A/S, Class B | 796 | 28,476 | ||||||
| Orion OYJ, Class B | 616 | 26,230 | ||||||
| Pfizer, Inc. | 6,552 | 207,764 | ||||||
| Roche Holding AG | 403 | 92,651 | ||||||
| Sanofi | 80 | 6,232 | ||||||
| Sanofi, ADR | 2,088 | 81,202 | ||||||
| Seikagaku Corp. | 2,700 | 43,408 | ||||||
| Shire PLC | 382 | 21,742 | ||||||
| Sumitomo Dainippon Pharma Co., Ltd. | 4,200 | 72,930 | ||||||
| Takeda Pharmaceutical Co., Ltd. | 200 | 8,963 | ||||||
| Teva Pharmaceutical Industries, Ltd., Sponsored ADR | 3,208 | 137,110 | ||||||
| 3,247,937 | ||||||||
PIPELINES (2.01%) | ||||||||
| Boardwalk Pipeline Partners LP | 15,425 | 265,464 | ||||||
| Enterprise Products Partners LP | 80,382 | 2,028,842 | ||||||
| Kinder Morgan, Inc. | 57 | 1,164 | ||||||
| MPLX LP | 2,325 | 79,096 | ||||||
| ONEOK Partners LP | 25,377 | 1,008,482 | ||||||
| Oneok, Inc. | 295 | 14,287 | ||||||
| Tesoro Logistics LP | 32,951 | 1,573,081 | ||||||
| The Williams Cos., Inc. | 105,075 | 3,068,190 | ||||||
| Williams Partners LP | 72,534 | 2,598,168 | ||||||
| 10,636,774 | ||||||||
PRIVATE EQUITY (0.06%) | ||||||||
| 3i Group PLC | 6,539 | 53,705 | ||||||
| Alaris Royalty Corp. | 325 | 4,776 | ||||||
Allied Minds PLC(a) | 1,430 | 5,951 | ||||||
| Altamir | 426 | 5,443 | ||||||
| Apollo Global Management LLC, Class A | 1,106 | 20,218 | ||||||
| AURELIUS Equity Opportunities SE & Co. KGaA | 259 | 15,433 | ||||||
| Bure Equity AB | 629 | 6,894 | ||||||
| Deutsche Beteiligungs AG | 172 | 5,807 | ||||||
| Eurazeo SA | 495 | 28,490 | ||||||
| Gimv NV | 234 | 12,587 | ||||||
| Hercules Capital, Inc. | 628 | 8,610 | ||||||
IP Group PLC(a) | 4,769 | 8,785 | ||||||
| Jafco Co., Ltd. | 500 | 16,663 | ||||||
| KKR & Co. LP | 2,638 | 37,433 | ||||||
| Onex Corp. | 619 | 40,039 | ||||||
| Ratos AB, Class B | 2,280 | 9,370 | ||||||
| See Notes to Financial Statements. |
| 24 |
| Redmont Resolute Fund | Consolidated Schedule of Investments |
October 31, 2016 (Unaudited)
| Description | Shares | Value (Note 2) | ||||||
PRIVATE EQUITY (0.06%) (continued) | ||||||||
Safeguard Scientifics, Inc.(a) | 247 | $ | 2,915 | |||||
| The Blackstone Group LP | 1,486 | 37,195 | ||||||
| The Carlyle Group LP | 821 | 12,725 | ||||||
| 333,039 | ||||||||
REAL ESTATE (0.12%) | ||||||||
| Aeon Mall Co., Ltd. | 1,900 | 28,264 | ||||||
| Bumi Serpong Damai Tbk PT | 404,100 | 67,205 | ||||||
| Daikyo, Inc. | 58,000 | 124,440 | ||||||
| Daito Trust Construction Co., Ltd. | 400 | 67,035 | ||||||
| Deutsche Wohnen AG | 185 | 6,036 | ||||||
| Lippo Karawaci Tbk PT | 968,900 | 67,202 | ||||||
| Mitsubishi Estate Co., Ltd. | 2,000 | 39,697 | ||||||
| Mitsui Fudosan Co., Ltd. | 5,000 | 113,974 | ||||||
| NTT Urban Development Corp. | 6,400 | 58,831 | ||||||
| Summarecon Agung Tbk PT | 530,000 | 67,022 | ||||||
| 639,706 | ||||||||
REAL ESTATE INVESTMENT TRUSTS (0.13%) | ||||||||
| American Capital Agency Corp. | 4,777 | 95,827 | ||||||
| AvalonBay Communities, Inc. | 66 | 11,298 | ||||||
Boston Properties, Inc.(b) | 808 | 97,348 | ||||||
| Brixmor Property Group, Inc. | 1,608 | 40,875 | ||||||
| Corrections Corp. of America | 1,400 | 20,230 | ||||||
| Equity Residential | 828 | 51,129 | ||||||
| Essex Property Trust, Inc. | 25 | 5,352 | ||||||
| Fibra Uno Administracion SA de CV | 114,700 | 218,282 | ||||||
| Fonciere Des Regions | 58 | 5,070 | ||||||
| General Growth Properties, Inc. | 62 | 1,547 | ||||||
| Host Hotels & Resorts, Inc. | 294 | 4,551 | ||||||
| Japan Real Estate Investment Corp. | 1 | 5,788 | ||||||
| Japan Retail Fund Investment Corp. | 8 | 18,148 | ||||||
| Kimco Realty Corp. | 306 | 8,143 | ||||||
| Public Storage | 40 | 8,549 | ||||||
| SL Green Realty Corp. | 740 | 72,683 | ||||||
| Welltower, Inc. | 30 | 2,056 | ||||||
| 666,876 | ||||||||
RETAIL (2.41%) | ||||||||
| Advance Auto Parts, Inc. | 1,268 | 177,621 | ||||||
| Alimentation Couche‐Tard, Inc., Class B | 42,834 | 2,151,759 | ||||||
| American Eagle Outfitters, Inc. | 7,712 | 131,413 | ||||||
| Astra International Tbk PT | 1,062,400 | 669,700 | ||||||
AutoZone, Inc.(a) | 35 | 25,976 | ||||||
| Best Buy Co., Inc. | 137 | 5,331 | ||||||
| Casey's General Stores, Inc. | 21,768 | 2,459,566 | ||||||
| Copart, Inc. | 10,885 | 571,136 | ||||||
CVS Health Corp.(b) | 2,441 | 205,288 | ||||||
| Darden Restaurants, Inc. | 240 | 15,550 | ||||||
| Dollar General Corp. | 49,583 | 3,425,690 | ||||||
Dollar Tree, Inc.(a) | 43 | 3,249 | ||||||
| El Puerto de Liverpool SAB de CV, Class 1 | 11,200 | 117,783 | ||||||
| See Notes to Financial Statements. |
| Semi-Annual Report | October 31, 2016 | 25 |
| Redmont Resolute Fund | Consolidated Schedule of Investments |
October 31, 2016 (Unaudited)
| Description | Shares | Value (Note 2) | ||||||
RETAIL (2.41%) (continued) | ||||||||
| FamilyMart Co., Ltd. | 800 | $ | 50,196 | |||||
| Fast Retailing Co., Ltd. | 200 | 67,627 | ||||||
| Foot Locker, Inc. | 2,238 | 149,431 | ||||||
| Grupo Comercial Chedraui SA de CV | 7,600 | 16,904 | ||||||
| HUGO BOSS AG | 68 | 4,271 | ||||||
| IDOM, Inc. | 5,600 | 29,263 | ||||||
| Isetan Mitsukoshi Holdings, Ltd. | 1,000 | 10,127 | ||||||
| J Front Retailing Co., Ltd. | 900 | 12,418 | ||||||
| Lawson, Inc. | 400 | 30,438 | ||||||
Lowe's Cos., Inc.(b) | 2,108 | 140,498 | ||||||
| Macy's, Inc. | 7 | 255 | ||||||
| Marks & Spencer Group PLC | 1,119 | 4,664 | ||||||
| Matahari Department Store Tbk PT | 122,500 | 169,226 | ||||||
| McDonald's Corp. | 103 | 11,595 | ||||||
| Nitori Holdings Co., Ltd. | 1,200 | 143,835 | ||||||
| Nordstrom, Inc. | 20 | 1,040 | ||||||
| O'Reilly Automotive, Inc. | 2,178 | 575,950 | ||||||
| PVH Corp. | 1,240 | 132,655 | ||||||
| Ross Stores, Inc. | 28 | 1,751 | ||||||
| Ryohin Keikaku Co,. Ltd. | 200 | 42,796 | ||||||
| Staples, Inc. | 206 | 1,524 | ||||||
| Starbucks Corp. | 92 | 4,882 | ||||||
| Sundrug Co., Ltd. | 1,400 | 110,403 | ||||||
| Target Corp. | 209 | 14,365 | ||||||
| The Home Depot, Inc. | 317 | 38,677 | ||||||
| The TJX Companies, Inc. | 432 | 31,860 | ||||||
Urban Outfitters, Inc.(a) | 46 | 1,539 | ||||||
| Walgreens Boots Alliance, Inc. | 1,644 | 136,008 | ||||||
| Wal‐Mart de Mexico SAB de CV | 268,000 | 566,882 | ||||||
| Wal‐Mart Stores, Inc. | 3,814 | 267,056 | ||||||
| World Fuel Services Corp. | 941 | 37,875 | ||||||
| 12,766,073 | ||||||||
SEMICONDUCTORS (0.36%) | ||||||||
| ASML Holding NV | 437 | 46,293 | ||||||
| Avago Technologies, Ltd. | 2,950 | 502,326 | ||||||
| Intel Corp. | 795 | 27,722 | ||||||
| KLA‐Tencor Corp. | 2,823 | 212,036 | ||||||
| Lam Research Corp. | 18 | 1,743 | ||||||
| Linear Technology Corp. | 38 | 2,282 | ||||||
| Megachips Corp. | 2,800 | 56,310 | ||||||
| NVIDIA Corp. | 103 | 7,329 | ||||||
ON Semiconductor Corp.(a)(b) | 29,208 | 340,857 | ||||||
Qorvo, Inc.(a) | 3,847 | 214,086 | ||||||
| QUALCOMM, Inc. | 138 | 9,483 | ||||||
| Sumco Corp. | 6,700 | 70,405 | ||||||
Texas Instruments, Inc.(b) | 5,770 | 408,805 | ||||||
| Xilinx, Inc. | 16 | 814 | ||||||
| 1,900,491 | ||||||||
| See Notes to Financial Statements. |
| 26 |
| Redmont Resolute Fund | Consolidated Schedule of Investments |
| October 31, 2016 (Unaudited) |
| Description | Shares | Value (Note 2) | ||||||
SHIPBUILDING (0.07%) | ||||||||
Huntington Ingalls Industries, Inc.(b) | 2,229 | $ | 359,671 | |||||
SOFTWARE (0.86%) | ||||||||
| Activision Blizzard, Inc. | 2,017 | 87,074 | ||||||
Adobe Systems, Inc.(a) | 432 | 46,444 | ||||||
| Amadeus IT Holding SA, Class A | 1,841 | 86,901 | ||||||
| CA, Inc. | 7 | 215 | ||||||
| Capcom Co., Ltd. | 4,500 | 116,501 | ||||||
Cerner Corp.(a) | 39 | 2,285 | ||||||
Citrix Systems, Inc.(a) | 406 | 34,429 | ||||||
Electronic Arts, Inc.(a) | 1,032 | 81,033 | ||||||
| Fidelity National Information Services, Inc. | 2,128 | 157,302 | ||||||
Fiserv, Inc.(a) | 244 | 24,029 | ||||||
Microsoft Corp.(b) | 8,333 | 499,313 | ||||||
NetEase, Inc., ADR(b) | 843 | 216,643 | ||||||
Oracle Corp.(b) | 9,602 | 368,909 | ||||||
Red Hat, Inc.(a) | 54 | 4,182 | ||||||
salesforce.com, Inc.(a) | 55 | 4,134 | ||||||
| SAP SE | 62 | 5,461 | ||||||
| SS&C Technologies Holdings, Inc. | 88,645 | 2,830,435 | ||||||
| 4,565,290 | ||||||||
SPECIAL CHEMICALS (0.52%) | ||||||||
| Valvoline, Inc. | 134,530 | 2,744,412 | ||||||
TELECOMMUNICATIONS (0.73%) | ||||||||
| America Movil SAB de CV, Class L | 1,508,400 | 999,162 | ||||||
Arista Networks, Inc.(a) | 300 | 25,425 | ||||||
| AT&T, Inc. | 4,315 | 158,749 | ||||||
| BT Group PLC | 3,750 | 17,256 | ||||||
| CenturyLink, Inc. | 1,622 | 43,113 | ||||||
| China Telecom Corp., Ltd., Class H | 348,000 | 179,933 | ||||||
Cisco Systems, Inc.(b) | 9,307 | 285,539 | ||||||
CommScope Holding Co., Inc.(a) | 2,986 | 91,222 | ||||||
| Deutsche Telekom AG | 1,632 | 26,595 | ||||||
| Eutelsat Communications SA | 689 | 14,446 | ||||||
| Juniper Networks, Inc. | 24 | 632 | ||||||
| KDDI Corp. | 7,800 | 237,414 | ||||||
| Millicom International Cellular SA, SDR | 9 | 396 | ||||||
| Motorola Solutions, Inc. | 14 | 1,016 | ||||||
| Nippon Telegraph & Telephone Corp. | 3,800 | 168,857 | ||||||
| Nokia OYJ | 629 | 2,809 | ||||||
| NTT DOCOMO, Inc. | 1,300 | 32,732 | ||||||
| Orange SA | 6,929 | 109,151 | ||||||
| Proximus SADP | 1,187 | 33,983 | ||||||
| SES SA | 543 | 12,488 | ||||||
| SoftBank Corp. | 2,600 | 163,681 | ||||||
| Telefonaktiebolaget LM Ericsson, Class B | 218 | 1,055 | ||||||
| Telefonica Deutschland Holding AG | 9,268 | 35,924 | ||||||
| Telefonica SA | 3,378 | 34,338 | ||||||
| See Notes to Financial Statements. |
| Semi-Annual Report | October 31, 2016 | 27 |
| Redmont Resolute Fund | Consolidated Schedule of Investments |
| October 31, 2016 (Unaudited) |
| Description | Shares | Value (Note 2) | ||||||
TELECOMMUNICATIONS (0.73%) (continued) | ||||||||
| Telekomunikasi Indonesia Persero Tbk PT | 2,645,200 | $ | 855,514 | |||||
| Tower Bersama Infrastructure Tbk PT | 125,900 | 57,653 | ||||||
| Verizon Communications, Inc. | 5,331 | 256,421 | ||||||
XL Axiata Tbk PT(a) | 196,100 | 33,064 | ||||||
| 3,878,568 | ||||||||
TEXTILES (0.01%) | ||||||||
| Toyobo Co., Ltd. | 26,000 | 42,643 | ||||||
TOYS, GAMES & HOBBIES (0.05%) | ||||||||
| Bandai Namco Holdings, Inc. | 800 | 24,030 | ||||||
| Hasbro, Inc. | 1,736 | 144,800 | ||||||
| Tomy Co., Ltd. | 10,300 | 111,476 | ||||||
| 280,306 | ||||||||
TRANSPORTATION (0.10%) | ||||||||
| Central Japan Railway Co. | 1,300 | 221,460 | ||||||
| CH Robinson Worldwide, Inc. | 297 | 20,232 | ||||||
| Deutsche Post AG | 917 | 28,417 | ||||||
| East Japan Railway Co. | 1,100 | 97,098 | ||||||
| Expeditors International of Washington, Inc. | 139 | 7,154 | ||||||
| Keisei Electric Railway Co., Ltd. | 2,000 | 48,384 | ||||||
| Mitsui OSK Lines, Ltd. | 1,000 | 2,508 | ||||||
| Royal Mail PLC | 2,536 | 15,241 | ||||||
| Tokyu Corp. | 10,000 | 75,045 | ||||||
| United Parcel Service, Inc., Class B | 22 | 2,371 | ||||||
| 517,910 | ||||||||
| TOTAL COMMON STOCKS | ||||||||
| (Cost $114,677,099) | 121,453,022 | |||||||
| EXCHANGE TRADED FUNDS (0.23%) | ||||||||
iShares® Europe ETF | 1,206 | 45,985 | ||||||
iShares® iBoxx $ Investment Grade Corporate Bond ETF | 6,900 | 834,762 | ||||||
iShares® MSCI Emerging Markets UCITS ETF | 96 | 3,370 | ||||||
iShares® MSCI Indonesia ETF | 2,637 | 69,221 | ||||||
iShares® MSCI Japan ETF | 6,686 | 84,444 | ||||||
iShares® MSCI Mexico Capped ETF | 303 | 15,401 | ||||||
iShares® MSCI World UCITS ETF DIST | 758 | 27,347 | ||||||
iShares® Russell 1000 Value ETF | 824 | 85,729 | ||||||
SPDR® S&P 500® ETF Trust | 247 | 52,500 | ||||||
| 1,218,759 | ||||||||
| TOTAL EXCHANGE TRADED FUNDS | ||||||||
| (Cost $1,152,365) | 1,218,759 | |||||||
| See Notes to Financial Statements. |
| 28 |
| Redmont Resolute Fund | Consolidated Schedule of Investments |
| October 31, 2016 (Unaudited) |
| Description | Shares | Value (Note 2) | ||||||
| LIMITED PARTNERSHIPS (0.02%) | ||||||||
OIL & GAS (0.02%) | ||||||||
| Viper Energy Partners LP | 5,968 | $ | 87,610 | |||||
| TOTAL LIMITED PARTNERSHIPS | ||||||||
| (Cost $107,374) | 87,610 | |||||||
| OPEN‐END MUTUAL FUNDS (45.83%) | ||||||||
| AQR Multi Strategy Alternative Fund, Class I | 9,470,389 | 92,146,890 | ||||||
| FPA Crescent Fund | 654,239 | 21,171,160 | ||||||
| Lazard Global Listed Infrastructure Portfolio, Institutional Class | 87,855 | 1,215,039 | ||||||
| PIMCO Short‐Term Fund, Institutional Class | 13,073,216 | 127,856,050 | ||||||
| 242,389,139 | ||||||||
| TOTAL OPEN‐END MUTUAL FUNDS | ||||||||
| (Cost $238,359,840) | 242,389,139 | |||||||
| PREFERRED STOCKS (0.01%) | ||||||||
AUTO MANUFACTURERS (0.00%)(c) | ||||||||
| Bayerische Motoren Werke AG | 214 | 16,245 | ||||||
BANKS (0.01%) | ||||||||
| Banco Bradesco SA | 4,100 | 42,991 | ||||||
CHEMICALS (0.00%)(c) | ||||||||
| Braskem SA, Class A | 600 | 5,327 | ||||||
HOUSEHOLD PRODUCTS & WARES (0.00%)(c) | ||||||||
| Henkel AG & Co. KGaA | 59 | 7,571 | ||||||
| TOTAL PREFERRED STOCKS | ||||||||
| (Cost $65,935) | 72,134 | |||||||
| Description | Principal Amount | Value (Note 2) | ||||||
| ASSET‐BACKED SECURITIES (0.05%) | ||||||||
| Honda Auto Receivables Owner Trust 2015‐3 A2 | ||||||||
| 0.92%, 11/20/2017 | $ | 239,443 | 239,434 | |||||
| TOTAL ASSET‐BACKED SECURITIES | ||||||||
| (Cost $239,440) | 239,434 | |||||||
| CORPORATE BONDS (2.00%) | ||||||||
| ADVERTISING (0.01%) | ||||||||
| Omnicom Group, Inc. | ||||||||
| 3.60%, 04/15/2026 | 18,000 | 18,744 | ||||||
| See Notes to Financial Statements. |
| Semi-Annual Report | October 31, 2016 | 29 |
| Redmont Resolute Fund | Consolidated Schedule of Investments |
| October 31, 2016 (Unaudited) |
| Description | Principal Amount | Value (Note 2) | ||||||
| ADVERTISING (0.01%) (continued) | ||||||||
| The Interpublic Group of Companies, Inc. | ||||||||
| 4.20%, 04/15/2024 | $ | 24,000 | $ | 25,649 | ||||
| 44,393 | ||||||||
| AEROSPACE & DEFENSE (0.01%) | ||||||||
| Harris Corp. | ||||||||
| 4.85%, 04/27/2035 | 22,000 | 23,665 | ||||||
| Moog, Inc. | ||||||||
5.25%, 12/01/2022(d) | 25,000 | 25,750 | ||||||
| The Boeing Co. | ||||||||
| 2.20%, 10/30/2022 | 15,000 | 15,207 | ||||||
| 64,622 | ||||||||
AGRICULTURE (0.00%)(c) | ||||||||
| Archer‐Daniels‐Midland Co. | ||||||||
| 2.50%, 08/11/2026 | 14,000 | 13,827 | ||||||
| AIRLINES (0.01%) | ||||||||
| Allegiant Travel Co. | ||||||||
| 5.50%, 07/15/2019 | 35,000 | 36,531 | ||||||
| United Airlines 2013‐1 Class B Pass Through Trust | ||||||||
| 5.38%, 08/15/2021 | 24,524 | 25,536 | ||||||
| 62,067 | ||||||||
APPAREL (0.00%)(c) | ||||||||
| Wolverine World Wide, Inc. | ||||||||
5.00%, 09/01/2026(d) | 3,000 | 3,008 | ||||||
| AUTO MANUFACTURERS (0.07%) | ||||||||
| American Honda Finance Corp. | ||||||||
| 1.20%, 07/14/2017 | 89,000 | 89,145 | ||||||
| 1.20%, 07/12/2019 | 28,000 | 27,814 | ||||||
| BMW US Capital LLC | ||||||||
1.50%, 04/11/2019(d) | 19,000 | 19,016 | ||||||
| Hyundia Capital America | ||||||||
2.40%, 10/30/2018(d) | 39,000 | 39,453 | ||||||
| JB Poindexter & Co., Inc. | ||||||||
9.00%, 04/01/2022(d) | 21,000 | 22,165 | ||||||
| PACCAR Financial Corp. | ||||||||
| 1.65%, 02/25/2019 | 6,000 | 6,039 | ||||||
| 2.20%, 09/15/2019 | 63,000 | 64,226 | ||||||
| Toyota Motor Credit Corp. | ||||||||
| 1.70%, 02/19/2019 | 100,000 | 100,537 | ||||||
| 2.00%, 10/24/2018 | 11,000 | 11,144 | ||||||
| 379,539 | ||||||||
| See Notes to Financial Statements. |
| 30 |
| Redmont Resolute Fund | Consolidated Schedule of Investments |
| October 31, 2016 (Unaudited) |
| Description | Principal Amount | Value (Note 2) | ||||||
| BANKS (0.23%) | ||||||||
| Bank of America Corp. | ||||||||
| 2.63%, 10/19/2020 | $ | 11,000 | $ | 11,196 | ||||
| 4.25%, 10/22/2026 | 46,000 | 48,307 | ||||||
| 7.25%, 10/15/2025 | 7,000 | 8,539 | ||||||
| Bank of America Corp., Series L | ||||||||
| 2.60%, 01/15/2019 | 61,000 | 62,046 | ||||||
| 3.95%, 04/21/2025 | 12,000 | 12,346 | ||||||
| BankUnited, Inc. | ||||||||
| 4.88%, 11/17/2025 | 38,000 | 38,738 | ||||||
| Capital One Financial Corp. | ||||||||
| 3.75%, 07/28/2026 | 11,000 | 10,990 | ||||||
| Citigroup, Inc. | ||||||||
| 4.40%, 06/10/2025 | 76,000 | 80,438 | ||||||
| 4.45%, 09/29/2027 | 38,000 | 40,142 | ||||||
| 6.00%, 10/31/2033 | 10,000 | 11,767 | ||||||
| Credit Suisse New York | ||||||||
| 1.70%, 04/27/2018 | 38,000 | 37,988 | ||||||
| Fifth Third Bancorp, Series J | ||||||||
4.90%, Perpetual Maturity(f)(g) | 48,000 | 46,584 | ||||||
| First Horizon National Corp. | ||||||||
| 3.50%, 12/15/2020 | 55,000 | 56,277 | ||||||
| JPMorgan Chase & Co. | ||||||||
| 2.30%, 08/15/2021 | 15,000 | 15,022 | ||||||
| 2.55%, 03/01/2021 | 50,000 | 50,799 | ||||||
| 2.70%, 05/18/2023 | 75,000 | 75,323 | ||||||
| 2.75%, 06/23/2020 | 10,000 | 10,236 | ||||||
| JPMorgan Chase & Co., Series U | ||||||||
6.13%, Perpetual Maturity(f)(g) | 9,000 | 9,540 | ||||||
| Morgan Stanley | ||||||||
| 2.13%, 04/25/2018 | 45,000 | 45,344 | ||||||
| 2.80%, 06/16/2020 | 11,000 | 11,262 | ||||||
| 4.10%, 05/22/2023 | 87,000 | 91,825 | ||||||
| 5.00%, 11/24/2025 | 22,000 | 24,389 | ||||||
| Regions Financial Corp. | ||||||||
| 3.20%, 02/08/2021 | 21,000 | 21,796 | ||||||
| 7.38%, 12/10/2037 | 71,000 | 89,598 | ||||||
| Royal Bank of Canada | ||||||||
| 4.65%, 01/27/2026 | 20,000 | 21,736 | ||||||
| The Goldman Sachs Group, Inc. | ||||||||
| 2.35%, 11/15/2021 | 26,000 | 25,896 | ||||||
2.64%, 10/28/2027(f) | 20,000 | 20,063 | ||||||
| 4.75%, 10/21/2045 | 11,000 | 12,160 | ||||||
| 5.15%, 05/22/2045 | 5,000 | 5,428 | ||||||
| 6.13%, 02/15/2033 | 30,000 | 37,260 | ||||||
| 6.75%, 10/01/2037 | 49,000 | 62,039 | ||||||
| The Toronto‐Dominion Bank | ||||||||
| 1.80%, 07/13/2021 | 27,000 | 26,852 | ||||||
3.63%, 09/15/2031(f) | 5,000 | 5,002 | ||||||
| Wells Fargo & Co. | ||||||||
| 3.00%, 10/23/2026 | 69,000 | 68,754 | ||||||
| 4.30%, 07/22/2027 | 18,000 | 19,164 | ||||||
| 4.40%, 06/14/2046 | 1,000 | 1,004 | ||||||
| See Notes to Financial Statements. |
| Semi-Annual Report | October 31, 2016 | 31 |
| Redmont Resolute Fund | Consolidated Schedule of Investments |
| October 31, 2016 (Unaudited) |
| Description | Principal Amount | Value (Note 2) | ||||||
| BANKS (0.23%) (continued) | ||||||||
| Wells Fargo Capital X | ||||||||
| 5.95%, 12/15/2036 | $ | 17,000 | $ | 18,275 | ||||
| 1,234,125 | ||||||||
| BEVERAGES (0.03%) | ||||||||
| Anheuser‐Busch InBev Worldwide, Inc. | ||||||||
| 1.38%, 07/15/2017 | 46,000 | 46,100 | ||||||
| 1.90%, 02/01/2019 | 13,000 | 13,093 | ||||||
| 2.65%, 02/01/2021 | 26,000 | 26,671 | ||||||
| 3.30%, 02/01/2023 | 12,000 | 12,567 | ||||||
| 4.70%, 02/01/2036 | 33,000 | 36,681 | ||||||
| 4.90%, 02/01/2046 | 8,000 | 9,200 | ||||||
| Diageo Capital PLC | ||||||||
| 5.75%, 10/23/2017 | 28,000 | 29,258 | ||||||
| 173,570 | ||||||||
BIOTECHNOLOGY (0.00%)(c) | ||||||||
| Amgen, Inc. | ||||||||
| 4.40%, 05/01/2045 | 10,000 | 10,220 | ||||||
| Gilead Sciences, Inc. | ||||||||
| 4.00%, 09/01/2036 | 7,000 | 7,032 | ||||||
| 17,252 | ||||||||
| BUILDING MATERIALS (0.02%) | ||||||||
| Lennox International, Inc. | ||||||||
| 3.00%, 11/15/2023 | 24,000 | 24,008 | ||||||
| Standard Industries, Inc. | ||||||||
6.00%, 10/15/2025(d) | 50,000 | 53,622 | ||||||
| 77,630 | ||||||||
| CHEMICALS (0.03%) | ||||||||
| A Schulman, Inc. | ||||||||
6.88%, 06/01/2023(d) | 40,000 | 40,900 | ||||||
| Airgas, Inc. | ||||||||
| 3.05%, 08/01/2020 | 12,000 | 12,514 | ||||||
| Eastman Chemical Co. | ||||||||
| 4.65%, 10/15/2044 | 12,000 | 12,121 | ||||||
| Lubrizol Corp. | ||||||||
| 6.50%, 10/01/2034 | 14,000 | 18,509 | ||||||
| RPM International, Inc. | ||||||||
| 5.25%, 06/01/2045 | 51,000 | 52,459 | ||||||
| Unifrax I LLC / Unifrax Holding Co. | ||||||||
7.50%, 02/15/2019(d) | 25,000 | 24,188 | ||||||
| Westlake Chemical Corp. | ||||||||
3.60%, 08/15/2026(d) | 17,000 | 16,992 | ||||||
| 177,683 | ||||||||
| COAL (0.01%) | ||||||||
| SunCoke Energy Partners LP / SunCoke Energy Partners Finance Corp. | ||||||||
| 7.38%, 02/01/2020 | 25,000 | 24,125 | ||||||
| See Notes to Financial Statements. |
| 32 |
| Redmont Resolute Fund | Consolidated Schedule of Investments |
| October 31, 2016 (Unaudited) |
| Description | Principal Amount | Value (Note 2) | ||||||
| COMMERCIAL SERVICES (0.05%) | ||||||||
| Automatic Data Processing, Inc. | ||||||||
| 2.25%, 09/15/2020 | $ | 5,000 | $ | 5,131 | ||||
| Avis Budget Car Rental LLC / Avis Budget Finance, Inc. | ||||||||
5.13%, 06/01/2022(d) | 5,000 | 4,919 | ||||||
5.25%, 03/15/2025(d) | 20,000 | 19,075 | ||||||
| Ecolab, Inc. | ||||||||
| 3.70%, 11/01/2046 | 3,000 | 2,964 | ||||||
| ERAC USA Finance LLC | ||||||||
4.20%, 11/01/2046(d) | 22,000 | 21,437 | ||||||
| Great Lakes Dredge & Dock Corp. | ||||||||
| 7.38%, 02/01/2019 | 46,000 | 45,367 | ||||||
| Harland Clarke Holdings Corp. | ||||||||
6.88%, 03/01/2020(d) | 55,000 | 52,937 | ||||||
| Herc Rentals, Inc. | ||||||||
7.50%, 06/01/2022(d) | 10,000 | 10,025 | ||||||
| Multi‐Color Corp. | ||||||||
6.13%, 12/01/2022(d) | 30,000 | 31,425 | ||||||
| Quad Graphics, Inc. | ||||||||
| 7.00%, 05/01/2022 | 30,000 | 28,950 | ||||||
| The Hertz Corp. | ||||||||
5.50%, 10/15/2024(d) | 20,000 | 19,468 | ||||||
| 241,698 | ||||||||
| COMPUTERS (0.08%) | ||||||||
| Apple, Inc. | ||||||||
| 2.45%, 08/04/2026 | 16,000 | 15,690 | ||||||
| 2.85%, 05/06/2021 | 18,000 | 18,808 | ||||||
| 2.85%, 02/23/2023 | 22,000 | 22,846 | ||||||
| 3.85%, 08/04/2046 | 12,000 | 11,738 | ||||||
| 4.50%, 02/23/2036 | 8,000 | 8,942 | ||||||
| Diamond 1 Finance Corp. | ||||||||
6.02%, 06/15/2026(d) | 70,000 | 76,411 | ||||||
7.13%, 06/15/2024(d) | 5,000 | 5,483 | ||||||
8.10%, 07/15/2036(d) | 25,000 | 29,803 | ||||||
8.35%, 07/15/2046(d) | 16,000 | 19,462 | ||||||
| Diebold, Inc. | ||||||||
8.50%, 04/15/2024(d) | 46,000 | 48,921 | ||||||
| Hewlett‐Packard Co. | ||||||||
6.45%, 10/15/2035(d) | 42,000 | 42,955 | ||||||
| International Business Machines Corp. | ||||||||
| 1.80%, 05/17/2019 | 100,000 | 101,166 | ||||||
| Western Digital Corp. | ||||||||
10.50%, 04/01/2024(d) | 25,000 | 28,968 | ||||||
| 431,193 | ||||||||
| CONSUMER PRODUCTS (0.01%) | ||||||||
| The Procter & Gamble Co. | ||||||||
| 1.70%, 11/03/2021 | 28,000 | 27,943 | ||||||
| See Notes to Financial Statements. |
| Semi-Annual Report | October 31, 2016 | 33 |
| Redmont Resolute Fund | Consolidated Schedule of Investments |
| October 31, 2016 (Unaudited) |
| Description | Principal Amount | Value (Note 2) | ||||||
| CONTAINERS & PACKAGING (0.01%) | ||||||||
| Brambles USA, Inc. | ||||||||
4.13%, 10/23/2025(d) | $ | 12,000 | $ | 12,744 | ||||
| Crown Cork & Seal Co., Inc. | ||||||||
| 7.38%, 12/15/2026 | 20,000 | 22,550 | ||||||
| 35,294 | ||||||||
DISTRIBUTION & WHOLESALE (0.00%)(c) | ||||||||
| WW Grainger, Inc. | ||||||||
| 3.75%, 05/15/2046 | 10,000 | 10,083 | ||||||
| DIVERSIFIED FINANCIAL SERVICES (0.10%) | ||||||||
| Ally Financial, Inc. | ||||||||
| 5.75%, 11/20/2025 | 50,000 | 51,375 | ||||||
| American Express Credit Corp. | ||||||||
| 1.70%, 10/30/2019 | 19,000 | 19,027 | ||||||
| 2.25%, 05/05/2021 | 28,000 | 28,301 | ||||||
| Credit Acceptance Corp. | ||||||||
| 7.38%, 03/15/2023 | 25,000 | 26,062 | ||||||
| Enova International, Inc. | ||||||||
| 9.75%, 06/01/2021 | 60,000 | 56,550 | ||||||
| General Electric Co. | ||||||||
| 1.25%, 05/15/2017 | 57,000 | 57,089 | ||||||
| International Lease Finance Corp. | ||||||||
| 5.88%, 08/15/2022 | 16,000 | 17,660 | ||||||
| National Rural Utilities Cooperative Finance Corp. | ||||||||
| 0.95%, 04/24/2017 | 9,000 | 8,999 | ||||||
| 1.10%, 01/27/2017 | 37,000 | 37,031 | ||||||
| 2.00%, 01/27/2020 | 26,000 | 26,183 | ||||||
| 2.30%, 11/01/2020 | 7,000 | 7,132 | ||||||
4.75%, 04/30/2043(f) | 42,000 | 42,994 | ||||||
| Navient Corp. | ||||||||
| 5.63%, 08/01/2033 | 87,000 | 69,383 | ||||||
| OneMain Financial Holdings LLC | ||||||||
6.75%, 12/15/2019(d) | 30,000 | 31,163 | ||||||
| Quicken Loans, Inc. | ||||||||
5.75%, 05/01/2025(d) | 40,000 | 39,700 | ||||||
| TD Ameritrade Holding Corp. | ||||||||
| 2.95%, 04/01/2022 | 13,000 | 13,451 | ||||||
| 532,100 | ||||||||
| ELECTRIC (0.13%) | ||||||||
| AES Corp. | ||||||||
| 5.50%, 03/15/2024 | 35,000 | 35,700 | ||||||
| Arizona Public Service Co. | ||||||||
| 2.20%, 01/15/2020 | 10,000 | 10,185 | ||||||
| Baltimore Gas & Electric Co. | ||||||||
| 3.50%, 08/15/2046 | 16,000 | 15,716 | ||||||
| Dominion Resources, Inc. | ||||||||
2.96%, 07/01/2019(h) | 8,000 | 8,188 | ||||||
5.75%, 10/01/2054(f) | 30,000 | 31,275 | ||||||
| See Notes to Financial Statements. |
| 34 |
| Redmont Resolute Fund | Consolidated Schedule of Investments |
| October 31, 2016 (Unaudited) |
| Description | Principal Amount | Value (Note 2) | ||||||
| ELECTRIC (0.13%) (continued) | ||||||||
| Duke Energy Progress LLC | ||||||||
| 2.80%, 05/15/2022 | $ | 20,000 | $ | 20,842 | ||||
| Dynegy, Inc. | ||||||||
| 7.38%, 11/01/2022 | 50,000 | 48,625 | ||||||
| Electricite de France SA | ||||||||
2.35%, 10/13/2020(d) | 56,000 | 56,940 | ||||||
3.63%, 10/13/2025(d) | 8,000 | 8,283 | ||||||
4.95%, 10/13/2045(d) | 29,000 | 31,000 | ||||||
| Entergy Arkansas, Inc. | ||||||||
| 4.95%, 12/15/2044 | 25,000 | 26,358 | ||||||
| Entergy Louisiana LLC | ||||||||
| 4.95%, 01/15/2045 | 45,000 | 47,975 | ||||||
| Exelon Generation Co. LLC | ||||||||
| 2.95%, 01/15/2020 | 14,000 | 14,386 | ||||||
| FirstEnergy Corp., Series C | ||||||||
| 7.38%, 11/15/2031 | 42,000 | 54,773 | ||||||
| Hydro‐Quebec | ||||||||
| 1.38%, 06/19/2017 | 53,000 | 53,096 | ||||||
| Louisville Gas & Electric Co. | ||||||||
| 4.38%, 10/01/2045 | 4,000 | 4,434 | ||||||
| Massachusetts Electric Co. | ||||||||
4.00%, 08/15/2046(d) | 44,000 | 44,821 | ||||||
| NRG Energy, Inc. | ||||||||
| 6.25%, 07/15/2022 | 35,000 | 35,263 | ||||||
| South Carolina Electric & Gas Co. | ||||||||
| 5.10%, 06/01/2065 | 10,000 | 11,406 | ||||||
| Talen Energy Supply LLC | ||||||||
4.63%, 07/15/2019(d) | 25,000 | 23,875 | ||||||
| The Southern Co. | ||||||||
| 1.30%, 08/15/2017 | 76,000 | 76,055 | ||||||
| Trans‐Allegheny Interstate Line Co. | ||||||||
3.85%, 06/01/2025(d) | 3,000 | 3,174 | ||||||
| 662,370 | ||||||||
| ELECTRICAL COMPONENTS & EQUIPMENT (0.02%) | ||||||||
| Belden, Inc. | ||||||||
5.25%, 07/15/2024(d) | 30,000 | 30,375 | ||||||
| EnerSys | ||||||||
5.00%, 04/30/2023(d) | 30,000 | 30,900 | ||||||
| General Cable Corp. | ||||||||
| 5.75%, 10/01/2022 | 25,000 | 23,750 | ||||||
| Hubbell, Inc. | ||||||||
| 3.35%, 03/01/2026 | 16,000 | 16,501 | ||||||
| 101,526 | ||||||||
| ELECTRONICS (0.02%) | ||||||||
| Avnet, Inc. | ||||||||
| 4.63%, 04/15/2026 | 10,000 | 10,229 | ||||||
| Corning, Inc. | ||||||||
| 1.50%, 05/08/2018 | 11,000 | 10,997 | ||||||
| See Notes to Financial Statements. |
| Semi-Annual Report | October 31, 2016 | 35 |
| Redmont Resolute Fund | Consolidated Schedule of Investments |
| October 31, 2016 (Unaudited) |
| Description | Principal Amount | Value (Note 2) | ||||||
| ELECTRONICS (0.02%) (continued) | ||||||||
| Honeywell International, Inc. | ||||||||
| 2.50%, 11/01/2026 | $ | 87,000 | $ | 85,747 | ||||
| 106,973 | ||||||||
| ENERGY & ALTERNATE SOURCES (0.01%) | ||||||||
| TerraForm Power Operating LLC | ||||||||
9.38%, 02/01/2023(d)(h) | 40,000 | 40,188 | ||||||
ENGINEERING & CONSTRUCTION (0.00%)(c) | ||||||||
| Weekley Homes LLC | ||||||||
| 6.00%, 02/01/2023 | 25,000 | 22,625 | ||||||
| ENTERTAINMENT (0.02%) | ||||||||
| LG FinanceCo Corp. | ||||||||
5.88%, 11/01/2024(d) | 20,000 | 20,287 | ||||||
| Mohegan Tribal Gaming Authority | ||||||||
7.88%, 10/15/2024(d) | 35,000 | 35,613 | ||||||
| Scientific Games International, Inc. | ||||||||
| 10.00%, 12/01/2022 | 55,000 | 50,875 | ||||||
| 106,775 | ||||||||
| FOOD (0.03%) | ||||||||
| Albertsons Cos. LLC / Safeway, Inc. | ||||||||
6.63%, 06/15/2024(d) | 22,000 | 22,880 | ||||||
| C&S Group Enterprises LLC | ||||||||
5.38%, 07/15/2022(d) | 30,000 | 29,250 | ||||||
| Kraft Heinz Foods Co. | ||||||||
4.88%, 02/15/2025(d) | 27,000 | 29,693 | ||||||
| Land O'Lakes Capital Trust I | ||||||||
7.45%, 03/15/2028(d) | 12,000 | 13,800 | ||||||
| The Kroger Co. | ||||||||
| 2.65%, 10/15/2026 | 23,000 | 22,420 | ||||||
| 3.88%, 10/15/2046 | 11,000 | 10,571 | ||||||
| 128,614 | ||||||||
| FOREST PRODUCTS & PAPER (0.05%) | ||||||||
| Clearwater Paper Corp. | ||||||||
| 4.50%, 02/01/2023 | 40,000 | 40,000 | ||||||
| Domtar Corp. | ||||||||
| 6.75%, 02/15/2044 | 46,000 | 50,713 | ||||||
| Georgia‐Pacific LLC | ||||||||
3.60%, 03/01/2025(d) | 78,000 | 82,002 | ||||||
3.73%, 07/15/2023(d) | 57,000 | 60,505 | ||||||
5.40%, 11/01/2020(d) | 30,000 | 33,684 | ||||||
| International Paper Co. | ||||||||
| 4.40%, 08/15/2047 | 9,000 | 8,809 | ||||||
| PH Glatfelter Co. | ||||||||
| 5.38%, 10/15/2020 | 10,000 | 10,250 | ||||||
| 285,963 | ||||||||
| See Notes to Financial Statements. |
| 36 |
| Redmont Resolute Fund | Consolidated Schedule of Investments |
| October 31, 2016 (Unaudited) |
| Description | Principal Amount | Value (Note 2) | ||||||
| GAS (0.01%) | ||||||||
| Dominion Gas Holdings LLC | ||||||||
| 4.80%, 11/01/2043 | $ | 22,000 | $ | 23,666 | ||||
| HAND & MACHINE TOOLS (0.01%) | ||||||||
| Stanley Black & Decker, Inc. | ||||||||
5.75%, 12/15/2053(f) | 51,000 | 54,443 | ||||||
HEALTHCARE ‐ PRODUCTS (0.00%)(c) | ||||||||
| Baxter International, Inc. | ||||||||
| 2.60%, 08/15/2026 | 15,000 | 14,564 | ||||||
| HEALTHCARE ‐ SERVICES (0.05%) | ||||||||
| Centene Corp. | ||||||||
| 4.75%, 01/15/2025 | 20,000 | 20,000 | ||||||
| CHS/Community Health Systems, Inc. | ||||||||
| 6.88%, 02/01/2022 | 50,000 | 37,500 | ||||||
| HCA, Inc. | ||||||||
| 5.25%, 06/15/2026 | 24,000 | 25,152 | ||||||
| IASIS Healthcare LLC / IASIS Capital Corp. | ||||||||
| 8.38%, 05/15/2019 | 31,000 | 29,682 | ||||||
| Laboratory Corp. of America Holdings | ||||||||
| 3.20%, 02/01/2022 | 10,000 | 10,416 | ||||||
| 3.60%, 02/01/2025 | 22,000 | 22,802 | ||||||
| 4.70%, 02/01/2045 | 7,000 | 7,442 | ||||||
| Quest Diagnostics, Inc. | ||||||||
| 3.45%, 06/01/2026 | 15,000 | 15,410 | ||||||
| RegionalCare Hospital Partners Holdings, Inc. | ||||||||
8.25%, 05/01/2023(d) | 50,000 | 50,812 | ||||||
| UnitedHealth Group, Inc. | ||||||||
| 1.40%, 12/15/2017 | 16,000 | 16,039 | ||||||
| 2.13%, 03/15/2021 | 19,000 | 19,191 | ||||||
| 3.35%, 07/15/2022 | 11,000 | 11,714 | ||||||
| 266,160 | ||||||||
| HOLDING COMPANIES ‐ DIVERSIFIED (0.01%) | ||||||||
| Opal Acquisition, Inc. | ||||||||
8.88%, 12/15/2021(d) | 45,000 | 36,900 | ||||||
| HOME BUILDERS (0.01%) | ||||||||
| K Hovnanian Enterprises, Inc. | ||||||||
7.25%, 10/15/2020(d) | 25,000 | 22,625 | ||||||
| Mattamy Group Corp. | ||||||||
6.50%, 11/15/2020(d) | 25,000 | 25,063 | ||||||
| 47,688 | ||||||||
| See Notes to Financial Statements. |
| Semi-Annual Report | October 31, 2016 | 37 |
| Redmont Resolute Fund | Consolidated Schedule of Investments |
| October 31, 2016 (Unaudited) |
| Description | Principal Amount | Value (Note 2) | ||||||
HOME FURNISHINGS (0.00%)(c) | ||||||||
| Whirlpool Corp. | ||||||||
| 4.50%, 06/01/2046 | $ | 13,000 | $ | 13,568 | ||||
HOUSEHOLD PRODUCTS & WARES (0.00%)(c) | ||||||||
| Kimberly‐Clark Corp. | ||||||||
| 1.85%, 03/01/2020 | 12,000 | 12,125 | ||||||
HOUSEWARES (0.00%)(c) | ||||||||
| Newell Brands, Inc. | ||||||||
| 4.20%, 04/01/2026 | 10,000 | 10,818 | ||||||
| 5.38%, 04/01/2036 | 7,000 | 8,127 | ||||||
| 18,945 | ||||||||
| INSURANCE (0.09%) | ||||||||
| Aflac, Inc. | ||||||||
| 4.00%, 10/15/2046 | 14,000 | 13,936 | ||||||
| American International Group, Inc. | ||||||||
| 3.30%, 03/01/2021 | 13,000 | 13,612 | ||||||
| 3.88%, 01/15/2035 | 56,000 | 54,621 | ||||||
| Assurant, Inc. | ||||||||
| 6.75%, 02/15/2034 | 98,000 | 121,482 | ||||||
| Berkshire Hathaway, Inc. | ||||||||
| 1.15%, 08/15/2018 | 19,000 | 18,977 | ||||||
| Jackson National Life Global Funding | ||||||||
3.05%, 04/29/2026(d) | 35,000 | 34,994 | ||||||
| Massachusetts Mutual Life Insurance Co. | ||||||||
4.50%, 04/15/2065(d) | 24,000 | 22,792 | ||||||
| MetLife, Inc. | ||||||||
| 4.60%, 05/13/2046 | 9,000 | 9,798 | ||||||
| New York Life Global Funding | ||||||||
2.10%, 01/02/2019(d) | 26,000 | 26,377 | ||||||
| Old Republic International Corp. | ||||||||
| 3.88%, 08/26/2026 | 7,000 | 6,899 | ||||||
| Pacific LifeCorp. | ||||||||
6.00%, 02/10/2020(d) | 29,000 | 32,035 | ||||||
| Prudential Financial, Inc. | ||||||||
5.38%, 05/15/2045(f) | 11,000 | 11,462 | ||||||
5.63%, 06/15/2043(f) | 49,000 | 52,736 | ||||||
| Unum Group | ||||||||
| 5.75%, 08/15/2042 | 8,000 | 8,937 | ||||||
| XLIT, Ltd. | ||||||||
| 4.45%, 03/31/2025 | 9,000 | 9,186 | ||||||
| 5.50%, 03/31/2045 | 15,000 | 14,502 | ||||||
| 452,346 | ||||||||
| INTERNET (0.02%) | ||||||||
| Cogent Communications Holdings, Inc. | ||||||||
5.38%, 03/01/2022(d) | 45,000 | 46,462 | ||||||
| Netflix, Inc. | ||||||||
| 5.88%, 02/15/2025 | 45,000 | 49,950 | ||||||
| See Notes to Financial Statements. |
| 38 |
| Redmont Resolute Fund | Consolidated Schedule of Investments |
| October 31, 2016 (Unaudited) |
| Description | Principal Amount | Value (Note 2) | ||||||
| INTERNET (0.02%) (continued) | ||||||||
| Zayo Group LLC | ||||||||
| 6.38%, 05/15/2025 | $ | 20,000 | $ | 21,100 | ||||
| 117,512 | ||||||||
| IRON & STEEL (0.03%) | ||||||||
| AK Steel Corp. | ||||||||
| 7.50%, 07/15/2023 | 30,000 | 32,400 | ||||||
| ArcelorMittal | ||||||||
| 7.25%, 02/25/2022 | 50,000 | 57,000 | ||||||
| Steel Dynamics, Inc. | ||||||||
| 5.13%, 10/01/2021 | 40,000 | 41,900 | ||||||
| United States Steel Corp. | ||||||||
8.38%, 07/01/2021(d) | 16,000 | 17,040 | ||||||
| 148,340 | ||||||||
| LEISURE TIME (0.01%) | ||||||||
| NCL Corp., Ltd. | ||||||||
4.63%, 11/15/2020(d) | 16,000 | 16,280 | ||||||
| Royal Caribbean Cruises, Ltd. | ||||||||
| 5.25%, 11/15/2022 | 47,000 | 51,641 | ||||||
| 67,921 | ||||||||
| LODGING (0.03%) | ||||||||
| Caesars Growth Properties Holdings LLC | ||||||||
| 9.38%, 05/01/2022 | 35,000 | 37,362 | ||||||
| Chester Downs & Marina LLC / Chester Downs Finance Corp. | ||||||||
9.25%, 02/01/2020(d) | 6,000 | 5,910 | ||||||
| Golden Nugget, Inc. | ||||||||
8.50%, 12/01/2021(d) | 40,000 | 42,200 | ||||||
| Interval Acquisition Corp. | ||||||||
| 5.63%, 04/15/2023 | 45,000 | 46,688 | ||||||
| Quapaw Downstream Development Authority of the Quapaw Tribe of Oklahoma | ||||||||
10.50%, 07/01/2019(d) | 26,000 | 26,390 | ||||||
| 158,550 | ||||||||
| MACHINERY ‐ DIVERSIFIED (0.03%) | ||||||||
| ATS Automation Tooling Systems, Inc. | ||||||||
6.50%, 06/15/2023(d) | 40,000 | 41,500 | ||||||
| John Deere Capital Corp. | ||||||||
| 1.13%, 06/12/2017 | 49,000 | 49,012 | ||||||
| 1.55%, 12/15/2017 | 53,000 | 53,261 | ||||||
| Xylem, Inc. | ||||||||
| 4.38%, 11/01/2046 | 6,000 | 6,028 | ||||||
| 149,801 | ||||||||
MACHINERY ‐ MANUFACTURING (0.00%)(c) | ||||||||
| Illinois Tool Works, Inc. | ||||||||
| 2.65%, 11/15/2026 | 22,000 | 21,931 | ||||||
| See Notes to Financial Statements. |
| Semi-Annual Report | October 31, 2016 | 39 |
| Redmont Resolute Fund | Consolidated Schedule of Investments |
October 31, 2016 (Unaudited)
| Description | Principal Amount | Value (Note 2) | ||||||
| MEDIA (0.06%) | ||||||||
| Block Communications, Inc. | ||||||||
7.25%, 02/01/2020(d) | $ | 29,000 | $ | 29,798 | ||||
| Cable One, Inc. | ||||||||
5.75%, 06/15/2022(d) | 28,000 | 29,610 | ||||||
| Charter Communications Operating LLC | ||||||||
6.38%, 10/23/2035(d) | 8,000 | 9,225 | ||||||
6.48%, 10/23/2045(d) | 8,000 | 9,436 | ||||||
| Clear Channel Worldwide Holdings, Inc., Series A | ||||||||
| 6.50%, 11/15/2022 | 35,000 | 35,175 | ||||||
| Comcast Corp. | ||||||||
| 2.35%, 01/15/2027 | 14,000 | 13,551 | ||||||
| 3.20%, 07/15/2036 | 15,000 | 14,335 | ||||||
| 3.40%, 07/15/2046 | 14,000 | 12,968 | ||||||
| DISH DBS Corp. | ||||||||
| 7.75%, 07/01/2026 | 38,000 | 41,824 | ||||||
| Sirius XM Radio, Inc. | ||||||||
5.38%, 07/15/2026(d) | 30,000 | 30,553 | ||||||
| The Walt Disney Co. | ||||||||
| 1.50%, 09/17/2018 | 18,000 | 18,142 | ||||||
| 1.65%, 01/08/2019 | 9,000 | 9,096 | ||||||
| Time Warner, Inc. | ||||||||
| 4.85%, 07/15/2045 | 22,000 | 23,480 | ||||||
| Viacom, Inc. | ||||||||
| 3.45%, 10/04/2026 | 15,000 | 14,947 | ||||||
| 5.85%, 09/01/2043 | 10,000 | 11,264 | ||||||
| 303,404 | ||||||||
| METAL FABRICATE & HARDWARE (0.02%) | ||||||||
| Novelis Corp. | ||||||||
6.25%, 08/15/2024(d) | 24,000 | 25,020 | ||||||
| Valmont Industries, Inc. | ||||||||
| 5.25%, 10/01/2054 | 60,000 | 55,091 | ||||||
| 80,111 | ||||||||
| MINING (0.01%) | ||||||||
| FMG Resources August 2006 Pty., Ltd. | ||||||||
9.75%, 03/01/2022(d) | 30,000 | 35,031 | ||||||
| Goldcorp, Inc. | ||||||||
| 5.45%, 06/09/2044 | 9,000 | 9,624 | ||||||
| Kaiser Aluminum Corp. | ||||||||
| 5.88%, 05/15/2024 | 15,000 | 15,881 | ||||||
| 60,536 | ||||||||
| MISCELLANEOUS MANUFACTURING (0.03%) | ||||||||
| General Electric Co. | ||||||||
| 2.70%, 10/09/2022 | 30,000 | 31,026 | ||||||
| Ingersoll‐Rand Global Holding Co., Ltd. | ||||||||
| 5.75%, 06/15/2043 | 54,000 | 66,265 | ||||||
| Ingersoll‐Rand Luxembourg Finance SA | ||||||||
| 4.65%, 11/01/2044 | 12,000 | 12,989 | ||||||
| Textron, Inc. | ||||||||
| 4.00%, 03/15/2026 | 19,000 | 19,804 | ||||||
See Notes to Financial Statements.
40
| Redmont Resolute Fund | Consolidated Schedule of Investments |
October 31, 2016 (Unaudited)
| Description | Principal Amount | Value (Note 2) | ||||||
| MISCELLANEOUS MANUFACTURING (0.03%) (continued) | ||||||||
| Trinity Industries, Inc. | ||||||||
| 4.55%, 10/01/2024 | $ | 17,000 | $ | 16,799 | ||||
| 146,883 | ||||||||
OFFICE & BUSINESS EQUIPMENT (0.00%)(c) | ||||||||
| Pitney Bowes, Inc. | ||||||||
| 3.38%, 10/01/2021 | 7,000 | 6,990 | ||||||
| OIL & GAS (0.12%) | ||||||||
| Anadarko Finance Co., Series B | ||||||||
| 7.50%, 05/01/2031 | 10,000 | 12,731 | ||||||
| Anadarko Petroleum Corp. | ||||||||
| 4.50%, 07/15/2044 | 15,000 | 14,189 | ||||||
| 6.45%, 09/15/2036 | 63,000 | 75,040 | ||||||
| BP Capital Markets PLC | ||||||||
| 1.68%, 05/03/2019 | 16,000 | 16,031 | ||||||
| 3.12%, 05/04/2026 | 13,000 | 13,175 | ||||||
| 3.25%, 05/06/2022 | 19,000 | 19,842 | ||||||
| Calumet Specialty Products Partners LP | ||||||||
| 6.50%, 04/15/2021 | 39,000 | 31,200 | ||||||
| Carrizo Oil & Gas, Inc. | ||||||||
| 6.25%, 04/15/2023 | 24,000 | 25,020 | ||||||
| Chevron Corp. | ||||||||
| 1.37%, 03/02/2018 | 28,000 | 28,051 | ||||||
| 1.96%, 03/03/2020 | 12,000 | 12,139 | ||||||
| Denbury Resources, Inc. | ||||||||
| 5.50%, 05/01/2022 | 33,000 | 26,235 | ||||||
9.00%, 05/15/2021(d) | 25,000 | 25,875 | ||||||
| Exxon Mobil Corp. | ||||||||
| 1.31%, 03/06/2018 | 6,000 | 6,018 | ||||||
| Hess Corp. | ||||||||
| 5.60%, 02/15/2041 | 13,000 | 12,913 | ||||||
| Hilcorp Energy I LP | ||||||||
5.00%, 12/01/2024(d) | 45,000 | 44,100 | ||||||
| Laredo Petroleum, Inc. | ||||||||
| 7.38%, 05/01/2022 | 23,000 | 23,805 | ||||||
| MEG Energy Corp. | ||||||||
6.38%, 01/30/2023(d) | 50,000 | 41,500 | ||||||
| Noble Energy, Inc. | ||||||||
| 3.90%, 11/15/2024 | 17,000 | 17,514 | ||||||
| 5.05%, 11/15/2044 | 24,000 | 24,186 | ||||||
| Occidental Petroleum Corp. | ||||||||
| 4.40%, 04/15/2046 | 14,000 | 14,983 | ||||||
| PBF Holding Co. LLC / PBF Finance Corp. | ||||||||
7.00%, 11/15/2023(d) | 25,000 | 23,250 | ||||||
| Petroleos Mexicanos | ||||||||
| 5.50%, 06/27/2044 | 12,000 | 10,512 | ||||||
| Sanchez Energy Corp. | ||||||||
| 6.13%, 01/15/2023 | 18,000 | 15,480 | ||||||
See Notes to Financial Statements.
| Semi-Annual Report | October 31, 2016 | 41 |
| Redmont Resolute Fund | Consolidated Schedule of Investments |
October 31, 2016 (Unaudited)
| Description | Principal Amount | Value (Note 2) | ||||||
| OIL & GAS (0.12%) (continued) | ||||||||
| Shell International Finance BV | ||||||||
| 1.25%, 11/10/2017 | $ | 17,000 | $ | 17,026 | ||||
| 2.13%, 05/11/2020 | 19,000 | 19,175 | ||||||
| 2.25%, 11/10/2020 | 21,000 | 21,291 | ||||||
| SM Energy Co. | ||||||||
| 5.63%, 06/01/2025 | 5,000 | 4,787 | ||||||
| WPX Energy, Inc. | ||||||||
| 7.50%, 08/01/2020 | 30,000 | 31,763 | ||||||
| 627,831 | ||||||||
| OIL & GAS SERVICES (0.02%) | ||||||||
| BP Capital Markets PLC | ||||||||
| 3.02%, 01/16/2027 | 12,000 | 12,054 | ||||||
| Bristow Group, Inc. | ||||||||
| 6.25%, 10/15/2022 | 25,000 | 20,063 | ||||||
| Hess Corp. | ||||||||
| 4.30%, 04/01/2027 | 14,000 | 13,972 | ||||||
| Petroleos Mexicanos | ||||||||
6.75%, 09/21/2047(d) | 44,000 | 43,666 | ||||||
| SESI LLC | ||||||||
| 7.13%, 12/15/2021 | 23,000 | 22,540 | ||||||
| Valero Energy Corp. | ||||||||
| 3.40%, 09/15/2026 | 2,000 | 1,956 | ||||||
| 114,251 | ||||||||
| PACKAGING & CONTAINERS (0.01%) | ||||||||
| Amcor Finance USA, Inc. | ||||||||
3.63%, 04/28/2026(d) | 26,000 | 26,557 | ||||||
| Owens ‐ Brockway Glass Container, Inc. | ||||||||
5.38%, 01/15/2025(d) | 44,000 | 45,485 | ||||||
| 72,042 | ||||||||
| PHARMACEUTICALS (0.03%) | ||||||||
| Baxalta, Inc. | ||||||||
| 3.60%, 06/23/2022 | 19,000 | 19,816 | ||||||
| Endo Finance LLC / Endo Finco, Inc. | ||||||||
7.25%, 01/15/2022(d) | 25,000 | 23,813 | ||||||
| Express Scripts Holding Co. | ||||||||
| 3.00%, 07/15/2023 | 10,000 | 9,976 | ||||||
| 4.50%, 02/25/2026 | 17,000 | 18,258 | ||||||
| 4.80%, 07/15/2046 | 23,000 | 23,155 | ||||||
| Forest Laboratories LLC | ||||||||
4.88%, 02/15/2021(d) | 43,000 | 47,699 | ||||||
| Teva Pharmaceutical Finance Netherlands III BV | ||||||||
| 2.80%, 07/21/2023 | 19,000 | 18,724 | ||||||
| 3.15%, 10/01/2026 | 13,000 | 12,678 | ||||||
| 4.10%, 10/01/2046 | 7,000 | 6,532 | ||||||
| 180,651 | ||||||||
| PIPELINES (0.09%) | ||||||||
| Antero Midstream Partners LP / Antero Midstream Finance Corp. | ||||||||
5.38%, 09/15/2024(d) | 19,000 | 19,178 | ||||||
See Notes to Financial Statements.
42
| Redmont Resolute Fund | Consolidated Schedule of Investments |
October 31, 2016 (Unaudited)
| Description | Principal Amount | Value (Note 2) | ||||||
| PIPELINES (0.09%) (continued) | ||||||||
| Colorado Interstate Gas Co. LLC / Colorado Interstate Issuing Corp. | ||||||||
4.15%, 08/15/2026(d) | $ | 15,000 | $ | 14,924 | ||||
| Columbia Pipeline Group, Inc. | ||||||||
| 2.45%, 06/01/2018 | 8,000 | 8,037 | ||||||
| Energy Transfer Equity LP | ||||||||
| 7.50%, 10/15/2020 | 30,000 | 32,850 | ||||||
| Energy Transfer Partners LP | ||||||||
| 4.90%, 03/15/2035 | 6,000 | 5,649 | ||||||
| 6.05%, 06/01/2041 | 2,000 | 2,044 | ||||||
| EnLink Midstream Partners LP | ||||||||
| 4.40%, 04/01/2024 | 8,000 | 7,974 | ||||||
| 4.85%, 07/15/2026 | 18,000 | 18,377 | ||||||
| Enterprise Products Operating LLC | ||||||||
| 3.95%, 02/15/2027 | 11,000 | 11,458 | ||||||
| 4.85%, 03/15/2044 | 7,000 | 7,115 | ||||||
| Genesis Energy LP | ||||||||
| 5.63%, 06/15/2024 | 40,000 | 39,800 | ||||||
| Holly Energy Partners LP | ||||||||
6.00%, 08/01/2024(d) | 26,000 | 27,170 | ||||||
| Kinder Morgan Energy Partners LP | ||||||||
| 3.45%, 02/15/2023 | 45,000 | 45,112 | ||||||
| 5.63%, 09/01/2041 | 7,000 | 6,995 | ||||||
| Kinder Morgan, Inc. | ||||||||
5.00%, 02/15/2021(d) | 11,000 | 11,923 | ||||||
| Phillips 66 Partners LP | ||||||||
| 4.90%, 10/01/2046 | 17,000 | 16,958 | ||||||
| Plains All American Pipeline LP / PAA Finance Corp. | ||||||||
| 3.60%, 11/01/2024 | 9,000 | 8,875 | ||||||
| 3.85%, 10/15/2023 | 10,000 | 10,160 | ||||||
| Rose Rock Midstream LP / Rose Rock Finance Corp. | ||||||||
| 5.63%, 07/15/2022 | 30,000 | 28,800 | ||||||
| Sabine Pass Liquefaction LLC | ||||||||
5.88%, 06/30/2026(d) | 60,000 | 64,887 | ||||||
| Spectra Energy Partners LP | ||||||||
| 3.38%, 10/15/2026 | 10,000 | 9,961 | ||||||
| Tallgrass Energy Partners LP / Tallgrass Energy Finance Corp. | ||||||||
5.50%, 09/15/2024(d) | 30,000 | 29,925 | ||||||
| TransCanada Trust | ||||||||
5.63%, 05/20/2075(f) | 15,000 | 15,206 | ||||||
| Western Gas Partners LP | ||||||||
| 4.65%, 07/01/2026 | 20,000 | 21,003 | ||||||
| 464,381 | ||||||||
RAILROAD (0.00%)(c) | ||||||||
| Wabtec | ||||||||
| 3.45%, 11/15/2026 | 17,000 | 16,994 | ||||||
| REAL ESTATE (0.01%) | ||||||||
| Greystar Real Estate Partners LLC | ||||||||
8.25%, 12/01/2022(d) | 25,000 | 27,312 | ||||||
See Notes to Financial Statements.
| Semi-Annual Report | October 31, 2016 | 43 |
| Redmont Resolute Fund | Consolidated Schedule of Investments |
October 31, 2016 (Unaudited)
| Description | Principal Amount | Value (Note 2) | ||||||
| REAL ESTATE (0.01%) (continued) | ||||||||
| Kennedy‐Wilson, Inc. | ||||||||
| 5.88%, 04/01/2024 | $ | 40,000 | $ | 40,600 | ||||
| 67,912 | ||||||||
| REAL ESTATE INVESTMENT TRUSTS (0.04%) | ||||||||
| American Tower Corp. | ||||||||
| 3.13%, 01/15/2027 | 22,000 | 21,415 | ||||||
| 3.38%, 10/15/2026 | 15,000 | 14,950 | ||||||
| Avalonbay Communities, Inc. | ||||||||
| 3.90%, 10/15/2046 | 7,000 | 6,881 | ||||||
| Columbia Property Trust Operating Partnership LP | ||||||||
| 3.65%, 08/15/2026 | 7,000 | 6,970 | ||||||
| CTR Partnership LP/CareTrust Capital Corp. | ||||||||
| 5.88%, 06/01/2021 | 39,000 | 40,365 | ||||||
| CubeSmart LP | ||||||||
| 3.13%, 09/01/2026 | 14,000 | 13,745 | ||||||
| DuPont Fabros Technology LP | ||||||||
| 5.63%, 06/15/2023 | 30,000 | 31,650 | ||||||
| ESH Hospitality, Inc. | ||||||||
5.25%, 05/01/2025(d) | 30,000 | 29,775 | ||||||
| Federal Realty Investment Trust | ||||||||
| 3.63%, 08/01/2046 | 3,000 | 2,821 | ||||||
| iStar, Inc. | ||||||||
| 6.50%, 07/01/2021 | 35,000 | 35,350 | ||||||
| Kimco Realty Corp. | ||||||||
| 2.80%, 10/01/2026 | 7,000 | 6,853 | ||||||
| Liberty Property LP | ||||||||
| 3.25%, 10/01/2026 | 10,000 | 9,954 | ||||||
| Realty Income Corp. | ||||||||
| 3.00%, 01/15/2027 | 6,000 | 5,911 | ||||||
| 226,640 | ||||||||
| RETAIL (0.05%) | ||||||||
| Brinker International, Inc. | ||||||||
5.00%, 10/01/2024(d) | 30,000 | 30,375 | ||||||
| Conn's, Inc. | ||||||||
| 7.25%, 07/15/2022 | 70,000 | 55,650 | ||||||
| Costco Wholesale Corp. | ||||||||
| 2.25%, 02/15/2022 | 21,000 | 21,439 | ||||||
| CVS Health Corp. | ||||||||
| 2.88%, 06/01/2026 | 22,000 | 21,893 | ||||||
| CVS Pass‐Through Trust | ||||||||
5.93%, 01/10/2034(d) | 32,505 | 38,332 | ||||||
| Dollar General Corp. | ||||||||
| 3.25%, 04/15/2023 | 20,000 | 20,484 | ||||||
| 4.15%, 11/01/2025 | 10,000 | 10,733 | ||||||
| McDonald's Corp. | ||||||||
| 4.70%, 12/09/2035 | 7,000 | 7,715 | ||||||
| PF Chang's China Bistro, Inc. | ||||||||
10.25%, 06/30/2020(d) | 23,000 | 22,022 | ||||||
See Notes to Financial Statements.
44
| Redmont Resolute Fund | Consolidated Schedule of Investments |
October 31, 2016 (Unaudited)
| Description | Principal Amount | Value (Note 2) | ||||||
| RETAIL (0.05%) (continued) | ||||||||
| The Home Depot, Inc. | ||||||||
| 3.50%, 09/15/2056 | $ | 10,000 | $ | 9,326 | ||||
| 237,969 | ||||||||
| SAVINGS & LOANS (0.04%) | ||||||||
| First Niagara Financial Group, Inc. | ||||||||
| 6.75%, 03/19/2020 | 151,000 | 173,336 | ||||||
| 7.25%, 12/15/2021 | 37,000 | 45,232 | ||||||
| 218,568 | ||||||||
| SEMICONDUCTORS (0.01%) | ||||||||
| Intel Corp. | ||||||||
| 1.35%, 12/15/2017 | 39,000 | 39,133 | ||||||
| Sensata Technologies BV | ||||||||
5.00%, 10/01/2025(d) | 20,000 | 20,600 | ||||||
| 59,733 | ||||||||
| SOFTWARE (0.05%) | ||||||||
| Donnelley Financial Solutions, Inc. | ||||||||
8.25%, 10/15/2024(d) | 20,000 | 20,750 | ||||||
| Fidelity National Information Services, Inc. | ||||||||
| 4.50%, 08/15/2046 | 11,000 | 10,877 | ||||||
| 5.00%, 10/15/2025 | 13,000 | 13,371 | ||||||
| Microsoft Corp. | ||||||||
| 1.30%, 11/03/2018 | 17,000 | 17,069 | ||||||
| 2.40%, 08/08/2026 | 21,000 | 20,654 | ||||||
| 3.45%, 08/08/2036 | 22,000 | 21,785 | ||||||
| 3.70%, 08/08/2046 | 9,000 | 8,838 | ||||||
| Oracle Corp. | ||||||||
| 1.90%, 09/15/2021 | 28,000 | 27,932 | ||||||
| 2.65%, 07/15/2026 | 7,000 | 6,925 | ||||||
| 2.80%, 07/08/2021 | 34,000 | 35,305 | ||||||
| 3.85%, 07/15/2036 | 15,000 | 15,182 | ||||||
| 3.90%, 05/15/2035 | 5,000 | 5,107 | ||||||
| Rackspace Hosting, Inc. | ||||||||
6.50%, 01/15/2024(d) | 50,000 | 57,438 | ||||||
| 261,233 | ||||||||
| TELECOMMUNICATIONS (0.14%) | ||||||||
| AT&T, Inc. | ||||||||
| 4.35%, 06/15/2045 | 28,000 | 25,813 | ||||||
| 4.50%, 05/15/2035 | 29,000 | 28,901 | ||||||
| 4.75%, 05/15/2046 | 71,000 | 69,820 | ||||||
| 5.80%, 02/15/2019 | 8,000 | 8,688 | ||||||
| CenturyLink, Inc. | ||||||||
| 5.63%, 04/01/2025 | 15,000 | 14,119 | ||||||
| Cincinnati Bell, Inc. | ||||||||
7.00%, 07/15/2024(d) | 25,000 | 26,250 | ||||||
See Notes to Financial Statements.
| Semi-Annual Report | October 31, 2016 | 45 |
| Redmont Resolute Fund | Consolidated Schedule of Investments | ||
October 31, 2016 (Unaudited)
| Description | Principal Amount | Value (Note 2) | ||||||
| TELECOMMUNICATIONS (0.14%) (continued) | ||||||||
| CISCO Systems, Inc. | ||||||||
| 1.40%, 02/28/2018 | $ | 24,000 | $ | 24,095 | ||||
| 2.13%, 03/01/2019 | 44,000 | 44,762 | ||||||
| 2.20%, 02/28/2021 | 21,000 | 21,375 | ||||||
| 2.50%, 09/20/2026 | 7,000 | 6,979 | ||||||
| Embarq Corp. | ||||||||
| 8.00%, 06/01/2036 | 40,000 | 40,700 | ||||||
| Frontier Communications Corp. | ||||||||
| 11.00%, 09/15/2025 | 55,000 | 56,357 | ||||||
| Hughes Satellite Systems Corp. | ||||||||
| 7.63%, 06/15/2021 | 40,000 | 43,950 | ||||||
| Plantronics, Inc. | ||||||||
5.50%, 05/31/2023(d) | 20,000 | 20,400 | ||||||
| Sprint Capital Corp. | ||||||||
| 8.75%, 03/15/2032 | 20,000 | 20,544 | ||||||
| Sprint Corp. | ||||||||
| 7.25%, 09/15/2021 | 110,000 | 112,887 | ||||||
| Telesat Canada / Telesat LLC | ||||||||
6.00%, 05/15/2017(d) | 40,000 | 40,150 | ||||||
| T‐Mobile USA, Inc. | ||||||||
| 6.54%, 04/28/2020 | 30,000 | 30,947 | ||||||
| Verizon Communications, Inc. | ||||||||
| 4.40%, 11/01/2034 | 8,000 | 8,143 | ||||||
| 4.52%, 09/15/2048 | 48,000 | 48,361 | ||||||
| 4.67%, 03/15/2055 | 27,000 | 26,432 | ||||||
| 4.86%, 08/21/2046 | 22,000 | 23,300 | ||||||
| 742,973 | ||||||||
| TRANSPORTATION (0.01%) | ||||||||
| Burlington North SF | ||||||||
| 3.90%, 08/01/2046 | 10,000 | 10,262 | ||||||
| Canadian Pacific Railway Co. | ||||||||
| 6.13%, 09/15/2115 | 11,000 | 13,362 | ||||||
| CSX Corp. | ||||||||
| 4.25%, 11/01/2066 | 11,000 | 10,739 | ||||||
| 34,363 | ||||||||
| TRUCKING & LEASING (0.01%) | ||||||||
| GATX Corp. | ||||||||
| 3.25%, 09/15/2026 | 9,000 | 8,840 | ||||||
| Penske Truck Leasing Co. LP / PTL Finance Corp. | ||||||||
3.38%, 02/01/2022(d) | 13,000 | 13,454 | ||||||
3.40%, 11/15/2026(d) | 10,000 | 10,015 | ||||||
| 32,309 | ||||||||
| TOTAL CORPORATE BONDS | ||||||||
| (Cost $10,238,617) | 10,565,420 | |||||||
See Notes to Financial Statements.
46
| Redmont Resolute Fund | Consolidated Schedule of Investments |
October 31, 2016 (Unaudited)
| Description | Currency | Principal Amount | Value (Note 2) | ||||||
| FOREIGN GOVERNMENT BONDS (2.50%) | |||||||||
| Argentine Republic Government International Bond | |||||||||
| 6.63%, 07/06/2028 | USD | 380,000 | $ | 391,780 | |||||
| 6.88%, 04/22/2021 | USD | 580,000 | 629,010 | ||||||
| 7.13%, 07/06/2036 | USD | 190,000 | 196,365 | ||||||
| 7.50%, 04/22/2026 | USD | 420,000 | 459,900 | ||||||
| Brazil Notas do Tesouro Nacional, Series F | |||||||||
| 10.00%, 01/01/2019 | BRL | 3,390,000 | 1,070,022 | ||||||
| 10.00%, 01/01/2021 | BRL | 3,440,000 | 1,073,361 | ||||||
| 10.00%, 01/01/2025 | BRL | 3,550,000 | 1,076,632 | ||||||
| 10.00%, 01/01/2027 | BRL | 3,700,000 | 1,106,913 | ||||||
| Bundesrepublik Deutschland | |||||||||
| 1.00%, 08/15/2025 | EUR | 18,000 | 21,498 | ||||||
| 2.50%, 07/04/2044 | EUR | 18,000 | 28,343 | ||||||
| 3.25%, 07/04/2042 | EUR | 24,000 | 41,917 | ||||||
| 4.75%, 07/04/2040 | EUR | 10,000 | 20,798 | ||||||
| Buoni Poliennali | |||||||||
| 3.75%, 09/01/2024 | EUR | 14,000 | 18,146 | ||||||
| Buoni Poliennali Del | |||||||||
4.75%, 09/01/2044(d) | EUR | 10,000 | 15,409 | ||||||
| 9.00%, 11/01/2023 | EUR | 7,000 | 11,768 | ||||||
| French Republic Government Bond OAT | |||||||||
| 3.25%, 05/25/2045 | EUR | 23,000 | 37,085 | ||||||
| 4.00%, 10/25/2038 | EUR | 12,000 | 20,687 | ||||||
| 4.50%, 04/25/2041 | EUR | 24,000 | 45,112 | ||||||
| 5.75%, 10/25/2032 | EUR | 10,000 | 19,161 | ||||||
| Indonesia Treasury Bond | |||||||||
| 7.88%, 04/15/2019 | IDR | 2,500,000,000 | 197,131 | ||||||
| 8.25%, 07/15/2021 | IDR | 3,400,000,000 | 273,773 | ||||||
| 8.25%, 05/15/2036 | IDR | 1,300,000,000 | 104,000 | ||||||
| 8.38%, 03/15/2024 | IDR | 2,400,000,000 | 195,892 | ||||||
| 8.38%, 09/15/2026 | IDR | 5,000,000,000 | 409,047 | ||||||
| 8.75%, 05/15/2031 | IDR | 1,200,000,000 | 102,890 | ||||||
| 9.00%, 03/15/2029 | IDR | 3,500,000,000 | 298,149 | ||||||
| Ireland Government Bond | |||||||||
| 5.40%, 03/13/2025 | EUR | 7,000 | 10,764 | ||||||
| Italy Buoni Poliennali Del Tesoro | |||||||||
| 5.00%, 09/01/2040 | EUR | 7,000 | 10,958 | ||||||
| 6.50%, 11/01/2027 | EUR | 7,000 | 11,334 | ||||||
| Japan Government Five Year Bond | |||||||||
| 0.10%, 06/20/2020 | JPY | 11,500,000 | 110,961 | ||||||
| 0.10%, 09/20/2020 | JPY | 5,900,000 | 56,954 | ||||||
| 0.10%, 12/20/2020 | JPY | 11,800,000 | 113,974 | ||||||
| 0.10%, 06/20/2021 | JPY | 11,500,000 | 111,171 | ||||||
| 0.20%, 12/20/2017 | JPY | 12,300,000 | 117,954 | ||||||
| Japan Government Ten Year Bond | |||||||||
| 1.70%, 09/20/2017 | JPY | 7,700,000 | 74,733 | ||||||
| Japan Government Thirty Year Bond | |||||||||
| 2.30%, 12/20/2036 | JPY | 5,900,000 | 76,937 | ||||||
| 2.50%, 09/20/2035 | JPY | 3,700,000 | 49,240 | ||||||
| Japan Government Twenty Year Bond | |||||||||
| 1.00%, 12/20/2035 | JPY | 4,200,000 | 44,890 | ||||||
| 1.20%, 09/20/2035 | JPY | 2,100,000 | 23,197 | ||||||
See Notes to Financial Statements.
| Semi-Annual Report | October 31, 2016 | 47 |
| Redmont Resolute Fund | Consolidated Schedule of Investments |
October 31, 2016 (Unaudited)
| Description | Currency | Principal Amount | Value (Note 2) | ||||||
| Japan Government Two Year Bond | |||||||||
| 0.10%, 06/15/2017 | JPY | 3,400,000 | $ | 32,507 | |||||
| 0.10%, 08/15/2017 | JPY | 11,100,000 | 106,199 | ||||||
| 0.10%, 09/15/2017 | JPY | 9,700,000 | 92,835 | ||||||
| Kingdom of Belgium Government Bond | |||||||||
0.80%, 06/22/2025(d) | EUR | 10,000 | 11,503 | ||||||
| 3.75%, 06/22/2045 | EUR | 6,000 | 10,591 | ||||||
| 4.00%, 03/28/2032 | EUR | 7,000 | 11,324 | ||||||
4.25%, 03/28/2041(d) | EUR | 25,000 | 45,980 | ||||||
4.50%, 03/28/2026(d) | EUR | 7,000 | 10,725 | ||||||
5.00%, 03/28/2035(d) | EUR | 19,000 | 35,584 | ||||||
| 5.50%, 03/28/2028 | EUR | 18,000 | 30,903 | ||||||
| Mexico Government International Bond | |||||||||
| 3.50%, 01/21/2021 | USD | 230,000 | 241,845 | ||||||
| 4.13%, 01/21/2026 | USD | 230,000 | 243,225 | ||||||
| 4.75%, 03/08/2044 | USD | 205,000 | 205,000 | ||||||
| Panama Government International Bond | |||||||||
| 5.20%, 01/30/2020 | USD | 110,000 | 121,412 | ||||||
| Peru Government Bond | |||||||||
6.35%, 08/12/2028(d) | PEN | 620,000 | 190,095 | ||||||
| 6.35%, 08/12/2028 | PEN | 3,003,000 | 920,737 | ||||||
| 6.90%, 08/12/2037 | PEN | 1,300,000 | 417,363 | ||||||
| 6.95%, 08/12/2031 | PEN | 1,300,000 | 421,082 | ||||||
| 7.84%, 08/12/2020 | PEN | 690,000 | 227,455 | ||||||
| 8.20%, 08/12/2026 | PEN | 1,915,000 | 676,484 | ||||||
| Republic of Austria Government Bond | |||||||||
3.15%, 06/20/2044(d) | EUR | 6,000 | 9,957 | ||||||
| Republic of Poland Government International Bond | |||||||||
| 3.00%, 03/17/2023 | USD | 240,000 | 247,392 | ||||||
| 3.25%, 04/06/2026 | USD | 70,000 | 72,770 | ||||||
| Spain Government Bond | |||||||||
5.15%, 10/31/2044(d) | EUR | 20,000 | 34,857 | ||||||
5.90%, 07/30/2026(d) | EUR | 19,000 | 29,906 | ||||||
| United Kingdom Gilt | |||||||||
| 2.25%, 09/07/2023 | GBP | 25,000 | 33,412 | ||||||
| 2.75%, 09/07/2024 | GBP | 8,000 | 11,078 | ||||||
| 4.25%, 03/07/2036 | GBP | 6,000 | 10,336 | ||||||
| 4.25%, 09/07/2039 | GBP | 22,000 | 39,005 | ||||||
| 4.50%, 12/07/2042 | GBP | 15,000 | 28,422 | ||||||
| 13,247,840 | |||||||||
| TOTAL FOREIGN GOVERNMENT BONDS (Cost $12,862,462) | 13,247,840 | ||||||||
| GOVERNMENT BONDS (0.31%) | |||||||||
| Tennessee Valley Authority | |||||||||
| 1.75%, 10/15/2018 | $ | 21,000 | 21,305 | ||||||
See Notes to Financial Statements.
48
| Redmont Resolute Fund | Consolidated Schedule of Investments |
October 31, 2016 (Unaudited)
| Description | Principal Amount | Value (Note 2) | ||||||
| U.S. Treasury Bonds | ||||||||
| 2.50%, 02/15/2046 | $ | 21,000 | $ | 20,638 | ||||
| 2.50%, 05/15/2046 | 49,000 | 48,167 | ||||||
| 3.00%, 11/15/2045 | 27,000 | 29,356 | ||||||
| 3.13%, 11/15/2041 | 47,000 | 52,337 | ||||||
| 3.13%, 08/15/2044 | 28,000 | 31,191 | ||||||
| 4.50%, 02/15/2036 | 29,000 | 39,462 | ||||||
| 5.25%, 11/15/2028 | 38,000 | 51,447 | ||||||
| 272,598 | ||||||||
| U.S. Treasury Inflation Indexed Notes | ||||||||
| 0.13%, 04/15/2018 | 90,645 | 91,541 | ||||||
| U.S. Treasury Notes | ||||||||
| 0.50%, 01/31/2017 | 150,000 | 150,083 | ||||||
| 0.75%, 09/30/2018 | 100,000 | 99,809 | ||||||
| 0.88%, 09/15/2019 | 100,000 | 99,664 | ||||||
| 1.38%, 03/31/2020 | 25,000 | 25,235 | ||||||
| 1.38%, 04/30/2020 | 20,000 | 20,183 | ||||||
| 1.38%, 09/30/2020 | 39,000 | 39,272 | ||||||
| 1.50%, 01/31/2022 | 10,000 | 10,054 | ||||||
| 1.50%, 02/28/2023 | 175,000 | 174,470 | ||||||
| 1.50%, 08/15/2026 | 46,000 | 44,650 | ||||||
| 1.63%, 04/30/2023 | 75,000 | 75,267 | ||||||
| 1.63%, 05/31/2023 | 65,000 | 65,198 | ||||||
| 1.63%, 02/15/2026 | 52,000 | 51,176 | ||||||
| 1.75%, 12/31/2020 | 48,000 | 48,997 | ||||||
| 1.75%, 02/28/2022 | 11,000 | 11,194 | ||||||
| 1.75%, 03/31/2022 | 54,000 | 54,922 | ||||||
| 1.75%, 04/30/2022 | 10,000 | 10,167 | ||||||
| 1.88%, 11/30/2021 | 10,000 | 10,249 | ||||||
| 1.88%, 05/31/2022 | 26,000 | 26,601 | ||||||
| 1.88%, 08/31/2022 | 48,000 | 49,046 | ||||||
| 2.00%, 08/31/2021 | 63,000 | 64,939 | ||||||
| 2.00%, 10/31/2021 | 11,000 | 11,341 | ||||||
| 2.00%, 07/31/2022 | 6,000 | 6,174 | ||||||
| 2.13%, 12/31/2021 | 43,000 | 44,594 | ||||||
| 2.13%, 05/15/2025 | 49,000 | 50,412 | ||||||
| 2.25%, 07/31/2021 | 10,000 | 10,424 | ||||||
| 2.25%, 11/15/2024 | 18,000 | 18,728 | ||||||
| 1,272,849 | ||||||||
| TOTAL GOVERNMENT BONDS (Cost $1,640,539) | 1,658,293 | |||||||
| Description | Principal Amount/Shares | Value (Note 2) | ||||||
| SHORT TERM INVESTMENTS (6.25%) | ||||||||
| MONEY MARKET FUNDS (5.84%) | ||||||||
| Dreyfus Treasury Cash Management Fund, Institutional Class, 7-day yield, 0.207% | 30,875,276 | 30,875,276 | ||||||
See Notes to Financial Statements.
| Semi-Annual Report | October 31, 2016 | 49 |
| Redmont Resolute Fund | Consolidated Schedule of Investments |
October 31, 2016 (Unaudited)
| Description | Principal Amount/Shares | Value (Note 2) | ||||||
| SHORT TERM INVESTMENTS (6.25%) (continued) | ||||||||
| U.S. TREASURY BILLS (0.41%) | ||||||||
0.577%, 03/30/2017(b)(i) | 2,170,000 | $ | 2,166,586 | |||||
| TOTAL SHORT TERM INVESTMENTS (Cost $33,040,174) | 33,041,862 | |||||||
| TOTAL INVESTMENTS (80.18%) (Cost $412,444,633) | $ | 424,034,005 | ||||||
SEGREGATED CASH WITH BROKERS (25.27%)(j) | 133,632,418 | |||||||
| SECURITIES SOLD SHORT (-5.36%) (Proceeds $28,084,625) | (28,338,578 | ) | ||||||
| LIABILITIES IN EXCESS OF OTHER ASSETS (-0.09%) | (445,039 | ) | ||||||
| NET ASSETS (100.00%) | $ | 528,882,806 | ||||||
SCHEDULE OF SECURITIES SOLD SHORT
| Description | Shares | Value (Note 2) | ||||||
| COMMON STOCKS (-3.56%) | ||||||||
| APPAREL (-0.03%) | ||||||||
| Under Armour, Inc., Class A | (4,489 | ) | $ | (139,608 | ) | |||
| AUTO MANUFACTURERS (-0.05%) | ||||||||
| Ferrari NV | (2,637 | ) | (139,155 | ) | ||||
| Tesla Motors, Inc. | (585 | ) | (115,672 | ) | ||||
| (254,827 | ) | |||||||
| AUTO PARTS & EQUIPMENT (-0.03%) | ||||||||
| Autoliv, Inc. | (1,333 | ) | (129,008 | ) | ||||
| Dorman Products, Inc. | (766 | ) | (49,208 | ) | ||||
| (178,216 | ) | |||||||
| BANKS (-0.32%) | ||||||||
| BancorpSouth, Inc. | (2,320 | ) | (54,520 | ) | ||||
| Bank of Hawaii Corp. | (492 | ) | (36,974 | ) | ||||
| BOK Financial Corp. | (1,228 | ) | (87,212 | ) | ||||
| Community Bank System, Inc. | (1,934 | ) | (91,111 | ) | ||||
| Cullen/Frost Bankers, Inc. | (1,131 | ) | (85,945 | ) | ||||
| CVB Financial Corp. | (8,370 | ) | (140,448 | ) | ||||
| First Financial Bankshares, Inc. | (5,298 | ) | (191,788 | ) | ||||
| Glacier Bancorp, Inc. | (2,695 | ) | (76,161 | ) | ||||
| HDFC Bank, Ltd., ADR | (956 | ) | (67,666 | ) | ||||
| Home BancShares, Inc. | (1,978 | ) | (42,547 | ) | ||||
| M&T Bank Corp. | (715 | ) | (87,752 | ) | ||||
| Prosperity Bancshares, Inc. | (1,492 | ) | (82,761 | ) | ||||
| Texas Capital Bancshares, Inc. | (1,051 | ) | (62,324 | ) | ||||
| Trustmark Corp. | (2,504 | ) | (69,311 | ) | ||||
| UMB Financial Corp. | (1,207 | ) | (74,894 | ) | ||||
| United Bankshares, Inc. | (4,745 | ) | (178,886 | ) | ||||
| Valley National Bancorp | (7,980 | ) | (78,683 | ) | ||||
| Westamerica Bancorporation | (3,321 | ) | (164,589 | ) | ||||
| (1,673,572 | ) | |||||||
See Notes to Financial Statements.
50
| Redmont Resolute Fund | Consolidated Schedule of Investments |
October 31, 2016 (Unaudited)
| Description | Shares | Value (Note 2) | ||||||
| BIOTECHNOLOGY (-0.05%) | ||||||||
| Illumina, Inc. | (563 | ) | $ | (76,647 | ) | |||
| Juno Therapeutics, Inc. | (3,911 | ) | (94,998 | ) | ||||
| Seattle Genetics, Inc. | (1,892 | ) | (97,816 | ) | ||||
| (269,461 | ) | |||||||
| BUILDING MATERIALS (-0.02%) | ||||||||
| Fortune Brands Home & Security, Inc. | (1,104 | ) | (60,311 | ) | ||||
| Trex Co., Inc. | (912 | ) | (49,075 | ) | ||||
| (109,386 | ) | |||||||
| CHEMICALS (-0.12%) | ||||||||
| Axalta Coating Systems, Ltd. | (4,823 | ) | (121,154 | ) | ||||
| Balchem Corp. | (1,449 | ) | (109,979 | ) | ||||
| FMC Corp. | (3,297 | ) | (154,596 | ) | ||||
| Ingevity Corp. | (2,132 | ) | (88,265 | ) | ||||
| NewMarket Corp. | (461 | ) | (184,820 | ) | ||||
| (658,814 | ) | |||||||
| COMMERCIAL SERVICES (-0.14%) | ||||||||
| Cimpress NV | (1,805 | ) | (150,266 | ) | ||||
| CoStar Group, Inc. | (496 | ) | (92,812 | ) | ||||
| Monro Muffler Brake, Inc. | (2,090 | ) | (114,950 | ) | ||||
| Nord Anglia Education, Inc. | (4,548 | ) | (97,964 | ) | ||||
| Rollins, Inc. | (5,360 | ) | (165,195 | ) | ||||
| Verisk Analytics, Inc. | (1,738 | ) | (141,734 | ) | ||||
| (762,921 | ) | |||||||
| COMPUTERS (-0.09%) | ||||||||
| Electronics for Imaging, Inc. | (3,601 | ) | (153,151 | ) | ||||
| Unisys Corp. | (8,624 | ) | (90,121 | ) | ||||
| Wipro, Ltd., ADR | (22,020 | ) | (212,933 | ) | ||||
| (456,205 | ) | |||||||
| DIVERSIFIED FINANCIAL SERVICES (-0.06%) | ||||||||
| Eaton Vance Corp. | (4,561 | ) | (159,909 | ) | ||||
| Financial Engines, Inc. | (3,067 | ) | (84,802 | ) | ||||
| WisdomTree Investments, Inc. | (7,693 | ) | (66,006 | ) | ||||
| (310,717 | ) | |||||||
| ELECTRIC (-0.03%) | ||||||||
| Ormat Technologies, Inc. | (3,768 | ) | (181,731 | ) | ||||
| ELECTRICAL COMPONENTS & EQUIPMENT (-0.02%) | ||||||||
| Emerson Electric Co. | (1,912 | ) | (96,900 | ) | ||||
| ELECTRONICS (-0.13%) | ||||||||
| Itron, Inc. | (7,385 | ) | (398,051 | ) | ||||
| National Instruments Corp. | (9,730 | ) | (273,316 | ) | ||||
| (671,367 | ) | |||||||
| ENTERTAINMENT (-0.03%) | ||||||||
| SeaWorld Entertainment, Inc. | (9,881 | ) | (138,433 | ) | ||||
| FOOD (-0.19%) | ||||||||
| B&G Foods, Inc. | (4,558 | ) | (193,259 | ) | ||||
| Blue Buffalo Pet Products, Inc. | (5,320 | ) | (133,638 | ) | ||||
| Flowers Foods, Inc. | (18,905 | ) | (293,405 | ) | ||||
| McCormick & Co., Inc. | (1,356 | ) | (130,000 | ) | ||||
| Sysco Corp. | (2,173 | ) | (104,565 | ) | ||||
See Notes to Financial Statements.
| Semi-Annual Report | October 31, 2016 | 51 |
| Redmont Resolute Fund | Consolidated Schedule of Investments |
October 31, 2016 (Unaudited)
| Description | Shares | Value (Note 2) | ||||||
| FOOD (-0.19%) (continued) | ||||||||
| TreeHouse Foods, Inc. | (1,660 | ) | $ | (145,217 | ) | |||
| (1,000,084 | ) | |||||||
| HEALTHCARE - PRODUCTS (-0.17%) | ||||||||
| Baxter International, Inc. | (1,754 | ) | (83,473 | ) | ||||
| Edwards Lifesciences Corp. | (967 | ) | (92,078 | ) | ||||
| Henry Schein, Inc. | (747 | ) | (111,452 | ) | ||||
| IDEXX Laboratories, Inc. | (1,421 | ) | (152,246 | ) | ||||
| Intuitive Surgical, Inc. | (202 | ) | (135,760 | ) | ||||
| The Cooper Cos., Inc. | (714 | ) | (125,693 | ) | ||||
| West Pharmaceutical Services, Inc. | (1,704 | ) | (129,555 | ) | ||||
| Wright Medical Group NV | (3,724 | ) | (81,593 | ) | ||||
| (911,850 | ) | |||||||
| HEALTHCARE - SERVICES (-0.02%) | ||||||||
| Brookdale Senior Living, Inc. | (6,633 | ) | (95,714 | ) | ||||
| HOUSEWARES (-0.02%) | ||||||||
| The Toro Co. | (2,657 | ) | (127,217 | ) | ||||
| INSURANCE (-0.07%) | ||||||||
| Arch Capital Group, Ltd. | (1,734 | ) | (135,200 | ) | ||||
| Mercury General Corp. | (2,136 | ) | (116,348 | ) | ||||
| RLI Corp. | (1,956 | ) | (109,027 | ) | ||||
| (360,575 | ) | |||||||
| INTERNET (-0.17%) | ||||||||
| 58.com, Inc., ADR | (1,620 | ) | (67,797 | ) | ||||
| Cogent Communications Holdings, Inc. | (4,570 | ) | (168,633 | ) | ||||
| F5 Networks, Inc. | (547 | ) | (75,601 | ) | ||||
| Netflix, Inc. | (1,462 | ) | (182,560 | ) | ||||
| Proofpoint, Inc. | (2,068 | ) | (162,090 | ) | ||||
| Wayfair, Inc., Class A | (2,245 | ) | (74,826 | ) | ||||
| Zillow Group, Inc., Class A | (5,582 | ) | (184,373 | ) | ||||
| (915,880 | ) | |||||||
| LEISURE TIME (-0.01%) | ||||||||
| Planet Fitness, Inc., Class A | (3,178 | ) | (67,374 | ) | ||||
| MACHINERY - CONSTRUCTION & MINING (-0.04%) | ||||||||
| Caterpillar, Inc. | (2,627 | ) | (219,249 | ) | ||||
| MACHINERY - DIVERSIFIED (-0.18%) | ||||||||
| Cognex Corp. | (4,795 | ) | (247,422 | ) | ||||
| Deere & Co. | (2,523 | ) | (222,781 | ) | ||||
| Flowserve Corp. | (2,439 | ) | (103,292 | ) | ||||
| Rockwell Automation, Inc. | (1,123 | ) | (134,446 | ) | ||||
| The Middleby Corp. | (912 | ) | (102,244 | ) | ||||
| Wabtec Corp. | (1,685 | ) | (130,267 | ) | ||||
| (940,452 | ) | |||||||
| MEDIA (-0.04%) | ||||||||
| FactSet Research Systems, Inc. | (1,288 | ) | (199,279 | ) | ||||
| METAL FABRICATE & HARDWARE (-0.01%) | ||||||||
| Sun Hydraulics Corp. | (2,245 | ) | (66,070 | ) | ||||
See Notes to Financial Statements.
52
| Redmont Resolute Fund | Consolidated Schedule of Investments |
October 31, 2016 (Unaudited)
| Description | Shares | Value (Note 2) | ||||||
| MINING (-0.04%) | ||||||||
| Goldcorp, Inc. | (12,177 | ) | $ | (185,090 | ) | |||
| MISCELLANEOUS MANUFACTURING (-0.04%) | ||||||||
| Actuant Corp., Class A | (5,420 | ) | (120,866 | ) | ||||
| Aptargroup, Inc. | (1,611 | ) | (115,090 | ) | ||||
| (235,956 | ) | |||||||
| OIL & GAS (-0.27%) | ||||||||
| Apache Corp. | (2,312 | ) | (137,518 | ) | ||||
| Continental Resources, Inc. | (2,516 | ) | (123,058 | ) | ||||
| Helmerich & Payne, Inc. | (885 | ) | (55,852 | ) | ||||
| Hess Corp. | (4,346 | ) | (208,478 | ) | ||||
| HollyFrontier Corp. | (5,757 | ) | (143,637 | ) | ||||
| Laredo Petroleum, Inc. | (17,057 | ) | (203,319 | ) | ||||
| Matador Resources Co. | (8,319 | ) | (181,437 | ) | ||||
| Murphy Oil Corp. | (4,327 | ) | (111,940 | ) | ||||
| Royal Dutch Shell PLC, Sponsored ADR, Class A | (5,674 | ) | (282,622 | ) | ||||
| (1,447,861 | ) | |||||||
| OIL & GAS SERVICES (-0.06%) | ||||||||
| National Oilwell Varco, Inc. | (5,918 | ) | (189,968 | ) | ||||
| Sunoco LP | (2,738 | ) | (78,006 | ) | ||||
| Weatherford International PLC | (11,936 | ) | (57,531 | ) | ||||
| (325,505 | ) | |||||||
| PACKAGING & CONTAINERS (-0.08%) | ||||||||
| Ball Corp. | (2,400 | ) | (184,968 | ) | ||||
| Bemis Co., Inc. | (2,772 | ) | (135,052 | ) | ||||
| Sonoco Products Co. | (1,555 | ) | (78,201 | ) | ||||
| (398,221 | ) | |||||||
| PHARMACEUTICALS (-0.04%) | ||||||||
| AmerisourceBergen Corp. | (1,284 | ) | (90,291 | ) | ||||
| Bristol-Myers Squibb Co. | (2,458 | ) | (125,137 | ) | ||||
| (215,428 | ) | |||||||
| PIPELINES (-0.06%) | ||||||||
| Kinder Morgan, Inc. | (4,889 | ) | (99,882 | ) | ||||
| Spectra Energy Corp. | (4,596 | ) | (192,159 | ) | ||||
| (292,041 | ) | |||||||
| REAL ESTATE INVESTMENT TRUSTS (-0.06%) | ||||||||
| Equinix, Inc. | (868 | ) | (310,119 | ) | ||||
| RETAIL (-0.22%) | ||||||||
| Bob Evans Farms, Inc. | (230 | ) | (9,480 | ) | ||||
| Buffalo Wild Wings, Inc. | (634 | ) | (92,342 | ) | ||||
| Casey's General Stores, Inc. | (819 | ) | (92,539 | ) | ||||
| Chipotle Mexican Grill, Inc. | (251 | ) | (90,551 | ) | ||||
| Dollar Tree, Inc. | (1,403 | ) | (105,997 | ) | ||||
| Jack in the Box, Inc. | (1,228 | ) | (115,100 | ) | ||||
| lululemon athletica, Inc. | (1,782 | ) | (102,019 | ) | ||||
| Panera Bread Co., Class A | (643 | ) | (122,659 | ) | ||||
| PriceSmart, Inc. | (2,134 | ) | (194,087 | ) | ||||
| Texas Roadhouse, Inc. | (3,130 | ) | (126,828 | ) | ||||
| The Cheesecake Factory, Inc. | (2,541 | ) | (135,156 | ) | ||||
| (1,186,758 | ) | |||||||
See Notes to Financial Statements.
| Semi-Annual Report | October 31, 2016 | 53 |
| Redmont Resolute Fund | Consolidated Schedule of Investments |
October 31, 2016 (Unaudited)
| Description | Shares | Value (Note 2) | ||||||
| SAVINGS & LOANS (-0.03%) | ||||||||
| New York Community Bancorp, Inc. | (5,103 | ) | $ | (73,279 | ) | |||
| People's United Financial, Inc. | (4,441 | ) | (72,122 | ) | ||||
| (145,401 | ) | |||||||
| SEMICONDUCTORS (-0.02%) | ||||||||
| Cavium, Inc. | (1,601 | ) | (90,376 | ) | ||||
| SOFTWARE (-0.36%) | ||||||||
| 2U, Inc. | (2,959 | ) | (103,151 | ) | ||||
| ACI Worldwide, Inc. | (11,173 | ) | (202,455 | ) | ||||
| Acxiom Corp. | (6,394 | ) | (150,642 | ) | ||||
| athenahealth, Inc. | (738 | ) | (76,250 | ) | ||||
| Blackbaud, Inc. | (3,472 | ) | (213,181 | ) | ||||
| Guidewire Software, Inc. | (3,401 | ) | (195,387 | ) | ||||
| Medidata Solutions, Inc. | (4,709 | ) | (225,985 | ) | ||||
| salesforce.com, Inc. | (2,044 | ) | (153,627 | ) | ||||
| Synchronoss Technologies, Inc. | (2,859 | ) | (104,954 | ) | ||||
| Veeva Systems, Inc., Class A | (6,555 | ) | (254,662 | ) | ||||
| Workday, Inc., Class A | (2,729 | ) | (236,550 | ) | ||||
| (1,916,844 | ) | |||||||
| STORAGE & WAREHOUSING (-0.01%) | ||||||||
| Mobile Mini, Inc. | (2,614 | ) | (66,265 | ) | ||||
| TELECOMMUNICATIONS (-0.15%) | ||||||||
| Arista Networks, Inc. | (1,986 | ) | (168,313 | ) | ||||
| Finisar Corp. | (2,959 | ) | (81,017 | ) | ||||
| Frontier Communications Corp. | (15,588 | ) | (62,664 | ) | ||||
| Sprint Corp. | (48,722 | ) | (300,128 | ) | ||||
| Telefonica SA, Sponsored ADR | (6,763 | ) | (68,577 | ) | ||||
| ViaSat, Inc. | (1,340 | ) | (94,684 | ) | ||||
| (775,383 | ) | |||||||
| TOYS, GAMES & HOBBIES (-0.03%) | ||||||||
| Mattel, Inc. | (4,911 | ) | (154,844 | ) | ||||
| TRANSPORTATION (-0.05%) | ||||||||
| Heartland Express, Inc. | (5,642 | ) | (103,813 | ) | ||||
| JB Hunt Transport Services, Inc. | (831 | ) | (67,818 | ) | ||||
| Old Dominion Freight Line, Inc. | (1,126 | ) | (84,089 | ) | ||||
| (255,720 | ) | |||||||
| TOTAL COMMON STOCKS (Proceeds $18,334,058) | (18,807,714 | ) | ||||||
| EXCHANGE TRADED FUNDS (-1.80%) | ||||||||
Energy Select Sector SPDR® Fund | (22,512 | ) | (1,544,773 | ) | ||||
Financial Select Sector SPDR® Fund | (29,871 | ) | (589,654 | ) | ||||
Health Care Select Sector SPDR® Fund | (21,097 | ) | (1,421,094 | ) | ||||
iShares® MSCI Australia ETF | (45,643 | ) | (925,640 | ) | ||||
iShares® Russell 2000® ETF | (6,969 | ) | (825,826 | ) | ||||
iShares® Russell 2000® Value ETF | (10,724 | ) | (1,088,272 | ) | ||||
SPDR® S&P 500® ETF Trust | (5,109 | ) | (1,085,918 | ) | ||||
SPDR® S&P Emerging Markets SmallCap ETF | (10,814 | ) | (465,002 | ) | ||||
VanEck® Vectors Agribusiness ETF | (18,749 | ) | (924,513 | ) | ||||
See Notes to Financial Statements.
54
| Redmont Resolute Fund | Consolidated Schedule of Investments |
October 31, 2016 (Unaudited)
| Description | Shares | Value (Note 2) | ||||||
| EXCHANGE TRADED FUNDS (-1.80%) (continued) | ||||||||
Vanguard® FTSE Emerging Markets ETF | (17,488 | ) | $ | (660,172 | ) | |||
| (9,530,864 | ) | |||||||
| TOTAL EXCHANGE TRADED FUNDS (-1.80%) (Proceeds $9,750,566) | (9,530,864 | ) | ||||||
| TOTAL SECURITIES SOLD SHORT (Proceeds $28,084,625) | $ | (28,338,578 | ) | |||||
SCHEDULE OF WRITTEN OPTIONS
| Description | Number of Contracts | Exercise Price | Maturity Date | Value (Note 2) | ||||||||
| WRITTEN OPTIONS | ||||||||||||
| Call Options | ||||||||||||
| Diamondback Energy, Inc. | (21) | $ | 92.50 | 03/20/2017 | $ | (16,065 | ) | |||||
| Phillips 66 | (40) | 85.00 | 01/20/2017 | (6,200 | ) | |||||||
| TOTAL WRITTEN OPTIONS (Proceeds $27,929) | $ | (22,265 | ) | |||||||||
| (a) | Non-income producing security. |
| (b) | Security position either entirely or partially held in a segregated account as collateral for securities sold short, written options, and futures contracts. Aggregate total market value of $15,905,698. |
| (c) | Less than 0.005%. |
| (d) | Security exempt from registration under rule 144A of the securities act of 1933. This security may be resold in transactions exempt from registration, normally to qualified institutional buyers. At period end, the market value of those securities was $3,196,833, representing 0.60% of the Fund's net assets. |
| (e) | Securities were purchased pursuant to Regulation S under the Securities Act of 1933, which exempts securities offered and sold outside the United States from registration. Such securities cannot be sold in the United States without either an effective registration statement filed pursuant to Securities Act of 1933, or pursuant to an exemption from registration. These securities have been deemed liquid under guidelines approved by the Fund's Board of Trustees. At period end, the aggregate market value of those securities was $12,679, representing 0.00% of net assets. |
| (f) | The rate shown on floating or adjustable rate securities represents the coupon rate at period end. |
| (g) | This security has no contractual maturity date, is not redeemable and contractually pays an indefinite stream of interest. |
| (h) | Step bond. Coupon increases periodically based upon a predetermined schedule. Interest rate disclosed is that which is in effect at October 31, 2016. |
| (i) | Rate shown represents the bond equivalent yield to maturity at date of purchase. |
| (j) | Includes cash which is being held as collateral for securities sold short, written options, forward foreign currency contracts, and total return swap contracts. |
See Notes to Financial Statements.
| Semi-Annual Report | October 31, 2016 | 55 |
| Redmont Resolute Fund | Consolidated Schedule of Investments |
| October 31, 2016 (Unaudited) |
OUTSTANDING FORWARD FOREIGN CURRENCY CONTRACTS
| Counterparty | Foreign Currency | Contracted Amount** | Purchase/Sale Contract | Settlement Date | Current Value | Unrealized Appreciation/(Depreciation) | |||||||||
| Morgan Stanley | CHF | 710,000 | Sale | 12/21/2016 | $ | 719,801 | $ | 14,746 | |||||||
| Morgan Stanley | CHF | 250,000 | Purchase | 12/21/2016 | 253,451 | 24 | |||||||||
| Morgan Stanley | EUR | 82,000 | Sale | 11/07/2016 | 90,040 | 2,405 | |||||||||
| Morgan Stanley | EUR | 421,000 | Sale | 12/07/2016 | 462,991 | 8,502 | |||||||||
| Morgan Stanley | EUR | 2,340,000 | Sale | 12/21/2016 | 2,575,161 | 65,777 | |||||||||
| Morgan Stanley | EUR | 25,000 | Sale | 01/10/2017 | 27,537 | 671 | |||||||||
| Morgan Stanley | GBP | 10,000 | Sale | 11/07/2016 | 12,242 | 1,098 | |||||||||
| Morgan Stanley | GBP | 57,500 | Sale | 12/07/2016 | 70,449 | 6,882 | |||||||||
| Morgan Stanley | GBP | 1,270,000 | Sale | 12/21/2016 | 1,556,575 | 127,665 | |||||||||
| Morgan Stanley | GBP | 250,000 | Purchase | 12/21/2016 | 306,412 | 984 | |||||||||
| Morgan Stanley | GBP | 39,700 | Sale | 01/10/2017 | 48,675 | 2,959 | |||||||||
| Morgan Stanley | GBP | 4,400 | Purchase | 01/10/2017 | 5,395 | 19 | |||||||||
| Morgan Stanley | INR | 115,770,000 | Purchase | 12/21/2016 | 1,720,080 | 11,045 | |||||||||
| Morgan Stanley | JPY | 24,470,000 | Sale | 11/07/2016 | 233,389 | 9,940 | |||||||||
| Morgan Stanley | JPY | 59,533,000 | Sale | 12/07/2016 | 568,647 | 16,018 | |||||||||
| Morgan Stanley | JPY | 290,190,000 | Sale | 12/21/2016 | 2,773,619 | 24,270 | |||||||||
| Morgan Stanley | JPY | 22,336,000 | Sale | 01/11/2017 | 213,648 | 7,268 | |||||||||
| Morgan Stanley | MXN | 15,420,000 | Purchase | 12/19/2016 | 812,036 | 30,089 | |||||||||
| $ | 330,362 | ||||||||||||||
| Morgan Stanley | EUR | 15,000 | Purchase | 12/07/2016 | $ | 16,496 | $ | (87 | ) | ||||||
| Morgan Stanley | EUR | 570,000 | Purchase | 12/21/2016 | 627,283 | (2,162 | ) | ||||||||
| Morgan Stanley | JPY | 322,020,000 | Purchase | 12/21/2016 | 3,077,849 | (118,713 | ) | ||||||||
| Morgan Stanley | MXN | 15,420,000 | Sale | 12/19/2016 | 812,036 | (542 | ) | ||||||||
| $ | (121,504 | ) | |||||||||||||
| ** | The contracted amount is stated in the currency in which the contract is denominated. |
FUTURES CONTRACTS
At October 31, 2016, the Fund had outstanding futures contracts:
| Description | Position | Contracts | Expiration Date | Underlying Face Amount at Value | Unrealized Appreciation | |||||||||
| Equity Contracts | ||||||||||||||
| Mexican Bolsa Index Future | Long | 36 | 12/16/2016 | $ | 908,523 | $ | 27,918 | |||||||
| Mini MSCI EAFE Index Future | Short | 18 | 12/16/2016 | (1,499,130 | ) | 20,610 | ||||||||
Russell® 1000 Value Future | Long | 21 | 12/16/2016 | 2,141,160 | 3,103 | |||||||||
| Tokyo Price Index Future | Long | 3 | 12/08/2016 | 399,066 | 21,014 | |||||||||
| Interest Rate Contracts | ||||||||||||||
| U.S. 10 Year Treasury Note Future | Short | 6 | 12/20/2016 | (777,750 | ) | 9,642 | ||||||||
| U.S. 5 Year Treasury Note Future | Short | 18 | 12/30/2016 | (2,174,346 | ) | 8,124 | ||||||||
| U.S. Treasury Long Bond Future | Short | 11 | 12/20/2016 | (1,789,909 | ) | 87,037 | ||||||||
| $ | (2,792,386 | ) | $ | 177,448 | ||||||||||
See Notes to Financial Statements.
56
| Redmont Resolute Fund | Consolidated Schedule of Investments |
| October 31, 2016 (Unaudited) |
| Description | Position | Contracts | Expiration Date | Underlying Face Amount at Value | Unrealized Depreciation | |||||||||
| Equity Contracts | ||||||||||||||
E‐Mini S&P 500® Future | Short | 39 | 12/16/2016 | $ | (4,134,195 | ) | $ | (2,030 | ) | |||||
Euro STOXX 50® Future | Short | 15 | 12/16/2016 | (502,715 | ) | (3,099 | ) | |||||||
FTSE® 100 Index Future | Short | 12 | 12/16/2016 | (1,017,732 | ) | (41,895 | ) | |||||||
| Mini MSCI Emerging Markets Index Future | Short | 12 | 12/16/2016 | (542,100 | ) | (6,634 | ) | |||||||
Russell® 2000 Mini Index Future | Long | 55 | 12/16/2016 | 6,541,150 | (106,313 | ) | ||||||||
| SGX CNX Nifty Index Future | Long | 458 | 11/24/2016 | 7,881,264 | (55,390 | ) | ||||||||
| $ | 8,225,672 | $ | (215,361 | ) | ||||||||||
TOTAL RETURN SWAP CONTRACTS*
| Counterparty | Reference Obligation | Notional Amount | Rate Paid by the Fund | Termination Date | Unrealized Appreciation/(Depreciation) | ||||||
| Morgan Stanley | BHDG Systematic Trading Segregated Portfolio(a) | $ | 24,958 | 1‐Month LIBOR BBA | 09/13/2018 | $ | (433,294 | ) | |||
| Morgan Stanley | Clinton Segregated Portfolio(b) | 20,000 | 1‐Month LIBOR BBA | 09/13/2018 | (83,442 | ) | |||||
| Morgan Stanley | Impala Segregated Portfolio(c) | 42,371 | 1‐Month LIBOR BBA | 03/20/2019 | (143,627 | ) | |||||
| Morgan Stanley | Melchior Segregated Portfolio(d) | 40,885 | 1‐Month LIBOR BBA | 03/20/2019 | (258,108 | ) | |||||
| Morgan Stanley | PSAM Highland(e) | 295,778 | 1‐Month EURIBOR | 06/03/2021 | 130,103 | ||||||
| Morgan Stanley | WABR Cayman Company Limited(f) | 61,691 | 1‐Month LIBOR BBA | 09/01/2020 | (734,392 | ) | |||||
| $ | 485,683 | $ | (1,522,760 | ) | |||||||
| * | The Fund receives payments based on any positive return of the Reference Obligation less the rate paid by the Fund. The Fund makes payments on any negative return of such Reference Obligation plus the rate paid by the Fund. |
| (a) | BHDG is a quantitative trend following strategy that uses futures. BHDG will employ some short, medium, and long term signals. Interest rate, commodity, equity, and sovereign debt futures will be used. Any asset class may have net long or short exposure, and exposures in aggregate may be net long or short. |
| (b) | Clinton is a global, quantitative equity market neutral strategy. Clinton will invest in large, mid, and small cap stocks in developed and some emerging markets. The strategy will also attempt to minimize net exposure to any given country or sector. The strategy attempts to generate returns primarily through trading value, momentum, and mean reversion models. |
| (c) | European equity long/short strategy that employs a flexible, low-net strategy (0% to 50%), and long exposure will vary between 60% and 100%. The portfolio is primarily comprised of large and mid-cap stocks listed on European exchanges. |
| (d) | Global equity long/short strategy that uses a long-biased strategy that is focused on cyclical sectors. The strategy has a net exposure that ranges between 50% and 80%, and long exposure varies between 80% and 100%. The strategy is comprised of large cap stocks listed on exchanges of developed and emerging market countries. |
| (e) | PSAM employs an event driven strategy. The fund will primarily make investments in equity special situations and merger arbitrage. The strategy will also opportunistically allocate to liquid high yield credit positions when trading at stressed levels. The strategy will employ have gross long exposure of up to 120%, and net exposure will typically vary from 40% to 80%. |
| (f) | Weiss Alpha Balanced Risk incorporates an absolute return oriented approach within a risk parity framework. Active absolute return strategies include fundamental long/short equity, credit relative value, discretionary macro, and equity market neutral strategies. The strategy also maintains a passive risk weighted allocation to equities and fixed income, but each of the three allocations is equally risk weighted subject to a 40% limit on the absolute return allocation. Gross equity long exposure will typically be 140% or less, and net equity exposure will vary between 5% and 35%. |
Currency Abbreviations
BRL - Brazilian Real
CHF - Swiss Franc
EUR - Euro
GBP - Great British Pound
IDR - Indonesian Rupiah
INR - Indian Rupee
JPY - Japanese Yen
MXN - Mexican Peso
PEN - Peruvian Nuevo Sol
USD - United States Dollar
| See Notes to Financial Statements. |
| Semi-Annual Report | October 31, 2016 | 57 |
| Redmont Resolute Fund | Consolidated Schedule of Investments |
| October 31, 2016 (Unaudited) |
Common Abbreviations:
AQR - AQR Capital Management LLC.
BBA - British Bankers Association.
Bolsa - The Spanish term for stock exchange.
CNX Nifty - The National Stock Exchange of India's benchmark stock market index for Indian equity market.
EURIBOR - Euro Interbank Offered Rate.
FPA - First Pacific Advisors LLC.
FTSE - Financial Times and the London Stock Exchange.
LIBOR - London Interbank Offered Rate.
MSCI - Morgan Stanley Capital International.
PIMCO - Pacific Investment Management Company.
S&P - Standard & Poor's.
SGX - Singapore Exchange.
SPDR - Standard & Poor's Depositary Receipt.
UCITS - Undertakings for Collective Investment in Transferable Securities.
| See Notes to Financial Statements. |
| 58 |
| Redmont Resolute Fund | Consolidated Statement of Assets and Liabilities |
October 31, 2016 (Unaudited)
| Redmont Resolute Fund | ||||
| ASSETS | ||||
| Investments, at value | $ | 424,034,005 | ||
| Unrealized appreciation on forward currency contracts | 330,362 | |||
| Deposits with brokers for securities sold short and written options | 27,732,207 | |||
| Deposits with brokers for total return swap contracts | 103,590,211 | |||
| Deposits with brokers for forward currency contracts | 2,310,000 | |||
| Receivable for investments sold | 2,023,445 | |||
| Receivable for dividends | 783,105 | |||
| Other assets | 7,375 | |||
| Total assets | 560,810,710 | |||
| LIABILITIES | ||||
| Securities sold short (Proceeds $28,084,625) | 28,338,578 | |||
| Written options, at value (Premiums received $27,929) | 22,265 | |||
| Unrealized depreciation on total return swap contracts | 1,522,760 | |||
| Unrealized depreciation on forward currency contracts | 121,504 | |||
| Foreign currency due to custodian(Cost $99,060) | 99,841 | |||
| Foreign capital gains tax | 2,992 | |||
| Investment advisory fees payable | 365,866 | |||
| Offering cost payable | 434 | |||
| Payable for dividend expense on securities sold short | 7,692 | |||
| Payable for interest expense on total return swap contracts | 106,716 | |||
| Payable for investments purchased | 1,189,854 | |||
| Variation margin payable | 33,969 | |||
| Trustee fees and expenses payable | 6,335 | |||
| Chief compliance officer fee payable | 4,252 | |||
| Principal financial officer fees payable | 2,542 | |||
| Administration fees payable | 42,143 | |||
| Transfer agent fees payable | 13,742 | |||
| Professional fees payable | 10,398 | |||
| Custody fees payable | 26,853 | |||
| Accrued expenses and other liabilities | 9,168 | |||
| Total liabilities | 31,927,904 | |||
| NET ASSETS | $ | 528,882,806 | ||
| NET ASSETS CONSIST OF | ||||
Paid‐in capital (Note 6) | $ | 514,737,332 | ||
| Accumulated net income | 2,185,662 | |||
| Accumulated net realized gain | 1,972,967 | |||
| Net unrealized appreciation | 9,986,845 | |||
| NET ASSETS | $ | 528,882,806 | ||
| INVESTMENTS, AT COST | $ | 412,444,633 | ||
| PRICING OF SHARES | ||||
| Class I: | ||||
| Net Asset Value, offering and redemption price per share | $ | 10.92 | ||
| Net Assets | $ | 528,882,806 | ||
| Shares of beneficial interest outstanding (unlimited number of shares, no par value common stock authorized) | 48,441,919 | |||
See Notes to Financial Statements.
| Semi-Annual Report | October 31, 2016 | 59 |
| Redmont Resolute Fund | Consolidated Statement of Operations |
For the Six Months Ended October 31, 2016 (Unaudited)
| Redmont Resolute Fund | ||||
| INVESTMENT INCOME | ||||
| Dividends | $ | 3,698,229 | ||
| Interest | 540,520 | |||
| Foreign taxes withheld | (46,670 | ) | ||
| Total investment income | 4,192,079 | |||
| EXPENSES | ||||
| Investment advisory fees (Note 7) | 4,795,148 | |||
Investment Advisory fees ‐ subsidiary (Note 7) | 49,386 | |||
| Broker fees and charges on securities sold short | 46,347 | |||
| Administration fees | 221,641 | |||
| Transfer agency fees | 30,676 | |||
| Professional fees | 24,641 | |||
| Custody fees | 71,884 | |||
| Reports to shareholders and printing fees | 3,780 | |||
| Trustee fees and expenses | 11,548 | |||
| Registration/filing fees | 2,908 | |||
| Chief compliance officer fees | 24,507 | |||
| Principal financial officer fees | 5,042 | |||
| Offering costs | 434 | |||
| Dividend expense on securities sold short | 184,614 | |||
| Other | 14,201 | |||
| Total expenses before waivers | 5,486,757 | |||
| Less fees waived/reimbursed by investment adviser (Note 7) | ||||
| Class I | (4,257,925 | ) | ||
Waiver of investment advisory fees ‐ subsidiary (Note 7) | (49,386 | ) | ||
| Total net expenses | 1,179,446 | |||
| NET INVESTMENT INCOME | 3,012,633 | |||
| Net realized gain on investments | 3,658,961 | |||
| Net realized loss on securities sold short | (2,740,278 | ) | ||
| Net realized gain on written options | 13,078 | |||
| Net realized gain on futures contracts | 84,911 | |||
| Net realized gain on total return swap contracts | 4,128,662 | |||
| Net realized loss on foreign currency transactions | (1,134,746 | ) | ||
| Total net realized gain | 4,010,588 | |||
| Net change in unrealized appreciation on investments | 3,091,774 | |||
| Net change in unrealized appreciation on securities sold short | 1,099,454 | |||
| Net change in unrealized appreciation on written options | 222,813 | |||
| Net change in unrealized depreciation on futures contracts | (94,719 | ) | ||
| Net change in unrealized depreciation on total return swap contracts | (2,229,707 | ) | ||
| Net change in unrealized appreciation on translation of assets and liabilities in foreign currency transactions | 1,234,811 | |||
| Total net change in unrealized appreciation | 3,324,426 | |||
| NET REALIZED AND UNREALIZED GAIN ON INVESTMENTS | 7,335,014 | |||
| NET INCREASE IN NET ASSETS RESULTING FROM OPERATIONS | $ | 10,347,647 | ||
See Notes to Financial Statements.
60
| Redmont Resolute Fund | Consolidated Statements of Changes in Net Assets |
| Redmont Resolute Fund | ||||||||
Six Months Ended October 31, 2016(a) (Unaudited) | For the Year Ended April 30, 2016 | |||||||
| OPERATIONS | ||||||||
| Net investment income | $ | 3,012,633 | $ | 10,201,232 | ||||
| Net realized gain/(loss) | 4,010,588 | (9,636,394 | ) | |||||
| Net realized gain distributions from other investment companies | – | 5,483,000 | ||||||
| Net change in unrealized appreciation/(depreciation) | 3,324,426 | (19,989,835 | ) | |||||
| Net increase/(decrease) in net assets resulting from operations | 10,347,647 | (13,941,997 | ) | |||||
| DISTRIBUTIONS (NOTE 4) | ||||||||
| Net investment income | ||||||||
| Class I | – | (11,108,106 | ) | |||||
| Net realized gains on investments | ||||||||
| Class I | – | (10,242,050 | ) | |||||
| Net decrease in net assets from distributions | – | (21,350,156 | ) | |||||
| BENEFICIAL INTEREST TRANSACTIONS (NOTE 6) | ||||||||
| Shares sold | ||||||||
| Class I | 84,048,323 | 49,423,534 | ||||||
| Dividends reinvested | ||||||||
| Class I | – | 21,244,058 | ||||||
| Shares redeemed, net of redemption fees | ||||||||
| Class I | (252,172,040 | ) | (37,982,086 | ) | ||||
| Net increase/(decrease) in net assets derived from beneficial interest transactions | (168,123,717 | ) | 32,685,506 | |||||
| Net decrease in Net Assets | (157,776,070 | ) | (2,606,647 | ) | ||||
| NET ASSETS: | ||||||||
| Beginning of period | 686,658,876 | 689,265,523 | ||||||
| End of period* | $ | 528,882,806 | $ | 686,658,876 | ||||
| * Includes accumulated net investment income/(loss) of: | $ | 2,185,662 | $ | (826,971 | ) | |||
| (a) | Prior to August 31, 2016 the Redmont Resolute Fund was known as the Redmont Resolute Fund II. |
See Notes to Financial Statements.
| Semi-Annual Report | October 31, 2016 | 61 |
| Redmont Resolute Fund | Consolidated Financial Highlights |
For a share outstanding throughout the periods presented
| Class I | ||||||||||||||||||||||||
For the Six Months Ended October 31, 2016(a) (Unaudited) | For the Year Ended April 30, 2016 | For the Year Ended April 30, 2015 | For the Year Ended April 30, 2014 | For the Year Ended April 30, 2013 | For the Period Ended April 30, 2012(b) | |||||||||||||||||||
| NET ASSET VALUE, BEGINNING OF PERIOD | $ | 10.75 | $ | 11.32 | $ | 11.18 | $ | 11.05 | $ | 10.34 | $ | 10.00 | ||||||||||||
| INCOME/(LOSS) FROM OPERATIONS | ||||||||||||||||||||||||
Net investment income/(loss)(c) | 0.05 | 0.16 | 0.20 | 0.13 | 0.11 | (0.03 | ) | |||||||||||||||||
| Net realized and unrealized gain/(loss) on investments | 0.12 | (0.39 | ) | 0.26 | 0.19 | 0.68 | 0.37 | |||||||||||||||||
| Total from Investment Operations | 0.17 | (0.23 | ) | 0.46 | 0.32 | 0.79 | 0.34 | |||||||||||||||||
| LESS DISTRIBUTIONS | ||||||||||||||||||||||||
| Net investment income | – | (0.18 | ) | (0.24 | ) | (0.11 | ) | (0.08 | ) | – | ||||||||||||||
| Net realized gain on investments | – | (0.16 | ) | (0.08 | ) | (0.08 | ) | – | – | |||||||||||||||
| Total Distributions | – | (0.34 | ) | (0.32 | ) | (0.19 | ) | (0.08 | ) | – | ||||||||||||||
| NET INCREASE/(DECREASE) IN NET ASSET VALUE | 0.17 | (0.57 | ) | 0.14 | 0.13 | 0.71 | 0.34 | |||||||||||||||||
| NET ASSET VALUE, END OF PERIOD | $ | 10.92 | $ | 10.75 | $ | 11.32 | $ | 11.18 | $ | 11.05 | $ | 10.34 | ||||||||||||
TOTAL RETURN(d) | 1.58 | % | (2.02 | )% | 4.16 | % | 2.85 | % | 7.65 | % | 3.40 | % | ||||||||||||
| RATIOS/SUPPLEMENTAL DATA | ||||||||||||||||||||||||
| Net assets, End of Period (000s) | $ | 528,883 | $ | 686,659 | $ | 689,266 | $ | 604,949 | $ | 446,319 | $ | 78,498 | ||||||||||||
| RATIOS TO AVERAGE NET ASSETS: | ||||||||||||||||||||||||
Operating expenses excluding reimbursement/waiver(e) | 1.63 | %(f)(g)(h) | 1.69 | %(g) | 1.68 | %(g) | 1.69 | %(g) | 1.32 | % | 1.63 | %(f) | ||||||||||||
Operating expenses including reimbursement/waiver(e) | 0.30 | %(f)(g) | 0.35 | %(g) | 0.33 | %(g) | 0.29 | %(g) | 0.22 | % | 1.13 | %(f) | ||||||||||||
Net investment income/(loss) including reimbursement/waiver(e) | 0.94 | %(f) | 1.49 | % | 1.79 | % | 1.19 | % | 1.08 | % | (0.97 | )%(f) | ||||||||||||
| PORTFOLIO TURNOVER RATE | 46 | %(i) | 27 | % | 54 | % | 114 | % | 51 | % | 18 | %(h) | ||||||||||||
| (a) | Prior to August 31, 2016, the Redmont Resolute Fund was known as the Redmont Resolute Fund II. |
| (b) | The Fund's inception was December 30, 2011. |
| (c) | Calculated using the average shares method. |
| (d) | Total investment return is calculated assuming a purchase of a common share at the opening of the first day and a sale at closing on the last day of each period reported. Dividends and distributions, if any, are assumed for purposes of this calculation to be reinvested at prices obtained under the Fund's dividend reinvestment plan. Total returns would have been lower had certain expenses not been waived during the period. Total investment returns do not reflect brokerage commissions, if any, and are not annualized. |
| (e) | The ratios exclude the impact of expenses of the underlying funds in which the Fund invests as represented in the Schedule of Investments. |
| (f) | Annualized. |
| (g) | Dividend and interest expense on securities sold short totaled 0.07%, 0.08%, 0.10%, and 0.08% of average net assets for the six months ended October 31, 2016 and the years ended April 30, 2016, 2015, and 2014, respectively. |
| (h) | The ratio of operating expenses excluding fee waiver/reimbursements to average net assets is calculated excluding the waived Subsidiary management fee (see Note 7 for additional detail). The ratio inclusive of that fee would be 1.65% for the six months ended October 31, 2016. |
| (i) | Not Annualized. |
See Notes to Financial Statements.
62
| Redmont Resolute Fund | Notes to Consolidated Financial Statements |
October 31, 2016 (Unaudited)
1. ORGANIZATION
Financial Investors Trust (the “Trust”), a Delaware statutory trust, is an open‐end management investment company registered under the Investment Company Act of 1940, as amended (“1940 Act”). The Trust consists of multiple separate portfolios or series. This semi‐annual report describes the Redmont Resolute Fund (the “Fund”). The Fund seeks to provide long‐term total return with reduced volatility and reduced correlation to the conventional stock and bond markets. The Fund offers Class I shares.
Basis of Consolidation: Redmont Resolute Cayman (the “Subsidiary”), a Cayman Islands exempted company, is a wholly owned subsidiary of the Fund. The Subsidiary’s investment objective is designed to enhance the ability of the Fund to obtain exposure to equities, financial, currency and commodities markets consistent with the limits of the U.S. federal tax law requirements applicable to registered investment companies. The Subsidiary is subject to substantially the same investment policies and investment restrictions as the Fund. The Subsidiary acts as an investment vehicle for the Fund in order to effect certain commodity‐related investments on behalf of the Fund. Investments in the Subsidiary are expected to provide the Fund with exposure to the commodity markets within the limitations of Subchapter M of the Internal Revenue Code of 1986, as amended (the “Code”), and recent IRS revenue rulings, as discussed below under “Federal Income Taxes”. The Fund is the sole shareholder of the Subsidiary pursuant to a subscription agreement, and it is intended that the Fund will remain the sole shareholder and will continue to control the Subsidiary. Under the Articles of Association of the Subsidiary, shares issued by the Subsidiary confer upon a shareholder the right to wholly own and vote at general meetings of the Subsidiary and certain rights in connection with any winding‐up or repayment of capital, as well as the right to participate in the profits or assets of the Subsidiary. The Fund may invest up to 25% of its total assets in shares of the Subsidiary. As a wholly owned subsidiary of the Fund, all assets and liabilities, income and expenses of the Subsidiary are consolidated in the financial statements and financial highlights of the Fund. All investments held by the Subsidiary are disclosed in the accounts of the Fund.
2. SIGNIFICANT ACCOUNTING POLICIES
The accompanying financial statements were prepared in accordance with accounting principles generally accepted in the United States of America (“U.S. GAAP”). The preparation of financial statements in conformity with U.S. GAAP requires management to make certain estimates and assumptions that affect the reported amounts of assets and liabilities and disclosures of contingent assets and liabilities at the date of the financial statements and the reported amounts of revenue and expenses during the period. Actual results could differ from those estimates. The Fund is considered an investment company for financial reporting purposes under U.S. GAAP. The following is a summary of significant accounting policies consistently followed by the Fund and Subsidiary in preparation of the financial statements.
Investment Valuation: The Fund generally values its securities based on market prices determined at the close of regular trading on the New York Stock Exchange (“NYSE”), normally 4:00 p.m. Eastern Time, on each day the NYSE is open for trading.
For equity securities and mutual funds that are traded on an exchange, the market price is usually the closing sale or official closing price on that exchange. In the case of equity securities not traded on an exchange, or if such closing prices are not otherwise available, the securities are valued at the mean of the most recent bid and ask prices on such day. Redeemable securities issued by open‐end registered investment companies are valued at the investment company’s applicable net asset value, with the exception of exchange‐traded open‐end investment companies, which are priced as equity securities.
The market price for debt obligations is generally the price supplied by an independent third‐party pricing service approved by the Board of Trustees (the “Board”), which may use a matrix, formula or other objective method that takes into consideration quotations from dealers, market transactions in comparable investments, market indices and yield curves. If vendors are unable to supply a price, or if the price supplied is deemed to be unreliable, the market price may be determined using quotations received from one or more brokers–dealers that make a market in the security. Municipal securities having a remaining maturity of greater than 60 days, are typically valued at the evaluated bid price formulated by an independent pricing service. Corporate Bonds, U.S. Government & Agency, and U.S. Treasury Bonds & Notes are valued using market models that consider trade data, quotations from dealers and active market makers, relevant yield curve and spread data, creditworthiness, trade data or market information on comparable securities, and other relevant security specific information. Mortgage‐related and asset‐backed securities are valued based on models that consider trade data, prepayment and default projections, benchmark yield and spread data and estimated cash flows of each tranche of the issuer. Publicly traded foreign government debt securities are typically traded internationally in the over‐the‐counter market and are valued at the mean between the bid and asked prices as of the close of business of that market.
Futures contracts that are listed or traded on a national securities exchange, commodities exchange, contract market or comparable over the counter market, and that are freely transferrable, are valued at their closing settlement price on the exchange on which they are primarily traded or based upon the current settlement price for a like instrument acquired on the day on which the instrument is being valued. A settlement price may not be used if the market makes a limit move with respect to a particular commodity. Over‐the‐counter swap contracts for which market quotations are readily available are valued based on quotes received from independent pricing services or one or more dealers that make markets in such securities. Options contracts listed for trading on a securities exchange or board of trade are valued at the last quoted sales price or, in the absence of a sale at the mean of the last bid and asked price.
| Semi-Annual Report | October 31, 2016 | 63 |
| Redmont Resolute Fund | Notes to Consolidated Financial Statements |
October 31, 2016 (Unaudited)
Forward currency exchange contracts have a fair value determined by the current foreign currency exchange forward rates. The foreign currency exchange forward rates are calculated using an automated system that estimates rates on the basis of the current day foreign currency exchange rates and forward foreign currency exchange rates supplied by a pricing service. Foreign exchange rates and forward foreign currency exchange rates may generally be obtained at the close of the NYSE, normally 4:00 p.m. Eastern Time.
When such prices or quotations are not available, or when Highland Associates, Inc. (the “Adviser”) believes that they are unreliable, securities may be priced using fair value procedures approved by the Board.
Fair Value Measurements: The Fund discloses the classification of its fair value measurements following a three‐tier hierarchy based on the inputs used to measure fair value. Inputs refer broadly to the assumptions that market participants would use in pricing the asset or liability, including assumptions about risk. Inputs may be observable or unobservable. Observable inputs reflect the assumptions market participants would use in pricing the asset or liability that are developed based on market data obtained from sources independent of the reporting entity. Unobservable inputs reflect the reporting entity’s own assumptions about the assumptions market participants would use in pricing the asset or liability that are developed based on the best information available.
Various inputs are used in determining the value of the Fund’s investments as of the end of the reporting period. When inputs used fall into different levels of the fair value hierarchy, the level in the hierarchy within which the fair value measurement falls is determined based on the lowest level input that is significant to the fair value measurement in its entirety. The designated input levels are not necessarily an indication of the risk or liquidity associated with these investments. These inputs are categorized in the following hierarchy under applicable financial accounting standards:
| Level 1 – | Unadjusted quoted prices in active markets for identical investments, unrestricted assets or liabilities that the Fund has the ability to access at the measurement date; |
| Level 2 – | Quoted prices which are not active, quoted prices for similar assets or liabilities in active markets or inputs other than quoted prices that are observable (either directly or indirectly) for substantially the full term of the asset or liability; and |
| Level 3 – | Significant unobservable prices or inputs (including the Fund’s own assumptions in determining the fair value of investments) where there is little or no market activity for the asset or liability at the measurement date. |
The following is a summary of the inputs used to value the Fund’s investments as of October 31, 2016:
Redmont Resolute Fund
| Investments in Securities at Value | Level 1 - Quoted Prices | Level 2 - Other Significant Observable Inputs | Level 3 - Significant Unobservable Inputs | Total | ||||||||||||
| Closed End Funds | $ | 60,492 | $ | – | $ | – | $ | 60,492 | ||||||||
Common Stocks(*) | 121,453,022 | – | – | 121,453,022 | ||||||||||||
| Exchange Traded Funds | 1,218,759 | – | – | 1,218,759 | ||||||||||||
| Limited Partnerships | 87,610 | – | – | 87,610 | ||||||||||||
Open‐End Mutual Funds | 242,389,139 | – | – | 242,389,139 | ||||||||||||
Preferred Stocks(*) | 72,134 | – | – | 72,134 | ||||||||||||
Asset‐Backed Securities | – | 239,434 | – | 239,434 | ||||||||||||
Corporate Bonds(*) | – | 10,565,420 | – | 10,565,420 | ||||||||||||
| Foreign Government Bonds | – | 13,247,840 | – | 13,247,840 | ||||||||||||
| Government Bonds | – | 1,658,293 | – | 1,658,293 | ||||||||||||
| Short Term Investments | ||||||||||||||||
| Money Market Funds | 30,875,276 | – | – | 30,875,276 | ||||||||||||
| U.S. Treasury Bills | – | 2,166,586 | – | 2,166,586 | ||||||||||||
| Total | $ | 396,156,432 | $ | 27,877,573 | $ | – | $ | 424,034,005 | ||||||||
64
| Redmont Resolute Fund | Notes to Consolidated Financial Statements |
October 31, 2016 (Unaudited)
| Other Financial Instruments | ||||||||||||||||
| Assets: | ||||||||||||||||
| Forward Foreign Currency Contracts | $ | – | $ | 330,362 | $ | – | $ | 330,362 | ||||||||
| Futures Contracts | 177,448 | – | – | 177,448 | ||||||||||||
| Total Return Swap Contracts | – | 130,103 | – | 130,103 | ||||||||||||
| Liabilities: | ||||||||||||||||
Common Stocks Sold Short(*) | (18,807,714 | ) | – | – | (18,807,714 | ) | ||||||||||
| Exchange Traded Funds Sold Short | (9,530,864 | ) | – | – | (9,530,864 | ) | ||||||||||
| Written Options | (22,265 | ) | – | – | (22,265 | ) | ||||||||||
| Forward Foreign Currency Contracts | – | (121,504 | ) | – | (121,504 | ) | ||||||||||
| Futures Contracts | (215,361 | ) | – | – | (215,361 | ) | ||||||||||
| Total Return Swap Contracts | – | (1,652,863 | ) | – | (1,652,863 | ) | ||||||||||
| Total | $ | (28,398,756 | ) | $ | (1,313,902 | ) | $ | – | $ | (29,712,658 | ) | |||||
| * | For detailed descriptions, see the accompanying Schedule of Investments. |
The Fund recognizes transfers between levels as of the end of the period. For the six months ended October 31, 2016, the Fund did not have any transfers between Level 1 and Level 2 securities. There were no Level 3 securities held during the period.
Trust Expenses: Some expenses of the Trust can be directly attributed to the Fund. Expenses which cannot be directly attributed to the Fund are apportioned among all funds in the Trust based on average net assets of the Fund.
Federal Income Taxes: The Fund complies with the requirements under Subchapter M of the Internal Revenue Code of 1986, as amended, applicable to regulated investment companies and intend to distribute substantially all of their net taxable income and net capital gains, if any, each year so that the Fund will not be subject to excise tax on undistributed income and gains. The Fund is not subject to income taxes to the extent such distributions are made.
As of and during the six months ended October 31, 2016, the Fund did not have a liability for any unrecognized tax benefits. The Fund files U.S. federal, state, and local tax returns as required. The Fund’s tax returns are subject to examination by the relevant tax authorities until expiration of the applicable statute of limitations, which is generally three years after the filing of the tax return for federal purposes and four years for most state returns. Tax returns for open years have incorporated no uncertain tax positions that require a provision for income taxes.
Investment Transactions and Investment Income: Investment transactions are accounted for on the date the investments are purchased or sold (trade date basis). Net realized gains and losses from investment transactions are reported on an identified cost basis. Interest income, which includes accretion of discounts and amortization of premiums, is accrued and recorded as earned. Dividend income is recognized on the ex‐dividend date or for certain foreign securities, as soon as information is available to the Fund. All of the realized and unrealized gains and losses and net investment income, are allocated daily to each class in proportion its average daily net assets.
Short Sales: The Fund may make short sales of securities consistent with its strategies. A short sale is a transaction in which a Fund sells a security it does not own in anticipation that the market price of that security will decline.
When a Fund makes a short sale, it must borrow the security sold short and deliver it to the broker dealer through which it made the short sale as collateral for its obligation to deliver the security upon conclusion of the sale. The Fund may have to pay a fee to borrow particular securities and is often obligated to pay over any accrued interest and dividends on such borrowed securities.
If the price of the security sold short increases between the time of the short sale and the time that a Fund replaces the borrowed security, the Fund will incur a loss; conversely, if the price declines, the Fund will realize a capital gain. Any gain will be decreased, and any loss increased, by the transaction costs described above. The successful use of short selling may be adversely affected by imperfect correlation between movements in the price of the security sold short and the securities being hedged.
To the extent that a Fund engages in short sales, it will provide collateral to the broker‐dealer and (except in the case of short sales “against the box”) will maintain additional asset coverage in the form of segregated or “earmarked” assets determined to be liquid in accordance with procedures established by the Board and that is equal to the current market value of the securities sold short, or will ensure that such positions are covered by “offsetting” positions, until the Fund replaces the borrowed security. A short sale is “against the box” to the extent that the Fund contemporaneously owns, or has the right to obtain at no added cost, securities identical to those sold short. The Fund may engage in short selling to the extent permitted by the federal securities laws and rules and interpretations thereunder. To the extent a Fund engages in short selling in foreign (non‐U.S.) jurisdictions, the Fund will do so to the extent permitted by the laws and regulations of such jurisdiction.
| Semi-Annual Report | October 31, 2016 | 65 |
| Redmont Resolute Fund | Notes to Consolidated Financial Statements |
October 31, 2016 (Unaudited)
Distributions to Shareholders: The Fund normally pays dividends and distributes capital gains, if any, on an annual basis. Income dividend distributions are derived from interest and dividends and other income the Fund receives from their investments, including distributions of short term capital gains. Capital gain distributions are derived from gains realized when the Fund sells a security it has owned for more than a year. The Fund may make additional distributions and dividends at other times if its portfolio manager or managers believe doing so may be necessary for the Fund to avoid or reduce taxes.
3. DERIVATIVE INSTRUMENTS
Swap Contracts: The Fund may enter into swap transactions for hedging purposes or to seek to increase total return. At the present time, the Fund primarily enters into swap transactions for the purpose of increasing total return. Risks may arise as a result of the failure of the counterparty to the swap contract to comply with the terms of the swap contract. The loss incurred by the failure of a counterparty is generally limited to the net payment to be received by the Fund and/or the termination value at the end of the contract.
Therefore, the Fund considers the creditworthiness of each counterparty to a contract in evaluating potential credit risk. Additionally, risks may arise from unanticipated movements in interest rates or in the value of the underlying reference asset or index. Entering into these agreements involves, to varying degrees, market risk, liquidity risk and elements of credit, legal and documentation risk that are not directly reflected in the amounts recognized in the Statements of Assets and Liabilities.
The Fund invests in total return swaps to obtain exposure to a security or market without owning such security or investing directly in that market or to transfer the risk/return of one market (e.g., fixed income) to another market (e.g., equity) (equity risk and/or interest rate risk). Total return swaps are agreements in which there is an exchange of cash flows whereby one party commits to make payments based on the total return (coupons plus capital gains/losses) of an underlying instrument in exchange for fixed or floating rate interest payments. To the extent the total return of the instrument or index underlying the transaction exceeds or falls short of the offsetting interest rate obligation, the Fund will receive a payment from or make a payment to the counterparty. The Fund may pay or receive cash as collateral on these contracts which may be recorded as an asset and/or liability. The Fund must set aside liquid assets, or engage in other appropriate measures, to cover its obligations under these contracts. Swaps are marked to market daily using either pricing vendor quotations, counterparty prices or model prices and the change in value, if any, is recorded as an unrealized gain or loss. Upfront payments made and/or received by the Fund are recorded as an asset and/or liability and realized gains or losses are recognized ratably over the contract’s term/event, with the exception of forward starting interest rate swaps, whose realized gains or losses are recognized ratably from the effective start date. Periodic payments received or made on swap contracts are recorded as realized gains or losses. Gains or losses are realized upon termination of a swap contract and are recorded on the Statement of Operations. Swap agreements held at October 31, 2016 are disclosed in the Schedule of Investments.
International Swaps and Derivatives Association, Inc. Master Agreements (“ISDA Master Agreements”) govern OTC financial derivative transactions entered into by the Fund and those counterparties. The ISDA Master Agreements maintain provisions for general obligations, representations, agreements, collateral and events of default or termination. Events of termination include conditions that may entitle counterparties to elect to terminate early and cause settlement of all outstanding transactions under the applicable ISDA Master Agreement. Any election to early terminate could be material to the financial statements.
Option Contracts: The Fund may enter into options transactions for hedging purposes and for non‐hedging purposes such as seeking to enhance return. The Fund may write covered put and call options on any stocks or stock indices, currencies traded on domestic and foreign securities exchanges, or futures contracts on stock indices, interest rates and currencies traded on domestic and, to the extent permitted by the CFTC, foreign exchanges. A call option on an asset written by a Fund obligates the Fund to sell the specified asset to the holder (purchaser) at a stated price (the exercise price) if the option is exercised before a specified date (the expiration date). A put option on an asset written by a Fund obligates the Fund to buy the specified asset from the purchaser at the exercise price if the option is exercised before the expiration date. Premiums received when writing options are recorded as liabilities and are subsequently adjusted to the current value of the options written. Premiums received from writing options that expire are treated as realized gains. Premiums received from writing options, which are either exercised or closed, are offset against the proceeds received or amount paid on the transaction to determine realized gains or losses which are recorded on the Statement of Operations.
66
| Redmont Resolute Fund | Notes to Consolidated Financial Statements |
| October 31, 2016 (Unaudited) |
Written option activity for the six months ended October 31, 2016 was as follows:
| Redmont Resolute Fund | |||||||
| Written Call Options | |||||||
| Contracts | Premiums | ||||||
| Outstanding, April 30, 2016 | (281) | $ | 135,671 | ||||
| Written | (61) | 27,929 | |||||
| Covered | 46 | (15,040 | ) | ||||
| Exercised | 204 | (107,553 | ) | ||||
| Expired | 31 | (13,078 | ) | ||||
| Outstanding, October 31, 2016 | (61) | $ | 27,929 | ||||
Futures: The Fund may enter into futures contracts for hedging purposes. A futures contract represents a commitment for the future purchase or sale of an asset at a specified price on a specified date. Upon entering into a futures contract, the Fund is required to deposit an initial margin with the broker in an amount equal to a certain percentage of the contract amount. The Fund receives from or pays to the broker, on a daily basis, an amount of cash equal to the daily fluctuation in value of the contract. Such receipts or payments are known as “variation margin,” and are recorded by the Fund as unrealized gains or losses. When the futures contract is closed, the Fund records a gain or loss equal to the difference between the value of the contract at the time it was opened and the value at the time it was closed.
A Fund’s potential losses from the use of futures extend beyond its initial investment in such contracts. The use of futures contracts involves, to varying degrees, elements of market risk in excess of the amount recognized in the Statements of Assets and Liabilities. The predominant risk is that the movement of a futures contract’s price may result in a loss, which could render a Fund’s hedging strategy unsuccessful. There is minimal counterparty credit risk since futures contracts are exchange traded and the exchange’s clearinghouse, as counterparty to all exchange traded futures, guarantees the futures against default.
Risk Exposure: The following tables disclose the amounts related to the Fund’s use of derivative instruments.
The effect of derivatives instruments on the Statements of Assets and Liabilities as of October 31, 2016:
| Risk Exposure | Asset Derivatives Statements of Assets and Liabilities Location | Fair Value | Liability Derivatives Statements of Assets and Liabilities Location | Fair Value | ||||||||
| Redmont Resolute Fund | ||||||||||||
| Equity Contracts (Total Return Swap Contracts) | Unrealized appreciation on total return swap contracts | $ | – | Unrealized depreciation on total return swap contracts | $ | 1,522,760 | ||||||
| Equity Contracts (Written Options) | N/A | N/A | Written options, at value | 22,265 | ||||||||
| Foreign Currency Contracts (Forward Currency Contracts) | Unrealized appreciation on forward currency contracts | 330,362 | Unrealized depreciation on forward currency contracts | 121,504 | ||||||||
| Futures Contracts* | Unrealized appreciation on futures contracts | 177,448 | (a) | Unrealized depreciation on futures contracts | 215,361 | (a) | ||||||
| Total | $ | 507,810 | $ | 1,881,890 | ||||||||
| * Risk Exposure to Fund | ||||||||||||
| Equity Contracts | $ | 72,645 | $ | 215,361 | ||||||||
| Interest Rate Contracts | 104,803 | – | ||||||||||
| $ | 177,448 | $ | 215,361 | |||||||||
(a) | Reflects cumulative unrealized appreciation (depreciation) of futures contracts as reported in the Schedule of Investments. The value reflected on the accompanying Statement of Assets and Liabilities is only the unsettled variation margin receivable as of October 31, 2016. |
| Semi-Annual Report | October 31, 2016 | 67 |
| Redmont Resolute Fund | Notes to Consolidated Financial Statements |
| October 31, 2016 (Unaudited) |
The effect of derivatives instruments on the Statements of Operations for the six months ended October 31, 2016:
| Risk Exposure | Statement of Operations Location | Realized Gain/(Loss) on Derivatives Recognized in Income | Change in Unrealized Appreciation/ (Depreciation) on Derivatives Recognized in Income | ||||||
| Redmont Resolute Fund | |||||||||
| Equity Contracts (Total Return Swap Contracts) | Net realized gain on total return swap contracts/Net change in unrealized depreciation on total return swap contracts | $ | 4,128,662 | $ | (2,229,707 | ) | |||
| Equity Contracts (Written Options) | Net change in unrealized appreciation on written options | 13,078 | 222,813 | ||||||
| Foreign Currency Contracts (Forward Currency Contracts) | Net realized loss on foreign currency transactions/Net change in unrealized appreciation on translation of assets and liabilities in foreign currency transactions | (1,081,719 | ) | 1,243,257 | |||||
| Futures Contracts* | Net realized gain on futures contracts/Net change in unrealized depreciation on futures contracts | 84,911 | (94,719 | ) | |||||
| Total | $ | 3,144,932 | $ | (858,356 | ) | ||||
| *Risk Exposure to Fund | |||||||||
| Commodity Contracts | $ | 161,987 | $ | (107,121 | ) | ||||
| Equity Contracts | 44,875 | (34,118 | ) | ||||||
| Interest Rate Contracts | (121,951 | ) | 46,520 | ||||||
| $ | 84,911 | $ | (94,719 | ) | |||||
Volume of Derivative Instruments for the Fund during the six months ended October 31, 2016 was as follows:
| Derivative Type | Unit of Measurement | Monthly Average | |||
| Redmont Resolute Fund | |||||
| Equity Swap Contracts | Notional Quantity | 524,267 | |||
| Forward Currency Contracts | Notional Quantity | 364,405,550 | |||
| Futures Contracts | Contracts | 469 | |||
| Written Option Contracts | Contracts | 71 | |||
Certain derivative contracts and repurchase agreements are executed under either standardized netting agreements or, for exchange‐traded derivatives, the relevant contracts for a particular exchange which contain enforceable netting provisions. A derivative netting arrangement creates an enforceable right of set‐off that becomes effective, and affects the realization of settlement on individual assets, liabilities and collateral amounts, only following a specified event of default or early termination. Default events may include the failure to make payments or deliver securities timely, material adverse changes in financial condition or insolvency, the breach of minimum regulatory capital requirements, or loss of license, charter or other legal authorization necessary to perform under the contract.
68
| Redmont Resolute Fund | Notes to Consolidated Financial Statements |
| October 31, 2016 (Unaudited) |
The following table presents financial instruments that are subject to enforceable netting arrangements or other similar agreements as of October 31, 2016:
Redmont Resolute Fund
Offsetting of Derivatives Assets
Gross Amounts Not Offset in the Statement of Assets and Liabilities | ||||||||||||||||||||||||
| Description | Gross Amounts of Recognized Assets | Gross Amounts Offset in the Statement of Assets and Liabilities | Net Amounts Presented in the Statement of Assets and Liabilities | Financial Instruments Available for Offset (a) | Cash Collateral Received(a) | Net Receivable Amount | ||||||||||||||||||
| Forward Currency Contracts | $ | 330,362 | $ | – | $ | 330,362 | $ | (121,504 | ) | $ | (208,858 | ) | $ | – | ||||||||||
| Total | $ | 330,362 | $ | – | $ | 330,362 | $ | (121,504 | ) | $ | (208,858 | ) | $ | – | ||||||||||
Redmont Resolute Fund
Offsetting of Derivatives Liabilities
Gross Amounts Not Offset in the Statement of Assets and Liabilities | ||||||||||||||||||||||||
| Description | Gross Amounts of Recognized Liabilities | Gross Amounts Offset in the Statement of Financial Position | Net Amounts Presented in the Statement of Financial Position | Financial Instruments Available for Offset (a) | Cash Collateral Pledged(a) | Net Payable Amount | ||||||||||||||||||
| Forward Currency Contracts | $ | 121,504 | $ | – | $ | 121,504 | $ | (121,504 | ) | $ | – | $ | – | |||||||||||
| Total Return Swap Contracts | 1,522,760 | – | 1,522,760 | – | (1,522,760 | ) | – | |||||||||||||||||
| Total | $ | 1,644,264 | $ | – | $ | 1,644,264 | $ | (121,504 | ) | $ | (1,522,760 | ) | $ | – | ||||||||||
(a) | These amounts are limited to the derivative asset/liability balance and, accordingly, do not include excess collateral received/pledged. |
4. TAX BASIS INFORMATION
Tax Basis of Investments: As of October 31, 2016, the aggregate cost of investments, gross unrealized appreciation/(depreciation) and net unrealized appreciation for Federal tax purposes were as follows:
| Gross Appreciation (excess of value over tax cost) | Gross Depreciation (excess of tax cost over value) | Net Unrealized Appreciation | Cost of Investments for Income Tax Purposes | |||||||||||||
| Redmont Resolute Fund | $ | 13,803,715 | $ | (4,707,399 | ) | $ | 9,096,316 | $ | 414,937,689 | |||||||
Tax Basis of Distributions to Shareholders: The character of distributions made during the year from net investment income or net realized gains may differ from its ultimate characterization for federal income tax purposes. Also, due to the timing of dividend distributions, the fiscal year in which amounts are distributed may differ from the fiscal year in which the income or realized gain were recorded by the Fund.
The tax character of distributions paid by the Fund for the fiscal year ended April 30, 2016, were as follows:
| Ordinary Income | Long-Term Capital Gains | |||||||
| Redmont Resolute Fund | $ | 11,135,675 | $ | 10,214,481 | ||||
| Semi-Annual Report | October 31, 2016 | 69 |
| Redmont Resolute Fund | Notes to Consolidated Financial Statements |
October 31, 2016 (Unaudited)
The amounts and characteristics of tax basis distributions and composition of distributable earnings/(accumulated losses) are finalized at fiscal year-end. Accordingly, tax basis balances have not been determined as of October 31, 2016.
5. SECURITIES TRANSACTIONS
Purchases and sales of securities, excluding short-term securities and U.S. Government Obligations during the six months ended October 31, 2016 were as follows:
| Fund | Purchases of Securities | Proceeds From Sales of Securities | ||||||
| Redmont Resolute Fund | $ | 204,586,226 | $ | 398,955,280 | ||||
Purchases and sales of U.S. Government Obligations during the six months ended October 31, 2016 were as follows:
| Fund | Purchases of Securities | Proceeds From Sales of Securities | ||||||
| Redmont Resolute Fund | $ | 13,293,271 | $ | 3,405,463 | ||||
6. BENEFICIAL SHARE TRANSACTIONS
The capitalization of the Trust consists of an unlimited number of shares of beneficial interest with no par value per share. Holders of the shares of the Fund of the Trust have one vote for each share held and a proportionate fraction of a vote for each fractional share. All shares issued and outstanding are fully paid and are transferable and redeemable at the option of the shareholder. Purchasers of the shares do not have any obligation to make payments to the Trust or its creditors solely by reason of the purchasers’ ownership of the shares. Shares have no pre‐emptive rights.
Transactions in common shares were as follows:
Redmont Resolute Fund
| Class I: | For the Six Months Ended October 31, 2016 (Unaudited) | For the Year Ended April 30, 2016 | ||||||
| Common Shares Outstanding - Beginning of Period | 63,881,394 | 60,903,896 | ||||||
| Common Shares Sold | 7,770,992 | 4,465,406 | ||||||
| Common Shares Issued as Reinvestment of Dividends | – | 1,981,722 | ||||||
| Common Shares Redeemed | (23,210,467 | ) | (3,469,630 | ) | ||||
| Common Shares Outstanding - End of Period | 48,441,919 | 63,881,394 | ||||||
Shares redeemed within 30 days of purchase may incur a 2% short‐term redemption fee deducted from the redemption amount. Redemption fees are reflected in the “Shares redeemed, net of redemption fees” in the Statements of Changes in Net Assets. For the six months ended October 31, 2016 and the year ended April 30, 2016, the Fund retained fees as follows:
| Fund | For the Six Months Ended October 31, 2016 (Unaudited) | For the Year Ended April 30, 2016 | ||||||
| Redmont Resolute Fund | $ | – | $ | – | ||||
7. MANAGEMENT AND RELATED PARTY TRANSACTIONS
Investment Advisory
The Adviser, subject to the authority of the Board, is responsible for the overall management and administration of the Fund’s business affairs. Pursuant to the Investment Advisory Agreement (the “Advisory Agreement”), the Adviser is entitled to an investment advisory fee, computed daily and payable monthly of 1.50% of the average daily net assets for the Fund. The management fee is paid on a monthly basis.
The Subsidiary has entered into a separate advisory agreement (the “Subsidiary Advisory Agreement”) with the Adviser for the management of the Subsidiary’s portfolio pursuant to which the Subsidiary is obligated to pay the Adviser a management fee at the same rate that the Fund pays the Adviser for investment advisory services provided to the Fund. The Adviser has agreed to waive the advisory fee it receives from the Fund in an amount equal to the management fee paid by the Subsidiary. This waiver may not be terminated or modified without the consent of the Board.
70
| Redmont Resolute Fund | Notes to Consolidated Financial Statements |
October 31, 2016 (Unaudited)
This agreement may not be terminated or modified prior to this date except with the approval of the Board. For the period ended October 31, 2016, this amount equaled $49,386 and is disclosed in the Consolidated Statement of Operations. These waivers are not subject to reimbursement/recoupment.
The Adviser entered into an Investment Sub‐Advisory Agreement with Robeco Investment Management, Inc. (“Robeco”), Pinebridge Investments LLC (“Pinebridge) and Incline Global Management, LLC. (“Incline”). The Investment Sub‐Advisory Agreements are in accordance with the Fund’s investment objective, policies and limitations and investment guidelines established jointly by the Adviser and the Board. The Adviser determines the allocation of the Fund’s assets among Robeco, Pinebridge and other open‐end investment companies. The Fund is not required to invest with any minimum number of sub‐advisers or open‐end investment companies, and do not have minimum or maximum limitations with respect to allocations of assets to Robeco, Prinebridge and Incline (collectively the “Sub‐Advisers”), investment strategy or market sector. Highland may change the allocation of the Fund’s assets among the available investment options, and may add or remove sub‐advisers, at any time. Each Sub‐Adviser is responsible for the day‐to‐day management of its allocated portion of Fund assets. Highland has ultimate responsibility, subject to the oversight of the Board of the Fund, to oversee the Sub‐Advisers, and to recommend their hiring, termination and replacement.
Pursuant to each Investment Sub‐Advisory Agreement, the Adviser pays the Sub‐Advisers an annual sub‐advisory management fee which is based on the Fund’s average quarterly market value of the assets managed by the Sub‐Advisers. The Adviser is required to pay all fees due to Sub‐Advisers out of the management fee the Adviser receives from the Fund. The following table reflects the Fund’s contractual sub‐advisory fee rates.
| Sub-Advisers | Average Daily Market Value of the Fund | Contractual Sub-Advisory Fee |
| First $50 Million | 0.55% | |
| Pinebridge Investments LLC | Over $50 Million | 0.50% |
| First $50 Million | 1.25% | |
| Robeco Investment Management, Inc. | Over $50 Million | 1.00% |
| Incline Global Management, LLC | 1.25% |
The Adviser has agreed, with respect to the Fund’s Class I shares, to waive the portion of its 1.50% management fee in excess of any sub‐advisory fees paid by the Adviser to Sub‐Adviser in connection with the Fund. This agreement is in effect August 31, 2013 through August 31, 2017. The Adviser may not discontinue this agreement to waive fees prior to August 31, 2017 without the approval of the Fund’s Board of Trustees. The Adviser is not permitted to recoup any amounts waived or reimbursed to the extent actual fees and expenses for a fiscal period are less than the expense limitation cap. Fees waived/reimbursed by adviser for the six months ended October 31, 2016 are disclosed in the Consolidated Statement of Operations.
For the six months ended October 31, 2016, the fee waivers and/or reimbursements were as follows:
Fees Waived/ Reimbursed By Adviser | ||||
| Redmont Resolute Fund ‐ Class I | $ | (4,257,925 | ) | |
Administrator Fees and Expenses
ALPS Fund Services, Inc. (“ALPS”) serves as administrator to the Fund, and the Fund has agreed to pay expenses incurred in connection with its administrative activities. Pursuant to an Administration Agreement, ALPS provides operational services to the Fund including, but not limited to, fund accounting and fund administration and generally assists in the Fund’s operations. Officers of the Trust are employees of ALPS. The Fund’s administration fee is accrued on a daily basis and paid monthly. Administration fees paid by the Fund for the six months ended October 31, 2016 are disclosed in the Consolidated Statement of Operations.
ALPS is reimbursed by the Fund for certain out‐of‐pocket expenses.
Transfer Agent
ALPS serves as transfer, dividend paying and shareholder servicing agent for the Fund. ALPS receives an annual minimum fee, a fee based upon the number of shareholder accounts and is also reimbursed by the Fund for certain out‐of‐pocket expenses. Transfer agent fees paid by the Fund for the six months ended October 31, 2016 are disclosed in the Consolidated Statement of Operations.
Compliance Services
ALPS provides services that assist the Fund’s chief compliance officer in monitoring and testing the policies and procedures of the Fund in conjunction with requirements under Rule 38a‐1 under the 1940 Act and receives an annual base fee. ALPS is reimbursed for certain out‐of‐pocket
| Semi-Annual Report | October 31, 2016 | 71 |
| Redmont Resolute Fund | Notes to Consolidated Financial Statements |
October 31, 2016 (Unaudited)
expenses by the Fund. Compliance service fees paid by the Fund for the six months ended October 31, 2016 are disclosed in the Consolidated Statement of Operations.
Principal Financial Officer
ALPS receives an annual fee for providing principal financial officer services to the Fund. Principal financial officer fees paid by the Fund for the six months ended October 31, 2016 are disclosed in the Consolidated Statement of Operations.
Distributor
ALPS Distributors, Inc. (“ADI” or the “Distributor”) (an affiliate of ALPS) acts as the distributor of the Fund’s shares pursuant to a Distribution Agreement with the Trust on behalf of the Fund. Shares are sold on a continuous basis by ADI as agent for the Fund, and ADI has agreed to use its best efforts to solicit orders for the sale of Fund’s shares, although it is not obliged to sell any particular amount of shares. ADI is not entitled to any compensation for its services as Distributor. ADI is registered as a broker‐dealer with the U.S. Securities and Exchange Commission.
8. INDEMNIFICATIONS
Under the Trust’s organizational documents, its officers and Trustees are indemnified against certain liability arising out of the performance of their duties to the Trust. Additionally, in the normal course of business, the Trust enters into contracts with service providers that may contain general indemnification clauses which may permit indemnification to the extent permissible under applicable law. The Trust’s maximum exposure under these arrangements is unknown, as this would involve future claims that may be made against the Trust that have not yet occurred.
72
| Redmont Resolute Fund | Additional Information |
October 31, 2016 (Unaudited)
1. FUND HOLDINGS
The Fund files its complete schedule of portfolio holdings with the Securities and Exchange Commission (the “SEC”) for the first and third quarters of each fiscal year on Form N‐Q within 60 days after the end of the period. Copies of the Fund’s Form N‐Q are available without charge on the SEC website at http:// www.sec.gov. You may also review and copy the Form N‐Q at the SEC’s Public Reference Room in Washington, D.C. For more information about the operation of the Public Reference Room, please call the SEC at 1‐800‐SEC‐0330.
2. FUND PROXY VOTING POLICIES, PROCEDURES AND SUMMARIES
Fund policies and procedures used in determining how to vote proxies and information regarding how each of the Funds voted proxies relating to portfolio securities during the most recent prior 12‐month period ending June 30 are available without charge, (1) upon request, by calling (toll‐ free) (866) 759‐5679 and (2) on the SEC’s website at http://www.sec.gov.
| Semi-Annual Report | October 31, 2016 | 73 |


TABLE OF CONTENTS
| Letter to Shareholders | 1 |
| Performance Review | |
| Seafarer Overseas Growth and Income Fund | 4 |
| Seafarer Overseas Value Fund | 9 |
| Disclosure of Fund Expenses | 14 |
| Portfolio of Investments | 16 |
| Statements of Assets and Liabilities | 24 |
| Statements of Operations | 25 |
| Statements of Changes in Net Assets | 26 |
| Financial Highlights | 30 |
| Notes to Financial Statements | 36 |
| Additional Information | 45 |
| Approval of Fund Advisory Agreement | 46 |
| Seafarer Funds | Letter to Shareholders |
October 31, 2016
LETTER TO SHAREHOLDERS
November 15, 2016
Dear Fellow Shareholders,
I am pleased to address you again on behalf of the Seafarer Funds. This report covers the first half of the 2016-17 fiscal year (May 1, 2016 to October 31, 2016).
Launch of the Seafarer Overseas Value Fund
On May 31, 2016, Seafarer launched the Overseas Value Fund, the second fund in the Seafarer Funds series.
Seafarer’s original fund, the Overseas Growth and Income Fund, is focused on finding relative value within the emerging markets: the Fund seeks to find securities that present balanced characteristics between prospective capital growth, current income, and present valuation.
The new Value Fund’s strategy is dedicated to a more traditional form of value investing, adapted for the particular challenges inherent to the emerging markets. Often, value-oriented strategies implemented in the emerging markets simply look for growth-oriented stocks with low valuations (e.g., perhaps cyclically-depressed growth stocks). By contrast, the Fund places particular emphasis on searching for value embedded in corporate balance sheets: the Fund attempts to mine value that has already been created, but perhaps not recognized or realized by investors.
My colleague, Paul Espinosa, has taken up leadership of the Value Fund; he describes its launch and initial performance in the “performance review” section of this report. I am deeply pleased by the advent of the Fund, as well as Paul’s leadership over it. The new Fund embodies an important evolution in Seafarer’s investment philosophy. As the Fund’s co-manager, I am excited and eager to contribute to its progress over the next decade and beyond.
Reduction in Fees and Economies of Scale
Beyond the launch of the new Fund, I am also pleased to report that Seafarer has lowered its management fee, consistent with its stated objective to reduce operating expenses over time, and with scale.
Effective August 31, 2016, the Funds’ Advisor (Seafarer Capital Partners, LLC) lowered its management fee for both funds by 0.05% (from 0.75% to 0.70%) on consolidated net assets in excess of $1.5 billion.1 Please note that the management fee is one component of each Fund’s total operating expenses. This is the second reduction in management fees in the Funds’ history; it is the fifth time that Seafarer has acted to reduce expenses by either capping expenses at a lower level or reducing management fees.
As of the date of this report, the Growth and Income Fund had net assets of approximately $1.9 billion. Happily, the Fund’s scale has begun to yield additional economies: the Fund’s Prospectus (dated August 31, 2016) states that operating expenses are 0.98% for the Institutional class and 1.08% for the Investor class, below the Funds’ contractual expense caps (1.05% and 1.15%, respectively).
Presently, the much smaller scale of the Value Fund (approximately $5 million in net assets as of the date of this report) means that its expenses are still subject to the Funds’ contractual caps (i.e. 1.05% for the Institutional class and 1.15% for the Investor class).
Expansion of Seafarer’s Team
As Seafarer has grown, it has continued to invest in its research capabilities and operational capacities, particularly via additions to the team. I am delighted by the caliber of the people that have joined our organization, and I am excited by the depth and breadth of talent they embody.
| Semi-Annual Report – October 31, 2016 | 1 |
| Seafarer Funds | Letter to Shareholders |
October 31, 2016
The firm’s new members include: David Lenik, the firm’s Chief Compliance Officer; Kevin Lammert, the firm’s Chief Financial Officer; Ryan Kelley and Natalia Urbanek, who serve in client service functions; Chris Clayton, the firm’s Director of Trading; and Inbok Song, who joins the firm as Director of Research.
I would like to single out Inbok Song, for a moment: it is a privilege to work with her again. Inbok and I worked together in the past; since that time, she held senior portfolio management positions at our former employer and elsewhere. She brings drive, analytical talent, and a wealth of experience, and Seafarer is lucky to have her. Inbok occupies a new role as Director of Research. Her primary remit is to ensure the quality and consistency of our research output, and to oversee the systems and models that drive our research; she will also produce fundamental securities research in support of the firm’s investment strategies.
Capacity Management
As long-term shareholders are aware, the Growth and Income Fund has experienced considerable growth in assets under management over the past two years. The Fund passed the third anniversary of its existence in February of 2015, at which time its net assets were slightly below $150 million. As of October 2016, the Fund had approximately $1.9 billion under management.
My goal in managing the Fund is to ensure that it has adequate capacity to serve its existing shareholders’ needs, both in the present and in the future. I currently estimate the strategy has a capacity of $4 billion (I reserve the right to revise this estimate in the future). I imagine that if the Fund were to reach this threshold, Seafarer would likely restrict subscriptions from existing clients. Personally, I have no desire to manage a fund subject to such restrictions, so I place great importance on managing capacity in a manner that reduces the possibility of their imposition.
In an effort to manage capacity and moderate the pace of subscription activity, I closed the Fund to most new investors at the end of September 2016 (known as a “soft close”).2 I did so at an asset level that should provide existing clients and shareholders ample capacity to expand their allocations to the Fund, over time, should they choose to do so. I estimate that, even if existing shareholders increase their allocations considerably, the Fund will have sufficient spare capacity such that it should “undershoot” its $4 billion limit. My ultimate goal is to ensure the strategy remains at a manageable size in prevailing market conditions, while still preserving relatively unfettered access to the Fund for existing clients and shareholders.
We appreciate the trust you afford our organization, and we are honored to serve as your investment advisor in the emerging markets.
Andrew Foster
Chief Investment Officer
Seafarer Capital Partners, LLC
Information on the Seafarer website is provided for textual reference only, and is not incorporated by reference into this report.
The views and information discussed in this commentary are as of the date of publication, are subject to change, and may not reflect the writer's current views. The views expressed represent an assessment of market conditions at a specific point in time, are opinions only and should not be relied upon as investment advice regarding a particular investment or markets in general. Such information does not constitute a recommendation to buy or sell specific securities or investment vehicles. It should not be assumed that any investment will be profitable or will equal the performance of the portfolios or any securities or any sectors mentioned herein. The subject matter contained herein has been derived from several sources believed to be reliable and accurate at the time of compilation. Seafarer does not accept any liability for losses either direct or consequential caused by the use of this information.
| 2 | (855) 732-9220 seafarerfunds.com |
| Seafarer Funds | Letter to Shareholders |
October 31, 2016
1 | The Seafarer Funds, in the aggregate, pay the Adviser an annual management fee of 0.75% of the aggregate average daily net assets of the Funds up to $1.5 billion and 0.70% of the aggregate average daily net assets of the Funds over $1.5 billion. Each Fund shall pay to the Adviser a monthly fee at the annual rate using the applicable management fee calculated based on the Fund’s pro rata share of the Funds’ average daily net assets. |
2 | For more information about the Growth and Income Fund’s soft close, see the Message to Shareholders at: www.seafarerfunds.com/message-to-shareholders/2016/08/31 |
| Semi-Annual Report – October 31, 2016 | 3 |
| Seafarer Overseas Growth and Income Fund | Performance Review |
| October 31, 2016 |
SEAFARER OVERSEAS GROWTH AND INCOME FUND
PERFORMANCE REVIEW
November 14, 2016
This report addresses the first half of the Seafarer Overseas Growth and Income Fund’s 2016-17 fiscal year (May 1, 2016 to October 31, 2016).
During the semi-annual period, the Fund gained 4.99%, while the Fund’s benchmark, the MSCI Emerging Markets Total Return Index, rose 9.68%.1 By way of broader comparison, the S&P 500 Index rose 4.06%.
The Fund began the fiscal year with a net asset value of $11.46 per share. In June, the Fund paid a semi-annual distribution of $0.088 per share. That payment brought the cumulative distribution per share, as measured from the Fund’s inception, to $1.260.2 The Fund finished the semi-annual period with a value of $11.94 per share.3
* * * * *
At the outset of the fiscal year, both the Fund and the benchmark index declined. This decline was perhaps a counter-reaction to the sharp rally that occurred between February and April of the same year. Emerging markets had just staged a strong rebound, led by Brazilian equities and the Brazilian currency, prompted by sudden political changes in that country. May saw the emerging markets retreat, ostensibly because investors thought the surge in Brazil’s financial markets had run ahead of the underlying economic reality. The Fund and the benchmark fell -3.49% and -3.71%, respectively, during May.
However, between the end of May and the end of October, the benchmark rose sharply once again, this time led by gains in Chinese internet companies and financial service firms. While China contributed the most to the index’s increase during the five-month period, most other developing countries also saw their equity markets advance. The gains were such that the benchmark finished the first half of the fiscal year up nearly 10%.
The broad-based gains in the emerging markets were seemingly prompted by three conditions: the reduced likelihood of an interest rate increase in the U.S., relatively stable emerging market currencies, and renewed optimism regarding the health of the Chinese economy. Every constituent sector contributed to the MSCI Emerging Index’s increase.
Amid the swift and broad-based rally, the Fund’s absolute performance was strong, but it fell short of the benchmark’s gains. The Fund gained 4.99% over the six-month span, trailing the index by 4.69%.
There are at least three ways to understand the Fund’s shortfall during the semi-annual period.
First, it can be explained in terms of relative positioning: the Fund’s underweight allocation in Chinese shares – particularly financial institutions and internet companies – created much of the performance gap. China’s financial institutions generally pay substantial dividends; but our assessment of their future risks, combined with generally low levels of capital adequacy among the banks, means that most do not satisfy the requirements of the Fund’s strategy. China’s internet companies also fall outside the Fund’s discipline: though most seem capable of producing the sustained growth that the Fund seeks, their anemic record of dividend payments means they generally do not satisfy the Fund’s income and valuation requirements.
Second, the Fund’s underperformance can be explained in strategic terms: historically, Seafarer’s growth and income strategy has tended to lag the overall market during short-term periods of sharp gains. The Fund’s strategy seeks investments in companies that are capable of sustained (typically steady) growth. This characteristic can help the strategy perform well during periods of economic weakness or uncertainty. However, this characteristic can also act as a drag on performance during periods when corporate financial performance might accelerate dramatically, such as a cyclical “bottom” in earnings. At such times, the market tends to rotate its attention to cyclically depressed shares – not the steadier sort the strategy favors. As such, the strategy often fails to capture the full benefit of recovery. I do not offer this explanation as an excuse, but rather as context for what shareholders might expect from the Fund’s strategy over time.
| 4 | (855) 732-9220 seafarerfunds.com |
| Seafarer Overseas Growth and Income Fund | Performance Review |
| October 31, 2016 |
Third, and perhaps most importantly, the Fund’s performance can be explained in terms of recent macro-economic history. Over the past five years, investors’ expectation for earnings growth from the developing world has been grossly mis-aligned with reality. Between 2011 and 2015, there was an immense “gap” between consensus expectations for growth in corporate profits and the actual results. Every year, analysts predicted growth between 10% and 13%, and the actual results fell far short – nearly zero growth, measured as a compounded average, over the past five years.
Five years ago, emerging market equities were generally valued richly, based on expectations for substantial growth. When that growth failed to materialize, most stock prices performed poorly. Conversely, the Fund’s holdings, which favor companies capable of sustained growth, performed somewhat better than the markets overall.
The situation appears to have changed in 2016. First, valuations were not as rich as the past. Second, forecasts became more reasonable: at the outset of the year, the consensus expectation for growth was finally realistic, at 8%. Third, the actual result for 2016, at least as it is known so far based on published mid-year corporate performance, is much more in line with the forecast. Using the benchmark index as a proxy for the markets as a whole, the emerging markets appear on track to produce 6% growth in profits during the calendar year. The gap between expectation and reality persists, but it has narrowed considerably. For the first time in five years, corporate profit growth appears nearly on track to meet expectation – and markets have rallied, seemingly in recognition of this fundamental fact.
There is no guarantee that “gap” will continue to narrow. I think that investors are speculating that corporate earnings have turned a corner in the developing world. I harbor doubts whether this is true: when I review the financial statements of individual companies, I see improved conditions, but not so much so that I believe a recovery is underway. Still, if this trend continues, it might in hindsight be considered the “bottom” in earnings – and the market is behaving as if it were so.
In summary: a modest recovery in earnings growth may be underway, though I have my doubts. However, as discussed above, the Fund’s strategy tends not to participate fully in such events. Shareholders should take note: if growth continues to recover and accelerate from here, the Fund might lag the market, especially if the market moves sharply and swiftly higher.
Andrew Foster
Lead Portfolio Manager
Seafarer Overseas Growth and Income Fund
The MSCI Emerging Markets Total Return Index, Standard (Large+Mid Cap) Core, Gross (dividends reinvested), USD is a free float-adjusted market capitalization index designed to measure equity market performance of emerging markets. Index code: GDUEEGF. It is not possible to invest directly in this or any index.
The S&P 500 Total Return Index is a stock market index based on the market capitalizations of 500 large companies with common stock listed on the NYSE or NASDAQ. It is not possible to invest directly in this or any index.
The Fund is subject to investment risks, including possible loss of the principal amount invested and therefore is not suitable for all investors. The Fund may not achieve its objectives. Diversification does not ensure a profit or guarantee against loss.
Information on the Seafarer website is provided for textual reference only, and is not incorporated by reference into this report.
The views and information discussed in this commentary are as of the date of publication, are subject to change, and may not reflect the writer's current views. The views expressed represent an assessment of market conditions at a specific point in time, are opinions only and should not be relied upon as investment advice
| Semi-Annual Report – October 31, 2016 | 5 |
| Seafarer Overseas Growth and Income Fund | Performance Review |
| October 31, 2016 |
regarding a particular investment or markets in general. Such information does not constitute a recommendation to buy or sell specific securities or investment vehicles. It should not be assumed that any investment will be profitable or will equal the performance of the portfolios or any securities or any sectors mentioned herein. The subject matter contained herein has been derived from several sources believed to be reliable and accurate at the time of compilation. Seafarer does not accept any liability for losses either direct or consequential caused by the use of this information.
| 1 | References to the “Fund” pertain to the Fund’s Institutional share class (ticker: SIGIX). The Investor share class (ticker: SFGIX) gained 4.90% during the semi-annual period. |
| 2 | The Fund’s inception date is February 15, 2012. |
| 3 | The Fund’s Investor share class began the fiscal year with a net asset value of $11.44 per share; it paid a semi-annual distribution of $0.087 per share in June; and it finished the semi-annual period with a value of $11.91 per share. |
| 6 | (855) 732-9220 seafarerfunds.com |
| Seafarer Overseas Growth and Income Fund | Performance Review |
| October 31, 2016 |
Total Returns
| As of October 31, 2016 | 1 Year | 3 Years | Since Inception Annualized(1) | Gross Expense Ratio(2) |
| Investor Class (SFGIX) | 10.20% | 3.00% | 6.19% | 1.08% |
| Institutional Class (SIGIX) | 10.34% | 3.15% | 6.33% | 0.98% |
MSCI Emerging Markets Total Return Index(3) | 9.67% | -1.70% | -0.43% |
All performance is in U.S. dollars with gross (pre-tax) dividends and/or distributions reinvested. The performance data quoted represents past performance and does not guarantee future results. Future returns may be lower or higher. The investment return and principal value will fluctuate so that an investor's shares, when redeemed, may be worth more or less than the original cost. Prior to August 31, 2016, shares of the Fund redeemed or exchanged within 90 days of purchase were subject to a 2% redemption fee. Performance does not reflect this fee, which if deducted would reduce an individual's return. To obtain the Fund’s most recent month-end performance, visit seafarerfunds.com or call (855) 732-9220.
| 1 | Inception Date: February 15, 2012. |
| 2 | Seafarer Capital Partners, LLC has agreed contractually to waive and/or reimburse fees or expenses in order to limit Total Annual Fund Operating Expenses After Fee Waiver/Expense Reimbursements (excluding brokerage expenses, interest expenses, taxes and extraordinary expenses) to 1.15% and 1.05% of the Fund’s average daily net assets for the Investor and Institutional share classes, respectively. This agreement is in effect through August 31, 2017. |
| 3 | The MSCI Emerging Markets Total Return Index, Standard (Large+Mid Cap) Core, Gross (dividends reinvested), USD is a free float-adjusted market capitalization index designed to measure equity market performance of emerging markets. Index code: GDUEEGF. The index is not actively managed and does not reflect any deductions for fees, expense or taxes. An investor may not invest directly in an index. |
| Semi-Annual Report – October 31, 2016 | 7 |
| Seafarer Overseas Growth and Income Fund | Performance Review |
| October 31, 2016 |
Performance of a $10,000 Investment Since Inception
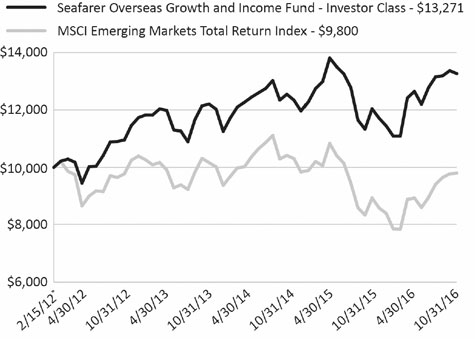
* | Inception Date: February 15, 2012. |
The chart shown above represents historical performance of a hypothetical investment of $10,000 in the Fund’s Investor Class shares for the period from inception to October 31, 2016. All returns reflect reinvested dividends and/or distributions, but do not reflect the deduction of taxes that an investor would pay on distributions or redemptions.
The Fund also offers Institutional Class shares, performance for which is not reflected in the chart above. The performance of Institutional Class shares may be higher or lower than the performance of the Investor Class shares shown above based upon differences in fees paid by shareholders investing in the Investor Class shares and Institutional Class shares.
Investment Objective
The Fund seeks to provide long-term capital appreciation along with some current income. The Fund seeks to mitigate adverse volatility in returns as a secondary objective.
Strategy
The Fund invests primarily in the securities of companies located in developing countries. The Fund invests in several asset classes including dividend-paying common stocks, preferred stocks, convertible bonds, and fixed-income securities.
The Fund seeks to offer investors a relatively stable means of participating in a portion of developing countries’ growth prospects, while providing some downside protection compared to a portfolio that invests only in the common stocks of those countries.
| 8 | (855) 732-9220 seafarerfunds.com |
| Seafarer Overseas Value Fund | Performance Review |
| October 31, 2016 |
SEAFARER OVERSEAS VALUE FUND
PERFORMANCE REVIEW
November 9, 2016
This report addresses the first half of the Seafarer Overseas Value Fund’s 2016-17 fiscal year (May 1, 2016 to October 31, 2016).
The Fund launched one month into the fiscal year, on May 31, 2016, with $2.8 million in assets under management, and ended the semi-annual period with $4.5 million.
During the semi-annual period (as measured from inception date May 31, 2016), the Fund gained 2.70%.1 The Fund’s benchmark, the MSCI Emerging Markets Total Return Index, rose 13.90% during the same period. By way of broader comparison, the S&P 500 Index gained 2.22% during the same period.
The Fund launched with a net asset value of $10.00 per share. The Fund paid no distributions during the first half of the fiscal year, and it finished the period with a value of $10.27 per share.2
I purposefully deployed the Fund’s cash on a gradual basis throughout the period, preferring an average price of entry for each holding over the arbitrariness of prices on launch date. The difficulty with this approach was lowering the average cost of entry for each position in a period when the emerging markets as a whole were appreciating considerably. That said, there was sufficient price volatility for individual securities within the period that I believe the portfolio was well served by this approach.
The primary difficulty of launching the Fund during a period of significant market appreciation was effectively implementing the portfolio I had intended to construct pre-launch. In fact, I did exclude several securities from the actual portfolio due to meaningful price appreciation prior to and during the launch period. By way of example, a potential holding located in Latin America more than doubled in price between the beginning of the year and the Fund’s launch, while another one in the same region appreciated by 66%. While not an ideal circumstance, I viewed this complication as a test and opportunity to practice what I preach as a value investor. The key tenet of the Seafarer Overseas Value Fund is to maintain discipline with regard to the prices paid for securities.
On the other hand, there are a number of potential holdings on our watch list that now meet our criteria for inclusion into the portfolio, to be funded by its additional liquid resources.
The Fund appreciated 2.70% during the semi-annual period (as measured from inception date May 31, 2016). While the Fund does not seek to track a benchmark, it is worth noting that performance during the period was distinctly more stable than that of the MSCI Emerging Markets Total Return Index. In other words, the Fund tended to underperform on days of strong index appreciation, and tended to outperform during negative performance days for the index. While not an a priori objective of the Fund, this behavior makes sense in hindsight, as the benchmark’s performance was heavily driven by the technology and financial sectors, which together accounted for 78% of the index appreciation, and to which the Fund has little exposure. As a result, I can identify two characteristics that drove the Fund’s idiosyncratic performance relative to the index during this particular period. First, the Fund tends to shy away from momentum stocks, favoring instead companies going through their own individual earnings cycles, with time horizons measured in years, as opposed to semi-annual periods. Second, the Fund’s sectoral exposure is a function of stock selection and nothing more. Indeed, the Fund’s active share score was 92% as of September 30, 2016.3
I cannot speculate with regard to how the Fund will perform relative to any emerging markets index in future periods, as there are too many variables to consider. However, given the nature of the Fund, I would expect it to maintain a relatively high active share score.
I view the Fund’s holdings within the framework of the sources of value defined in our white paper, On Value in Emerging Markets.4 From this perspective, the first half of the fiscal year saw strong appreciation of several holdings within the Asset Productivity category, where the source of value is a cyclical downturn following a period of asset expansion. The common denominator of these securities is that they operate in industries that have been in recession for several years now. Whether these share
| Semi-Annual Report – October 31, 2016 | 9 |
| Seafarer Overseas Value Fund | Performance Review |
| October 31, 2016 |
price gains prove sustainable remains to be seen, but at least the market has given some indication that these particular stocks may have been over-discounted in what was already known to be a difficult trading environment.
At a security level, it is worth noting that three Fund holdings announced meaningful profit warnings during the period. Yet, the resulting pullback in two of the three holdings was relatively muted and short-lived. I interpret this stock performance in the face of negative earnings surprises as validation that valuations are already supportive of our original entry points.
Specifically, Shangri-La Asia, an owner-operator of luxury hotels and mixed-use properties throughout Asia, reported a meaningful asset impairment charge related to weak performance at some of its Mainland China properties. Wilmar International, a vertically-integrated agribusiness company, pre-announced a second quarter earnings loss primarily due to untimely purchases of soya. These stocks are currently trading close to or at a higher price than they did prior to releasing their negative earnings surprises, suggesting valuation support for the share price in the face of earnings losses. The third holding to report a negative earnings surprise was AMVIG Holdings. First half earnings for this manufacturer of tobacco packaging declined 47% due to clients drawing down their existing packaging inventory in anticipation of changes to the rules governing the advertisement of health risks. Given the high dividend payout ratio, the company lowered the dividend in-line with earnings. The stock is down approximately 9% since the earnings announcement. Among the reasons I continue to hold this stock is the idea that I expect packaging volume to fully recover for this inelastic product, and pegging the corresponding future dividend to the current share price results in an expected dividend yield of close to 9%.5
The Seafarer Overseas Value Fund remains focused on finding what it deems to be undervalued securities. The first half of the Fund’s fiscal year witnessed two momentous events: the United Kingdom’s June 23 decision to leave the European Union and the inclusion by the International Monetary Fund (IMF) of the Chinese renminbi in the Special Drawing Rights (SDR) currency basket effective October 1, 2016.6,7,8 I am optimistic that the process of adjustment the world economy is likely undergoing will yield more opportunities for the Value Fund. For now I plan to maintain a healthy level of liquidity to both invest in new opportunities and partially guard against potential market drawdowns resulting from currency rearrangements.
Paul Espinosa
Lead Portfolio Manager
Seafarer Overseas Value Fund
The MSCI Emerging Markets Total Return Index, Standard (Large+Mid Cap) Core, Gross (dividends reinvested), USD is a free float-adjusted market capitalization index designed to measure equity market performance of emerging markets. Index code: GDUEEGF. It is not possible to invest directly in this or any index.
The S&P 500 Total Return Index is a stock market index based on the market capitalizations of 500 large companies with common stock listed on the NYSE or NASDAQ. It is not possible to invest directly in this or any index.
The Fund is subject to investment risks, including possible loss of the principal amount invested and therefore is not suitable for all investors. The Fund may not achieve its objectives. Diversification does not ensure a profit or guarantee against loss.
Information on the Seafarer website is provided for textual reference only, and is not incorporated by reference into this report.
The views and information discussed in this commentary are as of the date of publication, are subject to change, and may not reflect the writer's current views. The views expressed represent an assessment of market conditions at a specific point in time, are opinions only and should not be relied upon as investment advice regarding a particular investment or markets in general. Such information does not constitute a recommendation to buy or sell specific securities or investment vehicles. It should not be assumed that any
| 10 | (855) 732-9220 seafarerfunds.com |
| Seafarer Overseas Value Fund | Performance Review |
| October 31, 2016 |
investment will be profitable or will equal the performance of the portfolios or any securities or any sectors mentioned herein. The subject matter contained herein has been derived from several sources believed to be reliable and accurate at the time of compilation. Seafarer does not accept any liability for losses either direct or consequential caused by the use of this information.
As of October 31, 2016, Shangri-La Asia Ltd comprised 3.9% of the Seafarer Overseas Value Fund, Wilmar International Ltd comprised 3.7% of the Fund, and AMVIG Holdings Ltd comprised 3.8% of the Fund. Holdings are subject to change.
| 1 | References to the “Fund” pertain to the Fund’s Institutional share class (ticker: SIVLX). The Investor share class (ticker: SFVLX) gained 2.60% during the semi-annual period. |
| 2 | The Fund’s Investor share class launched on May 31, 2016 with a net asset value of $10.00 per share; it finished the semi-annual period with a value of $10.26 per share. |
| 3 | Active Share is a measure of a portfolio’s deviation from a benchmark index, where a value of 0% indicates that a portfolio is a perfect replica of the index, and a value of 100% indicates that a portfolio is entirely different than the index. |
| 4 | The whitepaper On Value in Emerging Markets is available at: www.seafarerfunds.com/documents/on-value-in-the-emerging-markets |
| 5 | Dividend yield is a measure of the sum of the dividends paid per share during the trailing 12 months divided by the current share price. |
| 6 | The International Monetary Fund (IMF) is an organization of countries whose primary purpose is to ensure the stability of the international monetary system – the system of exchange rates and international payments that enables countries (and their citizens) to transact with each other. Created in 1945, the IMF is governed by and accountable to the countries that make up its near-global membership. |
| 7 | The renminbi is the official currency of the People’s Republic of China. The name literally means “people's currency.” |
| 8 | Special Drawing Rights (SDR) is an international reserve asset created by the International Monetary Fund in 1969 to supplement its member countries’ official reserves. SDRs can be exchanged for freely usable currencies. As of October 1, 2016, the value of the SDR is based on a basket of five major currencies – the U.S. dollar, Euro, Chinese renminbi, Japanese yen, and pound sterling. |
| Semi-Annual Report – October 31, 2016 | 11 |
| Seafarer Overseas Value Fund | Performance Review |
| October 31, 2016 |
Total Returns
| As of October 31, 2016 | Since Inception(1) | Net Expense Ratio(2) |
| Investor Class (SFVLX) | 2.60% | 1.15% |
| Institutional Class (SIVLX) | 2.70% | 1.05% |
MSCI Emerging Markets Total Return Index(3) | 13.90% |
Gross expense ratio: 2.08% for Investor Class; 1.98% for Institutional Class. Ratios as of Prospectus dated August 31, 20162
All performance is in U.S. dollars with gross (pre-tax) dividends and/or distributions reinvested. The performance data quoted represents past performance and does not guarantee future results. Future returns may be lower or higher. The investment return and principal value will fluctuate so that an investor's shares, when redeemed, may be worth more or less than the original cost. Prior to August 31, 2016, shares of the Fund redeemed or exchanged within 90 days of purchase were subject to a 2% redemption fee. Performance does not reflect this fee, which if deducted would reduce an individual's return. To obtain the Fund’s most recent month-end performance, visit seafarerfunds.com or call (855) 732-9220.
| 1 | Inception Date: May 31, 2016. |
| 2 | Seafarer Capital Partners, LLC has agreed contractually to waive and/or reimburse fees or expenses in order to limit Total Annual Fund Operating Expenses After Fee Waiver/Expense Reimbursements (excluding brokerage expenses, interest expenses, taxes and extraordinary expenses) to 1.15% and 1.05% of the Fund’s average daily net assets for the Investor and Institutional share classes, respectively. This agreement is in effect through August 31, 2017. |
| 3 | The MSCI Emerging Markets Total Return Index, Standard (Large+Mid Cap) Core, Gross (dividends reinvested), USD is a free float-adjusted market capitalization index designed to measure equity market performance of emerging markets. Index code: GDUEEGF. The index is not actively managed and does not reflect any deductions for fees, expense or taxes. An investor may not invest directly in an index. |
| 12 | (855) 732-9220 seafarerfunds.com |
| Seafarer Overseas Value Fund | Performance Review |
| October 31, 2016 |
Performance of a $10,000 Investment Since Inception
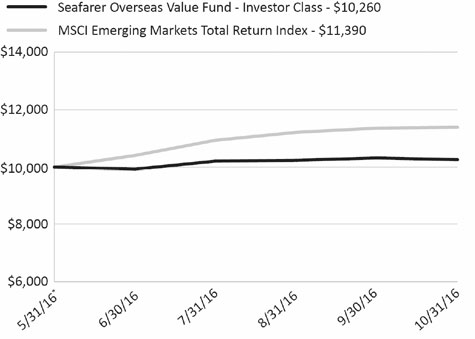
* | Inception Date: May 31, 2016. |
The chart shown above represents historical performance of a hypothetical investment of $10,000 in the Fund’s Investor Class shares for the period from inception to October 31, 2016. All returns reflect reinvested dividends and/or distributions, but do not reflect the deduction of taxes that an investor would pay on distributions or redemptions.
The Fund also offers Institutional Class shares, performance for which is not reflected in the chart above. The performance of Institutional Class shares may be higher or lower than the performance of the Investor Class shares shown above based upon differences in fees paid by shareholders investing in the Investor Class shares and Institutional Class shares.
Investment Objective
The Fund seeks to provide long-term capital appreciation.
Strategy
The Fund invests primarily in the securities of companies located in developing countries. The Fund invests in several asset classes including common stocks, preferred stocks, and fixed-income securities.
The Fund’s portfolio is comprised of securities identified through a bottom-up security selection process based on fundamental research. The Fund seeks to produce a minimum long-term rate of return by investing in securities priced at a discount to their intrinsic value.
| Semi-Annual Report – October 31, 2016 | 13 |
| Seafarer Funds | Disclosure of Fund Expenses |
| October 31, 2016 (Unaudited) |
DISCLOSURE OF FUND EXPENSES
As a shareholder of a Fund you will incur two types of costs: (1) transaction costs, including applicable redemption fees; and (2) ongoing costs, including management fees and other Fund expenses. The following examples are intended to help you understand your ongoing costs (in dollars) of investing in a Fund and to compare these costs with the ongoing costs of investing in other mutual funds. The examples are based on an investment of $1,000 invested on May 1, 2016 and held until October 31, 2016.
Actual Expenses. For each Fund and share class, the first line of the following table provides information about actual account values and actual expenses. You may use the information in this line, together with the amount you invested, to estimate the expenses that you paid over the period. Simply divide your account value by $1,000 (for example, an $8,600 account value divided by $1,000 = 8.6), then multiply the result by the number in the first line under the heading “Expenses Paid During Period” to estimate the expenses you paid on your account during this period.
Hypothetical Example for Comparison Purposes. For each Fund and share class, the second line of the following table provides information about hypothetical account values and hypothetical expenses based on the Fund’s actual expense ratio and an assumed rate of return of 5% per year before expenses, which is not the Fund’s actual return. The hypothetical account values and expenses may not be used to estimate the actual ending account balance or expenses you paid for the period. You may use this information to compare the ongoing costs of investing in the Fund and other mutual funds. To do so, compare this 5% hypothetical example with the 5% hypothetical examples that appear in the shareholder reports of the other mutual funds.
Please note the expenses shown in the following table are meant to highlight your ongoing costs only and do not reflect transactional costs, such as redemption fees or exchange fees. Therefore, for each Fund and share class, the second line of the following table is useful in comparing ongoing costs only, and will not help you determine the relative total costs of owning different funds. In addition, if these transactional costs were included, your costs would have been higher.
| 14 | (855) 732-9220 seafarerfunds.com |
| Seafarer Funds | Disclosure of Fund Expenses |
| October 31, 2016 (Unaudited) |
Beginning Account Value May 1, 2016 | Ending Account Value October 31, 2016 | Expense Ratio(1) | Expenses Paid During Period May 1, 2016 - October 31, 2016(2) | |
| SEAFARER OVERSEAS GROWTH AND INCOME FUND | ||||
| Investor Class | ||||
| Actual | $1,000.00 | $1,049.00 | 0.99% | $5.11 |
| Hypothetical (5% return before expenses) | $1,000.00 | $1,020.21 | 0.99% | $5.04 |
| Institutional Class | ||||
| Actual | $1,000.00 | $1,049.90 | 0.88% | $4.55 |
| Hypothetical (5% return before expenses) | $1,000.00 | $1,020.77 | 0.88% | $4.48 |
SEAFARER OVERSEAS VALUE FUND(3) | ||||
| Investor Class | ||||
| Actual | $1,000.00 | $1,026.00 | 1.15% | $4.88 |
| Hypothetical (5% return before expenses) | $1,000.00 | $1,019.41 | 1.15% | $5.85 |
| Institutional Class | ||||
| Actual | $1,000.00 | $1,027.00 | 1.05% | $4.46 |
| Hypothetical (5% return before expenses) | $1,000.00 | $1,019.91 | 1.05% | $5.35 |
(1) | Annualized, based on a Fund's most recent fiscal half year expenses. |
(2) | Expenses are equal to a Fund's annualized expense ratio multiplied by the average account value over the period, multiplied by the number of days in the most recent fiscal half-year (184)/365 (to reflect the half-year period). |
(3) | The Seafarer Overseas Value Fund launched on May 31, 2016. For the purpose of calculating the “Actual” figures, the actual number of days from the inception date May 31, 2016 through October 31, 2016 were used (153 days). |
| Semi-Annual Report – October 31, 2016 | 15 |
| Seafarer Overseas Growth and Income Fund | Portfolio of Investments |
| October 31, 2016 (Unaudited) |
| Currency | Shares | Value | |||||||
| COMMON STOCKS (78.5%) | |||||||||
| Brazil (7.3%) | |||||||||
| TOTVS SA | BRL | 6,353,700 | $ | 57,724,718 | |||||
| Odontoprev SA | BRL | 14,352,300 | 53,956,015 | ||||||
| Valid Solucoes e Servicos de Seguranca em Meios de Pagamento e Identificacao SA | BRL | 2,775,000 | 26,072,134 | ||||||
| Total Brazil | 137,752,867 | ||||||||
| China / Hong Kong (12.7%) | |||||||||
| Hang Lung Properties, Ltd. | HKD | 39,000,000 | 86,090,606 | ||||||
| Shandong Weigao Group Medical Polymer Co., Ltd., Class H | HKD | 78,234,000 | 51,042,678 | ||||||
| Texwinca Holdings, Ltd. | HKD | 51,438,000 | 36,080,319 | ||||||
Xinhua Winshare Publishing and Media Co., Ltd., Class H(a) | HKD | 28,500,000 | 29,141,067 | ||||||
| Greatview Aseptic Packaging Co., Ltd. | HKD | 45,250,000 | 22,988,054 | ||||||
| Pico Far East Holdings, Ltd. | HKD | 48,500,000 | 14,758,463 | ||||||
| Total China / Hong Kong | 240,101,187 | ||||||||
| India (8.8%) | |||||||||
| Infosys, Ltd., Sponsored ADR | USD | 5,750,000 | 87,745,000 | ||||||
Sun Pharma Advanced Research Co., Ltd.(a) | INR | 7,166,747 | 37,622,296 | ||||||
| Balkrishna Industries, Ltd. | INR | 1,403,256 | 22,309,557 | ||||||
| Cyient, Ltd. | INR | 2,500,000 | 18,325,186 | ||||||
| Total India | 166,002,039 | ||||||||
| Indonesia (4.2%) | |||||||||
| Astra International Tbk PT | IDR | 125,000,000 | 78,795,601 | ||||||
| Total Indonesia | 78,795,601 | ||||||||
| Japan (2.3%) | |||||||||
| Hisamitsu Pharmaceutical Co., Inc. | JPY | 806,400 | 43,138,209 | ||||||
| Total Japan | 43,138,209 | ||||||||
| Malaysia (0.7%) | |||||||||
| Hartalega Holdings Bhd | MYR | 12,000,000 | 14,016,687 | ||||||
| Total Malaysia | 14,016,687 | ||||||||
| Mexico (5.9%) | |||||||||
| Grupo Financiero Banorte SAB de CV | MXN | 11,250,000 | 66,365,536 | ||||||
| 16 | (855) 732-9220 seafarerfunds.com |
| Seafarer Overseas Growth and Income Fund | Portfolio of Investments |
| October 31, 2016 (Unaudited) |
| Currency | Shares | Value | |||||||
| Mexico (continued) | |||||||||
| Bolsa Mexicana de Valores SAB de CV | MXN | 16,850,000 | $ | 26,967,489 | |||||
| Grupo Herdez SAB de CV | MXN | 7,006,171 | 16,969,605 | ||||||
| Total Mexico | 110,302,630 | ||||||||
| Poland (6.5%) | |||||||||
| Bank Pekao SA | PLN | 2,400,000 | 74,050,851 | ||||||
| Asseco Poland SA | PLN | 1,950,000 | 26,019,881 | ||||||
| PGE Polska Grupa Energetyczna SA | PLN | 8,407,327 | 22,008,092 | ||||||
| Total Poland | 122,078,824 | ||||||||
| Singapore (5.6%) | |||||||||
| Singapore Telecommunications, Ltd. | SGD | 28,500,000 | 79,482,480 | ||||||
| SIA Engineering Co., Ltd. | SGD | 10,000,000 | 26,522,911 | ||||||
| Total Singapore | 106,005,391 | ||||||||
| South Africa (6.1%) | |||||||||
| Sanlam, Ltd. | ZAR | 18,500,000 | 89,675,350 | ||||||
| EOH Holdings, Ltd. | ZAR | 2,195,000 | 26,029,888 | ||||||
| Total South Africa | 115,705,238 | ||||||||
| South Korea (6.2%) | |||||||||
| Coway Co., Ltd. | KRW | 810,000 | 63,426,699 | ||||||
| Dongsuh Cos., Inc. | KRW | 1,660,595 | 39,401,489 | ||||||
| Sindoh Co., Ltd. | KRW | 318,836 | 14,628,700 | ||||||
| Total South Korea | 117,456,888 | ||||||||
| Taiwan (8.9%) | |||||||||
| Pou Chen Corp. | TWD | 47,250,000 | 63,933,296 | ||||||
| Taiwan Semiconductor Manufacturing Co., Ltd. | TWD | 8,175,000 | 48,831,102 | ||||||
| Vanguard International Semiconductor Corp. | TWD | 22,015,000 | 44,926,436 | ||||||
| Taiwan Semiconductor Manufacturing Co., Ltd., Sponsored ADR | USD | 298,670 | 9,288,637 | ||||||
| Total Taiwan | 166,979,471 | ||||||||
| Turkey (2.5%) | |||||||||
| Arcelik AS | TRY | 4,000,000 | 26,423,204 | ||||||
| Semi-Annual Report – October 31, 2016 | 17 |
| Seafarer Overseas Growth and Income Fund | Portfolio of Investments |
| October 31, 2016 (Unaudited) |
| Currency | Shares | Value | |||||||
| Turkey (continued) | |||||||||
| Aselsan Elektronik Sanayi Ve Ticaret AS | TRY | 6,490,000 | $ | 19,715,925 | |||||
| Total Turkey | 46,139,129 | ||||||||
| Vietnam (0.8%) | |||||||||
| Bao Viet Holdings | VND | 3,800,000 | 10,894,593 | ||||||
| Nam Long Investment Corp. | VND | 3,470,000 | 3,380,930 | ||||||
| Vietnam National Reinsurance Corp. | VND | 293,470 | 264,245 | ||||||
| Total Vietnam | 14,539,768 | ||||||||
| TOTAL COMMON STOCKS (Cost $1,449,429,960) | 1,479,013,929 | ||||||||
| PREFERRED STOCKS (7.6%) | |||||||||
| Brazil (2.9%) | |||||||||
| Banco Bradesco SA, ADR | USD | 5,270,000 | 54,860,700 | ||||||
| Total Brazil | 54,860,700 | ||||||||
| South Korea (4.7%) | |||||||||
| Samsung Electronics Co., Ltd. | KRW | 77,000 | 88,624,863 | ||||||
| Total South Korea | 88,624,863 | ||||||||
| TOTAL PREFERRED STOCKS (Cost $96,358,806) | 143,485,563 | ||||||||
| Currency | Rate | Maturity Date | Principal Amount | Value | ||||||||||
| FOREIGN CURRENCY CORPORATE BONDS (1.4%) | ||||||||||||||
| Mexico (1.4%) | ||||||||||||||
| America Movil SAB de CV | MXN | 6.45 | % | 12/05/22 | 250,000,000 | 13,028,411 | ||||||||
| America Movil SAB de CV | MXN | 7.13 | % | 12/09/24 | 244,710,000 | 13,071,225 | ||||||||
| Total Mexico | 26,099,636 | |||||||||||||
| TOTAL FOREIGN CURRENCY CORPORATE BONDS (Cost $26,885,853) | 26,099,636 | |||||||||||||
| FOREIGN CURRENCY GOVERNMENT BONDS (2.9%) | ||||||||||||||
| Brazil (1.8%) | ||||||||||||||
| Brazilian Government | ||||||||||||||
| International Bond | BRL | 10.25 | % | 01/10/28 | 44,000,000 | 14,266,917 | ||||||||
| 18 | (855) 732-9220 seafarerfunds.com |
| Seafarer Overseas Growth and Income Fund | Portfolio of Investments |
| October 31, 2016 (Unaudited) |
| Currency | Rate | Maturity Date | Principal Amount | Value | ||||||||||
| Brazil (continued) | ||||||||||||||
| Brazil Notas do Tesouro Nacional, Series F, Series NTNF | BRL | 10.00 | % | 01/01/25 | 65,000,000 | $ | 19,712,981 | |||||||
| Total Brazil | 33,979,898 | |||||||||||||
| Indonesia (0.8%) | ||||||||||||||
| Indonesia Treasury Bond, Series FR70 | IDR | 8.38 | % | 03/15/24 | 178,500,000,000 | 14,569,474 | ||||||||
| Total Indonesia | 14,569,474 | |||||||||||||
| Turkey (0.3%) | ||||||||||||||
| Turkey Government Bond | TRY | 8.80 | % | 09/27/23 | 20,000,000 | 6,159,813 | ||||||||
| Total Turkey | 6,159,813 | |||||||||||||
| TOTAL FOREIGN CURRENCY GOVERNMENT BONDS (Cost $48,158,281) | 54,709,185 | |||||||||||||
| USD CORPORATE BONDS (0.9%) | ||||||||||||||
| Brazil (0.9%) | ||||||||||||||
Cielo SA / Cielo USA, Inc.(b) | USD | 3.75 | % | 11/16/22 | 19,000,000 | 17,901,800 | ||||||||
| Total Brazil | 17,901,800 | |||||||||||||
| TOTAL USD CORPORATE BONDS (Cost $16,976,300) | 17,901,800 | |||||||||||||
| TOTAL INVESTMENTS (Cost $1,637,809,200) (91.3%) | $ | 1,721,210,113 | ||||||||||||
| Cash and Other Assets, Less Liabilities (8.7%) | 163,051,111 | |||||||||||||
| NET ASSETS (100.0%) | $ | 1,884,261,224 | ||||||||||||
Principal Amount is stated in local currency unless otherwise noted.
(a) | Non-income producing security. |
(b) | Security was purchased pursuant to Regulation S under the Securities Act of 1933, which exempts securities offered and sold outside of the United States from registration. Such security cannot be sold in the United States without either an effective registration statement filed pursuant to the Securities Act of 1933, or pursuant to an exemption from registration. The security has been deemed liquid under guidelines approved by the Fund's Board of Trustees. As of October 31, 2016, the aggregate market value of these securities was $17,901,800, representing 0.9% of net assets. |
| Semi-Annual Report – October 31, 2016 | 19 |
| Seafarer Overseas Growth and Income Fund | Portfolio of Investments |
| October 31, 2016 (Unaudited) |
| Currency Abbreviations | ||
| BRL | - | Brazil Real |
| HKD | - | Hong Kong Dollar |
| IDR | - | Indonesia Rupiah |
| INR | - | India Rupee |
| JPY | - | Japan Yen |
| KRW | - | South Korea Won |
| MXN | - | Mexico Peso |
| MYR | - | Malaysia Ringgit |
| PLN | - | Poland Zloty |
| SGD | - | Singapore Dollar |
| TRY | - | Turkey Lira |
| TWD | - | Taiwan New Dollar |
| USD | - | United States Dollar |
| VND | - | Vietnam Dong |
| ZAR | - | South Africa Rand |
For Fund compliance purposes, the Fund's geographical classifications refer to any one or more of the sub-classifications used by one or more widely recognized market indexes or ratings group indexes, and/or as defined by Fund management. This definition may not apply for purposes of this report, which may combine sub-classifications for reporting ease. Geographical regions are shown as a percentage of net assets.
See accompanying Notes to Financial Statements.
| 20 | (855) 732-9220 seafarerfunds.com |
| Seafarer Overseas Value Fund | Portfolio of Investments |
| October 31, 2016 (Unaudited) |
| Currency | Shares | Value | |||||||
| COMMON STOCKS (90.2%) | |||||||||
| Brazil (2.4%) | |||||||||
| Qualicorp SA | BRL | 17,000 | $ | 109,872 | |||||
| Total Brazil | 109,872 | ||||||||
| China / Hong Kong (50.1%) | |||||||||
| First Pacific Co., Ltd. | HKD | 282,000 | 213,803 | ||||||
| Melco International Development, Ltd. | HKD | 161,000 | 210,499 | ||||||
WH Group, Ltd.(a) | HKD | 227,500 | 184,510 | ||||||
| Shangri‐La Asia, Ltd. | HKD | 160,000 | 175,977 | ||||||
| AMVIG Holdings, Ltd. | HKD | 506,000 | 170,939 | ||||||
| Asia Satellite Telecommunications Holdings, Ltd. | HKD | 125,500 | 169,911 | ||||||
| Pacific Basin Shipping, Ltd. | HKD | 1,130,000 | 169,014 | ||||||
| Pico Far East Holdings, Ltd. | HKD | 538,000 | 163,712 | ||||||
| Xtep International Holdings, Ltd. | HKD | 359,000 | 158,310 | ||||||
| China Resources Beer Holdings Co., Ltd. | HKD | 70,000 | 148,926 | ||||||
| Hang Lung Properties, Ltd. | HKD | 62,000 | 136,862 | ||||||
| Texwinca Holdings, Ltd. | HKD | 190,000 | 133,272 | ||||||
| Giordano International, Ltd. | HKD | 244,000 | 128,677 | ||||||
| Greatview Aseptic Packaging Co., Ltd. | HKD | 189,000 | 96,016 | ||||||
| Total China / Hong Kong | 2,260,428 | ||||||||
| Czech Republic (6.8%) | |||||||||
| Pegas Nonwovens SA | CZK | 4,900 | 157,233 | ||||||
| Philip Morris CR AS | CZK | 300 | 148,176 | ||||||
| Total Czech Republic | 305,409 | ||||||||
| Philippines (3.3%) | |||||||||
| Del Monte Pacific, Ltd. | SGD | 606,500 | 150,399 | ||||||
| Total Philippines | 150,399 | ||||||||
| Qatar (3.5%) | |||||||||
| Qatar Gas Transport Co., Ltd. | QAR | 25,600 | 158,948 | ||||||
| Total Qatar | 158,948 | ||||||||
| Russia (6.4%) | |||||||||
| Global Ports Investments PLC | USD | 56,200 | 168,038 | ||||||
Cherkizovo Group PJSC, GDR(a) | USD | 15,000 | 119,850 | ||||||
| Total Russia | 287,888 | ||||||||
| Semi-Annual Report – October 31, 2016 | 21 |
| Seafarer Overseas Value Fund | Portfolio of Investments |
| October 31, 2016 (Unaudited) |
| Currency | Shares | Value | |||||||
| Singapore (9.9%) | |||||||||
| Wilmar International, Ltd. | SGD | 70,000 | $ | 166,542 | |||||
| Genting Singapore PLC | SGD | 291,000 | 155,827 | ||||||
| SIA Engineering Co., Ltd. | SGD | 46,000 | 122,005 | ||||||
| Total Singapore | 444,374 | ||||||||
| Taiwan (3.2%) | |||||||||
| Pou Chen Corp. | TWD | 106,000 | 143,427 | ||||||
| Total Taiwan | 143,427 | ||||||||
| Vietnam (4.6%) | |||||||||
| PetroVietnam Technical Services Corp. | VND | 125,000 | 107,512 | ||||||
| PetroVietnam Fertilizer & Chemicals JSC | VND | 79,000 | 98,383 | ||||||
| Total Vietnam | 205,895 | ||||||||
| TOTAL COMMON STOCKS (Cost $4,015,175) | 4,066,640 | ||||||||
| TOTAL INVESTMENTS (Cost $4,015,175) (90.2%) | $ | 4,066,640 | |||||||
| Cash and Other Assets, Less Liabilities (9.8%) | 443,017 | ||||||||
| NET ASSETS (100.0%) | $ | 4,509,657 | |||||||
(a) | Security was purchased pursuant to Regulation S under the Securities Act of 1933, which exempts securities offered and sold outside of the United States from registration. Such security cannot be sold in the United States without either an effective registration statement filed pursuant to the Securities Act of 1933, or pursuant to an exemption from registration. The security has been deemed liquid under guidelines approved by the Fund's Board of Trustees. As of October 31, 2016, the aggregate market value of these securities was $304,360, representing 6.7% of net assets. |
| 22 | (855) 732-9220 seafarerfunds.com |
| Seafarer Overseas Value Fund | Portfolio of Investments |
| October 31, 2016 (Unaudited) |
| Currency Abbreviations | ||
| BRL | - | Brazil Real |
| CZK | - | Czech Koruna |
| HKD | - | Hong Kong Dollar |
| QAR | - | Qatar Rial |
| SGD | - | Singapore Dollar |
| TWD | - | Taiwan New Dollar |
| USD | - | United States Dollar |
| VND | - | Vietnam Dong |
For Fund compliance purposes, the Fund's geographical classifications refer to any one or more of the sub-classifications used by one or more widely recognized market indexes or ratings group indexes, and/or as defined by Fund management. This definition may not apply for purposes of this report, which may combine sub-classifications for reporting ease. Geographical regions are shown as a percentage of net assets.
See accompanying Notes to Financial Statements.
| Semi-Annual Report – October 31, 2016 | 23 |
| Seafarer Funds | Statements of Assets and Liabilities |
October 31, 2016 (Unaudited)
Seafarer Overseas Growth and Income Fund | Seafarer Overseas Value Fund | |||||||
| ASSETS: | ||||||||
| Investments, at value | $ | 1,721,210,113 | $ | 4,066,640 | ||||
| Cash | 159,709,755 | 402,679 | ||||||
| Foreign currency, at value (Cost 3,506,536 and 35,200) | 3,514,170 | 35,239 | ||||||
| Receivable for investments sold | 337,914 | – | ||||||
| Receivable for shares sold | 3,149,844 | 125 | ||||||
| Receivable due from advisor | – | 10,152 | ||||||
| Interest and dividends receivable | 4,060,694 | 86 | ||||||
| Deferred offering costs | – | 34,911 | ||||||
| Prepaid expenses and other assets | 33,768 | 36,074 | ||||||
| Total Assets | 1,892,016,258 | 4,585,906 | ||||||
| LIABILITIES: | ||||||||
| Payable for investments purchased | 4,276,688 | 23 | ||||||
| Foreign capital gains tax | 854,579 | – | ||||||
| Administrative fees payable | 84,340 | 2,024 | ||||||
| Shareholder service plan fees payable | 310,308 | 850 | ||||||
| Payable for shares redeemed | 780,917 | – | ||||||
| Investment advisory fees payable | 1,172,862 | 3,009 | ||||||
| Payable for chief compliance officer fee | 3,135 | 22 | ||||||
| Trustee fees and expenses payable | 11,049 | 53 | ||||||
| Payable for principal financial officer fees | 1,714 | 5 | ||||||
| Audit and tax fees payable | 3,510 | 10,873 | ||||||
| Accrued expenses and other liabilities | 255,932 | 24,479 | ||||||
| Total Liabilities | 7,755,034 | 41,338 | ||||||
| NET ASSETS | $ | 1,884,261,224 | $ | 4,544,568 | ||||
| NET ASSETS CONSIST OF: | ||||||||
| Paid‐in capital (Note 5) | $ | 1,800,957,159 | $ | 4,427,814 | ||||
| Accumulated net investment income | 13,094,168 | 31,704 | ||||||
| Accumulated net realized loss | (12,345,889 | ) | (1,342 | ) | ||||
| Net unrealized appreciation | 82,555,786 | 51,481 | ||||||
| NET ASSETS | $ | 1,884,261,224 | $ | 4,509,657 | ||||
| INVESTMENTS, AT COST | $ | 1,637,809,200 | $ | 4,015,175 | ||||
| PRICING OF SHARES | ||||||||
| Investor Class: | ||||||||
| Net Asset Value, offering and redemption price per share | $ | 11.91 | $ | 10.26 | ||||
| Net Assets | $ | 780,947,020 | $ | 169,005 | ||||
| Shares of beneficial interest outstanding | 65,544,253 | 16,466 | ||||||
| Institutional Class: | ||||||||
| Net Asset Value, offering and redemption price per share | $ | 11.94 | $ | 10.27 | ||||
| Net Assets | $ | 1,103,314,204 | $ | 4,340,652 | ||||
| Shares of beneficial interest outstanding | 92,366,334 | 422,738 | ||||||
See accompanying Notes to Financial Statements.
| 24 | (855) 732-9220 seafarerfunds.com |
| Seafarer Funds | Statements of Operations |
Six Months or Period Ended October 31, 2016 (Unaudited)
Seafarer Overseas Growth and Income Fund | Seafarer Overseas Value Fund | |||||||
| INVESTMENT INCOME: | ||||||||
| Dividends | $ | 25,054,451 | $ | 50,535 | ||||
| Foreign taxes withheld on dividends | (1,939,064 | ) | (1,488 | ) | ||||
| Interest and other income | 3,544,897 | 468 | ||||||
| Total investment income | 26,660,284 | 49,515 | ||||||
| EXPENSES: | ||||||||
| Investment advisory fees (Note 6) | 5,685,803 | 12,625 | ||||||
| Administrative and transfer agency fees | 295,073 | 13,859 | ||||||
| Trustee fees and expenses | 13,470 | 56 | ||||||
| Registration/filing fees | 37,415 | 45 | ||||||
| Shareholder service plan fees | ||||||||
| Investor Class | 527,171 | 85 | ||||||
| Institutional Class | 164,754 | 818 | ||||||
| Legal fees | 11,200 | 36 | ||||||
| Audit fees | 12,247 | 10,873 | ||||||
| Reports to shareholders and printing fees | 34,353 | 275 | ||||||
| Custody fees | 277,359 | 17,503 | ||||||
| Offering costs | – | 25,662 | ||||||
| Chief compliance officer fees | 16,178 | 47 | ||||||
| Principal financial officer fees | 5,041 | 11 | ||||||
| Miscellaneous | 9,508 | 2,225 | ||||||
| Total expenses | 7,089,572 | 84,120 | ||||||
| Less fees waived/reimbursed by investment advisor (Note 6) | ||||||||
| Investor Class | – | (2,227 | ) | |||||
| Institutional Class | – | (64,082 | ) | |||||
| Total net expenses | 7,089,572 | 17,811 | ||||||
| NET INVESTMENT INCOME: | 19,570,712 | 31,704 | ||||||
| Net realized loss on investments | (490,122 | ) | (3 | ) | ||||
| Net realized loss on foreign currency transactions | (78,119 | ) | (1,339 | ) | ||||
| Net realized loss | (568,241 | ) | (1,342 | ) | ||||
Net change in unrealized appreciation on investments (net of foreign capital gains tax of 854,579 and –) | 47,725,668 | 51,465 | ||||||
| Net change in unrealized appreciation/(depreciation) on translation of assets and liabilities in foreign currency transactions | (52,971 | ) | 16 | |||||
| Net unrealized appreciation | 47,672,697 | 51,481 | ||||||
| NET REALIZED AND UNREALIZED GAIN ON INVESTMENTS AND FOREIGN CURRENCY TRANSLATIONS | 47,104,456 | 50,139 | ||||||
| NET INCREASE IN NET ASSETS RESULTING FROM OPERATIONS | $ | 66,675,168 | $ | 81,843 | ||||
See accompanying Notes to Financial Statements.
(a) | The Seafarer Overseas Value Fund launched on May 31, 2016. |
| Semi-Annual Report – October 31, 2016 | 25 |
| Seafarer Overseas Growth and Income Fund | Statements of Changes in Net Assets |
| Six Months Ended October 31, 2016 (Unaudited) | Year Ended April 30, 2016 | |||||||
| OPERATIONS: | ||||||||
| Net investment income | $ | 19,570,712 | $ | 10,446,517 | ||||
| Net realized loss | (568,241 | ) | (12,082,922 | ) | ||||
| Net change in unrealized appreciation | 47,672,697 | 20,391,822 | ||||||
| Net increase in net assets resulting from operations | 66,675,168 | 18,755,417 | ||||||
| DISTRIBUTIONS TO SHAREHOLDERS (NOTE 3): | ||||||||
| From net investment income | ||||||||
| Investor Class | $ | (4,993,657 | ) | $ | (2,584,508 | ) | ||
| Institutional Class | (5,148,295 | ) | (2,856,743 | ) | ||||
| From net realized gains on investments | ||||||||
| Investor Class | – | (883,213 | ) | |||||
| Institutional Class | – | (865,671 | ) | |||||
| Net decrease in net assets from distributions | (10,141,952 | ) | (7,190,135 | ) | ||||
| BENEFICIAL INTEREST TRANSACTIONS (NOTE 5): | ||||||||
| Shares sold | ||||||||
| Investor Class | $ | 195,058,945 | $ | 641,922,494 | ||||
| Institutional Class | 508,841,027 | 559,784,411 | ||||||
| Dividends reinvested | ||||||||
| Investor Class | 4,943,226 | 3,453,383 | ||||||
| Institutional Class | 3,389,412 | 2,613,473 | ||||||
| Shares Redeemed, net of redemption fees | ||||||||
| Investor Class | (61,907,485 | ) | (95,043,203 | ) | ||||
| Institutional Class | (41,570,922 | ) | (88,578,872 | ) | ||||
| Net increase in net assets derived from beneficial interest transactions | 608,754,203 | 1,024,151,686 | ||||||
| Net increase in net assets | $ | 665,287,419 | $ | 1,035,716,968 | ||||
| NET ASSETS: | ||||||||
| Beginning of period | $ | 1,218,973,805 | $ | 183,256,837 | ||||
| End of period (including accumulated net investment income of $13,094,168 and $3,665,408, respectively) | $ | 1,884,261,224 | $ | 1,218,973,805 | ||||
| 26 | (855) 732-9220 seafarerfunds.com |
| Seafarer Overseas Growth and Income Fund | Statements of Changes in Net Assets |
| Six Months Ended October 31, 2016 (Unaudited) | Year Ended April 30, 2016 | |||||||
| Other Information: | ||||||||
| SHARE TRANSACTIONS: | ||||||||
| Investor Class | ||||||||
| Sold | 16,740,735 | 58,019,970 | ||||||
| Distributions reinvested | 432,857 | 324,192 | ||||||
| Redeemed | (5,287,744 | ) | (8,922,148 | ) | ||||
| Net increase in shares outstanding | 11,885,848 | 49,422,014 | ||||||
| Institutional Class | ||||||||
| Sold | 42,832,451 | 50,734,276 | ||||||
| Distributions reinvested | 296,277 | 243,396 | ||||||
| Redeemed | (3,558,802 | ) | (8,430,296 | ) | ||||
| Net increase in shares outstanding | 39,569,926 | 42,547,376 | ||||||
See accompanying Notes to Financial Statements.
| Semi-Annual Report – October 31, 2016 | 27 |
| Seafarer Overseas Value Fund | Statements of Changes in Net Assets |
| May 31, 2016 (Inception) to October 31, 2016 | ||||
| OPERATIONS: | ||||
| Net investment income | $ | 31,704 | ||
| Net realized loss | (1,342 | ) | ||
| Net change in unrealized appreciation | 51,481 | |||
| Net increase in net assets resulting from operations | 81,843 | |||
| BENEFICIAL INTEREST TRANSACTIONS (NOTE 5): | ||||
| Shares sold | ||||
| Institutional Class | $ | 5,262,297 | ||
| Investor Class | 166,090 | |||
| Dividends reinvested | ||||
| Institutional Class | – | |||
| Investor Class | – | |||
| Shares Redeemed, net of redemption fees | ||||
| Institutional Class | (1,000,573 | ) | ||
| Investor Class | – | |||
| Net increase in net assets derived from beneficial interest transactions | 4,427,814 | |||
| Net increase in net assets | $ | 4,509,657 | ||
| NET ASSETS: | ||||
| Beginning of period | $ | – | ||
| End of period (including accumulated net investment income of $31,704, respectively) | $ | 4,509,657 | ||
| Other Information: | ||||
| SHARE TRANSACTIONS: | ||||
| Investor Class | ||||
| Sold | 16,466 | |||
| Net increase in shares outstanding | 16,466 | |||
| Institutional Class | ||||
| Sold | 519,547 | |||
| Redeemed | (96,809 | ) | ||
| Net increase in shares outstanding | 422,738 | |||
See accompanying Notes to Financial Statements.
| 28 | (855) 732-9220 seafarerfunds.com |
Intentionally Left Blank
Financial Highlights
For a share outstanding through the periods presented
| Investor Class |
| NET ASSET VALUE, BEGINNING OF PERIOD |
| INCOME FROM OPERATIONS: |
Net investment income(a) |
| Net realized and unrealized gain/(loss) on investments |
| Total from investment operations |
| LESS DISTRIBUTIONS: |
| From net investment income |
| From net realized gains on investments |
| Total distributions |
| REDEMPTION FEES ADDED TO PAID IN CAPITAL |
| NET INCREASE/(DECREASE) IN NET ASSET VALUE |
| NET ASSET VALUE, END OF PERIOD |
TOTAL RETURN(d) |
| SUPPLEMENTAL DATA: |
| Net assets, end of period (in 000s) |
| RATIOS TO AVERAGE NET ASSETS: |
| Operating expenses excluding reimbursement/waiver |
| Operating expenses including reimbursement/waiver |
| Net investment income including reimbursement/waiver |
PORTFOLIO TURNOVER RATE(g) |
(a) | Calculated using the average shares method. |
(b) | Less than $(0.005) per share. |
(c) | Less than $0.005 per share. |
(d) | Total returns are for the period indicated and have not been annualized. Total returns would have been lower had certain expenses not been waived during the period. Returns shown do not reflect the deduction of taxes that a shareholder would pay on Fund distributions or the redemption of Fund shares. |
(e) | Annualized. |
(f) | Effective September 1, 2015, the Adviser agreed to limit expenses to 1.15%. The Adviser agreed to limit expenses to 1.25% for the period September 1, 2014 through August 31, 2015. Prior to September 1, 2014, the Adviser agreed to limit expenses to 1.40%. (See Note 6). |
(g) | Portfolio turnover rate for periods less than one full year have not been annualized. |
| 30 | (855) 732-9220 seafarerfunds.com |
Seafarer Overseas Growth and Income Fund
| Six Months Ended October 31, 2016 (Unaudited) | Year Ended April 30, 2016 | Year Ended April 30, 2015 | Year Ended April 30, 2014 | Year Ended April 30, 2013 | February 15, 2012 (Inception) to April 30, 2012 | |||||||||||||||||
| $ | 11.44 | $ | 12.64 | $ | 11.58 | $ | 11.91 | $ | 10.18 | $ | 10.00 | |||||||||||
| 0.15 | 0.16 | 0.14 | 0.19 | 0.10 | 0.05 | |||||||||||||||||
| 0.41 | (1.23 | ) | 1.26 | 0.02 | 1.74 | 0.13 | ||||||||||||||||
| 0.56 | (1.07 | ) | 1.40 | 0.21 | 1.84 | 0.18 | ||||||||||||||||
| (0.09 | ) | (0.11 | ) | (0.19 | ) | (0.26 | ) | (0.11 | ) | – | ||||||||||||
| – | (0.02 | ) | (0.15 | ) | (0.28 | ) | (0.00 | )(b) | – | |||||||||||||
| (0.09 | ) | (0.13 | ) | (0.34 | ) | (0.54 | ) | (0.11 | ) | – | ||||||||||||
| 0.00 | (c) | 0.00 | (c) | 0.00 | (c) | 0.00 | (c) | 0.00 | (c) | – | ||||||||||||
| 0.47 | (1.20 | ) | 1.06 | (0.33 | ) | 1.73 | 0.18 | |||||||||||||||
| $ | 11.91 | $ | 11.44 | $ | 12.64 | $ | 11.58 | $ | 11.91 | $ | 10.18 | |||||||||||
| 4.90 | % | (8.39 | %) | 12.55 | % | 1.93 | % | 18.24 | % | 1.80 | % | |||||||||||
| $ | 780,947 | $ | 613,795 | $ | 53,543 | $ | 27,181 | $ | 26,348 | $ | 1,443 | |||||||||||
| 0.99 | %(e) | 1.14 | % | 1.30 | % | 1.78 | % | 2.82 | % | 18.96 | %(e) | |||||||||||
| 0.99 | %(e) | 1.14 | %(f) | 1.30 | %(f) | 1.40 | % | 1.49 | % | 1.60 | %(e) | |||||||||||
| 2.59 | %(e) | 1.50 | % | 1.19 | % | 1.66 | % | 0.90 | % | 2.61 | %(e) | |||||||||||
| 4 | % | 7 | % | 28 | % | 51 | % | 39 | % | 5 | % | |||||||||||
See accompanying Notes to Financial Statements.
| Semi-Annual Report – October 31, 2016 | 31 |
Financial Highlights
For a share outstanding through the periods presented
| Institutional Class |
| NET ASSET VALUE, BEGINNING OF PERIOD |
| INCOME FROM OPERATIONS: |
Net investment income(a) |
| Net realized and unrealized gain/(loss) on investments |
| Total from investment operations |
| LESS DISTRIBUTIONS: |
| From net investment income |
| From net realized gains on investments |
| Total distributions |
| REDEMPTION FEES ADDED TO PAID IN CAPITAL |
| NET INCREASE/(DECREASE) IN NET ASSET VALUE |
| NET ASSET VALUE, END OF PERIOD |
TOTAL RETURN(d) |
| SUPPLEMENTAL DATA: |
| Net assets, end of period (in 000s) |
| RATIOS TO AVERAGE NET ASSETS: |
| Operating expenses excluding reimbursement/waiver |
| Operating expenses including reimbursement/waiver |
| Net investment income including reimbursement/waiver |
PORTFOLIO TURNOVER RATE(g) |
(a) | Calculated using the average shares method. |
(b) | Less than $(0.005) per share. |
(c) | Less than $0.005 per share. |
(d) | Total returns are for the period indicated and have not been annualized. Total returns would have been lower had certain expenses not been waived during the period. Returns shown do not reflect the deduction of taxes that a shareholder would pay on Fund distributions or the redemption of Fund shares. |
(e) | Annualized. |
(f) | Effective September 1, 2014, the Adviser agreed to limit expenses to 1.05%. Prior to September 1, 2014, the Adviser agreed to limit expenses to 1.25%. (See Note 6). |
(g) | Portfolio turnover rate for periods less than one full year have not been annualized. |
| 32 | (855) 732-9220 seafarerfunds.com |
Seafarer Overseas Growth and Income Fund
| Six Months Ended October 31, 2016 (Unaudited) | Year Ended April 30, 2016 | Year Ended April 30, 2015 | Year Ended April 30, 2014 | Year Ended April 30, 2013 | February 15, 2012 (Inception) to April 30, 2012 | |||||||||||||||||
| $ | 11.46 | $ | 12.66 | $ | 11.59 | $ | 11.91 | $ | 10.18 | $ | 10.00 | |||||||||||
| 0.15 | 0.19 | 0.15 | 0.21 | 0.14 | 0.04 | |||||||||||||||||
| 0.42 | (1.26 | ) | 1.28 | 0.02 | 1.71 | 0.14 | ||||||||||||||||
| 0.57 | (1.07 | ) | 1.43 | 0.23 | 1.85 | 0.18 | ||||||||||||||||
| (0.09 | ) | (0.12 | ) | (0.21 | ) | (0.27 | ) | (0.12 | ) | – | ||||||||||||
| – | (0.02 | ) | (0.15 | ) | (0.28 | ) | (0.00 | )(b) | – | |||||||||||||
| (0.09 | ) | (0.14 | ) | (0.36 | ) | (0.55 | ) | (0.12 | ) | – | ||||||||||||
| 0.00 | (c) | 0.01 | 0.00 | (c) | 0.00 | (c) | 0.00 | (c) | – | |||||||||||||
| 0.48 | (1.20 | ) | 1.07 | (0.32 | ) | 1.73 | 0.18 | |||||||||||||||
| $ | 11.94 | $ | 11.46 | $ | 12.66 | $ | 11.59 | $ | 11.91 | $ | 10.18 | |||||||||||
| 4.99 | % | (8.32 | %) | 12.76 | % | 2.12 | % | 18.33 | % | 1.80 | % | |||||||||||
| $ | 1,103,314 | $ | 605,178 | $ | 129,714 | $ | 46,624 | $ | 11,486 | $ | 1,346 | |||||||||||
| 0.88 | %(e) | 1.03 | % | 1.18 | % | 1.61 | % | 2.88 | % | 21.65 | %(e) | |||||||||||
| 0.88 | %(e) | 1.03 | % | 1.10 | %(f) | 1.25 | % | 1.35 | % | 1.45 | %(e) | |||||||||||
| 2.55 | %(e) | 1.72 | % | 1.30 | % | 1.89 | % | 1.28 | % | 2.00 | %(e) | |||||||||||
| 4 | % | 7 | % | 28 | % | 51 | % | 39 | % | 5 | % | |||||||||||
See accompanying Notes to Financial Statements.
| Semi-Annual Report – October 31, 2016 | 33 |
| Financial Highlights | Seafarer Overseas Value Fund |
For a share outstanding through the period presented
| Investor Class | May 31, 2016 (Inception) to October 31, 2016 | |||
| NET ASSET VALUE, BEGINNING OF PERIOD | $ | 10.00 | ||
| INCOME FROM OPERATIONS: | ||||
Net investment income(a) | 0.07 | |||
| Net realized and unrealized gain on investments | 0.19 | |||
| Total from investment operations | 0.26 | |||
| NET INCREASE IN NET ASSET VALUE | 0.26 | |||
| NET ASSET VALUE, END OF PERIOD | $ | 10.26 | ||
TOTAL RETURN(b) | 2.60 | % | ||
| SUPPLEMENTAL DATA: | ||||
| Net assets, end of period (in 000s) | $ | 169 | ||
| RATIOS TO AVERAGE NET ASSETS: | ||||
| Operating expenses excluding reimbursement/waiver | 5.10 | %(c) | ||
| Operating expenses including reimbursement/waiver | 1.15 | %(c) | ||
| Net investment income including reimbursement/waiver | 1.59 | %(c) | ||
PORTFOLIO TURNOVER RATE(d) | 0 | % | ||
(a) | Calculated using the average shares method. |
(b) | Total returns are for the period indicated and have not been annualized. Total returns would have been lower had certain expenses not been waived during the period. Returns shown do not reflect the deduction of taxes that a shareholder would pay on Fund distributions or the redemption of Fund shares. |
(c) | Annualized. |
(d) | Portfolio turnover rate for periods less than one full year have not been annualized. |
See accompanying Notes to Financial Statements.
| 34 | (855) 732-9220 seafarerfunds.com |
| Financial Highlights | Seafarer Overseas Value Fund |
For a share outstanding through the period presented
| Institutional Class | May 31, 2016 (Inception) to October 31, 2016 | |||
| NET ASSET VALUE, BEGINNING OF PERIOD | $ | 10.00 | ||
| INCOME FROM OPERATIONS: | ||||
Net investment income(a) | 0.08 | |||
| Net realized and unrealized gain on investments | 0.19 | |||
| Total from investment operations | 0.27 | |||
| NET INCREASE IN NET ASSET VALUE | 0.27 | |||
| NET ASSET VALUE, END OF PERIOD | $ | 10.27 | ||
TOTAL RETURN(b) | 2.70 | % | ||
| SUPPLEMENTAL DATA: | ||||
| Net assets, end of period (in 000s) | $ | 4,341 | ||
| RATIOS TO AVERAGE NET ASSETS: | ||||
| Operating expenses excluding reimbursement/waiver | 4.97 | %(c) | ||
| Operating expenses including reimbursement/waiver | 1.05 | %(c) | ||
| Net investment income including reimbursement/waiver | 1.89 | %(c) | ||
PORTFOLIO TURNOVER RATE(d) | 0 | % | ||
(a) | Calculated using the average shares method. |
(b) | Total returns are for the period indicated and have not been annualized. Total returns would have been lower had certain expenses not been waived during the period. Returns shown do not reflect the deduction of taxes that a shareholder would pay on Fund distributions or the redemption of Fund shares. |
(c) | Annualized. |
(d) | Portfolio turnover rate for periods less than one full year have not been annualized. |
See accompanying Notes to Financial Statements.
| Semi-Annual Report – October 31, 2016 | 35 |
| Seafarer Funds | Notes to Financial Statements |
October 31, 2016 (Unaudited)
NOTES TO FINANCIAL STATEMENTS
1. Organization
Financial Investors Trust (the “Trust”), a Delaware statutory trust, is an open-end management investment company registered under the Investment Company Act of 1940, as amended (“1940 Act”). The Trust consists of multiple separate portfolios or series. This semi-annual report describes the Seafarer Overseas Growth and Income Fund and the Seafarer Overseas Value Fund (individually a “Fund” and collectively, the “Funds”). The Seafarer Overseas Growth and Income Fund seeks to provide long-term capital appreciation along with some current income; it also seeks to mitigate adverse volatility in returns as a secondary objective. The Seafarer Overseas Value Fund seeks to provide long-term capital appreciation. The Funds offers Investor Class and Institutional Class shares.
2. Significant Accounting Policies
The accompanying financial statements were prepared in accordance with accounting principles generally accepted in the United States of America (“U.S. GAAP”). The preparation of financial statements in conformity with U.S. GAAP requires management to make certain estimates and assumptions that affect the reported amounts of assets and liabilities and disclosures of contingent assets and liabilities at the date of the financial statements and the reported amounts of revenue and expenses during the period. Actual results could differ from those estimates. The Funds are considered an investment company for financial reporting purposes under U.S. GAAP. The following is a summary of significant accounting policies consistently followed by the Funds in preparation of its financial statements.
Investment Valuation
Each Fund generally values its securities based on market prices determined at the close of regular trading on the New York Stock Exchange (“NYSE”), normally 4:00 p.m. Eastern Time, on each day the NYSE is open for trading.
For equity securities and mutual funds that are traded on an exchange, the market price is usually the closing sale or official closing price on that exchange. In the case of equity securities not traded on an exchange, or if such closing prices are not otherwise available, the securities are valued at the mean of the most recent bid and ask prices on such day. Redeemable securities issued by open-end registered investment companies are valued at the investment company’s applicable net asset value, with the exception of exchange-traded open-end investment companies, which are priced as equity securities.
Equity securities that are primarily traded on foreign securities exchanges are valued at the closing values of such securities on their respective foreign exchanges, except when an event occurs subsequent to the close of the foreign exchange but before the close of the NYSE, such that the securities’ value would likely change. In such an event, the fair values of those securities are determined in good faith through consideration of other factors in accordance with procedures established by and under the general supervision of the Board of Trustees (the “Board”). Each Fund uses a fair valuation model provided by an independent pricing service, which is intended to reflect fair value when a security’s value or a meaningful portion of the Fund’s portfolio is believed to have been materially affected by a valuation event that has occurred between the close of the exchange or market on which the security is traded and the close of the regular trading day on the NYSE. The Funds’ valuation procedures set forth certain triggers that inform each Fund when to use the fair valuation model.
The market price for debt obligations is generally the price supplied by an independent third-party pricing service approved by the Board, which may use a matrix, formula or other objective method that takes into consideration quotations from dealers, market transactions in comparable investments, market indices and yield curves. If vendors are unable to supply a price, or if the price supplied is deemed to be unreliable, the market price may be determined using quotations received from one or more broker-dealers that make a market in the security. Corporate bonds and convertible bonds are valued using market models that consider trade data, quotations from dealers and active market makers, relevant yield curve and spread data, creditworthiness, trade data or market information on comparable securities, and other relevant
| 36 | (855) 732-9220 seafarerfunds.com |
| Seafarer Funds | Notes to Financial Statements |
October 31, 2016 (Unaudited)
security specific information. Publicly traded foreign government debt securities and foreign corporate bonds are typically traded internationally in the over-the-counter market and are valued at the mean between the bid and asked prices as of the close of business of that market.
Forward currency exchange contracts have a market value determined by the prevailing foreign currency exchange daily rates and current foreign currency exchange forward rates. The foreign currency exchange forward rates are calculated using an automated system that estimates rates on the basis of the current day foreign currency exchange rates and forward foreign currency exchange rates supplied by a pricing service.
When such prices or quotations are not available, or when Seafarer Capital Partners, LLC (the “Adviser”) believes that they are unreliable, securities may be priced using fair value procedures approved by the Board.
Certain foreign countries impose a tax on capital gains which is accrued by each Fund based on unrealized appreciation, if any, on affected securities. The tax is paid when the gain is realized.
Fair Value Measurements
Each Fund discloses the classification of its fair value measurements following a three-tier hierarchy based on the inputs used to measure fair value. Inputs refer broadly to the assumptions that market participants would use in pricing the asset or liability, including assumptions about risk. Inputs may be observable or unobservable. Observable inputs reflect the assumptions market participants would use in pricing the asset or liability. Such inputs are developed based on market data obtained from sources independent of the reporting entity. Unobservable inputs reflect the reporting entity’s own assumptions about the assumptions market participants would use in pricing the asset or liability, which are developed based on the information available and the reporting entity’s best efforts to interpret such information.
Various inputs are used in determining the value of the Funds’ investments as of the end of the reporting period. When inputs used fall into different levels of the fair value hierarchy, the level in the hierarchy within which the fair value measurement falls is determined based on the lowest level input that is significant to the fair value measurement in its entirety. The designated input levels are not necessarily an indication of the risk or liquidity associated with these investments. These inputs are categorized in the following hierarchy under applicable financial accounting standards:
| Level 1 – | Unadjusted quoted prices in active markets for identical investments, unrestricted assets or liabilities that the Funds have the ability to access at the measurement date; |
| Level 2 – | Quoted prices which are not active, quoted prices for similar assets or liabilities in active markets or inputs other than quoted prices that are observable (either directly or indirectly) for substantially the full term of the asset or liability; and |
| Level 3 – | Significant unobservable prices or inputs (including the Funds’ own assumptions in determining the fair value of investments) where there is little or no market activity for the asset or liability at the measurement date. |
| Semi-Annual Report – October 31, 2016 | 37 |
| Seafarer Funds | Notes to Financial Statements |
October 31, 2016 (Unaudited)
The following is a summary of the inputs used to value each Fund as of October 31, 2016:
Investments in Securities at Value(a) | Level 1 - Quoted Prices | Level 2 - Other Significant Observable Inputs | Level 3 - Significant Unobservable Inputs | Total | ||||||||||||
| Seafarer Overseas Growth and Income Fund | ||||||||||||||||
| Common Stocks | $ | 1,479,013,929 | $ | – | $ | – | $ | 1,479,013,929 | ||||||||
| Preferred Stocks | 143,485,563 | – | – | 143,485,563 | ||||||||||||
| Foreign Currency | ||||||||||||||||
| Corporate Bonds | – | 26,099,636 | – | 26,099,636 | ||||||||||||
| Foreign Currency | ||||||||||||||||
| Government Bonds | – | 54,709,185 | – | 54,709,185 | ||||||||||||
| USD Corporate Bonds | – | 17,901,800 | – | 17,901,800 | ||||||||||||
| Total | $ | 1,622,499,492 | $ | 98,710,621 | $ | – | $ | 1,721,210,113 | ||||||||
Investments in Securities at Value(a) | Level 1 - Quoted Prices | Level 2 - Other Significant Observable Inputs | Level 3 - Significant Unobservable Inputs | Total | ||||||||||||
| Seafarer Overseas Value Fund | ||||||||||||||||
| Common Stocks | $ | 4,066,640 | $ | – | $ | – | $ | 4,066,640 | ||||||||
| Total | $ | 4,066,640 | $ | – | $ | – | $ | 4,066,640 | ||||||||
(a) | For detailed descriptions of securities by country, see the accompanying Portfolio of Investments. |
The Funds recognize transfers between levels as of the end of the period. For the six months or period ended October 31, 2016, the Funds did not have any securities that used significant unobservable inputs (Level 3) in determining fair value.
Each Fund utilizes a fair value evaluation service with respect to international securities with an earlier market closing than the Fund’s net asset value computation cutoff. When events trigger the use of the fair value evaluation service on a reporting period date, it results in certain securities transferring from a Level 1 to a Level 2 classification. The transfer amounts disclosed in the preceding table represent the value of the securities as of October 31, 2016 transferred in/(out) of Level 1 and Level 2 during the reporting period that were also held at April 30, 2016.
Investment Transactions and Investment Income
Investment transactions are accounted for on the date the investments are purchased or sold (trade date). Realized gains and losses from investment transactions are reported on an identified cost basis. Interest income, which includes accretion of discounts and amortization of premiums, is accrued and recorded as earned. Dividend income is recognized on the ex-dividend date or for certain foreign securities, as soon as information is available to the Funds. All of the realized and unrealized gains and losses and net investment income are allocated daily to each class in proportion to its average daily net assets.
Cash Management Transactions
Each of the Funds subscribes to the Brown Brothers Harriman & Co. (“BBH”) Cash Management Service (“CMS”), whereby cash balances are automatically swept into overnight offshore demand deposits with either the BBH Grand Cayman branch or a branch of a pre-approved commercial bank. This fully automated program allows the Funds to earn interest on cash balances. Excess cash with deposit
| 38 | (855) 732-9220 seafarerfunds.com |
| Seafarer Funds | Notes to Financial Statements |
October 31, 2016 (Unaudited)
institutions domiciled outside of the U.S. are subject to sovereign actions in the jurisdiction of the deposit institution including, but not limited to, freeze, seizure or diminution. Cash balances in the BBH CMS are included on the Statement of Assets and Liabilities under Cash and Foreign Currency, at value. As of October 31, 2016, the Funds had the following cash balances participating in the BBH CMS:
| Fund | ||||
| Seafarer Overseas Growth and Income Fund | $ | 159,709,755 | ||
| Seafarer Overseas Value Fund | 402,679 | |||
As of October 31, 2016, the Funds had the following foreign cash balances participating in the BBH CMS (cost and value of foreign cash balances are equal):
| Fund | ||||
| Seafarer Overseas Growth and Income Fund | $ | 0 | ||
| Seafarer Overseas Value Fund | 29,325 | |||
Foreign Securities
The Funds may directly purchase securities of foreign issuers. Investing in securities of foreign issuers involves special risks not typically associated with investing in securities of U.S. issuers. The risks include possible revaluation of currencies, the inability to repatriate foreign currency, less complete financial information about companies, and possible future adverse political and economic developments. Moreover, securities of many foreign issuers and their markets may be less liquid and their prices more volatile than those of securities of comparable U.S. issuers.
Foreign Currency Translation
The books and records of the Funds are maintained in U.S. dollars. Investment valuations and other assets and liabilities initially expressed in foreign currencies are converted each business day into U.S. dollars based upon current exchange rates. Prevailing foreign exchange rates may generally be obtained at the close of the NYSE (normally, 4:00 p.m. Eastern time). The portion of realized and unrealized gains or losses on investments due to fluctuations in foreign currency exchange rates is not separately disclosed and is included in realized and unrealized gains or losses on investments, when applicable.
Foreign Currency Spot Contracts
Each Fund may enter into foreign currency spot contracts to facilitate transactions in foreign securities or to convert foreign currency receipts into U.S. dollars. A foreign currency spot contract is an agreement between two parties to buy and sell currencies at the current market rate, for settlement generally within two business days. The U.S. dollar value of the contracts is determined using current currency exchange rates supplied by a pricing service. The contract is marked-to-market daily for settlements beyond one day and any change in market value is recorded as an unrealized gain or loss. When the contract is closed, the Fund records a realized gain or loss equal to the difference between the value on the open and close date. Losses may arise from changes in the value of the foreign currency, or if the counterparties do not perform under the contract’s terms. The maximum potential loss from such contracts is the aggregate face value in U.S. dollars at the time the contract was opened.
Trust Expenses
Some expenses of the Trust can be directly attributed to the Funds. Expenses which cannot be directly attributed to the Funds are apportioned among all funds in the Trust based on the average daily net assets of each fund.
| Semi-Annual Report – October 31, 2016 | 39 |
| Seafarer Funds | Notes to Financial Statements |
October 31, 2016 (Unaudited)
Fund and Class Expenses
Expenses that are specific to a Fund or class of shares of a Fund, including shareholder servicing fees, are charged directly to that Fund or share class. Expenses that are common to all Funds are generally allocated among the Funds in proportion to their average daily net assets.
Federal Income Taxes
Each Fund complies with the requirements under Subchapter M of the Internal Revenue Code of 1986, as amended, applicable to regulated investment companies and intends to distribute substantially all of its net taxable income and net capital gains, if any, each year so that it will not be subject to excise tax on undistributed income and gains. The Funds are not subject to income taxes to the extent such distributions are made.
As of and during the six months or period ended October 31, 2016, the Funds did not have a liability for any unrecognized tax benefits. The Funds file U.S. federal, state, and local tax returns as required. The Funds’ tax returns are subject to examination by the relevant tax authorities until expiration of the applicable statute of limitations, which is generally three years after the filing of the tax return for federal purposes and four years for most state returns. Tax returns for open years have incorporated no uncertain tax positions that require a provision for income taxes.
Distributions to Shareholders
In general, the Seafarer Overseas Growth and Income Fund’s policy is to distribute to its shareholders substantially all net investment income, paid out via two semi-annual dividends, in June and December. The Seafarer Overseas Value Fund’s policy is to distribute to its shareholders substantially all net investment income via one annual dividend in December. It is also each Fund’s policy to distribute annually all net realized short-term and long-term capital gains, if any, after offsetting any capital loss carryovers. Income dividend distributions are derived from dividends and other income each Fund receives from its investments, including short term capital gains. Long term capital gain distributions are derived from gains realized when a Fund sells a security it has owned for more than one year. Each Fund may make additional distributions and at other times if the Adviser believes doing so may be necessary for the Fund to avoid or reduce taxes.
3. Tax Basis Information
Tax Basis of Investments
As of October 31, 2016, the aggregate cost of investments, gross unrealized appreciation/ (depreciation) and net unrealized appreciation for Federal tax purposes were as follows:
| Cost of Investments | Gross Unrealized Appreciation | Gross Unrealized Depreciation | Net Unrealized Appreciation | |||||||||||||
| Seafarer Overseas Growth and Income Fund | $ | 1,638,559,413 | $ | 186,954,900 | $ | (104,304,200 | ) | $ | 82,650,700 | |||||||
| Seafarer Overseas Value Fund | 4,015,175 | 194,349 | (142,884 | ) | 51,465 | |||||||||||
Tax Basis of Distributions to Shareholders
The character of distributions made during the year from net investment income or net realized gains may differ from its ultimate characterization for federal income tax purposes. Also, due to the timing of dividend distributions, the fiscal year in which amounts are distributed may differ from the fiscal year in which the income or realized gain is recorded by the Funds.
The tax character of distributions paid by the Seafarer Overseas Growth and Income Fund for the fiscal year ended April 30, 2016, were as follows:
| 40 | (855) 732-9220 seafarerfunds.com |
| Seafarer Funds | Notes to Financial Statements |
October 31, 2016 (Unaudited)
Ordinary Income | Long-Term Capital Gain | |||||||
| Seafarer Overseas Growth and Income Fund | $ | 1,973,654 | $ | 1,573,580 | ||||
The amounts and characteristics of tax basis distributions and composition of distributable earnings/(accumulated losses) are finalized at fiscal year end. Accordingly, tax basis balances have not been determined as of October 31, 2016.
4. Securities Transactions
The cost of purchases and proceeds from sales of securities excluding short term securities during the six months or period ended October 31, 2016, were as follows:
| Purchases of Securities | Proceeds From Sales of Securities | |||||||
| Seafarer Overseas Growth and Income Fund | $ | 606,841,432 | $ | 56,060,842 | ||||
| Seafarer Overseas Value Fund | 4,015,175 | – | ||||||
5. Shares of Beneficial Interest
The capitalization of the Trust consists of an unlimited number of shares of beneficial interest with no par value per share. Holders of shares of the Funds of the Trust have one vote for each share held and a proportionate fraction of a vote for each fractional share. All shares issued and outstanding are fully paid and are transferable and redeemable at the option of the shareholder. Purchasers of the shares do not have any obligation to make payments to the Trust or its creditors solely by reason of the purchasers’ ownership of the shares. Shares have no pre-emptive rights.
Prior to August, 31, 2016, shares redeemed within 90 days of purchase may incur a 2% short-term redemption fee deducted from the redemption amount. The redemption fee is reflected in the “Shares redeemed, net of redemption fees” in the Statements of Changes in Net Assets. Effective August 31, 2016, the Funds no longer impose a redemption fee. During the six months or period ended October 31, 2016, and the year ended April 30, 2016, the Funds retained the following redemption fees:
| Fund | Six Months Ended October 31, 2016 (Unaudited) | Year ended April 30, 2016 | ||||||
| Seafarer Overseas Growth and Income Fund | ||||||||
| Investor Class | $ | 40,363 | $ | 136,085 | ||||
| Institutional Class | 49,013 | 152,697 | ||||||
Seafarer Overseas Value Fund(a) | ||||||||
| Investor Class | – | – | ||||||
| Institutional Class | – | – | ||||||
(a) | The Seafarer Overseas Value Fund launched on May 31, 2016. |
6. Management and Related Party Transactions
The Adviser, subject to the authority of the Board, is responsible for the overall management and administration of the Funds’ business affairs. The Adviser manages the investments of the Funds in accordance with the Funds’ investment objectives, policies, limitations and investment guidelines established jointly by the Adviser and the Trustees. Pursuant to the investment advisory agreement, the Funds, in the aggregate, pay the Adviser an annual management fee of 0.75% of the aggregate average daily net assets of the Funds up to $1.5 billion and 0.70% of the aggregate average daily net assets of the Funds over $1.5 billion. Each Fund pays the Adviser a monthly fee at the annual rate using the applicable management fee calculated based on the Fund’s pro rata share of the Funds’ average
| Semi-Annual Report – October 31, 2016 | 41 |
| Seafarer Funds | Notes to Financial Statements |
October 31, 2016 (Unaudited)
daily net assets. Prior to August 31, 2016, the Funds paid the Adviser an annual management fee of 0.75% of the aggregate average daily net assets of the Funds. The management fee is paid on a monthly basis.
Effective September 1, 2014, the Adviser contractually agreed to limit certain Fund expenses (excluding brokerage expenses, interest expenses, taxes and extraordinary expenses), to 1.25% and 1.05% of the Funds’ average daily net assets in the Investor and Institutional share classes, respectively, through August 31, 2015. Effective September 1, 2015, the Adviser has agreed contractually to waive and/or reimburse fees or expenses in order to limit Total Annual Fund Operating Expenses After Fee Waiver / Expense Reimbursements (excluding brokerage expenses, interest expenses, taxes and extraordinary expenses) to 1.15% and 1.05% of the Funds’ average daily net assets for the Investor and Institutional share classes respectively. This agreement (the “Expense Agreement”) is in effect through August 31, 2017. The Adviser will be permitted to recover, on a class-by-class basis, expenses it has borne through the Expense Agreement to the extent that the Funds’ expenses in later periods fall below the expense cap in effect at the time of waiver or reimbursement. The Funds will not be obligated to pay any such deferred fees and expenses more than three years after the end of the fiscal year(s) in which the fees and expenses were deferred. This agreement may not be terminated or modified prior to August 31, 2017, except with the approval of the Funds’ Board. During the six months or period ended October 31, 2016, the Adviser agreed that it will only seek to recoup waived management fees and will not recoup any reimbursed expenses. As of October 31, 2016, the Adviser has recouped all available waived management fees from the Seafarer Overseas Growth and Income Fund.
For the period ended October 31, 2016, the fee waivers and/or reimbursements were as follows for the Seafarer Overseas Value Fund:
| Fund | Fees Waived/ Reimbursed By Adviser | |||
Seafarer Overseas Value Fund(a) | ||||
| Investor Class | $ | 2,227 | ||
| Institutional Class | 64,082 | |||
(a) | The Seafarer Overseas Value Fund launched on May 31, 2016. |
As of October 31, 2016, the balances of recoupable expenses for each class were as follows for the Funds:
| Fund | Expires 2016 | Expires 2017 | Expires 2018 | Total | ||||||||||||
| Seafarer Overseas Growth and Income Fund | ||||||||||||||||
| Investor Class | $ | – | $ | – | $ | – | $ | – | ||||||||
| Institutional Class | – | – | – | – | ||||||||||||
| Seafarer Overseas Value Fund | ||||||||||||||||
| Investor Class | – | – | – | – | ||||||||||||
| Institutional Class | – | – | – | – | ||||||||||||
Fund Administrator
ALPS Fund Services, Inc. (“ALPS” and the “Administrator”) (an affiliate of ALPS Distributors, Inc.) provides administrative, fund accounting and other services to the Funds under the Administration, Bookkeeping and Pricing Services Agreement with the Trust.
| 42 | (855) 732-9220 seafarerfunds.com |
| Seafarer Funds | Notes to Financial Statements |
| October 31, 2016 (Unaudited) |
The Funds’ administrative fee is accrued on a daily basis and paid monthly. The Administrator is also reimbursed by the Funds for certain out-of-pocket expenses. Administration fees paid by the Funds for the six months or period ended October 31, 2016 are disclosed in the Statements of Operations.
Transfer Agent
ALPS serves as transfer, dividend paying and shareholder servicing agent for the Funds (“Transfer Agent”). ALPS is paid an annual base fee per Fund and a fee based on the number of shareholder accounts. The Transfer Agent is also reimbursed by the Funds for certain out-of-pocket expenses. Transfer agent fees paid by the Funds for the six months or period ended October 31, 2016 are disclosed in the Statements of Operations.
Compliance Services
ALPS provides compliance services to the Funds under the Chief Compliance Officer Services Agreement with the Trust. ALPS provides services that assist the Trust’s chief compliance officer in monitoring and testing the policies and procedures of the Trust in accordance with the requirements of Rule 38a-1 under the 1940 Act. ALPS is paid an annual base fee and is reimbursed for certain out-of-pocket expenses. Compliance service fees paid by the Funds for the six months or period ended October 31, 2016 are disclosed in the Statements of Operations.
Principal Financial Officer
ALPS provides principal financial officer services to the Funds under the Principal Financial Officer Services Agreement with the Trust. Under this Agreement, ALPS is paid an annual base fee and is reimbursed for certain out-of-pocket expenses. Principal financial officer fees paid by the Funds for the six months or period ended October 31, 2016 are disclosed in the Statements of Operations.
Distributor
ALPS Distributors, Inc. (“ADI” or the “Distributor”) (an affiliate of ALPS) acts as the distributor of the Funds’ shares pursuant to the Distribution Agreement with the Trust. Under a side letter agreement, the Adviser pays ADI an annual base fee of $12,000 per Fund for the distribution services. The Adviser also reimburses ADI for certain out-of-pocket expenses. Shares are sold on a continuous basis by ADI as agent for the Funds, and ADI has agreed to use its best efforts to solicit orders for the sale of the Funds’ shares, although it is not obliged to sell any particular amount of shares. ADI is registered as a broker-dealer with the U.S. Securities and Exchange Commission.
Shareholder Service Plan for Investor Class and Institutional Class Shares
Each Fund has adopted a Shareholder Services Plan (a “Services Plan”) for each of its share classes. Under the Services Plan, each Fund is authorized to enter into shareholder service agreements with investment advisers, financial institutions and other service providers (“Participating Organizations”) to maintain and provide certain administrative and servicing functions in relation to the accounts of shareholders. Shareholder service arrangements typically include processing orders for shares, generating account and confirmation statements, sub-accounting, account maintenance, tax reporting, and disbursing cash dividends as well as other investment or administrative services required for the particular Participating Organizations’ products, programs, platform and accounts. The Services Plan will cause each Fund to pay an aggregate fee, not to exceed on an annual basis 0.15% and 0.05% of the average daily net asset value of the Investor and Institutional share classes, respectively. Such payments will be made on assets attributable to or held in the name of a Participating Organization, on behalf of its clients as compensation for providing service activities pursuant to an agreement with the Participating Organization. Any amount of such payment not paid to a Participating Organization during a Fund’s fiscal year for such service activities shall be reimbursed to the Fund as soon as practicable after the end of the fiscal year. Shareholder service plan fees paid by each Fund for the six months or period ended October 31, 2016 are disclosed in the Statements of Operations.
| Semi-Annual Report – October 31, 2016 | 43 |
| Seafarer Funds | Notes to Financial Statements |
| October 31, 2016 (Unaudited) |
7. Indemnifications
Under the Trust’s organizational documents, its officers and Trustees are indemnified against certain liability arising out of the performance of their duties to the Trust. Additionally, in the normal course of business, the Trust enters into contracts with service providers that may contain general indemnification clauses, which may permit indemnification to the extent permissible under the applicable law. The Trust’s maximum exposure under these arrangements is unknown, as this would involve future claims that may be made against the Trust that have not yet occurred.
| 44 | (855) 732-9220 seafarerfunds.com |
| Seafarer Funds | Additional Information |
| October 31, 2016 (Unaudited) |
ADDITIONAL INFORMATION
1. Fund Holdings
Each Fund files its complete schedule of portfolio holdings with the Securities and Exchange Commission (the “SEC”) for the first and third quarters of each fiscal year on Form N-Q within 60 days after the end of the period. Copies of the Funds’ Form N-Q are available without charge on the SEC website at http://www.sec.gov. You may also review and copy the Form N-Q at the SEC’s Public Reference Room in Washington, D.C. For more information about the operation of the Public Reference Room, please call the SEC at 1-800-SEC-0330.
2. Fund Proxy Voting Policies, Procedures and Summaries
The Funds’ policies and procedures used in determining how to vote proxies and information regarding how the Funds voted proxies relating to portfolio securities during the most recent prior 12-month period ending June 30 are available without charge, (1) upon request, by calling toll-free (855) 732-9220 and (2) on the SEC’s website at http://www.sec.gov.
| Semi-Annual Report – October 31, 2016 | 45 |
| Seafarer Funds | Approval of Fund Advisory Agreement |
| October 31, 2016 (Unaudited) |
DISCLOSURE REGARDING APPROVAL OF FUND ADVISORY AGREEMENT
On December 15, 2015, the Trustees met in person to discuss, among other things, the approval of the investment advisory agreement between the Trust and Seafarer Capital Partners, LLC (the “Adviser,” “Seafarer”) (the “Investment Advisory Agreement”), in accordance with Section 15(c) of the Investment Company Act of 1940, as amended. The Independent Trustees met with independent legal counsel during executive session and discussed the Investment Advisory Agreement and other related materials. In approving the Investment Advisory Agreement with the Adviser, the Trustees, including the Independent Trustees, considered the following factors with respect to the Seafarer Overseas Value Fund (the “Value Fund”):
Investment Advisory Fee Rate
The Trustees reviewed and considered the contractual annual advisory fee paid by the Trust, on behalf of the Value Fund, to Seafarer of 0.75% of the Value Fund’s average daily net assets, in light of the extent and quality of the advisory services provided by Seafarer to the Value Fund.
The Board received and considered information including a comparison of the Value Fund’s contractual and actual management fees and overall expenses with those of funds in the expense group and universes of funds selected by an independent provider of investment company data (the “Data Provider”). The Trustees noted that the contractual management fee rate for the Value Fund was below the average and median contractual management fee rates of the Data Provider expense group.
Total Expense Ratios
Based on such information, the Trustees further reviewed and considered the total expense ratio (after waivers) of 1.05% for the Institutional Class of Value Fund. The Trustees noted that the Value Fund’s total expense ratio (after waivers) was below the average and median total expense ratios of the Data Provider expense group.
Nature, Extent and Quality of the Services under the Investment Advisory Agreement
The Trustees received and considered information regarding the nature, extent and quality of services to be provided to the Value Fund under the Investment Advisory Agreement. The Trustees reviewed certain background materials supplied by Seafarer in its presentation, including its Form ADV.
The Trustees reviewed and considered Seafarer’s investment advisory personnel, its history as an asset manager and its performance and the amount of assets currently under management by Seafarer and its affiliated entities. The Trustees also reviewed the research and decision-making processes utilized by Seafarer, including the methods adopted to seek to achieve compliance with the investment objectives, policies and restrictions of the Value Fund.
The Trustees considered the background and experience of Seafarer’s management in connection with the Value Fund, including reviewing the qualifications, backgrounds and responsibilities of the management team primarily responsible for the day-to-day portfolio management of the Value Fund and the extent of the resources devoted to research and analysis of actual and potential investments.
The Trustees also reviewed, among other things, Seafarer’s insider trading policies and procedures and its Code of Ethics.
Performance
The Trustees noted that since the Value Fund has not yet begun operations, there is no performance of the Value Fund to be reviewed or analyzed at this time. The Trustees further considered Seafarer’s reputation generally and its investment techniques, risk management controls and decision-making processes.
| 46 | (855) 732-9220 seafarerfunds.com |
| Seafarer Funds | Approval of Fund Advisory Agreement |
| October 31, 2016 (Unaudited) |
Comparable Accounts
The Trustees noted certain information provided by Seafarer regarding fees charged to other Seafarer clients and considered Seafarer’s statements indicating that there were no clients with investment mandates directly comparable to that of the Value Fund.
Profitability
The Trustees received and considered a projected profitability analysis through September 30, 2016 prepared by Seafarer based on the fees to be payable under the Investment Advisory Agreement with respect to the Value Fund. The Trustees considered the profits, if any, anticipated to be realized by Seafarer in connection with the operation of the Value Fund. The Board then reviewed Seafarer’s unaudited financial statements, including profit and loss statements for the fiscal year 2014 and the period of October 1, 2014 to September 30, 2015 and balance sheets as of December 31, 2014 and September 30, 2015 in order to analyze the financial condition and stability and profitability of Seafarer.
Economies of Scale
The Trustees considered whether economies of scale in the provision of services to the Value Fund will be passed along to the shareholders under the proposed agreements.
Other Benefits to the Adviser
The Trustees reviewed and considered any other incidental benefits to be derived by Seafarer from its relationship with the Value Fund, including whether soft dollar arrangements were used.
In approving Seafarer as the Value Fund’s investment adviser and approving the Investment Advisory Agreement and the fees charged under the Investment Advisory Agreement, the Trustees concluded that no single factor reviewed by the Trustees was identified by the Trustees to be determinative as the principal factor in whether to approve the Investment Advisory Agreement. Further, the Independent Trustees were advised by separate independent legal counsel throughout the process. The Trustees, including all of the Independent Trustees, concluded that:
| ● | the contractual management fee rate was below the average and median expense group contractual management fee rate for the Value Fund; |
| ● | the terms of the proposed fee waiver/expense reimbursement letter agreement between the Trust, on behalf of the Value Fund, and Seafarer, were reasonable; |
| ● | the total expense ratio (after waivers) was below the average and median expense group total expense ratios (after waivers) for the Value Fund; |
| ● | the nature, extent and quality of services to be rendered by Seafarer under the Investment Advisory Agreement with respect to the Value Fund were adequate; |
| ● | since the Value Fund has not yet begun operations, there is no performance of the Value Fund to be reviewed or analyzed at this time; |
| ● | bearing in mind the limitations of comparing different types of managed accounts and the different levels of service typically associated with such accounts, the fee structures applicable to Seafarer’s other clients were not indicative of any unreasonableness with respect to the advisory fees proposed to be payable by the Value Fund; |
| ● | the profit, if any, to be realized by Seafarer in connection with the operation of the Value Fund is not unreasonable to the Value Fund; and |
| ● | there were no material economies of scale or other incidental benefits accruing to Seafarer in connection with its relationship with the Value Fund. |
| Semi-Annual Report – October 31, 2016 | 47 |
| Seafarer Funds | Approval of Fund Advisory Agreement |
| October 31, 2016 (Unaudited) |
During the review process, the Trustees noted certain instances where clarification or follow-up was appropriate and others where the Trustees determined that further clarification or follow-up was not necessary. In those instances where clarification or follow-up was requested, the Board determined that in each case either information responsive to its requests had been provided, or where any request was outstanding in whole or in part, given the totality of the information provided with respect to the Investment Advisory Agreement, the Board had received sufficient information to renew and approve the Investment Advisory Agreement.
Based on the Trustees’ deliberations and their evaluation of the information described above, the Trustees, including all of the Independent Trustees, concluded that Seafarer’s compensation for investment advisory services is consistent with the best interests of the Value Fund and its shareholders.
| 48 | (855) 732-9220 seafarerfunds.com |


Table of Contents
| CONTENTS | PAGE |
| Shareholder Letter | 1 |
| Fund Overview | |
| Vulcan Value Partners Fund | 5 |
| Vulcan Value Partners Small Cap Fund | 8 |
| Disclosure of Fund Expenses | |
| Vulcan Value Partners Fund | 7 |
| Vulcan Value Partners Small Cap Fund | 10 |
| Statements of Investments | |
| Vulcan Value Partners Fund | 11 |
| Vulcan Value Partners Small Cap Fund | 14 |
| Statements of Assets and Liabilities | 18 |
| Statements of Operations | 19 |
| Statements of Changes in Net Assets | |
| Vulcan Value Partners Fund | 20 |
| Vulcan Value Partners Small Cap Fund | 21 |
| Financial Highlights | |
| Vulcan Value Partners Fund | 22 |
| Vulcan Value Partners Small Cap Fund | 24 |
| Notes to Financial Statements | 26 |
| Additional Information | 34 |
www.vulcanvaluepartners.com
Shareholder Letter
October 31, 2016 (Unaudited)
PORTFOLIO REVIEW
General
For the six months ended October 31, 2016, Vulcan Value Partners Fund returned -1.34% and the Vulcan Value Partners Small Cap Fund returned 3.38%. Vulcan Value Partners Fund and Vulcan Value Partners Small Cap Fund have produced exceptional long-term returns. As you know, we place no weight on short-term results, good or bad, and neither should you. In fact, we have and will continue to willingly make decisions that negatively impact short-term performance when we think we can lower risk and improve our long-term returns. We encourage you to place more weight on our longer term historical results and a great deal of weight on our long-term prospects.
Record low interest rates engineered by the world’s leading central banks have created an almost desperate search for yield. This monetary stimulus has caused supposedly defensive, higher dividend-yielding stocks to become dangerously overvalued. Until recently, consumer staples companies, utilities, and Real Estate Investment Trusts (REITs) have outperformed the broader market. Valuation and, in the case of utilities, quality concerns, have kept us out of those areas. Recently, many of the companies in these sectors have begun to decline in price, but we believe they remain overvalued.
REITs deserve special mention. They just became a separate sector of the S&P 500. In the 1990’s, REITs were attractively priced. While several REITs are on our MVP list, all of them are overvalued today, in our opinion. As a group, REITs’ dividend yield is 3.2%, and they trade at just under 25 times free cash flow so their free cash flow(1) yield is approximately 4%. They are also highly leveraged. Over time, growth in rental income should approximate inflation, which the U.S. Federal Reserve is targeting at 2%. With financial leverage, REITs should be able to grow their bottom line (Funds from Operations in REIT parlance) and dividends at perhaps 4%. One other data point: Post Properties, an Atlanta based apartment REIT, recently announced that they are being acquired at roughly 26 times free cash flow, or for less than a 4% free cash flow yield. While higher quality retail and office REITs have longer leases ranging from 3 to 10 years, apartment REITs generally turn over roughly half of their units annually. So just to break even, they have to resell half of their product annually before they can grow.
Our results over the past year in particular have been held back because we refuse to buy, in our opinion, overvalued and extremely risky parts of the market. We instead allocate capital to what we believe are extremely high quality companies whose valuations are ludicrously low in comparison. As serious, long-term investors who are required to invest in equities exclusively through Vulcan Value Partners, we would not invest our money or yours any other way. We look nothing like an index, so it is reasonable to expect us to perform nothing like an index. In the short- run it can be painful. In the long-run we believe your patient capital, alongside of ours, will be amply rewarded for following our investment discipline instead of following the crowd.
Vulcan Value Partners Large Cap Fund Review
In the discussion that follows, we highlight a few holdings in the Vulcan Value Partners Fund.
| Semi-Annual Report | October 31, 2016 | 1 |
Shareholder Letter
October 31, 2016 (Unaudited)
Qualcomm was the largest contributor over the period, with a return of over 36%. As price and value converged, we followed our investment discipline and sold Qualcomm to redeploy capital into more discounted companies.
As we mentioned earlier, until recently, REITs have outperformed the broader market. So, what if Oracle, our largest position, was a REIT? How might it be valued? Oracle has over 90% customer retention. They have long-term contracts called licensing agreements that have inflation-adjusted escalators. So Oracle’s revenue structure looks a lot like higher quality REITs with long-term leases and much better than apartment REITs like Post Properties. Oracle, however, can add new services such as Cloud computing and acquire more customers without having to build new properties. In real estate terms, Oracle can grow its “occupancy” without physical constraints. We estimate that Oracle can grow its bottom line at a high upper single-digit rate for many, many years, so let us use 8% as an estimate. Moreover, unlike REITs, which are highly leveraged, Oracle has net cash on its balance sheet. So Oracle’s estimated growth rate is twice as fast as the typical REIT without leverage. Adjusted for cash, Oracle trades at less than 11.5 times free cash flow, so its free cash flow yield is roughly 8.8%.
So, Oracle, which can grow at 8%, or twice as fast as the average REIT, sells for less than half the valuation of the average REIT and less than half the valuation paid for Post Properties. Why? Oracle only has a relatively paltry 1.6% dividend yield. REITs use most of their free cash flow to pay a dividend. Oracle uses most of its free cash flow, roughly 80% in fact, to repurchase its discounted stock. This capital allocation decision is highly beneficial to us as long-term shareholders because a dollar of dividends is only worth a dollar while a dollar of share repurchases is worth more than a dollar because Oracle’s stock is selling for less than its estimated intrinsic worth. If the market valued Oracle’s free cash flow stream, which is higher quality and growing twice as fast as the average REIT, at the same yield as the average REIT, then Oracle’s stock price would be more than twice as high as it is currently.
Marriott was a new purchase during the period. Marriott International is buying Starwood Hotels and Resorts, another company we have owned in the past that worked out well for us. Marriott already has a number of global hotel brands but does not have much exposure to the boutique hotel segment that is increasingly popular with travelers. We think the combination with Starwood further enhances Marriott International’s competitive position in the industry.
We sold Check Point during the period. It was also a successful investment for us. We held it for nearly four years. Over that time period its value grew nicely, and its price compounded at rates in the mid-teens. As price and value converged, our margin of safety(2) narrowed, and we sold Check Point to reallocate capital into more discounted names.
Vulcan Value Partners Small Cap Fund Review
In the discussion that follows, we highlight a few holdings in the Vulcan Value Partners Small Cap Fund.
The largest contributor during the period to the Vulcan Value Partners Small Cap Fund, SAI Global, deserves special mention. SAI Global, an Australian based standards and assurance company, was up over 31% during the period. We are a forced seller as it is being acquired by Baring Private Equity Asia at a price very close to our estimate of fair value.
| 2 | www.vulcanvaluepartners.com |
Shareholder Letter
October 31, 2016 (Unaudited)
Fossil was a material detractor during the period. We think we are right about Fossil, but we will be the first to tell you that we are human and make mistakes. Fossil has committed substantial resources to expand into smart watches and wearables. We think they are making good decisions that will benefit long-term shareholders but these decisions have hurt short-term results. We should see evidence of their success or lack thereof this Christmas selling season. If Fossil executes well, our investment case is intact. If they do not execute, then we have made a mistake. So, the critical aspect of our analysis is our assessment of the people running the company. Management, led by Kosta Kartsotis, retains our confidence. Kosta has been the long serving CEO, and during his tenure, he has turned Fossil into a leading lifestyle branded watch company. In hindsight, he and Fossil were too cautious and moved too slowly into smart watches. As investments in wearables have weighed on results, Kosta has not taken a salary or bonus for the last three years. He is the largest private owner of Fossil’s stock. Actions speak louder than words, and we are impressed with the leadership Kosta has shown.
A new purchase, Sotheby’s, enjoys a global oligopoly with Christie’s and Phillips. The company, founded in 1744, is older than the United States and has strong brand name recognition among art buyers and sellers worldwide. Auction houses are the preferred venue to sell higher value art, so Sotheby’s has maintained market share despite competition from galleries and online auction sites. The company generates strong free cash flow and is using it to repurchase its discounted stock.
We sold Curtis-Wright during the period. It was an excellent investment for us. We held it for almost four years. Over that time the company grew its value at a low double-digit rate, and the stock price compounded at over 20% per annum as price and value converged. We sold Curtis- Wright because it rose to our estimate of fair value so that we no longer had a margin of safety.
Closing
We appreciate the confidence you have placed in us. Your stable capital, invested alongside our own stable capital provides a foundation that allows us make sound, long-term investment decisions that help mitigate risk and provide the opportunity to achieve superior long-term results. These decisions mean that we look nothing like an index, which can be painful for investors with time horizons shorter than yours and ours, which is why so few are able to do it and why so few outperform the market over the long-term. You, our client-partners, are one of our most important competitive advantages.
C.T. Fitzpatrick
Chief Executive Officer
Vulcan Value Partners, LLC
| Semi-Annual Report | October 31, 2016 | 3 |
Shareholder Letter
October 31, 2016 (Unaudited)
Past performance does not guarantee future results. Fund prices fluctuate as the underlying assets have exposure to market fluctuations and other risks, as described in the Fund’s prospectus. Please call 877.421.5078 to obtain current performance information and for the current prospectus and statement of additional information. This material must be preceded or accompanied by a prospectus. Please read the prospectus carefully before investing.
The views of the Vulcan Value Partners, LLC and information discussed in this commentary are as of the date of publication, are subject to change, and may not reflect the writer's current views. The views expressed represent an assessment of market conditions at a specific point in time, are opinions only and should not be relied upon as investment advice regarding a particular investment or markets in general. Such information does not constitute a recommendation to buy or sell specific securities or investment vehicles. It should not be assumed that any investment will be profitable or will equal the performance of the Funds or any securities or any sectors mentioned in this letter. The subject matter contained in this letter has been derived from several sources believed to be reliable and accurate at the time of compilation. Neither Vulcan Value Partners, LLC nor the Funds accept any liability for losses either direct or consequential caused by the use of this information.
The Funds are distributed by ALPS Distributors, Inc.
The Funds are subject to investment risks, including possible loss of the principal amount invested and therefore is not suitable for all investors. The Funds may not achieve their objectives.
Diversification does not eliminate the risk of experiencing investment losses.
| (1) | Free Cash Flow is a measure of how much a business generates after accounting for capital expenditures. It is calculated as operating cash flow less capital expenditures. |
| (2) | Margin of Safety is a favorable difference between the price of a company’s shares and the estimated intrinsic value of those shares. |
| 4 | www.vulcanvaluepartners.com |
Fund Overview
October 31, 2016 (Unaudited)
VULCAN VALUE PARTNERS FUND
Cumulative Total Returns (as of 10/31/16)
| Since Inception* | Expense Ratios | ||||||
| 6 Month | 1 Year | 3 Year | 5 Year | Total | Net(1) | ||
| Vulcan Value Partners Fund | -1.34% | -1.79% | 4.89% | 13.00% | 11.33% | 1.08% | 1.08% |
S&P 500® Total Return Index(2) | 4.06% | 4.51% | 8.84% | 13.57% | 12.07% | ||
Russell 1000® Value Index(3) | 4.36% | 6.37% | 7.59% | 13.31% | 11.57% | ||
Performance data quoted represents past performance. Past performance does not guarantee future results. Investment return and principal value of an investment will fluctuate so that an investor’s shares, when sold or redeemed, may be worth more or less than the original cost. The Fund imposes a 2.00% redemption fee on shares held for less than 90 days. Current performance data may be higher or lower than actual data quoted. For the most current month-end performance data, please call 1-877-421-5078.
The table does not reflect the deduction of taxes that a shareholder would pay on Fund distributions or the redemption of Fund shares.
Subject to investment risks, including possible loss of the principal amount invested.
Returns for periods greater than 1 year are annualized.
| * | Fund inception date of 12/30/09. |
(1) | Vulcan Value Partners, LLC (“Vulcan” or the “Adviser”) has contractually agreed to limit the Fund’s total annual fund operating expenses (exclusive of Acquired Fund Fees and Expenses, brokerage expenses, interest expense, taxes and extraordinary expenses) to 1.25% of the Fund’s average daily net assets. This agreement (the “Expense Agreement”) is in effect through August 31, 2017. The Adviser will be permitted to recover, on a class-by-class basis, expenses it has borne through the Expense Agreement to the extent that the Fund’s expenses in later periods fall below the expense cap in effect at the time of waiver or reimbursement. Notwithstanding the foregoing, the Fund will not be obligated to pay any such fees and expenses more than three years after the end of the fiscal year in which the fees or expenses were foregone or reimbursed. The Adviser may not discontinue or modify this waiver prior to August 31, 2017 without the approval by the Fund’s Board of Trustees. |
(2) | The S&P 500® Total Return Index is an unmanaged index of 500 common stocks chosen for market size, liquidity and industry group representation. It is a market-value weighted index. The Index is not actively managed and does not reflect any deductions for fees, expenses or taxes. An investor may not invest directly in the Index. |
(3) | The Russell 1000® Value Index measures the performance of the large-cap value segment of the U.S.equity universe. It includes those Russell 1000® companies with lower price-to-book ratios and lower expected growth values. The index is not actively managed and does not reflect any deductions for fees, expense or taxes. An investor may not invest directly in an index. |
| Semi-Annual Report | October 31, 2016 | 5 |
Fund Overview
October 31, 2016 (Unaudited)
Performance of $10,000 Initial Investment (for the period ended October 31, 2016)
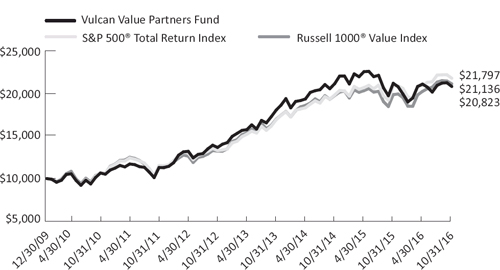
The chart above represents historical performance of a hypothetical investment of $10,000 in the Fund since inception. Past performance does not guarantee future results. This chart does not reflect the deduction of taxes that a shareholder would pay on Fund distributions or the redemption of Fund shares.
Investing in the Fund is subject to investment risks, including possible loss of the principal amount invested.
Industry Allocation (as a % of Net Assets)*
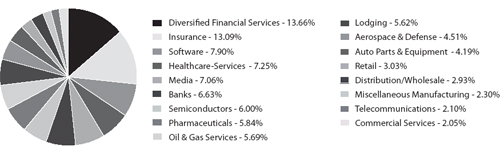
| * | Holdings are subject to change, and may not reflect the current or future position of the portfolio. |
| 6 | www.vulcanvaluepartners.com |
Disclosure of Fund Expenses
October 31, 2016 (Unaudited)
As a shareholder of the Vulcan Value Partners Fund (the “Fund”), you will incur two types of costs: (1) transaction costs, including applicable redemption fees; and (2) ongoing costs, including management fees and other fund operating expenses. The following examples are intended to help you understand your ongoing costs (in dollars) of investing in the Fund and to compare these costs with the ongoing costs of investing in other mutual funds. The examples are based on an investment of $1,000 invested on May 1, 2016 and held until October 31, 2016.
Actual Expenses. The first line of each table below provides information about actual account values and actual expenses. You may use the information in this line, together with the amount you invested, to estimate the expenses that you paid over the period. Simply divide your account value by $1,000 (for example, an $8,600 account value divided by $1,000 = 8.6), then multiply the result by the number in the first line under the heading “Expenses Paid During Period” to estimate the expenses you paid on your account during this period.
Hypothetical Example for Comparison Purposes. The second line of the table below provides information about hypothetical account values and hypothetical expenses based on the Fund’s actual expense ratio and an assumed rate of return of 5% per year before expenses, which is not the Fund’s actual return. The hypothetical account values and expenses may not be used to estimate the actual ending account balance or expenses you paid for the period. You may use this information to compare the ongoing costs of investing in the Fund and other mutual funds. To do so, compare this 5% hypothetical example with the 5% hypothetical examples that appear in the shareholder reports of the other mutual funds.
Please note the expenses shown in the table are meant to highlight ongoing Fund costs only and do not reflect transactional costs, such as redemption fees or exchange fees. Therefore, the second line of the table below is useful in comparing your ongoing costs only, and will not help you determine the relative total costs of owning different funds. In addition, if these transactional costs were included, your costs would have been higher.
Vulcan Value Partners Fund
Beginning Account Value 5/1/16 | Ending Account Value 10/31/16 | Expense Ratio(a) | Expenses Paid During period 5/1/16 - 10/31/16(b) | |
| Actual | $1,000.00 | $986.60 | 1.07% | $5.36 |
| Hypothetical (5% return before expenses) | $1,000.00 | $1,019.81 | 1.07% | $5.45 |
(a) | The Fund's expense ratios have been annualized based on the Fund's most recent fiscal half- year expenses. |
(b) | Expenses are equal to the Fund's annualized expense ratio multiplied by the average account value over the period, multiplied by the number of days in the most recent fiscal half-year (184)/365 (to reflect the half-year period). |
| Semi-Annual Report | October 31, 2016 | 7 |
Fund Overview
October 31, 2016 (Unaudited)
VULCAN VALUE PARTNERS SMALL CAP FUND
Cumulative Total Returns (as of 10/31/16)
Since Inception* | Expense Ratios | ||||||
| 6 Month | 1 Year | 3 Year | 5 Year | Total | Net(1) | ||
| Vulcan Value Partners Small Cap Fund | 3.38% | 3.51% | 4.24% | 13.82% | 13.44% | 1.26% | 1.26% |
Russell 2000® Value Index(2) | 7.54% | 8.81% | 4.47% | 11.63% | 10.54% | ||
Russell 2000® Index(3) | 6.13% | 4.11% | 4.12% | 11.51% | 11.18% | ||
Performance data quoted represents past performance. Past performance does not guarantee future results. Investment return and principal value of an investment will fluctuate so that an investor’s shares, when sold or redeemed, may be worth more or less than the original cost. The Fund imposes a 2.00% redemption fee on shares held for less than 90 days. Current performance data may be higher or lower than actual data quoted. For the most current month-end performance data, please call 1-877-421-5078.
The table does not reflect the deduction of taxes that a shareholder would pay on Fund distributions or the redemption of Fund shares.
Subject to investment risks, including possible loss of the principal amount invested.
Returns for periods greater than 1 year are annualized.
| * | Fund inception date of 12/30/09. |
(1) | Vulcan Value Partners, LLC (“Vulcan” or the “Adviser”) has contractually agreed to limit the Fund’s total annual fund operating expenses (exclusive of Acquired Fund Fees and Expenses, brokerage expenses, interest expense, taxes and extraordinary expenses) to 1.25% of the Fund’s average daily net assets. This agreement (the “Expense Agreement”) is in effect through August 31, 2017. The Adviser will be permitted to recover, on a class-by-class basis, expenses it has borne through the Expense Agreement to the extent that the Fund’s expenses in later periods fall below the expense cap in effect at the time of waiver or reimbursement. Notwithstanding the foregoing, the Fund will not be obligated to pay any such fees and expenses more than three years after the end of the fiscal year in which the fees or expenses were foregone or reimbursed. The Adviser may not discontinue or modify this waiver prior to August 31, 2017 without the approval by the Fund’s Board of Trustees. |
(2) | The Russell 2000® Value Index measures the performance of small-cap value segment of the U.S.equity universe. It includes those Russell 2000® companies with lower price-to-book ratios and lower forecasted growth values. The index is not actively managed and does not reflect any deductions for fees, expense or taxes. An investor may not invest directly in an index. |
(3) | The Russell 2000® Index measures the performance of the small-cap segment of the U.S. equity universe. The Russell 2000® Index is a subset of the Russell 3000® Index representing approximately 8% of the total market capitalization of that index. It includes approximately 2,000 of the smallest securities based on a combination of their market cap and current index membership. The index is not actively managed and does not reflect any deductions for fees, expense or taxes. An investor may not invest directly in an index. |
| 8 | www.vulcanvaluepartners.com |
Fund Overview
October 31, 2016 (Unaudited)
Performance of $10,000 Initial Investment (for the period ended October 31, 2016)
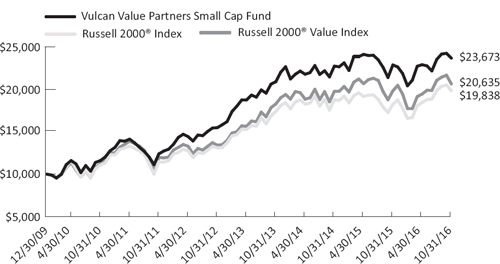
The chart above represents historical performance of a hypothetical investment of $10,000 in the Fund since inception. Past performance does not guarantee future results. This chart does not reflect the deduction of taxes that a shareholder would pay on Fund distributions or the redemption of Fund shares.
Investing in the Fund is subject to investment risks, including possible loss of the principal amount invested.
Industry Allocation (as a % of Net Assets)*
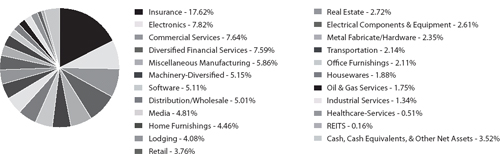
| * | Holdings are subject to change, and may not reflect the current or future position of the portfolio. |
| Semi-Annual Report | October 31, 2016 | 9 |
Disclosure of Fund Expenses
October 31, 2016 (Unaudited)
As a shareholder of the Vulcan Value Partners Small Cap Fund (the “Fund”), you will incur two types of costs: (1) transaction costs, including applicable redemption fees; and (2) ongoing costs, including management fees and other fund operating expenses. The following examples are intended to help you understand your ongoing costs (in dollars) of investing in the Fund and to compare these costs with the ongoing costs of investing in other mutual funds. The examples are based on an investment of $1,000 invested on May 1, 2016 and held until October 31, 2016.
Actual Expenses. The first line of each table below provides information about actual account values and actual expenses. You may use the information in this line, together with the amount you invested, to estimate the expenses that you paid over the period. Simply divide your account value by $1,000 (for example, an $8,600 account value divided by $1,000 = 8.6), then multiply the result by the number in the first line under the heading “Expenses Paid During Period” to estimate the expenses you paid on your account during this period.
Hypothetical Example for Comparison Purposes. The second line of the table below provides information about hypothetical account values and hypothetical expenses based on the Fund’s actual expense ratio and an assumed rate of return of 5% per year before expenses, which is not the Fund’s actual return. The hypothetical account values and expenses may not be used to estimate the actual ending account balance or expenses you paid for the period. You may use this information to compare the ongoing costs of investing in the Fund and other mutual funds. To do so, compare this 5% hypothetical example with the 5% hypothetical examples that appear in the shareholder reports of the other mutual funds.
Please note the expenses shown in the table are meant to highlight ongoing Fund costs only and do not reflect transactional costs, such as redemption fees or exchange fees. Therefore, the second line of the table below is useful in comparing your ongoing costs only, and will not help you determine the relative total costs of owning different funds. In addition, if these transactional costs were included, your costs would have been higher.
Vulcan Value Partners Small Cap Fund
Beginning Account Value 5/1/16 | Ending Account Value 10/31/16 | Expense Ratio(a) | Expenses Paid During period 5/1/16 - 10/31/16(b) | |
| Actual | $1,000.00 | $1,033.80 | 1.25% | $6.41 |
| Hypothetical (5% return before expenses) | $1,000.00 | $1,018.90 | 1.25% | $ 6.36 |
(a) | The Fund's expense ratios have been annualized based on the Fund's most recent fiscal half- year expenses. |
(b) | Expenses are equal to the Fund's annualized expense ratio multiplied by the average account value over the period, multiplied by the number of days in the most recent fiscal half-year (184)/365 (to reflect the half-year period). |
| 10 | www.vulcanvaluepartners.com |
| Vulcan Value Partners Fund | Statement of Investments |
October 31, 2016 (Unaudited)
| Shares | Value (Note 2) | |||||||
| COMMON STOCKS (99.85%) | ||||||||
| Communications (9.16%) | ||||||||
| Media (7.06%) | ||||||||
Discovery Communications, Inc., Class C(a) | 1,982,716 | $ | 49,785,999 | |||||
| Time Warner, Inc. | 239,322 | 21,297,265 | ||||||
| Walt Disney Co. | 288,610 | 26,751,261 | ||||||
| 97,834,525 | ||||||||
| Telecommunications (2.10%) | ||||||||
| Cisco Systems, Inc. | 951,127 | 29,180,576 | ||||||
| TOTAL COMMUNICATIONS | 127,015,101 | |||||||
| Consumer, Cyclical (15.77%) | ||||||||
| Auto Parts & Equipment (4.19%) | ||||||||
| GKN PLC | 14,862,018 | 58,066,092 | ||||||
| Distribution/Wholesale (2.93%) | ||||||||
Fossil Group, Inc.(a) | 1,489,979 | 40,631,727 | ||||||
| Lodging (5.62%) | ||||||||
| Hilton Worldwide Holdings, Inc. | 1,809,644 | 40,897,954 | ||||||
| Intercontinental Hotels Group PLC, ADR | 648,364 | 25,577,960 | ||||||
| Marriott International, Inc., Class A | 167,071 | 11,477,778 | ||||||
| 77,953,692 | ||||||||
| Retail (3.03%) | ||||||||
| CVS Health Corp. | 499,799 | 42,033,096 | ||||||
| TOTAL CONSUMER, CYCLICAL | 218,684,607 | |||||||
| Consumer, Non‐cyclical (15.14%) | ||||||||
| Commercial Services (2.05%) | ||||||||
| Sabre Corp. | 1,098,659 | 28,378,362 | ||||||
| Healthcare‐Services (7.25%) | ||||||||
| Aetna, Inc. | 240,296 | 25,795,775 | ||||||
| Anthem, Inc. | 443,959 | 54,100,844 | ||||||
| UnitedHealth Group, Inc. | 146,117 | 20,650,716 | ||||||
| 100,547,335 | ||||||||
| Pharmaceuticals (5.84%) | ||||||||
| AmerisourceBergen Corp. | 356,884 | 25,096,083 | ||||||
| Semi-Annual Report | October 31, 2016 | 11 |
| Statement of Investments | Vulcan Value Partners Fund |
October 31, 2016 (Unaudited)
| Shares | Value (Note 2) | |||||||
| Consumer, Non‐cyclical (continued) | ||||||||
| Pharmaceuticals (continued) | ||||||||
| McKesson Corp. | 439,092 | $ | 55,839,329 | |||||
| 80,935,412 | ||||||||
| TOTAL CONSUMER, NON‐CYCLICAL | 209,861,109 | |||||||
| Energy (5.69%) | ||||||||
| Oil & Gas Services (5.69%) | ||||||||
| National Oilwell Varco, Inc. | 2,457,779 | 78,894,706 | ||||||
| TOTAL ENERGY | 78,894,706 | |||||||
| Financial (33.38%) | ||||||||
| Banks (6.63%) | ||||||||
| Bank of New York Mellon Corp. | 891,386 | 38,570,272 | ||||||
| State Street Corp. | 759,665 | 53,336,080 | ||||||
| 91,906,352 | ||||||||
| Diversified Financial Services (13.66%) | ||||||||
| Franklin Resources, Inc. | 1,968,626 | 66,263,951 | ||||||
| Mastercard, Inc., Class A | 516,264 | 55,250,573 | ||||||
| T. Rowe Price Group, Inc. | 409,476 | 26,210,559 | ||||||
| Visa, Inc., Class A | 505,545 | 41,712,518 | ||||||
| 189,437,601 | ||||||||
| Insurance (13.09%) | ||||||||
| Axis Capital Holdings, Ltd. | 1,007,288 | 57,385,197 | ||||||
| Everest Re Group, Ltd. | 267,307 | 54,402,321 | ||||||
| Swiss Re AG | 751,191 | 69,763,481 | ||||||
| 181,550,999 | ||||||||
| TOTAL FINANCIAL | 462,894,952 | |||||||
| Industrial (6.81%) | ||||||||
| Aerospace & Defense (4.51%) | ||||||||
| Boeing Co. | 341,510 | 48,641,269 | ||||||
| United Technologies Corp. | 136,893 | 13,990,465 | ||||||
| 62,631,734 | ||||||||
| Miscellaneous Manufacturing (2.30%) | ||||||||
| Parker‐Hannifin Corp. | 259,452 | 31,847,733 | ||||||
| TOTAL INDUSTRIAL | 94,479,467 | |||||||
| 12 | www.vulcanvaluepartners.com |
| Vulcan Value Partners Fund | Statement of Investments |
October 31, 2016 (Unaudited)
| Shares | Value (Note 2) | |||||||
| Technology (13.90%) | ||||||||
| Semiconductors (6.00%) | ||||||||
Qorvo, Inc.(a) | 759,500 | $ | 42,266,175 | |||||
| Skyworks Solutions, Inc. | 532,681 | 40,984,476 | ||||||
| 83,250,651 | ||||||||
| Software (7.90%) | ||||||||
| Oracle Corp. | 2,850,812 | 109,528,197 | ||||||
| TOTAL TECHNOLOGY | 192,778,848 | |||||||
| TOTAL COMMON STOCKS (Cost $1,339,372,569) | 1,384,608,790 | |||||||
TOTAL INVESTMENTS (99.85%) (Cost $1,339,372,569) | $ | 1,384,608,790 | ||||||
| Other Assets In Excess Of Liabilities (0.15%) | 2,067,532 | |||||||
| NET ASSETS (100.00%) | $ | 1,386,676,322 | ||||||
(a) | Non-Income Producing Security. |
For Fund compliance purposes, the Fund's industry classifications refer to any one or more of the industry sub-classifications used by one or more widely recognized market indexes or ratings group indexes, and/or as defined by Fund management. This definition may not apply for purposes of this report, which may combine industry sub-classifications for reporting ease. Industries are shown as a percentage of net assets.
See Accompanying Notes to Financial Statements.
| Semi-Annual Report | October 31, 2016 | 13 |
| Statement of Investments | Vulcan Value Partners Small Cap Fund |
| October 31, 2016 (Unaudited) |
| Shares | Value (Note 2) | |||||||
| COMMON STOCKS (96.48%) | ||||||||
| Communications (4.81%) | ||||||||
| Media (4.81%) | ||||||||
| SAI Global, Ltd. | 15,447,712 | $ | 54,995,036 | |||||
| TOTAL COMMUNICATIONS | 54,995,036 | |||||||
| Consumer, Cyclical (21.30%) | ||||||||
| Distribution/Wholesale (5.01%) | ||||||||
Fossil Group, Inc.(a) | 1,469,127 | 40,063,093 | ||||||
WESCO International, Inc.(a) | 317,163 | 17,190,235 | ||||||
| 57,253,328 | ||||||||
| Home Furnishings (4.46%) | ||||||||
Select Comfort Corp.(a) | 2,657,673 | 51,000,745 | ||||||
| Housewares (1.88%) | ||||||||
| Tupperware Brands Corp. | 360,526 | 21,458,507 | ||||||
| Lodging (4.08%) | ||||||||
| Choice Hotels International, Inc. | 335,215 | 16,241,167 | ||||||
La Quinta Holdings, Inc.(a) | 3,043,728 | 30,467,717 | ||||||
| 46,708,884 | ||||||||
| Office Furnishings (2.11%) | ||||||||
| Herman Miller, Inc. | 868,511 | 24,144,606 | ||||||
| Retail (3.76%) | ||||||||
| Halfords Group PLC | 1,881,309 | 7,810,843 | ||||||
Sally Beauty Holdings, Inc.(a) | 1,355,447 | 35,160,295 | ||||||
| 42,971,138 | ||||||||
| TOTAL CONSUMER, CYCLICAL | 243,537,208 | |||||||
| Consumer, Non‐cyclical (8.15%) | ||||||||
| Commercial Services (7.64%) | ||||||||
| CEB, Inc. | 172,320 | 8,383,368 | ||||||
Navigant Consulting, Inc.(a) | 988,421 | 23,129,052 | ||||||
| Savills PLC | 2,819,197 | 23,947,866 | ||||||
| Sotheby’s | 890,774 | 31,960,971 | ||||||
| 87,421,257 | ||||||||
| 14 | www.vulcanvaluepartners.com |
| Vulcan Value Partners Small Cap Fund | Statement of Investments |
| October 31, 2016 (Unaudited) |
| Shares | Value (Note 2) | |||||||
| Consumer, Non‐cyclical (continued) | ||||||||
| Healthcare‐Services (0.51%) | ||||||||
| Chemed Corp | 41,332 | $ | 5,845,171 | |||||
| TOTAL CONSUMER, NON‐CYCLICAL | 93,266,428 | |||||||
| Energy (1.75%) | ||||||||
| Oil & Gas Services (1.75%) | ||||||||
Thermon Group Holdings, Inc.(a) | 1,093,403 | 20,042,077 | ||||||
| TOTAL ENERGY | 20,042,077 | |||||||
| Financial (28.09%) | ||||||||
| Diversified Financial Services (7.59%) | ||||||||
| Ashmore Group PLC | 5,086,585 | 21,859,442 | ||||||
| Eaton Vance Corp. | 643,834 | 22,572,820 | ||||||
| Virtus Investment Partners, Inc. | 394,731 | 42,354,636 | ||||||
| 86,786,898 | ||||||||
| Insurance (17.62%) | ||||||||
| Aspen Insurance Holdings, Ltd. | 1,137,307 | 54,875,063 | ||||||
| Axis Capital Holdings, Ltd. | 821,083 | 46,777,098 | ||||||
| Everest Re Group, Ltd. | 195,386 | 39,764,959 | ||||||
| Navigators Group, Inc. | 485,760 | 45,272,832 | ||||||
| Safety Insurance Group, Inc. | 219,093 | 14,832,596 | ||||||
| 201,522,548 | ||||||||
| Real Estate (2.72%) | ||||||||
| Jones Lang LaSalle, Inc. | 320,785 | 31,068,027 | ||||||
| REITS (0.16%) | ||||||||
| Outfront Media, Inc. | 83,929 | 1,805,313 | ||||||
| TOTAL FINANCIAL | 321,182,786 | |||||||
| Industrial (27.27%) | ||||||||
| Electrical Components & Equipment (2.61%) | ||||||||
| EnerSys | 458,703 | 29,875,326 | ||||||
| Electronics (7.82%) | ||||||||
| Ituran Location and Control, Ltd. | 1,936,082 | 51,499,781 | ||||||
| Woodward, Inc. | 643,416 | 37,948,676 | ||||||
| 89,448,457 | ||||||||
| Semi-Annual Report | October 31, 2016 | 15 |
| Statement of Investments | Vulcan Value Partners Small Cap Fund |
| October 31, 2016 (Unaudited) |
| Shares | Value (Note 2) | |||||||
| Industrial (continued) | ||||||||
| Industrial Services (1.34%) | ||||||||
| MSC Industrial Direct Co., Inc., Class A | 209,839 | $ | 15,276,279 | |||||
| Machinery‐Diversified (5.15%) | ||||||||
| Concentric AB | 2,123,280 | 25,271,126 | ||||||
| Lindsay Corp. | 429,673 | 33,643,396 | ||||||
| 58,914,522 | ||||||||
| Metal Fabricate/Hardware (2.35%) | ||||||||
| Timken Co. | 812,050 | 26,838,253 | ||||||
| Miscellaneous Manufacturing (5.86%) | ||||||||
| Actuant Corp., Class A | 1,504,974 | 33,560,920 | ||||||
| Crane Co. | 294,748 | 20,045,811 | ||||||
| Donaldson Co., Inc. | 367,240 | 13,411,605 | ||||||
| 67,018,336 | ||||||||
| Transportation (2.14%) | ||||||||
| Forward Air Corp. | 591,746 | 24,450,945 | ||||||
| TOTAL INDUSTRIAL | 311,822,118 | |||||||
| Technology (5.11%) | ||||||||
| Software (5.11%) | ||||||||
ACI Worldwide, Inc.(a) | 3,225,980 | 58,454,758 | ||||||
| TOTAL TECHNOLOGY | 58,454,758 | |||||||
| TOTAL COMMON STOCKS (Cost $1,066,989,631) | 1,103,300,411 | |||||||
| 16 | www.vulcanvaluepartners.com |
| Vulcan Value Partners Small Cap Fund | Statement of Investments |
| October 31, 2016 (Unaudited) |
| 7-Day Yield | Shares | Value (Note 2) | ||||||||||
| SHORT TERM INVESTMENTS (4.34%) | ||||||||||||
| Money Market Fund (4.34%) | ||||||||||||
| Dreyfus Treasury Prime Cash Management Fund, Institutional Shares | 0.210 | % | 49,594,213 | $ | 49,594,213 | |||||||
| TOTAL SHORT TERM INVESTMENTS (Cost $49,594,213) | 49,594,213 | |||||||||||
TOTAL INVESTMENTS (100.82%) (Cost $1,116,583,844) | $ | 1,152,894,624 | ||||||||||
| Liabilities In Excess Of Other Assets (‐0.82%) | (9,333,969 | ) | ||||||||||
| NET ASSETS (100.00%) | $ | 1,143,560,655 | ||||||||||
| (a) | Non-Income Producing Security. |
For Fund compliance purposes, the Fund’s industry classifications refer to any one or more of the industry sub-classifications used by one or more widely recognized market indexes or ratings group indexes, and/or as defined by Fund management. This definition may not apply for purposes of this report, which may combine industry sub-classifications for reporting ease. Industries are shown as a percentage of net assets.
| See Accompanying Notes to Financial Statements. |
| Semi-Annual Report | October 31, 2016 | 17 |
Statements of Assets and Liabilities
October 31, 2016 (Unaudited)
| Vulcan Value Partners Fund | Vulcan Value Partners Small Cap Fund | |||||||
| ASSETS: | ||||||||
| Investments, at value | $ | 1,384,608,790 | $ | 1,152,894,624 | ||||
| Receivable for investments sold | 44,774,327 | – | ||||||
| Receivable for shares sold | 73,971 | 202,182 | ||||||
| Dividends receivable | 901,722 | 363,555 | ||||||
| Other assets | 14,901 | 19,009 | ||||||
| Total assets | 1,430,373,711 | 1,153,479,370 | ||||||
| LIABILITIES: | ||||||||
| Cash due to custodian | 275,212 | – | ||||||
| Payable for investments purchased | 41,650,148 | 7,170,583 | ||||||
| Payable for shares redeemed | 360,608 | 1,409,712 | ||||||
| Payable to adviser | 1,205,974 | 1,147,086 | ||||||
| Payable for administration fees | 34,188 | 28,139 | ||||||
| Payable for transfer agency fees | 16,818 | 13,197 | ||||||
| Payable for delegated transfer agent equivalent services fees | 30,856 | 73,648 | ||||||
| Payable for professional fees | 15,460 | 13,358 | ||||||
| Payable for trustee fees and expenses | 5,741 | 3,439 | ||||||
| Payable for principal financial officer fees | 544 | 330 | ||||||
| Accrued expenses and other liabilities | 101,840 | 59,223 | ||||||
| Total liabilities | 43,697,389 | 9,918,715 | ||||||
| NET ASSETS | $ | 1,386,676,322 | $ | 1,143,560,655 | ||||
| NET ASSETS CONSIST OF: | ||||||||
| Paid‐in capital (Note 5) | $ | 1,370,727,310 | $ | 1,114,693,718 | ||||
| Accumulated net investment income | 17,628,794 | 2,532,560 | ||||||
| Accumulated net realized loss | (46,907,356 | ) | (9,975,834 | ) | ||||
| Net unrealized appreciation | 45,227,574 | 36,310,211 | ||||||
| NET ASSETS | $ | 1,386,676,322 | $ | 1,143,560,655 | ||||
| INVESTMENTS, AT COST | $ | 1,339,372,569 | $ | 1,116,583,844 | ||||
| PRICING OF SHARES: | ||||||||
| Net Asset Value, offering and redemption price per share | $ | 16.94 | $ | 17.14 | ||||
| Shares of beneficial interest outstanding (unlimited number of shares, no par value common stock authorized) | 81,846,538 | 66,720,511 | ||||||
See Accompanying Notes to Financial Statements.
| 18 | www.vulcanvaluepartners.com |
Statements of Operations
For the Six Months Ended October 31, 2016 (Unaudited)
| Vulcan Value Partners Fund | Vulcan Value Partners Small Cap Fund | |||||||
| INVESTMENT INCOME: | ||||||||
| Dividends | $ | 15,911,366 | $ | 7,355,921 | ||||
| Foreign taxes withheld | – | (166,042 | ) | |||||
| Total investment income | 15,911,366 | 7,189,879 | ||||||
| EXPENSES: | ||||||||
| Investment advisory fees (Note 6) | 7,201,355 | 6,729,195 | ||||||
| Administrative fees | 200,629 | 163,592 | ||||||
| Transfer agency fees | 71,894 | 55,795 | ||||||
| Delegated transfer agent equivalent services fees | 66,773 | 163,025 | ||||||
| Professional fees | 21,980 | 19,263 | ||||||
| Custodian fees | 107,238 | 73,883 | ||||||
| Principal financial officer fees | 2,835 | 2,205 | ||||||
| Trustee fees and expenses | 15,406 | 11,955 | ||||||
| Recoupment of previously waived fees | – | 48,100 | ||||||
| Other | 45,319 | 46,722 | ||||||
| Total net expenses | 7,733,429 | 7,313,735 | ||||||
| NET INVESTMENT INCOME/(LOSS) | 8,177,937 | (123,856 | ) | |||||
| Net realized gain on investments | 2,764,432 | 34,228,406 | ||||||
| Net realized gain/(loss) on foreign currency transactions | (253,594 | ) | 15,335 | |||||
| Net realized gain | 2,510,838 | 34,243,741 | ||||||
| Net change in unrealized appreciation/(depreciation) of investments | (31,978,856 | ) | 5,907,151 | |||||
| Net change in unrealized depreciation on translation of assets and liabilities denominated in foreign currencies | (87,374 | ) | (11,940 | ) | ||||
| Net change in unrealized appreciation/(depreciation) | (32,066,230 | ) | 5,895,211 | |||||
| NET REALIZED AND UNREALIZED GAIN/(LOSS) ON INVESTMENTS | (29,555,392 | ) | 40,138,952 | |||||
| NET INCREASE/(DECREASE) IN NET ASSETS RESULTING FROM OPERATIONS | $ | (21,377,455 | ) | $ | 40,015,096 | |||
See Accompanying Notes to Financial Statements.
| Semi-Annual Report | October 31, 2016 | 19 |
| Statements of Changes in Net Assets | Vulcan Value Partners Fund |
For the Six Months Ended October 31, 2016 (Unaudited) | For the Year Ended April 30, 2016 | |||||||
| OPERATIONS: | ||||||||
| Net investment income | $ | 8,177,937 | $ | 18,348,805 | ||||
| Net realized gain | 2,510,838 | 10,248,578 | ||||||
| Net change in unrealized depreciation | (32,066,230 | ) | (154,854,968 | ) | ||||
| Net decrease in net assets resulting from operations | (21,377,455 | ) | (126,257,585 | ) | ||||
| DISTRIBUTIONS TO SHAREHOLDERS (Note 3): | ||||||||
| From net investment income | – | (12,104,797 | ) | |||||
| From net realized gains on investments | – | (119,403,152 | ) | |||||
| Net decrease in net assets from distributions | – | (131,507,949 | ) | |||||
| SHARE TRANSACTIONS (Note 5): | ||||||||
| Proceeds from sales of shares | 91,785,010 | 572,087,701 | ||||||
| Issued to shareholders in reinvestment of distributions | – | 108,659,155 | ||||||
| Cost of shares redeemed, net of redemption fees | (211,811,663 | ) | (665,005,259 | ) | ||||
| Net increase/(decrease) from share transactions | (120,026,653 | ) | 15,741,597 | |||||
| Net decrease in net assets | (141,404,108 | ) | (242,023,937 | ) | ||||
| NET ASSETS: | ||||||||
| Beginning of year | 1,528,080,430 | 1,770,104,367 | ||||||
| End of period* | $ | 1,386,676,322 | $ | 1,528,080,430 | ||||
| *Includes accumulated net investment income of: | $ | 17,628,794 | $ | 9,450,857 | ||||
See Accompanying Notes to Financial Statements.
| 20 | www.vulcanvaluepartners.com |
| Vulcan Value Partners Small Cap Fund | Statements of Changes in Net Assets |
For the Six Months Ended October 31, 2016 (Unaudited) | For the Year Ended April 30, 2016 | |||||||
| OPERATIONS: | ||||||||
| Net investment income/(loss) | $ | (123,856 | ) | $ | 6,643,642 | |||
| Net realized gain | 34,243,741 | 2,674,138 | ||||||
| Net change in unrealized appreciation/(depreciation) | 5,895,211 | (62,869,159 | ) | |||||
| Net increase/(decrease) in net assets resulting from operations | 40,015,096 | (53,551,379 | ) | |||||
| DISTRIBUTIONS TO SHAREHOLDERS (Note 3): | ||||||||
| From net investment income | – | (3,951,718 | ) | |||||
| From net realized gains on investments | – | (63,400,984 | ) | |||||
| Net decrease in net assets from distributions | – | (67,352,702 | ) | |||||
| SHARE TRANSACTIONS (Note 5): | ||||||||
| Proceeds from sales of shares | 124,956,414 | 333,969,377 | ||||||
| Issued to shareholders in reinvestment of distributions | – | 55,331,982 | ||||||
| Cost of shares redeemed, net of redemption fees | (168,417,773 | ) | (254,512,720 | ) | ||||
| Net increase/(decrease) from share transactions | (43,461,359 | ) | 134,788,639 | |||||
| Net increase/(decrease) in net assets | (3,446,263 | ) | 13,884,558 | |||||
| NET ASSETS: | ||||||||
| Beginning of year | 1,147,006,918 | 1,133,122,360 | ||||||
| End of period* | $ | 1,143,560,655 | $ | 1,147,006,918 | ||||
| *Includes accumulated net investment income of: | $ | 2,532,560 | $ | 2,656,416 | ||||
See Accompanying Notes to Financial Statements.
| Semi-Annual Report | October 31, 2016 | 21 |
Financial Highlights
For a share outstanding throughout the years presented.
| NET ASSET VALUE, BEGINNING OF PERIOD |
| INCOME/(LOSS) FROM OPERATIONS: |
Net investment income(a) |
| Net realized and unrealized gain/(loss) on investments |
| Total from investment operations |
| LESS DISTRIBUTIONS TO SHAREHOLDERS: |
| From net investment income |
| From net realized gains on investments |
| Total distributions |
| Redemption fees added to paid‐in capital |
| Increase/(decrease) in net asset value |
| NET ASSET VALUE, END OF PERIOD |
| Total return |
| RATIOS AND SUPPLEMENTAL DATA: |
| Net assets, end of period (000's) |
| Ratio of expenses to average net assets without fee waivers/reimbursements |
| Ratio of expenses to average net assets including fee waivers/reimbursements |
| Net investment income to average net assets including fee waivers/reimbursements |
| Portfolio turnover rate |
(a) | Per share numbers have been calculated using the average shares method. |
(b) | Less than $0.005 per share. |
(c) | Not annualized. |
(d) | Annualized. |
| See Accompanying Notes to Financial Statements. |
| 22 | www.vulcanvaluepartners.com |
| Vulcan Value Partners Fund |
For the Six Months Ended October 31, 2016 (Unaudited) | For the Year Ended April 30, 2016 | For the Year Ended April 30, 2015 | For the Year Ended April 30, 2014 | For the Year Ended April 30, 2013 | For the Year Ended April 30, 2012 | |||||||||||||||||
| $ | 17.17 | $ | 19.97 | $ | 18.20 | $ | 15.28 | $ | 13.03 | $ | 11.66 | |||||||||||
| 0.10 | 0.20 | 0.22 | 0.14 | 0.15 | 0.02 | |||||||||||||||||
| (0.33 | ) | (1.51 | ) | 2.77 | 3.33 | 2.35 | 1.45 | |||||||||||||||
| (0.23 | ) | (1.31 | ) | 2.99 | 3.47 | 2.50 | 1.47 | |||||||||||||||
| – | (0.13 | ) | (0.17 | ) | (0.11 | ) | (0.12 | ) | (0.01 | ) | ||||||||||||
| – | (1.36 | ) | (1.05 | ) | (0.44 | ) | (0.13 | ) | (0.09 | ) | ||||||||||||
| – | (1.49 | ) | (1.22 | ) | (0.55 | ) | (0.25 | ) | (0.10 | ) | ||||||||||||
| 0.00 | (b) | 0.00 | (b) | 0.00 | (b) | 0.00 | (b) | 0.00 | (b) | 0.00 | (b) | |||||||||||
| (0.23 | ) | (2.80 | ) | 1.77 | 2.92 | 2.25 | 1.37 | |||||||||||||||
| $ | 16.94 | $ | 17.17 | $ | 19.97 | $ | 18.20 | $ | 15.28 | $ | 13.03 | |||||||||||
| (1.34 | %)(c) | (6.49 | %) | 16.61 | % | 22.84 | % | 19.33 | % | 12.73 | % | |||||||||||
| $ | 1,386,676 | $ | 1,528,080 | $ | 1,770,104 | $ | 929,829 | $ | 447,297 | $ | 125,087 | |||||||||||
| 1.07 | %(d) | 1.08 | % | 1.08 | % | 1.09 | % | 1.18 | % | 1.51 | % | |||||||||||
| 1.07 | %(d) | 1.08 | % | 1.08 | % | 1.09 | % | 1.18 | % | 1.50 | % | |||||||||||
| 1.14 | %(d) | 1.10 | % | 1.12 | % | 0.80 | % | 1.06 | % | 0.16 | % | |||||||||||
| 30 | %(c) | 85 | % | 64 | % | 56 | % | 24 | % | 49 | % | |||||||||||
| Semi-Annual Report | October 31, 2016 | 23 |
| Financial Highlights |
| For a share outstanding throughout the years presented. |
| NET ASSET VALUE, BEGINNING OF PERIOD |
| INCOME/(LOSS) FROM OPERATIONS: |
Net investment income/(loss)(a) |
| Net realized and unrealized gain/(loss) on investments |
| Total from investment operations |
| LESS DISTRIBUTIONS TO SHAREHOLDERS: |
| From net investment income |
| From net realized gains on investments |
| Total distributions |
| Redemption fees added to paid‐in capital |
| Increase/(decrease) in net asset value |
| NET ASSET VALUE, END OF PERIOD |
| Total return |
| RATIOS AND SUPPLEMENTAL DATA: |
| Net assets, end of period (000's) |
| Ratio of expenses to average net assets without fee waivers/reimbursements |
| Ratio of expenses to average net assets including fee waivers/reimbursements |
| Net investment income/(loss) to average net assets including fee waivers/reimbursements |
| Portfolio turnover rate |
(a) | Per share numbers have been calculated using the average shares method. |
(b) | Less than $(0.005) per share. |
(c) | Less than $0.005 per share. |
(d) | Not annualized. |
(e) | Annualized. |
| See Accompanying Notes to Financial Statements. |
| 24 | www.vulcanvaluepartners.com |
| Vulcan Value Partners Small Cap Fund |
For the Six Months Ended October 31, 2016 (Unaudited) | For the Year Ended April 30, 2016 | For the Year Ended April 30, 2015 | For the Year Ended April 30, 2014 | For the Year Ended April 30, 2013 | For the Year Ended April 30, 2012 | |||||||||||||||||
| $ | 16.58 | $ | 18.61 | $ | 18.74 | $ | 16.97 | $ | 13.18 | $ | 13.72 | |||||||||||
| (0.00 | )(b) | 0.10 | 0.10 | (0.01 | ) | 0.03 | 0.02 | |||||||||||||||
| 0.56 | (1.05 | ) | 1.77 | 2.76 | 3.91 | 0.17 | ||||||||||||||||
| 0.56 | (0.95 | ) | 1.87 | 2.75 | 3.94 | 0.19 | ||||||||||||||||
| – | (0.06 | ) | (0.11 | ) | – | (0.06 | ) | – | ||||||||||||||
| – | (1.02 | ) | (1.89 | ) | (0.98 | ) | (0.09 | ) | (0.73 | ) | ||||||||||||
| – | (1.08 | ) | (2.00 | ) | (0.98 | ) | (0.15 | ) | (0.73 | ) | ||||||||||||
| 0.00 | (c) | 0.00 | (c) | 0.00 | (c) | 0.00 | (c) | 0.00 | (c) | 0.00 | (c) | |||||||||||
| 0.56 | (2.03 | ) | (0.13 | ) | 1.77 | 3.79 | (0.54 | ) | ||||||||||||||
| $ | 17.14 | $ | 16.58 | $ | 18.61 | $ | 18.74 | $ | 16.97 | $ | 13.18 | |||||||||||
| 3.38 | %(d) | (5.04 | %) | 10.74 | % | 16.11 | % | 30.07 | % | 2.10 | % | |||||||||||
| $ | 1,143,561 | $ | 1,147,007 | $ | 1,133,122 | $ | 1,066,246 | $ | 425,152 | $ | 40,103 | |||||||||||
| 1.25 | %(e) | 1.25 | % | 1.26 | % | 1.30 | % | 1.38 | % | 1.86 | % | |||||||||||
| 1.25 | %(e) | 1.25 | % | 1.25 | % | 1.25 | % | 1.28 | % | 1.50 | % | |||||||||||
| (0.02 | %)(e) | 0.61 | % | 0.56 | % | (0.05 | %) | 0.21 | % | 0.15 | % | |||||||||||
| 20 | %(d) | 80 | % | 73 | % | 70 | % | 57 | % | 57 | % | |||||||||||
| Semi-Annual Report | October 31, 2016 | 25 |
Notes to Financial Statements
October 31, 2016 (Unaudited)
1. ORGANIZATION
Financial Investors Trust (the “Trust”) is organized as a Delaware statutory trust and is registered as an open-end management investment company under the Investment Company Act of 1940, as amended (“1940 Act”). The Trust consists of multiple separate portfolios or series. This semi-annual report describes the Vulcan Value Partners Fund and Vulcan Value Partners Small Cap Fund (each a “Fund” and collectively, the “Funds”). The Funds seek to achieve long-term capital appreciation. The Funds are classified as a non-diversified investment company for purpose of the 1940 Act.
2. SIGNIFICANT ACCOUNTING POLICIES
The accompanying financial statements were prepared in accordance with accounting principles generally accepted in the United States of America (“U.S. GAAP”), including policies specific to investment companies. The preparation of financial statements in conformity with U.S. GAAP requires management to make certain estimates and assumptions that affect the reported amounts of assets and liabilities and disclosures of contingent assets and liabilities at the date of the financial statements and the reported amounts of revenue and expenses during the period. Actual results could differ from those estimates. The Funds are considered an investment company for financial reporting purposes under U.S. GAAP. The following is a summary of significant accounting policies consistently followed by the Funds in preparation of their financial statements.
Investment Valuation: The Funds generally value their securities based on market prices determined at the close of regular trading on the New York Stock Exchange (“NYSE”), normally 4:00 p.m. Eastern Time, on each day the NYSE is open for trading.
For equity securities and mutual funds that are traded on an exchange, the market price is usually the closing sale or official closing price on that exchange. In the case of equity securities not traded on an exchange, or if such closing prices are not otherwise available, the securities are valued at the mean of the most recent bid and ask prices on such day. Redeemable securities issued by open-end registered investment companies are valued at the investment company’s applicable net asset value, with the exception of exchange-traded open-end investment companies, which are priced as equity securities.
The market price for debt obligations is generally the quote supplied by an independent third-party pricing service approved by the Board of Trustees (the “Board”), which may use a matrix, formula or other objective method that takes into consideration quotations from dealers, market transactions in comparable investments, market indices and yield curves. If vendors are unable to supply a quote, or if the quote supplied is deemed to be unreliable, the market price may be determined using quotations received from one or more broker–dealers that make a market in the security.
Equity securities that are primarily traded on foreign securities exchanges are valued at the preceding closing values of such securities on their respective exchanges, except when an occurrence subsequent to the time a value was so established is likely to have changed such value. In such an event, the fair values of those securities are determined in good faith through consideration of other factors in accordance with procedures established by and under the general supervision of the Board.
| 26 | www.vulcanvaluepartners.com |
Notes to Financial Statements
October 31, 2016 (Unaudited)
When such prices or quotations are not available, or when Vulcan Value Partners, LLC (the “Adviser”) believes that they are unreliable, securities may be priced using fair value procedures approved by the Board.
Fair Value Measurements: A three-tier hierarchy has been established to classify fair value measurements for disclosure purposes. Inputs refer broadly to the assumptions that market participants would use in pricing the asset or liability, including assumptions about risk. Inputs may be observable or unobservable. Observable inputs are inputs that reflect the assumptions market participants would use in pricing the asset or liability that are developed based on market data obtained from sources independent of the reporting entity. Unobservable inputs are inputs that reflect the reporting entity’s own assumptions about the assumptions market participants would use in pricing the asset or liability that are developed based on the best information available. Various inputs are used in determining the value of each Fund’s investments as of the reporting period end. The designated input levels are not necessarily an indication of the risk or liquidity associated with these investments. These inputs are categorized in the following hierarchy under applicable financial accounting standards:
| Level 1 – | Unadjusted quoted prices in active markets for identical investments, unrestricted assets or liabilities that the Funds have the ability to access at the measurement date; |
| Level 2 – | Quoted prices which are not active, quoted prices for similar assets or liabilities in active markets or inputs other than quoted prices that are observable (either directly or indirectly) for substantially the full term of the asset or liability; and |
| Level 3 – | Significant unobservable prices or inputs (including the Funds’ own assumptions in determining the fair value of investments) where there is little or no market activity for the asset or liability at the measurement date. |
The following is a summary of each input used to value each Fund’s investments as of October 31, 2016.
Vulcan Value Partners Fund:
| Investments in Securities at Value | Level 1 - Unadjusted Quoted Prices | Level 2 - Other Significant Observable Inputs | Level 3 - Significant Unobservable Inputs | Total | ||||||||||||
Common Stocks(a) | $ | 1,384,608,790 | $ | – | $ | – | $ | 1,384,608,790 | ||||||||
| TOTAL | $ | 1,384,608,790 | $ | – | $ | – | $ | 1,384,608,790 | ||||||||
Vulcan Value Partners Small Cap Fund:
| Investments in Securities at Value | Level 1 - Unadjusted Quoted Prices | Level 2 - Other Significant Observable Inputs | Level 3 - Significant Unobservable Inputs | Total | ||||||||||||
Common Stocks(a) | $ | 1,103,300,411 | $ | – | $ | – | $ | 1,103,300,411 | ||||||||
| Short Term Investments | 49,594,213 | – | – | 49,594,213 | ||||||||||||
| TOTAL | $ | 1,152,894,624 | $ | – | $ | – | $ | 1,152,894,624 | ||||||||
(a) | For detailed descriptions of the underlying industries, see the accompanying Statements of Investments. |
| Semi-Annual Report | October 31, 2016 | 27 |
Notes to Financial Statements
October 31, 2016 (Unaudited)
The Funds recognize transfers between levels as of the end of period. For the six months ended October 31, 2016, the Funds did not have any transfers between Level 1 and Level 2. For the six months ended October 31, 2016, the Funds did not have any securities that used significant unobservable inputs (Level 3) in determining fair value.
Investment Transactions and Investment Income: Investment transactions are accounted for on the date the investments are purchased or sold (trade date). Realized gains and losses from investment transactions are reported on an identified cost basis, which is the same basis the Funds use for federal income tax purposes. Interest income, which includes accretion of discounts and amortization of premiums, is accrued and recorded as earned. Dividend income is recognized on the ex-dividend date or for certain foreign securities, as soon as information is available to the Funds. All of the realized and unrealized gains and losses and net investment income, are allocated daily to each class in proportion to its average daily net assets.
Real Estate Investment Trusts (“REITs”): The Funds may invest a portion of their assets in REITs and are subject to certain risks associated with direct investment in REITs. REITs may be affected by changes in the value of their underlying properties and by defaults by borrowers or tenants. REITs depend generally on their ability to generate cash flow to make distributions to shareowners, and certain REITs have self-liquidation provisions by which mortgages held may be paid in full and distributions of capital returns may be made at any time. In addition, the performance of a REIT may be affected by its failure to qualify for tax-free pass-through of income under the Internal Revenue Code of 1986, as amended (the “Code”), or its failure to maintain exemption from registration under the 1940 Act. A Fund’s investments in REITs may result in such Fund’s receipt of cash in excess of the REITs’ earnings. If the Fund receives such distributions all or a portion of these distributions will constitute a return of capital to such Fund. Receiving a return of capital distribution from REITs will reduce the amount of income available to be distributed to Fund shareholders. Income from REITs generally will not be eligible for treatment as qualified dividend income. As the final character of the distributions is not known until reported by the REITs on their 1099s, the Funds utilize an average of the prior year’s reallocation information as an estimate for the current year character of distributions.
Foreign Securities: The Funds may directly purchase securities of foreign issuers. Investing in securities of foreign issuers involves special risks not typically associated with investing in securities of U.S. issuers. The risks include possible reevaluation of currencies, the inability to repatriate foreign currency, less complete financial information about companies and possible future adverse political and economic developments. Moreover, securities of many foreign issuers and their markets may be less liquid and their prices more volatile than those of securities of comparable U.S. issuers.
Foreign Currency Translation: The books and records of the Fund are maintained in U.S. dollars. Investment valuations and other assets and liabilities initially expressed in foreign currencies are converted each business day into U.S. dollars based upon current exchange rates. Prevailing foreign exchange rates may generally be obtained at the close of the NYSE (normally, 4:00 p.m. Eastern Time). The portion of realized and unrealized gains or losses on investments due to fluctuations in foreign currency exchange rates is not separately disclosed and is included in realized and unrealized gains or losses on investments, when applicable.
| 28 | www.vulcanvaluepartners.com |
Notes to Financial Statements
October 31, 2016 (Unaudited)
Trust Expenses: Some expenses of the Trust can be directly attributed to the Funds. Expenses which cannot be directly attributed are apportioned among all funds in the Trust based on average net assets of each fund.
Fund Expenses: Expenses that are specific to a Fund are charged directly to that Fund.
Federal Income Taxes: Each Fund complies with the requirements under Subchapter M of the Internal Revenue Code of 1986, as amended, applicable to regulated investment companies and intends to distribute substantially all of its net taxable income and net capital gains, if any, each year so that it will not be subject to excise tax on undistributed income and gains. The Funds are not subject to income taxes to the extent such distributions are made.
As of and during the six months ended October 31, 2016, the Funds did not have a liability for any unrecognized tax benefits. The Funds file U.S. federal, state, and local tax returns as required. The Fund’s tax returns are subject to examination by the relevant tax authorities until expiration of the applicable statute of limitations, which is generally three years after the filing of the tax return for federal purposes and four years for most state returns. Tax returns for open years have incorporated no uncertain tax positions that require a provision for income taxes.
Distributions to Shareholders: Each Fund normally pays dividends and distributes capital gains, if any, on an annual basis. Income dividend distributions are derived from dividends and other income each Fund receives from its investments, including short-term capital gains. Long term capital gain distributions are derived from gains realized when each Fund sells a security it has owned for more than a year. Each Fund may make additional distributions and dividends at other times if the portfolio manager believes doing so may be necessary for each Fund to avoid or reduce taxes.
3. TAX BASIS INFORMATION
Tax Basis of Investments: As of October 31, 2016, the aggregate cost of investments, gross unrealized appreciation/ (depreciation) and net unrealized appreciation for federal tax purposes was as follows:
| Vulcan Value Partners Fund | Vulcan Value Partners Small Cap Fund | |||||||
| Gross appreciation | ||||||||
| (excess of value over tax cost) | $ | 178,665,022 | $ | 140,887,012 | ||||
| Gross depreciation | ||||||||
| (excess of tax cost over value) | (156,889,577 | ) | (106,321,968 | ) | ||||
| Net unrealized appreciation | $ | 21,775,445 | $ | 34,565,044 | ||||
| Cost of investments for income tax purposes | $ | 1,362,833,345 | $ | 1,118,329,581 | ||||
Tax Basis of Distributions to Shareholders: The character of distributions made during the year from net investment income or net realized gains may differ from its ultimate characterization for federal income tax purposes. Also, due to the timing of dividend distributions, the fiscal year in which amounts are distributed may differ from the fiscal year in which the income or realized gain were recorded by each Fund.
| Semi-Annual Report | October 31, 2016 | 29 |
Notes to Financial Statements
October 31, 2016 (Unaudited)
The tax character of distributions paid by the Funds for the fiscal year ended April 30, 2016 were as follows:
| Ordinary Income | Long-Term Capital Gain | |||||||
| 2016 | ||||||||
| Vulcan Value Partners Fund | $ | 48,548,716 | $ | 82,959,233 | ||||
| Vulcan Value Partners Small Cap Fund | 10,661,578 | 56,691,124 | ||||||
The amounts and characteristics of tax basis distributions and composition of distributable earnings/(accumulated losses) are finalized at fiscal year‐end. Accordingly, tax basis balances have not been determined as of October 31, 2016.
4. SECURITIES TRANSACTIONS
The cost of purchases and proceeds from sales of securities (excluding short‐term securities) during the six months ended October 31, 2016 were as follows:
| Fund | Purchase of Securities | Proceeds From Sales of Securities | ||||||
| Vulcan Value Partners Fund | $ | 419,599,354 | $ | 474,365,464 | ||||
| Vulcan Value Partners Small Cap Fund | 358,233,384 | 200,415,045 | ||||||
5. CAPITAL SHARE TRANSACTIONS
The capitalization of the Trust consists of an unlimited number of shares of beneficial interest with no par value per share. Holders of the shares of the Funds of the Trust have one vote for each share held and a proportionate fraction of a vote for each fractional share. All shares issued and outstanding are fully paid and are transferable and redeemable at the option of the shareholder. Purchasers of the shares do not have any obligation to make payments to the Trust or its creditors solely by reason of the purchasers’ ownership of the shares. Shares have no pre‐emptive rights.
Shares redeemed within 90 days of purchase may incur a 2% short‐term redemption fee deducted from the redemption amount. The Vulcan Value Partners Fund and the Vulcan Value Partners Small Cap Fund retained $26,374 and $19,782, respectively, for the six months ended October 31, 2016, and $100,356 and $10,334, respectively, for the year ended April 30, 2016, which is reflected in the “Cost of shares redeemed, net of redemption fees” in the Statements of Changes in Net Assets.
| 30 | www.vulcanvaluepartners.com |
Notes to Financial Statements
October 31, 2016 (Unaudited)
Transactions in shares of capital stock for the dates listed below were as follows:
Vulcan Value Partners Fund
For the Six Months Ended October 31, 2016 (Unaudited) | For the Year Ended April 30, 2016 | |||||||
| Shares Sold | 5,414,027 | 32,133,506 | ||||||
| Shares Issued in Reinvestment of Dividends | – | 6,372,007 | ||||||
| Less Shares Redeemed | (12,541,530 | ) | (38,169,154 | ) | ||||
| Net Increase/(Decrease) | (7,127,503 | ) | 336,359 | |||||
Vulcan Value Partners Small Cap Fund
For the Six Months Ended October 31, 2016 (Unaudited) | For the Year Ended April 30, 2016 | |||||||
| Shares Sold | 7,396,189 | 20,302,249 | ||||||
| Shares Issued in Reinvestment of Dividends | – | 3,358,435 | ||||||
| Less Shares Redeemed | (9,865,792 | ) | (15,350,234 | ) | ||||
| Net Increase/(Decrease) | (2,469,603 | ) | 8,310,450 | |||||
6. MANAGEMENT AND RELATED‐PARTY TRANSACTIONS
The Adviser, subject to the authority of the Board, is responsible for the overall management and administration of the Funds’ business affairs. The Adviser manages the investments of the Funds in accordance with each Fund’s investment objective, policies and limitations and investment guidelines established jointly by the Adviser and the Board. Pursuant to the Investment Advisory Agreement (the “Advisory Agreement”), the Funds pay the Adviser an annual management fee of 1.00% and 1.15% for Vulcan Value Partners Fund and Vulcan Value Partners Small Cap Fund, respectively, based on each Fund’s average daily net assets. The management fee is paid on a monthly basis.
The Adviser has contractually agreed to limit the Fund’s total annual fund operating expenses (exclusive of acquired fund fees and expenses, brokerage expenses, interest expense, taxes and extraordinary expenses) to 1.25% of each Fund’s average daily net assets. This agreement (the “Expense Agreement”) is in effect from September 1, 2016 through August 31, 2017. The prior Expense Agreement was in effect from June 10, 2015 through August 31, 2016. The Adviser will be permitted to recover, on a class‐by‐class basis, expenses it has borne through the Expense Agreement to the extent that a Fund’s expenses in later periods fall below the expense cap in effect at the time of waiver or reimbursement. Notwithstanding the foregoing, the Funds will not be obligated to pay any such fees and expenses more than three years after the end of the fiscal year in which the fees or expenses were foregone or reimbursed. The Adviser may not discontinue or modify this waiver prior to August 31, 2017 without the approval by the Funds’ Board.
| Semi-Annual Report | October 31, 2016 | 31 |
Notes to Financial Statements
October 31, 2016 (Unaudited)
For the six months ended October 31, 2016, the fee waivers and/or reimbursements were as follows:
| Fund | Recoupment of Previously Waived Fees by Adviser | |||
| Vulcan Value Partners Fund | $ | – | ||
| Vulcan Value Partners Small Cap Fund | 48,100 | |||
As of October 31, 2016, the balances of recoupable expenses for each Fund were as follows:
| Fund | Expires 2016 | Expires 2017 | Expires 2018 | Total | ||||||||||||
| Vulcan Value Partners Fund | $ | – | $ | – | $ | – | $ | – | ||||||||
| Vulcan Value Partners Small Cap Fund | 113,058 | 400,224 | 79,989 | 641,371 | ||||||||||||
Fund Administrator Fees and Expenses: ALPS Fund Services, Inc. (“ALPS”) serves as administrator to the Funds and the Funds have agreed to pay expenses incurred in connection with their administrative activities. Pursuant to an Administration Agreement, ALPS provides operational services to the Funds including, but not limited to fund accounting and fund administration and generally assist in each Fund’s operations. Officers of the Trust are employees of ALPS. The Funds’ administration fee is accrued on a daily basis and paid monthly. Administration fees paid by the Funds for the six months ended October 31, 2016 are disclosed in the Statements of Operations.
ALPS is reimbursed by the Funds for certain out‐of‐pocket expenses.
Transfer Agent: ALPS serves as transfer, dividend paying and shareholder servicing agent for the Funds. ALPS receives an annual minimum fee, a fee based upon the number of shareholder accounts, and is also reimbursed by the Funds for certain out‐of‐pocket expenses. Transfer agent fees paid by the Funds for the six months ended October 31, 2016 are disclosed in the Statements of Operations.
Compliance Services: ALPS provides services that assist the Trust’s chief compliance officer in monitoring and testing the policies and procedures of the Trust in conjunction with requirements under Rule 38a‐1 under the 1940 Act and receives an annual base fee. ALPS is reimbursed for certain out‐of‐pocket expenses by the Funds. Vulcan pays this fee on behalf of the Funds.
Principal Financial Officer: ALPS Fund Services, Inc. (“ALPS” and the “Administrator”) (an affiliate of ADI) receives an annual fee for providing principal financial officer services to the Funds. Principal financial officer fees paid by the Fund for the six months ended October 31, 2016 are disclosed in the Statements of Operations.
Distributor: ALPS Distributors, Inc. (“ADI” or the “Distributor”) (an affiliate of ALPS Fund Services, Inc.) acts as the distributor of each Fund’s shares pursuant to a Distribution Agreement with the Trust. Shares are sold on a continuous basis by ADI as agent for the Funds, and ADI has agreed to use its best efforts to solicit orders for the sale of each Fund’s shares, although it is not obliged to sell any particular amount of shares. ADI is not entitled to any compensation for its services as Distributor. ADI is registered as a broker‐dealer with the U.S. Securities and Exchange Commission.
| 32 | www.vulcanvaluepartners.com |
Notes to Financial Statements
October 31, 2016 (Unaudited)
Certain intermediaries may charge networking, omnibus account or other administrative fees with respect to transactions in shares of the Funds. Transactions may be processed through the National Securities Clearing Corporation (“NSCC”) or similar systems or processed on a manual basis. These fees are paid by the Funds to the Distributor, which uses such fees to reimburse intermediaries. In the event an intermediary receiving payments from the Distributor on behalf of the Funds converts from a networking structure to an omnibus account structure or otherwise experiences increased costs, fees borne by the Funds may increase. Fees are disclosed on the Statements of Operations as “Delegated transfer agent equivalent services fees”.
7. INDEMNIFICATIONS
Under the Trust’s organizational documents, its Officers and Trustees are indemnified against certain liability arising out of the performance of their duties to the Trust. Additionally, in the normal course of business, the Trust enters into contracts with service providers that may contain general indemnification clauses which may permit indemnification to the extent permissible under applicable law. The Trust’s maximum exposure under these arrangements is unknown, as this would involve future claims that may be made against the Trust that have not yet occurred.
| Semi-Annual Report | October 31, 2016 | 33 |
Additional Information
October 31, 2016 (Unaudited)
1. FUND HOLDINGS
The Funds files their complete schedule of portfolio holdings with the Securities and Exchange Commission (the “SEC”) for the first and third quarters of each fiscal year on Form N-Q within 60 days after the end of the period. Copies of the Funds’ Form N-Q are available without charge on the SEC website at http://www.sec.gov. You may also review and copy the Form N-Q at the SEC’s Public Reference Room in Washington, DC. For more information about the operation of the Public Reference Room, please call the SEC at 1-800-SEC-0330.
2. FUND PROXY VOTING POLICIES, PROCEDURES AND SUMMARIES
The Funds’ policies and procedures used in determining how to vote proxies and information regarding how the Fund voted proxies relating to portfolio securities during the most recent prior 12‐month period ending June 30 are available without charge, (1) upon request, by calling (toll‐free) (866)‐759‐5679 and (2) on the SEC’s website at http://www.sec.gov.
| 34 | www.vulcanvaluepartners.com |
This page left intentionally blank.

Item 2. Code of Ethics.
Not applicable to this Report.
Item 3. Audit Committee Financial Expert.
Not applicable to this Report.
Item 4. Principal Accountant Fees and Services.
Not applicable to this Report.
Item 5. Audit Committee of Listed Registrants.
Not applicable to the Registrant.
Item 6. Investments.
| (a) | Schedule of Investments is included as part of the Reports to Stockholders filed under Item 1 of this Form N-CSR. |
| (b) | Not applicable. |
Item 7. Disclosure of Proxy Voting Policies and Procedures for Closed-End Management Investment Companies.
Not applicable to the Registrant.
Item 8. Portfolio Managers of Closed-End Management Investment Companies.
Not applicable to the Registrant.
Item 9. Purchases of Equity Securities by Closed-End Management Investment Company and Affiliated Purchasers.
Not applicable to the Registrant.
Item 10. Submission of Matters to a Vote of Security Holders.
There have been no material changes to the procedures by which shareholders may recommend nominees to the Registrant’s Board of Trustees, where those changes were implemented after the Registrant last provided disclosure in response to the requirements of Item 407(c)(2)(iv) of Regulation S-K, or this Item.
Item 11. Controls and Procedures.
| (a) | The Registrant’s principal executive officer and principal financial officer have concluded that the Registrant’s disclosure controls and procedures (as defined in Rule 30a-3(c) under the Investment Company Act of 1940, as amended) are effective based on their evaluation of these controls and procedures as of a date within 90 days of the filing date of this report. |
| (b) | There was no change in the Registrant’s internal control over financial reporting (as defined in Rule 30a-3(d) under the Investment Company Act of 1940, as amended) that occurred during the second fiscal quarter of the period covered by this report that has materially affected, or is reasonably likely to materially affect, the Registrant’s internal control over financial reporting. |
Item 12. Exhibits.
| (a)(1) | Not applicable to this Report. |
| (a)(2) | The certifications required by Rule 30a-2(a) of the Investment Company Act of 1940, as amended, and Section 302 of the Sarbanes-Oxley Act of 2002 are attached hereto as Exhibit 99.Cert. |
| (a)(3) | Not applicable to the Registrant. |
| (b) | The certifications by the Registrant’s principal executive officer and principal financial officer, as required by Rule 30a-2(b) of the Investment Company Act of 1940, as amended, and Section 906 of the Sarbanes-Oxley Act of 2002 are attached hereto as Exhibit 99.906Cert. |
SIGNATURES
Pursuant to the requirements of the Securities Exchange Act of 1934 and the Investment Company Act of 1940, the Registrant has duly caused this report to be signed on its behalf by the undersigned, thereunto duly authorized.
FINANCIAL INVESTORS TRUST
| By: | /s/ Edmund J. Burke | |
| Edmund J. Burke (Principal Executive Officer) | ||
| President | ||
| Date: | January 9, 2017 |
Pursuant to the requirements of the Securities Exchange Act of 1934 and the Investment Company Act of 1940, this report has been signed below by the following persons on behalf of the Registrant and in the capacities and on the dates indicated.
FINANCIAL INVESTORS TRUST
| By: | /s/ Edmund J. Burke | |
| Edmund J. Burke (Principal Executive Officer) | ||
| President | ||
| Date: | January 9, 2017 | |
| By: | /s/ Kimberly R. Storms | |
| Kimberly R. Storms (Principal Financial Officer) | ||
| Treasurer | ||
| Date: | January 9, 2017 |