UNITED STATES
SECURITIES AND EXCHANGE COMMISSION
Washington, D.C. 20549
FORM N-CSR
CERTIFIED SHAREHOLDER REPORT OF REGISTERED
MANAGEMENT INVESTMENT COMPANIES
Investment Company Act file number: 811-08194
FINANCIAL INVESTORS TRUST
(Exact name of Registrant as specified in charter)
1290 Broadway, Suite 1100, Denver, Colorado 80203
(Address of principal executive offices) (Zip code)
Karen Gilomen, Esq., Secretary
Financial Investors Trust
1290 Broadway, Suite 1100
Denver, Colorado 80203
(Name and address of agent for service)
Registrant’s telephone number, including area code: 303-623-2577
Date of fiscal year end: April 30
Date of reporting period: May 1, 2017 – October 31, 2017
Item 1. Reports to Stockholders.
TABLE OF CONTENTS
| PAGE | |
| Manager Commentary | |
| Aspen Managed Futures Strategy Fund | 1 |
| Aspen Portfolio Strategy Fund | 3 |
| Performance Update | |
| Aspen Managed Futures Strategy Fund | 5 |
| Aspen Portfolio Strategy Fund | 7 |
| Consolidated Disclosure of Fund Expenses | 9 |
| Consolidated Schedule of Investments | |
| Aspen Managed Futures Strategy Fund | 10 |
| Aspen Portfolio Strategy Fund | 12 |
| Consolidated Statements of Assets & Liabilities | 14 |
| Consolidated Statements of Operations | 16 |
| Consolidated Statements of Changes in Net Assets | |
| Aspen Managed Futures Strategy Fund | 17 |
| Aspen Portfolio Strategy Fund | 18 |
| Consolidated Financial Highlights | |
| Aspen Managed Futures Strategy Fund | 19 |
| Aspen Portfolio Strategy Fund | 21 |
| Notes to Consolidated Financial Statements | 23 |
| Additional Information | 33 |
| Aspen Managed Futures Strategy Fund | Manager Commentary |
October 31, 2017 (Unaudited)
November 17, 2017
Performance Results
For the six-month period ending October 31, 2017, the Class I shares of the Aspen Managed Futures Strategy Fund (the “Fund”) posted a return of -1.09%. Per its mandate, the Fund maintained tight correlation(1) to the Aspen Managed Futures Beta Index (“Aspen MFBI” or the “Index”). The Index uses a combination of trend and counter-trend algorithms to determine exposures to 23 futures markets. In following the Index, the Fund can take long or short positions in each of the eligible markets. A long position in a futures market may profit if the price of the futures contract rises, whereas a short position may profit if the price of the futures contract falls.
The BTOP50 Index(2), a managed futures benchmark, returned +0.90% over the same period. It is important to note that there are substantive differences between the Fund and this index in terms of construction. There were no significant changes to the Fund strategy during this period.
Explanation of Fund Performance
Over this six-month period, broad backdrop market volatility remained near all-time lows globally. While low volatility is typically not an auspicious backdrop for trend following strategies, it does not usually tend to produce significantly poor results either. This period was an example of that phenomenon, as a series of relatively small monthly gains and small monthly losses for the Fund combined to produce a small end-to-end loss for the full six months.
When backdrop volatility is abnormally low, occasional “events” that punctuate the markets with brief spikes of more elevated volatility can have an outsized effect on trend following performance. One such event occurred in May. Heading into that month, the Fund was positioned on the short side in energy futures. But midmonth, Saudi Arabia and Russia announced a deal in principle to extend an oil output freeze for an extra nine months. Energy prices soared on the news, causing losses for the Fund in energies, and causing the trend model to reverse into long energy positions. Then in late May the official OPEC meeting occurred. Though OPEC members ratified the pre-announced deal, no further supportive measures were forthcoming. Disappointment in the markets caused energy prices to plunge once again, causing classic “V-top” losses for the Fund (i.e., losses arising from prices moving up and then down in an inverted V-shaped pattern). Largely as a consequence of this move, the Fund returned 1.51% in May.
The first several weeks of June were profitable, if uneventful. Then in the last week of the month, European Central Bank (“ECB”) president Mario Draghi gave a speech that markets interpreted as unexpectedly hawkish. The resulting activity could be described as a European version of the “taper tantrum” that hit the markets after similar comments by US Federal Reserve president Ben Bernanke were interpreted similarly: Both equity and fixed income markets declined rapidly as markets contemplated the consequences of potentially faster-than-expected reductions in ECB accommodation. This produced losses for Fund, albeit insufficient to eliminate the entire monthly gain. The final June fund return was +1.10%.
The entire third quarter plus the month of October constituted a fairly uneventful and incredibly low-volatility period for investment markets. A few sustained trends developed (most notably long positions in equities and a long position in copper); others were profitable briefly and then reversed (e.g., downtrends in fixed income, which performed well in July but reversed in August; and uptrends across most currencies, which were profitable through most of the third quarter, but reversed at the end of September). The result of primarily low-vol, range-bound activity was a continued series of minor monthly returns. For the months of July, August, September, and October, Fund returns were +1.63%, 1.81%, 0.76%, and +0.33%, respectively.
Outlook
As noted above, volatility remains abnormally low. Such volatility “regimes” tend to be serially correlated (i.e., they tend to be sticky, evolving only slowly), and that has certainly been the case in 2017. For example, for the first 27 years since the inception of the VIX Volatility Index(3) (through 2016), the index closed below a level of 10 only nine times. But as of this writing, the VIX index has closed below 10 forty times so far in 2017. At one point it even spent ten consecutive days below the mark of 10—i.e., exceeding the total from VIX’s first 26 years in a mere two calendar weeks.
In such a backdrop, trend followers can either adopt modifications that add to expected performance in low-vol markets, or they can simply hope for their systems to tread water while waiting for volatility to return. The former decision comes at the cost of potentially modifying a trend system away from design tenets that allow trend following to be among the few diversifying strategies that tend to perform very well when volatility is abnormally high. Aspen Partners is unwilling to give up or blunt such characteristics, and in consequence we do not adopt such modifications, even in the face of an extraordinarily extended stretch of low volatility markets.
Sincerely,
Bryan R. Fisher
William Ware Bush
| Semi-Annual Report | October 31, 2017 | 1 |
| Aspen Managed Futures Strategy Fund | Manager Commentary |
October 31, 2017 (Unaudited)
Performance data quoted represents past performance. Past performance does not guarantee future results. Investment return and principal value of an investment will fluctuate so that an investor’s shares, when sold or redeemed, may be worth more or less than the original cost. Current performance data may be higher or lower than actual data quoted. For the most current month-end performance data please call 1-855-845-9444.
The views of Aspen Partners, Ltd. and information discussed in this commentary are as of the date of publication, are subject to change, and may not reflect the writers’ current views. The views expressed are those of the Fund’s adviser only, and represent an assessment of market conditions at a specific point in time, are opinions only and should not be relied upon as investment advice regarding a particular investment or markets in general. Such information does not constitute a recommendation to buy or sell specific securities or investment vehicles. It should not be assumed that any investment will be profitable or will equal the performance of the portfolios or any securities or any sectors mentioned in this letter. The subject matter contained in this letter has been derived from several sources believed to be reliable and accurate at the time of compilation. Neither Aspen Partners Ltd. nor the Fund accepts any liability for losses either direct or consequential caused by the use of this information.
The Aspen Managed Futures Strategy Fund is distributed by ALPS Distributors, Inc.
The Fund is subject to investment risks, including possible loss of the principal amount invested and therefore is not suitable for all investors. The Fund may not achieve its objectives.
Diversification does not eliminate the risk of experiencing investment losses.
| (1) | Correlation - Degree and type of relationship between any two or more quantities (variables) in which they vary together over a period. |
| (2) | The BTOP50 Index seeks to replicate the overall composition of the managed futures industry with regard to trading style and overall market exposure. The BTOP50 employs a top-down approach in selecting its constituents. The Index is not actively managed and does not reflect any deductions for fees, expenses or taxes. An investor may not invest directly in the Index. |
| (3) | VIX is the ticker symbol for the Chicago Board Options Exchange (CBOE) Volatility Index, which shows the market's expectation of 30-day volatility. It is constructed using the implied volatilities of a wide range of S&P 500 index options. The Index is not actively managed and does not reflect any deductions for fees, expenses or taxes. An investor may not invest directly in the Index. |
| 2 |
| Aspen Portfolio Strategy Fund | Manager Commentary |
October 31, 2017 (Unaudited)
November 16, 2017
Performance Results
For the six-month period ending October 31, 2017, the Class I shares of the Aspen Portfolio Strategy Fund (the “Fund”) posted a return of 8.42%. Per its mandate, the Fund traded the Aspen Portfolio Strategy, which combines full exposure to US large-cap equities (the “Equity Strategy”) with full exposure to Aspen’s proprietary diversified trend following program (the “Futures Strategy”). To capture the Equity Strategy, the Fund can employ a variety of vehicles, including exchange-traded funds and futures contracts. To capture the Futures Strategy, the Fund can take long or short positions in each eligible futures market. A long position in a futures market may profit if the price of the futures contract rises, whereas a short position may profit if the price of the futures contract falls.
The S&P 500® Index(1), a US large-cap equity benchmark, returned +9.10%. See the following section for a description of the sources of the sub-period and full-period return differential between the Fund and the S&P 500.
Explanation of Fund Performance
Over this six-month period, broad backdrop market volatility remained near all-time lows globally. A low volatility regime is often a good backdrop for risk assets like equities, and given the return of the Equity Strategy, the six-month period in question was obviously no exception. Conversely, low volatility is typically not an auspicious backdrop for trend following strategies, but neither does it usually tend to produce significantly poor results either. This period was also an example of the latter phenomenon, as a series of relatively small monthly gains and small monthly losses for the Futures Strategy combined to produce a very small end-to-end Fund return shortfall for the full six months relative to the S&P 500 stand-alone.
When backdrop volatility is abnormally low, occasional “events” that punctuate the markets with brief spikes of more elevated volatility can have an outsized effect on trend following performance. One such event occurred in May. Heading into that month, the Fund was positioned on the short side in energy futures. But midmonth, Saudi Arabia and Russia announced a deal in principle to extend an oil output freeze for an extra nine months. Energy prices soared on the news, causing losses for the Fund in energies, and causing the Futures Strategy to reverse into long energy positions. Then in late May the official OPEC meeting occurred. Though OPEC members ratified the pre-announced deal, no further supportive measures were forthcoming. Disappointment in the markets caused energy prices to plunge once again, causing classic “V-top” losses for the Futures Strategy (i.e., losses arising from prices moving up and then down in an inverted V-shaped pattern). Conversely, May was a strong positive month for equities, and the Fund was able to produce a mildly positive return of +0.20% despite the losses in the Futures Strategy.
The first several weeks of June were profitable for both the Equity Strategy and the Futures Strategy. Then in the last week of the month, European Central Bank president Mario Draghi gave a speech that markets interpreted as unexpectedly hawkish. The resulting activity could be described as a European version of the “taper tantrum”(2) that hit the markets after similar comments by US Federal Reserve president Ben Bernanke were interpreted similarly: Both equity and fixed income markets declined rapidly as markets contemplated the consequences of potentially faster-than-expected reductions in ECB accommodation. This produced losses for Fund, albeit insufficient to eliminate the entire monthly gain. The final June fund return was +0.82%.
The entire third quarter plus the month of October constituted a fairly uneventful and incredibly low-volatility period for investment markets. A few sustained trends developed and benefitted the Futures Strategy (most notably long positions in equities and a long position in copper); others were profitable briefly and then reversed (e.g., downtrends in fixed income, which performed well in July but reversed in August; and uptrends across most currencies, which were profitable through most of the third quarter, but reversed at the end of September). Over that same timeframe, the Equity Strategy continued to contribute positively and fairly consistently. Incredibly, the S&P 500 (which is tracked directly by the Equity Strategy) has now posted a positive total return for twelve consecutive months—the longest such streak in at least the last 30 years—and 19 of the last 20 months.
Overall Fund returns were +3.36%, -0.86%, +1.58%, and +3.11% in July, August, September, and October, respectively. (I.e., of these four months, only in August were there negative Futures Strategy returns in sufficient quantity to outrun minor positive Equity Strategy returns.)
Outlook
As noted above, volatility remains abnormally low. Such volatility “regimes” tend to be serially correlated (i.e., they tend to be sticky, evolving only slowly), and that has certainly been the case in 2017. For example, for the first 27 years since the inception of the VIX volatility index (through 2016), the index closed below a level of 10 only nine times. But as of this writing, the VIX index has closed below 10 forty times so far in 2017. At one point it even spent ten consecutive days below the mark of 10—i.e., exceeding the total from VIX’s first 26 years in a mere two calendar weeks.
In such a backdrop, trend followers can either adopt modifications that add to expected performance in low-vol markets, or they can simply hope for their systems to tread water while waiting for volatility to return. The former decision comes at the cost of potentially modifying a trend system away from design tenets that allow trend following to be among the few diversifying strategies that tend to perform very well when volatility is abnormally high. Rather than adopting such modifications within the Futures Strategy, which management believes would potentially degrade the
| Semi-Annual Report | October 31, 2017 | 3 |
| Aspen Portfolio Strategy Fund | Manager Commentary |
October 31, 2017 (Unaudited)
long-run diversification benefits of trend following, the Aspen Portfolio Strategy Fund seeks to enable investors to capture both a strategy that tends to perform well in low-volatility regimes (equities) and a strategy that tends to perform well in high-volatility regimes (trend following) in a single portfolio.
Sincerely,
Bryan R. Fisher
William Ware Bush
Performance data quoted represents past performance. Past performance does not guarantee future results. Investment return and principal value of an investment will fluctuate so that an investor’s shares, when sold or redeemed, may be worth more or less than the original cost. Current performance data may be higher or lower than actual data quoted. For the most current month-end performance data please call 1-855-845-9444.
The views of Aspen Partners, Ltd. and information discussed in this commentary are as of the date of publication, are subject to change, and may not reflect the writers’ current views. The views expressed are those of the Fund’s adviser only, and represent an assessment of market conditions at a specific point in time, are opinions only and should not be relied upon as investment advice regarding a particular investment or markets in general. Such information does not constitute a recommendation to buy or sell specific securities or investment vehicles. It should not be assumed that any investment will be profitable or will equal the performance of the portfolios or any securities or any sectors mentioned in this letter. The subject matter contained in this letter has been derived from several sources believed to be reliable and accurate at the time of compilation. Neither Aspen Partners Ltd. nor the Fund accepts any liability for losses either direct or consequential caused by the use of this information.
The Aspen Portfolio Strategy Funds are distributed by ALPS Distributors, Inc.
The Fund is subject to investment risks, including possible loss of the principal amount invested and therefore is not suitable for all investors. The Fund may not achieve its objectives.
The Fund is new with limited operating history.
Diversification does not eliminate the risk of experiencing investment losses.
| (1) | The S&P 500® Index is an unmanaged index of 500 common stocks chosen for market size, liquidity and industry group representation. It is a market-value weighted index. The Index is not actively managed and does not reflect any deductions for fees, expenses or taxes. An investor may not invest directly in the Index. |
| (2) | Taper tantrum - the term used to refer to the 2013 surge in U.S. Treasury yields, which resulted from the Federal Reserve's use of tapering to gradually reduce the amount of money it was feeding into the economy. |
| 4 |
| Aspen Managed Futures Strategy Fund | Performance Update |
October 31, 2017 (Unaudited)
Annualized Total Return Performance as of October 31, 2017
| Calendar Year-to- | Since | Expense Ratios | ||||||
| Aspen Managed Futures Strategy Fund | 6 Months | Date | 1 Year | 3 Year | 5 Year | Inception* | Total | Net(1) |
| Aspen Managed Futures Strategy Fund - Class A (NAV)(2) | -1.23% | -8.03% | -4.99% | -1.95% | 0.33% | -1.62% | 1.62% | 1.62% |
| Aspen Managed Futures Strategy Fund - Class A (MOP)(3) | -6.64% | -13.11% | -10.25% | -3.78% | -0.81% | -2.51% | 1.62% | 1.62% |
| Aspen Managed Futures Strategy Fund - Class I | -1.09% | -8.00% | -5.07% | -1.86% | 0.55% | -1.38% | 1.29% | 1.29% |
| SG CTA Index(4) | 1.53% | 1.47% | 0.22% | 1.88% | 2.58% | 0.99% | ||
| Aspen Managed Futures Beta Index(5) | 0.11% | 6.22% | 2.88% | 0.04% | 2.48% | 0.60% | ||
Performance data quoted represents past performance. Past performance does not guarantee future results. Investment return and principal value of an investment will fluctuate so that an investor’s shares, when sold or redeemed, may be worth more or less than the original cost. Current performance data may be higher or lower than actual data quoted. For the most current month-end performance data, please call 1-855-845-9444.
The table does not reflect the deduction of taxes that a shareholder would pay on Fund distributions or the redemption of Fund shares.
Subject to investment risks, including possible loss of the principal amount invested.
Returns for periods less than 1 year are cumulative.
| * | Fund Inception date of August 2, 2011. |
| (1) | Aspen Partners, Ltd. (the “Adviser”) has agreed to waive and/or reimburse fees or expenses in order to limit total annual Fund operating expenses after fee waiver/expense reimbursements (excluding distribution and service (12b-1) fees, shareholder services fees, acquired fund fees and expenses, brokerage expenses, interest expenses, taxes and extraordinary expenses) to 1.55% of the Funds’ average daily net assets. This agreement (the “Expense Agreement”) is in effect through August 31, 2018. The Adviser will be permitted to recover, on a class-by-class basis, expenses it has borne through the Expense Agreement to the extent that the Funds’ expenses in later periods fall below the expense cap in effect at the time of waiver or reimbursement. Notwithstanding the foregoing, the Fund will not be obligated to pay any such deferred fees and expenses more than three years after the date of the waiver or reimbursement. The Expense Agreement may not be terminated or modified prior to August 31, 2018 except with the approval of the Funds’ Board of Trustees |
| (2) | Net Asset Value (NAV) is the share price without sales charges. |
| (3) | Maximum Offering Price (MOP) includes sales charges. Class A returns include effects of the Funds’ maximum sales charge of 5.50%. |
| (4) | The SG CTA Index (formerly, the Newedge CTA Index) provides the market with a reliable daily performance benchmark of major commodity trading advisors (CTAs). The SG CTA Index calculates the daily rate of return for a pool of CTAs selected from the larger managers that are open to new investment. Selection of the pool of qualified CTAs used in construction of the Index will be conducted annually, with re-balancing on January 1st of each year. A committee of industry professionals has been established to monitor the methodology of the index on a regular basis. The Index is not actively managed and does not reflect any deduction for fees, expenses or taxes. An investor cannot invest directly in the Index. |
| (5) | Aspen Managed Futures Beta Index – The Managed Futures Beta Index is constructed using a quantitative, rules-based model designed to replicate the trend-following and counter-trend exposure of futures markets by allocating assets to liquid futures contracts of certain financial and commodities futures markets. The Index therefore seeks to reflect the performance of strategies and exposures common to a broad universe of futures markets, i.e., managed futures beta. The index is not actively managed and does not reflect any deductions for fees, expense or taxes. An investor may not invest directly in an index. |
Portfolio Composition as of October 31, 2017
As a percentage of Net Assets^
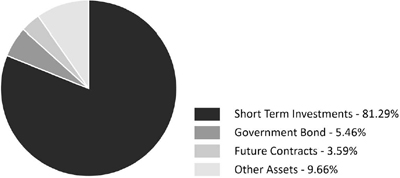
| ^ | Holdings subject to change, and may not reflect the current or future position of the portfolio. |
| Semi-Annual Report | October 31, 2017 | 5 |
| Aspen Managed Futures Strategy Fund | Performance Update |
October 31, 2017 (Unaudited)
Performance of $10,000 Initial Investment (as of October 31, 2017)
Comparison of change in value of a $10,000 investment (includes applicable sales loads)
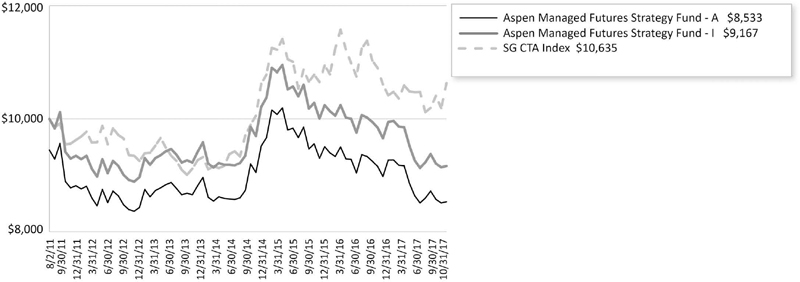
The chart above represents historical performance of a hypothetical investment of $10,000 in the Fund since inception. Past performance does not guarantee future results. This chart does not reflect the deduction of taxes that a shareholder would pay on Fund distributions or the redemption of Fund shares.
Investing in the Fund is subject to investment risks, including possible loss of the principal amount invested.
6
| Aspen Portfolio Strategy Fund | Performance Update |
October 31, 2017 (Unaudited)
Annualized Total Return Performance as of October 31, 2017
| Calendar Year-to-Date | Expense Ratios | ||||
| Aspen Portfolio Strategy Fund | 6 Months | Since Inception* | Gross | Net(1) | |
| Aspen Portfolio Strategy Fund - Class A (NAV)(2) | 8.18% | 6.14% | 5.80% | 2.83% | 1.99% |
| Aspen Portfolio Strategy Fund - Class A (MOP)(3) | 2.24% | 0.30% | -0.04% | 2.83% | 1.99% |
| Aspen Portfolio Strategy Fund - Class I | 8.42% | 6.50% | 6.16% | 2.26% | 1.59% |
| S&P 500 Total Return Index | 9.10% | 16.91% | 16.34% | ||
Performance data quoted represents past performance. Past performance does not guarantee future results. Investment return and principal value of an investment will fluctuate so that an investor’s shares, when sold or redeemed, may be worth more or less than the original cost. Current performance data may be higher or lower than actual data quoted. For the most current month-end performance data, please call 1-855-845-9444.
The table does not reflect the deduction of taxes that a shareholder would pay on Fund distributions or the redemption of Fund shares.
Subject to investment risks, including possible loss of the principal amount invested.
Returns for periods less than 1 year are cumulative.
| * | Fund Inception date of December 28, 2016. |
| (1) | Aspen Partners, Ltd. (the “Adviser”) has agreed to waive and/or reimburse fees or expenses in order to limit total annual Fund operating expenses after fee waiver/expense reimbursements (excluding distribution and service (12b-1) fees, shareholder services fees, acquired fund fees and expenses, brokerage expenses, interest expenses, taxes and extraordinary expenses) to 1.55% of the Funds’ average daily net assets. This agreement (the “Expense Agreement”) is in effect through August 31, 2018. The Adviser will be permitted to recover, on a class-by-class basis, expenses it has borne through the Expense Agreement to the extent that the Funds’ expenses in later periods fall below the expense cap in effect at the time of waiver or reimbursement. Notwithstanding the foregoing, the Fund will not be obligated to pay any such deferred fees and expenses more than three years after the date of the waiver or reimbursement. The Expense Agreement may not be terminated or modified prior to August 31, 2018 except with the approval of the Funds’ Board of Trustees |
| (2) | Net Asset Value (NAV) is the share price without sales charges. |
| (3) | Maximum Offering Price (MOP) includes sales charges. Class A returns include effects of the Funds’ maximum sales charge of 5.50%. |
Portfolio Composition as of October 31, 2017
As a percentage of Net Assets^
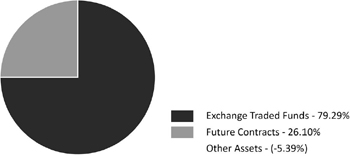
| ^ | Holdings subject to change, and may not reflect the current or future position of the portfolio. |
| Semi-Annual Report | October 31, 2017 | 7 |
| Aspen Portfolio Strategy Fund | Performance Update |
October 31, 2017 (Unaudited)
Performance of $10, 000 Initial Investment (as of October 31, 2017)
Comparison of change in value of a $10,000 investment (includes applicable sales loads)
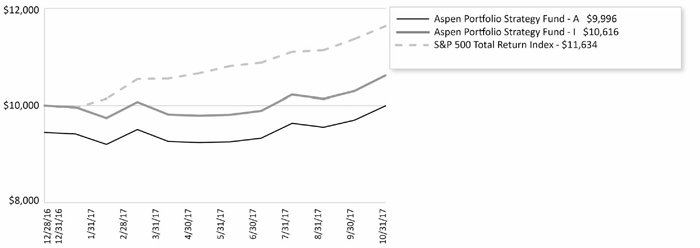
The chart above represents historical performance of a hypothetical investment of $10,000 in the Fund since inception. Past performance does not guarantee future results. This chart does not reflect the deduction of taxes that a shareholder would pay on Fund distributions or the redemption of Fund shares.
Investing in the Fund is subject to investment risks, including possible loss of the principal amount invested.
8
| Aspen Funds | Consolidated Disclosure of Fund Expenses |
October 31, 2017 (Unaudited)
As a shareholder of the Fund, you incur two types of costs: transaction costs, including sales charges (loads) on purchase payments, reinvested dividends, or other distributions; redemption fees; and exchange fees; and (2) ongoing costs, including management fees; distribution and/or service (12b-1) fees; shareholder servicing fees; and other fund operating expenses. This example is intended to help you understand your ongoing costs (in dollars), of investing in the Fund and to compare these costs with the ongoing costs of investing in other mutual funds.
This example is based on an investment of $1,000 invested at the beginning of the period and held for the entire six-month period of May 1, 2017 through October 31, 2017.
Actual Expenses The first line of the table below provides information about actual account values and actual expenses. You may use the information in this line, together with the amount you invested, to estimate the expenses that you paid over the period. Simply divide your account value by $1,000 (for example, an $8,600 account value divided by $1,000 = 8.6), then multiply the result by the number in the first line under the heading “Expenses Paid During Period” to estimate the expenses you paid on your account during this period.
Hypothetical Example for Comparison Purposes The second line of the table below provides information about hypothetical account values and hypothetical expenses based on the Funds’ actual expense ratio and an assumed rate of return of 5% per year before expenses, which is not the Funds’ actual return. The hypothetical account values and expenses may not be used to estimate the actual ending account balance or expenses you paid for the period. You may use this information to compare the ongoing costs of investing in the Fund and other funds. To do so, compare this 5% hypothetical example with the 5% hypothetical examples that appear in the shareholder reports of other mutual funds.
Please note that the expenses shown in the table are meant to highlight your ongoing costs only and do not reflect any transactional costs, such as applicable sales charges (loads), redemption fees, or exchange fees. Therefore, the second line of the table is useful in comparing ongoing costs only and will not help you determine the relative total costs of owning different funds. In addition, if these transactional costs were included, your costs would have been higher.
| Beginning Account Value 5/1/17 | Ending Account Value 10/31/17 | Expense Ratio(a) | Expenses Paid During period 5/1/17 - 10/31/17(b) | |
| Aspen Managed Futures Strategy Fund | ||||
| Class A | ||||
| Actual | $ 1,000.00 | $ 987.70 | 1.78% | $ 8.92 |
| Hypothetical (5% return before expenses) | $ 1,000.00 | $1,016.23 | 1.78% | $ 9.05 |
| Class I | ||||
| Actual | $ 1,000.00 | $ 989.10 | 1.47% | $ 7.37 |
| Hypothetical (5% return before expenses) | $ 1,000.00 | $ 1,017.80 | 1.47% | $ 7.48 |
| Aspen Portfolio Strategy Fund | ||||
| Class A | ||||
| Actual | $ 1,000.00 | $ 1,081.80 | 1.95% | $ 10.23 |
| Hypothetical (5% return before expenses) | $ 1,000.00 | $ 1,015.38 | 1.95% | $ 9.91 |
| Class I | ||||
| Actual | $ 1,000.00 | $ 1,084.20 | 1.55% | $ 8.14 |
| Hypothetical (5% return before expenses) | $ 1,000.00 | $ 1,017.39 | 1.55% | $ 7.88 |
| (a) | The Fund's expense ratios have been based on the Fund's most recent fiscal half-year expenses. |
| (b) | Expenses are equal to the Fund's annualized expense ratio multiplied by the average account value over the period, multiplied by the number of days in the most recent fiscal half-year (184)/365 (to reflect the half-year period). |
| Semi-Annual Report | October 31, 2017 | 9 |
| Aspen Managed Futures Strategy Fund | Consolidated Schedule of Investments |
October 31, 2017 (Unaudited)
| Principal Amount/ Shares | Value (Note 2) | |||||||
| GOVERNMENT BONDS (5.46%) | ||||||||
| U.S. TREASURY NOTES (5.46%) | ||||||||
| 0.625%, 11/30/2017 | $ | 3,759,000 | $ | 3,757,548 | ||||
| 0.750%, 12/31/2017 | 3,075,000 | 3,072,883 | ||||||
| TOTAL GOVERNMENT BONDS | ||||||||
| (Cost $6,832,712) | 6,830,431 | |||||||
| SHORT TERM INVESTMENTS (81.29%) | ||||||||
| MONEY MARKET FUND (6.26%) | ||||||||
| Dreyfus Treasury & Agency Cash Management Fund - Institutional Shares, 7-day yield, 0.930% | 7,822,041 | 7,822,041 | ||||||
| U.S. TREASURY BILLS (75.03%) | ||||||||
| 0.507%, 11/09/2017(a) | 10,000,000 | 9,997,875 | ||||||
| 0.670%, 12/07/2017(a) | 13,400,000 | 13,386,918 | ||||||
| 0.770%, 01/04/2018(a) | 10,600,000 | 10,580,355 | ||||||
| 0.578%, 02/01/2018(a) | 10,400,000 | 10,370,166 | ||||||
| 0.898%, 03/29/2018(a) | 8,800,000 | 8,756,813 | ||||||
| 1.004%, 04/26/2018(a) | 5,700,000 | 5,665,588 | ||||||
| 1.021%, 05/24/2018(a) | 5,500,000 | 5,461,120 | ||||||
| 0.929%, 06/21/2018(a) | 11,200,000 | 11,107,071 | ||||||
| 0.906%, 07/19/2018(a) | 9,000,000 | 8,914,606 | ||||||
| 1.185%, 08/16/2018(a) | 9,700,000 | 9,595,434 | ||||||
| 93,835,946 | ||||||||
| TOTAL SHORT TERM INVESTMENTS | ||||||||
| (Cost $101,716,262) | 101,657,987 | |||||||
| TOTAL INVESTMENTS (86.75%) | ||||||||
| (Cost $108,548,974) | $ | 108,488,418 | ||||||
| Other Assets In Excess Of Liabilities (13.25%) | 16,571,940 | (b) | ||||||
| NET ASSETS (100.00%) | $ | 125,060,358 | ||||||
| (a) | Rate shown represents the bond equivalent yield to maturity at date of purchase. |
| (b) | Includes cash which is being held as collateral for futures contracts. |
See Notes to Consolidated Financial Statements.
10
| Aspen Managed Futures Strategy Fund | Consolidated Schedule of Investments |
October 31, 2017 (Unaudited)
FUTURES CONTRACTS
At October 31, 2017, the Fund had the following outstanding futures contracts:
| Description | Position | Contracts | Expiration Date | Underlying Face Amount at Value | Unrealized Appreciation | |||||||||||||||
| Commodity Contracts | ||||||||||||||||||||
| Copper Future(a) | Long | 63 | 12/27/2017 | $ | 4,884,075 | $ | 80,245 | |||||||||||||
| Corn Future(a) | Short | 190 | 12/14/2017 | (3,284,625 | ) | 36,859 | ||||||||||||||
| NY Harbor ULSD Future(a) | Long | 44 | 11/30/2017 | 3,475,164 | 114,803 | |||||||||||||||
| Silver Future(a) | Short | 39 | 12/27/2017 | (3,255,135 | ) | 59,153 | ||||||||||||||
| Soybean Future(a) | Short | 33 | 01/12/2018 | (1,624,837 | ) | 2,016 | ||||||||||||||
| Sugar No. 11 (World) Future(a) | Long | 105 | 02/28/2018 | 1,733,424 | 65,452 | |||||||||||||||
| WTI Crude Future(a) | Long | 96 | 11/20/2017 | 5,220,480 | 203,208 | |||||||||||||||
| Equity Contracts | ||||||||||||||||||||
| Euro Stoxx 50 Index Future | Long | 354 | 12/15/2017 | 15,166,489 | 577,880 | |||||||||||||||
| Nikkei 225 Index Future | Long | 136 | 12/07/2017 | 15,113,000 | 1,348,081 | |||||||||||||||
| S&P® 500 E-Mini Future | Long | 116 | 12/15/2017 | 14,921,660 | 431,695 | |||||||||||||||
| Foreign Currency Contracts | ||||||||||||||||||||
| Euro FX Currency Future | Short | 144 | 12/18/2017 | (21,025,800 | ) | 248,349 | ||||||||||||||
| Japanese Yen Currency Future | Short | 179 | 12/18/2017 | (19,720,206 | ) | 149,861 | ||||||||||||||
| Swiss Franc Currency Future | Short | 218 | 12/18/2017 | (27,388,975 | ) | 918,475 | ||||||||||||||
| Interest Rate Contracts | ||||||||||||||||||||
| U.S. 10 Year Treasury Future | Short | 140 | 12/19/2017 | (17,491,250 | ) | 26,931 | ||||||||||||||
| $ | (33,276,536 | ) | $ | 4,263,008 | ||||||||||||||||
| Description | Position | Contracts | Expiration Date | Underlying Face Amount at Value | Unrealized Depreciation | |||||||||||||||
| Commodity Contracts | ||||||||||||||||||||
| Gold 100 Oz Future(a) | Long | 13 | 12/27/2017 | $ | 1,651,650 | $ | (23,962 | ) | ||||||||||||
| Equity Contracts | ||||||||||||||||||||
| FTSE 100 Index Future | Long | 153 | 12/15/2017 | 15,174,489 | (18,406 | ) | ||||||||||||||
| Foreign Currency Contracts | ||||||||||||||||||||
| Australian Dollar Currency Future | Long | 441 | 12/18/2017 | 33,745,320 | (1,551,762 | ) | ||||||||||||||
| Canadian Dollar Currency Future | Long | 83 | 12/19/2017 | 6,438,725 | (310,495 | ) | ||||||||||||||
| New Zealand Dollar Currency Future | Long | 402 | 12/18/2017 | 27,480,720 | (1,862,815 | ) | ||||||||||||||
| Interest Rate Contracts | ||||||||||||||||||||
| Canadian 10 Year Bond Future | Short | 109 | 12/18/2017 | (11,611,402 | ) | (150,977 | ) | |||||||||||||
| Euro Bond Future | Short | 92 | 12/07/2017 | (17,441,302 | ) | (184,105 | ) | |||||||||||||
| Long Gilt Future | Short | 107 | 12/27/2017 | (17,668,803 | ) | (59,046 | ) | |||||||||||||
| $ | 37,769,397 | $ | (4,161,568 | ) | ||||||||||||||||
Common Abbreviations:
FTSE - Financial Times and the London Stock Exchange
S&P - Standard and Poor's
ULSD - Ultra Low Sulfur Diesel
| (a) | Owned by an entity that is owned by the Fund and is consolidated as described in Note 1 of the Notes to the Consolidated Financial Statements. |
For Fund compliance purposes, the Fund's industry classifications refer to any one or more of the industry sub-classifications used by one or more widely recognized market indexes or ratings group indexes, and/or as defined by Fund management. This definition may not apply for purposes of this report, which may combine industry sub-classifications for reporting ease. Industries are shown as a percentage of net assets.
See Notes to Consolidated Financial Statements.
| Semi-Annual Report | October 31, 2017 | 11 |
| Aspen Portfolio Strategy Fund | Consolidated Schedule of Investments |
October 31, 2017 (Unaudited)
| Shares | Value (Note 2) | |||||||
| EXCHANGE TRADED FUNDS (79.29%) | ||||||||
| SPDR® S&P 500® ETF Trust | 142,459 | $ | 36,633,427 | |||||
TOTAL EXCHANGE TRADED FUNDS (Cost $33,299,104) | 36,633,427 | |||||||
| SHORT TERM INVESTMENTS (9.03%) | ||||||||
| MONEY MARKET FUND (9.03%) | ||||||||
| Dreyfus Treasury & Agency Cash Management Fund - Institutional Shares, 7-day yield, 0.930% | 4,169,937 | 4,169,937 | ||||||
| TOTAL SHORT TERM INVESTMENTS (Cost $4,169,937) | 4,169,937 | |||||||
| TOTAL INVESTMENTS (88.32%) (Cost $37,469,041) | $ | 40,803,364 | ||||||
| Other Assets In Excess Of Liabilities (11.68%) | 5,395,231 | (a) | ||||||
| NET ASSETS (100.00%) | $ | 46,198,595 | ||||||
| (a) | Includes cash which is being held as collateral for futures contracts. |
See Notes to Consolidated Financial Statements.
12
| Aspen Portfolio Strategy Fund | Consolidated Schedule of Investments |
October 31, 2017 (Unaudited)
FUTURES CONTRACTS
At October 31, 2017, the Fund had the following outstanding futures contracts:
| Description | Position | Contracts | Expiration Date | Underlying Face Amount at Value | Unrealized Appreciation | |||||||||||
| Commodity Contracts | ||||||||||||||||
| Copper Future(a) | Long | 26 | 12/27/2017 | $ | 2,015,650 | $ | 27,465 | |||||||||
| Corn Future(a) | Short | 79 | 12/14/2017 | (1,365,712 | ) | 22,358 | ||||||||||
| NY Harbor ULSD Future(a) | Long | 18 | 11/30/2017 | 1,421,658 | 40,992 | |||||||||||
| Silver Future(a) | Short | 17 | 12/27/2017 | (1,418,905 | ) | 26,290 | ||||||||||
| Soybean Future(a) | Short | 14 | 01/12/2018 | (689,325 | ) | 4,673 | ||||||||||
| Sugar No. 11 (World) Future(a) | Long | 43 | 02/28/2018 | 709,878 | 19,580 | |||||||||||
| WTI Crude Future(a) | Long | 40 | 11/20/2017 | 2,175,200 | 77,260 | |||||||||||
| Equity Contracts | ||||||||||||||||
| Euro STOXX 50 Index Future | Long | 148 | 12/15/2017 | 6,340,792 | 237,215 | |||||||||||
| Nikkei 225 Index Future | Long | 57 | 12/07/2017 | 6,334,125 | 605,603 | |||||||||||
| S&P® 500 E-Mini Future | Long | 128 | 12/15/2017 | 16,465,280 | 478,122 | |||||||||||
| Foreign Currency Contracts | ||||||||||||||||
| Japanese Yen Currency Future | Short | 75 | 12/18/2017 | (8,262,656 | ) | 69,380 | ||||||||||
| Interest Rate Contracts | ||||||||||||||||
| U.S. 10 Year Treasury Note Future | Short | 59 | 12/19/2017 | (7,371,313 | ) | 14,884 | ||||||||||
| $ | 16,354,672 | $ | 1,623,822 | |||||||||||||
| Description | Position | Contracts | Expiration Date | Underlying Face Amount at Value | Unrealized Depreciation | |||||||||||
| Commodity Contracts | ||||||||||||||||
| Gold 100 Oz Future(a) | Long | 6 | 12/27/2017 | $ | 762,300 | $ | (11,849 | ) | ||||||||
| Equity Contracts | ||||||||||||||||
| FTSE 100 Index Future | Long | 64 | 12/15/2017 | 6,347,499 | (1,113 | ) | ||||||||||
| Foreign Currency Contracts | �� | |||||||||||||||
| Australian Dollar Currency Future | Long | 35 | 12/18/2017 | 2,678,200 | (120,312 | ) | ||||||||||
| Canadian Dollar Currency Future | Long | 35 | 12/19/2017 | 2,715,125 | (148,147 | ) | ||||||||||
| Euro FX Currency Future | Long | 18 | 12/18/2017 | 2,628,225 | (49,223 | ) | ||||||||||
| Interest Rate Contracts | ||||||||||||||||
| Canadian 10 Year Bond Future | Short | 45 | 12/18/2017 | (4,793,698 | ) | (57,105 | ) | |||||||||
| Euro-Bund Future | Short | 38 | 12/07/2017 | (7,204,016 | ) | (79,683 | ) | |||||||||
| Long Gilt Future | Short | 45 | 12/27/2017 | (7,430,805 | ) | (30,974 | ) | |||||||||
| $ | (4,297,170 | ) | $ | (498,406 | ) | |||||||||||
Common Abbreviations:
FTSE - Financial Times and the London Stock Exchange
S&P - Standard and Poor's
ULSD - Ultra Low Sulfur Diesel
| (a) | Owned by an entity that is owned by the Fund and is consolidated as described in Note 1 of the Notes to the Consolidated Financial Statements. |
For Fund compliance purposes, the Fund's industry classifications refer to any one or more of the industry sub-classifications used by one or more widely recognized market indexes or ratings group indexes, and/or as defined by Fund management. This definition may not apply for purposes of this report, which may combine industry sub-classifications for reporting ease. Industries are shown as a percentage of net assets.
See Notes to Consolidated Financial Statements.
| Semi-Annual Report | October 31, 2017 | 13 |
| Aspen Funds | Consolidated Statements of Assets & Liabilities |
October 31, 2017 (Unaudited)
| Aspen Managed Futures Strategy Fund | Aspen Portfolio Strategy Fund | |||||||
| ASSETS: | ||||||||
| Investments, at value | $ | 108,488,418 | $ | 40,803,364 | ||||
| Foreign currency, at value(Cost $– and $84,434) (Note 3) | – | 81,687 | ||||||
| Deposit with broker for futures contracts (Note 3) | 18,008,807 | 5,364,867 | ||||||
| Receivable for investments sold | – | 93,689 | ||||||
| Receivable for shares sold | 2,187,101 | 19,475 | ||||||
| Interest receivable | 21,851 | 6,339 | ||||||
| Dividend receivable | – | 175,877 | ||||||
| Offering costs (Note 2) | – | 10,227 | ||||||
| Prepaid and other assets | 21,321 | 9,025 | ||||||
| Total assets | 128,727,498 | 46,564,550 | ||||||
| LIABILITIES: | ||||||||
| Foreign cash due to broker for futures contracts (Cost $2,917,770 and $–) (Note 3) | 3,051,246 | – | ||||||
| Payable to advisor | 81,401 | 29,715 | ||||||
| Payable for investments purchased | 108 | 47,153 | ||||||
| Variation margin payable | 329,219 | 226,936 | ||||||
| Payable for shares redeemed | 32,043 | 2,504 | ||||||
| Payable for administration fees | 22,151 | 14,968 | ||||||
| Payable for distribution and service fees | ||||||||
| Class A | 8,421 | 3,707 | ||||||
| Payable for transfer agency fees | 10,027 | 5,216 | ||||||
| Delegated transfer agent equivalent services fees | ||||||||
| Class A | 433 | – | ||||||
| Class I | 50,287 | 3,620 | ||||||
| Payable for trustee fees and expenses | 7,062 | 6,731 | ||||||
| Payable for professional fees | 32,129 | 20,586 | ||||||
| Payable for chief compliance officer fees | 4,261 | 149 | ||||||
| Payable for principal financial officer fees | 513 | 23 | ||||||
| Payable for licensing fees | 27,134 | – | ||||||
| Accrued expenses and other liabilities | 10,705 | 4,647 | ||||||
| Total liabilities | 3,667,140 | 365,955 | ||||||
| NET ASSETS | $ | 125,060,358 | $ | 46,198,595 | ||||
| NET ASSETS CONSIST OF: | ||||||||
| Paid-in capital (Note 5) | $ | 154,820,521 | $ | 42,769,731 | ||||
| Accumulated net investment income/(loss) | (1,154,853 | ) | 75,134 | |||||
| Accumulated net realized loss | (28,513,254 | ) | (1,103,122 | ) | ||||
| Net unrealized appreciation/(depreciation) | (92,056 | ) | 4,456,852 | |||||
| NET ASSETS | $ | 125,060,358 | $ | 46,198,595 | ||||
| INVESTMENTS, AT COST | $ | 108,548,974 | $ | 37,469,041 | ||||
See Notes to Consolidated Financial Statements.
14
| Aspen Funds | Consolidated Statements of Assets & Liabilities |
October 31, 2017 (Unaudited)
| Aspen Managed Futures Strategy Fund | Aspen Portfolio Strategy Fund | |||||||
| PRICING OF SHARES: | ||||||||
| Class A: | ||||||||
| Net Asset Value, offering and redemption price per share | $ | 8.02 | $ | 26.45 | ||||
| Net Assets | $ | 5,948,648 | $ | 2,492,843 | ||||
| Shares of beneficial interest outstanding | 742,141 | 94,239 | ||||||
| Maximum offering price per share (NAV/0.9450), based on maximum sales charge of 5.50% of the offering price | $ | 8.49 | $ | 27.99 | ||||
| Class I: | ||||||||
| Net Asset Value, offering and redemption price per share | $ | 8.16 | $ | 26.54 | ||||
| Net Assets | $ | 119,111,710 | $ | 43,705,752 | ||||
| Shares of beneficial interest outstanding | 14,596,133 | 1,646,776 | ||||||
See Notes to Consolidated Financial Statements.
| Semi-Annual Report | October 31, 2017 | 15 |
| Aspen Funds | Consolidated Statements of Operations |
| For the Six Months Ended October 31, 2017 (Unaudited) |
| Aspen Managed Futures Strategy Fund | Aspen Portfolio Strategy Fund | |||||||
| INVESTMENT INCOME: | ||||||||
| Interest | $ | 469,838 | $ | – | ||||
| Dividends | 35,605 | 366,685 | ||||||
| Total investment income | 505,443 | 366,685 | ||||||
| EXPENSES: | ||||||||
| Investment advisory fees (Note 6) | 540,226 | 225,043 | ||||||
| Investment advisory fees - subsidiary (Note 6) | 61,653 | 7,126 | ||||||
| Administrative fees | 123,056 | 54,835 | ||||||
| Distribution and service fees | ||||||||
| Class A | 12,925 | 4,642 | ||||||
| Transfer agency fees | 34,382 | 23,780 | ||||||
| Delegated transfer agent equivalent services fees | ||||||||
| Class A | 700 | – | ||||||
| Class I | 79,500 | 11,681 | ||||||
| Professional fees | 26,210 | 14,360 | ||||||
| Offering costs | – | 38,739 | ||||||
| Custodian fees | 5,851 | 4,895 | ||||||
| Trustee fees and expenses | 7,092 | 6,697 | ||||||
| Principal financial officer fees | 2,046 | 574 | ||||||
| Chief compliance officer fees | 18,477 | 4,570 | ||||||
| Licensing fees | 180,075 | – | ||||||
| Other | 36,975 | 9,933 | ||||||
| Total expenses before waiver/reimbursement | 1,129,168 | 406,875 | ||||||
| Waiver of investment advisory fees | – | (45,682 | ) | |||||
| Waiver of investment advisory fees - subsidiary (Note 6) | (61,653 | ) | (7,126 | ) | ||||
| Total net expenses | 1,067,515 | 354,067 | ||||||
| NET INVESTMENT INCOME/(LOSS) | (562,072 | ) | 12,618 | |||||
| Net realized loss on investments | (46,249 | ) | (346 | ) | ||||
| Net realized loss on futures contracts | (3,457,621 | ) | (247,087 | ) | ||||
| Net realized gain on foreign currency transactions | 26,221 | 22,706 | ||||||
| Total net realized loss | (3,477,649 | ) | (224,727 | ) | ||||
| Net change in unrealized appreciation of investments | 87,117 | 2,709,890 | ||||||
| Net change in unrealized appreciation on futures contracts | 2,617,072 | 1,106,641 | ||||||
| Net change in unrealized depreciation on translation of assets and liabilities denominated in foreign currency transactions | (198,198 | ) | (5,296 | ) | ||||
| Net change in unrealized appreciation | 2,505,991 | 3,811,235 | ||||||
| NET REALIZED AND UNREALIZED GAIN/(LOSS) ON INVESTMENTS | (971,658 | ) | 3,586,508 | |||||
| NET INCREASE/(DECREASE) IN NET ASSETS RESULTING FROM OPERATIONS | $ | (1,533,730 | ) | $ | 3,599,126 | |||
See Notes to Consolidated Financial Statements.
16
| Consolidated Statements | |
| Aspen Managed Futures Strategy Fund | of Changes in Net Assets |
| For the Six Months Ended October 31, 2017 (Unaudited) | For the Year Ended April 30, 2017 | |||||||
| OPERATIONS: | ||||||||
| Net investment loss | $ | (562,072 | ) | $ | (1,929,803 | ) | ||
| Net realized loss | (3,477,649 | ) | (7,661,403 | ) | ||||
| Net change in unrealized appreciation/(depreciation) | 2,505,991 | (7,772,050 | ) | |||||
| Net decrease in net assets resulting from operations | (1,533,730 | ) | (17,363,256 | ) | ||||
| DISTRIBUTIONS TO SHAREHOLDERS (Note 4): | ||||||||
| From net investment income | ||||||||
| Class A | – | (87,401 | ) | |||||
| Class I | – | (2,130,729 | ) | |||||
| Net decrease in net assets from distributions | – | (2,218,130 | ) | |||||
| SHARE TRANSACTIONS (Note 5): | ||||||||
| Class A | ||||||||
| Proceeds from sales of shares | 893,322 | 5,709,455 | ||||||
| Distributions reinvested | – | 77,296 | ||||||
| Cost of shares redeemed | (1,196,694 | ) | (18,518,215 | ) | ||||
| Redemption fees | – | 2,337 | ||||||
| Class I | ||||||||
| Proceeds from sales of shares | 21,354,792 | 67,326,891 | ||||||
| Distributions reinvested | – | 1,277,264 | ||||||
| Cost of shares redeemed | (95,873,295 | ) | (119,175,878 | ) | ||||
| Redemption fees | 7,806 | 9,991 | ||||||
| Net decrease from share transactions | (74,814,069 | ) | (63,290,859 | ) | ||||
| Net decrease in net assets | (76,347,799 | ) | (82,872,245 | ) | ||||
| NET ASSETS: | ||||||||
| Beginning of period | 201,408,157 | 284,280,402 | ||||||
| End of period* | $ | 125,060,358 | $ | 201,408,157 | ||||
| *Includes accumulated net investment loss of: | $ | (1,154,853 | ) | $ | (592,781 | ) | ||
| Other Information: | ||||||||
| SHARE TRANSACTIONS: | ||||||||
| Class A | ||||||||
| Sold | 110,924 | 657,148 | ||||||
| Distributions reinvested | – | 8,695 | ||||||
| Redeemed | (148,410 | ) | (2,116,176 | ) | ||||
| Net decrease in shares outstanding | (37,486 | ) | (1,450,333 | ) | ||||
| Class I | ||||||||
| Sold | 2,593,593 | 7,602,448 | ||||||
| Distributions reinvested | – | 141,447 | ||||||
| Redeemed | (11,634,009 | ) | (13,558,549 | ) | ||||
| Net decrease in shares outstanding | (9,040,416 | ) | (5,814,654 | ) | ||||
| See Notes to Consolidated Financial Statements. |
| Semi-Annual Report | October 31, 2017 | 17 |
| Consolidated Statements | |
| Aspen Portfolio Strategy Fund | of Changes in Net Assets |
| For the Six Months Ended October 31, 2017 (Unaudited) | For the Period Ended April 30, 2017(a) | |||||||
| OPERATIONS: | ||||||||
| Net investment income/(loss) | $ | 12,618 | $ | (2,905 | ) | |||
| Net realized loss | (224,727 | ) | (1,514,647 | ) | ||||
| Net change in unrealized appreciation | 3,811,235 | 645,617 | ||||||
| Net increase/(decrease) in net assets resulting from operations | 3,599,126 | (871,935 | ) | |||||
| SHARE TRANSACTIONS (Note 5): | ||||||||
| Class A | ||||||||
| Proceeds from sales of shares | 234,709 | 4,346,888 | ||||||
| Cost of shares redeemed | (122,655 | ) | (2,024,348 | ) | ||||
| Class I | ||||||||
| Proceeds from sales of shares | 2,930,280 | 42,535,105 | ||||||
| Cost of shares redeemed | (3,761,365 | ) | (669,987 | ) | ||||
| Redemption fees | 177 | 2,600 | ||||||
| Net increase/(decrease) from share transactions | (718,854 | ) | 44,190,258 | |||||
| Net increase in net assets | 2,880,272 | 43,318,323 | ||||||
| NET ASSETS: | ||||||||
| Beginning of period | 43,318,323 | – | ||||||
| End of period* | $ | 46,198,595 | $ | 43,318,323 | ||||
| *Includes accumulated net investment income of: | $ | 75,134 | $ | 62,516 | ||||
| Other Information: | ||||||||
| SHARE TRANSACTIONS: | ||||||||
| Class A | ||||||||
| Sold | 9,299 | 173,467 | ||||||
| Redeemed | (4,905 | ) | (83,622 | ) | ||||
| Net increase in shares outstanding | 4,394 | 89,845 | ||||||
| Class I | ||||||||
| Sold | 116,112 | 1,707,193 | ||||||
| Redeemed | (149,229 | ) | (27,300 | ) | ||||
| Net increase/(decrease) in shares outstanding | (33,117 | ) | 1,679,893 | |||||
| (a) | The Aspen Portfolio Strategy Fund is for the period from December 29, 2016 (commencement of operations) to April 30, 2017. |
| See Notes to Consolidated Financial Statements. |
| 18 |
| Aspen Managed Futures Strategy Fund – Class A | Consolidated Financial Highlights |
For a share outstanding throughout the periods presented.
| For the Six Months Ended October 31, 2017 (Unaudited) (a) | For the Year Ended April 30, 2017 (a) | For the Year Ended April 30, 2016 (a) | For the Year Ended April 30, 2015 (a) | For the Year Ended April 30, 2014 (a) | For the Year Ended April 30, 2013 (a) | |||||||||||||||||||
| NET ASSET VALUE, BEGINNING OF PERIOD | $ | 8.12 | $ | 8.83 | $ | 10.01 | $ | 8.97 | $ | 9.29 | $ | 8.95 | ||||||||||||
| INCOME/(LOSS) FROM OPERATIONS: | ||||||||||||||||||||||||
| Net investment loss(b) | (0.04 | ) | (0.04 | ) | (0.12 | ) | (0.14 | ) | (0.16 | ) | (0.16 | ) | ||||||||||||
| Net realized and unrealized gain/(loss) on investments | (0.06 | ) | (0.57 | ) | (0.39 | ) | 1.39 | (0.05 | ) | 0.50 | ||||||||||||||
| Total from investment operations | (0.10 | ) | (0.61 | ) | (0.51 | ) | 1.25 | (0.21 | ) | 0.34 | ||||||||||||||
| LESS DISTRIBUTIONS: | ||||||||||||||||||||||||
| From net investment income | – | (0.10 | ) | (0.14 | ) | – | – | – | ||||||||||||||||
| Distributions from net realized gain on investments | – | – | (0.53 | ) | (0.21 | ) | (0.12 | ) | – | |||||||||||||||
| Total distributions | – | (0.10 | ) | (0.67 | ) | (0.21 | ) | (0.12 | ) | – | ||||||||||||||
| REDEMPTION FEES ADDED TO PAID IN CAPITAL | – | 0.00 | (c) | 0.00 | (c) | 0.00 | (c) | 0.01 | 0.00 | (c) | ||||||||||||||
| INCREASE/(DECREASE) IN NET ASSET VALUE | (0.10 | ) | (0.71 | ) | (1.18 | ) | 1.04 | (0.32 | ) | 0.34 | ||||||||||||||
| NET ASSET VALUE, END OF PERIOD | $ | 8.02 | $ | 8.12 | $ | 8.83 | $ | 10.01 | $ | 8.97 | $ | 9.29 | ||||||||||||
| TOTAL RETURN(d) | (1.23 | %)(e) | (6.97 | %) | (5.20 | %) | 14.00 | % | (2.15 | %) | 3.80 | % | ||||||||||||
| RATIOS AND SUPPLEMENTAL DATA: | ||||||||||||||||||||||||
| Net assets, end of period (000's) | $ | 5,949 | $ | 6,331 | $ | 19,682 | $ | 23,850 | $ | 12,914 | $ | 3,350 | ||||||||||||
| RATIOS TO AVERAGE NET ASSETS: | ||||||||||||||||||||||||
| Operating expenses excluding fee waivers/reimbursements | 1.78 | %(f)(g) | 1.00 | %(g) | 1.56 | %(g) | 1.64 | % | 1.83 | % | 1.80 | % | ||||||||||||
| Operating expenses including fee waivers/reimbursements | 1.78 | %(f) | 1.00 | % | 1.56 | % | 1.64 | % | 1.83 | % | 1.80 | % | ||||||||||||
| Net investment loss including fee waivers/reimbursements | (1.07 | %)(f) | (0.52 | %) | (1.24 | %) | (1.50 | %) | (1.72 | %) | (1.75 | %) | ||||||||||||
| PORTFOLIO TURNOVER RATE | 0 | %(e) | 31 | % | 58 | % | 38 | % | 90 | % | 0 | % | ||||||||||||
| (a) | Per share amounts and ratios to average net assets include income and expenses of the Aspen Futures Fund Ltd. (subsidiary), exclusive of the subsidiary's management fee. |
| (b) | Per share numbers have been calculated using the average shares method. |
| (c) | Less than $0.005 per share. |
| (d) | Total return does not reflect the effect of sales charges. |
| (e) | Not annualized. |
| (f) | Annualized. |
| (g) | The ratio of operating expenses excluding fee waiver/reimbursements to average net assets is calculated excluding the waived Subsidiary management fee (see Note 6 for additional detail). The ratio inclusive of that fee would be 1.87%, 1.07% and 1.64% for six months ended October 31, 2017 and the years ended April 30, 2017 and April 30, 2016, respectively. |
| See Notes to Consolidated Financial Statements. | |
| Semi-Annual Report | October 31, 2017 | 19 |
| Aspen Managed Futures Strategy Fund – Class I | Consolidated Financial Highlights |
For a share outstanding throughout the periods presented.
| For the Six Months Ended October 31, 2017 (Unaudited) (a) | For the Year Ended April 30, 2017 (a) | For the Year Ended April 30, 2016 (a) | For the Year Ended April 30, 2015 (a) | For the Year Ended April 30, 2014 (a) | For the Year Ended April 30, 2013 (a) | |||||||||||||||||||
| NET ASSET VALUE, BEGINNING OF PERIOD | $ | 8.25 | $ | 8.98 | $ | 10.17 | $ | 9.07 | $ | 9.36 | $ | 8.98 | ||||||||||||
| INCOME/(LOSS) FROM OPERATIONS: | ||||||||||||||||||||||||
| Net investment loss(b) | (0.03 | ) | (0.07 | ) | (0.09 | ) | (0.11 | ) | (0.11 | ) | (0.11 | ) | ||||||||||||
| Net realized and unrealized gain/(loss) on investments | (0.06 | ) | (0.58 | ) | (0.40 | ) | 1.42 | (0.06 | ) | 0.49 | ||||||||||||||
| Total from investment operations | (0.09 | ) | (0.65 | ) | (0.49 | ) | 1.31 | (0.17 | ) | 0.38 | ||||||||||||||
| LESS DISTRIBUTIONS: | ||||||||||||||||||||||||
| From net investment income | – | (0.08 | ) | (0.17 | ) | – | – | – | ||||||||||||||||
| Distributions from net realized gain on investments | – | – | (0.53 | ) | (0.21 | ) | (0.12 | ) | – | |||||||||||||||
| Total distributions | – | (0.08 | ) | (0.70 | ) | (0.21 | ) | (0.12 | ) | – | ||||||||||||||
| REDEMPTION FEES ADDED TO PAID IN CAPITAL | 0.00 | (c) | 0.00 | (c) | 0.00 | (c) | 0.00 | (c) | 0.00 | (c) | 0.00 | (c) | ||||||||||||
| INCREASE/(DECREASE) IN NET ASSET VALUE | (0.09 | ) | (0.73 | ) | (1.19 | ) | 1.10 | (0.29 | ) | 0.38 | ||||||||||||||
| NET ASSET VALUE, END OF PERIOD | $ | 8.16 | $ | 8.25 | $ | 8.98 | $ | 10.17 | $ | 9.07 | $ | 9.36 | ||||||||||||
| TOTAL RETURN | (1.09 | %)(d) | (7.33 | %) | (4.97 | %) | 14.51 | % | (1.81 | %) | 4.23 | % | ||||||||||||
| RATIOS AND SUPPLEMENTAL DATA: | ||||||||||||||||||||||||
| Net assets, end of period (000's) | $ | 119,112 | $ | 195,077 | $ | 264,598 | $ | 242,575 | $ | 167,258 | $ | 120,769 | ||||||||||||
| RATIOS TO AVERAGE NET ASSETS: | ||||||||||||||||||||||||
| Operating expenses excluding fee waivers/reimbursements | 1.47 | %(e)(f) | 1.28 | %(f) | 1.22 | %(f) | 1.25 | % | 1.30 | % | 1.25 | % | ||||||||||||
| Operating expenses including fee waivers/reimbursements | 1.47 | %(e) | 1.28 | % | 1.22 | % | 1.25 | % | 1.30 | % | 1.25 | % | ||||||||||||
| Net investment loss including fee waivers/reimbursements | (0.77 | %)(e) | (0.78 | %) | (0.94 | %) | (1.11 | %) | (1.20 | %) | (1.20 | %) | ||||||||||||
| PORTFOLIO TURNOVER RATE | 0 | %(d) | 31 | % | 58 | % | 38 | % | 90 | % | 0 | % | ||||||||||||
| (a) | Per share amounts and ratios to average net assets include income and expenses of the Aspen Futures Fund Ltd. (subsidiary), exclusive of the subsidiary's management fee. |
| (b) | Per share numbers have been calculated using the average shares method. |
| (c) | Less than $0.005 per share. |
| (d) | Not annualized. |
| (e) | Annualized. |
| (f) | The ratio of operating expenses excluding fee waiver/reimbursements to average net assets is calculated excluding the waived Subsidiary management fee (see Note 6 for additional detail). The ratio inclusive of that fee would be 1.56%, 1.35% and 1.30% for the six months ended October 31, 2017 and the years ended April 30, 2017 and April 30, 2016, respectively. |
| See Notes to Consolidated Financial Statements. |
| 20 |
| Aspen Portfolio Strategy Fund – Class A | Consolidated Financial Highlights |
| For a share outstanding throughout the periods presented. |
| For the Six Months Ended October 31, 2017 (Unaudited) | For the Period Ended April 30, 2017(a)(b) | |||||||
| NET ASSET VALUE, BEGINNING OF PERIOD | $ | 24.45 | $ | 25.00 | ||||
| INCOME/(LOSS) FROM OPERATIONS: | ||||||||
| Net investment loss(c) | (0.04 | ) | (0.03 | ) | ||||
| Net realized and unrealized gain/(loss) on investments | 2.04 | (0.52 | ) | |||||
| Total from investment operations | 2.00 | (0.55 | ) | |||||
| INCREASE/(DECREASE) IN NET ASSET VALUE | 2.00 | (0.55 | ) | |||||
| NET ASSET VALUE, END OF PERIOD | $ | 26.45 | $ | 24.45 | ||||
| TOTAL RETURN(d) | 8.18 | %(e) | (2.20 | %)(e) | ||||
| RATIOS AND SUPPLEMENTAL DATA: | ||||||||
| Net assets, end of period (000's) | $ | 2,493 | $ | 2,196 | ||||
| RATIOS TO AVERAGE NET ASSETS: | ||||||||
| Operating expenses excluding fee waivers/reimbursements | 2.10 | %(f)(g) | 2.79 | %(f)(g) | ||||
| Operating expenses including fee waivers/reimbursements | 1.95 | %(f) | 1.95 | %(f) | ||||
| Net investment loss including fee waivers/reimbursements | (0.31 | %)(f) | (0.40 | %)(f) | ||||
| PORTFOLIO TURNOVER RATE | 0 | %(e) | 0 | %(e)(h) | ||||
| (a) | The Aspen Portfolio Strategy Fund is for the period from December 29, 2016 (commencement of operations) to April 30, 2017. |
| (b) | Per share amounts and ratios to average net assets include income and expenses of the Aspen Portfolio Strategy Fund Ltd. (subsidiary), exclusive of the subsidiary's management fee. |
| (c) | Per share numbers have been calculated using the average shares method. |
| (d) | Total return does not reflect the effect of sales charges. |
| (e) | Not annualized. |
| (f) | Annualized. |
| (g) | The ratio of operating expenses excluding fee waiver/reimbursements to average net assets is calculated excluding the waived Subsidiary management fee (see Note 6 for additional detail). The ratio inclusive of that fee would be 2.14% and 2.82% for the six months ended October 31, 2017 and for the period ended April 30, 2017, respectively. |
| (h) | Less than 0.05%. |
| See Notes to Consolidated Financial Statements. |
| Semi-Annual Report | October 31, 2017 | 21 |
| Aspen Portfolio Strategy Fund – Class I | Consolidated Financial Highlights |
| For a share outstanding throughout the periods presented. |
| For the Six Months Ended October 31, 2017 (Unaudited) | For the Period Ended April 30, 2017(a)(b) | |||||||
| NET ASSET VALUE, BEGINNING OF PERIOD | $ | 24.48 | $ | 25.00 | ||||
| INCOME/(LOSS) FROM OPERATIONS: | ||||||||
| Net investment income(c) | 0.01 | (d) | 0.00 | (d)(e) | ||||
| Net realized and unrealized gain/(loss) on investments | 2.05 | (0.52 | ) | |||||
| Total from investment operations | 2.06 | (0.52 | ) | |||||
| REDEMPTION FEES ADDED TO PAID IN CAPITAL | 0.00 | (e) | 0.00 | (e) | ||||
| INCREASE/(DECREASE) IN NET ASSET VALUE | 2.06 | (0.52 | ) | |||||
| NET ASSET VALUE, END OF PERIOD | $ | 26.54 | $ | 24.48 | ||||
| TOTAL RETURN | 8.42 | %(f) | (2.08 | %)(f) | ||||
| RATIOS AND SUPPLEMENTAL DATA: | ||||||||
| Net assets, end of period (000's) | $ | 43,706 | $ | 41,122 | ||||
| RATIOS TO AVERAGE NET ASSETS: | ||||||||
| Operating expenses excluding fee waivers/reimbursements | 1.76 | %(g)(h) | 2.22 | %(g)(h) | ||||
| Operating expenses including fee waivers/reimbursements | 1.55 | %(g) | 1.55 | %(g) | ||||
| Net investment income including fee waivers/reimbursements | 0.08 | %(g) | 0.01 | %(g) | ||||
| PORTFOLIO TURNOVER RATE | 0 | %(f) | 0 | %(f)(i) | ||||
| (a) | The Aspen Portfolio Strategy Fund is for the period from December 29, 2016 (commencement of operations) to April 30, 2017. |
| (b) | Per share amounts and ratios to average net assets include income and expenses of the Aspen Portfolio Strategy Fund Ltd. (subsidiary), exclusive of the subsidiary's management fee. |
| (c) | Per share numbers have been calculated using the average shares method. |
| (d) | The amount shown for a share outstanding throughout the period may not correlate with the Statement of Operations for the period due to the timing of sales and redemptions of Fund shares in relation to income earned and/or fluctuating market value of the investments of the Fund. |
| (e) | Less than $0.005 per share. |
| (f) | Not annualized. |
| (g) | Annualized. |
| (h) | The ratio of operating expenses excluding fee waiver/reimbursements to average net assets is calculated excluding the waived Subsidiary management fee (see Note 6 for additional detail). The ratio inclusive of that fee would be 1.79% and 2.25% for the six months ended October 31, 2017 and for the period ended April 30, 2017, respectively. |
| (i) | Less than 0.05%. |
| See Notes to Consolidated Financial Statements. |
| 22 |
| Aspen Funds | Notes to Consolidated Financial Statements |
October 31, 2017 (Unaudited)
1. ORGANIZATION
Financial Investors Trust (the “Trust”), a Delaware statutory trust, is an open-end management investment company registered under the Investment Company Act of 1940, as amended (“1940 Act”). As of October 31, 2017, the Trust consists of multiple separate portfolios or series. This semi-annual report describes the Aspen Managed Futures Strategy Fund and the Aspen Portfolio Strategy Fund (individually a “Fund” and collectively, the “Funds”). The Aspen Managed Futures Strategy Fund seeks investment results that replicate as closely as possible, before fees and expenses, the price and yield performance of the Aspen Managed Futures Beta Index (the “MFBI” or “Index”). The Aspen Portfolio Strategy Fund seeks long-term capital appreciation. The Funds offer Class A and Class I shares. The Aspen Portfolio Strategy Fund commenced operations on December 29, 2016.
Basis of Consolidation
Aspen Futures Fund, Ltd. (the “Aspen Fund Subsidiary”), a Cayman Islands exempted company, is a wholly owned subsidiary of the Aspen Managed Futures Strategy Fund and Aspen Portfolio Strategy Fund, Ltd. (the “Aspen Portfolio Subsidiary”), a Cayman Islands exempted company, is a wholly owned subsidiary of the Aspen Portfolio Strategy Fund. The investment objective of both the Aspen Fund Subsidiary and the Aspen Portfolio Subsidiary (collectively the “Subsidiaries”) is designed to enhance the ability of the Funds to obtain exposure to equities, financial, currency and commodities markets consistent with the limits of the U.S. federal tax law requirements applicable to registered investment companies. The Subsidiaries are subject to substantially the same investment policies and investment restrictions as the Funds. The Subsidiaries act as an investment vehicle for the Funds in order to effect certain commodity-related investments on behalf of the Funds. Investments in the Subsidiaries are expected to provide the Funds with exposure to the commodity markets within the limitations of Subchapter M of the Internal Revenue Code of 1986, as amended (the “Code”), and recent IRS revenue rulings, as discussed below under “Federal Income Taxes”. The Funds are the sole shareholder of the Subsidiaries pursuant to a subscription agreement dated as of August 2, 2011 for the Aspen Fund Subsidiary and December 16, 2016 for the Aspen Portfolio Subsidiary and it is intended that each Fund will remain the sole shareholder and will continue to control the Subsidiaries. Under the Articles of Association of the Subsidiaries, shares issued by the Subsidiaries confers upon a shareholder the right to wholly own and vote at general meetings of the Subsidiaries and certain rights in connection with any winding-up or repayment of capital, as well as the right to participate in the profits or assets of the Subsidiaries. Each Fund may invest up to 25% of their total assets in shares of the Subsidiaries. All investments held by the Subsidiaries are disclosed in the accounts of each Fund. As a wholly owned subsidiary of the Funds, all assets and liabilities, income and expenses of the Subsidiaries are consolidated in the financial statements and financial highlights of the Funds. All investments held by the Subsidiaries are disclosed in the accounts of the Funds. As of October 31, 2017, net assets of the Aspen Managed Futures Strategy Fund were $125,060,358, of which net assets of $15,898,969 or 12.71%, represented the Fund’s ownership of all issued shares and voting rights of the Aspen Fund Subsidiary. As of April 30, 2017, net assets of the Aspen Portfolio Strategy Fund were $46,198,595, of which $1,388,652 or 3.01%, represented the Fund’s ownership of all issued shares and voting rights of the Aspen Portfolio Subsidiary.
2. SIGNIFICANT ACCOUNTING POLICIES
The accompanying financial statements were prepared in accordance with accounting principles generally accepted in the United States of America (“U.S. GAAP”). The preparation of financial statements in conformity with U.S. GAAP requires management to make certain estimates and assumptions that affect the reported amounts of assets and liabilities and disclosures of contingent assets and liabilities at the date of the financial statements and the reported amounts of revenue and expenses during the period. Actual results could differ from those estimates. The Funds are considered an investment company for financial reporting purposes under U.S. GAAP. The following is a summary of significant accounting policies consistently followed by the Funds and Subsidiaries in preparation of the financial statements.
Investment Valuation: The Funds generally value their securities based on market prices determined at the close of regular trading on the New York Stock Exchange (“NYSE”), normally 4:00 p.m. Eastern Time, on each day the NYSE is open for trading.
For equity securities and mutual funds that are traded on an exchange, the market price is usually the closing sale or official closing price on that exchange. In the case of equity securities not traded on an exchange, or if such closing prices are not otherwise available, the securities are valued at the mean of the most recent bid and ask prices on such day. Redeemable securities issued by open-end registered investment companies are valued at the investment company’s applicable net asset value, with the exception of exchange-traded open-end investment companies, which are priced as equity securities.
The market price for debt obligations is generally the price supplied by an independent third-party pricing service approved by the Board of Trustees (the “Board”), which may use a matrix, formula or other objective method that takes into consideration quotations from dealers, market transactions in comparable investments, market indices and yield curves. If vendors are unable to supply a price, or if the price supplied is deemed to be unreliable, the market price may be determined using quotations received from one or more brokers-dealers that make a market in the security.
| Semi-Annual Report | October 31, 2017 | 23 |
| Aspen Funds | Notes to Consolidated Financial Statements |
October 31, 2017 (Unaudited)
Futures contracts that are listed or traded on a national securities exchange, commodities exchange, contract market or comparable over-the- counter market, and that are freely transferable, are valued at their closing settlement price on the exchange on which they are primarily traded or based upon the current settlement price for a like instrument acquired on the day on which the instrument is being valued. A settlement price may not be used if the market makes a limit move with respect to a particular commodity.
Forward currency exchange contracts have a fair value determined by the prevailing foreign currency exchange daily rates and current foreign currency exchange forward rates. The foreign currency exchange forward rates are calculated using an automated system that estimates rates on the basis of the current day foreign currency exchange rates and forward foreign currency exchange rates supplied by a pricing service.
Investment securities that are primarily traded on foreign securities exchanges are valued at the preceding closing values of such securities on their respective exchanges, except when an occurrence subsequent to the time a value was so established is likely to have changed such value. In such an event, the fair value of those securities are determined in good faith through consideration of other factors in accordance with procedures established by and under the general supervision of the Board.
When such prices or quotations are not available, or when Aspen Partners, Ltd. (the “Adviser”) believes that they are unreliable, securities may be priced using fair value procedures approved by the Board.
Fair Value Measurements: The Funds disclose the classification of their fair value measurements following a three-tier hierarchy based on the inputs used to measure fair value. Inputs refer broadly to the assumptions that market participants would use in pricing the asset or liability, including assumptions about risk. Inputs may be observable or unobservable. Observable inputs reflect the assumptions market participants would use in pricing the asset or liability that are developed based on market data obtained from sources independent of the reporting entity. Unobservable inputs reflect the reporting entity’s own assumptions about the assumptions market participants would use in pricing the asset or liability that are developed based on the best information available.
Various inputs are used in determining the value of each of the Funds’ investments as of the end of the reporting period. When inputs used fall into different levels of the fair value hierarchy, the level in the hierarchy within which the fair value measurement falls is determined based on the lowest level input that is significant to the fair value measurement in their entirety. The designated input levels are not necessarily an indication of the risk or liquidity associated with these investments. These inputs are categorized in the following hierarchy under applicable financial accounting standards:
| Level 1 – | Unadjusted quoted prices in active markets for identical investments, unrestricted assets or liabilities that the Funds have the ability to access at the measurement date; |
| Level 2 – | Quoted prices which are not active, quoted prices for similar assets or liabilities in active markets or inputs other than quoted prices that are observable (either directly or indirectly) for substantially the full term of the asset or liability; and |
| Level 3 – | Significant unobservable prices or inputs (including the Funds’ own assumptions in determining the fair value of investments) where there is little or no market activity for the asset or liability at the measurement date. |
| 24 |
| Aspen Funds | Notes to Consolidated Financial Statements |
October 31, 2017 (Unaudited)
The following is a summary of each input used to value the Funds as of October 31, 2017:
Aspen Managed Futures Strategy Fund
| Investments in Securities at Value | Level 1 - Quoted Prices | Level 2 - Other Significant Observable Inputs | Level 3 - Significant Unobservable Inputs | Total | ||||||||||||
| Government Bonds | $ | – | $ | 6,830,431 | $ | – | $ | 6,830,431 | ||||||||
| Short Term Investments | ||||||||||||||||
| Money Market Fund | 7,822,041 | – | – | 7,822,041 | ||||||||||||
| U.S. Treasury Bills | – | 93,835,946 | – | 93,835,946 | ||||||||||||
| TOTAL | $ | 7,822,041 | $ | 100,666,377 | $ | – | $ | 108,488,418 | ||||||||
| Other Financial Instruments Assets: | ||||||||||||||||
| Futures Contracts | ||||||||||||||||
| Commodity Contracts | $ | 561,736 | $ | – | $ | – | $ | 561,736 | ||||||||
| Equity Contracts | 2,357,656 | – | – | 2,357,656 | ||||||||||||
| Foreign Currency Contracts | 1,316,685 | – | – | 1,316,685 | ||||||||||||
| Interest Rate Contracts | 26,931 | – | – | 26,931 | ||||||||||||
| Liabilities: | ||||||||||||||||
| Futures Contracts | ||||||||||||||||
| Commodity Contracts | (23,962 | ) | – | – | (23,962 | ) | ||||||||||
| Equity Contracts | (18,406 | ) | – | – | (18,406 | ) | ||||||||||
| Foreign Currency Contracts | (3,725,072 | ) | – | – | (3,725,072 | ) | ||||||||||
| Interest Rate Contracts | (394,128 | ) | – | – | (394,128 | ) | ||||||||||
| TOTAL | $ | 101,440 | $ | – | $ | – | $ | 101,440 | ||||||||
Aspen Portfolio Strategy Fund
| �� | ||||||||||||||||
| Investments in Securities at Value | Level 1 - Quoted Prices | Level 2 - Other Significant Observable Inputs | Level 3 - Significant Unobservable Inputs | Total | ||||||||||||
| Exchange Traded Funds | $ | 36,633,427 | $ | – | $ | – | $ | 36,633,427 | ||||||||
| Short Term Investments | 4,345,814 | – | – | 4,345,814 | ||||||||||||
| TOTAL | $ | 40,979,241 | $ | – | $ | – | $ | 40,979,241 | ||||||||
| Other Financial Instruments Assets: | ||||||||||||||||
| Futures Contracts | ||||||||||||||||
| Commodity Contracts | $ | 218,618 | $ | – | $ | – | $ | 218,618 | ||||||||
| Equity Contracts | 1,320,940 | – | – | 1,320,940 | ||||||||||||
| Foreign Currency Contracts | 69,380 | – | – | 69,380 | ||||||||||||
| Interest Rate Contracts | 14,884 | – | – | 14,884 | ||||||||||||
| Liabilities: | ||||||||||||||||
| Futures Contracts | ||||||||||||||||
| Commodity Contracts | (11,849 | ) | – | – | (11,849 | ) | ||||||||||
| Equity Contracts | (1,113 | ) | – | – | (1,113 | ) | ||||||||||
| Foreign Currency Contracts | (317,682 | ) | – | – | (317,682 | ) | ||||||||||
| Interest Rate Contracts | (167,762 | ) | – | – | (167,762 | ) | ||||||||||
| TOTAL | $ | 1,125,416 | $ | – | $ | – | $ | 1,125,416 | ||||||||
The Funds recognize transfers between levels as of the end of the period. For the six months ended October 31, 2017, the Funds did not have any transfers between Level 1 and Level 2 securities. For the six months ended October 31, 2017, the Funds did not have any securities that used significant unobservable inputs (Level 3) in determining fair value.
| Semi-Annual Report | October 31, 2017 | 25 |
| Aspen Funds | Notes to Consolidated Financial Statements |
October 31, 2017 (Unaudited)
Investment Transactions and Investment Income: Investment transactions are accounted for on the date the investments are purchased or sold (trade date). Realized gains and losses from investment transactions are reported on an identified cost basis, which is the same basis the Funds use for federal income tax purposes. Interest income, which includes accretion of discounts, is accrued and recorded as earned. Dividend income is recognized on the ex-dividend date or for certain foreign securities, as soon as information is available to the Funds. All of the realized and unrealized gains and losses and net investment income, are allocated daily to each class in proportion to their average daily net assets.
Foreign Securities: The Funds may directly purchase securities of foreign issuers. Investing in securities of foreign issuers involves special risks not typically associated with investing in securities of U.S. issuers. The risks include possible reevaluation of currencies, the inability to repatriate foreign currency, less complete financial information about companies and possible future adverse political and economic developments. Moreover, securities of many foreign issuers and their markets may be less liquid and their prices more volatile than those of securities of comparable U.S. issuers.
Foreign Currency Translation: The books and records of the Funds are maintained in U.S. dollars. Investment valuations and other assets and liabilities initially expressed in foreign currencies are converted each business day into U.S. dollars based upon current exchange rates. Prevailing foreign exchange rates may generally be obtained at the close of the NYSE (normally, 4:00 p.m. Eastern Time). The portion of realized and unrealized gains or losses on investments due to fluctuations in foreign currency exchange rates is not separately disclosed and is included in realized and unrealized gains or losses on investments, when applicable.
Foreign Currency Spot Contracts: The Funds may enter into foreign currency spot contracts to facilitate transactions in foreign securities or to convert foreign currency receipts into U.S. dollars. A foreign currency spot contract is an agreement between two parties to buy and sell currencies at the current market rate, for settlement generally within two business days. The U.S. dollar value of the contracts is determined using current currency exchange rates supplied by a pricing service. The contract is marked-to-market daily for settlements beyond one day and any change in market value is recorded as an unrealized gain or loss. When the contract is closed, the Funds record a realized gain or loss equal to the difference between the value on the open and close date. Losses may arise from changes in the value of the foreign currency, or if the counterparties do not perform under the contract’s terms. The maximum potential loss from such contracts is the aggregate face value in U.S. dollars at the time the contract was opened.
Trust Expenses: Some expenses of the Trust can be directly attributed to each of the Funds. Expenses which cannot be directly attributed to the Funds are apportioned among all funds in the Trust based on average net assets of each fund.
Fund and Class Expenses: Expenses that are specific to a class of shares of the Funds, including distribution fees (Rule 12b-1 fees) and shareholder servicing fees, are charged directly to that share class. All expenses of the Funds, other than class specific expenses, are allocated daily to each class in proportion to their average daily net assets.
Offering Costs: Offering costs, including costs of printing initial prospectuses, legal and registration fees, are being amortized over twelve months from the inception date of the Aspen Portfolio Strategy Fund. Amounts amortized during the six months ended October 31, 2017 for the Aspen Portfolio Strategy Fund are shown on the Statements of Operations. As of October 31, 2017, $10,227, of offering costs remain to be amortized for the Aspen Portfolio Strategy Fund.
Federal Income Taxes: The Funds comply with the requirements under Subchapter M of the Internal Revenue Code of 1986, as amended, applicable to regulated investment companies and intends to distribute substantially all of their net taxable income and net capital gains, if any, each year so that it will not be subject to excise tax on distributed income and gains. The Funds are not subject to income taxes to the extent such distributions are made.
As of and during the six month period ended October 31, 2017, the Funds did not have a liability for any unrecognized tax benefits. The Funds file U.S. federal, state, and local tax returns as required. The Funds’ tax returns are subject to examination by the relevant tax authorities until expiration of the applicable statute of limitations, which is generally three years after the filing of the tax return for federal purposes and four years for most state returns. Tax returns for open years have incorporated no uncertain tax positions that require a provision for income taxes.
Distributions to Shareholders: The Funds normally pay dividends and distributes capital gains, if any, on an annual basis. Income dividend distributions are derived from interest and other income the Funds receive from their investments, including short term capital gains. Long term capital gains distributions are derived from gains realized when the Funds sell a security it has owned for more than a year. The Funds may make additional distributions and dividends at other times if the portfolio manager believes doing so may be necessary for the Funds to avoid or reduce taxes.
| 26 |
| Notes to Consolidated | |
| Aspen Funds | Financial Statements |
October 31, 2017 (Unaudited)
3. DERIVATIVE INSTRUMENTS
The Funds use derivatives (including futures) to pursue their investment objective. The Funds’ use of derivative instruments involves risks different from, or possibly greater than, the risks associated with investing directly in securities and other traditional investments. These risks may include (i) the risk that the counterparty to a derivative transaction may not fulfill their contractual obligations, (ii) risk of mispricing or improper valuation, and (iii) the risk that changes in the value of the derivative may not correlate perfectly with the underlying asset, rate or index. These risks could cause the Funds to lose more than the principal amount invested. In addition, investments in derivatives involve leverage, which means a small percentage of assets invested in derivatives can have a disproportionately large impact on the Funds.
The Funds’ use of derivatives can result in losses due to unanticipated changes in the market risk factors and the overall market. In instances where the Funds are using derivatives to decrease, or hedge, exposures to market risk factors for securities held by the Funds, there are also risks that those derivatives may not perform as expected resulting in losses for the combined or hedged positions. Derivatives may have little or no initial cash investment relative to their market value exposure and therefore can produce significant gains or losses in excess of their cost. This use of embedded leverage allows the Funds to increase their market value exposure relative to their net assets and can substantially increase the volatility of the Funds’ performance.
In addition, use of derivatives may increase or decrease exposure to the following risk factors:
| ● | Equity Risk: Equity risk relates to the change in value of equity securities as they relate to increases or decreases in the general market. |
| ● | Interest Rate Risk: When the Funds invest in fixed-income securities or derivatives, the value of an investment in the Funds will fluctuate with changes in interest rates. Typically, a rise in interest rates causes a decline in the value of fixed-income securities or derivatives owned by the Funds. In general, the market price of debt securities with longer maturities will increase or decrease more in response to changes in interest rates than shorter-term securities. Other risk factors include credit risk (the debtor may default) and prepayment risk (the debtor may pay their obligation early, reducing the amount of interest payments). |
| ● | Foreign Currency Risk: Currency trading involves significant risks, including market risk, interest rate risk, country risk, counterparty credit risk and short sale risk. Market risk results from the price movement of foreign currency values in response to shifting market supply and demand. Interest rate risk arises whenever a country changes its stated interest rate target associated with its currency. Country risk arises because virtually every country may interfere with international transactions in its currency. Counterparty credit risk arises when the counterparty will not fulfill its obligations to the Funds. Short sale risk arises from the sale of a security that is not owned, or any sale that is completed by the delivery of a security borrowed. |
| ● | Commodity Risk: Exposure to the commodities markets may subject the Funds to greater volatility than investments in traditional securities. Commodity prices are influenced by unfavorable weather, animal and plant disease, geologic and environmental factors, as well as changes in government regulation such as tariffs, embargoes or burdensome production rules and restrictions. |
Futures: The Funds and the Subsidiaries may enter into futures contracts. Futures contracts are agreements between two parties to buy and sell a particular commodity, instrument or index for a specified price on a specified future date. When the Funds or the Subsidiaries enter into a futures contract, it is required to deposit with (or for the benefit of) their broker an amount of cash or short-term high-quality securities as “initial margin”. The margin requirements are set by the exchange on which the contract is traded and may be modified during the term of the contract. The initial margin is in the nature of a performance bond or good faith deposit on the futures contract that is returned to the Funds upon termination of the contract, assuming all contractual obligations have been satisfied. As the value of the contract changes, the value of the futures contract position increases or declines. Subsequent payments, known as “variation margin”, are made or received by the Funds or the Subsidiaries each day, depending on the price fluctuations in the fair value of the contract and the value of cash or securities on deposit with the broker. Such payments or receipts are recorded for financial statement purposes as unrealized gains or losses by the Funds. Variation margin does not represent a borrowing or loan by the Funds but is instead a settlement between the Funds and the broker of the amount one would owe the other if the futures contract expired. When the contract is closed, the Funds record a realized gain or loss equal to the difference between the value of the contract at the time it was opened and the value at the time it was closed. When the Funds or the Subsidiaries enter into a futures contract certain risks may arise, such as illiquidity in the futures market, which may limit the Funds’ or the Subsidiaries’ ability to close out a futures contract prior to settlement date, and unanticipated movements in the value of securities, commodities or interest rates. Futures contracts are exchange-traded. Exchange-traded futures are standardized contracts and are settled through a clearing house with fulfillment supported by the credit of the exchange. Therefore, counterparty credit risk to the Funds and the Subsidiaries are reduced. With exchange traded futures, there is minimal counterparty credit risk to the Funds since futures are exchange traded and the exchange’s clearinghouse, as a counterparty to all exchange traded futures, guarantees the futures against default.
| Semi-Annual Report | October 31, 2017 | 27 |
| Notes to Consolidated | |
| Aspen Funds | Financial Statements |
October 31, 2017 (Unaudited)
Consolidated Statements of Assets and Liabilities – Fair Value of Derivative Instruments as of October 31, 2017:
| Risk Exposure | Asset Derivatives Statements of Assets and Liabilities Location | Fair Value | Liabilities Derivatives Statements of Assets and Liabilities Location | Fair Value | ||||||||
| Aspen Managed Futures Strategy Fund | ||||||||||||
| Futures Contracts | Unrealized appreciation on futures contracts(a) | $ | 4,263,008 | Unrealized depreciation on futures contracts(a) | $ | 4,161,568 | ||||||
| $ | 4,263,008 | $ | 4,161,568 | |||||||||
| Risk Exposure to Fund | ||||||||||||
| Commodity Contracts | $ | 561,736 | $ | 23,962 | ||||||||
| Equity Contracts | 2,357,656 | 18,406 | ||||||||||
| Foreign Currency Contracts | 1,316,685 | 3,725,072 | ||||||||||
| Interest Rate Contracts | 26,931 | 394,128 | ||||||||||
| $ | 4,263,008 | $ | 4,161,568 | |||||||||
| Aspen Portfolio Strategy Fund | ||||||||||||
| Futures Contracts | Unrealized appreciation on futures contracts(a) | $ | 1,623,822 | Unrealized depreciation on futures contracts(a) | $ | 498,406 | ||||||
| $ | 1,623,822 | $ | 498,406 | |||||||||
| Risk Exposure to Fund | ||||||||||||
| Commodity Contracts | $ | 218,618 | $ | 11,849 | ||||||||
| Equity Contracts | 1,320,940 | 1,113 | ||||||||||
| Foreign Currency Contracts | 69,380 | 317,682 | ||||||||||
| Interest Rate Contracts | 14,884 | 167,762 | ||||||||||
| $ | 1,623,822 | $ | 498,406 | |||||||||
| (a) | Represents cumulative appreciation/(depreciation) of futures contracts as reported in the Consolidated Schedule of Investments. Only the current day’s net variation margin is reported within the Consolidated Statements of Assets and Liabilities. |
28
| Notes to Consolidated | |
| Aspen Funds | Financial Statements |
October 31, 2017 (Unaudited)
Consolidated Statements of Operations – The effect of Derivative Instruments for the six months ended October 31, 2017:
| Derivatives Instruments | Location of Gain/(Loss) on Derivatives Statements of Operations | Realized Gain/(Loss) on Derivatives Statements of Operations | Change in Unrealized Appreciation/(Depreciation) on Derivatives Statements of Operations | |||||||
| Aspen Managed Futures Strategy Fund | ||||||||||
| Futures Contracts | Net realized loss on futures contracts/Net change in unrealized appreciation/(depreciation) on futures contracts | $ | (3,457,621 | ) | $ | 2,617,072 | ||||
| $ | (3,457,621 | ) | $ | 2,617,072 | ||||||
| Risk Exposure to Fund | ||||||||||
| Commodity Contracts | $ | (3,173,792 | ) | $ | (1,040,820 | ) | ||||
| Equity Contracts | 241,113 | (2,036,110 | ) | |||||||
| Foreign Currency Contracts | 270,266 | 136,764 | ||||||||
| Interest Rate Contracts | (795,208 | ) | 323,094 | |||||||
| $ | (3,457,621 | ) | $ | 2,617,072 | ||||||
| Aspen Portfolio Strategy Fund | ||||||||||
| Futures Contracts | Net realized loss on futures contracts/Net change in unrealized appreciation/(depreciation) on futures contracts | $ | (247,087 | ) | $ | (1,106,641 | ) | |||
| $ | (247,087 | ) | $ | (1,106,641 | ) | |||||
| Risk Exposure to Fund | ||||||||||
| Commodity Contracts | $ | (854,196 | ) | $ | (292,409 | ) | ||||
| Equity Contracts | 408,121 | (1,260,578 | ) | |||||||
| Foreign Currency Contracts | 449,219 | 303,595 | ||||||||
| Interest Rate Contracts | (250,221 | ) | 142,751 | |||||||
| $ | (247,087 | ) | $ | (1,106,641 | ) | |||||
The average value of net futures contracts held by the Aspen Managed Futures Strategy Fund and the Aspen Portfolio Strategy Fund during the period was $41,192,660 and $24,245,130, respectively.
4. TAX BASIS INFORMATION
Tax Basis of Investments: As of October 31, 2017, the aggregate cost of investments, gross unrealized appreciation/(depreciation) and net unrealized depreciation for Federal tax purposes was as follows:
| Cost of Investments | Gross Appreciation (excess of value over tax cost) | Gross Depreciation (excess of tax cost over value) | Net Appreciation on Investments | |||||||||||||
| Aspen Managed Futures Strategy Fund | $ | 108,548,974 | $ | 4,901,530 | $ | (4,860,646 | ) | $ | 40,884 | |||||||
| Aspen Portfolio Strategy Fund | 37,645,027 | 4,958,037 | (498,407 | ) | 4,459,630 | |||||||||||
Tax Basis of Distributions to Shareholders: Distributions are determined in accordance with federal income tax regulations, which differ from GAAP, and, therefore, may differ significantly in amount or character from net investment income and realized gains for financial reporting purposes. Financial reporting records are adjusted for permanent book/tax differences to reflect tax character but are not adjusted for temporary differences.
| Semi-Annual Report | October 31, 2017 | 29 |
| Notes to Consolidated | |
| Aspen Funds | Financial Statements |
October 31, 2017 (Unaudited)
The tax character of distributions paid during the year ending April 30, 2017 were as follows:
| Ordinary Income | Long-Term Capital Gain | |||||||
| Aspen Managed Futures Strategy Fund | $ | 2,217,954 | $ | – | ||||
| Aspen Portfolio Strategy Fund | – | – | ||||||
The amounts and characteristics of tax basis distributions and composition of distributable earnings/(accumulated losses) are finalized at fiscal year-end. Accordingly, tax basis balances have not been determined as of October 31, 2017.
5. SHARES OF BENEFICIAL INTEREST
The capitalization of the Trust consists of an unlimited number of shares of beneficial interest with no par value per share. Holders of the shares of each of the Funds of the Trust have one vote for each share held and a proportionate fraction of a vote for each fractional share. All shares issued and outstanding are fully paid and are transferable and redeemable at the option of the shareholder. Purchasers of the shares do not have any obligation to make payments to the Trust or its creditors solely by reason of the purchasers’ ownership of the shares. Shares have no pre-emptive rights.
Fund shares redeemed within 30 days of purchase may incur a 2% short-term redemption fee deducted from the redemption amount. The amount of redemption fees received during the period are presented in the Consolidated Statement of Changes in Net Assets.
6. MANAGEMENT AND RELATED-PARTY TRANSACTIONS
The Adviser, subject to the authority of the Board, is responsible for the overall management and administration of the Funds’ business affairs. The Adviser manages the investments of the Funds in accordance with the Funds’ investment objective, policies and limitations and investment guidelines established jointly by the Adviser and the Board. Pursuant to each Fund’s Investment Advisory Agreement, (the “Advisory Agreement”), the Aspen Managed Futures Strategy Fund will pay the Adviser an annual management fee of 0.75%, based on the Fund’s average daily net asset. The Aspen Portfolio Strategy Fund will pay the Adviser an annual management fee of 1.00%, based on the Fund’s average daily net assets. The management fee is paid on a monthly basis.
The Subsidiaries have each entered into a separate advisory agreement (collectively, the “Subsidiary Advisory Agreement”) with the Adviser for the management of each Subsidiary’s portfolio pursuant to which the Subsidiaries are obligated to pay the Adviser a management fee at the same rate that the Funds pay the Adviser for investment advisory services provided to the Funds. The Adviser has agreed to waive the advisory fee it receives from the Funds in an amount equal to the management fee paid by the Subsidiaries. This agreement may be terminated based on the terms of the Advisory Agreement. For the six months ended October 31, 2017, this amount equaled $61,653 and $7,126 for Aspen Managed Futures Strategy Fund and the Aspen Portfolio Strategy Fund, respectively, and are disclosed in the Consolidated Statements of Operations. These waivers are not subject to reimbursement/recoupment.
The Adviser has contractually agreed to limit the Funds’ total annual fund operating expenses (exclusive of distribution and service (12b-1) fees, shareholder services fees, acquired fund fees and expenses, brokerage expenses, interest expense, taxes and extraordinary expenses) to 1.55% of each of the Funds’ average daily net assets for each of Class A and Class I Shares. This agreement (the “Expense Agreement”) is in effect from September 1, 2017 through August 31, 2018 for the Aspen Managed Futures Strategy Fund. The prior Expense Agreement for the Aspen Managed Futures Strategy Fund was in effect from September 1, 2016 through August 31, 2017. The Expense Agreement for the Aspen Portfolio Strategy Fund is in effect from December 14, 2016 through August 31, 2018. The Adviser will be permitted to recover, on a class-by-class basis, expenses it has borne through the Expense Agreement to the extent that the Funds’ expenses in later periods fall below the expense cap in effect at the time of waiver or reimbursement. Notwithstanding the foregoing, the Funds will not be obligated to pay any such fees and expenses more than three years after the date of the waiver or reimbursement. The Adviser may not discontinue or modify this waiver prior to August 31, 2018 without the approval by the Funds’ Board of Trustees.
30
| Notes to Consolidated | |
| Aspen Funds | Financial Statements |
October 31, 2017 (Unaudited)
As of October 31, 2017, the fee waivers/reimbursements and recoupments of past waived fees were as follows:
| Fund | Fees Waived/Reimbursed By Advisor | Recoupment of Past Waived Fees By Advisor | Total | |||||||||
| Aspen Managed Futures Strategy Fund - Class A | $ | – | $ | – | $ | – | ||||||
| Aspen Managed Futures Strategy Fund - Class I | – | – | – | |||||||||
| Aspen Portfolio Strategy Fund - Class A | (1,770 | ) | – | (1,770 | ) | |||||||
| Aspen Portfolio Strategy Fund - Class I | (43,912 | ) | – | (43,912 | ) | |||||||
As of October 31, 2017, the balances of recoupable expenses for each Fund were as follows:
| Fund | Expires 2018 | Expires 2019 | Expires 2020 | Total | ||||||||||||
| Aspen Managed Futures Strategy Fund | ||||||||||||||||
| Class A | $ | – | $ | – | $ | – | $ | – | ||||||||
| Class I | – | – | – | – | ||||||||||||
| Aspen Portfolio Strategy Fund | ||||||||||||||||
| Class A | – | 8,063 | 1,770 | 9,833 | ||||||||||||
| Class I | – | 61,839 | 43,912 | 105,751 | ||||||||||||
Fund Administrator Fees and Expenses
ALPS Fund Services, Inc. (“ALPS”) serves as administrator to the Funds and the Funds have agreed to pay expenses incurred in connection with its administrative activities. Pursuant to an Administration Agreement, ALPS provides operational services to the Fund including, but not limited to, fund accounting and fund administration and generally assist in the Funds’ operations. Officers of the Trust are employees of ALPS. The Funds’ administration fee is accrued on a daily basis and paid monthly. Administration fees paid by the Funds for the six months ended October 31, 2017 are disclosed in the Consolidated Statements of Operations.
ALPS is reimbursed by the Funds for certain out-of-pocket expenses.
Transfer Agent
ALPS serves as transfer, dividend paying and shareholder servicing agent for the Funds. ALPS receives an annual minimum fee, a fee based upon the number of shareholder accounts, and is also reimbursed by the Funds for certain out-of-pocket expenses. Transfer agent fees paid by the Funds for the six months ended October 31, 2017 are disclosed in the Consolidated Statements of Operations.
Compliance Services
ALPS provides services that assist the Trust’s chief compliance officer in monitoring and testing the policies and procedures of the Trust in conjunction with requirements under Rule 38a-1 under the 1940 Act and receives an annual base fee. ALPS is reimbursed for certain out-of-pocket expenses by the Funds. Compliance service fees paid by the Funds for the six months ended October 31, 2017 are disclosed in the Consolidated Statements of Operations.
Principal Financial Officer
ALPS receives an annual fee for providing principal financial officer services to the Funds. Principal financial officer fees paid by the Funds for the six months ended October 31, 2017 are disclosed in the Consolidated Statements of Operations.
Distributor
ALPS Distributors, Inc. (“ADI” or the “Distributor”) (an affiliate of ALPS) acts as the distributor of the Funds’ shares pursuant to a Distribution Agreement with the Trust. Shares are sold on a continuous basis by ADI as agent for the Funds, and ADI has agreed to use its best efforts to solicit orders for the sale of the Funds’ shares, although it is not obliged to sell any particular amount of shares. ADI is not entitled to any compensation for its services as Distributor. ADI is registered as a broker-dealer with the U.S. Securities and Exchange Commission.
The Funds have adopted a plan of distribution for Class A shares pursuant to Rule 12b-1 under the 1940 Act (the “Plan”). The Plan allows the Funds to use Class A assets to pay fees in connection with the distribution and marketing of Class A shares and/or the provision of shareholder services to Class A shareholders. The Plan permits payment for services in connection with the administration of plans or programs that use Class A shares as their funding medium and for related expenses. The recipients of such payments may include the Distributor, other affiliates of the Adviser, broker-dealers, financial institutions, plan sponsors and administrators and other financial intermediaries through which investors may purchase shares of the Funds. The Plan permits the Funds to use their Class A assets to make total payments at an annual rate of up to 0.25% of the Funds’ average
| Semi-Annual Report | October 31, 2017 | 31 |
| Aspen Funds | Notes to Consolidated Financial Statements |
October 31, 2017 (Unaudited)
daily net assets attributable to their Class A shares. The expenses of the plan are reflected as distribution and service fees in the Consolidated Statements of Operations.
The Funds have adopted a shareholder service plan (a “Shareholder Services Plan”) for Class A shares. Under the Shareholder Services Plan the Funds are authorized to compensate certain financial intermediaries, including broker-dealers and the Funds’ affiliates, which may include the Distributor, Adviser and/or the transfer agent (“Participating Organizations”), an aggregate fee in an amount not to exceed on an annual basis 0.15% for Class A shares of the average daily net asset value of the Class A shares attributable to or held in the name of a Participating Organizations for its clients as compensation for providing shareholder service activities, which do not include distribution services, pursuant to an agreement with a Participating Organizations. Any amount of such payment not paid to the Participating Organizations during the Funds’ fiscal year for such service activities shall be reimbursed to the Funds as soon as practicable. Shareholder Services Plan fees are included with distribution and service fees on the Consolidated Statements of Operations. Fees recaptured pursuant to the Shareholder Services Plan for the six months ended October 31, 2017 are included as an offset to distribution and service fees as disclosed in the Consolidated Statements of Operations.
Certain intermediaries may charge networking, omnibus account or other administrative fees with respect to transactions in shares of the Funds. Transactions may be processed through the National Securities Clearing Corporation (“NSCC”) or similar systems or processed on a manual basis. These fees are paid by the Funds to the Distributor, which uses such fees to reimburse intermediaries. In the event an intermediary receiving payments from the Distributor on behalf of the Funds converts from a networking structure to an omnibus account structure or otherwise experiences increased costs, fees borne by the Funds may increase. Fees paid by the Funds for the six months ended October 31, 2017 are disclosed in the Consolidated Statements of Operations as Delegated Transfer Agent Equivalent Services.
Index Licensing Services
The Funds have adopted an Index Licensing Agreement and the Adviser pursuant to which the Fund pays the Adviser a monthly annualized licensing fee of 0.25%, based on the Funds’ average daily net assets for the right to use the Index in connection with the Fund. Fees paid by the Funds for the six months ended October 31, 2017 are disclosed in the Consolidated Statement of Operations as Licensing fees.
7. SECURITIES TRANSACTIONS
The cost of purchases and proceeds from sales of U.S. Government securities (excluding short-term securities) during the six months ended October 31, 2017 were as follows:
| Aspen Managed Futures Strategy Fund | ||||
| Cost of Investments Purchased | $ | 0 | ||
| Proceeds from Investments Sold | $ | 0 | ||
| Aspen Portfolio Strategy Fund | ||||
| Cost of Investments Purchased | $ | 1,312,354 | ||
| Proceeds from Investments Sold | $ | 0 | ||
8. INDEMNIFICATIONS
Under the Trust’s organizational documents, its officers and Trustees are indemnified against certain liability arising out of the performance of their duties to the Trust. Additionally, in the normal course of business, the Trust enters into contracts with service providers that may contain general indemnification clauses, which may permit indemnification to the extent permissible under applicable law. The Trust’s maximum exposure under these arrangements is unknown, as this would involve future claims that may be made against the Trust that have not yet occurred.
32
| Aspen Funds | Additional Information |
October 31, 2017 (Unaudited)
1. FUND HOLDINGS
The Fund files its complete schedule of portfolio holdings with the Securities and Exchange Commission (the “SEC”) for the first and third quarters of each fiscal year on Form N-Q within 60 days after the end of the period. Copies of the Funds’ Form N-Q are available without charge on the SEC website at http://www.sec.gov. You may also review and copy the Form N-Q at the SEC’s Public Reference Room in Washington, DC. For more information about the operation of the Public Reference Room, please call the SEC at 1-800-SEC-0330.
2. FUND PROXY VOTING POLICIES, PROCEDURES AND SUMMARIES
The Funds’ policies and procedures used in determining how to vote proxies and information regarding how the Fund voted proxies relating to portfolio securities during the most recent prior 12-month period ending June 30 are available without charge, (1) upon request, by calling (toll-free) 855-845-9444 and (2) on the SEC’s website at http://www.sec.gov.
Semi-Annual Report | October 31, 2017 | 33 |

This material must be accompanied or preceded by the prospectus.

TABLE OF CONTENTS
SEMI-ANNUAL REPORT
| SHARE HOLDER LETTER | 1 |
| PERFORMANCE UPDATE | 4 |
| DISCLOSURE OF FUND EXPENSES | 6 |
| PORTFOLIO OF INVESTMENTS | 7 |
| STATEMENT OF ASSETS AND LIABILITIES | 18 |
| STATEMENT OF OPERATIONS | 19 |
| STATEMENTS OF CHANGES IN NET ASSETS | 20 |
| FINANCIAL HIGHLIGHTS | 22 |
| NOTES TO FINANCIAL STATEMENTS | 24 |
| ADDITIONAL INFORMATION | 31 |
| DISCLOSURE REGARDING APPROVAL OF FUND ADVISORY AGREEMENTS | 32 |
Disciplined Growth Investors’ goal is to communicate clearly and transparently with our clients and mutual fund shareholders. It is mutually beneficial when our shareholders understand how we invest, what we are currently thinking and forecasting, and the specific investment decisions we have made. Our views and opinions regarding the investment prospects of our portfolio holdings and the Fund are “forward looking statements” which may or may not be accurate over the long term. While we believe we have a reasonable basis for these forecasts and have confidence in our investment team’s views, actual results may differ materially from those we anticipate. Information provided in this report should not be considered a recommendation to purchase or sell any particular security.
You can identify forward looking statements as those including words such as “believe”, “expect”, “anticipate”, “forecast”, and similar statement. We cannot assure future performance. These forward-looking statements are made only as-of the date of this report. Following the publication of this report, we will not update any of the forward-looking statements included here.
This material must be preceded or accompanied by a prospectus. Please read the prospectus carefully before investing.
THE DISCIPLINED GROWTH INVESTORS FUND
| OCTOBER 31, 2017 | DGIFUND.COM |
| The Disciplined Growth Investors Fund | Shareholder Letter |
October 31, 2017 (Unaudited)
The DGI Fund’s fiscal year starts on May 1st each year. October 31st marks the fiscal year’s midpoint. As of October 31, 2017, The Disciplined Growth Investors Fund (The DGI Fund) had total net assets of $186.2 million. In the past six months The DGI Fund appreciated by 5.22%. Equities have returned 7.37% in that time while fixed income holdings have returned 1.78%. The appreciation was again broadly-based. In the last six months, your Fund has owned 56 stocks. Thirty-three had a positive impact on performance while 22 detracted from the Fund’s total return.
Since inception, The DGI Fund has returned 12.30% on an annualized basis (6 years, 2 months). In this time, stocks in the Fund have grown at 17.37% and bonds at 3.26% (annualized).
Portfolio Asset Mix:
The portfolio currently holds 69.8% stocks and 30.2% bonds and cash. A list of holdings is included as part of this semi-annual report and is available on the Fund’s website at www.dgifund.com.
Portfolio Activity:
The DGI Fund’s turnover of stocks and bonds for the last six months was 11.87% (not annualized), a slight increase from the prior six months. The slightly increased turnover figure was driven by shorter term bonds maturing and being replaced. Turnover of stocks in the Fund was in-line with our long term average turnover.
In the past six months, our investment team added five new stocks to The DGI Fund. We sold one holding and two companies were acquired by or merged with competitors.
New investments
Nordstrom (NYSE: JWN) is a department store known for its customer service and prominent presence in malls across America. Department store retailers like Nordstrom are under an onslaught of competitive pressure from Amazon and a host of other online retailers, and thus the stock prices of Nordstrom and its peers have fallen precipitously. This disruption represents a potential opportunity. We believe that Nordstrom’s extensive investments in an omni-channel distribution model(1) and the development of their off-price “The Rack” business will not only enable Nordstrom to weather the storm, but ultimately thrive in a transformed retail environment. And its history of being good stewards of capital bolsters our confidence.
Gigamon (NASD: GIMO) is a company you have probably never heard of but nevertheless affects you indirectly on the internet. Gigamon is a pioneer in an important new class of tools for network managers called Visibility Fabric (VF). These tools provide granular information about how networks operate and thus help network managers diagnose issues and find solutions. With the ever-increasing demand for data, we believe Gigamon is well positioned for the future.
Gentherm (NASD: THRM) is a company we have many years of investment experience with. It is the leading company in a technology called thermoelectric devices (TED). For many years, this technology was primarily used to heat and cool car seats, but the company had the potential to expand to new markets and find new avenues of growth. The technology can now be found in industrial and medical applications, as well as bedding and office chairs. We believe Gentherm is just getting started.
| Semi-Annual Report | October 31, 2017 | 1 |
| The Disciplined Growth Investors Fund | Shareholder Letter |
October 31, 2017 (Unaudited)
Under Armour (NYSE: UAA) has become a leading brand in the ultra-competitive performance apparel industry. For years, our investment team has admired the company’s progress, but shied away from the premium price its stock commanded. That changed over the last few quarters. Excess inventory caused by multiple department and sporting goods store closings, and a poor reception of the Curry 3 shoe design, has caused Wall Street analysts to lower estimates and/or change ratings. We see a fundamentally great business with a transitory issue, so we made an initial investment.
Manhattan Associates (NASDAQ: MANH) is a warehouse management and supply chain software provider primarily for retailers. Its solution helps traditional retailers compete more effectively against Amazon by improving inventory management from the supply chain, through warehousing, to the point of sale. As a result of all the data it collects, the Manhattan Solution also helps forecast demand for retailers. And as the premier provider, it can command a premium price for its services. Our investment thesis is that the same competitive fears that have pressured stock prices for all retailers and related companies, including Manhattan Associates, will also escalate demand for their solution.
Sales & Acquisitions
E*Trade (NASD: EFTC) is a full service financial services company that operates primarily online. One of the reasons we first purchased E*Trade was because it was more than just a discount brokerage firm. Its burgeoning bank business helped leverage its low-cost delivery mechanism. But poor loan quality hurt E*Trade during the ’08 – ’09 recession. We believed the company had learned a lesson on credit quality, but apparently not. The company hasn’t made much meaningful progress upgrading the quality of its loan portfolio. Because of this, and an elevated stock price, we sold the entire position.
Corporate Executive Board (NYSE: CEB) was acquired by Gartner for cash and stock. The deal was announced in January and completed in April. The few shares we received of Gartner stock were sold to fund some of the aforementioned purchases of new stocks.
Cabela’s (NYSE: CAB) announced that it was selling the company to its chief rival, Bass Pro Shops, in October 2016. Since then the company’s stock has traded at a significant discount to the deal price much of the time. Once the company’s credit card division was sold the stock price rallied to only a slight discount, at which point we sold all shares.
Sincerely,

Frederick K. Martin, CFA
Portfolio Manager
| 2 | 1-855-DGI-FUND (344-3863) | www.DGIfund.com |
| The Disciplined Growth Investors Fund | Shareholder Letter |
October 31, 2017 (Unaudited)
The views of Disciplined Growth Investors, Inc. and information discussed in this commentary are as of the date of publication, are subject to change, and may not reflect the writers’ current views. The views expressed are those of the Fund’s adviser only, and represent an assessment of market conditions at a specific point in time, are opinions only and should not be relied upon as investment advice regarding a particular investment or markets in general. Such information does not constitute a recommendation to buy or sell specific securities or investment vehicles. It should not be assumed that any investment will be profitable or will equal the performance of the portfolios or any securities or any sectors mentioned in this letter. The subject matter contained in this letter has been derived from several sources believed to be reliable and accurate at the time of compilation. Neither Disciplined Growth Investors, Inc. nor the Fund accepts any liability for losses either direct or consequential caused by the use of this information.
The Fund is distributed by ALPS Distributors, Inc.
The Fund is subject to investment risks, including possible loss of the principal amount invested and therefore is not suitable for all investors. The Fund may not achieve its objectives.
Diversification does not eliminate the risk of experiencing investment losses.
Fred Martin is a registered representative of ALPS Distributors, Inc. CFA Institute Marks are trademarks owned by the CFA Institute.
Omni-channel is a cross-channel business model that companies use to improve their customer experience. The approach has applications in healthcare, government, financial services, retail and telecommunications industries, and includes channels such as physical locations, FAQ webpages, social media, live web chats, mobile applications and telephone communication. Companies that use omni-channel contend that a customer values the ability to be in constant contact with a company through multiple avenues at the same time.
| Semi-Annual Report | October 31, 2017 | 3 |
| The Disciplined Growth Investors Fund | Performance Update |
October 31, 2017 (Unaudited)
Annualized Total Return Performance (for the period ended October 31, 2017)
| 6 month | YTD | 1 Year | 3 Year | 5 Year | Since Inception* | |
| The Disciplined Growth Investors Fund | 5.22% | 10.36% | 14.46% | 7.44% | 10.82% | 12.30% |
| S&P 500® Total Return Index(1) | 9.10% | 16.91% | 23.63% | 10.77% | 15.18% | 15.83% |
Performance data quoted represents past performance. Past performance does not guarantee future results. Investment return and principal value of an investment will fluctuate so that an investor’s shares, when sold or redeemed, may be worth more or less than the original cost. Current performance data may be higher or lower than actual data quoted. For the most current month-end performance data please call 1.855.DGI.FUND.
The table does not reflect the deductions of taxes a shareholder would pay on Fund distributions or redemptions of Fund shares.
Subject to investment risks, including possible loss of the principal amount invested.
Returns for periods less than 1 year are cumulative.
| * | Fund Inception date of August 12, 2011. |
| (1) | The S&P 500® Total Return Index is an unmanaged index of 500 common stocks chosen for market size, liquidity and industry group representation. It is a market-value weighted index. The Index is not actively managed and does not reflect any deductions for fees, expenses or taxes. An investor may not invest directly in the Index. |
| 4 | 1-855-DGI-FUND (344-3863) | www.DGIfund.com |
| The Disciplined Growth Investors Fund | Performance Update |
October 31, 2017 (Unaudited)
Growth of $10,000 Investment in the Fund (for the period ended October 31, 2017)
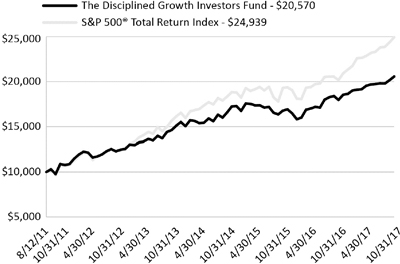
The chart above represents historical performance of a hypothetical investment of $10,000 in the Fund since inception. Past performance does not guarantee future results. This chart does not reflect the deduction of taxes that a shareholder would pay on Fund distributions or the redemption of Fund shares.
Investing in the Fund is subject to investment risks, including possible loss of the principal amount invested.
| Industry Sector Allocation | |
(as a % of Net Assets)*
| |
| Technology | 30.80% |
| Consumer Discretionary | 16.10% |
| Health Care | 12.10% |
| Industrials | 7.52% |
| Energy | 2.41% |
| Financials | 0.57% |
| Closed End Funds | 1.51% |
| Corporate Bond | 20.02% |
| Foreign Government Bonds | 0.45% |
| Government & Agency Obligations | 0.40% |
| Short Term Investments | 8.24% |
| Other Assets in Excess of Liabilities | -0.12% |
| Top Ten Holdings | |
(as a % of Net Assets)*
| |
| Edwards Lifesciences Corp. | 3.73% |
| Autodesk, Inc. | 3.41% |
| Align Technology, Inc. | 3.26% |
| United States Treasury Bill, 12/7/2017 | 3.22% |
| Intuit, Inc. | 3.00% |
| TJX Cos., Inc. | 2.90% |
| Intuitive Surgical, Inc. | 2.82% |
| Middleby Corp. | 2.71% |
| Open Text Corp. | 2.68% |
| Plexus Corp. | 2.67% |
| Top Ten Holdings | 30.40% |
| * | Holdings are subject to change, and may not reflect the current or future position of the portfolio. |
| Semi-Annual Report | October 31, 2017 | 5 |
| The Disciplined Growth Investors Fund | Disclosure of Fund Expenses |
October 31, 2017 (Unaudited)
As a shareholder of the Fund, you incur two types of costs: (1) transaction costs, including sales charges (loads) on purchase payments, reinvested dividends, or other distributions; redemption fees; and exchange fees; and (2) ongoing costs, including management fees; distribution and/or service (12b-1) fees; and other fund operating expenses. This example is intended to help you understand your ongoing costs (in dollars), of investing in the Fund and to compare these costs with the ongoing costs of investing in other mutual funds.
This example is based on an investment of $1,000 invested at the beginning of the period and held for the entire six-month period of May 1, 2017 through October 31, 2017.
Actual Expenses The first line of the table below provides information about actual account values and actual expenses. You may use the information in this line, together with the amount you invested, to estimate the expenses that you paid over the period. Simply divide your account value by $1,000 (for example, an $8,600 account value divided by $1,000 = 8.6), then multiply the result by the number in the first line under the heading “Expenses Paid During Period” to estimate the expenses you paid on your account during this period.
Hypothetical Example for Comparison Purposes The second line of the table below provides information about hypothetical account values and hypothetical expenses based on the Fund’s actual expense ratio and an assumed rate of return of 5% per year before expenses, which is not the Fund’s actual return. The hypothetical account values and expenses may not be used to estimate the actual ending account balance or expenses you paid for the period. You may use this information to compare the ongoing costs of investing in the Fund and other mutual funds. To do so, compare this 5% hypothetical example with the 5% hypothetical examples that appear in the shareholder reports of the other funds.
Please note that the expenses shown in the table are meant to highlight your ongoing costs only and do not reflect transactional costs, such as sales charges (loads), redemption fees or exchange fees. Therefore, the second line of the table is useful in comparing ongoing costs only and will not help you determine the relative total costs of owning different funds. In addition, if these transactional costs were included, your costs would have been higher.
Beginning Account Value 5/1/2017 | Ending Account Value 10/31/2017 | Expense Ratio(a) | Expenses Paid During period 5/1/2017 - 10/31/2017(b) | |
| Actual | $1,000.00 | $1,052.20 | 0.78% | $ 4.03 |
| Hypothetical (5% return before expenses) | $1,000.00 | $1,021.27 | 0.78% | $ 3.97 |
| (a) | The Fund's expense ratios have been annualized based on the Fund's most recent fiscal half-year expenses. |
| (b) | Expenses are equal to the Fund's annualized expense ratio, multiplied by the average account value over the period, multiplied by the number of days in the most recent fiscal half-year (184)/365 (to reflect the half-year period). |
| 6 | 1-855-DGI-FUND (344-3863) | www.DGIfund.com |
| The Disciplined Growth Investors Fund | Portfolio of Investments |
October 31, 2017 (Unaudited)
| Shares | Value (Note 2) | |||||||
| CLOSED END FUNDS (1.51%) | ||||||||
| Altaba, Inc. (a) | 40,000 | $ | 2,804,800 | |||||
| TOTAL CLOSED END FUNDS (Cost $1,262,502) | 2,804,800 | |||||||
| COMMON STOCKS (69.50%) | ||||||||
| CONSUMER DISCRETIONARY (16.10%) | ||||||||
| Apparel & Textile Products (1.16%) | ||||||||
| Ralph Lauren Corp. | 13,043 | 1,166,436 | ||||||
| Under Armour, Inc. , Class A(a) | 78,450 | 982,194 | ||||||
| 2,148,630 | ||||||||
| Automotive (2.07%) | ||||||||
| Gentex Corp. | 139,300 | 2,703,813 | ||||||
| Gentherm, Inc. (a) | 34,525 | 1,156,588 | ||||||
| 3,860,401 | ||||||||
| Gaming, Lodging & Restaurants (2.78%) | ||||||||
| Cheesecake Factory, Inc. | 21,487 | 961,328 | ||||||
| Royal Caribbean Cruises, Ltd. | 34,087 | 4,218,948 | ||||||
| 5,180,276 | ||||||||
| Leisure (0.31%) | ||||||||
| TripAdvisor, Inc. (a) | 15,512 | 581,700 | ||||||
| Passenger Transportation (1.50%) | ||||||||
| JetBlue Airways Corp. (a) | 145,700 | 2,790,155 | ||||||
| Retail (1.43%) | ||||||||
| Select Comfort Corp. (a) | 81,748 | 2,656,810 | ||||||
| Retail - Discretionary (6.85%) | ||||||||
| Ethan Allen Interiors, Inc. | 64,881 | 1,930,210 | ||||||
| L Brands, Inc. | 65,077 | 2,800,914 | ||||||
| Nordstrom, Inc. | 47,925 | 1,900,226 | ||||||
| TJX Cos., Inc. | 77,300 | 5,395,540 | ||||||
| Urban Outfitters, Inc. (a) | 29,250 | 717,210 | ||||||
| 12,744,100 | ||||||||
| TOTAL CONSUMER DISCRETIONARY | 29,962,072 | |||||||
| Semi-Annual Report | October 31, 2017 | 7 |
| The Disciplined Growth Investors Fund | Portfolio of Investments |
October 31, 2017 (Unaudited)
| Shares | Value (Note 2) | |||||||
| ENERGY (2.41%) | ||||||||
| Oil, Gas & Coal (2.41%) | ||||||||
| Core Laboratories NV | 10,762 | $ | 1,075,124 | |||||
| Southwestern Energy Co. (a) | 230,237 | 1,277,815 | ||||||
| Ultra Petroleum Corp. (a)(b)(c) | 19,213 | 137,296 | ||||||
| Ultra Petroleum Corp. (a) | 250,649 | 1,990,153 | ||||||
| 4,480,388 | ||||||||
| TOTAL ENERGY | 4,480,388 | |||||||
| FINANCIALS (0.57%) | ||||||||
| Banking (0.57%) | ||||||||
| TCF Financial Corp. | 58,712 | 1,069,733 | ||||||
| TOTAL FINANCIALS | 1,069,733 | |||||||
| HEALTH CARE (12.10%) | ||||||||
| Medical Equipment & Devices (12.10%) | ||||||||
| Align Technology, Inc. (a) | 25,400 | 6,070,092 | ||||||
| Edwards Lifesciences Corp. (a) | 67,825 | 6,933,750 | ||||||
| Intuitive Surgical, Inc. (a) | 13,968 | 5,243,028 | ||||||
| Myriad Genetics, Inc. (a) | 39,137 | 1,341,616 | ||||||
| Varex Imaging Corp. (a) | 9,975 | 342,841 | ||||||
| Varian Medical Systems, Inc. (a) | 24,925 | 2,596,936 | ||||||
| 22,528,263 | ||||||||
| TOTAL HEALTH CARE | 22,528,263 | |||||||
| INDUSTRIALS (7.52%) | ||||||||
| Electrical Equipment (0.93%) | ||||||||
| Cognex Corp. | 14,075 | 1,733,336 | ||||||
| Machinery (3.72%) | ||||||||
| Graco, Inc. | 14,162 | 1,866,410 | ||||||
| Middleby Corp. (a) | 43,591 | 5,052,197 | ||||||
| 6,918,607 | ||||||||
| Manufactured Goods (1.22%) | ||||||||
| Proto Labs, Inc. (a) | 26,175 | 2,283,769 | ||||||
| 8 | 1-855-DGI-FUND (344-3863) | www.DGIfund.com |
| The Disciplined Growth Investors Fund | Portfolio of Investments |
October 31, 2017 (Unaudited)
| Shares | Value (Note 2) | |||||||
| INDUSTRIALS (continued) | ||||||||
| Transportation & Logistics (1.65%) | ||||||||
| Landstar System, Inc. | 31,050 | $ | 3,066,187 | |||||
| TOTAL INDUSTRIALS | 14,001,899 | |||||||
| TECHNOLOGY (30.80%) | ||||||||
| Design, Manufacturing & Distribution (2.67%) | ||||||||
| Plexus Corp. (a) | 80,987 | 4,975,032 | ||||||
| Hardware (9.03%) | ||||||||
| Dolby Laboratories, Inc. , Class A | 23,725 | 1,374,626 | ||||||
| Garmin, Ltd. | 48,350 | 2,737,094 | ||||||
| Gigamon, Inc. (a) | 35,750 | 1,376,375 | ||||||
| Plantronics, Inc. | 50,287 | 2,281,018 | ||||||
| Seagate Technology PLC | 70,917 | 2,621,801 | ||||||
| Super Micro Computer, Inc. (a) | 58,425 | 1,162,658 | ||||||
| Ubiquiti Networks, Inc. (a) | 51,737 | 3,217,007 | ||||||
| ViaSat, Inc. (a) | 31,131 | 2,026,628 | ||||||
| 16,797,207 | ||||||||
| Semiconductors (3.22%) | ||||||||
| Microchip Technology, Inc. | 28,825 | 2,732,610 | ||||||
| Power Integrations, Inc. | 32,350 | 2,599,323 | ||||||
| Synaptics, Inc. (a) | 17,662 | 655,613 | ||||||
| 5,987,546 | ||||||||
| Software (12.45%) | ||||||||
| Akamai Technologies, Inc. (a) | 52,262 | 2,730,689 | ||||||
| Autodesk, Inc. (a) | 50,837 | 6,352,592 | ||||||
| Intuit, Inc. | 37,012 | 5,589,552 | ||||||
| Manhattan Associates, Inc. (a) | 31,500 | 1,318,590 | ||||||
| Open Text Corp. | 142,799 | 4,995,109 | ||||||
| RealPage, Inc. (a) | 50,637 | 2,192,582 | ||||||
| 23,179,114 | ||||||||
| Semi-Annual Report | October 31, 2017 | 9 |
| The Disciplined Growth Investors Fund | Portfolio of Investments |
October 31, 2017 (Unaudited)
| Shares | Value (Note 2) | |||||||
| TECHNOLOGY (continued) | ||||||||
| Technology Services (3.43%) | ||||||||
| FactSet Research Systems, Inc. | 19,808 | $ | 3,760,945 | |||||
| IHS Markit, Ltd. (a) | 25,381 | 1,081,484 | ||||||
| Medidata Solutions, Inc. (a) | 4,337 | 326,273 | ||||||
| Paychex, Inc. | 19,137 | 1,220,749 | ||||||
| 6,389,451 | ||||||||
| TOTAL TECHNOLOGY | 57,328,350 | |||||||
| TOTAL COMMON STOCKS (Cost $89,221,818) | 129,370,705 | |||||||
Principal Amount | Value (Note 2) | |||||||
| CORPORATE BONDS (20.02%) | ||||||||
| COMMUNICATIONS (1.23%) | ||||||||
| Media (0.31%) | ||||||||
| Comcast Corp. | ||||||||
| 3.375% 08/15/2025 | $ | 566,000 | 581,168 | |||||
| Publishing & Broadcasting (0.30%) | ||||||||
| 21st Century Fox America, Inc. | ||||||||
| 6.900% 03/01/2019 | 512,000 | 544,689 | ||||||
| Wireless Telecommunications Services (0.62%) | ||||||||
| AT&T, Inc. | ||||||||
| 4.450% 04/01/2024 | 549,000 | 584,135 | ||||||
| AT&T, Inc. | ||||||||
| 5.500% 02/01/2018 | 7,000 | 7,066 | ||||||
| Verizon Communications, Inc. | ||||||||
| 5.150% 09/15/2023 | 503,000 | 564,362 | ||||||
| 1,155,563 | ||||||||
| TOTAL COMMUNICATIONS | 2,281,420 | |||||||
| CONSUMER DISCRETIONARY (1.57%) | ||||||||
| Airlines (0.31%) | ||||||||
| Southwest Airlines Co. | ||||||||
| 3.000% 11/15/2026 | 583,000 | 575,907 | ||||||
| Automobiles Manufacturing (0.69%) | ||||||||
| Ford Motor Co. | ||||||||
| 4.346% 12/08/2026 | 554,000 | 578,320 | ||||||
| 10 | 1-855-DGI-FUND (344-3863) | www.DGIfund.com |
| The Disciplined Growth Investors Fund | Portfolio of Investments |
October 31, 2017 (Unaudited)
Principal Amount | Value (Note 2) | |||||||
| Automobiles Manufacturing (continued) | ||||||||
| General Motors Co. | ||||||||
| 4.875% 10/02/2023 | $ | 650,000 | $ | 709,485 | ||||
| 1,287,805 | ||||||||
| Restaurants (0.32%) | ||||||||
| McDonald’s Corp. | ||||||||
| 6.300% 03/01/2038 | 450,000 | 591,098 | ||||||
| Retail - Consumer Discretionary (0.25%) | ||||||||
| Advance Auto Parts, Inc. | ||||||||
| 5.750% 05/01/2020 | 437,000 | 471,459 | ||||||
| TOTAL CONSUMER DISCRETIONARY | 2,926,269 | |||||||
| CONSUMER STAPLES (1.00%) | ||||||||
| Food & Beverage (0.30%) | ||||||||
| Anheuser-Busch InBev Finance, Inc. | ||||||||
| 3.650% 02/01/2026 | 543,000 | 561,190 | ||||||
| Mass Merchants (0.41%) | ||||||||
| Costco Wholesale Corp. | ||||||||
| 2.750% 05/18/2024 | 760,000 | 766,240 | ||||||
| Supermarkets & Pharmacies (0.29%) | ||||||||
| CVS Health Corp. | ||||||||
| 5.000% 12/01/2024 | 487,000 | 534,368 | ||||||
| TOTAL CONSUMER STAPLES | 1,861,798 | |||||||
| ENERGY (2.37%) | ||||||||
| Exploration & Production (0.31%) | ||||||||
| Conoco Funding Co. | ||||||||
| 7.250% 10/15/2031 | 421,000 | 575,359 | ||||||
| Pipeline (2.06%) | ||||||||
| Boardwalk Pipelines LP | ||||||||
| 5.950% 06/01/2026 | 485,000 | 547,677 | ||||||
| Enbridge Energy Partners LP | ||||||||
| 4.200% 09/15/2021 | 484,000 | 508,827 | ||||||
| Enterprise Products Operating LLC | ||||||||
| 3.350% 03/15/2023 | 548,000 | 565,141 | ||||||
| Semi-Annual Report | October 31, 2017 | 11 |
| The Disciplined Growth Investors Fund | Portfolio of Investments |
October 31, 2017 (Unaudited)
Principal Amount | Value (Note 2) | |||||||
| Pipeline (continued) | ||||||||
| MarkWest Energy Partners LP / MarkWest Energy Finance Corp. | ||||||||
| 4.500% 07/15/2023 | $ | 503,000 | $ | 507,415 | ||||
| ONEOK Partners LP | ||||||||
| 3.375% 10/01/2022 | 554,000 | 562,448 | ||||||
| TransCanada PipeLines, Ltd. | ||||||||
| 7.250% 08/15/2038 | 412,000 | 588,519 | ||||||
| Williams Partners LP | ||||||||
| 3.900% 01/15/2025 | 545,000 | 560,425 | ||||||
| 3,840,452 | ||||||||
| TOTAL ENERGY | 4,415,811 | |||||||
| FINANCIALS (3.97%) | ||||||||
| Banks (0.30%) | ||||||||
| US Bancorp | ||||||||
| 2.950% 07/15/2022 | 548,000 | 561,167 | ||||||
| Consumer Finance (0.55%) | ||||||||
| American Express Co. | ||||||||
| 3.625% 12/05/2024 | 529,000 | 546,884 | ||||||
| Total System Services, Inc. | ||||||||
| 2.375% 06/01/2018 | 478,000 | 479,279 | ||||||
| 1,026,163 | ||||||||
| Diversified Banks (1.22%) | ||||||||
| Bank of America Corp. | ||||||||
| 3.875% 08/01/2025 | 544,000 | 570,987 | ||||||
| Citigroup, Inc. | ||||||||
| 2.900% 12/08/2021 | 567,000 | 573,813 | ||||||
| JPMorgan Chase & Co. | ||||||||
| 3.375% 05/01/2023 | 549,000 | 563,388 | ||||||
| Royal Bank of Scotland Group PLC, Series 1 | ||||||||
| 9.118% Perpetual Maturity (d) | 3,000 | 3,010 | ||||||
| Wells Fargo & Co., Series M | ||||||||
| 3.450% 02/13/2023 | 542,000 | 556,928 | ||||||
| 2,268,126 | ||||||||
| Financial Services (1.28%) | ||||||||
| Blackrock, Inc. | ||||||||
| 3.200% 03/15/2027 | 545,000 | 552,925 | ||||||
| Morgan Stanley | ||||||||
| 2.750% 05/19/2022 | 695,000 | 696,733 | ||||||
| National Rural Utilities Cooperative Finance Corp. | ||||||||
| 2.950% 02/07/2024 | 566,000 | 574,159 | ||||||
| 12 | 1-855-DGI-FUND (344-3863) | www.DGIfund.com |
| The Disciplined Growth Investors Fund | Portfolio of Investments |
October 31, 2017 (Unaudited)
Principal Amount | Value (Note 2) | |||||||
| Financial Services (continued) | ||||||||
| Northern Trust Corp. | ||||||||
| 3.950% 10/30/2025 | $ | 534,000 | $ | 570,086 | ||||
| 2,393,903 | ||||||||
| Property & Casualty Insurance (0.31%) | ||||||||
| American International Group, Inc. | ||||||||
| 3.750% 07/10/2025 | 556,000 | 575,739 | ||||||
| Real Estate (0.31%) | ||||||||
| Welltower, Inc. | ||||||||
| 4.250% 04/01/2026 | 545,000 | 573,441 | ||||||
| TOTAL FINANCIALS | 7,398,539 | |||||||
| HEALTH CARE (0.90%) | ||||||||
| Managed Care (0.29%) | ||||||||
| UnitedHealth Group, Inc. | ||||||||
| 3.750% 07/15/2025 | 514,000 | 544,224 | ||||||
| Pharmaceuticals (0.61%) | ||||||||
| AbbVie, Inc. | ||||||||
| 2.500% 05/14/2020 | 557,000 | 561,750 | ||||||
| Johnson & Johnson | ||||||||
| 5.850% 07/15/2038 | 433,000 | 578,206 | ||||||
| 1,139,956 | ||||||||
| TOTAL HEALTH CARE | 1,684,180 | |||||||
| INDUSTRIALS (2.68%) | ||||||||
| Aerospace & Defense (0.68%) | ||||||||
| Lockheed Martin Corp. | ||||||||
| 3.100% 01/15/2023 | 680,000 | 698,744 | ||||||
| Rockwell Collins, Inc. | ||||||||
| 3.700% 12/15/2023 | 538,000 | 562,371 | ||||||
| 1,261,115 | ||||||||
| Electrical Equipment Manufacturing (0.85%) | ||||||||
| Emerson Electric Co. | ||||||||
| 5.000% 04/15/2019 | 519,000 | 540,795 | ||||||
| General Electric Co. | ||||||||
| 5.875% 01/14/2038 | 437,000 | 562,822 | ||||||
| Tyco Electronics Group SA | ||||||||
| 3.500% 02/03/2022 | 460,000 | 477,753 | ||||||
| 1,581,370 | ||||||||
| Semi-Annual Report | October 31, 2017 | 13 |
| The Disciplined Growth Investors Fund | Portfolio of Investments |
October 31, 2017 (Unaudited)
Principal Amount | Value (Note 2) | |||||||
| Industrial Other (0.26%) | ||||||||
| Fluor Corp. | ||||||||
| 3.375% 09/15/2021 | $ | 466,000 | $ | 480,978 | ||||
| Railroad (0.30%) | ||||||||
| Burlington Northern Santa Fe LLC | ||||||||
| 3.000% 03/15/2023 | 543,000 | 556,733 | ||||||
| Transportation & Logistics (0.31%) | ||||||||
| United Parcel Service, Inc. | ||||||||
| 6.200% 01/15/2038 | 429,000 | 580,473 | ||||||
| Waste & Environmental Services & Equipment (0.28%) | ||||||||
| Republic Services, Inc. | ||||||||
| 5.500% 09/15/2019 | 492,000 | 523,635 | ||||||
| TOTAL INDUSTRIALS | 4,984,304 | |||||||
| MATERIALS (0.25%) | ||||||||
| Metals & Mining (0.25%) | ||||||||
| Nucor Corp. | ||||||||
| 5.750% 12/01/2017 | 456,000 | 457,456 | ||||||
| TOTAL MATERIALS | 457,456 | |||||||
| TECHNOLOGY (0.29%) | ||||||||
| Hardware (0.29%) | ||||||||
| Corning, Inc. | ||||||||
| 6.625% 05/15/2019 | 499,000 | 532,919 | ||||||
| TOTAL TECHNOLOGY | 532,919 | |||||||
| UTILITIES (5.76%) | ||||||||
| Utilities (5.76%) | ||||||||
| Ameren Illinois Co. | ||||||||
| 9.750% 11/15/2018 | 409,000 | 440,955 | ||||||
| Arizona Public Service Co. | ||||||||
| 8.750% 03/01/2019 | 412,000 | 447,636 | ||||||
| Baltimore Gas & Electric Co. | ||||||||
| 3.350% 07/01/2023 | 553,000 | 572,361 | ||||||
| 14 | 1-855-DGI-FUND (344-3863) | www.DGIfund.com |
| The Disciplined Growth Investors Fund | Portfolio of Investments |
October 31, 2017 (Unaudited)
Principal Amount | Value (Note 2) | |||||||
| Utilities (continued) | ||||||||
| CenterPoint Energy Resources Corp. | ||||||||
| 4.500% 01/15/2021 | $ | 343,000 | $ | 361,389 | ||||
| CMS Energy Corp. | ||||||||
| 5.050% 03/15/2022 | 414,000 | 454,757 | ||||||
| Consolidated Edison Co. of New York, Inc. | ||||||||
| 7.125% 12/01/2018 | 513,000 | 541,543 | ||||||
| Dominion Energy, Inc., Series B | ||||||||
| 2.750% 09/15/2022 | 695,000 | 697,659 | ||||||
| Duke Energy Corp. | ||||||||
| 3.750% 04/15/2024 | 552,000 | 577,910 | ||||||
| Edison International | ||||||||
| 2.400% 09/15/2022 | 561,000 | 556,338 | ||||||
| Interstate Power & Light Co. | ||||||||
| 3.650% 09/01/2020 | 416,000 | 432,416 | ||||||
| ITC Holdings Corp. | ||||||||
| 4.050% 07/01/2023 | 537,000 | 561,230 | ||||||
| Jersey Central Power & Light Co. | ||||||||
| 7.350% 02/01/2019 | 518,000 | 550,058 | ||||||
| Nevada Power Co. | ||||||||
| 7.125% 03/15/2019 | 354,000 | 378,398 | ||||||
| Oncor Electric Delivery Co. LLC | ||||||||
| 7.000% 09/01/2022 | 458,000 | 548,024 | ||||||
| PacifiCorp | ||||||||
| 5.650% 07/15/2018 | 17,000 | 17,476 | ||||||
| PPL Capital Funding, Inc. | ||||||||
| 3.500% 12/01/2022 | 584,000 | 607,237 | ||||||
| PSEG Power LLC | ||||||||
| 5.125% 04/15/2020 | 425,000 | 452,987 | ||||||
| Puget Energy, Inc. | ||||||||
| 5.625% 07/15/2022 | 413,000 | 462,156 | ||||||
| Sempra Energy | ||||||||
| 2.875% 10/01/2022 | 544,000 | 549,099 | ||||||
| Southern Power Co., Series 15B | ||||||||
| 2.375% 06/01/2020 | 561,000 | 561,125 | ||||||
| TECO Finance, Inc. | ||||||||
| 6.572% 11/01/2017 | 388,000 | 388,000 | ||||||
| Semi-Annual Report | October 31, 2017 | 15 |
| The Disciplined Growth Investors Fund | Portfolio of Investments |
October 31, 2017 (Unaudited)
Principal Amount | Value (Note 2) | |||||||
| Utilities (continued) | ||||||||
| Wisconsin Electric Power Co. | ||||||||
| 3.100% 06/01/2025 | $ | 554,000 | $ | 556,445 | ||||
| TOTAL UTILITIES | 10,715,199 | |||||||
| TOTAL CORPORATE BONDS (Cost $36,877,889) | 37,257,895 | |||||||
| FOREIGN GOVERNMENT BONDS (0.45%) | ||||||||
| Province of Quebec Canada, Series NN | ||||||||
| 7.125% 02/09/2024 | 349,000 | 434,872 | ||||||
| Corp Andina de Fomento | ||||||||
| 8.125% 06/04/2019 | 372,000 | 407,392 | ||||||
| TOTAL FOREIGN GOVERNMENT BONDS (Cost $832,358) | 842,264 | |||||||
| GOVERNMENT & AGENCY OBLIGATIONS (0.40%) | ||||||||
| U.S. Treasury Bond | ||||||||
| 1.500% 08/15/2026 | 689,000 | 643,031 | ||||||
| U.S. Treasury Bond | ||||||||
| 6.500% 11/15/2026 | 77,000 | 103,303 | ||||||
| TOTAL GOVERNMENT & AGENCY OBLIGATIONS (Cost $743,932) | 746,334 | |||||||
| Yield | Shares | Value (Note 2) | ||||||||||
| SHORT TERM INVESTMENTS (8.24%) | ||||||||||||
| MONEY MARKET FUND (0.76%) | ||||||||||||
| Fidelity Institutional Money Market | ||||||||||||
| Government Portfolio - Class I | 0.92 | %(e) | 1,417,291 | 1,417,291 | ||||||||
| U.S. TREASURY BILLS (7.48%) | ||||||||||||
| United States Treasury Bill, 12/07/2017 | 0.81 | %(f) | 6,000,000 | 5,994,143 | ||||||||
| United States Treasury Bill, 07/19/2018 | 1.20 | %(f) | 3,000,000 | 2,971,535 | ||||||||
| United States Treasury Bill, 08/16/2018 | 1.18 | %(f) | 5,000,000 | 4,946,100 | ||||||||
| 13,911,778 | ||||||||||||
| TOTAL SHORT TERM INVESTMENTS (Cost $15,340,013) | 15,329,069 | |||||||||||
| 16 | 1-855-DGI-FUND (344-3863) | www.DGIfund.com |
| The Disciplined Growth Investors Fund | Portfolio of Investments |
October 31, 2017 (Unaudited)
Value (Note 2) | ||||
| TOTAL INVESTMENTS (100.12%) (Cost $144,278,512) | $ | 186,351,067 | ||
| Liabilities In Excess Of Other Assets (-0.12%) | (220,874 | ) | ||
| NET ASSETS (100.00%) | $ | 186,130,193 | ||
| (a) | Non-Income Producing Security. |
| (b) | Restricted security; these securities may only be resold in transactions exempt from registration under the Securities Act of 1933. |
| (c) | Illiquid security. |
| (d) | This security has no contractual maturity date, is not redeemable and contractually pays an indefinite stream of interest. |
| (e) | Represents the 7-day yield. |
| (f) | Rate shown represents the bond equivalent yield to maturity at date of purchase. |
For Fund compliance purposes, the Fund’s industry classifications refer to any one or more of the industry sub-classifications used by one or more widely recognized market indexes or ratings group indexes, and/or as defined by Fund management. This definition may not apply for purposes of this report, which may combine industry sub-classifications for reporting ease. Industries are shown as a percent of net assets.
See Notes to Financial Statements.
| Semi-Annual Report | October 31, 2017 | 17 |
| The Disciplined Growth Investors Fund | Statement of Assets and Liabilities |
October 31, 2017 (Unaudited)
| ASSETS | ||||
| Investments, at value | $ | 186,351,067 | ||
| Receivable for shares sold | 10,000 | |||
| Dividends and interest receivable | 444,458 | |||
| Total assets | 186,805,525 | |||
| LIABILITIES | ||||
| Payable for investments purchased | 554,903 | |||
| Payable to adviser | 120,429 | |||
| Total liabilities | 675,332 | |||
| NET ASSETS | $ | 186,130,193 | ||
| NET ASSETS CONSIST OF | ||||
| Paid-in capital (Note 5) | $ | 136,991,006 | ||
| Accumulated net investment income | 81,917 | |||
| Accumulated net realized gain | 6,984,715 | |||
| Net unrealized appreciation | 42,072,555 | |||
| NET ASSETS | $ | 186,130,193 | ||
| INVESTMENTS, AT COST | $ | 144,278,512 | ||
| PRICING OF SHARES | ||||
| Net Asset Value, offering and redemption price per share | $ | 19.10 | ||
| Shares of beneficial interest outstanding | 9,744,907 |
See Notes to Financial Statements.
| 18 | 1-855-DGI-FUND (344-3863) | www.DGIfund.com |
| The Disciplined Growth Investors Fund | Statement of Operations |
For the Six Months Ended October 31, 2017 (Unaudited) | ||||
| INVESTMENT INCOME | ||||
| Dividends | $ | 578,870 | ||
| Foreign taxes withheld | (7,172 | ) | ||
| Interest | 587,102 | |||
| Total investment income | 1,158,800 | |||
| EXPENSES | ||||
| Investment advisory fees (Note 6) | 664,463 | |||
| Total expenses | 664,463 | |||
| NET INVESTMENT INCOME | 494,337 | |||
| REALIZED AND UNREALIZED GAIN ON INVESTMENTS | ||||
| Net realized gain on investments | 5,078,355 | |||
| Net change in unrealized appreciation on investments | 3,225,983 | |||
| NET REALIZED AND UNREALIZED GAIN ON INVESTMENTS | 8,304,338 | |||
| NET INCREASE IN NET ASSETS RESULTING FROM OPERATIONS | $ | 8,798,675 | ||
See Notes to Financial Statements.
| Semi-Annual Report | October 31, 2017 | 19 |
| The Disciplined Growth Investors Fund | Statements of Changes in Net Assets |
For the Six Months Ended October 31, 2017 (Unaudited) | For the Year Ended April 30, 2017 | |||||||
| OPERATIONS | ||||||||
| Net investment income | $ | 494,337 | $ | 702,109 | ||||
| Net realized gain | 5,078,355 | 3,378,091 | ||||||
| Net change in unrealized appreciation | 3,225,983 | 15,325,356 | ||||||
| Net increase in net assets resulting from operations | 8,798,675 | 19,405,556 | ||||||
| DISTRIBUTIONS (Note 3) | ||||||||
| From net investment income | (443,078 | ) | (707,562 | ) | ||||
| From net realized gains on investments | – | (415,680 | ) | |||||
| Net decrease in net assets from distributions | (443,078 | ) | (1,123,242 | ) | ||||
| CAPITAL SHARE TRANSACTIONS (Note 5) | ||||||||
| Proceeds from sales of shares | 30,130,607 | 40,314,153 | ||||||
| Issued to shareholders in reinvestment of distributions | 440,075 | 1,115,854 | ||||||
| Cost of shares redeemed, net of redemption fees | (12,570,218 | ) | (19,795,072 | ) | ||||
| Net increase from capital share transactions | 18,000,464 | 21,634,935 | ||||||
| Net increase in net assets | 26,356,061 | 39,917,249 | ||||||
| NET ASSETS | ||||||||
| Beginning of period | 159,774,132 | 119,856,883 | ||||||
| End of period* | $ | 186,130,193 | $ | 159,774,132 | ||||
| *Including accumulated net investment income of: | $ | 81,917 | $ | 30,658 | ||||
| OTHER INFORMATION | ||||||||
| Share Transactions | ||||||||
| Issued | 1,625,093 | 2,352,037 | ||||||
| Issued to shareholders in reinvestment of distributions | 23,771 | 64,640 | ||||||
| Redeemed | (681,148 | ) | (1,149,715 | ) | ||||
| Net increase in share transactions | 967,716 | 1,266,962 | ||||||
See Notes to Financial Statements.
| 20 | 1-855-DGI-FUND (344-3863) | www.DGIfund.com |
Intentionally Left Blank
The Disciplined Growth Investors Fund
| NET ASSET VALUE, BEGINNING OF PERIOD |
| INCOME FROM OPERATIONS |
| Net investment income(a) |
| Net realized and unrealized gain/(loss) on investments |
| Total from investment operations |
| DISTRIBUTIONS |
| From net investment income |
| From net realized gain on investments |
| Total distributions |
| REDEMPTION FEES ADDED TO PAID-IN CAPITAL |
| INCREASE/(DECREASE) IN NET ASSET VALUE |
| NET ASSET VALUE, END OF PERIOD |
| TOTAL RETURN |
| RATIOS AND SUPPLEMENTAL DATA |
| Net assets, end of period (000's) |
| RATIOS TO AVERAGE NET ASSETS |
| Expenses |
| Net investment income |
| PORTFOLIO TURNOVER RATE |
| (a) | Per share numbers have been calculated using the average shares method. |
| (b) | Not annualized. |
| (c) | Annualized. |
See Notes to Financial Statements.
| 22 | 1-855-DGI-FUND (344-3863) | www.DGIfund.com |
Financial Highlights
For a share outstanding during the periods presented
For the Six Months Ended October 31, 2017 (Unaudited) | For the Year Ended April 30, 2017 | For the Year Ended April 30, 2016 | For the Year Ended April 30, 2015 | For the Year Ended April 30, 2014 | For the Year Ended April 30, 2013 | |||||||||||||||||
| $ | 18.20 | $ | 15.96 | $ | 16.75 | $ | 15.02 | $ | 13.17 | $ | 12.13 | |||||||||||
| 0.05 | 0.09 | 0.09 | 0.10 | 0.07 | 0.11 | |||||||||||||||||
| 0.90 | 2.29 | (0.44 | ) | 1.83 | 1.90 | 1.09 | ||||||||||||||||
| 0.95 | 2.38 | (0.35 | ) | 1.93 | 1.97 | 1.20 | ||||||||||||||||
| (0.05 | ) | (0.09 | ) | (0.10 | ) | (0.09 | ) | (0.07 | ) | (0.11 | ) | |||||||||||
| – | (0.05 | ) | (0.34 | ) | (0.11 | ) | (0.05 | ) | (0.05 | ) | ||||||||||||
| (0.05 | ) | (0.14 | ) | (0.44 | ) | (0.20 | ) | (0.12 | ) | (0.16 | ) | |||||||||||
| – | – | – | – | – | – | |||||||||||||||||
| 0.90 | 2.24 | (0.79 | ) | 1.73 | 1.85 | 1.04 | ||||||||||||||||
| $ | 19.10 | $ | 18.20 | $ | 15.96 | $ | 16.75 | $ | 15.02 | $ | 13.17 | |||||||||||
| 5.22 | %(b) | 14.96 | % | (2.05 | %) | 12.87 | % | 15.02 | % | 9.93 | % | |||||||||||
| $ | 186,130 | $ | 159,774 | $ | 119,857 | $ | 113,342 | $ | 86,741 | $ | 66,967 | |||||||||||
| 0.78 | %(c) | 0.78 | % | 0.78 | % | 0.78 | % | 0.78 | % | 0.78 | % | |||||||||||
| 0.58 | %(c) | 0.50 | % | 0.59 | % | 0.61 | % | 0.47 | % | 0.90 | % | |||||||||||
| 12 | %(b) | 16 | % | 13 | % | 14 | % | 10 | % | 10 | % | |||||||||||
| Semi-Annual Report | October 31, 2017 | 23 |
| The Disciplined Growth Investors Fund | Notes to Financial Statements |
| October 31, 2017 (Unaudited) |
1. ORGANIZATION
Financial Investors Trust (the “Trust”), a Delaware statutory trust, is an open-end management investment company registered under the Investment Company Act of 1940, as amended (“1940 Act”). The Trust consists of multiple separate portfolios or series. This semi-annual report describes The Disciplined Growth Investors Fund (the “Fund”). The Fund seeks long-term capital growth and as a secondary objective, modest income with reasonable risk.
2. SIGNIFICANT ACCOUNTING POLICIES
The accompanying financial statements were prepared in accordance with accounting principles generally accepted in the United States of America (“U.S. GAAP”). The preparation of financial statements in conformity with U.S. GAAP requires management to make certain estimates and assumptions that affect the reported amounts of assets and liabilities and disclosures of contingent assets and liabilities at the date of the financial statements and the reported amounts of revenue and expenses during the period. Actual results could differ from those estimates. The Fund is considered an investment company for financial reporting purposes under U.S. GAAP. The following is a summary of significant accounting policies consistently followed by the Fund in preparation of its financial statements.
Investment Valuation: The Fund generally values its securities based on market prices determined at the close of regular trading on the New York Stock Exchange (“NYSE”), normally 4:00 p.m. Eastern Time, on each day the NYSE is open for trading.
For equity securities and mutual funds that are traded on an exchange, the market price is usually the closing sale or official closing price on that exchange. In the case of equity securities not traded on an exchange, or if such closing prices are not otherwise available, the securities are valued at the mean of the most recent bid and ask prices on such day. Redeemable securities issued by open-end registered investment companies are valued at the investment company’s applicable net asset value, with the exception of exchange-traded open-end investment companies, which are priced as equity securities.
The market price for debt obligations is generally the price supplied by an independent third-party pricing service approved by the Board of Trustees (the “Board”), which may use a matrix, formula or other objective method that takes into consideration quotations from dealers, market transactions in comparable investments, market indices and yield curves. If vendors are unable to supply a price, or if the price supplied is deemed to be unreliable, the market price may be determined using quotations received from one or more broker–dealers that make a market in the security. Fixed-income obligations, excluding municipal securities, having a remaining maturity of greater than 60 days, are typically valued at the mean between the evaluated bid and ask prices formulated by an independent pricing service. Corporate Bonds, U.S. Government & Agency, and U.S. Treasury Bonds & Notes are valued using market models that consider trade data, quotations from dealers and active market makers, relevant yield curve and spread data, creditworthiness, trade data or market information on comparable securities, and other relevant security specific information. Mortgage-related and asset-backed securities are valued based on models that consider trade data, prepayment and default projections, benchmark yield and spread data and estimated cash flows of each tranche of the issuer. Publicly traded foreign government debt securities are
| 24 | 1-855-DGI-FUND (344-3863) | www.DGIfund.com |
| The Disciplined Growth Investors Fund | Notes to Financial Statements |
| October 31, 2017 (Unaudited) |
typically traded internationally in the over-the-counter market and are valued at the mean between the bid and asked prices as of the close of business of that market.
When such prices or quotations are not available, or when Disciplined Growth Investors, Inc. (the “Adviser”) believes that they are unreliable, securities may be priced using fair value procedures approved by the Board.
Fair Value Measurements: The Fund discloses the classification of its fair value measurements following a three-tier hierarchy based on the inputs used to measure fair value. Inputs refer broadly to the assumptions that market participants would use in pricing the asset or liability, including assumptions about risk. Inputs may be observable or unobservable. Observable inputs reflect the assumptions market participants would use in pricing the asset or liability that are developed based on market data obtained from sources independent of the reporting entity. Unobservable inputs reflect the reporting entity’s own assumptions about the assumptions market participants would use in pricing the asset or liability that are developed based on the best information available.
Various inputs are used in determining the value of the Fund’s investments as of the end of the reporting period. When inputs used fall into different levels of the fair value hierarchy, the level in the hierarchy within which the fair value measurement falls is determined based on the lowest level input that is significant to the fair value measurement in its entirety. The designated input levels are not necessarily an indication of the risk or liquidity associated with these investments. These inputs are categorized in the following hierarchy under applicable financial accounting standards:
| Level 1 – | Unadjusted quoted prices in active markets for identical investments, unrestricted assets or liabilities that the Fund has the ability to access at the measurement date; |
| Level 2 – | Quoted prices which are not active, quoted prices for similar assets or liabilities in active markets or inputs other than quoted prices that are observable (either directly or indirectly) for substantially the full term of the asset or liability; and |
| Level 3 – | Significant unobservable prices or inputs (including the Fund’s own assumptions in determining the fair value of investments) where there is little or no market activity for the asset or liability at the measurement date. |
| Semi-Annual Report | October 31, 2017 | 25 |
| The Disciplined Growth Investors Fund | Notes to Financial Statements |
| October 31, 2017 (Unaudited) |
The following is a summary of each input used to value the Fund as of October 31, 2017:
| Investments in Securities at Value | Level 1 -Unadjusted Quoted Prices | Level 2 - Other Significant Observable Inputs | Level 3 -Significant Unobservable Inputs | Total | |||||||||
| Closed End Funds | $ | 2,804,800 | $ | – | $ | – | $ | 2,804,800 | |||||
| Common Stocks | |||||||||||||
| Consumer Discretionary | 29,962,072 | – | – | 29,962,072 | |||||||||
| Energy | 4,343,092 | – | 137,296 | 4,480,388 | |||||||||
| Financials | 1,069,733 | – | – | 1,069,733 | |||||||||
| Health Care | 22,528,263 | – | – | 22,528,263 | |||||||||
| Industrials | 14,001,899 | – | – | 14,001,899 | |||||||||
| Technology | 57,328,350 | – | – | 57,328,350 | |||||||||
| Corporate Bonds(a) | – | 37,257,895 | – | 37,257,895 | |||||||||
| Foreign Government Bonds | – | 842,264 | – | 842,264 | |||||||||
| Government & Agency Obligations | – | 746,334 | – | 746,334 | |||||||||
| Short Term Investments | |||||||||||||
| Money Market Fund | 1,417,291 | – | – | 1,417,291 | |||||||||
| U.S. Treasury Bills | – | 13,911,778 | – | 13,911,778 | |||||||||
| TOTAL | $ | 133,455,500 | $ | 52,758,271 | $ | 137,296 | $ | 186,351,067 | |||||
| (a) | For detailed descriptions of the underlying industries, see the accompanying Portfolio of Investments. |
The Fund recognizes transfers between levels as of the end of the period. For the six months ended October 31, 2017, the Fund did not have any transfers between Level 1 and Level 2 securities.
The following is a reconciliation of the investments in which significant unobservable inputs (Level 3) were used in determining fair value:
Investments in Securities at Value | Balance as of 04/30/2017 | Return of Capital | Realized gain/(loss) | Change in unrealized appreciation/ (depreciation) | Purchases | Sales Proceeds | Transfer in and/or (out) of Level 3 | 10/31/2017 | Net change in unrealized appreciation/ (depreciation) attributable to Level 3 investments held at 10/31/2017 | ||||||||||||||||||||
| Common Stock | $ | 193,667 | $ | – | $ | – | $ | (56,371 | ) | $ | – | $ | – | $ | – | $ | 137,296 | $ | (56,371 | ) | |||||||||
| Total | $ | 193,667 | $ | – | $ | – | $ | (56,371 | ) | $ | – | $ | – | $ | – | $ | 137,296 | $ | (56,731 | ) | |||||||||
Net change in unrealized appreciation/depreciation on Level 3 securities is included on the Statement of Operations under Net change in unrealized appreciation on investments.
| 26 | 1-855-DGI-FUND (344-3863) | www.DGIfund.com |
| The Disciplined Growth Investors Fund | Notes to Financial Statements |
| October 31, 2017 (Unaudited) |
Investment Transactions and Investment Income: Investment transactions are accounted for on the date the investments are purchased or sold (trade date). Realized gains and losses from investment transactions are reported on an identified cost basis, which is the same basis the Fund uses for federal income tax purposes. Interest income, which includes accretion of discounts, is accrued and recorded as earned. Dividend income is recognized on the ex-dividend date or for certain foreign securities, as soon as information is available to the Fund.
Trust Expenses: Some expenses of the Trust can be directly attributed to the Fund. Expenses which cannot be directly attributed to the Fund are apportioned among all funds in the Trust based on average net assets of each fund.
Fund Expenses: Expenses that are specific to the Fund are charged directly to the Fund.
Federal Income Taxes: The Fund complies with the requirements under Subchapter M of the Internal Revenue Code of 1986, as amended, applicable to regulated investment companies and intends to distribute substantially all of their net taxable income and net capital gains, if any, each year so that it will not be subject to excise tax on undistributed income and gains. The Fund is not subject to income taxes to the extent such distributions are made.
As of and during the six months ended October 31, 2017, the Fund did not have a liability for any unrecognized tax benefits. The Fund files U.S. federal, state, and local tax returns as required. The Fund’s tax returns are subject to examination by the relevant tax authorities until expiration of the applicable statute of limitations, which is generally three years after the filing of the tax return for federal purposes and four years for most state returns. Tax returns for open years have incorporated no uncertain tax positions that require a provision for income taxes.
Distributions to Shareholders: The Fund normally pays dividends, if any, quarterly and distributes capital gains, if any, on an annual basis. Income dividend distributions are derived from dividends and other income the Fund receives from its investments, including short term capital gains. Long term capital gain distributions are derived from gains realized when the Fund sells a security it has owned for more than a year. The Fund may make additional distributions and dividends at other times if the portfolio manager believes doing so may be necessary for the Fund to avoid or reduce taxes.
| Semi-Annual Report | October 31, 2017 | 27 |
| The Disciplined Growth Investors Fund | Notes to Financial Statements |
| October 31, 2017 (Unaudited) |
3. TAX BASIS INFORMATION
Tax Basis of Investments: As of October 31, 2017, the aggregate cost of investments, gross unrealized appreciation/ (depreciation) and net unrealized appreciation for Federal tax purposes was as follows:
| Disciplined Growth Investors Fund | ||||
| Gross appreciation (excess of value over tax cost) | $ | 48,741,144 | ||
| Gross depreciation (excess of tax cost over value) | (6,668,649 | ) | ||
| Net unrealized appreciation | $ | 42,072,495 | ||
| Cost of investments for income tax purposes | $ | 144,278,572 | ||
Tax Basis of Distributions to Shareholders: The character of distributions made during the year from net investment income or net realized gains may differ from its ultimate characterization for federal income tax purposes. Also, due to the timing of dividend distributions, the fiscal year in which amounts are distributed may differ from the fiscal year in which the income or realized gain was recorded by the Fund.
The tax character of distributions paid during the year ended April 30, 2017, were as follows:
| Ordinary Income | Long-Term Capital Gain | ||||||
| The Disciplined Growth Investors Fund | $ | 833,014 | $ | 290,228 | |||
The amounts and characteristics of tax basis distributions and composition of distributable earnings/(accumulated losses) are finalized at fiscal year-end. Accordingly, tax basis balances have not been determined as of October 31, 2017.
4. SECURITIES TRANSACTIONS
During the six months ended October 31, 2017, equity holdings, asset/mortgage backed securities, fixed income securities and U.S. Treasury Bonds were transferred in-kind into the Fund. The intent of the transfers was to save on equity transaction costs both for the new shareholders at the institution they transferred from and for the Fund on the addition of assets. The assets of four separate accounts were transferred-in-kind into the Fund in the amount of $17,809,759.
| 28 | 1-855-DGI-FUND (344-3863) | www.DGIfund.com |
| The Disciplined Growth Investors Fund | Notes to Financial Statements |
October 31, 2017 (Unaudited)
The cost of purchases and proceeds from sales of securities (excluding short-term securities, transfers-in-kind, and U.S. Government Obligations) during the six months ended October 31, 2017, were as follows:
| Fund | Purchases of Securities | Proceeds From Sales of Securities | ||||||
| The Disciplined Growth Investors Fund | $ | 19,768,190 | $ | 18,559,515 | ||||
Investment transactions in U.S. Government Obligations (excluding transfers-in-kind) during the six months ended October 31, 2017 were as follows:
| Fund | Purchases of Securities | Proceeds From Sales of Securities | ||||||
| The Disciplined Growth Investors Fund | $ | 233,923 | $ | – | ||||
5. SHARES OF BENEFICIAL INTEREST
The capitalization of the Trust consists of an unlimited number of shares of beneficial interest with no par value per share. Holders of the shares of the Fund of the Trust have one vote for each share held and a proportionate fraction of a vote for each fractional share. All shares issued and outstanding are fully paid and are transferable and redeemable at the option of the shareholder. Purchasers of the shares do not have any obligation to make payments to the Trust or its creditors (other than the purchase price for the shares or make contributions to the Trust or its creditors solely by reason of the purchasers’ ownership of the shares. Shares have no pre-emptive rights.
Prior to September 1, 2015, shares redeemed within 90 days of purchase may have incurred a 2% short-term redemption fee deducted from the redemption amount. Effective September 1, 2015, the Fund no longer imposes redemption fees. For the year ended April 30, 2017, the Fund did not receive any redemption fees.
6. MANAGEMENT AND RELATED-PARTY TRANSACTIONS
The Adviser, subject to the authority of the Board, is responsible for the overall management and administration of the Fund’s business affairs. The Adviser manages the investments of the Fund in accordance with the Fund’s investment objective, policies and limitations and investment guidelines established jointly by the Adviser and the Trustees. Pursuant to the Advisory Agreement, the Fund pays the Adviser a unitary management fee for the services and facilities it provides payable on a monthly basis at the annual rate of 0.78% of the Fund’s average daily net assets. The management fee is paid on a monthly basis.
Out of the unitary management fee, the Adviser pays substantially all expenses of the Fund, including the cost of transfer agency, custody, fund administration, bookkeeping and pricing services, legal, audit and other services, except for interest expenses, brokerage expenses, taxes and extraordinary expenses not incurred in the ordinary course of the Fund’s business. Also included are Trustee fees which were $1,661 for the six months ended October 31, 2017.
| Semi-Annual Report | October 31, 2017 | 29 |
| The Disciplined Growth Investors Fund | Notes to Financial Statements |
October 31, 2017 (Unaudited)
Fund Administrator Fees and Expenses
ALPS Fund Services, Inc. (“ALPS”) serves as administrator to the Fund. Pursuant to an Administration Agreement, ALPS provides operational services to the Fund including, but not limited to, fund accounting and fund administration and generally assists in the Fund’s operations. Officers of the Trust are employees of ALPS. The Fund’s administration fee is accrued on a daily basis and paid monthly. The Administrator is also reimbursed for certain out-of-pocket expenses. The administrative fee and out-of-pocket expenses are included in the unitary management fee paid to the Adviser.
Transfer Agent
ALPS serves as transfer, dividend paying and shareholder servicing agent for the Fund. ALPS receives an annual minimum fee, a fee based upon the number of shareholder accounts, and is also reimbursed for certain out-of-pocket expenses. The fee and out-of-pocket expenses are included in the unitary management fee paid to the Adviser.
Compliance Services
ALPS provides services that assist the Trust’s chief compliance officer in monitoring and testing the policies and procedures of the Trust in conjunction with requirements under Rule 38a-1 under the 1940 Act and receives an annual base fee. ALPS is reimbursed for certain out-of-pocket expenses. The fee and out-of-pocket expenses are included in the unitary management fee paid to the Adviser.
Principal Financial Officer
ALPS receives an annual fee for providing principal financial officer services to the Fund. The fee is included in the unitary management fee paid to the Adviser.
Distributor
ALPS Distributors, Inc. (“ADI” or the “Distributor”) (an affiliate of ALPS) acts as the distributor of the Fund’s shares pursuant to a Distribution Agreement with the Trust. Shares are sold on a continuous basis by ADI as agent for the Fund, and ADI has agreed to use its best efforts to solicit orders for the sale of the Fund’s shares, although it is not obliged to sell any particular amount of shares. ADI is not entitled to any compensation for its services as Distributor. ADI is registered as a broker-dealer with the Securities and Exchange Commission.
7. INDEMNIFICATIONS
Under the Trust’s organizational documents, its officers and Trustees are indemnified against certain liability arising out of the performance of their duties to the Trust. Additionally, in the normal course of business, the Trust enters into contracts with service providers that may contain general indemnification clauses, which may permit indemnification to the extent permissible under applicable law. The Trust’s maximum exposure under these arrangements is unknown, as this would involve future claims that may be made against the Trust that have not yet occurred.
| 30 | 1-855-DGI-FUND (344-3863) | www.DGIfund.com |
| The Disciplined Growth Investors Fund | Additional Information |
October 31, 2017 (Unaudited)
1. FUND HOLDINGS
The Fund files its complete schedule of portfolio holdings with the Securities and Exchange Commission (the “SEC”) for the first and third quarters of each fiscal year on Form N-Q within 60 days after the end of the period. Copies of the Fund’s Form N-Q are available without charge on the SEC website at http://www.sec.gov. You may also review and copy the Form N-Q at the SEC’s Public Reference Room in Washington, DC. For more information about the operation of the Public Reference Room, please call the SEC at 1-800-SEC-0330.
2. FUND PROXY VOTING POLICIES, PROCEDURES AND SUMMARIES
The Fund’s policies and procedures used in determining how to vote proxies and information regarding how the Fund voted proxies relating to portfolio securities during the most recent prior 12-month period ending June 30 are available without charge, (1) upon request, by calling (toll-free) 855-DGI-Fund and (2) on the SEC’s website at http://www.sec.gov.
| Semi-Annual Report | October 31, 2017 | 31 |
| The Disciplined Growth Investors Fund | Disclosure Regarding Approval of Fund Advisory Agreements |
October 31, 2017 (Unaudited)
On June 6-7, 2017, the Trustees met in person to discuss, among other things, the approval of the investment advisory agreement between Financial Investors Trust (the “Trust”), with respect to The Disciplined Growth Investors Fund (the “DGI Fund”), and Disciplined Growth Investors, Inc. (“DGI”) (the “Investment Advisory Agreement”), in accordance with Section 15(c) of the 1940 Act. In renewing and approving the Investment Advisory Agreement with the Adviser, the Trustees, including the Independent Trustees, considered the following factors:
Investment Advisory Fee Rate: The Trustees reviewed and considered the contractual annual advisory fee paid by the Trust, on behalf of the DGI Fund, to DGI, of 0.78% of the DGI Fund’s daily net assets, in light of the extent and quality of the advisory services provided by DGI to the DGI Fund.
The Board received and considered information including a comparison of the DGI Fund’s contractual advisory fee rate with those of funds in the expense group and universe of funds provided by an independent provider of investment company data (the “Data Provider”). The Trustees noted that the DGI Fund’s contractual advisory fee rate was above the Data Provider peer group median.
Total Expense Ratio: The Trustees further reviewed and considered that the DGI Fund’s total expense ratio of 0.78% was below the Data Provider peer group median.
Nature, Extent, and Quality of the Services under the Investment Advisory Agreement: The Trustees received and considered information regarding the nature, extent, and quality of services provided to the DGI Fund under the Investment Advisory Agreement. The Trustees reviewed certain background materials supplied by DGI in its presentation, including its Form ADV.
The Trustees reviewed and considered DGI’s investment advisory personnel, its history as an asset manager, and its performance and the amount of assets currently under management by DGI and its affiliated entities. The Trustees also reviewed the research and decision-making processes utilized by DGI, including the methods adopted to seek to achieve compliance with the investment objectives, policies, and restrictions of the DGI Fund.
The Trustees considered the background and experience of DGI’s management in connection with the DGI Fund, including reviewing the qualifications, backgrounds, and responsibilities of the management team primarily responsible for the day-to-day portfolio management of the Fund and the extent of the resources devoted to research and analysis of actual and potential investments.
The Trustees also reviewed, among other things, DGI’s insider trading policies and procedures and its Code of Ethics.
Performance: The Trustees reviewed performance information for the DGI Fund for the 3-month, 1-year, 3-year, and 5-year periods ended December 31, 2016. That review included a comparison of the DGI Fund’s performance to the performance of the group of comparable funds selected by the Data Provider. The Trustees noted that the performance of the DGI Fund was below the Data Provider peer group median for the 3-month period but above the Data Provider peer group median for the 1-year, 3-year, and 5-year periods. The Trustees also considered DGI’s discussion of its reputation generally and its investment techniques, risk management controls, and decision-making processes.
| 32 | 1-855-DGI-FUND (344-3863) | www.DGIfund.com |
| The Disciplined Growth Investors Fund | Disclosure Regarding Approval of Fund Advisory Agreements |
October 31, 2017 (Unaudited)
Comparable Accounts: The Trustees noted certain information provided by DGI regarding fees charged to its other clients utilizing a strategy similar to that employed by the DGI Fund.
Profitability: The Trustees received and considered a retrospective and projected profitability analysis prepared by DGI based on the fees payable under the Investment Advisory Agreement with respect to the DGI Fund. The Trustees considered the profits, if any, anticipated to be realized by DGI in connection with the operation of the Fund. The Board then reviewed DGI’s audited financial statements for the year ended December 31, 2016 in order to analyze the financial condition and stability and profitability of DGI.
Economies of Scale: The Trustees considered whether economies of scale in the provision of services to the DGI Fund will be passed along to the shareholders under the proposed agreements.
Other Benefits to the Adviser: The Trustees reviewed and considered any other incidental benefits derived or to be derived by DGI from its relationship with the DGI Fund, including whether soft dollar arrangements were used.
In renewing DGI as the DGI Fund’s investment adviser and renewing the Investment Advisory Agreement and the fees charged under the Investment Advisory Agreement, the Trustees concluded that no single factor reviewed by the Trustees was identified by the Trustees to be determinative as the principal factor in whether to renew the Investment Advisory Agreement. Further, the Independent Trustees were advised by separate independent legal counsel throughout the process. The Trustees, including all of the Independent Trustees, concluded that:
| ● | the DGI Fund’s contractual advisory fee rate was above the Data Provider peer group median; |
| ● | the DGI Fund’s total expense ratio (after waivers) was below its Data Provider peer group median; |
| ● | the nature, extent and quality of services rendered by DGI under the Investment Advisory Agreement with respect to the DGI Fund were adequate; |
| ● | for the period ended December 31, 2016, the performance of the Fund was below the Data Provider peer group median for the 3-month period but above the Data Provider peer group median for the 1-year, 3-year, and 5-year periods; |
| ● | bearing in mind the limitations of comparing different types of managed accounts and the different levels of service typically associated with such accounts, the fee structures applicable to DGI’ other clients employing a comparable strategy to the DGI Fund was not indicative of any unreasonableness with respect to the advisory fee payable by the DGI Fund; |
| ● | the profit, if any, realized by DGI in connection with the operation of the DGI Fund is not unreasonable to the Fund; and |
| ● | there were no material economies of scale or other incidental benefits accruing to DGI in connection with its relationship with the DGI Fund. |
Based on the Trustees’ deliberations and their evaluation of the information described above, the Trustees, including all of the Independent Trustees, concluded that DGI’s compensation for investment advisory services is consistent with the best interests of the DGI Fund and its shareholders.
| Semi-Annual Report | October 31, 2017 | 33 |

THIS MATERIAL MUST BE PRECEDED OR ACCOMPANIED BY A PROSPECTUS.
THE DISCIPLINED GROWTH INVESTORS FUND IS DISTRIBUTED BY ALPS DISTRIBUTORS, INC.
DGI000282 / 1218
TABLE OF CONTENTS
| Manager Commentary | |
| Emerald Growth Fund | 1 |
| Emerald Small Cap Value Fund | 6 |
| Emerald Insights Fund | 11 |
| Emerald Banking and Finance Fund | 15 |
| Disclosure of Fund Expenses | 21 |
| Schedule of Investments | |
| Emerald Growth Fund | 23 |
| Emerald Small Cap Value Fund | 25 |
| Emerald Insights Fund | 27 |
| Emerald Banking and Finance Fund | 29 |
| Statements of Assets and Liabilities | 31 |
| Statements of Operations | 32 |
| Statements of Changes of Net Assets | |
| Emerald Growth Fund | 33 |
| Emerald Small Cap Value Fund | 34 |
| Emerald Insights Fund | 36 |
| Emerald Banking and Finance Fund | 37 |
| Financial Highlights | |
| Emerald Growth Fund | 38 |
| Emerald Small Cap Value Fund | 42 |
| Emerald Insights Fund | 46 |
| Emerald Banking and Finance Fund | 50 |
| Notes to Financial Statements | 54 |
| Additional Information | 62 |
| Emerald Growth Fund | Manager Commentary |
October 31, 2017 (Unaudited)
October 31, 2017
Dear Shareholders:
Investment Results:
The performance of the Emerald Growth Fund’s Class A shares (without sales load), for the six months ended October 31, 2017, advanced by 14.25% outperforming the Russell 2000® Growth Index(1) which appreciated by 10.56%.
The market looked through geopolitical tensions, a series of destructive domestic hurricanes, hawkish Federal Reserve commentary, the start of balance sheet normalization and the ongoing legislative stalemate choosing instead to focus on the stability of economic growth and upward trajectory earnings for the support of the market’s advance. Domestically, both the ISM (Institute For Supply Management) manufacturing and non-manufacturing remain expansionary, business confidence and capital spending intentions are improving, unemployment is low, consumer confidence is high, consumer net worth is expanding and inflation has remained subdued. On a more global basis there are similarly encouraging data points that continue to reinforce the theme of synchronous global growth.
Growth stocks have thrived in this environment, as the market has leaned into those companies that are showing the most attractive relative earnings growth. For the trailing six-month period ended October 31, 2017 growth stocks, as measured by the Russell 2000® Growth Index gained 10.56%, meaningfully outpacing their value counterpart, as measured by the Russell 2000® Value Index(2), which gained 5.54%.
Investment Analysis:
On a relative basis, stock selection drove Emerald’s outperformance for the six-month period ended October 31, 2017. At the sector level, the most notable positive contributors to return included performance within the healthcare, financial services and technology sectors. These areas of positive contribution more than offset the relative underperformance within the consumer discretionary and producer durables sectors.
The healthcare sector was the largest source of relative outperformance for the trailing period driven by stock selection within the biotechnology, health care services and pharmaceutical industries. Stock selection was also the key driver of relative outperformance within the financial services sector with the portfolio achieving notable outperformance within the consumer lending industry. Holdings within the technology sector, specifically those holdings within the communications technology, electronics and telecommunications industries, contributed positively to the portfolio’s relative outperformance for the period.
Partially offsetting the strength experienced within the financial services, healthcare and technology sectors was stock selection driven relative underperformance within the producer durables and consumer discretionary sectors.
The producer durables sector was the most significant detractor to return for the trailing period. Stock selection within the air transport, engineering & contracting and industrial machinery industries offset relative outperformance within the aerospace and construction machinery industries. Performance within the consumer discretionary sector also detracted from returns for the reporting period as disappointing stock selection within the specialty retail and consumer services industries offset relative outperformance within the education and leisure industries.
Exiting October, the portfolio held the largest active exposures in the financial services, materials, and utilities sectors. Thoughts on those sectors are highlighted below.
The financial services sector represented the portfolio’s largest relative overweight position exiting October, with a notable overweight to the banking and consumer lending industries. Emerald believes that the bank industry will continue to outpace the broader market given the tailwinds of higher rates and a steepening of the yield curve(3), tax reform and bank merger and acquisition activity. In regards to the yield curve, the benchmark 10-year Treasury yield is projected to rise from the current level of 2.33% to 2.49% by December 2017, according to a Wall Street Journal survey of more than 60 economists. The same group of economists expects the 10-year yield to reach 3% by December 2018. Emerald believes that expectations for higher interest rates and a steepening of the yield curve should provide a positive backdrop for bank stocks to move higher. Additionally the U.S. banking industry continues to amass deposits at a steady clip even as banks collectively forge ahead with branch closures, extending a long-running trend. The Federal Deposit Insurance Corporation’s (FDIC) annual Summary of Deposits, released Oct. 3 and spanning the 12 months that ended June 30, 2017, shows that the industry grew total deposits 5.20% over the latest reporting period. The growth came even as banks shuttered far more branches than they opened. The summary of deposits shows 89,857 U.S. branches at June 30, down from 91,838 a year earlier. This marks a continuation of an uninterrupted trend that dates to the aftermath of the 2008 financial crisis. Emerald also expects merger and acquisition activity will continue at a robust pace. Through Sept. 30, S&P Global Market Intelligence counted 183 deal announcements in the U.S. banking sector with an aggregate disclosed deal value of $22.18 billion
| Semi-Annual Report | October 31, 2017 | 1 |
| Emerald Growth Fund | Manager Commentary |
October 31, 2017 (Unaudited)
and a median deal value-to-tangible common equity ratio of 162.17%. The comparable prior-year period saw 178 deal announcements with an aggregate disclosed deal value of $20.98 billion and a median deal value-to-tangible common equity ratio of 127.9%. All of these factors should provide a positive backdrop for the financial services sector.
The portfolio was also overweight the materials sector exiting the month of October. While Emerald continues to be confident regarding the durability of the recovery in the residential and commercial construction markets as has been the case for the better part of the last twelve months, the opportunity set within the materials sector has begun to broaden and now includes companies within the steel and chemicals industries positioned to benefit from a resurgent aerospace cycle and an improvement in the broader industrial end-market.
The portfolio also maintains an overweight position to the utilities sector. Within the utilities sector, Emerald continues to believe that adoption of unified communications among mid-market and enterprise customers is in the very early stages and that the segment will continue to expand, shifting market leadership from traditional telephony equipment providers to a new group of software/network centric companies.
Market Outlook:
Global growth has remained strong and broad based. According to an October 13, 2017 report from Joseph Lupton of JPMorgan “the rebound in global growth is clear, with Gross Domestic Product (GDP) expanding over the year at a pace on par with the strongest in over six years.” Notably, not only is real GDP growth running near a six year high, but global participation in this growth is similarly showing strength. According to the same report, nearly 75% of the 24 countries comprising JPMorgan’s global aggregate achieved above-potential growth in the year through the third quarter of 2017, a seven year high. Domestically growth has accelerated with third quarter preliminary GDP growth of 3.0% and the Atlanta Fed GDPNow forecasting model currently tracking fourth quarter GDP growth to an anticipated 3.3%. The Federal Reserve acknowledged the improving outlook by upgrading their assessment of US economic growth to “solid” for the first time since January 2015. Emerald continues to believe that the strong global economic backdrop will be supportive of further positive revisions in forward earnings growth and market returns as we move through the balance of 2017.
While confidence in the stability of economic growth has underpinned the market’s advance, policy issues ranging in scope from monetary to fiscal to foreign all remain sources of potential risk. Although the market has almost fully factored a December rate hike into expectations, there remains a wider range of expectations for 2018 which could be a source of volatility as the path of rate hikes becomes more visible. Further, while the market currently believes that Federal Reserve Chair Nominee Powell will not deviate meaningfully from the path defined under Chairwoman Yellen, the transition and the recalibration of the committee could add an additional layer of uncertainty to the future path of hikes. Geopolitical risk remains elevated in our view as is domestic political/policy risk, particularly as it relates to the outcome of the recently introduced tax plan.
| Top Contributors: | Top Detractors: | |
| LendingTree, Inc. | Spirit Airlines Inc. | |
| Puma Biotechnology Inc. | Tile Shop Holdings Inc. | |
| Chegg, Inc. | MicroStrategy Incorporated | |
| Trex Company Inc. | Alder Biopharmaceuticals Inc. | |
| IPG Photonics Corporation | Hostess Brands, Inc. | |
| Kenneth G. Mertz II, CFA | Stacey L. Sears | Joseph W. Garner |
| Chief Investment Officer | Portfolio Manager | Portfolio Manager |
| Portfolio Manager |
Emerald Mutual Fund Advisers Trust
Past performance does not guarantee future results. Fund prices fluctuate as the underlying assets have exposure to market fluctuations and other risks, as described in the Fund’s prospectus. Please visit www.emeraldmutualfunds.com to obtain current performance information and for the current prospectus and statement of additional information. This material must be preceded or accompanied by a prospectus. Please read the prospectus carefully before investing.
The views of Emerald Mutual Fund Advisers Trust and information discussed in this commentary are as of the date of publication, are subject to change, and may not reflect the writer’s current views. The views expressed are those of the author only, and represent an assessment of market conditions at a specific point in time, are opinions only and should not be relied upon as investment advice regarding a particular investment or markets in general. Such information does not constitute a recommendation to buy or sell specific securities or investment vehicles. It should not be assumed that any investment will be profitable or will equal the performance of the Fund or any securities or any sectors mentioned in this letter. The subject matter contained in this letter has been derived from several sources believed to be reliable and accurate at the time of compilation. Neither Emerald Mutual Fund Advisers Trust nor the Fund accepts any liability for losses either direct or consequential caused by the use of this information.
| 2 | www.emeraldmutualfunds.com |
| Emerald Growth Fund | Manager Commentary |
October 31, 2017 (Unaudited)
The Emerald Growth Fund is distributed by ALPS Distributors, Inc.
The Fund is subject to investment risks, including possible loss of the principal amount invested and therefore is not suitable for all investors. The Fund may not achieve its objectives.
Diversification does not eliminate the risk of experiencing investment losses.
| (1) | The Russell 2000® Growth Index measures the performance of the small-cap growth segment of the U.S. equity universe. It includes those Russell 2000® Index companies with higher price-to-value ratios and higher forecasted growth values. The Index is not actively managed and does not reflect any deductions for fees, expenses or taxes. An investor may not invest directly into the Index. |
| (2) | The Russell 2000® Value Index measures the performance of small-cap value segment of the U.S. equity universe. It includes those Russell 2000 companies with lower price-to-book ratios and lower forecasted growth values. The Index is not actively managed and does not reflect any deductions for fees, expenses or taxes. An investor may not invest directly into the Index. |
| (3) | A yield curve is a line that plots the interest rates, at a set point in time, of bonds having equal credit quality but differing maturity dates. The most frequently reported yield curve compares the three-month, two-year, five-year and 30-year U.S. Treasury debt. This yield curve is used as a benchmark for other debt in the market, such as mortgage rates or bank lending rates, and it is also used to predict changes in economic output and growth. |
| Semi-Annual Report | October 31, 2017 | 3 |
| Emerald Growth Fund | Manager Commentary |
October 31, 2017 (Unaudited)
| TOP TEN HOLDINGS | |
| (as a % of Net Assets)* | |
| LendingTree, Inc. | 3.15% |
| Trex Co., Inc. | 2.53% |
| Installed Building Products, Inc. | 2.05% |
| Puma Biotechnology, Inc. | 1.98% |
| Sarepta Therapeutics, Inc. | 1.77% |
| Chegg, Inc. | 1.75% |
| EPAM Systems, Inc. | 1.73% |
| KLX, Inc. | 1.52% |
| Vonage Holdings Corp. | 1.52% |
| QTS Realty Trust, Inc., REIT | 1.50% |
| Top Ten Holdings | 19.50% |
| INDUSTRY SECTOR ALLOCATION | |
| (as a % of Net Assets) | |
| Technology | 20.50% |
| Health Care | 19.76% |
| Financial Services | 15.22% |
| Consumer Discretionary | 13.13% |
| Producer Durables | 12.44% |
| Materials & Processing | 12.04% |
| Utilities | 3.82% |
| Energy | 1.01% |
| Consumer Staples | 1.01% |
| Cash, Cash Equivalents, & Other Net Assets | 1.07% |
| * | Holdings are subject to change, and may not reflect the current or future position of the portfolio. |
ANNUALIZED TOTAL RETURN (for the period ended October 31, 2017)
| 1 Year | 3 Year | 5 Year | 10 Year | Since Inception(1) | Expense Gross(2) | Ratio Net(2) | |
| Class A (NAV) | 34.52% | 12.50% | 17.17% | 9.11% | 11.45% | 1.08% | 1.08% |
| Class A (MOP) | 28.16% | 10.69% | 16.04% | 8.58% | 11.23% | 1.08% | 1.08% |
| Russell 2000® Growth Index† | 31.00% | 10.51% | 15.36% | 8.16% | 8.42% | ||
| Class C (NAV) | 33.60% | 11.77% | 16.42% | 8.41% | 6.37% | 1.73% | 1.73% |
| Class C (CDSC) | 32.60% | 11.77% | 16.42% | 8.41% | 6.37% | 1.73% | 1.73% |
| Russell 2000® Growth Index† | 31.00% | 10.51% | 15.36% | 8.16% | 5.27% | ||
| Investor Class | 34.42% | 12.46% | 17.13% | – | 12.36% | 1.13% | 1.13% |
| Russell 2000® | |||||||
| Growth Index† | 31.00% | 10.51% | 15.36% | – | 10.94% | ||
| Institutional Class | 34.92% | 12.85% | 17.54% | – | 16.13% | 0.77% | 0.77% |
| Russell 2000® Growth Index† | 31.00% | 10.51% | 15.36% | – | 14.99% |
Performance quoted represents past performance, does not guarantee future results and current performance may be lower or higher than the data quoted. The investment return and principal value of an investment will fluctuate so that shares, when redeemed, may be worth more or less than their original cost. Performance data current to the most recent month end may be obtained at www.emeraldmutualfunds.com.
Performance shown for periods prior to March 16, 2012, reflects the performance of the Forward Growth Fund, a series of Forward Funds (as a result of a reorganization of the Forward Growth Fund into the Emerald Growth Fund).
Returns for periods less than 1 year are cumulative.
The table does not reflect the deduction of taxes that a shareholder would pay on Fund distributions or the redemption of Fund shares.
Subject to investment risks, including possible loss of the principal amount invested.
Maximum Offering Price (MOP) for Class A shares includes the Fund's maximum sales charge of 4.75%. Performance shown at NAV does not include these sales charges and would have been lower had it been taken into account.
A Contingent Deferred Sales Charge (CDSC) of 1.00% may apply to Class C shares redeemed within the first 12 months after a purchase.
| (1) | Inception Dates - Class A: 10/01/1992, Class C: 07/01/2000, Class Institutional: 10/21/2008, Class Investor: 05/01/2011 |
| (2) | Emerald Mutual Fund Advisers Trust ("Emerald" or the "Adviser") has agreed contractually to waive a portion of its fees and reimburse other expenses until August 31, 2018 in amounts necessary to limit the Fund's operating expenses (exclusive of Acquired Fund Fees and Expenses, brokerage expenses, interest expenses, taxes and extraordinary expense) for Class A, Class C, Institutional Class, and Investor Class shares to an annual rate (as percentage of the Fund's average daily net assets) of 1.29%, 1.94%, 0.99% and 1.34% respectively. The Adviser will be permitted to recover, on a class-by-class basis, expenses it has borne through the agreement described above to the extent that the Fund's expenses in later periods fall below the annual rates set forth in the relevant agreement. The Fund will not be obligated to pay any such deferred fees and expenses more than three years after the year(s) in which the fees and expense were incurred. The Adviser may not discontinue this waiver prior to August 31, 2018, without the approval by the Fund's Board of Trustees. Ratios as of the Prospectus dated August 31, 2017 and may differ from the ratios presented in the Financial Highlights. |
| † | The Russell 2000® Growth Index measures the performance of the small-cap growth segment of the U.S. equity universe. It includes those Russell 2000® Index companies with higher price-to-value ratios and higher forecasted growth values. The Index is not actively managed and does not reflect any deduction for fees, expenses or taxes. An investor may not invest directly into the Index. |
| 4 | www.emeraldmutualfunds.com |
| Emerald Growth Fund | Manager Commentary |
October 31, 2017 (Unaudited)
GROWTH OF $10,000 INVESTMENT IN THE FUND (for the period ended October 31, 2017)
Comparison of change in value of a $10,000 investment (includes applicable sales loads)
The chart represents historical performance of a hypothetical investment of $10,000 in the Fund since inception. Past performance does not guarantee future results. This chart does not reflect the deduction of taxes that a shareholder would pay on Fund distributions or the redemption of Fund shares.
Investing in the Fund is subject to investment risks, including possible loss of the principal amount invested.
| Semi-Annual Report | October 31, 2017 | 5 |
| Emerald Small Cap Value Fund | Manager Commentary |
October 31, 2017 (Unaudited)
October 31, 2017
Dear Shareholders:
Investment Results:
The performance of the Emerald Small Cap Value Fund Investor Class (without sales load), for the six months ended October 31, 2017, reflected a gain of 9.59%, outperforming the Russell 2000® Value Index(1) which was up 5.54%.
So far this year small cap value companies lagged other US equity asset classes. While the major indices hit new all-time highs, the Russell 2000® Value Index continued to exhibit lackluster returns year to date, despite impressive performance during the month of September. The continuation of inflows to passive and outflows from active strategies are still headwinds for small cap managers.
In addition, government policies that target domestic growth via deregulation, tax cuts, and infrastructure spending have been slow to materialize, as partisan politics stymied progress on these issues. Unfortunately, this has been another significant headwind to small cap value companies, whose business is mostly conducted domestically.
Investment Analysis:
As noted above, the Emerald Small Cap Value Fund (without sales load) outperformed its benchmark for the 6-month period ended October 31, 2017. At the sector level, relative outperformance was driven by stock selection within the consumer discretionary, financial services, materials & processing sectors, and a relative underweight to the benchmark’s consumer staples sector. Relative underperformance was attributed to the producer durables sector, and a relative underweight to the benchmark’s health care sector.
Negative stock selection in the producer durables sector weighed on relative performance as holdings within the construction industry were impacted by weather, cost over-runs, and delay of awards of large projects.
The Fund’s outperformance in the consumer discretionary sector was due to strong stock selection, as a number of our holdings made great strides in lowering their costs, introducing new products or services, and gaining market share.
In the past few months, the portfolio management team has increased the portfolio’s exposure to Real Estate Investment Trusts (REITs). We find opportunities across the industry, particularly in developers/operators of niche properties serving various end-markets such as retail, energy, healthcare, and technology.
Market Outlook:
So far his year, investors ignored political gridlock, monetary uncertainty, and geopolitical risk, as markets kept trending higher since last year’s presidential election. U.S. economic data continue to be strong, particularly in manufacturing, employment, consumer demand, and business confidence. Buying growth has been a winning strategy throughout 2017, however, we think value can stage a comeback. Despite another failure to repeal and replace Obamacare, the administration is pushing forward with tax reform, hoping to have it done by year end. In anticipation of these bottlenecks that hindered domestic growth policies to be in the rear view mirror, we believe small cap value companies should perform better. With lower corporate taxes, diminished regulations, higher infrastructure spending, and higher interest rates, financial services companies (over 42% of our benchmark) should benefit to a greater extent.
With most domestic indices at or close to their all-time highs, there is always the concern that markets might be over-valued. Jim Furey of Furey Research has addressed this worry in a recent report(2) by looking at various factors (Economic, Policy, Technical, Earnings, Valuation, Sentiment, and Federal Reserve (FED)), concluding that traditional warnings signs of a market top are not present at this point in time. A few observations that support this conclusion are: an accommodative Fed, pockets of deflation (think Amazon), slow but steady economic growth in U.S. and abroad (mainly Europe), stocks cheap vs. bonds, improving corporate earnings, potential for lower taxes, and expectations for additional government spending supporting further economic growth.
However, given the continuous upward move in the stock prices, we believe that the upcoming earnings season will be a make or break situation for many companies, as valuations are highest for the S&P 500 in the past 15 years, and they won't be supported by weak fundamentals.
While we still don’t expect a significant market correction this year, we think that value strategies can do better in the current environment. Valuations of financial services companies are well below their peak as expectations for growth have been moderated. In addition, any benefits from lower taxes, reduced regulation, and infrastructure spending are not currently priced into these stocks.
| 6 | www.emeraldmutualfunds.com |
| Emerald Small Cap Value Fund | Manager Commentary |
October 31, 2017 (Unaudited)
We will continue to seek attractive investment opportunities for our clients by focusing on high-quality companies identified and evaluated by our fundamental research and active portfolio management.
| Top Contributors: | Top Detractors: |
| Zagg Inc | Xperi Corp |
| Viad Corp | Mammoth Energy Services, Inc. |
| ILG, Inc. | Jones Energy, Inc. |
| MDC Partners Inc. Class A | CoreCivic, Inc. |
| Tower Semiconductor Ltd | GEO Group, Inc. |
| Sincerely, | |
| Ori Elan | Steven E. Russell, Esq. |
| Vice President | Vice President |
| Portfolio Manager | Portfolio Manager |
Emerald Mutual Fund Advisers Trust
Past performance does not guarantee future results. Fund prices fluctuate as the underlying assets have exposure to market fluctuations and other risks, as described in the Fund’s prospectus. Please visit www.emeraldmutualfunds.com to obtain current performance information and for the current prospectus and statement of additional information. This material must be preceded or accompanied by a prospectus. Please read the prospectus carefully before investing.
The views of Emerald Mutual Fund Advisers Trust and information discussed in this commentary are as of the date of publication, are subject to change, and may not reflect the writer's current views. The views expressed are those of the author only, and represent an assessment of market conditions at a specific point in time, are opinions only and should not be relied upon as investment advice regarding a particular investment or markets in general. Such information does not constitute a recommendation to buy or sell specific securities or investment vehicles. It should not be assumed that any investment will be profitable or will equal the performance of the Fund or any securities or any sectors mentioned in this letter. The subject matter contained in this letter has been derived from several sources believed to be reliable and accurate at the time of compilation. Neither Emerald Mutual Fund Advisers Trust nor the Fund accepts any liability for losses either direct or consequential caused by the use of this information.
The Emerald Small Cap Value Fund is distributed by ALPS Distributors, Inc.
The Fund is subject to investment risks, including possible loss of the principal amount invested and therefore is not suitable for all investors. The Fund may not achieve its objectives.
Diversification does not eliminate the risk of experiencing investment losses.
| (1) | The Russell 2000® Value Index measures the performance of small-cap value segment of the U.S. equity universe. It includes those Russell 2000 companies with lower price-to-book ratios and lower forecasted growth values. The Index is not actively managed and does not reflect any deductions for fees, expenses or taxes. An investor may not invest directly into the Index. |
| (2) | Furey Research, What a Stock Market Top May Look Like, 12 July, 2017. |
| Semi-Annual Report | October 31, 2017 | 7 |
| Emerald Small Cap Value Fund | Manager Commentary |
October 31, 2017 (Unaudited)
| TOP TEN HOLDINGS | |
| (as a % of Net Assets)* | |
| ZAGG, Inc. | 3.84% |
| ILG, Inc. | 2.54% |
| Viad Corp. | 2.41% |
| Builders FirstSource, Inc. | 2.22% |
| Cubic Corp. | 2.05% |
| Gray Television, Inc. | 2.04% |
| Microsemi Corp. | 2.04% |
| Rudolph Technologies, Inc. | 2.01% |
| CyrusOne, Inc., REIT | 1.98% |
| CoreSite Realty Corp., REIT | 1.96% |
| Top Ten Holdings | 23.09% |
| INDUSTRY SECTOR ALLOCATION | |
| (as a % of Net Assets) | |
| Financial Services | 45.28% |
| Technology | 14.51% |
| Consumer Discretionary | 13.89% |
| Materials & Processing | 10.25% |
| Producer Durables | 7.00% |
| Energy | 2.79% |
| Utilities | 2.33% |
| Health Care | 1.32% |
| Cash, Cash Equivalents, & Other Net Assets | 2.63% |
| * | Holdings are subject to change, and may not reflect the current or future position of the portfolio. |
ANNUALIZED TOTAL RETURN (for the period ended October 31, 2017)(1),(2)
| Since | Expense Ratio | |||||||||||
| 1 Year | 3 Years | 5 Years | Inception(2) | Gross(3) | Net(3) | |||||||
| Class A (NAV) | 32.81% | 11.67% | 14.40% | 13.89% | 2.27% | 1.36% | ||||||
| Class A (MOP) | 26.49% | 9.87% | 13.29% | 12.80% | 2.27% | 1.36% | ||||||
| Russell 2000® Value Index(4) | 24.81% | 9.67% | 13.58% | 13.36% | ||||||||
| Class C (NAV) | 32.03% | 10.92% | 13.64% | 13.14% | 2.71% | 2.01% | ||||||
| Class C (CDSC) | 31.03% | 10.92% | 13.64% | 13.14% | 2.71% | 2.01% | ||||||
| Russell 2000® Value Index(4) | 24.81% | 9.67% | 13.58% | 13.36% | ||||||||
| Investor Class | 33.08% | 11.85% | 14.54% | 14.06% | 1.84% | 1.26% | ||||||
| Russell 2000® Value Index(4) | 24.81% | 9.67% | 13.58% | 13.36% | ||||||||
| Institutional Class | 33.31% | 12.04% | 14.78% | 14.28% | 1.57% | 1.01% | ||||||
| Russell 2000® Value Index(4) | 24.81% | 9.67% | 13.58% | 13.36% | ||||||||
Performance quoted represents past performance, does not guarantee future results and current performance may be lower or higher than the data quoted. The investment return and principal value of an investment will fluctuate so that shares, when redeemed, may be worth more or less than their original cost. Performance data current to the most recent month end may be obtained at www.emeraldmutualfunds.com.
Returns for periods less than 1 year are cumulative.
The table does not reflect the deduction of taxes that a shareholder would pay on Fund distributions or the redemption of Fund shares.
Subject to investment risks, including possible loss of the principal amount invested.
Maximum Offering Price (MOP) for Class A shares includes the Fund's maximum sales charge of 4.75%. Performance shown at NAV does not include these sales charges and would have been lower had it been taken into account.
A Contingent Deferred Sales Charge (CDSC) of 1.00% may apply to Class C shares redeemed within the first 12 months after a purchase.
| (1) | As of June 26, 2015, the Emerald Small Cap Value Fund was reorganized as a successor to the Elessar Small Cap Value Fund (the Predecessor Fund), a series of Elessar Investment Trust. The performance shown for periods prior to June 26, 2015 reflects the performance of the Predecessor Fund's Institutional Class and Investor Class shares. The Predecessor Fund did not offer Class A or Class C shares. The performance shown for Class A and C shares prior to June 30, 2015 reflect the historical performance of the Predecessor Fund’s Institutional and Investor Shares since inception on October 15, 2012, calculated using the fees and expenses of Class A and C shares, respectively. |
| (2) | Commencement Dates - Class A: 06/30/2015, Class C: 06/30/2015, Class Institutional: 10/15/2012, Class Investor:10/15/2012 |
| (3) | Emerald Mutual Fund Advisers Trust (“Emerald” or the “Adviser”) has agreed contractually to waive a portion of its fees and reimburse other expenses until August 31, 2018 in amounts necessary to limit the Fund’s operating expenses (exclusive of Acquired Fund Fees and Expenses, brokerage expenses, interest expenses, taxes and extraordinary expense) for Class A, Class C, Institutional Class, and Investor Class shares to an annual rate (as percentage of the Fund’s average daily net assets) of 1.35%, 2.00%, 1.00% and 1.25% respectively. The Adviser will be permitted to recover, on a class-by-class basis, expenses it has borne through the agreement described above to the extent that the Fund's expenses in later periods fall below the annual rates set forth in the relevant agreement. The Fund will not be obligated to pay any such deferred fees and expenses more than three years after the year(s) in which the fees and expense were incurred. The Adviser may not discontinue this waiver prior to August 31, 2018, without the approval by the Fund's Board of Trustees. Ratios as of the Prospectus dated August 31, 2017 and may differ from the ratios presented in the Financial Highlights. |
| 8 | www.emeraldmutualfunds.com |
| Emerald Small Cap Value Fund | Manager Commentary |
October 31, 2017 (Unaudited)
| (4) | The Russell 2000® Value Index measures the performance of small-cap value segment of the U.S. equity universe. It includes those Russell 2000 companies with lower price-to-book ratios and lower forecasted growth values. The Index is not actively managed and does not reflect any deductions for fees, expenses or taxes. An investor may not invest directly into the Index. | |
| Important Risks | ||
| Investing in smaller companies generally will present greater investment risks, including: greater price volatility, greater sensitivity to changing economic conditions and less liquidity than the securities of larger, more mature companies. | ||
| Semi-Annual Report | October 31, 2017 | 9 |
| Emerald Small Cap Value Fund | Manager Commentary |
October 31, 2017 (Unaudited)
GROWTH OF $10,000 INVESTMENT IN THE FUND (for the period ended October 31, 2017)
Comparison of change in value of a $10,000 investment (includes applicable sales loads)
The chart represents historical performance of a hypothetical investment of $10,000 in the Fund since inception. Past performance does not guarantee future results. This chart does not reflect the deduction of taxes that a shareholder would pay on Fund distributions or the redemption of Fund shares.
Investing in the Fund is subject to investment risks, including possible loss of the principal amount invested.
| 10 | www.emeraldmutualfunds.com |
| Emerald Insights Fund | Manager Commentary |
October 31, 2017 (Unaudited)
October 31, 2017
Dear Shareholder:
Investment Results:
The performance of the Emerald Insights Fund Class A shares (without sales load) for the six months ended October 31, 2017 reflected a return of 9.09%, trailing the Russell MidCap® Growth Index(1) benchmark of 11.14%. Performance for the period was driven by outperformance in healthcare and technology, offset by underperformance in producer durables and financial services.
Investment Analysis:
Economic indicators continued to point to moderate economic expansion, with the civilian unemployment rate reaching a new cycle low in September and consumer confidence and ISM (Institute for Supply Management) manufacturing data maintaining their robust trend. Many other indicators also remained in stock-friendly territory; the US Treasury yield curve(2) remains reasonably steep, calendar Q3 2017 estimated earnings growth, while down from initial estimates, remains healthy, high yield corporate spreads remained narrow and inflation remained low and stable. In short, it was no surprise to see the Russell MidCap® Growth Index up strongly over the period. We believe that the market, however, continued to bifurcate, with investors willing to pay increasingly elevated multiples for core growth names perceived to have modest earnings variability regardless of the company’s growth rate.
The Insights portfolio was positioned for a continuation of the moderate economic growth seen in the prior period, with a mixture of holdings in high growth, high valuation names, countered by holdings in growth names that could be defined as inexpensive by most metrics. While the fundamental performance of the majority of our names was largely as expected, with only a handful of names missing quarterly results, the misses resulted in outsized moves to the downside. Companies that exceeded expectations did not see stock moves to the upside as much as the misses skewed performance to the downside.
Market Outlook:
The economic indicators described above lead us to continued optimism regarding the direction of the equity markets. This is not to say we have our eyes closed towards the potential for a short-term market pull back, the risks of extended valuations and a very uncertain political environment. We believe that valuations are not cheap, but they are also not too far stretched given the level of interest rates and inflation. The bigger issue could be some unforeseen geopolitical event stemming from an action or reaction by or from a volatile White House or an unfriendly government. The situations with North Korea and Iran have the ability to crimp global growth or worse should the Administration fail to achieve a diplomatic solution.
As a fundamental manager, we think earnings growth drives stock prices; and we believe earnings growth should remain moderately positive as we end 2017 and move into 2018. The portfolio continues to trade at a valuation discount to the Russell Mid Cap Growth index on virtually all traditional metrics such as Price/Earnings(3), Price/Cashflow(4), and Price/Book(5) and at the same time have an estimated 3-5 year earnings per share growth rate significantly higher than the benchmark at 16.68% vs. 14.82% for our index (as of 9/30/17). The valuation/growth disparity vs. the benchmark gives us reason to be optimistic that over time our portfolio should outperform. If markets react rationally and we do our job to identify high growth companies with exemplary management teams, competitive advantages and differentiated growth drivers, with think our portfolio will be amply rewarded over time. Emerald has now been managing equities for 25 years and our research process has withstood the test of time. We look forward to the next 25 years.
| Top 5 Contributors: | Top 5 Detractors: | |
| Alnylam Pharmaceuticals, Inc | Dycom Industries, Inc. | |
| IPG Photonics Corporation | Acadia Healthcare Company, Inc. | |
| NVIDIA Corporation | Foot Locker, Inc. | |
| Puma Biotechnology, Inc. | Spirit Airlines, Inc. | |
| Catalent Inc | Kroger Co. | |
| David A. Volpe, CFA | Stephen L. Amsterdam | Joseph Hovorka |
| Deputy Chief Investment Officer | Associate Portfolio Manager | Associate Portfolio Manager |
| Portfolio Manager | ||
| Emerald Mutual Fund Advisers Trust |
| Semi-Annual Report | October 31, 2017 | 11 |
| Emerald Insights Fund | Manager Commentary |
October 31, 2017 (Unaudited)
Past performance does not guarantee future results. Fund prices fluctuate as the underlying assets have exposure to market fluctuations and other risks, as described in the Fund’s prospectus. Please visit www.emeraldmutualfunds.com to obtain current performance information and for the current prospectus and statement of additional information. This material must be preceded or accompanied by a prospectus. Please read the prospectus carefully before investing.
The views of Emerald Mutual Fund Advisers Trust and information discussed in this commentary are as of the date of publication, are subject to change, and may not reflect the writer's current views. The views expressed are those of the author only, and represent an assessment of market conditions at a specific point in time, are opinions only and should not be relied upon as investment advice regarding a particular investment or markets in general. Such information does not constitute a recommendation to buy or sell specific securities or investment vehicles. It should not be assumed that any investment will be profitable or will equal the performance of the Fund or any securities or any sectors mentioned in this letter. The subject matter contained in this letter has been derived from several sources believed to be reliable and accurate at the time of compilation. Neither Emerald Mutual Fund Advisers Trust nor the Fund accepts any liability for losses either direct or consequential caused by the use of this information.
The Emerald Insights Fund is distributed by ALPS Distributors, Inc.
The Fund is subject to investment risks, including possible loss of the principal amount invested and therefore is not suitable for all investors. The Fund may not achieve its objectives.
Diversification does not eliminate the risk of experiencing investment losses.
| (1) | The Russell MidCap® Growth Index measures the performance of the mid-cap growth segment of the U.S. equity universe. It includes those Russell MidCap Index companies with higher price-to-book ratios and higher forecasted growth values. The Index is not actively managed and does not reflect any deductions for fees, expenses or taxes. An investor may not invest directly into the Index. |
| (2) | A yield curve is a line that plots the interest rates, at a set point in time, of bonds having equal credit quality but differing maturity dates. The most frequently reported yield curve compares the three-month, two-year, five-year and 30-year U.S. Treasury debt. This yield curve is used as a benchmark for other debt in the market, such as mortgage rates or bank lending rates, and it is also used to predict changes in economic output and growth. |
| (3) | The price-earnings ratio (P/E ratio) is the ratio for valuing a company that measures its current share price relative to its per-share earnings. |
| (4) | The price-to-cash-flow ratio is the ratio of a stock's price to its cash flow per share. The price-to-cash-flow ratio is an indicator of a stock's valuation. The ratio takes into consideration a stock's operating cash flow, which adds non-cash earnings such as depreciation and amortization to net income. |
| (5) | Price-to-book value (P/B) is the ratio of market price of a company's shares (share price) over its book value of equity. This number is defined as the difference between the book value of assets and the book value of liabilities. |
| 12 | www.emeraldmutualfunds.com |
| Emerald Insights Fund | Manager Commentary |
October 31, 2017 (Unaudited)
TOP TEN HOLDINGS
(as a % of Net Assets)*
| MGM Resorts International | 2.23% |
| Diamondback Energy, Inc. | 2.15% |
| Eagle Materials, Inc. | 2.01% |
| Broadcom, Ltd. | 1.99% |
| SBA Communications Corp., REIT | 1.95% |
| Catalent, Inc. | 1.93% |
| ServiceNow, Inc. | 1.91% |
| Affiliated Managers Group, Inc. | 1.79% |
| Royal Caribbean Cruises, Ltd. | 1.76% |
| Berry Global Group, Inc. | 1.70% |
| Top Ten Holdings | 19.42% |
INDUSTRY SECTOR ALLOCATION
(as a % of Net Assets)
| Technology | 24.69% |
| Consumer Discretionary | 18.56% |
| Health Care | 14.66% |
| Producer Durables | 13.58% |
| Materials & Processing | 10.43% |
| Financial Services | 10.39% |
| Energy | 4.37% |
| Consumer Staples | 2.80% |
| Cash, Cash Equivalents, & Other Net Assets | 0.52% |
| * | Holdings are subject to change, and may not reflect the current or future position of the portfolio. |
ANNUALIZED TOTAL RETURN (for the period ended October 31, 2017)
| Since | Expense Ratio | ||||
| 1 Year | 3 Year | Inception(1) | Gross(2) | Net(2) | |
| Class A (NAV) | 23.60% | 6.58% | 6.74% | 2.10% | 1.35% |
| Class A (MOP) | 17.71% | 4.86% | 5.15% | 2.10% | 1.35% |
| Russell MidCap® Growth Index† | 26.25% | 9.98% | 10.93% | ||
| Class C (NAV) | 22.76% | 5.84% | 5.99% | 2.76% | 2.00% |
| Class C (CDSC) | 21.76% | 5.84% | 5.99% | 2.76% | 2.00% |
| Russell MidCap® Growth Index† | 26.25% | 9.98% | 10.93% | ||
| Investor Class | 23.45% | 6.50% | 6.63% | 2.16% | 1.40% |
| Russell MidCap® Growth Index† | 26.25% | 9.98% | 10.93% | ||
| Institutional Class | 23.96% | 6.89% | 7.03% | 1.80% | 1.05% |
| Russell MidCap® Growth Index† | 26.25% | 9.98% | 10.93% | ||
The performance quoted represents past performance, does not guarantee future results and current performance may be lower or higher than the data quoted. The investment return and principal value of an investment will fluctuate so that shares, when redeemed, may be worth more or less than their original cost. Performance data current to the most recent month end may be obtained at www.emeraldmutualfunds.com.
Returns for periods less than 1 year are cumulative.
The table does not reflect the deduction of taxes that a shareholder would pay on Fund distributions or the redemption of Fund shares.
Subject to investment risks, including possible loss of the principal amount invested.
Maximum Offering Price (MOP) for Class A shares includes the Fund's maximum sales charge of 4.75%. Performance shown at NAV does not include these sales charges and would have been lower had it been taken into account.
A Contingent Deferred Sales Charge (CDSC) of 1.00% may apply to Class C shares redeemed within the first 12 months after a purchase.
| (1) | Inception Date - August 1, 2014. |
| (2) | Emerald Mutual Fund Advisers Trust (“Emerald” or the “Adviser”) has agreed contractually to waive a portion of its fees and reimburse other expenses until August 31, 2018 in amounts necessary to limit the Fund's operating expenses (exclusive of Acquired Fund Fees and Expenses, brokerage expenses, interest expenses, taxes and extraordinary expense) for Class A, Class C, Institutional Class, and Investor Class shares to an annual rate (as percentage of the Fund's average daily net assets) of 1.35%, 2.00%, 1.05% and 1.40% respectively. The Adviser will be permitted to recover, on a class-by-class basis, expenses it has borne through the agreement described above to the extent that the Fund's expenses in later periods fall below the annual rates set forth in the relevant agreement. The Fund will not be obligated to pay any such deferred fees and expenses more than three years after the year(s) in which the fees and expense were incurred. The Adviser may not discontinue this waiver prior to August 31, 2018, without the approval by the Fund's Board of Trustees. Ratios as of the Prospectus dated August 31, 2017 and may differ from the ratios presented in the Financial Highlights. |
| † | The Russell MidCap® Growth Index measures the performance of the mid-cap growth segment of the U.S. equity universe. It includes those Russell Midcap Index companies with higher price-to-book ratios and higher forecasted growth values. The Index is not actively managed and does not reflect any deductions for fees, expenses or taxes. An investor may not invest directly into the Index. |
Important Risks
Investing in smaller companies generally will present greater investment risks, including: greater price volatility, greater sensitivity to changing economic conditions and less liquidity than the securities of larger, more mature companies.
| Semi-Annual Report | October 31, 2017 | 13 |
| Emerald Insights Fund | Manager Commentary |
October 31, 2017 (Unaudited)
GROWTH OF $10,000 INVESTMENT IN THE FUND (for the period ended October 31, 2017)
Comparison of change in value of a $10,000 investment (includes applicable sales loads)
The chart represents historical performance of a hypothetical investment of $10,000 in the Fund since inception. Past performance does not guarantee future results. This chart does not reflect the deduction of taxes that a shareholder would pay on Fund distributions or the redemption of Fund shares.
Investing in the Fund is subject to investment risks, including possible loss of the principal amount invested.
| 14 | www.emeraldmutualfunds.com |
| Emerald Banking and Finance Fund | Manager Commentary |
October 31, 2017 (Unaudited)
October 31, 2017
Dear Shareholder:
Investment Results:
The Emerald Bank & Finance Fund Class A shares (without sales load) outperformed the Russell 2000® Index(1) for the six months ended October 31, 2017, returning 9.03% vs. 8.01% for the Index. During the six months ended October 31, 2017, the Russell 2000® Financial Services Index(2) returned 5.95%; the SNL Small Cap U.S. Bank & Thrift Index(3) gained 4.39% versus a 9.10% gain delivered by the Standard & Poor’s 500 Index(4) and a gain of 5.54% for the Russell 2000® Value Index(5).
Since President Donald Trump’s election, bank investors have predicted that pro-business policies would lead to an increase in loan growth for the industry, thus leading to increased earnings growth for the bank sector. Instead, the growth of loans to companies has dropped precipitously from 8.1% last November to 2.1%, according to Federal Reserve data. Granted the data is heavily influenced by the money center and regional banks, we have witnessed a lower loan growth rate at the community bank level though not as drastic. Among banks with at least $50 billion in assets, the median year-over-year increase in total net loans and leases was just 1.3% in the third quarter, down from 2.7% in the second quarter and 7.3% a year ago. Smaller banks reported significantly higher loan growth; the median growth rate was 10.3% for banks with $1 billion to $9.99 billion of assets, according to SNL’s Data Dispatch dated October 30, 2017. The analysis only included banks with data available as of Oct. 27, so large banks U.S. Bancorp and Citigroup Inc. were excluded. Both reported soft loan growth for the quarter. Lenders attributed the slowdown to uncertainty around tax reform, an unexpected spike in payoffs and intense competition driving higher pricing and riskier structures. We believe that a lack of clarity on tax policy, health care and infrastructure spending has forced corporate borrowers into a wait-and-see mode, wary about expanding until they know what to expect.
The slowdown in commercial loan growth may just be the market’s way of reverting to the mean. Growth in commercial loans ran far above gross domestic product growth in the years following the financial crisis. Historically, bank investors have stated that such a streak has been difficult to maintain for any prolonged period. The degree to which bank investors need to rethink that premise may affect whether bank stocks continue to outperform.
Lending profits at community banks are largely dependent on the dynamic between loan growth and interest rates. While recent increases in short term interest rates have made floating rate commercial loans more lucrative, the benefit has been limited by increased deposit costs. According to a November 9, 2017 SNL Data Dispatch article, in the third-quarter, most community banks have reported improved net interest margins. Among publicly traded banks on major exchanges with less than $10 billion in assets and that had reported earnings up to Nov. 3, the median net interest margin was 3.62% in the third quarter, up 10 basis points(6) from the year-ago quarter.
Based on our recent visits with community bankers, we do not see any significant slowdown in commercial lending at the community banks. Combine our observations with the facts that the U.S. economy appears to have strengthened, unemployment remains low, the broader stock market has reached records and metrics of small business confidence are up, leads us to remain confident that the path forward for community bank stocks look promising.
We continue to have an overweight in assets-sensitive banks, which is the result of being invested in banks that focus on commercial lending. Our position in these banks are not a play on trying to time interest rate increases, but instead our preference for banks that have more of a commercial loan focus as they tend to be more growth oriented.
Investment Analysis:
So let’s look to the data of the most recent quarter to take account of the health of community banks. We previously discussed the improved net interest margins for banks with less than $10 billion in assets in the third quarter, but the good news does not stop there. According to SNL Data Dispatch, the median return on average assets and efficiency ratio also improved year over year to 0.97% and 61.54%, from 0.90% and 63.42%, respectively, a year earlier.
More specifically, community banks with $1 billion to $5 billion in assets reported the highest median net interest margin at 3.65%, compared to 3.56% for the third quarter of 2016. The largest community banks, those with $5 billion to $10 billion in assets, reported a median net interest margin of 3.60%, up 9 basis points from the year-ago quarter. The group posted the highest median return on average assets at 1.10% and the lowest median efficiency ratio at 56.17%. The smallest community banks, those with less than $1 billion in assets, reported the lowest median net interest margin at 3.55%. However, this represents a 5-basis-point increase year over year. The group also posted the lowest median return on average assets at 0.78% and the highest median efficiency ratio at 69.79%.
| Semi-Annual Report | October 31, 2017 | 15 |
| Emerald Banking and Finance Fund | Manager Commentary |
October 31, 2017 (Unaudited)
While overall deposit expenses remained low for U.S. banks and thrifts relative to historic norms, the cost of savings and interest-bearing transaction accounts rose noticeably in the third quarter, an analysis by S&P Global Market Intelligence shows.
Following a Federal Reserve interest rate increase late in 2016 and two more hikes in the first half of this year, banks have started to experience upward pressure on funding costs, with some clients looking for higher rates on their deposits after the Fed moves.
The banking industry's total cost of funds was 0.54% in the third quarter, up from 0.47% the previous quarter and up from 0.39% a year earlier. Cost of funds is defined as total interest expense as a percent of the sum of average interest bearing liabilities and average noninterest bearing deposits.
The analysis of regulatory data also found that the industrywide cost of interest-bearing transaction accounts, including demand deposit accounts, rose to 67 basis points in the third quarter from 51 basis points the previous quarter and from 28 basis points a year earlier. The cost for these accounts was just 19 basis points in the first quarter of 2014. Further, the analysis shows that the cost of savings accounts, including money market demand accounts, rose to 25 basis points in the third quarter from 20 basis points the previous quarter and from 15 basis points a year earlier. In the first quarter of 2014, the cost of savings accounts was 14 basis points.
Recently a bipartisan group of senators announced a bill aimed to reduce regulatory oversight on banks which includes a number of provisions for regulatory relief including raising the Significantly Important Financial Institution (SIFI) buffer from $50b to $250b that could lead to larger M&A and simplifying capital rules for banks under $10b that would allow banks to avoid more complex risk-based capital requirements. We believe bank reform was a key catalyst that a lot of bank investors were looking for post the election so this should come as a relief. Until any regulatory relief is passed, we continue to see increased Merger & Acquisitions (M&A) activity amongst banks. According to SNL Data Dispatch, through the first 10 months of 2017, 206 deals have been announced in the U.S. banking sector for an aggregate disclosed deal value of $23.20 billion. By comparison, last year there were 202 deals announced through October worth an aggregate $23.3 billion. The median deal value-to-tangible common equity ratio has climbed significantly this year to 163.6%, compared to 128.7% over the same period in 2016.
Market Outlook:
We believe that interest rates drove bank stock returns over the last six months and we believe they are likely to be the dominant force for shares through the end of the year, despite investor optimism around a tax code overhaul. Bank stocks have outperformed the market since the election in November 2016 but have struggled at times this year to maintain their momentum.
In late August and early September, for example, bank stocks tumbled. The decline mirrored a drop in the yield of the 10-year Treasury, which fell to 2.04% from 2.39% in July, amid several natural disasters here in the U.S. and rising geopolitical tensions. However, as the hurricane damage proved to be less than the dire expectations, the 10-year yield reversed course and climbed to 2.33% in short order and bank stocks rose along with the yield. Moving forward in 2017, we believe that investors will continue to price in a greater chance of a Federal Reserve interest rate increase in December. We believe this will lead to a classic reflation trade. When investors bet on a stronger economy, they expect interest rates and bond yields to rise, which will improve the profitability of banks and the performance of their stocks.
We believe the Trump administration’s unveiling of a tax-overhaul plan recently will provide a tailwind to the bank stocks as the bank sector depends on economic growth, and to the extent we get tax reform that flows through to better growth, that will support the stocks. Immediately, a great deal of the community banks will see their earnings improve as a result of a lower tax rate as the community banks tend to be some of the highest taxed corporate entities. We believe that the banks will be influenced differently by the tax cut based on size, with the largest beneficiaries being the smaller community banks. We believe that generally for a full-tax-paying bank, a reduction in the corporate tax rates to 25% or 20% would add a median 12% and 18% to our 2018 earnings per share estimates, respectively, and potentially a path to further upside support in the shares, all else equal. Thus, we believe an official change in corporate tax rates would make community banks seemingly less expensive and more profitable with a return-on-equity at or possibly above long-term averages.
Our focus remains on seeking companies capable of producing above average organic growth, relatively stable net interest margins, and improving earnings power aided by lower efficiency ratios, with potential for accretive mergers & acquisitions activity, as we deploy Emerald’s 10-Step research process - including important steps such as meeting with management, interviewing customers, competitors, suppliers and distributors - to seek out companies in this market environment that is poised for the potential of higher short-term interest rates.
| 16 | www.emeraldmutualfunds.com |
| Emerald Banking and Finance Fund | Manager Commentary |
October 31, 2017 (Unaudited)
| Top Five Contributors: | Top Five Detractors: |
| LendingTree, Inc. | TriState Capital Holdings, Inc. |
| SVB Financial Group | Customers Bancorp, Inc. |
| First Internet Bancorp | Gold Coast Bancorp, Inc. |
| First Foundation, Inc. | Franklin Financial Network, Inc. |
| Western Alliance Bancorporation | Home BancShares, Inc. |
| Kenneth G. Mertz II, CFA | Steven E. Russell, Esq. |
| Chief Investment Officer | Portfolio Manager |
| Portfolio Manager |
| Emerald Mutual Fund Advisers Trust |
Past performance does not guarantee future results. Fund prices fluctuate as the underlying assets have exposure to market fluctuations and other risks, as described in the Fund’s prospectus. Please visit www.emeraldmutualfunds.com to obtain current performance information and for the current prospectus and statement of additional information. This material must be preceded or accompanied by a prospectus. Please read the prospectus carefully before investing.
The views of Emerald Mutual Fund Advisers Trust and information discussed in this commentary are as of the date of publication, are subject to change, and may not reflect the writer's current views. The views expressed are those of the author only, and represent an assessment of market conditions at a specific point in time, are opinions only and should not be relied upon as investment advice regarding a particular investment or markets in general. Such information does not constitute a recommendation to buy or sell specific securities or investment vehicles. It should not be assumed that any investment will be profitable or will equal the performance of the Fund or any securities or any sectors mentioned in this letter. The subject matter contained in this letter has been derived from several sources believed to be reliable and accurate at the time of compilation. Neither Emerald Mutual Fund Advisers Trust nor the Fund accepts any liability for losses either direct or consequential caused by the use of this information.
The Emerald Banking and Finance Fund is distributed by ALPS Distributors, Inc.
The Fund is subject to investment risks, including possible loss of the principal amount invested and therefore is not suitable for all investors. The Fund may not achieve its objectives.
Diversification does not eliminate the risk of experiencing investment losses.
| (1) | The Russell 2000® Index measures the performance of the small-cap segment of the U.S. equity universe. The Russell 2000® Index is a subset of the Russell 3000® Index representing approximately 10% of the total market capitalization of that index. It includes approximately 2000 of the smallest securities based on a combination of their market cap and current index membership. The Index is not actively managed and does not reflect any deduction of fees, expenses or taxes. An investor may not invest directly into the Index. |
| (2) | The Russell 2000® Financial Services Index - is comprised of the smallest financial services companies in the Russell 3000 Index. The Index is not actively managed and does not reflect any deductions for fees, expense, or taxes. An investor may not invest directly in the Index. |
| (3) | SNL Small Cap U.S. Bank & Thrift Index: Includes all publicly traded Banks and Thrifts in SNL's coverage universe with $250M to $1B Total Common Market Capitalization as of most recent pricing data. Source: SNL Financial, data as of April 30, 2017. |
| (4) | The Standard & Poor’s 500® Index is an unmanaged index of 500 common stocks chosen for the market size, liquidity and industry group representation. It is a market-value weighted index. The Index is not actively managed and does not reflect any deduction for fees, expenses or taxes. An investor may not invest directly into the Index |
| (5) | The Russell 2000® Value Index measures the performance of small-cap value segment of the U.S. equity universe. It includes those Russell 2000 companies with lower price-to-book ratios and lower forecasted growth values. The Index is not actively managed and does not reflect any deductions for fees, expenses or taxes. An investor may not invest directly into the Index. |
(6) | Basis point (BPS) refer to a common unit of measure for interest rates and other percentages in finance. One basis point is equal to 1/100th of 1%, or 0.01% (0.0001), and is used to denote the percentage change in a financial instrument. |
| Semi-Annual Report | October 31, 2017 | 17 |
Emerald Banking and Finance Fund | Manager Commentary |
October 31, 2017 (Unaudited)
TOP TEN HOLDINGS (as a % of Net Assets)* | |
| LendingTree, Inc. | 3.54% |
| Meta Financial Group, Inc. | 2.23% |
| Eagle Bancorp, Inc. | 2.23% |
| First Foundation, Inc. | 2.13% |
| ServisFirst Bancshares, Inc. | 2.09% |
| Western Alliance Bancorp | 2.08% |
| Pacific Premier Bancorp, Inc. | 2.04% |
| Ameris Bancorp | 1.97% |
| CenterState Banks, Inc. | 1.96% |
| National Commerce Corp. | 1.94% |
| Top Ten Holdings | 22.21% |
| INDUSTRY SECTOR ALLOCATION (as a % of Net Assets) | |
| Banks: Diversified | 79.75% |
| Banks: Savings Thrift & Mortgage Lending | 7.88% |
| Consumer Lending | 3.54% |
| Real Estate Investment Trusts (REITs) | 1.96% |
| Insurance: Property-Casualty | 1.55% |
| Commercial Banks | 1.07% |
| Diversified Financial Services | 1.06% |
| Computer Services Software & Systems | 0.55% |
| Insurance: Multi Line | 0.42% |
| Financial Data & Services | 0.28% |
Cash, Cash Equivalents, & Other Net Assets | 1.94% |
| * | Holdings are subject to change, and may not reflect the current or future position of the portfolio. |
| ANNUALIZED TOTAL RETURN (for the period ended October 31, 2017) |
| Since | Expense Ratio | |||||||||||||
| 1 Year | 3 Year | 5 Year | 10 Year | Inception(1) | Gross(2) | Net(2) | ||||||||
| Class A (NAV) | 40.15% | 18.31% | 20.09% | 7.88% | 9.75% | 1.43% | 1.43% | |||||||
| Class A (MOP) | 33.51% | 16.41% | 18.92% | 7.36% | 9.49% | 1.43% | 1.43% | |||||||
| Russell 2000® Index† | 27.85% | 10.12% | 14.49% | 7.63% | 8.43% | |||||||||
Russell 2000® Financial Services TR Index†† | 25.54% | 12.32% | 15.36% | 6.87% | 9.01% | |||||||||
| Class C (NAV) | 39.26% | 17.56% | 19.32% | 7.19% | 10.04% | 2.08% | 2.08% | |||||||
| Class C (CDSC) | 38.26% | 17.56% | 19.32% | 7.19% | 10.04% | 2.08% | 2.08% | |||||||
| Russell 2000® Index† | 27.85% | 10.12% | 14.49% | 7.63% | 7.78% | |||||||||
Russell 2000® Financial Services TR Index†† | 25.54% | 12.32% | 15.36% | 6.87% | 10.07% | |||||||||
| Investor Class | 40.23% | 18.32% | 20.10% | – | 15.12% | 1.48% | 1.48% | |||||||
| Russell 2000® Index† | 27.85% | 10.12% | 14.49% | – | 12.48% | |||||||||
Russell 2000® Financial Services TR Index†† | 25.54% | 12.32% | 15.36% | – | 13.11% | |||||||||
| Institutional Class | 40.63% | 18.70% | 20.48% | – | 19.67% | 1.14% | 1.14% | |||||||
| Russell 2000® Index† | 27.85% | 10.12% | 14.49% | – | 12.51% | |||||||||
Russell 2000® Financial Services TR Index†† | 25.54% | 12.32% | 15.36% | – | 14.63% | |||||||||
The performance quoted represents past performance, does not guarantee future results and current performance may be lower or higher than the data quoted. The investment return and principal value of an investment will fluctuate so that shares, when redeemed, may be worth more or less than their original cost. Performance data current to the most recent month end may be obtained at www.emeraldmutualfunds.com.
Performance shown for periods prior to March 16, 2012, reflects the performance of the Forward Banking & Finance Fund, a series of Forward Funds (as a result of a reorganization of the Forward Banking & Finance Fund into the Emerald Banking & Finance Fund).
Returns for periods less than 1 year are cumulative.
The table does not reflect the deduction of taxes that a shareholder would pay on Fund distributions or the redemption of Fund shares.
Subject to investment risks, including possible loss of the principal amount invested.
Maximum Offering Price (MOP) for Class A shares includes the Fund's maximum sales charge of 4.75%. Performance shown at NAV does not include these sales charges and would have been lower had it been taken into account.
A Contingent Deferred Sales Charge (CDSC) of 1.00% may apply to Class C shares redeemed within the first 12 months after a purchase.
| (1) | Inception Dates - Class A: 02/18/1997, Class C: 07/01/2000, Class Institutional: 03/19/2012, Class Investor: 03/16/2010 |
| (2) | Emerald Mutual Fund Advisers Trust ("Emerald" or the "Adviser") has agreed contractually to waive a portion of its fees and reimburse other expenses until August 31, 2018 in amounts necessary to limit the Fund's operating expenses (exclusive of Acquired Fund Fees and Expenses, brokerage expenses, interest expenses, taxes and extraordinary expense) for Class A, Class C, Institutional Class, and Investor Class shares to an annual rate (as percentage of the Fund's average daily net assets) of 1.84%, 2.49%, 1.54% and 1.89% respectively. The Adviser will be permitted to recover, on a class-by-class basis, expenses it has borne through the agreement described above to the extent |
| 18 | www.emeraldmutualfunds.com |
Emerald Banking and Finance Fund | Manager Commentary |
October 31, 2017 (Unaudited)
| that the Fund's expenses in later periods fall below the annual rates set forth in the relevant agreement. The Fund will not be obligated to pay any such deferred fees and expenses more than three years after the year(s) in which the fees and expense were incurred. The Adviser may not discontinue this waiver prior to August 31, 2018, without the approval by the Fund's Board of Trustees. Ratios as of the Prospectus dated August 31, 2017 and may differ from the ratios presented in the Financial Highlights. |
| † | The Russell 2000® Index measures the performance of the small-cap segment of the U.S. equity universe. The Russell 2000® is a subset of the Russell 3000® Index representing approximately 8% of the total market capitalization of that index. It includes approximately 2000 of the smallest securities based on a combination of their market cap and current index membership. The index is not actively managed and does not reflect any deductions for fees, expenses or taxes. An investor may not invest directly into an index. |
| †† | The Russell 2000® Financial Services TR Index is comprised of the smallest financial services companies in the Russell 3000 Index. The Index is not actively managed and does not reflect any deductions for fees, expense, or taxes. An investor may not invest directly in the Index. |
Important Risks
A fund that concentrates in a particular industry will involve a greater degree of risk than a fund with a more diversified portfolio. Investing in smaller companies generally will present greater investment risks, including: greater price volatility, greater sensitivity to changing economic conditions and less liquidity than the securities of larger, more mature companies.
| Semi-Annual Report | October 31, 2017 | 19 |
Emerald Banking and Finance Fund | Manager Commentary |
October 31, 2017 (Unaudited)
GROWTH OF $10,000 INVESTMENT IN THE FUND (for the period ended October 31, 2017)
Comparison of change in value of a $10,000 investment (includes applicable sales loads)
The chart represents historical performance of a hypothetical investment of $10,000 in the Fund since inception. Past performance does not guarantee future results. This chart does not reflect the deduction of taxes that a shareholder would pay on Fund distributions or the redemption of Fund shares.
Investing in the Fund is subject to investment risks, including possible loss of the principal amount invested.
| 20 | www.emeraldmutualfunds.com |
| Emerald Funds | Disclosure of Fund Expenses |
October 31, 2017 (Unaudited)
As a shareholder of the Funds, you incur two types of costs: (1) transaction costs, including applicable sales charges (loads); and (2) ongoing costs, including management fees, distribution and service (12b-1) fees, shareholder services fees and other Fund expenses. This example is intended to help you understand your ongoing costs (in dollars) of investing in the Funds and to compare these costs with the ongoing costs of investing in other mutual funds. The example is based on an investment of $1,000 invested at the beginning of the (six-month) period and held for the entire period May 1, 2017 through October 31, 2017.
Actual Expenses
The first line for each share class of the Fund in the table below provides information about actual account values and actual expenses. You may use this information, together with the amount you invested, to estimate the expenses that you paid over the period. Simply divide your account value by $1,000 (for example, an $8,600 account value divided by $1,000 = 8.6), then multiply the result by the number in the applicable line under the heading titled “Expenses Paid During Period” to estimate the expenses you paid on your account during this period.
Hypothetical Example For Comparison Purposes
The second line for each share class of each Fund in the table below provides information about hypothetical account values and hypothetical expenses based on the Fund’s actual expense ratio and an assumed rate of return of 5% per year before expenses, which is not the Fund’s actual return. The hypothetical account values and expenses may not be used to estimate the actual ending account balance or expenses you paid for the period. You may use this information to compare the ongoing costs of investing in the Funds and other funds. To do so, compare this 5% hypothetical example with the 5% hypothetical examples that appear in the shareholder reports of other mutual funds.
Please note that the expenses shown in the table below are meant to highlight your ongoing costs only and do not reflect any transactional costs, such as sales charges (loads), redemption fees or exchange fees. Therefore, the second line for each share class of the Fund within the table is useful in comparing ongoing costs only, and will not help you determine the relative total costs of owning different funds. If these transactional costs were included, your costs would have been higher.
Beginning Account Value 05/01/17 | Ending Account Value 10/31/17 | Expense Ratio(a) | Expense Paid During Period 5/01/17 - 10/31/17(b) | |
| Emerald Growth Fund | ||||
| Class A | ||||
| Actual | $1,000.00 | $1,142.50 | 1.04% | $5.62 |
| Hypothetical (5% return before expenses) | $1,000.00 | $1,019.96 | 1.04% | $5.30 |
| Class C | ||||
| Actual | $1,000.00 | $1,138.70 | 1.69% | $9.11 |
| Hypothetical (5% return before expenses) | $1,000.00 | $1,016.69 | 1.69% | $8.59 |
| Institutional Class | ||||
| Actual | $1,000.00 | $1,144.10 | 0.74% | $4.00 |
| Hypothetical (5% return before expenses) | $1,000.00 | $1,021.48 | 0.74% | $3.77 |
| Investor Class | ||||
| Actual | $1,000.00 | $1,142.10 | 1.09% | $5.89 |
| Hypothetical (5% return before expenses) | $1,000.00 | $1,019.71 | 1.09% | $5.55 |
| Emerald Small Cap Value Fund | ||||
| Class A | ||||
| Actual | $1,000.00 | $1,094.70 | 1.35% | $7.13 |
| Hypothetical (5% return before expenses) | $1,000.00 | $1,018.40 | 1.35% | $6.87 |
| Class C | ||||
| Actual | $1,000.00 | $1,090.70 | 2.00% | $10.54 |
| Hypothetical (5% return before expenses) | $1,000.00 | $1,015.12 | 2.00% | $10.16 |
| Institutional Class | ||||
| Actual | $1,000.00 | $1,096.60 | 1.00% | $5.28 |
| Hypothetical (5% return before expenses) | $1,000.00 | $1,020.16 | 1.00% | $5.09 |
| Investor Class | ||||
| Actual | $1,000.00 | $1,095.90 | 1.25% | $6.60 |
| Hypothetical (5% return before expenses) | $1,000.00 | $1,018.90 | 1.25% | $6.36 |
| Semi-Annual Report | October 31, 2017 | 21 |
| Emerald Funds | Disclosure of Fund Expenses |
October 31, 2017 (Unaudited)
Beginning Account Value 05/01/17 | Ending Account Value 10/31/17 | Expense Ratio(a) | Expense Paid During Period 5/01/17 - 10/31/17(b) | |
| Emerald Insights Fund | ||||
| Class A | ||||
| Actual | $1,000.00 | $1,090.90 | 1.35% | $7.11 |
| Hypothetical (5% return before expenses) | $1,000.00 | $1,018.40 | 1.35% | $6.87 |
| Class C | ||||
| Actual | $1,000.00 | $1,087.30 | 2.00% | $10.52 |
| Hypothetical (5% return before expenses) | $1,000.00 | $1,015.12 | 2.00% | $10.16 |
| Institutional Class | ||||
| Actual | $1,000.00 | $1,092.90 | 1.05% | $5.54 |
| Hypothetical (5% return before expenses) | $1,000.00 | $1,019.91 | 1.05% | $5.35 |
| Investor Class | ||||
| Actual | $1,000.00 | $1,091.20 | 1.40% | $7.38 |
| Hypothetical (5% return before expenses) | $1,000.00 | $1,018.15 | 1.40% | $7.12 |
| Emerald Banking and Finance Fund | ||||
| Class A | ||||
| Actual | $1,000.00 | $1,090.60 | 1.40% | $7.38 |
| Hypothetical (5% return before expenses) | $1,000.00 | $1,018.15 | 1.40% | $7.12 |
| Class C | ||||
| Actual | $1,000.00 | $1,087.20 | 2.05% | $10.78 |
| Hypothetical (5% return before expenses) | $1,000.00 | $1,014.87 | 2.05% | $10.41 |
| Institutional Class | ||||
| Actual | $1,000.00 | $1,092.40 | 1.10% | $5.80 |
| Hypothetical (5% return before expenses) | $1,000.00 | $1,019.66 | 1.10% | $5.60 |
| Investor Class | ||||
| Actual | $1,000.00 | $1,090.60 | 1.45% | $7.64 |
| Hypothetical (5% return before expenses) | $1,000.00 | $1,017.90 | 1.45% | $7.38 |
| (a) | The Fund's expense ratios have been based on the Fund's most recent fiscal half-year expenses. |
| (b) | Expenses are equal to the Fund's annualized expense ratio multiplied by the average account value over the period, multiplied by the number of days in the most recent fiscal half-year (184)/365 (to reflect the half-year period). |
| 22 | www.emeraldmutualfunds.com |
| Emerald Growth Fund | Schedule of Investments |
October 31, 2017 (Unaudited)
| Shares | Value (Note 2) | |||||||
| COMMON STOCKS: 98.93% | ||||||||
| Consumer Discretionary: 13.13% | ||||||||
| 82,312 | Burlington Stores, Inc.(a) | $ | 7,728,274 | |||||
| 1,283,779 | Chegg, Inc.(a) | 19,911,412 | ||||||
| 17,073 | Churchill Downs, Inc. | 3,560,574 | ||||||
| 170,299 | Chuy’s Holdings, Inc.(a) | 3,831,728 | ||||||
| 58,972 | Dave & Buster’s Entertainment, Inc.(a) | 2,842,450 | ||||||
| 272,512 | Five Below, Inc.(a) | 15,056,288 | ||||||
| 167,352 | HealthStream, Inc.(a) | 4,093,430 | ||||||
| 58,044 | Jack in the Box, Inc. | 6,008,134 | ||||||
| 286,649 | Leaf Group, Ltd.(a) | 2,020,876 | ||||||
| 228,100 | Lindblad Expeditions Holdings, Inc.(a) | 2,445,232 | ||||||
| 249,690 | Marcus Corp. | 6,779,084 | ||||||
| 65,364 | Matthews International Corp., Class A | 4,108,127 | ||||||
| 216,696 | Meritage Homes Corp.(a) | 10,553,095 | ||||||
| 311,292 | Nutrisystem, Inc. | 15,549,035 | ||||||
| 239,632 | Ollie’s Bargain Outlet Holdings, Inc.(a) | 10,699,569 | ||||||
| 141,833 | Penn National Gaming, Inc.(a) | 3,700,423 | ||||||
| 328,673 | Planet Fitness, Inc., Class A | 8,755,849 | ||||||
| 91,851 | Red Robin Gourmet Burgers, Inc.(a) | 6,282,608 | ||||||
| 642,736 | Sequential Brands Group, Inc.(a) | 1,671,114 | ||||||
| 235,674 | Steven Madden, Ltd.(a) | 9,191,286 | ||||||
| 362,375 | Tilly’s, Inc., Class A | 4,315,886 | ||||||
| 149,104,474 | ||||||||
| Consumer Staples: 1.01% | ||||||||
| 383,978 | Freshpet, Inc.(a) | 5,970,858 | ||||||
| 471,773 | Hostess Brands, Inc.(a) | 5,439,543 | ||||||
| 11,410,401 | ||||||||
| Energy: 1.01% | ||||||||
| 537,863 | Callon Petroleum Co.(a) | 5,964,901 | ||||||
| 268,600 | Enphase Energy, Inc.(a) | 410,958 | ||||||
| 99,650 | PDC Energy, Inc.(a) | 5,075,174 | ||||||
| 11,451,033 | ||||||||
| Financial Services: 15.22% | ||||||||
| 267,721 | Bank of the Ozarks, Inc. | 12,481,153 | ||||||
| 547,246 | BofI Holding, Inc.(a) | 14,720,917 | ||||||
| 499,417 | CareTrust REIT, Inc. | 9,438,981 | ||||||
| 25,000 | CNB Financial Corp. | 718,750 | ||||||
| 146,088 | Customers Bancorp, Inc.(a) | 3,994,046 | ||||||
| 300,082 | FCB Financial Holdings, Inc., Class A(a) | 14,013,829 | ||||||
| 122,502 | First Choice Bank | 2,940,048 | ||||||
| 107,642 | Health Insurance Innovations, Inc., Class A(a) | 2,314,303 | ||||||
| 148,203 | Howard Bancorp, Inc.(a) | 3,097,443 | ||||||
| 133,495 | LendingTree, Inc.(a) | 35,783,335 | ||||||
| 187,963 | Live Oak Bancshares, Inc. | 4,454,723 | ||||||
| 207,690 | Merchants Bancorp(a) | 3,563,960 | ||||||
| Shares | Value (Note 2) | |||||||
| Financial Services (continued) | ||||||||
| 214,690 | Moelis & Co., Class A | $ | 9,177,998 | |||||
| 295,654 | Monmouth Real Estate Investment Corp., REIT | 5,037,944 | ||||||
| 209,926 | National Commerce Corp.(a) | 8,554,485 | ||||||
| 312,761 | Opus Bank(a) | 8,100,510 | ||||||
| 350,628 | Pacific Premier Bancorp, Inc.(a) | 14,165,371 | ||||||
| 294,128 | QTS Realty Trust, Inc., REIT, Class A | 17,015,305 | ||||||
| 57,787 | Walker & Dunlop, Inc.(a) | 3,171,928 | ||||||
| 172,745,029 | ||||||||
| Health Care: 19.76% | ||||||||
| 313,474 | Adamas Pharmaceuticals, Inc.(a) | 7,730,269 | ||||||
| 230,744 | Aimmune Therapeutics, Inc.(a) | 6,707,728 | ||||||
| 839,265 | Alder Biopharmaceuticals, Inc.(a) | 9,441,731 | ||||||
| 289,714 | AtriCure, Inc.(a) | 6,211,468 | ||||||
| 170,245 | Biohaven Pharmaceutical Holding Co., Ltd.(a) | 5,117,565 | ||||||
| 52,042 | Bluebird Bio, Inc.(a) | 7,239,042 | ||||||
| 490,000 | Bovie Medical Corp.(a) | 1,911,000 | ||||||
| 250,000 | CareDx, Inc.(a) | 1,462,500 | ||||||
| 325,867 | Catalent, Inc.(a) | 13,878,676 | ||||||
| 153,583 | Clovis Oncology, Inc.(a) | 11,575,551 | ||||||
| 179,844 | Deciphera Pharmaceuticals, Inc.(a) | 3,451,206 | ||||||
| 68,276 | Exact Sciences Corp.(a) | 3,754,497 | ||||||
| 337,573 | G1 Therapeutics, Inc.(a) | 7,976,850 | ||||||
| 660,626 | Ignyta, Inc.(a) | 10,173,640 | ||||||
| 415,004 | Insmed, Inc.(a) | 11,209,258 | ||||||
| 39,300 | Intercept Pharmaceuticals, Inc.(a) | 2,422,059 | ||||||
| 545,268 | K2M Group Holdings, Inc.(a) | 10,736,327 | ||||||
| 93,971 | Merit Medical Systems, Inc.(a) | 3,575,597 | ||||||
| 125,970 | NantHealth, Inc.(a) | 459,790 | ||||||
| 655,005 | NeoGenomics, Inc.(a) | 5,678,893 | ||||||
| 63,171 | Obalon Therapeutics, Inc.(a) | 532,532 | ||||||
| 218,686 | Portola Pharmaceuticals, Inc.(a) | 10,805,275 | ||||||
| 176,686 | Puma Biotechnology, Inc.(a) | 22,492,128 | ||||||
| 258,153 | Reata Pharmaceuticals, Inc., Class A(a) | 7,816,873 | ||||||
| 36,775 | Sage Therapeutics, Inc.(a) | 2,327,122 | ||||||
| 407,493 | Sarepta Therapeutics, Inc.(a) | 20,093,480 | ||||||
| 386,939 | Savara, Inc.(a) | 3,602,402 | ||||||
| 307,868 | Supernus Pharmaceuticals, Inc.(a) | 12,807,309 | ||||||
| 129,090 | Tabula Rasa HealthCare, Inc.(a) | 3,728,119 | ||||||
| 285,399 | Teladoc, Inc.(a) | 9,432,437 | ||||||
| 224,351,324 | ||||||||
| Materials & Processing: 12.04% | ||||||||
| 114,409 | Allegheny Technologies, Inc.(a) | 2,880,819 | ||||||
| 304,808 | Apogee Enterprises, Inc. | 14,548,486 | ||||||
| 234,508 | Carpenter Technology Corp. | 11,676,153 | ||||||
| 917,830 | Cliffs Natural Resources, Inc.(a) | 5,470,267 | ||||||
| 381,350 | GMS, Inc.(a) | 12,984,968 | ||||||
| 70,919 | Innospec, Inc. | 4,386,340 | ||||||
| 334,423 | Installed Building Products, Inc.(a) | 23,309,283 | ||||||
| Semi-Annual Report | October 31, 2017 | 23 |
| Emerald Growth Fund | Schedule of Investments |
October 31, 2017 (Unaudited)
| Shares | Value (Note 2) | |||||||
| Materials & Processing (continued) | ||||||||
| 186,065 | KapStone Paper and Packaging Corp. | $ | 4,179,020 | |||||
| 79,242 | Masonite International Corp.(a) | 5,317,138 | ||||||
| 512,140 | PQ Group Holdings, Inc.(a) | 8,399,096 | ||||||
| 81,058 | TimkenSteel Corp.(a) | 1,134,812 | ||||||
| 261,934 | Trex Co., Inc.(a) | 28,668,676 | ||||||
| 175,344 | US Concrete, Inc.(a) | 13,711,901 | ||||||
| 136,666,959 | ||||||||
| Producer Durables: 12.44% | ||||||||
| 209,773 | Air Transport Services Group, Inc.(a) | 5,076,507 | ||||||
| 85,823 | Atlas Air Worldwide Holdings, Inc.(a) | 5,265,241 | ||||||
| 47,752 | Blue Bird Corp.(a) | 986,079 | ||||||
| 494,635 | Daseke, Inc.(a) | 6,840,802 | ||||||
| 126,019 | Dycom Industries, Inc.(a) | 11,068,249 | ||||||
| 211,804 | H&E Equipment Services, Inc. | 6,976,824 | ||||||
| 386,824 | Kennametal, Inc. | 16,884,868 | ||||||
| 315,506 | KLX, Inc.(a) | 17,308,659 | ||||||
| 1,113,506 | Kratos Defense & Security Solutions, Inc.(a) | 13,406,612 | ||||||
| 545,735 | Manitowoc Co., Inc.(a) | 5,195,397 | ||||||
| 42,418 | NV5 Global, Inc.(a) | 2,464,486 | ||||||
| 67,380 | OSI Systems, Inc.(a) | 5,955,044 | ||||||
| 261,977 | Primoris Services Corp. | 7,406,090 | ||||||
| 264,370 | REV Group, Inc. | 6,820,746 | ||||||
| 101,381 | Tennant Co. | 7,030,772 | ||||||
| 211,574 | Tetra Tech, Inc. | 10,420,019 | ||||||
| 427,612 | Tutor Perini Corp.(a) | 12,058,658 | ||||||
| 141,165,053 | ||||||||
| Technology: 20.50% | ||||||||
| 230,141 | Alarm.com Holdings, Inc.(a) | 10,742,982 | ||||||
| 422,230 | Box, Inc., Class A(a) | 9,267,948 | ||||||
| 170,802 | Cavium, Inc.(a) | 11,783,630 | ||||||
| 256,359 | ChannelAdvisor Corp.(a) | 2,884,039 | ||||||
| 385,245 | Ciena Corp.(a) | 8,194,161 | ||||||
| 35,720 | Cirrus Logic, Inc.(a) | 2,000,320 | ||||||
| 167,922 | Cloudera, Inc.(a) | 2,540,660 | ||||||
| 215,379 | EPAM Systems, Inc.(a) | 19,631,796 | ||||||
| 99,090 | ForeScout Technologies, Inc.(a) | 2,561,477 | ||||||
| 48,300 | GrubHub, Inc.(a) | 2,947,266 | ||||||
| 446,638 | GTT Communications, Inc.(a) | 16,279,955 | ||||||
| 116,649 | Guidewire Software, Inc.(a) | 9,329,587 | ||||||
| 58,360 | II-VI, Inc.(a) | 2,637,872 | ||||||
| 166,930 | Imperva, Inc.(a) | 7,127,911 | ||||||
| 140,965 | Inphi Corp.(a) | 5,776,746 | ||||||
| 1,154,951 | Internap Corp.(a) | 5,370,522 | ||||||
| 75,635 | IPG Photonics Corp.(a) | 16,103,448 | ||||||
| 156,863 | Lumentum Holdings, Inc.(a) | 9,905,898 | ||||||
| 317,635 | Mercury Systems, Inc.(a) | 16,031,038 | ||||||
| 175,676 | Microsemi Corp.(a) | 9,375,828 | ||||||
| 311,360 | Model N, Inc.(a) | 4,530,288 | ||||||
| 15,000 | MongoDB, Inc.(a) | 457,200 | ||||||
| Shares | Value (Note 2) | |||||||
| Technology (continued) | ||||||||
| 57,834 | Monolithic Power Systems, Inc. | $ | 7,036,663 | |||||
| 336,494 | Oclaro, Inc.(a) | 2,782,805 | ||||||
| 160,820 | Proofpoint, Inc.(a) | 14,861,376 | ||||||
| 116,046 | Q2 Holdings, Inc.(a) | 4,937,757 | ||||||
| 101,080 | Quantenna Communications, Inc.(a) | 1,565,729 | ||||||
| 221,026 | Reis, Inc. | 4,033,725 | ||||||
| 75,000 | Switch, Inc., Class A(a) | 1,434,750 | ||||||
| 32,861 | Take-Two Interactive Software, Inc.(a) | 3,636,070 | ||||||
| 180,863 | USA Technologies, Inc.(a) | 1,148,480 | ||||||
| 335,471 | Varonis Systems, Inc.(a) | 14,626,536 | ||||||
| 100,000 | Yext, Inc.(a) | 1,148,000 | ||||||
| 232,692,463 | ||||||||
| Utilities: 3.82% | ||||||||
| 804,831 | 8x8, Inc.(a) | 10,744,494 | ||||||
| 229,458 | Cogent Communications Holdings, Inc. | 12,367,786 | ||||||
| 79,758 | Shenandoah Telecommunications Co. | 3,030,804 | ||||||
| 2,124,695 | Vonage Holdings Corp.(a) | 17,273,770 | ||||||
| 43,416,854 | ||||||||
| Total Common Stocks | ||||||||
| (Cost $799,067,606) | 1,123,003,590 | |||||||
| SHORT TERM INVESTMENTS: 1.76% | ||||||||
| 20,018,391 | Dreyfus Government Cash Management Fund - Institutional Class 0.937% (7-Day Yield) | 20,018,391 | ||||||
| Total Short Term Investments | ||||||||
(Cost $20,018,391) | 20,018,391 | |||||||
| Total Investments: 100.69% | ||||||||
| (Cost $819,085,997) | 1,143,021,981 | |||||||
| Liabilities In Excess Of Other Assets: (0.69)% | (7,849,135 | ) | ||||||
| Net Assets: 100.00% | $ | 1,135,172,846 | ||||||
| (a) | Non-income producing security. |
For Fund compliance purposes, the Fund’s industry classifications refer to any one or more of the industry sub-classifications used by one or more widely recognized market indexes or ratings group indexes, and/or as defined by Fund management. This definition may not apply for purposes of this report, which may combine industry sub-classifications for reporting ease. Industries are shown as a percentage of net assets.
See Notes to Financial Statements.
| 24 | www.emeraldmutualfunds.com |
| Emerald Small Cap Value Fund | Schedule of Investments |
October 31, 2017 (Unaudited)
| Shares | Value (Note 2) | |||||||
| COMMON STOCKS: 97.36% | ||||||||
| Consumer Discretionary: 13.89% | ||||||||
| 11,127 | Gray Television, Inc.(a) | $ | 173,247 | |||||
| 7,261 | ILG, Inc. | 215,434 | ||||||
| 13,711 | MDC Partners, Inc., Class A(a) | 157,677 | ||||||
| 2,165 | Penske Automotive Group, Inc. | 100,932 | ||||||
| 3,527 | Viad Corp. | 204,742 | ||||||
| 20,838 | ZAGG, Inc.(a) | 326,115 | ||||||
| 1,178,147 | ||||||||
| Energy: 2.79% | ||||||||
| 6,651 | Kosmos Energy, Ltd.(a) | 51,080 | ||||||
| 1,730 | PDC Energy, Inc.(a) | 88,109 | ||||||
| 10,195 | SRC Energy, Inc.(a) | 97,260 | ||||||
| 236,449 | ||||||||
| Financial Services: 45.28% | ||||||||
| 2,554 | Bankwell Financial Group, Inc. | 93,476 | ||||||
| 5,030 | Clifton Bancorp, Inc. | 85,661 | ||||||
| 3,400 | CNB Financial Corp. | 97,750 | ||||||
| 4,176 | Community Healthcare Trust, Inc., REIT | 114,548 | ||||||
| 1,697 | CorEnergy Infrastructure Trust, Inc., REIT | 61,228 | ||||||
| 1,501 | CoreSite Realty Corp., REIT | 166,236 | ||||||
| 2,736 | CyrusOne, Inc., REIT | 167,963 | ||||||
| 2,255 | eHealth, Inc.(a) | 57,232 | ||||||
| 2,071 | Employers Holdings, Inc. | 98,787 | ||||||
| 3,290 | Entegra Financial Corp.(a) | 89,653 | ||||||
| 3,897 | ESSA Bancorp, Inc. | 63,014 | ||||||
| 9,904 | Everi Holdings, Inc.(a) | 82,104 | ||||||
| 2,898 | First Financial Bancorp | 79,115 | ||||||
| 941 | First Merchants Corp. | 40,463 | ||||||
| 800 | First Savings Financial Group, Inc. | 44,128 | ||||||
| 3,269 | Four Corners Property Trust, Inc., REIT | 80,679 | ||||||
| 3,168 | Franklin Financial Network, Inc.(a) | 108,661 | ||||||
| 1,892 | FS Bancorp, Inc. | 102,698 | ||||||
| 1,468 | Getty Realty Corp., REIT | 41,706 | ||||||
| 1,956 | Great Western Bancorp, Inc. | 79,394 | ||||||
| 2,190 | HomeStreet, Inc.(a) | 63,620 | ||||||
| 3,654 | InfraREIT, Inc., REIT | 81,850 | ||||||
| 3,670 | Investar Holding Corp. | 85,144 | ||||||
| 2,311 | JBG SMITH Properties, REIT(a) | 72,126 | ||||||
| 3,638 | Live Oak Bancshares, Inc. | 86,221 | ||||||
| 1,330 | Meta Financial Group, Inc. | 116,042 | ||||||
| 1,825 | Moelis & Co., Class A | 78,019 | ||||||
| 5,122 | Monmouth Real Estate Investment Corp. | 87,279 | ||||||
| 3,107 | Northeast Bancorp | 80,005 | ||||||
| 1,420 | Northrim BanCorp, Inc. | 46,150 | ||||||
| 2,893 | OceanFirst Financial Corp. | 80,281 | ||||||
| 2,324 | PCSB Financial Corp.(a) | 43,505 | ||||||
| 3,656 | Pennsylvania Real Estate Investment Trust, REIT | 35,536 | ||||||
| 4,545 | PennyMac Financial Services, Inc., Class A(a) | 86,355 | ||||||
| 2,924 | People's Utah Bancorp | 90,936 | ||||||
| Shares | Value (Note 2) | |||||||
| Financial Services (continued) | ||||||||
| 4,638 | Plymouth Industrial REIT, Inc., REIT | $ | 83,948 | |||||
| 1,457 | Preferred Bank | 89,941 | ||||||
| 1,220 | QTS Realty Trust, Inc., REIT, Class A | 70,577 | ||||||
| 3,600 | Rexford Industrial Realty, Inc., REIT | 106,884 | ||||||
| 2,142 | Standard AVB Financial Corp. | 63,725 | ||||||
| 3,010 | State Bank Financial Corp. | 87,019 | ||||||
| 3,519 | STORE Capital Corp., REIT | 86,884 | ||||||
| 3,650 | Summit Financial Group, Inc. | 99,280 | ||||||
| 1,740 | Timberland Bancorp, Inc. | 52,739 | ||||||
| 2,172 | TriCo Bancshares | 89,964 | ||||||
| 1,501 | Urban Edge Properties, REIT | 35,213 | ||||||
| 8,410 | Western New England Bancorp, Inc. | 88,726 | ||||||
| 3,842,465 | ||||||||
| Health Care: 1.32% | ||||||||
| 7,201 | Invacare Corp. | 111,616 | ||||||
| Materials & Processing: 10.25% | ||||||||
| 1,824 | Apogee Enterprises, Inc. | 87,060 | ||||||
| 10,464 | Builders FirstSource, Inc.(a) | 188,561 | ||||||
| 3,131 | Kirkland Lake Gold, Ltd. | 36,852 | ||||||
| 2,899 | Koppers Holdings, Inc.(a) | 140,746 | ||||||
| 4,415 | Mercer International, Inc. | 64,901 | ||||||
| 3,249 | PolyOne Corp. | 149,681 | ||||||
| 825 | Universal Forest Products, Inc. | 93,143 | ||||||
| 1,386 | US Concrete, Inc.(a) | 108,385 | ||||||
| 869,329 | ||||||||
| Producer Durables: 7.00% | ||||||||
| 3,486 | Blue Bird Corp.(a) | 71,986 | ||||||
| 3,195 | Cubic Corp. | 174,287 | ||||||
| 1,117 | Dycom Industries, Inc.(a) | 98,106 | ||||||
| 2,560 | ICF International, Inc.(a) | 137,472 | ||||||
| 3,968 | Tutor Perini Corp.(a) | 111,898 | ||||||
| 593,749 | ||||||||
| Technology: 14.50% | ||||||||
| 4,984 | ARRIS International PLC(a) | 142,044 | ||||||
| 3,242 | Microsemi Corp.(a) | 173,025 | ||||||
| 17,745 | Mitel Networks Corp.(a) | 152,430 | ||||||
| 7,197 | Perficient, Inc.(a) | 139,982 | ||||||
| 12,925 | Photronics, Inc.(a) | 125,373 | ||||||
| 5,000 | Presidio, Inc.(a) | 74,000 | ||||||
| 6,151 | Rudolph Technologies, Inc.(a) | 170,689 | ||||||
| 3,732 | Tower Semiconductor, Ltd.(a) | 123,380 | ||||||
| 5,674 | Xperi Corp. | 130,502 | ||||||
| 1,231,425 | ||||||||
| Utilities: 2.33% | ||||||||
| 1,510 | Pattern Energy Group, Inc. | 34,836 | ||||||
| Semi-Annual Report | October 31, 2017 | 25 |
| Emerald Small Cap Value Fund | Schedule of Investments |
October 31, 2017 (Unaudited)
| Shares | Value (Note 2) | |||||||
| Utilities (continued) | ||||||||
| 19,993 | Vonage Holdings Corp.(a) | $ | 162,543 | |||||
| 197,379 | ||||||||
| Total Common Stocks | ||||||||
| (Cost $6,305,718) | 8,260,559 | |||||||
| SHORT TERM INVESTMENTS: 2.96% | ||||||||
| 250,864 | Dreyfus Government Cash Management Fund - Institutional Class 0.937% (7-Day Yield) | 250,864 | ||||||
| Total Short Term Investments | ||||||||
| (Cost $250,864) | 250,864 | |||||||
| Total Investments: 100.32% | ||||||||
| (Cost $6,556,582) | 8,511,423 | |||||||
| Liabilities In Excess Of Other Assets: (0.32)% | (27,488 | ) | ||||||
| Net Assets: 100.00% | $ | 8,483,935 | ||||||
| (a) | Non-income producing security. |
For Fund compliance purposes, the Fund’s industry classifications refer to any one or more of the industry sub-classifications used by one or more widely recognized market indexes or ratings group indexes, and/or as defined by Fund management. This definition may not apply for purposes of this report, which may combine industry sub-classifications for reporting ease. Industries are shown as a percentage of net assets.
See Notes to Financial Statements.
| 26 | www.emeraldmutualfunds.com |
| Emerald Insights Fund | Schedule of Investments |
October 31, 2017 (Unaudited)
| Shares | Value (Note 2) | ||||||
| COMMON STOCKS: 98.59% | |||||||
| Consumer Discretionary: 18.56% | |||||||
| 2,185 | BorgWarner, Inc. | $ | 115,193 | ||||
| 1,473 | Burlington Stores, Inc.(a) | 138,300 | |||||
| 4,913 | Cinemark Holdings, Inc. | 178,538 | |||||
| 1,098 | Delphi Automotive PLC | 109,119 | |||||
| 381 | Dollar General Corp. | 30,800 | |||||
| 2,238 | Five Below, Inc.(a) | 123,650 | |||||
| 771 | Hasbro, Inc. | 71,387 | |||||
| 2,362 | Match Group, Inc.(a) | 63,160 | |||||
| 7,645 | MGM Resorts International | 239,671 | |||||
| 10,147 | Oasis Petroleum, Inc.(a) | 95,889 | |||||
| 332 | PVH Corp. | 42,101 | |||||
| 1,525 | Royal Caribbean Cruises, Ltd. | 188,749 | |||||
| 5,424 | Sinclair Broadcast Group, Inc., Class A | 171,941 | |||||
| 2,133 | Six Flags Entertainment Corp. | 133,931 | |||||
| 3,409 | Toll Brothers, Inc. | 156,950 | |||||
| 910 | Wynn Resorts, Ltd. | 134,216 | |||||
| 1,993,595 | |||||||
| Consumer Staples: 2.80% | |||||||
| 3,702 | Energizer Holdings, Inc. | 159,149 | |||||
| 573 | Monster Beverage Corp.(a) | 33,194 | |||||
| 5,227 | The Kroger Co. | 108,199 | |||||
| 300,542 | |||||||
| Energy: 4.37% | |||||||
| 3,018 | Cabot Oil & Gas Corp. | 83,599 | |||||
| 2,158 | Diamondback Energy, Inc.(a) | 231,251 | |||||
| 1,342 | Parsley Energy, Inc., Class A(a) | 35,697 | |||||
| 2,342 | PDC Energy, Inc.(a) | 119,278 | |||||
| 469,825 | |||||||
| Financial Services: 9.50% | |||||||
| 1,031 | Affiliated Managers Group, Inc. | 192,281 | |||||
| 470 | Alliance Data Systems Corp. | 105,153 | |||||
| 2,428 | Bank of the Ozarks, Inc. | 113,193 | |||||
| 2,541 | CubeSmart, REIT | 69,166 | |||||
| 232 | Equinix, Inc., REIT | 107,532 | |||||
| 9,589 | First Data Corp., Class A(a) | 170,780 | |||||
| 332 | FleetCor Technologies, Inc.(a) | 54,870 | |||||
| 848 | S&P Global, Inc. | 132,687 | |||||
| 340 | SVB Financial Group(a) | 74,555 | |||||
| 1,020,217 | |||||||
| Health Care: 14.66% | |||||||
| 1,253 | Abbott Laboratories | 67,950 | |||||
| 4,888 | Acadia Healthcare Co., Inc.(a) | 153,288 | |||||
| 804 | Alnylam Pharmaceuticals, Inc.(a) | 97,959 | |||||
| 423 | Bluebird Bio, Inc.(a) | 58,839 | |||||
| 4,871 | Catalent, Inc.(a) | 207,456 | |||||
| 1,305 | Clovis Oncology, Inc.(a) | 98,358 | |||||
| 1,801 | DENTSPLY SIRONA, Inc. | 109,987 | |||||
| 761 | Edwards Lifesciences Corp.(a) | 77,797 | |||||
| Shares | Value (Note 2) | ||||||
| Health Care (continued) | |||||||
| 395 | Incyte Corp.(a) | $ | 44,734 | ||||
| 2,705 | Intrexon Corp.(a) | 44,227 | |||||
| 1,711 | Ionis Pharmaceuticals, Inc.(a) | 97,715 | |||||
| 875 | Jazz Pharmaceuticals PLC(a) | 123,839 | |||||
| 868 | Puma Biotechnology, Inc.(a) | 110,496 | |||||
| 2,353 | Sarepta Therapeutics, Inc.(a) | 116,027 | |||||
| 1,702 | Veeva Systems, Inc., Class A(a) | 103,720 | |||||
| 982 | Zoetis, Inc. | 62,671 | |||||
| 1,575,063 | |||||||
| Materials & Processing: 10.43% | |||||||
| 3,067 | Berry Global Group, Inc.(a) | 182,333 | |||||
| 2,647 | Crown Holdings, Inc.(a) | 159,270 | |||||
| 2,047 | Eagle Materials, Inc. | 216,102 | |||||
| 2,788 | International Paper Co. | 159,669 | |||||
| 3,312 | Masco Corp. | 131,884 | |||||
| 2,949 | Steel Dynamics, Inc. | 109,732 | |||||
| 1,250 | Trinity Industries, Inc. | 40,650 | |||||
| 989 | Vulcan Materials Co. | 120,411 | |||||
| 1,120,051 | |||||||
| Producer Durables: 13.58% | |||||||
| 534 | CoStar Group, Inc.(a) | 157,931 | |||||
| 1,225 | Dycom Industries, Inc.(a) | 107,592 | |||||
| 2,225 | Fortive Corp. | 160,779 | |||||
| 2,122 | Kennametal, Inc. | 92,625 | |||||
| 2,115 | Korn/Ferry International | 88,470 | |||||
| 482 | Middleby Corp.(a) | 55,864 | |||||
| 480 | Old Dominion Freight Line, Inc. | 58,142 | |||||
| 618 | Oshkosh Corp. | 56,584 | |||||
| 788 | Parker-Hannifin Corp. | 143,897 | |||||
| 4,492 | Quanta Services, Inc.(a) | 169,483 | |||||
| 1,305 | Southwest Airlines Co. | 70,287 | |||||
| 858 | United Rentals, Inc.(a) | 121,390 | |||||
| 2,633 | Xylem, Inc. | 175,173 | |||||
| 1,458,217 | |||||||
| Technology: 24.69% | |||||||
| 2,076 | Activision Blizzard, Inc. | 135,957 | |||||
| 1,811 | Analog Devices, Inc. | 165,344 | |||||
| 809 | Broadcom, Ltd. | 213,503 | |||||
| 2,027 | Cavium, Inc.(a) | 139,843 | |||||
| 413 | Coherent, Inc.(a) | 108,499 | |||||
| 4,452 | Fortinet, Inc.(a) | 175,453 | |||||
| 458 | IAC/InterActive Corp.(a) | 59,105 | |||||
| 613 | Intuit, Inc. | 92,575 | |||||
| 648 | IPG Photonics Corp.(a) | 137,966 | |||||
| 2,155 | Micron Technology, Inc.(a) | 95,488 | |||||
| 8,397 | ON Semiconductor Corp.(a) | 179,024 | |||||
| 1,149 | Palo Alto Networks, Inc.(a) | 169,133 | |||||
| 1,150 | Proofpoint, Inc.(a) | 106,272 | |||||
| 2,160 | PTC, Inc.(a) | 143,532 | |||||
| 1,335 | SBA Communications Corp., REIT(a) | 209,835 | |||||
| Semi-Annual Report | October 31, 2017 | 27 |
| Emerald Insights Fund | Schedule of Investments |
October 31, 2017 (Unaudited)
| Shares | Value (Note 2) | ||||||
| Technology (continued) | |||||||
| 1,626 | ServiceNow, Inc.(a) | $ | 205,478 | ||||
| 1,142 | Skyworks Solutions, Inc. | 130,028 | |||||
| 703 | Tableau Software, Inc., Class A(a) | 57,006 | |||||
| 513 | Take-Two Interactive Software, Inc.(a) | 56,764 | |||||
| 353 | Ultimate Software Group, Inc.(a) | 71,514 | |||||
| 2,652,319 | |||||||
| Total Common Stocks | |||||||
| (Cost $8,394,475) | 10,589,829 | ||||||
| MASTER LIMITED PARTNERSHIPS: 0.89% | |||||||
| Financial | Services: 0.89% | ||||||
| 2,005 | Lazard, Ltd., Class A | 95,318 | |||||
| Total Master Limited Partnerships | |||||||
| (Cost $65,104) | 95,318 | ||||||
| SHORT TERM INVESTMENTS: 0.81% | |||||||
| 87,206 | Dreyfus Government Cash Management Fund - Institutional Class 0.937% (7-Day Yield) | 87,206 | |||||
| Total Short Term Investments | |||||||
| (Cost $87,206) | 87,206 | ||||||
| Total Investments: 100.29% | |||||||
| (Cost $8,546,785) | 10,772,353 | ||||||
| Liabilities In Excess Of Other Assets: (0.29)% | (31,638 | ) | |||||
| Net Assets: 100.00% | $ | 10,740,715 | |||||
| (a) | Non-income producing security. |
For Fund compliance purposes, the Fund's industry classifications refer to any one or more of the industry sub-classifications used by one or more widely recognized market indexes or ratings group indexes, and/or as defined by Fund management. This definition may not apply for purposes of this report, which may combine industry sub-classifications for reporting ease. Industries are shown as a percentage of net assets.
See Notes to Financial Statements.
| 28 | www.emeraldmutualfunds.com |
| Emerald Banking and Finance Fund | Schedule of Investments |
October 31, 2017 (Unaudited)
| Shares | Value (Note 2) | ||||||
| COMMON STOCKS: 98.06% | |||||||
| Financial Services: 97.51% | |||||||
| Banks: | Diversified: 79.74% | ||||||
| 100,000 | 1st Source Corp. | $ | 5,131,000 | ||||
| 55,280 | Access National Corp. | 1,608,648 | |||||
| 59,178 | American Business Bank(a) | 2,358,243 | |||||
| 80,000 | American Riviera Bank(a) | 1,512,000 | |||||
| 206,237 | Ameris Bancorp | 9,878,752 | |||||
| 225,594 | Atlantic Coast Financial Corp.(a) | 1,967,180 | |||||
| 424,577 | Bank of Commerce Holdings | 5,094,924 | |||||
| 100,000 | Bank of Princeton(a) | 3,350,000 | |||||
| 116,196 | Bank of the Ozarks, Inc. | 5,417,058 | |||||
| 225,409 | Bridge Bancorp, Inc. | 8,002,019 | |||||
| 238,282 | Byline Bancorp, Inc.(a) | 4,777,554 | |||||
| 207,990 | Cadence BanCorp(a) | 5,066,636 | |||||
| 145,214 | Carolina Financial Corp. | 5,351,136 | |||||
| 370,213 | CenterState Banks, Inc. | 9,862,474 | |||||
| 121,319 | Civista Bancshares, Inc. | 2,738,170 | |||||
| 150,002 | CNB Financial Corp. | 4,312,557 | |||||
| 17,052 | Commerce Union Bancshares, Inc. | 411,976 | |||||
| 35,869 | County Bancorp, Inc. | 1,171,482 | |||||
| 173,801 | Customers Bancorp, Inc.(a) | 4,751,719 | |||||
| 167,748 | Eagle Bancorp, Inc.(a) | 11,180,404 | |||||
| 162,663 | East West Bancorp, Inc. | 9,733,754 | |||||
| 228,773 | Equity Bancshares, Inc., Class A(a) | 7,798,872 | |||||
| 325,700 | Esquire Financial Holdings, Inc.(a) | 5,442,447 | |||||
| 215 | Farmers & Merchants Bank of Long Beach | 1,692,050 | |||||
| 86,853 | Farmers National Banc Corp. | 1,259,368 | |||||
| 191,017 | FCB Financial Holdings, Inc., Class A(a) | 8,920,494 | |||||
| 65,000 | First Bancshares, Inc. | 2,073,500 | |||||
| 588,963 | First Bank | 7,597,623 | |||||
| 36,040 | First Busey Corp. | 1,121,565 | |||||
| 163,498 | First Choice Bank | 3,923,952 | |||||
| 20,280 | First Financial Bankshares, Inc. | 925,782 | |||||
| 578,105 | First Foundation, Inc.(a) | 10,700,724 | |||||
| 190,000 | First Internet Bancorp | 7,163,000 | |||||
| 41,281 | First Merchants Corp. | 1,775,083 | |||||
| 58,449 | First of Long Island Corp. | 1,844,066 | |||||
| 125,475 | First Resource Bank(a) | 1,229,655 | |||||
| 186,772 | Franklin Financial Network, Inc.(a) | 6,406,280 | |||||
| 258,714 | Freedom Bank of Virginia(a) | 3,460,300 | |||||
| 45,000 | FS Bancorp, Inc. | 2,442,600 | |||||
| 92,837 | FVCBankcorp, Inc.(a) | 1,740,694 | |||||
| 169,868 | Gold Coast Bank(a) | 2,170,064 | |||||
| 61,496 | Green Bancorp, Inc.(a) | 1,362,136 | |||||
| 177,886 | Guaranty Bancorp | 5,060,857 | |||||
| 200,000 | Guaranty Bancshares, Inc. | 5,736,000 | |||||
| 138,670 | Heritage Commerce Corp. | 2,132,745 | |||||
| 199,592 | Home BancShares, Inc. | 4,486,828 | |||||
| 18,520 | Home Federal Bancorp, Inc. | 490,780 | |||||
| 264,296 | Howard Bancorp, Inc.(a) | 5,523,786 | |||||
| 15,250 | Independent Bank Corp. | 1,099,525 | |||||
| 50,000 | Independent Bank Corporation | 1,125,000 | |||||
| Shares | Value (Note 2) | ||||||
| Banks: | Diversified (continued) | ||||||
| 15,731 | Independent Bank Group, Inc. | $ | 989,480 | ||||
| 254,042 | Investar Holding Corp. | 5,893,774 | |||||
| 75,150 | John Marshall Bancorp, Inc.(a) | 1,382,685 | |||||
| 65,781 | Lakeland Bancorp, Inc. | 1,351,800 | |||||
| 46,615 | Lakeland Financial Corp. | 2,250,572 | |||||
| 269,682 | Live Oak Bancshares, Inc. | 6,391,463 | |||||
| 259,003 | Malvern Bancorp, Inc.(a) | 6,993,081 | |||||
| 35 | Mechanics Bank(a) | 1,067,500 | |||||
| 87,881 | Mercantile Bank Corp. | 3,172,504 | |||||
| 92,310 | Merchants Bancorp(a) | 1,584,040 | |||||
| 45,870 | Meridian Bancorp, Inc. | 903,639 | |||||
| 51,013 | Midland States Bancorp, Inc. | 1,655,372 | |||||
| 1,716 | National Capital Bank of Washington | 372,801 | |||||
| 239,209 | National Commerce Corp.(a) | 9,747,767 | |||||
| 48,060 | Nicolet Bankshares, Inc.(a) | 2,736,536 | |||||
| 224 | Oak Valley Bancorp | 3,804 | |||||
| 203,594 | Old Line Bancshares, Inc. | 6,138,359 | |||||
| 599,284 | Pacific Mercantile Bancorp(a) | 5,603,305 | |||||
| 254,115 | Pacific Premier Bancorp, Inc.(a) | 10,266,246 | |||||
| 75,493 | Paragon Commercial Corp.(a) | 4,346,132 | |||||
| 212,884 | People's Utah Bancorp | 6,620,692 | |||||
| 133,412 | Pinnacle Financial Partners, Inc. | 8,831,874 | |||||
| 31,217 | Porter Bancorp, Inc.(a) | 390,837 | |||||
| 240,584 | Professional Holding Corp.(a) | 3,344,118 | |||||
| 114,430 | Puget Sound Bancorp, Inc.(a) | 4,062,265 | |||||
| 93,253 | QCR Holdings, Inc. | 4,452,831 | |||||
| 150,000 | RBB Bancorp | 3,760,500 | |||||
| 747,663 | Republic First Bancorp, Inc.(a) | 6,915,883 | |||||
| 163,413 | Seacoast Commerce Banc Holdings | 3,300,943 | |||||
| 256,130 | ServisFirst Bancshares, Inc. | 10,503,891 | |||||
| 200,000 | SmartFinancial, Inc.(a) | 4,698,000 | |||||
| 71,032 | Southern First Bancshares, Inc.(a) | 2,738,284 | |||||
| 20,598 | Southern National Bancorp of Virginia, Inc. | 336,365 | |||||
| 300,000 | Stewardship Financial Corp. | 2,925,000 | |||||
| 100,637 | Sunshine Bancorp, Inc.(a) | 2,349,874 | |||||
| 182,747 | Sussex Bancorp | 4,678,323 | |||||
| 39,376 | SVB Financial Group(a) | 8,634,369 | |||||
| 105,959 | Texas Capital Bancshares, Inc.(a) | 9,117,772 | |||||
| 625,049 | The Bancorp, Inc.(a) | 5,256,662 | |||||
| 139,610 | Triumph Bancorp, Inc.(a) | 4,327,910 | |||||
| 168,750 | Unity Bancorp, Inc. | 3,332,813 | |||||
| 135,517 | Veritex Holdings, Inc.(a) | 3,572,228 | |||||
| 109,942 | West Town Bank & Trust(a) | 2,759,544 | |||||
| 186,834 | Western Alliance Bancorp(a) | 10,425,337 | |||||
| 400,570,637 | |||||||
| Banks: Savings Thrift & Mortgage Lending: 7.88% | |||||||
| 82,750 | Flushing Financial Corp. | 2,480,845 | |||||
| 103,401 | Heritage Financial Corp. | 3,153,730 | |||||
| 11,680 | Home Bancorp, Inc. | 500,371 | |||||
| 67,200 | LegacyTexas Financial Group, Inc. | 2,680,608 | |||||
| 128,396 | Meta Financial Group, Inc. | 11,202,551 | |||||
| 182,919 | OceanFirst Financial Corp. | 5,076,002 | |||||
| Semi-Annual Report | October 31, 2017 | 29 |
| Emerald Banking and Finance Fund | Schedule of Investments |
October 31, 2017 (Unaudited)
| Shares | Value (Note 2) | ||||||
| Banks: Savings Thrift & Mortgage Lending (continued) | |||||||
| 211,713 | Sterling Bancorp | $ | 5,303,411 | ||||
| 40,000 | Waterstone Financial, Inc. | 768,000 | |||||
| 169,608 | WSFS Financial Corp. | 8,429,518 | |||||
| 39,595,036 | |||||||
| Commercial Banks: 1.07% | |||||||
| 131,782 | FB Financial Corp.(a) | 5,385,930 | |||||
| Consumer Lending: 3.54% | |||||||
| 66,381 | LendingTree, Inc.(a) | 17,793,427 | |||||
| Diversified Financial Services: 1.06% | |||||||
| 150,908 | MidWestOne Financial Group, Inc. | 5,313,471 | |||||
| Financial Data & Services: 0.28% | |||||||
| 16,995 | Cass Information Systems, Inc. | 1,096,177 | |||||
| 37,906 | Everi Holdings, Inc.(a) | 314,241 | |||||
| 1,410,418 | |||||||
| Insurance: Multi Line: 0.42% | |||||||
| 50,000 | James River Group Holdings, Ltd. | 2,116,000 | |||||
| Insurance: Property-Casualty: 1.56% | |||||||
| 40,000 | Federated National Holding Co. | 613,600 | |||||
| 48,211 | Health Insurance Innovations, Inc., Class A(a) | 1,036,536 | |||||
| 185,000 | Kingstone Cos., Inc. | 2,997,000 | |||||
| 47,570 | Kinsale Capital Group, Inc. | 2,063,587 | |||||
| 75,340 | NMI Holdings, Inc., Class A(a) | 1,096,197 | |||||
| 7,806,920 | |||||||
| Real Estate Investment Trusts (REITs): 1.96% | |||||||
| 250,000 | City Office REIT, Inc. | 3,260,000 | |||||
| 147,490 | Community Healthcare Trust, Inc., REIT | 4,045,651 | |||||
| 92,800 | Independence Realty Trust, Inc., REIT | 941,920 | |||||
| 138,936 | MedEquities Realty Trust, Inc., REIT | 1,614,436 | |||||
| 9,862,007 | |||||||
| Technology: 0.55% | |||||||
| Computer Services Software & Systems: 0.55% | |||||||
| 64,716 | Q2 Holdings, Inc.(a) | 2,753,666 | |||||
| Total Common Stocks | |||||||
| (Cost $332,785,373) | 492,607,512 | ||||||
| Shares | Value (Note 2) | ||||||
| SHORT TERM INVESTMENTS: 1.40% | |||||||
| 7,063,363 | Dreyfus Government Cash Management | $ | 7,063,363 | ||||
| Total Short Term Investments | |||||||
| (Cost $7,063,363) | 7,063,363 | ||||||
| Total Investments: 99.46% | |||||||
| (Cost $339,848,736) | 499,670,875 | ||||||
| Other Assets In Excess Of Liabilities: 0.54% | 2,690,595 | ||||||
| Net Assets: 100.00% | $ | 502,361,470 | |||||
| (a) | Non-income producing security. |
For Fund compliance purposes, the Fund's industry classifications refer to any one or more of the industry sub-classifications used by one or more widely recognized market indexes or ratings group indexes, and/or as defined by Fund management. This definition may not apply for purposes of this report, which may combine industry sub-classifications for reporting ease. Industries are shown as a percentage of net assets.
See Notes to Financial Statements.
| 30 | www.emeraldmutualfunds.com |
| Emerald Funds | Statements of Assets and Liabilities |
October 31, 2017 (Unaudited)
| Emerald Growth Fund | Emerald Small Cap Value Fund | Emerald Insights Fund | Emerald Banking and Finance Fund | |||||||||||||
| ASSETS: | ||||||||||||||||
| Investments, at value | $ | 1,143,021,981 | $ | 8,511,423 | $ | 10,772,353 | $ | 499,670,875 | ||||||||
| Cash | – | – | – | 5,019,686 | ||||||||||||
| Receivable for investments sold | 16,137 | 97 | 59,709 | – | ||||||||||||
| Receivable for shares sold | 510,343 | 67 | – | 387,246 | ||||||||||||
| Receivable due from advisor | – | 2,247 | 222 | – | ||||||||||||
| Interest and dividends receivable | 98,614 | 262 | 1,402 | 92,440 | ||||||||||||
| Other assets | 25,414 | 11,269 | 7,804 | 31,937 | ||||||||||||
| Total Assets | 1,143,672,489 | 8,525,365 | 10,841,490 | 505,202,184 | ||||||||||||
| LIABILITIES: | ||||||||||||||||
| Payable for investments purchased | 6,286,520 | – | 69,864 | 1,005,201 | ||||||||||||
| Payable for shares redeemed | 1,015,161 | 14,991 | – | 1,016,152 | ||||||||||||
| Investment advisory fees payable | 558,823 | – | – | 387,265 | ||||||||||||
| Payable to fund accounting and administration | 78,621 | 1,709 | 2,751 | 36,369 | ||||||||||||
| Payable for distribution and service fees | 371,461 | 1,048 | 3,602 | 306,569 | ||||||||||||
| Payable for trustee fees and expenses | 13,264 | 104 | 150 | 4,024 | ||||||||||||
| Payable for transfer agency fees | 62,558 | 5,770 | 6,480 | 33,418 | ||||||||||||
| Payable for chief compliance officer fee | 7,240 | 60 | 87 | 3,125 | ||||||||||||
| Payable for principal financial officer fee | 1,176 | 11 | 14 | 509 | ||||||||||||
| Payable for professional fees | 23,584 | 12,148 | 12,060 | 17,930 | ||||||||||||
| Accrued expenses and other liabilities | 81,235 | 5,589 | 5,767 | 30,152 | ||||||||||||
| Total Liabilities | 8,499,643 | 41,430 | 100,775 | 2,840,714 | ||||||||||||
| NET ASSETS | $ | 1,135,172,846 | $ | 8,483,935 | $ | 10,740,715 | $ | 502,361,470 | ||||||||
| NET ASSETS CONSIST OF: | ||||||||||||||||
| Paid-in capital (Note 5) | $ | 822,717,980 | $ | 3,104,279 | $ | 8,913,805 | $ | 330,462,524 | ||||||||
| Accumulated net investment income/(loss) | (4,125,771 | ) | 13,163 | (50,326 | ) | (2,239,702 | ) | |||||||||
| Accumulated net realized gain/(loss) | (7,355,347 | ) | 3,411,652 | (348,332 | ) | 14,316,509 | ||||||||||
| Net unrealized appreciation | 323,935,984 | 1,954,841 | 2,225,568 | 159,822,139 | ||||||||||||
| NET ASSETS | $ | 1,135,172,846 | $ | 8,483,935 | $ | 10,740,715 | $ | 502,361,470 | ||||||||
| INVESTMENTS, AT COST | $ | 819,085,997 | $ | 6,556,582 | $ | 8,546,785 | $ | 339,848,736 | ||||||||
| PRICING OF SHARES | ||||||||||||||||
| Class A: (a) | ||||||||||||||||
| Net Asset Value, offering and redemption price per share | $ | 24.94 | $ | 17.81 | $ | 12.36 | $ | 45.38 | ||||||||
| Net Assets | $ | 271,916,567 | $ | 2,752,635 | $ | 9,377,639 | $ | 176,464,166 | ||||||||
| Shares of beneficial interest outstanding | 10,903,458 | 154,546 | 758,732 | 3,888,194 | ||||||||||||
| Maximum offering price per share (NAV/.9525, based on maximum sales charge of 4.75% of the offering price) | $ | 26.18 | $ | 18.70 | $ | 12.98 | $ | 47.64 | ||||||||
| Class C: (a) | ||||||||||||||||
| Net Asset Value, offering and redemption price per share | $ | 21.35 | $ | 17.56 | $ | 12.08 | $ | 40.54 | ||||||||
| Net Assets | $ | 35,099,353 | $ | 105,310 | $ | 121,398 | $ | 76,887,226 | ||||||||
| Shares of beneficial interest outstanding | 1,643,953 | 5,997 | 10,048 | 1,896,751 | ||||||||||||
| Institutional Class: | ||||||||||||||||
| Net Asset Value, offering and redemption price per share | $ | 25.81 | $ | 17.93 | $ | 12.47 | $ | 46.21 | ||||||||
| Net Assets | $ | 722,879,268 | $ | 4,931,704 | $ | 1,139,744 | $ | 185,716,090 | ||||||||
| Shares of beneficial interest outstanding | 28,006,931 | 274,990 | 91,435 | 4,018,925 | ||||||||||||
| Investor Class: | ||||||||||||||||
| Net Asset Value, offering and redemption price per share | $ | 24.84 | $ | 17.82 | $ | 12.32 | $ | 43.47 | ||||||||
| Net Assets | $ | 105,277,658 | $ | 694,286 | $ | 101,934 | $ | 63,293,988 | ||||||||
| Shares of beneficial interest outstanding | 4,237,743 | 38,968 | 8,273 | 1,456,064 | ||||||||||||
| (a) | Redemption price per share may be reduced for any applicable contingent deferred sales charge. For a description of a possible sales charge, please see the Funds' Prospectus. |
See Notes to Financial Statements
| Semi-Annual Report | October 31, 2017 | 31 |
| Emerald Funds | Statements of Operations |
For the Six Months Ended October 31, 2017 (Unaudited)
| Emerald Growth Fund | Emerald Small Cap Value Fund | Emerald Insights Fund | Emerald Banking and Finance Fund | |||||||||||||
| INVESTMENT INCOME: | ||||||||||||||||
| Dividends | $ | 2,384,621 | $ | 58,510 | $ | 45,800 | $ | 2,027,479 | ||||||||
| Foreign taxes withheld | – | (4 | ) | – | – | |||||||||||
| Total Investment Income | 2,384,621 | 58,506 | 45,800 | 2,027,479 | ||||||||||||
| EXPENSES: | ||||||||||||||||
| Investment advisory fee (Note 6) | 3,204,652 | 29,829 | 41,739 | 2,213,251 | ||||||||||||
| Administration fee | 225,426 | 3,010 | 4,279 | 101,836 | ||||||||||||
| Custodian fee | 46,372 | 2,521 | 2,521 | 24,687 | ||||||||||||
| Professional fees | 18,974 | 8,917 | 8,829 | 14,316 | ||||||||||||
| Transfer agent fee | 137,727 | 14,901 | 16,450 | 91,801 | ||||||||||||
| Trustee fees and expenses | 12,735 | 96 | 142 | 3,859 | ||||||||||||
| Registration/filing fees | 37,382 | 22,085 | 18,564 | 34,620 | ||||||||||||
| Reports to shareholder and printing fees | 55,313 | 817 | 1,033 | 21,646 | ||||||||||||
| Distribution and service fees | ||||||||||||||||
| Class A | 485,542 | 4,100 | 17,198 | 297,860 | ||||||||||||
| Class C | 174,649 | 647 | 580 | 373,154 | ||||||||||||
| Institutional Class | 167,685 | – | 273 | 39,595 | ||||||||||||
| Investor Class | 210,187 | 800 | 188 | 154,827 | ||||||||||||
| Chief compliance officer fee | 21,274 | 164 | 236 | 9,399 | ||||||||||||
| Principal financial officer fee | 3,451 | 28 | 38 | 1,526 | ||||||||||||
| Other | 12,043 | 3,540 | 3,526 | 6,900 | ||||||||||||
| Total expenses before waiver | 4,813,412 | 91,455 | 115,596 | 3,389,277 | ||||||||||||
| Less fees waived/reimbursed by investment advisor (Note 6) | – | (46,112 | ) | (41,732 | ) | – | ||||||||||
| Total Net Expenses | 4,813,412 | 45,343 | 73,864 | 3,389,277 | ||||||||||||
| NET INVESTMENT INCOME/(LOSS): | (2,428,791 | ) | 13,163 | (28,064 | ) | (1,361,798 | ) | |||||||||
| REALIZED AND UNREALIZED GAIN/(LOSS) | ||||||||||||||||
| Net realized gain | 51,563,633 | 88,585 | 655,421 | 21,904,421 | ||||||||||||
| Net change in unrealized appreciation | 95,121,277 | 629,233 | 320,492 | 20,935,491 | ||||||||||||
| NET REALIZED AND UNREALIZED GAIN | 146,684,910 | 717,818 | 975,913 | 42,839,912 | ||||||||||||
| NET INCREASE IN NET ASSETS RESULTING FROM OPERATIONS | $ | 144,256,119 | $ | 730,981 | $ | 947,849 | $ | 41,478,114 | ||||||||
See Notes to Financial Statements.
| 32 | www.emeraldmutualfunds.com |
| Emerald Growth Fund | Statements of Changes in Net Assets |
| For the Six Months Ended October 31, 2017 (Unaudited) | Year Ended April 30, 2017 | |||||||
| OPERATIONS: | ||||||||
| Net investment loss | $ | (2,428,791 | ) | $ | (4,274,031 | ) | ||
| Net realized gain/(loss) | 51,563,633 | (12,296,303 | ) | |||||
| Net change in unrealized appreciation | 95,121,277 | 231,448,346 | ||||||
| Net increase in net assets resulting from operations | 144,256,119 | 214,878,012 | ||||||
| SHARE TRANSACTIONS (NOTE 5): | ||||||||
| Class A | ||||||||
| Proceeds from sale of shares | 20,042,671 | 49,638,686 | ||||||
| Cost of shares redeemed | (54,515,977 | ) | (171,619,113 | ) | ||||
| Net decrease from share transactions | (34,473,306 | ) | (121,980,427 | ) | ||||
| Class C | ||||||||
| Proceeds from sale of shares | 336,209 | 816,759 | ||||||
| Cost of shares redeemed | (4,377,482 | ) | (16,701,281 | ) | ||||
| Net decrease from share transactions | (4,041,273 | ) | (15,884,522 | ) | ||||
| Institutional Class | ||||||||
| Proceeds from sale of shares | 95,793,848 | 156,854,187 | ||||||
| Cost of shares redeemed | (59,003,709 | ) | (126,583,340 | ) | ||||
| Net increase from share transactions | 36,790,139 | 30,270,847 | ||||||
| Investor Class | ||||||||
| Proceeds from sale of shares | 7,709,686 | 33,837,835 | ||||||
| Cost of shares redeemed | (30,682,742 | ) | (56,901,183 | ) | ||||
| Net decrease from share transactions | (22,973,056 | ) | (23,063,348 | ) | ||||
| Net increase in net assets | $ | 119,558,623 | $ | 84,220,562 | ||||
| NET ASSETS: | ||||||||
| Beginning of period | 1,015,614,223 | 931,393,661 | ||||||
| End of period (including accumulated net investment loss of $(4,125,771) and $(1,696,980)) | $ | 1,135,172,846 | $ | 1,015,614,223 | ||||
| Other Information: | ||||||||
| SHARE TRANSACTIONS: | ||||||||
| Class A | ||||||||
| Sold | 870,475 | 2,527,651 | ||||||
| Redeemed | (2,352,552 | ) | (8,617,707 | ) | ||||
| Net decrease in shares outstanding | (1,482,077 | ) | (6,090,056 | ) | ||||
| Class C | ||||||||
| Sold | 17,209 | 47,529 | ||||||
| Redeemed | (220,696 | ) | (978,592 | ) | ||||
| Net decrease in shares outstanding | (203,487 | ) | (931,063 | ) | ||||
| Institutional Class | ||||||||
| Sold | 4,017,335 | 7,655,150 | ||||||
| Redeemed | (2,452,993 | ) | (6,327,481 | ) | ||||
| Net increase in shares outstanding | 1,564,342 | 1,327,669 | ||||||
| Investor Class | ||||||||
| Sold | 332,028 | 1,717,976 | ||||||
| Redeemed | (1,336,691 | ) | (2,920,705 | ) | ||||
| Net decrease in shares outstanding | (1,004,663 | ) | (1,202,729 | ) | ||||
See Notes to Financial Statements
| Semi-Annual Report | October 31, 2017 | 33 |
| Emerald Small Cap Value Fund | Statements of Changes in Net Assets |
| For the Six Months Ended October 31, 2017 (Unaudited) | Year Ended April 30, 2017 | |||||||
| OPERATIONS: | ||||||||
| Net investment income | $ | 13,163 | $ | 4,504 | ||||
| Net realized gain | 88,585 | 4,115,975 | ||||||
| Net change in unrealized appreciation/(depreciation) | 629,233 | (52,528 | ) | |||||
| Net increase in net assets resulting from operations | 730,981 | 4,067,951 | ||||||
| SHARE TRANSACTIONS (NOTE 5): | ||||||||
| Class A | ||||||||
| Proceeds from sale of shares | 641,820 | 1,560,733 | ||||||
| Cost of shares redeemed | (31,211 | ) | (134,941 | ) | ||||
| Net increase from share transactions | 610,609 | 1,425,792 | ||||||
| Class C | ||||||||
| Proceeds from sale of shares | 9,102 | 45,700 | ||||||
| Cost of shares redeemed | (123,065 | ) | (542,424 | ) | ||||
| Net decrease from share transactions | (113,963 | ) | (496,724 | ) | ||||
| Institutional Class | ||||||||
| Proceeds from sale of shares | 212,454 | 1,392,366 | ||||||
| Cost of shares redeemed | (699,249 | ) | (13,535,683 | ) | ||||
| Net decrease from share transactions | (486,795 | ) | (12,143,317 | ) | ||||
| Investor Class | ||||||||
| Proceeds from sale of shares | 28,006 | 208,364 | ||||||
| Cost of shares redeemed | (8,473 | ) | (1,881,505 | ) | ||||
| Net increase/(decrease) from share transactions | 19,533 | (1,673,141 | ) | |||||
| Net increase/(decrease) in net assets | $ | 760,365 | $ | (8,819,439 | ) | |||
| NET ASSETS: | ||||||||
| Beginning of period | 7,723,570 | 16,543,009 | ||||||
| End of period (including accumulated net investment income of $13,163 and $–) | $ | 8,483,935 | $ | 7,723,570 | ||||
| 34 | www.emeraldmutualfunds.com |
| Emerald Small Cap Value Fund | Statements of Changes in Net Assets |
| For the Six Months Ended October 31, 2017 (Unaudited) | Year Ended April 30, 2017 | |||||||
| Other Information: | ||||||||
| SHARE TRANSACTIONS: | ||||||||
| Class A | ||||||||
| Sold | 39,024 | 100,045 | ||||||
| Redeemed | (1,856 | ) | (8,816 | ) | ||||
| Net increase in shares outstanding | 37,168 | 91,229 | ||||||
| Class C | ||||||||
| Sold | 565 | 3,424 | ||||||
| Redeemed | (7,663 | ) | (34,059 | ) | ||||
| Net decrease in shares outstanding | (7,098 | ) | (30,635 | ) | ||||
| Institutional Class | ||||||||
| Sold | 12,748 | 93,538 | ||||||
| Redeemed | (42,973 | ) | (839,700 | ) | ||||
| Net decrease in shares outstanding | (30,225 | ) | (746,162 | ) | ||||
| Investor Class | ||||||||
| Sold | 1,690 | 15,147 | ||||||
| Redeemed | (490 | ) | (127,290 | ) | ||||
| Net increase/(decrease) in shares outstanding | 1,200 | (112,143 | ) | |||||
See Notes to Financial Statements.
| Semi-Annual Report | October 31, 2017 | 35 |
| Emerald Insights Fund | Statements of Changes in Net Assets |
| For the Six Months Ended October 31, 2017 (Unaudited) | Year Ended April 30, 2017 | |||||||
| OPERATIONS: | ||||||||
| Net investment loss | $ | (28,064 | ) | $ | (67,028 | ) | ||
| Net realized gain | 655,421 | 126,174 | ||||||
| Net change in unrealized appreciation on investments | 320,492 | 1,844,247 | ||||||
| Net increase in net assets resulting from operations | 947,849 | 1,903,393 | ||||||
| SHARE TRANSACTIONS (NOTE 5): | ||||||||
| Class A | ||||||||
| Proceeds from sale of shares | 200,571 | 462,283 | ||||||
| Cost of shares redeemed | (1,781,910 | ) | (3,391,810 | ) | ||||
| Net decrease from share transactions | (1,581,339 | ) | (2,929,527 | ) | ||||
| Class C | ||||||||
| Proceeds from sale of shares | – | 1,539 | ||||||
| Cost of shares redeemed | – | (6,433 | ) | |||||
| Net decrease from share transactions | – | (4,894 | ) | |||||
| Institutional Class | ||||||||
| Proceeds from sale of shares | 37,066 | 155,403 | ||||||
| Cost of shares redeemed | (42,443 | ) | (1,042,010 | ) | ||||
| Net decrease from share transactions | (5,377 | ) | (886,607 | ) | ||||
| Investor Class | ||||||||
| Proceeds from sale of shares | 6,000 | 20,000 | ||||||
| Cost of shares redeemed | – | (31,991 | ) | |||||
| Net increase/(decrease) from share transactions | 6,000 | (11,991 | ) | |||||
| Net decrease in net assets | $ | (632,867 | ) | $ | (1,929,626 | ) | ||
| NET ASSETS: | ||||||||
| Beginning of period | 11,373,582 | 13,303,208 | ||||||
| End of period (including accumulated net investment loss of $(50,326) and $(22,262)) | $ | 10,740,715 | $ | 11,373,582 | ||||
| Other Information: | ||||||||
| SHARE TRANSACTIONS: | ||||||||
| Class A | ||||||||
| Sold | 17,035 | 44,012 | ||||||
| Redeemed | (152,441 | ) | (325,340 | ) | ||||
| Net decrease in shares outstanding | (135,406 | ) | (281,328 | ) | ||||
| Class C | ||||||||
| Sold | – | 156 | ||||||
| Redeemed | – | (621 | ) | |||||
| Net decrease in shares outstanding | – | (465 | ) | |||||
| Institutional Class | ||||||||
| Sold | 3,175 | 14,591 | ||||||
| Redeemed | (3,614 | ) | (100,431 | ) | ||||
| Net decrease in shares outstanding | (439 | ) | (85,840 | ) | ||||
| Investor Class | ||||||||
| Sold | 513 | 1,928 | ||||||
| Redeemed | – | (3,068 | ) | |||||
| Net increase/(decrease) in shares outstanding | 513 | (1,140 | ) | |||||
See Notes to Financial Statements.
| 36 | www.emeraldmutualfunds.com |
| Emerald Banking and Finance Fund | Statements of Changes in Net Assets |
| For the Six Months Ended October 31, 2017 (Unaudited) | Year Ended April 30, 2017 | |||||||
| OPERATIONS: | ||||||||
| Net investment loss | $ | (1,361,798 | ) | $ | (1,792,957 | ) | ||
| Net realized gain | 21,904,421 | 4,322,806 | ||||||
| Net change in unrealized appreciation | 20,935,491 | 93,673,078 | ||||||
| Net increase in net assets resulting from operations | 41,478,114 | 96,202,927 | ||||||
| SHARE TRANSACTIONS (NOTE 5): | ||||||||
| Class A | ||||||||
| Proceeds from sale of shares | 30,504,720 | 82,950,236 | ||||||
| Cost of shares redeemed | (40,811,202 | ) | (54,060,196 | ) | ||||
| Net increase/(decrease) from share transactions | (10,306,482 | ) | 28,890,040 | |||||
| Class C | ||||||||
| Proceeds from sale of shares | 4,808,183 | 19,290,062 | ||||||
| Cost of shares redeemed | (10,139,408 | ) | (12,226,940 | ) | ||||
| Net increase/(decrease) from share transactions | (5,331,225 | ) | 7,063,122 | |||||
| Institutional Class | ||||||||
| Proceeds from sale of shares | 59,255,070 | 67,765,563 | ||||||
| Cost of shares redeemed | (22,317,826 | ) | (15,914,560 | ) | ||||
| Net increase from share transactions | 36,937,244 | 51,851,003 | ||||||
| Investor Class | ||||||||
| Proceeds from sale of shares | 22,592,965 | 70,741,101 | ||||||
| Cost of shares redeemed | (50,771,388 | ) | (92,011,035 | ) | ||||
| Net decrease from share transactions | (28,178,423 | ) | (21,269,934 | ) | ||||
| Net increase in net assets | $ | 34,599,228 | $ | 162,737,158 | ||||
| NET ASSETS: | ||||||||
| Beginning of period | 467,762,242 | 305,025,084 | ||||||
| End of period (including accumulated net investment loss of $(2,239,702) and $(877,904)) | $ | 502,361,470 | $ | 467,762,242 | ||||
| Other Information: | ||||||||
| SHARE TRANSACTIONS: | ||||||||
| Class A | ||||||||
| Sold | 707,275 | 2,115,853 | ||||||
| Redeemed | (955,042 | ) | (1,517,305 | ) | ||||
| Net increase/(decrease) in shares outstanding | (247,767 | ) | 598,548 | |||||
| Class C | ||||||||
| Sold | 125,419 | 562,255 | ||||||
| Redeemed | (268,739 | ) | (378,982 | ) | ||||
| Net increase/(decrease) in shares outstanding | (143,320 | ) | 183,273 | |||||
| Institutional Class | ||||||||
| Sold | 1,363,225 | 1,678,568 | ||||||
| Redeemed | (512,507 | ) | (456,066 | ) | ||||
| Net increase in shares outstanding | 850,718 | 1,222,502 | ||||||
| Investor Class | ||||||||
| Sold | 549,574 | 1,995,462 | ||||||
| Redeemed | (1,240,143 | ) | (2,533,701 | ) | ||||
| Net decrease in shares outstanding | (690,569 | ) | (538,239 | ) | ||||
See Notes to Financial Statements.
| Semi-Annual Report | October 31, 2017 | 37 |
| Emerald Growth Fund | Financial Highlights |
For a share outstanding throughout the periods presented
| CLASS A | ||||||||||||||||||||||||
For the Six Months Ended October 31, 2017 (Unaudited) | Year Ended April 30, 2017 | Year Ended April 30, 2016 | Year Ended April 30, 2015 | Year Ended April 30, 2014 | Year Ended April 30, 2013 | |||||||||||||||||||
| NET ASSET VALUE, BEGINNING OF PERIOD | $ | 21.83 | $ | 17.52 | $ | 20.02 | $ | 18.11 | $ | 15.60 | $ | 16.20 | ||||||||||||
| INCOME/(LOSS) FROM OPERATIONS: | ||||||||||||||||||||||||
| Net investment loss(a) | (0.07 | ) | (0.11 | ) | (0.15 | ) | (0.18 | ) | (0.21 | ) | (0.15 | ) | ||||||||||||
| Net realized and unrealized gain/(loss) on investments | 3.18 | 4.42 | (1.88 | ) | 3.43 | 4.33 | 1.40 | |||||||||||||||||
| Total from Investment Operations | 3.11 | 4.31 | (2.03 | ) | 3.25 | 4.12 | 1.25 | |||||||||||||||||
| LESS DISTRIBUTIONS: | ||||||||||||||||||||||||
| From capital gains | – | – | (0.47 | ) | (1.34 | ) | (1.61 | ) | (1.85 | ) | ||||||||||||||
| Total Distributions | – | – | (0.47 | ) | (1.34 | ) | (1.61 | ) | (1.85 | ) | ||||||||||||||
| NET INCREASE/(DECREASE) IN NET ASSET VALUE | 3.11 | 4.31 | (2.50 | ) | 1.91 | 2.51 | (0.60 | ) | ||||||||||||||||
| NET ASSET VALUE, END OF PERIOD | $ | 24.94 | $ | 21.83 | $ | 17.52 | $ | 20.02 | $ | 18.11 | $ | 15.60 | ||||||||||||
| TOTAL RETURN(b) | 14.25 | %(c) | 24.60 | % | (10.28 | )% | 18.38 | % | 26.01 | % | 9.14 | % | ||||||||||||
| RATIOS/SUPPLEMENTAL DATA: | ||||||||||||||||||||||||
| Net Assets, End of Period (000s) | $ | 271,917 | $ | 270,389 | $ | 323,603 | $ | 123,828 | $ | 77,900 | $ | 46,605 | ||||||||||||
| RATIOS TO AVERAGE NET ASSETS: | ||||||||||||||||||||||||
| Net Investment loss | (0.60 | )%(d) | (0.57 | )% | (0.81 | )% | (0.93 | )% | (1.12 | )% | (1.01 | )% | ||||||||||||
| Operating expenses excluding reimbursement/waiver | 1.04 | %(d) | 1.08 | % | 1.17 | % | 1.29 | % | 1.31 | % | 1.38 | % | ||||||||||||
| Operating expenses including reimbursement/waiver | 1.04 | %(d) | 1.08 | % | 1.17 | % | 1.29 | % | 1.29 | % | 1.29 | % | ||||||||||||
| PORTFOLIO TURNOVER RATE | 31 | %(c) | 54 | % | 45 | % | 68 | % | 70 | % | 78 | % | ||||||||||||
| (a) | Per share amounts are based upon average shares outstanding. |
| (b) | Total return does not reflect the effect of sales charges. |
| (c) | Not Annualized. |
| (d) | Annualized. |
See Notes to Financial Statements.
| 38 | www.emeraldmutualfunds.com |
| Emerald Growth Fund | Financial Highlights |
For a share outstanding throughout the periods presented
| CLASS C | ||||||||||||||||||||||||
For the Six Months Ended October 31, 2017 (Unaudited) | Year Ended April 30, 2017 | Year Ended April 30, 2016 | Year Ended April 30, 2015 | Year Ended April 30, 2014 | Year Ended April 30, 2013 | |||||||||||||||||||
| NET ASSET VALUE, BEGINNING OF PERIOD | $ | 18.75 | $ | 15.14 | $ | 17.48 | $ | 16.07 | $ | 14.07 | $ | 14.89 | ||||||||||||
| INCOME/(LOSS) FROM OPERATIONS: | ||||||||||||||||||||||||
| Net investment loss(a) | (0.13 | ) | (0.21 | ) | (0.24 | ) | (0.27 | ) | (0.30 | ) | (0.23 | ) | ||||||||||||
| Net realized and unrealized gain/(loss) on investments | 2.73 | 3.82 | (1.63 | ) | 3.02 | 3.91 | 1.26 | |||||||||||||||||
| Total from Investment Operations | 2.60 | 3.61 | (1.87 | ) | 2.75 | 3.61 | 1.03 | |||||||||||||||||
| LESS DISTRIBUTIONS: | ||||||||||||||||||||||||
| From capital gains | – | – | (0.47 | ) | (1.34 | ) | (1.61 | ) | (1.85 | ) | ||||||||||||||
| Total Distributions | – | – | (0.47 | ) | (1.34 | ) | (1.61 | ) | (1.85 | ) | ||||||||||||||
| NET INCREASE/(DECREASE) IN NET ASSET VALUE | 2.60 | 3.61 | (2.34 | ) | 1.41 | 2.00 | (0.82 | ) | ||||||||||||||||
| NET ASSET VALUE, END OF PERIOD | $ | 21.35 | $ | 18.75 | $ | 15.14 | $ | 17.48 | $ | 16.07 | $ | 14.07 | ||||||||||||
| TOTAL RETURN(b) | 13.87 | %(c) | 23.84 | % | (10.87 | )% | 17.58 | % | 25.19 | % | 8.43 | % | ||||||||||||
| RATIOS/SUPPLEMENTAL DATA: | ||||||||||||||||||||||||
| Net Assets, End of Period (000s) | $ | 35,099 | $ | 34,642 | $ | 42,075 | $ | 15,427 | $ | 11,645 | $ | 4,946 | ||||||||||||
| RATIOS TO AVERAGE NET ASSETS: | ||||||||||||||||||||||||
| Net Investment loss | (1.25 | )%(d) | (1.22 | )% | (1.46 | )% | (1.58 | )% | (1.77 | )% | (1.65 | )% | ||||||||||||
| Operating expenses excluding reimbursement/waiver | 1.69 | %(d) | 1.73 | % | 1.81 | % | 1.94 | % | 1.96 | % | 2.03 | % | ||||||||||||
| Operating expenses including reimbursement/waiver | 1.69 | %(d) | 1.73 | % | 1.81 | % | 1.94 | % | 1.94 | % | 1.94 | % | ||||||||||||
| PORTFOLIO TURNOVER RATE | 31 | %(c) | 54 | % | 45 | % | 68 | % | 70 | % | 78 | % | ||||||||||||
| (a) | Per share amounts are based upon average shares outstanding. |
| (b) | Total return does not reflect the effect of sales charges. |
| (c) | Not Annualized. |
| (d) | Annualized. |
See Notes to Financial Statements.
| Semi-Annual Report | October 31, 2017 | 39 |
| Emerald Growth Fund | Financial Highlights |
For a share outstanding throughout the periods presented
| INSTITUTIONAL CLASS | ||||||||||||||||||||||||
For the Six Months Ended October 31, 2017 (Unaudited) | Year Ended April 30, 2017 | Year Ended April 30, 2016 | Year Ended April 30, 2015 | Year Ended April 30, 2014 | Year Ended April 30, 2013 | |||||||||||||||||||
| NET ASSET VALUE, BEGINNING OF PERIOD | $ | 22.56 | $ | 18.04 | $ | 20.54 | $ | 18.49 | $ | 15.86 | $ | 16.39 | ||||||||||||
| INCOME/(LOSS) FROM OPERATIONS: | ||||||||||||||||||||||||
| Net investment loss(a) | (0.04 | ) | (0.05 | ) | (0.10 | ) | (0.12 | ) | (0.16 | ) | (0.11 | ) | ||||||||||||
| Net realized and unrealized gain/(loss) on investments | 3.29 | 4.57 | (1.93 | ) | 3.51 | 4.40 | 1.43 | |||||||||||||||||
| Total from Investment Operations | 3.25 | 4.52 | (2.03 | ) | 3.39 | 4.24 | 1.32 | |||||||||||||||||
| LESS DISTRIBUTIONS: | ||||||||||||||||||||||||
| From capital gains | – | – | (0.47 | ) | (1.34 | ) | (1.61 | ) | (1.85 | ) | ||||||||||||||
| Total Distributions | – | – | (0.47 | ) | (1.34 | ) | (1.61 | ) | (1.85 | ) | ||||||||||||||
| NET INCREASE/(DECREASE) IN NET ASSET VALUE | 3.25 | 4.52 | (2.50 | ) | 2.05 | 2.63 | (0.53 | ) | ||||||||||||||||
| NET ASSET VALUE, END OF PERIOD | $ | 25.81 | $ | 22.56 | $ | 18.04 | $ | 20.54 | $ | 18.49 | $ | 15.86 | ||||||||||||
| TOTAL RETURN | 14.41 | %(b) | 25.06 | % | (9.97 | )% | 18.77 | % | 26.35 | % | 9.47 | % | ||||||||||||
| RATIOS/SUPPLEMENTAL DATA: | ||||||||||||||||||||||||
| Net Assets, End of Period (000s) | $ | 722,879 | $ | 596,550 | $ | 453,190 | $ | 174,107 | $ | 134,440 | $ | 86,238 | ||||||||||||
| RATIOS TO AVERAGE NET ASSETS: | ||||||||||||||||||||||||
| Net Investment loss | (0.31 | )%(c) | (0.26 | )% | (0.51 | )% | (0.63 | )% | (0.82 | )% | (0.71 | )% | ||||||||||||
| Operating expenses excluding reimbursement/waiver | 0.74 | %(c) | 0.77 | % | 0.87 | % | 0.99 | % | 1.00 | % | 1.08 | % | ||||||||||||
| Operating expenses including reimbursement/waiver | 0.74 | %(c) | 0.77 | % | 0.87 | % | 0.99 | % | 0.99 | % | 0.99 | % | ||||||||||||
| PORTFOLIO TURNOVER RATE | 31 | %(b) | 54 | % | 45 | % | 68 | % | 70 | % | 78 | % | ||||||||||||
| (a) | Per share amounts are based upon average shares outstanding. |
| (b) | Not Annualized. |
| (c) | Annualized. |
See Notes to Financial Statements.
| 40 | www.emeraldmutualfunds.com |
| Emerald Growth Fund | Financial Highlights |
For a share outstanding throughout the periods presented
| INVESTOR CLASS | ||||||||||||||||||||||||
For the Six Months Ended October 31, 2017 (Unaudited) | Year Ended April 30, 2017 | Year Ended April 30, 2016 | Year Ended April 30, 2015 | Year Ended April 30, 2014 | Year Ended April 30, 2013 | |||||||||||||||||||
| NET ASSET VALUE, BEGINNING OF PERIOD | $ | 21.75 | $ | 17.46 | $ | 19.97 | $ | 18.06 | $ | 15.57 | $ | 16.18 | ||||||||||||
| INCOME/(LOSS) FROM OPERATIONS: | ||||||||||||||||||||||||
| Net investment loss(a) | (0.08 | ) | (0.12 | ) | (0.16 | ) | (0.17 | ) | (0.23 | ) | (0.16 | ) | ||||||||||||
| Net realized and unrealized gain/(loss) on investments | 3.17 | 4.41 | (1.88 | ) | 3.42 | 4.33 | 1.40 | |||||||||||||||||
| Total from Investment Operations | 3.09 | 4.29 | (2.04 | ) | 3.25 | 4.10 | 1.24 | |||||||||||||||||
| LESS DISTRIBUTIONS: | ||||||||||||||||||||||||
| From capital gains | – | – | (0.47 | ) | (1.34 | ) | (1.61 | ) | (1.85 | ) | ||||||||||||||
| Total Distributions | – | – | (0.47 | ) | (1.34 | ) | (1.61 | ) | (1.85 | ) | ||||||||||||||
| NET INCREASE/(DECREASE) IN NET ASSET VALUE | 3.09 | 4.29 | (2.51 | ) | 1.91 | 2.49 | (0.61 | ) | ||||||||||||||||
| NET ASSET VALUE, END OF PERIOD | $ | 24.84 | $ | 21.75 | $ | 17.46 | $ | 19.97 | $ | 18.06 | $ | 15.57 | ||||||||||||
| TOTAL RETURN | 14.21 | %(b) | 24.57 | % | (10.36 | )% | 18.44 | % | 25.93 | % | 9.08 | % | ||||||||||||
| RATIOS/SUPPLEMENTAL DATA: | ||||||||||||||||||||||||
| Net Assets, End of Period (000s) | $ | 105,278 | $ | 114,033 | $ | 112,526 | $ | 23,517 | $ | 15,870 | $ | 1,842 | ||||||||||||
| RATIOS TO AVERAGE NET ASSETS: | ||||||||||||||||||||||||
| Net Investment loss | (0.65 | )%(c) | (0.61 | )% | (0.84 | )% | (0.91 | )% | (1.18 | )% | (1.05 | )% | ||||||||||||
| Operating expenses excluding reimbursement/waiver | 1.09 | %(c) | 1.12 | % | 1.19 | % | 1.27 | % | 1.34 | % | 1.43 | % | ||||||||||||
| Operating expenses including reimbursement/waiver | 1.09 | %(c) | 1.12 | % | 1.19 | % | 1.27 | % | 1.34 | % | 1.34 | % | ||||||||||||
| PORTFOLIO TURNOVER RATE | 31 | %(b) | 54 | % | 45 | % | 68 | % | �� | 70 | % | 78 | % | |||||||||||
| (a) | Per share amounts are based upon average shares outstanding. |
| (b) | Not Annualized. |
| (c) | Annualized. |
See Notes to Financial Statements.
| Semi-Annual Report | October 31, 2017 | 41 |
| Emerald Small Cap Value Fund | Financial Highlights |
For a share outstanding throughout the periods presented
| CLASS A | ||||||||||||||||
| For the Six Months Ended October 31, 2017 (Unaudited) | Year Ended April 30, 2017 | For the Period October 1, 2015 to April 30, 2016(a) | Period Ended September 30, 2015(b) | |||||||||||||
| NET ASSET VALUE, BEGINNING OF PERIOD | $ | 16.27 | $ | 13.00 | $ | 12.70 | $ | 14.12 | ||||||||
| INCOME/(LOSS) FROM OPERATIONS: | ||||||||||||||||
| Net investment income/(loss)(c) | 0.01 | (0.07 | )(d) | (0.09 | ) | (0.01 | ) | |||||||||
| Net realized and unrealized gain/(loss) on investments | 1.53 | 3.34 | 0.44 | (1.03 | ) | |||||||||||
| Total from Investment Operations | 1.54 | 3.27 | 0.35 | (1.04 | ) | |||||||||||
| LESS DISTRIBUTIONS: | ||||||||||||||||
| From investment income | – | – | (0.05 | ) | – | |||||||||||
| From capital gains | – | – | – | (0.38 | ) | |||||||||||
| Total Distributions | – | – | (0.05 | ) | (0.38 | ) | ||||||||||
| NET INCREASE/(DECREASE) IN NET ASSET VALUE | 1.54 | 3.27 | 0.30 | (1.42 | ) | |||||||||||
| NET ASSET VALUE, END OF PERIOD | $ | 17.81 | $ | 16.27 | $ | 13.00 | $ | 12.70 | ||||||||
| TOTAL RETURN(e) | 9.47 | %(f) | 25.15 | % | 2.77 | %(f) | (7.49 | )%(f) | ||||||||
| RATIOS/SUPPLEMENTAL DATA: | ||||||||||||||||
| Net Assets, End of Period (000s) | $ | 2,753 | $ | 1,909 | $ | 340 | $ | 14 | ||||||||
| RATIOS TO AVERAGE NET ASSETS: | ||||||||||||||||
| Net Investment income/(loss) | 0.10 | %(g) | (0.46 | )% | (1.13 | )%(g) | (0.24 | )%(g) | ||||||||
| Operating expenses excluding reimbursement/waiver | 2.50 | %(g) | 2.26 | % | 2.69 | %(g) | 2.16 | %(g) | ||||||||
| Operating expenses including reimbursement/waiver | 1.35 | %(g) | 1.35 | % | 1.35 | %(g) | 1.35 | %(g) | ||||||||
| PORTFOLIO TURNOVER RATE | 29 | %(f) | 66 | % | 31 | %(f) | 69 | %(f)(h) | ||||||||
| (a) | Effective March 3, 2015 the Board approved changing the fiscal year-end of the Fund from September 30 to April 30. |
| (b) | Class A commenced operations on June 30, 2015. |
| (c) | Per share amounts are based upon average shares outstanding. |
| (d) | The amount shown for a share outstanding throughout the period may not correlate with the Statement of Operations for the period due to the timing of sales and redemptions of Fund shares in relation to income earned and/or fluctuating market value of the investments of the Fund. |
| (e) | Total return does not reflect the effect of sales charges. |
| (f) | Not Annualized. |
| (g) | Annualized. |
| (h) | Portfolio turnover rate is calculated at the Fund level and represents the year ended September 30, 2015. |
See Notes to Financial Statements.
| 42 | www.emeraldmutualfunds.com |
| Emerald Small Cap Value Fund | Financial Highlights |
For a share outstanding throughout the periods presented
| CLASS C | ||||||||||||||||
| For the Six Months Ended October 31, 2017 (Unaudited) | Year Ended April 30, 2017 | For the Period October 1, 2015 to April 30, 2016(a) | Period Ended September 30, 2015(b) | |||||||||||||
| NET ASSET VALUE, BEGINNING OF PERIOD | $ | 16.10 | $ | 12.94 | $ | 12.68 | $ | 14.12 | ||||||||
| INCOME/(LOSS) FROM OPERATIONS: | ||||||||||||||||
| Net investment loss(c) | (0.04 | )(d) | (0.13 | )(d) | (0.14 | ) | (0.03 | ) | ||||||||
| Net realized and unrealized gain/(loss) on investments | 1.50 | 3.29 | 0.43 | (1.03 | ) | |||||||||||
| Total from Investment Operations | 1.46 | 3.16 | 0.29 | (1.06 | ) | |||||||||||
| LESS DISTRIBUTIONS: | ||||||||||||||||
| From investment income | – | – | (0.03 | ) | – | |||||||||||
| From capital gains | – | – | – | (0.38 | ) | |||||||||||
| Total Distributions | – | – | (0.03 | ) | (0.38 | ) | ||||||||||
| NET INCREASE/(DECREASE) IN NET ASSET VALUE | 1.46 | 3.16 | 0.26 | (1.44 | ) | |||||||||||
| NET ASSET VALUE, END OF PERIOD | $ | 17.56 | $ | 16.10 | $ | 12.94 | $ | 12.68 | ||||||||
| TOTAL RETURN(e) | 9.07 | %(f) | 24.42 | % | 2.28 | %(f) | (7.63 | )%(f) | ||||||||
| RATIOS/SUPPLEMENTAL DATA: | ||||||||||||||||
| Net Assets, End of Period (000s) | $ | 105 | $ | 211 | $ | 566 | $ | 14 | ||||||||
| RATIOS TO AVERAGE NET ASSETS: | ||||||||||||||||
| Net Investment loss | (0.48 | )%(g) | (0.93 | )% | (2.06 | )%(g) | (0.89 | )%(g) | ||||||||
| Operating expenses excluding reimbursement/waiver | 3.18 | %(g) | 2.70 | % | 3.37 | %(g) | 2.81 | %(g) | ||||||||
| Operating expenses including reimbursement/waiver | 2.00 | %(g) | 2.00 | % | 2.00 | %(g) | 2.00 | %(g) | ||||||||
| PORTFOLIO TURNOVER RATE | 29 | %(f) | 66 | % | 31 | %(f) | 69 | %(f)(h) | ||||||||
| (a) | Effective March 3, 2015 the Board approved changing the fiscal year-end of the Fund from September 30 to April 30. |
| (b) | Class C commenced operations on June 30, 2015. |
| (c) | Per share amounts are based upon average shares outstanding. |
| (d) | The amount shown for a share outstanding throughout the period may not correlate with the Statement of Operations for the period due to the timing of sales and redemptions of Fund shares in relation to income earned and/or fluctuating market value of the investments of the Fund. |
| (e) | Total return does not reflect the effect of sales charges. |
| (f) | Not Annualized. |
| (g) | Annualized. |
| (h) | Portfolio turnover rate is calculated at the Fund level and represents the year ended September 30, 2015. |
See Notes to Financial Statements.
| Semi-Annual Report | October 31, 2017 | 43 |
| Emerald Small Cap Value Fund | Financial Highlights |
For a share outstanding throughout the periods presented
| INSTITUTIONAL CLASS | ||||||||||||||||||||||||
| For the Six Months Ended October 31, 2017 (Unaudited) | Year Ended April 30, 2017 | For the Period October 1, 2015 to April 30, 2016(a) | Year Ended September 30, 2015(b) | Year Ended September 30, 2014 | Period Ended September 30, 2013(c) | |||||||||||||||||||
| NET ASSET VALUE, BEGINNING OF PERIOD | $ | 16.35 | $ | 13.02 | $ | 12.71 | $ | 12.76 | $ | 12.56 | $ | 10.00 | ||||||||||||
| INCOME FROM OPERATIONS: | ||||||||||||||||||||||||
| Net investment income/(loss)(d) | 0.04 | 0.02 | (0.01 | ) | 0.06 | 0.09 | 0.05 | |||||||||||||||||
| Net realized and unrealized gain on investments | 1.54 | 3.31 | 0.38 | 0.33 | 0.76 | 2.54 | ||||||||||||||||||
| Total from Investment Operations | 1.58 | 3.33 | 0.37 | 0.39 | 0.85 | 2.59 | ||||||||||||||||||
| LESS DISTRIBUTIONS: | ||||||||||||||||||||||||
| From investment income | – | – | (0.06 | ) | (0.06 | ) | (0.01 | ) | (0.03 | ) | ||||||||||||||
| From capital gains | – | – | – | (0.38 | ) | (0.64 | ) | – | ||||||||||||||||
| Total Distributions | – | – | (0.06 | ) | (0.44 | ) | (0.65 | ) | (0.03 | ) | ||||||||||||||
| NET INCREASE/(DECREASE) IN NET ASSET VALUE | 1.58 | 3.33 | 0.31 | (0.05 | ) | 0.20 | 2.56 | |||||||||||||||||
| NET ASSET VALUE, END OF PERIOD | $ | 17.93 | $ | 16.35 | $ | 13.02 | $ | 12.71 | $ | 12.76 | $ | 12.56 | ||||||||||||
| TOTAL RETURN | 9.66 | %(e) | 25.58 | % | 2.94 | %(e) | 2.93 | % | 6.64 | % | 25.99 | %(e) | ||||||||||||
| SUPPLEMENTAL DATA: | ||||||||||||||||||||||||
| Net Assets, End of Period (000s) | $ | 4,932 | $ | 4,989 | $ | 13,691 | $ | 16,507 | $ | 24,343 | $ | 8,442 | ||||||||||||
| RATIOS TO AVERAGE NET ASSETS: | ||||||||||||||||||||||||
| Net Investment income/(loss) | 0.48 | %(f) | 0.13 | % | (0.07 | )%(f) | 0.45 | % | 0.65 | % | 0.48 | %(f) | ||||||||||||
| Operating expenses excluding reimbursement/waiver | 2.16 | %(f) | 1.56 | % | 1.75 | %(f) | 1.43 | % | 1.29 | % | 1.95 | %(f) | ||||||||||||
| Operating expenses including reimbursement/waiver | 1.00 | %(f) | 1.00 | % | 1.00 | %(f) | 1.00 | % | 1.00 | % | 1.00 | %(f) | ||||||||||||
| PORTFOLIO TURNOVER RATE | 29 | %(e) | 66 | % | 31 | %(e) | 69 | % | 49 | % | 67 | %(e) | ||||||||||||
| (a) | Effective March 3, 2015 the Board approved changing the fiscal year-end of the Fund from September 30 to April 30. |
| (b) | Prior to its June 26, 2015 reorganization with and into the Emerald Small Cap Value Fund, the Fund was known as the Elessar Small Cap Value Fund. |
| (c) | For the period October 15, 2012 (commencement of investment operations) through September 30, 2013. |
| (d) | Per share amounts are based upon average shares outstanding. |
| (e) | Not Annualized. |
| (f) | Annualized. |
See Notes to Financial Statements.
| 44 | www.emeraldmutualfunds.com |
| Emerald Small Cap Value Fund | Financial Highlights |
For a share outstanding throughout the periods presented
| INVESTOR CLASS | ||||||||||||||||||||||||
| For the Six Months Ended October 31, 2017 (Unaudited) | Year Ended April 30, 2017 | For the Period October 1, 2015 to April 30, 2016(a) | Year Ended September 30, 2015(b) | Year Ended September 30, 2014 | Period Ended September 30, 2013(c) | |||||||||||||||||||
| NET ASSET VALUE, BEGINNING OF PERIOD | $ | 16.26 | $ | 12.98 | $ | 12.68 | $ | 12.73 | $ | 12.54 | $ | 10.00 | ||||||||||||
| INCOME FROM OPERATIONS: | ||||||||||||||||||||||||
| Net investment income/(loss)(d) | 0.02 | (0.02 | )(e) | (0.02 | ) | 0.03 | 0.07 | 0.02 | ||||||||||||||||
| Net realized and unrealized gain on investments | 1.54 | 3.30 | 0.37 | 0.35 | 0.76 | 2.54 | ||||||||||||||||||
| Total from Investment Operations | 1.56 | 3.28 | 0.35 | 0.38 | 0.83 | 2.56 | ||||||||||||||||||
| LESS DISTRIBUTIONS: | ||||||||||||||||||||||||
| From investment income | – | – | (0.05 | ) | (0.05 | ) | – | (0.02 | ) | |||||||||||||||
| From capital gains | – | – | – | (0.38 | ) | (0.64 | ) | – | ||||||||||||||||
| Total Distributions | – | – | (0.05 | ) | (0.43 | ) | (0.64 | ) | (0.02 | ) | ||||||||||||||
| NET INCREASE/(DECREASE) IN NET ASSET VALUE | 1.56 | 3.28 | 0.30 | (0.05 | ) | 0.19 | 2.54 | |||||||||||||||||
| NET ASSET VALUE, END OF PERIOD | $ | 17.82 | $ | 16.26 | $ | 12.98 | $ | 12.68 | $ | 12.73 | $ | 12.54 | ||||||||||||
| TOTAL RETURN | 9.59 | %(f) | 25.27 | % | 2.80 | %(f) | 2.82 | % | 6.46 | % | 25.69 | %(f) | ||||||||||||
| SUPPLEMENTAL DATA: | ||||||||||||||||||||||||
| Net Assets, End of Period (000s) | $ | 694 | $ | 614 | $ | 1,946 | $ | 399 | $ | 474 | $ | 271 | ||||||||||||
| RATIOS TO AVERAGE NET ASSETS: | ||||||||||||||||||||||||
| Net Investment income/(loss) | 0.22 | %(g) | (0.11 | )% | (0.25 | )%(g) | 0.22 | % | 0.52 | % | 0.16 | %(g) | ||||||||||||
| Operating expenses excluding reimbursement/waiver | 2.41 | %(g) | 1.83 | % | 2.14 | %(g) | 1.67 | % | 1.56 | % | 2.49 | %(g) | ||||||||||||
| Operating expenses including reimbursement/waiver | 1.25 | %(g) | 1.25 | % | 1.25 | %(g) | 1.25 | % | 1.25 | % | 1.25 | %(g) | ||||||||||||
| PORTFOLIO TURNOVER RATE | 29 | %(f) | 66 | % | 31 | %(f) | 69 | % | 49 | % | 67 | %(f) | ||||||||||||
| (a) | Effective March 3, 2015 the Board approved changing the fiscal year-end of the Fund from September 30 to April 30. |
| (b) | Prior to its June 26, 2015 reorganization with and into the Emerald Small Cap Value Fund, the Fund was known as the Elessar Small Cap Value Fund. |
| (c) | For the period October 15, 2012 (commencement of investment operations) through September 30, 2013. |
| (d) | Per share amounts are based upon average shares outstanding. |
| (e) | The amount shown for a share outstanding throughout the period may not correlate with the Statement of Operations for the period due to the timing of sales and redemptions of Fund shares in relation to income earned and/or fluctuating market value of the investments of the Fund. |
| (f) | Not Annualized. |
| (g) | Annualized. |
See Notes to Financial Statements.
| Semi-Annual Report | October 31, 2017 | 45 |
| Emerald Insights Fund | Financial Highlights |
For a share outstanding throughout the period presented
| CLASS A | ||||||||||||||||
| For the Six Months Ended October 31, 2017 (Unaudited) | Year Ended April 30, 2017 | Year Ended April 30, 2016 | For the Period August 1, 2014 (Inception) to April 30, 2015 | |||||||||||||
| NET ASSET VALUE, BEGINNING OF PERIOD | $ | 11.33 | $ | 9.69 | $ | 10.98 | $ | 10.00 | ||||||||
| INCOME/(LOSS) FROM OPERATIONS: | ||||||||||||||||
| Net investment loss(a) | (0.03 | ) | (0.06 | ) | (0.05 | ) | (0.05 | ) | ||||||||
| Net realized and unrealized gain/(loss) on investments | 1.06 | 1.70 | (1.24 | ) | 1.03 | |||||||||||
| Total from Investment Operations | 1.03 | 1.64 | (1.29 | ) | 0.98 | |||||||||||
| NET INCREASE/(DECREASE) IN NET ASSET VALUE | 1.03 | 1.64 | (1.29 | ) | 0.98 | |||||||||||
| NET ASSET VALUE, END OF PERIOD | $ | 12.36 | $ | 11.33 | $ | 9.69 | $ | 10.98 | ||||||||
| TOTAL RETURN(b) | 9.09 | %(c) | 16.92 | % | (11.75 | %) | 9.80 | %(c) | ||||||||
| RATIOS/SUPPLEMENTAL DATA: | ||||||||||||||||
| Net Assets, End of Period (000s) | $ | 9,378 | $ | 10,127 | $ | 11,388 | $ | 6,493 | ||||||||
| RATIOS TO AVERAGE NET ASSETS: | ||||||||||||||||
| Net Investment loss | (0.53 | %)(d) | (0.57 | %) | (0.54 | %) | (0.66 | %)(d) | ||||||||
| Operating expenses excluding reimbursement/waiver | 2.10 | %(d) | 2.10 | % | 2.01 | % | 2.57 | %(d)(e) | ||||||||
| Operating expenses including reimbursement/waiver | 1.35 | %(d) | 1.35 | % | 1.35 | % | 1.35 | %(d)(e) | ||||||||
| PORTFOLIO TURNOVER RATE | 49 | %(c) | 75 | % | 99 | % | 88 | %(c) | ||||||||
| (a) | Per share amounts are based upon average shares outstanding. |
| (b) | Total return does not reflect the effect of sales charges. |
| (c) | Not Annualized. |
| (d) | Annualized. |
| (e) | Expense ratios before reductions for startup costs may not be representative of longer term operating periods. |
See Notes to Financial Statements.
| 46 | www.emeraldmutualfunds.com |
| Emerald Insights Fund | Financial Highlights |
For a share outstanding throughout the period presented
| CLASS C | ||||||||||||||||
| For the Six Months Ended October 31, 2017 (Unaudited) | Year Ended April 30, 2017 | Year Ended April 30, 2016 | For the Period August 1, 2014 (Inception) to April 30, 2015 | |||||||||||||
| NET ASSET VALUE, BEGINNING OF PERIOD | $ | 11.11 | $ | 9.56 | $ | 10.92 | $ | 10.00 | ||||||||
| INCOME/(LOSS) FROM OPERATIONS: | ||||||||||||||||
| Net investment loss(a) | (0.07 | ) | (0.13 | ) | (0.11 | ) | (0.10 | ) | ||||||||
| Net realized and unrealized gain/(loss) on investments | 1.04 | 1.68 | (1.25 | ) | 1.02 | |||||||||||
| Total from Investment Operations | 0.97 | 1.55 | (1.36 | ) | 0.92 | |||||||||||
| NET INCREASE/(DECREASE) IN NET ASSET VALUE | 0.97 | 1.55 | (1.36 | ) | 0.92 | |||||||||||
| NET ASSET VALUE, END OF PERIOD | $ | 12.08 | $ | 11.11 | $ | 9.56 | $ | 10.92 | ||||||||
| TOTAL RETURN(b) | 8.73 | %(c) | 16.21 | % | (12.45 | %) | 9.20 | %(c) | ||||||||
| RATIOS/SUPPLEMENTAL DATA: | ||||||||||||||||
| Net Assets, End of Period (000s) | $ | 121 | $ | 112 | $ | 101 | $ | 27 | ||||||||
| RATIOS TO AVERAGE NET ASSETS: | ||||||||||||||||
| Net Investment loss | (1.18 | %)(d) | (1.22 | %) | (1.17 | %) | (1.34 | %)(d) | ||||||||
| Operating expenses excluding reimbursement/waiver | 2.75 | %(d) | 2.76 | % | 2.70 | % | 7.25 | %(d)(e) | ||||||||
| Operating expenses including reimbursement/waiver | 2.00 | %(d) | 2.00 | % | 2.00 | % | 2.00 | %(d)(e) | ||||||||
| PORTFOLIO TURNOVER RATE | 49 | %(c) | 75 | % | 99 | % | 88 | %(c) | ||||||||
| (a) | Per share amounts are based upon average shares outstanding. |
| (b) | Total return does not reflect the effect of sales charges. |
| (c) | Not Annualized. |
| (d) | Annualized. |
| (e) | Expense ratios before reductions for startup costs may not be representative of longer term operating periods. |
See Notes to Financial Statements.
| Semi-Annual Report | October 31, 2017 | 47 |
| Emerald Insights Fund | Financial Highlights |
For a share outstanding throughout the period presented
| INSTITUTIONAL CLASS | ||||||||||||||||
| For the Six Months Ended October 31, 2017 (Unaudited) | Year Ended April 30, 2017 | Year Ended April 30, 2016 | For the Period August 1, 2014 (Inception) to April 30, 2015 | |||||||||||||
| NET ASSET VALUE, BEGINNING OF PERIOD | $ | 11.41 | $ | 9.73 | $ | 10.99 | $ | 10.00 | ||||||||
| INCOME/(LOSS) FROM OPERATIONS: | ||||||||||||||||
| Net investment loss(a) | (0.01 | ) | (0.03 | ) | (0.00 | )(b) | (0.03 | ) | ||||||||
| Net realized and unrealized gain/(loss) on investments | 1.07 | 1.71 | (1.26 | ) | 1.02 | |||||||||||
| Total from Investment Operations | 1.06 | 1.68 | (1.26 | ) | 0.99 | |||||||||||
| NET INCREASE/(DECREASE) IN NET ASSET VALUE | 1.06 | 1.68 | (1.26 | ) | 0.99 | |||||||||||
| NET ASSET VALUE, END OF PERIOD | $ | 12.47 | $ | 11.41 | $ | 9.73 | $ | 10.99 | ||||||||
| TOTAL RETURN | 9.29 | %(c) | 17.27 | % | (11.46 | %) | 9.90 | %(c) | ||||||||
| RATIOS/SUPPLEMENTAL DATA: | ||||||||||||||||
| Net Assets, End of Period (000s) | $ | 1,140 | $ | 1,048 | $ | 1,729 | $ | 279 | ||||||||
| RATIOS TO AVERAGE NET ASSETS: | ||||||||||||||||
| Net Investment loss | (0.23 | %)(d) | (0.28 | %) | (0.05 | %) | (0.34 | %)(d) | ||||||||
| Operating expenses excluding reimbursement/waiver | 1.80 | %(d) | 1.78 | % | 1.90 | % | 4.66 | %(d)(e) | ||||||||
| Operating expenses including reimbursement/waiver | 1.05 | %(d) | 1.05 | % | 1.05 | % | 1.05 | %(d)(e) | ||||||||
| PORTFOLIO TURNOVER RATE | 49 | %(c) | 75 | % | 99 | % | 88 | %(c) | ||||||||
| (a) | Per share amounts are based upon average shares outstanding. |
| (b) | Less than $0.005 per share. |
| (c) | Not Annualized. |
| (d) | Annualized. |
| (e) | Expense ratios before reductions for startup costs may not be representative of longer term operating periods. |
See Notes to Financial Statements.
| 48 | www.emeraldmutualfunds.com |
| Emerald Insights Fund | Financial Highlights |
For a share outstanding throughout the period presented
| INVESTOR CLASS | ||||||||||||||||
| For the Six Months Ended October 31, 2017 (Unaudited) | Year Ended April 30, 2017 | Year Ended April 30, 2016 | For the Period August 1, 2014 (Inception) to April 30, 2015 | |||||||||||||
| NET ASSET VALUE, BEGINNING OF PERIOD | $ | 11.29 | $ | 9.67 | $ | 10.96 | $ | 10.00 | ||||||||
| INCOME/(LOSS) FROM OPERATIONS: | ||||||||||||||||
| Net investment loss(a) | (0.03 | ) | (0.07 | ) | (0.08 | ) | (0.05 | ) | ||||||||
| Net realized and unrealized gain/(loss) on investments | 1.06 | 1.69 | (1.21 | ) | 1.01 | |||||||||||
| Total from Investment Operations | 1.03 | 1.62 | (1.29 | ) | 0.96 | |||||||||||
| NET INCREASE/(DECREASE) IN NET ASSET VALUE | 1.03 | 1.62 | (1.29 | ) | 0.96 | |||||||||||
| NET ASSET VALUE, END OF PERIOD | $ | 12.32 | $ | 11.29 | $ | 9.67 | $ | 10.96 | ||||||||
| TOTAL RETURN | 9.12 | %(b) | 16.75 | % | (11.77 | %) | 9.60 | %(b) | ||||||||
| RATIOS/SUPPLEMENTAL DATA: | ||||||||||||||||
| Net Assets, End of Period (000s) | $ | 102 | $ | 88 | $ | 86 | $ | 448 | ||||||||
| RATIOS TO AVERAGE NET ASSETS: | ||||||||||||||||
| Net Investment loss | (0.59 | %)(c) | (0.63 | %) | (0.72 | %) | (0.67 | %)(c) | ||||||||
| Operating expenses excluding reimbursement/waiver | 2.15 | %(c) | 2.09 | % | 1.91 | % | 2.96 | %(c)(d) | ||||||||
| Operating expenses including reimbursement/waiver | 1.40 | %(c) | 1.40 | % | 1.40 | % | 1.40 | %(c)(d) | ||||||||
| PORTFOLIO TURNOVER RATE | 49 | %(b) | 75 | % | 99 | % | 88 | %(b) | ||||||||
| (a) | Per share amounts are based upon average shares outstanding. |
| (b) | Not Annualized. |
| (c) | Annualized. |
| (d) | Expense ratios before reductions for startup costs may not be representative of longer term operating periods. |
See Notes to Financial Statements.
| Semi-Annual Report | October 31, 2017 | 49 |
| Emerald Banking and Finance Fund | Financial Highlights |
For a share outstanding throughout the periods presented
| CLASS A | ||||||||||||||||||||||||
| For the Six Months Ended October 31, 2017 (Unaudited) | Year Ended April 30, 2017 | Year Ended April 30, 2016 | Year Ended April 30, 2015 | Year Ended April 30, 2014 | Year Ended April 30, 2013 | |||||||||||||||||||
| NET ASSET VALUE, BEGINNING OF PERIOD | $ | 41.61 | $ | 31.27 | $ | 28.85 | $ | 26.11 | $ | 20.08 | $ | 16.96 | ||||||||||||
| INCOME/(LOSS) FROM OPERATIONS:(a) | ||||||||||||||||||||||||
| Net investment loss(b) | (0.12 | ) | (0.17 | ) | (0.06 | ) | (0.16 | ) | (0.13 | ) | (0.01 | ) | ||||||||||||
| Net realized and unrealized gain on investments | 3.89 | 10.51 | 2.48 | 2.90 | 6.16 | 3.13 | ||||||||||||||||||
| Total from Investment Operations | 3.77 | 10.34 | 2.42 | 2.74 | 6.03 | 3.12 | ||||||||||||||||||
| NET INCREASE IN NET ASSET VALUE | 3.77 | 10.34 | 2.42 | 2.74 | 6.03 | 3.12 | ||||||||||||||||||
| NET ASSET VALUE, END OF PERIOD | $ | 45.38 | $ | 41.61 | $ | 31.27 | $ | 28.85 | $ | 26.11 | $ | 20.08 | ||||||||||||
| TOTAL RETURN(c) | 9.06 | %(d) | 33.07 | % | 8.39 | % | 10.49 | % | 30.03 | % | 18.40 | % | ||||||||||||
| RATIOS/SUPPLEMENTAL DATA: | ||||||||||||||||||||||||
| Net Assets, End of Period (000s) | $ | 176,464 | $ | 172,106 | $ | 110,601 | $ | 48,575 | $ | 48,622 | $ | 25,496 | ||||||||||||
| RATIOS TO AVERAGE NET ASSETS: | ||||||||||||||||||||||||
| Net Investment loss | (0.55 | )%(e) | (0.46 | )% | (0.21 | )% | (0.58 | )% | (0.53 | )% | (0.06 | )% | ||||||||||||
| Operating expenses excluding reimbursement/waiver | 1.40 | %(e) | 1.43 | % | 1.48 | % | 1.60 | % | 1.72 | % | 1.88 | % | ||||||||||||
| Operating expenses including reimbursement/waiver | 1.40 | %(e) | 1.43 | % | 1.48 | % | 1.60 | % | 1.72 | % | 1.84 | % | ||||||||||||
| PORTFOLIO TURNOVER RATE | 21 | %(d) | 36 | % | 30 | % | 33 | % | 34 | % | 53 | % | ||||||||||||
| (a) | The amount shown for a share outstanding throughout the period may not correlate with the Statement of Operations for the period due to the timing of sales and redemptions of Fund shares in relation to income earned and/or fluctuating market value of the investments of the Fund. |
| (b) | Per share amounts are based upon average shares outstanding. |
| (c) | Total return does not reflect the effect of sales charges. |
| (d) | Not Annualized. |
| (e) | Annualized. |
See Notes to Financial Statements.
| 50 | www.emeraldmutualfunds.com |
| Emerald Banking and Finance Fund | Financial Highlights |
For a share outstanding throughout the periods presented
| CLASS C | ||||||||||||||||||||||||
| For the Six Months Ended October 31, 2017 (Unaudited) | Year Ended April 30, 2017 | Year Ended April 30, 2016 | Year Ended April 30, 2015 | Year Ended April 30, 2014 | Year Ended April 30, 2013 | |||||||||||||||||||
| NET ASSET VALUE, BEGINNING OF PERIOD | $ | 37.29 | $ | 28.20 | $ | 26.19 | $ | 23.86 | $ | 18.46 | $ | 15.70 | ||||||||||||
| INCOME/(LOSS) FROM OPERATIONS:(a) | ||||||||||||||||||||||||
| Net investment loss(b) | (0.23 | ) | (0.36 | ) | (0.24 | ) | (0.30 | ) | (0.26 | ) | (0.11 | ) | ||||||||||||
| Net realized and unrealized gain on investments | 3.48 | 9.45 | 2.25 | 2.63 | 5.66 | 2.87 | ||||||||||||||||||
| Total from Investment Operations | 3.25 | 9.09 | 2.01 | 2.33 | 5.40 | 2.76 | ||||||||||||||||||
| NET INCREASE IN NET ASSET VALUE | 3.25 | 9.09 | 2.01 | 2.33 | 5.40 | 2.76 | ||||||||||||||||||
| NET ASSET VALUE, END OF PERIOD | $ | 40.54 | $ | 37.29 | $ | 28.20 | $ | 26.19 | $ | 23.86 | $ | 18.46 | ||||||||||||
| TOTAL RETURN(c) | 8.72 | %(d) | 32.23 | % | 7.67 | % | 9.77 | % | 29.25 | % | 17.58 | % | ||||||||||||
| RATIOS/SUPPLEMENTAL DATA: | ||||||||||||||||||||||||
| Net Assets, End of Period (000s) | $ | 76,887 | $ | 76,072 | $ | 52,366 | $ | 31,862 | $ | 28,222 | $ | 17,705 | ||||||||||||
| RATIOS TO AVERAGE NET ASSETS: | ||||||||||||||||||||||||
| Net Investment loss | (1.20 | )%(e) | (1.11 | )% | (0.87 | )% | (1.23 | )% | (1.18 | )% | (0.68 | )% | ||||||||||||
| Operating expenses excluding reimbursement/waiver | 2.05 | %(e) | 2.08 | % | 2.13 | % | 2.25 | % | 2.38 | % | 2.54 | % | ||||||||||||
| Operating expenses including reimbursement/waiver | 2.05 | %(e) | 2.08 | % | 2.13 | % | 2.25 | % | 2.38 | % | 2.49 | % | ||||||||||||
| PORTFOLIO TURNOVER RATE | 21 | %(d) | 36 | % | 30 | % | 33 | % | 34 | % | 53 | % | ||||||||||||
| (a) | The amount shown for a share outstanding throughout the period may not correlate with the Statement of Operations for the period due to the timing of sales and redemptions of Fund shares in relation to income earned and/or fluctuating market value of the investments of the Fund. |
| (b) | Per share amounts are based upon average shares outstanding. |
| (c) | Total return does not reflect the effect of sales charges. |
| (d) | Not Annualized. |
| (e) | Annualized. |
See Notes to Financial Statements.
| Semi-Annual Report | October 31, 2017 | 51 |
| Emerald Banking and Finance Fund | Financial Highlights |
For a share outstanding throughout the periods presented
| INSTITUTIONAL CLASS | ||||||||||||||||||||||||
| For the Six Months Ended October 31, 2017 (Unaudited) | Year Ended April 30, 2017 | Year Ended April 30, 2016 | Year Ended April 30, 2015 | Year Ended April 30, 2014 | Year Ended April 30, 2013 | |||||||||||||||||||
| NET ASSET VALUE, BEGINNING OF PERIOD | $ | 42.30 | $ | 31.69 | $ | 29.15 | $ | 26.29 | $ | 20.15 | $ | 16.96 | ||||||||||||
| INCOME/(LOSS) FROM OPERATIONS: | ||||||||||||||||||||||||
| Net investment income/(loss)(a) | (0.06 | ) | (0.05 | ) | 0.03 | (0.07 | ) | (0.06 | ) | 0.01 | ||||||||||||||
| Net realized and unrealized gain on investments | 3.97 | 10.66 | 2.51 | 2.93 | 6.20 | 3.18 | ||||||||||||||||||
| Total from Investment Operations | 3.91 | 10.61 | 2.54 | 2.86 | 6.14 | 3.19 | ||||||||||||||||||
| NET INCREASE IN NET ASSET VALUE | 3.91 | 10.61 | 2.54 | 2.86 | 6.14 | 3.19 | ||||||||||||||||||
| NET ASSET VALUE, END OF PERIOD | $ | 46.21 | $ | 42.30 | $ | 31.69 | $ | 29.15 | $ | 26.29 | $ | 20.15 | ||||||||||||
| TOTAL RETURN | 9.24 | %(b) | 33.48 | % | 8.71 | % | 10.88 | % | 30.47 | % | 18.81 | % | ||||||||||||
| RATIOS/SUPPLEMENTAL DATA: | ||||||||||||||||||||||||
| Net Assets, End of Period (000s) | $ | 185,716 | $ | 134,027 | $ | 61,654 | $ | 23,730 | $ | 22,062 | $ | 4,321 | ||||||||||||
| RATIOS TO AVERAGE NET ASSETS: | ||||||||||||||||||||||||
| Net Investment income/(loss) | (0.27 | )%(c) | (0.14 | )% | 0.11 | % | (0.25 | )% | (0.23 | )% | 0.06 | % | ||||||||||||
| Operating expenses excluding reimbursement/waiver | 1.10 | %(c) | 1.11 | % | 1.15 | % | 1.27 | % | 1.37 | % | 1.62 | % | ||||||||||||
| Operating expenses including reimbursement/waiver | 1.10 | %(c) | 1.11 | % | 1.15 | % | 1.27 | % | 1.37 | % | 1.54 | % | ||||||||||||
| PORTFOLIO TURNOVER RATE | 21 | %(b) | 36 | % | 30 | % | 33 | % | 34 | % | 53 | % | ||||||||||||
| (a) | Per share amounts are based upon average shares outstanding. |
| (b) | Not Annualized. |
| (c) | Annualized. |
See Notes to Financial Statements.
| 52 | www.emeraldmutualfunds.com |
| Emerald Banking and Finance Fund | Financial Highlights |
For a share outstanding throughout the periods presented
| INVESTOR CLASS | ||||||||||||||||||||||||
| For the Six Months Ended October 31, 2017 (Unaudited) | Year Ended April 30, 2017 | Year Ended April 30, 2016 | Year Ended April 30, 2015 | Year Ended April 30, 2014 | Year Ended April 30, 2013 | |||||||||||||||||||
| NET ASSET VALUE, BEGINNING OF PERIOD | $ | 39.86 | $ | 29.95 | $ | 27.64 | $ | 25.01 | $ | 19.23 | $ | 16.25 | ||||||||||||
| INCOME/(LOSS) FROM OPERATIONS:(a) | ||||||||||||||||||||||||
| Net investment loss(b) | (0.12 | ) | (0.16 | ) | (0.07 | ) | (0.15 | ) | (0.12 | ) | (0.01 | ) | ||||||||||||
| Net realized and unrealized gain on investments | 3.73 | 10.07 | 2.38 | 2.78 | 5.90 | 2.99 | ||||||||||||||||||
| Total from Investment Operations | 3.61 | 9.91 | 2.31 | 2.63 | 5.78 | 2.98 | ||||||||||||||||||
| NET INCREASE IN NET ASSET VALUE | 3.61 | 9.91 | 2.31 | 2.63 | 5.78 | 2.98 | ||||||||||||||||||
| NET ASSET VALUE, END OF PERIOD | $ | 43.47 | $ | 39.86 | $ | 29.95 | $ | 27.64 | $ | 25.01 | $ | 19.23 | ||||||||||||
| TOTAL RETURN | 9.06 | %(c) | 33.09 | % | 8.36 | % | 10.52 | % | 30.06 | % | 18.34 | % | ||||||||||||
| RATIOS/SUPPLEMENTAL DATA: | ||||||||||||||||||||||||
| Net Assets, End of Period (000s) | $ | 63,294 | $ | 85,557 | $ | 80,404 | $ | 27,440 | $ | 19,235 | $ | 6,255 | ||||||||||||
| RATIOS TO AVERAGE NET ASSETS: | ||||||||||||||||||||||||
| Net Investment loss | (0.59 | )%(d) | (0.46 | )% | (0.23 | )% | (0.56 | )% | (0.53 | )% | (0.08 | )% | ||||||||||||
| Operating expenses excluding reimbursement/waiver | 1.45 | %(d) | 1.43 | % | 1.48 | % | 1.58 | % | 1.69 | % | 1.94 | % | ||||||||||||
| Operating expenses including reimbursement/waiver | 1.45 | %(d) | 1.43 | % | 1.48 | % | 1.58 | % | 1.69 | % | 1.89 | % | ||||||||||||
| PORTFOLIO TURNOVER RATE | 21 | %(c) | 36 | % | 30 | % | 33 | % | 34 | % | 53 | % | ||||||||||||
| (a) | The amount shown for a share outstanding throughout the period may not correlate with the Statement of Operations for the period due to the timing of sales and redemptions of Fund shares in relation to income earned and/or fluctuating market value of the investments of the Fund. |
| (b) | Per share amounts are based upon average shares outstanding. |
| (c) | Not Annualized. |
| (d) | Annualized. |
See Notes to Financial Statements.
| Semi-Annual Report | October 31, 2017 | 53 |
| Emerald Funds | Notes to Financial Statements |
October 31, 2017 (Unaudited)
1. ORGANIZATION
Financial Investors Trust (the “Trust”), a Delaware statutory trust, is an open-end management investment company registered under the Investment Company Act of 1940, as amended (the “1940 Act”). The Trust consists of multiple separate portfolios or series. This semi-annual report describes the Emerald Growth Fund, Emerald Small Cap Value Fund, Emerald Insights Fund, and Emerald Banking and Finance Fund (each a “Fund” and collectively, the “Funds”). The Emerald Small Cap Value Fund is a successor to a previously operational fund which was a series of Elessar Funds Investment Trust, a Delaware statutory trust, and was organized into a series of the Trust effective as of the close of business on June 26, 2015. Effective March 3, 2015, the Board approved changing the fiscal year end of the Emerald Small Cap Value Fund from September 30 to April 30.
The Emerald Growth Fund and Emerald Insights Fund seek to achieve long-term growth through capital appreciation. The Emerald Small Cap Value Fund seeks long-term capital appreciation. The Emerald Banking and Finance Fund seeks to achieve long term growth through capital appreciation with income as a secondary objective.
2. SIGNIFICANT ACCOUNTING POLICIES
The accompanying financial statements were prepared in accordance with accounting principles generally accepted in the United States of America (“U.S. GAAP”). The preparation of financial statements in conformity with U.S. GAAP requires management to make certain estimates and assumptions that affect the reported amounts of assets and liabilities and disclosures of contingent assets and liabilities at the date of the financial statements and the reported amounts of revenue and expenses during the period. Actual results could differ from those estimates. The Funds are considered an investment company for financial reporting purposes under U.S. GAAP. The following is a summary of significant accounting policies consistently followed by the Funds in preparation of their financial statements.
Investment Valuation: The Funds generally value their securities based on market prices determined at the close of regular trading on the New York Stock Exchange (“NYSE”), normally, 4:00 p.m. Eastern time, on each business day the NYSE is open for trading.
For equity securities and mutual funds that are traded on an exchange, the market price is usually the closing sale or official closing price on that exchange. In the case of equity securities not traded on an exchange, or if such closing prices are not otherwise available, the securities are valued at the mean of the most recent bid and ask prices on such day. Redeemable securities issued by open-end registered investment companies are valued at the investment company’s applicable net asset value, with the exception of exchange-traded open-end investment companies, which are priced as equity securities.
The market price for debt obligations is generally the price supplied by an independent third-party pricing service approved by the Board of Trustees (the “Board”), which may use a matrix, formula or other objective method that takes into consideration quotations from dealers, market transactions in comparable investments, market indices and yield curves. If vendors are unable to supply a price, or if the price supplied is deemed to be unreliable, the market price may be determined using quotations received from one or more brokers–dealers that make a market in the security.
Equity securities that are primarily traded on foreign securities exchanges are valued at the preceding closing values of such securities on their respective exchanges, except when an occurrence subsequent to the time a value was so established is likely to have changed such value. In such an event, the fair values of those securities are determined in good faith through consideration of other factors in accordance with procedures established by and under the general supervision of the Board.
When such prices or quotations are not available, or when Emerald Mutual Fund Advisers Trust, (the “Adviser”), believes that they are unreliable, securities may be priced using fair value procedures approved by the Board.
Fair Value Measurements: A three-tier hierarchy has been established to classify fair value measurements for disclosure purposes. Inputs refer broadly to the assumptions that market participants would use in pricing the asset or liability, including assumptions about risk. Inputs may be observable or unobservable. Observable inputs are inputs that reflect the assumptions market participants would use in pricing the asset or liability that are developed based on market data obtained from sources independent of the reporting entity. Unobservable inputs are inputs that reflect the reporting entity’s own assumptions about the assumptions market participants would use in pricing the asset or liability that are developed based on the best information available. Various inputs are used in determining the value of each Fund’s investments as of the reporting period end. The designated input levels are not necessarily an indication of the risk or liquidity associated with these investments.
| 54 | www.emeraldmutualfunds.com |
| Emerald Funds | Notes to Financial Statements |
October 31, 2017 (Unaudited)
These inputs are categorized in the following hierarchy under applicable financial accounting standards:
| Level 1 – | Unadjusted quoted prices in active markets for identical investments, unrestricted assets or liabilities that the Funds have the ability to access at the measurement date; |
| Level 2 – | Quoted prices which are not active, quoted prices for similar assets or liabilities in active markets or inputs other than quoted prices that are observable (either directly or indirectly) for substantially the full term of the asset or liability; and |
| Level 3 – | Significant unobservable prices or inputs (including the Funds’ own assumptions in determining the fair value of investments) where there is little or no market activity for the asset or liability at the measurement date. |
The following is a summary of each input used to value the Funds as of October 31, 2017:
| Investments in Securities at Value | Level 1 - Quoted Prices | Level 2 - Other Significant Observable Inputs | Level 3 - Significant Unobservable Inputs | Total | ||||||||||||
| Emerald Growth Fund | ||||||||||||||||
| Common Stocks(a) | $ | 1,123,003,590 | $ | – | $ | – | $ | 1,123,003,590 | ||||||||
| Short Term Investments | 20,018,391 | – | – | 20,018,391 | ||||||||||||
| TOTAL | $ | 1,143,021,981 | $ | – | $ | – | $ | 1,143,021,981 | ||||||||
| Investments in Securities at Value | Level 1 - Quoted Prices | Level 2 - Other Significant Observable Inputs | Level 3 - Significant Unobservable Inputs | Total | ||||||||||||
| Emerald Small Cap Value Fund | ||||||||||||||||
| Common Stocks(a) | $ | 8,260,559 | $ | – | $ | – | $ | 8,260,559 | ||||||||
| Short Term Investments | 250,864 | – | – | 250,864 | ||||||||||||
| TOTAL | $ | 8,511,423 | $ | – | $ | – | $ | 8,511,423 | ||||||||
| Investments in Securities at Value | Level 1 - Quoted Prices | Level 2 - Other Significant Observable Inputs | Level 3 - Significant Unobservable Inputs | Total | ||||||||||||
| Emerald Insights Fund | ||||||||||||||||
| Common Stocks(a) | $ | 10,589,829 | $ | – | $ | – | $ | 10,589,829 | ||||||||
| Master Limited Partnerships(a) | 95,318 | – | – | 95,318 | ||||||||||||
| Short Term Investments | 87,206 | – | – | 87,206 | ||||||||||||
| TOTAL | $ | 10,772,353 | $ | – | $ | – | $ | 10,772,353 | ||||||||
| Investments in Securities at Value | Level 1 - Quoted Prices | Level 2 - Other Significant Observable Inputs | Level 3 - Significant Unobservable Inputs | Total | ||||||||||||
| Emerald Banking and Finance Fund | ||||||||||||||||
| Common Stocks | ||||||||||||||||
| Banks: Diversified | $ | 397,226,519 | $ | 3,344,118 | $ | – | $ | 400,570,637 | ||||||||
| Other(a) | 92,036,875 | – | – | 92,036,875 | ||||||||||||
| Short Term Investments | 7,063,363 | – | – | 7,063,363 | ||||||||||||
| TOTAL | $ | 496,326,757 | $ | 3,344,118 | $ | – | $ | 499,670,875 | ||||||||
| (a) | For detailed descriptions of sector and industry, see the accompanying Schedule of Investments. |
| Semi-Annual Report | October 31, 2017 | 55 |
| Emerald Funds | Notes to Financial Statements |
October 31, 2017 (Unaudited)
The Funds recognize transfers between levels as of the end of the period. For the six months ended October 31, 2017, the Funds had the following transfers between Level 1 and Level 2 securities.
| Level 1 | Level 2 | |||||||||||||||
| Emerald Growth Fund | Transfer In | Transfers (Out) | Transfer In | Transfers (Out) | ||||||||||||
| Common Stocks | $ | 2,940,048 | $ | – | $ | – | $ | (2,940,048 | ) | |||||||
| Total | $ | 2,940,048 | $ | – | $ | – | $ | (2,940,048 | ) | |||||||
| Level 1 | Level 2 | |||||||||||||||
| Emerald Banking and Finance Fund | Transfer In | Transfers (Out) | Transfer In | Transfers (Out) | ||||||||||||
| Common Stocks | $ | 10,047,881 | $ | – | $ | – | $ | (10,047,881 | ) | |||||||
| Total | $ | 10,047,881 | $ | – | $ | – | $ | (10,047,881 | ) | |||||||
The above transfers from Level 2 to Level 1 were due to the ability to obtain a closing market price within an active market for a security that previously had no market to trade. Additionally, the above transfers from Level 1 to Level 2 were due to the inability to obtain a closing market price due to an inactive market to trade. For the six months ended October 31, 2017, the Emerald Small Cap Value Fund and Emerald Insights Fund did not have any transfers between Level 1 and Level 2 securities.
For the six months ended October 31, 2017, the Funds did not have any securities that used significant unobservable inputs (Level 3) in determining fair value.
Investment Transactions and Investment Income: Investment transactions are accounted for on the date the investments are purchased or sold (trade date). Realized gains and losses from investment transactions are reported on an identified cost basis, which is the same basis the Funds use for federal income tax purposes. Interest income, which includes accretion of discounts, is accrued and recorded as earned. Dividend income is recognized on the ex-dividend date or for certain foreign securities, as soon as information is available to the Funds. All of the realized and unrealized gains and losses and net investment income, are allocated daily to each class in proportion to its average daily net assets.
Real Estate Investment Trusts (“REITs”): The Funds may invest a portion of their assets in REITs and are subject to certain risks associated with direct investment in REITs. REITs may be affected by changes in the value of their underlying properties and by defaults by borrowers or tenants. REITs depend generally on their ability to generate cash flow to make distributions to shareowners, and certain REITs have self-liquidation provisions by which mortgages held may be paid in full and distributions of capital returns may be made at any time. In addition, the performance of a REIT may be affected by its failure to qualify for tax-free pass-through of income under the Internal Revenue Code of 1986, as amended (the “Code”), or its failure to maintain exemption from registration under the 1940 Act. A Fund’s investments in REITs may result in such Fund’s receipt of cash in excess of the REITs’ earnings. If the Fund receives such distributions all or a portion of these distributions will constitute a return of capital to such Fund. Receiving a return of capital distribution from REITs will reduce the amount of income available to be distributed to Fund shareholders. Income from REITs generally will not be eligible for treatment as qualified dividend income. As the final character of the distributions is not known until reported by the REITs on their 1099s, the Funds utilize an average of the prior year’s reallocation information as an estimate for the current year character of distributions.
Trust Expenses: Some expenses of the Trust can be directly attributed to the Funds. Expenses which cannot be directly attributed to the Funds are apportioned among all funds in the Trust based on average net assets of each fund.
Fund and Class Expenses: Expenses that are specific to a Fund or class of shares of a Fund, including distribution fees (Rule 12b-1 fees) and shareholder servicing fees, are charged directly to that Fund or share class. All expenses of a Fund, other than class specific expenses, are allocated daily to each class in proportion to its average daily net assets. Expenses that are common to the Funds generally are allocated among the Funds in proportion to their average daily net assets.
Federal Income Taxes: Each Fund complies with the requirements under Subchapter M of the Internal Revenue Code of 1986, as amended, applicable to regulated investment companies and intends to distribute substantially all of its net taxable income and net capital gains, if any, each year so that the Funds will not be subject to excise tax on undistributed income and gains. The Funds are not subject to income taxes to the extent such distributions are made.
As of and during the six months ended October 31, 2017, the Funds did not have a liability for any unrecognized tax benefits. The Funds file U.S. federal, state, and local tax returns as required. The Funds’ tax returns are subject to examination by the relevant tax authorities until expiration of the applicable statute of limitations, which is generally three years after the filing of the tax return for federal purposes and four years for most state returns. Tax returns for open years have incorporated no uncertain tax positions that require a provision for income taxes.
| 56 | www.emeraldmutualfunds.com |
| Emerald Funds | Notes to Financial Statements |
October 31, 2017 (Unaudited)
Distributions to Shareholders: Each Fund normally pays dividends and distributes capital gains, if any, on an annual basis. Income dividend distributions are derived from dividends and other income each Fund receives from its investments, including short-term capital gains. Long term capital gain distributions are derived from gains realized when each Fund sells a security it has owned for more than a year. Each Fund may make additional distributions and dividends at other times if the portfolio manager believes doing so may be necessary for each Fund to avoid or reduce taxes.
3. TAX BASIS INFORMATION
Tax Basis of Investments: As of October 31, 2017, the aggregate cost of investments, gross unrealized appreciation/(depreciation) and net unrealized appreciation/(depreciation) for Federal tax purposes was as follows:
| Gross Appreciation (excess of value over tax cost) | Gross Depreciation (excess of tax cost over value) | Net Unrealized Appreciation/(Depreciation) | Cost of Investments for Income Tax Purposes | |||||||||||||
| Emerald Growth Fund | $ | 350,959,721 | $ | (29,145,960 | ) | $ | 321,813,761 | $ | 801,189,829 | |||||||
| Emerald Small Cap Value Fund | 2,055,711 | (105,965 | ) | 1,949,746 | 6,310,813 | |||||||||||
| Emerald Insights Fund | 2,295,515 | (205,717 | ) | 2,089,798 | 8,500,031 | |||||||||||
| Emerald Banking and Finance Fund | 159,940,392 | (322,446 | ) | 159,617,946 | 332,989,566 | |||||||||||
Tax Basis of Distributions to Shareholders: The character of distributions made during the year from net investment income or net realized gains may differ from its ultimate characterization for federal income tax purposes. Also, due to the timing of dividend distributions, the fiscal year in which amounts are distributed may differ from the fiscal year in which the income or realized gain were recorded by each Fund.
For the fiscal year ended April 30, 2017, the Funds did not pay any distributions.
The amounts and characteristics of tax basis distributions and composition of distributable earnings/(accumulated losses) are finalized at fiscal year-end. Accordingly, tax basis balances have not been determined as of October 31, 2017.
4. SECURITIES TRANSACTIONS
The cost of purchases and proceeds from sales of securities (excluding short-term securities) during the six months ended October 31, 2017 was as follows:
| Funds | Cost of Investments Purchased | Proceeds from Investments Sold | ||||||
| Emerald Growth Fund | $ | 328,951,947 | $ | 353,100,706 | ||||
| Emerald Small Cap Value Fund | 2,274,415 | 2,383,899 | ||||||
| Emerald Insights Fund | 5,406,738 | 6,999,296 | ||||||
| Emerald Banking and Finance Fund | 99,565,763 | 109,829,047 | ||||||
5. SHARES OF BENEFICIAL INTEREST
The capitalization of the Trust consists of an unlimited number of shares of beneficial interest with no par value per share. Holders of the shares of the Funds of the Trust have one vote for each share held and a proportionate fraction of a vote for each fractional share. All shares issued and outstanding are fully paid and are transferable and redeemable at the option of the shareholder. Purchasers of the shares do not have any obligation to make payments to the Trust or its creditors (other than the purchase price for the shares) or make contributions to the Trust or its creditors solely by reason of the purchaser’s ownership of the shares. Shares have no pre-emptive rights.
6. MANAGEMENT AND RELATED-PARTY TRANSACTIONS
The Adviser, subject to the authority of the Board, is responsible for the overall management and administration of the Funds’ business affairs. The Adviser manages the investments of the Funds in accordance with the Funds’ investment objective, policies and limitations and investment guidelines established jointly by the Adviser and the Trustees. Pursuant to the Advisory Agreement, the Funds pay the Adviser fees for the services and facilities it provides payable on a monthly basis at the annual rate set forth below of the Funds’ average daily net assets. The management fee is paid on a monthly basis.
| Semi-Annual Report | October 31, 2017 | 57 |
| Emerald Funds | Notes to Financial Statements |
October 31, 2017 (Unaudited)
| Emerald Growth Fund | |
| Average Total Net Assets | Contractual Fee |
| Up to and including $250M | 0.75% |
| Over $250M and including $500M | 0.65% |
| Over $500M and including $750M | 0.55% |
| Over $750M | 0.45% |
| Emerald Small Cap Value Fund | |
| Average Total Net Assets | Contractual Fee |
| Up to and including $250M | 0.75% |
| Over $250M and including $500M | 0.65% |
| Over $500M and including $750M | 0.55% |
| Over $750M | 0.45% |
| Emerald Insights Fund | |
| Average Total Net Assets | Contractual Fee |
| Up to and including $250M | 0.75% |
| Over $250M and including $500M | 0.65% |
| Over $500M and including $750M | 0.55% |
| Over $750M | 0.45% |
| Emerald Banking and Finance Fund | |
| Average Total Net Assets | Contractual Fee |
| Up to and including $100M | 1.00% |
| Over $100M | 0.90% |
The Adviser has contractually agreed to limit each Fund’s total annual operating expenses (exclusive of acquired fund fees and expenses, brokerage expenses, interest expenses, taxes and extraordinary expense) set forth in the preceding table for Class A, Class C, Institutional Class, and Investor Class shares to the annual rates (as percentages of a Fund’s average daily net assets). This agreement (the “Expense Agreement”) is in effect from September 1, 2017 through August 31, 2018. The prior Expense Agreement was in effect from September 1, 2016 through August 31, 2017 for all Funds except the Emerald Small Cap Value Fund. The Emerald Small Cap Value Fund’s prior agreement was in effect from June 26, 2015 through August 31, 2017. The Adviser will be permitted to recover, on a class-by-class basis, expenses it has borne through the expense agreement to the extent that a Fund’s expenses in later periods fall below the expense cap in effect at the time of the waiver or reimbursement. Notwithstanding the foregoing, the Funds will not be obligated to pay any such fees and expenses more than three years after the date of the waiver or reimbursement. The Adviser may not discontinue this waiver, prior to August 31, 2018, without the approval by the Fund’s Board. Fees waived/reimbursed by the Adviser for the six months ended October 31, 2017 are disclosed in the Statements of Operations.
| 58 | www.emeraldmutualfunds.com |
| Emerald Funds | Notes to Financial Statements |
October 31, 2017 (Unaudited)
| Emerald Growth Fund | |||
| Class A | Class C | Institutional Class | Investor Class |
| 1.29% | 1.94% | 0.99% | 1.34% |
| Emerald Small Cap Value Fund | |||
| Class A | Class C | Institutional Class | Investor Class |
| 1.35% | 2.00% | 1.00% | 1.25% |
| Emerald Insights Fund | |||
| Class A | Class C | Institutional Class | Investor Class |
| 1.35% | 2.00% | 1.05% | 1.40% |
| Emerald Banking and Finance Fund | |||
| Class A | Class C | Institutional Class | Investor Class |
| 1.84% | 2.49% | 1.54% | 1.89% |
For the six months ended October 31, 2017, the fee waivers/reimbursements and recoupments of past waived fees were as follows:
| Fund | Fees Waived/ Reimbursed By Adviser | Recoupment of Past Waived Fees By Adviser | ||||||
| Emerald Growth Fund | ||||||||
| Class A | $ | – | $ | – | ||||
| Class C | – | – | ||||||
| Institutional Class | – | – | ||||||
| Investor Class | – | – | ||||||
| Emerald Small Cap Value Fund | ||||||||
| Class A | $ | 13,545 | $ | – | ||||
| Class C | 759 | – | ||||||
| Institutional Class | 28,100 | – | ||||||
| Investor Class | 3,708 | – | ||||||
| Emerald Insights Fund | ||||||||
| Class A | $ | 36,832 | $ | – | ||||
| Class C | 436 | – | ||||||
| Institutional Class | 4,110 | – | ||||||
| Investor Class | 354 | – | ||||||
| Emerald Banking and Finance Fund | ||||||||
| Class A | $ | – | $ | – | ||||
| Class C | – | – | ||||||
| Institutional Class | – | – | ||||||
| Investor Class | – | – | ||||||
| Semi-Annual Report | October 31, 2017 | 59 |
| Emerald Funds | Notes to Financial Statements |
October 31, 2017 (Unaudited)
As of October 31, 2017, the balances of recoupable expenses for each Fund were as follows:
| Fund | Expires 2018 | Expires 2019 | Expires 2020 | Expires 2021 | Total | |||||||||||||||
| Emerald Growth Fund | ||||||||||||||||||||
| Class A | $ | – | $ | – | $ | – | $ | – | $ | – | ||||||||||
| Class C | – | – | – | – | – | |||||||||||||||
| Institutional Class | – | – | – | – | – | |||||||||||||||
| Investor Class | – | – | – | – | – | |||||||||||||||
| Emerald Small Cap Value Fund | ||||||||||||||||||||
| Class A | $ | 30 | $ | 256 | $ | 6,552 | $ | 13,545 | $ | 20,383 | ||||||||||
| Class C | 30 | 617 | 4,441 | 759 | 5,847 | |||||||||||||||
| Institutional Class | 37,563 | 64,181 | 67,420 | 28,100 | 197,264 | |||||||||||||||
| Investor Class | 852 | 5,731 | 8,254 | 3,708 | 18,545 | |||||||||||||||
| Emerald Insights Fund | ||||||||||||||||||||
| Class A | $ | 25,475 | $ | 67,047 | $ | 80,509 | $ | 36,832 | $ | 209,863 | ||||||||||
| Class C | 115 | 467 | 792 | 436 | 1,810 | |||||||||||||||
| Institutional Class | 731 | 5,690 | 9,737 | 4,110 | 20,268 | |||||||||||||||
| Investor Class | 948 | 3,372 | 615 | 354 | 5,289 | |||||||||||||||
| Emerald Banking and Finance Fund | ||||||||||||||||||||
| Class A | $ | – | $ | – | $ | – | $ | – | $ | – | ||||||||||
| Class C | – | – | – | – | – | |||||||||||||||
| Institutional Class | – | – | – | – | – | |||||||||||||||
| Investor Class | – | – | – | – | – | |||||||||||||||
Fund Administrator Fees and Expenses: ALPS Fund Services, Inc. (“ALPS”) serves as administrator to the Funds and the Funds have agreed to pay expenses incurred in connection with their administrative activities. Pursuant to an Administration Agreement, ALPS provides operational services to the Funds including, but not limited to, fund accounting and fund administration and generally assist in the Funds’ operations. Officers of the Trust are employees of ALPS. The Funds’ administration fee is accrued on a daily basis and paid monthly. Administration fees paid by the Funds for the six months ended October 31, 2017 are disclosed in the Statements of Operations.
The Administrator is also reimbursed by the Funds for certain out-of-pocket expenses.
Transfer Agent: ALPS serves as transfer, dividend paying and shareholder servicing agent for the Funds. ALPS receives an annual minimum fee, a fee based upon the number of shareholder accounts, and is also reimbursed by the Funds for certain out-of-pocket expenses. Transfer agent fees paid by the Funds for the six months ended October 31, 2017 are disclosed in the Statements of Operations.
Compliance Services: ALPS provides services that assist the Trust’s chief compliance officer in monitoring and testing the policies and procedures of the Trust in conjunction with requirements under Rule 38a-1 under the 1940 Act and receives an annual base fee. ALPS is reimbursed for certain out-of-pocket expenses by the Funds. Compliance service fees paid by the Funds for the six months ended October 31, 2017 are disclosed in the Statements of Operations.
Principal Financial Officer: ALPS receives an annual fee for providing principal financial officer services to the Funds. Principal financial officer fees paid by the Funds for the six months ended October 31, 2017 are disclosed in the Statements of Operations.
Distributor: ALPS Distributors, Inc. (“ADI” or the “Distributor”) (an affiliate of ALPS Fund Services Inc. (“ALPS”)) acts as the distributor of the Funds’ shares pursuant to a Distribution Agreement with the Trust. Shares are sold on a continuous basis by ADI as agent for the Funds, and ADI has agreed to use its best efforts to solicit orders for the sale of Funds’ shares, although it is not obliged to sell any particular amount of shares. ADI is not entitled to any compensation for its services as Distributor. ADI is registered as a broker-dealer with the U.S. Securities and Exchange Commission.
Each Fund has adopted a separate Distribution and Services Plan (each a “Plan” and collectively, the “Plans”) pursuant to Rule 12b-1 of the 1940 Act. The Plans allow each Fund, as applicable, to use each Fund’s assets to pay fees in connection with the distribution and marketing of the Funds’ shares and/or the provision of shareholder services to the Funds’ shareholders. The Plan permits payment for services in connection with the administration of plans or programs that use shares of each Fund as their funding medium and for related expenses. The recipients of such payments may include other affiliates of the Adviser, broker-dealers, financial institutions, plan sponsors and administrators and other financial intermediaries through which investors may purchase shares of the Fund. The Plans permit each Fund to make total payments at an annual rate of
| 60 | www.emeraldmutualfunds.com |
| Emerald Funds | Notes to Financial Statements |
October 31, 2017 (Unaudited)
up to 0.35%, 0.75% and 0.25% of the average daily net asset value of Class A, Class C and Investor Class, respectively. Because these fees are paid out of the Funds’ assets on an ongoing basis, over time they will increase the cost of an investment in the Funds, and Plan fees may cost an investor more than other types of sales charges.
Each Fund, except the Emerald Small Cap Value Fund, has adopted a Shareholder Services Plan (a “Shareholder Services Plan”) with respect to its Class C, Institutional Class and Investor Class shares. Under the Shareholder Services Plan, a Fund is authorized to compensate certain financial intermediaries, including broker-dealers and Fund affiliates which may include the Distributor, Adviser and/or the transfer agent (the “Participating Organizations”), an aggregate fee in an amount not to exceed on an annual basis 0.25%, 0.05% and 0.15% of the average daily net asset value of Class C, Institutional Class and Investor Class, respectively, of the Funds attributable to or held in the name of the Participating Organizations pursuant to an agreement with such Participating Organizations (the “Agreement”). Each Agreement will set forth the non-distribution related shareholder services to be performed by the Participating Organizations for the benefit of a Fund’s shareholders who have elected to have such Participating Organizations service their accounts. Any amount of such payment not paid to Participating Organizations during a Fund’s fiscal year for such service activities shall be reimbursed to the Fund as soon as practicable. Shareholder Services Plan fees are included with distribution and service fees in the Statements of Operations. Fees recaptured pursuant to the Shareholder Services Plan for the six months ended October 31, 2017 are included as an offset to distribution and service fees as disclosed in the Statements of Operations.
The Emerald Small Cap Value Fund has adopted a Shareholder Services Plan (the “Plan”) with respect to its Class C shares. Under the Plan, the Fund is authorized to pay banks and its affiliates and other institutions, including broker-dealers and Fund affiliates which may include the Distributor, Adviser and/or the transfer agent (“Class C Participating Organizations”), an aggregate fee in an amount not to exceed on an annual basis 0.25% of the average daily net asset value of Class C shares of the Fund attributable to or held in the name of the Participating Organizations for its clients as compensation for providing shareholder service activities, which do not include distribution services pursuant to an agreement with Participating Organizations. Any amount of such payment not paid to the Participating Organizations during the Fund’s fiscal year for such service activities shall be reimbursed to the Fund as soon as practicable. Plan fees are included with distribution and service fees in the Statements of Operations. Fees recaptured pursuant to the Plan for the six months ended October 31, 2017 are included as an offset to distribution and service fees as disclosed in the Statements of Operations.
7. INDEMNIFICATIONS
Under the Trust’s organizational documents, its officers and Trustees are indemnified against certain liability arising out of the performance of their duties to the Trust. Additionally, in the normal course of business, the Trust enters into contracts with service providers that may contain general indemnification clauses, which may permit indemnification to the extent permissible under applicable law. The Trust’s maximum exposure under these arrangements is unknown, as this would involve future claims that may be made against the Trust that have not yet occurred.
| Semi-Annual Report | October 31, 2017 | 61 |
| Emerald Funds | Additional Information |
October 31, 2017 (Unaudited)
1. FUND HOLDINGS
The Funds file their complete schedule of portfolio holdings with the Securities and Exchange Commission (the “SEC”) for the first and third quarters of each fiscal year on Form N-Q within 60 days after the end of the period. Copies of the Funds’ Form N-Q are available without charge on the SEC website at http://www.sec.gov. You may also review and copy the Form N-Q at the SEC’s Public Reference Room in Washington, DC. For more information about the operation of the Public Reference Room, please call the SEC at 1-800-SEC-0330.
2. FUND PROXY VOTING POLICIES, PROCEDURES AND SUMMARIES
Each Fund’s policies and procedures used in determining how to vote proxies and information regarding how the Funds voted proxies relating to portfolio securities during the most recent prior 12-month period ending June 30 are available without charge, (1) upon request, by calling (toll-free) (855) 828-9909 and (2) on the SEC’s website at http://www.sec.gov.
| 62 | www.emeraldmutualfunds.com |
Intentionally Left Blank


TABLE OF CONTENTS
| Shareholder Letter | 1 |
| Performance Update | 10 |
| Disclosure of Fund Expenses | 31 |
| Portfolio of Investments | |
| Grandeur Peak Emerging Markets Opportunities Fund | 33 |
| Grandeur Peak Global Micro Cap Fund | 37 |
| Grandeur Peak Global Opportunities Fund | 41 |
| Grandeur Peak Global Reach Fund | 45 |
| Grandeur Peak Global Stalwarts Fund | 51 |
| Grandeur Peak International Opportunities Fund | 54 |
| Grandeur Peak International Stalwarts Fund | 58 |
| Statements of Assets and Liabilities | 61 |
| Statements of Operations | 63 |
| Statements of Changes in Net Assets | |
| Grandeur Peak Emerging Markets Opportunities Fund | 65 |
| Grandeur Peak Global Micro Cap Fund | 66 |
| Grandeur Peak Global Opportunities Fund | 67 |
| Grandeur Peak Global Reach Fund | 68 |
| Grandeur Peak Global Stalwarts Fund | 69 |
| Grandeur Peak International Opportunities Fund | 70 |
| Grandeur Peak International Stalwarts Fund | 71 |
| Financial Highlights | |
| Grandeur Peak Emerging Markets Opportunities Fund | 72 |
| Grandeur Peak Global Micro Cap Fund | 74 |
| Grandeur Peak Global Opportunities Fund | 75 |
| Grandeur Peak Global Reach Fund | 77 |
| Grandeur Peak Global Stalwarts Fund | 79 |
| Grandeur Peak International Opportunities Fund | 81 |
| Grandeur Peak International Stalwarts Fund | 83 |
| Notes to Financial Statements | 85 |
| Disclosure Regarding Approval of Fund Advisory Agreement | 96 |
| Additional Information | 98 |
| Grandeur Peak Funds® | Shareholder Letter |
October 31, 2017 (Unaudited)
Dear Fellow Shareholders,
We have previously expressed our opinion of passive investing. We want to carry on that thread to bring in a discussion on Exchange Traded Funds (ETFs)1. Since the introduction of the very first ETF on January 1, 19932, ETFs have opened up an opportunity for investors to gain market exposure across a huge array of asset classes, geographies, sectors and investment strategies. BlackRock, the largest provider of ETFs in the world, now manages over $1 Trillion in 800 ETFs3. The growth of ETFs’ assets under management (AUM) has been impressive, and much has been written about this AUM growth coming at the expense of the traditional mutual fund industry. Indeed, as shown in the following chart by Jeffrey Kleintop, Chief Global Investment Strategist at Charles Schwab, it would seem that ETFs are “eating the US stock market” as reported by the Financial Times4.
Exhibit 1: Cumulative Flows into Equity ETFs and Equity Mutual Funds
Source: Charles Schwab, Bloomberg and Investment Company Institute (data from Jan 2013 – Aug 2017)
(https://www.schwab.com/resource-center/insights/content/what-are-fund-flows-telling-us-about-trends-and-risks-in-the-global-stock-market).
Past performance does not guarantee future results.
According to the January 4, 2017 Financial Times article cited above, outflows from actively-managed mutual funds have hit a cumulative $1.2 Trillion since 2007, while overall inflows into passive mutual funds and ETFs have topped $1.4 Trillion over the same period. ETFs now account for about 30% of all US trading by value and 23% by share volume.
In fact, over the 12 months from July 2016 – July 2017 assets in domestic and global equity ETFs increased by a combined $576.3 billion, almost double the rate from the previous period, according to the Investment Company Institute (ICI)5. That ETFs are gathering record-setting amounts of assets at the same time that the US stock market continues to reach new record highs has raised suspicion among market pundits that the two are somehow connected – that we are seeing an ETF bubble in the making. We’re not buying it. Sure, the US market has been driven to ever astonishing heights this year, and valuations are at record levels (google “Shiller CAPE”), but we’re not so sure it’s due to ETFs. For one thing, despite the huge growth in assets, ETFs are still only about 1/6th the size of traditional Equity mutual funds according to data from ICI.
| 1 | An Exchange Traded Fund is a marketable security that owns the underlying assets and divides ownership of those assets into shares. |
| 2 | The SPDR S&P 500 trust (ticker: SPY) |
| 3 | Source: https://www.ishares.com/us |
| 4 | Source: https://www.ft.com/content/6dabad28-e19c-11e6-9645-c9357a75844a |
| 5 | Source: https://www.ici.org/research/stats/etf/etfs_07_17 |
| Semi-Annual Report | October 31, 2017 | 1 |
| Grandeur Peak Funds® | Shareholder Letter |
October 31, 2017 (Unaudited)
Exhibit 2: AUM of ETFs and Mutual Funds
Source: www.ici.org (data as of 3/31/2017)
At some point, if current flow trends continue, ETFs will indeed eat the US equity market, but for now we think the real danger that ETFs pose is that they are turning investors into speculators. We hate to generalize, but looking at trading data, as depicted in Exhibit 3 below, there is compelling evidence that owners of ETFs are doing more speculating than investing.
Currently, the largest ETF by assets is the SPDR® S&P 500® ETF (SPY)6 which as of 9/30/2017 had 968.2 million shares outstanding and an average daily trading volume over the month of September of 62.9 million shares7. That is, about 6.1% of the outstanding shares of this ETF change hands every day. Put another way, on average, the entire fund changes owners every 16.4 days.
Exhibit 3: Trading Volume of SPY as a % of shares outstanding
Source: Bloomberg (data from Jan 2012 – Sep 2017)
Past performance does not guarantee future results.
| 6 | The SPDR® S&P 500® ETF Trust seeks to provide investment results that, before expenses, correspond generally to the price and yield performance of the S&P 500® Index |
| 7 | Source: Bloomberg |
| 2 | 1.855.377.7325 | www.GrandeurPeakGlobal.com |
| Grandeur Peak Funds® | Shareholder Letter |
October 31, 2017 (Unaudited)
The good news is that trading volumes as a percentage of shares outstanding having been declining over the past 5 years. But, the fact that SPY is trading hands every 16 days (currently) would indicate a whole lot of “short-termism” going on out there. And that’s bad, of course, because in the investment game, time is your friend.
Historically, SPY trading volumes have shot up when market volatility has spiked, as shown in Exhibit 4.
Exhibit 4: Trading Volumes vs. 12-month return for SPY
Source: Bloomberg (data from Dec 2006 – Sep 2017).
Past performance does not guarantee future results.
When volatility picks up, ETF speculators come out of the woodwork to trade. You can see at point A in the chart that volume spiked as speculators tried to get out of a falling market. At points B and C, volume spiked as speculators came back in chasing a rebound in returns. In all three cases, they were late; selling low and buying high. To quote a phrase that has been kicking around the internet since 2012:
“One of the consequences of such a short investment time horizon is that investors have begun to fear short-term market events and volatility as much or more than the factors that shape prospects for long-term economic and profit growth that drive stocks over the longer term.” 8
| 8 | We’ll attribute this quote to Jeffrey Kleintop, who in 2012 was the Chief Market Strategist at LPL Financial. |
| Semi-Annual Report | October 31, 2017 | 3 |
| Grandeur Peak Funds® | Shareholder Letter |
October 31, 2017 (Unaudited)
You’ve probably all heard the phrase “time in the market beats timing the market.” JPMorgan Asset Management has illustrated how much an investor gives up in return by missing even a few big up-market days. Rather than re-invent the wheel, we’ll present their chart, which was most recently published on Jan 27, 2017:
Exhibit 5: Returns of the S&P 500
Performance of a $10,000 investment between 1/1/1997 and 12/30/2016
Source: JP Morgan Asset Management (https://am.jpmorgan.com/us/en/asset-management/gim/adv/insights/navigating-volatility).
Past performance does not guarantee future results.
In his June 2017 Insights, Richard Bernstein demonstrated that “it is painfully obvious that investors are very poor at timing investments regardless of whether they are active or passive” by publishing the following chart. He compared the 20-year performance of the “average investor” (as computed by DALBAR) to the returns of a broad range of asset and sub-asset class returns9.
| 9 | Richard Bernstein, Active vs. Passive, Insights, http://www.rbadvisors.com/images/pdfs/Active_vs_Passive.pdf (June, 2017) |
| 4 | 1.855.377.7325 | www.GrandeurPeakGlobal.com |
| Grandeur Peak Funds® | Shareholder Letter |
October 31, 2017 (Unaudited)
Exhibit 6: 20 Year Annualized Return: The “Average Investor” vs. Various Asset Classes
Source: Richard Bernstein Advisors LLC., Bloomberg, MSCI, Standard & Poor’s, Russell, HFRI, BofA Merrill Lynch, DALBAR Inc., FHFA, FRB, FTSE. Total Returns in USD. *Avg Investor Asset Allocation returns are represented by the DALBAR Inc. Average Investor Asset Allocation Returns. (Data from 12/31/1996 – 12/31/2016).
Past performance does not guarantee future results.
The bottom line is that when it comes to investing: Patience truly is a Virtue. Hopefully we have communicated to you all that we are long-term, patient investors; and we hope that you are too. Investing with a long-term focus allows us to use market volatility to our advantage and to construct portfolios that we believe will deliver strong earnings growth, and thus eventually out-perform over the long term. Obviously we may not actually deliver on this goal, but this is what we come to work each day trying to accomplish.
Over short periods of time (i.e.: days, months or quarters), we absolutely don’t expect to be able to outperform “the market10,” and we hope that you don’t hold that expectation either. But when it comes to the long term (i.e. 5-10 years), we know that it is imperative that we outperform. The following charts plot the daily returns of our Global Opportunities Fund (GPGIX)11 against the daily returns of the MSCI All Country World Investible Market Index (ACWI IMI) since the Fund’s October 18, 2011 inception through September 29, 2017.
| 10 | By “the market” we mean a broad global benchmark like the MSCI All Country World Index (ACWI) or the Russell Global Index. |
| 11 | We used Global Opportunities because this is our longest tenured global fund. |
| Semi-Annual Report | October 31, 2017 | 5 |
| Grandeur Peak Funds® | Shareholder Letter |
October 31, 2017 (Unaudited)
Exhibit 7: Daily Returns: GPGIX vs. MSCI ACWI IMI
Source: ALPS Fund Services, MSCI (data from 10/18/2011 – 9/30/2017).
Past performance does not guarantee future results.
The way to read this chart is that each grey dot above the diagonal line represents a day when GPGIX had a higher return than the index (outperformance) and each dot below the line represents a day when GPGIX had a lower return than the index (underperformance). Visually you can see that on a daily basis GPGIX has about a 50/50 chance of outperforming12.
Lengthening out the investment period to rolling 90-day returns (quarters), you can see below that our “batting average” goes up. That is, there are more grey dots above the line. Over this time period, GPGIX outperformed in 83.2% of the 90-day periods. The fat dotted line represents the average distance of the grey dots above the solid black line, or the average level of outperformance.
| 12 | In actuality, over this period, GPGIX outperformed 52.8% of the time. |
| 6 | 1.855.377.7325 | www.GrandeurPeakGlobal.com |
| Grandeur Peak Funds® | Shareholder Letter |
October 31, 2017 (Unaudited)
Exhibit 8: Rolling 90-day Returns: GPGIX vs. MSCI ACWI IMI
Source: ALPS Fund Services, MSCI (data from 10/18/2011 – 9/30/2017).
Past performance does not guarantee future results.
Looking at longer and longer periods we see that as the investment horizon lengthens, not only does our batting average go way up, but the average level of outperformance goes up as well (distance between the line and the dots) as shown in Exhibits 9 and 10, which represent rolling 750-day (3 year) and 1,250-day (5 year) returns respectively.
Exhibit 9: Rolling 750-day Returns: GPGIX vs. MSCI ACWI IMI
Source: ALPS Fund Services, MSCI (data from 10/18/2011 – 9/30/2017).
Past performance does not guarantee future results.
| Semi-Annual Report | October 31, 2017 | 7 |
| Grandeur Peak Funds® | Shareholder Letter |
October 31, 2017 (Unaudited)
Exhibit 10: Rolling 1,250-day Returns: GPGIX vs. MSCI ACWI IMI
Source: ALPS Fund Services, MSCI (data from 10/18/2011 – 9/30/2017).
Past performance does not guarantee future results.
Markets generally feel expensive right now, and the world is filled with uncertainty, but we continue to see and believe that taking a long-term approach to investing pays off.
Funds Commentary
We’re pleased with the performance of many of our Funds this period but point out the “tough” job of keeping up with a benchmark in this late-stage bull market. Many of our portfolios have an overweight to Emerging Markets, which has seen a deceleration in earnings momentum. Developed Markets such as Europe and our broad overweight to India have helped across the board and have seen some acceleration in momentum. As we review our Quality-Value-Momentum (QVM) matrix, we are largely comfortable with the quality of our owned names but continue to see stretched valuations in many pockets of the market. We’re continually asking ourselves where things can go well and where things might go wrong as we work to understand the relative defensiveness of our portfolios. We hope to continue to identify those companies with strong long-term growth potential, which can perform well in any given market environment.
Notes from the Road
Ben Gardiner is a global Research Analyst on the Healthcare Team and is a key member of the team covering India. He shares his thoughts on a recent trip to India below:
I traveled to India this quarter with Liping Cai, our Healthcare Portfolio Manager (PM), and Amy Hu Sunderland, our Consumer PM. We had an absolutely ruthless schedule on this trip but we’re home and have a healthy list of action items from the trip. I’m hopeful that when all is said and done, we’ll look back on this as a trip that helped us add performance for our clients. The goal was to combine timely meetings in tier-1 cities (e.g. Mumbai) with first-time visits to our companies located off the beaten path (e.g. Coimbatore). This was difficult to accomplish logistically but our broker was able to make it work.
We visited five cities across India in seven days (Mumbai, Ahmedabad, Hyderabad, Coimbatore, and Goa), which ultimately led to five domestic flights and an eight-hour road trip (in addition to the brutal 20+ hour international flights to and from the country). This really should have been six domestic flights and zero road trips but we got hit by the monsoon season, which caused a large number of delays and cancellations at the airport in Mumbai. It was quite frustrating actually. Our departure time from Mumbai was 9pm and we sat around at the departure gate until the airline finally told us that our flight was officially cancelled at 3am! Until that point, they hadn’t disclosed any updates! So we then called our driver and he agreed to drive us through the night all the way out to Ahmedabad (300 miles away) so that we wouldn’t miss several high priority meetings.
With multiple meetings scheduled for each day and flights to the next city at night, the obvious sacrifice on this trip was sleep. At the conclusion of our meetings on the one day where we didn’t have to get on an airplane, we got stuck in traffic due to the weather conditions. Essentially, what is normally a quick, 30-minute drive to our hotel became an interesting two-hour adventure. It was dark and
| 8 | 1.855.377.7325 | www.GrandeurPeakGlobal.com |
| Grandeur Peak Funds® | Shareholder Letter |
October 31, 2017 (Unaudited)
the rain was heavy, making it very difficult to see the crowded roadway. From the safety of our backseat position, it appeared that we were driving up a small river as the local infrastructure rarely includes gutters and drainage systems. Even our broker commented that investors tend to avoid visiting during monsoon season. I think we understood why after our rain-soaked week. Fortunately, we arrived at our hotel safely that night, albeit much later than anticipated.
There was a silver lining to all of the logistical challenges we faced. Given the extreme weather conditions and, consequently, the various cancelled flights, it’s no surprise that we were forced to reschedule certain priority meetings. For one of the most important of these, we realized the only time left open on our trip was in the evening just hours before our return flight to Salt Lake City. The chairman of the company offered to have our team to his home and he and his wife treated us to an authentic Indian dinner. It was a nice way to end one of the more adventurous trips!
The Indian stock market does appear quite expensive. It’s hard to find a good Consumer, Industrial, or Materials name at a reasonable price and our Financials exposure feels fully valued. The two places that seem a bit unloved right now are Healthcare (mostly Pharmaceuticals) and Tech (mostly IT Services). Many of the pharmaceuticals stocks have been disrupted because of GST. We believe the issues caused by GST are transient and that companies should recover in the coming quarter or two. We believe the near-term challenges pale in comparison to the long-term opportunities for Indian healthcare as the population as a whole has underserved healthcare needs. The insights we gained by visiting numerous industry leaders have reaffirmed our decision to invest in companies in India.
Business Update
As we reflect on our first six years, we are pleased with the success of the portfolios and feel like we are on track with most of our original goals. We wanted to keep our assets nimble, to leverage our global perspective, and to fill out our industry teams to effectively cover the universe of investable stocks. Each of our industry teams is well staffed, three analysts deep. We’ve had several team members take the opportunity to live overseas for an extended period of time to provide “boots on the ground” research. We’ve just hired a new class of college interns, which has proven to be an effective recruiting tool for us to fill our long-term hiring needs. Our teams feel well-rounded and our research processes feels solid, although our never satisfied team always has an evolving list of improvements to make.
We appreciate our relationship with you and continue to work hard on your behalf.
The objective of all Grandeur Peak Funds is long-term growth of capital.
RISKS: Mutual fund investing involves risks and loss of principal is possible. Investing in small and micro-cap funds will be more volatile and loss of principal could be greater than investing in large cap or more diversified funds. Investing in foreign securities entails special risks, such as currency fluctuations and political uncertainties, which are described in more detail in the prospectus. Investments in emerging markets are subject to the same risks as other foreign securities and may be subject to greater risks than investments in foreign countries with more established economies and securities markets.
An investor should consider investment objectives, risks, charges, and expenses carefully before investing. To obtain a Grandeur Peak Funds prospectus, containing this and other information, visit www.grandeurpeakglobal.com or call 1-855-377-PEAK (7325). Please read it carefully before investing.
The views and information discussed in this commentary are as of the date of publication, are subject to change, and may not reflect the writer's current views. The views expressed represent an assessment of market conditions at a specific point in time, are opinions only and should not be relied upon as investment advice regarding a particular investment or markets in general. Such information does not constitute a recommendation to buy or sell specific securities or investment vehicles. It should not be assumed that any investment will be profitable or will equal the performance of the Funds or any securities or any sectors mentioned herein. The subject matter contained herein has been derived from several sources believed to be reliable and accurate at the time of compilation. The Funds do not accept any liability for losses either direct or consequential caused by the use of this information.
Past performance does not guarantee future results.
A list of Fund holdings as of October 31, 2017 can be found within each Fund’s Portfolio of Investments.
ALPS Distributors, Inc. is the Distributor for the Grandeur Peak Funds.
| i | The MSCI ACWI Investable Market Index (IMI) captures large, mid and small cap representation across 23 Developed Markets (DM) and 24 Emerging Markets (EM) countries. With 8,636 constituents, the index is comprehensive, covering approximately 99% of the global equity investment opportunity set. You cannot invest directly in this or any index. |
| Semi-Annual Report | October 31, 2017 | 9 |
| Grandeur Peak Emerging Markets Opportunities Fund | Performance Update |
October 31, 2017 (Unaudited)
Annualized Total Return Performance for the periods ended October 31, 2017
| Expense Ratio(b) | ||||||
| 6 Months | 1 Year | 3 Year | Since Inception(a) | Gross | Net(c) | |
| Grandeur Peak Emerging Markets Opportunities Fund – Investor (GPEOX) | 6.75% | 14.40% | 5.80% | 7.31% | 1.80% | 1.80% |
| Grandeur Peak Emerging Markets Opportunities Fund – Institutional (GPEIX) | 6.81% | 14.62% | 6.02% | 7.53% | 1.50% | 1.50% |
| Russell Emerging Markets Small Cap Index(d) | 10.67% | 20.36% | 4.62% | 5.22% | ||
Performance data quoted represents past performance. Past performance does not guarantee future results. Investment return and principal value of an investment will fluctuate so that an investor’s shares, when sold or redeemed, may be worth more or less than the original cost. The Fund imposes a 2.00% redemption fee on shares held for less than 60 days. Current performance data may be higher or lower than actual data quoted. For the most current month-end performance data, please call 1-855-377-PEAK (7325).
The table does not reflect the deduction of taxes a shareholder would pay on Fund distributions or redemption of Fund shares.
Subject to investment risks, including possible loss of the principal amount invested.
Returns for periods less than 1 year are cumulative.
| (a) | Fund inception date of December 16, 2013. |
| (b) | Ratios as of the Prospectus dated August 31, 2017 and may differ from the ratios presented in the Financial Highlights. |
| (c) | Grandeur Peak Global Advisors, LLC (the “Adviser”), has agreed to waive and/or reimburse fees or expenses in order to limit Total Annual Fund Operating Expenses After Fee Waiver/Expense Reimbursement (excluding acquired fund fees and expenses, brokerage expenses, interest expenses, taxes and extraordinary expenses) to 1.95% and 1.70% of the Fund’s average daily net assets for the Fund’s Investor Class Shares and Institutional Class Shares, respectively. This agreement (the “Expense Agreement”) is in effect through August 31, 2018. The Adviser will be permitted to recover, on a class- by-class basis, expenses it has borne through the Expense Agreement to the extent that a Fund’s expenses in later periods fall below annual rates set forth in the Expense Agreement; provided, however, that such recapture payments do not cause the Fund’s expense ratio (after recapture) to exceed the lesser of (i) the expense cap in effect at the time of the waiver and (ii) the expense cap in effect at the time of the recapture. Notwithstanding the foregoing, the Fund will not be obligated to pay any such deferred fees and expenses more than three years after the date on which the fee and expenses was deferred. The Expense Agreement may not be terminated or modified prior to August 31, 2018 except with the approval of the Fund’s Board of Trustees. |
| (d) | The Russell Emerging Markets Small Cap Index seeks to measure the performance of the small-cap equity universe of emerging countries. The Index is not actively managed and does not reflect any deductions for fees, expense, or taxes. An investor may not invest directly in the Index. |
| 10 | 1.855.377.7325 | www.GrandeurPeakGlobal.com |
| Grandeur Peak Emerging Markets Opportunities Fund | Performance Update |
October 31, 2017 (Unaudited)
Growth of $10,000 for the period ended October 31, 2017
The chart shown above represent a hypothetical investment of $10,000 in the Fund’s Investor Class shares for the period from inception to October 31, 2017. All returns reflect reinvested dividends, but do not reflect the deduction of taxes that an investor would pay on distributions or redemptions.
Investing in the Fund is subject to investment risks, including possible loss of the principal amount invested.
The Fund also offers Institutional Class shares, performance for which is not reflected in the graphs above. The performance of Institutional Class shares may be higher or lower than the performance of the Investor Class shares shown in the graphs above based upon differences in fees paid by shareholders investing in the Investor Class shares and Institutional Class shares.
| Semi-Annual Report | October 31, 2017 | 11 |
| Grandeur Peak Emerging Markets Opportunities Fund | Performance Update |
October 31, 2017 (Unaudited)
| Regional Allocation (as a % of Net Assets)* | |
| Asia ex Japan | 71.7% |
| Africa/Middle East | 9.7% |
| Europe | 6.6% |
| Latin America | 6.3% |
| North America | 4.0% |
| Cash, Cash Equivalents, & Other Net Assets | 1.7% |
| Total | 100.0% |
| Industry Sector Allocation (as a % of Net Assets)* | |
| Consumer | 25.0% |
| Financials | 24.9% |
| Technology | 18.4% |
| Industrials | 12.5% |
| Health Care | 11.6% |
| Energy & Materials | 5.9% |
| Cash, Cash Equivalents, & Other Net Assets | 1.7% |
| Total | 100.0% |
| Top 10 Holdings (as a % of Net Assets)* | |
| Man Wah Holdings, Ltd. | 2.2% |
| China Medical System Holdings, Ltd. | 2.1% |
| Value Partners Group, Ltd. | 2.1% |
| Security Bank Corp. | 1.7% |
| Silergy Corp. | 1.7% |
| FirstCash, Inc. | 1.6% |
| Time Technoplast, Ltd. | 1.6% |
| Yes Bank, Ltd. | 1.5% |
| WNS Holdings, Ltd. | 1.4% |
| BGEO Group PLC | 1.3% |
| Total | 17.2% |
| * | Holdings are subject to change, and may not reflect the current or future position of the portfolio. |
| 12 | 1.855.377.7325 | www.GrandeurPeakGlobal.com |
| Grandeur Peak Global Micro Cap Fund | Performance Update |
October 31, 2017 (Unaudited)
Annualized Total Return Performance for the periods ended October 31, 2017
| Expense Ratio(b) | |||||
| 6 Months | 1 Year | Since Inception(a) | Gross | Net(c) | |
| Grandeur Peak Global MicroCap – Institutional (GPMCX) | 13.02% | 23.90% | 16.79% | 2.08% | 2.00% |
| Russell Global Small Cap Index(d) | 10.32% | 25.02% | 14.53% | ||
Performance data quoted represents past performance. Past performance does not guarantee future results. Investment return and principal value of an investment will fluctuate so that an investor’s shares, when sold or redeemed, may be worth more or less than the original cost. The Fund imposes a 2.00% redemption fee on shares held for less than 60 days. Current performance data may be higher or lower than actual data quoted. For the most current month-end performance data, please call 1-855-377-PEAK (7325).
The table does not reflect the deduction of taxes a shareholder would pay on Fund distributions or redemption of Fund shares.
Subject to investment risks, including possible loss of the principal amount invested.
Returns for periods less than 1 year are cumulative.
| (a) | Fund inception date of October 20, 2015. |
| (b) | Ratios as of the Prospectus dated August 31, 2017 and may differ from the ratios presented in the Financial Highlights. |
| (c) | Grandeur Peak Global Advisors, LLC (the “Adviser”), has agreed to waive and/or reimburse fees or expenses in order to limit Total Annual Fund Operating Expenses After Fee Waiver/ Expense Reimbursement (excluding acquired fund fees and expenses, brokerage expenses, interest expenses, taxes and extraordinary expenses) to 2.00% of the Fund’s average daily net assets for the Fund’s Institutional Class Shares. This agreement is in effect through August 31, 2018. The Adviser will be permitted to recover expenses it has borne through this agreement to the extent that a Fund’s expenses in later periods fall below annual rates set forth in the Expense Agreement; provided, however, that such recapture payments do not cause the Fund’s expense ratio (after recapture) to exceed the lesser of (i) the expense cap in effect at the time of the waiver and (ii) the expense cap in effect at the time of the recapture. Notwithstanding the foregoing, the Fund will not be obligated to pay any such deferred fees and expenses more than three years after the date on which the fee and expenses was deferred . This agreement may not be terminated or modified prior to August 31, 2018 except with the approval of the Fund’s Board of Trustees. |
| (d) | The Russell Global Small Cap Index seeks to measure the performance of the small-cap segment of the global equity universe. The Index is not actively managed and does not reflect any deductions for fees, expenses, or taxes. An investor may not invest directly in the Index. |
| Semi-Annual Report | October 31, 2017 | 13 |
| Grandeur Peak Global Micro Cap Fund | Performance Update |
October 31, 2017 (Unaudited)
Growth of $10,000 for the period ended October 31, 2017
The chart shown above represent a hypothetical investment of $10,000 in the Fund’s Institutional Class shares for the period from inception to October 31, 2017. All returns reflect reinvested dividends, but do not reflect the deduction of taxes that an investor would pay on distributions or redemptions.
Investing in the Fund is subject to investment risks, including possible loss of the principal amount invested.
| 14 | 1.855.377.7325 | www.GrandeurPeakGlobal.com |
| Grandeur Peak Global Micro Cap Fund | Performance Update |
October 31, 2017 (Unaudited)
| Regional Allocation (as a % of Net Assets)* | |
| Asia ex Japan | 34.6% |
| Europe | 26.7% |
| North America | 13.3% |
| Japan | 12.7% |
| Australia/New Zealand | 7.8% |
| Africa/Middle East | 2.1% |
| Latin America | 1.5% |
| Cash, Cash Equivalents, & Other Net Assets | 1.3% |
| Total | 100.0% |
| Industry Sector Allocation (as a % of Net Assets)* | |
| Financials | 26.4% |
| Consumer | 20.1% |
| Technology | 18.9% |
| Industrials | 15.0% |
| Health Care | 12.0% |
| Energy & Materials | 6.3% |
| Cash, Cash Equivalents, & Other Net Assets | 1.3% |
| Total | 100.0% |
| Top 10 Holdings (as a % of Net Assets)* | |
| M&A Capital Partners Co., Ltd. | 1.8% |
| Time Technoplast, Ltd. | 1.6% |
| BBI Life Sciences Corp. | 1.5% |
| Ananda Development PCL | 1.5% |
| Skandiabanken ASA | 1.4% |
| Pryce Corp. | 1.4% |
| Hingham Institution for Savings | 1.3% |
| Blue Sky Alternative Investments, Ltd. | 1.3% |
| Syuppin Co., Ltd. | 1.2% |
| Byke Hospitality, Ltd. | 1.2% |
| Total | 14.2% |
| * | Holdings are subject to change, and may not reflect the current or future position of the portfolio. |
| Semi-Annual Report | October 31, 2017 | 15 |
| Grandeur Peak Global Opportunities Fund | Performance Update |
October 31, 2017 (Unaudited)
Annualized Total Return Performance for the periods ended October 31, 2017
| Expense Ratio(b) | |||||||
| 6 Months | 1 Year | 3 Years | 5 Years | Since Inception(a) | Gross | Net(c) | |
| Grandeur Peak Global Opportunities Fund – Investor (GPGOX) | 13.35% | 26.82% | 11.10% | 15.34% | 16.07% | 1.62% | 1.62% |
| Grandeur Peak Global Opportunities Fund – Institutional (GPGIX) | 13.20% | 27.07% | 11.28% | 15.62% | 16.39% | 1.37% | 1.37% |
| Russell Global Small Cap Index(d) | 10.32% | 25.02% | 9.53% | 11.55% | 11.64% | ||
| Russell Global Index(e) | 10.45% | 24.14% | 8.71% | 11.67% | 11.94% | ||
Performance data quoted represents past performance. Past performance does not guarantee future results. Investment return and principal value of an investment will fluctuate so that an investor’s shares, when sold or redeemed, may be worth more or less than the original cost. The Fund imposes a 2.00% redemption fee on shares held for less than 60 days. Current performance data may be higher or lower than actual data quoted. For the most current month-end performance data, please call 1-855-377-PEAK (7325).
The table does not reflect the deduction of taxes a shareholder would pay on Fund distributions or redemption of Fund shares.
Subject to investment risks, including possible loss of the principal amount invested.
Returns for periods less than 1 year are cumulative.
| (a) | Fund inception date of October 17, 2011. |
| (b) | Ratios as of the Prospectus dated August 31, 2017 and may differ from the ratios presented in the Financial Highlights. |
| (c) | Grandeur Peak Global Advisors, LLC (the “Adviser”), has agreed to waive and/or reimburse fees or expenses in order to limit Total Annual Fund Operating Expenses After Fee Waiver/ Expense Reimbursement (excluding acquired fund fees and expenses, brokerage expenses, interest expenses, taxes and extraordinary expenses) to 1.75% and 1.50% of the Fund’s average daily net assets for the Fund’s Investor Class Shares and Institutional Class Shares, respectively. This agreement (the “Expense Agreement”) is in effect through August 31, 2018. The Adviser will be permitted to recover, on a class- by-class basis, expenses it has borne the Expense Agreement to the extent that a Fund’s expenses in later periods fall below annual rates set forth in the Expense Agreement; provided, however, that such recapture payments do not cause the Fund’s expense ratio (after recapture) to exceed the lesser of (i) the expense cap in effect at the time of the waiver and (ii) the expense cap in effect at the time of the recapture .. Notwithstanding the foregoing, the Fund will not be obligated to pay any such deferred fees and expenses more than three years after the date on which the fee and expenses was deferred. The Expense Agreement may not be terminated or modified prior to August 31, 2018 except with the approval of the Fund’s Board of Trustees. |
| (d) | The Russell Global Small Cap Index seeks to measure the performance of the small-cap segment of the global equity universe. The Index is not actively managed and does not reflect any deductions for fees, expense, or taxes. An investor may not invest directly in the Index. |
| (e) | The Russell Global Index seeks to measure the performance of the global equity universe. The Index is not actively managed and does not reflect any deductions for fees, expense, or taxes. An investor may not invest directly in the Index. |
| 16 | 1.855.377.7325 | www.GrandeurPeakGlobal.com |
| Grandeur Peak Global Opportunities Fund | Performance Update |
October 31, 2017 (Unaudited)
Growth of $10,000 for the period ended October 31, 2017
The chart shown above represent a hypothetical investment of $10,000 in the Fund’s Investor Class shares for the period from inception to October 31, 2017. All returns reflect reinvested dividends, but do not reflect the deduction of taxes that an investor would pay on distributions or redemptions.
Investing in the Fund is subject to investment risks, including possible loss of the principal amount invested.
The Fund also offers Institutional Class shares, performance for which is not reflected in the graphs above. The performance of Institutional Class shares may be higher or lower than the performance of the Investor Class shares shown in the graphs above based upon differences in fees paid by shareholders investing in the Investor Class shares and Institutional Class shares.
| Semi-Annual Report | October 31, 2017 | 17 |
| Grandeur Peak Global Opportunities Fund | Performance Update |
October 31, 2017 (Unaudited)
| Regional Allocation (as a % of Net Assets)* | |
| North America | 27.4% |
| Europe | 26.8% |
| Asia ex Japan | 26.4% |
| Japan | 8.3% |
| Australia/New Zealand | 2.8% |
| Latin America | 2.1% |
| Africa/Middle East | 1.7% |
| Cash, Cash Equivalents, & Other Net Assets | 4.5% |
| Total | 100.0% |
| Industry Sector Allocation (as a % of Net Assets)* | |
| Financials | 27.3% |
| Industrials | 19.4% |
| Technology | 19.2% |
| Consumer | 18.0% |
| Health Care | 9.7% |
| Energy & Materials | 1.9% |
| Cash, Cash Equivalents, & Other Net Assets | 4.5% |
| Total | 100.0% |
| Top 10 Holdings (as a % of Net Assets)* | |
| Power Integrations, Inc. | 2.1% |
| Man Wah Holdings, Ltd. | 1.9% |
| FirstCash, Inc. | 1.5% |
| First Republic Bank | 1.4% |
| Clinigen Group PLC | 1.3% |
| Palfinger AG | 1.2% |
| Alkem Laboratories, Ltd. | 1.0% |
| Skandiabanken ASA | 1.0% |
| Silergy Corp. | 1.0% |
| Value Partners Group, Ltd. | 1.0% |
| Total | 13.4% |
| * | Holdings are subject to change, and may not reflect the current or future position of the portfolio. |
| 18 | 1.855.377.7325 | www.GrandeurPeakGlobal.com |
| Grandeur Peak Global Reach Fund | Performance Update |
October 31, 2017 (Unaudited)
Annualized Total Return Performance for the periods ended October 31, 2017
| Expense Ratio(b) | ||||||
| 6 Months | 1 Year | 3 Years | Since Inception(a) | Gross | Net(c) | |
| Grandeur Peak Global Reach Fund – Investor (GPROX) | 11.09% | 24.72% | 10.01% | 13.05% | 1.54% | 1.54% |
| Grandeur Peak Global Reach Fund – Institutional (GPRIX) | 11.20% | 25.02% | 10.28% | 13.31% | 1.29% | 1.29% |
| Russell Global Small Cap Index(d) | 10.32% | 25.02% | 9.53% | 9.77% | ||
| Russell Global Index(e) | 10.45% | 24.14% | 8.71% | 10.20% | ||
Performance data quoted represents past performance. Past performance does not guarantee future results. Investment return and principal value of an investment will fluctuate so that an investor’s shares, when sold or redeemed, may be worth more or less than the original cost. The Fund imposes a 2.00% redemption fee on shares held for less than 60 days. Current performance data may be higher or lower than actual data quoted. For the most current month-end performance data, please call 1-855-377-PEAK (7325).
The table does not reflect the deduction of taxes a shareholder would pay on Fund distributions or redemption of Fund shares.
Subject to investment risks, including possible loss of the principal amount invested.
Returns for periods less than 1 year are cumulative.
| (a) | Fund inception date of June 19, 2013. |
| (b) | Ratios as of the Prospectus dated August 31, 2017 and may differ from the ratios presented in the Financial Highlights. |
| (c) | Grandeur Peak Global Advisors, LLC (the “Adviser”), has agreed to waive and/or reimburse fees or expenses in order to limit Total Annual Fund Operating Expenses After Fee Waiver/Expense Reimbursement (excluding acquired fund fees and expenses, brokerage expenses, interest expenses, taxes and extraordinary expenses) to 1. 60% and 1.35% of the Fund’s average daily net assets for the Fund’s Investor Class Shares and Institutional Class Shares, respectively. This agreement (the “Expense Agreement”) is in effect through August 31, 2018. The Adviser will be permitted to recover, on a class- by-class basis, expenses it has borne through the Expense Agreement to the extent that a Fund’s expenses in later periods fall below annual rates set forth in the Expense Agreement; provided, however, that such recapture payments do not cause the Fund’s expense ratio (after recapture) to exceed the lesser of (i) the expense cap in effect at the time of the waiver and (ii) the expense cap in effect at the time of the recapture . Notwithstanding the foregoing, the Fund will not be obligated to pay any such deferred fees and expenses more than three years after the date on which the fee and expenses was deferred. The Expense Agreement may not be terminated or modified prior to August 31, 2018 except with the approval of the Fund’s Board of Trustees. |
| (d) | The Russell Global Small Cap Index seeks to measure the performance of the small-cap segment of the global equity universe. The Index is not actively managed and does not reflect any deductions for fees, expense, or taxes. An investor may not invest directly in the Index. |
| (e) | The Russell Global Index seeks to measure the performance of the global equity universe. The Index is not actively managed and does not reflect any deductions for fees, expense, or taxes. An investor may not invest directly in the Index. |
| Semi-Annual Report | October 31, 2017 | 19 |
| Grandeur Peak Global Reach Fund | Performance Update |
October 31, 2017 (Unaudited)
Growth of $10,000 for the period ended October 31, 2017
The chart shown above represent a hypothetical investment of $10,000 in the Fund’s Investor Class shares for the period from inception to October 31, 2017. All returns reflect reinvested dividends, but do not reflect the deduction of taxes that an investor would pay on distributions or redemptions.
Investing in the Fund is subject to investment risks, including possible loss of the principal amount invested.
The Fund also offers Institutional Class shares, performance for which is not reflected in the graphs above. The performance of Institutional Class shares may be higher or lower than the performance of the Investor Class shares shown in the graphs above based upon differences in fees paid by shareholders investing in the Investor Class shares and Institutional Class shares.
| 20 | 1.855.377.7325 | www.GrandeurPeakGlobal.com |
| Grandeur Peak Global Reach Fund | Performance Update |
October 31, 2017 (Unaudited)
| Regional Allocation (as a % of Net Assets)* | |
| Asia ex Japan | 29.6% |
| Europe | 27.4% |
| North America | 24.2% |
| Japan | 6.7% |
| Africa/Middle East | 5.0% |
| Australia/New Zealand | 3.3% |
| Latin America | 2.7% |
| Cash, Cash Equivalents, & Other Net Assets | 1.1% |
| Total | 100.0% |
| Industry Sector Allocation (as a % of Net Assets)* | |
| Financials | 23.8% |
| Consumer | 21.9% |
| Technology | 19.5% |
| Industrials | 18.1% |
| Health Care | 11.2% |
| Energy & Materials | 4.4% |
| Cash, Cash Equivalents, & Other Net Assets | 1.1% |
| Total | 100.0% |
| Top 10 Holdings (as a % of Net Assets)* | |
| Man Wah Holdings, Ltd. | 1.7% |
| First Republic Bank | 1.5% |
| Wix.com, Ltd. | 1.1% |
| China Medical System Holdings, Ltd. | 1.0% |
| WNS Holdings, Ltd. | 0.8% |
| SVB Financial Group | 0.8% |
| Wirecard AG | 0.8% |
| Selamat Sempurna Tbk PT | 0.8% |
| Power Integrations, Inc. | 0.8% |
| Clinigen Group PLC | 0.8% |
| Total | 10.1% |
| * | Holdings are subject to change, and may not reflect the current or future position of the portfolio. |
| Semi-Annual Report | October 31, 2017 | 21 |
| Grandeur Peak Global Stalwarts Fund | Performance Update |
October 31, 2017 (Unaudited)
Annualized Total Return Performance for the periods ended October 31, 2017
| Expense Ratio(b) | |||||
| 6 Months | 1 Year | Since Inception(a) | Gross | Net(c) | |
| Grandeur Peak Global Stalwarts – Investor (GGSOX) | 11.60% | 25.79% | 17.81% | 1.39% | 1.35% |
| Grandeur Peak Global Stalwarts – Institutional (GGSYX) | 11.72%(d) | 26.05% | 18.12% | 1.14% | 1.10% |
| Russell Global SMID Cap Index(e) | 10.02% | 23.61% | 15.03% | ||
| Russell Global Index(f) | 10.45% | 24.14% | 15.31% | ||
Performance data quoted represents past performance. Past performance does not guarantee future results. Investment return and principal value of an investment will fluctuate so that an investor’s shares, when sold or redeemed, may be worth more or less than the original cost. The Fund imposes a 2.00% redemption fee on shares held for less than 60 days. Current performance data may be higher or lower than actual data quoted. For the most current month-end performance data, please call 1-855-377-PEAK (7325).
The table does not reflect the deduction of taxes a shareholder would pay on Fund distributions or redemption of Fund shares.
Subject to investment risks, including possible loss of the principal amount invested.
Returns for periods less than 1 year are cumulative.
| (a) | Fund inception date of September 1, 2015. |
| (b) | Ratios as of the Prospectus dated August 31, 2017 and may differ from the ratios presented in the Financial Highlights. |
| (c) | Grandeur Peak Global Advisors, LLC (the “Adviser”), has agreed to waive and/or reimburse fees or expenses in order to limit Total Annual Fund Operating Expenses After Fee Waiver/ Expense Reimbursement (excluding acquired fund fees and expenses, brokerage expenses, interest expenses, taxes and extraordinary expenses) to 1.35% and 1.10% of the Fund’s average daily net assets for the Fund’s Investor Class Shares and Institutional Class Shares, respectively. This agreement is in effect through August 31, 2018. The Adviser will be permitted to recover, on a class-by-class basis, expenses it has borne through this agreement to the extent that a Fund’s expenses in later periods fall below annual rates set forth in the Expense Agreement; provided, however, that such recapture payments do not cause the Fund’s expense ratio (after recapture) to exceed the lesser of (i) the expense cap in effect at the time of the waiver and (ii) the expense cap in effect at the time of the recapture . Notwithstanding the foregoing, the Fund will not be obligated to pay any such deferred fees and expenses more than three years after the date on which the fee and expenses was deferred. This agreement may not be terminated or modified prior to August 31, 2018 except with the approval of the Fund’s Board of Trustees. |
| (d) | Excludes adjustments in accordance with accounting principles generally accepted in the United States of America and as such, the net asset value and total return for shareholder transactions reported to the market may differ from the net asset value for financial reporting purposes. |
| (e) | The Russell Global SMid Cap Index is designed to measure the performance of small- and mid-cap (SMid) securities and all capitalization securities respectively of issuers located in countries throughout the world representing developed and emerging markets. The Index is not actively managed and does not reflect any deductions for fees, expenses, or taxes. An investor may not invest directly in the Index. |
| (f) | The Russell Global Index seeks to measure the performance of the global equity universe. The index is not actively managed and does not reflect any deductions for fees, expenses, or taxes. An investor may not invest directly in the Index. |
| 22 | 1.855.377.7325 | www.GrandeurPeakGlobal.com |
| Grandeur Peak Global Stalwarts Fund | Performance Update |
October 31, 2017 (Unaudited)
Growth of $10,000 for the period ended October 31, 2017
The graphs shown above represent a hypothetical investment of $10,000 in the Fund’s Investor Class shares for the period from inception to October 31, 2017. All returns reflect reinvested dividends, but do not reflect the deduction of taxes that an investor would pay on distributions or redemptions.
Investing in the Fund is subject to investment risks, including possible loss of the principal amount invested.
The Fund also offers Institutional Class shares, performance for which is not reflected in the graphs above. The performance of Institutional Class shares may be higher or lower than the performance of the Investor Class shares shown in the graphs above based upon differences in fees paid by shareholders investing in the Investor Class shares and Institutional Class shares.
| Semi-Annual Report | October 31, 2017 | 23 |
| Grandeur Peak Global Stalwarts Fund | Performance Update |
October 31, 2017 (Unaudited)
| Regional Allocation (as a % of Net Assets)* | |
| North America | 32.3% |
| Europe | 26.1% |
| Asia ex Japan | 23.5% |
| Japan | 7.6% |
| Latin America | 3.2% |
| Africa/Middle East | 1.5% |
| Australia/New Zealand | 1.2% |
| Cash, Cash Equivalents, & Other Net Assets | 4.6% |
| Total | 100.0% |
| Industry Sector Allocation (as a % of Net Assets)* | |
| Financials | 24.6% |
| Consumer | 23.1% |
| Industrials | 20.7% |
| Technology | 16.7% |
| Health Care | 8.1% |
| Energy & Materials | 2.2% |
| Cash, Cash Equivalents, & Other Net Assets | 4.6% |
| Total | 100.0% |
| Top 10 Holdings (as a % of Net Assets)* | |
| First Republic Bank | 2.5% |
| Nihon M&A Center, Inc. | 2.5% |
| Power Integrations, Inc. | 2.1% |
| Stantec, Inc. | 2.1% |
| B&M European Value Retail SA | 1.9% |
| Value Partners Group, Ltd. | 1.8% |
| FirstCash, Inc. | 1.5% |
| Brembo SpA | 1.5% |
| Man Wah Holdings, Ltd. | 1.5% |
| Aalberts Industries NV | 1.4% |
| Total | 18.8% |
| * | Holdings are subject to change, and may not reflect the current or future position of the portfolio. |
| 24 | 1.855.377.7325 | www.GrandeurPeakGlobal.com |
| Grandeur Peak International Opportunities Fund | Performance Update |
October 31, 2017 (Unaudited)
Annualized Total Return Performance for the periods ended October 31, 2017
| Expense Ratio(b) | |||||||
| 6 Months | 1 Year | 3 Years | 5 Years | Since Inception(a) | Gross | Net(c) | |
| Grandeur Peak International Opportunities Fund –Investor (GPIOX) | 13.80% | 26.36% | 10.55% | 14.85% | 15.66% | 1.62% | 1.62% |
| Grandeur Peak International Opportunities Fund –Institutional (GPIIX) | 13.73% | 26.80% | 10.80% | 15.03% | 15.90% | 1.37% | 1.37% |
| Russell Global ex-U.S. Small Cap Index(d) | 11.98% | 23.00% | 9.10% | 9.71% | 9.43% | ||
Performance data quoted represents past performance. Past performance does not guarantee future results. Investment return and principal value of an investment will fluctuate so that an investor’s shares, when sold or redeemed, may be worth more or less than the original cost. The Fund imposes a 2.00% redemption fee on shares held for less than 60 days. Current performance data may be higher or lower than actual data quoted. For the most current month-end performance data, please call 1-855-377-PEAK (7325).
The table does not reflect the deduction of taxes a shareholder would pay on Fund distributions or redemption of Fund shares.
Subject to investment risks, including possible loss of the principal amount invested.
Returns for periods less than 1 year are cumulative.
| (a) | Fund inception date of October 17, 2011. |
| (b) | Ratios as of the Prospectus dated August 31, 2017 and may differ from the ratios presented in the Financial Highlights. |
| (c) | Grandeur Peak Global Advisors, LLC (the “Adviser”), has agreed to waive and/or reimburse fees or expenses in order to limit Total Annual Fund Operating Expenses After Fee Waiver/Expense Reimbursements (excluding acquired fund fees and expenses, brokerage expenses, interest expenses, taxes and extraordinary expenses) to 1.75% and 1.50% of the Fund’s average daily net assets for the Fund’s Investor Class Shares and Institutional Class Shares, respectively. This agreement (the “Expense Agreement”) is in effect through August 31, 2018. The Adviser will be permitted to recover, on a class- by-class basis, expenses it has borne through the Expense Agreement to the extent that a Fund’s expenses in later periods fall below annual rates set forth in the Expense Agreement; provided, however, that such recapture payments do not cause the Fund’s expense ratio (after recapture) to exceed the lesser of (i) the expense cap in effect at the time of the waiver and (ii) the expense cap in effect at the time of the recapture . Notwithstanding the foregoing, the Funds will not be obligated to pay any such deferred fees and expenses more than three years after the date on which the fee and expenses was deferred. The Expense Agreement may not be terminated or modified prior to August 31, 2018 except with the approval of the Fund’s Board of Trustees. |
| (d) | The Russell Global ex-U.S. Small Cap Index seeks to measure the performance of the small-cap segment of the global equity universe, excluding companies assigned to the United States. The Index is not actively managed and does not reflect any deductions for fees, expense, or taxes. An investor may not invest directly in the Index. |
| Semi-Annual Report | October 31, 2017 | 25 |
| Grandeur Peak International Opportunities Fund | Performance Update |
October 31, 2017 (Unaudited)
Growth of $10,000 for the period ended October 31, 2017
The chart shown above represent a hypothetical investment of $10,000 in the Fund’s Investor Class shares for the period from inception to October 31, 2017. All returns reflect reinvested dividends, but do not reflect the deduction of taxes that an investor would pay on distributions or redemptions.
Investing in the Fund is subject to investment risks, including possible loss of the principal amount invested.
The Fund also offers Institutional Class shares, performance for which is not reflected in the graphs above. The performance of Institutional Class shares may be higher or lower than the performance of the Investor Class shares shown in the graphs above based upon differences in fees paid by shareholders investing in the Investor Class shares and Institutional Class shares.
| 26 | 1.855.377.7325 | www.GrandeurPeakGlobal.com |
| Grandeur Peak International Opportunities Fund | Performance Update |
October 31, 2017 (Unaudited)
| Regional Allocation (as a % of Net Assets)* | |
| Asia ex Japan | 33.7% |
| Europe | 33.4% |
| North America | 6.9% |
| Japan | 10.8% |
| Australia/New Zealand | 3.7% |
| Africa/Middle East | 2.8% |
| Latin America | 2.7% |
| Cash, Cash Equivalents, & Other Net Assets | 6.0% |
| Total | 100.0% |
| Industry Sector Allocation (as a % of Net Assets)* | |
| Financials | 25.5% |
| Industrials | 19.3% |
| Technology | 17.9% |
| Consumer | 17.9% |
| Health Care | 10.4% |
| Energy & Materials | 3.0% |
| Cash, Cash Equivalents, & Other Net Assets | 6.0% |
| Total | 100.0% |
| Top 10 Holdings (as a % of Net Assets)* | |
| Man Wah Holdings, Ltd. | 1.9% |
| FirstCash, Inc. | 1.5% |
| Clinigen Group PLC | 1.3% |
| Wirecard AG | 1.2% |
| Alkem Laboratories, Ltd. | 1.2% |
| Irish Residential Properties REIT PLC | 1.2% |
| Silergy Corp. | 1.1% |
| China Medical System Holdings, Ltd. | 1.1% |
| Palfinger AG | 1.1% |
| Skandiabanken ASA | 1.1% |
| Total | 12.7% |
| * | Holdings are subject to change, and may not reflect the current or future position of the portfolio. |
| Semi-Annual Report | October 31, 2017 | 27 |
| Grandeur Peak International Stalwarts Fund | Performance Update |
October 31, 2017 (Unaudited)
Annualized Total Return Performance for the periods ended October 31, 2017
| Expense Ratio(b) | |||||
| 6 Months | 1 Year | Since Inception(a) | Gross | Net(c) | |
| Grandeur Peak International Stalwarts – Investor | 12.58% | 26.05% | 19.57% | 1.27% | 1.27% |
| Grandeur Peak International Stalwarts – Institutional | 12.71% | 26.40% | 19.84% | 1.02% | 1.02% |
| Russell Global ex-U.S. SMID Cap Index(d) | 11.69% | 23.47% | 15.35% | ||
| Russell Global ex-U.S. Small Cap Index(e) | 11.98% | 23.00% | 15.76% | ||
Performance data quoted represents past performance. Past performance does not guarantee future results. Investment return and principal value of an investment will fluctuate so that an investor’s shares, when sold or redeemed, may be worth more or less than the original cost. The Fund imposes a 2.00% redemption fee on shares held for less than 60 days. Current performance data may be higher or lower than actual data quoted. For the most current month-end performance data, please call 1-855-377-PEAK (7325).
The table does not reflect the deduction of taxes a shareholder would pay on Fund distributions or redemption of Fund shares.
Subject to investment risks, including possible loss of the principal amount invested.
Returns for periods less than 1 year are cumulative.
| (a) | Fund inception date of September 1, 2015. |
| (b) | Ratios as of the Prospectus dated August 31, 2017 and may differ from the ratios presented in the Financial Highlights. |
| (c) | Grandeur Peak Global Advisors, LLC (the “Adviser”), has agreed to waive and/or reimburse fees or expenses in order to limit Total Annual Fund Operating Expenses After Fee Waiver/ Expense Reimbursements (excluding acquired fund fees and expenses, brokerage expenses, interest expenses, taxes and extraordinary expenses) to 1.35% and 1.10% of the Fund’s average daily net assets for the Fund’s Investor Class Shares and Institutional Class Shares, respectively. This agreement is in effect through August 31, 2018. The Adviser will be permitted to recover, on a class-by-class basis, expenses it has borne through this agreement to the extent that a Fund’s expenses in later periods fall below annual rates set forth in the Expense Agreement; provided, however, that such recapture payments do not cause the Fund’s expense ratio (after recapture) to exceed the lesser of (i) the expense cap in effect at the time of the waiver and (ii) the expense cap in effect at the time of the recapture. Notwithstanding the foregoing, the Funds will not be obligated to pay any such deferred fees and expenses more than three years after the date on which the fee and expenses was deferred This agreement may not be terminated or modified prior to August 31, 2018 except with the approval of the Fund’s Board of Trustees. |
| (d) | The Russell Global ex-US SMid Cap Index is constructed to provide a comprehensive and unbiased barometer for the small- and mid-cap (SMid) segments excluding companies assigned to the United States. The Russell Global ex-US SMid Cap Index is reconstituted annually to accurately reflect the changes in the market over time. The Index is not actively managed and does not reflect any deductions for fees, expenses, or taxes. An investor may not invest directly in the Index. |
| (e) | The Russell Global ex-U.S. Small Cap Index is designed to measure the performance of small capitalization securities outside of the U.S. The Index is not actively managed and does not reflect any deductions for fees, expenses, or taxes. An investor may not invest directly in the Index. |
| 28 | 1.855.377.7325 | www.GrandeurPeakGlobal.com |
| Grandeur Peak International Stalwarts Fund | Performance Update |
October 31, 2017 (Unaudited)
Growth of $10,000 for the period ended October 31, 2017
The chart shown above represent a hypothetical investment of $10,000 in the Fund’s Investor Class shares for the period from inception to October 31, 2017. All returns reflect reinvested dividends, but do not reflect the deduction of taxes that an investor would pay on distributions or redemptions.
Investing in the Fund is subject to investment risks, including possible loss of the principal amount invested.
The Fund also offers Institutional Class shares, performance for which is not reflected in the graphs above. The performance of Institutional Class shares may be higher or lower than the performance of the Investor Class shares shown in the graphs above based upon differences in fees paid by shareholders investing in the Investor Class shares and Institutional Class shares.
| Semi-Annual Report | October 31, 2017 | 29 |
| Grandeur Peak International Stalwarts Fund | Performance Update |
October 31, 2017 (Unaudited)
| Regional Allocation (as a % of Net Assets)* | |
| Europe | 35.4% |
| Asia ex Japan | 30.5% |
| North America | 11.0% |
| Japan | 9.4% |
| Latin America | 4.2% |
| Africa/Middle East | 2.0% |
| Australia/New Zealand | 1.4% |
| Cash, Cash Equivalents, & Other Net Assets | 6.1% |
| Total | 100.0% |
| Industry Sector Allocation (as a % of Net Assets)* | |
| Consumer | 25.6% |
| Financials | 22.6% |
| Industrials | 21.8% |
| Technology | 14.6% |
| Health Care | 7.4% |
| Energy & Materials | 1.9% |
| Cash, Cash Equivalents, & Other Net Assets | 6.1% |
| Total | 100.0% |
| Top 10 Holdings (as a % of Net Assets)* | |
| Nihon M&A Center, Inc. | 2.8% |
| Stantec, Inc. | 2.6% |
| Value Partners Group, Ltd. | 2.2% |
| B&M European Value Retail SA | 2.2% |
| Brembo SpA | 2.1% |
| Aalberts Industries NV | 2.0% |
| Man Wah Holdings, Ltd. | 1.9% |
| FirstCash, Inc. | 1.7% |
| China Medical System Holdings, Ltd. | 1.7% |
| MISUMI Group, Inc. | 1.6% |
| Total | 20.8% |
| * | Holdings are subject to change, and may not reflect the current or future position of the portfolio. |
| 30 | 1.855.377.7325 | www.GrandeurPeakGlobal.com |
| Grandeur Peak Funds® | Disclosure of Fund Expenses |
October 31, 2017 (Unaudited)
As a shareholder of a Fund, you incur two types of costs: (1) transaction costs, including sales charges (loads) on purchase payments, reinvested dividends, or other distributions; redemption fees; and exchange fees; and (2) ongoing costs, including management fees; distribution and/or service (12b-1) fees; and other Fund expenses. This example is intended to help you understand your ongoing costs (in dollars) of investing in the Fund and to compare these costs with the ongoing costs of investing in other mutual funds.
This example is based on an investment of $1,000 invested at the beginning of the period and held for the entire six-month period of May 1, 2017 through of October 31, 2017.
Actual Expenses The first line of the table provides information about actual account values and actual expenses. You may use the information in this line, together with the amount you invested, to estimate the expenses that you paid over the period. Simply divide your account value by $1,000 (for example, an $8,600 account value divided by $1,000 = 8.6), then multiply the result by the number in the first line under the heading “Expenses Paid During Period” to estimate the expenses you paid on your account during this period.
Hypothetical Example for Comparison Purposes The second line of the table provides information about hypothetical account values and hypothetical expenses based on the Fund’s actual expense ratio and an assumed rate of return of 5% per year before expenses, which is not the Fund’s actual return. The hypothetical account values and expenses may not be used to estimate the actual ending account balance or expenses you paid for the period. You may use this information to compare the ongoing costs of investing in the Fund and other mutual funds. To do so, compare this 5% hypothetical example with the 5% hypothetical examples that appear in the shareholder reports of the other funds.
Please note that the expenses shown in the table are meant to highlight your ongoing costs only and do not reflect any transactional costs, such as redemption fees or exchange fees. Therefore, the second line of the table is useful in comparing ongoing costs only and will not help you determine the relative total costs of owning different funds. In addition, if these transactional costs were included, your costs would have been higher.
| Semi-Annual Report | October 31, 2017 | 31 |
| Grandeur Peak Funds® | Disclosure of Fund Expenses |
October 31, 2017 (Unaudited)
| Beginning Account Value May 1, 2017 | Ending Account Value October 31, 2017 | Expense Ratio(a) | Expenses Paid During period May 1, 2017 - October 31, 2017(b) | |
| Grandeur Peak Emerging Markets Opportunities Fund | ||||
| Investor Class | ||||
| Actual | $1,000.00 | $1,067.50 | 1.79% | $9.33 |
| Hypothetical (5% return before expenses) | $1,000.00 | $1,016.18 | 1.79% | $9.10 |
| Institutional Class | ||||
| Actual | $1,000.00 | $1,068.10 | 1.55% | $8.08 |
| Hypothetical (5% return before expenses) | $1,000.00 | $1,017.39 | 1.55% | $7.88 |
| Grandeur Peak Global Micro Cap Fund | ||||
| Institutional Class | ||||
| Actual | $1,000.00 | $1,130.20 | 2.00% | $10.74 |
| Hypothetical (5% return before expenses) | $1,000.00 | $1,015.12 | 2.00% | $10.16 |
| Grandeur Peak Global Opportunities Fund | ||||
| Investor Class | ||||
| Actual | $1,000.00 | $1,133.50 | 1.56% | $8.39 |
| Hypothetical (5% return before expenses) | $1,000.00 | $1,017.34 | 1.56% | $7.93 |
| Institutional Class | ||||
| Actual | $1,000.00 | $1,132.00 | 1.31% | $7.04 |
| Hypothetical (5% return before expenses) | $1,000.00 | $1,018.60 | 1.31% | $6.67 |
| Grandeur Peak Global Reach Fund | ||||
| Investor Class | ||||
| Actual | $1,000.00 | $1,110.90 | 1.52% | $8.09 |
| Hypothetical (5% return before expenses) | $1,000.00 | $1,017.54 | 1.52% | $7.73 |
| Institutional Class | ||||
| Actual | $1,000.00 | $1,112.00 | 1.28% | $6.81 |
| Hypothetical (5% return before expenses) | $1,000.00 | $1,018.75 | 1.28% | $6.51 |
| Grandeur Peak Global Stalwarts Fund | ||||
| Investor Class | ||||
| Actual | $1,000.00 | $1,116.00 | 1.35% | $7.20 |
| Hypothetical (5% return before expenses) | $1,000.00 | $1,018.40 | 1.35% | $6.87 |
| Institutional Class | ||||
| Actual | $1,000.00 | $1,118.10 | 1.10% | $5.87 |
| Hypothetical (5% return before expenses) | $1,000.00 | $1,019.66 | 1.10% | $5.60 |
| Grandeur Peak International Opportunities Fund | ||||
| Investor Class | ||||
| Actual | $1,000.00 | $1,138.00 | 1.55% | $8.35 |
| Hypothetical (5% return before expenses) | $1,000.00 | $1,017.39 | 1.55% | $7.88 |
| Institutional Class | ||||
| Actual | $1,000.00 | $1,137.30 | 1.30% | $7.00 |
| Hypothetical (5% return before expenses) | $1,000.00 | $1,018.65 | 1.30% | $6.61 |
| Grandeur Peak International Stalwarts Fund | ||||
| Investor Class | ||||
| Actual | $1,000.00 | $1,125.80 | 1.18% | $6.32 |
| Hypothetical (5% return before expenses) | $1,000.00 | $1,019.26 | 1.18% | $6.01 |
| Institutional Class | ||||
| Actual | $1,000.00 | $1,127.10 | 0.93% | $4.99 |
| Hypothetical (5% return before expenses) | $1,000.00 | $1,020.52 | 0.93% | $4.74 |
| (a) | The Fund's expense ratios have been annualized based on the Fund's most recent fiscal half-year expenses. |
| (b) | Expenses are equal to the Fund's annualized expense ratio multiplied by the average account value over the period, multiplied by the number of days in the most recent fiscal half-year 184/365 (to reflect the half-year period). |
| 32 | 1.855.377.7325 | www.GrandeurPeakGlobal.com |
| Grandeur Peak Emerging Markets Opportunities Fund | Portfolio of Investments |
October 31, 2017 (Unaudited)
| Shares | Value (Note 2) | |||||||
| COMMON STOCKS (98.16%) | ||||||||
| Argentina (0.56%) | ||||||||
| Despegar.com Corp.(a) | 950 | $ | 29,260 | |||||
| Globant SA(a) | 64,562 | 2,435,279 | ||||||
| 2,464,539 | ||||||||
| Bangladesh (1.01%) | ||||||||
| Olympic Industries, Ltd. | 272,639 | 841,696 | ||||||
| Square Pharmaceuticals, Ltd. | 1,002,442 | 3,593,831 | ||||||
| 4,435,527 | ||||||||
| Brazil (1.68%) | ||||||||
| M Dias Branco SA | 199,200 | 2,946,014 | ||||||
| Raia Drogasil SA | 128,800 | 3,099,421 | ||||||
| Valid Solucoes e Servicos de Seguranca em Meios de Pagamento e Identificacao SA | 234,400 | 1,311,975 | ||||||
| 7,357,410 | ||||||||
| China (12.82%) | ||||||||
| 51job, Inc., ADR(a) | 3,125 | 193,437 | ||||||
| BBI Life Sciences Corp.(b) | 9,968,500 | 3,986,684 | ||||||
| BrightKing Holdings, Ltd. | 833,721 | 1,824,486 | ||||||
| China Medical System Holdings, Ltd. | 5,082,000 | 9,393,499 | ||||||
| CSPC Pharmaceutical Group, Ltd. | 2,500,000 | 4,345,374 | ||||||
| Ctrip.com International, Ltd., ADR(a) | 60,175 | 2,881,781 | ||||||
| Lida Holdings, Ltd. | 446,000 | 1,500,986 | ||||||
| Man Wah Holdings, Ltd. | 10,834,800 | 9,777,347 | ||||||
| O2Micro International, Ltd., ADR(a) | 462,244 | 919,866 | ||||||
| On-Bright Electronics, Inc. | 577,941 | 4,129,587 | ||||||
| Shanghai Haohai Biological Technology Co., Ltd., Class H(b)(c) | 484,800 | 2,370,744 | ||||||
| Silergy Corp. | 342,422 | 7,391,261 | ||||||
| Xiabuxiabu Catering Management China Holdings Co., Ltd.(b)(c) | 3,586,500 | 5,231,672 | ||||||
| Yum China Holdings, Inc.(a) | 54,375 | 2,194,031 | ||||||
| 56,140,755 | ||||||||
| Colombia (2.38%) | ||||||||
| Amerisur Resources PLC(a) | 5,811,200 | 1,505,039 | ||||||
| Bolsa de Valores de Colombia | 214,691,892 | 1,722,024 | ||||||
| Gran Tierra Energy, Inc.(a) | 1,124,500 | 2,440,165 | ||||||
| Parex Resources, Inc.(a) | 356,831 | 4,746,314 | ||||||
| 10,413,542 | ||||||||
| Egypt (2.05%) | ||||||||
| African Export-Import Bank(a) | 500,000 | 2,150,000 | ||||||
| Commercial International Bank Egypt SAE | 330,121 | 1,475,523 | ||||||
| Shares | Value (Note 2) | |||||||
| Egypt (continued) | ||||||||
| Integrated Diagnostics Holdings PLC(b)(c) | 371,100 | $ | 1,447,290 | |||||
| Juhayna Food Industries | 3,399,871 | 1,761,936 | ||||||
| Obour Land For Food Industries | 2,116,943 | 2,135,338 | ||||||
| 8,970,087 | ||||||||
| Georgia (2.70%) | ||||||||
| BGEO Group PLC | 118,812 | 5,617,689 | ||||||
| Georgia Healthcare Group PLC(a)(b)(c) | 319,225 | 1,483,927 | ||||||
| TBC Bank Group PLC | 207,206 | 4,711,438 | ||||||
| 11,813,054 | ||||||||
| Greece (0.74%) | ||||||||
| Sarantis SA | 223,934 | 3,221,492 | ||||||
| Hong Kong (6.16%) | ||||||||
| Essex Bio-technology, Ltd. | 6,022,000 | 3,882,721 | ||||||
| International Housewares Retail Co., Ltd. | 9,274,000 | 1,747,479 | ||||||
| Jacobson Pharma Corp., Ltd.(b) | 5,020,000 | 1,299,818 | ||||||
| Plover Bay Technologies, Ltd.(b) | 8,615,000 | 1,744,776 | ||||||
| Samsonite International SA | 753,900 | 3,145,518 | ||||||
| TK Group Holdings, Ltd. | 5,467,000 | 2,697,971 | ||||||
| Value Partners Group, Ltd. | 9,225,800 | 9,141,364 | ||||||
| Vitasoy International Holdings, Ltd. | 1,428,900 | 3,304,196 | ||||||
| 26,963,843 | ||||||||
| India (15.63%) | ||||||||
| Alkem Laboratories, Ltd. | 191,673 | 5,545,004 | ||||||
| Bajaj Finance, Ltd. | 166,000 | 4,614,696 | ||||||
| Byke Hospitality, Ltd. | 981,000 | 2,381,647 | ||||||
| City Union Bank, Ltd. | 1,295,250 | 3,230,563 | ||||||
| Control Print, Ltd. | 332,504 | 2,048,015 | ||||||
| Cyient, Ltd. | 537,595 | 4,486,512 | ||||||
| Dilip Buildcon, Ltd.(b)(c) | 30,000 | 395,129 | ||||||
| Eros International Media, Ltd.(a) | 164,198 | 529,697 | ||||||
| Essel Propack, Ltd. | 455,500 | 2,006,004 | ||||||
| Glenmark Pharmaceuticals, Ltd. | 153,500 | 1,463,874 | ||||||
| Hinduja Global Solutions, Ltd. | 121,684 | 1,084,558 | ||||||
| Indiabulls Housing Finance, Ltd. | 179,500 | 3,447,625 | ||||||
| Kellton Tech Solutions, Ltd.(a) | 576,175 | 871,763 | ||||||
| Kovai Medical Center and Hospital | 75,083 | 1,313,840 | ||||||
| Kwality, Ltd. | 985,200 | 1,530,932 | ||||||
| L&T Finance Holdings, Ltd. | 672,500 | 2,088,479 | ||||||
| L&T Technology Services, Ltd.(b)(c) | 187,964 | 2,417,338 | ||||||
See Notes to Financial Statements.
| Semi-Annual Report | October 31, 2017 | 33 |
| Grandeur Peak Emerging Markets Opportunities Fund | Portfolio of Investments |
October 31, 2017 (Unaudited)
| Shares | Value (Note 2) | |||||||
| India (continued) | ||||||||
| SBI Life Insurance Co., Ltd.(a)(b)(c) | 32,443 | $ | 331,636 | |||||
| Somany Ceramics, Ltd. | 132,000 | 1,730,416 | ||||||
| Time Technoplast, Ltd. | 2,417,221 | 6,960,059 | ||||||
| Vaibhav Global, Ltd.(a) | 200,319 | 2,028,202 | ||||||
| Vakrangee, Ltd. | 460,000 | 3,993,408 | ||||||
| Vesuvius India, Ltd. | 70,827 | 1,471,351 | ||||||
| WNS Holdings, Ltd., ADR(a) | 160,186 | 6,074,253 | ||||||
| Yes Bank, Ltd. | 1,325,000 | 6,428,489 | ||||||
| 68,473,490 | ||||||||
| Indonesia (5.73%) | ||||||||
| Ace Hardware Indonesia Tbk PT | 10,593,500 | 980,265 | ||||||
| Arwana Citramulia Tbk PT | 58,293,000 | 1,650,471 | ||||||
| Astra Graphia Tbk PT | 6,590,300 | 646,275 | ||||||
| Bank Rakyat Indonesia Persero Tbk PT | 1,872,600 | 2,153,921 | ||||||
| Bekasi Fajar Industrial Estate Tbk PT | 56,350,600 | 1,179,987 | ||||||
| Delfi, Ltd. | 866,400 | 940,703 | ||||||
| Hexindo Adiperkasa Tbk PT | 3,557,100 | 910,093 | ||||||
| Indonesia Pondasi Raya Tbk PT | 15,681,200 | 1,245,824 | ||||||
| Link Net Tbk PT | 7,350,500 | 2,704,442 | ||||||
| Lippo Cikarang Tbk PT(a) | 3,005,000 | 841,954 | ||||||
| Panin Sekuritas Tbk PT | 7,155,500 | 1,081,569 | ||||||
| Sarana Menara Nusantara Tbk Pt | 7,658,500 | 2,315,196 | ||||||
| Selamat Sempurna Tbk PT | 42,617,900 | 4,053,610 | ||||||
| Tempo Scan Pacific Tbk PT | 17,950,700 | 2,448,575 | ||||||
| Ultrajaya Milk Industry & Trading Co. Tbk PT | 20,171,600 | 1,940,935 | ||||||
| 25,093,820 | ||||||||
| Jordan (0.21%) | ||||||||
| Hikma Pharmaceuticals PLC | 60,400 | 933,764 | ||||||
| Kenya (0.62%) | ||||||||
| Safaricom, Ltd. | 11,093,200 | 2,726,521 | ||||||
| Malaysia (2.37%) | ||||||||
| AEON Credit Service M Bhd | 1,130,400 | 3,711,482 | ||||||
| Berjaya Food Bhd | 1,400,284 | 492,836 | ||||||
| Bison Consolidated Bhd | 740,500 | 423,293 | ||||||
| CB Industrial Product Holding Bhd | 3,616,200 | 1,648,580 | ||||||
| My EG Services Bhd | 5,214,900 | 2,697,681 | ||||||
| Scicom MSC Bhd | 3,146,500 | 1,404,721 | ||||||
| 10,378,593 | ||||||||
| Mexico (2.40%) | ||||||||
| Banregio Grupo Financiero SAB de CV | 649,900 | 3,466,495 | ||||||
| Shares | Value (Note 2) | |||||||
| Mexico (continued) | ||||||||
| Credito Real SAB de CV SOFOM ER | 2,044,271 | $ | 3,284,184 | |||||
| Grupo Herdez SAB de CV | 715,400 | 1,529,928 | ||||||
| Unifin Financiera SAB de CV SOFOM ENR | 663,600 | 2,249,873 | ||||||
| 10,530,480 | ||||||||
| Oman (0.70%) | ||||||||
| Tethys Oil AB | 416,623 | 3,073,047 | ||||||
| Pakistan (1.99%) | ||||||||
| Abbott Laboratories Pakistan, Ltd. | 132,850 | 933,929 | ||||||
| Akzo Nobel Pakistan, Ltd. | 852,800 | 1,700,580 | ||||||
| Bank Al Habib, Ltd. | 1,609,000 | 841,198 | ||||||
| Bata Pakistan, Ltd. | 5,960 | 148,526 | ||||||
| Kohinoor Textile Mills, Ltd. | 1,426,178 | 901,863 | ||||||
| Meezan Bank, Ltd. | 2,408,320 | 1,498,012 | ||||||
| Pak Elektron, Ltd. | 2,219,500 | 1,242,971 | ||||||
| Systems, Ltd. | 2,181,500 | 1,440,596 | ||||||
| 8,707,675 | ||||||||
| Peru (1.68%) | ||||||||
| Alicorp SAA | 1,049,255 | 3,276,400 | ||||||
| Credicorp, Ltd. | 19,475 | 4,078,844 | ||||||
| 7,355,244 | ||||||||
| Philippines (5.35%) | ||||||||
| Concepcion Industrial Corp. | 3,282,792 | 4,133,297 | ||||||
| Holcim Philippines, Inc. | 3,694,500 | 858,770 | ||||||
| Pepsi-Cola Products Philippines, Inc. | 23,627,000 | 1,318,078 | ||||||
| Puregold Price Club, Inc. | 3,372,100 | 3,331,276 | ||||||
| Robinsons Land Corp. | 6,379,600 | 3,114,110 | ||||||
| Robinsons Retail Holdings, Inc. | 1,675,000 | 3,147,215 | ||||||
| Security Bank Corp. | 1,580,600 | 7,531,769 | ||||||
| 23,434,515 | ||||||||
| Poland (2.56%) | ||||||||
| Dino Polska SA(a)(b)(c) | 241,300 | 4,542,336 | ||||||
| LiveChat Software SA | 208,859 | 2,768,567 | ||||||
| Medicalgorithmics SA | 27,700 | 1,534,175 | ||||||
| PGS Software SA | 426,467 | 1,609,818 | ||||||
| Wawel SA | 2,814 | 746,300 | ||||||
| 11,201,196 | ||||||||
| Russia (0.67%) | ||||||||
| MD Medical Group Investments PLC, GDR(b) | 117,400 | 1,220,960 | ||||||
| Moscow Exchange MICEX-RTS PJSC | 838,410 | 1,692,017 | ||||||
| 2,912,977 | ||||||||
See Notes to Financial Statements.
| 34 | 1.855.377.7325 | www.GrandeurPeakGlobal.com |
| Grandeur Peak Emerging Markets Opportunities Fund | Portfolio of Investments |
October 31, 2017 (Unaudited)
| Shares | Value (Note 2) | |||||||
| South Africa (3.83%) | ||||||||
| ARB Holdings, Ltd. | 1,134,108 | $ | 481,277 | |||||
| Blue Label Telecoms, Ltd. | 1,363,023 | 1,662,958 | ||||||
| Capitec Bank Holdings, Ltd. | 23,200 | 1,542,165 | ||||||
| Cartrack Holdings, Ltd. | 2,096,700 | 2,224,419 | ||||||
| Clicks Group, Ltd. | 113,000 | 1,266,207 | ||||||
| EOH Holdings, Ltd. | 396,824 | 2,958,481 | ||||||
| Interwaste Holdings, Ltd.(a) | 15,918,682 | 1,047,078 | ||||||
| Italtile, Ltd. | 1,502,579 | 1,467,641 | ||||||
| Transaction Capital, Ltd. | 3,877,628 | 4,111,088 | ||||||
| 16,761,314 | ||||||||
| South Korea (8.49%) | ||||||||
| BGF retail Co., Ltd. | 43,500 | 3,071,228 | ||||||
| Daebongls Co., Ltd. | 197,000 | 1,709,145 | ||||||
| Daewon Pharmaceutical Co., Ltd. | 37,324 | 594,665 | ||||||
| Hanssem Co., Ltd. | 11,000 | 1,674,030 | ||||||
| Hy-Lok Corp. | 127,297 | 2,806,477 | ||||||
| Interpark Holdings Corp. | 265,500 | 991,759 | ||||||
| ISC Co., Ltd. | 161,999 | 3,065,452 | ||||||
| i-SENS, Inc. | 86,500 | 1,822,109 | ||||||
| Koh Young Technology, Inc. | 32,744 | 2,244,601 | ||||||
| Korea Kolmar Co., Ltd. | 14,500 | 1,071,629 | ||||||
| LEENO Industrial, Inc. | 55,500 | 2,536,350 | ||||||
| LG Household & Health Care, Ltd. | 3,700 | 3,887,089 | ||||||
| Loen Entertainment, Inc. | 55,000 | 5,228,277 | ||||||
| Mando Corp. | 8,000 | 2,331,414 | ||||||
| Medy-Tox, Inc. | 3,000 | 1,134,021 | ||||||
| Vitzrocell Co., Ltd.(a)(d) | 444,769 | 3,022,095 | ||||||
| 37,190,341 | ||||||||
| Sri Lanka (2.12%) | ||||||||
| Hatton National Bank PLC | 1,185,402 | 2,081,832 | ||||||
| Hemas Holdings PLC | 3,255,526 | 2,754,880 | ||||||
| Royal Ceramics Lanka PLC | 3,593,775 | 2,760,393 | ||||||
| Sampath Bank PLC | 773,791 | 1,711,029 | ||||||
| 9,308,134 | ||||||||
| Switzerland (0.64%) | ||||||||
| Wizz Air Holdings PLC(a)(b)(c) | 64,800 | 2,818,602 | ||||||
| Taiwan (6.78%) | ||||||||
| ASPEED Technology, Inc. | 74,929 | 1,731,644 | ||||||
| Cub Elecparts, Inc. | 152,980 | 1,509,029 | ||||||
| Dr. Wu Skincare Co., Ltd. | 217,000 | 971,336 | ||||||
| I Yuan Precision Ind Co., Ltd. | 507,000 | 1,975,248 | ||||||
| Materials Analysis Technology, Inc. | 501,000 | 1,448,539 | ||||||
| Rafael Microelectronics, Inc. | 227,000 | 1,546,727 | ||||||
| Sinmag Equipment Corp. | 1,039,133 | 5,271,551 | ||||||
| Sitronix Technology Corp. | 942,000 | 2,667,378 | ||||||
| Sporton International, Inc. | 1,044,317 | 5,297,850 | ||||||
| Tehmag Foods Corp. | 145,200 | 1,076,019 | ||||||
| Test Research, Inc. | 1,950,000 | 2,715,562 | ||||||
| Shares | Value (Note 2) | |||||||
| Taiwan (continued) | ||||||||
| TSC Auto ID Technology Co., Ltd. | 171,000 | $ | 1,250,203 | |||||
| TTFB Co., Ltd. | 179,000 | 1,326,497 | ||||||
| Voltronic Power Technology Corp. | 49,000 | 922,827 | ||||||
| 29,710,410 | ||||||||
| Thailand (1.88%) | ||||||||
| Ananda Development PCL | 25,461,800 | 4,560,437 | ||||||
| Srisawad Power Corp. PCL | 1,750,240 | 3,661,700 | ||||||
| 8,222,137 | ||||||||
| Turkey (0.69%) | ||||||||
| Anadolu Hayat Emeklilik AS | 577,500 | 1,027,567 | ||||||
| Aselsan Elektronik Sanayi Ve Ticaret AS | 144,900 | 1,296,386 | ||||||
| AvivaSA Emeklilik ve Hayat AS | 140,700 | 695,053 | ||||||
| 3,019,006 | ||||||||
| United Arab Emirates (0.32%) | ||||||||
| Aramex PJSC | 1,018,125 | 1,419,357 | ||||||
| United States (1.63%) | ||||||||
| FirstCash, Inc. | 111,970 | 7,149,285 | ||||||
| Vietnam (1.77%) | ||||||||
| DHG Pharmaceutical JSC | 52,215 | 230,585 | ||||||
| FPT Corp. | 713,527 | 1,583,347 | ||||||
| Lix Detergent JSC | 437,310 | 866,437 | ||||||
| Nui Nho Stone JSC | 275,493 | 658,636 | ||||||
| Vietnam Dairy Products JSC | 666,076 | 4,428,287 | ||||||
| 7,767,292 | ||||||||
| TOTAL COMMON STOCKS | ||||||||
| (Cost $354,645,762) | 429,967,449 | |||||||
| Principal Amount | Value (Note 2) | |||||||
| CORPORATE BONDS (0.15%) | ||||||||
| Malaysia (0.15%) | ||||||||
| AEON Credit Service M Bhd 3.50%, 09/15/2020 | $ | 2,260,800 | $ | 667,533 | ||||
| TOTAL CORPORATE BONDS | ||||||||
| (Cost $537,071) | 667,533 | |||||||
See Notes to Financial Statements.
| Semi-Annual Report | October 31, 2017 | 35 |
| Grandeur Peak Emerging Markets Opportunities Fund | Portfolio of Investments |
October 31, 2017 (Unaudited)
| Shares | Value (Note 2) | |||||||
| RIGHTS AND WARRANTS (0.02%) | ||||||||
| Sri Lanka (0.02%) | ||||||||
| Sampath Bank Plc, strike price 245.00 LKR, expires 11/15/2017 | 128,965 | $ | 79,498 | |||||
| Taiwan (0.00%)(e) | ||||||||
| Materials Analysis Technology, strike price 82.00 TWD, expires 12/11/2017 | 67,660 | 11,666 | ||||||
| TOTAL RIGHTS AND WARRANTS | ||||||||
| (Cost $0) | 91,164 | |||||||
| TOTAL INVESTMENTS (98.33%) | ||||||||
| (Cost $355,182,833) | $ | 430,726,146 | ||||||
| Other Assets In Excess Of Liabilities (1.67%) | 7,306,008 | |||||||
| NET ASSETS (100.00%) | $ | 438,032,154 | ||||||
| (a) | Non-Income Producing Security. |
| (b) | Security was purchased pursuant to Regulation S under the Securities Act of 1933, which exempts securities offered and sold outside of the United States from registration. Such security cannot be sold in the United States without either an effective registration statement filed pursuant to the Securities Act of 1933, or pursuant to an exemption from registration. The security has been deemed liquid under guidelines approved by the Fund's Board of Trustees. As of October 31, 2017, the aggregate market value of those securities was $29,290,913, representing 6.69% of net assets. |
| (c) | Security exempt from registration under Rule 144A of the Securities Act of 1933. These securities may be resold in the ordinary course of business in transactions exempt from registration, normally to qualified institutional buyers. As of October 31, 2017, these securities had a total aggregate market value of $21,038,674 representing 4.80% of net assets. |
| (d) | Fair valued security under the procedures approved by the Fund's Board of Trustees. |
| (e) | Less than 0.005%. |
Currency Abbreviations:
LKR - Sri Lankan Rupee
TWD - Taiwan Dollar
For Fund compliance purposes, the Fund's geographical classifications refer to any one or more of the country sub-classifications used by one or more widely recognized market indexes or ratings group indexes, and/or as defined by Fund management. This definition may not apply for purposes of this report, which may combine sub-classifications for reporting ease. Geographical regions are shown as a percentage of net assets.
See Notes to Financial Statements.
| 36 | 1.855.377.7325 | www.GrandeurPeakGlobal.com |
| Grandeur Peak Global Micro Cap Fund | Portfolio of Investments |
October 31, 2017 (Unaudited)
| Shares | Value (Note 2) | |||||||
| COMMON STOCKS (98.12%) | ||||||||
| Australia (5.63%) | ||||||||
| Australian Ethical Investment, Ltd. | 415 | $ | 40,020 | |||||
| Beacon Lighting Group, Ltd. | 79,100 | 88,387 | ||||||
| Blue Sky Alternative Investments, Ltd. | 48,300 | 520,487 | ||||||
| CTI Logistics, Ltd. | 158,141 | 135,557 | ||||||
| Fiducian Group, Ltd. | 106,428 | 443,928 | ||||||
| Greencross, Ltd. | 46,500 | 188,977 | ||||||
| Lycopodium, Ltd. | 94,426 | 306,782 | ||||||
| Medical Developments International, Ltd. | 15,057 | 72,601 | ||||||
| Mitula Group, Ltd.(a) | 387,052 | 164,408 | ||||||
| Monash IVF Group, Ltd. | 79,900 | 95,396 | ||||||
| National Storage REIT | 158,694 | 179,149 | ||||||
| National Veterinary Care, Ltd. | 2,300 | 4,647 | ||||||
| Netwealth Group, Ltd.(a) | 200 | 566 | ||||||
| Reject Shop, Ltd. | 21,835 | 77,875 | ||||||
| 2,318,780 | ||||||||
| Bangladesh (0.32%) | ||||||||
| Berger Paints Bangladesh, Ltd. | 5,281 | 132,899 | ||||||
| Britain (9.14%) | ||||||||
| AB Dynamics PLC | 12,432 | 106,500 | ||||||
| Arrow Global Group PLC | 37,119 | 208,661 | ||||||
| City of London Investment Group PLC | 36,977 | 199,759 | ||||||
| dotdigital group PLC | 187,400 | 222,761 | ||||||
| Horizon Discovery Group PLC(a) | 42,400 | 144,163 | ||||||
| IDOX PLC | 92,000 | 76,216 | ||||||
| LoopUp Group PLC(a) | 103,800 | 403,247 | ||||||
| Morses Club PLC | 78,838 | 137,823 | ||||||
| Motorpoint group PLC(b) | 36,651 | 74,234 | ||||||
| On the Beach Group PLC(b)(c) | 51,200 | 280,505 | ||||||
| Oxford Immunotec Global PLC(a) | 22,794 | 301,337 | ||||||
| Premier Asset Management Group PLC | 121,300 | 325,431 | ||||||
| Premier Technical Services Group PLC | 83,600 | 185,981 | ||||||
| River & Mercantile Group PLC | 61,300 | 286,176 | ||||||
| S&U PLC | 3,000 | 79,490 | ||||||
| Sanne Group PLC | 42,937 | 456,214 | ||||||
| Softcat PLC | 21,500 | 153,199 | ||||||
| Tracsis PLC | 19,300 | 124,962 | ||||||
| 3,766,659 | ||||||||
| Canada (1.33%) | ||||||||
| Biosyent, Inc.(a) | 41,993 | 345,032 | ||||||
| Cipher Pharmaceuticals, Inc.(a) | 31,300 | 105,053 | ||||||
| Shares | Value (Note 2) | |||||||
| Canada (continued) | ||||||||
| DIRTT Environmental Solutions(a) | 20,200 | $ | 99,740 | |||||
| 549,825 | ||||||||
| China (5.56%) | ||||||||
| BBI Life Sciences Corp.(b) | 1,555,000 | 621,888 | ||||||
| BrightKing Holdings, Ltd. | 165,332 | 361,807 | ||||||
| Hop Hing Group Holdings, Ltd. | 3,397,000 | 101,456 | ||||||
| O2Micro International, Ltd., ADR(a) | 226,900 | 451,531 | ||||||
| On-Bright Electronics, Inc. | 49,572 | 354,209 | ||||||
| Xiabuxiabu Catering | ||||||||
| Management China Holdings Co., Ltd.(b)(c) | 274,500 | 400,417 | ||||||
| 2,291,308 | ||||||||
| Colombia (1.55%) | ||||||||
| Amerisur Resources PLC(a) | 1,326,900 | 343,653 | ||||||
| Bolsa de Valores de Colombia | 20,370,422 | 163,389 | ||||||
| Gran Tierra Energy, Inc.(a) | 59,850 | 129,875 | ||||||
| 636,917 | ||||||||
| Egypt (0.36%) | ||||||||
| Obour Land For Food Industries | 149,039 | 150,334 | ||||||
| France (2.51%) | ||||||||
| Esker SA | 3,500 | 216,487 | ||||||
| Infotel SA | 1,340 | 79,606 | ||||||
| Medicrea International(a) | 16,100 | 73,891 | ||||||
| Neurones | 4,800 | 160,190 | ||||||
| Tessi SA | 850 | 171,767 | ||||||
| Thermador Groupe | 2,721 | 332,582 | ||||||
| 1,034,523 | ||||||||
| Georgia (1.10%) | ||||||||
| Georgia Healthcare Group PLC(a)(b)(c) | 34,700 | 161,304 | ||||||
| TBC Bank Group PLC | 12,822 | 291,546 | ||||||
| 452,850 | ||||||||
| Germany (1.19%) | ||||||||
| Nexus AG | 6,200 | 188,171 | ||||||
| publity AG | 6,900 | 303,857 | ||||||
| 492,028 | ||||||||
| Greece (0.93%) | ||||||||
| Sarantis SA | 26,700 | 384,104 | ||||||
| Greenland (0.38%) | ||||||||
| Gronlandsbanken A/S | 1,552 | 155,485 | ||||||
See Notes to Financial Statements.
| Semi-Annual Report | October 31, 2017 | 37 |
| Grandeur Peak Global Micro Cap Fund | Portfolio of Investments |
October 31, 2017 (Unaudited)
| Shares | Value (Note 2) | |||||||
| Hong Kong (3.10%) | ||||||||
| Essex Bio-technology, Ltd. | 519,000 | $ | 334,628 | |||||
| International Housewares Retail Co., Ltd. | 1,210,000 | 227,998 | ||||||
| Jacobson Pharma Corp., Ltd.(b) | 775,000 | 200,669 | ||||||
| Plover Bay Technologies, Ltd.(b) | 1,096,000 | 221,971 | ||||||
| TK Group Holdings, Ltd. | 591,000 | 291,659 | ||||||
| 1,276,925 | ||||||||
| India (7.30%) | ||||||||
| Byke Hospitality, Ltd. | 196,779 | 477,735 | ||||||
| Control Print, Ltd. | 23,500 | 144,745 | ||||||
| Cyient, Ltd. | 23,640 | 197,288 | ||||||
| Essel Propack, Ltd. | 31,522 | 138,822 | ||||||
| Igarashi Motors India, Ltd. | 17,000 | 238,959 | ||||||
| Kellton Tech Solutions, Ltd.(a) | 49,232 | 74,489 | ||||||
| Kovai Medical Center and Hospital | 21,967 | 384,390 | ||||||
| Kwality, Ltd. | 107,500 | 167,047 | ||||||
| Somany Ceramics, Ltd. | 13,033 | 170,852 | ||||||
| Thyrocare Technologies, Ltd.(a) | 14,000 | 149,572 | ||||||
| Time Technoplast, Ltd. | 232,015 | 668,056 | ||||||
| Vaibhav Global, Ltd.(a) | 1,792 | 18,144 | ||||||
| Vesuvius India, Ltd. | 8,570 | 178,032 | ||||||
| 3,008,131 | ||||||||
| Indonesia (3.09%) | ||||||||
| Arwana Citramulia Tbk PT | 7,920,100 | 224,245 | ||||||
| Astra Graphia Tbk PT | 1,179,700 | 115,687 | ||||||
| BFI Finance Indonesia Tbk PT | 6,449,300 | 332,867 | ||||||
| Hexindo Adiperkasa Tbk PT | 634,500 | 162,338 | ||||||
| Lippo Cikarang Tbk PT(a) | 102,300 | 28,663 | ||||||
| Panin Sekuritas Tbk PT | 272,700 | 41,219 | ||||||
| Selamat Sempurna Tbk PT | 3,863,900 | 367,516 | ||||||
| 1,272,535 | ||||||||
| Ireland (1.63%) | ||||||||
| Hostelworld Group PLC(b)(c) | 43,487 | 197,386 | ||||||
| Irish Residential Properties REIT PLC | 275,700 | 473,695 | ||||||
| 671,081 | ||||||||
| Japan (12.66%) | ||||||||
| Abist Co., Ltd. | 4,400 | 175,683 | ||||||
| AIT Corp. | 19,600 | 228,053 | ||||||
| Amiyaki Tei Co., Ltd. | 4,800 | 224,581 | ||||||
| Anshin Guarantor Service Co., Ltd. | 19,200 | 82,403 | ||||||
| Arcland Service Holdings Co., Ltd. | 8,000 | 176,175 | ||||||
| Atrae, Inc.(a) | 3,400 | 201,240 | ||||||
| Central Automotive Products, Ltd. | 16,500 | 267,442 | ||||||
| eGuarantee, Inc. | 5,500 | 154,303 | ||||||
| Shares | Value (Note 2) | |||||||
| Japan (continued) | ||||||||
| Encourage Technologies Co., Ltd. | 4,000 | $ | 76,092 | |||||
| Future Corp. | 22,700 | 227,988 | ||||||
| GCA Corp. | 23,200 | 211,178 | ||||||
| Hard Off Corp. Co., Ltd. | 44,400 | 454,133 | ||||||
| Interworks, Inc. | 13,400 | 134,230 | ||||||
| Komehyo Co., Ltd. | 7,000 | 110,813 | ||||||
| M&A Capital Partners Co., Ltd.(a) | 14,200 | 740,565 | ||||||
| Marklines Co, Ltd. | 20,500 | 197,960 | ||||||
| Naigai Trans Line, Ltd. | 10,800 | 160,711 | ||||||
| Prestige International, Inc. | 16,900 | 181,775 | ||||||
| Qol Co., Ltd. | 11,400 | 208,840 | ||||||
| Quick Co., Ltd. | 12,900 | 222,024 | ||||||
| Synchro Food Co., Ltd.(a) | 6,800 | 104,657 | ||||||
| Syuppin Co., Ltd. | 22,500 | 510,532 | ||||||
| Trancom Co., Ltd. | 2,700 | 163,845 | ||||||
| 5,215,223 | ||||||||
| Malaysia (1.58%) | ||||||||
| AEON Credit Service M Bhd | 64,950 | 213,253 | ||||||
| Bison Consolidated Bhd | 571,000 | 326,401 | ||||||
| Scicom MSC Bhd | 251,600 | 112,324 | ||||||
| 651,978 | ||||||||
| Mexico (0.37%) | ||||||||
| Credito Real SAB de CV SOFOM ER | 95,430 | 153,311 | ||||||
| Netherlands (0.77%) | ||||||||
| Shop Apotheke Europe NV(a)(c) | 4,267 | 315,522 | ||||||
| New Zealand (2.19%) | ||||||||
| CBL Corp., Ltd. | 159,993 | 321,880 | ||||||
| Restaurant Brands New Zealand, Ltd. | 54,264 | 251,761 | ||||||
| Trilogy International, Ltd. | 204,522 | 328,893 | ||||||
| 902,534 | ||||||||
| Norway (4.37%) | ||||||||
| Infront ASA(a) | 65,100 | 195,268 | ||||||
| Medistim ASA | 25,862 | 221,638 | ||||||
| Multiconsult ASA(b)(c) | 22,900 | 242,513 | ||||||
| Nordic Semiconductor ASA(a) | 14,700 | 73,608 | ||||||
| Self Storage Group ASA(a) | 82,800 | 141,920 | ||||||
| Skandiabanken ASA(b)(c) | 57,900 | 586,585 | ||||||
| Webstep ASA(a) | 106,700 | 338,336 | ||||||
| 1,799,868 | ||||||||
| Oman (0.35%) | ||||||||
| Tethys Oil AB | 19,300 | 142,358 | ||||||
| Pakistan (0.59%) | ||||||||
| Akzo Nobel Pakistan, Ltd. | 71,300 | 142,180 | ||||||
See Notes to Financial Statements.
| 38 | 1.855.377.7325 | www.GrandeurPeakGlobal.com |
| Grandeur Peak Global Micro Cap Fund | Portfolio of Investments |
October 31, 2017 (Unaudited)
| Shares | Value (Note 2) | |||||||
| Pakistan (continued) | ||||||||
| Kohinoor Textile Mills, Ltd. | 159,000 | $ | 100,546 | |||||
| 242,726 | ||||||||
| Philippines (1.98%) | ||||||||
| Concepcion Industrial Corp. | 169,770 | 213,754 | ||||||
| Pepsi-Cola Products Philippines, Inc. | 371,000 | 20,697 | ||||||
| Pryce Corp.(a) | 4,586,500 | 579,254 | ||||||
| 813,705 | ||||||||
| Poland (1.26%) | ||||||||
| LiveChat Software SA | 13,800 | 182,928 | ||||||
| Medicalgorithmics SA | 2,600 | 144,002 | ||||||
| PGS Software SA | 51,047 | 192,691 | ||||||
| 519,621 | ||||||||
| Singapore (0.79%) | ||||||||
| Riverstone Holdings, Ltd. | 419,800 | 324,913 | ||||||
| South Africa (0.75%) | ||||||||
| ARB Holdings, Ltd. | 400,143 | 169,807 | ||||||
| Cartrack Holdings, Ltd. | 132,200 | 140,253 | ||||||
| 310,060 | ||||||||
| South Korea (2.80%) | ||||||||
| Daebongls Co., Ltd. | 19,226 | 166,802 | ||||||
| Daewon Pharmaceutical Co., Ltd. | 8,250 | 131,443 | ||||||
| Hy-Lok Corp. | 8,412 | 185,457 | ||||||
| ISC Co., Ltd. | 12,447 | 235,530 | ||||||
| Koh Young Technology, Inc. | 2,010 | 137,786 | ||||||
| LEENO Industrial, Inc. | 4,800 | 219,360 | ||||||
| Vitzrocell Co., Ltd.(a)(d) | 11,180 | 75,965 | ||||||
| 1,152,343 | ||||||||
| Sri Lanka (0.95%) | ||||||||
| Royal Ceramics Lanka PLC | 267,000 | 205,084 | ||||||
| Sampath Bank PLC | 84,605 | 187,081 | ||||||
| 392,165 | ||||||||
| Sweden (3.02%) | ||||||||
| Absolent Group AB | 8,029 | 114,369 | ||||||
| Bufab AB | 10,821 | 129,257 | ||||||
| HIQ International AB | 26,600 | 190,643 | ||||||
| Moberg Pharma AB(a) | 20,900 | 94,868 | ||||||
| Odd Molly International AB | 28,046 | 77,723 | ||||||
| Swedencare AB(a) | 50,955 | 146,079 | ||||||
| TF Bank AB(b) | 11,400 | 129,025 | ||||||
| Vitec Software Group AB, Class B | 35,500 | 360,443 | ||||||
| 1,242,407 | ||||||||
| Taiwan (3.82%) | ||||||||
| Dr. Wu Skincare Co., Ltd. | 26,100 | 116,829 | ||||||
| Shares | Value (Note 2) | |||||||
| Taiwan (continued) | ||||||||
| I Yuan Precision Ind Co., Ltd. | 35,000 | $ | 136,358 | |||||
| Materials Analysis Technology, Inc. | 48,045 | 138,912 | ||||||
| Rafael Microelectronics, Inc. | 20,000 | 136,276 | ||||||
| Sinmag Equipment Corp. | 34,000 | 172,483 | ||||||
| Sitronix Technology Corp. | 66,000 | 186,886 | ||||||
| Sporton International, Inc. | 24,481 | 124,193 | ||||||
| Tehmag Foods Corp. | 25,300 | 187,488 | ||||||
| TSC Auto ID Technology Co., Ltd. | 27,000 | 197,401 | ||||||
| TTFB Co., Ltd. | 24,000 | 177,854 | ||||||
| 1,574,680 | ||||||||
| Thailand (1.50%) | ||||||||
| Ananda Development PCL | 3,447,000 | 617,389 | ||||||
| United States (11.64%) | ||||||||
| Aratana Therapeutics, Inc.(a) | 19,400 | 111,162 | ||||||
| Bank of Marin Bancorp | 2,975 | 201,556 | ||||||
| BioDelivery Sciences International, Inc.(a) | 42,375 | 121,828 | ||||||
| Diamond Hill Investment Group, Inc. | 800 | 169,544 | ||||||
| Esquire Financial Holdings, Inc.(a) | 5,075 | 84,803 | ||||||
| First of Long Island Corp. | 13,150 | 414,882 | ||||||
| GBGI, Ltd.(a) | 192,500 | 444,864 | ||||||
| Hackett Group, Inc. | 12,350 | 190,684 | ||||||
| Hennessy Advisors, Inc. | 2,328 | 38,459 | ||||||
| Hingham Institution for Savings | 2,715 | 528,610 | ||||||
| Inphi Corp.(a) | 3,600 | 147,528 | ||||||
| K2M Group Holdings, Inc.(a) | 5,450 | 107,311 | ||||||
| Kinsale Capital Group, Inc. | 5,100 | 221,238 | ||||||
| LGI Homes, Inc.(a) | 2,900 | 174,957 | ||||||
| Malibu Boats, Inc., Class A(a) | 4,686 | 146,203 | ||||||
| NV5 Global, Inc.(a) | 4,350 | 252,735 | ||||||
| OrthoPediatrics Corp.(a) | 2,000 | 36,520 | ||||||
| Reis, Inc. | 4,375 | 79,844 | ||||||
| Seacoast Commerce Banc Holdings | 15,325 | 309,565 | ||||||
| STAAR Surgical Co.(a) | 15,175 | 201,069 | ||||||
| Transcat, Inc.(a) | 15,166 | 192,608 | ||||||
| Trecora Resources(a) | 13,258 | 161,085 | ||||||
| TriMas Corp.(a) | 5,900 | 156,645 | ||||||
| Veracyte, Inc.(a) | 19,333 | 165,297 | ||||||
| Zix Corp.(a) | 27,775 | 134,709 | ||||||
| 4,793,706 | ||||||||
| Vietnam (1.61%) | ||||||||
| DHG Pharmaceutical JSC | 59,780 | 263,993 | ||||||
| Lix Detergent JSC | 107,410 | 212,810 | ||||||
See Notes to Financial Statements.
| Semi-Annual Report | October 31, 2017 | 39 |
| Grandeur Peak Global Micro Cap Fund | Portfolio of Investments |
October 31, 2017 (Unaudited)
| Shares | Value (Note 2) | |||||||
| Vietnam (continued) | ||||||||
| Taisun Int'l Holding Corp. | 46,000 | $ | 188,365 | |||||
| 665,168 | ||||||||
| TOTAL COMMON STOCKS | ||||||||
| (Cost $32,353,895) | 40,424,061 | |||||||
| Principal Amount | Value (Note 2) | |||||||
| CORPORATE BONDS (0.52%) | ||||||||
| Germany (0.42%) | ||||||||
| publity AG | ||||||||
| 3.50%, 11/17/2020 | $ | 150,000 | $ | 174,028 | ||||
| Malaysia (0.10%) | ||||||||
| AEON Credit Service M Bhd | ||||||||
| 3.50%, 09/15/2020 | $ | 129,900 | 38,355 | |||||
| TOTAL CORPORATE BONDS | ||||||||
| (Cost $195,634) | 212,383 |
| Shares | Value (Note 2) | |||||||
| RIGHTS AND WARRANTS (0.02%) | ||||||||
| Sri Lanka (0.02%) | ||||||||
| Sampath Bank Plc, strike price 245.00 LKR, expires 11/15/2017 | 14,100 | 8,692 | ||||||
| Taiwan (0.00%)(e) | ||||||||
| Materials Analysis Technology, strike price 82.00 TWD, expires 12/11/2017 | 6,488 | 1,118 | ||||||
| TOTAL RIGHTS AND WARRANTS | ||||||||
| (Cost $0) | 9,810 | |||||||
| TOTAL INVESTMENTS (98.66%) | ||||||||
| (Cost $32,549,529) | $ | 40,646,254 | ||||||
| Other Assets In Excess Of Liabilities (1.34%) | 552,838 | |||||||
| NET ASSETS (100.00%) | $ | 41,199,092 | ||||||
| (a) | Non-Income Producing Security. |
| (b) | Security was purchased pursuant to Regulation S under the Securities Act of 1933, which exempts securities offered and sold outside of the United States from registration. Such security cannot be sold in the United States without either an effective registration statement filed pursuant to the Securities Act of 1933, or pursuant to an exemption from registration. The security has been deemed liquid under guidelines approved by the Fund's Board of Trustees. As of October 31, 2017, the aggregate market value of those securities was $3,116,497, representing 7.56% of net assets. |
| (c) | Security exempt from registration under Rule 144A of the Securities Act of 1933. These securities may be resold in the ordinary course of business in transactions exempt from registration, normally to qualified institutional buyers. As of October 31, 2017, these securities had a total aggregate market value of $2,184,232 representing 5.30% of net assets. |
| (d) | Fair valued security under the procedures approved by the Fund's Board of Trustees. |
| (e) | Less than 0.005%. |
Currency Abbreviations:
LKR - Sri Lankan Rupee
TWD - Taiwan Dollar
For Fund compliance purposes, the Fund's geographical classifications refer to any one or more of the country sub-classifications used by one or more widely recognized market indexes or ratings group indexes, and/or as defined by Fund management. This definition may not apply for purposes of this report, which may combine sub-classifications for reporting ease. Geographical regions are shown as a percentage of net assets.
See Notes to Financial Statements.
| 40 | 1.855.377.7325 | www.GrandeurPeakGlobal.com |
| Grandeur Peak Global Opportunities Fund | Portfolio of Investments |
October 31, 2017 (Unaudited)
| Shares | Value (Note 2) | |||||||
| COMMON STOCKS (95.47%) | ||||||||
| Argentina (0.42%) | ||||||||
| Globant SA(a) | 87,275 | $ | 3,292,013 | |||||
| Australia (1.57%) | ||||||||
| Blue Sky Alternative Investments, Ltd. | 291,700 | 3,143,398 | ||||||
| Greencross, Ltd. | 544,716 | 2,213,732 | ||||||
| Magellan Financial Group, Ltd. | 193,064 | 3,586,175 | ||||||
| National Storage REIT | 1,609,090 | 1,816,489 | ||||||
| National Veterinary Care, Ltd. | 280,456 | 566,668 | ||||||
| Netwealth Group, Ltd.(a) | 4,600 | 13,026 | ||||||
| Reject Shop, Ltd. | 276,478 | 986,068 | ||||||
| 12,325,556 | ||||||||
| Austria (1.20%) | ||||||||
| Palfinger AG | 213,105 | 9,432,945 | ||||||
| Belgium (0.82%) | ||||||||
| Melexis NV | 64,493 | 6,461,474 | ||||||
| Britain (9.62%) | ||||||||
| Abcam PLC | 139,253 | 1,840,243 | ||||||
| Arrow Global Group PLC | 765,039 | 4,300,589 | ||||||
| Ascential PLC | 471,400 | 2,109,298 | ||||||
| B&M European Value Retail SA | 1,065,300 | 5,621,315 | ||||||
| Clinigen Group PLC | 645,076 | 10,084,045 | ||||||
| Close Brothers Group PLC | 128,900 | 2,377,949 | ||||||
| Diploma PLC | 175,800 | 2,519,346 | ||||||
| Domino's Pizza Group PLC | 624,200 | 2,783,060 | ||||||
| EMIS Group PLC | 371,617 | 4,748,080 | ||||||
| Intertek Group PLC | 39,800 | 2,867,677 | ||||||
| Metro Bank PLC(a) | 75,800 | 3,580,968 | ||||||
| Motorpoint group PLC(b) | 747,358 | 1,513,721 | ||||||
| On the Beach Group PLC(b)(c) | 608,300 | 3,332,646 | ||||||
| Oxford Immunotec Global PLC(a) | 246,554 | 3,259,444 | ||||||
| Premier Asset Management Group PLC | 248,700 | 667,228 | ||||||
| River & Mercantile Group PLC | 477,200 | 2,227,785 | ||||||
| RPS Group PLC | 1,508,839 | 5,896,670 | ||||||
| Sanne Group PLC | 618,914 | 6,576,089 | ||||||
| Secure Trust Bank PLC | 110,600 | 2,710,185 | ||||||
| Ted Baker PLC | 75,000 | 2,759,233 | ||||||
| Ultra Electronics Holdings PLC | 150,750 | 3,651,990 | ||||||
| 75,427,561 | ||||||||
| Canada (2.05%) | ||||||||
| Biosyent, Inc.(a) | 238,700 | 1,961,259 | ||||||
| Cipher Pharmaceuticals, Inc.(a) | 588,400 | 1,974,864 | ||||||
| Richelieu Hardware, Ltd. | 173,865 | 4,553,832 | ||||||
| Spartan Energy Corp.(a) | 30,134 | 159,534 | ||||||
| Shares | Value (Note 2) | |||||||
| Canada (continued) | ||||||||
| Stantec, Inc. | 259,512 | $ | 7,414,628 | |||||
| 16,064,117 | ||||||||
| China (6.78%) | ||||||||
| BBI Life Sciences Corp.(b) | 12,969,000 | 5,186,669 | ||||||
| BrightKing Holdings, Ltd. | 342,000 | 748,421 | ||||||
| China Medical System Holdings, Ltd. | 3,354,000 | 6,199,487 | ||||||
| CSPC Pharmaceutical Group, Ltd. | 2,960,000 | 5,144,922 | ||||||
| Man Wah Holdings, Ltd. | 16,275,000 | 14,686,595 | ||||||
| O2Micro International, Ltd., ADR(a) | 870,186 | 1,731,670 | ||||||
| On-Bright Electronics, Inc. | 831,181 | 5,939,074 | ||||||
| Silergy Corp. | 353,852 | 7,637,980 | ||||||
| Xiabuxiabu Catering | ||||||||
| Management China | ||||||||
| Holdings Co., Ltd.(b)(c) | 4,005,000 | 5,842,144 | ||||||
| 53,116,962 | ||||||||
| Colombia (0.81%) | ||||||||
| Amerisur Resources PLC(a) | 3,109,700 | 805,379 | ||||||
| Gran Tierra Energy, Inc.(a) | 775,950 | 1,683,812 | ||||||
| Parex Resources, Inc.(a) | 288,300 | 3,834,763 | ||||||
| 6,323,954 | ||||||||
| Egypt (0.07%) | ||||||||
| Integrated Diagnostics | ||||||||
| Holdings PLC(b)(c) | 131,600 | 513,240 | ||||||
| Finland (0.38%) | ||||||||
| Metso OYJ | 81,000 | 2,944,753 | ||||||
| France (1.66%) | ||||||||
| Alten SA | 17,853 | 1,562,825 | ||||||
| Bureau Veritas SA | 81,100 | 2,172,323 | ||||||
| Esker SA | 30,047 | 1,858,513 | ||||||
| Infotel SA | 12,620 | 749,721 | ||||||
| Medicrea International(a) | 150,185 | 689,275 | ||||||
| Neurones | 39,608 | 1,321,836 | ||||||
| Tessi SA | 8,710 | 1,760,101 | ||||||
| Thermador Groupe | 23,869 | 2,917,454 | ||||||
| 13,032,048 | ||||||||
| Georgia (0.98%) | ||||||||
| BGEO Group PLC | 111,900 | 5,290,875 | ||||||
| TBC Bank Group PLC | 105,500 | 2,398,853 | ||||||
| 7,689,728 | ||||||||
| Germany (3.79%) | ||||||||
| Aroundtown SA | 734,200 | 5,157,055 | ||||||
| GRENKE AG | 20,700 | 2,025,683 | ||||||
| Nexus AG | 127,175 | 3,859,783 | ||||||
| Norma Group SE | 76,768 | 5,223,210 | ||||||
| PATRIZIA Immobilien AG(a) | 187,213 | 3,949,340 | ||||||
See Notes to Financial Statements.
| Semi-Annual Report | October 31, 2017 | 41 |
| Grandeur Peak Global Opportunities Fund | Portfolio of Investments |
October 31, 2017 (Unaudited)
| Shares | Value (Note 2) | |||||||
| Germany (continued) | ||||||||
| publity AG | 83,400 | $ | 3,672,699 | |||||
| Wirecard AG | 58,785 | 5,789,622 | ||||||
| 29,677,392 | ||||||||
| Hong Kong (2.05%) | ||||||||
| International Housewares Retail Co., Ltd. | 12,296,000 | 2,316,907 | ||||||
| Samsonite International SA | 845,000 | 3,525,617 | ||||||
| Value Partners Group, Ltd. | 7,635,000 | 7,565,123 | ||||||
| Vitasoy International Holdings, Ltd. | 1,135,483 | 2,625,697 | ||||||
| 16,033,344 | ||||||||
| India (7.31%) | ||||||||
| Alkem Laboratories, Ltd. | 270,131 | 7,814,755 | ||||||
| Bajaj Finance, Ltd. | 203,250 | 5,650,222 | ||||||
| Byke Hospitality, Ltd. | 869,500 | 2,110,950 | ||||||
| City Union Bank, Ltd. | 616,593 | 1,537,883 | ||||||
| Cyient, Ltd. | 532,616 | 4,444,959 | ||||||
| Essel Propack, Ltd. | 186,695 | 822,197 | ||||||
| Genpact, Ltd. | 52,450 | 1,597,103 | ||||||
| Glenmark Pharmaceuticals, Ltd. | 193,500 | 1,845,340 | ||||||
| Hinduja Global Solutions, Ltd. | 212,100 | 1,890,427 | ||||||
| Indiabulls Housing Finance, Ltd. | 143,500 | 2,756,179 | ||||||
| Kellton Tech Solutions, Ltd.(a) | 593,000 | 897,219 | ||||||
| Kovai Medical Center and Hospital | 25,501 | 446,229 | ||||||
| L&T Finance Holdings, Ltd. | 673,000 | 2,090,032 | ||||||
| L&T Technology Services, Ltd.(b)(c) | 29,848 | 383,865 | ||||||
| SBI Life Insurance Co., Ltd.(a)(b)(c) | 57,297 | 585,697 | ||||||
| Tata Investment Corp., Ltd. | 41,672 | 559,122 | ||||||
| Time Technoplast, Ltd. | 1,450,205 | 4,175,668 | ||||||
| Vakrangee, Ltd. | 650,000 | 5,642,859 | ||||||
| Vesuvius India, Ltd. | 37,365 | 776,216 | ||||||
| WNS Holdings, Ltd., ADR(a) | 158,125 | 5,996,100 | ||||||
| Yes Bank, Ltd. | 1,081,000 | 5,244,677 | ||||||
| 57,267,699 | ||||||||
| Indonesia (2.25%) | ||||||||
| Arwana Citramulia Tbk PT | 59,516,800 | 1,685,121 | ||||||
| Astra Graphia Tbk PT | 7,655,400 | 750,723 | ||||||
| Bank Rakyat Indonesia Persero Tbk PT | 1,973,500 | 2,269,980 | ||||||
| Delfi, Ltd. | 1,572,400 | 1,707,250 | ||||||
| Link Net Tbk PT | 3,945,800 | 1,451,763 | ||||||
| Panin Sekuritas Tbk PT | 4,960,800 | 749,835 | ||||||
| Selamat Sempurna Tbk PT | 59,713,000 | 5,679,614 | ||||||
| Tempo Scan Pacific Tbk PT | 15,553,000 | 2,121,515 | ||||||
| Shares | Value (Note 2) | |||||||
| Indonesia (continued) | ||||||||
| Ultrajaya Milk Industry & Trading Co. Tbk PT | 13,018,000 | $ | 1,252,608 | |||||
| 17,668,409 | ||||||||
| Ireland (0.34%) | ||||||||
| Irish Residential Properties REIT PLC | 1,553,046 | 2,668,372 | ||||||
| Israel (0.45%) | ||||||||
| Wix.com, Ltd.(a) | 50,750 | 3,542,350 | ||||||
| Italy (0.38%) | ||||||||
| Brembo SpA | 182,700 | 3,017,761 | ||||||
| Japan (8.29%) | ||||||||
| AIT Corp. | 365,500 | 4,252,729 | ||||||
| Amiyaki Tei Co., Ltd. | 69,200 | 3,237,712 | ||||||
| Arcland Service Holdings Co., Ltd. | 148,800 | 3,276,858 | ||||||
| Create SD Holdings Co., Ltd. | 146,700 | 3,669,274 | ||||||
| CyberAgent, Inc. | 68,200 | 2,099,292 | ||||||
| Dip Corp. | 123,300 | 2,995,071 | ||||||
| Future Corp. | 220,300 | 2,212,590 | ||||||
| GCA Corp. | 389,000 | 3,540,873 | ||||||
| Hard Off Corp. Co., Ltd. | 250,700 | 2,564,215 | ||||||
| Japan Lifeline Co., Ltd. | 52,400 | 2,506,979 | ||||||
| M&A Capital Partners Co., Ltd.(a) | 84,700 | 4,417,317 | ||||||
| Macromill, Inc. | 96,100 | 2,882,028 | ||||||
| MISUMI Group, Inc. | 136,600 | 3,724,199 | ||||||
| Naigai Trans Line, Ltd. | 55,300 | 822,898 | ||||||
| Nihon M&A Center, Inc. | 111,000 | 5,281,298 | ||||||
| Prestige International, Inc. | 219,000 | 2,355,543 | ||||||
| SK Kaken Co., Ltd. | 11,000 | 912,757 | ||||||
| Suruga Bank, Ltd. | 67,500 | 1,524,471 | ||||||
| Synchro Food Co., Ltd.(a) | 102,900 | 1,583,703 | ||||||
| Syuppin Co., Ltd. | 141,400 | 3,208,408 | ||||||
| Tokyo Century Corp. | 42,100 | 1,823,513 | ||||||
| Trancom Co., Ltd. | 100,470 | 6,096,856 | ||||||
| 64,988,584 | ||||||||
| Luxembourg (0.70%) | ||||||||
| Grand City Properties SA | 116,300 | 2,492,686 | ||||||
| L'Occitane International SA | 1,596,753 | 3,033,287 | ||||||
| 5,525,973 | ||||||||
| Malaysia (0.72%) | ||||||||
| AEON Credit Service M Bhd | 880,220 | 2,890,057 | ||||||
| My EG Services Bhd | 5,261,600 | 2,721,839 | ||||||
| 5,611,896 | ||||||||
| Mexico (0.61%) | ||||||||
| Banregio Grupo Financiero | ||||||||
| SAB de CV | 383,034 | 2,043,061 | ||||||
See Notes to Financial Statements.
| 42 | 1.855.377.7325 | www.GrandeurPeakGlobal.com |
| Grandeur Peak Global Opportunities Fund | Portfolio of Investments |
October 31, 2017 (Unaudited)
| Shares | Value (Note 2) | |||||||
| Mexico (continued) | ||||||||
| Credito Real SAB de CV SOFOM ER | 1,688,349 | $ | 2,712,384 | |||||
| 4,755,445 | ||||||||
| Netherlands (0.55%) | ||||||||
| Aalberts Industries NV | 87,822 | 4,331,871 | ||||||
| New Zealand (1.18%) | ||||||||
| CBL Corp., Ltd. | 1,107,672 | 2,228,462 | ||||||
| Restaurant Brands New Zealand, Ltd. | 1,021,020 | 4,737,078 | ||||||
| Trilogy International, Ltd. | 1,411,798 | 2,270,320 | ||||||
| 9,235,860 | ||||||||
| Norway (1.90%) | ||||||||
| Medistim ASA | 152,700 | 1,308,643 | ||||||
| Multiconsult ASA(b)(c) | 156,000 | 1,652,057 | ||||||
| Nordic Semiconductor ASA(a) | 350,111 | 1,753,127 | ||||||
| Norwegian Finans Holding ASA(a) | 195,467 | 2,440,944 | ||||||
| Skandiabanken ASA(b)(c) | 761,300 | 7,712,730 | ||||||
| 14,867,501 | ||||||||
| Oman (0.20%) | ||||||||
| Tethys Oil AB | 218,000 | 1,607,987 | ||||||
| Peru (0.82%) | ||||||||
| Alicorp SAA | 1,359,162 | 4,244,115 | ||||||
| Credicorp, Ltd. | 10,625 | 2,225,300 | ||||||
| 6,469,415 | ||||||||
| Philippines (2.08%) | ||||||||
| Concepcion Industrial Corp. | 1,390,152 | 1,750,313 | ||||||
| Pepsi-Cola Products Philippines, Inc. | 25,795,900 | 1,439,074 | ||||||
| Puregold Price Club, Inc. | 5,230,000 | 5,166,683 | ||||||
| Robinsons Retail Holdings, Inc. | 1,096,000 | 2,059,312 | ||||||
| Security Bank Corp. | 1,244,640 | 5,930,875 | ||||||
| 16,346,257 | ||||||||
| Poland (0.54%) | ||||||||
| Dino Polska SA(a)(b)(c) | 146,023 | 2,748,800 | ||||||
| PGS Software SA | 120,487 | 454,812 | ||||||
| Wawel SA | 3,856 | 1,022,649 | ||||||
| 4,226,261 | ||||||||
| Singapore (0.45%) | ||||||||
| CSE Global, Ltd. | 1,720,750 | 473,392 | ||||||
| Riverstone Holdings, Ltd. | 3,984,200 | 3,083,656 | ||||||
| 3,557,048 | ||||||||
| South Africa (0.74%) | ||||||||
| Cartrack Holdings, Ltd. | 3,204,086 | 3,399,260 | ||||||
| Shares | Value (Note 2) | |||||||
| South Africa (continued) | ||||||||
| EOH Holdings, Ltd. | 167,000 | $ | 1,245,051 | |||||
| Italtile, Ltd. | 1,177,166 | 1,149,795 | ||||||
| 5,794,106 | ||||||||
| South Korea (1.92%) | ||||||||
| Hy-Lok Corp. | 208,907 | 4,605,706 | ||||||
| ISC Co., Ltd. | 138,308 | 2,617,155 | ||||||
| Koh Young Technology, Inc. | 39,781 | 2,726,988 | ||||||
| LEENO Industrial, Inc. | 46,500 | 2,125,050 | ||||||
| Loen Entertainment, Inc. | 31,500 | 2,994,377 | ||||||
| 15,069,276 | ||||||||
| Sweden (2.99%) | ||||||||
| AddTech AB, Class B | 182,127 | 4,035,591 | ||||||
| Beijer Alma AB | 85,931 | 2,771,422 | ||||||
| Bufab AB | 252,708 | 3,018,616 | ||||||
| HIQ International AB | 203,792 | 1,460,587 | ||||||
| Hoist Finance AB(b)(c) | 247,700 | 2,603,740 | ||||||
| Indutrade AB | 154,800 | 4,293,605 | ||||||
| Moberg Pharma AB(a) | 255,657 | 1,160,460 | ||||||
| Nibe Industrier AB, Class B | 308,400 | 3,085,234 | ||||||
| TF Bank AB(b) | 86,200 | 975,608 | ||||||
| 23,404,863 | ||||||||
| Switzerland (1.03%) | ||||||||
| Luxoft Holding, Inc.(a) | 44,200 | 2,057,510 | ||||||
| VZ Holding AG | 11,875 | 4,103,550 | ||||||
| Wizz Air Holdings PLC(a)(b)(c) | 43,700 | 1,900,816 | ||||||
| 8,061,876 | ||||||||
| Taiwan (1.18%) | ||||||||
| ASPEED Technology, Inc. | 66,237 | 1,530,768 | ||||||
| Cub Elecparts, Inc. | 44,295 | 436,936 | ||||||
| Sinmag Equipment Corp. | 330,842 | 1,678,371 | ||||||
| Sporton International, Inc. | 773,249 | 3,922,714 | ||||||
| Test Research, Inc. | 554,000 | 771,498 | ||||||
| TSC Auto ID Technology Co., Ltd. | 125,000 | 913,891 | ||||||
| 9,254,178 | ||||||||
| Thailand (1.24%) | ||||||||
| Ananda Development PCL | 23,099,000 | 4,137,238 | ||||||
| Premier Marketing PCL | 5,382,700 | 2,365,666 | ||||||
| Srisawad Power Corp. PCL | 1,532,000 | 3,205,117 | ||||||
| 9,708,021 | ||||||||
| United Arab Emirates (0.21%) | ||||||||
| Aramex PJSC | 1,162,100 | 1,620,071 | ||||||
| United States (24.81%) | ||||||||
| Aratana Therapeutics, Inc.(a) | 282,375 | 1,618,009 | ||||||
| Bank of the Ozarks, Inc. | 109,475 | 5,103,724 | ||||||
| BioDelivery Sciences International, Inc.(a) | 543,200 | 1,561,700 | ||||||
| Blackline, Inc.(a) | 29,150 | 1,035,408 | ||||||
See Notes to Financial Statements.
| Semi-Annual Report | October 31, 2017 | 43 |
| Grandeur Peak Global Opportunities Fund | Portfolio of Investments |
October 31, 2017 (Unaudited)
| Shares | Value (Note 2) | |||||||
| United States (continued) | ||||||||
| Diamond Hill Investment Group, Inc. | 19,425 | $ | 4,116,740 | |||||
| Dril-Quip, Inc.(a) | 26,450 | 1,113,545 | ||||||
| EPAM Systems, Inc.(a) | 75,850 | 6,913,727 | ||||||
| ExlService Holdings, Inc.(a) | 52,700 | 3,289,534 | ||||||
| Fastenal Co. | 127,325 | 5,980,455 | ||||||
| First of Long Island Corp. | 25,425 | 802,159 | ||||||
| First Republic Bank | 111,975 | 10,906,365 | ||||||
| FirstCash, Inc. | 185,813 | 11,864,160 | ||||||
| Gentex Corp. | 220,250 | 4,275,052 | ||||||
| Grand Canyon Education, Inc.(a) | 18,475 | 1,653,697 | ||||||
| Hackett Group, Inc. | 136,025 | 2,100,226 | ||||||
| Hamilton Lane, Inc., Class A | 142,093 | 3,906,137 | ||||||
| Hibbett Sports, Inc.(a) | 74,683 | 955,942 | ||||||
| Hingham Institution for Savings | 20,000 | 3,894,000 | ||||||
| Home BancShares, Inc. | 186,775 | 4,198,702 | ||||||
| IDEX Corp. | 40,600 | 5,205,326 | ||||||
| Inphi Corp.(a) | 123,600 | 5,065,128 | ||||||
| Kinsale Capital Group, Inc. | 70,550 | 3,060,459 | ||||||
| Knight Transportation, Inc. | 163,570 | 6,779,977 | ||||||
| LGI Homes, Inc.(a) | 64,651 | 3,900,395 | ||||||
| Littelfuse, Inc. | 11,900 | 2,487,100 | ||||||
| LKQ Corp.(a) | 79,900 | 3,011,431 | ||||||
| MarketAxess Holdings, Inc. | 39,900 | 6,942,600 | ||||||
| MEDNAX, Inc.(a) | 100,975 | 4,421,695 | ||||||
| Microchip Technology, Inc. | 60,045 | 5,692,266 | ||||||
| MongoDB, Inc.(a) | 275 | 8,382 | ||||||
| Monro Muffler Brake, Inc. | 79,975 | 3,946,766 | ||||||
| MSC Industrial Direct Co., Inc., Class A | 86,350 | 7,158,415 | ||||||
| NV5 Global, Inc.(a) | 57,800 | 3,358,180 | ||||||
| Paycom Software, Inc.(a) | 57,375 | 4,716,225 | ||||||
| Power Integrations, Inc. | 208,475 | 16,750,966 | ||||||
| PRA Group, Inc.(a) | 149,525 | 4,171,748 | ||||||
| Resources Connection, Inc. | 155,850 | 2,454,638 | ||||||
| ServisFirst Bancshares, Inc. | 66,875 | 2,742,544 | ||||||
| Signature Bank(a) | 26,900 | 3,497,269 | ||||||
| Silicon Laboratories, Inc.(a) | 75,140 | 7,130,786 | ||||||
| Sportsman's Warehouse Holdings, Inc.(a) | 600,975 | 2,463,998 | ||||||
| STAAR Surgical Co.(a) | 270,895 | 3,589,359 | ||||||
| SVB Financial Group(a) | 25,250 | 5,536,820 | ||||||
| TriMas Corp.(a) | 145,225 | 3,855,724 | ||||||
| Veracyte, Inc.(a) | 147,402 | 1,260,287 | ||||||
| 194,497,766 | ||||||||
| Vietnam (0.38%) | ||||||||
| DHG Pharmaceutical JSC | 128,530 | 567,597 | ||||||
| Shares | Value (Note 2) | |||||||
| Vietnam (continued) | ||||||||
| Vietnam Dairy Products JSC | 358,800 | $ | 2,385,418 | |||||
| 2,953,015 | ||||||||
| TOTAL COMMON STOCKS | ||||||||
(Cost $521,293,953) | 748,386,948 | |||||||
| Principal Amount | Value (Note 2) | |||||||
| CORPORATE BONDS (0.06%) | ||||||||
| Malaysia (0.06%) | ||||||||
| AEON Credit Service M Bhd | ||||||||
| 3.50%, 09/15/2020 | $ | 1,678,440 | $ | 495,583 | ||||
| TOTAL CORPORATE BONDS | ||||||||
(Cost $398,726) | 495,583 | |||||||
| TOTAL INVESTMENTS (95.53%) | ||||||||
(Cost $521,692,679) | $ | 748,882,531 | ||||||
| Other Assets In Excess Of Liabilities (4.47%) | 35,034,349 | |||||||
| NET ASSETS (100.00%) | $ | 783,916,880 | ||||||
| (a) | Non-Income Producing Security. |
| (b) | Security was purchased pursuant to Regulation S under the Securities Act of 1933, which exempts securities offered and sold outside of the United States from registration. Such security cannot be sold in the United States without either an effective registration statement filed pursuant to the Securities Act of 1933, or pursuant to an exemption from registration. The security has been deemed liquid under guidelines approved by the Fund's Board of Trustees. As of October 31, 2017, the aggregate market value of those securities was $34,951,733, representing 4.46% of net assets. |
| (c) | Security exempt from registration under Rule 144A of the Securities Act of 1933. These securities may be resold in the ordinary course of business in transactions exempt from registration, normally to qualified institutional buyers. As of October 31, 2017, these securities had a total aggregate market value of $27,275,735 representing 3.48% of net assets. |
For Fund compliance purposes, the Fund's geographical classifications refer to any one or more of the country sub-classifications used by one or more widely recognized market indexes or ratings group indexes, and/or as defined by Fund management. This definition may not apply for purposes of this report, which may combine sub-classifications for reporting ease. Geographical regions are shown as a percentage of net assets.
See Notes to Financial Statements.
| 44 | 1.855.377.7325 | www.GrandeurPeakGlobal.com |
| Grandeur Peak Global Reach Fund | Portfolio of Investments |
October 31, 2017 (Unaudited)
| Shares | Value (Note 2) | |||||||
| COMMON STOCKS (98.45%) | ||||||||
| Argentina (0.31%) | ||||||||
| Globant SA(a) | 29,213 | $ | 1,101,914 | |||||
| Australia (1.66%) | ||||||||
| Australian Ethical Investment, Ltd. | 4,878 | 470,406 | ||||||
| Beacon Lighting Group, Ltd. | 477,900 | 534,011 | ||||||
| Blue Sky Alternative Investments, Ltd. | 132,202 | 1,424,627 | ||||||
| CTI Logistics, Ltd. | 323,146 | 276,998 | ||||||
| Fiducian Group, Ltd. | 61,644 | 257,127 | ||||||
| Greencross, Ltd. | 196,400 | 798,172 | ||||||
| Mitula Group, Ltd.(a) | 1,381,173 | 586,680 | ||||||
| Monash IVF Group, Ltd. | 206,100 | 246,072 | ||||||
| National Storage REIT | 433,616 | 489,506 | ||||||
| National Veterinary Care, Ltd. | 19,503 | 39,406 | ||||||
| Netwealth Group, Ltd.(a) | 2,014 | 5,703 | ||||||
| Reject Shop, Ltd. | 204,953 | 730,972 | ||||||
| 5,859,680 | ||||||||
| Austria (0.48%) | ||||||||
| Palfinger AG | 38,148 | 1,688,595 | ||||||
| Bangladesh (0.20%) | ||||||||
| Square Pharmaceuticals, Ltd. | 195,018 | 699,154 | ||||||
| Belgium (0.30%) | ||||||||
| Melexis NV | 10,597 | 1,061,700 | ||||||
| Bermuda (0.10%) | ||||||||
| Bank of NT Butterfield & Son, Ltd. | 9,000 | 336,150 | ||||||
| Brazil (0.38%) | ||||||||
| M Dias Branco SA | 78,500 | 1,160,954 | ||||||
| Valid Solucoes e Servicos de Seguranca em Meios de Pagamento e Identificacao SA | 33,110 | 185,322 | ||||||
| 1,346,276 | ||||||||
| Britain (9.45%) | ||||||||
| AB Dynamics PLC | 95,393 | 817,191 | ||||||
| Abcam PLC | 35,989 | 475,598 | ||||||
| Arrow Global Group PLC | 207,251 | 1,165,041 | ||||||
| Ascential PLC | 404,702 | 1,810,855 | ||||||
| B&M European Value Retail SA | 241,600 | 1,274,861 | ||||||
| Burford Capital, Ltd. | 51,500 | 848,157 | ||||||
| Clinigen Group PLC | 177,730 | 2,778,335 | ||||||
| Close Brothers Group PLC | 52,019 | 959,647 | ||||||
| Diploma PLC | 68,800 | 985,956 | ||||||
| Domino's Pizza Group PLC | 278,400 | 1,241,275 | ||||||
| dotdigital group PLC | 1,266,456 | 1,505,430 | ||||||
| EMIS Group PLC | 53,596 | 684,786 | ||||||
| Shares | Value (Note 2) | |||||||
| Britain (continued) | ||||||||
| Horizon Discovery Group PLC(a) | 212,900 | $ | 723,874 | |||||
| IDOX PLC | 550,000 | 455,639 | ||||||
| Intertek Group PLC | 17,100 | 1,232,092 | ||||||
| LoopUp Group PLC(a) | 218,949 | 850,582 | ||||||
| Metro Bank PLC(a) | 38,000 | 1,795,208 | ||||||
| Morses Club PLC | 475,200 | 830,735 | ||||||
| Mortgage Advice Bureau Holdings, Ltd. | 109,500 | 738,070 | ||||||
| Motorpoint group PLC(b) | 172,653 | 349,697 | ||||||
| On the Beach Group PLC(b)(c) | 327,200 | 1,792,605 | ||||||
| Oxford Immunotec Global PLC(a) | 68,850 | 910,197 | ||||||
| Premier Asset Management Group PLC | 231,500 | 621,083 | ||||||
| Premier Technical Services Group PLC | 423,700 | 942,585 | ||||||
| Purplebricks Group PLC(a) | 160,000 | 772,984 | ||||||
| RPS Group PLC | 195,399 | 763,636 | ||||||
| S&U PLC | 18,000 | 476,939 | ||||||
| Sanne Group PLC | 164,073 | 1,743,310 | ||||||
| Secure Trust Bank PLC | 24,000 | 588,105 | ||||||
| Softcat PLC | 129,138 | 920,177 | ||||||
| Ted Baker PLC | 18,379 | 676,159 | ||||||
| Ultra Electronics Holdings PLC | 34,450 | 834,568 | ||||||
| WANdisco PLC(a) | 66,045 | 710,514 | ||||||
| 33,275,891 | ||||||||
| Canada (2.33%) | ||||||||
| Biosyent, Inc.(a) | 113,100 | 929,277 | ||||||
| Birchcliff Energy, Ltd. | 193,000 | 785,404 | ||||||
| Cipher Pharmaceuticals, Inc.(a) | 160,200 | 537,684 | ||||||
| DIRTT Environmental Solutions(a) | 248,900 | 1,228,969 | ||||||
| Ritchie Bros Auctioneers, Inc. | 37,025 | 1,037,811 | ||||||
| Spartan Energy Corp.(a) | 227,700 | 1,205,481 | ||||||
| Stantec, Inc. | 62,520 | 1,786,285 | ||||||
| TFI International, Inc. | 29,396 | 709,551 | ||||||
| 8,220,462 | ||||||||
| China (6.99%) | ||||||||
| BBI Life Sciences Corp.(b) | 6,405,500 | 2,561,740 | ||||||
| BrightKing Holdings, Ltd. | 424,312 | 928,550 | ||||||
| China Medical System Holdings, Ltd. | 1,860,000 | 3,437,998 | ||||||
| CSPC Pharmaceutical Group, Ltd. | 1,014,000 | 1,762,484 | ||||||
| Hop Hing Group Holdings, Ltd. | 27,291,000 | 815,085 | ||||||
| Lida Holdings, Ltd. | 220,000 | 740,397 | ||||||
| Man Wah Holdings, Ltd. | 6,571,400 | 5,930,045 | ||||||
| O2Micro International, Ltd., ADR(a) | 292,039 | 581,157 | ||||||
| On-Bright Electronics, Inc. | 210,528 | 1,504,295 | ||||||
See Notes to Financial Statements.
| Semi-Annual Report | October 31, 2017 | 45 |
| Grandeur Peak Global Reach Fund | Portfolio of Investments |
October 31, 2017 (Unaudited)
| Shares | Value (Note 2) | |||||||
| China (continued) | ||||||||
| Shanghai Haohai Biological Technology Co., Ltd., Class H(b)(c) | 217,700 | $ | 1,064,585 | |||||
| Silergy Corp. | 120,925 | 2,610,195 | ||||||
| Xiabuxiabu Catering Management China Holdings Co., Ltd.(b)(c) | 1,831,000 | 2,670,903 | ||||||
| 24,607,434 | ||||||||
| Colombia (1.22%) | ||||||||
| Amerisur Resources PLC(a) | 5,262,400 | 1,362,906 | ||||||
| Gran Tierra Energy, Inc.(a) | 386,195 | 838,043 | ||||||
| Parex Resources, Inc.(a) | 158,361 | 2,106,406 | ||||||
| 4,307,355 | ||||||||
| Egypt (0.65%) | ||||||||
| African Export-Import Bank(a) | 200,000 | 860,000 | ||||||
| Commercial International Bank Egypt SAE | 147,762 | 660,444 | ||||||
| Integrated Diagnostics Holdings PLC(b)(c) | 201,400 | 785,460 | ||||||
| 2,305,904 | ||||||||
| Finland (0.67%) | ||||||||
| Ferratum OYJ(b) | 30,300 | 952,788 | ||||||
| Metso OYJ | 24,600 | 894,332 | ||||||
| Terveystalo Oyj(a) | 43,700 | 524,311 | ||||||
| 2,371,431 | ||||||||
| France (1.50%) | ||||||||
| Alten SA | 10,400 | 910,400 | ||||||
| Esker SA | 23,409 | 1,447,930 | ||||||
| Infotel SA | 14,560 | 864,971 | ||||||
| Medicrea International(a) | 68,768 | 315,611 | ||||||
| Neurones | 17,282 | 576,752 | ||||||
| Thermador Groupe | 9,404 | 1,149,430 | ||||||
| 5,265,094 | ||||||||
| Georgia (0.94%) | ||||||||
| BGEO Group PLC | 28,700 | 1,356,998 | ||||||
| Georgia Healthcare Group PLC(a)(b)(c) | 102,948 | 478,557 | ||||||
| TBC Bank Group PLC | 65,290 | 1,484,560 | ||||||
| 3,320,115 | ||||||||
| Germany (3.62%) | ||||||||
| Aroundtown SA | 198,277 | 1,392,707 | ||||||
| CANCOM SE | 9,800 | �� | 722,831 | |||||
| GRENKE AG | 17,800 | 1,741,891 | ||||||
| Hypoport AG(a) | 6,070 | 878,527 | ||||||
| Nexus AG | 32,485 | 985,925 | ||||||
| Norma Group SE | 36,160 | 2,460,287 | ||||||
| PATRIZIA Immobilien AG(a) | 49,904 | 1,052,747 | ||||||
| publity AG | 15,300 | 673,769 | ||||||
| Shares | Value (Note 2) | |||||||
| Germany (continued) | ||||||||
| Wirecard AG | 28,696 | $ | 2,826,214 | |||||
| 12,734,898 | ||||||||
| Greece (0.49%) | ||||||||
| Sarantis SA | 119,670 | 1,721,561 | ||||||
| Hong Kong (2.82%) | ||||||||
| Essex Bio-technology, Ltd. | 2,168,000 | 1,397,831 | ||||||
| International Housewares Retail Co., Ltd. | 8,915,000 | 1,679,833 | ||||||
| Jacobson Pharma Corp., Ltd.(b) | 3,565,000 | 923,078 | ||||||
| Plover Bay Technologies,Ltd.(b) | 2,065,000 | 418,220 | ||||||
| Samsonite International SA | 361,800 | 1,509,548 | ||||||
| TK Group Holdings, Ltd. | 2,778,000 | 1,370,946 | ||||||
| Value Partners Group, Ltd. | 696,000 | 689,630 | ||||||
| Vitasoy International Holdings, Ltd. | 847,000 | 1,958,608 | ||||||
| 9,947,694 | ||||||||
| India (6.99%) | ||||||||
| Alkem Laboratories, Ltd. | 50,482 | 1,460,419 | ||||||
| Bajaj Finance, Ltd. | 25,000 | 694,984 | ||||||
| Byke Hospitality, Ltd. | 756,500 | 1,836,611 | ||||||
| Control Print, Ltd. | 146,500 | 902,347 | ||||||
| Cyient, Ltd. | 181,100 | 1,511,374 | ||||||
| Essel Propack, Ltd. | 212,042 | 933,824 | ||||||
| Genpact, Ltd. | 12,100 | 368,445 | ||||||
| Glenmark Pharmaceuticals, Ltd. | 130,000 | 1,239,763 | ||||||
| Hinduja Global Solutions, Ltd. | 40,789 | 363,548 | ||||||
| Igarashi Motors India, Ltd. | 66,087 | 928,945 | ||||||
| Kellton Tech Solutions, Ltd.(a) | 269,512 | 407,776 | ||||||
| Kovai Medical Center and Hospital | 18,322 | 320,608 | ||||||
| Kwality, Ltd. | 575,814 | 894,775 | ||||||
| L&T Finance Holdings, Ltd. | 119,500 | 371,113 | ||||||
| L&T Technology Services, Ltd.(b)(c) | 78,000 | 1,003,130 | ||||||
| Natco Pharma, Ltd. | 28,500 | 425,996 | ||||||
| Poly Medicure, Ltd. | 190,208 | 781,139 | ||||||
| SBI Life Insurance Co., Ltd.(a)(b)(c) | 48,754 | 498,370 | ||||||
| Somany Ceramics, Ltd. | 104,500 | 1,369,913 | ||||||
| Thyrocare Technologies, Ltd.(a) | 33,000 | 352,564 | ||||||
| Time Technoplast, Ltd. | 572,285 | 1,647,817 | ||||||
| Vaibhav Global, Ltd.(a) | 102,142 | 1,034,174 | ||||||
| Vakrangee, Ltd. | 116,000 | 1,007,033 | ||||||
| Vesuvius India, Ltd. | 34,043 | 707,205 | ||||||
| WNS Holdings, Ltd., ADR(a) | 77,225 | 2,928,372 | ||||||
| Yes Bank, Ltd. | 127,500 | 618,590 | ||||||
| 24,608,835 | ||||||||
See Notes to Financial Statements.
| 46 | 1.855.377.7325 | www.GrandeurPeakGlobal.com |
| Grandeur Peak Global Reach Fund | Portfolio of Investments |
October 31, 2017 (Unaudited)
| Shares | Value (Note 2) | |||||||
| Indonesia (2.52%) | ||||||||
| Arwana Citramulia Tbk PT | 26,137,200 | $ | 740,032 | |||||
| Astra Graphia Tbk PT | 1,409,100 | 138,183 | ||||||
| Bank Rakyat Indonesia Persero Tbk PT | 345,000 | 396,830 | ||||||
| Delfi, Ltd. | 1,017,500 | 1,104,761 | ||||||
| Hexindo Adiperkasa Tbk PT | 1,636,900 | 418,805 | ||||||
| Indonesia Pondasi Raya Tbk PT | 4,178,000 | 331,930 | ||||||
| Link Net Tbk PT | 1,814,400 | 667,565 | ||||||
| Sarana Menara Nusantara Tbk Pt | 2,740,000 | 828,313 | ||||||
| Selamat Sempurna Tbk PT | 29,693,300 | 2,824,284 | ||||||
| Tempo Scan Pacific Tbk PT | 6,515,800 | 888,791 | ||||||
| Ultrajaya Milk Industry & Trading Co. Tbk PT | 5,474,800 | 526,792 | ||||||
| 8,866,286 | ||||||||
| Ireland (0.97%) | ||||||||
| Hostelworld Group PLC(b)(c) | 371,708 | 1,687,166 | ||||||
| Irish Residential Properties REIT PLC | 997,777 | 1,714,335 | ||||||
| 3,401,501 | ||||||||
| Israel (1.71%) | ||||||||
| IDI Insurance Co., Ltd. | 13,409 | 898,693 | ||||||
| Kornit Digital, Ltd.(a) | 89,560 | 1,392,658 | ||||||
| Wix.com, Ltd.(a) | 53,375 | 3,725,575 | ||||||
| 6,016,926 | ||||||||
| Italy (0.60%) | ||||||||
| Brembo SpA | 108,750 | 1,796,286 | ||||||
| Telit Communications PLC | 138,900 | 316,845 | ||||||
| 2,113,131 | ||||||||
| Japan (6.69%) | ||||||||
| Abist Co., Ltd. | 12,500 | 499,099 | ||||||
| AIT Corp. | 70,200 | 816,803 | ||||||
| Amiyaki Tei Co., Ltd. | 28,800 | 1,347,487 | ||||||
| Anshin Guarantor Service Co., Ltd. | 101,000 | 433,473 | ||||||
| Arcland Service Holdings Co., Ltd. | 45,600 | 1,004,199 | ||||||
| Create SD Holdings Co., Ltd. | 47,300 | 1,183,072 | ||||||
| CyberAgent, Inc. | 17,000 | 523,284 | ||||||
| Dip Corp. | 14,800 | 359,506 | ||||||
| Encourage Technologies Co., Ltd. | 23,400 | 445,136 | ||||||
| Future Corp. | 77,800 | 781,387 | ||||||
| Hard Off Corp. Co., Ltd. | 213,000 | 2,178,611 | ||||||
| Interworks, Inc. | 32,200 | 322,552 | ||||||
| Japan Lifeline Co., Ltd. | 11,800 | 564,549 | ||||||
| M&A Capital Partners Co., Ltd.(a) | 26,500 | 1,382,041 | ||||||
| Macromill, Inc. | 24,600 | 737,751 | ||||||
| MISUMI Group, Inc. | 67,800 | 1,848,467 | ||||||
| Shares | Value (Note 2) | |||||||
| Japan (continued) | ||||||||
| MonotaRO Co., Ltd. | 25,500 | $ | 697,463 | |||||
| Nihon M&A Center, Inc. | 35,100 | 1,670,032 | ||||||
| Prestige International, Inc. | 32,200 | 346,340 | ||||||
| Qol Co., Ltd. | 68,300 | 1,251,211 | ||||||
| Quick Co., Ltd. | 39,000 | 671,237 | ||||||
| SK Kaken Co., Ltd. | 2,000 | 165,956 | ||||||
| Synchro Food Co., Ltd.(a) | 42,500 | 654,105 | ||||||
| Syuppin Co., Ltd. | 92,300 | 2,094,314 | ||||||
| Trancom Co., Ltd. | 9,300 | 564,355 | ||||||
| Trust Tech, Inc. | 12,000 | 347,214 | ||||||
| Zenkoku Hosho Co., Ltd. | 16,500 | 674,772 | ||||||
| 23,564,416 | ||||||||
| Jordan (0.19%) | ||||||||
| Hikma Pharmaceuticals PLC | 43,400 | 670,950 | ||||||
| Kenya (0.24%) | ||||||||
| Safaricom, Ltd. | 3,427,700 | 842,471 | ||||||
| Luxembourg (0.21%) | ||||||||
| Grand City Properties SA | 34,400 | 737,304 | ||||||
| Malaysia (0.64%) | ||||||||
| AEON Credit Service M Bhd | 222,900 | 731,855 | ||||||
| Berjaya Food Bhd | 485,400 | 170,839 | ||||||
| Bison Consolidated Bhd | 909,000 | 519,613 | ||||||
| CB Industrial Product Holding Bhd | 876,633 | 399,646 | ||||||
| Scicom MSC Bhd | 934,000 | 416,974 | ||||||
| 2,238,927 | ||||||||
| Mexico (0.53%) | ||||||||
| Banregio Grupo Financiero SAB de CV | 219,657 | 1,171,626 | ||||||
| Unifin Financiera SAB de CV SOFOM ENR | 202,450 | 686,388 | ||||||
| 1,858,014 | ||||||||
| Netherlands (1.31%) | ||||||||
| Aalberts Industries NV | 53,682 | 2,647,896 | ||||||
| Shop Apotheke Europe NV(a)(c) | 26,570 | 1,964,710 | ||||||
| 4,612,606 | ||||||||
| New Zealand (1.60%) | ||||||||
| CBL Corp., Ltd. | 819,006 | 1,647,711 | ||||||
| Fisher & Paykel Healthcare Corp., Ltd. | 47,428 | 430,029 | ||||||
| Restaurant Brands New Zealand, Ltd. | 367,658 | 1,705,769 | ||||||
| Trilogy International, Ltd. | 1,145,563 | 1,842,186 | ||||||
| 5,625,695 | ||||||||
| Norway (1.67%) | ||||||||
| Infront ASA(a) | 156,700 | 470,023 | ||||||
See Notes to Financial Statements.
| Semi-Annual Report | October 31, 2017 | 47 |
| Grandeur Peak Global Reach Fund | Portfolio of Investments |
October 31, 2017 (Unaudited)
| Shares | Value (Note 2) | |||||||
| Norway (continued) | ||||||||
| Medistim ASA | 75,150 | $ | 644,038 | |||||
| Multiconsult ASA(b)(c) | 63,000 | 667,177 | ||||||
| Nordic Semiconductor ASA(a) | 99,900 | 500,234 | ||||||
| Norwegian Finans Holding ASA(a) | 56,100 | 700,563 | ||||||
| Self Storage Group ASA(a) | 304,900 | 522,600 | ||||||
| Skandiabanken ASA(b)(c) | 164,200 | 1,663,510 | ||||||
| Webstep ASA(a) | 228,300 | 723,919 | ||||||
| 5,892,064 | ||||||||
| Oman (0.29%) | ||||||||
| Tethys Oil AB | 137,900 | 1,017,162 | ||||||
| Pakistan (0.19%) | ||||||||
| Akzo Nobel Pakistan, Ltd. | 187,900 | 374,694 | ||||||
| Meezan Bank, Ltd. | 493,960 | 307,251 | ||||||
| 681,945 | ||||||||
| Peru (0.77%) | ||||||||
| Alicorp SAA | 620,299 | 1,936,943 | ||||||
| Credicorp, Ltd. | 3,700 | 774,928 | ||||||
| 2,711,871 | ||||||||
| Philippines (1.73%) | ||||||||
| Concepcion Industrial Corp. | 1,147,920 | 1,445,323 | ||||||
| Holcim Philippines, Inc. | 2,549,400 | 592,597 | ||||||
| Pepsi-Cola Products Philippines, Inc. | 13,292,100 | 741,525 | ||||||
| Pryce Corp.(a) | 5,447,000 | 687,931 | ||||||
| Puregold Price Club, Inc. | 860,700 | 850,280 | ||||||
| Security Bank Corp. | 369,700 | 1,761,670 | ||||||
| 6,079,326 | ||||||||
| Poland (1.27%) | ||||||||
| Dino Polska SA(a)(b)(c) | 145,618 | 2,741,177 | ||||||
| LiveChat Software SA | 91,450 | 1,212,232 | ||||||
| PGS Software SA | 138,887 | 524,267 | ||||||
| 4,477,676 | ||||||||
| Russia (0.27%) | ||||||||
| MD Medical Group Investments PLC, GDR(b) | 14,755 | 153,452 | ||||||
| TCS Group Holding PLC, GDR(b) | 44,300 | 808,475 | ||||||
| 961,927 | ||||||||
| Singapore (0.27%) | ||||||||
| CSE Global, Ltd. | 774,500 | 213,071 | ||||||
| Riverstone Holdings, Ltd. | 947,800 | 733,570 | ||||||
| 946,641 | ||||||||
| South Africa (1.74%) | ||||||||
| ARB Holdings, Ltd. | 2,093,266 | 888,310 | ||||||
| Blue Label Telecoms, Ltd. | 564,502 | 688,721 | ||||||
| Shares | Value (Note 2) | |||||||
| South Africa (continued) | ||||||||
| Capitec Bank Holdings, Ltd. | 4,800 | $ | 319,069 | |||||
| Cartrack Holdings, Ltd. | 1,471,000 | 1,560,605 | ||||||
| Clicks Group, Ltd. | 81,600 | 914,359 | ||||||
| EOH Holdings, Ltd. | 68,600 | 511,440 | ||||||
| Interwaste Holdings, Ltd.(a) | 5,043,434 | 331,740 | ||||||
| Italtile, Ltd. | 921,472 | 900,046 | ||||||
| 6,114,290 | ||||||||
| South Korea (2.34%) | ||||||||
| Daebongls Co., Ltd. | 62,400 | 541,374 | ||||||
| Hanssem Co., Ltd. | 3,300 | 502,209 | ||||||
| Hy-Lok Corp. | 36,240 | 798,972 | ||||||
| Interpark Holdings Corp. | 96,500 | 360,470 | ||||||
| ISC Co., Ltd. | 58,330 | 1,103,758 | ||||||
| Koh Young Technology, Inc. | 14,143 | 969,503 | ||||||
| Loen Entertainment, Inc. | 16,000 | 1,520,953 | ||||||
| Mando Corp. | 3,700 | 1,078,279 | ||||||
| Medy-Tox, Inc. | 2,004 | 757,526 | ||||||
| Vitzrocell Co., Ltd.(a)(d) | 88,536 | 601,580 | ||||||
| 8,234,624 | ||||||||
| Spain (0.00%)(e) | ||||||||
| Let's GOWEX SA(a)(d)(f) | 10,700 | 12 | ||||||
| Sri Lanka (0.54%) | ||||||||
| Hemas Holdings PLC | 1,037,261 | 877,748 | ||||||
| Royal Ceramics Lanka PLC | 1,352,145 | 1,038,588 | ||||||
| 1,916,336 | ||||||||
| Sweden (2.49%) | ||||||||
| Avanza Bank Holding Ab | 15,800 | 595,450 | ||||||
| Bufab AB | 74,698 | 892,273 | ||||||
| HIQ International AB | 90,026 | 645,221 | ||||||
| Hoist Finance AB(b)(c) | 103,900 | 1,092,162 | ||||||
| Indutrade AB | 36,300 | 1,006,834 | ||||||
| Moberg Pharma AB(a) | 111,100 | 504,297 | ||||||
| Nibe Industrier AB, Class B | 35,700 | 357,143 | ||||||
| Sweco AB, Class B | 54,500 | 1,165,953 | ||||||
| Swedencare AB(a) | 172,900 | 495,673 | ||||||
| TF Bank AB(b) | 116,700 | 1,320,806 | ||||||
| Vitec Software Group AB, Class B | 67,500 | 685,349 | ||||||
| 8,761,161 | ||||||||
| Switzerland (0.94%) | ||||||||
| Luxoft Holding, Inc.(a) | 21,100 | 982,205 | ||||||
| Wizz Air Holdings PLC(a)(b)(c) | 53,400 | 2,322,737 | ||||||
| 3,304,942 | ||||||||
| Taiwan (2.32%) | ||||||||
| ASPEED Technology, Inc. | 37,771 | 872,905 | ||||||
| Bioteque Corp. | 134,000 | 397,653 | ||||||
| Cub Elecparts, Inc. | 6,994 | 68,990 | ||||||
| Dr. Wu Skincare Co., Ltd. | 190,000 | 850,478 | ||||||
| I Yuan Precision Ind Co., Ltd. | 132,000 | 514,266 | ||||||
See Notes to Financial Statements.
| 48 | 1.855.377.7325 | www.GrandeurPeakGlobal.com |
| Grandeur Peak Global Reach Fund | Portfolio of Investments |
October 31, 2017 (Unaudited)
| Shares | Value (Note 2) | |||||||
| Taiwan (continued) | ||||||||
| Sinmag Equipment Corp. | 169,371 | $ | 859,224 | |||||
| Sitronix Technology Corp. | 267,000 | 756,040 | ||||||
| Sporton International, Inc. | 277,089 | 1,405,680 | ||||||
| Test Research, Inc. | 409,440 | 570,185 | ||||||
| TSC Auto ID Technology Co., Ltd. | 57,600 | 421,121 | ||||||
| TTFB Co., Ltd. | 148,000 | 1,096,769 | ||||||
| Voltronic Power Technology Corp. | 19,000 | 357,831 | ||||||
| 8,171,142 | ||||||||
| Thailand (0.74%) | ||||||||
| Ananda Development PCL | 6,517,100 | 1,167,271 | ||||||
| Srisawad Power Corp. PCL | 679,960 | 1,422,553 | ||||||
| 2,589,824 | ||||||||
| Turkey (0.18%) | ||||||||
| Anadolu Hayat Emeklilik AS | 213,300 | 379,532 | ||||||
| AvivaSA Emeklilik ve Hayat AS | 53,534 | 264,456 | ||||||
| 643,988 | ||||||||
| United States (21.24%) | ||||||||
| Acacia Communications, Inc.(a) | 8,475 | 358,577 | ||||||
| Aratana Therapeutics, Inc.(a) | 134,150 | 768,679 | ||||||
| Axalta Coating Systems, Ltd.(a) | 31,375 | 1,043,219 | ||||||
| Bank of the Ozarks, Inc. | 53,175 | 2,479,018 | ||||||
| BG Staffing, Inc. | 38,025 | 641,862 | ||||||
| BioDelivery Sciences International, Inc.(a) | 363,775 | 1,045,853 | ||||||
| Blackline, Inc.(a) | 22,650 | 804,528 | ||||||
| BofI Holding, Inc.(a) | 46,275 | 1,244,797 | ||||||
| CoBiz Financial, Inc. | 44,762 | 914,935 | ||||||
| Dril-Quip, Inc.(a) | 9,225 | 388,372 | ||||||
| Edwards Lifesciences Corp.(a) | 6,825 | 697,720 | ||||||
| EPAM Systems, Inc.(a) | 24,650 | 2,246,847 | ||||||
| ePlus, Inc.(a) | 7,717 | 737,745 | ||||||
| Esquire Financial Holdings, Inc.(a) | 14,692 | 245,503 | ||||||
| Evolent Health, Inc., Class A(a) | 19,625 | 318,906 | ||||||
| ExlService Holdings, Inc.(a) | 17,325 | 1,081,426 | ||||||
| Fastenal Co. | 39,225 | 1,842,398 | ||||||
| FCB Financial Holdings, Inc.(a) | 14,350 | 670,145 | ||||||
| First of Long Island Corp. | 45,475 | 1,434,736 | ||||||
| First Republic Bank | 53,900 | 5,249,860 | ||||||
| FirstCash, Inc. | 29,050 | 1,854,843 | ||||||
| GBGI, Ltd.(a) | 692,460 | 1,600,263 | ||||||
| German American Bancorp, Inc. | 27,625 | 993,948 | ||||||
| Hackett Group, Inc. | 43,575 | 672,798 | ||||||
| Hamilton Lane, Inc., Class A | 67,350 | 1,851,452 | ||||||
| Hingham Institution for Savings | 7,500 | 1,460,250 | ||||||
| Home BancShares, Inc. | 37,250 | 837,380 | ||||||
| Innospec, Inc. | 9,150 | 565,928 | ||||||
| Inphi Corp.(a) | 64,700 | 2,651,406 | ||||||
| Shares | Value (Note 2) | |||||||
| United States (continued) | ||||||||
| K2M Group Holdings, Inc.(a) | 21,800 | $ | 429,242 | |||||
| Kinsale Capital Group, Inc. | 40,775 | 1,768,820 | ||||||
| Knight Transportation, Inc. | 21,025 | 871,486 | ||||||
| Lakeland Financial Corp. | 21,550 | 1,040,434 | ||||||
| LGI Homes, Inc.(a) | 21,025 | 1,268,438 | ||||||
| Littelfuse, Inc. | 3,700 | 773,300 | ||||||
| MarketAxess Holdings, Inc. | 8,655 | 1,505,970 | ||||||
| MEDNAX, Inc.(a) | 43,400 | 1,900,486 | ||||||
| Microchip Technology, Inc. | 14,250 | 1,350,900 | ||||||
| MongoDB, Inc.(a) | 125 | 3,810 | ||||||
| Monro Muffler Brake, Inc. | 27,600 | 1,362,060 | ||||||
| MSC Industrial Direct Co., Inc., Class A | 18,750 | 1,554,375 | ||||||
| NV5 Global, Inc.(a) | 22,650 | 1,315,965 | ||||||
| Palo Alto Networks, Inc.(a) | 4,175 | 614,560 | ||||||
| Patrick Industries, Inc.(a) | 7,625 | 709,125 | ||||||
| Paycom Software, Inc.(a) | 22,750 | 1,870,050 | ||||||
| Power Integrations, Inc. | 34,590 | 2,779,307 | ||||||
| Proto Labs, Inc.(a) | 19,950 | 1,740,638 | ||||||
| Qualys, Inc.(a) | 23,825 | 1,260,343 | ||||||
| Seacoast Commerce Banc Holdings | 44,700 | 902,940 | ||||||
| ServisFirst Bancshares, Inc. | 35,500 | 1,455,855 | ||||||
| Signature Bank(a) | 6,850 | 890,569 | ||||||
| Silicon Laboratories, Inc.(a) | 20,175 | 1,914,608 | ||||||
| STAAR Surgical Co.(a) | 53,279 | 705,947 | ||||||
| SVB Financial Group(a) | 13,250 | 2,905,460 | ||||||
| Synaptics, Inc.(a) | 8,325 | 309,024 | ||||||
| Transcat, Inc.(a) | 119,952 | 1,523,390 | ||||||
| Trecora Resources(a) | 43,561 | 529,266 | ||||||
| TriMas Corp.(a) | 50,425 | 1,338,784 | ||||||
| Veracyte, Inc.(a) | 92,504 | 790,909 | ||||||
| Webster Financial Corp. | 13,025 | 716,245 | ||||||
| 74,805,700 | ||||||||
| Vietnam (1.15%) | ||||||||
| DHG Pharmaceutical JSC | 65,119 | 287,570 | ||||||
| Lix Detergent JSC | 577,800 | 1,144,788 | ||||||
| Taisun Int'l Holding Corp. | 274,000 | 1,122,002 | ||||||
| Vietnam Dairy Products JSC | 222,291 | 1,477,862 | ||||||
| 4,032,222 | ||||||||
| TOTAL COMMON STOCKS | ||||||||
| (Cost $265,329,861) | 346,671,223 | |||||||
| PREFERRED STOCKS (0.20%) | ||||||||
| Germany (0.20%) | ||||||||
| FUCHS PETROLUB SE | 12,600 | 707,364 | ||||||
| TOTAL PREFERRED STOCKS | ||||||||
| (Cost $656,398) | 707,364 | |||||||
See Notes to Financial Statements.
| Semi-Annual Report | October 31, 2017 | 49 |
| Grandeur Peak Global Reach Fund | Portfolio of Investments |
October 31, 2017 (Unaudited)
| Principal Amount | Value (Note 2) | |||||||
| CORPORATE BONDS (0.30%) | ||||||||
| Germany (0.26%) | ||||||||
| publity AG | ||||||||
| 3.50%, 11/17/2020 | $ | 800,000 | $ | 928,152 | ||||
| Malaysia (0.04%) | ||||||||
| AEON Credit Service M Bhd | ||||||||
| 3.50%, 09/15/2020 | $ | 445,800 | 131,629 | |||||
| TOTAL CORPORATE BONDS | ||||||||
| (Cost $984,704) | 1,059,781 | |||||||
| TOTAL INVESTMENTS (98.95%) | ||||||||
| (Cost $266,970,963) | $ | 348,438,368 | ||||||
| Other Assets In Excess Of Liabilities (1.05%) | 3,710,709 | |||||||
| NET ASSETS (100.00%) | $ | 352,149,077 | ||||||
| (a) | Non-Income Producing Security. |
| (b) | Security was purchased pursuant to Regulation S under the Securities Act of 1933, which exempts securities offered and sold outside of the United States from registration. Such security cannot be sold in the United States without either an effective registration statement filed pursuant to the Securities Act of 1933, or pursuant to an exemption from registration. The security has been deemed liquid under guidelines approved by the Fund's Board of Trustees. As of October 31, 2017, the aggregate market value of those securities was $25,955,795, representing 7.37% of net assets. |
| (c) | Security exempt from registration under Rule 144A of the Securities Act of 1933. These securities may be resold in the ordinary course of business in transactions exempt from registration, normally to qualified institutional buyers. As of October 31, 2017, these securities had a total aggregate market value of $20,432,249 representing 5.80% of net assets. |
| (d) | Fair valued security under the procedures approved by the Fund's Board of Trustees. |
| (e) | Less than 0.005%. |
| (f) | Security determined to be illiquid under the procedures approved by the Fund’s Board of Trustees. |
For Fund compliance purposes, the Fund's geographical classifications refer to any one or more of the country sub-classifications used by one or more widely recognized market indexes or ratings group indexes, and/or as defined by Fund management. This definition may not apply for purposes of this report, which may combine sub-classifications for reporting ease. Geographical regions are shown as a percentage of net assets.
See Notes to Financial Statements.
| 50 | 1.855.377.7325 | www.GrandeurPeakGlobal.com |
| Grandeur Peak Global Stalwarts Fund | Portfolio of Investments |
October 31, 2017 (Unaudited)
| Shares | Value (Note 2) | |||||||
| COMMON STOCKS (94.98%) | ||||||||
| Argentina (0.40%) | ||||||||
| Globant SA(a) | 15,050 | $ | 567,686 | |||||
| Australia (0.87%) | ||||||||
| carsales.com, Ltd. | 65,500 | 687,288 | ||||||
| Magellan Financial Group, Ltd. | 29,785 | 553,258 | ||||||
| 1,240,546 | ||||||||
| Bangladesh (0.36%) | ||||||||
| Square Pharmaceuticals, Ltd. | 144,203 | 516,979 | ||||||
| Belgium (0.73%) | ||||||||
| Melexis NV | 10,384 | 1,040,360 | ||||||
| Brazil (0.94%) | ||||||||
| M Dias Branco SA | 37,900 | 560,511 | ||||||
| Raia Drogasil SA | 32,600 | 784,481 | ||||||
| 1,344,992 | ||||||||
| Britain (8.44%) | ||||||||
| Abcam PLC | 52,725 | 696,766 | ||||||
| Ascential PLC | 153,206 | 685,526 | ||||||
| B&M European Value Retail SA | 505,300 | 2,666,339 | ||||||
| Burford Capital, Ltd. | 24,500 | 403,492 | ||||||
| Clinigen Group PLC | 25,244 | 394,623 | ||||||
| Close Brothers Group PLC | 33,980 | 626,864 | ||||||
| Diploma PLC | 128,050 | 1,835,052 | ||||||
| Domino’s Pizza Group PLC | 159,500 | 711,147 | ||||||
| Intertek Group PLC | 16,900 | 1,217,682 | ||||||
| Metro Bank PLC(a) | 20,100 | 949,571 | ||||||
| Sanne Group PLC | 46,100 | 489,822 | ||||||
| Ultra Electronics Holdings PLC | 55,075 | 1,334,218 | ||||||
| 12,011,102 | ||||||||
| Canada (5.05%) | ||||||||
| Birchcliff Energy, Ltd. | 51,049 | 207,742 | ||||||
| Gildan Activewear, Inc. | 31,059 | 950,476 | ||||||
| Ritchie Bros Auctioneers, Inc. | 70,700 | 1,981,721 | ||||||
| Spartan Energy Corp.(a) | 89,831 | 475,580 | ||||||
| Stantec, Inc. | 103,142 | 2,946,914 | ||||||
| TFI International, Inc. | 25,809 | 622,969 | ||||||
| 7,185,402 | ||||||||
| China (6.24%) | ||||||||
| China Medical System Holdings, Ltd. | 1,013,000 | 1,872,415 | ||||||
| CSPC Pharmaceutical Group, Ltd. | 548,000 | 952,506 | ||||||
| Ctrip.com International, Ltd., ADR(a) | 13,975 | 669,263 | ||||||
| Man Wah Holdings, Ltd. | 2,328,000 | 2,100,792 | ||||||
| Silergy Corp. | 83,000 | 1,791,575 | ||||||
| Tencent Holdings, Ltd. | 11,100 | 497,703 | ||||||
| Shares | Value (Note 2) | |||||||
| China (continued) | ||||||||
| Yum China Holdings, Inc.(a) | 24,825 | $ | 1,001,689 | |||||
| 8,885,943 | ||||||||
| Colombia (0.70%) | ||||||||
| Parex Resources, Inc.(a) | 74,695 | 993,540 | ||||||
| Egypt (0.24%) | ||||||||
| Commercial International Bank Egypt SAE | 76,062 | 339,970 | ||||||
| Finland (0.51%) | ||||||||
| Metso OYJ | 19,786 | 719,319 | ||||||
| France (1.87%) | ||||||||
| Alten SA | 17,732 | 1,552,232 | ||||||
| BioMerieux | 6,450 | 505,945 | ||||||
| Bureau Veritas SA | 22,550 | 604,018 | ||||||
| 2,662,195 | ||||||||
| Georgia (0.73%) | ||||||||
| BGEO Group PLC | 22,100 | 1,044,936 | ||||||
| Germany (5.16%) | ||||||||
| Aroundtown SA | 139,108 | 977,101 | ||||||
| CTS Eventim AG & Co. KGaA | 10,500 | 433,709 | ||||||
| GRENKE AG | 17,400 | 1,702,748 | ||||||
| Norma Group SE | 23,790 | 1,618,645 | ||||||
| PATRIZIA Immobilien AG(a) | 64,584 | 1,362,428 | ||||||
| Wirecard AG | 12,750 | 1,255,723 | ||||||
| 7,350,354 | ||||||||
| Hong Kong (3.89%) | ||||||||
| Samsonite International SA | 327,500 | 1,366,438 | ||||||
| Value Partners Group, Ltd. | 2,606,900 | 2,583,041 | ||||||
| Vitasoy International Holdings, Ltd. | 688,500 | 1,592,091 | ||||||
| 5,541,570 | ||||||||
| India (5.02%) | ||||||||
| Alkem Laboratories, Ltd. | 34,524 | 998,762 | ||||||
| Bajaj Finance, Ltd. | 31,200 | 867,340 | ||||||
| Glenmark Pharmaceuticals, Ltd. | 48,500 | 462,527 | ||||||
| Indiabulls Housing Finance, Ltd. | 28,200 | 541,633 | ||||||
| L&T Finance Holdings, Ltd. | 184,500 | 572,973 | ||||||
| SBI Life Insurance Co., Ltd.(a)(b)(c) | 45,318 | 463,246 | ||||||
| Vakrangee, Ltd. | 102,000 | 885,495 | ||||||
| WNS Holdings, Ltd., ADR(a) | 33,275 | 1,261,788 | ||||||
| Yes Bank, Ltd. | 224,500 | 1,089,204 | ||||||
| 7,142,968 | ||||||||
See Notes to Financial Statements.
| Semi-Annual Report | October 31, 2017 | 51 |
| Grandeur Peak Global Stalwarts Fund | Portfolio of Investments |
October 31, 2017 (Unaudited)
| Shares | Value (Note 2) | |||||||
| Indonesia (0.46%) | ||||||||
| Bank Rakyat Indonesia Persero Tbk PT | 402,100 | $ | 462,508 | |||||
| Delfi, Ltd. | 173,300 | 188,162 | ||||||
| 650,670 | ||||||||
| Israel (0.62%) | ||||||||
| Wix.com, Ltd.(a) | 12,550 | 875,990 | ||||||
| Italy (1.93%) | ||||||||
| Brembo SpA | 127,908 | 2,112,730 | ||||||
| DiaSorin SpA | 6,948 | 632,093 | ||||||
| 2,744,823 | ||||||||
| Japan (7.65%) | ||||||||
| Create SD Holdings Co., Ltd. | 39,300 | 982,975 | ||||||
| CyberAgent, Inc. | 12,200 | 375,533 | ||||||
| Dip Corp. | 44,600 | 1,083,375 | ||||||
| Ezaki Glico Co., Ltd. | 16,000 | 885,098 | ||||||
| MISUMI Group, Inc. | 66,700 | 1,818,478 | ||||||
| MonotaRO Co., Ltd. | 25,000 | 683,787 | ||||||
| Nihon M&A Center, Inc. | 73,700 | 3,506,592 | ||||||
| Seria Co., Ltd. | 19,300 | 1,096,504 | ||||||
| Tokyo Century Corp. | 10,500 | 454,795 | ||||||
| 10,887,137 | ||||||||
| Jordan (0.28%) | ||||||||
| Hikma Pharmaceuticals PLC | 25,900 | 400,406 | ||||||
| Luxembourg (0.66%) | ||||||||
| Grand City Properties SA | 43,600 | 934,489 | ||||||
| Mexico (0.58%) | ||||||||
| Banregio Grupo Financiero SAB de CV | 155,400 | 828,886 | ||||||
| Netherlands (1.41%) | ||||||||
| Aalberts Industries NV | 40,563 | 2,000,794 | ||||||
| New Zealand (0.36%) | ||||||||
| Fisher & Paykel Healthcare Corp., Ltd. | 56,237 | 509,900 | ||||||
| Norway (0.44%) | ||||||||
| Norwegian Finans Holding ASA(a) | 49,600 | 619,393 | ||||||
| Peru (1.11%) | ||||||||
| Alicorp SAA | 264,620 | 826,301 | ||||||
| Credicorp, Ltd. | 3,625 | 759,220 | ||||||
| 1,585,521 | ||||||||
| Philippines (2.66%) | ||||||||
| Puregold Price Club, Inc. | 924,000 | 912,813 | ||||||
| Robinsons Land Corp. | 633,000 | 308,990 | ||||||
| Shares | Value (Note 2) | |||||||
| Philippines (continued) | ||||||||
| Robinsons Retail Holdings, Inc. | 449,900 | $ | 845,333 | |||||
| Security Bank Corp. | 362,300 | 1,726,408 | ||||||
| 3,793,544 | ||||||||
| Poland (0.79%) | ||||||||
| AmRest Holdings SE(a) | 5,500 | 533,538 | ||||||
| Dino Polska SA(a)(b)(c) | 31,434 | 591,727 | ||||||
| 1,125,265 | ||||||||
| South Africa (0.36%) | ||||||||
| EOH Holdings, Ltd. | 69,650 | 519,268 | ||||||
| South Korea (3.13%) | ||||||||
| BGF retail Co., Ltd. | 10,800 | 762,512 | ||||||
| Hanssem Co., Ltd. | 4,050 | 616,348 | ||||||
| LG Household & Health Care, Ltd. | 1,175 | 1,234,413 | ||||||
| Loen Entertainment, Inc. | 6,401 | 608,476 | ||||||
| Mando Corp. | 1,850 | 539,140 | ||||||
| Medy-Tox, Inc. | 1,820 | 687,972 | ||||||
| 4,448,861 | ||||||||
| Sweden (1.66%) | ||||||||
| Indutrade AB | 44,325 | 1,229,419 | ||||||
| Nibe Industrier AB, Class B | 50,308 | 503,281 | ||||||
| Sweco AB, Class B | 29,500 | 631,112 | ||||||
| 2,363,812 | ||||||||
| Switzerland (1.36%) | ||||||||
| Luxoft Holding, Inc.(a) | 10,300 | 479,465 | ||||||
| VZ Holding AG | 1,540 | 532,166 | ||||||
| Wizz Air Holdings PLC(a)(b)(c) | 21,200 | 922,135 | ||||||
| 1,933,766 | ||||||||
| Taiwan (0.40%) | ||||||||
| Largan Precision Co., Ltd. | 3,000 | 568,478 | ||||||
| Thailand (0.51%) | ||||||||
| Srisawad Power Corp. PCL | 346,320 | 724,541 | ||||||
| United States (26.68%) | ||||||||
| Amazon.com, Inc.(a) | 700 | 773,696 | ||||||
| Axalta Coating Systems, Ltd.(a) | 26,450 | 879,463 | ||||||
| Bank of the Ozarks, Inc. | 16,800 | 783,216 | ||||||
| Blackline, Inc.(a) | 11,331 | 402,477 | ||||||
| BofI Holding, Inc.(a) | 19,075 | 513,117 | ||||||
| Dollar Tree, Inc.(a) | 14,075 | 1,284,344 | ||||||
| Edwards Lifesciences Corp.(a) | 7,825 | 799,950 | ||||||
| EPAM Systems, Inc.(a) | 17,850 | 1,627,027 | ||||||
| Fastenal Co. | 22,700 | 1,066,219 | ||||||
| First Republic Bank | 36,325 | 3,538,055 | ||||||
| FirstCash, Inc. | 33,853 | 2,161,514 | ||||||
| Hamilton Lane, Inc., Class A | 17,750 | 487,947 | ||||||
See Notes to Financial Statements.
| 52 | 1.855.377.7325 | www.GrandeurPeakGlobal.com |
| Grandeur Peak Global Stalwarts Fund | Portfolio of Investments |
October 31, 2017 (Unaudited)
| Shares | Value (Note 2) | |||||||
| United States (continued) | ||||||||
| HealthEquity, Inc.(a) | 19,075 | $ | 957,946 | |||||
| Home BancShares, Inc. | 16,187 | 363,884 | ||||||
| IDEX Corp. | 6,675 | 855,802 | ||||||
| Inphi Corp.(a) | 17,150 | 702,807 | ||||||
| Knight Transportation, Inc. | 27,350 | 1,133,657 | ||||||
| Littelfuse, Inc. | 4,675 | 977,075 | ||||||
| LKQ Corp.(a) | 34,050 | 1,283,344 | ||||||
| Lululemon Athletica, Inc.(a) | 10,375 | 638,166 | ||||||
| MarketAxess Holdings, Inc. | 9,550 | 1,661,700 | ||||||
| MEDNAX, Inc.(a) | 27,500 | 1,204,225 | ||||||
| Microchip Technology, Inc. | 12,775 | 1,211,070 | ||||||
| Monro Muffler Brake, Inc. | 24,000 | 1,184,400 | ||||||
| MSC Industrial Direct Co., Inc., Class A | 13,175 | 1,092,207 | ||||||
| Palo Alto Networks, Inc.(a) | 3,800 | 559,360 | ||||||
| Paycom Software, Inc.(a) | 8,800 | 723,360 | ||||||
| Power Integrations, Inc. | 37,450 | 3,009,108 | ||||||
| PRA Group, Inc.(a) | 25,200 | 703,080 | ||||||
| Proto Labs, Inc.(a) | 12,850 | 1,121,163 | ||||||
| SEI Investments Co. | 9,000 | 580,590 | ||||||
| ServisFirst Bancshares, Inc. | 11,900 | 488,019 | ||||||
| Signature Bank(a) | 5,050 | 656,551 | ||||||
| Silicon Laboratories, Inc.(a) | 11,675 | 1,107,958 | ||||||
| SVB Financial Group(a) | 5,025 | 1,101,882 | ||||||
| Tyler Technologies, Inc.(a) | 1,950 | 345,716 | ||||||
| 37,980,095 | ||||||||
| Vietnam (0.78%) | ||||||||
| Vietnam Dairy Products JSC | 167,864 | 1,116,014 | ||||||
| TOTAL COMMON STOCKS | ||||||||
| (Cost $108,100,688) | 135,199,515 | |||||||
| PREFERRED STOCKS (0.45%) | ||||||||
| Germany (0.45%) | ||||||||
| FUCHS PETROLUB SE | 11,500 | 645,609 | ||||||
| TOTAL PREFERRED STOCKS | ||||||||
| (Cost $598,204) | 645,609 | |||||||
| TOTAL INVESTMENTS (95.43%) | ||||||||
| (Cost $108,698,892) | $ | 135,845,124 | ||||||
| Other Assets In Excess Of Liabilities (4.57%) | 6,500,978 | |||||||
| NET ASSETS (100.00%) | $ | 142,346,102 | ||||||
| (a) | Non-Income Producing Security. |
| (b) | Security exempt from registration under Rule 144A of the Securities Act of 1933. These securities may be resold in the ordinary course of business in transactions exempt from registration, normally to qualified institutional buyers. As of October 31, 2017, these securities had a total aggregate market value of $1,977,108 representing 1.39% of net assets. |
| (c) | Security was purchased pursuant to Regulation S under the Securities Act of 1933, which exempts securities offered and sold outside of the United States from registration. Such security cannot be sold in the United States without either an effective registration statement filed pursuant to the Securities Act of 1933, or pursuant to an exemption from registration. The security has been deemed liquid under guidelines approved by the Fund’s Board of Trustees. As of October 31, 2017, the aggregate market value of those securities was $1,977,108, representing 1.39% of net assets. |
For Fund compliance purposes, the Fund’s geographical classifications refer to any one or more of the country sub-classifications used by one or more widely recognized market indexes or ratings group indexes, and/or as defined by Fund management. This definition may not apply for purposes of this report, which may combine sub-classifications for reporting ease. Geographical regions are shown as a percentage of net assets.
See Notes to Financial Statements.
| Semi-Annual Report | October 31, 2017 | 53 |
| Grandeur Peak International Opportunities Fund | Portfolio of Investments |
October 31, 2017 (Unaudited)
| Shares | Value (Note 2) | |||||||
| COMMON STOCKS (93.97%) | ||||||||
| Argentina (0.43%) | ||||||||
| Globant SA(a) | 98,475 | $ | 3,714,477 | |||||
| Australia (2.36%) | ||||||||
| Blue Sky Alternative Investments, Ltd. | 446,139 | 4,807,654 | ||||||
| Greencross, Ltd. | 983,600 | 3,997,361 | ||||||
| Magellan Financial Group, Ltd. | 219,500 | 4,077,224 | ||||||
| Medical Developments International, Ltd. | 520,709 | 2,510,707 | ||||||
| National Storage REIT | 3,541,439 | 3,997,902 | ||||||
| National Veterinary Care, Ltd. | 343,422 | 693,893 | ||||||
| Netwealth Group, Ltd.(a) | 5,100 | 14,442 | ||||||
| Reject Shop, Ltd. | 159,931 | 570,399 | ||||||
| 20,669,582 | ||||||||
| Austria (1.10%) | ||||||||
| Palfinger AG | 218,040 | 9,651,389 | ||||||
| Bangladesh (0.32%) | ||||||||
| Square Pharmaceuticals, Ltd. | 777,000 | 2,785,604 | ||||||
| Belgium (0.85%) | ||||||||
| Melexis NV | 74,492 | 7,463,261 | ||||||
| Brazil (0.19%) | ||||||||
| M Dias Branco SA | 92,400 | 1,366,525 | ||||||
| Valid Solucoes e Servicos de Seguranca em Meios de Pagamento e Identificacao SA | 53,770 | 300,959 | ||||||
| 1,667,484 | ||||||||
| Britain (11.58%) | ||||||||
| Abcam PLC | 187,866 | 2,482,668 | ||||||
| Alliance Pharma PLC | 3,193,134 | 2,533,976 | ||||||
| Arrow Global Group PLC | 1,086,141 | 6,105,632 | ||||||
| Ascential PLC | 745,100 | 3,333,980 | ||||||
| B&M European Value Retail SA | 1,374,500 | 7,252,884 | ||||||
| Clinigen Group PLC | 725,073 | 11,334,585 | ||||||
| Close Brothers Group PLC | 207,200 | 3,822,429 | ||||||
| Diploma PLC | 224,500 | 3,217,253 | ||||||
| Domino’s Pizza Group PLC | 699,900 | 3,120,576 | ||||||
| EMIS Group PLC | 404,800 | 5,172,053 | ||||||
| Intertek Group PLC | 59,600 | 4,294,310 | ||||||
| LoopUp Group PLC(a) | 332,200 | 1,290,544 | ||||||
| Metro Bank PLC(a) | 108,800 | 5,139,965 | ||||||
| Motorpoint group PLC(b) | 850,495 | 1,722,618 | ||||||
| On the Beach Group PLC(b)(c) | 958,750 | 5,252,629 | ||||||
| Oxford Immunotec Global PLC(a) | 271,830 | 3,593,593 | ||||||
| Premier Asset Management Group PLC | 404,400 | 1,084,950 | ||||||
| Shares | Value (Note 2) | |||||||
| Britain (continued) | ||||||||
| Purplebricks Group PLC(a) | 575,900 | $ | 2,782,259 | |||||
| River & Mercantile Group PLC | 625,400 | 2,919,649 | ||||||
| RPS Group PLC | 1,528,911 | 5,975,113 | ||||||
| Sanne Group PLC | 697,166 | 7,407,533 | ||||||
| Secure Trust Bank PLC | 122,300 | 2,996,886 | ||||||
| Ted Baker PLC | 84,300 | 3,101,378 | ||||||
| Tracsis PLC | 190,900 | 1,236,027 | ||||||
| Ultra Electronics Holdings PLC | 169,700 | 4,111,063 | ||||||
| 101,284,553 | ||||||||
| Canada (2.96%) | ||||||||
| Biosyent, Inc.(a) | 374,000 | 3,072,940 | ||||||
| Cipher Pharmaceuticals, Inc.(a) | 742,300 | 2,491,403 | ||||||
| DIRTT Environmental Solutions(a) | 552,900 | 2,730,000 | ||||||
| Richelieu Hardware, Ltd. | 211,550 | 5,540,869 | ||||||
| Spartan Energy Corp.(a) | 37,134 | 196,593 | ||||||
| Stantec, Inc. | 291,710 | 8,334,571 | ||||||
| TFI International, Inc. | 145,200 | 3,504,789 | ||||||
| 25,871,165 | ||||||||
| China (7.35%) | ||||||||
| BBI Life Sciences Corp.(b) | 14,481,500 | 5,791,560 | ||||||
| BrightKing Holdings, Ltd. | 723,291 | 1,582,825 | ||||||
| China Medical System Holdings, Ltd. | 5,319,000 | 9,831,566 | ||||||
| CSPC Pharmaceutical Group, Ltd. | 3,206,000 | 5,572,507 | ||||||
| Man Wah Holdings, Ltd. | 18,185,000 | 16,410,183 | ||||||
| O2Micro International, Ltd., ADR(a) | 950,233 | 1,890,964 | ||||||
| On-Bright Electronics, Inc. | 922,780 | 6,593,580 | ||||||
| Silergy Corp. | 463,199 | 9,998,261 | ||||||
| Xiabuxiabu Catering Management China Holdings Co., Ltd.(b)(c) | 4,534,000 | 6,613,803 | ||||||
| 64,285,249 | ||||||||
| Colombia (0.95%) | ||||||||
| Gran Tierra Energy, Inc.(a) | 1,178,037 | 2,556,340 | ||||||
| Parex Resources, Inc.(a) | 429,375 | 5,711,244 | ||||||
| 8,267,584 | ||||||||
| Denmark (0.36%) | ||||||||
| Ringkjoebing Landbobank A/S | 63,320 | 3,161,911 | ||||||
| Egypt (0.07%) | ||||||||
| Integrated Diagnostics Holdings PLC(b)(c) | 154,200 | 601,380 | ||||||
| Finland (0.58%) | ||||||||
| Ferratum OYJ(b) | 56,200 | 1,767,216 | ||||||
| Metso OYJ | 91,400 | 3,322,845 | ||||||
| 5,090,061 | ||||||||
See Notes to Financial Statements.
| 54 | 1.855.377.7325 | www.GrandeurPeakGlobal.com |
| Grandeur Peak International Opportunities Fund | Portfolio of Investments |
October 31, 2017 (Unaudited)
| Shares | Value (Note 2) | |||||||
| France (2.69%) | ||||||||
| Alten SA | 51,300 | $ | 4,490,725 | |||||
| Bureau Veritas SA | 124,800 | 3,342,859 | ||||||
| Esker SA | 97,543 | 6,033,380 | ||||||
| Infotel SA | 16,113 | 957,231 | ||||||
| Medicrea International(a) | 162,535 | 745,956 | ||||||
| Neurones | 50,872 | 1,697,749 | ||||||
| Tessi SA | 12,400 | 2,505,770 | ||||||
| Thermador Groupe | 30,729 | 3,755,936 | ||||||
| 23,529,606 | ||||||||
| Georgia (1.10%) | ||||||||
| BGEO Group PLC | 149,511 | 7,069,205 | ||||||
| TBC Bank Group PLC | 113,800 | 2,587,578 | ||||||
| 9,656,783 | ||||||||
| Germany (5.16%) | ||||||||
| Aroundtown SA | 805,600 | 5,658,572 | ||||||
| CANCOM SE | 42,100 | 3,105,225 | ||||||
| GRENKE AG | 28,800 | 2,818,341 | ||||||
| Nexus AG | 238,855 | 7,249,290 | ||||||
| Norma Group SE | 93,303 | 6,348,233 | ||||||
| PATRIZIA Immobilien AG(a) | 186,894 | 3,942,611 | ||||||
| publity AG | 115,200 | 5,073,081 | ||||||
| Wirecard AG | 110,611 | 10,893,865 | ||||||
| 45,089,218 | ||||||||
| Hong Kong (2.74%) | ||||||||
| International Housewares | ||||||||
| Retail Co., Ltd. | 13,906,000 | 2,620,276 | ||||||
| Samsonite International SA | 1,179,500 | 4,921,261 | ||||||
| TK Group Holdings, Ltd. | 5,555,000 | 2,741,399 | ||||||
| Value Partners Group, Ltd. | 9,567,000 | 9,479,441 | ||||||
| Vitasoy International Holdings, Ltd. | 1,797,338 | 4,156,174 | ||||||
| 23,918,551 | ||||||||
| India (8.38%) | ||||||||
| Alkem Laboratories, Ltd. | 350,113 | 10,128,595 | ||||||
| Bajaj Finance, Ltd. | 228,260 | 6,345,484 | ||||||
| Byke Hospitality, Ltd. | 959,500 | 2,329,450 | ||||||
| City Union Bank, Ltd. | 1,038,821 | 2,590,988 | ||||||
| Cyient, Ltd. | 598,912 | 4,998,234 | ||||||
| Essel Propack, Ltd. | 729,500 | 3,212,689 | ||||||
| Glenmark Pharmaceuticals, Ltd. | 306,000 | 2,918,211 | ||||||
| Hinduja Global Solutions, Ltd. | 303,026 | 2,700,842 | ||||||
| Indiabulls Housing Finance, Ltd. | 161,500 | 3,101,902 | ||||||
| Kellton Tech Solutions, Ltd.(a) | 668,779 | 1,011,874 | ||||||
| L&T Finance Holdings, Ltd. | 1,072,000 | 3,329,144 | ||||||
| L&T Technology Services, Ltd.(b)(c) | 38,311 | 492,704 | ||||||
| SBI Life Insurance Co., Ltd.(a)(b)(c) | 64,385 | 658,152 | ||||||
| Time Technoplast, Ltd. | 3,121,234 | 8,987,169 | ||||||
| Shares | Value (Note 2) | |||||||
| India (continued) | ||||||||
| Vakrangee, Ltd. | 928,000 | $ | 8,056,266 | |||||
| WNS Holdings, Ltd., ADR(a) | 188,200 | 7,136,544 | ||||||
| Yes Bank, Ltd. | 1,087,500 | 5,276,212 | ||||||
| 73,274,460 | ||||||||
| Indonesia (2.79%) | ||||||||
| Arwana Citramulia Tbk PT | 75,956,500 | 2,150,584 | ||||||
| Astra Graphia Tbk PT | 10,792,000 | 1,058,312 | ||||||
| Bekasi Fajar Industrial Estate Tbk PT | 68,518,500 | 1,434,784 | ||||||
| Delfi, Ltd. | 1,445,600 | 1,569,575 | ||||||
| Indonesia Pondasi Raya Tbk PT | 19,298,200 | 1,533,184 | ||||||
| Link Net Tbk PT | 8,897,400 | 3,273,587 | ||||||
| Lippo Cikarang Tbk PT(a) | 2,189,000 | 613,324 | ||||||
| Panin Sekuritas Tbk PT | 8,494,000 | 1,283,886 | ||||||
| Selamat Sempurna Tbk PT | 69,686,300 | 6,628,227 | ||||||
| Tempo Scan Pacific Tbk PT | 19,383,500 | 2,644,017 | ||||||
| Ultrajaya Milk Industry & Trading Co. Tbk PT | 22,958,000 | 2,209,046 | ||||||
| 24,398,526 | ||||||||
| Ireland (1.15%) | ||||||||
| Irish Residential Properties REIT PLC | 5,867,176 | 10,080,712 | ||||||
| Israel (0.61%) | ||||||||
| Sarine Technologies, Ltd. | 1,358,600 | 971,781 | ||||||
| Wix.com, Ltd.(a) | 62,825 | 4,385,185 | ||||||
| 5,356,966 | ||||||||
| Italy (0.43%) | ||||||||
| Brembo SpA | 227,675 | 3,760,639 | ||||||
| Japan (10.81%) | ||||||||
| AIT Corp. | 500,200 | 5,820,013 | ||||||
| Amiyaki Tei Co., Ltd. | 88,800 | 4,154,751 | ||||||
| Anshin Guarantor Service Co., Ltd. | 375,000 | 1,609,428 | ||||||
| Arcland Service Holdings Co., Ltd. | 158,800 | 3,497,078 | ||||||
| Create SD Holdings Co., Ltd. | 216,200 | 5,407,614 | ||||||
| CyberAgent, Inc. | 108,900 | 3,352,095 | ||||||
| Dip Corp. | 200,100 | 4,860,615 | ||||||
| Future Corp. | 389,600 | 3,912,961 | ||||||
| GCA Corp. | 616,400 | 5,610,782 | ||||||
| Hard Off Corp. Co., Ltd. | 279,800 | 2,861,857 | ||||||
| Japan Lifeline Co., Ltd. | 59,400 | 2,841,880 | ||||||
| M&A Capital Partners Co., Ltd.(a) | 139,800 | 7,290,920 | ||||||
| Macromill, Inc. | 106,200 | 3,184,926 | ||||||
| MISUMI Group, Inc. | 223,700 | 6,098,852 | ||||||
| Nihon M&A Center, Inc. | 126,300 | 6,009,261 | ||||||
| Prestige International, Inc. | 325,000 | 3,495,669 | ||||||
| Quick Co., Ltd. | 209,400 | 3,604,026 | ||||||
See Notes to Financial Statements.
| Semi-Annual Report | October 31, 2017 | 55 |
| Grandeur Peak International Opportunities Fund | Portfolio of Investments |
October 31, 2017 (Unaudited)
| Shares | Value (Note 2) | |||||||
| Japan (continued) | ||||||||
| SK Kaken Co., Ltd. | 14,000 | $ | 1,161,690 | |||||
| Synchro Food Co., Ltd.(a) | 115,800 | 1,782,244 | ||||||
| Syuppin Co., Ltd. | 178,400 | 4,047,949 | ||||||
| Tokyo Century Corp. | 104,500 | 4,526,296 | ||||||
| Trancom Co., Ltd. | 104,590 | 6,346,871 | ||||||
| Trust Tech, Inc. | 105,700 | 3,058,379 | ||||||
| 94,536,157 | ||||||||
| Luxembourg (0.73%) | ||||||||
| Grand City Properties SA | 187,800 | 4,025,163 | ||||||
| L’Occitane International SA | 1,238,712 | 2,353,131 | ||||||
| 6,378,294 | ||||||||
| Malaysia (1.35%) | ||||||||
| AEON Credit Service M Bhd | 1,130,560 | 3,712,007 | ||||||
| Berjaya Food Bhd | 1,652,216 | 581,505 | ||||||
| CB Industrial Product Holding Bhd | 3,120,200 | 1,422,460 | ||||||
| My EG Services Bhd | 8,532,400 | 4,413,832 | ||||||
| Scicom MSC Bhd | 3,754,500 | 1,676,156 | ||||||
| 11,805,960 | ||||||||
| Mexico (1.16%) | ||||||||
| Banregio Grupo Financiero SAB de CV | 560,065 | 2,987,325 | ||||||
| Credito Real SAB de CV SOFOM ER | 3,075,340 | 4,940,627 | ||||||
| Unifin Financiera SAB de CV SOFOM ENR | 650,400 | 2,205,120 | ||||||
| 10,133,072 | ||||||||
| Netherlands (0.71%) | ||||||||
| Aalberts Industries NV | 125,297 | 6,180,347 | ||||||
| New Zealand (1.30%) | ||||||||
| CBL Corp., Ltd. | 1,542,256 | 3,102,776 | ||||||
| Restaurant Brands New Zealand, Ltd. | 1,240,800 | 5,756,760 | ||||||
| Trilogy International, Ltd. | 1,571,085 | 2,526,470 | ||||||
| 11,386,006 | ||||||||
| Norway (2.46%) | ||||||||
| Medistim ASA | 420,559 | 3,604,203 | ||||||
| Multiconsult ASA(b)(c) | 176,700 | 1,871,272 | ||||||
| Nordic Semiconductor ASA(a) | 531,024 | 2,659,021 | ||||||
| Norwegian Finans Holding ASA(a) | 305,700 | 3,817,507 | ||||||
| Skandiabanken ASA(b)(c) | 945,100 | 9,574,807 | ||||||
| 21,526,810 | ||||||||
| Oman (0.42%) | ||||||||
| Tethys Oil AB | 496,508 | 3,662,285 | ||||||
| Shares | Value (Note 2) | |||||||
| Peru (1.10%) | ||||||||
| Alicorp SAA | 1,952,297 | $ | 6,096,236 | |||||
| Credicorp, Ltd. | 16,850 | 3,529,064 | ||||||
| 9,625,300 | ||||||||
| Philippines (2.89%) | ||||||||
| Concepcion Industrial Corp. | 3,236,800 | 4,075,390 | ||||||
| Holcim Philippines, Inc. | 2,303,300 | 535,392 | ||||||
| Pepsi-Cola Products Philippines, Inc. | 30,387,500 | 1,695,225 | ||||||
| Puregold Price Club, Inc. | 6,696,000 | 6,614,934 | ||||||
| Robinsons Retail Holdings, Inc. | 1,696,000 | 3,186,673 | ||||||
| Security Bank Corp. | 1,931,760 | 9,205,094 | ||||||
| 25,312,708 | ||||||||
| Poland (0.53%) | ||||||||
| Dino Polska SA(a)(b)(c) | 221,200 | 4,163,965 | ||||||
| PGS Software SA | 130,778 | 493,658 | ||||||
| 4,657,623 | ||||||||
| Singapore (0.56%) | ||||||||
| CSE Global, Ltd. | 1,924,755 | 529,516 | ||||||
| Riverstone Holdings, Ltd. | 5,677,000 | 4,393,834 | ||||||
| 4,923,350 | ||||||||
| South Africa (1.39%) | ||||||||
| Blue Label Telecoms, Ltd. | 1,526,900 | 1,862,896 | ||||||
| Cartrack Holdings, Ltd. | 3,576,400 | 3,794,253 | ||||||
| EOH Holdings, Ltd. | 349,156 | 2,603,097 | ||||||
| Italtile, Ltd. | 3,988,625 | 3,895,883 | ||||||
| 12,156,129 | ||||||||
| South Korea (2.80%) | ||||||||
| Hy-Lok Corp. | 258,001 | 5,688,066 | ||||||
| ISC Co., Ltd. | 259,949 | 4,918,926 | ||||||
| Koh Young Technology, Inc. | 44,883 | 3,076,730 | ||||||
| LEENO Industrial, Inc. | 73,500 | 3,358,950 | ||||||
| Loen Entertainment, Inc. | 49,909 | 4,744,329 | ||||||
| Vitzrocell Co., Ltd.(a)(d) | 390,884 | 2,655,960 | ||||||
| 24,442,961 | ||||||||
| Sweden (3.16%) | ||||||||
| AddTech AB, Class B | 343,608 | 7,613,706 | ||||||
| Bufab AB | 429,694 | 5,132,728 | ||||||
| HIQ International AB | 227,896 | 1,633,341 | ||||||
| Hoist Finance AB(b)(c) | 414,200 | 4,353,933 | ||||||
| Indutrade AB | 173,750 | 4,819,211 | ||||||
| Moberg Pharma AB(a) | 334,194 | 1,516,950 | ||||||
| Nibe Industrier AB, Class B | 82,700 | 827,331 | ||||||
| Odd Molly International AB | 72,938 | 202,130 | ||||||
| TF Bank AB(b) | 132,700 | 1,501,893 | ||||||
| 27,601,223 | ||||||||
See Notes to Financial Statements.
| 56 | 1.855.377.7325 | www.GrandeurPeakGlobal.com |
| Grandeur Peak International Opportunities Fund | Portfolio of Investments |
October 31, 2017 (Unaudited)
| Shares | Value (Note 2) | |||||||
| Switzerland (0.80%) | ||||||||
| Luxoft Holding, Inc.(a) | 50,225 | $ | 2,337,974 | |||||
| VZ Holding AG | 13,480 | 4,658,177 | ||||||
| 6,996,151 | ||||||||
| Taiwan (2.77%) | ||||||||
| ASPEED Technology, Inc. | 121,958 | 2,818,506 | ||||||
| Cub Elecparts, Inc. | 31,205 | 307,813 | ||||||
| Materials Analysis Technology, Inc. | 748,000 | 2,162,688 | ||||||
| Sinmag Equipment Corp. | 952,810 | 4,833,632 | ||||||
| Sitronix Technology Corp. | 841,000 | 2,381,385 | ||||||
| Sporton International, Inc. | 1,424,756 | 7,227,828 | ||||||
| Test Research, Inc. | 2,513,252 | 3,499,945 | ||||||
| TSC Auto ID Technology Co., Ltd. | 138,000 | 1,008,936 | ||||||
| 24,240,733 | ||||||||
| Thailand (1.30%) | ||||||||
| Ananda Development PCL | 26,514,800 | 4,749,039 | ||||||
| Premier Marketing PCL | 6,922,400 | 3,042,355 | ||||||
| Srisawad Power Corp. PCL | 1,722,000 | 3,602,619 | ||||||
| 11,394,013 | ||||||||
| United Arab Emirates (0.30%) | ||||||||
| Aramex PJSC | 1,855,000 | 2,586,035 | ||||||
| United States (2.78%) | ||||||||
| EPAM Systems, Inc.(a) | 83,750 | 7,633,813 | ||||||
| FirstCash, Inc. | 209,798 | 13,395,602 | ||||||
| GBGI, Ltd.(a) | 1,426,215 | 3,295,958 | ||||||
| 24,325,373 | ||||||||
| Vietnam (0.50%) | ||||||||
| DHG Pharmaceutical JSC | 97,210 | 429,286 | ||||||
| Vietnam Dairy Products JSC | 592,330 | 3,938,000 | ||||||
| 4,367,286 | ||||||||
| TOTAL COMMON STOCKS | ||||||||
| (Cost $573,129,352) | 821,816,977 | |||||||
| Principal Amount | Value (Note 2) | |||||||
| CORPORATE BONDS (0.08%) | ||||||||
| Malaysia (0.08%) | ||||||||
| AEON Credit Service M Bhd | ||||||||
| 3.50%, 09/15/2020 | $ | 2,235,120 | $ | 659,950 | ||||
| TOTAL CORPORATE BONDS | ||||||||
| (Cost $530,971) | 659,950 | |||||||
| Shares | Value (Note 2) | |||||||
| RIGHTS AND WARRANTS (0.00%)(e) | ||||||||
| Taiwan (0.00%)(e) | ||||||||
| Materials Analysis Technology, strike price 82.00 TWD, expires 12/11/2017 | 101,018 | $ | 17,417 | |||||
| TOTAL RIGHTS AND WARRANTS | ||||||||
| (Cost $0) | 17,417 | |||||||
| TOTAL INVESTMENTS (94.05%) | ||||||||
| (Cost $573,660,323) | $ | 822,494,344 | ||||||
| Other Assets In Excess Of Liabilities (5.95%) | 52,080,855 | |||||||
| NET ASSETS (100.00%) | $ | 874,575,199 | ||||||
| (a) | Non-Income Producing Security. |
| (b) | Security was purchased pursuant to Regulation S under the Securities Act of 1933, which exempts securities offered and sold outside of the United States from registration. Such security cannot be sold in the United States without either an effective registration statement filed pursuant to the Securities Act of 1933, or pursuant to an exemption from registration. The security has been deemed liquid under guidelines approved by the Fund’s Board of Trustees. As of October 31, 2017, the aggregate market value of those securities was $44,365,932, representing 5.07% of net assets. |
| (c) | Security exempt from registration under Rule 144A of the Securities Act of 1933. These securities may be resold in the ordinary course of business in transactions exempt from registration, normally to qualified institutional buyers. As of October 31, 2017, these securities had a total aggregate market value of $33,582,645 representing 3.84% of net assets. |
| (d) | Fair valued security under the procedures approved by the Fund’s Board of Trustees. |
| (e) | Less than 0.005%. |
Currency Abbreviations:
TWD - Taiwan Dollar
For Fund compliance purposes, the Fund’s geographical classifications refer to any one or more of the country sub-classifications used by one or more widely recognized market indexes or ratings group indexes, and/or as defined by Fund management. This definition may not apply for purposes of this report, which may combine sub-classifications for reporting ease. Geographical regions are shown as a percentage of net assets.
See Notes to Financial Statements.
| Semi-Annual Report | October 31, 2017 | 57 |
| Grandeur Peak International Stalwarts Fund | Portfolio of Investments |
October 31, 2017 (Unaudited)
| Shares | Value (Note 2) | |||||||
| COMMON STOCKS (93.43%) | ||||||||
| Argentina (0.60%) | ||||||||
| Globant SA(a) | 69,050 | $ | 2,604,566 | |||||
| Australia (0.98%) | ||||||||
| carsales.com, Ltd. | 201,600 | 2,115,380 | ||||||
| Magellan Financial Group, Ltd. | 113,709 | 2,112,151 | ||||||
| 4,227,531 | ||||||||
| Bangladesh (0.46%) | ||||||||
| Square Pharmaceuticals, Ltd. | 558,179 | 2,001,114 | ||||||
| Belgium (1.16%) | ||||||||
| Melexis NV | 50,139 | 5,023,364 | ||||||
| Brazil (1.25%) | ||||||||
| M Dias Branco SA | 157,200 | 2,324,867 | ||||||
| Raia Drogasil SA | 129,100 | 3,106,640 | ||||||
| 5,431,507 | ||||||||
| Britain (10.92%) | ||||||||
| Abcam PLC | 232,250 | 3,069,207 | ||||||
| Ascential PLC | 562,600 | 2,517,377 | ||||||
| B&M European Value Retail SA | 1,824,700 | 9,628,474 | ||||||
| Burford Capital, Ltd. | 85,600 | 1,409,753 | ||||||
| Clinigen Group PLC | 110,000 | 1,719,557 | ||||||
| Close Brothers Group PLC | 135,005 | 2,490,574 | ||||||
| Diploma PLC | 457,717 | 6,559,427 | ||||||
| Domino's Pizza Group PLC | 494,200 | 2,203,441 | ||||||
| Intertek Group PLC | 81,100 | 5,843,432 | ||||||
| Metro Bank PLC(a) | 93,100 | 4,398,261 | ||||||
| Sanne Group PLC | 203,400 | 2,161,167 | ||||||
| Ultra Electronics Holdings PLC | 220,450 | 5,340,505 | ||||||
| 47,341,175 | ||||||||
| Canada (6.24%) | ||||||||
| Birchcliff Energy, Ltd. | 179,108 | 728,871 | ||||||
| Gildan Activewear, Inc. | 132,029 | 4,040,388 | ||||||
| Ritchie Bros Auctioneers, Inc. | 235,750 | 6,608,073 | ||||||
| Spartan Energy Corp.(a) | 304,711 | 1,613,190 | ||||||
| Stantec, Inc. | 401,539 | 11,472,543 | ||||||
| TFI International, Inc. | 107,299 | 2,589,947 | ||||||
| 27,053,012 | ||||||||
| China (7.91%) | ||||||||
| China Medical System | ||||||||
| Holdings, Ltd. | 3,943,600 | 7,289,296 | ||||||
| CSPC Pharmaceutical Group, Ltd. | 1,937,000 | 3,366,796 | ||||||
| Ctrip.com International, Ltd., ADR(a) | 54,800 | 2,624,372 | ||||||
| Man Wah Holdings, Ltd. | 9,229,800 | 8,328,991 | ||||||
| Silergy Corp. | 325,000 | 7,015,202 | ||||||
| Tencent Holdings, Ltd. | 48,000 | 2,152,229 | ||||||
| Shares | Value (Note 2) | |||||||
| China (continued) | ||||||||
| Yum China Holdings, Inc.(a) | 87,525 | $ | 3,531,634 | |||||
| 34,308,520 | ||||||||
| Colombia (0.81%) | ||||||||
| Parex Resources, Inc.(a) | 265,519 | 3,531,746 | ||||||
| Egypt (0.33%) | ||||||||
| Commercial International Bank Egypt SAE | 320,752 | 1,433,647 | ||||||
| Finland (0.67%) | ||||||||
| Metso OYJ | 79,926 | 2,905,708 | ||||||
| France (2.48%) | ||||||||
| Alten SA | 74,014 | 6,479,074 | ||||||
| BioMerieux | 26,250 | 2,059,076 | ||||||
| Bureau Veritas SA | 82,200 | 2,201,787 | ||||||
| 10,739,937 | ||||||||
| Georgia (0.90%) | ||||||||
| BGEO Group PLC | 82,400 | 3,896,051 | ||||||
| Germany (6.93%) | ||||||||
| Aroundtown SA | 671,764 | 4,718,502 | ||||||
| CTS Eventim AG & Co. KGaA | 45,650 | 1,885,600 | ||||||
| GRENKE AG | 62,450 | 6,111,299 | ||||||
| Norma Group SE | 88,050 | 5,990,825 | ||||||
| PATRIZIA Immobilien AG(a) | 227,580 | 4,800,899 | ||||||
| Wirecard AG | 66,550 | 6,554,382 | ||||||
| 30,061,507 | ||||||||
| Hong Kong (4.81%) | ||||||||
| Samsonite International SA | 1,216,760 | 5,076,722 | ||||||
| Value Partners Group, Ltd. | 9,790,000 | 9,700,400 | ||||||
| Vitasoy International Holdings, Ltd. | 2,622,000 | 6,063,127 | ||||||
| 20,840,249 | ||||||||
| India (7.19%) | ||||||||
| Alkem Laboratories, Ltd. | 111,174 | 3,216,208 | ||||||
| Bajaj Finance, Ltd. | 128,250 | 3,565,269 | ||||||
| Genpact, Ltd. | 53,850 | 1,639,733 | ||||||
| Glenmark Pharmaceuticals,Ltd. | 150,000 | 1,430,496 | ||||||
| Indiabulls Housing Finance,Ltd. | 109,000 | 2,093,544 | ||||||
| L&T Finance Holdings, Ltd. | 761,000 | 2,363,319 | ||||||
| SBI Life Insurance Co., Ltd.(a)(b)(c) | 243,705 | 2,491,184 | ||||||
| Vakrangee, Ltd. | 441,000 | 3,828,463 | ||||||
| WNS Holdings, Ltd., ADR(a) | 160,045 | 6,068,906 | ||||||
| Yes Bank, Ltd. | 917,250 | 4,450,212 | ||||||
| 31,147,334 | ||||||||
See Notes to Financial Statements.
| 58 | 1.855.377.7325 | www.GrandeurPeakGlobal.com |
| Grandeur Peak International Stalwarts Fund | Portfolio of Investments |
October 31, 2017 (Unaudited)
| Shares | Value (Note 2) | |||||||
| Indonesia (0.74%) | ||||||||
| Bank Rakyat Indonesia Persero Tbk PT | 1,932,000 | $ | 2,222,245 | |||||
| Delfi, Ltd. | 893,700 | 970,344 | ||||||
| 3,192,589 | ||||||||
| Israel (0.78%) | ||||||||
| Wix.com, Ltd.(a) | 48,300 | 3,371,340 | ||||||
| Italy (2.66%) | ||||||||
| Brembo SpA | 553,046 | 9,134,979 | ||||||
| DiaSorin SpA | 26,480 | 2,409,013 | ||||||
| 11,543,992 | ||||||||
| Japan (9.45%) | ||||||||
| Create SD Holdings Co., Ltd. | 158,400 | 3,961,916 | ||||||
| CyberAgent, Inc. | 54,100 | 1,665,274 | ||||||
| Dip Corp. | 153,000 | 3,716,512 | ||||||
| Ezaki Glico Co., Ltd. | 62,000 | 3,429,752 | ||||||
| MISUMI Group, Inc. | 262,000 | 7,143,046 | ||||||
| MonotaRO Co., Ltd. | 94,000 | 2,571,039 | ||||||
| Nihon M&A Center, Inc. | 255,900 | 12,175,533 | ||||||
| Seria Co., Ltd. | 75,500 | 4,289,433 | ||||||
| Tokyo Century Corp. | 46,100 | 1,996,768 | ||||||
| 40,949,273 | ||||||||
| Jordan (0.31%) | ||||||||
| Hikma Pharmaceuticals PLC | 87,100 | 1,346,538 | ||||||
| Luxembourg (1.08%) | ||||||||
| Grand City Properties SA | 218,100 | 4,674,590 | ||||||
| Mexico (0.94%) | ||||||||
| Banregio Grupo Financiero SAB de CV | 764,550 | 4,078,025 | ||||||
| Netherlands (2.00%) | ||||||||
| Aalberts Industries NV | 175,971 | 8,679,872 | ||||||
| New Zealand (0.47%) | ||||||||
| Fisher & Paykel Healthcare Corp., Ltd. | 226,967 | 2,057,905 | ||||||
| Norway (0.67%) | ||||||||
| Norwegian Finans Holding ASA(a) | 231,238 | 2,887,644 | ||||||
| Peru (1.48%) | ||||||||
| Alicorp SAA | 1,022,439 | 3,192,665 | ||||||
| Credicorp, Ltd. | 15,475 | 3,241,084 | ||||||
| 6,433,749 | ||||||||
| Philippines (3.50%) | ||||||||
| Puregold Price Club, Inc. | 3,898,200 | 3,851,006 | ||||||
| Robinsons Land Corp. | 2,912,000 | 1,421,451 | ||||||
| Shares | Value (Note 2) | |||||||
| Philippines (continued) | ||||||||
| Robinsons Retail Holdings, Inc. | 1,811,320 | $ | 3,403,352 | |||||
| Security Bank Corp. | 1,361,200 | 6,486,299 | ||||||
| 15,162,108 | ||||||||
| Poland (1.07%) | ||||||||
| AmRest Holdings SE(a) | 23,400 | 2,269,960 | ||||||
| Dino Polska SA(a)(b)(c) | 126,072 | 2,373,234 | ||||||
| 4,643,194 | ||||||||
| South Africa (0.55%) | ||||||||
| EOH Holdings, Ltd. | 317,100 | 2,364,107 | ||||||
| South Korea (3.79%) | ||||||||
| BGF retail Co., Ltd. | 37,900 | 2,675,851 | ||||||
| Hanssem Co., Ltd. | 14,900 | 2,267,551 | ||||||
| LG Household & Health Care, Ltd. | 3,900 | 4,097,202 | ||||||
| Loen Entertainment, Inc. | 28,000 | 2,661,668 | ||||||
| Mando Corp. | 8,250 | 2,404,271 | ||||||
| Medy-Tox, Inc. | 6,150 | 2,324,742 | ||||||
| 16,431,285 | ||||||||
| Sweden (2.61%) | ||||||||
| Indutrade AB | 209,550 | 5,812,177 | ||||||
| Nibe Industrier AB, Class B | 279,000 | 2,791,116 | ||||||
| Sweco AB, Class B | 127,700 | 2,731,967 | ||||||
| 11,335,260 | ||||||||
| Switzerland (1.74%) | ||||||||
| Luxoft Holding, Inc.(a) | 43,900 | 2,043,545 | ||||||
| VZ Holding AG | 6,689 | 2,311,465 | ||||||
| Wizz Air Holdings PLC(a)(b)(c) | 73,500 | 3,197,025 | ||||||
| 7,552,035 | ||||||||
| Taiwan (0.44%) | ||||||||
| Largan Precision Co., Ltd. | 10,000 | 1,894,925 | ||||||
| Thailand (0.69%) | ||||||||
| Srisawad Power Corp. PCL | 1,427,920 | 2,987,370 | ||||||
| United States (3.83%) | ||||||||
| EPAM Systems, Inc.(a) | 71,650 | 6,530,898 | ||||||
| FirstCash, Inc. | 114,187 | 7,290,840 | ||||||
| Lululemon Athletica, Inc.(a) | 45,075 | 2,772,563 | ||||||
| 16,594,301 | ||||||||
| Vietnam (0.99%) | ||||||||
| Vietnam Dairy Products JSC | 642,964 | 4,274,631 | ||||||
| TOTAL COMMON STOCKS | ||||||||
| (Cost $321,472,424) | 405,001,701 | |||||||
See Notes to Financial Statements.
| Semi-Annual Report | October 31, 2017 | 59 |
| Grandeur Peak International Stalwarts Fund | Portfolio of Investments |
October 31, 2017 (Unaudited)
| Shares | Value (Note 2) | |||||||
| PREFERRED STOCKS (0.51%) | ||||||||
| Germany (0.51%) | ||||||||
| FUCHS PETROLUB SE | 39,500 | $ | 2,217,528 | |||||
| TOTAL PREFERRED STOCKS | ||||||||
| (Cost $2,089,789) | 2,217,528 | |||||||
| TOTAL INVESTMENTS (93.94%) | ||||||||
| (Cost $323,562,213) | $ | 407,219,229 | ||||||
| Other Assets In Excess Of Liabilities (6.06%) | 26,278,407 | |||||||
| NET ASSETS (100.00%) | $ | 433,497,636 | ||||||
| (a) | Non-Income Producing Security. |
| (b) | Security exempt from registration under Rule 144A of the Securities Act of 1933. These securities may be resold in the ordinary course of business in transactions exempt from registration, normally to qualified institutional buyers. As of October 31, 2017, these securities had a total aggregate market value of $8,061,443 representing 1.86% of net assets. |
| (c) | Security was purchased pursuant to Regulation S under the Securities Act of 1933, which exempts securities offered and sold outside of the United States from registration. Such security cannot be sold in the United States without either an effective registration statement filed pursuant to the Securities Act of 1933, or pursuant to an exemption from registration. The security has been deemed liquid under guidelines approved by the Fund's Board of Trustees. As of October 31, 2017, the aggregate market value of those securities was $8,061,443, representing 1.86% of net assets. |
For Fund compliance purposes, the Fund's geographical classifications refer to any one or more of the country sub-classifications used by one or more widely recognized market indexes or ratings group indexes, and/or as defined by Fund management. This definition may not apply for purposes of this report, which may combine sub-classifications for reporting ease. Geographical regions are shown as a percentage of net assets.
See Notes to Financial Statements.
| 60 | 1.855.377.7325 | www.GrandeurPeakGlobal.com |
| Grandeur Peak Funds® | Statements of Assets and Liabilities |
October 31, 2017 (Unaudited)
| Grandeur Peak Emerging Markets Opportunities Fund | Grandeur Peak Global Micro Cap Fund | Grandeur Peak Global Opportunities Fund | Grandeur Peak Global Reach Fund | |||||||||||||
| ASSETS | ||||||||||||||||
| Investments, at value (Cost - see below) | $ | 430,726,146 | $ | 40,646,254 | $ | 748,882,531 | $ | 348,438,368 | ||||||||
| Cash | 9,143,440 | 396,299 | 34,267,490 | 3,975,922 | ||||||||||||
| Foreign cash, at value (Cost $1,773,462, $127,498, $705,916 and $29,677, respectively) | 1,773,495 | 127,501 | 706,044 | 29,696 | ||||||||||||
| Dividends and interest receivable | 171,851 | 50,007 | 908,659 | 316,115 | ||||||||||||
| Receivable for investments sold | 7,481,608 | 255,003 | 1,725,812 | 2,457,041 | ||||||||||||
| Receivable for fund shares subscribed | 5,166 | 60 | 305,012 | 76,286 | ||||||||||||
| Prepaid and other assets | 9,263 | 12,808 | 28,813 | 21,978 | ||||||||||||
| Total assets | 449,310,969 | 41,487,932 | 786,824,361 | 355,315,406 | ||||||||||||
| LIABILITIES | ||||||||||||||||
| Payable for investments purchased | 9,719,838 | 186,596 | 1,229,211 | 2,464,523 | ||||||||||||
| Foreign capital gains tax | 802,754 | – | 73,765 | 130,418 | ||||||||||||
| Payable for fund shares redeemed | – | – | 571,249 | 75,266 | ||||||||||||
| Advisory fees payable | 500,284 | 48,277 | 790,624 | 327,088 | ||||||||||||
| Administration fees payable | 21,635 | 7,386 | 29,830 | 20,568 | ||||||||||||
| Custodian fees payable | 197,272 | 29,090 | 120,838 | 93,832 | ||||||||||||
| Payable for trustee fees and expenses | 4,555 | 406 | 7,737 | 3,562 | ||||||||||||
| Payable for chief compliance officer fee | 861 | 74 | 1,396 | 648 | ||||||||||||
| Payable for principal financial officer fees | 153 | 13 | 247 | 115 | ||||||||||||
| Distribution and service fees payable | 3,832 | – | 40,336 | 13,662 | ||||||||||||
| Payable for transfer agency fees | 4,160 | 4,174 | 9,611 | 7,496 | ||||||||||||
| Accrued expenses and other liabilities | 23,471 | 12,824 | 32,637 | 29,151 | ||||||||||||
| Total liabilities | 11,278,815 | 288,840 | 2,907,481 | 3,166,329 | ||||||||||||
| NET ASSETS | $ | 438,032,154 | $ | 41,199,092 | $ | 783,916,880 | $ | 352,149,077 | ||||||||
| NET ASSETS CONSISTS OF | ||||||||||||||||
| Paid-in capital (Note 5) | $ | 370,538,492 | $ | 30,290,213 | $ | 514,435,290 | $ | 265,701,854 | ||||||||
| Accumulated net investment income | 1,136,613 | 77,941 | 315,128 | 669,983 | ||||||||||||
| Accumulated net realized gain/(loss) | (8,386,735 | ) | 2,733,475 | 42,053,410 | 4,437,701 | |||||||||||
| Net unrealized appreciation | 74,743,784 | 8,097,463 | 227,113,052 | 81,339,539 | ||||||||||||
| NET ASSETS | $ | 438,032,154 | $ | 41,199,092 | $ | 783,916,880 | $ | 352,149,077 | ||||||||
| INVESTMENTS, AT COST | $ | 355,182,833 | $ | 32,549,529 | $ | 521,692,679 | $ | 266,970,963 | ||||||||
| PRICING OF SHARES | ||||||||||||||||
| Investor Class | ||||||||||||||||
| Net Assets | $ | 17,953,640 | $ | – | $ | 192,226,029 | $ | 64,535,220 | ||||||||
| Net Asset Value, offering and redemption price per share | $ | 12.33 | $ | – | $ | 3.99 | $ | 16.13 | ||||||||
| Shares of beneficial interest outstanding | 1,456,344 | – | 48,203,714 | 4,001,657 | ||||||||||||
| Institutional Class | ||||||||||||||||
| Net Assets | $ | 420,078,514 | $ | 41,199,092 | $ | 591,690,851 | $ | 287,613,857 | ||||||||
| Net Asset Value, offering and redemption price per share | $ | 12.39 | $ | 13.54 | $ | 4.03 | $ | 16.18 | ||||||||
| Shares of beneficial interest outstanding | 33,897,614 | 3,043,318 | 146,736,863 | 17,779,384 | ||||||||||||
See Notes to Financial Statements.
| Semi-Annual Report | October 31, 2017 | 61 |
| Grandeur Peak Funds® | Statements of Assets and Liabilities |
October 31, 2017 (Unaudited)
| Grandeur Peak Global Stalwarts Fund | Grandeur Peak International Opportunities Fund | Grandeur Peak International Stalwarts Fund | ||||||||||
| ASSETS | ||||||||||||
| Investments, at value (Cost - see below) | $ | 135,845,124 | $ | 822,494,344 | $ | 407,219,229 | ||||||
| Cash | 5,370,122 | 50,701,181 | 25,563,295 | |||||||||
| Foreign cash, at value (Cost $50,218, $579,820 and $393,288, respectively) | 50,239 | 580,130 | 393,430 | |||||||||
| Dividends and interest receivable | 98,131 | 1,164,035 | 343,749 | |||||||||
| Receivable for investments sold | 568,140 | 2,989,486 | 1,623,624 | |||||||||
| Receivable for fund shares subscribed | 1,014,241 | 89,143 | 62,138 | |||||||||
| Prepaid and other assets | 25,857 | 27,247 | 31,696 | |||||||||
| Total assets | 142,971,854 | 878,045,566 | 435,237,161 | |||||||||
| LIABILITIES | ||||||||||||
| Payable for investments purchased | 293,708 | 2,125,505 | 754,861 | |||||||||
| Foreign capital gains tax | 133,872 | 88,146 | 468,378 | |||||||||
| Payable for fund shares redeemed | 14,153 | 115,170 | 94,157 | |||||||||
| Advisory fees payable | 104,258 | 879,707 | 292,429 | |||||||||
| Administration fees payable | 7,288 | 33,107 | 15,470 | |||||||||
| Custodian fees payable | 32,744 | 160,968 | 70,233 | |||||||||
| Payable for trustee fees and expenses | 1,242 | 8,613 | 3,396 | |||||||||
| Payable for chief compliance officer fee | 171 | 1,472 | 323 | |||||||||
| Payable for principal financial officer fees | 30 | 258 | 57 | |||||||||
| Distribution and service fees payable | 16,399 | 17,419 | 9,010 | |||||||||
| Payable for transfer agency fees | 6,182 | 7,236 | 9,105 | |||||||||
| Accrued expenses and other liabilities | 15,705 | 32,766 | 22,106 | |||||||||
| Total liabilities | 625,752 | 3,470,367 | 1,739,525 | |||||||||
| NET ASSETS | $ | 142,346,102 | $ | 874,575,199 | $ | 433,497,636 | ||||||
| NET ASSETS CONSISTS OF | ||||||||||||
| Paid-in capital (Note 5) | $ | 113,259,222 | $ | 595,495,829 | $ | 344,837,693 | ||||||
| Accumulated net investment income/(loss) | (37,825 | ) | 2,464,018 | 580,315 | ||||||||
| Accumulated net realized gain | 2,111,679 | 27,876,801 | 4,887,549 | |||||||||
| Net unrealized appreciation | 27,013,026 | 248,738,551 | 83,192,079 | |||||||||
| NET ASSETS | $ | 142,346,102 | $ | 874,575,199 | $ | 433,497,636 | ||||||
| INVESTMENTS, AT COST | $ | 108,698,892 | $ | 573,660,323 | $ | 323,562,213 | ||||||
| PRICING OF SHARES | ||||||||||||
| Investor Class | ||||||||||||
| Net Assets | $ | 80,427,748 | $ | 82,430,601 | $ | 42,659,119 | ||||||
| Net Asset Value, offering and redemption price per share | $ | 14.24 | $ | 4.04 | $ | 14.68 | ||||||
| Shares of beneficial interest outstanding | 5,646,106 | 20,393,587 | 2,905,904 | |||||||||
| Institutional Class | ||||||||||||
| Net Assets | $ | 61,918,354 | $ | 792,144,598 | $ | 390,838,517 | ||||||
| Net Asset Value, offering and redemption price per share | $ | 14.30 | $ | 4.06 | $ | 14.72 | ||||||
| Shares of beneficial interest outstanding | 4,328,550 | 194,949,210 | 26,552,770 | |||||||||
See Notes to Financial Statements.
| 62 | 1.855.377.7325 | www.GrandeurPeakGlobal.com |
| Grandeur Peak Funds® | Statements of Operations |
For the Six Months Ended October 31, 2017 (Unaudited)
| Grandeur Peak Emerging Markets Opportunities Fund | Grandeur Peak Global Micro Cap Fund | Grandeur Peak Global Opportunities Fund | Grandeur Peak Global Reach Fund | ||||||||||||
| INVESTMENT INCOME | |||||||||||||||
| Dividends | $ | 5,877,736 | $ | 508,303 | $ | 6,572,963 | $ | 3,403,563 | |||||||
| Interest | 43,785 | 5,374 | 50,222 | 34,501 | |||||||||||
| Foreign taxes withheld | (544,226 | ) | (38,539 | ) | (450,298 | ) | (285,446 | ) | |||||||
| Total investment income | 5,377,295 | 475,138 | 6,172,887 | 3,152,618 | |||||||||||
| EXPENSES | |||||||||||||||
| Investment advisor fees (Note 6) | 2,919,750 | 295,773 | 4,668,231 | 1,882,957 | |||||||||||
| Administrative fees | 79,622 | 12,998 | 130,049 | 67,236 | |||||||||||
| Distribution and service fees - Investor Class | 21,273 | – | 218,163 | 81,193 | |||||||||||
| Transfer agent fees | 18,837 | 19,263 | 37,274 | 30,530 | |||||||||||
| Professional fees | 30,471 | 16,109 | 26,566 | 21,161 | |||||||||||
| Printing fees | 7,119 | 1,124 | 16,708 | 8,586 | |||||||||||
| Registration fees | 16,242 | 9,342 | 17,575 | 18,300 | |||||||||||
| Custodian fees | 269,102 | 47,633 | 172,597 | 140,764 | |||||||||||
| Trustee fees and expenses | 4,576 | 408 | 7,783 | 3,587 | |||||||||||
| Chief compliance officer fees | 4,408 | 395 | 7,467 | 3,446 | |||||||||||
| Principal financial officer fees | 780 | 70 | 1,321 | 610 | |||||||||||
| Other expenses | 6,960 | 2,733 | 10,307 | 6,171 | |||||||||||
| Total expenses | 3,379,140 | 405,848 | 5,314,041 | 2,264,541 | |||||||||||
| Waiver of investment advisory fees | – | – | (182,105 | ) | – | ||||||||||
| Less fees waived/reimbursed by investment advisor (Note 6) | – | (11,245 | ) | – | – | ||||||||||
| Total net expenses | 3,379,140 | 394,603 | 5,131,936 | 2,264,541 | |||||||||||
| NET INVESTMENT INCOME | 1,998,155 | 80,535 | 1,040,951 | 888,077 | |||||||||||
| REALIZED AND UNREALIZED GAIN/(LOSS) ON INVESTMENTS | |||||||||||||||
| Net realized gain on investments | 3,087,154 | 1,964,444 | 30,282,718 | 10,427,711 | |||||||||||
| Net realized loss on foreign currency transactions | (111,349 | ) | (1,563 | ) | (83,322 | ) | (47,385 | ) | |||||||
| Net realized gain | 2,975,805 | 1,962,881 | 30,199,396 | 10,380,326 | |||||||||||
| Net change in unrealized appreciation on investments (net of change in foreign capital gains tax of $(1,083,141), $(39,816),$(454,178) and $(181,318), respectively) | 23,372,776 | 2,713,195 | 60,760,842 | 24,693,746 | |||||||||||
| Net change in unrealized appreciation on translation of assets and liabilities in foreign currencies | 2,270 | 729 | 6,297 | 2,239 | |||||||||||
| Net change in unrealized appreciation | 23,375,046 | 2,713,924 | 60,767,139 | 24,695,985 | |||||||||||
| NET REALIZED AND UNREALIZED GAIN ON INVESTMENTS AND FOREIGN CURRENCY TRANSACTIONS | 26,350,851 | 4,676,805 | 90,966,535 | 35,076,311 | |||||||||||
| NET INCREASE IN NET ASSETS RESULTING FROM OPERATIONS | $ | 28,349,006 | $ | 4,757,340 | $ | 92,007,486 | $ | 35,964,388 | |||||||
See Notes to Financial Statements.
| Semi-Annual Report | October 31, 201 | 63 |
| Grandeur Peak Funds® | Statements of Operations |
For the Six Months Ended October 31, 2017 (Unaudited)
| Grandeur Peak Global Stalwarts Fund | Grandeur Peak International Opportunities Fund | Grandeur Peak International Stalwarts Fund | ||||||||||
| INVESTMENT INCOME | ||||||||||||
| Dividends | $ | 791,303 | $ | 9,433,496 | $ | 2,622,034 | ||||||
| Interest | 14,092 | 91,095 | 59,204 | |||||||||
| Foreign taxes withheld | (49,318 | ) | (862,706 | ) | (190,064 | ) | ||||||
| Total investment income | 756,077 | 8,661,885 | 2,491,174 | |||||||||
| EXPENSES | ||||||||||||
| Investment advisor fees (Note 6) | 510,870 | 5,252,550 | 1,483,085 | |||||||||
| Recoupment of previously waived fees (Note 6) | 50,698 | – | – | |||||||||
| Administrative fees | 24,477 | 145,745 | 64,021 | |||||||||
| Distribution and service fees - Investor Class | 87,953 | 98,892 | 46,870 | |||||||||
| Transfer agent fees | 26,990 | 28,857 | 40,164 | |||||||||
| Professional fees | 17,318 | 25,391 | 17,282 | |||||||||
| Printing fees | 3,614 | 11,728 | 5,627 | |||||||||
| Registration fees | 11,980 | 16,513 | 15,171 | |||||||||
| Custodian fees | 51,391 | 225,923 | 91,602 | |||||||||
| Trustee fees and expenses | 1,279 | 8,714 | 3,472 | |||||||||
| Chief compliance officer fees | 1,201 | 8,316 | 3,269 | |||||||||
| Principal financial officer fees | 213 | 1,468 | 579 | |||||||||
| Other expenses | 4,112 | 11,271 | 5,625 | |||||||||
| Total expenses | 792,096 | 5,835,368 | 1,776,767 | |||||||||
| Waiver of investment advisory fees | – | (252,224 | ) | – | ||||||||
| Total net expenses | 792,096 | 5,583,144 | 1,776,767 | |||||||||
| NET INVESTMENT INCOME/(LOSS) | (36,019 | ) | 3,078,741 | 714,407 | ||||||||
| REALIZED AND UNREALIZED GAIN/(LOSS) ON INVESTMENTS | ||||||||||||
| Net realized gain on investments | 1,656,922 | 27,534,051 | 4,603,414 | |||||||||
| Net realized loss on foreign currency transactions | (42,291 | ) | (198,309 | ) | (137,941 | ) | ||||||
| Net realized gain | 1,614,631 | 27,335,742 | 4,465,473 | |||||||||
| Net change in unrealized appreciation on investments (net of change in foreign capital gains tax of $24,239, $(1,021,439) and $227,370, respectively) | 12,411,618 | 76,586,830 | 38,810,527 | |||||||||
| Net change in unrealized appreciation on translation of assets and liabilities in foreign currencies | 31 | 40,930 | 2,416 | |||||||||
| Net change in unrealized appreciation | 12,411,649 | 76,627,760 | 38,812,943 | |||||||||
| NET REALIZED AND UNREALIZED GAIN ON INVESTMENTS AND FOREIGN CURRENCY TRANSACTIONS | 14,026,280 | 103,963,502 | 43,278,416 | |||||||||
| NET INCREASE IN NET ASSETS RESULTING FROM OPERATIONS | $ | 13,990,261 | $ | 107,042,243 | $ | 43,992,823 | ||||||
See Notes to Financial Statements.
| 64 | 1.855.377.7325 | www.GrandeurPeakGlobal.com |
| Grandeur Peak Emerging Markets Opportunities Fund | Statements of Changes in Net Assets |
| For the Six Months Ended October 31, 2017 (Unaudited) | For the Year Ended April 30, 2017 | |||||||
| OPERATIONS | ||||||||
| Net investment income | $ | 1,998,155 | $ | 1,312,958 | ||||
| Net realized gain | 2,975,805 | 1,045,085 | ||||||
| Net change in unrealized appreciation | 23,375,046 | 63,061,781 | ||||||
| Net increase in net assets resulting from operations | 28,349,006 | 65,419,824 | ||||||
| DISTRIBUTIONS TO SHAREHOLDERS (NOTE 3) | ||||||||
| Net investment income | ||||||||
| Investor Class | – | (66,810 | ) | |||||
| Institutional Class | – | (1,961,876 | ) | |||||
| Net decrease in net assets from distributions | – | (2,028,686 | ) | |||||
| CAPITAL SHARE TRANSACTIONS (NOTE 5) | ||||||||
| Investor Class | ||||||||
| Proceeds from sales of shares | 257,705 | 490,678 | ||||||
| Distributions reinvested | – | 65,088 | ||||||
| Cost of shares redeemed | (1,547,617 | ) | (6,113,284 | ) | ||||
| Redemption fees | – | 130 | ||||||
| Net decrease from capital shares transactions | (1,289,912 | ) | (5,557,388 | ) | ||||
| Institutional Class | ||||||||
| Proceeds from sales of shares | 3,694,147 | 15,112,959 | ||||||
| Distributions reinvested | – | 1,775,141 | ||||||
| Cost of shares redeemed | (9,686,603 | ) | (27,797,275 | ) | ||||
| Redemption fees | 81 | 110 | ||||||
| Net decrease from capital shares transactions | (5,992,375 | ) | (10,909,065 | ) | ||||
| Net increase in net assets | 21,066,719 | 46,924,685 | ||||||
| NET ASSETS | ||||||||
| Beginning of period | 416,965,434 | 370,040,749 | ||||||
| End of period* | $ | 438,032,153 | $ | 416,965,434 | ||||
| *Including accumulated net investment income/(loss) of: | $ | 1,136,613 | $ | (861,542 | ) | |||
| OTHER INFORMATION | ||||||||
| Shares Transactions | ||||||||
| Investor Class | ||||||||
| Issued | 21,566 | 46,050 | ||||||
| Issued to shareholders in reinvestment of distributions | – | 6,419 | ||||||
| Redeemed | (130,111 | ) | (580,153 | ) | ||||
| Net decrease in share transactions | (108,545 | ) | (527,684 | ) | ||||
| Institutional Class | ||||||||
| Issued | 308,759 | 1,431,423 | ||||||
| Issued to shareholders in reinvestment of distributions | – | 174,375 | ||||||
| Redeemed | (808,169 | ) | (2,673,849 | ) | ||||
| Net decrease in share transactions | (499,410 | ) | (1,068,051 | ) | ||||
See Notes to Financial Statements.
| Semi-Annual Report | October 31, 2017 | 65 |
| Grandeur Peak Global Micro Cap Fund | Statements of Changes in Net Assets |
| For the Six Months Ended October 31, 2017 (Unaudited) | For the Year Ended April 30, 2017 | |||||||
| OPERATIONS | ||||||||
| Net investment income | $ | 80,535 | $ | 36,054 | ||||
| Net realized gain | 1,962,881 | 1,195,943 | ||||||
| Net change in unrealized appreciation | 2,713,924 | 3,987,884 | ||||||
| Net increase in net assets resulting from operations | 4,757,340 | 5,219,881 | ||||||
| DISTRIBUTIONS TO SHAREHOLDERS (NOTE 3) | ||||||||
| Net investment income | ||||||||
| Institutional Class | – | (72,387 | ) | |||||
| Net realized gains on investments | ||||||||
| Institutional Class | – | (318,826 | ) | |||||
| Net decrease in net assets from distributions | – | (391,213 | ) | |||||
| CAPITAL SHARE TRANSACTIONS (NOTE 5) | ||||||||
| Institutional Class | ||||||||
| Proceeds from sales of shares | 774,460 | 2,802,634 | ||||||
| Distributions reinvested | – | 378,056 | ||||||
| Cost of shares redeemed | (952,353 | ) | (2,125,169 | ) | ||||
| Redemption fees | – | 2 | ||||||
| Net increase/(decrease) from capital shares transactions | (177,893 | ) | 1,055,523 | |||||
| Net increase in net assets | 4,579,447 | 5,884,191 | ||||||
| NET ASSETS | ||||||||
| Beginning of period | 36,619,645 | 30,735,454 | ||||||
| End of period* | $ | 41,199,092 | $ | 36,619,645 | ||||
| *Including accumulated net investment income/(loss) of: | $ | 77,941 | $ | (2,594 | ) | |||
| OTHER INFORMATION | ||||||||
| Shares Transactions | ||||||||
| Institutional Class | ||||||||
| Issued | 60,816 | 257,322 | ||||||
| Issued to shareholders in reinvestment of distributions | – | 34,940 | ||||||
| Redeemed | (75,020 | ) | (194,608 | ) | ||||
| Net increase/(decrease) in share transactions | (14,204 | ) | 97,654 | |||||
See Notes to Financial Statements.
| 66 | 1.855.377.7325 | www.GrandeurPeakGlobal.com |
| Grandeur Peak Global Opportunities Fund | Statements of Changes in Net Assets |
| For the Six Months Ended October 31, 2017 (Unaudited) | For the Year Ended April 30, 2017 | |||||||
| OPERATIONS | ||||||||
| Net investment income | $ | 1,040,951 | $ | 752,205 | ||||
| Net realized gain | 30,199,396 | 13,115,814 | ||||||
| Net change in unrealized appreciation | 60,767,139 | 91,442,710 | ||||||
| Net increase in net assets resulting from operations | 92,007,486 | 105,310,729 | ||||||
| DISTRIBUTIONS TO SHAREHOLDERS (NOTE 3) | ||||||||
| Net investment income | ||||||||
| Investor Class | – | – | ||||||
| Institutional Class | – | (682,795 | ) | |||||
| Net realized gains on investments | ||||||||
| Investor Class | – | (208,741 | ) | |||||
| Institutional Class | – | (563,234 | ) | |||||
| Net decrease in net assets from distributions | – | (1,454,770 | ) | |||||
| CAPITAL SHARE TRANSACTIONS (NOTE 5) | ||||||||
| Investor Class | ||||||||
| Proceeds from sales of shares | 15,192,061 | 16,005,788 | ||||||
| Distributions reinvested | – | 199,029 | ||||||
| Cost of shares redeemed | (11,194,452 | ) | (50,076,349 | ) | ||||
| Redemption fees | 9 | 1,088 | ||||||
| Net increase/(decrease) from capital shares transactions | 3,997,618 | (33,870,444 | ) | |||||
| Institutional Class | ||||||||
| Proceeds from sales of shares | 12,925,573 | 55,465,734 | ||||||
| Distributions reinvested | – | 1,194,887 | ||||||
| Cost of shares redeemed | (24,243,337 | ) | (52,607,866 | ) | ||||
| Redemption fees | 263 | 4,876 | ||||||
| Net increase/(decrease) from capital shares transactions | (11,317,501 | ) | 4,057,631 | |||||
| Net increase in net assets | 84,687,603 | 74,043,146 | ||||||
| NET ASSETS | ||||||||
| Beginning of period | 699,229,277 | 625,186,131 | ||||||
| End of period* | $ | 783,916,880 | $ | 699,229,277 | ||||
| *Including accumulated net investment income/(loss) of: | $ | 315,128 | $ | (725,823 | ) | |||
| OTHER INFORMATION | ||||||||
| Shares Transactions | ||||||||
| Investor Class | ||||||||
| Issued | 4,030,575 | 4,969,762 | ||||||
| Issued to shareholders in reinvestment of distributions | – | 62,984 | ||||||
| Redeemed | (3,010,367 | ) | (15,424,679 | ) | ||||
| Net increase/(decrease) in share transactions | 1,020,208 | (10,391,933 | ) | |||||
| Institutional Class | ||||||||
| Issued | 3,428,024 | 16,979,178 | ||||||
| Issued to shareholders in reinvestment of distributions | – | 374,573 | ||||||
| Redeemed | (6,425,689 | ) | (16,596,520 | ) | ||||
| Net increase/(decrease) in share transactions | (2,997,665 | ) | 757,231 | |||||
| See Notes to Financial Statements. |
| Semi-Annual Report | October 31, 2017 | 67 |
| Grandeur Peak Global Reach Fund | Statements of Changes in Net Assets |
| For the Six Months Ended October 31, 2017 (Unaudited) | For the Year Ended April 30, 2017 | |||||||
| OPERATIONS | ||||||||
| Net investment income | $ | 888,077 | $ | 697,491 | ||||
| Net realized gain | 10,380,326 | 7,092,527 | ||||||
| Net change in unrealized appreciation | 24,695,985 | 42,795,408 | ||||||
| Net increase in net assets resulting from operations | 35,964,388 | 50,585,426 | ||||||
| DISTRIBUTIONS TO SHAREHOLDERS (NOTE 3) | ||||||||
| Net investment income | ||||||||
| Investor Class | – | (84,133 | ) | |||||
| Institutional Class | – | (681,502 | ) | |||||
| Net decrease in net assets from distributions | – | (765,635 | ) | |||||
| CAPITAL SHARE TRANSACTIONS (NOTE 5) | ||||||||
| Investor Class | ||||||||
| Proceeds from sales of shares | 2,321,417 | 4,112,844 | ||||||
| Distributions reinvested | – | 81,122 | ||||||
| Cost of shares redeemed | (12,331,422 | ) | (14,422,937 | ) | ||||
| Redemption fees | 51 | 426 | ||||||
| Net decrease from capital shares transactions | (10,009,954 | ) | (10,228,545 | ) | ||||
| Institutional Class | ||||||||
| Proceeds from sales of shares | 7,976,940 | 24,646,538 | ||||||
| Distributions reinvested | – | 642,714 | ||||||
| Cost of shares redeemed | (8,038,715 | ) | (27,368,439 | ) | ||||
| Redemption fees | – | 1,027 | ||||||
| Net decrease from capital shares transactions | (61,775 | ) | (2,078,160 | ) | ||||
| Net increase in net assets | 25,892,659 | 37,513,086 | ||||||
| NET ASSETS | ||||||||
| Beginning of period | 326,256,419 | 288,743,333 | ||||||
| End of period* | $ | 352,149,078 | $ | 326,256,419 | ||||
| *Including accumulated net investment income/(loss) of: | $ | 669,983 | $ | (218,094 | ) | |||
| OTHER INFORMATION | ||||||||
| Shares Transactions | ||||||||
| Investor Class | ||||||||
| Issued | 153,725 | 318,050 | ||||||
| Issued to shareholders in reinvestment of distributions | – | 6,264 | ||||||
| Redeemed | (805,755 | ) | (1,110,221 | ) | ||||
| Net decrease in share transactions | (652,030 | ) | (785,907 | ) | ||||
| Institutional Class | ||||||||
| Issued | 522,730 | 1,860,022 | ||||||
| Issued to shareholders in reinvestment of distributions | – | 49,592 | ||||||
| Redeemed | (525,565 | ) | (2,115,611 | ) | ||||
| Net decrease in share transactions | (2,835 | ) | (205,997 | ) | ||||
See Notes to Financial Statements.
| 68 | 1.855.377.7325 | www.GrandeurPeakGlobal.com |
| Grandeur Peak Global Stalwarts Fund | Statements of Changes in Net Assets |
| For the Six Months Ended October 31, 2017 (Unaudited) | For the Year Ended April 30, 2017 | |||||||
| OPERATIONS | ||||||||
| Net investment loss | $ | (36,019 | ) | $ | (76,695 | ) | ||
| Net realized gain | 1,614,631 | 937,782 | ||||||
| Net change in unrealized appreciation | 12,411,649 | 12,316,556 | ||||||
| Net increase in net assets resulting from operations | 13,990,261 | 13,177,643 | ||||||
| DISTRIBUTIONS TO SHAREHOLDERS (NOTE 3) | ||||||||
| Net investment income | ||||||||
| Investor Class | – | (38,237 | ) | |||||
| Institutional Class | – | (70,513 | ) | |||||
| Net decrease in net assets from distributions | – | (108,750 | ) | |||||
| CAPITAL SHARE TRANSACTIONS (NOTE 5) | ||||||||
| Investor Class | ||||||||
| Proceeds from sales of shares | 16,327,962 | 40,939,429 | ||||||
| Distributions reinvested | – | 37,612 | ||||||
| Cost of shares redeemed | (4,834,810 | ) | (6,232,494 | ) | ||||
| Redemption fees | 779 | 1,969 | ||||||
| Net increase from capital shares transactions | 11,493,931 | 34,746,516 | ||||||
| Institutional Class | ||||||||
| Proceeds from sales of shares | 11,825,585 | 27,023,764 | ||||||
| Distributions reinvested | – | 66,016 | ||||||
| Cost of shares redeemed | (3,985,853 | ) | (2,576,566 | ) | ||||
| Redemption fees | – | 216 | ||||||
| Net increase from capital shares transactions | 7,839,732 | 24,513,430 | ||||||
| Net increase in net assets | 33,323,924 | 72,328,839 | ||||||
| NET ASSETS | ||||||||
| Beginning of period | 109,022,177 | 36,693,338 | ||||||
| End of period* | $ | 142,346,101 | $ | 109,022,177 | ||||
| *Including accumulated net investment loss of: | $ | (37,825 | ) | $ | (1,806 | ) | ||
| OTHER INFORMATION | ||||||||
| Shares Transactions | ||||||||
| Investor Class | ||||||||
| Issued | 1,209,185 | 3,565,906 | ||||||
| Issued to shareholders in reinvestment of distributions | – | 3,323 | ||||||
| Redeemed | (361,217 | ) | (533,831 | ) | ||||
| Net increase in share transactions | 847,968 | 3,035,398 | ||||||
| Institutional Class | ||||||||
| Issued | 880,097 | 2,334,427 | ||||||
| Issued to shareholders in reinvestment of distributions | – | 5,816 | ||||||
| Redeemed | (288,267 | ) | (218,942 | ) | ||||
| Net increase in share transactions | 591,830 | 2,121,301 | ||||||
See Notes to Financial Statements.
| Semi-Annual Report | October 31, 2017 | 69 |
| Grandeur Peak International Opportunities Fund | Statements of Changes in Net Assets |
| For the Six Months Ended October 31, 2017 (Unaudited) | For the Year Ended April 30, 2017 | |||||||
| OPERATIONS | ||||||||
| Net investment income | $ | 3,078,741 | $ | 2,817,200 | ||||
| Net realized gain | 27,335,742 | 15,154,690 | ||||||
| Net change in unrealized appreciation | 76,627,760 | 101,628,897 | ||||||
| Net increase in net assets resulting from operations | 107,042,243 | 119,600,787 | ||||||
| DISTRIBUTIONS TO SHAREHOLDERS (NOTE 3) | ||||||||
| Net investment income | ||||||||
| Investor Class | – | (373,708 | ) | |||||
| Institutional Class | – | (4,194,578 | ) | |||||
| Net realized gains on investments | ||||||||
| Investor Class | – | (1,243,840 | ) | |||||
| Institutional Class | – | (10,524,647 | ) | |||||
| Net decrease in net assets from distributions | – | (16,336,773 | ) | |||||
| CAPITAL SHARE TRANSACTIONS (NOTE 5) | ||||||||
| Investor Class | ||||||||
| Proceeds from sales of shares | 5,274,635 | 16,040,116 | ||||||
| Distributions reinvested | – | 1,519,011 | ||||||
| Cost of shares redeemed | (11,543,404 | ) | (73,177,961 | ) | ||||
| Redemption fees | – | 346 | ||||||
| Net decrease from capital shares transactions | (6,268,769 | ) | (55,618,488 | ) | ||||
| Institutional Class | ||||||||
| Proceeds from sales of shares | 15,408,116 | 82,878,502 | ||||||
| Distributions reinvested | – | 13,246,236 | ||||||
| Cost of shares redeemed | (18,513,784 | ) | (70,160,974 | ) | ||||
| Redemption fees | 36 | 5,235 | ||||||
| Net increase/(decrease) from capital shares transactions | (3,105,632 | ) | 25,968,999 | |||||
| Net increase in net assets | 97,667,842 | 73,614,525 | ||||||
| NET ASSETS | ||||||||
| Beginning of period | 776,907,357 | 703,292,832 | ||||||
| End of period* | $ | 874,575,199 | $ | 776,907,357 | ||||
| *Including accumulated net investment income/(loss) of: | $ | 2,464,018 | $ | (614,723 | ) | |||
| OTHER INFORMATION | ||||||||
| Shares Transactions | ||||||||
| Investor Class | ||||||||
| Issued | 1,376,804 | 5,029,639 | ||||||
| Issued to shareholders in reinvestment of distributions | – | 494,792 | ||||||
| Redeemed | (3,040,736 | ) | (23,531,613 | ) | ||||
| Net decrease in share transactions | (1,663,932 | ) | (18,007,182 | ) | ||||
| Institutional Class | ||||||||
| Issued | 4,006,294 | 26,474,706 | ||||||
| Issued to shareholders in reinvestment of distributions | – | 4,300,726 | ||||||
| Redeemed | (4,774,610 | ) | (21,629,721 | ) | ||||
| Net increase/(decrease) in share transactions | (768,316 | ) | 9,145,711 | |||||
See Notes to Financial Statements.
| 70 | 1.855.377.7325 | www.GrandeurPeakGlobal.com |
| Grandeur Peak International Stalwarts Fund | Statements of Changes in Net Assets |
| For the Six Months Ended October 31, 2017 (Unaudited) | For the Year Ended April 30, 2017 | |||||||
| OPERATIONS | ||||||||
| Net investment income | $ | 714,407 | $ | 707,009 | ||||
| Net realized gain | 4,465,473 | 1,792,829 | ||||||
| Net change in unrealized appreciation | 38,812,943 | 37,615,840 | ||||||
| Net increase in net assets resulting from operations | 43,992,823 | 40,115,678 | ||||||
| DISTRIBUTIONS TO SHAREHOLDERS (NOTE 3) | ||||||||
| Net investment income | ||||||||
| Investor Class | – | (73,124 | ) | |||||
| Institutional Class | – | (929,880 | ) | |||||
| Net decrease in net assets from distributions | – | (1,003,004 | ) | |||||
| CAPITAL SHARE TRANSACTIONS (NOTE 5) | ||||||||
| Investor Class | ||||||||
| Proceeds from sales of shares | 9,070,464 | 8,549,781 | ||||||
| Distributions reinvested | – | 22,941 | ||||||
| Cost of shares redeemed | (1,817,364 | ) | (4,109,607 | ) | ||||
| Redemption fees | 340 | 308 | ||||||
| Net increase from capital shares transactions | 7,253,440 | 4,463,423 | ||||||
| Institutional Class | ||||||||
| Proceeds from sales of shares | 110,250,796 | 143,867,333 | ||||||
| Distributions reinvested | – | 913,917 | ||||||
| Cost of shares redeemed | (24,442,340 | ) | (33,019,442 | ) | ||||
| Redemption fees | 4,040 | 3,133 | ||||||
| Net increase from capital shares transactions | 85,812,496 | 111,764,941 | ||||||
| Net increase in net assets | 137,058,759 | 155,341,038 | ||||||
| NET ASSETS | ||||||||
| Beginning of period | 296,438,877 | 141,097,839 | ||||||
| End of period* | $ | 433,497,636 | $ | 296,438,877 | ||||
| *Including accumulated net investment income/(loss) of: | $ | 580,315 | $ | (134,092 | ) | |||
| OTHER INFORMATION | ||||||||
| Shares Transactions | ||||||||
| Investor Class | ||||||||
| Issued | 654,917 | 728,649 | ||||||
| Issued to shareholders in reinvestment of distributions | – | 2,054 | ||||||
| Redeemed | (129,191 | ) | (349,537 | ) | ||||
| Net increase in share transactions | 525,726 | 381,166 | ||||||
| Institutional Class | ||||||||
| Issued | 7,993,326 | 12,243,757 | ||||||
| Issued to shareholders in reinvestment of distributions | – | 81,746 | ||||||
| Redeemed | (1,759,832 | ) | (2,803,836 | ) | ||||
| Net increase in share transactions | 6,233,494 | 9,521,667 | ||||||
See Notes to Financial Statements.
| Semi-Annual Report | October 31, 2017 | 71 |
| Grandeur Peak Emerging Markets Opportunities Fund | Financial Highlights |
For a Share Outstanding Throughout the Periods Presented
| Investor Class | For the Six Months Ended October 31, 2017 (Unaudited) | Year Ended April 30, 2017 | Year Ended April 30, 2016 | Year Ended April 30, 2015 | For the Period December 16, 2013 (Inception) to April 30, 2014 | |||||||||||||||
| NET ASSET VALUE, BEGINNING OF PERIOD | $ | 11.55 | $ | 9.82 | $ | 11.51 | $ | 10.53 | $ | 10.00 | ||||||||||
| INCOME FROM INVESTMENT OPERATIONS | ||||||||||||||||||||
| Net investment income/(loss)(a) | 0.04 | 0.02 | 0.07 | 0.02 | (0.05 | ) | ||||||||||||||
| Net realized and unrealized gain/(loss) on investments | 0.74 | 1.75 | (1.41 | ) | 1.22 | 0.58 | ||||||||||||||
| Total income/(loss) from investment operations | 0.78 | 1.77 | (1.34 | ) | 1.24 | 0.53 | ||||||||||||||
| DISTRIBUTIONS | ||||||||||||||||||||
| From net investment income | – | (0.04 | ) | – | (0.01 | ) | – | |||||||||||||
| From net realized gain on investments | – | – | (0.35 | ) | (0.25 | ) | – | |||||||||||||
| Total distributions | – | (0.04 | ) | (0.35 | ) | (0.26 | ) | – | ||||||||||||
| REDEMPTION FEES ADDED TO PAID-IN CAPITAL | – | 0.00 | (b) | 0.00 | (b) | 0.00 | (b) | 0.00 | (b) | |||||||||||
| INCREASE/DECREASE IN NET ASSET VALUE | 0.78 | 1.73 | (1.69 | ) | 0.98 | 0.53 | ||||||||||||||
| NET ASSET VALUE, END OF PERIOD | $ | 12.33 | $ | 11.55 | $ | 9.82 | $ | 11.51 | $ | 10.53 | ||||||||||
| TOTAL RETURN | 6.75 | %(c) | 18.08 | % | (11.62 | )% | 12.06 | % | 5.30 | %(c) | ||||||||||
| RATIOS AND SUPPLEMENTAL DATA | ||||||||||||||||||||
| Net assets, end of period (in 000s) | $ | 17,954 | $ | 18,074 | $ | 20,548 | $ | 39,896 | $ | 27,952 | ||||||||||
| RATIOS TO AVERAGE NET ASSETS | ||||||||||||||||||||
| Expenses (excluding fees waived/reimbursed by investment advisor) | 1.79 | %(d) | 1.76 | % | 1.77 | % | 1.82 | % | 2.01 | %(d)(e) | ||||||||||
| Expenses (including fees waived/reimbursed by investment advisor) | 1.79 | %(d) | 1.76 | % | 1.77 | % | 1.82 | % | 1.95 | %(d)(e) | ||||||||||
| Net investment income/(loss) | 0.70 | %(d) | 0.21 | % | 0.69 | % | 0.22 | % | (0.55 | )%(d) | ||||||||||
| PORTFOLIO TURNOVER RATE | 16 | %(c) | 42 | % | 40 | % | 53 | % | 26 | %(c) | ||||||||||
| (a) | Per share numbers have been calculated using the average shares method. |
| (b) | Less than $0.005 or ($0.005) per share. |
| (c) | Not Annualized. |
| (d) | Annualized. |
| (e) | Expense ratios during startup periods may not be representative of longer term operating periods. |
See Notes to Financial Statements.
| 72 | 1.855.377.7325 | www.GrandeurPeakGlobal.com |
| Grandeur Peak Emerging Markets Opportunities Fund | Financial Highlights |
For a Share Outstanding Throughout the Periods Presented
| Institutional Class | For the Six Months Ended October 31, 2017 (Unaudited) | Year Ended April 30, 2017 | Year Ended April 30, 2016 | Year Ended April 30, 2015 | For the Period December 16, 2013 (Inception) to April 30, 2014 | |||||||||||||||
| NET ASSET VALUE, BEGINNING OF PERIOD | $ | 11.60 | $ | 9.85 | $ | 11.52 | $ | 10.54 | $ | 10.00 | ||||||||||
| INCOME FROM INVESTMENT OPERATIONS | ||||||||||||||||||||
| Net investment income/(loss)(a) | 0.06 | 0.04 | 0.08 | 0.05 | (0.03 | ) | ||||||||||||||
| Net realized and unrealized gain/(loss) on investments | 0.73 | 1.77 | (1.40 | ) | 1.21 | 0.57 | ||||||||||||||
| Total income/(loss) from investment operations | 0.79 | 1.81 | (1.32 | ) | 1.26 | 0.54 | ||||||||||||||
| DISTRIBUTIONS | ||||||||||||||||||||
| From net investment income | – | (0.06 | ) | – | (0.03 | ) | – | |||||||||||||
| From net realized gain on investments | – | – | (0.35 | ) | (0.25 | ) | – | |||||||||||||
| Total distributions | – | (0.06 | ) | (0.35 | ) | (0.28 | ) | – | ||||||||||||
| REDEMPTION FEES ADDED TO PAID-IN CAPITAL | 0.00 | (b) | 0.00 | (b) | 0.00 | (b) | 0.00 | (b) | 0.00 | (b) | ||||||||||
| INCREASE/DECREASE IN NET ASSET VALUE | 0.79 | 1.75 | (1.67 | ) | 0.98 | 0.54 | ||||||||||||||
| NET ASSET VALUE, END OF PERIOD | $ | 12.39 | $ | 11.60 | $ | 9.85 | $ | 11.52 | $ | 10.54 | ||||||||||
| TOTAL RETURN | 6.81 | %(c) | 18.42 | % | (11.44 | )% | 12.22 | % | 5.40 | %(c) | ||||||||||
| RATIOS AND SUPPLEMENTAL DATA | ||||||||||||||||||||
| Net assets, end of period (in 000s) | $ | 420,079 | $ | 398,891 | $ | 349,493 | $ | 428,048 | $ | 255,819 | ||||||||||
| RATIOS TO AVERAGE NET ASSETS | ||||||||||||||||||||
| Expenses (excluding fees waived/reimbursed by investment advisor) | 1.55 | %(d) | 1.55 | % | 1.55 | % | 1.58 | % | 1.76 | %(d)(e) | ||||||||||
| Expenses (including fees waived/reimbursed by investment advisor) | 1.55 | %(d) | 1.55 | % | 1.55 | % | 1.58 | % | 1.70 | %(d)(e) | ||||||||||
| Net investment income/(loss) | 0.93 | %(d) | 0.35 | % | 0.75 | % | 0.43 | % | (0.37 | )%(d) | ||||||||||
| PORTFOLIO TURNOVER RATE | 16 | %(c) | 42 | % | 40 | % | 53 | % | 26 | %(c) | ||||||||||
| (a) | Per share numbers have been calculated using the average shares method. |
| (b) | Less than $0.005 or ($0.005) per share. |
| (c) | Not Annualized. |
| (d) | Annualized. |
| (e) | Expense ratios during startup periods may not be representative of longer term operating periods. |
See Notes to Financial Statements.
| Semi-Annual Report | October 31, 2017 | 73 |
| Grandeur Peak Global Micro Cap Fund | Financial Highlights |
For a Share Outstanding Throughout the Periods Presented
| Institutional Class | For the Six Months Ended October 31, 2017 (Unaudited) | Year Ended April 30, 2017 | For the Period October 21, 2015 (Commencement of Operations) to April 30, 2016 | |||||||||
| NET ASSET VALUE, BEGINNING OF PERIOD | $ | 11.98 | $ | 10.38 | $ | 10.00 | ||||||
| INCOME FROM INVESTMENT OPERATIONS | ||||||||||||
| Net investment income/(loss)(a) | 0.03 | 0.01 | (0.02 | ) | ||||||||
| Net realized and unrealized gain on investments | 1.53 | 1.72 | 0.40 | |||||||||
| Total income from investment operations | 1.56 | 1.73 | 0.38 | |||||||||
| DISTRIBUTIONS | ||||||||||||
| From net investment income | – | (0.02 | ) | – | ||||||||
| From net realized gain on investments | – | (0.11 | ) | – | ||||||||
| Total distributions | – | (0.13 | ) | – | ||||||||
| REDEMPTION FEES ADDED TO PAID-IN CAPITAL | – | 0.00 | (b) | 0.00 | (b) | |||||||
| INCREASE IN NET ASSET VALUE | 1.56 | 1.60 | 0.38 | |||||||||
| NET ASSET VALUE, END OF PERIOD | $ | 13.54 | $ | 11.98 | $ | 10.38 | ||||||
| TOTAL RETURN | 13.02 | %(c) | 16.81 | % | 3.80 | %(c) | ||||||
| RATIOS AND SUPPLEMENTAL DATA | ||||||||||||
| Net assets, end of period (in 000s) | $ | 41,199 | $ | 36,620 | $ | 30,735 | ||||||
| RATIOS TO AVERAGE NET ASSETS | ||||||||||||
| Expenses (excluding fees waived/ reimbursed by investment advisor) | 2.06 | %(d) | 2.17 | % | 2.30 | %(d)(e) | ||||||
| Expenses (including fees waived/ reimbursed by investment advisor) | 2.00 | %(d) | 2.00 | % | 2.00 | %(d)(e) | ||||||
| Net investment income/(loss) | 0.41 | %(d) | 0.11 | % | (0.41 | )%(d) | ||||||
| PORTFOLIO TURNOVER RATE | 22 | %(c) | 37 | % | 8 | %(c) | ||||||
| (a) | Per share numbers have been calculated using the average shares method. |
| (b) | Less than $0.005 or ($0.005) per share. |
| (c) | Not Annualized. |
| (d) | Annualized. |
| (e) | Expense ratios during startup periods may not be representative of longer term operating periods. |
See Notes to Financial Statements.
| 74 | 1.855.377.7325 | www.GrandeurPeakGlobal.com |
| Grandeur Peak Global Opportunities Fund | Financial Highlights |
For a Share Outstanding Throughout the Periods Presented
| Investor Class | For the Six Months Ended October 31, 2017 (Unaudited) | Year Ended April 30, 2017 | Year Ended April 30, 2016 | Year Ended April 30, 2015 | Year Ended April 30, 2014 | Year Ended April 30, 2013 | ||||||||||||||||||
| NET ASSET VALUE, BEGINNING OF PERIOD | $ | 3.52 | $ | 3.01 | $ | 3.43 | $ | 3.31 | $ | 2.77 | $ | 2.31 | ||||||||||||
| INCOME FROM INVESTMENT OPERATIONS | ||||||||||||||||||||||||
| Net investment income/(loss)(a) | 0.00 | (b) | (0.00 | )(b)(c) | 0.00 | (b) | 0.00 | (b) | (0.00 | )(b) | 0.00 | (b) | ||||||||||||
| Net realized and unrealized gain/(loss) on investments | 0.47 | 0.51 | (0.18 | ) | 0.35 | 0.67 | 0.51 | |||||||||||||||||
| Total income/(loss) from investment operations | 0.47 | 0.51 | (0.18 | ) | 0.35 | 0.67 | 0.51 | |||||||||||||||||
| DISTRIBUTIONS | ||||||||||||||||||||||||
| From net investment income | – | – | (0.00 | )(b) | (0.01 | ) | – | (0.01 | ) | |||||||||||||||
| From net realized gain on investments | – | (0.00 | )(b) | (0.24 | ) | (0.22 | ) | (0.13 | ) | (0.04 | ) | |||||||||||||
| Total distributions | – | (0.00 | )(b) | (0.24 | ) | (0.23 | ) | (0.13 | ) | (0.05 | ) | |||||||||||||
| REDEMPTION FEES ADDED TO PAID-IN CAPITAL | 0.00 | (b) | 0.00 | (b) | 0.00 | (b) | 0.00 | (b) | 0.00 | (b) | 0.00 | (b) | ||||||||||||
| INCREASE/DECREASE IN NET ASSET VALUE | 0.47 | 0.51 | (0.42 | ) | 0.12 | 0.54 | 0.46 | |||||||||||||||||
| NET ASSET VALUE, END OF PERIOD | $ | 3.99 | $ | 3.52 | $ | 3.01 | $ | 3.43 | $ | 3.31 | $ | 2.77 | ||||||||||||
| TOTAL RETURN | 13.35 | %(d) | 17.09 | % | (5.03 | )% | 11.09 | % | 24.31 | % | 22.34 | % | ||||||||||||
| RATIOS AND SUPPLEMENTAL DATA | ||||||||||||||||||||||||
| Net assets, end of period (in 000s) | $ | 192,226 | $ | 166,284 | $ | 173,156 | $ | 201,462 | $ | 216,247 | $ | 132,384 | ||||||||||||
| RATIOS TO AVERAGE NET ASSETS | ||||||||||||||||||||||||
| Expenses (excluding fees waived/ reimbursed by investment advisor) | 1.61 | %(e) | 1.61 | % | 1.62 | % | 1.62 | % | 1.68 | % | 1.76 | % | ||||||||||||
| Expenses (including fees waived/ reimbursed by investment advisor) | 1.56 | %(e) | 1.59 | % | 1.62 | % | 1.62 | % | 1.68 | % | 1.75 | % | ||||||||||||
| Net investment income/(loss) | 0.09 | %(e) | (0.06 | )% | 0.06 | % | 0.12 | % | (0.15 | )% | 0.19 | % | ||||||||||||
| PORTFOLIO TURNOVER RATE | 12 | %(d) | 30 | % | 32 | % | 37 | % | 38 | % | 35 | % | ||||||||||||
| (a) | Per share numbers have been calculated using the average shares method. |
| (b) | Less than $0.005 or ($0.005) per share. |
| (c) | The per share amount does not correspond to activity reflected in the Statement of Operations due to class specific expenses during the period. |
| (d) | Not Annualized. |
| (e) | Annualized. |
See Notes to Financial Statements.
| Semi-Annual Report | October 31, 2017 | 75 |
| Grandeur Peak Global Opportunities Fund | Financial Highlights |
For a Share Outstanding Throughout the Periods Presented
| Institutional Class | For the Six Months Ended October 31, 2017 (Unaudited) | Year Ended April 30, 2017 | Year Ended April 30, 2016 | Year Ended April 30, 2015 | Year Ended April 30, 2014 | Year Ended April 30, 2013 | ||||||||||||||||||
| NET ASSET VALUE, BEGINNING OF PERIOD | $ | 3.56 | $ | 3.03 | $ | 3.46 | $ | 3.34 | $ | 2.79 | $ | 2.32 | ||||||||||||
| INCOME FROM INVESTMENT OPERATIONS | ||||||||||||||||||||||||
| Net investment income(a) | 0.01 | 0.01 | 0.01 | 0.01 | 0.00 | (b) | 0.01 | |||||||||||||||||
| Net realized and unrealized gain/(loss) on investments | 0.46 | 0.52 | (0.19 | ) | 0.34 | 0.68 | 0.52 | |||||||||||||||||
| Total income/(loss) from investment operations | 0.47 | 0.53 | (0.18 | ) | 0.35 | 0.68 | 0.53 | |||||||||||||||||
| DISTRIBUTIONS | ||||||||||||||||||||||||
| From net investment income | – | (0.00 | )(b) | (0.01 | ) | (0.01 | ) | (0.00 | )(b) | (0.02 | ) | |||||||||||||
| From net realized gain on investments | – | (0.00 | )(b) | (0.24 | ) | (0.22 | ) | (0.13 | ) | (0.04 | ) | |||||||||||||
| Total distributions | – | (0.00 | )(b) | (0.25 | ) | (0.23 | ) | (0.13 | ) | (0.06 | ) | |||||||||||||
| REDEMPTION FEES ADDED TO PAID-IN CAPITAL | 0.00 | (b) | 0.00 | (b) | 0.00 | (b) | 0.00 | (b) | 0.00 | (b) | 0.00 | (b) | ||||||||||||
| INCREASE/DECREASE IN NET ASSET VALUE | 0.47 | 0.53 | (0.43 | ) | 0.12 | 0.55 | 0.47 | |||||||||||||||||
| NET ASSET VALUE, END OF PERIOD | $ | 4.03 | $ | 3.56 | $ | 3.03 | $ | 3.46 | $ | 3.34 | $ | 2.79 | ||||||||||||
| TOTAL RETURN | 13.20 | %(c) | 17.81 | % | (5.12 | )% | 11.20 | % | 24.67 | % | 22.86 | % | ||||||||||||
| RATIOS AND SUPPLEMENTAL DATA | ||||||||||||||||||||||||
| Net assets, end of period (in 000s) | $ | 591,691 | $ | 532,946 | $ | 452,030 | $ | 526,394 | $ | 492,869 | $ | 217,953 | ||||||||||||
| RATIOS TO AVERAGE NET ASSETS | ||||||||||||||||||||||||
| Expenses (excluding fees waived/ reimbursed by investment advisor) | 1.36 | %(d) | 1.37 | % | 1.38 | % | 1.38 | % | 1.44 | % | 1.51 | % | ||||||||||||
| Expenses (including fees waived/ reimbursed by investment advisor) | 1.31 | %(d) | 1.35 | % | 1.38 | % | 1.38 | % | 1.44 | % | 1.50 | % | ||||||||||||
| Net investment income | 0.34 | %(d) | 0.18 | % | 0.30 | % | 0.35 | % | 0.08 | % | 0.37 | % | ||||||||||||
| PORTFOLIO TURNOVER RATE | 12 | %(c) | 30 | % | 32 | % | 37 | % | 38 | % | 35 | % | ||||||||||||
| (a) | Per share numbers have been calculated using the average shares method. |
| (b) | Less than $0.005 or ($0.005) per share. |
| (c) | Not Annualized. |
| (d) | Annualized. |
See Notes to Financial Statements.
| 76 | 1.855.377.7325 | www.GrandeurPeakGlobal.com |
| Grandeur Peak Global Reach Fund | Financial Highlights |
For a Share Outstanding Throughout the Periods Presented
| Investor Class | For the Six Months Ended October 31, 2017 (Unaudited) | Year Ended April 30, 2017 | Year Ended April 30, 2016 | Year Ended April 30, 2015 | For the Period June 19, 2013 (Inception) to April 30, 2014 | |||||||||||||||
| NET ASSET VALUE, BEGINNING OF PERIOD | $ | 14.52 | $ | 12.31 | $ | 13.65 | $ | 12.43 | $ | 10.00 | ||||||||||
| INCOME FROM INVESTMENT OPERATIONS | ||||||||||||||||||||
| Net investment income/(loss)(a) | 0.03 | 0.01 | 0.01 | 0.00 | (b) | (0.02 | ) | |||||||||||||
| Net realized and unrealized gain/(loss) on investments | 1.58 | 2.22 | (0.89 | ) | 1.37 | 2.54 | ||||||||||||||
| Total income/(loss) from investment operations | 1.61 | 2.23 | (0.88 | ) | 1.37 | 2.52 | ||||||||||||||
| DISTRIBUTIONS | ||||||||||||||||||||
| From net investment income | – | (0.02 | ) | (0.01 | ) | (0.01 | ) | (0.02 | ) | |||||||||||
| From net realized gain on investments | – | – | (0.45 | ) | (0.14 | ) | (0.08 | ) | ||||||||||||
| Total distributions | – | (0.02 | ) | (0.46 | ) | (0.15 | ) | (0.10 | ) | |||||||||||
| REDEMPTION FEES ADDED TO PAID-IN CAPITAL | 0.00 | (b) | 0.00 | (b) | 0.00 | (b) | 0.00 | (b) | 0.01 | |||||||||||
| INCREASE/DECREASE IN NET ASSET VALUE | 1.61 | 2.21 | (1.34 | ) | 1.22 | 2.43 | ||||||||||||||
| NET ASSET VALUE, END OF PERIOD | $ | 16.13 | $ | 14.52 | $ | 12.31 | $ | 13.65 | $ | 12.43 | ||||||||||
| TOTAL RETURN | 11.09 | %(c) | 18.11 | % | (6.45 | )% | 11.09 | % | 25.31 | %(c) | ||||||||||
| RATIOS AND SUPPLEMENTAL DATA | ||||||||||||||||||||
| Net assets, end of period (in 000s) | $ | 64,535 | $ | 67,574 | $ | 66,984 | $ | 87,354 | $ | 46,163 | ||||||||||
| RATIOS TO AVERAGE NET ASSETS | ||||||||||||||||||||
| Expenses (excluding fees waived/reimbursed by investment advisor) | 1.52 | %(d) | 1.52 | % | 1.60 | % | 1.60 | % | 1.91 | %(d)(e) | ||||||||||
| Expenses (including fees waived/reimbursed by investment advisor) | 1.52 | %(d) | 1.52 | % | 1.60 | % | 1.60 | % | 1.60 | %(d)(e) | ||||||||||
| Net investment income/(loss) | 0.34 | %(d) | 0.07 | % | 0.10 | % | 0.03 | % | (0.17 | )%(d) | ||||||||||
| PORTFOLIO TURNOVER RATE | 20 | %(c) | 42 | % | 46 | % | 46 | % | 39 | %(c) | ||||||||||
| (a) | Per share numbers have been calculated using the average shares method. |
| (b) | Less than $0.005 or ($0.005) per share. |
| (c) | Not Annualized. |
| (d) | Annualized. |
| (e) | Expense ratios during startup periods may not be representative of longer term operating periods. |
See Notes to Financial Statements.
| Semi-Annual Report | October 31, 2017 | 77 |
| Grandeur Peak Global Reach Fund | Financial Highlights |
For a Share Outstanding Throughout the Periods Presented
| Institutional Class | For the Six Months Ended October 31, 2017 (Unaudited) | Year Ended April 30, 2017 | Year Ended April 30, 2016 | Year Ended April 30, 2015 | For the Period June 19, 2013 (Inception) to April 30, 2014 | |||||||||||||||
| NET ASSET VALUE, BEGINNING OF PERIOD | $ | 14.55 | $ | 12.33 | $ | 13.66 | $ | 12.42 | $ | 10.00 | ||||||||||
| INCOME FROM INVESTMENT OPERATIONS | ||||||||||||||||||||
| Net investment income(a) | 0.04 | 0.04 | 0.04 | 0.03 | 0.02 | |||||||||||||||
| Net realized and unrealized gain/(loss) on investments | 1.59 | 2.22 | (0.89 | ) | 1.37 | 2.52 | ||||||||||||||
| Total income/(loss) from investment operations | 1.63 | 2.26 | (0.85 | ) | 1.40 | 2.54 | ||||||||||||||
| DISTRIBUTIONS | ||||||||||||||||||||
| From net investment income | – | (0.04 | ) | (0.03 | ) | (0.02 | ) | (0.04 | ) | |||||||||||
| From net realized gain on investments | – | – | (0.45 | ) | (0.14 | ) | (0.08 | ) | ||||||||||||
| Total distributions | – | (0.04 | ) | (0.48 | ) | (0.16 | ) | (0.12 | ) | |||||||||||
| REDEMPTION FEES ADDED TO PAID-IN CAPITAL | – | 0.00 | (b) | 0.00 | (b) | 0.00 | (b) | 0.00 | (b) | |||||||||||
| INCREASE/DECREASE IN NET ASSET VALUE | 1.63 | 2.22 | (1.33 | ) | 1.24 | 2.42 | ||||||||||||||
| NET ASSET VALUE, END OF PERIOD | $ | 16.18 | $ | 14.55 | $ | 12.33 | $ | 13.66 | $ | 12.42 | ||||||||||
| TOTAL RETURN | 11.20 | %(c) | 18.36 | % | (6.18 | )% | 11.41 | % | 25.45 | %(c) | ||||||||||
| RATIOS AND SUPPLEMENTAL DATA | ||||||||||||||||||||
| Net assets, end of period (in 000s) | $ | 287,614 | $ | 258,683 | $ | 221,759 | $ | 260,239 | $ | 88,311 | ||||||||||
| RATIOS TO AVERAGE NET ASSETS | ||||||||||||||||||||
| Expenses (excluding fees waived/reimbursed by investment advisor) | 1.28 | %(d) | 1.29 | % | 1.35 | % | 1.35 | % | 1.75 | %(d)(e) | ||||||||||
| Expenses (including fees waived/reimbursed by investment advisor) | 1.28 | %(d) | 1.29 | % | 1.35 | % | 1.35 | % | 1.35 | %(d)(e) | ||||||||||
| Net investment income | 0.56 | %(d) | 0.28 | % | 0.34 | % | 0.23 | % | 0.21 | %(d) | ||||||||||
| PORTFOLIO TURNOVER RATE | 20 | %(c) | 42 | % | 46 | % | 46 | % | 39 | %(c) | ||||||||||
| (a) | Per share numbers have been calculated using the average shares method. |
| (b) | Less than $0.005 or ($0.005) per share. |
| (c) | Not Annualized. |
| (d) | Annualized. |
| (e) | Expense ratios during startup periods may not be representative of longer term operating periods. |
See Notes to Financial Statements.
| 78 | 1.855.377.7325 | www.GrandeurPeakGlobal.com |
| Grandeur Peak Global Stalwarts Fund | Financial Highlights |
For a Share Outstanding Throughout the Periods Presented
| Investor Class | For the Six Months Ended October 31, 2017 (Unaudited) | Year Ended April 30, 2017 | For the Period September 2, 2015 (Commencement of Operations) to April 30, 2016 | |||||||||
| NET ASSET VALUE, BEGINNING OF PERIOD | $ | 12.76 | $ | 10.85 | $ | 10.00 | ||||||
| INCOME FROM INVESTMENT OPERATIONS | ||||||||||||
| Net investment income/(loss)(a) | (0.01 | ) | (0.03 | ) | 0.00 | (b) | ||||||
| Net realized and unrealized gain on investments | 1.49 | 1.95 | 0.85 | |||||||||
| Total income from investment operations | 1.48 | 1.92 | 0.85 | |||||||||
| DISTRIBUTIONS | ||||||||||||
| From net investment income | – | (0.01 | ) | (0.00 | )(b) | |||||||
| From net realized gain on investments | – | – | (0.00 | )(b) | ||||||||
| Total distributions | – | (0.01 | ) | (0.00 | )(b) | |||||||
| REDEMPTION FEES ADDED TO PAID-IN CAPITAL | 0.00 | (b) | 0.00 | (b) | 0.00 | (b) | ||||||
| INCREASE IN NET ASSET VALUE | 1.48 | 1.91 | 0.85 | |||||||||
| NET ASSET VALUE, END OF PERIOD | $ | 14.24 | $ | 12.76 | $ | 10.85 | ||||||
| TOTAL RETURN | 11.60 | %(c) | 17.70 | % | 8.55 | %(c) | ||||||
| RATIOS AND SUPPLEMENTAL DATA | ||||||||||||
| Net assets, end of period (in 000s) | $ | 80,428 | $ | 61,212 | $ | 19,131 | ||||||
| RATIOS TO AVERAGE NET ASSETS | ||||||||||||
| Expenses (excluding fees waived/ reimbursed by investment advisor) | 1.35 | %(d) | 1.41 | % | 2.06 | %(d)(e) | ||||||
| Expenses (including fees waived/ reimbursed by investment advisor) | 1.35 | %(d) | 1.35 | % | 1.35 | %(d)(e) | ||||||
| Net investment loss | (0.17 | )%(d) | (0.23 | )% | 0.00 | %(d)(f) | ||||||
| PORTFOLIO TURNOVER RATE | 15 | %(c) | 32 | % | 24 | %(c) | ||||||
| (a) | Per share numbers have been calculated using the average shares method. |
| (b) | Less than $0.005 or ($0.005) per share. |
| (c) | Not Annualized. |
| (d) | Annualized. |
| (e) | Expense ratios during startup periods may not be representative of longer term operating periods. |
| (f) | Less than 0.005% of average net assets. |
See Notes to Financial Statements.
| Semi-Annual Report | October 31, 2017 | 79 |
| Grandeur Peak Global Stalwarts Fund | Financial Highlights |
For a Share Outstanding Throughout the Periods Presented
| Institutional Class | For the Six Months Ended October 31, 2017 (Unaudited) | Year Ended April 30, 2017 | For the Period September 2, 2015 (Commencement of Operations) to April 30, 2016 | |||||||||
| NET ASSET VALUE, BEGINNING OF PERIOD | $ | 12.79 | $ | 10.87 | $ | 10.00 | ||||||
| INCOME FROM INVESTMENT OPERATIONS | ||||||||||||
| Net investment income(a) | 0.01 | 0.01 | (b) | 0.02 | ||||||||
| Net realized and unrealized gain on investments | 1.50 | 1.93 | 0.85 | |||||||||
| Total income from investment operations | 1.51 | 1.94 | 0.87 | |||||||||
| DISTRIBUTIONS | ||||||||||||
| From net investment income | – | (0.02 | ) | (0.00 | )(c) | |||||||
| From net realized gain on investments | – | – | (0.00 | )(c) | ||||||||
| Total distributions | – | (0.02 | ) | (0.00 | )(c) | |||||||
| REDEMPTION FEES ADDED TO PAID-IN CAPITAL | – | 0.00 | (c) | 0.00 | (c) | |||||||
| INCREASE IN NET ASSET VALUE | 1.51 | 1.92 | 0.87 | |||||||||
| NET ASSET VALUE, END OF PERIOD | $ | 14.30 | $ | 12.79 | $ | 10.87 | ||||||
| TOTAL RETURN | 11.81 | %(d) | 17.92 | % | 8.76 | %(d) | ||||||
| RATIOS AND SUPPLEMENTAL DATA | ||||||||||||
| Net assets, end of period (in 000s) | $ | 61,918 | $ | 47,811 | $ | 17,562 | ||||||
| RATIOS TO AVERAGE NET ASSETS | ||||||||||||
| Expenses (excluding fees waived/ reimbursed by investment advisor) | 1.10 | %(e) | 1.17 | % | 1.86 | %(e)(f) | ||||||
| Expenses (including fees waived/ reimbursed by investment advisor) | 1.10 | %(e) | 1.10 | % | 1.10 | %(e)(f) | ||||||
| Net investment income | 0.08 | %(e) | 0.05 | % | 0.22 | %(e) | ||||||
| PORTFOLIO TURNOVER RATE | 15 | %(d) | 32 | % | 24 | %(d) | ||||||
| (a) | Per share numbers have been calculated using the average shares method. |
| (b) | The per share amount does not correspond to activity reflected in the Statement of Operations due to class specific expenses during the period. |
| (c) | Less than $0.005 or ($0.005) per share. |
| (d) | Not Annualized. |
| (e) | Annualized. |
| (f) | Expense ratios during startup periods may not be representative of longer term operating periods. |
See Notes to Financial Statements.
| 80 | 1.855.377.7325 | www.GrandeurPeakGlobal.com |
| Grandeur Peak International Opportunities Fund | Financial Highlights |
For a Share Outstanding Throughout the Periods Presented
| Investor Class | For the Six Months Ended October 31, 2017 (Unaudited) | Year Ended April 30, 2017 | Year Ended April 30, 2016 | Year Ended April 30, 2015 | Year Ended April 30, 2014 | Year Ended April 30, 2013 | ||||||||||||||||||
| NET ASSET VALUE, BEGINNING OF PERIOD | $ | 3.55 | $ | 3.09 | $ | 3.42 | $ | 3.41 | $ | 2.83 | $ | 2.29 | ||||||||||||
| INCOME FROM INVESTMENT OPERATIONS | ||||||||||||||||||||||||
| Net investment income(a) | 0.01 | 0.01 | 0.01 | 0.01 | 0.01 | 0.01 | ||||||||||||||||||
| Net realized and unrealized gain/(loss) on investments | 0.48 | 0.52 | (0.20 | ) | 0.21 | 0.68 | 0.55 | |||||||||||||||||
| Total income/(loss) from investment operations | 0.49 | 0.53 | (0.19 | ) | 0.22 | 0.69 | 0.56 | |||||||||||||||||
| DISTRIBUTIONS | ||||||||||||||||||||||||
| From net investment income | – | (0.02 | ) | (0.01 | ) | (0.01 | ) | (0.02 | ) | (0.01 | ) | |||||||||||||
| From net realized gain on investments | – | (0.05 | ) | (0.13 | ) | (0.20 | ) | (0.09 | ) | (0.01 | ) | |||||||||||||
| Total distributions | – | (0.07 | ) | (0.14 | ) | (0.21 | ) | (0.11 | ) | (0.02 | ) | |||||||||||||
| REDEMPTION FEES ADDED TO PAID-IN CAPITAL | – | 0.00 | (b) | 0.00 | (b) | 0.00 | (b) | 0.00 | (b) | 0.00 | (b) | |||||||||||||
| INCREASE/DECREASE IN NET ASSET VALUE | 0.49 | 0.46 | (0.33 | ) | 0.01 | 0.58 | 0.54 | |||||||||||||||||
| NET ASSET VALUE, END OF PERIOD | $ | 4.04 | $ | 3.55 | $ | 3.09 | $ | 3.42 | $ | 3.41 | $ | 2.83 | ||||||||||||
| TOTAL RETURN | 13.80 | %(c) | 17.50 | % | (5.53 | )% | 7.25 | % | 24.59 | % | 24.57 | % | ||||||||||||
| RATIOS AND SUPPLEMENTAL DATA | ||||||||||||||||||||||||
| Net assets, end of period (in 000s) | $ | 82,431 | $ | 78,403 | $ | 123,922 | $ | 173,842 | $ | 153,296 | $ | 96,550 | ||||||||||||
| RATIOS TO AVERAGE NET ASSETS | ||||||||||||||||||||||||
| Expenses (excluding fees waived/ reimbursed by investment advisor) | 1.61 | %(d) | 1.61 | % | 1.62 | % | 1.62 | % | 1.73 | % | 1.88 | % | ||||||||||||
| Expenses (including fees waived/reimbursed by investment advisor) | 1.55 | %(d) | 1.58 | % | 1.62 | % | 1.62 | % | 1.73 | % | 1.75 | % | ||||||||||||
| Net investment income | 0.53 | %(d) | 0.16 | % | 0.45 | % | 0.37 | % | 0.20 | % | 0.26 | % | ||||||||||||
| PORTFOLIO TURNOVER RATE | 10 | %(c) | 30 | % | 34 | % | 36 | % | 37 | % | 52 | % | ||||||||||||
| (a) | Per share numbers have been calculated using the average shares method. |
| (b) | Less than $0.005 or ($0.005) per share. |
| (c) | Not Annualized. |
| (d) | Annualized. |
See Notes to Financial Statements.
| Semi-Annual Report | October 31, 2017 | 81 |
| Grandeur Peak International Opportunities Fund | Financial Highlights |
For a Share Outstanding Throughout the Periods Presented
| Institutional Class | For the Six Months Ended October 31, 2017 (Unaudited) | Year Ended April 30, 2017 | Year Ended April 30, 2016 | Year Ended April 30, 2015 | Year Ended April 30, 2014 | Year Ended April 30, 2013 | ||||||||||||||||||
| NET ASSET VALUE, BEGINNING OF PERIOD | $ | 3.57 | $ | 3.11 | $ | 3.43 | $ | 3.42 | $ | 2.84 | $ | 2.29 | ||||||||||||
| INCOME FROM INVESTMENT OPERATIONS | ||||||||||||||||||||||||
| Net investment income(a) | 0.01 | 0.01 | 0.02 | 0.02 | 0.01 | 0.01 | ||||||||||||||||||
| Net realized and unrealized gain/(loss) on investments | 0.48 | 0.52 | (0.20 | ) | 0.21 | 0.69 | 0.57 | |||||||||||||||||
| Total income/(loss) from investment operations | 0.49 | 0.53 | (0.18 | ) | 0.23 | 0.70 | 0.58 | |||||||||||||||||
| DISTRIBUTIONS | ||||||||||||||||||||||||
| From net investment income | – | (0.02 | ) | (0.01 | ) | (0.02 | ) | (0.03 | ) | (0.02 | ) | |||||||||||||
| From net realized gain on investments | – | (0.05 | ) | (0.13 | ) | (0.20 | ) | (0.09 | ) | (0.01 | ) | |||||||||||||
| Total distributions | – | (0.07 | ) | (0.14 | ) | (0.22 | ) | (0.12 | ) | (0.03 | ) | |||||||||||||
| REDEMPTION FEES ADDED TO PAID-IN CAPITAL | 0.00 | (b) | 0.00 | (b) | 0.00 | (b) | 0.00 | (b) | 0.00 | (b) | 0.00 | (b) | ||||||||||||
| INCREASE/DECREASE IN NET ASSET VALUE | 0.49 | 0.46 | (0.32 | ) | 0.01 | 0.58 | 0.55 | |||||||||||||||||
| NET ASSET VALUE, END OF PERIOD | $ | 4.06 | $ | 3.57 | $ | 3.11 | $ | 3.43 | $ | 3.42 | $ | 2.84 | ||||||||||||
| TOTAL RETURN | 13.73 | %(c) | 17.59 | % | (5.02 | )% | 7.41 | % | 24.70 | % | 25.11 | % | ||||||||||||
| RATIOS AND SUPPLEMENTAL DATA | ||||||||||||||||||||||||
| Net assets, end of period (in 000s) | $ | 792,145 | $ | 698,504 | $ | 579,371 | $ | 682,364 | $ | 658,127 | $ | 250,962 | ||||||||||||
| RATIOS TO AVERAGE NET ASSETS | ||||||||||||||||||||||||
| Expenses (excluding fees waived/reimbursed by investment advisor) | 1.36 | %(d) | 1.37 | % | 1.38 | % | 1.38 | % | 1.46 | % | 1.59 | % | ||||||||||||
| Expenses (including fees waived/ reimbursed by investment advisor) | 1.30 | %(d) | 1.34 | % | 1.38 | % | 1.38 | % | 1.46 | % | 1.50 | % | ||||||||||||
| Net investment income | 0.75 | %(d) | 0.42 | % | 0.65 | % | 0.61 | % | 0.42 | % | 0.51 | % | ||||||||||||
| PORTFOLIO TURNOVER RATE | 10 | %(c) | 30 | % | 34 | % | 36 | % | 37 | % | 52 | % | ||||||||||||
| (a) | Per share numbers have been calculated using the average shares method. |
| (b) | Less than $0.005 or ($0.005) per share. |
| (c) | Not Annualized. |
| (d) | Annualized. |
See Notes to Financial Statements.
| 82 | 1.855.377.7325 | www.GrandeurPeakGlobal.com |
| Grandeur Peak International Stalwarts Fund | Financial Highlights |
For a Share Outstanding Throughout the Periods Presented
| Investor Class | For the Six Months Ended October 31, 2017 (Unaudited) | Year Ended April 30, 2017 | For the Period September 2, 2015 (Commencement of Operations) to April 30, 2016 | |||||||||
| NET ASSET VALUE, BEGINNING OF PERIOD | $ | 13.04 | $ | 11.02 | $ | 10.00 | ||||||
| INCOME FROM INVESTMENT OPERATIONS | ||||||||||||
| Net investment income(a) | 0.01 | 0.02 | 0.03 | |||||||||
| Net realized and unrealized gain on investments | 1.63 | 2.03 | 0.99 | |||||||||
| Total income from investment operations | 1.64 | 2.05 | 1.02 | |||||||||
| DISTRIBUTIONS | ||||||||||||
| From net investment income | – | (0.03 | ) | – | ||||||||
| Total distributions | – | (0.03 | ) | – | ||||||||
| REDEMPTION FEES ADDED TO PAID-IN CAPITAL | 0.00 | (b) | 0.00 | (b) | 0.00 | (b) | ||||||
| INCREASE IN NET ASSET VALUE | 1.64 | 2.02 | 1.02 | |||||||||
| NET ASSET VALUE, END OF PERIOD | $ | 14.68 | $ | 13.04 | $ | 11.02 | ||||||
| TOTAL RETURN | 12.58 | %(c) | 18.68 | % | 10.20 | %(c) | ||||||
| RATIOS AND SUPPLEMENTAL DATA | ||||||||||||
| Net assets, end of period (in 000s) | $ | 42,659 | $ | 31,045 | $ | 22,028 | ||||||
| RATIOS TO AVERAGE NET ASSETS | ||||||||||||
| Expenses (excluding fees waived/ reimbursed by investment advisor) | 1.18 | %(d) | 1.27 | % | 1.45 | %(d)(e) | ||||||
| Expenses (including fees waived/ reimbursed by investment advisor) | 1.18 | %(d) | 1.27 | % | 1.35 | %(d)(e) | ||||||
| Net investment income | 0.19 | %(d) | 0.19 | % | 0.44 | %(d) | ||||||
| PORTFOLIO TURNOVER RATE | 10 | %(c) | 37 | % | 59 | %(c) | ||||||
| (a) | Per share numbers have been calculated using the average shares method. |
| (b) | Less than $0.005 or ($0.005) per share. |
| (c) | Not Annualized. |
| (d) | Annualized. |
| (e) | Expense ratios during startup periods may not be representative of longer term operating periods. |
See Notes to Financial Statements.
| Semi-Annual Report | October 31, 2017 | 83 |
| Grandeur Peak International Stalwarts Fund | Financial Highlights |
For a Share Outstanding Throughout the Periods Presented
| Institutional Class | For the Six Months Ended October 31, 2017 (Unaudited) | Year Ended April 30, 2017 | For the Period September 2, 2015 (Commencement of Operations) to April 30, 2016 | |||||||||
| NET ASSET VALUE, BEGINNING OF PERIOD | $ | 13.06 | $ | 11.03 | $ | 10.00 | ||||||
| INCOME FROM INVESTMENT OPERATIONS | ||||||||||||
| Net investment income(a) | 0.03 | 0.04 | 0.04 | |||||||||
| Net realized and unrealized gain on investments | 1.63 | 2.04 | 0.99 | |||||||||
| Total income from investment operations | 1.66 | 2.08 | 1.03 | |||||||||
| DISTRIBUTIONS | ||||||||||||
| From net investment income | – | (0.05 | ) | (0.00 | )(b) | |||||||
| Total distributions | – | (0.05 | ) | (0.00 | )(b) | |||||||
| REDEMPTION FEES ADDED TO PAID-IN CAPITAL | 0.00 | (b) | 0.00 | (b) | 0.00 | (b) | ||||||
| INCREASE IN NET ASSET VALUE | 1.66 | 2.03 | 1.03 | |||||||||
| NET ASSET VALUE, END OF PERIOD | $ | 14.72 | $ | 13.06 | $ | 11.03 | ||||||
| TOTAL RETURN | 12.71 | %(c) | 18.96 | % | 10.34 | %(c) | ||||||
| RATIOS AND SUPPLEMENTAL DATA | ||||||||||||
| Net assets, end of period (in 000s) | $ | 390,839 | $ | 265,393 | $ | 119,070 | ||||||
| RATIOS TO AVERAGE NET ASSETS | ||||||||||||
| Expenses (excluding fees waived/ reimbursed by investment advisor) | 0.93 | %(d) | 1.02 | % | 1.20 | %(d)(e) | ||||||
| Expenses (including fees waived/ reimbursed by investment advisor) | 0.93 | %(d) | 1.02 | % | 1.10 | %(d)(e) | ||||||
| Net investment income | 0.41 | %(d) | 0.37 | % | 0.60 | %(d) | ||||||
| PORTFOLIO TURNOVER RATE | 10 | %(c) | 37 | % | 59 | %(c) | ||||||
| (a) | Per share numbers have been calculated using the average shares method. |
| (b) | Less than $0.005 or ($0.005) per share. |
| (c) | Not Annualized. |
| (d) | Annualized. |
| (e) | Expense ratios during startup periods may not be representative of longer term operating periods. |
See Notes to Financial Statements.
| 84 | 1.855.377.7325 | www.GrandeurPeakGlobal.com |
| Grandeur Peak Funds® | Notes to Financial Statements |
October 31, 2017 (Unaudited)
1. ORGANIZATION
Financial Investors Trust (the “Trust”), a Delaware statutory trust, is an open-end management investment company registered under the Investment Company Act of 1940, as amended (“1940 Act”). As of October 31, 2017, the Trust consists of multiple separate portfolios or series. This semi-annual report describes the Grandeur Peak Emerging Markets Opportunities Fund, Grandeur Peak Global Micro Cap Fund, Grandeur Peak Global Opportunities Fund, Grandeur Peak Global Reach Fund, Grandeur Peak Global Stalwarts Fund, Grandeur Peak International Opportunities Fund, and Grandeur Peak International Stalwarts Fund (individually a “Fund” and collectively, the “Funds”). The Funds seek long-term growth of capital. The Funds offer Investor Class (except the Grandeur Peak Global Micro Cap Fund) and Institutional Class shares.
2. SIGNIFICANT ACCOUNTING POLICIES
The accompanying financial statements were prepared in accordance with accounting principles generally accepted in the United States of America (“U.S. GAAP”). The preparation of financial statements in conformity with U.S. GAAP requires management to make certain estimates and assumptions that affect the reported amounts of assets and liabilities and disclosures of contingent assets and liabilities at the date of the financial statements and the reported amounts of revenue and expenses during the period. Actual results could differ from those estimates. The Funds are considered an investment company for financial reporting purposes under U.S. GAAP. The following is a summary of significant accounting policies consistently followed by the Funds in preparation of their financial statements.
Investment Valuation: The Funds generally value their securities based on market prices determined at the close of regular trading on the New York Stock Exchange (“NYSE”), normally 4:00 p.m. Eastern Time, on each day the NYSE is open for trading.
For equity securities and mutual funds that are traded on an exchange, the market price is usually the closing sale or official closing price on that exchange. In the case of equity securities not traded on an exchange, or if such closing prices are not otherwise available, the securities are valued at the mean of the most recent bid and ask prices on such day. Redeemable securities issued by open-end registered investment companies are valued at the investment company’s applicable net asset value, with the exception of exchange-traded open-end investment companies, which are priced as equity securities.
Equity securities that are primarily traded on foreign securities exchanges are valued at the closing values of such securities on their respective foreign exchanges, except when an event occurs subsequent to the close of the foreign exchange and the close of the NYSE that was likely to have changed such value. In such an event, the fair value of those securities are determined in good faith through consideration of other factors in accordance with procedures established by and under the general supervision of the Board of Trustees (the “Board”). The Funds will use a fair valuation model provided by an independent pricing service, which is intended to reflect fair value when a security’s value or a meaningful portion of each Fund’s portfolio is believed to have been materially affected by a valuation event that has occurred between the close of the exchange or market on which the security is traded and the close of the regular trading day on the NYSE. The Funds’ valuation procedures set forth certain triggers which instruct when to use the fair valuation model.
Forward currency exchange contracts have a fair value determined by the prevailing foreign currency exchange daily rates and current foreign currency exchange forward rates. The foreign currency exchange forward rates are calculated using an automated system that estimates rates on the basis of the current day foreign currency exchange rates and forward foreign currency exchange rates supplied by a pricing service.
When such prices or quotations are not available, or when Grandeur Peak Global Advisors, LLC (the “Adviser”) believes that they are unreliable, securities may be priced using fair value procedures approved by the Board.
Fair Value Measurements: The Funds disclose the classification of their fair value measurements following a three-tier hierarchy based on the inputs used to measure fair value. Inputs refer broadly to the assumptions that market participants would use in pricing the asset or liability, including assumptions about risk. Inputs may be observable or unobservable. Observable inputs reflect the assumptions market participants would use in pricing the asset or liability that are developed based on market data obtained from sources independent of the reporting entity. Unobservable inputs reflect the reporting entity’s own assumptions about the assumptions market participants would use in pricing the asset or liability that are developed based on the best information available.
Various inputs are used in determining the value of the Funds’ investments as of the end of the reporting period. When inputs used fall into different levels of the fair value hierarchy, the level in the hierarchy within which the fair value measurement falls is determined based on the lowest level input that is significant to the fair value measurement in its entirety. The designated input levels are not necessarily an indication of the risk or liquidity associated with these investments. These inputs are categorized in the following hierarchy under applicable financial accounting standards:
| Semi-Annual Report | October 31, 2017 | 85 |
| Grandeur Peak Funds® | Notes to Financial Statements |
October 31, 2017 (Unaudited)
Level 1 – Unadjusted quoted prices in active markets for identical investments, unrestricted assets or liabilities that the Funds have the ability to access at the measurement date;
Level 2 – Quoted prices which are not active, quoted prices for similar assets or liabilities in active markets or inputs other than quoted prices that are observable (either directly or indirectly) for substantially the full term of the asset or liability; and
Level 3 – Significant unobservable prices or inputs (including the Funds’ own assumptions in determining the fair value of investments) where there is little or no market activity for the asset or liability at the measurement date.
The following is a summary of each Fund’s investments in the fair value hierarchy as of October 31, 2017:
| Investments in Securities at Value | Level 1 - Quoted and Unadjusted Prices | Level 2 - Other Significant Observable Inputs | Level 3 - Significant Unobservable Inputs | Total | ||||||||||||
| Grandeur Peak Emerging Markets Opportunities Fund | ||||||||||||||||
| Common Stocks | ||||||||||||||||
| South Korea | $ | 31,097,018 | $ | 3,071,228 | $ | 3,022,095 | $ | 37,190,341 | ||||||||
| Other* | 392,777,108 | – | – | 392,777,108 | ||||||||||||
| Corporate Bonds* | $ | – | $ | 667,533 | $ | – | $ | 667,533 | ||||||||
| Rights and Warrants* | – | 91,164 | – | 91,164 | ||||||||||||
| Total | $ | 423,874,126 | $ | 3,829,925 | $ | 3,022,095 | $ | 430,726,146 | ||||||||
| Investments in Securities at Value | Level 1 - Quoted and Unadjusted Prices | Level 2 - Other Significant Observable Inputs | Level 3 - Significant Unobservable Inputs | Total | ||||||||||||
| Grandeur Peak Global Micro Cap Fund | ||||||||||||||||
| Common Stocks | ||||||||||||||||
| South Korea | $ | 1,076,378 | $ | – | $ | 75,965 | $ | 1,152,343 | ||||||||
| Other* | 39,271,718 | – | – | 39,271,718 | ||||||||||||
| Corporate Bonds* | $ | – | $ | 212,383 | $ | – | $ | 212,383 | ||||||||
| Rights and Warrants* | – | 9,810 | – | 9,810 | ||||||||||||
| Total | $ | 40,348,096 | $ | 222,193 | $ | 75,965 | $ | 40,646,254 | ||||||||
| Investments in Securities at Value | Level 1 - Quoted and Unadjusted Prices | Level 2 - Other Significant Observable Inputs | Level 3 - Significant Unobservable Inputs | Total | ||||||||||||
| Grandeur Peak Global Opportunities Fund | ||||||||||||||||
| Common Stocks* | $ | 748,386,948 | $ | – | $ | – | $ | 748,386,948 | ||||||||
| Corporate Bonds* | – | 495,583 | – | 495,583 | ||||||||||||
| Total | $ | 748,386,948 | $ | 495,583 | $ | – | $ | 748,882,531 | ||||||||
| Investments in Securities at Value | Level 1 - Quoted and Unadjusted Prices | Level 2 - Other Significant Observable Inputs | Level 3 - Significant Unobservable Inputs | Total | ||||||||||||
| Grandeur Peak Global Reach Fund | ||||||||||||||||
| Common Stocks | ||||||||||||||||
| South Korea | $ | 7,633,044 | $ | – | $ | 601,580 | $ | 8,234,624 | ||||||||
| Spain | – | – | 12 | 12 | ||||||||||||
| Other* | 338,436,587 | – | – | 338,436,587 | ||||||||||||
| Preferred Stocks* | $ | 707,364 | $ | – | $ | – | $ | 707,364 | ||||||||
| Corporate Bonds* | – | 1,059,781 | – | 1,059,781 | ||||||||||||
| Total | $ | 346,776,995 | $ | 1,059,781 | $ | 601,592 | $ | 348,438,368 | ||||||||
| 86 | 1.855.377.7325 | www.GrandeurPeakGlobal.com |
| Grandeur Peak Funds® | Notes to Financial Statements |
October 31, 2017 (Unaudited)
| Investments in Securities at Value | Level 1 - Quoted and Unadjusted Prices | Level 2 - Other Significant Observable Inputs | Level 3 - Significant Unobservable Inputs | Total | ||||||||||||
| Grandeur Peak Global Stalwarts Fund | ||||||||||||||||
| Common Stocks | ||||||||||||||||
| South Korea | $ | 3,686,349 | $ | 762,512 | $ | – | $ | 4,448,861 | ||||||||
| Other* | 130,750,654 | – | – | 130,750,654 | ||||||||||||
| Preferred Stocks* | $ | 645,609 | $ | – | $ | – | $ | 645,609 | ||||||||
| Total | $ | 135,082,612 | $ | 762,512 | $ | – | $ | 135,845,124 | ||||||||
| Investments in Securities at Value | Level 1 - Quoted and Unadjusted Prices | Level 2 - Other Significant Observable Inputs | Level 3 - Significant Unobservable Inputs | Total | ||||||||||||
| Grandeur Peak International Opportunities Fund | ||||||||||||||||
| Common Stocks | ||||||||||||||||
| South Korea | $ | 21,787,001 | $ | – | $ | 2,655,960 | $ | 24,442,961 | ||||||||
| Other* | 797,374,016 | – | – | 797,374,016 | ||||||||||||
| Corporate Bonds* | $ | – | $ | 659,950 | $ | – | $ | 659,950 | ||||||||
| Rights and Warrants* | – | 17,417 | – | 17,417 | ||||||||||||
| Total | $ | 819,161,017 | $ | 677,367 | $ | 2,655,960 | $ | 822,494,344 | ||||||||
| Investments in Securities at Value | Level 1 - Quoted and Unadjusted Prices | Level 2 - Other Significant Observable Inputs | Level 3 - Significant Unobservable Inputs | Total | ||||||||||||
| Grandeur Peak International Stalwarts Fund | ||||||||||||||||
| Common Stocks | ||||||||||||||||
| South Korea | $ | 13,755,434 | $ | 2,675,851 | $ | – | $ | 16,431,285 | ||||||||
| Other* | 388,570,416 | – | – | 388,570,416 | ||||||||||||
| Preferred Stocks* | $ | 2,217,528 | $ | – | $ | – | $ | 2,217,528 | ||||||||
| Total | $ | 404,543,378 | $ | 2,675,851 | $ | – | $ | 407,219,229 | ||||||||
| * | For a detailed country breakdown, see the accompanying Portfolio of Investments. |
The Fund utilizes a fair value evaluation service with respect to international securities with an earlier market closing than the Fund’s net asset value computation cutoff. When events trigger the use of the fair value evaluation service on a reporting period date, it results in certain securities transferring from a Level 1 to a Level 2 classification. When the trigger is not met at a period end, it could result in securities transferring from a Level 2 to a Level 1 classification. The transfer amount disclosed in the table below represents the value of the securities as of October 31, 2017 transferred in/(out) of Level 1 and Level 2 during the reporting period that were also held as of April 30, 2017. The below transfers from Level 2 to Level 1 were due to the ability to obtain a closing market price within an active market for a security that previously had no market to trade.
The Funds had the following transfers between levels 1 and 2 during the six months ended October 31, 2017:
| Level 1 - Quoted and Unadjusted Prices | Level 2 - Other Significant Observable Inputs | |||||||||||||||
| Transfers In | Transfers (Out) | Transfers In | Transfers (Out) | |||||||||||||
| Grandeur Peak Emerging Markets Opportunities Fund | ||||||||||||||||
| Common Stocks | $ | 1,394,350 | $ | – | $ | – | $ | (1,394,350 | ) | |||||||
| Total | $ | 1,394,350 | $ | – | $ | – | $ | (1,394,350 | ) | |||||||
| Level 1 - Quoted and Unadjusted Prices | Level 2 - Other Significant Observable Inputs | |||||||||||||||
| Transfers In | Transfers (Out) | Transfers In | Transfers (Out) | |||||||||||||
| Grandeur Peak Global Micro Cap Fund | ||||||||||||||||
| Common Stocks | $ | 445,122 | $ | – | $ | – | $ | (445,122 | ) | |||||||
| Total | $ | 445,122 | $ | – | $ | – | $ | (445,122 | ) | |||||||
| Semi-Annual Report | October 31, 2017 | 87 |
| Grandeur Peak Funds® | Notes to Financial Statements |
October 31, 2017 (Unaudited)
| Level 1 - Quoted and Unadjusted Prices | Level 2 - Other Significant Observable Inputs | |||||||||||||||
| Transfers In | Transfers (Out) | Transfers In | Transfers (Out) | |||||||||||||
| Grandeur Peak Global Reach Fund | ||||||||||||||||
| Common Stocks | $ | 1,511,868 | $ | – | $ | – | $ | (1,511,868 | ) | |||||||
| Total | $ | 1,511,868 | $ | – | $ | – | $ | (1,511,868 | ) | |||||||
| Level 1 - Quoted and Unadjusted Prices | Level 2 - Other Significant Observable Inputs | |||||||||||||||
| Transfers In | Transfers (Out) | Transfers In | Transfers (Out) | |||||||||||||
| Grandeur Peak International Opportunities Fund | ||||||||||||||||
| Common Stocks | $ | 1,533,184 | $ | – | $ | – | $ | (1,533,184 | ) | |||||||
| Total | $ | 1,533,184 | $ | – | $ | – | $ | (1,833,184 | ) | |||||||
The following is a reconciliation of the investments in which significant unobservable inputs (Level 3) were used in determining fair value:
| Grandeur Peak Emerging Markets Opportunities Fund | Common Stocks | Total | ||||||
| Balance as of April 30, 2017 | $ | 3,306,095 | $ | 3,306,095 | ||||
| Accrued discount/ premium | – | – | ||||||
| Return of Capital | – | – | ||||||
| Realized Gain/(Loss) | (1 | ) | (1 | ) | ||||
| Change in Unrealized Appreciation/(Depreciation) | (283,999 | ) | (283,999 | ) | ||||
| Purchases | – | – | ||||||
| Sales Proceeds | – | – | ||||||
| Transfer into Level 3 | – | – | ||||||
| Transfer out of Level 3 | – | – | ||||||
| Balance as of October 31, 2017 | $ | 3,022,095 | $ | 3,022,095 | ||||
| Net change in unrealized appreciation/(depreciation) included in the Statements of Operations attributable to Level 3 investments held at October 31, 2017 | $ | (283,999 | ) | $ | (283,999 | ) | ||
| Grandeur Peak Global Micro Cap Fund | Common Stocks | Total | ||||||
| Balance as of April 30, 2017 | $ | 83,107 | $ | 83,107 | ||||
| Accrued discount/ premium | – | – | ||||||
| Return of Capital | – | – | ||||||
| Realized Gain/(Loss) | (3 | ) | (3 | ) | ||||
| Change in Unrealized Appreciation/(Depreciation) | (7,139 | ) | (7,139 | ) | ||||
| Purchases | – | – | ||||||
| Sales Proceeds | – | – | ||||||
| Transfer into Level 3 | – | – | ||||||
| Transfer out of Level 3 | – | – | ||||||
| Balance as of October 31, 2017 | $ | 75,965 | $ | 75,965 | ||||
| Net change in unrealized appreciation/(depreciation) included in the Statements of Operations attributable to Level 3 investments held at October 31, 2017 | $ | (7,139 | ) | $ | (7,139 | ) | ||
| Grandeur Peak Global Reach Fund | Common Stocks | Total | ||||||
| Balance as of April 30, 2017 | $ | 658,125 | $ | 658,125 | ||||
| Accrued discount/ premium | – | – | ||||||
| Return of Capital | – | – | ||||||
| Realized Gain/(Loss) | – | – | ||||||
| Change in Unrealized Appreciation/(Depreciation) | (56,533 | ) | (56,533 | ) | ||||
| Purchases | – | – | ||||||
| Sales Proceeds | – | – | ||||||
| Transfer into Level 3 | – | – | ||||||
| Transfer out of Level 3 | – | – | ||||||
| Balance as of October 31, 2017 | $ | 601,592 | $ | 601,592 | ||||
| Net change in unrealized appreciation/(depreciation) included in the Statements of Operations attributable to Level 3 investments held at October 31, 2017 | $ | (56,533 | ) | $ | (56,533 | ) | ||
| 88 | 1.855.377.7325 | www.GrandeurPeakGlobal.com |
| Grandeur Peak Funds® | Notes to Financial Statements |
October 31, 2017 (Unaudited)
| Grandeur Peak International Opportunities Fund | Common Stocks | Total | ||||||
| Balance as of April 30, 2017 | $ | 2,905,555 | $ | 2,905,555 | ||||
| Accrued discount/ premium | – | – | ||||||
| Return of Capital | – | – | ||||||
| Realized Gain/(Loss) | (3 | ) | (3 | ) | ||||
| Change in Unrealized Appreciation/(Depreciation) | (249,592 | ) | (249,592 | ) | ||||
| Purchases | – | – | ||||||
| Sales Proceeds | – | – | ||||||
| Transfer into Level 3 | – | – | ||||||
| Transfer out of Level 3 | – | – | ||||||
| Balance as of October 31, 2017 | $ | 2,655,960 | $ | 2,655,960 | ||||
| Net change in unrealized appreciation/(depreciation) included in the Statements of Operations attributable to Level 3 investments held at October 31, 2017 | $ | (249,592 | ) | $ | (249,592 | ) | ||
Change in unrealized appreciation/depreciation on Level 3 securities is included on the Statements of Operations under Net change in unrealized appreciation/ (depreciation) on investments. Realized gain (loss) on Level 3 securities is included on the Statements of Operations under Net realized gain/(loss) on investments.
The table below provided additional information about the Level 3 Fair Value Measurements as of October 31, 2017:
Quantitative Information about Level 3 Fair Value Measurements
Grandeur Peak Emerging Markets Opportunities Fund
| Asset Class | Fair Value (USD) at 10/31/17 | Valuation Technique | Unobservable Inputs(a) | Value | ||||||||
| Foreign Common Stock | $ | 3,022,095 | Discount on last quoted exchange price due to factory production halt | Discount | 37% | |||||||
Grandeur Peak Global Micro Cap Fund
| Asset Class | Fair Value (USD) at 10/31/17 | Valuation Technique | Unobservable Inputs(a) | Value | ||||||||
| Foreign Common Stock | $ | 75,965 | Discount on last quoted exchange price due to factory production halt | Discount | 37% | |||||||
Grandeur Peak Global Reach Fund
| Asset Class | Fair Value (USD) at 10/31/17 | Valuation Technique | Unobservable Inputs(a) | Value | ||||||||
| Foreign Common Stock | $ | 601,592 | Discount on last quoted exchange price due to factory production halt | Discount | 37% | |||||||
Grandeur Peak International Opportunities Fund
| Asset Class | Fair Value (USD) at 10/31/17 | Valuation Technique | Unobservable Inputs(a) | Value | ||||||||
| Foreign Common Stock | $ | 2,655,960 | Discount on last quoted exchange price due to factory production halt | Discount | 37% | |||||||
| (a) | A change to the unobservable input may result in a significant change to the value of the investment as follows: |
| Unobservable Input | Impact to Value if Input Increases | Impact to Value if Input Decreases |
| Discount | Decrease | Increase |
| Semi-Annual Report | October 31, 2017 | 89 |
| Grandeur Peak Funds® | Notes to Financial Statements |
October 31, 2017 (Unaudited)
Investment Transactions and Investment Income: Investment transactions are accounted for on the date the investments are purchased or sold (trade date). Realized gains and losses from investment transactions are reported on an identified cost which is the same basis the Fund uses for federal income tax purposes. Interest income, which includes accretion of discounts and amortization of premiums, is accrued and recorded as earned. Dividend income is recognized on the ex-dividend date or for certain foreign securities, as soon as information is available to the Funds. All of the realized and unrealized gains and losses and net investment income, are allocated daily to each class in proportion to its average daily net assets.
Cash Management Transactions: The Funds subscribe to the Brown Brothers Harriman & Co. (“BBH”) Cash Management Service (“CMS”), whereby cash balances are automatically swept into overnight offshore demand deposits with either the BBH Grand Cayman branch or a branch of a pre-approved commercial bank. This fully automated program allows the Funds to earn interest on cash balances. Excess cash with deposit institutions domiciled outside of the U.S. are subject to sovereign actions in the jurisdiction of the deposit institution including, but not limited to, freeze, seizure or diminution. Cash balances in the BBH CMS are included on the Statements of Assets and Liabilities under Cash and Foreign Cash, at Value. As of October 31, 2017, the Funds had the following cash balances participating in the BBH CMS:
| Fund | ||||
| Grandeur Peak Emerging Markets Opportunities Fund | $ | 9,143,440 | ||
| Grandeur Peak Global Micro Cap Fund | 396,299 | |||
| Grandeur Peak Global Opportunities Fund | 34,267,491 | |||
| Grandeur Peak Global Reach Fund | 3,975,924 | |||
| Grandeur Peak Global Stalwarts Fund | 5,370,122 | |||
| Grandeur Peak International Opportunities Fund | 50,685,301 | |||
| Grandeur Peak International Stalwarts Fund | 25,563,295 | |||
As of October 31, 2017, the Funds had the following foreign cash balances participating in the BBH CMS (cost and value of foreign cash balances are equal):
| Fund | ||||
| Grandeur Peak Emerging Markets Opportunities Fund | $ | 0 | ||
| Grandeur Peak Global Micro Cap Fund | 8,349 | |||
| Grandeur Peak Global Opportunities Fund | 0 | |||
| Grandeur Peak Global Reach Fund | 0 | |||
| Grandeur Peak Global Stalwarts Fund | 0 | |||
| Grandeur Peak International Opportunities Fund | 0 | |||
| Grandeur Peak International Stalwarts Fund | 0 | |||
Foreign Securities: The Funds may directly purchase securities of foreign issuers. Investing in securities of foreign issuers involves special risks not typically associated with investing in securities of U.S. issuers. The risks include possible reevaluation of currencies, the inability to repatriate foreign currency, less complete financial information about companies and possible future adverse political and economic developments. Moreover, securities of many foreign issuers and their markets may be less liquid and their prices more volatile than those of securities of comparable U.S. issuers.
Foreign Currency Translation: The books and records of the Funds are maintained in U.S. dollars. Investment valuations and other assets and liabilities initially expressed in foreign currencies are converted each business day into U.S. dollars based upon current exchange rates. Prevailing foreign exchange rates may generally be obtained at the close of the NYSE (normally, 4:00 p.m. Eastern Time). The portion of realized and unrealized gains or losses on investments due to fluctuations in foreign currency exchange rates is not separately disclosed and is included in realized and unrealized gains or losses on investments, when applicable.
Foreign Currency Spot Contracts: The Funds may enter into foreign currency spot contracts to facilitate transactions in foreign securities or to convert foreign currency receipts into U.S. dollars. A foreign currency spot contract is an agreement between two parties to buy and sell currencies at the current market rate, for settlement generally within two business days. The U.S. dollar value of the contracts is determined using current currency exchange rates supplied by a pricing service.
The contract is marked-to-market daily for settlements beyond one day and any change in market value is recorded as an unrealized gain or loss. When the contract is closed, a realized gain or loss is recorded equal to the difference between the value on the open and close date. Losses may arise from changes in the value of the foreign currency, or if the counterparties do not perform under the contract’s terms. The maximum potential loss from such contracts is the aggregate face value in U.S. dollars at the time the contract was opened.
| 90 | 1.855.377.7325 | www.GrandeurPeakGlobal.com |
| Grandeur Peak Funds® | Notes to Financial Statements |
October 31, 2017 (Unaudited)
Trust Expenses: Some expenses of the Trust can be directly attributed to the Funds. Expenses which cannot be directly attributed to the Funds are apportioned among all funds in the Trust based on average net assets of each fund.
Fund and Class Expenses: Expenses that are specific to a Fund or class of shares of a Fund, including distribution fees (Rule 12b-1 fees), are charged directly to that Fund or share class. Expenses that are common to all Funds generally are allocated among the Funds in proportion to their average daily net assets.
Federal Income Taxes: The Funds comply with the requirements under Subchapter M of the Internal Revenue Code of 1986, as amended, applicable to regulated investment companies and intend to distribute substantially all of their net taxable income and net capital gains, if any, each year so that it will not be subject to excise tax on undistributed income and gains. The Funds are not subject to income taxes to the extent such distributions are made.
As of and during the six months ended October 31, 2017, the Funds had a liability for unrecognized capital gains tax. These amounts are disclosed as Foreign Capital Gains Tax on the Statements of Assets and Liabilities. The Funds file U.S. federal, state, and local tax returns as required. The Funds’ tax returns are subject to examination by the relevant tax authorities until expiration of the applicable statute of limitations, which is generally three years after the filing of the tax return for federal purposes and four years for most state returns. Tax returns for open years have incorporated no uncertain tax positions that require a provision for income taxes.
Distributions to Shareholders: Each Fund normally pays dividends and distributes capital gains, if any, on an annual basis. Income dividend distributions are derived from dividends and other income each Fund receives from their investments, including short term capital gains. Long term capital gain distributions are derived from gains realized when each Fund sells a security it has owned for more than a year. Each Fund may make additional distributions and dividends at other times if the portfolio manager believes doing so may be necessary for each Fund to avoid or reduce taxes. The Funds intend to pass through foreign tax credits to shareholders.
3. TAX BASIS INFORMATION
Tax Basis of Investments: As of October 31, 2017, the aggregate cost of investments, gross unrealized appreciation/(depreciation) and net unrealized appreciation for Federal tax purposes was as follows:
| Fund | Gross Appreciation (excess of value over tax cost) | Gross Depreciation (excess of tax cost over value) | Net Unrealized Appreciation/(Depreciation) | Cost of Investments for Income Tax Purposes | ||||||||||||
| Grandeur Peak Emerging Markets Opportunities Fund | $ | 101,914,651 | $ | (26,761,891 | ) | $ | 75,152,760 | $ | 355,573,386 | |||||||
| Grandeur Peak Global Micro Cap Fund | 9,939,694 | (1,842,970 | ) | 8,096,724 | 32,549,530 | |||||||||||
| Grandeur Peak Global Opportunities Fund | 265,934,510 | (38,915,814 | ) | 227,018,696 | 521,863,835 | |||||||||||
| Grandeur Peak Global Reach Fund | 98,739,734 | (17,506,811 | ) | 81,232,923 | 267,205,445 | |||||||||||
| Grandeur Peak Global Stalwarts Fund | 29,771,334 | (2,693,089 | ) | 27,078,245 | 108,766,879 | |||||||||||
| Grandeur Peak International Opportunities Fund | 282,673,007 | (33,930,080 | ) | 248,742,927 | 573,751,417 | |||||||||||
| Grandeur Peak International Stalwarts Fund | 90,143,893 | (6,939,324 | ) | 83,204,569 | 324,014,660 | |||||||||||
Tax Basis of Distributions to Shareholders: The character of distributions made during the year from net investment income or net realized gains may differ from its ultimate characterization for federal income tax purposes. Also, due to the timing of dividend distributions, the fiscal year in which amounts are distributed may differ from the fiscal year in which the income or realized gain were recorded by the Funds.
The tax character of distributions paid by the Funds for the fiscal year and or period ended April 30, 2017 were as follows:
| Fund | Ordinary Income | Long-Term Capital Gain | ||||||
| Grandeur Peak Emerging Markets Opportunities Fund | $ | 2,028,686 | $ | – | ||||
| Grandeur Peak Global Micro Cap Fund | 380,816 | 10,397 | ||||||
| Grandeur Peak Global Opportunities Fund | 682,795 | 771,975 | ||||||
| Grandeur Peak Global Reach Fund | 765,635 | – | ||||||
| Grandeur Peak Global Stalwarts Fund | 108,750 | – | ||||||
| Grandeur Peak International Opportunities Fund | 4,568,286 | 11,768,487 | ||||||
| Grandeur Peak International Stalwarts Fund | 1,003,004 | – | ||||||
| Semi-Annual Report | October 31, 2017 | 91 |
| Grandeur Peak Funds® | Notes to Financial Statements |
October 31, 2017 (Unaudited)
The amounts and characteristics of tax basis distributions and composition of distributable earnings/(accumulated losses) are finalized at fiscal year-end. Accordingly, tax basis balances have not been determined as of October 31, 2017.
4. SECURITIES TRANSACTIONS
The cost of purchases and proceeds from sales of securities (excluding short term securities) during the six months ended October 31, 2017 were as follows:
| Fund | Purchases of Securities | Proceeds From Sales of Securities | ||||||
| Grandeur Peak Emerging Markets Opportunities Fund | $ | 79,065,805 | $ | 67,978,565 | ||||
| Grandeur Peak Global Micro Cap Fund | 8,513,517 | 8,260,282 | ||||||
| Grandeur Peak Global Opportunities Fund | 86,941,413 | 125,855,802 | ||||||
| Grandeur Peak Global Reach Fund | 68,040,798 | 70,478,947 | ||||||
| Grandeur Peak Global Stalwarts Fund | 32,413,815 | 17,811,619 | ||||||
| Grandeur Peak International Opportunities Fund | 82,530,364 | 122,645,086 | ||||||
| Grandeur Peak International Stalwarts Fund | 106,792,646 | 35,820,614 | ||||||
5. SHARES OF BENEFICIAL INTEREST
The capitalization of the Trust consists of an unlimited number of shares of beneficial interest with no par value per share. Holders of the shares of the Funds of the Trust have one vote for each share held and a proportionate fraction of a vote for each fractional share. All shares issued and outstanding are fully paid and are transferable and redeemable at the option of the shareholder. Purchasers of the share do not have any obligation to make payments to the Trust or its creditors solely by reason of the purchasers’ ownership of the shares. Shares have no pre-emptive rights.
Shares redeemed within 60 days of purchase may incur a 2% short-term redemption fee deducted from the redemption amount. For the six months ended October 31, 2017 and the year ended April 30, 2017, the redemption fees charged by the Funds are presented in the Statements of Changes in Net Assets.
6. MANAGEMENT AND RELATED-PARTY TRANSACTIONS
The Adviser, subject to the authority of the Board, is responsible for the overall management and administration of the Funds’ business affairs. The Adviser manages the investments of the Funds in accordance with the Funds’ investment objective, policies and limitations and investment guidelines established jointly by the Adviser and the Trustees. Pursuant to the Advisory Agreement, (the “Advisory Agreement”), each Fund pays the Adviser an annual management fee based on each Fund’s average daily net assets. The management fee is paid on a monthly basis. The following table reflects the Funds’ advisory fee rates.
| Fund | Advisory Fee |
| Grandeur Peak Emerging Markets Opportunities Fund | 1.35% |
| Grandeur Peak Global Micro Cap Fund | 1.50% |
| Grandeur Peak Global Opportunities Fund | 1.25% |
| Grandeur Peak Global Reach Fund | 1.10% |
| Grandeur Peak Global Stalwarts Fund | 0.80% |
| Grandeur Peak International Opportunities Fund | 1.25% |
| Grandeur Peak International Stalwarts Fund | 0.80% |
| 92 | 1.855.377.7325 | www.GrandeurPeakGlobal.com |
| Grandeur Peak Funds® | Notes to Financial Statements |
October 31, 2017 (Unaudited)
The Adviser has contractually agreed to limit certain of each Fund’s expenses. The following table reflects the Funds’ expense cap.
| Fund | Expense Cap | Term of Expense Limit Agreements |
| Grandeur Peak Emerging Markets Opportunities Fund | ||
| Investor Class | 1.95% | September 1, 2016 – August 31, 2017 / |
| Institutional Class | 1.70% | September 1, 2017 – August 31, 2018 |
| Grandeur Peak Global Micro Cap Fund | ||
| Institutional Class | 2.00% | September 1, 2016 – August 31, 2017 / |
| September 1, 2017 – August 31, 2018 | ||
| Grandeur Peak Global Opportunities Fund | ||
| Investor Class | 1.75% | September 1, 2016 – August 31, 2017 / |
| Institutional Class | 1.50% | September 1, 2017 – August 31, 2018 |
| Grandeur Peak Global Reach Fund | ||
| Investor Class | 1.60% | September 1, 2016 – August 31, 2017 / |
| Institutional Class | 1.35% | September 1, 2017 – August 31, 2018 |
| Grandeur Peak Global Stalwarts Fund | ||
| Investor Class | 1.35% | September 1, 2016 – August 31, 2017 / |
| Institutional Class | 1.10% | September 1, 2017 – August 31, 2018 |
| Grandeur Peak International Opportunities Fund | ||
| Investor Class | 1.75% | September 1, 2016 – August 31, 2017 / |
| Institutional Class | 1.50% | September 1, 2017 – August 31, 2018 |
| Grandeur Peak International Stalwarts Fund | ||
| Investor Class | 1.35% | September 1, 2016 – August 31, 2017 / |
| Institutional Class | 1.10% | September 1, 2017 – August 31, 2018 |
Pursuant to these agreements, each Fund will reimburse the Adviser for any previous fee waivers and expense reimbursements made by the Adviser, provided that any such reimbursements made by the Funds to the Adviser will not cause the Funds’ expense limitation to exceed expense limitations in existence at the time the expense was incurred, or at the time of the reimbursement, whichever is lower, and the reimbursement is made within three years after the expenses were incurred. Fees waived/reimbursed by adviser for the six months ended October 31, 2017 are disclosed in the Statements of Operations.
In addition to the foregoing contractual arrangements, the Adviser has voluntarily agreed, effective September 1, 2016, to waive, with respect to the Grandeur Peak Global Opportunities Fund and the Grandeur Peak International Opportunities Fund only, annual management fees to the extent such fees exceed 1.10% on assets above $500 million in such Fund. This voluntary arrangement is not entitled to recoupment and may be terminated at any time by the Adviser.
| Semi-Annual Report | October 31, 2017 | 93 |
| Grandeur Peak Funds® | Notes to Financial Statements |
October 31, 2017 (Unaudited)
For the six months ended October 31, 2017, the fee waivers/reimbursements and/or recoupments were as follows:
| Fund | Fees Waived/Reimbursed By Adviser | Recoupment of Previously Waived Fees By Adviser | ||||||
| Grandeur Peak Emerging Markets Opportunities Fund | ||||||||
| Investor Class | $ | – | $ | – | ||||
| Institutional Class | – | – | ||||||
| Grandeur Peak Global Micro Cap Fund | ||||||||
| Institutional Class | 11,245 | – | ||||||
| Grandeur Peak Global Opportunities Fund | ||||||||
| Investor Class | $ | – | $ | – | ||||
| Institutional Class | – | – | ||||||
| Grandeur Peak Global Reach Fund | ||||||||
| Investor Class | $ | – | $ | – | ||||
| Institutional Class | – | – | ||||||
| Grandeur Peak Global Stalwarts Fund | ||||||||
| Investor Class | $ | – | $ | 28,442 | ||||
| Institutional Class | – | 22,256 | ||||||
| Grandeur Peak International Opportunities Fund | ||||||||
| Investor Class | $ | – | $ | – | ||||
| Institutional Class | – | – | ||||||
| Grandeur Peak International Stalwarts Fund | ||||||||
| Investor Class | $ | – | $ | – | ||||
| Institutional Class | – | – | ||||||
As of October 31, 2017, the balances of recoupable expenses for each Fund were as follows:
| Fund | Expires 2019 | Expires 2020 | Expires 2021 | Total | ||||||||||||
| Grandeur Peak Emerging Markets Opportunities Fund | ||||||||||||||||
| Investor Class | $ | – | $ | – | $ | – | $ | – | ||||||||
| Institutional Class | – | – | – | – | ||||||||||||
| Grandeur Peak Global Micro Cap Fund | ||||||||||||||||
| Institutional Class | $ | 44,561 | $ | 54,685 | $ | 11,245 | $ | 110,491 | ||||||||
| Grandeur Peak Global Opportunities Fund | ||||||||||||||||
| Investor Class | $ | – | $ | – | $ | – | $ | – | ||||||||
| Institutional Class | – | – | – | – | ||||||||||||
| Grandeur Peak Global Reach Fund | ||||||||||||||||
| Investor Class | $ | – | $ | – | $ | – | $ | – | ||||||||
| Institutional Class | – | – | – | – | ||||||||||||
| Grandeur Peak Global Stalwarts Fund | ||||||||||||||||
| Investor Class | $ | 28,320 | $ | 23,105 | $ | – | $ | 51,425 | ||||||||
| Institutional Class | 33,133 | 22,190 | – | 55,323 | ||||||||||||
| Grandeur Peak International Opportunities Fund | ||||||||||||||||
| Investor Class | $ | – | $ | – | $ | – | $ | – | ||||||||
| Institutional Class | – | – | – | – | ||||||||||||
| Grandeur Peak International Stalwarts Fund | ||||||||||||||||
| Investor Class | $ | – | $ | – | $ | – | $ | – | ||||||||
| Institutional Class | – | – | – | – | ||||||||||||
| 94 | 1.855.377.7325 | www.GrandeurPeakGlobal.com |
| Grandeur Peak Funds® | Notes to Financial Statements |
October 31, 2017 (Unaudited)
Administrator Fees and Expenses
ALPS Fund Services, Inc. (“ALPS”) serves as administrator to the Funds and the Funds have agreed to pay expenses incurred in connection with their administrative activities. Pursuant to an Administration Agreement, ALPS provides operational services to the Funds including, but not limited to, fund accounting and fund administration and generally assists in the Funds’ operations. Officers of the Trust are employees of ALPS. The Funds’ administration fee is accrued on a daily basis and paid monthly. Administration fees paid by the Funds for the six months ended October 31, 2017 are disclosed in the Statements of Operations.
ALPS is reimbursed by the Fund for certain out-of-pocket expenses.
Transfer Agent
ALPS serves as transfer, dividend paying and shareholder servicing agent for the Funds. ALPS receives an annual minimum fee, a fee based upon the number of shareholder accounts, and is also reimbursed by the Funds for certain out-of-pocket expenses. Transfer agent fees paid by the Funds for the six months ended October 31, 2017 are disclosed in the Statements of Operations.
Compliance Services
ALPS provides services that assist the Trust’s chief compliance officer in monitoring and testing the policies and procedures of the Trust in conjunction with requirements under Rule 38a-1 under the 1940 Act and receives an annual base fee. ALPS is reimbursed for certain out-of-pocket expenses by the Funds. Compliance service fees paid by the Funds for the six months ended October 31, 2017 are disclosed in the Statements of Operations.
Principal Financial Officer
ALPS receives an annual fee for providing principal financial officer services to the Funds. Principal financial officer fees paid by the Fund for the six months ended October 31, 2017 are disclosed in the Statements of Operations.
Distributor: ALPS Distributors, Inc. (“ADI” or the “Distributor”) (an affiliate of ALPS) acts as the distributor of the Funds’ shares pursuant to a Distribution Agreement with the Trust. Shares are sold on a continuous basis by ADI as agent for the Funds, and ADI has agreed to use its best efforts to solicit orders for the sale of each Fund’s shares, although it is not obliged to sell any particular amount of shares. ADI is not entitled to any compensation for its services as Distributor. ADI is registered as a broker-dealer with the U.S. Securities and Exchange Commission.
Each Fund has adopted a Distribution and Services (Rule 12b-1) Plan pursuant to Rule 12b-1 of the 1940 Act (the “Plan”) for its Investor Class shares. The Plan allows the Funds to use Investor Class assets to pay fees in connection with the distribution and marketing of Investor Class shares and/or the provision of shareholder services to Investor Class shareholders. The Plan permits payment for services in connection with the administration of plans or programs that use Investor Class shares of each Fund as their funding medium and for related expenses. The recipients of such payments may include the Distributor, other affiliates of the Adviser, broker-dealers, financial institutions, plan sponsors and administrators and other financial intermediaries through which investors may purchase shares of the Fund. The Plan permits the Funds to make total payments at an annual rate of up to 0.25% of each Fund’s average daily net assets attributable to its Investor Class shares. The expenses of the Plan are reflected as distribution and service fees in the Statements of Operations.
7. INDEMNIFICATIONS
Under the Trust’s organizational documents, its officers and Trustees are indemnified against certain liability arising out of the performance of their duties to the Trust. Additionally, in the normal course of business, the Trust enters into contracts with service providers that may contain general indemnification clauses, which may permit indemnification to the extent permissible under applicable law. The Trust’s maximum exposure under these arrangements is unknown, as this would involve future claims that may be made against the Trust that have not yet occurred.
| Semi-Annual Report | October 31, 2017 | 95 |
| Grandeur Peak Funds® | Disclosure Regarding Approval of Fund Advisory Agreement |
On September 12, 2017, the Trustees met in person to discuss, among other things, the renewal of the investment advisory agreement between the Trust, with respect to the Grandeur Peak Global Opportunities Fund (“Global Opportunities Fund”), Grandeur Peak International Opportunities Fund (“Global International Fund”), Grandeur Peak Global Reach Fund (“Global Reach Fund”), Grandeur Peak Emerging Markets Opportunities Fund (“Emerging Markets Opportunities Fund”), Grandeur Peak Global Stalwarts Fund (“Global Stalwart Fund”), Grandeur Peak International Stalwarts Fund (“International Stalwart Fund”), and Grandeur Peak Global Micro Cap Fund (“Micro Cap Fund”) (collectively, the “Grandeur Peak Funds”), and Grandeur Peak Global Advisors, LLC (“Grandeur Peak”) (the “Investment Advisory Agreement”), in accordance with Section 15(c) of the 1940 Act. The Independent Trustees met with independent legal counsel during executive session and discussed the Investment Advisory Agreement and other related materials. In renewing and approving the Investment Advisory Agreement, the Trustees, including the Independent Trustees, considered the following factors:
Investment Advisory Fee Rate: The Trustees reviewed and considered the contractual annual advisory fees paid by the Trust, on behalf of the Grandeur Peak Funds, to Grandeur Peak, of 1.25% of the Grandeur Peak Global Opportunities Fund’s and Grandeur Peak International Opportunities Fund’s daily net assets, 1.10% of the Grandeur Peak Global Reach Fund’s daily net assets, 1.35% of the Grandeur Peak Emerging Markets Opportunities Fund’s daily net assets, 0.80% of the Grandeur Peak Global Stalwarts Fund’s and Grandeur Peak International Stalwarts Fund’s daily net assets, and 1.50% of the Grandeur Peak Global Micro Cap Fund’s daily net assets, in light of the extent and quality of the advisory services provided by Grandeur Peak to each of the Grandeur Peak Funds.
The Board received and considered information including a comparison of each Grandeur Peak Fund’s contractual advisory fee rate with those of funds in the expense group and universe of funds provided by an independent provider of investment company data (the “Data Provider”). The Trustees noted that the contractual advisory fee rate of each class of each of the Grandeur Peak Funds was above the Data Provider peer group median, except for each class of the Grandeur Peak Global Stalwarts Fund and each class of the Grandeur Peak International Stalwarts Fund.
Total Expense Ratios: The Trustees further reviewed and considered that the total expense ratio (after waivers) of each class of each of the Grandeur Peak Funds was above the Data Provider peer group median, except for the Investor Class of the Grandeur Peak Emerging Markets Opportunities Fund and both classes of the Grandeur Peak Global Stalwarts Fund and Grandeur Peak International Stalwarts Fund.
Nature, Extent, and Quality of the Services under the Investment Advisory Agreement: The Trustees received and considered information regarding the nature, extent, and quality of services provided to the Grandeur Peak Funds under the Investment Advisory Agreement. The Trustees reviewed certain background materials supplied by Grandeur Peak in its presentation, including its Form ADV.
The Trustees reviewed and considered Grandeur Peak’s investment advisory personnel, its history as an asset manager, and its performance and the amount of assets currently under management by Grandeur Peak and its affiliated entities. The Trustees also reviewed the research and decision-making processes utilized by Grandeur Peak, including the methods adopted to seek to achieve compliance with the investment objectives, policies, and restrictions of the Grandeur Peak Funds.
The Trustees considered the background and experience of Grandeur Peak’s management in connection with the Grandeur Peak Funds, including reviewing the qualifications, backgrounds, and responsibilities of the management team primarily responsible for the day-to-day portfolio management of each Grandeur Peak Fund and the extent of the resources devoted to research and analysis of actual and potential investments.
The Trustees also reviewed, among other things, Grandeur Peak’s insider trading policies and procedures and its Code of Ethics.
Performance: The Trustees reviewed performance information for the Grandeur Peak Funds for the 3-month, 1-year, 3-year, and 5-year periods, as applicable, ended June 30, 2017. That review included a comparison of each Grandeur Peak Fund’s performance to the performance of a group of comparable funds selected by the Data Provider. The Trustees noted that the performance of both classes of the Grandeur Peak Emerging Markets Opportunities Fund was below the Data Provider peer group median for the 3-month and 1-year periods and above the Data Provider peer group median for the 3-year period, the performance of the Institutional Class of the Grandeur Peak Global Micro Cap Fund was above the Data Provider peer group median for the 3-month and 1-year periods, the performance of both classes of the Grandeur Peak Global Opportunities Fund was above the Data Provider peer group median for the 3-month, 1-year, 3-year, and 5-year periods, the performance of both classes of the Grandeur Peak Global Reach Fund was above the Data Provider peer group median for the 3-month, 1-year, and 3-year periods, the performance of both classes of the Grandeur Peak Global Stalwarts Fund was above the Data Provider peer group median for the 3-month period and below the Data Provider peer group median for the 1-year period, the performance of both classes of the Grandeur Peak International Opportunities Fund was below the Data Provider peer group median for the 3-month period and above the Data Provider peer group median for the 1-year, 3-year and 5-year periods, and the performance of both classes of the Grandeur Peak International Stalwarts Fund was below the Data Provider peer group median for the 3-month and 1-year periods. The Trustees also considered Grandeur Peak’s discussion of its reputation generally and its investment techniques, risk management controls, and decision-making processes.
| 96 | 1.855.377.7325 | www.GrandeurPeakGlobal.com |
| Grandeur Peak Funds® | Disclosure Regarding Approval of Fund Advisory Agreement |
Comparable Accounts: The Trustees noted certain information provided by Grandeur Peak regarding fees charged to its other clients utilizing a strategy similar to that employed by the Grandeur Peak Funds.
Profitability: The Trustees received and considered a retrospective and projected profitability analysis prepared by Grandeur Peak based on the fees payable under the Investment Advisory Agreement with respect to the Grandeur Peak Funds. The Trustees considered the profits, if any, anticipated to be realized by Grandeur Peak in connection with the operation of the Grandeur Peak Funds. The Board then reviewed Grandeur Peak’s income statement and balance sheet for the years ended December 31, 2011 through December 31, 2016 in order to analyze the financial condition, stability, and profitability of Grandeur Peak.
Economies of Scale: The Trustees considered whether economies of scale in the provision of services to the Grandeur Peak Funds will be passed along to the shareholders under the proposed agreements.
Other Benefits to the Adviser: The Trustees reviewed and considered any other incidental benefits derived or to be derived by Grandeur Peak from its relationship with the Grandeur Peak Funds, including whether soft dollar arrangements were used.
In renewing Grandeur Peak as the Grandeur Peak Funds’ investment adviser and renewing the Investment Advisory Agreement and the fees charged under the Investment Advisory Agreement, the Trustees concluded that no single factor reviewed by the Trustees was identified by the Trustees to be determinative as the principal factor in whether to renew the Investment Advisory Agreement. Further, the Independent Trustees were advised by separate independent legal counsel throughout the process. The Trustees, including all of the Independent Trustees, concluded that:
| • | the contractual advisory fee rate of each class of each of the Grandeur Peak Funds was above the Data Provider peer group median, except for each class of the Grandeur Peak Global Stalwarts Fund and each class of the Grandeur Peak International Stalwarts Fund; |
| • | the total expense ratio (after waivers) of each class of each of the Grandeur Peak Funds was above the Data Provider peer group median, except for the Investor Class of Grandeur Peak Emerging Markets Opportunities Fund and both classes of Grandeur Peak Global Stalwarts Fund and Grandeur Peak International Stalwarts Fund; |
| • | the nature, extent and quality of services rendered by Grandeur Peak under the Investment Advisory Agreement with respect to each Grandeur Peak Fund were adequate; |
| • | for the period ended June 30, 2017, the performance of both classes of the Grandeur Peak Emerging Markets Opportunities Fund was below the Data Provider peer group median for the 3-month and 1-year periods and above the Data Provider peer group median for the 3-year period, the performance of the Institutional Class of the Grandeur Peak Global Micro Cap Fund was above the Data Provider peer group median for the 3-month and 1-year periods, the performance of both classes of the Grandeur Peak Global Opportunities Fund was above the Data Provider peer group median for the 3-month, 1-year, 3-year, and 5-year periods, the performance of both classes of the Grandeur Peak Global Reach Fund was above the Data Provider peer group median for the 3-month, 1-year, and 3-year periods, the performance of both classes of the Grandeur Peak Global Stalwarts Fund was above the Data Provider peer group median for the 3- month period and below the Data Provider peer group median for the 1-year period, the performance of both classes of the Grandeur Peak International Opportunities Fund was below the Data Provider peer group median for the 3-month period and above the Data Provider peer group median for the 1-year, 3-year and 5-year periods, and the performance of both classes of the Grandeur Peak International Stalwarts Fund was below the Data Provider peer group median for the 3-month and 1-year periods; |
| • | bearing in mind the limitations of comparing different types of managed accounts and the different levels of service typically associated with such accounts, the fee structures applicable to Grandeur Peak’s other clients employing a comparable strategy to any of the Grandeur Peak Funds was not indicative of any unreasonableness with respect to the advisory fee payable by the Grandeur Peak Funds; |
| • | the profit, if any, realized by Grandeur Peak in connection with the operation of any of the Grandeur Peak Funds is not unreasonable to such Fund; and |
| • | there were no material economies of scale or other incidental benefits accruing to Grandeur Peak in connection with its relationship with any of the Grandeur Peak Funds. |
Based on the Trustees’ deliberations and their evaluation of the information described above, the Trustees, including all of the Independent Trustees, concluded that Grandeur Peak’s compensation for investment advisory services is consistent with the best interests of each of the Grandeur Peak Funds and their shareholders.
| Semi-Annual Report | October 31, 2017 | 97 |
| Grandeur Peak Funds® | Additional Information |
October 31, 2017 (Unaudited)
1. FUND HOLDINGS
The Funds file their complete schedule of portfolio holdings with the Securities and Exchange Commission (the “SEC”) for the first and third quarters of each fiscal year on Form N-Q within 60 days after the end of the period. Copies of the Funds’ Form N-Q are available without charge on the SEC website at http://www.sec.gov. You may also review and copy the Form N-Q at the SEC’s Public Reference Room in Washington, DC. For more information about the operation of the Public Reference Room, please call the SEC at 1-800-SEC-0330.
2. FUND PROXY VOTING POLICIES, PROCEDURES AND SUMMARIES
The Funds’ policies and procedures used in determining how to vote proxies and information regarding how the Funds voted proxies relating to portfolio securities during the most recent prior 12-month period ending June 30 are available without charge, (1) upon request, by calling (toll-free) 855-377-PEAK(7325) and (2) on the SEC’s website at http://www.sec.gov.
| 98 | 1.855.377.7325 | www.GrandeurPeakGlobal.com |
Intentionally Left Blank.

Contact Us
| Mail: | Grandeur Peak Funds, P.O. Box 13664, Denver, CO 80201 | E-Mail: | grandeurpeakglobal@alpsinc.com |
| Phone: | 1.855.377.PEAK (7325) | Web: | www.GrandeurPeakGlobal.com |
SEMI-ANNUAL October 31, 2017
Class I RMRGX
| Highland Resolute Fund | Table of Contents |
| PAGE | |
| Shareholder Letter | 2 |
| Performance Update | 7 |
| Consolidated Disclosure of Fund Expenses | 9 |
| Consolidated Schedule of Investments | 10 |
| Consolidated Statement of Assets and Liabilities | 37 |
| Consolidated Statement of Operations | 38 |
| Consolidated Statements of Changes in Net Assets | 39 |
| Consolidated Financial Highlights | 40 |
| Notes to Consolidated Financial Statements | 41 |
| Additional Information | 51 |
| 1
| Highland Resolute Fund | Shareholder Letter |
October 31, 2017 (Unaudited)
PERFORMANCE:
October 31, 2017
The Highland Resolute Fund outperformed the HFRX Global Index(1) by approximately 50 basis points(2) over the twelve months ending October 31, 2017. The Fund historically has strong up market capture with down market capture in line with the index. Since inception, the Fund has outperformed the HFRX Global Index by over 200 basis points annualized. This is due primarily to a higher level of net equity exposure than the benchmark to be able to keep up with strong equity markets.
When compared to the peer group (Morningstar Multi-Alternative Universe(3)), the Fund has outperformed the Universe over all time periods – by about 190 basis points during the past twelve months and 230 basis points annualized since inception. As with the HFRX Global Index, the Universe is very diverse and contains a number of market-neutral and other low net equity strategies that cause the average net equity exposure for the Universe to be considerably less than our Fund. So, we anticipate outperforming the Universe in up markets and underperforming in down markets - recent performance has been consistent with our expectations.
Long/Short Managers – Long/Short equity managers outperformed the HFRX Equity Hedge Index(4) in a period of steady growth and low volatility in global equities. Impala and Incline performed the best in the Long/Short book having significantly outperformed the index. Boston Partners slightly outperformed the index while Dalton posted negative absolute returns for the period.
Macro – The sole Macro manager, Brevan Howard, has slightly outperformed the HFRX Macro Index(5) over the last 12 months. Long positions in consumer and financial sectors were accretive from a sector perspective. However, the lack of meaningful participation in European equity markets slightly offset the outperformance. The systematic macro fund strives to take advantage of relative value differentials globally. This sector is a small allocation and is held as a risk-off return contributor.
Credit/GTAA – Chatham materially outperformed the HFRX Fixed Income – Credit Index(6) over the past 12 months. Long positions in special situations have largely driven performance, as well as select media positions.
Relative Value – The Relative Value sleeve underperformed the HFRX Relative Value Arbitrage Index(7) over the past 12 months. Slight outperformance from Weiss Alpha Balanced was largely due to the equity and bond sleeves of the fund. However, negative absolute returns from Clinton offset outperformance.
Event Driven – The absolute return oriented manager AQR Multi-Strategy performed roughly in-line with the HFRX Absolute Return Index(8) over the past 12 months with mixed returns from the nine different strategy groups. The event driven manager outperformed its index largely due to special situations and merger arbitrage positions.
2
| Highland Resolute Fund | Shareholder Letter |
October 31, 2017 (Unaudited)
HIGHLAND RESOLUTE FUND
Table 1 notes the performance for the Fund as of quarter end under standard reporting (since inception) as well as of October 31st.
Table 1 (1)(2)(3)(9)(10)
Performance (amounts greater than one year are annualized)
Standardized Performance Data as of September 30, 2017 | Non-Standardized Performance Data as of October 31, 2017 | |||||||||||||||||||
| YTD | 1-Year | 3-Year | 5-Year | Since Inception (12/30/11) | YTD | 1-Year | 3-Year | 5-Year | Since Inception (12/30/11) | |||||||||||
| Highland Resolute Fund - Class I NAV | 5.60% | 6.20% | 3.00% | 3.90% | 4.20% | 6.43% | 7.52% | 3.44% | 4.30% | 4.25% | ||||||||||
| Morningstar Multi- Alternative Universe | 3.87% | 3.95% | 0.81% | 1.40% | 1.77% | 4.76% | 5.61% | 1.22% | 1.69% | 1.90% | ||||||||||
| HFRX Global Index | 4.43% | 5.64% | 0.45% | 0.40% | 2.19% | 5.15% | 6.98% | 1.13% | 2.20% | 2.28% | ||||||||||
| S&P 500 Index | 14.24% | 18.61% | 10.81% | 14.22% | 15.27% | 16.91% | 23.63% | 10.77% | 15.20% | 15.49% | ||||||||||
| Gross Expense Ratio | Less Expense Waivers | Net Expense Ratio | Net Ratio ex Dividend & Short Expense | |||||
| Highland Resolute Fund - Class I NAV | 2.33% | -1.25% | 1.08% | 0.98% |
Performance data quoted represents past performance. Past performance does not guarantee future results. Investment return and principal value of an investment will fluctuate so that an investor’s shares, when sold or redeemed, may be worth more or less than the original cost. Current performance data may be higher or lower than actual data quoted. For the most current month-end performance data please call 1-855-268-2242.
The Fund has a redemption fee of 2.00% for shares redeemed within the first 90 days of purchase. Performance shown at NAV does not include these sales charges and would have been lower had it been taken into account.
The Adviser has agreed to waive the portion of its 1.50% Management Fee in excess of any sub-advisory fees paid by the Adviser to sub-advisors in connection with the Fund (“Sub-Advisory Fees”). This agreement (the “Expense Agreement”) is in effect through August 31, 2018. The Adviser may not discontinue this agreement to waive fees prior to August 31, 2018 without the approval by the Fund’s Board of Trustees.
Net Ratio ex Dividend & Short Expense is the Net Expense Ratio less any Dividend and Interest Expense on Securities Sold Short
Portfolio Changes:
There were a few manager changes during the period in the Credit/GTAA bucket. FPA Crescent Fund was liquidated to reduce the GTAA exposure, and Pinebridge GDAA was terminated as of July 31. Chatham was added as a new Credit strategy.
Closing:
We continue to add value both in our allocation and manager selection decisions. The changes outlined above should continue to provide additional value going forward. We appreciate your investment in our Highland Resolute Fund, please feel free to contact us with any questions.
Sincerely,

R. Scott Graham, CFA & Michael T. Lytle, CFA
Portfolio Managers(11)
| Semi-Annual Report | October 31, 2017 | 3 |
| Highland Resolute Fund | Shareholder Letter |
October 31, 2017 (Unaudited)
Underlying Allocation Weights:
Figure 1 lists the long-term target asset allocation for the Fund as well as the allocation as of October 31, 2017.
| Target Asset Allocation | October 31, 2017 Allocation |
 |  |
Holdings and allocations subject to change and may not reflect the current or future position of the portfolio.
4
| Highland Resolute Fund | Shareholder Letter |
October 31, 2017 (Unaudited)
IMPORTANT NOTES AND DISCLOSURES
Past performance does not guarantee future results.
Fund prices fluctuate as the underlying assets have exposure to market fluctuations and other risks, as described in the Fund’s prospectus. Please call 1-855-268-2242 to obtain current performance information and for the current prospectus and statement of additional information. This material must be preceded or accompanied by a prospectus. Please read the prospectus carefully before investing.
The views of Highland Associates, Inc. and the information discussed in this commentary are as of the date of publication, are subject to change, and may not reflect the writers’ current views. The views expressed are those of the Fund’s adviser only, and represent an assessment of market conditions at a specific point in time, are opinions only and should not be relied upon as investment advice regarding a particular investment or markets in general. Such information does not constitute a recommendation to buy or sell specific securities or investment vehicles. It should not be assumed that any investment will be profitable or will equal the performance of the portfolios or any securities or any sectors mentioned in this letter. The subject matter contained in this letter has been derived from several sources believed to be reliable and accurate at the time of compilation. Neither Highland Associates, Inc. nor the Fund accepts any liability for losses either direct or consequential caused by the use of this information.
The Highland Resolute Fund is distributed by ALPS Distributors, Inc.
The Fund is subject to investment risks, including possible loss of the principal amount invested and therefore is not suitable for all investors. The Fund may not achieve its objectives.
Diversification does not eliminate the risk of experiencing investment losses.
RISKS:
The Fund’s strategy may expose it to the risks of investments in Swap Contracts and Other Investment Companies. These risks include, but are not limited to higher expenses, allocation risk, underlying fund risk, transparency risk, and underlying fund managed portfolio risk. Investments which focus on alternative strategies are subject to increased risk and loss of principal and are not suitable for all investors. Swap Risk involves swap agreements and are subject to counterparty default risk and may not perform as intended. Derivatives Risk involves the exercise of skill and judgment. Derivatives may expire worthless or not perform as expected. Equity risk may cause the value of the securities held by the Fund to fall due to general market and economic conditions, perceptions regarding the industries in which the issuers of securities held by the Fund participate, or factors relating to specific companies in which the Fund invest.
The Fund’s investments in non-U.S. issuers may be even more volatile and may present more risks than investments in U.S. issuers.
Commodity Risk may subject the Funds to greater volatility than traditional investments because of global supply and demand, changes in interest rates, commodity index volatility, and factors affecting a particular industry or commodity. Commodity-linked investments may not move in the same direction and to the same extent as the underlying commodities.
| (1) | The HFRX Global Index is designed to be representative of the overall composition of the hedge fund universe, and includes convertible arbitrage, distressed securities, equity hedge, equity market neutral, event driven, macro, merger arbitrage, and relative value strategies. The index returns are updated periodically and are subject to change. The returns were accurate as of the date of this publication. Investors cannot invest directly in an index. |
| (2) | Basis point is a common unit of measure for interest rates and other percentages in finance. One basis point is equal to 1/100th of 1% or 0.01%(.0001). |
| (3) | The Morningstar Multi-Alternative Universe is designed to represent the exposure to alternative investment tactics. Funds in this category have the majority of their assets exposed to alternative strategies. An investor’s exposure to different tactics may change slightly over time in response to market movements. Funds in this category include both funds with static allocations to alternative strategies and funds tactically allocating among alternative strategies and asset classes. The gross short exposure is greater than 20%. |
| (4) | The HFRX Equity Hedge Index is designed to be representative of a subset of the overall composition of the hedge fund universe. Equity Hedge strategies maintain positions both long and short in primarily equity and equity derivative securities. The index returns are updated periodically and are subject to change. The returns were accurate as of the date of this publication. The index figures do not reflect any fees, expense, or taxes. Investors cannot invest directly in an index. |
| (5) | The HFRX Macro Index is designed to be representative of a subset of the overall composition of the hedge fund universe. Macro strategy managers trade a broad range of strategies in which the investment process is predicated on movements in underlying economic variables and the impact these have on equity, fixed income, hard currency and commodity markets. Managers employ a variety of techniques, both discretionary and systematic analysis, combinations of top down and bottom up theses, quantitative and fundamental approaches and long and short term holding periods. The index returns are updated periodically and are subject to change. The returns were accurate as of the date of this publication. The index figures do not reflect any fees, expense, or taxes. Investors cannot invest directly in an index. |
| (6) | The HFRX Fixed Income - Credit Index is designed to be representative of a subset of the overall composition of the hedge fund universe. It includes strategies with exposure to credit across a broad continuum of credit sub-strategies, including Corporate, Sovereign, Distressed, |
| Semi-Annual Report | October 31, 2017 | 5 |
| Highland Resolute Fund | Shareholder Letter |
October 31, 2017 (Unaudited)
Convertible, Asset Backed, Capital Structure Arbitrage, Multi-Strategy and other Relative Value and Event Driven sub-strategies. The index returns are updated periodically and are subject to change. The returns were accurate as of the date of this publication. The index figures do not reflect any fees, expense, or taxes. Investors cannot invest directly in an index.
| (7) | The HFRX Relative Value Arbitrage Index is designed to be representative of a subset of the overall composition of the hedge fund universe. Relative Value investment managers who maintain positions in which the investment thesis is predicated on realization of a valuation discrepancy in the relationship between multiple securities. Managers employ a variety of fundamental and quantitative techniques to establish investment theses, and security types range broadly across equity, fixed income, derivative or other security types. The index returns are updated periodically and are subject to change. The returns were accurate as of the date of this publication. The index figures do not reflect any fees, expense, or taxes. Investors cannot invest directly in an index. |
| (8) | The HFRX Absolute Return Index is designed to be representative of the overall composition of the hedge fund universe. It is comprised of all eligible hedge fund strategies; including but not limited to convertible arbitrage, distressed securities, equity hedge, equity market neutral, event driven, macro, merger arbitrage, and relative value arbitrage. The index returns are updated periodically and are subject to change. The returns were accurate as of the date of this publication. The index figures do not reflect any fees, expense, or taxes. Investors cannot invest directly in an index. |
| (9) | The S&P 500® Index is an unmanaged index of 500 common stocks chosen for market size, liquidity, and industry group representation. It is a market value weighted index. The S&P 500® Index figures do not reflect any fees, expenses, or taxes. Investors cannot invest directly in this index. |
| (10) | Highland Associates, Inc. has agreed to waive the portion of its 1.50% Management Fee in excess of any sub-advisory fees paid by the Adviser to sub-advisors in connection with the Redmont Resolute Fund. This agreement is in effect through August 31, 2018. The Adviser may not discontinue this agreement to waive fees without the approval by the Fund’s Board of Trustees. |
| (11) | R. Scott Graham and Michael T. Lytle are registered representatives of ALPS Distributors, Inc. CFA Institute Marks are trademarks owned by the CFA Institute. |
6
| Highland Resolute Fund | Performance Update |
October 31, 2017 (Unaudited)
Performance (for the period ended October 31, 2017)
Highland Resolute Fund
Cumulative Total Return (for the period ended October 31, 2017) | Year-to-Date | 1 Year | 3 Year | 5 Year | Since Inception* | Gross Ratio(a) | Net Ratio(a) | |||||||
| Highland Resolute Fund - Class I - NAV | 6.43% | 7.49% | 3.24% | 4.27% | 4.26% | 2.33% | 1.08% | |||||||
| S&P 500® Total Return Index | 16.91% | 23.63% | 10.77% | 15.18% | 15.48% | |||||||||
| Dow Jones U.S. Select Dividend Index | 10.06% | 16.82% | 10.59% | 14.47% | 14.27% | |||||||||
| HFRX Global Hedge Fund Index | 5.15% | 6.98% | 1.13% | 2.23% | 2.28% |
Performance data quoted represents past performance. Past performance does not guarantee future results. Investment return and principal value of an investment will fluctuate so that an investor’s shares, when sold or redeemed, may be worth more or less than the original cost. Current performance data may be higher or lower than actual data quoted. For the most current month-end performance data please call 1-855-268-2242.
The Fund has a redemption fee of 2.00% for shares redeemed within the first 90 days of purchase. Performance shown at NAV does not include these sales charges and would have been lower had it been taken into account.
The Adviser has agreed to waive the portion of its 1.50% Management Fee in excess of any sub-advisory fees paid by the Adviser to sub-advisors in connection with the Fund (“Sub-Advisory Fees”). This agreement (the “Expense Agreement”) is in effect through August 31, 2018. The Adviser may not discontinue this agreement to waive fees prior to August 31, 2018 without the approval by the Fund’s Board of Trustees.
| * | Fund inception date of 12/30/11. |
| (a) | Ratios as of the Prospectus dated August 31, 2017 and may differ from the ratios presented in the Financial Highlights. |
| (b) | The S&P 500® Index is the Standard & Poor’s composite index of 500 stocks, a widely recognized, unmanaged index of common stock prices. The index is not actively managed and does not reflect any deduction of fees, expenses or taxes. An investor may not invest directly in an index. |
| (c) | The Dow Jones U.S. Select Dividend Index represents the country’s top stocks by dividend yield, selected annually and subject to screening and buffering criteria. The index is not actively managed and does not reflect any deductions of fees, expenses or taxes. An investor may not invest directly in an index. |
| (d) | The HFRX Global Hedge Fund Index is designed to be representative of the overall composition of the hedge fund universe and includes convertible arbitrage, distressed securities, equity hedge, equity market neutral, event driven, macro, merger arbitrage and relative value strategies. The index returns are updated periodically and are subject to change. The returns were accurate as of the date of this publication. The index is not actively managed and does not reflect any deduction of fees, expenses or taxes. An investor may not invest directly in an index. |
The table does not reflect the deduction of taxes that a shareholder would pay on Fund distributions or the redemption of Fund shares.
Top Ten Holdings**
(for the period ended October 31, 2017)
| As a percentage of Net Assets | |
| PIMCO Short-Term Fund, Institutional Class | 24.74% |
| AQR Multi Strategy Alternative Fund, Class I | 14.85% |
| American Media, Inc. | 2.55% |
| Harland Clarke Holdings Corp. | 2.50% |
| Resolute Forest Products, Inc. | 2.32% |
| RR Donnelley & Sons Co. | 1.72% |
| Everi Payments, Inc. | 1.39% |
| Opal Acquisition, Inc. | 1.56% |
| iPayment, Inc. | 0.75% |
| Time, Inc. | 0.74% |
| Top Ten Holdings |
| ** | Holdings are subject to change, and may not reflect the current or future position of the portfolio. |
| Semi-Annual Report | October 31, 2017 | 7 |
| Highland Resolute Fund | Performance Update |
October 31, 2017 (Unaudited)
Performance of $10,000 Initial Investment (for the period ended October 31, 2017)
Comparison of change in value of a $10,000 investment
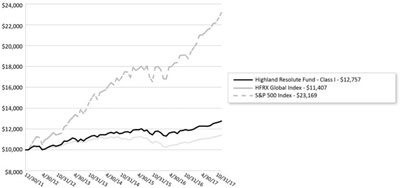
The chart represents historical performance of a hypothetical investment of $10,000 in the Fund since inception. Past performance does not guarantee future results. This chart does not reflect the deduction of taxes that a shareholder would pay on Fund distributions or the redemption of Fund shares.
Investing in the Fund is subject to investment risks, including possible loss of the principal amount invested.
| 8 |
| Highland Resolute Fund | Consolidated Disclosure of Fund Expenses |
October 31, 2017 (Unaudited)
As a shareholder of the Fund, you incur two types of costs: (1) transaction costs, including applicable sales charges (loads), redemption fees; and (2) ongoing costs, including management fees, distribution and service (12b-1) fees, shareholder services fees and other Fund operating expenses. This example is intended to help you understand your ongoing costs (in dollars) of investing in the Fund and to compare these costs with the ongoing costs of investing in other mutual funds.
This example is based on an investment of $1,000 invested at the beginning of the period and held for the six-month period of May 1, 2017 to October 31, 2017.
Actual Expenses. The first line of the table below provides information about actual account values and actual expenses. You may use the information in this line, together with the amount you invested to estimate the expenses that you paid over the period. Simply divide your account value by $1,000 (for example, an $8,600 account value divided by $1,000 = 8.6), then multiply the result by the number in the first line of the table below under the heading titled “Expenses Paid During Period” to estimate the expenses you paid on your account during this period.
Hypothetical Example for Comparison Purposes. The second line of the table below provides information about hypothetical account values and hypothetical expenses based on the Fund’s actual expense ratio and an assumed rate of return of 5% per year before expenses, which is not the Fund’s actual return. The hypothetical account values and expenses may not be used to estimate the actual ending account balance or expenses you paid for the period. You may use this information to compare the ongoing costs of investing in the Fund and other mutual funds. To do so, compare this 5% hypothetical example with the 5% hypothetical examples that appear in the shareholder reports of the other funds.
Please note that the expenses shown in the table below are meant to highlight your ongoing costs only and do not reflect any transactional costs, such as applicable sales charges (loads), redemption fees, or exchange fees. Therefore, the second line of the table below is useful in comparing ongoing costs only and will not help you determine the relative total costs of owning different funds. In addition, if these transactional costs were included, your costs would have been higher.
| Highland Resolute Fund | BEGINNING ACCOUNT VALUE
| ENDING ACCOUNT VALUE
| EXPENSE RATIO(a)
| EXPENSES PAID, 10/31/17(b)
|
| Class I | ||||
| Actual | $ 1,000.00 | $ 1,039.50 | 0.86% | $4.42 |
| Hypothetical (5% return before expenses) | $ 1,000.00 | $ 1,020.87 | 0.86% | $4.38 |
| (a) | Annualized, based on the Fund’s most recent fiscal half year expenses. |
| (b) | Expenses are equal to the Fund’s annualized expense ratio multiplied by the average account value over the period, multiplied by the number of days in the most recent fiscal half-year (181)/365 (to reflect the half-year period). |
| Semi-Annual Report | October 31, 2017 | 9 |
| Highland Resolute Fund | Consolidated Schedule of Investments |
October 31, 2017 (Unaudited)
| Description | Shares | Value (Note 2) | ||||||
| CLOSED END FUNDS (0.43%) | ||||||||
| Altaba, Inc.(a) | 23,538 | $ | 1,650,485 | |||||
| TOTAL CLOSED END FUNDS | ||||||||
| (Cost $1,386,291) | 1,650,485 | |||||||
| COMMON STOCKS (18.12%) | ||||||||
| ADVERTISING (0.05%) | ||||||||
| Omnicom Group, Inc. | 1,500 | 100,785 | ||||||
| The Interpublic Group of Cos., Inc. | 5,295 | 101,929 | ||||||
| 202,714 | ||||||||
| AEROSPACE & DEFENSE (0.64%) | ||||||||
| General Dynamics Corp.(b) | 1,839 | 373,280 | ||||||
| Harris Corp.(b) | 3,867 | 538,751 | ||||||
| L3 Technologies, Inc. | 829 | 155,172 | ||||||
| Lockheed Martin Corp.(b) | 1,124 | 346,372 | ||||||
| Northrop Grumman Corp.(b) | 804 | 237,606 | ||||||
| Raytheon Co.(b) | 2,142 | 385,988 | ||||||
| Spirit AeroSystems Holdings, Inc., Class A | 1,797 | 143,940 | ||||||
| United Technologies Corp.(b) | 2,136 | 255,807 | ||||||
| 2,436,916 | ||||||||
| AGRICULTURE (0.06%) | ||||||||
| Altria Group, Inc.(b) | 3,763 | 241,660 | ||||||
| AIRLINES (0.05%) | ||||||||
| Delta Air Lines, Inc.(b) | 2,566 | 128,377 | ||||||
| United Continental Holdings, Inc.(a)(b) | 926 | 54,152 | ||||||
| 182,529 | ||||||||
| AUTO MANUFACTURERS (0.04%) | ||||||||
| PACCAR, Inc. | 1,908 | 136,861 | ||||||
| AUTO PARTS & EQUIPMENT (0.11%) | ||||||||
| BorgWarner, Inc.(b) | 5,044 | 265,920 | ||||||
| Lear Corp. | 824 | 144,686 | ||||||
| 410,606 | ||||||||
| BANKS (1.13%) | ||||||||
| Bank of America Corp.(b) | 21,683 | 593,897 | ||||||
| BB&T Corp.(b) | 2,761 | 135,952 | ||||||
| Capital One Financial Corp.(b) | 1,518 | 139,929 | ||||||
| Citigroup, Inc.(b) | 7,765 | 570,728 | ||||||
| Citizens Financial Group, Inc. | 5,427 | 206,280 | ||||||
| East West Bancorp, Inc. | 2,732 | 163,484 | ||||||
| Fifth Third Bancorp(b) | 5,379 | 155,455 | ||||||
| Huntington Bancshares, Inc.(b) | 16,747 | 231,109 | ||||||
| JPMorgan Chase & Co.(b) | 5,017 | 504,760 | ||||||
| KeyCorp | 12,240 | 223,380 | ||||||
| Lloyds Banking Group PLC, ADR | 38,680 | 142,729 | ||||||
See Notes to Financial Statements.
10
| Highland Resolute Fund | Consolidated Schedule of Investments |
October 31, 2017 (Unaudited)
| Description | Shares | Value (Note 2) | ||||||
| BANKS (1.13%) (continued) | ||||||||
| Morgan Stanley | 1,298 | $ | 64,900 | |||||
| Regions Financial Corp. | 13,532 | 209,475 | ||||||
| State Street Corp.(b) | 1,528 | 140,576 | ||||||
| SunTrust Banks, Inc.(b) | 2,771 | 166,842 | ||||||
| The Goldman Sachs Group, Inc.(b) | 642 | 155,672 | ||||||
| U.S. Bancorp | 2,484 | 135,080 | ||||||
| Wells Fargo & Co.(b) | 7,177 | 402,917 | ||||||
| 4,343,165 | ||||||||
| BEVERAGES (0.13%) | ||||||||
| Coca-Cola European Partners PLC(b) | 6,490 | 265,182 | ||||||
| PepsiCo, Inc. | 2,031 | 223,877 | ||||||
| 489,059 | ||||||||
| BIOTECHNOLOGY (0.05%) | ||||||||
| Celgene Corp.(a) | 817 | 82,492 | ||||||
| Gilead Sciences, Inc. | 1,457 | 109,217 | ||||||
| 191,709 | ||||||||
| BUILDING MATERIALS (0.18%) | ||||||||
| Cemex SAB de CV, Sponsored ADR(a) | 24,384 | 197,754 | ||||||
| Masco Corp.(b) | 5,703 | 227,094 | ||||||
| Owens Corning(b) | 3,129 | 258,737 | ||||||
| 683,585 | ||||||||
| CHEMICALS (0.59%) | ||||||||
| Celanese Corp., Series A(b) | 2,075 | 216,443 | ||||||
| FMC Corp. | 1,450 | 134,647 | ||||||
| PPG Industries, Inc.(b) | 1,087 | 126,353 | ||||||
| PQ Group Holdings, Inc.(a) | 6,582 | 107,945 | ||||||
| The Sherwin-Williams Co.(b) | 3,831 | 1,513,820 | ||||||
| Versum Materials, Inc. | 3,902 | 164,196 | ||||||
| 2,263,404 | ||||||||
| COAL (0.02%) | ||||||||
| SunCoke Energy, Inc.(a) | 6,619 | 73,405 | ||||||
| COMMERCIAL SERVICES (1.55%) | ||||||||
| EVERTEC, Inc. | 5,515 | 82,725 | ||||||
| IHS Markit, Ltd.(a) | 8,675 | 369,642 | ||||||
| KAR Auction Services, Inc.(b) | 50,046 | 2,368,677 | ||||||
| PayPal Holdings, Inc.(a) | 1,432 | 103,906 | ||||||
| Robert Half International, Inc.(b) | 4,108 | 212,671 | ||||||
| S&P Global, Inc.(b) | 11,001 | 1,721,326 | ||||||
| Vantiv, Inc., Class A(a) | 15,505 | 1,085,350 | ||||||
| 5,944,297 | ||||||||
| COMPUTERS (0.43%) | ||||||||
| Amdocs, Ltd.(b) | 4,220 | 274,722 | ||||||
| Apple, Inc. | 1,382 | 233,613 | ||||||
| Dell Technologies, Inc., Class V(a) | 517 | 42,792 | ||||||
| DXC Technology Co.(b) | 5,617 | 514,068 | ||||||
See Notes to Financial Statements.
| Semi-Annual Report | October 31, 2017 | 11 |
| Highland Resolute Fund | Consolidated Schedule of Investments |
October 31, 2017 (Unaudited)
| Description | Shares | Value (Note 2) | ||||||
| COMPUTERS (0.43%) (continued) | ||||||||
| Hewlett Packard Enterprise Co.(b) | 18,328 | $ | 255,126 | |||||
| NetApp, Inc. | 7,260 | 322,489 | ||||||
| 1,642,810 | ||||||||
| CONTAINERS & PACKAGING (0.08%) | ||||||||
| WestRock Co.(b) | 4,855 | 297,757 | ||||||
| DISTRIBUTION & WHOLESALE (0.72%) | ||||||||
| Arrow Electronics, Inc.(a)(b) | 3,545 | 296,326 | ||||||
| LKQ Corp.(a)(b) | 65,701 | 2,476,271 | ||||||
| 2,772,597 | ||||||||
| DIVERSIFIED FINANCIAL SERVICES (0.68%) | ||||||||
| Air Lease Corp. | 1,665 | 72,344 | ||||||
| Alliance Data Systems Corp. | 923 | 206,503 | ||||||
| Discover Financial Services(b) | 4,813 | 320,209 | ||||||
| Intercontinental Exchange, Inc.(b) | 13,252 | 875,957 | ||||||
| Navient Corp.(b) | 11,012 | 137,209 | ||||||
| Raymond James Financial, Inc.(b) | 2,205 | 186,940 | ||||||
| SLM Corp.(a)(b) | 20,954 | 221,903 | ||||||
| Synchrony Financial(b) | 7,772 | 253,523 | ||||||
| TD Ameritrade Holding Corp.(b) | 3,218 | 160,868 | ||||||
| The Charles Schwab Corp. | 3,433 | 153,936 | ||||||
| 2,589,392 | ||||||||
| ELECTRIC (0.04%) | ||||||||
| AES Corp. | 16,257 | 172,812 | ||||||
| ELECTRICAL COMPONENTS & EQUIPMENT (0.10%) | ||||||||
| AMETEK, Inc.(b) | 3,780 | 255,112 | ||||||
| Belden, Inc. | 1,090 | 87,102 | ||||||
| EnerSys | 815 | 56,537 | ||||||
| 398,751 | ||||||||
| ELECTRONICS (0.30%) | ||||||||
| Flex, Ltd.(a)(b) | 23,544 | 419,083 | ||||||
| Honeywell International, Inc.(b) | 1,732 | 249,685 | ||||||
| Jabil, Inc.(b) | 2,300 | 65,044 | ||||||
| TE Connectivity, Ltd.(b) | 3,302 | 300,383 | ||||||
| Waters Corp.(a) | 600 | 117,630 | ||||||
| 1,151,825 | ||||||||
| ENGINEERING & CONSTRUCTION (0.03%) | ||||||||
| Tutor Perini Corp.(a) | 4,696 | 132,427 | ||||||
| ENTERTAINMENT (0.06%) | ||||||||
| Six Flags Entertainment Corp.(b) | 3,879 | 243,562 | ||||||
See Notes to Financial Statements.
12
| Highland Resolute Fund | Consolidated Schedule of Investments |
October 31, 2017 (Unaudited)
| Description | Shares | Value (Note 2) | ||||||
| FOOD (0.09%) | ||||||||
| Nomad Foods, Ltd.(a)(b) | 21,875 | $ | 330,313 | |||||
| HAND & MACHINE TOOLS (0.04%) | ||||||||
| Snap-on, Inc. | 960 | 151,469 | ||||||
| HEALTHCARE - SERVICES (0.26%) | ||||||||
| Anthem, Inc.(b) | 1,149 | 240,382 | ||||||
| Cigna Corp. | 905 | 178,484 | ||||||
| Laboratory Corp. of America Holdings(a)(b) | 1,369 | 210,429 | ||||||
| UnitedHealth Group, Inc.(b) | 873 | 183,522 | ||||||
| Universal Health Services, Inc., Class B | 1,634 | 167,812 | ||||||
| 980,629 | ||||||||
| HOUSEWARES (0.47%) | ||||||||
| Newell Brands, Inc.(b) | 44,216 | 1,803,128 | ||||||
| INSURANCE (0.56%) | ||||||||
| Alleghany Corp.(a) | 289 | 163,638 | ||||||
| American International Group, Inc. | 3,624 | 234,147 | ||||||
| Aon PLC(b) | 1,244 | 178,427 | ||||||
| Berkshire Hathaway, Inc., Class B(a)(b) | 1,347 | 251,808 | ||||||
| Chubb, Ltd.(b) | 1,770 | 266,951 | ||||||
| Marsh & McLennan Cos., Inc. | 2,241 | 181,364 | ||||||
| MetLife, Inc.(b) | 3,561 | 190,798 | ||||||
| The Allstate Corp.(b) | 2,379 | 223,293 | ||||||
| The Travelers Cos., Inc. | 1,084 | 143,576 | ||||||
| Validus Holdings, Ltd. | 3,145 | 163,792 | ||||||
| XL Group, Ltd. | 3,918 | 158,561 | ||||||
| 2,156,355 | ||||||||
| INTERNET (1.91%) | ||||||||
| Alibaba Group Holding, Ltd., Sponsored ADR(a)(b) | 4,511 | 834,039 | ||||||
| Alphabet, Inc., Class A(a)(b) | 3,250 | 3,357,380 | ||||||
| Alphabet, Inc., Class C(a) | 220 | 223,661 | ||||||
| Baidu, Inc., Sponsored ADR(a)(b) | 1,125 | 274,432 | ||||||
| CDW Corp.(b) | 2,294 | 160,580 | ||||||
| eBay, Inc.(a)(b) | 11,476 | 431,957 | ||||||
| The Priceline Group, Inc.(a)(b) | 856 | 1,636,638 | ||||||
| Yandex NV, Class A(a) | 2,645 | 89,480 | ||||||
| YY, Inc., ADR(a)(b) | 3,439 | 310,851 | ||||||
| 7,319,018 | ||||||||
| IRON & STEEL (0.05%) | ||||||||
| Steel Dynamics, Inc. | 5,245 | 195,166 | ||||||
| IT SERVICES (0.06%) | ||||||||
| Leidos Holdings, Inc.(b) | 3,509 | 219,384 | ||||||
See Notes to Financial Statements.
| Semi-Annual Report | October 31, 2017 | 13 |
| Highland Resolute Fund | Consolidated Schedule of Investments |
October 31, 2017 (Unaudited)
| Description | Shares | Value (Note 2) | ||||||
| LEISURE TIME (0.03%) | ||||||||
| Brunswick Corp.(b) | 2,303 | $ | 116,647 | |||||
| MACHINERY - DIVERSIFIED (0.04%) | ||||||||
| Cummins, Inc. | 840 | 148,579 | ||||||
| MEDIA (0.49%) | ||||||||
| CBS Corp., Class B(b) | 4,984 | 279,702 | ||||||
| Comcast Corp., Class A(b) | 11,648 | 419,677 | ||||||
| Liberty Global PLC, Class C(a)(b) | 11,675 | 348,966 | ||||||
| Liberty Global PLC LiLAC, Class C(a) | 3,577 | 78,694 | ||||||
| Time Warner, Inc.(b) | 4,482 | 440,536 | ||||||
| Twenty-First Century Fox, Inc., Class A(b) | 12,098 | 316,363 | ||||||
| 1,883,938 | ||||||||
| MISCELLANEOUS MANUFACTURING (0.30%) | ||||||||
| Eaton Corp. PLC(b) | 3,440 | 275,268 | ||||||
| General Electric Co. | 7,074 | 142,612 | ||||||
| Illinois Tool Works, Inc. | 1,271 | 198,937 | ||||||
| Textron, Inc.(b) | 7,039 | 371,237 | ||||||
| Trinseo SA | 2,062 | 146,402 | ||||||
| 1,134,456 | ||||||||
| OIL & GAS (0.85%) | ||||||||
| Anadarko Petroleum Corp. | 4,537 | 223,992 | ||||||
| Cabot Oil & Gas Corp. | 7,340 | 203,318 | ||||||
| Chevron Corp.(b) | 1,404 | 162,710 | ||||||
| Cimarex Energy Co.(b) | 1,092 | 127,687 | ||||||
| ConocoPhillips | 4,151 | 212,324 | ||||||
| Diamondback Energy, Inc.(a) | 3,256 | 348,913 | ||||||
| Energen Corp.(a)(b) | 2,521 | 130,336 | ||||||
| Enerplus Corp. | 10,382 | 95,203 | ||||||
| EQT Corp.(b) | 3,398 | 212,511 | ||||||
| Jagged Peak Energy, Inc.(a) | 10,843 | 150,609 | ||||||
| Kosmos Energy, Ltd.(a) | 7,508 | 57,661 | ||||||
| Marathon Petroleum Corp.(b) | 4,049 | 241,887 | ||||||
| Parsley Energy, Inc., Class A(a)(b) | 11,858 | 315,423 | ||||||
| Pioneer Natural Resources Co. | 1,508 | 225,702 | ||||||
| RSP Permian, Inc.(a)(b) | 8,771 | 301,810 | ||||||
| WildHorse Resource Development Corp.(a) | 5,391 | 70,137 | ||||||
| YPF SA, Sponsored ADR | 7,812 | 191,863 | ||||||
| 3,272,086 | ||||||||
| OIL & GAS SERVICES (0.02%) | ||||||||
| NCS Multistage Holdings, Inc.(a) | 4,129 | 89,930 | ||||||
| OIL, GAS & CONSUMABLE FUELS (0.07%) | ||||||||
| Andeavor(b) | 2,512 | 266,875 | ||||||
See Notes to Financial Statements.
14
| Highland Resolute Fund | Consolidated Schedule of Investments |
October 31, 2017 (Unaudited)
| Description | Shares | Value (Note 2) | ||||||
| PACKAGING & CONTAINERS (0.17%) | ||||||||
| Berry Global Group, Inc.(a)(b) | 2,802 | $ | 166,579 | |||||
| Crown Holdings, Inc.(a)(b) | 2,823 | 169,860 | ||||||
| Graphic Packaging Holding Co.(b) | 19,722 | 305,494 | ||||||
| 641,933 | ||||||||
| PHARMACEUTICALS (0.30%) | ||||||||
| Cardinal Health, Inc.(b) | 2,368 | 146,579 | ||||||
| Express Scripts Holding Co.(a) | 2,227 | 136,493 | ||||||
| Johnson & Johnson | 1,409 | 196,429 | ||||||
| Merck & Co., Inc.(b) | 6,628 | 365,137 | ||||||
| Pfizer, Inc. | 5,190 | 181,961 | ||||||
| Sanofi, ADR | 2,878 | 136,072 | ||||||
| 1,162,671 | ||||||||
| PIPELINES (0.05%) | ||||||||
| Targa Resources Corp. | 4,472 | 185,588 | ||||||
| RETAIL (1.72%) | ||||||||
| Alimentation Couche-Tard, Inc., Class B | 32,833 | 1,539,468 | ||||||
| CVS Health Corp.(b) | 2,949 | 202,095 | ||||||
| Liberty Interactive Corp. QVC Group, Class A(a)(b) | 10,867 | 246,898 | ||||||
| Lowe's Cos., Inc.(b) | 26,440 | 2,113,878 | ||||||
| The Home Depot, Inc. | 1,060 | 175,727 | ||||||
| The TJX Cos., Inc. | 2,169 | 151,396 | ||||||
| Yum! Brands, Inc.(b) | 28,975 | 2,157,189 | ||||||
| 6,586,651 | ||||||||
| SEMICONDUCTORS (0.38%) | ||||||||
| Broadcom, Ltd.(b) | 1,620 | 427,534 | ||||||
| KLA-Tencor Corp.(b) | 1,879 | 204,605 | ||||||
| Marvell Technology Group, Ltd.(b) | 15,481 | 285,934 | ||||||
| ON Semiconductor Corp.(a)(b) | 12,429 | 264,986 | ||||||
| Qorvo, Inc.(a) | 874 | 66,258 | ||||||
| Texas Instruments, Inc.(b) | 2,219 | 214,555 | ||||||
| 1,463,872 | ||||||||
| SHIPBUILDING (0.06%) | ||||||||
| Huntington Ingalls Industries, Inc. | 908 | 211,410 | ||||||
| SOFTWARE (2.25%) | ||||||||
| Activision Blizzard, Inc. | 2,083 | 136,415 | ||||||
| Broadridge Financial Solutions, Inc. | 4,701 | 403,910 | ||||||
| CDK Global, Inc. | 35,475 | 2,254,791 | ||||||
| Electronic Arts, Inc.(a)(b) | 1,340 | 160,264 | ||||||
| Fidelity National Information Services, Inc. | 21,126 | 1,959,648 | ||||||
| Micro Focus International PLC, Sponsored ADR(a)(b) | 2,517 | 87,919 | ||||||
| Microsoft Corp.(b) | 5,545 | 461,233 | ||||||
| NetEase, Inc., ADR(b) | 1,584 | 446,561 | ||||||
| Oracle Corp.(b) | 10,152 | 516,737 | ||||||
See Notes to Financial Statements.
| Semi-Annual Report | October 31, 2017 | 15 |
| Highland Resolute Fund | Consolidated Schedule of Investments |
October 31, 2017 (Unaudited)
| Description | Shares | Value (Note 2) | ||||||
| SOFTWARE (2.25%) (continued) | ||||||||
| SS&C Technologies Holdings, Inc.(b) | 54,614 | $ | 2,195,483 | |||||
| 8,622,961 | ||||||||
| SPECIAL CHEMICALS (0.04%) | ||||||||
| Valvoline, Inc. | 6,874 | 165,113 | ||||||
| TECHNOLOGY HARDWARE STORAGE & EQUIPMENT (0.06%) | ||||||||
| HP, Inc.(b) | 10,895 | 234,787 | ||||||
| TELECOMMUNICATIONS (0.14%) | ||||||||
| Cisco Systems, Inc.(b) | 8,635 | 294,885 | ||||||
| CommScope Holding Co., Inc.(a) | 2,535 | 81,475 | ||||||
| Verizon Communications, Inc. | 3,725 | 178,316 | ||||||
| 554,676 | ||||||||
| TEXTILES (0.60%) | ||||||||
| Mohawk Industries, Inc.(a)(b) | 8,840 | 2,313,958 | ||||||
| TOYS, GAMES & HOBBIES (0.07%) | ||||||||
| Hasbro, Inc. | 2,825 | 261,567 | ||||||
| TOTAL COMMON STOCKS | ||||||||
(Cost $56,288,249) | 69,475,003 | |||||||
| LIMITED PARTNERSHIPS (0.62%) | ||||||||
| OIL & GAS (0.05%) | ||||||||
| Viper Energy Partners LP(b) | 9,825 | 192,570 | ||||||
| OIL, GAS & CONSUMABLE FUELS (0.53%) | ||||||||
| Andeavor Logistics LP | 44,848 | 2,026,233 | ||||||
| PIPELINES (0.04%) | ||||||||
| Boardwalk Pipeline Partners LP | 11,255 | 157,795 | ||||||
| TOTAL LIMITED PARTNERSHIPS | ||||||||
(Cost $2,767,128) | 2,376,598 | |||||||
| OPEN-END MUTUAL FUNDS (39.59%) | ||||||||
| AQR Multi Strategy Alternative Fund, Class I | 5,797,509 | 56,931,538 | ||||||
| PIMCO Short-Term Fund, Institutional Class | 9,601,157 | 94,859,434 | ||||||
| 151,790,972 | ||||||||
| TOTAL OPEN-END MUTUAL FUNDS | ||||||||
(Cost $149,192,404) | 151,790,972 | |||||||
See Notes to Financial Statements.
16
| Highland Resolute Fund | Consolidated Schedule of Investments |
October 31, 2017 (Unaudited)
| Exercise Date | Exercise Price | Contracts | Value (Note 2) | |||||||||||||
| PURCHASED PUT OPTIONS (0.04%) | ||||||||||||||||
| S&P 500® Index | 11/30/2017 | $ | 2,475 | 69 | $ | 42,918 | ||||||||||
| S&P 500® Index | 11/30/2017 | 2,450 | 222 | 111,000 | ||||||||||||
| 153,918 | ||||||||||||||||
| TOTAL PURCHASED PUT OPTIONS | ||||||||||||||||
| (Cost $207,933) | 153,918 | |||||||||||||||
| Description | Principal Amount | Value (Note 2) | ||||||
| CORPORATE BONDS (17.24%) | ||||||||
| BEVERAGES (0.02%) | ||||||||
| Beverages & More, Inc. | ||||||||
| 11.50%, 06/15/2022(c) | $ | 97,000 | 87,543 | |||||
| CASINOS & GAMING (0.61%) | ||||||||
| Jack Ohio Finance LLC | ||||||||
| 10.25%, 11/15/2022(b)(c) | 2,124,000 | 2,341,710 | ||||||
| COMMERCIAL SERVICES (2.51%) | ||||||||
| Great Lakes Dredge & Dock Corp. | ||||||||
| 8.00%, 05/15/2022 | 100,000 | 105,500 | ||||||
| iPayment, Inc. | ||||||||
| 10.75%, 04/15/2024(c) | 2,563,000 | 2,889,782 | ||||||
| RR Donnelley & Sons Co. | ||||||||
| 6.00%, 04/01/2024 | 1,222,000 | 1,145,625 | ||||||
| 6.50%, 11/15/2023 | 5,656,000 | 5,458,040 | ||||||
| 9,598,947 | ||||||||
| COMPUTERS (3.89%) | ||||||||
| Everi Payments, Inc. | ||||||||
| 10.00%, 01/15/2022 | 4,878,000 | 5,329,215 | ||||||
| Harland Clarke Holdings Corp. | ||||||||
| 9.25%, 03/01/2021(b)(c) | 9,374,000 | 9,584,915 | ||||||
| 14,914,130 | ||||||||
| CONTAINERS & PACKAGING (0.25%) | ||||||||
| Coveris Holdings SA | ||||||||
| 7.88%, 11/01/2019(c) | 979,000 | 959,420 | ||||||
| COSMETICS/PERSONAL CARE (0.33%) | ||||||||
| Avon International Operations, Inc. | ||||||||
| 7.88%, 08/15/2022(c) | 1,237,000 | 1,264,833 | ||||||
| ENTERTAINMENT (0.56%) | ||||||||
| Mohegan Tribal Gaming | ||||||||
| 7.88%, 10/15/2024(c) | 2,002,000 | 2,139,637 | ||||||
| See Notes to Financial Statements. |
| Semi-Annual Report | October 31, 2017 | 17 |
| Highland Resolute Fund | Consolidated Schedule of Investments |
October 31, 2017 (Unaudited)
| Description | Principal Amount | Value (Note 2) | ||||||
| FOREST PRODUCTS & PAPER (2.32%) | ||||||||
| Resolute Forest Products, Inc. | ||||||||
| 5.88%, 05/15/2023(b) | $ | 8,787,000 | $ | 8,907,821 | ||||
| HEALTH CARE FACILITIES & SERVICES (0.24%) | ||||||||
| Kindred Healthcare, Inc. | ||||||||
| 8.75%, 01/15/2023 | 929,000 | 910,420 | ||||||
| HEALTHCARE-SERVICES (1.83%) | ||||||||
| Opal Acquisition, Inc. | ||||||||
| 7.50%, 07/01/2024(c) | 2,903,000 | 2,815,910 | ||||||
| 10.00%, 10/01/2024(c) | 3,652,000 | 3,149,850 | ||||||
| SP Finco LLC | ||||||||
| 6.75%, 07/01/2025(c) | 1,153,000 | 1,054,995 | ||||||
| 7,020,755 | ||||||||
| MEDIA (1.16%) | ||||||||
| Lee Enterprises, Inc. | ||||||||
| 9.50%, 03/15/2022(c) | 1,531,000 | 1,588,412 | ||||||
| Time, Inc. | ||||||||
| 5.75%, 04/15/2022(b)(c) | 2,808,000 | 2,846,610 | ||||||
| 4,435,022 | ||||||||
| PIPELINES (0.05%) | ||||||||
| Cheniere Corpus Christi Holdings LLC | ||||||||
| 5.13%, 06/30/2027(c) | 198,000 | 204,683 | ||||||
| PUBLISHING & BROADCASTING (3.17%) | ||||||||
| American Media, Inc. | ||||||||
| 0.00%, 03/01/2022(c)(d) | 11,007,000 | 9,782,471 | ||||||
| McClatchy Co. | ||||||||
| 6.88%, 03/15/2029 | 2,107,000 | 1,848,893 | ||||||
| 7.15%, 11/01/2027 | 71,000 | 71,355 | ||||||
| 9.00%, 12/15/2022 | 419,000 | 437,855 | ||||||
| 12,140,574 | ||||||||
| RETAIL (0.30%) | ||||||||
| Golden Nugget, Inc. | ||||||||
| 8.75%, 10/01/2025(c) | 1,120,000 | 1,153,600 | ||||||
| TOTAL CORPORATE BONDS | ||||||||
| (Cost $63,043,728) | 66,079,095 | |||||||
See Notes to Financial Statements.
18
| Highland Resolute Fund | Consolidated Schedule of Investments |
October 31, 2017 (Unaudited)
| Description | Principal Amount/ Shares | Value (Note 2) | ||||
| SHORT TERM INVESTMENTS (10.95%) | ||||||
| MONEY MARKET FUNDS (10.95%) | ||||||
| Dreyfus Treasury Cash Management Fund, Institutional Class, 7-day yield, 0.930%(b) | 41,968,897 | $ | 41,968,897 | |||
| TOTAL SHORT TERM INVESTMENTS | ||||||
| (Cost $41,968,897) | 41,968,897 | |||||
| TOTAL INVESTMENTS (86.99%) | ||||||
| (Cost $314,854,630) | $ | 333,494,968 | ||||
| SEGREGATED CASH WITH BROKERS (29.16%)(e) | 111,788,091 | |||||
| SECURITIES SOLD SHORT (-10.85%) | ||||||
| (Proceeds $39,886,701) | $ | (41,587,260) | ||||
| LIABILITIES IN EXCESS OF OTHER ASSETS (-5.30%) | (20,340,564) | |||||
| NET ASSETS (100.00%) | $ | 383,355,235 |
SCHEDULE OF SECURITIES SOLD SHORT
| Description | Shares | Value (Note 2) | |||||
| COMMON STOCKS (-5.13%) | |||||||
| APPAREL (-0.07%) | |||||||
| Gildan Activewear, Inc. | (3,760 | ) | $ | (115,056 | ) | ||
| NIKE, Inc., Class B | (1,722 | ) | (94,693 | ) | |||
| Under Armour, Inc., Class A | (5,792 | ) | (72,516 | ) | |||
| (282,265 | ) | ||||||
| AUTO MANUFACTURERS (-0.03%) | |||||||
| Tesla Motors, Inc. | (328 | ) | (108,742 | ) | |||
| AUTO PARTS & EQUIPMENT (-0.05%) | |||||||
| Autoliv, Inc. | (1,501 | ) | (187,415 | ) | |||
| BANKS (-0.44%) | |||||||
| BancorpSouth, Inc | (1,692 | ) | (53,467 | ) | |||
| Community Bank System, Inc. | (2,545 | ) | (140,713 | ) | |||
| Cullen/Frost Bankers, Inc. | (960 | ) | (94,560 | ) | |||
| CVB Financial Corp. | (5,605 | ) | (133,735 | ) | |||
| First Financial Bankshares, Inc. | (6,010 | ) | (274,356 | ) | |||
| Glacier Bancorp, Inc. | (3,162 | ) | (120,030 | ) | |||
| Independent Bank Corp. | (1,256 | ) | (90,558 | ) | |||
| M&T Bank Corp. | (534 | ) | (89,055 | ) | |||
| Prosperity Bancshares, Inc. | (1,790 | ) | (117,746 | ) | |||
| Trustmark Corp. | (3,552 | ) | (117,003 | ) | |||
| UMB Financial Corp. | (1,351 | ) | (99,339 | ) | |||
| United Bankshares, Inc. | (2,602 | ) | (93,542 | ) | |||
| Valley National Bancorp | (7,337 | ) | (84,375 | ) | |||
| Westamerica Bancorporation | (3,664 | ) | (213,355 | ) | |||
| (1,721,834 | ) |
See Notes to Financial Statements.
| Semi-Annual Report | October 31, 2017 | 19 |
| Highland Resolute Fund | Consolidated Schedule of Investments |
October 31, 2017 (Unaudited)
| Description | Shares | Value (Note 2) | ||||||
| BEVERAGES (-0.02%) | ||||||||
| The Boston Beer Co., Inc., Class A | (385 | ) | $ | (68,549 | ) | |||
| BIOTECHNOLOGY (-0.10%) | ||||||||
| BioMarin Pharmaceutical, Inc. | (845 | ) | (69,366 | ) | ||||
| Juno Therapeutics, Inc. | (4,125 | ) | (185,254 | ) | ||||
| Medicines Co. | (3,657 | ) | (105,102 | ) | ||||
| (359,722 | ) | |||||||
| BUILDING MATERIALS (-0.04%) | ||||||||
| Cree, Inc. | (4,472 | ) | (159,650 | ) | ||||
| CHEMICALS (-0.15%) | ||||||||
| Balchem Corp. | (1,528 | ) | (128,795 | ) | ||||
| HB Fuller Co. | (2,693 | ) | (153,151 | ) | ||||
| International Flavors & Fragrances, Inc. | (980 | ) | (144,472 | ) | ||||
| NewMarket Corp. | (423 | ) | (169,365 | ) | ||||
| (595,783 | ) | |||||||
| COMMERCIAL SERVICES (-0.25%) | ||||||||
| Cimpress NV | (2,085 | ) | (227,557 | ) | ||||
| Multi-Color Corp. | (1,624 | ) | (134,305 | ) | ||||
| Ritchie Bros Auctioneers, Inc. | (6,169 | ) | (172,917 | ) | ||||
| Rollins, Inc. | (2,186 | ) | (95,987 | ) | ||||
| Verisk Analytics, Inc. | (1,490 | ) | (126,724 | ) | ||||
| WEX, Inc. | (1,351 | ) | (166,970 | ) | ||||
| (924,460 | ) | |||||||
| COMPUTERS (-0.09%) | ||||||||
| Infosys, Ltd., Sponsored ADR | (8,271 | ) | (122,824 | ) | ||||
| VeriFone Systems, Inc. | (5,733 | ) | (109,386 | ) | ||||
| Wipro, Ltd., ADR | (18,436 | ) | (98,817 | ) | ||||
| (331,027 | ) | |||||||
| COSMETICS & PERSONAL CARE (-0.04%) | ||||||||
| Coty, Inc., Class A | (10,323 | ) | (158,974 | ) | ||||
| DIVERSIFIED FINANCIAL SERVICES (-0.21%) | ||||||||
| Credit Acceptance Corp. | (317 | ) | (90,893 | ) | ||||
| Eaton Vance Corp. | (4,382 | ) | (221,160 | ) | ||||
| Ellie Mae, Inc. | (1,465 | ) | (131,777 | ) | ||||
| Financial Engines, Inc. | (4,179 | ) | (150,862 | ) | ||||
| LendingClub Corp. | (14,220 | ) | (80,912 | ) | ||||
| WageWorks, Inc. | (300 | ) | (19,125 | ) | ||||
| WisdomTree Investments, Inc. | (11,563 | ) | (128,234 | ) | ||||
| (822,963 | ) | |||||||
| ELECTRONICS (-0.09%) | ||||||||
| Knowles Corp. | (9,390 | ) | (155,498 | ) | ||||
| National Instruments Corp. | (3,965 | ) | (178,425 | ) | ||||
| (333,923 | ) | |||||||
| ENVIRONMENTAL CONTROL (-0.04%) | ||||||||
| Stericycle, Inc. | (2,198 | ) | (155,728 | ) | ||||
| FOOD (-0.14%) | ||||||||
| McCormick & Co., Inc. | (1,199 | ) | (119,336 | ) | ||||
| Snyder’s-Lance, Inc. | (4,080 | ) | (153,530 | ) | ||||
| The Hain Celestial Group, Inc. | (3,201 | ) | (115,300 | ) | ||||
See Notes to Financial Statements.
20
| Highland Resolute Fund | Consolidated Schedule of Investments |
October 31, 2017 (Unaudited)
| Description | Shares | Value (Note 2) | ||||||
| FOOD (-0.14%) (continued) | ||||||||
| TreeHouse Foods, Inc. | (2,133 | ) | $ | (141,589 | ) | |||
| (529,755 | ) | |||||||
| HEALTHCARE - PRODUCTS (-0.17%) | ||||||||
| Insulet Corp. | (1,711 | ) | (100,624 | ) | ||||
| Nevro Corp. | (1,046 | ) | (91,609 | ) | ||||
| NuVasive, Inc. | (2,022 | ) | (114,708 | ) | ||||
| Penumbra, Inc. | (865 | ) | (86,976 | ) | ||||
| West Pharmaceutical Services, Inc. | (1,390 | ) | (140,946 | ) | ||||
| Wright Medical Group NV | (3,928 | ) | (102,953 | ) | ||||
| (637,816 | ) | |||||||
| HEALTHCARE-SERVICES (-0.02%) | ||||||||
| Teladoc, Inc. | (2,626 | ) | (86,789 | ) | ||||
| HOME BUILDERS (-0.03%) | ||||||||
| Thor Industries, Inc. | (788 | ) | (107,341 | ) | ||||
| INSURANCE (-0.22%) | ||||||||
| Arch Capital Group, Ltd. | (1,069 | ) | (106,515 | ) | ||||
| Cincinnati Financial Corp. | (1,728 | ) | (121,254 | ) | ||||
| Kemper Corp. | (1,771 | ) | (113,521 | ) | ||||
| Markel Corp. | (122 | ) | (132,285 | ) | ||||
| Mercury General Corp. | (2,253 | ) | (126,100 | ) | ||||
| RLI Corp. | (2,737 | ) | (161,729 | ) | ||||
| Voya Financial, Inc. | (2,853 | ) | (114,576 | ) | ||||
| (875,980 | ) | |||||||
| INTERNET (-0.36%) | ||||||||
| 58.com, Inc., ADR | (4,086 | ) | (274,457 | ) | ||||
| Bitauto Holdings, Ltd., ADR | (5,201 | ) | (234,929 | ) | ||||
| Cogent Communications Holdings, Inc. | (5,131 | ) | (276,561 | ) | ||||
| F5 Networks, Inc. | (559 | ) | (67,790 | ) | ||||
| Palo Alto Networks, Inc. | (559 | ) | (82,285 | ) | ||||
| Proofpoint, Inc. | (1,536 | ) | (141,942 | ) | ||||
| Wayfair, Inc., Class A | (1,921 | ) | (134,278 | ) | ||||
| Zendesk, Inc. | (5,529 | ) | (171,399 | ) | ||||
| (1,383,641 | ) | |||||||
| LEISURE TIME (-0.04%) | ||||||||
| Norwegian Cruise Line Holdings, Ltd. | (2,641 | ) | (147,236 | ) | ||||
| MACHINERY - DIVERSIFIED (-0.09%) | ||||||||
| Cognex Corp. | (950 | ) | (116,992 | ) | ||||
| The Middleby Corp. | (1,199 | ) | (138,964 | ) | ||||
| Wabtec Corp. | (1,003 | ) | (76,729 | ) | ||||
| (332,685 | ) | |||||||
| MEDIA (-0.08%) | ||||||||
| FactSet Research Systems, Inc. | (625 | ) | (118,669 | ) | ||||
| Houghton Mifflin Harcourt Co. | (12,150 | ) | (120,285 | ) | ||||
| Viacom, Inc., Class B | (2,529 | ) | (60,772 | ) | ||||
| (299,726 | ) | |||||||
| METAL FABRICATE & HARDWARE (-0.04%) | ||||||||
| Sun Hydraulics Corp. | (2,368 | ) | (136,231 | ) | ||||
See Notes to Financial Statements.
| Semi-Annual Report | October 31, 2017 | 21 |
| Highland Resolute Fund | Consolidated Schedule of Investments |
October 31, 2017 (Unaudited)
| Description | Shares | Value (Note 2) | ||||||
| MINING (-0.03%) | ||||||||
| Cameco Corp. | (13,270 | ) | $ | (108,018 | ) | |||
| MISCELLANEOUS MANUFACTURING (-0.13%) | ||||||||
| Actuant Corp., Class A | (4,711 | ) | (120,130 | ) | ||||
| AptarGroup, Inc. | (2,473 | ) | (215,324 | ) | ||||
| John Bean Technologies Corp. | (1,328 | ) | (141,963 | ) | ||||
| (477,417 | ) | |||||||
| OIL & GAS (-0.42%) | ||||||||
| Antero Resources Corp. | (7,581 | ) | (147,071 | ) | ||||
| Apache Corp. | (5,935 | ) | (245,531 | ) | ||||
| Centennial Resource Development, Inc., Class A | (4,948 | ) | (96,140 | ) | ||||
| Ecopetrol SA, Sponsored ADR | (12,701 | ) | (140,854 | ) | ||||
| Hess Corp. | (4,418 | ) | (195,099 | ) | ||||
| Laredo Petroleum, Inc. | (12,246 | ) | (145,972 | ) | ||||
| Murphy Oil Corp. | (9,433 | ) | (252,333 | ) | ||||
| Murphy USA, Inc. | (1,629 | ) | (121,132 | ) | ||||
| RPC, Inc. | (5,115 | ) | (124,346 | ) | ||||
| Ultra Petroleum Corp. | (14,817 | ) | (117,647 | ) | ||||
| (1,586,125 | ) | |||||||
| OIL & GAS SERVICES (-0.09%) | ||||||||
| Core Laboratories NV | (1,414 | ) | (141,259 | ) | ||||
| National Oilwell Varco, Inc. | (5,513 | ) | (188,489 | ) | ||||
| (329,748 | ) | |||||||
| PACKAGING & CONTAINERS (-0.11%) | ||||||||
| Ball Corp. | (5,062 | ) | (217,312 | ) | ||||
| Greif, Inc., Class A | (1,627 | ) | (90,347 | ) | ||||
| Sonoco Products Co. | (2,540 | ) | (131,547 | ) | ||||
| (439,206 | ) | |||||||
| PHARMACEUTICALS (-0.14%) | ||||||||
| Alkermes PLC | (1,932 | ) | (94,204 | ) | ||||
| Diplomat Pharmacy, Inc. | (4,759 | ) | (100,177 | ) | ||||
| Eli Lilly & Co. | (1,212 | ) | (99,311 | ) | ||||
| Perrigo Co. PLC | (2,043 | ) | (165,463 | ) | ||||
| TESARO, Inc. | (536 | ) | (62,053 | ) | ||||
| (521,208 | ) | |||||||
| PIPELINES (-0.10%) | ||||||||
| Tallgrass Energy GP LP | (2,224 | ) | (55,600 | ) | ||||
| Tallgrass Energy Partners LP | (2,434 | ) | (106,220 | ) | ||||
| TransCanada Corp. | (5,060 | ) | (240,249 | ) | ||||
| (402,069 | ) | |||||||
| REAL ESTATE INVESTMENT TRUSTS (-0.14%) | ||||||||
| Equinix, Inc. | (545 | ) | (252,607 | ) | ||||
| Lamar Advertising Co., Class A | (1,797 | ) | (126,581 | ) | ||||
| Washington Prime Group, Inc. | (20,069 | ) | (157,140 | ) | ||||
| (536,328 | ) | |||||||
| RETAIL (-0.22%) | ||||||||
| CarMax, Inc. | (2,683 | ) | (201,493 | ) | ||||
| Casey’s General Stores, Inc. | (1,432 | ) | (164,064 | ) | ||||
| Costco Wholesale Corp. | (673 | ) | (108,407 | ) | ||||
| Dollar General Corp. | (1,270 | ) | (102,667 | ) | ||||
| Domino’s Pizza, Inc. | (483 | ) | (88,389 | ) | ||||
| PriceSmart, Inc. | (974 | ) | (81,621 | ) | ||||
See Notes to Financial Statements.
22
| Highland Resolute Fund | Consolidated Schedule of Investments |
October 31, 2017 (Unaudited)
| Description | Shares | Value (Note 2) | ||||||
| RETAIL (-0.22%) (continued) | ||||||||
| Texas Roadhouse, Inc. | (2,457 | ) | $ | (122,875 | ) | |||
| (869,516 | ) | |||||||
| SAVINGS & LOANS (-0.07%) | ||||||||
| Investors Bancorp, Inc. | (6,577 | ) | (90,434 | ) | ||||
| New York Community Bancorp, Inc. | (6,781 | ) | (85,169 | ) | ||||
| People's United Financial, Inc. | (6,157 | ) | (114,890 | ) | ||||
| (290,493 | ) | |||||||
| SEMICONDUCTORS (-0.04%) | ||||||||
| Impinj, Inc. | (1,201 | ) | (41,002 | ) | ||||
| United Microelectronics Corp., Sponsored ADR | (47,356 | ) | (123,126 | ) | ||||
| (164,128 | ) | |||||||
| SOFTWARE (-0.60%) | ||||||||
| 2U, Inc. | (2,834 | ) | (180,327 | ) | ||||
| ACI Worldwide, Inc. | (11,783 | ) | (283,735 | ) | ||||
| Acxiom Corp. | (8,335 | ) | (209,709 | ) | ||||
| Blackbaud, Inc. | (1,855 | ) | (187,911 | ) | ||||
| Guidewire Software, Inc. | (1,618 | ) | (129,408 | ) | ||||
| HubSpot, Inc. | (1,772 | ) | (153,367 | ) | ||||
| Manhattan Associates, Inc. | (3,794 | ) | (158,817 | ) | ||||
| Medidata Solutions, Inc. | (2,133 | ) | (160,466 | ) | ||||
| MINDBODY, Inc., Class A | (4,538 | ) | (146,351 | ) | ||||
| salesforce.com, Inc. | (1,780 | ) | (182,165 | ) | ||||
| The Ultimate Software Group, Inc. | (894 | ) | (181,115 | ) | ||||
| Veeva Systems, Inc., Class A | (2,168 | ) | (132,118 | ) | ||||
| Workday, Inc., Class A | (1,963 | ) | (217,873 | ) | ||||
| (2,323,362 | ) | |||||||
| STORAGE & WAREHOUSING (-0.04%) | ||||||||
| Mobile Mini, Inc. | (4,901 | ) | (162,223 | ) | ||||
| TELECOMMUNICATIONS (-0.13%) | ||||||||
| Arista Networks, Inc. | (762 | ) | (152,316 | ) | ||||
| Frontier Communications Corp. | (3,735 | ) | (45,231 | ) | ||||
| Sprint Corp. | (16,660 | ) | (108,956 | ) | ||||
| Telefonica SA, Sponsored ADR | (7,355 | ) | (76,566 | ) | ||||
| ViaSat, Inc. | (1,580 | ) | (102,858 | ) | ||||
| (485,927 | ) | |||||||
| TOYS, GAMES & HOBBIES (-0.02%) | ||||||||
| Mattel, Inc. | (4,946 | ) | (69,838 | ) | ||||
| TRANSPORTATION (-0.04%) | ||||||||
| Heartland Express, Inc. | (4,045 | ) | (86,280 | ) | ||||
| JB Hunt Transport Services, Inc. | (761 | ) | (80,963 | ) | ||||
| (167,243 | ) | |||||||
| TOTAL COMMON STOCKS | ||||||||
(Proceeds $18,412,414) | (19,681,084 | ) | ||||||
See Notes to Financial Statements.
| Semi-Annual Report | October 31, 2017 | 23 |
| Highland Resolute Fund | Consolidated Schedule of Investments |
October 31, 2017 (Unaudited)
| Description | Principal | Value (Note 2) | ||||||
| CORPORATE BONDS (-3.68%) | ||||||||
| AUTO MANUFACTURERS (-0.32%) | ||||||||
| Tesla, Inc. | ||||||||
| 5.30%, 8/15/2025(c) | $ | (1,255,000 | ) | $ | (1,212,644 | ) | ||
| CASINO & GAMBLING (-0.38%) | ||||||||
| CRC Escrow Issuer LLC / CRC Finco, Inc. | ||||||||
| 5.25%, 10/15/2025(c) | (1,456,000 | ) | (1,469,104 | ) | ||||
| CHEMICALS (-0.47%) | ||||||||
| CVR Partners LP / CVR Nitrogen Finance Corp. | ||||||||
| 9.25%, 6/15/2023(c) | (1,691,000 | ) | (1,807,256 | ) | ||||
| COMPUTERS (-0.38%) | ||||||||
| West Corp. | ||||||||
| 8.50%, 10/15/2025(c) | (1,481,000 | ) | (1,456,008 | ) | ||||
| HEALTHCARE-SERVICES (-0.23%) | ||||||||
| West Street Merger Sub, Inc. | ||||||||
| 6.38%, 9/1/2025(c) | (858,000 | ) | (874,087 | ) | ||||
| PHARMACEUTICALS (-1.27%) | ||||||||
| Mylan NV | ||||||||
| 3.95%, 6/15/2026 | (122,000 | ) | (122,069 | ) | ||||
| Teva Pharmaceutical Finance Netherlands III BV | ||||||||
| 3.15%, 10/1/2026 | (3,552,000 | ) | (3,153,466 | ) | ||||
| Valeant Pharmaceuticals International, Inc. | ||||||||
| 6.13%, 4/15/2025(c) | (1,893,000 | ) | (1,597,219 | ) | ||||
| (4,872,754 | ) | |||||||
| SOFTWARE (-0.24%) | ||||||||
| Rackspace Hosting, Inc. | ||||||||
| 8.63%, 11/15/2024(c) | (863,000 | ) | (911,004 | ) | ||||
| TELECOMMUNICATIONS (-0.39%) | ||||||||
| T-Mobile USA, Inc. | ||||||||
| 6.50%, 1/15/2026 | (1,357,000 | ) | (1,504,737 | ) | ||||
| TOTAL CORPORATE BONDS | ||||||||
(Proceeds $14,163,278) | (14,107,594 | ) | ||||||
| Description | Shares | Value (Note 2) | ||||||
| EXCHANGE TRADED FUNDS (-2.03%) | ||||||||
| Consumer Discretionary Select Sector SPDR® Fund | (17,838 | ) | (1,640,918 | ) | ||||
| Consumer Staples Select Sector SPDR® Fund | (15,570 | ) | (826,611 | ) | ||||
| Health Care Select Sector SPDR® Fund | (12,939 | ) | (1,049,482 | ) | ||||
| iShares® 20+ Year Treasury Bond ETF | (11,401 | ) | (1,418,969 | ) | ||||
| iShares® 7-10 Year Treasury Bond ETF | (6,430 | ) | (682,609 | ) | ||||
| iShares® Euro Government 7-10 Year ETF | (6,076 | ) | (1,500,528 | ) | ||||
| Vanguard REIT ETF | (8,266 | ) | (679,465 | ) | ||||
| (7,798,582 | ) | |||||||
| TOTAL EXCHANGE TRADED FUNDS (-2.03%) | ||||||||
(Proceeds $7,311,009) | (7,798,582 | ) | ||||||
See Notes to Financial Statements.
24
| Highland Resolute Fund | Consolidated Schedule of Investments |
October 31, 2017 (Unaudited)
| TOTAL SECURITIES SOLD SHORT | ||||||||
| (Proceeds $39,886,701) | $ | (41,587,260 | ) |
| (a) | Non-income producing security. |
| (b) | Security position either entirely or partially held in a segregated account as collateral for securities sold short and total return swaps. Aggregate total fair value of $50,003,922. |
| (c) | Security exempt from registration under rule 144A of the securities act of 1933. This security may be resold in transactions exempt from registration, normally to qualified institutional buyers. At period end, the fair value of those securities held in long positions was $41,864,371 and the value of the securities held in short positions was $(9,327,322). This totals $32,537,049, which represents 8.49% of the Fund's net assets. |
| (d) | Issued with a zero coupon. Income is recognized through the accretion of discount. |
| (e) | Includes cash which is being held as collateral for securities sold short and total return swap contracts. |
See Notes to Financial Statements.
| Semi-Annual Report | October 31, 2017 | 25 |
| Highland Resolute Fund | Consolidated Schedule of Investments |
October 31, 2017 (Unaudited)
TOTAL RETURN SWAP CONTRACTS*
| Counterparty | Reference Obligation | Notional Amount | Market Value | Rate Paid by the Fund | Termination Date | Unrealized Appreciation/(Depreciation) | ||||||||||||
| Morgan Stanley | BHDG Systematic Trading Segregated Portfolio(a) | $ | 16,755,539 | $ | 16,755,543 | 1-Month LIBOR BBA | 09/13/2018 | $ | 4 | |||||||||
| Morgan Stanley | Clinton Segregated Portfolio(b) | 14,087,295 | $ | 14,087,297 | 1-Month LIBOR BBA | 09/13/2018 | 2 | |||||||||||
| Morgan Stanley | Iboxx HY Index | (13,027,000 | ) | $ | (13,197,493 | ) | 3-Month LIBOR BBA | 12/20/2017 | (170,493 | ) | ||||||||
| Morgan Stanley | Impala Segregated Portfolio(c) | 30,650,773 | $ | 30,650,766 | 1-Month LIBOR BBA | 03/20/2019 | (7 | ) | ||||||||||
| Morgan Stanley | Melchior Segregated Portfolio(d) | 29,596,562 | $ | 29,596,554 | 1-Month LIBOR BBA | 03/20/2019 | (8 | ) | ||||||||||
| Morgan Stanley | PSAM Highland(e) | 34,652,596 | $ | 34,792,530 | 1-Month EURIBOR | 06/03/2021 | 139,934 | |||||||||||
| Morgan Stanley | WABR Cayman Company Limited(f) | 48,587,975 | $ | 48,587,976 | 1-Month LIBOR BBA | 09/01/2020 | 1 | |||||||||||
| $ | 161,303,740 | $ | 161,273,173 | $ | (30,567 | ) | ||||||||||||
| * | For the long positions, the Fund receives payments based on any positive return of the Reference Obligation less the rate paid by the Fund. The Fund makes payments on any negative return of such Reference Obligation plus the rate paid by the Fund. For short positions, the Fund receives payments based on any negative return of the Reference Obligation less the rate paid by the fund. The Fund makes payments on any positive return of such Reference obligation plus the rate paid by the Fund. |
| (a) | BHDG Systematic Trading Segregated Portfolio is a quantitative trend following strategy that uses futures. BHDG will employ some short, medium, and long term signals. Interest rate, commodity, equity, and sovereign debt futures will be used. Any asset class may have net long or short exposure, and exposures in aggregate may be net long or short. |
| (b) | Clinton Segregated Portfolio is a global, quantitative equity market neutral strategy. The Portfolio will invest in large, mid, and small cap stocks in developed and some emerging markets. The strategy will also attempt to minimize net exposure to any given country or sector. The strategy attempts to generate returns primarily through trading value, momentum, and mean reversion models. |
| (c) | Impala Segregated Portfolio is a European equity long/short strategy that employs a flexible, low-net strategy (0% to 50%), and long exposure will vary between 60% and 100%. The portfolio is primarily comprised of large and mid-cap stocks listed on European exchanges. |
| (d) | Melchior Segregated Portfolio is a global equity long/short strategy that uses a long-biased strategy that is focused on cyclical sectors. The strategy has a net exposure that ranges between 50% and 80%, and long exposure varies between 80% and 100%. The strategy is comprised of large cap stocks listed on exchanges of developed and emerging market countries. |
| (e) | PSAM Highland employs an event driven strategy. The fund will primarily make investments in equity special situations and merger arbitrage. The strategy will also opportunistically allocate to liquid high yield credit positions when trading at stressed levels. The strategy will employ gross long exposure of up to 120%, and net exposure will typically vary from 40% to 80%. |
| (f) | Weiss Alpha Balanced Risk (“WABR”) Cayman Company Limited incorporates an absolute return oriented approach within a risk parity framework. Active absolute return strategies include fundamental long/short equity, credit relative value, discretionary macro, and equity market neutral strategies. The strategy also maintains a passive risk weighted allocation to equities and fixed income, but each of the three allocations is equally risk weighted subject to a 40% limit on the absolute return allocation. Gross equity long exposure will typically be 140% or less, and net equity exposure will vary between 5% and 35%. |
| See Notes to Financial Statements. |
26
| Highland Resolute Fund | Consolidated Schedule of Investments |
October 31, 2017 (Unaudited)
BHDG SYSTEMATIC TRADING SEGREGATED PORTFOLIO
| Description | Shares | Market Value | Percentage of Market Value | |||||||||
| LONG SECURITIES | ||||||||||||
| OUTSTANDING FORWARD FOREIGN CURRENCY CONTRACTS | ||||||||||||
| AUD TO JPY FORWARD SD : 20-Dec-2017 | 3,879,692 | 2,967,772 | 17.71 | % | ||||||||
| AUD TO USD FORWARD SD : 20-Dec-2017 | 4,150,931 | 3,175,257 | 18.95 | % | ||||||||
| BRL TO USD FORWARD SD : 20-Dec-2017 | 6,836,685 | 2,076,318 | 12.39 | % | ||||||||
| CAD TO USD FORWARD SD : 20-Dec-2017 | 4,170,305 | 3,234,883 | 19.31 | % | ||||||||
| CHF TO USD FORWARD SD : 20-Dec-2017 | 1,651,654 | 1,660,968 | 9.91 | % | ||||||||
| EUR TO USD FORWARD SD : 20-Dec-2017 | 5,696,026 | 6,652,678 | 39.70 | % | ||||||||
| GBP TO USD FORWARD SD : 20-Dec-2017 | 2,494,433 | 3,318,042 | 19.80 | % | ||||||||
| INR TO USD FORWARD SD : 20-Dec-2017 | 185,208,045 | 2,843,317 | 16.97 | % | ||||||||
| JPY TO AUD FORWARD SD : 20-Dec-2017 | 303,583,773 | 2,676,125 | 15.97 | % | ||||||||
| JPY TO USD FORWARD SD : 20-Dec-2017 | 238,569,545 | 2,103,017 | 12.55 | % | ||||||||
| MXN TO USD FORWARD SD : 20-Dec-2017 | 40,889,333 | 2,115,591 | 12.63 | % | ||||||||
| NOK TO USD FORWARD SD : 20-Dec-2017 | 13,692,744 | 1,678,306 | 10.02 | % | ||||||||
| SGD TO USD FORWARD SD : 20-Dec-2017 | 5,715,401 | 4,194,492 | 25.03 | % | ||||||||
| USD TO AUD FORWARD SD : 20-Dec-2017 | 3,857,612 | 3,857,612 | 23.02 | % | ||||||||
| USD TO BRL FORWARD SD : 20-Dec-2017 | 2,294,856 | 2,294,856 | 13.70 | % | ||||||||
| USD TO CAD FORWARD SD : 20-Dec-2017 | 2,561,389 | 2,561,389 | 15.29 | % | ||||||||
| USD TO CHF FORWARD SD : 20-Dec-2017 | 3,361,484 | 3,361,484 | 20.06 | % | ||||||||
| USD TO EUR FORWARD SD : 20-Dec-2017 | 6,357,733 | 6,357,733 | 37.94 | % | ||||||||
| USD TO GBP FORWARD SD : 20-Dec-2017 | 1,982,253 | 1,982,253 | 11.83 | % | ||||||||
| USD TO INR FORWARD SD : 20-Dec-2017 | 1,973,219 | 1,973,219 | 11.78 | % | ||||||||
| USD TO JPY FORWARD SD : 20-Dec-2017 | 5,508,320 | 5,508,320 | 32.87 | % | ||||||||
| USD TO MXN FORWARD SD : 20-Dec-2017 | 2,778,431 | 2,778,431 | 16.58 | % | ||||||||
| USD TO NZD FORWARD SD : 20-Dec-2017 | 1,649,077 | 1,649,077 | 9.84 | % | ||||||||
| USD TO PHP FORWARD SD : 20-Dec-2017 | 1,652,924 | 1,652,924 | 9.86 | % | ||||||||
| USD TO SGD FORWARD SD : 20-Dec-2017 | 3,621,295 | 3,621,295 | 21.61 | % | ||||||||
| 76,295,359 | 455.34 | % | ||||||||||
| CASH AND CASH EQUIVALENTS | ||||||||||||
| U.S. DOLLAR | 5,087,652 | 5,087,652 | 30.36 | % | ||||||||
| 5,087,652 | 30.36 | % | ||||||||||
| TOTAL LONG | 81,383,011 | 485.71 | % | |||||||||
| SECURITIES SOLD SHORT | ||||||||||||
| OUTSTANDING FORWARD FOREIGN CURRENCY CONTRACTS | ||||||||||||
| AUD TO JPY FORWARD SD : 20-Dec-2017 | 3,467,989 | 2,652,840 | 15.83 | % | ||||||||
| AUD TO USD FORWARD SD : 20-Dec-2017 | 4,935,588 | 3,775,481 | 22.53 | % | ||||||||
| BRL TO USD FORWARD SD : 20-Dec-2017 | 7,420,334 | 2,253,573 | 13.45 | % | ||||||||
| CAD TO USD FORWARD SD : 20-Dec-2017 | 3,240,342 | 2,513,516 | 15.00 | % | ||||||||
| CHF TO USD FORWARD SD : 20-Dec-2017 | 3,274,247 | 3,292,710 | 19.65 | % | ||||||||
| EUR TO USD FORWARD SD : 20-Dec-2017 | 5,390,882 | 6,296,284 | 37.58 | % | ||||||||
| GBP TO USD FORWARD SD : 20-Dec-2017 | 1,496,660 | 1,990,825 | 11.88 | % | ||||||||
| INR TO USD FORWARD SD : 20-Dec-2017 | 129,497,419 | 1,988,047 | 11.87 | % | ||||||||
| JPY TO AUD FORWARD SD : 20-Dec-2017 | 341,629,817 | 3,011,505 | 17.97 | % | ||||||||
| JPY TO USD FORWARD SD : 20-Dec-2017 | 617,631,390 | 5,444,489 | 32.49 | % | ||||||||
See Notes to Financial Statements.
| Semi-Annual Report | October 31, 2017 | 27 |
| Highland Resolute Fund | Consolidated Schedule of Investments |
October 31, 2017 (Unaudited)
| Description | Shares | Market Value | Percentage of Market Value | |||||||||
| SECURITIES SOLD SHORT | ||||||||||||
| OUTSTANDING FORWARD FOREIGN CURRENCY CONTRACTS (CONTINUED) | ||||||||||||
| MXN TO USD FORWARD SD : 20-Dec-2017 | 52,223,263 | 2,702,002 | 16.13 | % | ||||||||
| PHP TO USD FORWARD SD : 20-Dec-2017 | 84,989,946 | 1,647,554 | 9.83 | % | ||||||||
| SGD TO USD FORWARD SD : 20-Dec-2017 | 4,921,057 | 3,611,529 | 21.55 | % | ||||||||
| USD TO AUD FORWARD SD : 20-Dec-2017 | 3,305,393 | 3,305,393 | 19.73 | % | ||||||||
| USD TO BRL FORWARD SD : 20-Dec-2017 | 2,157,384 | 2,157,384 | 12.88 | % | ||||||||
| USD TO CAD FORWARD SD : 20-Dec-2017 | 3,379,245 | 3,379,245 | 20.17 | % | ||||||||
| USD TO CHF FORWARD SD : 20-Dec-2017 | 1,718,004 | 1,718,004 | 10.25 | % | ||||||||
| USD TO EUR FORWARD SD : 20-Dec-2017 | 6,796,104 | 6,796,104 | 40.56 | % | ||||||||
| USD TO GBP FORWARD SD : 20-Dec-2017 | 3,332,651 | 3,332,651 | 19.89 | % | ||||||||
| USD TO INR FORWARD SD : 20-Dec-2017 | 2,849,076 | 2,849,076 | 17.00 | % | ||||||||
| USD TO JPY FORWARD SD : 20-Dec-2017 | 2,146,271 | 2,146,271 | 12.81 | % | ||||||||
| USD TO MXN FORWARD SD : 20-Dec-2017 | 2,259,032 | 2,259,032 | 13.48 | % | ||||||||
| USD TO NOK FORWARD SD : 20-Dec-2017 | 1,742,931 | 1,742,931 | 10.40 | % | ||||||||
| USD TO SGD FORWARD SD : 20-Dec-2017 | 4,233,241 | 4,233,241 | 25.26 | % | ||||||||
| 75,099,687 | 448.21 | % | ||||||||||
| TOTAL SHORT | 75,099,687 | 448.21 | % | |||||||||
CLINTON SEGREGATED PORTFOLIO
| Description | Shares | Market Value | Percentage of Market Value | |||||||||
| LONG SECURITIES | ||||||||||||
| EQUITY SWAPS | ||||||||||||
| Covestro AG | 1,187 | 17,561 | 0.12 | % | ||||||||
| Country Garden Holdings Co. | 115,758 | 16,358 | 0.12 | % | ||||||||
| Guangzhou Automobile Group - Class H | 38,275 | 12,559 | 0.09 | % | ||||||||
| SMC Corp | 228 | 15,548 | 0.11 | % | ||||||||
| Hitachi LTD | 25,624 | 41,063 | 0.29 | % | ||||||||
| Suzuki Motor Corp | 1,582 | 12,763 | 0.09 | % | ||||||||
| Aristocrat Leisure LTD | 9,914 | 16,490 | 0.12 | % | ||||||||
| Fibria Celulose SA | 10,456 | 23,607 | 0.17 | % | ||||||||
| Fleury SA | 17,079 | 11,432 | 0.08 | % | ||||||||
| Grupo Financiero Banorte - Class O | 49,688 | 15,038 | 0.11 | % | ||||||||
| Magazine Luiza SA | 8,145 | 23,993 | 0.17 | % | ||||||||
| Orion OYJ - Class B | 2,559 | 11,871 | 0.08 | % | ||||||||
| Localiza Rent A Car | 7,987 | 12,153 | 0.09 | % | ||||||||
| Wellcare Health Plans Inc | 467 | 12,199 | 0.09 | % | ||||||||
| 242,634 | 1.72 | % | ||||||||||
| CASH AND CASH EQUIVALENTS | ||||||||||||
| AUSTRALIAN DOLLAR | 36,137 | 27,663 | 0.20 | % | ||||||||
| DANISH KRONE | 176,847 | 27,677 | 0.20 | % | ||||||||
| EURO | 127,335 | 148,294 | 1.05 | % | ||||||||
| EURO | 13,465 | 15,681 | 0.11 | % | ||||||||
| BRITISH POUND | 183,078 | 243,182 | 1.73 | % | ||||||||
| HONG KONG DOLLAR | 268,647 | 34,438 | 0.24 | % | ||||||||
| JAPANESE YEN | 1,416,023 | 12,461 | 0.09 | % | ||||||||
| See Notes to Financial Statements. |
28
| Highland Resolute Fund | Consolidated Schedule of Investments |
October 31, 2017 (Unaudited)
| Description | Shares | Market Value | Percentage of Market Value | |||||||||
| CASH AND CASH EQUIVALENTS (CONTINUED) | ||||||||||||
| NORWEGIAN KRONE | 394,104 | 48,238 | 0.34 | % | ||||||||
| POLISH ZLOTY | 89,169 | 24,495 | 0.17 | % | ||||||||
| SOUTH AFRICAN RAND | 711,204 | 50,344 | 0.36 | % | ||||||||
| SWEDISH KRONA | 195,750 | 23,346 | 0.17 | % | ||||||||
| SWISS FRANC | 135,042 | 135,380 | 0.96 | % | ||||||||
| TURKISH LIRA | 177,021 | 46,709 | 0.33 | % | ||||||||
| U.S. DOLLAR | 13,758,210 | 13,758,210 | 97.66 | % | ||||||||
| U.S. DOLLAR | 239,626 | 239,626 | 1.70 | % | ||||||||
| U.S. DOLLAR | 72,976 | 72,976 | 0.52 | % | ||||||||
| 14,908,720 | 105.83 | % | ||||||||||
| TOTAL LONG | 15,151,354 | 107.55 | % | |||||||||
| SECURITIES SOLD SHORT | ||||||||||||
| EQUITY SWAPS | ||||||||||||
| Mediatek Inc. | 12,131 | 22,521 | 0.16 | % | ||||||||
| Dentsu Inc. | 2,442 | 13,671 | 0.10 | % | ||||||||
| Semiconductor Manufacturing | 58,923 | 24,767 | 0.18 | % | ||||||||
| Acadia Healthcare Co Inc. | 1,896 | 14,372 | 0.10 | % | ||||||||
| Gentera SAB DE CV | 53,950 | 16,863 | 0.12 | % | ||||||||
| GrubHub Inc. | 1,489 | 11,891 | 0.08 | % | ||||||||
| JBS SA | 40,833 | 15,648 | 0.11 | % | ||||||||
| Santos Ltd. | 38,016 | 23,368 | 0.17 | % | ||||||||
| 143,100 | 1.02 | % | ||||||||||
| CASH AND CASH EQUIVALENTS | ||||||||||||
| AUSTRALIAN DOLLAR | 17,586 | 13,462 | 0.10 | % | ||||||||
| DANISH KRONE | 208,318 | 32,602 | 0.23 | % | ||||||||
| EURO | 116,503 | 135,680 | 0.96 | % | ||||||||
| BRITISH POUND | 154,408 | 205,101 | 1.46 | % | ||||||||
| MEXICAN PESO | 567,344 | 29,618 | 0.21 | % | ||||||||
| NORWEGIAN KRONE | 446,955 | 54,707 | 0.39 | % | ||||||||
| POLISH ZLOTY | 93,529 | 25,693 | 0.18 | % | ||||||||
| SOUTH AFRICAN RAND | 770,339 | 54,530 | 0.39 | % | ||||||||
| SWEDISH KRONA | 246,487 | 29,398 | 0.21 | % | ||||||||
| SWISS FRANC | 148,455 | 148,826 | 1.06 | % | ||||||||
| TURKISH LIRA | 91,716 | 24,200 | 0.17 | % | ||||||||
| U.S. DOLLAR | 78,900 | 78,900 | 0.56 | % | ||||||||
| 832,716 | 5.91 | % | ||||||||||
| TOTAL SHORT | 975,816 | 6.93 | % | |||||||||
See Notes to Financial Statements.
| Semi-Annual Report | October 31, 2017 | 29 |
| Highland Resolute Fund | Consolidated Schedule of Investments |
October 31, 2017 (Unaudited)
IMPALA SEGREGATED PORTFOLIO
| Description | Shares | Market Value | Percentage of Market Value | |||||||||
| LONG SECURITIES | ||||||||||||
| COMMON STOCKS | ||||||||||||
| Canfor Corp. | 52,216 | 1,039,056 | 3.39 | % | ||||||||
| Constellation Brands Inc. - Class A | 2,231 | 488,790 | 1.59 | % | ||||||||
| Dr Horton Inc. | 9,628 | 425,654 | 1.39 | % | ||||||||
| Deere & Co. | 2,747 | 365,021 | 1.19 | % | ||||||||
| Dowdupont Inc. | 9,566 | 691,717 | 2.26 | % | ||||||||
| Extended Stay America Inc. | 30,661 | 607,701 | 1.98 | % | ||||||||
| Fedex Corp. | 2,864 | 646,720 | 2.11 | % | ||||||||
| First Quantum Minerals Ltd. | 93,529 | 1,046,625 | 3.41 | % | ||||||||
| Harley-Davidson Inc. | 10,705 | 506,775 | 1.65 | % | ||||||||
| Hess Corp. | 17,795 | 785,827 | 2.56 | % | ||||||||
| Kansas City Southern | 8,716 | 908,382 | 2.96 | % | ||||||||
| Laredo Petroleum Inc. | 35,966 | 428,715 | 1.40 | % | ||||||||
| Marinemax Inc. | 27,398 | 508,233 | 1.66 | % | ||||||||
| Microsoft Corp. | 5,362 | 446,011 | 1.46 | % | ||||||||
| Navistar International Corp. | 20,446 | 865,070 | 2.82 | % | ||||||||
| Nintendo Co Ltd. | 777 | 299,359 | 0.98 | % | ||||||||
| Norwegian Cruise Line Holdings | 22,733 | 1,267,365 | 4.13 | % | ||||||||
| Nvidia Corp. | 1,381 | 285,605 | 0.93 | % | ||||||||
| Olin Corp. | 13,017 | 475,511 | 1.55 | % | ||||||||
| Philip Morris International | 5,374 | 562,335 | 1.83 | % | ||||||||
| Summit Materials Inc. - Class A | 13,703 | 430,274 | 1.40 | % | ||||||||
| Teck Resources Ltd. - Class B | 95,849 | 1,959,154 | 6.39 | % | ||||||||
| Priceline Group Inc. | 165 | 315,473 | 1.03 | % | ||||||||
| Trinity Industries Inc. | 17,213 | 559,767 | 1.83 | % | ||||||||
| Voestalpine AG | 8,465 | 465,699 | 1.52 | % | ||||||||
| West Fraser Timber Co. Ltd. | 10,387 | 632,081 | 2.06 | % | ||||||||
| 17,012,919 | 55.51 | % | ||||||||||
| EQUITY SWAPS | ||||||||||||
| Accelerated Pharma Inc. | 8,634 | 430,750 | 1.41 | % | ||||||||
| Alphabet Inc. - Class A | 676 | 698,335 | 2.28 | % | ||||||||
| Carnival Corp. | 13,468 | 894,141 | 2.92 | % | ||||||||
| Caterpillar Inc. | 6,767 | 918,959 | 3.00 | % | ||||||||
| Delta Air Lines Inc. | 12,683 | 634,530 | 2.07 | % | ||||||||
| Freeport-Mcmoran Inc. | 32,533 | 454,811 | 1.48 | % | ||||||||
| Knight-Swift Transportation | 17,101 | 708,836 | 2.31 | % | ||||||||
| Las Vegas Sands Corp. | 11,609 | 735,778 | 2.40 | % | ||||||||
| Monster Beverage Corp. | 7,910 | 458,226 | 1.49 | % | ||||||||
| NVR Inc. | 738 | 2,421,651 | 7.90 | % | ||||||||
| Plastic Omnium | 8,903 | 371,222 | 1.21 | % | ||||||||
| Rio Tinto Plc - Sponsored ADR | 27,227 | 1,304,990 | 4.26 | % | ||||||||
| Rio Tinto Plc - Sponsored ADR | 6,287 | 296,113 | 0.97 | % | ||||||||
| See Notes to Financial Statements. |
30
| Highland Resolute Fund | Consolidated Schedule of Investments |
October 31, 2017 (Unaudited)
| Description | Shares | Market Value | Percentage of Market Value | |||||||||
| EQUITY SWAPS (CONTINUED) | ||||||||||||
| Smurfit Kappa Group Plc | 13,250 | 394,646 | 1.29 | % | ||||||||
| Take-Two Interactive Software | 17,122 | 1,894,549 | 6.18 | % | ||||||||
| 12,617,538 | 41.17 | % | ||||||||||
| CASH AND CASH EQUIVALENTS | ||||||||||||
| SWEDISH KRONA | 3,042,142 | 364,563 | 1.19 | % | ||||||||
| 364,563 | 1.19 | % | ||||||||||
| TOTAL LONG | 29,995,020 | 97.86 | % | |||||||||
| SECURITIES SOLD SHORT | ||||||||||||
| COMMON STOCKS | ||||||||||||
| Regal Beloit | 5,334 | 432,854 | 1.41 | % | ||||||||
| Wyndham Worldwide | 4,550 | 486,168 | 1.59 | % | ||||||||
| 919,022 | 3.00 | % | ||||||||||
| EXCHANGE TRADED FUNDS | ||||||||||||
| Consumer Discretionary SPDR ETF | 3,064 | 281,857 | 0.92 | % | ||||||||
| iShares Stoxx 600 Ucits ETF | 8,367 | 380,057 | 1.24 | % | ||||||||
| Powershares QQQ Trust Series 1 ETF | 3,104 | 472,274 | 1.54 | % | ||||||||
| 1,134,188 | 3.70 | % | ||||||||||
| EQUITY SWAPS | ||||||||||||
| SPDR S&P 500 ETF | 8,490 | 2,183,204 | 7.12 | % | ||||||||
| 2,183,204 | 7.12 | % | ||||||||||
| CASH AND CASH EQUIVALENTS | ||||||||||||
| CANADIAN DOLLAR | 3,504,554 | 2,718,739 | 8.87 | % | ||||||||
| EURO | 525,663 | 614,200 | 2.00 | % | ||||||||
| 3,332,940 | 10.87 | % | ||||||||||
| TOTAL SHORT | 7,569,352 | 24.70 | % | |||||||||
MELCHIOR SEGREGATED PORTFOLIO
| Description | Shares | Market Value | Percentage of Market Value | |||||||||
| LONG SECURITIES | ||||||||||||
| COMMON STOCKS | ||||||||||||
| Asr Nederland | 23,934 | 175,290 | 0.59 | % | ||||||||
| Fluidra SA | 62,633 | 162,287 | 0.55 | % | ||||||||
| Inmobiliaria Colonial Socimi | 106,007 | 141,314 | 0.48 | % | ||||||||
| Prosegur Cash SA | 207,541 | 109,289 | 0.37 | % | ||||||||
| Jungheinrich - Preferred Stock | 15,162 | 107,639 | 0.36 | % | ||||||||
| Associated British Foods Plc | 21,501 | 101,518 | 0.34 | % | ||||||||
| Barclays Plc | 427,981 | 92,720 | 0.31 | % | ||||||||
| Abn Amro Group | 21,597 | 85,858 | 0.29 | % | ||||||||
| Saxton Products Inc. | 1,651 | 82,635 | 0.28 | % | ||||||||
| Prudential Plc | 38,267 | 82,492 | 0.28 | % | ||||||||
| Moncler SPA | 19,735 | 61,620 | 0.21 | % | ||||||||
| Prosegur Comp Seguridad | 64,129 | 60,180 | 0.20 | % | ||||||||
| Maisons Du Monde SA | 10,923 | 59,005 | 0.20 | % | ||||||||
See Notes to Financial Statements.
| Semi-Annual Report | October 31, 2017 | 31 |
| Highland Resolute Fund | Consolidated Schedule of Investments |
October 31, 2017 (Unaudited)
| Description | Shares | Market Value | Percentage of Market Value | |||||||||
| LONG SECURITIES | ||||||||||||
| COMMON STOCKS (CONTINUED) | ||||||||||||
| Shire Plc | 10,526 | 57,265 | 0.19 | % | ||||||||
| Finecobank SPA | 58,570 | 56,687 | 0.19 | % | ||||||||
| Erste Group Bank AG | 17,852 | 45,202 | 0.15 | % | ||||||||
| Engie | 52,200 | 44,158 | 0.15 | % | ||||||||
| Ceconomy AG | 52,004 | 44,129 | 0.15 | % | ||||||||
| Altran Technologies SA | 41,647 | 40,188 | 0.14 | % | ||||||||
| Unicredit SPA | 59,375 | 32,338 | 0.11 | % | ||||||||
| Gima TT SPA | 5,722 | 30,191 | 0.10 | % | ||||||||
| Crh Plc | 18,332 | 29,755 | 0.10 | % | ||||||||
| Compass Group Plc | 39,224 | 26,940 | 0.09 | % | ||||||||
| Ryanair Holdings Plc | 40,115 | 26,706 | 0.09 | % | ||||||||
| Howden Joinery Group Plc | 152,392 | 23,482 | 0.08 | % | ||||||||
| Sonae | 253,151 | 23,139 | 0.08 | % | ||||||||
| France Telecom SA | 58,105 | 21,802 | 0.07 | % | ||||||||
| Total SA | 17,691 | 21,646 | 0.07 | % | ||||||||
| Bayer AG | 10,427 | 20,911 | 0.07 | % | ||||||||
| Nestle SA | 9,948 | 20,698 | 0.07 | % | ||||||||
| 1,887,083 | 6.38 | % | ||||||||||
| INDEX OPTIONS | ||||||||||||
| Dax Index Put @ 12000.0 Dec 17 | 129 | 18,651 | 0.06 | % | ||||||||
| 18,651 | 0.06 | % | ||||||||||
| CASH AND CASH EQUIVALENTS | ||||||||||||
| U.S. DOLLAR | 4,870,192 | 4,870,192 | 16.46 | % | ||||||||
| EURO | 749,768 | 873,330 | 2.95 | % | ||||||||
| BRITISH POUND | 74,335 | 98,732 | 0.33 | % | ||||||||
| 5,842,254 | 19.74 | % | ||||||||||
| TOTAL LONG | 7,747,987 | 26.18 | % | |||||||||
| SECURITIES SOLD SHORT | ||||||||||||
| COMMON STOCKS | ||||||||||||
| Wirecard AG | 13,344 | 199,569 | 0.67 | % | ||||||||
| Airbus Se | 9,486 | 105,865 | 0.36 | % | ||||||||
| Intesa Sanpaolo | 202,553 | 101,297 | 0.34 | % | ||||||||
| Neste OYJ | 7,367 | 87,600 | 0.30 | % | ||||||||
| Glencore Plc | 151,114 | 83,609 | 0.28 | % | ||||||||
| FTSE Mid 250 Index | 52 | 72,279 | 0.24 | % | ||||||||
| Daimler AG | 6,703 | 71,648 | 0.24 | % | ||||||||
| Pets At Home Group Plc | 123,620 | 49,700 | 0.17 | % | ||||||||
| Intertek Group Plc | 4,129 | 44,618 | 0.15 | % | ||||||||
| Dksh Holding Ltd. | 7,115 | 40,189 | 0.14 | % | ||||||||
| Zalando Se | 13,908 | 39,562 | 0.13 | % | ||||||||
| Ald SA | 15,257 | 26,225 | 0.09 | % | ||||||||
| Mitie Group Plc | 86,235 | 21,767 | 0.07 | % | ||||||||
| 943,930 | 3.19 | % | ||||||||||
See Notes to Financial Statements.
32
| Highland Resolute Fund | Consolidated Schedule of Investments |
October 31, 2017 (Unaudited)
| Percentage of | ||||||||||||
| Description | Shares | Market Value | Market Value | |||||||||
| FUTURES | ||||||||||||
| Dax Mini Future Dec17 | 73 | 177,269 | 0.60 | % | ||||||||
| Euro Stoxx 50 Dec17 | 123 | 84,259 | 0.28 | % | ||||||||
| Ftse 100 Idx Future Dec17 | 13 | 16,950 | 0.06 | % | ||||||||
| 278,479 | 0.94 | % | ||||||||||
| TOTAL SHORTS | 1,222,408 | 4.13 | % | |||||||||
PSAM HIGHLAND
| Description | Shares | Market Value | Percentage of Market Value | |||||||||
| LONG SECURITIES | ||||||||||||
| COMMON STOCKS | ||||||||||||
| Aecon Group Inc. | 19,010 | 245,861 | 0.71 | % | ||||||||
| Altaba Inc. | 4,891 | 294,447 | 0.85 | % | ||||||||
| Altagas Ltd. | 8,150 | 158,730 | 0.46 | % | ||||||||
| Calatlantic Group Inc. | 11,732 | 496,959 | 1.43 | % | ||||||||
| Calpine Corp. | 56,299 | 722,140 | 2.08 | % | ||||||||
| Conduent Inc. | 32,403 | 430,644 | 1.24 | % | ||||||||
| Dell Technologies Inc. - Class V | 10,027 | 712,564 | 2.05 | % | ||||||||
| Dowdupont Inc. | 8,696 | 539,890 | 1.55 | % | ||||||||
| Firstenergy Corp. | 14,464 | 409,174 | 1.18 | % | ||||||||
| Global Logistic Properties | 80,450 | 168,224 | 0.48 | % | ||||||||
| Grupo Televisa SA - Sponsored ADR | 17,144 | 322,195 | 0.93 | % | ||||||||
| Liberty Interactive Corp | 40,050 | 781,223 | 2.25 | % | ||||||||
| Linn Energy Inc. | 52,788 | 1,747,122 | 5.02 | % | ||||||||
| Mangna Dem Npv Preferred Shares | 1,679 | 157,405 | 0.45 | % | ||||||||
| Mckesson Europe AG | 49,287 | 1,286,631 | 3.70 | % | ||||||||
| Monsanto Co. | 14,052 | 1,460,957 | 4.20 | % | ||||||||
| Nxp Semiconductors N | 26,692 | 2,682,403 | 7.71 | % | ||||||||
| Ocelot Partners Ltd. | 25,714 | 216,350 | 0.62 | % | ||||||||
| Orbital Atk Inc. | 4,154 | 474,141 | 1.36 | % | ||||||||
| Rockwell Collins Inc. | 5,162 | 600,956 | 1.73 | % | ||||||||
| Telecom Italia R | 529,222 | 323,090 | 0.93 | % | ||||||||
| Time Warner Inc. | 25,498 | 2,151,738 | 6.18 | % | ||||||||
| Trinity Industries Inc. | 25,126 | 701,526 | 2.02 | % | ||||||||
| Vivendi | 59,417 | 1,267,075 | 3.64 | % | ||||||||
| 18,351,443 | 52.75 | % | ||||||||||
| CORPORATE BONDS | ||||||||||||
| EXELA INTERMEDIATE LLC, 10%, 07/15/2023 | 625,136 | 514,094 | 1.48 | % | ||||||||
| BRUCE MANSFIELD, 6.85%, 06/01/2034 | 1,563,688 | 387,031 | 1.11 | % | ||||||||
| GENON ESCROW, 7.875%, 06/15/2018 | 419,714 | 256,974 | 0.74 | % | ||||||||
| GENON ESCROW, 9.125%, 05/01/2031 | 331,415 | 260,494 | 0.75 | % | ||||||||
| GENON ESCROW, 9.500%, 10/15/2018 | 805,386 | 487,920 | 1.40 | % | ||||||||
| GENON ESCROW, 9.875%, 10/15/2020 | 758,106 | 459,277 | 1.32 | % | ||||||||
| GUITAR CENTER, 6.50%, 04/15/2019 | 301,547 | 241,120 | 0.69 | % | ||||||||
| INTELSAT HOLDINGS LTD., 7.25%, 10/15/2020 | 686,045 | 565,448 | 1.63 | % | ||||||||
| INTELSAT HOLDINGS LTD., 8.125%, 06/01/2023 | 421,148 | 220,514 | 0.63 | % | ||||||||
| See Notes to Financial Statements. |
| Semi-Annual Report | October 31, 2017 | 33 |
| Highland Resolute Fund | Consolidated Schedule of Investments |
October 31, 2017 (Unaudited)
| Description | Shares | Market Value | Percentage of Market Value | |||||||||
| CORPORATE BONDS (CONTINUED) | ||||||||||||
| INTELSAT HOLDINGS LTD., 9.75%, 07/15/2025 | 384,629 | 332,288 | 0.96 | % | ||||||||
| WHOLE FOODS MARKET INC., 5.2%, 12/03/2025 | 798,930 | 787,193 | 2.26 | % | ||||||||
| 4,512,353 | 12.97 | % | ||||||||||
| EQUITY SWAPS | ||||||||||||
| Altaba Inc. | 32,034 | 866,238 | 2.49 | % | ||||||||
| 866,238 | 2.49 | % | ||||||||||
| Description | Shares | Market Value | Percentage of Market Value | |||||||||
| CASH AND CASH EQUIVALENTS | ||||||||||||
| EURO | 30,966,739 | 30,966,739 | 89.00 | % | ||||||||
| 30,966,739 | 89.00 | % | ||||||||||
| TOTAL LONG | 54,696,773 | 157.21 | % | |||||||||
| SECURITIES SOLD SHORT | ||||||||||||
| COMMON STOCKS | ||||||||||||
| Akorn Inc. | 12,576 | 351,661 | 1.01 | % | ||||||||
| Alibaba Group Holding Ltd. | 1,967 | 312,284 | 0.90 | % | ||||||||
| AT&T Inc. | 30,448 | 879,653 | 2.53 | % | ||||||||
| Lennar Corp. - Class A | 8,836 | 422,333 | 1.21 | % | ||||||||
| Spdr S&P Oil & Gas Exploration | 17,985 | 529,329 | 1.52 | % | ||||||||
| Utilities Select Sector SPDR | 6,805 | 322,031 | 0.93 | % | ||||||||
| Vmware Inc. - Class A | 7,960 | 817,967 | 2.35 | % | ||||||||
| 3,635,258 | 10.45 | % | ||||||||||
| EQUITY SWAPS | ||||||||||||
| Alibaba Group Holding Ltd. | 8,451 | 508,109 | 1.46 | % | ||||||||
| 508,109 | 1.46 | % | ||||||||||
| CORPORATE/GOVERNMENT BONDS | ||||||||||||
| US TREASURY NOTE, 2.00%, 08/15/2025 | 798,930 | 671,830 | 1.93 | % | ||||||||
| PACIFIC GAS & ELECTRIC CO., 6.05%, 03/01/2034 | 234,247 | 250,432 | 0.72 | % | ||||||||
| 922,263 | 2.65 | % | ||||||||||
| CASH AND CASH EQUIVALENTS | ||||||||||||
| CANADIAN DOLLAR | 614,265 | 408,885 | 1.18 | % | ||||||||
| U.S. DOLLAR | 18,333,402 | 15,740,205 | 45.24 | % | ||||||||
| SINGAPORE DOLLAR | 280,160 | 176,453 | 0.51 | % | ||||||||
| 16,325,542 | 46.92 | % | ||||||||||
| TOTAL SHORT | 21,391,172 | 61.48 | % | |||||||||
See Notes to Financial Statements.
34
| Highland Resolute Fund | Consolidated Schedule of Investments |
October 31, 2017 (Unaudited)
WABR CAYMAN COMPANY LIMITED
| Description | Shares | Market Value | Percentage of Market Value | |||||||||
| LONG SECURITIES | ||||||||||||
| COMMON STOCKS | ||||||||||||
| Equity Residential, REIT | 6,148 | 413,514 | 0.85 | % | ||||||||
| HCP Inc, REIT | 17,250 | 445,740 | �� | 0.92 | % | |||||||
| Liberty Property, REIT | 12,056 | 516,961 | 1.06 | % | ||||||||
| American Homes 4 Rent - Class A, REIT | 25,080 | 533,702 | 1.10 | % | ||||||||
| Hudson Pacific Properties, REIT | 20,948 | 708,461 | 1.46 | % | ||||||||
| Boston Properties Inc, REIT | 5,880 | 712,538 | 1.47 | % | ||||||||
| 3,330,918 | 6.86 | % | ||||||||||
| EXCHANGE TRADED-FUNDS | ||||||||||||
| Guggenheim S&P 500 Equal Weight ETF | 36,992 | 3,572,687 | 7.35 | % | ||||||||
| Ishares 7-10 Year Trsury Bond ETF | 43,126 | 4,578,256 | 9.42 | % | ||||||||
| Ishares Iboxx Invt Grade Bond ETF | 37,859 | 4,586,239 | 9.44 | % | ||||||||
| Ishares Iboxx High Yield Bond ETF | 51,858 | 4,587,877 | 9.44 | % | ||||||||
| 17,325,060 | 35.66 | % | ||||||||||
| CORPORATE BONDS | ||||||||||||
| MET LIFE INC, Floating Rate, 12/15/2036 | 355,000 | 409,684 | 0.84 | % | ||||||||
| HONGKONG&SHANG BK PRIM CAP, Floating Rate, 4/27/2049 | 510,000 | 441,150 | 0.91 | % | ||||||||
| TERRAFORM POWER OPERATOR LLC, Floating Rate, 2/1/2023 | 455,000 | 478,137 | 0.98 | % | ||||||||
| RITE AID CORP, 6.13%, 4/1/2023 | 561,000 | 520,328 | 1.07 | % | ||||||||
| CITGO HOLDING INC, 10.75%, 2/15/2020 | 485,000 | 524,532 | 1.08 | % | ||||||||
| HOVNANIAN K ENTERPRISES INC, 10.50%, 7/15/2024 | 495,000 | 551,084 | 1.13 | % | ||||||||
| NATURAL RESOURCE PTNRS, 10.50%, 3/15/2022 | 545,000 | 581,406 | 1.20 | % | ||||||||
| ALGECO SCOTSMAN GLOBAL, 8.50%, 10/15/2018 | 600,000 | 587,652 | 1.21 | % | ||||||||
| KRATON POLYMERS LLC, 10.50%, 4/15/2023 | 550,000 | 626,120 | 1.29 | % | ||||||||
| ALERIS INTL INC, 9.50%, 4/1/2021 | 600,000 | 640,170 | 1.32 | % | ||||||||
| PRIME SEC SVCS BORROWER LLC, 9.25%, 5/15/2023 | 623,000 | 685,300 | 1.41 | % | ||||||||
| COBALT INTL ENERGY INC, 10.75%, 12/1/2021 | 760,000 | 769,500 | 1.58 | % | ||||||||
| CAESARS GROWTH PROP HOLDINGS, 9.38%, 5/1/2022 | 784,000 | 842,024 | 1.73 | % | ||||||||
| TEEKAY OFFSHORE PARTNERS, 6.00%, 7/30/2019 | 866,000 | 861,670 | 1.77 | % | ||||||||
| HC2 HLDGS INC, 11.00%, 12/1/2019 | 1,079,000 | 1,111,370 | 2.29 | % | ||||||||
| NEPTUNE FINCO CORP, 10.88%, 10/15/2025 | 995,000 | 1,217,631 | 2.51 | % | ||||||||
| ALERIS INTL INC, 7.88%, 11/1/2020 | 1,480,000 | 1,478,505 | 3.04 | % | ||||||||
| 12,326,263 | 25.37 | % | ||||||||||
| GOVERNMENT BONDS | ||||||||||||
| US Treasury Note, 1.6250%, 05/15/2026 | 1,281,000 | 1,211,140 | 2.49 | % | ||||||||
| US Treasury Note, 1.5000%, 10/31/2019 | 7,770,000 | 7,756,101 | 15.96 | % | ||||||||
| 8,967,242 | 18.46 | % | ||||||||||
See Notes to Financial Statements.
| Semi-Annual Report | October 31, 2017 | 35 |
| Highland Resolute Fund | Consolidated Schedule of Investments |
October 31, 2017 (Unaudited)
| Description | Shares | Market Value | Percentage of Market Value | |||||||||
| FUTURES | ||||||||||||
| E-Mini S&P 500 Stock Index Dec '17 CME | 28 | 3,601,780 | 7.41 | % | ||||||||
| E-Mini S&P Midcap 400 Dec-17 | 20 | 3,667,800 | 7.55 | % | ||||||||
| US Long Bond Dec '17 Cbt | 3 | 457,406 | 0.94 | % | ||||||||
| Ultra Long Term US Treasury Bond Dec-17 | 25 | 4,119,531 | 8.48 | % | ||||||||
| 11,846,518 | 24.38 | % | ||||||||||
| TOTAL LONG | 53,796,000 | 110.72 | % | |||||||||
| SHORT SECURITIES | ||||||||||||
| COMMON STOCKS | ||||||||||||
| Duke Realty Corporation, REIT | (15,827 | ) | 450,753 | 0.93 | % | |||||||
| Vornado Realty, REIT | (6,349 | ) | 475,286 | 0.98 | % | |||||||
| Essex Property Trust Inc., REIT | (1,911 | ) | 501,504 | 1.03 | % | |||||||
| DCT Industrials Trust Inc., REIT | (8,820 | ) | 511,736 | 1.05 | % | |||||||
| Ventas Inc., REIT | (8,159 | ) | 511,977 | 1.05 | % | |||||||
| 2,451,256 | 5.04 | % | ||||||||||
| EXCHANGE TRADED-FUNDS | ||||||||||||
| SPDR Bloomberg Barclay High Yield Bond ETF | (13,253 | ) | 493,542 | 1.02 | % | |||||||
| Ishares Iboxx High Yield Bond ETF | (9,875 | ) | 873,641 | 1.80 | % | |||||||
| 1,367,183 | 2.81 | % | ||||||||||
| CORPORATE BONDS | ||||||||||||
| ALLY FINANCIAL INC, 5.7500%,11/20/2025 | (365,000 | ) | 404,716 | 0.83 | % | |||||||
| MARATHON PETROLEUM CORP, 3.6250%,09/15/2024 | (400,000 | ) | 410,300 | 0.84 | % | |||||||
| LIFEPOINT HEALTH INC, 5.3750%, 05/01/2024 | (420,000 | ) | 423,020 | 0.87 | % | |||||||
| GAMESTOP CORP, 6.7500%, 03/15/2021 | (403,000 | ) | 423,307 | 0.87 | % | |||||||
| VERIZON COMMUNICATIONS INC, 2.4500%, 11/01/2022 | (446,000 | ) | 442,283 | 0.91 | % | |||||||
| FORD MOTOR CO, 4.3460%, 12/08/2026 | (455,000 | ) | 474,335 | 0.98 | % | |||||||
| INEOS GROUP HOLDINGS PLC, 5.6250%, 08/01/2024 | (500,000 | ) | 522,830 | 1.08 | % | |||||||
| EMERA INC, 6.7500%, 06/15/2076 | (585,000 | ) | 669,702 | 1.38 | % | |||||||
| 3,770,493 | 7.76 | % | ||||||||||
| GOVERNMENT BONDS | ||||||||||||
| US Treasury Note, 2.25%, 10/31/2024 | (491,000 | ) | 491,575 | 1.01 | % | |||||||
| US Treasury Note, 2.00%, 10/31/2022 | (3,213,000 | ) | 3,211,623 | 6.61 | % | |||||||
| 3,703,198 | 7.62 | % | ||||||||||
| TOTAL SHORTS | 11,292,131 | 23.24 | % | |||||||||
Common Abbreviations:
AQR - AQR Capital Management LLC.
BBA - British Bankers Association.
EURIBOR - Euro Interbank Offered Rate.
LIBOR - London Interbank Offered Rate.
PIMCO - Pacific Investment Management Company.
S&P - Standard & Poor's.
SPDR - Standard & Poor's Depositary Receipt.
| See Notes to Financial Statements. |
| 36 |
| Highland Resolute Fund | Consolidated Statement of Assets and Liabilities |
October 31, 2017 (Unaudited)
| Highland Resolute Fund | ||||
| ASSETS | ||||
| Investments, at value | $ | 333,494,968 | ||
| Unrealized appreciation on total return swap contracts | 139,941 | |||
| Deposits with brokers for securities sold short | 36,021,881 | |||
| Deposits with brokers for total return swap contracts | 75,766,210 | |||
| Cash | 15,216 | |||
| Foreign currency, at value (Cost 1,661,489) | 1,822,335 | |||
| Receivable for investments sold | 933,047 | |||
| Dividends receivable | 207,166 | |||
| Interest receivable | 1,211,343 | |||
| Receivable for total return swap reset | 160,645 | |||
| Other assets | 396,949 | |||
| Total assets | 450,169,701 | |||
| LIABILITIES | ||||
| Securities sold short (Proceeds $39,886,701) | 41,587,260 | |||
| Unrealized depreciation on total return swap contracts | 170,508 | |||
| Payable to custodian due to overdraft on foreign currency (Cost $1,608,432) | 1,521,851 | |||
| Investment advisory fees payable | 402,715 | |||
| Payable for dividend expense on securities sold short | 185,090 | |||
| Payable for interest expense on total return swap contracts | 25,554 | |||
| Payable for investments purchased | 2,698,209 | |||
| Payable for shares redeemed | 19,500,000 | |||
| Trustee fees and expenses payable | 10,565 | |||
| Chief compliance officer fee payable | 3,620 | |||
| Principal financial officer fees payable | 875 | |||
| Administration fees payable | 127,768 | |||
| Transfer agent fees payable | 10,976 | |||
| Professional fees payable | 39,818 | |||
| Custody fees payable | 42,309 | |||
| Accrued expenses and other liabilities | 487,348 | |||
| Total liabilities | 66,814,466 | |||
| NET ASSETS | $ | 383,355,235 | ||
| NET ASSETS CONSIST OF | ||||
| Paid-in capital (Note 6) | $ | 340,372,655 | ||
| Accumulated net income | 13,816,930 | |||
| Accumulated net realized gain | 12,008,054 | |||
| Net unrealized appreciation | 17,157,596 | |||
| NET ASSETS | $ | 383,355,235 | ||
| INVESTMENTS, AT COST | $ | 314,854,630 | ||
| PRICING OF SHARES | ||||
| Class I: | ||||
| Net Asset Value, offering and redemption price per share | $ | 11.58 | ||
| Net Assets | $ | 383,355,235 | ||
| Shares of beneficial interest outstanding (unlimited number of shares, no par value common stock authorized) | 33,111,150 | |||
| See Notes to Financial Statements. |
| Semi-Annual Report | October 31, 2017 | 37 |
| Highland Resolute Fund | Consolidated Statement of Operations |
For the Six Months Ended October 31, 2017 (Unaudited)
| Highland Resolute Fund(a) | ||||
| INVESTMENT INCOME | ||||
| Dividends | $ | 1,582,196 | ||
| Interest | 3,192,964 | |||
| Foreign taxes withheld | (4,753 | ) | ||
| Total investment income | 4,770,407 | |||
| EXPENSES | ||||
| Investment advisory fees (Note 7) | 3,396,007 | |||
| Investment sub-advisory fee | 166,256 | |||
| Broker fees and charges on securities sold short | 49,496 | |||
| Administration fees | 216,976 | |||
| Transfer agency fees | 30,866 | |||
| Professional fees | 44,046 | |||
| Custody fees | 58,934 | |||
| Reports to shareholders and printing fees | 4,676 | |||
| Trustee fees and expenses | 9,618 | |||
| Registration/filing fees | 4,268 | |||
| Chief compliance officer fees | 25,261 | |||
| Principal financial officer fees | 5,042 | |||
| Offering costs | 14,866 | |||
| Dividend expense on securities sold short | 247,318 | |||
| Interest expense on securities sold short | 279,228 | |||
| Other | 23,175 | |||
| Total expenses before waivers | 4,576,033 | |||
| Less fees waived/reimbursed by investment adviser (Note 7) | ||||
| Class I | (2,504,141 | ) | ||
| Waiver of investment advisory fees - subsidiary (Note 7) | (166,256 | ) | ||
| Total net expenses | 1,905,636 | |||
| NET INVESTMENT INCOME | 2,864,771 | |||
| Net realized gain on investments | 1,900,378 | |||
| Net realized loss on securities sold short | (1,859,868 | ) | ||
| Net realized gain on total return swap contracts | 7,771,898 | |||
| Net realized loss on foreign currency transactions | (22,721 | ) | ||
| Total net realized gain | 7,789,687 | |||
| Net change in unrealized appreciation on investments | 5,636,078 | |||
| Net change in unrealized depreciation on securities sold short | (119,690 | ) | ||
| Net change in unrealized appreciation on total return swap contracts | 573,535 | |||
| Net change in unrealized appreciation on translation of assets and liabilities in foreign currency transactions | 245,800 | |||
| Total net change in unrealized appreciation | 6,335,723 | |||
| NET REALIZED AND UNREALIZED GAIN ON INVESTMENTS | 14,125,410 | |||
| NET INCREASE IN NET ASSETS RESULTING FROM OPERATIONS | $ | 16,990,181 | ||
| (a) | Prior to August 31, 2017 the Highland Resolute Fund was known as the Redmont Resolute Fund. |
See Notes to Financial Statements.
38
| Highland Resolute Fund | Consolidated Statements of Changes in Net Assets |
| Highland Resolute Fund | ||||||||
| Six Months Ended October 31, 2017(a) (Unaudited) | For the Year Ended April 30, 2017(b) | |||||||
| OPERATIONS | ||||||||
| Net investment income | $ | 2,864,771 | $ | 5,052,253 | ||||
| Net realized gain | 7,789,687 | 16,865,746 | ||||||
| Net realized gain distributions from other investment companies | - | 2,574,206 | ||||||
| Net change in unrealized appreciation | 6,335,723 | 4,159,454 | ||||||
| Net increase in net assets resulting from operations | 16,990,181 | 28,651,659 | ||||||
| DISTRIBUTIONS (NOTE 4) | ||||||||
| Net investment income | ||||||||
| Class I | - | (6,470,084 | ) | |||||
| Net realized gains on investments | ||||||||
| Class I | - | (778,253 | ) | |||||
| Net decrease in net assets from distributions | - | (7,248,337 | ) | |||||
| BENEFICIAL INTEREST TRANSACTIONS (NOTE 6) | ||||||||
| Shares sold | ||||||||
| Class I | 10,972,445 | 139,235,368 | ||||||
| Dividends reinvested | ||||||||
| Class I | - | 7,248,336 | ||||||
| Shares redeemed, net of redemption fees | ||||||||
| Class I | (136,418,741 | ) | (362,734,552 | ) | ||||
| Net decrease in net assets derived from beneficial interest transactions | (125,446,296 | ) | (216,250,848 | ) | ||||
| Net decrease in Net Assets | (108,456,115 | ) | (194,847,526 | ) | ||||
| NET ASSETS: | ||||||||
| Beginning of period | 491,811,350 | 686,658,876 | ||||||
| End of period* | $ | 383,355,235 | $ | 491,811,350 | ||||
| * Includes accumulated net investment income of: | $ | 13,816,930 | $ | 10,952,159 | ||||
| (a) | Prior to August 31, 2017 the Highland Resolute Fund was known as the Redmont Resolute Fund. |
| (b) | Prior to August 31, 2016 the Highland Resolute Fund was known as the Redmont Resolute Fund II. |
See Notes to Financial Statements.
| Semi-Annual Report | October 31, 2017 | 39 |
| Highland Resolute Fund | Consolidated Financial Highlights |
For a share outstanding throughout the periods presented
| Class I | ||||||||||||||||||||||||
| For the Six Months Ended October 31, 2017(a) (Unaudited) | For the Year Ended April 30, 2017(b) | For the Year Ended April 30, 2016 | For the Year Ended April 30, 2015 | For the Year Ended April 30, 2014 | For the Year Ended April 30, 2013 | |||||||||||||||||||
| NET ASSET VALUE, BEGINNING OF PERIOD | $ | 11.14 | $ | 10.75 | $ | 11.32 | $ | 11.18 | $ | 11.05 | $ | 10.34 | ||||||||||||
| INCOME/(LOSS) FROM OPERATIONS | ||||||||||||||||||||||||
| Net investment income(c) | 0.07 | 0.09 | 0.16 | 0.20 | 0.13 | 0.11 | ||||||||||||||||||
| Net realized and unrealized gain/(loss) on investments | 0.37 | 0.45 | (0.39 | ) | 0.26 | 0.19 | 0.68 | |||||||||||||||||
| Total from Investment Operations | 0.44 | 0.54 | (0.23 | ) | 0.46 | 0.32 | 0.79 | |||||||||||||||||
| LESS DISTRIBUTIONS | ||||||||||||||||||||||||
| Net investment income | - | (0.13 | ) | (0.18 | ) | (0.24 | ) | (0.11 | ) | (0.08 | ) | |||||||||||||
| Net realized gain on investments | - | (0.02 | ) | (0.16 | ) | (0.08 | ) | (0.08 | ) | - | ||||||||||||||
| Total Distributions | - | (0.15 | ) | (0.34 | ) | (0.32 | ) | (0.19 | ) | (0.08 | ) | |||||||||||||
| NET INCREASE/(DECREASE) IN NET ASSET VALUE | 0.44 | 0.39 | (0.57 | ) | 0.14 | 0.13 | 0.71 | |||||||||||||||||
| NET ASSET VALUE, END OF PERIOD | $ | 11.58 | $ | 11.14 | $ | 10.75 | $ | 11.32 | $ | 11.18 | $ | 11.05 | ||||||||||||
| TOTAL RETURN(d) | 3.95 | % | 5.04 | % | (2.02 | )% | 4.16 | % | 2.85 | % | 7.65 | % | ||||||||||||
| RATIOS/SUPPLEMENTAL DATA | ||||||||||||||||||||||||
| Net assets, End of Period (000s) | $ | 383,355 | $ | 491,811 | $ | 686,659 | $ | 689,266 | $ | 604,949 | $ | 446,319 | ||||||||||||
| RATIOS TO AVERAGE NET ASSETS: | ||||||||||||||||||||||||
| Operating expenses excluding reimbursement/waiver(e) | 1.97 | %(f)(g)(h) | 1.77 | %(g)(h) | 1.69 | %(g) | 1.68 | %(g) | 1.69 | %(g) | 1.32 | % | ||||||||||||
| Operating expenses including reimbursement/waiver(e) | 0.86 | %(f)(g) | 0.52 | %(g) | 0.35 | %(g) | 0.33 | %(g) | 0.29 | %(g) | 0.22 | % | ||||||||||||
| Net investment income including reimbursement/waiver(e) | 1.25 | %(f) | 0.86 | % | 1.49 | % | 1.79 | % | 1.19 | % | 1.08 | % | ||||||||||||
| PORTFOLIO TURNOVER RATE | 37 | %(i) | 94 | % | 27 | % | 54 | % | 114 | % | 51 | % | ||||||||||||
| (a) | Prior to August 31, 2017 the Highland Resolute Fund was known as the Redmont Resolute Fund. |
| (b) | Prior to August 31, 2016 the Highland Resolute Fund was known as the Redmont Resolute Fund II. |
| (c) | Calculated using the average shares method. |
| (d) | Total investment return is calculated assuming a purchase of a common share at the opening of the first day and a sale at closing on the last day of each period reported. Dividends and distributions, if any, are assumed for purposes of this calculation to be reinvested at prices obtained under the Fund's dividend reinvestment plan. Total returns would have been lower had certain expenses not been waived during the period. Total investment returns do not reflect brokerage commissions, if any, and are not annualized. |
| (e) | The ratios exclude the impact of expenses of the underlying funds in which the Fund invests as represented in the Schedule of Investments. |
| (f) | Annualized. |
| (g) | Dividend and interest expense on securities sold short totaled 0.10%, 0.10%, 0.08%, 0.10%, and 0.08% of average net assets for the six months ended October 31, 2017 and for the years ended April 30, 2017, 2016, 2015, and 2014, respectively. |
| (h) | The ratio of operating expenses excluding fee waiver/reimbursements to average net assets is calculated excluding the waived Subsidiary management fee (See Note 7 for additional detail). The ratio inclusive of that fee would be 2.04% and 1.81% for the six months ended October 31, 2017 and for the year ended April 30, 2017, respectively. |
| (i) | Not Annualized. |
See Notes to Financial Statements.
40
| Highland Resolute Fund | Notes to Consolidated Financial Statements |
October 31, 2017 (Unaudited)
1. ORGANIZATION
Financial Investors Trust (the “Trust”), a Delaware statutory trust, is an open-end management investment company registered under the Investment Company Act of 1940, as amended (“1940 Act”). The Trust consists of multiple separate portfolios or series. This semi-annual report describes the Highland Resolute Fund (the “Fund”). Effective August 31, 2017, the Fund changed its name from Redmont Resolute Fund. The Fund seeks to provide long-term total return with reduced volatility and reduced correlation to the conventional stock and bond markets. The Fund offers Class I shares.
Basis of Consolidation: Highland Resolute Cayman (the “Subsidiary”), a Cayman Islands exempted company, is a wholly owned subsidiary of the Fund. The Subsidiary’s investment objective is designed to enhance the ability of the Fund to obtain exposure to equities, financial, currency and commodities markets consistent with the limits of the U.S. federal tax law requirements applicable to registered investment companies. The Subsidiary is subject to substantially the same investment policies and investment restrictions as the Fund. The Subsidiary acts as an investment vehicle for the Fund in order to effect certain commodity-related investments on behalf of the Fund. Investments in the Subsidiary are expected to provide the Fund with exposure to the commodity markets within the limitations of Subchapter M of the Internal Revenue Code of 1986, as amended (the “Code”), and recent IRS revenue rulings, as discussed below under “Federal Income Taxes”. The Fund is the sole shareholder of the Subsidiary pursuant to a subscription agreement, and it is intended that the Fund will remain the sole shareholder and will continue to control the Subsidiary. Under the Articles of Association of the Subsidiary, shares issued by the Subsidiary confer upon a shareholder the right to wholly own and vote at general meetings of the Subsidiary and certain rights in connection with any winding-up or repayment of capital, as well as the right to participate in the profits or assets of the Subsidiary. The Fund may invest up to 25% of its total assets in shares of the Subsidiary. As a wholly owned subsidiary of the Fund, all assets and liabilities, income and expenses of the Subsidiary are consolidated in the financial statements and financial highlights of the Fund. All investments held by the Subsidiary are disclosed in the accounts of the Fund. As of October 31, 2017, net assets of the Fund were $491,811,350, of which $24,342,904 or 4.95%, represented the Fund’s ownership of all issued shares and voting rights of the Subsidiary.
2. SIGNIFICANT ACCOUNTING POLICIES
The accompanying financial statements were prepared in accordance with accounting principles generally accepted in the United States of America (“U.S. GAAP”). The preparation of financial statements in conformity with U.S. GAAP requires management to make certain estimates and assumptions that affect the reported amounts of assets and liabilities and disclosures of contingent assets and liabilities at the date of the financial statements and the reported amounts of revenue and expenses during the period. Actual results could differ from those estimates. The Fund is considered an investment company for financial reporting purposes under U.S. GAAP. The following is a summary of significant accounting policies consistently followed by the Fund and Subsidiary in preparation of the financial statements.
Investment Valuation: The Fund generally values its securities based on market prices determined at the close of regular trading on the New York Stock Exchange (“NYSE”), normally 4:00 p.m. Eastern Time, on each day the NYSE is open for trading.
For equity securities and mutual funds that are traded on an exchange, the market price is usually the closing sale or official closing price on that exchange. In the case of equity securities not traded on an exchange, or if such closing prices are not otherwise available, the securities are valued at the mean of the most recent bid and ask prices on such day. Redeemable securities issued by open-end registered investment companies are valued at the investment company’s applicable net asset value, with the exception of exchange-traded open-end investment companies, which are priced as equity securities.
The market price for debt obligations is generally the price supplied by an independent third-party pricing service approved by the Board of Trustees (the “Board”), which may use a matrix, formula or other objective method that takes into consideration quotations from dealers, market transactions in comparable investments, market indices and yield curves. If vendors are unable to supply a price, or if the price supplied is deemed to be unreliable, the market price may be determined using quotations received from one or more brokers–dealers that make a market in the security. Municipal securities having a remaining maturity of greater than 60 days, are typically valued at the evaluated bid price formulated by an independent pricing service. Corporate Bonds, U.S. Government & Agency, and U.S. Treasury Bonds & Notes are valued using market models that consider trade data, quotations from dealers and active market makers, relevant yield curve and spread data, creditworthiness, trade data or market information on comparable securities, and other relevant security specific information. Mortgage-related and asset-backed securities are valued based on models that consider trade data, prepayment and default projections, benchmark yield and spread data and estimated cash flows of each tranche of the issuer. Publicly traded foreign government debt securities are typically traded internationally in the over-the-counter market and are valued at the mean between the bid and asked prices as of the close of business of that market.
| Semi-Annual Report | October 31, 2017 | 41 |
| Highland Resolute Fund | Notes to Consolidated Financial Statements |
October 31, 2017 (Unaudited)
Futures contracts that are listed or traded on a national securities exchange, commodities exchange, contract market or comparable over the counter market, and that are freely transferrable, are valued at their closing settlement price on the exchange on which they are primarily traded or based upon the current settlement price for a like instrument acquired on the day on which the instrument is being valued. A settlement price may not be used if the market makes a limit move with respect to a particular commodity. Over-the-counter swap contracts for which market quotations are readily available are valued based on quotes received from independent pricing services or one or more dealers that make markets in such securities. Options contracts listed for trading on a securities exchange or board of trade are valued at the last quoted sales price or, in the absence of a sale at the mean of the last bid and asked price.
Forward currency exchange contracts have a fair value determined by the current foreign currency exchange forward rates. The foreign currency exchange forward rates are calculated using an automated system that estimates rates on the basis of the current day foreign currency exchange rates and forward foreign currency exchange rates supplied by a pricing service. Foreign exchange rates and forward foreign currency exchange rates may generally be obtained at the close of the NYSE, normally 4:00 p.m. Eastern Time.
When such prices or quotations are not available, or when Highland Associates, Inc. (the “Adviser”) believes that they are unreliable, securities may be priced using fair value procedures approved by the Board.
Fair Value Measurements: The Fund discloses the classification of its fair value measurements following a three-tier hierarchy based on the inputs used to measure fair value. Inputs refer broadly to the assumptions that market participants would use in pricing the asset or liability, including assumptions about risk. Inputs may be observable or unobservable. Observable inputs reflect the assumptions market participants would use in pricing the asset or liability that are developed based on market data obtained from sources independent of the reporting entity. Unobservable inputs reflect the reporting entity’s own assumptions about the assumptions market participants would use in pricing the asset or liability that are developed based on the best information available.
Various inputs are used in determining the value of the Fund’s investments as of the end of the reporting period. When inputs used fall into different levels of the fair value hierarchy, the level in the hierarchy within which the fair value measurement falls is determined based on the lowest level input that is significant to the fair value measurement in its entirety. The designated input levels are not necessarily an indication of the risk or liquidity associated with these investments. These inputs are categorized in the following hierarchy under applicable financial accounting standards:
| Level 1 – | Unadjusted quoted prices in active markets for identical investments, unrestricted assets or liabilities that the Fund has the ability to access at the measurement date; |
| Level 2 – | Quoted prices which are not active, quoted prices for similar assets or liabilities in active markets or inputs other than quoted prices that are observable (either directly or indirectly) for substantially the full term of the asset or liability; and |
| Level 3 – | Significant unobservable prices or inputs (including the Fund’s own assumptions in determining the fair value of investments) where there is little or no market activity for the asset or liability at the measurement date. |
42
| Highland Resolute Fund | Notes to Consolidated Financial Statements |
October 31, 2017 (Unaudited)
The following is a summary of the inputs used to value the Fund’s investments as of October 31, 2017:
Highland Resolute Fund
| Investments in Securities at Value | Level 1 -Quoted Prices | Level 2 -Other Significant Observable Inputs | Level 3 -Significant Unobservable Inputs | Total | ||||||||||||
| Closed End Funds | $ | 1,650,485 | $ | - | $ | - | $ | 1,650,485 | ||||||||
| Common Stocks(*) | 69,475,003 | - | - | 69,475,003 | ||||||||||||
| Limited Partnerships(*) | 2,376,598 | - | - | 2,376,598 | ||||||||||||
| Open-End Mutual Funds | 151,790,972 | - | - | 151,790,972 | ||||||||||||
| Purchased Put Options | 153,918 | - | - | 153,918 | ||||||||||||
| Corporate Bonds(*) | - | 66,079,095 | - | 66,079,095 | ||||||||||||
| Short Term Investments | ||||||||||||||||
| Money Market Funds | 41,968,897 | - | - | 41,968,897 | ||||||||||||
| Total | $ | 267,415,873 | $ | 66,079,095 | $ | - | $ | 333,494,968 | ||||||||
| Other Financial Instruments** | ||||||||||||||||
| Assets: | ||||||||||||||||
| Total Return Swap Contracts | $ | - | $ | 174,470,665 | $ | - | $ | 174,470,665 | ||||||||
| Liabilities: | ||||||||||||||||
| Common Stocks Sold Short(*) | (19,681,084 | ) | - | - | (19,681,084 | ) | ||||||||||
| Corporate Bonds - Sold Short | - | (14,107,594 | ) | - | (14,107,594 | ) | ||||||||||
| Exchange Traded Funds Sold Short | (7,798,582 | ) | - | - | (7,798,582 | ) | ||||||||||
| Total Return Swap Contracts | - | (13,197,493 | ) | - | (13,197,493 | ) | ||||||||||
| Total | $ | (27,479,666 | ) | $ | 147,165,578 | $ | - | $ | 119,685,912 | |||||||
| * | For detailed descriptions, see the accompanying Schedule of Investments. |
| ** | Other financial instruments are derivative instruments reflected in the Schedule of Investments. The derivatives shown in the table are reported at their unrealized appreciation/(depreciation) at measurement date, which represents the change in the contract’s value from trade date. |
For liabilities arising from overdrafts in the custody account, the carrying amount approximates fair value due to the relatively short-term maturity of these financial instruments. As of October 31, 2017, the liabilities related to custody overdrafts used level 2 inputs.
The Fund recognizes transfers between levels as of the end of the period. For the six months ended October 31, 2017, the Fund did not have any transfers between Level 1 and Level 2 securities. The following is a reconciliation of assets in which significant unobservable inputs (Level 3) were used in determining fair value:
| Investments in Securities at Value | Balance as of 4/30/2017 | Return of Capital | Realized gain/(loss) | Change in unrealized appreciation/ (depreciation) | Purchases | Sales Proceeds | Transfer in and/or (out) of Level 3 | 10/31/2017 | Net change in unrealized appreciation/ (depreciation) attributable to Level 3 investments held at 10/31/2017 | |||||||||||||||||||||||||||
| Common Stock | $ | 107,200 | $ | - | $ | (60,947 | ) | $ | (130,306 | ) | $ | - | $ | 84,053 | $ | - | $ | - | $ | - | ||||||||||||||||
| Total | $ | 107,200 | $ | - | $ | (60,947 | ) | $ | (130,306 | ) | $ | - | $ | 84,053 | $ | - | $ | - | $ | - | ||||||||||||||||
Trust Expenses: Some expenses of the Trust can be directly attributed to the Fund. Expenses which cannot be directly attributed to the Fund are apportioned among all funds in the Trust based on average net assets of the Fund.
Offering Costs: Offering costs, including costs of printing initial prospectuses, legal and registration fees, are being amortized over twelve months from the date the Subsidiary was established. Amounts amortized during the period ended October 31, 2017 for the Fund are shown on the Statements of Operations. As of October 31, 2017, $14,865, of offering costs remain to be amortized for the Fund.
| Semi-Annual Report | October 31, 2017 | 43 |
| Highland Resolute Fund | Notes to Consolidated Financial Statements |
October 31, 2017 (Unaudited)
Federal Income Taxes: The Fund complies with the requirements under Subchapter M of the Internal Revenue Code of 1986, as amended, applicable to regulated investment companies and intend to distribute substantially all of their net taxable income and net capital gains, if any, each year so that the Fund will not be subject to excise tax on undistributed income and gains. The Fund is not subject to income taxes to the extent such distributions are made.
As of and during the six months ended October 31, 2017, the Fund did not have a liability for any unrecognized tax benefits. The Fund files U.S. federal, state, and local tax returns as required. The Fund’s tax returns are subject to examination by the relevant tax authorities until expiration of the applicable statute of limitations, which is generally three years after the filing of the tax return for federal purposes and four years for most state returns. Tax returns for open years have incorporated no uncertain tax positions that require a provision for income taxes.
Investment Transactions and Investment Income: Investment transactions are accounted for on the date the investments are purchased or sold (trade date basis). Net realized gains and losses from investment transactions are reported on an identified cost basis. Interest income, which includes accretion of discounts and amortization of premiums, is accrued and recorded as earned. Dividend income is recognized on the ex-dividend date or for certain foreign securities, as soon as information is available to the Fund. All of the realized and unrealized gains and losses and net investment income, are allocated daily to each class in proportion its average daily net assets.
Short Sales: The Fund may make short sales of securities consistent with its strategies. A short sale is a transaction in which a Fund sells a security it does not own in anticipation that the market price of that security will decline.
When a Fund makes a short sale, it must borrow the security sold short and deliver it to the broker dealer through which it made the short sale as collateral for its obligation to deliver the security upon conclusion of the sale. The Fund may have to pay a fee to borrow particular securities and is often obligated to pay over any accrued interest and dividends on such borrowed securities.
If the price of the security sold short increases between the time of the short sale and the time that a Fund replaces the borrowed security, the Fund will incur a loss; conversely, if the price declines, the Fund will realize a capital gain. Any gain will be decreased, and any loss increased, by the transaction costs described above. The successful use of short selling may be adversely affected by imperfect correlation between movements in the price of the security sold short and the securities being hedged.
To the extent that a Fund engages in short sales, it will provide collateral to the broker-dealer and (except in the case of short sales “against the box”) will maintain additional asset coverage in the form of segregated or “earmarked” assets determined to be liquid in accordance with procedures established by the Board and that is equal to the current market value of the securities sold short, or will ensure that such positions are covered by “offsetting” positions, until the Fund replaces the borrowed security. A short sale is “against the box” to the extent that the Fund contemporaneously owns, or has the right to obtain at no added cost, securities identical to those sold short. The Fund may engage in short selling to the extent permitted by the federal securities laws and rules and interpretations thereunder. To the extent a Fund engages in short selling in foreign (non-U.S.) jurisdictions, the Fund will do so to the extent permitted by the laws and regulations of such jurisdiction.
Distributions to Shareholders: The Fund normally pays dividends and distributes capital gains, if any, on an annual basis. Income dividend distributions are derived from interest and dividends and other income the Fund receives from their investments, including distributions of short term capital gains. Capital gain distributions are derived from gains realized when the Fund sells a security it has owned for more than a year. The Fund may make additional distributions and dividends at other times if its portfolio manager or managers believe doing so may be necessary for the Fund to avoid or reduce taxes.
3. DERIVATIVE INSTRUMENTS
Swap Contracts: The Fund may enter into swap transactions for hedging purposes or to seek to increase total return. At the present time, the Fund primarily enters into swap transactions for the purpose of increasing total return. Risks may arise as a result of the failure of the counterparty to the swap contract to comply with the terms of the swap contract. The loss incurred by the failure of a counterparty is generally limited to the net payment to be received by the Fund and/or the termination value at the end of the contract.
Therefore, the Fund considers the creditworthiness of each counterparty to a contract in evaluating potential credit risk. Additionally, risks may arise from unanticipated movements in interest rates or in the value of the underlying reference asset or index. Entering into these agreements involves, to varying degrees, market risk, liquidity risk and elements of credit, legal and documentation risk that are not directly reflected in the amounts recognized in the Statements of Assets and Liabilities.
The Fund invests in total return swaps to obtain exposure to a security or market without owning such security or investing directly in that market or to transfer the risk/return of one market (e.g., fixed income) to another market (e.g., equity) (equity risk and/or interest rate risk). Total return
44
| Highland Resolute Fund | Notes to Consolidated Financial Statements |
October 31, 2017 (Unaudited)
swaps are agreements in which there is an exchange of cash flows whereby one party commits to make payments based on the total return (coupons plus capital gains/losses) of an underlying instrument in exchange for fixed or floating rate interest payments. To the extent the total return of the instrument or index underlying the transaction exceeds or falls short of the offsetting interest rate obligation, the Fund will receive a payment from or make a payment to the counterparty. The Fund may pay or receive cash as collateral on these contracts which may be recorded as an asset and/or liability. The Fund must set aside liquid assets, or engage in other appropriate measures, to cover its obligations under these contracts. Swaps are marked to market daily using either pricing vendor quotations, counterparty prices or model prices and the change in value, if any, is recorded as an unrealized gain or loss. Upfront payments made and/or received by the Fund are recorded as an asset and/or liability and realized gains or losses are recognized ratably over the contract’s term/event, with the exception of forward starting interest rate swaps, whose realized gains or losses are recognized ratably from the effective start date. Periodic payments received or made on swap contracts are recorded as realized gains or losses. Gains or losses are realized upon termination of a swap contract and are recorded on the Statement of Operations. Swap agreements held at October 31, 2017 are disclosed in the Consolidated Schedule of Investments.
International Swaps and Derivatives Association, Inc. Master Agreements (“ISDA Master Agreements”) govern OTC financial derivative transactions entered into by the Fund and those counterparties. The ISDA Master Agreements maintain provisions for general obligations, representations, agreements, collateral and events of default or termination. Events of termination include conditions that may entitle counterparties to elect to terminate early and cause settlement of all outstanding transactions under the applicable ISDA Master Agreement. Any election to early terminate could be material to the financial statements.
Option Contracts: The Fund may enter into options transactions for hedging purposes and for non-hedging purposes such as seeking to enhance return. The Fund may write covered put and call options on any stocks or stock indices, currencies traded on domestic and foreign securities exchanges, or futures contracts on stock indices, interest rates and currencies traded on domestic and, to the extent permitted by the CFTC, foreign exchanges. A call option on an asset written by the Fund obligates the Fund to sell the specified asset to the holder (purchaser) at a stated price (the exercise price) if the option is exercised before a specified date (the expiration date). A put option on an asset written by a Fund obligates the Fund to buy the specified asset from the purchaser at the exercise price if the option is exercised before the expiration date. Premiums received when writing options are recorded as liabilities and are subsequently adjusted to the current value of the options written. Premiums received from writing options that expire are treated as realized gains. Premiums received from writing options, which are either exercised or closed, are offset against the proceeds received or amount paid on the transaction to determine realized gains or losses which are recorded on the Statement of Operations.
Futures: The Fund may enter into futures contracts for hedging purposes. A futures contract represents a commitment for the future purchase or sale of an asset at a specified price on a specified date. Upon entering into a futures contract, the Fund is required to deposit an initial margin with the broker in an amount equal to a certain percentage of the contract amount. The Fund receives from or pays to the broker, on a daily basis, an amount of cash equal to the daily fluctuation in value of the contract. Such receipts or payments are known as “variation margin,” and are recorded by the Fund as unrealized gains or losses. When the futures contract is closed, the Fund records a gain or loss equal to the difference between the value of the contract at the time it was opened and the value at the time it was closed.
The Fund’s potential losses from the use of futures extend beyond its initial investment in such contracts. The use of futures contracts involves, to varying degrees, elements of market risk in excess of the amount recognized in the Statements of Assets and Liabilities. The predominant risk is that the movement of a futures contract’s price may result in a loss, which could render the Fund’s hedging strategy unsuccessful. There is minimal counterparty credit risk since futures contracts are exchange traded and the exchange’s clearinghouse, as counterparty to all exchange traded futures, guarantees the futures against default.
| Semi-Annual Report | October 31, 2017 | 45 |
| Highland Resolute Fund | Notes to Consolidated Financial Statements |
October 31, 2017 (Unaudited)
Risk Exposure: The following tables disclose the amounts related to the Fund’s use of derivative instruments.
The effect of derivatives instruments on the Statements of Assets and Liabilities as of October 31, 2017 was as follows:
| Risk Exposure | Asset Derivatives Statements of Assets and Liabilities Location | Fair Value | Liability Derivatives Statements of Assets and Liabilities Location | Fair Value | ||||||||
| Highland Resolute Fund | ||||||||||||
| Equity Contracts (Total Return Swap Contracts) | Unrealized appreciation on total return swap contracts | $ | 139,941 | Unrealized depreciation on total return swap contracts | $ | 15 | ||||||
| Interest Rate Contracts (Total Return Swap Contracts) | Unrealized appreciation on total return swap contracts | - | Unrealized depreciation on total return swap contracts | 170,493 | ||||||||
| Equity Contracts (Purchased Options) | Investments, at value | 153,918 | N/A | N/A | ||||||||
| Total | $ | 293,859 | $ | 170,508 | ||||||||
The effect of derivatives instruments on the Statements of Operations for the year ended October 31, 2017 was as follows:
| Risk Exposure | Statement of Operations Location | Realized Gain/(Loss) on Derivatives Recognized in Income | Change in Unrealized Appreciation/(Depreciation) on Derivatives Recognized in Income | |||||||
| Highland Resolute Fund | ||||||||||
| Equity Contracts (Total Return Swap Contracts) | Net realized gain on total return swap contracts/Net change in unrealized appreciation on total return swap contracts | $ | 7,341,002 | $ | 544,956 | |||||
| Interest Rate Contracts (Total Return Swap Contracts) | Net realized gain on total return swap contracts/Net change in unrealized appreciation on total return swap contracts | $ | 430,896 | $ | 28,579 | |||||
| Equity Contracts (Purchased Options) | Net realized loss on investments/Net change in unrealized depreciation on investments | (1,555,382 | ) | 24,965 | ||||||
| Total | $ | 6,216,516 | $ | 598,500 | ||||||
46
| Highland Resolute Fund | Notes to Consolidated Financial Statements |
October 31, 2017 (Unaudited)
Volume of Derivative Instruments for the Fund during the year ended October 31, 2017 was as follows:
| Derivative Type | Unit of Measurement | Monthly Average |
| Highland Resolute Fund | ||
| Total Return Swap Contracts | Notional Quantity | 188,033,752 |
| Purchased Options Contracts | Contracts | 649 |
Certain derivative contracts and repurchase agreements are executed under either standardized netting agreements or, for exchange-traded derivatives, the relevant contracts for a particular exchange which contain enforceable netting provisions. A derivative netting arrangement creates an enforceable right of set-off that becomes effective, and affects the realization of settlement on individual assets, liabilities and collateral amounts, only following a specified event of default or early termination. Default events may include the failure to make payments or deliver securities timely, material adverse changes in financial condition or insolvency, the breach of minimum regulatory capital requirements, or loss of license, charter or other legal authorization necessary to perform under the contract.
The following table presents financial instruments that are subject to enforceable netting arrangements or other similar agreements as of October 31, 2017:
| Highland Resolute Fund | ||||||||||||||||||||||||
| Offsetting of Derivatives Assets | ||||||||||||||||||||||||
| Gross Amounts Not Offset in the Statement of Assets and Liabilities | ||||||||||||||||||||||||
| Gross Amounts of Recognized Assets | Gross Amounts Offset in the Statement of Assets and Liabilities | Net Amounts Presented in the Statement of Assets and Liabilities | Financial Instruments Available for Offset (a) | Cash Collateral Received(a) | Net Receivable Amount | |||||||||||||||||||
| Total Return Swap Contracts | $ | 139,941 | $ | - | $ | 139,941 | $ | (139,941 | ) | $ | - | $ | - | |||||||||||
| Total | $ | 139,941 | $ | - | $ | 139,941 | $ | (139,941 | ) | $ | - | $ | - | |||||||||||
| Highland Resolute Fund | ||||||||||||||||||||||||
| Offsetting of Derivatives Liabilities | ||||||||||||||||||||||||
Gross Amounts Not Offset in the Statement of Assets and Liabilities | ||||||||||||||||||||||||
| Gross Amounts of Recognized Liabilities | Gross Amounts Offset in the Statement of Financial Position | Net Amounts Presented in the Statement of Financial Position | Financial Instruments Available for Offset (a) | Cash Collateral Pledged(a) | Net Payable Amount | |||||||||||||||||||
| Total Return Swap Contracts | $ | 170,508 | $ | - | $ | 170,508 | $ | (139,941 | ) | $ | (30,567 | ) | $ | - | ||||||||||
| Total | $ | 170,508 | $ | - | $ | 170,508 | $ | (139,941 | ) | $ | (30,567 | ) | $ | - | ||||||||||
| (a) | These amounts are limited to the derivative asset/liability balance and, accordingly, do not include excess collateral received/pledged. |
| Semi-Annual Report | October 31, 2017 | 47 |
| Highland Resolute Fund | Notes to Consolidated Financial Statements |
October 31, 2017 (Unaudited)
4. TAX BASIS INFORMATION
Tax Basis of Investments: As of October 31, 2017, the aggregate cost of investments, gross unrealized appreciation/(depreciation) and net unrealized appreciation for Federal tax purposes were as follows:
| Gross Appreciation (excess of value over tax cost) | Gross Depreciation (excess of tax cost over value) | Net Unrealized Appreciation | Cost of Investments for Income Tax Purposes | ||||||||||||||
| Highland Resolute Fund | $ | 212,750,789 | $ | (197,964,259 | ) | $ | 14,786,530 | $ | 302,399,325 | ||||||||
Tax Basis of Distributions to Shareholders: The character of distributions made during the year from net investment income or net realized gains may differ from its ultimate characterization for federal income tax purposes. Also, due to the timing of dividend distributions, the fiscal year in which amounts are distributed may differ from the fiscal year in which the income or realized gain were recorded by the Fund.
The tax character of distributions paid by the Fund for the fiscal year ended April 30, 2017, were as follows:
| Ordinary Income | Long-Term Capital Gains | ||||||||
| Highland Resolute Fund | $ | 6,470,084 | $ | 778,253 | |||||
5. SECURITIES TRANSACTIONS
Purchases and sales of securities, excluding short-term securities and U.S. Government Obligations during the six months ended October 31, 2017 were as follows:
| Fund | Purchases of Securities | Proceeds From Sales of Securities | |||||||
| Highland Resolute Fund | $ | 119,336,512 | $ | 156,026,255 | |||||
6. BENEFICIAL SHARE TRANSACTIONS
The capitalization of the Trust consists of an unlimited number of shares of beneficial interest with no par value per share. Holders of the shares of the Fund of the Trust have one vote for each share held and a proportionate fraction of a vote for each fractional share. All shares issued and outstanding are fully paid and are transferable and redeemable at the option of the shareholder. Purchasers of the shares do not have any obligation to make payments to the Trust or its creditors solely by reason of the purchasers’ ownership of the shares. Shares have no pre-emptive rights.
Transactions in common shares were as follows:
| Highland Resolute Fund | ||||||||
| Class I: | For the Six Months Ended October 31, 2017 (Unaudited) | For the Year Ended April 30, 2017 | ||||||
| Common Shares Outstanding - Beginning of Period | 44,145,034 | 63,881,394 | ||||||
| Common Shares Sold | 976,952 | 12,752,236 | ||||||
| Common Shares Issued as Reinvestment of Dividends | - | 666,208 | ||||||
| Common Shares Redeemed | (12,010,836 | ) | (33,154,804 | ) | ||||
| Common Shares Outstanding - End of Period | 33,111,150 | 44,145,034 | ||||||
48
| Highland Resolute Fund | Notes to Consolidated Financial Statements |
October 31, 2017 (Unaudited)
Shares redeemed within 30 days of purchase may incur a 2% short-term redemption fee deducted from the redemption amount. Redemption fees are reflected in the “Shares redeemed, net of redemption fees” in the Statements of Changes in Net Assets. For the six months ended October 31, 2017 and the year ended April 30, 2017, the Fund retained fees as follows:
| Fund | For the Six Months Ended October 31, 2017 (Unaudited) | For the Year Ended April 30, 2017 | |||||||
| Highland Resolute Fund | $ | - | $ | - |
7. MANAGEMENT AND RELATED PARTY TRANSACTIONS
Investment Advisory
The Adviser, subject to the authority of the Board, is responsible for the overall management and administration of the Fund’s business affairs. Pursuant to the Investment Advisory Agreement (the “Advisory Agreement”), the Adviser is entitled to an investment advisory fee, computed daily and payable monthly of 1.50% of the average daily net assets for the Fund. The management fee is paid on a monthly basis.
The Subsidiary has entered into a separate advisory agreement (the “Subsidiary Advisory Agreement”) with the Adviser for the management of the Subsidiary’s portfolio pursuant to which the Subsidiary is obligated to pay the Adviser a management fee at the same rate that the Fund pays the Adviser for investment advisory services provided to the Fund. The Adviser has agreed to waive the advisory fee it receives from the Fund in an amount equal to the management fee paid by the Subsidiary. This waiver may not be terminated or modified without the consent of the Board. This agreement may not be terminated or modified prior to this date except with the approval of the Board. For the six months ended October 31, 2017, this amount equaled $166,256 and is disclosed in the Consolidated Statement of Operations.
The Adviser entered into an Investment Sub-Advisory Agreement with Boston Partners, Pinebridge Investments LLC (“Pinebridge”), Incline Global Management, LLC. (“Incline”) . The Investment Sub-Advisory Agreements are in accordance with the Fund’s investment objective, policies and limitations and investment guidelines established jointly by the Adviser and the Board. The Adviser determines the allocation of the Fund’s assets among Boston Partners, Pinebridge, and Incline (collectively the “Sub-Advisers”) and other open-end investment companies. The Fund is not required to invest with any minimum number of sub-advisers or open-end investment companies, and does not have minimum or maximum limitations with respect to allocations of assets to the Sub-Advisers, investment strategy or market sector. Highland may change the allocation of the Fund’s assets among the available investment options, and may add or remove sub-advisers, at any time. Each Sub-Adviser is responsible for the day-to-day management of its allocated portion of Fund assets. Highland has ultimate responsibility, subject to the oversight of the Board of the Fund, to oversee the Sub-Advisers, and to recommend their hiring, termination and replacement.
Pursuant to each Investment Sub-Advisory Agreement, the Adviser pays the Sub-Advisers an annual sub-advisory management fee which is based on the Fund’s average quarterly market value of the assets managed by the Sub-Advisers. The Adviser is required to pay all fees due to Sub-Advisers out of the management fee the Adviser receives from the Fund. The following table reflects the Fund’s contractual sub-advisory fee rates.
| Sub-Advisers | Average Daily Market Value of the Fund | Contractual Sub-Advisory Fee |
| First $50 Million | 1.25% | |
| Boston Partners | Over $50 Million | 1.00% |
| Incline Global Management, LLC | 1.25% | |
| Chatham Asset Management, LLC | 1.00% |
The Adviser has agreed, with respect to the Fund’s Class I shares, to waive the portion of its 1.50% management fee in excess of any sub-advisory fees paid by the Adviser to Sub-Adviser in connection with the Fund. This agreement is in effect August 31, 2013 through August 31, 2017. The Adviser may not discontinue this agreement to waive fees prior to August 31, 2017 without the approval of the Fund’s Board of Trustees. The Adviser is not permitted to recoup any amounts waived or reimbursed to the extent actual fees and expenses for a fiscal period are less than the expense limitation cap. Fees waived/reimbursed by adviser for the six months ended October 31, 2017 are disclosed in the Consolidated Statement of Operations.
| Semi-Annual Report | October 31, 2017 | 49 |
| Highland Resolute Fund | Notes to Consolidated Financial Statements |
October 31, 2017 (Unaudited)
For the six months ended October 31, 2017, the fee waivers and/or reimbursements were as follows:
| Fees Waived/ Reimbursed By Adviser | ||||
| Highland Resolute Fund - Class I | $ | (2,504,141 | ) | |
Administrator Fees and Expenses
ALPS Fund Services, Inc. (“ALPS”) serves as administrator to the Fund, and the Fund has agreed to pay expenses incurred in connection with its administrative activities. Pursuant to an Administration Agreement, ALPS provides operational services to the Fund including, but not limited to, fund accounting and fund administration and generally assists in the Fund’s operations. Officers of the Trust are employees of ALPS. The Fund’s administration fee is accrued on a daily basis and paid monthly. Administration fees paid by the Fund for the six years ended October 31, 2017 are disclosed in the Consolidated Statement of Operations.
ALPS is reimbursed by the Fund for certain out-of-pocket expenses.
Transfer Agent
ALPS serves as transfer, dividend paying and shareholder servicing agent for the Fund. ALPS receives an annual minimum fee, a fee based upon the number of shareholder accounts and is also reimbursed by the Fund for certain out-of-pocket expenses. Transfer agent fees paid by the Fund for the six months ended October 31, 2017 are disclosed in the Consolidated Statement of Operations.
Compliance Services
ALPS provides services that assist the Fund’s chief compliance officer in monitoring and testing the policies and procedures of the Fund in conjunction with requirements under Rule 38a-1 under the 1940 Act and receives an annual base fee. ALPS is reimbursed for certain out-of-pocket expenses by the Fund. Compliance service fees paid by the Fund for the six months ended October 31, 2017 are disclosed in the Consolidated Statement of Operations.
Principal Financial Officer
ALPS receives an annual fee for providing principal financial officer services to the Fund. Principal financial officer fees paid by the Fund for the six months ended October 31, 2017 are disclosed in the Consolidated Statement of Operations.
Distributor
ALPS Distributors, Inc. (“ADI” or the “Distributor”) (an affiliate of ALPS) acts as the distributor of the Fund’s shares pursuant to a Distribution Agreement with the Trust on behalf of the Fund. Shares are sold on a continuous basis by ADI as agent for the Fund, and ADI has agreed to use its best efforts to solicit orders for the sale of Fund’s shares, although it is not obliged to sell any particular amount of shares. ADI is not entitled to any compensation for its services as Distributor. ADI is registered as a broker-dealer with the U.S. Securities and Exchange Commission.
8. INDEMNIFICATIONS
Under the Trust’s organizational documents, its officers and Trustees are indemnified against certain liability arising out of the performance of their duties to the Trust. Additionally, in the normal course of business, the Trust enters into contracts with service providers that may contain general indemnification clauses which may permit indemnification to the extent permissible under applicable law. The Trust’s maximum exposure under these arrangements is unknown, as this would involve future claims that may be made against the Trust that have not yet occurred.
50
| Highland Resolute Fund | Additional Information |
October 31, 2017 (Unaudited)
1. FUND HOLDINGS
The Fund files its complete schedule of portfolio holdings with the Securities and Exchange Commission (the “SEC”) for the first and third quarters of each fiscal year on Form N-Q within 60 days after the end of the period. Copies of the Fund’s Form N-Q are available without charge on the SEC website at http:// www.sec.gov. You may also review and copy the Form N-Q at the SEC’s Public Reference Room in Washington, D.C. For more information about the operation of the Public Reference Room, please call the SEC at 1-800-SEC-0330.
2. FUND PROXY VOTING POLICIES, PROCEDURES AND SUMMARIES
Fund policies and procedures used in determining how to vote proxies and information regarding how each of the Funds voted proxies relating to portfolio securities during the most recent prior 12-month period ending June 30 are available without charge, (1) upon request, by calling (toll-free) (866) 759-5679 and (2) on the SEC’s website at http://www.sec.gov.
| Semi-Annual Report | October 31, 2017 | 51 |

 | TABLE OF CONTENTS |
| Shareholder Letter | 1 |
| Performance Update | 7 |
| Disclosure of Fund Expenses | 13 |
| Portfolio of Investments | |
| Rondure New World Fund | 14 |
| Rondure Overseas Fund | 17 |
| Statements of Assets and Liabilities | 20 |
| Statements of Operations | 21 |
| Statement of Changes in Net Assets | |
| Rondure New World Fund | 22 |
| Rondure Overseas Fund | 23 |
| Financial Highlights | |
| Rondure New World Fund | 24 |
| Rondure Overseas Fund | 26 |
| Notes to Financial Statements | 28 |
| Disclosure Regarding Approval of Fund Advisory Agreement | 34 |
| Additional Information | 36 |
| Rondure Funds | Shareholder Letter |
October 31, 2017 (Unaudited)
Dear Fellow Shareholder,
You may or may not know this, but I am an avid reader. My husband would quip it is my best quality—it enables him to watch baseball in peace while I spend my weekends and evenings with my nose in a book or two. I have developed several reading habits through the years. The first is to read two or three books for every region or country I visit. I like to mix it up with history, fiction, economics, or literature, and I believe it serves several purposes. First, I believe studying history improves our ability to maneuver through stock market cycles—it leads to good pattern recognition and improves our ability to learn from our past mistakes. In addition, I believe books about places help set the cultural, political, and economic stage for our portfolio companies. My second reading habit is setting a topic or two at the start of each year that I would like to master. This year I selected two topics—science and Russia. For anyone who has read War and Peace, you will quickly recognize I bit off far more than I could chew this year. I’m learning. However, the classic piece has provided an interesting backdrop to my Russian travel this year. I don’t know exactly how to factor my reading habit into an alpha or return generation metric, but I know that accumulating knowledge in a competitive space is an advantage. It’s an integral part of investing. It’s like developing a stage for your actors—stocks. It’s hard work, and it’s underappreciated, because it cannot be captured in an attribution. But it matters.
I can’t help but connect my experience in market cycles and my latest science read, Elizabeth Kolbert’s Pulitzer Prize winning “The Sixth Extinction: An Unnatural History,” to the current state of the global markets—a state that the recent issue of The Economist called “The Bull Market in Everything.” This run in the markets is different from Japan’s deflationary tailspin, the DotCom Bubble, Peak Oil, the US Real Estate Bubble, and the ensuing global financial crisis. However, borrowing from the reputed words of Mark Twain, while “history doesn’t repeat itself…it sure does ‘rhyme’.” I see an increasing number of similarities between those market events and the market environment today, including the call of death of active management and death of value. I’m not going to rehash that cycle right now. Instead, I will focus on my experience and our process and how we, as active managers at Rondure Global, can adapt to avoid extinction.
During the tech bubble, I was a novice investment team member on the American Century Ultra strategy and spent a lot of time speaking with our clients. There was no way a risk-mitigated, diversified fund—active investors—could keep up with the concentrated tech rally capping off the 20th century. Some clients were frustrated with the lag versus the index, but fund leadership stuck to its discipline buying good businesses for the long haul. They focused on balance sheets, cash flows, persistent growth, dividends and valuation—all elements noted in my favorite investment book, “The Intelligent Investor,” by Benjamin Graham. Then, in a swift few days, valuations popped. Markets fell apart, and the fund held its ground. American Century’s absolute return strategy may have lagged for a period preceding the bubble, but in the end it saved disciplined investors a lot of money by performing through the cycle. This approach has stuck with me ever since. I think you are permanently colored by the timing of your start in the market, and mine came just as the tech bubble was building.
One element that is different this time, and that helped active investors during the Dot com cycle, was the 1999 asset bubble’s concentration in a few sectors. There were lots of basic, slower growth businesses left in the dust—a fundamental investor’s paradise if they were willing to go against the momentum grain. Today, thanks to extremely generous central banks around the globe, everything is pricey. There are bargains hidden out there, but there aren’t as many pockets of the market left behind as there were in 1999. Arguably only emerging and international markets have lagged in the recovery.
Another possible similarity is that we are just now entering the blow off stage where the overheated components of the market will be propelled by momentum, leaving behind less exciting businesses. This would benefit passive management in the short run, and cause more pain to fundamental, value-focused active managers as pressure continues to build. But in the long run, it could be great for active managers. The logic is simple: The snowballing of passive management has coincided with one of the greatest bull markets in history. The big passive strategies are momentum vehicles where position sizes in the indices they mimic are determined by market capitalization, not fundamentals. In this low volatility, low interest rate environment, momentum is simply trumping fundamentals. But it won’t last forever. And when the tide changes, I think we will see a shift back to fundamentals.
What is fabulous is that the proliferation of ETFs (Exchange Traded Funds) and index funds forced a complacent industry to bring down fees, which enhances returns for investors—adaptation at its very best. The flip side of that coin is that passive portfolios merely imitate the market, so passive investors could and should mimic the decline of potentially overvalued markets if they correct. And a correction is plausible if central banks start to ease off the gas pedal due to everything becoming too expensive. Low returns on cash have pushed momentum and pushed investors to take risks—that’s the blow off stage where everyone fears missing the rally and greed takes over. Eventually, it will go too far.
So how can active managers combat this and how can we serve you better? There are several things Rondure Global can do:
First, if our mandate is to be less risky than the market, and thus mitigate downside risk, then I should not be chasing momentum here—higher relative valuations are inherently more risky. I have a history of reasonable upside capture and typically very good downside capture on my past strategies. It is a hallmark of how we are different than passive strategies, which again tend to be liquidity driven vehicles. The notion of delivering
| Semi-Annual Report | October 31, 2017 | 1 |
| Rondure Funds | Shareholder Letter |
October 31, 2017 (Unaudited)
alpha against a momentum vehicle, especially as we get later and later in the market cycle, is incongruous with the notion of mitigating downside risk. Simply put, I just don’t think I can get out of the way when/if a correction comes, and my discipline of owning high quality companies means I shouldn’t have to do this.
Second, we can partner with a seasoned team that has seen cycles. This was a critical reason I was so excited to partner with Grandeur Peak. How often do you get to have a working relationship with a 30+ year veteran like Robert Gardiner who has seen multiple cycles? In addition to Robert, I am partnered with his world-class team at Grandeur Peak, many of whom I have worked with during past cycles at our previous firm on both the research and business sides of the equation. This partnership with the seasoned Grandeur team, and the focused, process-driven Rondure team continues to deliver far beyond my initial expectations of what we would and could accomplish this early in our journey as a new firm. We have great institutional tools, proprietary processes, and a discipline in place that hasn’t changed in my nearly 20 years of investing. Our focus is really not participating in huge bull markets, but rather finding investments that can protect and compound your capital for the long-term. I believe I have surrounded myself with incredibly talented and seasoned people who can help me do just that, and I hope this means good things for you—our Rondure clients—through thick and thin.
Third, we can appropriately manage risk. Many argue that active managers should have “high conviction” or highly concentrated portfolios in order to be good at what they do, but my personal opinion is that this is better applied to US focused portfolios. Country risk is too unpredictable in international investing, particularly in Emerging and Frontier Markets, so in my book you need to own enough stocks to diversify that risk while still having strong conviction in your ideas. For me, that number has always been around 100, but I’m not afraid to concentrate at the top when we have strong conviction. I am also very comfortable having sector concentration—focusing on the Rondure process of finding quality, value, and sustainable growth, and looking markedly different from the indices on a sector basis. The smaller the country or the more nascent the economy, the bigger impact country weight has on performance. We also aren’t afraid to go all over the cap spectrum for great companies at good prices or good companies at great prices. I see very little relationship between market capitalization and quality. It’s a total misconception in international investing. In small population countries or nascent economies, micro caps and small caps can be 800-pound gorillas. In big population countries, bigger caps tend to have dominance. We like dominant businesses or very good businesses with a margin of safety.1 It’s placed us in a median capitalization range that looks very similar to where I’ve been in the past. We have a strong quality bias for fundamentally sound companies with great risk/reward profiles. We seek to avoid having our tail composed of high risk, high return companies. We are simply waiting for better price tags to add to high-quality companies that already fit our process. The process and criteria for each portfolio company is exactly the same. And when we feel strongly, we aren’t afraid to increase position size, but with both risk and return in mind.
At the end of the day, we stick to our process. We emphasize bottom up, fundamental investing in high quality companies, agnostic of indices. We don’t ignore sectors. We don’t ignore countries. We simply let our bottom-up perspective color our top down view, so we start with bottom up screening for quality. Our process ends with company visits and calls, extensive travel, and detailed models to ensure our portfolio positions meet our rigorous criteria centered on sustainable growth, not heroic growth.
If you want to compare us to indices, we should generally tilt to higher ROE (Return on Equity), higher ROA (Return on Assets), lower debt levels, slightly higher multiples (for tax reasons—if the returns are better than cash), and lower but more sustainable and growing dividend yields funded by cash. I believe the sell side consistently understates the long-term earnings growth rates or dividend yields for our companies, because they have no idea how to deploy the excess cash on the corporate balance sheets or the free cash flow. Fortunately when we assess governance, we believe our companies know exactly what to do with that cash—deploy it into higher returning ventures or give it back to us in the form of dividends or share buybacks. Hence, our companies positively surprise on a durable basis due to the optionality of cash.
Fund Details
We completed our first full quarter at Rondure Global with two strategies—Rondure Overseas (a developed markets ex-US strategy) and Rondure New World (an emerging and frontier markets strategy) Our portfolios are now fully deployed, and we continue to seek new ideas that are either accretive to our long-term sustainable returns or lower our risk profile. We seek to rarely make thesis errors. We are more likely to sell for relative opportunity or to mitigate tax liabilities. We also realize short-term losses can be valuable to our clients. We harvest those when we think it makes sense for you.
Rondure Overseas
The story year to date has been good stock selection, with only financials and materials underperforming the index. However asset allocation has been difficult for us on a sector basis. Incoming cash creates a drag on performance in bull markets. And that drag has been approximately 2-3% for us since inception. Another factor that has impacted performance is simply that cyclical sectors have been strong. Energy, materials, information technology, consumer discretionary, and industrials have all outperformed the aggregate index, while the more defensive consumer staples and healthcare sectors barely participated. We do not own real estate stocks, energy stocks, utilities stocks, or telecommunications stocks. We are active. Our bottom up funnel is not leading to companies in these sectors—we either see too much debt or a lack of value. We have traditionally used consumer staples to mitigate downside risk. We love the cash flow characteristics of the businesses, and the persistency of their
| 2 | 1.855.775.3337 | www.rondureglobal.com |
| Rondure Funds | Shareholder Letter |
October 31, 2017 (Unaudited)
growth. Their balance sheets also provide a margin of safety, and we believe if high ROE can’t be redeployed to organic growth, the companies are keen to pay us through mergers & acquisitions, growing dividends, or share buybacks. You win from a variety of angles. The cyclical component of the portfolio at present, where we capture upside and where we see quality and value from the bottom up, is in the consumer discretionary space and in high quality industrials--later stage cyclicals.
On a country basis, I believe we set ourselves apart with a big Japan weight. I’ve been a Japan analyst for over a decade, and I have lived there off and on since my college years. I am currently a member of the Grandeur Peak Japan team, where we leverage the knowledge of several people who have lived in the country and speak the language. When I screen bottom up, Japan has very attractive balance sheets, the most stocks hitting our radar where high quality meets cheap valuations (below 12x ev/ebit2), and perhaps the best governance and ROE/ROA improvement stories. The kicker has been upside surprises to growth. We believe a heavy period of rain is having a temporary detrimental impact on some of our stocks. We will look for opportunities to capitalize on this. We own virtually all the drug stores in Japan. There, drug stores function like convenience stores, and you don’t have to hop in a car to visit them like you do in most US cities. Rain keeps people away, but people will return when the rain stops.
We’ve been adding to Australia. It has been accretive to our portfolios with regard to ROE, ROA, valuation and growth. It’s been a laggard market, even though it is up a lot. The one drawback is Australian balance sheets aren’t the best. I believe a steady, stable climb in the economy compounded with very low interest rates has led to a level of comfort with debt that I don’t see as healthy—and it’s not just Australia. We have seen this in Europe as well, where debt is cheap. We do not see as much of this in Japan—a country that prides itself on sustainable, long-term results and margins of safety. If the interest rates go up and the cost of capital rises, our higher quality balance sheet companies should really shine. The portfolio holdings in Australia are mainly names I have held at some point in my history. One notable holding is DuluxGroup, a decorative paints company which has a global industry pedigree of compounding returns. Another is REA Group, what we believe to be a world-class leader in online advertising for real estate. Both of these companies are deceptively sticky businesses through economic cycles with a tendency toward consolidation as well.
When I look at the health of the Rondure Overseas portfolio, I’m very happy with our holdings. We have delivered both good absolute and relative returns with better balance sheets, better ROE and ROA than the index, and hence what we believe will be more durable and persistent earnings per share and dividend growth. We buy companies we believe will redeploy capital well—do the heavy lifting for us—and we believe the sell side almost always understates the optionality of cash on the balance sheet. Index companies can rarely self-fund forecasted growth. The index with lower quality companies needs booming global economies or generous capital markets to deliver on expectations. For now, the acceleration in global growth and the generosity of investors is providing the help they need. However, that help can be pulled quickly. We love companies that don’t need our money—companies with sustainable growth (self-funding growth). That’s why I’m generally not a fan of IPOs (Initial Public Offerings) or secondary offerings. In fact I can’t remember the last time I have participated in or taken a call, though they can be a fantastic opportunity to learn about the companies, as you get access to the best management teams. We strive to be active and index agnostic in our stock selection, but we believe these higher quality companies have the potential to outperform a lower quality index through cycles.
Rondure New World
Emerging markets indices pose a more challenging hurdle for us on a relative basis. If I stare at the MSCI Emerging Markets Index versus the developed markets, it has higher ROE and ROA than the MSCI EAFE Index. It also has lower debt levels (the MSCI EAFE has a lot of debt and you have to question if this is the cost of capital being too cheap, not dear enough, in the developed world) and lower multiples. Hence, it is able to self-fund higher growth and dividends at a cheaper valuation than the developed world index. If you look at the MSCI Emerging Markets Index on a PEGY (P/E to Growth + Dividend Yield) basis in aggregate, it’s actually pretty reasonable. I also believe there are a lot of countries and companies in the Emerging Markets and Frontier universe that are suffering from depressed earnings. The commodity crash hit the companies and the countries hard (currencies too), and if a global synchronized recovery continues then the MSCI Emerging Markets Index will look even cheaper as earnings rebound.
The problem, or arguably the opportunity, might be that the aggregate index doesn’t do a great job of reflecting valuations at the company level. There are a lot of low-quality, deep value companies in the index that are truly cheap. We won’t participate there, as the balance sheet, governance, or accounting quality of these companies simply doesn’t fit our process. For example, we have been fighting against some really strong value bounces in real estate and commodity stocks, driven by stimulus in China. We won’t capture this in our portfolio because the balance sheets of these companies are low-quality, and many of the high-quality companies in the space are expensive. There are also some expensive consumer staples stocks—some of my favorites in Southeast Asia look expensive. However, we are careful when assessing consumer staples stocks in emerging and frontier markets because they don’t always perform like consumer staples in the developed world. Their purchasing power gets hit when currencies drop, which lifts consumer prices due to imported inputs. In addition, many purchases we see as everyday, affordable items in the USA (e.g. candy bars or soda) become unobtainable in these countries when developing economies drop. Consumer staples can become discretionary. The consumer may stop buying or trade down to lower cost items. Hence, some of the expense of these companies is probably optics—depressed earnings. If the global economy continues to bounce upward, I think the effects will eventually spill over into emerging markets
| Semi-Annual Report | October 31, 2017 | 3 |
| Rondure Funds | Shareholder Letter |
October 31, 2017 (Unaudited)
earnings, particularly in the hard hit commodity countries. Growth is being revised up for this very reason, and we saw solid “signs of life” in same store sales in a number of our emerging markets in the last month. The consumer might be perking up.
While very few companies in the world are cheap by historical standards right now, I see some very good pockets of value in China and South America. In fact, I like China so much better today than I did when it was deemed the highest growth country in the world in the mid-2000s. In the mid-2000s there was a boom in global Chinese IPOs and secondary offerings, so although you had strong top line growth, the arguably more important profitability and cash flow, were being diluted by more competition and cheap capital. This led to a land grab mentality—increased fragmentation, and lots of capital expenditures that couldn’t be deployed for higher returns due to excess capacity. The focus wasn’t on profit. Now, industries are consolidating. The weak are failing. Balance sheets and governance are improving. The general focus is on profitability and dividends, and I can find market leaders at very good valuations—usually in the small to mid-cap segment of the market. It is simply a better stock pickers market for the long-term investor.
South America has similar dynamics. The emerging markets boom led to bad capital allocation policies—capital wasn’t dear. If I stare at developed world balance sheets, you might argue the shoe is on the other foot now. The emerging world is repairing or has repaired its balance sheets on a relative basis. It has survived a pretty rough period, and while some people point to a less exciting growth story than during the BRIC’s3 heyday, the most robust period of stock market performance for the US has come during a period of slow growth—much of it driven by rising dividends and share buybacks. Emerging markets, frontier markets, and Japan all look well positioned to improve capital allocation, cut costs, and deliver dividends. If you believe this will drive a re-rating, this asset class has more flexibility for improvement the more stock markets boom and global growth improves. It may not be the sleek top line story it was 10 years ago, but it could be a much better profit driven cycle—profitable prosperity!
It has been a similar story for us in New World as in Overseas. We have a higher quality portfolio. We invest across the capitalization spectrum. We are broadly diversified on a country basis, and more narrowly focused on a sector basis—tilted to quality and domestic demand. Asset allocation has hurt the portfolio to date, while our stock picking against the respective segments of the indices has been reasonably good, as we have outperformed. The less cyclical components of the market have lagged, and we are overweight these spaces. Cash inflows also hurt the portfolio, as inflows into a strategy will typically drag against an index that is fully invested when markets are rising. In addition, smaller caps—where we love to hunt—have not participated as much in this emerging markets rally. I believe ETF/Index flows are fueling the bigger cap companies, and I believe if the rally continues it will eventually push out to small caps, small countries, and frontier markets. This would benefit us. Smaller countries and smaller caps tend to tilt more to domestic demand—local economies—and we believe the global recovery is just now starting to spill over into better results into a broader set of countries, particularly the hard hit commodity countries. If the global synchronized growth doesn’t continue, there should be less capital flowing out of these markets. We are active. We are differentiated. We are fully deployed now, but we own companies that have long-term sustainable competitive advantages and which have the potential to compound returns over time. We don’t chase short-term capital gains and momentum.
As with Overseas, we believe analysts consistently underestimate the power of cash on the balance sheets in emerging markets. We select companies that we think will reward us with that cash when they can’t reward us with growth. We believe we will participate nicely if the rally continues. However, our portfolio is constructed with a nice barbell of defensive growth companies in the consumer staples sector, where I see a lot of value, and more industrial and consumer cyclical participants, where I also see quality and value. We own one financial stock. Financials was our best performing relative sector in the quarter due to our position in Sberbank of Russia. It has one of the highest ROE profiles in the banking sector including Europe, and that ROE has been durable. It is a cost leader due to its scale. The weak banks are failing in Russia, so it is gathering steam. The stock is cheap, and the economy is recovering. They are also quite innovative—embracing technology. The icing on the cake is that Russia has an election coming and this will likely lead to continued stimulus. Politicians love a robust economy in an election year, and Russia has a lot of room to maneuver. Discount rates should fall. It is the perfect “process” stock.
Conclusion
A potential client asked me earlier this year if there is ever such a thing as too much travel for deep due diligence. I stuttered in answering—this client by the way is one of the best deep due diligence travelers I know. It’s a hard question to answer because, just like my reading habit, it’s a tough thing to measure in traditional attribution terms. However, I believe it is integral to setting the stage for our portfolios and selecting the best performers. In the words of Howard Marks, it leads to second level outside the box thinking and creativity as well, which is a critical differentiator. The Rondure and Grandeur teams have traveled a lot this year, and I was still pondering this question during a trip to Russia in the Spring.
A good friend of mine from the Soviet Union had been pushing me to visit the countryside to get a better understanding of the country. I’ve only visited Moscow in the past, and I tend to look at Russia from a stilted cold war perspective—an admittedly naïve view. When I visited Russia this year, I landed in the country on a stereotypical cold, snowy day. Our taxi driver chatted politics in stilted English. I asked what he thought of Putin. He said yap, yap, yap, yap, yap. He asked what I thought of US politics. I said the same thing. Square, cement Soviet era block buildings jutted out from the snowy landscape. A young woman in high fashion pulled a toddler in clear defiance. He was bundled up in Christmas Story fashion. An
| 4 | 1.855.775.3337 | www.rondureglobal.com |
| Rondure Funds | Shareholder Letter |
October 31, 2017 (Unaudited)
old man with cloudy blue eyes and a limp, drug a cane through the snow. I couldn't help but think of all the cycles he had seen and wished we could have stopped to gather his insight. Language would have been a barrier. The spirit was communal and happy—the landscape was straight out of Dr. Zhivago. The whimsical Kremlin completed the stage. I read Colin Thubron's wonderful books on Russia, "Among the Russians and In Siberia," as we met multiple companies and toured the city's stores. Then I hit the train and saw the countryside. I will save that for another time.
Russia has one of the world’s highest literacy rates. It mints great authors, scientists, and business people. Its citizens are incredibly friendly. Its corporate governance is improving, and you can see it bottom up in the form of improved board structures, balance sheets, a focus on core assets, and weak companies failing. Plus, the market was and is cheap. While people say investors are overweight Russia, this is only part of the story. Russia has fallen to a tiny component of the index. In my mind, it’s silly to think relative here, as the index again reflects the fact that this fell out of favor. Russia lost momentum and became a value country. Now, the quality is improving, and the growth is as well. We are thinking about the stocks and country in terms of the total potential risk and return for the portfolio, and from that perspective, it seems like a reasonable investment here.
I had one of the most pleasant evenings at the Bolshoi Ballet with a group of Russian and international investors. During the performance of Faust, the beautiful ballerinas slowly spun out of an egg-shaped prop in a haze of colorful smoke—an allegory for nesting dolls and arguably an allegory for how much travel matters to investing. I feel like after all of these years of travel and reading, I am only one layer deep in my understanding of Russia. It may take years or perhaps a new generation of team members to get to the final nesting doll here. The world is complex, but travel is instrumental in solving its many puzzles.
While I see similarities emerging between the tech bubble and today, the markets aren’t as frothy yet, in aggregate. The negative is that there are also fewer pockets of the market that have been left behind--the rally has benefitted almost everything. The tech bubble was just that—a tech bubble. Arguably, maybe international and emerging markets in general are laggards, which would be a case for asset diversification and increasing exposure. Time will tell. I truly believe this or I wouldn’t have started the firm with these two asset classes, where I have placed significant personal wealth. Regardless, we believe our bottom up process will guide us to good long-term investments, agnostic of this macro landscape. We focus on fundamental investing—compounders with competitive advantages—and our reading, travel, and experiences help set the stage for our stocks. As active managers, our discipline, hard work, and process focus sets us apart in the long run as we move further and further into the recovery. I don’t see extinction, but I do see an active industry that needed to adapt. We owe our clients the utmost transparency, side-by-side investment (skin in the game), cost discipline, and a focus on mitigating risk to produce a solid upside capture. We owe you discipline and hard work and differentiation. I believe this is what you will get when you invest with us.
Thank you for investing side-by-side with me.
Sincerely,
Laura
| 1 | A margin of safety exists when we believe there is a significant discount to intrinsic value at the time of purchase. |
| 2 | EV/EBIT is Economic Value to Earnings before Interest and Taxes. It is a financial ratio used to measure a company’s return on investment. |
| 3 | BRICs is an acronym for Brazil, Russia, India, and China. |
The objective of all Rondure Funds is long-term growth of capital.
RISKS: Investing in foreign securities entails special risks, such as currency fluctuations and political uncertainties, which are described in more detail in the prospectus. Investments in emerging and frontier markets are subject to the same risks as other foreign securities and may be subject to greater risks than investments in foreign countries with more established economies and securities markets. Diversification does not eliminate the risk of experiencing investment loses.
An investor should consider investment objectives, risks, charges, and expenses carefully before investing. To obtain a Rondure Funds prospectus, containing this and other information, visit www.rondureglobal.com or call 1-855-775-3337. Please read it carefully before investing.
The views and information discussed in this commentary are as of the date of publication, are subject to change, and may not reflect the writer’s current views. The views expressed represent an assessment of market conditions at a specific point in time, are opinions only and should not be relied upon as investment advice regarding a particular investment or markets in general. Such information does not constitute a recommendation to buy or sell specific securities or investment vehicles. It should not be assumed that any investment will be profitable or will equal the performance of the Funds or any securities or any sectors mentioned herein. The subject matter contained herein has been derived from several sources believed to be reliable and accurate at the time of compilation. The Funds do not accept any liability for losses either direct or consequential caused by the use of this information.
Past performance does not guarantee future results.
| Semi-Annual Report | October 31, 2017 | 5 |
| Rondure Funds | Shareholder Letter |
October 31, 2017 (Unaudited)
A list of Fund holdings as of October 31, 2017 can be found within each Fund’s Portfolio of Investments.
The MSCI EAFE Index is designed to represent the performance of large and mid-cap securities across 21 developed markets, including countries in Europe, Australasia and the Far East, excluding the U.S. and Canada. The MSCI EM (Emerging Markets) Index is designed to represent the performance of large and mid-cap securities across 24 Emerging Markets (EM) countries. The MSCI EM Small Cap Index is designed to represent the performance of small-cap securities across 24 Emerging Markets (EM) countries. You cannot invest directly in these or any index.
Alpha is considered the active return on an investment. It gauges the performance of an investment against a market index used as a benchmark, since they are often considered to represent the market’s movement as a whole. The excess returns of a fund relative to the return of a benchmark index is the fund’s alpha.
Upside Capture is the ratio of the fund’s return relative to the benchmark’s index during periods when the market (index) is going up. An upside capture of greater than 1 implies that the fund does better than the benchmark index during up markets.
Downside Capture is the ratio of the fund’s return relative to the benchmark’s index during periods when the market (index) is going down. A downside capture of less than 1 implies that the fund does better than the benchmark index during down markets.
Passive Investing is an investment strategy where the investor buys a basket of securities without regard to the individual securities in the basket (e.g. buying an index fund).
Active Investing is an investment strategy involving ongoing buying and selling of individual securities based on perceived opportunities in individual securities.
ROE is Returns of Equity. This is the amount of net income returned as a percentage of shareholders equity.
ROA is Return on Assets. This is the amount of net income returned as a percentage of assets.
Dividend Yield is the company’s annual cash dividend divided by the current stock price.
P/E is the stock’s current Price divided by its Earnings (usually the earnings over the last twelve months).
ALPS Distributors, Inc. is the Distributor for the Rondure Funds.
| 6 | 1.855.775.3337 | www.rondureglobal.com |
| Rondure New World Fund | Performance Update |
October 31, 2017 (Unaudited)
Annualized Total Return Performance for the periods ended October 31, 2017
| Expense Ratio(b) | ||||
| 6 Months | Since Inception(a) | Gross | Net(c) | |
| Rondure New World Fund - Institutional - NAV | 7.90% | 7.90% | 2.38% | 1.10% |
| MSCI EM (Emerging Markets) TR USD Index(d) | 16.19% | 16.19% | ||
| Rondure New World Fund - Investor – NAV | 7.70%(e) | 7.70%(e) | 2.63% | 1.35% |
| MSCI EM (Emerging Markets) TR USD Index(d) | 16.19% | 16.19% | ||
Performance data quoted represents past performance. Past performance does not guarantee future results. Investment return and principal value of an investment will fluctuate so that an investor’s shares, when sold or redeemed, may be worth more or less than the original cost. The Fund imposes a 2.00% redemption fee on shares held for less than 60 days. Current performance data may be higher or lower than actual data quoted. For the most current month-end performance data, please call 1-855-775-3337.
The table does not reflect the deduction of taxes a shareholder would pay on Fund distributions or redemption of Fund shares.
Subject to investment risks, including possible loss of the principal amount invested.
Returns for periods less than 1 year are cumulative.
| (a) | Fund inception date of May 1, 2017. |
| (b) | Ratios as of the Prospectus dated August 31, 2017 and may differ from the ratios presented in the Financial Highlights. |
| (c) | Rondure Global Advisors, LLC (the “Adviser”), has agreed to waive and/or reimburse fees or expenses in order to limit Total Annual Fund Operating Expenses After Fee Waiver/ Expense Reimbursement (excluding acquired fund fees and expenses, brokerage expenses, interest expenses, taxes and extraordinary expenses) to 1.35% and 1.10% of the Fund’s average daily net assets for the Fund’s Investor Class Shares and Institutional Class Shares, respectively. This agreement (the “Expense Agreement”) is in effect through August 31, 2018. The Adviser will be permitted to recover, on a class-by-class basis, expenses it has borne through the Expense Agreement to the extent that a Fund’s expenses in later periods fall below the expense cap in effect at the time of waiver or reimbursement. However, such recapture payments may not cause the Fund’s expense ratio (after recapture) to exceed the lesser of (i) the expense cap in effect at the time of the waiver and (ii) the expense cap in effect at the time of the recapture. Notwithstanding the foregoing, the Fund will not be obligated to pay any such deferred fees and expenses more than three years after the date of the waiver or reimbursement. The Expense Agreement may not be terminated or modified by the Adviser prior to August 31, 2018, except with the approval of the Fund’s Board of Trustees. |
| (d) | The MSCI Emerging Markets Total Return USD Index is an unmanaged total return index, reported in U.S. Dollars, based on share prices and reinvested dividends of approximately 800 companies from 24 emerging market countries. The Index is not actively managed and does not reflect any deductions for fees, expense, or taxes. An investor may not invest directly in the Index. |
| (e) | Excludes adjustments in accordance with accounting principles generally accepted in the United States of America and as such, the net asset value and total return for shareholder transactions reported to the market may differ from the net asset value for financial reporting purposes. |
| Semi-Annual Report | October 31, 2017 | 7 |
| Rondure New World Fund | Performance Update |
October 31, 2017 (Unaudited)
Growth of $10,000 for the period ended October 31, 2017
The chart shown above represent a hypothetical investment of $10,000 in the Fund’s Investor Class shares for the period from inception to October 31, 2017. All returns reflect reinvested dividends, but do not reflect the deduction of taxes that an investor would pay on distributions or redemptions.
Investing in the Fund is subject to investment risks, including possible loss of the principal amount invested.
The Fund also offers Institutional Class shares, performance for which is not reflected in the graphs above. The performance of Institutional Class shares may be higher or lower than the performance of the Investor Class shares shown in the graphs above based upon differences in fees paid by shareholders investing in the Investor Class shares and Institutional Class shares.
| 8 | 1.855.775.3337 | www.rondureglobal.com |
| Rondure New World Fund | Performance Update |
October 31, 2017 (Unaudited)
| Regional Allocation (as a % of Net Assets)* | |
| Asia ex Japan | 60.8% |
| North America | 11.8% |
| Latin America | 9.9% |
| Africa/Middle East | 6.9% |
| Europe | 6.7% |
| Cash, Cash Equivalents, & Other Net Assets | 3.9% |
| Total | 100.0% |
| Industry Sector Allocation (as a % of Net Assets)* | |
| Consumer | 59.3% |
| Technology | 15.0% |
| Industrials | 13.3% |
| Health Care | 4.2% |
| Financials | 2.3% |
| Energy & Materials | 2.0% |
| Cash, Cash Equivalents, & Other Net Assets | 3.9% |
| Total | 100.0% |
| Top 10 Holdings (as a % of Net Assets)* | |
| Samsung Electronics Co., Ltd. | 3.8% |
| Alibaba Group Holding, Ltd. | 3.6% |
| Yum China Holdings, Inc. | 3.4% |
| Carnival Corp. | 3.3% |
| Bharat Electronics, Ltd. | 3.2% |
| Royal Caribbean Cruises, Ltd. | 2.7% |
| Hypermarcas SA | 2.7% |
| President Chain Store Corp. | 2.6% |
| Vietnam Dairy Products JSC | 2.6% |
| Aselsan Elektronik Sanayi Ve Ticaret AS | 2.6% |
| Total | 30.5% |
| * | Holdings are subject to change, and may not reflect the current or future position of the portfolio. |
| Semi-Annual Report | October 31, 2017 | 9 |
| Rondure Overseas Fund | Performance Update |
October 31, 2017 (Unaudited)
Annualized Total Return Performance for the periods ended October 31, 2017
| Expense Ratio(b) | ||||
| 6 Months | Since Inception(a) | Gross | Net(c) | |
| Rondure Overseas Fund - Institutional - NAV | 11.60%(d) | 11.60%(d) | 2.25% | 0.85% |
| MSCI EAFE TR USD Index(e) | 10.68% | 10.68% | ||
| Rondure Overseas Fund - Investor - NAV | 11.50% | 11.50% | 2.50% | 1.10% |
| MSCI EAFE TR USD Index(e) | 10.68% | 10.68% | ||
Performance data quoted represents past performance. Past performance does not guarantee future results. Investment return and principal value of an investment will fluctuate so that an investor’s shares, when sold or redeemed, may be worth more or less than the original cost. The Fund imposes a 2.00% redemption fee on shares held for less than 60 days. Current performance data may be higher or lower than actual data quoted. For the most current month-end performance data, please call 1-855-775-3337.
The table does not reflect the deduction of taxes a shareholder would pay on Fund distributions or redemption of Fund shares.
Subject to investment risks, including possible loss of the principal amount invested.
Returns for periods less than 1 year are cumulative.
| (a) | Fund inception date of May 1, 2017. |
| (b) | Ratios as of the Prospectus dated August 31, 2017 and may differ from the ratios presented in the Financial Highlights. |
| (c) | Rondure Global Advisors, LLC (the “Adviser”), has agreed to waive and/or reimburse fees or expenses in order to limit Total Annual Fund Operating Expenses After Fee Waiver/ Expense Reimbursement (excluding acquired fund fees and expenses, brokerage expenses, interest expenses, taxes and extraordinary expenses) to 1.10% and 0.85% of the Fund’s average daily net assets for the Fund’s Investor Class Shares and Institutional Class Shares, respectively. This agreement (the “Expense Agreement”) is in effect through August 31, 2018. The Adviser will be permitted to recover, on a class-by-class basis, expenses it has borne through the Expense Agreement to the extent that a Fund’s expenses in later periods fall below the expense cap in effect at the time of waiver or reimbursement. However, such recapture payments may not cause the Fund’s expense ratio (after recapture) to exceed the lesser of (i) the expense cap in effect at the time of the waiver and (ii) the expense cap in effect at the time of the recapture. Notwithstanding the foregoing, the Fund will not be obligated to pay any such deferred fees and expenses more than three years after the date of the waiver or reimbursement. The Expense Agreement may not be terminated or modified by the Adviser prior to August 31, 2018, except with the approval of the Fund’s Board of Trustees. |
| (d) | Excludes adjustments in accordance with accounting principles generally accepted in the United States of America and as such, the net asset value and total return for shareholder transactions reported to the market may differ from the net asset value for financial reporting purposes. |
| (e) | The MSCI EAFE Total Return USD Index is an unmanaged total return index, reported in U.S. dollars, based on share prices and reinvested net dividends of approximately 1,100 companies from 22 developed market countries excluding the US and Canada. The Index is not actively managed and does not reflect any deductions for fees, expense, or taxes. An investor may not invest directly in the Index. |
| 10 | 1.855.775.3337 | www.rondureglobal.com |
| Rondure Overseas Fund | Performance Update |
October 31, 2017 (Unaudited)
Growth of $10,000 for the period ended October 31, 2017
The chart shown above represent a hypothetical investment of $10,000 in the Fund’s Investor Class shares for the period from inception to October 31, 2017. All returns reflect reinvested dividends, but do not reflect the deduction of taxes that an investor would pay on distributions or redemptions.
Investing in the Fund is subject to investment risks, including possible loss of the principal amount invested.
The Fund also offers Institutional Class shares, performance for which is not reflected in the graphs above. The performance of Institutional Class shares may be higher or lower than the performance of the Investor Class shares shown in the graphs above based upon differences in fees paid by shareholders investing in the Investor Class shares and Institutional Class shares.
| Semi-Annual Report | October 31, 2017 | 11 |
| Rondure Overseas Fund | Performance Update |
October 31, 2017 (Unaudited)
| Regional Allocation (as a % of Net Assets)* | |
| Europe | 35.1% |
| Japan | 28.2% |
| North America | 5.6% |
| Australia/New Zealand | 8.4% |
| Asia ex Japan | 6.5% |
| Africa/Middle East | 0.4% |
| Cash, Cash Equivalents, & Other Net Assets | 15.8% |
| Total | 100.0% |
| Industry Sector Allocation (as a % of Net Assets)* | |
| Consumer | 50.2% |
| Industrials | 15.6% |
| Technology | 8.1% |
| Energy & Materials | 4.9% |
| Financials | 3.3% |
| Health Care | 2.1% |
| Cash, Cash Equivalents, & Other Net Assets | 15.8% |
| Total | 100.0% |
| Top 10 Holdings (as a % of Net Assets)* | |
| WH Smith PLC | 2.7% |
| J D Wetherspoon PLC | 2.6% |
| Yaskawa Electric Corp. | 2.4% |
| Create SD Holdings Co., Ltd. | 2.3% |
| Amadeus IT Group SA | 2.1% |
| DuluxGroup, Ltd. | 2.1% |
| Ezaki Glico Co., Ltd. | 2.1% |
| Carnival Corp. | 2.1% |
| Seria Co., Ltd. | 2.0% |
| Cosmos Pharmaceutical Corp. | 1.9% |
| Total | 22.3% |
| * | Holdings are subject to change, and may not reflect the current or future position of the portfolio. |
| 12 | 1.855.775.3337 | www.rondureglobal.com |
| Rondure Funds | Disclosure of Fund Expenses |
October 31, 2017 (Unaudited)
As a shareholder of a Fund, you incur two types of costs: (1) transaction costs, including sales charges (loads) on purchase payments, reinvested dividends, or other distributions; redemption fees; and exchange fees; and (2) ongoing costs, including management fees; distribution and/or service (12b-1) fees; and other Fund expenses. This example is intended to help you understand your ongoing costs (in dollars) of investing in the Fund and to compare these costs with the ongoing costs of investing in other mutual funds.
This example is based on an investment of $1,000 invested at the beginning of the period and held for the entire six-month period of May 1, 2017 through of October 31, 2017.
Actual Expenses The first line of the table provides information about actual account values and actual expenses. You may use the information in this line, together with the amount you invested, to estimate the expenses that you paid over the period. Simply divide your account value by $1,000 (for example, an $8,600 account value divided by $1,000 = 8.6), then multiply the result by the number in the first line under the heading “Expenses Paid During Period” to estimate the expenses you paid on your account during this period.
Hypothetical Example for Comparison Purposes The second line of the table provides information about hypothetical account values and hypothetical expenses based on the Fund’s actual expense ratio and an assumed rate of return of 5% per year before expenses, which is not the Fund’s actual return. The hypothetical account values and expenses may not be used to estimate the actual ending account balance or expenses you paid for the period. You may use this information to compare the ongoing costs of investing in the Fund and other mutual funds. To do so, compare this 5% hypothetical example with the 5% hypothetical examples that appear in the shareholder reports of the other funds. Please note that the expenses shown in the table are meant to highlight your ongoing costs only and do not reflect any transactional costs, such as redemption fees or exchange fees. Therefore, the second line of the table is useful in comparing ongoing costs only and will not help you determine the relative total costs of owning different funds. In addition, if these transactional costs were included, your costs would have been higher.
Beginning Account Value May 1, 2017 | Ending Account Value October 31, 2017 | Expense Ratio(a) | Expenses Paid During period May 1, 2017 (Inception) - October 31, 2017(b) | |
| Rondure New World Fund | ||||
| Institutional Class | ||||
| Actual | $1,000.00 | $1,079.00 | 1.10% | $5.73 |
| Hypothetical (5% return before expenses) | $1,000.00 | $1,019.55 | 1.10% | $5.57 |
| Investor Class | ||||
| Actual | $1,000.00 | $1,078.00 | 1.35% | $7.03 |
| Hypothetical (5% return before expenses) | $1,000.00 | $1,018.30 | 1.35% | $6.83 |
| Rondure Overseas Fund | ||||
| Institutional Class | ||||
| Actual | $1,000.00 | $1,117.00 | 0.85% | $4.51 |
| Hypothetical (5% return before expenses) | $1,000.00 | $1,020.81 | 0.85% | $4.31 |
| Investor Class | ||||
| Actual | $1,000.00 | $1,115.00 | 1.10% | $5.83 |
| Hypothetical (5% return before expenses) | $1,000.00 | $1,019.55 | 1.10% | $5.57 |
| (a) | The Fund's expense ratios have been annualized based on the Fund's most recent fiscal half-year expenses. |
| (b) | Expenses are equal to the Fund's annualized expense ratio multiplied by the average account value over the period, multiplied by the number of days in the most recent fiscal half-year 183/365 (to reflect the half-year period). |
| Semi-Annual Report | October 31, 2017 | 13 |
| Rondure New World Fund | Portfolio of Investments |
October 31, 2017 (Unaudited)
| Shares | Value (Note 2) | |||||||
| COMMON STOCKS (96.09%) | ||||||||
| Argentina (0.42%) | ||||||||
| MercadoLibre, Inc. | 1,500 | $ | 360,465 | |||||
| Bangladesh (0.55%) | ||||||||
| GrameenPhone, Ltd. | 21,919 | 115,811 | ||||||
| Square Pharmaceuticals, Ltd. | 100,333 | 359,701 | ||||||
| 475,512 | ||||||||
| Brazil (6.00%) | ||||||||
| Ambev SA | 38,700 | 247,014 | ||||||
| Hypermarcas SA | 216,900 | 2,274,887 | ||||||
| M Dias Branco SA | 114,700 | 1,696,324 | ||||||
| Raia Drogasil SA | 33,300 | 801,326 | ||||||
| TOTVS SA | 12,700 | 126,173 | ||||||
| 5,145,724 | ||||||||
| China (21.27%) | ||||||||
| Alibaba Group Holding, Ltd., Sponsored ADR(a) | 16,650 | 3,078,418 | ||||||
| Anta Sports Products, Ltd. | 291,000 | 1,301,805 | ||||||
| Baidu, Inc., Sponsored ADR(a) | 4,675 | 1,140,420 | ||||||
| China Machinery Engineering Corp., | ||||||||
| Class H | 1,141,000 | 699,103 | ||||||
| China Resources Beer Holdings Co., Ltd. | 560,000 | 1,615,095 | ||||||
| Ctrip.com International, Ltd., ADR(a) | 1,300 | 62,257 | ||||||
| Haier Electronics Group Co., Ltd. | 637,000 | 1,677,949 | ||||||
| Haitian International Holdings, Ltd. | 272,000 | 814,110 | ||||||
| Hengan International Group Co., Ltd. | 149,000 | 1,468,724 | ||||||
| JD.com, Inc., ADR(a) | 27,650 | 1,037,428 | ||||||
| Sinotrans, Ltd., Class H | 803,000 | 385,988 | ||||||
| TravelSky Technology, Ltd., | ||||||||
| Class H | 326,000 | 844,105 | ||||||
| Tsingtao Brewery Co., Ltd., | ||||||||
| Class H | 172,000 | 719,845 | ||||||
| Want Want China Holdings, Ltd. | 590,000 | 482,503 | ||||||
| Shares | Value (Note 2) | |||||||
| China (continued) | ||||||||
| Yum China Holdings, Inc.(a) | 72,400 | $ | 2,921,340 | |||||
| 18,249,090 | ||||||||
| Colombia (0.07%) | ||||||||
| Grupo Nutresa SA | 6,962 | 61,838 | ||||||
| Germany (0.54%) | ||||||||
| KUKA AG | 2,100 | 459,883 | ||||||
| Greece (1.72%) | ||||||||
| JUMBO SA | 91,856 | 1,476,579 | ||||||
| Hong Kong (1.96%) | ||||||||
| Vitasoy International Holdings, Ltd. | 729,000 | 1,685,744 | ||||||
| India (7.72%) | ||||||||
| Asian Paints, Ltd. | 4,244 | 77,373 | ||||||
| Bharat Electronics, Ltd. | 969,100 | 2,761,964 | ||||||
| Britannia Industries, Ltd. | 7,311 | 523,680 | ||||||
| Castrol India, Ltd. | 60,500 | 373,529 | ||||||
| Colgate-Palmolive India, Ltd. | 4,704 | 77,320 | ||||||
| Dabur India, Ltd. | 83,000 | 426,525 | ||||||
| Eicher Motors, Ltd. | 1,400 | 696,710 | ||||||
| Godrej Consumer Products, Ltd. | 5,302 | 76,447 | ||||||
| Hindustan Unilever, Ltd. | 4,635 | 88,551 | ||||||
| Marico, Ltd. | 14,900 | 72,520 | ||||||
| Maruti Suzuki India, Ltd. | 6,070 | 769,512 | ||||||
| Nestle India, Ltd. | 718 | 80,245 | ||||||
| Pidilite Industries, Ltd. | 6,385 | 77,068 | ||||||
| Tata Global Beverages, Ltd. | 120,500 | 422,216 | ||||||
| Vakrangee, Ltd. | 11,480 | 99,662 | ||||||
| 6,623,322 | ||||||||
| Indonesia (1.69%) | ||||||||
| Indofood CBP Sukses Makmur Tbk PT | 2,049,500 | 1,329,814 | ||||||
| Kalbe Farma Tbk PT | 1,014,000 | 119,624 | ||||||
| 1,449,438 | ||||||||
| Kenya (1.78%) | ||||||||
| East African Breweries, Ltd. | 318,200 | 748,345 | ||||||
See Notes to Financial Statements.
| 14 | 1.855.775.3337 | www.rondureglobal.com |
| Rondure New World Fund | Portfolio of Investments |
October 31, 2017 (Unaudited)
| Shares | Value (Note 2) | |||||||
| Kenya (continued) | ||||||||
| Safaricom, Ltd. | 3,166,100 | $ | 778,174 | |||||
| 1,526,519 | ||||||||
| Malaysia (0.49%) | ||||||||
| Heineken Malaysia Bhd | 94,000 | 421,429 | ||||||
| Mexico (3.11%) | ||||||||
| Alsea SAB de CV | 16,300 | 49,329 | ||||||
| Arca Continental Sab De CV | 16,200 | 103,098 | ||||||
| Becle SAB de CV(a) | 398,300 | 636,141 | ||||||
| Corp Moctezuma SAB de CV | 90,700 | 360,496 | ||||||
| Gruma SAB de CV, Class B | 47,600 | 624,752 | ||||||
| Grupo Bimbo SAB de CV, Series A | 102,500 | 237,327 | ||||||
| Wal-Mart de Mexico SAB de CV | 293,500 | 657,062 | ||||||
| 2,668,205 | ||||||||
| Pakistan (0.60%) | ||||||||
| Nestle Pakistan, Ltd. | 4,578 | 517,190 | ||||||
| Peru (2.47%) | ||||||||
| Alicorp SAA | 550,225 | 1,718,131 | ||||||
| InRetail Peru Corp.(b)(c) | 20,196 | 400,890 | ||||||
| 2,119,021 | ||||||||
| Philippines (3.59%) | ||||||||
| International Container Termin | 448,000 | 918,997 | ||||||
| Jollibee Foods Corp. | 26,000 | 125,404 | ||||||
| Philippine Seven Corp. | 352,000 | 1,201,402 | ||||||
| Puregold Price Club, Inc. | 756,000 | 746,848 | ||||||
| Universal Robina Corp. | 33,000 | 91,409 | ||||||
| 3,084,060 | ||||||||
| Poland (0.27%) | ||||||||
| AmRest Holdings SE(a) | 2,400 | 232,816 | ||||||
| Russia (4.19%) | ||||||||
| Alrosa PJSC | 495,500 | 637,168 | ||||||
| LUKOIL PJSC, Sponsored ADR | 3,100 | 164,610 | ||||||
| Mail.Ru Group, Ltd., GDR(a)(c) | 12,500 | 406,250 | ||||||
| Sberbank of Russia PJSC, Sponsored ADR | 138,100 | 1,981,735 | ||||||
| Shares | Value (Note 2) | |||||||
| Russia (continued) | ||||||||
| Yandex NV, Class A(a) | 11,925 | $ | 403,423 | |||||
| 3,593,186 | ||||||||
| South Africa (3.19%) | ||||||||
| Clicks Group, Ltd. | 115,400 | 1,293,100 | ||||||
| Distell Group, Ltd. | 40,100 | 368,420 | ||||||
| Shoprite Holdings, Ltd. | 55,300 | 791,478 | ||||||
| Tiger Brands, Ltd. | 10,400 | 283,929 | ||||||
| 2,736,927 | ||||||||
| South Korea (8.01%) | ||||||||
| Amorepacific Corp. | 800 | 224,215 | ||||||
| BGF retail Co., Ltd. | 21,879 | 1,544,722 | ||||||
| LG Household & Health Care, Ltd. | 650 | 682,867 | ||||||
| Medy-Tox, Inc. | 2,146 | 811,203 | ||||||
| NAVER Corp. | 437 | 348,711 | ||||||
| Samsung Electronics Co., Ltd. | 1,325 | 3,257,062 | ||||||
| 6,868,780 | ||||||||
| Sri Lanka (0.44%) | ||||||||
| Lion Brewery Ceylon PLC(a) | 106,656 | 380,803 | ||||||
| Taiwan (6.16%) | ||||||||
| Eclat Textile Co., Ltd. | 49,980 | 597,417 | ||||||
| Giant Manufacturing Co., Ltd. | 44,000 | 226,131 | ||||||
| Merida Industry Co., Ltd. | 48,000 | 223,611 | ||||||
| President Chain Store Corp. | 245,000 | 2,201,462 | ||||||
| Standard Foods Corp. | 49,920 | 123,643 | ||||||
| Taiwan Semiconductor Manufacturing Co., Ltd. | 237,000 | 1,909,548 | ||||||
| 5,281,812 | ||||||||
| Thailand (0.47%) | ||||||||
| CP ALL PCL | 129,000 | 271,824 | ||||||
| Thai Beverage PCL | 179,000 | 128,692 | ||||||
| 400,516 | ||||||||
| Turkey (5.29%) | ||||||||
| Aselsan Elektronik Sanayi Ve Ticaret AS | 244,800 | 2,190,168 | ||||||
| BIM Birlesik Magazalar AS | 94,000 | 1,916,648 | ||||||
See Notes to Financial Statements.
| Semi-Annual Report | October 31, 2017 | 15 |
| Rondure New World Fund | Portfolio of Investments |
October 31, 2017 (Unaudited)
| Shares | Value (Note 2) | |||||||
| Turkey (continued) | ||||||||
| Ulker Biskuvi Sanayi AS | 81,200 | $ | 433,232 | |||||
| 4,540,048 | ||||||||
| United Arab Emirates (1.90%) | ||||||||
| Aramex PJSC | 711,000 | 991,197 | ||||||
| DP World, Ltd. | 26,720 | 634,600 | ||||||
| 1,625,797 | ||||||||
| United States (8.73%) | ||||||||
| Carnival Corp. | 43,250 | 2,871,367 | ||||||
| Kansas City Southern | 8,325 | 867,632 | ||||||
| PriceSmart, Inc. | 2,125 | 178,075 | ||||||
| Royal Caribbean Cruises, Ltd. | 18,825 | 2,329,970 | ||||||
| Starbucks Corp. | 22,700 | 1,244,868 | ||||||
| 7,491,912 | ||||||||
| Uruguay (0.90%) | ||||||||
| Arcos Dorados Holdings, Inc., Class A(a) | 77,600 | 776,000 | ||||||
| Vietnam (2.56%) | ||||||||
| Vietnam Dairy Products JSC | 330,760 | 2,198,999 | ||||||
| TOTAL COMMON STOCKS | ||||||||
| (Cost $77,601,337) | 82,451,615 | |||||||
| TOTAL INVESTMENTS (96.09%) | ||||||||
| (Cost $77,601,337) | $ | 82,451,615 | ||||||
| Other Assets In Excess Of Liabilities (3.91%) | 3,356,719 | |||||||
| NET ASSETS (100.00%) | $ | 85,808,334 | ||||||
| (a) | Non-Income Producing Security. |
| (b) | Security exempt from registration under Rule 144A of the Securities Act of 1933. These securities may be resold in the ordinary course of business in transactions exempt from registration, normally to qualified institutional buyers. As of October 31, 2017, these securities had a total aggregate market value of $400,890 representing 0.47% of net assets. |
| (c) | Security was purchased pursuant to Regulation S under the Securities Act of 1933, which exempts securities offered and sold outside of the United States from registration. Such security cannot be sold in the United States without either an effective registration statement filed pursuant to the Securities Act of 1933, or pursuant to an exemption from registration. The security has been deemed liquid under guidelines approved by the Fund’s Board of Trustees. As of October 31, 2017, the aggregate market value of those securities was $807,140, representing 0.94% of net assets. |
See Notes to Financial Statements.
| 16 | 1.855.775.3337 | www.rondureglobal.com |
| Rondure Overseas Fund | Portfolio of Investments |
October 31, 2017 (Unaudited)
| Shares | Value (Note 2) | |||||||
| COMMON STOCKS (83.71%) | ||||||||
| Australia (5.44%) | ||||||||
| carsales.com, Ltd. | 5,700 | $ | 59,810 | |||||
| Coca-Cola Amatil, Ltd. | 18,900 | 117,890 | ||||||
| Domino’s Pizza Enterprises, Ltd. | 3,059 | 109,077 | ||||||
| DuluxGroup, Ltd. | 53,608 | 302,383 | ||||||
| REA Group, Ltd. | 2,376 | 131,439 | ||||||
| SEEK, Ltd. | 4,300 | 60,456 | ||||||
| 781,055 | ||||||||
| Belgium (1.89%) | ||||||||
| Anheuser-Busch InBev SA | 865 | 105,848 | ||||||
| Lotus Bakeries | 22 | 55,866 | ||||||
| Ontex Group NV | 3,100 | 109,035 | ||||||
| 270,749 | ||||||||
| Britain (11.32%) | ||||||||
| Abcam PLC | 1,200 | 15,858 | ||||||
| B&M European Value Retail SA | 22,000 | 116,088 | ||||||
| BAE Systems PLC | 17,900 | 141,098 | ||||||
| Compass Group PLC | 4,696 | 103,098 | ||||||
| Dechra Pharmaceuticals PLC | 2,100 | 57,344 | ||||||
| Domino’s Pizza Group PLC | 40,900 | 182,357 | ||||||
| easyJet PLC | 5,700 | 101,369 | ||||||
| J D Wetherspoon PLC | 22,588 | 373,503 | ||||||
| Rightmove PLC | 700 | 38,620 | ||||||
| Unilever NV | 1,950 | 113,357 | ||||||
| WH Smith PLC | 14,047 | 381,899 | ||||||
| 1,624,591 | ||||||||
| Canada (0.54%) | ||||||||
| Dollarama, Inc. | 700 | 77,922 | ||||||
| Denmark (1.82%) | ||||||||
| Novo Nordisk A/S, Class B | 1,301 | 64,721 | ||||||
| Novozymes A/S, Class B | 1,025 | 56,607 | ||||||
| Royal Unibrew A/S | 2,440 | 140,482 | ||||||
| 261,810 | ||||||||
| Finland (1.30%) | ||||||||
| Olvi OYJ, Class A | 5,735 | 187,386 | ||||||
| France (0.74%) | ||||||||
| Laurent-Perrier | 550 | 51,580 | ||||||
| Shares | Value (Note 2) | |||||||
| France (continued) | ||||||||
| Sodexo SA | 430 | $ | 54,722 | |||||
| 106,302 | ||||||||
| Germany (5.96%) | ||||||||
| CTS Eventim AG & Co. KGaA | 1,645 | 67,948 | ||||||
| Deutsche Lufthansa AG | 4,377 | 139,700 | ||||||
| Deutsche Post AG | 5,280 | 241,834 | ||||||
| Fresenius Medical Care AG & Co. KGaA | 544 | 52,608 | ||||||
| Krones AG | 1,565 | 197,886 | ||||||
| KUKA AG | 299 | 65,479 | ||||||
| Rational AG | 30 | 19,674 | ||||||
| XING SE | 235 | 69,831 | ||||||
| 854,960 | ||||||||
| Hong Kong (0.97%) | ||||||||
| Vitasoy International Holdings, Ltd. | 60,000 | 138,744 | ||||||
| Ireland (0.41%) | ||||||||
| Glanbia PLC | 3,075 | 59,173 | ||||||
| Israel (0.42%) | ||||||||
| Elbit Systems, Ltd. | 404 | 59,890 | ||||||
| Italy (2.49%) | ||||||||
| Brembo SpA | 3,903 | 64,468 | ||||||
| Davide Campari-Milano SpA | 4,498 | 36,048 | ||||||
| De’ Longhi SpA | 447 | 14,657 | ||||||
| DiaSorin SpA | 383 | 34,843 | ||||||
| Moncler SpA | 7,304 | 207,427 | ||||||
| 357,443 | ||||||||
| Japan (28.24%) | ||||||||
| Aeon Delight Co., Ltd. | 7,000 | 260,411 | ||||||
| Calbee, Inc. | 6,000 | 201,310 | ||||||
| Cosmos Pharmaceutical Corp. | 1,300 | 269,707 | ||||||
| Create SD Holdings Co., Ltd. | 13,000 | 325,157 | ||||||
| Ezaki Glico Co., Ltd. | 5,400 | 298,720 | ||||||
| Kirin Holdings Co., Ltd. | 5,100 | 121,305 | ||||||
| Kusuri no Aoki Holdings Co., Ltd. | 2,500 | 138,516 | ||||||
| Kyushu Railway Co. | 6,400 | 204,037 | ||||||
| Lintec Corp. | 9,700 | 267,869 | ||||||
See Notes to Financial Statements.
| Semi-Annual Report | October 31, 2017 | 17 |
| Rondure Overseas Fund | Portfolio of Investments |
October 31, 2017 (Unaudited)
| Shares | Value (Note 2) | |||||||
| Japan (continued) | ||||||||
| Matsumotokiyoshi Holdings Co., Ltd. | 3,300 | $ | 236,243 | |||||
| MEIJI Holdings Co., Ltd. | 400 | 32,576 | ||||||
| MonotaRO Co., Ltd. | 4,400 | 120,346 | ||||||
| Morinaga & Co., Ltd. | 1,800 | 102,423 | ||||||
| Pigeon Corp. | 1,800 | 63,401 | ||||||
| Ryohin Keikaku Co., Ltd. | 500 | 146,871 | ||||||
| Seria Co., Ltd. | 5,100 | 289,750 | ||||||
| Seven & i Holdings Co., Ltd. | 4,400 | 176,921 | ||||||
| Sundrug Co., Ltd. | 2,500 | 108,504 | ||||||
| Suzuki Motor Corp. | 3,600 | 195,506 | ||||||
| TOTO, Ltd. | 800 | 38,908 | ||||||
| Tsuruha Holdings, Inc. | 900 | 111,051 | ||||||
| Yaskawa Electric Corp. | 9,700 | 344,646 | ||||||
| 4,054,178 | ||||||||
| Netherlands (1.96%) | ||||||||
| Euronext NV(a)(b) | 4,250 | 252,531 | ||||||
| Hunter Douglas NV | 350 | 28,339 | ||||||
| 280,870 | ||||||||
| New Zealand (3.74%) | ||||||||
| Air New Zealand, Ltd. | 107,302 | 242,308 | ||||||
| Mainfreight, Ltd. | 11,070 | 185,290 | ||||||
| Trade Me Group, Ltd. | 35,498 | 109,554 | ||||||
| 537,152 | ||||||||
| South Korea (1.51%) | ||||||||
| Samsung Electronics Co., Ltd. | 88 | 216,318 | ||||||
| Spain (2.34%) | ||||||||
| Amadeus IT Group SA | 4,540 | 308,051 | ||||||
| Industria de Diseno Textil SA | 747 | 27,927 | ||||||
| 335,978 | ||||||||
| Sweden (1.10%) | ||||||||
| Axfood AB | 4,544 | 82,178 | ||||||
| Indutrade AB | 1,260 | 34,948 | ||||||
| Loomis AB, Class B | 1,032 | 41,407 | ||||||
| 158,533 | ||||||||
| Switzerland (3.19%) | ||||||||
| ABB, Ltd. | 3,000 | 78,424 | ||||||
| Nestle SA | 1,800 | 151,376 | ||||||
| Shares | Value (Note 2) | |||||||
| Switzerland (continued) | ||||||||
| UBS Group AG | 13,400 | $ | 228,068 | |||||
| 457,868 | ||||||||
| Taiwan (3.27%) | ||||||||
| Eclat Textile Co., Ltd. | 13,260 | 158,498 | ||||||
| President Chain Store Corp. | 28,000 | 251,596 | ||||||
| Standard Foods Corp. | 23,920 | 59,246 | ||||||
| 469,340 | ||||||||
| United States (5.06%) | ||||||||
| Carnival Corp. | 4,450 | 295,435 | ||||||
| Johnson & Johnson | 500 | 69,705 | ||||||
| Royal Caribbean Cruises, Ltd. | 1,700 | 210,409 | ||||||
| Starbucks Corp. | 2,475 | 135,729 | ||||||
| The Walt Disney Co. | 150 | 14,672 | ||||||
| 725,950 | ||||||||
| TOTAL COMMON STOCKS | ||||||||
| (Cost $11,203,965) | 12,016,212 | |||||||
| PREFERRED STOCKS (0.53%) | ||||||||
| Germany (0.53%) | ||||||||
| FUCHS PETROLUB SE | 1,351 | 75,845 | ||||||
| TOTAL PREFERRED STOCKS | ||||||||
| (Cost $73,716) | 75,845 | |||||||
| TOTAL INVESTMENTS (84.24%) | ||||||||
| (Cost $11,277,681) | $ | 12,092,057 | ||||||
| Other Assets In Excess Of Liabilities (15.76%) | 2,262,056 | |||||||
| NET ASSETS (100.00%) | $ | 14,354,113 | ||||||
| (a) | Security exempt from registration under Rule 144A of the Securities Act of 1933. These securities may be resold in the ordinary course of business in transactions exempt from registration, normally to qualified institutional buyers. As of October 31, 2017, these securities had a total aggregate market value of $252,531 representing 1.76% of net assets. |
See Notes to Financial Statements.
| 18 | 1.855.775.3337 | www.rondureglobal.com |
| Rondure Overseas Fund | Portfolio of Investments |
October 31, 2017 (Unaudited)
| (b) | Security was purchased pursuant to Regulation S under the Securities Act of 1933, which exempts securities offered and sold outside of the United States from registration. Such security cannot be sold in the United States without either an effective registration statement filed pursuant to the Securities Act of 1933, or pursuant to an exemption from registration. The security has been deemed liquid under guidelines approved by the Fund’s Board of Trustees. As of October 31, 2017, the aggregate market value of those securities was $252,531, representing 1.76% of net assets. |
See Notes to Financial Statements.
| Semi-Annual Report | October 31, 2017 | 19 |
| Rondure Funds | Statements of Assets and Liabilities |
| October 31, 2017 (Unaudited) |
| Rondure New World Fund | Rondure Overseas Fund | |||||||
| ASSETS | ||||||||
| Investments, at value (Cost - see below) | $ | 82,451,615 | $ | 12,092,057 | ||||
| Foreign cash, at value (Cost $19,352 and $–, respectively) | 19,357 | – | ||||||
| Cash | 4,017,539 | 2,143,371 | ||||||
| Dividends and interest receivable | 8,843 | 18,866 | ||||||
| Receivable for fund shares subscribed | 402,863 | 313,743 | ||||||
| Receivable due from advisor | – | 15,652 | ||||||
| Prepaid and other assets | 47,122 | 37,724 | ||||||
| Total assets | 86,947,339 | 14,621,413 | ||||||
| LIABILITIES | ||||||||
| Payable for investments purchased | 824,778 | 192,830 | ||||||
| Foreign capital gains tax | 161,976 | – | ||||||
| Payable for fund shares redeemed | 2,150 | – | ||||||
| Advisory fees payable | 13,542 | – | ||||||
| Administration fees payable | 26,758 | 16,501 | ||||||
| Custodian fees payable | 56,287 | 33,915 | ||||||
| Payable for trustee fees and expenses | 511 | 141 | ||||||
| Payable for chief compliance officer fee | 854 | 2,156 | ||||||
| Payable for principal financial officer fees | 160 | 719 | ||||||
| Distribution and service fees payable | 3,233 | 299 | ||||||
| Payable for transfer agency fees | 40,079 | 10,763 | ||||||
| Accrued expenses and other liabilities | 8,677 | 9,976 | ||||||
| Total liabilities | 1,139,005 | 267,300 | ||||||
| NET ASSETS | $ | 85,808,334 | $ | 14,354,113 | ||||
| NET ASSETS CONSISTS OF | ||||||||
| Paid-in capital (Note 5) | $ | 80,924,052 | $ | 13,390,264 | ||||
| Accumulated net investment income | 229,862 | 31,889 | ||||||
| Accumulated net realized gain/(loss) | (33,804 | ) | 117,981 | |||||
| Net unrealized appreciation | 4,688,224 | 813,979 | ||||||
| NET ASSETS | $ | 85,808,334 | $ | 14,354,113 | ||||
| INVESTMENTS, AT COST | $ | 77,601,337 | $ | 11,277,681 | ||||
| PRICING OF SHARES | ||||||||
| Institutional Class | ||||||||
| Net Assets | $ | 69,334,042 | $ | 12,009,774 | ||||
| Net Asset Value, offering and redemption price per share | $ | 10.79 | $ | 11.17 | ||||
| Shares of beneficial interest outstanding | 6,426,054 | 1,075,648 | ||||||
| Investor Class | ||||||||
| Net Assets | $ | 16,474,292 | $ | 2,344,339 | ||||
| Net Asset Value, offering and redemption price per share | $ | 10.78 | $ | 11.15 | ||||
| Shares of beneficial interest outstanding | 1,528,853 | 210,182 | ||||||
| See Notes to Financial Statements. |
| 20 | 1.855.775.3337 | www.rondureglobal.com |
| Rondure Funds | Statements of Operations |
| For the Six Months Ended October 31, 2017 (Unaudited) |
| Rondure New World Fund(a) | Rondure Overseas Fund(a) | |||||||
| INVESTMENT INCOME | ||||||||
| Dividends | $ | 646,194 | $ | 78,018 | ||||
| Foreign taxes withheld | (63,844 | ) | (7,375 | ) | ||||
| Other Income | 8,421 | 2,162 | ||||||
| Total investment income | 590,771 | 72,805 | ||||||
| EXPENSES | ||||||||
| Investment advisor fees (Note 6) | 266,067 | 32,497 | ||||||
| Administrative fees | 112,366 | 30,572 | ||||||
| Distribution and service fees - Investor Class | 14,497 | 1,224 | ||||||
| Transfer agent fees | 57,939 | 26,874 | ||||||
| Professional fees | 9,249 | 9,021 | ||||||
| Printing fees | 2,254 | 377 | ||||||
| Registration fees | 3,791 | 2,570 | ||||||
| Custodian fees | 70,635 | 40,912 | ||||||
| Trustee fees and expenses | 511 | 141 | ||||||
| Chief compliance officer fees | 11,606 | 3,823 | ||||||
| Principal financial officer fees | 3,744 | 1,275 | ||||||
| Offering costs | 36,047 | 31,495 | ||||||
| Other expenses | 5,393 | 3,956 | ||||||
| Total expenses | 594,099 | 184,737 | ||||||
| Less fees waived/reimbursed by investment advisor (Note 6) | (233,190 | ) | (143,821 | ) | ||||
| Total net expenses | 360,909 | 40,916 | ||||||
| NET INVESTMENT INCOME | 229,862 | 31,889 | ||||||
| REALIZED AND UNREALIZED GAIN/(LOSS) ON INVESTMENTS | ||||||||
| Net realized gain on investments | 11,470 | 117,473 | ||||||
| Net realized gain/(loss) on foreign currency transactions | (45,274 | ) | 508 | |||||
| Net realized gain/(loss) | (33,804 | ) | 117,981 | |||||
| Net change in unrealized appreciation on investments (net of change in foreign capital gains tax of $161,976 and $0, respectively) | 4,688,302 | 814,376 | ||||||
| Net change in unrealized depreciation on translation of assets and liabilities in foreign currencies | (78 | ) | (397 | ) | ||||
| Net change in unrealized appreciation | 4,688,224 | 813,979 | ||||||
| NET REALIZED AND UNREALIZED GAIN ON INVESTMENTS AND FOREIGN CURRENCY TRANSACTIONS | 4,654,420 | 931,960 | ||||||
| NET INCREASE IN NET ASSETS RESULTING FROM OPERATIONS | $ | 4,884,282 | $ | 963,849 | ||||
| (a) | Represents the period May 1, 2017 (Inception) to October 31, 2017. |
| See Notes to Financial Statements. |
| Semi-Annual Report | October 31, 2017 | 21 |
| Rondure New World Fund | Statement of Changes in Net Assets |
| For the Period May 1, 2017 (Inception) to October 31, 2017 | ||||
| OPERATIONS | ||||
| Net investment income | $ | 229,862 | ||
| Net realized loss | (33,804 | ) | ||
| Net change in unrealized appreciation | 4,688,224 | |||
| Net increase in net assets resulting from operations | 4,884,282 | |||
| CAPITAL SHARE TRANSACTIONS (NOTE 5) | ||||
| Institutional Class | ||||
| Proceeds from sales of shares | 67,337,451 | |||
| Cost of shares redeemed | (1,979,505 | ) | ||
| Redemption fees | 686 | |||
| Net increase from capital shares transactions | 65,358,632 | |||
| Investor Class | ||||
| Proceeds from sales of shares | 16,136,824 | |||
| Cost of shares redeemed | (572,357 | ) | ||
| Redemption fees | 953 | |||
| Net increase from capital shares transactions | 15,565,420 | |||
| Net increase in net assets | 85,808,334 | |||
| NET ASSETS | ||||
| Beginning of period | – | |||
| End of period* | $ | 85,808,334 | ||
| *Including accumulated net investment income of: | $ | 229,862 | ||
| OTHER INFORMATION | ||||
| Shares Transactions | ||||
| Institutional Class | ||||
| Issued | 6,616,699 | |||
| Redeemed | (190,645 | ) | ||
| Net increase in share transactions | 6,426,054 | |||
| Investor Class | ||||
| Issued | 1,584,001 | |||
| Redeemed | (55,148 | ) | ||
| Net increase in share transactions | 1,528,853 | |||
| See Notes to Financial Statements. |
| 22 | 1.855.775.3337 | www.rondureglobal.com |
| Rondure Overseas Fund | Statement of Changes in Net Assets |
| For the Period May 1, 2017 (Inception) to October 31, 2017 | ||||
| OPERATIONS | ||||
| Net investment income | $ | 31,889 | ||
| Net realized gain | 117,981 | |||
| Net change in unrealized appreciation | 813,979 | |||
| Net increase in net assets resulting from operations | 963,849 | |||
| CAPITAL SHARE TRANSACTIONS (NOTE 5) | ||||
| Institutional Class | ||||
| Proceeds from sales of shares | 11,638,591 | |||
| Cost of shares redeemed | (502,341 | ) | ||
| Redemption fees | 42 | |||
| Net increase from capital shares transactions | 11,136,292 | |||
| Investor Class | ||||
| Proceeds from sales of shares | 2,526,392 | |||
| Cost of shares redeemed | (272,466 | ) | ||
| Redemption fees | 46 | |||
| Net increase from capital shares transactions | 2,253,972 | |||
| Net increase in net assets | 14,354,113 | |||
| NET ASSETS | ||||
| Beginning of period | – | |||
| End of period* | $ | 14,354,113 | ||
| *Including accumulated net investment income of: | $ | 31,889 | ||
| OTHER INFORMATION | ||||
| Shares Transactions | ||||
| Institutional Class | ||||
| Issued | 1,122,485 | |||
| Redeemed | (46,837 | ) | ||
| Net increase in share transactions | 1,075,648 | |||
| Investor Class | ||||
| Issued | 235,110 | |||
| Redeemed | (24,928 | ) | ||
| Net increase in share transactions | 210,182 | |||
| See Notes to Financial Statements. |
| Semi-Annual Report | October 31, 2017 | 23 |
| Rondure New World Fund – Institutional Class | Financial Highlights |
| For a Share Outstanding Throughout the Periods Presented |
| Institutional Class | For the Period May 1, 2017 (Inception) to October 31, 2017 | |||
| NET ASSET VALUE, BEGINNING OF PERIOD | $ | 10.00 | ||
| INCOME FROM INVESTMENT OPERATIONS | ||||
| Net investment income(a) | 0.04 | |||
| Net realized and unrealized gain on investments | 0.75 | |||
| Total income from investment operations | 0.79 | |||
| REDEMPTION FEES ADDED TO PAID-IN CAPITAL | 0.00 | (b) | ||
| INCREASE IN NET ASSET VALUE | 0.79 | |||
| NET ASSET VALUE, END OF PERIOD | $ | 10.79 | ||
| TOTAL RETURN | 7.90 | %(c) | ||
| RATIOS AND SUPPLEMENTAL DATA | ||||
| Net assets, end of period (in 000s) | $ | 69,334 | ||
| RATIOS TO AVERAGE NET ASSETS | ||||
| Expenses (excluding fees waived/ reimbursed by investment advisor) | 1.85 | %(d) | ||
| Expenses (including fees waived/ reimbursed by investment advisor) | 1.10 | %(d) | ||
| Net investment income | 0.75 | %(d) | ||
| PORTFOLIO TURNOVER RATE | 7 | %(c) | ||
| (a) | Per share numbers have been calculated using the average shares method. |
| (b) | Less than $0.005 or ($0.005) per share. |
| (c) | Not Annualized. |
| (d) | Annualized. |
| See Notes to Financial Statements. |
| 24 | 1.855.775.3337 | www.rondureglobal.com |
| Rondure New World Fund – Investor Class | Financial Highlights |
| For a Share Outstanding Throughout the Periods Presented |
| Investor Class | For the Period May 1, 2017 (Inception) to October 31, 2017 | |||
| NET ASSET VALUE, BEGINNING OF PERIOD | $ | 10.00 | ||
| INCOME FROM INVESTMENT OPERATIONS | ||||
| Net investment income(a) | 0.03 | |||
| Net realized and unrealized gain on investments | 0.75 | |||
| Total income from investment operations | 0.78 | |||
| REDEMPTION FEES ADDED TO PAID-IN CAPITAL | 0.00 | (b) | ||
| INCREASE IN NET ASSET VALUE | 0.78 | |||
| NET ASSET VALUE, END OF PERIOD | $ | 10.78 | ||
| TOTAL RETURN | 7.80 | %(c) | ||
| RATIOS AND SUPPLEMENTAL DATA | ||||
| Net assets, end of period (in 000s) | $ | 16,474 | ||
| RATIOS TO AVERAGE NET ASSETS | ||||
| Expenses (excluding fees waived/ reimbursed by investment advisor) | 2.06 | %(d) | ||
| Expenses (including fees waived/ reimbursed by investment advisor) | 1.35 | %(d) | ||
| Net investment income | 0.63 | %(d) | ||
| PORTFOLIO TURNOVER RATE | 7 | %(c) | ||
| (a) | Per share numbers have been calculated using the average shares method. |
| (b) | Less than $0.005 or ($0.005) per share. |
| (c) | Not Annualized. |
| (d) | Annualized. |
| See Notes to Financial Statements. |
| Semi-Annual Report | October 31, 2017 | 25 |
| Rondure Overseas Fund – Institutional Class | Financial Highlights |
| For a Share Outstanding Throughout the Periods Presented |
| Institutional Class | For the Period May 1, 2017 (Inception) to October 31, 2017 | |||
| NET ASSET VALUE, BEGINNING OF PERIOD | $ | 10.00 | ||
| INCOME FROM INVESTMENT OPERATIONS | ||||
| Net investment income(a) | 0.04 | |||
| Net realized and unrealized gain on investments | 1.13 | |||
| Total income from investment operations | 1.17 | |||
| REDEMPTION FEES ADDED TO PAID-IN CAPITAL | 0.00 | (b) | ||
| INCREASE IN NET ASSET VALUE | 1.17 | |||
| NET ASSET VALUE, END OF PERIOD | $ | 11.17 | ||
| TOTAL RETURN | 11.70 | %(c) | ||
| RATIOS AND SUPPLEMENTAL DATA | ||||
| Net assets, end of period (in 000s) | $ | 12,010 | ||
| RATIOS TO AVERAGE NET ASSETS | ||||
| Expenses (excluding fees waived/ reimbursed by investment advisor) | 3.95 | %(d) | ||
| Expenses (including fees waived/ reimbursed by investment advisor) | 0.85 | %(d) | ||
| Net investment income | 0.71 | %(d) | ||
| PORTFOLIO TURNOVER RATE | 15 | %(c) | ||
| (a) | Per share numbers have been calculated using the average shares method. |
| (b) | Less than $0.005 or ($0.005) per share. |
| (c) | Not Annualized. |
| (d) | Annualized. |
| See Notes to Financial Statements. |
| 26 | 1.855.775.3337 | www.rondureglobal.com |
| Rondure Overseas Fund – Investor Class | Financial Highlights |
| For a Share Outstanding Throughout the Periods Presented |
| Investor Class | For the Period May 1, 2017 (Inception) to October 31, 2017 | |||
| NET ASSET VALUE, BEGINNING OF PERIOD | $ | 10.00 | ||
| INCOME FROM INVESTMENT OPERATIONS | ||||
| Net investment income(a) | 0.03 | |||
| Net realized and unrealized gain on investments | 1.12 | |||
| Total income from investment operations | 1.15 | |||
| REDEMPTION FEES ADDED TO PAID-IN CAPITAL | 0.00 | (b) | ||
| INCREASE IN NET ASSET VALUE | 1.15 | |||
| NET ASSET VALUE, END OF PERIOD | $ | 11.15 | ||
| TOTAL RETURN | 11.50 | %(c) | ||
| RATIOS AND SUPPLEMENTAL DATA | ||||
| Net assets, end of period (in 000s) | $ | 2,344 | ||
| RATIOS TO AVERAGE NET ASSETS | ||||
| Expenses (excluding fees waived/ reimbursed by investment advisor) | 4.00 | %(d) | ||
| Expenses (including fees waived/ reimbursed by investment advisor) | 1.10 | %(d) | ||
| Net investment income | 0.47 | %(d) | ||
| PORTFOLIO TURNOVER RATE | 15 | %(c) | ||
| (a) | Per share numbers have been calculated using the average shares method. |
| (b) | Less than $0.005 or ($0.005) per share. |
| (c) | Not Annualized. |
| (d) | Annualized. |
| See Notes to Financial Statements. |
| Semi-Annual Report | October 31, 2017 | 27 |
| Rondure Funds | Notes to Financial Statements |
October 31, 2017 (Unaudited)
1. ORGANIZATION
Financial Investors Trust (the “Trust”), a Delaware statutory trust, is an open-end management investment company registered under the Investment Company Act of 1940, as amended (“1940 Act”). As of October 31, 2017, the Trust consists of multiple separate Portfolios or series. This semi-annual report describes the Rondure New World Fund and the Rondure Overseas Fund (individually a “Fund” and collectively, the “Funds”). The Funds seek long-term growth of capital. The Funds offer Investor Class and Institutional Class shares.
2. SIGNIFICANT ACCOUNTING POLICIES
The accompanying Portfolios of Investments were prepared in accordance with accounting principles generally accepted in the United States of America (“U.S. GAAP”). The preparation of the Portfolios of Investments in conformity with U.S. GAAP requires management to make certain estimates and assumptions that affect the reported amounts in the Portfolios of Investments Actual results could differ from those estimates. The Funds are considered an investment company for financial reporting purposes under U.S. GAAP. The following is a summary of significant accounting policies consistently followed by the Funds in preparation of their Portfolios of Investments.
Investment Valuation: The Funds generally value their securities based on market prices determined at the close of regular trading on the New York Stock Exchange (“NYSE”), normally 4:00 p.m. Eastern Time, on each day the NYSE is open for trading.
For equity securities and mutual funds that are traded on an exchange, the market price is usually the closing sale or official closing price on that exchange. In the case of equity securities not traded on an exchange, or if such closing prices are not otherwise available, the securities are valued at the mean of the most recent bid and ask prices on such day. Redeemable securities issued by open-end registered investment companies are valued at the investment company’s applicable net asset value, with the exception of exchange-traded open-end investment companies, which are priced as equity securities.
Equity securities that are primarily traded on foreign securities exchanges are valued at the closing values of such securities on their respective foreign exchanges, except when an event occurs subsequent to the close of the foreign exchange and the close of the NYSE that was likely to have changed such value. In such an event, the fair value of those securities are determined in good faith through consideration of other factors in accordance with procedures established by and under the general supervision of the Board of Trustees (the “Board”). The Funds will use a fair valuation model provided by an independent pricing service, which is intended to reflect fair value when a security’s value or a meaningful portion of each Fund’s portfolio is believed to have been materially affected by a valuation event that has occurred between the close of the exchange or market on which the security is traded and the close of the regular trading day on the NYSE. The Funds’ valuation procedures set forth certain triggers which instruct when to use the fair valuation model.
Forward currency exchange contracts have a fair value determined by the prevailing foreign currency exchange daily rates and current foreign currency exchange forward rates. The foreign currency exchange forward rates are calculated using an automated system that estimates rates on the basis of the current day foreign currency exchange rates and forward foreign currency exchange rates supplied by a pricing service.
When such prices or quotations are not available, or when Rondure Global Advisors, LLC (the “Adviser”) believes that they are unreliable, securities may be priced using fair value procedures approved by the Board.
Fair Value Measurements: The Funds disclose the classification of their fair value measurements following a three-tier hierarchy based on the inputs used to measure fair value. Inputs refer broadly to the assumptions that market participants would use in pricing the asset or liability, including assumptions about risk. Inputs may be observable or unobservable. Observable inputs reflect the assumptions market participants would use in pricing the asset or liability that are developed based on market data obtained from sources independent of the reporting entity. Unobservable inputs reflect the reporting entity’s own assumptions about the assumptions market participants would use in pricing the asset or liability that are developed based on the best information available.
Various inputs are used in determining the value of the Funds’ investments as of the end of the reporting period. When inputs used fall into different levels of the fair value hierarchy, the level in the hierarchy within which the fair value measurement falls is determined based on the lowest level input that is significant to the fair value measurement in its entirety. The designated input levels are not necessarily an indication of the risk or liquidity associated with these investments. These inputs are categorized in the following hierarchy under applicable financial accounting standards:
Level 1 – Unadjusted quoted prices in active markets for identical investments, unrestricted assets or liabilities that the Funds have the ability to access at the measurement date;
| 28 | 1.855.775.3337 | www.rondureglobal.com |
| Rondure Funds | Notes to Financial Statements |
October 31, 2017 (Unaudited)
Level 2 – Quoted prices which are not active, quoted prices for similar assets or liabilities in active markets or inputs other than quoted prices that are observable (either directly or indirectly) for substantially the full term of the asset or liability; and
Level 3 – Significant unobservable prices or inputs (including the Funds’ own assumptions in determining the fair value of investments) where there is little or no market activity for the asset or liability at the measurement date.
The following is a summary of each Fund’s investments in the fair value hierarchy as of October 31, 2017:
| Investments in Securities at Value | Level 1 - Quoted and Unadjusted Prices | Level 2 - Other Significant Observable Inputs | Level 3 - Significant Unobservable Inputs | Total | ||||||||||||
| Rondure New World Fund | ||||||||||||||||
| Common Stocks | ||||||||||||||||
| South Korea | $ | 5,324,058 | $ | 1,544,722 | $ | – | $ | 6,868,780 | ||||||||
| Other* | 75,582,835 | – | – | 75,582,835 | ||||||||||||
| Total | $ | 80,906,893 | $ | 1,544,722 | $ | – | $ | 82,451,615 | ||||||||
| Investments in Securities at Value | Level 1 - Quoted and Unadjusted Prices | Level 2 - Other Significant Observable Inputs | Level 3 - Significant Unobservable Inputs | Total | ||||||||||||
| Rondure Overseas Fund | ||||||||||||||||
| Common Stocks* | $ | 12,016,212 | $ | – | $ | – | $ | 12,016,212 | ||||||||
| Preferred Stocks* | 75,845 | – | – | 75,845 | ||||||||||||
| Total | $ | 12,092,057 | $ | – | $ | – | $ | 12,092,057 | ||||||||
| * | For a detailed country breakdown, see the accompanying Portfolio of Investments. |
For the six months ended October 31, 2017, the Funds did not have any transfers in/(out) of Level 1 and Level 2 securities.
The Funds recognize transfers between levels as of the end of the period. For the six months ended October 31, 2017, the Funds did not have any securities that used significant unobservable inputs (Level 3) in determining fair value.
Investment Transactions and Investment Income: Investment transactions are accounted for on the date the investments are purchased or sold (trade date). Realized gains and losses from investment transactions are reported on an identified cost which is the same basis the Fund uses for federal income tax purposes. Interest income, which includes accretion of discounts and amortization of premiums, is accrued and recorded as earned. Dividend income is recognized on the ex-dividend date or for certain foreign securities, as soon as information is available to the Funds. All of the realized and unrealized gains and losses and net investment income, are allocated daily to each class in proportion to its average daily net assets.
Cash Management Transactions: The Funds subscribe to the Brown Brothers Harriman & Co. (“BBH”) Cash Management Service (“CMS”), whereby cash balances are automatically swept into overnight offshore demand deposits with either the BBH Grand Cayman branch or a branch of a pre-approved commercial bank. This fully automated program allows the Funds to earn interest on cash balances. Excess cash with deposit institutions domiciled outside of the U.S. are subject to sovereign actions in the jurisdiction of the deposit institution including, but not limited to, freeze, seizure or diminution. Cash balances in the BBH CMS are included on the Statements of Assets and Liabilities under Cash and Foreign Cash, at Value. As of October 31, 2017, the Funds had the following cash balances participating in the BBH CMS:
| Fund | ||||
| Rondure New World Fund | $ | 4,017,539 | ||
| Rondure Overseas Fund | 2,143,371 | |||
| Semi-Annual Report | October 31, 2017 | 29 |
| Rondure Funds | Notes to Financial Statements |
October 31, 2017 (Unaudited)
As of October 31, 2017, the Funds had the following foreign cash balances participating in the BBH CMS (cost and value of foreign cash balances are equal):
| Fund | ||||
| Rondure New World Fund | $ | – | ||
| Rondure Overseas Fund | – |
Foreign Securities: The Funds may directly purchase securities of foreign issuers. Investing in securities of foreign issuers involves special risks not typically associated with investing in securities of U.S. issuers. The risks include possible reevaluation of currencies, the inability to repatriate foreign currency, less complete financial information about companies and possible future adverse political and economic developments. Moreover, securities of many foreign issuers and their markets may be less liquid and their prices more volatile than those of securities of comparable U.S. issuers.
Foreign Currency Translation: The books and records of the Funds are maintained in U.S. dollars. Investment valuations and other assets and liabilities initially expressed in foreign currencies are converted each business day into U.S. dollars based upon current exchange rates. Prevailing foreign exchange rates may generally be obtained at the close of the NYSE (normally, 4:00 p.m. Eastern Time). The portion of realized and unrealized gains or losses on investments due to fluctuations in foreign currency exchange rates is not separately disclosed and is included in realized and unrealized gains or losses on investments, when applicable.
Foreign Currency Spot Contracts: The Funds may enter into foreign currency spot contracts to facilitate transactions in foreign securities or to convert foreign currency receipts into U.S. dollars. A foreign currency spot contract is an agreement between two parties to buy and sell currencies at the current market rate, for settlement generally within two business days. The U.S. dollar value of the contracts is determined using current currency exchange rates supplied by a pricing service.
The contract is marked-to-market daily for settlements beyond one day and any change in market value is recorded as an unrealized gain or loss. When the contract is closed, a realized gain or loss is recorded equal to the difference between the value on the open and close date. Losses may arise from changes in the value of the foreign currency, or if the counterparties do not perform under the contract’s terms. The maximum potential loss from such contracts is the aggregate face value in U.S. dollars at the time the contract was opened.
Trust Expenses: Some expenses of the Trust can be directly attributed to the Funds. Expenses which cannot be directly attributed to the Funds are apportioned among all funds in the Trust based on average net assets of each fund.
Fund and Class Expenses: Expenses that are specific to a Fund or class of shares of a Fund, including distribution fees (Rule 12b-1 fees), are charged directly to that Fund or share class. Expenses that are common to all Funds generally are allocated among the Funds in proportion to their average daily net assets.
Offering Costs: Offering costs, including costs of printing initial prospectuses, legal and registration fees, are being amortized over twelve months from the inception date of the Funds. Amounts amortized during the six months ended October 31, 2017 for Funds are shown on the Statements of Operations.
Federal Income Taxes: The Funds comply with the requirements under Subchapter M of the Internal Revenue Code of 1986, as amended, applicable to regulated investment companies and intend to distribute substantially all of their net taxable income and net capital gains, if any, each year so that it will not be subject to excise tax on undistributed income and gains. The Funds are not subject to income taxes to the extent such distributions are made.
Distributions to Shareholders: Each Fund normally pays dividends and distributes capital gains, if any, on an annual basis. Income dividend distributions are derived from dividends and other income each Fund receives from their investments, including short term capital gains. Long term capital gain distributions are derived from gains realized when each Fund sells a security it has owned for more than a year. Each Fund may make additional distributions and dividends at other times if the portfolio manager believes doing so may be necessary for each Fund to avoid or reduce taxes. The Funds intend to pass through foreign tax credits to shareholders.
| 30 | 1.855.775.3337 | www.rondureglobal.com |
| Rondure Funds | Notes to Financial Statements |
October 31, 2017 (Unaudited)
3. TAX BASIS INFORMATION
Tax Basis of Investments: As of October 31, 2017, the aggregate cost of investments, gross unrealized appreciation/(depreciation) and net unrealized appreciation for Federal tax purposes was as follows:
| Fund | Gross Appreciation (excess of value over tax cost) | Gross Depreciation (excess of tax cost over value) | Net Unrealized Appreciation/(Depreciation) | Cost of Investments for Income Tax Purposes | ||||||||||||
| Rondure New World Fund | $ | 7,274,765 | $ | (2,424,487 | ) | $ | 4,850,278 | $ | 77,601,337 | |||||||
| Rondure Overseas Fund | 999,396 | (185,023 | ) | 814,373 | 11,277,684 | |||||||||||
Tax Basis of Distributions to Shareholders: The character of distributions made during the year from net investment income or net realized gains may differ from its ultimate characterization for federal income tax purposes. Also, due to the timing of dividend distributions, the fiscal year in which amounts are distributed may differ from the fiscal year in which the income or realized gain were recorded by the Funds.
The amounts and characteristics of tax basis distributions and composition of distributable earnings/(accumulated losses) are finalized at fiscal year-end. Accordingly, tax basis balances have not been determined as of October 31, 2017.
4. SECURITIES TRANSACTIONS
The cost of purchases and proceeds from sales of securities (excluding short term securities) during the six months ended October 31, 2017 were as follows:
| Fund | Purchases of Securities | Proceeds From Sales of Securities | ||||||
| Rondure New World Fund | $ | 81,342,429 | $ | 3,751,403 | ||||
| Rondure Overseas Fund | 12,336,159 | 1,175,782 | ||||||
5. SHARES OF BENEFICIAL INTEREST
The capitalization of the Trust consists of an unlimited number of shares of beneficial interest with no par value per share. Holders of the shares of the Funds of the Trust have one vote for each share held and a proportionate fraction of a vote for each fractional share. All shares issued and outstanding are fully paid and are transferable and redeemable at the option of the shareholder. Purchasers of the share do not have any obligation to make payments to the Trust or its creditors solely by reason of the purchasers’ ownership of the shares. Shares have no pre-emptive rights.
Shares redeemed within 60 days of purchase may incur a 2% short-term redemption fee deducted from the redemption amount. For the six months ended October 31, 2017, the redemption fees charged by the Funds are presented in the Statements of Changes in Net Assets.
| Fund | Redemption Fee Retained | |||
| Rondure New World Fund - Institutional | $ | 686 | ||
| Rondure New World Fund - Investor | 953 | |||
| Rondure Overseas Fund - Institutional | 42 | |||
| Rondure Overseas Fund - Investor | 46 | |||
6. MANAGEMENT AND RELATED-PARTY TRANSACTIONS
The Adviser, subject to the authority of the Board, is responsible for the overall management and administration of the Funds’ business affairs. The Adviser manages the investments of the Funds in accordance with the Funds’ investment objective, policies and limitations and investment guidelines established jointly by the Adviser and the Trustees. Pursuant to the Advisory Agreement, (the “Advisory Agreement”), each Fund pays
| Semi-Annual Report | October 31, 2017 | 31 |
| Rondure Funds | Notes to Financial Statements |
October 31, 2017 (Unaudited)
the Adviser an annual management fee based on each Fund’s average daily net assets. The management fee is paid on a monthly basis. The following table reflects the Funds’ advisory fee rates.
| Fund | Advisory Fee |
| Rondure New World Fund | 0.85% |
| Rondure Overseas Fund | 0.70% |
The Adviser has contractually agreed to limit certain of each Funds’ expenses. The following table reflects the Funds’ expense cap.
| Fund | Expense Cap | Term of Expense Limit Agreements |
| Rondure New World Fund | ||
| Institutional Class | 1.10% | |
| Investor Class | 1.35% | March 23, 2017 – August 31, 2018 |
| Rondure Overseas Fund | ||
| Institutional Class | 0.85% | |
| Investor Class | 1.10% | March 23, 2017 – August 31, 2018 |
Pursuant to these agreements, each Fund will reimburse the Adviser for any fee waivers and expense reimbursements made by the Adviser, provided that any such reimbursements made by the Funds to the Adviser will not cause the Funds’ expense limitation to exceed expense limitations in existence at the time the expense was incurred, or at the time of the reimbursement, whichever is lower, and the reimbursement is made within three years after the expenses were incurred. Fees waived/reimbursed by adviser for the six months ended October 31, 2017 are disclosed in the Statements of Operations.
For the six months ended October 31, 2017, the fee waivers/reimbursements and/or recoupments were as follows:
| Fund | Fees Waived/Reimbursed By Adviser | |||
| Rondure New World Fund | ||||
| Institutional Class | $ | 191,786 | ||
| Investor Class | 41,404 | |||
| Rondure Overseas Fund | ||||
| Institutional Class | $ | 129,426 | ||
| Investor Class | 14,395 | |||
| Fund | Expires 2021 | Total | ||||||
| Rondure New World Fund | ||||||||
| Institutional Class | $ | 191,786 | $ | 191,786 | ||||
| Investor Class | 41,404 | 41,404 | ||||||
| Rondure Overseas Fund | ||||||||
| Institutional Class | $ | 129,426 | $ | 129,426 | ||||
| Investor Class | 14,395 | 14,395 | ||||||
Administrator Fees and Expenses
ALPS Fund Services, Inc. (“ALPS”) serves as administrator to the Funds and the Funds have agreed to pay expenses incurred in connection with their administrative activities. Pursuant to an Administration Agreement, ALPS provides operational services to the Funds including, but not limited to, fund accounting and fund administration and generally assists in the Funds’ operations. Officers of the Trust are employees of ALPS. The Funds’ administration fee is accrued on a daily basis and paid monthly. Administration fees paid by the Funds for the six months ended October 31, 2017 are disclosed in the Statements of Operations.
ALPS is reimbursed by the Fund for certain out-of-pocket expenses.
| 32 | 1.855.775.3337 | www.rondureglobal.com |
| Rondure Funds | Notes to Financial Statements |
October 31, 2017 (Unaudited)
Transfer Agent
ALPS serves as transfer, dividend paying and shareholder servicing agent for the Funds. ALPS receives an annual minimum fee, a fee based upon the number of shareholder accounts, and is also reimbursed by the Funds for certain out-of-pocket expenses. Transfer agent fees paid by the Funds for the six months ended October 31, 2017 are disclosed in the Statements of Operations.
Compliance Services
ALPS provides services that assist the Trust’s chief compliance officer in monitoring and testing the policies and procedures of the Trust in conjunction with requirements under Rule 38a-1 under the 1940 Act and receives an annual base fee. ALPS is reimbursed for certain out-of-pocket expenses by the Funds. Compliance service fees paid by the Funds for the six months ended October 31, 2017 are disclosed in the Statements of Operations.
Principal Financial Officer
ALPS receives an annual fee for providing principal financial officer services to the Funds. Principal financial officer fees paid by the Fund for the six months ended October 31, 2017 are disclosed in the Statements of Operations.
Distributor: ALPS Distributors, Inc. (“ADI” or the “Distributor”) (an affiliate of ALPS) acts as the distributor of the Funds’ shares pursuant to a Distribution Agreement with the Trust. Shares are sold on a continuous basis by ADI as agent for the Funds, and ADI has agreed to use its best efforts to solicit orders for the sale of each Fund’s shares, although it is not obliged to sell any particular amount of shares. ADI is not entitled to any compensation for its services as Distributor. ADI is registered as a broker-dealer with the U.S. Securities and Exchange Commission.
Each Fund has adopted a Distribution and Services (Rule 12b-1) Plan pursuant to Rule 12b-1 of the 1940 Act (the “Plan”) for its Investor Class shares. The Plan allows the Funds to use Investor Class assets to pay fees in connection with the distribution and marketing of Investor Class shares and/or the provision of shareholder services to Investor Class shareholders. The Plan permits payment for services in connection with the administration of plans or programs that use Investor Class shares of each Fund as their funding medium and for related expenses. The recipients of such payments may include the Distributor, other affiliates of the Adviser, broker-dealers, financial institutions, plan sponsors and administrators and other financial intermediaries through which investors may purchase shares of the Fund. The Plan permits the Funds to make total payments at an annual rate of up to 0.25% of each Fund’s average daily net assets attributable to its Investor Class shares. The expenses of the Plan are reflected as distribution and service fees in the Statements of Operations.
7. INDEMNIFICATIONS
Under the Trust’s organizational documents, its officers and Trustees are indemnified against certain liability arising out of the performance of their duties to the Trust. Additionally, in the normal course of business, the Trust enters into contracts with service providers that may contain general indemnification clauses, which may permit indemnification to the extent permissible under applicable law. The Trust’s maximum exposure under these arrangements is unknown, as this would involve future claims that may be made against the Trust that have not yet occurred.
| Semi-Annual Report | October 31, 2017 | 33 |
| Rondure Funds | Disclosure Regarding Approval of Fund Advisory Agreement |
October 31, 2017 (Unaudited)
On March 14, 2017, the Trustees met in person to discuss, among other things, the renewal of the investment advisory agreement between the Trust, with respect to the Rondure Overseas Fund and the Rondure New World Fund (collectively, the “Rondure Funds”), and Rondure Global Advisors, LLC (“Rondure”) (the “Investment Advisory Agreement”), in accordance with Section 15(c) of the 1940 Act. The Independent Trustees met with independent legal counsel during executive session and discussed the Investment Advisory Agreement and other related materials. In renewing and approving the Investment Advisory Agreement, the Trustees, including the Independent Trustees, considered the following factors:
Investment Advisory Fee Rate: The Trustees reviewed and considered the contractual annual advisory fee to be paid by the Trust, on behalf of the Rondure Funds, to Rondure of 0.85% of the Rondure New World Fund’s daily average net assets and 0.70% of the Rondure Overseas Fund’s daily average net assets, in light of the extent and quality of the advisory services to be provided by Rondure to the Rondure Funds.
The Board received and considered information including a comparison of each of the Rondure Funds’ contractual and actual management fees and overall expenses with those of funds in the expense group and universes of funds provided by an independent provider of investment company data (the “Data Provider”). The Trustees noted that the contractual advisory fee rate for each of the Rondure Funds was below the respective median contractual advisory fee rate of its Data Provider peer group.
Total Expense Ratios: The Trustees further reviewed and considered the projected total expense ratios (after waivers) of 1.10% for the Rondure New World Fund’s Institutional Class shares, 1.35% for the Rondure New World Fund’s Investor Class shares, 0.85% of the Rondure Overseas Fund’s Institutional Class shares, and 1.10% of the Rondure Overseas Fund’s Investor Class shares. The Trustees noted that the total expense ratios (after waivers) for each class of both of the Rondure Funds were below the median total expense ratio (after waivers) for its applicable Data Provider expense group.
Nature, Extent, and Quality of the Services under the Investment Advisory Agreement: The Trustees received and considered information regarding the nature, extent, and quality of services to be provided to the Rondure Funds under the Investment Advisory Agreement. The Trustees reviewed certain background materials supplied by Rondure in its presentation, including its Form ADV.
The Trustees considered the background and experience of Rondure’s management in connection with the Rondure Funds, including reviewing the qualifications, backgrounds, and responsibilities of the management team primarily responsible for the day-to-day portfolio management of the Rondure Funds and the extent of the resources devoted to research and analysis of actual and potential investments. The Trustees also reviewed the research and decision-making processes utilized by Rondure, including the methods adopted to seek to achieve compliance with the investment objectives, policies, and restrictions of the Rondure Funds.
The Trustees also reviewed, among other things, Rondure’s insider trading policies and procedures and its Code of Ethics.
Performance: The Trustees noted that since the Rondure Funds have not yet begun operations, there is no performance to be reviewed or analyzed at this time. The Trustees further considered the reputation of Rondure’s personnel generally and its investment techniques, risk management controls, and decision-making processes.
Comparable Accounts: The Trustees noted that Rondure had no other clients at this time.
Profitability: The Trustees noted that given the start-up nature of Rondure, there were no financial statements to review. It was noted that Rondure had been capitalized with $500,000 and had access to a $1 million line of credit. The Trustees considered the projected profitability analysis prepared by Rondure based on the fees to be payable under the Investment Advisory Agreement with respect to the Rondure Funds.
Economies of Scale: The Trustees considered whether economies of scale in the provision of services to the Rondure Funds will be passed along to the shareholders under the proposed agreements.
Other Benefits to the Adviser: The Trustees reviewed and considered any other incidental benefits to be derived by Rondure from its relationship with the Rondure Funds, including whether soft dollar arrangements would be used.
| 34 | 1.855.775.3337 | www.rondureglobal.com |
| Rondure Funds | Disclosure Regarding Approval of Fund Advisory Agreement |
October 31, 2017 (Unaudited)
In approving Rondure as the Rondure Funds’ investment adviser and approving the Investment Advisory Agreement and the fees charged under the Investment Advisory Agreement, the Trustees concluded that no single factor reviewed by the Trustees was identified by the Trustees to be determinative as the principal factor in whether to approve the Investment Advisory Agreement. Further, the Independent Trustees were advised by separate independent legal counsel throughout the process. The Trustees, including all of the Independent Trustees, concluded that:
| ● | each of the Rondure Funds’ contractual advisory fee rates was below its Data Provider peer group median contractual advisory fee rate; |
| ● | the anticipated total expense ratio (after waivers) for each class of the Rondure Funds was below its respective Data Provider peer group median total expense ratio (after waivers); |
| ● | the nature, extent, and quality of services to be rendered by Rondure under the Investment Advisory Agreement with respect to the Rondure Funds were adequate; |
| ● | since the Rondure Funds had not yet begun operations, there was no performance to be reviewed or analyzed at this time; |
| ● | there were no directly comparable accounts managed by Rondure for the Board to consider; |
| ● | the profit, if any, to be realized by Rondure in connection with the operation of the Rondure Funds was not unreasonable to the Funds; and |
| ● | there were no material economies of scale or other incidental benefits accruing to Rondure in connection with its relationship with the Rondure Funds. |
Based on the Trustees’ deliberations and their evaluation of the information described above, the Trustees, including all of the Independent Trustees, concluded that Rondure’s compensation for investment advisory services is consistent with the best interests of the Rondure Funds and their shareholders.
| Semi-Annual Report | October 31, 2017 | 35 |
| Rondure Funds | Additional Information |
October 31, 2017 (Unaudited)
1. FUND HOLDINGS
The Funds file their complete schedule of portfolio holdings with the Securities and Exchange Commission (the “SEC”) for the first and third quarters of each fiscal year on Form N-Q within 60 days after the end of the period. Copies of the Funds’ Form N-Q are available without charge on the SEC website at http://www.sec.gov. You may also review and copy the Form N-Q at the SEC’s Public Reference Room in Washington, DC. For more information about the operation of the Public Reference Room, please call the SEC at 1-800-SEC-0330.
2. FUND PROXY VOTING POLICIES, PROCEDURES AND SUMMARIES
The Funds’ policies and procedures used in determining how to vote proxies and information regarding how the Funds voted proxies relating to portfolio securities during the most recent prior 12-month period ending June 30 are available without charge, (1) upon request, by calling (toll-free) 1-855-775-3337 and (2) on the SEC’s website at http://www.sec.gov.
| 36 | 1.855.775.3337 | www.rondureglobal.com |
| RON000168/1218 |
TABLE OF CONTENTS
| Letter to Shareholders | 1 |
| Performance Review | |
| Seafarer Overseas Growth and Income Fund | 5 |
| Seafarer Overseas Value Fund | 9 |
| Disclosure of Fund Expenses | 14 |
| Portfolio of Investments | 16 |
| Statements of Assets and Liabilities | 25 |
| Statements of Operations | 26 |
| Statements of Changes in Net Assets | 27 |
| Financial Highlights | 30 |
| Notes to Financial Statements | 36 |
| Additional Information | 45 |
| Seafarer Funds | Letter to Shareholders |
October 31, 2017
LETTER TO SHAREHOLDERS
November 13, 2017
Dear Fellow Shareholders,
I am pleased to address you again on behalf of the Seafarer Funds. This report covers the first half of the 2017-18 fiscal year (May 1, 2017 to October 31, 2017).
It is not an accident that you hear so much about China in the news these days. Within the developing world, it is situated at the very center: it has the largest population; it possesses the largest economy, and the largest accompanying financial markets; it enjoys the greatest absolute store of wealth and power. Its influence dominates the rest – politically, economically and, increasingly, culturally. In many ways, for better or for worse, China serves as a model for development for many other emerging nations.
A great deal of change is taking place in China now, so I will use this letter to offer my perspective on the evolution of the place known as the “Middle Kingdom.”
My China Dream
Throughout my adult life, I have been an interested observer of China. I studied economic development in school, and was in awe of how a nominally communist country had harnessed market forces to lift hundreds of millions of people out of desperate poverty. When I graduated from college in 1996, I sought work in Asia. I wanted a job where I could study China’s evolution and emergence firsthand. I worked in Southeast Asia for two years, and the closest I came to the mainland was through several extended trips to Hong Kong for business.
In 1998, I returned to the U.S., and I sought a career in investment management. I was determined to work for an investment management firm focused on Asia. I was convinced that China was both the most important and the most under-appreciated and misunderstood market in the world. I thought China’s rise as an economic power would dramatically re-shape the world during my lifetime. I hoped then – as I hope now – for peace, progress and prosperity in the Middle Kingdom.
Over a decade later, in 2010, my work took me to Shanghai when the city was hosting the World Expo. The Expo featured pavilions representing nations from around the world. I toured the host’s pavilion and viewed a special exhibition dedicated to “The Chinese Dream.” One portion of the exhibit offered an animated glimpse of the future. It depicted gleaming, orderly, highly developed cities. They were free of pollution, and resplendent in greenery and blue skies. The society seemed too controlled and orderly for my taste; nevertheless, it was a powerful and inspiring vision, even if it seemed far-fetched at the time, given that China was choked with pollution, and its development was far from complete.
Still, the Expo had demonstrated that the Chinese people had made a great deal of progress over the preceding three decades. Through hard work, competition and economic liberalization, millions had earned better lives and livelihoods. The communist party had undertaken small-scale experiments with modes of governance that allowed for greater openness. I felt as though a realistic hope hung in the air, penetrating the smog.
At the time, I had only a passing knowledge of Xi Jinping, the man who would become China’s next President in 2012. I later learned that Xi had adopted “The Chinese Dream” as his slogan to guide the nation’s development. I suspect he had a substantial hand in the exhibit I saw in Shanghai in 2010: it was his Dream, and it was on display at the Expo.
When Xi assumed the Presidency in the autumn of 2012, I wrote a letter to the shareholders of the Growth and Income Fund, in which I discussed China’s “bright prospects” and its “dark clouds.”1 I saw several looming problems for the country. However, my hope rested on a simple idea: Deng Xiaoping started China on a path toward greater social and economic freedom. As long as China remained on that path, growth would continue, and prosperity would ensue.
| Semi-annual Report – October 31, 2017 | 1 |
| Seafarer Funds | Letter to Shareholders |
October 31, 2017
The Right Plan
My optimism stemmed from the fact that China had publicly expressed an intent to pursue a more “balanced” economic model – a model that placed greater emphasis on the domestic consumption of goods and services, rather than an economy dependent on manufactured exports and the construction of large-scale infrastructure (e.g., roads, bridges, ports, cities).
I was convinced that if the country pursued re-balancing, it would unlock additional potential to grow, and help the country avoid the “middle income trap.” The “trap” refers to a typical feature of many emerging markets. Such countries initially manage to improve the average income per capita, but due to declining returns to scale, development is often arrested at a middling level, before incomes reach thresholds associated with richer, developed nations.
At that time, my analysis suggested that China had the right development plan – a plan to undertake economic reform, unlock new growth potential, and avoid the “trap.” The more I understood of China’s plan, the more impressed I grew. The plan was comprehensive; it was clearly the product of careful deliberation, designed to address many of the concerns raised by external critics; and it seemed to represent the consensus view among China’s leadership about how to move forward. I knew the underlying reforms would be difficult to implement, but I thought they were exactly what was required to sustain the country’s long-term growth and development.
In the spring of 2014, I wrote a letter to shareholders in which I spelled out those reforms underway in China.2 This is a reproduction of the list of the reforms from that letter:
| ● | A substantial (but unfortunately not exhaustive) anti-corruption drive. |
| ● | Liberalization of the local currency and of interest rates within the banking system. Both are “backdoor” reforms of the domestic banking sector. |
| ● | Recapitalization of the domestic banking system to address financial weaknesses. |
| ● | Major stock market reforms, including: enhanced access for foreign investors via the “through train” policy, new mechanisms for companies to issue capital, and a liberalized market for initial public offerings (IPOs). |
| ● | Major reforms to reduce excess capacities within state-owned enterprises. |
| ● | Modernization of provincial governments’ finances, possibly culminating in the authority to levy local taxes (i.e. property and sales taxes), and the authority to issue municipal-style bonds. |
| ● | Liberalization of most key input prices, especially energy and natural resources. |
| ● | Environmental regulation, targeting sharp reduction in carbon emissions, with severe penalties for polluters. |
| ● | Reformed property and land use rights. |
| ● | Reform of the hukou (“household registration”) system. Hukou is a set of identification documents, somewhat like a domestic passport. The hukou system defines a household’s civil, economic and legal rights within a given municipality, broadly analogous to a locally-based entitlement scheme. |
| ● | A major overhaul of the national healthcare delivery system. |
| ● | Relaxation of the “one child” policy. |
At the time – and unlike today, apparently – there was a great deal of skepticism regarding China’s economic and financial stability. However, I was reasonably confident that China would implement most of the reforms above, and confident in China’s future, I encouraged investors to peer over “China’s Great Wall of Worry.”
A Different Path
During his first five-year term, Xi led China on a path quite different from the one that I described in the 2014 letter to shareholders. His agenda had only a passing resemblance to the plan that I thought reflected the consensus of China’s leadership, and which I believed to be essential to the country’s future. Despite rhetoric to the contrary, economic and political reform largely stalled during Xi’s term. Some modest reforms were activated, but with little vigor; the plan I thought so critical for China went mostly un-implemented.
| 2 | (855) 732-9220 seafarerfunds.com |
| Seafarer Funds | Letter to Shareholders |
October 31, 2017
Instead, Xi placed a clear emphasis on three main objectives: purging corruption from the communist party; launching “Belt and Road,” a vast international program to spur investment and trade links between China, central Asia and Europe; and a major effort to reinvigorate of China’s military. The first project tackled the endemic corruption at every level of the communist party; however, it also appeared to permit Xi to remove his political enemies. The second program gave China a means to build economic, strategic and military ties with nations on its southern and western borders, while stimulating infrastructure construction, lending and investment. The third project sought to cut corruption in the military, while new investments in armaments and fleets allowed China to project newfound strength and power in the South China seas. This in turn has fomented conflict with other nations, including Japan and the U.S.
At the same time, Xi took steps to consolidate his personal power and control over the party in a manner not seen since Mao Zedong. This was visible when the National People’s Congress convened in 2017 to nominate Xi for a second term as president, as expected. Rather unexpectedly, Xi had his name and his personal doctrine codified in the communist party’s constitution. His doctrine is known as “Socialism with Chinese Characteristics for a New Era.”
A New Era
Apparently, such codification has occurred only twice before in modern China: for Mao (during his life) and Deng (posthumously). The act was more than symbolic: it conveyed a degree of elevated personal power and authority to Xi that no ruler has enjoyed since Mao. It appears that Xi no longer serves the communist party within China; rather, it seems he has the power to define it, and his leadership over the party is absolute.
Xi’s New Era doctrine is only a vague vision at this time, but it is sweeping in its scope, and its main thrust is to install China as a global superpower alongside the United States. Xi has announced goals to reform the economy and the country’s governance, but the New Era’s main ambition is to cultivate influence and project power around the world. Gone are the days of Deng’s policy, which was to remain independent, peaceful, inward-looking, and to keep a low profile. Xi is prepared to lead the nation in a “tireless struggle” to stand “tall and firm in the east.”3
To underscore the extent of his newly accumulated power, Xi again broke with precedent, and did not name a successor during the recent congressional convention. His apparent aim was to enjoy greater freedom to advance his “New Era” agenda, as any successor would inevitably detract from Xi as his second term drew to a close. Xi went unchallenged in public.
Xi may yet name a successor, at a time and place of his choosing. However, many suspect he will not do so, preferring to seek a third term. If so, Xi will break a third precedent meant to check the abuse of power. In post-revolutionary China, only Mao formally ruled beyond one decade.
Requiem for My Dream
To be candid, this was not what I had dreamt for China. I had hoped the country would rigorously implement the original package of reforms, thereby sustaining its growth. I had hoped the country would move slowly toward an open system of government – perhaps one that offered greater personal liberties, basic self-expression, and possibly even a limited form of representation.
Instead, Xi has pursued reforms half-heartedly, preferring to focus on the accumulation of political power, while shielding domestic industries from competition. His administration has made limited progress toward a number of elements within the original plan, but that progress has fallen well short of my expectation. He has invoked China’s security apparatus to silence anyone that dares critique his administration openly. Meanwhile, the economy has remained dangerously reliant on excessive credit expansion to stimulate growth. In summary, the past five years fell far short of what I had hoped for China, and I am concerned as to whether the country will ever reach its potential.
Not all the news is bad, though. Happily, Xi has brought a needed dose of stability to international affairs, wisely seeking to expand China’s influence by remaining open to foreign alliances and trading partners. As the U.S. has receded from the international arena, China has advanced. Even as I write
| Semi-annual Report – October 31, 2017 | 3 |
| Seafarer Funds | Letter to Shareholders |
October 31, 2017
now, China has announced a sweeping set of reforms tied to foreign participation within the domestic banking system, lifting previous restrictions on ownership. The reforms may bring much needed change and foreign competition to the financial system. While I have not yet had time to review the details, the announcement cements Xi as a bold and thoughtful leader, if not a zealous reformer. While Xi’s first term left much to be desired with respect to the pace and quality of reform, perhaps there is room for hope.
Still, I worry about Xi’s pursuit of absolute power, and the instability it might invoke. I never suffered from any illusion that China might adopt a Western-style democracy. At the same time, I never thought the country would vest such immense power in one person. Though Xi’s political ascent has gone unchallenged in public, I suspect a great deal of strife simmers below the surface. Furthermore, such centralized decision-making might detract from long-term economic efficiency. As a consequence, I worry the “New Era” is more susceptible to large-scale economic or political crisis.
China’s rise is nearly inevitable in my view. I remain convinced its ascent will shape the course of world events for the next two decades, for better or worse. Xi’s will to determine China’s future is absolute and unshakeable. Thus far, he has exhibited a stable and carefully calculated mode of leadership. Yet by accumulating such personal power, he has definitively broken with China’s past, and initiated a third era in China’s modern history.
China is not the country I dreamt it might become. China’s economic rise was the product of policies that began under Deng in the late 1970s; but a new era has arisen, and any assumptions we might hold about the Middle Kingdom must be revisited, if not cast aside. We must all watch carefully what happens next, and take nothing for granted, as the country’s past is not necessarily a reliable guide to its future.
We thank you for the trust you have afforded us, and we appreciate the opportunity to serve as your investment adviser in the emerging markets.
Andrew Foster
Chief Investment Officer
Seafarer Capital Partners, LLC
Information on the Seafarer website is provided for textual reference only, and is not incorporated by reference into this report.
The views and information discussed in this commentary are as of the date of publication, are subject to change, and may not reflect Seafarer’s current views. The views expressed represent an assessment of market conditions at a specific point in time, are opinions only and should not be relied upon as investment advice regarding a particular investment or markets in general. Such information does not constitute a recommendation to buy or sell specific securities or investment vehicles. It should not be assumed that any investment will be profitable or will equal the performance of the portfolios or any securities or any sectors mentioned herein. The subject matter contained herein has been derived from several sources believed to be reliable and accurate at the time of compilation. Seafarer does not accept any liability for losses either direct or consequential caused by the use of this information.
| 1 | The Letter to Shareholders for the period ended October 31, 2012 is available at: www.seafarerfunds.com/letters-to-shareholders/2012/10/semi-annual |
| 2 | The Letter to Shareholders for the period ended April 30, 2014 is available at: www.seafarerfunds.com/letters-to-shareholders/2014/04/annual#great-wall |
| 3 | Tom Phillips, “Xi Jinping Heralds 'New Era' of Chinese Power at Communist Party Congress,” The Guardian, 18 October 2017. The article is available at: www.theguardian.com/world/2017/oct/18/xi-jinping-speech-new-era-chinese-power-party-congress |
| 4 | (855) 732-9220 seafarerfunds.com |
| Seafarer Overseas Growth and Income Fund | Performance Review |
October 31, 2017
SEAFARER OVERSEAS GROWTH AND INCOME FUND
PERFORMANCE REVIEW
November 14, 2017
This report addresses the first half of the Seafarer Overseas Growth and Income Fund’s 2017-18 fiscal year (May 1, 2017 to October 31, 2017).
During the semi-annual period, the Fund returned 6.80%, while the Fund’s benchmark, the MSCI Emerging Markets Total Return Index, rose 16.40%.1 By way of broader comparison, the S&P 500 Index gained 9.10%.
The Fund began the fiscal year with a net asset value of $12.54 per share. In June, the Fund paid a semi-annual distribution of $0.107 per share. That payment brought the cumulative distribution per share, as measured from the Fund’s inception, to $1.478.2 The Fund finished the semi-annual period with a value of $13.28 per share.3
* * * * *
As is evident from the performance of the Fund’s benchmark, equities in the emerging markets rose sharply during the first half of the fiscal year.
All sectors contributed positively to the benchmark’s performance during the past six months. However, consistent with trends in global markets, technology shares were dominant, accounting for nearly half of the index’s gains. Semiconductor stocks and computer hardware makers boosted returns within the tech sector, but Chinese internet stocks led the way, singlehandedly contributing nearly 30% of the index’s return (or nearly 60% of the return attributable to the tech sector). Please see the Fund’s second quarter 2017 portfolio review for an in-depth discussion of the Chinese internet industry.4
Importantly, China’s contribution to the index’s gains went beyond internet stocks, encompassing a wide number of sectors, such that the Middle Kingdom accounted for nearly half of the index’s performance. Chinese bank, insurance, real estate and auto stocks made notable contributions to the benchmark’s performance. Nearly every other constituent country within the index also generated gains, but China’s performance held sway.
Against this strong backdrop, the Fund performed well in absolute terms, but lagged considerably in relative terms. Nearly three-quarters of the Fund’s relative gap in performance stemmed from its lack of exposure to higher risk sectors within China (i.e., internet, financial services and residential real estate). I question whether these three industries offer sustainable growth prospects (see the portfolio reviews for the second and third quarters of 2017 for further discussion), and as such I do not believe most of the stocks in these sectors are applicable to the Fund’s strategy.4,5 I am therefore comfortable with their omission for the foreseeable future, even as their absence represented a forgone opportunity in the last six months.
Though most of the gap in performance was due to the Fund’s omission of certain sectors, one Fund holding exacerbated the gap: the common stock of Hang Lung Properties (HLP). HLP is a Hong Kong-based developer; it enjoys a balance sheet in excellent health, and a superior portfolio of commercial properties scattered throughout China. Strangely, and for no obvious reason, the stock declined moderately during the six-month period, even as the shares of a number of highly speculative China-based residential property developers surged higher. Perhaps the decline was due to the fact that HLP is engaged in the development of commercial properties (shopping centers, malls) rather than residential units. Whatever the case, HLP’s shares currently trade well below book value, and it has executed on its development portfolio quite well, despite difficult conditions within China. I remain convinced of HLP’s merits, even as speculative stocks ruled the quarter.
When the market surges, as it did in the semi-annual period, I do not expect the Fund to keep up. I wish it were otherwise. However, the “growth and income” strategy necessarily places the Fund on a conservative path. The strategy pursues growth and income as a means to balance risk and reward, and when all goes well, it can realize a portion of the gains produced by the developing world. If
| Semi-annual Report – October 31, 2017 | 5 |
| Seafarer Overseas Growth and Income Fund | Performance Review |
October 31, 2017
successful, it does so with volatility lower than that of the benchmark index. Yet these same characteristics mean the Fund is not poised to capture maximum growth, and therefore it is not primed for gains amid a sharp upswing. I believe the Fund’s strategy works well for shareholders over long horizons, but its shortcomings are apparent in the short term.
We appreciate your patience and willingness to invest for the long term, and we thank you for the opportunity to serve as your investment adviser in the emerging markets.
Andrew Foster
Lead Portfolio Manager
Seafarer Overseas Growth and Income Fund
The MSCI Emerging Markets Total Return Index, Standard (Large+Mid Cap) Core, Gross (dividends reinvested), USD is a free float-adjusted market capitalization index designed to measure equity market performance of emerging markets. Index code: GDUEEGF.
The S&P 500 Total Return Index is a stock market index based on the market capitalizations of 500 large companies with common stock listed on the NYSE or NASDAQ.
It is not possible to invest directly in an index.
The Fund is subject to investment risks, including possible loss of the principal amount invested and therefore is not suitable for all investors. The Fund may not achieve its objectives. Diversification does not ensure a profit or guarantee against loss.
Information on the Seafarer website is provided for textual reference only, and is not incorporated by reference into this report.
The views and information discussed in this commentary are as of the date of publication, are subject to change, and may not reflect the writer's current views. The views expressed represent an assessment of market conditions at a specific point in time, are opinions only and should not be relied upon as investment advice regarding a particular investment or markets in general. Such information does not constitute a recommendation to buy or sell specific securities or investment vehicles. It should not be assumed that any investment will be profitable or will equal the performance of the portfolios or any securities or any sectors mentioned herein. The subject matter contained herein has been derived from several sources believed to be reliable and accurate at the time of compilation. Seafarer does not accept any liability for losses either direct or consequential caused by the use of this information.
| 1 | References to the “Fund” pertain to the Fund’s Institutional share class (ticker: SIGIX). The Investor share class (ticker: SFGIX) gained 6.80% during the semi-annual period. Includes adjustments in accordance with accounting principles generally accepted in the United States of America (“U.S. GAAP”) and as such, the total return for shareholder transactions reported to the market may differ from the total return for financial reporting purposes. As a result, the total return decreased from 6.88% to 6.80%. |
| 2 | The Fund’s inception date is February 15, 2012. |
| 3 | The Fund’s Investor share class began the fiscal year with a net asset value of $12.51 per share (adjustments in accordance with U.S. GAAP were applied during the financial statement preparation and increased the net asset value from $12.50 to $12.51); it paid a semi-annual distribution of $0.105 per share in June; and it finished the semi-annual period with a value of $13.25 per share. |
| 4 | The Fund’s second quarter 2017 portfolio review is available at: www.seafarerfunds.com/funds/ogi/portfolio-review/2017/06/Q2 |
| 5 | The Fund’s third quarter 2017 portfolio review is available at: www.seafarerfunds.com/funds/ogi/portfolio-review/2017/09/Q3 |
| 6 | (855) 732-9220 seafarerfunds.com |
| Seafarer Overseas Growth and Income Fund | Performance Review |
October 31, 2017
Total Returns
As of October 31, 2017 |
6 Months |
1 Year |
3 Years |
5 Years | Since Inception Annualized(1) | Gross Expense Ratio(2) |
| Investor Class (SFGIX) | 6.80%(3) | 13.23% | 6.19% | 6.62% | 7.39% | 1.02% |
| Institutional Class (SIGIX) | 6.80% | 13.28% | 6.29% | 6.75% | 7.52% | 0.92% |
MSCI Emerging Markets Total Return Index(4) | 16.40% | 26.91% | 6.08% | 5.21% | 3.89% |
All performance is in U.S. dollars with gross (pre-tax) dividends and/or distributions reinvested. The performance data quoted represents past performance and does not guarantee future results. Future returns may be lower or higher. The investment return and principal value will fluctuate so that an investor's shares, when redeemed, may be worth more or less than the original cost. Prior to August 31, 2016, shares of the Fund redeemed or exchanged within 90 days of purchase were subject to a 2% redemption fee. Performance does not reflect this fee, which if deducted would reduce an individual's return. To obtain the Fund’s most recent month-end performance, visit seafarerfunds.com or call (855) 732-9220.
| 1 | Inception Date: February 15, 2012. |
| 2 | Ratios as of Prospectus dated August 31, 2017. Seafarer Capital Partners, LLC has agreed contractually to waive and/or reimburse fees or expenses in order to limit Total Annual Fund Operating Expenses After Fee Waiver/Expense Reimbursements (excluding brokerage expenses, interest expenses, taxes and extraordinary expenses) to 1.15% and 1.05% of the Fund’s average daily net assets for the Investor and Institutional share classes, respectively. This agreement is in effect through August 31, 2018. |
| 3 | Includes adjustments in accordance with U.S. GAAP and as such, the total return for shareholder transactions reported to the market may differ from the total return for financial reporting purposes. As a result, the total return decreased from 6.88% to 6.80%. |
| 4 | The MSCI Emerging Markets Total Return Index, Standard (Large+Mid Cap) Core, Gross (dividends reinvested), USD is a free float-adjusted market capitalization index designed to measure equity market performance of emerging markets. Index code: GDUEEGF. The index is not actively managed and does not reflect any deductions for fees, expense or taxes. An investor may not invest directly in an index. |
| Semi-annual Report – October 31, 2017 | 7 |
| Seafarer Overseas Growth and Income Fund | Performance Review |
October 31, 2017
Performance of a $10,000 Investment Since Inception
| * | Inception Date: February 15, 2012. |
The chart shown above represents historical performance of a hypothetical investment of $10,000 in the Fund’s Investor Class shares for the period from inception to October 31, 2017. All returns reflect reinvested dividends and/or distributions, but do not reflect the deduction of taxes that an investor would pay on distributions or redemptions.
The Fund also offers Institutional Class shares, performance for which is not reflected in the chart above. The performance of Institutional Class shares may be higher or lower than the performance of the Investor Class shares shown above based upon differences in fees paid by shareholders investing in the Investor Class shares and Institutional Class shares.
Investment Objective
The Fund seeks to provide long-term capital appreciation along with some current income. The Fund seeks to mitigate adverse volatility in returns as a secondary objective.
Strategy
The Fund invests primarily in the securities of companies located in developing countries. The Fund invests in several asset classes including dividend-paying common stocks, preferred stocks, convertible bonds, and fixed-income securities.
The Fund seeks to offer investors a relatively stable means of participating in a portion of developing countries’ growth prospects, while providing some downside protection compared to a portfolio that invests only in the common stocks of those countries.
| 8 | (855) 732-9220 seafarerfunds.com |
| Seafarer Overseas Value Fund | Performance Review |
October 31, 2017
SEAFARER OVERSEAS VALUE FUND
PERFORMANCE REVIEW
November 10, 2017
This report addresses the first half of the Seafarer Overseas Value Fund’s 2017-18 fiscal year (May 1, 2017 to October 31, 2017).
During the semi-annual period, the Fund gained 8.51%, while the Fund’s benchmark, the MSCI Emerging Markets Total Return Index, rose 16.40%.1 By way of broader comparison, the S&P 500 Index gained 9.10%.
The Fund began the fiscal year with a net asset value of $11.28 per share.2 The Fund paid no distributions during the first half of the fiscal year, and it finished the period with a value of $12.24 per share.3
This performance review examines the Fund within the context of what is by now a confirmed rally in emerging market equities, which have appreciated consistently since the beginning of 2016. In the Annual Report for the period ended April 30, 2017, I concluded my review of the Fund’s first year of performance by stating that “it has truly been a year in which earnings momentum and nothing else seemed to drive stock price performance.”4 The first half of the current fiscal year represents a continuation of this condition.
An examination of the top five contributors to the Fund’s 8.51% total return during the semi-annual period reveals earnings growth as a common driver across the names in the portfolio. However, this observation requires qualification. The first qualification is that at the time of initial purchase, the motivation for including these securities in the portfolio was not earnings momentum, but other considerations. In fact, at the time of first purchase, these stocks suffered from declining earnings. Thus, the reason for initiating a position in the top contributor to performance, China Foods, was the expectation of the company selling non-core assets (Structural Shift category of value, as defined in the white paper On Value in the Emerging Markets), and the low utilization of what I expected to eventually constitute the company’s core asset (Asset Productivity category of value).5 The company also happens to have started reporting earnings growth since I introduced it in the Fund.
Similarly, the original reason for investing in the second-best performer during this period, Melco International Development, a Hong Kong-based casino developer, owner and operator, was the undervaluation of the company’s balance sheet (Breakup Value category of value). However, over a year ago Macau’s gross gaming revenue began to grow once again after several years of contraction, and the company’s earnings have begun to reflect that fact. The same argument applies to the other top contributors to portfolio performance: Qualicorp, a Brazilian insurance broker that falls under the Structural Shift category of value; Samsung SDI, a Korean battery manufacturer (Breakup Value); and Shangri-La, a pan-Asian hospitality company (Breakup Value).
The second qualification required by the above observation that earnings growth constitutes the common thread among the Value Fund’s top contributors to total return is that this factor is not the sole explanatory variable. Particularly in the case of China Foods, the company’s announcement of the sale of two non-core subsidiaries holds greater explanatory power over its stock price appreciation than earnings momentum, in my opinion. Similarly, management and operational changes at Shangri-La better explain the rise in the company’s share price than earnings growth to date.
The reason I make these nuanced distinctions is because they aid in the understanding of the Value Fund’s performance relative to the benchmark, and they address the broader question of the role of the Fund within the context of what appears to be a growth-driven market. In essence, one should not conclude based on the foregoing that only value names that begin to grow earnings again will drive portfolio returns. Even within the context of a rising market that seems driven by growth-oriented names, value-driven stocks have performed well for the right reasons. Based on the evidence thus far, I conclude that there is still room for a value-oriented strategy within the present growth-driven market.
I am satisfied with the Fund’s absolute performance of 8.51% over the past six months; however, this figure significantly underperforms the benchmark’s total return of 16.40% over the same period. The above discussion of the portfolio’s top contributors should illustrate the heterogeneous nature of the portfolio’s drivers. In contrast, the primary contributors to the benchmark’s total return over the past six
| Semi-annual Report – October 31, 2017 | 9 |
| Seafarer Overseas Value Fund | Performance Review |
October 31, 2017
months are a narrow group of technology and internet firms: Taiwan Semiconductor Manufacturing Company (TSMC), Samsung Electronics, Alibaba, Naspers (owner of one third of Tencent), and Tencent.
More broadly, the Value Fund consists of a collection of investment ideas, each one having its own relatively idiosyncratic driver for value realization. While I classify these drivers into broad categories – the seven sources of value defined in the white paper On Value in the Emerging Markets – each investment holding has its own individual set of characteristics.5 More importantly, from the perspective of portfolio performance relative to the benchmark, the timing of value realization for each individual investment is unpredictable. To illustrate the point, consider this period’s top contributor to the portfolio’s total return: China Foods. The company had no compulsion to sell two of its subsidiaries this past quarter, apart from state-owned enterprise reform within the company and its parent COFCO (China National Cereals, Oils and Foodstuffs Corporation, a relatively opaque company). This restructuring process could have taken another year to complete.
Thus, given that the timing of value realization is unpredictable, together with the idiosyncratic nature of the portfolio’s holdings, the Value Fund’s performance relative to the benchmark will probably be a circumstantial question most of the time. Indeed, the Value Fund’s active share throughout the period under review was slightly above 93%.6
Within the context of strongly rising emerging market equities seemingly driven by an inflection point in earnings growth (please refer to Seafarer’s Emerging Markets Briefing7), the Value Fund is likely to trail the benchmark. In my opinion, this performance lag is not due to the Fund having lower return potential than the market, but due to the timing difference between strongly growing and appreciating equities in the benchmark and still gestating value in the Value Fund.
Furthermore, not only does the portfolio include investment ideas that are still maturing, but it also owns companies that continue to report declining earnings. Given the market environment, it should not come as a surprise that this period’s top detractors to portfolio performance share negative earnings momentum as a common characteristic. Qatar Gas (Deleveraging category of value), Asia Satellite (Deleveraging), Amvig Holdings (Balance Sheet Liquidity), Xtep International Holdings (Balance Sheet Liquidity), and Petrovietnam Technical Services (Management Change and Balance Sheet Liquidity) have all continued to report declining earnings and their respective share prices have continued to decline.
As was the case with the top contributors to performance, the above comment on negative earnings growth needs qualification. Qatar Gas also suffered from an embargo imposed by other members of the Gulf Cooperation Council (GCC) in June of this year. The continued pressure on the share prices of Asia Satellite and Amvig Holdings may not be surprising from the perspective of earnings momentum, but is surprising from the perspective that the former re-started dividend payments, and the latter increased the dividend in its most recent payment, despite an accounting earnings decline.
Switching to the performance of the portfolio as a whole, it has proven steady over the first half of the fiscal year. Indeed, while the benchmark has appreciated more than the portfolio, the Value Fund has proven remarkably consistent in its appreciation. During two episodes of performance retracement for the benchmark in early August and late September, the Value Fund’s net asset value (NAV) proved quite stable in relative terms. The steady appreciation of the portfolio since May of this year continued uninterrupted until mid-September when the Fund’s NAV stabilized and declined a modest amount, while the benchmark continued to appreciate.
Focusing on this period from September 20 to October 31 reveals a confluence of diverse factors that explain the portfolio’s performance. First, the Brazilian real and the Mexican peso both depreciated meaningfully, making Qualicorp, a Brazilian insurance broker (Structural Shift), and Credito Real, a Mexican financial company (Asset Productivity), rank among the top detractors to performance during the period. Global Ports, a Russian port company (Asset Productivity), suffered from indications that Russian authorities would force the company to price its services in Russian rubles instead of U.S. dollars. Pegas Nonwovens, a Czech manufacturer of nonwoven, absorbent textiles (Segregated Market), experienced a decline in its share price after the conclusion of a tender offer for the shares by a Czech industrialist. Lastly, Samsung SDI, a Korean battery manufacturer (Breakup Value), suffered a meaningful stock price decline related to iPhone X production delays. Of course, there were other portfolio holdings that appreciated during this short time frame, but the severity of these price declines dominated the portfolio’s performance.
| 10 | (855) 732-9220 seafarerfunds.com |
| Seafarer Overseas Value Fund | Performance Review |
October 31, 2017
It’s important to note that the Value Fund’s NAV also proved quite stable during its first year of performance, specifically during the emerging market sell-off after the election of President Trump. At that time, I attributed the Fund’s relative NAV stability to the low valuation of its holdings. One year hence, it remains difficult to explain the portfolio’s relative stability during two subsequent episodes of benchmark retracement in August and September 2017, as many of the Fund’s holdings have appreciated significantly. Furthermore, the period discussed above from late September to the end of October 2017 – when the Fund’s NAV declined modestly while the benchmark appreciated – also defies an easy, all-encompassing explanation. My conclusion is that the Seafarer Overseas Value Fund has been dancing to its own tune.
Paul Espinosa
Lead Portfolio Manager
Seafarer Overseas Value Fund
The MSCI Emerging Markets Total Return Index, Standard (Large+Mid Cap) Core, Gross (dividends reinvested), USD is a free float-adjusted market capitalization index designed to measure equity market performance of emerging markets. Index code: GDUEEGF.
The S&P 500 Total Return Index is a stock market index based on the market capitalizations of 500 large companies with common stock listed on the NYSE or NASDAQ.
It is not possible to invest directly in an index.
The Fund is subject to investment risks, including possible loss of the principal amount invested and therefore is not suitable for all investors. The Fund may not achieve its objectives. Diversification does not ensure a profit or guarantee against loss.
Information on the Seafarer website is provided for textual reference only, and is not incorporated by reference into this report.
The views and information discussed in this commentary are as of the date of publication, are subject to change, and may not reflect Seafarer’s current views. The views expressed represent an assessment of market conditions at a specific point in time, are opinions only and should not be relied upon as investment advice regarding a particular investment or markets in general. Such information does not constitute a recommendation to buy or sell specific securities or investment vehicles. It should not be assumed that any investment will be profitable or will equal the performance of the portfolios or any securities or any sectors mentioned herein. The subject matter contained herein has been derived from several sources believed to be reliable and accurate at the time of compilation. Seafarer does not accept any liability for losses either direct or consequential caused by the use of this information.
As of October 31, 2017 the Fund had no economic interest in Taiwan Semiconductor Manufacturing Company (TSMC), Samsung Electronics, Alibaba, Naspers (owner of one third of Tencent), Tencent, and COFCO.
| 1 | References to the “Fund” pertain to the Fund’s Institutional share class (ticker: SIVLX). Includes adjustments in accordance with U.S. GAAP and as such, the total return for shareholder transactions reported to the market may differ from the total return for financial reporting purposes. As a result, the total return for the Institutional share class increased from 8.41% to 8.51%. The Investor share class (ticker: SFVLX) gained 8.41% during the semi-annual period. |
| 2 | Adjustments in accordance with the U.S. GAAP were applied during the financial statement preparation and decreased the net asset value from $11.29 to $11.28. |
| 3 | The Fund’s Investor share class began the fiscal year with a net asset value of $11.30 per share. It finished the period with a value of $12.25 per share. |
| 4 | The Seafarer Funds’ Annual Report for the period ended April 30, 2017 is available at: www.seafarerfunds.com/reports/2017/annual |
| 5 | The white paper On Value in the Emerging Markets is available at: www.seafarerfunds.com/value-white-paper |
| 6 | Active Share is a measure of a portfolio’s deviation from a benchmark index, where a value of 0% indicates that a portfolio is a perfect replica of the index, and a value of 100% indicates that a portfolio is entirely different than the index. |
| 7 | The Emerging Markets Briefing as of September 30, 2017 is available at: www.seafarerfunds.com/em-briefing/2017/09 |
| Semi-annual Report – October 31, 2017 | 11 |
| Seafarer Overseas Value Fund | Performance Review |
October 31, 2017
Total Returns
| As of October 31, 2017 | 6 Months | 1 Year | Since Inception Annualized(1) | Net Expense Ratio(2) |
| Investor Class (SFVLX) | 8.41% | 20.61% | 16.20% | 1.15% |
| Institutional Class (SIVLX) | 8.51%(3) | 20.64% | 16.30% | 1.05% |
| MSCI Emerging Markets Total Return Index(4) | 16.40% | 26.91% | 29.65% |
Gross expense ratio: 3.71% for Investor Class; 3.63% for Institutional Class. Ratios as of Prospectus dated August 31, 20172
All performance is in U.S. dollars with gross (pre-tax) dividends and/or distributions reinvested. The performance data quoted represents past performance and does not guarantee future results. Future returns may be lower or higher. The investment return and principal value will fluctuate so that an investor's shares, when redeemed, may be worth more or less than the original cost. Prior to August 31, 2016, shares of the Fund redeemed or exchanged within 90 days of purchase were subject to a 2% redemption fee. Performance does not reflect this fee, which if deducted would reduce an individual's return. To obtain the Fund’s most recent month-end performance, visit seafarerfunds.com or call (855) 732-9220.
| 1 | Inception Date: May 31, 2016. |
| 2 | Ratios as of Prospectus dated August 31, 2017. Seafarer Capital Partners, LLC has agreed contractually to waive and/or reimburse fees or expenses in order to limit Total Annual Fund Operating Expenses After Fee Waiver/Expense Reimbursements (excluding brokerage expenses, interest expenses, taxes and extraordinary expenses) to 1.15% and 1.05% of the Fund’s average daily net assets for the Investor and Institutional share classes, respectively. This agreement is in effect through August 31, 2018. |
| 3 | Includes adjustments in accordance with U.S. GAAP and as such, the total return for shareholder transactions reported to the market may differ from the total return for financial reporting purposes. As a result, the total return increased from 8.41% to 8.51%. |
| 4 | The MSCI Emerging Markets Total Return Index, Standard (Large+Mid Cap) Core, Gross (dividends reinvested), USD is a free float-adjusted market capitalization index designed to measure equity market performance of emerging markets. Index code: GDUEEGF. The index is not actively managed and does not reflect any deductions for fees, expense or taxes. An investor may not invest directly in an index. |
| 12 | (855) 732-9220 seafarerfunds.com |
| Seafarer Overseas Value Fund | Performance Review |
October 31, 2017
Performance of a $10,000 Investment Since Inception
| * | Inception Date: May 31, 2016. |
The chart shown above represents historical performance of a hypothetical investment of $10,000 in the Fund’s Investor Class shares for the period from inception to October 31, 2017. All returns reflect reinvested dividends and/or distributions, but do not reflect the deduction of taxes that an investor would pay on distributions or redemptions.
The Fund also offers Institutional Class shares, performance for which is not reflected in the chart above. The performance of Institutional Class shares may be higher or lower than the performance of the Investor Class shares shown above based upon differences in fees paid by shareholders investing in the Investor Class shares and Institutional Class shares.
Investment Objective
The Fund seeks to provide long-term capital appreciation.
Strategy
The Fund invests primarily in the securities of companies located in developing countries. The Fund invests in several asset classes including common stocks, preferred stocks, and fixed-income securities.
The Fund’s portfolio is comprised of securities identified through a bottom-up security selection process based on fundamental research. The Fund seeks to produce a minimum long-term rate of return by investing in securities priced at a discount to their intrinsic value.
| Semi-annual Report – October 31, 2017 | 13 |
| Seafarer Funds | Disclosure of Fund Expenses |
October 31, 2017 (Unaudited)
DISCLOSURE OF FUND EXPENSES
As a shareholder of a Fund you will incur two types of costs: (1) transaction costs, including applicable redemption fees; and (2) ongoing costs, including management fees and other Fund expenses. The following examples are intended to help you understand your ongoing costs (in dollars) of investing in a Fund and to compare these costs with the ongoing costs of investing in other mutual funds. The examples are based on an investment of $1,000 invested on May 1, 2017 and held until October 31, 2017.
Actual Expenses. For each Fund and share class, the first line of the following table provides information about actual account values and actual expenses. You may use the information in this line, together with the amount you invested, to estimate the expenses that you paid over the period. Simply divide your account value by $1,000 (for example, an $8,600 account value divided by $1,000 = 8.6), then multiply the result by the number in the first line under the heading “Expenses Paid During Period” to estimate the expenses you paid on your account during this period.
Hypothetical Example for Comparison Purposes. For each Fund and share class, the second line of the following table provides information about hypothetical account values and hypothetical expenses based on the Fund’s actual expense ratio and an assumed rate of return of 5% per year before expenses, which is not the Fund’s actual return. The hypothetical account values and expenses may not be used to estimate the actual ending account balance or expenses you paid for the period. You may use this information to compare the ongoing costs of investing in the Fund and other mutual funds. To do so, compare this 5% hypothetical example with the 5% hypothetical examples that appear in the shareholder reports of the other mutual funds.
Please note the expenses shown in the following table are meant to highlight your ongoing costs only and do not reflect transactional costs, such as redemption fees or exchange fees. Therefore, for each Fund and share class, the second line of the following table is useful in comparing ongoing costs only, and will not help you determine the relative total costs of owning different funds. In addition, if these transactional costs were included, your costs would have been higher.
| 14 | (855) 732-9220 seafarerfunds.com |
| Seafarer Funds | Disclosure of Fund Expenses |
October 31, 2017 (Unaudited)
Beginning Account Value 05/01/17 | Ending Account Value 10/31/17 | Expense Ratio(a) | Expenses Paid During Period 05/01/17 - 10/31/17(b) | |
| SEAFARER OVERSEAS GROWTH AND INCOME FUND | ||||
| Investor Class | ||||
| Actual | $ 1,000.00 | $ 1,068.00 | 0.97% | $ 5.06 |
| Hypothetical (5% return before expenses) | $ 1,000.00 | $ 1,020.32 | 0.97% | $ 4.94 |
| Institutional Class | ||||
| Actual | $ 1,000.00 | $ 1,068.00 | 0.87% | $ 4.53 |
| Hypothetical (5% return before expenses) | $ 1,000.00 | $ 1,020.82 | 0.87% | $ 4.43 |
| SEAFARER OVERSEAS VALUE FUND | ||||
| Investor Class | ||||
| Actual | $ 1,000.00 | $ 1,084.10 | 1.15% | $ 6.04 |
| Hypothetical (5% return before expenses) | $ 1,000.00 | $ 1,019.41 | 1.15% | $ 5.85 |
| Institutional Class | ||||
| Actual | $ 1,000.00 | $ 1,085.10 | 1.05% | $ 5.52 |
| Hypothetical (5% return before expenses) | $ 1,000.00 | $ 1,019.91 | 1.05% | $ 5.35 |
| (a) | Annualized, based on the Fund's most recent fiscal half year expenses. |
| (b) | Expenses are equal to the Fund's annualized expense ratio multiplied by the average account value over the period, multiplied by the number of days in the most recent fiscal half-year (184)/365 (to reflect the half-year period). |
| Semi-annual Report – October 31, 2017 | 15 |
| Seafarer Overseas Growth and Income Fund | Portfolio of Investments |
October 31, 2017 (Unaudited)
| Currency | Shares | Value | ||||||||||
| COMMON STOCKS (81.9%) | ||||||||||||
| Brazil (5.2%) | ||||||||||||
| TOTVS SA | BRL | 7,657,600 | $ | 76,077,400 | ||||||||
| Odontoprev SA | BRL | 15,500,000 | 74,389,387 | |||||||||
| Total Brazil | 150,466,787 | |||||||||||
| China / Hong Kong (18.6%) | ||||||||||||
| Hang Lung Properties, Ltd. | HKD | 43,500,000 | 99,920,527 | |||||||||
| China Yangtze Power Co., Ltd. | CNY | 34,099,321 | 81,860,186 | |||||||||
| Hengan International Group Co., Ltd. | HKD | 7,650,500 | 75,412,548 | |||||||||
| China Telecom Corp., Ltd. | HKD | 129,001,200 | 64,654,382 | |||||||||
| Fuyao Glass Industry Group Co., Ltd., Class H | HKD | 16,490,000 | 62,777,578 | |||||||||
| Shandong Weigao Group Medical Polymer Co., Ltd., Class H | HKD | 70,606,000 | 50,682,390 | |||||||||
| Texwinca Holdings, Ltd. | HKD | 56,500,000 | 34,111,185 | |||||||||
| Xinhua Winshare Publishing and Media Co., Ltd., Class H | HKD | 31,500,000 | 27,335,478 | |||||||||
| Greatview Aseptic Packaging Co., Ltd. | HKD | 35,004,000 | 21,896,009 | |||||||||
| Pico Far East Holdings, Ltd. | HKD | 47,888,000 | 20,256,672 | |||||||||
| Total China / Hong Kong | 538,906,955 | |||||||||||
| Hungary (3.3%) | ||||||||||||
| Richter Gedeon Nyrt | HUF | 3,800,000 | 94,534,754 | |||||||||
| Total Hungary | 94,534,754 | |||||||||||
| India (9.6%) | ||||||||||||
| Infosys, Ltd., Sponsored ADR | USD | 9,675,000 | 143,673,750 | |||||||||
| Sun Pharma Advanced Research Co., Ltd.(a) | INR | 8,100,000 | 52,504,545 | |||||||||
| Balkrishna Industries, Ltd. | INR | 1,421,239 | 37,410,756 | |||||||||
| Cyient, Ltd. | INR | 3,250,000 | 27,122,952 | |||||||||
| Infosys, Ltd. | INR | 1,092,821 | 15,553,460 | |||||||||
| Total India | 276,265,463 | |||||||||||
| Indonesia (3.7%) | ||||||||||||
| Astra International Tbk PT | IDR | 181,000,000 | 106,764,977 | |||||||||
| Total Indonesia | 106,764,977 | |||||||||||
| 16 | (855) 732-9220 seafarerfunds.com |
| Seafarer Overseas Growth and Income Fund | Portfolio of Investments |
October 31, 2017 (Unaudited)
| Currency | Shares | Value | ||||||||||
| Japan (1.3%) | ||||||||||||
| Hisamitsu Pharmaceutical Co., Inc. | JPY | 675,000 | $ | 36,983,862 | ||||||||
| Total Japan | 36,983,862 | |||||||||||
| Malaysia (0.7%) | ||||||||||||
| Hartalega Holdings Bhd | MYR | 12,000,000 | 21,599,149 | |||||||||
| Total Malaysia | 21,599,149 | |||||||||||
| Mexico (1.3%) | ||||||||||||
| Bolsa Mexicana de Valores SAB de CV | MXN | 22,000,000 | 36,709,220 | |||||||||
| Total Mexico | 36,709,220 | |||||||||||
| Poland (2.9%) | ||||||||||||
| Bank Pekao SA | PLN | 1,500,000 | 48,997,926 | |||||||||
| Asseco Poland SA | PLN | 2,636,648 | 34,552,153 | |||||||||
| Total Poland | 83,550,079 | |||||||||||
| Singapore (7.2%) | ||||||||||||
| Singapore Telecommunications, Ltd. | SGD | 45,000,000 | 123,798,694 | |||||||||
| Venture Corp., Ltd. | SGD | 3,650,000 | 52,188,761 | |||||||||
| SIA Engineering Co., Ltd. | SGD | 13,000,000 | 31,090,896 | |||||||||
| Total Singapore | 207,078,351 | |||||||||||
| South Africa (4.2%) | ||||||||||||
| Sanlam, Ltd. | ZAR | 24,125,000 | 120,635,664 | |||||||||
| Total South Africa | 120,635,664 | |||||||||||
| South Korea (12.3%) | ||||||||||||
| Hyundai Mobis Co., Ltd. | KRW | 740,147 | 176,060,317 | |||||||||
| Coway Co., Ltd. | KRW | 1,247,500 | 108,342,705 | |||||||||
| Dongsuh Cos., Inc. | KRW | 2,075,000 | 50,932,744 | |||||||||
| Sindoh Co., Ltd. | KRW | 355,185 | 19,972,915 | |||||||||
| Total South Korea | 355,308,681 | |||||||||||
| Taiwan (11.1%) | ||||||||||||
| Delta Electronics, Inc. | TWD | 19,800,000 | 95,193,886 | |||||||||
| Pou Chen Corp. | TWD | 66,289,000 | 83,522,008 | |||||||||
| Taiwan Semiconductor Manufacturing Co., Ltd. | TWD | 9,000,000 | 72,514,465 | |||||||||
| Vanguard International Semiconductor Corp. | TWD | 26,350,000 | 49,974,966 | |||||||||
Semi-annual Report – October 31, 2017 | 17 |
| Seafarer Overseas Growth and Income Fund | Portfolio of Investments |
October 31, 2017 (Unaudited)
| Currency | Shares | Value | ||||||||||
| Taiwan (continued) | ||||||||||||
| Taiwan Semiconductor Manufacturing Co., Ltd., Sponsored ADR | USD | 476,739 | $ | 20,180,362 | ||||||||
| Total Taiwan | 321,385,687 | |||||||||||
| Vietnam (0.5%) | ||||||||||||
| Bao Viet Holdings | VND | 4,450,000 | 9,796,368 | |||||||||
| Nam Long Investment Corp. | VND | 4,200,000 | 4,946,615 | |||||||||
| Total Vietnam | 14,742,983 | |||||||||||
| TOTAL COMMON STOCKS | ||||||||||||
| (Cost $2,156,206,901) | 2,364,932,612 | |||||||||||
| PREFERRED STOCKS (7.0%) | ||||||||||||
| Brazil (2.7%) | ||||||||||||
| Banco Bradesco SA, ADR | USD | 7,325,000 | 77,425,250 | |||||||||
| Total Brazil | 77,425,250 | |||||||||||
| South Korea (4.3%) | ||||||||||||
| Samsung Electronics Co., Ltd. | KRW | 62,500 | 124,960,950 | |||||||||
| Total South Korea | 124,960,950 | |||||||||||
| TOTAL PREFERRED STOCKS | ||||||||||||
| (Cost $105,890,889) | 202,386,200 | |||||||||||
| Currency | Rate | Maturity Date | Principal Amount | Value | ||||||||||||||
| CORPORATE BOND - FOREIGN CURRENCY (1.2%) | ||||||||||||||||||
| Mexico (1.2%) | ||||||||||||||||||
| America Movil SAB de CV | MXN | 7.13 | % | 12/09/24 | 140,290,000 | 7,005,152 | ||||||||||||
| America Movil SAB de CV | MXN | 7.13 | % | 12/09/24 | 209,710,000 | 10,471,526 | ||||||||||||
| America Movil SAB de CV | MXN | 6.45 | % | 12/05/22 | 350,000,000 | 17,258,336 | ||||||||||||
| Total Mexico | 34,735,014 | |||||||||||||||||
| TOTAL CORPORATE BOND - FOREIGN CURRENCY | ||||||||||||||||||
| (Cost $36,639,549) | 34,735,014 | |||||||||||||||||
| 18 | (855) 732-9220 seafarerfunds.com |
| Seafarer Overseas Growth and Income Fund | Portfolio of Investments |
October 31, 2017 (Unaudited)
| Currency | Rate | Maturity Date | Principal Amount | Value | ||||||||||||||
| CORPORATE BOND - USD (0.7%) | ||||||||||||||||||
| Brazil (0.7%) | ||||||||||||||||||
| Cielo SA / Cielo USA, Inc. | USD | 3.75 | % | 11/16/22 | 20,000,000 | $ | 20,008,000 | |||||||||||
| Total Brazil | 20,008,000 | |||||||||||||||||
| TOTAL CORPORATE BOND - USD | ||||||||||||||||||
| (Cost $18,232,632) | 20,008,000 | |||||||||||||||||
| GOVERNMENT BOND, MEDIUM/LONG-TERM-FOREIGN CURRENCY (2.0%) | ||||||||||||||||||
| Brazil (1.5%) | ||||||||||||||||||
| Brazilian Government International Bond | BRL | 10.25 | % | 01/10/28 | 60,000,000 | 20,049,644 | ||||||||||||
| Brazil Notas do Tesouro Nacional Serie F, Series NTNF | BRL | 10.00 | % | 01/01/25 | 70,000,000 | 22,375,756 | ||||||||||||
| Total Brazil | 42,425,400 | |||||||||||||||||
| Indonesia (0.5%) | ||||||||||||||||||
| Indonesia Treasury Bond, Series FR70 | IDR | 8.38 | % | 03/15/24 | 200,000,000,000 | 16,002,020 | ||||||||||||
| Total Indonesia | 16,002,020 | |||||||||||||||||
| TOTAL GOVERNMENT BOND, MEDIUM/LONG-TERM - FOREIGN CURRENCY | ||||||||||||||||||
| (Cost $50,463,722) | 58,427,420 | |||||||||||||||||
| GOVERNMENT BOND, SHORT-TERM - USD AND FOREIGN CURRENCY (2.8%) | ||||||||||||||||||
| Hungary (0.2%) | ||||||||||||||||||
| Hungary Government International Bond | USD | 4.13 | % | 02/19/18 | 6,000,000 | 6,045,642 | ||||||||||||
| Total Hungary | 6,045,642 | |||||||||||||||||
| Israel (0.3%) | ||||||||||||||||||
| Israel Government International Bond | USD | 5.13 | % | 03/26/19 | 9,000,000 | 9,418,014 | ||||||||||||
| Total Israel | 9,418,014 | |||||||||||||||||
Semi-annual Report – October 31, 2017 | 19 |
| Seafarer Overseas Growth and Income Fund | Portfolio of Investments |
October 31, 2017 (Unaudited)
| Currency | Rate | Maturity Date | Principal Amount | Value | ||||||||||||||
| Poland (0.3%) | ||||||||||||||||||
| Republic of Poland | ||||||||||||||||||
| Government International Bond | USD | 6.38 | % | 07/15/19 | 9,000,000 | $ | 9,691,038 | |||||||||||
| Total Poland | 9,691,038 | |||||||||||||||||
| Singapore (0.6%) | ||||||||||||||||||
| Singapore Government Bond | SGD | 4.00 | % | 09/01/18 | 11,000,000 | 8,248,991 | ||||||||||||
| Singapore Government Bond | SGD | 0.50 | % | 04/01/18 | 12,000,000 | 8,777,052 | ||||||||||||
| Total Singapore | 17,026,043 | |||||||||||||||||
| South Africa (0.2%) | ||||||||||||||||||
| Republic of South Africa | ||||||||||||||||||
| Government International Bond | USD | 6.88 | % | 05/27/19 | 5,000,000 | 5,324,100 | ||||||||||||
| Total South Africa | 5,324,100 | |||||||||||||||||
| South Korea (1.2%) | ||||||||||||||||||
| The Korea Development Bank | USD | 1.38 | % | 09/12/19 | 5,000,000 | 4,905,842 | ||||||||||||
| The Korea Development Bank | USD | 2.88 | % | 08/22/18 | 5,000,000 | 5,028,200 | ||||||||||||
| Korea Treasury Bond, Series 1812 | KRW | 1.75 | % | 12/10/18 | 6,000,000,000 | 5,348,903 | ||||||||||||
| Korea Treasury Bond, Series 1806 | KRW | 1.63 | % | 06/10/18 | 6,000,000,000 | 5,356,487 | ||||||||||||
| Korea International Bond | USD | 7.13 | % | 04/16/19 | 5,000,000 | 5,357,300 | ||||||||||||
| Korea Treasury Bond, Series 1712 | KRW | 2.00 | % | 12/10/17 | 9,000,000,000 | 8,037,984 | ||||||||||||
| Total South Korea | 34,034,716 | |||||||||||||||||
| TOTAL GOVERNMENT BOND, SHORT-TERM - USD AND FOREIGN CURRENCY | ||||||||||||||||||
| (Cost $81,211,552) | 81,539,553 | |||||||||||||||||
| TOTAL INVESTMENTS | ||||||||||||||||||
| (Cost $2,448,645,245) (95.6%) | $ | 2,762,028,799 | ||||||||||||||||
| Cash and Other Assets, Less Liabilities (4.4%) | 126,286,741 | |||||||||||||||||
| NET ASSETS (100.0%) | $ | 2,888,315,540 | ||||||||||||||||
| 20 | (855) 732-9220 seafarerfunds.com |
| Seafarer Overseas Growth and Income Fund | Portfolio of Investments |
October 31, 2017 (Unaudited)
Principal Amount is stated in local currency unless otherwise noted.
| (a) | Non-income producing security. |
Currency Abbreviations
| BRL | - | Brazil Real |
| CNY | - | China Yuan |
| HKD | - | Hong Kong Dollar |
| HUF | - | Hungary Forint |
| IDR | - | Indonesia Rupiah |
| INR | - | India Rupee |
| JPY | - | Japan Yen |
| KRW | - | South Korea Won |
| MXN | - | Mexico Peso |
| MYR | - | Malaysia Ringgit |
| PLN | - | Poland Zloty |
| SGD | - | Singapore Dollar |
| TWD | - | Taiwan New Dollar |
| USD | - | United States Dollar |
| VND | - | Vietnam Dong |
| ZAR | - | South Africa Rand |
For Fund compliance purposes, the Fund's geographical classifications refer to any one or more of the sub-classifications used by one or more widely recognized market indexes or ratings group indexes, and/or as defined by Fund management. This definition may not apply for purposes of this report, which may combine sub-classifications for reporting ease. Geographical regions are shown as a percentage of net assets.
See accompanying Notes to Financial Statements.
Semi-annual Report – October 31, 2017 | 21 |
| Seafarer Overseas Value Fund | Portfolio of Investments |
October 31, 2017 (Unaudited)
| Currency | Shares | Value | ||||||||||
| COMMON STOCKS (88.3%) | ||||||||||||
| Brazil (1.8%) | ||||||||||||
| Qualicorp SA | BRL | 31,000 | $ | 331,483 | ||||||||
| Total Brazil | 331,483 | |||||||||||
| China / Hong Kong (44.6%) | ||||||||||||
| China Foods, Ltd. | HKD | 1,318,000 | 832,894 | |||||||||
| First Pacific Co., Ltd. | HKD | 924,000 | 703,535 | |||||||||
| China Resources Beer Holdings Co., Ltd. | HKD | 224,000 | 646,038 | |||||||||
| Melco International Development, Ltd. | HKD | 234,000 | 640,384 | |||||||||
| Xtep International Holdings, Ltd. | HKD | 1,924,000 | 636,286 | |||||||||
| AMVIG Holdings, Ltd. | HKD | 2,148,000 | 608,491 | |||||||||
| WH Group, Ltd. | HKD | 580,000 | 587,330 | |||||||||
| Shangri-La Asia, Ltd. | HKD | 280,000 | 557,028 | |||||||||
| Asia Satellite Telecommunications Holdings, Ltd. | HKD | 583,000 | 538,057 | |||||||||
| Texwinca Holdings, Ltd. | HKD | 874,000 | 527,667 | |||||||||
| China Yangtze Power Co., Ltd. | CNY | 196,990 | 472,902 | |||||||||
| Giordano International, Ltd. | HKD | 748,000 | 422,832 | |||||||||
| Greatview Aseptic Packaging Co., Ltd. | HKD | 520,000 | 325,275 | |||||||||
| Hang Lung Properties, Ltd. | HKD | 132,000 | 303,207 | |||||||||
| Pacific Basin Shipping, Ltd.(a) | HKD | 1,130,000 | 257,826 | |||||||||
| Pico Far East Holdings, Ltd. | HKD | 538,000 | 227,575 | |||||||||
| Total China / Hong Kong | 8,287,327 | |||||||||||
| Czech Republic (4.0%) | ||||||||||||
| Pegas Nonwovens SA | CZK | 11,000 | 431,630 | |||||||||
| Philip Morris CR AS | CZK | 430 | 318,171 | |||||||||
| Total Czech Republic | 749,801 | |||||||||||
| Mexico (2.8%) | ||||||||||||
| Credito Real SAB de CV SOFOM ER | MXN | 321,000 | 515,696 | |||||||||
| Total Mexico | 515,696 | |||||||||||
| Philippines (2.9%) | ||||||||||||
| Del Monte Pacific, Ltd. | SGD | 2,350,000 | 534,444 | |||||||||
| Total Philippines | 534,444 | |||||||||||
| 22 | (855) 732-9220 seafarerfunds.com |
| Seafarer Overseas Value Fund | Portfolio of Investments |
October 31, 2017 (Unaudited)
| Currency | Shares | Value | ||||||||||
| Qatar (3.6%) | ||||||||||||
| Qatar Gas Transport Co., Ltd. | QAR | 163,000 | $ | 678,187 | ||||||||
| Total Qatar | 678,187 | |||||||||||
| Russia (4.8%) | ||||||||||||
| Global Ports Investments PLC, GDR(a) | USD | 127,000 | 482,600 | |||||||||
| Cherkizovo Group PJSC, GDR | USD | 29,000 | 413,250 | |||||||||
| Total Russia | 895,850 | |||||||||||
| Singapore (10.4%) | ||||||||||||
| Wilmar International, Ltd. | SGD | 296,000 | 736,145 | |||||||||
| SIA Engineering Co., Ltd. | SGD | 273,000 | 652,909 | |||||||||
| Genting Singapore Plc | SGD | 616,000 | 551,332 | |||||||||
| Total Singapore | 1,940,386 | |||||||||||
| South Korea (2.8%) | ||||||||||||
| Samsung SDI Co., Ltd. | KRW | 2,700 | 521,275 | |||||||||
| Total South Korea | 521,275 | |||||||||||
| Taiwan (2.5%) | ||||||||||||
| Pou Chen Corp. | TWD | 362,000 | 456,108 | |||||||||
| Total Taiwan | 456,108 | |||||||||||
| United Arab Emirates (2.9%) | ||||||||||||
| National Central Cooling Co. PJSC | AED | 954,000 | 545,492 | |||||||||
| Total United Arab Emirates | 545,492 | |||||||||||
| Vietnam (5.2%) | ||||||||||||
| PetroVietnam Technical Services Corp. | VND | 724,000 | 484,527 | |||||||||
| Petrovietnam Fertilizer & Chemicals JSC | VND | 507,000 | 475,469 | |||||||||
| Total Vietnam | 959,996 | |||||||||||
| TOTAL COMMON STOCKS | ||||||||||||
| (Cost $14,887,475) | 16,416,045 | |||||||||||
Semi-annual Report – October 31, 2017 | 23 |
| Seafarer Overseas Value Fund | Portfolio of Investments |
October 31, 2017 (Unaudited)
| Currency | Shares | Value | ||||||||||
| TOTAL INVESTMENTS | ||||||||||||
| (Cost $14,887,475) (88.3%) | $ | 16,416,045 | ||||||||||
| Cash and Other Assets, Less Liabilities (11.7%) | 2,184,484 | |||||||||||
| NET ASSETS (100.0%) | $ | 18,600,529 | ||||||||||
| (a) | Non-income producing security. |
Currency Abbreviations
| AED | - | United Arab Emirates Dirham |
| BRL | - | Brazil Real |
| CNY | - | China Yuan |
| CZK | - | Czech Koruna |
| HKD | - | Hong Kong Dollar |
| KRW | - | South Korea Won |
| MXN | - | Mexico Peso |
| QAR | - | Qatar Rial |
| SGD | - | Singapore Dollar |
| TWD | - | Taiwan New Dollar |
| USD | - | United States Dollar |
| VND | - | Vietnam Dong |
For Fund compliance purposes, the Fund's geographical classifications refer to any one or more of the sub-classifications used by one or more widely recognized market indexes or ratings group indexes, and/or as defined by Fund management. This definition may not apply for purposes of this report, which may combine sub-classifications for reporting ease. Geographical regions are shown as a percentage of net assets.
See accompanying Notes to Financial Statements.
| 24 | (855) 732-9220 seafarerfunds.com |
| Seafarer Funds | Statements of Assets and Liabilities |
October 31, 2017 (Unaudited)
| Seafarer Overseas Growth and Income Fund | Seafarer Overseas Value Fund | |||||||
| ASSETS: | ||||||||
| Investments, at value | $ | 2,762,028,799 | $ | 16,416,045 | ||||
| Cash | 119,804,056 | 2,270,600 | ||||||
| Foreign currency, at value (Cost $1,267,947 and $22,135) | 1,264,539 | 22,141 | ||||||
| Receivable for investments sold | 1,538,287 | 94,730 | ||||||
| Receivable for shares sold | 2,073,121 | 61,435 | ||||||
| Interest and dividends receivable | 7,525,067 | 28,111 | ||||||
| Prepaid expenses and other assets | 35,068 | 17,300 | ||||||
| Total Assets | 2,894,268,937 | 18,910,362 | ||||||
| LIABILITIES: | ||||||||
| Payable for investments purchased | 1,353,415 | 274,411 | ||||||
| Foreign capital gains tax | 590,983 | – | ||||||
| Administrative fees payable | 54,888 | 2,383 | ||||||
| Shareholder service plan fees payable | 224,764 | 1,506 | ||||||
| Payable for shares redeemed | 1,513,256 | – | ||||||
| Investment advisory fees payable | 1,767,530 | 955 | ||||||
| Payable for chief compliance officer fee | 1,877 | 1,873 | ||||||
| Trustee fees and expenses payable | 28,119 | 116 | ||||||
| Payable for principal financial officer fees | 438 | 437 | ||||||
| Audit and tax fees payable | 10,266 | 16,029 | ||||||
| Accrued expenses and other liabilities | 407,861 | 12,123 | ||||||
| Total Liabilities | 5,953,397 | 309,833 | ||||||
| NET ASSETS | $ | 2,888,315,540 | $ | 18,600,529 | ||||
| NET ASSETS CONSIST OF: | ||||||||
| Paid-in capital (Note 5) | $ | 2,540,888,550 | $ | 16,853,917 | ||||
| Accumulated net investment income | 29,684,570 | 216,589 | ||||||
| Accumulated net realized gain | 5,062,986 | 1,265 | ||||||
| Net unrealized appreciation | 312,679,434 | 1,528,758 | ||||||
| NET ASSETS | $ | 2,888,315,540 | $ | 18,600,529 | ||||
| INVESTMENTS, AT COST | $ | 2,448,645,245 | $ | 14,887,475 | ||||
| PRICING OF SHARES | ||||||||
| Investor Class: | ||||||||
| Net Asset Value, offering and redemption price per share | $ | 13.25 | $ | 12.25 | ||||
| Net Assets | $ | 936,345,998 | $ | 308,496 | ||||
| Shares of beneficial interest outstanding | 70,685,116 | 25,177 | ||||||
| Institutional Class: | ||||||||
| Net Asset Value, offering and redemption price per share | $ | 13.28 | $ | 12.24 | ||||
| Net Assets | $ | 1,951,969,542 | $ | 18,292,033 | ||||
| Shares of beneficial interest outstanding | 146,935,026 | 1,493,846 | ||||||
See accompanying Notes to Financial Statements.
| Semi-annual Report – October 31, 2017 | 25 |
| Seafarer Funds | Statements of Operations |
Six Months Ended October 31, 2017 (Unaudited)
Seafarer Overseas Growth and Income Fund | Seafarer Overseas Value Fund | |||||||
| INVESTMENT INCOME: | ||||||||
| Dividends | $ | 56,248,805 | $ | 265,548 | ||||
| Foreign taxes withheld | (4,831,934 | ) | (7,319 | ) | ||||
| Interest and other income | 5,337,618 | 5,574 | ||||||
| Total investment income | 56,754,489 | 263,803 | ||||||
| EXPENSES: | ||||||||
| Investment advisory fees (Note 6) | 9,731,533 | 48,697 | ||||||
| Administrative and transfer agency fees | 401,184 | 18,510 | ||||||
| Trustee fees and expenses | 28,011 | 122 | ||||||
| Registration/filing fees | 48,953 | 16,288 | ||||||
| Shareholder service plan fees | ||||||||
| Investor Class | 695,146 | 22 | ||||||
| Institutional Class | 409,770 | 2,242 | ||||||
| Legal fees | 12,536 | 50 | ||||||
| Audit fees | 15,872 | 8,527 | ||||||
| Reports to shareholders and printing fees | 53,518 | 262 | ||||||
| Custody fees | 718,760 | 18,589 | ||||||
| Offering costs (Note 2) | – | 5,362 | ||||||
| Chief compliance officer fees | 10,806 | 10,806 | ||||||
| Principal financial officer fees | 2,521 | 2,521 | ||||||
| Miscellaneous | 14,346 | 2,069 | ||||||
| Total expenses | 12,142,956 | 134,067 | ||||||
| Less fees waived/reimbursed by investment adviser (Note 6) | ||||||||
| Investor Class | – | (1,323 | ) | |||||
| Institutional Class | – | (62,111 | ) | |||||
| Total net expenses | 12,142,956 | 70,633 | ||||||
| NET INVESTMENT INCOME: | 44,611,533 | 193,170 | ||||||
| Net realized gain on investments | 25,034,352 | 0 | ||||||
| Net realized gain/(loss) on foreign currency transactions | (261,936 | ) | 1,269 | |||||
| Net realized gain | 24,772,416 | 1,269 | ||||||
| Net change in unrealized appreciation on investments (net of foreign capital gains tax of ($59,047) and $–) | 103,958,146 | 753,729 | ||||||
| Net change in unrealized depreciation on translation of assets and liabilities in foreign currency transactions | (169,854 | ) | (58 | ) | ||||
| Net unrealized appreciation | 103,788,292 | 753,671 | ||||||
| NET REALIZED AND UNREALIZED GAIN ON INVESTMENTS AND FOREIGN CURRENCY TRANSLATIONS | 128,560,708 | 754,940 | ||||||
| NET INCREASE IN NET ASSETS RESULTING FROM OPERATIONS | $ | 173,172,241 | $ | 948,110 | ||||
See accompanying Notes to Financial Statements.
| 26 | (855) 732-9220 seafarerfunds.com |
| Seafarer Overseas Growth and Income Fund | Statements of Changes in Net Assets |
Six Months Ended October 31, 2017 (Unaudited) | Year Ended April 30, 2017 | |||||||
| OPERATIONS: | ||||||||
| Net investment income | $ | 44,611,533 | $ | 32,247,036 | ||||
| Net realized gain/(loss) | 24,772,416 | (10,282,431 | ) | |||||
| Net change in unrealized appreciation | 103,788,292 | 174,008,053 | ||||||
| Net increase in net assets resulting from operations | 173,172,241 | 195,972,658 | ||||||
| DISTRIBUTIONS TO SHAREHOLDERS (NOTE 3): | ||||||||
| From net investment income | ||||||||
| Investor Class | $ | (7,523,047 | ) | $ | (11,816,708 | ) | ||
| Institutional Class | (13,702,836 | ) | (15,268,463 | ) | ||||
| Net decrease in net assets from distributions | (21,225,883 | ) | (27,085,171 | ) | ||||
| BENEFICIAL INTEREST TRANSACTIONS (NOTE 5): | ||||||||
| Shares sold | ||||||||
| Investor Class | $ | 97,691,487 | $ | 323,883,071 | ||||
| Institutional Class | 445,429,655 | 987,397,573 | ||||||
| Dividends reinvested | ||||||||
| Investor Class | 7,441,371 | 11,687,348 | ||||||
| Institutional Class | 9,597,875 | 10,058,555 | ||||||
| Shares Redeemed, net of redemption fees | ||||||||
| Investor Class | (98,822,985 | ) | (141,954,140 | ) | ||||
| Institutional Class | (102,662,041 | ) | (201,239,879 | ) | ||||
| Net increase in net assets derived from beneficial interest transactions | 358,675,362 | 989,832,528 | ||||||
| Net increase in net assets | $ | 510,621,720 | $ | 1,158,720,015 | ||||
| NET ASSETS: | ||||||||
| Beginning of period | $ | 2,377,693,820 | $ | 1,218,973,805 | ||||
| End of period (including accumulated net investment income of $29,684,570 and $6,298,920, respectively) | $ | 2,888,315,540 | $ | 2,377,693,820 | ||||
| Semi-annual Report – October 31, 2017 | 27 |
| Seafarer Overseas Growth and Income Fund | Statements of Changes in Net Assets |
Six Months Ended October 31, 2017 (Unaudited) | Year Ended April 30, 2017 | |||||||
| Other Information: | ||||||||
| SHARE TRANSACTIONS: | ||||||||
| Investor Class | ||||||||
| Sold | 7,590,625 | 27,609,055 | ||||||
| Distributions reinvested | 588,716 | 1,045,402 | ||||||
| Redeemed | (7,645,776 | ) | (12,161,311 | ) | ||||
| Net increase in shares outstanding | 533,565 | 16,493,146 | ||||||
| Institutional Class | ||||||||
| Sold | 34,427,140 | 83,448,584 | ||||||
| Distributions reinvested | 757,528 | 900,914 | ||||||
| Redeemed | (7,910,536 | ) | (17,485,012 | ) | ||||
| Net increase in shares outstanding | 27,274,132 | 66,864,486 | ||||||
See accompanying Notes to Financial Statements.
| 28 | (855) 732-9220 seafarerfunds.com |
| Seafarer Overseas Value Fund | Statements of Changes in Net Assets |
Six Months Ended October 31, 2017 (Unaudited) | May 31, 2016 (Inception) to April 30, 2017 | |||||||
| OPERATIONS: | ||||||||
| Net investment income | $ | 193,170 | $ | 68,088 | ||||
| Net realized gain/(loss) | 1,269 | (2,768 | ) | |||||
| Net change in unrealized appreciation | 753,671 | 775,087 | ||||||
| Net increase in net assets resulting from operations | 948,110 | 840,407 | ||||||
| DISTRIBUTIONS TO SHAREHOLDERS (NOTE 3): | ||||||||
| From net investment income | ||||||||
| Investor Class | $ | – | $ | (2,017 | ) | |||
| Institutional Class | – | (60,374 | ) | |||||
| Net decrease in net assets from distributions | – | (62,391 | ) | |||||
| BENEFICIAL INTEREST TRANSACTIONS (NOTE 5): | ||||||||
| Shares sold | ||||||||
| Investor Class | $ | 69,477 | $ | 253,053 | ||||
| Institutional Class | 8,178,078 | 11,072,675 | ||||||
| Dividends reinvested | ||||||||
| Investor Class | – | 2,017 | ||||||
| Institutional Class | – | 60,374 | ||||||
| Shares Redeemed | ||||||||
| Investor Class | (65,522 | ) | – | |||||
| Institutional Class | (655,164 | ) | (2,040,585 | ) | ||||
| Net increase in net assets derived from beneficial interest transactions | 7,526,869 | 9,347,534 | ||||||
| Net increase in net assets | $ | 8,474,979 | $ | 10,125,550 | ||||
| NET ASSETS: | ||||||||
| Beginning of period | $ | 10,125,550 | $ | – | ||||
| End of period (including accumulated net investment income of $216,589 and $23,419) | $ | 18,600,529 | $ | 10,125,550 | ||||
| Other Information: | ||||||||
| SHARE TRANSACTIONS: | ||||||||
| Investor Class | ||||||||
| Sold | 5,748 | 24,578 | ||||||
| Distributions reinvested | – | 198 | ||||||
| Redeemed | (5,347 | ) | – | |||||
| Net increase in shares outstanding | 401 | 24,776 | ||||||
| Institutional Class | ||||||||
| Sold | 676,426 | 1,062,151 | ||||||
| Distributions reinvested | – | 5,925 | ||||||
| Redeemed | (55,040 | ) | (195,616 | ) | ||||
| Net increase in shares outstanding | 621,386 | 872,460 | ||||||
See accompanying Notes to Financial Statements
| Semi-annual Report – October 31, 2017 | 29 |
Financial Highlights
For a share outstanding through the periods presented
| Investor Class |
| NET ASSET VALUE, BEGINNING OF PERIOD |
| INCOME FROM OPERATIONS: |
| Net investment income(a) |
| Net realized and unrealized gain/(loss) on investments |
| Total from investment operations |
| LESS DISTRIBUTIONS: |
| From net investment income |
| From net realized gains on investments |
| Total distributions |
| REDEMPTION FEES ADDED TO PAID IN CAPITAL |
| NET INCREASE/(DECREASE) IN NET ASSET VALUE |
| NET ASSET VALUE, END OF PERIOD |
| TOTAL RETURN(e) |
| SUPPLEMENTAL DATA: |
| Net assets, end of period (in 000s) |
| RATIOS TO AVERAGE NET ASSETS: |
| Operating expenses excluding reimbursement/waiver |
| Operating expenses including reimbursement/waiver |
| Net investment income including reimbursement/waiver |
| PORTFOLIO TURNOVER RATE(j) |
| (a) | Calculated using the average shares method. |
| (b) | Less than $(0.005) per share. |
| (c) | Less than $0.005 per share. |
| (d) | In preparing the financial statements in accordance with U.S. GAAP, management made certain adjustments as required by U.S. GAAP which caused the net asset value for purposes of these financial statements to differ from the net asset value used to process shareholder transactions as of the date of these financial statements. As a result, the NAV increased by $0.01 from $12.50 to $12.51. |
| (e) | Total returns are for the periods indicated and have not been annualized. In some periods, total returns would have been lower had certain expenses not been waived during the period. Returns shown do not reflect the deduction of taxes that a shareholder would pay on Fund distributions or the redemption of Fund shares. |
| (f) | Includes adjustments in accordance with U.S. GAAP and as such, the total return for shareholder transactions reported to the market may differ from the total return for financial reporting purposes. As a result, the total return decreased from 6.88% to 6.80%. |
| (g) | Includes adjustments in accordance with U.S. GAAP and as such, the total return for shareholder transactions reported to the market may differ from the total return for financial reporting purposes. As a result, the total return increased from 11.13% to 11.22%. |
| (h) | Annualized. |
| (i) | Effective September 1, 2015, the Adviser agreed to limit expenses to 1.15%. The Adviser agreed to limit expenses to 1.25% for the period September 1, 2014 through August 31, 2015. Prior to September 1, 2014, the Adviser agreed to limit expenses to 1.40%. (See Note 6). |
| (j) | Portfolio turnover rate for periods less than one full year have not been annualized. |
| 30 | (855) 732-9220 seafarerfunds.com |
Seafarer Overseas Growth and Income Fund
Six Months Ended October 31, 2017 (Unaudited) | Year Ended April 30, 2017 | Year Ended April 30, 2016 | Year Ended April 30, 2015 | Year Ended April 30, 2014 | Year Ended April 30, 2013 | |||||||||||||||||
| $ | 12.51 | $ | 11.44 | $ | 12.64 | $ | 11.58 | $ | 11.91 | $ | 10.18 | |||||||||||
| 0.22 | 0.22 | 0.16 | 0.14 | 0.19 | 0.10 | |||||||||||||||||
| 0.63 | 1.04 | (1.23 | ) | 1.26 | 0.02 | 1.74 | ||||||||||||||||
| 0.85 | 1.26 | (1.07 | ) | 1.40 | 0.21 | 1.84 | ||||||||||||||||
| (0.11 | ) | (0.19 | ) | (0.11 | ) | (0.19 | ) | (0.26 | ) | (0.11 | ) | |||||||||||
| – | – | (0.02 | ) | (0.15 | ) | (0.28 | ) | (0.00 | )(b) | |||||||||||||
| (0.11 | ) | (0.19 | ) | (0.13 | ) | (0.34 | ) | (0.54 | ) | (0.11 | ) | |||||||||||
| – | 0.00 | (c) | 0.00 | (c) | 0.00 | (c) | 0.00 | (c) | 0.00 | (c) | ||||||||||||
| 0.74 | 1.07 | (1.20 | ) | 1.06 | (0.33 | ) | 1.73 | |||||||||||||||
| $ | 13.25 | $ | 12.51 | (d) | $ | 11.44 | $ | 12.64 | $ | 11.58 | $ | 11.91 | ||||||||||
| 6.80 | %(f) | 11.22 | %(g) | (8.39 | %) | 12.55 | % | 1.93 | % | 18.24 | % | |||||||||||
| $ | 936,346 | $ | 877,384 | $ | 613,795 | $ | 53,543 | $ | 27,181 | $ | 26,348 | |||||||||||
| 0.97 | %(h) | 1.02 | % | 1.14 | % | 1.30 | % | 1.78 | % | 2.82 | % | |||||||||||
| 0.97 | %(h) | 1.02 | % | 1.14 | %(i) | 1.30 | %(i) | 1.40 | % | 1.49 | % | |||||||||||
| 3.33 | %(h) | 1.88 | % | 1.50 | % | 1.19 | % | 1.66 | % | 0.90 | % | |||||||||||
| 9 | % | 14 | % | 7 | % | 28 | % | 51 | % | 39 | % | |||||||||||
See accompanying Notes to Financial Statements.
| Semi-annual Report – October 31, 2017 | 31 |
Financial Highlights
For a share outstanding through the periods presented
| Institutional Class |
| NET ASSET VALUE, BEGINNING OF PERIOD |
| INCOME FROM OPERATIONS: |
| Net investment income(a) |
| Net realized and unrealized gain/(loss) on investments |
| Total from investment operations |
| LESS DISTRIBUTIONS: |
| From net investment income |
| From net realized gains on investments |
| Total distributions |
| REDEMPTION FEES ADDED TO PAID IN CAPITAL |
| NET INCREASE/(DECREASE) IN NET ASSET VALUE |
| NET ASSET VALUE, END OF PERIOD |
| TOTAL RETURN(d) |
| SUPPLEMENTAL DATA: |
| Net assets, end of period (in 000s) |
| RATIOS TO AVERAGE NET ASSETS: |
| Operating expenses excluding reimbursement/waiver |
| Operating expenses including reimbursement/waiver |
| Net investment income including reimbursement/waiver |
| PORTFOLIO TURNOVER RATE(g) |
| (a) | Calculated using the average shares method. |
| (b) | Less than $(0.005) per share. |
| (c) | Less than $0.005 per share. |
| (d) | Total returns are for the periods indicated and have not been annualized. In some periods, total returns would have been lower had certain expenses not been waived during the period. Returns shown do not reflect the deduction of taxes that a shareholder would pay on Fund distributions or the redemption of Fund shares. |
| (e) | Annualized. |
| (f) | Effective September 1, 2014, the Adviser agreed to limit expenses to 1.05%. Prior to September 1, 2014, the Adviser agreed to limit expenses to 1.25%. (See Note 6). |
| (g) | Portfolio turnover rate for periods less than one full year have not been annualized. |
| 32 | (855) 732-9220 seafarerfunds.com |
Seafarer Overseas Growth and Income Fund
Six Months Ended October 31, 2017 (Unaudited) | Year Ended April 30, 2017 | Year Ended April 30, 2016 | Year Ended April 30, 2015 | Year Ended April 30, 2014 | Year Ended April 30, 2013 | |||||||||||||||||
| $ | 12.54 | $ | 11.46 | $ | 12.66 | $ | 11.59 | $ | 11.91 | $ | 10.18 | |||||||||||
| 0.22 | 0.21 | 0.19 | 0.15 | 0.21 | 0.14 | |||||||||||||||||
| 0.63 | 1.07 | (1.26 | ) | 1.28 | 0.02 | 1.71 | ||||||||||||||||
| 0.85 | 1.28 | (1.07 | ) | 1.43 | 0.23 | 1.85 | ||||||||||||||||
| (0.11 | ) | (0.20 | ) | (0.12 | ) | (0.21 | ) | (0.27 | ) | (0.12 | ) | |||||||||||
| – | – | (0.02 | ) | (0.15 | ) | (0.28 | ) | (0.00 | )(b) | |||||||||||||
| (0.11 | ) | (0.20 | ) | (0.14 | ) | (0.36 | ) | (0.55 | ) | (0.12 | ) | |||||||||||
| – | 0.00 | (c) | 0.01 | 0.00 | (c) | 0.00 | (c) | 0.00 | (c) | |||||||||||||
| 0.74 | 1.08 | (1.20 | ) | 1.07 | (0.32 | ) | 1.73 | |||||||||||||||
| $ | 13.28 | $ | 12.54 | $ | 11.46 | $ | 12.66 | $ | 11.59 | $ | 11.91 | |||||||||||
| 6.80 | % | 11.37 | % | (8.32 | %) | 12.76 | % | 2.12 | % | 18.33 | % | |||||||||||
| $ | 1,951,970 | $ | 1,500,310 | $ | 605,178 | $ | 129,714 | $ | 46,624 | $ | 11,486 | |||||||||||
| 0.87 | %(e) | 0.92 | % | 1.03 | % | 1.18 | % | 1.61 | % | 2.88 | % | |||||||||||
| 0.87 | %(e) | 0.92 | % | 1.03 | % | 1.10 | %(f) | 1.25 | % | 1.35 | % | |||||||||||
| 3.34 | %(e) | 1.82 | % | 1.72 | % | 1.30 | % | 1.89 | % | 1.28 | % | |||||||||||
| 9 | % | 14 | % | 7 | % | 28 | % | 51 | % | 39 | % | |||||||||||
See accompanying Notes to Financial Statements.
| Semi-annual Report – October 31, 2017 | 33 |
| Financial Highlights | Seafarer Overseas Value Fund |
For a share outstanding through the period presented
| Investor Class | Six Months Ended October 31, 2017 (Unaudited) | May 31, 2016 (Inception) to April 30, 2017 | ||||||
| NET ASSET VALUE, BEGINNING OF PERIOD | $ | 11.30 | $ | 10.00 | ||||
| INCOME FROM OPERATIONS: | ||||||||
| Net investment income(a) | 0.18 | 0.12 | ||||||
| Net realized and unrealized gain on investments | 0.77 | 1.28 | ||||||
| Total from investment operations | 0.95 | 1.40 | ||||||
| LESS DISTRIBUTIONS: | ||||||||
| From net investment income | – | (0.10 | ) | |||||
| Total distributions | – | (0.10 | ) | |||||
| NET INCREASE IN NET ASSET VALUE | 0.95 | 1.30 | ||||||
| NET ASSET VALUE, END OF PERIOD | $ | 12.25 | $ | 11.30 | ||||
| TOTAL RETURN(b) | 8.41 | % | 14.15 | % | ||||
| SUPPLEMENTAL DATA: | ||||||||
| Net assets, end of period (in 000s) | $ | 308 | $ | 280 | ||||
| RATIOS TO AVERAGE NET ASSETS: | ||||||||
| Operating expenses excluding reimbursement/waiver | 2.00 | %(c) | 3.71 | %(c) | ||||
| Operating expenses including reimbursement/waiver | 1.15 | %(c) | 1.15 | %(c) | ||||
| Net investment income including reimbursement/waiver | 2.90 | %(c) | 1.24 | %(c) | ||||
| PORTFOLIO TURNOVER RATE(d) | 0 | % | 0 | % | ||||
| (a) | Calculated using the average shares method. |
| (b) | Total returns are for the periods indicated and have not been annualized. Total returns would have been lower had certain expenses not been waived during the periods. Returns shown do not reflect the deduction of taxes that a shareholder would pay on Fund distributions or the redemption of Fund shares. |
| (c) | Annualized. |
| (d) | Portfolio turnover rate for periods less than one full year have not been annualized. |
See accompanying Notes to Financial Statements.
| 34 | (855) 732-9220 seafarerfunds.com |
| Financial Highlights | Seafarer Overseas Value Fund |
For a share outstanding through the period presented
| Institutional Class | Six Months Ended October 31, 2017 (Unaudited) | May 31, 2016 (Inception) to April 30, 2017 | ||||||
| NET ASSET VALUE, BEGINNING OF PERIOD | $ | 11.28 | $ | 10.00 | ||||
| INCOME FROM OPERATIONS: | ||||||||
| Net investment income(a) | 0.17 | 0.13 | ||||||
| Net realized and unrealized gain on investments | 0.79 | 1.28 | ||||||
| Total from investment operations | 0.96 | 1.41 | ||||||
| LESS DISTRIBUTIONS: | ||||||||
| From net investment income | – | (0.13 | ) | |||||
| Total distributions | – | (0.13 | ) | |||||
| NET INCREASE IN NET ASSET VALUE | 0.96 | 1.28 | ||||||
| NET ASSET VALUE, END OF PERIOD | $ | 12.24 | $ | 11.28 | (b) | |||
| TOTAL RETURN(c) | 8.51 | %(d) | 14.18 | %(e) | ||||
| SUPPLEMENTAL DATA: | ||||||||
| Net assets, end of period (in 000s) | $ | 18,292 | $ | 9,846 | ||||
| RATIOS TO AVERAGE NET ASSETS: | ||||||||
| Operating expenses excluding reimbursement/waiver | 2.00 | %(f) | 3.63 | %(f) | ||||
| Operating expenses including reimbursement/waiver | 1.05 | %(f) | 1.05 | %(f) | ||||
| Net investment income including reimbursement/waiver | 2.88 | %(f) | 1.36 | %(f) | ||||
| PORTFOLIO TURNOVER RATE(g) | 0 | % | 0 | % | ||||
| (a) | Calculated using the average shares method. |
| (b) | In preparing the financial statements in accordance with U.S. GAAP, management made certain adjustments as required by U.S. GAAP which caused the net asset value for purposes of these financial statements to differ from the net asset value used to process shareholder transactions as of the date of these financial statements. As a result, the net asset value decreased by $0.01 from $11.29 to $11.28. |
| (c) | Total returns are for the periods indicated and have not been annualized. Total returns would have been lower had certain expenses not been waived during the periods. Returns shown do not reflect the deduction of taxes that a shareholder would pay on Fund distributions or the redemption of Fund shares. |
| (d) | Includes adjustments in accordance with U.S. GAAP and as such, the total return for shareholder transactions reported to the market may differ from the total return for financial reporting purposes. As a result, the total return increased from 8.41% to 8.51%. |
| (e) | Includes adjustments in accordance with U.S. GAAP and as such, the total return for shareholder transactions reported to the market may differ from the total return for financial reporting purposes. As a result, the total return decreased from 14.29% to 14.18%. |
| (f) | Annualized. |
| (g) | Portfolio turnover rate for periods less than one full year have not been annualized. |
See accompanying Notes to Financial Statements.
| Semi-annual Report – October 31, 2017 | 35 |
| Seafarer Funds | Notes to Financial Statements |
October 31, 2017 (Unaudited)
NOTES TO FINANCIAL STATEMENTS
1. Organization
Financial Investors Trust (the “Trust”), a Delaware statutory trust, is an open-end management investment company registered under the Investment Company Act of 1940, as amended (“1940 Act”). The Trust consists of multiple separate portfolios or series. This semi-annual report describes the Seafarer Overseas Growth and Income Fund and the Seafarer Overseas Value Fund (individually a “Fund” and collectively, the “Funds”). The Seafarer Overseas Growth and Income Fund seeks to provide long-term capital appreciation along with some current income; it also seeks to mitigate adverse volatility in returns as a secondary objective. The Seafarer Overseas Value Fund seeks to provide long-term capital appreciation. The Funds each offer Investor Class and Institutional Class shares.
2. Significant Accounting Policies
The accompanying financial statements were prepared in accordance with accounting principles generally accepted in the United States of America (“U.S. GAAP”). The preparation of financial statements in conformity with U.S. GAAP requires management to make certain estimates and assumptions that affect the reported amounts of assets and liabilities and disclosures of contingent assets and liabilities at the date of the financial statements and the reported amounts of revenue and expenses during the period. Actual results could differ from those estimates. The Funds are considered an investment company for financial reporting purposes under U.S. GAAP. The following is a summary of significant accounting policies consistently followed by the Funds in preparation of their financial statements.
Investment Valuation
Each Fund generally values its securities based on market prices determined at the close of regular trading on the New York Stock Exchange (“NYSE”), normally 4:00 p.m. Eastern Time, on each day the NYSE is open for trading.
For equity securities and exchange traded funds, the market price is usually the closing sale or official closing price on that exchange. In the case of equity securities not traded on an exchange, or if such closing prices are not otherwise available, the securities are valued at the mean of the most recent bid and ask prices on such day. Redeemable securities issued by open-end registered investment companies are valued at the investment company’s applicable net asset value, with the exception of exchange-traded open-end investment companies, which are priced as equity securities.
Equity securities that are primarily traded on foreign securities exchanges are valued at the closing values of such securities on their respective foreign exchanges, except when an event occurs subsequent to the close of the foreign exchange but before the close of the NYSE, such that the securities’ value would likely change. In such an event, the fair values of those securities are determined in good faith through consideration of other factors in accordance with procedures established by and under the general supervision of the Board of Trustees (the “Board”). Each Fund uses a fair valuation model provided by an independent pricing service, which is intended to reflect fair value when a security’s value or a meaningful portion of the Fund’s portfolio is believed to have been materially affected by a valuation event that has occurred between the close of the exchange or market on which the security is traded and the close of the regular trading day on the NYSE. The Funds’ valuation procedures set forth certain triggers that inform each Fund when to use the fair valuation model.
The market price for debt obligations is generally the price supplied by an independent third-party pricing service approved by the Board, which may use a matrix, formula or other objective method that takes into consideration quotations from dealers, market transactions in comparable investments, market indices and yield curves. If vendors are unable to supply a price, or if the price supplied is deemed to be unreliable, the market price may be determined using quotations received from one or more broker-dealers that make a market in the security. Corporate bonds and convertible bonds are valued using market models that consider trade data, quotations from dealers and active market makers, relevant yield curve and spread data, creditworthiness, trade data or market information on comparable securities, and other relevant
| 36 | (855) 732-9220 seafarerfunds.com |
| Seafarer Funds | Notes to Financial Statements |
October 31, 2017 (Unaudited)
security specific information. Publicly traded foreign government debt securities and foreign corporate bonds are typically traded internationally in the over-the-counter market and are valued at the mean between the bid and asked prices as of the close of business of that market.
Forward currency exchange contracts have a market value determined by the prevailing foreign currency exchange daily rates and current foreign currency exchange forward rates. The foreign currency exchange forward rates are calculated using an automated system that estimates rates on the basis of the current day foreign currency exchange rates and forward foreign currency exchange rates supplied by a pricing service.
When such prices or quotations are not available, or when the Trust’s Valuation Committee believes that they are unreliable, securities may be priced using fair value procedures approved by the Board.
Certain foreign countries impose a tax on capital gains which is accrued by each Fund based on unrealized appreciation, if any, on affected securities. The tax is paid when the gain is realized.
Fair Value Measurements
Each Fund discloses the classification of its fair value measurements following a three-tier hierarchy based on the inputs used to measure fair value. Inputs refer broadly to the assumptions that market participants would use in pricing the asset or liability, including assumptions about risk. Inputs may be observable or unobservable. Observable inputs reflect the assumptions market participants would use in pricing the asset or liability. Such inputs are developed based on market data obtained from sources independent of the reporting entity. Unobservable inputs reflect the reporting entity’s own assumptions about the assumptions market participants would use in pricing the asset or liability, which are developed based on the information available and the reporting entity’s best efforts to interpret
such information.
Various inputs are used in determining the value of the Funds’ investments as of the end of the reporting period. When inputs used fall into different levels of the fair value hierarchy, the level in the hierarchy within which the fair value measurement falls is determined based on the lowest level input that is significant to the fair value measurement in its entirety. The designated input levels are not necessarily an indication of the risk or liquidity associated with these investments. These inputs are categorized in the following hierarchy under applicable financial accounting standards:
| Level 1 – | Unadjusted quoted prices in active markets for identical investments, unrestricted assets or liabilities that the Funds have the ability to access at the measurement date; |
| Level 2 – | Quoted prices which are not active, quoted prices for similar assets or liabilities in active markets or inputs other than quoted prices that are observable (either directly or indirectly) for substantially the full term of the asset or liability; and |
| Level 3 – | Significant unobservable prices or inputs (including the Funds’ own assumptions in determining the fair value of investments) where there is little or no market activity for the asset or liability at the measurement date. |
| Semi-annual Report – October 31, 2017 | 37 |
| Seafarer Funds | Notes to Financial Statements |
October 31, 2017 (Unaudited)
The following is a summary of the inputs used to value each Fund as of October 31, 2017:
| Investments in Securities at Value(a) | Level 1 - Quoted Prices | Level 2 - Other Significant Observable Inputs | Level 3 - Significant Unobservable Inputs | Total | ||||||||||||
| Seafarer Overseas Growth and Income Fund | ||||||||||||||||
| Common Stocks | $ | 2,364,932,612 | $ | – | $ | – | $ | 2,364,932,612 | ||||||||
| Preferred Stocks | 202,386,200 | – | – | 202,386,200 | ||||||||||||
| Corporate Bond - Foreign Currency | – | 34,735,014 | – | 34,735,014 | ||||||||||||
| Corporate Bond - USD | – | 20,008,000 | – | 20,008,000 | ||||||||||||
| Government Bond, Medium/Long-term - Foreign Currency | – | 58,427,420 | – | 58,427,420 | ||||||||||||
| Government Bond, Short-term - USD and Foreign Currency | – | 81,539,553 | – | 81,539,553 | ||||||||||||
| Total | $ | 2,567,318,812 | $ | 194,709,987 | $ | – | $ | 2,762,028,799 | ||||||||
| Investments in Securities at Value(a) | Level 1 - Quoted Prices | Level 2 - Other Significant Observable Inputs | Level 3 - Significant Unobservable Inputs | Total | ||||||||||||
| Seafarer Overseas Value Fund | ||||||||||||||||
| Common Stocks | ||||||||||||||||
| South Korea | $ | – | $ | 521,275 | $ | – | $ | 521,275 | ||||||||
| Other | $ | 15,894,770 | $ | – | $ | – | $ | 15,894,770 | ||||||||
| Total | $ | 15,894,770 | $ | 521,275 | $ | – | $ | 16,416,045 | ||||||||
| (a) | For detailed descriptions of securities by country, see the accompanying Portfolio of Investments. |
The Funds recognize transfers between levels as of the end of the period. For the six months ended October 31, 2017, the Funds did not have any securities that used significant unobservable inputs (Level 3) in determining fair value.
Level 1 - Quoted and Unadjusted Prices | Level 2 - Other Significant Observable Inputs | |||||||||||||||
| Seafarer Overseas Value Fund | Transfer In | Transfers (Out) | Transfer In | Transfers (Out) | ||||||||||||
| Common Stocks | $ | – | $ | (521,275 | ) | $ | 521,275 | $ | – | |||||||
| Total | $ | – | $ | (521,275 | ) | $ | 521,275 | $ | – | |||||||
Each Fund utilizes a fair value evaluation service with respect to international securities with an earlier market closing than the Fund’s net asset value computation cutoff. When events trigger the use of the fair value evaluation service on a reporting period date, it results in certain securities transferring from a Level 1 to a Level 2 classification. The transfer amounts disclosed in the table above represent the value of the securities as of October 31, 2017 transferred in/(out) of Level 1 and Level 2 during the reporting period that were also held at April 30, 2017. The above transfers from Level 1 to Level 2 were due to the
| 38 | (855) 732-9220 seafarerfunds.com |
| Seafarer Funds | Notes to Financial Statements |
October 31, 2017 (Unaudited)
inability to obtain a closing market price due to an inactive market to trade. For the six months ended October 31, 2017, the Seafarer Overseas Growth and Income Fund did not have any transfers in/(out) of Level 1 and Level 2 securities.
Investment Transactions and Investment Income
Investment transactions are accounted for on the date the investments are purchased or sold (trade date). Realized gains and losses from investment transactions are reported on an identified cost basis. Interest income, which includes accretion of discounts and amortization of premiums, is accrued and recorded as earned. Dividend income is recognized on the ex-dividend date or for certain foreign securities, as soon as information is available to the Funds. All of the realized and unrealized gains and losses and net investment income are allocated daily to each share class in proportion to its average daily net assets.
Cash Management Transactions
Each of the Funds subscribes to the Brown Brothers Harriman & Co. (“BBH”) Cash Management Service (“CMS”), whereby cash balances are automatically swept into overnight offshore demand deposits with either the BBH Grand Cayman branch or a branch of a pre-approved commercial bank. This fully automated program allows the Funds to earn interest on cash balances. Excess cash with deposit institutions domiciled outside of the U.S. are subject to sovereign actions in the jurisdiction of the deposit institution including, but not limited to, freeze, seizure or diminution. Cash balances in the BBH CMS are included on the Statements of Assets and Liabilities under Cash and Foreign Currency, at value. As of October 31, 2017, the Funds had the following cash balances participating in the BBH CMS:
| Fund | ||||
| Seafarer Overseas Growth and Income Fund | $ | 119,804,056 | ||
| Seafarer Overseas Value Fund | 2,270,600 | |||
As of October 31, 2017, the Funds had the following foreign cash balances participating in the BBH CMS (cost and value of foreign cash balances are equal):
| Fund | ||||
| Seafarer Overseas Growth and Income Fund | $ | – | ||
| Seafarer Overseas Value Fund | – |
Foreign Securities
The Funds may directly purchase securities of foreign issuers. Investing in securities of foreign issuers involves special risks not typically associated with investing in securities of U.S. issuers. The risks include possible revaluation of currencies, the inability to repatriate foreign currency, less complete financial information about companies, and possible future adverse political and economic developments. Moreover, securities of many foreign issuers and their markets may be less liquid and their prices more volatile than those of securities of comparable U.S. issuers.
Foreign Currency Translation
The books and records of the Funds are maintained in U.S. dollars. Investment valuations and other assets and liabilities initially expressed in foreign currencies are converted each business day into U.S. dollars based upon current exchange rates. Prevailing foreign exchange rates may generally be obtained at the close of the NYSE (normally, 4:00 p.m. Eastern time). The portion of realized and unrealized gains or losses on investments due to fluctuations in foreign currency exchange rates is not separately disclosed and is included in realized and unrealized gains or losses on investments, when applicable.
Foreign Currency Spot Contracts
Each Fund may enter into foreign currency spot contracts to facilitate transactions in foreign securities or to convert foreign currency receipts into U.S. dollars. A foreign currency spot contract is an agreement between two parties to buy and sell currencies at the current market rate, for settlement generally within two business days. The U.S. dollar value of a contract is determined using current
| Semi-annual Report – October 31, 2017 | 39 |
| Seafarer Funds | Notes to Financial Statements |
October 31, 2017 (Unaudited)
currency exchange rates supplied by a pricing service. The contract is marked-to-market daily for settlements beyond one day and any change in market value is recorded as an unrealized gain or loss. When the contract is closed, the Fund records a realized gain or loss equal to the difference between the value on the open and close date. Losses may arise from changes in the value of the foreign currency, or if the counterparties do not perform under the contract’s terms. The maximum potential loss from such contracts is the aggregate face value in U.S. dollars at the time the contract was opened.
Trust Expenses
Some expenses of the Trust can be directly attributed to the Funds. Expenses which cannot be directly attributed to the Funds are apportioned among all funds in the Trust based on the average daily net assets of each fund.
Fund and Class Expenses
Expenses that are specific to a Fund or class of shares of a Fund, including shareholder servicing fees, are charged directly to that Fund or share class. Expenses that are common to all Funds are generally allocated among the Funds in proportion to their average daily net assets.
Offering Costs
Offering costs, including costs of printing initial prospectuses, legal and registration fees, are being amortized over twelve months from the inception date of the Seafarer Overseas Value Fund. Amounts amortized during the six months ended October 31, 2017 for the Seafarer Overseas Value Fund are shown on the Statements of Operations. As of October 31, 2017, all offering costs have been amortized for the Seafarer Overseas Value Fund.
Federal Income Taxes
Each Fund complies with the requirements under Subchapter M of the Internal Revenue Code of 1986, as amended, applicable to regulated investment companies and intends to distribute substantially all of its net taxable income and net capital gains, if any, each year so that it will not be subject to excise tax on undistributed income and gains. The Funds are not subject to income taxes to the extent such distributions are made.
As of and during the six months ended October 31, 2017, the Funds did not have a liability for any unrecognized tax benefits. The Funds file U.S. federal, state, and local tax returns as required. The Funds’ tax returns are subject to examination by the relevant tax authorities until expiration of the applicable statute of limitations, which is generally three years after the filing of the tax return for federal purposes and four years for most state returns. Tax returns for open years have incorporated no uncertain tax positions that require a provision for income taxes.
Distributions to Shareholders
In general, the Seafarer Overseas Growth and Income Fund’s policy is to distribute to its shareholders substantially all net investment income, paid out via two semi-annual dividends, in June and December. The Seafarer Overseas Value Fund’s policy is to distribute to its shareholders substantially all net investment income via one annual dividend in December. It is also each Fund’s policy to distribute annually all net realized short-term and long-term capital gains, if any, after offsetting any capital loss carryovers. Income dividend distributions are derived from dividends and other income each Fund receives from its investments, including short-term capital gains. Long-term capital gain distributions are derived from gains realized when a Fund sells a security it has owned for more than one year. Each Fund may make additional distributions if Seafarer Capital Partners, LLC (the “Adviser”) believes doing so may be necessary for the Fund to avoid or reduce taxes.
| 40 | (855) 732-9220 seafarerfunds.com |
| Seafarer Funds | Notes to Financial Statements |
October 31, 2017 (Unaudited)
3. Tax Basis Information
Tax Basis of Investments
As of October 31, 2017, the aggregate cost of investments, gross unrealized appreciation/(depreciation) and net unrealized appreciation for Federal tax purposes were as follows:
| Cost of Investments | Gross Unrealized Appreciation | Gross Unrealized Depreciation | Net Unrealized Appreciation | |||||||||||||
| Seafarer Overseas Growth and Income Fund | $ | 2,475,728,126 | $ | 368,234,933 | $ | (81,934,260 | ) | $ | 286,300,673 | |||||||
| Seafarer Overseas Value Fund | 15,130,816 | 2,095,954 | (810,725 | ) | 1,285,229 | |||||||||||
Tax Basis of Distributions to Shareholders
The character of distributions made during the year from net investment income or net realized gains may differ from the ultimate characterization for federal income tax purposes. Also, due to the timing of dividend distributions, the fiscal year in which amounts are distributed may differ from the fiscal year in which the income or realized gain is recorded by a Fund.
The tax character of distributions paid by the Funds for the fiscal year or period ended April 30, 2017 was as follows:
| Ordinary Income | Long-Term Capital Gain | |||||||
| Seafarer Overseas Growth and Income Fund | $ | 27,085,171 | $ | – | ||||
| Seafarer Overseas Value Fund | 62,391 | – | ||||||
The amounts and characteristics of tax basis distributions and composition of distributable earnings/(accumulated losses) are finalized at fiscal year-end. Accordingly, tax basis balances have not been determined as of October 31, 2017.
4. Securities Transactions
The cost of purchases and proceeds from sales of securities excluding short-term securities during the six months ended October 31, 2017 were as follows:
| Purchases of Securities | Proceeds From Sales of Securities | |||||||
| Seafarer Overseas Growth and Income Fund | $ | 537,064,309 | $ | 224,080,489 | ||||
| Seafarer Overseas Value Fund | 7,440,120 | – |
5. Shares of Beneficial Interest
The capitalization of the Trust consists of an unlimited number of shares of beneficial interest with no par value per share. Holders of shares of the Funds of the Trust have one vote for each share held and a proportionate fraction of a vote for each fractional share. All shares issued and outstanding are fully paid and are transferable and redeemable at the option of the shareholder. Purchasers of the shares do not have any obligation to make payments to the Trust or its creditors solely by reason of the purchasers’ ownership of the shares. Shares have no pre-emptive rights.
| Semi-annual Report – October 31, 2017 | 41 |
| Seafarer Funds | Notes to Financial Statements |
October 31, 2017 (Unaudited)
Prior to August, 31, 2016, shares redeemed within 90 days of purchase may incur a 2% short-term redemption fee deducted from the redemption amount. The redemption fee is reflected in the “Shares redeemed, net of redemption fees” in the Statements of Changes in Net Assets. Effective August 31, 2016, the Funds no longer impose a redemption fee.
During the year or period ended April 30, 2017, the Funds retained the following redemption fees:
| Fund | For the Year ended April 30, 2017 | |||
| Seafarer Overseas Growth and Income Fund | ||||
| Investor Class | $ | 40,363 | ||
| Institutional Class | $ | 49,013 | ||
| Seafarer Overseas Value Fund | ||||
| Investor Class | $ | – | ||
| Institutional Class | $ | – | ||
6. Management and Related Party Transactions
The Adviser, subject to the authority of the Board, is responsible for the overall management and administration of the Funds’ business affairs. The Adviser manages the investments of the Funds in accordance with the Funds’ investment objectives, policies, limitations and investment guidelines established jointly by the Adviser and the Trustees. Pursuant to the investment advisory agreement, the Funds, in the aggregate, pay the Adviser an annual management fee of 0.75% of the aggregate average daily net assets of the Funds up to $1.5 billion and 0.70% of the aggregate average daily net assets of the Funds over $1.5 billion. Each Fund pays the Adviser a monthly fee at the annual rate using the applicable management fee calculated based on the Fund’s pro rata share of the Funds’ combined average daily net assets. Prior to August 31, 2016, the Funds paid the Adviser an annual management fee of 0.75% of the aggregate average daily net assets of the Funds. The management fee is paid on a monthly basis.
Effective September 1, 2014, the Adviser contractually agreed to limit certain Fund expenses (excluding brokerage expenses, interest expenses, taxes and extraordinary expenses) to 1.25% and 1.05% of the Funds’ average daily net assets in the Investor and Institutional share classes, respectively, through August 31, 2015. Effective September 1, 2015, the Adviser contractually agreed to waive and/or reimburse fees or expenses in order to limit Total Annual Fund Operating Expenses After Fee Waiver / Expense Reimbursements (excluding brokerage expenses, interest expenses, taxes and extraordinary expenses) to 1.15% and 1.05% of the Funds’ average daily net assets for the Investor and Institutional share classes respectively. This agreement (the “Expense Agreement”) is in effect through August 31, 2018. The Adviser will be permitted to recover, on a class-by-class basis, expenses it has borne through the Expense Agreement to the extent that the Funds’ expenses in later periods fall below the expense cap in effect at the time of waiver or reimbursement. The Funds will not be obligated to pay any such deferred fees and expenses more than three years after the date of the waiver. This agreement may not be terminated or modified prior to August 31, 2018, except with the approval of the Funds’ Board. During the six months ended October 31, 2017, the Adviser agreed that it will only seek to recoup waived management fees and will not recoup any reimbursed expenses. As of October 31, 2017, the Adviser has recouped all available waived management fees from the Seafarer Overseas Growth and Income Fund.
| 42 | (855) 732-9220 seafarerfunds.com |
| Seafarer Funds | Notes to Financial Statements |
October 31, 2017 (Unaudited)
For the six months ended October 31, 2017, the fee waivers and/or reimbursements were as follows for the Seafarer Overseas Value Fund:
| Fund | Fees Waived/ Reimbursed By Adviser | |||
| Seafarer Overseas Value Fund | ||||
| Investor Class | $ | 1,323 | ||
| Institutional Class | 62,111 | |||
As of October 31, 2017, the balances of recoupable expenses for each class were as follows for the Funds:
| Fund | Expires 2020 | Expires 2021 | Expires 2022 | Total | ||||||||||||
| Seafarer Overseas Growth and Income Fund | ||||||||||||||||
| Investor Class | $ | – | $ | – | $ | – | $ | – | ||||||||
| Institutional Class | – | – | – | – | ||||||||||||
| Seafarer Overseas Value Fund | ||||||||||||||||
| Investor Class | $ | 1,168 | 1,027 | $ | – | $ | 2,195 | |||||||||
| Institutional Class | 34,396 | 46,716 | – | 81,112 | ||||||||||||
Fund Administrator
ALPS Fund Services, Inc. (“ALPS” and the “Administrator”) (an affiliate of ALPS Distributors, Inc.) provides administrative, fund accounting and other services to the Funds under the Administration, Bookkeeping and Pricing Services Agreement with the Trust.
The Funds’ administrative fee is accrued on a daily basis and paid monthly. The Administrator is also reimbursed by the Funds for certain out-of-pocket expenses. Administration fees paid by the Funds for the six months ended October 31, 2017 are disclosed in the Statements of Operations.
Transfer Agent
ALPS serves as transfer, dividend paying and shareholder servicing agent for the Funds (“Transfer Agent”). ALPS is paid an annual base fee per Fund and a fee based on the number of shareholder accounts. The Transfer Agent is also reimbursed by the Funds for certain out-of-pocket expenses. Transfer agent fees paid by the Funds for the six months ended October 31, 2017 are disclosed in the Statements of Operations.
Compliance Services
ALPS provides compliance services to the Funds under the Chief Compliance Officer Services Agreement with the Trust. ALPS provides services that assist the Trust’s chief compliance officer in monitoring and testing the policies and procedures of the Trust in accordance with the requirements of Rule 38a-1 under the 1940 Act. ALPS is paid an annual base fee and is reimbursed for certain out-of-pocket expenses. Compliance service fees paid by the Funds for the six months ended October 31, 2017 are disclosed in the Statements of Operations.
| Semi-annual Report – October 31, 2017 | 43 |
| Seafarer Funds | Notes to Financial Statements |
October 31, 2017 (Unaudited)
Principal Financial Officer
ALPS provides principal financial officer services to the Funds under the Principal Financial Officer Services Agreement with the Trust. Under this Agreement, ALPS is paid an annual base fee and is reimbursed for certain out-of-pocket expenses. Principal financial officer fees paid by the Funds for the six months ended October 31, 2017 are disclosed in the Statements of Operations.
Distributor
ALPS Distributors, Inc. (“ADI” or the “Distributor”) (an affiliate of ALPS) acts as the distributor of the Funds’ shares pursuant to the Distribution Agreement with the Trust. Under a side letter agreement, the Adviser pays ADI an annual base fee of $12,000 per Fund for the distribution services. The Adviser also reimburses ADI for certain out-of-pocket expenses. Shares are sold on a continuous basis by ADI as agent for the Funds, and ADI has agreed to use its best efforts to solicit orders for the sale of the Funds’ shares, although it is not obliged to sell any particular amount of shares. ADI is registered as a broker-dealer with the U.S. Securities and Exchange Commission.
Shareholder Service Plan for Investor Class and Institutional Class Shares
Each Fund has adopted a Shareholder Services Plan (a “Services Plan”) for each of its share classes. Under the Services Plan, each Fund is authorized to enter into shareholder service agreements with investment advisers, financial institutions and other service providers (“Participating Organizations”) to maintain and provide certain administrative and servicing functions in relation to the accounts of shareholders. Shareholder service arrangements typically include processing orders for shares, generating account and confirmation statements, sub-accounting, account maintenance, tax reporting, and disbursing cash dividends as well as other investment or administrative services required for the particular Participating Organizations’ products, programs, platform and accounts. The Services Plan will cause each Fund to pay an aggregate fee, not to exceed on an annual basis 0.15% and 0.05% of the average daily net asset value of the Investor and Institutional share classes, respectively. Such payments will be made on assets attributable to or held in the name of a Participating Organization, on behalf of its clients as compensation for providing service activities pursuant to an agreement with the Participating Organization. Any amount of such payment not paid to a Participating Organization during a Fund’s fiscal year for such service activities shall be reimbursed to the Fund as soon as practicable, after the end of the fiscal year. Shareholder service plan fees paid by the Funds for the six months ended October 31, 2017 are disclosed in the Statements of Operations.
7. Indemnifications
Under the Trust’s organizational documents, its officers and Trustees are indemnified against certain liability arising out of the performance of their duties to the Trust. Additionally, in the normal course of business, the Trust enters into contracts with service providers that may contain general indemnification clauses, which may permit indemnification to the extent permissible under the applicable law. The Trust’s maximum exposure under these arrangements is unknown, as this would involve future claims that may be made against the Trust that have not yet occurred.
| 44 | (855) 732-9220 seafarerfunds.com |
| Seafarer Funds | Additional Information |
October 31, 2017 (Unaudited)
ADDITIONAL INFORMATION
1. Fund Holdings
Each Fund files its complete schedule of portfolio holdings with the Securities and Exchange Commission (the “SEC”) for the first and third quarters of each fiscal year on Form N-Q within 60 days after the end of the period. Copies of the Funds’ Form N-Q are available without charge on the SEC website at http://www.sec.gov. You may also review and copy the Form N-Q at the SEC’s Public Reference Room in Washington, D.C. For more information about the operation of the Public Reference Room, please call the SEC at 1-800-SEC-0330.
2. Fund Proxy Voting Policies, Procedures and Summaries
The Funds’ policies and procedures used in determining how to vote proxies and information regarding how the Funds voted proxies relating to portfolio securities during the most recent prior 12-month period ending June 30 are available without charge, (1) upon request, by calling toll-free (855) 732-9220 and (2) on the SEC’s website at http://www.sec.gov.
| Semi-annual Report – October 31, 2017 | 45 |

Table of Contents
| CONTENTS | PAGE |
| Shareholder Letter | 1 |
| Fund Overview | |
| Vulcan Value Partners Fund | 4 |
| Vulcan Value Partners Small Cap Fund | 7 |
| Disclosure of Fund Expenses | |
| Vulcan Value Partners Fund | 6 |
| Vulcan Value Partners Small Cap Fund | 9 |
| Statements of Investments | |
| Vulcan Value Partners Fund | 10 |
| Vulcan Value Partners Small Cap Fund | 13 |
| Statements of Assets and Liabilities | 17 |
| Statements of Operations | 18 |
| Statements of Changes in Net Assets | |
| Vulcan Value Partners Fund | 19 |
| Vulcan Value Partners Small Cap Fund | 20 |
| Financial Highlights | |
| Vulcan Value Partners Fund | 22 |
| Vulcan Value Partners Small Cap Fund | 24 |
| Notes to Financial Statements | 26 |
| Additional Information | 35 |
www.vulcanvaluepartners.com
Shareholder Letter
October 31, 2017 (Unaudited)
PORTFOLIO REVIEW
General
For the six months ended October 31, 2017, Vulcan Value Partners Fund returned 4.66% and the Vulcan Value Partners Small Cap Fund returned 1.74%. As you know, we place no weight on short-term results, good or bad, and neither should you. In fact, we have and will continue to willingly make decisions that negatively impact short-term performance when we think we can mitigate risk and improve our long-term returns. We encourage you to place more weight on our longer term historical results and a great deal of weight on our long-term prospects.
Vulcan Value Partners Large Cap Fund Review
In the discussion that follows, we highlight a few holdings in the Vulcan Value Partners Fund.
Oracle was the largest contributor over the period and continues to be our biggest position in the fund. We remain very pleased with our stake in this company and its transition to the Cloud continues to be on track. We believe that Oracle has many ways to win. Data is growing rapidly, applications that capture this data and make it usable are proliferating, and they have a full suite of applications to serve this demand across all industry verticals both for on-premise and in the Cloud. Their value proposition to customers is very strong: moving to the Cloud can lower IT costs up to 50%, and this resonates with customers and the market.
The transition to the Cloud is still in the early innings. Oracle generates $30B of software revenue and $7B from hardware and services. Of the $30B in software revenue, $5B is already represented in the Cloud, which leaves $25B in revenue with the potential to convert to the Cloud. Their revenue lift is about 3X greater in the Cloud than on-premise, so if you flipped a switch today and all customers were in the Cloud, that would be $75B in additional software-related revenue. We obviously do not know what percentage of on-premise users will convert nor over what time period, but this simple example illustrates why we believe we are still in the early innings.
WPP was a new purchase for the period. It is based in London and is the world’s largest multinational advertising company. The company was formed in 1985 when founder Sir Martin Sorrell took control of a shell company, Wire & Plastic Products, and established it as a marketing services group in 1986. As a parent company of 160 unique marketing companies, WPP has extreme scale and cost advantages. The advertising industry as a whole has consolidated, but the need for creative content remains and this is where WPP excels. It owns four of the top seven creative agencies in the world, and is able to deliver a comprehensive and integrated range of communications services to national, multinational and global clients. Advertising growth continues to be in-line with global Gross Domestic Product and we believe WPP provides great value to their clients.
We sold our position in Time Warner this quarter as its stock price approached our estimate of intrinsic value. Time Warner was purchased in the second quarter of 2011. It was a large position for many years, but was trimmed over time. The company contributed greatly to our portfolio. While we admired Time Warner’s media assets for a long time, we were never comfortable with owning the company until Jeffrey Bewkes proved himself as CEO. We thank him and the management team for being shareholder oriented and creating value while we owned it.
| Semi-Annual Report | October 31, 2017 | 1 |
Shareholder Letter
October 31, 2017 (Unaudited)
Vulcan Value Partners Small Cap Fund Review
In the discussion that follows, we highlight a few holdings in the Vulcan Value Partners Small Cap Fund.
Credit Acceptance Corporation has been on our MVP list for some time, and with a recent deep dive into the business, we were excited to purchase it during the period. The company provides auto loans to borrowers at the lower end of the credit spectrum distributed through a network of 10,000 dealers in the U.S. Over the past fifteen years, the company has grown earnings per share(1) at a rate of 26% and achieved an average return on equity(2) of 28%, demonstrating its strong economics and competitive advantages. The company’s biggest competitive advantage is the unique way in which it structures loans. The structure aligns incentives with their dealer network by providing the dealers the opportunity to earn back end payments dependent on loan performance. This opportunity for future payments allows Credit Acceptance Corporation to achieve a greater margin of safety as the dealer is only advanced enough of the loan to earn a small profit at the time of sale. Credit Acceptance Corporation’s approach has led to strong underwriting results and stable performance during difficult periods in the cycle.
We sold Ashmore Group during the period. It is an emerging markets debt manager. In recent years, the emerging markets debt asset class has been facing some headwinds, and Ashmore was not immune. Through 2017, good performance in this asset class led to an improvement in Ashmore’s stock price. The value had begun to decline. Following our discipline, we exited the position.
Closing
The current environment is challenging for us. Volatility is at record lows, stock prices are rising steadily, and valuation levels are not attractive for the vast majority of the market. We would benefit greatly from increased volatility. In the meantime, we will continue to execute our investment process with discipline. We appreciate the confidence you have placed in us. Your stable capital, invested alongside our own stable capital provides a foundation that allows us to make sound, long-term investment decisions that mitigate risk and provide the opportunity to achieve attractive long-term results. You, our client-partners, are one of our most important competitive advantages.
C.T. Fitzpatrick
Chief Executive Officer
Vulcan Value Partners, LLC
| 2 | www.vulcanvaluepartners.com |
Shareholder Letter
October 31, 2017 (Unaudited)
Past performance does not guarantee future results. The Fund’s prices fluctuate as the underlying assets have exposure to market fluctuations and other risks, as described in the Funds’ prospectus. Please call 877.421.5078 to obtain current performance information and for the current prospectus and statement of additional information. This material must be preceded or accompanied by a prospectus. Please read the prospectus carefully before investing.
The views of the Vulcan Value Partners, LLC and information discussed in this commentary are as of the date of publication, are subject to change, and may not reflect the writer's current views. The views expressed represent an assessment of market conditions at a specific point in time, are opinions only and should not be relied upon as investment advice regarding a particular investment or markets in general. Such information does not constitute a recommendation to buy or sell specific securities or investment vehicles. It should not be assumed that any investment will be profitable or will equal the performance of the Funds or any securities or any sectors mentioned in this letter. The subject matter contained in this letter has been derived from several sources believed to be reliable and accurate at the time of compilation. Neither Vulcan Value Partners, LLC nor the Funds accept any liability for losses either direct or consequential caused by the use of this information.
The Funds are distributed by ALPS Distributors, Inc.
The Funds are subject to investment risks, including possible loss of the principal amount invested and therefore is not suitable for all investors. The Funds may not achieve their objectives.
Diversification does not eliminate the risk of experiencing investment losses.
| (1) | Earnings per share (EPS) is the portion of a company's profit allocated to each outstanding share of common stock. Earnings per share serves as an indicator of a company's profitability. |
| (2) | Return on equity measures a corporation's profitability by revealing how much profit a company generates with the money shareholders have invested. |
| Semi-Annual Report | October 31, 2017 | 3 |
Fund Overview
October 31, 2017 (Unaudited)
VULCAN VALUE PARTNERS FUND
Annualized Total Returns (as of 10/31/17)
| 6 Month | 1 Year | 3 Year | 5 Year | Since Inception* | Expense Ratios(1) | ||
| Total | Net(2) | ||||||
| Vulcan Value Partners Fund | 4.66% | 13.17% | 20.78% | 5.94% | 12.98% | 1.07% | 1.07% |
| S&P 500® Total Return Index(3) | 9.10% | 16.91% | 23.63% | 10.77% | 15.18% | ||
| Russell 1000® Value Index(4) | 5.46% | 8.70% | 17.78% | 7.99% | 13.48% | ||
Performance data quoted represents past performance. Past performance does not guarantee future results. Investment return and principal value of an investment will fluctuate so that an investor’s shares, when sold or redeemed, may be worth more or less than the original cost. The Fund imposes a 2.00% redemption fee on shares held for less than 90 days. Current performance data may be higher or lower than actual data quoted. For the most current month-end performance data, please call 1-877-421-5078.
The table does not reflect the deduction of taxes that a shareholder would pay on Fund distributions or the redemption of Fund shares.
Subject to investment risks, including possible loss of the principal amount invested.
Returns for periods less than 1 year are cumulative.
| * | Fund inception date of 12/30/09. |
| (1) | Ratios as of the Prospectus dated August 31, 2017 and may differ from the ratios presented in the Financial Highlights. |
| (2) | Vulcan Value Partners, LLC (“Vulcan” or the “Adviser”) has contractually agreed to limit the Fund’s total annual fund operating expenses (exclusive of Acquired Fund Fees and Expenses, brokerage expenses, interest expense, taxes and extraordinary expenses) to 1.25% of the Fund’s average daily net assets. This agreement (the “Expense Agreement”) is in effect through August 31, 2018. The Adviser will be permitted to recover, on a class-by-class basis, expenses it has borne through the Expense Agreement to the extent that the Fund’s expenses in later periods fall below the expense cap in effect at the time of waiver or reimbursement. Notwithstanding the foregoing, the Fund will not be obligated to pay any such fees and expenses more than three years after the end of the fiscal year in which the fees or expenses were foregone or reimbursed. The Adviser may not discontinue or modify this waiver prior to August 31, 2018 without the approval by the Fund’s Board of Trustees. |
| (3) | The S&P 500® Total Return Index is an unmanaged index of 500 common stocks chosen for market size, liquidity and industry group representation. It is a market-value weighted index. The Index is not actively managed and does not reflect any deductions for fees, expenses or taxes. An investor may not invest directly in the Index. |
| (4) | The Russell 1000® Value Index measures the performance of the large-cap value segment of the U.S. equity universe. It includes those Russell 1000® companies with lower price-to-book ratios and lower expected growth values. The index is not actively managed and does not reflect any deductions for fees, expense or taxes. An investor may not invest directly in an index. |
| 4 | www.vulcanvaluepartners.com |
Fund Overview
October 31, 2017 (Unaudited)
Performance of $10,000 Initial Investment (for the period ended October 31, 2017)
The chart above represents historical performance of a hypothetical investment of $10,000 in the Fund since inception. Past performance does not guarantee future results. This chart does not reflect the deduction of taxes that a shareholder would pay on Fund distributions or the redemption of Fund shares.
Investing in the Fund is subject to investment risks, including possible loss of the principal amount invested.
Industry Allocation (as a % of Net Assets)*
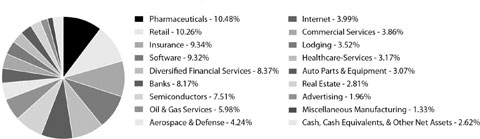
Top Ten Holdings (as a % of Net Assets)*
| Oracle Corp. | 7.96% |
| National Oilwell Varco, Inc. | 5.98% |
| CVS Health Corp. | 4.87% |
| Qorvo, Inc. | 4.52% |
| Swiss Re AG | 4.40% |
| Visa, Inc., Class A | 4.26% |
| Mastercard, Inc., Class A | 4.11% |
| McKesson Corp. | 4.06% |
| Alphabet, Inc. | 3.99% |
| AmerisourceBergen Corp. | 3.84% |
| Top Ten Holdings | 47.99% |
| * | Holdings are subject to change, and may not reflect the current or future position of the portfolio. |
| Semi-Annual Report | October 31, 2017 | 5 |
Disclosure of Fund Expenses
October 31, 2017 (Unaudited)
As a shareholder of the Vulcan Value Partners Fund (the “Fund”), you will incur two types of costs: (1) transaction costs, including applicable redemption fees; and (2) ongoing costs, including management fees and other fund operating expenses. The following examples are intended to help you understand your ongoing costs (in dollars) of investing in the Fund and to compare these costs with the ongoing costs of investing in other mutual funds. The examples are based on an investment of $1,000 invested on May 1, 2017 and held until October 31, 2017.
Actual Expenses. The first line of each table below provides information about actual account values and actual expenses. You may use the information in this line, together with the amount you invested, to estimate the expenses that you paid over the period. Simply divide your account value by $1,000 (for example, an $8,600 account value divided by $1,000 = 8.6), then multiply the result by the number in the first line under the heading “Expenses Paid During Period” to estimate the expenses you paid on your account during this period.
Hypothetical Example for Comparison Purposes. The second line of the table below provides information about hypothetical account values and hypothetical expenses based on the Fund’s actual expense ratio and an assumed rate of return of 5% per year before expenses, which is not the Fund’s actual return. The hypothetical account values and expenses may not be used to estimate the actual ending account balance or expenses you paid for the period. You may use this information to compare the ongoing costs of investing in the Fund and other mutual funds. To do so, compare this 5% hypothetical example with the 5% hypothetical examples that appear in the shareholder reports of the other mutual funds.
Please note the expenses shown in the table are meant to highlight ongoing Fund costs only and do not reflect transactional costs, such as redemption fees or exchange fees. Therefore, the second line of the table below is useful in comparing your ongoing costs only, and will not help you determine the relative total costs of owning different funds. In addition, if these transactional costs were included, your costs would have been higher.
Vulcan Value Partners Fund
| Beginning Account Value 5/1/17 | Ending Account Value 10/31/17 | Expense Ratio(a) | Expenses Paid During period 5/1/17 - 10/31/17(b) | |
| Actual | $1,000.00 | $1,046.60 | 1.08% | $ 5.57 |
| Hypothetical (5% return before expenses) | $1,000.00 | $1,019.76 | 1.08% | $ 5.50 |
| (a) | The Fund's expense ratios have been annualized based on the Fund's most recent fiscal half-year expenses. |
| (b) | Expenses are equal to the Fund's annualized expense ratio multiplied by the average account value over the period, multiplied by the number of days in the most recent fiscal half-year (184)/365 (to reflect the half-year period). |
| 6 | www.vulcanvaluepartners.com |
Fund Overview
October 31, 2017 (Unaudited)
VULCAN VALUE PARTNERS SMALL CAP FUND
Annualized Total Returns (as of 10/31/17)
| Expense Ratios(1) | |||||||
| 6 Month | 1 Year | 3 Year | 5 Year | Since Inception* | Total | Net(2) | |
| Vulcan Value Partners Small Cap Fund | 1.74% | 9.39% | 20.04% | 7.73% | 12.92% | 1.27% | 1.27% |
| Russell 2000® Value Index(3) | 5.54% | 5.82% | 24.81% | 9.67% | 13.58% | ||
| Russell 2000® Index(4) | 8.01% | 11.89% | 27.85% | 10.12% | 14.49% | ||
Performance data quoted represents past performance. Past performance does not guarantee future results. Investment return and principal value of an investment will fluctuate so that an investor’s shares, when sold or redeemed, may be worth more or less than the original cost. The Fund imposes a 2.00% redemption fee on shares held for less than 90 days. Current performance data may be higher or lower than actual data quoted. For the most current month-end performance data, please call 1-877-421-5078.
The table does not reflect the deduction of taxes that a shareholder would pay on Fund distributions or the redemption of Fund shares.
Subject to investment risks, including possible loss of the principal amount invested.
Returns for periods less than 1 year are cumulative.
| * | Fund inception date of 12/30/09. |
| (1) | Ratios as of the Prospectus dated August 31, 2017 and may differ from the ratios presented in the Financial Highlights. |
| (2) | Vulcan Value Partners, LLC (“Vulcan” or the “Adviser”) has contractually agreed to limit the Fund’s total annual fund operating expenses (exclusive of Acquired Fund Fees and Expenses, brokerage expenses, interest expense, taxes and extraordinary expenses) to 1.25% of the Fund’s average daily net assets. This agreement (the “Expense Agreement”) is in effect through August 31, 2018. The Adviser will be permitted to recover, on a class-by-class basis, expenses it has borne through the Expense Agreement to the extent that the Fund’s expenses in later periods fall below the expense cap in effect at the time of waiver or reimbursement. Notwithstanding the foregoing, the Fund will not be obligated to pay any such fees and expenses more than three years after the end of the fiscal year in which the fees or expenses were foregone or reimbursed. The Adviser may not discontinue or modify this waiver prior to August 31, 2018 without the approval by the Fund’s Board of Trustees. |
| (3) | The Russell 2000® Value Index measures the performance of small-cap value segment of the U.S.equity universe. It includes those Russell 2000® companies with lower price-to-book ratios and lower forecasted growth values. The index is not actively managed and does not reflect any deductions for fees, expense or taxes. An investor may not invest directly in an index. |
| (4) | The Russell 2000® Index measures the performance of the small-cap segment of the U.S. equity universe. The Russell 2000® Index is a subset of the Russell 3000® Index representing approximately 8% of the total market capitalization of that index. It includes approximately 2,000 of the smallest securities based on a combination of their market cap and current index membership. The index is not actively managed and does not reflect any deductions for fees, expense or taxes. An investor may not invest directly in an index. |
| Semi-Annual Report | October 31, 2017 | 7 |
Fund Overview
October 31, 2017 (Unaudited)
Performance of $10,000 Initial Investment (for the period ended October 31, 2017)
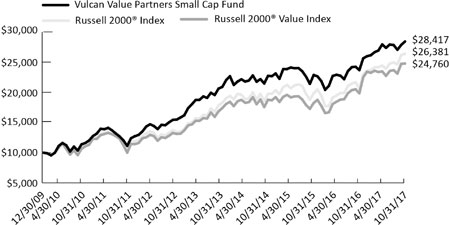
The chart above represents historical performance of a hypothetical investment of $10,000 in the Fund since inception. Past performance does not guarantee future results. This chart does not reflect the deduction of taxes that a shareholder would pay on Fund distributions or the redemption of Fund shares.
Investing in the Fund is subject to investment risks, including possible loss of the principal amount invested.
Industry Allocation (as a % of Net Assets)*
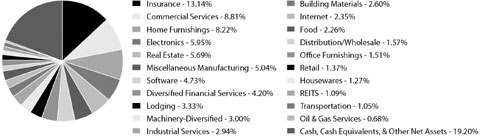
Top Ten Holdings (as a % of Net Assets)*
| Jones Lang LaSalle, Inc. | 5.69% |
| Select Comfort Corp. | 5.22% |
| Sabre Corp. | 4.79% |
| ACI Worldwide, Inc. | 4.73% |
| Axis Capital Holdings, Ltd. | 4.35% |
| Ituran Location and Control, Ltd. | 3.81% |
| Aspen Insurance Holdings, Ltd. | 3.43% |
| Howden Joinery Group PLC | 3.00% |
| MSC Industrial Direct Co., Inc., Class A | 2.94% |
| Credit Acceptance Corp. | 2.75% |
| Top Ten Holdings | 40.71% |
| * | Holdings are subject to change, and may not reflect the current or future position of the portfolio. |
| 8 | www.vulcanvaluepartners.com |
Disclosure of Fund Expenses
October 31, 2017 (Unaudited)
As a shareholder of the Vulcan Value Partners Small Cap Fund (the “Fund”), you will incur two types of costs: (1) transaction costs, including applicable redemption fees; and (2) ongoing costs, including management fees and other fund operating expenses. The following examples are intended to help you understand your ongoing costs (in dollars) of investing in the Fund and to compare these costs with the ongoing costs of investing in other mutual funds. The examples are based on an investment of $1,000 invested on May 1, 2017 and held until October 31, 2017.
Actual Expenses. The first line of each table below provides information about actual account values and actual expenses. You may use the information in this line, together with the amount you invested, to estimate the expenses that you paid over the period. Simply divide your account value by $1,000 (for example, an $8,600 account value divided by $1,000 = 8.6), then multiply the result by the number in the first line under the heading “Expenses Paid During Period” to estimate the expenses you paid on your account during this period.
Hypothetical Example for Comparison Purposes. The second line of the table below provides information about hypothetical account values and hypothetical expenses based on the Fund’s actual expense ratio and an assumed rate of return of 5% per year before expenses, which is not the Fund’s actual return. The hypothetical account values and expenses may not be used to estimate the actual ending account balance or expenses you paid for the period. You may use this information to compare the ongoing costs of investing in the Fund and other mutual funds. To do so, compare this 5% hypothetical example with the 5% hypothetical examples that appear in the shareholder reports of the other mutual funds.
Please note the expenses shown in the table are meant to highlight ongoing Fund costs only and do not reflect transactional costs, such as redemption fees or exchange fees. Therefore, the second line of the table below is useful in comparing your ongoing costs only, and will not help you determine the relative total costs of owning different funds. In addition, if these transactional costs were included, your costs would have been higher.
Vulcan Value Partners Small Cap Fund
| Beginning Account Value 5/1/17 | Ending Account Value 10/31/17 | Expense Ratio(a) | Expenses Paid During period 5/1/17 - 10/31/17(b) | |
| Actual | $1,000.00 | $1,017.40 | 1.25% | $ 6.36 |
| Hypothetical (5% return before expenses) | $1,000.00 | $1,018.90 | 1.25% | $ 6.36 |
| (a) | The Fund's expense ratios have been annualized based on the Fund's most recent fiscal half-year expenses. |
| (b) | Expenses are equal to the Fund's annualized expense ratio multiplied by the average account value over the period, multiplied by the number of days in the most recent fiscal half-year (184)/365 (to reflect the half-year period). |
| Semi-Annual Report | October 31, 2017 | 9 |
| Statement of Investments | Vulcan Value Partners Fund |
October 31, 2017 (Unaudited)
| Shares | Value (Note 2) | |||||||
| COMMON STOCKS (97.38%) | ||||||||
| Communications (5.95%) | ||||||||
| Advertising (1.96%) | ||||||||
| WPP PLC | 1,435,083 | $ | 25,426,130 | |||||
| Internet (3.99%) | ||||||||
| Alphabet, Inc., Class C(a) | 50,916 | 51,763,242 | ||||||
| TOTAL COMMUNICATIONS | 77,189,372 | |||||||
| Consumer, Cyclical (16.85%) | ||||||||
| Auto Parts & Equipment (3.07%) | ||||||||
| GKN PLC | 9,458,737 | 39,823,537 | ||||||
| Lodging (3.52%) | ||||||||
| Hilton Worldwide Holdings, Inc. | 332,536 | 24,035,702 | ||||||
| InterContinental Hotels Group PLC, ADR | 390,817 | 21,725,517 | ||||||
| 45,761,219 | ||||||||
| Retail (10.26%) | ||||||||
| AutoZone, Inc.(a) | 57,950 | 34,161,525 | ||||||
| CVS Health Corp. | 921,173 | 63,127,986 | ||||||
| O'Reilly Automotive, Inc.(a) | 169,702 | 35,798,637 | ||||||
| 133,088,148 | ||||||||
| TOTAL CONSUMER, CYCLICAL | 218,672,904 | |||||||
| Consumer, Non-cyclical (17.51%) | ||||||||
| Commercial Services (3.86%) | ||||||||
| Moody's Corp. | 141,525 | 20,154,575 | ||||||
| S&P Global, Inc. | 115,936 | 18,140,506 | ||||||
| Sabre Corp. | 605,748 | 11,848,431 | ||||||
| 50,143,512 | ||||||||
| Healthcare-Services (3.17%) | ||||||||
| Aetna, Inc. | 129,100 | 21,950,873 | ||||||
| Anthem, Inc. | 91,811 | 19,207,779 | ||||||
| 41,158,652 | ||||||||
| Pharmaceuticals (10.48%) | ||||||||
| AmerisourceBergen Corp. | 648,071 | 49,869,063 | ||||||
| Cardinal Health, Inc. | 540,273 | 33,442,899 | ||||||
| McKesson Corp. | 381,778 | 52,639,551 | ||||||
| 135,951,513 | ||||||||
| TOTAL CONSUMER, NON-CYCLICAL | 227,253,677 | |||||||
| 10 | www.vulcanvaluepartners.com |
| Vulcan Value Partners Fund | Statement of Investments |
October 31, 2017 (Unaudited)
| Shares | Value (Note 2) | |||||||
| Energy (5.98%) | ||||||||
| Oil & Gas Services (5.98%) | ||||||||
| National Oilwell Varco, Inc. | 2,268,978 | $ | 77,576,358 | |||||
| TOTAL ENERGY | 77,576,358 | |||||||
| Financial (28.69%) | ||||||||
| Banks (8.17%) | ||||||||
| Bank of New York Mellon Corp. | 605,004 | 31,127,456 | ||||||
| Northern Trust Corp. | 290,410 | 27,159,143 | ||||||
| State Street Corp. | 518,136 | 47,668,512 | ||||||
| 105,955,111 | ||||||||
| Diversified Financial Services (8.37%) | ||||||||
| Mastercard, Inc., Class A | 358,685 | 53,361,568 | ||||||
| Visa, Inc., Class A | 502,049 | 55,215,349 | ||||||
| 108,576,917 | ||||||||
| Insurance (9.34%) | ||||||||
| Axis Capital Holdings, Ltd. | 607,162 | 33,023,541 | ||||||
| Everest Re Group, Ltd. | 130,619 | 31,015,482 | ||||||
| Swiss Re AG | 607,249 | 57,124,561 | ||||||
| 121,163,584 | ||||||||
| Real Estate (2.81%) | ||||||||
| CBRE Group, Inc., Class A(a) | 928,619 | 36,513,299 | ||||||
| TOTAL FINANCIAL | 372,208,911 | |||||||
| Industrial (5.57%) | ||||||||
| Aerospace & Defense (4.24%) | ||||||||
| Airbus SE | 425,912 | 43,534,852 | ||||||
| United Technologies Corp. | 95,319 | 11,415,404 | ||||||
| 54,950,256 | ||||||||
| Miscellaneous Manufacturing (1.33%) | ||||||||
| Parker-Hannifin Corp. | 94,645 | 17,283,123 | ||||||
| TOTAL INDUSTRIAL | 72,233,379 | |||||||
| Technology (16.83%) | ||||||||
| Semiconductors (7.51%) | ||||||||
| Qorvo, Inc.(a) | 772,721 | 58,579,979 | ||||||
| Skyworks Solutions, Inc. | 340,723 | 38,794,720 | ||||||
| 97,374,699 | ||||||||
| Semi-Annual Report | October 31, 2017 | 11 |
| Statement of Investments | Vulcan Value Partners Fund |
October 31, 2017 (Unaudited)
| Shares | Value (Note 2) | |||||||
| Technology (continued) | ||||||||
| Software (9.32%) | ||||||||
| Oracle Corp. | 2,028,682 | $ | 103,259,914 | |||||
| SS&C Technologies Holdings, Inc. | 440,430 | 17,705,286 | ||||||
| 120,965,200 | ||||||||
| TOTAL TECHNOLOGY | 218,339,899 | |||||||
| TOTAL COMMON STOCKS | ||||||||
| (Cost $1,053,310,655) | 1,263,474,500 | |||||||
| 7-Day Yield | Shares | Value (Note 2) | ||||||||||
| SHORT TERM INVESTMENTS (0.98%) | ||||||||||||
| Money Market Fund (0.98%) | ||||||||||||
| Dreyfus Treasury Prime Cash Management Fund, Institutional Shares | 0.930 | % | 12,675,228 | 12,675,228 | ||||||||
| TOTAL SHORT TERM INVESTMENTS | ||||||||||||
| (Cost $12,675,228) | 12,675,228 | |||||||||||
| TOTAL INVESTMENTS (98.36%) | ||||||||||||
| (Cost $1,065,985,883) | $ | 1,276,149,728 | ||||||||||
| Other Assets In Excess Of Liabilities (1.64%) | 21,235,511 | |||||||||||
| NET ASSETS (100.00%) | $ | 1,297,385,239 | ||||||||||
| (a) | Non-Income Producing Security. |
For Fund compliance purposes, the Fund's industry classifications refer to any one or more of the industry sub-classifications used by one or more widely recognized market indexes or ratings group indexes, and/or as defined by Fund management. This definition may not apply for purposes of this report, which may combine industry sub-classifications for reporting ease. Industries are shown as a percentage of net assets.
See Accompanying Notes to Financial Statements.
| 12 | www.vulcanvaluepartners.com |
| Vulcan Value Partners Small Cap Fund | Statement of Investments |
October 31, 2017 (Unaudited)
| Shares | Value (Note 2) | |||||||
| COMMON STOCKS (80.80%) | ||||||||
| Communications (2.35%) | ||||||||
| Internet (2.35%) | ||||||||
| Criteo SA, Sponsored ADR(a) | 675,225 | $ | 28,204,148 | |||||
| TOTAL COMMUNICATIONS | 28,204,148 | |||||||
| Consumer, Cyclical (17.27%) | ||||||||
| Distribution/Wholesale (1.57%) | ||||||||
| WESCO International, Inc.(a) | 298,523 | 18,851,727 | ||||||
| Home Furnishings (8.22%) | ||||||||
| Howden Joinery Group PLC | 6,613,864 | 36,024,043 | ||||||
| Select Comfort Corp.(a) | 1,930,230 | 62,732,475 | ||||||
| 98,756,518 | ||||||||
| Housewares (1.27%) | ||||||||
| Tupperware Brands Corp. | 259,547 | 15,248,386 | ||||||
| Lodging (3.33%) | ||||||||
| Choice Hotels International, Inc. | 284,663 | 19,855,244 | ||||||
| La Quinta Holdings Inc(a) | 1,141,054 | 20,105,372 | ||||||
| 39,960,616 | ||||||||
| Office Furnishings (1.51%) | ||||||||
| Herman Miller, Inc. | 538,992 | 18,110,131 | ||||||
| Retail (1.37%) | ||||||||
| Halfords Group PLC | 3,747,622 | 16,450,332 | ||||||
| TOTAL CONSUMER, CYCLICAL | 207,377,710 | |||||||
| Consumer, Non-cyclical (11.07%) | ||||||||
| Commercial Services (8.81%) | ||||||||
| Sabre Corp. | 2,937,857 | 57,464,483 | ||||||
| Savills PLC | 1,740,360 | 21,565,928 | ||||||
| Sotheby's(a) | 515,876 | 26,732,694 | ||||||
| 105,763,105 | ||||||||
| Food (2.26%) | ||||||||
| Ebro Foods SA, ADR | 1,126,443 | 27,062,793 | ||||||
| TOTAL CONSUMER, NON-CYCLICAL | 132,825,898 | |||||||
| Semi-Annual Report | October 31, 2017 | 13 |
| Statement of Investments | Vulcan Value Partners Small Cap Fund |
October 31, 2017 (Unaudited)
| Shares | Value (Note 2) | |||||||
| Energy (0.68%) | ||||||||
| Oil & Gas Services (0.68%) | ||||||||
| Thermon Group Holdings, Inc.(a) | 379,164 | $ | 8,155,818 | |||||
| TOTAL ENERGY | 8,155,818 | |||||||
| Financial (24.12%) | ||||||||
| Diversified Financial Services (4.20%) | ||||||||
| Credit Acceptance Corp.(a) | 114,958 | 32,961,907 | ||||||
| Virtus Investment Partners, Inc. | 149,889 | 17,447,080 | ||||||
| 50,408,987 | ||||||||
| Insurance (13.14%) | ||||||||
| Aspen Insurance Holdings, Ltd. | 960,485 | 41,204,807 | ||||||
| Axis Capital Holdings, Ltd. | 961,011 | 52,269,388 | ||||||
| Everest Re Group, Ltd. | 136,405 | 32,389,367 | ||||||
| Navigators Group, Inc. | 550,857 | 31,949,706 | ||||||
| 157,813,268 | ||||||||
| Real Estate (5.69%) | ||||||||
| Jones Lang LaSalle, Inc. | 527,129 | 68,257,934 | ||||||
| REITS (1.09%) | ||||||||
| Outfront Media, Inc. | 559,755 | 13,126,255 | ||||||
| TOTAL FINANCIAL | 289,606,444 | |||||||
| Industrial (20.58%) | ||||||||
| Building Materials (2.60%) | ||||||||
| Ibstock PLC(b)(c) | 9,473,089 | 31,215,177 | ||||||
| Electronics (5.95%) | ||||||||
| Ituran Location and Control, Ltd. | 1,288,897 | 45,755,844 | ||||||
| Woodward, Inc. | 331,816 | 25,659,331 | ||||||
| 71,415,175 | ||||||||
| Industrial Services (2.94%) | ||||||||
| MSC Industrial Direct Co., Inc., Class A | 426,386 | 35,347,399 | ||||||
| Machinery-Diversified (3.00%) | ||||||||
| Concentric AB | 898,259 | 15,075,330 | ||||||
| Lindsay Corp. | 229,318 | 20,996,356 | ||||||
| 36,071,686 | ||||||||
| Miscellaneous Manufacturing (5.04%) | ||||||||
| Actuant Corp., Class A | 515,923 | 13,156,036 | ||||||
| Carlisle Cos., Inc. | 249,713 | 27,425,979 | ||||||
| 14 | www.vulcanvaluepartners.com |
| Vulcan Value Partners Small Cap Fund | Statement of Investments |
October 31, 2017 (Unaudited)
| Shares | Value (Note 2) | |||||||
| Industrial (continued) | ||||||||
| Miscellaneous Manufacturing (continued) | ||||||||
| Crane Co. | 239,430 | $ | 19,901,422 | |||||
| 60,483,437 | ||||||||
| Transportation (1.05%) | ||||||||
| Forward Air Corp. | 218,556 | 12,553,857 | ||||||
| TOTAL INDUSTRIAL | 247,086,731 | |||||||
| Technology (4.73%) | ||||||||
| Software (4.73%) | ||||||||
| ACI Worldwide, Inc.(a) | 2,359,079 | 56,806,622 | ||||||
| TOTAL TECHNOLOGY | 56,806,622 | |||||||
| TOTAL COMMON STOCKS | ||||||||
| (Cost $769,881,448) | 970,063,371 | |||||||
| 7-Day Yield | Shares | Value (Note 2) | ||||||||||
| SHORT TERM INVESTMENTS (20.16%) | ||||||||||||
| Money Market Fund (20.16%) | ||||||||||||
| Dreyfus Treasury Prime Cash Management Fund, Institutional Shares | 0.930 | % | 241,996,715 | 241,996,715 | ||||||||
| TOTAL SHORT TERM INVESTMENTS | ||||||||||||
| (Cost $241,996,715) | 241,996,715 | |||||||||||
| TOTAL INVESTMENTS (100.96%) | ||||||||||||
| (Cost $1,011,878,163) | $ | 1,212,060,086 | ||||||||||
| Liabilities In Excess Of Other Assets (-0.96%) | (11,480,579 | ) | ||||||||||
| NET ASSETS (100.00%) | $ | 1,200,579,507 | ||||||||||
| (a) | Non-Income Producing Security. |
| (b) | Security exempt from registration under Rule 144A of the Securities Act of 1933. These securities may be resold in the ordinary course of business in transactions exempt from registration, normally to qualified institutional buyers. As of October 31, 2017, these securities had a total aggregate market value of $31,215,177 representing 2.60% of net assets. |
| Semi-Annual Report | October 31, 2017 | 15 |
| Statement of Investments | Vulcan Value Partners Small Cap Fund |
October 31, 2017 (Unaudited)
| (c) | Securities were purchased pursuant to Regulation S under the Securities Act of 1933, which exempts from registration securities offered and sold outside of the United States. Such securities cannot be sold by the issuer in the United States without either an effective registration statement filed pursuant to the Securities Act of 1933, or pursuant to an exemption from registration. These securities have been deemed liquid under guidelines approved by the Fund’s Board of Trustees, unless otherwise noted below. As of October 31, 2017, these securities had a total aggregate market value of $31,215,177, representing 2.60% of net assets. |
For Fund compliance purposes, the Fund's industry classifications refer to any one or more of the industry sub-classifications used by one or more widely recognized market indexes or ratings group indexes, and/or as defined by Fund management. This definition may not apply for purposes of this report, which may combine industry sub-classifications for reporting ease. Industries are shown as a percentage of net assets.
See Accompanying Notes to Financial Statements.
| 16 | www.vulcanvaluepartners.com |
Statements of Assets and Liabilities
October 31, 2017 (Unaudited)
| Vulcan Value Partners Fund | Vulcan Value Partners Small Cap Fund | |||||||
| ASSETS: | ||||||||
| Investments, at value | $ | 1,276,149,728 | $ | 1,212,060,086 | ||||
| Cash | – | 12,639,709 | ||||||
| Receivable for investments sold | 26,483,655 | 7,349,799 | ||||||
| Receivable for shares sold | 55,376 | 834,961 | ||||||
| Dividends receivable | 2,355,922 | 531,842 | ||||||
| Other assets | 15,057 | 13,848 | ||||||
| Total assets | 1,305,059,738 | 1,233,430,245 | ||||||
| LIABILITIES: | ||||||||
| Payable for investments purchased | 5,986,632 | 30,697,226 | ||||||
| Payable for shares redeemed | 340,140 | 827,683 | ||||||
| Payable to adviser | 1,139,672 | 1,173,248 | ||||||
| Payable for administration fees | 32,511 | 29,472 | ||||||
| Payable for transfer agency fees | 17,758 | 15,804 | ||||||
| Payable for delegated transfer agent equivalent services fees | 9,469 | 39,482 | ||||||
| Payable for professional fees | 17,845 | 16,972 | ||||||
| Payable for trustee fees and expenses | 6,422 | 6,176 | ||||||
| Payable for principal financial officer fees | 429 | 446 | ||||||
| Payable to ReFlow (Note 2) | 77,082 | – | ||||||
| Accrued expenses and other liabilities | 46,539 | 44,229 | ||||||
| Total liabilities | 7,674,499 | 32,850,738 | ||||||
| NET ASSETS | $ | 1,297,385,239 | $ | 1,200,579,507 | ||||
| NET ASSETS CONSIST OF: | ||||||||
| Paid-in capital (Note 5) | $ | 1,085,408,088 | $ | 955,988,407 | ||||
| Accumulated net investment income | 7,699,145 | 1,035,769 | ||||||
| Accumulated net realized gain/(loss) | (5,875,449 | ) | 43,371,166 | |||||
| Net unrealized appreciation | 210,153,455 | 200,184,165 | ||||||
| NET ASSETS | $ | 1,297,385,239 | $ | 1,200,579,507 | ||||
| INVESTMENTS, AT COST | $ | 1,065,985,883 | $ | 1,011,878,163 | ||||
| PRICING OF SHARES: | ||||||||
| Net Asset Value, offering and redemption price per share | $ | 20.20 | $ | 20.51 | ||||
| Shares of beneficial interest outstanding (unlimited number of shares, no par value common stock authorized) | 64,217,762 | 58,536,305 | ||||||
See Accompanying Notes to Financial Statements.
| Semi-Annual Report | October 31, 2017 | 17 |
Statements of Operations
For the Six Months Ended October 31, 2017 (Unaudited)
| Vulcan Value Partners Fund | Vulcan Value Partners Small Cap Fund | |||||||
| INVESTMENT INCOME: | ||||||||
| Dividends | $ | 9,765,207 | $ | 7,680,219 | ||||
| Foreign taxes withheld | (12,159 | ) | (193,499 | ) | ||||
| Total investment income | 9,753,048 | 7,486,720 | ||||||
| EXPENSES: | ||||||||
| Investment advisory fees (Note 6) | 6,654,859 | 6,899,458 | ||||||
| Administrative fees | 187,123 | 169,309 | ||||||
| Transfer agency fees | 64,649 | 55,737 | ||||||
| Delegated transfer agent equivalent services fees | 68,052 | 140,191 | ||||||
| Professional fees | 22,275 | 21,387 | ||||||
| Custodian fees | 89,577 | 80,519 | ||||||
| Principal financial officer fees | 2,618 | 2,423 | ||||||
| Trustee fees and expenses | 14,387 | 13,307 | ||||||
| Recoupment of previously waived fees | – | 59,895 | ||||||
| ReFlow Fees (Note 2) | 77,082 | – | ||||||
| Other | 37,938 | 37,736 | ||||||
| Total net expenses | 7,218,560 | 7,479,962 | ||||||
| NET INVESTMENT INCOME | 2,534,488 | 6,758 | ||||||
| Net realized loss on investments | (5,809,954 | )(a) | (26,400,797 | ) | ||||
| Net realized gain on foreign currency transactions | 49,102 | 13,948 | ||||||
| Net realized loss | (5,760,852 | ) | (26,386,849 | ) | ||||
| Net change in unrealized appreciation of investments | 63,581,538 | 46,025,020 | ||||||
| Net change in unrealized depreciation on translation of assets and liabilities denominated in foreign currencies | (35,458 | ) | (28,226 | ) | ||||
| Net change in unrealized appreciation | 63,546,080 | 45,996,794 | ||||||
| NET REALIZED AND UNREALIZED GAIN ON INVESTMENTS | 57,785,228 | 19,609,945 | ||||||
| NET INCREASE IN NET ASSETS RESULTING FROM OPERATIONS | $ | 60,319,716 | $ | 19,616,703 | ||||
| (a) | See Note 2 for gain/(loss) on In-Kind transactions. |
See Accompanying Notes to Financial Statements.
| 18 | www.vulcanvaluepartners.com |
| Vulcan Value Partners Fund | Statements of Changes in Net Assets |
For the Six Months Ended October 31, 2017 (Unaudited) | For the Year Ended April 30, 2017 | |||||||
| OPERATIONS: | ||||||||
| Net investment income | $ | 2,534,488 | $ | 13,943,068 | ||||
| Net realized gain/(loss) | (5,760,852 | ) | 89,567,315 | |||||
| Net change in unrealized appreciation | 63,546,080 | 69,313,571 | ||||||
| Net increase in net assets resulting from operations | 60,319,716 | 172,823,954 | ||||||
| DISTRIBUTIONS TO SHAREHOLDERS (Note 3): | ||||||||
| From net investment income | – | (17,969,116 | ) | |||||
| Net decrease in net assets from distributions | – | (17,969,116 | ) | |||||
| SHARE TRANSACTIONS (Note 5): | ||||||||
| Proceeds from sales of shares | 106,483,250 | 162,065,966 | ||||||
| Issued to shareholders in reinvestment of distributions | – | 13,362,586 | ||||||
| Cost of shares redeemed, net of redemption fees | (154,086,383 | ) | (573,695,164 | ) | ||||
| Net decrease from share transactions | (47,603,133 | ) | (398,266,612 | ) | ||||
| Net increase/(decrease) in net assets | 12,716,583 | (243,411,774 | ) | |||||
| NET ASSETS: | ||||||||
| Beginning of year | 1,284,668,656 | 1,528,080,430 | ||||||
| End of period* | $ | 1,297,385,239 | $ | 1,284,668,656 | ||||
| *Includes accumulated net investment income of: | $ | 7,699,145 | $ | 5,164,657 | ||||
See Accompanying Notes to Financial Statements.
| Semi-Annual Report | October 31, 2017 | 19 |
| Statements of Changes in Net Assets | Vulcan Value Partners Small Cap Fund |
For the Six Months Ended October 31, 2017 (Unaudited) | For the Year Ended April 30, 2017 | |||||||
| OPERATIONS: | ||||||||
| Net investment income | $ | 6,758 | $ | 2,130,748 | ||||
| Net realized gain/(loss) | (26,386,849 | ) | 114,144,015 | |||||
| Net change in unrealized appreciation | 45,996,794 | 123,772,371 | ||||||
| Net increase in net assets resulting from operations | 19,616,703 | 240,047,134 | ||||||
| DISTRIBUTIONS TO SHAREHOLDERS (Note 3): | ||||||||
| From net investment income | – | (3,924,578 | ) | |||||
| Net decrease in net assets from distributions | – | (3,924,578 | ) | |||||
| SHARE TRANSACTIONS (Note 5): | ||||||||
| Proceeds from sales of shares | 119,632,280 | 274,573,708 | ||||||
| Issued to shareholders in reinvestment of distributions | – | 2,400,082 | ||||||
| Cost of shares redeemed, net of redemption fees | (194,275,306 | ) | (404,497,434 | ) | ||||
| Net decrease from share transactions | (74,643,026 | ) | (127,523,644 | ) | ||||
| Net increase/(decrease) in net assets | (55,026,323 | ) | 108,598,912 | |||||
| NET ASSETS: | ||||||||
| Beginning of year | 1,255,605,830 | 1,147,006,918 | ||||||
| End of period* | $ | 1,200,579,507 | $ | 1,255,605,830 | ||||
| *Includes accumulated net investment income of: | $ | 1,035,769 | $ | 1,029,011 | ||||
See Accompanying Notes to Financial Statements.
| 20 | www.vulcanvaluepartners.com |
Intentionally Left Blank
Financial Highlights
For a share outstanding throughout the years presented.
| NET ASSET VALUE, BEGINNING OF PERIOD |
| INCOME/(LOSS) FROM OPERATIONS: |
| Net investment income(a) |
| Net realized and unrealized gain/(loss) on investments |
| Total from investment operations |
| LESS DISTRIBUTIONS TO SHAREHOLDERS: |
| From net investment income |
| From net realized gains on investments |
| Total distributions |
| Redemption fees added to paid-in capital |
| Increase/(decrease) in net asset value |
| NET ASSET VALUE, END OF PERIOD |
| Total return |
| RATIOS AND SUPPLEMENTAL DATA: |
| Net assets, end of period (000's) |
| Ratio of expenses to average net assets without fee waivers/reimbursements |
| Ratio of expenses to average net assets including fee waivers/reimbursements |
| Net investment income to average net assets including fee waivers/reimbursements |
| Portfolio turnover rate |
| (a) | Per share numbers have been calculated using the average shares method. |
| (b) | Less than $0.005 per share. |
| (c) | Not annualized. |
| (d) | Annualized. |
See Accompanying Notes to Financial Statements.
| 22 | www.vulcanvaluepartners.com |
Vulcan Value Partners Fund
For the Six Months Ended October 31, 2017 (Unaudited) | For the Year Ended April 30, 2017 | For the Year Ended April 30, 2016 | For the Year Ended April 30, 2015 | For the Year Ended April 30, 2014 | For the Year Ended April 30, 2013 | |||||||||||||||||
| $ | 19.30 | $ | 17.17 | $ | 19.97 | $ | 18.20 | $ | 15.28 | $ | 13.03 | |||||||||||
| 0.04 | 0.18 | 0.20 | 0.22 | 0.14 | 0.15 | |||||||||||||||||
| 0.86 | 2.18 | (1.51 | ) | 2.77 | 3.33 | 2.35 | ||||||||||||||||
| 0.90 | 2.36 | (1.31 | ) | 2.99 | 3.47 | 2.50 | ||||||||||||||||
| – | (0.23 | ) | (0.13 | ) | (0.17 | ) | (0.11 | ) | (0.12 | ) | ||||||||||||
| – | – | (1.36 | ) | (1.05 | ) | (0.44 | ) | (0.13 | ) | |||||||||||||
| – | (0.23 | ) | (1.49 | ) | (1.22 | ) | (0.55 | ) | (0.25 | ) | ||||||||||||
| 0.00 | (b) | 0.00 | (b) | 0.00 | (b) | 0.00 | (b) | 0.00 | (b) | 0.00 | (b) | |||||||||||
| 0.90 | 2.13 | (2.80 | ) | 1.77 | 2.92 | 2.25 | ||||||||||||||||
| $ | 20.20 | $ | 19.30 | $ | 17.17 | $ | 19.97 | $ | 18.20 | $ | 15.28 | |||||||||||
| 4.66 | %(c) | 13.85 | % | (6.49 | %) | 16.61 | % | 22.84 | % | 19.33 | % | |||||||||||
| $ | 1,297,385 | $ | 1,284,669 | $ | 1,528,080 | $ | 1,770,104 | $ | 929,829 | $ | 447,297 | |||||||||||
| 1.08 | %(d) | 1.07 | % | 1.08 | % | 1.08 | % | 1.09 | % | 1.18 | % | |||||||||||
| 1.08 | %(d) | 1.07 | % | 1.08 | % | 1.08 | % | 1.09 | % | 1.18 | % | |||||||||||
| 0.38 | %(d) | 1.01 | % | 1.10 | % | 1.12 | % | 0.80 | % | 1.06 | % | |||||||||||
| 25 | %(c) | 49 | % | 85 | % | 64 | % | 56 | % | 24 | % | |||||||||||
| Semi-Annual Report | October 31, 2017 | 23 |
Financial Highlights
For a share outstanding throughout the years presented.
| NET ASSET VALUE, BEGINNING OF PERIOD |
| INCOME/(LOSS) FROM OPERATIONS: |
| Net investment income/(loss)(a) |
| Net realized and unrealized gain/(loss) on investments |
| Total from investment operations |
| LESS DISTRIBUTIONS TO SHAREHOLDERS: |
| From net investment income |
| From net realized gains on investments |
| Total distributions |
| Redemption fees added to paid-in capital |
| Increase/(decrease) in net asset value |
| NET ASSET VALUE, END OF PERIOD |
| Total return |
| RATIOS AND SUPPLEMENTAL DATA: |
| Net assets, end of period (000's) |
| Ratio of expenses to average net assets without fee waivers/reimbursements |
| Ratio of expenses to average net assets including fee waivers/reimbursements |
| Net investment income/(loss) to average net assets including fee waivers/reimbursements |
| Portfolio turnover rate |
| (a) | Per share numbers have been calculated using the average shares method. |
| (b) | Less than $0.005 per share. |
| (c) | Not annualized. |
| (d) | Annualized. |
| (e) | Less than 0.005% |
See Accompanying Notes to Financial Statements.
| 24 | www.vulcanvaluepartners.com |
Vulcan Value Partners Small Cap Fund
For the Six Months Ended October 31, 2017 (Unaudited) | For the Year Ended April 30, 2017 | For the Year Ended April 30, 2016 | For the Year Ended April 30, 2015 | For the Year Ended April 30, 2014 | For the Year Ended April 30, 2013 | |||||||||||||||||
| $ | 20.16 | $ | 16.58 | $ | 18.61 | $ | 18.74 | $ | 16.97 | $ | 13.18 | |||||||||||
| 0.00 | (b) | 0.03 | 0.10 | 0.10 | (0.01 | ) | 0.03 | |||||||||||||||
| 0.35 | 3.61 | (1.05 | ) | 1.77 | 2.76 | 3.91 | ||||||||||||||||
| 0.35 | 3.64 | (0.95 | ) | 1.87 | 2.75 | 3.94 | ||||||||||||||||
| – | (0.06 | ) | (0.06 | ) | (0.11 | ) | – | (0.06 | ) | |||||||||||||
| – | – | (1.02 | ) | (1.89 | ) | (0.98 | ) | (0.09 | ) | |||||||||||||
| – | (0.06 | ) | (1.08 | ) | (2.00 | ) | (0.98 | ) | (0.15 | ) | ||||||||||||
| 0.00 | (b) | 0.00 | (b) | 0.00 | (b) | 0.00 | (b) | 0.00 | (b) | 0.00 | (b) | |||||||||||
| 0.35 | 3.58 | (2.03 | ) | (0.13 | ) | 1.77 | 3.79 | |||||||||||||||
| $ | 20.51 | $ | 20.16 | $ | 16.58 | $ | 18.61 | $ | 18.74 | $ | 16.97 | |||||||||||
| 1.74 | %(c) | 21.97 | % | (5.04 | %) | 10.74 | % | 16.11 | % | 30.07 | % | |||||||||||
| $ | 1,200,580 | $ | 1,255,606 | $ | 1,147,007 | $ | 1,133,122 | $ | 1,066,246 | $ | 425,152 | |||||||||||
| 1.25 | %(d) | 1.25 | % | 1.25 | % | 1.26 | % | 1.30 | % | 1.38 | % | |||||||||||
| 1.25 | %(d) | 1.25 | % | 1.25 | % | 1.25 | % | 1.25 | % | 1.28 | % | |||||||||||
| 0.00 | %(d)(e) | 0.18 | % | 0.61 | % | 0.56 | % | (0.05 | %) | 0.21 | % | |||||||||||
| 32 | %(c) | 52 | % | 80 | % | 73 | % | 70 | % | 57 | % | |||||||||||
| Semi-Annual Report | October 31, 2017 | 25 |
Notes to Financial Statements
October 31, 2017 (Unaudited)
1. ORGANIZATION
Financial Investors Trust (the “Trust”) is organized as a Delaware statutory trust and is registered as an open-end management investment company under the Investment Company Act of 1940, as amended (“1940 Act”). The Trust consists of multiple separate portfolios or series. This semi-annual report describes the Vulcan Value Partners Fund and Vulcan Value Partners Small Cap Fund (each a “Fund” and collectively, the “Funds”). The Funds seek to achieve long-term capital appreciation.
2. SIGNIFICANT ACCOUNTING POLICIES
The accompanying financial statements were prepared in accordance with accounting principles generally accepted in the United States of America (“U.S. GAAP”), including policies specific to investment companies. The preparation of financial statements in conformity with U.S. GAAP requires management to make certain estimates and assumptions that affect the reported amounts of assets and liabilities and disclosures of contingent assets and liabilities at the date of the financial statements and the reported amounts of revenue and expenses during the period. Actual results could differ from those estimates. The Funds are considered an investment company for financial reporting purposes under U.S. GAAP. The following is a summary of significant accounting policies consistently followed by the Funds in preparation of their financial statements.
Investment Valuation: The Funds generally value their securities based on market prices determined at the close of regular trading on the New York Stock Exchange (“NYSE”), normally 4:00 p.m. Eastern Time, on each day the NYSE is open for trading.
For equity securities and mutual funds that are traded on an exchange, the market price is usually the closing sale or official closing price on that exchange. In the case of equity securities not traded on an exchange, or if such closing prices are not otherwise available, the securities are valued at the mean of the most recent bid and ask prices on such day. Redeemable securities issued by open-end registered investment companies are valued at the investment company’s applicable net asset value, with the exception of exchange-traded open-end investment companies, which are priced as equity securities.
The market price for debt obligations is generally the quote supplied by an independent third-party pricing service approved by the Board of Trustees (the “Board”), which may use a matrix, formula or other objective method that takes into consideration quotations from dealers, market transactions in comparable investments, market indices and yield curves. If vendors are unable to supply a quote, or if the quote supplied is deemed to be unreliable, the market price may be determined using quotations received from one or more broker–dealers that make a market in the security.
Equity securities that are primarily traded on foreign securities exchanges are valued at the preceding closing values of such securities on their respective exchanges, except when an occurrence subsequent to the time a value was so established is likely to have changed such value. In such an event, the fair values of those securities are determined in good faith through consideration of other factors in accordance with procedures established by and under the general supervision of the Board.
| 26 | www.vulcanvaluepartners.com |
Notes to Financial Statements
October 31, 2017 (Unaudited)
When such prices or quotations are not available, or when Vulcan Value Partners, LLC (the “Adviser”) believes that they are unreliable, securities may be priced using fair value procedures approved by the Board.
Fair Value Measurements: A three-tier hierarchy has been established to classify fair value measurements for disclosure purposes. Inputs refer broadly to the assumptions that market participants would use in pricing the asset or liability, including assumptions about risk. Inputs may be observable or unobservable. Observable inputs are inputs that reflect the assumptions market participants would use in pricing the asset or liability that are developed based on market data obtained from sources independent of the reporting entity. Unobservable inputs are inputs that reflect the reporting entity’s own assumptions about the assumptions market participants would use in pricing the asset or liability that are developed based on the best information available. Various inputs are used in determining the value of each Fund’s investments as of the reporting period end. The designated input levels are not necessarily an indication of the risk or liquidity associated with these investments. These inputs are categorized in the following hierarchy under applicable financial accounting standards:
| Level 1 – | Unadjusted quoted prices in active markets for identical investments, unrestricted assets or liabilities that the Funds have the ability to access at the measurement date; |
| Level 2 – | Quoted prices which are not active, quoted prices for similar assets or liabilities in active markets or inputs other than quoted prices that are observable (either directly or indirectly) for substantially the full term of the asset or liability; and |
| Level 3 – | Significant unobservable prices or inputs (including the Funds’ own assumptions in determining the fair value of investments) where there is little or no market activity for the asset or liability at the measurement date. |
The following is a summary of each input used to value each Fund’s investments as of October 31, 2017.
Vulcan Value Partners Fund:
| Investments in Securities at Value | Level 1 - Unadjusted Quoted Prices | Level 2 - Other Significant Observable Inputs | Level 3 - Significant Unobservable Inputs | Total | ||||||||||||
| Common Stocks(a) | $ | 1,263,474,500 | $ | – | $ | – | $ | 1,263,474,500 | ||||||||
| Short Term Investments | 12,675,228 | – | – | 12,675,228 | ||||||||||||
| TOTAL | $ | 1,276,149,728 | $ | – | $ | – | $ | 1,276,149,728 | ||||||||
Vulcan Value Partners Small Cap Fund:
| Investments in Securities at Value | Level 1 - Unadjusted Quoted Prices | Level 2 - Other Significant Observable Inputs | Level 3 - Significant Unobservable Inputs | Total | ||||||||||||
| Common Stocks(a) | $ | 970,063,371 | $ | – | $ | – | $ | 970,063,371 | ||||||||
| Short Term Investments | 241,996,715 | – | – | 241,996,715 | ||||||||||||
| TOTAL | $ | 1,212,060,086 | $ | – | $ | – | $ | 1,212,060,086 | ||||||||
| (a) | For detailed descriptions, see the accompanying Statements of Investments. |
| Semi-Annual Report | October 31, 2017 | 27 |
Notes to Financial Statements
October 31, 2017 (Unaudited)
The Funds recognize transfers between levels as of the end of period. For the six months ended October 31, 2017, the Funds did not have any transfers between Level 1 and Level 2. For the six months ended October 31, 2017, the Funds did not have any securities that used significant unobservable inputs (Level 3) in determining fair value.
Investment Transactions and Investment Income: Investment transactions are accounted for on the date the investments are purchased or sold (trade date). Realized gains and losses from investment transactions are reported on an identified cost basis, which is the same basis the Funds use for federal income tax purposes. Interest income, which includes accretion of discounts and amortization of premiums, is accrued and recorded as earned. Dividend income is recognized on the ex-dividend date or for certain foreign securities, as soon as information is available to the Funds. All of the realized and unrealized gains and losses and net investment income, are allocated daily to each class in proportion to its average daily net assets.
ReFlow Liquidity Program: Each Fund may participate in the ReFlow liquidity program, which is designed to provide an alternative liquidity source for mutual funds experiencing net redemptions of their shares. Pursuant to the program, ReFlow Fund, LLC (“ReFlow”) provides participating mutual funds with a source of cash to meet net shareholder redemptions by standing ready each business day to purchase fund shares up to the value of the net shares redeemed by other shareholders that are to settle the next business day. ReFlow will purchase shares of the Fund at net asset value and will not be subject to any investment minimums. Following purchases of Fund shares, ReFlow then generally redeems those shares when the Fund experiences net subscriptions, at the end of a maximum holding period determined by ReFlow (currently 28 days), or at other times as the Fund may request. ReFlow may choose to redeem its position in the Fund with an in-kind transfer of securities, instead of cash, enabling the Fund to avoid a realization of capital gains on the securities it transfers. ReFlow will not be subject to any short-term redemption fees. While ReFlow holds Fund shares, it will have the same rights and privileges with respect to those shares as any other shareholder. For use of the ReFlow service, a Fund pays a fee to ReFlow each time it purchases Fund shares, calculated by applying to the purchase amount a fee rate determined through an automated daily auction among participating mutual funds. The current minimum fee rate is 0.20% of the value of the Fund shares purchased by ReFlow although the Fund may submit a bid at a higher fee rate if it determines that doing so is in the best interest of Fund shareholders. In accordance with federal securities laws, ReFlow is prohibited from acquiring more than 3% of the outstanding voting securities of a Fund. There is no assurance that ReFlow will have sufficient funds available to meet the Funds’ liquidity needs on a particular day. During the six months ended October 31, 2017, the Funds participated in ReFlow. Fees associated with ReFlow are disclosed in the Statements of Operations.
Real Estate Investment Trusts (“REITs”): The Funds may invest a portion of their assets in REITs and are subject to certain risks associated with direct investment in REITs. REITs may be affected by changes in the value of their underlying properties and by defaults by borrowers or tenants. REITs depend generally on their ability to generate cash flow to make distributions to shareowners, and certain REITs have self-liquidation provisions by which mortgages held may be paid in full and distributions of capital returns may be made at any time. In addition, the performance of a REIT may be affected by its failure to qualify for tax-free pass-through of income under the Internal Revenue Code of 1986, as amended (the “Code”), or its failure to maintain exemption from registration under the 1940 Act. A Fund’s investments in REITs may result in such
| 28 | www.vulcanvaluepartners.com |
Notes to Financial Statements
October 31, 2017 (Unaudited)
Fund’s receipt of cash in excess of the REITs’ earnings. If the Fund receives such distributions all or a portion of these distributions will constitute a return of capital to such Fund. Receiving a return of capital distribution from REITs will reduce the amount of income available to be distributed to Fund shareholders. Income from REITs generally will not be eligible for treatment as qualified dividend income. As the final character of the distributions is not known until reported by the REITs on their 1099s, the Funds utilize an average of the prior year’s reallocation information as an estimate for the current year character of distributions.
Foreign Securities: The Funds may directly purchase securities of foreign issuers. Investing in securities of foreign issuers involves special risks not typically associated with investing in securities of U.S. issuers. The risks include possible reevaluation of currencies, the inability to repatriate foreign currency, less complete financial information about companies and possible future adverse political and economic developments. Moreover, securities of many foreign issuers and their markets may be less liquid and their prices more volatile than those of securities of comparable U.S. issuers.
Foreign Currency Translation: The books and records of the Funds are maintained in U.S. dollars. Investment valuations and other assets and liabilities initially expressed in foreign currencies are converted each business day into U.S. dollars based upon current exchange rates. Prevailing foreign exchange rates may generally be obtained at the close of the NYSE (normally, 4:00 p.m. Eastern Time). The portion of realized and unrealized gains or losses on investments due to fluctuations in foreign currency exchange rates is not separately disclosed and is included in realized and unrealized gains or losses on investments, when applicable.
In-Kind Redemptions: On October 30, 2017, the Vulcan Value Partners Fund distributed portfolio securities rather than cash as payment for certain redemptions of fund shares (in-kind redemptions). The proceeds for the in-kind redemptions, which are included in Redemption of shares in the Statements of Changes in Net Assets, were $37,345,537 and represented 2.88% of the Fund’s net assets on October 30, 2017. For financial reporting purposes, the Fund recognized gains on the in-kind redemptions in the amount of $18,903,352. For tax purposes, the gains are not recognized.
Trust Expenses: Some expenses of the Trust can be directly attributed to the Funds. Expenses which cannot be directly attributed are apportioned among all funds in the Trust based on average net assets of each fund.
Fund Expenses: Expenses that are specific to a Fund are charged directly to that Fund.
Federal Income Taxes: Each Fund complies with the requirements under Subchapter M of the Internal Revenue Code of 1986, as amended, applicable to regulated investment companies and intends to distribute substantially all of its net taxable income and net capital gains, if any, each year so that it will not be subject to excise tax on undistributed income and gains. The Funds are not subject to income taxes to the extent such distributions are made.
As of and during the six months ended October 31, 2017, the Funds did not have a liability for any unrecognized tax benefits. The Funds file U.S. federal, state, and local tax returns as required. The Fund’s tax returns are subject to examination by the relevant tax authorities until expiration of the
| Semi-Annual Report | October 31, 2017 | 29 |
Notes to Financial Statements
October 31, 2017 (Unaudited)
applicable statute of limitations, which is generally three years after the filing of the tax return for federal purposes and four years for most state returns. Tax returns for open years have incorporated no uncertain tax positions that require a provision for income taxes.
Distributions to Shareholders: Each Fund normally pays dividends and distributes capital gains, if any, on an annual basis. Income dividend distributions are derived from dividends and other income each Fund receives from its investments, including short-term capital gains. Long term capital gain distributions are derived from gains realized when each Fund sells a security it has owned for more than a year. Each Fund may make additional distributions and dividends at other times if the portfolio manager believes doing so may be necessary for each Fund to avoid or reduce taxes.
3. TAX BASIS INFORMATION
Tax Basis of Investments: As of October 31, 2017, the aggregate cost of investments, gross unrealized appreciation/ (depreciation) and net unrealized appreciation for federal tax purposes was as follows:
| Vulcan Value Partners Fund | Vulcan Value Partners Small Cap Fund | |||||||
| Gross appreciation (excess of value over tax cost) | $ | 243,130,474 | $ | 209,829,435 | ||||
| Gross depreciation (excess of tax cost over value) | (42,702,855 | ) | (10,273,119 | ) | ||||
| Net unrealized appreciation | $ | 200,427,619 | $ | 199,556,316 | ||||
| Cost of investments for income tax purposes | $ | 1,063,046,881 | $ | 770,507,055 | ||||
Tax Basis of Distributions to Shareholders: The character of distributions made during the year from net investment income or net realized gains may differ from its ultimate characterization for federal income tax purposes. Also, due to the timing of dividend distributions, the fiscal year in which amounts are distributed may differ from the fiscal year in which the income or realized gain were recorded by each Fund.
The tax character of distributions paid by the Funds for the fiscal year ended April 30, 2017 were as follows:
| Ordinary Income | Long-Term Capital Gain | ||||||||
| 2017 | |||||||||
| Vulcan Value Partners Fund | $ | 17,969,116 | $ | – | |||||
| Vulcan Value Partners Small Cap Fund | 3,924,578 | – | |||||||
| 30 | www.vulcanvaluepartners.com |
Notes to Financial Statements
October 31, 2017 (Unaudited)
The amounts and characteristics of tax basis distributions and composition of distributable earnings/(accumulated losses) are finalized at fiscal year-end. Accordingly, tax basis balances have not been determined as of October 31, 2017.
4. SECURITIES TRANSACTIONS
The cost of purchases and proceeds from sales of securities (excluding short-term securities) during the six months ended October 31, 2017 were as follows:
| Fund | Purchases of Securities | Proceeds From Sales of Securities | ||||||
| Vulcan Value Partners Fund | $ | 307,490,557 | $ | 347,414,476 | ||||
| Vulcan Value Partners Small Cap Fund | 313,128,206 | 418,751,719 | ||||||
5. SHARES OF BENEFICIAL INTEREST
The capitalization of the Trust consists of an unlimited number of shares of beneficial interest with no par value per share. Holders of the shares of the Funds of the Trust have one vote for each share held and a proportionate fraction of a vote for each fractional share. All shares issued and outstanding are fully paid and are transferable and redeemable at the option of the shareholder. Purchasers of the shares do not have any obligation to make payments to the Trust or its creditors solely by reason of the purchasers’ ownership of the shares. Shares have no pre-emptive rights.
Shares redeemed within 90 days of purchase may incur a 2% short-term redemption fee deducted from the redemption amount. The Vulcan Value Partners Fund and the Vulcan Value Partners Small Cap Fund retained $1,881 and $5,900, respectively, for the six months ended October 31, 2017, and $34,938 and $32,740, respectively, for the year ended April 30, 2017, which is reflected in the “Cost of shares redeemed, net of redemption fees” in the Statements of Changes in Net Assets.
Transactions in shares of capital stock for the dates listed below were as follows:
Vulcan Value Partners Fund
For the Six Months Ended October 31, 2017 (Unaudited) | For the Year Ended April 30, 2017 | |||||||
| Shares Sold | 5,350,046 | 9,220,974 | ||||||
| Shares Issued in Reinvestment of Dividends | – | 737,043 | ||||||
| Less Shares Redeemed | (7,704,737 | ) | (32,359,605 | ) | ||||
| Net Decrease | (2,354,691 | ) | (22,401,588 | ) | ||||
| Semi-Annual Report | October 31, 2017 | 31 |
Notes to Financial Statements
October 31, 2017 (Unaudited)
Vulcan Value Partners Small Cap Fund
| For the Six Months Ended October 31, 2017 (Unaudited) | For the Year Ended April 30, 2017 | |||||||
| Shares Sold | 6,007,076 | 15,271,480 | ||||||
| Shares Issued in Reinvestment of Dividends | – | 125,989 | ||||||
| Less Shares Redeemed | (9,758,714 | ) | (22,299,640 | ) | ||||
| Net Decrease | (3,751,638 | ) | (6,902,171 | ) | ||||
6. MANAGEMENT AND RELATED-PARTY TRANSACTIONS
The Adviser, subject to the authority of the Board, is responsible for the overall management and administration of the Funds’ business affairs. The Adviser manages the investments of the Funds in accordance with each Fund’s investment objective, policies and limitations and investment guidelines established jointly by the Adviser and the Board. Pursuant to the Investment Advisory Agreement (the “Advisory Agreement”), the Funds pay the Adviser an annual management fee of 1.00% and 1.15% for Vulcan Value Partners Fund and Vulcan Value Partners Small Cap Fund, respectively, based on each Fund’s average daily net assets. The management fee is paid on a monthly basis.
The Adviser has contractually agreed to limit the Fund’s total annual fund operating expenses (exclusive of acquired fund fees and expenses, brokerage expenses, interest expense, taxes and extraordinary expenses) to 1.25% of each Fund’s average daily net assets. This agreement (the “Expense Agreement”) is in effect from September 1, 2017 through August 31, 2018. The prior Expense Agreement was in effect from September 1, 2016 through August 31, 2017. The Adviser will be permitted to recover, on a class-by-class basis, expenses it has borne through the Expense Agreement to the extent that a Fund’s expenses in later periods fall below the expense cap in effect at the time of waiver or reimbursement. Notwithstanding the foregoing, the Funds will not be obligated to pay any such fees and expenses more than three years after the date of the waiver or reimbursement. The Adviser may not discontinue or modify this waiver prior to August 31, 2018 without the approval by the Funds’ Board.
For the six months ended October 31, 2017, the fee waivers and/or reimbursements and recoupment amounts were as follows:
| Fund | Fees Waived/Reimbursed By Adviser | Recoupment of Previously Waived Fees by Adviser | ||||||
| Vulcan Value Partners Fund | $ | – | $ | – | ||||
| Vulcan Value Partners Small Cap Fund | – | 59,895 | ||||||
As of October 31, 2017, the Funds do not have any balances of recoupable expenses.
| 32 | www.vulcanvaluepartners.com |
Notes to Financial Statements
October 31, 2017 (Unaudited)
Fund Administrator Fees and Expenses: ALPS Fund Services, Inc. (“ALPS”) serves as administrator to the Funds and the Funds have agreed to pay expenses incurred in connection with their administrative activities. Pursuant to an Administration Agreement, ALPS provides operational services to the Funds including, but not limited to fund accounting and fund administration and generally assist in each Fund’s operations. Officers of the Trust are employees of ALPS. The Funds’ administration fee is accrued on a daily basis and paid monthly. Administration fees paid by the Funds for the six months ended October 31, 2017 are disclosed in the Statements of Operations.
ALPS is reimbursed by the Funds for certain out-of-pocket expenses.
Transfer Agent: ALPS serves as transfer, dividend paying and shareholder servicing agent for the Funds. ALPS receives an annual minimum fee, a fee based upon the number of shareholder accounts, and is also reimbursed by the Funds for certain out-of-pocket expenses. Transfer agent fees paid by the Funds for the six months ended October 31, 2017 are disclosed in the Statements of Operations.
Compliance Services: ALPS provides services that assist the Trust’s chief compliance officer in monitoring and testing the policies and procedures of the Trust in conjunction with requirements under Rule 38a-1 under the 1940 Act and receives an annual base fee. ALPS is reimbursed for certain out-of-pocket expenses by the Funds. Vulcan pays this fee on behalf of the Funds.
Principal Financial Officer: ALPS Fund Services, Inc. (“ALPS” and the “Administrator”) (an affiliate of ADI) receives an annual fee for providing principal financial officer services to the Funds. Principal financial officer fees paid by the Fund for the six months ended October 31, 2017 are disclosed in the Statements of Operations.
Distributor: ALPS Distributors, Inc. (“ADI” or the “Distributor”) (an affiliate of ALPS Fund Services, Inc.) acts as the distributor of each Fund’s shares pursuant to a Distribution Agreement with the Trust. Shares are sold on a continuous basis by ADI as agent for the Funds, and ADI has agreed to use its best efforts to solicit orders for the sale of each Fund’s shares, although it is not obliged to sell any particular amount of shares. ADI is not entitled to any compensation for its services as Distributor. ADI is registered as a broker-dealer with the U.S. Securities and Exchange Commission. Certain intermediaries may charge networking, omnibus account or other administrative fees with respect to transactions in shares of the Funds. Transactions may be processed through the National Securities Clearing Corporation (“NSCC”) or similar systems or processed on a manual basis. These fees are paid by the Funds to the Distributor, which uses such fees to reimburse intermediaries. In the event an intermediary receiving payments from the Distributor on behalf of the Funds converts from a networking structure to an omnibus account structure or otherwise experiences increased costs, fees borne by the Funds may increase. Fees are disclosed on the Statements of Operations as “Delegated transfer agent equivalent services fees”.
| Semi-Annual Report | October 31, 2017 | 33 |
Notes to Financial Statements
October 31, 2017 (Unaudited)
7. INDEMNIFICATIONS
Under the Trust’s organizational documents, its Officers and Trustees are indemnified against certain liability arising out of the performance of their duties to the Trust. Additionally, in the normal course of business, the Trust enters into contracts with service providers that may contain general indemnification clauses which may permit indemnification to the extent permissible under applicable law. The Trust’s maximum exposure under these arrangements is unknown, as this would involve future claims that may be made against the Trust that have not yet occurred.
| 34 | www.vulcanvaluepartners.com |
Additional Information
October 31, 2017 (Unaudited)
1. FUND HOLDINGS
The Funds files their complete schedule of portfolio holdings with the Securities and Exchange Commission (the “SEC”) for the first and third quarters of each fiscal year on Form N-Q within 60 days after the end of the period. Copies of the Funds’ Form N-Q are available without charge on the SEC website at http://www.sec.gov. You may also review and copy the Form N-Q at the SEC’s Public Reference Room in Washington, DC. For more information about the operation of the Public Reference Room, please call the SEC at 1-800-SEC-0330.
2. FUND PROXY VOTING POLICIES, PROCEDURES AND SUMMARIES
The Funds’ policies and procedures used in determining how to vote proxies and information regarding how the Fund voted proxies relating to portfolio securities during the most recent prior 12-month period ending June 30 are available without charge, (1) upon request, by calling (toll-free) (866)-759-5679 and (2) on the SEC’s website at http://www.sec.gov.
| Semi-Annual Report | October 31, 2017 | 35 |
This page left intentionally blank.

| Item 2. | Code of Ethics. |
Not applicable to this Report.
| Item 3. | Audit Committee Financial Expert. |
Not applicable to this Report.
| Item 4. | Principal Accountant Fees and Services. |
Not applicable to this Report.
| Item 5. | Audit Committee of Listed Registrants. |
Not applicable to the Registrant.
| Item 6. | Investments. |
| (a) | Schedule of Investments is included as part of the Reports to Stockholders filed under Item 1 of this Form N-CSR. |
| (b) | Not applicable. |
| Item 7. | Disclosure of Proxy Voting Policies and Procedures for Closed-End Management Investment Companies. |
Not applicable to the Registrant.
| Item 8. | Portfolio Managers of Closed-End Management Investment Companies. |
Not applicable to the Registrant.
| Item 9. | Purchases of Equity Securities by Closed-End Management Investment Company and Affiliated Purchasers. |
Not applicable to the Registrant.
| Item 10. | Submission of Matters to a Vote of Security Holders. |
There have been no material changes to the procedures by which shareholders may recommend nominees to the Registrant’s Board of Trustees, where those changes were implemented after the Registrant last provided disclosure in response to the requirements of Item 407(c)(2)(iv) of Regulation S-K, or this Item.
| Item 11. | Controls and Procedures. |
| (a) | The Registrant’s principal executive officer and principal financial officer have concluded that the Registrant’s disclosure controls and procedures (as defined in Rule 30a-3(c) under the Investment Company Act of 1940, as amended) are effective based on their evaluation of these controls and procedures as of a date within 90 days of the filing date of this report. |
| (b) | There was no change in the Registrant’s internal control over financial reporting (as defined in Rule 30a-3(d) under the Investment Company Act of 1940, as amended) that occurred during the period covered by this report that has materially affected, or is reasonably likely to materially affect, the Registrant’s internal control over financial reporting. |
| Item 12. | Disclosure of Securities Lending Activities for Closed-End Management Investment Companies. |
Not applicable to the Registrant.
| Item 13. | Exhibits. |
| (a)(1) | Not applicable to this Report. |
| (a)(2) | The certifications required by Rule 30a-2(a) of the Investment Company Act of 1940, as amended, and Section 302 of the Sarbanes-Oxley Act of 2002 are attached hereto as Exhibit 99.Cert. |
| (a)(3) | Not applicable to the Registrant. |
| (a)(4) | Not applicable to the Registrant. |
| (b) | The certifications by the Registrant’s principal executive officer and principal financial officer, as required by Rule 30a-2(b) of the Investment Company Act of 1940, as amended, and Section 906 of the Sarbanes-Oxley Act of 2002 are attached hereto as Exhibit 99.906Cert. |
SIGNATURES
Pursuant to the requirements of the Securities Exchange Act of 1934 and the Investment Company Act of 1940, the Registrant has duly caused this report to be signed on its behalf by the undersigned, thereunto duly authorized.
FINANCIAL INVESTORS TRUST
| By: | /s/ Edmund J. Burke | |
| Edmund J. Burke (Principal Executive Officer) | ||
| President | ||
| Date: | January 8, 2018 |
Pursuant to the requirements of the Securities Exchange Act of 1934 and the Investment Company Act of 1940, this report has been signed below by the following persons on behalf of the Registrant and in the capacities and on the dates indicated.
FINANCIAL INVESTORS TRUST
| By: | /s/ Edmund J. Burke | |
| Edmund J. Burke (Principal Executive Officer) | ||
| President | ||
| Date: | January 8, 2018 | |
| By: | /s/ Kimberly R. Storms | |
| Kimberly R. Storms (Principal Financial Officer) | ||
| Treasurer | ||
| Date: | January 8, 2018 |