UNITED STATES
SECURITIES AND EXCHANGE COMMISSION
Washington, D.C. 20549
FORM N-CSR
CERTIFIED SHAREHOLDER REPORT OF REGISTERED
MANAGEMENT INVESTMENT COMPANIES
Investment Company Act file number: 811-08194
FINANCIAL INVESTORS TRUST
(Exact name of Registrant as specified in charter)
1290 Broadway, Suite 1100, Denver, Colorado 80203
(Address of principal executive offices) (Zip code)
Karen Gilomen, Esq., Secretary
Financial Investors Trust
1290 Broadway, Suite 1100
Denver, Colorado 80203
(Name and address of agent for service)
Registrant’s telephone number, including area code: 303-623-2577
Date of fiscal year end: April 30
Date of reporting period: October 31, 2018
| Item 1. | Reports to Stockholders. |

TABLE OF CONTENTS
| PAGE | |
| Manager Commentary | |
| Aspen Managed Futures Strategy Fund | 1 |
| Aspen Portfolio Strategy Fund | 3 |
| Performance Update | |
| Aspen Managed Futures Strategy Fund | 5 |
| Aspen Portfolio Strategy Fund | 7 |
| Consolidated Disclosure of Fund Expenses | 9 |
| Consolidated Schedule of Investments | |
| Aspen Managed Futures Strategy Fund | 10 |
| Aspen Portfolio Strategy Fund | 12 |
| Consolidated Statements of Assets & Liabilities | 14 |
| Consolidated Statements of Operations | 15 |
| Consolidated Statements of Changes in Net Assets | |
| Aspen Managed Futures Strategy Fund | 16 |
| Aspen Portfolio Strategy Fund | 17 |
| Consolidated Financial Highlights | |
| Aspen Managed Futures Strategy Fund | 18 |
| Aspen Portfolio Strategy Fund | 20 |
| Notes to Consolidated Financial Statements | 22 |
| Additional Information | 33 |
| Privacy Policy | 34 |
Beginning on January 1, 2021, as permitted by regulations adopted by the U.S. Securities and Exchange Commission, paper copies of the Fund’s annual and semi-annual shareholder reports will no longer be sent by mail, unless you specifically request paper copies of the reports. Instead, the reports will be made available on the Funds’ website at www.aspenfuturesfund.com and you will be notified by mail each time a report is posted and provided with a website link to access the report.
Beginning on January 1, 2019, you may, notwithstanding the availability of shareholder reports online, elect to receive all future shareholder reports in paper free of charge. If you invest through a financial intermediary, you can contact your financial intermediary to request that you continue to receive paper copies of your shareholder reports. If you invest directly with the Funds, you can call 1.855.845.9444 to let the Funds know you wish to continue receiving paper copies of your shareholder reports.
If you already elected to receive shareholder reports electronically, you will not be affected by this change and you need not take any action. You may elect to receive shareholder reports and other communications from the Funds electronically anytime by contacting your financial intermediary (such as a broker-dealer or bank) or, if you are a direct investor, by enrolling at www.aspenfuturesfund.com.
| Aspen Managed Futures Strategy Fund | Manager Commentary |
October 31, 2018 (Unaudited)
November 5, 2018
Performance Results
For the six-month period ending October 31, 2018, the Class I shares of the Aspen Managed Futures Strategy Fund (the “Fund”) posted a return of -1.25%. Per its mandate, the Fund maintained tight correlation to the Aspen Managed Futures Beta Index (“Aspen MFBI” or the “Index”). The Index uses a combination of trend and counter-trend algorithms to determine exposures to 23 futures markets. In following the Index, the Fund can take long or short positions in each of the eligible markets. A long position in a futures market may profit if the price of the futures contract rises, whereas a short position may profit if the price of the futures contract falls.
The BTOP50 Index, a managed futures benchmark, returned -2.77% over the same period. It is important to note that there are substantive differences between the Fund and this index in terms of construction. There were no significant changes to the Fund strategy during this period.
Explanation of Fund Performance
Over most of this six-month period, backdrop market volatility was very low, and that was reflected in low monthly volatility for the Fund itself. Every monthly return for the Fund in the six-month period was less than 1% in magnitude, and June, July, and August produced a remarkable three-month stretch of 0.00% Fund returns each month.
While low-volatility market environments are not typically auspicious for trend-following models like the Aspen MFBI, they do not generally produce significant losses either. The low-vol backdrop that prevailed from May through September fit this mold, as the Fund’s minor losses aggregated to just -0.44%, via a -0.89% return in May, a +0.45% return in September, and the 0.00% returns in each of the three months in between. Losses from trend following were mitigated by gains in the counter-trend model.
In October, the market backdrop changed dramatically, in a manner reminiscent of the activity in February, 2018. As in February, U.S. equity markets in October reversed from all-time highs into a rapidly developing correction (i.e., a drop of greater than 10% in major indices). Global equity markets participated in the decline. Short positions in European equity futures markets mitigated the resulting losses, but could not overcome them entirely. By mid-month, the trend model was net short equities.
Initially the drop was accompanied by rising global interest rates, which enabled gains from the trend model’s short fixed income positioning (bond prices generally fall as interest rates rise), but as the correction deepened, markets assumed more traditional “risk-off” behavior, such that model losses from rising bond prices offset gains from the recently established net short equity positioning. An equity rally at the end of the month pulled U.S. equities out of their correction; on those days the short fixed income trends mitigated losses from the short equity trends. In the end, the Fund returned -0.88% for the month of October.
Another notable similarity to February is that both months exemplified the common tendency for Aspen’s model to outperform the managed futures universe in particularly difficult backdrops for equities. The industry benchmark BTOP50 Index’s return for the month of October was -2.44%, so October returns produced the entire differential between the Fund and the benchmark over the reporting period.
Outlook
Despite the low volatility that has prevailed for much of the year, 2018 has provided a couple of glimpses indicating markets may be more likely to demonstrate increased volatility given an inducement to do so. Historically, persistently elevated volatility has tended to provide a relatively favorable backdrop for trend following. However, given the strength of the domestic and global economies, a full-blown equity bear market would come as a surprise at present (though of course not an impossible surprise), and for the past several years, the only circumstances under which even historically “normal” levels of volatility have prevailed is during brief periods of equity stress. As October demonstrates, short-lived volatility spikes are typically not helpful to a trend system, since they are usually sparked by a change of direction for risk assets, and they often end just as rapidly with another change of direction (and both such changes are essentially anti-trend by nature). To catalyze improved fortunes for trend following models, we continue to look for more sustained market volatility. With less accommodative monetary policy and an economy where a decade of recovery may be approaching its peak, a return to more normalized volatility appears increasingly likely, though of course timing is always difficult to gauge.
Sincerely,
Bryan R. Fisher
William Ware Bush
Aspen Partners, Ltd.
Performance data quoted represents past performance. Past performance does not guarantee future results. Investment return and principal value of an investment will fluctuate so that an investor’s shares, when sold or redeemed, may be worth more or less than the original cost. Current performance data may be higher or lower than actual data quoted. For the most current month-end performance data please call 1-855-845-9444.
| Semi-Annual Report | October 31, 2018 | 1 |
| Aspen Managed Futures Strategy Fund | Manager Commentary |
October 31, 2018 (Unaudited)
The views of Aspen Partners, Ltd. and information discussed in this commentary are as of the date of publication, are subject to change, and may not reflect the writers’ current views. The views expressed are those of the Fund’s adviser only, and represent an assessment of market conditions at a specific point in time, are opinions only and should not be relied upon as investment advice regarding a particular investment or markets in general. Such information does not constitute a recommendation to buy or sell specific securities or investment vehicles. It should not be assumed that any investment will be profitable or will equal the performance of the portfolios or any securities or any sectors mentioned in this letter. The subject matter contained in this letter has been derived from several sources believed to be reliable and accurate at the time of compilation. Neither Aspen Partners Ltd. nor the Fund accepts any liability for losses either direct or consequential caused by the use of this information.
The Aspen Managed Futures Strategy Fund is distributed by ALPS Distributors, Inc.
The Fund is subject to investment risks, including possible loss of the principal amount invested and therefore is not suitable for all investors. The Fund may not achieve its objectives.
Diversification does not eliminate the risk of experiencing investment losses.
Correlation - a statistical measure of how two securities or portfolios move in relation to each other.
Aspen Managed Futures Beta Index (Aspen MFBI) is constructed using a quantitative, rules-based model designed to replicate the trend following and counter-trend exposure of futures markets by allocating assets to liquid futures contracts of certain financial and commodities futures markets. The Index therefore seeks to reflect the performance of strategies and exposures common to a broad universe of futures markets, i.e., managed futures beta. The Index is not actively managed and does not reflect any deduction for fees, expenses or taxes. An investor cannot invest directly in the Index.
Barclay BTOP50 Index is an index of the largest investable CTA programs as measured by assets under management. The index is not actively managed and does not reflect any deduction for fees, expenses or taxes. An investor may not invest directly into the Index.
2
| Aspen Portfolio Strategy Fund | Manager Commentary |
October 31, 2018 (Unaudited)
November 5, 2018
Performance Results
For the six-month period ending October 31, 2018, the Class I shares of the Aspen Portfolio Strategy Fund (the “Fund”) posted a return of -1.36%. Per its mandate, the Fund traded the Aspen Portfolio Strategy, which combines full exposure to US large-cap equities (the “Equity Strategy”) with full exposure to Aspen’s proprietary diversified trend following program (the “Futures Strategy”). To capture the Equity Strategy, the Fund can employ a variety of vehicles, including exchange-traded funds and futures contracts. To capture the Futures Strategy, the Fund can take long or short positions in each eligible futures market. A long position in a futures market may profit if the price of the futures contract rises, whereas a short position may profit if the price of the futures contract falls.
The S&P 500® Index, a US large-cap equity benchmark, returned +3.40%. See the following section for a description of the sources of the sub-period and full-period return differential between the Fund and the S&P 500.
Explanation of Fund Performance
Over the first five months of this six-month period, backdrop market volatility was very low, and that was reflected in single-digit annualized volatility for the Fund. May (+0.53%), June (+0.45%), and September (+0.45%) returns were each only about half a percent in magnitude, while July (+3.04%) and August (+3.28%) returns were larger. All five months were profitable, via positive returns for the S&P 500, which were captured by the Equity Strategy.
While low-volatility market environments are not typically auspicious for trend-following models like the Aspen MFBI, they do not generally produce significant losses either. The low-vol backdrop that prevailed from May through September fit this mold, as the Fund’s trend-following Futures Strategy produced modest losses over the five-month period, but never large enough to overcome the monthly gains from equities.
In October, the market backdrop changed dramatically, in a manner reminiscent of the activity in February, 2018. As in February, U.S. equity markets in October reversed from all-time highs into a rapidly developing correction (i.e., a drop of greater than 10% in major indices). Global equity markets participated in the decline. Short positions in the Futures Strategy’s European equity futures trend positions mitigated the resulting losses in the Strategy, but could not overcome them entirely. By mid-month, the trend model was net short equities.
Initially the equity drop was accompanied by rising global interest rates, which enabled gains from the Futures Strategy’s short fixed income positioning (bond prices generally fall as interest rates rise), but as the correction deepened, markets assumed more traditional “risk-off” behavior, such that model losses from rising bond prices offset gains from the recently established net short equity positioning. An equity rally at the end of the month pulled U.S. equities out of their correction; the S&P 500 produced a -6.84% return for October (total return). In the end-of-month rally, the short fixed income trends mitigated losses from the short equity trends within the Futures Strategy. In the end, the Fund returned -8.73% for the month of October.
Outlook
Despite the low volatility that has prevailed for much of the year, 2018 has provided a couple of glimpses indicating markets may be more likely to demonstrate increased vol given an inducement to do so. Historically, persistently elevated volatility has tended to provide a relatively favorable backdrop for trend following strategies, such as the Fund’s Futures Strategy. However, given the strength of the domestic and global economies, a full-blown equity bear market would come as a surprise at present (though of course not an impossible surprise), and for the past several years, the only circumstances under which even historically “normal” levels of volatility have prevailed is during brief periods of equity stress. As October demonstrates, short-lived volatility spikes are typically not helpful to a trend system, since they are usually sparked by a change of direction for risk assets, and they often end just as rapidly with another change of direction (and both such changes are essentially anti-trend by nature). To catalyze improved fortunes for trend following models, we continue to look for more sustained market volatility, with an ideal environment for the Fund most likely being one of equity gains against more a volatile backdrop. With less accommodative monetary policy and an economy where a decade of recovery may be approaching its peak, a return to more normalized volatility appears increasingly likely, though of course timing is always difficult to gauge.
Sincerely,
Bryan R. Fisher
William Ware Bush
Performance data quoted represents past performance. Past performance does not guarantee future results. Investment return and principal value of an investment will fluctuate so that an investor’s shares, when sold or redeemed, may be worth more or less than the original cost. Current performance data may be higher or lower than actual data quoted. For the most current month-end performance data please call 1-855-845-9444.
| Semi-Annual Report | October 31, 2018 | 3 |
| Aspen Portfolio Strategy Fund | Manager Commentary |
October 31, 2018 (Unaudited)
The views of Aspen Partners, Ltd. and information discussed in this commentary are as of the date of publication, are subject to change, and may not reflect the writers’ current views. The views expressed are those of the Fund’s adviser only, and represent an assessment of market conditions at a specific point in time, are opinions only and should not be relied upon as investment advice regarding a particular investment or markets in general. Such information does not constitute a recommendation to buy or sell specific securities or investment vehicles. It should not be assumed that any investment will be profitable or will equal the performance of the portfolios or any securities or any sectors mentioned in this letter. The subject matter contained in this letter has been derived from several sources believed to be reliable and accurate at the time of compilation. Neither Aspen Partners Ltd. nor the Fund accepts any liability for losses either direct or consequential caused by the use of this information.
The Aspen Portfolio Strategy Funds are distributed by ALPS Distributors, Inc.
The Fund is subject to investment risks, including possible loss of the principal amount invested and therefore is not suitable for all investors. The Fund may not achieve its objectives.
Diversification does not eliminate the risk of experiencing investment losses.
The S&P 500® Index is an unmanaged index of 500 common stocks chosen for market size, liquidity and industry group representation. It is a market-value weighted index. The Index is not actively managed and does not reflect any deductions for fees, expenses or taxes. An investor may not invest directly in the Index.
4
| Aspen Managed Futures Strategy Fund | Performance Update |
October 31, 2018 (Unaudited)
Annualized Total Return Performance as of October 31, 2018
| Since | Expense Ratios | |||||
| Aspen Managed Futures Strategy Fund | 1 Year | 3 Year | 5 Year | Inception* | Total | Net(1) |
| Aspen Managed Futures Strategy Fund - Class A (NAV)(2) | -3.37% | -3.95% | -0.97% | -1.87% | 1.82% | 1.82% |
| Aspen Managed Futures Strategy Fund - Class A (MOP)(3) | -8.72% | -5.74% | -2.08% | -2.63% | 1.82% | 1.82% |
| Aspen Managed Futures Strategy Fund - Class I | -3.31% | -3.96% | -0.81% | -1.65% | 1.48% | 1.48% |
| SG CTA Index(4) | -5.22% | -1.84% | 2.02% | 0.11% | ||
| Aspen Managed Futures Beta Index(5) | -2.60% | -3.47% | -0.38% | -1.16% | ||
Performance data quoted represents past performance. Past performance does not guarantee future results. Investment return and principal value of an investment will fluctuate so that an investor’s shares, when sold or redeemed, may be worth more or less than the original cost. Current performance data may be higher or lower than actual data quoted. For the most current month-end performance data, please call 1-855-845-9444.
The table does not reflect the deduction of taxes that a shareholder would pay on Fund distributions or the redemption of Fund shares.
Subject to investment risks, including possible loss of the principal amount invested.
Returns for periods less than 1 year are cumulative.
| * | Fund Inception date of August 2, 2011. |
| (1) | Aspen Partners, Ltd. (the “Adviser”) has agreed to waive and/or reimburse fees or expenses in order to limit total annual Fund operating expenses after fee waiver/expense reimbursements (excluding distribution and service (12b-1) fees, shareholder services fees, acquired fund fees and expenses, brokerage expenses, interest expenses, taxes and extraordinary expenses) to 1.55% of the Funds’ average daily net assets. This agreement (the “Expense Agreement”) is in effect through August 31, 2019. The Adviser will be permitted to recover, on a class-by-class basis, expenses it has borne through the Expense Agreement to the extent that the Funds’ expenses in later periods fall below the expense cap in effect at the time of waiver or reimbursement. Notwithstanding the foregoing, the Fund will not be obligated to pay any such deferred fees and expenses more than three years after the date of the waiver or reimbursement. The Expense Agreement may not be terminated or modified prior to August 31, 2019 except with the approval of the Funds’ Board of Trustees |
| (2) | Net Asset Value (NAV) is the share price without sales charges. |
| (3) | Maximum Offering Price (MOP) includes sales charges. Class A returns include effects of the Funds’ maximum sales charge of 5.50%. |
| (4) | The SG CTA Index (formerly, the Newedge CTA Index) provides the market with a reliable daily performance benchmark of major commodity trading advisors (CTAs). The SG CTA Index calculates the daily rate of return for a pool of CTAs selected from the larger managers that are open to new investment. Selection of the pool of qualified CTAs used in construction of the Index will be conducted annually, with re-balancing on January 1st of each year. A committee of industry professionals has been established to monitor the methodology of the index on a regular basis. The Index is not actively managed and does not reflect any deduction for fees, expenses or taxes. An investor cannot invest directly in the Index. |
| (5) | Aspen Managed Futures Beta Index – The Managed Futures Beta Index is constructed using a quantitative, rules-based model designed to replicate the trend-following and counter-trend exposure of futures markets by allocating assets to liquid futures contracts of certain financial and commodities futures markets. The Index therefore seeks to reflect the performance of strategies and exposures common to a broad universe of futures markets, i.e., managed futures beta. The index is not actively managed and does not reflect any deductions for fees, expense or taxes. An investor may not invest directly in an index. |
Portfolio Composition as of October 31, 2018
As a percentage of Net Assets^
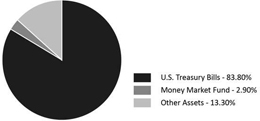
| ^ | Holdings subject to change, and may not reflect the current or future position of the portfolio. |
| Semi-Annual Report | October 31, 2018 | 5 |
| Aspen Managed Futures Strategy Fund | Performance Update |
October 31, 2018 (Unaudited)
Performance of $10,000 Initial Investment (as of October 31, 2018)
Comparison of change in value of a $10,000 investment (includes applicable sales loads)

The chart above represents historical performance of a hypothetical investment of $10,000 in the Fund since inception. Past performance does not guarantee future results. This chart does not reflect the deduction of taxes that a shareholder would pay on Fund distributions or the redemption of Fund shares.
Investing in the Fund is subject to investment risks, including possible loss of the principal amount invested.
6
| Aspen Portfolio Strategy Fund | Performance Update |
October 31, 2018 (Unaudited)
Annualized Total Return Performance as of October 31, 2018
| Since | Expense Ratios | |||
| Aspen Portfolio Strategy Fund | 1 Year | Inception* | Gross | Net(1) |
| Aspen Portfolio Strategy Fund - Class A (NAV)(2) | -2.14% | 1.90% | 2.03% | 1.97% |
| Aspen Portfolio Strategy Fund - Class A (MOP)(3) | -7.53% | -1.19% | 2.03% | 1.97% |
Aspen Portfolio Strategy Fund - Class I | -1.95% | 2.20% | 1.70% | 1.57% |
| S&P 500® Index(4) | 7.35% | 12.83% | ||
Performance data quoted represents past performance. Past performance does not guarantee future results. Investment return and principal value of an investment will fluctuate so that an investor’s shares, when sold or redeemed, may be worth more or less than the original cost. Current performance data may be higher or lower than actual data quoted. For the most current month-end performance data, please call 1-855-845-9444.
The table does not reflect the deduction of taxes that a shareholder would pay on Fund distributions or the redemption of Fund shares.
Subject to investment risks, including possible loss of the principal amount invested.
Returns for periods less than 1 year are cumulative.
| * | Fund Inception date of December 28, 2016. |
| (1) | Aspen Partners, Ltd. (the “Adviser”) has agreed to waive and/or reimburse fees or expenses in order to limit total annual Fund operating expenses after fee waiver/expense reimbursements (excluding distribution and service (12b-1) fees, shareholder services fees, acquired fund fees and expenses, brokerage expenses, interest expenses, taxes and extraordinary expenses) to 1.55% of the Funds’ average daily net assets. This agreement (the “Expense Agreement”) is in effect through August 31, 2019. The Adviser will be permitted to recover, on a class-by-class basis, expenses it has borne through the Expense Agreement to the extent that the Funds’ expenses in later periods fall below the expense cap in effect at the time of waiver or reimbursement. Notwithstanding the foregoing, the Fund will not be obligated to pay any such deferred fees and expenses more than three years after the date of the waiver or reimbursement. The Expense Agreement may not be terminated or modified prior to August 31, 2019 except with the approval of the Funds’ Board of Trustees |
| (2) | Net Asset Value (NAV) is the share price without sales charges. |
| (3) | Maximum Offering Price (MOP) includes sales charges. Class A returns include effects of the Funds’ maximum sales charge of 5.50%. |
| (4) | The S&P 500® Index is an unmanaged index of 500 common stocks chosen for market size, liquidity and industry group representation. It is a market-value weighted index. The Index is not actively managed and does not reflect any deductions for fees, expenses or taxes. An investor may not invest directly in the Index. |
Portfolio Composition as of October 31, 2018
As a percentage of Net Assets^

| ^ | Holdings subject to change, and may not reflect the current or future position of the portfolio. |
| Semi-Annual Report | October 31, 2018 | 7 |
| Aspen Portfolio Strategy Fund | Performance Update |
October 31, 2018 (Unaudited)
Performance of $10, 000 Initial Investment (as of October 31, 2018)
Comparison of change in value of a $10,000 investment (includes applicable sales loads)
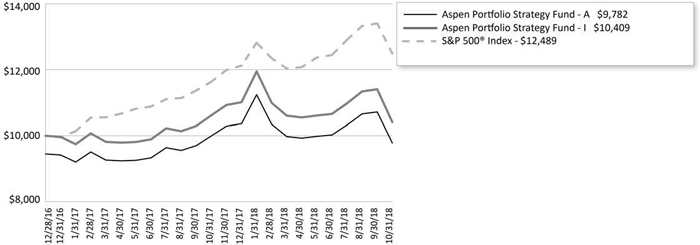
The chart above represents historical performance of a hypothetical investment of $10,000 in the Fund since inception. Past performance does not guarantee future results. This chart does not reflect the deduction of taxes that a shareholder would pay on Fund distributions or the redemption of Fund shares.
Investing in the Fund is subject to investment risks, including possible loss of the principal amount invested.
8
| Aspen Funds | Consolidated Disclosure of Fund Expenses |
October 31, 2018 (Unaudited)
As a shareholder of the Fund, you incur two types of costs: transaction costs, including sales charges (loads) on purchase payments, reinvested dividends, or other distributions; redemption fees; and exchange fees; and (2) ongoing costs, including management fees; distribution and/or service (12b-1) fees; shareholder servicing fees; and other fund operating expenses. This example is intended to help you understand your ongoing costs (in dollars), of investing in the Fund and to compare these costs with the ongoing costs of investing in other mutual funds.
This example is based on an investment of $1,000 invested at the beginning of the period and held for the entire six-month period of May 1, 2018 through October 31, 2018.
Actual Expenses The first line of the table below provides information about actual account values and actual expenses. You may use the information in this line, together with the amount you invested, to estimate the expenses that you paid over the period. Simply divide your account value by $1,000 (for example, an $8,600 account value divided by $1,000 = 8.6), then multiply the result by the number in the first line under the heading “Expenses Paid During Period” to estimate the expenses you paid on your account during this period.
Hypothetical Example for Comparison Purposes The second line of the table below provides information about hypothetical account values and hypothetical expenses based on the Funds’ actual expense ratio and an assumed rate of return of 5% per year before expenses, which is not the Funds’ actual return. The hypothetical account values and expenses may not be used to estimate the actual ending account balance or expenses you paid for the period. You may use this information to compare the ongoing costs of investing in the Fund and other funds. To do so, compare this 5% hypothetical example with the 5% hypothetical examples that appear in the shareholder reports of other mutual funds.
Please note that the expenses shown in the table are meant to highlight your ongoing costs only and do not reflect any transactional costs, such as applicable sales charges (loads), redemption fees, or exchange fees. Therefore, the second line of the table is useful in comparing ongoing costs only and will not help you determine the relative total costs of owning different funds. In addition, if these transactional costs were included, your costs would have been higher.
Beginning Account Value 5/1/18 | Ending Account Value 10/31/18 | Expense Ratio(a) | Expenses Paid During period 5/1/18 - 10/31/18(b) | |
| Aspen Managed Futures Strategy Fund | ||||
| Class A | ||||
| Actual | $1,000.00 | $987.30 | 1.76% | $8.82 |
| Hypothetical (5% return before expenses) | $1,000.00 | $1,016.33 | 1.76% | $8.94 |
| Class I | ||||
| Actual | $1,000.00 | $987.50 | 1.55% | $7.76 |
| Hypothetical (5% return before expenses) | $1,000.00 | $1,017.39 | 1.55% | $7.88 |
| Aspen Portfolio Strategy Fund | ||||
| Class A | ||||
| Actual | $1,000.00 | $985.30 | 1.81% | $9.06 |
| Hypothetical (5% return before expenses) | $1,000.00 | $1,016.08 | 1.81% | $9.20 |
| Class I | ||||
| Actual | $1,000.00 | $986.50 | 1.55% | $7.76 |
| Hypothetical (5% return before expenses) | $1,000.00 | $1,017.39 | 1.55% | $7.88 |
| (a) | The Fund's expense ratios have been based on the Fund's most recent fiscal half-year expenses. |
| (b) | Expenses are equal to the Fund's annualized expense ratio multiplied by the average account value over the period, multiplied by the number of days in the most recent fiscal half-year (184)/365 (to reflect the half-year period). |
| Semi-Annual Report | October 31, 2018 | 9 |
| Aspen Managed Futures Strategy Fund | Consolidated Schedule of Investments |
October 31, 2018 (Unaudited)
Principal Amount/Shares | Value (Note 2) | |||||||
| SHORT TERM INVESTMENTS (86.70%) | ||||||||
| MONEY MARKET FUND (2.90%) | ||||||||
| Dreyfus Treasury & Agency Cash Management Fund - Institutional Shares, 7-day yield, 2.071% | 1,643,374 | $ | 1,643,374 | |||||
| U.S. TREASURY BILLS (83.80%) | ||||||||
| 1.752%, 11/08/2018(a) | $ | 6,550,000 | 6,547,330 | |||||
| 1.819%, 12/06/2018(a) | 9,150,000 | 9,131,019 | ||||||
| 2.074%, 01/31/2019(a) | 5,500,000 | 5,468,232 | ||||||
| 2.087%, 02/28/2019(a) | 5,000,000 | 4,961,986 | ||||||
| 2.118%, 03/28/2019(a) | 8,200,000 | 8,121,147 | ||||||
| 2.259%, 04/25/2019(a) | 10,000,000 | 9,882,969 | ||||||
| 2.325%, 06/20/2019(a) | 3,400,000 | 3,346,167 | ||||||
| 47,458,850 | ||||||||
| TOTAL SHORT TERM INVESTMENTS | ||||||||
| (Cost $49,128,628) | 49,102,224 | |||||||
| TOTAL INVESTMENTS (86.70%) | ||||||||
| (Cost $49,128,628) | $ | 49,102,224 | ||||||
| Other Assets In Excess Of Liabilities (13.30%) | 7,529,803 | (b) | ||||||
| NET ASSETS (100.00%) | $ | 56,632,027 | ||||||
| (a) | Rate shown represents the bond equivalent yield to maturity at date of purchase. |
| (b) | Includes cash which is being held as collateral for futures contracts. |
10
| Aspen Managed Futures Strategy Fund | Consolidated Schedule of Investments |
October 31, 2018 (Unaudited)
FUTURES CONTRACTS
At October 31, 2018, the Fund had the following outstanding futures contracts:
| Description | Counterparty | Position | Contracts | Expiration Date | Notional Value | Value and Unrealized Appreciation | |||||||||
| Commodity Contracts | |||||||||||||||
| Copper Future(a) | R.J. O'Brien & Associates LLC | Short | 30 | 12/27/2018 | $ | (1,994,250 | ) | $ | 87,940 | ||||||
| Silver Future(a) | R.J. O'Brien & Associates LLC | Short | 42 | 12/27/2018 | (2,999,220 | ) | 25,039 | ||||||||
| Soybean Future(a) | R.J. O'Brien & Associates LLC | Short | 72 | 01/14/2019 | (3,066,300 | ) | 28,521 | ||||||||
| WTI Crude Future(a) | R.J. O'Brien & Associates LLC | Short | 15 | 11/19/2018 | (979,650 | ) | 22,601 | ||||||||
| Equity Contracts | |||||||||||||||
| Euro Stoxx 50 Index Future | R.J. O'Brien & Associates LLC | Short | 150 | 12/21/2018 | (5,426,528 | ) | 120,358 | ||||||||
| Foreign Currency Contracts | |||||||||||||||
| Australian Dollar Currency Future | R.J. O'Brien & Associates LLC | Short | 173 | 12/17/2018 | (12,243,210 | ) | 58,690 | ||||||||
| Canadian Dollar Currency Future | R.J. O'Brien & Associates LLC | Short | 100 | 12/18/2018 | (7,599,500 | ) | 88,665 | ||||||||
| Euro FX Currency Future | R.J. O'Brien & Associates LLC | Short | 90 | 12/17/2018 | (12,774,938 | ) | 203,662 | ||||||||
| Japanese Yen Currency Future | R.J. O'Brien & Associates LLC | Short | 37 | 12/17/2018 | (4,104,919 | ) | 23,926 | ||||||||
| Swiss Franc Currency Future | R.J. O'Brien & Associates LLC | Short | 5 | 12/17/2018 | (622,375 | ) | 7,958 | ||||||||
| Interest Rate Contracts | |||||||||||||||
| 10 Year U.S. Treasury Note Future | R.J. O'Brien & Associates LLC | Short | 110 | 12/19/2018 | (13,028,125 | ) | 13,881 | ||||||||
| Canadian 10 Year Bond Future | R.J. O'Brien & Associates LLC | Short | 86 | 12/18/2018 | (8,632,990 | ) | 3,417 | ||||||||
| Euro-Bond Future | R.J. O'Brien & Associates LLC | Long | 24 | 12/10/2008 | 4,356,445 | 217 | |||||||||
| $ | (69,115,560 | ) | $ | 684,875 | |||||||||||
| Description | Counter party | Position | Contracts | Expiration Date | Notional Value | Value and Unrealized Depreciation | |||||||||
| Commodity Contracts | |||||||||||||||
| Corn Future(a) | R.J. O'Brien & Associates LLC | Long | 110 | 12/14/2018 | $ | 1,997,875 | $ | (59,107 | ) | ||||||
| FTSE 100 Index Future | R.J. O'Brien & Associates LLC | Short | 40 | 12/21/2018 | (3,635,715 | ) | (43,077 | ) | |||||||
| Gold 100 Oz Future(a) | R.J. O'Brien & Associates LLC | Short | 9 | 12/26/2018 | (1,093,500 | ) | (17,309 | ) | |||||||
| Long Gilt Future | R.J. O'Brien & Associates LLC | Short | 28 | 12/27/2008 | (4,381,009 | ) | (48,029 | ) | |||||||
| NY Harbor ULSD Future(a) | R.J. O'Brien & Associates LLC | Long | 21 | 11/30/2018 | 1,985,735 | (1,391 | ) | ||||||||
| Sugar No. 11 (World) Future(a) | R.J. O'Brien & Associates LLC | Long | 135 | 02/28/2019 | 1,994,328 | (103,806 | ) | ||||||||
| Equity Contracts | |||||||||||||||
| Nikkei 225 Index Future | R.J. O'Brien & Associates LLC | Short | 33 | 12/13/2018 | (3,596,175 | ) | (32,579 | ) | |||||||
| S&P 500 E-Mini Future | R.J. O'Brien & Associates LLC | Short | 14 | 12/21/2018 | (1,897,770 | ) | (3,124 | ) | |||||||
| $ | (8,626,231 | ) | $ | (308,422 | ) | ||||||||||
Common Abbreviations:
FTSE - Financial Times and the London Stock Exchange
S&P - Standard and Poor's
ULSD - Ultra Low Sulfur Diesel
| (a) | Owned by an entity that is owned by the Fund and is consolidated as described in Note 1 of the Notes to the Consolidated Financial Statements. |
For Fund compliance purposes, the Fund's industry classifications refer to any one or more of the industry sub-classifications used by one or more widely recognized market indexes or ratings group indexes, and/or as defined by Fund management. This definition may not apply for purposes of this report, which may combine industry sub-classifications for reporting ease. Industries are shown as a percentage of net assets.
| Semi-Annual Report | October 31, 2018 | 11 |
| Aspen Portfolio Strategy Fund | Consolidated Schedule of Investments |
October 31, 2018 (Unaudited)
| Shares | Value (Note 2) | |||||||
| EXCHANGE TRADED FUNDS (75.88%) | ||||||||
| SPDR® S&P 500® ETF Trust | 138,319 | $ | 37,433,303 | |||||
| iShares® Core S&P 500® ETF | 37,179 | 10,140,944 | ||||||
| TOTAL EXCHANGE TRADED FUNDS | ||||||||
| (Cost $42,836,476) | 47,574,247 | |||||||
| SHORT TERM INVESTMENTS (15.99%) | ||||||||
| MONEY MARKET FUND (15.99%) | ||||||||
| Dreyfus Treasury & Agency Cash Management Fund - Institutional Shares, 7-day yield, 2.071% | 10,026,338 | 10,026,338 | ||||||
| TOTAL SHORT TERM INVESTMENTS | ||||||||
| (Cost $10,026,338) | 10,026,338 | |||||||
| TOTAL INVESTMENTS (91.87%) | ||||||||
| (Cost $52,862,814) | $ | 57,600,585 | ||||||
| Other Assets In Excess Of Liabilities (8.13%) | 5,099,219 | (a) | ||||||
| NET ASSETS (100.00%) | $ | 62,699,804 | ||||||
| (a) | Includes cash which is being held as collateral for futures contracts. |
12
| Aspen Portfolio Strategy Fund | Consolidated Schedule of Investments |
October 31, 2018 (Unaudited)
FUTURES CONTRACTS
At October 31, 2018, the Fund had the following outstanding futures contracts:
| Description | Counterparty | Position | Contracts | Expiration Date | Notional Value | Value and Unrealized Appreciation | |||||||||
| Commodity Contracts | |||||||||||||||
| Copper Future(a) | R.J. O'Brien & Associates LLC | Short | 35 | 12/27/2018 | $ | (2,326,625 | ) | $ | 114,536 | ||||||
| Silver Future(a) | R.J. O'Brien & Associates LLC | Short | 48 | 12/27/2018 | (3,427,680 | ) | 34,689 | ||||||||
| Soybean Future(a) | R.J. O'Brien & Associates LLC | Short | 81 | 01/14/2019 | (3,449,587 | ) | 35,513 | ||||||||
| WTI Crude Future(a) | R.J. O'Brien & Associates LLC | Short | 18 | 11/19/2018 | (1,175,580 | ) | 31,901 | ||||||||
| Equity Contracts | |||||||||||||||
| Euro Stoxx 50 Index Future | R.J. O'Brien & Associates LLC | Short | 172 | 12/21/2018 | (6,222,419 | ) | 187,890 | ||||||||
| Nikkei 225 Index Future | R.J. O'Brien & Associates LLC | Short | 38 | 12/13/2018 | (4,141,050 | ) | 31,102 | ||||||||
| Foreign Currency Contracts | |||||||||||||||
| Australian Dollar Currency Future | R.J. O'Brien & Associates LLC | Short | 197 | 12/17/2018 | (13,941,690 | ) | 68,780 | ||||||||
| Canadian Dollar Currency Future | R.J. O'Brien & Associates LLC | Short | 122 | 12/18/2018 | (9,271,390 | ) | 56,426 | ||||||||
| Euro FX Currency Future | R.J. O'Brien & Associates LLC | Short | 98 | 12/17/2018 | (13,910,488 | ) | 224,534 | ||||||||
| Japanese Yen Currency Future | R.J. O'Brien & Associates LLC | Short | 42 | 12/17/2018 | (4,659,638 | ) | 20,609 | ||||||||
| Interest Rate Contracts | |||||||||||||||
| 10 Year U.S. Treasury Note Future | R.J. O'Brien & Associates LLC | Short | 125 | 12/19/2018 | (14,804,688 | ) | 76,266 | ||||||||
| Canadian 10 Year Bond Future | R.J. O'Brien & Associates LLC | Short | 98 | 12/18/2018 | (9,837,593 | ) | 32,391 | ||||||||
| $ | (87,168,428 | ) | $ | 914,637 | |||||||||||
| Description | Counter party | Position | Contracts | Expiration Date | Notional Value | Value and Unrealized Depreciation | |||||||||
| Commodity Contracts | |||||||||||||||
| Corn Future(a) | R.J. O'Brien & Associates LLC | Long | 126 | 12/14/2018 | $ | 2,288,475 | $ | (73,741 | ) | ||||||
| FTSE 100 Index Future | R.J. O'Brien & Associates LLC | Short | 45 | 12/21/2018 | (4,090,180 | ) | (16,113 | ) | |||||||
| Gold 100 Oz Future(a) | R.J. O'Brien & Associates LLC | Short | 9 | 12/26/2018 | (1,093,500 | ) | (16,899 | ) | |||||||
| Long Gilt Future | R.J. O'Brien & Associates LLC | Short | 32 | 12/27/2008 | (5,006,867 | ) | (62,777 | ) | |||||||
| NY Harbor ULSD Future(a) | R.J. O'Brien & Associates LLC | Long | 24 | 11/30/2018 | 2,269,411 | (6,533 | ) | ||||||||
| Sugar No. 11 (World) Future(a) | R.J. O'Brien & Associates LLC | Long | 154 | 02/28/2019 | 2,275,011 | (113,254 | ) | ||||||||
| Equity Contracts | |||||||||||||||
| S&P 500 E-Mini Future | R.J. O'Brien & Associates LLC | Long | 94 | 12/21/2018 | 12,742,170 | (751,475 | ) | ||||||||
| Interest Rate Contracts | |||||||||||||||
| Euro-Bond Future | R.J. O'Brien & Associates LLC | Long | 27 | 12/10/2008 | 4,901,001 | (220 | ) | ||||||||
| $ | 14,285,521 | $ | (1,041,012 | ) | |||||||||||
Common Abbreviations:
FTSE - Financial Times and the London Stock Exchange
S&P - Standard and Poor's
ULSD - Ultra Low Sulfur Diesel
| (a) | Owned by an entity that is owned by the Fund and is consolidated as described in Note 1 of the Notes to the Consolidated Financial Statements. |
For Fund compliance purposes, the Fund's industry classifications refer to any one or more of the industry sub-classifications used by one or more widely recognized market indexes or ratings group indexes, and/or as defined by Fund management. This definition may not apply for purposes of this report, which may combine industry sub-classifications for reporting ease. Industries are shown as a percentage of net assets.
| Semi-Annual Report | October 31, 2018 | 13 |
| Aspen Funds | Consolidated Statements of Assets & Liabilities |
October 31, 2018 (Unaudited)
Aspen Managed Futures Strategy Fund | Aspen Portfolio Strategy Fund | |||||||
| ASSETS: | ||||||||
| Investments, at value | $ | 49,102,224 | $ | 57,600,585 | ||||
| Foreign cash due from broker for futures contracts(Cost $167,149 and $123,804) (Note 3) | 167,149 | 123,597 | ||||||
| Deposit with broker for futures contracts (Note 3) | 7,354,839 | 4,329,133 | ||||||
| Receivable for investments sold | 383,808 | 190,956 | ||||||
| Receivable for shares sold | 11,726 | 1,105 | ||||||
| Variation margin receivable | 271,913 | 643,217 | ||||||
| Interest receivable | 10,024 | 14,928 | ||||||
| Prepaid and other assets | 23,439 | 5,207 | ||||||
| Total assets | 57,325,122 | 62,908,728 | ||||||
| LIABILITIES: | ||||||||
| Foreign cash due to broker for futures contracts (Note 3) | 165,563 | 24,872 | ||||||
| Payable to advisor | 39,035 | 52,708 | ||||||
| Payable for investments purchased | 312 | 66 | ||||||
| Variation margin payable | 19,173 | 41,253 | ||||||
| Payable for shares redeemed | 383,467 | 37,115 | ||||||
| Payable for administration fees | 16,955 | 19,140 | ||||||
| Payable for distribution and service fees | ||||||||
| Class A | 2,099 | 2,192 | ||||||
| Payable for transfer agency fees | 8,683 | 6,829 | ||||||
| Delegated transfer agent equivalent services fees | ||||||||
| Class A | 56 | – | ||||||
| Class I | 12,863 | 2,976 | ||||||
| Payable for trustee fees and expenses | 6,886 | 6,476 | ||||||
| Payable for professional fees | 14,893 | 9,702 | ||||||
| Payable for chief compliance officer fees | 5,258 | 2,611 | ||||||
| Payable for principal financial officer fees | 569 | 283 | ||||||
| Payable for licensing fees | 13,012 | – | ||||||
| Accrued expenses and other liabilities | 4,271 | 2,701 | ||||||
| Total liabilities | 693,095 | 208,924 | ||||||
| NET ASSETS | $ | 56,632,027 | $ | 62,699,804 | ||||
| NET ASSETS CONSIST OF: | ||||||||
| Paid-in capital (Note 5) | $ | 85,560,287 | $ | 61,074,376 | ||||
| Total distributable earnings | $ | (28,928,260 | ) | $ | 1,625,428 | |||
| NET ASSETS | $ | 56,632,027 | $ | 62,699,804 | ||||
| INVESTMENTS, AT COST | $ | 49,128,628 | $ | 52,862,814 | ||||
| PRICING OF SHARES: | ||||||||
| Class A: | ||||||||
| Net Asset Value, offering and redemption price per share | $ | 7.75 | $ | 25.43 | ||||
| Net Assets | $ | 1,718,057 | $ | 2,844,777 | ||||
| Shares of beneficial interest outstanding | 221,728 | 111,863 | ||||||
| Maximum offering price per share (NAV/0.9450), based on maximum sales charge of 5.50% of the offering price | $ | 8.20 | $ | 26.91 | ||||
| Class I: | ||||||||
| Net Asset Value, offering and redemption price per share | $ | 7.89 | $ | 25.52 | ||||
| Net Assets | $ | 54,913,970 | $ | 59,855,027 | ||||
| Shares of beneficial interest outstanding | 6,956,942 | 2,345,659 | ||||||
See Notes to Consolidated Financial Statements.
| 14 |
| Aspen Funds | Consolidated Statements of Operations |
For the Six Months Ended October 31, 2018 (Unaudited)
Aspen Managed Futures Strategy Fund | Aspen Portfolio Strategy Fund | |||||||
| INVESTMENT INCOME: | ||||||||
| Interest | $ | 575,195 | $ | – | ||||
| Dividends | 61,232 | 516,906 | ||||||
| Total investment income | 636,427 | 516,906 | ||||||
| EXPENSES: | ||||||||
| Investment advisory fees (Note 6) | 282,932 | 292,590 | ||||||
| Investment advisory fees - subsidiary (Note 6) | 58,772 | 7,320 | ||||||
| Administrative fees | 103,180 | 85,579 | ||||||
| Distribution and service fees | ||||||||
| Class A | 6,173 | 6,083 | ||||||
| Transfer agency fees | 26,095 | 26,078 | ||||||
| Delegated transfer agent equivalent services fees | ||||||||
| Class A | 73 | – | ||||||
| Class I | 32,528 | 14,266 | ||||||
| Professional fees | 14,543 | 16,702 | ||||||
| Custodian fees | 5,612 | 5,037 | ||||||
| Trustee fees and expenses | 7,397 | 6,918 | ||||||
| Principal financial officer fees | 1,543 | 975 | ||||||
| Chief compliance officer fees | 14,272 | 9,014 | ||||||
| Licensing fees | 94,311 | – | ||||||
| Other | 22,791 | 23,637 | ||||||
| Total expenses before waiver/reimbursement | 670,222 | 494,199 | ||||||
| Waiver of investment advisory fees (Note 6) | (23,658 | ) | (29,308 | ) | ||||
| Waiver of investment advisory fees - subsidiary (Note 6) | (58,772 | ) | (7,320 | ) | ||||
| Total net expenses | 587,792 | 457,571 | ||||||
| NET INVESTMENT INCOME | 48,635 | 59,335 | ||||||
| Net realized gain/(loss) on investments | (4,560 | ) | 166,160 | |||||
| Net realized loss on futures contracts | (1,806,276 | ) | (2,321,720 | ) | ||||
| Net realized gain/(loss) on foreign currency transactions | 25,588 | (21,290 | ) | |||||
| Total net realized loss | (1,785,248 | ) | (2,176,850 | ) | ||||
| Net change in unrealized appreciation of investments | 57,115 | 435,236 | ||||||
| Net change in unrealized appreciation on futures contracts | 655,677 | 506,147 | ||||||
| Net change in unrealized appreciation/(depreciation) on translation of assets and liabilities denominated in foreign currency transactions | (11,369 | ) | 1,628 | |||||
| Net change in unrealized appreciation | 701,423 | 943,011 | ||||||
| NET REALIZED AND UNREALIZED LOSS ON INVESTMENTS | (1,083,825 | ) | (1,233,839 | ) | ||||
| NET DECREASE IN NET ASSETS RESULTING FROM OPERATIONS | $ | (1,035,190 | ) | $ | (1,174,504 | ) | ||
See Notes to Consolidated Financial Statements.
| Semi-Annual Report | October 31, 2018 | 15 |
| Aspen Managed Futures Strategy Fund | Consolidated Statement of Changes in Net Assets |
For the Six Months Ended October 31, 2018 (Unaudited) | For the Year Ended April 30, 2018 | |||||||
| OPERATIONS: | ||||||||
| Net investment income/(loss) | $ | 48,635 | $ | (659,959 | ) | |||
| Net realized loss | (1,785,248 | ) | (5,221,890 | ) | ||||
| Net change in unrealized appreciation | 701,423 | 2,248,600 | ||||||
| Net decrease in net assets resulting from operations | (1,035,190 | ) | (3,633,249 | ) | ||||
| SHARE TRANSACTIONS (Note 5): | ||||||||
| Class A | ||||||||
| Proceeds from sales of shares | 214,997 | 1,957,143 | ||||||
| Cost of shares redeemed | (1,907,107 | ) | (4,685,659 | ) | ||||
| Redemption fees | 2,248 | 40 | ||||||
| Class I | ||||||||
| Proceeds from sales of shares | 3,079,264 | 36,658,111 | ||||||
| Cost of shares redeemed | (32,509,667 | ) | (142,925,441 | ) | ||||
| Redemption fees | 522 | 7,858 | ||||||
| Net decrease from share transactions | (31,119,743 | ) | (108,987,948 | ) | ||||
| Net decrease in net assets | (32,154,933 | ) | (112,621,197 | ) | ||||
| NET ASSETS: | ||||||||
| Beginning of period | 88,786,960 | 201,408,157 | ||||||
| End of period | $ | 56,632,027 | $ | 88,786,960 | (a) | |||
| Other Information: | ||||||||
| SHARE TRANSACTIONS: | ||||||||
| Class A | ||||||||
| Sold | 27,677 | 244,494 | ||||||
| Redeemed | (245,576 | ) | (584,494 | ) | ||||
| Net decrease in shares outstanding | (217,899 | ) | (340,000 | ) | ||||
| Class I | ||||||||
| Sold | 386,423 | 4,482,058 | ||||||
| Redeemed | (4,105,867 | ) | (17,442,220 | ) | ||||
| Net decrease in shares outstanding | (3,719,444 | ) | (12,960,162 | ) | ||||
| (a) | For the year ended April 30, 2018, included Accumulated Net Investment loss of $367,562. |
See Notes to Consolidated Financial Statements.
| 16 |
| Aspen Portfolio Strategy Fund | Consolidated Statement of Changes in Net Assets |
For the Six Months Ended October 31, 2018 (Unaudited) | For the Year Ended April 30, 2018 | |||||||
| OPERATIONS: | ||||||||
| Net investment income | $ | 59,335 | $ | 60,396 | ||||
| Net realized gain/(loss) | (2,176,850 | ) | 10,886 | |||||
| Net change in unrealized appreciation | 943,011 | 3,022,499 | ||||||
| Net increase/(decrease) in net assets resulting from operations | (1,174,504 | ) | 3,093,781 | |||||
| DISTRIBUTIONS TO SHAREHOLDERS (Note 4): | ||||||||
| From distributable earnings | ||||||||
| Class I | – | (44,849 | ) | |||||
| Class A | – | (881,756 | ) | |||||
| Net decrease in net assets from distributions | – | (926,605 | )(a) | |||||
| SHARE TRANSACTIONS (Note 5): | ||||||||
| Class A | ||||||||
| Proceeds from sales of shares | 514,312 | 717,112 | ||||||
| Distributions reinvested | – | 44,794 | ||||||
| Cost of shares redeemed | (352,971 | ) | (345,910 | ) | ||||
| Class I | ||||||||
| Proceeds from sales of shares | 16,398,904 | 9,638,520 | ||||||
| Distributions reinvested | – | 767,869 | ||||||
| Cost of shares redeemed | (2,948,138 | ) | (6,046,036 | ) | ||||
| Redemption fees | 69 | 284 | ||||||
| Net increase from share transactions | 13,612,176 | 4,776,633 | ||||||
| Net increase in net assets | 12,437,672 | 6,943,809 | ||||||
| NET ASSETS: | ||||||||
| Beginning of period | 50,262,132 | 43,318,323 | ||||||
| End of period | $ | 62,699,804 | $ | 50,262,132 | (b) | |||
| Other Information: | ||||||||
| SHARE TRANSACTIONS: | ||||||||
| Class A | ||||||||
| Sold | 19,267 | 27,302 | ||||||
| Distributions reinvested | – | 1,679 | ||||||
| Redeemed | (13,151 | ) | (13,079 | ) | ||||
| Net increase in shares outstanding | 6,116 | 15,902 | ||||||
| Class I | ||||||||
| Sold | 617,525 | 361,712 | ||||||
| Distributions reinvested | – | 28,731 | ||||||
| Redeemed | (109,457 | ) | (232,745 | ) | ||||
| Net increase in shares outstanding | 508,068 | 157,698 | ||||||
| (a) | For the year ended April 30, 2018, Total Distributions consisted of Net Investment Income of $10,269 for Class A and $268,936 for Class I, and Net Realized Gains of $34,580 for Class A and $612,820 for Class I. |
| (b) | For the year ended April 30, 2018, included Accumulated Net Investment loss of $24,568. |
See Notes to Consolidated Financial Statements.
| Semi-Annual Report | October 31, 2018 | 17 |
| Aspen Managed Futures Strategy Fund – Class A | Consolidated Financial Highlights |
For a share outstanding throughout the periods presented.
For the Six Months Ended October 31, 2018 (Unaudited) (a) | For the Year Ended April 30, 2018 (a) | For the Year Ended April 30, 2017 (a) | For the Year Ended April 30, 2016 (a) | For the Year Ended April 30, 2015 (a) | For the Year Ended April 30, 2014 (a) | |||||||||||||||||||
| NET ASSET VALUE, BEGINNING OF PERIOD | $ | 7.85 | $ | 8.12 | $ | 8.83 | $ | 10.01 | $ | 8.97 | $ | 9.29 | ||||||||||||
| INCOME/(LOSS) FROM OPERATIONS: | ||||||||||||||||||||||||
| Net investment loss(b) | (0.00 | ) | (0.06 | ) | (0.04 | ) | (0.12 | ) | (0.14 | ) | (0.16 | ) | ||||||||||||
| Net realized and unrealized gain/(loss) on investments | (0.11 | ) | (0.21 | ) | (0.57 | ) | (0.39 | ) | 1.39 | (0.05 | ) | |||||||||||||
| Total from investment operations | (0.11 | ) | (0.27 | ) | (0.61 | ) | (0.51 | ) | 1.25 | (0.21 | ) | |||||||||||||
| LESS DISTRIBUTIONS: | ||||||||||||||||||||||||
| From net investment income | – | – | (0.10 | ) | (0.14 | ) | – | – | ||||||||||||||||
| Distributions from net realized gain on investments | – | – | – | (0.53 | ) | (0.21 | ) | (0.12 | ) | |||||||||||||||
| Total distributions | – | – | (0.10 | ) | (0.67 | ) | (0.21 | ) | (0.12 | ) | ||||||||||||||
| REDEMPTION FEES ADDED TO PAID IN CAPITAL | 0.01 | 0.00 | (c) | 0.00 | (c) | 0.00 | (c) | 0.00 | (c) | 0.01 | ||||||||||||||
| INCREASE/(DECREASE) IN NET ASSET VALUE | (0.10 | ) | (0.27 | ) | (0.71 | ) | (1.18 | ) | 1.04 | (0.32 | ) | |||||||||||||
| NET ASSET VALUE, END OF PERIOD | $ | 7.75 | $ | 7.85 | $ | 8.12 | $ | 8.83 | $ | 10.01 | $ | 8.97 | ||||||||||||
| TOTAL RETURN(d) | (1.27 | %)(e) | (3.33 | %) | (6.97 | %) | (5.20 | %) | 14.00 | % | (2.15 | %) | ||||||||||||
| RATIOS AND SUPPLEMENTAL DATA: | ||||||||||||||||||||||||
| Net assets, end of period (000's) | $ | 1,718 | $ | 3,452 | $ | 6,331 | $ | 19,682 | $ | 23,850 | $ | 12,914 | ||||||||||||
| RATIOS TO AVERAGE NET ASSETS: | ||||||||||||||||||||||||
| Operating expenses excluding fee waivers/reimbursements | 1.76% | (f)(g) | 1.66 | %(g) | 1.00 | %(g) | 1.56 | %(g) | 1.64 | % | 1.83 | % | ||||||||||||
| Operating expenses including fee waivers/reimbursements | 1.76 | %(f) | 1.66 | % | 1.00 | % | 1.56 | % | 1.64 | % | 1.83 | % | ||||||||||||
| Net investment loss including fee waivers/reimbursements | (0.06 | %)(f) | (0.72 | %) | (0.52 | %) | (1.24 | %) | (1.50 | %) | (1.72 | %) | ||||||||||||
| PORTFOLIO TURNOVER RATE | 0 | %(e) | 0 | % | 31 | % | 58 | % | 38 | % | 90 | % | ||||||||||||
| (a) | Per share amounts and ratios to average net assets include income and expenses of the Aspen Futures Fund Ltd. (subsidiary), exclusive of the subsidiary's management fee. |
| (b) | Per share numbers have been calculated using the average shares method. |
| (c) | Less than $0.005 per share. |
| (d) | Total return does not reflect the effect of sales charges. |
| (e) | Not annualized. |
| (f) | Annualized. |
| (g) | The ratio of operating expenses excluding fee waiver/reimbursements to average net assets is calculated excluding the waived Subsidiary management fee (see Note 6 for additional detail). The ratio inclusive of that fee would be 1.92%, 1.76%, 1.07% and 1.64% for the period/years ended October 31, 2018, April 30, 2018, April 30, 2017 and April 30, 2016, respectively. |
See Notes to Consolidated Financial Statements.
| 18 |
| Aspen Managed Futures Strategy Fund – Class I | Consolidated Financial Highlights |
For a share outstanding throughout the periods presented.
| For the Six Months Ended October 31, 2018 (Unaudited) (a) | For the Year Ended April 30, 2018 (a) | For the Year Ended April 30, 2017 (a) | For the Year Ended April 30, 2016 (a) | For the Year Ended April 30, 2015 (a) | For the Year Ended April 30, 2014 (a) | |||||||||||||||||||
| NET ASSET VALUE, BEGINNING OF PERIOD | $ | 7.99 | $ | 8.25 | $ | 8.98 | $ | 10.17 | $ | 9.07 | $ | 9.36 | ||||||||||||
| INCOME/(LOSS) FROM OPERATIONS: | ||||||||||||||||||||||||
| Net investment income/(loss)(b) | 0.01 | (0.04 | ) | (0.07 | ) | (0.09 | ) | (0.11 | ) | (0.11 | ) | |||||||||||||
| Net realized and unrealized gain/(loss) on investments | (0.11 | ) | (0.22 | ) | (0.58 | ) | (0.40 | ) | 1.42 | (0.06 | ) | |||||||||||||
| Total from investment operations | (0.10 | ) | (0.26 | ) | (0.65 | ) | (0.49 | ) | 1.31 | (0.17 | ) | |||||||||||||
| LESS DISTRIBUTIONS: | ||||||||||||||||||||||||
| From net investment income | – | – | (0.08 | ) | (0.17 | ) | – | – | ||||||||||||||||
| Distributions from net realized gain on investments | – | – | – | (0.53 | ) | (0.21 | ) | (0.12 | ) | |||||||||||||||
| Total distributions | – | – | (0.08 | ) | (0.70 | ) | (0.21 | ) | (0.12 | ) | ||||||||||||||
| REDEMPTION FEES ADDED TO PAID IN CAPITAL | 0.00 | (c) | 0.00 | (c) | 0.00 | (c) | 0.00 | (c) | 0.00 | (c) | 0.00 | (c) | ||||||||||||
| INCREASE/(DECREASE) IN NET ASSET VALUE | (0.10 | ) | (0.26 | ) | (0.73 | ) | (1.19 | ) | 1.10 | (0.29 | ) | |||||||||||||
| NET ASSET VALUE, END OF PERIOD | $ | 7.89 | $ | 7.99 | $ | 8.25 | $ | 8.98 | $ | 10.17 | $ | 9.07 | ||||||||||||
| TOTAL RETURN | (1.25 | %)(d) | (3.15 | %) | (7.33 | %) | (4.97 | %) | 14.51 | % | (1.81 | %) | ||||||||||||
| RATIOS AND SUPPLEMENTAL DATA: | ||||||||||||||||||||||||
| Net assets, end of period (000's) | $ | 54,914 | $ | 85,335 | $ | 195,077 | $ | 264,598 | $ | 242,575 | $ | 167,258 | ||||||||||||
| RATIOS TO AVERAGE NET ASSETS: | ||||||||||||||||||||||||
| Operating expenses excluding fee waivers/reimbursements | 1.62% | (e)(f) | 1.46 | %(f) | 1.28 | %(f) | 1.22 | %(f) | 1.25 | % | 1.30 | % | ||||||||||||
| Operating expenses including fee waivers/reimbursements | 1.55 | %(e) | 1.46 | % | 1.28 | % | 1.22 | % | 1.25 | % | 1.30 | % | ||||||||||||
| Net investment income/(loss) including fee waivers/reimbursements | 0.14 | %(e) | (0.53 | %) | (0.78 | %) | (0.94 | %) | (1.11 | %) | (1.20 | %) | ||||||||||||
| PORTFOLIO TURNOVER RATE | 0 | %(d) | 0 | % | 31 | % | 58 | % | 38 | % | 90 | % | ||||||||||||
| (a) | Per share amounts and ratios to average net assets include income and expenses of the Aspen Futures Fund Ltd. (subsidiary), exclusive of the subsidiary's management fee. |
| (b) | Per share numbers have been calculated using the average shares method. |
| (c) | Less than $0.005 per share. |
| (d) | Not annualized. |
| (e) | Annualized. |
| (f) | The ratio of operating expenses excluding fee waiver/reimbursements to average net assets is calculated excluding the waived Subsidiary management fee (see Note 6 for additional detail). The ratio inclusive of that fee would be 1.78%, 1.56%, 1.35% and 1.30% for the period/years ended October 31, 2018, April 30, 2018, April 30, 2017 and April 30, 2016, respectively. |
See Notes to Consolidated Financial Statements.
| Semi-Annual Report | October 31, 2018 | 19 |
| Aspen Portfolio Strategy Fund – Class A | Consolidated Financial Highlights |
For a share outstanding throughout the periods presented.
For the Six Months Ended October 31, 2018 (Unaudited) | For the Year Ended April 30, 2018(a) | For the Period Ended April 30, 2017(a)(b) | ||||||||||
| NET ASSET VALUE, BEGINNING OF PERIOD | $ | 25.81 | $ | 24.45 | $ | 25.00 | ||||||
| INCOME/(LOSS) FROM OPERATIONS: | ||||||||||||
| Net investment loss(c) | (0.01 | )(d) | (0.02 | )(d) | (0.03 | ) | ||||||
| Net realized and unrealized gain/(loss) on investments | (0.37 | ) | 1.86 | (0.52 | ) | |||||||
| Total from investment operations | (0.38 | ) | 1.84 | (0.55 | ) | |||||||
| LESS DISTRIBUTIONS: | ||||||||||||
| From net investment income | – | (0.11 | ) | – | ||||||||
| Distributions from net realized gain on investments | – | (0.37 | ) | – | ||||||||
| Total distributions | – | (0.47 | ) | – | ||||||||
| INCREASE/(DECREASE) IN NET ASSET VALUE | (0.38 | ) | 1.36 | (0.55 | ) | |||||||
| NET ASSET VALUE, END OF PERIOD | $ | 25.43 | $ | 25.81 | $ | 24.45 | ||||||
| TOTAL RETURN(e) | (1.47 | %)(f) | 7.44 | % | (2.20 | %)(f) | ||||||
| RATIOS AND SUPPLEMENTAL DATA: | ||||||||||||
| Net assets, end of period (000's) | $ | 2,845 | $ | 2,730 | $ | 2,196 | ||||||
| RATIOS TO AVERAGE NET ASSETS: | ||||||||||||
| Operating expenses excluding fee waivers/reimbursements | 1.87 | %(g)(h) | 1.93 | %(h) | 2.79 | %(g)(h) | ||||||
| Operating expenses including fee waivers/reimbursements | 1.81 | %(g) | 1.79 | % | 1.95 | %(g) | ||||||
| Net investment loss including fee waivers/reimbursements | (0.05 | %)(g) | (0.09 | %) | (0.40 | %)(g) | ||||||
| PORTFOLIO TURNOVER RATE | 8 | %(f) | 0 | % | 0 | %(f)(i) | ||||||
| (a) | Per share amounts and ratios to average net assets include income and expenses of the Aspen Portfolio Strategy Fund Ltd. (subsidiary), exclusive of the subsidiary's management fee. |
| (b) | The Aspen Portfolio Strategy Fund is for the period from December 29, 2016 (commencement of operations) to April 30, 2017. |
| (c) | Per share numbers have been calculated using the average shares method. |
| (d) | The amount shown for a share outstanding throughout the period may not correlate with the Statement of Operations for the period due to the timing of sales and redemptions of Fund shares in relation to income earned and/or fluctuating market value of the investments of the Fund. |
| (e) | Total return does not reflect the effect of sales charges. |
| (f) | Not annualized. |
| (g) | Annualized. |
| (h) | The ratio of operating expenses excluding fee waiver/reimbursements to average net assets is calculated excluding the waived Subsidiary management fee (see Note 6 for additional detail). The ratio inclusive of that fee would be 1.89%, 1.96% and 2.82% for the periods/year ended October 31, 2018, April 30, 2018 and for the period ended April 30, 2017, respectively. |
| (i) | Less than 0.05%. |
See Notes to Consolidated Financial Statements.
| 20 |
| Aspen Portfolio Strategy Fund – Class I | Consolidated Financial Highlights |
For a share outstanding throughout the periods presented.
For the Six Months Ended October 31, 2018 (Unaudited) | For the Year Ended April 30, 2018(a) | For the Period Ended April 30, 2017(a)(b) | ||||||||||
| NET ASSET VALUE, BEGINNING OF PERIOD | $ | 25.87 | $ | 24.48 | $ | 25.00 | ||||||
| INCOME/(LOSS) FROM OPERATIONS: | ||||||||||||
| Net investment income(c) | 0.03 | 0.04 | 0.00 | (d)(e) | ||||||||
| Net realized and unrealized gain/(loss) on investments | (0.38 | ) | 1.88 | (0.52 | ) | |||||||
| Total from investment operations | (0.35 | ) | 1.92 | (0.52 | ) | |||||||
| LESS DISTRIBUTIONS: | ||||||||||||
| From net investment income | – | (0.16 | ) | – | ||||||||
| Distributions from net realized gain on investments | – | (0.37 | ) | – | ||||||||
| Total distributions | – | (0.52 | ) | – | ||||||||
| REDEMPTION FEES ADDED TO PAID IN CAPITAL | 0.00 | (d) | 0.00 | (d) | 0.00 | (d) | ||||||
| INCREASE/(DECREASE) IN NET ASSET VALUE | (0.35 | ) | 1.39 | (0.52 | ) | |||||||
| NET ASSET VALUE, END OF PERIOD | $ | 25.52 | $ | 25.87 | $ | 24.48 | ||||||
| TOTAL RETURN | (1.35 | %)(f) | 7.76 | % | (2.08 | %)(f) | ||||||
| RATIOS AND SUPPLEMENTAL DATA: | ||||||||||||
| Net assets, end of period (000's) | $ | 59,855 | $ | 47,532 | $ | 41,122 | ||||||
| RATIOS TO AVERAGE NET ASSETS: | ||||||||||||
| Operating expenses excluding fee waivers/reimbursements | 1.65 | %(g)(h) | 1.75 | %(h) | 2.22 | %(g)(h) | ||||||
| Operating expenses including fee waivers/reimbursements | 1.55 | %(g) | 1.55 | % | 1.55 | %(g) | ||||||
| Net investment income including fee waivers/reimbursements | 0.22 | %(g) | 0.14 | % | 0.01 | %(g) | ||||||
| PORTFOLIO TURNOVER RATE | 8 | %(f) | 0 | % | 0 | %(f)(i) | ||||||
| (a) | Per share amounts and ratios to average net assets include income and expenses of the Aspen Portfolio Strategy Fund Ltd. (subsidiary), exclusive of the subsidiary's management fee. |
| (b) | The Aspen Portfolio Strategy Fund is for the period from December 29, 2016 (commencement of operations) to April 30, 2017. |
| (c) | Per share numbers have been calculated using the average shares method. |
| (d) | Less than $0.005 per share. |
| (e) | The amount shown for a share outstanding throughout the period may not correlate with the Statement of Operations for the period due to the timing of sales and redemptions of Fund shares in relation to income earned and/or fluctuating market value of the investments of the Fund. |
| (f) | Not annualized. |
| (g) | Annualized. |
| (h) | The ratio of operating expenses excluding fee waiver/reimbursements to average net assets is calculated excluding the waived Subsidiary management fee (see Note 6 for additional detail). The ratio inclusive of that fee would be 1.67%, 1.78% and 2.25% for the periods/year ended October 31, 2018, April 30, 2018 and for the period ended April 30, 2017, respectively. |
| (i) | Less than 0.05%. |
See Notes to Consolidated Financial Statements.
| Semi-Annual Report | October 31, 2018 | 21 |
| Aspen Funds | Notes to Consolidated Financial Statements |
October 31, 2018 (Unaudited)
1. ORGANIZATION
Financial Investors Trust (the “Trust”), a Delaware statutory trust, is an open-end management investment company registered under the Investment Company Act of 1940, as amended (“1940 Act”). As of October 31, 2017, the Trust consists of multiple separate portfolios or series. This semi-annual report describes the Aspen Managed Futures Strategy Fund and the Aspen Portfolio Strategy Fund (individually a “Fund” and collectively, the “Funds”). The Aspen Managed Futures Strategy Fund seeks investment results that replicate as closely as possible, before fees and expenses, the price and yield performance of the Aspen Managed Futures Beta Index (the “MFBI” or “Index”). The Aspen Portfolio Strategy Fund seeks long-term capital appreciation. The Funds offer Class A and Class I shares.
Basis of Consolidation
Aspen Futures Fund, Ltd. (the “Aspen Fund Subsidiary”), a Cayman Islands exempted company, is a wholly owned subsidiary of the Aspen Managed Futures Strategy Fund and Aspen Portfolio Strategy Fund, Ltd. (the “Aspen Portfolio Subsidiary”), a Cayman Islands exempted company, is a wholly owned subsidiary of the Aspen Portfolio Strategy Fund. The investment objective of both the Aspen Fund Subsidiary and the Aspen Portfolio Subsidiary (collectively the “Subsidiaries”) is designed to enhance the ability of the Funds to obtain exposure to equities, financial, currency and commodities markets consistent with the limits of the U.S. federal tax law requirements applicable to registered investment companies. The Subsidiaries are subject to substantially the same investment policies and investment restrictions as the Funds. The Subsidiaries act as an investment vehicle for the Funds in order to effect certain commodity-related investments on behalf of the Funds. Investments in the Subsidiaries are expected to provide the Funds with exposure to the commodity markets within the limitations of Subchapter M of the Internal Revenue Code of 1986, as amended (the “Code”), and recent IRS revenue rulings, as discussed below under “Federal Income Taxes”. The Funds are the sole shareholder of the Subsidiaries pursuant to a subscription agreement dated as of August 2, 2011 for the Aspen Fund Subsidiary and December 16, 2016 for the Aspen Portfolio Subsidiary and it is intended that each Fund will remain the sole shareholder and will continue to control the Subsidiaries. Under the Articles of Association of the Subsidiaries, shares issued by the Subsidiaries confers upon a shareholder the right to wholly own and vote at general meetings of the Subsidiaries and certain rights in connection with any winding-up or repayment of capital, as well as the right to participate in the profits or assets of the Subsidiaries. Each Fund may invest up to 25% of their total assets in shares of the Subsidiaries. All investments held by the Subsidiaries are disclosed in the accounts of each Fund. As a wholly owned subsidiary of the Funds, all assets and liabilities, income and expenses of the Subsidiaries are consolidated in the financial statements and financial highlights of the Funds. All investments held by the Subsidiaries are disclosed in the accounts of the Funds. As of October 31, 2018, net assets of the Aspen Managed Futures Strategy Fund were $56,632,027, of which net assets of $15,319,807 or 27.05%, represented the Fund’s ownership of all issued shares and voting rights of the Aspen Fund Subsidiary. As of October 31, 2018, net assets of the Aspen Portfolio Strategy Fund were $62,699,804, of which $944,973 or 2.18%, represented the Fund’s ownership of all issued shares and voting rights of the Aspen Portfolio Subsidiary.
2. SIGNIFICANT ACCOUNTING POLICIES
The accompanying financial statements were prepared in accordance with accounting principles generally accepted in the United States of America (“U.S. GAAP”). The preparation of financial statements in conformity with U.S. GAAP requires management to make certain estimates and assumptions that affect the reported amounts of assets and liabilities and disclosures of contingent assets and liabilities at the date of the financial statements and the reported amounts of revenue and expenses during the period. Actual results could differ from those estimates. The Funds are considered an investment company for financial reporting purposes under U.S. GAAP and follows the accounting and reporting guidance applicable to investment companies in the Financial Accounting Standards Board Accounting Standards Codification Topic 946. The following is a summary of significant accounting policies consistently followed by the Funds and Subsidiaries in preparation of the financial statements.
Investment Valuation: The Funds generally value their securities based on market prices determined at the close of regular trading on the New York Stock Exchange (“NYSE”), normally 4:00 p.m. Eastern Time, on each day the NYSE is open for trading.
For equity securities and mutual funds that are traded on an exchange, the market price is usually the closing sale or official closing price on that exchange. In the case of equity securities not traded on an exchange, or if such closing prices are not otherwise available, the securities are valued at the mean of the most recent bid and ask prices on such day. Redeemable securities issued by open-end registered investment companies are valued at the investment company’s applicable net asset value, with the exception of exchange-traded open-end investment companies, which are priced as equity securities.
The market price for debt obligations is generally the price supplied by an independent third-party pricing service approved by the Board of Trustees (the “Board”), which may use a matrix, formula or other objective method that takes into consideration quotations from dealers, market transactions in comparable investments, market indices and yield curves. If vendors are unable to supply a price, or if the price supplied is deemed to be unreliable, the market price may be determined using quotations received from one or more brokers–dealers that make a market in the security.
22
| Aspen Funds | Notes to Consolidated Financial Statements |
October 31, 2018 (Unaudited)
Futures contracts that are listed or traded on a national securities exchange, commodities exchange, contract market or comparable over-the-counter market, and that are freely transferable, are valued at their closing settlement price on the exchange on which they are primarily traded or based upon the current settlement price for a like instrument acquired on the day on which the instrument is being valued. A settlement price may not be used if the market makes a limit move with respect to a particular commodity.
Forward currency exchange contracts have a fair value determined by the prevailing foreign currency exchange daily rates and current foreign currency exchange forward rates. The foreign currency exchange forward rates are calculated using an automated system that estimates rates on the basis of the current day foreign currency exchange rates and forward foreign currency exchange rates supplied by a pricing service.
Investment securities that are primarily traded on foreign securities exchanges are valued at the preceding closing values of such securities on their respective exchanges, except when an occurrence subsequent to the time a value was so established is likely to have changed such value. In such an event, the fair value of those securities are determined in good faith through consideration of other factors in accordance with procedures established by and under the general supervision of the Board.
When such prices or quotations are not available, or when Aspen Partners, Ltd. (the “Adviser”) believes that they are unreliable, securities may be priced using fair value procedures approved by the Board.
Fair Value Measurements: The Funds disclose the classification of their fair value measurements following a three-tier hierarchy based on the inputs used to measure fair value. Inputs refer broadly to the assumptions that market participants would use in pricing the asset or liability, including assumptions about risk. Inputs may be observable or unobservable. Observable inputs reflect the assumptions market participants would use in pricing the asset or liability that are developed based on market data obtained from sources independent of the reporting entity. Unobservable inputs reflect the reporting entity’s own assumptions about the assumptions market participants would use in pricing the asset or liability that are developed based on the best information available.
Various inputs are used in determining the value of each of the Funds’ investments as of the end of the reporting period. When inputs used fall into different levels of the fair value hierarchy, the level in the hierarchy within which the fair value measurement falls is determined based on the lowest level input that is significant to the fair value measurement in their entirety. The designated input levels are not necessarily an indication of the risk or liquidity associated with these investments. These inputs are categorized in the following hierarchy under applicable financial accounting standards:
| Level 1 – | Unadjusted quoted prices in active markets for identical investments, unrestricted assets or liabilities that the Funds have the ability to access at the measurement date; |
| Level 2– | Quoted prices which are not active, quoted prices for similar assets or liabilities in active markets or inputs other than quoted prices that are observable (either directly or indirectly) for substantially the full term of the asset or liability; and |
| Level 3 – | Significant unobservable prices or inputs (including the Funds’ own assumptions in determining the fair value of investments) where there is little or no market activity for the asset or liability at the measurement date. |
| Semi-Annual Report | October 31, 2018 | 23 |
| Aspen Funds | Notes to Consolidated Financial Statements |
October 31, 2018 (Unaudited)
The following is a summary of each input used to value the Funds as of October 31, 2018:
Aspen Managed Futures Strategy Fund
| Investments in Securities at Value | Level 1 - Quoted Prices | Level 2 - Other Significant Observable Inputs | Level 3 - Significant Unobservable Inputs | Total | ||||||||||||
| Short Term Investments Money Market Fund | $ | 1,643,374 | $ | – | $ | – | $ | 1,643,374 | ||||||||
| U.S. Treasury Bills | – | 47,458,850 | – | 47,458,850 | ||||||||||||
| TOTAL | $ | 1,643,374 | $ | 47,458,850 | $ | – | $ | 49,102,224 | ||||||||
| Other Financial Instruments Assets: | ||||||||||||||||
| Futures Contracts | ||||||||||||||||
| Commodity Contracts | $ | 164,101 | $ | – | $ | – | $ | 164,101 | ||||||||
| Equity Contracts | 120,358 | – | – | 120,358 | ||||||||||||
| Foreign Currency Contracts | 382,901 | – | – | 382,901 | ||||||||||||
| Interest Rate Contracts | 17,515 | – | – | 17,515 | ||||||||||||
| Liabilities: | ||||||||||||||||
| Futures Contracts | ||||||||||||||||
| Commodity Contracts | (272,719 | ) | – | – | (272,719 | ) | ||||||||||
| Equity Contracts | (35,703 | ) | – | – | (35,703 | ) | ||||||||||
| TOTAL | $ | 376,453 | $ | – | $ | – | $ | 376,453 | ||||||||
Aspen Portfolio Strategy Fund
| Investments in Securities at Value | Level 1 - Quoted Prices | Level 2 - Other Significant Observable Inputs | Level 3 - Significant Unobservable Inputs | Total | ||||||||||||
| Exchange Traded Funds | $ | 47,574,247 | $ | – | $ | – | $ | 47,574,247 | ||||||||
| Short Term Investments | 10,026,338 | – | – | 10,026,338 | ||||||||||||
| TOTAL | $ | 57,600,585 | $ | – | $ | – | $ | 57,600,585 | ||||||||
| Other Financial Instruments | �� | |||||||||||||||
| Assets: | ||||||||||||||||
| Futures Contracts | ||||||||||||||||
| Commodity Contracts | $ | 216,639 | $ | – | $ | – | $ | 216,639 | ||||||||
| Equity Contracts | 218,992 | – | – | 218,992 | ||||||||||||
| Foreign Currency Contracts | 370,349 | – | – | 370,349 | ||||||||||||
| Interest Rate Contracts | 108,657 | – | – | 108,657 | ||||||||||||
| Liabilities: | ||||||||||||||||
| Futures Contracts | ||||||||||||||||
| Commodity Contracts | (289,317 | ) | – | – | (289,317 | ) | ||||||||||
| Equity Contracts | (751,475 | ) | – | – | (751,475 | ) | ||||||||||
| Interest Rate Contracts | (220 | ) | – | – | (220 | ) | ||||||||||
| TOTAL | $ | (126,375 | ) | $ | – | $ | – | $ | (126,375 | ) | ||||||
24
| Aspen Funds | Notes to Consolidated Financial Statements |
October 31, 2018 (Unaudited)
Investment Transactions and Investment Income: Investment transactions are accounted for on the date the investments are purchased or sold (trade date). Realized gains and losses from investment transactions are reported on an identified cost basis, which is the same basis the Funds use for federal income tax purposes. Interest income, which includes accretion of discounts, is accrued and recorded as earned. Dividend income is recognized on the ex-dividend date or for certain foreign securities, as soon as information is available to the Funds. All of the realized and unrealized gains and losses and net investment income, are allocated daily to each class in proportion to their average daily net assets.
Foreign Securities: The Funds may directly purchase securities of foreign issuers. Investing in securities of foreign issuers involves special risks not typically associated with investing in securities of U.S. issuers. The risks include possible reevaluation of currencies, the inability to repatriate foreign currency, less complete financial information about companies and possible future adverse political and economic developments. Moreover, securities of many foreign issuers and their markets may be less liquid and their prices more volatile than those of securities of comparable U.S. issuers.
Foreign Currency Translation: The books and records of the Funds are maintained in U.S. dollars. Investment valuations and other assets and liabilities initially expressed in foreign currencies are converted each business day into U.S. dollars based upon current exchange rates. Prevailing foreign exchange rates may generally be obtained at the close of the NYSE (normally, 4:00 p.m. Eastern Time). The portion of realized and unrealized gains or losses on investments due to fluctuations in foreign currency exchange rates is not separately disclosed and is included in realized and unrealized gains or losses on investments, when applicable.
Foreign Currency Spot Contracts: The Funds may enter into foreign currency spot contracts to facilitate transactions in foreign securities or to convert foreign currency receipts into U.S. dollars. A foreign currency spot contract is an agreement between two parties to buy and sell currencies at the current market rate, for settlement generally within two business days. The U.S. dollar value of the contracts is determined using current currency exchange rates supplied by a pricing service. The contract is marked-to-market daily for settlements beyond one day and any change in market value is recorded as an unrealized gain or loss. When the contract is closed, the Funds record a realized gain or loss equal to the difference between the value on the open and close date. Losses may arise from changes in the value of the foreign currency, or if the counterparties do not perform under the contract’s terms. The maximum potential loss from such contracts is the aggregate face value in U.S. dollars at the time the contract was opened.
Trust Expenses: Some expenses of the Trust can be directly attributed to each of the Funds. Expenses which cannot be directly attributed to the Funds are apportioned among all funds in the Trust based on average net assets of each fund.
Fund and Class Expenses: Expenses that are specific to a class of shares of the Funds, including distribution fees (Rule 12b-1 fees) and shareholder servicing fees, are charged directly to that share class. All expenses of the Funds, other than class specific expenses, are allocated daily to each class in proportion to their average daily net assets.
Federal Income Taxes: The Funds comply with the requirements under Subchapter M of the Internal Revenue Code of 1986, as amended, applicable to regulated investment companies and intends to distribute substantially all of their net taxable income and net capital gains, if any, each year so that it will not be subject to excise tax on distributed income and gains. The Funds are not subject to income taxes to the extent such distributions are made.
As of and during the year or period ended October 31, 2018, the Funds did not have a liability for any unrecognized tax benefits. The Funds file U.S. federal, state, and local tax returns as required. The Funds’ tax returns are subject to examination by the relevant tax authorities until expiration of the applicable statute of limitations, which is generally three years after the filing of the tax return for federal purposes and four years for most state returns. Tax returns for open years have incorporated no uncertain tax positions that require a provision for income taxes.
Distributions to Shareholders: The Funds normally pay dividends and distributes capital gains, if any, on an annual basis. Income dividend distributions are derived from interest and other income the Funds receive from their investments, including short term capital gains. Long term capital gains distributions are derived from gains realized when the Funds sell a security it has owned for more than a year. The Funds may make additional distributions and dividends at other times if the portfolio manager believes doing so may be necessary for the Funds to avoid or reduce taxes.
| Semi-Annual Report | October 31, 2018 | 25 |
| Aspen Funds | Notes to Consolidated Financial Statements |
October 31, 2018 (Unaudited)
3. DERIVATIVE INSTRUMENTS
The Funds use derivatives (including futures) to pursue their investment objective. The Funds’ use of derivative instruments involves risks different from, or possibly greater than, the risks associated with investing directly in securities and other traditional investments. These risks may include (i) the risk that the counterparty to a derivative transaction may not fulfill their contractual obligations, (ii) risk of mispricing or improper valuation, and (iii) the risk that changes in the value of the derivative may not correlate perfectly with the underlying asset, rate or index. These risks could cause the Funds to lose more than the principal amount invested. In addition, investments in derivatives involve leverage, which means a small percentage of assets invested in derivatives can have a disproportionately large impact on the Funds.
The Funds’ use of derivatives can result in losses due to unanticipated changes in the market risk factors and the overall market. In instances where the Funds are using derivatives to decrease, or hedge, exposures to market risk factors for securities held by the Funds, there are also risks that those derivatives may not perform as expected resulting in losses for the combined or hedged positions. Derivatives may have little or no initial cash investment relative to their market value exposure and therefore can produce significant gains or losses in excess of their cost. This use of embedded leverage allows the Funds to increase their market value exposure relative to their net assets and can substantially increase the volatility of the Funds’ performance.
In addition, use of derivatives may increase or decrease exposure to the following risk factors:
| ● | Equity Risk: Equity risk relates to the change in value of equity securities as they relate to increases or decreases in the general market. |
| ● | Interest Rate Risk: When the Funds invest in fixed-income securities or derivatives, the value of an investment in the Funds will fluctuate with changes in interest rates. Typically, a rise in interest rates causes a decline in the value of fixed-income securities or derivatives owned by the Funds. In general, the market price of debt securities with longer maturities will increase or decrease more in response to changes in interest rates than shorter-term securities. Other risk factors include credit risk (the debtor may default) and prepayment risk (the debtor may pay their obligation early, reducing the amount of interest payments). |
| ● | Foreign Currency Risk: Currency trading involves significant risks, including market risk, interest rate risk, country risk, counterparty credit risk and short sale risk. Market risk results from the price movement of foreign currency values in response to shifting market supply and demand. Interest rate risk arises whenever a country changes its stated interest rate target associated with its currency. Country risk arises because virtually every country may interfere with international transactions in its currency. Counterparty credit risk arises when the counterparty will not fulfill its obligations to the Funds. Short sale risk arises from the sale of a security that is not owned, or any sale that is completed by the delivery of a security borrowed. |
| ● | Commodity Risk: Exposure to the commodities markets may subject the Funds to greater volatility than investments in traditional securities. Commodity prices are influenced by unfavorable weather, animal and plant disease, geologic and environmental factors, as well as changes in government regulation such as tariffs, embargoes or burdensome production rules and restrictions. |
Futures: The Funds and the Subsidiaries may enter into futures contracts. Futures contracts are agreements between two parties to buy and sell a particular commodity, instrument or index for a specified price on a specified future date. When the Funds or the Subsidiaries enter into a futures contract, it is required to deposit with (or for the benefit of) their broker an amount of cash or short-term high-quality securities as “initial margin”. The margin requirements are set by the exchange on which the contract is traded and may be modified during the term of the contract. The initial margin is in the nature of a performance bond or good faith deposit on the futures contract that is returned to the Funds upon termination of the contract, assuming all contractual obligations have been satisfied. As the value of the contract changes, the value of the futures contract position increases or declines. Subsequent payments, known as “variation margin”, are made or received by the Funds or the Subsidiaries each day, depending on the price fluctuations in the fair value of the contract and the value of cash or securities on deposit with the broker. Such payments or receipts are recorded for financial statement purposes as unrealized gains or losses by the Funds. Variation margin does not represent a borrowing or loan by the Funds but is instead a settlement between the Funds and the broker of the amount one would owe the other if the futures contract expired. When the contract is closed, the Funds record a realized gain or loss equal to the difference between the value of the contract at the time it was opened and the value at the time it was closed. When the Funds or the Subsidiaries enter into a futures contract certain risks may arise, such as illiquidity in the futures market, which may limit the Funds’ or the Subsidiaries’ ability to close out a futures contract prior to settlement date, and unanticipated movements in the value of securities, commodities or interest rates. Futures contracts are exchange-traded. Exchange-traded futures are standardized contracts and are settled through a clearing house with fulfillment supported by the credit of the exchange. Therefore, counterparty credit risk to the Funds and the Subsidiaries are reduced. With exchange traded futures, there is minimal counterparty credit risk to the Funds since futures are exchange traded and the exchange’s clearinghouse, as a counterparty to all exchange traded futures, guarantees the futures against default.
26
| Aspen Funds | Notes to Consolidated Financial Statements |
October 31, 2018 (Unaudited)
Consolidated Statements of Assets and Liabilities – Fair Value of Derivative Instruments as of October 31, 2018:
| Risk Exposure | Asset Derivatives Statements of Assets and Liabilities Location | Fair Value | Liabilities Derivatives Statements of Assets and Liabilities Location | Fair Value | ||||||||
| Aspen Managed Futures Strategy Fund | ||||||||||||
| Futures Contracts | Unrealized appreciation on futures contracts(a) | $ | 684,875 | Unrealized depreciation on futures contracts(a) | $ | 308,422 | ||||||
| $ | 648,875 | $ | 308,422 | |||||||||
| Risk Exposure to Fund | ||||||||||||
| Commodity Contracts | $ | 164,101 | $ | 272,719 | ||||||||
| Equity Contracts | 120,358 | 35,703 | ||||||||||
| Foreign Currency Contracts | 382,901 | – | ||||||||||
| Interest Rate Contracts | 17,515 | – | ||||||||||
| $ | 684,875 | $ | 308,422 | |||||||||
| Aspen Portfolio Strategy Fund | ||||||||||||
| Futures Contracts | Unrealized appreciation on futures contracts(a) | $ | 914,637 | Unrealized depreciation on futures contracts(a) | $ | 1,041,012 | ||||||
| $ | 914,637 | $ | 1,041,012 | |||||||||
| Risk Exposure to Fund | ||||||||||||
| Commodity Contracts | 216,639 | 289,317 | ||||||||||
| Equity Contracts | 218,992 | 751,475 | ||||||||||
| Foreign Currency Contracts | 370,349 | – | ||||||||||
| Interest Rate Contracts | 108,657 | 220 | ||||||||||
| $ | 914,637 | $ | 1,041,012 | |||||||||
| (a) | Represents cumulative appreciation/(depreciation) of futures contracts as reported in the Consolidated Schedule of Investments. Only the current day’s net variation margin is reported within the Consolidated Statements of Assets and Liabilities. |
| Semi-Annual Report | October 31, 2018 | 27 |
| Aspen Funds | Notes to Consolidated Financial Statements |
October 31, 2018 (Unaudited)
Consolidated Statements of Operations – The effect of Derivative Instruments for the six months ended October 31, 2018:
| Derivatives Instruments | Location of Gain/(Loss) on Derivatives Statements of Operations | Realized Gain/(Loss) on Derivatives Statements of Operations | Change in Unrealized Appreciation/ (Depreciation) on Derivatives Statements of Operations | |||||||
| Aspen Managed Futures Strategy Fund | ||||||||||
| Futures Contracts | Net realized loss on futures contracts/Net change in unrealized appreciation/ (depreciation) on futures contracts | $ | (1,806,276 | ) | $ | 655,677 | ||||
| $ | (1,806,276 | ) | $ | 655,677 | ||||||
| Risk Exposure to Fund | ||||||||||
| Commodity Contracts | $ | (1,198,491 | ) | $ | 66,913 | |||||
| Equity Contracts | (549,772 | ) | (143,976 | ) | ||||||
| Foreign Currency Contracts | 1,023,004 | 382,273 | ||||||||
| Interest Rate Contracts | (1,081,017 | ) | 350,467 | |||||||
| $ | (1,806,276 | ) | $ | 655,677 | ||||||
| Aspen Portfolio Strategy Fund | ||||||||||
| Futures Contracts | Net realized loss on futures contracts/Net change in unrealized appreciation/ (depreciation) on futures contracts | $ | (2,321,720 | ) | $ | 506,147 | ||||
| $ | (2,321,720 | ) | $ | 506,147 | ||||||
| Risk Exposure to Fund | ||||||||||
| Commodity Contracts | $ | (1,170,723 | ) | $ | (1,436 | ) | ||||
| Equity Contracts | 66,668 | (359,582 | ) | |||||||
| Foreign Currency Contracts | (234,865 | ) | 541,440 | |||||||
| Interest Rate Contracts | (982,799 | ) | 325,725 | |||||||
| $ | (2,321,720 | ) | $ | 506,147 | ||||||
The average notional value of futures contracts, net of both long and short positions, held by the Aspen Managed Futures Strategy Fund and the Aspen Portfolio Strategy Fund during the six month period ended October 31, 2018 were $51,008,624 and $30,378,356, respectively.
4. TAX BASIS INFORMATION
Tax Basis of Investments: As of October 31, 2018, the aggregate cost of investments, gross unrealized appreciation/(depreciation) and net unrealized depreciation for Federal tax purposes was as follows:
| Cost of Investments | Gross Appreciation (excess of value over tax cost) | Gross Depreciation (excess of tax cost over value) | Net Appreciation/(Depreciation) on Investments | |||||||||||||
| Aspen Managed Futures Strategy Fund | $ | 49,128,628 | $ | 1,047,443 | $ | (697,394 | ) | $ | 350,049 | |||||||
| Aspen Portfolio Strategy Fund | 52,862,923 | 6,489,098 | (1,877,811 | ) | 4,611,287 | |||||||||||
28
| Aspen Funds | Notes to Consolidated Financial Statements |
October 31, 2018 (Unaudited)
Tax Basis of Distributions to Shareholders: Distributions are determined in accordance with federal income tax regulations, which differ from U.S. GAAP, and, therefore, may differ significantly in amount or character from net investment income and realized gains for financial reporting purposes. Financial reporting records are adjusted for permanent book/tax differences to reflect tax character but are not adjusted for temporary differences.
The tax character of distributions paid during the year ending April 30, 2018 were as follows:
Ordinary Income | Long-Term Capital Gain | |||||||
| Aspen Managed Futures Strategy Fund | $ | – | $ | – | ||||
| Aspen Portfolio Strategy Fund | 538,089 | 388,516 | ||||||
The amounts and characteristics of tax basis distributions and composition of distributable earnings/(accumulated losses) are finalized at fiscal year-end. Accordingly, tax basis balances have not been determined as of October 31, 2018.
5. SHARES OF BENEFICIAL INTEREST
The capitalization of the Trust consists of an unlimited number of shares of beneficial interest with no par value per share. Holders of the shares of each of the Funds of the Trust have one vote for each share held and a proportionate fraction of a vote for each fractional share. All shares issued and outstanding are fully paid and are transferable and redeemable at the option of the shareholder. Purchasers of the shares do not have any obligation to make payments to the Trust or its creditors solely by reason of the purchasers’ ownership of the shares. Shares have no pre-emptive rights.
Fund shares redeemed within 30 days of purchase may incur a 2% short-term redemption fee deducted from the redemption amount. The amount of redemption fees received during the period are presented in the Consolidated Statements of Changes in Net Assets.
6. MANAGEMENT AND RELATED-PARTY TRANSACTIONS
The Adviser, subject to the authority of the Board, is responsible for the overall management and administration of the Funds’ business affairs. The Adviser manages the investments of the Funds in accordance with the Funds’ investment objective, policies and limitations and investment guidelines established jointly by the Adviser and the Board. Pursuant to each Fund’s Investment Advisory Agreement, (the “Advisory Agreement”), the Aspen Managed Futures Strategy Fund will pay the Adviser an annual management fee of 0.75%, based on the Fund’s average daily net asset. The Aspen Portfolio Strategy Fund will pay the Adviser an annual management fee of 1.00%, based on the Fund’s average daily net assets. The management fee is paid on a monthly basis.
The Subsidiaries have each entered into a separate advisory agreement (collectively, the “Subsidiary Advisory Agreement”) with the Adviser for the management of each Subsidiary’s portfolio pursuant to which the Subsidiaries are obligated to pay the Adviser a management fee at the same rate that the Funds pay the Adviser for investment advisory services provided to the Funds. The Adviser has agreed to waive the advisory fee it receives from the Funds in an amount equal to the management fee paid by the Subsidiaries. This agreement may be terminated based on the terms of the Advisory Agreement. For the six month period ended October 31, 2018, this amount equaled $58,772 and $7,320 for Aspen Managed Futures Strategy Fund and the Aspen Portfolio Strategy Fund, respectively, and are disclosed in the Consolidated Statements of Operations. These waivers are not subject to reimbursement/recoupment.
The Adviser has contractually agreed to limit the Funds’ total annual fund operating expenses (exclusive of distribution and service (12b-1) fees, shareholder services fees, acquired fund fees and expenses, brokerage expenses, interest expense, taxes and extraordinary expenses) to 1.55% of each of the Funds’ average daily net assets for each of Class A and Class I Shares. This agreement (the “Expense Agreement”) is in effect from September 1, 2018 through August 31, 2019 for the Funds. The prior Expense Agreement for the Aspen Managed Futures Strategy Fund was in effect from September 1, 2017 through August 31, 2018. The prior Expense Agreement for the Aspen Portfolio Strategy Fund was in effect from December 14, 2016 through August 31, 2018. The Adviser will be permitted to recover, on a class-by-class basis, expenses it has borne through the Expense Agreement to the extent that the Funds’ expenses in later periods fall below the expense cap in effect at the time of waiver or reimbursement. Notwithstanding the foregoing, the Funds will not be obligated to pay any such fees and expenses more than three years after the date of the waiver or reimbursement. The Adviser may not discontinue or modify this waiver prior to August 31, 2019 without the approval by the Funds’ Board of Trustees.
| Semi-Annual Report | October 31, 2018 | 29 |
| Aspen Funds | Notes to Consolidated Financial Statements |
October 31, 2018 (Unaudited)
As of October 31, 2018, the fee waivers/reimbursements and recoupments of past waived fees were as follows:
| Fund | Fees Waived/Reimbursed By Advisor | Recoupment of Past Waived Fees By Advisor | Total | |||||||||
| Aspen Managed Futures Strategy Fund - Class A | $ | – | $ | – | $ | – | ||||||
| Aspen Managed Futures Strategy Fund - Class I | (23,658 | ) | – | (23,658 | ) | |||||||
| Aspen Portfolio Strategy Fund - Class A | (764 | ) | – | (764 | ) | |||||||
| Aspen Portfolio Strategy Fund - Class I | (28,544 | ) | – | (28,544 | ) | |||||||
As of October 31, 2018, the balances of recoupable expenses for each Fund were as follows:
| Fund | Expires 2019 | Expires 2020 | Expires 2021 | Expires 2021 | Total | |||||||||||||
| Aspen Managed Futures Strategy Fund | ||||||||||||||||||
| Class A | $ | – | $ | – | $ | – | $ | – | $ | – | ||||||||
| Class I | – | – | – | 23,658 | 23,658 | |||||||||||||
| Aspen Portfolio Strategy Fund | ||||||||||||||||||
| Class A | – | 8,063 | 3,450 | 764 | 12,277 | |||||||||||||
| Class I | – | 61,839 | 89,774 | 28,544 | 180,157 | |||||||||||||
Fund Administrator Fees and Expenses
ALPS Fund Services, Inc. (“ALPS”) serves as administrator to the Funds and the Funds have agreed to pay expenses incurred in connection with its administrative activities. Pursuant to an Administration Agreement, ALPS provides operational services to the Fund including, but not limited to, fund accounting and fund administration and generally assist in the Funds’ operations. Officers of the Trust are employees of ALPS. The Funds’ administration fee is accrued on a daily basis and paid monthly. Administration fees paid by the Funds for the six months ended October 31, 2018 are disclosed in the Consolidated Statements of Operations.
ALPS is reimbursed by the Funds for certain out-of-pocket expenses.
Transfer Agent
ALPS serves as transfer, dividend paying and shareholder servicing agent for the Funds. ALPS receives an annual minimum fee, a fee based upon the number of shareholder accounts, and is also reimbursed by the Funds for certain out-of-pocket expenses. Transfer agent fees paid by the Funds for the six month period ended October 31, 2018 are disclosed in the Consolidated Statements of Operations.
Compliance Services
ALPS provides services that assist the Trust’s chief compliance officer in monitoring and testing the policies and procedures of the Trust in conjunction with requirements under Rule 38a-1 under the 1940 Act and receives an annual base fee. ALPS is reimbursed for certain out-of-pocket expenses by the Funds. Compliance service fees paid by the Funds for the six month period ended October 31, 2018 are disclosed in the Consolidated Statements of Operations.
Principal Financial Officer
ALPS receives an annual fee for providing principal financial officer services to the Funds. Principal financial officer fees paid by the Funds for the six month period ended October 31, 2018 are disclosed in the Consolidated Statements of Operations.
Distributor
ALPS Distributors, Inc. (“ADI” or the “Distributor”) (an affiliate of ALPS) acts as the distributor of the Funds’ shares pursuant to a Distribution Agreement with the Trust. Shares are sold on a continuous basis by ADI as agent for the Funds, and ADI has agreed to use its best efforts to solicit orders for the sale of the Funds’ shares, although it is not obliged to sell any particular amount of shares. ADI is not entitled to any compensation for its services as Distributor. ADI is registered as a broker-dealer with the U.S. Securities and Exchange Commission.
The Funds have adopted a plan of distribution for Class A shares pursuant to Rule 12b-1 under the 1940 Act (the “Plan”). The Plan allows the Funds to use Class A assets to pay fees in connection with the distribution and marketing of Class A shares and/or the provision of shareholder services to Class A shareholders. The Plan permits payment for services in connection with the administration of plans or programs that use Class A shares as their funding medium and for related expenses. The recipients of such payments may include the Distributor, other affiliates of the Adviser, broker-dealers, financial institutions, plan sponsors and administrators and other financial intermediaries through which investors may purchase shares of the Funds. The Plan permits the Funds to use their Class A assets to make total payments at an annual rate of up to 0.25% of the Funds’ average
30
| Aspen Funds | Notes to Consolidated Financial Statements |
October 31, 2018 (Unaudited)
daily net assets attributable to their Class A shares. The expenses of the plan are reflected as distribution and service fees in the Consolidated Statements of Operations.
The Funds have adopted a shareholder service plan (a “Shareholder Services Plan”) for Class A shares. Under the Shareholder Services Plan the Funds are authorized to compensate certain financial intermediaries, including broker-dealers and the Funds’ affiliates, which may include the Distributor, Adviser and/or the transfer agent (“Participating Organizations”), an aggregate fee in an amount not to exceed on an annual basis 0.15% for Class A shares of the average daily net asset value of the Class A shares attributable to or held in the name of a Participating Organizations for its clients as compensation for providing shareholder service activities, which do not include distribution services, pursuant to an agreement with a Participating Organizations. Any amount of such payment not paid to the Participating Organizations during the Funds’ fiscal year for such service activities shall be reimbursed to the Funds as soon as practicable. Shareholder Services Plan fees are included with distribution and service fees on the Consolidated Statements of Operations. Fees recaptured pursuant to the Shareholder Services Plan for six month period ended October 31, 2018 are included as an offset to distribution and service fees as disclosed in the Consolidated Statements of Operations.
Certain intermediaries may charge networking, omnibus account or other administrative fees with respect to transactions in shares of the Funds. Transactions may be processed through the National Securities Clearing Corporation (“NSCC”) or similar systems or processed on a manual basis. These fees are paid by the Funds to the Distributor, which uses such fees to reimburse intermediaries. In the event an intermediary receiving payments from the Distributor on behalf of the Funds converts from a networking structure to an omnibus account structure or otherwise experiences increased costs, fees borne by the Funds may increase. Fees paid by the Funds for the six month period ended October 31, 2018 are disclosed in the Consolidated Statements of Operations as Delegated Transfer Agent Equivalent Services.
Index Licensing Services
The Aspen Managed Futures Strategy Fund has adopted an Index Licensing Agreement and the Adviser pursuant to which the Fund pays the Adviser a monthly annualized licensing fee of 0.25%, based on the Fund’s average daily net assets for the right to use the Index in connection with the Fund. Fees paid by the Fund for the six month period ended October 31, 2018 are disclosed in the Consolidated Statement of Operations as Licensing fees.
7. SECURITIES TRANSACTIONS
The cost of purchases and proceeds from sales (excluding short-term securities) of U.S. Government securities for the Aspen Managed Futures Strategy Fund and Exchange Traded Funds for the Aspen Portfolio Strategy Fund during the six month period ended October 31, 2018 were as follows:
| Aspen Managed Futures Strategy Fund | ||||
| Cost of Investments Purchased | $ | 0 | ||
| Proceeds from Investments Sold | $ | 0 | ||
| Aspen Portfolio Strategy Fund | ||||
| Cost of Investments Purchased | $ | 10,836,644 | ||
| Proceeds from Investments Sold | $ | 3,493,440 | ||
8. INDEMNIFICATIONS
Under the Trust’s organizational documents, its officers and Trustees are indemnified against certain liability arising out of the performance of their duties to the Trust. Additionally, in the normal course of business, the Trust enters into contracts with service providers that may contain general indemnification clauses, which may permit indemnification to the extent permissible under applicable law. The Trust’s maximum exposure under these arrangements is unknown, as this would involve future claims that may be made against the Trust that have not yet occurred.
9. NEW ACCOUNTING PROUNCEMENTS
On October 4, 2018, the SEC amended Regulation S-X to require certain financial statement disclosure requirements to conform them to U.S. GAAP for investment companies. Effective November 4, 2018, the Funds adopted disclosure requirement changes for Regulation S-X and these changes are reflected throughout this report. The Funds’ adoption of those amendments, effective with the financial statements prepared as of October 31, 2018, had no effect on the Funds’ net assets or results of operations.
| Semi-Annual Report | October 31, 2018 | 31 |
| Aspen Funds | Notes to Consolidated Financial Statements |
October 31, 2018 (Unaudited)
In August 2018, the Financial Accounting Standards Board (“FASB”) issued Accounting Standards Update (“ASU”) 2018-13, which changes the fair value measurement disclosure requirements of FASB Accounting Standards Codification Topic 820, Fair Value Measurement. The update to Topic 820 includes new, eliminated, and modified disclosure requirements. ASU 2018-13 is effective for fiscal years beginning after December 15, 2019, including interim periods. Early adoption is permitted for any eliminated or modified disclosures. Management is currently evaluating the impact of the ASU to the Funds’ financial statements.
32
| Aspen Funds | Additional Information |
October 31, 2018 (Unaudited)
1. FUND HOLDINGS
The Fund files its complete schedule of portfolio holdings with the Securities and Exchange Commission (the “SEC”) for the first and third quarters of each fiscal year on Form N-Q within 60 days after the end of the period. Copies of the Funds’ Form N-Q are available without charge on the SEC website at http://www.sec.gov. You may also review and copy the Form N-Q at the SEC’s Public Reference Room in Washington, DC. For more information about the operation of the Public Reference Room, please call the SEC at 1-800-SEC-0330.
2. FUND PROXY VOTING POLICIES, PROCEDURES AND SUMMARIES
The Funds’ policies and procedures used in determining how to vote proxies and information regarding how the Fund voted proxies relating to portfolio securities during the most recent prior 12-month period ending June 30 are available without charge, (1) upon request, by calling (toll-free) 855-845-9444 and (2) on the SEC’s website at http://www.sec.gov.
| Semi-Annual Report | October 31, 2018 | 33 |
| Aspen Funds | Privacy Policy |
October 31, 2018 (Unaudited)
| Who We Are | |
| Who is providing this notice? | Aspen Managed Futures Strategy Fund and Aspen Portfolio Strategy Fund. |
| What We Do | |
| How do the Funds protect my personal information? | To protect your personal information from unauthorized access and use, we use security measures that comply with federal law. These measures include computer safeguards and secured files and buildings. |
| How do the Funds collect my personal information? | We collect your personal information, for example, when you
● open an account ● provide account information or give us your contact information ● make a wire transfer or deposit money
|
| Why can’t I limit all sharing? | Federal law gives you the right to limit only
● sharing for affiliates’ everyday business purposes - information about your creditworthiness ● affiliates from using your information to market to you ● sharing for non-affiliates to market to you
State laws and individual companies may give you additional rights to limit sharing. |
| Definitions | |
| Affiliates | Companies related by common ownership or control. They can be financial and nonfinancial companies. |
| Non-affiliates | Companies not related by common ownership or control. They can be financial and nonfinancial companies.
● The Funds do not share with non-affiliates so they can market to you. |
| Joint marketing | A formal agreement between non-affiliated financial companies that together market financial products or services to you.
● The Funds do not jointly market. |
| Other Important Information | |
| California Residents | If your account has a California home address, your personal information will not be disclosed to nonaffiliated third parties except as permitted by applicable California law, and we will limit sharing such personal information with our affiliates to comply with California privacy laws that apply to us. |
| Vermont Residents | The State of Vermont requires financial institutions to obtain your consent prior to sharing personal information that they collect about you with affiliated companies and nonaffiliated third parties other than in certain limited circumstances. Except as permitted by law, we will not share personal information we collect about you with nonaffiliated third parties or other affiliated companies unless you provide us with your written consent to share such information. |
34
| Aspen Funds | Privacy Policy |
October 31, 2018 (Unaudited)
| FACTS | WHAT DO THE FUNDS DO WITH YOUR PERSONAL INFORMATION? |
| Why? | Financial companies choose how they share your personal information. Federal law gives consumers the right to limit some but not all sharing. Federal law also requires us to tell you how we collect, share, and protect your personal information. Please read this notice carefully to understand what we do. |
| What? | The types of personal information we collect and share depend on the product or service you have with us. This information can include:
● Social Security number and account transactions ● Account balances and transaction history ● Wire transfer instructions |
| How? | All financial companies need to share customers’ personal information to run their everyday business. In the section below, we list the reasons financial companies can share their customers’ personal information; the reasons the Funds choose to share; and whether you can limit this sharing. |
| Reasons we can share your personal information | Do the Funds share: | Can you limit this sharing? |
| For our everyday business purposes — such as to process your transactions, maintain your account(s), respond to court orders and legal investigations, or report to credit bureaus | Yes | No |
| For our marketing purposes — to offer our products and services to you | No | We do not share. |
| For joint marketing with other financial companies | No | We do not share. |
| For our affiliates’ everyday business purposes — information about your transactions and experiences | Yes | No |
| For our affiliates’ everyday business purposes — information about your creditworthiness | No | We do not share. |
| For non-affiliates to market to you | No | We do not share. |
| Semi-Annual Report | October 31, 2018 | 35 |

This material must be accompanied or preceded by the prospectus.


TABLE OF CONTENTS
SEMI-ANNUAL REPORT
| SHAREHOLDER LETTER | 1 |
| PERFORMANCE UPDATE | 3 |
| DISCLOSURE OF FUND EXPENSES | 5 |
| PORTFOLIO OF INVESTMENTS | 6 |
| STATEMENT OF ASSETS AND LIABILITIES | 17 |
| STATEMENT OF OPERATIONS | 18 |
| STATEMENTS OF CHANGES IN NET ASSETS | 19 |
| FINANCIAL HIGHLIGHTS | 20 |
| NOTES TO FINANCIAL STATEMENTS | 22 |
| ADDITIONAL INFORMATION | 29 |
| PRIVACY POLICY | 30 |
Disciplined Growth Investors’ goal is to communicate clearly and transparently with our clients and mutual fund shareholders. It is mutually beneficial when our shareholders understand how we invest, what we are currently thinking and forecasting, and the specific investment decisions we have made. Our views and opinions regarding the investment prospects of our portfolio holdings and the Fund are “forward looking statements” which may or may not be accurate over the long term. While we believe we have a reasonable basis for these forecasts and have confidence in our investment team’s views, actual results may differ materially from those we anticipate. Information provided in this report should not be considered a recommendation to purchase or sell any particular security.
You can identify forward looking statements as those including words such as “believe”, “expect”, “anticipate”, “forecast”, and similar statement. We cannot assure future performance. These forward-looking statements are made only as-of the date of this report. Following the publication of this report, we will not update any of the forward-looking statements included here.
This material must be preceded or accompanied by a prospectus. Please read the prospectus carefully before investing.
Beginning on January 1, 2021, as permitted by regulations adopted by the U.S. Securities and Exchange Commission, paper copies of the Fund’s annual and semi-annual shareholder reports will no longer be sent by mail, unless you specifically request paper copies of the reports. Instead, the reports will be made available on the Fund’s website at www.dgifund.com, and you will be notified by mail each time a report is posted and provided with a website link to access the report.
Beginning on January 1, 2019, you may, notwithstanding the availability of shareholder reports online, elect to receive all future shareholder reports in paper free of charge. If you invest through a financial intermediary, you can contact your financial intermediary to request that you continue to receive paper copies of your shareholder reports. If you invest directly with the Fund, you can call 1.855.DGI.FUND (1-855-344-3863) to let the Fund know you wish to continue receiving paper copies of your shareholder reports.
If you already elected to receive shareholder reports electronically, you will not be affected by this change and you need not take any action. You may elect to receive shareholder reports and other communications from the Fund electronically anytime by contacting your financial intermediary (such as a broker-dealer or bank) or, if you are a direct investor, by enrolling at www.dgifund.com.
THE DISCIPLINED GROWTH INVESTORS FUND
| OCTOBER 31, 2018 | DGIFUND.COM |
| The Disciplined Growth Investors Fund | Shareholder Letter |
October 31, 2018 (Unaudited)
Fund Performance and Asset Mix:
The Disciplined Growth Investor Fund’s (“The DGI Fund”) fiscal year midpoint is October 31st. For the 2018 fiscal year-to-date (5/1/18-10/31/18), The DGI Fund returned 3.13%.
During the last six months, The DGI Fund held 25 stocks that increased in value and 27 stocks that declined in value. The ten largest equity holdings accounted for 0.64% of the Fund’s total performance. Stocks in The DGI Fund returned 4.42% while bonds returned 0.37%.* The S&P 500® Total Return Index(a) , The DGI Fund’s benchmark, increased 3.40% during the last six months.
Past performance is no guarantee of future results.
With 68.3% stocks and 31.7% bonds and cash as of 10/31/18, we have positioned The DGI Fund to reflect our view that the investment environment favors stocks while recognizing bond yields are increasing as interest rates increase. This is the first time since The DGI Fund’s inception in which we are encouraged by the change in the bond environment. Although increases in rates may cause reduction in the value of bonds in the shorter term, they should increase the yield to maturity for new investments versus what we experienced in The DGI Fund’s past.
You can find additional performance information and a full list of The DGI Fund’s holdings in this Semi Annual report and at www.dgifund.com.
Portfolio Activity:
In the past six months, our investment team added one new stock to The DGI Fund and increased the position size of another (Power Integrations and SuperMicro, respectively). We sold two holdings - the remaining position of Altaba, Inc and of Ethan Allen Interiors.
Power Integrations (POWI) develops and manufactures the technology found in power supplies for many electronic devices like cell phones, personal computers, televisions, appliances, etc. Increasing interest in power conservation and greater device complexity is fueling demand for their capabilities. The company’s relentless focus on product innovation has also enabled it to enter previously untapped markets.
Supermicro (SMCI) designs high-performance servers for corporations and cloud-based service providers to use in their data centers. The company has experienced accounting issues related to some of their resellers causing concern with investors and depressing the stock price. An agreement between the company and their lenders eased our concerns regarding this matter, so we modestly increased the Fund’s investment.
We sold the position in Altaba due to business execution risk. After Yahoo was split apart and sold off, Altaba was created to hold the remaining assets, primarily equity of Chinese eCommerce giant Alibaba group. As such, Altaba is a closed-end fund and it’s business model and expected return prospects did not fit our objectives with The DGI Fund.
Ethan Allen was also sold due to business execution risk. The DGI Fund had held the stock for several years. Over time, it became apparent to our investment team the company faced significant headwinds which have prevented it from reaching its stated milestones.
Sincerely,

Portfolio Manager
Disciplined Growth Investors, Inc.
| Semi-Annual Report | October 31, 2018 | 1 |
| The Disciplined Growth Investors Fund | Shareholder Letter |
October 31, 2018 (Unaudited)
| * | Asset class-specific performance is before fees. The Fund’s single fee – the management fee – is paid from the Fund’s holding of cash. Total Fund net-of-fees performance is presented in this letter, later in this annual report, and is updated monthly on the Fund’s website, www.dgifund.com. |
The views of Disciplined Growth Investors, Inc. and information discussed in this commentary are as of the date of publication, are subject to change, and may not reflect the writers’ current views. The views expressed are those of the Fund’s adviser only, and represent an assessment of market conditions at a specific point in time, are opinions only and should not be relied upon as investment advice regarding a particular investment or markets in general. Such information does not constitute a recommendation to buy or sell specific securities or investment vehicles. It should not be assumed that any investment will be profitable or will equal the performance of the portfolios or any securities or any sectors mentioned in this letter. The subject matter contained in this letter has been derived from several sources believed to be reliable and accurate at the time of compilation. Neither Disciplined Growth Investors, Inc. nor the Fund accepts any liability for losses either direct or consequential caused by the use of this information.
The Fund is distributed by ALPS Distributors, Inc.
The Fund is subject to investment risks, including possible loss of the principal amount invested and therefore is not suitable for all investors. The Fund may not achieve its objectives.
Diversification does not eliminate the risk of experiencing investment losses.
Fred Martin is a registered representative of ALPS Distributors, Inc. CFA Institute Marks are trademarks owned by the CFA Institute.
| (a) | The S&P 500® Total Return Index is an unmanaged index of 500 common stocks chosen for market size, liquidity and industry group representation. It is a market-value weighted index. The Index is not actively managed and does not reflect any deductions for fees, expenses or taxes. An investor may not invest directly in the Index. |
| 2 | 1-855-DGI-FUND (344-3863) | www.DGIfund.com |
| The Disciplined Growth Investors Fund | Performance Update |
October 31, 2018 (Unaudited)
Annualized Total Return Performance (for the period ended October 31, 2018)
| 6 month | Calendar YTD | 1 Year | 3 Year | 5 Year | Since Inception* | |
| The Disciplined Growth Investors Fund | 3.13% | 3.34% | 7.58% | 9.68% | 8.65% | 11.63% |
| S&P 500® Total Return Index(1) | 3.40% | 3.01% | 7.35% | 11.52% | 11.34% | 14.61% |
Performance data quoted represents past performance. Past performance does not guarantee future results. Investment return and principal value of an investment will fluctuate so that an investor’s shares, when sold or redeemed, may be worth more or less than the original cost. Current performance data may be higher or lower than actual data quoted. For the most current month-end performance data please call 1.855.DGI.FUND.
The table does not reflect the deductions of taxes a shareholder would pay on Fund distributions or redemptions of Fund shares.
Subject to investment risks, including possible loss of the principal amount invested.
Returns for periods less than 1 year are cumulative.
| * | Fund Inception date of August 12, 2011. |
| (1) | The S&P 500® Total Return Index is an unmanaged index of 500 common stocks chosen for market size, liquidity and industry group representation. It is a market-value weighted index. The Index is not actively managed and does not reflect any deductions for fees, expenses or taxes. An investor may not invest directly in the Index. |
| Semi-Annual Report | October 31, 2018 | 3 |
| The Disciplined Growth Investors Fund | Performance Update |
October 31, 2018 (Unaudited)
Growth of $10,000 Investment in the Fund (for the period ended October 31, 2018)
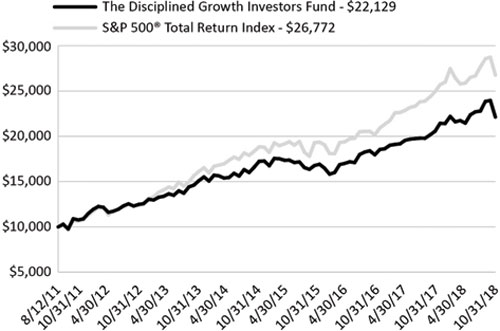
The chart above represents historical performance of a hypothetical investment of $10,000 in the Fund since inception. Past performance does not guarantee future results. This chart does not reflect the deduction of taxes that a shareholder would pay on Fund distributions or the redemption of Fund shares.
Investing in the Fund is subject to investment risks, including possible loss of the principal amount invested.
Industry Sector Allocation
(as a % of Net Assets)*
| Technology | 30.61% |
| Consumer Discretionary | 15.93% |
| Health Care | 11.86% |
| Industrials | 6.67% |
| Financials | 0.58% |
| Energy | 1.93% |
| Consumer, Cyclical | 0.76% |
| Corporate Bonds | 21.35% |
| Foreign Corporate Bonds | 0.45% |
| Foreign Government Bonds | 0.50% |
| Government & Agency Obligations | 6.80% |
| Short Term Investments | 2.36% |
| Other Assets in Excess of Liabilities | 0.20% |
Top Ten Holdings
(as a % of Net Assets)*
| Edwards Lifesciences Corp. | 4.74% |
| TJX Cos., Inc. | 4.02% |
| U.S. Treasury Note | 3.26% |
| Intuit, Inc. | 3.07% |
| Autodesk, Inc. | 2.75% |
| Intuitive Surgical, Inc. | 2.61% |
| Middleby Corp. | 2.32% |
| U.S. Treasury Note | 2.30% |
| Open Text Corp. | 2.29% |
| Ubiquiti Networks, Inc. | 2.28% |
| Top Ten Holdings | 29.64% |
| * | Holdings are subject to change, and may not reflect the current or future position of the portfolio. |
| 4 | 1-855-DGI-FUND (344-3863) | www.DGIfund.com |
| The Disciplined Growth Investors Fund | Disclosure of Fund Expenses |
October 31, 2018 (Unaudited)
As a shareholder of the Fund, you incur two types of costs: (1) transaction costs, including sales charges (loads) on purchase payments, reinvested dividends, or other distributions; redemption fees; and exchange fees; and (2) ongoing costs, including management fees; distribution and/or service (12b-1) fees; and other fund operating expenses. This example is intended to help you understand your ongoing costs (in dollars), of investing in the Fund and to compare these costs with the ongoing costs of investing in other mutual funds.
This example is based on an investment of $1,000 invested at the beginning of the period and held for the entire six-month period of May 1, 2018 through October 31, 2018.
Actual Expenses The first line of the table below provides information about actual account values and actual expenses. You may use the information in this line, together with the amount you invested, to estimate the expenses that you paid over the period. Simply divide your account value by $1,000 (for example, an $8,600 account value divided by $1,000 = 8.6), then multiply the result by the number in the first line under the heading “Expenses Paid During Period” to estimate the expenses you paid on your account during this period.
Hypothetical Example for Comparison Purposes The second line of the table below provides information about hypothetical account values and hypothetical expenses based on the Fund’s actual expense ratio and an assumed rate of return of 5% per year before expenses, which is not the Fund’s actual return. The hypothetical account values and expenses may not be used to estimate the actual ending account balance or expenses you paid for the period. You may use this information to compare the ongoing costs of investing in the Fund and other mutual funds. To do so, compare this 5% hypothetical example with the 5% hypothetical examples that appear in the shareholder reports of the other funds.
Please note that the expenses shown in the table are meant to highlight your ongoing costs only and do not reflect transactional costs, such as sales charges (loads), redemption fees or exchange fees. Therefore, the second line of the table is useful in comparing ongoing costs only and will not help you determine the relative total costs of owning different funds. In addition, if these transactional costs were included, your costs would have been higher.
Beginning Account Value 5/1/2018 | Ending Account Value 10/31/2018 | Expense Ratio(a) | Expenses Paid During period 5/1/2018 - 10/31/2018(b) | |
| Actual | $1,000.00 | $1,031.30 | 0.78% | $3.99 |
| Hypothetical (5% return before expenses) | $1,000.00 | $1,021.27 | 0.78% | $3.97 |
| (a) | The Fund's expense ratios have been annualized based on the Fund's most recent fiscal half-year expenses. |
| (b) | Expenses are equal to the Fund's annualized expense ratio, multiplied by the average account value over the period, multiplied by the number of days in the most recent fiscal half-year (184)/365 (to reflect the half-year period). |
| Semi-Annual Report | October 31, 2018 | 5 |
| The Disciplined Growth Investors Fund | Portfolio of Investments |
October 31, 2018 (Unaudited)
| Shares | Value (Note 2) | |||||||
| COMMON STOCKS (68.34%) | ||||||||
| CONSUMER DISCRETIONARY (15.93%) | ||||||||
| Apparel & Textile Products (1.63%) | ||||||||
| Ralph Lauren Corp. | 13,293 | $ | 1,722,906 | |||||
| Under Armour, Inc. , Class A(a) | 79,530 | 1,758,408 | ||||||
| 3,481,314 | ||||||||
| Automotive (2.10%) | ||||||||
| Gentex Corp. | 141,545 | 2,979,523 | ||||||
| Gentherm, Inc. (a) | 35,055 | 1,529,800 | ||||||
| 4,509,323 | ||||||||
| Gaming, Lodging & Restaurants (2.18%) | ||||||||
| Cheesecake Factory, Inc. | 21,872 | 1,057,292 | ||||||
| Royal Caribbean Cruises, Ltd. | 34,582 | 3,621,773 | ||||||
| 4,679,065 | ||||||||
| Leisure (0.38%) | ||||||||
| TripAdvisor, Inc. (a) | 15,752 | 821,309 | ||||||
| Passenger Transportation (1.16%) | ||||||||
| JetBlue Airways Corp. (a) | 148,200 | 2,479,386 | ||||||
| Retail - Consumer Discretionary (8.48%) | ||||||||
| L Brands, Inc. | 66,387 | 2,152,267 | ||||||
| Nordstrom, Inc. | 48,625 | 3,198,066 | ||||||
| Sleep Number Corp. (a) | 83,483 | 3,036,277 | ||||||
| TJX Cos., Inc. | 78,530 | 8,628,876 | ||||||
| Urban Outfitters, Inc. (a) | 29,790 | 1,175,513 | ||||||
| 18,190,999 | ||||||||
| TOTAL CONSUMER DISCRETIONARY | 34,161,396 | |||||||
| CONSUMER, CYCLICAL (0.76%) | ||||||||
| Retail (0.76%) | ||||||||
| MSC Industrial Direct Co., Inc. , Class A | 20,127 | 1,631,495 | ||||||
| TOTAL CONSUMER, CYCLICAL | 1,631,495 | |||||||
| 6 | 1-855-DGI-FUND (344-3863) | www.DGIfund.com |
| The Disciplined Growth Investors Fund | Portfolio of Investments |
October 31, 2018 (Unaudited)
| Shares | Value (Note 2) | |||||||
| ENERGY (1.93%) | ||||||||
| Oil, Gas & Coal (1.93%) | ||||||||
| Core Laboratories NV | 10,952 | $ | 933,549 | |||||
| Southwestern Energy Co. (a) | 449,566 | 2,400,682 | ||||||
| Ultra Petroleum Corp. (a) | 674,376 | 809,251 | ||||||
| 4,143,482 | ||||||||
| TOTAL ENERGY | 4,143,482 | |||||||
| FINANCIALS (0.58%) | ||||||||
| Banks (0.58%) | ||||||||
| TCF Financial Corp. | 59,817 | 1,248,979 | ||||||
| TOTAL FINANCIALS | 1,248,979 | |||||||
| HEALTH CARE (11.86%) | ||||||||
| Medical Equipment & Devices (11.86%) | ||||||||
| Align Technology, Inc. (a) | 21,976 | 4,861,091 | ||||||
| Edwards Lifesciences Corp. (a) | 68,845 | 10,161,522 | ||||||
| Intuitive Surgical, Inc. (a) | 10,754 | 5,604,770 | ||||||
| Myriad Genetics, Inc. (a) | 39,887 | 1,796,111 | ||||||
| Varian Medical Systems, Inc. (a) | 25,305 | 3,020,658 | ||||||
| 25,444,152 | ||||||||
| TOTAL HEALTH CARE | 25,444,152 | |||||||
| INDUSTRIALS (6.67%) | ||||||||
| Electrical Equipment (0.57%) | ||||||||
| Cognex Corp. | 28,730 | 1,230,793 | ||||||
| Machinery (3.14%) | ||||||||
| Graco, Inc. | 43,386 | 1,762,773 | ||||||
| Middleby Corp. (a) | 44,321 | 4,977,249 | ||||||
| 6,740,022 | ||||||||
| Manufactured Goods (1.48%) | ||||||||
| Proto Labs, Inc. (a) | 26,585 | 3,175,578 | ||||||
| Transportation & Logistics (1.48%) | ||||||||
| Landstar System, Inc. | 31,615 | 3,164,345 | ||||||
| TOTAL INDUSTRIALS | 14,310,738 | |||||||
| Semi-Annual Report | October 31, 2018 | 7 |
| The Disciplined Growth Investors Fund | Portfolio of Investments |
October 31, 2018 (Unaudited)
| Shares | Value (Note 2) | |||||||
| TECHNOLOGY (30.61%) | ||||||||
| Design, Manufacturing & Distribution (2.24%) | ||||||||
| Plexus Corp. (a) | 82,267 | $ | 4,804,393 | |||||
| Hardware (9.76%) | ||||||||
| Dolby Laboratories, Inc. , Class A | 51,611 | 3,551,353 | ||||||
| Garmin, Ltd. | 49,230 | 3,257,057 | ||||||
| Plantronics, Inc. | 51,072 | 3,011,716 | ||||||
| Seagate Technology PLC | 72,240 | 2,906,215 | ||||||
| Super Micro Computer, Inc. (a) | 99,178 | 1,299,232 | ||||||
| Ubiquiti Networks, Inc. | 52,537 | 4,890,669 | ||||||
| ViaSat, Inc. (a) | 31,601 | 2,014,880 | ||||||
| 20,931,122 | ||||||||
| Semiconductors (2.60%) | ||||||||
| Microchip Technology, Inc. | 29,315 | 1,928,341 | ||||||
| Power Integrations, Inc. | 52,773 | 2,972,175 | ||||||
| Synaptics, Inc. (a) | 18,022 | 676,546 | ||||||
| 5,577,062 | ||||||||
| Software (11.88%) | ||||||||
| Akamai Technologies, Inc. (a) | 53,182 | 3,842,399 | ||||||
| Autodesk, Inc. (a) | 45,567 | 5,889,535 | ||||||
| Intuit, Inc. | 31,241 | 6,591,851 | ||||||
| Manhattan Associates, Inc. (a) | 31,890 | 1,522,429 | ||||||
| Open Text Corp. | 145,199 | 4,907,726 | ||||||
| RealPage, Inc. (a) | 51,517 | 2,730,401 | ||||||
| 25,484,341 | ||||||||
| Technology Services (4.13%) | ||||||||
| FactSet Research Systems, Inc. | 20,188 | 4,517,267 | ||||||
| IHS Markit, Ltd. (a) | 25,911 | 1,361,105 | ||||||
| Medidata Solutions, Inc. (a) | 24,130 | 1,696,339 | ||||||
| Paychex, Inc. | 19,487 | 1,276,203 | ||||||
| 8,850,914 | ||||||||
| TOTAL TECHNOLOGY | 65,647,832 | |||||||
| TOTAL COMMON STOCKS | ||||||||
| (Cost $95,860,160) | 146,588,074 | |||||||
| 8 | 1-855-DGI-FUND (344-3863) | www.DGIfund.com |
| The Disciplined Growth Investors Fund | Portfolio of Investments |
October 31, 2018 (Unaudited)
Principal Amount | Value (Note 2) | |||||||
| CORPORATE BONDS (21.35%) | ||||||||
| COMMUNICATIONS (1.35%) | ||||||||
| Cable & Satellite (0.36%) | ||||||||
| Comcast Corp. | ||||||||
| 3.375% 08/15/2025 | $ | 810,000 | $ | 779,955 | ||||
| Entertainment Content (0.33%) | ||||||||
| CBS Corp. | ||||||||
| 4.000%01/15/2026 | 717,000 | 695,039 | ||||||
| Wireless Telecommunications Services (0.66%) | ||||||||
| AT&T, Inc. | ||||||||
| 4.250% 03/01/2027 | 741,000 | 719,933 | ||||||
| 4.450% 04/01/2024 | 4,000 | 4,044 | ||||||
| Verizon Communications, Inc. | ||||||||
| 4.125% 03/16/2027 | 698,000 | 691,775 | ||||||
| 1,415,752 | ||||||||
| TOTAL COMMUNICATIONS | 2,890,746 | |||||||
| CONSUMER DISCRETIONARY (2.64%) | ||||||||
| Airlines (0.32%) | ||||||||
| Southwest Airlines Co. | ||||||||
| 3.000% 11/15/2026 | 756,000 | 693,091 | ||||||
| Apparel & Textile Products (0.32%) | ||||||||
| Cintas Corp. No 2 | ||||||||
| 3.700% 04/01/2027 | 710,000 | 686,004 | ||||||
| Automobiles Manufacturing (0.61%) | ||||||||
| Ford Motor Co. | ||||||||
| 4.346% 12/08/2026 | 725,000 | 658,767 | ||||||
| General Motors Co. | ||||||||
| 4.875% 10/02/2023 | 650,000 | 658,607 | ||||||
| 1,317,374 | ||||||||
| Restaurants (0.32%) | ||||||||
| McDonald's Corp. | ||||||||
| 6.300% 03/01/2038 | 575,000 | 677,640 | ||||||
| Retail - Consumer Discretionary (1.07%) | ||||||||
| Advance Auto Parts, Inc. | ||||||||
| 4.500% 12/01/2023 | 620,000 | 631,813 | ||||||
| 5.750% 05/01/2020 | 3,000 | 3,089 | ||||||
| Amazon.com, Inc. | ||||||||
| 5.200% 12/03/2025 | 885,000 | 959,776 | ||||||
| Semi-Annual Report | October 31, 2018 | 9 |
| The Disciplined Growth Investors Fund | Portfolio of Investments |
October 31, 2018 (Unaudited)
Principal Amount | Value (Note 2) | |||||||
| Retail - Consumer Discretionary (continued) | ||||||||
| Lowe's Cos., Inc. | ||||||||
| 2.500% 04/15/2026 | $ | 770,000 | $ | 697,814 | ||||
| 2,292,492 | ||||||||
| TOTAL CONSUMER DISCRETIONARY | 5,666,601 | |||||||
| CONSUMER STAPLES (0.96%) | ||||||||
| Food & Beverage (0.32%) | ||||||||
| Anheuser-Busch InBev Finance, Inc. | ||||||||
| 3.650% 02/01/2026 | 715,000 | 679,230 | ||||||
| Mass Merchants (0.34%) | ||||||||
| Costco Wholesale Corp. | ||||||||
| 2.750% 05/18/2024 | 760,000 | 732,777 | ||||||
| Supermarkets & Pharmacies (0.30%) | ||||||||
| CVS Health Corp. | ||||||||
| 5.000% 12/01/2024 | 620,000 | 642,591 | ||||||
| TOTAL CONSUMER STAPLES | 2,054,598 | |||||||
| ENERGY (2.23%) | ||||||||
| Exploration & Production (0.29%) | ||||||||
| Conoco Funding Co. | ||||||||
| 7.250% 10/15/2031 | 496,000 | 629,033 | ||||||
| Pipeline (1.94%) | ||||||||
| Boardwalk Pipelines LP | ||||||||
| 5.950% 06/01/2026 | 670,000 | 701,218 | ||||||
| Enbridge Energy Partners LP | ||||||||
| 4.200% 09/15/2021 | 4,000 | 4,049 | ||||||
| 5.875% 10/15/2025 | 643,000 | 700,697 | ||||||
| Enterprise Products Operating LLC | ||||||||
| 3.950% 02/15/2027 | 710,000 | 695,598 | ||||||
| MPLX LP | ||||||||
| 4.125% 03/01/2027 | 710,000 | 678,618 | ||||||
| ONEOK Partners LP | ||||||||
| 4.900% 03/15/2025 | 671,000 | 688,173 | ||||||
| Williams Cos., Inc. | ||||||||
| 3.900% 01/15/2025 | 711,000 | 689,960 | ||||||
| 4,158,313 | ||||||||
| TOTAL ENERGY | 4,787,346 | |||||||
| FINANCIALS (4.18%) | ||||||||
| Banks (0.64%) | ||||||||
| Bank of America Corp., Series L | ||||||||
| 4.183% 11/25/2027 | 715,000 | 687,934 | ||||||
| Wells Fargo & Co., Series GMTN | ||||||||
| 4.300% 07/22/2027 | 700,000 | 688,691 | ||||||
| 1,376,625 | ||||||||
| 10 | 1-855-DGI-FUND (344-3863) | www.DGIfund.com |
| The Disciplined Growth Investors Fund | Portfolio of Investments |
October 31, 2018 (Unaudited)
Principal Amount | Value (Note 2) | |||||||
| Consumer Finance (0.32%) | ||||||||
| American Express Co. | ||||||||
| 3.625% 12/05/2024 | $ | 708,000 | $ | 692,563 | ||||
| Diversified Banks (0.98%) | ||||||||
| Citigroup, Inc. | ||||||||
| 4.300% 11/20/2026 | 720,000 | 700,371 | ||||||
| JPMorgan Chase & Co. | ||||||||
| 3.375% 05/01/2023 | 717,000 | 699,603 | ||||||
| US Bancorp | ||||||||
| 3.100% 04/27/2026 | 739,000 | 690,133 | ||||||
| 2,090,107 | ||||||||
| Financial Services (1.27%) | ||||||||
| BlackRock, Inc. | ||||||||
| 3.200% 03/15/2027 | 736,000 | 701,750 | ||||||
| Morgan Stanley | ||||||||
| 2.750% 05/19/2022 | 695,000 | 672,208 | ||||||
| National Rural Utilities Cooperative Finance Corp. | ||||||||
| 2.950% 02/07/2024 | 707,000 | 682,160 | ||||||
| Northern Trust Corp. | ||||||||
| 3.950% 10/30/2025 | 668,000 | 674,179 | ||||||
| 2,730,297 | ||||||||
| Life Insurance (0.32%) | ||||||||
| MetLife, Inc. | ||||||||
| 3.600% 11/13/2025 | 710,000 | 695,498 | ||||||
| Property & Casualty Insurance (0.32%) | ||||||||
| American International Group, Inc. | ||||||||
| 3.750% 07/10/2025 | 715,000 | 683,717 | ||||||
| Real Estate (0.33%) | ||||||||
| Welltower, Inc. | ||||||||
| 4.250% 04/01/2026 | 712,000 | 705,026 | ||||||
| TOTAL FINANCIALS | 8,973,833 | |||||||
| HEALTH CARE (1.28%) | ||||||||
| Managed Care (0.64%) | ||||||||
| Anthem, Inc. | ||||||||
| 3.650% 12/01/2027 | 731,000 | 684,714 | ||||||
| UnitedHealth Group, Inc. | ||||||||
| 3.750% 07/15/2025 | 691,000 | 684,999 | ||||||
| 1,369,713 | ||||||||
| Pharmaceuticals (0.64%) | ||||||||
| AbbVie, Inc. | ||||||||
| 3.600% 05/14/2025 | 719,000 | 687,033 | ||||||
| Semi-Annual Report | October 31, 2018 | 11 |
| The Disciplined Growth Investors Fund | Portfolio of Investments |
October 31, 2018 (Unaudited)
Principal Amount | Value (Note 2) | |||||||
| Pharmaceuticals (continued) | ||||||||
| Johnson & Johnson | ||||||||
| 5.850% 07/15/2038 | $ | 572,000 | $ | 695,316 | ||||
| 1,382,349 | ||||||||
| 2,752,062 | ||||||||
| TOTAL HEALTH CARE | ||||||||
| INDUSTRIALS (2.71%) | ||||||||
| Aerospace & Defense (0.63%) | ||||||||
| Lockheed Martin Corp. | ||||||||
| 3.100% 01/15/2023 | 680,000 | 666,437 | ||||||
| Rockwell Collins, Inc. | ||||||||
| 3.500%03/15/2027 | 730,000 | 688,181 | ||||||
| 1,354,618 | ||||||||
| Commercial Services & Supplies (0.33%) | ||||||||
| Waste Management, Inc. | ||||||||
| 3.150% 11/15/2027 | 745,000 | 699,580 | ||||||
| Electrical Equipment Manufacturing (0.31%) | ||||||||
| Emerson Electric Co. | ||||||||
| 5.000% 04/15/2019 | 1,000 | 1,009 | ||||||
| General Electric Co. | ||||||||
| 5.875% 01/14/2038 | 653,000 | 664,951 | ||||||
| 665,960 | ||||||||
| Engineering & Construction (0.33%) | ||||||||
| Fluor Corp. | ||||||||
| 4.250% 09/15/2028 | 725,000 | 695,281 | ||||||
| Railroad (0.47%) | ||||||||
| Burlington Northern Santa Fe LLC | ||||||||
| 3.000% 03/15/2023 | 2,000 | 1,957 | ||||||
| 4.700% 10/01/2019 | 1,000,000 | 1,014,928 | ||||||
| 1,016,885 | ||||||||
| Transportation & Logistics (0.32%) | ||||||||
| United Parcel Service, Inc. | ||||||||
| 6.200% 01/15/2038 | 558,000 | 676,662 | ||||||
| 12 | 1-855-DGI-FUND (344-3863) | www.DGIfund.com |
| The Disciplined Growth Investors Fund | Portfolio of Investments |
October 31, 2018 (Unaudited)
Principal Amount | Value (Note 2) | |||||||
| Waste & Environmental Services & Equipment (0.32%) | ||||||||
| Republic Services, Inc. | ||||||||
| 3.375% 11/15/2027 | $ | 735,000 | $ | 692,215 | ||||
| 5.500% 09/15/2019 | 1,000 | 1,021 | ||||||
| 693,236 | ||||||||
| TOTAL INDUSTRIALS | 5,802,222 | |||||||
| TECHNOLOGY (0.24%) | ||||||||
| Hardware (0.24%) | ||||||||
| Corning, Inc. | ||||||||
| 6.625% 05/15/2019 | 502,000 | 511,319 | ||||||
| TOTAL TECHNOLOGY | 511,319 | |||||||
| UTILITIES (5.76%) | ||||||||
| Electric (0.97%) | ||||||||
| Interstate Power & Light Co. | ||||||||
| 3.400% 08/15/2025 | 723,000 | 692,502 | ||||||
| Potomac Electric Power Co. | ||||||||
| 3.600% 03/15/2024 | 698,000 | 696,549 | ||||||
| Puget Energy, Inc. | ||||||||
| 3.650% 05/15/2025 | 725,000 | 695,934 | ||||||
| 2,084,985 | ||||||||
| Gas (0.33%) | ||||||||
| NiSource, Inc. | ||||||||
| 3.850% 02/15/2023 | 695,000 | 690,925 | ||||||
| Utilities (4.46%) | ||||||||
| Ameren Illinois Co. | ||||||||
| 9.750% 11/15/2018 | 411,000 | 412,038 | ||||||
| Arizona Public Service Co. | ||||||||
| 8.750% 03/01/2019 | 415,000 | 422,796 | ||||||
| Black Hills Corp. | ||||||||
| 3.150% 01/15/2027 | 700,000 | 641,965 | ||||||
| CenterPoint Energy Resources Corp. | ||||||||
| 4.500% 01/15/2021 | 346,000 | 352,142 | ||||||
| CMS Energy Corp. | ||||||||
| 5.050% 03/15/2022 | 417,000 | 433,766 | ||||||
| Dominion Energy, Inc., Series B | ||||||||
| 2.750% 09/15/2022 | 695,000 | 670,985 | ||||||
| DTE Energy Co., Series C | ||||||||
| 3.500% 06/01/2024 | 645,000 | 631,177 | ||||||
| Duke Energy Corp. | ||||||||
| 3.750% 04/15/2024 | 708,000 | 702,524 | ||||||
| Edison International | ||||||||
| 2.400% 09/15/2022 | 745,000 | 703,193 | ||||||
| ITC Holdings Corp. | ||||||||
| 4.050% 07/01/2023 | 540,000 | 537,535 | ||||||
| Semi-Annual Report | October 31, 2018 | 13 |
| The Disciplined Growth Investors Fund | Portfolio of Investments |
October 31, 2018 (Unaudited)
Principal Amount | Value (Note 2) | |||||||
| Utilities (continued) | ||||||||
| Jersey Central Power & Light Co. | ||||||||
| 7.350% 02/01/2019 | $ | 521,000 | $ | 526,578 | ||||
| Nevada Power Co. | ||||||||
| 7.125% 03/15/2019 | 3,000 | 3,045 | ||||||
| Oncor Electric Delivery Co. LLC | ||||||||
| 7.000% 09/01/2022 | 620,000 | 698,079 | ||||||
| PPL Capital Funding, Inc. | ||||||||
| 3.100% 05/15/2026 | 820,000 | 756,458 | ||||||
| PSEG Power LLC | ||||||||
| 4.300% 11/15/2023 | 675,000 | 680,683 | ||||||
| Sempra Energy | ||||||||
| 2.875% 10/01/2022 | 720,000 | 695,028 | ||||||
| Wisconsin Electric Power Co. | ||||||||
| 3.100% 06/01/2025 | 735,000 | 698,842 | ||||||
| 9,566,834 | ||||||||
| TOTAL UTILITIES | 12,342,744 | |||||||
| TOTAL CORPORATE BONDS | ||||||||
| (Cost $47,539,975) | 45,781,471 | |||||||
| FOREIGN CORPORATE BONDS (0.45%) | ||||||||
| ENERGY (0.23%) | ||||||||
| Pipeline (0.23%) | ||||||||
| TransCanada PipeLines, Ltd. | ||||||||
| 7.250% 08/15/2038 | 415,000 | 501,295 | ||||||
| TOTAL ENERGY | 501,295 | |||||||
| INDUSTRIALS (0.22%) | ||||||||
| Electrical Equipment Manufacturing (0.22%) | ||||||||
| Tyco Electronics Group SA | ||||||||
| 3.500% 02/03/2022 | 463,000 | 462,326 | ||||||
| TOTAL INDUSTRIALS | 462,326 | |||||||
| TOTAL FOREIGN CORPORATE BONDS | ||||||||
| (Cost $1,025,441) | 963,621 | |||||||
| FOREIGN GOVERNMENT BONDS (0.50%) | ||||||||
| Corp Andina de Fomento | ||||||||
| 8.125% 06/04/2019 | 375,000 | 385,980 | ||||||
| 14 | 1-855-DGI-FUND (344-3863) | www.DGIfund.com |
| The Disciplined Growth Investors Fund | Portfolio of Investments |
October 31, 2018 (Unaudited)
Principal Amount | Value (Note 2) | |||||||
| FOREIGN GOVERNMENT BONDS (continued) | ||||||||
| Province of Quebec Canada, Series NN | ||||||||
| 7.125% 02/09/2024 | $ | 590,000 | $ | 690,572 | ||||
| 1,076,552 | ||||||||
| TOTAL | 1,076,552 | |||||||
| TOTAL FOREIGN GOVERNMENT BONDS | ||||||||
| (Cost $1,090,939) | 1,076,552 | |||||||
| GOVERNMENT & AGENCY OBLIGATIONS (6.80%) | ||||||||
| U.S. Treasury Bonds | ||||||||
| 1.500% 08/15/2026 | 689,000 | 613,183 | ||||||
| 2.875% 05/15/2028 | 2,000,000 | 1,955,899 | ||||||
| 6.500% 11/15/2026 | 77,000 | 95,624 | ||||||
| U.S. Treasury Notes | ||||||||
| 0.875% 07/31/2019 | 5,000,000 | 4,937,207 | ||||||
| 1.500% 01/31/2019 | 7,000,000 | 6,986,081 | ||||||
| TOTAL | 14,587,994 | |||||||
| TOTAL GOVERNMENT & AGENCY OBLIGATIONS | ||||||||
| (Cost $14,561,242) | 14,587,994 | |||||||
| Yield | Shares | Value (Note 2) | |||||||||
| SHORT TERM INVESTMENTS (2.36%) | |||||||||||
| MONEY MARKET FUND (0.97%) | |||||||||||
| Fidelity Investments Money Market Funds - Government Portfolio - Class I | 2.059 | %(b) | 2,071,486 | 2,071,486 | |||||||
| U.S. TREASURY BILLS (1.39%) | |||||||||||
| United States Treasury Bill, 12/06/2018 | 1.695 | %(c) | 3,000,000 | 2,993,776 | |||||||
| TOTAL SHORT TERM INVESTMENTS | |||||||||||
| (Cost $5,066,542) | 5,065,262 | ||||||||||
| TOTAL INVESTMENTS (99.80%) | |||||||||||
| (Cost $165,144,299) | $ | 214,062,974 | |||||||||
| Other Assets In Excess Of Liabilities (0.20%) | 436,890 | ||||||||||
| NET ASSETS (100.00%) | $ | 214,499,864 | |||||||||
| (a) | Non-Income Producing Security. |
| (b) | Represents the 7-day yield. |
| Semi-Annual Report | October 31, 2018 | 15 |
| The Disciplined Growth Investors Fund | Portfolio of Investments |
October 31, 2018 (Unaudited)
| (c) | Rate shown represents the bond equivalent yield to maturity at date of purchase. |
For Fund compliance purposes, the Fund's industry classifications refer to any one or more of the industry sub-classifications used by one or more widely recognized market indexes or ratings group indexes, and/or as defined by Fund management. This definition may not apply for purposes of this report, which may combine industry sub-classifications for reporting ease. Industries are shown as a percent of net assets.
See Notes to Financial Statements.
| 16 | 1-855-DGI-FUND (344-3863) | www.DGIfund.com |
| The Disciplined Growth Investors Fund | Statement of Assets and Liabilities |
October 31, 2018 (Unaudited)
| ASSETS | ||||
| Investments, at value | $ | 214,062,974 | ||
| Receivable for investments sold | 783,722 | |||
| Receivable for shares sold | 5,550 | |||
| Dividends and interest receivable | 636,681 | |||
| Total assets | 215,488,927 | |||
| LIABILITIES | ||||
| Payable for investments purchased | 829,667 | |||
| Payable for shares redeemed | 15,500 | |||
| Payable to adviser | 143,896 | |||
| Total liabilities | 989,063 | |||
| NET ASSETS | $ | 214,499,864 | ||
| NET ASSETS CONSIST OF | ||||
| Paid-in capital (Note 5) | $ | 159,745,803 | ||
| Distributable Earnings | 54,754,061 | |||
| NET ASSETS | $ | 214,499,864 | ||
| INVESTMENTS, AT COST | $ | 165,144,299 | ||
| PRICING OF SHARES | ||||
| Net Asset Value, offering and redemption price per share | $ | 19.65 | ||
| Shares of beneficial interest outstanding | 10,918,231 | |||
See Notes to Financial Statements.
| Semi-Annual Report | October 31, 2018 | 17 |
| The Disciplined Growth Investors Fund | Statement of Operations |
For the Six Months Ended October 31, 2018 (Unaudited) | ||||
| INVESTMENT INCOME | ||||
| Dividends | $ | 705,832 | ||
| Foreign taxes withheld | (8,394 | ) | ||
| Interest | 987,969 | |||
| Total investment income | 1,685,407 | |||
| EXPENSES | ||||
| Investment advisory fees (Note 6) | 867,029 | |||
| Total expenses | 867,029 | |||
| NET INVESTMENT INCOME | 818,378 | |||
| REALIZED AND UNREALIZED GAIN ON INVESTMENTS | ||||
| Net realized gain on investments | 4,983,711 | |||
| Net change in unrealized appreciation on investments | 269,675 | |||
| NET REALIZED AND UNREALIZED GAIN ON INVESTMENTS | 5,253,386 | |||
| NET INCREASE IN NET ASSETS RESULTING FROM OPERATIONS | $ | 6,071,764 | ||
See Notes to Financial Statements.
| 18 | 1-855-DGI-FUND (344-3863) | www.DGIfund.com |
| The Disciplined Growth Investors Fund | Statements of Changes in Net Assets |
For the Six Months Ended October 31, 2018 (Unaudited) | For the Year Ended April 30, 2018 | |||||||
| OPERATIONS | ||||||||
| Net investment income | $ | 818,378 | $ | 1,179,799 | ||||
| Net realized gain | 4,983,711 | 5,834,973 | ||||||
| Net change in unrealized appreciation | 269,675 | 9,802,428 | ||||||
| Net increase in net assets resulting from operations | 6,071,764 | 16,817,200 | ||||||
| DISTRIBUTIONS | ||||||||
| Total distributions to shareholders(a) | (799,752 | ) | (8,118,741 | ) | ||||
| Net decrease in net assets from distributions | (799,752 | ) | (8,118,741 | ) | ||||
| CAPITAL SHARE TRANSACTIONS (Note 5) | ||||||||
| Proceeds from sales of shares | 11,317,084 | 50,597,596 | ||||||
| Issued to shareholders in reinvestment of distributions | 792,522 | 8,084,564 | ||||||
| Cost of shares redeemed, net of redemption fees | (6,950,231 | ) | (23,086,274 | ) | ||||
| Net increase from capital share transactions | 5,159,375 | 35,595,886 | ||||||
| Net increase in net assets | 10,431,387 | 44,294,345 | ||||||
| NET ASSETS | ||||||||
| Beginning of period | 204,068,477 | 159,774,132 | ||||||
| End of period* | $ | 214,499,864 | $ | 204,068,477 | ||||
| *Including accumulated net investment income of: | $ | – | $ | 76,473 | ||||
| OTHER INFORMATION | ||||||||
| Share Transactions | ||||||||
| Issued | 553,253 | 2,685,263 | ||||||
| Issued to shareholders in reinvestment of distributions | 37,763 | 428,168 | ||||||
| Redeemed | (344,583 | ) | (1,218,824 | ) | ||||
| Net increase in share transactions | 246,433 | 1,894,607 | ||||||
See Notes to Financial Statements.
| (a) | For the prior year ended April 30, 2018, total distributions consisted of Net Investment Income of $(1,134,526), and Net Realized Gains of $(6,984,215). |
| Semi-Annual Report | October 31, 2018 | 19 |
| The Disciplined Growth Investors Fund |
| NET ASSET VALUE, BEGINNING OF PERIOD |
| INCOME FROM OPERATIONS |
| Net investment income(a) |
| Net realized and unrealized gain/(loss) on investments |
| Total from investment operations |
| DISTRIBUTIONS |
| From net investment income |
| From net realized gain on investments |
| Total distributions |
| REDEMPTION FEES ADDED TO PAID-IN CAPITAL |
| INCREASE/(DECREASE) IN NET ASSET VALUE |
| NET ASSET VALUE, END OF PERIOD |
| TOTAL RETURN |
| RATIOS AND SUPPLEMENTAL DATA |
| Net assets, end of period (000's) |
| RATIOS TO AVERAGE NET ASSETS |
| Expenses |
| Net investment income |
| PORTFOLIO TURNOVER RATE |
| (a) | Per share numbers have been calculated using the average shares method. |
| (b) | Not annualized. |
| (c) | In 2018 the Fund's total return consists of a voluntary reimbursement by the advisor for a realized investment loss. Excluding this item, total return would not have been impacted. (Note 6). |
| (d) | Annualized. |
| 20 | 1-855-DGI-FUND (344-3863) | www.DGIfund.com |
| Financial Highlights |
| For a share outstanding during the periods presented |
For the Six Months Ended October 31, 2018 (Unaudited) | For the Year Ended April 30, 2018 | For the Year Ended April 30, 2017 | For the Year Ended April 30, 2016 | For the Year Ended April 30, 2015 | For the Year Ended April 30, 2014 | |||||||||||||||||
| $ | 19.12 | $ | 18.20 | $ | 15.96 | $ | 16.75 | $ | 15.02 | $ | 13.17 | |||||||||||
| 0.08 | 0.12 | 0.09 | 0.09 | 0.10 | 0.07 | |||||||||||||||||
| 0.52 | 1.64 | 2.29 | (0.44 | ) | 1.83 | 1.90 | ||||||||||||||||
| 0.60 | 1.76 | 2.38 | (0.35 | ) | 1.93 | 1.97 | ||||||||||||||||
| (0.07 | ) | (0.12 | ) | (0.09 | ) | (0.10 | ) | (0.09 | ) | (0.07 | ) | |||||||||||
| – | (0.72 | ) | (0.05 | ) | (0.34 | ) | (0.11 | ) | (0.05 | ) | ||||||||||||
| (0.07 | ) | (0.84 | ) | (0.14 | ) | (0.44 | ) | (0.20 | ) | (0.12 | ) | |||||||||||
| – | – | – | – | – | – | |||||||||||||||||
| 0.53 | 0.92 | 2.24 | (0.79 | ) | 1.73 | 1.85 | ||||||||||||||||
| $ | 19.65 | $ | 19.12 | $ | 18.20 | $ | 15.96 | $ | 16.75 | $ | 15.02 | |||||||||||
| 3.13 | %(b) | 9.75 | %(c) | 14.96 | % | (2.05 | %) | 12.87 | % | 15.02 | % | |||||||||||
| $ | 214,500 | $ | 204,068 | $ | 159,774 | $ | 119,857 | $ | 113,342 | $ | 86,741 | |||||||||||
| 0.78 | %(d) | 0.78 | % | 0.78 | % | 0.78 | % | 0.78 | % | 0.78 | % | |||||||||||
| 0.74 | %(d) | 0.64 | % | 0.50 | % | 0.59 | % | 0.61 | % | 0.47 | % | |||||||||||
| 7 | %(b) | 18 | % | 16 | % | 13 | % | 14 | % | 10 | % | |||||||||||
| Semi-Annual Report | October 31, 2018 | 21 |
| The Disciplined Growth Investors Fund | Notes to Financial Statements |
October 31, 2018 (Unaudited)
1. ORGANIZATION
Financial Investors Trust (the “Trust”), a Delaware statutory trust, is an open-end management investment company registered under the Investment Company Act of 1940, as amended (“1940 Act”). The Trust consists of multiple separate portfolios or series. This semi-annual report describes The Disciplined Growth Investors Fund (the “Fund”). The Fund seeks long-term capital growth and as a secondary objective, modest income with reasonable risk.
2. SIGNIFICANT ACCOUNTING POLICIES
The accompanying financial statements were prepared in accordance with accounting principles generally accepted in the United States of America (“U.S. GAAP”). The preparation of financial statements in conformity with U.S. GAAP requires management to make certain estimates and assumptions that affect the reported amounts of assets and liabilities and disclosures of contingent assets and liabilities at the date of the financial statements and the reported amounts of revenue and expenses during the period. Actual results could differ from those estimates. The Fund is considered an investment company for financial reporting purposes under U.S. GAAP and follows the accounting and reporting guidance applicable to investment companies in the Financial Accounting Standards Board Accounting Standards Codification Topic 946. The following is a summary of significant accounting policies consistently followed by the Fund in preparation of its financial statements.
Investment Valuation: The Fund generally values its securities based on market prices determined at the close of regular trading on the New York Stock Exchange (“NYSE”), normally 4:00 p.m. Eastern Time, on each day the NYSE is open for trading.
For equity securities and mutual funds that are traded on an exchange, the market price is usually the closing sale or official closing price on that exchange. In the case of equity securities not traded on an exchange, or if such closing prices are not otherwise available, the securities are valued at the mean of the most recent bid and ask prices on such day. Redeemable securities issued by open-end registered investment companies are valued at the investment company’s applicable net asset value, with the exception of exchange-traded open-end investment companies, which are priced as equity securities.
The market price for debt obligations is generally the price supplied by an independent third-party pricing service approved by the Board of Trustees (the “Board”), which may use a matrix, formula or other objective method that takes into consideration quotations from dealers, market transactions in comparable investments, market indices and yield curves. If vendors are unable to supply a price, or if the price supplied is deemed to be unreliable, the market price may be determined using quotations received from one or more broker-dealers that make a market in the security. Fixed-income obligations, excluding municipal securities, having a remaining maturity of greater than 60 days, are typically valued at the mean between the evaluated bid and ask prices formulated by an independent pricing service. Corporate Bonds, U.S. Government & Agency, and U.S. Treasury Bonds & Notes are valued using market models that consider trade data, quotations from dealers and active market makers, relevant yield curve and spread data, creditworthiness, trade data or market information on comparable securities, and other relevant security specific information. Publicly traded Foreign Government Debt securities and Foreign Corporate Bonds are typically
| 22 | 1-855-DGI-FUND (344-3863) | www.DGIfund.com |
| The Disciplined Growth Investors Fund | Notes to Financial Statements |
October 31, 2018 (Unaudited)
traded internationally in the over-the-counter market and are valued at the mean between the bid and asked prices as of the close of business of that market. Mortgage-related and asset-backed securities are valued based on models that consider trade data, prepayment and default projections, benchmark yield and spread data and estimated cash flows of each tranche of the issuer. Publicly traded foreign government debt securities are typically traded internationally in the over-the-counter market and are valued at the mean between the bid and asked prices as of the close of business of that market.
When such prices or quotations are not available, or when Disciplined Growth Investors, Inc. (the “Adviser”) believes that they are unreliable, securities may be priced using fair value procedures approved by the Board.
Fair Value Measurements: The Fund discloses the classification of its fair value measurements following a three-tier hierarchy based on the inputs used to measure fair value. Inputs refer broadly to the assumptions that market participants would use in pricing the asset or liability, including assumptions about risk. Inputs may be observable or unobservable. Observable inputs reflect the assumptions market participants would use in pricing the asset or liability that are developed based on market data obtained from sources independent of the reporting entity. Unobservable inputs reflect the reporting entity’s own assumptions about the assumptions market participants would use in pricing the asset or liability that are developed based on the best information available.
Various inputs are used in determining the value of the Fund’s investments as of the end of the reporting period. When inputs used fall into different levels of the fair value hierarchy, the level in the hierarchy within which the fair value measurement falls is determined based on the lowest level input that is significant to the fair value measurement in its entirety. The designated input levels are not necessarily an indication of the risk or liquidity associated with these investments. These inputs are categorized in the following hierarchy under applicable financial accounting standards:
| Level 1 – | Unadjusted quoted prices in active markets for identical investments, unrestricted assets or liabilities that the Fund has the ability to access at the measurement date; |
| Level 2 – | Quoted prices which are not active, quoted prices for similar assets or liabilities in active markets or inputs other than quoted prices that are observable (either directly or indirectly) for substantially the full term of the asset or liability; and |
| Level 3 – | Significant unobservable prices or inputs (including the Fund’s own assumptions in determining the fair value of investments) where there is little or no market activity for the asset or liability at the measurement date. |
| Semi-Annual Report | October 31, 2018 | 23 |
| The Disciplined Growth Investors Fund | Notes to Financial Statements |
October 31, 2018 (Unaudited)
The following is a summary of each input used to value the Fund as of October 31, 2018:
| Investments in Securities at Value | Level 1 - Unadjusted Quoted Prices | Level 2 - Other Significant Observable Inputs | Level 3 - Significant Unobservable Inputs | Total | ||||||||||||
| Common Stocks(a) | $ | 146,588,074 | $ | – | $ | – | $ | 146,588,074 | ||||||||
| Corporate Bonds(a) | – | 45,781,471 | – | 45,781,471 | ||||||||||||
| Foreign Corporate Bonds(a) | – | 963,621 | – | 963,621 | ||||||||||||
| Foreign Government Bonds(a) | – | 1,076,552 | – | 1,076,552 | ||||||||||||
| Government & Agency Obligations(a) | – | 14,587,994 | – | 14,587,994 | ||||||||||||
| Short Term Investments | ||||||||||||||||
| Money Market Fund | 2,071,486 | – | – | 2,071,486 | ||||||||||||
| U.S. Treasury Bills | – | 2,993,776 | – | 2,993,776 | ||||||||||||
| TOTAL | $ | 148,659,560 | $ | 65,403,414 | $ | – | $ | 214,062,974 | ||||||||
| (a) | For detailed descriptions of the underlying industries, see the accompanying Portfolio of Investments. |
The following is a reconciliation of the investments in which significant unobservable inputs (Level 3) were used in determining fair value:
Investments in Securities at Value | Balance as of 04/30/2018 | Return of Capital | Realized Gain/(Loss) | Change in Unrealized Appreciation/ Depreciation | Purchases | Sales Proceeds | Transfer in and/or (out) of Level 3 | Balance as of 10/31/2018 | Net change in unrealized appreciation/ (depreciation) attributable to Level 3 investments held at 10/31/2018 | |||||||||||||||||||||||||||
| Common Stocks | $ | 41,846 | $ | – | $ | – | $ | 224,254 | $ | – | $ | (266,100 | ) | $ | – | $ | – | $ | – | |||||||||||||||||
| Total | $ | 41,846 | $ | – | $ | – | $ | 224,254 | $ | – | $ | (266,100 | ) | $ | – | $ | – | $ | – | |||||||||||||||||
Net change in unrealized appreciation/depreciation on Level 3 securities is included on the Statement of Operations under Net change in unrealized appreciation on investments.
Investment Transactions and Investment Income: Investment transactions are accounted for on the date the investments are purchased or sold (trade date). Realized gains and losses from investment transactions are reported on an identified cost basis, which is the same basis the Fund uses for federal income tax purposes. Interest income, which includes accretion of discounts, is accrued and recorded as earned. Dividend income is recognized on the ex-dividend date or for certain foreign securities, as soon as information is available to the Fund.
Trust Expenses: Some expenses of the Trust can be directly attributed to the Fund. Expenses which cannot be directly attributed to the Fund are apportioned among all funds in the Trust based on average net assets of each fund.
| 24 | 1-855-DGI-FUND (344-3863) | www.DGIfund.com |
| The Disciplined Growth Investors Fund | Notes to Financial Statements |
October 31, 2018 (Unaudited)
Fund Expenses: Expenses that are specific to the Fund are charged directly to the Fund.
Federal Income Taxes: The Fund complies with the requirements under Subchapter M of the Internal Revenue Code of 1986, as amended, applicable to regulated investment companies and intends to distribute substantially all of their net taxable income and net capital gains, if any, each year so that it will not be subject to excise tax on undistributed income and gains. The Fund is not subject to income taxes to the extent such distributions are made.
As of and during the six months ended October 31, 2018, the Fund did not have a liability for any unrecognized tax benefits. The Fund files U.S. federal, state, and local tax returns as required. The Fund’s tax returns are subject to examination by the relevant tax authorities until expiration of the applicable statute of limitations, which is generally three years after the filing of the tax return for federal purposes and four years for most state returns. Tax returns for open years have incorporated no uncertain tax positions that require a provision for income taxes.
Distributions to Shareholders: The Fund normally pays dividends, if any, quarterly and distributes capital gains, if any, on an annual basis. Income dividend distributions are derived from dividends and other income the Fund receives from its investments, including short term capital gains. Long term capital gain distributions are derived from gains realized when the Fund sells a security it has owned for more than a year. The Fund may make additional distributions and dividends at other times if the portfolio manager believes doing so may be necessary for the Fund to avoid or reduce taxes.
3. TAX BASIS INFORMATION
Tax Basis of Investments: As of October 31, 2018, the aggregate cost of investments, gross unrealized appreciation/ (depreciation) and net unrealized appreciation for Federal tax purposes was as follows:
The Disciplined Growth Investors Fund | ||||
| Gross appreciation (excess of value over tax cost) | $ | 59,941,562 | ||
| Gross depreciation (excess of tax cost over value) | (11,023,024 | ) | ||
| Net unrealized appreciation | $ | 48,918,538 | ||
| Cost of investments for income tax purposes | $ | 165,144,436 | ||
Tax Basis of Distributions to Shareholders: The character of distributions made during the year from net investment income or net realized gains may differ from its ultimate characterization for federal income tax purposes. Also, due to the timing of dividend distributions, the fiscal year in which amounts are distributed may differ from the fiscal year in which the income or realized gain was recorded by the Fund.
| Semi-Annual Report | October 31, 2018 | 25 |
| The Disciplined Growth Investors Fund | Notes to Financial Statements |
October 31, 2018 (Unaudited)
The tax character of distributions paid during the year ended April 30, 2018, were as follows:
| Ordinary Income | Long-Term Capital Gain | |||||||
| The Disciplined Growth Investors Fund | $ | 1,182,759 | $ | 6,935,982 | ||||
The amounts and characteristics of tax basis distributions and composition of distributable earnings/(accumulated losses) are finalized at fiscal year-end. Accordingly, tax basis balances have not been determined as of October 31, 2018.
4. SECURITIES TRANSACTIONS
During the six months ended October 31, 2018, equity holdings were transferred in-kind into the Fund. The intent of the transfers was to save on equity transaction costs both for the new shareholders at the institution they transferred from and for the Fund on the addition of assets. The assets of two separate accounts were transferred-in-kind into the Fund in the amount of $1,191,807.
The cost of purchases and proceeds from sales of securities (excluding short-term securities, transfers-in-kind, and U.S. Government Obligations) during the six months ended October 31, 2018, were as follows:
| Fund | Purchases of Securities | Proceeds From Sales of Securities | ||||||
| The Disciplined Growth Investors Fund | $ | 16,427,920 | $ | 15,116,693 | ||||
Investment transactions in U.S. Government Obligations (excluding transfers-in-kind) during the six months ended October 31, 2018 were as follows:
| Fund | Purchases of Securities | Proceeds From Sales of Securities | ||||||
| The Disciplined Growth Investors Fund | $ | 7,204,582 | $ | – | ||||
5. SHARES OF BENEFICIAL INTEREST
The capitalization of the Trust consists of an unlimited number of shares of beneficial interest with no par value per share. Holders of the shares of the Fund of the Trust have one vote for each share held and a proportionate fraction of a vote for each fractional share. All shares issued and outstanding are fully paid and are transferable and redeemable at the option of the shareholder. Purchasers of the shares do not have any obligation to make payments to the Trust or its creditors (other than the purchase price for the shares or make contributions to the Trust or its creditors solely by reason of the purchasers’ ownership of the shares. Shares have no pre-emptive rights.
Prior to September 1, 2015, shares redeemed within 90 days of purchase may have incurred a 2% short-term redemption fee deducted from the redemption amount. Effective September 1, 2015, the Fund no longer imposes redemption fees. For the six months ended October 31, 2018, the Fund did not receive any redemption fees.
| 26 | 1-855-DGI-FUND (344-3863) | www.DGIfund.com |
| The Disciplined Growth Investors Fund | Notes to Financial Statements |
October 31, 2018 (Unaudited)
6. MANAGEMENT AND RELATED-PARTY TRANSACTIONS
The Adviser, subject to the authority of the Board, is responsible for the overall management and administration of the Fund’s business affairs. The Adviser manages the investments of the Fund in accordance with the Fund’s investment objective, policies and limitations and investment guidelines established jointly by the Adviser and the Trustees. Pursuant to the Advisory Agreement, the Fund pays the Adviser a unitary management fee for the services and facilities it provides payable on a monthly basis at the annual rate of 0.78% of the Fund’s average daily net assets. The management fee is paid on a monthly basis.
Out of the unitary management fee, the Adviser pays substantially all expenses of the Fund, including the cost of transfer agency, custody, fund administration, bookkeeping and pricing services, legal, audit and other services, except for interest expenses, brokerage expenses, taxes and extraordinary expenses not incurred in the ordinary course of the Fund’s business. Also included are Trustee fees which were $2,137 for the six months ended October 31, 2018.
Payment from Affiliate
For the year ended April 30, 2018, the Fund was reimbursed $36,717 from the Advisor as a result of a trading error.
Fund Administrator Fees and Expenses
ALPS Fund Services, Inc. (“ALPS”) serves as administrator to the Fund. Pursuant to an Administration Agreement, ALPS provides operational services to the Fund including, but not limited to, fund accounting and fund administration and generally assists in the Fund’s operations. Officers of the Trust are employees of ALPS. The Fund’s administration fee is accrued on a daily basis and paid monthly. The Administrator is also reimbursed for certain out-of-pocket expenses. The administrative fee and out-of-pocket expenses are included in the unitary management fee paid to the Adviser.
Transfer Agent
ALPS serves as transfer, dividend paying and shareholder servicing agent for the Fund. ALPS receives an annual minimum fee, a fee based upon the number of shareholder accounts, and is also reimbursed for certain out-of-pocket expenses. The fee and out-of-pocket expenses are included in the unitary management fee paid to the Adviser.
Compliance Services
ALPS provides services that assist the Trust’s chief compliance officer in monitoring and testing the policies and procedures of the Trust in conjunction with requirements under Rule 38a-1 under the 1940 Act and receives an annual base fee. ALPS is reimbursed for certain out-of-pocket expenses. The fee and out-of-pocket expenses are included in the unitary management fee paid to the Adviser.
Principal Financial Officer
ALPS receives an annual fee for providing principal financial officer services to the Fund. The fee is included in the unitary management fee paid to the Adviser.
| Semi-Annual Report | October 31, 2018 | 27 |
| The Disciplined Growth Investors Fund | Notes to Financial Statements |
October 31, 2018 (Unaudited)
Distributor
ALPS Distributors, Inc. (“ADI” or the “Distributor”) (an affiliate of ALPS) acts as the distributor of the Fund’s shares pursuant to a Distribution Agreement with the Trust. Shares are sold on a continuous basis by ADI as agent for the Fund, and ADI has agreed to use its best efforts to solicit orders for the sale of the Fund’s shares, although it is not obliged to sell any particular amount of shares. ADI is not entitled to any compensation for its services as Distributor. ADI is registered as a broker-dealer with the Securities and Exchange Commission.
7. INDEMNIFICATIONS
Under the Trust’s organizational documents, its officers and Trustees are indemnified against certain liability arising out of the performance of their duties to the Trust. Additionally, in the normal course of business, the Trust enters into contracts with service providers that may contain general indemnification clauses, which may permit indemnification to the extent permissible under applicable law. The Trust’s maximum exposure under these arrangements is unknown, as this would involve future claims that may be made against the Trust that have not yet occurred.
8. RECENT ACCOUNTING PRONOUNCEMENTS
On October 4, 2018, the SEC amended Regulation S-X to require certain financial statement disclosure requirements to conform them to U.S. GAAP for investment companies. Effective November 4, 2018, the Fund adopted disclosure requirement changes for Regulation S-X and these changes are reflected throughout this report. The Fund’s adoption of those amendments, effective with the financial statements prepared as of October 31, 2018, had no effect on the Fund’s net assets or results of operations.
In August 2018, the Financial Accounting Standards Board (“FASB”) issued Accounting Standards Update (“ASU”) 2018-13, which changes the fair value measurement disclosure requirements of FASB Accounting Standards Codification Topic 820, Fair Value Measurement. The update to Topic 820 includes new, eliminated, and modified disclosure requirements. ASU 2018-13 is effective for fiscal years beginning after December 15, 2019, including interim periods. Early adoption is permitted for any eliminated or modified disclosures. Management is currently evaluating the impact of the ASU to the Fund’s financial statements.
9. SUBSEQUENT EVENT
Subsequent events after the date of the Statement of Assets and Liabilities have been evaluated through the date the financial statements were issued.
| 28 | 1-855-DGI-FUND (344-3863) | www.DGIfund.com |
| The Disciplined Growth Investors Fund | Additional Information |
October 31, 2018 (Unaudited)
1. FUND HOLDINGS
The Fund files its complete schedule of portfolio holdings with the Securities and Exchange Commission (the “SEC”) for the first and third quarters of each fiscal year on Form N-Q within 60 days after the end of the period. Copies of the Fund’s Form N-Q are available without charge on the SEC website at http://www.sec.gov. You may also review and copy the Form N-Q at the SEC’s Public Reference Room in Washington, DC. For more information about the operation of the Public Reference Room, please call the SEC at 1-800-SEC-0330.
2. FUND PROXY VOTING POLICIES, PROCEDURES AND SUMMARIES
The Fund’s policies and procedures used in determining how to vote proxies and information regarding how the Fund voted proxies relating to portfolio securities during the most recent prior 12-month period ending June 30 are available without charge, (1) upon request, by calling (toll-free) 855-DGI-Fund and (2) on the SEC’s website at http://www.sec.gov.
| Semi-Annual Report | October 31, 2018 | 29 |
| The Disciplined Growth Investors Fund | Privacy Policy |
| WHO WE ARE | |
| Who is providing this notice? | The Disciplined Growth Investors Fund |
| WHAT WE DO | |
| How does the Fund protect my personal information? | To protect your personal information from unauthorized access and use, we use security measures that comply with federal law. These measures include computer safeguards and secured files and buildings. |
| How does the Fund collect my personal information? | We collect your personal information, for example, when you
● open an account ● provide account information or give us your contact information ● make a wire transfer or deposit money |
| Why can’t I limit all sharing? | Federal law gives you the right to limit only
● sharing for affiliates’ everyday business purposes- information about your creditworthiness ● affiliates from using your information to market to you ● sharing for non-affiliates to market to you
State laws and individual companies may give you additional rights to limit sharing. |
| DEFINITIONS | |
| Affiliates | Companies related by common ownership or control. They can be financial and nonfinancial companies. |
| Non-affiliates | Companies not related by common ownership or control. They can be financial and nonfinancial companies.
● The Fund does not share with non-affiliates so they can market to you. |
| Joint marketing | A formal agreement between non-affiliated financial companies that together market financial products or services to you.
● The Fund does not jointly market. |
| 30 | 1-855-DGI-FUND (344-3863) | www.DGIfund.com |
| The Disciplined Growth Investors Fund | Privacy Policy |
| FACTS | WHAT DOES THE FUND DO WITH YOUR PERSONAL INFORMATION? |
| WHY? | Financial companies choose how they share your personal information. Federal law gives consumers the right to limit some but not all sharing. Federal law also requires us to tell you how we collect, share, and protect your personal information. Please read this notice carefully to understand what we do. |
| WHAT? | The types of personal information we collect and share depend on the product or service you have with us. This information can include:
● Social Security number and account transactions ● Account balances and transaction history ● Wire transfer instructions |
| HOW? | All financial companies need to share customers’ personal information to run their everyday business. In the section below, we list the reasons financial companies can share their customers’ personal information; the reasons the Fund chooses to share; and whether you can limit this sharing. |
| REASONS WE CAN SHARE YOUR PERSONAL INFORMATION | DOES THE FUND SHARE: | CAN YOU LIMIT THIS SHARING? |
For our everyday business purposes – such as to process your transactions, maintain your account(s), respond to court orders and legal investigations, or report to credit bureaus | Yes | No |
For our marketing purposes – to offer our products and services to you | No | We do not share. |
| For joint marketing with other financial companies | No | We do not share. |
For our affiliates’ everyday business purposes – information about your transactions and experiences | Yes | No |
For our affiliates’ everyday business purposes – information about your creditworthiness | No | We do not share. |
| For non-affiliates to market to you | No | We do not share. |
| Semi-Annual Report | October 31, 2018 | 31 |
| The Disciplined Growth Investors Fund | Privacy Policy |
| OTHER IMPORTANT INFORMATION | |
| California Residents | If your account has a California home address, your personal information will not be disclosed to nonaffiliated third parties except as permitted by applicable California law, and we will limit sharing such personal information with our affiliates to comply with California privacy laws that apply to us. |
| Vermont Residents | The State of Vermont requires financial institutions to obtain your consent prior to sharing personal information that they collect about you with affiliated companies and nonaffiliated third parties other than in certain limited circumstances. Except as permitted by law, we will not share personal information we collect about you with nonaffiliated third parties or other affiliated companies unless you provide us with your written consent to share such information. |
| 32 | 1-855-DGI-FUND (344-3863) | www.DGIfund.com |
THIS MATERIAL MUST BE PRECEDED OR ACCOMPANIED BY A PROSPECTUS.
THE DISCIPLINED GROWTH INVESTORS FUND IS DISTRIBUTED BY ALPS DISTRIBUTORS, INC.
TABLE OF CONTENTS
| Manager Commentary | |
| Emerald Growth Fund | 1 |
| Emerald Small Cap Value Fund | 6 |
| Emerald Insights Fund | 12 |
| Emerald Banking and Finance Fund | 17 |
| Disclosure of Fund Expenses | 23 |
| Schedule of Investments | |
| Emerald Growth Fund | 25 |
| Emerald Small Cap Value Fund | 27 |
| Emerald Insights Fund | 29 |
| Emerald Banking and Finance Fund | 31 |
| Statements of Assets and Liabilities | 33 |
| Statements of Operations | 34 |
| Statements of Changes in Net Assets | |
| Emerald Growth Fund | 35 |
| Emerald Small Cap Value Fund | 36 |
| Emerald Insights Fund | 38 |
| Emerald Banking and Finance Fund | 39 |
| Financial Highlights | |
| Emerald Growth Fund | 41 |
| Emerald Small Cap Value Fund | 45 |
| Emerald Insights Fund | 49 |
| Emerald Banking and Finance Fund | 53 |
| Notes to Financial Statements | 57 |
| Disclosure Regarding Approval of Fund Advisory Agreement | 65 |
| Additional Information | 67 |
| Shareholder Voting Results | 68 |
| Privacy Policy | 69 |
Beginning on January 1, 2021, as permitted by regulations adopted by the U.S. Securities and Exchange Commission, paper copies of the Fund’s annual and semi-annual shareholder reports will no longer be sent by mail, unless you specifically request paper copies of the reports. Instead, the reports will be made available on the Funds’ website at www.emeraldmutualfunds.com and you will be notified by mail each time a report is posted and provided with a website link to access the report.
Beginning on January 1, 2019, you may, notwithstanding the availability of shareholder reports online, elect to receive all future shareholder reports in paper free of charge. If you invest through a financial intermediary, you can contact your financial intermediary to request that you continue to receive paper copies of your shareholder reports. If you invest directly with the Funds, you can call 1.855.828.9909 to let the Funds know you wish to continue receiving paper copies of your shareholder reports.
If you already elected to receive shareholder reports electronically, you will not be affected by this change and you need not take any action. You may elect to receive shareholder reports and other communications from the Funds electronically anytime by contacting your financial intermediary (such as a broker-dealer or bank) or, if you are a direct investor, by enrolling at www.emeraldmutualfunds.com.
| Emerald Growth Fund | Manager Commentary |
| October 31, 2018 (Unaudited) |
October 31, 2018
Dear Shareholders:
Investment Results:
The performance of the Emerald Growth Fund’s Class A shares (without sales load), for the six months ended October 31, 2018, advanced by 0.08% outpacing the Russell 2000® Growth Index(1) which declined by -1.26%.
After a strong five month period ended September for equity returns that was characterized by accelerating domestic economic and corporate earnings growth, the market took a meaningful step-back in month of October. As the calendar turned to October, the market backdrop began to shift and after generally being range bound throughout most of 2018, treasury yields surged with the 10-year breaching 3.20% for the first time since 2011. This sudden and rapid move in treasury yields appeared to be driven by stronger than expected domestic economic data (Institute of Supply Management Non-Manufacturing report for September which reached 61.6, setting a record for strength and significantly outpacing consensus of 58.0, and a strong report from ADP on payrolls for the month of September), and incrementally hawkish commentary from Federal Reserve Chairman Powell which collectively led to an upward adjustment to the outlook for rate hikes in 2019. While these factors may have initially catalyzed the sell-off, as the month progressed concerns broadened reflecting weakening global fundamentals, most notably in China. These concerns were compounded by disappointing domestic housing figures, worsening trade tensions, and rising concerns regarding a policy mistake by the Federal Reserve. Collectively all of these factors led to meaningful multiple compression and downward pressure on market returns which effectively erased the vast majority of the market gains that had been accumulated to that point.
As we have seen with many market corrections, small capitalization stocks bore the brunt of the pain with the Russell 2000® Growth Index retracing -10.86% during the month of October as compared to large capitalization stocks as measured by the Russell 1000® Growth Index(2) which fell by -7.08%. Growth stocks after outperforming value stocks year-to-date through the end of September, took a meaningful step back in October, with the Russell 2000® Growth Index declining by -12.65% and the Russell 1000® Growth Index declining by -8.94%. While value stocks outperformed during the month of October, the asset class was not immune to market pressures. The Russell 2000® Value Index(3) declined by -8.95% and the Russell 1000® Value Index(4) declined by -5.18%.
On a calendar year to date basis through the end of October, the Russell 2000® Growth Index has gained 1.11% which trailed the Russell 1000® Growth Index’s 6.62% gain, and outpaced the Russell 2000® Value Index which moved into negative territory with a calendar year-to-date return of -2.46%.
Investment Analysis:
On a relative basis, the portfolio outpaced the benchmark for the trailing 6-month period as the positive contribution to return from stock selection within the consumer discretionary, healthcare, materials, consumer staples and utilities sectors offset relative underperformance within the financial services, producer durables and energy sectors.
The consumer discretionary sector was the largest contributor to return for the trailing 6-month period as stock selection within the specialty retail, leisure time, and consumer services industries contributed to the relative outperformance. The healthcare sector also contributed positively to return driven by stock selection within the biotechnology, medical equipment, health care services, and medical services industries. The portfolio also demonstrated relative outperformance within the materials, consumer staples and utilities sectors driven largely by stock selection within building materials, foods, and telecommunications industries.
Relative outperformance in the aforementioned was partially offset by relative underperformance within the financial services, producer durables and energy sectors. Performance within the financial services sector was the most significant detractor to performance as both the portfolio’s relative overweight position and challenging stock selection with the banking industry constrained relative performance. Performance within the producer durables and energy sectors also detracted from returns as the collective negative contribution from stock selection within the trucking, scientific instrument and oil: crude producers weighed on relative performance.
Exiting October 2018, the portfolio held the largest active exposure to the technology, consumer discretionary and utilities sectors. Thoughts on those sectors and other areas of notable opportunity/ portfolio exposure are highlighted below:
The technology sector was the portfolio’s largest relative overweight position exiting the month of October. Within the sector, the computer software and services industry continues to represent the portfolio’s largest exposure as we continue to see a strong secular growth opportunity in enterprise security and vertical software. Software spending is being further supported by increased corporate profitability, increased investment by the financial services industry (20% of technology spending), deregulation and better spending in Europe. Beyond software, Emerald continues to be optimistic regarding network infrastructure spending as consumer demand for bandwidth continues to drive network upgrades, and at this
| Semi-Annual Report | October 31, 2018 | 1 |
| Emerald Growth Fund | Manager Commentary |
| October 31, 2018 (Unaudited) |
point, multiple segments are in the early stages of network expansion/evolution. Datacenters are upgrading speeds from 25G to 100G as well as laying the foundation for 200G/400G. Telecom and cable companies are driving fiber deeper into their networks to provide customers with faster speeds, which has the potential to change the fundamental architecture of the entire system, and the emergence of 5G/IoT/autonomous vehicles creates another potentially dramatic growth catalyst for network infrastructure.
The portfolio also exited the period with an overweight position in the consumer discretionary sector. The overweight to the consumer discretionary sector is comprised of a diverse subset of companies within the specialty retail, education services, leisure time, diversified retail, consumer services, apparel & shoes, and restaurant industries. Emerald believes that each of these companies is positioned to benefit from company specific initiatives and opportunities.
The portfolio also maintains an overweight position to the utilities sector. Within the utilities sector, Emerald continues to believe that adoption of unified communications among mid-market and enterprise customers remains in the very early stages and that the segment will continue to expand, shifting market leadership from traditional telephony equipment providers to a new group of software/network centric companies.
Market Outlook:
As we look to the balance of 2018, while the recent evidence of slowing global growth is indisputable, we don’t believe at this point that the slowdown is indicative of rising near-term domestic recession risk. Domestic earnings growth across capitalization sizes continues to track in aggregate better than expected, with third quarter S&P Earnings per Share (“EPS”) sales, earnings and EPS growth currently tracking at 8%, 24.8% and 26.9%, respectively according to a November 9, 2018 report from Jonathon Golub of Credit Suisse. That being said, both the sales and earnings revision ratios, according to a November 4th 2018 report from Savita Subramanian of Bank of America Merrill Lynch, have shown some sequential deceleration. We believe that while 2019 earnings expectations were already embedding a significant year over year deceleration, the market is grappling with assessing the base case expectations for the absolute level of earnings growth in 2019.
In this regard, while Emerald expects that the U.S. economy will expand at a lower pace of growth during the fourth quarter of 2018 then that experienced in the second and third quarters of 2018, economic growth should still remain stronger than what the U.S. experienced in the fourth quarter of 2017. Looking to 2019, the slowdown that we have started to see in worldwide growth, that has been especially visible in China, along with the natural slowdown in the U.S. following the massive tax cut of 2018 (already been assumed by the market) will result in domestic Gross Domestic Product (“GDP”) growth next year of between 2.0-2.5%. We expect productivity and capital spending will be positive contributors in 2019 but at significantly lower levels than in 2018. Earnings growth in the U.S. should again be the bright spot among the global developed markets, though the absolute rate of growth will fall below 2018’s projected earnings growth of 20% plus for both the S&P 500 and Russell 2000 Growth. While we acknowledge the absolute rate of earnings growth is slowing as a result of lapping the strong earnings growth experienced during 2018, we think that slowing growth is not indicating recession.
Risks to this outlook, and the catalysts behind the 10-15% market correction, remain the trajectory of the Federal Reserve dot plot (which currently forecasts five rate increases between now and the end of 2019), and the trade dispute with China. First, let’s look at the rate picture and the inevitability of an inverted yield curve(5) that eventually leads to a recession. We believe that historically, markets do not top out, nor do economies, until over a year after the yield curve actually inverts. On the question of tariffs and their economic effect on China, the U.S.’s imported goods and the effect on worldwide growth is just not known. But if we remain on this path it will continue to drag down GDP expectations and market valuations. China’s central bank in recent weeks has implemented several initiatives to stunt the notable slowdown in domestic business investment and consumption trends. While we don’t believe these initiatives by themselves are enough to offset the downward pressure on Chinese economic growth, these efforts certainly could lessen the blow. The market is now looking to the G20 Summit at the end of November for some resolution/mitigation of the trade dispute with China. While recent rhetoric from both sides appears to be encouraging, there remains little visibility to a deal.
Although the time-frame to resolution of these concerns remains uncertain, Emerald believes that the magnitude of market correction likely overstates the impact to growth. Ultimately we believe the Federal Reserve will once again be data dependent and there is little chance the Federal Reserve will hike rates throughout 2019 thereby assuring slowing the economy. In the case of the tariff dispute with China, we believe a solution to escalation will likely be reached before more meaningful damage is done. In the interim, we believe market volatility is likely to remain elevated. That being said, market dislocations create opportunities and Emerald remains focused on capitalizing on those opportunities.
| 2 | www.emeraldmutualfunds.com |
| Emerald Growth Fund | Manager Commentary |
| October 31, 2018 (Unaudited) |
| Top Contributors: | Top Detractors: | |
| Five Below Inc. | Cadence Bancorporation | |
| Reata Pharmaceuticals Inc. | Pacific Premier Bancorp Inc. | |
| Sarepta Therapeutics Inc. | Dycom Industries Inc. | |
| Freshpet Inc. | Clovis Oncology Inc. | |
| Teladoc Health Inc. | Adamas Pharmaceuticals Inc. | |
| Kenneth G. Mertz II, CFA | Stacey L. Sears | Joseph W. Garner |
| Chief Investment Officer | Portfolio Manager | Portfolio Manager |
| Portfolio Manager | ||
Emerald Mutual Fund Advisers Trust
Past performance does not guarantee future results. Fund prices fluctuate as the underlying assets have exposure to market fluctuations and other risks, as described in the Fund’s prospectus. Please visit www.emeraldmutualfunds.com to obtain current performance information and for the current prospectus and statement of additional information. This material must be preceded or accompanied by a prospectus. Please read the prospectus carefully before investing.
The views of Emerald Mutual Fund Advisers Trust and information discussed in this commentary are as of the date of publication, are subject to change, and may not reflect the writer's current views. The views expressed are those of the author only, and represent an assessment of market conditions at a specific point in time, are opinions only and should not be relied upon as investment advice regarding a particular investment or markets in general. Such information does not constitute a recommendation to buy or sell specific securities or investment vehicles. It should not be assumed that any investment will be profitable or will equal the performance of the Fund or any securities or any sectors mentioned in this letter. The subject matter contained in this letter has been derived from several sources believed to be reliable and accurate at the time of compilation. Neither Emerald Mutual Fund Advisers Trust nor the Fund accepts any liability for losses either direct or consequential caused by the use of this information.
The Emerald Growth Fund is distributed by ALPS Distributors, Inc.
The Fund is subject to investment risks, including possible loss of the principal amount invested and therefore is not suitable for all investors. The Fund may not achieve its objectives.
Diversification does not eliminate the risk of experiencing investment losses.
| (1) | The Russell 2000® Growth Index measures the performance of the small-cap growth segment of the U.S. equity universe. It includes those Russell 2000® Index companies with higher price-to-value ratios and higher forecasted growth values. The Index is not actively managed and does not reflect any deductions for fees, expenses or taxes. An investor may not invest directly into the Index. |
| (2) | The Russell 1000® Growth Index refers to a composite that includes large and mid-cap companies located in the United States that also exhibit a growth probability. The Index is not actively managed and does not reflect any deductions for fees, expenses or taxes. An investor may not invest directly into the Index. |
| (3) | The Russell 2000® Value Index measures the performance of small-cap value segment of the U.S. equity universe. It includes those Russell 2000 companies with lower price-to-book ratios (A ratio used to compare a stock's market value to its book value. It is calculated by dividing the current closing price of the stock by the latest quarter's book value per share.) and lower forecasted growth values. The Index is not actively managed and does not reflect any deductions for fees, expenses or taxes. An investor may not invest directly into the Index. |
| (4) | The Russell 1000® Value Index refers to a composite of large and mid-cap companies located in the United States that also exhibit a value probability. The Index is not actively managed and does not reflect any deductions for fees, expenses or taxes. An investor may not invest directly into the Index. |
| (5) | A yield curve is a line that plots the interest rates, at a set point in time, of bonds having equal credit quality but differing maturity dates. The most frequently reported yield curve compares the three-month, two-year, five-year and 30-year U.S. Treasury debt. This yield curve is used as a benchmark for other debt in the market, such as mortgage rates or bank lending rates, and it is also used to predict changes in economic output and growth. |
| Semi-Annual Report | October 31, 2018 | 3 |
| Emerald Growth Fund | Manager Commentary |
October 31, 2018 (Unaudited)
TOP TEN HOLDINGS
(as a % of Net Assets)*
| Chegg, Inc. | 2.80% |
| Vonage Holdings Corp. | 2.26% |
| Five Below, Inc. | 2.02% |
| Ciena Corp. | 1.84% |
| Cadence BanCorp | 1.84% |
| Children's Place, Inc. | 1.83% |
| EPAM Systems, Inc. | 1.79% |
| Varonis Systems, Inc. | 1.76% |
| American Eagle Outfitters, Inc. | 1.67% |
| Trex Co., Inc. | 1.65% |
| Top Ten Holdings | 19.46% |
INDUSTRY SECTOR ALLOCATION
(as a % of Net Assets)
| Technology | 22.49% |
| Health Care | 22.14% |
| Consumer Discretionary | 21.46% |
| Financial Services | 10.92% |
| Producer Durables | 8.30% |
| Utilities | 4.39% |
| Materials & Processing | 4.72% |
| Consumer Staples | 2.35% |
| Energy | 0.52% |
| Cash, Cash Equivalents, & Other Net Assets | 2.71% |
| * | Holdings are subject to change, and may not reflect the current or future position of the portfolio. |
ANNUALIZED TOTAL RETURN (for the period ended October 31, 2018)
| 6 Month | 1 Year | 3 Year | 5 Year | 10 Year | Since Inception(1) | Expense Ratio | ||
| Gross(2) | Net(2) | |||||||
| Class A (NAV) | 0.08% | 4.29% | 10.60% | 9.49% | 15.13% | 11.16% | 1.03% | 1.03% |
| Class A (MOP) | -4.69% | -0.65% | 8.83% | 8.43% | 14.57% | 10.96% | 1.03% | 1.03% |
| Russell 2000® Growth Index(3) | -1.26% | 4.13% | 10.72% | 8.75% | 13.89% | 8.26% | ||
| Class C (NAV) | -0.27% | 3.61% | 9.88% | 8.78% | 14.41% | 6.22% | 1.68% | 1.68% |
| Class C (CDSC) | -1.27% | 2.61% | 9.88% | 8.78% | 14.41% | 6.22% | 1.68% | 1.68% |
| Russell 2000® Growth Index(3) | -1.26% | 4.13% | 10.72% | 8.75% | 13.89% | 5.20% | ||
| Investor Class | 0.08% | 4.27% | 10.54% | 9.45% | – | 11.25% | 1.08% | 1.08% |
| Russell 2000® Growth Index(3) | -1.26% | 4.13% | 10.72% | 8.75% | – | 10.01% | ||
| Institutional Class | 0.22% | 4.61% | 10.96% | 9.83% | 15.50% | 14.92% | 0.73% | 0.73% |
| Russell 2000® Growth Index(3) | -1.26% | 4.13% | 10.72% | 8.75% | 13.89% | 13.86% | ||
Performance quoted represents past performance, does not guarantee future results and current performance may be lower or higher than the data quoted. The investment return and principal value of an investment will fluctuate so that shares, when redeemed, may be worth more or less than their original cost. Performance data current to the most recent month end may be obtained at www.emeraldmutualfunds.com.
Performance shown for periods prior to March 16, 2012, reflects the performance of the Forward Growth Fund, a series of Forward Funds (as a result of a reorganization of the Forward Growth Fund into the Emerald Growth Fund).
Returns for periods less than 1 year are cumulative.
The table does not reflect the deduction of taxes that a shareholder would pay on Fund distributions or the redemption of Fund shares.
Subject to investment risks, including possible loss of the principal amount invested.
Maximum Offering Price (MOP) for Class A shares includes the Fund's maximum sales charge of 4.75%. Performance shown at NAV does not include these sales charges and would have been lower had it been taken into account.
A Contingent Deferred Sales Charge (CDSC) of 1.00% may apply to Class C shares redeemed within the first 12 months after a purchase.
| (1) | Inception Dates - Class A: 10/01/1992, Class C: 07/01/2000, Institutional Class: 10/21/2008, Investor Class: 05/01/2011 |
| (2) | Emerald Mutual Fund Advisers Trust ("Emerald" or the "Adviser") has agreed contractually to waive a portion of its fees and reimburse other expenses until August 31, 2019 in amounts necessary to limit the Fund's operating expenses (exclusive of Acquired Fund Fees and Expenses, brokerage expenses, interest expenses, taxes and extraordinary expense) for Class A, Class C, Institutional Class, and Investor Class shares to an annual rate (as percentage of the Fund's average daily net assets) of 1.29%, 1.94%, 0.99% and 1.34% respectively. The Adviser will be permitted to recover, on a class-by-class basis, expenses it has borne through the agreement described above to the extent that the Fund's expenses in later periods fall below the annual rates set forth in the relevant agreement. The Fund will not be obligated to pay any such deferred fees and expenses more than three years after the year(s) in which the fees and expense were incurred. The Adviser may not discontinue this waiver prior to August 31, 2019, without the approval by the Fund's Board of Trustees. Ratios as of the Prospectus dated August 31, 2018 and may differ from the ratios presented in the Financial Highlights. |
| (3) | The Russell 2000® Growth Index measures the performance of the small-cap growth segment of the U.S. equity universe. It includes those Russell 2000® Index companies with higher price-to-value ratios and higher forecasted growth values. The Index is not actively managed and does not reflect any deduction for fees, expenses or taxes. An investor may not invest directly into the Index. |
| 4 | www.emeraldmutualfunds.com |
| Emerald Growth Fund | Manager Commentary |
October 31, 2018 (Unaudited)
GROWTH OF $10,000 INVESTMENT IN THE FUND (for the period ended October 31, 2018)
Comparison of change in value of a $10,000 investment (includes applicable sales loads)
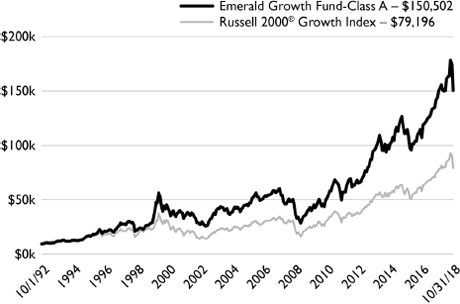
The chart represents historical performance of a hypothetical investment of $10,000 in the Fund since inception. Past performance does not guarantee future results. This chart does not reflect the deduction of taxes that a shareholder would pay on Fund distributions or the redemption of Fund shares.
Investing in the Fund is subject to investment risks, including possible loss of the principal amount invested.
| Semi-Annual Report | October 31, 2018 | 5 |
| Emerald Small Cap Value Fund | Manager Commentary |
October 31, 2018 (Unaudited)
October 31, 2018
Dear Shareholders:
Investment Results:
The performance of the Emerald Small Cap Value Fund Investor Class, for the six months ended October 31, 2018, reflected a loss of 10.23% (without sales load) underperforming the Russell 2000® Value Index(1) which was down 1.52%.
It seems that investors are negative on domestic economic activity. Housing, autos, industrials, infrastructure construction, oil & gas, banks, and consumer staples are out of favor. We believe a meaningful shift in favor of value can occur in the near term, as value becomes cheaper relative to growth, valuation factors would start to matter, value companies could exhibit greater improvement in earning and sales, along with a strong domestic economy throughout next year.
Investment Analysis:
The Emerald Small Cap Value Fund (without sales load) underperformed its benchmark for the 6-month period ended October 31, 2018. At the sector level, relative outperformance was driven by stock selection within the consumer discretionary sector. Relative underperformance was observed within financial services, materials & processing, energy, technology, producer durables, and a relative underweight to the benchmark’s utilities sector.
Engineering and construction companies were challenged by permitting delays, large customers pushing out project start dates (causing under-absorption issues), higher labor costs, and adverse weather. With that said, bulging backlogs at higher margins, pushouts not cancellations, a strong economy, and need for infrastructure spending, keep us positive on this group. In addition, public infrastructure projects are secured by long term funding and demand is starting to inflect and poise for a multi-year recovery.
Materials companies exposed to homebuilding have been lagging due to bearish sentiment on this industry. Some of the concerns are decelerating housing starts, higher interest rates, and weakening affordability. However, favorable trends in household formation, low inventory levels for new and existing homes, high demand for low-priced “starter” homes, and strong consumer confidence, lead us to believe that the housing market will rebound and show mid single digit growth in the next several years. Current valuations discount a near recession scenario with multiples last seen during the most recent financial crisis (i.e. peak housing cycle). However, we believe that today’s fundamentals are much stronger and less risky than a decade ago. According to Raymond James, in 2019, homebuilders are projected to grow earnings and ROEs double digits, generate positive cash flow from operations, while maintaining de-risked balance sheets(2).
Materials companies in our portfolio that supply to large infrastructure projects, also been adversely impacted by higher labor costs, rising raw materials prices, and abnormally wet weather. Again, our assessment is that demand is deferred not cancelled, and these companies are trading at near trough multiples and are extremely attractive investments based on our long term view.
Our Semiconductor stock investments declined in recent months due to fears that capital spending by OEMs (original equipment manufacturers) will be cut significantly as they push-out or cancel next generation node investments, and by worries about declining memory prices due to high inventory. Current market sentiment is that the industry will go through a multi-quarter downturn rather than a short correction period. We don’t think that will be the case. We believe that the semiconductor market is more resilient than in the past, and the industry landscape has also vastly changed (largely through consolidation) where cyclical trends have become minimized. Underlying demand for semiconductors remains robust, driven by the data economy (5G, AI, Big Data, IoT, autonomous cars, etc.). Capital intensity and equipment spending levels need to rise just to support stable industry growth. Memory market fundamentals are still strong as equipment makers are much more efficient tool producers, and manufacturers can respond quickly to market softness. We expect strong growth in the memory market (both DRAM and NAND) in the next several years, which will drive a very robust wafer fab equipment capital spending environment.
Within financial services, bank and thrift stock performance lagged significantly in the past six months. Logic would lead us to believe that rising rates are a tailwind for bank earnings but that is not always the case. We believe that the “rising rate tailwind” will play out for banks with good core deposit franchises and good core deposit costs. For many years since the financial crisis, deposits were not a concern as banks were awash in low cost deposits. In fact, as the Federal Reserve (Fed) began raising interest rates into 2016, deposit costs and deposit betas remained anemic. In the first quarter of 2018 all that changed as we saw a significant uptick in deposit betas that has continued throughout the year. We believe that the remainder of 2018 will continue to see the smaller community banks continue to post good loan growth and indeed return to increased net interest margins in the fourth quarter of 2018. Longer term, we feel that the macro background is still strong, and current Street estimates do not incorporate meaningful net interest margin expansion or strong loan growth for small and community banks. Our theory is that banks with higher loan to deposit ratios will be less aggressive on pricing when competing for loans and typically, increases in deposit costs when there are rate increases lag the increase by about six months. We also remain encouraged by our long term belief that community banks are in the midst of an
| 6 | www.emeraldmutualfunds.com |
| Emerald Small Cap Value Fund | Manager Commentary |
October 31, 2018 (Unaudited)
industry consolidation. Even though trends slowed in the third quarter, this year is set for the most active year since at least 1991. In fact, the third quarter was the fourth strongest quarter since 1991, with 59 deals announced, after 2Q 2018 with 84 deals, and 64 deals announced in 3Q 2017.
We are disappointed with the performance thus far this year, but we have strong conviction in our portfolio holdings. We believe that the small cap value portfolio is well positioned to benefit from an improving domestic economy and the eventual turnaround in some of the industries discussed above. We still maintain an overweight to banks within the Financial Services sector, and we continue to search for and invest in high quality companies that generate prodigious amounts of free cash flow.
Market Outlook:
We still view the current domestic economic environment as very positive for companies focused on generating revenues and growing their operations in the U.S.. We acknowledge investors concerns with rising interest rates, trade tensions, results of mid-term elections, and margin headwinds due to higher labor/materials/transportation costs. However, we think there are many more positive dynamics that would create tailwinds to the economy and prevent it from slowing meaningfully in the next year or two. As such, we believe the recent downturn in small caps is a correction within the current bull market rather than a beginning of a bear market, as we are not seeing the tell-tale signs of a looming recession.
According to the BLS (U.S. Bureau of Labor Statistics), September’s unemployment rate came in at 3.68%, lowest unemployment rate since December 1969! Meanwhile the U6 rate (the unemployment rate that includes discouraged workers who have quit looking for a job and part-time workers who are seeking full-time employment) rose slightly to 7.5% from 7.4%, as more people are encouraged to re-join the labor force. Also, average hourly earnings grew 0.3% month over month, and 2.8% year over year. There is less slack as the labor market continues to tighten. This has been positive for consumers. With stronger prospects for employment and wage growth, the University of Michigan's Consumer Sentiment Index is close to decade highs at 99 (October).
The Fed is on a path to continue raising rates, three times so far this year and another hike is expected in December. These actions are fanning fears of a potential policy misstep that would cause the economy to slow down and eventually enter into a recession. Our take is that the Fed tightening policy is not a response to inflationary concerns, but rather an attempt to gradually get back to normalized levels for both interest rates and the Fed’s balance sheet. As such, with a stronger economy, the yield curve(3) should actually steepen rather than invert. In that scenario, smaller banks with relative lower loan to deposit ratios will do very well, and see their net interest margins expand.
As mentioned above, there are mounting headwinds affecting construction, such as rising interest rates higher input costs, and bad weather. However, the data tells us that there is a still lot of activity throughout the country, which we believe, should continue for several more years. Domestic industrial metrics strengthened sequentially in 3Q18 with the ISM PMI averaging 59.7 for the quarter and up slightly from 58.7 in 2Q18, and in-line with a strong 59.7 in 1Q18, tying the best calendar quarter of industrial activity since 1Q11. October was the 26th consecutive month of growth in manufacturing. The sector remains in expansionary mode with activity at a high level. The Dodge Momentum Index, which tracks initial reports of construction projects in planning, was at its highest reading in history, 169.8, in July 2018. The April – August 2018 period was the only time since the index’s inception (in 2012) that the index exceeded 160. The August 2018 Architectural Billings Index (ABI) was 54.2. The ABI offers an approximately 9- to 12-month glimpse into the future of nonresidential construction spending activity. A reading above 50 tends to coincide with rising demand. In addition, construction and remodel activity remains at a high level. If only weather would normalize (less wet in prime construction regions), this group would benefit from both top line growth and improving margins, as they become more efficient in managing logistics and labor.
The extent of the damage that trade wars can inflict on the U.S. economy ($19 trillion) should be manageable in our view, as we see progress and eventual resolution on several fronts. The U.S. economy is being stimulated by tax cuts, deregulation and improved sentiment, and tariffs are potentially bullish to domestic companies that are able to raise prices which lead to higher profits, assuming they can keep their costs down. The major disagreement with China had little impact on the growth rate of our domestic economy, and so far only a handful of industries have been targeted. While we do not have any unique insights to the trade negotiations, we believe a deal, or even cessation of tit-for-tat tariffs, can send the markets higher again. However, as we have seen with the announcement of the new trade agreement between the U.S. – Canada – Mexico, investors favor buying larger companies over small ones.
Banks have been out of favor due to investors concerns over diminishing earnings power related to increasing deposit betas, eventual normalization of credit costs, and a flattening yield curve. However, we feel that the macro background is still strong, and current Street estimates do not incorporate meaningful net interest margin expansion or strong loan growth for small and community banks.
We strongly believe that companies that are generating prodigious amount of free cash flow are higher quality companies, and will outperform over a market cycle. In the past few quarters, companies that have low return on equity or "non-earners", which we consider lower quality companies, have done very well. We expect this trend to reverse as investors will start to focus on earnings growth and balance sheet strength, as valuation gap between growth and value widens, and concerns over an eventual economic slowdown increase.
| Semi-Annual Report | October 31, 2018 | 7 |
| Emerald Small Cap Value Fund | Manager Commentary |
October 31, 2018 (Unaudited)
We remain committed in our pursuit of finding attractive investment opportunities for our clients by focusing on high-quality companies identified and evaluated by our fundamental research and active portfolio management.
| Top Contributors: | Top Detractors: | |
| Five Below Inc. | Cadence Bancorporation | |
| Reata Pharmaceuticals Inc. | Pacific Premier Bancorp Inc. | |
| Sarepta Therapeutics Inc. | Dycom Industries Inc. | |
| Freshpet Inc. | Clovis Oncology Inc. | |
| Teladoc Health Inc. | Adamas Pharmaceuticals Inc. | |
| Kenneth G. Mertz II, CFA | Stacey L. Sears | Joseph W. Garner |
| Chief Investment Officer | Portfolio Manager | Portfolio Manager |
| Portfolio Manager | ||
Emerald Mutual Fund Advisers Trust
Past performance does not guarantee future results. Fund prices fluctuate as the underlying assets have exposure to market fluctuations and other risks, as described in the Fund’s prospectus. Please visit www.emeraldmutualfunds.com to obtain current performance information and for the current prospectus and statement of additional information. This material must be preceded or accompanied by a prospectus. Please read the prospectus carefully before investing.
The views of Emerald Mutual Fund Advisers Trust and information discussed in this commentary are as of the date of publication, are subject to change, and may not reflect the writer's current views. The views expressed are those of the author only, and represent an assessment of market conditions at a specific point in time, are opinions only and should not be relied upon as investment advice regarding a particular investment or markets in general. Such information does not constitute a recommendation to buy or sell specific securities or investment vehicles. It should not be assumed that any investment will be profitable or will equal the performance of the Fund or any securities or any sectors mentioned in this letter. The subject matter contained in this letter has been derived from several sources believed to be reliable and accurate at the time of compilation. Neither Emerald Mutual Fund Advisers Trust nor the Fund accepts any liability for losses either direct or consequential caused by the use of this information.
The Emerald Small Cap Value Fund is distributed by ALPS Distributors, Inc.
The Fund is subject to investment risks, including possible loss of the principal amount invested and therefore is not suitable for all investors. The Fund may not achieve its objectives.
Diversification does not eliminate the risk of experiencing investment losses.
| (1) | The term Russell 2000® Value Index refers to a composite of small cap companies located in the United States that also exhibit a value probability. The Russell 2000® Value is published does not reflect any deductions for fees, expenses or taxes. An investor may not invest directly into the Index. |
| (2) | Raymond James, Housing: History Is On Homebuilders' Side Heading Into "Hope Trade 2019", 15 October, 2018 |
| (3) | A yield curve is a line that plots the interest rates, at a set point in time, of bonds having equal credit quality but differing maturity dates. The most frequently reported yield curve compares the three-month, two-year, five-year and 30-year U.S. Treasury debt. This yield curve is used as a benchmark for other debt in the market, such as mortgage rates or bank lending rates, and it is also used to predict changes in economic output and growth. |
| 8 | www.emeraldmutualfunds.com |
| Emerald Small Cap Value Fund | Manager Commentary |
October 31, 2018 (Unaudited)
TOP TEN HOLDINGS
(as a % of Net Assets)*
| MKS Instruments, Inc. | 2.23% |
| Focus Financial Partners, Inc. | 2.16% |
| Gray Television, Inc. | 2.12% |
| Ares Management LP | 2.11% |
| ICF International, Inc. | 2.08% |
| Meritor, Inc. | 1.82% |
| Nutrisystem, Inc. | 1.81% |
| Popular, Inc. | 1.75% |
| Photronics, Inc. | 1.72% |
| Aaron’s, Inc. | 1.70% |
| Top Ten Holdings | 19.50% |
INDUSTRY SECTOR ALLOCATION
(as a % of Net Assets)
| Financial Services | 47.25% |
| Consumer Discretionary | 12.39% |
| Technology | 11.77% |
| Producer Durables | 7.90% |
| Materials & Processing | 6.74% |
| Energy | 5.59% |
| Health Care | 2.24% |
| Utilities | 1.60% |
| Cash, Cash Equivalents, & Other Net Assets | 4.52% |
| * | Holdings are subject to change, and may not reflect the current or future position of the portfolio. |
ANNUALIZED TOTAL RETURN (for the period ended October 31, 2018)(1),(2)
| 6 Month | 1 Year | 3 Years | 5 Years | Since Inception(2) | Expense Ratio | ||
| Gross(3) | Net(3) | ||||||
| Class A (NAV) | -10.43% | -8.02% | 7.17% | 6.54% | 9.94% | 2.56% | 1.35% |
| Class A (MOP) | -14.68% | -12.40% | 5.44% | 5.52% | 9.05% | 2.56% | 1.35% |
| Russell 2000® Value Index(4) | -1.52% | -0.59% | 10.52% | 7.18% | 10.92% | ||
| Class C (NAV) | -10.74% | -8.64% | 6.45% | 5.83% | 9.21% | 3.20% | 2.00% |
| Class C (CDSC) | -11.63% | -9.16% | 6.45% | 5.83% | 9.21% | 3.20% | 2.00% |
| Russell 2000® Value Index(4) | -1.52% | -0.59% | 10.52% | 7.18% | 10.92% | ||
| Investor Class | -10.23% | -7.82% | 7.34% | 6.70% | 10.11% | 2.44% | 1.25% |
| Russell 2000® Value Index(4) | -1.52% | -0.59% | 10.52% | 7.18% | 10.92% | ||
| Institutional Class | -10.20% | -7.66% | 7.53% | 6.91% | 10.32% | 2.20% | 1.00% |
| Russell 2000® Value Index(4) | -1.52% | -0.59% | 10.52% | 7.18% | 10.92% | ||
Performance quoted represents past performance, does not guarantee future results and current performance may be lower or higher than the data quoted. The investment return and principal value of an investment will fluctuate so that shares, when redeemed, may be worth more or less than their original cost. Performance data current to the most recent month end may be obtained at www.emeraldmutualfunds.com.
Returns for periods less than 1 year are cumulative.
The table does not reflect the deduction of taxes that a shareholder would pay on Fund distributions or the redemption of Fund shares.
Subject to investment risks, including possible loss of the principal amount invested.
Maximum Offering Price (MOP) for Class A shares includes the Fund's maximum sales charge of 4.75%. Performance shown at NAV does not include these sales charges and would have been lower had it been taken into account.
A Contingent Deferred Sales Charge (CDSC) of 1.00% may apply to Class C shares redeemed within the first 12 months after a purchase.
| (1) | As of June 26, 2015, the Emerald Small Cap Value Fund was reorganized as a successor to the Elessar Small Cap Value Fund (the Predecessor Fund), a series of Elessar Investment Trust. The performance shown for periods prior to June 26, 2015 reflects the performance of the Predecessor Fund's Institutional Class and Investor Class shares. The Predecessor Fund did not offer Class A or Class C shares. The performance shown for Class A and C shares prior to June 30, 2015 reflect the historical performance of the Predecessor Fund’s Institutional and Investor Shares since inception on October 15, 2012, calculated using the fees and expenses of Class A and C shares, respectively. |
| (2) | Commencement Dates - Class A: 06/30/2015, Class C: 06/30/2015, Institutional Class: 10/15/2012, Investor Class:10/15/2012 |
| (3) | Emerald Mutual Fund Advisers Trust (“Emerald” or the “Adviser”) has agreed contractually to waive a portion of its fees and reimburse other expenses until August 31, 2019 in amounts necessary to limit the Fund’s operating expenses (exclusive of Acquired Fund Fees and Expenses, brokerage expenses, interest expenses, taxes and extraordinary expense) for Class A, Class C, Institutional Class, and Investor Class shares to an annual rate (as percentage of the Fund’s average daily net assets) of 1.35%, 2.00%, 1.00% and 1.25% respectively. The Adviser will be permitted to recover, on a class-by-class basis, expenses it has borne through the agreement described above to the extent that the Fund's expenses in later periods fall below the annual rates set forth in the relevant agreement. The Fund will not be obligated to pay any such deferred fees and expenses more than three years after the year(s) in which the fees and expense were incurred. The Adviser may not discontinue this waiver prior to August 31, 2019, without the approval by the Fund's Board of Trustees. Ratios as of the Prospectus dated August 31, 2018 and may differ from the ratios presented in the Financial Highlights. |
| Semi-Annual Report | October 31, 2018 | 9 |
| Emerald Small Cap Value Fund | Manager Commentary |
October 31, 2018 (Unaudited)
| (4) | The Russell 2000® Value Index measures the performance of small-cap value segment of the U.S. equity universe. It includes those Russell 2000 companies with lower price-to-book ratios and lower forecasted growth values. The Index is not actively managed and does not reflect any deductions for fees, expenses or taxes. An investor may not invest directly into the Index. |
Important Risks
Investing in smaller companies generally will present greater investment risks, including: greater price volatility, greater sensitivity to changing economic conditions and less liquidity than the securities of larger, more mature companies.
| 10 | www.emeraldmutualfunds.com |
| Emerald Small Cap Value Fund | Manager Commentary |
October 31, 2018 (Unaudited)
GROWTH OF $10,000 INVESTMENT IN THE FUND (for the period ended October 31, 2018)
Comparison of change in value of a $10,000 investment (includes applicable sales loads)
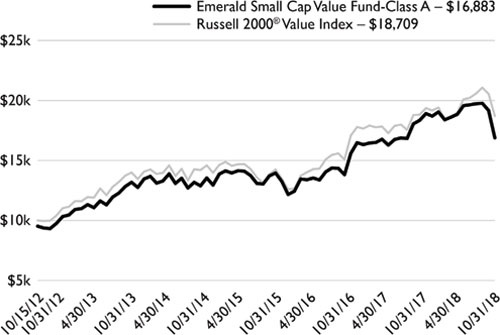
The chart represents historical performance of a hypothetical investment of $10,000 in the Fund since inception. Past performance does not guarantee future results. This chart does not reflect the deduction of taxes that a shareholder would pay on Fund distributions or the redemption of Fund shares.
Investing in the Fund is subject to investment risks, including possible loss of the principal amount invested.
| Semi-Annual Report | October 31, 2018 | 11 |
| Emerald Insights Fund | Manager Commentary |
October 31, 2018 (Unaudited)
October 31, 2018
Dear Shareholders:
Investment Results:
The performance of the Emerald Insights Fund Class A shares (without sales load) for the six months ended October 31, 2018 reflected a return of 0.15%, trailing the Russell 3000® Growth Index(1) benchmark return of 4.29%. Performance for the period was hampered by weak results in October, which offset robust results in the earlier five months of the reporting period. Strength in the Consumer Discretionary and Healthcare sectors was offset by weakness in the Financial Services, Energy and Materials sectors as part of a late quarter risk off trade.
Investment Analysis:
Economic indicators continued to strengthen in the domestic economy with real U.S. Gross Domestic Product (GDP) growing 3.5% quarter-over-quarter in October, civilian unemployment at a decade low, consumer confidence at a multi-year high and average hourly earnings steadily improving. Second quarter S&P 500 earnings grew at a near record 27% with net profit margins coming in at 11.8%: the highest since 2008 (Factset). The only areas of concern that started to emerge late in the reporting period related to housing starts and existing home sales, as mortgage rates continued to rise. Trade tensions also impacted selected company earnings and forecasts by creating a drag on export opportunities while casting a negative pall over companies with significant China exposure.
The Insights portfolio was positioned with a modest degree of cyclical exposure with over-weights to Energy and Materials given our relatively optimistic outlook for economic growth, the strong earnings reported and guided to by companies in these sectors, as well as the very large growth/valuation gap between the cyclical companies and the broader market. Unfortunately, most names with real or perceived cyclical economic exposure continued to lag through the end of October regardless of actual results or guidance. The Insights portfolio was positioned at a modestly smaller market capitalization than the benchmark, but still large with an average market cap of $215bn composed of names with significantly higher projected earnings growth rates than the benchmark. Momentum carried the day for most of the reporting period as valuations were increasingly irrelevant until the month of October, when the fastest growing names underperformed the most given the aforementioned risk off trade.
Market Outlook:
As noted above, the U.S. economy is strong with 3% plus GDP growth and solid consumer & business conditions. Unfortunately, there is a true dichotomy between our economy and most other regions. European Union economies and those of most Asian nations, particularly emerging markets, have seen their economic growth contract significantly, as the strength of the U.S. Dollar, tariffs, and lower commodity prices have all served to drive down many currencies and grind economic growth to a halt. Concerns over the Federal Reserve (Fed) overshooting and tightening too much, along with the aforementioned emerging and developed international economic weakness caused one of the largest October equity market swoons on record. We are of the opinion that the risk of a near-term domestic economic slowdown is quite low as long as employment remains strong, the yield curve(2) remains positive and credit conditions, especially in the form of corporate credit spreads, remain tame. We look for some movement on the China trade situation at the November G20 trade summit. We also think there is increasing likelihood of the Fed taking a bit more dovish tone given the Dollar’s strength and the concomitant emerging market economic weakness.
Given the international weakness, we have positioned the portfolio with a domestic revenue bent with overweights in Energy, Materials, and other domestically focused sectors and industries. While this positioning did not work in October, we are confident in our sector allocations. Price/Earnings multiples and other valuation metrics for many of our portfolio holdings are approaching trough valuations last seen during the most recent industrial recession of 2015-2016. At that time WTI oil slipped to $26, job growth slowed and a variety of production indices and sentiment indicators were very weak. The situation is almost the polar opposite today with Q3 and Q4 2018 S&P 500 earnings expected to grow 19.1 and 17% respectively (Factset). Our confidence is buttressed when considering that portfolio holdings are expected to grow earnings 20.85% over the next 3-5 years vs. 17.61% for the index, according to our internal models. This higher growth rate and lower valuation scenario is quite rare and normally bodes well for superior future returns assuming the earnings projections come to fruition. As always, we employ our time-tested 10-step research process as we seek to identify the fastest growing companies with the best management teams in the domestic equity universe. Corrections are inevitable, but we think that over time investors will reward companies with above average earnings growth, especially those trading at discounted values based on temporary market inefficiencies.
| Top Contributors: | Top Detractors: |
| Apple Inc. | GMS Inc. |
| Chegg, Inc. | Extraction Oil & Gas, Inc. |
| SeaWorld Entertainment, Inc. | Koppers Holdings Inc. |
| Teladoc Health, Inc. | Dycom Industries, Inc. |
| Microsoft Corporation | TopBuild Corp. |
| 12 | www.emeraldmutualfunds.com |
| Emerald Insights Fund | Manager Commentary |
October 31, 2018 (Unaudited)
| David A. Volpe, CFA | Stephen L. Amsterdam | Joseph Hovorka |
| Deputy Chief Investment Officer | Associate Portfolio Manager | Associate Portfolio Manager |
| Portfolio Manager |
Emerald Mutual Fund Advisers Trust
Past performance does not guarantee future results. Fund prices fluctuate as the underlying assets have exposure to market fluctuations and other risks, as described in the Fund’s prospectus. Please visit www.emeraldmutualfunds.com to obtain current performance information and for the current prospectus and statement of additional information. This material must be preceded or accompanied by a prospectus. Please read the prospectus carefully before investing.
The views of Emerald Mutual Fund Advisers Trust and information discussed in this commentary are as of the date of publication, are subject to change, and may not reflect the writer's current views. The views expressed are those of the author only, and represent an assessment of market conditions at a specific point in time, are opinions only and should not be relied upon as investment advice regarding a particular investment or markets in general. Such information does not constitute a recommendation to buy or sell specific securities or investment vehicles. It should not be assumed that any investment will be profitable or will equal the performance of the Fund or any securities or any sectors mentioned in this letter. The subject matter contained in this letter has been derived from several sources believed to be reliable and accurate at the time of compilation. Neither Emerald Mutual Fund Advisers Trust nor the Fund accepts any liability for losses either direct or consequential caused by the use of this information.
The Emerald Insights Fund is distributed by ALPS Distributors, Inc.
The Fund is subject to investment risks, including possible loss of the principal amount invested and therefore is not suitable for all investors. The Fund may not achieve its objectives.
Diversification does not eliminate the risk of experiencing investment losses.
| (1) | The Russell 3000® Growth Index is a market capitalization weighted index based on the Russell 3000® index. The Russell 3000® Growth Index includes companies that display signs of above average growth. The index is used to provide a gauge of the performance of growth stocks in the United States. The Index is not actively managed and does not reflect any deductions for fees, expenses or taxes. An investor may not invest directly into the Index. |
| (2) | A yield curve is a line that plots the interest rates, at a set point in time, of bonds having equal credit quality but differing maturity dates. The most frequently reported yield curve compares the three-month, two-year, five-year and 30-year U.S. Treasury debt. This yield curve is used as a benchmark for other debt in the market, such as mortgage rates or bank lending rates, and it is also used to predict changes in economic output and growth. |
| Semi-Annual Report | October 31, 2018 | 13 |
| Emerald Insights Fund | Manager Commentary |
October 31, 2018 (Unaudited)
TOP TEN HOLDINGS
(as a % of Net Assets)*
| Amazon.com, Inc. | 5.20% |
| Apple, Inc. | 5.20% |
| Microsoft Corp. | 5.13% |
| Chegg, Inc. | 3.23% |
| Alphabet, Inc. | 3.02% |
| Facebook, Inc. | 2.64% |
| SeaWorld Entertainment, Inc. | 2.07% |
| Vonage Holdings Corp. | 1.86% |
| Varonis Systems, Inc. | 1.66% |
| Citigroup, Inc. | 1.60% |
| Top Ten Holdings | 31.61% |
INDUSTRY SECTOR ALLOCATION
(as a % of Net Assets)
| Technology | 32.21% |
| Consumer Discretionary | 19.66% |
| Health Care | 13.12% |
| Financial Services | 9.07% |
| Materials & Processing | 7.94% |
| Producer Durables | 6.17% |
| Energy | 5.67% |
| Consumer Staples | 2.22% |
| Utilities | 1.86% |
| Cash, Cash Equivalents, & Other Net Assets | 2.08% |
| * | Holdings are subject to change, and may not reflect the current or future position of the portfolio. |
ANNUALIZED TOTAL RETURN (for the period ended October 31, 2018)
| 6 Month | 1 Year | 3 Year | Since Inception(1) | Expense Ratio | ||
| Gross(2) | Net(2) | |||||
| Class A (NAV) | 0.15% | 6.07% | 7.78% | 6.58% | 2.10% | 1.35% |
| Class A (MOP) | -4.59% | 1.00% | 6.06% | 5.36% | 2.10% | 1.35% |
| Russell MidCap® Growth Index(3) | 0.94% | 6.14% | 10.39% | 9.78% | ||
| Russell 3000® Growth Index(4) | 4.29% | 10.20% | 13.45% | 13.05% | ||
| Class C (NAV) | -0.24%(5) | 5.38% | 7.07% | 5.84% | 2.75% | 2.00% |
| Class C (CDSC) | -1.23%(5) | 4.38% | 7.07% | 5.84% | 2.75% | 2.00% |
| Russell MidCap® Growth Index(3) | 0.94% | 6.14% | 10.39% | 9.78% | ||
| Russell 3000® Growth Index(4) | 4.29% | 10.20% | 13.45% | 13.05% | ||
| Investor Class | 0.08% | 6.01% | 7.71% | 6.48% | 2.17% | 1.40% |
| Russell MidCap® Growth Index(3) | 0.94% | 6.14% | 10.39% | 9.78% | ||
| Russell 3000® Growth Index(4) | 4.29% | 10.20% | 13.45% | 13.05% | ||
| Institutional Class | 0.30% | 6.34% | 8.12% | 6.87% | 1.80% | 1.05% |
| Russell MidCap® Growth Index(3) | 0.94% | 6.14% | 10.39% | 9.78% | ||
| Russell 3000® Growth Index(4) | 4.29% | 10.20% | 13.45% | 13.05% | ||
The performance quoted represents past performance, does not guarantee future results and current performance may be lower or higher than the data quoted. The investment return and principal value of an investment will fluctuate so that shares, when redeemed, may be worth more or less than their original cost. Performance data current to the most recent month end may be obtained at www.emeraldmutualfunds.com.
Returns for periods less than 1 year are cumulative.
The table does not reflect the deduction of taxes that a shareholder would pay on Fund distributions or the redemption of Fund shares.
Subject to investment risks, including possible loss of the principal amount invested.
Maximum Offering Price (MOP) for Class A shares includes the Fund's maximum sales charge of 4.75%. Performance shown at NAV does not include these sales charges and would have been lower had it been taken into account.
A Contingent Deferred Sales Charge (CDSC) of 1.00% may apply to Class C shares redeemed within the first 12 months after a purchase.
| (1) | Inception Date – August 1, 2014. |
| (2) | Emerald Mutual Fund Advisers Trust ("Emerald" or the "Adviser") has agreed contractually to waive a portion of its fees and reimburse other expenses until August 31, 2019 in amounts necessary to limit the Fund's operating expenses (exclusive of Acquired Fund Fees and Expenses, brokerage expenses, interest expenses, taxes and extraordinary expense) for Class A, Class C, Institutional Class, and Investor Class shares to an annual rate (as percentage of the Fund's average daily net assets) of 1.35%, 2.00%, 1.05% and 1.40% respectively. The Adviser will be permitted to recover, on a class-by-class basis, expenses it has borne through the agreement described above to the extent that the Fund's expenses in later periods fall below the annual rates set forth in the relevant agreement. The Fund will not be obligated to pay any such deferred fees and expenses more than three years after the year(s) in which the fees and expense were incurred. The Adviser may not discontinue this waiver prior to August 31, 2019, without the approval by the Fund's Board of Trustees. Ratios as of the Prospectus dated August 31, 2018 and may differ from the ratios presented in the Financial Highlights. |
| (3) | The Russell MidCap® Growth Index measures the performance of the mid-cap growth segment of the U.S. equity universe. It includes those Russell Midcap Index companies with higher price-to-book ratios and higher forecasted growth values. The Index is not actively managed and does not reflect any deductions for fees, expenses or taxes. An investor may not invest directly into the Index. |
| 14 | www.emeraldmutualfunds.com |
| Emerald Insights Fund | Manager Commentary |
October 31, 2018 (Unaudited)
| (4) | The Russell 3000® Growth Index is a market capitalization weighted index based on the Russell 3000® index. The Russell 3000® Growth Index includes companies that display signs of above average growth. The index is used to provide a gauge of the performance of growth stocks in the United States. The Index is not actively managed and does not reflect any deductions for fees, expenses or taxes. An investor may not invest directly into the Index. |
| (5) | Excludes adjustments in accordance with accounting principles generally accepted in the United States of America and as such, the net asset value and total return for shareholder transactions reported to the market may differ from the net asset value for financial reporting purposes. |
Important Risks
Investing in smaller companies generally will present greater investment risks, including: greater price volatility, greater sensitivity to changing economic conditions and less liquidity than the securities of larger, more mature companies.
| Semi-Annual Report | October 31, 2018 | 15 |
| Emerald Insights Fund | Manager Commentary |
October 31, 2018 (Unaudited)
GROWTH OF $10,000 INVESTMENT IN THE FUND (for the period ended October 31, 2018)
Comparison of change in value of a $10,000 investment (includes applicable sales loads)
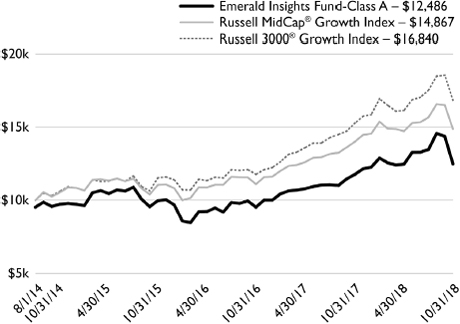
The chart represents historical performance of a hypothetical investment of $10,000 in the Fund since inception. Past performance does not guarantee future results. This chart does not reflect the deduction of taxes that a shareholder would pay on Fund distributions or the redemption of Fund shares.
Investing in the Fund is subject to investment risks, including possible loss of the principal amount invested.
| 16 | www.emeraldmutualfunds.com |
| Emerald Banking and Finance Fund | Manager Commentary |
October 31, 2018 (Unaudited)
October 31, 2018
Dear Shareholders:
Investment Results:
The Emerald Bank & Finance Fund underperformed the Russell 2000® Index(1) for the six months ended October 31, 2018, returning negative -8.15% vs. negative -1.37% for the Russell 2000® Index. During the six months ended October 31, 2018, the Russell 2000® Financial Services Index(2) returned -2.14%; the SNL Small Cap U.S. Bank & Thrift Index(3) lost -6.58% versus a 3.40% gain delivered by the Standard & Poor’s 500 Index(4) and a loss of -1.52% for the Russell 2000® Value Index(5).
Bank investors became laser focused on loan growth and deposit betas (the percentage of changes in the fed fund rate that banks pass on to their customers) coming out of the bank conference season in August and September given management concerns communicated during those conferences. Just like that, the bank sector that had performed well through the first half of 2018 began to melt like ice cubes on a hot summer day. We believe, however, that the recent decline in bank stocks the last few months has left investors with attractive investment opportunities given the current valuations. In fact, the current bank stock environment reminds us of early 2016, when bank indices fell about 20%, largely due to concerns over negative interest rates around the globe and a potential turn in the credit cycle. Those fears proved to be unfounded and bank stocks ultimately recovered those losses by mid-year 2016.
Investment Analysis:
Bank merger and acquisition (M&A) activity remains robust and pricing is trending higher in 2018. Through October 31st, 220 bank and thrift deals have been announced in 2018 for a combined value of $26.6 billion and a median deal value to tangible book value of 169.9%. Over the same time frame in 2017, 201 deals worth $23.2 billion were announced with a median deal value to tangible book value of 162.4%. In the month of October we have seen an increase in deal values and we believe that is the result of bidding wars for banks with attractive core deposit franchises and low loan-to-deposit ratios. Among the 18 deals announced in October, the median deal value to tangible book value was 177.7%.
As widely anticipated, the policymaking Federal Open Market Committee (FOMC) increased the fed funds rate 25 basis points on September 26th. That now takes the rate to a range of between 2% and 2.5%, where it last was in April 2008. This was the eighth increase since the Federal Reserve (Fed) began normalizing policy in December 2015. Along with the rate increase, the FOMC continued to project one more hike before the end of the year and three in 2019. Short term rate increases pushed the industry’s cost of interest bearing deposits to 0.68% through the first six months of 2018 from 0.49% in 2017. Deposit betas, or the percentage of changes in the fed fund rate that banks pass on to their customers, rose to 36.6% in the 12 month period ended June 30, 2018, compared to 30% in the prior 12 month period and 19.6% in full year 2017 according to S&P Global Market Intelligence. The Fed’s rate hikes have also driven loan yields higher. Through the first six months of 2018, the banking industry reported a loan beta, or the percentage of the change in fed funds rate passed on to borrowers, of 47.1% through the 12 months ended June 30, 2018 according to S&P Global Market Intelligence.
Despite an increase in cost of deposits, publicly traded banks and thrifts with less than $10 billion in assets reported improved profitability ratios in the third quarter. Among the community banks that reported third quarter results as of October 26th, the median efficiency ratio fell to 60.22%, down 63 basis points year-over-year. Meanwhile, the median return on average assets increased 20 basis points to 1.20% and the median net interest margin inched up 3 basis points to 3.71% according to S&P Global Market Intelligence.
Market Outlook:
We remain positive on the bank sector and believe the fundamentals will bring investors back to the bank sector once again as profitability continues to improve from current levels. During third quarter 2018 earnings season, investors focused on deposit and loan betas (as noted above). While deposit betas did increase in the third quarter we believe that loan betas continue to offset deposit betas, thus keeping net interest margins relatively flat (loan beta measures loan rate changes relative to market rate changes).
Since the financial crisis of 2008, a combination of low interest rates and excess liquidity placed a reduced emphasis on the value of a bank’s core deposit franchise. However, since the Federal Reserve Open Market Committee has continued to raise rates since December of 2015, the true value of a bank’s deposit franchise has become a key focus for bank investors. After all, how are community banks going to continue to grow loans if they cannot fund them with low cost deposits? With three rate increases this year and expectations for a December rate increase, we are beginning to hear more instances of banks facing increased deposit competition, especially for community banks with above-average growth aspirations or in highly competitive markets where banks tend to have higher loan-to-deposit ratios. In the second quarter of 2018, the bank sector experienced what many are calling a “catch-up” period with respect to deposit repricing where deposit costs were up substantially and deposit betas moved higher once again in Q3’18. We believe that deposit competition and higher loan-to-deposit ratios in some markets have and will continue to lead to an emerging trend in the community bank group where we are witnessing deposit motivated acquisition activity, often focused on granular core deposit franchises, which would be a notable shift from prior years’ acquisition activity that has been frequently motivated by asset generation.
| Semi-Annual Report | October 31, 2018 | 17 |
| Emerald Banking and Finance Fund | Manager Commentary |
October 31, 2018 (Unaudited)
The fight for core deposits has been driven by the need to fund loan growth. The question is do we continue to see loan growth amongst the community bank sector? Organic loan growth slowed in the third quarter of 2018 to approximately 4% quarter-over-quarter annualized after a seasonally strong 7% increase in total loans in Q2’18. Community banks continue to face headwinds from increased payoffs and pay-downs particularly for those banks that focus on originating commercial real estate loans. Commercial real estate loan growth has been under pressure as nonbank lenders have stepped into the market and are competing on pricing and structure as well as investors taking money out of projects in some instances based on where cap rates are currently. We are encouraged to hear that generally, small community banks are remaining disciplined in their underwriting and have been willing to slow loan growth rather than “stretch” on credit or pricing. As a result, asset quality remains healthy and many management teams we have met with remain optimistic about the outlook for loan growth in their markets given the economic activity they are seeing and the continued opportunity to take market share from the larger regional banks.
With a greater dependence on the shape of the yield curve(6) and higher loan-to-deposit ratios, we remain focused on net interest margin and believe that community banks net interest margins will remain flat to slightly down in the coming months. We will be keeping a close eye on margins as the third quarter was the first where less than half the banks saw quarter-over-quarter improvements in net interest margin since the Fed started regularly raising rates at the end of 2016. An additional factor that weighed on margin performance in the third quarter was the more muted move in LIBOR, particularly three month LIBOR which was flat on an average basis quarter-over-quarter, although one month LIBOR rates also trailed the 25 basis points move in Fed Funds. We believe that the increase in deposit betas will continue in 2019, although we at a slower pace, given the rate outlook, and we believe that banks that are capable of delivering improved margins will have more moderate deposit betas than the small community bank sector.
We remain positive on the community bank space for the remainder of 2018 and into 2019. Specifically, we are focusing on those community banks with differentiated business models and those that are competitively positioned to benefit from strong core deposits as the fed further normalizes interest rates. We also continue to focus on community banks that have a heavier mix of commercial loans as we believe that they are better positioned to benefit from a rising short end of the yield curve. Given the recent sell-off in banks, we believe that banks are currently trading below historical values and present attractive opportunities.
| Top Five Contributors to Return | Top Five Detractors to Return |
| Goosehead Insurance, Inc. (GSHD) | CURO Group Holdings Corp. (CURO) |
| NMI Holdings, Inc. (NMIH) | eXp World Holdings, Inc. (EXPI) |
| CBTX, Inc. (CBTX) | Live Oak Bancshares, Inc. (LOB) |
| Cardlytics, Inc. (CDLX) | Meta Financial Group, Inc. (CASH) |
| Guaranty Bancorp (GBNK) | Bank of N.T. Butterfield & Son Limited (NTB) |
| Kenneth G. Mertz II, CFA | Steven E. Russell, Esq. |
| Chief Investment Officer | Portfolio Manager |
| Portfolio Manager |
Emerald Mutual Fund Advisers Trust
Past performance does not guarantee future results. Fund prices fluctuate as the underlying assets have exposure to market fluctuations and other risks, as described in the Fund’s prospectus. Please visit www.emeraldmutualfunds.com to obtain current performance information and for the current prospectus and statement of additional information. This material must be preceded or accompanied by a prospectus. Please read the prospectus carefully before investing.
The views of Emerald Mutual Fund Advisers Trust and information discussed in this commentary are as of the date of publication, are subject to change, and may not reflect the writer's current views. The views expressed are those of the author only, and represent an assessment of market conditions at a specific point in time, are opinions only and should not be relied upon as investment advice regarding a particular investment or markets in general. Such information does not constitute a recommendation to buy or sell specific securities or investment vehicles. It should not be assumed that any investment will be profitable or will equal the performance of the Fund or any securities or any sectors mentioned in this letter. The subject matter contained in this letter has been derived from several sources believed to be reliable and accurate at the time of compilation. Neither Emerald Mutual Fund Advisers Trust nor the Fund accepts any liability for losses either direct or consequential caused by the use of this information.
The Emerald Banking and Finance Fund is distributed by ALPS Distributors, Inc.
The Fund is subject to investment risks, including possible loss of the principal amount invested and therefore is not suitable for all investors. The Fund may not achieve its objectives.
| 18 | www.emeraldmutualfunds.com |
| Emerald Banking and Finance Fund | Manager Commentary |
October 31, 2018 (Unaudited)
Diversification does not eliminate the risk of experiencing investment losses.
| (1) | The Russell 2000® Index measures the performance of the small-cap segment of the U.S. equity universe. The Russell 2000® Index is a subset of the Russell 3000® Index representing approximately 10% of the total market capitalization of that index. It includes approximately 2000 of the smallest securities based on a combination of their market cap and current index membership. The Index is not actively managed and does not reflect any deduction of fees, expenses or taxes. An investor may not invest directly into the Index. |
| (2) | The Russell 2000® Financial Services Index – is comprised of the smallest financial services companies in the Russell 3000 Index. The Index is not actively managed and does not reflect any deductions for fees, expense, or taxes. An investor may not invest directly in the Index. |
| (3) | SNL Small Cap Bank & Thrift Index: Includes all publicly traded (NYSE, NYSE Amex, NASDAQ, OTC BB, Pink Sheets) Banks and Thrifts in SNL's coverage universe with $250M to $1B Total Common Market Capitalization as of most recent pricing data. Source: SNL Financial, data as of April 30, 2018. |
| (4) | The Standard & Poor’s 500® Index is an unmanaged index of 500 common stocks chosen for the market size, liquidity and industry group representation. It is a market-value weighted index. The Index is not actively managed and does not reflect any deduction for fees, expenses or taxes. An investor may not invest directly into the Index |
| (5) | The Russell 2000® Value Index measures the performance of small-cap value segment of the U.S. equity universe. It includes those Russell 2000 companies with lower price-to-book ratios (A ratio used to compare a stock's market value to its book value. It is calculated by dividing the current closing price of the stock by the latest quarter's book value per share.) and lower forecasted growth values. The Index is not actively managed and does not reflect any deductions for fees, expenses or taxes. An investor may not invest directly into the Index. |
| (6) | A yield curve is a line that plots the interest rates, at a set point in time, of bonds having equal credit quality but differing maturity dates. The most frequently reported yield curve compares the three-month, two-year, five-year and 30-year U.S. Treasury debt. This yield curve is used as a benchmark for other debt in the market, such as mortgage rates or bank lending rates, and it is also used to predict changes in economic output and growth. |
| Semi-Annual Report | October 31, 2018 | 19 |
| Emerald Banking and Finance Fund | Manager Commentary |
October 31, 2018 (Unaudited)
TOP TEN HOLDINGS
(as a % of Net Assets)*
| TriState Capital Holdings, Inc. | 2.68% |
| SVB Financial Group | 2.58% |
| CBTX, Inc. | 2.39% |
| Merchants Bancorp | 2.32% |
| Triumph Bancorp, Inc. | 2.31% |
| Meta Financial Group, Inc. | 2.28% |
| Byline Bancorp, Inc. | 2.02% |
| Bank of NT Butterfield & Son, Ltd. | 1.92% |
| The Bancorp, Inc. | 1.92% |
| Innovative Industrial Properties, Inc., REIT | 1.78% |
| Top Ten Holdings | 22.20% |
INDUSTRY SECTOR ALLOCATION
(as a % of Net Assets)
| Banks: Diversified | 69.17% |
| Banks: Savings, Thrift & Mortgage Lending | 7.00% |
| Insurance: Property-Casualty | 2.67% |
| Consumer Lending | 2.53% |
| Real Estate Services | 2.15% |
| Insurance: Multi-Line | 2.65% |
| Financial Data & Systems | 1.82% |
| Equity Reit - Industrial | 1.78% |
| Asset Management & Custodian | 1.53% |
| Computer Services Software & Systems | 1.51% |
| Insurance: Life | 1.31% |
| Advertising Agencies | 1.17% |
| Equity Reit - Diversified | 0.80% |
| Commercial Services: | |
| Rental & Leasing | 0.51% |
| Cash, Cash Equivalents, & Other Net Assets | 3.40% |
| * | Holdings are subject to change, and may not reflect the current or future position of the portfolio. |
ANNUALIZED TOTAL RETURN (for the period ended October 31, 2018)
| 6 Month | 1 Year | 3 Year | 5 Year | 10 Year | Since Inception(1) | Expense Ratio | ||
| Gross(2) | Net(2) | |||||||
| Class A (NAV) | -8.15% | -4.33% | 10.29% | 12.69% | 9.97% | 9.05% | 1.42% | 1.42% |
| Class A (MOP) | -12.51% | -8.87% | 8.52% | 11.60% | 9.44% | 8.81% | 1.42% | 1.42% |
| Russell 2000® Index† | -1.37% | 1.85% | 10.68% | 8.01% | 12.44% | 8.12% | ||
| Russell 2000® Financial Services Index†† | -2.14% | -2.12% | 9.96% | 9.23% | 10.18% | 8.47% | ||
| Class C (NAV) | -8.45% | -4.96% | 9.58% | 11.96% | 9.27% | 9.16% | 2.07% | 2.07% |
| Class C (CDSC) | -9.37% | -5.89% | 9.58% | 11.96% | 9.27% | 9.16% | 2.07% | 2.07% |
| Russell 2000® Index† | -1.37% | 1.85% | 10.68% | 8.01% | 12.44% | 8.12% | ||
| Russell 2000® Financial Services Index†† | -2.14% | -2.12% | 9.96% | 9.23% | 10.18% | 8.47% | ||
| Investor Class | -8.15% | -4.27% | 10.31% | 12.71% | – | 12.69% | 1.47% | 1.47% |
| Russell 2000® Index† | -1.37% | 1.85% | 10.68% | 8.01% | – | 8.12% | ||
| Russell 2000® Financial Services Index†† | -2.14% | -2.12% | 9.96% | 9.23% | – | 8.47% | ||
| Institutional Class | -7.99% | -4.01% | 10.65% | 13.05% | 0.00% | 15.75% | 1.12% | 1.12% |
| Russell 2000® Index† | -1.37% | 1.85% | 10.68% | 8.01% | 12.44% | 8.12% | ||
| Russell 2000® Financial Services Index†† | -2.14% | -2.12% | 9.96% | 9.23% | 10.18% | 8.47% | ||
The performance quoted represents past performance, does not guarantee future results and current performance may be lower or higher than the data quoted. The investment return and principal value of an investment will fluctuate so that shares, when redeemed, may be worth more or less than their original cost. Performance data current to the most recent month end may be obtained at www.emeraldmutualfunds.com.
Performance shown for periods prior to March 16, 2012, reflects the performance of the Forward Banking & Finance Fund, a series of Forward Funds (as a result of a reorganization of the Forward Banking & Finance Fund into the Emerald Banking & Finance Fund).
Returns for periods less than 1 year are cumulative.
The table does not reflect the deduction of taxes that a shareholder would pay on Fund distributions or the redemption of Fund shares.
Subject to investment risks, including possible loss of the principal amount invested.
Maximum Offering Price (MOP) for Class A shares includes the Fund's maximum sales charge of 4.75%. Performance shown at NAV does not include these sales charges and would have been lower had it been taken into account.
A Contingent Deferred Sales Charge (CDSC) of 1.00% may apply to Class C shares redeemed within the first 12 months after a purchase.
| (1) | Inception Dates - Class A: 02/18/1997, Class C: 07/01/2000, Institutional Class: 03/19/2012, Investor Class: 03/16/2010 |
| (2) | Emerald Mutual Fund Advisers Trust ("Emerald" or the "Adviser") has agreed contractually to waive a portion of its fees and reimburse other expenses until August 31, 2019 in amounts necessary to limit the Fund's operating expenses (exclusive of Acquired Fund Fees and Expenses, brokerage expenses, interest expenses, taxes and extraordinary expense) for Class A, Class C, Institutional Class, and Investor Class shares to an annual rate (as percentage of the Fund's average daily net assets) of 1.84%, 2.49%, 1.54% and 1.89% respectively. The Adviser will be permitted to recover, on a class-by-class basis, expenses it has borne through the agreement described above to the extent |
| 20 | www.emeraldmutualfunds.com |
| Emerald Banking and Finance Fund | Manager Commentary |
October 31, 2018 (Unaudited)
that the Fund's expenses in later periods fall below the annual rates set forth in the relevant agreement. The Fund will not be obligated to pay any such deferred fees and expenses more than three years after the year(s) in which the fees and expense were incurred. The Adviser may not discontinue this waiver prior to August 31, 2019, without the approval by the Fund's Board of Trustees. Ratios as of the Prospectus dated August 31, 2018 and may differ from the ratios presented in the Financial Highlights.
| † | The Russell 2000® Index measures the performance of the small-cap segment of the U.S. equity universe. The Russell 2000® is a subset of the Russell 3000® Index representing approximately 8% of the total market capitalization of that index. It includes approximately 2000 of the smallest securities based on a combination of their market cap and current index membership. The index is not actively managed and does not reflect any deductions for fees, expenses or taxes. An investor may not invest directly into an index. |
| †† | The Russell 2000® Financial Services Index is an additional index, and is comprised of the smallest financial services companies in the Russell 3000 Index. The Index is not actively managed and does not reflect any deductions for fees, expense, or taxes. An investor may not invest directly in the Index. |
Important Risks
A fund that concentrates in a particular industry will involve a greater degree of risk than a fund with a more diversified portfolio. Investing in smaller companies generally will present greater investment risks, including: greater price volatility, greater sensitivity to changing economic conditions and less liquidity than the securities of larger, more mature companies.
| Semi-Annual Report | October 31, 2018 | 21 |
| Emerald Banking and Finance Fund | Manager Commentary |
October 31, 2018 (Unaudited)
GROWTH OF $10,000 INVESTMENT IN THE FUND (for the period ended October 31, 2018)
Comparison of change in value of a $10,000 investment (includes applicable sales loads)
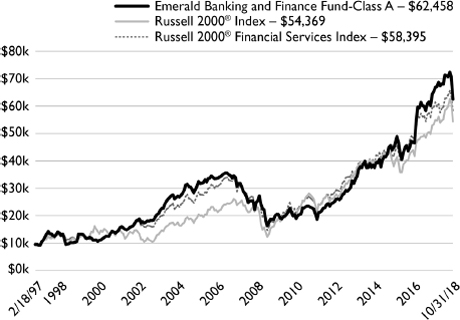
The chart represents historical performance of a hypothetical investment of $10,000 in the Fund since inception. Past performance does not guarantee future results. This chart does not reflect the deduction of taxes that a shareholder would pay on Fund distributions or the redemption of Fund shares.
Investing in the Fund is subject to investment risks, including possible loss of the principal amount invested.
| 22 | www.emeraldmutualfunds.com |
| Emerald Funds | Disclosure of Fund Expenses |
October 31, 2018 (Unaudited)
As a shareholder of the Funds, you incur two types of costs: (1) transaction costs, including applicable sales charges (loads); and (2) ongoing costs, including management fees, distribution and service (12b-1) fees, shareholder services fees and other Fund expenses. This example is intended to help you understand your ongoing costs (in dollars) of investing in the Funds and to compare these costs with the ongoing costs of investing in other mutual funds. The example is based on an investment of $1,000 invested at the beginning of the (six-month) period and held for the entire period May 1, 2018 through October 31, 2018.
Actual Expenses
The first line for each share class of the Fund in the table below provides information about actual account values and actual expenses. You may use this information, together with the amount you invested, to estimate the expenses that you paid over the period. Simply divide your account value by $1,000 (for example, an $8,600 account value divided by $1,000 = 8.6), then multiply the result by the number in the applicable line under the heading titled “Expenses Paid During Period” to estimate the expenses you paid on your account during this period.
Hypothetical Example For Comparison Purposes
The second line for each share class of each Fund in the table below provides information about hypothetical account values and hypothetical expenses based on the Fund’s actual expense ratio and an assumed rate of return of 5% per year before expenses, which is not the Fund’s actual return. The hypothetical account values and expenses may not be used to estimate the actual ending account balance or expenses you paid for the period. You may use this information to compare the ongoing costs of investing in the Funds and other funds. To do so, compare this 5% hypothetical example with the 5% hypothetical examples that appear in the shareholder reports of other mutual funds.
Please note that the expenses shown in the table below are meant to highlight your ongoing costs only and do not reflect any transactional costs, such as sales charges (loads), redemption fees or exchange fees. Therefore, the second line for each share class of the Fund within the table is useful in comparing ongoing costs only, and will not help you determine the relative total costs of owning different funds. If these transactional costs were included, your costs would have been higher.
| Emerald Growth Fund | Beginning Account Value 05/01/18 | Ending Account Value 10/31/18 | Expense Ratio(a) | Expense Paid During Period 5/01/18 - 10/31/18(b) |
| Class A | ||||
| Actual | $1,000.00 | $1,000.80 | 1.00% | $5.04 |
| Hypothetical (5% return before expenses) | $1,000.00 | $1,020.16 | 1.00% | $5.09 |
| Class C | ||||
| Actual | $1,000.00 | $997.30 | 1.65% | $8.31 |
| Hypothetical (5% return before expenses) | $1,000.00 | $1,016.89 | 1.65% | $8.39 |
| Institutional Class | ||||
| Actual | $1,000.00 | $1,002.20 | 0.68% | $3.43 |
| Hypothetical (5% return before expenses) | $1,000.00 | $1,021.78 | 0.68% | $3.47 |
| Investor Class | ||||
| Actual | $1,000.00 | $1,000.80 | 1.02% | $5.14 |
| Hypothetical (5% return before expenses) | $1,000.00 | $1,020.06 | 1.02% | $5.19 |
| Emerald Small Cap Value Fund | ||||
| Class A | ||||
| Actual | $1,000.00 | $895.70 | 1.35% | $6.45 |
| Hypothetical (5% return before expenses) | $1,000.00 | $1,018.40 | 1.35% | $6.87 |
| Class C | ||||
| Actual | $1,000.00 | $892.60 | 2.00% | $9.54 |
| Hypothetical (5% return before expenses) | $1,000.00 | $1,015.12 | 2.00% | $10.16 |
| Institutional Class | ||||
| Actual | $1,000.00 | $898.00 | 1.00% | $4.78 |
| Hypothetical (5% return before expenses) | $1,000.00 | $1,020.16 | 1.00% | $5.09 |
| Investor Class | ||||
| Actual | $1,000.00 | $897.70 | 1.25% | $5.98 |
| Hypothetical (5% return before expenses) | $1,000.00 | $1,018.90 | 1.25% | $6.36 |
| Semi-Annual Report | October 31, 2018 | 23 |
| Emerald Funds | Disclosure of Fund Expenses |
October 31, 2018 (Unaudited)
| Emerald Insights Fund | Beginning Account Value 05/01/18 | Ending Account Value 10/31/18 | Expense Ratio(a) | Expense Paid During Period 5/01/18 - 10/31/18(b) |
| Class A | ||||
| Actual | $1,000.00 | $1,001.50 | 1.35% | $6.81 |
| Hypothetical (5% return before expenses) | $1,000.00 | $1,018.40 | 1.35% | $6.87 |
| Class C | ||||
| Actual | $1,000.00 | $998.40 | 2.00% | $10.07 |
| Hypothetical (5% return before expenses) | $1,000.00 | $1,015.12 | 2.00% | $10.16 |
| Institutional Class | ||||
| Actual | $1,000.00 | $1,003.00 | 1.05% | $5.30 |
| Hypothetical (5% return before expenses) | $1,000.00 | $1,019.91 | 1.05% | $5.35 |
| Investor Class | ||||
| Actual | $1,000.00 | $1,000.80 | 1.40% | $7.06 |
| Hypothetical (5% return before expenses) | $1,000.00 | $1,018.15 | 1.40% | $7.12 |
| Emerald Banking and Finance Fund | ||||
| Class A | ||||
| Actual | $1,000.00 | $918.50 | 1.40% | $6.77 |
| Hypothetical (5% return before expenses) | $1,000.00 | $1,018.15 | 1.40% | $7.12 |
| Class C | ||||
| Actual | $1,000.00 | $915.50 | 2.04% | $9.85 |
| Hypothetical (5% return before expenses) | $1,000.00 | $1,014.92 | 2.04% | $10.36 |
| Institutional Class | ||||
| Actual | $1,000.00 | $920.10 | 1.03% | $4.98 |
| Hypothetical (5% return before expenses) | $1,000.00 | $1,020.01 | 1.03% | $5.24 |
| Investor Class | ||||
| Actual | $1,000.00 | $918.50 | 1.40% | $6.77 |
| Hypothetical (5% return before expenses) | $1,000.00 | $1,018.15 | 1.40% | $7.12 |
| (a) | The Fund's expense ratios have been based on the Fund's most recent fiscal half-year expenses. |
| (b) | Expenses are equal to the Fund's annualized expense ratio multiplied by the average account value over the period, multiplied by the number of days in the most recent fiscal half-year (184)/365 (to reflect the half-year period). |
| 24 | www.emeraldmutualfunds.com |
| Emerald Growth Fund | Schedule of Investments |
October 31, 2018 (Unaudited)
| Shares | Value (Note 2) | ||||||
| COMMON STOCKS: 97.29% | |||||||
| Consumer Discretionary: 21.46% | |||||||
| 904,605 | American Eagle Outfitters, Inc. | $ | 20,860,191 | ||||
| 1,283,779 | Chegg, Inc.(a) | 35,021,491 | |||||
| 153,416 | Children's Place, Inc. | 22,920,350 | |||||
| 30,249 | Churchill Downs, Inc. | 7,550,453 | |||||
| 202,299 | Chuy's Holdings, Inc.(a) | 4,930,027 | |||||
| 512,123 | Del Taco Restaurants, Inc.(a) | 5,582,141 | |||||
| 155,218 | Eldorado Resorts, Inc.(a) | 5,665,457 | |||||
| 276,941 | Etsy, Inc.(a) | 11,775,531 | |||||
| 222,162 | Five Below, Inc.(a) | 25,286,479 | |||||
| 256,290 | Instructure, Inc.(a) | 9,569,869 | |||||
| 74,934 | Jack in the Box, Inc. | 5,914,541 | |||||
| 249,281 | Marcus Corp. | 9,726,945 | |||||
| 76,323 | Meritage Homes Corp.(a) | 2,843,032 | |||||
| 432,129 | Noodles & Co.(a) | 4,074,976 | |||||
| 400,965 | Nutrisystem, Inc. | 14,258,315 | |||||
| 198,716 | Ollie's Bargain Outlet Holdings, Inc.(a) | 18,460,716 | |||||
| 385,313 | Planet Fitness, Inc., Class A(a) | 18,915,015 | |||||
| 509,778 | SeaWorld Entertainment, Inc.(a) | 13,315,401 | |||||
| 455,511 | Steven Madden, Ltd. | 14,243,829 | |||||
| 370,375 | Tilly's, Inc., Class A | 6,570,452 | |||||
| 174,450 | Urban Outfitters, Inc.(a) | 6,883,797 | |||||
| 232,706 | YETI Holdings, Inc.(a) | 3,707,007 | |||||
| 268,076,015 | |||||||
| Consumer Staples: 2.35% | |||||||
| 451,962 | Freshpet, Inc.(a) | 17,219,752 | |||||
| 637,889 | Simply Good Foods Co.(a) | 12,094,376 | |||||
| 29,314,128 | |||||||
| Energy: 0.52% | |||||||
| 249,667 | Callon Petroleum Co.(a) | 2,489,180 | |||||
| 34,894 | Delek US Holdings, Inc. | 1,281,308 | |||||
| 425,000 | Enphase Energy, Inc.(a) | 1,929,500 | |||||
| 100,594 | Extraction Oil & Gas, Inc.(a) | 803,746 | |||||
| 6,503,734 | |||||||
| Financial Services: 10.92% | |||||||
| 70,764 | Bryn Mawr Bank Corp. | 2,826,314 | |||||
| 1,040,117 | Cadence BanCorp | 22,944,981 | |||||
| 55,159 | CNB Financial Corp. | 1,412,070 | |||||
| 1,011,100 | Everi Holdings, Inc.(a) | 7,279,920 | |||||
| 122,502 | First Choice Bancorp | 2,756,295 | |||||
| 364,575 | Industrial Logistics Properties Trust, REIT | 7,871,174 | |||||
| 57,823 | LendingTree, Inc.(a) | 11,662,321 | |||||
| 313,373 | Live Oak Bancshares, Inc. | 5,766,063 | |||||
| 303,990 | Moelis & Co., Class A | 12,269,036 | |||||
| 544,605 | Monmouth Real Estate Investment Corp. | 8,147,291 | |||||
| 229,926 | National Commerce Corp.(a) | 8,530,255 | |||||
| 349,268 | OceanFirst Financial Corp. | 8,843,466 | |||||
| Shares | Value (Note 2) | ||||||
| Financial Services (continued) | |||||||
| 172,312 | Opus Bank | $ | 3,272,205 | ||||
| 528,186 | Pacific Premier Bancorp, Inc.(a) | 15,438,877 | |||||
| 199,849 | Triumph Bancorp, Inc.(a) | 7,166,585 | |||||
| 301,054 | Union Bankshares Corp. | 10,277,984 | |||||
| 136,464,837 | |||||||
| Health Care: 22.14% | |||||||
| 125,000 | Acer Therapeutics, Inc.(a) | 2,822,500 | |||||
| 373,701 | Adamas Pharmaceuticals, Inc.(a) | 6,184,751 | |||||
| 283,041 | Aimmune Therapeutics, Inc.(a) | 7,523,230 | |||||
| 231,410 | Arena Pharmaceuticals, Inc.(a) | 8,252,080 | |||||
| 218,394 | Assembly Biosciences, Inc.(a) | 4,996,855 | |||||
| 269,960 | AtriCure, Inc.(a) | 8,587,428 | |||||
| 222,200 | Avrobio, Inc.(a) | 6,679,332 | |||||
| 258,720 | Biohaven Pharmaceutical Holding Co., Ltd.(a) | 9,326,856 | |||||
| 222,991 | Catalent, Inc.(a) | 8,995,457 | |||||
| 86,053 | Cutera, Inc.(a) | 1,746,876 | |||||
| 397,833 | Deciphera Pharmaceuticals, Inc.(a) | 8,032,248 | |||||
| 560,543 | Dicerna Pharmaceuticals, Inc.(a) | 7,376,746 | |||||
| 200,000 | Eloxx Pharmaceuticals, Inc.(a) | 2,406,000 | |||||
| 48,698 | FibroGen, Inc.(a) | 2,087,683 | |||||
| 274,572 | G1 Therapeutics, Inc.(a) | 10,985,626 | |||||
| 359,745 | Insmed, Inc.(a) | 5,252,277 | |||||
| 178,170 | Integer Holdings Corp.(a) | 13,268,320 | |||||
| 557,396 | K2M Group Holdings, Inc.(a) | 15,261,502 | |||||
| 385,413 | Karyopharm Therapeutics, Inc.(a) | 4,062,253 | |||||
| 69,279 | Loxo Oncology, Inc.(a) | 10,576,132 | |||||
| 174,830 | Merit Medical Systems, Inc.(a) | 9,986,290 | |||||
| 997,359 | NeoGenomics, Inc.(a) | 18,391,300 | |||||
| 443,374 | OraSure Technologies, Inc.(a) | 6,162,899 | |||||
| 124,080 | PTC Therapeutics, Inc.(a) | 4,779,562 | |||||
| 266,752 | Reata Pharmaceuticals, Inc., Class A(a) | 15,719,695 | |||||
| 332,325 | Replimune Group, Inc.(a) | 4,280,346 | |||||
| 140,081 | Sarepta Therapeutics, Inc.(a) | 18,737,234 | |||||
| 186,939 | Savara, Inc.(a) | 1,682,451 | |||||
| 381,980 | Senseonics Holdings, Inc.(a) | 1,417,146 | |||||
| 73,000 | Sientra, Inc.(a) | 1,503,070 | |||||
| 155,571 | T2 Biosystems, Inc.(a) | 816,748 | |||||
| 94,360 | Tabula Rasa HealthCare, Inc.(a) | 6,971,317 | |||||
| 361,878 | Tandem Diabetes Care, Inc.(a) | 13,610,231 | |||||
| 216,729 | Teladoc, Inc.(a) | 15,027,989 | |||||
| 60,242 | Twist Bioscience Corp.(a) | 843,388 | |||||
| 400,000 | Vericel Corp.(a) | 4,460,000 | |||||
| 186,676 | Zogenix, Inc.(a) | 7,795,590 | |||||
| 276,609,408 | |||||||
| Materials & Processing: 4.72% | |||||||
| 277,081 | Allegheny Technologies, Inc.(a) | 7,173,627 | |||||
| 289,508 | Carpenter Technology Corp. | 12,625,444 | |||||
| 56,752 | Innospec, Inc. | 3,797,844 | |||||
| 465,340 | Livent Corp.(a) | 7,259,304 | |||||
| Semi-Annual Report | October 31, 2018 | 25 |
| Emerald Growth Fund | Schedule of Investments |
October 31, 2018 (Unaudited)
| Shares | Value (Note 2) | ||||||
| Materials & Processing (continued) | |||||||
| 470,670 | PQ Group Holdings, Inc.(a) | $ | 7,554,253 | ||||
| 335,946 | Trex Co., Inc.(a) | 20,593,490 | |||||
| 59,003,962 | |||||||
| Producer Durables: 8.30% | |||||||
| 251,363 | Atlas Air Worldwide Holdings, Inc.(a) | 12,975,358 | |||||
| 641,975 | Daseke, Inc.(a) | 3,903,208 | |||||
| 138,520 | Dycom Industries, Inc.(a) | 9,402,738 | |||||
| 330,815 | H&E Equipment Services, Inc. | 7,969,333 | |||||
| 283,600 | Knoll, Inc. | 5,629,460 | |||||
| 964,626 | Kratos Defense & Security Solutions, Inc.(a) | 12,086,764 | |||||
| 160,133 | NV5 Global, Inc.(a) | 12,501,583 | |||||
| 211,574 | Tetra Tech, Inc. | 13,972,347 | |||||
| 293,276 | TriNet Group, Inc.(a) | 13,781,039 | |||||
| 415,770 | Tutor Perini Corp.(a) | 6,444,435 | |||||
| 527,533 | US Xpress Enterprises, Inc., Class A(a) | 5,080,143 | |||||
| 103,746,408 | |||||||
| Technology: 22.49% | |||||||
| 236,340 | Alarm.com Holdings, Inc.(a) | 10,512,403 | |||||
| 315,359 | Box, Inc., Class A(a) | 5,676,462 | |||||
| 737,185 | Ciena Corp.(a) | 23,044,403 | |||||
| 482,437 | Cloudera, Inc.(a) | 6,638,333 | |||||
| 187,018 | EPAM Systems, Inc.(a) | 22,343,041 | |||||
| 538,431 | ForeScout Technologies, Inc.(a) | 14,828,390 | |||||
| 978,189 | Glu Mobile, Inc.(a) | 6,896,232 | |||||
| 173,498 | GTT Communications, Inc.(a) | 6,228,578 | |||||
| 137,074 | II-VI, Inc.(a) | 5,103,265 | |||||
| 279,118 | Imperva, Inc.(a) | 15,449,181 | |||||
| 279,324 | Integrated Device Technology, Inc.(a) | 13,075,156 | |||||
| 298,737 | Internap Corp.(a) | 2,560,176 | |||||
| 730,058 | Leaf Group, Ltd.(a) | 6,388,008 | |||||
| 202,703 | Lumentum Holdings, Inc.(a) | 11,077,719 | |||||
| 235,742 | Mercury Systems, Inc.(a) | 11,046,870 | |||||
| 362,060 | Model N, Inc.(a) | 5,561,242 | |||||
| 469,206 | PlayAGS, Inc.(a) | 11,378,246 | |||||
| 273,179 | Pluralsight, Inc., Class A(a) | 6,121,941 | |||||
| 160,820 | Proofpoint, Inc.(a) | 14,626,579 | |||||
| 304,190 | Pure Storage, Inc., Class A(a) | 6,138,554 | |||||
| 116,046 | Q2 Holdings, Inc.(a) | 6,177,129 | |||||
| 517,130 | Rapid7, Inc.(a) | 18,740,791 | |||||
| 156,154 | Sailpoint Technologies Holding, Inc.(a) | 4,066,250 | |||||
| 82,307 | Semtech Corp.(a) | 3,698,877 | |||||
| 349,480 | SVMK, Inc.(a) | 3,742,931 | |||||
| 640,986 | USA Technologies, Inc.(a) | 3,717,719 | |||||
| 360,161 | Varonis Systems, Inc.(a) | 21,995,032 | |||||
| 304,654 | Vocera Communications, Inc.(a) | 10,574,540 | |||||
| 98,586 | Zscaler, Inc.(a) | 3,577,686 | |||||
| 280,985,734 | |||||||
| Shares | Value (Note 2) | ||||||
| Utilities: 4.39% | |||||||
| 354,809 | Boingo Wireless, Inc.(a) | $ | 11,116,166 | ||||
| 153,911 | Cogent Communications Holdings, Inc. | 8,000,294 | |||||
| 197,613 | Shenandoah Telecommunications Co. | 7,513,246 | |||||
| 2,124,695 | Vonage Holdings Corp.(a) | 28,173,456 | |||||
| 54,803,162 | |||||||
| Total Common Stocks | |||||||
| (Cost $965,271,076) | 1,215,507,388 | ||||||
| SHORT TERM INVESTMENTS: 2.69% | |||||||
| 33,558,289 | Dreyfus Government Cash Management Fund - Institutional Class 2.049% (7-Day Yield) | 33,558,289 | |||||
| Total Short Term Investments | |||||||
| (Cost $33,558,289) | 33,558,289 | ||||||
| Total Investments: 99.98% | |||||||
| (Cost $998,829,365) | 1,249,065,677 | ||||||
| Other Assets In Excess Of Liabilities: 0.02% | 288,782 | ||||||
| Net Assets: 100.00% | $ | 1,249,354,459 | |||||
| (a) | Non-income producing security. |
For Fund compliance purposes, the Fund's industry classifications refer to any one or more of the industry sub-classifications used by one or more widely recognized market indexes or ratings group indexes, and/or as defined by Fund management. This definition may not apply for purposes of this report, which may combine industry sub-classifications for reporting ease. Industries are shown as a percentage of net assets.
See Notes to Financial Statements.
| 26 | www.emeraldmutualfunds.com |
| Emerald Small Cap Value Fund | Schedule of Investments |
October 31, 2018 (Unaudited)
| Shares | Value (Note 2) | ||||||
| COMMON STOCKS: 95.48% | |||||||
| Consumer Discretionary: 12.39% | |||||||
| 2,558 | Aaron's, Inc. | $ | 120,559 | ||||
| 2,733 | Eldorado Resorts, Inc.(a) | 99,755 | |||||
| 8,691 | Gray Television, Inc.(a) | 150,441 | |||||
| 7,603 | Meritor, Inc.(a) | 129,175 | |||||
| 3,597 | Nutrisystem, Inc. | 127,909 | |||||
| 2,476 | Penske Automotive Group, Inc. | 109,885 | |||||
| 1,299 | Viad Corp. | 62,209 | |||||
| 6,400 | ZAGG, Inc.(a) | 77,504 | |||||
| 877,437 | |||||||
| Energy: 5.59% | |||||||
| 2,304 | Delek US Holdings, Inc. | 84,603 | |||||
| 8,916 | Extraction Oil & Gas, Inc.(a) | 71,239 | |||||
| 4,743 | Mammoth Energy Services, Inc. | 118,385 | |||||
| 7,963 | SRC Energy, Inc.(a) | 56,378 | |||||
| 8,351 | Superior Energy Services, Inc.(a) | 65,388 | |||||
| 395,993 | |||||||
| Financial Services: 47.29% | |||||||
| 4,851 | Amalgamated Bank, Class A(a) | 94,109 | |||||
| 7,604 | Ares Management LP | 149,114 | |||||
| 1,503 | Bank of NT Butterfield & Son, Ltd. | 60,556 | |||||
| 5,510 | Bank7 Corp.(a) | 91,191 | |||||
| 4,950 | Baycom Corp.(a) | 119,741 | |||||
| 6,086 | Bridgewater Bancshares, Inc.(a) | 67,555 | |||||
| 2,792 | Capital Bancorp, Inc.(a) | 31,270 | |||||
| 2,874 | CNB Financial Corp. | 73,574 | |||||
| 5,200 | Coastal Financial Corp.(a) | 84,916 | |||||
| 4,626 | Donnelley Financial Solutions, Inc.(a) | 71,934 | |||||
| 2,071 | Employers Holdings, Inc. | 95,183 | |||||
| 2,104 | Equity Bancshares, Inc., Class A(a) | 75,933 | |||||
| 635 | Euronet Worldwide, Inc.(a) | 70,599 | |||||
| 9,309 | Everi Holdings, Inc.(a) | 67,025 | |||||
| 2,588 | First Internet Bancorp | 66,693 | |||||
| 941 | First Merchants Corp. | 39,155 | |||||
| 4,011 | Focus Financial Partners, Inc., Class A(a) | 153,221 | |||||
| 6,870 | Freedom Bank of Virginia(a) | 74,127 | |||||
| 3,180 | FVCBankcorp, Inc.(a) | 55,650 | |||||
| 1,903 | HCI Group, Inc. | 83,104 | |||||
| 7,241 | Heritage Insurance Holdings, Inc. | 101,085 | |||||
| 2,489 | Innovative Industrial Properties, Inc., REIT | 102,024 | |||||
| 3,670 | Investar Holding Corp. | 95,750 | |||||
| 2,208 | JBG SMITH Properties, REIT | 82,756 | |||||
| 3,638 | Live Oak Bancshares, Inc. | 66,939 | |||||
| 4,388 | Meta Financial Group, Inc. | 110,753 | |||||
| 1,825 | Moelis & Co., Class A | 73,657 | |||||
| 3,559 | NMI Holdings, Inc., Class A(a) | 75,237 | |||||
| 2,924 | People's Utah Bancorp | 97,983 | |||||
| 4,261 | Piedmont Office Realty Trust, Inc., Class A | 76,783 | |||||
| 4,076 | Plymouth Industrial REIT, Inc., REIT | 57,064 | |||||
| 2,380 | Popular, Inc. | 123,785 | |||||
| 3,600 | Rexford Industrial Realty, Inc., REIT | 114,012 | |||||
| Shares | Value (Note 2) | ||||||
| Financial Services (continued) | |||||||
| 1,104 | Texas Capital Bancshares, Inc.(a) | $ | 72,014 | ||||
| 8,215 | The Bancorp, Inc.(a) | 86,258 | |||||
| 4,105 | TPG RE Finance Trust, Inc. | 81,361 | |||||
| 3,333 | TriState Capital Holdings, Inc.(a) | 84,058 | |||||
| 2,118 | Triumph Bancorp, Inc.(a) | 75,951 | |||||
| 2,060 | Union Bankshares Corp. | 70,328 | |||||
| 4,052 | Uniti Group, Inc. | 77,555 | |||||
| 3,350,003 | |||||||
| Health Care: 2.23% | |||||||
| 1,217 | Biohaven Pharmaceutical Holding Co., Ltd.(a) | 43,873 | |||||
| 2,265 | Karyopharm Therapeutics, Inc.(a) | 23,873 | |||||
| 3,488 | Varex Imaging Corp.(a) | 90,548 | |||||
| 158,294 | |||||||
| Materials & Processing: 6.74% | |||||||
| 2,355 | Apogee Enterprises, Inc. | 85,016 | |||||
| 6,381 | Builders FirstSource, Inc.(a) | 78,997 | |||||
| 3,131 | Kirkland Lake Gold, Ltd. | 61,242 | |||||
| 3,941 | Koppers Holdings, Inc.(a) | 105,422 | |||||
| 1,933 | Universal Forest Products, Inc. | 54,646 | |||||
| 2,824 | US Concrete, Inc.(a) | 92,175 | |||||
| 477,498 | |||||||
| Producer Durables: 8.88% | |||||||
| 1,814 | Air Lease Corp. | 69,113 | |||||
| 872 | Dycom Industries, Inc.(a) | 59,191 | |||||
| 20,933 | Goldfield Corp.(a) | 77,452 | |||||
| 1,999 | ICF International, Inc. | 147,207 | |||||
| 2,644 | Kennametal, Inc. | 93,730 | |||||
| 1,437 | OSI Systems, Inc.(a) | 99,383 | |||||
| 8,593 | US Xpress Enterprises, Inc., Class A(a) | 82,751 | |||||
| 628,827 | |||||||
| Technology: 10.76% | |||||||
| 4,924 | Kulicke & Soffa Industries, Inc. | 100,105 | |||||
| 5,114 | MaxLinear, Inc.(a) | 99,263 | |||||
| 617 | MicroStrategy, Inc., Class A(a) | 77,723 | |||||
| 2,140 | MKS Instruments, Inc. | 157,697 | |||||
| 12,540 | Photronics, Inc.(a) | 122,140 | |||||
| 4,152 | PlayAGS, Inc.(a) | 100,686 | |||||
| 6,654 | Tower Semiconductor, Ltd.(a) | 104,401 | |||||
| 762,015 | |||||||
| Utilities: 1.60% | |||||||
| 8,572 | Vonage Holdings Corp.(a) | 113,665 | |||||
| Total Common Stocks | |||||||
| (Cost $6,651,149) | 6,763,732 | ||||||
| Semi-Annual Report | October 31, 2018 | 27 |
| Emerald Small Cap Value Fund | Schedule of Investments |
October 31, 2018 (Unaudited)
| Shares | Value (Note 2) | ||||||
| SHORT TERM INVESTMENTS: 1.10% | |||||||
| 77,803 | Dreyfus Government Cash Management Fund - Institutional Class 2.049% (7-Day Yield) | $ | 77,803 | ||||
| Total Short Term Investments | |||||||
| (Cost $77,803) | 77,803 | ||||||
| Total Investments: 96.58% | |||||||
| (Cost $6,728,952) | 6,841,535 | ||||||
| Other Assets In Excess Of Liabilities: 3.42% | 242,244 | ||||||
| Net Assets: 100.00% | $ | 7,083,779 | |||||
| (a) | Non-income producing security. |
For Fund compliance purposes, the Fund's industry classifications refer to any one or more of the industry sub-classifications used by one or more widely recognized market indexes or ratings group indexes, and/or as defined by Fund management. This definition may not apply for purposes of this report, which may combine industry sub-classifications for reporting ease. Industries are shown as a percentage of net assets.
See Notes to Financial Statements.
| 28 | www.emeraldmutualfunds.com |
| Emerald Insights Fund | Schedule of Investments |
October 31, 2018 (Unaudited)
| Shares | Value (Note 2) | |||||||
| COMMON STOCKS: 97.52% | ||||||||
| Consumer Discretionary: 19.66% | ||||||||
| 337 | Amazon.com, Inc.(a) | $ | 538,529 | |||||
| 1,912 | BorgWarner, Inc. | 75,352 | ||||||
| 1,502 | Brunswick Corp. | 78,089 | ||||||
| 642 | Burlington Stores, Inc.(a) | 110,097 | ||||||
| 12,267 | Chegg, Inc.(a) | 334,644 | ||||||
| 3,629 | Cinemark Holdings, Inc. | 150,858 | ||||||
| 514 | Home Depot, Inc. | 90,402 | ||||||
| 1,150 | Malibu Boats, Inc., Class A(a) | 46,230 | ||||||
| 2,193 | MGM Resorts International | 58,509 | ||||||
| 3,259 | Nutrisystem, Inc. | 115,890 | ||||||
| 647 | PVH Corp. | 78,151 | ||||||
| 1,384 | Royal Caribbean Cruises, Ltd. | 144,946 | ||||||
| 8,192 | SeaWorld Entertainment, Inc.(a) | 213,975 | ||||||
| 2,035,672 | ||||||||
| Consumer Staples: 2.22% | ||||||||
| 383 | Boston Beer Co., Inc., Class A(a) | 117,692 | ||||||
| 1,913 | Energizer Holdings, Inc. | 112,427 | ||||||
| 230,119 | ||||||||
| Energy: 5.67% | ||||||||
| 1,132 | Delek US Holdings, Inc. | 41,567 | ||||||
| 8,845 | Extraction Oil & Gas, Inc.(a) | 70,671 | ||||||
| 4,543 | Magnolia Oil & Gas Corp.(a) | 56,560 | ||||||
| 2,527 | Mammoth Energy Services, Inc. | 63,074 | ||||||
| 4,693 | Oasis Petroleum, Inc.(a) | 47,212 | ||||||
| 7,476 | Patterson-UTI Energy, Inc. | 124,401 | ||||||
| 2,552 | Viper Energy Partners LP | 91,770 | ||||||
| 5,690 | WPX Energy, Inc.(a) | 91,268 | ||||||
| 586,523 | ||||||||
| Financial Services: 8.67% | ||||||||
| 434 | Alliance Data Systems Corp. | 89,482 | ||||||
| 3,062 | Bank of America Corp. | 84,205 | ||||||
| 636 | Bank of NT Butterfield & Son, Ltd. | 25,625 | ||||||
| 2,533 | Citigroup, Inc. | 165,810 | ||||||
| 2,046 | Curo Group Holdings Corp.(a) | 28,787 | ||||||
| 6,470 | First Data Corp., Class A(a) | 121,248 | ||||||
| 780 | LendingTree, Inc.(a) | 157,318 | ||||||
| 253 | SVB Financial Group(a) | 60,019 | ||||||
| 879 | Visa, Inc., Class A | 121,170 | ||||||
| 917 | Western Alliance Bancorp(a) | 44,236 | ||||||
| 897,900 | ||||||||
| Health Care: 13.12% | ||||||||
| 1,194 | Abbott Laboratories | 82,315 | ||||||
| 1,298 | AbbVie, Inc. | 101,049 | ||||||
| 1,219 | Acadia Healthcare Co., Inc.(a) | 50,589 | ||||||
| 1,204 | Alnylam Pharmaceuticals, Inc.(a) | 96,838 | ||||||
| 1,447 | Biohaven Pharmaceutical Holding Co., Ltd.(a) | 52,164 | ||||||
| 1,683 | BioTelemetry, Inc.(a) | 97,782 | ||||||
| Shares | Value (Note 2) | |||||||
| Health Care (continued) | ||||||||
| 2,537 | Deciphera Pharmaceuticals, Inc.(a) | $ | 51,222 | |||||
| 9,614 | Dicerna Pharmaceuticals, Inc.(a) | 126,520 | ||||||
| 5,462 | Inovio Pharmaceuticals, Inc.(a) | 26,928 | ||||||
| 2,389 | Insmed, Inc.(a) | 34,880 | ||||||
| 1,779 | Integer Holdings Corp.(a) | 132,482 | ||||||
| 643 | PTC Therapeutics, Inc.(a) | 24,768 | ||||||
| 1,223 | Puma Biotechnology, Inc.(a) | 45,312 | ||||||
| 1,601 | Reata Pharmaceuticals, Inc., Class A(a) | 94,347 | ||||||
| 322 | Sage Therapeutics, Inc.(a) | 41,435 | ||||||
| 791 | Sarepta Therapeutics, Inc.(a) | 105,804 | ||||||
| 1,856 | Teladoc, Inc.(a) | 128,695 | ||||||
| 718 | Veeva Systems, Inc., Class A(a) | 65,589 | ||||||
| 1,358,719 | ||||||||
| Materials & Processing: 7.94% | ||||||||
| 4,404 | Allegheny Technologies, Inc.(a) | 114,020 | ||||||
| 1,260 | Berry Global Group, Inc.(a) | 54,961 | ||||||
| 7,386 | GMS, Inc.(a) | 121,426 | ||||||
| 1,272 | Innospec, Inc. | 85,122 | ||||||
| 4,123 | Koppers Holdings, Inc.(a) | 110,290 | ||||||
| 3,410 | Livent Corp.(a) | 53,196 | ||||||
| 2,416 | Masco Corp. | 72,480 | ||||||
| 970 | Scotts Miracle-Gro Co. | 64,738 | ||||||
| 2,384 | Trex Co., Inc.(a) | 146,139 | ||||||
| 822,372 | ||||||||
| Producer Durables: 6.17% | ||||||||
| 242 | CoStar Group, Inc.(a) | 87,464 | ||||||
| 1,075 | Dycom Industries, Inc.(a) | 72,971 | ||||||
| 4,118 | Kratos Defense & Security Solutions, Inc.(a) | 51,598 | ||||||
| 690 | NV5 Global, Inc.(a) | 53,868 | ||||||
| 1,602 | OSI Systems, Inc.(a) | 110,794 | ||||||
| 893 | Parker-Hannifin Corp. | 135,406 | ||||||
| 980 | Southwest Airlines Co. | 48,118 | ||||||
| 1,022 | TopBuild Corp.(a) | 46,624 | ||||||
| 3,346 | US Xpress Enterprises, Inc., Class A(a) | 32,222 | ||||||
| 639,065 | ||||||||
| Technology: 32.21% | ||||||||
| 161 | Adobe, Inc.(a) | 39,567 | ||||||
| 1,668 | Alarm.com Holdings, Inc.(a) | 74,193 | ||||||
| 287 | Alphabet, Inc., Class A(a) | 312,997 | ||||||
| 2,458 | Apple, Inc. | 537,958 | ||||||
| 356 | Coherent, Inc.(a) | 43,838 | ||||||
| 1,799 | Facebook, Inc., Class A(a) | 273,070 | ||||||
| 1,669 | Fortinet, Inc.(a) | 137,158 | ||||||
| 14,545 | Glu Mobile, Inc.(a) | 102,542 | ||||||
| 3,988 | Internap Corp.(a) | 34,177 | ||||||
| 977 | Lumentum Holdings, Inc.(a) | 53,393 | ||||||
| 4,971 | Microsoft Corp. | 530,953 | ||||||
| 778 | Nutanix, Inc., Class A(a) | 32,295 | ||||||
| 601 | NVIDIA Corp. | 126,709 | ||||||
| Semi-Annual Report | October 31, 2018 | 29 |
| Emerald Insights Fund | Schedule of Investments |
October 31, 2018 (Unaudited)
| Shares | Value (Note 2) | |||||||
| Technology (continued) | ||||||||
| 4,738 | ON Semiconductor Corp.(a) | $ | 80,546 | |||||
| 508 | Palo Alto Networks, Inc.(a) | 92,984 | ||||||
| 24,757 | Pixelworks, Inc.(a) | 103,484 | ||||||
| 5,884 | PlayAGS, Inc.(a) | 142,687 | ||||||
| 1,091 | Proofpoint, Inc.(a) | 99,227 | ||||||
| 760 | PTC, Inc.(a) | 62,632 | ||||||
| 1,745 | Rapid7, Inc.(a) | 63,239 | ||||||
| 656 | salesforce.com, Inc.(a) | 90,029 | ||||||
| 310 | ServiceNow, Inc.(a) | 56,122 | ||||||
| 636 | Splunk, Inc.(a) | 63,498 | ||||||
| 1,570 | USA Technologies, Inc.(a) | 9,106 | ||||||
| 2,820 | Varonis Systems, Inc.(a) | 172,217 | ||||||
| 3,334,621 | ||||||||
| Utilities: 1.86% | ||||||||
| 14,490 | Vonage Holdings Corp.(a) | 192,138 | ||||||
| Total Common Stocks | ||||||||
| (Cost $9,341,775) | 10,097,129 | |||||||
| MASTER LIMITED PARTNERSHIPS: 0.40% | ||||||||
| Financial Services: 0.40% | ||||||||
| 1,040 | Lazard, Ltd., Class A | 41,329 | ||||||
| Total Master Limited Partnerships | ||||||||
| (Cost $33,112) | 41,329 | |||||||
| SHORT TERM INVESTMENTS: 2.35% | ||||||||
| 243,234 | Dreyfus Government Cash Management Fund - Institutional Class 2.049% (7-Day Yield) | 243,234 | ||||||
| Total Short Term Investments | ||||||||
| (Cost $243,234) | 243,234 | |||||||
| Total Investments: 100.27% | ||||||||
| (Cost $9,618,121) | 10,381,692 | |||||||
| Liabilities In Excess Of Other Assets: (0.27)% | (28,282 | ) | ||||||
| Net Assets: 100.00% | $ | 10,353,410 | ||||||
| (a) | Non-income producing security. |
For Fund compliance purposes, the Fund's industry classifications refer to any one or more of the industry sub-classifications used by one or more widely recognized market indexes or ratings group indexes, and/or as defined by Fund management. This definition may not apply for purposes of this report, which may combine industry sub-classifications for reporting ease. Industries are shown as a percentage of net assets.
See Notes to Financial Statements.
| 30 | www.emeraldmutualfunds.com |
| Emerald Banking and Finance Fund | Schedule of Investments |
October 31, 2018 (Unaudited)
| Shares | Value (Note 2) | |||||||
| COMMON STOCKS: 96.60% | ||||||||
| Consumer Discretionary: 1.17% | ||||||||
| Advertising Agencies: 1.17% | ||||||||
| 276,355 | Cardlytics, Inc.(a) | $ | 5,847,672 | |||||
| Financial Services: 93.41% | ||||||||
| Asset Management & Custodian: 1.53% | ||||||||
| 200,000 | Focus Financial Partners, Inc., Class A(a) | 7,640,000 | ||||||
| Banks: Diversified: 69.17% | ||||||||
| 100,000 | 1st Source Corp. | 4,659,000 | ||||||
| 37,164 | Amalgamated Bank, Class A(a) | 720,982 | ||||||
| 59,178 | American Business Bank(a) | 2,278,353 | ||||||
| 169,900 | American Riviera Bank(a) | 3,253,585 | ||||||
| 424,577 | Bank of Commerce Holdings | 5,069,449 | ||||||
| 238,604 | Bank of NT Butterfield & Son, Ltd. | 9,613,355 | ||||||
| 495,614 | Bank7 Corp.(a) | 8,202,412 | ||||||
| 241,551 | Baycom Corp.(a) | 5,843,119 | ||||||
| 722,896 | Bridgewater Bancshares, Inc.(a) | 8,024,146 | ||||||
| 224,440 | Business First Bancshares, Inc. | 5,918,483 | ||||||
| 457,815 | Byline Bancorp, Inc.(a) | 10,071,930 | ||||||
| 297,208 | Capital Bancorp, Inc.(a) | 3,328,730 | ||||||
| 145,214 | Carolina Financial Corp. | 4,805,131 | ||||||
| 344,000 | Carolina Trust Bancshares, Inc.(a) | 2,838,000 | ||||||
| 358,750 | CBTX, Inc. | 11,921,262 | ||||||
| 202,144 | CenterState Bank Corp. | 4,968,699 | ||||||
| 118,810 | Civista Bancshares, Inc. | 2,751,640 | ||||||
| 150,002 | CNB Financial Corp. | 3,840,051 | ||||||
| 437,810 | Coastal Financial Corp.(a) | 7,149,437 | ||||||
| 228,773 | Equity Bancshares, Inc., Class A(a) | 8,256,418 | ||||||
| 351,830 | Esquire Financial Holdings, Inc.(a) | 8,436,883 | ||||||
| 113,927 | First Bancshares, Inc. | 4,105,929 | ||||||
| 528,554 | First Bank | 6,279,221 | ||||||
| 163,498 | First Choice Bancorp | 3,678,705 | ||||||
| 201,825 | First Internet Bancorp | 5,201,030 | ||||||
| 109,850 | First Mid-Illinois Bancshares, Inc. | 4,095,208 | ||||||
| 125,475 | First Resource Bank(a) | 1,380,225 | ||||||
| 263,800 | Freedom Bank of Virginia(a) | 2,846,402 | ||||||
| 66,405 | FS Bancorp, Inc. | 2,997,522 | ||||||
| 288,277 | FVCBankcorp, Inc.(a) | 5,044,847 | ||||||
| 169,868 | Gold Coast Bancorp, Inc.(a) | 1,970,469 | ||||||
| 200,000 | Guaranty Bancshares, Inc. | 5,964,000 | ||||||
| 211,862 | Heritage Commerce Corp. | 3,074,118 | ||||||
| 254,042 | Investar Holding Corp. | 6,627,956 | ||||||
| 121,689 | John Marshall Bancorp, Inc.(a) | 2,190,402 | ||||||
| 204,472 | Live Oak Bancshares, Inc. | 3,762,285 | ||||||
| 53 | Mechanics Bank(a) | 1,725,150 | ||||||
| 503,773 | Merchants Bancorp | 11,586,779 | ||||||
| 217,881 | Metropolitan Bank Holding Corp.(a) | 8,031,094 | ||||||
| 239,209 | National Commerce Corp.(a) | 8,874,654 | ||||||
| 203,594 | Old Line Bancshares, Inc. | 6,095,604 | ||||||
| 158,129 | Opus Bank | 3,002,870 | ||||||
| 150,710 | Origin Bancorp, Inc. | 5,629,018 | ||||||
| 599,284 | Pacific Mercantile Bancorp(a) | 4,956,079 | ||||||
| Shares | Value (Note 2) | |||||||
| Banks: Diversified (continued) | ||||||||
| 212,884 | People's Utah Bancorp | $ | 7,133,743 | |||||
| 240,584 | Professional Holding Corp.(a) | 4,126,016 | ||||||
| 398,258 | RBB Bancorp | 8,594,408 | ||||||
| 254,684 | Seacoast Commerce Banc Holdings | 5,641,251 | ||||||
| 246,130 | ServisFirst Bancshares, Inc. | 8,855,757 | ||||||
| 200,000 | SmartFinancial, Inc.(a) | 4,068,000 | ||||||
| 71,032 | Southern First Bancshares, Inc.(a) | 2,550,759 | ||||||
| 262,100 | Spirit Of Texas Bancshares Inc(a) | 5,470,027 | ||||||
| 300,000 | Stewardship Financial Corp. | 2,985,000 | ||||||
| 54,290 | SVB Financial Group(a) | 12,879,217 | ||||||
| 913,279 | The Bancorp, Inc.(a) | 9,589,429 | ||||||
| 530,851 | TriState Capital Holdings, Inc.(a) | 13,388,062 | ||||||
| 321,966 | Triumph Bancorp, Inc.(a) | 11,545,701 | ||||||
| 231,891 | Union Bankshares Corp. | 7,916,759 | ||||||
| 168,750 | Unity Bancorp, Inc. | 3,572,437 | ||||||
| 135,517 | Veritex Holdings, Inc.(a) | 3,192,780 | ||||||
| 117,942 | West Town Bancorp, Inc.(a) | 3,160,846 | ||||||
| 345,740,824 | ||||||||
| Banks: Savings, Thrift & Mortgage Lending: 7.00% | ||||||||
| 230,146 | Heritage Financial Corp. | 7,530,377 | ||||||
| 267,003 | Malvern Bancorp, Inc.(a) | 5,422,831 | ||||||
| 451,878 | Meta Financial Group, Inc. | 11,405,401 | ||||||
| 778,700 | Sterling Bancorp, Inc. | 8,059,545 | ||||||
| 250,000 | University Bancorp, Inc./Ann Arbor MI(a) | 2,550,000 | ||||||
| 34,968,154 | ||||||||
| Consumer Lending: 2.53% | ||||||||
| 525,277 | Curo Group Holdings Corp.(a) | 7,390,648 | ||||||
| 26,138 | LendingTree, Inc.(a) | 5,271,773 | ||||||
| 12,662,421 | ||||||||
| Equity REIT - Diversified: 0.80% | ||||||||
| 208,500 | Uniti Group, Inc. | 3,990,690 | ||||||
| Equity REIT - Industrial: 1.78% | ||||||||
| 216,600 | Innovative Industrial Properties, Inc., REIT | 8,878,434 | ||||||
| Financial Data & Systems: 1.82% | ||||||||
| 201,784 | Evo Payments, Inc., Class A(a) | 4,790,352 | ||||||
| 71,410 | First Data Corp., Class A(a) | 1,338,223 | ||||||
| 39,270 | Green Dot Corp., Class A(a) | 2,974,310 | ||||||
| 9,102,885 | ||||||||
| Insurance: Life: 1.31% | ||||||||
| 134,166 | Health Insurance Innovations, Inc., Class A(a) | 6,560,717 | ||||||
| Insurance: Multi-Line: 2.65% | ||||||||
| 212,221 | Goosehead Insurance, Inc., Class A(a) | 7,274,936 | ||||||
| 50,000 | James River Group Holdings, Ltd. | 1,925,000 | ||||||
| 281,048 | Mr Cooper Group, Inc.(a) | 4,072,385 | ||||||
| 13,272,321 | ||||||||
| Semi-Annual Report | October 31, 2018 | 31 |
| Emerald Banking and Finance Fund | Schedule of Investments |
October 31, 2018 (Unaudited)
| Shares | Value (Note 2) | |||||
| Insurance: Property-Casualty: 2.67% | ||||||
| 185,000 | Kingstone Cos., Inc. | $ | 3,145,000 | |||
| 42,570 | Kinsale Capital Group, Inc. | 2,541,855 | ||||
| 361,308 | NMI Holdings, Inc., Class A(a) | 7,638,051 | ||||
| 13,324,906 | ||||||
| Real Estate Services: 2.15% | ||||||
| 623,177 | eXp World Holdings, Inc.(a) | 6,481,041 | ||||
| 438,107 | Newmark Group, Inc., Class A | 4,267,162 | ||||
| 10,748,203 | ||||||
| Producer Durables: 0.51% | ||||||
| Commercial Services: Rental & Leasing: 0.51% | ||||||
| 96,527 | Marlin Business Services, Inc. | 2,565,687 | ||||
| Technology: 1.51% | ||||||
| Computer Services Software & Systems: 1.51% | ||||||
| 141,914 | Q2 Holdings, Inc.(a) | 7,554,082 | ||||
| Total Common Stocks | ||||||
| (Cost $429,693,712) | 482,856,996 | |||||
| SHORT TERM INVESTMENTS: 1.70% | ||||||
| 8,495,316 | Dreyfus Government Cash Management Fund - Institutional Class 2.049% (7-Day Yield) | 8,495,316 | ||||
| Total Short Term Investments | ||||||
| (Cost $8,495,316) | 8,495,316 | |||||
| Total Investments: 98.30% | ||||||
| (Cost $438,189,028) | 491,352,312 | |||||
| Other Assets In Excess Of Liabilities: 1.70% | 8,473,927 | |||||
| Net Assets: 100.00% | $ | 499,826,239 | ||||
| (a) | Non-income producing security. |
For Fund compliance purposes, the Fund's industry classifications refer to any one or more of the industry sub-classifications used by one or more widely recognized market indexes or ratings group indexes, and/or as defined by Fund management. This definition may not apply for purposes of this report, which may combine industry sub-classifications for reporting ease. Industries are shown as a percentage of net assets.
See Notes to Financial Statements.
| 32 | www.emeraldmutualfunds.com |
| Emerald Funds | Statements of Assets and Liabilities |
October 31, 2018 (Unaudited)
Emerald Growth Fund | Emerald Small Cap Value Fund | Emerald Insights Fund | Emerald Banking and Finance Fund | |||||||||||||
| ASSETS: | ||||||||||||||||
| Investments, at value | $ | 1,249,065,677 | $ | 6,841,535 | $ | 10,381,692 | $ | 491,352,312 | ||||||||
| Receivable for investments sold | 8,395,331 | 343,143 | 59,867 | 24,190,291 | ||||||||||||
| Receivable for shares sold | 1,135,900 | 15,474 | – | 522,499 | ||||||||||||
| Receivable due from advisor | – | 3,343 | 381 | – | ||||||||||||
| Interest and dividends receivable | 328,559 | 1,233 | 1,884 | 37,564 | ||||||||||||
| Other assets | 37,299 | 25,118 | 24,481 | 33,370 | ||||||||||||
| Total Assets | 1,258,962,766 | 7,229,846 | 10,468,305 | 516,136,036 | ||||||||||||
| LIABILITIES: | ||||||||||||||||
| Payable for investments purchased | 7,395,691 | 123,623 | 96,233 | 14,058,539 | ||||||||||||
| Payable for shares redeemed | 1,136,221 | 4,652 | – | 1,545,417 | ||||||||||||
| Investment advisory fees payable | 626,151 | – | – | 412,015 | ||||||||||||
| Payable to fund accounting and administration | 45,313 | 2,487 | 1,924 | 20,078 | ||||||||||||
| Payable for distribution and service fees | 306,438 | 1,599 | 3,235 | 209,392 | ||||||||||||
| Payable for trustee fees and expenses | 6,592 | 40 | 67 | 3,370 | ||||||||||||
| Payable for transfer agency fees | 24,225 | 3,204 | 3,406 | 21,276 | ||||||||||||
| Payable for chief compliance officer fee | 7,341 | 47 | 70 | 3,379 | ||||||||||||
| Payable for principal financial officer fee | 1,158 | 9 | 11 | 533 | ||||||||||||
| Payable for professional fees | 12,106 | 8,732 | 8,744 | 11,448 | ||||||||||||
| Accrued expenses and other liabilities | 47,071 | 1,674 | 1,205 | 24,350 | ||||||||||||
| Total Liabilities | 9,608,307 | 146,067 | 114,895 | 16,309,797 | ||||||||||||
| NET ASSETS | $ | 1,249,354,459 | $ | 7,083,779 | $ | 10,353,410 | $ | 499,826,239 | ||||||||
| NET ASSETS CONSIST OF: | ||||||||||||||||
| Paid-in capital (Note 5) | $ | 887,525,170 | $ | 5,755,570 | $ | 7,804,971 | $ | 363,482,519 | ||||||||
| Total distributable earnings | 361,829,289 | 1,328,209 | 2,548,439 | 136,343,720 | ||||||||||||
| NET ASSETS | $ | 1,249,354,459 | $ | 7,083,779 | $ | 10,353,410 | $ | 499,826,239 | ||||||||
| INVESTMENTS, AT COST | $ | 998,829,365 | $ | 6,728,952 | $ | 9,618,121 | $ | 438,189,028 | ||||||||
| PRICING OF SHARES | ||||||||||||||||
| Class A: (a) | ||||||||||||||||
| Net Asset Value, offering and redemption price per share | $ | 26.01 | $ | 9.36 | $ | 13.11 | $ | 42.26 | ||||||||
| Net Assets | $ | 203,285,696 | $ | 4,498,049 | $ | 8,669,523 | $ | 159,676,825 | ||||||||
| Shares of beneficial interest outstanding | 7,816,648 | 480,481 | 661,152 | 3,778,680 | ||||||||||||
| Maximum offering price per share (NAV/.9525, based on maximum sales charge of 4.75% of the offering price) | $ | 27.30 | $ | 9.83 | $ | 13.77 | $ | 44.36 | ||||||||
| Class C: (a) | ||||||||||||||||
| Net Asset Value, offering and redemption price per share | $ | 22.12 | $ | 9.06 | $ | 12.73 | $ | 37.38 | ||||||||
| Net Assets | $ | 30,235,572 | $ | 74,075 | $ | 107,184 | $ | 68,204,132 | ||||||||
| Shares of beneficial interest outstanding | 1,366,856 | 8,173 | 8,417 | 1,824,792 | ||||||||||||
| Institutional Class: | ||||||||||||||||
| Net Asset Value, offering and redemption price per share | $ | 27.00 | $ | 9.51 | $ | 13.26 | $ | 43.20 | ||||||||
| Net Assets | $ | 919,580,690 | $ | 1,948,559 | $ | 1,436,546 | $ | 209,912,416 | ||||||||
| Shares of beneficial interest outstanding | 34,054,579 | 204,910 | 108,305 | 4,858,781 | ||||||||||||
| Investor Class: | ||||||||||||||||
| Net Asset Value, offering and redemption price per share | $ | 25.90 | $ | 9.39 | $ | 13.06 | $ | 40.46 | ||||||||
| Net Assets | $ | 96,252,501 | $ | 563,096 | $ | 140,157 | $ | 62,032,866 | ||||||||
| Shares of beneficial interest outstanding | 3,716,328 | 59,945 | 10,728 | 1,533,374 | ||||||||||||
| (a) | Redemption price per share may be reduced for any applicable contingent deferred sales charge. For a description of a possible sales charge, please see the Funds' Prospectus. |
See Notes to Financial Statements.
| Semi-Annual Report | October 31, 2018 | 33 |
| Emerald Funds | Statements of Operations |
For the Six Months Ended October 31, 2018 (Unaudited)
Emerald Growth Fund | Emerald Small Cap Value Fund | Emerald Insights Fund | Emerald Banking and Finance Fund | |||||||||||||
| INVESTMENT INCOME: | ||||||||||||||||
| Dividends | $ | 3,778,998 | $ | 48,233 | $ | 36,772 | $ | 2,263,694 | ||||||||
| Total Investment Income | 3,778,998 | 48,233 | 36,772 | 2,263,694 | ||||||||||||
| EXPENSES: | ||||||||||||||||
| Investment advisory fee (Note 6) | 3,837,749 | 30,162 | 43,556 | 2,670,415 | ||||||||||||
| Administration fee | 261,930 | 6,648 | 6,839 | 114,549 | ||||||||||||
| Custodian fee | 53,935 | 2,521 | 2,521 | 28,664 | ||||||||||||
| Professional fees | 17,499 | 8,763 | 8,789 | 13,738 | ||||||||||||
| Transfer agent fee | 108,137 | 15,464 | 16,491 | 104,133 | ||||||||||||
| Delegated transfer agent equivalent services fees | ||||||||||||||||
| Class A | 1,309 | – | – | 6,191 | ||||||||||||
| Class C | 465 | – | – | 1,369 | ||||||||||||
| Institutional Class | 435 | 209 | – | – | ||||||||||||
| Investor Class | 1,221 | 15 | – | 13 | ||||||||||||
| Trustee fees and expenses | 16,512 | 98 | 145 | 7,482 | ||||||||||||
| Registration/filing fees | 33,393 | 21,284 | 18,405 | 38,088 | ||||||||||||
| Reports to shareholder and printing fees | 43,981 | 848 | 1,107 | 27,226 | ||||||||||||
| Distribution and service fees | ||||||||||||||||
| Class A | 412,420 | 8,266 | 17,439 | 317,826 | ||||||||||||
| Class C | 177,454 | 449 | 610 | 405,440 | ||||||||||||
| Institutional Class | 160,826 | – | 223 | – | ||||||||||||
| Investor Class | 211,605 | 771 | 156 | 140,860 | ||||||||||||
| Chief compliance officer fee | 21,985 | 136 | 195 | 9,782 | ||||||||||||
| Principal financial officer fee | 3,454 | 22 | 30 | 1,537 | ||||||||||||
| Other | 16,094 | 3,632 | 3,676 | 3,332 | ||||||||||||
| Total expenses before waiver | 5,380,404 | 99,288 | 120,182 | 3,890,645 | ||||||||||||
| Less fees waived/reimbursed by investment advisor (Note 6) | – | (49,605 | ) | (43,445 | ) | – | ||||||||||
| Total Net Expenses | 5,380,404 | 49,683 | 76,737 | 3,890,645 | ||||||||||||
| NET INVESTMENT INCOME/(LOSS): | (1,601,406 | ) | (1,450 | ) | (39,965 | ) | (1,626,951 | ) | ||||||||
| REALIZED AND UNREALIZED GAIN/(LOSS) | ||||||||||||||||
| Net realized gain | 49,055,599 | 112,093 | 377,865 | 48,713,270 | ||||||||||||
| Net change in unrealized depreciation | (50,670,364 | ) | (945,911 | ) | (292,706 | ) | (91,931,833 | ) | ||||||||
| NET REALIZED AND UNREALIZED GAIN/(LOSS) | (1,614,765 | ) | (833,818 | ) | 85,159 | (43,218,563 | ) | |||||||||
| NET INCREASE/(DECREASE) IN NET ASSETS RESULTING FROM OPERATIONS | $ | (3,216,171 | ) | $ | (835,268 | ) | $ | 45,194 | $ | (44,845,514 | ) | |||||
See Notes to Financial Statements.
| 34 | www.emeraldmutualfunds.com |
| Emerald Growth Fund | Statements of Changes in Net Assets |
For the Six Months Ended October 31, 2018 (Unaudited) | Year Ended April 30, 2018 | |||||||
| OPERATIONS: | ||||||||
| Net investment loss | $ | (1,601,406 | ) | $ | (5,367,786 | ) | ||
| Net realized gain | 49,055,599 | 124,517,595 | ||||||
| Net change in unrealized appreciation/(depreciation) | (50,670,364 | ) | 72,091,969 | |||||
| Net increase/(decrease) in net assets resulting from operations | (3,216,171 | ) | 191,241,778 | |||||
| SHARE TRANSACTIONS (NOTE 5): | ||||||||
| Class A | ||||||||
| Proceeds from sale of shares | 15,805,837 | 37,090,912 | ||||||
| Cost of shares redeemed | (55,046,784 | ) | (116,095,204 | ) | ||||
| Net decrease from share transactions | (39,240,947 | ) | (79,004,292 | ) | ||||
| Class C | ||||||||
| Proceeds from sale of shares | 389,421 | 725,120 | ||||||
| Cost of shares redeemed | (3,542,518 | ) | (8,056,239 | ) | ||||
| Net decrease from share transactions | (3,153,097 | ) | (7,331,119 | ) | ||||
| Institutional Class | ||||||||
| Proceeds from sale of shares | 168,905,330 | 259,029,418 | ||||||
| Cost of shares redeemed | (80,571,839 | ) | (135,414,218 | ) | ||||
| Net increase from share transactions | 88,333,491 | 123,615,200 | ||||||
| Investor Class | ||||||||
| Proceeds from sale of shares | 9,470,587 | 22,305,690 | ||||||
| Cost of shares redeemed | (22,056,919 | ) | (47,223,965 | ) | ||||
| Net decrease from share transactions | (12,586,332 | ) | (24,918,275 | ) | ||||
| Net increase in net assets | $ | 30,136,944 | $ | 203,603,292 | ||||
| NET ASSETS: | ||||||||
| Beginning of period | 1,219,217,515 | 1,015,614,223 | ||||||
| End of period | $ | 1,249,354,459 | $ | 1,219,217,515 | ||||
| Other Information: | ||||||||
| SHARE TRANSACTIONS: | ||||||||
| Class A | ||||||||
| Sold | 554,425 | 1,523,709 | ||||||
| Redeemed | (1,946,966 | ) | (4,700,055 | ) | ||||
| Net decrease in shares outstanding | (1,392,541 | ) | (3,176,346 | ) | ||||
| Class C | ||||||||
| Sold | 15,972 | 34,568 | ||||||
| Redeemed | (146,122 | ) | (385,002 | ) | ||||
| Net decrease in shares outstanding | (130,150 | ) | (350,434 | ) | ||||
| Institutional Class | ||||||||
| Sold | 5,642,372 | 9,981,574 | ||||||
| Redeemed | (2,736,425 | ) | (5,275,531 | ) | ||||
| Net increase in shares outstanding | 2,905,947 | 4,706,043 | ||||||
| Investor Class | ||||||||
| Sold | 330,895 | 888,563 | ||||||
| Redeemed | (772,816 | ) | (1,972,720 | ) | ||||
| Net decrease in shares outstanding | (441,921 | ) | (1,084,157 | ) | ||||
See Notes to Financial Statements.
| Semi-Annual Report | October 31, 2018 | 35 |
| Emerald Small Cap Value Fund | Statements of Changes in Net Assets |
For the Six Months Ended October 31, 2018 (Unaudited) | Year Ended April 30, 2018 | |||||||
| OPERATIONS: | ||||||||
| Net investment loss | $ | (1,450 | ) | $ | (13,355 | ) | ||
| Net realized gain | 112,093 | 1,207,917 | ||||||
| Net change in unrealized depreciation | (945,911 | ) | (267,114 | ) | ||||
| Net increase/(decrease) in net assets resulting from operations | (835,268 | ) | 927,448 | |||||
| DISTRIBUTIONS TO SHAREHOLDERS (NOTE 3):(a) | ||||||||
| Total amount of distributions | ||||||||
| Class A | – | (1,059,065 | ) | |||||
| Class C | – | (47,326 | ) | |||||
| Institutional Class | – | (2,006,350 | ) | |||||
| Investor Class | – | (306,751 | ) | |||||
| Net decrease in net assets from distributions | – | (3,419,492 | ) | |||||
| SHARE TRANSACTIONS (NOTE 5): | ||||||||
| Class A | ||||||||
| Proceeds from sale of shares | 1,465,153 | 2,516,038 | ||||||
| Issued to shareholders in reinvestment of distributions | – | 1,059,065 | ||||||
| Cost of shares redeemed | (359,943 | ) | (740,130 | ) | ||||
| Net increase from share transactions | 1,105,210 | 2,834,973 | ||||||
| Class C | ||||||||
| Proceeds from sale of shares | 4,768 | 9,102 | ||||||
| Issued to shareholders in reinvestment of distributions | – | 47,327 | ||||||
| Cost of shares redeemed | (31,327 | ) | (123,065 | ) | ||||
| Net decrease from share transactions | (26,559 | ) | (66,636 | ) | ||||
| Institutional Class | ||||||||
| Proceeds from sale of shares | 290,467 | 2,040,666 | ||||||
| Issued to shareholders in reinvestment of distributions | – | 2,006,349 | ||||||
| Cost of shares redeemed | (1,326,196 | ) | (4,415,382 | ) | ||||
| Net decrease from share transactions | (1,035,729 | ) | (368,367 | ) | ||||
| Investor Class | ||||||||
| Proceeds from sale of shares | 121,421 | 72,427 | ||||||
| Issued to shareholders in reinvestment of distributions | – | 306,751 | ||||||
| Cost of shares redeemed | (45,744 | ) | (210,226 | ) | ||||
| Net increase from share transactions | 75,677 | 168,952 | ||||||
| Net increase/(decrease) in net assets | $ | (716,669 | ) | $ | 76,878 | |||
| NET ASSETS: | ||||||||
| Beginning of period | 7,800,448 | 7,723,570 | ||||||
| End of period | $ | 7,083,779 | $ | 7,800,448 | ||||
| 36 | www.emeraldmutualfunds.com |
| Emerald Small Cap Value Fund | Statements of Changes in Net Assets |
For the Six Months Ended October 31, 2018 (Unaudited) | Year Ended April 30, 2018 | |||||||
| Other Information: | ||||||||
| SHARE TRANSACTIONS: | ||||||||
| Class A | ||||||||
| Sold | 134,828 | 204,655 | ||||||
| Distributions reinvested | – | 100,671 | ||||||
| Redeemed | (33,293 | ) | (43,758 | ) | ||||
| Net increase in shares outstanding | 101,535 | 261,568 | ||||||
| Class C | ||||||||
| Sold | 494 | 565 | ||||||
| Distributions reinvested | – | 4,622 | ||||||
| Redeemed | (2,940 | ) | (7,663 | ) | ||||
| Net decrease in shares outstanding | (2,446 | ) | (2,476 | ) | ||||
| Institutional Class | ||||||||
| Sold | 26,079 | 131,987 | ||||||
| Distributions reinvested | – | 188,390 | ||||||
| Redeemed | (121,115 | ) | (325,646 | ) | ||||
| Net decrease in shares outstanding | (95,036 | ) | (5,269 | ) | ||||
| Investor Class | ||||||||
| Sold | 11,022 | 5,844 | ||||||
| Distributions reinvested | – | 29,131 | ||||||
| Redeemed | (4,226 | ) | (19,594 | ) | ||||
| Net increase in shares outstanding | 6,796 | 15,381 | ||||||
| (a) | For the year ended April 30, 2018, total distributions consisted of Net Investment Income of $–, and Net Realized Gains of $3,419,492. |
See Notes to Financial Statements.
| Semi-Annual Report | October 31, 2018 | 37 |
| Emerald Insights Fund | Statements of Changes in Net Assets |
For the Six Months Ended October 31, 2018 (Unaudited) | Year Ended April 30, 2018 | |||||||
| OPERATIONS: | ||||||||
| Net investment loss | $ | (39,965 | ) | $ | (62,064 | ) | ||
| Net realized gain | 377,865 | 2,535,047 | ||||||
| Net change in unrealized depreciation | (292,706 | ) | (848,799 | ) | ||||
| Net increase in net assets resulting from operations | 45,194 | 1,624,184 | ||||||
| SHARE TRANSACTIONS (NOTE 5): | ||||||||
| Class A | ||||||||
| Proceeds from sale of shares | 186,631 | 842,288 | ||||||
| Cost of shares redeemed | (906,157 | ) | (3,072,936 | ) | ||||
| Net decrease from share transactions | (719,526 | ) | (2,230,648 | ) | ||||
| Class C | ||||||||
| Proceeds from sale of shares | – | 614 | ||||||
| Cost of shares redeemed | (22,797 | ) | – | |||||
| Net increase/(decrease) from share transactions | (22,797 | ) | 614 | |||||
| Institutional Class | ||||||||
| Proceeds from sale of shares | 258,250 | 103,001 | ||||||
| Cost of shares redeemed | (27,617 | ) | (90,992 | ) | ||||
| Net increase from share transactions | 230,633 | 12,009 | ||||||
| Investor Class | ||||||||
| Proceeds from sale of shares | 36,500 | 24,500 | ||||||
| Cost of shares redeemed | (20,835 | ) | – | |||||
| Net increase from share transactions | 15,665 | 24,500 | ||||||
| Net decrease in net assets | $ | (450,831 | ) | $ | (569,341 | ) | ||
| NET ASSETS: | ||||||||
| Beginning of period | 10,804,241 | 11,373,582 | ||||||
| End of period | $ | 10,353,410 | $ | 10,804,241 | ||||
| Other Information: | ||||||||
| SHARE TRANSACTIONS: | ||||||||
| Class A | ||||||||
| Sold | 12,669 | 67,803 | ||||||
| Redeemed | (63,550 | ) | (249,908 | ) | ||||
| Net decrease in shares outstanding | (50,881 | ) | (182,105 | ) | ||||
| Class C | ||||||||
| Sold | – | 49 | ||||||
| Redeemed | (1,680 | ) | – | |||||
| Net increase/(decrease) in shares outstanding | (1,680 | ) | 49 | |||||
| Institutional Class | ||||||||
| Sold | 17,336 | 8,256 | ||||||
| Redeemed | (1,933 | ) | (7,228 | ) | ||||
| Net increase in shares outstanding | 15,403 | 1,028 | ||||||
| Investor Class | ||||||||
| Sold | 2,578 | 1,890 | ||||||
| Redeemed | (1,500 | ) | – | |||||
| Net increase in shares outstanding | 1,078 | 1,890 | ||||||
See Notes to Financial Statements.
| 38 | www.emeraldmutualfunds.com |
| Emerald Banking and Finance Fund | Statements of Changes in Net Assets |
For the Six Months Ended October 31, 2018 (Unaudited) | Year Ended April 30, 2018 | |||||||
| OPERATIONS: | ||||||||
| Net investment loss | $ | (1,626,951 | ) | $ | (3,180,919 | ) | ||
| Net realized gain | 48,713,270 | 59,497,046 | ||||||
| Net change in unrealized appreciation/(depreciation) | (91,931,833 | ) | 6,208,469 | |||||
| Net increase/(decrease) in net assets resulting from operations | (44,845,514 | ) | 62,524,596 | |||||
| DISTRIBUTIONS TO SHAREHOLDERS (NOTE 3):(a) | ||||||||
| Total amount of distributions | ||||||||
| Class A | – | (4,810,448 | ) | |||||
| Class C | – | (2,417,291 | ) | |||||
| Institutional Class | – | (5,388,614 | ) | |||||
| Investor Class | – | (1,956,089 | ) | |||||
| Net decrease in net assets from distributions | – | (14,572,442 | ) | |||||
| SHARE TRANSACTIONS (NOTE 5): | ||||||||
| Class A | ||||||||
| Proceeds from sale of shares | 32,557,908 | 61,794,273 | ||||||
| Issued to shareholders in reinvestment of distributions | – | 4,334,289 | ||||||
| Cost of shares redeemed | (31,294,636 | ) | (82,932,615 | ) | ||||
| Net increase/(decrease) from share transactions | 1,263,272 | (16,804,053 | ) | |||||
| Class C | ||||||||
| Proceeds from sale of shares | 6,178,380 | 11,650,753 | ||||||
| Issued to shareholders in reinvestment of distributions | – | 2,128,924 | ||||||
| Cost of shares redeemed | (10,568,067 | ) | (17,500,493 | ) | ||||
| Net decrease from share transactions | (4,389,687 | ) | (3,720,816 | ) | ||||
| Institutional Class | ||||||||
| Proceeds from sale of shares | 50,918,327 | 109,407,696 | ||||||
| Issued to shareholders in reinvestment of distributions | – | 3,157,033 | ||||||
| Cost of shares redeemed | (44,236,945 | ) | (42,560,350 | ) | ||||
| Net increase from share transactions | 6,681,382 | 70,004,379 | ||||||
| Investor Class | ||||||||
| Proceeds from sale of shares | 14,384,883 | 41,406,943 | ||||||
| Issued to shareholders in reinvestment of distributions | – | 1,838,759 | ||||||
| Cost of shares redeemed | (17,467,151 | ) | (64,240,554 | ) | ||||
| Net decrease from share transactions | (3,082,268 | ) | (20,994,852 | ) | ||||
| Net increase/(decrease) in net assets | $ | (44,372,815 | ) | $ | 76,436,812 | |||
| NET ASSETS: | ||||||||
| Beginning of period | 544,199,054 | 467,762,242 | ||||||
| End of period | $ | 499,826,239 | $ | 544,199,054 | ||||
| Semi-Annual Report | October 31, 2018 | 39 |
| Emerald Banking and Finance Fund | Statements of Changes in Net Assets |
For the Six Months Ended October 31, 2018 (Unaudited) | Year Ended April 30, 2018 | |||||||
| Other Information: | ||||||||
| SHARE TRANSACTIONS: | ||||||||
| Class A | ||||||||
| Sold | 691,519 | 1,390,894 | ||||||
| Distributions reinvested | – | 92,023 | ||||||
| Redeemed | (658,465 | ) | (1,873,252 | ) | ||||
| Net increase/(decrease) in shares outstanding | 33,054 | (390,335 | ) | |||||
| Class C | ||||||||
| Sold | 145,889 | 291,776 | ||||||
| Distributions reinvested | – | 50,822 | ||||||
| Redeemed | (255,741 | ) | (448,025 | ) | ||||
| Net decrease in shares outstanding | (109,852 | ) | (105,427 | ) | ||||
| Institutional Class | ||||||||
| Sold | 1,038,854 | 2,429,922 | ||||||
| Distributions reinvested | – | 65,771 | ||||||
| Redeemed | (900,682 | ) | (943,291 | ) | ||||
| Net increase in shares outstanding | 138,172 | 1,552,402 | ||||||
| Investor Class | ||||||||
| Sold | 311,007 | 976,209 | ||||||
| Distributions reinvested | – | 40,807 | ||||||
| Redeemed | (394,859 | ) | (1,546,423 | ) | ||||
| Net decrease in shares outstanding | (83,852 | ) | (529,407 | ) | ||||
| (a) | For the year ended April 30, 2018, total distributions consisted of Net Investment Income of $–, and Net Realized Gains of $14,572,442. |
See Notes to Financial Statements.
| 40 | www.emeraldmutualfunds.com |
| Emerald Growth Fund | Financial Highlights |
For a share outstanding throughout the periods presented
| CLASS A | |||||||||||||||||||
For the Six Months Ended October 31, 2018 (Unaudited) | Year Ended April 30, 2018 | Year Ended April 30, 2017 | Year Ended April 30, 2016 | Year Ended April 30, 2015 | Year Ended April 30, 2014 | ||||||||||||||
| NET ASSET VALUE, BEGINNING OF PERIOD | $ | 25.99 | $ | 21.83 | $ | 17.52 | $ | 20.02 | $ | 18.11 | $ | 15.60 | |||||||
| INCOME/(LOSS) FROM OPERATIONS: | |||||||||||||||||||
| Net investment loss(a) | (0.06 | ) | (0.16 | ) | (0.11 | ) | (0.15 | ) | (0.18 | ) | (0.21 | ) | |||||||
| Net realized and unrealized gain/(loss) on investments | 0.08 | 4.32 | 4.42 | (1.88 | ) | 3.43 | 4.33 | ||||||||||||
| Total from Investment Operations | 0.02 | 4.16 | 4.31 | (2.03 | ) | 3.25 | 4.12 | ||||||||||||
| LESS DISTRIBUTIONS: | |||||||||||||||||||
| From capital gains | – | – | – | (0.47 | ) | (1.34 | ) | (1.61 | ) | ||||||||||
| Total Distributions | – | – | – | (0.47 | ) | (1.34 | ) | (1.61 | ) | ||||||||||
| NET INCREASE/(DECREASE) IN NET ASSET VALUE | 0.02 | 4.16 | 4.31 | (2.50 | ) | 1.91 | 2.51 | ||||||||||||
| NET ASSET VALUE, END OF PERIOD | $ | 26.01 | $ | 25.99 | $ | 21.83 | $ | 17.52 | $ | 20.02 | $ | 18.11 | |||||||
| TOTAL RETURN(b) | 0.08 | %(c) | 19.06 | % | 24.60 | % | (10.28 | )% | 18.38 | % | 26.01 | % | |||||||
| RATIOS/SUPPLEMENTAL DATA: | |||||||||||||||||||
| Net Assets, End of Period (000s) | $ | 203,286 | $ | 239,316 | $ | 270,389 | $ | 323,603 | $ | 123,828 | $ | 77,900 | |||||||
| RATIOS TO AVERAGE NET ASSETS: | |||||||||||||||||||
| Net Investment loss | (0.44 | )%(d) | (0.64 | )% | (0.57 | )% | (0.81 | )% | (0.93 | )% | (1.12 | )% | |||||||
| Operating expenses excluding reimbursement/waiver | 1.00 | %(d) | 1.03 | % | 1.08 | % | 1.17 | % | 1.29 | % | 1.31 | % | |||||||
| Operating expenses including reimbursement/waiver | 1.00 | %(d) | 1.03 | % | 1.08 | % | 1.17 | % | 1.29 | % | 1.29 | % | |||||||
| PORTFOLIO TURNOVER RATE | 37 | %(c) | 66 | % | 54 | % | 45 | % | 68 | % | 70 | % | |||||||
| (a) | Per share amounts are based upon average shares outstanding. |
| (b) | Total return does not reflect the effect of sales charges. |
| (c) | Not Annualized. |
| (d) | Annualized. |
See Notes to Financial Statements.
| Semi-Annual Report | October 31, 2018 | 41 |
| Emerald Growth Fund | Financial Highlights |
For a share outstanding throughout the periods presented
| CLASS C | |||||||||||||||||||
For the Six Months Ended October 31, 2018 (Unaudited) | Year Ended April 30, 2018 | Year Ended April 30, 2017 | Year Ended April 30, 2016 | Year Ended April 30, 2015 | Year Ended April 30, 2014 | ||||||||||||||
| NET ASSET VALUE, BEGINNING OF PERIOD | $ | 22.18 | $ | 18.75 | $ | 15.14 | $ | 17.48 | $ | 16.07 | $ | 14.07 | |||||||
| INCOME/(LOSS) FROM OPERATIONS: | |||||||||||||||||||
| Net investment loss(a) | (0.13 | ) | (0.27 | ) | (0.21 | ) | (0.24 | ) | (0.27 | ) | (0.30 | ) | |||||||
| Net realized and unrealized gain/(loss) on investments | 0.07 | 3.70 | 3.82 | (1.63 | ) | 3.02 | 3.91 | ||||||||||||
| Total from Investment Operations | (0.06 | ) | 3.43 | 3.61 | (1.87 | ) | 2.75 | 3.61 | |||||||||||
| LESS DISTRIBUTIONS: | |||||||||||||||||||
| From capital gains | – | – | – | (0.47 | ) | (1.34 | ) | (1.61 | ) | ||||||||||
| Total Distributions | – | – | – | (0.47 | ) | (1.34 | ) | (1.61 | ) | ||||||||||
| NET INCREASE/(DECREASE) IN NET ASSET VALUE | (0.06 | ) | 3.43 | 3.61 | (2.34 | ) | 1.41 | 2.00 | |||||||||||
| NET ASSET VALUE, END OF PERIOD | $ | 22.12 | $ | 22.18 | $ | 18.75 | $ | 15.14 | $ | 17.48 | $ | 16.07 | |||||||
| TOTAL RETURN(b) | (0.27 | )%(c) | 18.29 | % | 23.84 | % | (10.87 | )% | 17.58 | % | 25.19 | % | |||||||
| RATIOS/SUPPLEMENTAL DATA: | |||||||||||||||||||
| Net Assets, End of Period (000s) | $ | 30,236 | $ | 33,197 | $ | 34,642 | $ | 42,075 | $ | 15,427 | $ | 11,645 | |||||||
| RATIOS TO AVERAGE NET ASSETS: | |||||||||||||||||||
| Net Investment loss | (1.09 | )%(d) | (1.30 | )% | (1.22 | )% | (1.46 | )% | (1.58 | )% | (1.77 | )% | |||||||
| Operating expenses excluding reimbursement/waiver | 1.65 | %(d) | 1.68 | % | 1.73 | % | 1.81 | % | 1.94 | % | 1.96 | % | |||||||
| Operating expenses including reimbursement/waiver | 1.65 | %(d) | 1.68 | % | 1.73 | % | 1.81 | % | 1.94 | % | 1.94 | % | |||||||
| PORTFOLIO TURNOVER RATE | 37 | %(c) | 66 | % | 54 | % | 45 | % | 68 | % | 70 | % | |||||||
| (a) | Per share amounts are based upon average shares outstanding. |
| (b) | Total return does not reflect the effect of sales charges. |
| (c) | Not Annualized. |
| (d) | Annualized. |
See Notes to Financial Statements.
| 42 | www.emeraldmutualfunds.com |
| Emerald Growth Fund | Financial Highlights |
For a share outstanding throughout the periods presented
| INSTITUTIONAL CLASS | |||||||||||||||||||
For the Six Months Ended October 31, 2018 (Unaudited) | Year Ended April 30, 2018 | Year Ended April 30, 2017 | Year Ended April 30, 2016 | Year Ended April 30, 2015 | Year Ended April 30, 2014 | ||||||||||||||
| NET ASSET VALUE, BEGINNING OF PERIOD | $ | 26.94 | $ | 22.56 | $ | 18.04 | $ | 20.54 | $ | 18.49 | $ | 15.86 | |||||||
| INCOME/(LOSS) FROM OPERATIONS: | |||||||||||||||||||
| Net investment loss(a) | (0.02 | ) | (0.09 | ) | (0.05 | ) | (0.10 | ) | (0.12 | ) | (0.16 | ) | |||||||
| Net realized and unrealized gain/(loss) on investments | 0.08 | 4.47 | 4.57 | (1.93 | ) | 3.51 | 4.40 | ||||||||||||
| Total from Investment Operations | 0.06 | 4.38 | 4.52 | (2.03 | ) | 3.39 | 4.24 | ||||||||||||
| LESS DISTRIBUTIONS: | |||||||||||||||||||
| From capital gains | – | – | – | (0.47 | ) | (1.34 | ) | (1.61 | ) | ||||||||||
| Total Distributions | – | – | – | (0.47 | ) | (1.34 | ) | (1.61 | ) | ||||||||||
| NET INCREASE/(DECREASE) IN NET ASSET VALUE | 0.06 | 4.38 | 4.52 | (2.50 | ) | 2.05 | 2.63 | ||||||||||||
| NET ASSET VALUE, END OF PERIOD | $ | 27.00 | $ | 26.94 | $ | 22.56 | $ | 18.04 | $ | 20.54 | $ | 18.49 | |||||||
| TOTAL RETURN | 0.22 | %(b) | 19.41 | % | 25.06 | % | (9.97 | )% | 18.77 | % | 26.35 | % | |||||||
| RATIOS/SUPPLEMENTAL DATA: | |||||||||||||||||||
| Net Assets, End of Period (000s) | $ | 919,581 | $ | 839,076 | $ | 596,550 | $ | 453,190 | $ | 174,107 | $ | 134,440 | |||||||
| RATIOS TO AVERAGE NET ASSETS: | |||||||||||||||||||
| Net Investment loss | (0.13 | )%(c) | (0.33 | )% | (0.26 | )% | (0.51 | )% | (0.63 | )% | (0.82 | )% | |||||||
| Operating expenses excluding reimbursement/waiver | 0.68 | %(c) | 0.72 | % | 0.77 | % | 0.87 | % | 0.99 | % | 1.00 | % | |||||||
| Operating expenses including reimbursement/waiver | 0.68 | %(c) | 0.72 | % | 0.77 | % | 0.87 | % | 0.99 | % | 0.99 | % | |||||||
| PORTFOLIO TURNOVER RATE | 37 | %(b) | 66 | % | 54 | % | 45 | % | 68 | % | 70 | % | |||||||
| (a) | Per share amounts are based upon average shares outstanding. |
| (b) | Not Annualized. |
| (c) | Annualized. |
See Notes to Financial Statements.
| Semi-Annual Report | October 31, 2018 | 43 |
| Emerald Growth Fund | Financial Highlights |
For a share outstanding throughout the periods presented
| INVESTOR CLASS | |||||||||||||||||||
For the Six Months Ended October 31, 2018 (Unaudited) | Year Ended April 30, 2018 | Year Ended April 30, 2017 | Year Ended April 30, 2016 | Year Ended April 30, 2015 | Year Ended April 30, 2014 | ||||||||||||||
| NET ASSET VALUE, BEGINNING OF PERIOD | $ | 25.88 | $ | 21.75 | $ | 17.46 | $ | 19.97 | $ | 18.06 | $ | 15.57 | |||||||
| INCOME/(LOSS) FROM OPERATIONS: | |||||||||||||||||||
| Net investment loss(a) | (0.07 | ) | (0.17 | ) | (0.12 | ) | (0.16 | ) | (0.17 | ) | (0.23 | ) | |||||||
| Net realized and unrealized gain/(loss) on investments | 0.09 | 4.30 | 4.41 | (1.88 | ) | 3.42 | 4.33 | ||||||||||||
| Total from Investment Operations | 0.02 | 4.13 | 4.29 | (2.04 | ) | 3.25 | 4.10 | ||||||||||||
| LESS DISTRIBUTIONS: | |||||||||||||||||||
| From capital gains | – | – | – | (0.47 | ) | (1.34 | ) | (1.61 | ) | ||||||||||
| Total Distributions | – | – | – | (0.47 | ) | (1.34 | ) | (1.61 | ) | ||||||||||
| NET INCREASE/(DECREASE) IN NET ASSET VALUE | 0.02 | 4.13 | 4.29 | (2.51 | ) | 1.91 | 2.49 | ||||||||||||
| NET ASSET VALUE, END OF PERIOD | $ | 25.90 | $ | 25.88 | $ | 21.75 | $ | 17.46 | $ | 19.97 | $ | 18.06 | |||||||
| TOTAL RETURN | 0.08 | %(b) | 18.99 | % | 24.57 | % | (10.36 | )% | 18.44 | % | 25.93 | % | |||||||
| RATIOS/SUPPLEMENTAL DATA: | |||||||||||||||||||
| Net Assets, End of Period (000s) | $ | 96,253 | $ | 107,629 | $ | 114,033 | $ | 112,526 | $ | 23,517 | $ | 15,870 | |||||||
| RATIOS TO AVERAGE NET ASSETS: | |||||||||||||||||||
| Net Investment loss | (0.47 | )%(c) | (0.68 | )% | (0.61 | )% | (0.84 | )% | (0.91 | )% | (1.18 | )% | |||||||
| Operating expenses excluding reimbursement/waiver | 1.02 | %(c) | 1.07 | % | 1.12 | % | 1.19 | % | 1.27 | % | 1.34 | % | |||||||
| Operating expenses including reimbursement/waiver | 1.02 | %(c) | 1.07 | % | 1.12 | % | 1.19 | % | 1.27 | % | 1.34 | % | |||||||
| PORTFOLIO TURNOVER RATE | 37 | %(b) | 66 | % | 54 | % | 45 | % | 68 | % | 70 | % | |||||||
| (a) | Per share amounts are based upon average shares outstanding. |
| (b) | Not Annualized. |
| (c) | Annualized. |
See Notes to Financial Statements.
| 44 | www.emeraldmutualfunds.com |
| Emerald Small Cap Value Fund | Financial Highlights |
For a share outstanding throughout the periods presented
| CLASS A | ||||||||||||||||
For the Six Months Ended October 31, 2018 (Unaudited) | Year Ended April 30, 2018 | Year Ended April 30, 2017 | For the Period October 1, 2015 to April 30, 2016(a) | Period Ended September 30, 2015(b) | ||||||||||||
| NET ASSET VALUE, BEGINNING OF PERIOD | $ | 10.45 | $ | 16.27 | $ | 13.00 | $ | 12.70 | $ | 14.12 | ||||||
| INCOME/(LOSS) FROM OPERATIONS: | ||||||||||||||||
| Net investment loss(c) | (0.01 | ) | (0.06 | )(d) | (0.07 | )(d) | (0.09 | ) | (0.01 | ) | ||||||
| Net realized and unrealized gain/(loss) on investments | (1.08 | ) | 2.13 | 3.34 | 0.44 | (1.03 | ) | |||||||||
| Total from Investment Operations | (1.09 | ) | 2.07 | 3.27 | 0.35 | (1.04 | ) | |||||||||
| LESS DISTRIBUTIONS: | ||||||||||||||||
| From investment income | – | – | – | (0.05 | ) | – | ||||||||||
| From capital gains | – | (7.89 | ) | – | – | (0.38 | ) | |||||||||
| Total Distributions | – | (7.89 | ) | – | (0.05 | ) | (0.38 | ) | ||||||||
| NET INCREASE/(DECREASE) IN NET ASSET VALUE | (1.09 | ) | (5.82 | ) | 3.27 | 0.30 | (1.42 | ) | ||||||||
| NET ASSET VALUE, END OF PERIOD | $ | 9.36 | $ | 10.45 | $ | 16.27 | $ | 13.00 | $ | 12.70 | ||||||
| TOTAL RETURN(e) | (10.43 | )%(f) | 12.41 | % | 25.15 | % | 2.77 | %(f) | (7.49 | )%(f) | ||||||
| RATIOS/SUPPLEMENTAL DATA: | ||||||||||||||||
| Net Assets, End of Period (000s) | $ | 4,498 | $ | 3,959 | $ | 1,909 | $ | 340 | $ | 14 | ||||||
| RATIOS TO AVERAGE NET ASSETS: | ||||||||||||||||
| Net Investment loss | (0.15 | )%(g) | (0.42 | )% | (0.46 | )% | (1.13 | )%(g) | (0.24 | )%(g) | ||||||
| Operating expenses excluding reimbursement/waiver | 2.58 | %(g) | 2.56 | % | 2.26 | % | 2.69 | %(g) | 2.16 | %(g) | ||||||
| Operating expenses including reimbursement/waiver | 1.35 | %(g) | 1.35 | % | 1.35 | % | 1.35 | %(g) | 1.35 | %(g) | ||||||
| PORTFOLIO TURNOVER RATE | 63 | %(f) | 71 | % | 66 | % | 31 | %(f) | 69 | %(f)(h) | ||||||
| (a) | Effective March 3, 2015 the Board approved changing the fiscal year-end of the Fund from September 30 to April 30. |
| (b) | Class A commenced operations on June 30, 2015. |
| (c) | Per share amounts are based upon average shares outstanding. |
| (d) | The amount shown for a share outstanding throughout the period may not correlate with the Statement of Operations for the period due to the timing of sales and redemptions of Fund shares in relation to income earned and/or fluctuating market value of the investments of the Fund. |
| (e) | Total return does not reflect the effect of sales charges. |
| (f) | Not Annualized. |
| (g) | Annualized. |
| (h) | Portfolio turnover rate is calculated at the Fund level and represents the year ended September 30, 2015. |
See Notes to Financial Statements.
| Semi-Annual Report | October 31, 2018 | 45 |
| Emerald Small Cap Value Fund | Financial Highlights |
For a share outstanding throughout the periods presented
| CLASS C | ||||||||||||||||
For the Six Months Ended October 31, 2018 (Unaudited) | Year Ended April 30, 2018 | Year Ended April 30, 2017 | For the Period October 1, 2015 to April 30, 2016(a) | Period Ended September 30, 2015(b) | ||||||||||||
| NET ASSET VALUE, BEGINNING OF PERIOD | $ | 10.15 | $ | 16.10 | $ | 12.94 | $ | 12.68 | $ | 14.12 | ||||||
| INCOME/(LOSS) FROM OPERATIONS: | ||||||||||||||||
| Net investment loss(c) | (0.04 | ) | (0.13 | )(d) | (0.13 | )(d) | (0.14 | ) | (0.03 | ) | ||||||
| Net realized and unrealized gain/(loss) on investments | (1.05 | ) | 2.07 | 3.29 | 0.43 | (1.03 | ) | |||||||||
| Total from Investment Operations | (1.09 | ) | 1.94 | 3.16 | 0.29 | (1.06 | ) | |||||||||
| LESS DISTRIBUTIONS: | ||||||||||||||||
| From investment income | – | – | – | (0.03 | ) | – | ||||||||||
| From capital gains | – | (7.89 | ) | – | – | (0.38 | ) | |||||||||
| Total Distributions | – | (7.89 | ) | – | (0.03 | ) | (0.38 | ) | ||||||||
| NET INCREASE/(DECREASE) IN NET ASSET VALUE | (1.09 | ) | (5.95 | ) | 3.16 | 0.26 | (1.44 | ) | ||||||||
| NET ASSET VALUE, END OF PERIOD | $ | 9.06 | $ | 10.15 | $ | 16.10 | $ | 12.94 | $ | 12.68 | ||||||
| TOTAL RETURN(e) | (10.74 | )%(f) | 11.63 | % | 24.42 | % | 2.28 | %(f) | (7.63 | )%(f) | ||||||
| RATIOS/SUPPLEMENTAL DATA: | ||||||||||||||||
| Net Assets, End of Period (000s) | $ | 74 | $ | 108 | $ | 211 | $ | 566 | $ | 14 | ||||||
| RATIOS TO AVERAGE NET ASSETS: | ||||||||||||||||
| Net Investment loss | (0.81 | )%(g) | (0.98 | )% | (0.93 | )% | (2.06 | )%(g) | (0.89 | )%(g) | ||||||
| Operating expenses excluding reimbursement/waiver | 3.23 | %(g) | 3.20 | % | 2.70 | % | 3.37 | %(g) | 2.81 | %(g) | ||||||
| Operating expenses including reimbursement/waiver | 2.00 | %(g) | 2.00 | % | 2.00 | % | 2.00 | %(g) | 2.00 | %(g) | ||||||
| PORTFOLIO TURNOVER RATE | 63 | %(f) | 71 | % | 66 | % | 31 | %(f) | 69 | %(f)(h) | ||||||
| (a) | Effective March 3, 2015 the Board approved changing the fiscal year-end of the Fund from September 30 to April 30. |
| (b) | Class C commenced operations on June 30, 2015. |
| (c) | Per share amounts are based upon average shares outstanding. |
| (d) | The amount shown for a share outstanding throughout the period may not correlate with the Statement of Operations for the period due to the timing of sales and redemptions of Fund shares in relation to income earned and/or fluctuating market value of the investments of the Fund. |
| (e) | Total return does not reflect the effect of sales charges. |
| (f) | Not Annualized. |
| (g) | Annualized. |
| (h) | Portfolio turnover rate is calculated at the Fund level and represents the year ended September 30, 2015. |
See Notes to Financial Statements.
| 46 | www.emeraldmutualfunds.com |
| Emerald Small Cap Value Fund | Financial Highlights |
For a share outstanding throughout the periods presented
| INSTITUTIONAL CLASS | |||||||||||||||||||
For the Six Months Ended October 31, 2018 (Unaudited) | Year Ended April 30, 2018 | Year Ended April 30, 2017 | For the Period October 1, 2015 to April 30, 2016(a) | Year Ended September 30, 2015(b) | Year Ended September 30, 2014 | ||||||||||||||
| NET ASSET VALUE, BEGINNING OF PERIOD | $ | 10.59 | $ | 16.35 | $ | 13.02 | $ | 12.71 | $ | 12.76 | $ | 12.56 | |||||||
| INCOME FROM OPERATIONS: | |||||||||||||||||||
| Net investment income/(loss)(c) | 0.01 | 0.00 | (d) | 0.02 | (0.01 | ) | 0.06 | 0.09 | |||||||||||
| Net realized and unrealized gain/(loss) on investments | (1.09 | ) | 2.13 | 3.31 | 0.38 | 0.33 | 0.76 | ||||||||||||
| Total from Investment Operations | (1.08 | ) | 2.13 | 3.33 | 0.37 | 0.39 | 0.85 | ||||||||||||
| LESS DISTRIBUTIONS: | |||||||||||||||||||
| From investment income | – | – | – | (0.06 | ) | (0.06 | ) | (0.01 | ) | ||||||||||
| From capital gains | – | (7.89 | ) | – | – | (0.38 | ) | (0.64 | ) | ||||||||||
| Total Distributions | – | (7.89 | ) | – | (0.06 | ) | (0.44 | ) | (0.65 | ) | |||||||||
| NET INCREASE/(DECREASE) IN NET ASSET VALUE | (1.08 | ) | (5.76 | ) | 3.33 | 0.31 | (0.05 | ) | 0.20 | ||||||||||
| NET ASSET VALUE, END OF PERIOD | $ | 9.51 | $ | 10.59 | $ | 16.35 | $ | 13.02 | $ | 12.71 | $ | 12.76 | |||||||
| TOTAL RETURN | (10.20 | )%(e) | 12.76 | % | 25.58 | % | 2.94 | %(e) | 2.93 | % | 6.64 | % | |||||||
| SUPPLEMENTAL DATA: | |||||||||||||||||||
| Net Assets, End of Period (000s) | $ | 1,949 | $ | 3,177 | $ | 4,989 | $ | 13,691 | $ | 16,507 | $ | 24,343 | |||||||
| RATIOS TO AVERAGE NET ASSETS: | |||||||||||||||||||
| Net Investment income/(loss) | 0.21 | %(f) | 0.02 | % | 0.13 | % | (0.07 | )%(f) | 0.45 | % | 0.65 | % | |||||||
| Operating expenses excluding reimbursement/waiver | 2.25 | %(f) | 2.20 | % | 1.56 | % | 1.75 | %(f) | 1.43 | % | 1.29 | % | |||||||
| Operating expenses including reimbursement/waiver | 1.00 | %(f) | 1.00 | % | 1.00 | % | 1.00 | %(f) | 1.00 | % | 1.00 | % | |||||||
| PORTFOLIO TURNOVER RATE | 63 | %(e) | 71 | % | 66 | % | 31 | %(e) | 69 | % | 49 | % | |||||||
| (a) | Effective March 3, 2015 the Board approved changing the fiscal year-end of the Fund from September 30 to April 30. |
| (b) | Prior to its June 26, 2015 reorganization with and into the Emerald Small Cap Value Fund, the Fund was known as the Elessar Small Cap Value Fund. |
| (c) | Per share amounts are based upon average shares outstanding. |
| (d) | Less than $0.005 per share. |
| (e) | Not Annualized. |
| (f) | Annualized. |
See Notes to Financial Statements.
| Semi-Annual Report | October 31, 2018 | 47 |
| Emerald Small Cap Value Fund | Financial Highlights |
For a share outstanding throughout the periods presented
| INVESTOR CLASS | |||||||||||||||||||
For the Six Months Ended October 31, 2018 (Unaudited) | Year Ended April 30, 2018 | Year Ended April 30, 2017 | For the Period October 1, 2015 to April 30, 2016(a) | Year Ended September 30, 2015(b) | Year Ended September 30, 2014 | ||||||||||||||
| NET ASSET VALUE, BEGINNING OF PERIOD | $ | 10.46 | $ | 16.26 | $ | 12.98 | $ | 12.68 | $ | 12.73 | $ | 12.54 | |||||||
| INCOME FROM OPERATIONS: | |||||||||||||||||||
| Net investment income/(loss)(c) | (0.00 | )(d) | (0.04 | )(e) | (0.02 | )(e) | (0.02 | ) | 0.03 | 0.07 | |||||||||
| Net realized and unrealized gain/(loss) on investments | (1.07 | ) | 2.13 | 3.30 | 0.37 | 0.35 | 0.76 | ||||||||||||
| Total from Investment Operations | (1.07 | ) | 2.09 | 3.28 | 0.35 | 0.38 | 0.83 | ||||||||||||
| LESS DISTRIBUTIONS: | |||||||||||||||||||
| From investment income | – | – | – | (0.05 | ) | (0.05 | ) | – | |||||||||||
| From capital gains | – | (7.89 | ) | – | – | (0.38 | ) | (0.64 | ) | ||||||||||
| Total Distributions | – | (7.89 | ) | – | (0.05 | ) | (0.43 | ) | (0.64 | ) | |||||||||
| NET INCREASE/(DECREASE) IN NET ASSET VALUE | (1.07 | ) | (5.80 | ) | 3.28 | 0.30 | (0.05 | ) | 0.19 | ||||||||||
| NET ASSET VALUE, END OF PERIOD | $ | 9.39 | $ | 10.46 | $ | 16.26 | $ | 12.98 | $ | 12.68 | $ | 12.73 | |||||||
| TOTAL RETURN | (10.23 | )%(f) | 12.54 | % | 25.27 | % | 2.80 | %(f) | 2.82 | % | 6.46 | % | |||||||
| SUPPLEMENTAL DATA: | |||||||||||||||||||
| Net Assets, End of Period (000s) | $ | 563 | $ | 556 | $ | 614 | $ | 1,946 | $ | 399 | $ | 474 | |||||||
| RATIOS TO AVERAGE NET ASSETS: | |||||||||||||||||||
| Net Investment income/(loss) | (0.06 | )%(g) | (0.25 | )% | (0.11 | )% | (0.25 | )%(g) | 0.22 | % | 0.52 | % | |||||||
| Operating expenses excluding reimbursement/waiver | 2.48 | %(g) | 2.44 | % | 1.83 | % | 2.14 | %(g) | 1.67 | % | 1.56 | % | |||||||
| Operating expenses including reimbursement/waiver | 1.25 | %(g) | 1.25 | % | 1.25 | % | 1.25 | %(g) | 1.25 | % | 1.25 | % | |||||||
| PORTFOLIO TURNOVER RATE | 63 | %(f) | 71 | % | 66 | % | 31 | %(f) | 69 | % | 49 | % | |||||||
| (a) | Effective March 3, 2015 the Board approved changing the fiscal year-end of the Fund from September 30 to April 30. |
| (b) | Prior to its June 26, 2015 reorganization with and into the Emerald Small Cap Value Fund, the Fund was known as the Elessar Small Cap Value Fund. |
| (c) | Per share amounts are based upon average shares outstanding. |
| (d) | Less than $0.005 per share. |
| (e) | The amount shown for a share outstanding throughout the period may not correlate with the Statement of Operations for the period due to the timing of sales and redemptions of Fund shares in relation to income earned and/or fluctuating market value of the investments of the Fund. |
| (f) | Not Annualized. |
| (g) | Annualized. |
See Notes to Financial Statements.
| 48 | www.emeraldmutualfunds.com |
| Emerald Insights Fund | Financial Highlights |
For a share outstanding throughout the periods presented
| CLASS A | ||||||||||||||||
For the Six Months Ended October 31, 2018 (Unaudited) | Year Ended April 30, 2018 | Year Ended April 30, 2017 | Year Ended April 30, 2016 | For the Period August 1, 2014 (Inception) to April 30, 2015 | ||||||||||||
| NET ASSET VALUE, BEGINNING OF PERIOD | $ | 13.09 | $ | 11.33 | $ | 9.69 | $ | 10.98 | $ | 10.00 | ||||||
| INCOME/(LOSS) FROM OPERATIONS: | ||||||||||||||||
| Net investment loss(a) | (0.05 | ) | (0.07 | ) | (0.06 | ) | (0.05 | ) | (0.05 | ) | ||||||
| Net realized and unrealized gain/(loss) on investments | 0.07 | 1.83 | 1.70 | (1.24 | ) | 1.03 | ||||||||||
| Total from Investment Operations | 0.02 | 1.76 | 1.64 | (1.29 | ) | 0.98 | ||||||||||
| NET INCREASE/(DECREASE) IN NET ASSET VALUE | 0.02 | 1.76 | 1.64 | (1.29 | ) | 0.98 | ||||||||||
| NET ASSET VALUE, END OF PERIOD | $ | 13.11 | $ | 13.09 | $ | 11.33 | $ | 9.69 | $ | 10.98 | ||||||
| TOTAL RETURN(b) | 0.15 | %(c) | 15.53 | % | 16.92 | % | (11.75 | %) | 9.80 | %(c) | ||||||
| RATIOS/SUPPLEMENTAL DATA: | ||||||||||||||||
| Net Assets, End of Period (000s) | $ | 8,670 | $ | 9,321 | $ | 10,127 | $ | 11,388 | $ | 6,493 | ||||||
| RATIOS TO AVERAGE NET ASSETS: | ||||||||||||||||
| Net Investment loss | (0.71 | %)(d) | (0.58 | %) | (0.57 | %) | (0.54 | %) | (0.66 | %)(d) | ||||||
| Operating expenses excluding reimbursement/waiver | 2.10 | %(d) | 2.10 | % | 2.10 | % | 2.01 | % | 2.57 | %(d)(e) | ||||||
| Operating expenses including reimbursement/waiver | 1.35 | %(d) | 1.35 | % | 1.35 | % | 1.35 | % | 1.35 | %(d)(e) | ||||||
| PORTFOLIO TURNOVER RATE | 31 | %(c) | 138 | % | 75 | % | 99 | % | 88 | %(c) | ||||||
| (a) | Per share amounts are based upon average shares outstanding. |
| (b) | Total return does not reflect the effect of sales charges. |
| (c) | Not Annualized. |
| (d) | Annualized. |
| (e) | Expense ratios before reductions for startup costs may not be representative of longer term operating periods. |
See Notes to Financial Statements.
| Semi-Annual Report | October 31, 2018 | 49 |
| Emerald Insights Fund | Financial Highlights |
For a share outstanding throughout the periods presented
| CLASS C | ||||||||||||||||
For the Six Months Ended October 31, 2018 (Unaudited) | Year Ended April 30, 2018 | Year Ended April 30, 2017 | Year Ended April 30, 2016 | For the Period August 1, 2014 (Inception) to April 30, 2015 | ||||||||||||
| NET ASSET VALUE, BEGINNING OF PERIOD | $ | 12.75 | $ | 11.11 | $ | 9.56 | $ | 10.92 | $ | 10.00 | ||||||
| INCOME/(LOSS) FROM OPERATIONS: | ||||||||||||||||
| Net investment loss(a) | (0.09 | ) | (0.15 | ) | (0.13 | ) | (0.11 | ) | (0.10 | ) | ||||||
| Net realized and unrealized gain/(loss) on investments | 0.07 | 1.79 | 1.68 | (1.25 | ) | 1.02 | ||||||||||
| Total from Investment Operations | (0.02 | ) | 1.64 | 1.55 | (1.36 | ) | 0.92 | |||||||||
| NET INCREASE/(DECREASE) IN NET ASSET VALUE | (0.02 | ) | 1.64 | 1.55 | (1.36 | ) | 0.92 | |||||||||
| NET ASSET VALUE, END OF PERIOD | $ | 12.73 | $ | 12.75 | $ | 11.11 | $ | 9.56 | $ | 10.92 | ||||||
| TOTAL RETURN(b) | (0.16 | %)(c) | 14.76 | % | 16.21 | % | (12.45 | %) | 9.20 | %(c) | ||||||
| RATIOS/SUPPLEMENTAL DATA: | ||||||||||||||||
| Net Assets, End of Period (000s) | $ | 107 | $ | 129 | $ | 112 | $ | 101 | $ | 27 | ||||||
| RATIOS TO AVERAGE NET ASSETS: | ||||||||||||||||
| Net Investment loss | (1.35 | %)(d) | (1.24 | %) | (1.22 | %) | (1.17 | %) | (1.34 | %)(d) | ||||||
| Operating expenses excluding reimbursement/waiver | 2.75 | %(d) | 2.75 | % | 2.76 | % | 2.70 | % | 7.25 | %(d)(e) | ||||||
| Operating expenses including reimbursement/waiver | 2.00 | %(d) | 2.00 | % | 2.00 | % | 2.00 | % | 2.00 | %(d)(e) | ||||||
| PORTFOLIO TURNOVER RATE | 31 | %(c) | 138 | % | 75 | % | 99 | % | 88 | %(c) | ||||||
| (a) | Per share amounts are based upon average shares outstanding. |
| (b) | Total return does not reflect the effect of sales charges. |
| (c) | Not Annualized. |
| (d) | Annualized. |
| (e) | Expense ratios before reductions for startup costs may not be representative of longer term operating periods. |
See Notes to Financial Statements.
| 50 | www.emeraldmutualfunds.com |
| Emerald Insights Fund | Financial Highlights |
For a share outstanding throughout the periods presented
| INSTITUTIONAL CLASS | ||||||||||||||||
For the Six Months Ended October 31, 2018 (Unaudited) | Year Ended April 30, 2018 | Year Ended April 30, 2017 | Year Ended April 30, 2016 | For the Period August 1, 2014 (Inception) to April 30, 2015 | ||||||||||||
| NET ASSET VALUE, BEGINNING OF PERIOD | $ | 13.22 | $ | 11.41 | $ | 9.73 | $ | 10.99 | $ | 10.00 | ||||||
| INCOME/(LOSS) FROM OPERATIONS: | ||||||||||||||||
| Net investment loss(a) | (0.03 | ) | (0.04 | ) | (0.03 | ) | (0.00 | )(b) | (0.03 | ) | ||||||
| Net realized and unrealized gain/(loss) on investments | 0.07 | 1.85 | 1.71 | (1.26 | ) | 1.02 | ||||||||||
| Total from Investment Operations | 0.04 | 1.81 | 1.68 | (1.26 | ) | 0.99 | ||||||||||
| NET INCREASE/(DECREASE) IN NET ASSET VALUE | 0.04 | 1.81 | 1.68 | (1.26 | ) | 0.99 | ||||||||||
| NET ASSET VALUE, END OF PERIOD | $ | 13.26 | $ | 13.22 | $ | 11.41 | $ | 9.73 | $ | 10.99 | ||||||
| TOTAL RETURN | 0.30 | %(c) | 15.86 | % | 17.27 | % | (11.46 | %) | 9.90 | %(c) | ||||||
| RATIOS/SUPPLEMENTAL DATA: | ||||||||||||||||
| Net Assets, End of Period (000s) | $ | 1,437 | $ | 1,228 | $ | 1,048 | $ | 1,729 | $ | 279 | ||||||
| RATIOS TO AVERAGE NET ASSETS: | ||||||||||||||||
| Net Investment loss | (0.43 | %)(d) | (0.29 | %) | (0.28 | %) | (0.05 | %) | (0.34 | %)(d) | ||||||
| Operating expenses excluding reimbursement/waiver | 1.79 | %(d) | 1.77 | % | 1.78 | % | 1.90 | % | 4.66 | %(d)(e) | ||||||
| Operating expenses including reimbursement/waiver | 1.05 | %(d) | 1.05 | % | 1.05 | % | 1.05 | % | 1.05 | %(d)(e) | ||||||
| PORTFOLIO TURNOVER RATE | 31 | %(c) | 138 | % | 75 | % | 99 | % | 88 | %(c) | ||||||
| (a) | Per share amounts are based upon average shares outstanding. |
| (b) | Less than $0.005 per share. |
| (c) | Not Annualized. |
| (d) | Annualized. |
| (e) | Expense ratios before reductions for startup costs may not be representative of longer term operating periods. |
See Notes to Financial Statements.
| Semi-Annual Report | October 31, 2018 | 51 |
| Emerald Insights Fund | Financial Highlights |
For a share outstanding throughout the periods presented
| INVESTOR CLASS | ||||||||||||||||
For the Six Months Ended October 31, 2018 (Unaudited) | Year Ended April 30, 2018 | Year Ended April 30, 2017 | Year Ended April 30, 2016 | For the Period August 1, 2014 (Inception) to April 30, 2015 | ||||||||||||
| NET ASSET VALUE, BEGINNING OF PERIOD | $ | 13.05 | $ | 11.29 | $ | 9.67 | $ | 10.96 | $ | 10.00 | ||||||
| INCOME/(LOSS) FROM OPERATIONS: | ||||||||||||||||
| Net investment loss(a) | (0.06 | ) | (0.08 | ) | (0.07 | ) | (0.08 | ) | (0.05 | ) | ||||||
| Net realized and unrealized gain/(loss) on investments | 0.07 | 1.84 | 1.69 | (1.21 | ) | 1.01 | ||||||||||
| Total from Investment Operations | 0.01 | 1.76 | 1.62 | (1.29 | ) | 0.96 | ||||||||||
| NET INCREASE/(DECREASE) IN NET ASSET VALUE | 0.01 | 1.76 | 1.62 | (1.29 | ) | 0.96 | ||||||||||
| NET ASSET VALUE, END OF PERIOD | $ | 13.06 | $ | 13.05 | $ | 11.29 | $ | 9.67 | $ | 10.96 | ||||||
| TOTAL RETURN | 0.08 | %(b) | 15.59 | % | 16.75 | % | (11.77 | %) | 9.60 | %(b) | ||||||
| RATIOS/SUPPLEMENTAL DATA: | ||||||||||||||||
| Net Assets, End of Period (000s) | $ | 140 | $ | 126 | $ | 88 | $ | 86 | $ | 448 | ||||||
| RATIOS TO AVERAGE NET ASSETS: | ||||||||||||||||
| Net Investment loss | (0.78 | %)(c) | (0.65 | %) | (0.63 | %) | (0.72 | %) | (0.67 | %)(c) | ||||||
| Operating expenses excluding reimbursement/waiver | 1.96 | %(c) | 2.07 | % | 2.09 | % | 1.91 | % | 2.96 | %(c)(d) | ||||||
| Operating expenses including reimbursement/waiver | 1.40 | %(c) | 1.40 | % | 1.40 | % | 1.40 | % | 1.40 | %(c)(d) | ||||||
| PORTFOLIO TURNOVER RATE | 31 | %(b) | 138 | % | 75 | % | 99 | % | 88 | %(b) | ||||||
| (a) | Per share amounts are based upon average shares outstanding. |
| (b) | Not Annualized. |
| (c) | Annualized. |
| (d) | Expense ratios before reductions for startup costs may not be representative of longer term operating periods. |
See Notes to Financial Statements.
| 52 | www.emeraldmutualfunds.com |
| Emerald Banking and Finance Fund | Financial Highlights |
| For a share outstanding throughout the periods presented |
| CLASS A | |||||||||||||||||||
For the Six Months Ended October 31, 2018 (Unaudited) | Year Ended April 30, 2018 | Year Ended April 30, 2017 | Year Ended April 30, 2016 | Year Ended April 30, 2015 | Year Ended April 30, 2014 | ||||||||||||||
| NET ASSET VALUE, BEGINNING OF PERIOD | $ | 46.01 | $ | 41.61 | $ | 31.27 | $ | 28.85 | $ | 26.11 | $ | 20.08 | |||||||
| INCOME/(LOSS) FROM OPERATIONS: | |||||||||||||||||||
| Net investment loss(a) | (0.15 | ) | (0.29 | ) | (0.17 | ) | (0.06 | ) | (0.16 | ) | (0.13 | ) | |||||||
| Net realized and unrealized gain/(loss) on investments | (3.60 | ) | 5.98 | 10.51 | 2.48 | 2.90 | 6.16 | ||||||||||||
| Total from Investment Operations | (3.75 | ) | 5.69 | 10.34 | 2.42 | 2.74 | 6.03 | ||||||||||||
| LESS DISTRIBUTIONS: | |||||||||||||||||||
| From capital gains | – | (1.29 | ) | – | – | – | – | ||||||||||||
| Total Distributions | – | (1.29 | ) | – | – | – | – | ||||||||||||
| NET INCREASE/(DECREASE) IN NET ASSET VALUE | (3.75 | ) | 4.40 | 10.34 | 2.42 | 2.74 | 6.03 | ||||||||||||
| NET ASSET VALUE, END OF PERIOD | $ | 42.26 | $ | 46.01 | $ | 41.61 | $ | 31.27 | $ | 28.85 | $ | 26.11 | |||||||
| TOTAL RETURN(b) | (8.15 | )%(c) | 13.59 | % | 33.07 | % | 8.39 | % | 10.49 | % | 30.03 | % | |||||||
| RATIOS/SUPPLEMENTAL DATA: | |||||||||||||||||||
| Net Assets, End of Period (000s) | $ | 159,677 | $ | 172,338 | $ | 172,106 | $ | 110,601 | $ | 48,575 | $ | 48,622 | |||||||
| RATIOS TO AVERAGE NET ASSETS: | |||||||||||||||||||
| Net Investment loss | (0.62 | )%(d) | (0.65 | )% | (0.46 | )% | (0.21 | )% | (0.58 | )% | (0.53 | )% | |||||||
| Operating expenses excluding reimbursement/waiver | 1.40 | %(d) | 1.41 | % | 1.43 | % | 1.48 | % | 1.60 | % | 1.72 | % | |||||||
| Operating expenses including reimbursement/waiver | 1.40 | %(d) | 1.41 | % | 1.43 | % | 1.48 | % | 1.60 | % | 1.72 | % | |||||||
| PORTFOLIO TURNOVER RATE | 34 | %(c) | 62 | % | 36 | % | 30 | % | 33 | % | 34 | % | |||||||
| (a) | Per share amounts are based upon average shares outstanding. |
| (b) | Total return does not reflect the effect of sales charges. |
| (c) | Not Annualized. |
| (d) | Annualized. |
See Notes to Financial Statements.
| Semi-Annual Report | October 31, 2018 | 53 |
| Emerald Banking and Finance Fund | Financial Highlights |
| For a share outstanding throughout the periods presented |
| CLASS C | |||||||||||||||||||
For the Six Months Ended October 31, 2018 (Unaudited) | Year Ended April 30, 2018 | Year Ended April 30, 2017 | Year Ended April 30, 2016 | Year Ended April 30, 2015 | Year Ended April 30, 2014 | ||||||||||||||
| NET ASSET VALUE, BEGINNING OF PERIOD | $ | 40.83 | $ | 37.29 | $ | 28.20 | $ | 26.19 | $ | 23.86 | $ | 18.46 | |||||||
| INCOME/(LOSS) FROM OPERATIONS: | |||||||||||||||||||
| Net investment loss(a) | (0.27 | ) | (0.51 | ) | (0.36 | ) | (0.24 | ) | (0.30 | ) | (0.26 | ) | |||||||
| Net realized and unrealized gain/(loss) on investments | (3.18 | ) | 5.34 | 9.45 | 2.25 | 2.63 | 5.66 | ||||||||||||
| Total from Investment Operations | (3.45 | ) | 4.83 | 9.09 | 2.01 | 2.33 | 5.40 | ||||||||||||
| LESS DISTRIBUTIONS: | |||||||||||||||||||
| From capital gains | – | (1.29 | ) | – | – | – | – | ||||||||||||
| Total Distributions | – | (1.29 | ) | – | – | – | – | ||||||||||||
| NET INCREASE/(DECREASE) IN NET ASSET VALUE | (3.45 | ) | 3.54 | 9.09 | 2.01 | 2.33 | 5.40 | ||||||||||||
| NET ASSET VALUE, END OF PERIOD | $ | 37.38 | $ | 40.83 | $ | 37.29 | $ | 28.20 | $ | 26.19 | $ | 23.86 | |||||||
| TOTAL RETURN(b) | (8.45 | )%(c) | 12.85 | % | 32.23 | % | 7.67 | % | 9.77 | % | 29.25 | % | |||||||
| RATIOS/SUPPLEMENTAL DATA: | |||||||||||||||||||
| Net Assets, End of Period (000s) | $ | 68,204 | $ | 78,988 | $ | 76,072 | $ | 52,366 | $ | 31,862 | $ | 28,222 | |||||||
| RATIOS TO AVERAGE NET ASSETS: | |||||||||||||||||||
| Net Investment loss | (1.26 | )%(d) | (1.30 | )% | (1.11 | )% | (0.87 | )% | (1.23 | )% | (1.18 | )% | |||||||
| Operating expenses excluding reimbursement/waiver | 2.04 | %(d) | 2.06 | % | 2.08 | % | 2.13 | % | 2.25 | % | 2.38 | % | |||||||
| Operating expenses including reimbursement/waiver | 2.04 | %(d) | 2.06 | % | 2.08 | % | 2.13 | % | 2.25 | % | 2.38 | % | |||||||
| PORTFOLIO TURNOVER RATE | 34 | %(c) | 62 | % | 36 | % | 30 | % | 33 | % | 34 | % | |||||||
| (a) | Per share amounts are based upon average shares outstanding. |
| (b) | Total return does not reflect the effect of sales charges. |
| (c) | Not Annualized. |
| (d) | Annualized. |
See Notes to Financial Statements.
| 54 | www.emeraldmutualfunds.com |
| Emerald Banking and Finance Fund | Financial Highlights |
For a share outstanding throughout the periods presented
| INSTITUTIONAL CLASS | |||||||||||||||||||
For the Six Months Ended October 31, 2018 (Unaudited) | Year Ended April 30, 2018 | Year Ended April 30, 2017 | Year Ended April 30, 2016 | Year Ended April 30, 2015 | Year Ended April 30, 2014 | ||||||||||||||
| NET ASSET VALUE, BEGINNING OF PERIOD | $ | 46.95 | $ | 42.30 | $ | 31.69 | $ | 29.15 | $ | 26.29 | $ | 20.15 | |||||||
| INCOME/(LOSS) FROM OPERATIONS: | |||||||||||||||||||
| Net investment income/(loss)(a) | (0.06 | ) | (0.15 | ) | (0.05 | ) | 0.03 | (0.07 | ) | (0.06 | ) | ||||||||
| Net realized and unrealized gain/(loss) on investments | (3.69 | ) | 6.09 | 10.66 | 2.51 | 2.93 | 6.20 | ||||||||||||
| Total from Investment Operations | (3.75 | ) | 5.94 | 10.61 | 2.54 | 2.86 | 6.14 | ||||||||||||
| LESS DISTRIBUTIONS: | |||||||||||||||||||
| From capital gains | – | (1.29 | ) | – | – | – | – | ||||||||||||
| Total Distributions | – | (1.29 | ) | – | – | – | – | ||||||||||||
| NET INCREASE/(DECREASE) IN NET ASSET VALUE | (3.75 | ) | 4.65 | 10.61 | 2.54 | 2.86 | 6.14 | ||||||||||||
| NET ASSET VALUE, END OF PERIOD | $ | 43.20 | $ | 46.95 | $ | 42.30 | $ | 31.69 | $ | 29.15 | $ | 26.29 | |||||||
| TOTAL RETURN | (7.99 | )%(b) | 13.97 | % | 33.48 | % | 8.71 | % | 10.88 | % | 30.47 | % | |||||||
| RATIOS/SUPPLEMENTAL DATA: | |||||||||||||||||||
| Net Assets, End of Period (000s) | $ | 209,912 | $ | 221,638 | $ | 134,027 | $ | 61,654 | $ | 23,730 | $ | 22,062 | |||||||
| RATIOS TO AVERAGE NET ASSETS: | |||||||||||||||||||
| Net Investment income/(loss) | (0.26 | )%(c) | (0.34 | )% | (0.14 | )% | 0.11 | % | (0.25 | )% | (0.23 | )% | |||||||
| Operating expenses excluding reimbursement/waiver | 1.03 | %(c) | 1.09 | % | 1.11 | % | 1.15 | % | 1.27 | % | 1.37 | % | |||||||
| Operating expenses including reimbursement/waiver | 1.03 | %(c) | 1.09 | % | 1.11 | % | 1.15 | % | 1.27 | % | 1.37 | % | |||||||
| PORTFOLIO TURNOVER RATE | 34 | %(b) | 62 | % | 36 | % | 30 | % | 33 | % | 34 | % | |||||||
| (a) | Per share amounts are based upon average shares outstanding. |
| (b) | Not Annualized. |
| (c) | Annualized. |
See Notes to Financial Statements.
| Semi-Annual Report | October 31, 2018 | 55 |
| Emerald Banking and Finance Fund | Financial Highlights |
| For a share outstanding throughout the periods presented |
| INVESTOR CLASS | |||||||||||||||||||
For the Six Months Ended October 31, 2018 (Unaudited) | Year Ended April 30, 2018 | Year Ended April 30, 2017 | Year Ended April 30, 2016 | Year Ended April 30, 2015 | Year Ended April 30, 2014 | ||||||||||||||
| NET ASSET VALUE, BEGINNING OF PERIOD | $ | 44.05 | $ | 39.86 | $ | 29.95 | $ | 27.64 | $ | 25.01 | $ | 19.23 | |||||||
| INCOME/(LOSS) FROM OPERATIONS: | |||||||||||||||||||
| Net investment loss(a) | (0.14 | ) | (0.25 | ) | (0.16 | ) | (0.07 | ) | (0.15 | ) | (0.12 | ) | |||||||
| Net realized and unrealized gain/(loss) on investments | (3.45 | ) | 5.73 | 10.07 | 2.38 | 2.78 | 5.90 | ||||||||||||
| Total from Investment Operations | (3.59 | ) | 5.48 | 9.91 | 2.31 | 2.63 | 5.78 | ||||||||||||
| LESS DISTRIBUTIONS: | |||||||||||||||||||
| From capital gains | – | (1.29 | ) | – | – | – | – | ||||||||||||
| Total Distributions | – | (1.29 | ) | – | – | – | – | ||||||||||||
| NET INCREASE/(DECREASE) IN NET ASSET VALUE | (3.59 | ) | 4.19 | 9.91 | 2.31 | 2.63 | 5.78 | ||||||||||||
| NET ASSET VALUE, END OF PERIOD | $ | 40.46 | $ | 44.05 | $ | 39.86 | $ | 29.95 | $ | 27.64 | $ | 25.01 | |||||||
| TOTAL RETURN | (8.15 | )%(b) | 13.67 | % | 33.09 | % | 8.36 | % | 10.52 | % | 30.06 | % | |||||||
| RATIOS/SUPPLEMENTAL DATA: | |||||||||||||||||||
| Net Assets, End of Period (000s) | $ | 62,033 | $ | 71,236 | $ | 85,557 | $ | 80,404 | $ | 27,440 | $ | 19,235 | |||||||
| RATIOS TO AVERAGE NET ASSETS: | |||||||||||||||||||
| Net Investment loss | (0.62 | )%(c) | (0.60 | )% | (0.46 | )% | (0.23 | )% | (0.56 | )% | (0.53 | )% | |||||||
| Operating expenses excluding reimbursement/waiver | 1.40 | %(c) | 1.37 | % | 1.43 | % | 1.48 | % | 1.58 | % | 1.69 | % | |||||||
| Operating expenses including reimbursement/waiver | 1.40 | %(c) | 1.37 | % | 1.43 | % | 1.48 | % | 1.58 | % | 1.69 | % | |||||||
| PORTFOLIO TURNOVER RATE | 34 | %(b) | 62 | % | 36 | % | 30 | % | 33 | % | 34 | % | |||||||
| (a) | Per share amounts are based upon average shares outstanding. |
| (b) | Not Annualized. |
| (c) | Annualized. |
See Notes to Financial Statements.
| 56 | www.emeraldmutualfunds.com |
| Emerald Funds | Notes to Financial Statements |
October 31, 2018 (Unaudited)
1. ORGANIZATION
Financial Investors Trust (the “Trust”), a Delaware statutory trust, is an open-end management investment company registered under the Investment Company Act of 1940, as amended (the “1940 Act”). The Trust consists of multiple separate portfolios or series. This semi-annual report describes the Emerald Growth Fund, Emerald Small Cap Value Fund, Emerald Insights Fund, and Emerald Banking and Finance Fund (each a “Fund” and collectively, the “Funds”). The Emerald Small Cap Value Fund is a successor to a previously operational fund which was a series of Elessar Funds Investment Trust, a Delaware statutory trust, and was organized into a series of the Trust effective as of the close of business on June 26, 2015. Effective March 3, 2015, the Board approved changing the fiscal year end of the Emerald Small Cap Value Fund from September 30 to April 30.
The Emerald Growth Fund and Emerald Insights Fund seek to achieve long-term growth through capital appreciation. The Emerald Small Cap Value Fund seeks long-term capital appreciation. The Emerald Banking and Finance Fund seeks to achieve long term growth through capital appreciation with income as a secondary objective.
2. SIGNIFICANT ACCOUNTING POLICIES
The accompanying financial statements were prepared in accordance with accounting principles generally accepted in the United States of America (“U.S. GAAP”). The preparation of financial statements in conformity with U.S. GAAP requires management to make certain estimates and assumptions that affect the reported amounts of assets and liabilities and disclosures of contingent assets and liabilities at the date of the financial statements and the reported amounts of revenue and expenses during the period. Actual results could differ from those estimates. The Funds are considered an investment company for financial reporting purposes under U.S. GAAP and follows the accounting and reporting guidance applicable to investment companies in the Financial Accounting Standards Board Accounting Standards Codification Topic 946. The following is a summary of significant accounting policies consistently followed by the Funds in preparation of their financial statements.
Investment Valuation: The Funds generally value their securities based on market prices determined at the close of regular trading on the New York Stock Exchange (“NYSE”), normally, 4:00 p.m. Eastern time, on each business day the NYSE is open for trading.
For equity securities and mutual funds that are traded on an exchange, the market price is usually the closing sale or official closing price on that exchange. In the case of equity securities not traded on an exchange, or if such closing prices are not otherwise available, the securities are valued at the mean of the most recent bid and ask prices on such day. Redeemable securities issued by open-end registered investment companies are valued at the investment company’s applicable net asset value, with the exception of exchange-traded open-end investment companies, which are priced as equity securities.
The market price for debt obligations is generally the price supplied by an independent third-party pricing service approved by the Board of Trustees (the “Board”), which may use a matrix, formula or other objective method that takes into consideration quotations from dealers, market transactions in comparable investments, market indices and yield curves. If vendors are unable to supply a price, or if the price supplied is deemed to be unreliable, the market price may be determined using quotations received from one or more brokers-dealers that make a market in the security.
Equity securities that are primarily traded on foreign securities exchanges are valued at the preceding closing values of such securities on their respective exchanges, except when an occurrence subsequent to the time a value was so established is likely to have changed such value. In such an event, the fair values of those securities are determined in good faith through consideration of other factors in accordance with procedures established by and under the general supervision of the Board.
When such prices or quotations are not available, or when Emerald Mutual Fund Advisers Trust, (the “Adviser”), believes that they are unreliable, securities may be priced using fair value procedures approved by the Board.
Fair Value Measurements: A three-tier hierarchy has been established to classify fair value measurements for disclosure purposes. Inputs refer broadly to the assumptions that market participants would use in pricing the asset or liability, including assumptions about risk. Inputs may be observable or unobservable. Observable inputs are inputs that reflect the assumptions market participants would use in pricing the asset or liability that are developed based on market data obtained from sources independent of the reporting entity. Unobservable inputs are inputs that reflect the reporting entity’s own assumptions about the assumptions market participants would use in pricing the asset or liability that are developed based on the best information available. Various inputs are used in determining the value of each Fund’s investments as of the reporting period end. The designated input levels are not necessarily an indication of the risk or liquidity associated with these investments.
These inputs are categorized in the following hierarchy under applicable financial accounting standards:
| Level 1 – | Unadjusted quoted prices in active markets for identical investments, unrestricted assets or liabilities that the Funds have the ability to access at the measurement date; |
Level 2 – | Quoted prices which are not active, quoted prices for similar assets or liabilities in active markets or inputs other than quoted prices that are observable (either directly or indirectly) for substantially the full term of the asset or liability; and |
| Semi-Annual Report | October 31, 2018 | 57 |
| Emerald Funds | Notes to Financial Statements |
| October 31, 2018 (Unaudited) |
Level 3 – | Significant unobservable prices or inputs (including the Funds’ own assumptions in determining the fair value of investments) where there is little or no market activity for the asset or liability at the measurement date. |
The following is a summary of each input used to value the Funds as of October 31, 2018:
| Investments in Securities at Value | Level 1 - Quoted Prices | Level 2 - Other Significant Observable Inputs | Level 3 - Significant Unobservable Inputs | Total | ||||||||||||
| Emerald Growth Fund | ||||||||||||||||
| Common Stocks(a) | $ | 1,215,507,388 | $ | – | $ | – | $ | 1,215,507,388 | ||||||||
| Short Term Investments | 33,558,289 | – | – | 33,558,289 | ||||||||||||
| TOTAL | $ | 1,249,065,677 | $ | – | $ | – | $ | 1,249,065,677 | ||||||||
| Investments in Securities at Value | Level 1 - Quoted Prices | Level 2 - Other Significant Observable Inputs | Level 3 - Significant Unobservable Inputs | Total | ||||||||||||
| Emerald Small Cap Value Fund | ||||||||||||||||
| Common Stocks | ||||||||||||||||
| Financial Services | $ | 3,275,876 | $ | 74,127 | $ | – | $ | 3,350,003 | ||||||||
| Other(a) | 3,413,729 | – | – | 3,413,729 | ||||||||||||
| Short Term Investments | 77,803 | – | – | 77,803 | ||||||||||||
| TOTAL | $ | 6,767,408 | $ | 74,127 | $ | – | $ | 6,841,535 | ||||||||
| Investments in Securities at Value | Level 1 - Quoted Prices | Level 2 - Other Significant Observable Inputs | Level 3 - Significant Unobservable Inputs | Total | ||||||||||||
| Emerald Insights Fund | ||||||||||||||||
| Common Stocks(a) | $ | 10,097,129 | $ | – | $ | – | $ | 10,097,129 | ||||||||
| Master Limited Partnerships(a) | 41,329 | – | – | 41,329 | ||||||||||||
| Short Term Investments | 243,234 | – | – | 243,234 | ||||||||||||
| TOTAL | $ | 10,381,692 | $ | – | $ | – | $ | 10,381,692 | ||||||||
| Investments in Securities at Value | Level 1 - Quoted Prices | Level 2 - Other Significant Observable Inputs | Level 3 - Significant Unobservable Inputs | Total | ||||||||||||
| Emerald Banking and Finance Fund | ||||||||||||||||
| Common Stocks | ||||||||||||||||
| Banks: Diversified | $ | 337,043,256 | $ | 8,697,568 | $ | – | $ | 345,740,824 | ||||||||
| Banks: Savings, Thrift & Mortgage Lending | 32,418,154 | 2,550,000 | – | 34,968,154 | ||||||||||||
| Other(a) | 102,148,018 | – | – | 102,148,018 | ||||||||||||
| Short Term Investments | 8,495,316 | – | – | 8,495,316 | ||||||||||||
| TOTAL | $ | 480,104,744 | $ | 11,247,568 | $ | – | $ | 491,352,312 | ||||||||
| (a) | For detailed descriptions of sector and industry, see the accompanying Schedule of Investments. |
For the six months ended October 31, 2018, the Funds did not have any securities that used significant unobservable inputs (Level 3) in determining fair value.
Investment Transactions and Investment Income: Investment transactions are accounted for on the date the investments are purchased or sold (trade date). Realized gains and losses from investment transactions are reported on an identified cost basis, which is the same basis the Funds use for federal income tax purposes. Interest income, which includes accretion of discounts, is accrued and recorded as earned. Dividend income is recognized on the ex-dividend date or for certain foreign securities, as soon as information is available to the Funds. All of the realized and unrealized gains and losses and net investment income, are allocated daily to each class in proportion to its average daily net assets.
| 58 | www.emeraldmutualfunds.com |
| Emerald Funds | Notes to Financial Statements |
| October 31, 2018 (Unaudited) |
Real Estate Investment Trusts (“REITs”): The Funds may invest a portion of their assets in REITs and are subject to certain risks associated with direct investment in REITs. REITs may be affected by changes in the value of their underlying properties and by defaults by borrowers or tenants. REITs depend generally on their ability to generate cash flow to make distributions to shareowners, and certain REITs have self-liquidation provisions by which mortgages held may be paid in full and distributions of capital returns may be made at any time. In addition, the performance of a REIT may be affected by its failure to qualify for tax-free pass-through of income under the Internal Revenue Code of 1986, as amended (the “Code”), or its failure to maintain exemption from registration under the 1940 Act. A Fund’s investments in REITs may result in such Fund’s receipt of cash in excess of the REITs’ earnings. If the Fund receives such distributions all or a portion of these distributions will constitute a return of capital to such Fund. Receiving a return of capital distribution from REITs will reduce the amount of income available to be distributed to Fund shareholders. Income from REITs generally will not be eligible for treatment as qualified dividend income. As the final character of the distributions is not known until reported by the REITs on their 1099s, the Funds utilize an average of the prior year’s reallocation information as an estimate for the current year character of distributions.
Trust Expenses: Some expenses of the Trust can be directly attributed to the Funds. Expenses which cannot be directly attributed to the Funds are apportioned among all funds in the Trust based on average net assets of each fund.
Fund and Class Expenses: Expenses that are specific to a Fund or class of shares of a Fund, including distribution fees (Rule 12b-1 fees) and shareholder servicing fees, are charged directly to that Fund or share class. All expenses of a Fund, other than class specific expenses, are allocated daily to each class in proportion to its average daily net assets. Expenses that are common to the Funds generally are allocated among the Funds in proportion to their average daily net assets.
Federal Income Taxes: Each Fund complies with the requirements under Subchapter M of the Internal Revenue Code of 1986, as amended, applicable to regulated investment companies and intends to distribute substantially all of its net taxable income and net capital gains, if any, each year so that the Funds will not be subject to excise tax on undistributed income and gains. The Funds are not subject to income taxes to the extent such distributions are made.
As of and during the six months ended October 31, 2018, the Funds did not have a liability for any unrecognized tax benefits. The Funds file U.S. federal, state, and local tax returns as required. The Funds’ tax returns are subject to examination by the relevant tax authorities until expiration of the applicable statute of limitations, which is generally three years after the filing of the tax return for federal purposes and four years for most state returns. Tax returns for open years have incorporated no uncertain tax positions that require a provision for income taxes.
Distributions to Shareholders: Each Fund normally pays dividends and distributes capital gains, if any, on an annual basis. Income dividend distributions are derived from dividends and other income each Fund receives from its investments, including short-term capital gains. Long term capital gain distributions are derived from gains realized when each Fund sells a security it has owned for more than a year. Each Fund may make additional distributions and dividends at other times if the portfolio manager believes doing so may be necessary for each Fund to avoid or reduce taxes.
3. TAX BASIS INFORMATION
Tax Basis of Investments: As of October 31, 2018, the aggregate cost of investments, gross unrealized appreciation/(depreciation) and net unrealized appreciation/(depreciation) for Federal tax purposes was as follows:
Gross Appreciation (excess of value over tax cost) | Gross Depreciation (excess of tax cost over value) | Net Unrealized Appreciation/ (Depreciation) | Cost of Investments for Income Tax Purposes | |||||||||||||
| Emerald Growth Fund | $ | 332,768,406 | $ | (84,489,125 | ) | $ | 248,279,281 | $ | 1,000,786,396 | |||||||
| Emerald Small Cap Value Fund | 723,883 | (614,606 | ) | 109,277 | 6,732,258 | |||||||||||
| Emerald Insights Fund | 1,464,127 | (810,040 | ) | 654,087 | 9,727,605 | |||||||||||
| Emerald Banking and Finance Fund | 78,568,065 | (25,404,785 | ) | 53,163,280 | 438,189,032 | |||||||||||
Tax Basis of Distributions to Shareholders: The character of distributions made during the year from net investment income or net realized gains may differ from its ultimate characterization for federal income tax purposes. Also, due to the timing of dividend distributions, the fiscal year in which amounts are distributed may differ from the fiscal year in which the income or realized gain were recorded by each Fund.
| Semi-Annual Report | October 31, 2018 | 59 |
| Emerald Funds | Notes to Financial Statements |
| October 31, 2018 (Unaudited) |
The tax characters of distributions paid by the Funds for the fiscal year ended April 30, 2018 were as follows:
Ordinary Income | Long-Term Capital Gain | |||||||
| Emerald Growth Fund | $ | – | $ | – | ||||
| Emerald Small Cap Value Fund | 506,928 | 2,912,564 | ||||||
| Emerald Insights Fund | – | – | ||||||
| Emerald Banking and Finance Fund | – | 14,572,442 | ||||||
The amounts and characteristics of tax basis distributions and composition of distributable earnings/(accumulated losses) are finalized at fiscal year-end. Accordingly, tax basis balances have not been determined as of October 31, 2018.
4. SECURITIES TRANSACTIONS
The cost of purchases and proceeds from sales of securities (excluding short-term securities) during the six months ended October 31, 2018 was as follows:
| Funds | Cost of Investments Purchased | Proceeds from Investments Sold | ||||||
| Emerald Growth Fund | $ | 492,634,967 | $ | 480,726,527 | ||||
| Emerald Small Cap Value Fund | 4,799,152 | 4,693,863 | ||||||
| Emerald Insights Fund | 3,423,354 | 3,953,319 | ||||||
| Emerald Banking and Finance Fund | 188,900,184 | 204,376,853 | ||||||
5. SHARES OF BENEFICIAL INTEREST
The capitalization of the Trust consists of an unlimited number of shares of beneficial interest with no par value per share. Holders of the shares of the Funds of the Trust have one vote for each share held and a proportionate fraction of a vote for each fractional share. All shares issued and outstanding are fully paid and are transferable and redeemable at the option of the shareholder. Purchasers of the shares do not have any obligation to make payments to the Trust or its creditors (other than the purchase price for the shares) or make contributions to the Trust or its creditors solely by reason of the purchaser’s ownership of the shares. Shares have no pre-emptive rights.
6. MANAGEMENT AND RELATED-PARTY TRANSACTIONS
The Adviser, subject to the authority of the Board, is responsible for the overall management and administration of the Funds’ business affairs. The Adviser manages the investments of the Funds in accordance with the Funds’ investment objective, policies and limitations and investment guidelines established jointly by the Adviser and the Trustees. Pursuant to the Advisory Agreement, the Funds pay the Adviser fees for the services and facilities it provides payable on a monthly basis at the annual rate set forth below of the Funds’ average daily net assets. The management fee is paid on a monthly basis.
| Emerald Growth Fund | |
| Average Total Net Assets | Contractual Fee |
| Up to and including $250M | 0.75% |
| Over $250M and including $500M | 0.65% |
| Over $500M and including $750M | 0.55% |
| Over $750M | 0.45% |
| Emerald Small Cap Value Fund | |
| Average Total Net Assets | Contractual Fee |
| Up to and including $250M | 0.75% |
| Over $250M and including $500M | 0.65% |
| Over $500M and including $750M | 0.55% |
| Over $750M | 0.45% |
| 60 | www.emeraldmutualfunds.com |
| Emerald Funds | Notes to Financial Statements |
| October 31, 2018 (Unaudited) |
| Emerald Insights Fund | |
| Average Total Net Assets | Contractual Fee |
| Up to and including $250M | 0.75% |
| Over $250M and including $500M | 0.65% |
| Over $500M and including $750M | 0.55% |
| Over $750M | 0.45% |
| Emerald Banking and Finance Fund | |
| Average Total Net Assets | Contractual Fee |
| Up to and including $100M | 1.00% |
| Over $100M | 0.90% |
The Adviser has contractually agreed to limit each Fund’s total annual operating expenses (exclusive of acquired fund fees and expenses, brokerage expenses, interest expenses, taxes and extraordinary expense) set forth in the preceding table for Class A, Class C, Institutional Class, and Investor Class shares to the annual rates (as percentages of a Fund’s average daily net assets). This agreement (the “Expense Agreement”) is in effect from September 1, 2018 through August 31, 2019. The prior Expense Agreement was in effect from September 1, 2017 through August 31, 2018 for the Funds. The Adviser will be permitted to recover, on a class-by-class basis, expenses it has borne through the expense agreement to the extent that a Fund’s expenses in later periods fall below the expense cap in effect at the time of the waiver or reimbursement. Notwithstanding the foregoing, the Funds will not be obligated to pay any such fees and expenses more than three years after the date of the waiver or reimbursement. The Adviser may not discontinue this waiver, prior to August 31, 2019, without the approval by the Fund’s Board. Fees waived/reimbursed by the Adviser for the six months ended October 31, 2018 are disclosed in the Statements of Operations.
| Emerald Growth Fund | |||
| Class A | Class C | Institutional Class | Investor Class |
| 1.29% | 1.94% | 0.99% | 1.34% |
| Emerald Small Cap Value Fund | |||
| Class A | Class C | Institutional Class | Investor Class |
| 1.35% | 2.00% | 1.00% | 1.25% |
| Emerald Insights Fund | |||
| Class A | Class C | Institutional Class | Investor Class |
| 1.35% | 2.00% | 1.05% | 1.40% |
| Emerald Banking and Finance Fund | |||
| Class A | Class C | Institutional Class | Investor Class |
| 1.84% | 2.49% | 1.54% | 1.89% |
| Semi-Annual Report | October 31, 2018 | 61 |
| Emerald Funds | Notes to Financial Statements |
| October 31, 2018 (Unaudited) |
For the six months ended October 31, 2018, the fee waivers/reimbursements and recoupments of past waived fees were as follows:
| Fund | Fees Waived/ Reimbursed By Adviser | Recoupment of Past Waived Fees By Adviser | ||||||
| Emerald Growth Fund | ||||||||
| Class A | $ | – | $ | – | ||||
| Class C | – | – | ||||||
| Institutional Class | – | – | ||||||
| Investor Class | – | – | ||||||
| Emerald Small Cap Value Fund | ||||||||
| Class A | $ | 28,995 | $ | – | ||||
| Class C | 554 | – | ||||||
| Institutional Class | 16,251 | – | ||||||
| Investor Class | 3,805 | – | ||||||
| Emerald Insights Fund | ||||||||
| Class A | $ | 37,484 | $ | – | ||||
| Class C | 460 | – | ||||||
| Institutional Class | 5,083 | – | ||||||
| Investor Class | 418 | – | ||||||
| Emerald Banking and Finance Fund | ||||||||
| Class A | $ | – | $ | – | ||||
| Class C | – | – | ||||||
| Institutional Class | – | – | ||||||
| Investor Class | – | – | ||||||
As of October 31, 2017, the balances of recoupable expenses for each Fund were as follows:
| Fund | Expires 2019 | Expires 2020 | Expires 2021 | Expires 2022 | Total | |||||||||||||||
| Emerald Growth Fund | ||||||||||||||||||||
| Class A | $ | – | $ | – | $ | – | $ | – | $ | – | ||||||||||
| Class C | – | – | – | – | – | |||||||||||||||
| Institutional Class | – | – | – | – | – | |||||||||||||||
| Investor Class | – | – | – | – | – | |||||||||||||||
| Emerald Small Cap Value Fund | ||||||||||||||||||||
| Class A | $ | 251 | $ | 6,552 | $ | 32,984 | $ | 28,995 | $ | 68,782 | ||||||||||
| Class C | 612 | 4,441 | 1,410 | 554 | 7,017 | |||||||||||||||
| Institutional Class | 58,075 | 67,421 | 53,258 | 16,251 | 195,005 | |||||||||||||||
| Investor Class | 5,540 | 8,254 | 7,303 | 3,805 | 24,902 | |||||||||||||||
| Emerald Insights Fund | ||||||||||||||||||||
| Class A | $ | 43,036 | $ | 80,509 | $ | 72,407 | $ | 37,484 | $ | 233,436 | ||||||||||
| Class C | 357 | 793 | 908 | 460 | 2,518 | |||||||||||||||
| Institutional Class | 4,793 | 9,737 | 8,238 | 5,083 | 27,851 | |||||||||||||||
| Investor Class | 1,154 | 615 | 693 | 418 | 2,880 | |||||||||||||||
| Emerald Banking and Finance Fund | ||||||||||||||||||||
| Class A | $ | – | $ | – | $ | – | $ | – | $ | – | ||||||||||
| Class C | – | – | – | – | – | |||||||||||||||
| Institutional Class | – | – | – | – | – | |||||||||||||||
| Investor Class | – | – | – | – | – | |||||||||||||||
Fund Administrator Fees and Expenses: ALPS Fund Services, Inc. (“ALPS”) serves as administrator to the Funds and the Funds have agreed to pay expenses incurred in connection with their administrative activities. Pursuant to an Administration Agreement, ALPS provides operational services to the Funds including, but not limited to, fund accounting and fund administration and generally assist in the Funds’ operations. Officers of the Trust are employees of ALPS. The Funds’ administration fee is accrued on a daily basis and paid monthly. Administration fees paid by the Funds for the six months ended October 31, 2018 are disclosed in the Statements of Operations.
The Administrator is also reimbursed by the Funds for certain out-of-pocket expenses.
| 62 | www.emeraldmutualfunds.com |
| Emerald Funds | Notes to Financial Statements |
| October 31, 2018 (Unaudited) |
Transfer Agent: ALPS serves as transfer, dividend paying and shareholder servicing agent for the Funds. ALPS receives an annual minimum fee, a fee based upon the number of shareholder accounts, and is also reimbursed by the Funds for certain out-of-pocket expenses. Transfer agent fees paid by the Funds for the six months ended October 31, 2018 are disclosed in the Statements of Operations.
Compliance Services: ALPS provides services that assist the Trust’s chief compliance officer in monitoring and testing the policies and procedures of the Trust in conjunction with requirements under Rule 38a-1 under the 1940 Act and receives an annual base fee. ALPS is reimbursed for certain out-of-pocket expenses by the Funds. Compliance service fees paid by the Funds for the six months ended October 31, 2018 are disclosed in the Statements of Operations.
Principal Financial Officer: ALPS receives an annual fee for providing principal financial officer services to the Funds. Principal financial officer fees paid by the Funds for the six months ended October 31, 2018 are disclosed in the Statements of Operations.
Distributor: ALPS Distributors, Inc. (“ADI” or the “Distributor”) (an affiliate of ALPS) acts as the distributor of the Funds’ shares pursuant to a Distribution Agreement with the Trust. Shares are sold on a continuous basis by ADI as agent for the Funds, and ADI has agreed to use its best efforts to solicit orders for the sale of Funds’ shares, although it is not obliged to sell any particular amount of shares. ADI is not entitled to any compensation for its services as Distributor. ADI is registered as a broker-dealer with the U.S. Securities and Exchange Commission.
Each Fund has adopted a separate Distribution and Services Plan (each a “Plan” and collectively, the “Plans”) pursuant to Rule 12b-1 of the 1940 Act. The Plans allow each Fund, as applicable, to use each Fund’s assets to pay fees in connection with the distribution and marketing of the Funds’ shares and/or the provision of shareholder services to the Funds’ shareholders. The Plan permits payment for services in connection with the administration of plans or programs that use shares of each Fund as their funding medium and for related expenses. The recipients of such payments may include other affiliates of the Adviser, broker-dealers, financial institutions, plan sponsors and administrators and other financial intermediaries through which investors may purchase shares of the Fund. The Plans permit each Fund to make total payments at an annual rate of up to 0.35%, 0.75% and 0.25% of the average daily net asset value of Class A, Class C and Investor Class, respectively. Because these fees are paid out of the Funds’ assets on an ongoing basis, over time they will increase the cost of an investment in the Funds, and Plan fees may cost an investor more than other types of sales charges.
Each Fund, except the Emerald Small Cap Value Fund, has adopted a Shareholder Services Plan (a “Shareholder Services Plan”) with respect to its Class C, Institutional Class and Investor Class shares. Under the Shareholder Services Plan, a Fund is authorized to compensate certain financial intermediaries, including broker-dealers and Fund affiliates which may include the Distributor, Adviser and/or the transfer agent (the “Participating Organizations”), an aggregate fee in an amount not to exceed on an annual basis 0.25%, 0.05% and 0.15% of the average daily net asset value of Class C, Institutional Class and Investor Class, respectively, of the Funds attributable to or held in the name of the Participating Organizations pursuant to an agreement with such Participating Organizations (the “Agreement”). Each Agreement will set forth the non-distribution related shareholder services to be performed by the Participating Organizations for the benefit of a Fund’s shareholders who have elected to have such Participating Organizations service their accounts. Any amount of such payment not paid to Participating Organizations during a Fund’s fiscal year for such service activities shall be reimbursed to the Fund as soon as practicable. Shareholder Services Plan fees are included with distribution and service fees in the Statements of Operations. Fees recaptured pursuant to the Shareholder Services Plan for the six months ended October 31, 2018 are included as an offset to distribution and service fees as disclosed in the Statements of Operations.
The Emerald Small Cap Value Fund has adopted a Shareholder Services Plan (the “Plan”) with respect to its Class C shares. Under the Plan, the Fund is authorized to pay banks and its affiliates and other institutions, including broker-dealers and Fund affiliates which may include the Distributor, Adviser and/or the transfer agent (“Class C Participating Organizations”), an aggregate fee in an amount not to exceed on an annual basis 0.25% of the average daily net asset value of Class C shares of the Fund attributable to or held in the name of the Participating Organizations for its clients as compensation for providing shareholder service activities, which do not include distribution services pursuant to an agreement with Participating Organizations. Any amount of such payment not paid to the Participating Organizations during the Fund’s fiscal year for such service activities shall be reimbursed to the Fund as soon as practicable. Plan fees are included with distribution and service fees in the Statements of Operations. Fees recaptured pursuant to the Plan for the six months ended October 31, 2018 are included as an offset to distribution and service fees as disclosed in the Statements of Operations.
7. INDEMNIFICATIONS
Under the Trust’s organizational documents, its officers and Trustees are indemnified against certain liability arising out of the performance of their duties to the Trust. Additionally, in the normal course of business, the Trust enters into contracts with service providers that may contain general indemnification clauses, which may permit indemnification to the extent permissible under applicable law. The Trust’s maximum exposure under these arrangements is unknown, as this would involve future claims that may be made against the Trust that have not yet occurred.
| Semi-Annual Report | October 31, 2018 | 63 |
| Emerald Funds | Notes to Financial Statements |
| October 31, 2018 (Unaudited) |
8. NEW ACCOUNTING PRONOUNCEMENTS
On October 4, 2018, the SEC amended Regulation S-X to require certain financial statement disclosure requirements to conform them to US GAAP for investment companies. Effective November 4, 2018, the Funds adopted disclosure requirement changes for Regulation S-X and these changes are reflected throughout this report. The Funds’ adoption of those amendments, effective with the financial statements prepared as of October 31, 2018, had no effect on the Funds’ net assets or results of operations.
In August 2018, the Financial Accounting Standards Board (“FASB”) issued Accounting Standards Update (“ASU”) 2018-13, which changes the fair value measurement disclosure requirements of FASB Accounting Standards Codification Topic 820, Fair Value Measurement. The update to Topic 820 includes new, eliminated, and modified disclosure requirements. ASU 2018-13 is effective for fiscal years beginning after December 15, 2019, including interim periods. Early adoption is permitted for any eliminated or modified disclosures. Management is currently evaluating the impact of the ASU to the Funds’ financial statements.
9. SUBSEQUENT EVENTS
Subsequent events after the date of the Statements of Assets and Liabilities have been evaluated through the date the financial statements were issued.
| 64 | www.emeraldmutualfunds.com |
| Emerald Funds | Disclosure Regarding Approval of Fund Advisory Agreement |
| October 31, 2018 (Unaudited) |
On May 21, 2018, the Trustees met in person to discuss, among other things, the approval of the Investment Advisory Agreement between the Trust and Emerald, in accordance with Section 15(c) of the 1940 Act. In approving the Investment Advisory Agreement, the Trustees, including the Independent Trustees, considered the following factors with respect to the Emerald Funds:
Nature, Extent, and Quality of the Services under the Investment Advisory Agreement: The Trustees received and considered information regarding the nature, extent, and quality of services to be provided to each Fund under the Investment Advisory Agreement. The Trustees reviewed certain background materials supplied by Emerald in its presentation, including its Form ADV. The Trustees reviewed and considered Emerald’s investment advisory personnel, its history as an asset manager, and its performance and the amount of assets currently under management by Emerald and its affiliated entities. The Trustees also noted the research and decision-making processes utilized by Emerald, including the methods adopted to seek to achieve compliance with the investment objectives, policies, and restrictions of each Fund.
The Trustees considered the background and experience of Emerald’s management in connection with each Fund, including reviewing the qualifications, backgrounds, and responsibilities of the management team primarily responsible for the day-to-day portfolio management of each Fund.
The Trustees also reviewed, among other things, Emerald’s Code of Ethics.
Investment Advisory Fee Rate: The Trustees reviewed and considered the contractual annual advisory fee to be paid by the Trust, on behalf of each Fund, to Emerald of 1.00% of the Emerald Banking and Finance Fund’s daily average net asset up to and including $100 million and 0.90% in excess of $100 million and 0.75% of each of the other Fund’s daily average net assets up to and including $250 million, 0.65% in excess of $250 million and up to and including $500 million, 0.55% in excess of $500 million and up to and including $750 million, and 0.45% in excess of $750 million, in light of the extent and quality of the advisory services provided by Emerald to the Funds.
The Board received and considered information including a comparison of each Fund’s contractual advisory fees and total expenses (net of waivers) with those of funds in the expense groups and universes of funds provided by an independent provider of investment company data (the “Data Provider”). The Trustees noted that the Banking and Finance Fund’s contractual advisory fee rate, for each share class, was above its Data Provider peer group median contractual advisory fee rate. The Trustees further noted that each of the other Fund’s contractual advisory fee rates, for each share class, were at or below their respective Data Provider peer group median contractual advisory fee rates.
Total Expense Ratios: The Trustees further reviewed and considered the total expense ratios (after waivers) of 1.43% for Class A, 2.08% for Class C, 1.14% for Institutional Class, and 1.48% for Investor Class of the Emerald Banking and Finance Fund; 1.08% for Class A, 1.73% for Class C, 0.77% for Institutional Class, and 1.13% for Investor Class of the Emerald Growth Fund; 1.35% for Class A, 2.00% for Class C, 1.05% for Institutional Class, and 1.40% for Investor Class of the Emerald Insights Fund; and 1.35% for Class A, 2.00% for Class C, 1.00% for Institutional Class, and 1.25% for Investor Class of the Emerald Small Cap Value Fund.
The Trustees noted that the total expense ratios (after waivers) for all classes of the Emerald Growth Fund and the Emerald Insights Fund were below or equal to the applicable Data Provider median total expense ratios (after waivers). The Trustees also noted that the total expense ratios (after waivers) for all classes of Emerald Banking and Finance Fund were greater or equal to the applicable Data Provider median total expense ratios (after waivers). The Trustees also noted that the total expense ratios (after waivers) for Class C, Institutional Class, and Investor Class of Emerald Small Cap Value Fund were below or equal to the applicable Data Provider median total expense ratios (after waivers) and for Class A were above.
Performance: The Trustees reviewed performance information for each Fund for the 3-month, 1-year, 3-year, 5-year, 10-year, and since inception periods ended March 31, 2018, as applicable. That review included a comparison of each Fund’s performance to the performance of the group of comparable funds selected by the Data Provider. The Trustees noted that the performance of all of the share classes of the Emerald Small Cap Value Fund for the available time periods were above their respective Data Provider universe median; the performance of all of the share classes of the other Emerald Banking and Finance Fund for the available time periods were above their respective Data Provider universe median, except for the one-year period; the performance of all of the share classes of the Emerald Growth Fund were generally above their respective Data Provider universe median, except for the 3-month time period; and the performance of all of the share classes of the Emerald Insights Fund were below their respective Data Provider universe median.
Comparable Accounts: The Trustees noted certain information provided by Emerald regarding fees charged to its other clients utilizing a strategy similar to that employed by each Fund.
Profitability: The Trustees received and considered a retrospective and projected profitability analysis prepared by Emerald based on the fees payable under the Investment Advisory Agreement with respect to each Fund. The Trustees considered the profits, if any, anticipated to be realized by Emerald in connection with the operation of each Fund. The Board then reviewed Emerald Advisers, Inc.’s audited consolidated financial statements for the years ended September 30, 2017 and 2016 in order to analyze the financial condition and stability and profitability of Emerald. The Board also discussed the investment to be made by 1251 Capital.
| Semi-Annual Report | October 31, 2018 | 65 |
| Emerald Funds | Disclosure Regarding Approval of Fund Advisory Agreement |
| October 31, 2018 (Unaudited) |
Economies of Scale: The Trustees considered whether economies of scale in the provision of services to each Fund will be passed along to the shareholders under the Investment Advisory Agreement, noting that each Fund had breakpoints in its advisory fee schedule.
Other Benefits to the Adviser: The Trustees reviewed and considered any other incidental benefits derived or to be derived by Emerald from its relationship with each Fund, including whether soft dollar arrangements would be used.
In renewing Emerald as the Funds’ investment adviser and approving the Investment Advisory Agreement and the fees charged under the Investment Advisory Agreement, the Trustees concluded that no single factor reviewed by the Trustees was identified by the Trustees to be determinative as the principal factor in whether to approve the Investment Advisory Agreement. Further, the Independent Trustees were advised by separate independent legal counsel throughout the process. The Trustees, including all of the Independent Trustees, concluded that:
| ● | the nature, extent, and quality of services to be rendered by Emerald under the Investment Advisory Agreement with respect to each Fund would be adequate; |
| ● | the Banking and Finance Fund’s contractual advisory fee rate, for each share class, was above its Data Provider peer group median contractual advisory fee rate, and for each of the other Fund’s contractual advisory fee rates, for each share class, were at or below their respective Data Provider peer group median contractual advisory fee rates; |
| ● | the total expense ratios (after waivers) for all classes of the Emerald Growth Fund and the Emerald Insights Fund were below or equal to the applicable Data Provider median total expense ratios (after waivers). The Trustees also noted that the total expense ratios (after waivers) for all classes of Emerald Banking and Finance Fund were greater or equal to the applicable Data Provider median total expense ratios (after waivers). The Trustees also noted that the total expense ratios (after waivers) for Class C, Institutional Class, and Investor Class of Emerald Small Cap Value Fund were below or equal to the applicable Data Provider median total expense ratios (after waivers) and for Class A were above; |
| ● | performance of all of the share classes of the Emerald Small Cap Value Fund for the available time periods were above their respective Data Provider universe median; the performance of all of the share classes of the other Emerald Banking and Finance Fund for the available time periods were above their respective Data Provider universe median, except for the one-year period; the performance of all of the share classes of the Emerald Growth Fund were generally above their respective Data Provider universe median, except for the 3-month time period; and the performance of all of the share classes of the Emerald Insights Fund were below their respective Data Provider universe median; |
| ● | bearing in mind the limitations of comparing different types of managed accounts and the different levels of service typically associated with such accounts, the fee structures applicable to Emerald’s other clients employing a comparable strategy to a Fund were not indicative of any unreasonableness with respect to the advisory fees proposed to be payable by that Fund; |
| ● | the profit, if any, realized by Emerald in connection with the operation of a Fund is not unreasonable to that Fund; and |
| ● | there were no material economies of scale or other incidental benefits accruing to Emerald in connection with its relationship with a Fund, other than noting that each fund had breakpoints in its advisory fee schedule. |
Based on the Trustees’ deliberations and their evaluation of the information described above, the Trustees, including all of the Independent Trustees, concluded that Emerald’s compensation for investment advisory services is consistent with the best interests of the Funds and their shareholders.
| 66 | www.emeraldmutualfunds.com |
| Emerald Funds | Additional Information |
| October 31, 2018 (Unaudited) |
1. FUND HOLDINGS
The Funds file their complete schedule of portfolio holdings with the Securities and Exchange Commission (the “SEC”) for the first and third quarters of each fiscal year on Form N-Q within 60 days after the end of the period. Copies of the Funds’ Form N-Q are available without charge on the SEC website at http://www.sec.gov. You may also review and copy the Form N-Q at the SEC’s Public Reference Room in Washington, DC. For more information about the operation of the Public Reference Room, please call the SEC at 1-800-SEC-0330.
2. FUND PROXY VOTING POLICIES, PROCEDURES AND SUMMARIES
Each Fund’s policies and procedures used in determining how to vote proxies and information regarding how the Funds voted proxies relating to portfolio securities during the most recent prior 12-month period ending June 30 are available without charge, (1) upon request, by calling (toll-free) (855) 828-9909 and (2) on the SEC’s website at http://www.sec.gov.
| Semi-Annual Report | October 31, 2018 | 67 |
| Emerald Funds | Shareholder Voting Results |
| October 31, 2018 (Unaudited) |
A Special Meeting of Shareholders of the Emerald Growth Fund was held on September 26, 2018. Shareholders of record as of the close of business on July 17, 2018 voted to approve the following proposal:
Proposal: To approve a new Advisory Agreement among Financial Investors Trust, on behalf of the Emerald Growth Fund, and Emerald Mutual Advisers Trust.
| Shares Voted in Favor | Shares Voted Against or Abstentions | |
| 19,836,585 | 4,307,914 |
| 68 | www.emeraldmutualfunds.com |
| Emerald Funds | Privacy Policy |
| Who We Are | |
| Who is providing this notice? | Emerald Banking and Finance Fund, Emerald Growth Fund, Emerald Insights Fund and Emerald Small Cap Value Fund |
| What We Do | |
| How do the Funds protect my personal information? | To protect your personal information from unauthorized access and use, we use security measures that comply with federal law. These measures include computer safeguards and secured files and buildings. |
| How do the Funds collect my personal information? | We collect your personal information, for example, when you
● open an account ● provide account information or give us your contact information ● make a wire transfer or deposit money |
| Why can’t I limit all sharing? | Federal law gives you the right to limit only
● sharing for affiliates’ everyday business purposes-information about your creditworthiness ● affiliates from using your information to market to you ● sharing for non-affiliates to market to you
State laws and individual companies may give you additional rights to limit sharing. |
| Definitions | |
| Affiliates | Companies related by common ownership or control. They can be financial and nonfinancial companies. |
| Non-affiliates | Companies not related by common ownership or control. They can be financial and nonfinancial companies.
● The Funds do not share with non-affiliates so they can market to you. |
| Joint marketing | A formal agreement between non-affiliated financial companies that together market financial products or services to you.
● The Funds do not jointly market. |
| Other Important Information | |
| California residents | If your account has a California home address, your personal information will not be disclosed to nonaffiliated third parties except as permitted by applicable California law, and we will limit sharing such personal information with our affiliates to comply with California privacy laws that apply to us. |
| Vermont residents | The State of Vermont requires financial institutions to obtain your consent prior to sharing personal information that they collect about you with affiliated companies and nonaffiliated third parties other than in certain limited circumstances. Except as permitted by law, we will not share personal information we collect about you with nonaffiliated third parties or other affiliated companies unless you provide us with your written consent to share such information. |
| Semi-Annual Report | October 31, 2018 | 69 |
| Emerald Funds | Privacy Policy |
| FACTS | WHAT DO THE FUNDS DO WITH YOUR PERSONAL INFORMATION? |
| WHY? | Financial companies choose how they share your personal information. Federal law gives consumers the right to limit some but not all sharing. Federal law also requires us to tell you how we collect, share, and protect your personal information. Please read this notice carefully to understand what we do. |
| WHAT? | The types of personal information we collect and share depend on the product or service you have with us. This information can include:
● Social Security number and account transactions ● Account balances and transaction history ● Wire transfer instructions |
| HOW? | All financial companies need to share customers’ personal information to run their everyday business. In the section below, we list the reasons financial companies can share their customers’ personal information; the reasons the Funds choose to share; and whether you can limit this sharing. |
| Reasons we can share your personal information | Do the funds share: | Can you limit this sharing? |
For our everyday business purposes – such as to process your transactions, maintain your account(s), respond to court orders and legal investigations, or report to credit bureaus | Yes | No |
For our marketing purposes – to offer our products and services to you | No | We do not share. |
| For joint marketing with other financial companies | No | We do not share. |
For our affiliates’ everyday business purposes – information about your transactions and experiences | Yes | No |
For our affiliates’ everyday business purposes – information about your creditworthiness | No | We do not share. |
| For non-affiliates to market to you | No | We do not share. |
| 70 | www.emeraldmutualfunds.com |
Intentionally Left Blank

Beginning on January 1, 2021, as permitted by regulations adopted by the U.S. Securities and Exchange Commission, paper copies of the Fund’s annual and semi-annual shareholder reports will no longer be sent by mail, unless you specifically request paper copies of the reports. Instead, the reports will be made available on the Funds’ website at www.GrandeurPeakGlobal.com and you will be notified by mail each time a report is posted and provided with a website link to access the report.
Beginning on January 1, 2019, you may, notwithstanding the availability of shareholder reports online, elect to receive all future shareholder reports in paper free of charge. If you invest through a financial intermediary, you can contact your financial intermediary to request that you continue to receive paper copies of your shareholder reports. If you invest directly with the Funds, you can call 1.855.377.7325 to let the Funds know you wish to continue receiving paper copies of your shareholder reports.
If you already elected to receive shareholder reports electronically, you will not be affected by this change and you need not take any action. You may elect to receive shareholder reports and other communications from the Funds electronically anytime by contacting your financial intermediary (such as a broker-dealer or bank) or, if you are a direct investor, by enrolling at www.GrandeurPeakGlobal.com.

TABLE OF CONTENTS
| Shareholder Letter | 2 |
| Performance Update | 7 |
| Disclosure of Fund Expenses | 28 |
| Portfolio of Investments | |
| Grandeur Peak Emerging Markets Opportunities Fund | 30 |
| Grandeur Peak Global Micro Cap Fund | 34 |
| Grandeur Peak Global Opportunities Fund | 38 |
| Grandeur Peak Global Reach Fund | 43 |
| Grandeur Peak Global Stalwarts Fund | 48 |
| Grandeur Peak International Opportunities Fund | 51 |
| Grandeur Peak International Stalwarts Fund | 55 |
| Statements of Assets and Liabilities | 58 |
| Statements of Operations | 60 |
| Statements of Changes in Net Assets | |
| Grandeur Peak Emerging Markets Opportunities Fund | 62 |
| Grandeur Peak Global Micro Cap Fund | 63 |
| Grandeur Peak Global Opportunities Fund | 64 |
| Grandeur Peak Global Reach Fund | 65 |
| Grandeur Peak Global Stalwarts Fund | 66 |
| Grandeur Peak International Opportunities Fund | 67 |
| Grandeur Peak International Stalwarts Fund | 68 |
| Financial Highlights | |
| Grandeur Peak Emerging Markets Opportunities Fund | 69 |
| Grandeur Peak Global Micro Cap Fund | 71 |
| Grandeur Peak Global Opportunities Fund | 72 |
| Grandeur Peak Global Reach Fund | 74 |
| Grandeur Peak Global Stalwarts Fund | 76 |
| Grandeur Peak International Opportunities Fund | 78 |
| Grandeur Peak International Stalwarts Fund | 80 |
| Notes to Financial Statements | 82 |
| Disclosure Regarding Approval of Fund Advisory Agreement | 98 |
| Additional Information | 100 |
| Privacy Policy | 101 |
| Grandeur Peak Funds® | Shareholder Letter |
October 31, 2018 (Unaudited)
Dear Fellow Shareholders,
It has been a disappointing year for us, as our portfolios have been out of sync with the markets. Through October 31, 2018, the S&P 500 was up slightly for the year, while global indices were down, global small-cap indices were down further, and our global funds trailed all three. Beyond being in an out-of-favor segment of the market, we have faced two additional major headwinds. First, a weighting headwind with our significant overweight to Emerging Markets across all portfolios and our underweight to the US market in our global portfolios – this has been a seven-year headwind for us, but particularly strong in calendar 2018. Second, an investment style headwind, as momentum investing has significantly outpaced value investing this year.
Emerging Market (EM) indices were down roughly 20 percent year-to-date as of October 31. This led to a significant hit to our portfolios given our 15-20 percent overweight to Emerging Markets relative to our MSCI benchmarks. Similarly, our 13-35 percent underweight to a resilient US bull market across our global portfolios hurt. These are significant over/under weight percentages, creating stiff headwinds. We’ve carried similar over/under weights in EM & US for several years now, overcoming smaller headwinds in prior years. We believe our weightings are likely to soon turn to a tailwind given the disproportional valuations across countries and companies, but until then we will continue to fight through it with our best effort in bottom-up stock selection.
The second factor is that momentum investing has meaningfully outperformed value investing this year. This can be seen, for example, in such areas as biotechnology, life sciences, software and internet related names where high-flying companies have, in our view, attracted uncomfortably high valuations. We see this in our own portfolios, where our highest quality names with good momentum have been bid up to very high levels. We are generally not a firm to chase valuations; instead, we tend to prune back on names as they become very expensive. This has been a mistake in the short run, as many of these great companies have gone to higher, what we consider to be nosebleed, valuations this year.
Being on the wrong side of the market’s preference for large-cap over small-cap this year has only added insult; and additional insult in our portfolios skewing towards the micro-cap range, which has been hit even harder. We believe the new SEC liquidity rule for mutual funds may be exacerbating the market-cap issue, and especially punishing micro-cap stocks. But over the long run, we believe stock prices will follow earnings growth, and small- and micro-cap stocks can potentially grow faster, longer due to their smaller size.
In summary, those heavily invested in US large-cap stocks have probably been okay this year. But for those of us invested in international small-caps, with a bias toward Value, it’s been a very difficult environment.
Recent Selloff
I had my first lesson in market corrections 31 years ago in October of 1987. Two weeks after my engagement to my wife, Susie, at the age of 22, the market crashed on October 19th – “Black Monday.” Indelibly engrained in my mind is a phone call to her at her work where I tried my best to explain a “market correction.” She wondered if I was still going to have a job. Fortunately for me, I was at a good firm that could not only weather a downturn but actually thrive through it.
Susie and I have been through many corrections since then. Each one is a little different, but each is quite painful, and yet at the same time kind of exciting. Painful because clients see portfolio values decline, but exciting because it’s during market corrections where we can usually find truly great investment opportunities and add a lot of value as active managers.
I have a trophy in my office that I earned for my first “Double” as an analyst. We had bought a US medical device company, Biomet, that made hip and knee implants. The trophy reads: “Purchased 10/22/1987 at $17.00 per share. Doubled in 343 days.” That purchase was just 3 days after Black Monday. At the time, Biomet was a micro-cap company that had experienced a major correction in the selloff; we bought into the selloff and saw a substantial and quick return. Biomet was eventually sold to Zimmer for $13 billion in 2014. I keep this trophy in my office to serve as a reminder of what to do in market corrections.
You’ve heard the old adage: “Buy low, Sell high;” it’s obvious to say, but much harder to actually achieve. I believe the more profound piece of advice is: “Buy when there is fear; Sell when there is greed.”1 This too can be difficult, even for sophisticated institutions. Investors are clearly fearful of Emerging Markets right now, and our current opinion of value-oriented, international small-cap companies is that they are highly attractive.
We view selloffs like this as not only an opportunity to buy our favorite companies at better valuations in the portfolios, but also a chance to invest more of our firm’s balance sheet, and our personal assets, in the Grandeur Peak Funds. The firm has recently added to its position, and we will likely continue to increase our investment if the market goes farther south. Individually, and as a firm, we are heavily invested in our own funds because we are confident in our potential to succeed over the long run.
| 1 | A takeoff of a quote credited to Warren Buffet saying “Be Fearful When Others Are Greedy and Greedy When Others Are Fearful.” |
| 2 | 1.855.377.7325 | www.GrandeurPeakGlobal.com |
| Grandeur Peak Funds® | Shareholder Letter |
October 31, 2018 (Unaudited)
We are sensitive to the fact that four of our seven funds are hard closed. For the time being, we feel the need to keep them closed to stay nimble. Meanwhile, our Emerging Market Opportunities Fund is open to existing investors, and our two Stalwarts funds (Global and International) are open to all investors. To be clear, growing assets is not a priority for us, but with the recent market selloff and our investment style being somewhat out of favor this year, it feels like an interesting time to be investing in our style and niche.
Please don’t misunderstand this letter as simply making excuses for our underperformance this year; we are very disappointed in our relative performance. We would have hoped to hold up much better than we have in the current environment. Our Opportunities portfolios and our Global Micro Cap Fund have particularly struggled this year. These are the portfolios in which I am personally most involved. I have struggled with my own stock picks in 2018 and have made far too many mistakes.
I am reminded of a period in 1996 when I struggled as a stock picker. The year as a whole wasn’t going great for me, and then, while on summer vacation at the beach in July of 1996, three of my biggest holdings announced disappointing results and suffered stock price declines of 30-50 percent. I can remember explaining to Susie what a stock “blow-up” was, and how this was different than a market correction. Fortunately for me, I was at a good firm that understood that everyone goes through slumps and they stood fully behind me, despite a tough personal year. While 1996 was a bad year for both me and the firm, we had quite a nice run for the next several years. Sometimes a good manager/stock picker has their best years after a poor year.
Now after 30 years of marriage, and having lived through plenty of “market corrections” and “blow-ups,” I’m grateful for Susie’s words to me this past week when I was really feeling beaten up. She said, “Robert, you’ve been here before and found your way out of it just fine. I have confidence in you to do it again.” I’m grateful for her words and I commit to each of you to do all I can to be worthy of that confidence. We want this downturn to be the start of a very exciting upturn over the coming years.
I’m also grateful for the words of my son, Benjamin, who is a member of the Global Opportunities team and one of our analysts covering Healthcare and India. He emailed me after one of my companies reported disappointing results for Q3. He wrote, “I’ve just got a feeling we’re going to be okay, Dad. We just gotta stick to good numbers and good stories. Names that are question marks by the team need to be trimmed or sold out. Let’s make sure we can always tell clients they own a bunch of great companies and that we’ve put our best team on the field. And if it doesn’t work, then it doesn’t work, but we had our game plan and we did our best.”
This illustrates a hallmark of all of the individuals at Grandeur Peak and our culture. We have each other’s back. When someone is down, we don’t kick them, we pick them up.
In the past year, both of my mentors in my early career – Jeff Cardon and Sam Stewart – retired from Wasatch Advisors. I learned many lessons from them, but there is no greater lesson than the power of resiliency. We went through many market corrections together and we also went through many periods of personal underperformance. We had clients resign, and we had partners within the firm losing faith in us. But we clung together, hunkered down and stayed focused. We worked to correct mistakes, we stayed clear-thinking in times of market panic and in times when our style was out of favor, and we built each other up in times of personal discouragement. In the end, over three decades, these bad periods amounted to nothing more than a blip.
Grandeur Peak
We launched Grandeur Peak in mid-2011, at the start of what has turned out to be one of the longest bull markets ever. For the first six years – despite some of the headwinds I mentioned at the beginning of this letter – most things that could have gone right for us, did. Now in our seventh year (2018), pretty much everything that could have gone wrong, has. I can’t predict markets, but what I can tell you is that our entire team is deeply committed to improving performance. We are absolutely committed to continuing to build a world-class, enduring firm. Our primary goal is to deliver long-term top-decile performance for our clients in a careful, prudent way.
To this end, we feel the right move is to stay the course on our Emerging Markets overweight and US underweight. From our bottom-up perspective, we continue to see better growth, and at better valuations, outside the US. We also plan to stick with our value bias, which in long-term studies of stock market performance has been shown to deliver better results. We will not change our stripes now.
We will, however, continue to examine our mistakes. Discouragingly, we have made some of the same mistakes over again. We have been especially good at pulling the flowers and watering the weeds. For example, we have found some great companies, small and undiscovered, but have let them go too soon when we believed their valuation had become too stretched. Our other recurring weakness is that we have not always paid enough attention to the warning signs that we call “red flags.” We have a process in place to track red flags on all of our companies, but we may need to raise the threshold on our red-flag scores. In a similar vein, we have not paid enough attention to our fellow analysts who sign up as “detractors” against owned positions. While we say we prize “multiple minds,” we have not always followed through in our actions. Our biggest
| Semi-Annual Report | October 31, 2018 | 3 |
| Grandeur Peak Funds® | Shareholder Letter |
October 31, 2018 (Unaudited)
mistakes this year have again been along these lines. I’m sorry to report that sometimes we’ve had to repeat our mistakes before we truly learn from them.
From the beginning, our analysts have operated under the motto of “no stone left unturned” so that no company slips through the cracks. We have done a great job developing a thorough understanding of the global landscape of public companies and touching thousands upon thousands of interesting companies (what I have previously described as the front end of our process), but it has come at the expense of deeper research (the back end). Having scoured the world for seven years, we believe a little shift in that mindset is now appropriate. It’s time for our awesome Director of Research (DOR)/quantitative team to take the lead in not letting anything new slip thru the cracks (great IPOs (Initial Public Offerings), numbers turning, etc.). Meanwhile, the analysts will narrow their focus in order to go deeper and have richer discussions on the most interesting companies. Along these lines, we are raising the bar on our Watch list categorizations to further differentiate the companies we’re watching and better focus our time on the names that are most likely to be owned in our portfolios; we’re asking our quant team to keep a close eye on the rest of our Watch companies, looking for meaningful inflection points.
Another challenge for us this year has been keeping our trading team fully staffed. We were sad to lose both Gerome Gregory and Josh Clay – our lead traders. Gerome was ready to take on a different trading role and Josh found his true passion shifting away from trading. As a result of their departures, our veteran operations team has worked double time as traders as well. Amy Hone, Dustin Brown and Angela Bowcutt have been absolutely incredible in filling the void. As strong as we feel the research team is, we feel equally proud of our business and operations team. Fortunately, we were recently able to hire a very seasoned trader, Adam Rowbotham, who joined us in October. Adam, a UK native, comes to Grandeur Peak from New York with more experience than any of our previous traders. We are very excited to have him on board and look forward to learning from him. A second global trader will be added to the team when we find the right person.
Year’s Accomplishments
I would now like to turn to the accomplishments of the year. While this year’s performance has been tough, we do still have many accomplishments.
First, the transition to Blake Walker as CEO over the last two years has gone smoothly. I’m grateful that my co-founding partners, Blake and Eric Huefner have taken on virtually all of the day-to-day management of the firm. Managing the firm was not something I enjoyed, and relinquishing these duties has allowed me to focus on stock picking. Blake and Eric’s commitment to Grandeur Peak, our mission, our employees, and above all, to you our clients, is unwavering and inspiring.
The transition to Rob Green as Director of Research (DOR) has also gone well. That said, I have continued to focus on many DOR projects over the past year. We added Aaron Kinney to the DOR team as Director of Information Systems a year ago and he has been amazing. Aaron has measurably increased the productivity of our entire research team. His ability with information systems has been a game changer to provide our team with greater business intelligence. We now have five full-time people on the DOR team, not including me, 100 percent dedicated to supporting our analysts and PMs (Portfolio Managers) in business intelligence and productivity. We’ve also invested in additional support staff to boost our research team’s productivity. It feels great and should help us tremendously. With this strong team, I anticipate focusing even more of my time on the front lines—in the trenches analyzing companies and picking stocks.
We’re very excited to report that the Global Reach Fund, which is the fund run by our five industry teams, hit its five-year mark in June and was within the top-decile of its peer group over that five-year period. While the Reach Fund took a big team effort to initiate, our research structure and industry teams are a considerable strength of Grandeur Peak now, and we could not be happier with our structure. It’s gratifying to see the Fund’s success. We have been working to replicate this structure for our geography teams. We call the geography teams’ product effort Global Explorer. The final piece to this effort would be to have this team running their own real-money portfolio (they run a paper portfolio today).
Equally exciting, the International Stalwarts and Global Stalwarts funds hit their three-year mark in September and were within the top decile and top quartile of their peer groups, respectively. Randy Pearce, our Chief Investment Officer, has done an exceptional job managing these funds. Randy was our first hire at Grandeur Peak. He’s been the MVP of our research team these last seven years with consistent year-in and year-out performance as an analyst and portfolio manager.
We recently promoted Brad Barth to co-portfolio manager on International Stalwarts in recognition of his strong contribution to the Stalwarts team and more broadly as the Industry PM on Financials. Brad joined Grandeur Peak from Goldman Sachs over three years ago and has a Master’s Degree from the London School of Economics. We’ve also promoted Keefer Babbitt to Lead Analyst on the Stalwarts team. Keefer who was one of our first interns, out of the University of Utah, and has been with us for nearly seven years. Randy, Brad, and Keefer also continue in their roles as industry and geography analysts across all of our portfolios.
The Stalwart effort began as a carve-out of the smid and mid-cap names from the Opportunities funds, but the reality is that the Stalwarts team has led the firm in performance these last three years by also generating many great ideas that the other portfolios have been able to buy.
| 4 | 1.855.377.7325 | www.GrandeurPeakGlobal.com |
| Grandeur Peak Funds® | Shareholder Letter |
October 31, 2018 (Unaudited)
We’re excited to announce that Juliette Douglas was promoted to lead manager for both our Global Reach (Industry) teams and our Global Explorer (Geography) teams. Juliette has worked with us for many years (at Grandeur Peak and Wasatch Advisors), has a business finance degree from Westminster College, and joined us at Grandeur Peak originally to help with operations and trading. We quickly recognized Juliette’s potential on the research side and moved her to research three years ago. Juliette has a particular skill in keeping the research team and PMs focused and productive.
With regard to the Global and International Opportunities portfolios, Blake and I have made a determination that while we will both remain engaged in these sister products, I will focus more intently on Global Opportunities and Blake will focus more on International Opportunities. The two portfolios are closely related and will move largely together in their approach, but this separation of primary duties will give each portfolio greater individual focus.
To support Blake on the International Opportunities portfolio we’ve shifted Mark Madsen’s responsibility as co-PM of Global Micro Cap to co-PM of International Opportunities. Mark is an industry veteran and someone we’ve worked closely with for many years. He has a Master of Accountancy (MAcc) Degree from BYU, and was with us at Wasatch; he joined us at Grandeur Peak three years ago from a family office.
We have named Liping Cai as Guardian PM on the Emerging Markets Opportunities Fund. Liping, who currently lives much of the year in Shanghai and leads our research effort in China as well as for our Healthcare team, will be a strong addition in the Guardian PM role. Liping has significant experience. She has science degrees from Tsinghua University in China and the University of Delaware in the US, and an MBA from Northwestern University. She has worked both in the health care field and for William Blair prior to joining us nearly 6 years ago. We believe China, in particular will be one of the most important themes for the next decade and are grateful to have Liping there on the ground.
I feel great about the generational succession plan we have in place: Blake and I as founders, then a solid next-generation of Senior Analysts and PMs, followed by the first group of interns hired in 2012/13 who are now 5-6 years into their experience. Behind them, our most recent full-time addition is Preston Williams, who has worked with us for three years and graduated this past spring from the University of Utah with honors. Preston formerly worked in a hospital ER and is a member of our Healthcare team. He and his wife will be living in Poland and Western Europe for four months next spring. As you may recall, we encourage members of the team to live abroad to increase our global understanding. Mark Madsen and his family will similarly be living in Australia for the first half of 2019.
We continue to bring in interns every year, believing some will be great and recognizing that others will ultimately choose different paths. We have recently extended full-time offers to two more of our interns who will be graduating next spring: Dane Nielson and Miranda Jacobs. Dane, who will graduate in finance from Brigham Young University, works on our Industrials team. Miranda, a native of Michigan, will graduate from the University of Utah and has worked on both the Industrials and the Technology teams. We have two other interns who have now been with us for over a year, and we have just recently added two new interns. We are also exploring summer and other internships from schools outside of Utah and had two Harvard students intern with us this past summer. We feel very good about our promote-from-within/internal development strategy.
So, year seven has been very hard for us. I’m reminded of a quote by Louisa May Alcott: “I am not afraid of storms for I am learning how to sail my ship.” While we have faced some stiff headwinds, we also have to admit to mistakes we’ve made this year. We are learning from them and we will hopefully be better for them. In particular, I personally feel like I’ve struck out at the plate for you this year. I’m grateful for a team that has my back. In this business, even the old veterans need to continue to learn from mistakes. We’re going to work very hard, stay focused, improve our game, and do all we can to get performance back on track. I really feel the evolution of our team, data access, and processes will help us become a better firm and deliver better performance. Within the research team, we have a great combination of experience and high-energy youth. The more experienced of us have been through periods of underperformance before and we still have a great deal of energy to work our way out of our current soft patch, and hopefully take advantage of the current market volatility.
Thank you for your trust and taking the journey with us.
Sincerely,

Robert Gardiner
Chairman & Co-Founder
Grandeur Peak Global Advisors
| Semi-Annual Report | October 31, 2018 | 5 |
| Grandeur Peak Funds® | Shareholder Letter |
October 31, 2018 (Unaudited)
RISKS: Mutual fund investing involves risks and loss of principal is possible. Investing in small and micro-cap funds will be more volatile and loss of principal could be greater than investing in large cap or more diversified funds. Investing in foreign securities entails special risks, such as currency fluctuations and political uncertainties, which are described in more detail in the prospectus. Investments in emerging markets are subject to the same risks as other foreign securities and may be subject to greater risks than investments in foreign countries with more established economies and securities markets.
Must be proceeded by or accompanied by a prospectus.
The views and information discussed in this commentary are as of the date of publication, are subject to change, and may not reflect the writer's current views. The views expressed represent an assessment of market conditions at a specific point in time, are opinions only and should not be relied upon as investment advice regarding a particular investment or markets in general. Such information does not constitute a recommendation to buy or sell specific securities or investment vehicles. It should not be assumed that any investment will be profitable or will equal the performance of the Funds or any securities or any sectors mentioned herein. The subject matter contained herein has been derived from several sources believed to be reliable and accurate at the time of compilation. The Funds do not accept any liability for losses either direct or consequential caused by the use of this information.
Past performance does not guarantee future results.
Eric Huefner, Amy Hone and Dustin Brown are registered representatives of ALPS Distributors, Inc.
ALPS Distributors, Inc. is the Distributor for the Grandeur Peak Funds.
Grandeur Peak Global Advisors, Rondure Global Advisors, Wasatch Advisors and ALPS Distributors, Inc are not affiliated.
| 6 | 1.855.377.7325 | www.GrandeurPeakGlobal.com |
| Grandeur Peak Emerging Markets Opportunities Fund | Performance Update |
October 31, 2018 (Unaudited)
Annualized Total Return Performance for the periods ended October 31, 2018
| Since | Expense Ratio(b) | |||||
| 6 Months | 1 Year | 3 Year | Inception(a) | Gross | Net(c) | |
| Grandeur Peak Emerging Markets Opportunities Fund – Investor (GPEOX) | -20.15% | -15.49% | 2.10% | 2.18% | 1.80% | 1.80% |
| Grandeur Peak Emerging Markets Opportunities Fund – Institutional (GPEIX) | -20.05% | -15.24% | 2.32% | 2.41% | 1.55% | 1.55% |
| Russell Emerging Markets Small Cap Index(d) | -21.38% | -16.49% | 2.10% | 0.35% | ||
| MSCI Emerging Markets SMid Cap Index(e) | -19.64% | -14.21% | 2.90% | 0.72% | ||
| MSCI Emerging Markets IMI Index(f) | -16.89% | -12.71% | 6.27% | 1.91% | ||
Performance data quoted represents past performance. Past performance does not guarantee future results. Investment return and principal value of an investment will fluctuate so that an investor’s shares, when sold or redeemed, may be worth more or less than the original cost. The Fund imposes a 2.00% redemption fee on shares held for less than 60 days. Current performance data may be higher or lower than actual data quoted. For the most current month-end performance data, please call 1-855-377-PEAK (7325).
The table does not reflect the deduction of taxes a shareholder would pay on Fund distributions or redemption of Fund shares.
Subject to investment risks, including possible loss of the principal amount invested.
Returns for periods less than 1 year are cumulative.
| (a) | Fund inception date of December 16, 2013. |
| (b) | Ratios as of the Prospectus dated August 31, 2018 and may differ from the ratios presented in the Financial Highlights. |
| (c) | Grandeur Peak Global Advisors, LLC (the “Adviser”), has agreed to waive and/or reimburse fees or expenses in order to limit Total Annual Fund Operating Expenses After Fee Waiver/Expense Reimbursement (excluding acquired fund fees and expenses, brokerage expenses, interest expenses, taxes and extraordinary expenses) to 1.95% and 1.70% of the Fund’s average daily net assets for the Fund’s Investor Class Shares and Institutional Class Shares, respectively. This agreement (the “Expense Agreement”) is in effect through August 31, 2019. The Adviser will be permitted to recover, on a class- by-class basis, expenses it has borne through the Expense Agreement to the extent that a Fund’s expenses in later periods fall below annual rates set forth in the Expense Agreement; provided, however, that such recapture payments do not cause the Fund’s expense ratio (after recapture) to exceed the lesser of (i) the expense cap in effect at the time of the waiver and (ii) the expense cap in effect at the time of the recapture. Notwithstanding the foregoing, the Fund will not be obligated to pay any such deferred fees and expenses more than three years after the date on which the fee and expenses was deferred. The Expense Agreement may not be terminated or modified prior to August 31, 2019 except with the approval of the Fund’s Board of Trustees. |
| (d) | The Russell Emerging Markets Small Cap Index is designed to measure the equity market performance of small-cap companies across emerging markets. The Index is not actively managed and does not reflect any deductions for fees, expenses or taxes. An investor may not invest directly into the Index. |
| (e) | The MSCI Emerging Markets SMID Cap Index is replacing the Russell Emerging Markets Small Cap Index as the Fund’s primary index. The MSCI Emerging Markets SMID Cap Index is designed to measure the equity market performance of small and mid-cap companies across emerging markets. The Adviser made this recommendation to the Board because the Russell indices are being decommissioned and the Advisor believes the MSCI index most closely aligns to the Fund’s investment strategies and investment restrictions. Information on both indices will be shown for a one-year transition period. MSCI makes no express or implied warranties or representations and shall have no liability whatsoever with respect to any MSCI data contained herein. The MSCI data may not be further redistributed or used to create indices or financial products. The Index is not actively managed and does not reflect any deductions for fees, expenses or taxes. An investor may not invest directly into the Index. |
| (f) | The MSCI Emerging Markets IMI index is designed to measure the equity market performance of large, mid, and small-cap companies across emerging markets. The Index is not actively managed and does not reflect any deductions for fees, expenses or taxes. An investor may not invest directly into the Index. |
| Semi-Annual Report | October 31, 2018 | 7 |
| Grandeur Peak Emerging Markets Opportunities Fund | Performance Update |
October 31, 2018 (Unaudited)
Growth of $10,000 for the period ended October 31, 2018
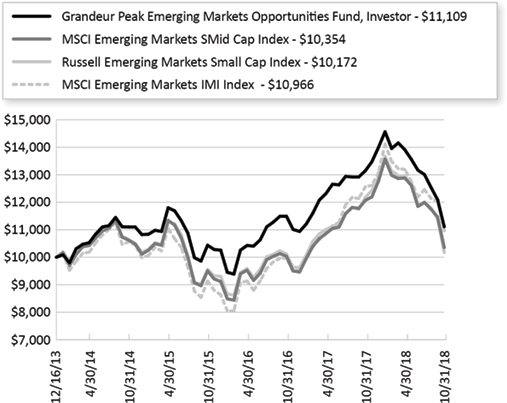
The chart shown above represent a hypothetical investment of $10,000 in the Fund’s Investor Class shares for the period from inception to October 31, 2018. All returns reflect reinvested dividends, but do not reflect the deduction of taxes that an investor would pay on distributions or redemptions.
Investing in the Fund is subject to investment risks, including possible loss of the principal amount invested.
The Fund also offers Institutional Class shares, performance for which is not reflected in the graphs above. The performance of Institutional Class shares may be higher or lower than the performance of the Investor Class shares shown in the graphs above based upon differences in fees paid by shareholders investing in the Investor Class shares and Institutional Class shares.
| 8 | 1.855.377.7325 | www.GrandeurPeakGlobal.com |
| Grandeur Peak Emerging Markets Opportunities Fund | Performance Update |
October 31, 2018 (Unaudited)
| Regional Allocation (as a % of Net Assets)* | |
| Asia ex Japan | 58.5% |
| North America | 3.2% |
| Latin America | 10.0% |
| Europe | 7.9% |
| Africa/Middle East | 7.5% |
| Cash, Cash Equivalents, & Other Net Assets | 12.9% |
| Total | 100.0% |
| Industry Sector Allocation (as a % of Net Assets)* | |
| Consumer | 27.2% |
| Financials | 19.3% |
| Technology | 15.7% |
| Health Care | 12.9% |
| Industrials | 7.6% |
| Energy & Materials | 4.4% |
| Cash, Cash Equivalents, & Other Net Assets | 12.9% |
| Total | 100.0% |
| Top 10 Holdings (as a % of Net Assets)* | |
| WNS Holdings, Ltd. | 2.0% |
| Fleury SA | 1.8% |
| Dino Polska SA | 1.8% |
| Value Partners Group, Ltd. | 1.7% |
| China Medical System Holdings, Ltd. | 1.7% |
| Vitasoy International Holdings, Ltd. | 1.6% |
| Bajaj Finance, Ltd. | 1.3% |
| FirstCash, Inc. | 1.3% |
| Cyient, Ltd. | 1.2% |
| TBC Bank Group PLC | 1.2% |
| Total | 15.6% |
| * | Holdings are subject to change, and may not reflect the current or future position of the portfolio. |
| Semi-Annual Report | October 31, 2018 | 9 |
| Grandeur Peak Global Micro Cap Fund | Performance Update |
October 31, 2018 (Unaudited)
Annualized Total Return Performance for the periods ended October 31, 2018
| Since | Expense Ratio(b) | ||||
| 6 Months | 1 Year | Inception(a) | Gross | Net(c) | |
| Grandeur Peak Global MicroCap – Institutional (GPMCX) | -11.89% | -8.26% | 7.85% | 2.06% | 2.00% |
| Russell Global Small Cap Index(d) | -9.61% | -5.55% | 7.47% | ||
| MSCI All Country World Index Small Cap(e) | -7.51% | -3.38% | 8.40% | ||
| MSCI World Micro Cap Index(f) | -10.06% | -5.80% | 9.21% | ||
Performance data quoted represents past performance. Past performance does not guarantee future results. Investment return and principal value of an investment will fluctuate so that an investor’s shares, when sold or redeemed, may be worth more or less than the original cost. The Fund imposes a 2.00% redemption fee on shares held for less than 60 days. Current performance data may be higher or lower than actual data quoted. For the most current month-end performance data, please call 1-855-377-PEAK (7325).
The table does not reflect the deduction of taxes a shareholder would pay on Fund distributions or redemption of Fund shares.
Subject to investment risks, including possible loss of the principal amount invested.
Returns for periods less than 1 year are cumulative.
| (a) | Fund inception date of October 20, 2015. |
| (b) | Ratios as of the Prospectus dated August 31, 2018 and may differ from the ratios presented in the Financial Highlights. |
| (c) | Grandeur Peak Global Advisors, LLC (the “Adviser”), has agreed to waive and/or reimburse fees or expenses in order to limit Total Annual Fund Operating Expenses After Fee Waiver/ Expense Reimbursement (excluding acquired fund fees and expenses, brokerage expenses, interest expenses, taxes and extraordinary expenses) to 2.00% of the Fund’s average daily net assets for the Fund’s Institutional Class Shares. This agreement is in effect through August 31, 2019. The Adviser will be permitted to recover expenses it has borne through this agreement to the extent that a Fund’s expenses in later periods fall below annual rates set forth in the Expense Agreement; provided, however, that such recapture payments do not cause the Fund’s expense ratio (after recapture) to exceed the lesser of (i) the expense cap in effect at the time of the waiver and (ii) the expense cap in effect at the time of the recapture. Notwithstanding the foregoing, the Fund will not be obligated to pay any such deferred fees and expenses more than three years after the date on which the fee and expenses was deferred. This agreement may not be terminated or modified prior to August 31, 2019 except with the approval of the Fund’s Board of Trustees. |
| (d) | The Russell Global Small Cap Index is designed to measure the equity market performance of small-cap companies across developed and emerging markets globally. The Index is not actively managed and does not reflect any deductions for fees, expenses or taxes. An investor may not invest directly into the Index. |
| (e) | The MSCI ACWI Small Cap Index is replacing the Russell Global Small Cap Index as the Fund’s primary index. The MSCI ACWI Small Cap Index is designed to measure the equity market performance of performance of small-cap companies across developed and emerging markets globally. The Adviser made this recommendation to the Board because the Russell indices are being decommissioned and the Advisor believes the MSCI index most closely aligns to the Fund’s investment strategies and investment restrictions. Information on both indices will be shown for a one-year transition period. MSCI makes no express or implied warranties or representations and shall have no liability whatsoever with respect to any MSCI data contained herein. The MSCI data may not be further redistributed or used to create indices or financial products. The Index is not actively managed and does not reflect any deductions for fees, expenses or taxes. An investor may not invest directly into the Index. |
| (f) | The MSCI World Micro Cap Index is designed to measure the equity market performance of micro-cap companies across developed markets globally. It does not include emerging markets. The Index is not actively managed and does not reflect any deductions for fees, expenses or taxes. An investor may not invest directly into the Index. |
| 10 | 1.855.377.7325 | www.GrandeurPeakGlobal.com |
| Grandeur Peak Global Micro Cap Fund | Performance Update |
October 31, 2018 (Unaudited)
Growth of $10,000 for the period ended October 31, 2018
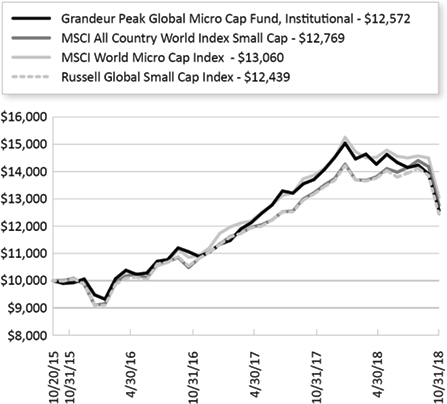
The chart shown above represent a hypothetical investment of $10,000 in the Fund’s Institutional Class shares for the period from inception to October 31, 2018. All returns reflect reinvested dividends, but do not reflect the deduction of taxes that an investor would pay on distributions or redemptions.
Investing in the Fund is subject to investment risks, including possible loss of the principal amount invested.
| Semi-Annual Report | October 31, 2018 | 11 |
| Grandeur Peak Global Micro Cap Fund | Performance Update |
October 31, 2018 (Unaudited)
| Regional Allocation (as a % of Net Assets)* | |
| Europe | 30.4% |
| Asia ex Japan | 26.9% |
| North America | 15.8% |
| Japan | 11.2% |
| Australia/New Zealand | 9.4% |
| Africa/Middle East | 2.7% |
| Latin America | 0.6% |
| Cash, Cash Equivalents, & Other Net Assets | 3.0% |
| Total | 100.0% |
| Industry Sector Allocation (as a % of Net Assets)* | |
| Financials | 25.4% |
| Consumer | 19.3% |
| Industrials | 18.3% |
| Technology | 17.1% |
| Health Care | 13.5% |
| Energy & Materials | 3.4% |
| Cash, Cash Equivalents, & Other Net Assets | 3.0% |
| Total | 100.0% |
| Top 10 Holdings (as a % of Net Assets)* | |
| Heska Corp. | 2.8% |
| Esquire Financial Holdings, Inc. | 2.1% |
| Fiducian Group, Ltd. | 2.0% |
| M&A Capital Partners Co., Ltd. | 2.0% |
| Sbanken ASA | 1.6% |
| Plover Bay Technologies, Ltd. | 1.6% |
| National Veterinary Care, Ltd. | 1.4% |
| BBI Life Sciences Corp. | 1.4% |
| Pryce Corp. | 1.4% |
| Webstep AS | 1.4% |
| Total | 17.7% |
| * | Holdings are subject to change, and may not reflect the current or future position of the portfolio. |
| 12 | 1.855.377.7325 | www.GrandeurPeakGlobal.com |
| Grandeur Peak Global Opportunities Fund | Performance Update |
October 31, 2018 (Unaudited)
Annualized Total Return Performance for the periods ended October 31, 2018
| Since | Expense Ratio(b) | ||||||
| 6 Months | 1 Year | 3 Years | 5 Years | Inception(a) | Gross | Net(c) | |
| Grandeur Peak Global Opportunities Fund – Investor (GPGOX) | -11.65% | -7.70% | 7.52% | 6.29% | 12.35% | 1.61% | 1.61% |
| Grandeur Peak Global Opportunities Fund – Institutional (GPGIX) | -11.75% | -7.53% | 7.71% | 6.52% | 12.64% | 1.36% | 1.36% |
| Russell Global Small Cap Index(d) | -9.61% | -5.55% | 7.60% | 5.09% | 9.02% | ||
| MSCI All Country World Index Small Cap(e) | -7.51% | -3.38% | 8.47% | 6.39% | 10.64% | ||
| MSCI All Country World Index IMI(f) | -4.20% | -0.45% | 8.35% | 6.67% | 10.05% | ||
Performance data quoted represents past performance. Past performance does not guarantee future results. Investment return and principal value of an investment will fluctuate so that an investor’s shares, when sold or redeemed, may be worth more or less than the original cost. The Fund imposes a 2.00% redemption fee on shares held for less than 60 days. Current performance data may be higher or lower than actual data quoted. For the most current month-end performance data, please call 1-855-377-PEAK (7325).
The table does not reflect the deduction of taxes a shareholder would pay on Fund distributions or redemption of Fund shares.
Subject to investment risks, including possible loss of the principal amount invested.
Returns for periods less than 1 year are cumulative.
| (a) | Fund inception date of October 17, 2011. |
| (b) | Ratios as of the Prospectus dated August 31, 2018 and may differ from the ratios presented in the Financial Highlights. |
| (c) | Grandeur Peak Global Advisors, LLC (the “Adviser”), has agreed to waive and/or reimburse fees or expenses in order to limit Total Annual Fund Operating Expenses After Fee Waiver/ Expense Reimbursement (excluding acquired fund fees and expenses, brokerage expenses, interest expenses, taxes and extraordinary expenses) to 1.75% and 1.50% of the Fund’s average daily net assets for the Fund’s Investor Class Shares and Institutional Class Shares, respectively. This agreement (the “Expense Agreement”) is in effect through August 31, 2019. The Adviser will be permitted to recover, on a class- by-class basis, expenses it has borne the Expense Agreement to the extent that a Fund’s expenses in later periods fall below annual rates set forth in the Expense Agreement; provided, however, that such recapture payments do not cause the Fund’s expense ratio (after recapture) to exceed the lesser of (i) the expense cap in effect at the time of the waiver and (ii) the expense cap in effect at the time of the recapture. Notwithstanding the foregoing, the Fund will not be obligated to pay any such deferred fees and expenses more than three years after the date on which the fee and expenses was deferred. The Expense Agreement may not be terminated or modified prior to August 31, 2019 except with the approval of the Fund’s Board of Trustees. |
| (d) | The Russell Global Small Cap Index is designed to measure the equity market performance of small-cap companies across developed and emerging markets globally. The Index is not actively managed and does not reflect any deductions for fees, expenses or taxes. An investor may not invest directly into the Index. |
| (e) | The MSCI ACWI Small Cap Index is replacing the Russell Global Small Cap Index as the Fund’s primary index. The MSCI ACWI Small Cap Index is designed to measure the equity market performance of performance of small-cap companies across developed and emerging markets globally. The Adviser made this recommendation to the Board because the Russell indices are being decommissioned and the Advisor believes the MSCI index most closely aligns to the Fund’s investment strategies and investment restrictions. Information on both indices will be shown for a one-year transition period. MSCI makes no express or implied warranties or representations and shall have no liability whatsoever with respect to any MSCI data contained herein. The MSCI data may not be further redistributed or used to create indices or financial products. The Index is not actively managed and does not reflect any deductions for fees, expenses or taxes. An investor may not invest directly into the Index. |
| (f) | The MSCI ACWI IMI Index is designed to measure the equity market performance of large, mid, and small-cap companies across developed and emerging markets globally. The Index is not actively managed and does not reflect any deductions for fees, expenses or taxes. An investor may not invest directly into the Index. |
| Semi-Annual Report | October 31, 2018 | 13 |
| Grandeur Peak Global Opportunities Fund | Performance Update |
October 31, 2018 (Unaudited)
Growth of $10,000 for the period ended October 31, 2018
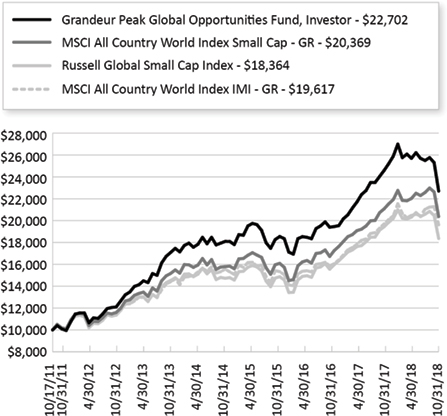
The chart shown above represent a hypothetical investment of $10,000 in the Fund’s Investor Class shares for the period from inception to October 31, 2018. All returns reflect reinvested dividends, but do not reflect the deduction of taxes that an investor would pay on distributions or redemptions.
Investing in the Fund is subject to investment risks, including possible loss of the principal amount invested.
The Fund also offers Institutional Class shares, performance for which is not reflected in the graphs above. The performance of Institutional Class shares may be higher or lower than the performance of the Investor Class shares shown in the graphs above based upon differences in fees paid by shareholders investing in the Investor Class shares and Institutional Class shares.
| 14 | 1.855.377.7325 | www.GrandeurPeakGlobal.com |
| Grandeur Peak Global Opportunities Fund | Performance Update |
October 31, 2018 (Unaudited)
| Regional Allocation (as a % of Net Assets)* | |
| North America | 31.6% |
| Europe | 31.4% |
| Asia ex Japan | 19.0% |
| Japan | 8.9% |
| Latin America | 3.2% |
| Australia/New Zealand | 2.0% |
| Africa/Middle East | 1.8% |
| Cash, Cash Equivalents, & Other Net Assets | 2.1% |
| Total | 100.0% |
| Industry Sector Allocation (as a % of Net Assets)* | |
| Industrials | 22.6% |
| Financials | 22.4% |
| Technology | 18.7% |
| Consumer | 18.3% |
| Health Care | 13.0% |
| Energy & Materials | 2.9% |
| Cash, Cash Equivalents, & Other Net Assets | 2.1% |
| Total | 100.0% |
| Top 10 Holdings (as a % of Net Assets)* | |
| Knight-Swift Transportation Holdings, Inc. | 2.4% |
| Power Integrations, Inc. | 1.7% |
| First Republic Bank | 1.3% |
| MarketAxess Holdings, Inc. | 1.2% |
| EPAM Systems, Inc. | 1.2% |
| B&M European Value Retail SA | 1.1% |
| Dechra Pharmaceuticals PLC | 1.1% |
| Sbanken ASA | 1.1% |
| DiaSorin SpA | 1.1% |
| Stantec, Inc. | 1.0% |
| Total | 13.2% |
| * | Holdings are subject to change, and may not reflect the current or future position of the portfolio. |
| Semi-Annual Report | October 31, 2018 | 15 |
| Grandeur Peak Global Reach Fund | Performance Update |
October 31, 2018 (Unaudited)
Annualized Total Return Performance for the periods ended October 31, 2018
| Since | Expense Ratio(b) | |||||
| 6 Months | 1 Year | 3 Years | Inception(a) | Gross | Net(c) | |
| Grandeur Peak Global Reach Fund – Investor (GPROX) | -11.31% | -5.45% | 8.13% | 9.35% | 1.53% | 1.53% |
| Grandeur Peak Global Reach Fund – Institutional (GPRIX) | -11.22% | -5.25% | 8.39% | 9.59% | 1.28% | 1.28% |
| Russell Global Small Cap Index(d) | -9.61% | -5.55% | 7.60% | 6.74% | ||
| MSCI All Country World Small Cap Index(e) | -7.51% | -3.38% | 8.47% | 8.15% | ||
| MSCI All Country World IMI Index(f) | -4.20% | -0.45% | 8.35% | 8.08% | ||
Performance data quoted represents past performance. Past performance does not guarantee future results. Investment return and principal value of an investment will fluctuate so that an investor’s shares, when sold or redeemed, may be worth more or less than the original cost. The Fund imposes a 2.00% redemption fee on shares held for less than 60 days. Current performance data may be higher or lower than actual data quoted. For the most current month-end performance data, please call 1-855-377-PEAK (7325).
The table does not reflect the deduction of taxes a shareholder would pay on Fund distributions or redemption of Fund shares.
Subject to investment risks, including possible loss of the principal amount invested.
Returns for periods less than 1 year are cumulative.
| (a) | Fund inception date of June 19, 2013. |
| (b) | Ratios as of the Prospectus dated August 31, 2018 and may differ from the ratios presented in the Financial Highlights. |
| (c) | Grandeur Peak Global Advisors, LLC (the “Adviser”), has agreed to waive and/or reimburse fees or expenses in order to limit Total Annual Fund Operating Expenses After Fee Waiver/Expense Reimbursement (excluding acquired fund fees and expenses, brokerage expenses, interest expenses, taxes and extraordinary expenses) to 1. 60% and 1.35% of the Fund’s average daily net assets for the Fund’s Investor Class Shares and Institutional Class Shares, respectively. This agreement (the “Expense Agreement”) is in effect through August 31, 2019. The Adviser will be permitted to recover, on a class- by-class basis, expenses it has borne through the Expense Agreement to the extent that a Fund’s expenses in later periods fall below annual rates set forth in the Expense Agreement; provided, however, that such recapture payments do not cause the Fund’s expense ratio (after recapture) to exceed the lesser of (i) the expense cap in effect at the time of the waiver and (ii) the expense cap in effect at the time of the recapture. Notwithstanding the foregoing, the Fund will not be obligated to pay any such deferred fees and expenses more than three years after the date on which the fee and expenses was deferred. The Expense Agreement may not be terminated or modified prior to August 31, 2019 except with the approval of the Fund’s Board of Trustees. |
| (d) | The Russell Global Small Cap Index is designed to measure the equity market performance of small-cap companies across developed and emerging markets globally. The Index is not actively managed and does not reflect any deductions for fees, expenses or taxes. An investor may not invest directly into the Index. |
| (e) | The MSCI ACWI Small Cap Index is replacing the Russell Global Small Cap Index as the Fund’s primary index. The MSCI ACWI Small Cap Index is designed to measure the equity market performance of performance of small-cap companies across developed and emerging markets globally. The Adviser made this recommendation to the Board because the Russell indices are being decommissioned and the Advisor believes the MSCI index most closely aligns to the Fund’s investment strategies and investment restrictions. Information on both indices will be shown for a one-year transition period. MSCI makes no express or implied warranties or representations and shall have no liability whatsoever with respect to any MSCI data contained herein. The MSCI data may not be further redistributed or used to create indices or financial products. The Index is not actively managed and does not reflect any deductions for fees, expenses or taxes. An investor may not invest directly into the Index. |
| (f) | The MSCI ACWI IMI Index is designed to measure the equity market performance of large, mid, and small-cap companies across developed and emerging markets globally. The Index is not actively managed and does not reflect any deductions for fees, expenses or taxes. An investor may not invest directly into the Index. |
| 16 | 1.855.377.7325 | www.GrandeurPeakGlobal.com |
| Grandeur Peak Global Reach Fund | Performance Update |
October 31, 2018 (Unaudited)
Growth of $10,000 for the period ended October 31, 2018
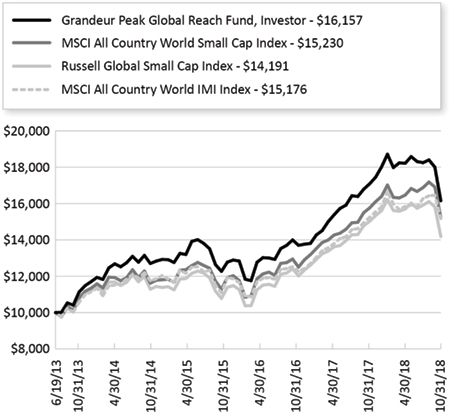
The chart shown above represent a hypothetical investment of $10,000 in the Fund’s Investor Class shares for the period from inception to October 31, 2018. All returns reflect reinvested dividends, but do not reflect the deduction of taxes that an investor would pay on distributions or redemptions.
Investing in the Fund is subject to investment risks, including possible loss of the principal amount invested.
The Fund also offers Institutional Class shares, performance for which is not reflected in the graphs above. The performance of Institutional Class shares may be higher or lower than the performance of the Investor Class shares shown in the graphs above based upon differences in fees paid by shareholders investing in the Investor Class shares and Institutional Class shares.
| Semi-Annual Report | October 31, 2018 | 17 |
| Grandeur Peak Global Reach Fund | Performance Update |
October 31, 2018 (Unaudited)
| Regional Allocation (as a % of Net Assets)* | |
| Europe | 30.7% |
| North America | 30.2% |
| Asia ex Japan | 21.2% |
| Japan | 6.2% |
| Africa/Middle East | 4.1% |
| Australia/New Zealand | 3.5% |
| Latin America | 2.9% |
| Cash, Cash Equivalents, & Other Net Assets | 1.2% |
| Total | 100.0% |
| Industry Sector Allocation (as a % of Net Assets)* | |
| Financials | 24.0% |
| Consumer | 20.6% |
| Industrials | 19.6% |
| Technology | 19.4% |
| Health Care | 11.7% |
| Energy & Materials | 3.5% |
| Cash, Cash Equivalents, & Other Net Assets | 1.2% |
| Total | 100.0% |
| Top 10 Holdings (as a % of Net Assets)* | |
| Knight-Swift Transportation Holdings, Inc. | 2.2% |
| First Republic Bank | 1.5% |
| Dino Polska SA | 1.4% |
| Bank of NT Butterfield & Son, Ltd. | 1.3% |
| Fastenal Co. | 1.2% |
| Wix.com, Ltd. | 1.2% |
| Goosehead Insurance, Inc. | 1.1% |
| SVB Financial Group | 1.0% |
| WNS Holdings, Ltd. | 1.0% |
| Parex Resources, Inc. | 0.9% |
| Total | 12.8% |
| * | Holdings are subject to change, and may not reflect the current or future position of the portfolio. |
| 18 | 1.855.377.7325 | www.GrandeurPeakGlobal.com |
| Grandeur Peak Global Stalwarts Fund | Performance Update |
October 31, 2018 (Unaudited)
Annualized Total Return Performance for the periods ended October 31, 2018
| Since | Expense Ratio(b) | ||||
| 6 Months | 1 Year | Inception(a) | Gross | Net(c) | |
| Grandeur Peak Global Stalwarts – Investor (GGSOX) | -11.29% | -4.77% | 10.15% | 1.35% | 1.35% |
| Grandeur Peak Global Stalwarts – Institutional (GGSYX) | -11.16% | -4.54% | 10.43% | 1.10% | 1.10% |
| Russell Global SMid Index(d) | -8.46% | -4.48% | 8.47% | ||
| MSCI All Country World Mid Cap Index(e) | -7.67% | -3.22% | 8.22% | ||
| MSCI All Country World Small Cap Index(f) | -7.51% | -3.38% | 9.41% | ||
Performance data quoted represents past performance. Past performance does not guarantee future results. Investment return and principal value of an investment will fluctuate so that an investor’s shares, when sold or redeemed, may be worth more or less than the original cost. The Fund imposes a 2.00% redemption fee on shares held for less than 60 days. Current performance data may be higher or lower than actual data quoted. For the most current month-end performance data, please call 1-855-377-PEAK (7325).
The table does not reflect the deduction of taxes a shareholder would pay on Fund distributions or redemption of Fund shares.
Subject to investment risks, including possible loss of the principal amount invested.
Returns for periods less than 1 year are cumulative.
| (a) | Fund inception date of September 1, 2015. |
| (b) | Ratios as of the Prospectus dated August 31, 2018 and may differ from the ratios presented in the Financial Highlights. |
| (c) | Grandeur Peak Global Advisors, LLC (the “Adviser”), has agreed to waive and/or reimburse fees or expenses in order to limit Total Annual Fund Operating Expenses After Fee Waiver/ Expense Reimbursement (excluding acquired fund fees and expenses, brokerage expenses, interest expenses, taxes and extraordinary expenses) to 1.35% and 1.10% of the Fund’s average daily net assets for the Fund’s Investor Class Shares and Institutional Class Shares, respectively. This agreement is in effect through August 31, 2019. The Adviser will be permitted to recover, on a class-by-class basis, expenses it has borne through this agreement to the extent that a Fund’s expenses in later periods fall below annual rates set forth in the Expense Agreement; provided, however, that such recapture payments do not cause the Fund’s expense ratio (after recapture) to exceed the lesser of (i) the expense cap in effect at the time of the waiver and (ii) the expense cap in effect at the time of the recapture. Notwithstanding the foregoing, the Fund will not be obligated to pay any such deferred fees and expenses more than three years after the date on which the fee and expenses was deferred. This agreement may not be terminated or modified prior to August 31, 2019 except with the approval of the Fund’s Board of Trustees. |
| (d) | The Russell Global SMid Index is designed to measure the equity market performance of small and mid-cap companies across developed and emerging markets globally. The Index is not actively managed and does not reflect any deductions for fees, expenses or taxes. An investor may not invest directly into the Index. |
| (e) | The MSCI ACWI Mid Cap Index is replacing the Russell Global SMid Index as the Fund’s primary index. The MSCI ACWI Mid Cap Index is designed to measure the equity market performance of performance of mid-cap companies across developed and emerging markets globally. The Adviser made this recommendation to the Board because the Russell indices are being decommissioned and the Advisor believes the MSCI index most closely aligns to the Fund’s investment strategies and investment restrictions. Information on both indices will be shown for a one-year transition period. MSCI makes no express or implied warranties or representations and shall have no liability whatsoever with respect to any MSCI data contained herein. The MSCI data may not be further redistributed or used to create indices or financial products. The Index is not actively managed and does not reflect any deductions for fees, expenses or taxes. An investor may not invest directly into the Index. |
| (f) | The MSCI ACWI Small Cap Index is designed to measure the equity market performance of small-cap companies across developed and emerging markets globally. The Index is not actively managed and does not reflect any deductions for fees, expenses or taxes. An investor may not invest directly into the Index. |
| Semi-Annual Report | October 31, 2018 | 19 |
| Grandeur Peak Global Stalwarts Fund | Performance Update |
October 31, 2018 (Unaudited)
Growth of $10,000 for the period ended October 31, 2018
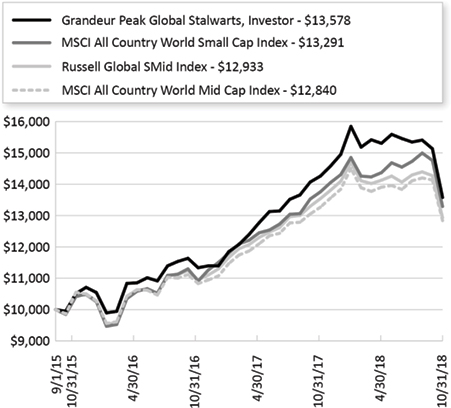
The graphs shown above represent a hypothetical investment of $10,000 in the Fund’s Investor Class shares for the period from inception to October 31, 2018. All returns reflect reinvested dividends, but do not reflect the deduction of taxes that an investor would pay on distributions or redemptions.
Investing in the Fund is subject to investment risks, including possible loss of the principal amount invested.
The Fund also offers Institutional Class shares, performance for which is not reflected in the graphs above. The performance of Institutional Class shares may be higher or lower than the performance of the Investor Class shares shown in the graphs above based upon differences in fees paid by shareholders investing in the Investor Class shares and Institutional Class shares.
| 20 | 1.855.377.7325 | www.GrandeurPeakGlobal.com |
| Grandeur Peak Global Stalwarts Fund | Performance Update |
October 31, 2018 (Unaudited)
| Regional Allocation (as a % of Net Assets)* | |
| North America | 36.8% |
| Europe | 28.3% |
| Asia ex Japan | 16.4% |
| Japan | 7.3% |
| Latin America | 3.8% |
| Africa/Middle East | 1.5% |
| Australia/New Zealand | 0.4% |
| Cash, Cash Equivalents, & Other Net Assets | 5.5% |
| Total | 100.0% |
| Industry Sector Allocation (as a % of Net Assets)* | |
| Financials | 24.8% |
| Consumer | 20.2% |
| Industrials | 19.3% |
| Technology | 16.3% |
| Health Care | 10.8% |
| Energy & Materials | 3.1% |
| Cash, Cash Equivalents, & Other Net Assets | 5.5% |
| Total | 100.0% |
| Top 10 Holdings (as a % of Net Assets)* | |
| First Republic Bank | 3.2% |
| Knight-Swift Transportation Holdings, Inc. | 3.0% |
| Stantec, Inc. | 2.3% |
| Vitasoy International Holdings, Ltd. | 2.0% |
| B&M European Value Retail SA | 1.9% |
| Fastenal Co. | 1.8% |
| St James's Place PLC | 1.7% |
| Nihon M&A Center, Inc. | 1.7% |
| Monro, Inc. | 1.6% |
| MarketAxess Holdings, Inc. | 1.6% |
| Total | 20.8% |
| * | Holdings are subject to change, and may not reflect the current or future position of the portfolio. |
| Semi-Annual Report | October 31, 2018 | 21 |
| Grandeur Peak International Opportunities Fund | Performance Update |
October 31, 2018 (Unaudited)
Annualized Total Return Performance for the periods ended October 31, 2018
| Since | Expense Ratio(b) | ||||||
| 6 Months | 1 Year | 3 Years | 5 Years | Inception(a) | Gross | Net(c) | |
| Grandeur Peak International Opportunities Fund – Investor (GPIOX) | -15.37% | -11.28% | 6.65% | 5.39% | 11.39% | 1.62% | 1.62% |
| Grandeur Peak International Opportunities Fund – Institutional (GPIIX) | -15.05% | -10.83% | 7.01% | 5.67% | 11.66% | 1.37% | 1.37% |
| Russell Global ex-U.S. Small Cap Index(d) | -14.99% | -10.46% | 5.47% | 3.09% | 6.35% | ||
| MSCI All Country World Index ex USA Small Cap Index(e) | -14.21% | -9.39% | 5.85% | 3.73% | 7.01% | ||
| MSCI All Country World IMI ex USA Index(f) | -11.54% | -8.01% | 5.01% | 2.32% | 5.68% | ||
Performance data quoted represents past performance. Past performance does not guarantee future results. Investment return and principal value of an investment will fluctuate so that an investor’s shares, when sold or redeemed, may be worth more or less than the original cost. The Fund imposes a 2.00% redemption fee on shares held for less than 60 days. Current performance data may be higher or lower than actual data quoted. For the most current month-end performance data, please call 1-855-377-PEAK (7325).
The table does not reflect the deduction of taxes a shareholder would pay on Fund distributions or redemption of Fund shares.
Subject to investment risks, including possible loss of the principal amount invested.
Returns for periods less than 1 year are cumulative.
| (a) | Fund inception date of October 17, 2011. |
| (b) | Ratios as of the Prospectus dated August 31, 2018 and may differ from the ratios presented in the Financial Highlights. |
| (c) | Grandeur Peak Global Advisors, LLC (the “Adviser”), has agreed to waive and/or reimburse fees or expenses in order to limit Total Annual Fund Operating Expenses After Fee Waiver/Expense Reimbursements (excluding acquired fund fees and expenses, brokerage expenses, interest expenses, taxes and extraordinary expenses) to 1.75% and 1.50% of the Fund’s average daily net assets for the Fund’s Investor Class Shares and Institutional Class Shares, respectively. This agreement (the “Expense Agreement”) is in effect through August 31, 2019. The Adviser will be permitted to recover, on a class- by-class basis, expenses it has borne through the Expense Agreement to the extent that a Fund’s expenses in later periods fall below annual rates set forth in the Expense Agreement; provided, however, that such recapture payments do not cause the Fund’s expense ratio (after recapture) to exceed the lesser of (i) the expense cap in effect at the time of the waiver and (ii) the expense cap in effect at the time of the recapture. Notwithstanding the foregoing, the Funds will not be obligated to pay any such deferred fees and expenses more than three years after the date on which the fee and expenses was deferred. The Expense Agreement may not be terminated or modified prior to August 31, 2019 except with the approval of the Fund’s Board of Trustees. |
| (d) | The Russell Global ex-U.S. Small Cap Index is designed to measure the equity market performance of small-cap companies across developed and emerging markets globally, excluding the United States. The Index is not actively managed and does not reflect any deductions for fees, expenses or taxes. An investor may not invest directly into the Index. |
| (e) | The MSCI ACWI ex USA Small Cap Index is replacing the Russell Global ex-U.S. Small Cap Index as the Fund’s primary index. The MSCI ACWI ex USA Small Cap Index is designed to measure the equity market performance of small-cap companies across developed and emerging markets globally, excluding the United States. The Adviser made this recommendation to the Board because the Russell indices are being decommissioned and the Advisor believes the MSCI index most closely aligns to the Fund’s investment strategies and investment restrictions. Information on both indices will be shown for a one-year transition period. MSCI makes no express or implied warranties or representations and shall have no liability whatsoever with respect to any MSCI data contained herein. The MSCI data may not be further redistributed or used to create indices or financial products. The Index is not actively managed and does not reflect any deductions for fees, expenses or taxes. An investor may not invest directly into the Index. |
| (f) | The MSCI ACWI ex USA IMI Index is designed to measure the equity market performance of large, mid, and small-cap companies across developed and emerging markets globally, excluding the United States. The Index is not actively managed and does not reflect any deductions for fees, expenses or taxes. An investor may not invest directly into the Index. |
| 22 | 1.855.377.7325 | www.GrandeurPeakGlobal.com |
| Grandeur Peak International Opportunities Fund | Performance Update |
October 31, 2018 (Unaudited)
Growth of $10,000 for the period ended October 31, 2018
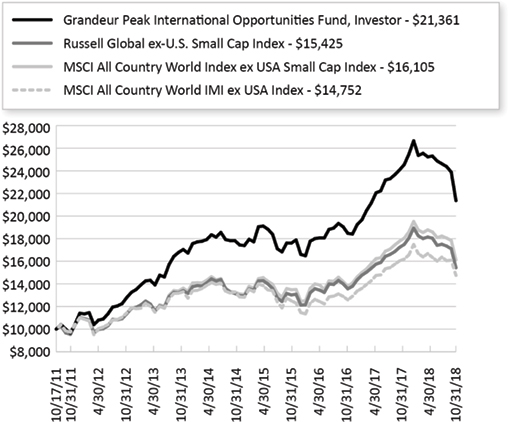
The chart shown above represent a hypothetical investment of $10,000 in the Fund’s Investor Class shares for the period from inception to October 31, 2018. All returns reflect reinvested dividends, but do not reflect the deduction of taxes that an investor would pay on distributions or redemptions.
Investing in the Fund is subject to investment risks, including possible loss of the principal amount invested.
The Fund also offers Institutional Class shares, performance for which is not reflected in the graphs above. The performance of Institutional Class shares may be higher or lower than the performance of the Investor Class shares shown in the graphs above based upon differences in fees paid by shareholders investing in the Investor Class shares and Institutional Class shares.
| Semi-Annual Report | October 31, 2018 | 23 |
| Grandeur Peak International Opportunities Fund | Performance Update |
October 31, 2018 (Unaudited)
| Regional Allocation (as a % of Net Assets)* | |
| Europe | 37.9% |
| Asia ex Japan | 25.5% |
| North America | 10.0% |
| Japan | 10.6% |
| Latin America | 4.1% |
| Africa/Middle East | 3.3% |
| Australia/New Zealand | 2.5% |
| Cash, Cash Equivalents, & Other Net Assets | 6.1% |
| Total | 100.0% |
| Industry Sector Allocation (as a % of Net Assets)* | |
| Financials | 22.1% |
| Industrials | 20.6% |
| Consumer | 18.2% |
| Technology | 16.8% |
| Health Care | 12.6% |
| Energy & Materials | 3.6% |
| Cash, Cash Equivalents, & Other Net Assets | 6.1% |
| Total | 100.0% |
| Top 10 Holdings (as a % of Net Assets)* | |
| Sbanken ASA | 1.3% |
| EPAM Systems, Inc. | 1.3% |
| Wix.com, Ltd. | 1.2% |
| WNS Holdings, Ltd. | 1.2% |
| Create SD Holdings Co., Ltd. | 1.2% |
| Wirecard AG | 1.2% |
| FirstCash, Inc. | 1.1% |
| Stantec, Inc. | 1.1% |
| Dechra Pharmaceuticals PLC | 1.1% |
| B&M European Value Retail SA | 1.0% |
| Total | 11.7% |
| * | Holdings are subject to change, and may not reflect the current or future position of the portfolio. |
| 24 | 1.855.377.7325 | www.GrandeurPeakGlobal.com |
| Grandeur Peak International Stalwarts Fund | Performance Update |
| October 31, 2018 (Unaudited) |
Annualized Total Return Performance for the periods ended October 31, 2018
| 6 Months | 1 Year | Since Inception(a) | Expense Ratio(b) | ||
| Gross | Net(c) | ||||
| Grandeur Peak International Stalwarts – Investor | -13.46% | -7.37% | 10.30% | 1.19% | 1.19% |
| Grandeur Peak International Stalwarts – Institutional | -13.36% | -7.15% | 10.55% | 0.94% | 0.94% |
| Russell Global ex-U.S. SMid Cap Index(d) | -13.30% | -9.10% | 6.98% | ||
| MSCI All Country World ex USA Mid Cap Index(e) | -12.30% | -8.29% | 6.42% | ||
| MSCI All Country World ex USA Small Index(f) | -14.21% | -9.39% | 7.15% | ||
Performance data quoted represents past performance. Past performance does not guarantee future results. Investment return and principal value of an investment will fluctuate so that an investor’s shares, when sold or redeemed, may be worth more or less than the original cost. The Fund imposes a 2.00% redemption fee on shares held for less than 60 days. Current performance data may be higher or lower than actual data quoted. For the most current month-end performance data, please call 1-855-377-PEAK (7325).
The table does not reflect the deduction of taxes a shareholder would pay on Fund distributions or redemption of Fund shares.
Subject to investment risks, including possible loss of the principal amount invested.
Returns for periods less than 1 year are cumulative.
| (a) | Fund inception date of September 1, 2015. |
| (b) | Ratios as of the Prospectus dated August 31, 2018 and may differ from the ratios presented in the Financial Highlights. |
| (c) | Grandeur Peak Global Advisors, LLC (the “Adviser”), has agreed to waive and/or reimburse fees or expenses in order to limit Total Annual Fund Operating Expenses After Fee Waiver/ Expense Reimbursements (excluding acquired fund fees and expenses, brokerage expenses, interest expenses, taxes and extraordinary expenses) to 1.35% and 1.10% of the Fund’s average daily net assets for the Fund’s Investor Class Shares and Institutional Class Shares, respectively. This agreement is in effect through August 31, 2019. The Adviser will be permitted to recover, on a class-by-class basis, expenses it has borne through this agreement to the extent that a Fund’s expenses in later periods fall below annual rates set forth in the Expense Agreement; provided, however, that such recapture payments do not cause the Fund’s expense ratio (after recapture) to exceed the lesser of (i) the expense cap in effect at the time of the waiver and (ii) the expense cap in effect at the time of the recapture. Notwithstanding the foregoing, the Funds will not be obligated to pay any such deferred fees and expenses more than three years after the date on which the fee and expenses was deferred This agreement may not be terminated or modified prior to August 31, 2019 except with the approval of the Fund’s Board of Trustees. |
| (d) | The Russell Global ex-US SMid Cap Index is constructed to provide a comprehensive and unbiased barometer for the small- and mid-cap (SMid) segments excluding companies assigned to the United States. The Russell Global ex-US SMid Cap Index is reconstituted annually to accurately reflect the changes in the market over time. The Index is not actively managed and does not reflect any deductions for fees, expenses, or taxes. An investor may not invest directly in the Index. The Index is not actively managed and does not reflect any deductions for fees, expenses or taxes. An investor may not invest directly into the Index. |
| (e) | The MSCI ACWI ex USA Mid Cap Index is replacing the Russell Global ex-US SMid Cap Index as the Fund’s primary index. The MSCI ACWI ex USA Mid Cap Index is designed to measure the equity market performance of midcap companies across developed and emerging markets globally, excluding the United States. The Adviser made this recommendation to the Board because the Russell indices are being decommissioned and the Advisor believes the MSCI index most closely aligns to the Fund’s investment strategies and investment restrictions. Information on both indices will be shown for a one-year transition period. MSCI makes no express or implied warranties or representations and shall have no liability whatsoever with respect to any MSCI data contained herein. The MSCI data may not be further redistributed or used to create indices or financial products. The Index is not actively managed and does not reflect any deductions for fees, expenses or taxes. An investor may not invest directly into the Index. |
| (f) | The MSCI ACWI ex USA Small Cap Index is designed to measure the equity market performance of small-cap companies across developed and emerging markets globally, excluding the United States. The Index is not actively managed and does not reflect any deductions for fees, expenses or taxes. An investor may not invest directly into the Index. |
| Semi-Annual Report | October 31, 2018 | 25 |
| Grandeur Peak International Stalwarts Fund | Performance Update |
| October 31, 2018 (Unaudited) |
Growth of $10,000 for the period ended October 31, 2018
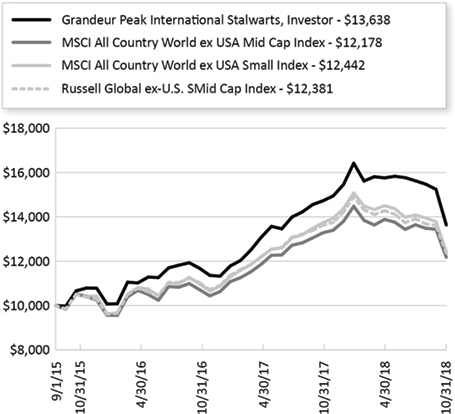
The chart shown above represent a hypothetical investment of $10,000 in the Fund’s Investor Class shares for the period from inception to October 31, 2018. All returns reflect reinvested dividends, but do not reflect the deduction of taxes that an investor would pay on distributions or redemptions.
Investing in the Fund is subject to investment risks, including possible loss of the principal amount invested.
The Fund also offers Institutional Class shares, performance for which is not reflected in the graphs above. The performance of Institutional Class shares may be higher or lower than the performance of the Investor Class shares shown in the graphs above based upon differences in fees paid by shareholders investing in the Investor Class shares and Institutional Class shares.
| 26 | 1.855.377.7325 | www.GrandeurPeakGlobal.com |
| Grandeur Peak International Stalwarts Fund | Performance Update |
| October 31, 2018 (Unaudited) |
| Regional Allocation (as a % of Net Assets)* | |
| Europe | 38.9% |
| Asia ex Japan | 21.5% |
| North America | 15.2% |
| Japan | 10.0% |
| Latin America | 5.3% |
| Africa/Middle East | 1.9% |
| Australia/New Zealand | 0.9% |
| Cash, Cash Equivalents, & Other Net Assets | 6.3% |
| Total | 100.0% |
| Industry Sector Allocation (as a % of Net Assets)* | |
| Financials | 23.1% |
| Consumer | 22.1% |
| Industrials | 18.5% |
| Technology | 14.6% |
| Health Care | 12.2% |
| Energy & Materials | 3.2% |
| Cash, Cash Equivalents, & Other Net Assets | 6.3% |
| Total | 100.0% |
| Top 10 Holdings (as a % of Net Assets)* | |
| Stantec, Inc. | 2.8% |
| Vitasoy International Holdings, Ltd. | 2.3% |
| B&M European Value Retail SA | 2.3% |
| Nihon M&A Center, Inc. | 2.2% |
| St James's Place PLC | 2.1% |
| Aalberts Industries NV | 1.8% |
| Dechra Pharmaceuticals PLC | 1.7% |
| EPAM Systems, Inc. | 1.7% |
| MISUMI Group, Inc. | 1.6% |
| Lululemon Athletica, Inc. | 1.6% |
| Total | 20.1% |
| * | Holdings are subject to change, and may not reflect the current or future position of the portfolio. |
| Semi-Annual Report | October 31, 2018 | 27 |
| Grandeur Peak Funds® | Disclosure of Fund Expenses |
| October 31, 2018 (Unaudited) |
As a shareholder of a Fund, you incur two types of costs: (1) transaction costs, including sales charges (loads) on purchase payments, reinvested dividends, or other distributions; redemption fees; and exchange fees; and (2) ongoing costs, including management fees; distribution and/or service (12b-1) fees; and other Fund expenses. This example is intended to help you understand your ongoing costs (in dollars) of investing in the Fund and to compare these costs with the ongoing costs of investing in other mutual funds.
This example is based on an investment of $1,000 invested at the beginning of the period and held for the entire six-month period of May 1, 2018 through of October 31, 2018.
Actual Expenses The first line of the table provides information about actual account values and actual expenses. You may use the information in this line, together with the amount you invested, to estimate the expenses that you paid over the period. Simply divide your account value by $1,000 (for example, an $8,600 account value divided by $1,000 = 8.6), then multiply the result by the number in the first line under the heading “Expenses Paid During Period” to estimate the expenses you paid on your account during this period.
Hypothetical Example for Comparison Purposes The second line of the table provides information about hypothetical account values and hypothetical expenses based on the Fund’s actual expense ratio and an assumed rate of return of 5% per year before expenses, which is not the Fund’s actual return. The hypothetical account values and expenses may not be used to estimate the actual ending account balance or expenses you paid for the period. You may use this information to compare the ongoing costs of investing in the Fund and other mutual funds. To do so, compare this 5% hypothetical example with the 5% hypothetical examples that appear in the shareholder reports of the other funds.
Please note that the expenses shown in the table are meant to highlight your ongoing costs only and do not reflect any transactional costs, such as redemption fees or exchange fees. Therefore, the second line of the table is useful in comparing ongoing costs only and will not help you determine the relative total costs of owning different funds. In addition, if these transactional costs were included, your costs would have been higher.
| 28 | 1.855.377.7325 | www.GrandeurPeakGlobal.com |
| Grandeur Peak Funds® | Disclosure of Fund Expenses |
| October 31, 2018 (Unaudited) |
Beginning Account Value May 1, 2018 | Ending Account Value October 31, 2018 | Expense Ratio(a) | Expenses Paid During period May 1, 2018 - October 31, 2018(b) | |
| Grandeur Peak Emerging Markets Opportunities Fund | ||||
| Investor Class | ||||
| Actual | $1,000.00 | $798.50 | 1.77% | $8.02 |
| Hypothetical (5% return before expenses) | $1,000.00 | $1,016.28 | 1.77% | $9.00 |
| Institutional Class | ||||
| Actual | $1,000.00 | $799.50 | 1.53% | $6.94 |
| Hypothetical (5% return before expenses) | $1,000.00 | $1,017.49 | 1.53% | $7.78 |
| Grandeur Peak Global Micro Cap Fund | ||||
| Institutional Class | ||||
| Actual | $1,000.00 | $881.10 | 2.00% | $9.48 |
| Hypothetical (5% return before expenses) | $1,000.00 | $1,015.12 | 2.00% | $10.16 |
| Grandeur Peak Global Opportunities Fund | ||||
| Investor Class | ||||
| Actual | $1,000.00 | $883.50 | 1.55% | $7.36 |
| Hypothetical (5% return before expenses) | $1,000.00 | $1,017.39 | 1.55% | $7.88 |
| Institutional Class | ||||
| Actual | $1,000.00 | $882.50 | 1.31% | $6.22 |
| Hypothetical (5% return before expenses) | $1,000.00 | $1,018.60 | 1.31% | $6.67 |
| Grandeur Peak Global Reach Fund | ||||
| Investor Class | ||||
| Actual | $1,000.00 | $886.90 | 1.51% | $7.18 |
| Hypothetical (5% return before expenses) | $1,000.00 | $1,017.59 | 1.51% | $7.68 |
| Institutional Class | ||||
| Actual | $1,000.00 | $887.80 | 1.27% | $6.04 |
| Hypothetical (5% return before expenses) | $1,000.00 | $1,018.80 | 1.27% | $6.46 |
| Grandeur Peak Global Stalwarts Fund | ||||
| Investor Class | ||||
| Actual | $1,000.00 | $887.10 | 1.27% | $6.04 |
| Hypothetical (5% return before expenses) | $1,000.00 | $1,018.80 | 1.27% | $6.46 |
| Institutional Class | ||||
| Actual | $1,000.00 | $888.40 | 1.03% | $4.90 |
| Hypothetical (5% return before expenses) | $1,000.00 | $1,020.01 | 1.03% | $5.24 |
| Grandeur Peak International Opportunities Fund | ||||
| Investor Class | ||||
| Actual | $1,000.00 | $846.30 | 1.56% | $7.26 |
| Hypothetical (5% return before expenses) | $1,000.00 | $1,017.34 | 1.56% | $7.93 |
| Institutional Class | ||||
| Actual | $1,000.00 | $849.50 | 1.31% | $6.11 |
| Hypothetical (5% return before expenses) | $1,000.00 | $1,018.60 | 1.31% | $6.67 |
| Grandeur Peak International Stalwarts Fund | ||||
| Investor Class | ||||
| Actual | $1,000.00 | $865.40 | 1.18% | $5.55 |
| Hypothetical (5% return before expenses) | $1,000.00 | $1,019.26 | 1.18% | $6.01 |
| Institutional Class | ||||
| Actual | $1,000.00 | $866.40 | 0.93% | $4.38 |
| Hypothetical (5% return before expenses) | $1,000.00 | $1,020.52 | 0.93% | $4.74 |
| (a) | The Fund's expense ratios have been annualized based on the Fund's most recent fiscal half-year expenses. |
| (b) | Expenses are equal to the Fund's annualized expense ratio multiplied by the average account value over the period, multiplied by the number of days in the most recent fiscal half-year 184/365 (to reflect the half-year period). |
| Semi-Annual Report | October 31, 2018 | 29 |
| Grandeur Peak Emerging Markets Opportunities Fund | Portfolio of Investments |
October 31, 2018 (Unaudited)
| Shares | Value (Note 2) | |||||||
| COMMON STOCKS (86.97%) | ||||||||
| Argentina (1.30%) | ||||||||
| Despegar.com Corp.(a) | 139,525 | $ | 2,242,167 | |||||
| Globant SA(a) | 60,502 | 3,114,643 | ||||||
| 5,356,810 | ||||||||
| Bangladesh (1.16%) | ||||||||
| Olympic Industries, Ltd. | 272,639 | 710,243 | ||||||
| Square Pharmaceuticals, Ltd. | 1,274,822 | 4,061,191 | ||||||
| 4,771,434 | ||||||||
| Brazil (4.72%) | ||||||||
| Arco Platform, Ltd., Class A(a) | 23,025 | 490,663 | ||||||
| Fleury SA | 1,337,200 | 7,506,142 | ||||||
| Hypera SA | 373,200 | 2,965,343 | ||||||
| M Dias Branco SA | 218,700 | 2,589,845 | ||||||
Pagseguro Digital, Ltd., Class A(a) | 117,850 | 3,180,772 | ||||||
| Raia Drogasil SA | 161,900 | 2,737,704 | ||||||
| StoneCo, Ltd.(a) | 1,000 | 28,690 | ||||||
| 19,499,159 | ||||||||
| China (14.19%) | ||||||||
| 51job, Inc., ADR(a) | 55,225 | 3,391,367 | ||||||
| 58.com, Inc., ADR(a) | 41,750 | 2,738,382 | ||||||
| AK Medical Holdings, Ltd.(b)(c) | 3,187,000 | 1,936,093 | ||||||
| Alibaba Group Holding, Ltd., Sponsored ADR(a) | 18,900 | 2,689,092 | ||||||
| ANTA Sports Products, Ltd. | 644,000 | 2,658,781 | ||||||
| BBI Life Sciences Corp.(c) | 9,968,500 | 3,214,311 | ||||||
| China Medical System Holdings, Ltd. | 5,783,000 | 6,907,471 | ||||||
| CSPC Pharmaceutical Group, Ltd. | 1,320,000 | 2,812,666 | ||||||
| Ctrip.com International, Ltd., ADR(a) | 81,725 | 2,719,808 | ||||||
| Essex Bio-technology, Ltd. | 4,604,000 | 2,994,204 | ||||||
| Hangzhou Robam Appliances Co., Ltd., Class A(a) | 365,200 | 1,107,848 | ||||||
| Hangzhou Tigermed Consulting Co., Ltd., Class A(a) | 158,000 | 971,727 | ||||||
| HUYA, Inc., ADR(a) | 46,402 | 803,683 | ||||||
| JD.com, Inc., ADR(a) | 98,150 | 2,308,488 | ||||||
| Jiangsu Hengrui Medicine Co., Ltd., Class A(a) | 124,000 | 1,100,922 | ||||||
| Man Wah Holdings, Ltd. | 3,743,400 | 1,727,378 | ||||||
| O2Micro International, Ltd., ADR(a) | 462,244 | 748,835 | ||||||
| On-Bright Electronics, Inc. | 578,941 | 3,228,542 | ||||||
| Shanghai Haohai Biological Technology Co., Ltd., Class H(b)(c) | 554,100 | 2,903,227 | ||||||
| Silergy Corp. | 319,422 | 4,069,577 | ||||||
| Tencent Holdings, Ltd. | 58,900 | 2,017,871 | ||||||
| Shares | Value (Note 2) | |||||||
| China (continued) | ||||||||
Wuxi Biologics Cayman, Inc.(a)(b)(c) | 234,000 | $ | 1,674,257 | |||||
| Yum China Holdings, Inc. | 107,825 | 3,890,326 | ||||||
| 58,614,856 | ||||||||
| Colombia (1.88%) | ||||||||
| Amerisur Resources PLC(a) | 7,380,422 | 1,018,836 | ||||||
| Gran Tierra Energy, Inc.(a) | 684,525 | 2,087,801 | ||||||
| Parex Resources, Inc.(a) | 320,431 | 4,666,081 | ||||||
| 7,772,718 | ||||||||
| Egypt (1.67%) | ||||||||
| African Export-Import Bank, GDR | 500,000 | 1,730,000 | ||||||
| Commercial International Bank Egypt SAE | 374,454 | 1,677,729 | ||||||
| Integrated Diagnostics Holdings PLC(b)(c) | 371,100 | 1,280,295 | ||||||
| Obour Land For Food Industries | 2,116,943 | 2,185,460 | ||||||
| 6,873,484 | ||||||||
| Georgia (2.82%) | ||||||||
| Bank of Georgia Group PLC | 185,712 | 3,701,661 | ||||||
| Georgia Capital PLC(a) | 122,812 | 1,836,648 | ||||||
Georgia Healthcare Group PLC(a)(b)(c) | 356,781 | 1,095,427 | ||||||
| TBC Bank Group PLC | 232,132 | 5,014,422 | ||||||
| 11,648,158 | ||||||||
| Greece (1.69%) | ||||||||
| JUMBO SA | 151,000 | 2,198,597 | ||||||
| Sarantis SA | 603,670 | 4,787,910 | ||||||
| 6,986,507 | ||||||||
| Hong Kong (5.03%) | ||||||||
| International Housewares Retail Co., Ltd. | 7,672,000 | 1,617,882 | ||||||
| Jacobson Pharma Corp., Ltd.(c) | 5,020,000 | 1,035,668 | ||||||
| Plover Bay Technologies, Ltd.(c) | 8,956,000 | 1,294,036 | ||||||
| TK Group Holdings, Ltd. | 6,055,000 | 3,223,780 | ||||||
| Value Partners Group, Ltd. | 9,436,800 | 7,038,166 | ||||||
| Vitasoy International Holdings, Ltd. | 2,060,900 | 6,569,960 | ||||||
| 20,779,492 | ||||||||
| India (10.39%) | ||||||||
| Alkem Laboratories, Ltd. | 105,385 | 2,725,656 | ||||||
| Bajaj Finance, Ltd. | 171,500 | 5,518,171 | ||||||
| Byke Hospitality, Ltd. | 981,000 | 995,082 | ||||||
| City Union Bank, Ltd. | 1,202,575 | 2,768,377 | ||||||
| Control Print, Ltd. | 255,504 | 1,214,043 | ||||||
| Cyient, Ltd. | 597,595 | 5,026,141 | ||||||
| Dr Lal PathLabs, Ltd.(b)(c) | 218,500 | 2,603,597 | ||||||
See Notes to Financial Statements
| 30 | 1.855.377.7325 | www.GrandeurPeakGlobal.com |
| Grandeur Peak Emerging Markets Opportunities Fund | Portfolio of Investments |
October 31, 2018 (Unaudited)
| Shares | Value (Note 2) | |||||||
| India (continued) | ||||||||
HDFC Asset Management Co., Ltd.(a)(b)(c) | 46,000 | $ | 871,229 | |||||
| Indiabulls Housing Finance, Ltd. | 146,000 | 1,646,741 | ||||||
| Kellton Tech Solutions, Ltd.(a) | 1,096,298 | 440,533 | ||||||
| Kovai Medical Center and Hospital | 75,083 | 833,330 | ||||||
L&T Technology Services, Ltd.(b)(c) | 88,540 | 2,034,570 | ||||||
| Thyrocare Technologies, Ltd.(b)(c) | 73,644 | 557,948 | ||||||
| Time Technoplast, Ltd. | 2,390,721 | 3,646,183 | ||||||
| Vaibhav Global, Ltd.(a) | 231,319 | 2,315,380 | ||||||
| WNS Holdings, Ltd., ADR(a) | 162,486 | 8,155,172 | ||||||
| Yes Bank, Ltd. | 609,000 | 1,548,824 | ||||||
| 42,900,977 | ||||||||
| Indonesia (3.58%) | ||||||||
| Ace Hardware Indonesia Tbk PT | 26,553,000 | 2,395,002 | ||||||
| Arwana Citramulia Tbk PT | 45,188,500 | 1,130,564 | ||||||
| Bekasi Fajar Industrial Estate Tbk PT | 52,350,600 | 482,436 | ||||||
| Hexindo Adiperkasa Tbk PT | 3,557,100 | 666,847 | ||||||
| Indonesia Pondasi Raya Tbk PT | 14,738,400 | 797,256 | ||||||
| Link Net Tbk PT | 7,350,500 | 2,121,400 | ||||||
| Panin Sekuritas Tbk PT | 7,155,500 | 639,587 | ||||||
| Sarana Menara Nusantara Tbk PT | 35,494,500 | 1,130,245 | ||||||
| Selamat Sempurna Tbk PT | 38,902,900 | 3,775,446 | ||||||
| Ultrajaya Milk Industry & Trading Co. Tbk PT | 20,171,600 | 1,643,290 | ||||||
| 14,782,073 | ||||||||
| Kenya (0.68%) | ||||||||
| Safaricom PLC | 12,390,800 | 2,810,439 | ||||||
| Malaysia (1.80%) | ||||||||
| AEON Credit Service M Bhd | 1,224,400 | 4,422,914 | ||||||
| My EG Services Bhd | 2,607,900 | 749,917 | ||||||
| Mynews Holdings Bhd | 2,292,100 | 795,524 | ||||||
| Scicom MSC Bhd | 3,685,500 | 1,480,084 | ||||||
| 7,448,439 | ||||||||
| Mexico (1.86%) | ||||||||
| Credito Real SAB de CV SOFOM ER | 890,354 | 1,013,377 | ||||||
| Grupo Herdez SAB de CV | 1,230,766 | 2,281,188 | ||||||
| Regional SAB de CV | 649,900 | 3,201,629 | ||||||
| Unifin Financiera SAB de CV SOFOM ENR | 633,021 | 1,186,374 | ||||||
| 7,682,568 | ||||||||
| Shares | Value (Note 2) | |||||||
| Oman (0.67%) | ||||||||
| Tethys Oil AB | 287,923 | $ | 2,763,391 | |||||
| Pakistan (0.62%) | ||||||||
| Akzo Nobel Pakistan, Ltd. | 496,500 | 556,778 | ||||||
| Meezan Bank, Ltd. | 2,649,152 | 1,985,359 | ||||||
| 2,542,137 | ||||||||
| Peru (2.12%) | ||||||||
| Alicorp SAA | 1,439,086 | 4,161,675 | ||||||
| Credicorp, Ltd. | 20,325 | 4,587,556 | ||||||
| 8,749,231 | ||||||||
| Philippines (4.65%) | ||||||||
| Concepcion Industrial Corp. | 1,704,792 | 1,210,767 | ||||||
| Holcim Philippines, Inc. | 6,363,500 | 767,464 | ||||||
| Pepsi-Cola Products Philippines, Inc. | 13,744,000 | 425,335 | ||||||
| Philippine Seven Corp. | 917,000 | 1,799,552 | ||||||
| Puregold Price Club, Inc. | 3,620,100 | 2,750,002 | ||||||
| Robinsons Land Corp. | 7,151,762 | 2,811,212 | ||||||
| Robinsons Retail Holdings, Inc. | 1,675,000 | 2,372,956 | ||||||
| Security Bank Corp. | 1,375,980 | 3,718,524 | ||||||
| Wilcon Depot, Inc. | 15,904,900 | 3,364,949 | ||||||
| 19,220,761 | ||||||||
| Poland (2.69%) | ||||||||
| CCC SA | 30,600 | 1,330,938 | ||||||
| Dino Polska SA(a)(b)(c) | 330,313 | 7,258,275 | ||||||
| LiveChat Software SA | 239,800 | 1,601,797 | ||||||
| PGS Software SA | 426,467 | 900,247 | ||||||
| 11,091,257 | ||||||||
| Russia (0.48%) | ||||||||
| MD Medical Group | ||||||||
| Investments PLC, GDR(c) | 89,732 | 529,419 | ||||||
| TCS Group Holding PLC, GDR(c) | 86,700 | 1,439,220 | ||||||
| 1,968,639 | ||||||||
| South Africa (3.44%) | ||||||||
| ARB Holdings, Ltd. | 1,134,108 | 430,504 | ||||||
| Capitec Bank Holdings, Ltd. | 23,200 | 1,558,571 | ||||||
| Cartrack Holdings, Ltd. | 328,700 | 322,906 | ||||||
| Cashbuild, Ltd. | 77,300 | 1,413,171 | ||||||
| City Lodge Hotels, Ltd. | 57,892 | 513,652 | ||||||
| Clicks Group, Ltd. | 191,800 | 2,443,263 | ||||||
| Interwaste Holdings, Ltd. | 3,266,380 | 214,770 | ||||||
| Italtile, Ltd. | 2,942,072 | 2,578,613 | ||||||
| Shoprite Holdings, Ltd. | 83,700 | 1,021,825 | ||||||
| Transaction Capital, Ltd. | 3,071,128 | 3,697,220 | ||||||
| 14,194,495 | ||||||||
| South Korea (5.10%) | ||||||||
| BGF retail Co., Ltd. | 14,174 | 2,096,874 | ||||||
| Hanssem Co., Ltd. | 17,500 | 752,499 | ||||||
See Notes to Financial Statements.
| Semi-Annual Report | October 31, 2018 | 31 |
| Grandeur Peak Emerging Markets Opportunities Fund | Portfolio of Investments |
October 31, 2018 (Unaudited)
| Shares | Value (Note 2) | |||||||
| South Korea (continued) | ||||||||
| Hy-Lok Corp. | 18,500 | $ | 371,618 | |||||
| ISC Co., Ltd. | 112,752 | 903,222 | ||||||
| Koh Young Technology, Inc. | 22,244 | 1,762,565 | ||||||
| LEENO Industrial, Inc. | 68,200 | 3,588,868 | ||||||
| LG Household & Health Care, Ltd. | 4,825 | 4,437,095 | ||||||
| Medy-Tox, Inc. | 5,230 | 2,142,563 | ||||||
| NAVER Corp. | 27,560 | 2,775,412 | ||||||
| Vitzrocell Co., Ltd.(a) | 245,269 | 2,209,322 | ||||||
| 21,040,038 | ||||||||
| Sri Lanka (0.32%) | ||||||||
| Royal Ceramics Lanka PLC | 2,965,133 | 1,332,996 | ||||||
| Switzerland (0.23%) | ||||||||
| Wizz Air Holdings PLC(a)(b)(c) | 29,200 | 957,731 | ||||||
| Taiwan (6.58%) | ||||||||
| ASPEED Technology, Inc. | 59,929 | 883,102 | ||||||
| Bioteque Corp. | 588,000 | 1,589,928 | ||||||
| Gourmet Master Co., Ltd. | 276,760 | 1,678,592 | ||||||
| I Yuan Precision Ind Co., Ltd. | 430,000 | 790,306 | ||||||
| LandMark Optoelectronics Corp. | 210,000 | 1,395,791 | ||||||
| Materials Analysis Technology, Inc. | 501,000 | 678,065 | ||||||
| Poya International Co., Ltd. | 292,000 | 2,544,682 | ||||||
| Rafael Microelectronics, Inc. | 262,000 | 835,692 | ||||||
| Sinmag Equipment Corp. | 1,075,502 | 4,329,097 | ||||||
| Sporton International, Inc. | 1,054,760 | 3,930,537 | ||||||
| Tehmag Foods Corp. | 145,200 | 914,535 | ||||||
| Test Research, Inc. | 1,626,000 | 2,261,440 | ||||||
| TSC Auto ID Technology Co., Ltd. | 208,000 | 1,158,096 | ||||||
| TTFB Co., Ltd. | 179,000 | 1,292,800 | ||||||
| Voltronic Power Technology Corp. | 178,000 | 2,881,199 | ||||||
| 27,163,862 | ||||||||
| Thailand (1.70%) | ||||||||
| Beauty Community PCL | 4,010,000 | 1,212,416 | ||||||
| Muangthai Capital PCL | 2,120,000 | 3,345,219 | ||||||
| TOA Paint Thailand PCL | 2,428,000 | 2,477,282 | ||||||
| �� | 7,034,917 | |||||||
| Turkey (0.64%) | ||||||||
| Aselsan Elektronik Sanayi Ve Ticaret AS | 144,900 | 655,955 | ||||||
| DP Eurasia NV(a)(b)(c) | 1,347,000 | 1,997,215 | ||||||
| 2,653,170 | ||||||||
| United Arab Emirates (0.40%) | ||||||||
| Aramex PJSC | 1,536,272 | 1,652,063 | ||||||
| Shares | Value (Note 2) | |||||||
| United States (1.30%) | ||||||||
| FirstCash, Inc. | 66,970 | $ | 5,384,388 | |||||
| Vietnam (3.26%) | ||||||||
| FPT Corp. | 820,556 | 1,478,668 | ||||||
| Ho Chi Minh City Development Joint Stock Commercial Bank | 2,240,203 | 3,153,494 | ||||||
| Lix Detergent JSC | 437,310 | 915,783 | ||||||
| Vietnam Dairy Products JSC | 998,575 | 4,982,138 | ||||||
| Vietnam Technological & Commercial Joint Stock Bank(a) | 2,542,629 | 2,947,087 | ||||||
| 13,477,170 | ||||||||
| TOTAL COMMON STOCKS | ||||||||
| (Cost $366,612,880) | 359,153,360 | |||||||
Principal Amount | Value (Note 2) | |||||||
| CORPORATE BONDS (0.18%) | ||||||||
| Malaysia (0.18%) | ||||||||
| AEON Credit Service M Bhd | ||||||||
| 3.50%, 09/15/2020 | $ | 2,260,800 | $ | 759,093 | ||||
| TOTAL CORPORATE BONDS | ||||||||
| (Cost $537,071) | 759,093 | |||||||
| TOTAL INVESTMENTS (87.15%) | ||||||||
| (Cost $367,149,951) | $ | 359,912,453 | ||||||
| Other Assets In Excess Of Liabilities (12.85%) | 53,074,040 | |||||||
| NET ASSETS (100.00%) | $ | 412,986,493 | ||||||
See Notes to Financial Statements
| 32 | 1.855.377.7325 | www.GrandeurPeakGlobal.com |
| Grandeur Peak Emerging Markets Opportunities Fund | Portfolio of Investments |
October 31, 2018 (Unaudited)
| (a) | Non-Income Producing Security. |
| (b) | Security exempt from registration under Rule 144A of the Securities Act of 1933. These securities may be resold in the ordinary course of business in transactions exempt from registration, normally to qualified institutional buyers. As of October 31, 2018, these securities had a total aggregate market value of $25,169,864 representing 6.09% of net assets. |
| (c) | Security was purchased pursuant to Regulation S under the Securities Act of 1933, which exempts securities offered and sold outside of the United States from registration. Such security cannot be sold in the United States without either an effective registration statement filed pursuant to the Securities Act of 1933, or pursuant to an exemption from registration. The security has been deemed liquid under guidelines approved by the Fund's Board of Trustees. As of October 31, 2018, the aggregate market value of those securities was $32,682,518, representing 7.91% of net assets. |
For Fund compliance purposes, the Fund's geographical classifications refer to any one or more of the country sub-classifications used by one or more widely recognized market indexes or ratings group indexes, and/or as defined by Fund management. This definition may not apply for purposes of this report, which may combine sub-classifications for reporting ease. Geographical regions are shown as a percentage of net assets.
See Notes to Financial Statements.
| Semi-Annual Report | October 31, 2018 | 33 |
| Grandeur Peak Global Micro Cap Fund | Portfolio of Investments |
October 31, 2018 (Unaudited)
| Shares | Value (Note 2) | |||||||
| COMMON STOCKS (96.48%) | ||||||||
| Australia (8.73%) | ||||||||
| Australian Ethical Investment, Ltd. | 415 | $ | 48,523 | |||||
| Class, Ltd. | 122,533 | 159,895 | ||||||
| Fiducian Group, Ltd. | 241,628 | 712,868 | ||||||
| HUB24, Ltd. | 21,200 | 172,876 | ||||||
| Kogan.com, Ltd. | 191,633 | 387,177 | ||||||
| Lycopodium, Ltd. | 89,026 | 287,263 | ||||||
| Mainstream Group Holdings, Ltd. | 988,086 | 454,813 | ||||||
| National Storage REIT | 339,959 | 410,763 | ||||||
| National Veterinary Care, Ltd. | 334,500 | 516,619 | ||||||
| 3,150,797 | ||||||||
| Brazil (0.09%) | ||||||||
| Arco Platform, Ltd., Class A(a) | 1,475 | 31,432 | ||||||
| Britain (11.90%) | ||||||||
| AB Dynamics PLC | 8,532 | 126,481 | ||||||
| Arrow Global Group PLC | 31,219 | 76,226 | ||||||
| City of London Investment Group PLC | 37,697 | 181,651 | ||||||
| Clipper Logistics PLC | 105,400 | 350,278 | ||||||
| Curtis Banks Group PLC | 64,879 | 232,199 | ||||||
| dotdigital group PLC | 152,400 | 163,425 | ||||||
| Horizon Discovery Group PLC(a) | 42,400 | 108,391 | ||||||
| Impax Asset Management Group PLC | 146,541 | 429,874 | ||||||
| JTC PLC(b)(c) | 81,500 | 348,981 | ||||||
| K3 Capital Group PLC | 77,133 | 249,436 | ||||||
| LoopUp Group PLC(a) | 89,733 | 381,367 | ||||||
| Morses Club PLC | 78,838 | 141,142 | ||||||
| On the Beach Group PLC(b)(c) | 51,200 | 280,119 | ||||||
| Oxford Immunotec Global PLC(a) | 17,467 | 269,166 | ||||||
| Premier Asset Management Group PLC | 59,900 | 165,379 | ||||||
| River & Mercantile Group PLC | 61,300 | 227,612 | ||||||
| RPS Group PLC | 27,795 | 55,707 | ||||||
| Tracsis PLC | 19,300 | 138,156 | ||||||
| Volution Group PLC | 79,200 | 175,134 | ||||||
| XPS Pensions Group PLC(c) | 90,680 | 194,385 | ||||||
| 4,295,109 | ||||||||
| Canada (0.47%) | ||||||||
| Biosyent, Inc.(a) | 23,793 | 168,627 | ||||||
| China (3.46%) | ||||||||
| BBI Life Sciences Corp.(c) | 1,555,000 | 501,405 | ||||||
| Essex Bio-technology, Ltd. | 329,000 | 213,965 | ||||||
| Hop Hing Group Holdings, Ltd. | 6,984,000 | 133,862 | ||||||
| O2Micro International, Ltd., ADR(a) | 142,325 | 230,566 | ||||||
| Shares | Value (Note 2) | |||||||
| China (continued) | ||||||||
| On-Bright Electronics, Inc. | 30,572 | $ | 170,489 | |||||
| 1,250,287 | ||||||||
| Colombia (0.47%) | ||||||||
| Amerisur Resources PLC(a) | 1,240,600 | 171,259 | ||||||
| Egypt (0.53%) | ||||||||
| Obour Land For Food Industries | 186,387 | 192,420 | ||||||
| Finland (0.26%) | ||||||||
| Siili Solutions Oyj | 10,200 | 93,334 | ||||||
| France (1.51%) | ||||||||
| Esker SA | 3,500 | 234,826 | ||||||
| Neurones | 3,900 | 92,242 | ||||||
| Thermador Groupe | 4,074 | 218,935 | ||||||
| 546,003 | ||||||||
| Georgia (1.22%) | ||||||||
| Georgia Healthcare Group PLC(a)(b)(c) | 50,204 | 154,142 | ||||||
| TBC Bank Group PLC | 13,187 | 284,860 | ||||||
| 439,002 | ||||||||
| Germany (1.17%) | ||||||||
| FinTech Group AG(a) | 6,400 | 162,788 | ||||||
| Marley Spoon AG(a) | 150,636 | 90,672 | ||||||
| Nexus AG | 6,200 | 169,241 | ||||||
| 422,701 | ||||||||
| Greece (1.17%) | ||||||||
| Sarantis SA | 53,400 | 423,533 | ||||||
| Hong Kong (3.16%) | ||||||||
| International Housewares Retail Co., Ltd. | 832,000 | 175,453 | ||||||
| Jacobson Pharma Corp., Ltd.(c) | 775,000 | 159,889 | ||||||
| Plover Bay Technologies, Ltd.(c) | 3,899,000 | 563,360 | ||||||
| TK Group Holdings, Ltd. | 457,000 | 243,314 | ||||||
| 1,142,016 | ||||||||
| India (4.67%) | ||||||||
| Byke Hospitality, Ltd. | 196,779 | 199,604 | ||||||
| Control Print, Ltd. | 18,500 | 87,904 | ||||||
| Cyient, Ltd. | 23,640 | 198,827 | ||||||
| Kellton Tech Solutions, Ltd.(a) | 98,464 | 39,567 | ||||||
| Kovai Medical Center and Hospital | 22,618 | 251,032 | ||||||
| Poly Medicure, Ltd. | 12,837 | 38,736 | ||||||
| TCI Express, Ltd. | 51,000 | 407,637 | ||||||
| Thyrocare Technologies, Ltd.(b)(c) | 5,890 | 44,624 | ||||||
See Notes to Financial Statements.
| 34 | 1.855.377.7325 | www.GrandeurPeakGlobal.com |
| Grandeur Peak Global Micro Cap Fund | Portfolio of Investments |
October 31, 2018 (Unaudited)
| Shares | Value (Note 2) | |||||||
| India (continued) | ||||||||
| Time Technoplast, Ltd. | 141,015 | $ | 215,068 | |||||
| Vaibhav Global, Ltd.(a) | 20,170 | 201,891 | ||||||
| 1,684,890 | ||||||||
| Indonesia (2.56%) | ||||||||
| Arwana Citramulia Tbk PT | 7,920,100 | 198,152 | ||||||
| Astra Graphia Tbk PT | 240,100 | 21,242 | ||||||
| BFI Finance Indonesia Tbk PT | 5,268,300 | 183,797 | ||||||
| Hexindo Adiperkasa Tbk PT | 917,000 | 171,909 | ||||||
| Selamat Sempurna Tbk PT | 3,592,000 | 348,596 | ||||||
| 923,696 | ||||||||
| Ireland (0.68%) | ||||||||
| Hostelworld Group PLC(b)(c) | 43,487 | 109,392 | ||||||
| Irish Residential Properties REIT PLC | 84,300 | 135,776 | ||||||
| 245,168 | ||||||||
| Italy (0.34%) | ||||||||
| Piovan SpA(a)(b)(c) | 12,488 | 124,472 | ||||||
| Japan (11.22%) | ||||||||
| AIT Corp. | 19,600 | 184,027 | ||||||
| Amiyaki Tei Co., Ltd. | 2,200 | 77,472 | ||||||
| Anshin Guarantor Service Co., Ltd. | 19,200 | 49,252 | ||||||
| Arcland Service Holdings Co., Ltd. | 8,000 | 163,983 | ||||||
| Atrae, Inc.(a) | 6,900 | 123,068 | ||||||
| Central Automotive Products, Ltd. | 16,500 | 224,630 | ||||||
| eGuarantee, Inc. | 22,000 | 205,432 | ||||||
| Future Corp. | 18,900 | 257,235 | ||||||
| M&A Capital Partners Co., Ltd.(a) | 14,400 | 708,108 | ||||||
| MarkLines Co., Ltd. | 22,100 | 303,651 | ||||||
| Naigai Trans Line, Ltd. | 25,300 | 363,191 | ||||||
| Open Door, Inc.(a) | 6,700 | 159,076 | ||||||
| Quick Co., Ltd. | 6,000 | 96,638 | ||||||
| Silver Life Co., Ltd.(a) | 3,700 | 151,643 | ||||||
| Synchro Food Co., Ltd.(a) | 29,400 | 204,487 | ||||||
| Syuppin Co., Ltd. | 12,100 | 150,942 | ||||||
| Trancom Co., Ltd. | 2,700 | 154,597 | ||||||
| Vega Corp. Co., Ltd.(a) | 27,500 | 261,891 | ||||||
| Yakuodo Co., Ltd. | 6,800 | 210,221 | ||||||
| 4,049,544 | ||||||||
| Malaysia (1.68%) | ||||||||
| AEON Credit Service M Bhd | 64,950 | 234,620 | ||||||
| Mynews Holdings Bhd | 781,000 | 271,063 | ||||||
| Scicom MSC Bhd | 251,600 | 101,042 | ||||||
| 606,725 | ||||||||
| Shares | Value (Note 2) | |||||||
| Netherlands (0.97%) | ||||||||
| Shop Apotheke Europe NV(a)(b) | 6,875 | $ | 349,631 | |||||
| New Zealand (0.69%) | ||||||||
| CBL Corp., Ltd.(a)(d) | 159,993 | 24,013 | ||||||
| Restaurant Brands New Zealand, Ltd. | 40,364 | 226,263 | ||||||
| 250,276 | ||||||||
| Norway (6.38%) | ||||||||
| Infront ASA | 155,600 | 479,916 | ||||||
| Medistim ASA | 25,862 | 217,583 | ||||||
| Multiconsult ASA(b)(c) | 22,900 | 154,706 | ||||||
| Sbanken ASA(b)(c) | 57,900 | 576,658 | ||||||
| Self Storage Group ASA(a) | 202,748 | 383,216 | ||||||
| Webstep AS(b)(c) | 145,752 | 491,039 | ||||||
| 2,303,118 | ||||||||
| Oman (0.92%) | ||||||||
| Tethys Oil AB | 34,717 | 333,202 | ||||||
| Philippines (1.54%) | ||||||||
| Concepcion Industrial Corp. | 78,770 | 55,944 | ||||||
| Pryce Corp. | 4,740,000 | 498,892 | ||||||
| 554,836 | ||||||||
| Poland (0.64%) | ||||||||
| LiveChat Software SA | 18,500 | 123,575 | ||||||
| PGS Software SA | 51,047 | 107,757 | ||||||
| 231,332 | ||||||||
| Singapore (0.47%) | ||||||||
| Riverstone Holdings, Ltd./Singapore | 197,800 | 170,209 | ||||||
| South Africa (1.23%) | ||||||||
| ARB Holdings, Ltd. | 400,143 | 151,893 | ||||||
| Cartrack Holdings, Ltd. | 19,600 | 19,254 | ||||||
| Cashbuild, Ltd. | 8,400 | 153,566 | ||||||
| Trellidor Holdings, Ltd. | 344,300 | 121,360 | ||||||
| 446,073 | ||||||||
| South Korea (0.70%) | ||||||||
| LEENO Industrial, Inc. | 4,800 | 252,589 | ||||||
| Sri Lanka (0.28%) | ||||||||
| Royal Ceramics Lanka PLC | 224,570 | 100,957 | ||||||
| Sweden (3.77%) | ||||||||
| Absolent Group AB | 6,876 | 180,331 | ||||||
| Bufab AB | 10,821 | 109,544 | ||||||
| HIQ International AB(a) | 5,412 | 30,417 | ||||||
| KNOW IT AB | 19,150 | 372,416 | ||||||
| OEM International AB | 2,885 | 66,084 | ||||||
| SwedenCare AB(a) | 44,878 | 277,571 | ||||||
See Notes to Financial Statements.
| Semi-Annual Report | October 31, 2018 | 35 |
| Grandeur Peak Global Micro Cap Fund | Portfolio of Investments |
October 31, 2018 (Unaudited)
| Shares | Value (Note 2) | |||||||
| Sweden (continued) | ||||||||
| Vitec Software Group AB, Class B | 35,500 | $ | 325,043 | |||||
| 1,361,406 | ||||||||
| Taiwan (5.27%) | ||||||||
| Bioteque Corp. | 69,000 | 186,573 | ||||||
| FineTek Co., Ltd. | 5,000 | 11,726 | ||||||
| Materials Analysis Technology, Inc. | 48,045 | 65,025 | ||||||
| Poya International Co., Ltd. | 46,000 | 400,875 | ||||||
| Rafael Microelectronics, Inc. | 32,000 | 102,069 | ||||||
| RiTdisplay Corp. | 69,390 | 152,696 | ||||||
| Sinmag Equipment Corp. | 35,190 | 141,646 | ||||||
| Sporton International, Inc. | 74,725 | 278,461 | ||||||
| Tai Shing Electronics Components Corp. | 16,000 | 26,626 | ||||||
| Tehmag Foods Corp. | 30,300 | 190,843 | ||||||
| TSC Auto ID Technology Co., Ltd. | 27,000 | 150,330 | ||||||
| TTFB Co., Ltd. | 27,000 | 195,003 | ||||||
| 1,901,873 | ||||||||
| Thailand (0.35%) | ||||||||
| WICE Logistics PCL | 961,000 | 127,394 | ||||||
| Turkey (0.72%) | ||||||||
| DP Eurasia NV(a)(b)(c) | 174,800 | 259,178 | ||||||
| United States (15.35%) | ||||||||
| Aratana Therapeutics, Inc.(a) | 31,500 | 187,110 | ||||||
| Coastal Financial Corp.(a) | 12,400 | 202,492 | ||||||
| DXP Enterprises, Inc.(a) | 12,925 | 410,756 | ||||||
| Esquire Financial Holdings, Inc.(a) | 32,060 | 768,799 | ||||||
| First of Long Island Corp. | 6,425 | 129,849 | ||||||
| GBGI, Ltd. | 192,500 | 207,915 | ||||||
| Goosehead Insurance, Inc., Class A(a) | 6,450 | 221,106 | ||||||
| Hackett Group, Inc. | 18,175 | 372,042 | ||||||
| Heska Corp.(a) | 10,000 | 1,002,200 | ||||||
| Hingham Institution for Savings | 2,315 | 471,334 | ||||||
| I3 Verticals, Inc., Class A(a) | 2,150 | 46,204 | ||||||
| Kinsale Capital Group, Inc. | 2,725 | 162,710 | ||||||
| LGI Homes, Inc.(a) | 2,900 | 124,091 | ||||||
| NV5 Global, Inc.(a) | 1,925 | 150,285 | ||||||
| Resources Connection, Inc. | 9,450 | 154,224 | ||||||
| Seacoast Commerce Banc Holdings | 15,325 | 339,449 | ||||||
| SI-BONE, Inc.(a) | 4,250 | 79,688 | ||||||
| STAAR Surgical Co.(a) | 8,300 | 332,913 | ||||||
| Transcat, Inc.(a) | 8,616 | 178,437 | ||||||
| 5,541,604 | ||||||||
| Shares | Value (Note 2) | |||||||
| Vietnam (1.91%) | ||||||||
| Lix Detergent JSC | 208,790 | $ | 437,233 | |||||
| Taisun Int'l Holding Corp. | 67,000 | 251,779 | ||||||
| 689,012 | ||||||||
| TOTAL COMMON STOCKS | ||||||||
| (Cost $32,277,225) | 34,833,705 | |||||||
Principal Amount | Value (Note 2) | |||||||
| CORPORATE BONDS (0.54%) | ||||||||
| Germany (0.42%) | ||||||||
| publity AG | ||||||||
| 3.50%, 11/17/2020 | $ | 150,000 | $ | 150,784 | ||||
| Malaysia (0.12%) | ||||||||
| AEON Credit Service M Bhd | ||||||||
| 3.50%, 09/15/2020 | 129,900 | 43,616 | ||||||
| TOTAL CORPORATE BONDS | ||||||||
| (Cost $195,634) | 194,400 | |||||||
| TOTAL INVESTMENTS (97.02%) | ||||||||
| (Cost $32,472,859) | $ | 35,028,105 | ||||||
| Other Assets In Excess Of Liabilities (2.98%) | 1,074,223 | |||||||
| NET ASSETS (100.00%) | $ | 36,102,328 |
See Notes to Financial Statements.
| 36 | 1.855.377.7325 | www.GrandeurPeakGlobal.com |
| Grandeur Peak Global Micro Cap Fund | Portfolio of Investments |
October 31, 2018 (Unaudited)
| (a) | Non-Income Producing Security. |
| (b) | Security exempt from registration under Rule 144A of the Securities Act of 1933. These securities may be resold in the ordinary course of business in transactions exempt from registration, normally to qualified institutional buyers. As of October 31, 2018, these securities had a total aggregate market value of $2,892,942 representing 8.01% of net assets. |
| (c) | Security was purchased pursuant to Regulation S under the Securities Act of 1933, which exempts securities offered and sold outside of the United States from registration. Such security cannot be sold in the United States without either an effective registration statement filed pursuant to the Securities Act of 1933, or pursuant to an exemption from registration. The security has been deemed liquid under guidelines approved by the Fund's Board of Trustees. As of October 31, 2018, the aggregate market value of those securities was $3,962,350, representing 10.98% of net assets. |
| (d) | As a result of the use of significant unobservable inputs to determine fair value, these investments have been classified as level 3 assets. See also footnote 2 to the financial statements for additional information. |
For Fund compliance purposes, the Fund's geographical classifications refer to any one or more of the country sub-classifications used by one or more widely recognized market indexes or ratings group indexes, and/or as defined by Fund management. This definition may not apply for purposes of this report, which may combine sub-classifications for reporting ease. Geographical regions are shown as a percentage of net assets.
See Notes to Financial Statements.
| Semi-Annual Report | October 31, 2018 | 37 |
| Grandeur Peak Global Opportunities Fund | Portfolio of Investments |
October 31, 2018 (Unaudited)
| Shares | Value (Note 2) | |||||||
| COMMON STOCKS (97.53%) | ||||||||
| Argentina (0.45%) | ||||||||
| Globant SA(a) | 59,025 | $ | 3,038,607 | |||||
| Australia (1.15%) | ||||||||
| Class, Ltd. | 974,499 | 1,271,636 | ||||||
| Fiducian Group, Ltd. | 141,400 | 417,168 | ||||||
| Kogan.com, Ltd. | 824,712 | 1,666,258 | ||||||
| National Storage REIT | 2,252,817 | 2,722,015 | ||||||
| National Veterinary Care, Ltd. | 1,105,146 | 1,706,845 | ||||||
| 7,783,922 | ||||||||
| Austria (0.93%) | ||||||||
| Palfinger AG | 207,498 | 6,326,986 | ||||||
| Bangladesh (0.33%) | ||||||||
| Square Pharmaceuticals, Ltd. | 703,385 | 2,240,769 | ||||||
| Belgium (0.57%) | ||||||||
| Melexis NV | 59,193 | 3,893,068 | ||||||
| Bermuda (0.66%) | ||||||||
| Bank of NT Butterfield & Son, Ltd. | 111,650 | 4,498,378 | ||||||
| Brazil (1.17%) | ||||||||
| Arco Platform, Ltd., Class A(a) | 27,975 | 596,147 | ||||||
| Fleury SA | 885,200 | 4,968,918 | ||||||
| Hypera SA | 299,400 | 2,378,949 | ||||||
| 7,944,014 | ||||||||
| Britain (12.66%) | ||||||||
| Arrow Global Group PLC | 607,739 | 1,483,897 | ||||||
| Ascential PLC | 968,100 | 4,657,199 | ||||||
| B&M European Value Retail SA | 1,445,800 | 7,693,476 | ||||||
| boohoo Group PLC(a) | 1,684,700 | 4,560,704 | ||||||
| City of London Investment Group PLC | 58,770 | 283,195 | ||||||
| Clinigen Group PLC | 331,376 | 3,828,600 | ||||||
| Clipper Logistics PLC | 483,500 | 1,606,827 | ||||||
| Close Brothers Group PLC | 132,522 | 2,489,051 | ||||||
| Curtis Banks Group PLC | 124,300 | 444,865 | ||||||
| CVS Group PLC | 347,817 | 3,732,250 | ||||||
| Dechra Pharmaceuticals PLC | 254,700 | 7,441,854 | ||||||
| Diploma PLC | 175,800 | 2,947,984 | ||||||
| Endava PLC, ADR(a) | 62,237 | 1,447,633 | ||||||
| FDM Group Holdings PLC | 148,200 | 1,627,199 | ||||||
| Impax Asset Management Group PLC | 195,254 | 572,772 | ||||||
| Intertek Group PLC | 47,700 | 2,858,012 | ||||||
| JTC PLC(b)(c) | 984,104 | 4,213,907 | ||||||
| K3 Capital Group PLC | 56,587 | 182,994 | ||||||
| Metro Bank PLC(a) | 101,300 | 2,874,702 | ||||||
| On the Beach Group PLC(b)(c) | 608,300 | 3,328,050 | ||||||
| Shares | Value (Note 2) | |||||||
| Britain (continued) | ||||||||
| Oxford Immunotec Global PLC(a) | 232,304 | $ | 3,579,805 | |||||
| Premier Asset Management Group PLC | 420,400 | 1,160,688 | ||||||
| River & Mercantile Group PLC | 477,200 | 1,771,880 | ||||||
| RPS Group PLC | 1,938,739 | 3,885,658 | ||||||
| Sabre Insurance Group PLC(b)(c) | 1,004,400 | 3,389,299 | ||||||
| Sanne Group PLC | 644,314 | 4,611,952 | ||||||
| Secure Trust Bank PLC | 81,142 | 1,503,879 | ||||||
| St James’s Place PLC | 378,431 | 4,890,563 | ||||||
| Ted Baker PLC | 89,718 | 2,100,895 | ||||||
| Volution Group PLC | 291,700 | 645,033 | ||||||
| 85,814,823 | ||||||||
| Canada (3.43%) | ||||||||
| Biosyent, Inc.(a) | 167,000 | 1,183,569 | ||||||
| Cipher Pharmaceuticals, Inc.(a) | 513,000 | 1,098,910 | ||||||
| Gildan Activewear, Inc. | 196,600 | 5,876,570 | ||||||
| Richelieu Hardware, Ltd. | 275,065 | 5,277,938 | ||||||
| Ritchie Bros Auctioneers, Inc. | 83,550 | 2,808,115 | ||||||
| Stantec, Inc. | 268,212 | 6,980,093 | ||||||
| 23,225,195 | ||||||||
| China (3.54%) | ||||||||
| BBI Life Sciences Corp.(c) | 13,832,000 | 4,460,085 | ||||||
| China Medical System Holdings, Ltd. | 3,504,000 | 4,185,332 | ||||||
| CSPC Pharmaceutical Group, Ltd. | 1,815,000 | 3,867,416 | ||||||
| Man Wah Holdings, Ltd. | 4,374,200 | 2,018,458 | ||||||
| O2Micro International, Ltd., ADR(a) | 954,611 | 1,546,470 | ||||||
| On-Bright Electronics, Inc. | 709,181 | 3,954,843 | ||||||
| Silergy Corp. | 308,852 | 3,934,910 | ||||||
| 23,967,514 | ||||||||
| Colombia (0.79%) | ||||||||
| Amerisur Resources PLC(a) | 1,883,500 | 260,009 | ||||||
| Gran Tierra Energy, Inc.(a) | 296,749 | 905,085 | ||||||
| Parex Resources, Inc.(a) | 287,500 | 4,186,543 | ||||||
| 5,351,637 | ||||||||
| Egypt (0.07%) | ||||||||
| Integrated Diagnostics Holdings PLC(b)(c) | 131,600 | 454,020 | ||||||
| France (1.65%) | ||||||||
| Alten SA | 30,081 | 2,901,167 | ||||||
| Bureau Veritas SA | 103,500 | 2,334,969 | ||||||
| Esker SA | 30,047 | 2,015,949 | ||||||
| Infotel SA | 12,620 | 543,174 | ||||||
| Medicrea International(a) | 88,751 | 165,232 | ||||||
| Neurones | 39,608 | 936,801 | ||||||
See Notes to Financial Statements.
| 38 | 1.855.377.7325 | www.GrandeurPeakGlobal.com |
| Grandeur Peak Global Opportunities Fund | Portfolio of Investments |
October 31, 2018 (Unaudited)
| Shares | Value (Note 2) | |||||||
| France (continued) | ||||||||
| Thermador Groupe | 42,660 | $ | 2,292,526 | |||||
| 11,189,818 | ||||||||
| Georgia (0.96%) | ||||||||
| Bank of Georgia Group PLC | 111,900 | 2,230,421 | ||||||
| Georgia Capital PLC(a) | 114,900 | 1,718,324 | ||||||
| TBC Bank Group PLC | 118,171 | 2,552,682 | ||||||
| 6,501,427 | ||||||||
| Germany (4.91%) | ||||||||
| Aroundtown SA | 428,300 | 3,549,161 | ||||||
| Dermapharm Holding SE(a) | 185,600 | 5,286,187 | ||||||
| FinTech Group AG(a) | 60,500 | 1,538,856 | ||||||
| Grand City Properties SA | 149,423 | 3,612,420 | ||||||
| GRENKE AG | 20,700 | 1,985,199 | ||||||
| Nexus AG | 115,924 | 3,164,363 | ||||||
| Norma Group SE | 104,068 | 5,618,829 | ||||||
| PATRIZIA Immobilien AG | 187,213 | 3,218,268 | ||||||
| Wirecard AG | 28,285 | 5,290,905 | ||||||
| 33,264,188 | ||||||||
| Hong Kong (1.72%) | ||||||||
| International Housewares Retail Co., Ltd. | 11,258,000 | 2,374,102 | ||||||
| Value Partners Group, Ltd. | 7,593,000 | 5,663,021 | ||||||
| Vitasoy International Holdings, Ltd. | 1,135,483 | 3,619,816 | ||||||
| 11,656,939 | ||||||||
| India (4.65%) | ||||||||
| Alkem Laboratories, Ltd. | 165,628 | 4,283,768 | ||||||
| Bajaj Finance, Ltd. | 200,250 | 6,443,229 | ||||||
| Byke Hospitality, Ltd. | 869,500 | 881,981 | ||||||
| City Union Bank, Ltd. | 553,952 | 1,275,220 | ||||||
| Cyient, Ltd. | 489,116 | 4,113,766 | ||||||
| Indiabulls Housing Finance, Ltd. | 118,500 | 1,336,567 | ||||||
| Kellton Tech Solutions, Ltd.(a) | 1,186,000 | 476,579 | ||||||
| Kovai Medical Center and Hospital | 25,501 | 283,030 | ||||||
| L&T Technology Services, Ltd.(b)(c) | 29,848 | 685,880 | ||||||
| Poly Medicure, Ltd. | 23,106 | 69,723 | ||||||
| TCI Express, Ltd. | 105,649 | 844,441 | ||||||
| Thyrocare Technologies, Ltd.(b)(c) | 26,000 | 196,984 | ||||||
| Time Technoplast, Ltd. | 1,488,705 | 2,270,482 | ||||||
| WNS Holdings, Ltd., ADR(a) | 138,025 | 6,927,475 | ||||||
| Yes Bank, Ltd. | 561,000 | 1,426,750 | ||||||
| 31,515,875 | ||||||||
| Indonesia (1.69%) | ||||||||
| Arwana Citramulia Tbk PT | 59,516,800 | 1,489,041 | ||||||
| Astra Graphia Tbk PT | 3,242,900 | 286,907 | ||||||
| Delfi, Ltd. | 1,491,700 | 1,378,462 | ||||||
| Shares | Value (Note 2) | |||||||
| Indonesia (continued) | ||||||||
| Link Net Tbk PT | 3,945,800 | $ | 1,138,783 | |||||
| Panin Sekuritas Tbk PT | 4,915,400 | 439,358 | ||||||
| Selamat Sempurna Tbk PT | 59,412,900 | 5,765,898 | ||||||
| Ultrajaya Milk Industry & Trading Co. Tbk PT | 11,829,000 | 963,656 | ||||||
| 11,462,105 | ||||||||
| Ireland (0.40%) | ||||||||
| Irish Residential Properties REIT PLC | 1,704,246 | 2,744,908 | ||||||
| Israel (0.73%) | ||||||||
| Wix.com, Ltd.(a) | 50,909 | 4,955,991 | ||||||
| Italy (2.66%) | ||||||||
| Brembo SpA | 289,211 | 3,201,825 | ||||||
| DiaSorin SpA | 76,875 | 7,291,832 | ||||||
| FinecoBank Banca Fineco SpA | 324,812 | 3,394,815 | ||||||
| Interpump Group SpA | 122,576 | 3,536,328 | ||||||
| Piovan SpA(a)(b)(c) | 61,200 | 610,000 | ||||||
| 18,034,800 | ||||||||
| Japan (8.91%) | ||||||||
| AIT Corp. | 365,500 | 3,431,724 | ||||||
| Amiyaki Tei Co., Ltd. | 5,800 | 204,244 | ||||||
| Arcland Service Holdings Co., Ltd. | 214,200 | 4,390,643 | ||||||
| Cosmos Pharmaceutical Corp. | 8,500 | 1,737,377 | ||||||
| Create SD Holdings Co., Ltd. | 265,400 | 6,723,147 | ||||||
| Future Corp. | 155,200 | 2,112,321 | ||||||
| Japan Lifeline Co., Ltd. | 354,800 | 5,172,643 | ||||||
| M&A Capital Partners Co., Ltd.(a) | 76,500 | 3,761,824 | ||||||
| MISUMI Group, Inc. | 228,100 | 4,571,306 | ||||||
| Naigai Trans Line, Ltd. | 69,100 | 991,958 | ||||||
| Nihon M&A Center, Inc. | 146,900 | 3,520,065 | ||||||
| Open Door, Inc.(a) | 85,100 | 2,020,502 | ||||||
| Seria Co., Ltd. | 119,600 | 4,012,470 | ||||||
| Sundrug Co., Ltd. | 85,500 | 3,106,975 | ||||||
| Synchro Food Co., Ltd.(a) | 299,700 | 2,084,520 | ||||||
| Syuppin Co., Ltd. | 195,800 | 2,442,521 | ||||||
| Tokyo Century Corp. | 37,200 | 1,996,654 | ||||||
| Trancom Co., Ltd. | 70,370 | 4,029,257 | ||||||
| Tsuruha Holdings, Inc. | 26,300 | 2,744,936 | ||||||
| Yakuodo Co., Ltd. | 42,700 | 1,320,061 | ||||||
| 60,375,148 | ||||||||
| Malaysia (0.49%) | ||||||||
| AEON Credit Service M Bhd | 912,220 | 3,295,222 | ||||||
| Mexico (0.28%) | ||||||||
| Regional SAB de CV | 383,034 | 1,886,956 | ||||||
See Notes to Financial Statements.
| Semi-Annual Report | October 31, 2018 | 39 |
| Grandeur Peak Global Opportunities Fund | Portfolio of Investments |
October 31, 2018 (Unaudited)
| Shares | Value (Note 2) | |||||||
| Netherlands (0.83%) | ||||||||
| Aalberts Industries NV | 153,522 | $ | 5,627,824 | |||||
| New Zealand (0.82%) | ||||||||
| CBL Corp., Ltd.(a)(d) | 1,107,672 | 166,247 | ||||||
| Restaurant Brands New Zealand, Ltd. | 961,802 | 5,391,441 | ||||||
| 5,557,688 | ||||||||
| Norway (1.77%) | ||||||||
| Medistim ASA | 152,700 | 1,284,702 | ||||||
| Multiconsult ASA(b)(c) | 156,000 | 1,053,889 | ||||||
| Sbanken ASA(b)(c) | 733,800 | 7,308,317 | ||||||
| TGS NOPEC Geophysical Co. ASA | 69,800 | 2,331,648 | ||||||
| 11,978,556 | ||||||||
| Oman (0.32%) | ||||||||
| Tethys Oil AB | 228,000 | 2,188,270 | ||||||
| Peru (0.77%) | ||||||||
| Alicorp SAA | 1,171,061 | 3,386,577 | ||||||
| Credicorp, Ltd. | 8,050 | 1,816,966 | ||||||
| 5,203,543 | ||||||||
| Philippines (1.49%) | ||||||||
| Concepcion Industrial Corp. | 692,152 | 491,576 | ||||||
| Pepsi-Cola Products Philippines, Inc. | 16,403,900 | 507,651 | ||||||
| Puregold Price Club, Inc. | 5,230,000 | 3,972,960 | ||||||
| Robinsons Retail Holdings, Inc. | 2,030,000 | 2,875,881 | ||||||
| Security Bank Corp. | 845,450 | 2,284,790 | ||||||
| 10,132,858 | ||||||||
| Poland (0.81%) | ||||||||
| Dino Polska SA(a)(b)(c) | 216,823 | 4,764,453 | ||||||
| LiveChat Software SA | 76,200 | 508,995 | ||||||
| PGS Software SA | 120,487 | 254,341 | ||||||
| 5,527,789 | ||||||||
| Singapore (0.51%) | ||||||||
| Riverstone Holdings, Ltd./Singapore | 3,984,200 | 3,428,440 | ||||||
| South Africa (0.47%) | ||||||||
| Cartrack Holdings, Ltd. | 570,444 | 560,388 | ||||||
| Cashbuild, Ltd. | 67,249 | 1,229,423 | ||||||
| Italtile, Ltd. | 1,595,243 | 1,398,169 | ||||||
| 3,187,980 | ||||||||
| South Korea (1.31%) | ||||||||
| Hy-Lok Corp. | 75,841 | 1,523,453 | ||||||
| ISC Co., Ltd. | 97,755 | 783,086 | ||||||
| Koh Young Technology, Inc. | 19,581 | 1,551,555 | ||||||
| Shares | Value (Note 2) | |||||||
| South Korea (continued) | ||||||||
| LEENO Industrial, Inc. | 46,500 | $ | 2,446,955 | |||||
| Medy-Tox, Inc. | 6,255 | 2,562,472 | ||||||
| 8,867,521 | ||||||||
| Sweden (3.10%) | ||||||||
| AddTech AB, Class B | 182,127 | 3,724,661 | ||||||
| Beijer Alma AB | 171,862 | 2,592,059 | ||||||
| Bufab AB | 212,153 | 2,147,673 | ||||||
| HIQ International AB(a) | 87,340 | 490,876 | ||||||
| Hoist Finance AB(b)(c) | 292,200 | 2,343,692 | ||||||
| Indutrade AB | 180,100 | 4,323,041 | ||||||
| KNOW IT AB | 57,300 | 1,114,332 | ||||||
| Nibe Industrier AB, Class B | 308,400 | 3,218,762 | ||||||
| OEM International AB | 13,639 | 312,415 | ||||||
| TF Bank AB(c) | 86,200 | 744,147 | ||||||
| 21,011,658 | ||||||||
| Switzerland (0.10%) | ||||||||
| VZ Holding AG | 2,435 | 689,797 | ||||||
| Taiwan (1.81%) | ||||||||
| ASPEED Technology, Inc. | 18,237 | 268,737 | ||||||
| Bioteque Corp. | 902,000 | 2,438,971 | ||||||
| FineTek Co., Ltd. | 14,000 | 32,832 | ||||||
| LandMark Optoelectronics Corp. | 340,000 | 2,259,852 | ||||||
| Poya International Co., Ltd. | 181,000 | 1,577,354 | ||||||
| Sinmag Equipment Corp. | 342,421 | 1,378,309 | ||||||
| Sporton International, Inc. | 749,671 | 2,793,630 | ||||||
| Test Research, Inc. | 665,000 | 924,882 | ||||||
| TSC Auto ID Technology Co., Ltd. | 104,000 | 579,048 | ||||||
| 12,253,615 | ||||||||
| Turkey (0.09%) | ||||||||
| DP Eurasia NV(a)(b)(c) | 403,911 | 598,884 | ||||||
| United Arab Emirates (0.24%) | ||||||||
| Aramex PJSC | 1,524,192 | 1,639,072 | ||||||
| United States (27.01%) | ||||||||
| Aratana Therapeutics, Inc.(a) | 445,425 | 2,645,824 | ||||||
| Cactus, Inc., Class A(a) | 78,925 | 2,640,830 | ||||||
| Core Laboratories NV | 53,450 | 4,556,078 | ||||||
| Diamond Hill Investment Group, Inc. | 13,575 | 2,337,343 | ||||||
| Dollar Tree, Inc.(a) | 41,000 | 3,456,300 | ||||||
| DXP Enterprises, Inc.(a) | 132,000 | 4,194,960 | ||||||
| EPAM Systems, Inc.(a) | 66,575 | 7,953,715 | ||||||
| Esquire Financial Holdings, Inc.(a) | 13,051 | 312,963 | ||||||
| ExIService Holdings, Inc.(a) | 52,700 | 3,378,070 | ||||||
| Fastenal Co. | 134,500 | 6,914,645 | ||||||
| First Republic Bank | 96,400 | 8,771,436 | ||||||
| FirstCash, Inc. | 69,232 | 5,566,253 | ||||||
See Notes to Financial Statements.
| 40 | 1.855.377.7325 | www.GrandeurPeakGlobal.com |
| Grandeur Peak Global Opportunities Fund | Portfolio of Investments |
October 31, 2018 (Unaudited)
| Shares | Value (Note 2) | |||||||
| United States (continued) | ||||||||
| Genpact, Ltd. | 174,100 | $ | 4,772,081 | |||||
| Hackett Group, Inc. | 172,900 | 3,539,263 | ||||||
| Hamilton Lane, Inc., Class A | 55,942 | 2,147,054 | ||||||
| Heska Corp.(a) | 57,675 | 5,780,189 | ||||||
| Hingham Institution for Savings | 20,620 | 4,198,232 | ||||||
| I3 Verticals, Inc., Class A(a) | 40,325 | 866,584 | ||||||
| IDEX Corp. | 25,175 | 3,192,694 | ||||||
| Inphi Corp.(a) | 109,500 | 3,504,000 | ||||||
| Kinsale Capital Group, Inc. | 70,550 | 4,212,541 | ||||||
| Knight-Swift Transportation Holdings, Inc. | 513,720 | 16,439,040 | ||||||
| LGI Homes, Inc.(a) | 47,826 | 2,046,475 | ||||||
| Littelfuse, Inc. | 6,900 | 1,250,004 | ||||||
| LKQ Corp.(a) | 111,975 | 3,053,558 | ||||||
| Lululemon Athletica, Inc.(a) | 48,125 | 6,772,631 | ||||||
| MarketAxess Holdings, Inc. | 39,575 | 8,297,690 | ||||||
| Microchip Technology, Inc. | 63,945 | 4,206,302 | ||||||
| Monro, Inc. | 81,750 | 6,082,200 | ||||||
| MSC Industrial Direct Co., Inc., Class A | 65,200 | 5,285,112 | ||||||
| NV5 Global, Inc.(a) | 34,425 | 2,687,560 | ||||||
| Paycom Software, Inc.(a) | 38,050 | 4,763,860 | ||||||
| Pluralsight, Inc., Class A(a) | 81,941 | 1,836,298 | ||||||
| Power Integrations, Inc. | 206,275 | 11,617,408 | ||||||
| Qualys, Inc.(a) | 16,575 | 1,180,803 | ||||||
| Resources Connection, Inc. | 236,443 | 3,858,750 | ||||||
| SI-BONE, Inc.(a) | 19,950 | 374,063 | ||||||
| Silicon Laboratories, Inc.(a) | 66,915 | 5,455,580 | ||||||
| STAAR Surgical Co.(a) | 54,022 | 2,166,822 | ||||||
| SVB Financial Group(a) | 25,800 | 6,120,534 | ||||||
| TriMas Corp.(a) | 158,744 | 4,675,011 | ||||||
| 183,110,756 | ||||||||
| Vietnam (1.28%) | ||||||||
| Ho Chi Minh City Development Joint Stock Commercial Bank | 2,005,870 | 2,823,628 | ||||||
| Vietnam Dairy Products JSC | 430,560 | 2,148,171 | ||||||
| Vietnam Technological & Commercial Joint Stock Bank(a) | 3,191,904 | 3,699,642 | ||||||
| 8,671,441 | ||||||||
| TOTAL COMMON STOCKS | ||||||||
| (Cost $550,770,147) | 661,098,002 | |||||||
| Shares | Value (Note 2) | |||||||
| PREFERRED STOCKS (0.29%) | ||||||||
| United States (0.29%) | ||||||||
| Dataminr Inc - Private Placement(a) | 96,640 | $ | 1,923,136 | |||||
| TOTAL PREFERRED STOCKS | ||||||||
| (Cost $$1,923,136) | 1,923,136 | |||||||
| Principal Amount | Value (Note 2) | |||||||
| CORPORATE BONDS (0.08%) | ||||||||
| Malaysia (0.08%) | ||||||||
| AEON Credit Service M Bhd | ||||||||
| 3.50%, 09/15/2020 | $ | 1,678,440 | $ | 563,558 | ||||
| TOTAL CORPORATE BONDS | ||||||||
| (Cost $398,727) | 563,558 | |||||||
| TOTAL INVESTMENTS (97.90%) | ||||||||
| (Cost $553,092,010) | $ | 663,584,696 | ||||||
| Other Assets In Excess Of Liabilities (2.10%) | 14,256,036 | |||||||
| NET ASSETS (100.00%) | $ | 677,840,732 | ||||||
| (a) | Non-Income Producing Security. |
| (b) | Security exempt from registration under Rule 144A of the Securities Act of 1933. These securities may be resold in the ordinary course of business in transactions exempt from registration, normally to qualified institutional buyers. As of October 31, 2018, these securities had a total aggregate market value of $28,947,375 representing 4.27% of net assets. |
| (c) | Security was purchased pursuant to Regulation S under the Securities Act of 1933, which exempts securities offered and sold outside of the United States from registration. Such security cannot be sold in the United States without either an effective registration statement filed pursuant to the Securities Act of 1933, or pursuant to an exemption from registration. The security has been deemed liquid under guidelines approved by the Fund's Board of Trustees. As of October 31, 2018, the aggregate market value of those securities was $34,151,607, representing 5.04% of net assets. |
| (d) | As a result of the use of significant unobservable inputs to determine fair value, these investments have been classified as level 3 assets. See also footnote 2 to the financial statements for additional information. |
See Notes to Financial Statements.
| Semi-Annual Report | October 31, 2018 | 41 |
| Grandeur Peak Global Opportunities Fund | Portfolio of Investments |
October 31, 2018 (Unaudited)
For Fund compliance purposes, the Fund's geographical classifications refer to any one or more of the country sub-classifications used by one or more widely recognized market indexes or ratings group indexes, and/or as defined by Fund management. This definition may not apply for purposes of this report, which may combine sub-classifications for reporting ease. Geographical regions are shown as a percentage of net assets.
See Notes to Financial Statements.
| 42 | 1.855.377.7325 | www.GrandeurPeakGlobal.com |
| Grandeur Peak Global Reach Fund | Portfolio of Investments |
October 31, 2018 (Unaudited)
| Shares | Value (Note 2) | |||||||
| COMMON STOCKS (98.21%) | ||||||||
| Argentina (0.31%) | ||||||||
| Globant SA(a) | 19,088 | $ | 982,650 | |||||
| Australia (3.05%) | ||||||||
| Appen, Ltd. | 46,842 | 355,632 | ||||||
| Australian Ethical Investment, Ltd. | 4,878 | 570,348 | ||||||
| Class, Ltd. | 436,300 | 569,333 | ||||||
| Domino’s Pizza Enterprises, Ltd. | 38,900 | 1,490,912 | ||||||
| IPH, Ltd. | 209,697 | 805,028 | ||||||
| Kogan.com, Ltd. | 523,915 | 1,058,524 | ||||||
| Lycopodium, Ltd. | 211,800 | 683,422 | ||||||
| Mainstream Group Holdings, Ltd. | 2,472,852 | 1,138,248 | ||||||
| National Storage REIT | 618,282 | 747,053 | ||||||
| National Veterinary Care, Ltd. | 720,900 | 1,113,395 | ||||||
| Netwealth Group, Ltd. | 238,426 | 1,188,026 | ||||||
| 9,719,921 | ||||||||
| Austria (0.36%) | ||||||||
| Palfinger AG | 38,148 | 1,163,201 | ||||||
| Bangladesh (0.34%) | ||||||||
| Square Pharmaceuticals, Ltd. | 335,766 | 1,069,647 | ||||||
| Belgium (0.20%) | ||||||||
| Melexis NV | 9,497 | 624,609 | ||||||
| Bermuda (1.29%) | ||||||||
| Bank of NT Butterfield & Son, Ltd. | 102,325 | 4,122,674 | ||||||
| Brazil (1.05%) | ||||||||
| Arco Platform, Ltd., Class A(a) | 11,550 | 246,131 | ||||||
| Fleury SA | 270,500 | 1,518,405 | ||||||
| Hypera SA | 80,000 | 635,658 | ||||||
| Pagseguro Digital, Ltd., Class A(a) | 34,475 | 930,480 | ||||||
| 3,330,674 | ||||||||
| Britain (11.39%) | ||||||||
| AB Dynamics PLC | 67,493 | 1,000,534 | ||||||
| Ascential PLC | 134,300 | 646,072 | ||||||
| ASOS PLC(a) | 17,100 | 1,191,282 | ||||||
| B&M European Value Retail SA | 241,600 | 1,285,616 | ||||||
| boohoo Group PLC(a) | 510,600 | 1,382,261 | ||||||
| Clinigen Group PLC | 58,130 | 671,613 | ||||||
| Close Brothers Group PLC | 44,180 | 829,797 | ||||||
| Curtis Banks Group PLC | 250,000 | 894,741 | ||||||
| CVS Group PLC | 79,500 | 853,075 | ||||||
| Dechra Pharmaceuticals PLC | 61,300 | 1,791,070 | ||||||
| Diploma PLC | 59,900 | 1,004,461 | ||||||
| dotdigital group PLC | 1,212,256 | 1,299,951 | ||||||
| Shares | Value (Note 2) | |||||||
| Britain (continued) | ||||||||
| Endava PLC, ADR(a) | 22,325 | $ | 519,280 | |||||
| Horizon Discovery Group PLC(a) | 282,600 | 722,439 | ||||||
| Impax Asset Management Group PLC | 407,837 | 1,196,378 | ||||||
| Intertek Group PLC | 11,400 | 683,047 | ||||||
| JTC PLC(b)(c) | 549,742 | 2,353,981 | ||||||
| LoopUp Group PLC(a) | 218,949 | 930,537 | ||||||
| Metro Bank PLC(a) | 72,943 | 2,069,984 | ||||||
| Morses Club PLC | 475,200 | 850,739 | ||||||
| Mortgage Advice Bureau Holdings, Ltd. | 112,200 | 829,214 | ||||||
| On the Beach Group PLC(b)(c) | 275,700 | 1,508,373 | ||||||
| Oxford Immunotec Global PLC(a) | 50,575 | 779,361 | ||||||
| RPS Group PLC | 425,399 | 852,593 | ||||||
| Sabre Insurance Group PLC(b)(c) | 697,900 | 2,355,029 | ||||||
| Sanne Group PLC | 327,073 | 2,341,164 | ||||||
| Softcat PLC | 58,883 | 485,713 | ||||||
| St James’s Place PLC | 189,929 | 2,454,502 | ||||||
| Volution Group PLC | 354,400 | 783,681 | ||||||
| XPS Pensions Group PLC(c) | 804,128 | 1,723,755 | ||||||
| 36,290,243 | ||||||||
| Canada (1.96%) | ||||||||
| Biosyent, Inc.(a) | 93,300 | 661,240 | ||||||
| Cipher Pharmaceuticals, Inc.(a) | 152,100 | 325,817 | ||||||
| NCS Multistage Holdings, Inc.(a) | 20,175 | 227,977 | ||||||
| Richelieu Hardware, Ltd. | 62,200 | 1,193,492 | ||||||
| Ritchie Bros Auctioneers, Inc. | 45,900 | 1,542,699 | ||||||
| Shopify, Inc.(a) | 2,550 | 352,282 | ||||||
| Stantec, Inc. | 74,420 | 1,936,746 | ||||||
| 6,240,253 | ||||||||
| China (5.01%) | ||||||||
| 51job, Inc., ADR(a) | 16,625 | 1,020,941 | ||||||
| 58.com, Inc., ADR(a) | 12,475 | 818,235 | ||||||
| AK Medical Holdings, Ltd.(b)(c) | 795,000 | 482,960 | ||||||
| BBI Life Sciences Corp.(c) | 7,001,500 | 2,257,612 | ||||||
| China Medical System Holdings, Ltd. | 1,222,000 | 1,459,611 | ||||||
| CSPC Pharmaceutical Group, Ltd. | 668,000 | 1,423,379 | ||||||
| Essex Bio-technology, Ltd. | 1,461,000 | 950,159 | ||||||
| Hop Hing Group Holdings, Ltd. | 43,436,000 | 832,540 | ||||||
| HUYA, Inc., ADR(a) | 6,488 | 112,372 | ||||||
| Man Wah Holdings, Ltd. | 1,569,600 | 724,286 | ||||||
| O2Micro International, Ltd., ADR(a) | 292,039 | 473,103 | ||||||
| On-Bright Electronics, Inc. | 191,528 | 1,068,082 | ||||||
| Shanghai Haohai Biological Technology Co., Ltd., Class H(b)(c) | 217,700 | 1,140,647 | ||||||
See Notes to Financial Statements.
| Semi-Annual Report | October 31, 2018 | 43 |
| Grandeur Peak Global Reach Fund | Portfolio of Investments |
October 31, 2018 (Unaudited)
| Shares | Value (Note 2) | |||||||
| China (continued) | ||||||||
| Silergy Corp. | 92,925 | $ | 1,183,905 | |||||
Wuxi Biologics Cayman, Inc.(a)(b)(c) | 69,000 | 493,691 | ||||||
| Yum China Holdings, Inc. | 42,275 | 1,525,282 | ||||||
| 15,966,805 | ||||||||
| Colombia (1.20%) | ||||||||
| Amerisur Resources PLC(a) | 6,094,200 | 841,278 | ||||||
| Parex Resources, Inc.(a) | 203,961 | 2,970,058 | ||||||
| 3,811,336 | ||||||||
| Denmark (0.08%) | ||||||||
| Netcompany Group A/S(a)(b)(c) | 7,500 | 247,720 | ||||||
| Egypt (0.45%) | ||||||||
| African Export-Import Bank, GDR | 200,000 | 692,000 | ||||||
| Commercial International Bank Egypt SAE | 68,939 | 308,879 | ||||||
| Integrated Diagnostics Holdings PLC(b)(c) | 129,237 | 445,868 | ||||||
| 1,446,747 | ||||||||
| Finland (0.41%) | ||||||||
| Metso OYJ | 25,300 | 798,770 | ||||||
| Terveystalo Oyj(b)(c) | 59,800 | 511,148 | ||||||
| 1,309,918 | ||||||||
| France (1.71%) | ||||||||
| Alten SA | 10,400 | 1,003,030 | ||||||
| Bureau Veritas SA | 36,300 | 818,931 | ||||||
| Esker SA | 23,409 | 1,570,584 | ||||||
| Infotel SA | 14,560 | 626,673 | ||||||
| Neurones | 17,282 | 408,751 | ||||||
| Thermador Groupe | 18,808 | 1,010,732 | ||||||
| 5,438,701 | ||||||||
| Georgia (0.63%) | ||||||||
| Bank of Georgia Group PLC | 27,900 | 556,110 | ||||||
| Georgia Healthcare Group PLC(a)(b)(c) | 166,298 | 510,586 | ||||||
| TBC Bank Group PLC | 43,184 | 932,844 | ||||||
| 1,999,540 | ||||||||
| Germany (4.31%) | ||||||||
| CANCOM SE | 12,600 | 513,749 | ||||||
| Dermapharm Holding SE(a) | 39,700 | 1,130,720 | ||||||
| FinTech Group AG(a) | 23,000 | 585,020 | ||||||
| FUCHS PETROLUB SE | 12,900 | 597,137 | ||||||
| Grand City Properties SA | 69,400 | 1,677,801 | ||||||
| GRENKE AG | 16,000 | 1,534,453 | ||||||
| Hypoport AG(a) | 3,170 | 635,010 | ||||||
| Marley Spoon AG(a) | 1,361,517 | 819,535 | ||||||
| Nexus AG | 32,485 | 886,739 | ||||||
| Norma Group SE | 35,260 | 1,903,754 | ||||||
| Shares | Value (Note 2) | |||||||
| Germany (continued) | ||||||||
| PATRIZIA Immobilien AG | 36,404 | $ | 625,800 | |||||
| Wirecard AG | 15,096 | 2,823,811 | ||||||
| 13,733,529 | ||||||||
| Greece (0.60%) | ||||||||
| Sarantis SA | 239,340 | 1,898,286 | ||||||
| Hong Kong (1.84%) | ||||||||
| International Housewares Retail Co., Ltd. | 6,339,000 | 1,336,777 | ||||||
| Jacobson Pharma Corp., Ltd.(c) | 2,313,000 | 477,191 | ||||||
| Plover Bay Technologies, Ltd.(c) | 2,930,000 | 423,350 | ||||||
| TK Group Holdings, Ltd. | 1,720,000 | 915,756 | ||||||
| Vitasoy International Holdings, Ltd. | 847,000 | 2,700,159 | ||||||
| 5,853,233 | ||||||||
| India (4.70%) | ||||||||
| Alkem Laboratories, Ltd. | 38,182 | 987,531 | ||||||
| Bajaj Finance, Ltd. | 55,000 | 1,769,676 | ||||||
| Byke Hospitality, Ltd. | 756,500 | 767,359 | ||||||
| Control Print, Ltd. | 152,000 | 722,237 | ||||||
| Cyient, Ltd. | 181,100 | 1,523,162 | ||||||
| HDFC Asset Management Co., Ltd. (a)(b)(c) | 38,000 | 719,711 | ||||||
| HDFC Bank, Ltd. | 5,788 | 150,288 | ||||||
| HDFC Standard Life Insurance Co., Ltd.(b)(c) | 66,500 | 335,126 | ||||||
| Kellton Tech Solutions, Ltd.(a) | 518,158 | 208,215 | ||||||
| Kovai Medical Center and Hospital | 18,322 | 203,352 | ||||||
| Poly Medicure, Ltd. | 242,220 | 730,906 | ||||||
| TCI Express, Ltd. | 158,959 | 1,270,542 | ||||||
| Thyrocare Technologies, Ltd.(b)(c) | 58,000 | 439,425 | ||||||
| Time Technoplast, Ltd. | 542,756 | 827,779 | ||||||
| Vaibhav Global, Ltd.(a) | 128,447 | 1,285,686 | ||||||
| WNS Holdings, Ltd., ADR(a) | 60,475 | 3,035,240 | ||||||
| 14,976,235 | ||||||||
| Indonesia (1.61%) | ||||||||
| Arwana Citramulia Tbk PT | 26,137,200 | 653,923 | ||||||
| Bank Central Asia Tbk PT | 452,500 | 704,570 | ||||||
| Hexindo Adiperkasa Tbk PT | 1,636,900 | 306,868 | ||||||
| Indonesia Pondasi Raya Tbk PT | 4,149,800 | 224,478 | ||||||
| Link Net Tbk PT | 1,814,400 | 523,647 | ||||||
| Sarana Menara Nusantara Tbk PT | 10,771,300 | 342,989 | ||||||
| Selamat Sempurna Tbk PT | 20,026,300 | 1,943,511 | ||||||
| Ultrajaya Milk Industry & Trading Co. Tbk PT | 5,474,800 | 446,008 | ||||||
| 5,145,994 | ||||||||
See Notes to Financial Statements.
| 44 | 1.855.377.7325 | www.GrandeurPeakGlobal.com |
| Grandeur Peak Global Reach Fund | Portfolio of Investments |
October 31, 2018 (Unaudited)
| Shares | Value (Note 2) | |||||||
| Ireland (0.39%) | ||||||||
| Hostelworld Group PLC(b)(c) | 371,708 | $ | 935,031 | |||||
| Keywords Studios PLC | 17,000 | 297,693 | ||||||
| 1,232,724 | ||||||||
| Israel (1.16%) | ||||||||
| Wix.com, Ltd.(a) | 37,875 | 3,687,131 | ||||||
| Italy (1.90%) | ||||||||
| Brembo SpA | 108,750 | 1,203,960 | ||||||
| DiaSorin SpA | 10,928 | 1,036,555 | ||||||
| FinecoBank Banca Fineco SpA | 204,698 | 2,139,428 | ||||||
| Interpump Group SpA | 33,917 | 978,508 | ||||||
| Piovan SpA(a)(b)(c) | 70,933 | 707,012 | ||||||
| 6,065,463 | ||||||||
| Japan (6.24%) | ||||||||
| Aeon Delight Co., Ltd. | 18,900 | 631,027 | ||||||
| AIT Corp. | 84,700 | 795,259 | ||||||
| Arcland Service Holdings Co., Ltd. | 45,600 | 934,703 | ||||||
| Cosmos Pharmaceutical Corp. | 4,100 | 838,029 | ||||||
| Create SD Holdings Co., Ltd. | 47,300 | 1,198,210 | ||||||
| Future Corp. | 69,300 | 943,195 | ||||||
| Japan Lifeline Co., Ltd. | 75,200 | 1,096,344 | ||||||
| MISUMI Group, Inc. | 54,800 | 1,098,235 | ||||||
| Naigai Trans Line, Ltd. | 21,500 | 308,641 | ||||||
| Nihon M&A Center, Inc. | 77,100 | 1,847,495 | ||||||
| Open Door, Inc.(a) | 48,100 | 1,142,023 | ||||||
| SBI FinTech Solutions Co., Ltd. | 75,000 | 474,158 | ||||||
| Seria Co., Ltd. | 36,100 | 1,211,122 | ||||||
| Strike Co., Ltd. | 17,100 | 496,184 | ||||||
| Sundrug Co., Ltd. | 25,200 | 915,740 | ||||||
| Synchro Food Co., Ltd.(a) | 113,400 | 788,737 | ||||||
| Syuppin Co., Ltd. | 87,400 | 1,090,278 | ||||||
| Trancom Co., Ltd. | 10,200 | 584,033 | ||||||
| Tsuruha Holdings, Inc. | 7,400 | 772,339 | ||||||
| Vega Corp. Co., Ltd.(a) | 143,900 | 1,370,403 | ||||||
| Yakuodo Co., Ltd. | 43,200 | 1,335,518 | ||||||
| 19,871,673 | ||||||||
| Kenya (0.24%) | ||||||||
| Safaricom PLC | 3,427,700 | 777,459 | ||||||
| Malaysia (0.32%) | ||||||||
| Mynews Holdings Bhd | 1,818,000 | 630,978 | ||||||
| Scicom MSC Bhd | 934,000 | 375,091 | ||||||
| 1,006,069 | ||||||||
| Mexico (0.12%) | ||||||||
| Regional SAB de CV | 74,857 | 368,771 | ||||||
| Netherlands (0.99%) | ||||||||
| Aalberts Industries NV | 40,582 | 1,487,659 | ||||||
| Shares | Value (Note 2) | |||||||
| Netherlands (continued) | ||||||||
| Shop Apotheke Europe NV(a)(b) | 33,000 | $ | 1,678,229 | |||||
| 3,165,888 | ||||||||
| New Zealand (0.46%) | ||||||||
| CBL Corp., Ltd.(a)(d) | 819,006 | 122,922 | ||||||
| Restaurant Brands New Zealand, Ltd. | 241,685 | 1,354,780 | ||||||
| 1,477,702 | ||||||||
| Norway (1.76%) | ||||||||
| Infront ASA | 156,700 | 483,309 | ||||||
| Medistim ASA | 75,150 | 632,255 | ||||||
| Multiconsult ASA(b)(c) | 63,000 | 425,609 | ||||||
| Sbanken ASA(b)(c) | 158,900 | 1,582,572 | ||||||
| Self Storage Group ASA(a) | 481,500 | 910,088 | ||||||
| TGS NOPEC Geophysical Co. ASA | 17,800 | 594,604 | ||||||
| Webstep AS(b)(c) | 288,000 | 970,272 | ||||||
| 5,598,709 | ||||||||
| Oman (0.53%) | ||||||||
| Tethys Oil AB | 175,000 | 1,679,593 | ||||||
| Pakistan (0.13%) | ||||||||
| Meezan Bank, Ltd. | 543,356 | 407,208 | ||||||
| Peru (0.33%) | ||||||||
| Alicorp SAA | 368,841 | 1,066,647 | ||||||
| Philippines (1.15%) | ||||||||
| Concepcion Industrial Corp. | 805,920 | 572,376 | ||||||
| Holcim Philippines, Inc. | 3,883,400 | 468,354 | ||||||
| Pryce Corp. | 6,408,800 | 674,535 | ||||||
| Puregold Price Club, Inc. | 860,700 | 653,829 | ||||||
| Wilcon Depot, Inc. | 6,177,400 | 1,306,933 | ||||||
| 3,676,027 | ||||||||
| Poland (1.97%) | ||||||||
| CCC SA | 20,500 | 891,641 | ||||||
| Dino Polska SA(a)(b)(c) | 196,418 | 4,316,076 | ||||||
| LiveChat Software SA | 115,250 | 769,838 | ||||||
| PGS Software SA | 138,887 | 293,182 | ||||||
| 6,270,737 | ||||||||
| Russia (0.02%) | ||||||||
| MD Medical Group | ||||||||
| Investments PLC, GDR(c) | 11,955 | 70,535 | ||||||
| Singapore (0.27%) | ||||||||
| Riverstone Holdings, Ltd./Singapore | 1,008,800 | 868,081 | ||||||
| South Africa (1.12%) | ||||||||
| ARB Holdings, Ltd. | 2,093,266 | 794,597 | ||||||
See Notes to Financial Statements.
| Semi-Annual Report | October 31, 2018 | 45 |
| Grandeur Peak Global Reach Fund | Portfolio of Investments |
October 31, 2018 (Unaudited)
| Shares | Value (Note 2) | |||||||
| South Africa (continued) | ||||||||
| Cartrack Holdings, Ltd. | 275,302 | $ | 270,449 | |||||
| Cashbuild, Ltd. | 36,500 | 667,280 | ||||||
| Clicks Group, Ltd. | 64,000 | 815,271 | ||||||
| Interwaste Holdings, Ltd. | 4,589,334 | 301,756 | ||||||
| Italtile, Ltd. | 822,600 | 720,977 | ||||||
| 3,570,330 | ||||||||
| South Korea (0.93%) | ||||||||
| Hy-Lok Corp. | 18,410 | 369,810 | ||||||
| ISC Co., Ltd. | 56,696 | 454,174 | ||||||
| Koh Young Technology, Inc. | 8,993 | 712,586 | ||||||
| Medy-Tox, Inc. | 2,136 | 875,050 | ||||||
| Vitzrocell Co., Ltd.(a) | 62,036 | 558,805 | ||||||
| 2,970,425 | ||||||||
| Spain (0.00%)(e) | ||||||||
| Let’s GOWEX SA(a)(d) | 10,700 | 1 | ||||||
| Sri Lanka (0.13%) | ||||||||
| Royal Ceramics Lanka PLC | 893,948 | 401,881 | ||||||
| Sweden (2.52%) | ||||||||
| Bufab AB | 69,710 | 705,690 | ||||||
| HIQ International AB(a) | 39,763 | 223,480 | ||||||
| Hoist Finance AB(b)(c) | 147,200 | 1,180,669 | ||||||
| Indutrade AB | 36,300 | 871,329 | ||||||
| KNOW IT AB | 44,700 | 869,296 | ||||||
| Nibe Industrier AB, Class B | 93,000 | 970,638 | ||||||
| OEM International AB | 10,585 | 242,460 | ||||||
| Sweco AB, Class B | 41,100 | 926,684 | ||||||
| SwedenCare AB(a) | 157,700 | 975,377 | ||||||
| TF Bank AB(c) | 51,530 | 444,848 | ||||||
| Vitec Software Group AB, Class B | 67,500 | 618,040 | ||||||
| 8,028,511 | ||||||||
| Switzerland (1.16%) | ||||||||
| Luxoft Holding, Inc.(a) | 33,350 | 1,375,020 | ||||||
| Partners Group Holding AG | 2,735 | 1,947,197 | ||||||
| Wizz Air Holdings PLC(a)(b)(c) | 11,300 | 370,629 | ||||||
| 3,692,846 | ||||||||
| Taiwan (2.12%) | ||||||||
| ASPEED Technology, Inc. | 15,771 | 232,398 | ||||||
| Bioteque Corp. | 299,000 | 808,484 | ||||||
| FineTek Co., Ltd. | 13,000 | 30,487 | ||||||
| Poya International Co., Ltd. | 146,000 | 1,272,341 | ||||||
| Sinmag Equipment Corp. | 175,298 | 705,607 | ||||||
| Sporton International, Inc. | 378,859 | 1,411,809 | ||||||
| Test Research, Inc. | 409,440 | 569,449 | ||||||
| TSC Auto ID Technology Co., Ltd. | 64,600 | 359,678 | ||||||
| TTFB Co., Ltd. | 148,000 | 1,068,907 | ||||||
| Shares | Value (Note 2) | |||||||
| Taiwan (continued) | ||||||||
| Voltronic Power Technology Corp. | 19,000 | $ | 307,544 | |||||
| 6,766,704 | ||||||||
| Thailand (0.10%) | ||||||||
| WICE Logistics PCL | 2,432,000 | 322,396 | ||||||
| Turkey (0.51%) | ||||||||
| DP Eurasia NV(a)(b)(c) | 1,094,525 | 1,622,867 | ||||||
| United Arab Emirates (0.51%) | ||||||||
| Aramex PJSC | 1,518,033 | 1,632,449 | ||||||
| United States (26.54%) | ||||||||
| 8x8, Inc.(a) | 18,675 | 321,023 | ||||||
| Accenture PLC, Class A | 2,125 | 334,943 | ||||||
| Amazon.com, Inc.(a) | 950 | 1,518,109 | ||||||
| Appian Corp.(a) | 13,225 | 340,015 | ||||||
| Aratana Therapeutics, Inc.(a) | 180,525 | 1,072,318 | ||||||
| Axos Financial, Inc.(a) | 34,825 | 1,057,287 | ||||||
| Bank of Hawaii Corp. | 15,525 | 1,217,781 | ||||||
| BioDelivery Sciences International, Inc.(a) | 144,925 | 537,672 | ||||||
| Blackline, Inc.(a) | 13,250 | 614,535 | ||||||
| Burford Capital, Ltd. | 99,800 | 2,115,462 | ||||||
| Cactus, Inc., Class A(a) | 38,425 | 1,285,700 | ||||||
| Core Laboratories NV | 12,850 | 1,095,334 | ||||||
| CoreSite Realty Corp. | 8,250 | 774,345 | ||||||
| DexCom, Inc.(a) | 4,300 | 570,911 | ||||||
| Dollar Tree, Inc.(a) | 13,375 | 1,127,512 | ||||||
| DXP Enterprises, Inc.(a) | 91,803 | 2,917,499 | ||||||
| Edwards Lifesciences Corp.(a) | 6,275 | 926,190 | ||||||
| EPAM Systems, Inc.(a) | 21,925 | 2,619,380 | ||||||
| Esquire Financial Holdings, Inc.(a) | 114,787 | 2,752,592 | ||||||
| ExIService Holdings, Inc.(a) | 20,275 | 1,299,628 | ||||||
| Fastenal Co. | 72,300 | 3,716,943 | ||||||
| First Republic Bank | 54,075 | 4,920,284 | ||||||
| Focus Financial Partners, Inc.(a) | 11,775 | 449,805 | ||||||
| GBGI, Ltd. | 692,460 | 747,912 | ||||||
| Genpact, Ltd. | 47,375 | 1,298,549 | ||||||
| Goosehead Insurance, Inc.(a) | 105,385 | 3,612,598 | ||||||
| Hackett Group, Inc. | 36,925 | 755,855 | ||||||
| Hamilton Lane, Inc., Class A | 29,300 | 1,124,534 | ||||||
| HealthEquity, Inc.(a) | 5,600 | 514,080 | ||||||
| Heska Corp.(a) | 11,000 | 1,102,420 | ||||||
| Hingham Institution for Savings | 3,550 | 722,780 | ||||||
| I3 Verticals, Inc., Class A(a) | 25,875 | 556,054 | ||||||
| Inphi Corp.(a) | 49,400 | 1,580,800 | ||||||
| IPG Photonics Corp.(a) | 2,100 | 280,455 | ||||||
| Kinsale Capital Group, Inc. | 40,775 | 2,434,675 | ||||||
| Knight-Swift Transportation Holdings, Inc. | 223,975 | 7,167,200 | ||||||
| LGI Homes, Inc.(a) | 19,500 | 834,405 | ||||||
See Notes to Financial Statements.
| 46 | 1.855.377.7325 | www.GrandeurPeakGlobal.com |
| Grandeur Peak Global Reach Fund | Portfolio of Investments |
October 31, 2018 (Unaudited)
| Shares | Value (Note 2) | |||||||
| United States (continued) | ||||||||
| Littelfuse, Inc. | 3,100 | $ | 561,596 | |||||
| Lululemon Athletica, Inc.(a) | 9,975 | 1,403,782 | ||||||
| MarketAxess Holdings, Inc. | 7,205 | 1,510,672 | ||||||
| MEDNAX, Inc.(a) | 18,950 | 782,446 | ||||||
| Microchip Technology, Inc. | 15,325 | 1,008,079 | ||||||
| Mimecast, Ltd.(a) | 14,650 | 510,699 | ||||||
| Monolithic Power Systems, Inc. | 1,052 | 124,262 | ||||||
| Monro, Inc. | 27,600 | 2,053,440 | ||||||
| MSC Industrial Direct Co., Inc., Class A | 12,525 | 1,015,277 | ||||||
| NV5 Global, Inc.(a) | 10,225 | 798,266 | ||||||
| Palo Alto Networks, Inc.(a) | 3,950 | 723,008 | ||||||
| Paycom Software, Inc.(a) | 13,400 | 1,677,680 | ||||||
| Pluralsight, Inc., Class A(a) | 52,064 | 1,166,754 | ||||||
| Power Integrations, Inc. | 33,340 | 1,877,709 | ||||||
| Qualys, Inc.(a) | 17,200 | 1,225,328 | ||||||
| Resources Connection, Inc. | 32,675 | 533,256 | ||||||
| Seacoast Commerce Banc Holdings | 44,700 | 990,105 | ||||||
| SI-BONE, Inc.(a) | 9,600 | 180,000 | ||||||
| Silicon Laboratories, Inc.(a) | 18,250 | 1,487,923 | ||||||
| STAAR Surgical Co.(a) | 18,254 | 732,168 | ||||||
| SVB Financial Group(a) | 13,575 | 3,220,397 | ||||||
| Transcat, Inc.(a) | 55,827 | 1,156,177 | ||||||
| TriMas Corp.(a) | 34,075 | 1,003,509 | ||||||
| Veracyte, Inc.(a) | 54,644 | 811,463 | ||||||
| Webster Financial Corp. | 28,675 | 1,687,237 | ||||||
| 84,558,818 | ||||||||
| Vietnam (2.09%) | ||||||||
| Lix Detergent JSC | 577,800 | 1,209,986 | ||||||
| Taisun Int’l Holding Corp. | 301,400 | 1,132,631 | ||||||
| Vietnam Dairy Products JSC | 365,929 | 1,825,711 | ||||||
| Vietnam Technological & Commercial Joint Stock Bank(a) | 2,138,281 | 2,478,419 | ||||||
| 6,646,747 | ||||||||
| TOTAL COMMON STOCKS | ||||||||
| (Cost $279,783,851) | 312,876,308 | |||||||
| PREFERRED STOCKS (0.29%) | ||||||||
| United States (0.29%) | ||||||||
| Dataminr Inc - Private Placement(a) | 45,833 | 912,077 | ||||||
| TOTAL PREFERRED STOCKS | ||||||||
| (Cost $$912,077) | 912,077 | |||||||
| Principal Amount | Value (Note 2) | |||||||
| CORPORATE BONDS (0.30%) | ||||||||
| Germany (0.25%) | ||||||||
| publity AG 3.50%, 11/17/2020 | $ | 800,000 | $ | 804,182 | ||||
| Malaysia (0.05%) | ||||||||
| AEON Credit Service M Bhd 3.50%, 09/15/2020 | 445,800 | 149,683 | ||||||
| TOTAL CORPORATE BONDS (Cost $984,703) | 953,865 | |||||||
| TOTAL INVESTMENTS (98.80%) (Cost $281,680,631) | $ | 314,742,250 | ||||||
| Other Assets In Excess Of Liabilities (1.20%) | 3,817,079 | |||||||
| NET ASSETS (100.00%) | $ | 318,559,329 | ||||||
| (a) | Non-Income Producing Security. |
| (b) | Security exempt from registration under Rule 144A of the Securities Act of 1933. These securities may be resold in the ordinary course of business in transactions exempt from registration, normally to qualified institutional buyers. As of October 31, 2018, these securities had a total aggregate market value of $25,333,231 representing 7.95% of net assets. |
| (c) | Security was purchased pursuant to Regulation S under the Securities Act of 1933, which exempts securities offered and sold outside of the United States from registration. Such security cannot be sold in the United States without either an effective registration statement filed pursuant to the Securities Act of 1933, or pursuant to an exemption from registration. The security has been deemed liquid under guidelines approved by the Fund's Board of Trustees. As of October 31, 2018, the aggregate market value of those securities was $29,052,293, representing 9.12% of net assets. |
| (d) | As a result of the use of significant unobservable inputs to determine fair value, these investments have been classified as level 3 assets. See also footnote 2 to the financial statements for additional information. |
| (e) | Less than 0.005%. |
For Fund compliance purposes, the Fund's geographical classifications refer to any one or more of the country sub-classifications used by one or more widely recognized market indexes or ratings group indexes, and/or as defined by Fund management. This definition may not apply for purposes of this report, which may combine sub-classifications for reporting ease. Geographical regions are shown as a percentage of net assets.
See Notes to Financial Statements.
| Semi-Annual Report | October 31, 2018 | 47 |
| Grandeur Peak Global Stalwarts Fund | Portfolio of Investments |
October 31, 2018 (Unaudited)
| Shares | Value (Note 2) | |||||||
| COMMON STOCKS (94.24%) | ||||||||
| Argentina (0.39%) | ||||||||
| Globant SA(a) | 13,300 | $ | 684,684 | |||||
| Australia (0.40%) | ||||||||
| Domino’s Pizza Enterprises, Ltd. | 18,500 | 709,045 | ||||||
| Bangladesh (0.52%) | ||||||||
| Square Pharmaceuticals, Ltd. | 289,218 | 921,360 | ||||||
| Belgium (0.62%) | ||||||||
| Melexis NV | 16,795 | 1,104,591 | ||||||
| Bermuda (1.04%) | ||||||||
| Bank of NT Butterfield & Son, Ltd. | 45,610 | 1,837,627 | ||||||
| Brazil (1.53%) | ||||||||
| Fleury SA | 194,600 | 1,092,354 | ||||||
| Hypera SA | 116,800 | 928,060 | ||||||
| Raia Drogasil SA(a) | 40,800 | 689,922 | ||||||
| 2,710,336 | ||||||||
| Britain (9.96%) | ||||||||
| B&M European Value Retail SA | 616,900 | 3,282,684 | ||||||
| boohoo Group PLC(a) | 340,800 | 922,590 | ||||||
| Close Brothers Group PLC | 44,834 | 842,080 | ||||||
| Dechra Pharmaceuticals PLC | 75,200 | 2,197,202 | ||||||
| Diploma PLC | 97,850 | 1,640,844 | ||||||
| Intertek Group PLC | 17,400 | 1,042,545 | ||||||
| Metro Bank PLC(a) | 74,375 | 2,110,622 | ||||||
| Sanne Group PLC | 297,120 | 2,126,763 | ||||||
| St James’s Place PLC | 230,207 | 2,975,026 | ||||||
| Ted Baker PLC | 20,385 | 477,348 | ||||||
| 17,617,704 | ||||||||
| Canada (4.37%) | ||||||||
| Gildan Activewear, Inc. | 57,267 | 1,711,767 | ||||||
| Ritchie Bros Auctioneers, Inc. | 37,675 | 1,266,257 | ||||||
| Shopify, Inc.(a) | 4,925 | 680,389 | ||||||
| Stantec, Inc. | 156,792 | 4,080,439 | ||||||
| 7,738,852 | ||||||||
| China (4.92%) | ||||||||
| 51job, Inc., ADR(a) | 15,675 | 962,602 | ||||||
| 58.com, Inc., ADR(a) | 4,050 | 265,639 | ||||||
| China Medical System Holdings, Ltd. | 814,000 | 972,278 | ||||||
| CSPC Pharmaceutical Group, Ltd. | 552,000 | 1,176,206 | ||||||
| Ctrip.com International, Ltd., ADR | 26,650 | 886,912 | ||||||
| Silergy Corp. | 137,000 | 1,745,440 | ||||||
| Tencent Holdings, Ltd. | 16,100 | 551,574 | ||||||
| Shares | Value (Note 2) | |||||||
| China (continued) | ||||||||
| Wuxi Biologics Cayman, Inc.(a)(b)(c) | 66,000 | $ | 472,226 | |||||
| Yum China Holdings, Inc. | 46,325 | 1,671,406 | ||||||
| 8,704,283 | ||||||||
| Colombia (0.83%) | ||||||||
| Parex Resources, Inc.(a) | 100,695 | 1,466,309 | ||||||
| Egypt (0.26%) | ||||||||
| Commercial International Bank Egypt SAE | 103,662 | 464,454 | ||||||
| France (2.26%) | ||||||||
| Alten SA | 19,982 | 1,927,168 | ||||||
| BioMerieux | 8,975 | 684,420 | ||||||
| Bureau Veritas SA | 39,250 | 885,483 | ||||||
| Eurofins Scientific SE | 1,000 | 503,943 | ||||||
| 4,001,014 | ||||||||
| Georgia (0.81%) | ||||||||
| Bank of Georgia Group PLC | 49,962 | 995,856 | ||||||
| Georgia Capital PLC(a) | 29,100 | 435,189 | ||||||
| 1,431,045 | ||||||||
| Germany (5.63%) | ||||||||
| Aroundtown SA | 71,808 | 595,046 | ||||||
| Dermapharm Holding SE(a) | 52,500 | 1,495,285 | ||||||
| FUCHS PETROLUB SE | 19,000 | 879,504 | ||||||
| Grand City Properties SA | 45,500 | 1,099,999 | ||||||
| GRENKE AG | 14,000 | 1,342,647 | ||||||
| Norma Group SE | 34,590 | 1,867,580 | ||||||
| PATRIZIA Immobilien AG | 58,715 | 1,009,335 | ||||||
| Wirecard AG | 8,950 | 1,674,159 | ||||||
| 9,963,555 | ||||||||
| Hong Kong (2.91%) | ||||||||
| Value Partners Group, Ltd. | 2,098,900 | 1,565,404 | ||||||
| Vitasoy International Holdings, Ltd. | 1,123,500 | 3,581,615 | ||||||
| 5,147,019 | ||||||||
| India (3.38%) | ||||||||
| Alkem Laboratories, Ltd. | 34,524 | 892,922 | ||||||
| Bajaj Finance, Ltd. | 62,570 | 2,013,248 | ||||||
| HDFC Asset Management Co., Ltd. (a)(b)(c) | 40,500 | 767,060 | ||||||
| HDFC Standard Life Insurance Co., Ltd.(b)(c) | 88,500 | 445,994 | ||||||
| WNS Holdings, Ltd., ADR(a) | 36,950 | 1,854,520 | ||||||
| 5,973,744 | ||||||||
| Indonesia (0.36%) | ||||||||
| Bank Central Asia Tbk PT | 410,500 | 639,174 | ||||||
See Notes to Financial Statements.
| 48 | 1.855.377.7325 | www.GrandeurPeakGlobal.com |
| Grandeur Peak Global Stalwarts Fund | Portfolio of Investments |
October 31, 2018 (Unaudited)
| Shares | Value (Note 2) | |||||||
| Israel (0.95%) | ||||||||
| Wix.com, Ltd.(a) | 17,300 | $ | 1,684,155 | |||||
| Italy (3.22%) | ||||||||
| Brembo SpA | 170,349 | 1,885,916 | ||||||
| DiaSorin SpA | 21,296 | 2,019,992 | ||||||
| FinecoBank Banca Fineco SpA | 125,340 | 1,310,007 | ||||||
| Interpump Group SpA | 16,592 | 478,681 | ||||||
| 5,694,596 | ||||||||
| Japan (7.34%) | ||||||||
| Aeon Delight Co., Ltd. | 31,600 | 1,055,050 | ||||||
| Cosmos Pharmaceutical Corp. | 3,000 | 613,192 | ||||||
| Create SD Holdings Co., Ltd. | 56,800 | 1,438,865 | ||||||
| Japan Lifeline Co., Ltd. | 113,000 | 1,647,431 | ||||||
| MISUMI Group, Inc. | 119,700 | 2,398,883 | ||||||
| Nihon M&A Center, Inc. | 123,800 | 2,966,535 | ||||||
| Seria Co., Ltd. | 31,900 | 1,070,216 | ||||||
| Sundrug Co., Ltd. | 21,600 | 784,920 | ||||||
| Tokyo Century Corp. | 6,500 | 348,878 | ||||||
| Tsuruha Holdings, Inc. | 6,400 | 667,969 | ||||||
| 12,991,939 | ||||||||
| Kenya (0.31%) | ||||||||
| Safaricom PLC | 2,406,400 | 545,812 | ||||||
| Mexico (0.49%) | ||||||||
| Regional SAB de CV | 174,046 | 857,410 | ||||||
| Netherlands (1.44%) | ||||||||
| Aalberts Industries NV | 69,588 | 2,550,964 | ||||||
| Norway (0.45%) | ||||||||
| TGS NOPEC Geophysical Co. ASA | 24,000 | 801,713 | ||||||
| Peru (1.06%) | ||||||||
| Alicorp SAA | 324,645 | 938,837 | ||||||
| Credicorp, Ltd. | 4,150 | 936,696 | ||||||
| 1,875,533 | ||||||||
| Philippines (1.76%) | ||||||||
| Philippine Seven Corp. | 259,000 | 508,270 | ||||||
| Puregold Price Club, Inc. | 1,189,000 | 903,221 | ||||||
| Robinsons Retail Holdings, Inc. | 462,900 | 655,786 | ||||||
| Security Bank Corp. | 389,300 | 1,052,066 | ||||||
| 3,119,343 | ||||||||
| Poland (0.78%) | ||||||||
| Dino Polska SA(a)(b)(c) | 63,134 | 1,387,302 | ||||||
| South Korea (0.87%) | ||||||||
| LG Household & Health Care, Ltd. | 875 | 804,655 | ||||||
| Shares | Value (Note 2) | |||||||
| South Korea (continued) | ||||||||
| Medy-Tox, Inc. | 1,770 | $ | 725,112 | |||||
| 1,529,767 | ||||||||
| Sweden (1.90%) | ||||||||
| AddTech AB, Class B | 35,800 | 732,142 | ||||||
| Indutrade AB | 47,725 | 1,145,570 | ||||||
| Nibe Industrier AB, Class B | 61,408 | 640,914 | ||||||
| Sweco AB, Class B | 37,500 | 845,515 | ||||||
| 3,364,141 | ||||||||
| Switzerland (1.21%) | ||||||||
| Luxoft Holding, Inc.(a) | 13,250 | 546,298 | ||||||
| Partners Group Holding AG | 1,850 | 1,317,117 | ||||||
| Wizz Air Holdings PLC(a)(b)(c) | 8,700 | 285,351 | ||||||
| 2,148,766 | ||||||||
| United States (30.58%) | ||||||||
| Accenture PLC, Class A | 4,750 | 748,695 | ||||||
| Amazon.com, Inc.(a) | 425 | 679,154 | ||||||
| Axos Financial, Inc.(a) | 13,675 | 415,173 | ||||||
| Bank of Hawaii Corp. | 7,250 | 568,690 | ||||||
| Burford Capital, Ltd. | 52,300 | 1,108,604 | ||||||
| Cactus, Inc., Class A(a) | 30,500 | 1,020,530 | ||||||
| Core Laboratories NV | 15,425 | 1,314,827 | ||||||
| Dollar Tree, Inc.(a) | 22,475 | 1,894,642 | ||||||
| Edwards Lifesciences Corp.(a) | 8,125 | 1,199,250 | ||||||
| EPAM Systems, Inc.(a) | 19,525 | 2,332,652 | ||||||
| ExIService Holdings, Inc.(a) | 11,150 | 714,715 | �� | |||||
| Fastenal Co. | 63,425 | 3,260,679 | ||||||
| First Republic Bank | 62,800 | 5,714,172 | ||||||
| FirstCash, Inc. | 18,928 | 1,521,811 | ||||||
| Genpact, Ltd. | 35,600 | 975,796 | ||||||
| Hamilton Lane, Inc., Class A | 14,750 | 566,105 | ||||||
| HealthEquity, Inc.(a) | 23,582 | 2,164,828 | ||||||
| IDEX Corp. | 5,275 | 668,975 | ||||||
| IPG Photonics Corp. | 4,575 | 610,991 | ||||||
| Knight-Swift Transportation Holdings, Inc. | 166,050 | 5,313,600 | ||||||
| LGI Homes, Inc.(a) | 10,375 | 443,946 | ||||||
| Littelfuse, Inc. | 3,725 | 674,821 | ||||||
| LKQ Corp.(a) | 32,350 | 882,185 | ||||||
| Lululemon Athletica, Inc.(a) | 14,800 | 2,082,804 | ||||||
| MarketAxess Holdings, Inc. | 13,225 | 2,772,886 | ||||||
| Microchip Technology, Inc. | 26,700 | 1,756,326 | ||||||
| Monro, Inc. | 38,125 | 2,836,500 | ||||||
| NVIDIA Corp. | 2,150 | 453,285 | ||||||
| Palo Alto Networks, Inc.(a) | 3,975 | 727,584 | ||||||
| Paycom Software, Inc.(a) | 8,450 | 1,057,940 | ||||||
| Pluralsight, Inc., Class A(a) | 24,759 | 554,849 | ||||||
| Power Integrations, Inc. | 48,675 | 2,741,376 | ||||||
| Qualys, Inc.(a) | 8,375 | 596,635 | ||||||
| Silicon Laboratories, Inc.(a) | 15,025 | 1,224,988 | ||||||
| SVB Financial Group(a) | 10,560 | 2,505,149 | ||||||
| 54,105,163 | ||||||||
See Notes to Financial Statements.
| Semi-Annual Report | October 31, 2018 | 49 |
| Grandeur Peak Global Stalwarts Fund | Portfolio of Investments |
October 31, 2018 (Unaudited)
| Shares | Value (Note 2) | |||||||
| Vietnam (1.69%) | ||||||||
| Ho Chi Minh City Development Joint Stock Commercial Bank | 544,106 | $ | 765,928 | |||||
| Vietnam Dairy Products JSC | 255,454 | 1,274,523 | ||||||
| Vietnam Technological & Commercial Joint Stock Bank(a) | 817,275 | 947,280 | ||||||
| 2,987,731 | ||||||||
| TOTAL COMMON STOCKS | ||||||||
| (Cost $156,761,145) | 166,759,131 | |||||||
| PREFERRED STOCKS (0.27%) | ||||||||
| United States (0.27%) | ||||||||
| Dataminr Inc - Private Placement(a) | 24,262 | 482,814 | ||||||
| TOTAL PREFERRED STOCKS | ||||||||
| (Cost $$482,814) | 482,814 | |||||||
| TOTAL INVESTMENTS (94.51%) (Cost $157,243,959) | $ | 167,241,945 | ||||||
| Other Assets In Excess Of Liabilities (5.49%) | 9,710,433 | |||||||
| NET ASSETS (100.00%) | $ | 176,952,378 | ||||||
| (a) | Non-Income Producing Security. |
| (b) | Security exempt from registration under Rule 144A of the Securities Act of 1933. These securities may be resold in the ordinary course of business in transactions exempt from registration, normally to qualified institutional buyers. As of October 31, 2018, these securities had a total aggregate market value of $3,357,933 representing 1.90% of net assets. |
| (c) | Security was purchased pursuant to Regulation S under the Securities Act of 1933, which exempts securities offered and sold outside of the United States from registration. Such security cannot be sold in the United States without either an effective registration statement filed pursuant to the Securities Act of 1933, or pursuant to an exemption from registration. The security has been deemed liquid under guidelines approved by the Fund's Board of Trustees. As of October 31, 2018, the aggregate market value of those securities was $3,357,933, representing 1.90% of net assets. |
For Fund compliance purposes, the Fund's geographical classifications refer to any one or more of the country sub-classifications used by one or more widely recognized market indexes or ratings group indexes, and/or as defined by Fund management. This definition may not apply for purposes of this report, which may combine sub-classifications for reporting ease. Geographical regions are shown as a percentage of net assets.
See Notes to Financial Statements.
| 50 | 1.855.377.7325 | www.GrandeurPeakGlobal.com |
| Grandeur Peak International Opportunities Fund | Portfolio of Investments |
October 31, 2018 (Unaudited)
| Shares | Value (Note 2) | |||||||
| COMMON STOCKS (93.78%) | ||||||||
| Argentina (0.52%) | ||||||||
| Globant SA(a) | 71,275 | $ | 3,669,237 | |||||
| Australia (1.90%) | ||||||||
| Class, Ltd. | 1,043,018 | 1,361,047 | ||||||
| Fiducian Group, Ltd. | 151,700 | 447,556 | ||||||
| IPH, Ltd. | 783,978 | 3,009,697 | ||||||
| Kogan.com, Ltd. | 802,822 | 1,622,031 | ||||||
| National Storage REIT | 4,332,957 | 5,235,390 | ||||||
| National Veterinary Care, Ltd. | 1,102,500 | 1,702,758 | ||||||
| 13,378,479 | ||||||||
| Austria (0.93%) | ||||||||
| Palfinger AG | 214,731 | 6,547,534 | ||||||
| Bangladesh (0.59%) | ||||||||
| Square Pharmaceuticals, Ltd. | 1,314,094 | 4,186,300 | ||||||
| Belgium (0.66%) | ||||||||
| Melexis NV | 70,792 | 4,655,923 | ||||||
| Bermuda (1.00%) | ||||||||
| Bank of NT Butterfield & Son, Ltd. | 174,884 | 7,046,076 | ||||||
| Brazil (1.03%) | ||||||||
| Arco Platform, Ltd., Class A(a) | 28,925 | 616,392 | ||||||
| Fleury SA | 992,000 | 5,568,421 | ||||||
| M Dias Branco SA | 92,400 | 1,094,201 | ||||||
| 7,279,014 | ||||||||
| Britain (14.13%) | ||||||||
| Alliance Pharma PLC | 2,321,634 | 1,982,300 | ||||||
| B&M European Value Retail SA | 1,374,500 | 7,314,070 | ||||||
| boohoo Group PLC(a) | 2,022,600 | 5,475,444 | ||||||
| Clinigen Group PLC | 381,473 | 4,407,403 | ||||||
| Clipper Logistics PLC | 707,700 | 2,351,916 | ||||||
| Close Brothers Group PLC | 213,022 | 4,001,017 | ||||||
| CVS Group PLC | 333,900 | 3,582,913 | ||||||
| Dechra Pharmaceuticals PLC | 268,000 | 7,830,455 | ||||||
| Diploma PLC | 192,900 | 3,234,734 | ||||||
| Endava PLC, ADR(a) | 57,463 | 1,336,589 | ||||||
| FDM Group Holdings PLC | 226,200 | 2,483,619 | ||||||
| Impax Asset Management Group PLC | 711,817 | 2,088,095 | ||||||
| Intertek Group PLC | 59,600 | 3,571,017 | ||||||
| JTC PLC(b)(c) | 1,110,899 | 4,756,840 | ||||||
| K3 Capital Group PLC | 59,200 | 191,444 | ||||||
| LoopUp Group PLC(a) | 462,200 | 1,964,359 | ||||||
| Metro Bank PLC(a) | 107,000 | 3,036,458 | ||||||
| Motorpoint group PLC(c) | 584,139 | 1,641,798 | ||||||
| On the Beach Group PLC(b)(c) | 1,020,250 | 5,581,855 | ||||||
| Oxford Immunotec Global PLC(a) | 261,915 | 4,036,110 | ||||||
| Shares | Value (Note 2) | |||||||
| Britain (continued) | ||||||||
| Purplebricks Group PLC(a) | 575,900 | $ | 1,308,078 | |||||
| River & Mercantile Group PLC | 625,400 | 2,322,158 | ||||||
| RPS Group PLC | 2,007,946 | 4,024,364 | ||||||
| Sabre Insurance Group PLC(b)(c) | 961,000 | 3,242,847 | ||||||
| Sanne Group PLC | 786,206 | 5,627,605 | ||||||
| Secure Trust Bank PLC | 92,800 | 1,719,947 | ||||||
| St James’s Place PLC | 430,179 | 5,559,316 | ||||||
| Ted Baker PLC | 87,228 | 2,042,587 | ||||||
| Tracsis PLC | 190,900 | 1,366,530 | ||||||
| Volution Group PLC | 631,500 | 1,396,428 | ||||||
| 99,478,296 | ||||||||
| Canada (3.39%) | ||||||||
| Biosyent, Inc.(a) | 239,100 | 1,694,560 | ||||||
| Cipher Pharmaceuticals, Inc.(a) | 678,200 | 1,452,789 | ||||||
| Gildan Activewear, Inc. | 114,200 | 3,413,551 | ||||||
| Richelieu Hardware, Ltd. | 291,450 | 5,592,333 | ||||||
| Ritchie Bros Auctioneers, Inc. | 115,300 | 3,875,233 | ||||||
| Stantec, Inc. | 302,210 | 7,864,875 | ||||||
| 23,893,341 | ||||||||
| China (4.61%) | ||||||||
| 51job, Inc., ADR(a) | 49,950 | 3,067,430 | ||||||
| BBI Life Sciences Corp.(c) | 15,551,500 | 5,014,532 | ||||||
| China Medical System Holdings, Ltd. | 4,685,000 | 5,595,971 | ||||||
| CSPC Pharmaceutical Group, Ltd. | 1,687,000 | 3,594,672 | ||||||
| Hop Hing Group Holdings, Ltd. | 33,160,000 | 635,579 | ||||||
| Man Wah Holdings, Ltd. | 6,963,000 | 3,213,050 | ||||||
| O2Micro International, Ltd., ADR(a) | 1,054,233 | 1,707,857 | ||||||
| On-Bright Electronics, Inc. | 839,780 | 4,683,146 | ||||||
| Silergy Corp. | 386,199 | 4,920,345 | ||||||
| 32,432,582 | ||||||||
| Colombia (1.15%) | ||||||||
| Amerisur Resources PLC(a) | 3,542,068 | 488,967 | ||||||
| Gran Tierra Energy, Inc.(a) | 722,137 | 2,202,518 | ||||||
| Parex Resources, Inc.(a) | 372,475 | 5,423,940 | ||||||
| 8,115,425 | ||||||||
| Egypt (0.08%) | ||||||||
| Integrated Diagnostics Holdings PLC(b)(c) | 154,200 | 531,990 | ||||||
| Finland (0.41%) | ||||||||
| Metso OYJ | 91,400 | 2,885,674 | ||||||
| France (3.32%) | ||||||||
| Alten SA | 53,500 | 5,159,817 | ||||||
| Bureau Veritas SA | 208,100 | 4,694,755 | ||||||
| Esker SA | 90,643 | 6,081,528 | ||||||
See Notes to Financial Statements.
| Semi-Annual Report | October 31, 2018 | 51 |
| Grandeur Peak International Opportunities Fund | Portfolio of Investments |
October 31, 2018 (Unaudited)
| Shares | Value (Note 2) | |||||||
| France (continued) | ||||||||
| Eurofins Scientific SE | 5,000 | $ | 2,519,714 | |||||
| Infotel SA | 16,113 | 693,515 | ||||||
| Medicrea International(a) | 60,536 | 112,702 | ||||||
| Neurones | 50,872 | 1,203,216 | ||||||
| Thermador Groupe | 54,436 | 2,925,361 | ||||||
| 23,390,608 | ||||||||
| Georgia (1.15%) | ||||||||
| Bank of Georgia Group PLC | 175,211 | 3,492,353 | ||||||
| Georgia Capital PLC(a) | 149,511 | 2,235,930 | ||||||
| TBC Bank Group PLC | 108,450 | 2,342,693 | ||||||
| 8,070,976 | ||||||||
| Germany (6.06%) | ||||||||
| Aroundtown SA | 313,700 | 2,599,514 | ||||||
| CANCOM SE | 52,800 | 2,152,853 | ||||||
| Dermapharm Holding SE(a) | 207,700 | 5,915,631 | ||||||
| FinTech Group AG(a) | 91,000 | 2,314,643 | ||||||
| Grand City Properties SA | 203,956 | 4,930,800 | ||||||
| GRENKE AG | 28,800 | 2,762,016 | ||||||
| Nexus AG | 204,206 | 5,574,185 | ||||||
| Norma Group SE | 93,303 | 5,037,606 | ||||||
| PATRIZIA Immobilien AG | 186,894 | 3,212,784 | ||||||
| Wirecard AG | 43,611 | 8,157,739 | ||||||
| 42,657,771 | ||||||||
| Greece (0.11%) | ||||||||
| Sarantis SA | 100,600 | 797,892 | ||||||
| Hong Kong (2.54%) | ||||||||
| International Housewares | ||||||||
| Retail Co., Ltd. | 13,130,000 | 2,768,872 | ||||||
| TK Group Holdings, Ltd. | 4,923,000 | 2,621,085 | ||||||
| Value Partners Group, Ltd. | 9,103,000 | 6,789,211 | ||||||
| Vitasoy International Holdings, Ltd. | 1,797,338 | 5,729,749 | ||||||
| 17,908,917 | ||||||||
| India (5.54%) | ||||||||
| Alkem Laboratories, Ltd. | 198,868 | 5,143,481 | ||||||
| Bajaj Finance, Ltd. | 205,760 | 6,620,518 | ||||||
| Byke Hospitality, Ltd. | 959,500 | 973,273 | ||||||
| City Union Bank, Ltd. | 757,903 | 1,744,724 | ||||||
| Cyient, Ltd. | 598,912 | 5,037,218 | ||||||
| Indiabulls Housing Finance, Ltd. | 115,500 | 1,302,730 | ||||||
| Kellton Tech Solutions, Ltd.(a) | 1,337,558 | 537,480 | ||||||
| L&T Technology Services, Ltd.(b)(c) | 38,311 | 880,353 | ||||||
| TCI Express, Ltd. | 201,000 | 1,606,571 | ||||||
Thyrocare Technologies, Ltd.(b)(c) | 134,159 | 1,016,428 | ||||||
| Time Technoplast, Ltd. | 2,884,734 | 4,399,621 | ||||||
| WNS Holdings, Ltd., ADR(a) | 162,925 | 8,177,206 | ||||||
| Shares | Value (Note 2) | |||||||
| India (continued) | ||||||||
| Yes Bank, Ltd. | 621,000 | $ | 1,579,343 | |||||
| 39,018,946 | ||||||||
| Indonesia (2.21%) | ||||||||
| Arwana Citramulia Tbk PT | 63,783,500 | 1,595,789 | ||||||
| Astra Graphia Tbk PT | 3,624,600 | 320,677 | ||||||
| Bekasi Fajar Industrial Estate Tbk PT | 67,154,100 | 618,857 | ||||||
| Indonesia Pondasi Raya Tbk PT | 19,093,100 | 1,032,818 | ||||||
| Link Net Tbk PT | 8,897,400 | 2,567,845 | ||||||
| Panin Sekuritas Tbk PT | 8,494,000 | 759,228 | ||||||
| Selamat Sempurna Tbk PT | 69,686,300 | 6,762,910 | ||||||
| Ultrajaya Milk Industry & Trading Co. Tbk PT | 22,958,000 | 1,870,286 | ||||||
| 15,528,410 | ||||||||
| Ireland (0.58%) | ||||||||
| Irish Residential Properties REIT PLC | 2,529,576 | 4,074,208 | ||||||
| Israel (1.23%) | ||||||||
| Wix.com, Ltd.(a) | 89,083 | 8,672,230 | ||||||
| Italy (2.53%) | ||||||||
| Brembo SpA | 235,810 | 2,610,629 | ||||||
| DiaSorin SpA | 60,134 | 5,703,896 | ||||||
| FinecoBank Banca Fineco SpA | 407,187 | 4,255,768 | ||||||
| Interpump Group SpA | 127,702 | 3,684,213 | ||||||
| Piovan SpA(a)(b)(c) | 156,285 | 1,557,743 | ||||||
| 17,812,249 | ||||||||
| Japan (10.64%) | ||||||||
| Aeon Delight Co., Ltd. | 72,400 | 2,417,266 | ||||||
| AIT Corp. | 500,200 | 4,696,439 | ||||||
| Amiyaki Tei Co., Ltd. | 59,000 | 2,077,650 | ||||||
| Anshin Guarantor Service Co., Ltd. | 375,000 | 961,957 | ||||||
| Arcland Service Holdings Co., Ltd. | 143,200 | 2,935,295 | ||||||
| Create SD Holdings Co., Ltd. | 322,400 | 8,167,078 | ||||||
| Future Corp. | 341,200 | 4,643,841 | ||||||
| Japan Lifeline Co., Ltd. | 306,100 | 4,462,644 | ||||||
| M&A Capital Partners Co., Ltd.(a) | 126,200 | 6,205,780 | ||||||
| Matsumotokiyoshi Holdings Co., Ltd. | 21,000 | 759,231 | ||||||
| MISUMI Group, Inc. | 253,800 | 5,086,354 | ||||||
| Naigai Trans Line, Ltd. | 47,200 | 677,575 | ||||||
| Nihon M&A Center, Inc. | 181,000 | 4,337,180 | ||||||
| Open Door, Inc.(a) | 120,400 | 2,858,618 | ||||||
| Seria Co., Ltd. | 121,800 | 4,086,278 | ||||||
| Sundrug Co., Ltd. | 81,200 | 2,950,717 | ||||||
| Synchro Food Co., Ltd.(a) | 337,500 | 2,347,432 | ||||||
| Syuppin Co., Ltd. | 231,200 | 2,884,121 | ||||||
See Notes to Financial Statements.
| 52 | 1.855.377.7325 | www.GrandeurPeakGlobal.com |
| Grandeur Peak International Opportunities Fund | Portfolio of Investments |
October 31, 2018 (Unaudited)
| Shares | Value (Note 2) | |||||||
| Japan (continued) | ||||||||
| Tokyo Century Corp. | 85,200 | $ | 4,572,982 | |||||
| Trancom Co., Ltd. | 78,990 | 4,522,823 | ||||||
| Tsuruha Holdings, Inc. | 17,500 | 1,826,479 | ||||||
| Yakuodo Co., Ltd. | 45,500 | 1,406,623 | ||||||
| 74,884,363 | ||||||||
| Luxembourg (0.26%) | ||||||||
| L’Occitane International SA | 989,212 | 1,852,677 | ||||||
| Malaysia (0.93%) | ||||||||
| AEON Credit Service M Bhd | 1,155,560 | 4,174,242 | ||||||
| My EG Services Bhd | 2,986,400 | 858,757 | ||||||
| Scicom MSC Bhd | 3,754,500 | 1,507,794 | ||||||
| 6,540,793 | ||||||||
| Mexico (0.74%) | ||||||||
| Credito Real SAB de CV SOFOM ER | 1,104,342 | 1,256,933 | ||||||
| Regional SAB de CV | 560,065 | 2,759,071 | ||||||
| Unifin Financiera SAB de CV SOFOM ENR | 620,500 | 1,162,908 | ||||||
| 5,178,912 | ||||||||
| Netherlands (0.89%) | ||||||||
| Aalberts Industries NV | 171,397 | 6,283,088 | ||||||
| New Zealand (0.65%) | ||||||||
| CBL Corp., Ltd.(a)(d) | 1,542,256 | 231,472 | ||||||
| Restaurant Brands New Zealand, Ltd. | 773,486 | 4,335,824 | ||||||
| 4,567,296 | ||||||||
| Norway (2.40%) | ||||||||
| Medistim ASA | 420,559 | 3,538,263 | ||||||
| Multiconsult ASA(b)(c) | 176,700 | 1,193,733 | ||||||
| Sbanken ASA(b)(c) | 945,100 | 9,412,769 | ||||||
| TGS NOPEC Geophysical Co. ASA | 82,300 | 2,749,207 | ||||||
| 16,893,972 | ||||||||
| Oman (0.56%) | ||||||||
| Tethys Oil AB | 409,108 | 3,926,485 | ||||||
| Peru (1.34%) | ||||||||
| Alicorp SAA | 1,952,297 | 5,645,824 | ||||||
| Credicorp, Ltd. | 16,850 | 3,803,214 | ||||||
| 9,449,038 | ||||||||
| Philippines (2.10%) | ||||||||
| Concepcion Industrial Corp. | 1,942,800 | 1,379,804 | ||||||
| Holcim Philippines, Inc. | 5,918,300 | 713,771 | ||||||
| Pepsi-Cola Products Philippines, Inc. | 20,111,500 | 622,390 | ||||||
| Puregold Price Club, Inc. | 6,696,000 | 5,086,604 | ||||||
| Shares | Value (Note 2) | |||||||
| Philippines (continued) | ||||||||
| Robinsons Retail Holdings, Inc. | 1,696,000 | $ | 2,402,707 | |||||
| Security Bank Corp. | 1,695,760 | 4,582,715 | ||||||
| 14,787,991 | ||||||||
| Poland (0.85%) | ||||||||
| Dino Polska SA(a)(b)(c) | 232,462 | 5,108,104 | ||||||
| LiveChat Software SA | 85,000 | 567,776 | ||||||
| PGS Software SA | 130,778 | 276,065 | ||||||
| 5,951,945 | ||||||||
| Singapore (0.69%) | ||||||||
| Riverstone Holdings, Ltd./Singapore | 5,677,000 | 4,885,109 | ||||||
| South Africa (1.08%) | ||||||||
| Cartrack Holdings, Ltd. | 594,710 | 584,226 | ||||||
| Cashbuild, Ltd. | 124,286 | 2,272,153 | ||||||
| Italtile, Ltd. | 4,209,423 | 3,689,398 | ||||||
| Shoprite Holdings, Ltd. | 84,200 | 1,027,929 | ||||||
| 7,573,706 | ||||||||
| South Korea (1.81%) | ||||||||
| Hy-Lok Corp. | 84,332 | 1,694,016 | ||||||
| ISC Co., Ltd. | 231,519 | 1,854,628 | ||||||
| Koh Young Technology, Inc. | 25,383 | 2,011,293 | ||||||
| LEENO Industrial, Inc. | 79,500 | 4,183,504 | ||||||
| Medy-Tox, Inc. | 2,895 | 1,185,988 | ||||||
| Vitzrocell Co., Ltd.(a) | 198,884 | 1,791,497 | ||||||
| 12,720,926 | ||||||||
| Sweden (3.16%) | ||||||||
| AddTech AB, Class B | 343,608 | 7,027,093 | ||||||
| Bufab AB | 347,208 | 3,514,865 | ||||||
| HIQ International AB(a) | 124,653 | 700,587 | ||||||
| Hoist Finance AB(b)(c) | 434,800 | 3,487,465 | ||||||
| Indutrade AB | 186,250 | 4,470,663 | ||||||
| KNOW IT AB | 51,800 | 1,007,372 | ||||||
| Nibe Industrier AB, Class B | 82,700 | 863,137 | ||||||
| TF Bank AB(c) | 132,700 | 1,145,572 | ||||||
| 22,216,754 | ||||||||
| Switzerland (0.45%) | ||||||||
| Luxoft Holding, Inc.(a) | 59,075 | 2,435,662 | ||||||
| VZ Holding AG | 2,560 | 725,207 | ||||||
| 3,160,869 | ||||||||
| Taiwan (2.72%) | ||||||||
| ASPEED Technology, Inc. | 37,958 | 559,342 | ||||||
| Bioteque Corp. | 908,000 | 2,455,195 | ||||||
| Materials Analysis Technology, Inc. | 748,000 | 1,012,361 | ||||||
| Poya International Co., Ltd. | 216,000 | 1,882,367 | ||||||
| Sinmag Equipment Corp. | 986,158 | 3,969,471 | ||||||
| Sporton International, Inc. | 1,439,003 | 5,362,409 | ||||||
See Notes to Financial Statements.
| Semi-Annual Report | October 31, 2018 | 53 |
| Grandeur Peak International Opportunities Fund | Portfolio of Investments |
October 31, 2018 (Unaudited)
| Shares | Value (Note 2) | |||||||
| Taiwan (continued) | ||||||||
| Test Research, Inc. | 2,238,252 | $ | 3,112,960 | |||||
| TSC Auto ID Technology Co., Ltd. | 138,000 | 768,352 | ||||||
| 19,122,457 | ||||||||
| Turkey (0.08%) | ||||||||
| DP Eurasia NV(a)(b)(c) | 386,540 | 573,128 | ||||||
| United Arab Emirates (0.38%) | ||||||||
| Aramex PJSC | 2,477,239 | 2,663,952 | ||||||
| United States (4.86%) | ||||||||
| Core Laboratories NV | 60,676 | 5,172,022 | ||||||
| EPAM Systems, Inc.(a) | 77,275 | 9,232,044 | ||||||
| FirstCash, Inc. | 99,911 | 8,032,845 | ||||||
| GBGI, Ltd. | 1,426,215 | 1,540,426 | ||||||
| Genpact, Ltd. | 154,200 | 4,226,622 | ||||||
| Lululemon Athletica, Inc.(a) | 42,625 | 5,998,616 | ||||||
| 34,202,575 | ||||||||
| Vietnam (1.52%) | ||||||||
| Ho Chi Minh City Development Joint Stock Commercial Bank | 2,161,861 | 3,043,214 | ||||||
| Vietnam Dairy Products JSC | 710,796 | 3,546,337 | ||||||
| Vietnam Technological & Commercial Joint Stock Bank(a) | 3,570,063 | 4,137,955 | ||||||
| 10,727,506 | ||||||||
| TOTAL COMMON STOCKS | ||||||||
| (Cost $568,465,156) | 660,195,620 | |||||||
Principal Amount | Value (Note 2) | |||||||
| CORPORATE BONDS (0.11%) | ||||||||
| Malaysia (0.11%) | ||||||||
| AEON Credit Service M Bhd | ||||||||
| 3.50%, 09/15/2020 | $ | 2,235,120 | $ | 750,470 | ||||
| TOTAL CORPORATE BONDS | ||||||||
| (Cost $530,970) | 750,470 | |||||||
| TOTAL INVESTMENTS (93.89%) | ||||||||
| (Cost $568,996,126) | $ | 660,946,090 | ||||||
| Other Assets In Excess Of Liabilities (6.11%) | 43,041,404 | |||||||
| NET ASSETS (100.00%) | $ | 703,987,494 | ||||||
| (a) | Non-Income Producing Security. |
| (b) | Security exempt from registration under Rule 144A of the Securities Act of 1933. These securities may be resold in the ordinary course of business in transactions exempt from registration, normally to qualified institutional buyers. As of October 31, 2018, these securities had a total aggregate market value of $37,343,255 representing 5.30% of net assets. |
| (c) | Security was purchased pursuant to Regulation S under the Securities Act of 1933, which exempts securities offered and sold outside of the United States from registration. Such security cannot be sold in the United States without either an effective registration statement filed pursuant to the Securities Act of 1933, or pursuant to an exemption from registration. The security has been deemed liquid under guidelines approved by the Fund's Board of Trustees. As of October 31, 2018, the aggregate market value of those securities was $45,145,157, representing 6.41% of net assets. |
| (d) | As a result of the use of significant unobservable inputs to determine fair value, these investments have been classified as level 3 assets. See also footnote 2 to the financial statements for additional information. |
For Fund compliance purposes, the Fund's geographical classifications refer to any one or more of the country sub-classifications used by one or more widely recognized market indexes or ratings group indexes, and/or as defined by Fund management. This definition may not apply for purposes of this report, which may combine sub-classifications for reporting ease. Geographical regions are shown as a percentage of net assets.
See Notes to Financial Statements.
| 54 | 1.855.377.7325 | www.GrandeurPeakGlobal.com |
| Grandeur Peak International Stalwarts Fund | Portfolio of Investments |
October 31, 2018 (Unaudited)
| Shares | Value (Note 2) | |||||||
| COMMON STOCKS (93.66%) | ||||||||
| Argentina (0.56%) | ||||||||
| Globant SA(a) | 58,500 | $ | 3,011,580 | |||||
| Australia (0.91%) | ||||||||
| carsales.com, Ltd. | 243,460 | 2,110,203 | ||||||
| Domino’s Pizza Enterprises, Ltd. | 74,000 | 2,836,182 | ||||||
| 4,946,385 | ||||||||
| Bangladesh (0.60%) | ||||||||
| Square Pharmaceuticals, Ltd. | 1,026,742 | 3,270,885 | ||||||
| Belgium (0.86%) | ||||||||
| Melexis NV | 70,590 | 4,642,637 | ||||||
| Bermuda (1.48%) | ||||||||
| Bank of NT Butterfield & Son, Ltd. | 198,382 | 7,992,811 | ||||||
| Brazil (2.23%) | ||||||||
| Fleury SA | 865,100 | 4,856,090 | ||||||
| Hypera SA | 439,100 | 3,488,966 | ||||||
Pagseguro Digital, Ltd., Class A(a) | 26,075 | 703,764 | ||||||
| Raia Drogasil SA | 179,800 | 3,040,391 | ||||||
| 12,089,211 | ||||||||
| Britain (13.05%) | ||||||||
| Ascential PLC | 352,900 | 1,697,682 | ||||||
| B&M European Value Retail SA | 2,377,900 | 12,653,421 | ||||||
| boohoo Group PLC(a) | 1,496,200 | 4,050,410 | ||||||
| Close Brothers Group PLC | 183,998 | 3,455,882 | ||||||
| Dechra Pharmaceuticals PLC | 315,200 | 9,209,550 | ||||||
| Diploma PLC | 406,417 | 6,815,193 | ||||||
| Intertek Group PLC | 79,200 | 4,745,378 | ||||||
| Metro Bank PLC(a) | 270,225 | 7,668,474 | ||||||
| Sanne Group PLC | 1,010,300 | 7,231,653 | ||||||
| St James’s Place PLC | 859,332 | �� | 11,105,373 | |||||
| Ted Baker PLC | 85,619 | 2,004,910 | ||||||
| 70,637,926 | ||||||||
| Canada (5.52%) | ||||||||
| Gildan Activewear, Inc. | 233,794 | 6,988,335 | ||||||
| Ritchie Bros Auctioneers, Inc. | 138,150 | 4,643,222 | ||||||
| Shopify, Inc.(a) | 21,500 | 2,970,225 | ||||||
| Stantec, Inc. | 586,489 | 15,263,104 | ||||||
| 29,864,886 | ||||||||
| China (7.30%) | ||||||||
| 51job, Inc., ADR(a) | 63,675 | 3,910,282 | ||||||
| 58.com, Inc., ADR(a) | 20,700 | 1,357,713 | ||||||
| Alibaba Group Holding, Ltd., Sponsored ADR(a) | 20,025 | 2,849,157 | ||||||
| Shares | Value (Note 2) | |||||||
| China (continued) | ||||||||
| China Medical System Holdings, Ltd. | 3,412,600 | $ | 4,076,160 | |||||
| CSPC Pharmaceutical Group, Ltd. | 2,262,000 | 4,819,887 | ||||||
| Ctrip.com International, Ltd., ADR(a) | 108,225 | 3,601,728 | ||||||
| Man Wah Holdings, Ltd. | 3,446,600 | 1,590,421 | ||||||
| Silergy Corp. | 537,200 | 6,844,164 | ||||||
| Tencent Holdings, Ltd. | 69,000 | 2,363,889 | ||||||
| Wuxi Biologics Cayman, Inc.(a)(b)(c) | 275,000 | 1,967,609 | ||||||
| Yum China Holdings, Inc. | 170,225 | 6,141,718 | ||||||
| 39,522,728 | ||||||||
| Colombia (1.04%) | ||||||||
| Parex Resources, Inc.(a) | 386,219 | 5,624,079 | ||||||
| Egypt (0.35%) | ||||||||
| Commercial International Bank Egypt SAE | 420,752 | 1,885,166 | ||||||
| France (3.56%) | ||||||||
| Alten SA | 88,664 | 8,551,215 | ||||||
| BioMerieux | 45,650 | 3,481,200 | ||||||
| Bureau Veritas SA | 188,650 | 4,255,961 | ||||||
| Eurofins Scientific SE | 5,900 | 2,973,262 | ||||||
| 19,261,638 | ||||||||
| Georgia (0.99%) | ||||||||
| Bank of Georgia Group PLC | 186,600 | 3,719,361 | ||||||
| Georgia Capital PLC(a) | 108,500 | 1,622,613 | ||||||
| 5,341,974 | ||||||||
| Germany (7.83%) | ||||||||
| Aroundtown SA | 255,964 | 2,121,077 | ||||||
| Dermapharm Holding SE(a) | 207,534 | 5,910,903 | ||||||
| FUCHS PETROLUB SE | 78,500 | 3,633,742 | ||||||
| Grand City Properties SA | 290,500 | 7,023,070 | ||||||
| GRENKE AG | 51,650 | 4,953,407 | ||||||
| Norma Group SE | 129,350 | 6,983,852 | ||||||
| PATRIZIA Immobilien AG | 243,280 | 4,182,082 | ||||||
| Wirecard AG | 40,450 | 7,566,453 | ||||||
| 42,374,586 | ||||||||
| Hong Kong (3.34%) | ||||||||
| Value Partners Group, Ltd. | 7,241,000 | 5,400,491 | ||||||
| Vitasoy International Holdings, Ltd. | 3,975,000 | 12,671,936 | ||||||
| 18,072,427 | ||||||||
| India (4.47%) | ||||||||
| Alkem Laboratories, Ltd. | 127,174 | 3,289,202 | ||||||
| Bajaj Finance, Ltd. | 232,930 | 7,494,738 | ||||||
| HDFC Asset Management Co., Ltd.(a)(b)(c) | 157,000 | 2,973,541 | ||||||
See Notes to Financial Statements.
| Semi-Annual Report | October 31, 2018 | 55 |
| Grandeur Peak International Stalwarts Fund | Portfolio of Investments |
October 31, 2018 (Unaudited)
| Shares | Value (Note 2) | |||||||
| India (continued) | ||||||||
| HDFC Standard Life Insurance Co., Ltd.(b)(c) | 388,000 | $ | 1,955,321 | |||||
| WNS Holdings, Ltd., ADR(a) | 168,895 | 8,476,840 | ||||||
| 24,189,642 | ||||||||
| Indonesia (0.53%) | ||||||||
| Bank Central Asia Tbk PT | 1,833,000 | 2,854,094 | ||||||
| Israel (1.23%) | ||||||||
| Wix.com, Ltd.(a) | 68,250 | 6,644,138 | ||||||
| Italy (4.47%) | ||||||||
| Brembo SpA | 697,857 | 7,725,903 | ||||||
| DiaSorin SpA | 89,920 | 8,529,190 | ||||||
| FinecoBank Banca Fineco SpA | 512,500 | 5,356,461 | ||||||
| Interpump Group SpA | 90,662 | 2,615,606 | ||||||
| 24,227,160 | ||||||||
| Japan (9.97%) | ||||||||
| Aeon Delight Co., Ltd. | 136,300 | 4,550,738 | ||||||
| Cosmos Pharmaceutical Corp. | 11,900 | 2,432,327 | ||||||
| Create SD Holdings Co., Ltd. | 210,900 | 5,342,546 | ||||||
| Japan Lifeline Co., Ltd. | 483,800 | 7,053,339 | ||||||
| MISUMI Group, Inc. | 430,800 | 8,633,575 | ||||||
| Nihon M&A Center, Inc. | 497,700 | 11,926,047 | ||||||
| Seria Co., Ltd. | 159,700 | 5,357,788 | ||||||
| Sundrug Co., Ltd. | 99,600 | 3,619,353 | ||||||
| Tokyo Century Corp. | 37,300 | 2,002,022 | ||||||
| Tsuruha Holdings, Inc. | 29,600 | 3,089,358 | ||||||
| 54,007,093 | ||||||||
| Kenya (0.36%) | ||||||||
| Safaricom PLC | 8,489,600 | 1,925,582 | ||||||
| Mexico (0.72%) | ||||||||
| Regional SAB de CV | 795,350 | 3,918,165 | ||||||
| Netherlands (1.79%) | ||||||||
| Aalberts Industries NV | 265,071 | 9,716,998 | ||||||
| Norway (0.54%) | ||||||||
| TGS NOPEC Geophysical Co. ASA | 88,264 | 2,948,433 | ||||||
| Peru (1.45%) | ||||||||
| Alicorp SAA | 1,302,439 | 3,766,507 | ||||||
| Credicorp, Ltd. | 18,025 | 4,068,423 | ||||||
| 7,834,930 | ||||||||
| Philippines (2.04%) | ||||||||
| Puregold Price Club, Inc. | 5,236,200 | 3,977,670 | ||||||
| Robinsons Retail Holdings, Inc. | 2,119,320 | 3,002,419 | ||||||
| Shares | Value (Note 2) | |||||||
| Philippines (continued) | ||||||||
| Security Bank Corp. | 1,508,200 | $ | 4,075,843 | |||||
| 11,055,932 | ||||||||
| Poland (1.18%) | ||||||||
| Dino Polska SA(a)(b)(c) | 291,772 | 6,411,378 | ||||||
| South Korea (1.17%) | ||||||||
| LG Household & Health Care, Ltd. | 3,550 | 3,264,598 | ||||||
| Medy-Tox, Inc. | 7,550 | 3,092,992 | ||||||
| 6,357,590 | ||||||||
| Sweden (2.77%) | ||||||||
| AddTech AB, Class B | 165,200 | 3,378,489 | ||||||
| Indutrade AB | 217,150 | 5,212,373 | ||||||
| Nibe Industrier AB, Class B | 305,300 | 3,186,407 | ||||||
| Sweco AB, Class B | 143,900 | 3,244,523 | ||||||
| 15,021,792 | ||||||||
| Switzerland (1.79%) | ||||||||
| Luxoft Holding, Inc.(a) | 63,450 | 2,616,043 | ||||||
| Partners Group Holding AG | 7,790 | 5,546,130 | ||||||
| VZ Holding AG | 1,654 | 468,552 | ||||||
| Wizz Air Holdings PLC(a)(b)(c) | 31,832 | 1,044,058 | ||||||
| 9,674,783 | ||||||||
| United States (7.50%) | ||||||||
| Accenture PLC, Class A | 26,300 | 4,145,406 | ||||||
| Burford Capital, Ltd. | 201,100 | 4,262,720 | ||||||
| Core Laboratories NV | 60,750 | 5,178,330 | ||||||
| EPAM Systems, Inc.(a) | 76,800 | 9,175,296 | ||||||
| FirstCash, Inc. | 64,859 | 5,214,663 | ||||||
| Genpact, Ltd. | 146,300 | 4,010,083 | ||||||
| Lululemon Athletica, Inc.(a) | 61,175 | 8,609,158 | ||||||
| 40,595,656 | ||||||||
| Vietnam (2.06%) | ||||||||
| Ho Chi Minh City Development Joint Stock Commercial Bank | 1,946,248 | 2,739,699 | ||||||
| Vietnam Dairy Products JSC | 962,910 | 4,804,197 | ||||||
| Vietnam Technological & Commercial Joint Stock Bank(a) | 3,118,067 | 3,614,060 | ||||||
| 11,157,956 | ||||||||
| TOTAL COMMON STOCKS | ||||||||
| (Cost $489,476,302) | 507,080,241 | |||||||
See Notes to Financial Statements.
| 56 | 1.855.377.7325 | www.GrandeurPeakGlobal.com |
| Grandeur Peak International Stalwarts Fund | Portfolio of Investments |
October 31, 2018 (Unaudited)
| TOTAL INVESTMENTS (93.66%) | ||||
| (Cost $489,476,302) | $ | 507,080,241 | ||
| Other Assets In Excess Of Liabilities (6.34%) | 34,351,210 | |||
| NET ASSETS (100.00%) | $ | 541,431,451 | ||
| (a) | Non-Income Producing Security. |
| (b) | Security exempt from registration under Rule 144A of the Securities Act of 1933. These securities may be resold in the ordinary course of business in transactions exempt from registration, normally to qualified institutional buyers. As of October 31, 2018, these securities had a total aggregate market value of $14,351,907 representing 2.65% of net assets. |
| (c) | Security was purchased pursuant to Regulation S under the Securities Act of 1933, which exempts securities offered and sold outside of the United States from registration. Such security cannot be sold in the United States without either an effective registration statement filed pursuant to the Securities Act of 1933, or pursuant to an exemption from registration. The security has been deemed liquid under guidelines approved by the Fund's Board of Trustees. As of October 31, 2018, the aggregate market value of those securities was $14,351,907, representing 2.65% of net assets. |
For Fund compliance purposes, the Fund's geographical classifications refer to any one or more of the country sub-classifications used by one or more widely recognized market indexes or ratings group indexes, and/or as defined by Fund management. This definition may not apply for purposes of this report, which may combine sub-classifications for reporting ease. Geographical regions are shown as a percentage of net assets.
See Notes to Financial Statements.
| Semi-Annual Report | October 31, 2018 | 57 |
| Grandeur Peak Funds® | Statements of Assets and Liabilities |
October 31, 2018 (Unaudited)
Grandeur Peak Emerging Markets Opportunities Fund | Grandeur Peak Global Micro Cap Fund | Grandeur Peak Global Opportunities Fund | Grandeur Peak Global Reach Fund | |||||||||||||
| ASSETS | ||||||||||||||||
| Investments, at value (Cost - see below) | $ | 359,912,453 | $ | 35,028,105 | $ | 663,584,696 | $ | 314,742,250 | ||||||||
| Cash | 52,861,746 | 941,766 | 8,030,007 | 927,089 | ||||||||||||
| Foreign cash, at value (Cost $2,387,509, $127,068, $1,563,226 and $904,028, respectively) | 2,383,775 | 126,922 | 1,560,777 | 902,777 | ||||||||||||
| Dividends and interest receivable | 300,601 | 46,885 | 1,040,289 | 357,850 | ||||||||||||
| Receivable for investments sold | 1,778,720 | 33,281 | 11,068,615 | 4,398,467 | ||||||||||||
| Receivable for fund shares subscribed | 2,293 | 60 | 138,181 | 52,392 | ||||||||||||
| Prepaid and other assets | 8,934 | 12,283 | 24,407 | 20,611 | ||||||||||||
| Total assets | 417,248,522 | 36,189,302 | 685,446,972 | 321,401,436 | ||||||||||||
| LIABILITIES | ||||||||||||||||
| Payable for investments purchased | 3,447,930 | 1,907 | 6,422,143 | 2,355,054 | ||||||||||||
| Foreign capital gains tax | 136,564 | 4,134 | – | 22,912 | ||||||||||||
| Payable for fund shares redeemed | 19,590 | – | 275,050 | 29,540 | ||||||||||||
| Advisory fees payable | 474,710 | 45,429 | 722,665 | 314,696 | ||||||||||||
| Administration fees payable | 19,079 | 9,564 | 26,942 | 22,061 | ||||||||||||
| Custodian fees payable | 115,953 | 8,177 | 64,571 | 40,175 | ||||||||||||
| Payable for trustee fees and expenses | 3,184 | 257 | 4,800 | 2,177 | ||||||||||||
| Payable for chief compliance officer fee | 1,485 | 132 | 2,389 | 1,101 | ||||||||||||
| Payable for principal financial officer fees | 255 | 22 | 411 | 188 | ||||||||||||
| Distribution and service fees payable | 3,041 | – | 34,352 | 12,355 | ||||||||||||
| Payable for transfer agency fees | 4,352 | 4,340 | 11,081 | 8,275 | ||||||||||||
| Accrued expenses and other liabilities | 35,886 | 13,012 | 41,836 | 33,573 | ||||||||||||
| Total liabilities | 4,262,029 | 86,974 | 7,606,240 | 2,842,107 | ||||||||||||
| NET ASSETS | $ | 412,986,493 | $ | 36,102,328 | $ | 677,840,732 | $ | 318,559,329 | ||||||||
| NET ASSETS CONSISTS OF | ||||||||||||||||
| Paid-in capital (Note 5) | $ | 418,294,610 | $ | 31,450,822 | $ | 505,961,825 | $ | 255,336,095 | ||||||||
| Total distributable earnings | (5,308,117 | ) | 4,651,506 | 171,878,907 | 63,223,234 | |||||||||||
| NET ASSETS | $ | 412,986,493 | $ | 36,102,328 | $ | 677,840,732 | $ | 318,559,329 | ||||||||
| INVESTMENTS, AT COST | $ | 367,149,951 | $ | 32,472,859 | $ | 553,092,010 | $ | 281,680,631 | ||||||||
| PRICING OF SHARES | ||||||||||||||||
| Investor Class | ||||||||||||||||
| Net Assets | $ | 13,012,931 | $ | – | $ | 155,057,387 | $ | 55,619,009 | ||||||||
| Net Asset Value, offering and redemption price per share | $ | 10.42 | $ | – | $ | 3.49 | $ | 15.05 | ||||||||
| Shares of beneficial interest outstanding | 1,248,396 | – | 44,444,432 | 3,696,707 | ||||||||||||
| Institutional Class | ||||||||||||||||
| Net Assets | $ | 399,973,562 | $ | 36,102,328 | $ | 522,783,345 | $ | 262,940,320 | ||||||||
| Net Asset Value, offering and redemption price per share | $ | 10.49 | $ | 11.56 | $ | 3.53 | $ | 15.11 | ||||||||
| Shares of beneficial interest outstanding | 38,129,436 | 3,123,277 | 147,907,105 | 17,401,444 | ||||||||||||
See Notes to Financial Statements.
| 58 | 1.855.377.7325 | www.GrandeurPeakGlobal.com |
| Grandeur Peak Funds® | Statements of Assets and Liabilities |
October 31, 2018 (Unaudited)
Grandeur Peak Global Stalwarts Fund | Grandeur Peak International Opportunities Fund | Grandeur Peak International Stalwarts Fund | ||||||||||
| ASSETS | ||||||||||||
| Investments, at value (Cost - see below) | $ | 167,241,945 | $ | 660,946,090 | $ | 507,080,241 | ||||||
| Cash | 7,594,972 | 38,014,729 | 31,569,366 | |||||||||
| Foreign cash, at value (Cost $354,998, $1,405,363 and $1,451,281, respectively) | 353,890 | 1,402,692 | 1,447,623 | |||||||||
| Dividends and interest receivable | 187,301 | 1,292,496 | 682,678 | |||||||||
| Receivable for investments sold | 1,259,966 | 3,863,456 | 4,354,746 | |||||||||
| Receivable for fund shares subscribed | 1,097,877 | 34,481 | 100,213 | |||||||||
| Prepaid and other assets | 24,882 | 24,964 | 35,078 | |||||||||
| Total assets | 177,760,833 | 705,578,908 | 545,269,945 | |||||||||
| LIABILITIES | ||||||||||||
| Payable for investments purchased | 453,145 | 180,502 | 3,105,352 | |||||||||
| Foreign capital gains tax | 25,337 | – | 102,101 | |||||||||
| Payable for fund shares redeemed | 140,936 | 464,202 | 132,934 | |||||||||
| Advisory fees payable | 123,097 | 751,858 | 382,399 | |||||||||
| Administration fees payable | 9,524 | 28,116 | 19,479 | |||||||||
| Custodian fees payable | 12,207 | 93,229 | 39,332 | |||||||||
| Payable for trustee fees and expenses | 1,032 | 5,824 | 2,783 | |||||||||
| Payable for chief compliance officer fee | 538 | 2,774 | 1,521 | |||||||||
| Payable for principal financial officer fees | 93 | 477 | 261 | |||||||||
| Distribution and service fees payable | 17,329 | 14,054 | 11,869 | |||||||||
| Payable for transfer agency fees | 8,272 | 8,856 | 16,245 | |||||||||
| Accrued expenses and other liabilities | 16,945 | 41,522 | 24,218 | |||||||||
| Total liabilities | 808,455 | 1,591,414 | 3,838,494 | |||||||||
| NET ASSETS | $ | 176,952,378 | $ | 703,987,494 | $ | 541,431,451 | ||||||
| NET ASSETS CONSISTS OF | ||||||||||||
| Paid-in capital (Note 5) | $ | 161,659,528 | $ | 540,772,763 | $ | 510,797,905 | ||||||
| Total distributable earnings | 15,292,850 | 163,214,731 | 30,633,546 | |||||||||
| NET ASSETS | $ | 176,952,378 | $ | 703,987,494 | $ | 541,431,451 | ||||||
| INVESTMENTS, AT COST | $ | 157,243,959 | $ | 568,996,126 | $ | 489,476,302 | ||||||
| PRICING OF SHARES | ||||||||||||
| Investor Class | ||||||||||||
| Net Assets | $ | 79,724,390 | $ | 62,868,800 | $ | 53,628,193 | ||||||
| Net Asset Value, offering and redemption price per share | $ | 13.36 | $ | 3.47 | $ | 13.44 | ||||||
| Shares of beneficial interest outstanding | 5,967,763 | 18,097,702 | 3,991,224 | |||||||||
| Institutional Class | ||||||||||||
| Net Assets | $ | 97,227,988 | $ | 641,118,694 | $ | 487,803,258 | ||||||
| Net Asset Value, offering and redemption price per share | $ | 13.45 | $ | 3.50 | $ | 13.49 | ||||||
| Shares of beneficial interest outstanding | 7,230,346 | 183,416,265 | 36,168,383 | |||||||||
See Notes to Financial Statements.
| Semi-Annual Report | October 31, 2018 | 59 |
| Grandeur Peak Funds® | Statements of Operations |
For the Six Months Ended October 31, 2018 (Unaudited)
Grandeur Peak Emerging Markets Opportunities Fund | Grandeur Peak Global Micro Cap Fund | Grandeur Peak Global Opportunities Fund | Grandeur Peak Global Reach Fund | |||||||||||||
| INVESTMENT INCOME | ||||||||||||||||
| Dividends | $ | 5,622,121 | $ | 463,138 | $ | 6,280,767 | $ | 3,284,122 | ||||||||
| Interest | 9,812 | 3,645 | 50,984 | 40,072 | ||||||||||||
| Foreign taxes withheld | (408,572 | ) | (34,928 | ) | (377,010 | ) | (220,599 | ) | ||||||||
| Total investment income | 5,223,361 | 431,855 | 5,954,741 | 3,103,595 | ||||||||||||
| EXPENSES | ||||||||||||||||
| Investment advisor fees (Note 6) | 3,039,804 | 308,974 | 4,835,504 | 2,032,092 | ||||||||||||
| Recoupment of previously waived fees (Note 6) | – | 4,885 | – | – | ||||||||||||
| Administrative fees | 82,078 | 20,602 | 132,525 | 77,808 | ||||||||||||
| Distribution and service fees - Investor Class | 19,385 | – | 221,846 | 79,607 | ||||||||||||
| Transfer agent fees | 18,929 | 18,902 | 36,169 | 28,954 | ||||||||||||
| Professional fees | 30,401 | 17,306 | 28,696 | 24,022 | ||||||||||||
| Printing fees | 5,457 | 1,392 | 15,043 | 9,126 | ||||||||||||
| Registration fees | 17,035 | 9,346 | 16,891 | 14,640 | ||||||||||||
| Custodian fees | 275,508 | 34,617 | 182,374 | 138,632 | ||||||||||||
| Trustee fees and expenses | 6,184 | 554 | 10,398 | 4,913 | ||||||||||||
| Chief compliance officer fees | 4,195 | 378 | 7,008 | 3,308 | ||||||||||||
| Principal financial officer fees | 719 | 64 | 1,201 | 566 | ||||||||||||
| Other expenses | 6,687 | 2,528 | 9,937 | 5,843 | ||||||||||||
| Total expenses | 3,506,382 | 419,548 | 5,497,592 | 2,419,511 | ||||||||||||
| Voluntary waiver of investment advisory fees (Note 6) | (35,304 | ) | – | (202,178 | ) | – | ||||||||||
| Less fees waived/reimbursed by investment advisor (Note 6) | – | (7,880 | ) | – | – | |||||||||||
| Total net expenses | 3,471,078 | 411,668 | 5,295,414 | 2,419,511 | ||||||||||||
| NET INVESTMENT INCOME | 1,752,283 | 20,187 | 659,327 | 684,084 | ||||||||||||
| REALIZED AND UNREALIZED GAIN/(LOSS) ON INVESTMENTS | ||||||||||||||||
| Net realized gain/(loss) on investments | (2,855,260 | ) | 273,983 | 27,383,787 | 16,909,342 | |||||||||||
| Net realized loss on foreign currency transactions | (197,070 | ) | (12,365 | ) | (154,251 | ) | (112,136 | ) | ||||||||
| Net realized gain/(loss) | (3,052,330 | ) | 261,618 | 27,229,536 | 16,797,206 | |||||||||||
| Net change in unrealized depreciation on investments (net of change in foreign capital gains tax of $(106,491), $1,887, $(93,577) and $(26,640), respectively) | (96,376,200 | ) | (5,167,230 | ) | (117,022,971 | ) | (58,816,556 | ) | ||||||||
| Net change in unrealized depreciation on translation of assets and liabilities in foreign currencies | (6,013 | ) | (748 | ) | (13,772 | ) | (4,713 | ) | ||||||||
| Net change in unrealized depreciation | (96,382,213 | ) | (5,167,978 | ) | (117,036,743 | ) | (58,821,269 | ) | ||||||||
| NET REALIZED AND UNREALIZED LOSS ON INVESTMENTS AND FOREIGN CURRENCY TRANSACTIONS | (99,434,543 | ) | (4,906,360 | ) | (89,807,207 | ) | (42,024,063 | ) | ||||||||
| NET DECREASE IN NET ASSETS RESULTING FROM OPERATIONS | $ | (97,682,260 | ) | $ | (4,886,173 | ) | $ | (89,147,880 | ) | $ | (41,339,979 | ) | ||||
See Notes to Financial Statements.
| 60 | 1.855.377.7325 | www.GrandeurPeakGlobal.com |
| Grandeur Peak Funds® | Statements of Operations |
For the Six Months Ended October 31, 2018 (Unaudited)
Grandeur Peak Global Stalwarts Fund | Grandeur Peak International Opportunities Fund | Grandeur Peak International Stalwarts Fund | ||||||||||
| INVESTMENT INCOME | ||||||||||||
| Dividends | $ | 1,396,724 | $ | 8,621,108 | $ | 4,531,843 | ||||||
| Interest | – | 9,701 | 164,747 | |||||||||
| Foreign taxes withheld | (81,673 | ) | (650,533 | ) | (326,165 | ) | ||||||
| Total investment income | 1,315,051 | 7,980,276 | 4,370,425 | |||||||||
| EXPENSES | ||||||||||||
| Investment advisor fees (Note 6) | 784,730 | 5,226,102 | 2,340,890 | |||||||||
| Recoupment of previously waived fees (Note 6) | 39,413 | – | – | |||||||||
| Administrative fees | 39,182 | 142,856 | 98,908 | |||||||||
| Distribution and service fees - Investor Class | 116,355 | 90,384 | 70,255 | |||||||||
| Transfer agent fees | 30,223 | 28,315 | 51,165 | |||||||||
| Professional fees | 18,140 | 28,083 | 20,401 | |||||||||
| Printing fees | 5,025 | 10,292 | 9,430 | |||||||||
| Registration fees | 12,028 | 16,234 | 15,354 | |||||||||
| Custodian fees | 65,369 | 253,817 | 158,468 | |||||||||
| Trustee fees and expenses | 2,569 | 11,621 | 7,476 | |||||||||
| Chief compliance officer fees | 1,713 | 7,852 | 4,973 | |||||||||
| Principal financial officer fees | 294 | 1,345 | 852 | |||||||||
| Other expenses | 5,496 | 10,765 | 8,936 | |||||||||
| Total expenses | 1,120,537 | 5,827,666 | 2,787,108 | |||||||||
| Voluntary waiver of investment advisory fees (Note 6) | – | (249,050 | ) | – | ||||||||
| Total net expenses | 1,120,537 | 5,578,616 | 2,787,108 | |||||||||
| NET INVESTMENT INCOME | 194,514 | 2,401,660 | 1,583,317 | |||||||||
| REALIZED AND UNREALIZED GAIN/(LOSS) ON INVESTMENTS | ||||||||||||
| Net realized gain on investments | 2,154,944 | 31,298,279 | 2,664,709 | |||||||||
| Net realized loss on foreign currency transactions | (27,425 | ) | (263,860 | ) | (181,449 | ) | ||||||
| Net realized gain | 2,127,519 | 31,034,419 | 2,483,260 | |||||||||
| Net change in unrealized depreciation on investments (net of change in foreign capital gains tax of $4,490, $(176,474) and $37,806, respectively) | (24,647,734 | ) | (162,070,365 | ) | (87,699,497 | ) | ||||||
| Net change in unrealized depreciation on translation of assets and liabilities in foreign currencies | (8,348 | ) | (15,396 | ) | (28,203 | ) | ||||||
| Net change in unrealized depreciation | (24,656,082 | ) | (162,085,761 | ) | (87,727,700 | ) | ||||||
| NET REALIZED AND UNREALIZED LOSS ON INVESTMENTS AND FOREIGN CURRENCY TRANSACTIONS | (22,528,563 | ) | (131,051,342 | ) | (85,244,440 | ) | ||||||
| NET DECREASE IN NET ASSETS RESULTING FROM OPERATIONS | $ | (22,334,049 | ) | $ | (128,649,682 | ) | $ | (83,661,123 | ) | |||
See Notes to Financial Statements.
| Semi-Annual Report | October 31, 2018 | 61 |
| Grandeur Peak Emerging Markets Opportunities Fund | Statements of Changes in Net Assets |
For the Six Months Ended October 31, 2018 (Unaudited) | For the Year Ended April 30, 2018 | |||||||
| OPERATIONS | ||||||||
| Net investment income | $ | 1,752,283 | $ | 2,165,202 | ||||
| Net realized gain/(loss) | (3,052,330 | ) | 14,017,210 | |||||
| Net change in unrealized appreciation/(depreciation) | (96,382,213 | ) | 37,631,237 | |||||
| Net increase/(decrease) in net assets resulting from operations | (97,682,260 | ) | 53,813,649 | |||||
| DISTRIBUTIONS TO SHAREHOLDERS (NOTE 3)(a) | ||||||||
| Investor Class | – | – | ||||||
| Institutional Class | – | (518,950 | ) | |||||
| Net decrease in net assets from distributions | – | (518,950 | ) | |||||
| CAPITAL SHARE TRANSACTIONS (NOTE 5) | ||||||||
| Investor Class | ||||||||
| Proceeds from sales of shares | 365,565 | 775,580 | ||||||
| Cost of shares redeemed | (2,396,776 | ) | (2,386,409 | ) | ||||
| Redemption fees | 2 | – | ||||||
| Net decrease from capital shares transactions | (2,031,209 | ) | (1,610,829 | ) | ||||
| Institutional Class | ||||||||
| Proceeds from sales of shares | 54,111,953 | 49,952,122 | ||||||
| Distributions reinvested | – | 468,941 | ||||||
| Cost of shares redeemed | (31,340,499 | ) | (29,142,671 | ) | ||||
| Redemption fees | 490 | 322 | ||||||
| Net increase from capital shares transactions | 22,771,944 | 21,278,714 | ||||||
| Net increase/(decrease) in net assets | (76,941,525 | ) | 72,962,584 | |||||
| NET ASSETS | ||||||||
| Beginning of period | 489,928,018 | 416,965,434 | ||||||
| End of period | $ | 412,986,493 | $ | 489,928,018 | (b) | |||
| OTHER INFORMATION | ||||||||
| Shares Transactions | ||||||||
| Investor Class | ||||||||
| Issued | 30,729 | 60,550 | ||||||
| Redeemed | (212,907 | ) | (194,865 | ) | ||||
| Net decrease in share transactions | (182,178 | ) | (134,315 | ) | ||||
| Institutional Class | ||||||||
| Issued | 4,803,033 | 3,752,939 | ||||||
| Issued to shareholders in reinvestment of distributions | – | 36,017 | ||||||
| Redeemed | (2,601,360 | ) | (2,258,217 | ) | ||||
| Net increase in share transactions | 2,201,673 | 1,530,739 | ||||||
| (a) | For the prior year ended April 30, 2018, Total Distributions consisted of Net Investment Income (518,950), and Net Realized Gains –. |
| (b) | For the prior year ended April 30, 2018, included accumulated net investment income of $309,589. |
See Notes to Financial Statements.
| 62 | 1.855.377.7325 | www.GrandeurPeakGlobal.com |
| Grandeur Peak Global Micro Cap Fund | Statements of Changes in Net Assets |
For the Six Months Ended October 31, 2018 (Unaudited) | For the Year Ended April 30, 2018 | |||||||
| OPERATIONS | ||||||||
| Net investment income/(loss) | $ | 20,187 | $ | (1,052 | ) | |||
| Net realized gain | 261,618 | 4,075,012 | ||||||
| Net change in unrealized appreciation/(depreciation) | (5,167,978 | ) | 2,334,379 | |||||
| Net increase/(decrease) in net assets resulting from operations | (4,886,173 | ) | 6,408,339 | |||||
| DISTRIBUTIONS TO SHAREHOLDERS (NOTE 3)(a) | ||||||||
| Institutional Class | – | (2,928,849 | ) | |||||
| Net decrease in net assets from distributions | – | (2,928,849 | ) | |||||
| CAPITAL SHARE TRANSACTIONS (NOTE 5) | ||||||||
| Institutional Class | ||||||||
| Proceeds from sales of shares | 490,780 | 1,986,506 | ||||||
| Distributions reinvested | – | 2,815,178 | ||||||
| Cost of shares redeemed | (1,211,629 | ) | (3,191,486 | ) | ||||
| Redemption fees | – | 17 | ||||||
| Net increase/(decrease) from capital shares transactions | (720,849 | ) | 1,610,215 | |||||
| Net increase/(decrease) in net assets | (5,607,022 | ) | 5,089,705 | |||||
| NET ASSETS | ||||||||
| Beginning of period | 41,709,350 | 36,619,645 | ||||||
| End of period | $ | 36,102,328 | $ | 41,709,350 | (b) | |||
| OTHER INFORMATION | ||||||||
| Shares Transactions | ||||||||
| Institutional Class | ||||||||
| Issued | 38,286 | 150,447 | ||||||
| Issued to shareholders in reinvestment of distributions | – | 212,948 | ||||||
| Redeemed | (94,808 | ) | (241,118 | ) | ||||
| Net increase/(decrease) in share transactions | (56,522 | ) | 122,277 | |||||
| (a) | For the prior year ended April 30, 2018, Total Distributions consisted of Net Investment Income (184,962), and Net Realized Gains 2,743,887. |
| (b) | For the prior year ended April 30, 2018, included accumulated net investment income of $–. |
See Notes to Financial Statements.
| Semi-Annual Report | October 31, 2018 | 63 |
| Grandeur Peak Global Opportunities Fund | Statements of Changes in Net Assets |
For the Six Months Ended October 31, 2018 (Unaudited) | For the Year Ended April 30, 2018 | |||||||
| OPERATIONS | ||||||||
| Net investment income | $ | 659,327 | $ | 1,706,038 | ||||
| Net realized gain | 27,229,536 | 65,306,493 | ||||||
| Net change in unrealized appreciation/(depreciation) | (117,036,743 | ) | 61,142,695 | |||||
| Net increase/(decrease) in net assets resulting from operations | (89,147,880 | ) | 128,155,226 | |||||
| DISTRIBUTIONS TO SHAREHOLDERS (NOTE 3)(a) | ||||||||
| Investor Class | – | (10,280,542 | ) | |||||
| Institutional Class | – | (32,134,010 | ) | |||||
| Net decrease in net assets from distributions | – | (42,414,552 | ) | |||||
| CAPITAL SHARE TRANSACTIONS (NOTE 5) | ||||||||
| Investor Class | ||||||||
| Proceeds from sales of shares | 5,826,767 | 22,888,443 | ||||||
| Distributions reinvested | – | 9,719,833 | ||||||
| Cost of shares redeemed | (18,507,897 | ) | (30,840,920 | ) | ||||
| Redemption fees | 179 | 1,110 | ||||||
| Net increase/(decrease) from capital shares transactions | (12,680,951 | ) | 1,768,466 | |||||
| Institutional Class | ||||||||
| Proceeds from sales of shares | 13,712,863 | 26,846,472 | ||||||
| Distributions reinvested | – | 30,664,935 | ||||||
| Cost of shares redeemed | (13,892,477 | ) | (64,400,921 | ) | ||||
| Redemption fees | – | 274 | ||||||
| Net decrease from capital shares transactions | (179,614 | ) | (6,889,240 | ) | ||||
| Net increase/(decrease) in net assets | (102,008,445 | ) | 80,619,900 | |||||
| NET ASSETS | ||||||||
| Beginning of period | 779,849,177 | 699,229,277 | ||||||
| End of period | $ | 677,840,732 | $ | 779,849,177 | (b) | |||
| OTHER INFORMATION | ||||||||
| Shares Transactions | ||||||||
| Investor Class | ||||||||
| Issued | 1,482,228 | 5,933,663 | ||||||
| Issued to shareholders in reinvestment of distributions | – | 2,460,717 | ||||||
| Redeemed | (4,719,377 | ) | (7,896,305 | ) | ||||
| Net increase/(decrease) in share transactions | (3,237,149 | ) | 498,075 | |||||
| Institutional Class | ||||||||
| Issued | 3,474,304 | 6,845,193 | ||||||
| Issued to shareholders in reinvestment of distributions | – | 7,666,235 | ||||||
| Redeemed | (3,516,882 | ) | (16,296,273 | ) | ||||
| Net decrease in share transactions | (42,578 | ) | (1,784,845 | ) | ||||
| (a) | For the prior year ended April 30, 2018, Total Distributions consisted of Net Investment Income $676,490, and Net Realized Gains 41,738,062. |
| (b) | For the prior year ended April 30, 2018, included accumulated net investment income of $607,070. |
See Notes to Financial Statements.
| 64 | 1.855.377.7325 | www.GrandeurPeakGlobal.com |
| Grandeur Peak Global Reach Fund | Statements of Changes in Net Assets |
For the Six Months Ended October 31, 2018 (Unaudited) | For the Year Ended April 30, 2018 | |||||||
| OPERATIONS | ||||||||
| Net investment income | $ | 684,084 | $ | 814,714 | ||||
| Net realized gain | 16,797,206 | 23,684,460 | ||||||
| Net change in unrealized appreciation/(depreciation) | (58,821,269 | ) | 35,204,597 | |||||
| Net increase/(decrease) in net assets resulting from operations | (41,339,979 | ) | 59,703,771 | |||||
| DISTRIBUTIONS TO SHAREHOLDERS (NOTE 3)(a) | ||||||||
| Investor Class | – | (871,964 | ) | |||||
| Institutional Class | – | (4,329,408 | ) | |||||
| Net decrease in net assets from distributions | – | (5,201,372 | ) | |||||
| CAPITAL SHARE TRANSACTIONS (NOTE 5) | ||||||||
| Investor Class | ||||||||
| Proceeds from sales of shares | 3,214,344 | 4,258,731 | ||||||
| Distributions reinvested | – | 821,348 | ||||||
| Cost of shares redeemed | (6,302,071 | ) | (17,054,715 | ) | ||||
| Redemption fees | – | 51 | ||||||
| Net decrease from capital shares transactions | (3,087,727 | ) | (11,974,585 | ) | ||||
| Institutional Class | ||||||||
| Proceeds from sales of shares | 9,188,461 | 18,157,332 | ||||||
| Distributions reinvested | – | 4,111,759 | ||||||
| Cost of shares redeemed | (14,393,857 | ) | (22,861,068 | ) | ||||
| Redemption fees | 8 | 167 | ||||||
| Net decrease from capital shares transactions | (5,205,388 | ) | (591,810 | ) | ||||
| Net increase/(decrease) in net assets | (49,633,094 | ) | 41,936,004 | |||||
| NET ASSETS | ||||||||
| Beginning of period | 368,192,423 | 326,256,419 | ||||||
| End of period | $ | 318,559,329 | $ | 368,192,423 | (b) | |||
| OTHER INFORMATION | ||||||||
| Shares Transactions | ||||||||
| Investor Class | ||||||||
| Issued | 187,939 | 268,300 | ||||||
| Issued to shareholders in reinvestment of distributions | – | 49,360 | ||||||
| Redeemed | (375,521 | ) | (1,087,058 | ) | ||||
| Net decrease in share transactions | (187,582 | ) | (769,398 | ) | ||||
| Institutional Class | ||||||||
| Issued | 542,741 | 1,125,868 | ||||||
| Issued to shareholders in reinvestment of distributions | – | 246,656 | ||||||
| Redeemed | (896,752 | ) | (1,399,288 | ) | ||||
| Net decrease in share transactions | (354,011 | ) | (26,764 | ) | ||||
| (a) | For the prior year ended April 30, 2018, Total Distributions consisted of Net Investment Income (374,631), and Net Realized Gains 4,826,741. |
| (b) | For the prior year ended April 30, 2018, included accumulated net investment income of $4,867. |
See Notes to Financial Statements.
| Semi-Annual Report | October 31, 2018 | 65 |
| Grandeur Peak Global Stalwarts Fund | Statements of Changes in Net Assets |
For the Six Months Ended October 31, 2018 (Unaudited) | For the Year Ended April 30, 2018 | |||||||
| OPERATIONS | ||||||||
| Net investment income | $ | 194,514 | $ | 138,744 | ||||
| Net realized gain | 2,127,519 | 4,911,437 | ||||||
| Net change in unrealized appreciation/(depreciation) | (24,656,082 | ) | 20,023,502 | |||||
| Net increase/(decrease) in net assets resulting from operations | (22,334,049 | ) | 25,073,683 | |||||
| DISTRIBUTIONS TO SHAREHOLDERS (NOTE 3)(a) | ||||||||
| Investor Class | – | (1,233,885 | ) | |||||
| Institutional Class | – | (1,137,784 | ) | |||||
| Net decrease in net assets from distributions | – | (2,371,669 | ) | |||||
| CAPITAL SHARE TRANSACTIONS (NOTE 5) | ||||||||
| Investor Class | ||||||||
| Proceeds from sales of shares | 22,120,654 | 30,508,717 | ||||||
| Distributions reinvested | – | 1,207,967 | ||||||
| Cost of shares redeemed | (24,725,217 | ) | (12,629,686 | ) | ||||
| Redemption fees | 4,536 | 2,502 | ||||||
| Net increase/(decrease) from capital shares transactions | (2,600,027 | ) | 19,089,500 | |||||
| Institutional Class | ||||||||
| Proceeds from sales of shares | 20,200,261 | 47,116,433 | ||||||
| Distributions reinvested | – | 1,036,423 | ||||||
| Cost of shares redeemed | (6,398,625 | ) | (10,882,140 | ) | ||||
| Redemption fees | 116 | 295 | ||||||
| Net increase from capital shares transactions | 13,801,752 | 37,271,011 | ||||||
| Net increase/(decrease) in net assets | (11,132,324 | ) | 79,062,525 | |||||
| NET ASSETS | ||||||||
| Beginning of period | 188,084,702 | 109,022,177 | ||||||
| End of period | $ | 176,952,378 | $ | 188,084,702 | (b) | |||
| OTHER INFORMATION | ||||||||
| Shares Transactions | ||||||||
| Investor Class | ||||||||
| Issued | 1,482,926 | 2,152,925 | ||||||
| Issued to shareholders in reinvestment of distributions | – | 82,511 | ||||||
| Redeemed | (1,660,198 | ) | (888,539 | ) | ||||
| Net increase/(decrease) in share transactions | (177,272 | ) | 1,346,897 | |||||
| Institutional Class | ||||||||
| Issued | 1,352,054 | 3,250,939 | ||||||
| Issued to shareholders in reinvestment of distributions | – | 70,505 | ||||||
| Redeemed | (430,181 | ) | (749,691 | ) | ||||
| Net increase in share transactions | 921,873 | 2,571,753 | ||||||
| (a) | For the prior year ended April 30, 2018, Total Distributions consisted of Net Investment Income –, and Net Realized Gains $2,371,669. |
| (b) | For the prior year ended April 30, 2018, included accumulated net investment income of $–. |
See Notes to Financial Statements.
| 66 | 1.855.377.7325 | www.GrandeurPeakGlobal.com |
| Grandeur Peak International Opportunities Fund | Statements of Changes in Net Assets |
For the Six Months Ended October 31, 2018 (Unaudited) | For the Year Ended April 30, 2018 | |||||||
| OPERATIONS | ||||||||
| Net investment income | $ | 2,401,660 | $ | 4,535,773 | ||||
| Net realized gain | 31,034,419 | 65,202,002 | ||||||
| Net change in unrealized appreciation/(depreciation) | (162,085,761 | ) | 81,871,437 | |||||
| Net increase/(decrease) in net assets resulting from operations | (128,649,682 | ) | 151,609,212 | |||||
| DISTRIBUTIONS TO SHAREHOLDERS (NOTE 3)(a) | ||||||||
| Investor Class | – | (2,773,544 | ) | |||||
| Institutional Class | – | (27,677,996 | ) | |||||
| Net decrease in net assets from distributions | – | (30,451,540 | ) | |||||
| CAPITAL SHARE TRANSACTIONS (NOTE 5) | ||||||||
| Investor Class | ||||||||
| Proceeds from sales of shares | 8,265,716 | 9,422,538 | ||||||
| Distributions reinvested | – | 2,591,766 | ||||||
| Cost of shares redeemed | (12,508,653 | ) | (23,474,795 | ) | ||||
| Redemption fees | 3,199 | 18 | ||||||
| Net decrease from capital shares transactions | (4,239,738 | ) | (11,460,473 | ) | ||||
| Institutional Class | ||||||||
| Proceeds from sales of shares | 10,558,203 | 34,216,073 | ||||||
| Distributions reinvested | – | 24,999,053 | ||||||
| Cost of shares redeemed | (65,690,465 | ) | (53,812,908 | ) | ||||
| Redemption fees | 594 | 1,808 | ||||||
| Net increase/(decrease) from capital shares transactions | (55,131,668 | ) | 5,404,026 | |||||
| Net increase/(decrease) in net assets | (188,021,088 | ) | 115,101,225 | |||||
| NET ASSETS | ||||||||
| Beginning of period | 892,008,582 | 776,907,357 | ||||||
| End of period | $ | 703,987,494 | $ | 892,008,582 | (b) | |||
| OTHER INFORMATION | ||||||||
| Shares Transactions | ||||||||
| Investor Class | ||||||||
| Issued | 2,026,516 | 2,374,458 | ||||||
| Issued to shareholders in reinvestment of distributions | – | 632,138 | ||||||
| Redeemed | (3,105,272 | ) | (5,887,657 | ) | ||||
| Net decrease in share transactions | (1,078,756 | ) | (2,881,061 | ) | ||||
| Institutional Class | ||||||||
| Issued | 2,685,931 | 8,496,775 | ||||||
| Issued to shareholders in reinvestment of distributions | – | 6,067,731 | ||||||
| Redeemed | (16,480,159 | ) | (13,071,539 | ) | ||||
| Net increase/(decrease) in share transactions | (13,794,228 | ) | 1,492,967 | |||||
| (a) | For the prior year ended April 30, 2018, Total Distributions consisted of Net Investment Income (2,499,365), and Net Realized Gains 27,952,175. |
| (b) | For the prior year ended April 30, 2018, included accumulated net investment income of $1,101,791. |
See Notes to Financial Statements.
| Semi-Annual Report | October 31, 2018 | 67 |
| Grandeur Peak International Stalwarts Fund | Statements of Changes in Net Assets |
For the Six Months Ended October 31, 2018 (Unaudited) | For the Year Ended April 30, 2018 | |||||||
| OPERATIONS | ||||||||
| Net investment income | $ | 1,583,317 | $ | 2,349,601 | ||||
| Net realized gain | 2,483,260 | 13,362,555 | ||||||
| Net change in unrealized appreciation/(depreciation) | (87,727,700 | ) | 60,834,947 | |||||
| Net increase/(decrease) in net assets resulting from operations | (83,661,123 | ) | 76,547,103 | |||||
| DISTRIBUTIONS TO SHAREHOLDERS (NOTE 3)(a) | ||||||||
| Investor Class | – | (527,381 | ) | |||||
| Institutional Class | – | (5,642,167 | ) | |||||
| Net decrease in net assets from distributions | – | (6,169,548 | ) | |||||
| CAPITAL SHARE TRANSACTIONS (NOTE 5) | ||||||||
| Investor Class | ||||||||
| Proceeds from sales of shares | 14,687,765 | 21,050,455 | ||||||
| Distributions reinvested | – | 485,971 | ||||||
| Cost of shares redeemed | (5,230,124 | ) | (6,873,308 | ) | ||||
| Redemption fees | 208 | 663 | ||||||
| Net increase from capital shares transactions | 9,457,849 | 14,663,781 | ||||||
| Institutional Class | ||||||||
| Proceeds from sales of shares | 99,935,017 | 225,088,542 | ||||||
| Distributions reinvested | – | 5,267,972 | ||||||
| Cost of shares redeemed | (33,139,324 | ) | (63,009,263 | ) | ||||
| Redemption fees | 2,564 | 9,004 | ||||||
| Net increase from capital shares transactions | 66,798,257 | 167,356,255 | ||||||
| Net increase/(decrease) in net assets | (7,405,017 | ) | 252,397,591 | |||||
| NET ASSETS | ||||||||
| Beginning of period | 548,836,468 | 296,438,877 | ||||||
| End of period | $ | 541,431,451 | $ | 548,836,468 | (b) | |||
| OTHER INFORMATION | ||||||||
| Shares Transactions | ||||||||
| Investor Class | ||||||||
| Issued | 966,199 | 1,425,304 | ||||||
| Issued to shareholders in reinvestment of distributions | – | 32,141 | ||||||
| Redeemed | (354,664 | ) | (457,934 | ) | ||||
| Net increase in share transactions | 611,535 | 999,511 | ||||||
| Institutional Class | ||||||||
| Issued | 6,451,890 | 15,450,477 | ||||||
| Issued to shareholders in reinvestment of distributions | – | 347,951 | ||||||
| Redeemed | (2,170,267 | ) | (4,230,944 | ) | ||||
| Net increase in share transactions | 4,281,623 | 11,567,484 | ||||||
| (a) | For the prior year ended April 30, 2018, Total Distributions consisted of Net Investment Income (604,680), and Net Realized Gains 5,564,868. |
| (b) | For the prior year ended April 30, 2018, included accumulated net investment income of $–. |
See Notes to Financial Statements.
| 68 | 1.855.377.7325 | www.GrandeurPeakGlobal.com |
| Grandeur Peak Emerging Markets Opportunities Fund | Financial Highlights |
For a Share Outstanding Throughout the Periods Presented
| Investor Class | For the Six Months Ended October 31, 2018 (Unaudited) | Year Ended April 30, 2018 | Year Ended April 30, 2017 | Year Ended April 30, 2016 | Year Ended April 30, 2015 | For the Period December 16, 2013 (Inception) to April 30, 2014 | ||||||||||||||||||
| NET ASSET VALUE, BEGINNING OF PERIOD | $ | 13.05 | $ | 11.55 | $ | 9.82 | $ | 11.51 | $ | 10.53 | $ | 10.00 | ||||||||||||
| INCOME FROM INVESTMENT OPERATIONS | ||||||||||||||||||||||||
| Net investment income/(loss)(a) | 0.04 | 0.03 | 0.02 | 0.07 | 0.02 | (0.05 | ) | |||||||||||||||||
| Net realized and unrealized gain/(loss) on investments | (2.67 | ) | 1.47 | 1.75 | (1.41 | ) | 1.22 | 0.58 | ||||||||||||||||
| Total income/(loss) from investment operations | (2.63 | ) | 1.50 | 1.77 | (1.34 | ) | 1.24 | 0.53 | ||||||||||||||||
| DISTRIBUTIONS | ||||||||||||||||||||||||
| From net investment income | – | – | (0.04 | ) | – | (0.01 | ) | – | ||||||||||||||||
| From net realized gain on investments | – | – | – | (0.35 | ) | (0.25 | ) | – | ||||||||||||||||
| Total distributions | – | – | (0.04 | ) | (0.35 | ) | (0.26 | ) | – | |||||||||||||||
| REDEMPTION FEES ADDED TO PAID-IN CAPITAL | 0.00 | (b) | – | 0.00 | (b) | 0.00 | (b) | 0.00 | (b) | 0.00 | (b) | |||||||||||||
| INCREASE/DECREASE IN NET ASSET VALUE | (2.63 | ) | 1.50 | 1.73 | (1.69 | ) | 0.98 | 0.53 | ||||||||||||||||
| NET ASSET VALUE, END OF PERIOD | $ | 10.42 | $ | 13.05 | $ | 11.55 | $ | 9.82 | $ | 11.51 | $ | 10.53 | ||||||||||||
| TOTAL RETURN | (20.15 | )%(c) | 12.99 | % | 18.08 | % | (11.62 | )% | 12.06 | % | 5.30 | %(c) | ||||||||||||
| RATIOS AND SUPPLEMENTAL DATA | ||||||||||||||||||||||||
| Net assets, end of period (in 000s) | $ | 13,013 | $ | 18,668 | $ | 18,074 | $ | 20,548 | $ | 39,896 | $ | 27,952 | ||||||||||||
| RATIOS TO AVERAGE NET ASSETS | ||||||||||||||||||||||||
| Expenses (excluding fees waived/reimbursed by investment advisor) | 1.78 | %(d) | 1.79 | % | 1.76 | % | 1.77 | % | 1.82 | % | 2.01 | %(d)(e) | ||||||||||||
| Expenses (including fees waived/reimbursed by investment advisor) | 1.77 | %(d) | 1.78 | % | 1.76 | % | 1.77 | % | 1.82 | % | 1.95 | %(d)(e) | ||||||||||||
| Net investment income/(loss) | 0.58 | %(d) | 0.26 | % | 0.21 | % | 0.69 | % | 0.22 | % | (0.55 | )%(d) | ||||||||||||
| PORTFOLIO TURNOVER RATE | 19 | %(c) | 33 | % | 42 | % | 40 | % | 53 | % | 26 | %(c) | ||||||||||||
| (a) | Per share numbers have been calculated using the average shares method. |
| (b) | Less than $0.005 or ($0.005) per share. |
| (c) | Not Annualized. |
| (d) | Annualized. |
| (e) | Expense ratios during startup periods may not be representative of longer term operating periods. |
See Notes to Financial Statements.
| Semi-Annual Report | October 31, 2018 | 69 |
| Grandeur Peak Emerging Markets Opportunities Fund | Financial Highlights |
For a Share Outstanding Throughout the Periods Presented
| Institutional Class | For the Six Months Ended October 31, 2018 (Unaudited) | Year Ended April 30, 2018 | Year Ended April 30, 2017 | Year Ended April 30, 2016 | Year Ended April 30, 2015 | For the Period December 16, 2013 (Inception) to April 30, 2014 | ||||||||||||||||||
| NET ASSET VALUE, BEGINNING OF PERIOD | $ | 13.12 | $ | 11.60 | $ | 9.85 | $ | 11.52 | $ | 10.54 | $ | 10.00 | ||||||||||||
| INCOME FROM INVESTMENT OPERATIONS | ||||||||||||||||||||||||
| Net investment income/(loss)(a) | 0.05 | 0.06 | 0.04 | 0.08 | 0.05 | (0.03 | ) | |||||||||||||||||
| Net realized and unrealized gain/(loss) on investments | (2.68 | ) | 1.48 | 1.77 | (1.40 | ) | 1.21 | 0.57 | ||||||||||||||||
| Total income/(loss) from investment operations | (2.63 | ) | 1.54 | 1.81 | (1.32 | ) | 1.26 | 0.54 | ||||||||||||||||
| DISTRIBUTIONS | ||||||||||||||||||||||||
| From net investment income | – | (0.02 | ) | (0.06 | ) | – | (0.03 | ) | – | |||||||||||||||
| From net realized gain on investments | – | – | – | (0.35 | ) | (0.25 | ) | – | ||||||||||||||||
| Total distributions | – | (0.02 | ) | (0.06 | ) | (0.35 | ) | (0.28 | ) | – | ||||||||||||||
| REDEMPTION FEES ADDED TO PAID-IN CAPITAL | 0.00 | (b) | 0.00 | (b) | 0.00 | (b) | 0.00 | (b) | 0.00 | (b) | 0.00 | (b) | ||||||||||||
| INCREASE/DECREASE IN NET ASSET VALUE | (2.63 | ) | 1.52 | 1.75 | (1.67 | ) | 0.98 | 0.54 | ||||||||||||||||
| NET ASSET VALUE, END OF PERIOD | $ | 10.49 | $ | 13.12 | $ | 11.60 | $ | 9.85 | $ | 11.52 | $ | 10.54 | ||||||||||||
| TOTAL RETURN | (20.05 | )%(c) | 13.24 | % | 18.42 | % | (11.44 | )% | 12.22 | % | 5.40 | %(c) | ||||||||||||
| RATIOS AND SUPPLEMENTAL DATA | ||||||||||||||||||||||||
| Net assets, end of period (in 000s) | $ | 399,974 | $ | 471,260 | $ | 398,891 | $ | 349,493 | $ | 428,048 | $ | 255,819 | ||||||||||||
| RATIOS TO AVERAGE NET ASSETS | ||||||||||||||||||||||||
| Expenses (excluding fees waived/reimbursed by investment advisor) | 1.55 | %(d) | 1.55 | % | 1.55 | % | 1.55 | % | 1.58 | % | 1.76 | %(d)(e) | ||||||||||||
| Expenses (including fees waived/reimbursed by investment advisor) | 1.53 | %(d) | 1.54 | % | 1.55 | % | 1.55 | % | 1.58 | % | 1.70 | %(d)(e) | ||||||||||||
| Net investment income/(loss) | 0.79 | %(d) | 0.49 | % | 0.35 | % | 0.75 | % | 0.43 | % | (0.37 | )%(d) | ||||||||||||
| PORTFOLIO TURNOVER RATE | 19 | %(c) | 33 | % | 42 | % | 40 | % | 53 | % | 26 | %(c) | ||||||||||||
| (a) | Per share numbers have been calculated using the average shares method. |
| (b) | Less than $0.005 or ($0.005) per share. |
| (c) | Not Annualized. |
| (d) | Annualized. |
| (e) | Expense ratios during startup periods may not be representative of longer term operating periods. |
See Notes to Financial Statements.
| 70 | 1.855.377.7325 | www.GrandeurPeakGlobal.com |
| Grandeur Peak Global Micro Cap Fund | Financial Highlights |
For a Share Outstanding Throughout the Periods Presented
| Institutional Class | For the Six Months Ended October 31, 2018 (Unaudited) | Year Ended April 30, 2018 | Year Ended April 30, 2017 | For the Period October 21, 2015 (Commencement of Operations) to April 30, 2016 | ||||||||||||
| NET ASSET VALUE, BEGINNING OF PERIOD | $ | 13.12 | $ | 11.98 | $ | 10.38 | $ | 10.00 | ||||||||
| INCOME FROM INVESTMENT OPERATIONS | ||||||||||||||||
| Net investment income/(loss)(a) | 0.01 | (0.00 | )(b) | 0.01 | (0.02 | ) | ||||||||||
| Net realized and unrealized gain/(loss) on investments | (1.57 | ) | 2.12 | 1.72 | 0.40 | |||||||||||
| Total income/(loss) from investment operations | (1.56 | ) | 2.12 | 1.73 | 0.38 | |||||||||||
| DISTRIBUTIONS | ||||||||||||||||
| From net investment income | – | (0.06 | ) | (0.02 | ) | – | ||||||||||
| From net realized gain on investments | – | (0.92 | ) | (0.11 | ) | – | ||||||||||
| Total distributions | – | (0.98 | ) | (0.13 | ) | – | ||||||||||
| REDEMPTION FEES ADDED TO PAID-IN CAPITAL | – | 0.00 | (b) | 0.00 | (b) | 0.00 | (b) | |||||||||
| INCREASE/DECREASE IN NET ASSET VALUE | (1.56 | ) | 1.14 | 1.60 | 0.38 | |||||||||||
| NET ASSET VALUE, END OF PERIOD | $ | 11.56 | $ | 13.12 | $ | 11.98 | $ | 10.38 | ||||||||
| TOTAL RETURN | (11.89 | )%(c) | 17.68 | % | 16.81 | % | 3.80 | %(c) | ||||||||
| RATIOS AND SUPPLEMENTAL DATA | ||||||||||||||||
| Net assets, end of period (in 000s) | $ | 36,102 | $ | 41,709 | $ | 36,620 | $ | 30,735 | ||||||||
| RATIOS TO AVERAGE NET ASSETS | ||||||||||||||||
| Expenses (excluding fees waived/ reimbursed by investment advisor) | 2.01 | %(d) | 2.06 | % | 2.17 | % | 2.30 | %(d)(e) | ||||||||
| Expenses (including fees waived/ reimbursed by investment advisor) | 2.00 | %(d) | 2.00 | % | 2.00 | % | 2.00 | %(d)(e) | ||||||||
| Net investment income/(loss) | 0.10 | %(d) | 0.00 | %(f) | 0.11 | % | (0.41 | )%(d) | ||||||||
| PORTFOLIO TURNOVER RATE | 20 | %(c) | 46 | % | 37 | % | 8 | %(c) | ||||||||
| (a) | Per share numbers have been calculated using the average shares method. |
| (b) | Less than $0.005 or ($0.005) per share. |
| (c) | Not Annualized. |
| (d) | Annualized. |
| (e) | Expense ratios during startup periods may not be representative of longer term operating periods. |
| (f) | Less than 0.005% of average net assets. |
See Notes to Financial Statements.
| Semi-Annual Report | October 31, 2018 | 71 |
| Grandeur Peak Global Opportunities Fund | Financial Highlights |
For a Share Outstanding Throughout the Periods Presented
| Investor Class | For the Six Months Ended October 31, 2018 (Unaudited) | Year Ended April 30, 2018 | Year Ended April 30, 2017 | Year Ended April 30, 2016 | Year Ended April 30, 2015 | Year Ended April 30, 2014 | ||||||||||||||||||
| NET ASSET VALUE, BEGINNING OF PERIOD | $ | 3.95 | $ | 3.52 | $ | 3.01 | $ | 3.43 | $ | 3.31 | $ | 2.77 | ||||||||||||
| INCOME FROM INVESTMENT OPERATIONS | ||||||||||||||||||||||||
| Net investment income/(loss)(a) | (0.00 | )(b) | 0.00 | (b) | (0.00 | )(b)(c) | 0.00 | (b) | 0.00 | (b) | (0.00 | )(b) | ||||||||||||
| Net realized and unrealized gain/(loss) on investments | (0.46 | ) | 0.65 | 0.51 | (0.18 | ) | 0.35 | 0.67 | ||||||||||||||||
| Total income/(loss) from investment operations | (0.46 | ) | 0.65 | 0.51 | (0.18 | ) | 0.35 | 0.67 | ||||||||||||||||
| DISTRIBUTIONS | ||||||||||||||||||||||||
| From net investment income | – | – | – | (0.00 | )(b) | (0.01 | ) | – | ||||||||||||||||
| From net realized gain on investments | – | (0.22 | ) | (0.00 | )(b) | (0.24 | ) | (0.22 | ) | (0.13 | ) | |||||||||||||
| Total distributions | – | (0.22 | ) | (0.00 | )(b) | (0.24 | ) | (0.23 | ) | (0.13 | ) | |||||||||||||
| REDEMPTION FEES ADDED TO PAID-IN CAPITAL | 0.00 | (b) | 0.00 | (b) | 0.00 | (b) | 0.00 | (b) | 0.00 | (b) | 0.00 | (b) | ||||||||||||
| INCREASE/DECREASE IN NET ASSET VALUE | (0.46 | ) | 0.43 | 0.51 | (0.42 | ) | 0.12 | 0.54 | ||||||||||||||||
| NET ASSET VALUE, END OF PERIOD | $ | 3.49 | $ | 3.95 | $ | 3.52 | $ | 3.01 | $ | 3.43 | $ | 3.31 | ||||||||||||
| TOTAL RETURN | (11.65 | )%(d) | 18.41 | % | 17.09 | % | (5.03 | )% | 11.09 | % | 24.31 | % | ||||||||||||
| RATIOS AND SUPPLEMENTAL DATA | ||||||||||||||||||||||||
| Net assets, end of period (in 000s) | $ | 155,057 | $ | 188,379 | $ | 166,284 | $ | 173,156 | $ | 201,462 | $ | 216,247 | ||||||||||||
| RATIOS TO AVERAGE NET ASSETS | ||||||||||||||||||||||||
| Expenses (excluding fees waived/reimbursed by investment advisor) | 1.61 | %(e) | 1.61 | % | 1.61 | % | 1.62 | % | 1.62 | % | 1.68 | % | ||||||||||||
| Expenses (including fees waived/reimbursed by investment advisor) | 1.55 | %(e) | 1.55 | % | 1.59 | % | 1.62 | % | 1.62 | % | 1.68 | % | ||||||||||||
| Net investment income/(loss) | (0.01 | )%(e) | 0.03 | % | (0.06 | )% | 0.06 | % | 0.12 | % | (0.15 | )% | ||||||||||||
| PORTFOLIO TURNOVER RATE | 23 | %(d) | 29 | % | 30 | % | 32 | % | 37 | % | 38 | % | ||||||||||||
| (a) | Per share numbers have been calculated using the average shares method. |
| (b) | Less than $0.005 or ($0.005) per share. |
| (c) | The per share amount does not correspond to activity reflected in the Statement of Operations due to class specific expenses during the period. |
| (d) | Not Annualized. |
| (e) | Annualized. |
See Notes to Financial Statements.
| 72 | 1.855.377.7325 | www.GrandeurPeakGlobal.com |
| Grandeur Peak Global Opportunities Fund | Financial Highlights |
For a Share Outstanding Throughout the Periods Presented
| Institutional Class | For the Six Months Ended October 31, 2018 (Unaudited) | Year Ended April 30, 2018 | Year Ended April 30, 2017 | Year Ended April 30, 2016 | Year Ended April 30, 2015 | Year Ended April 30, 2014 | ||||||||||||||||||
| NET ASSET VALUE, BEGINNING OF PERIOD | $ | 4.00 | $ | 3.56 | $ | 3.03 | $ | 3.46 | $ | 3.34 | $ | 2.79 | ||||||||||||
| INCOME FROM INVESTMENT OPERATIONS | ||||||||||||||||||||||||
| Net investment income(a) | 0.00 | (b) | 0.01 | 0.01 | 0.01 | 0.01 | 0.00 | (b) | ||||||||||||||||
| Net realized and unrealized gain/(loss) on investments | (0.47 | ) | 0.65 | 0.52 | (0.19 | ) | 0.34 | 0.68 | ||||||||||||||||
| Total income/(loss) from investment operations | (0.47 | ) | 0.66 | 0.53 | (0.18 | ) | 0.35 | 0.68 | ||||||||||||||||
| DISTRIBUTIONS | ||||||||||||||||||||||||
| From net investment income | – | (0.00 | )(b) | (0.00 | )(b) | (0.01 | ) | (0.01 | ) | (0.00 | )(b) | |||||||||||||
| From net realized gain on investments | – | (0.22 | ) | (0.00 | )(b) | (0.24 | ) | (0.22 | ) | (0.13 | ) | |||||||||||||
| Total distributions | – | (0.22 | ) | (0.00 | )(a) | (0.25 | ) | (0.23 | ) | (0.13 | ) | |||||||||||||
| REDEMPTION FEES ADDED TO PAID-IN CAPITAL | – | 0.00 | (b) | 0.00 | (b) | 0.00 | (b) | 0.00 | (b) | 0.00 | (b) | |||||||||||||
| INCREASE/DECREASE IN NET ASSET VALUE | (0.47 | ) | 0.44 | 0.53 | (0.43 | ) | 0.12 | 0.55 | ||||||||||||||||
| NET ASSET VALUE, END OF PERIOD | $ | 3.53 | $ | 4.00 | $ | 3.56 | $ | 3.03 | $ | 3.46 | $ | 3.34 | ||||||||||||
| TOTAL RETURN | (11.75 | )%(c) | 18.62 | % | 17.81 | % | (5.12 | )% | 11.20 | % | 24.67 | % | ||||||||||||
| RATIOS AND SUPPLEMENTAL DATA | ||||||||||||||||||||||||
| Net assets, end of period (in 000s) | $ | 522,783 | $ | 591,470 | $ | 532,946 | $ | 452,030 | $ | 526,394 | $ | 492,869 | ||||||||||||
| RATIOS TO AVERAGE NET ASSETS | ||||||||||||||||||||||||
| Expenses (excluding fees waived/reimbursed by investment advisor) | 1.36 | %(d) | 1.36 | % | 1.37 | % | 1.38 | % | 1.38 | % | 1.44 | % | ||||||||||||
| Expenses (including fees waived/reimbursed by investment advisor) | 1.31 | %(d) | 1.31 | % | 1.35 | % | 1.38 | % | 1.38 | % | 1.44 | % | ||||||||||||
| Net investment income | 0.23 | %(d) | 0.28 | % | 0.18 | % | 0.30 | % | 0.35 | % | 0.08 | % | ||||||||||||
| PORTFOLIO TURNOVER RATE | 23 | %(c) | 29 | % | 30 | % | 32 | % | 37 | % | 38 | % | ||||||||||||
| (a) | Per share numbers have been calculated using the average shares method. |
| (b) | Less than $0.005 or ($0.005) per share. |
| (c) | Not Annualized. |
| (d) | Annualized. |
See Notes to Financial Statements.
| Semi-Annual Report | October 31, 2018 | 73 |
| Grandeur Peak Global Reach Fund | Financial Highlights |
For a Share Outstanding Throughout the Periods Presented
| Investor Class | For the Six Months Ended October 31, 2018 (Unaudited) | Year Ended April 30, 2018 | Year Ended April 30, 2017 | Year Ended April 30, 2016 | Year Ended April 30, 2015 | For the Period June 19, 2013 (Inception) to April 30, 2014 | ||||||||||||||||||
| NET ASSET VALUE, BEGINNING OF PERIOD | $ | 16.97 | $ | 14.52 | $ | 12.31 | $ | 13.65 | $ | 12.43 | $ | 10.00 | ||||||||||||
| INCOME FROM INVESTMENT OPERATIONS | ||||||||||||||||||||||||
| Net investment income/(loss)(a) | 0.02 | 0.01 | 0.01 | 0.01 | 0.00 | (b) | (0.02 | ) | ||||||||||||||||
| Net realized and unrealized gain/(loss) on investments | (1.94 | ) | 2.66 | 2.22 | (0.89 | ) | 1.37 | 2.54 | ||||||||||||||||
| Total income/(loss) from investment operations | (1.92 | ) | 2.67 | 2.23 | (0.88 | ) | 1.37 | 2.52 | ||||||||||||||||
| DISTRIBUTIONS | ||||||||||||||||||||||||
| From net investment income | – | – | (0.02 | ) | (0.01 | ) | (0.01 | ) | (0.02 | ) | ||||||||||||||
| From net realized gain on investments | – | (0.22 | ) | – | (0.45 | ) | (0.14 | ) | (0.08 | ) | ||||||||||||||
| Total distributions | – | (0.22 | ) | (0.02 | ) | (0.46 | ) | (0.15 | ) | (0.10 | ) | |||||||||||||
| REDEMPTION FEES ADDED TO PAID-IN CAPITAL | – | 0.00 | (b) | 0.00 | (b) | 0.00 | (b) | 0.00 | (b) | 0.01 | ||||||||||||||
| INCREASE/DECREASE IN NET ASSET VALUE | (1.92 | ) | 2.45 | 2.21 | (1.34 | ) | 1.22 | 2.43 | ||||||||||||||||
| NET ASSET VALUE, END OF PERIOD | $ | 15.05 | $ | 16.97 | $ | 14.52 | $ | 12.31 | $ | 13.65 | $ | 12.43 | ||||||||||||
| TOTAL RETURN | (11.31 | )%(c) | 18.44 | % | 18.11 | % | (6.45 | )% | 11.09 | % | 25.31 | %(c) | ||||||||||||
| RATIOS AND SUPPLEMENTAL DATA | ||||||||||||||||||||||||
| Net assets, end of period (in 000s) | $ | 55,619 | $ | 65,923 | $ | 67,574 | $ | 66,984 | $ | 87,354 | $ | 46,163 | ||||||||||||
| RATIOS TO AVERAGE NET ASSETS | ||||||||||||||||||||||||
| Expenses (excluding fees waived/reimbursed by investment advisor) | 1.51 | %(d) | 1.52 | % | 1.52 | % | 1.60 | % | 1.60 | % | 1.91 | %(d)(e) | ||||||||||||
| Expenses (including fees waived/reimbursed by investment advisor) | 1.51 | %(d) | 1.52 | % | 1.52 | % | 1.60 | % | 1.60 | % | 1.60 | %(d)(e) | ||||||||||||
| Net investment income/(loss) | 0.18 | %(d) | 0.06 | % | 0.07 | % | 0.10 | % | 0.03 | % | (0.17 | )%(d) | ||||||||||||
| PORTFOLIO TURNOVER RATE | 31 | %(c) | 43 | % | 42 | % | 46 | % | 46 | % | 39 | %(c) | ||||||||||||
| (a) | Per share numbers have been calculated using the average shares method. |
| (b) | Less than $0.005 or ($0.005) per share. |
| (c) | Not Annualized. |
| (d) | Annualized. |
| (e) | Expense ratios during startup periods may not be representative of longer term operating periods. |
See Notes to Financial Statements.
| 74 | 1.855.377.7325 | www.GrandeurPeakGlobal.com |
| Grandeur Peak Global Reach Fund | Financial Highlights |
For a Share Outstanding Throughout the Periods Presented
| Institutional Class | For the Six Months Ended October 31, 2018 (Unaudited) | Year Ended April 30, 2018 | Year Ended April 30, 2017 | Year Ended April 30, 2016 | Year Ended April 30, 2015 | For the Period June 19, 2013 (Inception) to April 30, 2014 | ||||||||||||||||||
| NET ASSET VALUE, BEGINNING OF PERIOD | $ | 17.02 | $ | 14.55 | $ | 12.33 | $ | 13.66 | $ | 12.42 | $ | 10.00 | ||||||||||||
| INCOME FROM INVESTMENT OPERATIONS | ||||||||||||||||||||||||
| Net investment income(a) | 0.04 | 0.04 | 0.04 | 0.04 | 0.03 | 0.02 | ||||||||||||||||||
| Net realized and unrealized gain/(loss) on investments | (1.95 | ) | 2.67 | 2.22 | (0.89 | ) | 1.37 | 2.52 | ||||||||||||||||
| Total income/(loss) from investment operations | (1.91 | ) | 2.71 | 2.26 | (0.85 | ) | 1.40 | 2.54 | ||||||||||||||||
| DISTRIBUTIONS | ||||||||||||||||||||||||
| From net investment income | – | (0.02 | ) | (0.04 | ) | (0.03 | ) | (0.02 | ) | (0.04 | ) | |||||||||||||
| From net realized gain on investments | – | (0.22 | ) | – | (0.45 | ) | (0.14 | ) | (0.08 | ) | ||||||||||||||
| Total distributions | – | (0.24 | ) | (0.04 | ) | (0.48 | ) | (0.16 | ) | (0.12 | ) | |||||||||||||
| REDEMPTION FEES ADDED TO PAID-IN CAPITAL | 0.00 | (b) | 0.00 | (b) | 0.00 | (b) | 0.00 | (b) | 0.00 | (b) | 0.00 | (b) | ||||||||||||
| INCREASE/DECREASE IN NET ASSET VALUE | (1.91 | ) | 2.47 | 2.22 | (1.33 | ) | 1.24 | 2.42 | ||||||||||||||||
| NET ASSET VALUE, END OF PERIOD | $ | 15.11 | $ | 17.02 | $ | 14.55 | $ | 12.33 | $ | 13.66 | $ | 12.42 | ||||||||||||
| TOTAL RETURN | (11.22 | )%(c) | 18.69 | % | 18.36 | % | (6.18 | )% | 11.41 | % | 25.45 | %(c) | ||||||||||||
| RATIOS AND SUPPLEMENTAL DATA | ||||||||||||||||||||||||
| Net assets, end of period (in 000s) | $ | 262,940 | $ | 302,269 | $ | 258,683 | $ | 221,759 | $ | 260,239 | $ | 88,311 | ||||||||||||
| RATIOS TO AVERAGE NET ASSETS | ||||||||||||||||||||||||
| Expenses (excluding fees waived/reimbursed by investment advisor) | 1.27 | %(d) | 1.28 | % | 1.29 | % | 1.35 | % | 1.35 | % | 1.75 | %(d)(e) | ||||||||||||
| Expenses (including fees waived/reimbursed by investment advisor) | 1.27 | %(d) | 1.28 | % | 1.29 | % | 1.35 | % | 1.35 | % | 1.35 | %(d)(e) | ||||||||||||
| Net investment income | 0.41 | %(d) | 0.27 | % | 0.28 | % | 0.34 | % | 0.23 | % | 0.21 | %(d) | ||||||||||||
| PORTFOLIO TURNOVER RATE | 31 | %(c) | 43 | % | 42 | % | 46 | % | 46 | % | 39 | %(c) | ||||||||||||
| (a) | Per share numbers have been calculated using the average shares method. |
| (b) | Less than $0.005 or ($0.005) per share. |
| (c) | Not Annualized. |
| (d) | Annualized. |
| (e) | Expense ratios during startup periods may not be representative of longer term operating periods. |
See Notes to Financial Statements.
| Semi-Annual Report | October 31, 2018 | 75 |
| Grandeur Peak Global Stalwarts Fund | Financial Highlights |
For a Share Outstanding Throughout the Periods Presented
| Investor Class | For the Six Months Ended October 31, 2018 (Unaudited) | Year Ended April 30, 2018 | Year Ended April 30, 2017 | For the Period September 2, 2015 (Commencement of Operations) to April 30, 2016 | ||||||||||||
| NET ASSET VALUE, BEGINNING OF PERIOD | $ | 15.06 | $ | 12.76 | $ | 10.85 | $ | 10.00 | ||||||||
| INCOME FROM INVESTMENT OPERATIONS | ||||||||||||||||
| Net investment income/(loss)(a) | 0.01 | (0.00 | )(b) | (0.03 | ) | 0.00 | (b) | |||||||||
| Net realized and unrealized gain/(loss) on investments | (1.71 | ) | 2.52 | 1.95 | 0.85 | |||||||||||
| Total income/(loss) from investment operations | (1.70 | ) | 2.52 | 1.92 | 0.85 | |||||||||||
| DISTRIBUTIONS | ||||||||||||||||
| From net investment income | – | – | (0.01 | ) | (0.00 | )(b) | ||||||||||
| From net realized gain on investments | – | (0.22 | ) | – | (0.00 | )(b) | ||||||||||
| Total distributions | – | (0.22 | ) | (0.01 | ) | (0.00 | )(a) | |||||||||
| REDEMPTION FEES ADDED TO PAID-IN CAPITAL | 0.00 | (b) | 0.00 | (b) | 0.00 | (b) | 0.00 | (b) | ||||||||
| INCREASE/DECREASE IN NET ASSET VALUE | (1.70 | ) | 2.30 | 1.91 | 0.85 | |||||||||||
| NET ASSET VALUE, END OF PERIOD | $ | 13.36 | $ | 15.06 | $ | 12.76 | $ | 10.85 | ||||||||
| TOTAL RETURN | (11.29 | )%(c) | 19.79 | % | 17.70 | % | 8.55 | %(c) | ||||||||
| RATIOS AND SUPPLEMENTAL DATA | ||||||||||||||||
| Net assets, end of period (in 000s) | $ | 79,724 | $ | 92,552 | $ | 61,212 | $ | 19,131 | ||||||||
| RATIOS TO AVERAGE NET ASSETS | ||||||||||||||||
| Expenses (excluding fees waived/ reimbursed by investment advisor) | 1.27 | %(d) | 1.35 | % | 1.41 | % | 2.06 | %(d)(e) | ||||||||
| Expenses (including fees waived/ reimbursed by investment advisor) | 1.27 | %(d) | 1.35 | % | 1.35 | % | 1.35 | %(d)(e) | ||||||||
| Net investment income/(loss) | 0.08 | %(d) | (0.03 | )% | (0.23 | )% | 0.00 | %(d)(f) | ||||||||
| PORTFOLIO TURNOVER RATE | 31 | %(c) | 30 | % | 32 | % | 24 | %(c) | ||||||||
| (a) | Per share numbers have been calculated using the average shares method. |
| (b) | Less than $0.005 or ($0.005) per share. |
| (c) | Not Annualized. |
| (d) | Annualized. |
| (e) | Expense ratios during startup periods may not be representative of longer term operating periods. |
| (f) | Less than 0.005% of average net assets. |
See Notes to Financial Statements.
| 76 | 1.855.377.7325 | www.GrandeurPeakGlobal.com |
| Grandeur Peak Global Stalwarts Fund | Financial Highlights |
For a Share Outstanding Throughout the Periods Presented
| Institutional Class | For the Six Months Ended October 31, 2018 (Unaudited) | Year Ended April 30, 2018 | Year Ended April 30, 2017 | For the Period September 2, 2015 (Commencement of Operations) to April 30, 2016 | ||||||||||||
| NET ASSET VALUE, BEGINNING OF PERIOD | $ | 15.14 | $ | 12.79 | $ | 10.87 | $ | 10.00 | ||||||||
| INCOME FROM INVESTMENT OPERATIONS | ||||||||||||||||
| Net investment income(a) | 0.02 | 0.03 | 0.01 | (b) | 0.02 | |||||||||||
| Net realized and unrealized gain/(loss) on investments | (1.71 | ) | 2.54 | 1.93 | 0.85 | |||||||||||
| Total income/(loss) from investment operations | (1.69 | ) | 2.57 | 1.94 | 0.87 | |||||||||||
| DISTRIBUTIONS | ||||||||||||||||
| From net investment income | – | – | (0.02 | ) | (0.00 | )(c) | ||||||||||
| From net realized gain on investments | – | (0.22 | ) | – | (0.00 | )(c) | ||||||||||
| Total distributions | – | (0.22 | ) | (0.02 | ) | (0.00 | )(a) | |||||||||
| REDEMPTION FEES ADDED TO PAID-IN CAPITAL | 0.00 | (c) | 0.00 | (c) | 0.00 | (c) | 0.00 | (c) | ||||||||
| INCREASE/DECREASE IN NET ASSET VALUE | (1.69 | ) | 2.35 | 1.92 | 0.87 | |||||||||||
| NET ASSET VALUE, END OF PERIOD | $ | 13.45 | $ | 15.14 | $ | 12.79 | $ | 10.87 | ||||||||
| TOTAL RETURN | (11.16 | )%(d) | 20.14 | % | 17.92 | % | 8.76 | %(d) | ||||||||
| RATIOS AND SUPPLEMENTAL DATA | ||||||||||||||||
| Net assets, end of period (in 000s) | $ | 97,228 | $ | 95,533 | $ | 47,811 | $ | 17,562 | ||||||||
| RATIOS TO AVERAGE NET ASSETS | ||||||||||||||||
| Expenses (excluding fees waived/ reimbursed by investment advisor) | 1.03 | %(e) | 1.10 | % | 1.17 | % | 1.86 | %(e)(f) | ||||||||
| Expenses (including fees waived/ reimbursed by investment advisor) | 1.03 | %(e) | 1.10 | % | 1.10 | % | 1.10 | %(e)(f) | ||||||||
| Net investment income | 0.30 | %(e) | 0.24 | % | 0.05 | % | 0.22 | %(e) | ||||||||
| PORTFOLIO TURNOVER RATE | 31 | %(d) | 30 | % | 32 | % | 24 | %(d) | ||||||||
| (a) | Per share numbers have been calculated using the average shares method. |
| (b) | The per share amount does not correspond to activity reflected in the Statement of Operations due to class specific expenses during the period. |
| (c) | Less than $0.005 or ($0.005) per share. |
| (d) | Not Annualized. |
| (e) | Annualized. |
| (f) | Expense ratios during startup periods may not be representative of longer term operating periods. |
See Notes to Financial Statements.
| Semi-Annual Report | October 31, 2018 | 77 |
| Grandeur Peak International Opportunities Fund | Financial Highlights |
For a Share Outstanding Throughout the Periods Presented
| Investor Class | For the Six Months Ended October 31, 2018 (Unaudited) | Year Ended April 30, 2018 | Year Ended April 30, 2017 | Year Ended April 30, 2016 | Year Ended April 30, 2015 | Year Ended April 30, 2014 | ||||||||||||||||||
| NET ASSET VALUE, BEGINNING OF PERIOD | $ | 4.10 | $ | 3.55 | $ | 3.09 | $ | 3.42 | $ | 3.41 | $ | 2.83 | ||||||||||||
| INCOME FROM INVESTMENT OPERATIONS | ||||||||||||||||||||||||
| Net investment income(a) | 0.01 | 0.01 | 0.01 | 0.01 | 0.01 | 0.01 | ||||||||||||||||||
| Net realized and unrealized gain/(loss) on investments | (0.64 | ) | 0.68 | 0.52 | (0.20 | ) | 0.21 | 0.68 | ||||||||||||||||
| Total income/(loss) from investment operations | (0.63 | ) | 0.69 | 0.53 | (0.19 | ) | 0.22 | 0.69 | ||||||||||||||||
| DISTRIBUTIONS | ||||||||||||||||||||||||
| From net investment income | – | (0.01 | ) | (0.02 | ) | (0.01 | ) | (0.01 | ) | (0.02 | ) | |||||||||||||
| From net realized gain on investments | – | (0.13 | ) | (0.05 | ) | (0.13 | ) | (0.20 | ) | (0.09 | ) | |||||||||||||
| Total distributions | – | (0.14 | ) | (0.07 | ) | (0.14 | ) | (0.21 | ) | (0.11 | ) | |||||||||||||
| REDEMPTION FEES ADDED TO PAID-IN CAPITAL | 0.00 | (b) | 0.00 | (b) | 0.00 | (b) | 0.00 | (b) | 0.00 | (b) | 0.00 | (b) | ||||||||||||
| INCREASE/DECREASE IN NET ASSET VALUE | (0.63 | ) | 0.55 | 0.46 | (0.33 | ) | 0.01 | 0.58 | ||||||||||||||||
| NET ASSET VALUE, END OF PERIOD | $ | 3.47 | $ | 4.10 | $ | 3.55 | $ | 3.09 | $ | 3.42 | $ | 3.41 | ||||||||||||
| TOTAL RETURN | (15.37 | )%(c) | 19.30 | % | 17.50 | % | (5.53 | )% | 7.25 | % | 24.59 | % | ||||||||||||
| RATIOS AND SUPPLEMENTAL DATA | ||||||||||||||||||||||||
| Net assets, end of period (in 000s) | $ | 62,869 | $ | 78,686 | $ | 78,403 | $ | 123,922 | $ | 173,842 | $ | 153,296 | ||||||||||||
| RATIOS TO AVERAGE NET ASSETS | ||||||||||||||||||||||||
| Expenses (excluding fees waived/reimbursed by investment advisor) | 1.62 | %(d) | 1.61 | % | 1.61 | % | 1.62 | % | 1.62 | % | 1.73 | % | ||||||||||||
| Expenses (including fees waived/reimbursed by investment advisor) | 1.56 | %(d) | 1.55 | % | 1.58 | % | 1.62 | % | 1.62 | % | 1.73 | % | ||||||||||||
| Net investment income | 0.35 | %(d) | 0.31 | % | 0.16 | % | 0.45 | % | 0.37 | % | 0.20 | % | ||||||||||||
| PORTFOLIO TURNOVER RATE | 16 | %(c) | 26 | % | 30 | % | 34 | % | 36 | % | 37 | % | ||||||||||||
| (a) | Per share numbers have been calculated using the average shares method. |
| (b) | Less than $0.005 or ($0.005) per share. |
| (c) | Not Annualized. |
| (d) | Annualized. |
See Notes to Financial Statements.
| 78 | 1.855.377.7325 | www.GrandeurPeakGlobal.com |
| Grandeur Peak International Opportunities Fund | Financial Highlights |
For a Share Outstanding Throughout the Periods Presented
| Institutional Class | For the Six Months Ended October 31, 2018 (Unaudited) | Year Ended April 30, 2018 | Year Ended April 30, 2017 | Year Ended April 30, 2016 | Year Ended April 30, 2015 | Year Ended April 30, 2014 | ||||||||||||||||||
| NET ASSET VALUE, BEGINNING OF PERIOD | $ | 4.12 | $ | 3.57 | $ | 3.11 | $ | 3.43 | $ | 3.42 | $ | 2.84 | ||||||||||||
| INCOME FROM INVESTMENT OPERATIONS | ||||||||||||||||||||||||
| Net investment income(a) | 0.01 | 0.02 | 0.01 | 0.02 | 0.02 | 0.01 | ||||||||||||||||||
| Net realized and unrealized gain/(loss) on investments | (0.63 | ) | 0.67 | 0.52 | (0.20 | ) | 0.21 | 0.69 | ||||||||||||||||
| Total income/(loss) from investment operations | (0.62 | ) | 0.69 | 0.53 | (0.18 | ) | 0.23 | 0.70 | ||||||||||||||||
| DISTRIBUTIONS | ||||||||||||||||||||||||
| From net investment income | – | (0.01 | ) | (0.02 | ) | (0.01 | ) | (0.02 | ) | (0.03 | ) | |||||||||||||
| From net realized gain on investments | – | (0.13 | ) | (0.05 | ) | (0.13 | ) | (0.20 | ) | (0.09 | ) | |||||||||||||
| Total distributions | – | (0.14 | ) | (0.07 | ) | (0.14 | ) | (0.22 | ) | (0.12 | ) | |||||||||||||
| REDEMPTION FEES ADDED TO PAID-IN CAPITAL | 0.00 | (b) | 0.00 | (b) | 0.00 | (b) | 0.00 | (b) | 0.00 | (b) | 0.00 | (b) | ||||||||||||
| INCREASE/DECREASE IN NET ASSET VALUE | (0.62 | ) | 0.55 | 0.46 | (0.32 | ) | 0.01 | 0.58 | ||||||||||||||||
| NET ASSET VALUE, END OF PERIOD | $ | 3.50 | $ | 4.12 | $ | 3.57 | $ | 3.11 | $ | 3.43 | $ | 3.42 | ||||||||||||
| TOTAL RETURN | (15.05 | )%(c) | 19.38 | % | 17.59 | % | (5.02 | )% | 7.41 | % | 24.70 | % | ||||||||||||
| RATIOS AND SUPPLEMENTAL DATA | ||||||||||||||||||||||||
| Net assets, end of period (in 000s) | $ | 641,119 | $ | 813,322 | $ | 698,504 | $ | 579,371 | $ | 682,364 | $ | 658,127 | ||||||||||||
| RATIOS TO AVERAGE NET ASSETS | ||||||||||||||||||||||||
| Expenses (excluding fees waived/reimbursed by investment advisor) | 1.37 | %(d) | 1.37 | % | 1.37 | % | 1.38 | % | 1.38 | % | 1.46 | % | ||||||||||||
| Expenses (including fees waived/reimbursed by investment advisor) | 1.31 | %(d) | 1.30 | % | 1.34 | % | 1.38 | % | 1.38 | % | 1.46 | % | ||||||||||||
| Net investment income | 0.60 | %(d) | 0.54 | % | 0.42 | % | 0.65 | % | 0.61 | % | 0.42 | % | ||||||||||||
| PORTFOLIO TURNOVER RATE | 16 | %(c) | 26 | % | 30 | % | 34 | % | 36 | % | 37 | % | ||||||||||||
| (a) | Per share numbers have been calculated using the average shares method. |
| (b) | Less than $0.005 or ($0.005) per share. |
| (c) | Not Annualized. |
| (d) | Annualized. |
See Notes to Financial Statements.
| Semi-Annual Report | October 31, 2018 | 79 |
| Grandeur Peak International Stalwarts Fund | Financial Highlights |
For a Share Outstanding Throughout the Periods Presented
| Investor Class | For the Six Months Ended October 31, 2018 (Unaudited) | Year Ended April 30, 2018 | Year Ended April 30, 2017 | For the Period September 2, 2015 (Commencement of Operations) to April 30, 2016 | ||||||||||||
| NET ASSET VALUE, BEGINNING OF PERIOD | $ | 15.53 | $ | 13.04 | $ | 11.02 | $ | 10.00 | ||||||||
| INCOME FROM INVESTMENT OPERATIONS | ||||||||||||||||
| Net investment income(a) | 0.02 | 0.05 | 0.02 | 0.03 | ||||||||||||
| Net realized and unrealized gain/(loss) on investments | (2.11 | ) | 2.62 | 2.03 | 0.99 | |||||||||||
| Total income/(loss) from investment operations | (2.09 | ) | 2.67 | 2.05 | 1.02 | |||||||||||
| DISTRIBUTIONS | ||||||||||||||||
| From net investment income | – | – | (0.03 | ) | – | |||||||||||
| From net realized gain on investments | – | (0.18 | ) | – | – | |||||||||||
| Total distributions | – | (0.18 | ) | (0.03 | ) | – | ||||||||||
| REDEMPTION FEES ADDED TO PAID-IN CAPITAL | 0.00 | (b) | 0.00 | (b) | 0.00 | (b) | 0.00 | (b) | ||||||||
| INCREASE/DECREASE IN NET ASSET VALUE | (2.09 | ) | 2.49 | 2.02 | 1.02 | |||||||||||
| NET ASSET VALUE, END OF PERIOD | $ | 13.44 | $ | 15.53 | $ | 13.04 | $ | 11.02 | ||||||||
| TOTAL RETURN | (13.46 | )%(c) | 20.50 | % | 18.68 | % | 10.20 | %(c) | ||||||||
| RATIOS AND SUPPLEMENTAL DATA | ||||||||||||||||
| Net assets, end of period (in 000s) | $ | 53,628 | $ | 52,478 | $ | 31,045 | $ | 22,028 | ||||||||
| RATIOS TO AVERAGE NET ASSETS | ||||||||||||||||
| Expenses (excluding fees waived/ reimbursed by investment advisor) | 1.18 | %(d) | 1.19 | % | 1.27 | % | 1.45 | %(d)(e) | ||||||||
| Expenses (including fees waived/ reimbursed by investment advisor) | 1.18 | %(d) | 1.19 | % | 1.27 | % | 1.35 | %(d)(e) | ||||||||
| Net investment income | 0.31 | %(d) | 0.33 | % | 0.19 | % | 0.44 | %(d) | ||||||||
| PORTFOLIO TURNOVER RATE | 25 | %(c) | 24 | % | 37 | % | 59 | %(c) | ||||||||
| (a) | Per share numbers have been calculated using the average shares method. |
| (b) | Less than $0.005 or ($0.005) per share. |
| (c) | Not Annualized. |
| (d) | Annualized. |
| (e) | Expense ratios during startup periods may not be representative of longer term operating periods. |
See Notes to Financial Statements.
| 80 | 1.855.377.7325 | www.GrandeurPeakGlobal.com |
| Grandeur Peak International Stalwarts Fund | Financial Highlights |
For a Share Outstanding Throughout the Periods Presented
| Institutional Class | For the Six Months Ended October 31, 2018 (Unaudited) | Year Ended April 30, 2018 | Year Ended April 30, 2017 | For the Period September 2, 2015 (Commencement of Operations) to April 30, 2016 | ||||||||||||
| NET ASSET VALUE, BEGINNING OF PERIOD | $ | 15.57 | $ | 13.06 | $ | 11.03 | $ | 10.00 | ||||||||
| INCOME FROM INVESTMENT OPERATIONS | ||||||||||||||||
| Net investment income(a) | 0.04 | 0.08 | 0.04 | 0.04 | ||||||||||||
| Net realized and unrealized gain/(loss) on investments | (2.12 | ) | 2.63 | 2.04 | 0.99 | |||||||||||
| Total income/(loss) from investment operations | (2.08 | ) | 2.71 | 2.08 | 1.03 | |||||||||||
| DISTRIBUTIONS | ||||||||||||||||
| From net investment income | – | (0.02 | ) | (0.05 | ) | (0.00 | )(b) | |||||||||
| From net realized gain on investments | – | (0.18 | ) | – | – | |||||||||||
| Total distributions | – | (0.20 | ) | (0.05 | ) | (0.00 | )(b) | |||||||||
| REDEMPTION FEES ADDED TO PAID-IN CAPITAL | 0.00 | (b) | 0.00 | (b) | 0.00 | (b) | 0.00 | (b) | ||||||||
| INCREASE/DECREASE IN NET ASSET VALUE | (2.08 | ) | 2.51 | 2.03 | 1.03 | |||||||||||
| NET ASSET VALUE, END OF PERIOD | $ | 13.49 | $ | 15.57 | $ | 13.06 | $ | 11.03 | ||||||||
| TOTAL RETURN | (13.36 | )%(c) | 20.79 | % | 18.96 | % | 10.34 | %(c) | ||||||||
| RATIOS AND SUPPLEMENTAL DATA | ||||||||||||||||
| Net assets, end of period (in 000s) | $ | 487,803 | $ | 496,358 | $ | 265,393 | $ | 119,070 | ||||||||
| RATIOS TO AVERAGE NET ASSETS | ||||||||||||||||
| Expenses (excluding fees waived/ reimbursed by investment advisor) | 0.93 | %(d) | 0.94 | % | 1.02 | % | 1.20 | %(d)(e) | ||||||||
| Expenses (including fees waived/ reimbursed by investment advisor) | 0.93 | %(d) | 0.94 | % | 1.02 | % | 1.10 | %(d)(e) | ||||||||
| Net investment income | 0.57 | %(d) | 0.57 | % | 0.37 | % | 0.60 | %(d) | ||||||||
| PORTFOLIO TURNOVER RATE | 25 | %(c) | 24 | % | 37 | % | 59 | %(c) | ||||||||
| (a) | Per share numbers have been calculated using the average shares method. |
| (b) | Less than $0.005 or ($0.005) per share. |
| (c) | Not Annualized. |
| (d) | Annualized. |
| (e) | Expense ratios during startup periods may not be representative of longer term operating periods. |
See Notes to Financial Statements.
| Semi-Annual Report | October 31, 2018 | 81 |
| Grandeur Peak Funds® | Notes to Financial Statements |
October 31, 2018 (Unaudited)
1. ORGANIZATION
Financial Investors Trust (the “Trust”), a Delaware statutory trust, is an open-end management investment company registered under the Investment Company Act of 1940, as amended (“1940 Act”). As of October 31, 2018, the Trust consists of multiple separate portfolios or series. This semi-annual report describes the Grandeur Peak Emerging Markets Opportunities Fund, Grandeur Peak Global Micro Cap Fund, Grandeur Peak Global Opportunities Fund, Grandeur Peak Global Reach Fund, Grandeur Peak Global Stalwarts Fund, Grandeur Peak International Opportunities Fund, and Grandeur Peak International Stalwarts Fund (individually a “Fund” and collectively, the “Funds”). The Funds seek long-term growth of capital. The Funds offer Investor Class (except the Grandeur Peak Global Micro Cap Fund) and Institutional Class shares.
2. SIGNIFICANT ACCOUNTING POLICIES
The accompanying financial statements were prepared in accordance with accounting principles generally accepted in the United States of America (“U.S. GAAP”). The preparation of financial statements in conformity with U.S. GAAP requires management to make certain estimates and assumptions that affect the reported amounts of assets and liabilities and disclosures of contingent assets and liabilities at the date of the financial statements and the reported amounts of revenue and expenses during the period. Actual results could differ from those estimates. The Funds are considered an investment company for financial reporting purposes under U.S. GAAP and follows the accounting and reporting guidance applicable to investment companies in the Financial Accounting Standards Board Accounting Standards Codification Topic 946. The following is a summary of significant accounting policies consistently followed by the Funds in preparation of their financial statements.
Investment Valuation: The Funds generally value their securities based on market prices determined at the close of regular trading on the New York Stock Exchange (“NYSE”), normally 4:00 p.m. Eastern Time, on each day the NYSE is open for trading.
For equity securities and mutual funds that are traded on an exchange, the market price is usually the closing sale or official closing price on that exchange. In the case of equity securities not traded on an exchange, or if such closing prices are not otherwise available, the securities are valued at the mean of the most recent bid and ask prices on such day. Redeemable securities issued by open-end registered investment companies are valued at the investment company’s applicable net asset value, with the exception of exchange-traded open-end investment companies, which are priced as equity securities.
Equity securities that are primarily traded on foreign securities exchanges are valued at the closing values of such securities on their respective foreign exchanges, except when an event occurs subsequent to the close of the foreign exchange and the close of the NYSE that was likely to have changed such value. In such an event, the fair value of those securities are determined in good faith through consideration of other factors in accordance with procedures established by and under the general supervision of the Board of Trustees (the “Board”). The Funds will use a fair valuation model provided by an independent pricing service, which is intended to reflect fair value when a security’s value or a meaningful portion of each Fund’s portfolio is believed to have been materially affected by a valuation event that has occurred between the close of the exchange or market on which the security is traded and the close of the regular trading day on the NYSE. The Funds’ valuation procedures set forth certain triggers which instruct when to use the fair valuation model.
Corporate Bonds are valued using market models that consider trade data, quotations from dealers and active market makers, relevant yield curve and spread data, creditworthiness, trade data or market information on comparable securities, and other relevant security specific information.
Forward currency exchange contracts have a fair value determined by the prevailing foreign currency exchange daily rates and current foreign currency exchange forward rates. The foreign currency exchange forward rates are calculated using an automated system that estimates rates on the basis of the current day foreign currency exchange rates and forward foreign currency exchange rates supplied by a pricing service.
When such prices or quotations are not available, or when Grandeur Peak Global Advisors, LLC (the “Adviser”) believes that they are unreliable, securities may be priced using fair value procedures approved by the Board.
Fair Value Measurements: The Funds disclose the classification of their fair value measurements following a three-tier hierarchy based on the inputs used to measure fair value. Inputs refer broadly to the assumptions that market participants would use in pricing the asset or liability, including assumptions about risk. Inputs may be observable or unobservable. Observable inputs reflect the assumptions market participants would use in pricing the asset or liability that are developed based on market data obtained from sources independent of the reporting entity. Unobservable inputs reflect the reporting entity’s own assumptions about the assumptions market participants would use in pricing the asset or liability that are developed based on the best information available.
Various inputs are used in determining the value of the Funds’ investments as of the end of the reporting period. When inputs used fall into different levels of the fair value hierarchy, the level in the hierarchy within which the fair value measurement falls is determined based on the
| 82 | 1.855.377.7325 | www.GrandeurPeakGlobal.com |
| Grandeur Peak Funds® | Notes to Financial Statements |
October 31, 2018 (Unaudited)
lowest level input that is significant to the fair value measurement in its entirety. The designated input levels are not necessarily an indication of the risk or liquidity associated with these investments. These inputs are categorized in the following hierarchy under applicable financial accounting standards:
Level 1 – Unadjusted quoted prices in active markets for identical investments, unrestricted assets or liabilities that the Funds have the ability to access at the measurement date;
Level 2 – Quoted prices which are not active, quoted prices for similar assets or liabilities in active markets or inputs other than quoted prices that are observable (either directly or indirectly) for substantially the full term of the asset or liability; and
Level 3 – Significant unobservable prices or inputs (including the Funds’ own assumptions in determining the fair value of investments) where there is little or no market activity for the asset or liability at the measurement date.
The following is a summary of each Fund’s investments in the fair value hierarchy as of October 31, 2018:
| Investments in Securities at Value | Level 1 - Quoted and Unadjusted Prices | Level 2 - Other Significant Observable Inputs | Level 3 - Significant Unobservable Inputs | Total | ||||||||||||
| Grandeur Peak Emerging Markets Opportunities Fund | ||||||||||||||||
| Common Stocks | ||||||||||||||||
| China | $ | 22,284,185 | $ | 36,330,671 | $ | – | $ | 58,614,856 | ||||||||
| Georgia | 10,552,731 | 1,095,427 | – | 11,648,158 | ||||||||||||
| Greece | – | 6,986,507 | – | 6,986,507 | ||||||||||||
| Hong Kong | – | 20,779,492 | – | 20,779,492 | ||||||||||||
| India | 12,175,111 | 30,725,866 | – | 42,900,977 | ||||||||||||
| Indonesia | 666,847 | 14,115,226 | – | 14,782,073 | ||||||||||||
| Kenya | – | 2,810,439 | – | 2,810,439 | ||||||||||||
| Malaysia | – | 7,448,439 | – | 7,448,439 | ||||||||||||
| Oman | – | 2,763,391 | – | 2,763,391 | ||||||||||||
| Pakistan | – | 2,542,137 | – | 2,542,137 | ||||||||||||
| Philippines | 5,383,275 | 13,837,486 | – | 19,220,761 | ||||||||||||
| Poland | 900,247 | 10,191,010 | – | 11,091,257 | ||||||||||||
| South Africa | 8,334,278 | 5,860,217 | – | 14,194,495 | ||||||||||||
| South Korea | – | 21,040,038 | – | 21,040,038 | ||||||||||||
| Sri Lanka | – | 1,332,996 | – | 1,332,996 | ||||||||||||
| Switzerland | – | 957,731 | – | 957,731 | ||||||||||||
| Taiwan | – | 27,163,862 | – | 27,163,862 | ||||||||||||
| Thailand | – | 7,034,917 | – | 7,034,917 | ||||||||||||
| Turkey | 1,997,215 | 655,955 | – | 2,653,170 | ||||||||||||
| Vietnam | – | 13,477,170 | – | 13,477,170 | ||||||||||||
| Other* | 69,710,494 | – | – | 69,710,494 | ||||||||||||
| Corporate Bonds* | $ | – | $ | 759,093 | $ | – | $ | 759,093 | ||||||||
| Total | $ | 132,004,383 | $ | 227,908,070 | $ | – | $ | 359,912,453 | ||||||||
| Semi-Annual Report | October 31, 2018 | 83 |
| Grandeur Peak Funds® | Notes to Financial Statements |
October 31, 2018 (Unaudited)
| Investments in Securities at Value | Level 1 - Quoted and Unadjusted Prices | Level 2 - Other Significant Observable Inputs | Level 3 - Significant Unobservable Inputs | Total | ||||||||||||
| Grandeur Peak Global Micro Cap Fund | ||||||||||||||||
| Common Stocks | ||||||||||||||||
| Australia | $ | 454,813 | $ | 2,695,984 | $ | – | $ | 3,150,797 | ||||||||
| Britain | 2,415,634 | 1,529,197 | – | 3,944,831 | ||||||||||||
| China | 444,531 | 805,756 | – | 1,250,287 | ||||||||||||
| Finland | – | 93,334 | – | 93,334 | ||||||||||||
| France | – | 546,003 | – | 546,003 | ||||||||||||
| Georgia | 284,860 | 154,142 | – | 439,002 | ||||||||||||
| Germany | 259,913 | 162,788 | – | 422,701 | ||||||||||||
| Greece | – | 423,533 | – | 423,533 | ||||||||||||
| Hong Kong | – | 1,142,016 | – | 1,142,016 | ||||||||||||
| India | 452,923 | 1,231,967 | – | 1,684,890 | ||||||||||||
| Indonesia | 193,151 | 730,545 | – | 923,696 | ||||||||||||
| Japan | – | 4,049,544 | – | 4,049,544 | ||||||||||||
| Malaysia | – | 606,725 | – | 606,725 | ||||||||||||
| Netherlands | – | 349,631 | – | 349,631 | ||||||||||||
| New Zealand | – | 226,263 | 24,013 | 250,276 | ||||||||||||
| Norway | 970,955 | 1,332,163 | – | 2,303,118 | ||||||||||||
| Oman | – | 333,202 | – | 333,202 | ||||||||||||
| Philippines | 55,944 | 498,892 | – | 554,836 | ||||||||||||
| Poland | 107,757 | 123,575 | – | 231,332 | ||||||||||||
| Singapore | – | 170,209 | – | 170,209 | ||||||||||||
| South Africa | 426,819 | 19,254 | – | 446,073 | ||||||||||||
| South Korea | – | 252,589 | – | 252,589 | ||||||||||||
| Sri Lanka | – | 100,957 | – | 100,957 | ||||||||||||
| Sweden | 457,902 | 903,504 | – | 1,361,406 | ||||||||||||
| Taiwan | – | 1,901,873 | – | 1,901,873 | ||||||||||||
| Thailand | – | 127,394 | – | 127,394 | ||||||||||||
| Vietnam | – | 689,012 | – | 689,012 | ||||||||||||
| Other* | 7,084,438 | – | – | 7,084,438 | ||||||||||||
| Corporate Bonds* | $ | – | $ | 194,400 | $ | – | $ | 194,400 | ||||||||
| Total | $ | 13,609,640 | $ | 21,394,452 | $ | 24,013 | $ | 35,028,105 | ||||||||
| 84 | 1.855.377.7325 | www.GrandeurPeakGlobal.com |
| Grandeur Peak Funds® | Notes to Financial Statements |
October 31, 2018 (Unaudited)
| Investments in Securities at Value | Level 1 - Quoted and Unadjusted Prices | Level 2 - Other Significant Observable Inputs | Level 3 - Significant Unobservable Inputs | Total | ||||||||||||
| Grandeur Peak Global Opportunities Fund | ||||||||||||||||
| Common Stocks | ||||||||||||||||
| Australia | $ | – | $ | 7,783,922 | $ | – | $ | 7,783,922 | ||||||||
| Austria | – | 6,326,986 | – | 6,326,986 | ||||||||||||
| Belgium | – | 3,893,068 | – | 3,893,068 | ||||||||||||
| Britain | 31,471,630 | 51,109,167 | – | 82,580,797 | ||||||||||||
| China | 1,546,470 | 22,421,044 | – | 23,967,514 | ||||||||||||
| France | 3,444,341 | 7,745,477 | – | 11,189,818 | ||||||||||||
| Germany | 3,164,363 | 30,099,825 | – | 33,264,188 | ||||||||||||
| Hong Kong | – | 11,656,939 | – | 11,656,939 | ||||||||||||
| India | 7,210,505 | 24,305,370 | – | 31,515,875 | ||||||||||||
| Indonesia | 1,665,369 | 9,796,736 | – | 11,462,105 | ||||||||||||
| Italy | 610,000 | 17,424,800 | – | 18,034,800 | ||||||||||||
| Japan | – | 60,375,148 | – | 60,375,148 | ||||||||||||
| Malaysia | – | 3,295,222 | – | 3,295,222 | ||||||||||||
| Netherlands | – | 5,627,824 | – | 5,627,824 | ||||||||||||
| New Zealand | – | 5,391,441 | 166,247 | 5,557,688 | ||||||||||||
| Norway | – | 11,978,556 | – | 11,978,556 | ||||||||||||
| Oman | – | 2,188,270 | – | 2,188,270 | ||||||||||||
| Philippines | 3,367,457 | 6,765,401 | – | 10,132,858 | ||||||||||||
| Poland | 254,341 | 5,273,448 | – | 5,527,789 | ||||||||||||
| Singapore | – | 3,428,440 | – | 3,428,440 | ||||||||||||
| South Africa | 2,627,592 | 560,388 | – | 3,187,980 | ||||||||||||
| South Korea | – | 8,867,521 | – | 8,867,521 | ||||||||||||
| Sweden | 3,087,839 | 17,923,819 | – | 21,011,658 | ||||||||||||
| Switzerland | – | 689,797 | – | 689,797 | ||||||||||||
| Taiwan | – | 12,253,615 | – | 12,253,615 | ||||||||||||
| Vietnam | – | 8,671,441 | – | 8,671,441 | ||||||||||||
| Other* | 256,628,183 | – | – | 256,628,183 | ||||||||||||
| Preferred Stocks* | $ | – | $ | 1,923,136 | $ | – | $ | 1,923,136 | ||||||||
| Corporate Bonds* | – | 563,558 | – | 563,558 | ||||||||||||
| Total | $ | 315,078,090 | $ | 348,340,359 | $ | 166,247 | $ | 663,584,696 | ||||||||
| Semi-Annual Report | October 31, 2018 | 85 |
| Grandeur Peak Funds® | Notes to Financial Statements |
October 31, 2018 (Unaudited)
| Investments in Securities at Value | Level 1 - Quoted and Unadjusted Prices | Level 2 - Other Significant Observable Inputs | Level 3 - Significant Unobservable Inputs | Total | ||||||||||||
| Grandeur Peak Global Reach Fund | ||||||||||||||||
| Common Stocks | ||||||||||||||||
| Australia | $ | 1,138,248 | $ | 8,581,673 | $ | – | $ | 9,719,921 | ||||||||
| Austria | – | 1,163,201 | – | 1,163,201 | ||||||||||||
| Belgium | – | 624,609 | – | 624,609 | ||||||||||||
| Britain | 14,582,259 | 21,707,984 | – | 36,290,243 | ||||||||||||
| China | 4,900,092 | 11,066,713 | – | 15,966,805 | ||||||||||||
| Denmark | – | 247,720 | – | 247,720 | ||||||||||||
| Finland | – | 1,309,918 | – | 1,309,918 | ||||||||||||
| France | 1,629,703 | 3,808,998 | – | 5,438,701 | ||||||||||||
| Georgia | 1,488,954 | 510,586 | – | 1,999,540 | ||||||||||||
| Germany | 1,706,274 | 12,027,255 | – | 13,733,529 | ||||||||||||
| Greece | – | 1,898,286 | – | 1,898,286 | ||||||||||||
| Hong Kong | – | 5,853,233 | – | 5,853,233 | ||||||||||||
| India | 5,394,277 | 9,581,958 | – | 14,976,235 | ||||||||||||
| Indonesia | 306,868 | 4,839,126 | – | 5,145,994 | ||||||||||||
| Ireland | 935,031 | 297,693 | – | 1,232,724 | ||||||||||||
| Italy | 707,012 | 5,358,451 | – | 6,065,463 | ||||||||||||
| Japan | – | 19,871,673 | – | 19,871,673 | ||||||||||||
| Kenya | – | 777,459 | – | 777,459 | ||||||||||||
| Malaysia | – | 1,006,069 | – | 1,006,069 | ||||||||||||
| Netherlands | – | 3,165,888 | – | 3,165,888 | ||||||||||||
| New Zealand | – | 1,354,780 | 122,922 | 1,477,702 | ||||||||||||
| Norway | 1,453,581 | 4,145,128 | – | 5,598,709 | ||||||||||||
| Oman | – | 1,679,593 | – | 1,679,593 | ||||||||||||
| Pakistan | – | 407,208 | – | 407,208 | ||||||||||||
| Philippines | 572,376 | 3,103,651 | – | 3,676,027 | ||||||||||||
| Poland | 293,182 | 5,977,555 | – | 6,270,737 | ||||||||||||
| Singapore | – | 868,081 | – | 868,081 | ||||||||||||
| South Africa | 2,484,610 | 1,085,720 | – | 3,570,330 | ||||||||||||
| South Korea | – | 2,970,425 | – | 2,970,425 | ||||||||||||
| Spain | – | – | 1 | 1 | ||||||||||||
| Sri Lanka | – | 401,881 | – | 401,881 | ||||||||||||
| Sweden | 2,600,894 | 5,427,617 | – | 8,028,511 | ||||||||||||
| Switzerland | 1,375,020 | 2,317,826 | – | 3,692,846 | ||||||||||||
| Taiwan | – | 6,766,704 | – | 6,766,704 | ||||||||||||
| Thailand | – | 322,396 | – | 322,396 | ||||||||||||
| United States | 82,443,356 | 2,115,462 | – | 84,558,818 | ||||||||||||
| Vietnam | – | 6,646,747 | – | 6,646,747 | ||||||||||||
| Other* | 29,452,381 | – | – | 29,452,381 | ||||||||||||
| Preferred Stocks* | $ | – | $ | 912,077 | $ | – | $ | 912,077 | ||||||||
| Corporate Bonds* | – | 953,865 | – | 953,865 | ||||||||||||
| Total | $ | 153,464,118 | $ | 161,155,209 | $ | 122,923 | $ | 314,742,250 | ||||||||
| 86 | 1.855.377.7325 | www.GrandeurPeakGlobal.com |
| Grandeur Peak Funds® | Notes to Financial Statements |
October 31, 2018 (Unaudited)
| Investments in Securities at Value | Level 1 - Quoted and Unadjusted Prices | Level 2 - Other Significant Observable Inputs | Level 3 - Significant Unobservable Inputs | Total | ||||||||||||
| Grandeur Peak Global Stalwarts Fund | ||||||||||||||||
| Common Stocks | ||||||||||||||||
| Australia | $ | – | $ | 709,045 | $ | – | $ | 709,045 | ||||||||
| Belgium | – | 1,104,591 | – | 1,104,591 | ||||||||||||
| Britain | 2,604,111 | 15,013,593 | – | 17,617,704 | ||||||||||||
| China | 3,786,559 | 4,917,724 | – | 8,704,283 | ||||||||||||
| France | 1,927,168 | 2,073,846 | – | 4,001,014 | ||||||||||||
| Germany | – | 9,963,555 | – | 9,963,555 | ||||||||||||
| Hong Kong | – | 5,147,019 | – | 5,147,019 | ||||||||||||
| India | 2,621,580 | 3,352,164 | – | 5,973,744 | ||||||||||||
| Indonesia | – | 639,174 | – | 639,174 | ||||||||||||
| Italy | – | 5,694,596 | – | 5,694,596 | ||||||||||||
| Japan | – | 12,991,939 | – | 12,991,939 | ||||||||||||
| Kenya | – | 545,812 | – | 545,812 | ||||||||||||
| Netherlands | – | 2,550,964 | – | 2,550,964 | ||||||||||||
| Norway | – | 801,713 | – | 801,713 | ||||||||||||
| Philippines | 1,164,056 | 1,955,287 | – | 3,119,343 | ||||||||||||
| Poland | – | 1,387,302 | – | 1,387,302 | ||||||||||||
| South Korea | – | 1,529,767 | – | 1,529,767 | ||||||||||||
| Sweden | – | 3,364,141 | – | 3,364,141 | ||||||||||||
| Switzerland | 546,298 | 1,602,468 | – | 2,148,766 | ||||||||||||
| United States | 52,996,559 | 1,108,604 | – | 54,105,163 | ||||||||||||
| Vietnam | – | 2,987,731 | – | 2,987,731 | ||||||||||||
| Other* | 21,671,765 | – | – | 21,671,765 | ||||||||||||
| Preferred Stocks* | $ | – | $ | 482,814 | $ | – | $ | 482,814 | ||||||||
| Total | $ | 87,318,096 | $ | 79,923,849 | $ | – | $ | 167,241,945 | ||||||||
| Semi-Annual Report | October 31, 2018 | 87 |
| Grandeur Peak Funds® | Notes to Financial Statements |
October 31, 2018 (Unaudited)
| Investments in Securities at Value | Level 1 - Quoted and Unadjusted Prices | Level 2 - Other Significant Observable Inputs | Level 3 - Significant Unobservable Inputs | Total | ||||||||||||
| Grandeur Peak International Opportunities Fund | ||||||||||||||||
| Common Stocks | ||||||||||||||||
| Australia | $ | – | $ | 13,378,479 | $ | – | $ | 13,378,479 | ||||||||
| Austria | – | 6,547,534 | – | 6,547,534 | ||||||||||||
| Belgium | – | 4,655,923 | – | 4,655,923 | ||||||||||||
| Britain | 39,300,506 | 55,342,255 | – | 94,642,761 | ||||||||||||
| China | 4,775,287 | 27,657,295 | – | 32,432,582 | ||||||||||||
| Finland | – | 2,885,674 | – | 2,885,674 | ||||||||||||
| France | 5,853,332 | 17,537,276 | – | 23,390,608 | ||||||||||||
| Germany | 5,574,185 | 37,083,586 | – | 42,657,771 | ||||||||||||
| Greece | – | 797,892 | – | 797,892 | ||||||||||||
| Hong Kong | – | 17,908,917 | – | 17,908,917 | ||||||||||||
| India | 8,177,206 | 30,841,740 | – | 39,018,946 | ||||||||||||
| Indonesia | 320,677 | 15,207,733 | – | 15,528,410 | ||||||||||||
| Italy | 1,557,743 | 16,254,506 | – | 17,812,249 | ||||||||||||
| Japan | – | 74,884,363 | – | 74,884,363 | ||||||||||||
| Luxembourg | – | 1,852,677 | – | 1,852,677 | ||||||||||||
| Malaysia | – | 6,540,793 | – | 6,540,793 | ||||||||||||
| Netherlands | – | 6,283,088 | – | 6,283,088 | ||||||||||||
| New Zealand | – | 4,335,824 | 231,472 | 4,567,296 | ||||||||||||
| Norway | – | 16,893,972 | – | 16,893,972 | ||||||||||||
| Oman | – | 3,926,485 | – | 3,926,485 | ||||||||||||
| Philippines | 3,782,511 | 11,005,480 | – | 14,787,991 | ||||||||||||
| Poland | 276,065 | 5,675,880 | – | 5,951,945 | ||||||||||||
| Singapore | – | 4,885,109 | – | 4,885,109 | ||||||||||||
| South Africa | 5,961,551 | 1,612,155 | – | 7,573,706 | ||||||||||||
| South Korea | – | 12,720,926 | – | 12,720,926 | ||||||||||||
| Sweden | 4,633,037 | 17,583,717 | – | 22,216,754 | ||||||||||||
| Switzerland | 2,435,662 | 725,207 | – | 3,160,869 | ||||||||||||
| Taiwan | – | 19,122,457 | – | 19,122,457 | ||||||||||||
| Vietnam | – | 10,727,506 | – | 10,727,506 | ||||||||||||
| Other* | 132,441,937 | – | – | 132,441,937 | ||||||||||||
| Corporate Bonds* | $ | – | $ | 750,470 | $ | – | $ | 750,470 | ||||||||
| Total | $ | 215,089,699 | $ | 445,624,919 | $ | 231,472 | $ | 660,946,090 | ||||||||
| 88 | 1.855.377.7325 | www.GrandeurPeakGlobal.com |
| Grandeur Peak Funds® | Notes to Financial Statements |
October 31, 2018 (Unaudited)
| Investments in Securities at Value | Level 1 - Quoted and Unadjusted Prices | Level 2 - Other Significant Observable Inputs | Level 3 - Significant Unobservable Inputs | Total | ||||||||||||
| Grandeur Peak International Stalwarts Fund | ||||||||||||||||
| Common Stocks | ||||||||||||||||
| Australia | $ | – | $ | 4,946,385 | $ | – | $ | 4,946,385 | ||||||||
| Belgium | – | 4,642,637 | – | 4,642,637 | ||||||||||||
| Britain | 9,236,563 | 61,401,363 | – | 70,637,926 | ||||||||||||
| China | 17,860,598 | 21,662,130 | – | 39,522,728 | ||||||||||||
| France | 8,551,215 | 10,710,423 | – | 19,261,638 | ||||||||||||
| Germany | – | 42,374,586 | – | 42,374,586 | ||||||||||||
| Hong Kong | – | 18,072,427 | – | 18,072,427 | ||||||||||||
| India | 11,450,381 | 12,739,261 | – | 24,189,642 | ||||||||||||
| Indonesia | – | 2,854,094 | – | 2,854,094 | ||||||||||||
| Italy | – | 24,227,160 | – | 24,227,160 | ||||||||||||
| Japan | – | 54,007,093 | – | 54,007,093 | ||||||||||||
| Kenya | – | 1,925,582 | – | 1,925,582 | ||||||||||||
| Netherlands | – | 9,716,998 | – | 9,716,998 | ||||||||||||
| Norway | – | 2,948,433 | – | 2,948,433 | ||||||||||||
| Philippines | 3,002,419 | 8,053,513 | – | 11,055,932 | ||||||||||||
| Poland | – | 6,411,378 | – | 6,411,378 | ||||||||||||
| South Korea | – | 6,357,590 | – | 6,357,590 | ||||||||||||
| Sweden | – | 15,021,792 | – | 15,021,792 | ||||||||||||
| Switzerland | 2,616,043 | 7,058,740 | – | 9,674,783 | ||||||||||||
| United States | 36,332,936 | 4,262,720 | – | 40,595,656 | ||||||||||||
| Vietnam | – | 11,157,956 | – | 11,157,956 | ||||||||||||
| Other* | 87,477,825 | – | – | 87,477,825 | ||||||||||||
| Total | $ | 176,527,980 | $ | 330,552,261 | $ | – | $ | 507,080,241 | ||||||||
| * | For a detailed country breakdown, see the accompanying Portfolio of Investments. |
The following is a reconciliation of the investments in which significant unobservable inputs (Level 3) were used in determining fair value:
| Grandeur Peak Emerging Markets Opportunities Fund | Common Stocks | Total | ||||||
| Balance as of April 30, 2018 | $ | 3,657,929 | $ | 3,657,929 | ||||
| Accrued discount/ premium | – | – | ||||||
| Return of Capital | – | – | ||||||
| Realized Gain/(Loss) | 1,240,894 | 1,240,894 | ||||||
| Change in Unrealized Appreciation/(Depreciation) | (301,174 | ) | (301,174 | ) | ||||
| Purchases | – | – | ||||||
| Sales Proceeds | (2,388,327 | ) | (2,388,327 | ) | ||||
| Transfer into Level 3 | – | – | ||||||
| Transfer out of Level 3 | (2,209,322 | ) | (2,209,322 | ) | ||||
| Balance as of October 31, 2018 | $ | – | $ | – | ||||
| Net change in unrealized appreciation/(depreciation) included in the Statements of Operations attributable to Level 3 investments held at October 31, 2018 | $ | – | $ | – | ||||
| Semi-Annual Report | October 31, 2018 | 89 |
| Grandeur Peak Funds® | Notes to Financial Statements |
October 31, 2018 (Unaudited)
| Grandeur Peak Global Micro Cap Fund | Common Stocks | Total | ||||||
| Balance as of April 30, 2018 | $ | 117,839 | $ | 117,839 | ||||
| Accrued discount/ premium | – | – | ||||||
| Return of Capital | – | – | ||||||
| Realized Gain/(Loss) | 39,153 | 39,153 | ||||||
| Change in Unrealized Appreciation/(Depreciation) | (1,063 | ) | (1,063 | ) | ||||
| Purchases | – | – | ||||||
| Sales Proceeds | (131,916 | ) | (131,916 | ) | ||||
| Transfer into Level 3 | – | – | ||||||
| Transfer out of Level 3 | – | – | ||||||
| Balance as of October 31, 2018 | $ | 24,013 | $ | 24,013 | ||||
| Net change in unrealized appreciation/(depreciation) included in the Statements of Operations attributable to Level 3 investments held at October 31, 2018 | $ | (1,878 | ) | $ | (1,878 | ) | ||
| Grandeur Peak Global Opportunities Fund | Common Stocks | Total | ||||||
| Balance as of April 30, 2018 | $ | 179,252 | $ | 179,252 | ||||
| Accrued discount/ premium | – | – | ||||||
| Return of Capital | – | – | ||||||
| Realized Gain/(Loss) | – | – | ||||||
| Change in Unrealized Appreciation/(Depreciation) | (13,005 | ) | (13,005 | ) | ||||
| Purchases | – | – | ||||||
| Sales Proceeds | – | – | ||||||
| Transfer into Level 3 | – | – | ||||||
| Transfer out of Level 3 | – | – | ||||||
| Balance as of October 31, 2018 | $ | 166,247 | $ | 166,247 | ||||
| Net change in unrealized appreciation/(depreciation) included in the Statements of Operations attributable to Level 3 investments held at October 31, 2018 | $ | (13,005 | ) | $ | (13,005 | ) | ||
| Grandeur Peak Global Reach Fund | Common Stocks | Total | ||||||
| Balance as of April 30, 2018 | $ | 860,689 | $ | 860,689 | ||||
| Accrued discount/ premium | – | – | ||||||
| Return of Capital | – | – | ||||||
| Realized Gain/(Loss) | 183,964 | 183,964 | ||||||
| Change in Unrealized Appreciation/(Depreciation) | (53,969 | ) | (53,969 | ) | ||||
| Purchases | – | – | ||||||
| Sales Proceeds | (308,956 | ) | (308,956 | ) | ||||
| Transfer into Level 3 | – | – | ||||||
| Transfer out of Level 3 | (558,805 | ) | (558,805 | ) | ||||
| Balance as of October 31, 2018 | $ | 122,923 | $ | 122,923 | ||||
| Net change in unrealized appreciation/(depreciation) included in the Statements of Operations attributable to Level 3 investments held at October 31, 2018 | $ | (9,616 | ) | $ | (9,616 | ) | ||
| Grandeur Peak International Opportunities Fund | Common Stocks | Total | ||||||
| Balance as of April 30, 2018 | $ | 3,464,341 | $ | 3,464,341 | ||||
| Accrued discount/ premium | – | – | ||||||
| Return of Capital | – | – | ||||||
| Realized Gain/(Loss) | 847,041 | 847,041 | ||||||
| Change in Unrealized Appreciation/(Depreciation) | (8,596 | ) | (8,596 | ) | ||||
| Purchases | – | – | ||||||
| Sales Proceeds | (2,279,817 | ) | (2,279,817 | ) | ||||
| Transfer into Level 3 | – | – | ||||||
| Transfer out of Level 3 | (1,791,497 | ) | (1,791,497 | ) | ||||
| Balance as of October 31, 2018 | $ | 231,472 | $ | 231,472 | ||||
| Net change in unrealized appreciation/(depreciation) included in the Statements of Operations attributable to Level 3 investments held at October 31, 2018 | $ | (18,108 | ) | $ | (18,108 | ) | ||
| 90 | 1.855.377.7325 | www.GrandeurPeakGlobal.com |
| Grandeur Peak Funds® | Notes to Financial Statements |
October 31, 2018 (Unaudited)
Change in unrealized appreciation/depreciation on Level 3 securities is included on the Statements of Operations under Net change in unrealized appreciation/(depreciation) on investments. Realized gain (loss) on Level 3 securities is included on the Statements of Operations under Net realized gain/(loss) on investments.
The table below provided additional information about the Level 3 Fair Value Measurements as of October 31, 2018:
Quantitative Information about Level 3 Fair Value Measurements
Grandeur Peak Global Micro Cap Fund
| Asset Class | Fair Value (USD) at 10/31/18 | Valuation Technique | Unobservable Inputs(a) | Value | ||||||||
| Foreign Common Stock | $ | 24,013 | Expected liquidation value | Book value multiple | 93 | % | ||||||
Grandeur Peak Global Opportunities Fund
| Asset Class | Fair Value (USD) at 10/31/18 | Valuation Technique | Unobservable Inputs(a) | Value | ||||||||
| Foreign Common Stock | $ | 166,247 | Expected liquidation value | Book value multiple | 93 | % | ||||||
Grandeur Peak Global Reach Fund
| Asset Class | Fair Value (USD) at 10/31/18 | Valuation Technique | Unobservable Inputs(a) | Value | ||||||||
| Foreign Common Stock | $ | 122,922 | Expected liquidation value | Book value multiple | 93 | % | ||||||
Grandeur Peak International Opportunities Fund
| Asset Class | Fair Value (USD) at 10/31/18 | Valuation Technique | Unobservable Inputs(a) | Value | ||||||||
| Foreign Common Stock | $ | 231,472 | Expected liquidation value | Book value multiple | 93 | % | ||||||
| (a) | A change to the unobservable input may result in a significant change to the value of the investment as follows: |
| Unobservable Input | Impact to Value if Input Increases | Impact to Value if Input Decreases |
| Book value multiple | Decrease | Increase |
| Semi-Annual Report | October 31, 2018 | 91 |
| Grandeur Peak Funds® | Notes to Financial Statements |
October 31, 2018 (Unaudited)
Investment Transactions and Investment Income: Investment transactions are accounted for on the date the investments are purchased or sold (trade date). Realized gains and losses from investment transactions are reported on an identified cost which is the same basis the Fund uses for federal income tax purposes. Interest income, which includes accretion of discounts and amortization of premiums, is accrued and recorded as earned. Dividend income is recognized on the ex-dividend date or for certain foreign securities, as soon as information is available to the Funds. All of the realized and unrealized gains and losses and net investment income, are allocated daily to each class in proportion to its average daily net assets.
Cash Management Transactions: The Funds subscribe to the Brown Brothers Harriman & Co. (“BBH”) Cash Management Service (“CMS”), whereby cash balances are automatically swept into overnight offshore demand deposits with either the BBH Grand Cayman branch or a branch of a pre-approved commercial bank. This fully automated program allows the Funds to earn interest on cash balances. Excess cash with deposit institutions domiciled outside of the U.S. are subject to sovereign actions in the jurisdiction of the deposit institution including, but not limited to, freeze, seizure or diminution. Cash balances in the BBH CMS are included on the Statements of Assets and Liabilities under Cash and Foreign Cash, at Value. As of October 31, 2018, the Funds had the following cash balances participating in the BBH CMS:
| Fund | ||||
| Grandeur Peak Emerging Markets Opportunities Fund | $ | 52,861,746 | ||
| Grandeur Peak Global Micro Cap Fund | 941,766 | |||
| Grandeur Peak Global Opportunities Fund | 8,030,007 | |||
| Grandeur Peak Global Reach Fund | 927,089 | |||
| Grandeur Peak Global Stalwarts Fund | 7,594,972 | |||
| Grandeur Peak International Opportunities Fund | 38,014,729 | |||
| Grandeur Peak International Stalwarts Fund | 31,569,366 | |||
As of October 31, 2018, the Funds had the following foreign cash balances participating in the BBH CMS (cost and value of foreign cash balances are equal):
| Fund | ||||
| Grandeur Peak Emerging Markets Opportunities Fund | $ | 7,280 | ||
| Grandeur Peak Global Micro Cap Fund | 15,855 | |||
| Grandeur Peak Global Opportunities Fund | 514,211 | |||
| Grandeur Peak Global Reach Fund | 11,881 | |||
| Grandeur Peak Global Stalwarts Fund | 8,034 | |||
| Grandeur Peak International Opportunities Fund | 1,405,363 | |||
| Grandeur Peak International Stalwarts Fund | 28,908 | |||
Foreign Securities: The Funds may directly purchase securities of foreign issuers. Investing in securities of foreign issuers involves special risks not typically associated with investing in securities of U.S. issuers. The risks include possible reevaluation of currencies, the inability to repatriate foreign currency, less complete financial information about companies and possible future adverse political and economic developments. Moreover, securities of many foreign issuers and their markets may be less liquid and their prices more volatile than those of securities of comparable U.S. issuers.
Foreign Currency Translation: The books and records of the Funds are maintained in U.S. dollars. Investment valuations and other assets and liabilities initially expressed in foreign currencies are converted each business day into U.S. dollars based upon current exchange rates. Prevailing foreign exchange rates may generally be obtained at the close of the NYSE (normally, 4:00 p.m. Eastern Time). The portion of realized and unrealized gains or losses on investments due to fluctuations in foreign currency exchange rates is not separately disclosed and is included in realized and unrealized gains or losses on investments, when applicable.
Foreign Currency Spot Contracts: The Funds may enter into foreign currency spot contracts to facilitate transactions in foreign securities or to convert foreign currency receipts into U.S. dollars. A foreign currency spot contract is an agreement between two parties to buy and sell currencies at the current market rate, for settlement generally within two business days. The U.S. dollar value of the contracts is determined using current currency exchange rates supplied by a pricing service.
The contract is marked-to-market daily for settlements beyond one day and any change in market value is recorded as an unrealized gain or loss. When the contract is closed, a realized gain or loss is recorded equal to the difference between the value on the open and close date. Losses may arise from changes in the value of the foreign currency, or if the counterparties do not perform under the contract’s terms. The maximum potential loss from such contracts is the aggregate face value in U.S. dollars at the time the contract was opened.
| 92 | 1.855.377.7325 | www.GrandeurPeakGlobal.com |
| Grandeur Peak Funds® | Notes to Financial Statements |
October 31, 2018 (Unaudited)
Trust Expenses: Some expenses of the Trust can be directly attributed to the Funds. Expenses which cannot be directly attributed to the Funds are apportioned among all funds in the Trust based on average net assets of each fund.
Fund and Class Expenses: Expenses that are specific to a Fund or class of shares of a Fund, including distribution fees (Rule 12b-1 fees), are charged directly to that Fund or share class. Expenses that are common to all Funds generally are allocated among the Funds in proportion to their average daily net assets.
Federal Income Taxes: The Funds comply with the requirements under Subchapter M of the Internal Revenue Code of 1986, as amended, applicable to regulated investment companies and intend to distribute substantially all of their net taxable income and net capital gains, if any, each year so that it will not be subject to excise tax on undistributed income and gains. The Funds are not subject to income taxes to the extent such distributions are made.
As of and during the six months ended October 31, 2018, the Funds had a liability for unrecognized capital gains tax. These amounts are disclosed as Foreign Capital Gains Tax on the Statements of Assets and Liabilities. The Funds file U.S. federal, state, and local tax returns as required. The Funds’ tax returns are subject to examination by the relevant tax authorities until expiration of the applicable statute of limitations, which is generally three years after the filing of the tax return for federal purposes and four years for most state returns. Tax returns for open years have incorporated no uncertain tax positions that require a provision for income taxes.
Distributions to Shareholders: Each Fund normally pays dividends and distributes capital gains, if any, on an annual basis. Income dividend distributions are derived from dividends and other income each Fund receives from their investments, including short term capital gains. Long term capital gain distributions are derived from gains realized when each Fund sells a security it has owned for more than a year. Each Fund may make additional distributions and dividends at other times if the portfolio manager believes doing so may be necessary for each Fund to avoid or reduce taxes. The Funds intend to pass through foreign tax credits to shareholders.
3. TAX BASIS INFORMATION
Tax Basis of Investments: As of October 31, 2018, the aggregate cost of investments, gross unrealized appreciation/(depreciation) and net unrealized appreciation for Federal tax purposes was as follows:
| Fund | Gross Appreciation (excess of value over tax cost) | Gross Depreciation (excess of tax cost over value) | Net Unrealized Appreciation/(Depreciation) | Cost of Investments for Income Tax Purposes | ||||||||||||
| Grandeur Peak Emerging Markets Opportunities Fund | $ | 51,952,629 | $ | (59,724,623 | ) | $ | (7,771,994 | ) | $ | 367,684,447 | ||||||
| Grandeur Peak Global Micro Cap Fund | 6,777,735 | (4,222,489 | ) | 2,555,246 | 32,472,859 | |||||||||||
| Grandeur Peak Global Opportunities Fund | 172,285,080 | (61,896,537 | ) | 110,388,543 | 553,196,153 | |||||||||||
| Grandeur Peak Global Reach Fund | 65,111,265 | (32,204,593 | ) | 32,906,672 | 281,835,578 | |||||||||||
| Grandeur Peak Global Stalwarts Fund | 24,526,750 | (14,658,699 | ) | 9,868,051 | 157,373,894 | |||||||||||
| Grandeur Peak International Opportunities Fund | 162,714,719 | (71,328,541 | ) | 91,386,178 | 569,559,912 | |||||||||||
| Grandeur Peak International Stalwarts Fund | 66,792,217 | (49,749,072 | ) | 17,043,145 | 490,037,096 | |||||||||||
Tax Basis of Distributions to Shareholders: The character of distributions made during the year from net investment income or net realized gains may differ from its ultimate characterization for federal income tax purposes. Also, due to the timing of dividend distributions, the fiscal year in which amounts are distributed may differ from the fiscal year in which the income or realized gain were recorded by the Funds.
The tax character of distributions paid by the Funds for the fiscal year ended April 30, 2018 were as follows:
| Fund | Ordinary Income | Long-Term Capital Gain | ||||||
| Grandeur Peak Emerging Markets Opportunities Fund | $ | 518,950 | $ | – | ||||
| Grandeur Peak Global Micro Cap Fund | 834,856 | 2,093,993 | ||||||
| Grandeur Peak Global Opportunities Fund | 1,359,717 | 41,054,835 | ||||||
| Grandeur Peak Global Reach Fund | 374,631 | 4,826,741 | ||||||
| Grandeur Peak Global Stalwarts Fund | – | 2,371,669 | ||||||
| Grandeur Peak International Opportunities Fund | 3,123,114 | 27,328,426 | ||||||
| Grandeur Peak International Stalwarts Fund | 604,680 | 5,564,868 | ||||||
| Semi-Annual Report | October 31, 2018 | 93 |
| Grandeur Peak Funds® | Notes to Financial Statements |
October 31, 2018 (Unaudited)
The amounts and characteristics of tax basis distributions and composition of distributable earnings/(accumulated losses) are finalized at fiscal year-end. Accordingly, tax basis balances have not been determined as of October 31, 2018.
4. SECURITIES TRANSACTIONS
The cost of purchases and proceeds from sales of securities (excluding short term securities) during the six months ended October 31, 2018 were as follows:
| Fund | Purchases of Securities | Proceeds From Sales of Securities | ||||||
| Grandeur Peak Emerging Markets Opportunities Fund | $ | 79,782,574 | $ | 82,325,061 | ||||
| Grandeur Peak Global Micro Cap Fund | 7,814,654 | 8,675,798 | ||||||
| Grandeur Peak Global Opportunities Fund | 169,998,872 | 202,522,340 | ||||||
| Grandeur Peak Global Reach Fund | 110,297,983 | 123,759,685 | ||||||
| Grandeur Peak Global Stalwarts Fund | 65,663,201 | 58,897,679 | ||||||
| Grandeur Peak International Opportunities Fund | 124,536,125 | 212,530,067 | ||||||
| Grandeur Peak International Stalwarts Fund | 210,704,149 | 137,643,391 | ||||||
5. SHARES OF BENEFICIAL INTEREST
The capitalization of the Trust consists of an unlimited number of shares of beneficial interest with no par value per share. Holders of the shares of the Funds of the Trust have one vote for each share held and a proportionate fraction of a vote for each fractional share. All shares issued and outstanding are fully paid and are transferable and redeemable at the option of the shareholder. Purchasers of the share do not have any obligation to make payments to the Trust or its creditors solely by reason of the purchasers’ ownership of the shares. Shares have no pre-emptive rights.
Shares redeemed within 60 days of purchase may incur a 2% short-term redemption fee deducted from the redemption amount. For the six months ended October 31, 2018 and the year ended April 30, 2018, the redemption fees charged by the Funds are presented in the Statements of Changes in Net Assets.
6. MANAGEMENT AND RELATED-PARTY TRANSACTIONS
The Adviser, subject to the authority of the Board, is responsible for the overall management and administration of the Funds’ business affairs. The Adviser manages the investments of the Funds in accordance with the Funds’ investment objective, policies and limitations and investment guidelines established jointly by the Adviser and the Trustees. Pursuant to the Advisory Agreement, (the “Advisory Agreement”), each Fund pays the Adviser an annual management fee based on each Fund’s average daily net assets. The management fee is paid on a monthly basis. The following table reflects the Funds’ advisory fee rates.
| Fund | Advisory Fee |
| Grandeur Peak Emerging Markets Opportunities Fund | 1.35% |
| Grandeur Peak Global Micro Cap Fund | 1.50% |
| Grandeur Peak Global Opportunities Fund | 1.25% |
| Grandeur Peak Global Reach Fund | 1.10% |
| Grandeur Peak Global Stalwarts Fund | 0.80% |
| Grandeur Peak International Opportunities Fund | 1.25% |
| Grandeur Peak International Stalwarts Fund | 0.80% |
| 94 | 1.855.377.7325 | www.GrandeurPeakGlobal.com |
| Grandeur Peak Funds® | Notes to Financial Statements |
October 31, 2018 (Unaudited)
The Adviser has contractually agreed to limit certain of each Fund’s expenses. The following table reflects the Funds’ expense cap.
| Fund | Expense Cap | Term of Expense Limit Agreements |
| Grandeur Peak Emerging Markets Opportunities Fund | ||
| Investor Class | 1.95% | September 1, 2018 – August 31, 2019 / |
| Institutional Class | 1.70% | September 1, 2017 – August 31, 2018 |
| Grandeur Peak Global Micro Cap Fund | ||
| Institutional Class | 2.00% | September 1, 2018 – August 31, 2019 / |
| September 1, 2017 – August 31, 2018 | ||
| Grandeur Peak Global Opportunities Fund | ||
| Investor Class | 1.75% | September 1, 2018 – August 31, 2019 / |
| Institutional Class | 1.50% | September 1, 2017 – August 31, 2018 |
| Grandeur Peak Global Reach Fund | ||
| Investor Class | 1.60% | September 1, 2018 – August 31, 2019 / |
| Institutional Class | 1.35% | September 1, 2017 – August 31, 2018 |
| Grandeur Peak Global Stalwarts Fund | ||
| Investor Class | 1.35% | September 1, 2018 – August 31, 2019 / |
| Institutional Class | 1.10% | September 1, 2017 – August 31, 2018 |
| Grandeur Peak International Opportunities Fund | ||
| Investor Class | 1.75% | September 1, 2018 – August 31, 2019 / |
| Institutional Class | 1.50% | September 1, 2017 – August 31, 2018 |
| Grandeur Peak International Stalwarts Fund | ||
| Investor Class | 1.35% | September 1, 2018 – August 31, 2019 / |
| Institutional Class | 1.10% | September 1, 2017 – August 31, 2018 |
Pursuant to these agreements, each Fund will reimburse the Adviser for any previous fee waivers and expense reimbursements made by the Adviser, provided that any such reimbursements made by the Funds to the Adviser will not cause the Funds’ expense limitation to exceed expense limitations in existence at the time the expense was incurred, or at the time of the reimbursement, whichever is lower, and the reimbursement is made within three years after the expenses were incurred. Fees waived/reimbursed by adviser for the six months ended October 31, 2018 are disclosed in the Statements of Operations.
In addition to the foregoing contractual arrangements, the Adviser has voluntarily agreed, effective September 1, 2016, to waive, with respect to the Grandeur Peak Global Opportunities Fund and the Grandeur Peak International Opportunities Fund, annual management fees to the extent such fees exceed 1.10% on assets above $500 million (the annual management fee rate with respect to such funds will remain 1.25% on the first $500 million in assets). The Adviser has also voluntarily agreed, effective January 1, 2018, to waive, with respect to the Grandeur Peak Emerging Markets Opportunities Fund, annual management fees to the extent such fees exceed 1.20% on all assets above $400 million (the annual management fee rate with respect to the Fund will remain 1.35% on the first $400 million in assets). These voluntary arrangements may be terminated at any time by the Adviser. Voluntary waivers are not subject to recoupment by the Adviser. Voluntary fees waive by the Adviser for the six months ended October 31, 2018 are disclosed in the Statements of Operations.
| Semi-Annual Report | October 31, 2018 | 95 |
| Grandeur Peak Funds® | Notes to Financial Statements |
October 31, 2018 (Unaudited)
For the six months ended October 31, 2018, the fee waivers/reimbursements and/or recoupments were as follows:
| Fund | Fees Waived/Reimbursed By Adviser | Recoupment of Previously Waived Fees By Adviser | ||||||
| Grandeur Peak Emerging Markets Opportunities Fund | ||||||||
| Investor Class | $ | – | $ | – | ||||
| Institutional Class | – | – | ||||||
| Grandeur Peak Global Micro Cap Fund | ||||||||
| Institutional Class | $ | 7,880 | $ | 4,885 | ||||
| Grandeur Peak Global Opportunities Fund | ||||||||
| Investor Class | $ | – | $ | – | ||||
| Institutional Class | – | – | ||||||
| Grandeur Peak Global Reach Fund | ||||||||
| Investor Class | $ | – | $ | – | ||||
| Institutional Class | – | – | ||||||
| Grandeur Peak Global Stalwarts Fund | ||||||||
| Investor Class | $ | – | $ | 16,519 | ||||
| Institutional Class | – | 22,894 | ||||||
| Grandeur Peak International Opportunities Fund | ||||||||
| Investor Class | $ | – | $ | – | ||||
| Institutional Class | – | – | ||||||
| Grandeur Peak International Stalwarts Fund | ||||||||
| Investor Class | $ | – | $ | – | ||||
| Institutional Class | – | – | ||||||
As of October 31, 2018, the balances of recoupable expenses for each Fund were as follows:
| Fund | Expires 2019 | Expires 2020 | Expires 2021 | Expires 2022 | Total | |||||||||||||||
| Grandeur Peak Emerging Markets Opportunities Fund | ||||||||||||||||||||
| Investor Class | $ | – | $ | – | $ | – | $ | – | $ | – | ||||||||||
| Institutional Class | – | – | – | – | – | |||||||||||||||
| Grandeur Peak Global Micro Cap Fund | ||||||||||||||||||||
| Institutional Class | $ | 38,535 | $ | 55,827 | $ | 27,510 | $ | 7,880 | $ | 129,752 | ||||||||||
| Grandeur Peak Global Opportunities Fund | ||||||||||||||||||||
| Investor Class | $ | – | $ | – | $ | – | $ | – | $ | – | ||||||||||
| Institutional Class | – | – | – | – | – | |||||||||||||||
| Grandeur Peak Global Reach Fund | ||||||||||||||||||||
| Investor Class | $ | – | $ | – | $ | – | $ | – | $ | – | ||||||||||
| Institutional Class | – | – | – | – | – | |||||||||||||||
| Grandeur Peak Global Stalwarts Fund | ||||||||||||||||||||
| Investor Class | $ | – | $ | – | $ | – | $ | – | $ | – | ||||||||||
| Institutional Class | – | – | – | – | – | |||||||||||||||
| Grandeur Peak International Opportunities Fund | ||||||||||||||||||||
| Investor Class | $ | – | $ | – | $ | – | $ | – | $ | – | ||||||||||
| Institutional Class | – | – | – | – | – | |||||||||||||||
| Grandeur Peak International Stalwarts Fund | ||||||||||||||||||||
| Investor Class | $ | – | $ | – | $ | – | $ | – | $ | – | ||||||||||
| Institutional Class | – | – | – | – | – | |||||||||||||||
Administrator Fees and Expenses: ALPS Fund Services, Inc. (“ALPS”) serves as administrator to the Funds and the Funds have agreed to pay expenses incurred in connection with their administrative activities. Pursuant to an Administration Agreement, ALPS provides operational services to the Funds including, but not limited to, fund accounting and fund administration and generally assists in the Funds’ operations. Officers of the
| 96 | 1.855.377.7325 | www.GrandeurPeakGlobal.com |
| Grandeur Peak Funds® | Notes to Financial Statements |
October 31, 2018 (Unaudited)
Trust are employees of ALPS. The Funds’ administration fee is accrued on a daily basis and paid monthly. Administration fees paid by the Funds for the six months ended October 31, 2018 are disclosed in the Statements of Operations.
ALPS is reimbursed by the Fund for certain out-of-pocket expenses.
Transfer Agent: ALPS serves as transfer, dividend paying and shareholder servicing agent for the Funds. ALPS receives an annual minimum fee, a fee based upon the number of shareholder accounts, and is also reimbursed by the Funds for certain out-of-pocket expenses. Transfer agent fees paid by the Funds for the six months ended October 31, 2018 are disclosed in the Statements of Operations.
Compliance Services: ALPS provides services that assist the Trust’s chief compliance officer in monitoring and testing the policies and procedures of the Trust in conjunction with requirements under Rule 38a-1 under the 1940 Act and receives an annual base fee. ALPS is reimbursed for certain out-of-pocket expenses by the Funds. Compliance service fees paid by the Funds for the six months ended October 31, 2018 are disclosed in the Statements of Operations.
Principal Financial Officer: ALPS receives an annual fee for providing principal financial officer services to the Funds. Principal financial officer fees paid by the Fund for the six months ended October 31, 2018 are disclosed in the Statements of Operations.
Distributor: ALPS Distributors, Inc. (“ADI” or the “Distributor”) (an affiliate of ALPS) acts as the distributor of the Funds’ shares pursuant to a Distribution Agreement with the Trust. Shares are sold on a continuous basis by ADI as agent for the Funds, and ADI has agreed to use its best efforts to solicit orders for the sale of each Fund’s shares, although it is not obliged to sell any particular amount of shares. ADI is not entitled to any compensation for its services as Distributor. ADI is registered as a broker-dealer with the U.S. Securities and Exchange Commission.
Each Fund has adopted a Distribution and Services (Rule 12b-1) Plan pursuant to Rule 12b-1 of the 1940 Act (the “Plan”) for its Investor Class shares. The Plan allows the Funds to use Investor Class assets to pay fees in connection with the distribution and marketing of Investor Class shares and/or the provision of shareholder services to Investor Class shareholders. The Plan permits payment for services in connection with the administration of plans or programs that use Investor Class shares of each Fund as their funding medium and for related expenses. The recipients of such payments may include the Distributor, other affiliates of the Adviser, broker-dealers, financial institutions, plan sponsors and administrators and other financial intermediaries through which investors may purchase shares of the Fund. The Plan permits the Funds to make total payments at an annual rate of up to 0.25% of each Fund’s average daily net assets attributable to its Investor Class shares. The expenses of the Plan are reflected as distribution and service fees in the Statements of Operations.
7. INDEMNIFICATIONS
Under the Trust’s organizational documents, its officers and Trustees are indemnified against certain liability arising out of the performance of their duties to the Trust. Additionally, in the normal course of business, the Trust enters into contracts with service providers that may contain general indemnification clauses, which may permit indemnification to the extent permissible under applicable law. The Trust’s maximum exposure under these arrangements is unknown, as this would involve future claims that may be made against the Trust that have not yet occurred.
8. NEW ACCOUNTING PROUNCEMENTS
On October 4, 2018, the SEC amended Regulation S-X to require certain financial statement disclosure requirements to conform them to US GAAP for investment companies. Effective November 4, 2018, the Funds adopted disclosure requirement changes for Regulation S-X and these changes are reflected throughout this report. The Funds’ adoption of those amendments, effective with the financial statements prepared as of October 31, 2018, had no effect on the Funds’ net assets or results of operations.
In August 2018, the Financial Accounting Standards Board (“FASB”) issued Accounting Standards Update (“ASU”) 2018-13, which changes the fair value measurement disclosure requirements of FASB Accounting Standards Codification Topic 820, Fair Value Measurement. The update to Topic 820 includes new, eliminated, and modified disclosure requirements. ASU 2018-13 is effective for fiscal years beginning after December 15, 2019, including interim periods. Early adoption is permitted for any eliminated or modified disclosures. Management is currently evaluating the impact of the ASU to the Funds’ financial statements.
| Semi-Annual Report | October 31, 2018 | 97 |
| Grandeur Peak Funds® | Disclosure Regarding Approval of Fund Advisory Agreement |
On September 11, 2018, the Trustees met in person to discuss, among other things, the approval of the investment advisory agreement between the Trust and the Adviser, in accordance with Section 15(c) of the 1940 Act. In renewing and approving the Investment Advisory Agreement, the Trustees, including the Independent Trustees, considered the following factors with respect to the Grandeur Peak Funds:
Investment Advisory Fee Rate: The Trustees reviewed and considered the contractual annual advisory fees paid by the Trust, on behalf of the Grandeur Peak Funds, to Grandeur Peak, of 1.25% of the Grandeur Peak Global Opportunities Fund’s and Grandeur Peak International Opportunities Fund’s daily net assets, 1.10% of the Grandeur Peak Global Reach Fund’s daily net assets, 1.35% of the Grandeur Peak Emerging Markets Opportunities Fund’s daily net assets, 0.80% of the Grandeur Peak Global Stalwarts Fund’s and Grandeur Peak International Stalwarts Fund’s daily net assets, and 1.50% of the Grandeur Peak Global Micro Cap Fund’s daily net assets, in light of the extent and quality of the advisory services provided by Grandeur Peak to each of the Grandeur Peak Funds.
The Board received and considered information including a comparison of the Investor Class and Institutional Class, as applicable, of each Grandeur Peak Fund’s contractual advisory fee rate with those of funds in the expense group and universe of funds provided by an independent provider of investment company data (the “Data Provider”). The Trustees noted that the contractual advisory fee rate of the Investor Class and Institutional Class, as applicable, of each of the Grandeur Peak Funds was above the Data Provider peer group median, except for the Grandeur Peak Global Stalwarts Fund and the Grandeur Peak International Stalwarts Fund.
Total Expense Ratios: The Trustees further reviewed and considered that the total expense ratio (after waivers) of the Investor Class and Institutional Class, as applicable, of each of the Grandeur Peak Funds was above the Data Provider peer group median, except for the Grandeur Peak Global Stalwarts Fund and the Grandeur Peak International Stalwarts Fund.
Nature, Extent, and Quality of the Services under the Investment Advisory Agreement: The Trustees received and considered information regarding the nature, extent, and quality of services provided to the Grandeur Peak Funds under the Investment Advisory Agreement. The Trustees reviewed certain background materials supplied by Grandeur Peak in its presentation, including its Form ADV.
The Trustees reviewed and considered Grandeur Peak’s investment advisory personnel, its history as an asset manager, and its performance and the amount of assets currently under management by Grandeur Peak and its affiliated entities. The Trustees also reviewed the research and decision-making processes utilized by Grandeur Peak, including the methods adopted to seek to achieve compliance with the investment objectives, policies, and restrictions of the Grandeur Peak Funds.
The Trustees considered the background and experience of Grandeur Peak’s management in connection with the Grandeur Peak Funds, including reviewing the qualifications, backgrounds, and responsibilities of the management team primarily responsible for the day-to-day portfolio management of each Grandeur Peak Fund and the extent of the resources devoted to research and analysis of actual and potential investments.
The Trustees also reviewed, among other things, Grandeur Peak’s insider trading policies and procedures and its Code of Ethics.
Performance: The Trustees reviewed performance information of the Investor Class and Institutional Class, as applicable, of the Grandeur Peak Funds for the 3-month, 1-year, 3-year, and 5-year periods, as applicable, ended June 30, 2018. That review included a comparison of each Grandeur Peak Fund’s performance to the performance of a group of comparable funds selected by the Data Provider. The Trustees noted that the performance of both classes of the Grandeur Peak Emerging Markets Opportunities Fund was at or above the Data Provider peer group median for the 3-month and 3-year periods and below the Data Provider peer group median for the 1-year period, the performance of the Institutional Class of the Grandeur Peak Global Micro Cap Fund was below the Data Provider peer group median for the 3-month and 1-year periods, the performance of both classes of the Grandeur Peak Global Opportunities Fund was above the Data Provider peer group median for the 3-year and 5-year periods and below the Data Provider peer group median for the 3-month and 1-year periods, the performance of both classes of the Grandeur Peak Global Reach Fund was above the Data Provider peer group median for the 1-year, 3-year, and 5-year periods and at or below the peer group median for the 3-month period, the performance of both classes of the Grandeur Peak Global Stalwarts Fund was above the Data Provider peer group median for the 1-year period and below the Data Provider peer group median for the 3-month period, the performance of both classes of the Grandeur Peak International Opportunities Fund was above the Data Provider peer group median for the 3-year and 5-year periods and below the Data Provider peer group median for the 3-month and 1-year periods, and the performance of both classes of the Grandeur Peak International Stalwarts Fund was above the Data Provider peer group median for the 3-month and 1-year periods. The Trustees also considered Grandeur Peak’s discussion of its reputation generally and its investment techniques, risk management controls, and decision-making processes.
Comparable Accounts: The Trustees noted certain information provided by Grandeur Peak regarding fees charged to its other clients utilizing a strategy similar to that employed by the Grandeur Peak Funds.
| 98 | 1.855.377.7325 | www.GrandeurPeakGlobal.com |
| Grandeur Peak Funds® | Disclosure Regarding Approval of Fund Advisory Agreement |
Profitability: The Trustees received and considered a retrospective and projected profitability analysis prepared by Grandeur Peak based on the fees payable under the Investment Advisory Agreement with respect to the Grandeur Peak Funds. The Trustees considered the profits, if any, anticipated to be realized by Grandeur Peak in connection with the operation of the Grandeur Peak Funds. The Board then reviewed Grandeur Peak’s income statement and balance sheet for the years ended December 31, 2011 through December 31, 2017 in order to analyze the financial condition, stability, and profitability of Grandeur Peak.
Economies of Scale: The Trustees considered whether economies of scale in the provision of services to the Grandeur Peak Funds will be passed along to the shareholders under the proposed agreements.
Other Benefits to the Adviser: The Trustees reviewed and considered any other incidental benefits derived or to be derived by Grandeur Peak from its relationship with the Grandeur Peak Funds, including whether soft dollar arrangements were used.
In renewing Grandeur Peak as the Grandeur Peak Funds’ investment adviser and renewing the Investment Advisory Agreement and the fees charged under the Investment Advisory Agreement, the Trustees concluded that no single factor reviewed by the Trustees was identified by the Trustees to be determinative as the principal factor in whether to renew the Investment Advisory Agreement. Further, the Independent Trustees were advised by separate independent legal counsel throughout the process. The Trustees, including all of the Independent Trustees, concluded that:
| ● | the contractual advisory fee rate of the Investor Class and Institutional Class, as applicable, of each of the Grandeur Peak Funds was above, but within an acceptable range of, the respective Data Provider peer group median, except for the Grandeur Peak Global Stalwarts Fund and the Grandeur Peak International Stalwarts Fund, whose contractual advisory fee rates were below their peer group medians; |
| ● | the total expense ratio (after waivers) of the Investor Class and Institutional Class, as applicable, of each of the Grandeur Peak Funds was above, but within an acceptable range of, the respective Data Provider peer group median, except for the Grandeur Peak Global Stalwarts Fund and the Grandeur Peak International Stalwarts Fund, whose total expense ratios (after waivers) were below their peer group medians; |
| ● | the nature, extent and quality of services rendered by Grandeur Peak under the Investment Advisory Agreement with respect to each Grandeur Peak Fund were adequate; |
| ● | for the period ended June 30, 2018, the performance of both classes of the Grandeur Peak Emerging Markets Opportunities Fund was at or above the Data Provider peer group median for the 3-month and 3-year periods and below, but within an acceptable range of, the Data Provider peer group median for the 1-year period, the performance of the Institutional Class of the Grandeur Peak Global Micro Cap Fund was below, but within an acceptable range of, the Data Provider peer group median for the 3-month and 1-year periods, the performance of both classes of the Grandeur Peak Global Opportunities Fund was above the Data Provider peer group median for the 3- year and 5-year periods and below, but within an acceptable range of, the Data Provider peer group median for the 3-month and 1-year periods, the performance of both classes of the Grandeur Peak Global Reach Fund was above the Data Provider peer group median for the 1-year, 3-year, and 5-year periods and at or below, but within an acceptable range of, the peer group median for the 3-month period, the performance of both classes of the Grandeur Peak Global Stalwarts Fund was above the Data Provider peer group median for the 1-year period and below, but within an acceptable range of, the Data Provider peer group median for the 3-month period, the performance of both classes of the Grandeur Peak International Opportunities Fund was above the Data Provider peer group median for the 3-year and 5-year periods and below, but within an acceptable range of, the Data Provider peer group median for the 3-month and 1-year periods, and the performance of both classes of the Grandeur Peak International Stalwarts Fund was above the Data Provider peer group median for the 3-month and 1-year periods; |
| ● | bearing in mind the limitations of comparing different types of managed accounts and the different levels of service typically associated with such accounts, the fee structures applicable to Grandeur Peak’s other clients employing a comparable strategy to any of the Grandeur Peak Funds were not indicative of any unreasonableness with respect to the advisory fee payable by the Grandeur Peak Funds; |
| ● | the profit, if any, realized by Grandeur Peak in connection with the operation of any of the Grandeur Peak Funds is not unreasonable to such Fund; and |
| ● | there were no material economies of scale or other incidental benefits accruing to Grandeur Peak in connection with its relationship with any of the Grandeur Peak Funds. |
Based on the Trustees’ deliberations and their evaluation of the information described above, the Trustees, including all of the Independent Trustees, concluded that Grandeur Peak’s compensation for investment advisory services is consistent with the best interests of each of the Grandeur Peak Funds and their shareholders.
| Semi-Annual Report | October 31, 2018 | 99 |
| Grandeur Peak Funds® | Additional Information |
1. FUND HOLDINGS
The Funds file their complete schedule of portfolio holdings with the Securities and Exchange Commission (the “SEC”) for the first and third quarters of each fiscal year on Form N-Q within 60 days after the end of the period. Copies of the Funds’ Form N-Q are available without charge on the SEC website at http://www.sec.gov. You may also review and copy the Form N-Q at the SEC’s Public Reference Room in Washington, DC. For more information about the operation of the Public Reference Room, please call the SEC at 1-800-SEC–0330.
2. FUND PROXY VOTING POLICIES, PROCEDURES AND SUMMARIES
The Funds’ policies and procedures used in determining how to vote proxies and information regarding how the Funds voted proxies relating to portfolio securities during the most recent prior 12–month period ending June 30 are available without charge, (1) upon request, by calling (toll-free) 855-377-PEAK(7325) and (2) on the SEC’s website at http://www.sec.gov.
| 100 | 1.855.377.7325 | www.GrandeurPeakGlobal.com |
| Grandeur Peak Funds® | Privacy Policy |
October 31, 2018 (Unaudited)
| Who We Are | |
| Who is providing this notice? | Grandeur Peak Global Opportunities Fund, Grandeur Peak International Opportunities Fund, Grandeur Peak Global Reach Fund, Grandeur Peak Emerging Markets Opportunities Fund, Grandeur Peak Global Micro Cap Fund, Grandeur Peak Global Stalwarts Fund, and Grandeur Peak International Stalwarts Fund. |
| What We Do | |
| How do the Funds protect my personal information? | To protect your personal information from unauthorized access and use, we use security measures that comply with federal law. These measures include computer safeguards and secured files and buildings. |
| How do the Funds collect my personal information? | We collect your personal information, for example, when you
● open an account ● provide account information or give us your contact information ● make a wire transfer or deposit money |
| Why can't I limit all sharing? | Federal law gives you the right to limit only
● sharing for affiliates’ everyday business purposes-information about your creditworthiness ● affiliates from using your information to market to you ● sharing for non-affiliates to market to you
State laws and individual companies may give you additional rights to limit sharing. |
| Definitions | |
| Affiliates | Companies related by common ownership or control. They can be financial and nonfinancial companies. |
| Non–affiliates | Companies not related by common ownership or control. They can be financial and nonfinancial companies. ● The Funds does not share with non-affiliates so they can market to you. |
| Joint marketing | A formal agreement between non-affiliated financial companies that together market financial products or services to you.
● The Funds does not jointly market. |
| Other Important Information | |
| California Residents | If your account has a California home address, your personal information will not be disclosed to nonaffiliated third parties except as permitted by applicable California law, and we will limit sharing such personal information with our affiliates to comply with California privacy laws that apply to us. |
| Vermont Residents | The State of Vermont requires financial institutions to obtain your consent prior to sharing personal information that they collect about you with affiliated companies and nonaffiliated third parties other than in certain limited circumstances. Except as permitted by law, we will not share personal information we collect about you with nonaffiliated third parties or other affiliated companies unless you provide us with your written consent to share such information. |
| Semi-Annual Report | October 31, 2018 | 101 |
| Grandeur Peak Funds® | Privacy Policy |
October 31, 2018 (Unaudited)
| FACTS | WHAT DO THE FUNDS DO WITH YOUR PERSONAL INFORMATION? |
| Why? | Financial companies choose how they share your personal information. Federal law gives consumers the right to limit some but not all sharing. Federal law also requires us to tell you how we collect, share, and protect your personal information. Please read this notice carefully to understand what we do. |
| What? | The types of personal information we collect and share depend on the product or service you have with us. This information can include:
● Social Security number and account transactions ● Account balances and transaction history ● Wire transfer instructions |
| HOW? | All financial companies need to share customers’ personal information to run their everyday business. In the section below, we list the reasons financial companies can share their customers’ personal information; the reasons the Funds choose to share; and whether you can limit this sharing. |
| Reasons we can share your personal information | Do the Funds share: | Can you limit this sharing? |
| For our everyday business purposes — such as to process your transactions, maintain your account(s), respond to court orders and legal investigations, or report to credit bureaus | Yes | No |
| For our marketing purposes — to offer our products and services to you | No | We do not share. |
| For joint marketing with other financial companies | No | We do not share. |
| For our affiliates’ everyday business purposes — information about your transactions and experiences | Yes | No |
| For our affiliates’ everyday business purposes — information about your creditworthiness | No | We do not share. |
| For nonaffiliates to market to you | No | We do not share. |
| 102 | 1.855.377.7325 | www.GrandeurPeakGlobal.com |
Intentionally Left Blank.

Contact Us
| Mail: | Grandeur Peak Funds, P.O. Box 13664, Denver, CO 80201 | E-Mail: | grandeurpeakglobal@alpsinc.com |
| Phone: | 1.855.377.PEAK (7325) | Web: | www.GrandeurPeakGlobal.com |
SEMI-ANNUAL October 31, 2018
Highland Resolute Fund
Class I RMRGX
| Highland Resolute Fund | Table of Contents |
| PAGE | |
| Shareholder Letter | 2 |
| Performance Update | 7 |
| Consolidated Disclosure of Fund Expenses | 9 |
| Consolidated Schedule of Investments | 10 |
| Consolidated Statement of Assets and Liabilities | 26 |
| Consolidated Statement of Operations | 27 |
| Consolidated Statements of Changes in Net Assets | 28 |
| Consolidated Financial Highlights | 29 |
| Notes to Consolidated Financial Statements | 30 |
| Additional Information | 40 |
| Privacy Policy | 41 |
1
| Highland Resolute Fund | Shareholder Letter |
October 31, 2018 (Unaudited)
PERFORMANCE:
October 31, 2018
The Highland Resolute Fund outperformed the HFRX Global Hedge Index(1) by about 90 basis points(2) over the six months ending October 31, 2018. The Fund historically has strong up market capture with down market capture in line with the index. Since inception, the Fund has outperformed the HFRX Global Hedge Index by nearly 180 basis points annualized. This is due primarily to a higher level of net equity exposure than the benchmark to be able to keep up with strong equity markets.
When compared to the peer group (Morningstar Multi-Alternative Universe(3)), the Fund has underperformed the Universe over the last six months, but continues to outperform the Universe materially over longer time horizons – by about 190 basis points annualized since inception. As with the HFRX Global Hedge Index, the Universe is very diverse and contains a number of market-neutral and other low net equity strategies that cause the average net equity exposure for the Universe to be considerably less than our Fund. So, we anticipate outperforming the Universe in up markets and underperforming in down markets - recent performance has been consistent with our expectations.
Long/Short Managers – Long/Short equity underperformed the HFRX Equity Hedge Index(4) slightly as a cyclicals strategy and a generalist lagged. Positions in homebuilders and suppliers to the home repair and remodeling market hurt performance in these strategies, respectively.
Macro – The sole Macro manager has outperformed the HFRX Macro Index(5) over the last 6 months. Foreign exchange and commodity positions have been accretive in 2018, while increased volatility in equity markets has caused some of the outperformance to be offset by the strategy’s equity positions. This sector is a small allocation and is held as a risk-off return contributor.
Credit/GTAA – The lone credit strategy outperformed the HFRX Fixed Income – Credit Index(6) over the past 6 months. Option hedges were accretive in periods of increased volatility throughout the year.
Relative Value – The Relative Value sleeve underperformed the HFRX Relative Value Arbitrage Index(7) over the past 6 months. Outperformance from a multi-strategy fund was offset by negative absolute returns from a quantitative equity strategy that performed poorly due to its emerging markets exposure.
Event Driven – The Event Driven sleeve outperformed the HFRX Event Driven Index(8) over the past 6 months. A merger arbitrage focused manager has been the best performer in the sleeve with a few large mergers being responsible for most of the gains. A quantitative strategy struggled during the year with convertible bond and emerging market positions.
Past performance is no guarantee of future results.
2
| Highland Resolute Fund | Shareholder Letter |
October 31, 2018 (Unaudited)
HIGHLAND RESOLUTE FUND
Table 1 notes the performance for the Fund as of quarter end under standard reporting (since inception) as well as of October 31st.
Table 1 (1)(3)(9)(10)
Performance (amounts greater than one year are annualized)
Standardized Performance Data as of September 30, 2018 | Non-Standardized Performance Data as of October 31, 2018 | |||||||||
| YTD | 1-Year | 3-Year | 5-Year | Since Inception (12/30/11) | YTD | 1-Year | 3-Year | 5-Year | Since Inception (12/30/11) | |
| Highland Resolute Fund - Class I NAV | -0.46% | 2.11% | 4.15% | 3.14% | 3.87% | -4.52% | -2.82% | 1.75% | 2.05% | 3.19% |
| Morningstar Multi-Alternative Universe | -0.10% | 1.63% | 2.22% | 1.46% | 1.75% | -2.70% | -1.72% | 0.68% | 0.70% | 1.34% |
| HFRX Global Hedge Fund Index | -1.23% | 0.25% | 2.17% | 1.02% | 1.90% | -4.30% | -3.53% | 0.61% | 0.14% | 1.41% |
| S&P 500® Index | 10.56% | 17.91% | 17.31% | 13.95% | 15.66% | 3.01% | 7.35% | 11.52% | 11.34% | 14.26% |
Gross Expense Ratio | Less Expense Waivers | Net Expense Ratio | Net Ratio ex Dividend & Short Expense | |
| Highland Resolute Fund - Class I NAV | 2.47% | -1.20% | 1.27% | 1.19% |
Performance data quoted represents past performance. Past performance does not guarantee future results. Investment return and principal value of an investment will fluctuate so that an investor’s shares, when sold or redeemed, may be worth more or less than the original cost. Current performance data may be higher or lower than actual data quoted. For the most current month-end performance data please call 1-855-268-2242.
The Fund has a redemption fee of 2.00% for shares redeemed within the first 90 days of purchase. Performance shown at NAV does not include these sales charges and would have been lower had it been taken into account.
The Adviser has agreed to waive the portion of its 1.50% Management Fee in excess of any sub-advisory fees paid by the Adviser to sub-advisors in connection with the Fund (“Sub-Advisory Fees”). This agreement (the “Expense Agreement”) is in effect through August 31, 2019. The Adviser may not discontinue this agreement to waive fees prior to August 31, 2019 without the approval by the Fund’s Board of Trustees.
Net Ratio ex Dividend & Short Expense is the Net Expense Ratio less any Dividend and Interest Expense on Securities Sold Short.
Portfolio Changes:
There were no changes to the portfolio during the period.
Closing:
We continue to add value both in our allocation and manager selection decisions. We appreciate your investment in our Highland Resolute Fund, please feel free to contact us with any questions.
Sincerely,

R. Scott Graham, CFA & Michael T. Lytle, CFA
Portfolio Managers (11)
| Semi-Annual Report | October 31, 2018 | 3 |
| Highland Resolute Fund | Shareholder Letter |
October 31, 2018 (Unaudited)
Underlying Allocation Weights:
Figure 1 lists the long-term target asset allocation for the Fund as well as the allocation as of October 31, 2018.
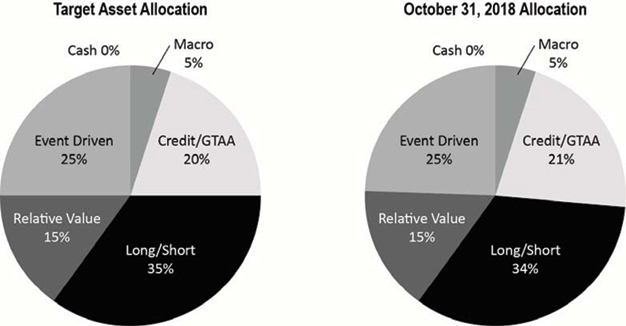
Holdings and allocations subject to change and may not reflect the current or future position of the portfolio.
4
| Highland Resolute Fund | Shareholder Letter |
October 31, 2018 (Unaudited)
IMPORTANT NOTES AND DISCLOSURES
Past performance does not guarantee future results.
Fund prices fluctuate as the underlying assets have exposure to market fluctuations and other risks, as described in the Fund’s prospectus. Please call 1-855-268-2242 to obtain current performance information and for the current prospectus and statement of additional information. This material must be preceded or accompanied by a prospectus. Please read the prospectus carefully before investing.
The views of Highland Associates, Inc. and the information discussed in this commentary are as of the date of publication, are subject to change, and may not reflect the writers’ current views. The views expressed are those of the Fund’s adviser only, and represent an assessment of market conditions at a specific point in time, are opinions only and should not be relied upon as investment advice regarding a particular investment or markets in general. Such information does not constitute a recommendation to buy or sell specific securities or investment vehicles. It should not be assumed that any investment will be profitable or will equal the performance of the portfolios or any securities or any sectors mentioned in this letter. The subject matter contained in this letter has been derived from several sources believed to be reliable and accurate at the time of compilation. Neither Highland Associates, Inc. nor the Fund accepts any liability for losses either direct or consequential caused by the use of this information.
The Highland Resolute Fund is distributed by ALPS Distributors, Inc.
The Fund is subject to investment risks, including possible loss of the principal amount invested and therefore is not suitable for all investors. The Fund may not achieve its objectives.
Diversification does not eliminate the risk of experiencing investment losses.
RISKS:
The Fund’s strategy may expose it to the risks of investments in Swap Contracts and Other Investment Companies. These risks include, but are not limited to higher expenses, allocation risk, underlying fund risk, transparency risk, and underlying fund managed portfolio risk. Investments which focus on alternative strategies are subject to increased risk and loss of principal and are not suitable for all investors. Swap Risk involves swap agreements and are subject to counterparty default risk and may not perform as intended. Derivatives Risk involves the exercise of skill and judgment. Derivatives may expire worthless or not perform as expected. Equity risk may cause the value of the securities held by the Fund to fall due to general market and economic conditions, perceptions regarding the industries in which the issuers of securities held by the Fund participate, or factors relating to specific companies in which the Fund invest.
The Fund’s investments in non-U.S. issuers may be even more volatile and may present more risks than investments in U.S. issuers.
Commodity Risk may subject the Funds to greater volatility than traditional investments because of global supply and demand, changes in interest rates, commodity index volatility, and factors affecting a particular industry or commodity. Commodity-linked investments may not move in the same direction and to the same extent as the underlying commodities.
| (1) | The HFRX Global Hedge Fund Index is designed to be representative of the overall composition of the hedge fund universe, and includes convertible arbitrage, distressed securities, equity hedge, equity market neutral, event driven, macro, merger arbitrage, and relative value strategies. The index returns are updated periodically and are subject to change. The returns were accurate as of the date of this publication. Investors cannot invest directly in an index. |
| (2) | Basis point is a common unit of measure for interest rates and other percentages in finance. One basis point is equal to 1/100th of 1% or 0.01%(.0001). |
| (3) | The Morningstar Multi-Alternative Universe is designed to represent the exposure to alternative investment tactics. Funds in this category have the majority of their assets exposed to alternative strategies. An investor’s exposure to different tactics may change slightly over time in response to market movements. Funds in this category include both funds with static allocations to alternative strategies and funds tactically allocating among alternative strategies and asset classes. The gross short exposure is greater than 20%. |
| (4) | The HFRX Equity Hedge Index is designed to be representative of a subset of the overall composition of the hedge fund universe. Equity Hedge strategies maintain positions both long and short in primarily equity and equity derivative securities. The index returns are updated periodically and are subject to change. The returns were accurate as of the date of this publication. The index figures do not reflect any fees, expense, or taxes. Investors cannot invest directly in an index. |
| (5) | The HFRX Macro Index is designed to be representative of a subset of the overall composition of the hedge fund universe. Macro strategy managers trade a broad range of strategies in which the investment process is predicated on movements in underlying economic variables and the impact these have on equity, fixed income, hard currency and commodity markets. Managers employ a variety of techniques, both discretionary and systematic analysis, combinations of top down and bottom up theses, quantitative and fundamental approaches and long and short-term holding periods. The index returns are updated periodically and are subject to change. The returns were accurate as of the date of this publication. The index figures do not reflect any fees, expense, or taxes. Investors cannot invest directly in an index. |
| Semi-Annual Report | October 31, 2018 | 5 |
| Highland Resolute Fund | Shareholder Letter |
October 31, 2018 (Unaudited)
| (6) | The HFRX Fixed Income – Credit Index is designed to be representative of a subset of the overall composition of the hedge fund universe. It includes strategies with exposure to credit across a broad continuum of credit sub-strategies, including Corporate, Sovereign, Distressed, Convertible, Asset Backed, Capital Structure Arbitrage, Multi-Strategy and other Relative Value and Event Driven sub-strategies. The index returns are updated periodically and are subject to change. The returns were accurate as of the date of this publication. The index figures do not reflect any fees, expense, or taxes. Investors cannot invest directly in an index. |
| (7) | The HFRX Relative Value Arbitrage Index is designed to be representative of a subset of the overall composition of the hedge fund universe. Relative Value investment managers who maintain positions in which the investment thesis is predicated on realization of a valuation discrepancy in the relationship between multiple securities. Managers employ a variety of fundamental and quantitative techniques to establish investment theses, and security types range broadly across equity, fixed income, derivative or other security types. The index returns are updated periodically and are subject to change. The returns were accurate as of the date of this publication. The index figures do not reflect any fees, expense, or taxes. Investors cannot invest directly in an index. |
| (8) | The HFRX Event Driven Index maintains positions in companies currently or prospectively involved in corporate transactions of a wide variety including but not limited to mergers, restructurings, financial distress, tender offers, shareholder buybacks, debt exchanges, security issuance or other capital structure adjustments. Security types can range from most senior in the capital structure to most junior or subordinated, and frequently involve additional derivative securities. Event Driven exposure includes a combination of sensitivities to equity markets, credit markets and idiosyncratic, company specific developments. The index returns are updated periodically and are subject to change. The returns were accurate as of the date of this publication. The index figures do not reflect any fees, expense, or taxes. Investors cannot invest directly in an index. |
| (9) | The S&P 500® Index is an unmanaged index of 500 common stocks chosen for market size, liquidity, and industry group representation. It is a market value weighted index. The S&P 500® Index figures do not reflect any fees, expenses, or taxes. Investors cannot invest directly in this index. |
| (10) | Highland Associates, Inc. has agreed to waive the portion of its 1.50% Management Fee in excess of any sub-advisory fees paid by the Adviser to sub-advisors in connection with the Highland Resolute Fund. This agreement is in effect through August 31, 2019. The Adviser may not discontinue this agreement to waive fees without the approval by the Fund’s Board of Trustees. |
| (11) | R. Scott Graham and Michael T. Lytle are registered representatives of ALPS Distributors, Inc. CFA Institute Marks are trademarks owned by the CFA Institute. |
6
| Highland Resolute Fund | Performance Update |
October 31, 2018 (Unaudited)
Performance (for the period ended October 31, 2018)
Highland Resolute Fund
| Cumulative Total Return | �� | |||||
| (for the period ended October 31, 2018) | 1 Year | 3 Year | 5 Year | Since Inception* | Gross Ratio(a) | Net Ratio(a) |
| Highland Resolute Fund - Class I - NAV | -2.82% | 1.75% | 2.05% | 3.19% | 2.47% | 1.27% |
| S&P 500® Index | 7.35% | 11.52% | 11.34% | 14.25% | ||
| Dow Jones U.S. Select Dividend Index | 5.00% | 11.66% | 10.50% | 12.87% | ||
| HFRX Global Hedge Fund Index | -3.53% | 0.61% | 0.14% | 1.41% |
Performance data quoted represents past performance. Past performance does not guarantee future results. Investment return and principal value of an investment will fluctuate so that an investor’s shares, when sold or redeemed, may be worth more or less than the original cost. Current performance data may be higher or lower than actual data quoted. For the most current month-end performance data please call 1-855-268-2242.
The Fund has a redemption fee of 2.00% for shares redeemed within the first 90 days of purchase. Performance shown at NAV does not include these sales charges and would have been lower had it been taken into account.
The Adviser has agreed to waive the portion of its 1.50% Management Fee in excess of any sub-advisory fees paid by the Adviser to sub-advisors in connection with the Fund (“Sub-Advisory Fees”). This agreement (the “Expense Agreement”) is in effect through August 31, 2018. The Adviser may not discontinue this agreement to waive fees prior to August 31, 2019 without the approval by the Fund’s Board of Trustees.
| * | Fund inception date of 12/30/11. |
| (a) | Ratios as of the Prospectus dated August 31, 2018 and may differ from the ratios presented in the Financial Highlights. |
| (b) | The S&P 500® Index is the Standard & Poor's composite index of 500 stocks, a widely recognized, unmanaged index of common stock prices. The index is not actively managed and does not reflect any deduction of fees, expenses or taxes. An investor may not invest directly in an index. |
| (c) | The Dow Jones U.S. Select Dividend Index is an additional index, and represents the country’s top stocks by dividend yield, selected annually and subject to screening and buffering criteria. The index is not actively managed and does not reflect any deductions of fees, expenses or taxes. An investor may not invest directly in an index. |
| (d) | The HFRX Global Hedge Fund Index is an additional index, and is designed to be representative of the overall composition of the hedge fund universe and includes convertible arbitrage, distressed securities, equity hedge, equity market neutral, event driven, macro, merger arbitrage and relative value strategies. The index returns are updated periodically and are subject to change. The returns were accurate as of the date of this publication. The index is not actively managed and does not reflect any deduction of fees, expenses or taxes. An investor may not invest directly in an index. |
The table does not reflect the deduction of taxes that a shareholder would pay on Fund distributions or the redemption of Fund shares.
Top Ten Holdings**
(for the period ended October 31, 2018)
| As a percentage of Net Assets | |
| PIMCO Short-Term Fund, | |
| Institutional Class | 32.33% |
| AQR Multi Strategy Alternative Fund, Class I | 10.42% |
| American Media, Inc. | 3.12% |
| Harland Clarke Holdings Corp. | 2.47% |
| Resolute Forest Products, Inc. | 2.35% |
| One Call Corp. | 1.30% |
| RR Donnelley & Sons Co. | 1.29% |
| Mohegan Gaming & Entertainment | 1.22% |
| Dean Foods Co. | 1.13% |
| McClatchy Co. | 1.11% |
| Top Ten Holdings |
| ** | Holdings are subject to change, and may not reflect the current or future position of the portfolio. |
| Semi-Annual Report | October 31, 2018 | 7 |
| Highland Resolute Fund | Performance Update |
October 31, 2018 (Unaudited)
Performance of $10,000 Initial Investment (for the period ended October 31, 2018)
Comparison of change in value of a $10,000 investment
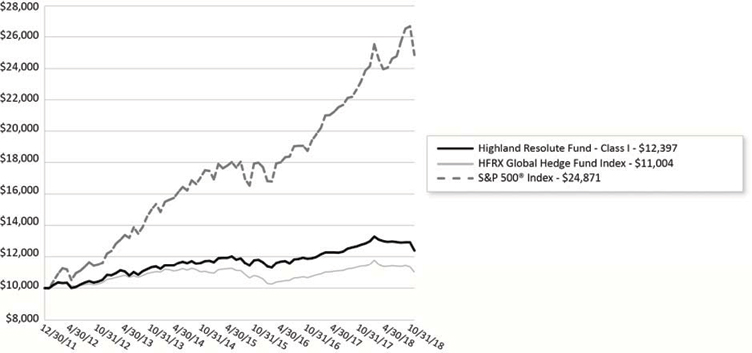
The chart represents historical performance of a hypothetical investment of $10,000 in the Fund since inception. Past performance does not guarantee future results. This chart does not reflect the deduction of taxes that a shareholder would pay on Fund distributions or the redemption of Fund shares.
Investing in the Fund is subject to investment risks, including possible loss of the principal amount invested.
| Highland Resolute Fund | Consolidated Disclosure of Fund Expenses |
October 31, 2018 (Unaudited)
As a shareholder of the Fund, you incur two types of costs: (1) transaction costs, including applicable sales charges (loads), redemption fees; and (2) ongoing costs, including management fees, distribution and service (12b-1) fees, shareholder services fees and other Fund operating expenses. This example is intended to help you understand your ongoing costs (in dollars) of investing in the Fund and to compare these costs with the ongoing costs of investing in other mutual funds.
This example is based on an investment of $1,000 invested at the beginning of the period and held for the six-month period of May 1, 2018 to October 31, 2018.
Actual Expenses. The first line of the table below provides information about actual account values and actual expenses. You may use the information in this line, together with the amount you invested to estimate the expenses that you paid over the period. Simply divide your account value by $1,000 (for example, an $8,600 account value divided by $1,000 = 8.6), then multiply the result by the number in the first line of the table below under the heading titled “Expenses Paid During Period” to estimate the expenses you paid on your account during this period.
Hypothetical Example for Comparison Purposes. The second line of the table below provides information about hypothetical account values and hypothetical expenses based on the Fund’s actual expense ratio and an assumed rate of return of 5% per year before expenses, which is not the Fund’s actual return. The hypothetical account values and expenses may not be used to estimate the actual ending account balance or expenses you paid for the period. You may use this information to compare the ongoing costs of investing in the Fund and other mutual funds. To do so, compare this 5% hypothetical example with the 5% hypothetical examples that appear in the shareholder reports of the other funds.
Please note that the expenses shown in the table below are meant to highlight your ongoing costs only and do not reflect any transactional costs, such as applicable sales charges (loads), redemption fees, or exchange fees. Therefore, the second line of the table below is useful in comparing ongoing costs only and will not help you determine the relative total costs of owning different funds. In addition, if these transactional costs were included, your costs would have been higher.
| Highland Resolute Fund | BEGINNING ACCOUNT VALUE 05/01/18 | ENDING ACCOUNT VALUE 10/31/18 | EXPENSE RATIO(a) | EXPENSES PAID, and DURING PERIOD 05/01/18-10/31/18(b) |
| Class I | ||||
| Actual | $1,000.00 | $956.50 | 0.75% | $3.70 |
| Hypothetical (5% return before expenses) | $1,000.00 | $1,021.42 | 0.75% | $3.82 |
| (a) | Annualized, based on the Fund's most recent fiscal half year expenses. |
| (b) | Expenses are equal to the Fund's annualized expense ratio multiplied by the average account value over the period, multiplied by the number of days in the most recent fiscal half-year (184)/365 (to reflect the half-year period). |
| Semi-Annual Report | October 31, 2018 | 9 |
| Highland Resolute Fund | Consolidated Schedule of Investments |
October 31, 2018 (Unaudited)
| Description | Shares | Value (Note 2) | ||||||
| CLOSED-END FUNDS (0.49%) | ||||||||
| Altaba, Inc.(a) | 27,721 | $ | 1,666,032 | |||||
| TOTAL CLOSED-END FUNDS | ||||||||
| (Cost $$1,663,801) | 1,666,032 | |||||||
| COMMON STOCKS (9.68%) | ||||||||
| BUILDING MATERIALS (0.16%) | ||||||||
| Fortune Brands Home & Security, Inc. | 3,845 | 172,371 | ||||||
| Masco Corp. | 12,320 | 369,600 | ||||||
| 541,971 | ||||||||
| CASINO & GAMBLING (0.43%) | ||||||||
| Caesars Entertainment Corp.(a)(b) | 171,150 | 1,470,178 | ||||||
| CHEMICALS (0.49%) | ||||||||
| The Sherwin-Williams Co.(b) | 4,249 | 1,671,854 | ||||||
| COMMERCIAL SERVICES (1.01%) | ||||||||
| PayPal Holdings, Inc.(a) | 20,100 | 1,692,219 | ||||||
| S&P Global, Inc.(b) | 9,736 | 1,775,068 | ||||||
| 3,467,287 | ||||||||
| DISTRIBUTION/WHOLESALE (0.67%) | ||||||||
| LKQ Corp.(a)(b) | 84,488 | 2,303,988 | ||||||
| DIVERSIFIED FINANCIAL SERVICES (1.03%) | ||||||||
| Mastercard, Inc., Class A | 8,931 | 1,765,391 | ||||||
| Visa, Inc., Class A | 12,782 | 1,761,998 | ||||||
| 3,527,389 | ||||||||
| HOTELS, RESTAURANTS & LEISURE (1.18%) | ||||||||
| Marriott International, Inc., Class A | 15,343 | 1,793,443 | ||||||
| Wyndham Hotels & Resorts, Inc. | 45,308 | 2,233,232 | ||||||
| 4,026,675 | ||||||||
| INTERNET (1.18%) | ||||||||
| Alibaba Group Holding, Ltd., Sponsored ADR(a) | 196 | 27,887 | ||||||
| Alphabet, Inc., Class A(a)(b) | 2,118 | 2,309,848 | ||||||
| Booking Holdings, Inc.(a) | 903 | 1,692,746 | ||||||
| 4,030,481 | ||||||||
| MACHINERY-DIVERSIFIED (0.45%) | ||||||||
| The Middleby Corp.(a)(b) | 13,584 | 1,525,483 | ||||||
| MEDIA (0.56%) | ||||||||
| Liberty Media Corp.-Liberty SiriusXM, Class A(a)(b) | 37,914 | 1,563,573 | ||||||
See Notes to Financial Statements.
10
| Highland Resolute Fund | Consolidated Schedule of Investments |
October 31, 2018 (Unaudited)
| Description | Shares | Value (Note 2) | ||||||
| MEDIA (0.56%) (continued) | ||||||||
| Liberty Media Corp.-Liberty SiriusXM, Class C(a)(b) | 8,878 | $ | 366,395 | |||||
| 1,929,968 | ||||||||
| PIPELINES (0.31%) | ||||||||
| Energy Transfer LP | 68,996 | 1,072,198 | ||||||
| RESTAURANTS (0.51%) | ||||||||
| Restaurant Brands International, Inc. | 31,562 | 1,728,651 | ||||||
| SOFTWARE (1.16%) | ||||||||
| CDK Global, Inc. | 30,716 | 1,758,184 | ||||||
| SS&C Technologies Holdings, Inc.(b) | 43,563 | 2,228,683 | ||||||
| 3,986,867 | ||||||||
| SPECIALTY FINANCE (0.54%) | ||||||||
| Worldpay, Inc., Class A(a) | 20,126 | 1,848,372 | ||||||
| TOTAL COMMON STOCKS | ||||||||
| (Cost $33,500,785) | 33,131,362 | |||||||
| OPEN-END MUTUAL FUNDS (42.75%) | ||||||||
| AQR Multi Strategy Alternative Fund, Class I | 4,572,357 | 35,664,385 | ||||||
| PIMCO Short-Term Fund, Institutional Class(b) | 11,189,339 | 110,662,562 | ||||||
| 146,326,947 | ||||||||
| TOTAL OPEN-END MUTUAL FUNDS | ||||||||
| (Cost $151,494,575) | 146,326,947 | |||||||
| Notional Amount | Exercise Date | Exercise Price | Contracts | Value (Note 2) | ||||||||||||||
| PURCHASED PUT OPTIONS (0.04%) | ||||||||||||||||||
| S&P 500® Index | $ | 35,252,620 | 11/16/2018 | $ | 2,500 | 130 | 81,900 | |||||||||||
| S&P 500® Index | 12,745,178 | 11/16/2018 | 2,550 | 47 | 47,000 | |||||||||||||
| 128,900 | ||||||||||||||||||
| TOTAL PURCHASED PUT OPTIONS | ||||||||||||||||||
| (Cost $200,730) | 128,900 | |||||||||||||||||
| Description | Principal Amount | Value (Note 2) | |||||||
| CORPORATE BONDS (19.52%) | |||||||||
| COMMERCIAL SERVICES (2.18%) | |||||||||
| Great Lakes Dredge & Dock Corp. | |||||||||
| 8.00%, | 05/15/2022 | $ | 65,000 | 66,969 | |||||
See Notes to Financial Statements.
| Semi-Annual Report | October 31, 2018 | 11 |
| Highland Resolute Fund | Consolidated Schedule of Investments |
October 31, 2018 (Unaudited)
| Description | Principal Amount | Value (Note 2) | |||||||
| COMMERCIAL SERVICES (2.18%) (continued) | |||||||||
| RR Donnelley & Sons Co. | |||||||||
| 6.00%, | 04/01/2024 | $ | 1,369,000 | $ | 1,324,508 | ||||
| 6.50%, | 11/15/2023 | 4,575,000 | 4,420,594 | ||||||
| 6.63%, | 04/15/2029 | 109,000 | 101,642 | ||||||
| 7.00%, | 02/15/2022 | 765,000 | 776,475 | ||||||
| 8.88%, | 04/15/2021 | 740,000 | 784,400 | ||||||
| 7,474,588 | |||||||||
| COMPUTERS (3.26%) | |||||||||
| Everi Payments, Inc. | |||||||||
| 7.50%, | 12/15/2025(c) | 2,707,000 | 2,700,233 | ||||||
| Harland Clarke Holdings Corp. | |||||||||
| 9.25%, | 03/01/2021(b)(c) | 9,458,500 | 8,453,534 | ||||||
| 11,153,767 | |||||||||
| DIVERSIFIED FINANCIAL SERVICES (0.31%) | |||||||||
| Navient Corp. | |||||||||
| 6.75%, | 06/15/2026 | 1,106,000 | 1,058,995 | ||||||
| ENTERTAINMENT (1.42%) | |||||||||
| Enterprise Development Authority | |||||||||
| 12.00%, | 07/15/2024(c) | 693,000 | 663,547 | ||||||
| Mohegan Tribal Gaming | |||||||||
| 7.88%, | 10/15/2024(c) | 4,293,000 | 4,180,309 | ||||||
| 4,843,856 | |||||||||
| ENVIRONMENTAL CONTROL (0.20%) | |||||||||
| GFL Environmental, Inc. | |||||||||
| 5.63%, | 05/01/2022(c) | 375,000 | 358,125 | ||||||
| Wrangler Buyer Corp. | |||||||||
| 6.00%, | 10/01/2025(c) | 300,000 | 322,500 | ||||||
| 680,625 | |||||||||
| FOOD (1.28%) | |||||||||
| Chobani LLC / Chobani Finance Corp., Inc. | |||||||||
| 7.50%, | 04/15/2025(c) | 632,000 | 542,730 | ||||||
| Dean Foods Co. | |||||||||
| 6.50%, | 03/15/2023(b)(c) | 4,174,000 | 3,855,733 | ||||||
| 4,398,463 | |||||||||
| FOREST PRODUCTS & PAPER (2.35%) | |||||||||
| Resolute Forest Products, Inc. | |||||||||
| 5.88%, | 05/15/2023(b) | 7,867,000 | 8,039,398 | ||||||
| HEALTHCARE-SERVICES (2.58%) | |||||||||
| AHP Health Partners, Inc. | |||||||||
| 9.75%, | 07/15/2026(c) | 1,782,000 | 1,817,640 | ||||||
See Notes to Financial Statements.
12
| Highland Resolute Fund | Consolidated Schedule of Investments |
October 31, 2018 (Unaudited)
| Description | Principal Amount | Value (Note 2) | |||||||
| HEALTHCARE-SERVICES (2.58%) (continued) | |||||||||
| One Call Corp. | |||||||||
| 7.50%, | 07/01/2024(c) | $ | 4,595,000 | $ | 4,457,150 | ||||
| 10.00%, | 10/01/2024(c) | 3,171,000 | 2,552,655 | ||||||
| 8,827,445 | |||||||||
| MACHINERY-CONSTR&MINING (0.14%) | |||||||||
| Vertiv Intermediate Holding Corp. | |||||||||
| 12.00%, | 02/15/2022(c) | 498,000 | 487,417 | ||||||
| OIL & GAS (0.07%) | |||||||||
| Par Petroleum LLC / Par Petroleum Finance Corp. | |||||||||
| 7.75%, | 12/15/2025(c) | 241,000 | 239,192 | ||||||
| PUBLISHING & BROADCASTING (5.09%) | |||||||||
| American Media, Inc. | |||||||||
| 0.00%, | 03/01/2022(c)(d) | 11,355,000 | 10,673,700 | ||||||
| McClatchy Co. | |||||||||
| 6.88%, | 03/15/2029 | 2,318,000 | 2,958,348 | ||||||
| 9.00%, | 07/15/2026(c) | 3,680,000 | 3,785,800 | ||||||
| 17,417,848 | |||||||||
| RETAIL (0.64%) | |||||||||
| Golden Nugget, Inc. | |||||||||
| 8.75%, | 10/01/2025(c) | 2,141,000 | 2,205,230 | ||||||
| TOTAL CORPORATE BONDS | |||||||||
| (Cost $65,237,463) | 66,826,824 | ||||||||
| Description | Principal Amount/ Shares | Value (Note 2) | ||||||
| Short Term Investments (2.87%) | ||||||||
| MONEY MARKET FUNDS (2.87%) | ||||||||
| Dreyfus Treasury Cash Management Fund, Institutional Class, 7-day yield, 2.070%(b) | 9,820,252 | 9,820,252 | ||||||
| TOTAL SHORT TERM INVESTMENTS | ||||||||
| (Cost $9,820,252) | 9,820,252 | |||||||
| TOTAL INVESTMENTS (75.35%) | ||||||||
| (Cost $261,917,606) | $ | 257,900,317 | ||||||
| SEGREGATED CASH WITH BROKERS (28.83%)(e) | 98,686,443 | |||||||
| SECURITIES SOLD SHORT (-3.96%) | ||||||||
| (Proceeds $13,423,228) | $ | (13,554,922 | ) | |||||
| OTHER ASSETS IN EXCESS OF LIABILITIES (-0.22%) | (755,737 | ) | ||||||
| NET ASSETS (100.00%) | $ | 342,276,101 | ||||||
See Notes to Financial Statements.
| Semi-Annual Report | October 31, 2018 | 13 |
| Highland Resolute Fund | Consolidated Schedule of Investments |
October 31, 2018 (Unaudited)
SCHEDULE OF SECURITIES SOLD SHORT
| Description | Shares | Value (Note 2) | ||||||
| EXCHANGE TRADED FUNDS (-2.40%) | ||||||||
| Consumer Staples Select Sector SPDR® Fund | (4,605 | ) | $ | (253,321 | ) | |||
| Health Care Select Sector SPDR® Fund | (14,344 | ) | (1,272,313 | ) | ||||
| iShares® 20+ Year Treasury Bond ETF | (7,447 | ) | (845,830 | ) | ||||
| iShares® 3-7 Year Treasury Bond ETF | (6,590 | ) | (783,815 | ) | ||||
| iShares® 7-10 Year Treasury Bond ETF | (8,067 | ) | (812,024 | ) | ||||
| iShares® Nasdaq Biotechnology ETF | (919 | ) | (95,640 | ) | ||||
| SPDR® S&P Pharmaceuticals ETF | (11,802 | ) | (510,790 | ) | ||||
| SPDR® S&P Retail ETF | (21,101 | ) | (994,701 | ) | ||||
| Utilities Select Sector SPDR® Fund | (8,868 | ) | (476,123 | ) | ||||
| Vaneck Vectors Pharmaceutical ETF | (8,702 | ) | (526,123 | ) | ||||
| Vanguard Total International Bond ETF | (30,039 | ) | (1,638,027 | ) | ||||
| (8,208,707 | ) | |||||||
| TOTAL EXCHANGE TRADED FUNDS (-2.40%) | ||||||||
| (Proceeds $7,955,606) | (8,208,707 | ) | ||||||
| Description | Shares | Value (Note 2) | ||||||
| CORPORATE BONDS (-1.56%) | ||||||||
| ADVERTISING (-0.22%) | ||||||||
| MDC Partners, Inc. | ||||||||
| 6.50%, 5/1/2024(c) | $ | (900,000 | ) | $ | (742,500 | ) | ||
| CHEMICALS (-0.36%) | ||||||||
| CVR Partners LP / CVR Nitrogen Finance Corp. | ||||||||
| 9.25%, 6/15/2023(c) | (1,158,000 | ) | (1,224,585 | ) | ||||
| FOOD (-0.24%) | ||||||||
| TreeHouse Foods, Inc. | ||||||||
| 6.00%, 2/15/2024(c) | (837,000 | ) | (839,093 | ) | ||||
| MEDIA (-0.15%) | ||||||||
| Meredith Corp. | ||||||||
| 6.88%, 2/1/2026(c) | (501,000 | ) | (502,252 | ) | ||||
| OIL & GAS (-0.06%) | ||||||||
| Precision Drilling Corp. | ||||||||
| 7.13%, 1/15/2026(c) | (217,000 | ) | (215,915 | ) | ||||
| TELECOMMUNICATIONS (-0.53%) | ||||||||
| GTT Communications, Inc. | ||||||||
| 7.88%, 12/31/2024(c) | (1,630,000 | ) | (1,540,350 | ) | ||||
| Plantronics, Inc. | ||||||||
| 5.50%, 5/31/2023(c) | (288,000 | ) | (281,520 | ) | ||||
| (1,821,870 | ) | |||||||
| TOTAL CORPORATE BONDS | ||||||||
| (Proceeds $5,467,622) | (5,346,215 | ) | ||||||
| TOTAL SECURITIES SOLD SHORT | ||||||||
| (Proceeds $13,423,228) | $ | (13,554,922 | ) | |||||
See Notes to Financial Statements.
14
| Highland Resolute Fund | Consolidated Schedule of Investments |
October 31, 2018 (Unaudited)
| (a) | Non-income producing security. |
| (b) | Security position either entirely or partially held in a segregated account as collateral for securities sold short and total return swaps. Aggregate total fair value of $133,390,941. |
| (c) | Security exempt from registration under rule 144A of the securities act of 1933. This security may be resold in transactions exempt from registration, normally to qualified institutional buyers. At period end, the fair value of those securities held in long positions was $47,295,495 and the value of the securities held in short positions was $(5,346,215). This totals $41,949,280, which represents 12.26% of the Fund's net assets. |
| (d) | Issued with a zero coupon. Income is recognized through the accretion of discount. |
| (e) | Includes cash which is being held as collateral for securities sold short and total return swap contracts. |
See Notes to Financial Statements.
| Semi-Annual Report | October 31, 2018 | 15 |
| Highland Resolute Fund | Consolidated Schedule of Investments |
October 31, 2018 (Unaudited)
TOTAL RETURN SWAP CONTRACTS*
| Counterparty | Reference Obligation | Notional Amount | Value | Rate Paid by the Fund | Termination Date | Unrealized Appreciation/ (Depreciation) | ||||||||||||
| Morgan Stanley | BHDG Systematic Trading Segregated Portfolio(a) | $ | 17,435,278 | $ | 17,414,120 | 1-Month LIBOR BBA | 09/13/2023 | $ | 21,158 | |||||||||
| Morgan Stanley | Clinton Segregated Portfolio(b) | 16,912,856 | 16,834,316 | 1-Month LIBOR BBA | 09/13/2023 | 78,540 | ||||||||||||
| Morgan Stanley | iBoxx USD Liquid High Yield Index | 6,697,000 | 6,611,617 | 3-Month LIBOR BBA | 12/20/2018 | 85,383 | ||||||||||||
| Morgan Stanley | Long/Short Segregated Portfolio(c) | 37,683,845 | 37,096,916 | 1-Month LIBOR BBA | 03/20/2019 | 586,929 | ||||||||||||
| Morgan Stanley | Melchior Segregated Portfolio(d) | 40,930,784 | 40,747,401 | 1-Month LIBOR BBA | 03/20/2019 | 183,383 | ||||||||||||
| Morgan Stanley | PSAM Highland(e) | 46,900,941 | 47,727,110 | 1-Month EURIBOR | 06/03/2021 | (826,169 | ) | |||||||||||
| Morgan Stanley | WABR(f) | 35,094,166 | 35,080,655 | 1-Month LIBOR BBA | 09/01/2020 | 13,511 | ||||||||||||
| $ | 201,654,870 | $ | 201,512,135 | $ | 142,735 | |||||||||||||
| * | For the long positions, the Fund receives payments based on any positive return of the Reference Obligation less the rate paid by the Fund. The Fund makes payments on any negative return of such Reference Obligation plus the rate paid by the Fund. For short positions, the Fund receives payments based on any negative return of the Reference Obligation less the rate paid by the fund. The Fund makes payments on any positive return of such Reference obligation plus the rate paid by the Fund. Payments are made weekly. |
| (a) | BHDG Systematic Trading Segregated Portfolio is a quantitative trend following strategy that uses futures. BHDG will employ some short, medium, and long term signals. Interest rate, commodity, equity, and sovereign debt futures will be used. Any asset class may have net long or short exposure, and exposures in aggregate may be net long or short. |
| (b) | Clinton Segregated Portfolio is a global, quantitative equity market neutral strategy. The Portfolio will invest in large, mid, and small cap stocks in developed and some emerging markets. The strategy will also attempt to minimize net exposure to any given country or sector. The strategy attempts to generate returns primarily through trading value, momentum, and mean reversion models. |
| (c) | Long/Short Segregated Portfolio is a European equity long/short strategy that employs a flexible, low-net strategy (0% to 50%), and long exposure will vary between 60% and 100%. The portfolio is primarily comprised of large and mid-cap stocks listed on European exchanges. |
| (d) | Melchior Segregated Portfolio is a global equity long/short strategy that uses a long-biased strategy that is focused on cyclical sectors. The strategy has a net exposure that ranges between 50% and 80%, and long exposure varies between 80% and 100%. The strategy is comprised of large cap stocks listed on exchanges of developed and emerging market countries. |
| (e) | PSAM Highland employs an event driven strategy. The fund will primarily make investments in equity special situations and merger arbitrage. The strategy will also opportunistically allocate to liquid high yield credit positions when trading at stressed levels. The strategy will employ gross long exposure of up to 120%, and net exposure will typically vary from 40% to 80%. |
| (f) | WABR incorporates an absolute return oriented approach within a risk parity framework. Active absolute return strategies include fundamental long/short equity, credit relative value, discretionary macro, and equity market neutral strategies. The strategy also maintains a passive risk weighted allocation to equities and fixed income, but each of the three allocations is equally risk weighted subject to a 40% limit on the absolute return allocation. Gross equity long exposure will typically be 140% or less, and net equity exposure will vary between 5% and 35%. |
See Notes to Financial Statements.
16
| Highland Resolute Fund | Consolidated Schedule of Investments |
October 31, 2018 (Unaudited)
BHDG SYSTEMATIC TRADING SEGREGATED PORTFOLIO
| Description | Contracts | Value | Percentage of Value | |||||||||
| LONG SECURITIES | ||||||||||||
| OUTSTANDING FORWARD FOREIGN CURRENCY CONTRACTS | ||||||||||||
| AUD TO JPY FORWARD SD : 19-Dec-2018 | 4,896,630 | $ | 3,469,095 | 19.90 | % | |||||||
| AUD TO USD FORWARD SD : 19-Dec-2018 | 2,718,968 | 1,926,296 | 11.05 | % | ||||||||
| CAD TO USD FORWARD SD : 19-Dec-2018 | 4,162,447 | 3,165,018 | 18.15 | % | ||||||||
| EUR TO PLN FORWARD SD : 19-Dec-2018 | 2,611,846 | 2,970,646 | 17.04 | % | ||||||||
| EUR TO USD FORWARD SD : 19-Dec-2018 | 3,938,459 | 4,479,500 | 25.69 | % | ||||||||
| GBP TO USD FORWARD SD : 19-Dec-2018 | 1,860,346 | 2,383,511 | 13.67 | % | ||||||||
| JPY TO AUD FORWARD SD : 19-Dec-2018 | 500,133,392 | 4,449,911 | 25.52 | % | ||||||||
| JPY TO USD FORWARD SD : 19-Dec-2018 | 467,369,984 | 4,158,400 | 23.85 | % | ||||||||
| PLN TO EUR FORWARD SD : 19-Dec-2018 | 8,430,666 | 2,199,834 | 12.62 | % | ||||||||
| SGD TO USD FORWARD SD : 19-Dec-2018 | 6,122,343 | 4,424,441 | 25.38 | % | ||||||||
| USD TO AUD FORWARD SD : 19-Dec-2018 | 3,783,156 | 3,783,156 | 21.70 | % | ||||||||
| USD TO CAD FORWARD SD : 19-Dec-2018 | 4,229,065 | 4,229,065 | 24.26 | % | ||||||||
| USD TO CHF FORWARD SD : 19-Dec-2018 | 2,539,920 | 2,539,920 | 14.57 | % | ||||||||
| USD TO EUR FORWARD SD : 19-Dec-2018 | 8,072,171 | 8,072,171 | 46.30 | % | ||||||||
| USD TO GBP FORWARD SD : 19-Dec-2018 | 4,177,747 | 4,177,747 | 23.96 | % | ||||||||
| USD TO ILS FORWARD SD : 19-Dec-2018 | 1,865,916 | 1,865,916 | 10.70 | % | ||||||||
| USD TO INR FORWARD SD : 19-Dec-2018 | 3,040,336 | 3,040,336 | 17.44 | % | ||||||||
| USD TO JPY FORWARD SD : 19-Dec-2018 | 5,717,576 | 5,717,576 | 32.79 | % | ||||||||
| USD TO KRW FORWARD SD : 19-Dec-2018 | 2,705,041 | 2,705,041 | 15.51 | % | ||||||||
| USD TO MXN FORWARD SD : 19-Dec-2018 | 1,912,854 | 1,912,854 | 10.97 | % | ||||||||
| USD TO NOK FORWARD SD : 19-Dec-2018 | 2,995,818 | 2,995,818 | 17.18 | % | ||||||||
| USD TO NZD FORWARD SD : 19-Dec-2018 | 2,306,173 | 2,306,173 | 13.23 | % | ||||||||
| USD TO PLN FORWARD SD : 19-Dec-2018 | 2,805,204 | 2,805,204 | 16.09 | % | ||||||||
| USD TO SEK FORWARD SD : 19-Dec-2018 | 2,229,306 | 2,229,306 | 12.79 | % | ||||||||
| USD TO SGD FORWARD SD : 19-Dec-2018 | 7,920,610 | 7,920,610 | 45.43 | % | ||||||||
| 89,927,542 | 515.78 | % | ||||||||||
| TOTAL LONG | $ | 89,927,542 | 515.78 | % | ||||||||
| SECURITIES SOLD SHORT | ||||||||||||
| OUTSTANDING FORWARD FOREIGN CURRENCY CONTRACTS | ||||||||||||
| AUD TO JPY FORWARD SD : 19-Dec-2018 | (6,296,556 | ) | (4,460,895 | ) | -25.59 | % | ||||||
| AUD TO USD FORWARD SD : 19-Dec-2018 | (5,307,275 | ) | (3,760,023 | ) | -21.57 | % | ||||||
| CAD TO USD FORWARD SD : 19-Dec-2018 | (5,506,376 | ) | (4,186,907 | ) | -24.01 | % | ||||||
| CHF TO USD FORWARD SD : 19-Dec-2018 | (2,482,536 | ) | (2,476,333 | ) | -14.20 | % | ||||||
| EUR TO PLN FORWARD SD : 19-Dec-2018 | (1,955,277 | ) | (2,223,881 | ) | -12.76 | % | ||||||
| EUR TO USD FORWARD SD : 19-Dec-2018 | (6,931,190 | ) | (7,883,354 | ) | -45.21 | % | ||||||
| GBP TO USD FORWARD SD : 19-Dec-2018 | (3,204,275 | ) | (4,105,378 | ) | -23.55 | % | ||||||
| INR TO USD FORWARD SD : 19-Dec-2018 | (223,795,292 | ) | (3,008,911 | ) | -17.26 | % | ||||||
| JPY TO AUD FORWARD SD : 19-Dec-2018 | (394,146,157 | ) | (3,506,895 | ) | -20.11 | % | ||||||
| JPY TO USD FORWARD SD : 19-Dec-2018 | (636,798,369 | ) | (5,665,881 | ) | -32.50 | % | ||||||
| KRW TO USD FORWARD SD : 19-Dec-2018 | (3,049,891,371 | ) | (2,675,774 | ) | -15.35 | % | ||||||
| MXN TO USD FORWARD SD : 19-Dec-2018 | (37,225,590 | ) | (1,819,264 | ) | -10.43 | % | ||||||
| NOK TO USD FORWARD SD : 19-Dec-2018 | (24,769,359 | ) | (2,944,390 | ) | -16.89 | % | ||||||
| NZD TO USD FORWARD SD : 19-Dec-2018 | (3,534,036 | ) | (2,306,937 | ) | -13.23 | % | ||||||
| PLN TO EUR FORWARD SD : 19-Dec-2018 | (11,305,181 | ) | (2,949,888 | ) | -16.92 | % | ||||||
| PLN TO USD FORWARD SD : 19-Dec-2018 | (10,446,559 | ) | (2,725,845 | ) | -15.63 | % | ||||||
| SEK TO USD FORWARD SD : 19-Dec-2018 | (20,034,497 | ) | (2,199,739 | ) | -12.62 | % | ||||||
| SGD TO USD FORWARD SD : 19-Dec-2018 | (10,882,092 | ) | (7,864,173 | ) | -45.10 | % | ||||||
| USD TO AUD FORWARD SD : 19-Dec-2018 | (1,953,868 | ) | (1,953,868 | ) | -11.21 | % | ||||||
| USD TO CAD FORWARD SD : 19-Dec-2018 | (3,217,606 | ) | (3,217,606 | ) | -18.45 | % | ||||||
See Notes to Financial Statements.
| Semi-Annual Report | October 31, 2018 | 17 |
| Highland Resolute Fund | Consolidated Schedule of Investments |
October 31, 2018 (Unaudited)
| Description | Contracts | Value | Percentage of Value | |||||||||
| OUTSTANDING FORWARD FOREIGN CURRENCY CONTRACTS (CONTINUED) | ||||||||||||
| USD TO EUR FORWARD SD : 19-Dec-2018 | (4,619,264 | ) | (4,619,264 | ) | -26.49 | % | ||||||
| USD TO GBP FORWARD SD : 19-Dec-2018 | (2,447,297 | ) | (2,447,297 | ) | -14.04 | % | ||||||
| USD TO JPY FORWARD SD : 19-Dec-2018 | (4,177,236 | ) | (4,177,236 | ) | -23.96 | % | ||||||
| USD TO NOK FORWARD SD : 19-Dec-2018 | (1,865,818 | ) | (1,865,818 | ) | -10.70 | % | ||||||
| USD TO SGD FORWARD SD : 19-Dec-2018 | (4,472,401 | ) | (4,472,401 | ) | -25.65 | % | ||||||
| (89,517,958 | ) | -513.43 | % | |||||||||
| TOTAL SHORT | $ | (89,517,958 | ) | -513.43 | % | |||||||
| REMAINING SECURITIES, CASH AND OTHER ASSETS AND LIABILITIES | $ | 17,025,694 | 97.65 | % | ||||||||
| TOTAL VALUE | $ | 17,435,278 | ||||||||||
CLINTON SEGREGATED PORTFOLIO
| Description | Contracts | Value | Percentage of Value | Swap Counterparty | Floating Rate/Fixed Rate Amount paid by Fund | Floating Rate Index | Termination Date | |||||||||||||
| LONG SECURITIES | ||||||||||||||||||||
| EQUITY SWAPS | ||||||||||||||||||||
| Altran Technologies SA | 14,129 | $ | 29,720 | 0.18 | % | Morgan Stanley & Co., LLC | 9.7 bps + 1D EONIA | 1D EONIA | 9/18/2019 | |||||||||||
| Ametek Inc | 1,718 | (9,901 | ) | -0.06 | % | Morgan Stanley & Co., LLC | 265 bps + 1D FEDEF | 1D FEDEF | 6/11/2019 | |||||||||||
| Anadarko Petroleum Corp | 4,001 | (23,441 | ) | -0.14 | % | Morgan Stanley & Co., LLC | 265 bps + 1D FEDEF | 1D FEDEF | 6/11/2019 | |||||||||||
| ArcelorMittal | 10,407 | (14,860 | ) | -0.09 | % | Morgan Stanley & Co., LLC | 9.7 bps + 1D EONIA | 1D EONIA | 9/18/2019 | |||||||||||
| Avery Dennison Corp | 1,193 | (7,885 | ) | -0.05 | % | Morgan Stanley & Co., LLC | 265 bps + 1D FEDEF | 1D FEDEF | 6/11/2019 | |||||||||||
| Broadridge Financial Solutions | 1,773 | (14,307 | ) | -0.08 | % | Morgan Stanley & Co., LLC | 265 bps + 1D FEDEF | 1D FEDEF | 6/11/2019 | |||||||||||
| Eaton Corp PLC | 4,357 | (10,704 | ) | -0.06 | % | Morgan Stanley & Co., LLC | 265 bps + 1D FEDEF | 1D FEDEF | 6/11/2019 | |||||||||||
| Eregli Demir ve Celik Fabrikal | 54,878 | (15,403 | ) | -0.09 | % | Morgan Stanley & Co., LLC | 25.26 bps + 1D COF | 1D COF | 9/20/2019 | |||||||||||
| Fortive Corp | 6,190 | 10,755 | 0.06 | % | Morgan Stanley & Co., LLC | 265 bps + 1D FEDEF | 1D FEDEF | 6/11/2019 | ||||||||||||
| Harris Corp | 1,020 | (9,767 | ) | -0.06 | % | Morgan Stanley & Co., LLC | 265 bps + 1D FEDEF | 1D FEDEF | 6/11/2019 | |||||||||||
| Kering SA | 619 | 10,458 | 0.06 | % | Morgan Stanley & Co., LLC | 9.7 bps + 1D EONIA | 1D EONIA | 9/18/2019 | ||||||||||||
| Lockheed Martin Corp | 1,043 | (13,565 | ) | -0.08 | % | Morgan Stanley & Co., LLC | 265 bps + 1D FEDEF | 1D FEDEF | 6/11/2019 | |||||||||||
| L'Oreal SA | 1,249 | 12,327 | 0.07 | % | Morgan Stanley & Co., LLC | 9.7 bps + 1D EONIA | 1D EONIA | 9/18/2019 | ||||||||||||
| MTU Aero Engines AG | 786 | 7,849 | 0.05 | % | Morgan Stanley & Co., LLC | 9.7 bps + 1D EONIA | 1D EONIA | 9/18/2019 | ||||||||||||
| Naspers Ltd | 1,582 | 20,568 | 0.12 | % | Morgan Stanley & Co., LLC | 7.25 bps + 1D SABOR | 1D SABOR | 9/19/2019 | ||||||||||||
| Nolato AB | 800 | (18,533 | ) | -0.11 | % | Morgan Stanley & Co., LLC | 1M STIBO - 19 bps | 1M STIBO | 9/18/2019 | |||||||||||
| Northrop Grumman Corp | 745 | (33,614 | ) | -0.20 | % | Morgan Stanley & Co., LLC | 265 bps + 1D FEDEF | 1D FEDEF | 6/11/2019 | |||||||||||
| Petkim Petrokimya Holding AS | 157,143 | (10,967 | ) | -0.06 | % | Morgan Stanley & Co., LLC | 25.26 bps + 1D COF | 1D COF | 9/20/2019 | |||||||||||
| Regions Financial Corp | 11,381 | 12,541 | 0.07 | % | Morgan Stanley & Co., LLC | 265 bps + 1D FEDEF | 1D FEDEF | 6/11/2019 | ||||||||||||
| Sixt SE | 424 | (7,800 | ) | -0.05 | % | Morgan Stanley & Co., LLC | 9.7 bps + 1D EONIA | 1D EONIA | 9/18/2019 | |||||||||||
| Tauron Polska Energia SA | 113,639 | (16,044 | ) | -0.09 | % | Morgan Stanley & Co., LLC | 25.26 bps + 1D COF | 1D COF | 9/18/2019 | |||||||||||
| Tekfen Holding AS | 15,471 | 16,561 | 0.10 | % | Morgan Stanley & Co., LLC | 25.26 bps + 1D COF | 1D COF | 9/20/2019 | ||||||||||||
| Tele2 AB | 18,132 | (9,970 | ) | -0.06 | % | Morgan Stanley & Co., LLC | 1M STIBO - 19 bps | 1M STIBO | 9/18/2019 | |||||||||||
| Telecom Italia SpA/Milano | 224,416 | 9,209 | 0.05 | % | Morgan Stanley & Co., LLC | 9.7 bps + 1D EONIA | 1D EONIA | 9/18/2019 | ||||||||||||
| WW Grainger Inc | 309 | (13,045 | ) | -0.08 | % | Morgan Stanley & Co., LLC | 265 bps + 1D FEDEF | 1D FEDEF | 6/11/2019 | |||||||||||
| (99,820 | ) | -0.59 | % | |||||||||||||||||
| TOTAL LONG | $ | (99,820 | ) | -0.59 | % | |||||||||||||||
| SECURITIES SOLD SHORT | ||||||||||||||||||||
| EQUITY SWAPS | ||||||||||||||||||||
| Adecco Group AG | (3,845 | ) | (9,781 | ) | -0.06 | % | Morgan Stanley & Co., LLC | 1M LIBOR-113 bps | 1M LIBOR | 9/28/2019 | ||||||||||
| ams AG | (3,746 | ) | (12,059 | ) | -0.07 | % | Morgan Stanley & Co., LLC | 1M LIBOR-113 bps | 1M LIBOR | 9/18/2019 | ||||||||||
| AngloGold Ashanti Ltd | (13,415 | ) | (24,912 | ) | -0.15 | % | Morgan Stanley & Co., LLC | 7.25 bps + 1D SABOR | 1D SABOR | 9/19/2019 | ||||||||||
| Arcelik AS | (23,667 | ) | (9,166 | ) | -0.05 | % | Morgan Stanley & Co., LLC | 25.26 bps + 1D COF | 1D COF | 9/20/2019 | ||||||||||
| CaixaBank SA | (57,118 | ) | (8,050 | ) | -0.05 | % | Morgan Stanley & Co., LLC | 9.7 bps + 1D EONIA | 1D EONIA | 9/18/2019 | ||||||||||
| CBS Corp | (2,988 | ) | (10,721 | ) | -0.06 | % | Morgan Stanley & Co., LLC | 265 bps + 1D FEDEF | 1D FEDEF | 6/11/2019 | ||||||||||
See Notes to Financial Statements.
18
| Highland Resolute Fund | Consolidated Schedule of Investments |
October 31, 2018 (Unaudited)
| Description | Contracts | Value | Percentage of Value | Swap Counterparty | Floating Rate/Fixed Rate Amount paid by Fund | Floating Rate Index | Termination Date | |||||||||||||
| EQUITY SWAPS (CONTINUED) | ||||||||||||||||||||
| Cie Financiere Richemont SA | (3,111 | ) | (11,248 | ) | -0.07 | % | Morgan Stanley & Co., LLC | 1M LIBOR - 113 bps | 1M LIBOR | 9/18/2019 | ||||||||||
| Comcast Corp | (8,278 | ) | (8,824 | ) | -0.05 | % | Morgan Stanley & Co., LLC | 265 bps + 1D FEDEF | 1D FEDEF | 6/11/2019 | ||||||||||
| Core Laboratories NV | (1,258 | ) | 24,445 | 0.14 | % | Morgan Stanley & Co., LLC | 265 bps + 1D FEDEF | 1D FEDEF | 6/11/2019 | |||||||||||
| Covestro AG | (4,290 | ) | (18,647 | ) | -0.11 | % | Morgan Stanley & Co., LLC | 9.7 bps + 1D EONIA | 1D EONIA | 9/18/2019 | ||||||||||
| dormakaba Holding AG | (155 | ) | (10,290 | ) | -0.06 | % | Morgan Stanley & Co., LLC | 1M LIBOR - 113 bps | 1M LIBOR | 9/18/2019 | ||||||||||
| Electrolux AB | (13,503 | ) | (9,738 | ) | -0.06 | % | Morgan Stanley & Co., LLC | 1M STIBO - 19 bps | 1M STIBO | 9/18/2019 | ||||||||||
| Franklin Resources Inc | (13,149 | ) | (9,476 | ) | -0.06 | % | Morgan Stanley & Co., LLC | 265 bps + 1D FEDEF | 1D FEDEF | 6/11/2019 | ||||||||||
| Givaudan SA | (109 | ) | (13,961 | ) | -0.08 | % | Morgan Stanley & Co., LLC | 1M LIBOR-113 bps | 1M LIBOR | 9/18/2019 | ||||||||||
| HeidelbergCement AG | (4,096 | ) | (9,247 | ) | -0.05 | % | Morgan Stanley & Co., LLC | 9.7 bps + 1D EONIA | 1D EONIA | 9/18/2019 | ||||||||||
| Illinois Tool Works Inc | (2,905 | ) | (8,512 | ) | -0.05 | % | Morgan Stanley & Co., LLC | 265 bps + 1D FEDEF | 1D FEDEF | 6/11/2019 | ||||||||||
| Kraft Heinz Co/The | (7,856 | ) | 11,424 | 0.07 | % | Morgan Stanley & Co., LLC | 265 bps + 1D FEDEF | 1D FEDEF | 6/11/2019 | |||||||||||
| LafargeHolcim Ltd | (6,075 | ) | (10,192 | ) | -0.06 | % | Morgan Stanley & Co., LLC | 1M LIBOR-113 bps | 1M LIBOR | 9/18/2019 | ||||||||||
| Marsh & McLennan Cos Inc | (3,636 | ) | (8,038 | ) | -0.05 | % | Morgan Stanley & Co., LLC | 265 bps + 1D FEDEF | 1D FEDEF | 6/11/2019 | ||||||||||
| Mettler-Toledo International I | (117 | ) | 7,778 | 0.05 | % | Morgan Stanley & Co., LLC | 265 bps + 1D FEDEF | 1D FEDEF | 6/11/2019 | |||||||||||
| Nasdaq Inc | (2,705 | ) | (13,175 | ) | -0.08 | % | Morgan Stanley & Co., LLC | 265 bps + 1D FEDEF | 1D FEDEF | 6/11/2019 | ||||||||||
| PNC Financial Services Group I | (2,797 | ) | (9,510 | ) | -0.06 | % | Morgan Stanley & Co., LLC | 265 bps + 1D FEDEF | 1D FEDEF | 6/11/2019 | ||||||||||
| Sanofi | (3,116 | ) | (8,330 | ) | -0.05 | % | Morgan Stanley & Co., LLC | 9.7 bps + 1D EONIA | 1D EONIA | 9/18/2019 | ||||||||||
| Smiths Group PLC | (7,965 | ) | (8,160 | ) | -0.05 | % | Morgan Stanley & Co., LLC | 70 bps + 1D SONIA | 1D SONIA | 9/18/2019 | ||||||||||
| Valeo SA | (8,631 | ) | (15,878 | ) | -0.09 | % | Morgan Stanley & Co., LLC | 9.7 bps + 1D EONIA | 1D EONIA | 9/18/2019 | ||||||||||
| (204,269 | ) | -1.21 | % | |||||||||||||||||
| TOTAL SHORT | (204,269 | ) | -1.21 | % | ||||||||||||||||
| REMAINING SECURITIES AND CASH | $ | 17,216,945 | 101.80 | % | ||||||||||||||||
| TOTAL VALUE | $ | 16,912,856 | ||||||||||||||||||
IMPALA SEGREGATED PORTFOLIO
| Description | Contracts | Value | Percentage of Value | Swap Counterparty | Floating Rate/Fixed Rate Amount paid by Fund | Floating Rate Index | Termination Date | |||||||||||||
| LONG SECURITIES | ||||||||||||||||||||
| EQUITY SWAPS | ||||||||||||||||||||
| Alphabet Inc | 732 | 113,158 | 0.30 | % | Morgan Stanley & Co., LLC | 270 bps + 1D FEDEF | 1D FEDEF | 11/27/2018 | ||||||||||||
| Caterpillar Inc | 10,722 | (271,966 | ) | -0.72 | % | Morgan Stanley & Co., LLC | 270 bps + 1D FEDEF | 1D FEDEF | 11/27/2018 | |||||||||||
| Cie Plastic Omnium SA | 6,183 | (68,783 | ) | -0.18 | % | Morgan Stanley & Co., LLC | 13 bps + 1M EURIB | 1M EURIB | 5/13/2019 | |||||||||||
| Knight-Swift Transportation Ho | 14,954 | (103,115 | ) | -0.27 | % | Morgan Stanley & Co., LLC | 270 bps + 1D FEDEF | 1D FEDEF | 11/27/2018 | |||||||||||
| Royal Caribbean Cruises Ltd | 14,612 | (138,236 | ) | -0.37 | % | Morgan Stanley & Co., LLC | 270 bps + 1D FEDEF | 1D FEDEF | 11/27/2018 | |||||||||||
| Take-Two Interactive Software | 11,129 | 285,304 | 0.76 | % | Morgan Stanley & Co., LLC | 270 bps + 1D FEDEF | 1D FEDEF | 11/27/2018 | ||||||||||||
| (183,638 | ) | -0.49 | % | |||||||||||||||||
| COMMON STOCKS | ||||||||||||||||||||
| AP Moller - Maersk A/S | 114 | $ | 144,484 | 0.38 | % | |||||||||||||||
| Apple, Inc. | 2,592 | 567,285 | 1.51 | % | ||||||||||||||||
| Belmond, Ltd. | 12,854 | 220,060 | 0.58 | % | ||||||||||||||||
| Boeing Co. | 2,998 | 1,063,870 | 2.82 | % | ||||||||||||||||
| Booking Holdings, Inc. | 146 | 273,689 | 0.73 | % | ||||||||||||||||
| Brunswick Corp. | 28,469 | 1,480,103 | 3.93 | % | ||||||||||||||||
| Canfor Corp. | 24,288 | 349,068 | 0.93 | % | ||||||||||||||||
| Constellation Brands, Inc. | 5,875 | 1,170,476 | 3.11 | % | ||||||||||||||||
| DowDuPont, Inc. | 1,342 | 72,361 | 0.19 | % | ||||||||||||||||
| First Quantum Minerals, Ltd. | 95,924 | 957,964 | 2.54 | % | ||||||||||||||||
| Hess Corp. | 22,222 | 1,275,543 | 3.38 | % | ||||||||||||||||
| Host Hotels & Resorts, Inc. | 7,683 | 146,822 | 0.39 | % | ||||||||||||||||
| Hudson, Ltd. | 13,798 | 291,690 | 0.77 | % | ||||||||||||||||
See Notes to Financial Statements.
| Semi-Annual Report | October 31, 2018 | 19 |
| Highland Resolute Fund | Consolidated Schedule of Investments |
October 31, 2018 (Unaudited)
| Description | Contracts | Value | Percentage of Value | |||||||||
| COMMON STOCKS (CONTINUED) | ||||||||||||
| Kratos Defense & Security Solutions, Inc. | 10,850 | 135,951 | 0.36 | % | ||||||||
| Macy's, Inc. | 16,086 | 551,589 | 1.46 | % | ||||||||
| MarineMax, Inc. | 33,062 | 752,491 | 2.00 | % | ||||||||
| Marriott International, Inc. | 2,632 | 307,654 | 0.82 | % | ||||||||
| Microsoft Corp. | 10,234 | 1,093,094 | 2.90 | % | ||||||||
| Norfolk Southern Corp. | 8,378 | 1,406,080 | 3.73 | % | ||||||||
| Norwegian Cruise Line Holdings, Ltd. | 6,279 | 276,716 | 0.73 | % | ||||||||
| Royal Caribbean Cruises, Ltd. | 1,385 | 145,051 | 0.38 | % | ||||||||
| SeaWorld Entertainment, Inc. | 9,409 | 245,763 | 0.65 | % | ||||||||
| Southwest Airlines Co. | 40,083 | 1,968,075 | 5.22 | % | ||||||||
| Teck Resources, Ltd. | 133,359 | 2,756,531 | 7.31 | % | ||||||||
| Thor Industries, Inc. | 15,221 | 1,059,990 | 2.81 | % | ||||||||
| United Continental Holdings, Inc. | 1,533 | 131,087 | 0.35 | % | ||||||||
| 18,843,487 | 50.00 | % | ||||||||||
| TOTAL LONG | 18,659,849 | 49.51 | % | |||||||||
| SECURITIES SOLD SHORT | ||||||||||||
| COMMON STOCKS | ||||||||||||
| AGCO Corp. | (3,775 | ) | (211,551 | ) | -0.56 | % | ||||||
| BRP, Inc. | (9,178 | ) | (369,422 | ) | -0.98 | % | ||||||
| Cracker Barrel Old Country Store, Inc. | (1,248 | ) | (198,033 | ) | -0.53 | % | ||||||
| Domtar Corp. | (2,764 | ) | (128,001 | ) | -0.34 | % | ||||||
| Genesee & Wyoming, Inc. | (2,818 | ) | (223,270 | ) | -0.59 | % | ||||||
| ISHARES STOXX EU | (11,170 | ) | (450,363 | ) | -1.20 | % | ||||||
| Japan Airlines Co., Ltd. | (7,114 | ) | (252,781 | ) | -0.67 | % | ||||||
| LafargeHolcim Ltd | (1,678 | ) | (77,565 | ) | -0.21 | % | ||||||
| Lockheed Martin Corp. | (424 | ) | (124,592 | ) | -0.33 | % | ||||||
| Louisiana-Pacific Corp. | (10,522 | ) | (229,064 | ) | -0.61 | % | ||||||
| Mondelez International, Inc. | (14,193 | ) | (595,822 | ) | -1.58 | % | ||||||
| Northrop Grumman Corp. | (920 | ) | (240,994 | ) | -0.64 | % | ||||||
| PulteGroup, Inc. | (6,368 | ) | (156,462 | ) | -0.42 | % | ||||||
| SAS AB | (110,468 | ) | (249,163 | ) | -0.66 | % | ||||||
| Terex Corp. | (5,235 | ) | (174,797 | ) | -0.46 | % | ||||||
| Toll Brothers, Inc. | (2,157 | ) | (72,605 | ) | -0.19 | % | ||||||
| Fastenal Co. | (1,307 | ) | (67,193 | ) | -0.18 | % | ||||||
| Valmont Industries, Inc. | (537 | ) | (66,754 | ) | -0.18 | % | ||||||
| (3,888,432 | ) | -10.32 | % | |||||||||
| TOTAL SHORT | $ | (3,888,432 | ) | -10.32 | % | |||||||
| REMAINING SECURITIES AND CASH | 22,912,428 | 60.81 | % | |||||||||
| TOTAL VALUE | $ | 37,683,845 | ||||||||||
See Notes to Financial Statements.
20
| Highland Resolute Fund | Consolidated Schedule of Investments |
October 31, 2018 (Unaudited)
MELCHIOR SEGREGATED PORTFOLIO
| Description | Contracts | Value | Percentage of Value | |||||||||
| LONG SECURITIES | ||||||||||||
| CONTRACTS FOR DIFFERENCE | ||||||||||||
| Abn Amro Group NV | 22,856 | $ | (57,865 | ) | -0.14 | % | ||||||
| Alten SA | 9,434 | 39,347 | 0.10 | % | ||||||||
| Ascential PLC | 118,507 | (68,048 | ) | -0.17 | % | |||||||
| ASML Holding NV | 5,698 | (110,804 | ) | -0.27 | % | |||||||
| Asr nederland NV | 26,350 | 111,988 | 0.27 | % | ||||||||
| Associated British Foods PLC | 40,035 | (78,571 | ) | -0.19 | % | |||||||
| Barclays PLC | 163,438 | (30,866 | ) | -0.08 | % | |||||||
| Bayer AG | 14,005 | (259,878 | ) | -0.63 | % | |||||||
| Befesa SA | 24,633 | (35,923 | ) | -0.09 | % | |||||||
| Cerved Group SPA | 146,323 | (327,927 | ) | -0.80 | % | |||||||
| CRH PLC | 34,012 | (92,698 | ) | -0.23 | % | |||||||
| DS Smith PLC | 194,323 | (222,913 | ) | -0.54 | % | |||||||
| Erste Group Bank AG | 23,671 | (53,918 | ) | -0.13 | % | |||||||
| Ferguson PLC | 26,037 | (266,885 | ) | -0.65 | % | |||||||
| Finecobank SPA | 79,298 | (36,697 | ) | -0.09 | % | |||||||
| Fluidra SA | 49,628 | (113,241 | ) | -0.28 | % | |||||||
| Howden Joinery Group PLC | 196,801 | (29,612 | ) | -0.07 | % | |||||||
| Inficon Holding AG | 892 | 39,992 | 0.10 | % | ||||||||
| ING Groep NV | 34,381 | (100,590 | ) | -0.25 | % | |||||||
| Inmobiliaria Colonial Socimi | 98,341 | (29,254 | ) | -0.07 | % | |||||||
| Intertrust NV | 67,605 | (102,347 | ) | -0.25 | % | |||||||
| JD Sports Fashion PLC | 146,176 | (35,146 | ) | -0.09 | % | |||||||
| Jungheinrich-Preferred Stock | 27,167 | (143,317 | ) | -0.35 | % | |||||||
| Lonza Group AG | 3,276 | 155,270 | 0.38 | % | ||||||||
| Maisons Du Monde SA | 16,022 | (103,589 | ) | -0.25 | % | |||||||
| Moncler SPA | 16,408 | (124,797 | ) | -0.30 | % | |||||||
| MTU Aero Engines AG | 3,797 | 137,458 | 0.33 | % | ||||||||
| Nestle SA | 9,569 | 80,989 | 0.20 | % | ||||||||
| Prosegur Cash SA | 717,185 | (335,202 | ) | -0.82 | % | |||||||
| Prudential PLC | 67,770 | (149,481 | ) | -0.37 | % | |||||||
| Recticel SA | 93,786 | (267,629 | ) | -0.65 | % | |||||||
| Roche Holding AG | 5,974 | 77,633 | 0.19 | % | ||||||||
| Ryanair Holdings PLC | 32,388 | (109,564 | ) | -0.27 | % | |||||||
| Shire PLC | 8,659 | 58,524 | 0.14 | % | ||||||||
| (2,585,561 | ) | -6.32 | % | |||||||||
| INDEX OPTIONS | ||||||||||||
| DJ Euro STOXX 50 EUR PRICE P @ 3100.0 NOV | 432 | 92,534 | 0.23 | % | ||||||||
| 92,534 | 0.23 | % | ||||||||||
| COMMON STOCKS | ||||||||||||
| Grifols SA | 62,102 | 1,268,119 | 3.10 | % | ||||||||
| 1,268,119 | 3.10 | % | ||||||||||
| TOTAL LONG | $ | (1,224,908 | ) | -2.99 | % | |||||||
| SECURITIES SOLD SHORT | ||||||||||||
| CONTRACTS FOR DIFFERENCE | ||||||||||||
| Babcock INTL Group PLC | (68,061 | ) | 52,041 | 0.13 | % | |||||||
| Boohoo Group PLC | (183,922 | ) | 64,217 | 0.15 | % | |||||||
| Evolution Gaming Group AB | (13,466 | ) | (58,479 | ) | -0.14 | % | ||||||
| Gima TT SPA | (16,314 | ) | 94,572 | 0.23 | % | |||||||
| Glanbia PLC | (71,201 | ) | (84,653 | ) | -0.21 | % | ||||||
| Koenig & Bauer AG | (6,052 | ) | 81,518 | 0.20 | % | |||||||
See Notes to Financial Statements.
| Semi-Annual Report | October 31, 2018 | 21 |
| Highland Resolute Fund | Consolidated Schedule of Investments |
October 31, 2018 (Unaudited)
| Description | Contracts | Value | Percentage of Value | |||||||||
| CONTRACTS FOR DIFFERENCE (CONTINUED) | ||||||||||||
| Metro Bank PLC | (7,384 | ) | 89,906 | 0.22 | % | |||||||
| Rockwool International AS | (1,757 | ) | 110,288 | 0.27 | % | |||||||
| Rolls-Royce Holdings PLC | (32,507 | ) | 60,081 | 0.14 | % | |||||||
| SKF AB | (25,280 | ) | 77,602 | 0.19 | % | |||||||
| Societe BIC SA | (6,651 | ) | (35,133 | ) | -0.09 | % | ||||||
| Stoxx Europe 600 Banks | (2,965 | ) | 72,449 | 0.18 | % | |||||||
| Teleperformance | (2,318 | ) | 35,059 | 0.09 | % | |||||||
| 559,469 | 1.36 | % | ||||||||||
| EQUITY FUTURES | ||||||||||||
| Euro STOXX 50 Dec18 | (173.44 | ) | (91,279 | ) | -0.22 | % | ||||||
| (91,279 | ) | -0.22 | % | |||||||||
| TOTAL SHORTS | $ | 468,190 | 1.14 | % | ||||||||
| REMAINING SECURITIES AND CASH | $ | 41,687,502 | 101.85 | % | ||||||||
| TOTAL VALUE | $ | 40,930,784 | ||||||||||
PSAM HIGHLAND
| Description | Contracts | Value | Percentage of Value | Swap Counterparty | Floating Rate/Fixed Rate Amount paid by Fund | Floating Rate Index | Termination Date | |||||||||||||
| LONG SECURITIES | ||||||||||||||||||||
| EQUITY SWAPS | ||||||||||||||||||||
| Altaba Inc. | 32,607 | 317,112 | 0.68 | % | Morgan Stanley & Co., LLC | 250 bps + 1D FEDEF | 1D FEDEF | 12/17/2018 | ||||||||||||
| Nex Group PLC | 130,462 | 182,743 | 0.39 | % | Morgan Stanley & Co., LLC | 65 bps + 1D SONIA | 1D SONIA | 7/18/2019 | ||||||||||||
| Shire PLC | 64,713 | 229,391 | 0.49 | % | Morgan Stanley & Co., LLC | 125 bps + 1D FEDEF | 1D FEDEF | 12/23/2019 | ||||||||||||
| 729,246 | 1.55 | % | ||||||||||||||||||
| COMMON STOCKS | ||||||||||||||||||||
| Aetna Inc. | 17,101 | $ | 2,995,682 | 6.39 | % | |||||||||||||||
| Dell Technologies Inc. | 36,151 | 2,885,112 | 6.15 | % | ||||||||||||||||
| Class V | ||||||||||||||||||||
| Eqt Corp. | 12,103 | 363,006 | 0.77 | % | ||||||||||||||||
| Express Scripts | 7,821 | 669,648 | 1.43 | % | ||||||||||||||||
| Grupo Televisa SA ADR | 18,171 | 230,708 | 0.49 | % | ||||||||||||||||
| Integrated Device | 6,079 | 251,232 | 0.53 | % | ||||||||||||||||
| Technology Inc. | ||||||||||||||||||||
| Lasalle Hotel Properties | 9,639 | 280,935 | 0.60 | % | ||||||||||||||||
| REIT | ||||||||||||||||||||
| Mckesson Europe AG | 45,398 | 1,189,417 | 2.54 | % | ||||||||||||||||
| Ocean Outdoor Ltd | 22,053 | 182,247 | 0.39 | % | ||||||||||||||||
| Qurate Retail Inc. | 36,523 | 707,491 | 1.51 | % | ||||||||||||||||
| Red Hat Inc. | 3,390 | 513,681 | 1.10 | % | ||||||||||||||||
| Riviera Resources Inc. | 36,351 | 684,266 | 1.46 | % | ||||||||||||||||
| Roan Resources Inc. | 30,906 | 443,977 | 0.95 | % | ||||||||||||||||
| Rockwell Collins Inc. | 2,998 | 338,922 | 0.72 | % | ||||||||||||||||
| Telecom Italia | 537,477 | 279,058 | 0.59 | % | ||||||||||||||||
| Twenty-First Century Fox - | 95,200 | 3,826,162 | 8.16 | % | ||||||||||||||||
| Class A | ||||||||||||||||||||
| VIVENDI | 17,591 | 375,383 | 0.80 | % | ||||||||||||||||
| Vodafone Group PLC ADR | 16,769 | 280,278 | 0.60 | % | ||||||||||||||||
| 16,497,205 | 35.18 | % | ||||||||||||||||||
See Notes to Financial Statements.
22
| Highland Resolute Fund | Consolidated Schedule of Investments |
October 31, 2018 (Unaudited)
| Description | Contracts | Value | Percentage of Value | |||||||||
| CORPORATE BONDS | ||||||||||||
| Altice Luxembourg SA | 391,502 | 319,741 | 0.68 | % | ||||||||
| Bausch Health Cos., Inc. | 614,154 | 497,783 | 1.06 | % | ||||||||
| Bruce Mansfield FE 6.85 06/01/34 | 2,669,483 | 1,157,757 | 2.47 | % | ||||||||
| GenOn Energy, Inc. | 484,176 | 293,633 | 0.62 | % | ||||||||
| GenOn Energy, Inc. | 1,075,064 | 644,863 | 1.37 | % | ||||||||
| GenOn Energy, Inc. | 1,039,325 | 623,425 | 1.33 | % | ||||||||
| Hexion, Inc. | 726,627 | 578,203 | 1.23 | % | ||||||||
| Hexion, Inc. | 244,185 | 190,803 | 0.41 | % | ||||||||
| Hexion, Inc. / Hexion Nova Scotia Finance ULC | 350,003 | 179,235 | 0.38 | % | ||||||||
| Neiman Marcus Group, Ltd. LLC | 659,848 | 349,558 | 0.74 | % | ||||||||
| Neiman Marcus Group, Ltd. LLC | 510,518 | 270,449 | 0.58 | % | ||||||||
| NOBLE GROUP ASSET CO 10.00% DUE 04/29/20 | 531,324 | 457,391 | 0.98 | % | ||||||||
| NOBLE GROUP TRADE CO 8.75% DUE 04/29/202 | 251,680 | 195,548 | 0.42 | % | ||||||||
| Ohio Air Quality Development Authority | 265,103 | 161,505 | 0.62 | % | ||||||||
| Solarcity Corp | 372,039 | 309,184 | 0.66 | % | ||||||||
| 6,229,078 | 13.55 | % | ||||||||||
| OUTSTANDING FORWARD FOREIGN CURRENCY CONTRACTS | ||||||||||||
| MXN TO USD FORWARD SD : 29-Mar-2019 | 4,498,243 | 188,382 | 0.40 | % | ||||||||
| USD TO GBP FORWARD SD : 29-Mar-2019 | 330,176 | 287,648 | 0.62 | % | ||||||||
| USD TO MXN FORWARD SD : 29-Mar-2019 | 624,679 | 544,219 | 1.16 | % | ||||||||
| 1,020,249 | 2.18 | % | ||||||||||
| TOTAL LONG | $ | 24,475,778 | 52.46 | % | ||||||||
| SECURITIES SOLD SHORT | ||||||||||||
| COMMON STOCKS | ||||||||||||
| Alibaba Group Holding | (2,959 | ) | (371,748 | ) | -0.79 | % | ||||||
| Cigna Corporation | (1,909 | ) | (360,381 | ) | -0.77 | % | ||||||
| Cvs Health Corp | (14,345 | ) | (916,882 | ) | -1.96 | % | ||||||
| Esterline Technologies Corp. | (1,631 | ) | (168,998 | ) | -0.64 | % | ||||||
| Vmware Inc. - Class A | (2,655 | ) | (331,441 | ) | -0.71 | % | ||||||
| (2,149,450 | ) | -4.87 | % | |||||||||
| CORPORATE BONDS | ||||||||||||
| NRG Energy, Inc. | (258,056 | ) | (243,935 | ) | -0.52 | % | ||||||
| Olin Corp. | (227,518 | ) | (189,507 | ) | -0.41 | % | ||||||
| Tronox, Inc. | (273,380 | ) | (222,315 | ) | -0.47 | % | ||||||
| (655,757 | ) | -1.40 | % | |||||||||
| OUTSTANDING FORWARD FOREIGN CURRENCY CONTRACTS | ||||||||||||
| GBP TO USD FORWARD SD : 29-Mar-2019 | (249,443 | ) | (279,877 | ) | -0.60 | % | ||||||
| MXN TO USD FORWARD SD : 29-Mar-2019 | (12,354,285 | ) | (517,384 | ) | -1.10 | % | ||||||
| USD TO MXN FORWARD SD : 29-Mar-2019 | (219,734 | ) | (191,431 | ) | -0.41 | % | ||||||
| (988,692 | ) | -2.11 | % | |||||||||
| TOTAL SHORT | $ | (3,793,899 | ) | -8.37 | % | |||||||
| REMAINING SECURITIES AND CASH | $ | 26,219,062 | 55.91 | % | ||||||||
| TOTAL VALUE | $ | 46,900,941 | ||||||||||
See Notes to Financial Statements.
| Semi-Annual Report | October 31, 2018 | 23 |
| Highland Resolute Fund | Consolidated Schedule of Investments |
October 31, 2018 (Unaudited)
WABR CAYMAN COMPANY LIMITED
| Description | Contracts | Value | Percentage of Value | |||||||||
| LONG SECURITIES | ||||||||||||
| COMMON STOCKS | ||||||||||||
| Agree Realty REIT ORD (NYS) | 3,391 | $ | 194,202 | 0.55 | % | |||||||
| American Assets REIT ORD (NYS) | 7,662 | 293,914 | 0.84 | % | ||||||||
| American Electric Power ORD (NYS) | 2,594 | 190,296 | 0.54 | % | ||||||||
| American Homes 4 Rent CL A REIT ORD (NYS) | 11,830 | 249,258 | 0.71 | % | ||||||||
| Caretrust REIT ORD (NMS) | 13,992 | 247,099 | 0.71 | % | ||||||||
| Comscore INC (NMQ) | 14,624 | 233,253 | 0.67 | % | ||||||||
| Entergy ORD (NYS) | 2,187 | 183,598 | 0.52 | % | ||||||||
| Equity Lifestyle Prop REIT ORD (NYS) | 1,943 | 183,983 | 0.52 | % | ||||||||
| Equity Residential REIT ORD (NYS) | 3,211 | 208,587 | 0.59 | % | ||||||||
| Evergy ORD (NYS) | 3,094 | 173,233 | 0.49 | % | ||||||||
| First Industrial Realty Trust ORD (NYS) | 8,121 | 249,315 | 0.71 | % | ||||||||
| Firstenergy ORD (NYS) | 4,277 | 159,447 | 0.45 | % | ||||||||
| Healthcar TRST of AM CL A REIT ORD (NYS) | 9,192 | 241,382 | 0.69 | % | ||||||||
| Invitation Homes ORD (NYS) | 7,525 | 164,647 | 0.47 | % | ||||||||
| Invsc S P 500 Equal Weight ETF (PSE) | 16,384 | 1,623,163 | 4.63 | % | ||||||||
| Ishares Iboxx High Yield Bond ETF (PSE) | 47,858 | 4,036,822 | 11.50 | % | ||||||||
| Ishares Iboxx INVT Grade Bond ETF (PSE) | 35,821 | 4,020,191 | 11.46 | % | ||||||||
| Kilroy Realty REIT ORD (NYS) | 2,164 | 149,056 | 0.42 | % | ||||||||
| Stag Industrial REIT ORD (NYS) | 12,938 | 342,339 | 0.98 | % | ||||||||
| VICI PPTYS ORD (NYS) | 17,487 | 377,544 | 1.08 | % | ||||||||
| 13,521,329 | 38.53 | % | ||||||||||
| CORPORATE BONDS | ||||||||||||
| AXA Equitable Holdings, Inc. | 1,060,000 | 953,748 | 2.72 | % | ||||||||
| Banco Espirito Santo SA | 700,000 | 209,875 | 0.60 | % | ||||||||
| ING Groep NV | 200,000 | 200,113 | 0.57 | % | ||||||||
| Kraft Heinz Food Co. | 340,000 | 346,225 | 0.99 | % | ||||||||
| NXP BV / NXP Funding LLC | 600,000 | 597,732 | 1.70 | % | ||||||||
| Voya Financial, Inc. | 1,600,000 | 1,384,704 | 3.94 | % | ||||||||
| 3,692,397 | 10.52 | % | ||||||||||
| GOVERNMENT BONDS | ||||||||||||
| WI 2.8750% 2028-08-15 | 404,000 | 394,433 | 1.12 | % | ||||||||
| 394,433 | 1.12 | % | ||||||||||
| FUTURES | ||||||||||||
| E-MINI S&P MIDCAP 400 Dec '18 CME | 9 | (195,875 | ) | -0.56 | % | |||||||
| ULTRA LONG TERM US TREASURY BOND Dec '18 C | 24 | (229,805 | ) | -0.65 | % | |||||||
| (425,680 | ) | -1.21 | % | |||||||||
| TOTAL LONG | $ | 17,182,479 | 48.96 | % | ||||||||
| SHORT SECURITIES | ||||||||||||
| COMMON STOCKS | ||||||||||||
| Eastgroup Properties REIT ORD (NYS) | (2,432 | ) | (232,961 | ) | -0.66 | % | ||||||
| Ishares cohen and steers REIT ETF (BAT) | (3,640 | ) | (358,940 | ) | -1.02 | % | ||||||
| National Health Investors REIT ORD (NYS) | (3,184 | ) | (233,897 | ) | -0.67 | % | ||||||
| National Retail Properties REIT ORD (NYS) | (4,186 | ) | (195,696 | ) | -0.56 | % | ||||||
| Ramco Gershensn REIT ORD (NYS) | (24,570 | ) | (326,290 | ) | -0.93 | % | ||||||
| Rexford Insudtrial Realty REIT ORD (NYS) | (4,916 | ) | (155,690 | ) | -0.44 | % | ||||||
| Sabra Health Care REIT ORD (NMS) | (11,005 | ) | (238,258 | ) | -0.68 | % | ||||||
| Select Sector UTI Sector SPDR ETF (PSE) | (3,412 | ) | (183,190 | ) | -0.52 | % | ||||||
| SPDR S&P 500 ETF (PSE) | (691 | ) | (187,005 | ) | -0.53 | % | ||||||
See Notes to Financial Statements.
24
| Highland Resolute Fund | Consolidated Schedule of Investments |
October 31, 2018 (Unaudited)
| Description | Contracts | Value | Percentage of Value | |||||||||
| COMMON STOCKS (CONTINUED) | ||||||||||||
| Sun Communities REIT ORD (NYS) | (1,888 | ) | (189,687 | ) | -0.54 | % | ||||||
| UDR REIT ORD (NYS) | (4,095 | ) | (160,483 | ) | -0.46 | % | ||||||
| Vanguard Real Estate ETF (PSE) | (4,550 | ) | (356,356 | ) | -1.02 | % | ||||||
| Vornado Realty REIT ORD (NYS) | (2,730 | ) | (185,858 | ) | -0.53 | % | ||||||
| W P Carey REIT ORD (NYS) | (3,351 | ) | (221,200 | ) | -0.63 | % | ||||||
| (3,225,511 | ) | -9.19 | % | |||||||||
| CORPORATE BONDS | ||||||||||||
| BNP Paribas | (400,000 | ) | (382,930 | ) | -1.09 | % | ||||||
| Capital One Financial Corp. | (185,000 | ) | (170,662 | ) | -0.49 | % | ||||||
| Citigroup, Inc | (205,000 | ) | (187,591 | ) | -0.54 | % | ||||||
| Deutsche Bank AG | (400,000 | ) | (366,432 | ) | -1.04 | % | ||||||
| HSBC Holdings | (200,000 | ) | (198,218 | ) | -0.56 | % | ||||||
| Lloyds BK GR PLC | (200,000 | ) | (193,466 | ) | -0.55 | % | ||||||
| Societe Generale SOC | (400,000 | ) | (390,374 | ) | -1.11 | % | ||||||
| (1,889,673 | ) | -5.38 | % | |||||||||
| TOTAL SHORT | $ | (5,115,184 | ) | -14.57 | % | |||||||
| REMAINING SECURITIES, CASH AND OTHER ASSETS AND LIABILITIES | $ | 23,026,871 | 65.61 | % | ||||||||
| TOTAL VALUE | $ | 35,094,166 | ||||||||||
Common Abbreviations:
AQR - AQR Capital Management LLC.
BBA - British Bankers Association.
EURIBOR - Euro Interbank Offered Rate.
LIBOR - London Interbank Offered Rate.
PIMCO - Pacific Investment Management Company.
S&P - Standard & Poor's.
SPDR - Standard & Poor's Depositary Receipt.
Currency Abbreviations:
AUD - Australian Dollar
EUR - Euro
GBP - Great British Pound
HKD - Hong Kong Dollar
INR - India Rupee
JPY - Japan Yen
KRW - South Korea Won
MXN - Mexico Peso
NOK - Norwegian Krone
NZD - New Zealand Dollar
PLN - Poland Zloty
SEK - Swedish Krona
SGD - Singapore Dollar
USD - United States Dollar
See Notes to Financial Statements.
| Semi-Annual Report | October 31, 2018 | 25 |
| Highland Resolute Fund | Consolidated Statement of Assets and Liabilities |
October 31, 2018 (Unaudited)
| Highland Resolute Fund | ||||
| ASSETS | ||||
| Investments, at value | $ | 257,900,317 | ||
| Unrealized appreciation on total return swap contracts | 968,904 | |||
| Deposits with brokers for securities sold short | 13,889,935 | |||
| Deposits with brokers for total return swap contracts | 84,796,508 | |||
| Cash | 70,715 | |||
| Receivable for investments sold | 1,495,074 | |||
| Dividends receivable | 252,851 | |||
| Interest receivable | 1,092,966 | |||
| Other assets | 16,256 | |||
| Total assets | 360,483,526 | |||
| LIABILITIES | ||||
| Securities sold short (Proceeds $13,423,228) | 13,554,922 | |||
| Unrealized depreciation on total return swap contracts | 826,169 | |||
| Investment advisory fees payable | 100,165 | |||
| Distributions and service fees payable | 69,523 | |||
| Payable for interest expense on securities sold short | 187,897 | |||
| Payable for interest expense on total return swap contracts | 41,925 | |||
| Payable for investments purchased | 3,316,436 | |||
| Trustee fees and expenses payable | 5,516 | |||
| Chief compliance officer fee payable | 9,179 | |||
| Principal financial officer fees payable | 1,708 | |||
| Administration fees payable | 30,614 | |||
| Transfer agent fees payable | 10,564 | |||
| Professional fees payable | 33,780 | |||
| Custody fees payable | 10,139 | |||
| Accrued expenses and other liabilities | 8,888 | |||
| Total liabilities | 18,207,425 | |||
| NET ASSETS | $ | 342,276,101 | ||
| NET ASSETS CONSIST OF | ||||
| Paid-in capital (Note 6) | $ | 340,156,449 | ||
| Total distributable earnings | 2,119,652 | |||
| NET ASSETS | $ | 342,276,101 | ||
| INVESTMENTS, AT COST | $ | 261,917,606 | ||
| PRICING OF SHARES | ||||
| Class I: | ||||
| Net Asset Value, offering and redemption price per share | $ | 10.34 | ||
| Net Assets | $ | 342,276,101 | ||
| Shares of beneficial interest outstanding (unlimited number of shares, no par value common stock authorized) | 33,094,716 | |||
See Notes to Financial Statements.
26
| Highland Resolute Fund | Consolidated Statement of Operations |
For the Six Months Ended October 31, 2018 (Unaudited)
| Highland Resolute Fund | ||||
| INVESTMENT INCOME | ||||
| Dividends | $ | 1,461,310 | ||
| Interest | 2,904,429 | |||
| Foreign taxes withheld | (4,881 | ) | ||
| Total investment income | 4,360,858 | |||
| EXPENSES | ||||
| Investment advisory fees (Note 7) | 2,757,718 | |||
| Investment advisory fee-subsidiary | 137,694 | |||
| Administration fees | 140,174 | |||
| Transfer agency fees | 31,264 | |||
| Distribution and service fees | ||||
| Class I | 18,406 | |||
| Professional fees | 34,930 | |||
| Custody fees | 36,167 | |||
| Reports to shareholders and printing fees | 3,127 | |||
| Trustee fees and expenses | 8,338 | |||
| Registration/filing fees | 15,872 | |||
| Chief compliance officer fees | 26,513 | |||
| Principal financial officer fees | 5,042 | |||
| Dividend expense on securities sold short | 75,940 | |||
| Interest expense on securities sold short | 352,568 | |||
| Other | 10,137 | |||
| Total expenses before waivers | 3,653,890 | |||
| Less fees waived/reimbursed by investment adviser (Note 7) | ||||
| Class I | (2,133,525 | ) | ||
| Waiver of investment advisory fees - subsidiary (Note 7) | (137,694 | ) | ||
| Total net expenses | 1,382,671 | |||
| NET INVESTMENT INCOME | 2,978,187 | |||
| Net realized loss on investments | (2,265,673 | ) | ||
| Net realized gain on securities sold short | 49,601 | |||
| Net realized loss on total return swap contracts | (9,815,781 | ) | ||
| Net realized loss on foreign currency transactions | (204 | ) | ||
| Total net realized loss | (12,032,057 | ) | ||
| Net change in unrealized depreciation on investments | (6,473,924 | ) | ||
| Net change in unrealized depreciation on securities sold short | (259,417 | ) | ||
| Net change in unrealized appreciation on total return swap contracts | 319,304 | |||
| Net change in unrealized appreciation on translation of assets and liabilities in foreign currency transactions | 1,466 | |||
| Total net change in unrealized depreciation | (6,412,571 | ) | ||
| NET REALIZED AND UNREALIZED LOSS ON INVESTMENTS | (18,444,628 | ) | ||
| NET DECREASE IN NET ASSETS RESULTING FROM OPERATIONS | $ | (15,466,441 | ) | |
See Notes to Financial Statements.
| Semi-Annual Report | October 31, 2018 | 27 |
| Highland Resolute Fund | Consolidated Statements of Changes in Net Assets |
| Highland Resolute Fund | ||||||||
Six Months Ended October 31, 2018 (Unaudited) | For the Year Ended April 30, 2018(a) | |||||||
| OPERATIONS | ||||||||
| Net investment income | $ | 2,978,187 | $ | 9,150,835 | ||||
| Net realized gain/(loss) | (12,032,057 | ) | 22,993,298 | |||||
| Net realized gain distributions from other investment companies | – | – | ||||||
| Net change in unrealized depreciation | (6,412,571 | ) | (8,414,624 | ) | ||||
| Net increase/(decrease) in net assets resulting from operations | (15,466,441 | ) | 23,729,510 | |||||
| TOTAL DISTRIBUTIONS (NOTE 4)(b) | ||||||||
| Class I | – | (32,044,404 | ) | |||||
| Net decrease in net assets from distributions | – | (32,044,404 | ) | |||||
| BENEFICIAL INTEREST TRANSACTIONS (NOTE 6) | ||||||||
| Shares sold | ||||||||
| Class I | 5,400,979 | 101,112,642 | ||||||
| Dividends reinvested | ||||||||
| Class I | – | 32,044,404 | ||||||
| Shares redeemed, net of redemption fees | ||||||||
| Class I | (21,523,356 | ) | (242,788,583 | ) | ||||
| Net decrease in net assets derived from beneficial interest transactions | (16,122,377 | ) | (109,631,537 | ) | ||||
| Net decrease in Net Assets | (31,588,818 | ) | (117,946,431 | ) | ||||
| NET ASSETS: | ||||||||
| Beginning of period | 373,864,919 | 491,811,350 | ||||||
| End of period | $ | 342,276,101 | $ | 373,864,919 | ||||
| (a) | Prior to August 31, 2017 the Highland Resolute Fund was known as the Redmont Resolute Fund. |
| (b) | For the prior year ended April 30, 2018, Total Distributions consisted of Net Investment Income $25,692,479, and Net Realized Gains $6,351.925. |
See Notes to Financial Statements.
| 28 |
| Highland Resolute Fund | Consolidated Financial Highlights |
For a share outstanding throughout the periods presented
| Class I | ||||||||||||||||||||||||
For the Six Months Ended October 31, 2018 (Unaudited) | For the Year Ended April 30, 2018(a) | For the Year Ended April 30, 2017(b) | For the Year Ended April 30, 2016 | For the Year Ended April 30, 2015 | For the Year Ended April 30, 2014 | |||||||||||||||||||
| NET ASSET VALUE, BEGINNING OF PERIOD | $ | 10.81 | $ | 11.14 | $ | 10.75 | $ | 11.32 | $ | 11.18 | $ | 11.05 | ||||||||||||
| INCOME/(LOSS) FROM OPERATIONS | ||||||||||||||||||||||||
| Net investment income(c) | 0.09 | 0.25 | 0.09 | 0.16 | 0.20 | 0.13 | ||||||||||||||||||
| Net realized and unrealized gain/(loss) on investments | (0.56 | ) | 0.38 | 0.45 | (0.39 | ) | 0.26 | 0.19 | ||||||||||||||||
| Total from Investment Operations | (0.47 | ) | 0.63 | 0.54 | (0.23 | ) | 0.46 | 0.32 | ||||||||||||||||
| LESS DISTRIBUTIONS | ||||||||||||||||||||||||
| Net investment income | – | (0.77 | ) | (0.13 | ) | (0.18 | ) | (0.24 | ) | (0.11 | ) | |||||||||||||
| Net realized gain on investments | – | (0.19 | ) | (0.02 | ) | (0.16 | ) | (0.08 | ) | (0.08 | ) | |||||||||||||
| Total Distributions | – | (0.96 | ) | (0.15 | ) | (0.34 | ) | (0.32 | ) | (0.19 | ) | |||||||||||||
| REDEMPTION FEES ADDED TO PAID IN CAPITAL | 0.00 | (d) | – | – | – | – | – | |||||||||||||||||
| NET INCREASE/(DECREASE) IN NET ASSET VALUE | (0.47 | ) | (0.33 | ) | 0.39 | (0.57 | ) | 0.14 | 0.13 | |||||||||||||||
| NET ASSET VALUE, END OF PERIOD | $ | 10.34 | $ | 10.81 | $ | 11.14 | $ | 10.75 | $ | 11.32 | $ | 11.18 | ||||||||||||
| TOTAL RETURN(e) | (4.35 | )% | 5.51 | % | 5.04 | % | (2.02 | )% | 4.16 | % | 2.85 | % | ||||||||||||
| RATIOS/SUPPLEMENTAL DATA | ||||||||||||||||||||||||
| Net assets, End of Period (000s) | $ | 342,276 | $ | 373,865 | $ | 491,811 | $ | 686,659 | $ | 689,266 | $ | 604,949 | ||||||||||||
| RATIOS TO AVERAGE NET ASSETS: | ||||||||||||||||||||||||
| Operating expenses excluding reimbursement/waiver(f) | 1.91 | %(g)(h)(i) | 1.94 | %(h)(i) | 1.77 | %(h)(i) | 1.69 | %(h) | 1.68 | %(h) | 1.69 | %(h) | ||||||||||||
| Operating expenses including reimbursement/waiver(f) | 0.75 | %(g)(h) | 0.82 | %(h) | 0.52 | %(h) | 0.35 | %(h) | 0.33 | %(h) | 0.29 | %(h) | ||||||||||||
| Net investment income including reimbursement/waiver(f) | 1.62 | %(g) | 2.24 | % | 0.86 | % | 1.49 | % | 1.79 | % | 1.19 | % | ||||||||||||
| PORTFOLIO TURNOVER RATE | 19 | %(j) | 79 | % | 94 | % | 27 | % | 54 | % | 114 | % | ||||||||||||
| (a) | Prior to August 31, 2017 the Highland Resolute Fund was known as the Redmont Resolute Fund. |
| (b) | Prior to August 31, 2016 the Highland Resolute Fund was known as the Redmont Resolute Fund II. |
| (c) | Calculated using the average shares method. |
| (d) | Less than $0.005 per share. |
| (e) | Total investment return is calculated assuming a purchase of a common share at the opening of the first day and a sale at closing on the last day of each period reported. Dividends and distributions, if any, are assumed for purposes of this calculation to be reinvested at prices obtained under the Fund's dividend reinvestment plan. Total returns would have been lower had certain expenses not been waived during the period. Total investment returns do not reflect brokerage commissions, if any, and are not annualized. |
| (f) | The ratios exclude the impact of expenses of the underlying funds in which the Fund invests as represented in the Schedule of Investments. |
| (g) | Annualized. |
| (h) | Dividend and interest expense on securities sold short totaled 0.23%, 0.25%, 0.10%, 0.08%, 0.10%, and 0.08% of average net assets for the six months ended October 31, 2018 and for the years ended April 30, 2018, 2017, 2016, 2015, and 2014, respectively. |
| (i) | The ratio of operating expenses excluding fee waiver/reimbursements to average net assets is calculated excluding the waived Subsidiary management fee (See Note 7 for additional detail). The ratio inclusive of that fee would be 1.99%, 2.01% and 1.81% for the six months ended October 31, 2018 and for the years ended April 30, 2018 and 2017, respectively. |
| (j) | Not Annualized. |
See Notes to Financial Statements.
| Semi-Annual Report | October 31, 2018 | 29 |
| Highland Resolute Fund | Notes to Consolidated Financial Statements |
| October 31, 2018 (Unaudited) |
1. ORGANIZATION
Financial Investors Trust (the “Trust”), a Delaware statutory trust, is an open-end management investment company registered under the Investment Company Act of 1940, as amended (“1940 Act”). The Trust consists of multiple separate portfolios or series. This semi-annual report describes the Highland Resolute Fund (the “Fund”). Effective August 31, 2017, the Fund changed its name from Redmont Resolute Fund. The Fund seeks to provide long-term total return with reduced volatility and reduced correlation to the conventional stock and bond markets. The Fund offers Class I shares.
Basis of Consolidation: Highland Resolute Cayman (the “Subsidiary”), a Cayman Islands exempted company, is a wholly owned subsidiary of the Fund. The Subsidiary’s investment objective is designed to enhance the ability of the Fund to obtain exposure to equities, financial, currency and commodities markets consistent with the limits of the U.S. federal tax law requirements applicable to registered investment companies. The Subsidiary is subject to substantially the same investment policies and investment restrictions as the Fund. The Subsidiary acts as an investment vehicle for the Fund in order to effect certain commodity-related investments on behalf of the Fund. Investments in the Subsidiary are expected to provide the Fund with exposure to the commodity markets within the limitations of Subchapter M of the Internal Revenue Code of 1986, as amended (the “Code”), and recent IRS revenue rulings, as discussed below under “Federal Income Taxes”. The Fund is the sole shareholder of the Subsidiary pursuant to a subscription agreement, and it is intended that the Fund will remain the sole shareholder and will continue to control the Subsidiary. Under the Articles of Association of the Subsidiary, shares issued by the Subsidiary confer upon a shareholder the right to wholly own and vote at general meetings of the Subsidiary and certain rights in connection with any winding-up or repayment of capital, as well as the right to participate in the profits or assets of the Subsidiary. The Fund may invest up to 25% of its total assets in shares of the Subsidiary. As a wholly owned subsidiary of the Fund, all assets and liabilities, income and expenses of the Subsidiary are consolidated in the financial statements and financial highlights of the Fund. All investments held by the Subsidiary are disclosed in the accounts of the Fund. As of October 31, 2018, net assets of the Fund were $342,276,101, of which $18,187,513 or 5.31%, represented the Fund’s ownership of all issued shares and voting rights of the Subsidiary.
2. SIGNIFICANT ACCOUNTING POLICIES
The accompanying financial statements were prepared in accordance with accounting principles generally accepted in the United States of America (“U.S. GAAP”). The preparation of financial statements in conformity with U.S. GAAP requires management to make certain estimates and assumptions that affect the reported amounts of assets and liabilities and disclosures of contingent assets and liabilities at the date of the financial statements and the reported amounts of revenue and expenses during the period. Actual results could differ from those estimates. The Fund is considered an investment company for financial reporting purposes under U.S. GAAP and follows the accounting and reporting guidance applicable to investment companies in the Financial Accounting Standards Board Accounting Standards Codification Topic 946. The following is a summary of significant accounting policies consistently followed by the Fund and Subsidiary in preparation of the financial statements.
Investment Valuation: The Fund generally values its securities based on market prices determined at the close of regular trading on the New York Stock Exchange (“NYSE”), normally 4:00 p.m. Eastern Time, on each day the NYSE is open for trading.
For equity securities and mutual funds that are traded on an exchange, the market price is usually the closing sale or official closing price on that exchange. In the case of equity securities not traded on an exchange, or if such closing prices are not otherwise available, the securities are valued at the mean of the most recent bid and ask prices on such day. Redeemable securities issued by open-end registered investment companies are valued at the investment company’s applicable net asset value, with the exception of exchange-traded open-end investment companies, which are priced as equity securities.
The market price for debt obligations is generally the price supplied by an independent third-party pricing service approved by the Board of Trustees (the “Board”), which may use a matrix, formula or other objective method that takes into consideration quotations from dealers, market transactions in comparable investments, market indices and yield curves. If vendors are unable to supply a price, or if the price supplied is deemed to be unreliable, the market price may be determined using quotations received from one or more brokers-dealers that make a market in the security. Municipal securities having a remaining maturity of greater than 60 days, are typically valued at the evaluated bid price formulated by an independent pricing service. Corporate Bonds, U.S. Government & Agency, and U.S. Treasury Bonds & Notes are valued using market models that consider trade data, quotations from dealers and active market makers, relevant yield curve and spread data, creditworthiness, trade data or market information on comparable securities, and other relevant security specific information. Mortgage-related and asset-backed securities are valued based on models that consider trade data, prepayment and default projections, benchmark yield and spread data and estimated cash flows of each tranche of the issuer. Publicly traded foreign government debt securities are typically traded internationally in the over-the-counter market and are valued at the mean between the bid and asked prices as of the close of business of that market.
30
| Highland Resolute Fund | Notes to Consolidated Financial Statements |
| October 31, 2018 (Unaudited) |
Futures contracts that are listed or traded on a national securities exchange, commodities exchange, contract market or comparable over the counter market, and that are freely transferrable, are valued at their closing settlement price on the exchange on which they are primarily traded or based upon the current settlement price for a like instrument acquired on the day on which the instrument is being valued. A settlement price may not be used if the market makes a limit move with respect to a particular commodity. Over-the-counter swap contracts for which market quotations are readily available are valued based on quotes received from independent pricing services or one or more dealers that make markets in such securities. Options contracts listed for trading on a securities exchange or board of trade are valued at the last quoted sales price or, in the absence of a sale at the mean of the last bid and asked price.
Forward currency exchange contracts have a fair value determined by the current foreign currency exchange forward rates. The foreign currency exchange forward rates are calculated using an automated system that estimates rates on the basis of the current day foreign currency exchange rates and forward foreign currency exchange rates supplied by a pricing service. Foreign exchange rates and forward foreign currency exchange rates may generally be obtained at the close of the NYSE, normally 4:00 p.m. Eastern Time.
When such prices or quotations are not available, or when Highland Associates, Inc. (the “Adviser”) believes that they are unreliable, securities may be priced using fair value procedures approved by the Board.
Fair Value Measurements: The Fund discloses the classification of its fair value measurements following a three-tier hierarchy based on the inputs used to measure fair value. Inputs refer broadly to the assumptions that market participants would use in pricing the asset or liability, including assumptions about risk. Inputs may be observable or unobservable. Observable inputs reflect the assumptions market participants would use in pricing the asset or liability that are developed based on market data obtained from sources independent of the reporting entity. Unobservable inputs reflect the reporting entity’s own assumptions about the assumptions market participants would use in pricing the asset or liability that are developed based on the best information available.
Various inputs are used in determining the value of the Fund’s investments as of the end of the reporting period. When inputs used fall into different levels of the fair value hierarchy, the level in the hierarchy within which the fair value measurement falls is determined based on the lowest level input that is significant to the fair value measurement in its entirety. The designated input levels are not necessarily an indication of the risk or liquidity associated with these investments. These inputs are categorized in the following hierarchy under applicable financial accounting standards:
| Level 1 – | Unadjusted quoted prices in active markets for identical investments, unrestricted assets or liabilities that the Fund has the ability to access at the measurement date; |
| Level 2 – | Quoted prices which are not active, quoted prices for similar assets or liabilities in active markets or inputs other than quoted prices that are observable (either directly or indirectly) for substantially the full term of the asset or liability; and |
| Level 3 – | Significant unobservable prices or inputs (including the Fund’s own assumptions in determining the fair value of investments) where there is little or no market activity for the asset or liability at the measurement date. |
| Semi-Annual Report | October 31, 2018 | 31 |
| Highland Resolute Fund | Notes to Consolidated Financial Statements |
| October 31, 2018 (Unaudited) |
The following is a summary of the inputs used to value the Fund’s investments as of October 31, 2018:
Highland Resolute Fund
| Investments in Securities at Value | Level 1 - Quoted Prices | Level 2 - Other Significant Observable Inputs | Level 3 - Significant Unobservable Inputs | Total | ||||||||||||
| Common Stocks* | $ | 33,131,362 | $ | – | $ | – | $ | 33,131,362 | ||||||||
| Closed-End Funds | 1,666,032 | – | – | 1,666,032 | ||||||||||||
| Open-End Mutual Funds | 146,326,947 | – | – | 146,326,947 | ||||||||||||
| Purchased Put Options | 128,900 | – | – | 128,900 | ||||||||||||
| Corporate Bonds* | – | 66,826,824 | – | 66,826,824 | ||||||||||||
| Short Term Investments | ||||||||||||||||
| Money Market Funds | 9,820,252 | – | – | 9,820,252 | ||||||||||||
| Total | $ | 191,073,493 | $ | 66,826,824 | $ | – | $ | 257,900,317 | ||||||||
| Other Financial Instruments** | ||||||||||||||||
| Assets: | ||||||||||||||||
| Total Return Swap Contracts | $ | – | $ | 968,904 | $ | – | $ | 968,904 | ||||||||
| Liabilities: | ||||||||||||||||
| Corporate Bonds* | – | (5,346,215 | ) | – | (5,346,215 | ) | ||||||||||
| Exchange Traded Funds Sold Short | (8,208,707 | ) | – | – | (8,208,707 | ) | ||||||||||
| Total Return Swap Contracts | – | (826,169 | ) | – | (826,169 | ) | ||||||||||
| Total | $ | (8,208,707 | ) | $ | (5,203,480 | ) | $ | – | $ | (13,412,187 | ) | |||||
| * | For detailed descriptions, see the accompanying Schedule of Investments. |
| ** | Other financial instruments are derivative instruments reflected in the Schedule of Investments. The derivatives shown in the table are reported at their unrealized appreciation/(depreciation) at measurement date, which represents the change in the contract’s value from trade date. |
For liabilities arising from overdrafts in the custody account, the carrying amount approximates fair value due to the relatively short-term maturity of these financial instruments. As of October 31, 2018, the liabilities related to custody overdrafts used level 2 inputs.
For the six month period ended October 31, 2018, the Fund did not have any securities that used significant unobservable inputs (Level 3) in determining fair value.
Trust Expenses: Some expenses of the Trust can be directly attributed to the Fund. Expenses which cannot be directly attributed to the Fund are apportioned among all funds in the Trust based on average net assets of the Fund.
Federal Income Taxes: The Fund complies with the requirements under Subchapter M of the Internal Revenue Code of 1986, as amended, applicable to regulated investment companies and intend to distribute substantially all of their net taxable income and net capital gains, if any, each year so that the Fund will not be subject to excise tax on undistributed income and gains. The Fund is not subject to income taxes to the extent such distributions are made.
As of and during the six months ended October 31, 2018, the Fund did not have a liability for any unrecognized tax benefits. The Fund files U.S. federal, state, and local tax returns as required. The Fund’s tax returns are subject to examination by the relevant tax authorities until expiration of the applicable statute of limitations, which is generally three years after the filing of the tax return for federal purposes and four years for most state returns. Tax returns for open years have incorporated no uncertain tax positions that require a provision for income taxes.
Investment Transactions and Investment Income: Investment transactions are accounted for on the date the investments are purchased or sold (trade date basis). Net realized gains and losses from investment transactions are reported on an identified cost basis. Interest income, which includes accretion of discounts and amortization of premiums, is accrued and recorded as earned. Dividend income is recognized on the ex-dividend date or for certain foreign securities, as soon as information is available to the Fund. All of the realized and unrealized gains and losses and net investment income, are allocated daily to each class in proportion its average daily net assets.
Short Sales: The Fund may make short sales of securities consistent with its strategies. A short sale is a transaction in which a Fund sells a security it does not own in anticipation that the market price of that security will decline.
32
| Highland Resolute Fund | Notes to Consolidated Financial Statements |
| October 31, 2018 (Unaudited) |
When a Fund makes a short sale, it must borrow the security sold short and deliver it to the broker dealer through which it made the short sale as collateral for its obligation to deliver the security upon conclusion of the sale. The Fund may have to pay a fee to borrow particular securities and is often obligated to pay over any accrued interest and dividends on such borrowed securities.
If the price of the security sold short increases between the time of the short sale and the time that a Fund replaces the borrowed security, the Fund will incur a loss; conversely, if the price declines, the Fund will realize a capital gain. Any gain will be decreased, and any loss increased, by the transaction costs described above. The successful use of short selling may be adversely affected by imperfect correlation between movements in the price of the security sold short and the securities being hedged.
To the extent that a Fund engages in short sales, it will provide collateral to the broker-dealer and (except in the case of short sales “against the box”) will maintain additional asset coverage in the form of segregated or “earmarked” assets determined to be liquid in accordance with procedures established by the Board and that is equal to the current market value of the securities sold short, or will ensure that such positions are covered by “offsetting” positions, until the Fund replaces the borrowed security. A short sale is “against the box” to the extent that the Fund contemporaneously owns, or has the right to obtain at no added cost, securities identical to those sold short. The Fund may engage in short selling to the extent permitted by the federal securities laws and rules and interpretations thereunder. To the extent a Fund engages in short selling in foreign (non-U.S.) jurisdictions, the Fund will do so to the extent permitted by the laws and regulations of such jurisdiction.
Distributions to Shareholders: The Fund normally pays dividends and distributes capital gains, if any, on an annual basis. Income dividend distributions are derived from interest and dividends and other income the Fund receives from their investments, including distributions of short term capital gains. Capital gain distributions are derived from gains realized when the Fund sells a security it has owned for more than a year. The Fund may make additional distributions and dividends at other times if its portfolio manager or managers believe doing so may be necessary for the Fund to avoid or reduce taxes.
3. DERIVATIVE INSTRUMENTS
Swap Contracts: The Fund may enter into swap transactions for hedging purposes or to seek to increase total return. At the present time, the Fund primarily enters into swap transactions for the purpose of increasing total return. Risks may arise as a result of the failure of the counterparty to the swap contract to comply with the terms of the swap contract. The loss incurred by the failure of a counterparty is generally limited to the net payment to be received by the Fund and/or the termination value at the end of the contract.
Therefore, the Fund considers the creditworthiness of each counterparty to a contract in evaluating potential credit risk. Additionally, risks may arise from unanticipated movements in interest rates or in the value of the underlying reference asset or index. Entering into these agreements involves, to varying degrees, market risk, liquidity risk and elements of credit, legal and documentation risk that are not directly reflected in the amounts recognized in the Statements of Assets and Liabilities.
The Fund invests in total return swaps to obtain exposure to a security or market without owning such security or investing directly in that market or to transfer the risk/return of one market (e.g., fixed income) to another market (e.g., equity) (equity risk and/or interest rate risk). Total return swaps are agreements in which there is an exchange of cash flows whereby one party commits to make payments based on the total return (coupons plus capital gains/losses) of an underlying instrument in exchange for fixed or floating rate interest payments. To the extent the total return of the instrument or index underlying the transaction exceeds or falls short of the offsetting interest rate obligation, the Fund will receive a payment from or make a payment to the counterparty. The Fund may pay or receive cash as collateral on these contracts which may be recorded as an asset and/or liability. The Fund must set aside liquid assets, or engage in other appropriate measures, to cover its obligations under these contracts. Swaps are marked to market daily using either pricing vendor quotations, counterparty prices or model prices and the change in value, if any, is recorded as an unrealized gain or loss. Upfront payments made and/or received by the Fund are recorded as an asset and/or liability and realized gains or losses are recognized ratably over the contract’s term/event, with the exception of forward starting interest rate swaps, whose realized gains or losses are recognized ratably from the effective start date. Periodic payments received or made on swap contracts are recorded as realized gains or losses. Gains or losses are realized upon termination of a swap contract and are recorded on the Statement of Operations. Swap agreements held at October 31, 2018 are disclosed in the Consolidated Schedule of Investments.
International Swaps and Derivatives Association, Inc. Master Agreements (“ISDA Master Agreements”) govern OTC financial derivative transactions entered into by the Fund and those counterparties. The ISDA Master Agreements maintain provisions for general obligations, representations, agreements, collateral and events of default or termination. Events of termination include conditions that may entitle counterparties to elect to terminate early and cause settlement of all outstanding transactions under the applicable ISDA Master Agreement. Any election to early terminate could be material to the financial statements.
| Semi-Annual Report | October 31, 2018 | 33 |
| Highland Resolute Fund | Notes to Consolidated Financial Statements |
| October 31, 2018 (Unaudited) |
Option Contracts: The Fund may enter into options transactions for hedging purposes and for non-hedging purposes such as seeking to enhance return. The Fund may write covered put and call options on any stocks or stock indices, currencies traded on domestic and foreign securities exchanges, or futures contracts on stock indices, interest rates and currencies traded on domestic and, to the extent permitted by the CFTC, foreign exchanges. A call option on an asset written by the Fund obligates the Fund to sell the specified asset to the holder (purchaser) at a stated price (the exercise price) if the option is exercised before a specified date (the expiration date). A put option on an asset written by a Fund obligates the Fund to buy the specified asset from the purchaser at the exercise price if the option is exercised before the expiration date. Premiums received when writing options are recorded as liabilities and are subsequently adjusted to the current value of the options written. Premiums received from writing options that expire are treated as realized gains. Premiums received from writing options, which are either exercised or closed, are offset against the proceeds received or amount paid on the transaction to determine realized gains or losses which are recorded on the Statement of Operations.
Futures: The Fund may enter into futures contracts for hedging purposes. A futures contract represents a commitment for the future purchase or sale of an asset at a specified price on a specified date. Upon entering into a futures contract, the Fund is required to deposit an initial margin with the broker in an amount equal to a certain percentage of the contract amount. The Fund receives from or pays to the broker, on a daily basis, an amount of cash equal to the daily fluctuation in value of the contract. Such receipts or payments are known as “variation margin,” and are recorded by the Fund as unrealized gains or losses. When the futures contract is closed, the Fund records a gain or loss equal to the difference between the value of the contract at the time it was opened and the value at the time it was closed.
The Fund’s potential losses from the use of futures extend beyond its initial investment in such contracts. The use of futures contracts involves, to varying degrees, elements of market risk in excess of the amount recognized in the Statements of Assets and Liabilities. The predominant risk is that the movement of a futures contract’s price may result in a loss, which could render the Fund’s hedging strategy unsuccessful. There is minimal counterparty credit risk since futures contracts are exchange traded and the exchange’s clearinghouse, as counterparty to all exchange traded futures, guarantees the futures against default.
Risk Exposure: The following tables disclose the amounts related to the Fund’s use of derivative instruments.
The effect of derivatives instruments on the Statements of Assets and Liabilities as of October 31, 2018 was as follows:
| Risk Exposure | Asset Derivatives Statements of Assets and Liabilities Location | Fair Value | Liability Derivatives Statements of Assets and Liabilities Location | Fair Value | ||||||||
| Highland Resolute Fund | ||||||||||||
| Equity Contracts (Total Return Swap Contracts) | Unrealized appreciation on total return swap contracts | $ | 883,521 | Unrealized depreciation on total return swap contracts | $ | 826,169 | ||||||
| Interest Rate Contracts (Total Return Swap Contracts) | Unrealized appreciation on total return swap contracts | 85,383 | Unrealized depreciation on total return swap contracts | – | ||||||||
| Equity Contracts (Purchased Options) | Investments, at value | 128,900 | N/A | N/A | ||||||||
| Total | $ | 1,097,804 | $ | 826,169 | ||||||||
34
| Highland Resolute Fund | Notes to Consolidated Financial Statements |
| October 31, 2018 (Unaudited) |
The effect of derivatives instruments on the Statements of Operations for the six months ended October 31, 2018 was as follows:
| Risk Exposure | Statement of Operations Location | Realized Gain/(Loss) on Derivatives Recognized in Income | Change in Unrealized Appreciation/(Depreciation) on Derivatives Recognized in Income | |||||||
| Highland Resolute Fund | ||||||||||
| Equity Contracts (Total Return Swap Contracts) | Net realized gain on total return swap contracts/Net change in unrealized depreciation on total return swap contracts | $ | (9,474,658 | ) | $ | 518,376 | ||||
| Interest Rate Contracts(Total Return Swap Contracts) | Net realized gain on total return swap contracts/Net change in unrealized depreciation on total return swap contracts | $ | (341,123 | ) | $ | (199,072 | ) | |||
| Equity Contracts(Purchased Options) | Net realized loss on investments/Net change in unrealized depreciation on investments | (709,683 | ) | 7,150 | ||||||
| Total | $ | (10,525,464 | ) | $ | 326,454 | |||||
Volume of Derivative Instruments for the Fund during the year ended October 31, 2018 was as follows:
| Derivative Type | Unit of Measurement | Monthly Average | ||||
| Highland Resolute Fund | ||||||
| Total Return Swap Contracts | Notional Quantity | 197,841,464 | ||||
| Purchased Options Contracts | Contracts | 282 | ||||
Certain derivative contracts and repurchase agreements are executed under either standardized netting agreements or, for exchange-traded derivatives, the relevant contracts for a particular exchange which contain enforceable netting provisions. A derivative netting arrangement creates an enforceable right of set-off that becomes effective, and affects the realization of settlement on individual assets, liabilities and collateral amounts, only following a specified event of default or early termination. Default events may include the failure to make payments or deliver securities timely, material adverse changes in financial condition or insolvency, the breach of minimum regulatory capital requirements, or loss of license, charter or other legal authorization necessary to perform under the contract.
| Semi-Annual Report | October 31, 2018 | 35 |
| Highland Resolute Fund | Notes to Consolidated Financial Statements |
| October 31, 2018 (Unaudited) |
The following table presents financial instruments that are subject to enforceable netting arrangements or other similar agreements as of October 31, 2018:
Highland Resolute Fund
Offsetting of Derivatives Assets
Gross Amounts Not Offset in the Statement of Assets and Liabilities | ||||||||||||||||||||||||
Gross Amounts of Recognized Assets | Gross Amounts Offset in the Statement of Assets and Liabilities | Net Amounts Presented in the Statement of Assets and Liabilities | Financial Instruments Available for Offset (a) | Cash Collateral Received(a) | Net Receivable Amount | |||||||||||||||||||
| Total Return Swap Contracts | $ | 968,904 | $ | – | $ | 968,904 | $ | (968,904 | ) | $ | – | $ | – | |||||||||||
| Total | $ | 968,904 | $ | – | $ | 968,904 | $ | (968,904 | ) | $ | – | $ | – | |||||||||||
Highland Resolute Fund
Offsetting of Derivatives Liabilities
Gross Amounts Not Offset in the Statement of Assets and Liabilities | ||||||||||||||||||||||||
Gross Amounts of Recognized Liabilities | Gross Amounts Offset in the Statement of Financial Position | Net Amounts Presented in the Statement of Financial Position | Financial Instruments Available for Offset (a) | Cash Collateral Pledged(a) | Net Payable Amount | |||||||||||||||||||
| Total Return Swap Contracts | $ | 826,169 | $ | – | $ | 826,169 | $ | (968,904 | ) | $ | 142,735 | $ | – | |||||||||||
| Total | $ | 826,169 | $ | – | $ | 826,169 | $ | (968,904 | ) | $ | 142,735 | $ | – | |||||||||||
| (a) | These amounts are limited to the derivative asset/liability balance and, accordingly, do not include excess collateral received/pledged. |
4. TAX BASIS INFORMATION
Tax Basis of Investments: As of October 31, 2018, the aggregate cost of investments, gross unrealized appreciation/(depreciation) and net unrealized appreciation for Federal tax purposes were as follows:
Gross Appreciation (excess of value over tax cost) | Gross Depreciation (excess of tax cost over value) | Net Unrealized Appreciation | Cost of Investments for Income Tax Purposes | ||||||||||||||
| Highland Resolute Fund | $ | 207,670,179 | $ | (213,051,146 | ) | $ | (5,380,967 | ) | $ | 263,292,325 | |||||||
Tax Basis of Distributions to Shareholders: The character of distributions made during the year from net investment income or net realized gains may differ from its ultimate characterization for federal income tax purposes. Also, due to the timing of dividend distributions, the fiscal year in which amounts are distributed may differ from the fiscal year in which the income or realized gain were recorded by the Fund.
36
| Highland Resolute Fund | Notes to Consolidated Financial Statements |
| October 31, 2018 (Unaudited) |
The tax character of distributions paid by the Fund for the fiscal year ended April 30, 2018, were as follows:
| Ordinary Income | Long-Term Capital Gains | ||||||||
| Highland Resolute Fund | $ | 25,692,479 | $ | 6,351,925 | |||||
5. SECURITIES TRANSACTIONS
Purchases and sales of securities, excluding short-term securities and U.S. Government Obligations during the six months ended October 31, 2018 were as follows:
| Fund | Purchases of Securities | Proceeds From Sales of Securities | |||||||
| Highland Resolute Fund | $ | 47,608,785 | $ | 51,902,033 | |||||
6. BENEFICIAL SHARE TRANSACTIONS
The capitalization of the Trust consists of an unlimited number of shares of beneficial interest with no par value per share. Holders of the shares of the Fund of the Trust have one vote for each share held and a proportionate fraction of a vote for each fractional share. All shares issued and outstanding are fully paid and are transferable and redeemable at the option of the shareholder. Purchasers of the shares do not have any obligation to make payments to the Trust or its creditors solely by reason of the purchasers’ ownership of the shares. Shares have no pre-emptive rights.
Transactions in common shares were as follows:
Highland Resolute Fund
| Class I: | For the Six Months Ended October 31, 2018 (Unaudited) | For the Year Ended April 30, 2018 | ||||||
| Common Shares Outstanding - Beginning of Period | 34,589,249 | 44,145,034 | ||||||
| Common Shares Sold | 501,957 | 9,179,527 | ||||||
| Common Shares Issued as Reinvestment of Dividends | – | 2,958,854 | ||||||
| Common Shares Redeemed | (1,996,490 | ) | (21,694,166 | ) | ||||
| Common Shares Outstanding - End of Period | 33,094,716 | 34,589,249 | ||||||
Shares redeemed within 30 days of purchase may incur a 2% short-term redemption fee deducted from the redemption amount. Redemption fees are reflected in the “Shares redeemed, net of redemption fees” in the Statements of Changes in Net Assets. For the six months ended October 31, 2018 and the year ended April 30, 2018, the Fund retained fees as follows:
| Fund | For the Six Months Ended October 31, 2018 (Unaudited) | For the Year Ended April 30, 2018 | |||||||
| Highland Resolute Fund | $ | 278 | $ | – | |||||
7. MANAGEMENT AND RELATED PARTY TRANSACTIONS
Investment Advisory
The Adviser, subject to the authority of the Board, is responsible for the overall management and administration of the Fund’s business affairs. Pursuant to the Investment Advisory Agreement (the “Advisory Agreement”), the Adviser is entitled to an investment advisory fee, computed daily and payable monthly of 1.50% of the average daily net assets for the Fund. The management fee is paid on a monthly basis.
The Subsidiary has entered into a separate advisory agreement (the “Subsidiary Advisory Agreement”) with the Adviser for the management of the Subsidiary’s portfolio pursuant to which the Subsidiary is obligated to pay the Adviser a management fee at the same rate that the Fund pays the Adviser for investment advisory services provided to the Fund. The Adviser has agreed to waive the advisory fee it receives from the Fund in an amount equal to the management fee paid by the Subsidiary. This waiver may not be terminated or modified without the consent of the Board.
| Semi-Annual Report | October 31, 2018 | 37 |
| Highland Resolute Fund | Notes to Consolidated Financial Statements |
| October 31, 2018 (Unaudited) |
This agreement may not be terminated or modified prior to this date except with the approval of the Board. For the six months ended October 31, 2018, this amount equaled $137,694 and is disclosed in the Consolidated Statement of Operations.
he Adviser entered into an Investment Sub-Advisory Agreement with Incline Global Management, LLC. (“Incline”), and Chatham Asset Management, LLC (“Chatham”). The Investment Sub-Advisory Agreements are in accordance with the Fund’s investment objective, policies and limitations and investment guidelines established jointly by the Adviser and the Board. The Adviser determines the allocation of the Fund’s assets among Incline and Chatham (collectively the “Sub-Advisers”) and other open-end investment companies. The Fund is not required to invest with any minimum number of sub-advisers or open-end investment companies, and does not have minimum or maximum limitations with respect to allocations of assets to the Sub-Advisers, investment strategy or market sector. Highland may change the allocation of the Fund’s assets among the available investment options, and may add or remove sub-advisers, at any time. Each Sub-Adviser is responsible for the day-to-day management of its allocated portion of Fund assets. Highland has ultimate responsibility, subject to the oversight of the Board of the Fund, to oversee the Sub-Advisers, and to recommend their hiring, termination and replacement.
Pursuant to each Investment Sub-Advisory Agreement, the Adviser pays the Sub-Advisers an annual sub-advisory management fee which is based on the Fund’s average quarterly market value of the assets managed by the Sub-Advisers. The Adviser is required to pay all fees due to Sub-Advisers out of the management fee the Adviser receives from the Fund. The following table reflects the Fund’s contractual sub-advisory fee rates.
| Sub-Advisers | Average Daily Market Value of the Fund | Contractual Sub-Advisory Fee |
| Incline Global Management, LLC | 1.25% | |
| Chatham Asset Management, LLC | 1.00% |
The Adviser has agreed, with respect to the Fund’s Class I shares, to waive the portion of its 1.50% management fee in excess of any sub-advisory fees paid by the Adviser to Sub-Adviser in connection with the Fund. This agreement is in effect September 1, 2018 through August 31, 2019. The prior agreement was in effect from September 1, 2017 through August 31, 2018. The Adviser may not discontinue this agreement to waive fees prior to August 31, 2018 without the approval of the Fund’s Board of Trustees. The Adviser is not permitted to recoup any amounts waived or reimbursed to the extent actual fees and expenses for a fiscal period are less than the expense limitation cap. Fees waived/reimbursed by adviser for the six months ended October 31, 2018 are disclosed in the Consolidated Statement of Operations.
For the six months ended October 31, 2018, the fee waivers and/or reimbursements were as follows:
| Fees Waived/ Reimbursed By Adviser | ||||
| Highland Resolute Fund - Class I | $ | (2,133,525 | ) | |
Administrator Fees and Expenses
ALPS Fund Services, Inc. (“ALPS”) serves as administrator to the Fund, and the Fund has agreed to pay expenses incurred in connection with its administrative activities. Pursuant to an Administration Agreement, ALPS provides operational services to the Fund including, but not limited to, fund accounting and fund administration and generally assists in the Fund’s operations. Officers of the Trust are employees of ALPS. The Fund’s administration fee is accrued on a daily basis and paid monthly. Administration fees paid by the Fund for the six months ended October 31, 2018 are disclosed in the Consolidated Statement of Operations.
ALPS is reimbursed by the Fund for certain out-of-pocket expenses.
Transfer Agent
ALPS serves as transfer, dividend paying and shareholder servicing agent for the Fund. ALPS receives an annual minimum fee, a fee based upon the number of shareholder accounts and is also reimbursed by the Fund for certain out-of-pocket expenses. Transfer agent fees paid by the Fund for the six months ended October 31, 2018 are disclosed in the Consolidated Statement of Operations.
Compliance Services
ALPS provides services that assist the Fund’s chief compliance officer in monitoring and testing the policies and procedures of the Fund in conjunction with requirements under Rule 38a-1 under the 1940 Act and receives an annual base fee. ALPS is reimbursed for certain out-of-pocket expenses by the Fund. Compliance service fees paid by the Fund for the six months ended October 31, 2018 are disclosed in the Consolidated Statement of Operations.
38
| Highland Resolute Fund | Notes to Consolidated Financial Statements |
| October 31, 2018 (Unaudited) |
Principal Financial Officer
ALPS receives an annual fee for providing principal financial officer services to the Fund. Principal financial officer fees paid by the Fund for the six months ended October 31, 2018 are disclosed in the Consolidated Statement of Operations.
Distributor
ALPS Distributors, Inc. (“ADI” or the “Distributor”) (an affiliate of ALPS) acts as the distributor of the Fund’s shares pursuant to a Distribution Agreement with the Trust on behalf of the Fund. Shares are sold on a continuous basis by ADI as agent for the Fund, and ADI has agreed to use its best efforts to solicit orders for the sale of Fund’s shares, although it is not obliged to sell any particular amount of shares. ADI is not entitled to any compensation for its services as Distributor. ADI is registered as a broker-dealer with the U.S. Securities and Exchange Commission.
Shareholder Services Plan
Effective December 12, 2017, the Fund has adopted a Shareholder Services Plan (the “Plan”) with respect to its Class I shares. Under the Plan, the Fund is authorized to pay banks and its affiliates and other institutions, including broker-dealers and Fund affiliates which may include the Distributor, Adviser and/or the transfer agent (“Participating Organizations”), an aggregate fee in an amount not to exceed on an annual basis 0.10% of the average daily net asset value of Class I shares of the Fund attributable to or held in the name of the Participating Organizations for its clients as compensation for providing shareholder service activities, which do not include distribution services pursuant to an agreement with Participating Organizations. Any amount of such payment not paid to the Participating Organizations during the Fund’s fiscal year for such service activities shall be reimbursed to the Fund as soon as practicable. Plan fees are included with distribution and service fees in the Statement of Operations. Fees recaptured pursuant to the Plan for the six month period ended October 31, 2018 are included as an offset to distribution and service fees as disclosed in the Statement of Operations.
8. INDEMNIFICATIONS
Under the Trust’s organizational documents, its officers and Trustees are indemnified against certain liability arising out of the performance of their duties to the Trust. Additionally, in the normal course of business, the Trust enters into contracts with service providers that may contain general indemnification clauses which may permit indemnification to the extent permissible under applicable law. The Trust’s maximum exposure under these arrangements is unknown, as this would involve future claims that may be made against the Trust that have not yet occurred.
9. NEW ACCOUNTING PROUNCEMENTS
On October 4, 2018, the SEC amended Regulation S-X to require certain financial statement disclosure requirements to conform them to U.S. GAAP for investment companies. Effective November 4, 2018, the Fund adopted disclosure requirement changes for Regulation S-X and these changes are reflected throughout this report. The Fund’s adoption of those amendments, effective with the financial statements prepared as of September 30, 2018, had no effect on the Fund’s net assets or results of operations.
In August 2018, the Financial Accounting Standards Board (“FASB”) issued Accounting Standards Update (“ASU”) 2018-13, which changes the fair value measurement disclosure requirements of FASB Accounting Standards Codification Topic 820, Fair Value Measurement. The update to Topic 820 includes new, eliminated, and modified disclosure requirements. ASU 2018-13 is effective for fiscal years beginning after December 15, 2019, including interim periods. Early adoption is permitted for any eliminated or modified disclosures. Management is currently evaluating the impact of the ASU to the Fund’s financial statements.
| Semi-Annual Report | October 31, 2018 | 39 |
| Highland Resolute Fund | Additional Information |
| October 31, 2018 (Unaudited) |
1. FUND HOLDINGS
The Fund files its complete schedule of portfolio holdings with the Securities and Exchange Commission (the “SEC”) for the first and third quarters of each fiscal year on Form N-Q within 60 days after the end of the period. Copies of the Fund’s Form N-Q are available without charge on the SEC website at http:// www.sec.gov. You may also review and copy the Form N-Q at the SEC’s Public Reference Room in Washington, D.C. For more information about the operation of the Public Reference Room, please call the SEC at 1-800-SEC-0330.
2. FUND PROXY VOTING POLICIES, PROCEDURES AND SUMMARIES
Fund policies and procedures used in determining how to vote proxies and information regarding how each of the Funds voted proxies relating to portfolio securities during the most recent prior 12-month period ending June 30 are available without charge, (1) upon request, by calling (toll- free) (866) 759-5679 and (2) on the SEC’s website at http://www.sec.gov.
40
| Highland Resolute Fund | Privacy Policy |
| October 31, 2018 (Unaudited) |
| Who We Are | |
| Who is providing this notice? | Redmont Resolute Fund |
| What We Do | |
| How does the Fund protect my personal information? | To protect your personal information from unauthorized access and use, we use security measures that comply with federal law. These measures include computer safeguards and secured files and buildings. |
| How does the Fund collect my personal information? | We collect your personal information, for example, when you |
| ● open an account | |
| ● provide account information or give us your contact information | |
| ● make a wire transfer or deposit money | |
| Why can't I limit all sharing? | Federal law gives you the right to limit only |
| ● sharing for affiliates’ everyday business purposes-information about your creditworthiness | |
| ● affiliates from using your information to market to you | |
| ● sharing for non-affiliates to market to you | |
| State laws and individual companies may give you additional rights to limit sharing. | |
| Definitions | |
| Affiliates | Companies related by common ownership or control. They can be financial and nonfinancial companies. |
| Non-affiliates | Companies not related by common ownership or control. They can be financial and nonfinancial companies. |
| ● The Fund does not share with non-affiliates so they can market to you. | |
| Joint marketing | A formal agreement between non-affiliated financial companies that together market financial products or services to you. |
| ● The Fund does not jointly market. | |
| Other Important Information | |
| California Residents | If your account has a California home address, your personal information will not be disclosed to nonaffiliated third parties except as permitted by applicable California law, and we will limit sharing such personal information with our affiliates to comply with California privacy laws that apply to us. |
| Vermont Residents | The State of Vermont requires financial institutions to obtain your consent prior to sharing personal information that they collect about you with affiliated companies and nonaffiliated third parties other than in certain limited circumstances. Except as permitted by law, we will not share personal information we collect about you with nonaffiliated third parties or other affiliated companies unless you provide us with your written consent to share such information. |
| Semi-Annual Report | October 31, 2018 | 41 |
| Highland Resolute Fund | Privacy Policy |
| October 31, 2018 (Unaudited) |
| FACTS | WHAT DOES THE FUND DO WITH YOUR PERSONAL INFORMATION? |
| Why? | Financial companies choose how they share your personal information. Federal law gives consumers the right to limit some but not all sharing. Federal law also requires us to tell you how we collect, share, and protect your personal information. Please read this notice carefully to understand what we do. |
| What? | The types of personal information we collect and share depend on the product or service you have with us. This information can include: |
| ● Social Security number and account transactions | |
| ● Account balances and transaction history | |
| ● Wire transfer instructions | |
| How? | All financial companies need to share customers’ personal information to run their everyday business. In the section below, we list the reasons financial companies can share their customers’ personal information; the reasons the Fund chooses to share; and whether you can limit this sharing. |
| Reasons we can share your personal information | Does the Fund share: | Can you limit this sharing? |
| For our everyday business purposes – such as to process your transactions, maintain your account(s), respond to court orders and legal investigations, or report to credit bureaus | Yes | No |
| For our marketing purposes – to offer our products and services to you | No | We do not share. |
| For joint marketing with other financial companies | No | We do not share. |
| For our affiliates’ everyday business purposes – information about your transactions and experiences | Yes | No |
| For our affiliates’ everyday business purposes – information about your creditworthiness | No | We do not share. |
| For nonaffiliates to market to you | No | We do not share. |
42
Page intentionally left blank

 | TABLE OF CONTENTS |
| Shareholder Letter | 1 |
| Performance Update | 11 |
| Disclosure of Fund Expenses | 17 |
| Portfolio of Investments | |
| Rondure New World Fund | 18 |
| Rondure Overseas Fund | 21 |
| Statements of Assets and Liabilities | 24 |
| Statements of Operations | 25 |
| Statement of Changes in Net Assets | |
| Rondure New World Fund | 26 |
| Rondure Overseas Fund | 27 |
| Financial Highlights | |
| Rondure New World Fund | 28 |
| Rondure Overseas Fund | 30 |
| Notes to Financial Statements | 32 |
| Disclosure Regarding Approval of Fund Advisory Agreement | 39 |
| Additional Information | 41 |
Beginning on January 1, 2021, as permitted by regulations adopted by the U.S. Securities and Exchange Commission, paper copies of the Fund’s annual and semi-annual shareholder reports will no longer be sent by mail, unless you specifically request paper copies of the reports. Instead, the reports will be made available on the Funds’ website at www.rondureglobal.com and you will be notified by mail each time a report is posted and provided with a website link to access the report.
Beginning on January 1, 2019, you may, notwithstanding the availability of shareholder reports online, elect to receive all future shareholder reports in paper free of charge. If you invest through a financial intermediary, you can contact your financial intermediary to request that you continue to receive paper copies of your shareholder reports. If you invest directly with the Funds, you can call 1.855.775.3337 to let the Funds know you wish to continue receiving paper copies of your shareholder reports.
If you already elected to receive shareholder reports electronically, you will not be affected by this change and you need not take any action. You may elect to receive shareholder reports and other communications from the Funds electronically anytime by contacting your financial intermediary (such as a broker-dealer or bank) or, if you are a direct investor, by enrolling at www.rondureglobal.com.
| Rondure Funds | Shareholder Letter |
| October 31, 2018 (Unaudited) |
Dear Fellow Shareholders,
I love this time of year. Soft snowflakes have started to fall, streaking orange pumpkins and crinkly, fallen amber leaves in fresh white. On Sunday, I put the first kindling in the fireplace, sat by the heat, and tuned into Scream 4, sparking an early start to Halloween—one of my favorite holidays.
For those of you who haven’t seen Scream 4, an ensemble cast—stars of the 90s—returns to Woodsboro, where the Ghostface killer comes back to haunt Sydney Prescott—Neve Campbell, a 90s superstar. The serial killer flick—also a tongue in cheek jab at the horror film genre—is the last in the series. The series received critical acclaim. Scream still stands as the top grossing horror film and does a fantastic job poking fun at the clichés and predictable plot twists in horror movies.
Spike Lee stated “one thing Hollywood does well is sequels.” However, Hollywood doesn’t have a monopoly on repeats. Wall Street/Mr. Market does a pretty great job of rewriting history according to the same clichés and plot twists—or lack thereof—of the Scream genre.
I have consistently told my team that I’m stuck in the Bill Murray film Groundhog Day when it comes to markets. In Groundhog Day, the great Bill Murray film of the 90s, Murray, a weatherman, finds himself reliving the same day over and over again. The market today feels to me almost exactly like it did in the late 90s—when an emerging markets (EM) crisis was brewing and the flight to US growth stocks, particularly in the technology space, drove a big bubble. It’s almost the same thing today—day after day—watching a big bubble rise in US momentum stocks—story stocks. Unlike Groundhog Day too, frothy markets almost never end on a happy note for investors who are late to the party.
Yet, the problem is no market is an exact reproduction of the past—not the perfect Groundhog Day. Instead, the market is more like a movie sequel, where yes, some of what happened in the past is repeating itself exactly, but there are a few differences that keep us alert—on our feet— trying to survive for the next plot twist for our fellow shareholders.
Let me elaborate. For simplicity, I’m only going to go back to the 1970s when I was born, but we could go back through history and recount Mr. Market’s greatest series. The 1970s was the oil boom and stagflation. It was my first exposure to Wall Street’s flicks. In the 1980s, Japan was the center of the investment universe, and Japan was going to take over the world. Then, you had the 1990s, the age of American exceptionalism. We had booming biotechnology and technology stocks.
Large capitalization stocks were on fire, and the emerging markets, with Thailand at the helm, went through a crisis of their own making from foreign currency borrowing and speculation—boom turned to bust. The 2000s or at least part of that decade was all about the BRICS (Brazil, Russia, India, China, and South Africa), as many markets that communism had closed to the world, reopened, catapulting commodities to the forefront for investors as billions of new consumers built things that the west already had. In addition, the US spurred a Global Financial Crisis (GFC) that ripped apart its status as the darling of the 90s, and today, I’m seeing the first of these market cycles repeating itself—the US exceptionalism of the 90s seems to be the main theme in the markets today, but there are some differences when I dig into what is happening in global markets—we have a 90s style technology, story stock sequel, not a perfect match.
The first difference in today’s 90s market remake is that the bubble this time around is in US small cap growth stocks (best represented by the Russell 2000 Growth Index). In the 1990s, it was in the large caps. On almost any metric, this flight to safety asset class—US small caps—looks overvalued. Some investors view these stocks as safe havens because they have very little exposure to the emerging world, which is under attack from trade wars. The problem is two-fold. First, it is a crowded trade, and second, how safe could an asset class that is not always profitable truly be? It is an asset class that is full of momentum oriented story stocks. I believe it will come to an end, and as I write this letter in late October, it appears that is already happening.
Another big difference is that Japan is actually outgrowing the rest of the world. The earnings here are great, but the market seems to look into the rearview mirror of twenty years of deflation and not recognize that Japan has changed—it is profit-focused and growing again. Yes, it has longer-term demographic issues, but valuations don’t exactly interpret booming growth.
In addition, the end of the 90s tech and biotechnology bubble was at least occurring during a more normal interest rate environment. Central banks everywhere—globally—have let growth (and I think much of that growth is a mirage created by debt bubbles and the resultant wealth effect spending) go too far—leaving rates at near zero for nearly a decade. What is different is that debt levels are much higher this time around with much lower interest rates to repair problems when they come, and they will come.
The most important similarity to the late 90s market is that there was very little role for fundamental investors or active managers. That has also been true for the post GFC world. Injections of liquidity drove up all asset prices—bad and good companies—and indices, which are fundamentally agnostic but sensitive to liquidity injections—get a massive boost from these injections. Low quality goes up. High quality goes up. Liquidity can make the worst company look great. Fundamentals have no relevance. Index flows beget liquidity runs, not quality runs. Of course, those who
| Semi-Annual Report | October 31, 2018 | 1 |
| Rondure Funds | Shareholder Letter |
| October 31, 2018 (Unaudited) |
cannot self-fund their growth and borrow during these asset injections will ultimately pay a price when the central banks become less generous and investors realize that not all companies are the same. As liquidity gets pulled, as it is now, the market should return to good old fashioned fundamentals. The simple catalyst for this could just be profit taking of big bull market beneficiaries and the unwinding of that liquidity.
It has been a great run for US markets—2010s has been a period of American exceptionalism, but we have to question if we haven’t walked straight into Groundhog Day—with credit bubbles as high or higher than they were during the GFC but in different spots—unique as with a sequel—but much the same, which could lead to the same consequences—corrections in overvalued pockets of the markets.
I had great mentors during the 90s tech bubble. They were fundamental, and they taught me to sit still and focus bottom up in all markets. They taught me to survive when market horror strikes, so we have cash in reserve in both funds for this, and we don’t stray from our process—we buy what we believe to be quality compounders with sustainable competitive advantages at the right prices. In fact, these corrections are what get us excited. We are looking to pick away at the opportunities in our favorite names, and as a reminder, we do not look at value on a P/E basis. We are huge believers in incorporating the balance sheet into our assessments. If you look at the return on equity (ROE), return on assets (ROA), and balance sheet characteristics of our portfolios, they have much higher self-funding capabilities than Mr. Market predicts. The optionality of conservatively managed balance sheets coupled with businesses that have moats allows these companies the opportunity to grow in any environment. They can buy back shares, acquire, and pay higher dividends and do this even in tough times. Our corporates are a microcosm of who we are. They won’t deliver linear, straight up growth, but they have the ability to swoop in and buy companies that handcuffed their businesses by borrowing too much in good times or that need equity to grow. The indices are heavily tilted to lower quality (as measured by ROE, ROA, debt and hence self-funding capabilities) that need the generosity of equity markets or the liquidity pumping of central banks for the businesses to do well.
Latest Quarter
There were five trades in effect this last quarter in the broad market. That was pretty much it. You had long USA small caps. Short emerging markets. Short frontier and emerging market small countries and small capitalization stocks. Short USA stocks with global exposure that might be impacted by the China trade wars and long India. These trades went really far this quarter, and yet again, it was one of the strongest non-fundamental, momentum driven global markets I have seen.
As all cap investors with a higher tilt than both peers and the index to small and mid-cap stocks where we see quality and value, we were definitely impacted by the hit to international and emerging small cap stocks. I think this is partially liquidity driven, and I’m not sure it is over. Studying the frontier market peer group, the redemptions have been like nothing I’ve seen, yet valuations are getting really good here. The problem is liquidity exacerbates the valuations to extremely low levels, as buyers disappear and redemptions come in, you are forced to sell at any price. We don’t have a lot of exposure here, but we certainly have more than peers who are tucked away in bigger capitalization stocks. We are starting to see really great value emerge in these spots of the market, and perhaps you could argue we’ve seen the liquidity cause capitulation in these asset classes or at least we are closer to a bottom than a top.
The Ghostface in the room though is simple. Interest rates are going up. USA valuations are really high, and I personally would rather hold CDs in the USA than stocks that have very low dividend yields after a very big 10 year bull market. Cash is simply a good option at higher yields, and that is the main reason markets are correcting. The alternative too is for the Fed to get more active in lifting rates, which will slow growth in the global economy. The USA consumer has been up to its old tricks, which is buying items on credit. US debt is very high, and growth cycles end simply. Either the consumer runs out of credit to borrow to buy stuff, or higher interest rates mean they can afford to buy less stuff. Either way, this cycle is long in the tooth.
International markets started this correction already—one that accounts for higher interest rates globally. Cash has been moving into the US for growth—that is getting propped up by a robust, borrowing consumer, or global investors are moving higher yielding US dollar cash. To keep cash from moving out of the local markets, countries in the emerging world must lift interest rates, which either causes a slowing in growth—their consumers can’t buy as much at higher interest rates—or a movement of their local investors into higher yielding cash issued by banks. Why risk owning equities where prices can be volatile if you get an adequate return from CDs—short-term government instruments? You either need valuations to correct and high quality stocks to yield more than the short-term instruments to draw investors back to the market or you need clear visibility on where rates are going to top out. So the emerging and international markets have been correcting already for this, and we’ve really been in a bull market for the US and a bear market for most other equities for some time—even though you have the same circumstances in the USA, where rising interest rates should be pulling investors to cash. The good news is perhaps the next decade will bring a new and improved international and emerging market story. For value investors like ourselves, we do not watch for growth—growth can be fleeting and a product of credit cycles—we watch for value to emerge in great companies. I think that is finally starting to happen, and growth always comes back at times and places you least expect if you buy high quality businesses.
| 2 | 1.855.775.3337 | www.rondureglobal.com |
| Rondure Funds | Shareholder Letter |
| October 31, 2018 (Unaudited) |
Repeat in charts—The S&P 500 Index (SPX Index) right back where we were in 1999, but with global debt levels at much higher levels.
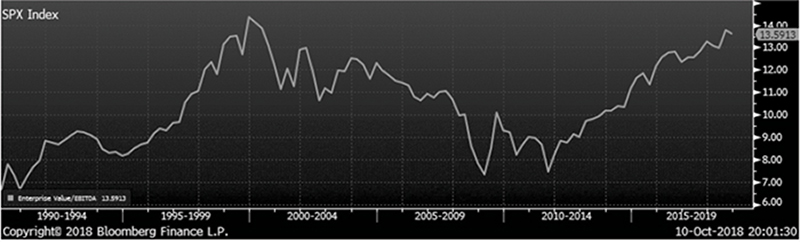
And this time it is different—the twist today from ‘99 is a more overvalued small cap growth market as measured by the Russell 2000 Growth Index (RUO Index)—this is three times more expensive than international or emerging markets, and it has really frothed up more in the “flight to safety.” The irony here is by our measures (ROE, ROA, debt) this is a lower quality set of companies.
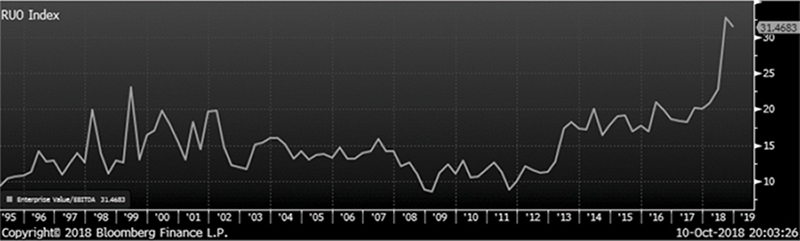
This state of global markets—the frothiness we see in the USA—is a big reason we decided to launch strategies in what we would call the value spaces—the world outside of the USA. The USA has not corrected yet for higher interest rates, and hence, the inevitable slowing growth that causes (and lower multiples as cash moves to safer instruments with higher yields). We think the rest of the world is already starting to incorporate the move up in interest rates as reflected in valuations. I will continue to discuss this as we turn to the strategies.
Rondure Overseas
While small caps have been the strongest space in the USA, it has been the opposite in the rest of the world. USA investors are riding the momentum in the riskier small cap space, while international investors have been shunning the small caps since our inception. The very good news is that we are really starting to see some decent valuations emerge in quality names. We will be taking advantage of the market sell off in this space to add. We still have just under 20% cash. We don’t think international stocks could buck a USA sell off. That said, valuations don’t look stretched either. They are basically trading slightly below their long run averages.
| Semi-Annual Report | October 31, 2018 | 3 |
| Rondure Funds | Shareholder Letter |
| October 31, 2018 (Unaudited) |
Here is the MSCI EAFE Index, representing developed markets. It doesn’t look bad. I see no ‘99 style bubble here.
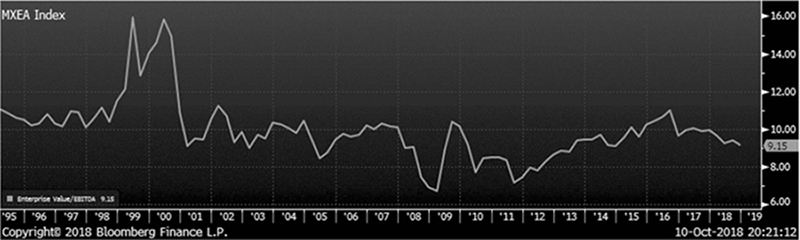
So, we are patiently biding our time with the cash in the fund, but we are getting more excited with each pull back in the market.
One of the comments we often hear is that people don’t understand our overweight to Japan. As many readers know, I’m a big fan of the culture. However, I take a more clinical, fundamental view of the market. I would never invest in a place simply because I like the country. I’m too old for that, and I’m also too competitive to do something foolish with my own money and with client capital. I also haven’t expensed any of my trips to the firm yet, so there is no silver lining for my purse strings—free vacations. So what do I see? I see a country where I can find many companies that fit our balance sheet margin of safety. The corporates are flush with cash. In addition, what I think most people looking in the deflationary rear view mirror are missing is that Japan is growing earnings.
According to Nicholas Smith of CLSA Ltd. in his recent piece from September 24, 2018, entitled “Abe’s untold story: ‘ il sorpasso,’” Japan has outstripped the USA on earnings per share (EPS) growth. All many investors focus on is the Abe reflation story—his efforts in bringing prices back to more desirable levels—but the real story here is one of profit growth, not a more opaque macro story. EPS growth for Japan has more than made up for the decline in the 1990s as Japan’s property bubble unwound, and now the EPS of the TOPIX has risen more than the S&P EPS since 1993. That’s a pretty powerful growth story. The good news too is that many companies have saved the excess profit generated during that time frame leaving us with a margin of safety on the balance sheet. In addition, 40% of TOPIX companies trade below tangible book value. That’s more than 4x the percentage of Europe, where market ROE is broadly the same as the TOPIX.
Why do I think this happens—Japan stays cheap? Because Japan is much harder for Western minded investors to understand. The weather is volatile, so you don’t tend to get perfectly linear quarterly growth, and the corporates tend to reserve cash for rainy days. The culture embraces silence too, so you don’t often hear high conviction growth tales like we do in the West. You need experience and a good understanding of mosaic theory to do well in Japan.
You can stock pick your way to success too. The key is there is a lot of cash on the balance sheets to use for bleaker times. I think the case is pretty strong for Japanese corporates to continue slimming down their structures (Kirin), investing in growth (Unicharm), and paying higher dividends (almost all) and for ROEs to go higher. ROEs will likely go higher here. Japanese companies are strongly improving the “G” in ESG, so I am pretty optimistic on many stocks in this market for the long term.
| 4 | 1.855.775.3337 | www.rondureglobal.com |
| Rondure Funds | Shareholder Letter |
| October 31, 2018 (Unaudited) |
Yet here is the TOPIX (TPX Index) multiple:
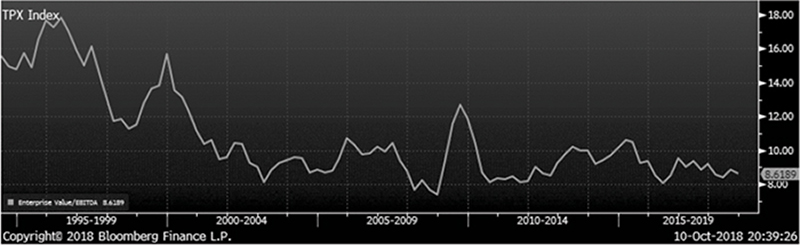
Plus the MSCI Japan Index (MXJP Index) paints a very similar picture:
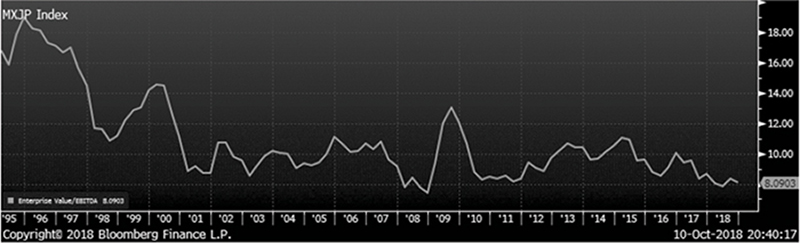
So as a value investor I really love this market, and would only invest client capital (along with mine) in something I could strongly justify on fundamentals. Yes, I understand the government has debt. Given that most of it is owned by locals, this isn’t a systemic risk to the global system. In addition, the corporates and consumer are plum with cash, so I think you have to look at the country holistically. The picture of balance sheets in totality is why the Japanese yen continues to be a huge flight to safety trade on down days. It is a good fit for us.
We have been starting to find ideas in Europe as the market pulls back. I’ve mentioned before that balance sheet margin of safety is important to us. We look at balance sheets first, and then we move to the cash flow statement, where we look for attributes that suggest sustainable competitive advantages. I believe Japanese corporates, with their recent long bout of deflation, have a tendency to preserve cash for risk mitigation, while European companies have feasted at the trough of cheap debt for a much longer period of time. There are many corporates in Europe with great attributes of compounding quality, however there is some element of taking debt too far—the best business moat can easily be unraveled by good competition against a lousy balance sheet. In addition, the story of a recovering Europe has just made valuations more challenging than in Japan—people were trying to get in front of a recovery that in my book has likely already happened. I don’t see how you can have the world’s biggest economy—the USA—curtailing growth through interest rates and the world’s second biggest economy—China—putting on the capital expenditure brakes to prepare for an extended trade war—and have accelerating global growth. That math doesn’t work for me, and in this environment we lean on the Quality and the Value in the Quality, Value, Growth (QVG) growth equation, because the short-run G is likely to slow. Since we measure growth as the sustainability of growth in the equation R*ROE, that slowdown in growth is generally just cyclical, so we absolutely love the ensuing market environment—correction—to pick away at what we believe to be the best companies.
| Semi-Annual Report | October 31, 2018 | 5 |
| Rondure Funds | Shareholder Letter |
| October 31, 2018 (Unaudited) |
For comparison, here is the MSCI Europe Index (MXEU Index) as an illustration of value:
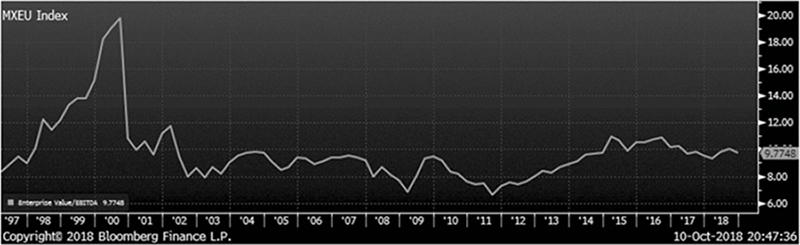
While it is no Russell 2000 Growth, where I think multiples look stretched, it is also no Japan, where valuations are quite reasonable. Also, as you can see when you look at ‘99 valuations in Europe, the movie script here has departed from the ‘99 tech bubble story. Frothy markets are a US-only thing. I’d lump India into that mix as well. It was the emerging flight to safety poster child.
So in summary, we will use the sell offs in all markets that we are seeing at the start of Q4 to start to pick away at our favorite ideas. We have also used the turbulence to shorten our list. I can envision a tighter future portfolio. The portfolio stocks are neutral cash and if you add the cash we have for a rainy day, we believe the portfolio is in good shape to take advantage of the market pullbacks. We even have our eyes on a few superb cyclicals. We believe net cash to market capitalization indicators are where you step to the plate on these names—a cycle is ahead. We are ready.
Rondure New World
We have a very defensive portfolio of stocks, so I am surprised we haven’t hung in better this year—at least on a relative basis. Our portfolio companies have much better ROE and ROA than the index. The portfolio companies are net cash—strongly—so they have a big margin of safety in bad times. We are paying more for that, but the premium looks normal to me for the quality attributes of the portfolio (i.e. the sustainability of growth and returns + the moats), so the only thing I could put my finger on was the small cap and small country tilt of the portfolio. The simple explanation for the disappointing performance is that we were underweight energy, which showed even stronger performance than in the developed world. Energy raged. We owned one stock here—Lukoil—that has a solid balance sheet and improving governance, and it outperformed the strong energy space, which we were underweight. In addition, we were overweight consumer staples, and they have yet to show their defensive stripes. The space underperformed. I think even more simplistically though we have struggled thanks to our all cap position, and especially our weight to small caps and small countries.
As with the developed world, small caps have really just been tossed out this year, and we have between a 35-40% weight to the small and mid-cap stocks. I do not believe anything uniquely fundamental is happening to these companies either. I believe a number of funds, especially when I stare at the frontier universe, have seen very large redemptions. These funds have to sell regardless of valuation, and so I think, the small caps and small countries have been hit with liquidity issues—outflows begetting bad performance. We will take advantage of this with the cash we have on the sidelines if market conditions worsen. We will buy into the weakness. We have several names on a high priority list, and we absolutely think Yum China’s latent value potential—cash to market-cap, ability to take on debt to grow, and latent potential from franchising, not to mention its nascent growth story over the long haul versus Yum in the USA—is tremendous. While the stock might go down further as growth slows with a global cyclical peak, I believe the look-through the cycle potential of the stock is tremendous.
If you look at the EM asset class in general, it is trading at decent not fabulous valuations. Here is the MSCI Emerging Markets (EM) Index—this is a big cap index with stocks like Tencent, Alibaba, Samsung, Taiwan Semiconductor, Baidu, Naspers and a lot of Chinese banks. As of today, this index has over a 50% weight to China, Taiwan, and South Korea. The latter two are hard to even call emerging markets. A prudent investor—one who has been on the ground in these countries—would call these developed. However, I believe if they were removed from the MSCI EM Index (as they should be) there would be little justification in calling the MSCI EM Index diversified—it would be highly skewed to China, which has proven to be volatile through the years, but for purposes of simplistic valuation comments, here is the valuation of the MSCI EM Index (MXEF Index):
| 6 | 1.855.775.3337 | www.rondureglobal.com |
| Rondure Funds | Shareholder Letter |
| October 31, 2018 (Unaudited) |
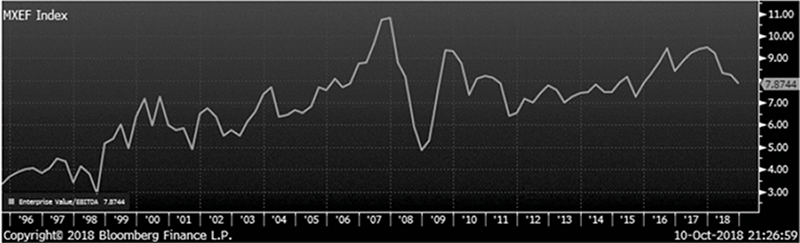
It is very different in terms of composition than it was in the late ‘90s, but for simplicity sake again, it isn’t grossly overvalued nor is it as cheap as it has been at other points in history.
The aggregate country set obfuscates what lies underneath the surface. The developing world is getting much more interesting in certain pockets. There is value in high quality emerging!
Frontier, as represented by the MSCI Frontier Index (MXFM Index), is trading well below long run averages:
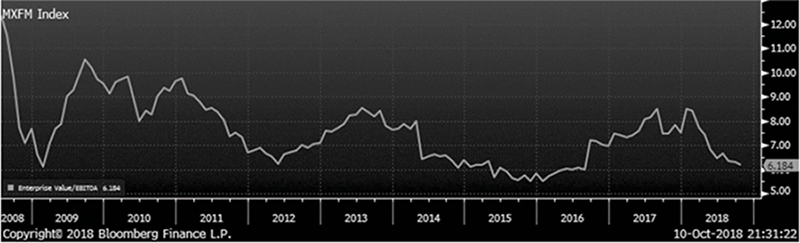
Of course the caveat here again is that this index is quite different today than it was during the GFC. The index used to have big weights to the United Arab Emirates (UAE) and Qatar—dollar pegged countries that tend to hold in well in a strong dollar environment (good hiding spots). Today, the big weights are Kuwait, Vietnam, and Argentina. Argentina is graduating to EM status, while the International Monetary Fund (IMF) is coming into help a collapsing currency. As usual, I’m not sure how the index constituents are rewarding graduation status. A collapsing currency would have received a fail in even my easiest cakewalk college class. It should be relegated to frontier. The powers that be—the MSCI—last graduated Pakistan and that has ended in another IMF request for bail out this week. I see little rhyme or reason anymore to what is developed, emerging, frontier…mainly there are liquidity differentials (i.e. the smaller countries can’t take on the passive flows).
The easier way to judge values for emerging small countries and for frontier markets is to look at the more inclusive MSCI Frontier Emerging Markets Index (MXFEM Index), which includes the smaller emerging markets like Colombia and the Philippines.
| Semi-Annual Report | October 31, 2018 | 7 |
| Rondure Funds | Shareholder Letter |
| October 31, 2018 (Unaudited) |
Here you can see that valuations are lower than any other time outside of the GFC:
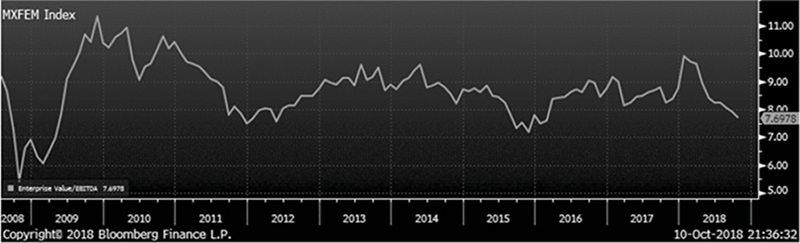
As with our developed market strategy (Rondure Overseas), we have over 10% cash in our Rondure New World (developing markets) strategy. We are slowly, patiently waiting for quality to pull back, but as you can see from the above valuation charts, there are pockets of the market that are getting very reasonable. In light of this environment, we are tightening our portfolio list. Adding where we see the best companies at reasonable price tags, and we are using our nimble size and all cap status to buy into quality in weak pockets of the market—there are particularly interesting pockets in smaller caps and small countries.
Many of you know I have a fondness for consumer stocks. I like their defensive attributes, and they typically have strong brands and low capital intensity, so strong cash flow characteristics. There has been an argument that the moats for these businesses are fading, as the consumer opts for healthier products and more customization (i.e. more expensive consumer goods). I do not believe that the old school staples are broken though. If I look back at the late 90s, one of the consumer tendencies that was exhibited was the wealth effect (money from stock market booms but also from housing market booms) made the consumer feel rich (at least on paper), so they overspent and traded up and even used credit to do this as the good times kept rolling. In addition, the job market felt very safe. Then the tech bubble popped, and the consumer went back to more basic affordable items—the stuff they could pay for with cash from wages and savings. It is my hypothesis that this wealth effect has been even stronger this go around thanks to the greatest Bull Run in history, and the consumer is trading up yet again. It’s very hard to measure, but optically, I see the consumer walk down to the very expensive local coffee shop vs. brewing a cup at home. How much of this is done with cash versus borrowed money or stock market winnings? If I am really in a 90s feedback loop or at least a sequel, then the consumer will trade back down. This also has earnings implications for anything that has benefitted. I’d love to put together an adult toy indicator—RV spending, boat spending, and other toys that promise instant gratification are a clear 90s parallel.
The result here is that boring slow growth stocks have struggled. Ditto in the late 90s. Do we have a big pocket of companies that were too boring for a momentum growth markets just like we did in ‘99? I think so. If anything, the current sequel will be to bring not sexy back. That’s what happened when ‘99 went bust. Basic, boring, cash flow businesses did well. You had a return to fundamentals. I think we will have a return to fundamentals sequel, and we are seeing strong signs of this at the start of Q4.
The thing I worry most about as a New World investor is that last year was probably just a dead cat bounce in a long emerging bear market. The good news is this long bear market has gradually given us much better valuations for the long term. This is elevating my level of enthusiasm for EM. Of course, if the US goes into a tailspin, which I think will be caused by higher wages, higher interest rates, and hence a retraction in growth, then everything else goes down too. Hopefully though, the rest of the world is closer to the bottom than to the top. India is an exception here. It is still expensive, but as Q4 has ensued, even India is pulling back—and swiftly. I believe reasonable valuations in India = full capitulation in all of emerging markets. We are ready and excited for this.
Conclusion
Gale Weathers (Courtney Cox from Friends) in the Scream series was a big part of my 90s, and the US stock market also seems to be in sequel mode—repeating a lot of what I saw in the 90s when America was a one-way bet and the emerging world was in correction mode, the consumer was spending thanks in part to easy credit but also thanks to a wealth effect from the stock market and housing prices, and the technology and biotechnology spaces—lots of story stocks with no profit to back the stock runs—were on fire. It is the 90s all over again with some unique attributes—a sequel not Groundhog Day.
| 8 | 1.855.775.3337 | www.rondureglobal.com |
| Rondure Funds | Shareholder Letter |
| October 31, 2018 (Unaudited) |
In addition if you think about the history of the market, basically by decades, we have a remake of the 90s. This is one of the few times in my life span that what worked in one decade worked in another. You have to beg the question will the 2020s (or before if you think discounting works in the market) will not be a repeat of the post-GFC period of exceptional US stock markets (not particularly exceptional growth—Japan has outpaced us). We do live in a phenomenal country, but valuations suggest that the exceptional US stock market is unlikely to continue at this pace. I think the future will be different, and given where valuations are sitting, the Rest of the World stands a strong shot as central characters in the next market series—could we remake the 80s with a Japan boom or the 2000s with EM and frontier in the lead. Valuations might not have completely capitulated, but I think we are closer to a bottom than a top outside of the USA.
So in summary, in the post-GFC landscape, it has been pretty much a one way trade based on constant global injections of liquidity—a remake of the American exceptionalism of the 90s with slightly different pockets of greed. This has been an awful period of time for fundamental, value investors. If you think about our process, which is focusing on great companies at good prices or even great prices, an environment where all assets get propped up by constant global Federal Reserve asset injections is not a great environment for those of us who pick stocks. Liquidity props up the good and the bad and is a boon for passive investing. I think it is also deflationary as the survival of the weak doesn’t allow any pricing power for the strong. You need the weak to fail for the strong to really prevail.
The horror genre has some pretty clear rules for survival, and if I think about the 90s and my lessons learned from great mentors, the rules were pretty simple. Stick to your fundamental process. Buy great companies. Pay reasonable prices. Be willing to lose in the short run in hopes of winning in the long run when markets go crazy. Don’t chase momentum where there is no value (so unlike the horror movie cliché-DO NOT RUN) and reserve some cash to buy into weakness. While markets may seem scary right now outside of the USA, we love this. We are getting a crack at what we believe to be the best—it is a treat and we look forward to deploying the cash we have on the side lines in search of compounding quality companies at reasonable valuations. It could get worse, but valuations suggest the rest of the world could get meaningfully better in the future— the next story in the Wall Street series. Thank you for your confidence in us.
Sincerely,
Laura Geritz, CFA
CEO, Founder, and Portfolio Manager
The views in this investor letter were those of the Fund Manager as of the letter’s publication date and may not reflect her views on the date this letter is first distributed or anytime thereafter. These views are intended to assist readers in understanding the Fund’s investment methodology and do not constitute investment advice.
RISKS: Investing in foreign securities entails special risks, such as currency fluctuations and political uncertainties, which are described in more detail in the prospectus. Investments in emerging and frontier markets are subject to the same risks as other foreign securities and may be subject to greater risks than investments in foreign countries with more established economies and securities markets. Diversification does not eliminate the risk of experiencing investment loses.
Must be preceded or accompanied by a prospectus.
The S&P 500 Index is widely regarded as the best single gauge of large-cap U.S. equities. There is over USD 7.8 trillion benchmarked to the index, with index assets comprising approximately USD 2.2 trillion of this total. The index includes 500 leading companies and captures approximately 80% coverage of available market capitalization.
The Russell 2000 Growth Index measures the performance of the Russell 2000 companies with higher price-to-book ratios and higher forecasted growth values.
Tokyo Stock Price Index, commonly known as TOPIX, along with the Nikkei 225, is a stock market index for the Tokyo Stock Exchange in Japan, tracking all domestic companies of the exchange's First Section. It is calculated and published by the TSE.
The MSCI Japan Index is designed to measure the performance of the large and mid cap segments of the Japanese market. With 322 constituents, the index covers approximately 85% of the free float-adjusted market capitalization in Japan.
The MSCI Europe Index captures large and mid cap representation across 15 Developed Markets (DM) countries in Europe. With 445 constituents, the index covers approximately 85% of the free float-adjusted market capitalization across the European Developed Markets equity universe. DM countries in Europe include: Austria, Belgium, Denmark, Finland, France, Germany, Ireland, Italy, the Netherlands, Norway, Portugal, Spain, Sweden, Switzerland and the UK.
| Semi-Annual Report | October 31, 2018 | 9 |
| Rondure Funds | Shareholder Letter |
| October 31, 2018 (Unaudited) |
The MSCI Emerging Markets Index captures large and mid cap representation across 24 Emerging Markets (EM) countries. With 1,151 constituents, the index covers approximately 85% of the free float-adjusted market capitalization in each country. EM countries include: Brazil, Chile, China, Colombia, Czech Republic, Egypt, Greece, Hungary, India, Indonesia, Korea, Malaysia, Mexico, Pakistan, Peru, Philippines, Poland, Qatar, Russia, South Africa, Taiwan,Thailand, Turkey and United Arab Emirates.
The MSCI Frontier Markets Index captures large and mid cap representation across 29 Frontier Markets (FM) countries*. The index includes 115 constituents, covering about 85% of the free float-adjusted market capitalization in each country. Frontier Markets countries include: Argentina, Bahrain, Bangladesh, Burkina Faso, Benin, Croatia, Estonia, Guinea-Bissau, Ivory Coast, Jordan, Kenya, Kuwait, Lebanon, Lithuania, Kazakhstan, Mauritius, Mali, Morocco, Niger, Nigeria, Oman, Romania, Serbia, Senegal, Slovenia, Sri Lanka, Togo, Tunisia and Vietnam.
The MSCI Frontier Emerging Markets (FEM) Index captures large and mid cap representation across 34 Frontier Emerging Markets countries*. The index includes 158 constituents, covering about 85% of the free float-adjusted market capitalization in each country. FEM countries include: Argentina, Bahrain, Bangladesh, Burkina Faso, Benin, Colombia, Croatia, Estonia, Egypt, Guinea-Bissau, Ivory Coast, Jordan, Kenya, Kuwait, Kazakhstan, Lebanon, Lithuania, Mauritius, Mali, Morocco, Niger, Nigeria, Oman, Peru, Philippines, Pakistan, Romania, Serbia, Senegal, Slovenia, Sri Lanka, Togo, Tunisia and Vietnam.
The MSCI EAFE Index is designed to represent the performance of large and mid-cap securities across 21 developed markets, including countries in Europe, Australasia and the Far East, excluding the U.S. and Canada. The MSCI Emerging Markets Index is designed to represent the performance of large and mid-cap securities across 24 Emerging Markets (EM) countries. The MSCI EM Small Cap Index is designed to represent the performance of small-cap securities across 24 Emerging Markets (EM) countries. You cannot invest directly in this or any index.
MSCI ACWI Ex USA NR USD is designed to represent the performance of large and mid cap securities across 22 of 23 Developed Markets (DM) countries (excluding the US) and 24 Emerging Markets (EM) countries. With 2,154 constituents, the index covers approximately 85% of the global equity opportunity set outside the US.
Indexes are unmanaged and cannot be invested into directly. Past performance is not indicative of future results.
EV/EBITDA is valuation multiple used to measure the value of a company. It is the most widely used valuation multiple based on enterprise value and is often used in conjunction with the Price/Earnings ratio to determine the fair market value of a company
Tangible Book Value is the total net asset value of a company (book value) minus the company’s intangible assets and goodwill.
Reflation is the restoration of deflated prices to a more desirable level.
Mosaic Theory is a method of analyzing securities that involves piecing together bits of information about a company in order to reach a conclusion about the company.
The Rondure New World Fund has been categorized in the Diversified Emerging Markets peer group by Morningstar. Diversified emerging-markets portfolios tend to divide their assets among 20 or more nations, although they tend to focus on the emerging markets of Asia and Latin America rather than on those of the Middle East, Africa, or Europe. These portfolios invest predominantly in emerging market equities, but some funds also invest in both equities and fixed income investments from emerging markets.
The Rondure Overseas Fund has been included in the Foreign Large Growth category by Morningstar. Foreign large-growth portfolios focus on high-priced growth stocks, mainly outside of the United States. Most of these portfolios divide their assets among a dozen or more developed markets, including Japan, Britain, France, and Germany. These portfolios primarily invest in stocks that have market caps in the top 70% of each economically integrated market (such as Europe or Asia ex-Japan). Growth is defined based on fast growth (high growth rates for earnings, sales, book value, and cash flow) and high valuations (high price ratios and low dividend yields). These portfolios typically will have less than 20% of assets invested in U.S. stocks.
Margin of safety refers to any conservative allowance used by value investors in effort to protect their capital and portfolios from downside risk.
Upside/Downside capture is the degree to which an investment has captured the positive or negative performance of a given benchmark. An upside capture ratio over 100 indicates a fund has generally outperformed the benchmark during periods of positive returns for the benchmark. Meanwhile, a downside capture ratio of less than 100 indicates that a fund has lost less than its benchmark in periods when the benchmark has been in the red.
Stagflation is slow economic growth combined with high rates of inflation, or rising prices.
The CFA designation is owned by the CFA institute.
The Rondure Funds and Grandeur Peak Funds are distributed by ALPS Distributors Inc. (ADI). ADI is not affiliated with Rondure Global Advisors or Grandeur Peak Global Advisors.
| 10 | 1.855.775.3337 | www.rondureglobal.com |
| Rondure New World Fund | Performance Update |
| October 31, 2018 (Unaudited) |
Annualized Total Return Performance for the periods ended October 31, 2018
Since Inception(a) | Expense Ratio(b) | ||||
| 6 Months | 1 Year | Gross | Net(c) | ||
| Rondure New World Fund - Institutional (RNWIX) | -16.00% | -12.20% | -3.54% | 1.53% | 1.10% |
| Rondure New World Fund - Investor (RNWOX) | -16.19% | -12.44% | -3.83% | 1.82% | 1.35% |
| MSCI EM (Emerging Markets) TR USD Index(d) | -16.31% | -12.19% | 1.35% | ||
Performance data quoted represents past performance. Past performance does not guarantee future results. Investment return and principal value of an investment will fluctuate so that an investor’s shares, when sold or redeemed, may be worth more or less than the original cost. The Fund imposes a 2.00% redemption fee on shares held for less than 60 days. Current performance data may be higher or lower than actual data quoted. For the most current month-end performance data, please call 1-855-775-3337.
The table does not reflect the deduction of taxes a shareholder would pay on Fund distributions or redemption of Fund shares.
Subject to investment risks, including possible loss of the principal amount invested.
Returns for periods less than 1 year are cumulative.
| (a) | Fund inception date of May 1, 2017. |
| (b) | Ratios as of the Prospectus dated August 31, 2018 and may differ from the ratios presented in the Financial Highlights. |
| (c) | Rondure Global Advisors, LLC (the “Advisor”), has agreed to waive and/or reimburse fees or expenses in order to limit Total Annual Fund Operating Expenses After Fee Waiver/ Expense Reimbursement (excluding acquired fund fees and expenses, brokerage expenses, interest expenses, taxes and extraordinary expenses) to 1.35% and 1.10% of the Fund’s average daily net assets for the Fund’s Investor Class Shares and Institutional Class Shares, respectively. This agreement (the “Expense Agreement”) is in effect through August 31, 2019. The Advisor will be permitted to recover, on a class-by-class basis, expenses it has borne through the Expense Agreement to the extent that a Fund’s expenses in later periods fall below the expense cap in effect at the time of waiver or reimbursement. However, such recapture payments may not cause the Fund’s expense ratio (after recapture) to exceed the lesser of (i) the expense cap in effect at the time of the waiver and (ii) the expense cap in effect at the time of the recapture. Notwithstanding the foregoing, the Fund will not be obligated to pay any such deferred fees and expenses more than three years after the date of the waiver or reimbursement. The Expense Agreement may not be terminated or modified by the Advisor prior to August 31, 2019, except with the approval of the Fund’s Board of Trustees. |
| (d) | The MSCI Emerging Markets Total Return USD Index is an unmanaged total return index, reported in U.S. Dollars, based on share prices and reinvested dividends of approximately 800 companies from 24 emerging market countries. The Index is not actively managed and does not reflect any deductions for fees, expense, or taxes. An investor may not invest directly in the Index. |
| Semi-Annual Report | October 31, 2018 | 11 |
| Rondure New World Fund | Performance Update |
| October 31, 2018 (Unaudited) |
Growth of $10,000 for the period ended October 31, 2018
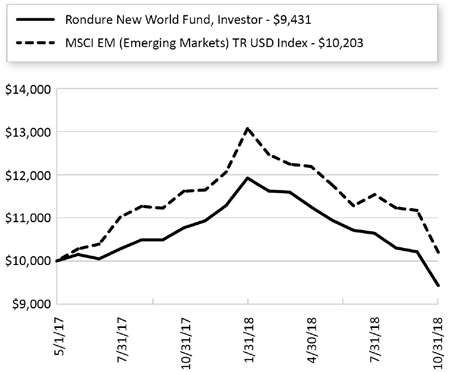
The chart shown above represent a hypothetical investment of $10,000 in the Fund’s Investor Class shares for the period from inception to October 31, 2018. All returns reflect reinvested dividends, but do not reflect the deduction of taxes that an investor would pay on distributions or redemptions.
Investing in the Fund is subject to investment risks, including possible loss of the principal amount invested.
The Fund also offers Institutional Class shares, performance for which is not reflected in the graphs above. The performance of Institutional Class shares may be higher or lower than the performance of the Investor Class shares shown in the graphs above based upon differences in fees paid by shareholders investing in the Investor Class shares and Institutional Class shares.
| 12 | 1.855.775.3337 | www.rondureglobal.com |
| Rondure New World Fund | Performance Update |
| October 31, 2018 (Unaudited) |
| Regional Allocation (as a % of Net Assets)* | |
| Asia ex Japan | 54.3% |
| North America | 11.3% |
| Africa/Middle East | 8.1% |
| Latin America | 6.4% |
| Europe | 5.1% |
| Japan | 1.2% |
| Cash, Cash Equivalents, & Other Net Assets | 13.6% |
| Total | 100.0% |
| Industry Sector Allocation (as a % of Net Assets)* | |
| Consumer | 61.8% |
| Industrials | 8.9% |
| Technology | 7.5% |
| Energy & Materials | 4.4% |
| Health Care | 2.4% |
| Financials | 1.4% |
| Cash, Cash Equivalents, & Other Net Assets | 13.6% |
| Total | 100.0% |
| Top 10 Holdings (as a % of Net Assets)* | |
| Yum China Holdings, Inc. | 3.4% |
| Philippine Seven Corp. | 2.4% |
| President Chain Store Corp. | 2.4% |
| Aramex PJSC | 2.3% |
| TOA Paint Thailand PCL | 2.2% |
| Carnival Corp. | 2.1% |
| Saigon Beer Alcohol Beverage Corp. | 2.0% |
| Alibaba Group Holding, Ltd. | 2.0% |
| Vitasoy International Holdings, Ltd. | 2.0% |
| TravelSky Technology, Ltd. | 1.9% |
| Total | 22.7% |
| * | Holdings are subject to change, and may not reflect the current or future position of the portfolio. |
| Semi-Annual Report | October 31, 2018 | 13 |
| Rondure Overseas Fund | Performance Update |
| October 31, 2018 (Unaudited) |
Annualized Total Return Performance for the periods ended October 31, 2018
Since Inception(a) | Expense Ratio(b) | ||||
| 6 Months | 1 Year | Gross | Net(c) | ||
| Rondure Overseas Fund - Institutional (ROSIX) | -6.54% | -2.96% | 5.45% | 2.09% | 0.85% |
| Rondure Overseas Fund - Investor (ROSOX) | -6.71% | -3.25% | 5.18% | 1.97% | 1.10% |
| MSCI EAFE TR USD Index(d) | -9.71% | -6.39% | 2.39% | ||
Performance data quoted represents past performance. Past performance does not guarantee future results. Investment return and principal value of an investment will fluctuate so that an investor’s shares, when sold or redeemed, may be worth more or less than the original cost. The Fund imposes a 2.00% redemption fee on shares held for less than 60 days. Current performance data may be higher or lower than actual data quoted. For the most current month-end performance data, please call 1-855-775-3337.
The table does not reflect the deduction of taxes a shareholder would pay on Fund distributions or redemption of Fund shares.
Subject to investment risks, including possible loss of the principal amount invested.
Returns for periods less than 1 year are cumulative.
| (a) | Fund inception date of May 1, 2017. |
| (b) | Ratios as of the Prospectus dated August 31, 2018 and may differ from the ratios presented in the Financial Highlights. |
| (c) | Rondure Global Advisors, LLC (the “Advisor”), has agreed to waive and/or reimburse fees or expenses in order to limit Total Annual Fund Operating Expenses After Fee Waiver/ Expense Reimbursement (excluding acquired fund fees and expenses, brokerage expenses, interest expenses, taxes and extraordinary expenses) to 1.10% and 0.85% of the Fund’s average daily net assets for the Fund’s Investor Class Shares and Institutional Class Shares, respectively. This agreement (the “Expense Agreement”) is in effect through August 31, 2019. The Advisor will be permitted to recover, on a class-by-class basis, expenses it has borne through the Expense Agreement to the extent that a Fund’s expenses in later periods fall below the expense cap in effect at the time of waiver or reimbursement. However, such recapture payments may not cause the Fund’s expense ratio (after recapture) to exceed the lesser of (i) the expense cap in effect at the time of the waiver and (ii) the expense cap in effect at the time of the recapture. Notwithstanding the foregoing, the Fund will not be obligated to pay any such deferred fees and expenses more than three years after the date of the waiver or reimbursement. The Expense Agreement may not be terminated or modified by the Advisor prior to August 31, 2019, except with the approval of the Fund’s Board of Trustees. |
| (d) | The MSCI EAFE Total Return USD Index is an unmanaged total return index, reported in U.S. dollars, based on share prices and reinvested net dividends of approximately 1,100 companies from 22 developed market countries excluding the US and Canada. The Index is not actively managed and does not reflect any deductions for fees, expense, or taxes. An investor may not invest directly in the Index. |
| 14 | 1.855.775.3337 | www.rondureglobal.com |
| Rondure Overseas Fund | Performance Update |
| October 31, 2018 (Unaudited) |
Growth of $10,000 for the period ended October 31, 2018
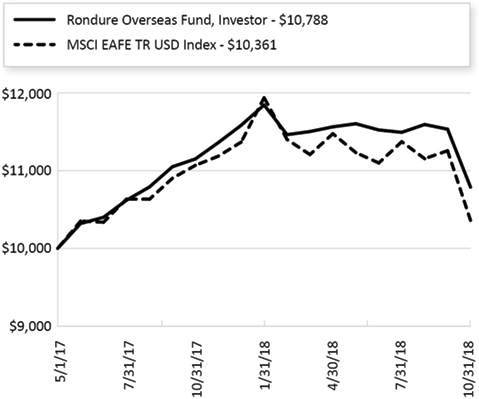
The chart shown above represent a hypothetical investment of $10,000 in the Fund’s Investor Class shares for the period from inception to October 31, 2018. All returns reflect reinvested dividends, but do not reflect the deduction of taxes that an investor would pay on distributions or redemptions.
Investing in the Fund is subject to investment risks, including possible loss of the principal amount invested.
The Fund also offers Institutional Class shares, performance for which is not reflected in the graphs above. The performance of Institutional Class shares may be higher or lower than the performance of the Investor Class shares shown in the graphs above based upon differences in fees paid by shareholders investing in the Investor Class shares and Institutional Class shares.
| Semi-Annual Report | October 31, 2018 | 15 |
| Rondure Overseas Fund | Performance Update |
| October 31, 2018 (Unaudited) |
| Regional Allocation (as a % of Net Assets)* | |
| Europe | 36.9% |
| Japan | 32.1% |
| Australia/New Zealand | 10.3% |
| North America | 7.6% |
| Asia ex Japan | 3.3% |
| Africa/Middle East | 0.2% |
| Cash, Cash Equivalents, & Other Net Assets | 9.6% |
| Total | 100.0% |
| Industry Sector Allocation (as a % of Net Assets)* | |
| Consumer | 53.9% |
| Industrials | 19.3% |
| Technology | 7.3% |
| Energy & Materials | 4.2% |
| Health Care | 3.6% |
| Financials | 2.1% |
| Cash, Cash Equivalents, & Other Net Assets | 9.6% |
| Total | 100.0% |
| Top 10 Holdings (as a % of Net Assets)* | |
| Seven & i Holdings Co., Ltd. | 2.1% |
| Nestle SA | 2.1% |
| Alimentation Couche-Tard, Inc. | 2.0% |
| WH Smith PLC | 2.0% |
| DuluxGroup, Ltd. | 2.0% |
| Amadeus IT Group SA | 1.8% |
| Create SD Holdings Co., Ltd. | 1.8% |
| J D Wetherspoon PLC | 1.7% |
| Lululemon Athletica, Inc. | 1.6% |
| Suzuki Motor Corp. | 1.6% |
| Total | 18.7% |
| * | Holdings are subject to change, and may not reflect the current or future position of the portfolio. |
| 16 | 1.855.775.3337 | www.rondureglobal.com |
| Rondure Funds | Disclosure of Fund Expenses |
| October 31, 2018 (Unaudited) |
As a shareholder of a Fund, you incur two types of costs: (1) transaction costs, including sales charges (loads) on purchase payments, reinvested dividends, or other distributions; redemption fees; and exchange fees; and (2) ongoing costs, including management fees; distribution and/or service (12b-1) fees; and other Fund expenses. This example is intended to help you understand your ongoing costs (in dollars) of investing in the Fund and to compare these costs with the ongoing costs of investing in other mutual funds.
This example is based on an investment of $1,000 invested at the beginning of the period and held for the entire six-month period of May 1, 2018 through October 31, 2018.
Actual Expenses The first line of the table provides information about actual account values and actual expenses. You may use the information in this line, together with the amount you invested, to estimate the expenses that you paid over the period. Simply divide your account value by $1,000 (for example, an $8,600 account value divided by $1,000 = 8.6), then multiply the result by the number in the first line under the heading “Expenses Paid During Period” to estimate the expenses you paid on your account during this period.
Hypothetical Example for Comparison Purposes The second line of the table provides information about hypothetical account values and hypothetical expenses based on the Fund’s actual expense ratio and an assumed rate of return of 5% per year before expenses, which is not the Fund’s actual return. The hypothetical account values and expenses may not be used to estimate the actual ending account balance or expenses you paid for the period. You may use this information to compare the ongoing costs of investing in the Fund and other mutual funds. To do so, compare this 5% hypothetical example with the 5% hypothetical examples that appear in the shareholder reports of the other funds. Please note that the expenses shown in the table are meant to highlight your ongoing costs only and do not reflect any transactional costs, such as redemption fees or exchange fees. Therefore, the second line of the table is useful in comparing ongoing costs only and will not help you determine the relative total costs of owning different funds. In addition, if these transactional costs were included, your costs would have been higher.
Beginning Account Value May 1, 2018 | Ending Account Value October 31, 2018 | Expense Ratio(a) | Expenses Paid During Period May 1, 2018 - October 31, 2018(b) | |
| Rondure New World Fund | ||||
| Institutional Class | ||||
| Actual | $1,000.00 | $840.00 | 1.10% | $5.10 |
| Hypothetical (5% return before expenses) | $1,000.00 | $1,019.66 | 1.10% | $5.60 |
| Investor Class | ||||
| Actual | $1,000.00 | $838.10 | 1.35% | $6.25 |
| Hypothetical (5% return before expenses) | $1,000.00 | $1,018.40 | 1.35% | $6.87 |
| Rondure Overseas Fund | ||||
| Institutional Class | ||||
| Actual | $1,000.00 | $934.60 | 0.85% | $4.14 |
| Hypothetical (5% return before expenses) | $1,000.00 | $1,020.92 | 0.85% | $4.33 |
| Investor Class | ||||
| Actual | $1,000.00 | $932.90 | 1.10% | $5.36 |
| Hypothetical (5% return before expenses) | $1,000.00 | $1,019.66 | 1.10% | $5.60 |
| (a) | The Fund's expense ratios have been annualized based on the Fund's most recent fiscal half-year expenses. |
| (b) | Expenses are equal to the Fund's annualized expense ratio multiplied by the average account value over the period, multiplied by the number of days in the most recent fiscal half-year 184/365 (to reflect the half-year period). |
| Semi-Annual Report | October 31, 2018 | 17 |
| Rondure New World Fund | Portfolio of Investments |
October 31, 2018 (Unaudited)
| Shares | Value (Note 2) | |||||||
| Common Stocks (86.35%) | ||||||||
| Bangladesh (0.58%) | ||||||||
| GrameenPhone, Ltd. | 21,919 | $ | 99,253 | |||||
| Square Pharmaceuticals, Ltd. | 183,525 | 584,654 | ||||||
| 683,907 | ||||||||
| Brazil (4.09%) | ||||||||
| Ambev SA | 244,200 | 1,065,648 | ||||||
| Hypera SA | 228,200 | 1,813,214 | ||||||
| M Dias Branco SA | 114,700 | 1,358,277 | ||||||
| Raia Drogasil SA | 33,300 | 563,098 | ||||||
| 4,800,237 | ||||||||
| China (18.12%) | ||||||||
| Alibaba Group Holding, Ltd., Sponsored ADR(a) | 16,650 | 2,368,962 | ||||||
| ANTA Sports Products, Ltd. | 223,000 | 920,665 | ||||||
| Baidu, Inc., Sponsored ADR(a) | 9,375 | 1,781,812 | ||||||
| China Resources Beer Holdings Co., Ltd. | 560,000 | 1,951,390 | ||||||
| Haier Electronics Group Co., Ltd. | 778,000 | 1,633,784 | ||||||
| Haitian International Holdings, Ltd. | 531,000 | 1,042,854 | ||||||
| Hengan International Group Co., Ltd. | 194,000 | 1,542,179 | ||||||
| Sinotrans, Ltd., Class H | 5,301,000 | 1,854,446 | ||||||
| TravelSky Technology, Ltd., Class H | 938,000 | 2,278,586 | ||||||
| Tsingtao Brewery Co., Ltd., Class H | 381,000 | 1,506,661 | ||||||
| Want Want China Holdings, Ltd. | 590,000 | 422,098 | ||||||
| Yum China Holdings, Inc. | 110,425 | 3,984,134 | ||||||
| 21,287,571 | ||||||||
| Greece (1.43%) | ||||||||
| JUMBO SA | 115,656 | 1,683,980 | ||||||
| Hong Kong (1.98%) | ||||||||
| Vitasoy International Holdings, Ltd. | 729,000 | 2,323,985 | ||||||
| Shares | Value (Note 2) | |||||||
| India (4.78%) | ||||||||
| Asian Paints, Ltd. | 31,244 | $ | 520,028 | |||||
| Britannia Industries, Ltd. | 7,311 | 557,358 | ||||||
| Castrol India, Ltd. | 200,000 | 402,679 | ||||||
| Colgate-Palmolive India, Ltd. | 4,704 | 71,132 | ||||||
| Dabur India, Ltd. | 159,000 | 827,393 | ||||||
| Eicher Motors, Ltd. | 2,775 | 821,903 | ||||||
| Godrej Consumer Products, Ltd. | 7,953 | 78,127 | ||||||
| Hindustan Unilever, Ltd. | 25,135 | 551,826 | ||||||
| Marico, Ltd. | 14,900 | 64,766 | ||||||
| Maruti Suzuki India, Ltd. | 6,070 | 543,137 | ||||||
| Nestle India, Ltd. | 3,718 | 509,895 | ||||||
| Pidilite Industries, Ltd. | 6,385 | 82,807 | ||||||
| Radico Khaitan, Ltd. | 110,500 | 587,901 | ||||||
| 5,618,952 | ||||||||
| Indonesia (2.03%) | ||||||||
| Indofood CBP Sukses Makmur Tbk PT | 2,049,500 | 1,204,193 | ||||||
| Kalbe Farma Tbk PT | 1,014,000 | 91,458 | ||||||
| Multi Bintang Indonesia Tbk PT | 515,000 | 542,182 | ||||||
| Unilever Indonesia Tbk PT | 193,000 | 549,747 | ||||||
| 2,387,580 | ||||||||
| Japan (1.18%) | ||||||||
| Suzuki Motor Corp. | 27,900 | 1,391,282 | ||||||
| Kenya (2.15%) | ||||||||
| East African Breweries, Ltd. | 387,200 | 660,453 | ||||||
| Safaricom PLC | 8,236,600 | 1,868,198 | ||||||
| 2,528,651 | ||||||||
| Malaysia (2.79%) | ||||||||
| Carlsberg Brewery Malaysia Bhd | 487,000 | 2,073,000 | ||||||
| Heineken Malaysia Bhd | 280,000 | 1,204,662 | ||||||
| 3,277,662 | ||||||||
| Mexico (4.45%) | ||||||||
| Alsea SAB de CV | 16,300 | 41,743 | ||||||
| Arca Continental SAB de CV | 16,200 | 81,346 | ||||||
| Becle SAB de CV | 1,564,600 | 1,924,820 | ||||||
| Corp Moctezuma SAB de CV | 90,700 | 334,835 | ||||||
| Gruma SAB de CV, Class B | 118,200 | 1,236,508 | ||||||
See Notes to Financial Statements.
| 18 | 1.855.775.3337 | www.rondureglobal.com |
| Rondure New World Fund | Portfolio of Investments |
October 31, 2018 (Unaudited)
| Shares | Value (Note 2) | |||||||
| Mexico (continued) | ||||||||
| Wal-Mart de Mexico SAB de CV | 628,500 | $ | 1,607,044 | |||||
| 5,226,296 | ||||||||
| Pakistan (0.28%) | ||||||||
| Nestle Pakistan, Ltd. | 4,578 | 328,371 | ||||||
| Peru (1.80%) | ||||||||
| Alicorp SAA | 550,225 | 1,591,189 | ||||||
| InRetail Peru Corp.(a)(b)(c) | 20,196 | 521,057 | ||||||
| 2,112,246 | ||||||||
| Philippines (5.17%) | ||||||||
| International Container Terminal Services, Inc. | 601,000 | 1,016,550 | ||||||
| Jollibee Foods Corp. | 247,000 | 1,275,537 | ||||||
| Philippine Seven Corp. | 1,429,447 | 2,805,195 | ||||||
| Puregold Price Club, Inc. | 1,288,000 | 978,427 | ||||||
| 6,075,709 | ||||||||
| Poland (1.71%) | ||||||||
| AmRest Holdings SE(a) | 94,000 | 970,807 | ||||||
| Dino Polska SA(a)(b)(c) | 47,000 | 1,032,775 | ||||||
| 2,003,582 | ||||||||
| Russia (1.91%) | ||||||||
| Alrosa PJSC | 410,000 | 621,765 | ||||||
| LUKOIL PJSC, Sponsored ADR | 8,900 | 663,575 | ||||||
| Mail.Ru Group, Ltd., GDR(a)(c) | 18,600 | 492,984 | ||||||
| Yandex NV, Class A(a) | 15,425 | 464,755 | ||||||
| 2,243,079 | ||||||||
| South Africa (2.81%) | ||||||||
| Clicks Group, Ltd. | 115,400 | 1,470,034 | ||||||
| Distell Group Holdings, Ltd. | 40,100 | 298,457 | ||||||
| Shoprite Holdings, Ltd. | 126,000 | 1,538,231 | ||||||
| 3,306,722 | ||||||||
| South Korea (2.78%) | ||||||||
| BGF Retail Co., Ltd. | 7,632 | 1,129,063 | ||||||
| LG Household & Health Care, Ltd. | 650 | 597,744 | ||||||
| Medy-Tox, Inc. | 917 | 375,665 | ||||||
| Shares | Value (Note 2) | |||||||
| South Korea (continued) | ||||||||
| S-1 Corp. | 13,800 | $ | 1,168,656 | |||||
| 3,271,128 | ||||||||
| Sri Lanka (1.35%) | ||||||||
| Lion Brewery Ceylon PLC | 472,256 | 1,586,737 | ||||||
| Taiwan (4.88%) | ||||||||
| President Chain Store Corp. | 245,000 | 2,771,479 | ||||||
| Taiwan Semiconductor Manufacturing Co., Ltd. | 237,000 | 1,779,250 | ||||||
| Uni-President Enterprises Corp. | 487,000 | 1,180,417 | ||||||
| 5,731,146 | ||||||||
| Tanzania (0.16%) | ||||||||
| Tanzania Breweries, Ltd. | 34,234 | 192,636 | ||||||
| Thailand (2.51%) | ||||||||
| CP ALL PCL | 129,000 | 262,089 | ||||||
| Thai Beverage PCL | 307,000 | 138,663 | ||||||
| TOA Paint Thailand PCL | 2,494,000 | 2,544,622 | ||||||
| 2,945,374 | ||||||||
| Turkey (2.08%) | ||||||||
| Aselsan Elektronik Sanayi Ve Ticaret AS | 244,800 | 1,108,198 | ||||||
| BIM Birlesik Magazalar AS | 94,000 | 1,336,250 | ||||||
| 2,444,448 | ||||||||
| United Arab Emirates (2.72%) | ||||||||
| Aramex PJSC | 2,524,000 | 2,714,237 | ||||||
| DP World, Ltd. | 26,720 | 480,693 | ||||||
| 3,194,930 | ||||||||
| United States (6.84%) | ||||||||
| Carnival Corp. | 43,250 | 2,423,730 | ||||||
| Kansas City Southern | 10,525 | 1,073,129 | ||||||
| Lululemon Athletica, Inc.(a) | 13,250 | 1,864,673 | ||||||
| PriceSmart, Inc. | 5,875 | 412,131 | ||||||
| Starbucks Corp. | 38,875 | 2,265,246 | ||||||
| 8,038,909 | ||||||||
See Notes to Financial Statements.
| Semi-Annual Report | October 31, 2018 | 19 |
| Rondure New World Fund | Portfolio of Investments |
October 31, 2018 (Unaudited)
| Shares | Value (Note 2) | |||||||
| Uruguay (0.48%) | ||||||||
| Arcos Dorados Holdings, Inc., Class A | 77,600 | $ | 559,496 | |||||
| Vietnam (5.29%) | ||||||||
| Saigon Beer Alcohol Beverage Corp. | 249,320 | 2,379,444 | ||||||
| Vietnam Dairy Products JSC | 447,192 | 2,231,152 | ||||||
| Vincom Retail JSC(a) | 1,255,625 | 1,610,025 | ||||||
| 6,220,621 | ||||||||
| TOTAL Common Stocks | ||||||||
| (Cost $111,242,774) | 101,465,237 | |||||||
| TOTAL INVESTMENTS (86.35%) | ||||||||
| (Cost $111,242,774) | $ | 101,465,237 | ||||||
| Other Assets In Excess Of Liabilities (13.65%) | 16,044,860 | |||||||
| NET ASSETS (100.00%) | $ | 117,510,097 | ||||||
| (a) | Non-Income Producing Security. |
| (b) | Security exempt from registration under Rule 144A of the Securities Act of 1933. These securities may be resold in the ordinary course of business in transactions exempt from registration, normally to qualified institutional buyers. As of October 31, 2018, these securities had a total aggregate market value of $1,553,832 representing 1.32% of net assets. |
| (c) | Security was purchased pursuant to Regulation S under the Securities Act of 1933, which exempts securities offered and sold outside of the United States from registration. Such security cannot be sold in the United States without either an effective registration statement filed pursuant to the Securities Act of 1933, or pursuant to an exemption from registration. The security has been deemed liquid under guidelines approved by the Fund's Board of Trustees. As of October 31, 2018, the aggregate market value of those securities was $2,046,815, representing 1.74% of net assets. |
See Notes to Financial Statements.
| 20 | 1.855.775.3337 | www.rondureglobal.com |
| Rondure Overseas Fund | Portfolio of Investments |
October 31, 2018 (Unaudited)
| Shares | Value (Note 2) | |||||||
| Common Stocks (90.15%) | ||||||||
| Australia (6.84%) | ||||||||
| carsales.com, Ltd. | 7,428 | $ | 64,382 | |||||
| Coca-Cola Amatil, Ltd. | 50,200 | 353,293 | ||||||
| Domino's Pizza Enterprises, Ltd. | 3,059 | 117,242 | ||||||
| DuluxGroup, Ltd. | 90,708 | 476,802 | ||||||
| REA Group, Ltd. | 4,546 | 231,361 | ||||||
| SEEK, Ltd. | 10,000 | 127,050 | ||||||
| Sydney Airport | 50,600 | 231,271 | ||||||
| 1,601,401 | ||||||||
| Austria (1.00%) | ||||||||
| Mayr Melnhof Karton AG | 1,850 | 234,266 | ||||||
| Belgium (0.24%) | ||||||||
| Lotus Bakeries | 22 | 56,767 | ||||||
| Britain (13.83%) | ||||||||
| Abcam PLC | 12,000 | 183,953 | ||||||
| Auto Trader Group PLC(a)(b) | 8,900 | 46,506 | ||||||
| B&M European Value Retail SA | 48,000 | 255,420 | ||||||
| BAE Systems PLC | 17,900 | 120,025 | ||||||
| Compass Group PLC | 4,696 | 92,365 | ||||||
| Dechra Pharmaceuticals PLC | 2,100 | 61,358 | ||||||
| Diploma PLC | 8,700 | 145,890 | ||||||
| Domino's Pizza Group PLC | 56,400 | 204,044 | ||||||
| easyJet PLC | 17,400 | 266,565 | ||||||
| Intertek Group PLC | 2,400 | 143,799 | ||||||
| J D Wetherspoon PLC | 24,988 | 394,443 | ||||||
| Rightmove PLC | 19,800 | 114,297 | ||||||
| Sanne Group PLC | 9,000 | 64,421 | ||||||
| St James's Place PLC | 7,822 | 101,086 | ||||||
| Unilever NV | 6,500 | 349,278 | ||||||
| WH Smith PLC | 19,187 | 476,938 | ||||||
| Whitbread PLC | 3,900 | 219,288 | ||||||
| 3,239,676 | ||||||||
| Canada (3.06%) | ||||||||
| Alimentation Couche-Tard, Inc., Class B | 10,000 | 477,572 | ||||||
| Dollarama, Inc. | 2,100 | 58,081 | ||||||
| Shares | Value (Note 2) | |||||||
| Canada (continued) | ||||||||
| Ritchie Bros Auctioneers, Inc. | 5,400 | $ | 181,634 | |||||
| 717,287 | ||||||||
| Denmark (1.29%) | ||||||||
| Novo Nordisk A/S, Class B | 1,301 | 56,186 | ||||||
| Novozymes A/S, Class B | 1,488 | 73,485 | ||||||
| Royal Unibrew A/S | 2,440 | 173,148 | ||||||
| 302,819 | ||||||||
| Finland (1.54%) | ||||||||
| Olvi OYJ, Class A | 10,805 | 361,539 | ||||||
| France (2.99%) | ||||||||
| Bureau Veritas SA | 6,000 | 135,360 | ||||||
| Danone SA | 3,100 | 219,522 | ||||||
| Laurent-Perrier | 550 | 56,391 | ||||||
| Pernod Ricard SA | 1,500 | 228,730 | ||||||
| Sodexo SA | 600 | 61,246 | ||||||
| 701,249 | ||||||||
| Germany (6.73%) | ||||||||
| adidas AG | 1,130 | 265,735 | ||||||
| CTS Eventim AG & Co., KGaA | 3,745 | 140,400 | ||||||
| Deutsche Lufthansa AG | 8,057 | 161,729 | ||||||
| Deutsche Post AG | 11,005 | 347,486 | ||||||
| Krones AG | 2,645 | 236,471 | ||||||
| Puma SE | 690 | 354,812 | ||||||
| XING SE | 235 | 70,657 | ||||||
| 1,577,290 | ||||||||
| Hong Kong (1.21%) | ||||||||
| Hong Kong Exchanges & Clearing, Ltd. | 2,000 | 53,254 | ||||||
| Vitasoy International Holdings, Ltd. | 72,000 | 229,529 | ||||||
| 282,783 | ||||||||
| Israel (0.21%) | ||||||||
| Elbit Systems, Ltd. | 404 | 48,224 | ||||||
| Italy (1.91%) | ||||||||
| Brembo SpA | 5,959 | 65,971 | ||||||
| Davide Campari-Milano SpA | 4,498 | 34,618 | ||||||
| De' Longhi SpA | 11,781 | 311,775 | ||||||
See Notes to Financial Statements.
| Semi-Annual Report | October 31, 2018 | 21 |
| Rondure Overseas Fund | Portfolio of Investments |
October 31, 2018 (Unaudited)
| Shares | Value (Note 2) | |||||||
| Italy (continued) | ||||||||
| DiaSorin SpA | 383 | $ | 36,329 | |||||
| 448,693 | ||||||||
| Japan (32.08%) | ||||||||
| ABC-Mart, Inc. | 3,000 | 175,395 | ||||||
| Aeon Delight Co., Ltd. | 8,800 | 293,811 | ||||||
| Calbee, Inc. | 6,800 | 225,605 | ||||||
| Coca-Cola West Co. Ltd. | 8,800 | 230,307 | ||||||
| Cosmos Pharmaceutical Corp. | 1,300 | 265,716 | ||||||
| Create SD Holdings Co., Ltd. | 16,500 | 417,980 | ||||||
| Ezaki Glico Co., Ltd. | 5,400 | 269,191 | ||||||
| Kirin Holdings Co., Ltd. | 12,500 | 298,282 | ||||||
| Kusuri no Aoki Holdings Co., Ltd. | 2,500 | 179,683 | ||||||
| Lintec Corp. | 12,700 | 300,570 | ||||||
| Matsumotokiyoshi Holdings Co., Ltd. | 6,600 | 238,615 | ||||||
| McDonald's Holdings Co. Japan, Ltd. | 1,800 | 79,222 | ||||||
| MEIJI Holdings Co., Ltd. | 800 | 53,080 | ||||||
| MISUMI Group, Inc. | 6,400 | 128,261 | ||||||
| MonotaRO Co., Ltd. | 4,800 | 105,824 | ||||||
| Morinaga & Co., Ltd. | 3,900 | 156,479 | ||||||
| Nakanishi, Inc. | 12,000 | 280,751 | ||||||
| Oriental Land Co. Ltd./Japan | 2,500 | 235,184 | ||||||
| Pigeon Corp. | 2,600 | 109,960 | ||||||
| Ryohin Keikaku Co., Ltd. | 600 | 158,598 | ||||||
| Secom Co., Ltd. | 4,500 | 368,422 | ||||||
| Seria Co., Ltd. | 6,500 | 218,069 | ||||||
| Seven & i Holdings Co., Ltd. | 11,200 | 484,960 | ||||||
| Ship Healthcare Holdings, Inc. | 6,400 | 231,398 | ||||||
| SK Kaken Co., Ltd. | 174 | 73,795 | ||||||
| Sundrug Co., Ltd. | 3,300 | 119,918 | ||||||
| Suzuki Motor Corp. | 7,400 | 369,014 | ||||||
| TOTO, Ltd. | 3,500 | 125,217 | ||||||
| Tsuruha Holdings, Inc. | 900 | 93,933 | ||||||
| Unicharm Corp. | 9,800 | 265,862 | ||||||
| Yahoo Japan Corp. | 109,000 | 340,058 | ||||||
| Yamato Holdings Co., Ltd. | 12,500 | 341,730 | ||||||
| Yaskawa Electric Corp. | 9,700 | 280,366 | ||||||
| 7,515,256 | ||||||||
| Shares | Value (Note 2) | |||||||
| Netherlands (1.12%) | ||||||||
| Euronext NV(a)(b) | 4,250 | $ | 261,513 | |||||
| New Zealand (3.43%) | ||||||||
| Air New Zealand, Ltd. | 107,302 | 196,186 | ||||||
| Auckland International Airport, Ltd. | 51,800 | 236,886 | ||||||
| Mainfreight, Ltd. | 13,931 | 258,586 | ||||||
| Trade Me Group, Ltd. | 35,498 | 112,536 | ||||||
| 804,194 | ||||||||
| South Korea (0.78%) | ||||||||
| S-1 Corp. | 2,150 | 182,073 | ||||||
| Spain (1.81%) | ||||||||
| Amadeus IT Group SA | 5,257 | 423,318 | ||||||
| Sweden (2.13%) | ||||||||
| Axfood AB | 19,844 | 353,998 | ||||||
| Indutrade AB | 1,260 | 30,244 | ||||||
| Loomis AB, Class B | 3,682 | 113,846 | ||||||
| 498,088 | ||||||||
| Switzerland (2.05%) | ||||||||
| Nestle SA | 5,700 | 481,212 | ||||||
| Taiwan (1.35%) | ||||||||
| President Chain Store Corp. | 28,000 | 316,741 | ||||||
| United States (4.55%) | ||||||||
| Carnival Corp. | 4,450 | 249,378 | ||||||
| Lululemon Athletica, Inc.(c) | 2,675 | 376,452 | ||||||
| Starbucks Corp. | 4,325 | 252,018 | ||||||
| Yum! Brands, Inc. | 2,075 | 187,601 | ||||||
| 1,065,449 | ||||||||
| TOTAL Common Stocks | ||||||||
| (Cost $21,706,065) | 21,119,838 | |||||||
See Notes to Financial Statements.
| 22 | 1.855.775.3337 | www.rondureglobal.com |
| Rondure Overseas Fund | Portfolio of Investments |
October 31, 2018 (Unaudited)
| Shares | Value (Note 2) | |||||||
| Preferred Stocks (0.27%) | ||||||||
| Germany (0.27%) | ||||||||
| FUCHS PETROLUB SE | 1,351 | $ | 62,537 | |||||
| TOTAL Preferred Stocks | ||||||||
| (Cost $73,715) | 62,537 | |||||||
| TOTAL INVESTMENTS (90.42%) | ||||||||
| (Cost $21,779,780) | $ | 21,182,375 | ||||||
| Other Assets In Excess Of Liabilities (9.58%) | 2,243,391 | |||||||
| NET ASSETS (100.00%) | $ | 23,425,766 | ||||||
| (a) | Security exempt from registration under Rule 144A of the Securities Act of 1933. These securities may be resold in the ordinary course of business in transactions exempt from registration, normally to qualified institutional buyers. As of October 31, 2018, these securities had a total aggregate market value of $308,019 representing 1.31% of net assets. |
| (b) | Security was purchased pursuant to Regulation S under the Securities Act of 1933, which exempts securities offered and sold outside of the United States from registration. Such security cannot be sold in the United States without either an effective registration statement filed pursuant to the Securities Act of 1933, or pursuant to an exemption from registration. The security has been deemed liquid under guidelines approved by the Fund's Board of Trustees. As of October 31, 2018, the aggregate market value of those securities was $308,019, representing 1.31% of net assets. |
| (c) | Non-Income Producing Security. |
See Notes to Financial Statements.
| Semi-Annual Report | October 31, 2018 | 23 |
| Rondure Funds | Statements of Assets and Liabilities |
October 31, 2018 (Unaudited)
Rondure New World Fund | Rondure Overseas Fund | |||||||
| ASSETS | ||||||||
| Investments, at value (Cost - see below) | $ | 101,465,237 | $ | 21,182,375 | ||||
| Foreign cash, at value (Cost $152,041 and $2,117, respectively) | 151,801 | 2,117 | ||||||
| Cash | 16,283,350 | 2,920,628 | ||||||
| Dividends and interest receivable | 49,222 | 40,191 | ||||||
| Receivable for investments sold | – | 1,249 | ||||||
| Receivable for fund shares subscribed | 132,667 | – | ||||||
| Receivable due from advisor | – | 4,256 | ||||||
| Prepaid and other assets | 38,040 | 18,244 | ||||||
| Total assets | 118,120,317 | 24,169,060 | ||||||
| LIABILITIES | ||||||||
| Payable for investments purchased | 367,219 | 698,372 | ||||||
| Foreign capital gains tax | 22,422 | – | ||||||
| Payable for fund shares redeemed | 57,588 | 2,166 | ||||||
| Advisory fees payable | 46,877 | – | ||||||
| Administration fees payable | 25,325 | 12,954 | ||||||
| Custodian fees payable | 24,857 | 3,405 | ||||||
| Payable for professional fees | 11,821 | 12,866 | ||||||
| Payable for trustee fees and expenses | 722 | 96 | ||||||
| Payable for chief compliance officer fee | 4,563 | 683 | ||||||
| Payable for principal financial officer fees | 1,487 | 220 | ||||||
| Distribution and service fees payable - Investor Class | 4,729 | 958 | ||||||
| Payable for transfer agency fees | 29,516 | 9,273 | ||||||
| Accrued expenses and other liabilities | 13,094 | 2,301 | ||||||
| Total liabilities | 610,220 | 743,294 | ||||||
| NET ASSETS | $ | 117,510,097 | $ | 23,425,766 | ||||
| NET ASSETS CONSISTS OF | ||||||||
| Paid-in capital (Note 5) | $ | 130,903,892 | $ | 23,752,997 | ||||
| Total distributable earnings | (13,393,795 | ) | (327,231 | ) | ||||
| NET ASSETS | $ | 117,510,097 | $ | 23,425,766 | ||||
| INVESTMENTS, AT COST | $ | 111,242,774 | $ | 21,779,780 | ||||
| PRICING OF SHARES | ||||||||
| Institutional Class | ||||||||
| Net Assets | $ | 97,855,470 | $ | 18,838,409 | ||||
| Net Asset Value, offering and redemption price per share | $ | 9.45 | $ | 10.71 | ||||
| Shares of beneficial interest outstanding | 10,358,221 | 1,758,954 | ||||||
| Investor Class | ||||||||
| Net Assets | $ | 19,654,627 | $ | 4,587,357 | ||||
| Net Asset Value, offering and redemption price per share | $ | 9.43 | $ | 10.72 | ||||
| Shares of beneficial interest outstanding | 2,085,250 | 428,085 | ||||||
See Notes to Financial Statements.
| 24 | 1.855.775.3337 | www.rondureglobal.com |
| Rondure Funds | Statements of Operations |
For the Six Months Ended October 31, 2018 (Unaudited)
| Rondure New World Fund | Rondure Overseas Fund | |||||||
| INVESTMENT INCOME | ||||||||
| Dividends | $ | 1,590,819 | $ | 204,972 | ||||
| Foreign taxes withheld | (151,110 | ) | (18,696 | ) | ||||
| Other Income | 45,146 | 26,560 | ||||||
| Total investment income | 1,484,855 | 212,836 | ||||||
| EXPENSES | ||||||||
| Investment advisor fees (Note 6) | 522,262 | 83,662 | ||||||
| Administrative fees | 117,134 | 35,958 | ||||||
| Distribution and service fees - Investor Class | 29,961 | 6,105 | ||||||
| Transfer agent fees | 90,380 | 30,841 | ||||||
| Professional fees | 18,797 | 11,741 | ||||||
| Printing fees | 9,394 | 1,698 | ||||||
| Registration fees | 19,876 | 14,807 | ||||||
| Custodian fees | 84,058 | 15,221 | ||||||
| Trustee fees and expenses | 1,586 | 310 | ||||||
| Chief compliance officer fees | 13,248 | 2,339 | ||||||
| Principal financial officer fees | 4,287 | 754 | ||||||
| Offering costs | 226 | 181 | ||||||
| Other expenses | 9,351 | 3,418 | ||||||
| Total expenses | 920,560 | 207,035 | ||||||
| Less fees waived/reimbursed by investment advisor (Note 6) | (215,022 | ) | (99,260 | ) | ||||
| Total net expenses | 705,538 | 107,775 | ||||||
| NET INVESTMENT INCOME | 779,317 | 105,061 | ||||||
| REALIZED AND UNREALIZED GAIN/(LOSS) ON INVESTMENTS | ||||||||
| Net realized gain/(loss) on investments | (4,279,710 | ) | 62,290 | |||||
| Net realized loss on foreign currency transactions | (22,044 | ) | (1,986 | ) | ||||
| Net realized gain/(loss) | (4,301,754 | ) | 60,304 | |||||
| Net change in unrealized depreciation on investments (net of change in foreign capital gains tax of $(62,776) and $0, respectively) | (17,775,520 | ) | (1,863,972 | ) | ||||
| Net change in unrealized appreciation on translation of assets and liabilities in foreign currencies | 483 | 1,524 | ||||||
| Net change in unrealized depreciation | (17,775,037 | ) | (1,862,448 | ) | ||||
| NET REALIZED AND UNREALIZED LOSS ON INVESTMENTS AND FOREIGN CURRENCY TRANSACTIONS | (22,076,791 | ) | (1,802,144 | ) | ||||
| NET DECREASE IN NET ASSETS RESULTING FROM OPERATIONS | $ | (21,297,474 | ) | $ | (1,697,083 | ) | ||
See Notes to Financial Statements.
| Semi-Annual Report | October 31, 2018 | 25 |
| Rondure New World Fund | Statement of Changes in Net Assets |
For the Six Months Ended October 31, 2018 (Unaudited) | For the Period May 2, 2017 (Commencement of Operations) to April 30, 2018 | |||||||
| OPERATIONS | ||||||||
| Net investment income | $ | 779,317 | $ | 342,001 | ||||
| Net realized loss | (4,301,754 | ) | (280,302 | ) | ||||
| Net change in unrealized appreciation/(depreciation) | (17,775,037 | ) | 7,974,392 | |||||
| Net increase/(decrease) in net assets resulting from operations | (21,297,474 | ) | 8,036,091 | |||||
| TOTAL DISTRIBUTIONS TO SHAREHOLDERS (NOTE 3)(a) | ||||||||
| From distributable earnings | ||||||||
| Institutional Class | – | (195,933 | ) | |||||
| Investor Class | – | (20,535 | ) | |||||
| Net decrease in net assets from distributions | – | (216,468 | ) | |||||
| CAPITAL SHARE TRANSACTIONS (NOTE 5) | ||||||||
| Institutional Class | ||||||||
| Proceeds from sales of shares | 19,919,322 | 98,740,607 | ||||||
| Distributions reinvested | – | 185,431 | ||||||
| Cost of shares redeemed | (5,676,337 | ) | (4,530,207 | ) | ||||
| Redemption fees | 467 | 6,598 | ||||||
| Net increase from capital shares transactions | 14,243,452 | 94,402,429 | ||||||
| Investor Class | ||||||||
| Proceeds from sales of shares | 5,907,093 | 25,295,273 | ||||||
| Distributions reinvested | – | 20,535 | ||||||
| Cost of shares redeemed | (6,336,141 | ) | (2,546,642 | ) | ||||
| Redemption fees | 106 | 1,843 | ||||||
| Net increase/(decrease) from capital shares transactions | (428,942 | ) | 22,771,009 | |||||
| Net increase/(decrease) in net assets | (7,482,964 | ) | 124,993,061 | |||||
| NET ASSETS | ||||||||
| Beginning of period | 124,993,061 | – | ||||||
| End of period | $ | 117,510,097 | $ | 124,993,061 | (b) | |||
| OTHER INFORMATION | ||||||||
| Shares Transactions | ||||||||
| Institutional Class | ||||||||
| Issued | 1,964,530 | 9,350,867 | ||||||
| Issued to shareholders in reinvestment of distributions | – | 16,542 | ||||||
| Redeemed | (558,973 | ) | (414,745 | ) | ||||
| Net increase in share transactions | 1,405,557 | 8,952,664 | ||||||
| Investor Class | ||||||||
| Issued | 570,941 | 2,383,360 | ||||||
| Issued to shareholders in reinvestment of distributions | – | 1,832 | ||||||
| Redeemed | (641,269 | ) | (229,614 | ) | ||||
| Net increase/(decrease) in share transactions | (70,328 | ) | 2,155,578 | |||||
| (a) | For the prior year ended April 30, 2018, Total Distributions consisted of Net Investment Income $204,986, and Net Realized Gains $11,482. |
| (b) | For the prior year ended April 30, 2018, included accumulated net investment income of $118,506. |
See Notes to Financial Statements.
| 26 | 1.855.775.3337 | www.rondureglobal.com |
| Rondure Overseas Fund | Statement of Changes in Net Assets |
For the Six Months Ended October 31, 2018 (Unaudited) | For the Period May 2, 2017 (Commencement of Operations) to April 30, 2018 | |||||||
| OPERATIONS | ||||||||
| Net investment income | $ | 105,061 | $ | 120,241 | ||||
| Net realized gain | 60,304 | 119,067 | ||||||
| Net change in unrealized appreciation/(depreciation) | (1,862,448 | ) | 1,265,807 | |||||
| Net increase/(decrease) in net assets resulting from operations | (1,697,083 | ) | 1,505,115 | |||||
| TOTAL DISTRIBUTIONS TO SHAREHOLDERS (NOTE 3)(a) | ||||||||
| From distributable earnings | ||||||||
| Institutional Class | – | (140,954 | ) | |||||
| Investor Class | – | (25,519 | ) | |||||
| Net decrease in net assets from distributions | – | (166,473 | ) | |||||
| CAPITAL SHARE TRANSACTIONS (NOTE 5) | ||||||||
| Institutional Class | ||||||||
| Proceeds from sales of shares | 7,227,896 | 14,305,962 | ||||||
| Distributions reinvested | – | 139,017 | ||||||
| Cost of shares redeemed | (1,295,184 | ) | (1,341,389 | ) | ||||
| Redemption fees | 964 | 2,060 | ||||||
| Net increase from capital shares transactions | 5,933,676 | 13,105,650 | ||||||
| Investor Class | ||||||||
| Proceeds from sales of shares | 956,743 | 5,925,966 | ||||||
| Distributions reinvested | – | 25,519 | ||||||
| Cost of shares redeemed | (1,241,321 | ) | (924,780 | ) | ||||
| Redemption fees | 1,372 | 1,382 | ||||||
| Net increase/(decrease) from capital shares transactions | (283,206 | ) | 5,028,087 | |||||
| Net increase in net assets | 3,953,387 | 19,472,379 | ||||||
| NET ASSETS | ||||||||
| Beginning of period | 19,472,379 | – | ||||||
| End of period | $ | 23,425,766 | $ | 19,472,379 | (b) | |||
| OTHER INFORMATION | ||||||||
| Shares Transactions | ||||||||
| Institutional Class | ||||||||
| Issued | 628,594 | 1,355,282 | ||||||
| Issued to shareholders in reinvestment of distributions | – | 12,162 | ||||||
| Redeemed | (115,987 | ) | (121,097 | ) | ||||
| Net increase in share transactions | 512,607 | 1,246,347 | ||||||
| Investor Class | ||||||||
| Issued | 85,285 | 531,797 | ||||||
| Issued to shareholders in reinvestment of distributions | – | 2,227 | ||||||
| Redeemed | (109,237 | ) | (81,987 | ) | ||||
| Net increase/(decrease) in share transactions | (23,952 | ) | 452,037 | |||||
| (a) | For the prior year ended April 30, 2018, Total Distributions consisted of Net Investment Income $49,002, and Net Realized Gains $117,471. |
| (b) | For the prior year ended April 30, 2018, included accumulated net investment income of $104,048. |
See Notes to Financial Statements.
| Semi-Annual Report | October 31, 2018 | 27 |
| Rondure New World Fund – Institutional Class | Financial Highlights |
For a Share Outstanding Throughout the Period Presented
| Institutional Class | For the Six Months Ended October 31, 2018 (Unaudited) | For the Period May 2, 2017 (Commencement of Operations) to April 30, 2018 | ||||||
| NET ASSET VALUE, BEGINNING OF PERIOD | $ | 11.25 | $ | 10.00 | ||||
| INCOME FROM INVESTMENT OPERATIONS | ||||||||
| Net investment income(a) | 0.07 | 0.05 | ||||||
| Net realized and unrealized gain/(loss) on investments | (1.87 | ) | 1.23 | |||||
| Total income/(loss) from investment operations | (1.80 | ) | 1.28 | |||||
| DISTRIBUTIONS | ||||||||
| From net investment income | – | (0.03 | ) | |||||
| From net realized gain on investments | – | (0.00 | )(b) | |||||
| Total distributions | – | (0.03 | ) | |||||
| REDEMPTION FEES ADDED TO PAID-IN CAPITAL | 0.00 | (b) | 0.00 | (b) | ||||
| INCREASE/DECREASE IN NET ASSET VALUE | (1.80 | ) | 1.25 | |||||
| NET ASSET VALUE, END OF PERIOD | $ | 9.45 | $ | 11.25 | ||||
| TOTAL RETURN | (16.00 | )%(c) | 12.78 | %(c) | ||||
| RATIOS AND SUPPLEMENTAL DATA | ||||||||
| Net assets, end of period (in 000s) | $ | 97,855 | $ | 100,760 | ||||
| RATIOS TO AVERAGE NET ASSETS | ||||||||
| Expenses (excluding fees waived/ reimbursed by investment advisor) | 1.44 | %(d) | 1.62 | %(d) | ||||
| Expenses (including fees waived/ reimbursed by investment advisor) | 1.10 | %(d) | 1.10 | %(d) | ||||
| Net investment income | 1.31 | %(d) | 0.43 | %(d) | ||||
| PORTFOLIO TURNOVER RATE | 16 | %(c) | 13 | %(c) | ||||
| (a) | Per share numbers have been calculated using the average shares method. |
| (b) | Less than $0.005 or ($0.005) per share. |
| (c) | Not Annualized. |
| (d) | Annualized. |
See Notes to Financial Statements.
| 28 | 1.855.775.3337 | www.rondureglobal.com |
| Rondure New World Fund – Investor Class | Financial Highlights |
For a Share Outstanding Throughout the Period Presented
| Investor Class | For the Six Months Ended October 31, 2018 (Unaudited) | For the Period May 2, 2017 (Commencement of Operations) to April 30, 2018 | ||||||
| NET ASSET VALUE, BEGINNING OF PERIOD | $ | 11.24 | $ | 10.00 | ||||
| INCOME FROM INVESTMENT OPERATIONS | ||||||||
| Net investment income(a) | 0.06 | 0.03 | ||||||
| Net realized and unrealized gain/(loss) on investments | (1.87 | ) | 1.22 | |||||
| Total income/(loss) from investment operations | (1.81 | ) | 1.25 | |||||
| DISTRIBUTIONS | ||||||||
| From net investment income | – | (0.01 | ) | |||||
| From net realized gain on investments | – | (0.00 | )(b) | |||||
| Total distributions | – | (0.01 | ) | |||||
| REDEMPTION FEES ADDED TO PAID-IN CAPITAL | 0.00 | (b) | 0.00 | (b) | ||||
| INCREASE/DECREASE IN NET ASSET VALUE | (1.81 | ) | 1.24 | |||||
| NET ASSET VALUE, END OF PERIOD | $ | 9.43 | $ | 11.24 | ||||
| TOTAL RETURN | (16.19 | )%(c) | 12.53 | %(c) | ||||
| RATIOS AND SUPPLEMENTAL DATA | ||||||||
| Net assets, end of period (in 000s) | $ | 19,655 | $ | 24,233 | ||||
| RATIOS TO AVERAGE NET ASSETS | ||||||||
| Expenses (excluding fees waived/ reimbursed by investment advisor) | 1.74 | %(d) | 1.91 | %(d) | ||||
| Expenses (including fees waived/ reimbursed by investment advisor) | 1.35 | %(d) | 1.35 | %(d) | ||||
| Net investment income | 1.08 | %(d) | 0.24 | %(d) | ||||
| PORTFOLIO TURNOVER RATE | 16 | %(c) | 13 | %(c) | ||||
| (a) | Per share numbers have been calculated using the average shares method. |
| (b) | Less than $0.005 or ($0.005) per share. |
| (c) | Not Annualized. |
| (d) | Annualized. |
See Notes to Financial Statements.
| Semi-Annual Report | October 31, 2018 | 29 |
| Rondure Overseas Fund – Institutional Class | Financial Highlights |
For a Share Outstanding Throughout the Period Presented
| Institutional Class | For the Six Months Ended October 31, 2018 (Unaudited) | For the Period May 2, 2017 (Commencement of Operations) to April 30, 2018 | ||||||
| NET ASSET VALUE, BEGINNING OF PERIOD | $ | 11.46 | $ | 10.00 | ||||
| INCOME FROM INVESTMENT OPERATIONS | ||||||||
| Net investment income(a) | 0.05 | 0.10 | ||||||
| Net realized and unrealized gain/(loss) on investments | (0.80 | ) | 1.48 | |||||
| Total income/(loss) from investment operations | (0.75 | ) | 1.58 | |||||
| DISTRIBUTIONS | ||||||||
| From net investment income | – | (0.04 | ) | |||||
| From net realized gain on investments | – | (0.08 | ) | |||||
| Total distributions | – | (0.12 | ) | |||||
| REDEMPTION FEES ADDED TO PAID-IN CAPITAL | 0.00 | (b) | 0.00 | (b) | ||||
| INCREASE/DECREASE IN NET ASSET VALUE | (0.75 | ) | 1.46 | |||||
| NET ASSET VALUE, END OF PERIOD | $ | 10.71 | $ | 11.46 | ||||
| TOTAL RETURN | (6.54 | )%(c) | 15.88 | %(c) | ||||
| RATIOS AND SUPPLEMENTAL DATA | ||||||||
| Net assets, end of period (in 000s) | $ | 18,838 | $ | 14,283 | ||||
| RATIOS TO AVERAGE NET ASSETS | ||||||||
| Expenses (excluding fees waived/ reimbursed by investment advisor) | 1.66 | %(d) | 2.57 | %(d) | ||||
| Expenses (including fees waived/ reimbursed by investment advisor) | 0.85 | %(d) | 0.85 | %(d) | ||||
| Net investment income | 0.90 | %(d) | 0.92 | %(d) | ||||
| PORTFOLIO TURNOVER RATE | 12 | %(c) | 14 | %(c) | ||||
| (a) | Per share numbers have been calculated using the average shares method. |
| (b) | Less than $0.005 or ($0.005) per share. |
| (c) | Not Annualized. |
| (d) | Annualized. |
See Notes to Financial Statements.
| 30 | 1.855.775.3337 | www.rondureglobal.com |
| Rondure Overseas Fund – Investor Class | Financial Highlights |
For a Share Outstanding Throughout the Period Presented
| Investor Class | For the Six Months Ended October 31, 2018 (Unaudited) | For the Period May 2, 2017 (Commencement of Operations) to April 30, 2018 | ||||||
| NET ASSET VALUE, BEGINNING OF PERIOD | $ | 11.48 | $ | 10.00 | ||||
| INCOME FROM INVESTMENT OPERATIONS | ||||||||
| Net investment income(a) | 0.04 | 0.09 | ||||||
| Net realized and unrealized gain/(loss) on investments | (0.80 | ) | 1.46 | |||||
| Total income/(loss) from investment operations | (0.76 | ) | 1.55 | |||||
| DISTRIBUTIONS | ||||||||
| From net realized gain on investments | – | (0.08 | ) | |||||
| Total distributions | – | (0.08 | ) | |||||
| REDEMPTION FEES ADDED TO PAID-IN CAPITAL | 0.00 | (b) | 0.01 | |||||
| INCREASE/DECREASE IN NET ASSET VALUE | (0.76 | ) | 1.48 | |||||
| NET ASSET VALUE, END OF PERIOD | $ | 10.72 | $ | 11.48 | ||||
| TOTAL RETURN | (6.71 | )%(c) | 15.63 | %(c) | ||||
| RATIOS AND SUPPLEMENTAL DATA | ||||||||
| Net assets, end of period (in 000s) | $ | 4,587 | $ | 5,189 | ||||
| RATIOS TO AVERAGE NET ASSETS | ||||||||
| Expenses (excluding fees waived/ reimbursed by investment advisor) | 2.01 | %(d) | 2.45 | %(d) | ||||
| Expenses (including fees waived/ reimbursed by investment advisor) | 1.10 | %(d) | 1.10 | %(d) | ||||
| Net investment income | 0.78 | %(d) | 0.82 | %(d) | ||||
| PORTFOLIO TURNOVER RATE | 12 | %(c) | 14 | %(c) | ||||
| (a) | Per share numbers have been calculated using the average shares method. |
| (b) | Less than $0.005 or ($0.005) per share. |
| (c) | Not Annualized. |
| (d) | Annualized. |
See Notes to Financial Statements.
| Semi-Annual Report | October 31, 2018 | 31 |
| Rondure Funds | Notes to Financial Statements |
October 31, 2018 (Unaudited)
1. ORGANIZATION
Financial Investors Trust (the “Trust”), a Delaware statutory trust, is an open-end management investment company registered under the Investment Company Act of 1940, as amended (“1940 Act”). As of October 31, 2018, the Trust consists of multiple separate Portfolios or series. This semi-annual report describes the Rondure New World Fund and the Rondure Overseas Fund (individually a “Fund” and collectively, the “Funds”). The Funds seek long-term growth of capital. The Funds offer Investor Class and Institutional Class shares.
2. SIGNIFICANT ACCOUNTING POLICIES
The accompanying financial statements were prepared in accordance with accounting principles generally accepted in the United States of America (“U.S. GAAP”). The preparation of financial statements in conformity with U.S. GAAP requires management to make certain estimates and assumptions that affect the reported amounts of assets and liabilities and disclosures of contingent assets and liabilities at the date of the financial statements and the reported amounts of revenue and expenses during the period. Actual results could differ from those estimates. The Funds are considered an investment company for financial reporting purposes under U.S. GAAP and follows the accounting and reporting guidance applicable to investment companies in the Financial Accounting Standards Board Accounting Standards Codification Topic 946. The following is a summary of significant accounting policies consistently followed by the Funds in preparation of its financial statements.
Investment Valuation: The Funds generally value their securities based on market prices determined at the close of regular trading on the New York Stock Exchange (“NYSE”), normally 4:00 p.m. Eastern Time, on each day the NYSE is open for trading.
For equity securities and mutual funds that are traded on an exchange, the market price is usually the closing sale or official closing price on that exchange. In the case of equity securities not traded on an exchange, or if such closing prices are not otherwise available, the securities are valued at the mean of the most recent bid and ask prices on such day. Redeemable securities issued by open-end registered investment companies are valued at the investment company’s applicable net asset value, with the exception of exchange-traded open-end investment companies, which are priced as equity securities.
Equity securities that are primarily traded on foreign securities exchanges are valued at the closing values of such securities on their respective foreign exchanges, except when an event occurs subsequent to the close of the foreign exchange and the close of the NYSE that was likely to have changed such value. In such an event, the fair value of those securities are determined in good faith through consideration of other factors in accordance with procedures established by and under the general supervision of the Board of Trustees (the “Board”). The Funds will use a fair valuation model provided by an independent pricing service, which is intended to reflect fair value when a security’s value or a meaningful portion of each Fund’s portfolio is believed to have been materially affected by a valuation event that has occurred between the close of the exchange or market on which the security is traded and the close of the regular trading day on the NYSE. The Funds’ valuation procedures set forth certain triggers which instruct when to use the fair valuation model.
Forward currency exchange contracts have a fair value determined by the prevailing foreign currency exchange daily rates and current foreign currency exchange forward rates. The foreign currency exchange forward rates are calculated using an automated system that estimates rates on the basis of the current day foreign currency exchange rates and forward foreign currency exchange rates supplied by a pricing service.
When such prices or quotations are not available, or when Rondure Global Advisors, LLC (the “Advisor”) believes that they are unreliable, securities may be priced using fair value procedures approved by the Board.
Fair Value Measurements: The Funds disclose the classification of their fair value measurements following a three-tier hierarchy based on the inputs used to measure fair value. Inputs refer broadly to the assumptions that market participants would use in pricing the asset or liability, including assumptions about risk. Inputs may be observable or unobservable. Observable inputs reflect the assumptions market participants would use in pricing the asset or liability that are developed based on market data obtained from sources independent of the reporting entity. Unobservable inputs reflect the reporting entity’s own assumptions about the assumptions market participants would use in pricing the asset or liability that are developed based on the best information available.
Various inputs are used in determining the value of the Funds’ investments as of the end of the reporting period. When inputs used fall into different levels of the fair value hierarchy, the level in the hierarchy within which the fair value measurement falls is determined based on the lowest level input that is significant to the fair value measurement in its entirety. The designated input levels are not necessarily an indication of the risk or liquidity associated with these investments. These inputs are categorized in the following hierarchy under applicable financial accounting standards:
| 32 | 1.855.775.3337 | www.rondureglobal.com |
| Rondure Funds | Notes to Financial Statements |
October 31, 2018 (Unaudited)
Level 1 – Unadjusted quoted prices in active markets for identical investments, unrestricted assets or liabilities that the Funds have the ability to access at the measurement date;
Level 2 – Quoted prices which are not active, quoted prices for similar assets or liabilities in active markets or inputs other than quoted prices that are observable (either directly or indirectly) for substantially the full term of the asset or liability; and
Level 3 – Significant unobservable prices or inputs (including the Funds’ own assumptions in determining the fair value of investments) where there is little or no market activity for the asset or liability at the measurement date.
The following is a summary of each Fund’s investments in the fair value hierarchy as of October 31, 2018:
| Investments in Securities at Value | Level 1 - Quoted and Unadjusted | Level 2 - Other Inputs | Level 3 - Significant Unobservable | Total | ||||||||||||
| Rondure New World Fund | ||||||||||||||||
| Common Stocks | ||||||||||||||||
| China | $ | 8,134,908 | $ | 13,152,663 | $ | – | $ | 21,287,571 | ||||||||
| Greece | – | 1,683,980 | – | 1,683,980 | ||||||||||||
| Hong Kong | – | 2,323,985 | – | 2,323,985 | ||||||||||||
| India | – | 5,618,952 | – | 5,618,952 | ||||||||||||
| Indonesia | – | 2,387,580 | – | 2,387,580 | ||||||||||||
| Japan | – | 1,391,282 | – | 1,391,282 | ||||||||||||
| Kenya | – | 2,528,651 | – | 2,528,651 | ||||||||||||
| Malaysia | – | 3,277,662 | – | 3,277,662 | ||||||||||||
| Pakistan | – | 328,371 | – | 328,371 | ||||||||||||
| Philippines | 3,821,745 | 2,253,964 | – | 6,075,709 | ||||||||||||
| Poland | – | 2,003,582 | – | 2,003,582 | ||||||||||||
| Russia | 464,755 | 1,778,324 | – | 2,243,079 | ||||||||||||
| South Africa | 298,457 | 3,008,265 | – | 3,306,722 | ||||||||||||
| South Korea | – | 3,271,128 | – | 3,271,128 | ||||||||||||
| Taiwan | – | 5,731,146 | – | 5,731,146 | ||||||||||||
| Thailand | – | 2,945,374 | – | 2,945,374 | ||||||||||||
| Turkey | – | 2,444,448 | – | 2,444,448 | ||||||||||||
| Vietnam | – | 6,220,621 | – | 6,220,621 | ||||||||||||
| Other* | 26,395,394 | – | – | 26,395,394 | ||||||||||||
| Total | $ | 39,115,259 | $ | 62,349,978 | $ | – | $ | 101,465,237 | ||||||||
| Semi-Annual Report | October 31, 2018 | 33 |
| Rondure Funds | Notes to Financial Statements |
October 31, 2018 (Unaudited)
| Investments in Securities at Value | Level 1 - Quoted and Unadjusted Prices | Level 2 - Other Significant Observable Inputs | Level 3 - Significant Unobservable Inputs | Total | ||||||||||||
| Rondure Overseas Fund | ||||||||||||||||
| Common Stocks | ||||||||||||||||
| Australia | $ | – | $ | 1,601,401 | $ | – | $ | 1,601,401 | ||||||||
| Belgium | – | 56,767 | – | 56,767 | ||||||||||||
| Britain | 64,421 | 2,955,967 | – | 3,020,388 | ||||||||||||
| Denmark | – | 302,819 | – | 302,819 | ||||||||||||
| Finland | – | 361,539 | – | 361,539 | ||||||||||||
| France | – | 701,249 | – | 701,249 | ||||||||||||
| Germany | – | 1,577,290 | – | 1,577,290 | ||||||||||||
| Great Britain | – | 219,288 | – | 219,288 | ||||||||||||
| Hong Kong | – | 282,783 | – | 282,783 | ||||||||||||
| Israel | – | 48,224 | – | 48,224 | ||||||||||||
| Italy | – | 448,693 | – | 448,693 | ||||||||||||
| Japan | – | 7,515,256 | – | 7,515,256 | ||||||||||||
| Netherlands | – | 261,513 | – | 261,513 | ||||||||||||
| New Zealand | – | 804,194 | – | 804,194 | ||||||||||||
| South Korea | – | 182,073 | – | 182,073 | ||||||||||||
| Spain | – | 423,318 | – | 423,318 | ||||||||||||
| Sweden | – | 498,088 | – | 498,088 | ||||||||||||
| Switzerland | – | 481,212 | – | 481,212 | ||||||||||||
| Taiwan | – | 316,741 | – | 316,741 | ||||||||||||
| Other* | 2,017,002 | – | – | 2,017,002 | ||||||||||||
| Preferred Stocks* | $ | – | $ | 62,537 | $ | – | $ | 62,537 | ||||||||
| Total | $ | 2,081,423 | $ | 19,100,952 | $ | – | $ | 21,182,375 | ||||||||
| * | For a detailed country breakdown, see the accompanying Portfolio of Investments. |
The Funds recognize transfers between levels as of the end of the period. For the six months ended October 31, 2018, the Funds did not have any securities that used significant unobservable inputs (Level 3) in determining fair value.
Investment Transactions and Investment Income: Investment transactions are accounted for on the date the investments are purchased or sold (trade date). Realized gains and losses from investment transactions are reported on an identified cost which is the same basis the Fund uses for federal income tax purposes. Interest income, which includes accretion of discounts and amortization of premiums, is accrued and recorded as earned. Dividend income is recognized on the ex-dividend date or for certain foreign securities, as soon as information is available to the Funds. All of the realized and unrealized gains and losses and net investment income, are allocated daily to each class in proportion to its average daily net assets.
Cash Management Transactions: The Funds subscribe to the Brown Brothers Harriman & Co. (“BBH”) Cash Management Service (“CMS”), whereby cash balances are automatically swept into overnight offshore demand deposits with either the BBH Grand Cayman branch or a branch of a pre-approved commercial bank. This fully automated program allows the Funds to earn interest on cash balances. Excess cash with deposit institutions domiciled outside of the U.S. are subject to sovereign actions in the jurisdiction of the deposit institution including, but not limited to, freeze, seizure or diminution. Cash balances in the BBH CMS are included on the Statements of Assets and Liabilities under Cash and Foreign Cash, at Value. As of October 31, 2018, the Funds had the following cash balances participating in the BBH CMS:
| Fund | ||||
| Rondure New World Fund | $ | 16,283,350 | ||
| Rondure Overseas Fund | 2,920,628 | |||
| 34 | 1.855.775.3337 | www.rondureglobal.com |
| Rondure Funds | Notes to Financial Statements |
October 31, 2018 (Unaudited)
As of October 31, 2018, the Funds had the following foreign cash balances participating in the BBH CMS (cost and value of foreign cash balances are equal):
| Fund | ||||
| Rondure New World Fund | $ | 99,640 | ||
| Rondure Overseas Fund | 2,117 | |||
Foreign Securities: The Funds may directly purchase securities of foreign issuers. Investing in securities of foreign issuers involves special risks not typically associated with investing in securities of U.S. issuers. The risks include possible reevaluation of currencies, the inability to repatriate foreign currency, less complete financial information about companies and possible future adverse political and economic developments. Moreover, securities of many foreign issuers and their markets may be less liquid and their prices more volatile than those of securities of comparable U.S. issuers.
Foreign Currency Translation: The books and records of the Funds are maintained in U.S. dollars. Investment valuations and other assets and liabilities initially expressed in foreign currencies are converted each business day into U.S. dollars based upon current exchange rates. Prevailing foreign exchange rates may generally be obtained at the close of the NYSE (normally, 4:00 p.m. Eastern Time). The portion of realized and unrealized gains or losses on investments due to fluctuations in foreign currency exchange rates are separately disclosed.
Foreign Currency Spot Contracts: The Funds may enter into foreign currency spot contracts to facilitate transactions in foreign securities or to convert foreign currency receipts into U.S. dollars. A foreign currency spot contract is an agreement between two parties to buy and sell currencies at the current market rate, for settlement generally within two business days. The U.S. dollar value of the contracts is determined using current currency exchange rates supplied by a pricing service.
The contract is marked-to-market daily for settlements beyond one day and any change in market value is recorded as an unrealized gain or loss. When the contract is closed, a realized gain or loss is recorded equal to the difference between the value on the open and close date. Losses may arise from changes in the value of the foreign currency, or if the counterparties do not perform under the contract’s terms. The maximum potential loss from such contracts is the aggregate face value in U.S. dollars at the time the contract was opened.
Trust Expenses: Some expenses of the Trust can be directly attributed to the Funds. Expenses which cannot be directly attributed to the Funds are apportioned among all funds in the Trust based on average net assets of each fund.
Fund and Class Expenses: Expenses that are specific to a Fund or class of shares of a Fund, including distribution fees (Rule 12b-1 fees), are charged directly to that Fund or share class. Expenses that are common to all Funds generally are allocated among the Funds in proportion to their average daily net assets.
Offering Costs: Offering costs, including costs of printing initial prospectuses, legal and registration fees, are being amortized over twelve months from the inception date of the Funds. Amounts amortized during the six month period ended October 31, 2018 for Funds are shown on the Statements of Operations. All Offering costs have been fully amortized as of October 31, 2018.
Federal Income Taxes: The Funds comply with the requirements under Subchapter M of the Internal Revenue Code of 1986, as amended, applicable to regulated investment companies and intend to distribute substantially all of their net taxable income and net capital gains, if any, each year so that it will not be subject to excise tax on undistributed income and gains. The Funds are not subject to income taxes to the extent such distributions are made.
Distributions to Shareholders: Each Fund normally pays dividends and distributes capital gains, if any, on an annual basis. Income dividend distributions are derived from dividends and other income each Fund receives from their investments, including short term capital gains. Long term capital gain distributions are derived from gains realized when each Fund sells a security it has owned for more than a year. Each Fund may make additional distributions and dividends at other times if the portfolio manager believes doing so may be necessary for each Fund to avoid or reduce taxes. The Funds intend to pass through foreign tax credits to shareholders.
| Semi-Annual Report | October 31, 2018 | 35 |
| Rondure Funds | Notes to Financial Statements |
October 31, 2018 (Unaudited)
3. TAX BASIS INFORMATION
Tax Basis of Investments: As of October 31, 2018, the aggregate cost of investments, gross unrealized appreciation/(depreciation) and net unrealized appreciation for Federal tax purposes was as follows:
| Fund | Gross Appreciation (excess of value over tax cost) | Gross Depreciation (excess of tax cost over value) | Net Unrealized Appreciation | Cost of Investments for Income Tax Purposes | ||||||||||||
| Rondure New World Fund | $ | 4,799,242 | $ | (14,576,780 | ) | $ | (9,777,538 | ) | $ | 111,242,775 | ||||||
| Rondure Overseas Fund | 1,067,358 | (1,664,767 | ) | (597,409 | ) | 21,779,784 | ||||||||||
Tax Basis of Distributions to Shareholders: The character of distributions made during the year from net investment income or net realized gains may differ from its ultimate characterization for federal income tax purposes. Also, due to the timing of dividend distributions, the fiscal year in which amounts are distributed may differ from the fiscal year in which the income or realized gain were recorded by the Funds.
The tax character of distributions paid by the Funds for the period ended April 30, 2018 were as follows:
| Fund | Ordinary Income | Long-Term Capital Gain | ||||||
| Rondure New World Fund | $ | 216,468 | $ | – | ||||
| Rondure Overseas Fund | 166,473 | – | ||||||
The amounts and characteristics of tax basis distributions and composition of distributable earnings/(accumulated losses) are finalized at fiscal year-end. Accordingly, tax basis balances have not been determined as of October 31, 2018.
4. SECURITIES TRANSACTIONS
The cost of purchases and proceeds from sales of securities (excluding short term securities) during the six months ended October 31, 2018 were as follows:
Purchases of Securities | Proceeds From Sales of Securities | |||||||
| Fund | ||||||||
| Rondure New World Fund | $ | 19,252,022 | $ | 18,794,403 | ||||
| Rondure Overseas Fund | 6,704,229 | 2,402,686 | ||||||
5. SHARES OF BENEFICIAL INTEREST
The capitalization of the Trust consists of an unlimited number of shares of beneficial interest with no par value per share. Holders of the shares of the Funds of the Trust have one vote for each share held and a proportionate fraction of a vote for each fractional share. All shares issued and outstanding are fully paid and are transferable and redeemable at the option of the shareholder. Purchasers of the share do not have any obligation to make payments to the Trust or its creditors solely by reason of the purchasers’ ownership of the shares. Shares have no pre-emptive rights.
Shares redeemed within 60 days of purchase may incur a 2% short-term redemption fee deducted from the redemption amount. For the six months ended October 31, 2018, the redemption fees charged by the Funds are presented in the Statement of Changes in Net Assets.
| 36 | 1.855.775.3337 | www.rondureglobal.com |
| Rondure Funds | Notes to Financial Statements |
October 31, 2018 (Unaudited)
6. MANAGEMENT AND RELATED-PARTY TRANSACTIONS
The Advisor, subject to the authority of the Board, is responsible for the overall management and administration of the Funds’ business affairs. The Advisor manages the investments of the Funds in accordance with the Funds’ investment objective, policies and limitations and investment guidelines established jointly by the Advisor and the Trustees. Pursuant to the Advisory Agreement, (the “Advisory Agreement”), each Fund pays the Advisor an annual management fee based on each Fund’s average daily net assets. The management fee is paid on a monthly basis. The following table reflects the Funds’ advisory fee rates.
| Fund | Advisory Fee |
| Rondure New World Fund | 0.85% |
| Rondure Overseas Fund | 0.70% |
The Advisor has contractually agreed to limit certain of each Fund’s expenses (excluding acquired fund fees and expenses, brokerage expenses, interest expense, taxes and extraordinary expenses). The following table reflects the Funds’ expense cap.
| Fund | Expense Cap | Term of Expense Limit Agreements |
| Rondure New World Fund | ||
| Institutional Class | 1.10% | September 1, 2018 – August 31, 2019/ |
| Investor Class | 1.35% | March 23, 2017 – August 31, 2018 |
| Rondure Overseas Fund | ||
| Institutional Class | 0.85% | September 1, 2018 – August 31, 2019/ |
| Investor Class | 1.10% | March 23, 2017 – August 31, 2018 |
Pursuant to these agreements, the Advisor may seek reimbursement from a Fund for any previous fee waivers and expense reimbursements made by the Advisor, provided that any such reimbursements made by the Funds to the Advisor will not cause the Funds’ expense limitation to exceed expense limitations in existence at the time the expense was incurred, or at the time of the reimbursement, whichever is lower, and the reimbursement is made within three years after the expenses were incurred. Fees waived/reimbursed by Advisor for the six months ended October 31, 2018 are disclosed in the Statements of Operations.
For the six months ended October 31, 2018, the fee waivers/reimbursements and/or recoupments were as follows:
| Fund | Fees Waived/Reimbursed By Adviser | |||
| Rondure New World Fund Fund | ||||
| Institutional Class | $ | 167,879 | ||
| Investor Class | 47,143 | |||
| Rondure Overseas Fund Fund | ||||
| Institutional Class | $ | 77,098 | ||
| Investor Class | 22,162 | |||
| Fund | Expires 2021 | Expires 2022 | Total | |||||||||
| Rondure New World Fund Fund | ||||||||||||
| Institutional Class | $ | 366,501 | $ | 167,879 | $ | 534,380 | ||||||
| Investor Class | 90,647 | 47,143 | 137,790 | |||||||||
| Rondure Overseas Fund Fund | ||||||||||||
| Institutional Class | $ | 186,581 | $ | 77,098 | $ | 263,679 | ||||||
| Investor Class | 33,311 | 22,162 | 55,473 | |||||||||
| Semi-Annual Report | October 31, 2018 | 37 |
| Rondure Funds | Notes to Financial Statements |
October 31, 2018 (Unaudited)
Administrator Fees and Expenses
ALPS Fund Services, Inc. (“ALPS”) serves as administrator to the Funds and the Funds have agreed to pay expenses incurred in connection with their administrative activities. Pursuant to an Administration Agreement, ALPS provides operational services to the Funds including, but not limited to, fund accounting and fund administration and generally assists in the Funds’ operations. Officers of the Trust are employees of ALPS. The Funds’ administration fee is accrued on a daily basis and paid monthly. Administration fees paid by the Funds for the six months ended October 31, 2018 are disclosed in the Statements of Operations.
ALPS is reimbursed by the Fund for certain out-of-pocket expenses.
Transfer Agent
ALPS serves as transfer, dividend paying and shareholder servicing agent for the Funds. ALPS receives an annual minimum fee, a fee based upon the number of shareholder accounts, and is also reimbursed by the Funds for certain out-of-pocket expenses. Transfer agent fees paid by the Funds for the six months ended October 31, 2018 are disclosed in the Statements of Operations.
Compliance Services
ALPS provides services that assist the Trust’s chief compliance officer in monitoring and testing the policies and procedures of the Trust in conjunction with requirements under Rule 38a-1 under the 1940 Act and receives an annual base fee. ALPS is reimbursed for certain out-of-pocket expenses by the Funds. Compliance service fees paid by the Funds for the six months ended October 31, 2018 are disclosed in the Statements of Operations.
Principal Financial Officer
ALPS receives an annual fee for providing principal financial officer services to the Funds. Principal financial officer fees paid by the Fund for the six months ended October 31, 2018 are disclosed in the Statements of Operations.
Distributor: ALPS Distributors, Inc. (“ADI” or the “Distributor”) (an affiliate of ALPS) acts as the distributor of the Funds’ shares pursuant to a Distribution Agreement with the Trust. Shares are sold on a continuous basis by ADI as agent for the Funds, and ADI has agreed to use its best efforts to solicit orders for the sale of each Fund’s shares, although it is not obliged to sell any particular amount of shares. ADI is not entitled to any compensation for its services as Distributor. ADI is registered as a broker-dealer with the U.S. Securities and Exchange Commission.
Each Fund has adopted a Distribution and Services (Rule 12b-1) Plan pursuant to Rule 12b-1 of the 1940 Act (the “Plan”) for its Investor Class shares. The Plan allows the Funds to use Investor Class assets to pay fees in connection with the distribution and marketing of Investor Class shares and/or the provision of shareholder services to Investor Class shareholders. The Plan permits payment for services in connection with the administration of plans or programs that use Investor Class shares of each Fund as their funding medium and for related expenses. The recipients of such payments may include the Distributor, other affiliates of the Advisor, broker-dealers, financial institutions, plan sponsors and administrators and other financial intermediaries through which investors may purchase shares of the Fund. The Plan permits the Funds to make total payments at an annual rate of up to 0.25% of each Fund’s average daily net assets attributable to its Investor Class shares. The expenses of the Plan are reflected as distribution and service fees in the Statements of Operations.
7. INDEMNIFICATIONS
Under the Trust’s organizational documents, its officers and Trustees are indemnified against certain liability arising out of the performance of their duties to the Trust. Additionally, in the normal course of business, the Trust enters into contracts with service providers that may contain general indemnification clauses, which may permit indemnification to the extent permissible under applicable law. The Trust’s maximum exposure under these arrangements is unknown, as this would involve future claims that may be made against the Trust that have not yet occurred.
8. NEW ACCOUNTING PROUNOUNCEMENTS
On October 4, 2018, the SEC amended Regulation S-X to require certain financial statement disclosure requirements to conform them to U.S. GAAP for investment companies. Effective November 4, 2018, the Funds adopted disclosure requirement changes for Regulation S-X and these changes are reflected throughout this report. The Funds’ adoption of those amendments, effective with the financial statements prepared as of October 31, 2018, had no effect on the Funds’ net assets or results of operations.
In August 2018, the Financial Accounting Standards Board (“FASB”) issued Accounting Standards Update (“ASU”) 2018-13, which changes the fair value measurement disclosure requirements of FASB Accounting Standards Codification Topic 820, Fair Value Measurement. The update to Topic 820 includes new, eliminated, and modified disclosure requirements. ASU 2018-13 is effective for fiscal years beginning after December 15, 2019, including interim periods. Early adoption is permitted for any eliminated or modified disclosures. Management is currently evaluating the impact of the ASU to the Funds’ financial statements.
9. SUBSEQUENT EVENT
Subsequent events after the date of the Statements of Assets and Liabilities have been evaluated through the date the financial statements were issued.
| 38 | 1.855.775.3337 | www.rondureglobal.com |
| Rondure Funds | Disclosure Regarding Approval of Fund Advisory Agreement |
October 31, 2018 (Unaudited)
On September 11, 2018, the Trustees met in person to discuss, among other things, the approval of the investment advisory agreement between the Trust and the Adviser, in accordance with Section 15(c) of the 1940 Act. In renewing and approving the Investment Advisory Agreement, the Trustees, including the Independent Trustees, considered the following factors with respect to the Rondure Funds:
Investment Advisory Fee Rate: The Trustees reviewed and considered the contractual annual advisory fees paid by the Trust, on behalf of the Rondure Funds, to Rondure, of 0.85% of the Rondure New World Fund’s daily net assets and 0.70% of the Rondure Overseas Fund’s daily net assets, in light of the extent and quality of the advisory services provided by Rondure to each of the Rondure Funds.
The Board received and considered information including a comparison of the Investor Class and Institutional Class of each Rondure Fund’s contractual advisory fee rate with those of funds in the expense group and universe of funds provided by an independent provider of investment company data (the “Data Provider”). The Trustees noted that the contractual advisory fee rate of both classes of each of the Rondure Funds was below the Data Provider peer group median.
Total Expense Ratios: The Trustees further reviewed and considered that the total expense ratio (after waivers) of both classes of each of the Rondure Funds was below the Data Provider peer group median.
Nature, Extent, and Quality of the Services under the Investment Advisory Agreement: The Trustees received and considered information regarding the nature, extent, and quality of services provided to the Rondure Funds under the Investment Advisory Agreement. The Trustees reviewed certain background materials supplied by Rondure in its presentation, including its Form ADV.
The Trustees reviewed and considered Rondure’s investment advisory personnel, its history as an asset manager, and its performance and the amount of assets currently under management by Rondure and its affiliated entities. The Trustees also reviewed the research and decision-making processes utilized by Rondure, including the methods adopted to seek to achieve compliance with the investment objectives, policies, and restrictions of the Rondure Funds.
The Trustees considered the background and experience of Rondure’s management in connection with the Rondure Funds, including reviewing the qualifications, backgrounds, and responsibilities of the management team primarily responsible for the day-to-day portfolio management of each Rondure Fund and the extent of the resources devoted to research and analysis of actual and potential investments.
The Trustees also reviewed, among other things, Rondure’s insider trading policies and procedures and its Code of Ethics.
Performance: The Trustees reviewed performance information for the Investor Class and Institutional Class shares of the Rondure Funds for the 3-month and 1-year periods ended June 30, 2018. That review included a comparison of each Rondure Fund’s performance to the performance of a group of comparable funds selected by the Data Provider. The Trustees noted that the performance of both classes of the Rondure New World Fund was approximately at or above the Data Provider peer group median for the 3-month and 1-year periods, the performance of both classes of the Rondure Overseas Fund was above the respective Data Provider peer group median for the 3-month and 1-year periods. The Trustees also considered Rondure’s discussion of its reputation generally and its investment techniques, risk management controls, and decision-making processes.
Comparable Accounts: The Trustees noted that Rondure has no other clients at this time.
Profitability: The Trustees received and considered a retrospective and projected profitability analysis prepared by Rondure based on the fees payable under the Investment Advisory Agreement with respect to the Rondure Funds. The Trustees considered the profits, if any, anticipated to be realized by Rondure in connection with the operation of the Rondure Funds. The Board then reviewed Rondure’s income statement and balance sheet for the years ended December 31, 2016 through December 31, 2017 in order to analyze the financial condition, stability, and profitability of Rondure.
Economies of Scale: The Trustees considered whether economies of scale in the provision of services to the Rondure Funds will be passed along to the shareholders under the proposed agreements.
Other Benefits to the Adviser: The Trustees reviewed and considered any other incidental benefits derived or to be derived by Rondure from its relationship with the Rondure Funds, including whether soft dollar arrangements were used.
| Semi-Annual Report | October 31, 2018 | 39 |
| Rondure Funds | Disclosure Regarding Approval of Fund Advisory Agreement |
October 31, 2018 (Unaudited)
In renewing Rondure as the Rondure Funds’ investment adviser and renewing the Investment Advisory Agreement and the fees charged under the Investment Advisory Agreement, the Trustees concluded that no single factor reviewed by the Trustees was identified by the Trustees to be determinative as the principal factor in whether to renew the Investment Advisory Agreement. Further, the Independent Trustees were advised by separate independent legal counsel throughout the process. The Trustees, including all of the Independent Trustees, concluded that:
| • | the contractual advisory fee rate of both classes of each of the Rondure Funds was below the Data Provider peer group median; |
| • | the total expense ratio (after waivers) of both classes of each of the Rondure Funds was below the Data Provider peer group median; |
| • | the nature, extent and quality of services rendered by Rondure under the Investment Advisory Agreement with respect to each Rondure Fund were adequate; |
| • | for the period ended June 30, 2018, the performance of both classes of the Rondure New World Fund was approximately at or above the Data Provider peer group median for the 3-month and 1-year periods, and the performance of both classes of the Rondure Overseas Fund was above the respective Data Provider peer group median for the 3-month and 1-year periods; |
| • | Rondure has no other clients at this time; |
| • | the profit, if any, realized by Rondure in connection with the operation of any of the Rondure Funds is not unreasonable to such Fund; and |
| • | there were no material economies of scale or other incidental benefits accruing to Rondure in connection with its relationship with any of the Rondure Funds. |
Based on the Trustees’ deliberations and their evaluation of the information described above, the Trustees, including all of the Independent Trustees, concluded that Rondure’s compensation for investment advisory services is consistent with the best interests of each of the Rondure Funds and their shareholders.
| 40 | 1.855.775.3337 | www.rondureglobal.com |
| Rondure Funds | Additional Information |
October 31, 2018 (Unaudited)
1. FUND HOLDINGS
The Funds file their complete schedule of portfolio holdings with the Securities and Exchange Commission (the “SEC”) for the first and third quarters of each fiscal year on Form N-Q within 60 days after the end of the period. Copies of the Funds’ Form N-Q are available without charge on the SEC website at http://www.sec.gov. You may also review and copy the Form N-Q at the SEC’s Public Reference Room in Washington, DC. For more information about the operation of the Public Reference Room, please call the SEC at 1-800-SEC-0330.
2. FUND PROXY VOTING POLICIES, PROCEDURES AND SUMMARIES
The Funds’ policies and procedures used in determining how to vote proxies and information regarding how the Funds voted proxies relating to portfolio securities during the most recent prior 12-month period ending June 30 are available without charge, (1) upon request, by calling (toll-free) 1-855-775-3337 and (2) on the SEC’s website at http://www.sec.gov.
| Semi-Annual Report | October 31, 2018 | 41 |


TABLE OF CONTENTS
| Letter to Shareholders | 1 |
| Performance Review | |
| Seafarer Overseas Growth and Income Fund | 4 |
| Seafarer Overseas Value Fund | 10 |
| Disclosure of Fund Expenses | 16 |
| Portfolio of Investments | 18 |
| Statements of Assets and Liabilities | 26 |
| Statements of Operations | 27 |
| Statements of Changes in Net Assets | 28 |
| Financial Highlights | 32 |
| Notes to Financial Statements | 38 |
| Additional Information | 47 |
| Privacy Policy | 48 |
Beginning on January 1, 2021, as permitted by regulations adopted by the U.S. Securities and Exchange Commission, paper copies of the Funds’ annual and semi-annual shareholder reports will no longer be sent by mail, unless you specifically request paper copies of the reports. Instead, the reports will be made available on the Funds’ website at www.seafarerfunds.com and you will be notified by mail each time a report is posted and provided with a website link to access the report.
Beginning on January 1, 2019, you may, notwithstanding the availability of shareholder reports online, elect to receive all future shareholder reports in paper format free of charge. If you invest through a financial intermediary, you can contact your financial intermediary to request that you continue to receive paper copies of your shareholder reports.
If you invest directly with the Funds, you can call 1.855.732.9220 to let the Funds know you wish to continue receiving paper copies of your shareholder reports. If you already elected to receive shareholder reports electronically, you will not be affected by this change and you need not take any action. You may elect to receive shareholder reports and other communications from the Funds electronically anytime by contacting your financial intermediary (such as a broker-dealer or bank) or, if you are a direct investor, by logging into your Seafarer Funds account at www.seafarerfunds.com and enrolling in electronic delivery.
| Seafarer Funds | Letter to Shareholders |
October 31, 2018
LETTER TO SHAREHOLDERS
November 15, 2018
Dear Fellow Shareholders,
I appreciate the opportunity to address you once again on behalf of the Seafarer Funds. This semi-annual report covers the first half of the Funds’ 2018-2019 fiscal year (May 1, 2018 to October 31, 2018).
On Decoupling
The past six months have been dismal for the emerging markets. Indeed, the past five years have been dispiriting. Over the past half decade, much of the developing world has been beset by political corruption, poor economic management, fiscal profligacy, shaky financial markets and anemic growth. The Funds’ benchmark index, the MSCI Emerging Markets Total Return Index, has risen at an annualized rate of 1.15% from October 2013 to October 2018.1 The Seafarer Overseas Growth and Income Fund has done little better, generating an annualized return of 1.32% over the same period.2 (The Seafarer Overseas Value Fund was launched in 2016 and does not have a five year performance record.) By contrast, the S&P 500 Index has risen at an annualized rate of 11.34%. After five years of material risk with little reward, the merit of the emerging market asset class is wanting.
My personal frustration is all the greater for the “false dawn” in performance that occurred within emerging markets between June 2016 and January 2018, when the Funds’ benchmark rose cumulatively 56.25%.3 As I argued in various commentaries throughout 2017, I perceived that the surge was spurred by one-time fiscal stimulus by China. I speculated that China undertook this stimulus to facilitate an internal political transition; and I was clear that once the transition was accomplished – as it was in February of this year – the stimulus would be withdrawn. I was concerned that growth within the asset class would then revert to a lower trend rate, disappointing investors and depressing stock prices. While it is debatable what happened during this anomalous nineteen-month period, I see plenty of evidence to support my argument regarding the root cause of the “false dawn.” Yet even with the benefit of such clarity, I was not able to steer the Growth and Income Fund to safety in the aftermath, frustrating me to no end.
Despite such dispiriting performance, I believe that the developing world warrants long-term investment. My view rests primarily on one idea: that the economic and financial cycles that govern the emerging markets are diverging from the developed, rich world; and as those cycles diverge, the asset class should begin to offer differentiated returns, and this in turn could generate an important diversification benefit for long-term investors. This benefit has not been available in the past, when the fortunes of emerging markets have been dominated by economic cycles of the developed world, particularly that of the U.S. Yet I think this domination is ending, and investors should contemplate a different future.
I admit, this an odd and stubborn argument to make. It is an odd argument because China – despite its wealth and scale – is acutely dependent on its bilateral trade relationship with the U.S. (The U.S. government has recently exploited this vulnerability via the imposition of import tariffs.) It is a stubborn argument because I offered a similar prediction one year ago, and I was decidedly wrong, at least with respect to financial performance of the past year. Still, I remain steadfast in the view that change is coming, and I believe that it will structurally change the characteristics of this fraught asset class.
In the argument that I advanced last year,4 I suggested that the emerging market asset class might “decouple” from other asset classes because of three nascent characteristics: first, developing nations exercised independence in monetary policy, whereas in the past they were beholden to the policies of the U.S. Federal Reserve; second, apart from China, most developing nations adopted floating exchange rates, and were no longer tied to the U.S. dollar; third, corporate profit cycles – once deeply intertwined with international trade – were increasingly driven by domestic consumption. I wrote then that I was not certain that decoupling would occur, but given monetary independence, currency independence and profit independence, there was a better chance than ever before that it might.
| Semi-annual Report – October 31, 2018 | 1 |
| Seafarer Funds | Letter to Shareholders |
October 31, 2018
While my prediction evidently failed this year, my view is unchanged. Indeed, I perceive a new, fourth component to the argument, such that I am as certain as ever: the developing world now has both the economic means and the political desire to cleave apart.
On Separation and Independence
When the term “emerging markets” was coined in the 1980s, it applied to a financial asset class associated with a diverse and divergent set of developing nations. Most countries shared little in common, save that all were poor, and most sought to promote international trade to stimulate economic growth. Today, there are few common characteristics that unite the nations within the developing world: the emerging market asset class spans countries with disparate levels of wealth, economic development, technological sophistication, infrastructure and consumption. Most countries still engage in meaningful trade; but many now enjoy much larger domestic, consumer-driven economies, and thus are not as export-dependent as they once were. Yet to the extent that trade remains in the picture, these countries still share one common characteristic: dependence on wealthier trading partners, particularly on the U.S.
Nowhere is this dependence more acute than China. China’s domestic, consumer-driven economy has grown to vast scale, and it is now the primary engine of the country’s growth – not exports to the West. Yet China’s burgeoning wealth has fueled an enormous taste for imported goods – goods to fuel technological advancement, goods to satisfy consumer demand. China’s imports have grown so rapidly that the nation is now the primary trading partner for the rest of the developing world. This poses a problem for the country: how does it pay for such vast imports? China’s currency is not accepted as a global reserve currency, and thus it cannot finance its trade deficits with issuance of renminbi-denominated bonds (as the U.S. does with dollar-denominated bonds). The only way that China can afford such consumption is by earning dollars elsewhere – and that is why it is reliant on the large and sustained bilateral trade surplus with the U.S. China does not require trade with the U.S. to grow, as it once did; it only needs such trade in order to pay its bills elsewhere.
Yet for many developing nations – and especially for China – trade with the U.S. has become a thorny endeavor. Over the past two years, the U.S. has not only sought to curb its deficits with China, it has also sought to curtail certain transfers of sensitive technologies. The Chinese government and many private companies have discovered, painfully, that the U.S. will withhold critical exports – particularly technology goods – based on a broad assortment of security and political considerations. Chinese industries have been left reeling by a combination of trade sanctions on imports, and burdensome tariffs on most exports.
I neither wish to defend nor decry current U.S. trade policy. Regardless of its merit, I believe U.S. policy will have one primary ramification: it will push China to de-emphasize its trade with the U.S. and to develop an economic model that is wholly independent of the West, one which likely envelops most of the rest of the developing world. Tariffs, sanctions and dollar-dependency have exposed China’s short-term reliance on the U.S. Yet I think this exposure will spur China to undertake a rapid re-organization of its global trade relationships and domestic technology industries, and reinvigorate its efforts to internationalize use of the renminbi.
I believe the world will be surprised by how quickly China re-directs its export surpluses away from the U.S. and toward other developing nations. It will use its clout as the largest importer from developing countries to demand balanced trade in physical goods. If China cannot balance trade in goods, it will stipulate that the emerging world consume more of its service exports to offset – in other words, China will push consulting, management, processing, construction and technology services onto the developing world. Lastly, China will encourage such countries to increase use of the renminbi to fund its trade deficits, much as the U.S. does today with dollar-denominated bonds. Meanwhile, China will spur investment in its own domestic technology industries, with the aim of severing its dependence on U.S. semiconductors – thereby reducing one of its most expensive categories of imports from the U.S.5
| 2 | (855) 732-9220 seafarerfunds.com |
| Seafarer Funds | Letter to Shareholders |
October 31, 2018
China cannot create a world-class semiconductor industry overnight – and it may fail outright – but I believe the rest of this transformation is not only possible but will occur with blinding speed. I would guess that it is achievable in a decade, and perhaps in half that time. When the transition is complete, I think the emerging market asset class will function quite differently than it did during the past three decades. I suspect it will be organized around a new economic engine, and it will follow a differentiated investment cycle – one no longer dependent on trade with the West, but rather with China at its center.
For better or for worse, U.S. trade policies will serve as the final impetus for the asset class to decouple. What that will entail for expectations of performance, only time will tell; yet I am wholly convinced that it will deliver the long-promised, but oft-failed diversification benefit from the emerging market asset class.
We appreciate the trust and patience that you have extended to our firm amid such challenging conditions. Thank you for the opportunity to serve as your investment adviser in the emerging markets.
Andrew Foster
Chief Investment Officer
Seafarer Capital Partners, LLC
The MSCI Emerging Markets Total Return Index, Standard (Large+Mid Cap) Core, Gross (dividends reinvested), USD is a free float-adjusted market capitalization index designed to measure equity market performance of emerging markets. Index code: GDUEEGF.
The S&P 500 Total Return Index is a stock market index based on the market capitalizations of 500 large companies with common stock listed on the NYSE or NASDAQ.
It is not possible to invest directly in an index.
The Fund is subject to investment risks, including possible loss of the principal amount invested and therefore is not suitable for all investors. The Fund may not achieve its objectives. Diversification does not ensure a profit or guarantee against loss.
Information on the Seafarer website is provided for textual reference only, and is not incorporated by reference into this report.
The views and information discussed in this commentary are as of the date of publication, are subject to change, and may not reflect Seafarer’s current views. The views expressed represent an assessment of market conditions at a specific point in time, are opinions only and should not be relied upon as investment advice regarding a particular investment or markets in general. Such information does not constitute a recommendation to buy or sell specific securities or investment vehicles. It should not be assumed that any investment will be profitable or will equal the performance of the portfolios or any securities or any sectors mentioned herein. The subject matter contained herein has been derived from several sources believed to be reliable and accurate at the time of compilation. Seafarer does not accept any liability for losses either direct or consequential caused by the use of this information.
| 1 | The annualized return of the MSCI Emerging Markets Total Return Index is measured between October 31, 2013 and October 31, 2018. |
| 2 | References to the “Seafarer Overseas Growth and Income Fund” pertain to the Fund’s Institutional share class (ticker: SIGIX). The Investor share class (ticker: SFGIX) generated an annualized return of 1.20% over the five year period. |
| 3 | The cumulative return of the MSCI Emerging Markets Total Return Index is measured between June 30, 2016 and January 31, 2018. |
| 4 | The “argument that I advanced last year” refers to the section of the Seafarer Overseas Growth and Income Fund’s third quarter 2017 portfolio review titled “Decoupling – Is It Real This Time?” This commentary is available at: www.seafarerfunds.com/funds/ogi/portfolio-review/2017/09/Q3#decoupling |
| 5 | My colleague Nicholas Borst recently published a white paper (www.seafarerfunds.com/commentary/chinas-tech-rush/) that discusses China’s efforts to advance its technological capabilities and establish leading positions in semiconductors and other high-tech industries. |
| Semi-annual Report – October 31, 2018 | 3 |
| Seafarer Overseas Growth and Income Fund | Performance Review |
October 31, 2018
SEAFARER OVERSEAS GROWTH AND INCOME FUND
PERFORMANCE REVIEW
November 15, 2018
This report addresses the first half of the Seafarer Overseas Growth and Income Fund’s 2018-2019 fiscal year (May 1, 2018 to October 31, 2018).
During the semi-annual period, the Fund returned -15.12%, while the Fund’s benchmark, the MSCI Emerging Markets Total Return Index, fell -16.31%.1 By way of broader comparison, the S&P 500 Index gained 3.40%.
The Fund began the fiscal year with a net asset value (NAV) of $13.14 per share. In June, the Fund paid a semi-annual distribution of $0.114 per share. That payment brought the cumulative distribution per share, as measured from the Fund’s inception, to $1.895.2 The Fund finished the semi-annual period with a value of $11.05 per share.3
* * * * *
Relative to conditions one year ago, performance and sentiment associated with emerging markets has turned markedly for the worse – this despite naive and over-exuberant forecasts from many global strategists at the outset of this year. As I discussed in detail in the Fund’s second quarter 2018 Portfolio Review, I am skeptical that two popular narratives – Chinese trade tariffs and rising U.S. interest rates – are to blame for the decline in emerging equities during this semi-annual period.4 Both events have weighed on stock prices, but their effect has been exaggerated in my view. Instead, I would point to two other events, acting in tandem, as the primary cause for the downturn: lackluster corporate earnings growth and resurfacing inflationary pressures – spurring tighter local monetary conditions – in these markets. As investors have come to grips with the prospect of slower-than-expected earnings growth against a backdrop of rising local rates, they have retreated from equities.
The second half of this semi-annual period was notable for a sharp slump in China-related equities. Stocks in China – which had held up remarkably well through mid-year – suddenly yielded, such that they became one of the worst-performing markets in the developing world in the period under review. The sell-off appears spurred by lackluster results in the much-hyped technology sector, combined with a creeping (and then sudden) realization that China’s overall growth is not as resilient as it appeared at the outset of the year. Chinese authorities have sought to blame a “challenging external environment” for the slowdown – a euphemism for the trade tariffs imposed by the U.S.5 This excuse seems little more than a thin attempt to scapegoat the U.S. for China’s deceleration – China recorded a record trade surplus with the U.S. in September, so tariffs are hardly yet to blame.6 Rather, it appears that China’s domestic economic policies have contributed to the downturn.5 Personally, I think the true cause was the wind-down of politically-motivated fiscal stimulus that China undertook between mid-2016 and January 2018 (please see the Shareholder Letter included in this Semi-annual Report for further details); China’s economy is now hungover from the withdrawal.
Happily, the Fund sidestepped most of the aforementioned downturn in Chinese technology stocks. Yet its performance during the period was impacted negatively by a number of individual holdings.
Some of the Fund’s largest positions swung wildly lower in what I believe was a grossly-exaggerated response to short-term financial performance. Venture of Singapore (a contract manufacturer of high-end electronic devices) and Orion Corp of Korea (a pan-Asia confectionary company) were both impacted in this regard. Venture presented remarkably strong profit margins, and good capital management policies, but investors were apparently disappointed by a deceleration in revenue growth due to idiosyncratic customer orders. I believe that Venture’s niche and highly-profitable business model places it in an advantageous position, and the merits of its niche will resume over time.
Orion declined over this semi-annual period because of a setback in its China-related business. The company’s brand suffered from political disfavor in 2016 and 2017, and this led to weak sales in China.
| 4 | (855) 732-9220 seafarerfunds.com |
| Seafarer Overseas Growth and Income Fund | Performance Review |
October 31, 2018
Orion’s management crafted what I believe to be a superb and transparent means to restructure its business there; indeed, initial success in that plan saw Orion’s shares climb to new heights in June. Yet as second and third quarter results were presented, some investors were apparently displeased with Orion’s progress, and the shares plummeted, relinquishing all gains and more. I believe the short attention span of such investors is ridiculous, and the company’s plans to rebuild in China will bear material fruit over time.
Amid the broad-based sell-off, there were a few positive events within the portfolio during the semi-annual period. One long-term holding, Shandong Weigao (a China-based producer of medical equipment and consumable medical supplies), generated a total return of over 46% in U.S. dollar terms. Investors applauded certain internal governance changes that should rationalize Weigao’s corporate structure, and perhaps revitalize incentives for management performance. Unfortunately, though, this sudden improvement only represents the reversal of many years of weak performance, and not long-term gains for the Fund. As of October 31, the Fund no longer held shares in Weigao.
Infosys (an India-based, global consulting and software services company) was the other large holding that contributed substantially and positively to performance during the six-month period. I have discussed my views on the company in many preceding commentaries, so I will not repeat them in full here. However, it is sufficient to state that the company’s steady growth and resilient profitability has continued to surprise many analysts, upsetting their overly dour forecasts. As of October 31, the Fund substantially reduced its holding in Infosys in light of the long-term gains the position had generated, and because the company’s shares now claim a higher valuation. However, the Fund retains a modest position in the company, and as of the time of this writing, intends to do so for the immediately foreseeable future.
I appreciate your patience and your resolve during this period of difficult performance, and I thank you for your willingness to entrust your capital with the Fund for the long-term.
Andrew Foster
Lead Portfolio Manager, Seafarer Overseas Growth and Income Fund
Seafarer Capital Partners, LLC
The MSCI Emerging Markets Total Return Index, Standard (Large+Mid Cap) Core, Gross (dividends reinvested), USD is a free float-adjusted market capitalization index designed to measure equity market performance of emerging markets. Index code: GDUEEGF.
The S&P 500 Total Return Index is a stock market index based on the market capitalizations of 500 large companies with common stock listed on the NYSE or NASDAQ.
It is not possible to invest directly in an index.
The Fund is subject to investment risks, including possible loss of the principal amount invested and therefore is not suitable for all investors. The Fund may not achieve its objectives. Diversification does not ensure a profit or guarantee against loss.
Information on the Seafarer website is provided for textual reference only, and is not incorporated by reference into this report.
The views and information discussed in this commentary are as of the date of publication, are subject to change, and may not reflect Seafarer’s current views. The views expressed represent an assessment of market conditions at a specific point in time, are opinions only and should not be relied upon as investment advice regarding a particular investment or markets in general. Such information does not constitute a recommendation to buy or sell specific securities or investment vehicles. It should not be assumed that any investment will be profitable or will equal the performance of the portfolios or any securities or any sectors mentioned herein. The subject matter contained herein has been derived from several sources believed to be
| Semi-annual Report – October 31, 2018 | 5 |
| Seafarer Overseas Growth and Income Fund | Performance Review |
October 31, 2018
reliable and accurate at the time of compilation. Seafarer does not accept any liability for losses either direct or consequential caused by the use of this information.
| 1 | References to the “Fund” pertain to the Fund’s Institutional share class (ticker: SIGIX). The Investor share class (ticker: SFGIX) returned -15.17% during the semi-annual period. This performance reflects adjustments in accordance with accounting principles generally accepted in the U.S. (“U.S. GAAP”); as such, the total return for shareholder transactions reported to the market may differ from the total return for financial reporting purposes. As a result of the U.S. GAAP adjustment, the total return increased from -15.25% to -15.17%. |
| 2 | The Fund’s inception date is February 15, 2012. |
| 3 | The Fund’s Investor share class began the fiscal year with a net asset value of $13.11 per share; it paid a semi-annual distribution of $0.112 per share in June; and it finished the semi-annual period with a value of $11.02 per share (adjustments in accordance with U.S. GAAP were applied during the financial statement preparation and increased the net asset value from $11.01 to $11.02). |
| 4 | This discussion in the Fund’s second quarter 2018 portfolio review is available at: www.seafarerfunds.com/funds/ogi/portfolio-review/2018/06/Q2#performance-review |
| 5 | Christopher Balding, “Is the Trade War Really Holding China Back?” Bloomberg News, 14 November 2018. The article is available at: www.bloomberg.com/opinion/articles/2018-11-14/is-the-trade-war-really-holding-china-s-economy-back |
| 6 | “Rush to Beat Tariffs Fuels Record China Trade Surplus with U.S.,” Bloomberg News, 11 October 2018. The article is available at: www.bloomberg.com/news/articles/2018-10-12/china-s-export-growth-stable- imports-robust-amid-trade-war |
| 6 | (855) 732-9220 seafarerfunds.com |
| Seafarer Overseas Growth and Income Fund | Performance Review |
October 31, 2018
Total Returns
| As of October 31, 2018 | 6 Month | 1 Year | 3 Years | 5 Years | Since Inception Annualized(1) | Gross Expense Ratio(2) |
| Investor Class (SFGIX)(3) | -15.17% | -14.19% | 2.31% | 1.20% | 3.86% | 0.97% |
| Institutional Class (SIGIX) | -15.12% | -14.10% | 2.40% | 1.32% | 3.98% | 0.87% |
| MSCI Emerging Markets Total Return Index(4) | -16.31% | -12.19% | 6.92% | 1.15% | 1.32% |
All performance is in U.S. dollars with gross (pre-tax) dividends and/or distributions reinvested. The performance data quoted represents past performance and does not guarantee future results. Future returns may be lower or higher. The investment return and principal value will fluctuate so that an investor’s shares, when redeemed, may be worth more or less than the original cost. Prior to August 31, 2016, shares of the Fund redeemed or exchanged within 90 days of purchase were subject to a 2% redemption fee. Performance does not reflect this fee, which if deducted would reduce an individual’s return. To obtain the Fund’s most recent month-end performance, visit seafarerfunds.com or call (855) 732-9220.
| 1 | Inception Date: February 15, 2012. |
| 2 | Ratios as of Prospectus dated August 31, 2018. Seafarer Capital Partners, LLC has agreed contractually to waive and/or reimburse fees or expenses in order to limit Total Annual Fund Operating Expenses After Fee Waiver/Expense Reimbursements (inclusive of acquired fund fees and expenses, and exclusive of brokerage expenses, interest expenses, taxes and extraordinary expenses) to 1.15% and 1.05% of the Fund’s average daily net assets for the Investor and Institutional share classes, respectively. This agreement is in effect through August 31, 2019. |
| 3 | Includes adjustments in accordance with U.S. GAAP; as such, the total returns for shareholder transactions reported to the market may differ from the total returns for financial reporting purposes. |
| 4 | The MSCI Emerging Markets Total Return Index, Standard (Large+Mid Cap) Core, Gross (dividends reinvested), USD is a free float-adjusted market capitalization index designed to measure equity market performance of emerging markets. Index code: GDUEEGF. The index is not actively managed and does not reflect any deductions for fees, expense or taxes. An investor may not invest directly in an index. |
| Semi-annual Report – October 31, 2018 | 7 |
| Seafarer Overseas Growth and Income Fund | Performance Review |
October 31, 2018
Performance of a $10,000 Investment Since Inception
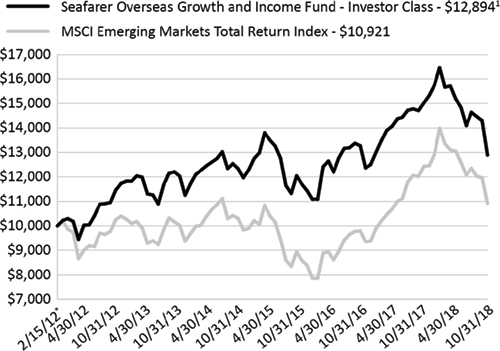
| * | Inception Date: February 15, 2012. |
| 1 | Includes adjustments in accordance with U.S. GAAP. |
The chart shown above represents historical performance of a hypothetical investment of $10,000 in the Fund’s Investor Class shares for the period from inception to October 31, 2018. All returns reflect reinvested dividends and/or distributions, but do not reflect the deduction of taxes that an investor would pay on distributions or redemptions.
The Fund also offers Institutional Class shares, performance for which is not reflected in the chart above. The performance of Institutional Class shares may be higher or lower than the performance of the Investor Class shares shown above based upon differences in fees paid by shareholders investing in the Investor Class shares and Institutional Class shares.
Investment Objective
The Fund seeks to provide long-term capital appreciation along with some current income. The Fund seeks to mitigate adverse volatility in returns as a secondary objective.
Strategy
The Fund invests primarily in the securities of companies located in developing countries. The Fund invests in several asset classes including dividend-paying common stocks, preferred stocks, and fixed-income securities.
The Fund seeks to offer investors a relatively stable means of participating in developing countries’ growth prospects, while attempting to mitigate adverse volatility in returns.
| 8 | (855) 732-9220 seafarerfunds.com |
| Seafarer Overseas Growth and Income Fund | Performance Review |
October 31, 2018
| Portfolio Composition by Region | % Net Assets |
| East & South Asia | 81.2% |
| Emerging Europe | 3.9% |
| Latin America | 7.5% |
| Middle East & Africa | 2.6% |
| Cash & Other Assets, Less Liabilities | 2.5% |
| Government Bond, Short-term - USD and Foreign Currency | 2.3% |
| Total | 100.0% |
| Portfolio Composition by Sector | % Net Assets |
| Communication Services | 3.5% |
| Consumer Discretionary | 20.9% |
| Consumer Staples | 13.2% |
| Financials | 9.2% |
| Health Care | 14.5% |
| Industrials | 4.9% |
| Information Technology | 20.8% |
| Materials | 1.7% |
| Real Estate | 2.6% |
| Utilities | 3.9% |
| Cash & Other Assets, Less Liabilities | 2.5% |
| Government Bond, Short-term - USD and Foreign Currency | 2.3% |
| Total | 100.0% |
| Top 10 Holdings | % Net Assets |
| Hyundai Mobis Co., Ltd. | 5.6% |
| Orion Corp. | 4.2% |
| Samsung Electronics Co., Ltd. | 4.1% |
| China Yangtze Power Co., Ltd. | 3.9% |
| Venture Corp., Ltd. | 3.9% |
| Richter Gedeon Nyrt | 3.8% |
| Hengan International Group Co., Ltd. | 3.3% |
| Odontoprev SA | 3.2% |
| Taiwan Semiconductor Manufacturing Co., Ltd. | 2.7% |
| Sanlam, Ltd. | 2.5% |
| Total | 37.2% |
| Total Number of Holdings | 521 |
Holdings are subject to change, and may not reflect the current or future position of the portfolio.
Source: ALPS Fund Services, Inc.
| 1 | Excludes short-term government bonds; includes medium- and long-term government bonds. |
| Semi-annual Report – October 31, 2018 | 9 |
| Seafarer Overseas Value Fund | Performance Review |
October 31, 2018
SEAFARER OVERSEAS VALUE FUND
PERFORMANCE REVIEW
November 15, 2018
This report addresses the first half of the Seafarer Overseas Value Fund’s 2018-2019 fiscal year (May 1, 2018 to October 31, 2018).
During the semi-annual period, the Fund returned -10.62%, while the Fund’s benchmark, the MSCI Emerging Markets Total Return Index, fell -16.31%.1 By way of broader comparison, the S&P 500 Index gained 3.40%.
The Fund began the fiscal year with a net asset value (NAV) of $11.96 per share. The Fund paid no distributions during the first half of the fiscal year, and it finished the period with a value of $10.69 per share.2
This performance review examines the Fund within a challenging and volatile market environment. The semi-annual period delivered a substantial depreciation in the MSCI Emerging Markets Index, which continued its weak returns that began in the first quarter of 2018.
In the Annual Report for the period ended April 30, 2018, I assessed the Fund’s second year of performance by stating that “the primary determinants of the Fund’s performance were companies that appreciated or depreciated mainly due to stock-specific drivers.” 3 The first half of the current fiscal year represents a divergence from this condition.
As I noted in the Fund’s second quarter portfolio review, two factors drove the benchmark index’s continued decline in the semi-annual period: depreciating emerging market currencies and the intensification of trade tensions between the U.S. and many of its trading partners.4 While the Fund’s performance drivers are quite different from those of the index, global trade and geopolitical developments meaningfully impacted performance for the first time since the Value Fund’s inception. Indeed, through the period, Fund performance reflected a significant reassessment of China’s growth prospects due to the indirect detrimental impacts of U.S. tariffs on Chinese firms.
Throughout the semi-annual period, the anticipation and subsequent implementation of tariffs negatively impacted the stock prices of a handful of portfolio holdings. Some of the dominant detractors to the Fund’s NAV are classified under the Breakup Value source of value (Seafarer’s seven sources of value,5 hereafter referenced using parenthesized italics, are defined in Figure 1.) Within this category of value, trade tariffs hit the stock prices of Melco International Development (Breakup Value), a casino owner and operator, and Shangri-La (Breakup Value), a hotel owner and operator. Tariffs also indirectly contributed to the price declines of Xtep International (Balance Sheet Liquidity), a sportswear manufacturer, and China Resources Beer (Structural Shift), a Chinese brewer. The common factor pressuring the share prices of these stocks is the mark-down of growth prospects for the entire Chinese economy precipitated by trade tariffs.
| 10 | (855) 732-9220 seafarerfunds.com |
| Seafarer Overseas Value Fund | Performance Review |
October 31, 2018
Figure 1. A Working Definition of Value
Seafarer has identified seven distinct sources of value in emerging markets that may give rise to viable opportunities for long-term, value-oriented investments.
| Opportunity Set | Source of Value | |
| Balance Sheet | Balance Sheet Liquidity | Cash or highly liquid assets undervalued by the market |
| Breakup | Assets whose liquidation value exceeds their market capitalization | |
| Management Change | Assets that would become substantially more productive under a new owner / operator | |
| Deleveraging | Shift of cash flow accrual from debt holders to equity holders | |
| Asset Productivity | Cyclical downturn following a period of asset expansion | |
| Structural Shift | Shift to a lower growth regime, but still highly cash generative | |
| Income Statement / Cash Flow | Segregated Market | Productive, cash-generative trading in an illiquid public market |
Source: Seafarer
WH Group (Management Change), a Chinese meat processor and owner of U.S.-based Smithfield Foods, unfortunately detracted from the Fund’s total return throughout the six-month period. At first, tariffs were to blame; however, other unique variables came into play: Hurricane Florence in the U.S. and African swine flu in China led to poor performance.
Other portfolio holding declines of note include First Pacific (Breakup Value), a conglomerate with assets in the Philippines and Indonesia, and Qualicorp (Structural Shift), a Brazilian health insurance broker. These declines occurred amidst the backdrop of company-specific drivers rather than global variables. The former faced questions regarding the recoverability of historical tariff adjustments; the latter encountered concern over the impact of significant insurance premium hikes on the affordability of its coverage plans.
Against challenging market conditions, I want to highlight two rebound cases during the semi-annual period. The rapidly rising London Interbank Offered Rate (LIBOR) - the base rate used to price offshore U.S. dollar debt - caused equity prices for Global Ports (Deleveraging and Asset Productivity), a Russian port owner and operator, and Del Monte Pacific (Deleveraging and Management Change), owner of the Del Monte packaged food brand, to decline in the first half of the period over concerns regarding their balance sheet de-levering.6 Remarkably, as I discussed in the Fund’s third quarter portfolio review, both holdings yielded positive returns in the latter half of the time period.7 This positive trend lends credibility to a core tenet of the Value Fund: that valuation, not only earnings growth, determines investment returns.
I was pleased to see Samsung SDI (Breakup Value), a Korean battery manufacturer, stand out as a positive contributor to Value Fund performance during this period. The steadily improving profitability of the electric vehicle battery unit at Samsung SDI accounts for its meaningful positive contribution to total return. In addition, Crédito Real (Asset Productivity), a Mexican non-bank finance company, lifted the Fund’s NAV after the successful NAFTA renegotiation and the reassertion of valuation considerations in determining price performance.
| Semi-annual Report – October 31, 2018 | 11 |
| Seafarer Overseas Value Fund | Performance Review |
October 31, 2018
Thank you for entrusting us with your capital. We are honored to serve as your investment adviser in the emerging markets.
Paul Espinosa
Lead Portfolio Manager, Seafarer Overseas Value Fund
Seafarer Capital Partners, LLC
The MSCI Emerging Markets Total Return Index, Standard (Large+Mid Cap) Core, Gross (dividends reinvested), USD is a free float-adjusted market capitalization index designed to measure equity market performance of emerging markets. Index code: GDUEEGF.
The S&P 500 Total Return Index is a stock market index based on the market capitalizations of 500 large companies with common stock listed on the NYSE or NASDAQ.
It is not possible to invest directly in an index.
The Fund is subject to investment risks, including possible loss of the principal amount invested and therefore is not suitable for all investors. The Fund may not achieve its objectives. Diversification does not ensure a profit or guarantee against loss.
Information on the Seafarer website is provided for textual reference only, and is not incorporated by reference into this report.
The views and information discussed in this commentary are as of the date of publication, are subject to change, and may not reflect Seafarer’s current views. The views expressed represent an assessment of market conditions at a specific point in time, are opinions only and should not be relied upon as investment advice regarding a particular investment or markets in general. Such information does not constitute a recommendation to buy or sell specific securities or investment vehicles. It should not be assumed that any investment will be profitable or will equal the performance of the portfolios or any securities or any sectors mentioned herein. The subject matter contained herein has been derived from several sources believed to be reliable and accurate at the time of compilation. Seafarer does not accept any liability for losses either direct or consequential caused by the use of this information.
As of October 31, 2018, the Fund did not own shares in Smithfield Foods, Inc.
| 1 | References to the “Fund” pertain to the Fund’s Institutional share class (ticker: SIVLX). The Investor share class (ticker: SFVLX) returned -10.63% during the semi-annual period. |
| 2 | The Fund’s Investor share class began the fiscal year with a net asset value of $11.95 per share. It finished the period with a value of $10.68 per share. |
| 3 | The Seafarer Funds’ Annual Report for the period ended April 30, 2018 is available at: www.seafarerfunds.com/reports/2018/annual |
| 4 | The Fund’s second quarter 2018 portfolio review is available at: www.seafarerfunds.com/funds/ovl/portfolio-review/2018/06/Q2 |
| 5 | Additional information on Seafarer’s seven sources of value is available in the white paper On Value in the Emerging Markets (www.seafarerfunds.com/value-in-em). |
| 6 | London Interbank Offered Rate (LIBOR) is the interest rate at which banks offer to lend funds (wholesale money) to one another in the international interbank market. |
| 7 | The Fund’s third quarter 2018 portfolio review is available at: www.seafarerfunds.com/funds/ovl/portfolio-review/2018/09/Q3 |
| 12 | (855) 732-9220 seafarerfunds.com |
| Seafarer Overseas Value Fund | Performance Review |
October 31, 2018
Total Returns
| As of October 31, 2018 | 6 Month | 1 Year | Since Inception Annualized(1) | Net Expense Ratio(2) |
| Investor Class (SFVLX) | -10.63% | -9.69% | 4.70% | 1.15% |
| Institutional Class (SIVLX) | -10.62% | -9.61% | 4.79% | 1.05% |
| MSCI Emerging Markets Total Return Index(3) | -16.31% | -12.19% | 10.36% |
Gross expense ratio: 1.92% for Investor Class; 1.75% for Institutional Class.2
All performance is in U.S. dollars with gross (pre-tax) dividends and/or distributions reinvested. The performance data quoted represents past performance and does not guarantee future results. Future returns may be lower or higher. The investment return and principal value will fluctuate so that an investor's shares, when redeemed, may be worth more or less than the original cost. Prior to August 31, 2016, shares of the Fund redeemed or exchanged within 90 days of purchase were subject to a 2% redemption fee. Performance does not reflect this fee, which if deducted would reduce an individual's return. To obtain the Fund’s most recent month-end performance, visit seafarerfunds.com or call (855) 732-9220.
| 1 | Inception Date: May 31, 2016. |
| 2 | Ratios as of Prospectus dated August 31, 2018. Seafarer Capital Partners, LLC has agreed contractually to waive and/or reimburse fees or expenses in order to limit Total Annual Fund Operating Expenses After Fee Waiver/Expense Reimbursements (inclusive of acquired fund fees and expenses, and exclusive of brokerage expenses, interest expenses, taxes and extraordinary expenses) to 1.15% and 1.05% of the Fund’s average daily net assets for the Investor and Institutional share classes, respectively. This agreement is in effect through August 31, 2019. |
| 3 | The MSCI Emerging Markets Total Return Index, Standard (Large+Mid Cap) Core, Gross (dividends reinvested), USD is a free float-adjusted market capitalization index designed to measure equity market performance of emerging markets. Index code: GDUEEGF. The index is not actively managed and does not reflect any deductions for fees, expense or taxes. An investor may not invest directly in an index. |
| Semi-annual Report – October 31, 2018 | 13 |
| Seafarer Overseas Value Fund | Performance Review |
October 31, 2018
Performance of a $10,000 Investment Since Inception
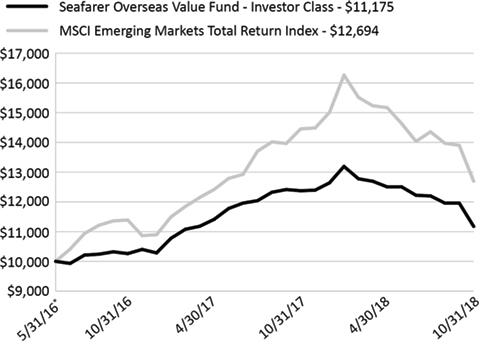
| * | Inception Date: May 31, 2016. |
The chart shown above represents historical performance of a hypothetical investment of $10,000 in the Fund’s Investor Class shares for the period from inception to October 31, 2018. All returns reflect reinvested dividends and/or distributions, but do not reflect the deduction of taxes that an investor would pay on distributions or redemptions.
The Fund also offers Institutional Class shares, performance for which is not reflected in the chart above. The performance of Institutional Class shares may be higher or lower than the performance of the Investor Class shares shown above based upon differences in fees paid by shareholders investing in the Investor Class shares and Institutional Class shares.
Investment Objective
The Fund seeks to provide long-term capital appreciation.
Strategy
The Fund invests primarily in the securities of companies located in developing countries. The Fund invests in several asset classes including common stocks, preferred stocks, and fixed-income securities.
The Fund’s portfolio is comprised of securities identified through a bottom-up security selection process based on fundamental research. The Fund seeks to produce a minimum long-term rate of return by investing in securities priced at a discount to their intrinsic value.
| 14 | (855) 732-9220 seafarerfunds.com |
| Seafarer Overseas Value Fund | Performance Review |
October 31, 2018
| Portfolio Composition by Region | % Net Assets |
| East & South Asia | 68.5% |
| Emerging Europe | 8.0% |
| Latin America | 6.5% |
| Middle East & Africa | 7.6% |
| Cash & Other Assets, Less Liabilities | 9.4% |
| Total | 100.0% |
| Portfolio Composition by Sector | % Net Assets |
| Communication Services | 4.6% |
| Consumer Discretionary | 20.9% |
| Consumer Staples | 20.9% |
| Energy | 7.0% |
| Financials | 7.0% |
| Health Care | 3.6% |
| Industrials | 10.8% |
| Information Technology | 4.5% |
| Materials | 7.1% |
| Real Estate | 1.7% |
| Utilities | 2.5% |
| Cash & Other Assets, Less Liabilities | 9.4% |
| Total | 100.0% |
| Top 10 Holdings | % Net Assets |
| Samsung SDI Co., Ltd. | 4.5% |
| Qatar Gas Transport Co., Ltd. | 4.2% |
| First Pacific Co., Ltd. | 4.1% |
| Xtep International Holdings, Ltd. | 3.9% |
| WH Group, Ltd. | 3.9% |
| Asia Satellite Telecommunications Holdings, Ltd. | 3.9% |
| Wilmar International, Ltd. | 3.9% |
| Qualicorp Consultoria e Corretora de Seguros SA | 3.6% |
| National Central Cooling Co. PJSC | 3.4% |
| China Foods, Ltd. | 3.4% |
| Total | 38.8% |
| Total Number of Holdings | 33 |
Holdings are subject to change, and may not reflect the current or future position of the portfolio.
Source: ALPS Fund Services, Inc.
| Semi-annual Report – October 31, 2018 | 15 |
| Seafarer Funds | Disclosure of Fund Expenses |
October 31, 2018 (Unaudited)
DISCLOSURE OF FUND EXPENSES
As a shareholder of a Fund you will incur two types of costs: (1) transaction costs, including applicable redemption fees; and (2) ongoing costs, including management fees and other Fund expenses. The following examples are intended to help you understand your ongoing costs (in dollars) of investing in a Fund and to compare these costs with the ongoing costs of investing in other mutual funds. The examples are based on an investment of $1,000 invested on May 1, 2018 and held until October 31, 2018.
Actual Expenses. For each Fund and share class, the first line of the following table provides information about actual account values and actual expenses. You may use the information in this line, together with the amount you invested, to estimate the expenses that you paid over the period. Simply divide your account value by $1,000 (for example, an $8,600 account value divided by $1,000 = 8.6), then multiply the result by the number in the first line under the heading “Expenses Paid During Period” to estimate the expenses you paid on your account during this period.
Hypothetical Example for Comparison Purposes. For each Fund and share class, the second line of the following table provides information about hypothetical account values and hypothetical expenses based on the Fund’s actual expense ratio and an assumed rate of return of 5% per year before expenses, which is not the Fund’s actual return. The hypothetical account values and expenses may not be used to estimate the actual ending account balance or expenses you paid for the period. You may use this information to compare the ongoing costs of investing in the Fund and other mutual funds. To do so, compare this 5% hypothetical example with the 5% hypothetical examples that appear in the shareholder reports of the other mutual funds.
Please note the expenses shown in the following table are meant to highlight your ongoing costs only and do not reflect transactional costs, such as redemption fees or exchange fees. Therefore, for each Fund and share class, the second line of the following table is useful in comparing ongoing costs only, and will not help you determine the relative total costs of owning different funds. In addition, if these transactional costs were included, your costs would have been higher.
| 16 | (855) 732-9220 seafarerfunds.com |
| Seafarer Funds | Disclosure of Fund Expenses |
October 31, 2018 (Unaudited)
Beginning Account Value 05/01/18 | Ending Account Value 10/31/18 | Expense Ratio(a) | Expenses Paid During Period 05/01/18 - 10/31/18(b) | |
| SEAFARER OVERSEAS GROWTH AND INCOME FUND | ||||
| Investor Class | ||||
| Actual | $1,000.00 | $848.30 | 0.98% | $4.57 |
| Hypothetical (5% return before expenses) | $1,000.00 | $1,020.27 | 0.98% | $4.99 |
| Institutional Class | ||||
| Actual | $1,000.00 | $848.80 | 0.89% | $4.15 |
| Hypothetical (5% return before expenses) | $1,000.00 | $1,020.72 | 0.89% | $4.53 |
| SEAFARER OVERSEAS VALUE FUND | ||||
| Investor Class | ||||
| Actual | $1,000.00 | $893.70 | 1.15% | $5.49 |
| Hypothetical (5% return before expenses) | $1,000.00 | $1,019.41 | 1.15% | $5.85 |
| Institutional Class | ||||
| Actual | $1,000.00 | $893.80 | 1.05% | $5.01 |
| Hypothetical (5% return before expenses) | $1,000.00 | $1,019.91 | 1.05% | $5.35 |
| (a) | Annualized, based on the Fund's most recent fiscal half year expenses. |
| (b) | Expenses are equal to the Fund's annualized expense ratio multiplied by the average account value over the period, multiplied by the number of days in the most recent fiscal half-year (184)/365 (to reflect the half-year period). |
| Semi-annual Report – October 31, 2018 | 17 |
| Seafarer Overseas Growth and Income Fund | Portfolio of Investments |
October 31, 2018 (Unaudited)
| Currency | Shares | Value | ||||||||||
| COMMON STOCKS (91.0%) | ||||||||||||
| Brazil (4.8%) | ||||||||||||
| Odontoprev SA | BRL | 16,100,000 | $ | 57,106,006 | ||||||||
| Qualicorp SA | BRL | 7,000,000 | 26,972,995 | |||||||||
| Total Brazil | 84,079,001 | |||||||||||
| China / Hong Kong (30.9%) | ||||||||||||
| China Yangtze Power Co., Ltd., Class A | CNY | 30,500,063 | 68,419,809 | |||||||||
| Hengan International Group Co., Ltd. | HKD | 7,300,000 | 58,030,437 | |||||||||
| Hang Lung Properties, Ltd. | HKD | 21,500,000 | 38,972,478 | |||||||||
| Shenzhou International Group Holdings, Ltd. | HKD | 2,900,000 | 32,151,146 | |||||||||
| Greatview Aseptic Packaging Co., Ltd. | HKD | 44,500,000 | 29,611,744 | |||||||||
| Alibaba Group Holding, Ltd., Sponsored ADR(a) | USD | 193,900 | 27,588,092 | |||||||||
| Techtronic Industries Co., Ltd. | HKD | 5,780,000 | 27,216,692 | |||||||||
| China International Travel Service Corp., Ltd.(a) | CNY | 3,366,189 | 26,063,939 | |||||||||
| WH Group, Ltd. | HKD | 35,000,000 | 24,579,266 | |||||||||
| Jiangsu Hengrui Medicine Co., Ltd.(a) | CNY | 2,699,516 | 23,967,402 | |||||||||
| Shangri-La Asia, Ltd. | HKD | 17,400,000 | 23,768,314 | |||||||||
| Foshan Haitian Flavouring & Food Co., Ltd., Class A(a) | CNY | 2,434,516 | 22,651,194 | |||||||||
| First Pacific Co., Ltd. | HKD | 50,000,000 | 22,375,353 | |||||||||
| Xinhua Winshare Publishing and Media Co., Ltd., Class H | HKD | 32,036,000 | 20,093,490 | |||||||||
| Texwinca Holdings, Ltd. | HKD | 57,500,000 | 19,584,755 | |||||||||
| Hangzhou Hikvision Digital Technology Co., Ltd., Class A(a) | CNY | 5,589,705 | 19,549,872 | |||||||||
| Pico Far East Holdings, Ltd. | HKD | 52,500,000 | 17,741,123 | |||||||||
| China Foods, Ltd. | HKD | 33,258,000 | 15,616,542 | |||||||||
| Xtep International Holdings, Ltd. | HKD | 26,638,500 | 14,613,878 | |||||||||
| China Resources Beer Holdings Co., Ltd. | HKD | 4,000,000 | 13,938,504 | |||||||||
| Total China / Hong Kong | 546,534,030 | |||||||||||
| Hungary (3.8%) | ||||||||||||
| Richter Gedeon Nyrt | HUF | 3,650,000 | 67,800,545 | |||||||||
| Total Hungary | 67,800,545 | |||||||||||
| India (5.4%) | ||||||||||||
| Infosys, Ltd., Sponsored ADR | USD | 3,625,000 | 34,328,750 | |||||||||
| Sun Pharma Advanced Research Co., Ltd.(a) | INR | 8,300,000 | 33,310,213 | |||||||||
| Container Corp. Of India, Ltd. | INR | 3,200,000 | 27,449,156 | |||||||||
| Total India | 95,088,119 | |||||||||||
| 18 | (855) 732-9220 seafarerfunds.com |
| Seafarer Overseas Growth and Income Fund | Portfolio of Investments |
October 31, 2018 (Unaudited)
| Currency | Shares | Value | ||||||||||
| Malaysia (1.3%) | ||||||||||||
| Inari Amertron Bhd | MYR | 50,310,100 | $ | 23,631,632 | ||||||||
| Total Malaysia | 23,631,632 | |||||||||||
| Mexico (2.8%) | ||||||||||||
| Bolsa Mexicana de Valores SAB de CV | MXN | 22,500,000 | 33,916,286 | |||||||||
| Credito Real SAB de CV SOFOM ER | MXN | 13,000,000 | 14,796,254 | |||||||||
| Total Mexico | 48,712,540 | |||||||||||
| Philippines (1.5%) | ||||||||||||
| Ayala Corp. | PHP | 1,550,000 | 26,683,606 | |||||||||
| Total Philippines | 26,683,606 | |||||||||||
| Singapore (6.9%) | ||||||||||||
| Venture Corp., Ltd. | SGD | 6,150,000 | 68,081,736 | |||||||||
| SIA Engineering Co., Ltd. | SGD | 13,500,000 | 27,578,040 | |||||||||
| Wilmar International, Ltd. | SGD | 11,000,000 | 25,127,434 | |||||||||
| Total Singapore | 120,787,210 | |||||||||||
| South Africa (2.5%) | ||||||||||||
| Sanlam, Ltd. | ZAR | 8,850,000 | 44,562,589 | |||||||||
| Total South Africa | 44,562,589 | |||||||||||
| South Korea (20.4%) | ||||||||||||
| Hyundai Mobis Co., Ltd. | KRW | 590,000 | 98,554,694 | |||||||||
| Orion Corp./ Republic of Korea | KRW | 874,961 | 73,250,600 | |||||||||
| NAVER Corp. | KRW | 435,000 | 43,806,390 | |||||||||
| Coway Co., Ltd. | KRW | 627,929 | 38,748,631 | |||||||||
| Koh Young Technology, Inc. | KRW | 336,724 | 26,681,265 | |||||||||
| Samsung SDI Co., Ltd. | KRW | 122,000 | 25,371,630 | |||||||||
| Dentium Co., Ltd. | KRW | 330,000 | 20,967,282 | |||||||||
| Sindoh Co., Ltd. | KRW | 455,000 | 17,400,351 | |||||||||
| LEENO Industrial, Inc. | KRW | 270,889 | 14,239,175 | |||||||||
| Total South Korea | 359,020,018 | |||||||||||
| Taiwan (7.6%) | ||||||||||||
| Taiwan Semiconductor Manufacturing Co., Ltd. | TWD | 6,250,000 | 46,921,138 | |||||||||
| Pou Chen Corp. | TWD | 40,000,000 | 40,589,929 | |||||||||
| Voltronic Power Technology Corp. | TWD | 1,781,000 | 28,828,172 | |||||||||
| Semi-annual Report – October 31, 2018 | 19 |
| Seafarer Overseas Growth and Income Fund | Portfolio of Investments |
October 31, 2018 (Unaudited)
| Currency | Shares | Value | ||||||||||
| Taiwan (continued) | ||||||||||||
| ASPEED Technology, Inc. | TWD | 1,180,000 | $ | 17,388,251 | ||||||||
| Total Taiwan | 133,727,490 | |||||||||||
| Thailand (1.5%) | ||||||||||||
| Bangkok Dusit Medical Services PCL, Class F | THB | 35,300,000 | 26,179,934 | |||||||||
| Total Thailand | 26,179,934 | |||||||||||
| United Arab Emirates (0.1%) | ||||||||||||
| National Central Cooling Co. PJSC | AED | 3,162,694 | 1,466,177 | |||||||||
| Total United Arab Emirates | 1,466,177 | |||||||||||
| Vietnam (1.5%) | ||||||||||||
| Bao Viet Holdings | VND | 4,695,300 | 19,793,393 | |||||||||
| Nam Long Investment Corp. | VND | 5,773,875 | 7,149,715 | |||||||||
| Total Vietnam | 26,943,108 | |||||||||||
| TOTAL COMMON STOCKS | ||||||||||||
| (Cost $1,800,097,526) | 1,605,215,999 | |||||||||||
| PREFERRED STOCKS (4.2%) | ||||||||||||
| South Korea (4.2%) | ||||||||||||
| Samsung Electronics Co., Ltd. | KRW | 2,315,000 | 73,039,986 | |||||||||
| Total South Korea | 73,039,986 | |||||||||||
| TOTAL PREFERRED STOCKS | ||||||||||||
| (Cost $46,921,085) | 73,039,986 | |||||||||||
| Currency | Rate | Maturity Date | Principal Amount | Value | ||||||||||||
| GOVERNMENT BOND, SHORT-TERM - USD AND FOREIGN CURRENCY (2.3%) | ||||||||||||||||
| Colombia (0.3%) | ||||||||||||||||
| Colombia Government International Bond | USD | 11.75 | % | 02/25/20 | 5,000,000 | 5,552,500 | ||||||||||
| Total Colombia | 5,552,500 | |||||||||||||||
| 20 | (855) 732-9220 seafarerfunds.com |
| Seafarer Overseas Growth and Income Fund | Portfolio of Investments |
October 31, 2018 (Unaudited)
| Currency | Rate | Maturity Date | Principal Amount | Value | ||||||||||||
| Israel (0.3%) | ||||||||||||||||
| Israel Government International Bond | USD | 5.13 | % | 03/26/19 | 5,000,000 | $ | 5,047,025 | |||||||||
| Total Israel | 5,047,025 | |||||||||||||||
| Latvia (0.3%) | ||||||||||||||||
| Republic of Latvia Government International Bond, Series REGS | USD | 2.75 | % | 01/12/20 | 5,000,000 | 4,968,500 | ||||||||||
| Total Latvia | 4,968,500 | |||||||||||||||
| Lithuania (0.3%) | ||||||||||||||||
| Lithuania Government International Bond, Series REGS | USD | 7.38 | % | 02/11/20 | 5,000,000 | 5,264,125 | ||||||||||
| Total Lithuania | 5,264,125 | |||||||||||||||
| Poland (0.3%) | ||||||||||||||||
| Republic of Poland Government International Bond | USD | 6.38 | % | 07/15/19 | 5,000,000 | 5,124,520 | ||||||||||
| Total Poland | 5,124,520 | |||||||||||||||
| South Africa (0.3%) | ||||||||||||||||
| Republic of South Africa Government International Bond | USD | 6.88 | % | 05/27/19 | 5,000,000 | 5,080,645 | ||||||||||
| Total South Africa | 5,080,645 | |||||||||||||||
| South Korea (0.5%) | ||||||||||||||||
| The Korea Development Bank | USD | 1.38 | % | 09/12/19 | 5,000,000 | 4,928,612 | ||||||||||
| Korea International Bond | USD | 7.13 | % | 04/16/19 | 5,000,000 | 5,112,500 | ||||||||||
| Total South Korea | 10,041,112 | |||||||||||||||
| TOTAL GOVERNMENT BOND, SHORT-TERM - USD AND FOREIGN CURRENCY | ||||||||||||||||
| (Cost $41,335,048) | 41,078,427 | |||||||||||||||
| Semi-annual Report – October 31, 2018 | 21 |
| Seafarer Overseas Growth and Income Fund | Portfolio of Investments |
October 31, 2018 (Unaudited)
| Currency | Rate | Maturity Date | Principal Amount | Value | ||||||||||||
| TOTAL INVESTMENTS | ||||||||||||||||
| (Cost $1,888,353,659) (97.5%) | $ | 1,719,334,412 | ||||||||||||||
| Cash and Other Assets, Less Liabilities (2.5%) | 44,196,021 | |||||||||||||||
| NET ASSETS (100.0%) | $ | 1,763,530,433 | ||||||||||||||
Principal Amount is stated in local currency unless otherwise noted.
| (a) | Non-income producing security. |
| Currency Abbreviations | ||
| AED | - | United Arab Emirates Dirham |
| BRL | - | Brazil Real |
| CNY | - | China Yuan |
| HKD | - | Hong Kong Dollar |
| HUF | - | Hungary Forint |
| INR | - | India Rupee |
| KRW | - | South Korea Won |
| MXN | - | Mexico Peso |
| MYR | - | Malaysia Ringgit |
| PHP | - | Philippine Peso |
| SGD | - | Singapore Dollar |
| THB | - | Thailand Baht |
| TWD | - | Taiwan New Dollar |
| USD | - | United States Dollar |
| VND | - | Vietnam Dong |
| ZAR | - | South Africa Rand |
For Fund compliance purposes, the Fund's geographical classifications refer to any one or more of the sub-classifications used by one or more widely recognized market indexes or ratings group indexes, and/or as defined by Fund management. This definition may not apply for purposes of this report, which may combine sub-classifications for reporting ease. Geographical regions are shown as a percentage of net assets.
See accompanying Notes to Financial Statements.
| 22 | (855) 732-9220 seafarerfunds.com |
| Seafarer Overseas Value Fund | Portfolio of Investments |
October 31, 2018 (Unaudited)
| Currency | Shares | Value | ||||||||||
| COMMON STOCKS (90.6%) | ||||||||||||
| Brazil (3.6%) | ||||||||||||
| Qualicorp SA | BRL | 251,000 | $ | 967,175 | ||||||||
| Total Brazil | 967,175 | |||||||||||
| China / Hong Kong (42.1%) | ||||||||||||
| First Pacific Co., Ltd. | HKD | 2,430,000 | 1,087,442 | |||||||||
| Xtep International Holdings, Ltd. | HKD | 1,924,000 | 1,055,506 | |||||||||
| WH Group, Ltd. | HKD | 1,498,000 | 1,051,992 | |||||||||
| Asia Satellite Telecommunications Holdings, Ltd. | HKD | 1,540,000 | 1,050,632 | |||||||||
| China Foods, Ltd. | HKD | 1,920,000 | 901,550 | |||||||||
| AMVIG Holdings, Ltd. | HKD | 3,554,000 | 888,279 | |||||||||
| Shangri-La Asia, Ltd. | HKD | 626,000 | 855,112 | |||||||||
| Melco International Development, Ltd. | HKD | 455,000 | 780,910 | |||||||||
| China Resources Beer Holdings Co., Ltd. | HKD | 224,000 | 780,556 | |||||||||
| China Yangtze Power Co., Ltd., Class A | CNY | 301,990 | 677,444 | |||||||||
| Texwinca Holdings, Ltd. | HKD | 1,470,000 | 500,689 | |||||||||
| Hang Lung Properties, Ltd. | HKD | 247,000 | 447,730 | |||||||||
| Giordano International, Ltd. | HKD | 958,000 | 425,716 | |||||||||
| Greatview Aseptic Packaging Co., Ltd. | HKD | 520,000 | 346,025 | |||||||||
| Pacific Basin Shipping, Ltd. | HKD | 1,130,000 | 247,596 | |||||||||
| Pico Far East Holdings, Ltd. | HKD | 538,000 | 181,804 | |||||||||
| Total China / Hong Kong | 11,278,983 | |||||||||||
| Czech Republic (4.7%) | ||||||||||||
| Pegas Nonwovens SA | CZK | 19,000 | 751,650 | |||||||||
| Philip Morris CR AS | CZK | 800 | 503,022 | |||||||||
| Total Czech Republic | 1,254,672 | |||||||||||
| Mexico (2.9%) | ||||||||||||
| Credito Real SAB de CV SOFOM ER | MXN | 689,609 | 784,895 | |||||||||
| Total Mexico | 784,895 | |||||||||||
| Philippines (3.1%) | ||||||||||||
| Del Monte Pacific, Ltd.(a) | SGD | 6,600,000 | 833,845 | |||||||||
| Total Philippines | 833,845 | |||||||||||
| Semi-annual Report – October 31, 2018 | 23 |
| Seafarer Overseas Value Fund | Portfolio of Investments |
October 31, 2018 (Unaudited)
| Currency | Shares | Value | ||||||||||
| Qatar (4.2%) | ||||||||||||
| Qatar Gas Transport Co., Ltd. | QAR | 237,000 | $ | 1,133,686 | ||||||||
| Total Qatar | 1,133,686 | |||||||||||
| Russia (3.3%) | ||||||||||||
| Cherkizovo Group PJSC | RUB | 30,000 | 487,296 | |||||||||
| Global Ports Investments PLC, GDR(a) | USD | 157,000 | 389,360 | |||||||||
| Total Russia | 876,656 | |||||||||||
| Singapore (11.6%) | ||||||||||||
| Wilmar International, Ltd. | SGD | 456,000 | 1,041,646 | |||||||||
| HRnetgroup, Ltd. | SGD | 1,350,000 | 789,797 | |||||||||
| Genting Singapore PLC | SGD | 1,119,000 | 712,093 | |||||||||
| SIA Engineering Co., Ltd. | SGD | 273,000 | 557,689 | |||||||||
| Total Singapore | 3,101,225 | |||||||||||
| South Korea (4.5%) | ||||||||||||
| Samsung SDI Co., Ltd. | KRW | 5,800 | 1,206,192 | |||||||||
| Total South Korea | 1,206,192 | |||||||||||
| Taiwan (1.9%) | ||||||||||||
| Pou Chen Corp. | TWD | 498,000 | 505,345 | |||||||||
| Total Taiwan | 505,345 | |||||||||||
| United Arab Emirates (3.4%) | ||||||||||||
| National Central Cooling Co. PJSC | AED | 1,952,000 | 904,918 | |||||||||
| Total United Arab Emirates | 904,918 | |||||||||||
| Vietnam (5.3%) | ||||||||||||
| PetroVietnam Technical Services Corp. | VND | 913,780 | 741,976 | |||||||||
| Petrovietnam Fertilizer & Chemicals JSC | VND | 842,000 | 679,168 | |||||||||
| Total Vietnam | 1,421,144 | |||||||||||
| TOTAL COMMON STOCKS | ||||||||||||
| (Cost $26,625,051) | 24,268,736 | |||||||||||
| 24 | (855) 732-9220 seafarerfunds.com |
| Seafarer Overseas Value Fund | Portfolio of Investments |
October 31, 2018 (Unaudited)
| Currency | Shares | Value | ||||||||||
| TOTAL INVESTMENTS | ||||||||||||
| (Cost $26,625,051) (90.6%) | $ | 24,268,736 | ||||||||||
| Cash and Other Assets, Less Liabilities (9.4%) | 2,520,832 | |||||||||||
| NET ASSETS (100.0%) | $ | 26,789,568 | ||||||||||
| (a) | Non-income producing security. |
| Currency Abbreviations | ||
| AED | - | United Arab Emirates Dirham |
| BRL | - | Brazil Real |
| CNY | - | China Yuan |
| CZK | - | Czech Koruna |
| HKD | - | Hong Kong Dollar |
| KRW | - | South Korea Won |
| MXN | - | Mexico Peso |
| QAR | - | Qatar Riyal |
| RUB | - | Russian Ruble |
| SGD | - | Singapore Dollar |
| TWD | - | Taiwan New Dollar |
| USD | - | United States Dollar |
| VND | - | Vietnam Dong |
For Fund compliance purposes, the Fund's geographical classifications refer to any one or more of the sub-classifications used by one or more widely recognized market indexes or ratings group indexes, and/or as defined by Fund management. This definition may not apply for purposes of this report, which may combine sub-classifications for reporting ease. Geographical regions are shown as a percentage of net assets.
See accompanying Notes to Financial Statements.
| Semi-annual Report – October 31, 2018 | 25 |
| Seafarer Funds | Statements of Assets and Liabilities |
October 31, 2018 (Unaudited)
Seafarer Overseas Growth and Income Fund | Seafarer Overseas Value Fund | |||||||
| ASSETS: | ||||||||
| Investments, at value | $ | 1,719,334,412 | $ | 24,268,736 | ||||
| Cash | 32,806,739 | 2,551,664 | ||||||
| Foreign currency, at value (Cost $2,356,026 and $43,481) | 2,314,585 | 43,415 | ||||||
| Receivable for investments sold | 17,225,416 | – | ||||||
| Receivable for shares sold | 1,174,196 | 24,432 | ||||||
| Interest and dividends receivable | 2,044,389 | 57,085 | ||||||
| Prepaid expenses and other assets | 27,369 | 14,013 | ||||||
| Total Assets | 1,774,927,106 | 26,959,345 | ||||||
| LIABILITIES: | ||||||||
| Payable for investments purchased | 4,509,911 | – | ||||||
| Administrative fees payable | 48,592 | 4,564 | ||||||
| Shareholder service plan fees payable | 247,662 | 3,284 | ||||||
| Payable for shares redeemed | 4,968,481 | 129,568 | ||||||
| Investment advisory fees payable | 1,196,421 | 8,232 | ||||||
| Payable for chief compliance officer fees | 3,766 | 3,766 | ||||||
| Trustee fees and expenses payable | 17,506 | 105 | ||||||
| Payable for principal financial officer fees | 854 | 854 | ||||||
| Audit and tax fees payable | 14,634 | 10,696 | ||||||
| Accrued expenses and other liabilities | 388,846 | 8,708 | ||||||
| Total Liabilities | 11,396,673 | 169,777 | ||||||
| NET ASSETS | $ | 1,763,530,433 | $ | 26,789,568 | ||||
| NET ASSETS CONSIST OF: | ||||||||
| Paid-in capital (Note 5) | $ | 1,847,742,415 | $ | 28,770,267 | ||||
| Total distributable earnings | (84,211,982 | ) | (1,980,699 | ) | ||||
| NET ASSETS | $ | 1,763,530,433 | $ | 26,789,568 | ||||
| INVESTMENTS, AT COST | $ | 1,888,353,659 | $ | 26,625,051 | ||||
| PRICING OF SHARES | ||||||||
| Investor Class: | ||||||||
| Net Asset Value, offering and redemption price per share | $ | 11.02 | $ | 10.68 | ||||
| Net Assets | $ | 256,854,544 | $ | 278,250 | ||||
| Shares of beneficial interest outstanding | 23,316,254 | 26,053 | ||||||
| Institutional Class: | ||||||||
| Net Asset Value, offering and redemption price per share | $ | 11.05 | $ | 10.69 | ||||
| Net Assets | $ | 1,506,675,889 | $ | 26,511,318 | ||||
| Shares of beneficial interest outstanding | 136,294,525 | 2,479,295 | ||||||
See accompanying Notes to Financial Statements.
| 26 | (855) 732-9220 seafarerfunds.com |
| Seafarer Funds | Statements of Operations |
Six Months Ended October 31, 2018 (Unaudited)
Seafarer Overseas Growth and Income Fund | Seafarer Overseas Value Fund | |||||||
| INVESTMENT INCOME: | ||||||||
| Dividends | $ | 55,233,369 | $ | 552,590 | ||||
| Foreign taxes withheld | (5,367,463 | ) | (10,665 | ) | ||||
| Interest and other income | 3,732,716 | 22,255 | ||||||
| Total investment income | 53,598,622 | 564,180 | ||||||
| EXPENSES: | ||||||||
| Investment advisory fees (Note 6) | 8,751,447 | 101,010 | ||||||
| Administrative and transfer agency fees | 336,083 | 26,810 | ||||||
| Trustee fees and expenses | 34,970 | 351 | ||||||
| Registration/filing fees | 27,243 | 16,456 | ||||||
| Shareholder service plan fees | ||||||||
| Investor Class | 351,700 | – | ||||||
| Institutional Class | 447,887 | 4,488 | ||||||
| Legal fees | 12,594 | 121 | ||||||
| Audit fees | 15,115 | 10,710 | ||||||
| Reports to shareholders and printing fees | 61,641 | 543 | ||||||
| Custody fees | 765,067 | 23,611 | ||||||
| Chief compliance officer fees | 11,155 | 11,155 | ||||||
| Principal financial officer fees | 2,521 | 2,521 | ||||||
| Miscellaneous | 17,130 | 1,756 | ||||||
| Total expenses | 10,834,553 | 199,541 | ||||||
| Less fees waived/reimbursed by investment adviser (Note 6) | ||||||||
| Investor Class | – | (392 | ) | |||||
| Institutional Class | – | (54,074 | ) | |||||
| Total net expenses | 10,834,553 | 145,075 | ||||||
| NET INVESTMENT INCOME: | 42,764,069 | 419,105 | ||||||
| Net realized loss on investments | (40,801,321 | ) | – | |||||
| Net realized loss on foreign currency transactions | (2,559,599 | ) | (2,321 | ) | ||||
| Net realized loss | (43,360,920 | ) | (2,321 | ) | ||||
| Net change in unrealized depreciation on investments | (364,964,680 | ) | (3,555,199 | ) | ||||
| Net change in unrealized appreciation on translation of assets and liabilities in foreign currency transactions | 39,610 | 165 | ||||||
| Net unrealized depreciation | (364,925,070 | ) | (3,555,034 | ) | ||||
| NET REALIZED AND UNREALIZED LOSS ON INVESTMENTS AND FOREIGN CURRENCY TRANSLATIONS | (408,285,990 | ) | (3,557,355 | ) | ||||
| NET DECREASE IN NET ASSETS RESULTING FROM OPERATIONS | $ | (365,521,921 | ) | $ | (3,138,250 | ) | ||
See accompanying Notes to Financial Statements.
| Semi-annual Report – October 31, 2018 | 27 |
| Seafarer Overseas Growth and Income Fund | Statements of Changes in Net Assets |
Six Months Ended October 31, 2018 (Unaudited) | Year Ended April 30, 2018 | |||||||
| OPERATIONS: | ||||||||
| Net investment income | $ | 42,764,069 | $ | 60,023,167 | ||||
| Net realized gain/(loss) | (43,360,920 | ) | 155,796,309 | |||||
| Net change in unrealized depreciation | (364,925,070 | ) | (13,047,581 | ) | ||||
| Net increase/(decrease) in net assets resulting from operations | (365,521,921 | ) | 202,771,895 | |||||
| DISTRIBUTIONS TO SHAREHOLDERS (NOTE 3):(a) | ||||||||
| Total amount of distribution | ||||||||
| Investor Class | $ | (7,110,663 | ) | $ | (28,418,560 | ) | ||
| Institutional Class | (16,169,782 | ) | (58,868,307 | ) | ||||
| Net decrease in net assets from distributions | (23,280,444 | ) | (87,286,867 | ) | ||||
| BENEFICIAL INTEREST TRANSACTIONS (NOTE 5): | ||||||||
| Shares sold | ||||||||
| Investor Class | $ | 24,288,061 | $ | 153,357,729 | ||||
| Institutional Class | 566,977,424 | 781,843,936 | ||||||
| Dividends reinvested | ||||||||
| Investor Class | 7,013,637 | 27,962,467 | ||||||
| Institutional Class | 13,080,526 | 47,081,170 | ||||||
| Shares Redeemed, net of redemption fees | ||||||||
| Investor Class | (581,368,900 | ) | (209,017,564 | ) | ||||
| Institutional Class | (905,949,269 | ) | (266,115,267 | ) | ||||
| Net increase/(decrease) in net assets derived from beneficial interest transactions | (875,958,521 | ) | 535,112,471 | |||||
| Net increase/(decrease) in net assets | $ | (1,264,760,886 | ) | $ | 650,597,499 | |||
| NET ASSETS: | ||||||||
| Beginning of period | $ | 3,028,291,319 | $ | 2,377,693,820 | ||||
| End of period | $ | 1,763,530,433 | $ | 3,028,291,319 | ||||
| Other Information: | ||||||||
| SHARE TRANSACTIONS: | ||||||||
| Investor Class | ||||||||
| Sold | 1,965,500 | 11,678,351 | ||||||
| Distributions reinvested | 574,888 | 2,137,427 | ||||||
| Redeemed | (47,451,274 | ) | (15,740,189 | ) | ||||
| Net decrease in shares outstanding | (44,910,886 | ) | (1,924,411 | ) | ||||
| Institutional Class | ||||||||
| Sold | 46,310,776 | 59,053,386 | ||||||
| Distributions reinvested | 1,069,544 | 3,579,963 | ||||||
| Redeemed | (73,440,464 | ) | (19,939,574 | ) | ||||
| Net increase/(decrease) in shares outstanding | (26,060,144 | ) | 42,693,775 | |||||
| 28 | (855) 732-9220 seafarerfunds.com |
| Seafarer Overseas Growth and Income Fund | Statements of Changes in Net Assets |
| (a) | For the year ended April 30, 2018, the Seafarer Overseas Growth and Income Fund had Total Distributions consisting of Net Investment Income of $80,952,386, and Net Realized Gains of $6,334,481. |
See accompanying Notes to Financial Statements.
| Semi-annual Report – October 31, 2018 | 29 |
| Seafarer Overseas Value Fund | Statements of Changes in Net Assets |
Six Months Ended October 31, 2018 (Unaudited) | Year Ended April 30, 2018 | |||||||
| OPERATIONS: | ||||||||
| Net investment income | $ | 419,105 | $ | 512,088 | ||||
| Net realized gain/(loss) | (2,321 | ) | 79,422 | |||||
| Net change in unrealized appreciation/(depreciation) | (3,555,034 | ) | 423,350 | |||||
| Net increase/(decrease) in net assets resulting from operations | (3,138,250 | ) | 1,014,861 | |||||
| DISTRIBUTIONS TO SHAREHOLDERS (NOTE 3):(a) | ||||||||
| Total amount of distribution | ||||||||
| Investor Class | $ | – | $ | (10,736 | ) | |||
| Institutional Class | – | (637,490 | ) | |||||
| Net decrease in net assets from distributions | – | (648,226 | ) | |||||
| BENEFICIAL INTEREST TRANSACTIONS (NOTE 5): | ||||||||
| Shares sold | ||||||||
| Investor Class | $ | 14,336 | $ | 117,980 | ||||
| Institutional Class | 6,143,012 | 16,887,311 | ||||||
| Dividends reinvested | ||||||||
| Investor Class | – | 10,352 | ||||||
| Institutional Class | – | 624,682 | ||||||
| Shares Redeemed | ||||||||
| Investor Class | (14,747 | ) | (113,172 | ) | ||||
| Institutional Class | (1,816,864 | ) | (2,417,257 | ) | ||||
| Net increase in net assets derived from beneficial interest transactions | 4,325,737 | 15,109,896 | ||||||
| Net increase in net assets | $ | 1,187,487 | $ | 15,476,531 | ||||
| NET ASSETS: | ||||||||
| Beginning of period | $ | 25,602,081 | $ | 10,125,550 | ||||
| End of period | $ | 26,789,568 | $ | 25,602,081 | ||||
| Other Information: | ||||||||
| SHARE TRANSACTIONS: | ||||||||
| Investor Class | ||||||||
| Sold | 1,244 | 9,613 | ||||||
| Distributions reinvested | – | 878 | ||||||
| Redeemed | (1,246 | ) | (9,212 | ) | ||||
| Net increase/(decrease) in shares outstanding | (2 | ) | 1,279 | |||||
| Institutional Class | ||||||||
| Sold | 527,002 | 1,388,144 | ||||||
| Distributions reinvested | – | 52,984 | ||||||
| Redeemed | (162,093 | ) | (199,202 | ) | ||||
| Net increase in shares outstanding | 364,909 | 1,241,926 | ||||||
| 30 | (855) 732-9220 seafarerfunds.com |
| Seafarer Overseas Value Fund | Statements of Changes in Net Assets |
| (a) | For the year ended April 30, 2018, the Seafarer Overseas Value Fund had Total Distributions consisting of Net Investment Income of $648,226, and Net Realized Gains of $0. |
See accompanying Notes to Financial Statements
| Semi-annual Report – October 31, 2018 | 31 |
Financial Highlights
For a share outstanding through the periods presented
| Investor Class |
| NET ASSET VALUE, BEGINNING OF PERIOD |
| INCOME FROM OPERATIONS: |
| Net investment income(a) |
| Net realized and unrealized gain/(loss) on investments |
| Total from investment operations |
| LESS DISTRIBUTIONS: |
| From net investment income |
| From net realized gains on investments |
| Total distributions |
| REDEMPTION FEES ADDED TO PAID IN CAPITAL |
| NET INCREASE/(DECREASE) IN NET ASSET VALUE |
| NET ASSET VALUE, END OF PERIOD |
| TOTAL RETURN(e) |
| SUPPLEMENTAL DATA: |
| Net assets, end of period (in 000s) |
| RATIOS TO AVERAGE NET ASSETS: |
| Operating expenses excluding reimbursement/waiver |
| Operating expenses including reimbursement/waiver |
| Net investment income including reimbursement/waiver |
| PORTFOLIO TURNOVER RATE(k) |
| (a) | Calculated using the average shares method. |
| (b) | Less than $0.005 per share. |
| (c) | In preparing the financial statements in accordance with U.S. GAAP, management made certain adjustments as required by U.S. GAAP which caused the net asset value for purposes of these financial statements to differ from the net asset value used to process shareholder transactions as of the date of these financial statements. As a result, the net asset value increased from $11.01 to $11.02. |
| (d) | In preparing the financial statements in accordance with U.S. GAAP, management made certain adjustments as required by U.S. GAAP which caused the net asset value for purposes of these financial statements to differ from the net asset value used to process shareholder transactions as of the date of these financial statements. As a result, the net asset value increased from $12.50 to $12.51. |
| (e) | Total returns are for the periods indicated and have not been annualized. In some periods, total returns would have been lower had certain expenses not been waived during the periods. Returns shown do not reflect the deduction of taxes that a shareholder would pay on Fund distributions or the redemption of Fund shares. |
| (f) | Includes adjustments in accordance with U.S. GAAP and as such, the total return for shareholder transactions reported to the market may differ from the total return for financial reporting purposes. As a result, the total return increased from -15.25% to -15.17%. |
| (g) | Includes adjustments in accordance with U.S. GAAP and as such, the total return for shareholder transactions reported to the market may differ from the total return for financial reporting purposes. As a result, the total return decreased from 8.12% to 8.03%. |
| (h) | Includes adjustments in accordance with U.S. GAAP and as such, the total return for shareholder transactions reported to the market may differ from the total return for financial reporting purposes. As a result, the total return increased from 11.13% to 11.22%. |
| (i) | Annualized. |
| (j) | Effective September 1, 2015, the Adviser agreed to limit expenses to 1.15%. The Adviser agreed to limit expenses to 1.25% for the period September 1, 2014 through August 31, 2015. Prior to September 1, 2014, the Adviser agreed to limit expenses to 1.40%. (See Note 6.) |
| (k) | Portfolio turnover rate for a period less than one full year has not been annualized. |
| 32 | (855) 732-9220 seafarerfunds.com |
Seafarer Overseas Growth and Income Fund
Six Months Ended October 31, 2018 (Unaudited) | Year Ended April 30, 2018 | Year Ended April 30, 2017 | Year Ended April 30, 2016 | Year Ended April 30, 2015 | Year Ended April 30, 2014 | |||||||||||||||||
| $ | 13.11 | $ | 12.51 | $ | 11.44 | $ | 12.64 | $ | 11.58 | $ | 11.91 | |||||||||||
| 0.25 | 0.28 | 0.22 | 0.16 | 0.14 | 0.19 | |||||||||||||||||
| (2.23 | ) | 0.72 | 1.04 | (1.23 | ) | 1.26 | 0.02 | |||||||||||||||
| (1.98 | ) | 1.00 | 1.26 | (1.07 | ) | 1.40 | 0.21 | |||||||||||||||
| (0.11 | ) | (0.37 | ) | (0.19 | ) | (0.11 | ) | (0.19 | ) | (0.26 | ) | |||||||||||
| – | (0.03 | ) | – | (0.02 | ) | (0.15 | ) | (0.28 | ) | |||||||||||||
| (0.11 | ) | (0.40 | ) | (0.19 | ) | (0.13 | ) | (0.34 | ) | (0.54 | ) | |||||||||||
| – | – | 0.00 | (b) | 0.00 | (b) | 0.00 | (b) | 0.00 | (b) | |||||||||||||
| (2.09 | ) | 0.60 | 1.07 | (1.20 | ) | 1.06 | (0.33 | ) | ||||||||||||||
| $ | 11.02 | (c) | $ | 13.11 | $ | 12.51 | (d) | $ | 11.44 | $ | 12.64 | $ | 11.58 | |||||||||
| (15.17 | %)(f) | 8.03 | %(g) | 11.22 | %(h) | (8.39 | %) | 12.55 | % | 1.93 | % | |||||||||||
| $ | 256,855 | $ | 894,241 | $ | 877,384 | $ | 613,795 | $ | 53,543 | $ | 27,181 | |||||||||||
| 0.98 | %(i) | 0.97 | % | 1.02 | % | 1.14 | % | 1.30 | % | 1.78 | % | |||||||||||
| 0.98 | %(i) | 0.97 | % | 1.02 | % | 1.14 | %(j) | 1.30 | %(j) | 1.40 | % | |||||||||||
| 4.06 | %(i) | 2.12 | % | 1.88 | % | 1.50 | % | 1.19 | % | 1.66 | % | |||||||||||
| 36 | % | 23 | % | 14 | % | 7 | % | 28 | % | 51 | % | |||||||||||
See accompanying Notes to Financial Statements.
| Semi-annual Report – October 31, 2018 | 33 |
Financial Highlights
For a share outstanding through the periods presented
| Institutional Class |
| NET ASSET VALUE, BEGINNING OF PERIOD |
| INCOME FROM OPERATIONS: |
| Net investment income(a) |
| Net realized and unrealized gain/(loss) on investments |
| Total from investment operations |
| LESS DISTRIBUTIONS: |
| From net investment income |
| From net realized gains on investments |
| Total distributions |
| REDEMPTION FEES ADDED TO PAID IN CAPITAL |
| NET INCREASE/(DECREASE) IN NET ASSET VALUE |
| NET ASSET VALUE, END OF PERIOD |
| TOTAL RETURN(c) |
| SUPPLEMENTAL DATA: |
| Net assets, end of period (in 000s) |
| RATIOS TO AVERAGE NET ASSETS: |
| Operating expenses excluding reimbursement/waiver |
| Operating expenses including reimbursement/waiver |
| Net investment income including reimbursement/waiver |
| PORTFOLIO TURNOVER RATE(f) |
| (a) | Calculated using the average shares method. |
| (b) | Less than $0.005 per share. |
| (c) | Total returns are for the periods indicated and have not been annualized. In some periods, total returns would have been lower had certain expenses not been waived during the periods. Returns shown do not reflect the deduction of taxes that a shareholder would pay on Fund distributions or the redemption of Fund shares. |
| (d) | Annualized. |
| (e) | Effective September 1, 2014, the Adviser agreed to limit expenses to 1.05%. Prior to September 1, 2014, the Adviser agreed to limit expenses to 1.25%. (See Note 6.) |
| (f) | Portfolio turnover rate for a period less than one full year has not been annualized. |
| 34 | (855) 732-9220 seafarerfunds.com |
Seafarer Overseas Growth and Income Fund
Six Months Ended October 31, 2018 (Unaudited) | Year Ended April 30, 2018 | Year Ended April 30, 2017 | Year Ended April 30, 2016 | Year Ended April 30, 2015 | Year Ended April 30, 2014 | |||||||||||||||||
| $ | 13.14 | $ | 12.54 | $ | 11.46 | $ | 12.66 | $ | 11.59 | $ | 11.91 | |||||||||||
| 0.21 | 0.28 | 0.21 | 0.19 | 0.15 | 0.21 | |||||||||||||||||
| (2.19 | ) | 0.73 | 1.07 | (1.26 | ) | 1.28 | 0.02 | |||||||||||||||
| (1.98 | ) | 1.01 | 1.28 | (1.07 | ) | 1.43 | 0.23 | |||||||||||||||
| (0.11 | ) | (0.38 | ) | (0.20 | ) | (0.12 | ) | (0.21 | ) | (0.27 | ) | |||||||||||
| – | (0.03 | ) | – | (0.02 | ) | (0.15 | ) | (0.28 | ) | |||||||||||||
| (0.11 | ) | (0.41 | ) | (0.20 | ) | (0.14 | ) | (0.36 | ) | (0.55 | ) | |||||||||||
| – | – | 0.00 | (b) | 0.01 | 0.00 | (b) | 0.00 | (b) | ||||||||||||||
| (2.09 | ) | 0.60 | 1.08 | (1.20 | ) | 1.07 | (0.32 | ) | ||||||||||||||
| $ | 11.05 | $ | 13.14 | $ | 12.54 | $ | 11.46 | $ | 12.66 | $ | 11.59 | |||||||||||
| (15.12 | %) | 8.08 | % | 11.37 | % | (8.32 | %) | 12.76 | % | 2.12 | % | |||||||||||
| $ | 1,506,676 | $ | 2,134,051 | $ | 1,500,310 | $ | 605,178 | $ | 129,714 | $ | 46,624 | |||||||||||
| 0.89 | %(d) | 0.87 | % | 0.92 | % | 1.03 | % | 1.18 | % | 1.61 | % | |||||||||||
| 0.89 | %(d) | 0.87 | % | 0.92 | % | 1.03 | % | 1.10 | %(e) | 1.25 | % | |||||||||||
| 3.46 | %(d) | 2.09 | % | 1.82 | % | 1.72 | % | 1.30 | % | 1.89 | % | |||||||||||
| 36 | % | 23 | % | 14 | % | 7 | % | 28 | % | 51 | % | |||||||||||
See accompanying Notes to Financial Statements.
| Semi-annual Report – October 31, 2018 | 35 |
| Financial Highlights | Seafarer Overseas Value Fund |
For a share outstanding through the period presented
| Investor Class | Six Months Ended October 31, 2018 (Unaudited) | Year Ended April 30, 2018 | May 31, 2016 (Inception) to April 30, 2017 | |||||||||
| NET ASSET VALUE, BEGINNING OF PERIOD | $ | 11.95 | $ | 11.30 | $ | 10.00 | ||||||
| INCOME FROM OPERATIONS: | ||||||||||||
| Net investment income(a) | 0.17 | 0.35 | 0.12 | |||||||||
| Net realized and unrealized gain/(loss) on investments | (1.44 | ) | 0.72 | 1.28 | ||||||||
| Total from investment operations | (1.27 | ) | 1.07 | 1.40 | ||||||||
| LESS DISTRIBUTIONS: | ||||||||||||
| From net investment income | – | (0.42 | ) | (0.10 | ) | |||||||
| Total distributions | – | (0.42 | ) | (0.10 | ) | |||||||
| NET INCREASE/(DECREASE) IN NET ASSET VALUE | (1.27 | ) | 0.65 | 1.30 | ||||||||
| NET ASSET VALUE, END OF PERIOD | $ | 10.68 | $ | 11.95 | $ | 11.30 | ||||||
| TOTAL RETURN(b) | (10.63 | %) | 9.55 | % | 14.15 | % | ||||||
| SUPPLEMENTAL DATA: | ||||||||||||
| Net assets, end of period (in 000s) | $ | 278 | $ | 311 | $ | 280 | ||||||
| RATIOS TO AVERAGE NET ASSETS: | ||||||||||||
| Operating expenses excluding reimbursement/waiver | 1.41 | %(c) | 1.80 | % | 3.71 | %(c) | ||||||
| Operating expenses including reimbursement/waiver | 1.15 | %(c) | 1.15 | % | 1.15 | %(c) | ||||||
| Net investment income including reimbursement/waiver | 2.98 | %(c) | 2.91 | % | 1.24 | %(c) | ||||||
| PORTFOLIO TURNOVER RATE(d) | 0 | % | 3 | % | 0 | % | ||||||
| (a) | Calculated using the average shares method. |
| (b) | Total returns are for the periods indicated and have not been annualized. Total returns would have been lower had certain expenses not been waived during the periods. Returns shown do not reflect the deduction of taxes that a shareholder would pay on Fund distributions or the redemption of Fund shares. |
| (c) | Annualized. |
| (d) | Portfolio turnover rate for a period less than one full year has not been annualized. |
See accompanying Notes to Financial Statements.
| 36 | (855) 732-9220 seafarerfunds.com |
| Financial Highlights | Seafarer Overseas Value Fund |
For a share outstanding through the period presented
| Institutional Class | Six Months Ended October 31, 2018 (Unaudited) | Year Ended April 30, 2018 | May 31, 2016 (Inception) to April 30, 2017 | |||||||||
| NET ASSET VALUE, BEGINNING OF PERIOD | $ | 11.96 | $ | 11.28 | $ | 10.00 | ||||||
| INCOME FROM OPERATIONS: | ||||||||||||
| Net investment income(a) | 0.18 | 0.35 | 0.13 | |||||||||
| Net realized and unrealized gain/(loss) on investments | (1.45 | ) | 0.74 | 1.28 | ||||||||
| Total from investment operations | (1.27 | ) | 1.09 | 1.41 | ||||||||
| LESS DISTRIBUTIONS: | ||||||||||||
| From net investment income | – | (0.41 | ) | (0.13 | ) | |||||||
| Total distributions | – | (0.41 | ) | (0.13 | ) | |||||||
| NET INCREASE/(DECREASE) IN NET ASSET VALUE | (1.27 | ) | 0.68 | 1.28 | ||||||||
| NET ASSET VALUE, END OF PERIOD | $ | 10.69 | $ | 11.96 | $ | 11.28 | (b) | |||||
| TOTAL RETURN(c) | (10.62 | %) | 9.74 | %(d) | 14.18 | %(e) | ||||||
| SUPPLEMENTAL DATA: | ||||||||||||
| Net assets, end of period (in 000s) | $ | 26,511 | $ | 25,291 | $ | 9,846 | ||||||
| RATIOS TO AVERAGE NET ASSETS: | ||||||||||||
| Operating expenses excluding reimbursement/waiver | 1.45 | %(f) | 1.76 | % | 3.63 | %(f) | ||||||
| Operating expenses including reimbursement/waiver | 1.05 | %(f) | 1.05 | % | 1.05 | %(f) | ||||||
| Net investment income including reimbursement/waiver | 3.04 | %(f) | 2.90 | % | 1.36 | %(f) | ||||||
| PORTFOLIO TURNOVER RATE(g) | 0 | % | 3 | % | 0 | % | ||||||
| (a) | Calculated using the average shares method. |
| (b) | In preparing the financial statements in accordance with U.S. GAAP, management made certain adjustments as required by U.S. GAAP which caused the net asset value for purposes of these financial statements to differ from the net asset value used to process shareholder transactions as of the date of these financial statements. As a result, the net asset value decreased from $11.29 to $11.28. |
| (c) | Total returns are for the periods indicated and have not been annualized. Total returns would have been lower had certain expenses not been waived during the periods. Returns shown do not reflect the deduction of taxes that a shareholder would pay on Fund distributions or the redemption of Fund shares. |
| (d) | Includes adjustments in accordance with U.S. GAAP and as such, the total return for shareholder transactions reported to the market may differ from the total return for financial reporting purposes. As a result, the total return increased from 9.64% to 9.74%. |
| (e) | Includes adjustments in accordance with U.S. GAAP and as such, the total return for shareholder transactions reported to the market may differ from the total return for financial reporting purposes. As a result, the total return decreased from 14.29% to 14.18%. |
| (f) | Annualized. |
| (g) | Portfolio turnover rate for a period less than one full year has not been annualized. |
See accompanying Notes to Financial Statements.
| Semi-annual Report – October 31, 2018 | 37 |
| Seafarer Funds | Notes to Financial Statements |
October 31, 2018 (Unaudited)
NOTES TO FINANCIAL STATEMENTS
1. Organization
Financial Investors Trust (the “Trust”), a Delaware statutory trust, is an open-end management investment company registered under the Investment Company Act of 1940, as amended (“1940 Act”). The Trust consists of multiple separate portfolios or series. This semi-annual report describes the Seafarer Overseas Growth and Income Fund and the Seafarer Overseas Value Fund (individually a “Fund” and collectively, the “Funds”). The Seafarer Overseas Growth and Income Fund seeks to provide long-term capital appreciation along with some current income; it also seeks to mitigate adverse volatility in returns as a secondary objective. The Seafarer Overseas Value Fund seeks to provide long-term capital appreciation. The Funds each offer Investor Class and Institutional Class shares.
2. Significant Accounting Policies
The accompanying financial statements were prepared in accordance with accounting principles generally accepted in the United States of America (“U.S. GAAP”). The preparation of financial statements in conformity with U.S. GAAP requires management to make certain estimates and assumptions that affect the reported amounts of assets and liabilities and disclosures of contingent assets and liabilities at the date of the financial statements and the reported amounts of revenue and expenses during the period. Actual results could differ from those estimates. The Funds are considered an investment company for financial reporting purposes under U.S. GAAP and follow the accounting and reporting guidance applicable to investment companies in the Financial Accounting Standards Board Accounting Standards Codification Topic 946.The following is a summary of significant accounting policies consistently followed by the Funds in preparation of their financial statements.
Investment Valuation
Each Fund generally values its securities based on market prices determined at the close of regular trading on the New York Stock Exchange (“NYSE”), normally 4:00 p.m. Eastern Time, on each day the NYSE is open for trading.
For equity securities and exchange traded funds, the market price is usually the closing sale or official closing price on that exchange. In the case of equity securities not traded on an exchange, or if such closing prices are not otherwise available, the securities are valued at the mean of the most recent bid and ask prices on such day. Redeemable securities issued by open-end registered investment companies are valued at the investment company’s applicable net asset value, with the exception of exchange-traded open-end investment companies, which are priced as equity securities.
Equity securities that are primarily traded on foreign securities exchanges are valued at the closing values of such securities on their respective foreign exchanges, except when an event occurs subsequent to the close of the foreign exchange but before the close of the NYSE, such that the securities’ value would likely change. In such an event, the fair values of those securities are determined in good faith through consideration of other factors in accordance with procedures established by and under the general supervision of the Board of Trustees (the “Board”). Each Fund uses a fair valuation model provided by an independent pricing service, which is intended to reflect fair value when a security’s value or a meaningful portion of the Fund’s portfolio is believed to have been materially affected by a valuation event that has occurred between the close of the exchange or market on which the security is traded and the close of the regular trading day on the NYSE. The Funds’ valuation procedures set forth certain triggers that inform each Fund when to use the fair valuation model.
The market price for debt obligations is generally the price supplied by an independent third-party pricing service approved by the Board, which may use a matrix, formula or other objective method that takes into consideration quotations from dealers, market transactions in comparable investments, market indices and yield curves. If vendors are unable to supply a price, or if the price supplied is deemed to be unreliable, the market price may be determined using quotations received from one or more broker-dealers that make a market in the security. Corporate bonds and convertible bonds are valued using market models that
| 38 | (855) 732-9220 seafarerfunds.com |
| Seafarer Funds | Notes to Financial Statements |
October 31, 2018 (Unaudited)
consider trade data, quotations from dealers and active market makers, relevant yield curve and spread data, creditworthiness, trade data or market information on comparable securities, and other relevant security specific information. Publicly traded foreign government debt securities and foreign corporate bonds are typically traded internationally in the over-the-counter market and are valued at the mean between the bid and asked prices as of the close of business of that market.
Forward currency exchange contracts have a market value determined by the prevailing foreign currency exchange daily rates and current foreign currency exchange forward rates. The foreign currency exchange forward rates are calculated using an automated system that estimates rates on the basis of the current day foreign currency exchange rates and forward foreign currency exchange rates supplied by a pricing service.
When such prices or quotations are not available, or when the Trust’s Valuation Committee believes that they are unreliable, securities may be priced using fair value procedures approved by the Board.
Certain foreign countries impose a tax on capital gains which is accrued by each Fund based on unrealized appreciation, if any, on affected securities. The tax is paid when the gain is realized.
Fair Value Measurements
Each Fund discloses the classification of its fair value measurements following a three-tier hierarchy based on the inputs used to measure fair value. Inputs refer broadly to the assumptions that market participants would use in pricing the asset or liability, including assumptions about risk. Inputs may be observable or unobservable. Observable inputs reflect the assumptions market participants would use in pricing the asset or liability. Such inputs are developed based on market data obtained from sources independent of the reporting entity. Unobservable inputs reflect the reporting entity’s own assumptions about the assumptions market participants would use in pricing the asset or liability, which are developed based on the information available and the reporting entity’s best efforts to interpret such information.
Various inputs are used in determining the value of the Funds’ investments as of the end of the reporting period. When inputs used fall into different levels of the fair value hierarchy, the level in the hierarchy within which the fair value measurement falls is determined based on the lowest level input that is significant to the fair value measurement in its entirety. The designated input levels are not necessarily an indication of the risk or liquidity associated with these investments. These inputs are categorized in the following hierarchy under applicable financial accounting standards:
| Level 1 – | Unadjusted quoted prices in active markets for identical investments, unrestricted assets or liabilities that the Funds have the ability to access at the measurement date; |
| Level 2 – | Quoted prices which are not active, quoted prices for similar assets or liabilities in active markets or inputs other than quoted prices that are observable (either directly or indirectly) for substantially the full term of the asset or liability; and |
| Level 3 – | Significant unobservable prices or inputs (including the Funds’ own assumptions in determining the fair value of investments) where there is little or no market activity for the asset or liability at the measurement date. |
| Semi-annual Report - October 31, 2018 | 39 |
| Seafarer Funds | Notes to Financial Statements |
October 31, 2018 (Unaudited)
The following is a summary of the inputs used to value each Fund as of October 31, 2018:
Investments in Securities at Value(a) | Level 1 - Quoted Prices | Level 2 - Other Significant Observable Inputs | Level 3 - Significant Unobservable Inputs | Total | ||||||||||||
| Seafarer Overseas Growth and Income Fund | ||||||||||||||||
| Common Stocks | ||||||||||||||||
| China | $ | 27,588,092 | $ | 124,383,553 | $ | – | $ | 151,971,645 | ||||||||
| China / Hong Kong | 17,741,123 | 349,604,570 | – | 367,345,693 | ||||||||||||
| Hong Kong | – | 27,216,692 | – | 27,216,692 | ||||||||||||
| Hungary | – | 67,800,545 | – | 67,800,545 | ||||||||||||
| India | 34,328,750 | 60,759,369 | – | 95,088,119 | ||||||||||||
| Malaysia | – | 23,631,632 | – | 23,631,632 | ||||||||||||
| Philippines | – | 26,683,606 | – | 26,683,606 | ||||||||||||
| Singapore | – | 120,787,210 | – | 120,787,210 | ||||||||||||
| South Africa | – | 44,562,589 | – | 44,562,589 | ||||||||||||
| South Korea | 14,239,175 | 344,780,843 | – | 359,020,018 | ||||||||||||
| Taiwan | – | 133,727,490 | – | 133,727,490 | ||||||||||||
| Thailand | – | 26,179,934 | – | 26,179,934 | ||||||||||||
| United Arab Emirates | – | 1,466,177 | – | 1,466,177 | ||||||||||||
| Vietnam | – | 26,943,108 | – | 26,943,108 | ||||||||||||
| Other | 132,791,541 | – | – | 132,791,541 | ||||||||||||
| Preferred Stocks | – | 73,039,986 | – | 73,039,986 | ||||||||||||
| Government Bond, Short-term - USD and Foreign Currency | – | 41,078,427 | – | 41,078,427 | ||||||||||||
| Total | $ | 226,688,681 | $ | 1,492,645,731 | $ | – | $ | 1,719,334,412 | ||||||||
Investments in Securities at Value(a) | Level 1 - Quoted Prices | Level 2 - Other Significant Observable Inputs | Level 3 - Significant Unobservable Inputs | Total | ||||||||||||
| Seafarer Overseas Value Fund | ||||||||||||||||
| Common Stocks | ||||||||||||||||
| China / Hong Kong | $ | 2,120,715 | $ | 9,158,268 | $ | – | $ | 11,278,983 | ||||||||
| Qatar | – | 1,133,686 | – | 1,133,686 | ||||||||||||
| Singapore | – | 3,101,225 | – | 3,101,225 | ||||||||||||
| South Korea | – | 1,206,192 | – | 1,206,192 | ||||||||||||
| Taiwan | – | 505,345 | – | 505,345 | ||||||||||||
| United Arab Emirates | – | 904,918 | – | 904,918 | ||||||||||||
| Vietnam | – | 1,421,144 | – | 1,421,144 | ||||||||||||
| Other | 4,717,243 | – | – | 4,717,243 | ||||||||||||
| Total | $ | 6,837,958 | $ | 17,430,778 | $ | – | $ | 24,268,736 | ||||||||
| (a) | For detailed descriptions of securities by country, see the accompanying Portfolio of Investments. |
| 40 | (855) 732-9220 seafarerfunds.com |
| Seafarer Funds | Notes to Financial Statements |
October 31, 2018 (Unaudited)
For the six months ended October 31, 2018, the Funds did not have any securities that used significant unobservable inputs (Level 3) in determining fair value.
Investment Transactions and Investment Income
Investment transactions are accounted for on the date the investments are purchased or sold (trade date). Realized gains and losses from investment transactions are reported on an identified cost basis. Interest income, which includes accretion of discounts and amortization of premiums, is accrued and recorded as earned. Dividend income is recognized on the ex-dividend date or for certain foreign securities, as soon as information is available to the Funds. All of the realized and unrealized gains and losses and net investment income are allocated daily to each share class in proportion to its average daily net assets.
Cash Management Transactions
Each of the Funds subscribes to the Brown Brothers Harriman & Co. (“BBH”) Cash Management Service (“CMS”), whereby cash balances are automatically swept into overnight offshore demand deposits with either the BBH Grand Cayman branch or a branch of a pre-approved commercial bank. This fully automated program allows the Funds to earn interest on cash balances. Excess cash with deposit institutions domiciled outside of the U.S. are subject to sovereign actions in the jurisdiction of the deposit institution including, but not limited to, freeze, seizure or diminution. Cash balances in the BBH CMS are included on the Statements of Assets and Liabilities under Cash and Foreign Currency, at value. As of October 31, 2018, the Funds had the following cash balances participating in the BBH CMS:
| Fund | ||||
| Seafarer Overseas Growth and Income Fund | $ | 32,806,739 | ||
| Seafarer Overseas Value Fund | 2,550,363 | |||
As of October 31, 2018, the Funds had the following foreign cash balances participating in the BBH CMS (cost and value of foreign cash balances are equal):
| Fund | ||||
| Seafarer Overseas Growth and Income Fund | $ | – | ||
| Seafarer Overseas Value Fund | – |
Foreign Securities
The Funds may directly purchase securities of foreign issuers. Investing in securities of foreign issuers involves special risks not typically associated with investing in securities of U.S. issuers. The risks include possible revaluation of currencies, the inability to repatriate foreign currency, less complete financial information about companies, and possible future adverse political and economic developments. Moreover, securities of many foreign issuers and their markets may be less liquid and their prices more volatile than those of securities of comparable U.S. issuers.
Foreign Currency Translation
The books and records of the Funds are maintained in U.S. dollars. Investment valuations and other assets and liabilities initially expressed in foreign currencies are converted each business day into U.S. dollars based upon current exchange rates. Prevailing foreign exchange rates may generally be obtained at the close of the NYSE (normally, 4:00 p.m. Eastern time). The portion of realized and unrealized gains or losses on investments due to fluctuations in foreign currency exchange rates is not separately disclosed and is included in realized and unrealized gains or losses on investments, when applicable.
| Semi-annual Report - October 31, 2018 | 41 |
| Seafarer Funds | Notes to Financial Statements |
October 31, 2018 (Unaudited)
Foreign Currency Spot Contracts
Each Fund may enter into foreign currency spot contracts to facilitate transactions in foreign securities or to convert foreign currency receipts into U.S. dollars. A foreign currency spot contract is an agreement between two parties to buy and sell currencies at the current market rate, for settlement generally within two business days. The U.S. dollar value of a contract is determined using current currency exchange rates supplied by a pricing service. The contract is marked-to-market daily for settlements beyond one day and any change in market value is recorded as an unrealized gain or loss. When the contract is closed, the Fund records a realized gain or loss equal to the difference between the value on the open and close date. Losses may arise from changes in the value of the foreign currency, or if the counterparties do not perform under the contract’s terms. The maximum potential loss from such contracts is the aggregate face value in U.S. dollars at the time the contract was opened.
Trust Expenses
Some expenses of the Trust can be directly attributed to the Funds. Expenses that cannot be directly attributed to the Funds are apportioned among all funds in the Trust based on the average daily net assets of each fund.
Fund and Class Expenses
Expenses that are specific to a Fund or class of shares of a Fund, including shareholder servicing fees, are charged directly to that Fund or share class. Expenses that are common to all Funds are generally allocated among the Funds in proportion to their average daily net assets.
Federal Income Taxes
Each Fund complies with the requirements under Subchapter M of the Internal Revenue Code of 1986, as amended, applicable to regulated investment companies and intends to distribute substantially all of its net taxable income and net capital gains, if any, each year so that it will not be subject to excise tax on undistributed income and gains. The Funds are not subject to income taxes to the extent such distributions are made.
As of and during the six months ended October 31, 2018, the Funds did not have a liability for any unrecognized tax benefits. The Funds file U.S. federal, state, and local tax returns as required. The Funds’ tax returns are subject to examination by the relevant tax authorities until expiration of the applicable statute of limitations, which is generally three years after the filing of the tax return for federal purposes and four years for most state returns. Tax returns for open years have incorporated no uncertain tax positions that require a provision for income taxes.
Distributions to Shareholders
In general, the Seafarer Overseas Growth and Income Fund’s policy is to distribute to its shareholders substantially all net investment income, paid out via two semi-annual dividends, in June and December. The Seafarer Overseas Value Fund’s policy is to distribute to its shareholders substantially all net investment income via one annual dividend in December. It is also each Fund’s policy to distribute annually all net realized short-term and long-term capital gains, if any, after offsetting any capital loss carryovers. Income dividend distributions are derived from dividends and other income each Fund receives from its investments, including short-term capital gains. Long-term capital gain distributions are derived from gains realized when a Fund sells a security it has owned for more than one year. Each Fund may make additional distributions if Seafarer Capital Partners, LLC (the “Adviser”) believes doing so may be necessary for the Fund to avoid or reduce taxes.
| 42 | (855) 732-9220 seafarerfunds.com |
| Seafarer Funds | Notes to Financial Statements |
October 31, 2018 (Unaudited)
3. Tax Basis Information
Tax Basis of Investments
As of October 31, 2018, the aggregate cost of investments, gross unrealized appreciation/(depreciation) and net unrealized appreciation for Federal tax purposes were as follows:
Cost of Investments | Gross Unrealized Appreciation | Gross Unrealized Depreciation | Net Unrealized Depreciation | |||||||||||||
| Seafarer Overseas Growth and Income Fund | $ | 1,890,051,589 | $ | 90,309,710 | $ | (261,026,887 | ) | $ | (170,717,177 | ) | ||||||
| Seafarer Overseas Value Fund | 26,625,051 | 1,836,660 | (4,192,975 | ) | (2,356,315 | ) | ||||||||||
Tax Basis of Distributions to Shareholders
The character of distributions made during the year from net investment income or net realized gains may differ from the ultimate characterization for federal income tax purposes. Also, due to the timing of dividend distributions, the fiscal year in which amounts are distributed may differ from the fiscal year in which the income or realized gain is recorded by a Fund.
The tax character of distributions paid by the Funds for the fiscal year ended April 30, 2018 was as follows:
Ordinary Income | Long-Term Capital Gain | |||||||
| Seafarer Overseas Growth and Income Fund | $ | 80,952,386 | $ | 6,334,481 | ||||
| Seafarer Overseas Value Fund | 648,226 | – | ||||||
The amounts and characteristics of tax basis distributions and composition of distributable earnings/(accumulated losses) are finalized at fiscal year-end. Accordingly, tax basis balances have not been determined as of October 31, 2018.
4. Securities Transactions
The cost of purchases and proceeds from sales of securities excluding short-term securities during the six months ended October 31, 2018 were as follows:
Purchases of Securities | Proceeds from Sales of Securities | |||||||
| Seafarer Overseas Growth and Income Fund | $ | 826,061,765 | $ | 1,520,826,741 | ||||
| Seafarer Overseas Value Fund | 5,987,186 | – | ||||||
5. Shares of Beneficial Interest
The capitalization of the Trust consists of an unlimited number of shares of beneficial interest with no par value per share. Holders of shares of the Funds of the Trust have one vote for each share held and a proportionate fraction of a vote for each fractional share. All shares issued and outstanding are fully paid and are transferable and redeemable at the option of the shareholder. Purchasers of the shares do not have any obligation to make payments to the Trust or its creditors solely by reason of the purchasers’ ownership of the shares. Shares have no pre-emptive rights.
| Semi-annual Report - October 31, 2018 | 43 |
| Seafarer Funds | Notes to Financial Statements |
October 31, 2018 (Unaudited)
6. Management and Related Party Transactions
The Adviser, subject to the authority of the Board, is responsible for the overall management and administration of the Funds’ business affairs. The Adviser manages the investments of the Funds in accordance with the Funds’ investment objectives, policies, limitations and investment guidelines established jointly by the Adviser and the Trustees. Pursuant to the investment advisory agreement, the Funds, in the aggregate, pay the Adviser an annual management fee of 0.75% of the aggregate average daily net assets of the Funds up to $1.5 billion and 0.70% of the aggregate average daily net assets of the Funds over $1.5 billion. Each Fund pays the Adviser a monthly fee at the annual rate using the applicable management fee calculated based on the Fund’s pro rata share of the Funds’ combined average daily net assets. Prior to August 31, 2016, the Funds paid the Adviser an annual management fee of 0.75% of the aggregate average daily net assets of the Funds. The management fee is paid on a monthly basis.
Effective September 1, 2014, the Adviser contractually agreed to limit certain Fund expenses (excluding brokerage expenses, interest expenses, taxes and extraordinary expenses) to 1.25% and 1.05% of the Funds’ average daily net assets in the Investor and Institutional share classes, respectively, through August 31, 2015. Effective September 1, 2015, the Adviser contractually agreed to waive and/or reimburse fees or expenses in order to limit Total Annual Fund Operating Expenses After Fee Waiver / Expense Reimbursements (excluding brokerage expenses, interest expenses, taxes and extraordinary expenses) to 1.15% and 1.05% of the Funds’ average daily net assets for the Investor and Institutional share classes respectively. This agreement (the “Expense Agreement”) is in effect through August 31, 2019. The Adviser will be permitted to recover, on a class-by-class basis, expenses it has borne through the Expense Agreement to the extent that the Funds’ expenses in later periods fall below the expense cap in effect at the time of waiver or reimbursement. The Funds will not be obligated to pay any such deferred fees and expenses more than three years after the date of the waiver. This agreement may not be terminated or modified prior to August 31, 2019, except with the approval of the Funds’ Board. During the six months ended October 31, 2018, the Adviser agreed that it will only seek to recoup waived management fees and will not recoup any reimbursed expenses. As of October 31, 2018, the Adviser has recouped all available waived management fees from the Seafarer Overseas Growth and Income Fund.
For the semi-annual period ended October 31, 2018, the fee waivers and/or reimbursements were as follows for the Seafarer Overseas Value Fund:
| Fund | Fees Waived/ Reimbursed By Adviser | Recoupment of Past Waived Fees By Adviser | ||||||
| Seafarer Overseas Value Fund | ||||||||
| Investor Class | $ | 392 | $ | 9 | ||||
| Institutional Class | 54,074 | – | ||||||
As of October 31, 2018, the balances of recoupable expenses for each class were as follows for the Funds:
| Fund | Expires 2020 | Expires 2021 | Expires 2022 | Total | ||||||||||||
| Seafarer Overseas Growth and Income Fund | ||||||||||||||||
| Investor Class | $ | – | $ | – | $ | – | $ | – | ||||||||
| Institutional Class | – | – | – | – | ||||||||||||
| Seafarer Overseas Value Fund | ||||||||||||||||
| Investor Class | $ | 1,159 | 1,723 | $ | 392 | $ | 3,274 | |||||||||
| Institutional Class | 34,396 | 108,082 | 54,074 | 196,552 | ||||||||||||
| 44 | (855) 732-9220 seafarerfunds.com |
| Seafarer Funds | Notes to Financial Statements |
October 31, 2018 (Unaudited)
Fund Administrator
ALPS Fund Services, Inc. (“ALPS” and the “Administrator”) (an affiliate of ALPS Distributors, Inc.) provides administrative, fund accounting and other services to the Funds under the Administration, Bookkeeping and Pricing Services Agreement with the Trust.
The Funds’ administrative fee is accrued on a daily basis and paid monthly. The Administrator is also reimbursed by the Funds for certain out-of-pocket expenses. Administration fees paid by the Funds for the six months ended October 31, 2018 are disclosed in the Statements of Operations.
Transfer Agent
ALPS serves as transfer, dividend paying and shareholder servicing agent for the Funds (“Transfer Agent”). ALPS is paid an annual base fee per Fund and a fee based on the number of shareholder accounts. The Transfer Agent is also reimbursed by the Funds for certain out-of-pocket expenses. Transfer agent fees paid by the Funds for the six months ended October 31, 2018 are disclosed in the Statements of Operations.
Compliance Services
ALPS provides compliance services to the Funds under the Chief Compliance Officer Services Agreement with the Trust. ALPS provides services that assist the Trust’s chief compliance officer in monitoring and testing the policies and procedures of the Trust in accordance with the requirements of Rule 38a-1 under the 1940 Act. ALPS is paid an annual base fee and is reimbursed for certain out-of-pocket expenses. Compliance service fees paid by the Funds for the six months ended October 31, 2018 are disclosed in the Statements of Operations.
Principal Financial Officer
ALPS provides principal financial officer services to the Funds under the Principal Financial Officer Services Agreement with the Trust. Under this Agreement, ALPS is paid an annual base fee and is reimbursed for certain out-of-pocket expenses. Principal financial officer fees paid by the Funds for the six months ended October 31, 2018 are disclosed in the Statements of Operations.
Distributor
ALPS Distributors, Inc. (“ADI” or the “Distributor”) (an affiliate of ALPS) acts as the distributor of the Funds’ shares pursuant to the Distribution Agreement with the Trust. Under a side letter agreement, the Adviser pays ADI an annual base fee of $12,000 per Fund for the distribution services. The Adviser also reimburses ADI for certain out-of-pocket expenses. Shares are sold on a continuous basis by ADI as agent for the Funds, and ADI has agreed to use its best efforts to solicit orders for the sale of the Funds’ shares, although it is not obliged to sell any particular amount of shares. ADI is registered as a broker-dealer with the U.S. Securities and Exchange Commission.
Shareholder Service Plan for Investor Class and Institutional Class Shares
Each Fund has adopted a Shareholder Services Plan (a “Services Plan”) for each of its share classes. Under the Services Plan, each Fund is authorized to enter into shareholder service agreements with investment advisers, financial institutions and other service providers (“Participating Organizations”) to maintain and provide certain administrative and servicing functions in relation to the accounts of shareholders. Shareholder service arrangements typically include processing orders for shares, generating account and confirmation statements, sub-accounting, account maintenance, tax reporting, and disbursing cash dividends as well as other investment or administrative services required for a particular Participating Organizations’ products, programs, platform and accounts. The Services Plan will cause each Fund to pay an aggregate fee, not to exceed on an annual basis 0.15% and 0.05% of the average daily net asset value of the Investor and Institutional share classes, respectively. Such payments will be made on assets attributable to or held in the name of a Participating Organization, on behalf of its clients as compensation for providing service activities pursuant to an agreement with the Participating Organization. Any amount of such payment not paid to a Participating Organization for such service activities shall be reimbursed
| Semi-annual Report - October 31, 2018 | 45 |
| Seafarer Funds | Notes to Financial Statements |
October 31, 2018 (Unaudited)
to the Fund as soon as practicable. Shareholder Services Plan fees paid by the Funds for the six months ended October 31, 2018 are disclosed in the Statements of Operations.
7. Indemnifications
Under the Trust’s organizational documents, its officers and Trustees are indemnified against certain liability arising out of the performance of their duties to the Trust. Additionally, in the normal course of business, the Trust enters into contracts with service providers that may contain general indemnification clauses, which may permit indemnification to the extent permissible under the applicable law. The Trust’s maximum exposure under these arrangements is unknown, as this would involve future claims that may be made against the Trust that have not yet occurred.
8. New Accounting Pronouncements
On October 4, 2018, the SEC amended Regulation S X to require certain financial statement disclosure requirements to conform them to US GAAP for investment companies. Effective November 4, 2018, the Funds adopted disclosure requirement changes for Regulation S X and these changes are reflected throughout this report. The Funds’ adoption of those amendments, effective with the financial statements prepared as of October 31, 2018, had no effect on the Funds’ net assets or results of operations.
In August 2018, the Financial Accounting Standards Board (“FASB”) issued Accounting Standards Update (“ASU”) 2018-13, which changes the fair value measurement disclosure requirements of FASB Accounting Standards Codification Topic 820, Fair Value Measurement. The update to Topic 820 includes new, eliminated, and modified disclosure requirements. ASU 2018-13 is effective for fiscal years beginning after December 15, 2019, including interim periods. Early adoption is permitted for any eliminated or modified disclosures. Management is currently evaluating the impact of the ASU to the Funds’ financial statements.
| 46 | (855) 732-9220 seafarerfunds.com |
| Seafarer Funds | Additional Information |
October 31, 2018 (Unaudited)
ADDITIONAL INFORMATION
1. Fund Holdings
Each Fund files its complete schedule of portfolio holdings with the Securities and Exchange Commission (the “SEC”) for the first and third quarters of each fiscal year on Form N-Q within 60 days after the end of the period. Copies of the Funds’ Form N-Q are available without charge on the SEC website at http://www.sec.gov. You may also review and copy the Form N-Q at the SEC’s Public Reference Room in Washington, D.C. For more information about the operation of the Public Reference Room, please call the SEC at 1-800-SEC-0330.
2. Fund Proxy Voting Policies, Procedures and Summaries
The Funds’ policies and procedures used in determining how to vote proxies and information regarding how the Funds voted proxies relating to portfolio securities during the most recent prior 12-month period ending June 30 are available without charge, (1) upon request, by calling toll-free (855) 732-9220 and (2) on the SEC’s website at http://www.sec.gov.
| Semi-annual Report - October 31, 2018 | 47 |
Seafarer Funds | Privacy Policy |
| October 31, 2018 (Unaudited) |
| FACTS | WHAT DO THE FUNDS DO WITH YOUR PERSONAL INFORMATION? | |
| Why? | Financial companies choose how they share your personal information. Federal law gives consumers the right to limit some but not all sharing. Federal law also requires us to tell you how we collect, share, and protect your personal information. Please read this notice carefully to understand what we do. | |
| What? | The types of personal information we collect and share depend on the product or service you have with us. This information can include: | |
| ● | Social Security number and account transactions | |
| ● | Account balances and transaction history | |
| ● | Wire transfer instructions | |
| How? | All financial companies need to share customers’ personal information to run their everyday business. In the section below, we list the reasons financial companies can share their customers’ personal information; the reasons the Funds choose to share; and whether you can limit this sharing. | |
| Reasons we can share your personal information | Do we share: | Can you limit this sharing? |
For our everyday business purposes – such as to process your transactions, maintain your account(s), respond to court orders and legal investigations, or report to credit bureaus | Yes | No |
For our marketing purposes – to offer our products and services to you | No | We do not share. |
| For joint marketing with other financial companies | No | We do not share. |
For our affiliates’ everyday business purposes – information about your transactions and experiences | Yes | No |
For our affiliates’ everyday business purposes – information about your creditworthiness | No | We do not share. |
| For nonaffiliates to market to you | No | We do not share. |
| 48 | (855) 732-9220 seafarerfunds.com |
Seafarer Funds | Privacy Policy |
| October 31, 2018 (Unaudited) |
| Who We Are | ||
| Who is providing this notice? | Seafarer Overseas Growth and Income Fund and Seafarer Overseas Value Fund. | |
| What We Do | ||
| How do the Funds protect my personal information? | To protect your personal information from unauthorized access and use, we use security measures that comply with federal law. These measures include computer safeguards and secured files and buildings. | |
| How do the Funds collect my personal information? | We collect your personal information, for example, when you | |
| ● | open an account | |
| ● | provide account information or give us your contact information | |
| ● | make a wire transfer or deposit money | |
| Why can't I limit all sharing? | Federal law gives you the right to limit only | |
| ● | sharing for affiliates’ everyday business purposes-information about your creditworthiness | |
| ● | affiliates from using your information to market to you | |
| ● | sharing for non-affiliates to market to you | |
| State laws and individual companies may give you additional rights to limit sharing. | ||
| Definitions | ||
| Affiliates | Companies related by common ownership or control. They can be financial and nonfinancial companies. | |
| Non-affiliates | Companies not related by common ownership or control. They can be financial and nonfinancial companies. | |
| ● | The Funds do not share with non-affiliates so they can market to you. | |
| Joint marketing | A formal agreement between non-affiliated financial companies that together market financial products or services to you. | |
| ● | The Funds do not jointly market. | |
| Other Important Information | ||
| California Residents | If your account has a California home address, your personal information will not be disclosed to nonaffiliated third parties except as permitted by applicable California law, and we will limit sharing such personal information with our affiliates to comply with California privacy laws that apply to us. | |
| Vermont Residents | The State of Vermont requires financial institutions to obtain your consent prior to sharing personal information that they collect about you with affiliated companies and nonaffiliated third parties other than in certain limited circumstances. Except as permitted by law, we will not share personal information we collect about you with nonaffiliated third parties or other affiliated companies unless you provide us with your written consent to share such information. | |
| Semi-annual Report – October 31, 2018 | 49 |
Table of Contents
| CONTENTS | PAGE |
| Shareholder Letter | 1 |
| Fund Overview | |
| Vulcan Value Partners Fund | 5 |
| Vulcan Value Partners Small Cap Fund | 8 |
| Disclosure of Fund Expenses | |
| Vulcan Value Partners Fund | 7 |
| Vulcan Value Partners Small Cap Fund | 10 |
| Statements of Investments | |
| Vulcan Value Partners Fund | 11 |
| Vulcan Value Partners Small Cap Fund | 14 |
| Statements of Assets and Liabilities | 18 |
| Statements of Operations | 19 |
| Statements of Changes in Net Assets | |
| Vulcan Value Partners Fund | 20 |
| Vulcan Value Partners Small Cap Fund | 21 |
| Financial Highlights | |
| Vulcan Value Partners Fund | 22 |
| Vulcan Value Partners Small Cap Fund | 24 |
| Notes to Financial Statements | 26 |
| Additional Information | 34 |
| Privacy Policy | 35 |
Beginning on January 1, 2021, as permitted by regulations adopted by the U.S. Securities and Exchange Commission, paper copies of the Fund’s annual and semi-annual shareholder reports will no longer be sent by mail, unless you specifically request paper copies of the reports. Instead, the reports will be made available on the Funds’ website at www.vulcanvaluepartners.com and you will be notified by mail each time a report is posted and provided with a website link to access the report.
Beginning on January 1, 2019, you may, notwithstanding the availability of shareholder reports online, elect to receive all future shareholder reports in paper free of charge. If you invest through a financial intermediary, you can contact your financial intermediary to request that you continue to receive paper copies of your shareholder reports. If you invest directly with the Funds, you can call 1.877.421.5078 to let the Funds know you wish to continue receiving paper copies of your shareholder reports.
If you already elected to receive shareholder reports electronically, you will not be affected by this change and you need not take any action. You may elect to receive shareholder reports and other communications from the Funds electronically anytime by contacting your financial intermediary (such as a broker-dealer or bank) or, if you are a direct investor, by enrolling at www.vulcanvaluepartners.com.
| www.vulcanvaluepartners.com |
| Shareholder Letter |
| October 31, 2018 (Unaudited) |
PORTFOLIO REVIEW
General
For the six months ended October 31, 2018, Vulcan Value Partners Fund returned -2.52% and the Vulcan Value Partners Small Cap Fund returned -7.89%. As you know, we place no weight on short-term results, good or bad, and neither should you. In fact, we have and will continue to willingly make decisions that negatively impact short-term performance when we think we can lower risk and improve our long-term returns. We encourage you to place more weight on our longer term historical results and a great deal of weight on our long-term prospects.
Past performance is no guarantee of future results.
We are pleased with the positioning of our portfolios at the end of the period. We have continued to make material progress reducing risk and improving our prospective returns by lowering the weighted average price to value ratios(1) of our portfolios. As a reminder, we are intently focused on our weighted average price to value ratio because it is our primary risk-control measure. The lower our price to value ratio, the larger our margin of safety.(2) It also bodes well for our prospective long-term returns. Our returns are a function of the underlying value growth of the businesses we own, and the closing of the price to value gap. We have no idea how markets will behave or how our portfolios will perform over the short-term. However, with price to value ratios improving and the majority of our businesses experiencing value growth, we are optimistic about our long-term prospects.
Vulcan Value Partners Fund Review
In the discussion that follows, we highlight a few holdings in the Vulcan Value Partners Fund. There were no material contributors. State Street Corporation was a material detractor.
Oracle was our largest contributor over the period and remains our largest position for reasons we have mentioned in previous quarters. Oracle continues to focus on migrating its customer base from on-premise to cloud-based software. The product mix shift has created lumpiness in the segmented numbers, which has caused stock price volatility. We took advantage of this volatility when the stock declined during the year and added to our position.
During the period, State Street Corporation was a material detractor. State Street experienced stock price declines following its July announcement of plans to acquire Charles River Development and again following its announcement of weaker than expected results for the third quarter of 2018. Despite both events, we believe State Street’s competitive advantages remain intact and its long-term outlook is favorable.
We purchased Teradyne during the period. Teradyne is the global leader in semiconductor test equipment. The business generates excellent free cash flow and returns on capital are high. In addition, Teradyne has a rapidly growing industrial automation business specializing in easy-to-operate robots that work alongside humans. These robots are commonly referred to as “cobots.” This segment of the robotics industry is small but growing faster than the industry as a whole. Teradyne’s strategy in the cobot segment is very much like Apple’s approach with the iPhone in that they champion ease of use (think iPhone apps). This open architecture, in turn, attracts a large
| Semi-Annual Report | | | October 31, 2018 | 1 |
| Shareholder Letter |
| October 31, 2018 (Unaudited) |
following of app designers who want to make a good return creating apps for cobots. We believe the increased adoption afforded by such an app ecosystem should make the cobots more valuable and improve Teradyne’s competitive position. By our estimation, we bought Teradyne for the price of its semiconductor test business and have acquired the rapidly-growing industrial automation business for free.
We sold Cardinal Health as a result of their acquisition of Cordis. Cardinal, along with McKesson and AmerisourceBergen, both of whom we also own, is one of the three largest U.S. pharmaceutical distributors, together controlling 85% of the market. Cardinal bought Cordis in 2015. Subsequently, Cardinal implemented new enterprise resource planning and inventory management systems, a process that took roughly two years. As a result, in the second quarter of 2018, Cardinal discovered they had a lot of inventory related to the Cordis acquisition, which they did not control and was going to expire before it could be used. When they disclosed their finding, we analyzed the situation and felt Cardinal’s capital allocation and operational decision-making were disappointing. We insist on good businesses run by capable shareholder-oriented managers who are also good capital allocators. Since Cardinal no longer meets these criteria, we followed our discipline and decided to sell our position.
Vulcan Value Partners Small Cap Fund Review
In the discussion that follows, we highlight a few holdings in the Vulcan Value Partners Small Cap Fund. There was one material contributor, Sleep Number Corp. Material detractors include Despegar.com Corp., Coherent, Inc., Ibstock plc, and Savills plc.
Sleep Number was our largest contributor during the period. Over our investment horizon in Sleep Number, its stock price has been volatile, but the underlying value of the business has remained stable. The company should realize considerable margin expansion when they complete their supply chain consolidation early next year. Sleep Number’s underlying business continues to be strong, free cash flow is at record levels, and management has signaled that they will continue to buy back shares. Its stock price volatility has given us the opportunity to follow our process and take advantage of price fluctuations.
During the period, Despegar.com was the largest detractor. Despegar.com reported results that disappointed Wall Street, but still managed to grow its operating income by 13%. The stock traded down due to fears that increased competition would lead to margin declines. In addition, the Argentinian Peso fell sharply. We believe that Despegar.com is making a wise decision to increase marketing expenditures in order to capture market share from weaker, local competitors. As Despegar.com continues to scale its business, we expect margins to improve over the long term. Despite its short-term performance, we have confidence in the company’s prospects as management is making the appropriate trade-offs in support of the long-term. It enjoys sustainable tailwinds due to increased internet adoption, the surge in smart phone usage, and a growing middle class.
Avast, a new purchase, is a company that provides a comprehensive set of internet security products. The growing threat of cyber-crime in our society is a driver of demand for Avast’s products. The company has a unique business model and a user base of over 430 million, which is roughly six times larger than their next biggest competitor.
| 2 | www.vulcanvaluepartners.com |
| Shareholder Letter |
| October 31, 2018 (Unaudited) |
We sold our position in Tupperware after owning it for several years. The company has not performed as well as we would have liked. Furthermore, its recent CEO transition and the departure of its longtime CFO have further increased its risk profile. We followed our discipline and made the decision to sell this underperforming business with heightened risk and redeploy capital into more promising companies.
Closing
We are ten years past the beginning of the financial crisis. Gathering macro risks include rising interest rates and a potential trade war with China. We see a market that has a number of excesses and, at the very least, is not cheap. Fortunately, we do not own the market. We are invested in a select group of what we consider high quality businesses with stable, steadily growing values at a discount to our estimate of fair value. We believe that by focusing on the fundamental building blocks of absolute returns we will create real wealth for you and for us and deliver attractive returns relative to benchmarks over the long term. Thank you for being our partners and providing us with the long-term capital that allows us to follow our discipline.
C.T. Fitzpatrick
Chief Executive Officer
Vulcan Value Partners, LLC
Past performance does not guarantee future results. The Funds’ prices fluctuate as the underlying assets have exposure to market fluctuations and other risks, as described in the Funds’ prospectus. Please call 877.421.5078 to obtain current performance information and for the current prospectus and statement of additional information. This material must be preceded or accompanied by a prospectus. Please read the prospectus carefully before investing.
The views of the Vulcan Value Partners, LLC and information discussed in this commentary are as of the date of publication, are subject to change, and may not reflect the writer's current views. The views expressed represent an assessment of market conditions at a specific point in time, are opinions only and should not be relied upon as investment advice regarding a particular investment or markets in general. Such information does not constitute a recommendation to buy or sell specific securities or investment vehicles. It should not be assumed that any investment will be profitable or will equal the performance of the Funds or any securities or any sectors mentioned in this letter. The subject matter contained in this letter has been derived from several sources believed to be reliable and accurate at the time of compilation. Neither Vulcan Value Partners, LLC nor the Funds accept any liability for losses either direct or consequential caused by the use of this information.
The Funds are distributed by ALPS Distributors, Inc.
The Funds are subject to investment risks, including possible loss of the principal amount invested and therefore is not suitable for all investors. The Funds may not achieve their objectives.
Diversification does not eliminate the risk of experiencing investment losses.
| (1) | Price to value ratio compares a firm's market to book value by dividing price per share by book value per share. It is also known as the price-equity ratio. |
| (2) | Margin of safety is a principle of investing in which an investor only purchases securities when their market price is significantly below their intrinsic value. In other words, when the market |
| Semi-Annual Report | | | October 31, 2018 | 3 |
| Shareholder Letter |
| October 31, 2018 (Unaudited) |
| price of a security is significantly below your estimation of its intrinsic value, the difference is the margin of safety. Because investors may set a margin of safety in accordance with their own risk preferences, buying securities when this difference is present allows an investment to be made with minimal downside risk. |
| 4 | www.vulcanvaluepartners.com |
| Fund Overview |
| October 31, 2018 (Unaudited) |
VULCAN VALUE PARTNERS FUND
Annualized Total Returns (as of 10/31/18)
Since Inception* | Expense Ratios(1) | ||||||
| 6 Month | 1 Year | 3 Year | 5 Year | Total | Net(2) | ||
| Vulcan Value Partners Fund | -2.52% | 4.98% | 7.58% | 7.91% | 11.61% | 1.09% | 1.09% |
| S&P 500® Total Return Index(3) | 3.40% | 7.35% | 11.52% | 11.34% | 12.77% | ||
| Russell 1000® Value Index(4) | 1.07% | 3.03% | 8.88% | 8.61% | 11.25% | ||
Performance data quoted represents past performance. Past performance does not guarantee future results. Investment return and principal value of an investment will fluctuate so that an investor’s shares, when sold or redeemed, may be worth more or less than the original cost. The Fund imposes a 2.00% redemption fee on shares held for less than 90 days. Current performance data may be higher or lower than actual data quoted. For the most current month-end performance data, please call 1-877-421-5078.
The table does not reflect the deduction of taxes that a shareholder would pay on Fund distributions or the redemption of Fund shares.
Subject to investment risks, including possible loss of the principal amount invested.
Returns for periods less than 1 year are cumulative.
| * | Fund inception date of 12/30/09. |
| (1) | Ratios as of the Prospectus dated August 31, 2018 and may differ from the ratios presented in the Financial Highlights. |
| (2) | Vulcan Value Partners, LLC (“Vulcan” or the “Adviser”) has contractually agreed to limit the Fund’s total annual fund operating expenses (exclusive of Acquired Fund Fees and Expenses, brokerage expenses, interest expense, taxes and extraordinary expenses) to 1.25% of the Fund’s average daily net assets. This agreement (the “Expense Agreement”) is in effect through August 31, 2019. The Adviser will be permitted to recover, on a class-by-class basis, expenses it has borne through the Expense Agreement to the extent that the Fund’s expenses in later periods fall below the expense cap in effect at the time of waiver or reimbursement. Notwithstanding the foregoing, the Fund will not be obligated to pay any such fees and expenses more than three years after the end of the fiscal year in which the fees or expenses were foregone or reimbursed. The Adviser may not discontinue or modify this waiver prior to August 31, 2019 without the approval by the Fund’s Board of Trustees. |
| (3) | The S&P 500® Total Return Index is an unmanaged index of 500 common stocks chosen for market size, liquidity and industry group representation. It is a market-value weighted index. The Index is not actively managed and does not reflect any deductions for fees, expenses or taxes. An investor may not invest directly in the Index. |
| (4) | The Russell 1000® Value Index is presented here as an additional index, and measures the performance of the large-cap value segment of the U.S. equity universe. It includes those Russell 1000® companies with lower price-to-book ratios and lower expected growth values. The index is not actively managed and does not reflect any deductions for fees, expense or taxes. An investor may not invest directly in an index. |
| Semi-Annual Report | | | October 31, 2018 | 5 |
| Fund Overview |
| October 31, 2018 (Unaudited) |
Growth of $10,000 Initial Investment (for the period ended October 31, 2018)
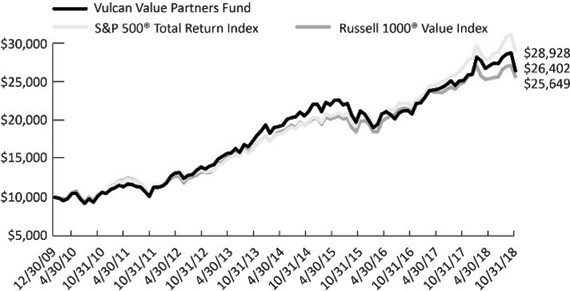
The chart above represents historical performance of a hypothetical investment of $10,000 in the Fund since inception. Past performance does not guarantee future results. This chart does not reflect the deduction of taxes that a shareholder would pay on Fund distributions or the redemption of Fund shares.
Investing in the Fund is subject to investment risks, including possible loss of the principal amount invested.
Industry Allocation (as a % of Net Assets)*
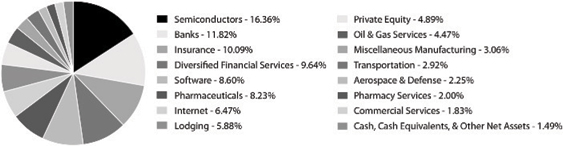
Top Ten Holdings (as a % of Net Assets)*
| Oracle Corp. | 8.60% |
| Hilton Worldwide Holdings, Inc. | 5.88% |
| Skyworks Solutions, Inc. | 5.46% |
| Qorvo, Inc. | 5.44% |
| McKesson Corp. | 5.26% |
| KKR & Co., Inc. | 4.89% |
| State Street Corp. | 4.77% |
| Swiss Re AG | 4.61% |
| National Oilwell Varco, Inc. | 4.47% |
| Alphabet, Inc. | 4.09% |
| Top Ten Holdings | 53.47% |
| * | Holdings are subject to change, and may not reflect the current or future position of the portfolio. |
| 6 | www.vulcanvaluepartners.com |
| Disclosure of Fund Expenses |
| October 31, 2018 (Unaudited) |
As a shareholder of the Vulcan Value Partners Fund (the “Fund”), you will incur two types of costs: (1) transaction costs, including applicable redemption fees; and (2) ongoing costs, including management fees and other fund operating expenses. The following examples are intended to help you understand your ongoing costs (in dollars) of investing in the Fund and to compare these costs with the ongoing costs of investing in other mutual funds. The examples are based on an investment of $1,000 invested on May 1, 2018 and held until October 31, 2018.
Actual Expenses. The first line of each table below provides information about actual account values and actual expenses. You may use the information in this line, together with the amount you invested, to estimate the expenses that you paid over the period. Simply divide your account value by $1,000 (for example, an $8,600 account value divided by $1,000 = 8.6), then multiply the result by the number in the first line under the heading “Expenses Paid During Period” to estimate the expenses you paid on your account during this period.
Hypothetical Example for Comparison Purposes. The second line of the table below provides information about hypothetical account values and hypothetical expenses based on the Fund’s actual expense ratio and an assumed rate of return of 5% per year before expenses, which is not the Fund’s actual return. The hypothetical account values and expenses may not be used to estimate the actual ending account balance or expenses you paid for the period. You may use this information to compare the ongoing costs of investing in the Fund and other mutual funds. To do so, compare this 5% hypothetical example with the 5% hypothetical examples that appear in the shareholder reports of the other mutual funds.
Please note the expenses shown in the table are meant to highlight ongoing Fund costs only and do not reflect transactional costs, such as redemption fees or exchange fees. Therefore, the second line of the table below is useful in comparing your ongoing costs only, and will not help you determine the relative total costs of owning different funds. In addition, if these transactional costs were included, your costs would have been higher.
Vulcan Value Partners Fund
Beginning Account Value 5/1/18 | Ending Account Value 10/31/18 | Expense Ratio(a) | Expenses Paid During period 5/1/18 - 10/31/18(b) | |
| Actual | $1,000.00 | $ 974.80 | 1.07% | $ 5.33 |
| Hypothetical (5% return before expenses) | $1,000.00 | $1,019.81 | 1.07% | $ 5.45 |
| (a) | The | Fund's expense ratios have been annualized based on the Fund's most recent fiscal half-year expenses. |
| (b) | Expenses are equal to the Fund's annualized expense ratio multiplied by the average account value over the period, multiplied by the number of days in the most recent fiscal half-year (184)/365 (to reflect the half-year period). |
| Semi-Annual Report | October 31, 2018 | 7 |
| Fund Overview |
| October 31, 2018 (Unaudited) |
VULCAN VALUE PARTNERS SMALL CAP FUND
Annualized Total Returns (as of 10/31/18)
| Expense Ratios(1) | |||||||
| 6 Month | 1 Year | 3 Year | 5 Year | Since Inception* | Total | Net(2) | |
| Vulcan Value Partners Small Cap Fund | -7.89% | -6.67% | 5.06% | 4.88% | 11.67% | 1.27% | 1.27% |
| Russell 2000® Value Index(3) | -1.52% | -0.59% | 10.52% | 7.18% | 10.73% | ||
| Russell 2000® Index(4) | -1.37% | 1.85% | 10.68% | 8.01% | 11.84% | ||
Performance data quoted represents past performance. Past performance does not guarantee future results. Investment return and principal value of an investment will fluctuate so that an investor’s shares, when sold or redeemed, may be worth more or less than the original cost. The Fund imposes a 2.00% redemption fee on shares held for less than 90 days. Current performance data may be higher or lower than actual data quoted. For the most current month-end performance data, please call 1-877-421-5078.
The table does not reflect the deduction of taxes that a shareholder would pay on Fund distributions or the redemption of Fund shares.
Subject to investment risks, including possible loss of the principal amount invested.
Returns for periods less than 1 year are cumulative.
| * | Fund inception date of 12/30/09. |
| (1) | Ratios as of the Prospectus dated August 31, 2018 and may differ from the ratios presented in the Financial Highlights. |
| (2) | Vulcan Value Partners, LLC (“Vulcan” or the “Adviser”) has contractually agreed to limit the Fund’s total annual fund operating expenses (exclusive of Acquired Fund Fees and Expenses, brokerage expenses, interest expense, taxes and extraordinary expenses) to 1.25% of the Fund’s average daily net assets. This agreement (the “Expense Agreement”) is in effect through August 31, 2019. The Adviser will be permitted to recover, on a class-by-class basis, expenses it has borne through the Expense Agreement to the extent that the Fund’s expenses in later periods fall below the expense cap in effect at the time of waiver or reimbursement. Notwithstanding the foregoing, the Fund will not be obligated to pay any such fees and expenses more than three years after the end of the fiscal year in which the fees or expenses were foregone or reimbursed. The Adviser may not discontinue or modify this waiver prior to August 31, 2019 without the approval by the Fund’s Board of Trustees. |
| (3) | The Russell 2000® Value Index is presented here as an additional index, and measures the performance of small-cap value segment of the U.S.equity universe. It includes those Russell 2000® companies with lower price-to-book ratios and lower forecasted growth values. The index is not actively managed and does not reflect any deductions for fees, expense or taxes. An investor may not invest directly in an index. |
| (4) | The Russell 2000® Index is presented here as an additional index, and measures the performance of the small-cap segment of the U.S. equity universe. The Russell 2000® Index is a subset of the Russell 3000® Index representing approximately 8% of the total market capitalization of that index. It includes approximately 2,000 of the smallest securities based on a combination of their market cap and current index membership. The index is not actively managed and does not reflect any deductions for fees, expense or taxes. An investor may not invest directly in an index. |
| 8 | www.vulcanvaluepartners.com |
| Fund Overview |
| October 31, 2018 (Unaudited) |
Growth of $10,000 Initial Investment (for the period ended October 31, 2018)
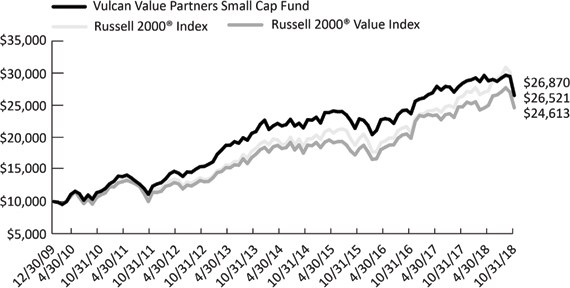
The chart above represents historical performance of a hypothetical investment of $10,000 in the Fund since inception. Past performance does not guarantee future results. This chart does not reflect the deduction of taxes that a shareholder would pay on Fund distributions or the redemption of Fund shares.
Investing in the Fund is subject to investment risks, including possible loss of the principal amount invested.
Industry Allocation (as a % of Net Assets)*
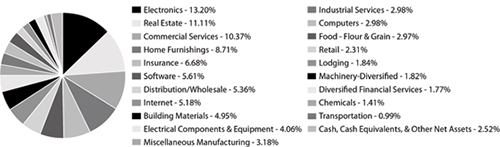
Top Ten Holdings (as a % of Net Assets)*
| Coherent, Inc. | 6.15% |
| Cushman & Wakefield PLC | 5.89% |
| Jones Lang LaSalle, Inc. | 5.22% |
| Ituran Location and Control, Ltd. | 5.21% |
| Despegar.com Corp. | 5.18% |
| Ibstock PLC | 4.95% |
| Acuity Brands, Inc. | 4.06% |
| Axis Capital Holdings, Ltd. | 3.93% |
| Sotheby's | 3.91% |
| Savills PLC | 3.87% |
| Top Ten Holdings | 48.37% |
| * | Holdings are subject to change, and may not reflect the current or future position of the portfolio. |
| Semi-Annual Report | October 31, 2018 | 9 |
| Disclosure of Fund Expenses |
| October 31, 2018 (Unaudited) |
As a shareholder of the Vulcan Value Partners Small Cap Fund (the “Fund”), you will incur two types of costs: (1) transaction costs, including applicable redemption fees; and (2) ongoing costs, including management fees and other fund operating expenses. The following examples are intended to help you understand your ongoing costs (in dollars) of investing in the Fund and to compare these costs with the ongoing costs of investing in other mutual funds. The examples are based on an investment of $1,000 invested on May 1, 2018 and held until October 31, 2018.
Actual Expenses. The first line of each table below provides information about actual account values and actual expenses. You may use the information in this line, together with the amount you invested, to estimate the expenses that you paid over the period. Simply divide your account value by $1,000 (for example, an $8,600 account value divided by $1,000 = 8.6), then multiply the result by the number in the first line under the heading “Expenses Paid During Period” to estimate the expenses you paid on your account during this period.
Hypothetical Example for Comparison Purposes. The second line of the table below provides information about hypothetical account values and hypothetical expenses based on the Fund’s actual expense ratio and an assumed rate of return of 5% per year before expenses, which is not the Fund’s actual return. The hypothetical account values and expenses may not be used to estimate the actual ending account balance or expenses you paid for the period. You may use this information to compare the ongoing costs of investing in the Fund and other mutual funds. To do so, compare this 5% hypothetical example with the 5% hypothetical examples that appear in the shareholder reports of the other mutual funds.
Please note the expenses shown in the table are meant to highlight ongoing Fund costs only and do not reflect transactional costs, such as redemption fees or exchange fees. Therefore, the second line of the table below is useful in comparing your ongoing costs only, and will not help you determine the relative total costs of owning different funds. In addition, if these transactional costs were included, your costs would have been higher.
Vulcan Value Partners Small Cap Fund
Beginning Account Value 5/1/18 | Ending Account Value 10/31/18 | Expense Ratio(a) | Expenses Paid During period 5/1/18 - 10/31/18(b) | |
| Actual | $1,000.00 | $ 921.10 | 1.25% | $ 6.05 |
| Hypothetical (5% return before expenses) | $1,000.00 | $1,018.90 | 1.25% | $ 6.36 |
| (a) | The Fund's expense ratios have been annualized based on the Fund's most recent fiscal half-year expenses. |
| (b) | Expenses are equal to the Fund's annualized expense ratio multiplied by the average account value over the period, multiplied by the number of days in the most recent fiscal half-year (184)/365 (to reflect the half-year period). |
| 10 | www.vulcanvaluepartners.com |
| Vulcan Value Partners Fund | Statement of Investments |
October 31, 2018 (Unaudited)
| Shares | Value (Note 2) | |||||||
| COMMON STOCKS (98.51%) | ||||||||
| Communications (6.47%) | ||||||||
| Internet (6.47%) | ||||||||
| Alphabet, Inc., Class C(a) | 51,760 | $ | 55,733,615 | |||||
| Facebook, Inc., Class A(a) | 213,643 | 32,428,871 | ||||||
| 88,162,486 | ||||||||
| TOTAL COMMUNICATIONS | 88,162,486 | |||||||
| Consumer, Cyclical (5.88%) | ||||||||
| Lodging (5.88%) | ||||||||
| Hilton Worldwide Holdings, Inc. | 1,125,769 | 80,120,980 | ||||||
| TOTAL CONSUMER, CYCLICAL | 80,120,980 | |||||||
| Consumer, Non-cyclical (10.06%) | ||||||||
| Commercial Services (1.83%) | ||||||||
| S&P Global, Inc. | 136,878 | 24,955,597 | ||||||
| Pharmaceuticals (8.23%) | ||||||||
| AmerisourceBergen Corp. | 458,973 | 40,389,624 | ||||||
| McKesson Corp. | 574,083 | 71,622,595 | ||||||
| 112,012,219 | ||||||||
| TOTAL CONSUMER, NON-CYCLICAL | 136,967,816 | |||||||
| Energy (4.47%) | ||||||||
| Oil & Gas Services (4.47%) | ||||||||
| National Oilwell Varco, Inc. | 1,655,568 | 60,924,902 | ||||||
| TOTAL ENERGY | 60,924,902 | |||||||
| Financial (36.44%) | ||||||||
| Banks (11.82%) | ||||||||
| Bank of New York Mellon Corp. | 1,155,550 | 54,692,182 | ||||||
| Northern Trust Corp. | 439,299 | 41,324,857 | ||||||
| State Street Corp. | 945,203 | 64,982,706 | ||||||
| 160,999,745 | ||||||||
| Diversified Financial Services (9.64%) | ||||||||
| BlackRock, Inc. | 69,521 | 28,602,330 | ||||||
| Mastercard, Inc., Class A | 264,223 | 52,228,960 | ||||||
| Visa, Inc., Class A | 365,673 | 50,408,023 | ||||||
| 131,239,313 | ||||||||
| Insurance (10.09%) | ||||||||
| Axis Capital Holdings, Ltd. | 630,347 | 35,167,059 | ||||||
| Semi-Annual Report | October 31, 2018 | 11 |
| Statement of Investments | Vulcan Value Partners Fund |
October 31, 2018 (Unaudited)
| Shares | Value (Note 2) | |||||||
| Financial (continued) | ||||||||
| Insurance (continued) | ||||||||
| Everest Re Group, Ltd. | 180,930 | $ | 39,417,410 | |||||
| Swiss Re AG | 695,592 | 62,821,872 | ||||||
| 137,406,341 | ||||||||
| Private Equity (4.89%) | ||||||||
| KKR & Co., Inc., Class A | 2,818,903 | 66,667,056 | ||||||
| TOTAL FINANCIAL | 496,312,455 | |||||||
| Industrial (8.23%) | ||||||||
| Aerospace & Defense (2.25%) | ||||||||
| Airbus SE | 277,327 | 30,692,130 | ||||||
| Miscellaneous Manufacturing (3.06%) | ||||||||
| Parker-Hannifin Corp. | 274,562 | 41,631,836 | ||||||
| Transportation (2.92%) | ||||||||
| United Parcel Service, Inc., Class B | 372,659 | 39,703,090 | ||||||
| TOTAL INDUSTRIAL | 112,027,056 | |||||||
| Pharmaceuticals (2.00%) | ||||||||
| Pharmacy Services (2.00%) | ||||||||
| CVS Health Corp. | 375,332 | 27,170,284 | ||||||
| TOTAL PHARMACEUTICALS | 27,170,284 | |||||||
| Technology (24.96%) | ||||||||
| Semiconductors (16.36%) | ||||||||
| Broadcom, Inc. | 119,574 | 26,723,593 | ||||||
| Qorvo, Inc.(a) | 1,007,926 | 74,092,640 | ||||||
| Skyworks Solutions, Inc. | 857,687 | 74,412,924 | ||||||
| Teradyne, Inc. | 1,378,810 | 47,500,005 | ||||||
| 222,729,162 | ||||||||
| Software (8.60%) | ||||||||
| Oracle Corp. | 2,399,145 | 117,174,242 | ||||||
| TOTAL TECHNOLOGY | 339,903,404 | |||||||
| TOTAL COMMON STOCKS | ||||||||
| (Cost $1,201,492,464) | 1,341,589,383 | |||||||
| 12 | www.vulcanvaluepartners.com |
| Vulcan Value Partners Fund | Statement of Investments |
October 31, 2018 (Unaudited)
7-Day Yield | Shares | Value (Note 2) | ||||||||||
| SHORT TERM INVESTMENTS (1.60%) | ||||||||||||
| Money Market Fund (1.60%) | ||||||||||||
| Dreyfus Treasury Cash Management | 2.071% | 21,797,083 | $ | 21,797,083 | ||||||||
| TOTAL SHORT TERM INVESTMENTS | ||||||||||||
| (Cost $21,797,083) | 21,797,083 | |||||||||||
| TOTAL INVESTMENTS (100.11%) | ||||||||||||
| (Cost $1,223,289,547) | $ | 1,363,386,466 | ||||||||||
| Liabilities In Excess Of Other Assets (-0.11%) | (1,442,653 | ) | ||||||||||
| NET ASSETS (100.00%) | $ | 1,361,943,813 | ||||||||||
| (a) | Non-Income Producing Security. |
For Fund compliance purposes, the Fund's industry classifications refer to any one or more of the industry sub-classifications used by one or more widely recognized market indexes or ratings group indexes, and/or as defined by Fund management. This definition may not apply for purposes of this report, which may combine industry sub-classifications for reporting ease. Industries are shown as a percentage of net assets.
See Accompanying Notes to Financial Statements.
| Semi-Annual Report | October 31, 2018 | 13 |
| Statement of Investments | Vulcan Value Partners Small Cap Fund |
October 31, 2018 (Unaudited)
| Shares | Value (Note 2) | |||||||
| COMMON STOCKS (97.48%) | ||||||||
| Basic Materials (1.41%) | ||||||||
| Chemicals (1.41%) | ||||||||
| Versum Materials, Inc. | 323,439 | $ | 10,207,735 | |||||
| TOTAL BASIC MATERIALS | 10,207,735 | |||||||
| Communications (5.18%) | ||||||||
| Internet (5.18%) | ||||||||
| Despegar.com Corp.(a) | 2,327,867 | 37,408,823 | ||||||
| TOTAL COMMUNICATIONS | 37,408,823 | |||||||
| Consumer, Cyclical (18.22%) | ||||||||
| Distribution/Wholesale (5.36%) | ||||||||
| Ahlsell AB(b)(c) | 2,709,966 | 13,716,924 | ||||||
| WESCO International, Inc.(a) | 498,080 | 24,993,654 | ||||||
| 38,710,578 | ||||||||
| Home Furnishings (8.71%) | ||||||||
| Howden Joinery Group PLC | 3,582,919 | 21,483,331 | ||||||
| Sleep Number Corp.(a) | 757,692 | 27,557,258 | ||||||
| Tempur Sealy International, Inc.(a) | 301,183 | 13,917,666 | ||||||
| 62,958,255 | ||||||||
| Lodging (1.84%) | ||||||||
| Choice Hotels International, Inc. | 95,866 | 7,036,564 | ||||||
| Wyndham Hotels & Resorts, Inc. | 127,250 | 6,272,153 | ||||||
| 13,308,717 | ||||||||
| Retail (2.31%) | ||||||||
| Sleep Country Canada Holdings, Inc.(b)(c) | 827,585 | 16,696,918 | ||||||
| TOTAL CONSUMER, CYCLICAL | 131,674,468 | |||||||
| Consumer, Non-cyclical (13.34%) | ||||||||
| Commercial Services (10.37%) | ||||||||
| Sabre Corp. | 761,480 | 18,770,482 | ||||||
| Savills PLC | 3,015,828 | 27,947,552 | ||||||
| Sotheby's(a) | 672,363 | 28,239,246 | ||||||
| 74,957,280 | ||||||||
| Food - Flour & Grain (2.97%) | ||||||||
| Ebro Foods SA | 1,084,263 | 21,479,250 | ||||||
| TOTAL CONSUMER, NON-CYCLICAL | 96,436,530 | |||||||
| 14 | www.vulcanvaluepartners.com |
| Vulcan Value Partners Small Cap Fund | Statement of Investments |
October 31, 2018 (Unaudited)
| Shares | Value (Note 2) | |||||||
| Financial (19.56%) | ||||||||
| Diversified Financial Services (1.77%) | ||||||||
| Virtus Investment Partners, Inc. | 128,514 | $ | 12,766,581 | |||||
| Insurance (6.68%) | ||||||||
| Axis Capital Holdings, Ltd. | 508,956 | 28,394,655 | ||||||
| Everest Re Group, Ltd. | 91,289 | 19,888,222 | ||||||
| 48,282,877 | ||||||||
| Real Estate (11.11%) | ||||||||
| Cushman & Wakefield PLC(a) | 2,617,303 | 42,557,346 | ||||||
| Jones Lang LaSalle, Inc. | 285,269 | 37,729,678 | ||||||
| 80,287,024 | ||||||||
| TOTAL FINANCIAL | 141,336,482 | |||||||
| Industrial (28.20%) | ||||||||
| Building Materials (4.95%) | ||||||||
| Ibstock PLC | 12,458,577 | 35,734,728 | ||||||
| Electrical Components & Equipment (4.06%) | ||||||||
| Acuity Brands, Inc. | 233,759 | 29,369,481 | ||||||
| Electronics (13.20%) | ||||||||
| Coherent, Inc.(a) | 360,655 | 44,411,057 | ||||||
| Ituran Location and Control, Ltd. | 1,103,612 | 37,655,241 | ||||||
| Woodward, Inc. | 181,224 | 13,345,335 | ||||||
| 95,411,633 | ||||||||
| Machinery-Diversified (1.82%) | ||||||||
| Concentric AB | 979,865 | 13,148,885 | ||||||
| Miscellaneous Manufacturing (3.18%) | ||||||||
| Carlisle Cos., Inc. | 153,266 | 14,803,963 | ||||||
| Crane Co. | 93,606 | 8,147,466 | ||||||
| 22,951,429 | ||||||||
| Transportation (0.99%) | ||||||||
| Landstar System, Inc. | 71,284 | 7,134,816 | ||||||
| TOTAL INDUSTRIAL | 203,750,972 | |||||||
| Retail (2.98%) | ||||||||
| Industrial Services (2.98%) | ||||||||
| MSC Industrial Direct Co., Inc., Class A | 265,387 | 21,512,270 | ||||||
| TOTAL RETAIL | 21,512,270 | |||||||
| Semi-Annual Report | October 31, 2018 | 15 |
| Statement of Investments | Vulcan Value Partners Small Cap Fund |
October 31, 2018 (Unaudited)
| Shares | Value (Note 2) | |||||||
| Technology (8.59%) | ||||||||
| Computers (2.98%) | ||||||||
| Avast PLC(a) | 6,101,255 | $ | 21,547,617 | |||||
| Software (5.61%) | ||||||||
| ACI Worldwide, Inc.(a) | 1,063,308 | 26,678,398 | ||||||
| Lectra | 651,667 | 13,817,435 | ||||||
| 40,495,833 | ||||||||
| TOTAL TECHNOLOGY | 62,043,450 | |||||||
| TOTAL COMMON STOCKS | ||||||||
| (Cost $674,724,370) | 704,370,730 | |||||||
7-Day Yield | Shares | Value (Note 2) | ||||||||||
| SHORT TERM INVESTMENTS (7.58%) | ||||||||||||
| Money Market Fund (7.58%) | ||||||||||||
| Dreyfus Treasury Cash Management | 2.071% | 54,803,250 | 54,803,250 | |||||||||
| TOTAL SHORT TERM INVESTMENTS | ||||||||||||
| (Cost $54,803,250) | 54,803,250 | |||||||||||
| TOTAL INVESTMENTS (105.06%) | ||||||||||||
| (Cost $729,527,620) | $ | 759,173,980 | ||||||||||
| Liabilities In Excess Of Other Assets (-5.06%) | (36,560,777 | ) | ||||||||||
| NET ASSETS (100.00%) | $ | 722,613,203 | ||||||||||
| (a) | Non-Income Producing Security. |
| (b) | Security exempt from registration under Rule 144A of the Securities Act of 1933. These securities may be resold in the ordinary course of business in transactions exempt from registration, normally to qualified institutional buyers. As of October 31, 2018, these securities had a total aggregate market value of $87,696,187 representing 12.14% of net assets. |
| (c) | Securities were purchased pursuant to Regulation S under the Securities Act of 1933, which exempts securities offered and sold outside of the United States from registration. Such securities cannot be sold in the United States without either an effective registration statement filed pursuant to the Securities Act of 1933, or pursuant to an exemption from registration. These securities have been deemed liquid under procedures approved by the Fund's Board of Trustees. As of October 31, 2018, the aggregate fair value of those securities was $87,696,187 representing 12.14% of net assets. |
| 16 | www.vulcanvaluepartners.com |
| Vulcan Value Partners Small Cap Fund | Statement of Investments |
October 31, 2018 (Unaudited)
For Fund compliance purposes, the Fund's industry classifications refer to any one or more of the industry sub-classifications used by one or more widely recognized market indexes or ratings group indexes, and/or as defined by Fund management. This definition may not apply for purposes of this report, which may combine industry sub-classifications for reporting ease. Industries are shown as a percentage of net assets.
See Accompanying Notes to Financial Statements.
| Semi-Annual Report | October 31, 2018 | 17 |
Statements of Assets and Liabilities
October 31, 2018 (Unaudited)
Vulcan Value Partners Fund | Vulcan Value Partners Small Cap Fund | |||||||
| ASSETS: | ||||||||
| Investments, at value | $ | 1,363,386,466 | $ | 759,173,980 | ||||
| Receivable for investments sold | – | 16,422,893 | ||||||
| Receivable for shares sold | 274,162 | 185,396 | ||||||
| Dividends receivable | 2,454,970 | 432,148 | ||||||
| Other assets | 17,225 | 15,388 | ||||||
| Total assets | 1,366,132,823 | 776,229,805 | ||||||
| LIABILITIES: | ||||||||
| Payable for investments purchased | – | 1,586,358 | ||||||
| Payable for shares redeemed | 2,856,937 | 51,082,224 | ||||||
| Payable to adviser | 1,197,868 | 790,736 | ||||||
| Payable for administration fees | 35,927 | 21,832 | ||||||
| Payable for transfer agency fees | 21,442 | 19,830 | ||||||
| Payable for delegated transfer agent equivalent services fees | 9,194 | 20,449 | ||||||
| Payable for professional fees | 14,262 | 14,539 | ||||||
| Payable for trustee fees and expenses | 7,184 | 8,299 | ||||||
| Payable for principal financial officer fees | 846 | 861 | ||||||
| Accrued expenses and other liabilities | 45,350 | 71,474 | ||||||
| Total liabilities | 4,189,010 | 53,616,602 | ||||||
| NET ASSETS | $ | 1,361,943,813 | $ | 722,613,203 | ||||
| NET ASSETS CONSIST OF: | ||||||||
| Paid-in capital (Note 5) | $ | 1,129,655,456 | $ | 599,433,397 | ||||
| Total distributable earnings | 232,288,357 | 123,179,806 | ||||||
| NET ASSETS | $ | 1,361,943,813 | $ | 722,613,203 | ||||
| INVESTMENTS, AT COST | $ | 1,223,289,547 | $ | 729,527,620 | ||||
| PRICING OF SHARES: | ||||||||
| Net Asset Value, offering and redemption price per share | $ | 20.85 | $ | 17.98 | ||||
| Shares of beneficial interest outstanding (unlimited number of shares, no par value common stock authorized) | 65,318,211 | 40,191,996 | ||||||
See Accompanying Notes to Financial Statements.
| 18 | www.vulcanvaluepartners.com |
Statements of Operations
For the Six Months Ended October 31, 2018 (Unaudited)
Vulcan Value Partners Fund | Vulcan Value Partners Small Cap Fund | |||||||
| INVESTMENT INCOME: | ||||||||
| Dividends | $ | 8,886,944 | $ | 11,793,264 | ||||
| Foreign taxes withheld | – | (539,399 | ) | |||||
| Total investment income | 8,886,944 | 11,253,865 | ||||||
| EXPENSES: | ||||||||
| Investment advisory fees (Note 6) | 7,106,058 | 6,111,509 | ||||||
| Administrative fees | 203,413 | 153,643 | ||||||
| Transfer agency fees | 53,132 | 53,829 | ||||||
| Delegated transfer agent equivalent services fees | 66,031 | 114,700 | ||||||
| Professional fees | 17,324 | 16,755 | ||||||
| Custodian fees | 106,869 | 87,983 | ||||||
| Principal financial officer fees | 2,682 | 2,360 | ||||||
| Trustee fees and expenses | 17,913 | 15,461 | ||||||
| ReFlow Fees (Note 2) | – | 52,989 | ||||||
| Other | 35,825 | 42,289 | ||||||
| Total net expenses | 7,609,247 | 6,651,518 | ||||||
| NET INVESTMENT INCOME | 1,277,697 | 4,602,347 | ||||||
| Net realized gain on investments | 50,530,680 | 74,054,975 | ||||||
| Net realized loss on foreign currency transactions | (45,861 | ) | (67,654 | ) | ||||
| Net realized gain | 50,484,819 | 73,987,321 | ||||||
| Net change in unrealized depreciation of investments | (90,542,990 | ) | (142,939,440 | ) | ||||
| Net change in unrealized appreciation/(depreciation) on translation of assets and liabilities denominated in foreign currencies | (21,275 | ) | 36,481 | |||||
| Net change in unrealized depreciation | (90,564,265 | ) | (142,902,959 | ) | ||||
| NET REALIZED AND UNREALIZED LOSS ON INVESTMENTS | (40,079,446 | ) | (68,915,638 | ) | ||||
| NET DECREASE IN NET ASSETS RESULTING FROM OPERATIONS | $ | (38,801,749 | ) | $ | (64,313,291 | ) | ||
See Accompanying Notes to Financial Statements.
| Semi-Annual Report | October 31, 2018 | 19 |
| Statements of Changes in Net Assets | Vulcan Value Partners Fund |
For the Six Months Ended October 31, 2018 (Unaudited) | For the Year Ended April 30, 2018 | |||||||
| OPERATIONS: | ||||||||
| Net investment income | $ | 1,277,697 | $ | 6,077,602 | ||||
| Net realized gain | 50,484,819 | 70,439,403 | ||||||
| Net change in unrealized appreciation/(depreciation) | (90,564,265 | ) | 84,016,759 | |||||
| Net increase/(decrease) in net assets resulting from operations | (38,801,749 | ) | 160,533,764 | |||||
| DISTRIBUTIONS TO SHAREHOLDERS (Note 3): | ||||||||
| Total distributions(a) | – | (22,197,741 | ) | |||||
| Net decrease in net assets from distributions | – | (22,197,741 | ) | |||||
| SHARE TRANSACTIONS (Note 5): | ||||||||
| Proceeds from sales of shares | 180,159,768 | 160,766,374 | ||||||
| Issued to shareholders in reinvestment of distributions | – | 17,693,956 | ||||||
| Cost of shares redeemed, net of redemption fees | (93,932,794 | ) | (286,946,421 | ) | ||||
| Net increase/(decrease) from share transactions | 86,226,974 | (108,486,091 | ) | |||||
| Net increase in net assets | 47,425,225 | 29,849,932 | ||||||
| NET ASSETS: | ||||||||
| Beginning of year | 1,314,518,588 | 1,284,668,656 | ||||||
| End of period | $ | 1,361,943,813 | $ | 1,314,518,588 | ||||
| (a) | For the year ended April 30, 2018, Total Distributions consisted of Net Investment Income of $7,670,305, and Net Realized Gains of $14,527,436. |
See Accompanying Notes to Financial Statements.
| 20 | www.vulcanvaluepartners.com |
| Vulcan Value Partners Small Cap Fund | Statements of Changes in Net Assets |
For the Six Months Ended October 31, 2018 (Unaudited) | For the Year Ended April 30, 2018 | |||||||
| OPERATIONS: | ||||||||
| Net investment income | $ | 4,602,347 | $ | 943,927 | ||||
| Net realized gain | 73,987,321 | 15,803,042 | ||||||
| Net change in unrealized appreciation/(depreciation) | (142,902,959 | ) | 18,367,056 | |||||
| Net increase/(decrease) in net assets resulting from operations | (64,313,291 | ) | 35,114,025 | |||||
| DISTRIBUTIONS TO SHAREHOLDERS (Note 3): | ||||||||
| Total distributions(a) | – | (72,595,325 | ) | |||||
| Net decrease in net assets from distributions | – | (72,595,325 | ) | |||||
| SHARE TRANSACTIONS (Note 5): | ||||||||
| Proceeds from sales of shares | 73,022,374 | 245,328,871 | ||||||
| Issued to shareholders in reinvestment of distributions | – | 58,614,533 | ||||||
| Cost of shares redeemed, net of redemption fees | (482,654,124 | ) | (325,509,690 | ) | ||||
| Net decrease from share transactions | (409,631,750 | ) | (21,566,286 | ) | ||||
| Net decrease in net assets | (473,945,041 | ) | (59,047,586 | ) | ||||
| NET ASSETS: | ||||||||
| Beginning of year | 1,196,558,244 | 1,255,605,830 | ||||||
| End of period | $ | 722,613,203 | $ | 1,196,558,244 | ||||
| (a) | For the year ended April 30, 2018, Total Distributions consisted of Net Investment Income of $2,029,542, and Net Realized Gains of $70,565,783. |
See Accompanying Notes to Financial Statements.
| Semi-Annual Report | October 31, 2018 | 21 |
Financial Highlights
For a share outstanding throughout the years presented.
| NET ASSET VALUE, BEGINNING OF PERIOD |
| INCOME/(LOSS) FROM OPERATIONS: |
| Net investment income(a) |
| Net realized and unrealized gain/(loss) on investments |
| Total from investment operations |
| LESS DISTRIBUTIONS TO SHAREHOLDERS: |
| From net investment income |
| From net realized gains on investments |
| Total distributions |
| Redemption fees added to paid-in capital |
| Increase/(decrease) in net asset value |
| NET ASSET VALUE, END OF PERIOD |
| Total return |
| RATIOS AND SUPPLEMENTAL DATA: |
| Net assets, end of period (000's) |
| Ratio of expenses to average net assets without fee waivers/reimbursements |
| Ratio of expenses to average net assets including fee waivers/reimbursements |
| Net investment income to average net assets including fee waivers/reimbursements |
| Portfolio turnover rate |
| (a) | Per share numbers have been calculated using the average shares method. |
| (b) | Less than $0.005 per share. |
| (c) | Annualized. |
| (d) | Not Annualized. |
See Accompanying Notes to Financial Statements.
| 22 | www.vulcanvaluepartners.com |
Vulcan Value Partners Fund
For the Six Months Ended October 31, 2018 (Unaudited) | For the Year Ended April 30, 2018 | For the Year Ended April 30, 2017 | For the Year Ended April 30, 2016 | For the Year Ended April 30, 2015 | For the Year Ended April 30, 2014 | |||||||||||||||||
| $ | 21.39 | $ | 19.30 | $ | 17.17 | $ | 19.97 | $ | 18.20 | $ | 15.28 | |||||||||||
| 0.02 | 0.09 | 0.18 | 0.20 | 0.22 | 0.14 | |||||||||||||||||
| (0.56 | ) | 2.35 | 2.18 | (1.51 | ) | 2.77 | 3.33 | |||||||||||||||
| (0.54 | ) | 2.44 | 2.36 | (1.31 | ) | 2.99 | 3.47 | |||||||||||||||
| – | (0.12 | ) | (0.23 | ) | (0.13 | ) | (0.17 | ) | (0.11 | ) | ||||||||||||
| – | (0.23 | ) | – | (1.36 | ) | (1.05 | ) | (0.44 | ) | |||||||||||||
| – | (0.35 | ) | (0.23 | ) | (1.49 | ) | (1.22 | ) | (0.55 | ) | ||||||||||||
| 0.00 | (b) | 0.00 | (b) | 0.00 | (b) | 0.00 | (b) | 0.00 | (b) | 0.00 | (b) | |||||||||||
| (0.54 | ) | 2.09 | 2.13 | (2.80 | ) | 1.77 | 2.92 | |||||||||||||||
| $ | 20.85 | $ | 21.39 | $ | 19.30 | $ | 17.17 | $ | 19.97 | $ | 18.20 | |||||||||||
| (2.52 | %)(c) | 12.72 | % | 13.85 | % | (6.49 | %) | 16.61 | % | 22.84 | % | |||||||||||
| $ | 1,361,944 | $ | 1,314,519 | $ | 1,284,669 | $ | 1,528,080 | $ | 1,770,104 | $ | 929,829 | |||||||||||
| 1.07 | %(d) | 1.08 | % | 1.07 | % | 1.08 | % | 1.08 | % | 1.09 | % | |||||||||||
| 1.07 | %(d) | 1.08 | % | 1.07 | % | 1.08 | % | 1.08 | % | 1.09 | % | |||||||||||
| 0.18 | %(d) | 0.46 | % | 1.01 | % | 1.10 | % | 1.12 | % | 0.80 | % | |||||||||||
| 27 | %(c) | 50 | % | 49 | % | 85 | % | 64 | % | 56 | % | |||||||||||
| Semi-Annual Report | October 31, 2018 | 23 |
Financial Highlights
For a share outstanding throughout the years presented.
| NET ASSET VALUE, BEGINNING OF PERIOD |
| INCOME/(LOSS) FROM OPERATIONS: |
| Net investment income/(loss)(a) |
| Net realized and unrealized gain/(loss) on investments |
| Total from investment operations |
| LESS DISTRIBUTIONS TO SHAREHOLDERS: |
| From net investment income |
| From net realized gains on investments |
| Total distributions |
| Redemption fees added to paid-in capital |
| Increase/(decrease) in net asset value |
| NET ASSET VALUE, END OF PERIOD |
| Total return |
| RATIOS AND SUPPLEMENTAL DATA: |
| Net assets, end of period (000's) |
| Ratio of expenses to average net assets without fee waivers/reimbursements |
| Ratio of expenses to average net assets including fee waivers/reimbursements |
| Net investment income/(loss) to average net assets including fee waivers/reimbursements |
| Portfolio turnover rate |
| (a) | Per share numbers have been calculated using the average shares method. |
| (b) | Less than $0.005 per share. |
| (c) | Annualized. |
| (d) | Not Annualized. |
See Accompanying Notes to Financial Statements.
| 24 | www.vulcanvaluepartners.com |
Vulcan Value Partners Small Cap Fund
For the Six Months Ended October 31, 2018 (Unaudited) | For the Year Ended April 30, 2018 | For the Year Ended April 30, 2017 | For the Year Ended April 30, 2016 | For the Year Ended April 30, 2015 | For the Year Ended April 30, 2014 | |||||||||||||||||
| $ | 19.52 | $ | 20.16 | $ | 16.58 | $ | 18.61 | $ | 18.74 | $ | 16.97 | |||||||||||
| 0.09 | 0.02 | 0.03 | 0.10 | 0.10 | (0.01 | ) | ||||||||||||||||
| (1.63 | ) | 0.59 | 3.61 | (1.05 | ) | 1.77 | 2.76 | |||||||||||||||
| (1.54 | ) | 0.61 | 3.64 | (0.95 | ) | 1.87 | 2.75 | |||||||||||||||
| – | (0.03 | ) | (0.06 | ) | (0.06 | ) | (0.11 | ) | – | |||||||||||||
| – | (1.22 | ) | – | (1.02 | ) | (1.89 | ) | (0.98 | ) | |||||||||||||
| – | (1.25 | ) | (0.06 | ) | (1.08 | ) | (2.00 | ) | (0.98 | ) | ||||||||||||
| 0.00 | (b) | 0.00 | (b) | 0.00 | (b) | 0.00 | (b) | 0.00 | (b) | 0.00 | (b) | |||||||||||
| (1.54 | ) | (0.64 | ) | 3.58 | (2.03 | ) | (0.13 | ) | 1.77 | |||||||||||||
| $ | 17.98 | $ | 19.52 | $ | 20.16 | $ | 16.58 | $ | 18.61 | $ | 18.74 | |||||||||||
| (7.89 | %)(c) | 3.08 | % | 21.97 | % | (5.04 | %) | 10.74 | % | 16.11 | % | |||||||||||
| $ | 722,613 | $ | 1,196,558 | $ | 1,255,606 | $ | 1,147,007 | $ | 1,133,122 | $ | 1,066,246 | |||||||||||
| 1.25 | %(d) | 1.24 | % | 1.25 | % | 1.25 | % | 1.26 | % | 1.30 | % | |||||||||||
| 1.25 | %(d) | 1.24 | % | 1.25 | % | 1.25 | % | 1.25 | % | 1.25 | % | |||||||||||
| 0.86 | %(d) | 0.08 | % | 0.18 | % | 0.61 | % | 0.56 | % | (0.05 | %) | |||||||||||
| 40 | %(c) | 68 | % | 52 | % | 80 | % | 73 | % | 70 | % | |||||||||||
| Semi-Annual Report | October 31, 2018 | 25 |
Notes to Financial Statements
October 31, 2018 (Unaudited)
1. ORGANIZATION
Financial Investors Trust (the “Trust”) is organized as a Delaware statutory trust and is registered as an open-end management investment company under the Investment Company Act of 1940, as amended (“1940 Act”). The Trust consists of multiple separate portfolios or series. This semi-annual report describes the Vulcan Value Partners Fund and Vulcan Value Partners Small Cap Fund (each a “Fund” and collectively, the “Funds”). The Funds seek to achieve long-term capital appreciation.
2. SIGNIFICANT ACCOUNTING POLICIES
The accompanying financial statements were prepared in accordance with accounting principles generally accepted in the United States of America (“U.S. GAAP”), including policies specific to investment companies. The preparation of financial statements in conformity with U.S. GAAP requires management to make certain estimates and assumptions that affect the reported amounts of assets and liabilities and disclosures of contingent assets and liabilities at the date of the financial statements and the reported amounts of revenue and expenses during the period. Actual results could differ from those estimates. The Funds are considered an investment company for financial reporting purposes under U.S. GAAP and follows the accounting and reporting guidance applicable to investment companies in the Financial Accounting Standards Board Accounting Standards Codification Topic 946. The following is a summary of significant accounting policies consistently followed by the Funds in preparation of their financial statements.
Investment Valuation: The Funds generally value their securities based on market prices determined at the close of regular trading on the New York Stock Exchange (“NYSE”), normally 4:00 p.m. Eastern Time, on each day the NYSE is open for trading.
For equity securities and mutual funds that are traded on an exchange, the market price is usually the closing sale or official closing price on that exchange. In the case of equity securities not traded on an exchange, or if such closing prices are not otherwise available, the securities are valued at the mean of the most recent bid and ask prices on such day. Redeemable securities issued by open-end registered investment companies are valued at the investment company’s applicable net asset value, with the exception of exchange-traded open-end investment companies, which are priced as equity securities.
The market price for debt obligations is generally the quote supplied by an independent third-party pricing service approved by the Board of Trustees (the “Board”), which may use a matrix, formula or other objective method that takes into consideration quotations from dealers, market transactions in comparable investments, market indices and yield curves. If vendors are unable to supply a quote, or if the quote supplied is deemed to be unreliable, the market price may be determined using quotations received from one or more broker-dealers that make a market in the security.
Equity securities that are primarily traded on foreign securities exchanges are valued at the preceding closing values of such securities on their respective exchanges, except when an occurrence subsequent to the time a value was so established is likely to have changed such value. In such an event, the fair values of those securities are determined in good faith through consideration of other factors in accordance with procedures established by and under the general supervision of the Board.
| 26 | www.vulcanvaluepartners.com |
Notes to Financial Statements
October 31, 2018 (Unaudited)
When such prices or quotations are not available, or when Vulcan Value Partners, LLC (the “Adviser”) believes that they are unreliable, securities may be priced using fair value procedures approved by the Board.
Fair Value Measurements: A three-tier hierarchy has been established to classify fair value measurements for disclosure purposes. Inputs refer broadly to the assumptions that market participants would use in pricing the asset or liability, including assumptions about risk. Inputs may be observable or unobservable. Observable inputs are inputs that reflect the assumptions market participants would use in pricing the asset or liability that are developed based on market data obtained from sources independent of the reporting entity. Unobservable inputs are inputs that reflect the reporting entity’s own assumptions about the assumptions market participants would use in pricing the asset or liability that are developed based on the best information available. Various inputs are used in determining the value of each Fund’s investments as of the reporting period end. The designated input levels are not necessarily an indication of the risk or liquidity associated with these investments. These inputs are categorized in the following hierarchy under applicable financial accounting standards:
| Level 1 – | Unadjusted quoted prices in active markets for identical investments, unrestricted assets or liabilities that the Funds have the ability to access at the measurement date; |
| Level 2 – | Quoted prices which are not active, quoted prices for similar assets or liabilities in active markets or inputs other than quoted prices that are observable (either directly or indirectly) for substantially the full term of the asset or liability; and |
| Level 3 – | Significant unobservable prices or inputs (including the Funds’ own assumptions in determining the fair value of investments) where there is little or no market activity for the asset or liability at the measurement date. |
The following is a summary of each input used to value each Fund’s investments as of October 31, 2018.
Vulcan Value Partners Fund:
| Investments in Securities at Value | Level 1 - Unadjusted Quoted Prices | Level 2 - Other Significant Observable Inputs | Level 3 - Significant Unobservable Inputs | Total | ||||||||||||
| Common Stocks(a) | $ | 1,341,589,383 | $ | – | $ | – | $ | 1,341,589,383 | ||||||||
| Short Term Investments | 21,797,083 | – | – | 21,797,083 | ||||||||||||
| TOTAL | $ | 1,363,386,466 | $ | – | $ | – | $ | 1,363,386,466 | ||||||||
Vulcan Value Partners Small Cap Fund:
| Investments in Securities at Value | Level 1 - Unadjusted Quoted Prices | Level 2 - Other Significant Observable Inputs | Level 3 - Significant Unobservable Inputs | Total | ||||||||||||
| Common Stocks(a) | $ | 704,370,730 | $ | – | $ | – | $ | 704,370,730 | ||||||||
| Short Term Investments | 54,803,250 | – | – | 54,803,250 | ||||||||||||
| TOTAL | $ | 759,173,980 | $ | – | $ | – | $ | 759,173,980 | ||||||||
| (a) | For detailed descriptions, see the accompanying Statements of Investments. |
| Semi-Annual Report | October 31, 2018 | 27 |
Notes to Financial Statements
October 31, 2018 (Unaudited)
For the six months ended October 31, 2018, the Funds did not have any securities that used significant unobservable inputs (Level 3) in determining fair value.
Investment Transactions and Investment Income: Investment transactions are accounted for on the date the investments are purchased or sold (trade date). Realized gains and losses from investment transactions are reported on an identified cost basis, which is the same basis the Funds use for federal income tax purposes. Interest income, which includes accretion of discounts and amortization of premiums, is accrued and recorded as earned. Dividend income is recognized on the ex-dividend date or for certain foreign securities, as soon as information is available to the Funds. All of the realized and unrealized gains and losses and net investment income, are allocated daily to each class in proportion to its average daily net assets.
ReFlow Liquidity Program: Each Fund may participate in the ReFlow liquidity program, which is designed to provide an alternative liquidity source for mutual funds experiencing net redemptions of their shares. Pursuant to the program, ReFlow Fund, LLC (“ReFlow”) provides participating mutual funds with a source of cash to meet net shareholder redemptions by standing ready each business day to purchase fund shares up to the value of the net shares redeemed by other shareholders that are to settle the next business day. ReFlow will purchase shares of the Fund at net asset value and will not be subject to any investment minimums. Following purchases of Fund shares, ReFlow then generally redeems those shares when the Fund experiences net subscriptions, at the end of a maximum holding period determined by ReFlow (currently 28 days), or at other times as the Fund may request. ReFlow may choose to redeem its position in the Fund with an in-kind transfer of securities, instead of cash, enabling the Fund to avoid a realization of capital gains on the securities it transfers. ReFlow will not be subject to any short-term redemption fees. While ReFlow holds Fund shares, it will have the same rights and privileges with respect to those shares as any other shareholder. For use of the ReFlow service, a Fund pays a fee to ReFlow each time it purchases Fund shares, calculated by applying to the purchase amount a fee rate determined through an automated daily auction among participating mutual funds. The current minimum fee rate is 0.20% of the value of the Fund shares purchased by ReFlow although the Fund may submit a bid at a higher fee rate if it determines that doing so is in the best interest of Fund shareholders. In accordance with federal securities laws, ReFlow is prohibited from acquiring more than 3% of the outstanding voting securities of a Fund. There is no assurance that ReFlow will have sufficient funds available to meet the Funds’ liquidity needs on a particular day. During the six months ended October 31, 2018, the Vulcan Value Partners Small Cap Fund participated in ReFlow. Fees associated with ReFlow are disclosed in the Statements of Operations.
Real Estate Investment Trusts (“REITs”): The Funds may invest a portion of their assets in REITs and are subject to certain risks associated with direct investment in REITs. REITs may be affected by changes in the value of their underlying properties and by defaults by borrowers or tenants. REITs depend generally on their ability to generate cash flow to make distributions to shareowners, and certain REITs have self-liquidation provisions by which mortgages held may be paid in full and distributions of capital returns may be made at any time. In addition, the performance of a REIT may be affected by its failure to qualify for tax-free pass-through of income under the Internal Revenue Code of 1986, as amended (the “Code”), or its failure to maintain exemption from registration under the 1940 Act. A Fund’s investments in REITs may result in such Fund’s receipt of cash in excess of the REITs’ earnings. If the Fund receives such distributions all or a portion of these distributions will constitute a return of capital to such Fund. Receiving a return
| 28 | www.vulcanvaluepartners.com |
Notes to Financial Statements
October 31, 2018 (Unaudited)
of capital distribution from REITs will reduce the amount of income available to be distributed to Fund shareholders. Income from REITs generally will not be eligible for treatment as qualified dividend income. As the final character of the distributions is not known until reported by the REITs on their 1099s, the Funds utilize an average of the prior year’s reallocation information as an estimate for the current year character of distributions.
Foreign Securities: The Funds may directly purchase securities of foreign issuers. Investing in securities of foreign issuers involves special risks not typically associated with investing in securities of U.S. issuers. The risks include possible reevaluation of currencies, the inability to repatriate foreign currency, less complete financial information about companies and possible future adverse political and economic developments. Moreover, securities of many foreign issuers and their markets may be less liquid and their prices more volatile than those of securities of comparable U.S. issuers.
Foreign Currency Translation: The books and records of the Funds are maintained in U.S. dollars. Investment valuations and other assets and liabilities initially expressed in foreign currencies are converted each business day into U.S. dollars based upon current exchange rates. Prevailing foreign exchange rates may generally be obtained at the close of the NYSE (normally, 4:00 p.m. Eastern Time). The portion of realized and unrealized gains or losses on investments due to fluctuations in foreign currency exchange rates is not separately disclosed and is included in realized and unrealized gains or losses on investments, when applicable.
Trust Expenses: Some expenses of the Trust can be directly attributed to the Funds. Expenses which cannot be directly attributed are apportioned among all funds in the Trust based on average net assets of each fund.
Fund Expenses: Expenses that are specific to a Fund are charged directly to that Fund.
Federal Income Taxes: Each Fund complies with the requirements under Subchapter M of the Internal Revenue Code of 1986, as amended, applicable to regulated investment companies and intends to distribute substantially all of its net taxable income and net capital gains, if any, each year so that it will not be subject to excise tax on undistributed income and gains. The Funds are not subject to income taxes to the extent such distributions are made.
As of and during the six months ended October 31, 2018, the Funds did not have a liability for any unrecognized tax benefits. The Funds file U.S. federal, state, and local tax returns as required. The Fund’s tax returns are subject to examination by the relevant tax authorities until expiration of the applicable statute of limitations, which is generally three years after the filing of the tax return for federal purposes and four years for most state returns. Tax returns for open years have incorporated no uncertain tax positions that require a provision for income taxes.
Distributions to Shareholders: Each Fund normally pays dividends and distributes capital gains, if any, on an annual basis. Income dividend distributions are derived from dividends and other income each Fund receives from its investments, including short-term capital gains. Long term capital gain distributions are derived from gains realized when each Fund sells a security it has owned for more than a year. Each Fund may make additional distributions and dividends at other
| Semi-Annual Report | October 31, 2018 | 29 |
Notes to Financial Statements
October 31, 2018 (Unaudited)
times if the portfolio manager believes doing so may be necessary for each Fund to avoid or reduce taxes.
3. TAX BASIS INFORMATION
Tax Basis of Investments: As of October 31, 2018, the aggregate cost of investments, gross unrealized appreciation/ (depreciation) and net unrealized appreciation for federal tax purposes was as follows:
Vulcan Value Partners Fund | Vulcan Value Partners Small Cap Fund | |||||||
| Gross appreciation (excess of value over tax cost) | $ | 197,045,029 | $ | 85,706,863 | ||||
| Gross depreciation (excess of tax cost over value) | (62,334,755 | ) | (63,228,394 | ) | ||||
| Net unrealized appreciation | $ | 134,710,274 | $ | 22,478,469 | ||||
| Cost of investments for income tax purposes | $ | 1,228,676,192 | $ | 736,695,511 | ||||
Tax Basis of Distributions to Shareholders: The character of distributions made during the year from net investment income or net realized gains may differ from its ultimate characterization for federal income tax purposes. Also, due to the timing of dividend distributions, the fiscal year in which amounts are distributed may differ from the fiscal year in which the income or realized gain were recorded by each Fund.
The tax character of distributions paid by the Funds for the fiscal year ended April 30, 2018 were as follows:
| Ordinary Income | Long-Term Capital Gain | |||||||
| 2018 | ||||||||
| Vulcan Value Partners Fund | $ | 22,197,741 | $ | – | ||||
| Vulcan Value Partners Small Cap Fund | 59,551,178 | 13,044,147 | ||||||
The amounts and characteristics of tax basis distributions and composition of distributable earnings/(accumulated losses) are finalized at fiscal year-end. Accordingly, tax basis balances have not been determined as of October 31, 2018.
4. SECURITIES TRANSACTIONS
The cost of purchases and proceeds from sales of securities (excluding short-term securities) during the six months ended October 31, 2018 were as follows:
| Fund | Purchases of Securities | Proceeds From Sales of Securities | ||||||
| Vulcan Value Partners Fund | $ | 468,203,476 | $ | 368,152,158 | ||||
| 30 | www.vulcanvaluepartners.com |
Notes to Financial Statements
October 31, 2018 (Unaudited)
| Fund | Purchases of Securities | Proceeds From Sales of Securities | ||||||
| Vulcan Value Partners Small Cap Fund | 403,851,399 | 783,549,380 | ||||||
5. SHARES OF BENEFICIAL INTEREST
The capitalization of the Trust consists of an unlimited number of shares of beneficial interest with no par value per share. Holders of the shares of the Funds of the Trust have one vote for each share held and a proportionate fraction of a vote for each fractional share. All shares issued and outstanding are fully paid and are transferable and redeemable at the option of the shareholder. Purchasers of the shares do not have any obligation to make payments to the Trust or its creditors solely by reason of the purchasers’ ownership of the shares. Shares have no pre-emptive rights.
Shares redeemed within 90 days of purchase may incur a 2% short-term redemption fee deducted from the redemption amount. The Vulcan Value Partners Fund and the Vulcan Value Partners Small Cap Fund retained $1,881 and $5,900, respectively, for the six months ended October 31, 2018, and $34,938 and $32,740, respectively, for the year ended April 30, 2018, which is reflected in the “Cost of shares redeemed, net of redemption fees” in the Statements of Changes in Net Assets.
Transactions in shares of capital stock for the dates listed below were as follows:
Vulcan Value Partners Fund
For the Six Months Ended October 31, 2018 (Unaudited) | For the Year Ended April 30, 2018 | |||||||
| Shares Sold | 8,148,834 | 7,896,160 | ||||||
| Shares Issued in Reinvestment of Dividends | – | 870,263 | ||||||
| Less Shares Redeemed | (4,282,625 | ) | (13,886,874 | ) | ||||
| Net Increase/(Decrease) | 3,866,209 | (5,120,451 | ) | |||||
Vulcan Value Partners Small Cap Fund
For the Six Months Ended October 31, 2018 (Unaudited) | For the Year Ended April 30, 2018 | |||||||
| Shares Sold | 3,775,534 | 12,345,631 | ||||||
| Shares Issued in Reinvestment of Dividends | – | 3,018,064 | ||||||
| Less Shares Redeemed | (24,882,401 | ) | (16,352,775 | ) | ||||
| Net Decrease | (21,106,867 | ) | (989,080 | ) | ||||
| Semi-Annual Report | October 31, 2018 | 31 |
Notes to Financial Statements
October 31, 2018 (Unaudited)
6. MANAGEMENT AND RELATED-PARTY TRANSACTIONS
The Adviser, subject to the authority of the Board, is responsible for the overall management and administration of the Funds’ business affairs. The Adviser manages the investments of the Funds in accordance with each Fund’s investment objective, policies and limitations and investment guidelines established jointly by the Adviser and the Board. Pursuant to the Investment Advisory Agreement (the “Advisory Agreement”), the Funds pay the Adviser an annual management fee of 1.00% and 1.15% for Vulcan Value Partners Fund and Vulcan Value Partners Small Cap Fund, respectively, based on each Fund’s average daily net assets. The management fee is paid on a monthly basis.
The Adviser has contractually agreed to limit each of the Fund’s total annual fund operating expenses (exclusive of acquired fund fees and expenses, brokerage expenses, interest expense, taxes and extraordinary expenses) to 1.25% of each Fund’s average daily net assets. This agreement (the “Expense Agreement”) is in effect from September 1, 2018 through August 31, 2019. The prior Expense Agreement was in effect from September 1, 2017 through August 31, 2018. The Adviser will be permitted to recover, on a class-by-class basis, expenses it has borne through the Expense Agreement to the extent that a Fund’s expenses in later periods fall below the expense cap in effect at the time of waiver or reimbursement. Notwithstanding the foregoing, the Funds will not be obligated to pay any such fees and expenses more than three years after the date of the waiver or reimbursement. The Adviser may not discontinue or modify this waiver prior to August 31, 2019 without the approval by the Funds’ Board.
Fund Administrator Fees and Expenses: ALPS Fund Services, Inc. (“ALPS”) serves as administrator to the Funds and the Funds have agreed to pay expenses incurred in connection with their administrative activities. Pursuant to an Administration Agreement, ALPS provides operational services to the Funds including, but not limited to fund accounting and fund administration and generally assist in each Fund’s operations. Officers of the Trust are employees of ALPS. The Funds’ administration fee is accrued on a daily basis and paid monthly. Administration fees paid by the Funds for the six months ended October 31, 2018 are disclosed in the Statements of Operations.
ALPS is reimbursed by the Funds for certain out-of-pocket expenses.
Transfer Agent: ALPS serves as transfer, dividend paying and shareholder servicing agent for the Funds. ALPS receives an annual minimum fee, a fee based upon the number of shareholder accounts, and is also reimbursed by the Funds for certain out-of-pocket expenses. Transfer agent fees paid by the Funds for the six months ended October 31, 2018 are disclosed in the Statements of Operations.
Compliance Services: ALPS provides services that assist the Trust’s chief compliance officer in monitoring and testing the policies and procedures of the Trust in conjunction with requirements under Rule 38a-1 under the 1940 Act and receives an annual base fee. ALPS is reimbursed for certain out-of-pocket expenses by the Funds. Vulcan pays this fee on behalf of the Funds.
Principal Financial Officer: ALPS Fund Services, Inc. (“ALPS” and the “Administrator”) (an affiliate of ADI) receives an annual fee for providing principal financial officer services to the Funds. Principal financial officer fees paid by the Fund for the six months ended October 31, 2018 are disclosed in the Statements of Operations.
| 32 | www.vulcanvaluepartners.com |
Notes to Financial Statements
October 31, 2018 (Unaudited)
Distributor: ALPS Distributors, Inc. (“ADI” or the “Distributor”) (an affiliate of ALPS Fund Services, Inc.) acts as the distributor of each Fund’s shares pursuant to a Distribution Agreement with the Trust. Shares are sold on a continuous basis by ADI as agent for the Funds, and ADI has agreed to use its best efforts to solicit orders for the sale of each Fund’s shares, although it is not obliged to sell any particular amount of shares. ADI is not entitled to any compensation for its services as Distributor. ADI is registered as a broker-dealer with the U.S. Securities and Exchange Commission. Certain intermediaries may charge networking, omnibus account or other administrative fees with respect to transactions in shares of the Funds. Transactions may be processed through the National Securities Clearing Corporation (“NSCC”) or similar systems or processed on a manual basis. These fees are paid by the Funds to the Distributor, which uses such fees to reimburse intermediaries. In the event an intermediary receiving payments from the Distributor on behalf of the Funds converts from a networking structure to an omnibus account structure or otherwise experiences increased costs, fees borne by the Funds may increase. Fees are disclosed on the Statements of Operations as “Delegated transfer agent equivalent services fees”.
7. INDEMNIFICATIONS
Under the Trust’s organizational documents, its Officers and Trustees are indemnified against certain liability arising out of the performance of their duties to the Trust. Additionally, in the normal course of business, the Trust enters into contracts with service providers that may contain general indemnification clauses which may permit indemnification to the extent permissible under applicable law. The Trust’s maximum exposure under these arrangements is unknown, as this would involve future claims that may be made against the Trust that have not yet occurred.
8. RECENT ACCOUNTING PRONOUCEMENTS
On October 4, 2018, the SEC amended Regulation S-X to require certain financial statement disclosure requirements to conform them to U.S. GAAP for investment companies. Effective November 4, 2018, the Funds adopted disclosure requirement changes for Regulation S-X and these changes are reflected throughout this report. The Funds’ adoption of those amendments, effective with the financial statements prepared as of October 31, 2018, had no effect on the Funds’ net assets or results of operations.
In August 2018, the Financial Accounting Standards Board (“FASB”) issued Accounting Standards Update (“ASU”) 2018-13, which changes the fair value measurement disclosure requirements of FASB Accounting Standards Codification Topic 820, Fair Value Measurement. The update to Topic 820 includes new, eliminated, and modified disclosure requirements. ASU 2018-13 is effective for fiscal years beginning after December 15, 2019, including interim periods. Early adoption is permitted for any eliminated or modified disclosures. Management is currently evaluating the impact of the ASU to the Funds’ financial statements.
9. SUBSEQUENT EVENT
Subsequent events after the date of the Statements of Assets and Liabilities have been evaluated through the date the financial statements were issued.
| Semi-Annual Report | October 31, 2018 | 33 |
Additional Information
October 31, 2018 (Unaudited)
1. FUND HOLDINGS
The Funds files their complete schedule of portfolio holdings with the Securities and Exchange Commission (the “SEC”) for the first and third quarters of each fiscal year on Form N-Q within 60 days after the end of the period. Copies of the Funds’ Form N-Q are available without charge on the SEC website at http://www.sec.gov. You may also review and copy the Form N-Q at the SEC’s Public Reference Room in Washington, DC. For more information about the operation of the Public Reference Room, please call the SEC at 1-800-SEC-0330.
2. FUND PROXY VOTING POLICIES, PROCEDURES AND SUMMARIES
The Funds’ policies and procedures used in determining how to vote proxies and information regarding how the Fund voted proxies relating to portfolio securities during the most recent prior 12-month period ending June 30 are available without charge, (1) upon request, by calling (toll-free) (866)-759-5679 and (2) on the SEC’s website at http://www.sec.gov.
| 34 | www.vulcanvaluepartners.com |
Privacy Policy
October 31, 2018 (Unaudited)
| WHO WE ARE | |
| Who is providing this notice? | Vulcan Value Partners Fund and Vulcan Value Partners Small Cap Fund. |
| WHAT WE DO | |
| How do the Funds protect my personal information? | To protect your personal information from unauthorized access and use, we use security measures that comply with federal law. These measures include computer safeguards and secured files and buildings. |
| How do the Funds collect my personal information? | We collect your personal information, for example, when you
● open an account ● provide account information or give us your contact information ● make a wire transfer or deposit money |
| Why can’t I limit all sharing? | Federal law gives you the right to limit only
● sharing for affiliates’ everyday business purposes-information about your creditworthiness ● affiliates from using your information to market to you ● sharing for non-affiliates to market to you
State laws and individual companies may give you additional rights to limit sharing. |
| Semi-Annual Report | October 31, 2018 | 35 |
Privacy Policy
October 31, 2018 (Unaudited)
| FACTS | WHAT DO THE FUNDS DO WITH YOUR PERSONAL INFORMATION? |
| WHY? | Financial companies choose how they share your personal information. Federal law gives consumers the right to limit some but not all sharing. Federal law also requires us to tell you how we collect, share, and protect your personal information. Please read this notice carefully to understand what we do. |
| WHAT? | The types of personal information we collect and share depend on the product or service you have with us. This information can include: ● Social Security number and account transactions ● Account balances and transaction history ● Wire transfer instructions |
| HOW? | All financial companies need to share customers’ personal information to run their everyday business. In the section below, we list the reasons financial companies can share their customers’ personal information; the reasons the Funds choose to share; and whether you can limit this sharing. |
| REASONS WE CAN SHARE YOUR PERSONAL INFORMATION | DO THE FUNDS SHARE: | CAN YOU LIMIT THIS SHARING? |
For our everyday business purposes – such as to process your transactions, maintain your account(s), respond to court orders and legal investigations, or report to credit bureaus | Yes | No |
For our marketing purposes – to offer our products and services to you | No | We do not share. |
| For joint marketing with other financial companies | No | We do not share. |
For our affiliates’ everyday business purposes – information about your transactions and experiences | Yes | No |
For our affiliates’ everyday business purposes – information about your creditworthiness | No | We do not share. |
| For non-affiliates to market to you | No | We do not share. |
| 36 | www.vulcanvaluepartners.com |

| Item 2. | Code of Ethics. |
Not applicable to this Report.
| Item 3. | Audit Committee Financial Expert. |
Not applicable to this Report.
| Item 4. | Principal Accountant Fees and Services. |
Not applicable to this Report.
| Item 5. | Audit Committee of Listed Registrants. |
Not applicable to the Registrant.
| Item 6. | Investments. |
| (a) | Schedule of Investments is included as part of the Reports to Stockholders filed under Item 1 of this Form N-CSR. |
| (b) | Not applicable. |
| Item 7. | Disclosure of Proxy Voting Policies and Procedures for Closed-End Management Investment Companies. |
Not applicable to the Registrant.
| Item 8. | Portfolio Managers of Closed-End Management Investment Companies. |
Not applicable to the Registrant.
| Item 9. | Purchases of Equity Securities by Closed-End Management Investment Company and Affiliated Purchasers. |
Not applicable to the Registrant.
| Item 10. | Submission of Matters to a Vote of Security Holders. |
There have been no material changes to the procedures by which shareholders may recommend nominees to the Registrant’s Board of Trustees, where those changes were implemented after the Registrant last provided disclosure in response to the requirements of Item 407(c)(2)(iv) of Regulation S-K, or this Item.
| Item 11. | Controls and Procedures. |
| (a) | The Registrant’s principal executive officer and principal financial officer have concluded that the Registrant’s disclosure controls and procedures (as defined in Rule 30a-3(c) under the Investment Company Act of 1940, as amended) are effective based on their evaluation of these controls and procedures as of a date within 90 days of the filing date of this report. |
| (b) | There was no change in the Registrant’s internal control over financial reporting (as defined in Rule 30a-3(d) under the Investment Company Act of 1940, as amended) that occurred during the Registrant’s last fiscal quarter that has materially affected, or is reasonably likely to materially affect, the Registrant’s internal control over financial reporting. |
| Item 12. | Disclosure of Securities Lending Activities for Closed-End Management Investment Companies. |
Not applicable to the Registrant.
| Item 13. | Exhibits. |
| (a)(1) | Not applicable to this Report. |
| (a)(2) | The certifications required by Rule 30a-2(a) of the Investment Company Act of 1940, as amended, and Section 302 of the Sarbanes-Oxley Act of 2002 are attached hereto as Exhibit 99.Cert. |
| (a)(3) | Not applicable to the Registrant. |
| (a)(4) | Not applicable to the Registrant. |
| (b) | The certifications by the Registrant’s principal executive officer and principal financial officer, as required by Rule 30a-2(b) of the Investment Company Act of 1940, as amended, and Section 906 of the Sarbanes-Oxley Act of 2002 are attached hereto as Exhibit 99.906Cert. |
SIGNATURES
Pursuant to the requirements of the Securities Exchange Act of 1934 and the Investment Company Act of 1940, the Registrant has duly caused this report to be signed on its behalf by the undersigned, thereunto duly authorized.
FINANCIAL INVESTORS TRUST
| By: | /s/ Edmund J. Burke | |
| Edmund J. Burke (Principal Executive Officer) | ||
| President | ||
| Date: | January 7, 2019 |
Pursuant to the requirements of the Securities Exchange Act of 1934 and the Investment Company Act of 1940, this report has been signed below by the following persons on behalf of the Registrant and in the capacities and on the dates indicated.
FINANCIAL INVESTORS TRUST
| By: | /s/ Edmund J. Burke | |
| Edmund J. Burke (Principal Executive Officer) | ||
| President | ||
| Date: | January 7, 2019 | |
| By: | /s/ Kimberly R. Storms | |
| Kimberly R. Storms (Principal Financial Officer) | ||
| Treasurer | ||
| Date: | January 7, 2019 |