UNITED STATES
SECURITIES AND EXCHANGE COMMISSION
Washington, D.C. 20549
FORM N-CSR
CERTIFIED SHAREHOLDER REPORT OF REGISTERED
MANAGEMENT INVESTMENT COMPANIES
Investment Company Act file number: 811-08194
FINANCIAL INVESTORS TRUST
(Exact name of Registrant as specified in charter)
1290 Broadway, Suite 1000, Denver, Colorado 80203
(Address of principal executive offices) (Zip code)
Karen Gilomen, Esq., Secretary
Financial Investors Trust
1290 Broadway, Suite 1000
Denver, Colorado 80203
(Name and address of agent for service)
Registrant’s telephone number, including area code:303-623-2577
Date of fiscal year end:April 30
Date of reporting period:October 31, 2019
Item 1.Reports to Stockholders.

TABLE OF CONTENTS
SEMI-ANNUAL REPORT
| SHAREHOLDER LETTER | 1 |
| PERFORMANCE UPDATE | 4 |
| DISCLOSURE OF FUND EXPENSES | 6 |
| PORTFOLIO OF INVESTMENTS | 7 |
| STATEMENT OF ASSETS AND LIABILITIES | 18 |
| STATEMENT OF OPERATIONS | 19 |
| STATEMENTS OF CHANGES IN NET ASSETS | 20 |
| FINANCIAL HIGHLIGHTS | 22 |
| NOTES TO FINANCIAL STATEMENTS | 24 |
| ADDITIONAL INFORMATION | 30 |
| PRIVACY POLICY | 31 |
Beginning on January 1, 2021, as permitted by regulations adopted by the U.S. Securities and Exchange Commission, paper copies of the Fund’s annual and semi-annual shareholder reports will no longer be sent by mail, unless you specifically request paper copies of the reports. Instead, the reports will be made available on the Fund’s website atwww.dgifund.com, and you will be notified by mail each time a report is posted and provided with a website link to access the report.
You may, notwithstanding the availability of shareholder reports online, elect to receive all future shareholder reports in paper free of charge. If you invest through a financial intermediary, you can contact your financial intermediary to request that you continue to receive paper copies of your shareholder reports. If you invest directly with the Fund, you can call 1.855.DGI. FUND (1-855-344-3863) to let the Fund know you wish to continue receiving paper copies of your shareholder reports.
If you already elected to receive shareholder reports electronically, you will not be affected by this change and you need not take any action. You may elect to receive shareholder reports and other communications from the Fund electronically anytime by contacting your financial intermediary (such as a broker-dealer or bank) or, if you are a direct investor, by enrolling atwww.dgifund.com.
Disciplined Growth Investors’ goal is to communicate clearly and transparently with our clients and mutual fund shareholders. It is mutually beneficial when our shareholders understand how we invest, what we are currently thinking and forecasting, and the specific investment decisions we have made. Our views and opinions regarding the investment prospects of our portfolio holdings and the Fund are “forward looking statements” which may or may not be accurate over the long term. While we believe we have a reasonable basis for these forecasts and have confidence in our investment team’s views, actual results may differ materially from those we anticipate. Information provided in this report should not be considered a recommendation to purchase or sell any particular security.
You can identify forward looking statements as those including words such as “believe”, “expect”, “anticipate”, “forecast”, and similar statement. We cannot assure future performance. These forward-looking statements are made only as-of the date of this report. Following the publication of this report, we will not update any of the forward-looking statements included here.
This material must be preceded or accompanied by a prospectus. Please read the prospectus carefully before investing.
| OCTOBER 31, 2019 | DGINV.COM |
| The Disciplined Growth Investors Fund | Shareholder Letter |
October 31, 2019 (Unaudited)
Fund Performance and Asset Mix:
The Disciplined Growth Investors Fund's (the "DGI Fund") fiscal year runs from May 1stto April 30th. For the 2019 fiscal year-to-date (5/1/19-10/31/19), The DGI Fund returned 0.95%. Stocks in the Fund decreased by 0.53% and bonds increased 5.52%.
Stocks in The DGI Fund underperformed the S&P 500® index, which increased 4.16%. The DGI Fund held 21 stocks that increased in value and 32 stocks that declined in value. The ten largest equity holdings in The DGI Fund combined to add 0.53% to the Fund’s total performance.
The Fund’s bond portfolio also underperformed the Barclays Intermediate Government & Corporate Credit index1, which gained 6.50% during the fiscal year-to-date.
Looking at different time periods, especially in the short term, can make market growth and Fund performance appear to vary wildly. 2019 is a good example. For the calendar year-to-date (January 1stthrough October 31st), The DGI Fund has increased 18.86% and the S&P 500 has increased 23.16%. Most of that increase took place in the first four months of the year. That leaves the fiscal year-to-date returns reflected in this report to be much more modest, especially considering the month of May was the worst performing month of the year so far.
We point this out as an example of the fickle manner with which the market can treat investors in the short term. We do not believe anyone can invest around these short term fluctuations or predict them accurately and repeatedly. We are focused on the long term ability of the companies in the portfolio to execute and the potential of those companies’ stocks for long term performance. With 69.4% stocks and 30.6% bonds & cash as of 10/31/19, we have positioned the Fund to reflect this long-term view and research, which shows expected returns for the Fund’s stocks materially in excess of expected returns for bonds.
You can find additional performance information and a full list of the Fund’s holdings in this Semi Annual report and atwww.dgifund.com.
Performance data quoted represents past performance. Past performance does not guarantee future results. Investment return and principal value of an investment will fluctuate so that an investor’s shares, when sold or redeemed, may be worth more or less than the original cost. Current performance data may be higher or lower than actual data quoted. For the most current month-end performance data please call 1.855.DGI.FUND.
Portfolio Activity:
Since we last wrote to you last (April 30th), we added three new stocks to The DGI Fund, sold the remaining position in one, and one portfolio holding was acquired by another company.
New Stocks:
Pure Storage (PSTG) has pioneered the development of innovative computer storage for larger organizations. These storage systems are made of solid-state arrays, a new technology that has important advantages over existing disk-based storage solutions. Pure Storage’s systems provides customers with not only a simple solution and superior performance, but offers it at a lower overall cost and provides industry-leading customer service. The stock price has come under pressure recently on fears of competition, allowing us to buy into the company at what we see as an attractive price.
| Semi-Annual Report | October 31, 2019 | 1 |
| The Disciplined Growth Investors Fund | Shareholder Letter |
October 31, 2019 (Unaudited)
Cabot Oil & Gas (COG) is an exploration and production (E&P) company with all of its focus on the most productive and economic natural gas region in the United States: The Marcellus Shale in Northeast Pennsylvania. Cabot is currently the fourth largest producer of natural gas in the U.S. and one of the few energy companies that currently generates positive free cash flow2& pays a dividend (despite historically low natural gas prices). We were given an opportunity to take an initial position in Cabot because the company decided to make a long-term strategic decision at the expense of short-term results, which Wall Street did not like because the decision delayed this year’s expected gas production totals.
Deluxe Corporation (DLX) is known for its very profitable, but declining, legacy check business. Over the last several years, the company has been adding new digital capabilities which it expects to be able to sell to its existing customer base of 4.8 million small businesses and 4600 financial institutions. We see this customer base as a strategic competitive advantage for Deluxe given the trusted partnerships the company forms with its clients. Deluxe also recently hired a new CEO who has extensive experience developing and growing businesses in these markets.
Complete Sales:
L Brands (LB) is the business behind the well-known Victoria’s Secret and Bath & Body Works brands. While it had a history of successfully developing these brands, recent missteps by management, significant market share losses at Victoria’s Secret, and evidence of a deteriorating internal culture ultimately caused us to sell our entire position in the company.
Acquisitions:
Medidata Solutions (MDSO) was acquired by the French technology company Dassault Systemes in June for $5.8 billion ($92.25 per share). While the acquisition will officially close later this calendar year, the two sides have agreed to all the terms, and we do not anticipate any regulatory or legal issues to prevent completion of the acquisition. The purchase price represents a 23% premium to Medidata’s valuation a few days prior to announcement of the acquisition.
Portfolio Construction Update:
We have updated the market cap range we consider to be Mid Cap equities to $1 billion to $15 billion. The previous upper limit we employed was $10 billion. This reflects what we believe to be a long-term increase in the upper limit of market cap size for companies that otherwise have the characteristics we look for in Mid Cap growth companies. This market cap range limitation applies only to the size of companies we typically consider to be new investment candidates for the Fund. We will continue to hold a position in companies whose market cap has exceeded $15 billion (or falls below $1 billion) based on our ongoing assessment of those companies’ individual risk profiles and expected returns. Prior to this change, we had not made a change to our definition of a Mid Cap company since the Fund’s inception.
Sincerely,

Portfolio Manager
Disciplined Growth Investors, Inc.
| 1 | The Barclay’s Government & Corporate Credit index includes both corporate (publicly-issued, fixed-rate, nonconvertible, investment grade, dollar-denominated, SEC-registered, corporate |
| 2 | 1-855-DGI-FUND (344-3863) | www.DGIfund.com |
| The Disciplined Growth Investors Fund | Shareholder Letter |
October 31, 2019 (Unaudited)
| | | dept.) and government (Treasury Bond index, Agency Bond index, 1-3 Year Government index, and the 20+-Year treasury) indexes, including bonds with maturities up to ten years. |
| 2 | For our purposes, defined here as operating cash flow less capital expenditures (CapEx). Operating Cash Flow is a measure of the amount of cash generated by a company's normal business operations. CapEx comprises money spent by a business or organization on acquiring or maintaining fixed assets, such as land, buildings, and equipment. |
Asset class-specific performance is before fees. The Fund’s single fee – the management fee – is paid from the Fund’s holding of cash. Total Fund net-of-fees performance is presented in this letter, later in this annual report, and is updated monthly on the Fund’s website,www.dgifund.com.
The views of Disciplined Growth Investors, Inc. and information discussed in this commentary are as of the date of publication, are subject to change, and may not reflect the writers’ current views.
The views expressed are those of the Fund’s adviser only, and represent an assessment of market conditions at a specific point in time, are opinions only and should not be relied upon as investment advice regarding a particular investment or markets in general. Such information does not constitute a recommendation to buy or sell specific securities or investment vehicles. It should not be assumed that any investment will be profitable or will equal the performance of the portfolios or any securities or any sectors mentioned in this letter. The subject matter contained in this letter has been derived from several sources believed to be reliable and accurate at the time of compilation. Neither Disciplined Growth Investors, Inc. nor the Fund accepts any liability for losses either direct or consequential caused by the use of this information.
The Fund is distributed by ALPS Distributors, Inc.
The Fund is subject to investment risks, including possible loss of the principal amount invested and therefore is not suitable for all investors. The Fund may not achieve its objectives.
Diversification does not eliminate the risk of experiencing investment losses.
Fred Martin is a registered representative of ALPS Distributors, Inc. CFA Institute Marks are trademarks owned by the CFA Institute.
The S&P 500®Total Return Index is an unmanaged index of 500 common stocks chosen for market size, liquidity and industry group representation. It is a market-value weighted index. The Index is not actively managed and does not reflect any deductions for fees, expenses or taxes. An investor may not invest directly in the Index.
| Semi-Annual Report | October 31, 2019 | 3 |
| The Disciplined Growth Investors Fund | Performance Update |
October 31, 2019 (Unaudited)
Annualized Total Return Performance(for the period ended October 31, 2019)
| | 6 month | Calendar YTD | 1 Year | 3 Year | 5 Year | Since Inception* |
| The Disciplined Growth Investors Fund | 0.95% | 18.86% | 12.31% | 11.41% | 8.42% | 11.71% |
| S&P 500® Total Return Index(1) | 4.16% | 23.16% | 14.33% | 14.91% | 10.78% | 14.58% |
Performance data quoted represents past performance. Past performance does not guarantee future results. Investment return and principal value of an investment will fluctuate so that an investor’s shares, when sold or redeemed, may be worth more or less than the original cost. Current performance data may be higher or lower than actual data quoted. For the most current month-end performance data please call 1.855.DGI.FUND.
The table does not reflect the deductions of taxes a shareholder would pay on Fund distributions or redemptions of Fund shares.
Subject to investment risks, including possible loss of the principal amount invested.
Returns for periods less than 1 year are cumulative.
| * | Fund Inception date of August 12, 2011. |
| (1) | The S&P 500®Total Return Index is an unmanaged index of 500 common stocks chosen for market size, liquidity and industry group representation. It is a market-value weighted index. The Index is not actively managed and does not reflect any deductions for fees, expenses or taxes. An investor may not invest directly in the Index. |
| 4 | 1-855-DGI-FUND (344-3863) | www.DGIfund.com |
| The Disciplined Growth Investors Fund | Performance Update |
October 31, 2019 (Unaudited)
Growth of $10,000 Investment in the Fund(for the period ended October 31, 2019)

The chart above represents historical performance of a hypothetical investment of $10,000 in the Fund since inception. Past performance does not guarantee future results. This chart does not reflect the deduction of taxes that a shareholder would pay on Fund distributions or the redemption of Fund shares.
Investing in the Fund is subject to investment risks, including possible loss of the principal amount invested.
Industry Sector Allocation
(as a % of Net Assets)*
| Technology | | | 31.54 | % |
| Consumer Discretionary | | | 13.88 | % |
| Health Care | | | 11.61 | % |
| Industrials | | | 7.09 | % |
| Energy | | | 1.73 | % |
| Communications | | | 1.55 | % |
| Financials | | | 1.40 | % |
| Consumer, Cyclical | | | 0.61 | % |
| Corporate Bonds | | | 21.74 | % |
| Foreign Corporate Bonds | | | 0.64 | % |
| Foreign Government Bonds | | | 0.31 | % |
| Government & Agency Obligations | | | 6.83 | % |
| Other Assets in Excess of Liabilities | | | 1.07 | % |
Top Ten Holdings
(as a % of Net Assets)*
| Edwards Lifesciences Corp. | | | 3.85 | % |
| TJX Cos., Inc. | | | 3.73 | % |
| Intuit, Inc. | | | 3.04 | % |
| Ubiquiti, Inc. | | | 2.69 | % |
| Align Technology, Inc. | | | 2.65 | % |
| Plexus Corp. | | | 2.50 | % |
| Intuitive Surgical, Inc. | | | 2.44 | % |
| Open Text Corp. | | | 2.26 | % |
| Middleby Corp. | | | 2.21 | % |
| FactSet Research Systems, Inc. | | | 1.96 | % |
| Top Ten Holdings | | | 27.33 | % |
| * | Holdings are subject to change, and may not reflect the current or future position of the portfolio. |
| Semi-Annual Report | October 31, 2019 | 5 |
| The Disciplined Growth Investors Fund | Disclosure of Fund Expenses |
October 31, 2019 (Unaudited)
As a shareholder of the Fund, you incur two types of costs: (1) transaction costs, including sales charges (loads) on purchase payments, reinvested dividends, or other distributions; redemption fees; and exchange fees; and (2) ongoing costs, including management fees; distribution and/or service (12b-1) fees; and other fund operating expenses. This example is intended to help you understand your ongoing costs (in dollars), of investing in the Fund and to compare these costs with the ongoing costs of investing in other mutual funds.
This example is based on an investment of $1,000 invested at the beginning of the period and held for the entire six-month period of May 1, 2019 through October 31, 2019.
Actual ExpensesThe first line of the table below provides information about actual account values and actual expenses. You may use the information in this line, together with the amount you invested, to estimate the expenses that you paid over the period. Simply divide your account value by $1,000 (for example, an $8,600 account value divided by $1,000 = 8.6), then multiply the result by the number in the first line under the heading “Expenses Paid During Period” to estimate the expenses you paid on your account during this period.
Hypothetical Example for Comparison PurposesThe second line of the table below provides information about hypothetical account values and hypothetical expenses based on the Fund’s actual expense ratio and an assumed rate of return of 5% per year before expenses, which is not the Fund’s actual return. The hypothetical account values and expenses may not be used to estimate the actual ending account balance or expenses you paid for the period. You may use this information to compare the ongoing costs of investing in the Fund and other mutual funds. To do so, compare this 5% hypothetical example with the 5% hypothetical examples that appear in the shareholder reports of the other funds.
Please note that the expenses shown in the table are meant to highlight your ongoing costs only and do not reflect transactional costs, such as sales charges (loads), redemption fees or exchange fees. Therefore, the second line of the table is useful in comparing ongoing costs only and will not help you determine the relative total costs of owning different funds. In addition, if these transactional costs were included, your costs would have been higher.
| | Beginning Account Value 5/1/2019 | Ending Account Value 10/31/2019 | Expense Ratio(a) | Expenses Paid During period 5/1/2019 - 10/31/2019(b) |
| Actual | $1,000.00 | $1,009.50 | 0.78% | $ 3.94 |
| Hypothetical (5% return before expenses) | $1,000.00 | $1,021.22 | 0.78% | $ 3.96 |
| (a) | The Fund's expense ratios have been annualized based on the Fund's most recent fiscal half-year expenses. |
| (b) | Expenses are equal to the Fund's annualized expense ratio, multiplied by the average account value over the period, multiplied by the number of days in the most recent fiscal half-year (184)/366 (to reflect the half-year period). |
| 6 | 1-855-DGI-FUND (344-3863) | www.DGIfund.com |
| The Disciplined Growth Investors Fund | Portfolio of Investments |
October 31, 2019 (Unaudited)
| | | Shares | | | Value (Note 2) | |
| COMMON STOCKS (69.41%) | | | | | | | | |
| COMMUNICATIONS (1.55%) | | | | | | | | |
| Media (1.55%) | | | | | | | | |
| Stamps.com, Inc.(a) | | | 36,943 | | | $ | 3,119,098 | |
| TripAdvisor, Inc.(a) | | | 16,505 | | | | 666,802 | |
| | | | | | | | 3,785,900 | |
| | | | | | | | | |
| TOTAL COMMUNICATIONS | | | | | | | 3,785,900 | |
| | | | | | | | | |
| CONSUMER DISCRETIONARY (13.88%) | | | | | | | | |
| Apparel & Textile Products (1.15%) | | | | | | | | |
| Ralph Lauren Corp. | | | 12,934 | | | | 1,242,440 | |
| Under Armour, Inc. , Class A(a) | | | 75,054 | | | | 1,549,865 | |
| | | | | | | | 2,792,305 | |
| | | | | | | | | |
| Automotive Manufacturing (2.24%) | | | | | | | | |
| Gentex Corp. | | | 141,545 | | | | 3,970,337 | |
| Gentherm, Inc.(a) | | | 35,826 | | | | 1,496,452 | |
| | | | | | | | 5,466,789 | |
| | | | | | | | | |
| Gaming, Lodging & Restaurants (1.93%) | | | | | | | | |
| Cheesecake Factory, Inc. | | | 22,470 | | | | 939,021 | |
| Royal Caribbean Cruises, Ltd. | | | 34,698 | | | | 3,776,184 | |
| | | | | | | | 4,715,205 | |
| | | | | | | | | |
| Passenger Transportation (1.77%) | | | | | | | | |
| JetBlue Airways Corp.(a) | | | 222,898 | | | | 4,301,931 | |
| | | | | | | | | |
| Retail - Consumer Discretionary (6.79%) | | | | | | | | |
| Nordstrom, Inc. | | | 71,346 | | | | 2,561,321 | |
| Sleep Number Corp.(a) | | | 83,681 | | | | 4,026,730 | |
| TJX Cos., Inc. | | | 157,601 | | | | 9,085,698 | |
| Urban Outfitters, Inc.(a) | | | 30,431 | | | | 873,370 | |
| | | | | | | | 16,547,119 | |
| | | | | | | | | |
| TOTAL CONSUMER DISCRETIONARY | | | | | | | 33,823,349 | |
| | | | | | | | | |
| CONSUMER, CYCLICAL (0.62%) | | | | | | | | |
| Retail (0.62%) | | | | | | | | |
| MSC Industrial Direct Co., Inc. , Class A | | | 20,443 | | | | 1,496,632 | |
| | | | | | | | | |
| TOTAL CONSUMER, CYCLICAL | | | | | | | 1,496,632 | |
| Semi-Annual Report | October 31, 2019 | 7 |
| The Disciplined Growth Investors Fund | Portfolio of Investments |
October 31, 2019 (Unaudited)
| | | Shares | | | Value (Note 2) | |
| ENERGY (1.73%) | | | | | | |
| Oil, Gas & Coal (1.73%) | | | | | | |
| Cabot Oil & Gas Corp. | | | 96,226 | | | $ | 1,793,653 | |
| Core Laboratories NV | | | 28,475 | | | | 1,254,039 | |
| Southwestern Energy Co.(a) | | | 535,154 | | | | 1,097,066 | |
| Ultra Petroleum Corp.(a) | | | 337,188 | | | | 67,437 | |
| | | | | | | | 4,212,195 | |
| | | | | | | | | |
| TOTAL ENERGY | | | | | | | 4,212,195 | |
| | | | | | | | | |
| FINANCIALS (1.40%) | | | | | | | | |
| Banking (0.46%) | | | | | | | | |
| TCF Financial Corp. | | | 28,375 | | | | 1,123,366 | |
| | | | | | | | | |
| Specialty Finance (0.94%) | | | | | | | | |
| Deluxe Corp. | | | 44,206 | | | | 2,291,197 | |
| | | | | | | | | |
| TOTAL FINANCIALS | | | | | | | 3,414,563 | |
| | | | | | | | | |
| HEALTH CARE (11.61%) | | | | | | | | |
| Medical Equipment & Devices Manufacturing (11.61%) | | | | | | | | |
| Align Technology, Inc.(a) | | | 25,576 | | | | 6,452,569 | |
| Edwards Lifesciences Corp.(a) | | | 39,356 | | | | 9,381,683 | |
| Intuitive Surgical, Inc.(a) | | | 10,754 | | | | 5,946,424 | |
| Myriad Genetics, Inc.(a) | | | 102,968 | | | | 3,466,933 | |
| Varian Medical Systems, Inc.(a) | | | 25,305 | | | | 3,057,097 | |
| | | | | | | | 28,304,706 | |
| | | | | | | | | |
| TOTAL HEALTH CARE | | | | | | | 28,304,706 | |
| | | | | | | | | |
| INDUSTRIALS (7.08%) | | | | | | | | |
| Electrical Equipment Manufacturing (1.59%) | | | | | | | | |
| Cognex Corp. | | | 75,310 | | | | 3,877,712 | |
| | | | | | | | | |
| Machinery Manufacturing (3.01%) | | | | | | | | |
| Graco, Inc. | | | 43,386 | | | | 1,961,047 | |
| Middleby Corp.(a) | | | 44,439 | | | | 5,374,897 | |
| | | | | | | | 7,335,944 | |
| Manufactured Goods (1.04%) | | | | | | | | |
| Proto Labs, Inc.(a) | | | 26,215 | | | | 2,542,068 | |
| 8 | 1-855-DGI-FUND (344-3863) | www.DGIfund.com |
| The Disciplined Growth Investors Fund | Portfolio of Investments |
October 31, 2019 (Unaudited)
| | | Shares | | | Value (Note 2) | |
| INDUSTRIALS (continued) | | | | | | |
| Transportation & Logistics (1.44%) | | | | | | |
| Landstar System, Inc. | | | 30,964 | | | $ | 3,503,577 | |
| | | | | | | | | |
| TOTAL INDUSTRIALS | | | | | | | 17,259,301 | |
| | | | | | | | | |
| TECHNOLOGY (31.54%) | | | | | | | | |
| Design, Manufacturing & Distribution (2.50%) | | | | | | | | |
| Plexus Corp.(a) | | | 82,562 | | | | 6,104,634 | |
| | | | | | | | | |
| Hardware (10.64%) | | | | | | | | |
| Dolby Laboratories, Inc. , Class A | | | 67,768 | | | | 4,359,515 | |
| Garmin, Ltd. | | | 49,173 | | | | 4,609,969 | |
| Plantronics, Inc. | | | 59,136 | | | | 2,331,141 | |
| Pure Storage, Inc. , Class A(a) | | | 113,655 | | | | 2,211,726 | |
| Super Micro Computer, Inc.(a) | | | 144,011 | | | | 2,978,148 | |
| Ubiquiti, Inc. | | | 51,883 | | | | 6,567,869 | |
| ViaSat, Inc.(a) | | | 41,592 | | | | 2,863,193 | |
| | | | | | | | 25,921,561 | |
| | | | | | | | | |
| Semiconductors (3.80%) | | | | | | | | |
| IPG Photonics Corp.(a) | | | 12,927 | | | | 1,735,837 | |
| Microchip Technology, Inc. | | | 31,555 | | | | 2,975,321 | |
| Power Integrations, Inc. | | | 49,825 | | | | 4,539,556 | |
| | | | | | | | 9,250,714 | |
| | | | | | | | | |
| Software (11.17%) | | | | | | | | |
| Akamai Technologies, Inc.(a) | | | 54,292 | | | | 4,696,258 | |
| Autodesk, Inc.(a) | | | 30,216 | | | | 4,452,630 | |
| Intuit, Inc. | | | 28,810 | | | | 7,418,575 | |
| Manhattan Associates, Inc.(a) | | | 20,701 | | | | 1,551,540 | |
| Open Text Corp. | | | 137,000 | | | | 5,515,620 | |
| RealPage, Inc.(a) | | | 59,502 | | | | 3,602,846 | |
| | | | | | | | 27,237,469 | |
| Semi-Annual Report | October 31, 2019 | 9 |
| The Disciplined Growth Investors Fund | Portfolio of Investments |
October 31, 2019 (Unaudited)
| | | Shares | | | Value (Note 2) | |
| TECHNOLOGY (continued) | | | | | | |
| Technology Services (3.43%) | | | | | | |
| FactSet Research Systems, Inc. | | | 18,888 | | | $ | 4,788,486 | |
| IHS Markit, Ltd.(a) | | | 27,705 | | | | 1,939,904 | |
| Paychex, Inc. | | | 19,487 | | | | 1,629,893 | |
| | | | | | | | 8,358,283 | |
| | | | | | | | | |
| TOTAL TECHNOLOGY | | | | | | | 76,872,661 | |
| | | | | | | | | |
| TOTAL COMMON STOCKS | | | | | | | | |
| (Cost $105,224,871) | | | | | | | 169,169,307 | |
| | | Principal Amount | | | Value (Note 2) | |
| CORPORATE BONDS (21.74%) | | | | | | |
| COMMUNICATIONS (1.33%) | | | | | | |
| Cable & Satellite (0.35%) | | | | | | |
| Comcast Corp. | | | | | | |
| 3.375% 08/15/2025 | | $ | 810,000 | | | | 863,657 | |
| | | | | | | | | |
| Entertainment Content (0.32%) | | | | | | | | |
| CBS Corp. | | | | | | | | |
| 4.000% 01/15/2026 | | | 726,000 | | | | 778,811 | |
| | | | | | | | | |
| Wireless Telecommunications Services (0.66%) | | | | | | | | |
| AT&T, Inc. | | | | | | | | |
| 4.250% 03/01/2027 | | | 741,000 | | | | 814,495 | |
| 4.450% 04/01/2024 | | | 4,000 | | | | 4,339 | |
| Verizon Communications, Inc. | | | | | | | | |
| 4.125% 03/16/2027 | | | 698,000 | | | | 778,438 | |
| | | | | | | | 1,597,272 | |
| | | | | | | | | |
| TOTAL COMMUNICATIONS | | | | | | | 3,239,740 | |
| | | | | | | | | |
| CONSUMER DISCRETIONARY (2.34%) | | | | | | | | |
| Airlines (0.32%) | | | | | | | | |
| Southwest Airlines Co. | | | | | | | | |
| 3.000% 11/15/2026 | | | 756,000 | | | | 775,874 | |
| | | | | | | | | |
| Automobiles Manufacturing (0.31%) | | | | | | | | |
| General Motors Financial Co., Inc. | | | | | | | | |
| 5.250% 03/01/2026 | | | 695,000 | | | | 754,563 | |
| 10 | 1-855-DGI-FUND (344-3863) | www.DGIfund.com |
| The Disciplined Growth Investors Fund | Portfolio of Investments |
October 31, 2019 (Unaudited)
| | | Principal Amount | | | Value (Note 2) | |
| CONSUMER DISCRETIONARY (continued) | | | | | | |
| Consumer Services (0.32%) | | | | | | |
| Cintas Corp. No 2 | | | | | | |
| 3.700% 04/01/2027 | | $ | 710,000 | | | $ | 777,075 | |
| | | | | | | | | |
| Restaurants (0.33%) | | | | | | | | |
| McDonald's Corp., Series MTN | | | | | | | | |
| 6.300% 03/01/2038 | | | 604,000 | | | | 824,184 | |
| | | | | | | | | |
| Retail - Consumer Discretionary (1.06%) | | | | | | | | |
| Advance Auto Parts, Inc. | | | | | | | | |
| 4.500% 12/01/2023 | | | 685,000 | | | | 739,203 | |
| Amazon.com, Inc. | | | | | | | | |
| 5.200% 12/03/2025 | | | 885,000 | | | | 1,042,117 | |
| Lowe's Cos., Inc. | | | | | | | | |
| 3.650% 04/05/2029 | | | 742,000 | | | | 799,089 | |
| | | | | | | | 2,580,409 | |
| | | | | | | | | |
| TOTAL CONSUMER DISCRETIONARY | | | | | | | 5,712,105 | |
| | | | | | | | | |
| CONSUMER STAPLES (0.32%) | | | | | | | | |
| Mass Merchants (0.32%) | | | | | | | | |
| Costco Wholesale Corp. | | | | | | | | |
| 2.750% 05/18/2024 | | | 760,000 | | | | 789,558 | |
| | | | | | | | | |
| TOTAL CONSUMER STAPLES | | | | | | | 789,558 | |
| | | | | | | | | |
| CONSUMER, NON-CYCLICAL (0.62%) | | | | | | | | |
| Pharmaceuticals (0.62%) | | | | | | | | |
| AbbVie, Inc. | | | | | | | | |
| 4.250% 11/14/2028 | | | 695,000 | | | | 755,988 | |
| CVS Health Corp. | | | | | | | | |
| 4.300% 03/25/2028 | | | 685,000 | | | | 744,198 | |
| | | | | | | | 1,500,186 | |
| | | | | | | | | |
| TOTAL CONSUMER, NON-CYCLICAL | | | | | | | 1,500,186 | |
| | | | | | | | | |
| ENERGY (2.19%) | | | | | | | | |
| Exploration & Production (0.32%) | | | | | | | | |
| Conoco Funding Co. | | | | | | | | |
| 7.250% 10/15/2031 | | | 551,000 | | | | 784,064 | |
| Semi-Annual Report | October 31, 2019 | 11 |
| The Disciplined Growth Investors Fund | Portfolio of Investments |
October 31, 2019 (Unaudited)
| | | Principal Amount | | | Value (Note 2) | |
| ENERGY (continued) | | | | | | |
| Pipeline (1.87%) | | | | | | |
| Boardwalk Pipelines LP | | | | | | |
| 5.950% 06/01/2026 | | $ | 670,000 | | | $ | 751,656 | |
| Enbridge Energy Partners LP | | | | | | | | |
| 4.200% 09/15/2021 | | | 4,000 | | | | 4,137 | |
| 5.875% 10/15/2025 | | | 643,000 | | | | 748,627 | |
| Enterprise Products Operating LLC | | | | | | | | |
| 3.950% 02/15/2027 | | | 710,000 | | | | 768,379 | |
| MPLX LP | | | | | | | | |
| 4.125% 03/01/2027 | | | 748,000 | | | | 786,182 | |
| ONEOK, Inc. | | | | | | | | |
| 4.550% 07/15/2028 | | | 694,000 | | | | 755,996 | |
| Williams Cos., Inc. | | | | | | | | |
| 3.750% 06/15/2027 | | | 718,000 | | | | 748,185 | |
| | | | | | | | 4,563,162 | |
| | | | | | | | | |
| TOTAL ENERGY | | | | | | | 5,347,226 | |
| | | | | | | | | |
| FINANCIALS (4.08%) | | | | | | | | |
| Banks (0.95%) | | | | | | | | |
| BB&T Corp., Series MTN | | | | | | | | |
| 3.875% 03/19/2029 | | | 695,000 | | | | 757,302 | |
| US Bancorp, Series MTN | | | | | | | | |
| 3.100% 04/27/2026 | | | 739,000 | | | | 774,606 | |
| Wells Fargo & Co., Series GMTN | | | | | | | | |
| 4.300% 07/22/2027 | | | 710,000 | | | | 777,024 | |
| | | | | | | | 2,308,932 | |
| | | | | | | | | |
| Consumer Finance (0.31%) | | | | | | | | |
| American Express Co. | | | | | | | | |
| 3.625% 12/05/2024 | | | 708,000 | | | | 751,901 | |
| | | | | | | | | |
| Diversified Banks (0.95%) | | | | | | | | |
| Bank of America Corp., Series L | | | | | | | | |
| 4.183% 11/25/2027 | | | 715,000 | | | | 775,097 | |
| Citigroup, Inc. | | | | | | | | |
| 4.300% 11/20/2026 | | | 720,000 | | | | 781,306 | |
| JPMorgan Chase & Co. | | | | | | | | |
| 4.125% 12/15/2026 | | | 690,000 | | | | 754,331 | |
| | | | | | | | 2,310,734 | |
| | | | | | | | | |
| Financial Services (0.61%) | | | | | | | | |
| Morgan Stanley, Series GMTN | | | | | | | | |
| 3.700% 10/23/2024 | | | 690,000 | | | | 734,148 | |
| 12 | 1-855-DGI-FUND (344-3863) | www.DGIfund.com |
| The Disciplined Growth Investors Fund | Portfolio of Investments |
October 31, 2019 (Unaudited)
| | | Principal Amount | | | Value (Note 2) | |
| FINANCIALS (continued) | | | | | | | | |
| Financial Services (continued) | | | | | | | | |
| Northern Trust Corp. | | | | | | | | |
| 3.950% 10/30/2025 | | $ | 693,000 | | | $ | 758,773 | |
| | | | | | | | 1,492,921 | |
| Life Insurance (0.31%) | | | | | | | | |
| Principal Financial Group, Inc. | | | | | | | | |
| 3.100% 11/15/2026 | | | 726,000 | | | | 753,881 | |
| | | | | | | | | |
| Property & Casualty Insurance (0.32%) | | | | | | | | |
| American International Group, Inc. | | | | | | | | |
| 4.250% 03/15/2029 | | | 700,000 | | | | 775,865 | |
| | | | | | | | | |
| Real Estate (0.63%) | | | | | | | | |
| Simon Property Group LP | | | | | | | | |
| 3.250% 11/30/2026 | | | 728,000 | | | | 767,545 | |
| Welltower, Inc. | | | | | | | | |
| 4.250% 04/01/2026 | | | 712,000 | | | | 778,728 | |
| | | | | | | | 1,546,273 | |
| | | | | | | | | |
| TOTAL FINANCIALS | | | | | | | 9,940,507 | |
| | | | | | | | | |
| HEALTH CARE (0.96%) | | | | | | | | |
| Managed Care (0.62%) | | | | | | | | |
| Anthem, Inc. | | | | | | | | |
| 3.650% 12/01/2027 | | | 731,000 | | | | 773,919 | |
| UnitedHealth Group, Inc. | | | | | | | | |
| 3.750% 07/15/2025 | | | 691,000 | | | | 750,032 | |
| | | | | | | | 1,523,951 | |
| | | | | | | | | |
| Pharmaceuticals (0.34%) | | | | | | | | |
| Johnson & Johnson | | | | | | | | |
| 5.850% 07/15/2038 | | | 572,000 | | | | 817,638 | |
| | | | | | | | | |
| TOTAL HEALTH CARE | | | | | | | 2,341,589 | |
| | | | | | | | | |
| INDUSTRIALS (3.52%) | | | | | | | | |
| Aerospace & Defense (0.92%) | | | | | | | | |
| Lockheed Martin Corp. | | | | | | | | |
| 3.100% 01/15/2023 | | | 680,000 | | | | 705,038 | |
| Rockwell Collins, Inc. | | | | | | | | |
| 3.500% 03/15/2027 | | | 730,000 | | | | 781,542 | |
| Semi-Annual Report | October 31, 2019 | 13 |
| The Disciplined Growth Investors Fund | Portfolio of Investments |
October 31, 2019 (Unaudited)
| | | Principal Amount | | | Value (Note 2) | |
| INDUSTRIALS (continued) | | | | | | |
| Aerospace & Defense (continued) | | | | | | |
| United Technologies Corp. | | | | | | |
| 3.950% 08/16/2025 | | $ | 680,000 | | | $ | 744,967 | |
| | | | | | | | 2,231,547 | |
| | | | | | | | | |
| Electrical Equipment Manufacturing (0.32%) | | | | | | | | |
| General Electric Co., Series MTN | | | | | | | | |
| 5.875% 01/14/2038 | | | 653,000 | | | | 782,218 | |
| | | | | | | | | |
| Engineering & Construction (0.29%) | | | | | | | | |
| Fluor Corp. | | | | | | | | |
| 4.250% 09/15/2028 | | | 725,000 | | | | 718,883 | |
| | | | | | | | | |
| Railroad (0.70%) | | | | | | | | |
| Burlington Northern Santa Fe LLC | | | | | | | | |
| 3.000% 03/15/2023 | | | 2,000 | | | | 2,065 | |
| 3.400% 09/01/2024 | | | 875,000 | | | | 931,692 | |
| Union Pacific Corp. | | | | | | | | |
| 3.250% 08/15/2025 | | | 735,000 | | | | 775,831 | |
| | | | | | | | 1,709,588 | |
| | | | | | | | | |
| Transportation & Logistics (0.64%) | | | | | | | | |
| FedEx Corp. | | | | | | | | |
| 3.300% 03/15/2027 | | | 756,000 | | | | 782,013 | |
| United Parcel Service, Inc. | | | | | | | | |
| 6.200% 01/15/2038 | | | 558,000 | | | | 777,633 | |
| | | | | | | | 1,559,646 | |
| | | | | | | | | |
| Waste & Environment Services & Equipment (0.65%) | | | | | | | | |
| Republic Services, Inc. | | | | | | | | |
| 3.375% 11/15/2027 | | | 735,000 | | | | 784,962 | |
| Waste Management, Inc. | | | | | | | | |
| 3.150% 11/15/2027 | | | 745,000 | | | | 787,309 | |
| | | | | | | | 1,572,271 | |
| | | | | | | | | |
| TOTAL INDUSTRIALS | | | | | | | 8,574,153 | |
| 14 | 1-855-DGI-FUND (344-3863) | www.DGIfund.com |
| The Disciplined Growth Investors Fund | Portfolio of Investments |
October 31, 2019 (Unaudited)
| | | Principal Amount | | | Value (Note 2) | |
| MATERIALS (0.31%) | | | | | | |
| Chemicals (0.31%) | | | | | | |
| DuPont de Nemours, Inc. | | | | | | |
| 4.725% 11/15/2028 | | $ | 666,000 | | | $ | 760,008 | |
| | | | | | | | | |
| TOTAL MATERIALS | | | | | | | 760,008 | |
| | | | | | | | | |
| TECHNOLOGY (0.32%) | | | | | | | | |
| Semiconductors (0.32%) | | | | | | | | |
| Analog Devices, Inc. | | | | | | | | |
| 3.900% 12/15/2025 | | | 711,000 | | | | 767,885 | |
| | | | | | | | | |
| TOTAL TECHNOLOGY | | | | | | | 767,885 | |
| | | | | | | | | |
| UTILITIES (5.75%) | | | | | | | | |
| Utilities (5.75%) | | | | | | | | |
| Ameren Corp. | | | | | | | | |
| 2.500% 09/15/2024 | | | 690,000 | | | | 695,497 | |
| American Electric Power Co., Inc. | | | | | | | | |
| 3.200% 11/13/2027 | | | 731,000 | | | | 770,107 | |
| Black Hills Corp. | | | | | | | | |
| 3.150% 01/15/2027 | | | 700,000 | | | | 710,669 | |
| CenterPoint Energy, Inc. | | | | | | | | |
| 3.850% 02/01/2024 | | | 700,000 | | | | 741,945 | |
| CMS Energy Corp. | | | | | | | | |
| 3.000% 05/15/2026 | | | 760,000 | | | | 782,612 | |
| Dominion Energy, Inc., Series B | | | | | | | | |
| 2.750% 09/15/2022 | | | 695,000 | | | | 707,190 | |
| DTE Energy Co., Series C | | | | | | | | |
| 3.500% 06/01/2024 | | | 715,000 | | | | 748,101 | |
| Duke Energy Corp. | | | | | | | | |
| 3.950% 10/15/2023 | | | 690,000 | | | | 733,506 | |
| Edison International | | | | | | | | |
| 2.400% 09/15/2022 | | | 745,000 | | | | 728,307 | |
| Interstate Power & Light Co. | | | | | | | | |
| 3.400% 08/15/2025 | | | 723,000 | | | | 758,632 | |
| ITC Holdings Corp. | | | | | | | | |
| 4.050% 07/01/2023 | | | 540,000 | | | | 568,257 | |
| NiSource, Inc. | | | | | | | | |
| 3.850% 02/15/2023 | | | 695,000 | | | | 724,790 | |
| Potomac Electric Power Co. | | | | | | | | |
| 3.600% 03/15/2024 | | | 698,000 | | | | 741,956 | |
| PPL Capital Funding, Inc. | | | | | | | | |
| 3.100% 05/15/2026 | | | 820,000 | | | | 840,870 | |
| Semi-Annual Report | October 31, 2019 | 15 |
| The Disciplined Growth Investors Fund | Portfolio of Investments |
October 31, 2019 (Unaudited)
| | | Principal Amount | | | Value (Note 2) | |
| UTILITIES (continued) | | | | | | |
| Utilities (continued) | | | | | | |
| PSEG Power LLC | | | | | | |
| 4.300% 11/15/2023 | | $ | 675,000 | | | $ | 718,326 | |
| Puget Energy, Inc. | | | | | | | | |
| 3.650% 05/15/2025 | | | 725,000 | | | | 755,061 | |
| Sempra Energy | | | | | | | | |
| 2.875% 10/01/2022 | | | 720,000 | | | | 734,774 | |
| Virginia Electric & Power Co., Series A | | | | | | | | |
| 3.800% 04/01/2028 | | | 710,000 | | | | 782,154 | |
| Wisconsin Electric Power Co. | | | | | | | | |
| 3.100% 06/01/2025 | | | 735,000 | | | | 768,230 | |
| | | | | | | | 14,010,984 | |
| | | | | | | | | |
| TOTAL UTILITIES | | | | | | | 14,010,984 | |
| | | | | | | | | |
| TOTAL CORPORATE BONDS | | | | | | | | |
| (Cost $49,954,468) | | | | | | | 52,983,941 | |
| | | | | | | | | |
| FOREIGN CORPORATE BONDS (0.64%) | | | | | | | | |
| ENERGY (0.33%) | | | | | | | | |
| Pipeline (0.33%) | | | | | | | | |
| TransCanada PipeLines, Ltd. | | | | | | | | |
| 7.250% 08/15/2038 | | | 572,000 | | | | 813,285 | |
| | | | | | | | | |
| TOTAL ENERGY | | | | | | | 813,285 | |
| | | | | | | | | |
| FINANCIALS (0.31%) | | | | | | | | |
| Diversified Banks (0.31%) | | | | | | | | |
| Royal Bank of Canada, Series GMTN | | | | | | | | |
| 2.550% 07/16/2024 | | | 746,000 | | | | 757,571 | |
| | | | | | | | | |
| TOTAL FINANCIALS | | | | | | | 757,571 | |
| | | | | | | | | |
| TOTAL FOREIGN CORPORATE BONDS | | | | | | | | |
| (Cost $1,488,801) | | | | | | | 1,570,856 | |
| | | | | | | | | |
| FOREIGN GOVERNMENT BONDS (0.31%) | | | | | | | | |
| Corp Andina de Fomento | | | | | | | | |
| 4.375% 06/15/2022 | | | 712,000 | | | | 751,018 | |
| | | | | | | | | |
| TOTAL FOREIGN GOVERNMENT BONDS | | | | | | | | |
| (Cost $742,930) | | | | | | | 751,018 | |
| 16 | 1-855-DGI-FUND (344-3863) | www.DGIfund.com |
| The Disciplined Growth Investors Fund | Portfolio of Investments |
October 31, 2019 (Unaudited)
| | | Principal Amount | | | Value (Note 2) | |
| GOVERNMENT & AGENCY OBLIGATIONS (6.82%) | | | | | | |
| U.S. Treasury Bonds | | | | | | |
| 1.500% 08/15/2026 | | $ | 689,000 | | | $ | 684,452 | |
| 2.875% 05/15/2028 | | | 2,000,000 | | | | 2,194,219 | |
| 6.500% 11/15/2026 | | | 77,000 | | | | 102,129 | |
| U.S. Treasury Notes | | | | | | | | |
| 1.250% 01/31/2020 | | | 4,500,000 | | | | 4,496,748 | |
| 1.375% 09/15/2020 | | | 1,150,000 | | | | 1,148,001 | |
| 1.375% 01/31/2021 | | | 3,550,000 | | | | 3,541,125 | |
| 1.500% 04/15/2020 | | | 4,470,000 | | | | 4,468,865 | |
| | | | | | | | | |
| TOTAL GOVERNMENT & AGENCY OBLIGATIONS | | | | | | | | |
| (Cost $16,375,447) | | | | | | | 16,635,539 | |
| | | Yield | | | Shares | | | Value (Note 2) | |
| SHORT TERM INVESTMENTS (0.89%) | | | | | | | | | | | | |
| (0.89%) | | | | | | | | | | | | |
| Fidelity Investments Money Market Government Portfolio - Class I | | | 1.736 | %(b) | | | 2,163,609 | | | | 2,163,609 | |
| | | | | | | | | | | | | |
| TOTAL SHORT TERM INVESTMENTS | | | | | | | | | | | | |
| (Cost $2,163,609) | | | | | | | | | | | 2,163,609 | |
| | | | | | | | | | | | | |
| TOTAL INVESTMENTS (99.81%) | | | | | | | | | | | | |
| (Cost $175,950,126) | | | | | | | | | | $ | 243,274,270 | |
| | | | | | | | | | | | | |
| Other Assets In Excess Of Liabilities (0.19%) | | | | | | | | | | | 456,266 | |
| | | | | | | | | | | | | |
| NET ASSETS (100.00%) | | | | | | | | | | $ | 243,730,536 | |
| (a) | Non-Income Producing Security. |
| (b) | Represents the 7-day yield. |
For Fund compliance purposes, the Fund's industry classifications refer to any one or more of the industry sub-classifications used by one or more widely recognized market indexes or ratings group indexes, and/or as defined by Fund management. This definition may not apply for purposes of this report, which may combine industry sub-classifications for reporting ease. Industries are shown as a percent of net assets.
See Notes to Financial Statements.
| Semi-Annual Report | October 31, 2019 | 17 |
| The Disciplined Growth Investors Fund | Statement of Assets and Liabilities |
October 31, 2019 (Unaudited)
| ASSETS | | | |
| Investments, at value | | $ | 243,274,270 | |
| Receivable for shares sold | | | 25 | |
| Dividends and interest receivable | | | 627,373 | |
| Total assets | | | 243,901,668 | |
| | | | | |
| LIABILITIES | | | | |
| Payable for shares redeemed | | | 14,000 | |
| Payable to adviser | | | 157,132 | |
| Total liabilities | | | 171,132 | |
| NET ASSETS | | $ | 243,730,536 | |
| | | | | |
| NET ASSETS CONSIST OF | | | | |
| Paid-in capital (Note 5) | | $ | 169,592,852 | |
| Distributable Earnings | | | 74,137,684 | |
| NET ASSETS | | $ | 243,730,536 | |
| | | | | |
| INVESTMENTS, AT COST | | $ | 175,950,126 | |
| | | | | |
| PRICING OF SHARES | | | | |
| Net Asset Value, offering and redemption price per share | | $ | 21.27 | |
| Shares of beneficial interest outstanding | | | 11,460,248 | |
See Notes to Financial Statements.
| 18 | 1-855-DGI-FUND (344-3863) | www.DGIfund.com |
| The Disciplined Growth Investors Fund | Statement of Operations |
| | | For the Six Months Ended October 31, 2019 (Unaudited) | |
| INVESTMENT INCOME | | | |
| Dividends | | $ | 705,638 | |
| Foreign taxes withheld | | | (11,874 | ) |
| Interest | | | 1,152,822 | |
| Total investment income | | | 1,846,586 | |
| | | | | |
| EXPENSES | | | | |
| Investment advisory fees (Note 6) | | | 920,281 | |
| Total expenses | | | 920,281 | |
| NET INVESTMENT INCOME | | | 926,305 | |
| | | | | |
| REALIZED AND UNREALIZED GAIN/LOSS ON INVESTMENTS | | | | |
| Net realized gain on investments | | | 3,701,404 | |
| Net change in unrealized depreciation on investments | | | (2,380,663 | ) |
| NET REALIZED AND UNREALIZED GAIN ON INVESTMENTS | | | 1,320,741 | |
| NET INCREASE IN NET ASSETS RESULTING FROM OPERATIONS | | $ | 2,247,046 | |
See Notes to Financial Statements.
| Semi-Annual Report | October 31, 2019 | 19 |
| The Disciplined Growth Investors Fund | Statements of Changes in Net Assets |
| | | For the Six Months Ended October 31, 2019 (Unaudited) | | | For the Year Ended April 30, 2019 | |
| OPERATIONS | | | | | | |
| Net investment income | | $ | 926,305 | | | $ | 1,766,931 | |
| Net realized gain | | | 3,701,404 | | | | 7,977,814 | |
| Net change in unrealized appreciation/(depreciation) | | | (2,380,663 | ) | | | 21,055,807 | |
| Net increase in net assets resulting from operations | | | 2,247,046 | | | | 30,800,552 | |
| | | | | | | | | |
| DISTRIBUTIONS (Note 3) | | | | | | | | |
| Total distributions to shareholders | | | (883,844 | ) | | | (7,508,119 | ) |
| Net decrease in net assets from distributions | | | (883,844 | ) | | | (7,508,119 | ) |
| | | | | | | | | |
| CAPITAL SHARE TRANSACTIONS (Note 5) | | | | | | | | |
| Proceeds from sales of shares | | | 5,316,088 | | | | 20,768,296 | |
| Issued to shareholders in reinvestment of distributions | | | 876,683 | | | | 7,471,582 | |
| Cost of shares redeemed | | | (3,996,961 | ) | | | (15,429,264 | ) |
| Net increase from capital share transactions | | | 2,195,810 | | | | 12,810,614 | |
| | | | | | | | | |
| Net increase in net assets | | | 3,559,012 | | | | 36,103,047 | |
| | | | | | | | | |
| NET ASSETS | | | | | | | | |
| Beginning of period | | | 240,171,524 | | | | 204,068,477 | |
| End of period | | $ | 243,730,536 | | | $ | 240,171,524 | |
| | | | | | | | | |
| OTHER INFORMATION | | | | | | | | |
| Share Transactions | | | | | | | | |
| Issued | | | 258,705 | | | | 1,042,174 | |
| Issued to shareholders in reinvestment of distributions | | | 42,628 | | | | 410,272 | |
| Redeemed | | | (194,439 | ) | | | (770,890 | ) |
| Net increase in share transactions | | | 106,894 | | | | 681,556 | |
See Notes to Financial Statements.
| 20 | 1-855-DGI-FUND (344-3863) | www.DGIfund.com |
Page Intentionally Left Blank
| The Disciplined Growth Investors Fund |
| NET ASSET VALUE, BEGINNING OF PERIOD | |
| | |
| INCOME FROM OPERATIONS | |
| Net investment income(a) | |
| Net realized and unrealized gain/(loss) on investments | |
| Total from investment operations | |
| | |
| DISTRIBUTIONS | |
| From net investment income | |
| From net realized gain on investments | |
| Total distributions | |
| | |
| REDEMPTION FEES ADDED TO PAID-IN CAPITAL | |
| INCREASE/(DECREASE) IN NET ASSET VALUE | |
| NET ASSET VALUE, END OF PERIOD | |
| | |
| TOTAL RETURN | |
| | |
| RATIOS AND SUPPLEMENTAL DATA | |
| Net assets, end of period (000's) | |
| | |
| RATIOS TO AVERAGE NET ASSETS | |
| Expenses | |
| Net investment income | |
| | |
| PORTFOLIO TURNOVER RATE | |
| (a) | Per share numbers have been calculated using the average shares method. |
| (c) | In 2018 the Fund's total return consists of a voluntary reimbursement by the advisor for a realized investment loss. Excluding this item, total return would not have been impacted. |
See Notes to Financial Statements.
| 22 | 1-855-DGI-FUND (344-3863) | www.DGIfund.com |
For a share outstanding during the periods presented
| For the Six Months Ended October 31, 2019 (Unaudited) | | | For the Year Ended April 30, 2019 | | | For the Year Ended April 30, 2018 | | | For the Year Ended April 30, 2017 | | | For the Year Ended April 30, 2016 | | | For the Year Ended April 30, 2015 | |
| $ | 21.15 | | | $ | 19.12 | | | $ | 18.20 | | | $ | 15.96 | | | $ | 16.75 | | | $ | 15.02 | |
| | | | | | | | | | | | | | | | | | | | | | | |
| | 0.08 | | | | 0.16 | | | | 0.12 | | | | 0.09 | | | | 0.09 | | | | 0.10 | |
| | 0.12 | | | | 2.55 | | | | 1.64 | | | | 2.29 | | | | (0.44 | ) | | | 1.83 | |
| | 0.20 | | | | 2.71 | | | | 1.76 | | | | 2.38 | | | | (0.35 | ) | | | 1.93 | |
| | | | | | | | | | | | | | | | | | | | | | | |
| | (0.08 | ) | | | (0.12 | ) | | | (0.12 | ) | | | (0.09 | ) | | | (0.10 | ) | | | (0.09 | ) |
| | – | | | | (0.56 | ) | | | (0.72 | ) | | | (0.05 | ) | | | (0.34 | ) | | | (0.11 | ) |
| | (0.08 | ) | | | (0.68 | ) | | | (0.84 | ) | | | (0.14 | ) | | | (0.44 | ) | | | (0.20 | ) |
| | | | | | | | | | | | | | | | | | | | | | | |
| | – | | | | – | | | | – | | | | – | | | | – | | | | – | |
| | 0.12 | | | | 2.03 | | | | 0.92 | | | | 2.24 | | | | (0.79 | ) | | | 1.73 | |
| $ | 21.27 | | | $ | 21.15 | | | $ | 19.12 | | | $ | 18.20 | | | $ | 15.96 | | | $ | 16.75 | |
| | | | | | | | | | | | | | | | | | | | | | | |
| | 0.95 | %(b) | | | 14.74 | % | | | 9.75 | %(c) | | | 14.96 | % | | | (2.05 | %) | | | 12.87 | % |
| | | | | | | | | | | | | | | | | | | | | | | |
| $ | 243,731 | | | $ | 240,172 | | | $ | 204,068 | | | $ | 159,774 | | | $ | 119,857 | | | $ | 113,342 | |
| | | | | | | | | | | | | | | | | | | | | | | |
| | 0.78 | %(d) | | | 0.78 | % | | | 0.78 | % | | | 0.78 | % | | | 0.78 | % | | | 0.78 | % |
| | 0.79 | %(d) | | | 0.80 | % | | | 0.64 | % | | | 0.50 | % | | | 0.59 | % | | | 0.61 | % |
| | | | | | | | | | | | | | | | | | | | | | | |
| | 10 | %(b) | | | 22 | % | | | 18 | % | | | 16 | % | | | 13 | % | | | 14 | % |
| Semi-Annual Report | October 31, 2019 | 23 |
| The Disciplined Growth Investors Fund | Notes to Financial Statements |
October 31, 2019 (Unaudited)
1. ORGANIZATION
Financial Investors Trust (the “Trust”), a Delaware statutory trust, is an open-end management investment company registered under the Investment Company Act of 1940, as amended (“1940 Act”). The Trust consists of multiple separate portfolios or series. This semi-annual report describes The Disciplined Growth Investors Fund (the “Fund”). The Fund seeks long-term capital growth and as a secondary objective, modest income with reasonable risk.
2. SIGNIFICANT ACCOUNTING POLICIES
The accompanying financial statements were prepared in accordance with accounting principles generally accepted in the United States of America (“U.S. GAAP”). The preparation of financial statements in conformity with U.S. GAAP requires management to make certain estimates and assumptions that affect the reported amounts of assets and liabilities and disclosures of contingent assets and liabilities at the date of the financial statements and the reported amounts of revenue and expenses during the period. Actual results could differ from those estimates. The Fund is considered an investment company for financial reporting purposes under U.S. GAAP and follows the accounting and reporting guidance applicable to investment companies in the Financial Accounting Standards Board Accounting Standards Codification Topic 946. The following is a summary of significant accounting policies consistently followed by the Fund in preparation of its financial statements.
Investment Valuation:The Fund generally values its securities based on market prices determined at the close of regular trading on the New York Stock Exchange (“NYSE”), normally 4:00 p.m. Eastern Time, on each day the NYSE is open for trading.
For equity securities and mutual funds that are traded on an exchange, the market price is usually the closing sale or official closing price on that exchange. In the case of equity securities not traded on an exchange, or if such closing prices are not otherwise available, the securities are valued at the mean of the most recent bid and ask prices on such day. Redeemable securities issued by open-end registered investment companies are valued at the investment company’s applicable net asset value, with the exception of exchange-traded open-end investment companies, which are priced as equity securities.
The market price for debt obligations is generally the price supplied by an independent third-party pricing service approved by the Board of Trustees of the Trust (the “Board” or the “Trustees”), which may use a matrix, formula or other objective method that takes into consideration quotations from dealers, market transactions in comparable investments, market indices and yield curves. If vendors are unable to supply a price, or if the price supplied is deemed to be unreliable, the market price may be determined using quotations received from one or more broker–dealers that make a market in the security. Fixed-income obligations, excluding municipal securities, having a remaining maturity of greater than 60 days, are typically valued at the mean between the evaluated bid and ask prices formulated by an independent pricing service. Corporate Bonds, U.S. Government & Agency, and U.S. Treasury Bonds & Notes are valued using market models that consider trade data, quotations from dealers and active market makers, relevant yield curve and spread data, creditworthiness, trade data or market information on comparable securities, and other relevant security specific information. Publicly traded Foreign Government Debt securities and Foreign Corporate Bonds are
| 24 | 1-855-DGI-FUND (344-3863) | www.DGIfund.com |
| The Disciplined Growth Investors Fund | Notes to Financial Statements |
October 31, 2019 (Unaudited)
typically traded internationally in the over-the-counter market and are valued at the mean between the bid and asked prices as of the close of business of that market. Mortgage-related and asset-backed securities are valued based on models that consider trade data, prepayment and default projections, benchmark yield and spread data and estimated cash flows of each tranche of the issuer. Publicly traded foreign government debt securities are typically traded internationally in the over-the-counter market and are valued at the mean between the bid and asked prices as of the close of business of that market.
When such prices or quotations are not available, or when Disciplined Growth Investors, Inc. (the “Adviser”) believes that they are unreliable, securities may be priced using fair value procedures approved by the Board.
Fair Value Measurements:The Fund discloses the classification of its fair value measurements following a three-tier hierarchy based on the inputs used to measure fair value. Inputs refer broadly to the assumptions that market participants would use in pricing the asset or liability, including assumptions about risk. Inputs may be observable or unobservable. Observable inputs reflect the assumptions market participants would use in pricing the asset or liability that are developed based on market data obtained from sources independent of the reporting entity. Unobservable inputs reflect the reporting entity’s own assumptions about the assumptions market participants would use in pricing the asset or liability that are developed based on the best information available.
Various inputs are used in determining the value of the Fund’s investments as of the end of the reporting period. When inputs used fall into different levels of the fair value hierarchy, the level in the hierarchy within which the fair value measurement falls is determined based on the lowest level input that is significant to the fair value measurement in its entirety. The designated input levels are not necessarily an indication of the risk or liquidity associated with these investments. These inputs are categorized in the following hierarchy under applicable financial accounting standards:
| Level 1 – | Unadjusted quoted prices in active markets for identical investments, unrestricted assets or liabilities that the Fund has the ability to access at the measurement date; |
| Level 2 – | Quoted prices which are not active, quoted prices for similar assets or liabilities in active markets or inputs other than quoted prices that are observable (either directly or indirectly) for substantially the full term of the asset or liability; and |
| Level 3 – | Significant unobservable prices or inputs (including the Fund’s own assumptions in determining the fair value of investments) where there is little or no market activity for the asset or liability at the measurement date. |
| Semi-Annual Report | October 31, 2019 | 25 |
| The Disciplined Growth Investors Fund | Notes to Financial Statements |
October 31, 2019 (Unaudited)
The following is a summary of each input used to value the Fund as of October 31, 2019:
| Investments in Securities at Value | | Level 1 - Unadjusted Quoted Prices | | | Level 2 - Other Significant Observable Inputs | | | Level 3 - Significant Unobservable Inputs | | | Total | |
| Common Stocks(a) | | $ | 169,169,307 | | | $ | – | | | $ | – | | | $ | 169,169,307 | |
| Corporate Bonds(a) | | | – | | | | 52,983,941 | | | | – | | | | 52,983,941 | |
| Foreign Corporate Bonds(a) | | | – | | | | 1,570,856 | | | | – | | | | 1,570,856 | |
| Foreign Government Bonds | | | – | | | | 751,018 | | | | – | | | | 751,018 | |
| Government & Agency Obligations | | | – | | | | 16,635,539 | | | | – | | | | 16,635,539 | |
| Short Term Investments | | | 2,163,609 | | | | – | | | | – | | | | 2,163,609 | |
| TOTAL | | $ | 171,332,916 | | | $ | 71,941,354 | | | $ | – | | | $ | 243,274,270 | |
| (a) | For detailed descriptions of the underlying industries, see the accompanying Portfolio of Investments. |
For the six months ended October 31, 2019, the Fund did not have any securities that used significant unobservable inputs (Level 3) in determining fair value.
Investment Transactions and Investment Income:Investment transactions are accounted for on the date the investments are purchased or sold (trade date). Realized gains and losses from investment transactions are reported on an identified cost basis, which is the same basis the Fund uses for federal income tax purposes. Interest income, which includes accretion of discounts, is accrued and recorded as earned. Dividend income is recognized on the ex-dividend date or for certain foreign securities, as soon as information is available to the Fund.
Trust Expenses:Some expenses of the Trust can be directly attributed to the Fund. Expenses which cannot be directly attributed to the Fund are apportioned among all funds in the Trust based on average net assets of each fund.
Fund Expenses:Expenses that are specific to the Fund are charged directly to the Fund.
Federal Income Taxes:The Fund complies with the requirements under Subchapter M of the Internal Revenue Code of 1986, as amended, applicable to regulated investment companies and intends to distribute substantially all of their net taxable income and net capital gains, if any, each year so that it will not be subject to excise tax on undistributed income and gains. The Fund is not subject to income taxes to the extent such distributions are made.
As of and during the six months ended October 31, 2019, the Fund did not have a liability for any unrecognized tax benefits. The Fund files U.S. federal, state, and local tax returns as required. The Fund’s tax returns are subject to examination by the relevant tax authorities until expiration of the applicable statute of limitations, which is generally three years after the filing of the tax return for federal purposes and four years for most state returns. Tax returns for open years have incorporated no uncertain tax positions that require a provision for income taxes.
| 26 | 1-855-DGI-FUND (344-3863) | www.DGIfund.com |
| The Disciplined Growth Investors Fund | Notes to Financial Statements |
October 31, 2019 (Unaudited)
Distributions to Shareholders:The Fund normally pays dividends, if any, quarterly and distributes capital gains, if any, on an annual basis. Income dividend distributions are derived from dividends and other income the Fund receives from its investments, including short term capital gains. Long term capital gain distributions are derived from gains realized when the Fund sells a security it has owned for more than a year. The Fund may make additional distributions and dividends at other times if the portfolio manager believes doing so may be necessary for the Fund to avoid or reduce taxes.
3. TAX BASIS INFORMATION
Tax Basis of Investments:As of October 31, 2019, the aggregate cost of investments, gross unrealized appreciation/ (depreciation) and net unrealized appreciation for Federal tax purposes was as follows:
| | | The Disciplined Growth Investors Fund | |
| Gross appreciation(excess of value over tax cost) | | $ | 74,661,020 | |
| Gross depreciation (excess of tax cost over value) | | | (7,336,876 | ) |
| Net unrealized appreciation | | $ | 67,324,144 | |
| Cost of investments for income tax purposes | | $ | 175,950,126 | |
Tax Basis of Distributions to Shareholders:The character of distributions made during the year from net investment income or net realized gains may differ from its ultimate characterization for federal income tax purposes. Also, due to the timing of dividend distributions, the fiscal year in which amounts are distributed may differ from the fiscal year in which the income or realized gain was recorded by the Fund.
The tax character of distributions paid during the year ended April 30, 2019, were as follows:
| | | Ordinary Income | | | Long-Term Capital Gain | |
| The Disciplined Growth Investors Fund | | $ | 1,871,972 | | | $ | 5,636,147 | |
The amounts and characteristics of tax basis distributions and composition of distributable earnings/(accumulated losses) are finalized at fiscal year-end. Accordingly, tax basis balances have not been determined as of October 31, 2019.
| Semi-Annual Report | October 31, 2019 | 27 |
| The Disciplined Growth Investors Fund | Notes to Financial Statements |
October 31, 2019 (Unaudited)
4. SECURITIES TRANSACTIONS
The Fund utilizes transfer in-kind transactions with the intent of saving on equity transaction costs for new shareholders at the institution they transferred from and for the Fund on the addition of assets. During the six months ended October 31, 2019, no assets were transferred in-kind.
The cost of purchases and proceeds from sales of securities (excluding short-term securities, transfers-in-kind, and U.S. Government Obligations) during the six months ended October 31, 2019, were as follows:
| Fund | | Purchases of Securities | | | Proceeds From Sales of Securities | |
| The Disciplined Growth Investors Fund | | $ | 19,426,355 | | | $ | 16,859,291 | |
Investment transactions in U.S. Government Obligations (excluding transfers-in-kind) during the six months ended October 31, 2019 were as follows:
| Fund | | Purchases of Securities | | | Proceeds From Sales of Securities | |
| The Disciplined Growth Investors Fund | | $ | 4,685,748 | | | $ | 6,092,934 | |
5. SHARES OF BENEFICIAL INTEREST
The capitalization of the Trust consists of an unlimited number of shares of beneficial interest with no par value per share. Holders of the shares of the Fund of the Trust have one vote for each share held and a proportionate fraction of a vote for each fractional share. All shares issued and outstanding are fully paid and are transferable and redeemable at the option of the shareholder. Purchasers of the shares do not have any obligation to make payments to the Trust or its creditors (other than the purchase price for the shares or make contributions to the Trust or its creditors solely by reason of the purchasers’ ownership of the shares. Shares have no pre-emptive rights.
6. MANAGEMENT AND RELATED-PARTY TRANSACTIONS
The Adviser, subject to the authority of the Board, is responsible for the overall management and administration of the Fund’s business affairs. The Adviser manages the investments of the Fund in accordance with the Fund’s investment objective, policies and limitations and investment guidelines established jointly by the Adviser and the Trustees. Pursuant to the Advisory Agreement, the Fund pays the Adviser a unitary management fee for the services and facilities it provides payable on a monthly basis at the annual rate of 0.78% of the Fund’s average daily net assets. The management fee is paid on a monthly basis.
Out of the unitary management fee, the Adviser pays substantially all expenses of the Fund, including the cost of transfer agency, custody, fund administration, bookkeeping and pricing services, legal, audit and other services, except for interest expenses, brokerage expenses, taxes and extraordinary expenses not incurred in the ordinary course of the Fund’s business. Also included are Trustee fees which were $4,375 for the six months ended October 31, 2019.
| 28 | 1-855-DGI-FUND (344-3863) | www.DGIfund.com |
| The Disciplined Growth Investors Fund | Notes to Financial Statements |
October 31, 2019 (Unaudited)
Fund Administrator Fees and Expenses
ALPS Fund Services, Inc. (“ALPS”) serves as administrator to the Fund. Pursuant to an Administration Agreement, ALPS provides operational services to the Fund including, but not limited to, fund accounting and fund administration and generally assists in the Fund’s operations. Officers of the Trust are employees of ALPS. The Fund’s administration fee is accrued on a daily basis and paid monthly. The Administrator is also reimbursed for certain out-of-pocket expenses. The administrative fee and out-of-pocket expenses are included in the unitary management fee paid to the Adviser.
Transfer Agent
ALPS serves as transfer, dividend paying and shareholder servicing agent for the Fund. ALPS receives an annual minimum fee, a fee based upon the number of shareholder accounts, and is also reimbursed for certain out-of-pocket expenses. The fee and out-of-pocket expenses are included in the unitary management fee paid to the Adviser.
Compliance Services
ALPS provides services that assist the Trust’s chief compliance officer in monitoring and testing the policies and procedures of the Trust in conjunction with requirements under Rule 38a-1 under the 1940 Act and receives an annual base fee. ALPS is reimbursed for certain out-of-pocket expenses. The fee and out-of-pocket expenses are included in the unitary management fee paid to the Adviser.
Principal Financial Officer
ALPS receives an annual fee for providing principal financial officer services to the Fund. The fee is included in the unitary management fee paid to the Adviser.
Distributor
ALPS Distributors, Inc. (“ADI” or the “Distributor”) (an affiliate of ALPS) acts as the distributor of the Fund’s shares pursuant to a Distribution Agreement with the Trust. Shares are sold on a continuous basis by ADI as agent for the Fund, and ADI has agreed to use its best efforts to solicit orders for the sale of the Fund’s shares, although it is not obliged to sell any particular amount of shares. ADI is not entitled to any compensation for its services as Distributor. ADI is registered as a broker-dealer with the Securities and Exchange Commission.
7. INDEMNIFICATIONS
Under the Trust’s organizational documents, its officers and Trustees are indemnified against certain liability arising out of the performance of their duties to the Trust. Additionally, in the normal course of business, the Trust enters into contracts with service providers that may contain general indemnification clauses, which may permit indemnification to the extent permissible under applicable law. The Trust’s maximum exposure under these arrangements is unknown, as this would involve future claims that may be made against the Trust that have not yet occurred.
8. SUBSEQUENT EVENTS
Subsequent events after the date of the Statement of Assets and Liabilities have been evaluated through the date the financial statements were issued.
| Semi-Annual Report | October 31, 2019 | 29 |
| The Disciplined Growth Investors Fund | Additional Information |
October 31, 2019 (Unaudited)
1. FUND HOLDINGS
The Fund’s portfolio holdings are made available semi-annually in shareholder reports within 60 days after the close of the period for which the report is being made, as required by federal securities laws. The Fund also files monthly portfolio holdings on Form N-PORT on a quarterly basis, with the schedule of portfolio holdings filed on Form N-PORT for the third month of the Fund’s fiscal quarter made publicly available 60 days after the end of the Fund’s fiscal quarter.
2. FUND PROXY VOTING POLICIES, PROCEDURES AND SUMMARIES
The Fund’s policies and procedures used in determining how to vote proxies and information regarding how the Fund voted proxies relating to portfolio securities during the most recent prior 12-month period ending June 30 are available without charge, (1) upon request, by calling (toll-free) 855-DGI-Fund and (2) on the SEC’s website at http://www.sec.gov.
| 30 | 1-855-DGI-FUND (344-3863) | www.DGIfund.com |
| The Disciplined Growth Investors Fund | Privacy Policy |
| WHO WE ARE | |
| Who is providing this notice? | The Disciplined Growth Investors Fund |
| WHAT WE DO | |
| How does the Fund protect my personal information? | To protect your personal information from unauthorized access and use, we use security measures that comply with federal law. These measures include computer safeguards and secured files and buildings. |
How does the Fund collect my personal information? | We collect your personal information, for example, when you • open an account • provide account information or give us your contact information • make a wire transfer or deposit money |
Why can’t I limit all sharing? | Federal law gives you the right to limit only • sharing for affiliates’ everyday business purposes-information about your creditworthiness • affiliates from using your information to market to you • sharing for non-affiliates to market to you State laws and individual companies may give you additional rights to limit sharing. |
| DEFINITIONS | |
| Affiliates | Companies related by common ownership or control. They can be financial and nonfinancial companies. |
Non-affiliates | Companies not related by common ownership or control. They can be financial and nonfinancial companies. ��� The Fund does not share with non-affiliates so they can market to you. |
| Joint marketing | A formal agreement between non-affiliated financial companies that together market financial products or services to you. • The Fund does not jointly market. |
| Semi-Annual Report | October 31, 2019 | 31 |
| The Disciplined Growth Investors Fund | Privacy Policy |
| FACTS | WHAT DOES THE FUND DO WITH YOUR PERSONAL INFORMATION? |
| WHY? | Financial companies choose how they share your personal information. Federal law gives consumers the right to limit some but not all sharing. Federal law also requires us to tell you how we collect, share, and protect your personal information. Please read this notice carefully to understand what we do. |
| WHAT? | The types of personal information we collect and share depend on the product or service you have with us. This information can include: |
| | • Social Security number and account transactions • Account balances and transaction history • Wire transfer instructions |
| HOW? | All financial companies need to share customers’ personal information to run their everyday business. In the section below, we list the reasons financial companies can share their customers’ personal information; the reasons the Fund chooses to share; and whether you can limit this sharing. |
| REASONS WE CAN SHARE YOUR PERSONAL INFORMATION | DOES THE FUND SHARE: | CAN YOU LIMIT THIS SHARING? |
For our everyday business purposes –
such as to process your transactions, maintain your account(s), respond to court orders and legal investigations, or report to credit bureaus | Yes | No |
For our marketing purposes –
to offer our products and services to you | No | We do not share. |
| For joint marketing with other financial companies | No | We do not share. |
For our affiliates’ everyday business purposes –
information about your transactions and experiences | Yes | No |
For our affiliates’ everyday business purposes –
information about your creditworthiness | No | We do not share. |
| For non-affiliates to market to you | No | We do not share. |
| 32 | 1-855-DGI-FUND (344-3863) | www.DGIfund.com |
| The Disciplined Growth Investors Fund | Privacy Policy |
| OTHER IMPORTANT INFORMATION |
| California Residents | If your account has a California home address, your personal information will not be disclosed to nonaffiliated third parties except as permitted by applicable California law, and we will limit sharing such personal information with our affiliates to comply with California privacy laws that apply to us. |
| Vermont Residents | The State of Vermont requires financial institutions to obtain your consent prior to sharing personal information that they collect about you with affiliated companies and nonaffiliated third parties other than in certain limited circumstances. Except as permitted by law, we will not share personal information we collect about you with nonaffiliated third parties or other affiliated companies unless you provide us with your written consent to share such information. |
| Semi-Annual Report | October 31, 2019 | 33 |

THIS MATERIAL MUST BE PRECEDED OR ACCOMPANIED BY A PROSPECTUS.
THE DISCIPLINED GROWTH INVESTORS FUND IS DISTRIBUTED BY ALPS DISTRIBUTORS, INC.

TABLE OF CONTENTS
| Manager Commentary | |
| Emerald Growth Fund | 1 |
| Emerald Small Cap Value Fund | 6 |
| Emerald Insights Fund | 12 |
| Emerald Banking and Finance Fund | 17 |
| Disclosure of Fund Expenses | 23 |
| Schedule of Investments | |
| Emerald Growth Fund | 25 |
| Emerald Small Cap Value Fund | 27 |
| Emerald Insights Fund | 29 |
| Emerald Banking and Finance Fund | 31 |
| Statements of Assets and Liabilities | 33 |
| Statements of Operations | 34 |
| Statements of Changes in Net Assets | |
| Emerald Growth Fund | 35 |
| Emerald Small Cap Value Fund | 37 |
| Emerald Insights Fund | 39 |
| Emerald Banking and Finance Fund | 41 |
| Financial Highlights | |
| Emerald Growth Fund | 43 |
| Emerald Small Cap Value Fund | 47 |
| Emerald Insights Fund | 51 |
| Emerald Banking and Finance Fund | 55 |
| Notes to Financial Statements | 59 |
| Additional Information | 67 |
| Privacy Policy | 68 |
| Emerald Growth Fund | Manager Commentary |
| | October 31, 2019 (Unaudited) |
October 31, 2019
Dear Shareholders:
Investment Results:
The performance of the Emerald Growth Fund’s Class A shares (without sales load), for the six months ended October 31, 2019, declined by -4.23%, trailing the Russell 2000® Growth Index which declined by -1.73%.
Performance data quoted represents past performance. Past performance does not guarantee future results.
The market had a lot to contend with during the course of the last six months as trade tensions with China escalated, bond yields rallied, then retreated and rallied again, the 2yr-10yr yield curve inverted then steepened, downward revisions to global and domestic economic and earnings growth, fluctuating opinions on the pace at which the Federal Reserve (the “Fed”) will lower interest rates and the necessity of the cuts, ongoing social unrest in Hong Kong and last but not least the late September announcement of a Democratic led impeachment inquiry of President Trump.
The fall-out of all of the aforementioned was a meaningful late period style rotation which pressured growth stocks and drove meaningful outperformance by value stocks. After lagging throughout the first eight months of 2019, value stocks gained significant ground on their growth counterparts during the third calendar quarter. Value stocks surged driven by a meaningful factor rotation in the marketplace that took place during the month of September in which investors aggressively sold growth/momentum stocks and rotated to areas of the market that have underperformed and were more value in orientation. The shift occurred in tandem with a significant rally in treasury yields which was reflective of what we believe was a string of steadying global economic growth statistics, which appeared to indicate some level of stabilization in the global economic outlook. The abruptness and velocity of the shift was notable in its magnitude particularly during the month of September, with the Russell 2000® Growth underperforming the Russell 2000® Value by 596 basis points (bps) for the month.
The Value rotation was particularly painful for the fastest growing companies within the Russell 2000® Growth benchmark. According to a recent report from Steve DeSanctis of Jeffries, the top quartile of companies measured by sales growth declined by -10.09% for the third quarter, underperforming the Russell 2000® Growth Index total return of -4.17%. This underperformance represented a meaningful shift in trend from the first half of calendar 2019 where the top quartile of companies measured by sales growth appreciated by +19.47% on a year-to-date basis through September 30, 2019 and substantially outperformed the aggregate Russell 2000® Growth Index which returned +15.34% for the same period.
Investment Analysis:
The headwinds to growth and challenging stock selection within the Emerald Growth Fund led to the portfolio’s relative underperformance to the benchmark for the trailing period. At the sector level, underperformance within the Technology, Producer Durables, Consumer Discretionary and Financial Services sectors offset relative outperformance within the Healthcare, Consumer Staples and Energy sectors.
Relative underperformance within the Technology sector was the most significant detractor to return for the period driven by challenging stock selection within the software, electronic entertainment and telecommunications industries. Performance within the Producer Durables, Consumer Discretionary, and Financial Services sectors also detracted from performance for the period driven largely by relative underperformance within the air transport, machinery, back office, specialty retail, and education services industries.
Relative underperformance in the aforementioned sectors was partially offset by relative outperformance within the Healthcare, Consumer Staples and Energy sectors. The Healthcare sector was the largest positive contributor to return for the period driven by stock selection within the biotechnology, pharmaceuticals and healthcare services industries. Also contributing was performance within the Consumer Staples and Energy sectors, and specifically, holdings within the foods, energy equipment and alternative energy industries.
Exiting October 2019, the portfolio held the largest active exposure to the Consumer Discretionary, Consumer Staples and Financial Services sectors. Thoughts on those sectors and other areas of notable opportunity/ portfolio exposure are highlighted below:
| • | The overweight position in the Consumer Discretionary sector is comprised of a diverse subset of companies within the casino & gambling, specialty retail, education services, home building, leisure time, diversified retail, apparel & shoes, and restaurant industries. Emerald Mutual Fund Advisers Trust (“Emerald” or the “Adviser”) believes that even amidst a more moderate consumer spending backdrop, these companies are positioned to benefit from company-specific initiatives to capture market-share and drive growth. |
| • | Similarly, the overweight to the Consumer Staples sector is comprised largely of a select group of niche high growth opportunities within the foods industry, which are poised to benefit from the addition of new retail outlets, expansion of shelf space within those outlets, market share gains, and further acquisition activity to build-out their individual stable of brands. |
| • | The Fund also held a relative overweight position to the Financial Services sector. Emerald continues to find opportunities in the sector, specifically within the banking, consumer lending and multi-line insurance industries. Within the banking industry, we believe that lower |
| Semi-Annual Report | October 31, 2019 | 1 |
| Emerald Growth Fund | Manager Commentary |
| | October 31, 2019 (Unaudited) |
net interest margin and Earnings Per Share (EPS) expectations have already been factored into small capitalization bank stocks with banks in the Russell 2000 trading 23% below their 20 year median on a Price-to-Earnings (P/E) basis and 11% below their 20 year median on a Price to Tangible Book Value (P/TBV) basis. Further, we believe that net interest margins are poised to move higher over next several quarters as loan yields are starting to hit floors, and thus we believe there will be less pressure on earning asset yields in the 2H’19 and 2020. Lastly, our longer-term consolidation theme continues to playout as expected, with 81 deals announced during the third calendar quarter of 2019, which when annualized translates to 5.93% of all Federal Deposit Insurance Corporation (FDIC) insured banks being acquired. In fact, according to an October 1, 2019 industry brief from Raymond James, calendar year 2019 is on track to be the strongest year for mergers and acquisitions (M&A) activity since 1991.
| • | The Healthcare sector, while underweight relative to the benchmark, also remains an area of meaningful exposure within the portfolio. At the industry level, the biotechnology industry remains the largest aggregate exposure. We continue to look for innovative therapeutics that can command premium pricing, though we note that competition for small niche patient populations is becoming a challenge. That being said, there continues to be a high-level of successful innovation in the marketplace. There were 14 drugs approved by the U.S. Food and Drug Administration (FDA) during the third quarter bringing the year-to-date total to 27 approvals. As a point of reference, on average the FDA has approved approximately 10.8 drugs per quarter from 2015-2018. Further, we also believe there is a developing opportunity in companies that have launched drugs in the past 2-3 years, as it often takes small companies several quarters to get their commercial organization running efficiently. Rounding out the portfolio’s Healthcare sector exposure are niche opportunities within the healthcare services, medical equipment, medical & dental instruments and pharmaceutical industries. While we continue to see select opportunities within the Healthcare sector, our enthusiasm for the broader sector remains guarded as we expect healthcare policy to remain a key point of debate and source of heightened sector volatility over the course of the 2020 Presidential Election Cycle. |
Market Outlook:
As we look to the balance of 2019, recession fears appear to be subsiding and confidence increasing as both global manufacturing and global economic growth are showing signs of stabilization. From an earnings perspective, third quarter EPS for the S&P 500 are tracking toward a (-1%) year over year decline. While this is better than the (-3 to -4%) decline expected at the beginning of earnings season, the third quarter decline in earnings marks the first decline since the 2015-2016 manufacturing recession, according to a November 11, 2019 report from Savita Subramanian of Bank of America Merrill Lynch. According to the same report, forward estimates for the fourth quarter have continued to be revised downward as well with EPS for the S&P 500 now expected to be approximately flat, as compared to +3% growth expected on October 1. The market, however, appears to be looking through the weak absolute growth rates and is focused on a reacceleration in global economic growth and earnings growth in 2020. Therefore, in the near-term as long as incoming economic data and progress on trade continue to support the narrative of a 2020 global economic and earnings growth reacceleration, we believe the market is likely to be stable to higher through year-end. With that said, any deviation from that narrative whether from incoming economic data points, trade developments with China or perceived implications from changes in the political landscape (impeachment/2020 election) is likely to result in heightened market volatility.
Moving beyond 2019, the pace at which global growth can accelerate however, remains a significant point of uncertainty as the twin headwinds to business investment: China Trade Policy and Brexit remain unresolved. As a consequence, we do not believe the Federal Reserve’s (Fed) efforts to lower rates is likely to result in a meaningful uptick in economic growth until there is visible path to resolution with China. Even then, we question how quickly global growth can accelerate if growth in China continues to stagnate as we believe the lingering impact from the tariff driven shift of manufacturing to locations outside of China is likely to remain a headwind to growth. Under this scenario, and as we look around the globe, we believe the U.S. economy, thanks to the U.S. consumer, will remain the strongest of the developed market economies. Within this backdrop of a slowing but still growing U.S. economy, we believe small capitalization stocks which on a relative P/E of small vs. large capitalization stocks (at 0.9x) trade at a 17-year low to their large capitalization peers (according to a recent report from Jill Carey Hall of Bank of America Merrill Lynch), as well as growth stocks, given the ongoing scarcity of growth in the market, remain particularly well positioned.
Emerald as always remains focused on utilizing our fundamental bottom up research process to identify the most attractive growth opportunities within the small capitalization universe.
| Top Contributors | Top Detractors | |
| Reata Pharmaceuticals | ForeScout Technologies Inc. | |
| Trex Company | Green Dot Corporation | |
| Karyopharm Therapeutics Inc. | Pluralsight Inc. | |
| Churchill Downs Inc. | Glu Mobile Inc. | |
| Tetra Tech Inc. | Chegg Inc. | |
| | | |
| Kenneth G. Mertz II, CFA | Stacey L. Sears | Joseph W. Garner |
| Chief Investment Officer | Portfolio Manager | Portfolio Manager |
| Portfolio Manager | | |
Emerald Mutual Fund Advisers Trust
| 2 | www.emeraldmutualfunds.com |
| Emerald Growth Fund | Manager Commentary |
October 31, 2019 (Unaudited)
Past performance does not guarantee future results. Fund prices fluctuate as the underlying assets have exposure to market fluctuations and other risks, as described in the Fund’s prospectus. Please visit www.emeraldmutualfunds.com to obtain current performance information and for the current prospectus and statement of additional information. This material must be preceded or accompanied by a prospectus. Please read the prospectus carefully before investing.
The views of Emerald Mutual Fund Advisers Trust and information discussed in this commentary are as of the date of publication, are subject to change, and may not reflect the writer's current views. The views expressed are those of the author only, and represent an assessment of market conditions at a specific point in time, are opinions only and should not be relied upon as investment advice regarding a particular investment or markets in general. Such information does not constitute a recommendation to buy or sell specific securities or investment vehicles. It should not be assumed that any investment will be profitable or will equal the performance of the Fund or any securities or any sectors mentioned in this letter. The subject matter contained in this letter has been derived from several sources believed to be reliable and accurate at the time of compilation. Neither Emerald Mutual Fund Advisers Trust nor the Fund accepts any liability for losses either direct or consequential caused by the use of this information.
The Emerald Growth Fund is distributed by ALPS Distributors, Inc.
The Fund is subject to investment risks, including possible loss of the principal amount invested and therefore is not suitable for all investors. The Fund may not achieve its objectives.
Diversification does not eliminate the risk of experiencing investment losses.
The Russell 2000® Growth Index measures the performance of the small-cap growth segment of the U.S. equity universe. It includes those Russell 2000® Index companies with higher price-to-value ratios and higher forecasted growth values. The Index is not actively managed and does not reflect any deductions for fees, expenses or taxes. An investor may not invest directly into the Index.
The Russell 2000® Value Index measures the performance of small-cap value segment of the U.S. equity universe. It includes those Russell 2000 companies with lower price-to-book ratios (A ratio used to compare a stock's market value to its book value. It is calculated by dividing the current closing price of the stock by the latest quarter's book value per share.) and lower forecasted growth values. The Index is not actively managed and does not reflect any deductions for fees, expenses or taxes. An investor may not invest directly into the Index.
A yield curve is a line that plots the interest rates, at a set point in time, of bonds having equal credit quality but differing maturity dates. The most frequently reported yield curve compares the three-month, two-year, five-year and 30-year U.S. Treasury debt. This yield curve is used as a benchmark for other debt in the market, such as mortgage rates or bank lending rates, and it is also used to predict changes in economic output and growth.
Basis points refers to a common unit of measure for interest rates and other percentages in finance. One basis point is equal to 1/100th of 1%, or 0.01%, or 0.0001, and is used to denote the percentage change in a financial instrument. The relationship between percentage changes and basis points can be summarized as follows: 1% change = 100 basis points and 0.01% = 1 basis point.
Earnings per share (EPS) is calculated as a company's profit divided by the outstanding shares of its common stock. The resulting number serves as an indicator of a company's profitability. It is common for a company to report EPS that is adjusted for extraordinary items and potential share dilution.
The price-to-earnings ratio (P/E ratio) is the ratio for valuing a company that measures its current share price relative to its per-share earnings (EPS).
The price to tangible book value (PTBV) is a valuation ratio expressing the price of a security compared to its hard, or tangible, book value as reported in the company's balance sheet. The tangible book value number is equal to the company's total book value less than the value of any intangible assets.
The S&P 500® Total Return Index is an unmanaged index of 500 common stocks chosen for market size, liquidity and industry group representation. It is a market-value weighted index. The Index is not actively managed and does not reflect any deductions for fees, expenses or taxes. An investor may not invest directly in the Index.
| Semi-Annual Report | October 31, 2019 | 3 |
| Emerald Growth Fund | Manager Commentary |
October 31, 2019 (Unaudited)
TOP TEN HOLDINGS
(as a % of Net Assets)*
| Trex Co., Inc. | | | 2.72 | % |
| Chegg, Inc. | | | 2.55 | % |
| Reata Pharmaceuticals, Inc. | | | 2.22 | % |
| Five Below, Inc. | | | 2.11 | % |
| Freshpet, Inc. | | | 1.95 | % |
| NeoGenomics, Inc. | | | 1.91 | % |
| Planet Fitness, Inc. | | | 1.90 | % |
| Churchill Downs, Inc. | | | 1.86 | % |
| Ciena Corp. | | | 1.85 | % |
| LendingTree, Inc. | | | 1.76 | % |
| Top Ten Holdings | | | 20.83 | % |
INDUSTRY SECTOR ALLOCATION
(as a % of Net Assets)
| Health Care | | | 27.11 | % |
| Consumer Discretionary | | | 20.90 | % |
| Technology | | | 16.35 | % |
| Financial Services | | | 12.85 | % |
| Producer Durables | | | 10.38 | % |
| Consumer Staples | | | 5.14 | % |
| Materials & Processing | | | 3.66 | % |
| Utilities | | | 2.45 | % |
| Energy | | | 0.89 | % |
| Cash, Cash Equivalents, & Other Net Assets | | | 0.27 | % |
| * | Holdings are subject to change, and may not reflect the current or future position of the portfolio. |
ANNUALIZED TOTAL RETURN (for the period ended October 31, 2019)
| | | | | | | Since | Expense Ratio |
| | 6 Month | 1 Year | 3 Year | 5 Year | 10 Year | Inception(1) | Gross(2) | Net(2) |
| Class A (NAV) | -4.23% | 6.98% | 14.49% | 9.70% | 14.94% | 11.01% | 1.01% | 1.01% |
| Class A (MOP) | -8.79% | 1.89% | 12.66% | 8.64% | 14.37% | 10.81% | 1.01% | 1.01% |
| Russell 2000®Growth Index(3) | -1.73% | 6.40% | 13.22% | 8.38% | 13.38% | 8.19% | | |
| Class C (NAV) | -4.59% | 6.28% | 13.73% | 8.98% | 14.18% | 6.22% | 1.66% | 1.66% |
| Class C (CDSC) | -5.54% | 5.34% | 13.73% | 8.98% | 14.18% | 6.22% | 1.66% | 1.66% |
| Russell 2000®Growth Index(3) | -1.73% | 6.40% | 13.22% | 8.38% | 13.38% | 8.19% | | |
| Investor Class | -4.29% | 6.93% | 14.44% | 9.66% | – | 10.73% | 1.06% | 1.06% |
| Russell 2000®Growth Index(3) | -1.73% | 6.40% | 13.22% | 8.38% | 13.38% | 8.19% | | |
| Institutional Class | -4.09% | 7.35% | 14.85% | 10.05% | 15.29% | 14.22% | 0.71% | 0.71% |
| Russell 2000®Growth Index(3) | -1.73% | 6.40% | 13.22% | 8.38% | 13.38% | 8.19% | | |
Performance quoted represents past performance, does not guarantee future results and current performance may be lower or higher than the data quoted. The investment return and principal value of an investment will fluctuate so that shares, when redeemed, may be worth more or less than their original cost. Performance data current to the most recent month end may be obtained at www.emeraldmutualfunds.com.
Performance shown for periods prior to March 16, 2012, reflects the performance of the Forward Growth Fund, a series of Forward Funds (as a result of a reorganization of the Forward Growth Fund into the Emerald Growth Fund).
Returns for periods less than 1 year are cumulative.
The table does not reflect the deduction of taxes that a shareholder would pay on Fund distributions or the redemption of Fund shares.
Subject to investment risks, including possible loss of the principal amount invested.
Maximum Offering Price (MOP) for Class A shares includes the Fund's maximum sales charge of 4.75%. Performance shown at NAV does not include these sales charges and would have been lower had it been taken into account.
A Contingent Deferred Sales Charge (CDSC) of 1.00% may apply to Class C shares redeemed within the first 12 months after a purchase.
| (1) | Inception Dates - Class A: 10/01/1992, Class C: 07/01/2000, Institutional Class: 10/21/2008, Investor Class: 05/01/2011 |
| (2) | Emerald Mutual Fund Advisers Trust ("Emerald" or the "Adviser") has agreed contractually to waive a portion of its fees and reimburse other expenses until August 31, 2020 in amounts necessary to limit the Fund's operating expenses (exclusive of Acquired Fund Fees and Expenses, brokerage expenses, interest expenses, taxes and extraordinary expense) for Class A, Class C, Institutional Class, and Investor Class shares to an annual rate (as percentage of the Fund's average daily net assets) of 1.29%, 1.94%, 0.99% and 1.34% respectively. The Adviser will be permitted to recover, on a class-by-class basis, expenses it has borne through the agreement described above to the extent that the Fund's expenses in later periods fall below the annual rates set forth in the relevant agreement. The Fund will not be obligated to pay any such deferred fees and expenses more than three years after the year(s) in which the fees and expense were incurred. The Adviser may not discontinue this waiver prior to August 31, 2020, without the approval by the Fund's Board of Trustees. Ratios as of the Prospectus dated August 31, 2019 and may differ from the ratios presented in the Financial Highlights. |
| (3) | The Russell 2000® Growth Index measures the performance of the small-cap growth segment of the U.S. equity universe. It includes those Russell 2000® Index companies with higher price-to-value ratios and higher forecasted growth values. The Index is not actively managed and does not reflect any deduction for fees, expenses or taxes. An investor may not invest directly into the Index. |
| 4 | www.emeraldmutualfunds.com |
| Emerald Growth Fund | Manager Commentary |
October 31, 2019 (Unaudited)
GROWTH OF $10,000 INVESTMENT IN THE FUND (for the period ended October 31, 2019)
Comparison of change in value of a $10,000 investment (includes applicable sales loads)
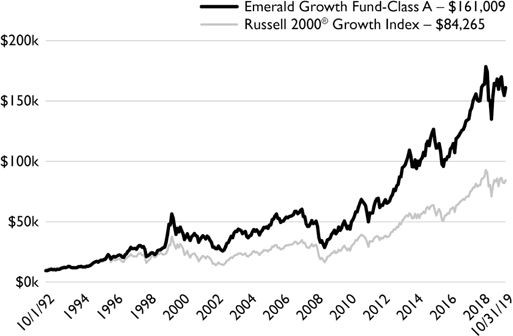
The chart represents historical performance of a hypothetical investment of $10,000 in the Fund since inception. Past performance does not guarantee future results. This chart does not reflect the deduction of taxes that a shareholder would pay on Fund distributions or the redemption of Fund shares.
Investing in the Fund is subject to investment risks, including possible loss of the principal amount invested.
| Semi-Annual Report | October 31, 2019 | 5 |
| Emerald Small Cap Value Fund | Manager Commentary |
October 31, 2019 (Unaudited)
October 31, 2019
Dear Shareholders:
Investment Results:
The performance of the Emerald Small Cap Value Fund Investor Class, for the six months ended October 31, 2018, reflected a gain of +2.18% (without sales load) outperforming the Russell 2000® Value Index which was down (-0.53%).
Performance data quoted represents past performance. Past performance does not guarantee future results.
At the end of August, we saw a shift in investors’ sentiment away from momentum and expensive stocks, and at the same time crowding into low valuation companies. This was a positive for small cap value stocks. However, will it last given weaker domestic economic data, lackluster earnings growth, and geopolitical concerns? (See our thoughts below)
Investment Analysis:
The Emerald Small Cap Value Fund (the “Small Cap Value Fund”) (without sales load) outperformed its benchmark for the 6-month period ended October 31, 2019. At the sector level, relative outperformance was driven by stock selection within the Materials & Processing, Energy, Financials, and Healthcare sectors. Relative underperformance was observed within Consumer Technology and Technology sectors, and a relative underweight to the benchmark’s Utilities sector.
As we mentioned in the past, banks are very important part of our benchmark and The Small Cap Value Fund’s portfolio. Banks and thrifts represent over 20% of the Russell 2000® Value holdings by weight. With recent changes to Fed policy and its impact on the yield curve, we anticipate headwinds for banks as we move into the third quarter 2019 earnings season. These headwinds will be driven by margin pressure due to the recent movement in London Interbank Offered Rate (LIBOR) rates and the most recent rate cut and the expectation for a third rate cut in December of 2019.
We anticipate continued downward pressure on net interest margins as banks report earnings given that the cost of deposits for banks have not moved down as fast as yields on adjustable/variable rate loans have adjusted downward after the most recent rate cuts. In fact, we expect the average net interest margin to be down 2 to 4 bps when banks report. During our most recent meetings with bank management teams, our takeaway has been that while rate cards for Certificates of Deposit (CDs) have moved lower and certainly, money market rates have reduced, these rates did not move by 25 basis points after the Fed cut in July. Our expectation is for cost of deposits to further reduce in 4Q19 and 1Q20 but net interest margin pressure will not subside until 1Q20.
While management teams have done a good job reducing expenses via branch closures and renegotiating contracts with core providers as well as reducing their labor force, we believe that expense reductions and share buybacks will not be enough to offset lower loan yields, slowing loan growth and stubborn deposit costs. As a result, our expectations are for an increased number of downward earnings revisions when banks report their third quarter results.
However, we believe the lower Net Interest Margin (NIM) and Earnings Per Share (EPS) expectations for 3Q19 are priced into the small cap bank stocks. In fact, we think the sector has been oversold. Banks in the Russell 2000 are trading 23% below their 20-year median on a Price-to-Earnings (P/E) basis and 11% below their 20-year median on a Price to Tangible Book Value (P/TBV) basis. To get back to their median relative P/TBV of past 10 years, small banks would have to write off 36% of their book value(1).
Additionally, we see an improving net interest margin scenario on the horizon as loan yields are starting to hit floors and thus we believe there will be less pressure on earning asset yields in the 2H19 and 2020. As a result, we believe that net interest margins for community banks as a group will be down 2-4 bps for the second half of 2019 but will stabilize and rise into the first half of 2020. Therefore, during the quarter, we reduced our exposure to banks, but we are still equal-weight to the industry within our benchmark.
We continue to believe that the Small Cap Value Fund’s portfolio is well positioned to benefit from a slowing, yet growing, domestic economy and the eventual turnaround in domestically focused industries. We continue to search for and invest in high quality companies that generate prodigious amounts of free cash flow, as well as financial services enterprises that trade significantly below their terminal value.
Market Outlook:
The economic data in the past few months have been telling us that the US economy is slowing down. While the overall economy seems okay, there is a material slowdown in manufacturing. In 3Q19, the Institute of Supply Management (ISM) Manufacturing Purchasing Managers Index (PMI) averaged 49.4 for the quarter, down from 52.2 in 2Q19, and 58.7 for all 2018, the best year since 2004. The September ISM reading of 47.8
| 6 | www.emeraldmutualfunds.com |
| Emerald Small Cap Value Fund | Manager Commentary |
October 31, 2019 (Unaudited)
represented the 2nd consecutive monthly decline after 30 months of manufacturing growth since the sector emerged from recession in autumn of 2016, and the weakest report in more than 10 years (since June 2009). ISM metrics have deteriorated every month this year (save March). However, Industrial production and capacity utilization remained at high levels through August 2019, with the data showing little to no moderation from levels in 2Q19. The fear is that the manufacturing sector’s problems, while not as big as it was in the past, will spillover to healthier parts of the economy.
There are many other worries on investors’ minds: We are in the 11th year of economic expansion, trade wars, yield curve inversion, slowing global economies (China 3Q19 Gross Domestic Product (GDP) lowest in three decades), Brexit, impeachment, etc. These headwinds have also shaken US CEOs’ confidence, with the latest reading (survey by the Conference Board) plunging into recession territory, thus explaining slowdowns in capital spending. While employment data continues to be strong, with unemployment claims remaining close to a five-decade low, the unemployment rate is a lagging indicator, and can worsen as trade wars protract and/or the US consumer would show signs of spending fatigue.
We believe that these concerns about a looming recession (timing uncertain), as well as lackluster earnings growth for small cap companies, are the causes for small caps underperformance by almost 600 bps relative to large caps year to date. Despite a strong performance in September for small cap value stocks, the Russell 2000® Value (R2V) is trailing the Russell 2000® Growth (R2G) by over 300 bps year to date, but growth’s edge over the last 12 months has almost entirely disappeared. Recently, valuations started to matter, and investors were not willing to buy growth at any price. The big question is, can the value rally continue?
We say: Value is cheap! On a P/E basis the R2V trades at 14.7X vs. the R2G at 24.8X, whereas, 41% of the companies in the growth benchmark are loss making vs. 27% in value benchmark. The R2V is also historically significantly cheaper relative to the R2G for the following valuation metrics: Price to Cash Flow, Price to Sales, and P/E to Growth(2). In addition, if the Fed continues to lower rates and facilitate easing monetary policy, the dollar should weaken and it would favor longer duration equities more prevalent within small-caps. If there would not be a recession next year, 2020 earnings growth would re-accelerate. 2020 earnings growth for small caps are expected to be 18.5% vs. 9% for large caps, and 18.7% for small cap value vs. 12.6% for small cap growth(3). With broadening earnings growth, the premium for growth companies should diminish.
We believe that the backdrop is positive for small cap value stocks to continue to outperform other asset classes. However, we have two concerns about our thesis: 1. Since banks make up over 20% of our benchmark, without their leadership, it would be hard to beat growth. Moreover, with the Fed lowering rates, banks will have tough time showing earnings growth in the near term. However, as stated above, we believe that conditions will improve in 1H20, and currently banks are trading at trough valuations; 2. If plunging rates mean that the global economy is heading into a recession, then large caps will have the upper hand, as investors will shy away from riskier small cap companies.
As always, we will continue to seek attractive investment opportunities for our clients by focusing on high-quality companies identified and evaluated by our fundamental research and active portfolio management.
| Top Contributors | Top Detractors |
| Kirkland Lake Gold Ltd. | Whiting Petroleum Corporation |
| Aaron’s, Inc. | Gray Television, Inc. |
| Reata Pharmaceuticals, Inc. | Blucora, Inc. |
| Rexford Industrial Realty, Inc. | PlayAGS, Inc. |
| Universal Forest Products, Inc. | Magnolia Oil & Gas Corp. |
| | |
| Sincerely, | |
| | |
| Ori Elan | Steven E. Russell, Esq. |
| Vice President | Vice President |
| Portfolio Manager | Portfolio Manager |
Emerald Mutual Fund Advisers Trust
| Semi-Annual Report | October 31, 2019 | 7 |
| Emerald Small Cap Value Fund | Manager Commentary |
October 31, 2019 (Unaudited)
Past performance does not guarantee future results. Fund prices fluctuate as the underlying assets have exposure to market fluctuations and other risks, as described in the Fund’s prospectus. Please visit www.emeraldmutualfunds.com to obtain current performance information and for the current prospectus and statement of additional information. This material must be preceded or accompanied by a prospectus. Please read the prospectus carefully before investing.
The views of Emerald Mutual Fund Advisers Trust and information discussed in this commentary are as of the date of publication, are subject to change, and may not reflect the writer's current views. The views expressed are those of the author only, and represent an assessment of market conditions at a specific point in time, are opinions only and should not be relied upon as investment advice regarding a particular investment or markets in general. Such information does not constitute a recommendation to buy or sell specific securities or investment vehicles. It should not be assumed that any investment will be profitable or will equal the performance of the Fund or any securities or any sectors mentioned in this letter. The subject matter contained in this letter has been derived from several sources believed to be reliable and accurate at the time of compilation. Neither Emerald Mutual Fund Advisers Trust nor the Fund accepts any liability for losses either direct or consequential caused by the use of this information.
The Emerald Small Cap Value Fund is distributed by ALPS Distributors, Inc.
The Fund is subject to investment risks, including possible loss of the principal amount invested and therefore is not suitable for all investors. The Fund may not achieve its objectives.
Diversification does not eliminate the risk of experiencing investment losses.
The term Russell 2000® Value Index refers to a composite of small cap companies located in the United States that also exhibit a value probability. The Russell 2000® Value is published does not reflect any deductions for fees, expenses or taxes. An investor may not invest directly into the Index.
A yield curve is a line that plots the interest rates, at a set point in time, of bonds having equal credit quality but differing maturity dates. The most frequently reported yield curve compares the three-month, two-year, five-year and 30-year U.S. Treasury debt. This yield curve is used as a benchmark for other debt in the market, such as mortgage rates or bank lending rates, and it is also used to predict changes in economic output and growth.
| (1) | Raymond James, Institutional Equity Strategy, 04 September, 2019 |
| (2) | Jefferies, JEF's Valuation Handbook—Despite Shifts Last Month, No Change in Rel Valuations, 03 October, 2019 |
| (3) | Jefferies, JEF's SMID-Cap Strategy—Q3 '19 Recap & Outlook, 02 October, 2019 |
Tangible book value (TBV) is a valuation ratio expressing the price of a security compared to its hard, or tangible, book value as reported in the company's balance sheet. The tangible book value number is equal to the company's total book value less the value of any intangible assets.
The London Interbank Offered Rate (LIBOR) is a benchmark interest rate at which major global banks lend to one another in the international interbank market for short-term loans.
Net interest margin is a metric that examines how successful a firm's investment decisions are compared to its debt situations.
The ISM Manufacturing Index is a widely-watched indicator of recent U.S. economic activity. The index is often referred to as the Purchasing Manager's Index (PMI).
| 8 | www.emeraldmutualfunds.com |
| Emerald Small Cap Value Fund | Manager Commentary |
October 31, 2019 (Unaudited)
TOP TEN HOLDINGS
(as a % of Net Assets)*
| Rexford Industrial Realty, Inc. | | | 2.96 | % |
| Aaron's, Inc. | | | 2.73 | % |
| Photronics, Inc. | | | 2.53 | % |
| Kirkland Lake Gold, Ltd. | | | 2.51 | % |
| Universal Forest Products, Inc. | | | 2.50 | % |
| Meta Financial Group, Inc. | | | 2.37 | % |
| ICF International, Inc. | | | 2.21 | % |
| Delek US Holdings, Inc. | | | 2.21 | % |
| Cubic Corp. | | | 2.05 | % |
| OSI Systems, Inc. | | | 2.01 | % |
| Top Ten Holdings | | | 24.08 | % |
INDUSTRY SECTOR ALLOCATION
(as a % of Net Assets)
| Financial Services | | | 41.49 | % |
| Producer Durables | | | 16.89 | % |
| Consumer Discretionary | | | 12.80 | % |
| Technology | | | 11.54 | % |
| Materials & Processing | | | 6.28 | % |
| Energy | | | 5.79 | % |
| Health Care | | | 2.97 | % |
| Utilities | | | 1.17 | % |
| Cash, Cash Equivalents, & Other Net Assets | | | 1.07 | % |
| * | Holdings are subject to change, and may not reflect the current or future position of the portfolio. |
ANNUALIZED TOTAL RETURN (for the period ended October 31, 2019)(1),(2)
| | | | | | Since | Expense Ratio |
| | 6 Month | 1 Year | 3 Years | 5 Years | Inception(2) | Gross(3) | Net(3) |
| Class A (NAV) | 2.19% | 5.76% | 8.91% | 6.26% | 9.33% | 2.89% | 1.35% |
| Class A (MOP) | -2.61% | 0.71% | 7.16% | 5.23% | 8.58% | 2.89% | 1.35% |
| Russell 2000® Value Index(4) | -0.53% | 3.22% | 8.60% | 6.24% | 9.79% | | |
| Class C (NAV) | 1.87% | 5.13% | 8.24% | 5.56% | 8.62% | 3.44% | 2.00% |
| Class C (CDSC) | 0.87% | 4.35% | 8.24% | 5.56% | 8.62% | 3.44% | 2.00% |
| Russell 2000® Value Index(4) | -0.53% | 3.22% | 8.60% | 6.24% | 9.79% | | |
| Investor Class | 2.18% | 5.87% | 9.11% | 6.43% | 9.50% | 2.83% | 1.25% |
| Russell 2000® Value Index(4) | -0.53% | 3.22% | 8.60% | 6.24% | 9.79% | | |
| Institutional Class | 2.41% | 6.18% | 9.34% | 6.63% | 9.72% | 2.44% | 1.00% |
| Russell 2000® Value Index(4) | -0.53% | 3.22% | 8.60% | 6.24% | 9.79% | | |
Performance quoted represents past performance, does not guarantee future results and current performance may be lower or higher than the data quoted. The investment return and principal value of an investment will fluctuate so that shares, when redeemed, may be worth more or less than their original cost. Performance data current to the most recent month end may be obtained at www.emeraldmutualfunds.com.
Returns for periods less than 1 year are cumulative.
The table does not reflect the deduction of taxes that a shareholder would pay on Fund distributions or the redemption of Fund shares.
Subject to investment risks, including possible loss of the principal amount invested.
Maximum Offering Price (MOP) for Class A shares includes the Fund's maximum sales charge of 4.75%. Performance shown at NAV does not include these sales charges and would have been lower had it been taken into account.
A Contingent Deferred Sales Charge (CDSC) of 1.00% may apply to Class C shares redeemed within the first 12 months after a purchase.
| (1) | As of June 26, 2015, the Emerald Small Cap Value Fund was reorganized as a successor to the Elessar Small Cap Value Fund (the Predecessor Fund), a series of Elessar Investment Trust. The performance shown for periods prior to June 26, 2015 reflects the performance of the Predecessor Fund's Institutional Class and Investor Class shares. The Predecessor Fund did not offer Class A or Class C shares. The performance shown for Class A and C shares prior to June 30, 2015 reflect the historical performance of the Predecessor Fund’s Institutional and Investor Shares since inception on October 15, 2012, calculated using the fees and expenses of Class A and C shares, respectively. |
| (2) | Commencement Dates - Class A: 06/30/2015, Class C: 06/30/2015, Institutional Class: 10/15/2012, Investor Class:10/15/2012 |
| (3) | Emerald Mutual Fund Advisers Trust (“Emerald” or the “Adviser”) has agreed contractually to waive a portion of its fees and reimburse other expenses until August 31, 2020 in amounts necessary to limit the Fund’s operating expenses (exclusive of Acquired Fund Fees and Expenses, brokerage expenses, interest expenses, taxes and extraordinary expense) for Class A, Class C, Institutional Class, and Investor Class shares to an annual rate (as percentage of the Fund’s average daily net assets) of 1.35%, 2.00%, 1.00% and 1.25% respectively. The Adviser will be permitted to recover, on a class-by-class basis, expenses it has borne through the agreement described above to the extent that the Fund's expenses in later periods fall below the annual rates set forth in the relevant agreement. The Fund will not be obligated to pay any such deferred fees and expenses more than three years after the year(s) in which the fees and expense were incurred. The Adviser may not discontinue this waiver prior to August 31, 2020, without the approval by the Fund's Board of Trustees. Ratios as of the Prospectus dated August 31, 2019 and may differ from the ratios presented in the Financial Highlights. |
| Semi-Annual Report | October 31, 2019 | 9 |
| Emerald Small Cap Value Fund | Manager Commentary |
October 31, 2019 (Unaudited)
| (4) | The Russell 2000® Value Index measures the performance of small-cap value segment of the U.S. equity universe. It includes those Russell 2000 companies with lower price-to-book ratios and lower forecasted growth values. The Index is not actively managed and does not reflect any deductions for fees, expenses or taxes. An investor may not invest directly into the Index. |
Important Risks
Investing in smaller companies generally will present greater investment risks, including: greater price volatility, greater sensitivity to changing economic conditions and less liquidity than the securities of larger, more mature companies.
| 10 | www.emeraldmutualfunds.com |
| Emerald Small Cap Value Fund | Manager Commentary |
October 31, 2019 (Unaudited)
GROWTH OF $10,000 INVESTMENT IN THE FUND (for the period ended October 31, 2019)
Comparison of change in value of a $10,000 investment (includes applicable sales loads)
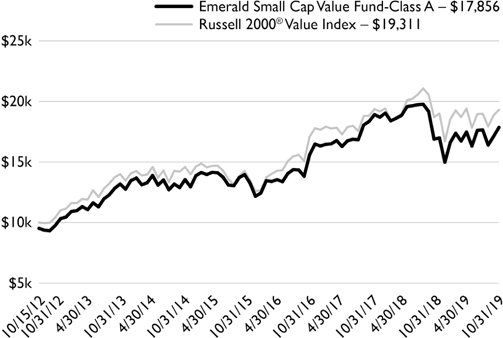
The chart represents historical performance of a hypothetical investment of $10,000 in the Fund since inception. Past performance does not guarantee future results. This chart does not reflect the deduction of taxes that a shareholder would pay on Fund distributions or the redemption of Fund shares.
Investing in the Fund is subject to investment risks, including possible loss of the principal amount invested.
| Semi-Annual Report | October 31, 2019 | 11 |
| Emerald Insights Fund | Manager Commentary |
October 31, 2019 (Unaudited)
October 31, 2019
Dear Shareholders:
Investment Results:
The performance of the Emerald Insights Fund (the “Insights Fund”) Class A Shares (without the sales load) for the six months ended October 31, 2019 reflected a return of +0.26%, trailing the Russel 3000® Growth Index benchmark return of +4.05%. Performance for the period suffered in large part due to the continued flow of funds into low volatility, bond proxy, momentum-type names as well as from the severe underperformance of small capitalization stocks (an area of overweight for the Fund) vs. large caps in the benchmark.
Performance data quoted represents past performance. Past performance does not guarantee future results.
Investment Analysis:
From an economic perspective, indicators were mixed during the period - with most consumer, employment and housing related measures registering moderate strength, with domestic manufacture, construction and corporate profit measures weakening and then stabilizing as the period progressed. Monetary indicators improved, with M2 growth(1) improving and the Fed cutting rates twice for a total of 50 basis points (bps). The yield curve, as measured by the U.S. 10/1 year note/bill ratio, inverted and then normalized toward the end of the reporting period, although negative rates persisted in many global economies. The ongoing trade war had a negative impact on a number of the Insights Fund holdings over the period, but trade tensions appeared to ease as the reporting cycle progressed.
The Insights Fund portfolio continued to have estimated earnings growth rates substantially above the benchmark per our internal estimates (>300bps), while at the same time trading at a discount on Price/Cash Flow, Price/Book and Price/Sales ratios. The Insights Fund had a lower weighted average market capitalization than the benchmark but was still very large, and contained more non-earners than the benchmark in the Technology and Healthcare sectors. This exposure to non-earners as well as our overweight vs. the benchmark to some smaller, high-growth names, detracted from performance, as non-earners and small-caps were some of the indices worst performers.
Market Outlook:
After more than two years of low volatility, low growth, bond proxy momentum stock outperformance, the market finally began to witness a sector rotation into growthier, and in some cases more cyclically oriented exposure - an area where Emerald has generally been overweight. Given our portfolio growth/valuation metrics mentioned above, if this growth/valuation disparity narrows, we believe our portfolio is positioned to take advantage of the rotation as well as any movement back to small caps which are tracking toward historic valuation lows vs. large caps.
Related to the domestic U.S. economy, based on the current data in front of us, we do not believe a recession is likely in the next one year period. It is widely held that consumer spending constitutes at least 70% of GDP, while manufacturing, which is clearly in a slowdown, makes up just 11% of economic activity. By most measures the consumer is in good shape. Employment is at record levels, the savings rate, consumer sentiment and retail a sales are strong, and monetary policy is stimulative. Mortgage rates, inflation and unemployment are all at extreme lows - hardly an environment for a contraction. As growth managers with a belief that earnings growth drives stock prices, and while earnings growth was weak during the reporting period, we expect growth to re-emerge as 2020 progresses, especially for some of the Fund’s overweight sectors like Energy and Materials. At this point, we are comfortable that, absent an exogenous shock, i.e. Trade, Geopolitics, no recession is in the near-term offing.
The Insights Fund’s portfolio remains overweight the Energy, Material and Utilities sectors. We are underweight Technology, Staples, Consumer Discretionary, Financials, and Producer Durables and approximately equal weight Healthcare. We think we have the correct balance of secular and cyclical growers, along with exposure to names that position us defensively should the economy falter, offset by higher-octane holdings in Energy, Materials, Banking, Software, and Security. This barbell approach has served us well in the past. We continue to employ our 10-step research process to identify and analyze high growth companies with strong management teams and differentiated, competitively defensible technologies. We feel confident that over time our process will result in rust-adjusted returns above our benchmark.
| Top Contributors | Top Detractors | |
| InMode Ltd. | Glu Mobile Inc. | |
| Apple Inc. | PlayAGS, Inc. | |
| Reata Pharmaceuticals, Inc. Class A | Chart Industries, Inc. | |
| Microsoft Corporation | Amazon.com, Inc. | |
| Trex Company, Inc. | Malibu Boats Inc Class A | |
| | | |
| David A. Volpe, CFA | Stephen L. Amsterdam | Joseph Hovorka |
| Deputy Chief Investment Officer | Associate Portfolio Manager | Associate Portfolio Manager |
| Portfolio Manager | | |
Emerald Mutual Fund Advisers Trust
| 12 | www.emeraldmutualfunds.com |
| Emerald Insights Fund | Manager Commentary |
October 31, 2019 (Unaudited)
Past performance does not guarantee future results. Fund prices fluctuate as the underlying assets have exposure to market fluctuations and other risks, as described in the Fund’s prospectus. Please visit www.emeraldmutualfunds.com to obtain current performance information and for the current prospectus and statement of additional information. This material must be preceded or accompanied by a prospectus. Please read the prospectus carefully before investing.
The views of Emerald Mutual Fund Advisers Trust and information discussed in this commentary are as of the date of publication, are subject to change, and may not reflect the writer's current views. The views expressed are those of the author only, and represent an assessment of market conditions at a specific point in time, are opinions only and should not be relied upon as investment advice regarding a particular investment or markets in general. Such information does not constitute a recommendation to buy or sell specific securities or investment vehicles. It should not be assumed that any investment will be profitable or will equal the performance of the Fund or any securities or any sectors mentioned in this letter. The subject matter contained in this letter has been derived from several sources believed to be reliable and accurate at the time of compilation. Neither Emerald Mutual Fund Advisers Trust nor the Fund accepts any liability for losses either direct or consequential caused by the use of this information.
The Emerald Insights Fund is distributed by ALPS Distributors, Inc.
The Fund is subject to investment risks, including possible loss of the principal amount invested and therefore is not suitable for all investors. The Fund may not achieve its objectives.
Diversification does not eliminate the risk of experiencing investment losses.
The Russell 3000® Growth Index is a market capitalization weighted index based on the Russell 3000® index. The Russell 3000® Growth Index includes companies that display signs of above average growth. The index is used to provide a gauge of the performance of growth stocks in the United States. The Index is not actively managed and does not reflect any deductions for fees, expenses or taxes. An investor may not invest directly into the Index.
A yield curve is a line that plots the interest rates, at a set point in time, of bonds having equal credit quality but differing maturity dates. The most frequently reported yield curve compares the three-month, two-year, five-year and 30-year U.S. Treasury debt. This yield curve is used as a benchmark for other debt in the market, such as mortgage rates or bank lending rates, and it is also used to predict changes in economic output and growth.
The price-to-cash flow (P/CF) ratio is a stock valuation indicator or multiple that measures the value of a stock’s price relative to its operating cash flow per share.
The price-to-book ratio compares a company's market value to its book value. The market value of a company is its share price multiplied by the number of outstanding shares. The book value is the net assets of a company.
The price-to-sales (P/S) ratio is a valuation ratio that compares a company’s stock price to its revenues. It is an indicator of the value placed on each dollar of a company’s sales or revenues.
The U.S. 10 year note/1 year bill ratio is a ratio of normally positive sloping interest rates across maturities of identical credit instruments.
| (1) | M2 is a measure of the money supply that includes cash, checking deposits, and easily convertible near money. |
| Semi-Annual Report | October 31, 2019 | 13 |
| Emerald Insights Fund | Manager Commentary |
October 31, 2019 (Unaudited)
TOP TEN HOLDINGS
(as a % of Net Assets)*
| Microsoft Corp. | | | 5.39 | % |
| Apple, Inc. | | | 4.84 | % |
| Amazon.com, Inc. | | | 4.54 | % |
| Alphabet, Inc. | | | 3.53 | % |
| iShares Expanded Tech-Software Sector ETF | | | 2.57 | % |
| Chegg, Inc. | | | 2.30 | % |
| Harsco Corp. | | | 2.15 | % |
| Trex Co., Inc. | | | 2.04 | % |
| Visa, Inc. | | | 1.91 | % |
| LendingTree, Inc. | | | 1.88 | % |
| Top Ten Holdings | | | 31.15 | % |
INDUSTRY SECTOR ALLOCATION
(as a % of Net Assets)
| Technology | | | 32.58 | % |
| Health Care | | | 16.94 | % |
| Consumer Discretionary | | | 14.44 | % |
| Producer Durables | | | 9.03 | % |
| Financial Services | | | 8.31 | % |
| Materials & Processing | | | 4.35 | % |
| Energy | | | 4.24 | % |
| Consumer Staples | | | 3.44 | % |
| Utilities | | | 1.60 | % |
| Cash, Cash Equivalents, & Other Net Assets | | | 5.07 | % |
| * | Holdings are subject to change, and may not reflect the current or future position of the portfolio. |
ANNUALIZED TOTAL RETURN (for the period ended October 31, 2019)
| | | | | | Since | Expense Ratio |
| | 6 Month | 1 Year | 3 Year | 5 Year | Inception(1) | Gross(2) | Net(2) |
| Class A (NAV) | 0.26% | 11.65% | 13.54% | 7.47% | 7.53% | 2.19% | 1.35% |
| Class A (MOP) | -4.47% | 6.37% | 11.71% | 6.43% | 6.53% | 2.19% | 1.35% |
| Russell MidCap® Growth Index(3) | 2.04% | 18.93% | 16.81% | 10.92% | 11.47% | | |
| Russell 3000® Growth Index(4) | 4.05% | 16.34% | 18.50% | 13.05% | 13.67% | | |
| Class C (NAV) | 0.00% | 10.92% | 12.79% | 6.74% | 6.79% | 2.84% | 2.00% |
| Class C (CDSC) | -1.00% | 10.06% | 12.79% | 6.74% | 6.79% | 2.84% | 2.00% |
| Russell MidCap® Growth Index(3) | 2.04% | 18.93% | 16.81% | 10.92% | 11.47% | | |
| Russell 3000® Growth Index(4) | 4.05% | 16.34% | 18.50% | 13.05% | 13.67% | | |
| Investor Class | 0.35% | 11.71% | 13.49% | 7.42% | 7.46% | 2.24% | 1.40% |
| Russell MidCap® Growth Index(3) | 2.04% | 18.93% | 16.81% | 10.92% | 11.47% | | |
| Russell 3000® Growth Index(4) | 4.05% | 16.34% | 18.50% | 13.05% | 13.67% | | |
| Institutional Class | 0.43% | 11.95% | 13.85% | 7.77% | 7.82% | 1.89% | 1.05% |
| Russell MidCap® Growth Index(3) | 2.04% | 18.93% | 16.81% | 10.92% | 11.47% | | |
| Russell 3000® Growth Index(4) | 4.05% | 16.34% | 18.50% | 13.05% | 13.67% | | |
The performance quoted represents past performance, does not guarantee future results and current performance may be lower or higher than the data quoted. The investment return and principal value of an investment will fluctuate so that shares, when redeemed, may be worth more or less than their original cost. Performance data current to the most recent month end may be obtained at www.emeraldmutualfunds.com.
Returns for periods less than 1 year are cumulative.
The table does not reflect the deduction of taxes that a shareholder would pay on Fund distributions or the redemption of Fund shares.
Subject to investment risks, including possible loss of the principal amount invested.
Maximum Offering Price (MOP) for Class A shares includes the Fund's maximum sales charge of 4.75%. Performance shown at NAV does not include these sales charges and would have been lower had it been taken into account.
A Contingent Deferred Sales Charge (CDSC) of 1.00% may apply to Class C shares redeemed within the first 12 months after a purchase.
| (1) | Inception Date – August 1, 2014. |
| (2) | Emerald Mutual Fund Advisers Trust ("Emerald" or the "Adviser") has agreed contractually to waive a portion of its fees and reimburse other expenses until August 31, 2020 in amounts necessary to limit the Fund's operating expenses (exclusive of Acquired Fund Fees and Expenses, brokerage expenses, interest expenses, taxes and extraordinary expense) for Class A, Class C, Institutional Class, and Investor Class shares to an annual rate (as percentage of the Fund's average daily net assets) of 1.35%, 2.00%, 1.05% and 1.40% respectively. The Adviser will be permitted to recover, on a class-by-class basis, expenses it has borne through the agreement described above to the extent that the Fund's expenses in later periods fall below the annual rates set forth in the relevant agreement. The Fund will not be obligated to pay any such deferred fees and expenses more than three years after the year(s) in which the fees and expense were incurred. The Adviser may not discontinue this waiver prior to August 31, 2020, without the approval by the Fund's Board of Trustees. Ratios as of the Prospectus dated August 31, 2019 and may differ from the ratios presented in the Financial Highlights. |
| (3) | The Russell MidCap® Growth Index measures the performance of the mid-cap growth segment of the U.S. equity universe. It includes those Russell Midcap Index companies with higher price-to-book ratios and higher forecasted growth values. The Index is not actively managed and does not reflect any deductions for fees, expenses or taxes. An investor may not invest directly into the Index. |
| (4) | The Russell 3000® Growth Index is a market capitalization weighted index based on the Russell 3000® index. The Russell 3000® Growth Index includes companies that display signs of above average growth. The index is used to provide a gauge of the performance of growth stocks in the United States. The Index is not actively managed and does not reflect any deductions for fees, expenses or taxes. An investor may not invest directly into the Index. |
| 14 | www.emeraldmutualfunds.com |
| Emerald Insights Fund | Manager Commentary |
October 31, 2019 (Unaudited)
Important Risks
Investing in smaller companies generally will present greater investment risks, including: greater price volatility, greater sensitivity to changing economic conditions and less liquidity than the securities of larger, more mature companies.
| Semi-Annual Report | October 31, 2019 | 15 |
| Emerald Insights Fund | Manager Commentary |
October 31, 2019 (Unaudited)
GROWTH OF $10,000 INVESTMENT IN THE FUND (for the period ended October 31, 2019)
Comparison of change in value of a $10,000 investment (includes applicable sales loads)

The chart represents historical performance of a hypothetical investment of $10,000 in the Fund since inception. Past performance does not guarantee future results. This chart does not reflect the deduction of taxes that a shareholder would pay on Fund distributions or the redemption of Fund shares.
Investing in the Fund is subject to investment risks, including possible loss of the principal amount invested.
| 16 | www.emeraldmutualfunds.com |
| Emerald Banking and Finance Fund | Manager Commentary |
October 31, 2019 (Unaudited)
October 31, 2019
Dear Shareholders:
Investment Results:
The Emerald Banking & Finance Fund (the “Banking & Finance Fund”) outperformed the Russell 2000® Index for the six months ended October 31, 2019, returning 0.52% (without sales charge) vs. (-1.09)% for the Index. During the six month ended October 31, 2019, the Russell 2000® Financial Services Index returned +2.95%; the SNL Small Cap U.S. Bank & Thrift Index gained +2.38% versus a +4.16% gain delivered by the Standard & Poor’s 500 Index and a loss of (-0.53)% for the Russell 2000® Value Index.
Performance data quoted represents past performance. Past performance does not guarantee future results.
Our April 30, 2019 Annual Report shareholder letter lamented the fact that,
Uncertainty continues to rule “bank land.” Will the yield curve invert? Will the Fed raise rates in 2019? Will the Fed cut rates? Will the strong dollar come home to roost? Will there be a trade deal with China? Iran...Venezuela...North Korea, etcetera, etcetera, etcetera.
Well in fact the yield curve did invert, although the 2 and 10 year yield curve only inverted for a matter of hours and in our opinion the curve needs to be inverted for several weeks before it becomes a reliable predictor of a recession. The Federal Reserve (Fed) did not raise rates but instead has cut rates by 25 basis points three times in 2019 nearly reversing all of the four increases in 2018, with the last cut lowering the range to 1.5% from 1.75%. There still has been no trade deal with China and there have been so many reports of trade deal- on and trade deal- off we fear this uncertainty will last well into 2020. Meanwhile investors seemingly have become numb to the headlines about global risks such as Iran, Venezuela, North Korea and now Syria as we close out 2019.
With that said, banks continue to grow earnings, loans and deposits while credit quality remains impressive despite the “one-off” concerns investors have endured related to shared national credits in the energy patch as well as quick service food franchises and healthcare. Despite the ongoing health and profitability of the banking sector, banks continue to trade at attractive valuations. Market sentiment was tempered as the three Fed interest rate decreases resulted in an almost immediate reduction in loan yields while deposit pricing typically lags Fed rate decreases by six months thus leading to a market sure to experience lower net interest margins in the second half of 2019 and so far this has played out as expected.
With that said the volatile ride continues as the financial sector continues its rebound from the dismal Q4’18 performance with Class A shares (HSSAX) having rebounded 18.57% from the bottom of December 24, 2018 through October 31, 2019 (without sales charge).
Investment Analysis:
Profitability at U.S. banks with less than $10 billion in assets continued their upward ascend despite fears of a slowing economy and the Fed cutting rates, according to S&P Global. According to the S&P Global Data Dispatch report, the median return on average equity among the 247 publicly traded banks and thrifts in the analysis was 10.69% for the quarter, slightly above the 10.68% posted in the third quarter of 2018. However, the group’s median net interest margin fell to 3.63% from 3.72% year-over-year.
To help offset the net interest margin compression management teams have successfully reduced expenses as they renegotiate contracts, rationalize the banks’ branch footprints and reduce wage expense. In the third quarter, dozens of banks reported a year-over-year decline in full-time employee numbers and we believe headcount and other expense shrinkage will continue to be a long term trend. With that said, the median efficiency ratio improved in Q3 to 59.60%, down from 60.38% in the year ago quarter.
Ten years after the “financial crisis” and credit quality remains, dare we say “pristine?” No, we won’t go that far we will say it remains “good.” The median net charge-off ratio for banks with less than $10 billion in assets increased 1 basis point year-over-year to 0.05%. As previously mentioned, we have seen some “one-off” credit deterioration in shared national credits focused in the energy, healthcare and franchise restaurant sectors but nothing that has proven to be a systemic issue. Moving forward we have been focusing our attention to agriculture loans. We believe loss of income resulting from the continuing trade war between the U.S. and China is forcing more farmers to tap the resilient value of their land to keep them going through next year’s planting season. According to a survey of lenders released at the American Bankers Association’s annual agricultural banking conference, more than 46% of bankers expect an increase in loans secured by farmland over the next year, compared with 37% who saw an uptick in this kind of financing over the previous 12 months. The findings suggest that many farmers are burning through cash they had put aside to weather unprofitable harvests from lower commodity prices. The equity stored in the value of their farmland is considered the last financial resort for some to cover operating expenses. So far, loans secured by farmland are holding up well, but bankers are growing increasingly concerned that credit quality will weaken if the trade war drags on much longer. Roughly three out of four of the agriculture lenders surveyed by the ABA and Farmer Mac said that farmers’ ability to repay loans is their top concern.
| Semi-Annual Report | October 31, 2019 | 17 |
| Emerald Banking and Finance Fund | Manager Commentary |
October 31, 2019 (Unaudited)
Median year-over-year loan growth has slowed as loans grew 7.4% in Q3 down from 10.7% loan growth in the third quarter of 2018. Deposit growth also slowed to a median 7.8% year-over-year, down from 8.7% in the third quarter of 2018.
Market Outlook:
In our last shareholder letter we stated that, “the set-up for the next 12 months for the bank sector is the ‘haziest’ we have seen in some time.” We believe that the picture has cleared somewhat since then and feel incrementally more positive. While the trade war with China has not come to a conclusion we believe an agreement will be reached prior to the 2020 election, likely in the first half of 2020 and bank stocks will likely react positively. Additionally, we believe that several ongoing themes will support the bank stocks such as deregulation, solid credit quality, continued earnings growth, and merger activity.
We believe our long term consolidation theme will continue to play out as a tailwind for the sector. In Q3’19, 81 acquisitions were announced which when annualized translates to 5.93% of all FDIC insured banks being acquired. That 5.93% annualized rate was above the 5.13% reported in Q2’19 and the 4.73% reported in Q3’18. In fact, 2019 is on track to be the strongest year for M&A activity since 1991 and Q3’19 was the strongest third quarter in the data set. (Source: Raymond James Industry Brief - October 1st 2019)
Additionally, we see an improving net interest margin scenario on the horizon as loan yields are starting to hit floors and thus we believe there will be less pressure on earning asset yields in the 2H’19 and 2020. As a result, we believe that net interest margin for community banks as a group will be down 2-4 basis points in the 2H’19 but will stabilize and rise into the first half of 2020.
We believe that as in the fourth quarter of 2018, the expectations for lower net interest margins and slower earnings growth was priced into community stocks and the pull back in community bank valuations was overdone. In fact at the beginning of the month of September, banks in the Russell 2000 were trading 23% below their 20 year median on a price-to-earnings (P/E) basis and 11% below their 20 year median on a P/TBV basis. At those valuations, to get back to the relative P/TBV of the past 10 years, small banks would have to write off 31% of their book value. (Source: Raymond James; Equity Strategy September 4th 2019) We believe that community banks were oversold in the fourth quarter of 2018 leading to a rebound in performance in HSSAX of 18.57% from its low in 2018 seen on December 24th 2018. We believe the community bank sector is currently repricing from the oversold levels experienced in September of 2019. In fact, HSSAX has rebounded 6.86% from its low in the month of September 2019 (September 3, 2019).
We believe that bank valuations will continue to rebound to the median 10 year historical valuations at a minimum. Our focus remains on seeking companies capable of producing above average organic growth, relatively stable net interest margin moving forward, and improving earnings power aided by lower efficiency ratios, with potential for accretive mergers and acquisition activity, as we deploy Emerald’s 10-step research process.
| Top Contributors | Top Detractors | |
| Meta Financial Group, Inc. | Merchants Bancorp | |
| Kirkland Lake Gold Ltd. | Green Dot Corporation Class A | |
| Stewardship Financial Corporation | Bank of N.T. Butterfield & Son Limited | |
| Amerant Bancorp Inc. Class A | SVB Financial Group | |
| MoneyGram International, Inc. | CBTX, Inc. | |
| | | |
| Kenneth G. Mertz II, CFA | Steven E. Russell, Esq. | |
| Chief Investment Officer | Portfolio Manager | |
| Portfolio Manager | | |
Emerald Mutual Fund Advisers Trust
| 18 | www.emeraldmutualfunds.com |
| Emerald Banking and Finance Fund | Manager Commentary |
October 31, 2019 (Unaudited)
Past performance does not guarantee future results. Fund prices fluctuate as the underlying assets have exposure to market fluctuations and other risks, as described in the Fund’s prospectus. Please visit www.emeraldmutualfunds.com to obtain current performance information and for the current prospectus and statement of additional information. This material must be preceded or accompanied by a prospectus. Please read the prospectus carefully before investing.
The views of Emerald Mutual Fund Advisers Trust and information discussed in this commentary are as of the date of publication, are subject to change, and may not reflect the writer's current views. The views expressed are those of the author only, and represent an assessment of market conditions at a specific point in time, are opinions only and should not be relied upon as investment advice regarding a particular investment or markets in general. Such information does not constitute a recommendation to buy or sell specific securities or investment vehicles. It should not be assumed that any investment will be profitable or will equal the performance of the Fund or any securities or any sectors mentioned in this letter. The subject matter contained in this letter has been derived from several sources believed to be reliable and accurate at the time of compilation. Neither Emerald Mutual Fund Advisers Trust nor the Fund accepts any liability for losses either direct or consequential caused by the use of this information.
The Emerald Banking and Finance Fund is distributed by ALPS Distributors, Inc.
The Fund is subject to investment risks, including possible loss of the principal amount invested and therefore is not suitable for all investors. The Fund may not achieve its objectives.
Diversification does not eliminate the risk of experiencing investment losses.
The Russell 2000® Index measures the performance of the small-cap segment of the U.S. equity universe. The Russell 2000® Index is a subset of the Russell 3000® Index representing approximately 10% of the total market capitalization of that index. It includes approximately 2000 of the smallest securities based on a combination of their market cap and current index membership. The Index is not actively managed and does not reflect any deduction of fees, expenses or taxes. An investor may not invest directly into the Index.
The Russell 2000® Financial Services Index – is comprised of the smallest financial services companies in the Russell 3000 Index. The Index is not actively managed and does not reflect any deductions for fees, expense, or taxes. An investor may not invest directly in the Index.
SNL Small Cap Bank & Thrift Index: Includes all publicly traded (NYSE, NYSE Amex, NASDAQ, OTC BB, Pink Sheets) Banks and Thrifts in SNL's coverage universe with $250M to $1B Total Common Market Capitalization as of most recent pricing data. Source: SNL Financial, data as of April 30, 2019.
The Standard & Poor’s 500® Index is an unmanaged index of 500 common stocks chosen for the market size, liquidity and industry group representation. It is a market-value weighted index. The Index is not actively managed and does not reflect any deduction for fees, expenses or taxes. An investor may not invest directly into the Index
The Russell 2000® Value Index measures the performance of small-cap value segment of the U.S. equity universe. It includes those Russell 2000 companies with lower price-to-book ratios (A ratio used to compare a stock's market value to its book value. It is calculated by dividing the current closing price of the stock by the latest quarter's book value per share.) and lower forecasted growth values. The Index is not actively managed and does not reflect any deductions for fees, expenses or taxes. An investor may not invest directly into the Index.
A yield curve is a line that plots the interest rates, at a set point in time, of bonds having equal credit quality but differing maturity dates. The most frequently reported yield curve compares the three-month, two-year, five-year and 30-year U.S. Treasury debt. This yield curve is used as a benchmark for other debt in the market, such as mortgage rates or bank lending rates, and it is also used to predict changes in economic output and growth.
| Semi-Annual Report | October 31, 2019 | 19 |
| Emerald Banking and Finance Fund | Manager Commentary |
October 31, 2019 (Unaudited)
TOP TEN HOLDINGS
(as a % of Net Assets)*
| Triumph Bancorp, Inc. | | | 3.87 | % |
| Meta Financial Group, Inc. | | | 3.70 | % |
| Bancorp, Inc. | | | 3.68 | % |
| Metropolitan Bank Holding Corp. | | | 3.64 | % |
| Bank7 Corp. | | | 3.34 | % |
| Esquire Financial Holdings, Inc. | | | 3.16 | % |
| ServisFirst Bancshares, Inc. | | | 3.16 | % |
| Amerant Bancorp, Inc. | | | 3.15 | % |
| Innovative Industrial Properties, Inc. | | | 2.47 | % |
| Kirkland Lake Gold, Ltd. | | | 2.42 | % |
| Top Ten Holdings | | | 32.59 | % |
INDUSTRY SECTOR ALLOCATION
(as a % of Net Assets)
| Banks: Diversified | | | 67.12 | % |
| Banks: Savings, Thrift & Mortgage Lending | | | 9.39 | % |
| Consumer Lending | | | 3.60 | % |
| Equity Reit - Industrial | | | 3.20 | % |
| Diversified Financial Services | | | 2.82 | % |
| Mining | | | 2.58 | % |
| Computer Services Software & Systems | | | 2.29 | % |
| Asset Management & Custodian | | | 1.97 | % |
| Insurance: Property-Casualty | | | 1.56 | % |
| Commercial Finance & Mortgage Companies | | | 1.50 | % |
| Insurance: Multi-Line | | | 0.93 | % |
| Equity Reit - Office | | | 0.86 | % |
| Financial Data & Systems | | | 0.65 | % |
| Advertising Agencies | | | 0.53 | % |
| Equity Reit - Diversified | | | 0.24 | % |
| Cash, Cash Equivalents, & Other Net Assets | | | 0.76 | % |
| * | Holdings are subject to change, and may not reflect the current or future position of the portfolio. |
ANNUALIZED TOTAL RETURN (for the period ended October 31, 2019)
| | 6 | | | | 10 | Since | Expense Ratio |
| | Month | 1 Year | 3 Year | 5 Year | Year | Inception(1) | Gross(2) | Net(2) |
| Class A (NAV) | 0.52% | -2.21% | 9.45% | 9.15% | 12.36% | 8.53% | 1.42% | 1.42% |
| Class A (MOP) | -4.25% | -6.86% | 7.69% | 8.09% | 11.82% | 8.30% | 1.42% | 1.42% |
| Russell 2000® Index(3) | -1.09% | 4.91% | 10.96% | 7.37% | 12.27% | 7.97% | | |
| Russell 2000®Financial Services Index(4) | 2.95% | 9.48% | 10.39% | 8.71% | 12.62% | 8.52% | | |
| Class C (NAV) | 0.14% | -2.88% | 8.73% | 8.44% | 11.65% | 8.51% | 2.07% | 2.07% |
| Class C (CDSC) | -0.86% | -3.62% | 8.73% | 8.44% | 11.65% | 8.51% | 2.07% | 2.07% |
| Russell 2000® Index(3) | -1.09% | 4.91% | 10.96% | 7.37% | 12.27% | 7.97% | | |
| Russell 2000® Financial Services Index(4) | 2.95% | 9.48% | 10.39% | 8.71% | 12.62% | 8.52% | | |
| Investor Class | 0.48% | -2.24% | 9.48% | 9.17% | – | 11.04% | 1.47% | 1.47% |
| Russell 2000® Index(3) | -1.09% | 4.91% | 10.96% | 7.37% | 12.27% | 7.97% | | |
| Russell 2000® Financial Services Index(4) | 2.95% | 9.48% | 10.39% | 8.71% | 12.62% | 8.52% | | |
| Institutional Class | 0.65% | -1.88% | 9.82% | 9.51% | – | 13.26% | 1.12% | 1.12% |
| Russell 2000® Index(3) | -1.09% | 4.91% | 10.96% | 7.37% | 12.27% | 7.97% | | |
| Russell 2000® Financial Services Index(4) | 2.95% | 9.48% | 10.39% | 8.71% | 12.62% | 8.52% | | |
The performance quoted represents past performance, does not guarantee future results and current performance may be lower or higher than the data quoted. The investment return and principal value of an investment will fluctuate so that shares, when redeemed, may be worth more or less than their original cost. Performance data current to the most recent month end may be obtained at www.emeraldmutualfunds.com.
Performance shown for periods prior to March 16, 2012, reflects the performance of the Forward Banking & Finance Fund, a series of Forward Funds (as a result of a reorganization of the Forward Banking & Finance Fund into the Emerald Banking & Finance Fund).
Returns for periods less than 1 year are cumulative.
The table does not reflect the deduction of taxes that a shareholder would pay on Fund distributions or the redemption of Fund shares.
Subject to investment risks, including possible loss of the principal amount invested.
Maximum Offering Price (MOP) for Class A shares includes the Fund's maximum sales charge of 4.75%. Performance shown at NAV does not include these sales charges and would have been lower had it been taken into account.
A Contingent Deferred Sales Charge (CDSC) of 1.00% may apply to Class C shares redeemed within the first 12 months after a purchase.
| (1) | Inception Dates - Class A: 02/18/1997, Class C: 07/01/2000, Institutional Class: 03/19/2012, Investor Class: 03/16/2010 |
| (2) | Emerald Mutual Fund Advisers Trust ("Emerald" or the "Adviser") has agreed contractually to waive a portion of its fees and reimburse other expenses until August 31, 2020 in amounts necessary to limit the Fund's operating expenses (exclusive of Acquired Fund Fees and Expenses, brokerage expenses, interest expenses, taxes and extraordinary expense) for Class A, Class C, Institutional Class, and Investor Class shares to an annual rate (as percentage of the Fund's average daily net assets) of 1.84%, 2.49%, 1.54% and 1.89% respectively. The Adviser will be permitted to recover, on a class-by-class basis, expenses it has borne through the agreement described above to the extent |
| 20 | www.emeraldmutualfunds.com |
| Emerald Banking and Finance Fund | Manager Commentary |
October 31, 2019 (Unaudited)
that the Fund's expenses in later periods fall below the annual rates set forth in the relevant agreement. The Fund will not be obligated to pay any such deferred fees and expenses more than three years after the year(s) in which the fees and expense were incurred. The Adviser may not discontinue this waiver prior to August 31, 2020, without the approval by the Fund's Board of Trustees. Ratios as of the Prospectus dated August 31, 2019 and may differ from the ratios presented in the Financial Highlights.
| (3) | The Russell 2000® Index measures the performance of the small-cap segment of the U.S. equity universe. The Russell 2000® is a subset of the Russell 3000® Index representing approximately 8% of the total market capitalization of that index. It includes approximately 2000 of the smallest securities based on a combination of their market cap and current index membership. The index is not actively managed and does not reflect any deductions for fees, expenses or taxes. An investor may not invest directly into an index. |
| (4) | The Russell 2000® Financial Services Index is an additional index, and is comprised of the smallest financial services companies in the Russell 3000 Index. The Index is not actively managed and does not reflect any deductions for fees, expense, or taxes. An investor may not invest directly in the Index. |
Important Risks
A fund that concentrates in a particular industry will involve a greater degree of risk than a fund with a more diversified portfolio. Investing in smaller companies generally will present greater investment risks, including: greater price volatility, greater sensitivity to changing economic conditions and less liquidity than the securities of larger, more mature companies.
| Semi-Annual Report | October 31, 2019 | 21 |
| Emerald Banking and Finance Fund | Manager Commentary |
October 31, 2019 (Unaudited)
GROWTH OF $10,000 INVESTMENT IN THE FUND (for the period ended October 31, 2019)
Comparison of change in value of a $10,000 investment (includes applicable sales loads)

The chart represents historical performance of a hypothetical investment of $10,000 in the Fund since inception. Past performance does not guarantee future results. This chart does not reflect the deduction of taxes that a shareholder would pay on Fund distributions or the redemption of Fund shares.
Investing in the Fund is subject to investment risks, including possible loss of the principal amount invested.
| 22 | www.emeraldmutualfunds.com |
| Emerald Funds | Disclosure of Fund Expenses |
October 31, 2019 (Unaudited)
As a shareholder of the Funds, you incur two types of costs: (1) transaction costs, including applicable sales charges (loads); and (2) ongoing costs, including management fees, distribution and service (12b-1) fees, shareholder services fees and other Fund expenses. This example is intended to help you understand your ongoing costs (in dollars) of investing in the Funds and to compare these costs with the ongoing costs of investing in other mutual funds. The example is based on an investment of $1,000 invested at the beginning of the (six-month) period and held for the entire period May 1, 2019 through October 31, 2019.
Actual Expenses
The first line for each share class of the Fund in the table below provides information about actual account values and actual expenses. You may use this information, together with the amount you invested, to estimate the expenses that you paid over the period. Simply divide your account value by $1,000 (for example, an $8,600 account value divided by $1,000 = 8.6), then multiply the result by the number in the applicable line under the heading titled “Expenses Paid During Period” to estimate the expenses you paid on your account during this period.
Hypothetical Example For Comparison Purposes
The second line for each share class of each Fund in the table below provides information about hypothetical account values and hypothetical expenses based on the Fund’s actual expense ratio and an assumed rate of return of 5% per year before expenses, which is not the Fund’s actual return. The hypothetical account values and expenses may not be used to estimate the actual ending account balance or expenses you paid for the period. You may use this information to compare the ongoing costs of investing in the Funds and other funds. To do so, compare this 5% hypothetical example with the 5% hypothetical examples that appear in the shareholder reports of other mutual funds.
Please note that the expenses shown in the table below are meant to highlight your ongoing costs only and do not reflect any transactional costs, such as sales charges (loads), redemption fees or exchange fees. Therefore, the second line for each share class of the Fund within the table is useful in comparing ongoing costs only, and will not help you determine the relative total costs of owning different funds. If these transactional costs were included, your costs would have been higher.
| | | Beginning
Account Value
05/01/19 | | Ending
Account Value
10/31/19 | | Expense
Ratio(a) | | Expense Paid
During Period
5/01/19 - 10/31/19(b) |
| Emerald Growth Fund | | | | | | | | |
| Class A | | | | | | | | |
| Actual | | $ | 1,000.00 | | | $ | 957.70 | | | | 1.01 | % | | $ | 4.97 | |
| Hypothetical (5% return before expenses) | | $ | 1,000.00 | | | $ | 1,020.06 | | | | 1.01 | % | | $ | 5.13 | |
| Class C | | | | | | | | | | | | | | | | |
| Actual | | $ | 1,000.00 | | | $ | 954.10 | | | | 1.67 | % | | $ | 8.20 | |
| Hypothetical (5% return before expenses) | | $ | 1,000.00 | | | $ | 1,016.74 | | | | 1.67 | % | | $ | 8.47 | |
| Institutional Class | | | | | | | | | | | | | | | | |
| Actual | | $ | 1,000.00 | | | $ | 959.10 | | | | 0.69 | % | | $ | 3.40 | |
| Hypothetical (5% return before expenses) | | $ | 1,000.00 | | | $ | 1,021.67 | | | | 0.69 | % | | $ | 3.51 | |
| Investor Class | | | | | | | | | | | | | | | | |
| Actual | | $ | 1,000.00 | | | $ | 957.10 | | | | 1.05 | % | | $ | 5.17 | |
| Hypothetical (5% return before expenses) | | $ | 1,000.00 | | | $ | 1,019.86 | | | | 1.05 | % | | $ | 5.33 | |
| | | | | | | | | | | | | | | | | |
| Emerald Small Cap Value Fund | | | | | | | | | | | | | | | | |
| Class A | | | | | | | | | | | | | | | | |
| Actual | | $ | 1,000.00 | | | $ | 1,021.90 | | | | 1.35 | % | | $ | 6.86 | |
| Hypothetical (5% return before expenses) | | $ | 1,000.00 | | | $ | 1,018.35 | | | | 1.35 | % | | $ | 6.85 | |
| Class C | | | | | | | | | | | | | | | | |
| Actual | | $ | 1,000.00 | | | $ | 1,018.70 | | | | 2.00 | % | | $ | 10.15 | |
| Hypothetical (5% return before expenses) | | $ | 1,000.00 | | | $ | 1,015.08 | | | | 2.00 | % | | $ | 10.13 | |
| Institutional Class | | | | | | | | | | | | | | | | |
| Actual | | $ | 1,000.00 | | | $ | 1,024.10 | | | | 1.00 | % | | $ | 5.09 | |
| Hypothetical (5% return before expenses) | | $ | 1,000.00 | | | $ | 1,020.11 | | | | 1.00 | % | | $ | 5.08 | |
| Investor Class | | | | | | | | | | | | | | | | |
| Actual | | $ | 1,000.00 | | | $ | 1,021.80 | | | | 1.25 | % | | $ | 6.35 | |
| Hypothetical (5% return before expenses) | | $ | 1,000.00 | | | $ | 1,018.85 | | | | 1.25 | % | | $ | 6.34 | |
| Semi-Annual Report | October 31, 2019 | 23 |
| Emerald Funds | Disclosure of Fund Expenses |
October 31, 2019 (Unaudited)
| | | Beginning
Account Value
05/01/19 | | | Ending
Account Value
10/31/19 | | | Expense
Ratio(a) | | | Expense Paid
During Period
5/01/19 - 10/31/19(b) | |
| Emerald Insights Fund | | | | | | | | | | | | |
| Class A | | | | | | | | | | | | | | | | |
| Actual | | $ | 1,000.00 | | | $ | 1,002.60 | | | | 1.35 | % | | $ | 6.80 | |
| Hypothetical (5% return before expenses) | | $ | 1,000.00 | | | $ | 1,018.35 | | | | 1.35 | % | | $ | 6.85 | |
| Class C | | | | | | | | | | | | | | | | |
| Actual | | $ | 1,000.00 | | | $ | 1,000.00 | | | | 2.00 | % | | $ | 10.05 | |
| Hypothetical (5% return before expenses) | | $ | 1,000.00 | | | $ | 1,015.08 | | | | 2.00 | % | | $ | 10.13 | |
| Institutional Class | | | | | | | | | | | | | | | | |
| Actual | | $ | 1,000.00 | | | $ | 1,004.30 | | | | 1.05 | % | | $ | 5.29 | |
| Hypothetical (5% return before expenses) | | $ | 1,000.00 | | | $ | 1,019.86 | | | | 1.05 | % | | $ | 5.33 | |
| Investor Class | | | | | | | | | | | | | | | | |
| Actual | | $ | 1,000.00 | | | $ | 1,003.50 | | | | 1.40 | % | | $ | 7.05 | |
| Hypothetical (5% return before expenses) | | $ | 1,000.00 | | | $ | 1,018.10 | | | | 1.40 | % | | $ | 7.10 | |
| | | | | | | | | | | | | | | | | |
| Emerald Banking and Finance Fund | | | | | | | | | | | | | | | | |
| Class A | | | | | | | | | | | | | | | | |
| Actual | | $ | 1,000.00 | | | $ | 1,005.20 | | | | 1.49 | % | | $ | 7.51 | |
| Hypothetical (5% return before expenses) | | $ | 1,000.00 | | | $ | 1,017.65 | | | | 1.49 | % | | $ | 7.56 | |
| Class C | | | | | | | | | | | | | | | | |
| Actual | | $ | 1,000.00 | | | $ | 1,001.40 | | | | 2.13 | % | | $ | 10.72 | |
| Hypothetical (5% return before expenses) | | $ | 1,000.00 | | | $ | 1,014.43 | | | | 2.13 | % | | $ | 10.79 | |
| Institutional Class | | | | | | | | | | | | | | | | |
| Actual | | $ | 1,000.00 | | | $ | 1,006.50 | | | | 1.13 | % | | $ | 5.70 | |
| Hypothetical (5% return before expenses) | | $ | 1,000.00 | | | $ | 1,019.46 | | | | 1.13 | % | | $ | 5.74 | |
| Investor Class | | | | | | | | | | | | | | | | |
| Actual | | $ | 1,000.00 | | | $ | 1,004.80 | | | | 1.50 | % | | $ | 7.56 | |
| Hypothetical (5% return before expenses) | | $ | 1,000.00 | | | $ | 1,017.60 | | | | 1.50 | % | | $ | 7.61 | |
| (a) | The Fund's expense ratios have been based on the Fund's most recent fiscal half-year expenses. |
| (b) | Expenses are equal to the Fund's annualized expense ratio multiplied by the average account value over the period, multiplied by the number of days in the most recent fiscal half-year (184)/366 (to reflect the half-year period). |
| 24 | www.emeraldmutualfunds.com |
| Emerald Growth Fund | Schedule of Investments |
October 31, 2019 (Unaudited)
| Shares | | | | | Value (Note 2) | |
| COMMON STOCKS: 99.73% | | | |
| Consumer Discretionary: 20.90% | | | |
| | 768,349 | | | American Eagle Outfitters, Inc. | | $ | 11,817,208 | |
| | 1,044,667 | | | Chegg, Inc.(a) | | | 32,029,490 | |
| | 164,826 | | | Children's Place, Inc. | | | 13,500,898 | |
| | 179,706 | | | Churchill Downs, Inc. | | | 23,359,983 | |
| | 202,299 | | | Chuy's Holdings, Inc.(a) | | | 4,930,027 | |
| | 487,123 | | | Del Taco Restaurants, Inc.(a) | | | 3,719,184 | |
| | 211,882 | | | Five Below, Inc.(a) | | | 26,508,557 | |
| | 191,070 | | | Jack in the Box, Inc. | | | 16,053,701 | |
| | 249,281 | | | Marcus Corp. | | | 8,999,044 | |
| | 202,187 | | | Meritage Homes Corp.(a) | | | 14,575,661 | |
| | 575,849 | | | Noodles & Co.(a) | | | 3,069,275 | |
| | 246,016 | | | Ollie's Bargain Outlet Holdings, Inc.(a) | | | 15,715,502 | |
| | 374,933 | | | Planet Fitness, Inc., Class A(a) | | | 23,868,235 | |
| | 523,272 | | | SeaWorld Entertainment, Inc.(a) | | | 13,824,846 | |
| | 430,101 | | | Steven Madden, Ltd. | | | 17,711,559 | |
| | 381,200 | | | Taylor Morrison Home Corp., ClassA(a) | | | 9,549,060 | |
| | 370,375 | | | Tilly's, Inc., Class A | | | 3,800,047 | |
| | 250,360 | | | Urban Outfitters, Inc.(a) | | | 7,185,332 | |
| | 370,606 | | | YETI Holdings, Inc.(a) | | | 12,344,886 | |
| | | | | | | | 262,562,495 | |
| | | | | | | | | |
| Consumer Staples: 5.14% | | | | |
| | 945,701 | | | BellRing Brands, Inc., Class A(a) | | | 16,521,397 | |
| | 7,184 | | | Boston Beer Co., Inc., Class A(a) | | | 2,690,121 | |
| | 469,817 | | | Freshpet, Inc.(a) | | | 24,552,636 | |
| | 847,045 | | | Simply Good Foods Co.(a) | | | 20,786,484 | |
| | | | | | | | 64,550,638 | |
| | | | | | | | | |
| Energy: 0.89% |
| | 478,011 | | | New Fortress Energy LLC(a) | | | 8,240,910 | |
| | 120,420 | | | Viper Energy Partners LP | | | 2,898,509 | |
| | | | | | | | 11,139,419 | |
| | | | | | | | | |
| Financial Services: 12.85% | | | |
| | 79,593 | | | Agree Realty Corp. | | | 6,269,541 | |
| | 159,120 | | | Ameris Bancorp | | | 6,818,292 | |
| | 266,841 | | | Axos Financial, Inc.(a) | | | 7,751,731 | |
| | 480,456 | | | BRP Group, Inc., Class A(a) | | | 7,783,387 | |
| | 81,892 | | | Bryn Mawr Bank Corp. | | | 3,120,904 | |
| | 27,043 | | | CenterState Bank Corp. | | | 685,811 | |
| | 55,159 | | | CNB Financial Corp. | | | 1,724,822 | |
| | 525,752 | | | CrossFirst Bankshares, Inc.(a) | | | 7,029,304 | |
| | 122,232 | | | eHealth, Inc.(a) | | | 8,438,897 | |
| | 1,011,100 | | | Everi Holdings, Inc.(a) | | | 10,171,666 | |
| | 146,592 | | | Evo Payments, Inc., Class A(a) | | | 4,167,611 | |
| | 122,502 | | | First Choice Bancorp | | | 2,739,145 | |
| | 57,497 | | | Industrial Logistics Properties Trust | | | 1,221,236 | |
| | 61,453 | | | LendingTree, Inc.(a) | | | 22,113,862 | |
| | 280,509 | | | Moelis & Co., Class A | | | 10,008,561 | |
| | 134,758 | | | Monmouth Real Estate Investment Corp. | | | 2,032,151 | |
| Shares | | | | | Value (Note 2) | |
| Financial Services (continued) | | |
| | 460,737 | | | OceanFirst Financial Corp. | | $ | 11,025,436 | |
| | 448,774 | | | Pacific Premier Bancorp, Inc. | | | 15,148,366 | |
| | 173,409 | | | Palomar Holdings, Inc.(a) | | | 7,829,416 | |
| | 238,038 | | | Pinnacle Financial Partners, Inc. | | | 14,001,395 | |
| | 73,480 | | | QTS Realty Trust, Inc., REIT, Class A | | | 3,937,793 | |
| | 237,840 | | | STAG Industrial, Inc. | | | 7,382,554 | |
| | | | | | | | 161,401,881 | |
| | | | | | | | | |
| Health Care: 27.11% | | | |
| | 320,427 | | | Adamas Pharmaceuticals, Inc.(a) | | | 1,316,955 | |
| | 127,224 | | | Addus HomeCare Corp.(a) | | | 10,713,533 | |
| | 359,176 | | | Aimmune Therapeutics, Inc.(a) | | | 9,992,276 | |
| | 466,137 | | | Applied Therapeutics, Inc.(a) | | | 7,695,922 | |
| | 152,451 | | | Arena Pharmaceuticals, Inc.(a) | | | 7,426,650 | |
| | 853,513 | | | ArQule, Inc.(a) | | | 8,629,016 | |
| | 269,960 | | | AtriCure, Inc.(a) | | | 7,178,236 | |
| | 390,128 | | | Avrobio, Inc.(a) | | | 5,664,659 | |
| | 1,178,244 | | | BioDelivery Sciences International, Inc.(a) | | | 6,810,250 | |
| | 276,010 | | | Biohaven Pharmaceutical Holding Co., Ltd.(a) | | | 12,674,379 | |
| | 655,619 | | | Catalyst Pharmaceuticals, Inc.(a) | | | 3,101,078 | |
| | 370,320 | | | Collegium Pharmaceutical, Inc.(a) | | | 4,443,840 | |
| | 452,950 | | | Dicerna Pharmaceuticals, Inc.(a) | | | 7,469,146 | |
| | 500,000 | | | Exicure, Inc.(a) | | | 1,305,000 | |
| | 102,057 | | | Haemonetics Corp.(a) | | | 12,321,342 | |
| | 725,347 | | | Horizon Therapeutics PLC(a) | | | 20,969,782 | |
| | 371,540 | | | Insmed, Inc.(a) | | | 6,906,929 | |
| | 216,038 | | | Integer Holdings Corp.(a) | | | 16,729,983 | |
| | 871,986 | | | Karyopharm Therapeutics, Inc.(a) | | | 10,202,236 | |
| | 88,947 | | | LivaNova PLC(a) | | | 6,291,221 | |
| | 45,150 | | | Livongo Health, Inc.(a) | | | 974,789 | |
| | 129,603 | | | Merit Medical Systems, Inc.(a) | | | 2,676,950 | |
| | 78,141 | | | Mirati Therapeutics, Inc.(a) | | | 7,359,319 | |
| | 1,046,059 | | | NeoGenomics, Inc.(a) | | | 23,986,133 | |
| | 2,035,891 | | | Oncocyte Corp.(a) | | | 3,461,015 | |
| | 163,963 | | | Oyster Point Pharma, Inc.(a) | | | 3,079,225 | |
| | 215,634 | | | PTC Therapeutics, Inc.(a) | | | 8,817,274 | |
| | 427,963 | | | Radius Health, Inc.(a) | | | 12,171,268 | |
| | 135,072 | | | Reata Pharmaceuticals, Inc., Class A(a) | | | 27,835,638 | |
| | 460,203 | | | Replimune Group, Inc.(a) | | | 7,823,451 | |
| | 178,978 | | | Tabula Rasa HealthCare, Inc.(a) | | | 9,117,139 | |
| | 326,979 | | | Tandem Diabetes Care, Inc.(a) | | | 20,135,367 | |
| | 207,824 | | | Teladoc Health, Inc.(a) | | | 15,919,318 | |
| | 120,197 | | | TransMedics Group, Inc.(a) | | | 2,156,334 | |
| | 340,850 | | | Twist Bioscience Corp.(a) | | | 8,119,047 | |
| | 183,015 | | | Varex Imaging Corp.(a) | | | 5,492,280 | |
| | 342,591 | | | Vericel Corp.(a) | | | 5,436,919 | |
| | 180,523 | | | Zogenix, Inc.(a) | | | 8,060,352 | |
| | | | | | | | 340,464,251 | |
| | | | | | | | | |
| Materials & Processing: 3.66% | | | |
| | 91,725 | | | Carpenter Technology Corp. | | | 4,496,360 | |
| Semi-Annual Report | October 31, 2019 | 25 |
| Emerald Growth Fund | Schedule of Investments |
October 31, 2019 (Unaudited)
| Shares | | | | | Value (Note 2) | |
| Materials & Processing (continued) | |
| | 439,013 | | | PQ Group Holdings, Inc.(a) | | $ | 7,230,544 | |
| | 389,399 | | | Trex Co., Inc.(a) | | | 34,224,278 | |
| | | | | | | | 45,951,182 | |
| | | | | | | | | |
| Producer Durables: 10.38% | | | |
| | 229,970 | | | Aerojet Rocketdyne Holdings, Inc.(a) | | | 9,941,603 | |
| | 200,000 | | | Air Transport Services Group, Inc.(a) | | | 4,182,000 | |
| | 60,125 | | | Allied Motion Technologies, Inc. | | | 2,276,333 | |
| | 202,888 | | | Chart Industries, Inc.(a) | | | 11,895,324 | |
| | 399,593 | | | Harsco Corp.(a) | | | 8,099,750 | |
| | 127,607 | | | Insperity, Inc. | | | 13,479,127 | |
| | 190,337 | | | Knoll, Inc. | | | 5,089,611 | |
| | 1,161,756 | | | Kratos Defense & Security Solutions, Inc.(a) | | | 21,933,953 | |
| | 155,734 | | | NV5 Global, Inc.(a) | | | 11,279,814 | |
| | 215,416 | | | Tetra Tech, Inc. | | | 18,842,438 | |
| | 319,956 | | | TriNet Group, Inc.(a) | | | 16,954,468 | |
| | 415,770 | | | Tutor Perini Corp.(a) | | | 6,431,962 | |
| | | | | | | | 130,406,383 | |
| | | | | | | | | |
| Technology: 16.35% | | | |
| | 187,500 | | | Alarm.com Holdings, Inc.(a) | | | 9,262,500 | |
| | 626,079 | | | Ciena Corp.(a) | | | 23,240,052 | |
| | 66,150 | | | EverQuote, Inc., Class A(a) | | | 1,342,845 | |
| | 340,571 | | | ForeScout Technologies, Inc.(a) | | | 10,475,964 | |
| | 1,516,391 | | | Glu Mobile, Inc.(a) | | | 8,992,199 | |
| | 482,910 | | | Leaf Group, Ltd.(a) | | | 1,434,243 | |
| | 21,573 | | | Lumentum Holdings, Inc.(a) | | | 1,351,764 | |
| | 28,184 | | | MACOM Technology Solutions Holdings, Inc.(a) | | | 640,904 | |
| | 244,392 | | | Mercury Systems, Inc.(a) | | | 18,001,915 | |
| | 362,060 | | | Model N, Inc.(a) | | | 10,785,767 | |
| | 66,765 | | | New Relic, Inc.(a) | | | 4,276,966 | |
| | 156,015 | | | Perficient, Inc.(a) | | | 6,115,788 | |
| | 432,018 | | | PlayAGS, Inc.(a) | | | 4,985,488 | |
| | 756,598 | | | Pluralsight, Inc., Class A(a) | | | 13,679,292 | |
| | 73,550 | | | Proofpoint, Inc.(a) | | | 8,485,463 | |
| | 109,616 | | | Q2 Holdings, Inc.(a) | | | 7,836,448 | |
| | 419,395 | | | Rapid7, Inc.(a) | | | 21,007,495 | |
| | 384,466 | | | SailPoint Technologies Holding, Inc.(a) | | | 7,443,262 | |
| | 488,358 | | | SVMK, Inc.(a) | | | 8,985,787 | |
| | 696,516 | | | USA Technologies, Inc.(a) | | | 4,513,424 | |
| | 292,454 | | | Varonis Systems, Inc.(a) | | | 20,925,084 | |
| | 623,956 | | | Viavi Solutions, Inc.(a) | | | 9,958,338 | |
| | 84,687 | | | Vocera Communications, Inc.(a) | | | 1,686,965 | |
| | | | | | | | 205,427,953 | |
| | | | | | | | | |
| Utilities: 2.45% | | | |
| | 14,982 | | | Boingo Wireless, Inc.(a) | | | 141,880 | |
| | 205,625 | | | Cogent Communications Holdings, Inc. | | | 12,057,850 | |
| | 155,697 | | | Shenandoah Telecommunications Co. | | | 5,007,215 | |
| Shares | | | | | Value (Note 2) | |
| Utilities (continued) | | | |
| | 1,387,075 | | | Vonage Holdings Corp.(a) | | $ | 13,551,723 | |
| | | | | | | | 30,758,668 | |
| | | | | | | | | |
| | | | | Total Common Stocks | | | | |
| | | | | (Cost $914,688,269) | | | 1,252,662,870 | |
| | | | | | | | | |
| SHORT TERM INVESTMENTS: 0.24% | | | |
| | 2,985,193 | | | Dreyfus Government Cash Management Fund - Institutional Class 1.741% (7-Day Yield) | | | 2,985,193 | |
| | | | | | | | | |
| | | | | Total Short Term Investments | | | | |
| | | | | (Cost $2,985,193) | | | 2,985,193 | |
| | | | | | | | | |
| Total Investments: 99.97% | | | | |
| (Cost $917,673,462) | | | 1,255,648,063 | |
| | | | | | | | | |
| Other Assets In Excess Of Liabilities: 0.03% | | | 417,389 | |
| Net Assets: 100.00% | | $ | 1,256,065,452 | |
| (a) | Non-income producing security. |
For Fund compliance purposes, the Fund's industry classifications refer to any one or more of the industry sub-classifications used by one or more widely recognized market indexes or ratings group indexes, and/or as defined by Fund management. This definition may not apply for purposes of this report, which may combine industry sub-classifications for reporting ease. Industries are shown as a percentage of net assets.
See Notes to Financial Statements.
| 26 | www.emeraldmutualfunds.com |
| Emerald Small Cap Value Fund | Schedule of Investments |
October 31, 2019 (Unaudited)
| Shares | | | | | Value (Note 2) | |
| COMMON STOCKS: 98.93% |
| Consumer Discretionary: 12.80% | | | | |
| | 1,138 | | | Aaron's, Inc. | | $ | 85,270 | |
| | 477 | | | Children's Place, Inc. | | | 39,071 | |
| | 1,200 | | | Eldorado Resorts, Inc.(a) | | | 53,724 | |
| | 6,759 | | | GameStop Corp., Class A | | | 36,769 | |
| | 3,699 | | | Gray Television, Inc.(a) | | | 60,701 | |
| | 2,825 | | | Meritor, Inc.(a) | | | 62,235 | |
| | 4,678 | | | Party City Holdco, Inc.(a) | | | 26,290 | |
| | 4,906 | | | ZAGG, Inc.(a) | | | 36,157 | |
| | | | | | | | 400,217 | |
| | | | | | | | | |
| Energy: 5.79% | | | | |
| | 1,310 | | | Arcosa, Inc. | | | 50,317 | |
| | 1,728 | | | Delek US Holdings, Inc. | | | 69,033 | |
| | 3,936 | | | Magnolia Oil & Gas Corp., Class A(a) | | | 38,652 | |
| | 962 | | | Viper Energy Partners LP | | | 23,155 | |
| | | | | | | | 181,157 | |
| | | | | | | | | |
| Financial Services: 41.49% | | | | |
| | 2,582 | | | Amalgamated Bank, Class A | | | 47,018 | |
| | 3,392 | | | Amerant Bancorp, Inc., Class B(a) | | | 48,166 | |
| | 727 | | | Americold Realty Trust | | | 29,145 | |
| | 1,239 | | | Ameris Bancorp | | | 53,091 | |
| | 1,814 | | | Ares Management Corp., Class A | | | 53,640 | |
| | 1,669 | | | Axos Financial, Inc.(a) | | | 48,484 | |
| | 4,384 | | | Bancorp, Inc.(a) | | | 47,786 | |
| | 3,074 | | | Bank7 Corp. | | | 55,947 | |
| | 2,635 | | | Baycom Corp.(a) | | | 55,704 | |
| | 3,242 | | | Bridgewater Bancshares, Inc.(a) | | | 40,817 | |
| | 2,910 | | | BRP Group, Inc., Class A(a) | | | 47,142 | |
| | 1,529 | | | CNB Financial Corp. | | | 47,812 | |
| | 1,407 | | | Easterly Government Properties, Inc. | | | 31,404 | |
| | 1,102 | | | Employers Holdings, Inc. | | | 46,659 | |
| | 258 | | | Euronet Worldwide, Inc.(a) | | | 36,138 | |
| | 503 | | | First Merchants Corp. | | | 19,894 | |
| | 2,879 | | | Heritage Insurance Holdings, Inc. | | | 38,348 | |
| | 703 | | | Innovative Industrial Properties, Inc. | | | 53,428 | |
| | 1,433 | | | Investar Holding Corp. | | | 35,553 | |
| | 2,336 | | | Meta Financial Group, Inc. | | | 73,958 | |
| | 976 | | | Moelis & Co., Class A | | | 34,824 | |
| | 1,563 | | | People's Utah Bancorp | | | 45,483 | |
| | 2,177 | | | Plymouth Industrial REIT, Inc. | | | 41,058 | |
| | 1,924 | | | Rexford Industrial Realty, Inc. | | | 92,526 | |
| | 1,234 | | | Synovus Financial Corp. | | | 41,796 | |
| | 2,193 | | | TPG RE Finance Trust, Inc. | | | 44,364 | |
| | 1,169 | | | Triumph Bancorp, Inc.(a) | | | 37,934 | |
| | 988 | | | Western Alliance Bancorp | | | 48,738 | |
| | | | | | | | 1,296,857 | |
| | | | | | | | | |
| Health Care: 2.97% | | | | |
| | 336 | | | Biohaven Pharmaceutical Holding Co., Ltd.(a) | | | 15,429 | |
| | 1,478 | | | Karyopharm Therapeutics, Inc.(a) | | | 17,293 | |
| Shares | | | | | Value (Note 2) | |
| Health Care (continued) |
| | 2,006 | | | Varex Imaging Corp.(a) | | $ | 60,200 | |
| | | | | | | | 92,922 | |
| | | | | | | | | |
| Materials & Processing: 6.28% | | | | |
| | 1,673 | | | Kirkland Lake Gold, Ltd. | | | 78,547 | |
| | 1,237 | | | Koppers Holdings, Inc.(a) | | | 39,708 | |
| | 1,551 | | | Universal Forest Products, Inc. | | | 78,108 | |
| | | | | | | | 196,363 | |
| | | | | | | | | |
| Producer Durables: 16.89% | | | | |
| | 1,073 | | | Air Lease Corp. | | | 47,191 | |
| | 1,071 | | | Allied Motion Technologies, Inc. | | | 40,548 | |
| | 1,539 | | | Columbus McKinnon Corp. | | | 57,743 | |
| | 868 | | | Cubic Corp. | | | 64,006 | |
| | 1,028 | | | Douglas Dynamics, Inc. | | | 48,141 | |
| | 2,535 | | | Harsco Corp.(a) | | | 51,384 | |
| | 1,525 | | | Hillenbrand, Inc. | | | 46,955 | |
| | 807 | | | ICF International, Inc. | | | 69,152 | |
| | 633 | | | OSI Systems, Inc.(a) | | | 62,819 | |
| | 906 | | | SP Plus Corp.(a) | | | 40,018 | |
| | | | | | | | 527,957 | |
| | | | | | | | | |
| Technology: 11.54% | | | | |
| | 1,749 | | | Blucora, Inc.(a) | | | 37,831 | |
| | 2,280 | | | Cerence, Inc.(a) | | | 35,340 | |
| | 1,255 | | | Ebix, Inc. | | | 53,501 | |
| | 1,924 | | | Kulicke & Soffa Industries, Inc. | | | 45,685 | |
| | 417 | | | MKS Instruments, Inc. | | | 45,128 | |
| | 6,690 | | | Photronics, Inc.(a) | | | 78,941 | |
| | 2,623 | | | PlayAGS, Inc.(a) | | | 30,269 | |
| | 3,130 | | | Turtle Beach Corp.(a) | | | 34,055 | |
| | | | | | | | 360,750 | |
| | | | | | | | | |
| Utilities: 1.17% | | | | |
| | 3,732 | | | Vonage Holdings Corp.(a) | | | 36,462 | |
| | | | | | | | | |
| | | | | Total Common Stocks | | | | |
| | | | | (Cost $2,563,831) | | | 3,092,685 | |
| | | | | | | | | |
| SHORT TERM INVESTMENTS: 0.42% | | | | |
| | 13,247 | | | Dreyfus Government Cash Management Fund - Institutional Class 1.741% (7-Day Yield) | | | 13,247 | |
| | | | | | | | | |
| | | | | Total Short Term Investments | | | | |
| | | | | (Cost $13,247) | | | 13,247 | |
| | | | | | | | | |
| Total Investments: 99.35% | | | | |
(Cost $2,577,078) | | | 3,105,932 | |
| Semi-Annual Report | October 31, 2019 | 27 |
| Emerald Small Cap Value Fund | Schedule of Investments |
October 31, 2019 (Unaudited)
| Shares | | Value (Note 2) | |
| Utilities (continued) | | | | |
| | | | | |
| Other Assets In Excess Of Liabilities: 0.65% | | | 20,193 | |
| Net Assets: 100.00% | | $ | 3,126,125 | |
| (a) | Non-income producing security. |
For Fund compliance purposes, the Fund's industry classifications refer to any one or more of the industry sub-classifications used by one or more widely recognized market indexes or ratings group indexes, and/or as defined by Fund management. This definition may not apply for purposes of this report, which may combine industry sub-classifications for reporting ease. Industries are shown as a percentage of net assets.
See Notes to Financial Statements.
| 28 | www.emeraldmutualfunds.com |
| Emerald Insights Fund | Schedule of Investments |
October 31, 2019 (Unaudited)
| Shares | | | | | Value (Note 2) | |
| COMMON STOCKS: 92.36% |
| Consumer Discretionary: 14.44% |
| | 302 | | | Amazon.com, Inc.(a) | | $ | 536,551 | |
| | 599 | | | Burlington Stores, Inc.(a) | | | 115,110 | |
| | 8,864 | | | Chegg, Inc.(a) | | | 271,770 | |
| | 953 | | | Churchill Downs, Inc. | | | 123,880 | |
| | 3,937 | | | Cinemark Holdings, Inc. | | | 144,094 | |
| | 930 | | | Dine Brands Global, Inc. | | | 68,030 | |
| | 479 | | | Home Depot, Inc. | | | 112,364 | |
| | 1,076 | | | Lennar Corp., Class A | | | 64,130 | |
| | 616 | | | Polaris, Inc. | | | 60,768 | |
| | 7,928 | | | SeaWorld Entertainment, Inc.(a) | | | 209,458 | |
| | | | | | | | 1,706,155 | |
| | | | | | | | | |
| Consumer Staples: 3.44% | | | | |
| | 8,644 | | | BellRing Brands, Inc., Class A(a) | | | 151,010 | |
| | 428 | | | Boston Beer Co., Inc., Class A(a) | | | 160,269 | |
| | 1,830 | | | Freshpet, Inc.(a) | | | 95,636 | |
| | | | | | | | 406,915 | |
| | | | | | | | | |
| Energy: 4.24% | | | | |
| | 2,041 | | | Diamondback Energy, Inc. | | | 175,036 | |
| | 5,577 | | | Magnolia Oil & Gas Corp., Class A(a) | | | 54,766 | |
| | 4,134 | | | Oil States International, Inc.(a) | | | 58,992 | |
| | 3,248 | | | Parsley Energy, Inc., Class A | | | 51,351 | |
| | 6,808 | | | Tellurian, Inc.(a) | | | 54,260 | |
| | 4,445 | | | Viper Energy Partners LP | | | 106,991 | |
| | | | | | | | 501,396 | |
| | | | | | | | | |
| Financial Services: 8.31% | | | | |
| | 1,029 | | | Blackstone Group, Inc., Class A | | | 54,702 | |
| | 831 | | | Citigroup, Inc. | | | 59,716 | |
| | 562 | | | Euronet Worldwide, Inc.(a) | | | 78,719 | |
| | 640 | | | Fiserv, Inc.(a) | | | 67,930 | |
| | 989 | | | JPMorgan Chase & Co. | | | 123,546 | |
| | 617 | | | LendingTree, Inc.(a) | | | 222,027 | |
| | 1,262 | | | Visa, Inc., Class A | | | 225,721 | |
| | 3,041 | | | Western Alliance Bancorp | | | 150,013 | |
| | | | | | | | 982,374 | |
| | | | | | | | | |
| Health Care: 16.94% | | | | |
| | 1,116 | | | Abbott Laboratories | | | 93,309 | |
| | 1,002 | | | Alnylam Pharmaceuticals, Inc.(a) | | | 86,914 | |
| | 3,284 | | | Applied Therapeutics, Inc.(a) | | | 54,219 | |
| | 2,747 | | | Avrobio, Inc.(a) | | | 39,886 | |
| | 9,556 | | | BioDelivery Sciences International, Inc.(a) | | | 55,234 | |
| | 1,922 | | | Biohaven Pharmaceutical Holding Co., Ltd.(a) | | | 88,258 | |
| | 1,592 | | | BioTelemetry, Inc.(a) | | | 62,661 | |
| | 11,833 | | | Catalyst Pharmaceuticals, Inc.(a) | | | 55,970 | |
| | 3,930 | | | Dicerna Pharmaceuticals, Inc.(a) | | | 64,806 | |
| | 2,406 | | | Horizon Therapeutics PLC(a) | | | 69,558 | |
| | 6,977 | | | Inmode, Ltd.(a) | | | 214,613 | |
| | 8,199 | | | Insmed, Inc.(a) | | | 152,419 | |
| Shares | | | | | Value (Note 2) | |
| Health Care (continued) | | | | |
| | 2,055 | | | Integer Holdings Corp.(a) | | $ | 159,139 | |
| | 659 | | | Merck & Co., Inc. | | | 57,109 | |
| | 1,845 | | | Merit Medical Systems, Inc.(a) | | | 38,109 | |
| | 1,490 | | | Oyster Point Pharma, Inc.(a) | | | 27,982 | |
| | 2,115 | | | PTC Therapeutics, Inc.(a) | | | 86,482 | |
| | 379 | | | Reata Pharmaceuticals, Inc., Class A(a) | | | 78,104 | |
| | 1,311 | | | Sarepta Therapeutics, Inc.(a) | | | 108,892 | |
| | 4,850 | | | SmileDirectClub, Inc.(a) | | | 56,721 | |
| | 2,229 | | | Tabula Rasa HealthCare, Inc.(a) | | | 113,545 | |
| | 1,168 | | | Tandem Diabetes Care, Inc.(a) | | | 71,925 | |
| | 924 | | | Teladoc Health, Inc.(a) | | | 70,778 | |
| | 669 | | | Veeva Systems, Inc., Class A(a) | | | 94,884 | |
| | | | | | | | 2,001,517 | |
| | | | | | | | | |
| Materials & Processing: 4.35% | | | | |
| | 7,862 | | | Cleveland-Cliffs, Inc. | | | 56,842 | |
| | 2,816 | | | GMS, Inc.(a) | | | 84,368 | |
| | 1,308 | | | Scotts Miracle-Gro Co. | | | 131,310 | |
| | 2,747 | | | Trex Co., Inc.(a) | | | 241,434 | |
| | | | | | | | 513,954 | |
| | | | | | | | | |
| Producer Durables: 9.03% | | | | |
| | 2,627 | | | Chart Industries, Inc.(a) | | | 154,021 | |
| | 275 | | | CoStar Group, Inc.(a) | | | 151,118 | |
| | 12,524 | | | Harsco Corp.(a) | | | 253,861 | |
| | 6,372 | | | Kratos Defense & Security Solutions, Inc.(a) | | | 120,303 | |
| | 217 | | | Lockheed Martin Corp. | | | 81,740 | |
| | 797 | | | NV5 Global, Inc.(a) | | | 57,727 | |
| | 1,498 | | | OSI Systems, Inc.(a) | | | 148,662 | |
| | 956 | | | TopBuild Corp.(a) | | | 99,357 | |
| | | | | | | | 1,066,789 | |
| | | | | | | | | |
| Technology: 30.01% | | | | |
| | 102 | | | Adobe, Inc.(a) | | | 28,349 | |
| | 331 | | | Alphabet, Inc., Class A(a) | | | 416,663 | |
| | 1,876 | | | Anaplan, Inc.(a) | | | 88,547 | |
| | 2,300 | | | Apple, Inc. | | | 572,148 | |
| | 3,336 | | | Dropbox, Inc., Class A(a) | | | 66,120 | |
| | 640 | | | Facebook, Inc., Class A(a) | | | 122,656 | |
| | 722 | | | Fortinet, Inc.(a) | | | 58,886 | |
| | 14,389 | | | Glu Mobile, Inc.(a) | | | 85,327 | |
| | 1,621 | | | Knowles Corp.(a) | | | 34,981 | |
| | 912 | | | Lumentum Holdings, Inc.(a) | | | 57,146 | |
| | 4,444 | | | Microsoft Corp. | | | 637,136 | |
| | 7,878 | | | MobileIron, Inc.(a) | | | 49,316 | |
| | 1,086 | | | NVIDIA Corp. | | | 218,308 | |
| | 474 | | | Palo Alto Networks, Inc.(a) | | | 107,783 | |
| | 4,916 | | | PlayAGS, Inc.(a) | | | 56,731 | |
| | 3,118 | | | Pluralsight, Inc., Class A(a) | | | 56,374 | |
| | 844 | | | Proofpoint, Inc.(a) | | | 97,372 | |
| | 7,682 | | | Pure Storage, Inc., Class A(a) | | | 149,492 | |
| | 3,233 | | | Rapid7, Inc.(a) | | | 161,941 | |
| Semi-Annual Report | October 31, 2019 | 29 |
| Emerald Insights Fund | Schedule of Investments |
October 31, 2019 (Unaudited)
| Shares | | | | | Value (Note 2) | |
| Technology (continued) | | | | |
| | 1,382 | | | RealPage, Inc.(a) | | $ | 83,680 | |
| | 362 | | | salesforce.com, Inc.(a) | | | 56,649 | |
| | 288 | | | ServiceNow, Inc.(a) | | | 71,211 | |
| | 924 | | | Take-Two Interactive Software, Inc.(a) | | | 111,203 | |
| | 2,202 | | | Varonis Systems, Inc.(a) | | | 157,553 | |
| | | | | | | | 3,545,572 | |
| | | | | | | | | |
| Utilities: 1.60% | | | | |
| | 2,292 | | | Aqua America, Inc. | | | 103,896 | |
| | 8,713 | | | Vonage Holdings Corp.(a) | | | 85,126 | |
| | | | | | | | 189,022 | |
| | | | | Total Common Stocks | | | | |
| | | | | (Cost $8,861,189) | | | 10,913,694 | |
| | | | | | | | | |
| EXCHANGE TRADED FUNDS: 2.57% | | | | |
| Technology: 2.57% | | | | |
| | 1,411 | | | iShares Expanded Tech-Software Sector ETF | | | 303,252 | |
| | | | | | | | | |
| | | | | Total Exchange Traded Funds | | | | |
| | | | | (Cost $303,743) | | | 303,252 | |
| SHORT TERM INVESTMENTS: 5.07% | | | | |
| | 599,193 | | | Dreyfus Government Cash Management Fund - Institutional Class 1.741% (7-Day Yield) | | | 599,193 | |
| | | | | | | | | |
| | | | | Total Short Term Investments | | | | |
| | | | | (Cost $599,193) | | | 599,193 | |
| Total Investments: 100.00% | | | | |
(Cost $9,764,125) | | | 11,816,139 | |
| | | | | |
| Other Assets In Excess Of Liabilities: 0.00% | | | 159 | |
| Net Assets: 100.00% | | $ | 11,816,298 | |
| (a) | Non-income producing security. |
For Fund compliance purposes, the Fund's industry classifications refer to any one or more of the industry sub-classifications used by one or more widely recognized market indexes or ratings group indexes, and/or as defined by Fund management. This definition may not apply for purposes of this report, which may combine industry sub-classifications for reporting ease. Industries are shown as a percentage of net assets.
See Notes to Financial Statements.
| 30 | www.emeraldmutualfunds.com |
| Emerald Banking and Finance Fund | Schedule of Investments |
October 31, 2019 (Unaudited)
| Shares | | | | | Value
(Note 2) | |
| COMMON STOCKS: 99.24% | | | |
| Consumer Discretionary: 0.53% | | | |
| Advertising Agencies: 0.53% | | | | |
| | 111,560 | | | QuinStreet, Inc.(a) | | $ | 1,431,315 | |
| | | | | | | | | |
| Financial Services: 93.84% | | | | |
| Asset Management & Custodian: 1.97% | | | | |
| | 243,486 | | | Focus Financial Partners, Inc., Class A(a) | | | 5,327,474 | |
| | | | | | | | | |
| Banks: Diversified: 67.12% | | | | |
| | 70,605 | | | 1st Source Corp. | | | 3,613,564 | |
| | 19,953 | | | Amalgamated Bank, Class A | | | 363,344 | |
| | 65,534 | | | Amerant Bancorp, Inc., Class B(a) | | | 930,583 | |
| | 433,450 | | | Amerant Bancorp, Inc., Class A(a) | | | 8,517,292 | |
| | 69,178 | | | American Business Bank(a) | | | 2,358,970 | |
| | 80,890 | | | Ameris Bancorp | | | 3,466,136 | |
| | 913,279 | | | Bancorp, Inc.(a) | | | 9,954,741 | |
| | 316,977 | | | Bank of Commerce Holdings | | | 3,556,482 | |
| | 189,583 | | | Bank of NT Butterfield & Son, Ltd. | | | 6,246,760 | |
| | 495,424 | | | Bank7 Corp. | | | 9,016,717 | |
| | 241,551 | | | Baycom Corp.(a) | | | 5,106,388 | |
| | 224,440 | | | Business First Bancshares, Inc. | | | 5,485,314 | |
| | 175,146 | | | CBTX, Inc. | | | 5,017,933 | |
| | 107,000 | | | Centric Financial Corp.(a) | | | 1,025,060 | |
| | 118,810 | | | Civista Bancshares, Inc. | | | 2,670,849 | |
| | 110,003 | | | CNB Financial Corp. | | | 3,439,794 | |
| | 195,152 | | | Coastal Financial Corp.(a) | | | 2,937,038 | |
| | 26,842 | | | Community Heritage Financial, Inc. | | | 546,235 | |
| | 135,870 | | | CrossFirst Bankshares, Inc.(a) | | | 1,816,582 | |
| | 15,353 | | | Enterprise Financial Services Corp. | | | 672,461 | |
| | 351,830 | | | Esquire Financial Holdings, Inc.(a) | | | 8,549,469 | |
| | 104,051 | | | First Mid Bancshares, Inc. | | | 3,631,380 | |
| | 66,405 | | | FS Bancorp, Inc. | | | 3,801,686 | |
| | 169,547 | | | FVCBankcorp, Inc.(a) | | | 2,919,599 | |
| | 200,000 | | | Guaranty Bancshares, Inc. | | | 6,332,000 | |
| | 211,862 | | | Heritage Commerce Corp. | | | 2,546,581 | |
| | 103,116 | | | Investar Holding Corp. | | | 2,558,308 | |
| | 107,636 | | | Live Oak Bancshares, Inc. | | | 1,953,593 | |
| | 53 | | | Mechanics Bank/Walnut Creek CA(a) | | | 1,636,401 | |
| | 339,799 | | | Merchants Bancorp | | | 5,548,918 | |
| | 229,276 | | | Metropolitan Bank Holding Corp.(a) | | | 9,845,111 | |
| | 27,451 | | | Opus Bank | | | 680,510 | |
| | 150,710 | | | Origin Bancorp, Inc. | | | 5,303,485 | |
| | 127,472 | | | People's Utah Bancorp | | | 3,709,435 | |
| | 19,234 | | | Potomac Bancshares, Inc. | | | 265,622 | |
| | 279,177 | | | Professional Holding Corp.(a) | | | 5,164,774 | |
| | 254,684 | | | Seacoast Commerce Banc Holdings | | | 4,635,249 | |
| | 243,750 | | | ServisFirst Bancshares, Inc. | | | 8,531,250 | |
| | 71,032 | | | Southern First Bancshares, Inc.(a) | | | 2,863,300 | |
| | 307,100 | | | Spirit of Texas Bancshares, Inc.(a) | | | 6,418,390 | |
| | 14,044 | | | TriState Capital Holdings, Inc.(a) | | | 324,697 | |
| | 321,966 | | | Triumph Bancorp, Inc.(a) | | | 10,447,797 | |
| | 168,750 | | | Unity Bancorp, Inc. | | | 3,685,500 | |
| Shares | | | | | Value
(Note 2) | |
| Banks: Diversified (continued) | | | | |
| | 135,517 | | | Veritex Holdings, Inc. | | $ | 3,336,429 | |
| | | | | | | | 181,431,727 | |
| | | | | | | | | |
| Banks: Savings, Thrift & Mortgage Lending: 9.39% | | | | |
| | 22,330 | | | Axos Financial, Inc.(a) | | | 648,686 | |
| | 52,558 | | | Heritage Financial Corp. | | | 1,446,922 | |
| | 262,103 | | | Malvern Bancorp, Inc.(a) | | | 5,865,865 | |
| | 315,532 | | | Meta Financial Group, Inc. | | | 9,989,743 | |
| | 561,684 | | | Sterling Bancorp, Inc. | | | 5,442,718 | |
| | 250,000 | | | University Bancorp, Inc./Ann Arbor MI(a) | | | 2,000,000 | |
| | | | | | | | 25,393,934 | |
| | | | | | | | | |
| Commercial Finance & Mortgage Companies: 1.50% | | | | |
| | 1,222,440 | | | ECN Capital Corp. | | | 4,047,132 | |
| | | | | | | | | |
| Consumer Lending: 3.60% | | | | |
| | 184,318 | | | Curo Group Holdings Corp.(a) | | | 2,578,609 | |
| | 1,970 | | | LendingTree, Inc.(a) | | | 708,905 | |
| | 624,263 | | | MoneyGram International, Inc.(a) | | | 2,472,081 | |
| | 99,650 | | | OneMain Holdings, Inc. | | | 3,986,000 | |
| | | | | | | | 9,745,595 | |
| | | | | | | | | |
| Diversified Financial Services: 2.82% | | | | |
| | 176,340 | | | Cannae Holdings, Inc.(a) | | | 5,149,128 | |
| | 184,790 | | | Repay Holdings Corp.(a) | | | 2,481,730 | |
| | | | | | | | 7,630,858 | |
| | | | | | | | | |
| Equity REIT: Diversified: 0.24% | | | | |
| | 23,330 | | | Acadia Realty Trust | | | 652,773 | |
| | | | | | | | | |
| Equity REIT: Industrial: 3.20% | | | | |
| | 17,700 | | | Americold Realty Trust | | | 709,593 | |
| | 88,000 | | | Innovative Industrial Properties, Inc. | | | 6,688,000 | |
| | 29,490 | | | Plymouth Industrial REIT, Inc. | | | 556,181 | |
| | 14,710 | | | Rexford Industrial Realty, Inc. | | | 707,404 | |
| | | | | | | | 8,661,178 | |
| | | | | | | | | |
| Equity REIT: Office: 0.86% | | | | |
| | 30,610 | | | Easterly Government Properties, Inc. | | | 683,215 | |
| | 97,846 | | | Postal Realty Trust, Inc., Class A | | | 1,643,813 | |
| | | | | | | | 2,327,028 | |
| | | | | | | | | |
| Financial Data & Systems: 0.65% | | | | |
| | 34,921 | | | CPI Card Group, Inc.(a) | | | 63,906 | |
| | 110,410 | | | International Money Express, Inc.(a) | | | 1,691,481 | |
| | | | | | | | 1,755,387 | |
| | | | | | | | | |
| Insurance: Multi-Line: 0.93% | | | | |
| | 86,740 | | | BRP Group, Inc., Class A(a) | | | 1,405,188 | |
| | 30,648 | | | James River Group Holdings, Ltd. | | | 1,097,505 | |
| | | | | | | | 2,502,693 | |
| | | | | | | | | |
| Insurance: Property-Casualty: 1.56% | | | | |
| | 94,901 | | | Kingstone Cos., Inc. | | | 765,851 | |
| Semi-Annual Report | October 31, 2019 | 31 |
| Emerald Banking and Finance Fund | Schedule of Investments |
October 31, 2019 (Unaudited)
| Shares | | | | | Value
(Note 2) | |
| Insurance: Property-Casualty (continued) | | | |
| | 18,353 | | | Kinsale Capital Group, Inc. | | $ | 1,940,279 | |
| | 51,270 | | | NMI Holdings, Inc., Class A(a) | | | 1,499,648 | |
| | | | | | | | 4,205,778 | |
| | | | | | | | | |
| Materials & Processing: 2.58% | | | | |
| Precious Metals & Minerals: 2.58% | | | | |
| | 251,100 | | | Bonterra Resources, Inc.(a) | | | 419,337 | |
| | 139,458 | | | Kirkland Lake Gold, Ltd. | | | 6,547,553 | |
| | | | | | | | 6,966,890 | |
| | | | | | | | | |
| Technology: 2.29% | | | | |
| Computer Services Software & Systems: 2.29% | | | | |
| | 145,310 | | | Ebix, Inc. | | | 6,194,565 | |
| | | | | | | | | |
| | | | | Total Common Stocks | | | | |
| | | | | (Cost $231,995,458) | | | 268,274,327 | |
| SHORT TERM INVESTMENTS: 0.35% | | | | |
| | 947,905 | | | Dreyfus Government Cash Management Fund - Institutional Class 1.741% (7-Day Yield) | | | 947,905 | |
| | | | | | | | | |
| | | | | Total Short Term Investments | | | | |
| | | | | (Cost $947,905) | | | 947,905 | |
| Total Investments: 99.59% | | | | |
(Cost $232,943,363) | | | 269,222,232 | |
| Other Assets In Excess Of Liabilities: 0.41% | | | 1,095,155 | |
| Net Assets: 100.00% | | $ | 270,317,387 | |
| (a) | Non-income producing security. |
For Fund compliance purposes, the Fund's industry classifications refer to any one or more of the industry sub-classifications used by one or more widely recognized market indexes or ratings group indexes, and/or as defined by Fund management. This definition may not apply for purposes of this report, which may combine industry sub-classifications for reporting ease. Industries are shown as a percentage of net assets.
See Notes to Financial Statements.
| 32 | www.emeraldmutualfunds.com |
| Emerald Funds | Statements of Assets and Liabilities |
October 31, 2019 (Unaudited)
| | | Emerald Growth Fund | | | Emerald Small Cap Value Fund | | | Emerald Insights Fund | | | Emerald Banking and Finance Fund | |
| ASSETS: | | | | | | | | | | | | |
| Investments, at value | | $ | 1,255,648,063 | | | $ | 3,105,932 | | | $ | 11,816,139 | | | $ | 269,222,232 | |
| Receivable for investments sold | | | 13,575,625 | | | | 16,000 | | | | 142,024 | | | | 3,719,550 | |
| Receivable for shares sold | | | 810,800 | | | | 15 | | | | 16,000 | | | | 128,844 | |
| Receivable due from advisor | | | – | | | | 10,658 | | | | 3,637 | | | | – | |
| Interest and dividends receivable | | | 223,920 | | | | – | | | | 429 | | | | 28,502 | |
| Other assets | | | 47,069 | | | | 26,939 | | | | 24,184 | | | | 30,515 | |
| Total Assets | | | 1,270,305,477 | | | | 3,159,544 | | | | 12,002,413 | | | | 273,129,643 | |
| LIABILITIES: | | | | | | | | | | | | | | | | |
| Payable for investments purchased | | | 12,149,209 | | | | – | | | | 149,501 | | | | 1,881,691 | |
| Payable for shares redeemed | | | 1,214,249 | | | | 16,000 | | | | 16,000 | | | | 510,332 | |
| Investment advisory fees payable | | | 591,090 | | | | – | | | | – | | | | 213,718 | |
| Payable to fund accounting and administration | | | 44,289 | | | | 1,939 | | | | 2,264 | | | | 9,743 | |
| Payable for distribution and service fees | | | 144,033 | | | | 659 | | | | 3,167 | | | | 119,385 | |
| Payable for trustee fees and expenses | | | 23,951 | | | | 78 | | | | 198 | | | | 5,950 | |
| Payable for transfer agency fees | | | 25,251 | | | | 2,987 | | | | 2,942 | | | | 34,845 | |
| Payable for chief compliance officer fee | | | 3,543 | | | | 17 | | | | 27 | | | | 1,161 | |
| Payable for principal financial officer fee | | | 1,709 | | | | 8 | | | | 13 | | | | 438 | |
| Payable for professional fees | | | 13,108 | | | | 9,865 | | | | 9,870 | | | | 11,869 | |
| Accrued expenses and other liabilities | | | 29,593 | | | | 1,866 | | | | 2,133 | | | | 23,124 | |
| Total Liabilities | | | 14,240,025 | | | | 33,419 | | | | 186,115 | | | | 2,812,256 | |
| NET ASSETS | | $ | 1,256,065,452 | | | $ | 3,126,125 | | | $ | 11,816,298 | | | $ | 270,317,387 | |
| NET ASSETS CONSIST OF: | | | | | | | | | | | | | | | | |
| Paid-in capital (Note 5) | | $ | 918,474,099 | | | $ | 2,938,025 | | | $ | 9,917,952 | | | $ | 238,928,142 | |
| Total distributable earnings | | | 337,591,353 | | | | 188,100 | | | | 1,898,346 | | | | 31,389,245 | |
| NET ASSETS | | $ | 1,256,065,452 | | | $ | 3,126,125 | | | $ | 11,816,298 | | | $ | 270,317,387 | |
| INVESTMENTS, AT COST | | $ | 917,673,462 | | | $ | 2,577,078 | | | $ | 9,764,125 | | | $ | 232,943,363 | |
| PRICING OF SHARES | | | | | | | | | | | | | | | | |
| Class A:(a) | | | | | | | | | | | | | | | | |
| Net Asset Value, offering and redemption price per share | | $ | 24.90 | | | $ | 7.45 | | | $ | 11.54 | | | $ | 32.88 | |
| Net Assets | | $ | 163,601,473 | | | $ | 1,792,228 | | | $ | 10,222,725 | | | $ | 67,976,898 | |
| Shares of beneficial interest outstanding | | | 6,571,487 | | | | 240,470 | | | | 885,938 | | | | 2,067,698 | |
| Maximum offering price per share (NAV/.9525, based on maximum sales charge of 4.75% of the offering price) | | $ | 26.14 | | | $ | 7.82 | | | $ | 12.12 | | | $ | 34.52 | |
| Class C:(a) | | | | | | | | | | | | | | | | |
| Net Asset Value, offering and redemption price per share | | $ | 20.60 | | | $ | 7.09 | | | $ | 11.04 | | | $ | 27.91 | |
| Net Assets | | $ | 23,148,683 | | | $ | 41,602 | | | $ | 141,297 | | | $ | 37,555,657 | |
| Shares of beneficial interest outstanding | | | 1,123,551 | | | | 5,867 | | | | 12,797 | | | | 1,345,366 | |
| Institutional Class: | | | | | | | | | | | | | | | | |
| Net Asset Value, offering and redemption price per share | | $ | 26.05 | | | $ | 7.64 | | | $ | 11.74 | | | $ | 33.92 | |
| Net Assets | | $ | 982,494,544 | | | $ | 813,638 | | | $ | 1,392,707 | | | $ | 133,690,807 | |
| Shares of beneficial interest outstanding | | | 37,722,750 | | | | 106,542 | | | | 118,592 | | | | 3,940,802 | |
| Investor Class: | | | | | | | | | | | | | | | | |
| Net Asset Value, offering and redemption price per share | | $ | 24.77 | | | $ | 7.49 | | | $ | 11.49 | | | $ | 31.11 | |
| Net Assets | | $ | 86,820,752 | | | $ | 478,657 | | | $ | 59,569 | | | $ | 31,094,025 | |
| Shares of beneficial interest outstanding | | | 3,504,748 | | | | 63,874 | | | | 5,186 | | | | 999,570 | |
| (a) | Redemption price per share may be reduced for any applicable contingent deferred sales charge. For a description of a possible sales charge, please see the Funds' Prospectus. |
See Notes to Financial Statements.
| Semi-Annual Report | October 31, 2019 | 33 |
| Emerald Funds | Statements of Operations |
For the Six Months Ended October 31, 2019 (Unaudited)
| | | Emerald Growth Fund | | | Emerald Small Cap Value Fund | | | Emerald Insights Fund | | | Emerald Banking and Finance Fund | |
| INVESTMENT INCOME: | | | | | | | | | | | | |
| Dividends | | $ | 3,326,994 | | | $ | 22,014 | | | $ | 34,854 | | | $ | 1,820,503 | |
| Foreign taxes withheld | | | – | | | | (23 | ) | | | – | | | | (10,323 | ) |
| Total Investment Income | | | 3,326,994 | | | | 21,991 | | | | 34,854 | | | | 1,810,180 | |
| | | | | | | | | | | | | | | | | |
| EXPENSES: | | | | | | | | | | | | | | | | |
| Investment advisory fee (Note 6) | | | 3,691,289 | | | | 13,041 | | | | 41,012 | | | | 1,402,479 | |
| Administration fee | | | 269,875 | | | | 8,450 | | | | 10,227 | | | | 66,584 | |
| Custodian fee | | | 57,866 | | | | 2,726 | | | | 2,527 | | | | 24,995 | |
| Professional fees | | | 20,127 | | | | 8,894 | | | | 8,942 | | | | 13,082 | |
| Transfer agent fee | | | 110,585 | | | | 15,810 | | | | 16,760 | | | | 96,033 | |
| Delegated transfer agent equivalent services fees | | | | | | | | | | | | | | | | |
| Class A | | | 1,219 | | | | – | | | | – | | | | 4,251 | |
| Class C | | | 335 | | | | – | | | | – | | | | 996 | |
| Institutional Class | | | 420 | | | | 9 | | | | – | | | | – | |
| Investor Class | | | 736 | | | | 2 | | | | – | | | | – | |
| Trustee fees and expenses | | | 24,001 | | | | 67 | | | | 198 | | | | 5,757 | |
| Registration/filing fees | | | 32,593 | | | | 21,342 | | | | 18,408 | | | | 31,781 | |
| Reports to shareholder and printing fees | | | 59,344 | | | | 591 | | | | 811 | | | | 29,848 | |
| Distribution and service fees | | | | | | | | | | | | | | | | |
| Class A | | | 303,868 | | | | 3,748 | | | | 16,252 | | | | 132,962 | |
| Class C | | | 127,697 | | | | 188 | | | | 712 | | | | 209,512 | |
| Institutional Class | | | 135,909 | | | | – | | | | 139 | | | | 5,647 | |
| Investor Class | | | 178,622 | | | | 622 | | | | 169 | | | | 66,381 | |
| Chief compliance officer fee | | | 28,289 | | | | 82 | | | | 231 | | | | 6,858 | |
| Principal financial officer fee | | | 4,394 | | | | 15 | | | | 35 | | | | 1,058 | |
| Other | | | 19,432 | | | | 4,494 | | | | 4,614 | | | | 9,078 | |
| Total expenses before waiver | | | 5,066,601 | | | | 80,081 | | | | 121,037 | | | | 2,107,302 | |
| Less fees waived/reimbursed by investment advisor (Note 6) | | | – | | | | (58,167 | ) | | | (48,761 | ) | | | – | |
| Total Net Expenses | | | 5,066,601 | | | | 21,914 | | | | 72,276 | | | | 2,107,302 | |
| NET INVESTMENT INCOME/(LOSS): | | | (1,739,607 | ) | | | 77 | | | | (37,422 | ) | | | (297,122 | ) |
| | | | | | | | | | | | | | | | | |
| REALIZED AND UNREALIZED GAIN/(LOSS) | | | | | | | | | | | | | | | | |
| Net realized gain/(loss) | | | (12,083,106 | ) | | | 66,486 | | | | 235,496 | | | | 4,843,546 | |
| Net realized gain on foreign currency transactions | | | – | | | | – | | | | – | | | | 79 | |
| Net change in unrealized depreciation | | | (42,638,752 | ) | | | (16,232 | ) | | | (133,341 | ) | | | (4,574,983 | ) |
| NET REALIZED AND UNREALIZED GAIN/(LOSS) | | | (54,721,858 | ) | | | 50,254 | | | | 102,155 | | | | 268,642 | |
| NET INCREASE/(DECREASE) IN NET ASSETS RESULTING FROM OPERATIONS | | $ | (56,461,465 | ) | | $ | 50,331 | | | $ | 64,733 | | | $ | (28,480 | ) |
See Notes to Financial Statements.
| 34 | www.emeraldmutualfunds.com |
| Emerald Growth Fund | Statements of Changes in Net Assets |
| | | For the Six Months Ended October 31, 2019 (Unaudited) | | | Year Ended April 30, 2019 | |
| OPERATIONS: | | | | | | | | |
| Net investment loss | | $ | (1,739,607 | ) | | $ | (3,687,116 | ) |
| Net realized gain/(loss) | | | (12,083,106 | ) | | | 65,609,700 | |
| Net change in unrealized appreciation/(depreciation) | | | (42,638,752 | ) | | | 79,706,677 | |
| Net increase/(decrease) in net assets resulting from operations | | | (56,461,465 | ) | | | 141,629,261 | |
| DISTRIBUTIONS TO SHAREHOLDERS (NOTE 3): | | | | | | | 0 0 | |
| Total amount of distributions | | | | | | | | |
| Class A | | | – | | | | (18,783,708 | ) |
| Class C | | | – | | | | (3,291,825 | ) |
| Institutional Class | | | – | | | | (85,437,977 | ) |
| Investor Class | | | – | | | | (9,170,727 | ) |
| Net decrease in net assets from distributions | | | – | | | | (116,684,237 | ) |
| SHARE TRANSACTIONS (NOTE 5): | | | | | | | | |
| Class A | | | | | | | | |
| Proceeds from sale of shares | | | 10,349,204 | | | | 28,831,338 | |
| Issued to shareholders in reinvestment of distributions | | | – | | | | 17,242,400 | |
| Cost of shares redeemed | | | (27,885,748 | ) | | | (100,627,275 | ) |
| Net decrease from share transactions | | | (17,536,544 | ) | | | (54,553,537 | ) |
| Class C | | | | | | | | |
| Proceeds from sale of shares | | | 96,452 | | | | 1,048,239 | |
| Issued to shareholders in reinvestment of distributions | | | – | | | | 2,913,276 | |
| Cost of shares redeemed | | | (5,620,709 | ) | | | (7,089,084 | ) |
| Net decrease from share transactions | | | (5,524,257 | ) | | | (3,127,569 | ) |
| Institutional Class | | | | | | | | |
| Proceeds from sale of shares | | | 87,260,343 | | | | 294,328,397 | |
| Issued to shareholders in reinvestment of distributions | | | – | | | | 76,474,139 | |
| Cost of shares redeemed | | | (112,113,390 | ) | | | (176,456,213 | ) |
| Net increase/(decrease) from share transactions | | | (24,853,047 | ) | | | 194,346,323 | |
| Investor Class | | | | | | | | |
| Proceeds from sale of shares | | | 10,725,622 | | | | 30,586,078 | |
| Issued to shareholders in reinvestment of distributions | | | – | | | | 3,282,222 | |
| Cost of shares redeemed | | | (24,083,121 | ) | | | (40,897,792 | ) |
| Net decrease from share transactions | | | (13,357,499 | ) | | | (7,029,492 | ) |
| Net increase/(decrease) in net assets | | $ | (117,732,812 | ) | | $ | 154,580,749 | |
| NET ASSETS: | | | | | | | | |
| Beginning of period | | | 1,373,798,264 | | | | 1,219,217,515 | |
| End of period | | $ | 1,256,065,452 | | | $ | 1,373,798,264 | |
| Semi-Annual Report | October 31, 2019 | 35 |
| Emerald Growth Fund | Statements of Changes in Net Assets |
| | | For the Six Months Ended October 31, 2019 (Unaudited) | | | Year Ended April 30, 2019 | |
| Other Information: | | | | | | |
| SHARE TRANSACTIONS: | | | | | | |
| Class A | | | | | | |
| Sold | | | 413,334 | | | | 1,099,455 | |
| Distributions reinvested | | | – | | | | 819,116 | |
| Redeemed | | | (1,106,537 | ) | | | (3,863,070 | ) |
| Net decrease in shares outstanding | | | (693,203 | ) | | | (1,944,499 | ) |
| Class C | | | | | | | | |
| Sold | | | 4,592 | | | | 52,709 | |
| Distributions reinvested | | | – | | | | 166,283 | |
| Redeemed | | | (269,676 | ) | | | (327,363 | ) |
| Net decrease in shares outstanding | | | (265,084 | ) | | | (108,371 | ) |
| Institutional Class | | | | | | | | |
| Sold | | | 3,323,832 | | | | 10,623,887 | |
| Distributions reinvested | | | – | | | | 3,482,429 | |
| Redeemed | | | (4,286,275 | ) | | | (6,569,755 | ) |
| Net increase/(decrease) in shares outstanding | | | (962,443 | ) | | | 7,536,561 | |
| Investor Class | | | | | | | | |
| Sold | | | 429,411 | | | | 1,272,243 | |
| Distributions reinvested | | | – | | | | 156,669 | |
| Redeemed | | | (959,519 | ) | | | (1,552,305 | ) |
| Net decrease in shares outstanding | | | (530,108 | ) | | | (123,393 | ) |
See Notes to Financial Statements.
| 36 | www.emeraldmutualfunds.com |
| Emerald Small Cap Value Fund | Statements of Changes in Net Assets |
| | | For the Six Months Ended October 31, 2019 (Unaudited) | | | Year Ended April 30, 2019 | |
| OPERATIONS: | | | | | | | | |
| Net investment income/(loss) | | $ | 77 | | | $ | (6,269 | ) |
| Net realized gain/(loss) | | | 66,486 | | | | (289,522 | ) |
| Net change in unrealized depreciation | | | (16,232 | ) | | | (513,409 | ) |
| Net increase/(decrease) in net assets resulting from operations | | | 50,331 | | | | (809,200 | ) |
| DISTRIBUTIONS TO SHAREHOLDERS (NOTE 3): | | | | | | | 0 0 | |
| Total amount of distributions | | | | | | | | |
| Class A | | | – | | | | (832,298 | ) |
| Class C | | | – | | | | (2,956 | ) |
| Institutional Class | | | – | | | | (268,960 | ) |
| Investor Class | | | – | | | | (122,718 | ) |
| Net decrease in net assets from distributions | | | – | | | | (1,226,932 | ) |
| SHARE TRANSACTIONS (NOTE 5): | | | | | | | | |
| Class A | | | | | | | | |
| Proceeds from sale of shares | | | 68,002 | | | | 1,888,438 | |
| Issued to shareholders in reinvestment of distributions | | | – | | | | 832,298 | |
| Cost of shares redeemed | | | (962,578 | ) | | | (2,655,284 | ) |
| Net increase/(decrease) from share transactions | | | (894,576 | ) | | | 65,452 | |
| Class C | | | | | | | | |
| Proceeds from sale of shares | | | 2,800 | | | | 26,343 | |
| Issued to shareholders in reinvestment of distributions | | | – | | | | 2,956 | |
| Cost of shares redeemed | | | – | | | | (88,998 | ) |
| Net increase/(decrease) from share transactions | | | 2,800 | | | | (59,699 | ) |
| Institutional Class | | | | | | | | |
| Proceeds from sale of shares | | | 8,494 | | | | 340,310 | |
| Issued to shareholders in reinvestment of distributions | | | – | | | | 268,960 | |
| Cost of shares redeemed | | | (86,857 | ) | | | (2,426,213 | ) |
| Net decrease from share transactions | | | (78,363 | ) | | | (1,816,943 | ) |
| Investor Class | | | | | | | | |
| Proceeds from sale of shares | | | 16,864 | | | | 134,280 | |
| Issued to shareholders in reinvestment of distributions | | | – | | | | 122,718 | |
| Cost of shares redeemed | | | (55,856 | ) | | | (125,199 | ) |
| Net increase/(decrease) from share transactions | | | (38,992 | ) | | | 131,799 | |
| Net decrease in net assets | | $ | (958,800 | ) | | $ | (3,715,523 | ) |
| NET ASSETS: | | | | | | | | |
| Beginning of period | | | 4,084,925 | | | | 7,800,448 | |
| End of period | | $ | 3,126,125 | | | $ | 4,084,925 | |
| Semi-Annual Report | October 31, 2019 | 37 |
| Emerald Small Cap Value Fund | Statements of Changes in Net Assets |
| | | For the Six Months Ended October 31, 2019 (Unaudited) | | | Year Ended April 30, 2019 | |
| Other Information: | | | | | | | | |
| SHARE TRANSACTIONS: | | | | | | | | |
| Class A | | | | | | | | |
| Sold | | | 9,543 | | | | 193,926 | |
| Distributions reinvested | | | – | | | | 131,485 | |
| Redeemed | | | (134,520 | ) | | | (338,910 | ) |
| Net decrease in shares outstanding | | | (124,977 | ) | | | (13,499 | ) |
| Class C | | | | | | | | |
| Sold | | | 422 | | | | 4,031 | |
| Distributions reinvested | | | – | | | | 488 | |
| Redeemed | | | – | | | | (9,693 | ) |
| Net increase/(decrease) in shares outstanding | | | 422 | | | | (5,174 | ) |
| Institutional Class | | | | | | | | |
| Sold | | | 1,166 | | | | 31,414 | |
| Distributions reinvested | | | – | | | | 41,570 | |
| Redeemed | | | (11,795 | ) | | | (255,759 | ) |
| Net decrease in shares outstanding | | | (10,629 | ) | | | (182,775 | ) |
| Investor Class | | | | | | | | |
| Sold | | | 2,326 | | | | 12,696 | |
| Distributions reinvested | | | – | | | | 19,295 | |
| Redeemed | | | (7,937 | ) | | | (15,655 | ) |
| Net increase/(decrease) in shares outstanding | | | (5,611 | ) | | | 16,336 | |
See Notes to Financial Statements.
| 38 | www.emeraldmutualfunds.com |
| Emerald Insights Fund | Statements of Changes in Net Assets |
| | | For the Six Months Ended October 31, 2019 (Unaudited) | | | Year Ended April 30, 2019 | |
| OPERATIONS: | | | | | | | | |
| Net investment loss | | $ | (37,422 | ) | | $ | (74,164 | ) |
| Net realized gain | | | 235,496 | | | | 165,436 | |
| Net change in unrealized appreciation/(depreciation) | | | (133,341 | ) | | | 1,129,078 | |
| Net increase in net assets resulting from operations | | | 64,733 | | | | 1,220,350 | |
| DISTRIBUTIONS TO SHAREHOLDERS (NOTE 3): | | | | | | | 0 0 | |
| Total amount of distributions | | | | | | | | |
| Class A | | | – | | | | (1,601,857 | ) |
| Class C | | | – | | | | (21,254 | ) |
| Institutional Class | | | – | | | | (260,149 | ) |
| Investor Class | | | – | | | | (27,338 | ) |
| Net decrease in net assets from distributions | | | – | | | | (1,910,598 | ) |
| SHARE TRANSACTIONS (NOTE 5): | | | | | | | | |
| Class A | | | | | | | | |
| Proceeds from sale of shares | | | 1,374,942 | | | | 875,418 | |
| Issued to shareholders in reinvestment of distributions | | | – | | | | 1,591,552 | |
| Cost of shares redeemed | | | (610,596 | ) | | | (1,860,087 | ) |
| Net increase from share transactions | | | 764,346 | | | | 606,883 | |
| Class C | | | | | | | | |
| Proceeds from sale of shares | | | 5,000 | | | | 17,884 | |
| Issued to shareholders in reinvestment of distributions | | | – | | | | 21,254 | |
| Cost of shares redeemed | | | (5,078 | ) | | | (22,797 | ) |
| Net increase/(decrease) from share transactions | | | (78 | ) | | | 16,341 | |
| Institutional Class | | | | | | | | |
| Proceeds from sale of shares | | | 35,330 | | | | 282,451 | |
| Issued to shareholders in reinvestment of distributions | | | – | | | | 260,149 | |
| Cost of shares redeemed | | | (31,698 | ) | | | (242,872 | ) |
| Net increase from share transactions | | | 3,632 | | | | 299,728 | |
| Investor Class | | | | | | | | |
| Proceeds from sale of shares | | | 4,600 | | | | 53,100 | |
| Issued to shareholders in reinvestment of distributions | | | – | | | | 27,338 | |
| Cost of shares redeemed | | | (117,483 | ) | | | (20,835 | ) |
| Net increase/(decrease) from share transactions | | | (112,883 | ) | | | 59,603 | |
| Net increase in net assets | | $ | 719,750 | | | $ | 292,307 | |
| NET ASSETS: | | | | | | | | |
| Beginning of period | | | 11,096,548 | | | | 10,804,241 | |
| End of period | | $ | 11,816,298 | | | $ | 11,096,548 | |
| Semi-Annual Report | October 31, 2019 | 39 |
| Emerald Insights Fund | Statements of Changes in Net Assets |
| | | For the Six Months Ended October 31, 2019 (Unaudited) | | | Year Ended April 30, 2019 | |
| Other Information: | | | | | | |
| SHARE TRANSACTIONS: | | | | | | |
| Class A | | | | | | | | |
| Sold | | | 123,184 | | | | 83,189 | |
| Distributions reinvested | | | – | | | | 169,134 | |
| Redeemed | | | (54,060 | ) | | | (147,542 | ) |
| Net increase in shares outstanding | | | 69,124 | | | | 104,781 | |
| Class C | | | | | | | | |
| Sold | | | 457 | | | | 2,031 | |
| Distributions reinvested | | | – | | | | 2,349 | |
| Redeemed | | | (457 | ) | | | (1,680 | ) |
| Net increase in shares outstanding | | | – | | | | 2,700 | |
| Institutional Class | | | | | | | | |
| Sold | | | 3,096 | | | | 19,447 | |
| Distributions reinvested | | | – | | | | 27,241 | |
| Redeemed | | | (2,829 | ) | | | (21,265 | ) |
| Net increase in shares outstanding | | | 267 | | | | 25,423 | |
| Investor Class | | | | | | | | |
| Sold | | | 406 | | | | 4,162 | |
| Distributions reinvested | | | – | | | | 2,921 | |
| Redeemed | | | (10,453 | ) | | | (1,500 | ) |
| Net increase/(decrease) in shares outstanding | | | (10,047 | ) | | | 5,583 | |
See Notes to Financial Statements.
| 40 | www.emeraldmutualfunds.com |
| Emerald Banking and Finance Fund | Statements of Changes in Net Assets |
| | | For the Six Months Ended October 31, 2019 (Unaudited) | | | Year Ended April 30, 2019 | |
| OPERATIONS: | | | | | | |
| Net investment loss | | $ | (297,122 | ) | | $ | (2,526,089 | ) |
| Net realized gain | | | 4,843,625 | | | | 39,986,351 | |
| Net change in unrealized depreciation | | | (4,574,983 | ) | | | (104,241,265 | ) |
| Net decrease in net assets resulting from operations | | | (28,480 | ) | | | (66,781,003 | ) |
| DISTRIBUTIONS TO SHAREHOLDERS (NOTE 3): | | | | | | | | |
| Total amount of distributions | | | | | | | | |
| Class A | | | – | | | | (24,656,256 | ) |
| Class C | | | – | | | | (13,297,550 | ) |
| Institutional Class | | | – | | | | (37,095,621 | ) |
| Investor Class | | | – | | | | (11,056,960 | ) |
| Net decrease in net assets from distributions | | | – | | | | (86,106,387 | ) |
| SHARE TRANSACTIONS (NOTE 5): | | | | | | | | |
| Class A | | | | | | | | |
| Proceeds from sale of shares | | | 5,017,390 | | | | 42,099,315 | |
| Issued to shareholders in reinvestment of distributions | | | – | | | | 20,425,832 | |
| Cost of shares redeemed | | | (24,259,396 | ) | | | (101,578,106 | ) |
| Net decrease from share transactions | | | (19,242,006 | ) | | | (39,052,959 | ) |
| Class C | | | | | | | | |
| Proceeds from sale of shares | | | 357,744 | | | | 8,581,109 | |
| Issued to shareholders in reinvestment of distributions | | | – | | | | 11,494,938 | |
| Cost of shares redeemed | | | (12,693,927 | ) | | | (26,316,417 | ) |
| Net decrease from share transactions | | | (12,336,183 | ) | | | (6,240,370 | ) |
| Institutional Class | | | | | | | | |
| Proceeds from sale of shares | | | 9,193,115 | | | | 96,435,931 | |
| Issued to shareholders in reinvestment of distributions | | | – | | | | 24,683,933 | |
| Cost of shares redeemed | | | (38,654,855 | ) | | | (115,500,368 | ) |
| Net increase/(decrease) from share transactions | | | (29,461,740 | ) | | | 5,619,496 | |
| Investor Class | | | | | | | | |
| Proceeds from sale of shares | | | 447,398 | | | | 16,871,872 | |
| Issued to shareholders in reinvestment of distributions | | | – | | | | 10,138,517 | |
| Cost of shares redeemed | | | (10,726,518 | ) | | | (36,983,304 | ) |
| Net decrease from share transactions | | | (10,279,120 | ) | | | (9,972,915 | ) |
| Net decrease in net assets | | $ | (71,347,529 | ) | | $ | (202,534,138 | ) |
| NET ASSETS: | | | | | | | | |
| Beginning of period | | | 341,664,916 | | | | 544,199,054 | |
| End of period | | $ | 270,317,387 | | | $ | 341,664,916 | |
| Semi-Annual Report | October 31, 2019 | 41 |
| Emerald Banking and Finance Fund | Statements of Changes in Net Assets |
| | | For the Six Months Ended October 31, 2019 (Unaudited) | | | Year Ended April 30, 2019 | |
| Other Information: | | | | | | | | |
| SHARE TRANSACTIONS: | | | | | | | | |
| Class A | | | | | | | | |
| Sold | | | 156,963 | | | | 975,875 | |
| Distributions reinvested | | | – | | | | 679,954 | |
| Redeemed | | | (756,954 | ) | | | (2,733,766 | ) |
| Net decrease in shares outstanding | | | (599,991 | ) | | | (1,077,937 | ) |
| Class C | | | | | | | | |
| Sold | | | 13,150 | | | | 233,767 | |
| Distributions reinvested | | | – | | | | 448,146 | |
| Redeemed | | | (464,890 | ) | | | (819,451 | ) |
| Net decrease in shares outstanding | | | (451,740 | ) | | | (137,538 | ) |
| Institutional Class | | | | | | | | |
| Sold | | | 276,916 | | | | 2,318,054 | |
| Distributions reinvested | | | – | | | | 798,833 | |
| Redeemed | | | (1,170,804 | ) | | | (3,002,806 | ) |
| Net increase/(decrease) in shares outstanding | | | (893,888 | ) | | | 114,081 | |
| Investor Class | | | | | | | | |
| Sold | | | 14,609 | | | | 392,263 | |
| Distributions reinvested | | | – | | | | 356,613 | |
| Redeemed | | | (352,780 | ) | | | (1,028,361 | ) |
| Net decrease in shares outstanding | | | (338,171 | ) | | | (279,485 | ) |
See Notes to Financial Statements.
| 42 | www.emeraldmutualfunds.com |
| Emerald Growth Fund | Financial Highlights |
For a share outstanding throughout the years presented
| | | CLASS A | |
| | | For the Six Months Ended October 31, 2019 (Unaudited) | | | Year Ended April 30, 2019 | | | Year Ended April 30, 2018 | | | Year Ended April 30, 2017 | | | Year Ended April 30, 2016 | | | Year Ended April 30, 2015 | |
| NET ASSET VALUE, BEGINNING OF PERIOD | | $ | 26.00 | | | $ | 25.99 | | | $ | 21.83 | | | $ | 17.52 | | | $ | 20.02 | | | $ | 18.11 | |
| INCOME/(LOSS) FROM OPERATIONS: | | | | | | | | | | | | | | | | | | | | | | | | |
| Net investment loss(a) | | | (0.06 | ) | | | (0.13 | ) | | | (0.16 | ) | | | (0.11 | ) | | | (0.15 | ) | | | (0.18 | ) |
| Net realized and unrealized gain/(loss) on investments | | | (1.04 | ) | | | 2.61 | | | | 4.32 | | | | 4.42 | | | | (1.88 | ) | | | 3.43 | |
| Total from Investment Operations | | | (1.10 | ) | | | 2.48 | | | | 4.16 | | | | 4.31 | | | | (2.03 | ) | | | 3.25 | |
| | | | | | | | | | | | | | | | | | | | | | | | | |
| LESS DISTRIBUTIONS: | | | | | | | | | | | | | | | | | | | | | | | | |
| From capital gains | | | – | | | | (2.47 | ) | | | – | | | | – | | | | (0.47 | ) | | | (1.34 | ) |
| Total Distributions | | | – | | | | (2.47 | ) | | | – | | | | – | | | | (0.47 | ) | | | (1.34 | ) |
| NET INCREASE/(DECREASE) IN NET ASSET VALUE | | | (1.10 | ) | | | 0.01 | | | | 4.16 | | | | 4.31 | | | | (2.50 | ) | | | 1.91 | |
| NET ASSET VALUE, END OF PERIOD | | $ | 24.90 | | | $ | 26.00 | | | $ | 25.99 | | | $ | 21.83 | | | $ | 17.52 | | | $ | 20.02 | |
| | | | | | | | | | | | | | | | | | | | | | | | | |
| TOTAL RETURN(b) | | | (4.23 | )%(c) | | | 11.79 | % | | | 19.06 | % | | | 24.60 | % | | | (10.28 | )% | | | 18.38 | % |
| RATIOS/SUPPLEMENTAL DATA: | | | | | | | | | | | | | | | | | | | | | | | | |
| Net Assets, End of Period (000s) | | $ | 163,601 | | | $ | 188,883 | | | $ | 239,316 | | | $ | 270,389 | | | $ | 323,603 | | | $ | 123,828 | |
| RATIOS TO AVERAGE NET ASSETS: | | | | | | | | | | | | | | | | | | | | | | | | |
| Net Investment loss | | | (0.50 | )%(d) | | | (0.50 | )% | | | (0.64 | )% | | | (0.57 | )% | | | (0.81 | )% | | | (0.93 | )% |
| Operating expenses excluding reimbursement/waiver | | | 1.01 | %(d) | | | 1.01 | % | | | 1.03 | % | | | 1.08 | % | | | 1.17 | % | | | 1.29 | % |
| Operating expenses including reimbursement/waiver | | | 1.01 | %(d) | | | 1.01 | % | | | 1.03 | % | | | 1.08 | % | | | 1.17 | % | | | 1.29 | % |
| PORTFOLIO TURNOVER RATE | | | 22 | %(c) | | | 64 | % | | | 66 | % | | | 54 | % | | | 45 | % | | | 68 | % |
| (a) | Per share amounts are based upon average shares outstanding. |
| (b) | Total return does not reflect the effect of sales charges. |
See Notes to Financial Statements.
| Semi-Annual Report | October 31, 2019 | 43 |
| Emerald Growth Fund | Financial Highlights |
For a share outstanding throughout the years presented
| | | CLASS C | |
| | | For the Six Months Ended October 31, 2019 (Unaudited) | | | Year Ended April 30, 2019 | | | Year Ended April 30, 2018 | | | Year Ended April 30, 2017 | | | Year Ended April 30, 2016 | | | Year Ended April 30, 2015 | |
| NET ASSET VALUE, BEGINNING OF PERIOD | | $ | 21.59 | | | $ | 22.18 | | | $ | 18.75 | | | $ | 15.14 | | | $ | 17.48 | | | $ | 16.07 | |
| INCOME/(LOSS) FROM OPERATIONS: | | | | | | | | | | | | | | | | | | | | | | | | |
| Net investment loss(a) | | | (0.12 | ) | | | (0.26 | ) | | | (0.27 | ) | | | (0.21 | ) | | | (0.24 | ) | | | (0.27 | ) |
| Net realized and unrealized gain/(loss) on investments | | | (0.87 | ) | | | 2.14 | | | | 3.70 | | | | 3.82 | | | | (1.63 | ) | | | 3.02 | |
| Total from Investment Operations | | | (0.99 | ) | | | 1.88 | | | | 3.43 | | | | 3.61 | | | | (1.87 | ) | | | 2.75 | |
| | | | | | | | | | | | | | | | | | | | | | | | | |
| LESS DISTRIBUTIONS: | | | | | | | | | | | | | | | | | | | | | | | | |
| From capital gains | | | – | | | | (2.47 | ) | | | – | | | | – | | | | (0.47 | ) | | | (1.34 | ) |
| Total Distributions | | | – | | | | (2.47 | ) | | | – | | | | – | | | | (0.47 | ) | | | (1.34 | ) |
| NET INCREASE/(DECREASE) IN NET ASSET VALUE | | | (0.99 | ) | | | (0.59 | ) | | | 3.43 | | | | 3.61 | | | | (2.34 | ) | | | 1.41 | |
| NET ASSET VALUE, END OF PERIOD | | $ | 20.60 | | | $ | 21.59 | | | $ | 22.18 | | | $ | 18.75 | | | $ | 15.14 | | | $ | 17.48 | |
| | | | | | | | | | | | | | | | | | | | | | | | | |
| TOTAL RETURN(b) | | | (4.59 | )%(c) | | | 11.08 | % | | | 18.29 | % | | | 23.84 | % | | | (10.87 | )% | | | 17.58 | % |
| RATIOS/SUPPLEMENTAL DATA: | | | | | | | | | | | | | | | | | | | | | | | | |
| Net Assets, End of Period (000s) | | $ | 23,149 | | | $ | 29,975 | | | $ | 33,197 | | | $ | 34,642 | | | $ | 42,075 | | | $ | 15,427 | |
| RATIOS TO AVERAGE NET ASSETS: | | | | | | | | | | | | | | | | | | | | | | | | |
| Net Investment loss | | | (1.15 | )%(d) | | | (1.15 | )% | | | (1.30 | )% | | | (1.22 | )% | | | (1.46 | )% | | | (1.58 | )% |
| Operating expenses excluding reimbursement/waiver | | | 1.67 | %(d) | | | 1.66 | % | | | 1.68 | % | | | 1.73 | % | | | 1.81 | % | | | 1.94 | % |
| Operating expenses including reimbursement/waiver | | | 1.67 | %(d) | | | 1.66 | % | | | 1.68 | % | | | 1.73 | % | | | 1.81 | % | | | 1.94 | % |
| PORTFOLIO TURNOVER RATE | | | 22 | %(c) | | | 64 | % | | | 66 | % | | | 54 | % | | | 45 | % | | | 68 | % |
| (a) | Per share amounts are based upon average shares outstanding. |
| (b) | Total return does not reflect the effect of sales charges. |
See Notes to Financial Statements.
| 44 | www.emeraldmutualfunds.com |
| Emerald Growth Fund | Financial Highlights |
For a share outstanding throughout the years presented
| | | INSTITUTIONAL CLASS | |
| | | For the Six Months Ended October 31, 2019 (Unaudited) | | | Year Ended April 30, 2019 | | | Year Ended April 30, 2018 | | | Year Ended April 30, 2017 | | | Year Ended April 30, 2016 | | | Year Ended April 30, 2015 | |
| NET ASSET VALUE, BEGINNING OF PERIOD | | $ | 27.16 | | | $ | 26.94 | | | $ | 22.56 | | | $ | 18.04 | | | $ | 20.54 | | | $ | 18.49 | |
| INCOME/(LOSS) FROM OPERATIONS: | | | | | | | | | | | | | | | | | | | | | | | | |
| Net investment loss(a) | | | (0.02 | ) | | | (0.05 | ) | | | (0.09 | ) | | | (0.05 | ) | | | (0.10 | ) | | | (0.12 | ) |
| Net realized and unrealized gain/(loss) on investments | | | (1.09 | ) | | | 2.74 | | | | 4.47 | | | | 4.57 | | | | (1.93 | ) | | | 3.51 | |
| Total from Investment Operations | | | (1.11 | ) | | | 2.69 | | | | 4.38 | | | | 4.52 | | | | (2.03 | ) | | | 3.39 | |
| | | | | | | | | | | | | | | | | | | | | | | | | |
| LESS DISTRIBUTIONS: | | | | | | | | | | | | | | | | | | | | | | | | |
| From capital gains | | | – | | | | (2.47 | ) | | | – | | | | – | | | | (0.47 | ) | | | (1.34 | ) |
| Total Distributions | | | – | | | | (2.47 | ) | | | – | | | | – | | | | (0.47 | ) | | | (1.34 | ) |
| NET INCREASE/(DECREASE) IN NET ASSET VALUE | | | (1.11 | ) | | | 0.22 | | | | 4.38 | | | | 4.52 | | | | (2.50 | ) | | | 2.05 | |
| NET ASSET VALUE, END OF PERIOD | | $ | 26.05 | | | $ | 27.16 | | | $ | 26.94 | | | $ | 22.56 | | | $ | 18.04 | | | $ | 20.54 | |
| | | | | | | | | | | | | | | | | | | | | | | | | |
| TOTAL RETURN | | | (4.09 | )%(b) | | | 12.17 | % | | | 19.41 | % | | | 25.06 | % | | | (9.97 | )% | | | 18.77 | % |
| RATIOS/SUPPLEMENTAL DATA: | | | | | | | | | | | | | | | | | | | | | | | | |
| Net Assets, End of Period (000s) | | $ | 982,495 | | | $ | 1,050,538 | | | $ | 839,076 | | | $ | 596,550 | | | $ | 453,190 | | | $ | 174,107 | |
| RATIOS TO AVERAGE NET ASSETS: | | | | | | | | | | | | | | | | | | | | | | | | |
| Net Investment loss | | | (0.18 | )%(c) | | | (0.18 | )% | | | (0.33 | )% | | | (0.26 | )% | | | (0.51 | )% | | | (0.63 | )% |
| Operating expenses excluding reimbursement/waiver | | | 0.69 | %(c) | | | 0.69 | % | | | 0.72 | % | | | 0.77 | % | | | 0.87 | % | | | 0.99 | % |
| Operating expenses including reimbursement/waiver | | | 0.69 | %(c) | | | 0.69 | % | | | 0.72 | % | | | 0.77 | % | | | 0.87 | % | | | 0.99 | % |
| PORTFOLIO TURNOVER RATE | | | 22 | %(b) | | | 64 | % | | | 66 | % | | | 54 | % | | | 45 | % | | | 68 | % |
| (a) | Per share amounts are based upon average shares outstanding. |
See Notes to Financial Statements.
| Semi-Annual Report | October 31, 2019 | 45 |
| Emerald Growth Fund | Financial Highlights |
For a share outstanding throughout the years presented
| | | INVESTOR CLASS | |
| | | For the Six Months Ended October 31, 2019 (Unaudited) | | | Year Ended April 30, 2019 | | | Year Ended April 30, 2018 | | | Year Ended April 30, 2017 | | | Year Ended April 30, 2016 | | | Year Ended April 30, 2015 | |
| NET ASSET VALUE, BEGINNING OF PERIOD | | $ | 25.88 | | | $ | 25.88 | | | $ | 21.75 | | | $ | 17.46 | | | $ | 19.97 | | | $ | 18.06 | |
| INCOME/(LOSS) FROM OPERATIONS: | | | | | | | | | | | | | | | | | | | | | | | | |
| Net investment loss(a) | | | (0.07 | ) | | | (0.14 | ) | | | (0.17 | ) | | | (0.12 | ) | | | (0.16 | ) | | | (0.17 | ) |
| Net realized and unrealized gain/(loss) on investments | | | (1.04 | ) | | | 2.61 | | | | 4.30 | | | | 4.41 | | | | (1.88 | ) | | | 3.42 | |
| Total from Investment Operations | | | (1.11 | ) | | | 2.47 | | | | 4.13 | | | | 4.29 | | | | (2.04 | ) | | | 3.25 | |
| | | | | | | | | | | | | | | | | | | | | | | | | |
| LESS DISTRIBUTIONS: | | | | | | | | | | | | | | | | | | | | | | | | |
| From capital gains | | | – | | | | (2.47 | ) | | | – | | | | – | | | | (0.47 | ) | | | (1.34 | ) |
| Total Distributions | | | – | | | | (2.47 | ) | | | – | | | | – | | | | (0.47 | ) | | | (1.34 | ) |
| NET INCREASE/(DECREASE) IN NET ASSET VALUE | | | (1.11 | ) | | | 0.00 | | | | 4.13 | | | | 4.29 | | | | (2.51 | ) | | | 1.91 | |
| NET ASSET VALUE, END OF PERIOD | | $ | 24.77 | | | $ | 25.88 | | | $ | 25.88 | | | $ | 21.75 | | | $ | 17.46 | | | $ | 19.97 | |
| | | | | | | | | | | | | | | | | | | | | | | | | |
| TOTAL RETURN | | | (4.29 | )%(b) | | | 11.81 | % | | | 18.99 | % | | | 24.57 | % | | | (10.36 | )% | | | 18.44 | % |
| RATIOS/SUPPLEMENTAL DATA: | | | | | | | | | | | | | | | | | | | | | | | | |
| Net Assets, End of Period (000s) | | $ | 86,821 | | | $ | 104,403 | | | $ | 107,629 | | | $ | 114,033 | | | $ | 112,526 | | | $ | 23,517 | |
| RATIOS TO AVERAGE NET ASSETS: | | | | | | | | | | | | | | | | | | | | | | | | |
| Net Investment loss | | | (0.53 | )%(c) | | | (0.53 | )% | | | (0.68 | )% | | | (0.61 | )% | | | (0.84 | )% | | | (0.91 | )% |
| Operating expenses excluding reimbursement/waiver | | | 1.05 | %(c) | | | 1.04 | % | | | 1.07 | % | | | 1.12 | % | | | 1.19 | % | | | 1.27 | % |
| Operating expenses including reimbursement/waiver | | | 1.05 | %(c) | | | 1.04 | % | | | 1.07 | % | | | 1.12 | % | | | 1.19 | % | | | 1.27 | % |
| PORTFOLIO TURNOVER RATE | | | 22 | %(b) | | | 64 | % | | | 66 | % | | | 54 | % | | | 45 | % | | | 68 | % |
| (a) | Per share amounts are based upon average shares outstanding. |
See Notes to Financial Statements.
| 46 | www.emeraldmutualfunds.com |
| Emerald Small Cap Value Fund | Financial Highlights |
For a share outstanding throughout the periods presented
| | | CLASS A | |
| | | For the Six Months Ended October 31, 2019 (Unaudited) | | | Year Ended April 30, 2019 | | | Year Ended April 30, 2018 | | | Year Ended April 30, 2017 | | | For the Period October 1, 2015 to April 30, 2016(a) | | | Period Ended September 30, 2015(b) | |
| NET ASSET VALUE, BEGINNING OF PERIOD | | $ | 7.29 | | | $ | 10.45 | | | $ | 16.27 | | | $ | 13.00 | | | $ | 12.70 | | | $ | 14.12 | |
| INCOME/(LOSS) FROM OPERATIONS: | | | | | | | | | | | | | | | | | | | | | | | | |
| Net investment loss(c) | | | (0.00 | )(d) | | | (0.02 | ) | | | (0.06 | )(e) | | | (0.07 | )(e) | | | (0.09 | ) | | | (0.01 | ) |
| Net realized and unrealized gain/(loss) on investments | | | 0.16 | | | | (1.06 | ) | | | 2.13 | | | | 3.34 | | | | 0.44 | | | | (1.03 | ) |
| Total from Investment Operations | | | 0.16 | | | | (1.08 | ) | | | 2.07 | | | | 3.27 | | | | 0.35 | | | | (1.04 | ) |
| | | | | | | | | | | | | | | | | | | | | | | | | |
| LESS DISTRIBUTIONS: | | | | | | | | | | | | | | | | | | | | | | | | |
| From investment income | | | – | | | | – | | | | – | | | | – | | | | (0.05 | ) | | | – | |
| From capital gains | | | – | | | | (2.08 | ) | | | (7.89 | ) | | | – | | | | – | | | | (0.38 | ) |
| Total Distributions | | | – | | | | (2.08 | ) | | | (7.89 | ) | | | – | | | | (0.05 | ) | | | (0.38 | ) |
| NET INCREASE/(DECREASE) IN NET ASSET VALUE | | | 0.16 | | | | (3.16 | ) | | | (5.82 | ) | | | 3.27 | | | | 0.30 | | | | (1.42 | ) |
| NET ASSET VALUE, END OF PERIOD | | $ | 7.45 | | | $ | 7.29 | | | $ | 10.45 | | | $ | 16.27 | | | $ | 13.00 | | | $ | 12.70 | |
| | | | | | | | | | | | | | | | | | | | | | | | | |
| TOTAL RETURN(f) | | | 2.19 | %(g) | | | (7.30 | )% | | | 12.41 | % | | | 25.15 | % | | | 2.77 | %(g) | | | (7.49 | )%(g) |
| RATIOS/SUPPLEMENTAL DATA: | | | | | | | | | | | | | | | | | | | | | | | | |
| Net Assets, End of Period (000s) | | $ | 1,792 | | | $ | 2,664 | | | $ | 3,959 | | | $ | 1,909 | | | $ | 340 | | | $ | 14 | |
| RATIOS TO AVERAGE NET ASSETS: | | | | | | | | | | | | | | | | | | | | | | | | |
| Net Investment loss | | | (0.07 | )%(h) | | | (0.19 | )% | | | (0.42 | )% | | | (0.46 | )% | | | (1.13 | )%(h) | | | (0.24 | )%(h) |
| Operating expenses excluding reimbursement/waiver | | | 4.68 | %(h) | | | 2.89 | % | | | 2.56 | % | | | 2.26 | % | | | 2.69 | %(h) | | | 2.16 | %(h) |
| Operating expenses including reimbursement/waiver | | | 1.35 | %(h) | | | 1.35 | % | | | 1.35 | % | | | 1.35 | % | | | 1.35 | %(h) | | | 1.35 | %(h) |
| PORTFOLIO TURNOVER RATE | | | 22 | %(g) | | | 101 | % | | | 71 | % | | | 66 | % | | | 31 | %(g) | | | 69 | %(g)(i) |
| (a) | Effective March 3, 2015 the Board approved changing the fiscal year-end of the Fund from September 30 to April 30. |
| (b) | Class A commenced operations on June 30, 2015. |
| (c) | Per share amounts are based upon average shares outstanding. |
| (d) | Less than $0.005 per share. |
| (e) | The amount shown for a share outstanding throughout the period may not correlate with the Statement of Operations for the period due to the timing of sales and redemptions of Fund shares in relation to income earned and/or fluctuating market value of the investments of the Fund. |
| (f) | Total return does not reflect the effect of sales charges. |
| (i) | Portfolio turnover rate is calculated at the Fund level and represents the year ended September 30, 2015. |
See Notes to Financial Statements.
| Semi-Annual Report | October 31, 2019 | 47 |
| Emerald Small Cap Value Fund | Financial Highlights |
For a share outstanding throughout the periods presented
| | | CLASS C | |
| | | For the Six Months Ended October 31, 2019 (Unaudited) | | | Year Ended April 30, 2019 | | | Year Ended April 30, 2018 | | | Year Ended April 30, 2017 | | | For the Period October 1, 2015 to April 30, 2016(a) | | | Period Ended September 30, 2015(b) | |
| NET ASSET VALUE, BEGINNING OF PERIOD | | $ | 6.96 | | | $ | 10.15 | | | $ | 16.10 | | | $ | 12.94 | | | $ | 12.68 | | | $ | 14.12 | |
| INCOME/(LOSS) FROM OPERATIONS: | | | | | | | | | | | | | | | | | | | | | | | | |
| Net investment loss(c) | | | (0.03 | ) | | | (0.08 | ) | | | (0.13 | )(d) | | | (0.13 | )(d) | | | (0.14 | ) | | | (0.03 | ) |
| Net realized and unrealized gain/(loss) on investments | | | 0.16 | | | | (1.03 | ) | | | 2.07 | | | | 3.29 | | | | 0.43 | | | | (1.03 | ) |
| Total from Investment Operations | | | 0.13 | | | | (1.11 | ) | | | 1.94 | | | | 3.16 | | | | 0.29 | | | | (1.06 | ) |
| | | | | | | | | | | | | | | | | | | | | | | | | |
| LESS DISTRIBUTIONS: | | | | | | | | | | | | | | | | | | | | | | | | |
| From investment income | | | – | | | | – | | | | – | | | | – | | | | (0.03 | ) | | | – | |
| From capital gains | | | – | | | | (2.08 | ) | | | (7.89 | ) | | | – | | | | – | | | | (0.38 | ) |
| Total Distributions | | | – | | | | (2.08 | ) | | | (7.89 | ) | | | – | | | | (0.03 | ) | | | (0.38 | ) |
| NET INCREASE/(DECREASE) IN NET ASSET VALUE | | | 0.13 | | | | (3.19 | ) | | | (5.95 | ) | | | 3.16 | | | | 0.26 | | | | (1.44 | ) |
| NET ASSET VALUE, END OF PERIOD | | $ | 7.09 | | | $ | 6.96 | | | $ | 10.15 | | | $ | 16.10 | | | $ | 12.94 | | | $ | 12.68 | |
| | | | | | | | | | | | | | | | | | | | | | | | | |
| TOTAL RETURN(e) | | | 1.87 | %(f) | | | (7.88 | )% | | | 11.63 | % | | | 24.42 | % | | | 2.28 | %(f) | | | (7.63 | )%(f) |
| RATIOS/SUPPLEMENTAL DATA: | | | | | | | | | | | | | | | | | | | | | | | | |
| Net Assets, End of Period (000s) | | $ | 42 | | | $ | 38 | | | $ | 108 | | | $ | 211 | | | $ | 566 | | | $ | 14 | |
| RATIOS TO AVERAGE NET ASSETS: | | | | | | | | | | | | | | | | | | | | | | | | |
| Net Investment loss | | | (0.76 | )%(g) | | | (0.88 | )% | | | (0.98 | )% | | | (0.93 | )% | | | (2.06 | )%(g) | | | (0.89 | )%(g) |
| Operating expenses excluding reimbursement/waiver | | | 5.41 | %(g) | | | 3.44 | % | | | 3.20 | % | | | 2.70 | % | | | 3.37 | %(g) | | | 2.81 | %(g) |
| Operating expenses including reimbursement/waiver | | | 2.00 | %(g) | | | 2.00 | % | | | 2.00 | % | | | 2.00 | % | | | 2.00 | %(g) | | | 2.00 | %(g) |
| PORTFOLIO TURNOVER RATE | | | 22 | %(f) | | | 101 | % | | | 71 | % | | | 66 | % | | | 31 | %(f) | | | 69 | %(f)(h) |
| (a) | Effective March 3, 2015 the Board approved changing the fiscal year-end of the Fund from September 30 to April 30. |
| (b) | Class C commenced operations on June 30, 2015. |
| (c) | Per share amounts are based upon average shares outstanding. |
| (d) | The amount shown for a share outstanding throughout the period may not correlate with the Statement of Operations for the period due to the timing of sales and redemptions of Fund shares in relation to income earned and/or fluctuating market value of the investments of the Fund. |
| (e) | Total return does not reflect the effect of sales charges. |
| (h) | Portfolio turnover rate is calculated at the Fund level and represents the year ended September 30, 2015. |
See Notes to Financial Statements.
| 48 | www.emeraldmutualfunds.com |
| Emerald Small Cap Value Fund | Financial Highlights |
For a share outstanding throughout the periods presented
| | | INSTITUTIONAL CLASS | |
| | | For the Six Months Ended October 31, 2019 (Unaudited) | | | Year Ended April 30, 2019 | | | Year Ended April 30, 2018 | | | Year Ended April 30, 2017 | | | For the Period October 1, 2015 to April 30, 2016(a) | | | Year Ended September 30, 2015(b) | |
| NET ASSET VALUE, BEGINNING OF PERIOD | | $ | 7.46 | | | $ | 10.59 | | | $ | 16.35 | | | $ | 13.02 | | | $ | 12.71 | | | $ | 12.76 | |
| INCOME FROM OPERATIONS: | | | | | | | | | | | | | | | | | | | | | | | | |
| Net investment income/(loss)(c) | | | 0.01 | | | | 0.01 | (d) | | | 0.00 | (e) | | | 0.02 | | | | (0.01 | ) | | | 0.06 | |
| Net realized and unrealized gain/(loss) on investments | | | 0.17 | | | | (1.06 | ) | | | 2.13 | | | | 3.31 | | | | 0.38 | | | | 0.33 | |
| Total from Investment Operations | | | 0.18 | | | | (1.05 | ) | | | 2.13 | | | | 3.33 | | | | 0.37 | | | | 0.39 | |
| | | | | | | | | | | | | | | | | | | | | | | | | |
| LESS DISTRIBUTIONS: | | | | | | | | | | | | | | | | | | | | | | | | |
| From investment income | | | – | | | | – | | | | – | | | | – | | | | (0.06 | ) | | | (0.06 | ) |
| From capital gains | | | – | | | | (2.08 | ) | | | (7.89 | ) | | | – | | | | – | | | | (0.38 | ) |
| Total Distributions | | | – | | | | (2.08 | ) | | | (7.89 | ) | | | – | | | | (0.06 | ) | | | (0.44 | ) |
| NET INCREASE/(DECREASE) IN NET ASSET VALUE | | | 0.18 | | | | (3.13 | ) | | | (5.76 | ) | | | 3.33 | | | | 0.31 | | | | (0.05 | ) |
| NET ASSET VALUE, END OF PERIOD | | $ | 7.64 | | | $ | 7.46 | | | $ | 10.59 | | | $ | 16.35 | | | $ | 13.02 | | | $ | 12.71 | |
| | | | | | | | | | | | | | | | | | | | | | | | | |
| TOTAL RETURN | | | 2.41 | %(f) | | | (6.90 | )% | | | 12.76 | % | | | 25.58 | % | | | 2.94 | %(f) | | | 2.93 | % |
| SUPPLEMENTAL DATA: | | | | | | | | | | | | | | | | | | | | | | | | |
| Net Assets, End of Period (000s) | | $ | 814 | | | $ | 874 | | | $ | 3,177 | | | $ | 4,989 | | | $ | 13,691 | | | $ | 16,507 | |
| RATIOS TO AVERAGE NET ASSETS: | | | | | | | | | | | | | | | | | | | | | | | | |
| Net Investment income/(loss) | | | 0.24 | %(g) | | | 0.13 | % | | | 0.02 | % | | | 0.13 | % | | | (0.07 | )%(g) | | | 0.45 | % |
| Operating expenses excluding reimbursement/waiver | | | 4.38 | %(g) | | | 2.44 | % | | | 2.20 | % | | | 1.56 | % | | | 1.75 | %(g) | | | 1.43 | % |
| Operating expenses including reimbursement/waiver | | | 1.00 | %(g) | | | 1.00 | % | | | 1.00 | % | | | 1.00 | % | | | 1.00 | %(g) | | | 1.00 | % |
| PORTFOLIO TURNOVER RATE | | | 22 | %(f) | | | 101 | % | | | 71 | % | | | 66 | % | | | 31 | %(f) | | | 69 | % |
| (a) | Effective March 3, 2015 the Board approved changing the fiscal year-end of the Fund from September 30 to April 30. |
| (b) | Prior to its June 26, 2015 reorganization with and into the Emerald Small Cap Value Fund, the Fund was known as the Elessar Small Cap Value Fund. |
| (c) | Per share amounts are based upon average shares outstanding. |
| (d) | The amount shown for a share outstanding throughout the period may not correlate with the Statement of Operations for the period due to the timing of sales and redemptions of Fund shares in relation to income earned and/or fluctuating market value of the investments of the Fund. |
| (e) | Less than $0.005 per share. |
See Notes to Financial Statements.
| Semi-Annual Report | October 31, 2019 | 49 |
| Emerald Small Cap Value Fund | Financial Highlights |
For a share outstanding throughout the periods presented
| | | INVESTOR CLASS | |
| | | For the Six Months Ended October 31, 2019 (Unaudited) | | | Year Ended April 30, 2019 | | | Year Ended April 30, 2018 | | | Year Ended April 30, 2017 | | | For the Period October 1, 2015 to April 30, 2016(a) | | | Year Ended September 30, 2015(b) | |
| NET ASSET VALUE, BEGINNING OF PERIOD | | $ | 7.33 | | | $ | 10.46 | | | $ | 16.26 | | | $ | 12.98 | | | $ | 12.68 | | | $ | 12.73 | |
| INCOME FROM OPERATIONS: | | | | | | | | | | | | | | | | | | | | | | | | |
| Net investment income/(loss)(c) | | | (0.00 | )(d) | | | (0.01 | ) | | | (0.04 | )(e) | | | (0.02 | )(e) | | | (0.02 | ) | | | 0.03 | |
| Net realized and unrealized gain/(loss) on investments | | | 0.16 | | | | (1.04 | ) | | | 2.13 | | | | 3.30 | | | | 0.37 | | | | 0.35 | |
| Total from Investment Operations | | | 0.16 | | | | (1.05 | ) | | | 2.09 | | | | 3.28 | | | | 0.35 | | | | 0.38 | |
| | | | | | | | | | | | | | | | | | | | | | | | | |
| LESS DISTRIBUTIONS: | | | | | | | | | | | | | | | | | | | | | | | | |
| From investment income | | | – | | | | – | | | | – | | | | – | | | | (0.05 | ) | | | (0.05 | ) |
| From capital gains | | | – | | | | (2.08 | ) | | | (7.89 | ) | | | – | | | | – | | | | (0.38 | ) |
| Total Distributions | | | – | | | | (2.08 | ) | | | (7.89 | ) | | | – | | | | (0.05 | ) | | | (0.43 | ) |
| NET INCREASE/(DECREASE) IN NET ASSET VALUE | | | 0.16 | | | | (3.13 | ) | | | (5.80 | ) | | | 3.28 | | | | 0.30 | | | | (0.05 | ) |
| NET ASSET VALUE, END OF PERIOD | | $ | 7.49 | | | $ | 7.33 | | | $ | 10.46 | | | $ | 16.26 | | | $ | 12.98 | | | $ | 12.68 | |
| | | | | | | | | | | | | | | | | | | | | | | | | |
| TOTAL RETURN | | | 2.18 | %(f) | | | (6.99 | )% | | | 12.54 | % | | | 25.27 | % | | | 2.80 | %(f) | | | 2.82 | % |
| SUPPLEMENTAL DATA: | | | | | | | | | | | | | | | | | | | | | | | | |
| Net Assets, End of Period (000s) | | $ | 479 | | | $ | 509 | | | $ | 556 | | | $ | 614 | | | $ | 1,946 | | | $ | 399 | |
| RATIOS TO AVERAGE NET ASSETS: | | | | | | | | | | | | | | | | | | | | | | | | |
| Net Investment income/(loss) | | | 0.00 | %(g)(h) | | | (0.10 | )% | | | (0.25 | )% | | | (0.11 | )% | | | (0.25 | )%(g) | | | 0.22 | % |
| Operating expenses excluding reimbursement/waiver | | | 4.62 | %(g) | | | 2.83 | % | | | 2.44 | % | | | 1.83 | % | | | 2.14 | %(g) | | | 1.67 | % |
| Operating expenses including reimbursement/waiver | | | 1.25 | %(g) | | | 1.25 | % | | | 1.25 | % | | | 1.25 | % | | | 1.25 | %(g) | | | 1.25 | % |
| PORTFOLIO TURNOVER RATE | | | 22 | %(f) | | | 101 | % | | | 71 | % | | | 66 | % | | | 31 | %(f) | | | 69 | % |
| (a) | Effective March 3, 2015 the Board approved changing the fiscal year-end of the Fund from September 30 to April 30. |
| (b) | Prior to its June 26, 2015 reorganization with and into the Emerald Small Cap Value Fund, the Fund was known as the Elessar Small Cap Value Fund. |
| (c) | Per share amounts are based upon average shares outstanding. |
| (d) | Less than $0.005 per share. |
| (e) | The amount shown for a share outstanding throughout the period may not correlate with the Statement of Operations for the period due to the timing of sales and redemptions of Fund shares in relation to income earned and/or fluctuating market value of the investments of the Fund. |
See Notes to Financial Statements.
| 50 | www.emeraldmutualfunds.com |
| Emerald Insights Fund | Financial Highlights |
For a share outstanding throughout the periods presented
| | | CLASS A | |
| | | For the Six Months Ended October 31, 2019 (Unaudited) | | | Year Ended April 30, 2019 | | | Year Ended April 30, 2018 | | | Year Ended April 30, 2017 | | | Year Ended April 30, 2016 | | | For the Period August 1, 2014 (Inception) to April 30, 2015 | |
| NET ASSET VALUE, BEGINNING OF PERIOD | | $ | 11.51 | | | $ | 13.09 | | | $ | 11.33 | | | $ | 9.69 | | | $ | 10.98 | | | $ | 10.00 | |
| INCOME/(LOSS) FROM OPERATIONS: | | | | | | | | | | | | | | | | | | | | | | | | |
| Net investment loss(a) | | | (0.04 | ) | | | (0.09 | ) | | | (0.07 | ) | | | (0.06 | ) | | | (0.05 | ) | | | (0.05 | ) |
| Net realized and unrealized gain/(loss) on investments | | | 0.07 | | | | 1.04 | | | | 1.83 | | | | 1.70 | | | | (1.24 | ) | | | 1.03 | |
| Total from Investment Operations | | | 0.03 | | | | 0.95 | | | | 1.76 | | | | 1.64 | | | | (1.29 | ) | | | 0.98 | |
| | | | | | | | | | | | | | | | | | | | | | | | | |
| LESS DISTRIBUTIONS: | | | | | | | | | | | | | | | | | | | | | | | | |
| From capital gains | | | – | | | | (2.53 | ) | | | – | | | | – | | | | – | | | | – | |
| Total Distributions | | | – | | | | (2.53 | ) | | | – | | | | – | | | | – | | | | – | |
| NET INCREASE/(DECREASE) IN NET ASSET VALUE | | | 0.03 | | | | (1.58 | ) | | | 1.76 | | | | 1.64 | | | | (1.29 | ) | | | 0.98 | |
| NET ASSET VALUE, END OF PERIOD | | $ | 11.54 | | | $ | 11.51 | | | $ | 13.09 | | | $ | 11.33 | | | $ | 9.69 | | | $ | 10.98 | |
| | | | | | | | | | | | | | | | | | | | | | | | | |
| TOTAL RETURN(b) | | | 0.26 | %(c) | | | 11.53 | % | | | 15.53 | % | | | 16.92 | % | | | (11.75 | %) | | | 9.80 | %(c) |
| RATIOS/SUPPLEMENTAL DATA: | | | | | | | | | | | | | | | | | | | | | | | | |
| Net Assets, End of Period (000s) | | $ | 10,223 | | | $ | 9,397 | | | $ | 9,321 | | | $ | 10,127 | | | $ | 11,388 | | | $ | 6,493 | |
| RATIOS TO AVERAGE NET ASSETS: | | | | | | | | | | | | | | | | | | | | | | | | |
| Net Investment loss | | | (0.71% | )(d) | | | (0.71% | ) | | | (0.58% | ) | | | (0.57% | ) | | | (0.54% | ) | | | (0.66% | )(d) |
| Operating expenses excluding reimbursement/waiver | | | 2.25 | %(d) | | | 2.18 | % | | | 2.10 | % | | | 2.10 | % | | | 2.01 | % | | | 2.57 | %(d)(e) |
| Operating expenses including reimbursement/waiver | | | 1.35 | %(d) | | | 1.35 | % | | | 1.35 | % | | | 1.35 | % | | | 1.35 | % | | | 1.35 | %(d)(e) |
| PORTFOLIO TURNOVER RATE | | | 38 | %(c) | | | 63 | % | | | 138 | % | | | 75 | % | | | 99 | % | | | 88 | %(c) |
| (a) | Per share amounts are based upon average shares outstanding. |
| (b) | Total return does not reflect the effect of sales charges. |
| (e) | Expense ratios before reductions for startup costs may not be representative of longer term operating periods. |
See Notes to Financial Statements.
| Semi-Annual Report | October 31, 2019 | 51 |
| Emerald Insights Fund | Financial Highlights |
For a share outstanding throughout the periods presented
| | | CLASS C | |
| | | For the Six Months Ended October 31, 2019 (Unaudited) | | | Year Ended April 30, 2019 | | | Year Ended April 30, 2018 | | | Year Ended April 30, 2017 | | | Year Ended April 30, 2016 | | | For the Period August 1, 2014 (Inception) to April 30, 2015 | |
| NET ASSET VALUE, BEGINNING OF PERIOD | | $ | 11.04 | | | $ | 12.75 | | | $ | 11.11 | | | $ | 9.56 | | | $ | 10.92 | | | $ | 10.00 | |
| INCOME/(LOSS) FROM OPERATIONS: | | | | | | | | | | | | | | | | | | | | | | | | |
| Net investment loss(a) | | | (0.07 | ) | | | (0.16 | ) | | | (0.15 | ) | | | (0.13 | ) | | | (0.11 | ) | | | (0.10 | ) |
| Net realized and unrealized gain/(loss) on investments | | | 0.07 | | | | 0.98 | | | | 1.79 | | | | 1.68 | | | | (1.25 | ) | | | 1.02 | |
| Total from Investment Operations | | | 0.00 | | | | 0.82 | | | | 1.64 | | | | 1.55 | | | | (1.36 | ) | | | 0.92 | |
| | | | | | | | | | | | | | | | | | | | | | | | | |
| LESS DISTRIBUTIONS: | | | | | | | | | | | | | | | | | | | | | | | | |
| From capital gains | | | – | | | | (2.53 | ) | | | – | | | | – | | | | – | | | | – | |
| Total Distributions | | | – | | | | (2.53 | ) | | | – | | | | – | | | | – | | | | – | |
| NET INCREASE/(DECREASE) IN NET ASSET VALUE | | | 0.00 | | | | (1.71 | ) | | | 1.64 | | | | 1.55 | | | | (1.36 | ) | | | 0.92 | |
| NET ASSET VALUE, END OF PERIOD | | $ | 11.04 | | | $ | 11.04 | | | $ | 12.75 | | | $ | 11.11 | | | $ | 9.56 | | | $ | 10.92 | |
| | | | | | | | | | | | | | | | | | | | | | | | | |
| TOTAL RETURN(b) | | | 0.00 | %(c) | | | 10.75 | % | | | 14.76 | % | | | 16.21 | % | | | (12.45% | ) | | | 9.20 | %(c) |
| RATIOS/SUPPLEMENTAL DATA: | | | | | | | | | | | | | | | | | | | | | | | | |
| Net Assets, End of Period (000s) | | $ | 141 | | | $ | 141 | | | $ | 129 | | | $ | 112 | | | $ | 101 | | | $ | 27 | |
| RATIOS TO AVERAGE NET ASSETS: | | | | | | | | | | | | | | | | | | | | | | | | |
| Net Investment loss | | | (1.36% | )(d) | | | (1.36% | ) | | | (1.24% | ) | | | (1.22% | ) | | | (1.17% | ) | | | (1.34% | )(d) |
| Operating expenses excluding reimbursement/waiver | | | 2.90 | %(d) | | | 2.84 | % | | | 2.75 | % | | | 2.76 | % | | | 2.70 | % | | | 7.25 | %(d)(e) |
| Operating expenses including reimbursement/waiver | | | 2.00 | %(d) | | | 2.00 | % | | | 2.00 | % | | | 2.00 | % | | | 2.00 | % | | | 2.00 | %(d)(e) |
| PORTFOLIO TURNOVER RATE | | | 38 | %(c) | | | 63 | % | | | 138 | % | | | 75 | % | | | 99 | % | | | 88 | %(c) |
| (a) | Per share amounts are based upon average shares outstanding. |
| (b) | Total return does not reflect the effect of sales charges. |
| (e) | Expense ratios before reductions for startup costs may not be representative of longer term operating periods. |
See Notes to Financial Statements.
| 52 | www.emeraldmutualfunds.com |
| Emerald Insights Fund | Financial Highlights |
For a share outstanding throughout the periods presented
| | | INSTITUTIONAL CLASS | |
| | | For the Six Months Ended October 31, 2019 (Unaudited) | | | Year Ended April 30, 2019 | | | Year Ended April 30, 2018 | | | Year Ended April 30, 2017 | | | Year Ended April 30, 2016 | | | For the Period August 1, 2014 (Inception) to April 30, 2015 | |
| NET ASSET VALUE, BEGINNING OF PERIOD | | $ | 11.69 | | | $ | 13.22 | | | $ | 11.41 | | | $ | 9.73 | | | $ | 10.99 | | | $ | 10.00 | |
| INCOME/(LOSS) FROM OPERATIONS: | | | | | | | | | | | | | | | | | | | | | | | | |
| Net investment loss(a) | | | (0.02 | ) | | | (0.05 | ) | | | (0.04 | ) | | | (0.03 | ) | | | (0.00 | )(b) | | | (0.03 | ) |
| Net realized and unrealized gain/(loss) on investments | | | 0.07 | | | | 1.05 | | | | 1.85 | | | | 1.71 | | | | (1.26 | ) | | | 1.02 | |
| Total from Investment Operations | | | 0.05 | | | | 1.00 | | | | 1.81 | | | | 1.68 | | | | (1.26 | ) | | | 0.99 | |
| | | | | | | | | | | | | | | | | | | | | | | | | |
| LESS DISTRIBUTIONS: | | | | | | | | | | | | | | | | | | | | | | | | |
| From capital gains | | | – | | | | (2.53 | ) | | | – | | | | – | | | | – | | | | – | |
| Total Distributions | | | – | | | | (2.53 | ) | | | – | | | | – | | | | – | | | | – | |
| NET INCREASE/(DECREASE) IN NET ASSET VALUE | | | 0.05 | | | | (1.53 | ) | | | 1.81 | | | | 1.68 | | | | (1.26 | ) | | | 0.99 | |
| NET ASSET VALUE, END OF PERIOD | | $ | 11.74 | | | $ | 11.69 | | | $ | 13.22 | | | $ | 11.41 | | | $ | 9.73 | | | $ | 10.99 | |
| | | | | | | | | | | | | | | | | | | | | | | | | |
| TOTAL RETURN | | | 0.43 | %(c) | | | 11.81 | % | | | 15.86 | % | | | 17.27 | % | | | (11.46% | ) | | | 9.90 | %(c) |
| RATIOS/SUPPLEMENTAL DATA: | | | | | | | | | | | | | | | | | | | | | | | | |
| Net Assets, End of Period (000s) | | $ | 1,393 | | | $ | 1,383 | | | $ | 1,228 | | | $ | 1,048 | | | $ | 1,729 | | | $ | 279 | |
| RATIOS TO AVERAGE NET ASSETS: | | | | | | | | | | | | | | | | | | | | | | | | |
| Net Investment loss | | | (0.41% | )(d) | | | (0.41% | ) | | | (0.29% | ) | | | (0.28% | ) | | | (0.05% | ) | | | (0.34% | )(d) |
| Operating expenses excluding reimbursement/waiver | | | 1.92 | %(d) | | | 1.87 | % | | | 1.77 | % | | | 1.78 | % | | | 1.90 | % | | | 4.66 | %(d)(e) |
| Operating expenses including reimbursement/waiver | | | 1.05 | %(d) | | | 1.05 | % | | | 1.05 | % | | | 1.05 | % | | | 1.05 | % | | | 1.05 | %(d)(e) |
| PORTFOLIO TURNOVER RATE | | | 38 | %(c) | | | 63 | % | | | 138 | % | | | 75 | % | | | 99 | % | | | 88 | %(c) |
| (a) | Per share amounts are based upon average shares outstanding. |
| (b) | Less than $0.005 per share. |
| (e) | Expense ratios before reductions for startup costs may not be representative of longer term operating periods. |
See Notes to Financial Statements.
| Semi-Annual Report | October 31, 2019 | 53 |
| Emerald Insights Fund | Financial Highlights |
For a share outstanding throughout the periods presented
| | | INVESTOR CLASS | |
| | | For the Six Months Ended October 31, 2019 (Unaudited) | | | Year Ended April 30, 2019 | | | Year Ended April 30, 2018 | | | Year Ended April 30, 2017 | | | Year Ended April 30, 2016 | | | For the Period August 1, 2014 (Inception) to April 30, 2015 | |
| NET ASSET VALUE, BEGINNING OF PERIOD | | $ | 11.45 | | | $ | 13.05 | | | $ | 11.29 | | | $ | 9.67 | | | $ | 10.96 | | | $ | 10.00 | |
| INCOME/(LOSS) FROM OPERATIONS: | | | | | | | | | | | | | | | | | | | | | | | | |
| Net investment loss(a) | | | (0.04 | ) | | | (0.10 | ) | | | (0.08 | ) | | | (0.07 | ) | | | (0.08 | ) | | | (0.05 | ) |
| Net realized and unrealized gain/(loss) on investments | | | 0.08 | | | | 1.03 | | | | 1.84 | | | | 1.69 | | | | (1.21 | ) | | | 1.01 | |
| Total from Investment Operations | | | 0.04 | | | | 0.93 | | | | 1.76 | | | | 1.62 | | | | (1.29 | ) | | | 0.96 | |
| | | | | | | | | | | | | | | | | | | | | | | | | |
| LESS DISTRIBUTIONS: | | | | | | | | | | | | | | | | | | | | | | | | |
| From capital gains | | | – | | | | (2.53 | ) | | | – | | | | – | | | | – | | | | – | |
| Total Distributions | | | – | | | | (2.53 | ) | | | – | | | | – | | | | – | | | | – | |
| NET INCREASE/(DECREASE) IN NET ASSET VALUE | | | 0.04 | | | | (1.60 | ) | | | 1.76 | | | | 1.62 | | | | (1.29 | ) | | | 0.96 | |
| NET ASSET VALUE, END OF PERIOD | | $ | 11.49 | | | $ | 11.45 | | | $ | 13.05 | | | $ | 11.29 | | | $ | 9.67 | | | $ | 10.96 | |
| | | | | | | | | | | | | | | | | | | | | | | | | |
| TOTAL RETURN | | | 0.35 | %(b) | | | 11.41 | % | | | 15.59 | % | | | 16.75 | % | | | (11.77% | ) | | | 9.60 | %(b) |
| RATIOS/SUPPLEMENTAL DATA: | | | | | | | | | | | | | | | | | | | | | | | | |
| Net Assets, End of Period (000s) | | $ | 60 | | | $ | 174 | | | $ | 126 | | | $ | 88 | | | $ | 86 | | | $ | 448 | |
| RATIOS TO AVERAGE NET ASSETS: | | | | | | | | | | | | | | | | | | | | | | | | |
| Net Investment loss | | | (0.67% | )(c) | | | (0.77% | ) | | | (0.65% | ) | | | (0.63% | ) | | | (0.72% | ) | | | (0.67% | )(c) |
| Operating expenses excluding reimbursement/waiver | | | 2.11 | %(c) | | | 2.08 | % | | | 2.07 | % | | | 2.09 | % | | | 1.91 | % | | | 2.96 | %(c)(d) |
| Operating expenses including reimbursement/waiver | | | 1.40 | %(c) | | | 1.40 | % | | | 1.40 | % | | | 1.40 | % | | | 1.40 | % | | | 1.40 | %(c)(d) |
| PORTFOLIO TURNOVER RATE | | | 38 | %(b) | | | 63 | % | | | 138 | % | | | 75 | % | | | 99 | % | | | 88 | %(b) |
| (a) | Per share amounts are based upon average shares outstanding. |
| (d) | Expense ratios before reductions for startup costs may not be representative of longer term operating periods. |
See Notes to Financial Statements.
| 54 | www.emeraldmutualfunds.com |
| Emerald Banking and Finance Fund | Financial Highlights |
For a share outstanding throughout the years presented
| | | CLASS A | | |
| | | For the Six Months Ended October 31, 2019 (Unaudited) | | | Year Ended April 30, 2019 | | | Year Ended April 30, 2018 | | | Year Ended April 30, 2017 | | | Year Ended April 30, 2016 | | | Year Ended April 30, 2015 | |
| NET ASSET VALUE, BEGINNING OF PERIOD | | $ | 32.71 | | | $ | 46.01 | | | $ | 41.61 | | | $ | 31.27 | | | $ | 28.85 | | | $ | 26.11 | |
| INCOME/(LOSS) FROM OPERATIONS: | | | | | | | | | | | | | | | | | | | | | | | | |
| Net investment loss(a) | | | (0.04 | ) | | | (0.24 | ) | | | (0.29 | ) | | | (0.17 | ) | | | (0.06 | ) | | | (0.16 | ) |
| Net realized and unrealized gain/(loss) on investments | | | 0.21 | | | | (5.35 | ) | | | 5.98 | | | | 10.51 | | | | 2.48 | | | | 2.90 | |
| Total from Investment Operations | | | 0.17 | | | | (5.59 | ) | | | 5.69 | | | | 10.34 | | | | 2.42 | | | | 2.74 | |
| | | | | | | | | | | | | | | | | | | | | | | | | |
| LESS DISTRIBUTIONS: | | | | | | | | | | | | | | | | | | | | | | | | |
| From capital gains | | | – | | | | (7.71 | ) | | | (1.29 | ) | | | – | | | | – | | | | – | |
| Total Distributions | | | – | | | | (7.71 | ) | | | (1.29 | ) | | | – | | | | – | | | | – | |
| NET INCREASE/(DECREASE) IN NET ASSET VALUE | | | 0.17 | | | | (13.30 | ) | | | 4.40 | | | | 10.34 | | | | 2.42 | | | | 2.74 | |
| NET ASSET VALUE, END OF PERIOD | | $ | 32.88 | | | $ | 32.71 | | | $ | 46.01 | | | $ | 41.61 | | | $ | 31.27 | | | $ | 28.85 | |
| | | | | | | | | | | | | | | | | | | | | | | | | |
| TOTAL RETURN(b) | | | 0.52 | %(c) | | | (10.65 | )% | | | 13.59 | % | | | 33.07 | % | | | 8.39 | % | | | 10.49 | % |
| RATIOS/SUPPLEMENTAL DATA: | | | | | | | | | | | | | | | | | | | | | | | | |
| Net Assets, End of Period (000s) | | $ | 67,977 | | | $ | 87,267 | | | $ | 172,338 | | | $ | 172,106 | | | $ | 110,601 | | | $ | 48,575 | |
| RATIOS TO AVERAGE NET ASSETS: | | | | | | | | | | | | | | | | | | | | | | | | |
| Net Investment loss | | | (0.28 | )%(d) | | | (0.58 | )% | | | (0.65 | )% | | | (0.46 | )% | | | (0.21 | )% | | | (0.58 | )% |
| Operating expenses excluding reimbursement/waiver | | | 1.49 | %(d) | | | 1.42 | % | | | 1.41 | % | | | 1.43 | % | | | 1.48 | % | | | 1.60 | % |
| Operating expenses including reimbursement/waiver | | | 1.49 | %(d) | | | 1.42 | % | | | 1.41 | % | | | 1.43 | % | | | 1.48 | % | | | 1.60 | % |
| PORTFOLIO TURNOVER RATE | | | 11 | %(c) | | | 55 | % | | | 62 | % | | | 36 | % | | | 30 | % | | | 33 | % |
| (a) | Per share amounts are based upon average shares outstanding. |
| (b) | Total return does not reflect the effect of sales charges. |
See Notes to Financial Statements.
| Semi-Annual Report | October 31, 2019 | 55 |
| Emerald Banking and Finance Fund | Financial Highlights |
For a share outstanding throughout the years presented
| | | CLASS C | |
| | | For the Six Months Ended October 31, 2019 (Unaudited) | | | Year Ended April 30, 2019 | | | Year Ended April 30, 2018 | | | Year Ended April 30, 2017 | | | Year Ended April 30, 2016 | | | Year Ended April 30, 2015 | |
| NET ASSET VALUE, BEGINNING OF PERIOD | | $ | 27.87 | | | $ | 40.83 | | | $ | 37.29 | | | $ | 28.20 | | | $ | 26.19 | | | $ | 23.86 | |
| INCOME/(LOSS) FROM OPERATIONS: | | | | | | | | | | | | | | | | | | | | | | | | |
| Net investment loss(a) | | | (0.13 | ) | | | (0.44 | ) | | | (0.51 | ) | | | (0.36 | ) | | | (0.24 | ) | | | (0.30 | ) |
| Net realized and unrealized gain/(loss) on investments | | | 0.17 | | | | (4.81 | ) | | | 5.34 | | | | 9.45 | | | | 2.25 | | | | 2.63 | |
| Total from Investment Operations | | | 0.04 | | | | (5.25 | ) | | | 4.83 | | | | 9.09 | | | | 2.01 | | | | 2.33 | |
| | | | | | | | | | | | | | | | | | | | | | | | | |
| LESS DISTRIBUTIONS: | | | | | | | | | | | | | | | | | | | | | | | | |
| From capital gains | | | – | | | | (7.71 | ) | | | (1.29 | ) | | | – | | | | – | | | | – | |
| Total Distributions | | | – | | | | (7.71 | ) | | | (1.29 | ) | | | – | | | | – | | | | – | |
| NET INCREASE/(DECREASE) IN NET ASSET VALUE | | | 0.04 | | | | (12.96 | ) | | | 3.54 | | | | 9.09 | | | | 2.01 | | | | 2.33 | |
| NET ASSET VALUE, END OF PERIOD | | $ | 27.91 | | | $ | 27.87 | | | $ | 40.83 | | | $ | 37.29 | | | $ | 28.20 | | | $ | 26.19 | |
| | | | | | | | | | | | | | | | | | | | | | | | | |
| TOTAL RETURN(b) | | | 0.14 | %(c) | | | (11.21 | )% | | | 12.85 | % | | | 32.23 | % | | | 7.67 | % | | | 9.77 | % |
| RATIOS/SUPPLEMENTAL DATA: | | | | | | | | | | | | | | | | | | | | | | | | |
| Net Assets, End of Period (000s) | | $ | 37,556 | | | $ | 50,079 | | | $ | 78,988 | | | $ | 76,072 | | | $ | 52,366 | | | $ | 31,862 | |
| RATIOS TO AVERAGE NET ASSETS: | | | | | | | | | | | | | | | | | | | | | | | | |
| Net Investment loss | | | (0.93 | )%(d) | | | (1.23 | )% | | | (1.30 | )% | | | (1.11 | )% | | | (0.87 | )% | | | (1.23 | )% |
| Operating expenses excluding reimbursement/waiver | | | 2.13 | %(d) | | | 2.07 | % | | | 2.06 | % | | | 2.08 | % | | | 2.13 | % | | | 2.25 | % |
| Operating expenses including reimbursement/waiver | | | 2.13 | %(d) | | | 2.07 | % | | | 2.06 | % | | | 2.08 | % | | | 2.13 | % | | | 2.25 | % |
| PORTFOLIO TURNOVER RATE | | | 11 | %(c) | | | 55 | % | | | 62 | % | | | 36 | % | | | 30 | % | | | 33 | % |
| (a) | Per share amounts are based upon average shares outstanding. |
| (b) | Total return does not reflect the effect of sales charges. |
See Notes to Financial Statements.
| 56 | www.emeraldmutualfunds.com |
| Emerald Banking and Finance Fund | Financial Highlights |
For a share outstanding throughout the years presented
| | | INSTITUTIONAL CLASS | |
| | | For the Six Months Ended October 31, 2019 (Unaudited) | | | Year Ended April 30, 2019 | | | Year Ended April 30, 2018 | | | Year Ended April 30, 2017 | | | Year Ended April 30, 2016 | | | Year Ended April 30, 2015 | |
| NET ASSET VALUE, BEGINNING OF PERIOD | | $ | 33.70 | | | $ | 46.95 | | | $ | 42.30 | | | $ | 31.69 | | | $ | 29.15 | | | $ | 26.29 | |
| INCOME/(LOSS) FROM OPERATIONS: | | | | | | | | | | | | | | | | | | | | | | | | |
| Net investment income/(loss)(a) | | | 0.01 | | | | (0.09 | ) | | | (0.15 | ) | | | (0.05 | ) | | | 0.03 | | | | (0.07 | ) |
| Net realized and unrealized gain/(loss) on investments | | | 0.21 | | | | (5.45 | ) | | | 6.09 | | | | 10.66 | | | | 2.51 | | | | 2.93 | |
| Total from Investment Operations | | | 0.22 | | | | (5.54 | ) | | | 5.94 | | | | 10.61 | | | | 2.54 | | | | 2.86 | |
| | | | | | | | | | | | | | | | | | | | | | | | | |
| LESS DISTRIBUTIONS: | | | | | | | | | | | | | | | | | | | | | | | | |
| From capital gains | | | – | | | | (7.71 | ) | | | (1.29 | ) | | | – | | | | – | | | | – | |
| Total Distributions | | | – | | | | (7.71 | ) | | | (1.29 | ) | | | – | | | | – | | | | – | |
| NET INCREASE/(DECREASE) IN NET ASSET VALUE | | | 0.22 | | | | (13.25 | ) | | | 4.65 | | | | 10.61 | | | | 2.54 | | | | 2.86 | |
| NET ASSET VALUE, END OF PERIOD | | $ | 33.92 | | | $ | 33.70 | | | $ | 46.95 | | | $ | 42.30 | | | $ | 31.69 | | | $ | 29.15 | |
| | | | | | | | | | | | | | | | | | | | | | | | | |
| TOTAL RETURN | | | 0.65 | %(b) | | | (10.30 | )% | | | 13.97 | % | | | 33.48 | % | | | 8.71 | % | | | 10.88 | % |
| RATIOS/SUPPLEMENTAL DATA: | | | | | | | | | | | | | | | | | | | | | | | | |
| Net Assets, End of Period (000s) | | $ | 133,691 | | | $ | 162,910 | | | $ | 221,638 | | | $ | 134,027 | | | $ | 61,654 | | | $ | 23,730 | |
| RATIOS TO AVERAGE NET ASSETS: | | | | | | | | | | | | | | | | | | | | | | | | |
| Net Investment income/(loss) | | | 0.07 | %(c) | | | (0.23 | )% | | | (0.34 | )% | | | (0.14 | )% | | | 0.11 | % | | | (0.25 | )% |
| Operating expenses excluding reimbursement/waiver | | | 1.13 | %(c) | | | 1.06 | % | | | 1.09 | % | | | 1.11 | % | | | 1.15 | % | | | 1.27 | % |
| Operating expenses including reimbursement/waiver | | | 1.13 | %(c) | | | 1.06 | % | | | 1.09 | % | | | 1.11 | % | | | 1.15 | % | | | 1.27 | % |
| PORTFOLIO TURNOVER RATE | | | 11 | %(b) | | | 55 | % | | | 62 | % | | | 36 | % | | | 30 | % | | | 33 | % |
| (a) | Per share amounts are based upon average shares outstanding. |
See Notes to Financial Statements.
| Semi-Annual Report | October 31, 2019 | 57 |
| Emerald Banking and Finance Fund | Financial Highlights |
For a share outstanding throughout the years presented
| | | INVESTOR CLASS | |
| | | For the Six Months Ended October 31, 2019 (Unaudited) | | | Year Ended April 30, 2019 | | | Year Ended April 30, 2018 | | | Year Ended April 30, 2017 | | | Year Ended April 30, 2016 | | | Year Ended April 30, 2015 | |
| NET ASSET VALUE, BEGINNING OF PERIOD | | $ | 30.96 | | | $ | 44.05 | | | $ | 39.86 | | | $ | 29.95 | | | $ | 27.64 | | | $ | 25.01 | |
| INCOME/(LOSS) FROM OPERATIONS: | | | | | | | | | | | | | | | | | | | | | | | | |
| Net investment loss(a) | | | (0.04 | ) | | | (0.23 | ) | | | (0.25 | ) | | | (0.16 | ) | | | (0.07 | ) | | | (0.15 | ) |
| Net realized and unrealized gain/(loss) on investments | | | 0.19 | | | | (5.15 | ) | | | 5.73 | | | | 10.07 | | | | 2.38 | | | | 2.78 | |
| Total from Investment Operations | | | 0.15 | | | | (5.38 | ) | | | 5.48 | | | | 9.91 | | | | 2.31 | | | | 2.63 | |
| | | | | | | | | | | | | | | | | | | | | | | | | |
| LESS DISTRIBUTIONS: | | | | | | | | | | | | | | | | | | | | | | | | |
| From capital gains | | | – | | | | (7.71 | ) | | | (1.29 | ) | | | – | | | | – | | | | – | |
| Total Distributions | | | – | | | | (7.71 | ) | | | (1.29 | ) | | | – | | | | – | | | | – | |
| NET INCREASE/(DECREASE) IN NET ASSET VALUE | | | 0.15 | | | | (13.09 | ) | | | 4.19 | | | | 9.91 | | | | 2.31 | | | | 2.63 | |
| NET ASSET VALUE, END OF PERIOD | | $ | 31.11 | | | $ | 30.96 | | | $ | 44.05 | | | $ | 39.86 | | | $ | 29.95 | | | $ | 27.64 | |
| | | | | | | | | | | | | | | | | | | | | | | | | |
| TOTAL RETURN | | | 0.48 | %(b) | | | (10.64 | )% | | | 13.67 | % | | | 33.09 | % | | | 8.36 | % | | | 10.52 | % |
| RATIOS/SUPPLEMENTAL DATA: | | | | | | | | | | | | | | | | | | | | | | | | |
| Net Assets, End of Period (000s) | | $ | 31,094 | | | $ | 41,410 | | | $ | 71,236 | | | $ | 85,557 | | | $ | 80,404 | | | $ | 27,440 | |
| RATIOS TO AVERAGE NET ASSETS: | | | | | | | | | | | | | | | | | | | | | | | | |
| Net Investment loss | | | (0.29 | )%(c) | | | (0.60 | )% | | | (0.60 | )% | | | (0.46 | )% | | | (0.23 | )% | | | (0.56 | )% |
| Operating expenses excluding reimbursement/waiver | | | 1.50 | %(c) | | | 1.43 | % | | | 1.37 | % | | | 1.43 | % | | | 1.48 | % | | | 1.58 | % |
| Operating expenses including reimbursement/waiver | | | 1.50 | %(c) | | | 1.43 | % | | | 1.37 | % | | | 1.43 | % | | | 1.48 | % | | | 1.58 | % |
| PORTFOLIO TURNOVER RATE | | | 11 | %(b) | | | 55 | % | | | 62 | % | | | 36 | % | | | 30 | % | | | 33 | % |
| (a) | Per share amounts are based upon average shares outstanding. |
See Notes to Financial Statements.
| 58 | www.emeraldmutualfunds.com |
| Emerald Funds | Notes to Financial Statements |
October 31, 2019 (Unaudited)
1. ORGANIZATION
Financial Investors Trust (the “Trust”), a Delaware statutory trust, is an open-end management investment company registered under the Investment Company Act of 1940, as amended (the “1940 Act”). The Trust consists of multiple separate portfolios or series. This semi-annual report describes the Emerald Growth Fund, Emerald Small Cap Value Fund, Emerald Insights Fund, and Emerald Banking and Finance Fund (each a “Fund” and collectively, the “Funds”). The Emerald Small Cap Value Fund is a successor to a previously operational fund which was a series of Elessar Funds Investment Trust, a Delaware statutory trust, and was organized into a series of the Trust effective as of the close of business on June 26, 2015. Effective March 3, 2015, the Board approved changing the fiscal year end of the Emerald Small Cap Value Fund from September 30 to April 30.
The Emerald Growth Fund and Emerald Insights Fund seek to achieve long-term growth through capital appreciation. The Emerald Small Cap Value Fund seeks long-term capital appreciation. The Emerald Banking and Finance Fund seeks to achieve long term growth through capital appreciation with income as a secondary objective.
2. SIGNIFICANT ACCOUNTING POLICIES
The accompanying financial statements were prepared in accordance with accounting principles generally accepted in the United States of America (“U.S. GAAP”). The preparation of financial statements in conformity with U.S. GAAP requires management to make certain estimates and assumptions that affect the reported amounts of assets and liabilities and disclosures of contingent assets and liabilities at the date of the financial statements and the reported amounts of revenue and expenses during the period. Actual results could differ from those estimates. The Funds are considered an investment company for financial reporting purposes under U.S. GAAP and follows the accounting and reporting guidance applicable to investment companies in the Financial Accounting Standards Board Accounting Standards Codification Topic 946. The following is a summary of significant accounting policies consistently followed by the Funds in preparation of their financial statements.
Investment Valuation:The Funds generally value their securities based on market prices determined at the close of regular trading on the New York Stock Exchange (“NYSE”), normally, 4:00 p.m. Eastern Time, on each business day the NYSE is open for trading.
For equity securities and mutual funds that are traded on an exchange, the market price is usually the closing sale or official closing price on that exchange. In the case of equity securities not traded on an exchange, or if such closing prices are not otherwise available, the securities are valued at the mean of the most recent bid and ask prices on such day. Redeemable securities issued by open-end registered investment companies are valued at the investment company’s applicable net asset value, with the exception of exchange-traded open-end investment companies, which are priced as equity securities.
The market price for debt obligations is generally the price supplied by an independent third-party pricing service approved by the Board of Trustees of the Trust (the “Board” or the “Trustees”), which may use a matrix, formula or other objective method that takes into consideration quotations from dealers, market transactions in comparable investments, market indices and yield curves. If vendors are unable to supply a price, or if the price supplied is deemed to be unreliable, the market price may be determined using quotations received from one or more brokers–dealers that make a market in the security.
Equity securities that are primarily traded on foreign securities exchanges are valued at the preceding closing values of such securities on their respective exchanges, except when an occurrence subsequent to the time a value was so established is likely to have changed such value. In such an event, the fair values of those securities are determined in good faith through consideration of other factors in accordance with procedures established by and under the general supervision of the Board.
When such prices or quotations are not available, or when Emerald Mutual Fund Advisers Trust, (the “Adviser”), believes that they are unreliable, securities may be priced using fair value procedures approved by the Board.
Fair Value Measurements:A three-tier hierarchy has been established to classify fair value measurements for disclosure purposes. Inputs refer broadly to the assumptions that market participants would use in pricing the asset or liability, including assumptions about risk. Inputs may be observable or unobservable. Observable inputs are inputs that reflect the assumptions market participants would use in pricing the asset or liability that are developed based on market data obtained from sources independent of the reporting entity. Unobservable inputs are inputs that reflect the reporting entity’s own assumptions about the assumptions market participants would use in pricing the asset or liability that are developed based on the best information available. Various inputs are used in determining the value of each Fund’s investments as of the reporting period end. The designated input levels are not necessarily an indication of the risk or liquidity associated with these investments.
| Semi-Annual Report | October 31, 2019 | 59 |
| Emerald Funds | Notes to Financial Statements |
October 31, 2019 (Unaudited)
These inputs are categorized in the following hierarchy under applicable financial accounting standards:
| Level 1 – | Unadjusted quoted prices in active markets for identical investments, unrestricted assets or liabilities that the Funds have the ability to access at the measurement date; |
| Level 2 – | Quoted prices which are not active, quoted prices for similar assets or liabilities in active markets or inputs other than quoted prices that are observable (either directly or indirectly) for substantially the full term of the asset or liability; and |
| Level 3 – | Significant unobservable prices or inputs (including the Funds’ own assumptions in determining the fair value of investments) where there is little or no market activity for the asset or liability at the measurement date. |
The following is a summary of each input used to value the Funds as of October 31, 2019:
| Investments in Securities at Value | | Level 1 - Quoted Prices | | | Level 2 - Other Significant Observable Inputs | | | Level 3 - Significant Unobservable Inputs | | | Total | |
| Emerald Growth Fund | | | | | | | | | | | | | | | | |
| Common Stocks(a) | | $ | 1,252,662,870 | | | $ | – | | | $ | – | | | $ | 1,252,662,870 | |
| Short Term Investments | | | 2,985,193 | | | | – | | | | – | | | | 2,985,193 | |
| TOTAL | | $ | 1,255,648,063 | | | $ | – | | | $ | – | | | $ | 1,255,648,063 | |
| Investments in Securities at Value | | Level 1 - Quoted Prices | | | Level 2 - Other Significant Observable Inputs | | | Level 3 - Significant Unobservable Inputs | | | Total | |
| Emerald Small Cap Value Fund | | | | | | | | | | | | |
| Common Stocks(a) | | $ | 3,092,685 | | | $ | – | | | $ | – | | | $ | 3,092,685 | |
| Short Term Investments | | | 13,247 | | | | – | | | | – | | | | 13,247 | |
| TOTAL | | $ | 3,105,932 | | | $ | – | | | $ | – | | | $ | 3,105,932 | |
| Investments in Securities at Value | | Level 1 - Quoted Prices | | | Level 2 - Other Significant Observable Inputs | | | Level 3 - Significant Unobservable Inputs | | | Total | |
| Emerald Insights Fund | | | | | | | | | | | | |
| Common Stocks(a) | | $ | 10,913,694 | | | $ | – | | | $ | – | | | $ | 10,913,694 | |
| Exchange Traded Funds(a) | | | 303,252 | | | | – | | | | – | | | | 303,252 | |
| Short Term Investments | | | 599,193 | | | | – | | | | – | | | | 599,193 | |
| TOTAL | | $ | 11,816,139 | | | $ | – | | | $ | – | | | $ | 11,816,139 | |
| Investments in Securities at Value | | Level 1 - Quoted Prices | | | Level 2 - Other Significant Observable Inputs | | | Level 3 - Significant Unobservable Inputs | | | Total | |
| Emerald Banking and Finance Fund | | | | | | | | | | | | |
| Common Stocks | | | | | | | | | | | | |
| Banks: Diversified | | $ | 176,266,953 | | | $ | 5,164,774 | | | $ | – | | | $ | 181,431,727 | |
| Other(a) | | | 86,842,600 | | | | – | | | | – | | | | 86,842,600 | |
| Short Term Investments | | | 947,905 | | | | – | | | | – | | | | 947,905 | |
| TOTAL | | $ | 264,057,458 | | | $ | 5,164,774 | | | $ | – | | | $ | 269,222,232 | |
| (a) | For detailed descriptions of sector and industry, see the accompanying Schedule of Investments. |
For the six months ended October 31, 2019, the Funds did not have any securities that used significant unobservable inputs (Level 3) in determining fair value.
| 60 | www.emeraldmutualfunds.com |
| Emerald Funds | Notes to Financial Statements |
October 31, 2019 (Unaudited)
Investment Transactions and Investment Income:Investment transactions are accounted for on the date the investments are purchased or sold (trade date). Realized gains and losses from investment transactions are reported on an identified cost basis, which is the same basis the Funds use for federal income tax purposes. Interest income, which includes accretion of discounts, is accrued and recorded as earned. Dividend income is recognized on the ex-dividend date or for certain foreign securities, as soon as information is available to the Funds. All of the realized and unrealized gains and losses and net investment income, are allocated daily to each class in proportion to its average daily net assets.
Real Estate Investment Trusts (“REITs”):The Funds may invest a portion of their assets in REITs and are subject to certain risks associated with direct investment in REITs. REITs may be affected by changes in the value of their underlying properties and by defaults by borrowers or tenants. REITs depend generally on their ability to generate cash flow to make distributions to shareowners, and certain REITs have self-liquidation provisions by which mortgages held may be paid in full and distributions of capital returns may be made at any time. In addition, the performance of a REIT may be affected by its failure to qualify for tax-free pass-through of income under the Internal Revenue Code of 1986, as amended (the “Code”), or its failure to maintain exemption from registration under the 1940 Act. A Fund’s investments in REITs may result in such Fund’s receipt of cash in excess of the REITs’ earnings. If the Fund receives such distributions all or a portion of these distributions will constitute a return of capital to such Fund. Receiving a return of capital distribution from REITs will reduce the amount of income available to be distributed to Fund shareholders. Income from REITs generally will not be eligible for treatment as qualified dividend income. As the final character of the distributions is not known until reported by the REITs on their 1099s, the Funds utilize an average of the prior year’s reallocation information as an estimate for the current year character of distributions.
Trust Expenses:Some expenses of the Trust can be directly attributed to the Funds. Expenses which cannot be directly attributed to the Funds are apportioned among all funds in the Trust based on average net assets of each fund.
Fund and Class Expenses:Expenses that are specific to a Fund or class of shares of a Fund, including distribution fees (Rule 12b-1 fees) and shareholder servicing fees, are charged directly to that Fund or share class. All expenses of a Fund, other than class specific expenses, are allocated daily to each class in proportion to its average daily net assets. Expenses that are common to the Funds generally are allocated among the Funds in proportion to their average daily net assets.
Federal Income Taxes:Each Fund complies with the requirements under Subchapter M of the Code, applicable to regulated investment companies and intends to distribute substantially all of its net taxable income and net capital gains, if any, each year so that the Funds will not be subject to excise tax on undistributed income and gains. The Funds are not subject to income taxes to the extent such distributions are made.
As of and during the six months ended October 31, 2019, the Funds did not have a liability for any unrecognized tax benefits. The Funds file U.S. federal, state, and local tax returns as required. The Funds’ tax returns are subject to examination by the relevant tax authorities until expiration of the applicable statute of limitations, which is generally three years after the filing of the tax return for federal purposes and four years for most state returns. Tax returns for open years have incorporated no uncertain tax positions that require a provision for income taxes.
Distributions to Shareholders:Each Fund normally pays dividends and distributes capital gains, if any, on an annual basis. Income dividend distributions are derived from dividends and other income each Fund receives from its investments, including short-term capital gains. Long term capital gain distributions are derived from gains realized when each Fund sells a security it has owned for more than a year. Each Fund may make additional distributions and dividends at other times if the portfolio manager believes doing so may be necessary for each Fund to avoid or reduce taxes.
3. TAX BASIS INFORMATION
Tax Basis of Investments:As of October 31, 2019, the aggregate cost of investments, gross unrealized appreciation/(depreciation) and net unrealized appreciation/(depreciation) for Federal tax purposes was as follows:
| | | Gross Appreciation (excess of value over tax cost) | | | Gross Depreciation (excess of tax cost over value) | | | Net Unrealized Appreciation/(Depreciation) | | | Cost of Investments for Income Tax Purposes | |
| Emerald Growth Fund | | $ | 405,240,692 | | | $ | (70,278,085 | ) | | $ | 334,962,607 | | | $ | 920,685,456 | |
| Emerald Small Cap Value Fund | | | 628,553 | | | | (117,057 | ) | | | 511,496 | | | | 2,594,436 | |
| Emerald Insights Fund | | | 2,289,220 | | | | (327,427 | ) | | | 1,961,793 | | | | 9,854,346 | |
| Emerald Banking and Finance Fund | | | 47,309,853 | | | | (11,030,986 | ) | | | 36,278,867 | | | | 232,943,365 | |
| Semi-Annual Report | October 31, 2019 | 61 |
| Emerald Funds | Notes to Financial Statements |
October 31, 2019 (Unaudited)
Tax Basis of Distributions to Shareholders:The character of distributions made during the year from net investment income or net realized gains may differ from its ultimate characterization for federal income tax purposes. Also, due to the timing of dividend distributions, the fiscal year in which amounts are distributed may differ from the fiscal year in which the income or realized gain were recorded by each Fund.
The tax characters of distributions paid by the Funds for the fiscal year ended April 30, 2019 were as follows:
| | | Ordinary Income | | | Long-Term Capital Gain | |
| Emerald Growth Fund | | $ | – | | | $ | 116,684,237 | |
| Emerald Small Cap Value Fund | | | – | | | | 1,226,932 | |
| Emerald Insights Fund | | | 170,539 | | | | 1,740,059 | |
| Emerald Banking and Finance Fund | | | – | | | | 86,106,387 | |
The amounts and characteristics of tax basis distributions and composition of distributable earnings/(accumulated losses) are finalized at fiscal year-end. Accordingly, tax basis balances have not been determined as of October 31, 2018.
4. SECURITIES TRANSACTIONS
The cost of purchases and proceeds from sales of securities (excluding short-term securities) during the six months ended October 31, 2019 was as follows:
| Funds | | Cost of Investments Purchased | | | Proceeds from Investments Sold | |
| Emerald Growth Fund | | $ | 286,613,630 | | | $ | 330,651,310 | |
| Emerald Small Cap Value Fund | | | 761,719 | | | | 1,769,639 | |
| Emerald Insights Fund | | | 4,257,199 | | | | 4,039,857 | |
| Emerald Banking and Finance Fund | | | 32,860,023 | | | | 104,913,475 | |
5. SHARES OF BENEFICIAL INTEREST
The capitalization of the Trust consists of an unlimited number of shares of beneficial interest with no par value per share. Holders of the shares of the Funds of the Trust have one vote for each share held and a proportionate fraction of a vote for each fractional share. All shares issued and outstanding are fully paid and are transferable and redeemable at the option of the shareholder. Purchasers of the shares do not have any obligation to make payments to the Trust or its creditors (other than the purchase price for the shares) or make contributions to the Trust or its creditors solely by reason of the purchaser’s ownership of the shares. Shares have no pre-emptive rights.
6. MANAGEMENT AND RELATED-PARTY TRANSACTIONS
The Adviser, subject to the authority of the Board, is responsible for the overall management and administration of the Funds’ business affairs. The Adviser manages the investments of the Funds in accordance with the Funds’ investment objective, policies and limitations and investment guidelines established jointly by the Adviser and the Trustees. Pursuant to the Advisory Agreement, the Funds pay the Adviser fees for the services and facilities it provides payable on a monthly basis at the annual rate set forth below of the Funds’ average daily net assets. The management fee is paid on a monthly basis.
| Emerald Growth Fund | |
| Average Total Net Assets | Contractual Fee |
| Up to and including $250M | 0.75% |
| Over $250M and including $500M | 0.65% |
| Over $500M and including $750M | 0.55% |
| Over $750M | 0.45% |
| Emerald Small Cap Value Fund | |
| Average Total Net Assets | Contractual Fee |
| Up to and including $250M | 0.75% |
| Over $250M and including $500M | 0.65% |
| Over $500M and including $750M | 0.55% |
| Over $750M | 0.45% |
| 62 | www.emeraldmutualfunds.com |
| Emerald Funds | Notes to Financial Statements |
October 31, 2019 (Unaudited)
| Emerald Insights Fund | |
| Average Total Net Assets | Contractual Fee |
| Up to and including $250M | 0.75% |
| Over $250M and including $500M | 0.65% |
| Over $500M and including $750M | 0.55% |
| Over $750M | 0.45% |
| Emerald Banking and Finance Fund | |
| Average Total Net Assets | Contractual Fee |
| Up to and including $100M | 1.00% |
| Over $100M | 0.90% |
The Adviser has contractually agreed to limit each Fund’s total annual operating expenses (exclusive of acquired fund fees and expenses, brokerage expenses, interest expenses, taxes and extraordinary expense) set forth to the annual shares (as percentages of a Fund’s average daily net assets) in the following table for Class A, Class C, Institutional Class, and Investor Class shares. This agreement (the “Expense Agreement”) is in effect from September 1, 2019 through August 31, 2020. The prior Expense Agreement was in effect from September 1, 2018 through August 31, 2019. The Adviser will be permitted to recover, on a class-by-class basis, expenses it has borne through the expense agreement to the extent that a Fund’s expenses in later periods fall below the expense cap in effect at the time of the waiver or reimbursement. Notwithstanding the foregoing, the Funds will not be obligated to pay any such fees and expenses more than three years after the date of the waiver or reimbursement. The Adviser may not discontinue this waiver, prior to August 31, 2020, without the approval by the Fund’s Board. Fees waived/reimbursed by the Adviser for the six months ended October 31, 2019 are disclosed in the Statements of Operations.
| Emerald Growth Fund | | | |
| Class A | Class C | Institutional Class | Investor Class |
| 1.29% | 1.94% | 0.99% | 1.34% |
| Emerald Small Cap Value Fund |
| Class A | Class C | Institutional Class | Investor Class |
| 1.35% | 2.00% | 1.00% | 1.25% |
| Emerald Insights Fund | | | |
| Class A | Class C | Institutional Class | Investor Class |
| 1.35% | 2.00% | 1.05% | 1.40% |
| Emerald Banking and Finance Fund |
| Class A | Class C | Institutional Class | Investor Class |
| 1.84% | 2.49% | 1.54% | 1.89% |
| Semi-Annual Report | October 31, 2019 | 63 |
| Emerald Funds | Notes to Financial Statements |
October 31, 2019 (Unaudited)
For the six months ended October 31, 2019, the fee waivers/reimbursements and recoupments of past waived fees were as follows:
| Fund | | Fees Waived/ Reimbursed By Adviser | | | Recoupment of Past Waived Fees By Adviser | |
| Emerald Growth Fund | | | | | | |
| Class A | | $ | – | | | $ | – | |
| Class C | | | – | | | | – | |
| Institutional Class | | | – | | | | – | |
| Investor Class | | | – | | | | – | |
| Emerald Small Cap Value Fund | | | | | | | | |
| Class A | | $ | 35,607 | | | $ | – | |
| Class C | | | 641 | | | | – | |
| Institutional Class | | | 13,532 | | | | – | |
| Investor Class | | | 8,387 | | | | – | |
| Emerald Insights Fund | | | | | | | | |
| Class A | | $ | 41,705 | | | $ | – | |
| Class C | | | 638 | | | | – | |
| Institutional Class | | | 5,959 | | | | – | |
| Investor Class | | | 459 | | | | – | |
| Emerald Banking and Finance Fund | | | | | | | | |
| Class A | | $ | – | | | $ | – | |
| Class C | | | – | | | | – | |
| Institutional Class | | | – | | | | – | |
| Investor Class | | | – | | | | – | |
As of October 31, 2019, the balances of recoupable expenses for each Fund were as follows:
| Fund | | Expires 2020 | | | Expires 2021 | | | Expires 2022 | | | Expires 2023 | | | Total | |
| Emerald Growth Fund | | | | | | | | | | | | | | | |
| Class A | | $ | – | | | $ | – | | | $ | – | | | $ | – | | | $ | – | |
| Class C | | | – | | | | – | | | | – | | | | – | | | | – | |
| Institutional Class | | | – | | | | – | | | | – | | | | – | | | | – | |
| Investor Class | | | – | | | | – | | | | – | | | | – | | | | – | |
| Emerald Small Cap Value Fund | | | | | | | | | | | | | | | | | | | | |
| Class A | | $ | 5,682 | | | $ | 32,984 | | | $ | 63,581 | | | $ | 35,607 | | | $ | 137,854 | |
| Class C | | | 3,066 | | | | 1,410 | | | | 936 | | | | 641 | | | | 6,052 | |
| Institutional Class | | | 35,060 | | | | 53,528 | | | | 27,060 | | | | 13,532 | | | | 129,180 | |
| Investor Class | | | 4,234 | | | | 7,303 | | | | 8,872 | | | | 8,387 | | | | 28,795 | |
| Emerald Insights Fund | | | | | | | | | | | | | | | | | | | | |
| Class A | | $ | 42,505 | | | $ | 72,407 | | | $ | 77,413 | | | $ | 41,705 | | | $ | 234,031 | |
| Class C | | | 445 | | | | 908 | | | | 1,019 | | | | 638 | | | | 3,010 | |
| Institutional Class | | | 4,736 | | | | 8,238 | | | | 11,141 | | | | 5,959 | | | | 30,073 | |
| Investor Class | | | 306 | | | | 693 | | | | 1,004 | | | | 459 | | | | 2,462 | |
| Emerald Banking and Finance Fund | | | | | | | | | | | | | | | | | | | | |
| Class A | | $ | – | | | $ | – | | | $ | – | | | $ | – | | | $ | – | |
| Class C | | | – | | | | – | | | | – | | | | – | | | | – | |
| Institutional Class | | | – | | | | – | | | | – | | | | – | | | | – | |
| Investor Class | | | – | | | | – | | | | – | | | | – | | | | – | |
| 64 | www.emeraldmutualfunds.com |
| Emerald Funds | Notes to Financial Statements |
October 31, 2019 (Unaudited)
Fund Administrator Fees and Expenses:ALPS Fund Services, Inc. (“ALPS”) serves as administrator to the Funds and the Funds have agreed to pay expenses incurred in connection with their administrative activities. Pursuant to an Administration Agreement, ALPS provides operational services to the Funds including, but not limited to, fund accounting and fund administration and generally assist in the Funds’ operations. Officers of the Trust are employees of ALPS. The Funds’ administration fee is accrued on a daily basis and paid monthly. Administration fees paid by the Funds for the six months ended October 31, 2019 are disclosed in the Statements of Operations.
The Administrator is also reimbursed by the Funds for certain out-of-pocket expenses.
Transfer Agent:ALPS serves as transfer, dividend paying and shareholder servicing agent for the Funds. ALPS receives an annual minimum fee, a fee based upon the number of shareholder accounts, and is also reimbursed by the Funds for certain out-of-pocket expenses. Transfer agent fees paid by the Funds for the six months ended October 31, 2019 are disclosed in the Statements of Operations.
Compliance Services:ALPS provides services that assist the Trust’s chief compliance officer in monitoring and testing the policies and procedures of the Trust in conjunction with requirements under Rule 38a-1 under the 1940 Act and receives an annual base fee. ALPS is reimbursed for certain out-of-pocket expenses by the Funds. Compliance service fees paid by the Funds for the six months ended October 31, 2019 are disclosed in the Statements of Operations.
Principal Financial Officer:ALPS receives an annual fee for providing principal financial officer services to the Funds. Principal financial officer fees paid by the Funds for the six months ended October 31, 2019 are disclosed in the Statements of Operations.
Distributor:ALPS Distributors, Inc. (“ADI” or the “Distributor”) (an affiliate of ALPS) acts as the distributor of the Funds’ shares pursuant to a Distribution Agreement with the Trust. Shares are sold on a continuous basis by ADI as agent for the Funds, and ADI has agreed to use its best efforts to solicit orders for the sale of Funds’ shares, although it is not obliged to sell any particular amount of shares. ADI is not entitled to any compensation for its services as Distributor. ADI is registered as a broker-dealer with the U.S. Securities and Exchange Commission.
Each Fund has adopted a separate Distribution and Services Plan (each a “Plan” and collectively, the “Plans”) pursuant to Rule 12b-1 of the 1940 Act. The Plans allow each Fund, as applicable, to use each Fund’s assets to pay fees in connection with the distribution and marketing of the Funds’ shares and/or the provision of shareholder services to the Funds’ shareholders. The Plan permits payment for services in connection with the administration of plans or programs that use shares of each Fund as their funding medium and for related expenses. The recipients of such payments may include other affiliates of the Adviser, broker-dealers, financial institutions, plan sponsors and administrators and other financial intermediaries through which investors may purchase shares of the Fund. The Plans permit each Fund to make total payments at an annual rate of up to 0.35%, 0.75% and 0.25% of the average daily net asset value of Class A, Class C and Investor Class, respectively. Because these fees are paid out of the Funds’ assets on an ongoing basis, over time they will increase the cost of an investment in the Funds, and Plan fees may cost an investor more than other types of sales charges.
Each Fund, except the Emerald Small Cap Value Fund, has adopted a Shareholder Services Plan (a “Shareholder Services Plan”) with respect to its Class C, Institutional Class and Investor Class shares. Under the Shareholder Services Plan, a Fund is authorized to compensate certain financial intermediaries, including broker-dealers and Fund affiliates which may include the Distributor, Adviser and/or the transfer agent (the “Participating Organizations”), an aggregate fee in an amount not to exceed on an annual basis 0.25%, 0.05% and 0.15% of the average daily net asset value of Class C, Institutional Class and Investor Class, respectively, of the Funds attributable to or held in the name of the Participating Organizations pursuant to an agreement with such Participating Organizations (the “Agreement”). Each Agreement will set forth the non-distribution related shareholder services to be performed by the Participating Organizations for the benefit of a Fund’s shareholders who have elected to have such Participating Organizations service their accounts. Any amount of such payment not paid to Participating Organizations during a Fund’s fiscal year for such service activities shall be reimbursed to the Fund as soon as practicable. Shareholder Services Plan fees are included with distribution and service fees in the Statements of Operations. Fees recaptured pursuant to the Shareholder Services Plan for the six months ended October 31, 2019 are included as an offset to distribution and service fees as disclosed in the Statements of Operations.
The Emerald Small Cap Value Fund has adopted a Shareholder Services Plan (the “Plan”) with respect to its Class C shares. Under the Plan, the Fund is authorized to pay banks and its affiliates and other institutions, including broker-dealers and Fund affiliates which may include the Distributor, Adviser and/or the transfer agent (“Class C Participating Organizations”), an aggregate fee in an amount not to exceed on an annual basis 0.25% of the average daily net asset value of Class C shares of the Fund attributable to or held in the name of the Participating Organizations for its clients as compensation for providing shareholder service activities, which do not include distribution services pursuant to an agreement with Participating Organizations. Any amount of such payment not paid to the Participating Organizations during the Fund’s fiscal year for such service activities shall be reimbursed to the Fund as soon as practicable. Plan fees are included with distribution and service fees in the Statements of Operations. Fees recaptured pursuant to the Plan for the six months ended October 31, 2019 are included as an offset to distribution and service fees as disclosed in the Statements of Operations.
| Semi-Annual Report | October 31, 2019 | 65 |
| Emerald Funds | Notes to Financial Statements |
October 31, 2019 (Unaudited)
Trustees
The fees and expenses of the independent Trustees of the Board are presented in the Statements of Operations.
7. INDEMNIFICATIONS
Under the Trust’s organizational documents, its officers and Trustees are indemnified against certain liability arising out of the performance of their duties to the Trust. Additionally, in the normal course of business, the Trust enters into contracts with service providers that may contain general indemnification clauses, which may permit indemnification to the extent permissible under applicable law. The Trust’s maximum exposure under these arrangements is unknown, as this would involve future claims that may be made against the Trust that have not yet occurred.
8. SUBSEQUENT EVENTS
Subsequent events after the date of the Statements of Assets and Liabilities have been evaluated through the date the financial statements were issued.
| 66 | www.emeraldmutualfunds.com |
| Emerald Funds | Additional Information |
October 31, 2019 (Unaudited)
1. FUND HOLDINGS
The Funds’ portfolio holdings are made available semi-annually in shareholder reports within 60 days after the close of the period for which the report is being made, as required by federal securities laws. The Funds also file monthly portfolio holdings on Form N-PORT on a quarterly basis, with the schedule of portfolio holdings filed on Form N-PORT for the third month of each Fund’s fiscal quarter made publicly available 60 days after the end of the Funds’ fiscal quarter.
2. FUND PROXY VOTING POLICIES, PROCEDURES AND SUMMARIES
Each Fund’s policies and procedures used in determining how to vote proxies and information regarding how the Funds voted proxies relating to portfolio securities during the most recent prior 12-month period ending June 30 are available without charge, (1) upon request, by calling (toll-free) (855) 828-9909 and (2) on the SEC’s website at http://www.sec.gov.
| Semi-Annual Report | October 31, 2019 | 67 |
| Emerald Funds | Privacy Policy |
| Who We Are | |
| Who is providing this notice? | Emerald Banking and Finance Fund, Emerald Growth Fund, Emerald InsightsFund and Emerald Small Cap Value Fund |
| What We Do | |
| How do the Funds protect my personal information? | To protect your personal information from unauthorized access and use, we use security measures that comply with federal law. These measures include computer safeguards and secured files and buildings. |
| How do the Funds collect my personal information? | We collect your personal information, for example, when you |
| | • open an account |
| | • provide account information or give us your contact information |
| | • make a wire transfer or deposit money |
| Why can’t I limit all sharing? | Federal law gives you the right to limit only |
| | • sharing for affiliates’ everyday business purposes-information about your creditworthiness |
| | • affiliates from using your information to market to you |
| | • sharing for non-affiliates to market to you |
| | State laws and individual companies may give you additional rights to limit sharing. |
| Definitions | |
| Affiliates | Companies related by common ownership or control. They can be financial and nonfinancial companies. |
| Non-affiliates | Companies not related by common ownership or control. They can be financial and nonfinancial companies. |
| | • The Funds do not share with non-affiliates so they can market to you. |
| Joint marketing | A formal agreement between non-affiliated financial companies that together market financial products or services to you. |
| | • The Funds do not jointly market. |
| Other Important Information | |
| California residents | If your account has a California home address, your personal information will not be disclosed to nonaffiliated third parties except as permitted by applicable California law, and we will limit sharing such personal information with our affiliates to comply with California privacy laws that apply to us. |
| Vermont residents | The State of Vermont requires financial institutions to obtain your consent prior to sharing personal information that they collect about you with affiliated companies and nonaffiliated third parties other than in certain limited circumstances. Except as permitted by law, we will not share personal information we collect about you with nonaffiliated third parties or other affiliated companies unless you provide us with your written consent to share such information. |
| 68 | www.emeraldmutualfunds.com |
| Emerald Funds | Privacy Policy |
| FACTS | WHAT DO THE FUNDS DO WITH YOUR PERSONAL INFORMATION? |
| WHY? | Financial companies choose how they share your personal information. Federal law gives consumers the right to limit some but not all sharing. Federal law also requires us to tell you how we collect, share, and protect your personal information. Please read this notice carefully to understand what we do. |
| WHAT? | The types of personal information we collect and share depend on the product or service you have with us. This information can include: |
| | • Social Security number and account transactions |
| | • Account balances and transaction history |
| | • Wire transfer instructions |
| HOW? | All financial companies need to share customers’ personal information to run their everyday business. In the section below, we list the reasons financial companies can share their customers’ personal information; the reasons the Funds choose to share; and whether you can limit this sharing. |
| Reasons we can share your personal information | Do the funds share: | Can you limit this sharing? |
For our everyday business purposes –
such as to process your transactions, maintain your account(s), respond to court orders and legal investigations, or report to credit bureaus | Yes | No |
For our marketing purposes –
to offer our products and services to you | No | We do not share. |
| For joint marketing with other financial companies | No | We do not share. |
For our affiliates’ everyday business purposes –
information about your transactions and experiences | Yes | No |
For our affiliates’ everyday business purposes –
information about your creditworthiness | No | We do not share. |
| For non-affiliates to market to you | No | We do not share. |
| Semi-Annual Report | October 31, 2019 | 69 |

Beginning on January 1, 2021, as permitted by regulations adopted by the U.S. Securities and Exchange Commission, paper copies of the Fund’s annual and semi-annual shareholder reports will no longer be sent by mail, unless you specifically request paper copies of the reports. Instead, the reports will be made available on the Funds’ website at www.GrandeurPeakGlobal.com and you will be notified by mail each time a report is posted and provided with a website link to access the report.
You may, notwithstanding the availability of shareholder reports online, elect to receive all future shareholder reports in paper free of charge. If you invest through a financial intermediary, you can contact your financial intermediary to request that you continue to receive paper copies of your shareholder reports. If you invest directly with the Funds, you can call 1.855.377.7325 to let the Funds know you wish to continue receiving paper copies of your shareholder reports.
If you already elected to receive shareholder reports electronically, you will not be affected by this change and you need not take any action. You may elect to receive shareholder reports and other communications from the Funds electronically anytime by contacting your financial intermediary (such as a broker-dealer or bank) or, if you are a direct investor, by enrolling at www.GrandeurPeakGlobal.com.

TABLE OF CONTENTS
| Shareholder Letter | 2 |
| Performance Update | 10 |
| Disclosure of Fund Expenses | 34 |
| Portfolio of Investments | |
| Grandeur Peak Emerging Markets Opportunities Fund | 36 |
| Grandeur Peak Global Contrarian Fund | 39 |
| Grandeur Peak Global Micro Cap Fund | 42 |
| Grandeur Peak Global Opportunities Fund | 45 |
| Grandeur Peak Global Reach Fund | 49 |
| Grandeur Peak Global Stalwarts Fund | 54 |
| Grandeur Peak International Opportunities Fund | 57 |
| Grandeur Peak International Stalwarts Fund | 61 |
| Statements of Assets and Liabilities | 64 |
| Statements of Operations | 66 |
| Statements of Changes in Net Assets | |
| Grandeur Peak Emerging Markets Opportunities Fund | 68 |
| Grandeur Peak Global Contrarian Fund | 69 |
| Grandeur Peak Global Micro Cap Fund | 70 |
| Grandeur Peak Global Opportunities Fund | 71 |
| Grandeur Peak Global Reach Fund | 72 |
| Grandeur Peak Global Stalwarts Fund | 73 |
| Grandeur Peak International Opportunities Fund | 74 |
| Grandeur Peak International Stalwarts Fund | 75 |
| Financial Highlights | |
| Grandeur Peak Emerging Markets Opportunities Fund | 76 |
| Grandeur Peak Global Contarian Fund | 78 |
| Grandeur Peak Global Micro Cap Fund | 79 |
| Grandeur Peak Global Opportunities Fund | 80 |
| Grandeur Peak Global Reach Fund | 82 |
| Grandeur Peak Global Stalwarts Fund | 84 |
| Grandeur Peak International Opportunities Fund | 86 |
| Grandeur Peak International Stalwarts Fund | 88 |
| Notes to Financial Statements | 90 |
| Disclosure Regarding Approval of Fund Advisory Agreement | 102 |
| Additional Information | 106 |
| Privacy Policy | 107 |
| Grandeur Peak Funds® | Shareholder Letter |
October 31, 2019 (Unaudited)
Dear Fellow Shareholders,
In 2014, after almost three years in business, we wrote in the Q1 investor letter:
“Here we sit with the global economy still struggling, our companies without a lot of wind in their sails and valuations not that great.”
Since then the market, as measured by the MSCI All Country World Investible Market Index (ACWI IMI)1, is up another 44.4% or about 7% annualized. Back in 2014, when we had doubts that we would continue to have a strong market wind filling our sails, we wrote:
“As an investment team we have to take to the oars and figure out which of our names we should be adding to and to a lesser degree find some new names, first looking over our watch lists, then elsewhere. This, of course is easier said than done.”
Now 22 quarters later in 2019, we have a nearly similar feeling. We thought it would be helpful (again) to remind you of how we attempt to generate returns for our portfolios in a tough market environment.
The Grandeur Peak Process of Investing
While there are 8,820 stocks in the ACWI IMI, there are actually close to 40,000 publicly listed companies that we consider investible2. Our goal is to look at the financials of all 40,000 companies at least twice a year and make a determination as to which of these companies we will add to our research universe. What we’re looking for in these screens are certain characteristics (e.g. growth rates, profitability, cash flow generation, etc.) that we believe are indicative of high quality companies. We employ a very systematic approach to screening this universe whereby over the course of a 52-week schedule we screen the entire universe twice to hopefully minimize the number of high quality companies that slip through the cracks.
For us, a great (high quality) company is one that operates a good business. According to CNBC, Warren Buffett once said: “I try to buy stock in businesses that are so wonderful that an idiot can run them. Because sooner or later, one will.”3 We look for companies that have plenty of headroom to grow. We believe a good business allows for the possibility of large market share gains. Think about Cisco4 back in 1990. The company became public on February 16, 1990 with a $200 million market capitalization. The opportunity for growth was enormous. But just as important as the opportunity to grow, a business must have economies of scale such that growth will lead to increased profitability as measured by factors such as rising returns on assets and capital. A third important characteristic that is indicative of a great business is a strong competitive advantage, what Buffett refers to as a “moat”5. Having a strong competitive advantage can allow a company to stay profitable for years. Indicators of a moat around a business are sticky customers, steady recurring revenue, a diverse customer base with little risk of revenue drying up if a large customer or two were to leave, and strong bargaining power with suppliers and customers.
Another very important aspect of a good company, we believe, is the motivation, integrity and skill of the management team. In many cases, making a good business into a good company requires the right management team. This is why we travel so much. We think it’s vitally important to meet management face to face. More recently, we’ve refined our approach to evaluating the environmental, social and governance (ESG) aspects of the companies we research. While we’ve always felt that ESG principles are at the heart of our focus on Quality, and ESG analysis has always been an inherent part of our fundamental research process, we are now developing more systematic tools to help us incorporate ESG analysis into our process.
Finally, we make a distinction between good companies and good stocks. Finding a great company is only half the battle. If a great company’s stock isn’t attractively priced, it might not make a very good investment. So ultimately, the entire framework of our investment process can be boiled down to a three dimensional matrix through which we analyze each company along the key measures: Quality, Value and Momentum (QVM). When we speak of “momentum,” we’re not talking about stock price momentum or technical momentum, but rather fundamental business momentum: how well the business is doing. Through our screening and follow-on research process, what we’re ultimately trying to determine is where on the QVM spectrum a company lies and does that make it a buy, hold, trim, or sell.
| 1 | The MSCI ACWI Investable Market Index (IMI) captures large, mid and small cap representation across 23 Developed Markets (DM) and 26 Emerging Markets (EM) countries. With 9,072 constituents, the index is comprehensive, covering approximately 99% of the global equity investment opportunity set. |
| 2 | Up from 30,000 when we wrote in Q1-2014 |
| 3 | Schuyler Velasco, “Ten pieces of investment advice from America's greatest investor” (Aug 30, 2013), http://www.cnbc.com/id/101000052 |
| 4 | As of 10/31/2019, Grandeur Peak Funds owned zero shares of Cisco Systems, Inc. |
| 5 | A moat, as Buffet has popularized the term, refers to a business' ability to maintain competitive advantages over its competitors in order to protect its long-term profits and market share from competing firms. |
| 2 | 1.855.377.7325 | www.GrandeurPeakGlobal.com |
| Grandeur Peak Funds® | Shareholder Letter |
October 31, 2019 (Unaudited)
One question we get asked by prospective clients is: Are we Growth or Value investors? The easy, although confusing answer to that question is: “Yes.” What we really are though, are Quality investors. Some might refine our classification as “Quality Growth,” and while that is partially true, we are firm believers that the Value factor in our QVM matrix is as important as the Quality factor. In the words of Professor Robert Novy-Marx:
“Buying high quality assets without paying premium prices is just as much value investing as buying average quality assets at discount prices. Strategies that exploit the quality dimension of value are profitable on their own, and accounting for both dimensions of value by trading on combined quality and price signals yields dramatic performance improvements over traditional value strategies. Accounting for quality also yields significant performance improvements for investors trading momentum as well as value.”6
In September we launched our Global Contrarian strategy. Many of you have asked why we think a fifth global strategy is necessary. There’s a subtle nuance to our research framework that we think this manifestation of our process can bring to the table. As outlined above, our process is to identify what we believe are the highest quality companies in the market, and then own them at acceptable valuations (“Quality-then-Value”). The approach of the Contrarian strategy is to mine our internal database of quality companies for those that we believe exhibit exceptionally good valuations. With Value as the starting point, we then make a determination if the overall Quality is acceptable. This “Value-then-Quality” approach can lead to a different perspective that we think will enhance our research process, and ultimately could benefit all of our strategies and clients.
While it is impossible to time these things (and more importantly to note, we’re not trying to time anything here), we think a “Value-then-Quality” approach might be a good approach to global markets after a brief period of underperformance of traditional Value investing as detailed in Exhibit 1:
Exhibit 1: Total Return of the MSCI ACWI Growth and Value Indices
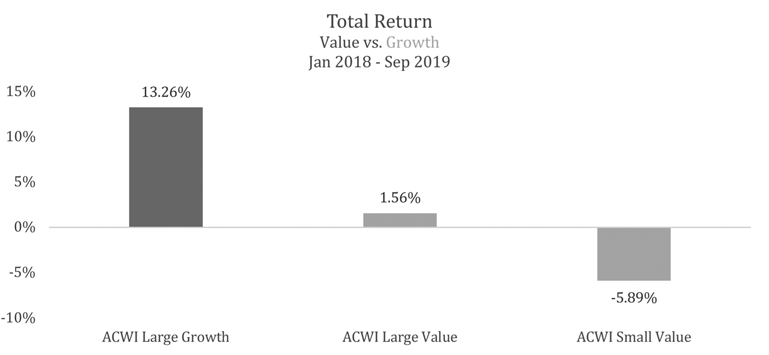
Source: MSCI (data from 12/31/2018 - 9/30/2019)
Past performance does not guarantee future results.
Exhibit 1 shows the total return of the MSCI ACWI Large Cap Growth, MSCI ACWI Large Cap Value, and MSCI ACWI Small Cap Value Indexes7 over the past seven quarters. Over this period, there has been an unusual bifurcation between the return of the Growth and Value indices. This
| 6 | Robert Novy-Marx, “The Quality Dimension of Value Investing”, Recent Working Papers http://rnm.simon.rochester.edu (March 2013) |
| 7 | The MSCI ACWI Large Cap Growth Index captures large-cap securities exhibiting overall growth style characteristics across 23 Developed Markets (DM) countries and 26 Emerging Markets (EM) countries. The MSCI ACWI Large Cap Value Index captures large cap securities exhibiting overall value style characteristics across 23 Developed Markets (DM) countries* and 26 Emerging Markets (EM) countries. The MSCI ACWI Small Cap Value Index captures small cap securities exhibiting overall value style characteristics across 23 Developed Markets (DM) countries* and 26 Emerging Markets (EM) countries. |
| Semi-Annual Report | October 31, 2019 | 3 |
| Grandeur Peak Funds® | Shareholder Letter |
October 31, 2019 (Unaudited)
difference is especially stark between the US and non-US markets as shown in Exhibit 2 which breaks the analysis into US and non-US markets as measured by the MSCI USA, the MSCI Europe, Australasia and the Far East (EAFE), and the MSCI Emerging Markets (EM) Indices.8
Exhibit 2: Total Return of the MSCI USA, EAFE, and EM Growth and Value Indices9

Source: MSCI (data from 12/31/2018 - 9/30/2019)
Past performance does not guarantee future results
The bottom line is that we believe that our investment process, using a Quality, Value and fundamental Momentum framework can continue to deliver attractive long-term results, even if in the short run we’re pretty cautious about the current market environment.
Portfolio Commentary
Overall performance for equity markets and Grandeur Peak strategies has been lackluster the last several months, but zooming out to a year-to-date view, the numbers are much more interesting. Of particular note for us, while the emerging market indices continue to lag, our Emerging Markets Opportunities Fund has been able to outperform the MSCI ACWI Emerging Markets SMID Cap benchmark by more than 1200 basis points
| 8 | The MSCI USA Index is designed to measure the performance of the large and mid cap segments of the US market. With 640 constituents, the index covers approximately 85% of the free float-adjusted market capitalization in the US. The MSCI Europe Index captures large and mid cap representation across 15 Developed Markets (DM) countries in Europe. The MSCI Europe, Australasia and the Far East (EAFE) Index is a stock market index that is designed to measure the equity market performance of developed markets outside of the U.S. & Canada. The MSCI Emerging Markets (EM) Index captures large and mid cap representation across 26 Emerging Markets countries. |
| 9 | The MSCI U.S. Large Cap Growth Index refers to a composite that includes large cap companies located in the United States with favorable growth profiles. The MSCI USA Value Index captures large and mid cap US securities exhibiting overall value style characteristics. The value investment style characteristics for index construction are defined using three variables: book value to price, 12-month forward earnings to price and dividend yield. The MSCI US Small Cap Value Index captures small cap US securities exhibiting overall value style characteristics. The value investment style characteristics for index construction are defined using three variables: book value to price, 12- month forward earnings to price and dividend yield. The MSCI EAFE Growth Index captures large and mid cap securities exhibiting overall growth style characteristics across Developed Markets countries* around the world, excluding the US and Canada. The MSCI EAFE Large Cap Index is an equity index which captures large cap representation across Developed Markets countries* around the world, excluding the US and Canada. With 396 constituents, the index covers approximately 70% of the free float-adjusted market capitalization in each country. The MSCI EAFE Small Cap Value Index captures small cap securities exhibiting overall value style characteristics across Developed Markets countries* around the world, excluding the US and Canada. The MSCI Emerging Markets Growth Index captures large and mid cap securities exhibiting overall growth style characteristics across 26 Emerging Markets (EM) countries. The MSCI Emerging Markets Value Index captures large and mid cap securities exhibiting overall value characteristics across 26 Emerging Markets (EM) countries. The MSCI Emerging Markets (EM) Small Cap Value Index captures small cap securities exhibiting overall value style characteristics across 26 Emerging Markets (EM) countries. |
| 4 | 1.855.377.7325 | www.GrandeurPeakGlobal.com |
| Grandeur Peak Funds® | Shareholder Letter |
October 31, 2019 (Unaudited)
year-to-date.10 Only the Global Micro Cap Fund lagged its primary benchmark year-to-date, as it continued to face strong micro-cap headwinds vs its small-cap benchmark. As we look under the hood of our portfolios, not every name is working out as we envisioned, but we are encouraged by the work we’re doing and with the companies in which we are investing.
At a company, geography, and sector level, our team is continually evaluating the dynamism of our QVM positioning. Technology is an area where we are focusing to get Value right. The market is not patient; software companies without perfect execution are being severely penalized. We continue to trim as names get expensive and add when we think there is nice upside potential.
Within industrials, energy, and materials, our team has not been willing to take any chances on lower Quality companies, and has thoughtfully become defensively positioned as we pay attention to cyclicality. Owning better balance sheets and reducing exposure to levered names has been a priority. We see timid customers and supply chain disruptions across the globe. Purchasing Managers’ Index11 data is trending in the wrong direction and has become particularly concerning in Germany, where the Q3 reading came in at 41.7 (on a scale of 1 to 100), the lowest reading since 2009, where anything below 50 signals contraction in the manufacturing sector. See Exhibit 3 on next page. This trend of softening leads us to focus on strength of management in our companies. We look for leaders who will not have to deleverage in a downturn, and who will be able to engage in strategic mergers and acquisitions (M&A) activity in an opportune environment. For ease of identifying large moves away from 50, the data are highlighted where the index has moved at least 5 points away from center.
| 10 | 1200 basis points is equivalent to 12 percentage points. Basis points refers to a common unit of measure for interest rates and other percentages in finance. One basis point is equal to 1/100th of 1%, or 0.01%, or 0.0001, and is used to denote the percentage change in a financial instrument. The relationship between percentage changes and basis points can be summarized as follows: 1% change = 100 basis points and 0.01% = 1 basis point. |
| 11 | The Purchasing Managers’ Index is a diffusion index that summarizes whether market conditions, as viewed by purchasing managers, are expanding, staying the same, or contracting. Index data is compiled based on a survey of over 400 companies in each country where purchasing managers are required to answer a series of questions based on a variety of economic data points, relative to the prior month. The possible responses of “increase,” “decrease.” or “no change,” are aggregated to create a diffusion index, where the index is a sum of the percentage of “increase” responses and half of the percentage of “no change” responses for each variable. The resulting score ranges from 1 to 100 with a score greater than 50 indicating an increase or expansion and a score below 50 indicating a contraction. For ease of interpreting trends, the data are colored to indicate the monthly changes over time, >55: dark green; 50.1-54.9: light green; 45.1-50.0: light red; <44.9: dark red |
| Semi-Annual Report | October 31, 2019 | 5 |
| Grandeur Peak Funds® | Shareholder Letter |
October 31, 2019 (Unaudited)
Exhibit 3: Global Purchasing Managers’ Index – Monthly Data

Source: IHS Markit, Global Purchasing Managers’ Index, 1/31/2017-9/30/19
In healthcare, our tilt towards Quality and Momentum has seen nice results in China in recent months. This is a market historically driven by generic drugs, where increasing inflows of private equity dollars and government pricing pressure on generics have stimulated aggressive research and development. There is a definite case of a rising tide lifting all boats, but we can do better than just rely on the tide. Not wanting the binary risks of biotech, our focus remains on life sciences companies. These are firms like contract research organizations (CROs), which provide outsourced research, diagnostics, and other services. We are willing to pay up for Quality in this space, as we believe there is still plenty of headroom, while always watching valuation carefully.
No mention of China can avoid the topic of trade wars. Across healthcare, tech, and other sectors, we are connecting important global dots that we feel position us well, with a few examples listed here: 1) Chinese companies that target a domestic customer base are greatly benefiting from closing borders; 2) mainland exporters are accelerating the move of production to neighboring Southeast Asian countries to not only avoid potential tariffs but also as a cost reduction measure; 3) companies in other developed international countries are benefitting from Chinese importers looking for new non-US counterparts. While we continue to be bottom up investors, we are constantly aware that the economy is truly global and all events can create opportunities and risks.
Elsewhere in the portfolio, we are trying to take advantage of the blending of technology and consumer. Every visit to your local shopping mall (if you still go these days) seems to spark reflections on the drastic shift taking place in brick and mortar retail. The world is undergoing serious changes in consumer behavior, with buyers demanding more choices, real-time results, and customization (see Global e-Commerce Growth graph below). We continue to like companies that play into this trend. We find that consumer companies that are sophisticated in their use of technology, with advanced customer data and loyalty programs, are able to streamline supply chains and provide rapid online adaptation. These companies feel head and shoulders above their competition due to the nimbleness and knowledge of customer base that technology provides. As a somewhat related aside, if you haven’t heard of digital fashion, you need to google it…. mind blowing. Perhaps a foreshadowing of things to come in the marrying of technology and retail?
| 6 | 1.855.377.7325 | www.GrandeurPeakGlobal.com |
| Grandeur Peak Funds® | Shareholder Letter |
October 31, 2019 (Unaudited)
Exhibit 4: Global eCommerce growth (ex-travel) ($ millions)

y/y means year-over-year
Other pieces of our consumer portfolio include drug stores (ageing population theme), the athleisure trend’s effects on fast fashion and traditional retail, and education platforms/technology. We are also closely watching Indian consumer companies, but despite recent sell-offs, they remain extremely expensive. We aim to own strong brands that are adapting well, crossing borders, and increasing standards of living.
Within the Financials sector, we are looking for beneficiaries of the “passivization” of public equity management and the “privatization” of active equity management. Private asset managers are appealing to us due to their recurring revenue profiles and opportunities to consolidate large markets that are expanding through rising alternatives allocations. Historically, financials exposure at Grandeur Peak has been heavy on banks and light on real estate, as real estate investment trusts (REITS) generally do not fit our best-in-class growth profile. As a result, we have tended to do better when rates are rising and worse when they are falling. We are finding that the addition of private asset managers to the portfolio helps us to balance out that sensitivity to the monetary cycle, given their high yields and growing real estate exposures. To round this out we have selectively been able to add REITS in areas like self-storage and data centers that are more in our strike zone.
The High Quality, High Momentum positioning of our Stalwarts portfolios has been in vogue for several years, but is showing some signs of movement lately. While Stalwarts is higher beta12, it is also fairly balanced in terms of having meaningful Value exposure. In attempting to achieve a good equilibrium, we anticipate there is more we can do in defensive positioning while also using current volatility to selectively double down on high quality growth. Stalwarts is reducing some opportunistic exposure at the top end of its market cap, and plans to use the liquidity to increase position sizes in our highest conviction companies.
While these thoughts in no way encapsulate all of the work we are doing on the research side, we do hope that this commentary will help you to have a feel for what we are working on as we approach the end of 2019.
| 12 | Beta is a statistical measure of volatility, or systematic risk of an individual stock or mutual fund compared to the unsystematic risk of the entire market. |
| Semi-Annual Report | October 31, 2019 | 7 |
| Grandeur Peak Funds® | Shareholder Letter |
October 31, 2019 (Unaudited)
Notes from the Road
Research analysts Spencer Randall and Miranda Jacobs recently traveled to Malaysia. Here are a few of Spencer’s thoughts from their trip.
Malaysia is a melting pot of different cultures and ideas. There are major influences from Australian, Japanese, Chinese, and Middle Eastern cultures. The languages, food, religions, and people are rich and diverse. This was the first visit to Malaysia for both me and Miranda. We spent much of our time in between research meetings pounding the pavement and soaking in every drop of culture that we could.
Our first day, we traveled to the island of Penang in the north. Everyone we talked to referred to Penang as the “Silicon Valley” of Asia due to the abundance of tech companies with offices or factories on the island. The rest of our time was spent visiting with management teams in and around the capital city of Kuala Lumpur. The traffic in the capital and sheer number of motorcycles zipping through the streets is dizzying. I don’t think we would have been able to navigate or survive without our gracious driver, Mr. Din. Kuala Lumpur’s skyline is framed by numerous skyscrapers including the beautiful Petronas Twin Towers. While the giant towers are a sight to see, we were equally impressed by the number of cranes dotting the skyline as the city prepares for a surge in tourism through the government’sVisit Malaysia 2020initiative.
Mall culture is alive and well in Malaysia with a massive mall seemingly located on every other corner. We were amazed to see the crowds of locals and tourist packed into each mall. The hot, humid climate is certainly a factor driving foot traffic indoors. We’ll be the first to admit that we took advantage of air conditioning whenever and wherever possible. While the stores appeared full, we were surprised at the various entertainment options available. We saw movie theatres, numerous restaurants, indoor parks, and even an aquarium. Mr. Din informed us that when he isn’t working, he spends a lot of his time with his family at the malls instead of staying home where the air conditioning bill can ramp up quickly.
A big talking point in each of our research meetings was labor. Almost every management team that we met with told us that their biggest challenge is finding enough of the right kind of workers to hire. The government has been limiting the number of foreign workers allowed into the country, but many companies aren’t able to meet demand using only local labor. In efforts to attract workers, companies are focused on improving their company culture and revamping compensation packages. One company that we were particularly impressed with was a large convenience store operator. We witnessed a group of new employees participating in new-hire training surrounded by executives and managers at the company headquarters. We were impressed to see the connection and unity created between executives and the lower level employees.
While Malaysia may be less mainstream than some of the other Asian markets, we feel it is important to visit these types of countries frequently and to keep up with the economic and political developments that they are undergoing. There really is no substitute for seeing it firsthand.
Business Update
This semi-annual reports marks eight years since we launched our first mutual funds and provides us a chance to reflect on a few milestones. When we launched the initial Funds, we had eight employees. Our goal to cover the globe at that time meant Randy Pearce covered all Financials, Amy Hu Sunderland led the Consumer coverage and Robert Gardiner and Blake Walker straddled both Healthcare and Technology. Today, our team of over 25 research analysts has collectively touched over 10,000 companies, and our process to screen, track and understand these opportunities has continued to evolve.
As mentioned earlier, in September we launched our eighth fund, the Grandeur Peak Global Contrarian Fund, which will leverage the research of the entire team. Mark Madsen and Keefer Babbitt have been named as portfolio managers on the Fund, with Robert Gardiner as Guardian Portfolio Manager. The Fund aims to take larger and broader positions in out-of-favor and undervalued companies, sectors and geographies.
As part of our culture, we value strong work ethic, personal responsibility, collaboration and being process driven. Brad Barth and Juliette Douglas are strong culture carriers at Grandeur Peak and have been given additional responsibilities which reflect their passion and leadership within the firm. In these newly created positions, Brad has been named Deputy Chief Investment Officer and Juliette Douglas has been named Deputy Director of Research. They will work closely with Chief Investment Officer, Randy Pearce, and Director of Research, Rob Green, in tackling a number of exciting projects we hope will strengthen our global research process.
As always, please feel free to reach out any time with any questions, requests or comments. We appreciate the opportunity to work on your behalf.
Sincerely,
Your Grandeur Peak Team
| 8 | 1.855.377.7325 | www.GrandeurPeakGlobal.com |
| Grandeur Peak Funds® | Shareholder Letter |
October 31, 2019 (Unaudited)
The objective of all Grandeur Peak Funds is long-term growth of capital.
RISKS: Investing in small and micro-cap funds will be more volatile and loss of principal could be greater than investing in large cap or more diversified funds. Investing in foreign securities entails special risks, such as currency fluctuations and political uncertainties, which are described in more detail in the prospectus. Investments in emerging markets are subject to the same risks as other foreign securities and may be subject to greater risks than investments in foreign countries with more established economies and securities markets.
Must be proceeded by or accompanied by a prospectus.
The views and information discussed in this commentary are as of the date of publication, are subject to change, and may not reflect the writer's current views. The views expressed represent an assessment of market conditions at a specific point in time, are opinions only and should not be relied upon as investment advice regarding a particular investment or markets in general. Such information does not constitute a recommendation to buy or sell specific securities or investment vehicles. It should not be assumed that any investment will be profitable or will equal the performance of the Funds or any securities or any sectors mentioned herein. The subject matter contained herein has been derived from several sources believed to be reliable and accurate at the time of compilation. The Funds do not accept any liability for losses either direct or consequential caused by the use of this information.
Past performance does not guarantee future results.
Eric Huefner, Amy Hone and Dustin Brown are registered representatives of ALPS Distributors, Inc.
ALPS Distributors, Inc. is the Distributor for the Grandeur Peak Funds.
Grandeur Peak Global Advisors and ALPS Distributors, Inc. are not affiliated.
| Semi-Annual Report | October 31, 2019 | 9 |
| Grandeur Peak Emerging Markets Opportunities Fund | Performance Update |
October 31, 2019 (Unaudited)
Annualized Total Return Performance for the periods ended October 31, 2019
| | | | | | Since | Expense Ratio(b) |
| | 6 Months | 1 Year | 3 Years | 5 Years | Inception(a) | Gross | Net(c) |
| Grandeur Peak Emerging Markets Opportunities Fund – Investor (GPEOX) | 3.72% | 18.89% | 4.75% | 3.54% | 4.85% | 1.78% | 1.77% |
| Grandeur Peak Emerging Markets Opportunities Fund – Institutional (GPEIX) | 3.87% | 19.10% | 4.99% | 3.76% | 5.08% | 1.53% | 1.52% |
| MSCI Emerging Markets SMid Cap Index(d) | -1.77% | 10.85% | 4.57% | 1.56% | 2.37% | | |
| MSCI Emerging Markets IMI Index(e) | -1.46% | 12.05% | 7.25% | 3.08% | 3.57% | | |
Performance data quoted represents past performance. Past performance does not guarantee future results. Investment return and principal value of an investment will fluctuate so that an investor’s shares, when sold or redeemed, may be worth more or less than the original cost. The Fund imposes a 2.00% redemption fee on shares held for less than 60 days. Current performance data may be higher or lower than actual data quoted. For the most current month-end performance data, please call 1-855-377-PEAK (7325).
The table does not reflect the deduction of taxes a shareholder would pay on Fund distributions or redemption of Fund shares.
Subject to investment risks, including possible loss of the principal amount invested.
Returns for periods less than 1 year are cumulative.
| (a) | Fund inception date of December 16, 2013. |
| (b) | Ratios as of the Prospectus dated August 31, 2019 and may differ from the ratios presented in the Financial Highlights. |
| (c) | Grandeur Peak Global Advisors, LLC (the “Adviser”), has agreed to waive and/or reimburse fees or expenses in order to limit Total Annual Fund Operating Expenses After Fee Waiver/Expense Reimbursement (excluding acquired fund fees and expenses, brokerage expenses, interest expenses, taxes and extraordinary expenses) to 1.95% and 1.70% of the Fund’s average daily net assets for the Fund’s Investor Class Shares and Institutional Class Shares, respectively. This agreement (the “Expense Agreement”) is in effect through August 31, 2020. The Adviser will be permitted to recover, on a class- by-class basis, expenses it has borne through the Expense Agreement to the extent that a Fund’s expenses in later periods fall below annual rates set forth in the Expense Agreement; provided, however, that such recapture payments do not cause the Fund’s expense ratio (after recapture) to exceed the lesser of (i) the expense cap in effect at the time of the waiver and (ii) the expense cap in effect at the time of the recapture. Notwithstanding the foregoing, the Fund will not be obligated to pay any such deferred fees and expenses more than three years after the date on which the fee and expenses was deferred. The Expense Agreement may not be terminated or modified prior to August 31, 2020 except with the approval of the Fund’s Board of Trustees. |
| (d) | The MSCI Emerging Markets SMID Cap Index is designed to measure the equity market performance of small and mid-cap companies across emerging markets. The Adviser made this recommendation to the Board because the Russell indices are being decommissioned and the Advisor believes the MSCI index most closely aligns to the Fund’s investment strategies and investment restrictions. Information on both indices will be shown for a one-year transition period. MSCI makes no express or implied warranties or representations and shall have no liability whatsoever with respect to any MSCI data contained herein. The MSCI data may not be further redistributed or used to create indices or financial products. The Index is not actively managed and does not reflect any deductions for fees, expenses or taxes. An investor may not invest directly into the Index. |
| (e) | The MSCI Emerging Markets IMI Index is designed to measure the equity market performance of large, mid, and small-cap companies across emerging markets. The Index is not actively managed and does not reflect any deductions for fees, expenses or taxes. An investor may not invest directly into the Index. |
| 10 | 1.855.377.7325 | www.GrandeurPeakGlobal.com |
| Grandeur Peak Emerging Markets Opportunities Fund | Performance Update |
October 31, 2019 (Unaudited)
Growth of $10,000 for the period ended October 31, 2019

The chart shown above represent a hypothetical investment of $ 10,000 in the Fund’s Investor Class shares for the period from inception to October 31, 2019. All returns reflect reinvested dividends, but do not reflect the deduction of taxes that an investor would pay on distributions or redemptions.
Investing in the Fund is subject to investment risks, including possible loss of the principal amount invested.
The Fund also offers Institutional Class shares, performance for which is not reflected in the graphs above. The performance of Institutional Class shares may be higher or lower than the performance of the Investor Class shares shown in the graphs above based upon differences in fees paid by shareholders investing in the Investor Class shares and Institutional Class shares.
| Semi-Annual Report | October 31, 2019 | 11 |
| Grandeur Peak Emerging Markets Opportunities Fund | Performance Update |
October 31, 2019 (Unaudited)
| Regional Allocation (as a % of Net Assets)* | |
| Asia ex Japan | 65.3% |
| Latin America | 10.0% |
| Europe | 7.3% |
| Africa/Middle East | 6.6% |
| North America | 4.7% |
| Cash, Cash Equivalents, & Other Net Assets | 6.1% |
| Total | 100.0% |
| Industry Sector Allocation (as a % of Net Assets)* | |
| Consumer | 29.0% |
| Technology | 21.6% |
| Financials | 18.8% |
| Health Care | 13.4% |
| Industrials | 7.4% |
| Energy & Materials | 3.7% |
| Cash, Cash Equivalents, & Other Net Assets | 6.1% |
| Total | 100.0% |
| Top 10 Holdings (as a % of Net Assets)* | |
| WNS Holdings, Ltd. | 2.4% |
| Bajaj Finance, Ltd. | 2.3% |
| Silergy Corp. | 2.3% |
| Fleury SA | 2.0% |
| Genpact, Ltd. | 1.7% |
| Metropolis Healthcare, Ltd. | 1.6% |
| Dino Polska SA | 1.4% |
| Pagseguro Digital, Ltd. | 1.3% |
| New Oriental Education & Technology Group, Inc. | 1.3% |
| Value Partners Group, Ltd. | 1.3% |
| Total | 17.6% |
| * | Holdings are subject to change, and may not reflect the current or future position of the portfolio. |
| 12 | 1.855.377.7325 | www.GrandeurPeakGlobal.com |
| Grandeur Peak Global Contrarian Fund | Performance Update |
October 31, 2019 (Unaudited)
Annualized Total Return Performance for the periods ended October 31, 2019
| | | | Expense Ratio(b) |
| | 1 Month | Since Inception(a) | Gross | Net(c) |
| Grandeur Peak Global Contrarian Fund – Institutional (GPGCX) | 2.32% | 1.60% | 1.90% | 1.35% |
| MSCI All Country World Index Small Cap(d) | 2.89% | 1.27% | | |
| MSCI All Country World Index Small Cap Value(e) | 3.04% | 1.83% | | |
Performance data quoted represents past performance. Past performance does not guarantee future results. Investment return and principal value of an investment will fluctuate so that an investor’s shares, when sold or redeemed, may be worth more or less than the original cost. The Fund imposes a 2.00% redemption fee on shares held for less than 60 days. Current performance data may be higher or lower than actual data quoted. For the most current month-end performance data, please call 1-855-377-PEAK (7325).
The table does not reflect the deduction of taxes a shareholder would pay on Fund distributions or redemption of Fund shares.
Subject to investment risks, including possible loss of the principal amount invested.
Returns for periods less than 1 year are cumulative.
| (a) | Fund inception date of September 17, 2019. |
| (b) | Ratios as of the Prospectus dated September 12, 2019 and may differ from the ratios presented in the Financial Highlights. |
| (c) | Grandeur Peak Global Advisors, LLC (the “Adviser”), has agreed to waive and/or reimburse fees or expenses in order to limit Total Annual Fund Operating Expenses After Fee Waiver/Expense Reimbursement (excluding acquired fund fees and expenses, brokerage expenses, interest expenses, taxes and extraordinary expenses) to 1.35% of the Fund’s average daily net assets for the Fund’s Institutional Class Shares. This agreement (the “Expense Agreement”) is in effect through August 31, 2021. The Adviser will be permitted to recover, on a class- by-class basis, expenses it has borne through the Expense Agreement to the extent that a Fund’s expenses in later periods fall below annual rates set forth in the Expense Agreement; provided, however, that such recapture payments do not cause the Fund’s expense ratio (after recapture) to exceed the lesser of (i) the expense cap in effect at the time of the waiver and (ii) the expense cap in effect at the time of the recapture. Notwithstanding the foregoing, the Fund will not be obligated to pay any such deferred fees and expenses more than three years after the date on which the fee and expenses was deferred. The Expense Agreement may not be terminated or modified prior to August 31, 2021 except with the approval of the Fund’s Board of Trustees. |
| (d) | The MSCI ACWI Small Cap Index is designed to measure the equity market performance of performance of small-cap companies across developed and emerging markets globally. The Adviser made this recommendation to the Board because the Russell indices are being decommissioned and the Advisor believes the MSCI index most closely aligns to the Fund’s investment strategies and investment restrictions. Information on both indices will be shown for a one-year transition period. MSCI makes no express or implied warranties or representations and shall have no liability whatsoever with respect to any MSCI data contained herein. The MSCI data may not be further redistributed or used to create indices or financial products. The Index is not actively managed and does not reflect any deductions for fees, expenses or taxes. An investor may not invest directly into the Index. |
| (e) | The MSCI ACWI Small Cap Value Index is designed to measure small cap companies exhibiting overall value style characteristics across developed and emerging markets globally. The Index is not actively managed and does not reflect any deductions for fees, expenses or taxes. An investor may not invest directly into the Index. |
| Semi-Annual Report | October 31, 2019 | 13 |
| Grandeur Peak Global Contrarian Fund | Performance Update |
October 31, 2019 (Unaudited)
Growth of $10,000 for the period ended October 31, 2019
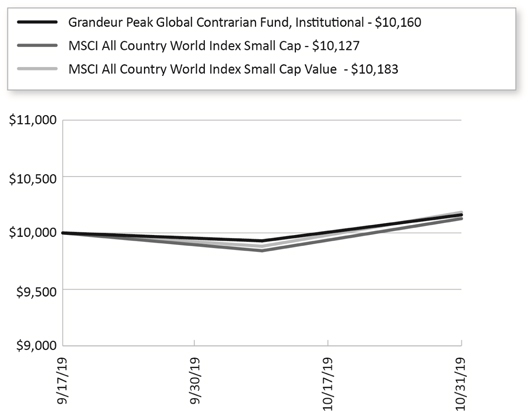
The chart shown above represent a hypothetical investment of $10,000 in the Fund’s Institutional Class shares for the period from inception to October 31, 2019. All returns reflect reinvested dividends, but do not reflect the deduction of taxes that an investor would pay on distributions or redemptions.
Investing in the Fund is subject to investment risks, including possible loss of the principal amount invested.
| 14 | 1.855.377.7325 | www.GrandeurPeakGlobal.com |
| Grandeur Peak Global Contrarian Fund | Performance Update |
October 31, 2019 (Unaudited)
| Regional Allocation (as a % of Net Assets)* | |
| Europe | 30.9% |
| Asia ex Japan | 29.9% |
| North America | 17.9% |
| Japan | 12.0% |
| Australia/New Zealand | 5.0% |
| Africa/Middle East | 2.2% |
| Latin America | 1.6% |
| Cash, Cash Equivalents, & Other Net Assets | 0.5% |
| Total | 100.0% |
| Industry Sector Allocation (as a % of Net Assets)* | |
| Financials | 22.5% |
| Consumer | 22.0% |
| Industrials | 21.9% |
| Technology | 14.3% |
| Health Care | 12.8% |
| Energy & Materials | 6.0% |
| Cash, Cash Equivalents, & Other Net Assets | 0.5% |
| Total | 100.0% |
| Top 10 Holdings (as a % of Net Assets)* | |
| Fiducian Group, Ltd. | 2.3% |
| Bioteque Corp. | 2.2% |
| BBI Life Sciences Corp. | 2.1% |
| Plover Bay Technologies, Ltd. | 2.1% |
| Hackett Group, Inc. | 1.8% |
| KNOW IT AB | 1.8% |
| Selamat Sempurna Tbk PT | 1.7% |
| Central Automotive Products, Ltd. | 1.7% |
| Parex Resources, Inc. | 1.6% |
| Riverstone Holdings, Ltd./Singapore | 1.6% |
| Total | 18.9% |
| * | Holdings are subject to change, and may not reflect the current or future position of the portfolio. |
| Semi-Annual Report | October 31, 2019 | 15 |
| Grandeur Peak Global Micro Cap Fund | Performance Update |
October 31, 2019 (Unaudited)
Annualized Total Return Performance for the periods ended October 31, 2019
| | | | | Since | Expense Ratio(b) |
| | 6 Months | 1 Year | 3 Years | Inception(a) | Gross | Net(c) |
| Grandeur Peak Global Micro Cap Fund – Institutional (GPMCX) | 2.83% | 7.75% | 6.99% | 7.82% | 2.05% | 2.00% |
| MSCI All Country World Index Small Cap(d) | 0.71% | 8.54% | 9.76% | 8.44% | | |
| MSCI World Micro Cap Index(e) | 0.08% | 1.40% | 6.85% | 7.22% | | |
Performance data quoted represents past performance. Past performance does not guarantee future results. Investment return and principal value of an investment will fluctuate so that an investor’s shares, when sold or redeemed, may be worth more or less than the original cost. The Fund imposes a 2.00% redemption fee on shares held for less than 60 days. Current performance data may be higher or lower than actual data quoted. For the most current month-end performance data, please call 1-855-377-PEAK (7325).
The table does not reflect the deduction of taxes a shareholder would pay on Fund distributions or redemption of Fund shares.
Subject to investment risks, including possible loss of the principal amount invested.
Returns for periods less than 1 year are cumulative.
| (a) | Fund inception date of October 20, 2015. |
| (b) | Ratios as of the Prospectus dated August 31, 2019 and may differ from the ratios presented in the Financial Highlights. |
| (c) | Grandeur Peak Global Advisors, LLC (the “Adviser”), has agreed to waive and/or reimburse fees or expenses in order to limit Total Annual Fund Operating Expenses After Fee Waiver/ Expense Reimbursement (excluding acquired fund fees and expenses, brokerage expenses, interest expenses, taxes and extraordinary expenses) to 2.00% of the Fund’s average daily net assets for the Fund’s Institutional Class Shares. This agreement is in effect through August 31, 2020. The Adviser will be permitted to recover expenses it has borne through this agreement to the extent that a Fund’s expenses in later periods fall below annual rates set forth in the Expense Agreement; provided, however, that such recapture payments do not cause the Fund’s expense ratio (after recapture) to exceed the lesser of (i) the expense cap in effect at the time of the waiver and (ii) the expense cap in effect at the time of the recapture. Notwithstanding the foregoing, the Fund will not be obligated to pay any such deferred fees and expenses more than three years after the date on which the fee and expenses was deferred . This agreement may not be terminated or modified prior to August 31, 2020 except with the approval of the Fund’s Board of Trustees. |
| (d) | The MSCI ACWI Small Cap Index is designed to measure the equity market performance of performance of small-cap companies across developed and emerging markets globally. The Adviser made this recommendation to the Board because the Russell indices are being decommissioned and the Advisor believes the MSCI index most closely aligns to the Fund’s investment strategies and investment restrictions. Information on both indices will be shown for a one-year transition period. MSCI makes no express or implied warranties or representations and shall have no liability whatsoever with respect to any MSCI data contained herein. The MSCI data may not be further redistributed or used to create indices or financial products. The Index is not actively managed and does not reflect any deductions for fees, expenses or taxes. An investor may not invest directly into the Index. |
| (e) | The MSCI World Micro Cap Index is designed to measure the equity market performance of micro-cap companies across developed markets globally. It does not include emerging markets. The Index is not actively managed and does not reflect any deductions for fees, expenses or taxes. An investor may not invest directly into the Index. |
| 16 | 1.855.377.7325 | www.GrandeurPeakGlobal.com |
| Grandeur Peak Global Micro Cap Fund | Performance Update |
October 31, 2019 (Unaudited)
Growth of $10,000 for the period ended October 31, 2019
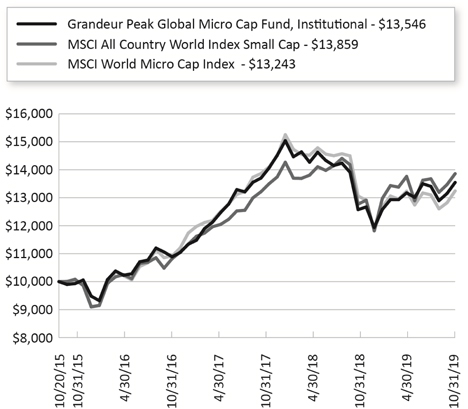
The chart shown above represent a hypothetical investment of $10,000 in the Fund’s Institutional Class shares for the period from inception to October 31, 2019. All returns reflect reinvested dividends, but do not reflect the deduction of taxes that an investor would pay on distributions or redemptions.
Investing in the Fund is subject to investment risks, including possible loss of the principal amount invested.
| Semi-Annual Report | October 31, 2019 | 17 |
| Grandeur Peak Global Micro Cap Fund | Performance Update |
October 31, 2019 (Unaudited)
| Regional Allocation (as a % of Net Assets)* | |
| Europe | 31.1% |
| Asia ex Japan | 28.4% |
| Japan | 15.4% |
| Australia/New Zealand | 11.5% |
| North America | 10.7% |
| Africa/Middle East | 1.1% |
| Latin America | 0.6% |
| Cash, Cash Equivalents, & Other Net Assets | 1.2% |
| Total | 100.0% |
| Industry Sector Allocation (as a % of Net Assets)* | |
| Consumer | 24.1% |
| Financials | 21.7% |
| Health Care | 18.6% |
| Industrials | 17.0% |
| Technology | 14.2% |
| Energy & Materials | 3.2% |
| Cash, Cash Equivalents, & Other Net Assets | 1.2% |
| Total | 100.0% |
| Top 10 Holdings (as a % of Net Assets)* | |
| National Veterinary Care, Ltd. | 2.5% |
| M&A Capital Partners Co., Ltd. | 2.5% |
| Sarantis SA | 2.4% |
| Fiducian Group, Ltd. | 2.1% |
| Kogan.com, Ltd. | 2.0% |
| BBI Life Sciences Corp. | 1.9% |
| Self Storage Group ASA | 1.7% |
| Pacific Hospital Supply Co., Ltd. | 1.6% |
| Bioteque Corp. | 1.6% |
| Vaibhav Global, Ltd. | 1.6% |
| Total | 19.9% |
| * | Holdings are subject to change, and may not reflect the current or future position of the portfolio. |
| 18 | 1.855.377.7325 | www.GrandeurPeakGlobal.com |
| Grandeur Peak Global Opportunities Fund | Performance Update |
October 31, 2019 (Unaudited)
Annualized Total Return Performance for the periods ended October 31, 2019
| | | | | | Since | Expense Ratio(b) |
| | 6 Months | 1 Year | 3 Years | 5 Years | Inception(a) | Gross | Net(c) |
| Grandeur Peak Global Opportunities Fund – Investor (GPGOX) | 2.01% | 13.34% | 9.88% | 7.48% | 12.48% | 1.62% | 1.58% |
| Grandeur Peak Global Opportunities Fund – Institutional (GPGIX) | 2.27% | 13.76% | 10.16% | 7.71% | 12.78% | 1.37% | 1.33% |
| MSCI All Country World Index Small Cap(d) | 0.71% | 8.54% | 9.76% | 7.02% | 10.37% | | |
| MSCI All Country World Index IMI(e) | 2.92% | 12.62% | 11.66% | 7.59% | 10.36% | | |
Performance data quoted represents past performance. Past performance does not guarantee future results. Investment return and principal value of an investment will fluctuate so that an investor’s shares, when sold or redeemed, may be worth more or less than the original cost. The Fund imposes a 2.00% redemption fee on shares held for less than 60 days. Current performance data may be higher or lower than actual data quoted. For the most current month-end performance data, please call 1-855-377-PEAK (7325).
The table does not reflect the deduction of taxes a shareholder would pay on Fund distributions or redemption of Fund shares.
Subject to investment risks, including possible loss of the principal amount invested.
Returns for periods less than 1 year are cumulative.
| (a) | Fund inception date of October 17, 2011. |
| (b) | Ratios as of the Prospectus dated August 31, 2019 and may differ from the ratios presented in the Financial Highlights. |
| (c) | Grandeur Peak Global Advisors, LLC (the “Adviser”), has agreed to waive and/or reimburse fees or expenses in order to limit Total Annual Fund Operating Expenses After Fee Waiver/ Expense Reimbursement (excluding acquired fund fees and expenses, brokerage expenses, interest expenses, taxes and extraordinary expenses) to 1.75% and 1.50% of the Fund’s average daily net assets for the Fund’s Investor Class Shares and Institutional Class Shares, respectively. This agreement (the “Expense Agreement”) is in effect through August 31, 2020. The Adviser will be permitted to recover, on a class- by-class basis, expenses it has borne the Expense Agreement to the extent that a Fund’s expenses in later periods fall below annual rates set forth in the Expense Agreement; provided, however, that such recapture payments do not cause the Fund’s expense ratio (after recapture) to exceed the lesser of (i) the expense cap in effect at the time of the waiver and (ii) the expense cap in effect at the time of the recapture . Notwithstanding the foregoing, the Fund will not be obligated to pay any such deferred fees and expenses more than three years after the date on which the fee and expenses was deferred. The Expense Agreement may not be terminated or modified prior to August 31, 2020 except with the approval of the Fund’s Board of Trustees. |
| (d) | The MSCI ACWI Small Cap Index is designed to measure the equity market performance of performance of small-cap companies across developed and emerging markets globally. The Adviser made this recommendation to the Board because the Russell indices are being decommissioned and the Advisor believes the MSCI index most closely aligns to the Fund’s investment strategies and investment restrictions. Information on both indices will be shown for a one-year transition period. MSCI makes no express or implied warranties or representations and shall have no liability whatsoever with respect to any MSCI data contained herein. The MSCI data may not be further redistributed or used to create indices or financial products. The Index is not actively managed and does not reflect any deductions for fees, expenses or taxes. An investor may not invest directly into the Index. |
| (e) | The MSCI ACWI IMI Index is designed to measure the equity market performance of large, mid, and small-cap companies across developed and emerging markets globally. The Index is not actively managed and does not reflect any deductions for fees, expenses or taxes. An investor may not invest directly into the Index. |
| Semi-Annual Report | October 31, 2019 | 19 |
| Grandeur Peak Global Opportunities Fund | Performance Update |
October 31, 2019 (Unaudited)
Growth of $10,000 for the period ended October 31, 2019
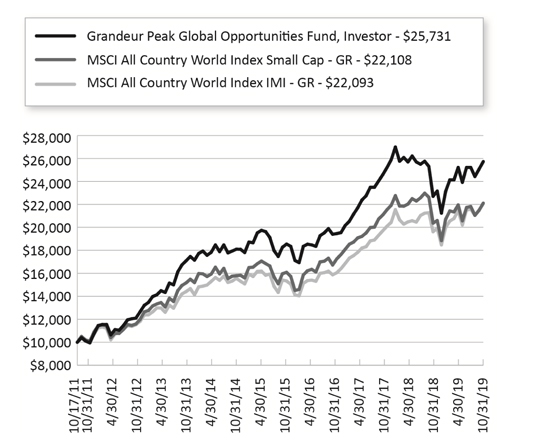
The chart shown above represent a hypothetical investment of $ 10,000 in the Fund’s Investor Class shares for the period from inception to October 31, 2019. All returns reflect reinvested dividends, but do not reflect the deduction of taxes that an investor would pay on distributions or redemptions.
Investing in the Fund is subject to investment risks, including possible loss of the principal amount invested.
The Fund also offers Institutional Class shares, performance for which is not reflected in the graphs above. The performance of Institutional Class shares may be higher or lower than the performance of the Investor Class shares shown in the graphs above based upon differences in fees paid by shareholders investing in the Investor Class shares and Institutional Class shares.
| 20 | 1.855.377.7325 | www.GrandeurPeakGlobal.com |
| Grandeur Peak Global Opportunities Fund | Performance Update |
October 31, 2019 (Unaudited)
| Regional Allocation (as a % of Net Assets)* | |
| Europe | 34.3% |
| North America | 28.1% |
| Asia ex Japan | 17.1% |
| Japan | 12.7% |
| Latin America | 2.3% |
| Australia/New Zealand | 1.7% |
| Africa/Middle East | 1.1% |
| Cash, Cash Equivalents, & Other Net Assets | 2.7% |
| Total | 100.0% |
| Industry Sector Allocation (as a % of Net Assets)* | |
| Technology | 23.8% |
| Industrials | 19.2% |
| Financials | 18.4% |
| Consumer | 17.7% |
| Health Care | 17.1% |
| Energy & Materials | 1.1% |
| Cash, Cash Equivalents, & Other Net Assets | 2.7% |
| Total | 100.0% |
| Top 10 Holdings (as a % of Net Assets)* | |
| Power Integrations, Inc. | 2.0% |
| First Republic Bank | 1.7% |
| Dechra Pharmaceuticals PLC | 1.7% |
| Silergy Corp. | 1.7% |
| EPAM Systems, Inc. | 1.6% |
| B&M European Value Retail SA | 1.5% |
| WNS Holdings, Ltd. | 1.3% |
| Bajaj Finance, Ltd. | 1.3% |
| Lululemon Athletica, Inc. | 1.3% |
| CVS Group PLC | 1.3% |
| Total | 15.4% |
| * | Holdings are subject to change, and may not reflect the current or future position of the portfolio. |
| Semi-Annual Report | October 31, 2019 | 21 |
| Grandeur Peak Global Reach Fund | Performance Update |
October 31, 2019 (Unaudited)
Annualized Total Return Performance for the periods ended October 31, 2019
| | | | | | Since | Expense Ratio(b) |
| | 6 Months | 1 Year | 3 Years | 5 Years | Inception(a) | Gross | Net(c) |
| Grandeur Peak Global Reach Fund – Investor (GPROX) | 2.00% | 13.17% | 10.10% | 7.34% | 9.94% | 1.52% | 1.52% |
| Grandeur Peak Global Reach Fund – Institutional (GPRIX) | 2.13% | 13.51% | 10.37% | 7.60% | 10.20% | 1.27% | 1.27% |
| MSCI All Country World Small Cap Index(d) | 0.71% | 8.54% | 9.76% | 7.02% | 8.21% | | |
| MSCI All Country World IMI Index(e) | 2.92% | 12.62% | 11.66% | 7.59% | 8.78% | | |
Performance data quoted represents past performance. Past performance does not guarantee future results. Investment return and principal value of an investment will fluctuate so that an investor’s shares, when sold or redeemed, may be worth more or less than the original cost. The Fund imposes a 2.00% redemption fee on shares held for less than 60 days. Current performance data may be higher or lower than actual data quoted. For the most current month-end performance data, please call 1-855-377-PEAK (7325).
The table does not reflect the deduction of taxes a shareholder would pay on Fund distributions or redemption of Fund shares.
Subject to investment risks, including possible loss of the principal amount invested.
Returns for periods less than 1 year are cumulative.
| (a) | Fund inception date of June 19, 2013. |
| (b) | Ratios as of the Prospectus dated August 31, 2019 and may differ from the ratios presented in the Financial Highlights. |
| (c) | Grandeur Peak Global Advisors, LLC (the “Adviser”), has agreed to waive and/or reimburse fees or expenses in order to limit Total Annual Fund Operating Expenses After Fee Waiver/Expense Reimbursement (excluding acquired fund fees and expenses, brokerage expenses, interest expenses, taxes and extraordinary expenses) to 1.60% and 1.35% of the Fund’s average daily net assets for the Fund’s Investor Class Shares and Institutional Class Shares, respectively. This agreement (the “Expense Agreement”) is in effect through August 31, 2020. The Adviser will be permitted to recover, on a class- by-class basis, expenses it has borne through the Expense Agreement to the extent that a Fund’s expenses in later periods fall below annual rates set forth in the Expense Agreement; provided, however, that such recapture payments do not cause the Fund’s expense ratio (after recapture) to exceed the lesser of (i) the expense cap in effect at the time of the waiver and (ii) the expense cap in effect at the time of the recapture . Notwithstanding the foregoing, the Fund will not be obligated to pay any such deferred fees and expenses more than three years after the date on which the fee and expenses was deferred. The Expense Agreement may not be terminated or modified prior to August 31, 2020 except with the approval of the Fund’s Board of Trustees. |
| (d) | The MSCI ACWI Small Cap Index is designed to measure the equity market performance of performance of small-cap companies across developed and emerging markets globally. The Adviser made this recommendation to the Board because the Russell indices are being decommissioned and the Advisor believes the MSCI index most closely aligns to the Fund’s investment strategies and investment restrictions. Information on both indices will be shown for a one-year transition period. MSCI makes no express or implied warranties or representations and shall have no liability whatsoever with respect to any MSCI data contained herein. The MSCI data may not be further redistributed or used to create indices or financial products. The Index is not actively managed and does not reflect any deductions for fees, expenses or taxes. Aninvestor may not invest directly into the Index. |
| (e) | The MSCI ACWI IMI Index is designed to measure the equity market performance of large, mid, and small-cap companies across developed and emerging markets globally. The Index is not actively managed and does not reflect any deductions for fees, expenses or taxes. An investor may not invest directly into the Index. |
| 22 | 1.855.377.7325 | www.GrandeurPeakGlobal.com |
| Grandeur Peak Global Reach Fund | Performance Update |
October 31, 2019 (Unaudited)
Growth of $10,000 for the period ended October 31, 2019

The chart shown above represent a hypothetical investment of $ 10,000 in the Fund’s Investor Class shares for the period from inception to October 31, 2019. All returns reflect reinvested dividends, but do not reflect the deduction of taxes that an investor would pay on distributions or redemptions.
Investing in the Fund is subject to investment risks, including possible loss of the principal amount invested.
The Fund also offers Institutional Class shares, performance for which is not reflected in the graphs above. The performance of Institutional Class shares may be higher or lower than the performance of the Investor Class shares shown in the graphs above based upon differences in fees paid by shareholders investing in the Investor Class shares and Institutional Class shares.
| Semi-Annual Report | October 31, 2019 | 23 |
| Grandeur Peak Global Reach Fund | Performance Update |
October 31, 2019 (Unaudited)
| Regional Allocation (as a % of Net Assets)* | |
| Europe | 29.3% |
| North America | 28.2% |
| Asia ex Japan | 21.7% |
| Japan | 8.0% |
| Australia/New Zealand | 4.4% |
| Latin America | 3.7% |
| Africa/Middle East | 3.0% |
| Cash, Cash Equivalents, & Other Net Assets | 1.7% |
| Total | 100.0% |
| Industry Sector Allocation (as a % of Net Assets)* | |
| Technology | 21.9% |
| Consumer | 21.7% |
| Financials | 21.4% |
| Industrials | 17.5% |
| Health Care | 12.2% |
| Energy & Materials | 3.6% |
| Cash, Cash Equivalents, & Other Net Assets | 1.7% |
| Total | 100.0% |
| Top 10 Holdings (as a % of Net Assets)* | |
| First Republic Bank | 2.0% |
| WNS Holdings, Ltd. | 1.2% |
| B&M European Value Retail SA | 1.1% |
| EPAM Systems, Inc. | 1.0% |
| Parex Resources, Inc. | 1.0% |
| Silergy Corp. | 0.9% |
| NV5 Global, Inc. | 0.9% |
| Fastenal Co. | 0.9% |
| Sanne Group PLC | 0.9% |
| Wix.com, Ltd. | 0.8% |
| Total | 10.7% |
| * | Holdings are subject to change, and may not reflect the current or future position of the portfolio. |
| 24 | 1.855.377.7325 | www.GrandeurPeakGlobal.com |
| Grandeur Peak Global Stalwarts Fund | Performance Update |
October 31, 2019 (Unaudited)
Annualized Total Return Performance for the periods ended October 31, 2019
| | | | | Since | Expense Ratio(b) |
| | 6 Months | 1 Year | 3 Years | Inception(a) | Gross | Net(c) |
| Grandeur Peak Global Stalwarts Fund – Investor (GGSOX) | 0.20% | 14.96% | 11.26% | 11.29% | 1.27% | 1.27% |
| Grandeur Peak Global Stalwarts Fund – Institutional (GGSYX) | 0.27% | 15.22% | 11.50% | 11.56% | 1.02% | 1.02% |
| MSCI All Country World Mid Cap Index(d) | 2.81% | 12.74% | 10.15% | 9.29% | | |
| MSCI All Country World Small Cap Index(e) | 0.71% | 8.54% | 9.76% | 9.20% | | |
Performance data quoted represents past performance. Past performance does not guarantee future results. Investment return and principal value of an investment will fluctuate so that an investor’s shares, when sold or redeemed, may be worth more or less than the original cost. The Fund imposes a 2.00% redemption fee on shares held for less than 60 days. Current performance data may be higher or lower than actual data quoted. For the most current month-end performance data, please call 1-855-377-PEAK (7325).
The table does not reflect the deduction of taxes a shareholder would pay on Fund distributions or redemption of Fund shares.
Subject to investment risks, including possible loss of the principal amount invested.
Returns for periods less than 1 year are cumulative.
| (a) | Fund inception date of September 1, 2015. |
| (b) | Ratios as of the Prospectus dated August 31, 2019 and may differ from the ratios presented in the Financial Highlights. |
| (c) | Grandeur Peak Global Advisors, LLC (the “Adviser”), has agreed to waive and/or reimburse fees or expenses in order to limit Total Annual Fund Operating Expenses After Fee Waiver/ Expense Reimbursement (excluding acquired fund fees and expenses, brokerage expenses, interest expenses, taxes and extraordinary expenses) to 1.35% and 1.10% of the Fund’s average daily net assets for the Fund’s Investor Class Shares and Institutional Class Shares, respectively. This agreement is in effect through August 31, 2020. The Adviser will be permitted to recover, on a class-by-class basis, expenses it has borne through this agreement to the extent that a Fund’s expenses in later periods fall below annual rates set forth in the Expense Agreement; provided, however, that such recapture payments do not cause the Fund’s expense ratio (after recapture) to exceed the lesser of (i) the expense cap in effect at the time of the waiver and (ii) the expense cap in effect at the time of the recapture .. Notwithstanding the foregoing, the Fund will not be obligated to pay any such deferred fees and expenses more than three years after the date on which the fee and expenses was deferred. This agreement may not be terminated or modified prior to August 31, 2020 except with the approval of the Fund’s Board of Trustees. |
| (d) | The MSCI ACWI Mid Cap Index is designed to measure the equity market performance of performance of mid-cap companies across developed and emerging markets globally. The Adviser made this recommendation to the Board because the Russell indices are being decommissioned and the Advisor believes the MSCI index most closely aligns to the Fund’s investment strategies and investment restrictions. Information on both indices will be shown for a one-year transition period. MSCI makes no express or implied warranties or representations and shall have no liability whatsoever with respect to any MSCI data contained herein. The MSCI data may not be further redistributed or used to create indices or financial products. The Index is not actively managed and does not reflect any deductions for fees, expenses or taxes. An investor may not invest directly into the Index. |
| (e) | The MSCI ACWI Small Cap Index is designed to measure the equity market performance of small-cap companies across developed and emerging markets globally. The Index is not actively managed and does not reflect any deductions for fees, expenses or taxes. An investor may not invest directly into the Index. |
| Semi-Annual Report | October 31, 2019 | 25 |
| Grandeur Peak Global Stalwarts Fund | Performance Update |
October 31, 2019 (Unaudited)
Growth of $10,000 for the period ended October 31, 2019
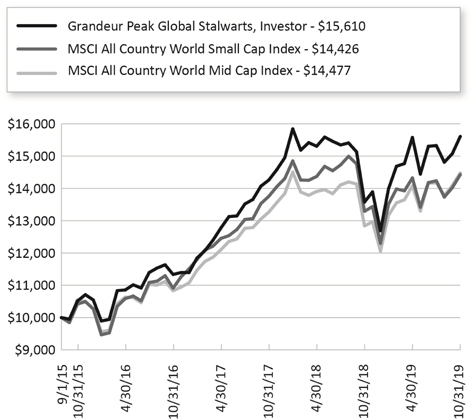
The graphs shown above represent a hypothetical investment of $10,000 in the Fund’s Investor Class shares for the period from inception to October 31, 2019. All returns reflect reinvested dividends, but do not reflect the deduction of taxes that an investor would pay on distributions or redemptions.
Investing in the Fund is subject to investment risks, including possible loss of the principal amount invested.
The Fund also offers Institutional Class shares, performance for which is not reflected in the graphs above. The performance of Institutional Class shares may be higher or lower than the performance of the Investor Class shares shown in the graphs above based upon differences in fees paid by shareholders investing in the Investor Class shares and Institutional Class shares.
| 26 | 1.855.377.7325 | www.GrandeurPeakGlobal.com |
| Grandeur Peak Global Stalwarts Fund | Performance Update |
October 31, 2019 (Unaudited)
| Regional Allocation (as a % of Net Assets)* | |
| North America | 36.9% |
| Europe | 31.5% |
| Asia ex Japan | 15.1% |
| Japan | 8.2% |
| Latin America | 2.2% |
| Australia/New Zealand | 1.7% |
| Africa/Middle East | 1.6% |
| Cash, Cash Equivalents, & Other Net Assets | 2.8% |
| Total | 100.0% |
| Industry Sector Allocation (as a % of Net Assets)* | |
| Financials | 26.1% |
| Technology | 24.5% |
| Consumer | 19.7% |
| Industrials | 14.1% |
| Health Care | 12.4% |
| Energy & Materials | 0.4% |
| Cash, Cash Equivalents, & Other Net Assets | 2.8% |
| Total | 100.0% |
| Top 10 Holdings (as a % of Net Assets)* | |
| First Republic Bank | 4.1% |
| St. James's Place PLC | 2.8% |
| B&M European Value Retail SA | 2.3% |
| Silergy Corp. | 2.3% |
| Power Integrations, Inc. | 2.2% |
| ABIOMED, Inc. | 2.2% |
| Fastenal Co. | 2.0% |
| Lululemon Athletica, Inc. | 1.9% |
| Nihon M&A Center, Inc. | 1.8% |
| Dechra Pharmaceuticals PLC | 1.8% |
| Total | 23.4% |
| * | Holdings are subject to change, and may not reflect the current or future position of the portfolio. |
| Semi-Annual Report | October 31, 2019 | 27 |
| Grandeur Peak International Opportunities Fund | Performance Update |
October 31, 2019 (Unaudited)
Annualized Total Return Performance for the periods ended October 31, 2019
| | | | | | Since | Expense Ratio(b) |
| | 6 Months | 1 Year | 3 Years | 5 Years | Inception(a) | Gross | Net(c) |
| Grandeur Peak International Opportunities Fund – Investor (GPIOX) | 0.60% | 10.07% | 7.26% | 5.70% | 11.22% | 1.62% | 1.57% |
| Grandeur Peak International Opportunities Fund – Institutional (GPIIX) | 0.60% | 9.91% | 7.51% | 5.92% | 11.44% | 1.37% | 1.32% |
| MSCI All Country World Index ex USA Small Cap Index(d) | 2.06% | 9.23% | 7.39% | 5.71% | 7.28% | | |
| MSCI All Country World IMI ex USA Index(e) | 2.22% | 11.48% | 8.44% | 4.49% | 6.38% | | |
Performance data quoted represents past performance. Past performance does not guarantee future results. Investment return and principal value of an investment will fluctuate so that an investor’s shares, when sold or redeemed, may be worth more or less than the original cost. The Fund imposes a 2.00% redemption fee on shares held for less than 60 days. Current performance data may be higher or lower than actual data quoted. For the most current month-end performance data, please call 1-855-377-PEAK (7325).
The table does not reflect the deduction of taxes a shareholder would pay on Fund distributions or redemption of Fund shares.
Subject to investment risks, including possible loss of the principal amount invested.
Returns for periods less than 1 year are cumulative.
| (a) | Fund inception date of October 17, 2011. |
| (b) | Ratios as of the Prospectus dated August 31, 2019 and may differ from the ratios presented in the Financial Highlights. |
| (c) | Grandeur Peak Global Advisors, LLC (the “Adviser”), has agreed to waive and/or reimburse fees or expenses in order to limit Total Annual Fund Operating Expenses After Fee Waiver/Expense Reimbursements (excluding acquired fund fees and expenses, brokerage expenses, interest expenses, taxes and extraordinary expenses) to 1.75% and 1.50% of the Fund’s average daily net assets for the Fund’s Investor Class Shares and Institutional Class Shares, respectively. This agreement (the “Expense Agreement”) is in effect through August 31, 2020. The Adviser will be permitted to recover, on a class- by-class basis, expenses it has borne through the Expense Agreement to the extent that a Fund’s expenses in later periods fall below annual rates set forth in the Expense Agreement; provided, however, that such recapture payments do not cause the Fund’s expense ratio (after recapture) to exceed the lesser of (i) the expense cap in effect at the time of the waiver and (ii) the expense cap in effect at the time of the recapture . Notwithstanding the foregoing, the Funds will not be obligated to pay any such deferred fees and expenses more than three years after the date on which the fee and expenses was deferred. The Expense Agreement may not be terminated or modified prior to August 31, 2020 except with the approval of the Fund’s Board of Trustees. |
| (d) | The MSCI ACWI ex USA Small Cap Index is designed to measure the equity market performance of small-cap companies across developed and emerging markets globally, excluding the United States. The Adviser made this recommendation to the Board because the Russell indices are being decommissioned and the Advisor believes the MSCI index most closely aligns to the Fund’s investment strategies and investment restrictions. Information on both indices will be shown for a one-year transition period. MSCI makes no express or implied warranties or representations and shall have no liability whatsoever with respect to any MSCI data contained herein. The MSCI data may not be further redistributed or used to create indices or financial products. The Index is not actively managed and does not reflect any deductions for fees, expenses or taxes. An investor may not invest directly into the Index. |
| (e) | The MSCI ACWI ex USA IMI Index is designed to measure the equity market performance of large, mid, and small-cap companies across developed and emerging markets globally, excluding the United States. The Index is not actively managed and does not reflect any deductions for fees, expenses or taxes. An investor may not invest directly into the Index. |
| 28 | 1.855.377.7325 | www.GrandeurPeakGlobal.com |
| Grandeur Peak International Opportunities Fund | Performance Update |
October 31, 2019 (Unaudited)
Growth of $10,000 for the period ended October 31, 2019
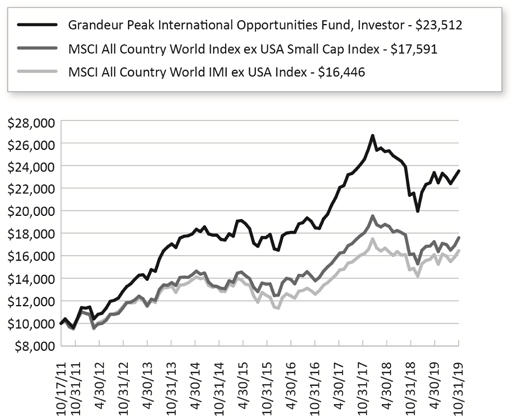
The chart shown above represent a hypothetical investment of $10,000 in the Fund’s Investor Class shares for the period from inception to October 31, 2019. All returns reflect reinvested dividends, but do not reflect the deduction of taxes that an investor would pay on distributions or redemptions.
Investing in the Fund is subject to investment risks, including possible loss of the principal amount invested.
The Fund also offers Institutional Class shares, performance for which is not reflected in the graphs above. The performance of Institutional Class shares may be higher or lower than the performance of the Investor Class shares shown in the graphs above based upon differences in fees paid by shareholders investing in the Investor Class shares and Institutional Class shares.
| Semi-Annual Report | October 31, 2019 | 29 |
| Grandeur Peak International Opportunities Fund | Performance Update |
October 31, 2019 (Unaudited)
| Regional Allocation (as a % of Net Assets)* | |
| Europe | 37.4% |
| Asia ex Japan | 24.9% |
| Japan | 16.9% |
| North America | 9.0% |
| Australia/New Zealand | 3.0% |
| Latin America | 2.9% |
| Africa/Middle East | 2.5% |
| Cash, Cash Equivalents, & Other Net Assets | 3.4% |
| Total | 100.0% |
| Industry Sector Allocation (as a % of Net Assets)* | |
| Technology | 21.9% |
| Industrials | 19.6% |
| Consumer | 19.3% |
| Financials | 17.9% |
| Health Care | 14.9% |
| Energy & Materials | 3.0% |
| Cash, Cash Equivalents, & Other Net Assets | 3.4% |
| Total | 100.0% |
| Top 10 Holdings (as a % of Net Assets)* | |
| B&M European Value Retail SA | 2.0% |
| EPAM Systems, Inc. | 1.8% |
| Silergy Corp. | 1.7% |
| Aalberts NV | 1.7% |
| WNS Holdings, Ltd. | 1.6% |
| Dechra Pharmaceuticals PLC | 1.5% |
| Bajaj Finance, Ltd. | 1.4% |
| CVS Group PLC | 1.4% |
| Tokyo Century Corp. | 1.4% |
| Seria Co., Ltd. | 1.3% |
| Total | 15.8% |
| * | Holdings are subject to change, and may not reflect the current or future position of the portfolio. |
| 30 | 1.855.377.7325 | www.GrandeurPeakGlobal.com |
| Grandeur Peak International Stalwarts Fund | Performance Update |
October 31, 2019 (Unaudited)
Annualized Total Return Performance for the periods ended October 31, 2019
| | | | | Since | Expense Ratio(b) |
| | 6 Months | 1 Year | 3 Years | Inception(a) | Gross | Net(c) |
| Grandeur Peak International Stalwarts Fund – Investor (GISOX) | 0.75% | 13.29% | 9.77% | 11.01% | 1.19% | 1.19% |
| Grandeur Peak International Stalwarts Fund – Institutional (GISYX) | 0.88% | 13.53% | 10.04% | 11.26% | 0.94% | 0.94% |
| MSCI All Country World ex USA Mid Cap Index(d) | 3.01% | 11.22% | 8.12% | 7.56% | | |
| MSCI All Country World ex USA Small Index(e) | 2.06% | 9.23% | 7.39% | 7.65% | | |
Performance data quoted represents past performance. Past performance does not guarantee future results. Investment return and principal value of an investment will fluctuate so that an investor’s shares, when sold or redeemed, may be worth more or less than the original cost. The Fund imposes a 2.00% redemption fee on shares held for less than 60 days. Current performance data may be higher or lower than actual data quoted. For the most current month-end performance data, please call 1-855-377-PEAK (7325).
The table does not reflect the deduction of taxes a shareholder would pay on Fund distributions or redemption of Fund shares.
Subject to investment risks, including possible loss of the principal amount invested.
Returns for periods less than 1 year are cumulative.
| (a) | Fund inception date of September 1, 2015. |
| (b) | Ratios as of the Prospectus dated August 31, 2019 and may differ from the ratios presented in the Financial Highlights. |
| (c) | Grandeur Peak Global Advisors, LLC (the “Adviser”), has agreed to waive and/or reimburse fees or expenses in order to limit Total Annual Fund Operating Expenses After Fee Waiver/ Expense Reimbursements (excluding acquired fund fees and expenses, brokerage expenses, interest expenses, taxes and extraordinary expenses) to 1.35% and 1.10% of the Fund’s average daily net assets for the Fund’s Investor Class Shares and Institutional Class Shares, respectively. This agreement is in effect through August 31, 2020. The Adviser will be permitted to recover, on a class-by-class basis, expenses it has borne through this agreement to the extent that a Fund’s expenses in later periods fall below annual rates set forth in the Expense Agreement; provided, however, that such recapture payments do not cause the Fund’s expense ratio (after recapture) to exceed the lesser of (i) the expense cap in effect at the time of the waiver and (ii) the expense cap in effect at the time of the recapture .. Notwithstanding the foregoing, the Funds will not be obligated to pay any such deferred fees and expenses more than three years after the date on which the fee and expenses was deferred This agreement may not be terminated or modified prior to August 31, 2020 except with the approval of the Fund’s Board of Trustees. |
| (d) | The MSCI ACWI ex USA Mid Cap Index is designed to measure the equity market performance of midcap companies across developed and emerging markets globally, excluding the United States. The Adviser made this recommendation to the Board because the Russell indices are being decommissioned and the Advisor believes the MSCI index most closely aligns to the Fund’s investment strategies and investment restrictions. Information on both indices will be shown for a one-year transition period. MSCI makes no express or implied warranties or representations and shall have no liability whatsoever with respect to any MSCI data contained herein. The MSCI data may not be further redistributed or used to create indices or financial products. The Index is not actively managed and does not reflect any deductions for fees, expenses or taxes. An investor may not invest directly into the Index. |
| (e) | The MSCI ACWI ex USA Small Cap Index is designed to measure the equity market performance of small-cap companies across developed and emerging markets globally, excluding the United States. The Index is not actively managed and does not reflect any deductions for fees, expenses or taxes. An investor may not invest directly into the Index. |
| Semi-Annual Report | October 31, 2019 | 31 |
| Grandeur Peak International Stalwarts Fund | Performance Update |
October 31, 2019 (Unaudited)
Growth of $10,000 for the period ended October 31, 2019
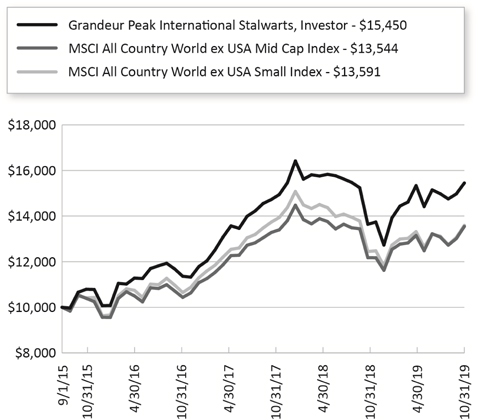
The chart shown above represent a hypothetical investment of $ 10,000 in the Fund’s Investor Class shares for the period from inception to October 31, 2019. All returns reflect reinvested dividends, but do not reflect the deduction of taxes that an investor would pay on distributions or redemptions.
Investing in the Fund is subject to investment risks, including possible loss of the principal amount invested.
The Fund also offers Institutional Class shares, performance for which is not reflected in the graphs above. The performance of Institutional Class shares may be higher or lower than the performance of the Investor Class shares shown in the graphs above based upon differences in fees paid by shareholders investing in the Investor Class shares and Institutional Class shares.
| 32 | 1.855.377.7325 | www.GrandeurPeakGlobal.com |
| Grandeur Peak International Stalwarts Fund | Performance Update |
October 31, 2019 (Unaudited)
| Regional Allocation (as a % of Net Assets)* | |
| Europe | 43.8% |
| Asia ex Japan | 20.5% |
| Japan | 12.3% |
| North America | 11.3% |
| Latin America | 3.2% |
| Australia/New Zealand | 2.6% |
| Africa/Middle East | 1.9% |
| Cash, Cash Equivalents, & Other Net Assets | 4.4% |
| Total | 100.0% |
| Industry Sector Allocation (as a % of Net Assets)* | |
| Financials | 24.0% |
| Consumer | 23.8% |
| Technology | 18.8% |
| Industrials | 15.2% |
| Health Care | 13.2% |
| Energy & Materials | 0.6% |
| Cash, Cash Equivalents, & Other Net Assets | 4.4% |
| Total | 100.0% |
| Top 10 Holdings (as a % of Net Assets)* | |
| St. James's Place PLC | 3.4% |
| Silergy Corp. | 3.0% |
| B&M European Value Retail SA | 2.8% |
| Nihon M&A Center, Inc. | 2.4% |
| Lululemon Athletica, Inc. | 2.3% |
| Aalberts NV | 2.3% |
| Dechra Pharmaceuticals PLC | 2.3% |
| EPAM Systems, Inc. | 2.0% |
| WNS Holdings, Ltd. | 2.0% |
| DiaSorin SpA | 1.9% |
| Total | 24.4% |
| * | Holdings are subject to change, and may not reflect the current or future position of the portfolio. |
| Semi-Annual Report | October 31, 2019 | 33 |
| Grandeur Peak Funds® | Disclosure of Fund Expenses |
October 31, 2019 (Unaudited)
As a shareholder of a Fund, you incur two types of costs: (1) transaction costs, including sales charges (loads) on purchase payments, reinvested dividends, or other distributions; redemption fees; and exchange fees; and (2) ongoing costs, including management fees; distribution and/or service (12b-1) fees; and other Fund expenses. This example is intended to help you understand your ongoing costs (in dollars) of investing in the Fund and to compare these costs with the ongoing costs of investing in other mutual funds.
This example is based on an investment of $1,000 invested at the beginning of the period and held for the entire six-month period of May 1, 2019 through October 31, 2019.
Actual ExpensesThe first line of the table provides information about actual account values and actual expenses. You may use the information in this line, together with the amount you invested, to estimate the expenses that you paid over the period. Simply divide your account value by $1,000 (for example, an $8,600 account value divided by $1,000 = 8.6), then multiply the result by the number in the first line under the heading “Expenses Paid During Period” to estimate the expenses you paid on your account during this period.
Hypothetical Example for Comparison PurposesThe second line of the table provides information about hypothetical account values and hypothetical expenses based on the Fund’s actual expense ratio and an assumed rate of return of 5% per year before expenses, which is not the Fund’s actual return. The hypothetical account values and expenses may not be used to estimate the actual ending account balance or expenses you paid for the period. You may use this information to compare the ongoing costs of investing in the Fund and other mutual funds. To do so, compare this 5% hypothetical example with the 5% hypothetical examples that appear in the shareholder reports of the other funds.
Please note that the expenses shown in the table are meant to highlight your ongoing costs only and do not reflect any transactional costs, such as redemption fees or exchange fees. Therefore, the second line of the table is useful in comparing ongoing costs only and will not help you determine the relative total costs of owning different funds. In addition, if these transactional costs were included, your costs would have been higher.
| 34 | 1.855.377.7325 | www.GrandeurPeakGlobal.com |
| Grandeur Peak Funds® | Disclosure of Fund Expenses |
October 31, 2019 (Unaudited)
| | Beginning Account Value May 1, 2019 | Ending Account Value October 31, 2019 | Expense Ratio(a) | Expenses Paid During period May 1, 2019 - October 31, 2019(b) |
| Grandeur Peak Emerging Markets Opportunities Fund | | | | |
| Investor Class | | | | |
| Actual | $ 1,000.00 | $ 1,037.20 | 1.74% | $ 8.91 |
| Hypothetical (5% return before expenses) | $ 1,000.00 | $ 1,016.39 | 1.74% | $ 8.82 |
| Institutional Class | | | | |
| Actual | $ 1,000.00 | $ 1,038.70 | 1.52% | $ 7.79 |
| Hypothetical (5% return before expenses) | $ 1,000.00 | $ 1,017.50 | 1.52% | $ 7.71 |
| Grandeur Peak Global Contrarian Fund | | | | |
| Institutional Class | | | | |
| Actual | $ 1,000.00 | $ 1,016.00 | 1.38% | $ 6.99 |
| Hypothetical (5% return before expenses) | $ 1,000.00 | $ 1,018.20 | 1.38% | $ 7.00 |
| Grandeur Peak Global Micro Cap Fund | | | | |
| Institutional Class | | | | |
| Actual | $ 1,000.00 | $ 1,028.30 | 2.00% | $ 10.20 |
| Hypothetical (5% return before expenses) | $ 1,000.00 | $ 1,015.08 | 2.00% | $ 10.13 |
| Grandeur Peak Global Opportunities Fund | | | | |
| Investor Class | | | | |
| Actual | $ 1,000.00 | $ 1,020.10 | 1.57% | $ 7.97 |
| Hypothetical (5% return before expenses) | $ 1,000.00 | $ 1,017.24 | 1.57% | $ 7.96 |
| Institutional Class | | | | |
| Actual | $ 1,000.00 | $ 1,022.70 | 1.34% | $ 6.81 |
| Hypothetical (5% return before expenses) | $ 1,000.00 | $ 1,018.40 | 1.34% | $ 6.80 |
| Grandeur Peak Global Reach Fund | | | | |
| Investor Class | | | | |
| Actual | $ 1,000.00 | $ 1,020.00 | 1.52% | $ 7.72 |
| Hypothetical (5% return before expenses) | $ 1,000.00 | $ 1,017.50 | 1.52% | $ 7.71 |
| Institutional Class | | | | |
| Actual | $ 1,000.00 | $ 1,021.30 | 1.28% | $ 6.50 |
| Hypothetical (5% return before expenses) | $ 1,000.00 | $ 1,018.70 | 1.28% | $ 6.50 |
| Grandeur Peak Global Stalwarts Fund | | | | |
| Investor Class | | | | |
| Actual | $ 1,000.00 | $ 1,002.00 | 1.25% | $ 6.29 |
| Hypothetical (5% return before expenses) | $ 1,000.00 | $ 1,018.85 | 1.25% | $ 6.34 |
| Institutional Class | | | | |
| Actual | $ 1,000.00 | $ 1,002.70 | 1.00% | $ 5.03 |
| Hypothetical (5% return before expenses) | $ 1,000.00 | $ 1,020.11 | 1.00% | $ 5.08 |
| Grandeur Peak International Opportunities Fund | | | | |
| Investor Class | | | | |
| Actual | $ 1,000.00 | $ 1,006.00 | 1.58% | $ 7.97 |
| Hypothetical (5% return before expenses) | $ 1,000.00 | $ 1,017.19 | 1.58% | $ 8.01 |
| Institutional Class | | | | |
| Actual | $ 1,000.00 | $ 1,006.00 | 1.34% | $ 6.76 |
| Hypothetical (5% return before expenses) | $ 1,000.00 | $ 1,018.40 | 1.34% | $ 6.80 |
| Grandeur Peak International Stalwarts Fund | | | | |
| Investor Class | | | | |
| Actual | $ 1,000.00 | $ 1,007.50 | 1.17% | $ 5.90 |
| Hypothetical (5% return before expenses) | $ 1,000.00 | $ 1,019.25 | 1.17% | $ 5.94 |
| Institutional Class | | | | |
| Actual | $ 1,000.00 | $ 1,008.80 | 0.92% | $ 4.65 |
| Hypothetical (5% return before expenses) | $ 1,000.00 | $ 1,020.51 | 0.92% | $ 4.67 |
| (a) | The Fund's expense ratios have been annualized based on the Fund's most recent fiscal half-year expenses. |
| (b) | Expenses are equal to the Fund's annualized expense ratio multiplied by the average account value over the period, multiplied by the number of days in the most recent fiscal half-year (184)/366 (to reflect the half-year period). |
| Semi-Annual Report | October 31, 2019 | 35 |
| Grandeur Peak Emerging Markets Opportunities Fund | Portfolio of Investments |
October 31, 2019 (Unaudited)
| | | Shares | | | Value (Note 2) | |
| COMMON STOCKS (93.92%) | | | | | | | | |
| Argentina (0.85%) | | | | | | | | |
| Globant SA(a) | | | 41,823 | | | $ | 3,900,413 | |
| | | | | | | | | |
| Bangladesh (0.88%) | | | | | | | | |
| Square Pharmaceuticals, Ltd. | | | 1,455,559 | | | | 4,036,828 | |
| | | | | | | | | |
| Brazil (6.24%) | | | | | | | | |
| Arco Platform, Ltd., Class A(a) | | | 92,525 | | | | 3,839,788 | |
| Fleury SA | | | 1,416,100 | | | | 8,940,444 | |
| Hypera SA | | | 397,400 | | | | 3,410,674 | |
| Magazine Luiza SA | | | 220,800 | | | | 2,444,463 | |
| Pagseguro Digital, Ltd., Class A(a) | | | 159,850 | | | | 5,927,238 | |
| Raia Drogasil SA | | | 144,900 | | | | 3,972,872 | |
| | | | | | | | 28,535,479 | |
| | | | | | | | | |
| China (19.10%) | | | | | | | | |
| 51job, Inc., ADR(a) | | | 48,650 | | | | 3,832,161 | |
| 58.com, Inc., ADR(a) | | | 56,525 | | | | 2,985,085 | |
| AK Medical Holdings, Ltd.(b)(c) | | | 3,499,000 | | | | 3,991,993 | |
| Alibaba Group Holding, Ltd., Sponsored ADR(a) | | | 21,675 | | | | 3,829,322 | |
| ANTA Sports Products, Ltd. | | | 524,000 | | | | 5,135,714 | |
| Baozun, Inc., Sponsored ADR(a) | | | 65,200 | | | | 2,837,504 | |
| BBI Life Sciences Corp.(c) | | | 9,968,500 | | | | 3,002,273 | |
| CSPC Pharmaceutical Group, Ltd. | | | 2,192,000 | | | | 5,636,687 | |
| Ctrip.com International, Ltd., ADR(a) | | | 151,950 | | | | 5,012,830 | |
| Essex Bio-technology, Ltd. | | | 4,931,000 | | | | 3,800,846 | |
| Hangzhou Robam Appliances Co., Ltd., Class A | | | 365,200 | | | | 1,635,650 | |
| Hangzhou Tigermed | | | | | | | | |
| Consulting Co., Ltd., Class A | | | 176,250 | | | | 1,711,043 | |
| HUYA, Inc., ADR(a) | | | 86,952 | | | | 1,933,812 | |
| Jiangsu Hengrui Medicine Co., Ltd., Class A | | | 148,800 | | | | 1,922,129 | |
| Koolearn Technology Holding, Ltd.(a)(b)(c) | | | 1,964,000 | | | | 4,616,783 | |
| Man Wah Holdings, Ltd. | | | 5,220,400 | | | | 3,564,232 | |
| New Oriental Education & Technology Group, Inc., Sponsored ADR(a) | | | 48,050 | | | | 5,864,983 | |
| O2Micro International, Ltd., ADR(a) | | | 462,244 | | | | 573,183 | |
| Shanghai Haohai Biological Technology Co., Ltd., Class H(b)(c) | | | 538,100 | | | | 3,110,782 | |
| Silergy Corp. | | | 368,422 | | | | 10,384,392 | |
| Tencent Holdings, Ltd. | | | 58,900 | | | | 2,411,337 | |
| WuXi AppTec Co., Ltd., Class H(b)(c) | | | 378,000 | | | | 4,568,253 | |
| Wuxi Biologics Cayman, Inc.(a)(b)(c) | | | 231,000 | | | | 2,726,855 | |
| | | Shares | | | Value (Note 2) | |
| China (continued) | | | | | | |
| Yum China Holdings, Inc. | | | 53,475 | | | $ | 2,272,688 | |
| | | | | | | | 87,360,537 | |
| | | | | | | | | |
| Colombia (1.31%) | | | | | | | | |
| Amerisur Resources PLC(a) | | | 6,493,622 | | | | 1,604,921 | |
| Parex Resources, Inc.(a) | | | 324,731 | | | | 4,400,918 | |
| | | | | | | | 6,005,839 | |
| | | | | | | | | |
| Egypt (1.14%) | | | | | | | | |
| African Export-Import Bank, GDR | | | 500,000 | | | | 2,070,000 | |
| Integrated Diagnostics Holdings PLC(b)(c) | | | 371,100 | | | | 1,751,592 | |
| Obour Land For Food Industries | | | 4,233,886 | | | | 1,377,193 | |
| | | | | | | | 5,198,785 | |
| | | | | | | | | |
| Georgia (2.04%) | | | | | | | | |
| Bank of Georgia Group PLC | | | 185,712 | | | | 3,124,910 | |
| Georgia Capital PLC(a) | | | 115,112 | | | | 1,450,848 | |
| Georgia Healthcare Group PLC(b)(c) | | | 356,781 | | | | 784,512 | |
| TBC Bank Group PLC | | | 240,293 | | | | 3,984,184 | |
| | | | | | | | 9,344,454 | |
| | | | | | | | | |
| Greece (2.14%) | | | | | | | | |
| JUMBO SA | | | 227,400 | | | | 4,438,335 | |
| Sarantis SA | | | 603,670 | | | | 5,332,322 | |
| | | | | | | | 9,770,657 | |
| | | | | | | | | |
| Hong Kong (3.34%) | | | | | | | | |
| Jacobson Pharma Corp., Ltd.(c) | | | 10,222,000 | | | | 1,539,311 | |
| Plover Bay Technologies, Ltd.(c) | | | 8,956,000 | | | | 1,268,661 | |
| TK Group Holdings, Ltd. | | | 6,362,000 | | | | 3,004,026 | |
| Value Partners Group, Ltd. | | | 10,871,800 | | | | 5,743,943 | |
| Vitasoy International Holdings, Ltd. | | | 916,383 | | | | 3,730,577 | |
| | | | | | | | 15,286,518 | |
| | | | | | | | | |
| India (13.96%) | | | | | | | | |
| Bajaj Finance, Ltd. | | | 185,000 | | | | 10,504,862 | |
| City Union Bank, Ltd. | | | 1,202,575 | | | | 3,592,699 | |
| Cyient, Ltd. | | | 668,095 | | | | 3,831,276 | |
| Gulf Oil Lubricants India, Ltd. | | | 168,535 | | | | 2,091,933 | |
| HDFC Asset Management Co., Ltd.(b)(c) | | | 80,858 | | | | 3,413,469 | |
| HDFC Bank, Ltd. | | | 246,000 | | | | 4,267,185 | |
| HDFC Life Insurance Co., Ltd.(b)(c) | | | 370,000 | | | | 3,266,574 | |
| Hero MotoCorp, Ltd. | | | 61,000 | | | | 2,325,661 | |
| Hexaware Technologies, Ltd. | | | 358,000 | | | | 1,679,495 | |
| Kovai Medical Center and Hospital | | | 50,167 | | | | 474,555 | |
See Notes to Financial Statements.
| 36 | 1.855.377.7325 | www.GrandeurPeakGlobal.com |
| Grandeur Peak Emerging Markets Opportunities Fund | Portfolio of Investments |
October 31, 2019 (Unaudited)
| | | Shares | | | Value (Note 2) | |
| India (continued) | | | | | | |
| L&T Technology Services, Ltd.(b)(c) | | | 161,040 | | | $ | 3,413,958 | |
| Metropolis Healthcare, Ltd.(a)(b)(c) | | | 367,701 | | | | 7,502,156 | |
| Mindtree, Ltd. | | | 186,000 | | | | 1,869,211 | |
| Time Technoplast, Ltd. | | | 2,390,721 | | | | 2,123,475 | |
| Vaibhav Global, Ltd. | | | 225,319 | | | | 2,587,736 | |
| WNS Holdings, Ltd., ADR(a) | | | 175,986 | | | | 10,882,974 | |
| | | | | | | | 63,827,219 | |
| | | | | | | | | |
| Indonesia (4.15%) | | | | | | | | |
| Ace Hardware Indonesia Tbk PT | | | 22,574,100 | | | | 2,717,833 | |
| Arwana Citramulia Tbk PT | | | 45,188,500 | | | | 1,603,183 | |
| Bank Central Asia Tbk PT | | | 1,169,000 | | | | 2,619,153 | |
| Hexindo Adiperkasa Tbk PT | | | 3,557,100 | | | | 884,397 | |
| Indonesia Pondasi Raya Tbk PT | | | 14,738,400 | | | | 403,188 | |
| Link Net Tbk PT | | | 7,350,500 | | | | 2,304,068 | |
| Panin Sekuritas Tbk PT | | | 7,155,500 | | | | 810,518 | |
| Selamat Sempurna Tbk PT | | | 52,028,900 | | | | 5,467,167 | |
| Ultrajaya Milk Industry & Trading Co. Tbk PT | | | 20,171,600 | | | | 2,184,287 | |
| | | | | | | | 18,993,794 | |
| | | | | | | | | |
| Kenya (0.70%) | | | | | | | | |
| Safaricom PLC | | | 11,096,600 | | | | 3,195,778 | |
| | | | | | | | | |
| Malaysia (1.72%) | | | | | | | | |
| AEON Credit Service M Bhd | | | 1,430,114 | | | | 5,236,507 | |
| My EG Services Bhd | | | 3,821,900 | | | | 1,042,711 | |
| Mynews Holdings Bhd | | | 2,292,100 | | | | 729,566 | |
| Scicom MSC Bhd | | | 3,545,500 | | | | 856,995 | |
| | | | | | | | 7,865,779 | |
| | | | | | | | | |
| Mexico (2.29%) | | | | | | | | |
| Credito Real SAB de CV SOFOM ER | | | 1,448,154 | | | | 1,793,207 | |
| Grupo Herdez SAB de CV | | | 1,762,360 | | | | 3,590,409 | |
| Regional SAB de CV | | | 952,000 | | | | 5,068,689 | |
| | | | | | | | 10,452,305 | |
| | | | | | | | | |
| Oman (0.28%) | | | | | | | | |
| Tethys Oil AB | | | 171,623 | | | | 1,304,631 | |
| | | | | | | | | |
| Pakistan (0.39%) | | | | | | | | |
| Akzo Nobel Pakistan, Ltd. | | | 496,500 | | | | 312,710 | |
| Meezan Bank, Ltd. | | | 2,914,067 | | | | 1,463,497 | |
| | | | | | | | 1,776,207 | |
| | | | | | | | | |
| Peru (1.55%) | | | | | | | | |
| Alicorp SAA | | | 999,553 | | | | 2,740,425 | |
| Credicorp, Ltd. | | | 20,325 | | | | 4,350,363 | |
| | | | | | | | 7,090,788 | |
| | | Shares | | | Value (Note 2) | |
| Philippines (3.99%) | | | | | | |
| Altus San Nicolas Corp.(a)(d) | | | 71,561 | | | $ | 7,014 | |
| Concepcion Industrial Corp. | | | 1,861,792 | | | | 1,119,020 | |
| D&L Industries, Inc. | | | 11,306,000 | | | | 1,900,486 | |
| Philippine Seven Corp. | | | 917,000 | | | | 2,692,541 | |
| Puregold Price Club, Inc. | | | 4,121,100 | | | | 3,317,508 | |
| Robinsons Land Corp. | | | 3,716,762 | | | | 1,864,057 | |
| Robinsons Retail Holdings, Inc. | | | 1,464,000 | | | | 2,188,282 | |
| Wilcon Depot, Inc. | | | 15,904,900 | | | | 5,171,561 | |
| | | | | | | 18,260,469 | |
| | | | | | | | | |
| Poland (2.40%) | | | | | | | | |
| CCC SA | | | 30,600 | | | | 893,816 | |
| Dino Polska SA(a)(b)(c) | | | 168,413 | | | | 6,567,871 | |
| LiveChat Software SA | | | 239,800 | | | | 2,378,763 | |
| PGS Software SA | | | 426,467 | | | | 1,116,216 | |
| | | | | | | | 10,956,666 | |
| | | | | | | | | |
| Russia (0.73%) | | | | | | | | |
| HeadHunter Group PLC, ADR | | | 96,125 | | | | 1,678,342 | |
| TCS Group Holding PLC, GDR(c) | | | 86,700 | | | | 1,649,034 | |
| | | | | | | | 3,327,376 | |
| | | | | | | | | |
| South Africa (3.10%) | | | | | | | | |
| ARB Holdings, Ltd. | | | 1,134,108 | | | | 258,562 | |
| Capitec Bank Holdings, Ltd. | | | 23,200 | | | | 2,108,014 | |
| City Lodge Hotels, Ltd. | | | 57,892 | | | | 306,155 | |
| Clicks Group, Ltd. | | | 177,900 | | | | 2,893,634 | |
| Italtile, Ltd. | | | 3,636,472 | | | | 3,369,221 | |
| Shoprite Holdings, Ltd. | | | 83,700 | | | | 750,062 | |
| Transaction Capital, Ltd. | | | 3,071,128 | | | | 4,481,544 | |
| | | | | | | | 14,167,192 | |
| | | | | | | | | |
| South Korea (4.70%) | | | | | | | | |
| Douzone Bizon Co., Ltd. | | | 62,500 | | | | 3,943,014 | |
| Hy-Lok Corp. | | | 18,500 | | | | 272,702 | |
| Koh Young Technology, Inc. | | | 18,244 | | | | 1,475,577 | |
| LEENO Industrial, Inc. | | | 99,700 | | | | 4,558,890 | |
| LG Household & Health Care, Ltd. | | | 4,825 | | | | 5,229,554 | |
| NAVER Corp. | | | 27,560 | | | | 3,884,860 | |
| Tokai Carbon Korea Co., Ltd. | | | 46,000 | | | | 2,115,261 | |
| | | | | | | | 21,479,858 | |
| | | | | | | | | |
| Taiwan (8.22%) | | | | | | | | |
| ASPEED Technology, Inc. | | | 95,000 | | | | 2,490,432 | |
| Bioteque Corp. | | | 667,000 | | | | 2,859,464 | |
| FineTek Co., Ltd. | | | 409,500 | | | | 1,146,151 | |
| Gourmet Master Co., Ltd. | | | 372,760 | | | | 1,702,128 | |
| LandMark Optoelectronics Corp. | | | 210,000 | | | | 1,776,416 | |
| M31 Technology Corp. | | | 41,000 | | | | 515,185 | |
| Poya International Co., Ltd. | | | 342,000 | | | | 4,701,861 | |
| Rafael Microelectronics, Inc. | | | 312,000 | | | | 1,885,909 | |
| Sinmag Equipment Corp. | | | 972,502 | | | | 3,290,606 | |
See Notes to Financial Statements.
| Semi-Annual Report | October 31, 2019 | 37 |
| Grandeur Peak Emerging Markets Opportunities Fund | Portfolio of Investments |
October 31, 2019 (Unaudited)
| | | Shares | | | Value (Note 2) | |
| Taiwan (continued) | | | | | | |
| Sporton International, Inc. | | | 696,760 | | | $ | 4,348,956 | |
| Tehmag Foods Corp. | | | 145,200 | | | | 1,063,701 | |
| Test Research, Inc. | | | 1,626,000 | | | | 2,724,200 | |
| TSC Auto ID Technology Co., Ltd. | | | 228,800 | | | | 1,871,559 | |
| TTFB Co., Ltd. | | | 179,000 | | | | 1,570,047 | |
| Voltronic Power Technology Corp. | | | 254,100 | | | | 5,634,517 | |
| | | | | | | | 37,581,132 | |
| | | | | | | | | |
| Thailand (1.64%) | | | | | | | | |
| Muangthai Capital PCL | | | 2,120,000 | | | | 4,353,039 | |
| TOA Paint Thailand PCL | | | 2,107,000 | | | | 3,140,089 | |
| | | | | | | | 7,493,128 | |
| | | | | | | | | |
| Turkey (0.32%) | | | | | | | | |
| DP Eurasia NV(a)(b)(c) | | | 1,646,300 | | | | 1,471,453 | |
| | | | | | | | | |
| United Arab Emirates (0.98%) | | | | | | | | |
| Aramex PJSC | | | 2,626,419 | | | | 2,803,230 | |
| Network International Holdings PLC(a)(b)(c) | | | 236,400 | | | | 1,656,659 | |
| | | | | | | | 4,459,889 | |
| | | | | | | | | |
| United States (2.41%) | | | | | | | | |
| FirstCash, Inc. | | | 33,570 | | | | 2,832,972 | |
| Frontage Holdings Corp.(a)(b)(c) | | | 333,000 | | | | 226,081 | |
| Genpact, Ltd. | | | 202,850 | | | | 7,945,635 | |
| | | | | | | | 11,004,688 | |
| | | | | | | | | |
| Vietnam (3.35%) | | | | | | | | |
| FPT Corp. | | | 1,364,611 | | | | 3,405,205 | |
| Ho Chi Minh City Development Joint Stock Commercial Bank(a) | | | 2,240,203 | | | | 2,843,338 | |
| Lix Detergent JSC | | | 437,310 | | | | 780,271 | |
| Vietnam Dairy Products JSC | | | 892,665 | | | | 5,001,356 | |
| Vietnam Technological & Commercial Joint Stock Bank(a) | | | 3,207,629 | | | | 3,276,335 | |
| | | | | | | | 15,306,505 | |
| | | | | | | | | |
| TOTAL COMMON STOCKS | | | | | | | | |
| (Cost $352,282,793) | | | | | | | 429,454,367 | |
| | | | | | | | | |
| TOTAL INVESTMENTS (93.92%) | | | | | | | | |
| (Cost $352,282,793) | | | | | | $ | 429,454,367 | |
| | | | | | | | | |
| Other Assets In Excess Of Liabilities (6.08%) | | | | | | | 27,813,729 | |
| | | | | | | | | |
| NET ASSETS (100.00%) | | | | | | $ | 457,268,096 | |
| (a) | Non-Income Producing Security. |
| (b) | Security exempt from registration under Rule 144A of the Securities Act of 1933. These securities may be resold in the ordinary course of business in transactions exempt from registration, normally to qualified institutional buyers. As of October 31, 2019, these securities had a total aggregate market value of $49,068,991 representing 10.73% of net assets. |
| (c) | Security was purchased pursuant to Regulation S under the Securities Act of 1933, which exempts securities offered and sold outside of the United States from registration. Such security cannot be sold in the United States without either an effective registration statement filed pursuant to the Securities Act of 1933, or pursuant to an exemption from registration. The security has been deemed liquid under guidelines approved by the Fund's Board of Trustees. As of October 31, 2019, the aggregate market value of these securities was $56,528,270, representing 12.36% of net assets. |
| (d) | As a result of the use of significant unobservable inputs to determine fair value, these investments have been classified as level 3 assets. See also Note 2 to the financial statements for additional information. |
For Fund compliance purposes, the Fund's geographical classifications refer to any one or more of the country sub-classifications used by one or more widely recognized market indexes or ratings group indexes, and/or as defined by Fund management. This definition may not apply for purposes of this report, which may combine sub-classifications for reporting ease. Geographical regions are shown as a percentage of net assets.
See Notes to Financial Statements.
| 38 | 1.855.377.7325 | www.GrandeurPeakGlobal.com |
| Grandeur Peak Global Contrarian Fund | Portfolio of Investments |
October 31, 2019 (Unaudited)
| | | Shares | | | Value (Note 2) | |
| COMMON STOCKS (99.49%) | | | | | | | | |
| Australia (4.11%) | | | | | | | | |
| Fiducian Group, Ltd. | | | 28,580 | | | $ | 106,389 | |
| Lycopodium, Ltd. | | | 9,557 | | | | 36,432 | |
| National Storage REIT | | | 38,969 | | | | 49,966 | |
| | | | | | | | 192,787 | |
| | | | | | | | | |
| Belgium (0.74%) | | | | | | | | |
| X-Fab Silicon Foundries SE(a)(b)(c) | | | 7,729 | | | | 34,825 | |
| | | | | | | | | |
| Bermuda (0.86%) | | | | | | | | |
| Bank of NT Butterfield & Son, Ltd. | | | 1,224 | | | | 40,331 | |
| | | | | | | | | |
| Britain (9.46%) | | | | | | | | |
| B&M European Value Retail SA | | | 10,489 | | | | 50,312 | |
| City of London Investment Group PLC | | | 6,408 | | | | 35,277 | |
| Close Brothers Group PLC | | | 1,880 | | | | 33,680 | |
| CVS Group PLC | | | 4,132 | | | | 51,784 | |
| K3 Capital Group PLC | | | 26,619 | | | | 49,653 | |
| LoopUp Group PLC(a) | | | 64,000 | | | | 53,472 | |
| River & Mercantile Group PLC | | | 10,693 | | | | 34,213 | |
| Sabre Insurance Group PLC(b)(c) | | | 12,757 | | | | 48,748 | |
| Senior PLC | | | 21,807 | | | | 52,174 | |
| Volution Group PLC | | | 13,363 | | | | 34,533 | |
| | | | | | | | 443,846 | |
| | | | | | | | | |
| Canada (2.57%) | | | | | | | | |
| Biosyent, Inc.(a) | | | 10,654 | | | | 48,534 | |
| Guardian Capital Group, Ltd. | | | 3,655 | | | | 72,317 | |
| | | | | | | | 120,851 | |
| | | | | | | | | |
| China (6.40%) | | | | | | | | |
| BBI Life Sciences Corp.(c) | | | 332,500 | | | | 100,141 | |
| Essex Bio-technology, Ltd. | | | 61,000 | | | | 47,019 | |
| Hangzhou Robam Appliances Co., Ltd., Class A | | | 10,000 | | | | 44,788 | |
| Man Wah Holdings, Ltd. | | | 53,600 | | | | 36,595 | |
| O2Micro International, Ltd., ADR(a) | | | 28,900 | | | | 35,836 | |
| Xin Point Holdings, Ltd.(c) | | | 168,000 | | | | 36,233 | |
| | | | | | | | 300,612 | |
| | | | | | | | | |
| Colombia (1.62%) | | | | | | | | |
| Parex Resources, Inc.(a) | | | 5,602 | | | | 75,921 | |
| | | | | | | | | |
| France (1.99%) | | | | | | | | |
| Thermador Groupe | | | 872 | | | | 53,879 | |
| Vetoquinol SA | | | 605 | | | | 39,406 | |
| | | | | | | | 93,285 | |
| | | Shares | | | Value (Note 2) | |
| Georgia (1.79%) | | | | | | |
| Bank of Georgia Group PLC | | | 2,996 | | | $ | 50,412 | |
| TBC Bank Group PLC | | | 2,034 | | | | 33,725 | |
| | | | | | | | 84,137 | |
| | | | | | | | | |
| Germany (2.87%) | | | | | | | | |
| Aroundtown SA | | | 4,500 | | | | 37,973 | |
| Grand City Properties SA | | | 2,159 | | | | 50,470 | |
| Norma Group SE | | | 1,256 | | | | 46,171 | |
| | | | | | | | 134,614 | |
| | | | | | | | | |
| Greece (1.54%) | | | | | | | | |
| JUMBO SA | | | 1,900 | | | | 37,083 | |
| Sarantis SA | | | 4,000 | | | | 35,333 | |
| | | | | | | | 72,416 | |
| | | | | | | | | |
| Hong Kong (5.12%) | | | | | | | | |
| Jacobson Pharma Corp., Ltd.(c) | | | 382,000 | | | | 57,525 | |
| Plover Bay Technologies, Ltd.(c) | | | 704,000 | | | | 99,725 | |
| TK Group Holdings, Ltd. | | | 74,000 | | | | 34,942 | |
| Value Partners Group, Ltd. | | | 91,000 | | | | 48,078 | |
| | | | | | | | 240,270 | |
| | | | | | | | | |
| India (2.36%) | | | | | | | | |
| Cyient, Ltd. | | | 10,500 | | | | 60,214 | |
| Time Technoplast, Ltd. | | | 57,000 | | | | 50,628 | |
| | | | | | | | 110,842 | |
| | | | | | | | | |
| Indonesia (1.73%) | | | | | | | | |
| Selamat Sempurna Tbk PT | | | 772,100 | | | | 81,132 | |
| | | | | | | | | |
| Ireland (1.93%) | | | | | | | | |
| Hostelworld Group PLC(b)(c) | | | 31,425 | | | | 47,545 | |
| Irish Residential Properties REIT PLC | | | 22,000 | | | | 43,086 | |
| | | | | | | | 90,631 | |
| | | | | | | | | |
| Italy (2.41%) | | | | | | | | |
| Freni Brembo SpA | | | 4,085 | | | | 43,441 | |
| Piovan SpA(b)(c) | | | 11,328 | | | | 69,741 | |
| | | | | | | | 113,182 | |
| | | | | | | | | |
| Japan (11.99%) | | | | | | | | |
| Beenos, Inc. | | | 2,800 | | | | 34,225 | |
| Central Automotive Products, Ltd. | | | 4,000 | | | | 78,452 | |
| Create SD Holdings Co., Ltd. | | | 2,200 | | | | 54,862 | |
| Japan Lifeline Co., Ltd. | | | 2,200 | | | | 34,246 | |
| Medikit Co., Ltd. | | | 700 | | | | 44,402 | |
| Naigai Trans Line, Ltd. | | | 3,600 | | | | 51,005 | |
| Seria Co., Ltd. | | | 2,700 | | | | 68,156 | |
| Sundrug Co., Ltd. | | | 2,200 | | | | 73,239 | |
| Tokyo Century Corp. | | | 1,100 | | | | 51,338 | |
See Notes to Financial Statements.
| Semi-Annual Report | October 31, 2019 | 39 |
| Grandeur Peak Global Contrarian Fund | Portfolio of Investments |
October 31, 2019 (Unaudited)
| | | Shares | | | Value (Note 2) | |
| Japan (continued) | | | | | | |
| Trancom Co., Ltd. | | | 1,100 | | | $ | 72,933 | |
| | | | | | | | 562,858 | |
| | | | | | | | | |
| Malaysia (0.73%) | | | | | | | | |
| AEON Credit Service M Bhd | | | 9,300 | | | | 34,053 | |
| | | | | | | | | |
| Mexico (2.78%) | | | | | | | | |
| Credito Real SAB de CV SOFOM ER | | | 42,800 | | | | 52,998 | |
| Grupo Herdez SAB de CV | | | 18,000 | | | | 36,671 | |
| Regional SAB de CV | | | 7,700 | | | | 40,997 | |
| | | | | | | | 130,666 | |
| | | | | | | | | |
| Netherlands (1.45%) | | | | | | | | |
| Aalberts NV | | | 1,687 | | | | 67,847 | |
| | | | | | | | | |
| New Zealand (0.92%) | | | | | | | | |
| Kathmandu Holdings, Ltd. | | | 21,562 | | | | 43,409 | |
| | | | | | | | | |
| Norway (1.60%) | | | | | | | | |
| Sbanken ASA(b)(c) | | | 4,524 | | | | 32,124 | |
| Webstep AS(b)(c) | | | 17,397 | | | | 42,754 | |
| | | | | | | | 74,878 | |
| | | | | | | | | |
| Philippines (1.96%) | | | | | | | | |
| Concepcion Industrial Corp. | | | 96,800 | | | | 58,181 | |
| Pryce Corp. | | | 317,700 | | | | 33,808 | |
| | | | | | | | 91,989 | |
| | | | | | | | | |
| Poland (1.74%) | | | | | | | | |
| Benefit Systems SA(a) | | | 210 | | | | 38,475 | |
| PGS Software SA | | | 16,456 | | | | 43,071 | |
| | | | | | | | 81,546 | |
| | | | | | | | | |
| Singapore (1.61%) | | | | | | | | |
| Riverstone Holdings, Ltd./Singapore | | | 105,700 | | | | 75,753 | |
| | | | | | | | | |
| South Africa (1.05%) | | | | | | | | |
| Italtile, Ltd. | | | 53,296 | | | | 49,379 | |
| | | | | | | | | |
| South Korea (0.85%) | | | | | | | | |
| Tokai Carbon Korea Co., Ltd. | | | 864 | | | | 39,730 | |
| | | | | | | | | |
| Sweden (3.38%) | | | | | | | | |
| Hoist Finance AB(a)(b)(c) | | | 6,790 | | | | 37,165 | |
| KNOW IT AB | | | 4,181 | | | | 82,271 | |
| TF Bank AB(c) | | | 3,256 | | | | 39,454 | |
| | | | | | | | 158,890 | |
| | | | | | | | | |
| Taiwan (6.20%) | | | | | | | | |
| Bioteque Corp. | | | 24,000 | | | | 102,889 | |
| FineTek Co., Ltd. | | | 12,000 | | | | 33,587 | |
| Rafael Microelectronics, Inc. | | | 7,000 | | | | 42,312 | |
| | | Shares | | | Value (Note 2) | |
| Taiwan (continued) | | | | | | |
| Sinmag Equipment Corp. | | | 9,000 | | | $ | 30,453 | |
| Taiwan Sakura Corp. | | | 24,000 | | | | 37,963 | |
| TTFB Co., Ltd. | | | 5,000 | | | | 43,856 | |
| | | | | | | | 291,060 | |
| | | | | | | | | |
| Turkey (1.05%) | | | | | | | | |
| DP Eurasia NV(a)(b)(c) | | | 55,331 | | | | 49,455 | |
| | | | | | | | | |
| United Arab Emirates (1.11%) | | | | | | | | |
| Aramex PJSC | | | 49,000 | | | | 52,299 | |
| | | | | | | | | |
| United States (11.64%) | | | | | | | | |
| Carnival Corp. | | | 1,188 | | | | 50,953 | |
| CH Robinson Worldwide, Inc. | | | 816 | | | | 61,722 | |
| Core Laboratories NV | | | 839 | | | | 36,949 | |
| Hackett Group, Inc. | | | 4,915 | | | | 83,113 | |
| HD Supply Holdings, Inc.(a) | | | 900 | | | | 35,586 | |
| Hingham Institution for Savings | | | 216 | | | | 41,038 | |
| MSC Industrial Direct Co., Inc., Class A | | | 681 | | | | 49,856 | |
| RPC, Inc. | | | 8,113 | | | | 33,588 | |
| Systemax, Inc. | | | 2,974 | | | | 64,358 | |
| TriMas Corp.(a) | | | 1,070 | | | | 34,582 | |
| Virtusa Corp.(a) | | | 1,468 | | | | 54,727 | |
| | | | | | | | 546,472 | |
| | | | | | | | | |
| Vietnam (1.93%) | | | | | | | | |
| Ho Chi Minh City | | | | | | | | |
| Development Joint Stock | | | | | | | | |
| Commercial Bank(a) | | | 30,500 | | | | 38,712 | |
| Hoa Phat Group JSC(a) | | | 55,000 | | | | 51,674 | |
| | | | | | | | 90,386 | |
| | | | | | | | | |
| TOTAL COMMON STOCKS | | | | | | | | |
| (Cost $4,606,276) | | | | | | | 4,670,352 | |
| | | | | | | | | |
| TOTAL INVESTMENTS (99.49%) | | | | | | | | |
| (Cost $4,606,276) | | | | | | $ | 4,670,352 | |
| | | | | | | | | |
| Other Assets In Excess Of Liabilities (0.51%) | | | | | | | 23,866 | |
| | | | | | | | | |
| NET ASSETS (100.00%) | | | | | | $ | 4,694,218 | |
| (a) | Non-Income Producing Security. |
| (b) | Security exempt from registration under Rule 144A of the Securities Act of 1933. These securities may be resold in the ordinary course of business in transactions exempt from registration, normally to qualified institutional buyers. As of October 31, 2019, these securities had a total aggregate market value of $362,357 representing 7.72% of net assets. |
See Notes to Financial Statements.
| 40 | 1.855.377.7325 | www.GrandeurPeakGlobal.com |
| Grandeur Peak Global Contrarian Fund | Portfolio of Investments |
October 31, 2019 (Unaudited)
| (c) | Security was purchased pursuant to Regulation S under the Securities Act of 1933, which exempts securities offered and sold outside of the United States from registration. Such security cannot be sold in the United States without either an effective registration statement filed pursuant to the Securities Act of 1933, or pursuant to an exemption from registration. The security has been deemed liquid under guidelines approved by the Fund's Board of Trustees. As of October 31, 2019, the aggregate market value of these securities was $695,435, representing 14.81% of net assets. |
For Fund compliance purposes, the Fund's geographical classifications refer to any one or more of the country sub-classifications used by one or more widely recognized market indexes or ratings group indexes, and/or as defined by Fund management. This definition may not apply for purposes of this report, which may combine sub-classifications for reporting ease. Geographical regions are shown as a percentage of net assets.
See Notes to Financial Statements.
| Semi-Annual Report | October 31, 2019 | 41 |
| Grandeur Peak Global Micro Cap Fund | Portfolio of Investments |
October 31, 2019 (Unaudited)
| | | Shares | | | Value (Note 2) | |
| COMMON STOCKS (98.79%) | | | | | | |
| Australia (11.09%) | | | | | | |
| Australian Ethical Investment, Ltd. | | | 41,500 | | | $ | 78,672 | |
| Fiducian Group, Ltd. | | | 190,828 | | | | 710,356 | |
| Kogan.com, Ltd. | | | 144,289 | | | | 673,383 | |
| Lycopodium, Ltd. | | | 43,026 | | | | 164,020 | |
| Mainstream Group Holdings, Ltd. | | | 465,778 | | | | 178,202 | |
| National Storage REIT | | | 358,861 | | | | 460,129 | |
| National Veterinary Care, Ltd. | | | 524,152 | | | | 831,047 | |
| People Infrastructure, Ltd. | | | 74,514 | | | | 174,645 | |
| PWR Holdings, Ltd. | | | 60,900 | | | | 199,412 | |
| Temple & Webster Group, Ltd.(a) | | | 177,000 | | | | 279,415 | |
| | | | | | | | 3,749,281 | |
| | | | | | | | | |
| Brazil (0.18%) | | | | | | | | |
| Arco Platform, Ltd., Class A(a) | | | 1,475 | | | | 61,213 | |
| | | | | | | | | |
| Britain (12.37%) | | | | | | | | |
| AB Dynamics PLC | | | 6,614 | | | | 179,917 | |
| City of London Investment Group PLC | | | 40,547 | | | | 223,221 | |
| Curtis Banks Group PLC | | | 78,479 | | | | 294,808 | |
| CVS Group PLC | | | 31,500 | | | | 394,775 | |
| dotdigital group PLC | | | 152,400 | | | | 180,632 | |
| Impax Asset Management Group PLC | | | 111,598 | | | | 378,744 | |
| JTC PLC(b)(c) | | | 51,800 | | | | 242,229 | |
| K3 Capital Group PLC | | | 143,979 | | | | 268,565 | |
| LoopUp Group PLC(a) | | | 110,133 | | | | 92,016 | |
| On the Beach Group PLC(b)(c) | | | 43,800 | | | | 254,293 | |
| Oxford Immunotec Global PLC(a) | | | 28,042 | | | | 434,931 | |
| Premier Asset Management Group PLC | | | 50,268 | | | | 117,207 | |
| River & Mercantile Group PLC | | | 61,300 | | | | 196,131 | |
| Sanne Group PLC | | | 59,000 | | | | 403,529 | |
| Tracsis PLC | | | 19,300 | | | | 150,002 | |
| Volution Group PLC | | | 86,601 | | | | 223,797 | |
| XPS Pensions Group PLC(c) | | | 90,380 | | | | 146,343 | |
| | | | | | | | 4,181,140 | |
| | | | | | | | | |
| China (2.76%) | | | | | | | | |
| BBI Life Sciences Corp.(c) | | | 2,155,000 | | | | 649,034 | |
| Essex Bio-technology, Ltd. | | | 186,000 | | | | 143,370 | |
| O2Micro International, Ltd., ADR(a) | | | 112,655 | | | | 139,692 | |
| | | | | | | | 932,096 | |
| | | | | | | | | |
| Colombia (0.39%) | | | | | | | | |
| Amerisur Resources PLC(a) | | | 536,017 | | | | 132,478 | |
| | | Shares | | | Value (Note 2) | |
| Egypt (0.36%) | | | | | | |
| Obour Land For Food Industries | | | 372,774 | | | $ | 121,256 | |
| | | | | | | | | |
| Finland (0.27%) | | | | | | | | |
| Siili Solutions Oyj | | | 10,200 | | | | 89,871 | |
| | | | | | | | | |
| France (2.02%) | | | | | | | | |
| Esker SA | | | 3,500 | | | | 321,262 | |
| Thermador Groupe | | | 5,874 | | | | 362,940 | |
| | | | | | | | 684,202 | |
| | | | | | | | | |
| Georgia (1.06%) | | | | | | | | |
| Georgia Healthcare Group PLC(b)(c) | | | 60,281 | | | | 132,550 | |
| TBC Bank Group PLC | | | 13,650 | | | | 226,324 | |
| | | | | | | | 358,874 | |
| | | | | | | | | |
| Germany (0.50%) | | | | | | | | |
| Marley Spoon AG(a) | | | 150,636 | | | | 44,132 | |
| Nexus AG | | | 3,500 | | | | 124,133 | |
| | | | | | | | 168,265 | |
| | | | | | | | | |
| Greece (2.43%) | | | | | | | | |
| Sarantis SA | | | 92,942 | | | | 820,973 | |
| | | | | | | | | |
| Hong Kong (2.48%) | | | | | | | | |
| Jacobson Pharma Corp., Ltd.(c) | | | 859,000 | | | | 129,355 | |
| Plover Bay Technologies, Ltd.(c) | | | 3,747,000 | | | | 530,780 | |
| TK Group Holdings, Ltd. | | | 381,000 | | | | 179,902 | |
| | | | | | | | 840,037 | |
| | | | | | | | | |
| India (5.12%) | | | | | | | | |
| Cyient, Ltd. | | | 23,640 | | | | 135,567 | |
| Gulf Oil Lubricants India, Ltd. | | | 21,500 | | | | 266,868 | |
| Kovai Medical Center and Hospital | | | 1,084 | | | | 10,254 | |
| Metropolis Healthcare, Ltd.(a)(b)(c) | | | 18,316 | | | | 373,699 | |
| Time Technoplast, Ltd. | | | 65,971 | | | | 58,596 | |
| Vaibhav Global, Ltd. | | | 48,170 | | | | 553,221 | |
| Westlife Development, Ltd.(a) | | | 67,000 | | | | 331,275 | |
| | | | | | | | 1,729,480 | |
| | | | | | | | | |
| Indonesia (2.62%) | | | | | | | | |
| Arwana Citramulia Tbk PT | | | 7,920,100 | | | | 280,987 | |
| Hexindo Adiperkasa Tbk PT | | | 557,000 | | | | 138,486 | |
| Selamat Sempurna Tbk PT | | | 4,434,000 | | | | 465,922 | |
| | | | | | | | 885,395 | |
| | | | | | | | | |
| Ireland (1.10%) | | | | | | | | |
| Irish Residential Properties REIT PLC | | | 137,000 | | | | 268,310 | |
See Notes to Financial Statements.
| 42 | 1.855.377.7325 | www.GrandeurPeakGlobal.com |
| Grandeur Peak Global Micro Cap Fund | Portfolio of Investments |
October 31, 2019 (Unaudited)
| | | Shares | | | Value (Note 2) | |
| Ireland (continued) | | | | | | |
| Uniphar PLC(a) | | | 77,700 | | | $ | 103,817 | |
| | | | | | | | 372,127 | |
| | | | | | | | | |
| Italy (0.86%) | | | | | | | | |
| Piovan SpA(b)(c) | | | 47,181 | | | | 290,468 | |
| | | | | | | | | |
| Japan (15.44%) | | | | | | | | |
| Atrae, Inc.(a) | | | 4,500 | | | | 133,554 | |
| BayCurrent Consulting, Inc. | | | 3,700 | | | | 187,415 | |
| Beenos, Inc. | | | 9,500 | | | | 116,122 | |
| Central Automotive Products, Ltd. | | | 16,500 | | | | 323,613 | |
| eGuarantee, Inc. | | | 22,000 | | | | 311,084 | |
| Future Corp. | | | 19,900 | | | | 326,353 | |
| M&A Capital Partners Co., Ltd.(a) | | | 12,400 | | | | 830,188 | |
| MarkLines Co., Ltd. | | | 9,100 | | | | 179,152 | |
| Medikit Co., Ltd. | | | 2,000 | | | | 126,864 | |
| Naigai Trans Line, Ltd. | | | 37,300 | | | | 528,466 | |
| Open Door, Inc.(a) | | | 19,300 | | | | 372,096 | |
| SBI FinTech Solutions Co., Ltd. | | | 14,215 | | | | 120,958 | |
| Silver Life Co., Ltd.(a) | | | 7,400 | | | | 212,427 | |
| Strike Co., Ltd. | | | 3,700 | | | | 133,795 | |
| Synchro Food Co., Ltd.(a) | | | 32,700 | | | | 152,008 | |
| System Information Co., Ltd. | | | 12,000 | | | | 109,343 | |
| Syuppin Co., Ltd. | | | 23,100 | | | | 201,502 | |
| Trancom Co., Ltd. | | | 2,700 | | | | 179,017 | |
| Vega Corp. Co., Ltd.(a) | | | 27,500 | | | | 137,513 | |
| YAKUODO Holdings Co., Ltd. | | | 22,100 | | | | 536,384 | |
| | | | | | | | 5,217,854 | |
| | | | | | | | | |
| Malaysia (1.33%) | | | | | | | | |
| AEON Credit Service M Bhd | | | 76,769 | | | | 281,098 | |
| Mynews Holdings Bhd | | | 535,000 | | | | 170,288 | |
| | | | | | | | 451,386 | |
| | | | | | | | | |
| Netherlands (1.02%) | | | | | | | | |
| Shop Apotheke Europe NV(a)(b)(c) | | | 7,875 | | | | 343,415 | |
| | | | | | | | | |
| New Zealand (0.37%) | | | | | | | | |
| CBL Corp., Ltd.(a)(d) | | | 159,993 | | | | 0 | |
| NZX, Ltd. | | | 151,700 | | | | 125,468 | |
| | | | | | | | 125,468 | |
| | | | | | | | | |
| Norway (4.67%) | | | | | | | | |
| Infront ASA(a) | | | 220,833 | | | | 552,314 | |
| Medistim ASA | | | 9,989 | | | | 168,363 | |
| Sbanken ASA(b)(c) | | | 24,431 | | | | 173,479 | |
| Self Storage Group ASA(a) | | | 227,748 | | | | 577,038 | |
| Webstep AS(b)(c) | | | 43,352 | | | | 106,540 | |
| | | | | | | | 1,577,734 | |
| | | Shares | | | Value (Note 2) | |
| Oman (0.51%) | | | | | | |
| Tethys Oil AB | | | 22,717 | | | $ | 172,688 | |
| | | | | | | | | |
| Philippines (1.98%) | | | | | | | | |
| Concepcion Industrial Corp. | | | 334,770 | | | | 201,212 | |
| Pryce Corp. | | | 4,395,000 | | | | 467,691 | |
| | | | | | | | 668,903 | |
| | | | | | | | | |
| Poland (0.94%) | | | | | | | | |
| LiveChat Software SA | | | 18,500 | | | | 183,516 | |
| PGS Software SA | | | 51,047 | | | | 133,608 | |
| | | | | | | | 317,124 | |
| | | | | | | | | |
| Singapore (0.42%) | | | | | | | | |
| Riverstone Holdings, Ltd./Singapore | | | 197,800 | | | | 141,758 | |
| | | | | | | | | |
| South Africa (0.27%) | | | | | | | | |
| ARB Holdings, Ltd. | | | 400,143 | | | | 91,228 | |
| | | | | | | | | |
| South Korea (0.65%) | | | | | | | | |
| LEENO Industrial, Inc. | | | 4,800 | | | | 219,485 | |
| | | | | | | | | |
| Sweden (3.91%) | | | | | | | | |
| Absolent Group AB | | | 4,788 | | | | 207,771 | |
| KNOW IT AB | | | 19,150 | | | | 376,824 | |
| OEM International AB, Class B | | | 5,685 | | | | 120,109 | |
| SwedenCare AB(a) | | | 36,978 | | | | 295,650 | |
| Vitec Software Group AB, Class B | | | 22,600 | | | | 323,001 | |
| | | | | | | | 1,323,355 | |
| | | | | | | | | |
| Taiwan (9.10%) | | | | | | | | |
| Bioteque Corp. | | | 130,000 | | | | 557,317 | |
| FineTek Co., Ltd. | | | 87,150 | | | | 243,924 | |
| Gourmet Master Co., Ltd. | | | 34,000 | | | | 155,254 | |
| Pacific Hospital Supply Co., Ltd. | | | 210,000 | | | | 557,415 | |
| Poya International Co., Ltd. | | | 25,000 | | | | 343,703 | |
| Rafael Microelectronics, Inc. | | | 32,000 | | | | 193,426 | |
| Sporton International, Inc. | | | 51,725 | | | | 322,851 | |
| Tehmag Foods Corp. | | | 30,300 | | | | 221,971 | |
| TSC Auto ID Technology Co., Ltd. | | | 29,700 | | | | 242,943 | |
| TTFB Co., Ltd. | | | 27,000 | | | | 236,823 | |
| | | | | | | | 3,075,627 | |
| | | | | | | | | |
| Turkey (0.80%) | | | | | | | | |
| DP Eurasia NV(a)(b)(c) | | | 301,284 | | | | 269,286 | |
| | | | | | | | | |
| United States (10.67%) | | | | | | | | |
| BioDelivery Sciences International, Inc.(a) | | | 35,225 | | | | 203,600 | |
| Castle Biosciences, Inc.(a) | | | 8,925 | | | | 210,095 | |
| Coastal Financial Corp.(a) | | | 12,400 | | | | 186,620 | |
| DXP Enterprises, Inc.(a) | | | 3,350 | | | | 115,642 | |
See Notes to Financial Statements.
| Semi-Annual Report | October 31, 2019 | 43 |
| Grandeur Peak Global Micro Cap Fund | Portfolio of Investments |
October 31, 2019 (Unaudited)
| | | Shares | | | Value (Note 2) | |
| United States (continued) | | | | | | |
| Esquire Financial Holdings, Inc.(a) | | | 14,510 | | | $ | 352,593 | |
| Hackett Group, Inc. | | | 21,100 | | | | 356,801 | |
| Heska Corp.(a) | | | 2,216 | | | | 179,540 | |
| Hingham Institution for Savings | | | 1,415 | | | | 268,836 | |
| Kinsale Capital Group, Inc. | | | 1,625 | | | | 171,795 | |
| MaxCyte, Inc.(a) | | | 74,400 | | | | 108,903 | |
| NV5 Global, Inc.(a) | | | 3,750 | | | | 271,613 | |
| Seacoast Commerce Banc Holdings | | | 15,325 | | | | 278,915 | |
| STAAR Surgical Co.(a) | | | 8,300 | | | | 272,074 | |
| Systemax, Inc. | | | 7,450 | | | | 161,218 | |
| Transcat, Inc.(a) | | | 6,466 | | | | 202,644 | |
| Veracyte, Inc.(a) | | | 11,529 | | | | 264,360 | |
| | | | | | | | 3,605,249 | |
| | | | | | | | | |
| Vietnam (1.10%) | | | | | | | | |
| Lix Detergent JSC | | | 208,790 | | | | 372,534 | |
| | | | | | | | | |
| TOTAL COMMON STOCKS | | | | | | | | |
| (Cost $28,385,793) | | | | | | | 33,390,250 | |
| | | | | | | | | |
| TOTAL INVESTMENTS (98.79%) | | | | | | | | |
| (Cost $28,385,793) | | | | | | $ | 33,390,250 | |
| | | | | | | | | |
| Other Assets In Excess Of Liabilities (1.21%) | | | | | | | 409,632 | |
| | | | | | | | | |
| NET ASSETS (100.00%) | | | | | | $ | 33,799,882 | |
| (a) | Non-Income Producing Security. |
| (b) | Security exempt from registration under Rule 144A of the Securities Act of 1933. These securities may be resold in the ordinary course of business in transactions exempt from registration, normally to qualified institutional buyers. As of October 31, 2019, these securities had a total aggregate market value of $2,185,959 representing 6.47% of net assets. |
| (c) | Security was purchased pursuant to Regulation S under the Securities Act of 1933, which exempts securities offered and sold outside of the United States from registration. Such security cannot be sold in the United States without either an effective registration statement filed pursuant to the Securities Act of 1933, or pursuant to an exemption from registration. The security has been deemed liquid under guidelines approved by the Fund's Board of Trustees. As of October 31, 2019, the aggregate market value of these securities was $3,641,471, representing 10.77% of net assets. |
| (d) | As a result of the use of significant unobservable inputs to determine fair value, these investments have been classified as level 3 assets. See also Note 2 to the financial statements for additional information. |
For Fund compliance purposes, the Fund's geographical classifications refer to any one or more of the country sub-classifications used by one or more widely recognized market indexes or ratings group indexes, and/or as defined by Fund management. This definition may not apply for purposes of this report, which may combine sub-classifications for reporting ease. Geographical regions are shown as a percentage of net assets.
See Notes to Financial Statements.
| 44 | 1.855.377.7325 | www.GrandeurPeakGlobal.com |
| Grandeur Peak Global Opportunities Fund | Portfolio of Investments |
October 31, 2019 (Unaudited)
| | | Shares | | | Value (Note 2) | |
| COMMON STOCKS (96.98%) | | | | | | | | |
| Argentina (0.31%) | | | | | | | | |
| Globant SA(a) | | | 21,650 | | | $ | 2,019,079 | |
| | | | | | | | | |
| Australia (1.68%) | | | | | | | | |
| Corporate Travel | | | | | | | | |
| Management, Ltd. | | | 256,900 | | | | 3,122,172 | |
| Fiducian Group, Ltd. | | | 181,000 | | | | 673,772 | |
| Kogan.com, Ltd. | | | 569,012 | | | | 2,655,525 | |
| National Storage REIT | | | 1,872,856 | | | | 2,401,362 | |
| National Veterinary Care, Ltd. | | | 1,405,859 | | | | 2,228,999 | |
| | | | | | | | 11,081,830 | |
| | | | | | | | | |
| Austria (0.49%) | | | | | | | | |
| Palfinger AG | | | 112,934 | | | | 3,224,455 | |
| | | | | | | | | |
| Bangladesh (0.19%) | | | | | | | | |
| Square Pharmaceuticals, Ltd. | | | 442,421 | | | | 1,227,005 | |
| | | | | | | | | |
| Belgium (0.62%) | | | | | | | | |
| Melexis NV | | | 58,193 | | | | 4,075,885 | |
| | | | | | | | | |
| Bermuda (0.63%) | | | | | | | | |
| Bank of NT Butterfield & Son, Ltd. | | | 126,225 | | | | 4,159,114 | |
| | | | | | | | | |
| Brazil (1.96%) | | | | | | | | |
| Arco Platform, Ltd., Class A(a) | | | 17,864 | | | | 741,356 | |
| Fleury SA | | | 773,800 | | | | 4,885,330 | |
| Pagseguro Digital, Ltd., Class A(a) | | | 196,125 | | | | 7,272,315 | |
| | | | | | | | 12,899,001 | |
| | | | | | | | | |
| Britain (13.93%) | | | | | | | | |
| AB Dynamics PLC | | | 3,000 | | | | 81,607 | |
| Ascential PLC(b)(c) | | | 1,249,100 | | | | 5,650,147 | |
| B&M European Value Retail SA | | | 2,107,600 | | | | 10,109,513 | |
| boohoo Group PLC(a) | | | 1,894,900 | | | | 6,480,053 | |
| City of London Investment Group PLC | | | 73,063 | | | | 402,230 | |
| Clipper Logistics PLC | | | 643,195 | | | | 1,832,963 | |
| Curtis Banks Group PLC | | | 196,200 | | | | 737,030 | |
| CVS Group PLC | | | 658,817 | | | | 8,256,654 | |
| Dechra Pharmaceuticals PLC | | | 324,000 | | | | 11,037,967 | |
| Endava PLC, ADR(a) | | | 119,857 | | | | 5,155,050 | |
| FDM Group Holdings PLC | | | 182,400 | | | | 1,708,250 | |
| Impax Asset Management Group PLC | | | 199,020 | | | | 675,439 | |
| Intermediate Capital Group PLC | | | 92,500 | | | | 1,780,528 | |
| JTC PLC(b)(c) | | | 596,738 | | | | 2,790,482 | |
| K3 Capital Group PLC | | | 523,900 | | | | 977,236 | |
| On the Beach Group PLC(b)(c) | | | 687,605 | | | | 3,992,080 | |
| Oxford Immunotec Global PLC(a) | | | 407,658 | | | | 6,322,776 | |
| | | Shares | | | Value (Note 2) | |
| Britain (continued) | | | | | | | | |
| Premier Asset Management Group PLC | | | 427,969 | | | $ | 997,868 | |
| River & Mercantile Group PLC | | | 499,300 | | | | 1,597,522 | |
| Sabre Insurance Group PLC(b)(c) | | | 837,400 | | | | 3,199,951 | |
| Sanne Group PLC | | | 642,700 | | | | 4,395,725 | |
| Softcat PLC | | | 253,300 | | | | 3,085,903 | |
| St. James's Place PLC | | | 420,717 | | | | 5,673,213 | |
| Ted Baker PLC | | | 47,343 | | | | 249,351 | |
| Ultra Electronics Holdings PLC | | | 151,000 | | | | 3,814,169 | |
| Volution Group PLC | | | 291,700 | | | | 753,820 | |
| | | | | | | | 91,757,527 | |
| | | | | | | | | |
| Canada (3.70%) | | | | | | | | |
| Biosyent, Inc.(a) | | | 142,800 | | | | 650,520 | |
| Gildan Activewear, Inc. | | | 173,000 | | | | 4,419,900 | |
| Lululemon Athletica, Inc.(a) | | | 40,625 | | | | 8,298,469 | |
| Richelieu Hardware, Ltd. | | | 276,865 | | | | 5,684,025 | |
| Ritchie Bros Auctioneers, Inc. | | | 52,550 | | | | 2,160,856 | |
| Stantec, Inc. | | | 146,612 | | | | 3,127,930 | |
| | | | | | | | 24,341,700 | |
| | | | | | | | | |
| China (3.68%) | | | | | | | | |
| BBI Life Sciences Corp.(c) | | | 13,832,000 | | | | 4,165,866 | |
| Ctrip.com International, Ltd., ADR(a) | | | 109,850 | | | | 3,623,951 | |
| Hangzhou Tigermed Consulting Co., Ltd., Class A | | | 174,800 | | | | 1,696,967 | |
| O2Micro International, Ltd., ADR(a) | | | 954,611 | | | | 1,183,718 | |
| Silergy Corp. | | | 386,852 | | | | 10,903,862 | |
| WuXi AppTec Co., Ltd., Class H(b)(c) | | | 218,200 | | | | 2,637,018 | |
| | | | | | | | 24,211,382 | |
| | | | | | | | | |
| Denmark (0.66%) | | | | | | | | |
| Ambu A/S, Class B | | | 275,699 | | | | 4,329,661 | |
| | | | | | | | | |
| Egypt (0.09%) | | | | | | | | |
| Integrated Diagnostics Holdings PLC(b)(c) | | | 131,600 | | | | 621,152 | |
| | | | | | | | | |
| France (2.25%) | | | | | | | | |
| Alten SA | | | 28,581 | | | | 3,138,230 | |
| BioMerieux 42,200 | | | | | | | 3,452,265 | |
| Esker SA | | | 34,078 | | | | 3,127,991 | |
| Neurones | | | 39,608 | | | | 923,253 | |
| Thermador Groupe | | | 67,778 | | | | 4,187,840 | |
| | | | | | | | 14,829,579 | |
| | | | | | | | | |
| Georgia (0.75%) | | | | | | | | |
| Bank of Georgia Group PLC | | | 102,600 | | | | 1,726,414 | |
| Georgia Capital PLC(a) | | | 112,900 | | | | 1,422,968 | |
See Notes to Financial Statements.
| Semi-Annual Report | October 31, 2019 | 45 |
| Grandeur Peak Global Opportunities Fund | Portfolio of Investments |
October 31, 2019 (Unaudited)
| | | Shares | | | Value (Note 2) | |
| Georgia (continued) | | | | | | |
| TBC Bank Group PLC | | | 109,179 | | | $ | 1,810,245 | |
| | | | | | | | 4,959,627 | |
| | | | | | | | | |
| Germany (3.62%) | | | | | | | | |
| Dermapharm Holding SE | | | 179,900 | | | | 7,036,530 | |
| Grand City Properties SA | | | 134,223 | | | | 3,137,688 | |
| GRENKE AG | | | 20,700 | | | | 1,958,907 | |
| Nexus AG | | | 94,624 | | | | 3,355,985 | |
| Norma Group SE | | | 138,468 | | | | 5,090,122 | |
| PATRIZIA AG | | | 160,113 | | | | 3,280,404 | |
| | | | | | | | 23,859,636 | |
| | | | | | | | | |
| Hong Kong (0.77%) | | | | | | | | |
| Jacobson Pharma Corp., Ltd.(c) | | | 6,659,000 | | | | 1,002,765 | |
| Value Partners Group, Ltd. | | | 7,703,000 | | | | 4,069,758 | |
| | | | | | | | 5,072,523 | |
| | | | | | | | | |
| India (5.19%) | | | | | | | | |
| Bajaj Finance, Ltd. | | | 146,250 | | | | 8,304,519 | |
| Cyient, Ltd. | | | 558,616 | | | | 3,203,455 | |
| Gulf Oil Lubricants India, Ltd. | | | 138,167 | | | | 1,714,992 | |
| HDFC Bank, Ltd. | | | 201,000 | | | | 3,486,602 | |
| Kovai Medical Center and Hospital | | | 25,501 | | | | 241,227 | |
| L&T Technology Services, Ltd.(b)(c) | | | 64,348 | | | | 1,364,142 | |
| Metropolis Healthcare, Ltd.(a)(b)(c) | | | 301,291 | | | | 6,147,201 | |
| Time Technoplast, Ltd. | | | 1,305,759 | | | | 1,159,795 | |
| WNS Holdings, Ltd., ADR(a) | | | 138,025 | | | | 8,535,466 | |
| | | | | | | | 34,157,399 | |
| | | | | | | | | |
| Indonesia (1.41%) | | | | | | | | |
| Arwana Citramulia Tbk PT | | | 59,516,800 | | | | 2,111,517 | |
| Selamat Sempurna Tbk PT | | | 55,961,200 | | | | 5,880,371 | |
| Ultrajaya Milk Industry & Trading Co. Tbk PT | | | 11,829,000 | | | | 1,280,907 | |
| | | | | | | | 9,272,795 | |
| | | | | | | | | |
| Ireland (1.27%) | | | | | | | | |
| Irish Residential Properties | | | | | | | | |
| REIT PLC | | | 2,586,846 | | | | 5,066,250 | |
| Keywords Studios PLC | | | 228,100 | | | | 3,279,719 | |
| | | | | | | | 8,345,969 | |
| | | | | | | | | |
| Israel (0.43%) | | | | | | | | |
| Wix.com, Ltd.(a) | | | 23,234 | | | | 2,836,174 | |
| | | | | | | | | |
| Italy (3.08%) | | | | | | | | |
| DiaSorin SpA | | | 65,588 | | | | 7,388,178 | |
| FinecoBank Banca Fineco SpA | | | 412,145 | | | | 4,642,619 | |
| Freni Brembo SpA | | | 287,111 | | | | 3,053,248 | |
| Interpump Group SpA | | | 157,145 | | | | 4,304,478 | |
| | | Shares | | | Value (Note 2) | |
| Italy (continued) | | | | | | | | |
| Piovan SpA(b)(c) | | | 144,291 | | | $ | 888,321 | |
| | | | | | | | 20,276,844 | |
| | | | | | | | | |
| Japan (12.73%) | | | | | | | | |
| AIT Corp. | | | 360,900 | | | | 3,094,670 | |
| BayCurrent Consulting, Inc. | | | 72,600 | | | | 3,677,396 | |
| Cosmos Pharmaceutical Corp. | | | 9,900 | | | | 2,047,106 | |
| Create SD Holdings Co., Ltd. | | | 283,000 | | | | 7,057,311 | |
| Future Corp. | | | 182,400 | | | | 2,991,299 | |
| Japan Lifeline Co., Ltd. | | | 396,600 | | | | 6,173,577 | |
| M&A Capital Partners Co., Ltd.(a) | | | 39,100 | | | | 2,617,770 | |
| MarkLines Co., Ltd. | | | 61,200 | | | | 1,204,845 | |
| Medikit Co., Ltd. | | | 25,200 | | | | 1,598,482 | |
| MISUMI Group, Inc. | | | 144,700 | | | | 3,676,792 | |
| MonotaRO Co., Ltd. | | | 145,300 | | | | 4,446,861 | |
| Naigai Trans Line, Ltd. | | | 80,400 | | | | 1,139,106 | |
| Nihon M&A Center, Inc. | | | 156,300 | | | | 4,790,749 | |
| Open Door, Inc.(a) | | | 120,600 | | | | 2,325,115 | |
| Seria Co., Ltd. | | | 234,300 | | | | 5,914,453 | |
| Strike Co., Ltd. | | | 70,300 | | | | 2,542,101 | |
| Sundrug Co., Ltd. | | | 102,100 | | | | 3,398,921 | |
| Synchro Food Co., Ltd.(a) | | | 410,300 | | | | 1,907,312 | |
| Systena Corp. | | | 229,700 | | | | 3,322,450 | |
| Syuppin Co., Ltd. | | | 215,200 | | | | 1,877,196 | |
| Tokyo Century Corp. | | | 99,900 | | | | 4,662,432 | |
| Trancom Co., Ltd. | | | 77,270 | | | | 5,123,189 | |
| Tsuruha Holdings, Inc. | | | 50,000 | | | | 5,662,562 | |
| YAKUODO Holdings Co., Ltd. | | | 107,100 | | | | 2,599,399 | |
| | | | | | | | 83,851,094 | |
| | | | | | | | | |
| Malaysia (0.49%) | | | | | | | | |
| AEON Credit Service M Bhd | | | 883,444 | | | | 3,234,819 | |
| | | | | | | | | |
| Mexico (0.79%) | | | | | | | | |
| Grupo Herdez SAB de CV | | | 1,553,200 | | | | 3,164,292 | |
| Regional SAB de CV | | | 378,034 | | | | 2,012,749 | |
| | | | | | | | 5,177,041 | |
| | | | | | | | | |
| Netherlands (2.55%) | | | | | | | | |
| Aalberts NV | | | 179,122 | | | | 7,203,876 | |
| QIAGEN NV(a) | | | 123,200 | | | | 3,672,592 | |
| Shop Apotheke Europe NV(a)(b)(c) | | | 68,600 | | | | 2,991,524 | |
| Takeaway.com NV(a)(b)(c) | | | 36,300 | | | | 2,955,432 | |
| | | | | | | | 16,823,424 | |
| | | | | | | | | |
| New Zealand (0.00%)(d) | | | | | | | | |
| CBL Corp., Ltd.(a)(e) | | | 1,107,672 | | | | 1 | |
| | | | | | | | | |
| Norway (1.01%) | | | | | | | | |
| Medistim ASA | | | 106,000 | | | | 1,786,617 | |
| Sbanken ASA(b)(c) | | | 685,110 | | | | 4,864,828 | |
| | | | | | | | 6,651,445 | |
See Notes to Financial Statements.
| 46 | 1.855.377.7325 | www.GrandeurPeakGlobal.com |
| Grandeur Peak Global Opportunities Fund | Portfolio of Investments |
October 31, 2019 (Unaudited)
| | | Shares | | | Value (Note 2) | |
| Philippines (0.70%) | | | | | | | | |
| Concepcion Industrial Corp. | | | 1,035,152 | | | $ | 622,172 | |
| Puregold Price Club, Inc. | | | 4,918,000 | | | | 3,959,017 | |
| | | | | | | | 4,581,189 | |
| | | | | | | | | |
| Poland (0.87%) | | | | | | | | |
| Dino Polska SA(a)(b)(c) | | | 138,697 | | | | 5,408,989 | |
| PGS Software SA | | | 120,487 | | | | 315,357 | |
| | | | | | | | 5,724,346 | |
| | | | | | | | | |
| Singapore (0.40%) | | | | | | | | |
| Riverstone Holdings, Ltd./Singapore | | | 3,665,000 | | | | 2,626,613 | |
| | | | | | | | | |
| South Africa (0.24%) | | | | | | | | |
| Italtile, Ltd. | | | 1,723,941 | | | | 1,597,245 | |
| | | | | | | | | |
| South Korea (0.60%) | | | | | | | | |
| Hy-Lok Corp. | | | 47,641 | | | | 702,259 | |
| LEENO Industrial, Inc. | | | 71,000 | | | | 3,246,551 | |
| | | | | | | | 3,948,810 | |
| | | | | | | | | |
| Sweden (2.82%) | | | | | | | | |
| AddTech AB, Class B | | | 78,727 | | | | 2,189,194 | |
| EQT AB(a) | | | 181,100 | | | | 1,737,534 | |
| Hexpol AB | | | 439,500 | | | | 3,914,475 | |
| Indutrade AB | | | 53,300 | | | | 1,640,560 | |
| KNOW IT AB | | | 99,400 | | | | 1,955,943 | |
| Nibe Industrier AB, Class B | | | 276,600 | | | | 3,781,311 | |
| OEM International AB, Class B | | | 15,188 | | | | 320,883 | |
| Sweco AB, Class B | | | 85,885 | | | | 3,020,656 | |
| | | | | | | | 18,560,556 | |
| | | | | | | | | |
| Switzerland (0.40%) | | | | | | | | |
| Partners Group Holding AG | | | 2,550 | | | | 1,988,302 | |
| VZ Holding AG | | | 2,335 | | | | 650,912 | |
| | | | | | | | 2,639,214 | |
| | | | | | | | | |
| Taiwan (1.91%) | | | | | | | | |
| Bioteque Corp. | | | 967,000 | | | | 4,145,579 | |
| FineTek Co., Ltd. | | | 127,050 | | | | 355,601 | |
| Poya International Co., Ltd. | | | 171,000 | | | | 2,350,930 | |
| Rafael Microelectronics, Inc. | | | 273,000 | | | | 1,650,170 | |
| Sporton International, Inc. | | | 648,671 | | | | 4,048,800 | |
| | | | | | | | 12,551,080 | |
| | | | | | | | | |
| Turkey (0.05%) | | | | | | | | |
| DP Eurasia NV(a)(b)(c) | | | 403,911 | | | | 361,013 | |
| | | | | | | | | |
| United Arab Emirates (0.38%) | | | | | | | | |
| Aramex PJSC | | | 2,330,645 | | | | 2,487,544 | |
| | | | | | | | | |
| United States (22.65%) | | | | | | | | |
| ABIOMED, Inc.(a) | | | 24,964 | | | | 5,182,027 | |
| | | Shares | | | Value (Note 2) | |
| United States (continued) | | | | | | | | |
| BioDelivery Sciences International, Inc.(a) | | | 851,374 | | | $ | 4,920,942 | |
| Burford Capital, Ltd. | | | 326,600 | | | | 3,720,834 | |
| CH Robinson Worldwide, Inc. | | | 22,575 | | | | 1,707,573 | |
| Core Laboratories NV | | | 13,000 | | | | 572,520 | |
| EPAM Systems, Inc.(a) | | | 59,775 | | | | 10,518,009 | |
| Esquire Financial Holdings, Inc.(a) | | | 17,086 | | | | 415,190 | |
| ExlService Holdings, Inc.(a) | | | 52,700 | | | | 3,669,501 | |
| Fastenal Co. | | | 217,175 | | | | 7,805,269 | |
| First Republic Bank | | | 104,350 | | | | 11,098,666 | |
| Genpact, Ltd. | | | 199,400 | | | | 7,810,498 | |
| Hackett Group, Inc. | | | 182,025 | | | | 3,078,043 | |
| Hamilton Lane, Inc., Class A | | | 28,467 | | | | 1,697,203 | |
| Heska Corp.(a) | | | 42,913 | | | | 3,476,811 | |
| Hingham Institution for Savings | | | 16,645 | | | | 3,162,384 | |
| Inphi Corp.(a) | | | 97,125 | | | | 6,981,345 | |
| Knight-Swift Transportation Holdings, Inc. | | | 85,436 | | | | 3,114,997 | |
| Littelfuse, Inc. | | | 12,475 | | | | 2,190,236 | |
| Microchip Technology, Inc. | | | 50,470 | | | | 4,758,816 | |
| Monro, Inc. | | | 51,725 | | | | 3,626,440 | |
| MSC Industrial Direct Co., Inc., Class A | | | 43,325 | | | | 3,171,823 | |
| New Relic, Inc.(a) | | | 55,275 | | | | 3,540,916 | |
| NV5 Global, Inc.(a) | | | 82,950 | | | | 6,008,068 | |
| Old Dominion Freight Line, Inc. | | | 7,550 | | | | 1,374,704 | |
| Paycom Software, Inc.(a) | | | 25,200 | | | | 5,330,556 | |
| Pluralsight, Inc., Class A(a) | | | 190,714 | | | | 3,448,109 | |
| Power Integrations, Inc. | | | 145,750 | | | | 13,279,282 | |
| Qualys, Inc.(a) | | | 62,175 | | | | 5,305,393 | |
| Revolve Group, Inc.(a) | | | 41,645 | | | | 864,550 | |
| Silicon Laboratories, Inc.(a) | | | 20,240 | | | | 2,150,298 | |
| STAAR Surgical Co.(a) | | | 63,225 | | | | 2,072,516 | |
| SVB Financial Group(a) | | | 20,275 | | | | 4,490,507 | |
| Systemax, Inc. | | | 207,020 | | | | 4,479,913 | |
| TriMas Corp.(a) | | | 128,594 | | | | 4,156,158 | |
| | | | | | | | 149,180,097 | |
| | | | | | | | | |
| Vietnam (1.68%) | | | | | | | | |
| Ho Chi Minh City Development Joint Stock Commercial Bank(a) | | | 1,602,160 | | | | 2,033,513 | |
| Vietnam Dairy Products JSC | | | 756,440 | | | | 4,238,124 | |
| Vietnam Technological & Commercial Joint Stock Bank(a) | | | 3,191,904 | | | | 3,260,274 | |
| Vincom Retail JSC | | | 1,051,930 | | | | 1,505,154 | |
| | | | | | | | 11,037,065 | |
| | | | | | | | | |
| TOTAL COMMON STOCKS | | | | | | | | |
| (Cost $492,736,792) | | | | | | | 638,590,933 | |
See Notes to Financial Statements.
| Semi-Annual Report | October 31, 2019 | 47 |
| Grandeur Peak Global Opportunities Fund | Portfolio of Investments |
October 31, 2019 (Unaudited)
| | | Shares | | | Value (Note 2) | |
| PREFERRED STOCKS (0.29%) | | | | | | |
| United States (0.29%) | | | | | | | | |
| Dataminr, Inc.(a)(e) | | | 96,640 | | | $ | 1,923,136 | |
| | | | | | | | | |
| TOTAL PREFERRED STOCKS | | | | | | | | |
| (Cost $1,923,136) | | | | | | | 1,923,136 | |
| | | | | | | | | |
| TOTAL INVESTMENTS (97.27%) | | | | | | | | |
| (Cost $494,659,928) | | | | | | $ | 640,514,069 | |
| | | | | | | | | |
| Other Assets In Excess Of Liabilities (2.73%) | | | | | | | 17,989,224 | |
| | | | | | | | | |
| NET ASSETS (100.00%) | | | | | | $ | 658,503,293 | |
| (a) | Non-Income Producing Security. |
| (b) | Security exempt from registration under Rule 144A of the Securities Act of 1933. These securities may be resold in the ordinary course of business in transactions exempt from registration, normally to qualified institutional buyers. As of October 31, 2019, these securities had a total aggregate market value of $43,872,280 representing 6.66% of net assets. |
| (c) | Security was purchased pursuant to Regulation S under the Securities Act of 1933, which exempts securities offered and sold outside of the United States from registration. Such security cannot be sold in the United States without either an effective registration statement filed pursuant to the Securities Act of 1933, or pursuant to an exemption from registration. The security has been deemed liquid under guidelines approved by the Fund's Board of Trustees. As of October 31, 2019, the aggregate market value of these securities was $49,040,911, representing 7.45% of net assets. |
| (e) | As a result of the use of significant unobservable inputs to determine fair value, these investments have been classified as level 3 assets. See also Note 2 to the financial statements for additional information. |
For Fund compliance purposes, the Fund's geographical classifications refer to any one or more of the country sub-classifications used by one or more widely recognized market indexes or ratings group indexes, and/or as defined by Fund management. This definition may not apply for purposes of this report, which may combine sub-classifications for reporting ease. Geographical regions are shown as a percentage of net assets.
See Notes to Financial Statements.
| 48 | 1.855.377.7325 | www.GrandeurPeakGlobal.com |
| Grandeur Peak Global Reach Fund | Portfolio of Investments |
October 31, 2019 (Unaudited)
| | | Shares | | | Value (Note 2) | |
| COMMON STOCKS (97.97%) | | | | | | |
| Argentina (0.41%) | | | | | | | | |
| Globant SA(a) | | | 13,563 | | | $ | 1,264,885 | |
| | | | | | | | | |
| Australia (4.07%) | | | | | | | | |
| Appen, Ltd. | | | 55,042 | | | | 829,819 | |
| Australian Ethical Investment, Ltd. | | | 487,800 | | | | 924,730 | |
| Corporate Travel Management, Ltd. | | | 27,881 | | | | 338,845 | |
| Domino's Pizza Enterprises, Ltd. | | | 38,800 | | | | 1,364,355 | |
| Kogan.com, Ltd. | | | 264,508 | | | | 1,234,434 | |
| Lycopodium, Ltd. | | | 181,976 | | | | 693,713 | |
| Mainstream Group Holdings, Ltd. | | | 2,531,035 | | | | 968,348 | |
| National Storage REIT | | | 1,113,721 | | | | 1,428,005 | |
| National Veterinary Care, Ltd. | | | 720,900 | | | | 1,142,992 | |
| Netwealth Group, Ltd. | | | 243,326 | | | | 1,479,440 | |
| People Infrastructure, Ltd. | | | 303,330 | | | | 710,943 | |
| PWR Holdings, Ltd. | | | 167,100 | | | | 547,155 | |
| Temple & Webster Group, Ltd.(a) | | | 493,000 | | | | 778,256 | |
| | | | | | | | 12,441,035 | |
| | | | | | | | | |
| Austria (0.21%) | | | | | | | | |
| Palfinger AG | | | 22,948 | | | | 655,204 | |
| | | | | | | | | |
| Belgium (0.22%) | | | | | | | | |
| Melexis NV | | | 9,497 | | | | 665,178 | |
| | | | | | | | | |
| Bermuda (0.58%) | | | | | | | | |
| Bank of NT Butterfield & Son, Ltd. | | | 53,900 | | | | 1,776,005 | |
| | | | | | | | | |
| Brazil (1.91%) | | | | | | | | |
| Arco Platform, Ltd., Class A(a) | | | 36,350 | | | | 1,508,525 | |
| Fleury SA | | | 191,700 | | | | 1,210,284 | |
| Pagseguro Digital, Ltd., Class A(a) | | | 54,175 | | | | 2,008,809 | |
| Raia Drogasil SA | | | 41,000 | | | | 1,124,139 | |
| | | | | | | | 5,851,757 | |
| | | | | | | | | |
| Britain (11.81%) | | | | | | | | |
| AB Dynamics PLC | | | 36,676 | | | | 997,676 | |
| Alpha FX Group PLC(b) | | | 57,400 | | | | 765,839 | |
| Ascential PLC(b)(c) | | | 101,100 | | | | 457,313 | |
| B&M European Value Retail SA | | | 674,000 | | | | 3,232,972 | |
| boohoo Group PLC(a) | | | 409,800 | | | | 1,401,407 | |
| Curtis Banks Group PLC | | | 278,800 | | | | 1,047,319 | |
| CVS Group PLC | | | 99,700 | | | | 1,249,495 | |
| Dechra Pharmaceuticals PLC | | | 51,400 | | | | 1,751,085 | |
| dotdigital group PLC | | | 1,212,256 | | | | 1,436,825 | |
| Endava PLC, ADR(a) | | | 48,423 | | | | 2,082,673 | |
| FDM Group Holdings PLC | | | 49,500 | | | | 463,588 | |
| | | Shares | | | Value (Note 2) | |
| Britain (continued) | | | | | | | | |
| First Derivatives PLC | | | 14,850 | | | $ | 437,619 | |
| Gamma Communications PLC | | | 34,400 | | | | 530,266 | |
| Horizon Discovery Group PLC(a) | | | 233,200 | | | | 496,614 | |
| Impax Asset Management Group PLC | | | 550,165 | | | | 1,867,164 | |
| Intermediate Capital Group PLC | | | 47,300 | | | | 910,475 | |
| Intertek Group PLC | | | 11,400 | | | | 790,331 | |
| JTC PLC(b)(c) | | | 438,093 | | | | 2,048,622 | |
| K3 Capital Group PLC | | | 170,800 | | | | 318,595 | |
| LoopUp Group PLC(a) | | | 378,449 | | | | 316,195 | |
| On the Beach Group PLC(b)(c) | | | 275,700 | | | | 1,600,652 | |
| Oxford Immunotec Global PLC(a) | | | 60,225 | | | | 934,090 | |
| Sabre Insurance Group PLC(b)(c) | | | 415,800 | | | | 1,588,894 | |
| Sanne Group PLC | | | 381,373 | | | | 2,608,388 | |
| Softcat PLC | | | 71,799 | | | | 874,713 | |
| St. James's Place PLC | | | 159,538 | | | | 2,151,311 | |
| Trainline PLC(a)(b)(c) | | | 205,700 | | | | 1,109,782 | |
| Volution Group PLC | | | 346,347 | | | | 895,040 | |
| XPS Pensions Group PLC(b) | | | 1,094,928 | | | | 1,772,899 | |
| | | | | | | | 36,137,842 | |
| | | | | | | | | |
| Canada (1.97%) | | | | | | | | |
| Biosyent, Inc.(a) | | | 93,300 | | | | 425,025 | |
| Gildan Activewear, Inc. | | | 28,700 | | | | 733,243 | |
| Lululemon Athletica, Inc.(a) | | | 10,350 | | | | 2,114,195 | |
| Richelieu Hardware, Ltd. | | | 53,300 | | | | 1,094,246 | |
| Ritchie Bros Auctioneers, Inc. | | | 40,750 | | | | 1,675,640 | |
| | | | | | | | 6,042,349 | |
| | | | | | | | | |
| China (5.15%) | | | | | | | | |
| 58.com, Inc., ADR(a) | | | 12,475 | | | | 658,805 | |
| BBI Life Sciences Corp.(b) | | | 7,001,500 | | | | 2,108,684 | |
| CSPC Pharmaceutical Group, Ltd. | | | 597,000 | | | | 1,535,174 | |
| Essex Bio-technology, Ltd. | | | 1,207,000 | | | | 930,363 | |
| Hangzhou Tigermed Consulting Co., Ltd., Class A | | | 36,750 | | | | 356,771 | |
| Hop Hing Group Holdings, Ltd. | | | 6,196,000 | | | | 87,769 | |
| HUYA, Inc., ADR(a) | | | 21,488 | | | | 477,893 | |
| Koolearn Technology Holding, Ltd.(a)(b)(c) | | | 494,000 | | | | 1,161,248 | |
| Man Wah Holdings, Ltd. | | | 1,608,400 | | | | 1,098,136 | |
| O2Micro International, Ltd., ADR(a) | | | 292,039 | | | | 362,128 | |
| Shanghai Haohai Biological Technology Co., Ltd., Class H(b)(c) | | | 65,700 | | | | 379,815 | |
| Silergy Corp. | | | 98,925 | | | | 2,788,313 | |
| WuXi AppTec Co., Ltd., Class H(b)(c) | | | 197,400 | | | | 2,385,643 | |
See Notes to Financial Statements.
| Semi-Annual Report | October 31, 2019 | 49 |
| Grandeur Peak Global Reach Fund | Portfolio of Investments |
October 31, 2019 (Unaudited)
| | | Shares | | | Value (Note 2) | |
| China (continued) | | | | | | | | |
| Yum China Holdings, Inc. | | | 33,325 | | | $ | 1,416,313 | |
| | | | | | | | 15,747,055 | |
| | | | | | | | | |
| Colombia (1.38%) | | | | | | | | |
| Amerisur Resources PLC(a) | | | 5,260,978 | | | | 1,300,269 | |
| Parex Resources, Inc.(a) | | | 215,961 | | | | 2,926,812 | |
| | | | | | | | 4,227,081 | |
| | | | | | | | | |
| Denmark (0.14%) | | | | | | | | |
| Ambu A/S, Class B | | | 27,656 | | | | 434,318 | |
| | | | | | | | | |
| Egypt (0.42%) | | | | | | | | |
| African Export-Import Bank, GDR | | | 200,000 | | | | 828,000 | |
| Integrated Diagnostics Holdings PLC(b)(c) | | | 95,137 | | | | 449,047 | |
| | | | | | | | 1,277,047 | |
| | | | | | | | | |
| France (2.46%) | | | | | | | | |
| Alten SA | | | 10,400 | | | | 1,141,933 | |
| BioMerieux | | | 8,000 | | | | 654,458 | |
| Bureau Veritas SA | | | 31,962 | | | | 815,965 | |
| Esker SA | | | 21,509 | | | | 1,974,293 | |
| Infotel SA | | | 21,060 | | | | 869,064 | |
| Neurones | | | 17,282 | | | | 402,839 | |
| Thermador Groupe | | | 26,908 | | | | 1,662,581 | |
| | | | | | | | 7,521,133 | |
| | | | | | | | | |
| Georgia (0.20%) | | | | | | | | |
| Georgia Healthcare Group PLC(b)(c) | | | 284,198 | | | | 624,912 | |
| | | | | | | | | |
| Germany (3.84%) | | | | | | | | |
| CANCOM SE | | | 15,800 | | | | 843,024 | |
| Dermapharm Holding SE | | | 30,400 | | | | 1,189,052 | |
| FUCHS PETROLUB SE | | | 15,500 | | | | 661,752 | |
| Grand City Properties SA | | | 69,400 | | | | 1,622,342 | |
| GRENKE AG | | | 8,900 | | | | 842,235 | |
| Marley Spoon AG(a) | | | 1,162,278 | | | | 340,517 | |
| Nexus AG | | | 23,085 | | | | 818,745 | |
| Norma Group SE | | | 28,260 | | | | 1,038,845 | |
| PATRIZIA AG | | | 99,904 | | | | 2,046,839 | |
| Puma SE | | | 21,800 | | | | 1,639,948 | |
| Wirecard AG | | | 5,496 | | | | 696,026 | |
| | | | | | | | 11,739,325 | |
| | | | | | | | | |
| Greece (0.79%) | | | | | | | | |
| JUMBO SA | | | 33,700 | | | | 657,748 | |
| Sarantis SA | | | 199,040 | | | | 1,758,155 | |
| | | | | | | | 2,415,903 | |
| | | | | | | | | |
| Hong Kong (1.01%) | | | | | | | | |
| Jacobson Pharma Corp., Ltd.(b) | | | 5,581,000 | | | | 840,432 | |
| Plover Bay Technologies, Ltd.(b) | | | 2,930,000 | | | | 415,048 | |
| | | Shares | | | Value (Note 2) | |
| Hong Kong (continued) | | | | | | | | |
| TK Group Holdings, Ltd. | | | 1,720,000 | | | $ | 812,154 | |
| Vitasoy International Holdings, Ltd. | | | 254,000 | | | | 1,034,029 | |
| | | | | | | | 3,101,663 | |
| India (6.06%) | | | | | | | | |
| Bajaj Finance, Ltd. | | | 38,000 | | | | 2,157,756 | |
| Cyient, Ltd. | | | 181,100 | | | | 1,038,541 | |
| Gulf Oil Lubricants India, Ltd. | | | 68,300 | | | | 847,771 | |
| HDFC Bank, Ltd. | | | 112,000 | | | | 1,942,783 | |
| HDFC Life Insurance Co., Ltd.(b)(c) | | | 110,000 | | | | 971,144 | |
| Hero MotoCorp, Ltd. | | | 23,831 | | | | 908,571 | |
| IndiaMart InterMesh, Ltd.(a)(b)(c) | | | 22,969 | | | | 601,890 | |
| L&T Technology Services, Ltd.(b)(c) | | | 21,000 | | | | 445,188 | |
| Metropolis Healthcare, Ltd.(a)(b)(c) | | | 83,879 | | | | 1,711,372 | |
| Poly Medicure, Ltd. | | | 242,220 | | | | 702,461 | |
| TCI Express, Ltd. | | | 133,959 | | | | 1,466,341 | |
| Time Technoplast, Ltd. | | | 712,756 | | | | 633,081 | |
| Vaibhav Global, Ltd. | | | 77,947 | | | | 895,203 | |
| Westlife Development, Ltd.(a) | | | 126,000 | | | | 622,994 | |
| WNS Holdings, Ltd., ADR(a) | | | 58,075 | | | | 3,591,358 | |
| | | | | | | | 18,536,454 | |
| | | | | | | | | |
| Indonesia (2.08%) | | | | | | | | |
| Arwana Citramulia Tbk PT | | | 26,137,200 | | | | 927,287 | |
| Bank Central Asia Tbk PT | | | 571,500 | | | | 1,280,450 | |
| Bank Tabungan Pensiunan Nasional Syariah Tbk PT(a) | | | 3,448,500 | | | | 943,381 | |
| Hexindo Adiperkasa Tbk PT | | | 1,636,900 | | | | 406,980 | |
| Indonesia Pondasi Raya Tbk PT | | | 4,149,800 | | | | 113,523 | |
| Selamat Sempurna Tbk PT | | | 20,026,300 | | | | 2,104,352 | |
| Ultrajaya Milk Industry & Trading Co. Tbk PT | | | 5,474,800 | | | | 592,840 | |
| | | | | | | | 6,368,813 | |
| | | | | | | | | |
| Ireland (1.22%) | | | | | | | | |
| Irish Residential Properties | | | | | | | | |
| REIT PLC | | | 871,726 | | | | 1,707,246 | |
| Keywords Studios PLC | | | 40,800 | | | | 586,640 | |
| Uniphar PLC(a) | | | 1,074,600 | | | | 1,435,804 | |
| | | | | | | | 3,729,690 | |
| | | | | | | | | |
| Israel (0.82%) | | | | | | | | |
| Wix.com, Ltd.(a) | | | 20,627 | | | | 2,517,938 | |
| | | | | | | | | |
| Italy (1.38%) | | | | | | | | |
| DiaSorin SpA | | | 8,212 | | | | 925,043 | |
| FinecoBank Banca Fineco SpA | | | 94,698 | | | | 1,066,728 | |
| Freni Brembo SpA | | | 43,093 | | | | 458,268 | |
See Notes to Financial Statements.
| 50 | 1.855.377.7325 | www.GrandeurPeakGlobal.com |
| Grandeur Peak Global Reach Fund | Portfolio of Investments |
October 31, 2019 (Unaudited)
| | | Shares | | | Value (Note 2) | |
| Italy (continued) | | | | | | | | |
| Interpump Group SpA | | | 32,697 | | | $ | 895,628 | |
| Piovan SpA(b)(c) | | | 140,839 | | | | 867,069 | |
| | | | | | | | 4,212,736 | |
| | | | | | | | | |
| Japan (7.96%) | | | | | | | | |
| AIT Corp. | | | 79,700 | | | | 683,417 | |
| Asics Corp. | | | 26,200 | | | | 453,205 | |
| BayCurrent Consulting, Inc. | | | 26,100 | | | | 1,322,039 | |
| Cosmos Pharmaceutical Corp. | | | 3,200 | | | | 661,691 | |
| Create SD Holdings Co., Ltd. | | | 37,500 | | | | 935,156 | |
| eGuarantee, Inc. | | | 29,200 | | | | 412,894 | |
| Future Corp. | | | 69,300 | | | | 1,136,497 | |
| Japan Lifeline Co., Ltd. | | | 66,100 | | | | 1,028,929 | |
| MarkLines Co., Ltd. | | | 36,300 | | | | 714,638 | |
| Medikit Co., Ltd. | | | 7,800 | | | | 494,768 | |
| MISUMI Group, Inc. | | | 29,800 | | | | 757,211 | |
| MonotaRO Co., Ltd. | | | 32,100 | | | | 982,410 | |
| Naigai Trans Line, Ltd. | | | 59,150 | | | | 838,036 | |
| Nihon M&A Center, Inc. | | | 39,200 | | | | 1,201,519 | |
| Open Door, Inc.(a) | | | 53,100 | | | | 1,023,745 | |
| Pigeon Corp. | | | 30,500 | | | | 1,502,547 | |
| SBI FinTech Solutions Co., Ltd. | | | 75,000 | | | | 638,188 | |
| Seria Co., Ltd. | | | 35,600 | | | | 898,654 | |
| Sundrug Co., Ltd. | | | 19,900 | | | | 662,473 | |
| Synchro Food Co., Ltd.(a) | | | 113,400 | | | | 527,149 | |
| System Information Co., Ltd. | | | 49,100 | | | | 447,397 | |
| Systena Corp. | | | 51,200 | | | | 740,572 | |
| Syuppin Co., Ltd. | | | 147,200 | | | | 1,284,030 | |
| Trancom Co., Ltd. | | | 18,300 | | | | 1,213,335 | |
| Tsuruha Holdings, Inc. | | | 10,500 | | | | 1,189,138 | |
| Unicharm Corp. | | | 23,600 | | | | 806,189 | |
| Vega Corp. Co., Ltd.(a) | | | 130,900 | | | | 654,561 | |
| YAKUODO Holdings Co., Ltd. | | | 47,200 | | | | 1,145,580 | |
| | | | | | | | 24,355,968 | |
| | | | | | | | | |
| Kenya (0.17%) | | | | | | | | |
| Safaricom PLC | | | 1,836,500 | | | | 528,905 | |
| | | | | | | | | |
| Malaysia (0.19%) | | | | | | | | |
| Mynews Holdings Bhd | | | 1,818,000 | | | | 578,662 | |
| | | | | | | | | |
| Mexico (0.29%) | | | | | | | | |
| Grupo Herdez SAB de CV | | | 235,790 | | | | 480,368 | |
| Regional SAB de CV | | | 74,857 | | | | 398,558 | |
| | | | | | | | 878,926 | |
| | | | | | | | | |
| Netherlands (1.17%) | | | | | | | | |
| Aalberts NV | | | 43,782 | | | | 1,760,812 | |
| | | | | | | | | |
| Shop Apotheke Europe | | | | | | | | |
| NV(a)(b)(c) | | | 32,100 | | | | 1,399,824 | |
| Takeaway.com NV(a)(b)(c) | | | 5,000 | | | | 407,084 | |
| | | | | | | | 3,567,720 | |
| | | | | | | | | |
| New Zealand (0.33%) | | | | | | | | |
| CBL Corp., Ltd.(a)(d) | | | 819,006 | | | | 0 | |
| | | Shares | | | Value (Note 2) | |
| New Zealand (continued) | | | | | | | | |
| NZX, Ltd. | | | 1,230,372 | | | $ | 1,017,619 | |
| | | | | | | | 1,017,619 | |
| | | | | | | | | |
| Norway (1.32%) | | | | | | | | |
| Infront ASA(a) | | | 190,066 | | | | 475,364 | |
| Medistim ASA | | | 25,541 | | | | 430,491 | |
| Sbanken ASA(b)(c) | | | 101,000 | | | | 717,181 | |
| Self Storage Group ASA(a) | | | 777,569 | | | | 1,970,102 | |
| Webstep AS(b)(c) | | | 175,000 | | | | 430,071 | |
| | | | | | | | 4,023,209 | |
| | | | | | | | | |
| Oman (0.28%) | | | | | | | | |
| Tethys Oil AB | | | 112,700 | | | | 856,715 | |
| | | | | | | | | |
| Philippines (1.61%) | | | | | | | | |
| Concepcion Industrial Corp. | | | 1,793,920 | | | | 1,078,226 | |
| Pryce Corp. | | | 6,894,800 | | | | 733,706 | |
| Puregold Price Club, Inc. | | | 1,332,700 | | | | 1,072,831 | |
| Wilcon Depot, Inc. | | | 6,270,400 | | | | 2,038,853 | |
| | | | | | | | 4,923,616 | |
| | | | | | | | | |
| Poland (1.11%) | | | | | | | | |
| Dino Polska SA(a)(b)(c) | | | 60,618 | | | | 2,364,017 | |
| LiveChat Software SA | | | 68,104 | | | | 675,576 | |
| PGS Software SA | | | 138,887 | | | | 363,517 | |
| | | | | | | | 3,403,110 | |
| | | | | | | | | |
| Singapore (0.15%) | | | | | | | | |
| Riverstone Holdings, Ltd./Singapore | | | 652,800 | | | | 467,845 | |
| | | | | | | | | |
| South Africa (0.75%) | | | | | | | | |
| ARB Holdings, Ltd. | | | 2,093,266 | | | | 477,238 | |
| Clicks Group, Ltd. | | | 64,000 | | | | 1,040,993 | |
| Italtile, Ltd. | | | 822,600 | | | | 762,145 | |
| | | | | | | | 2,280,376 | |
| | | | | | | | | |
| South Korea (0.53%) | | | | | | | | |
| Koh Young Technology, Inc. | | | 7,493 | | | | 606,035 | |
| LG Household & Health Care, Ltd. | | | 500 | | | | 541,923 | |
| Tokai Carbon Korea Co., Ltd. | | | 10,000 | | | | 459,839 | |
| | | | | | | | 1,607,797 | |
| | | | | | | | | |
| Spain (0.00%)(e) | | | | | | | | |
| Let's GOWEX SA(a)(d) | | | 10,700 | | | | 0 | |
| | | | | | | | | |
| Sweden (2.74%) | | | | | | | | |
| Epiroc AB, Class B | | | 63,300 | | | | 688,350 | |
| EQT AB(a) | | | 112,400 | | | | 1,078,403 | |
| Hexpol AB | | | 106,900 | | | | 952,122 | |
| KNOW IT AB | | | 74,700 | | | | 1,469,909 | |
| Nibe Industrier AB, Class B | | | 93,000 | | | | 1,271,373 | |
| OEM International AB, Class B | | | 13,943 | | | | 294,580 | |
| Sweco AB, Class B | | | 18,300 | | | | 643,628 | |
See Notes to Financial Statements.
| Semi-Annual Report | October 31, 2019 | 51 |
| Grandeur Peak Global Reach Fund | Portfolio of Investments |
October 31, 2019 (Unaudited)
| | | Shares | | | Value (Note 2) | |
| Sweden (continued) | | | | | | | | |
| SwedenCare AB(a) | | | 148,604 | | | $ | 1,188,130 | |
| Vitec Software Group AB, Class B | | | 55,500 | | | | 793,210 | |
| | | | | | | | 8,379,705 | |
| | | | | | | | | |
| Switzerland (0.72%) | | | | | | | | |
| Partners Group Holding AG | | | 2,835 | | | | 2,210,524 | |
| | | | | | | | | |
| Taiwan (2.93%) | | | | | | | | |
| Bioteque Corp. | | | 271,000 | | | | 1,161,791 | |
| FineTek Co., Ltd. | | | 155,400 | | | | 434,949 | |
| Gourmet Master Co., Ltd. | | | 94,000 | | | | 429,231 | |
| Pacific Hospital Supply Co., Ltd. | | | 449,000 | | | | 1,191,807 | |
| Poya International Co., Ltd. | | | 98,000 | | | | 1,347,317 | |
| Sporton International, Inc. | | | 212,859 | | | | 1,328,599 | |
| Test Research, Inc. | | | 409,440 | | | | 685,976 | |
| TSC Auto ID Technology Co., Ltd. | | | 78,060 | | | | 638,522 | |
| TTFB Co., Ltd. | | | 148,000 | | | | 1,298,139 | |
| Voltronic Power Technology Corp. | | | 19,950 | | | | 442,379 | |
| | | | | | | | 8,958,710 | |
| | | | | | | | | |
| Thailand (0.32%) | | | | | | | | |
| TOA Paint Thailand PCL | | | 648,000 | | | | 965,723 | |
| | | | | | | | | |
| Turkey (0.32%) | | | | | | | | |
| DP Eurasia NV(a)(b)(c) | | | 1,086,201 | | | | 970,840 | |
| | | | | | | | | |
| United Arab Emirates (0.53%) | | | | | | | | |
| Aramex PJSC | | | 1,518,033 | | | | 1,620,227 | |
| | | | | | | | | |
| United States (25.04%) | | | | | | | | |
| 8x8, Inc.(a) | | | 50,400 | | | | 973,728 | |
| ABIOMED, Inc.(a) | | | 3,875 | | | | 804,372 | |
| Accenture PLC, Class A | | | 2,125 | | | | 394,018 | |
| Adaptive Biotechnologies Corp.(a) | | | 10,800 | | | | 281,502 | |
| Amazon.com, Inc.(a) | | | 950 | | | | 1,687,827 | |
| Apollo Global Management, Inc., Class A | | | 55,225 | | | | 2,273,061 | |
| BioDelivery Sciences International, Inc.(a) | | | 198,750 | | | | 1,148,775 | |
| Blackline, Inc.(a) | | | 15,450 | | | | 722,133 | |
| Blackstone Group, Inc., Class A | | | 32,075 | | | | 1,705,107 | |
| Burford Capital, Ltd. | | | 103,200 | | | | 1,175,720 | |
| Cactus, Inc., Class A(a) | | | 39,650 | | | | 1,178,398 | |
| Castle Biosciences, Inc.(a) | | | 57,025 | | | | 1,342,368 | |
| CH Robinson Worldwide, Inc. | | | 18,100 | | | | 1,369,084 | |
| CoreSite Realty Corp. | | | 15,075 | | | | 1,771,312 | |
| DexCom, Inc.(a) | | | 3,450 | | | | 532,128 | |
| DXP Enterprises, Inc.(a) | | | 53,525 | | | | 1,847,683 | |
| Edwards Lifesciences Corp.(a) | | | 1,425 | | | | 339,691 | |
| | | Shares | | | Value (Note 2) | |
| United States (continued) | | | | | | | | |
| EPAM Systems, Inc.(a) | | | 16,800 | | | $ | 2,956,128 | |
| Equinix, Inc. | | | 2,325 | | | | 1,317,763 | |
| Esquire Financial Holdings, Inc.(a) | | | 65,162 | | | | 1,583,437 | |
| ExlService Holdings, Inc.(a) | | | 18,350 | | | | 1,277,710 | |
| Fastenal Co. | | | 75,897 | | | | 2,727,738 | |
| Fastly, Inc., Class A(a) | | | 27,500 | | | | 550,550 | |
| First Republic Bank | | | 57,525 | | | | 6,118,359 | |
| Focus Financial Partners, Inc., Class A(a) | | | 11,775 | | | | 257,637 | |
| Frontage Holdings Corp.(a)(b)(c) | | | 685,000 | | | | 465,062 | |
| Genpact, Ltd. | | | 55,750 | | | | 2,183,728 | |
| Goosehead Insurance, Inc., Class A | | | 30,610 | | | | 1,566,620 | |
| Hackett Group, Inc. | | | 28,025 | | | | 473,903 | |
| Hannon Armstrong Sustainable Infrastructure Capital, Inc. | | | 37,025 | | | | 1,105,566 | |
| HD Supply Holdings, Inc.(a) | | | 24,000 | | | | 948,960 | |
| HealthEquity, Inc.(a) | | | 12,725 | | | | 722,653 | |
| Heska Corp.(a) | | | 10,075 | | | | 816,276 | |
| I3 Verticals, Inc., Class A(a) | | | 26,875 | | | | 549,594 | |
| Inphi Corp.(a) | | | 20,525 | | | | 1,475,337 | |
| Kinsale Capital Group, Inc. | | | 14,525 | | | | 1,535,583 | |
| Knight-Swift Transportation Holdings, Inc. | | | 24,300 | | | | 885,978 | |
| LGI Homes, Inc.(a) | | | 10,500 | | | | 824,040 | |
| Littelfuse, Inc. | | | 3,100 | | | | 544,267 | |
| Microchip Technology, Inc. | | | 9,650 | | | | 909,898 | |
| Monro, Inc. | | | 13,350 | | | | 935,969 | |
| MSC Industrial Direct Co., Inc., Class A | | | 8,150 | | | | 596,661 | |
| New Relic, Inc.(a) | | | 30,925 | | | | 1,981,056 | |
| NV5 Global, Inc.(a) | | | 38,300 | | | | 2,774,069 | |
| NVIDIA Corp. | | | 2,575 | | | | 517,627 | |
| Old Dominion Freight Line, Inc. | | | 3,350 | | | | 609,968 | |
| Palo Alto Networks, Inc.(a) | | | 2,700 | | | | 613,953 | |
| Paycom Software, Inc.(a) | | | 9,150 | | | | 1,935,500 | |
| Pluralsight, Inc., Class A(a) | | | 108,264 | | | | 1,957,413 | |
| Power Integrations, Inc. | | | 17,365 | | | | 1,582,125 | |
| Qualys, Inc.(a) | | | 22,000 | | | | 1,877,260 | |
| Revolve Group, Inc.(a) | | | 68,375 | | | | 1,419,465 | |
| Silicon Laboratories, Inc.(a) | | | 6,900 | | | | 733,056 | |
| STAAR Surgical Co.(a) | | | 9,979 | | | | 327,112 | |
| SVB Financial Group(a) | | | 7,850 | | | | 1,738,618 | |
| Systemax, Inc. | | | 79,088 | | | | 1,711,464 | |
| Transcat, Inc.(a) | | | 35,752 | | | | 1,120,468 | |
| Veracyte, Inc.(a) | | | 18,597 | | | | 426,429 | |
| Virtusa Corp.(a) | | | 39,675 | | | | 1,479,084 | |
| Watsco, Inc. | | | 5,375 | | | | 947,613 | |
| | | | | | | | 76,628,604 | |
| | | | | | | | | |
| Vietnam (1.38%) | | | | | | | | |
| Vietnam Dairy Products JSC | | | 365,929 | | | | 2,050,199 | |
See Notes to Financial Statements.
| 52 | 1.855.377.7325 | www.GrandeurPeakGlobal.com |
| Grandeur Peak Global Reach Fund | Portfolio of Investments |
October 31, 2019 (Unaudited)
| | | Shares | | | Value (Note 2) | |
| Vietnam (continued) | | | | | | | | |
| Vietnam Technological & Commercial Joint Stock Bank(a) | | | 2,138,281 | | | $ | 2,184,082 | |
| | | | | | | | 4,234,281 | |
| | | | | | | | | |
| TOTAL COMMON STOCKS | | | | | | | | |
| (Cost $237,523,813) | | | | | | | 299,747,405 | |
| | | | | | | | | |
| PREFERRED STOCKS (0.30%) | | | | | | | | |
| United States (0.30%) | | | | | | | | |
| Dataminr, Inc.(a)(d) | | | 45,833 | | | | 912,077 | |
| | | | | | | | | |
| TOTAL PREFERRED STOCKS | | | | | | | | |
| (Cost $912,077) | | | | | | | 912,077 | |
| | | | | | | | | |
| TOTAL INVESTMENTS (98.27%) | | | | | | | | |
| (Cost $238,435,890) | | | | | | $ | 300,659,482 | |
| | | | | | | | | |
| Other Assets In Excess Of Liabilities (1.73%) | | | | | | | 5,306,859 | |
| | | | | | | | | |
| NET ASSETS (100.00%) | | | | | | $ | 305,966,341 | |
| (a) | Non-Income Producing Security. |
| (b) | Security was purchased pursuant to Regulation S under the Securities Act of 1933, which exempts securities offered and sold outside of the United States from registration. Such security cannot be sold in the United States without either an effective registration statement filed pursuant to the Securities Act of 1933, or pursuant to an exemption from registration. The security has been deemed liquid under guidelines approved by the Fund's Board of Trustees. As of October 31, 2019, the aggregate market value of these securities was $29,059,572, representing 9.50% of net assets. |
| (c) | Security exempt from registration under Rule 144A of the Securities Act of 1933. These securities may be resold in the ordinary course of business in transactions exempt from registration, normally to qualified institutional buyers. As of October 31, 2019, these securities had a total aggregate market value of $23,156,670 representing 7.57% of net assets. |
| (d) | As a result of the use of significant unobservable inputs to determine fair value, these investments have been classified as level 3 assets. See also Note 2 to the financial statements for additional information. |
For Fund compliance purposes, the Fund's geographical classifications refer to any one or more of the country sub-classifications used by one or more widely recognized market indexes or ratings group indexes, and/or as defined by Fund management. This definition may not apply for purposes of this report, which may combine sub-classifications for reporting ease. Geographical regions are shown as a percentage of net assets.
See Notes to Financial Statements.
| Semi-Annual Report | October 31, 2019 | 53 |
| Grandeur Peak Global Stalwarts Fund | Portfolio of Investments |
October 31, 2019 (Unaudited)
| | | Shares | | | Value (Note 2) | |
| COMMON STOCKS (96.98%) | | | | | | |
| Argentina (0.59%) | | | | | | | | |
| Globant SA(a) | | | 11,875 | | | $ | 1,107,463 | |
| | | | | | | | | |
| Australia (1.72%) | | | | | | | | |
| Appen, Ltd. | | | 44,500 | | | | 670,887 | |
| Corporate Travel Management, Ltd. | | | 70,700 | | | | 859,235 | |
| Domino's Pizza Enterprises, Ltd. | | | 28,800 | | | | 1,012,717 | |
| Netwealth Group, Ltd. | | | 112,000 | | | | 680,969 | |
| | | | | | | | 3,223,808 | |
| | | | | | | | | |
| Bangladesh (0.32%) | | | | | | | | |
| Square Pharmaceuticals, Ltd. | | | 219,463 | | | | 608,656 | |
| | | | | | | | | |
| Belgium (0.85%) | | | | | | | | |
| Melexis NV | | | 22,596 | | | | 1,582,642 | |
| | | | | | | | | |
| Bermuda (0.84%) | | | | | | | | |
| Bank of NT Butterfield & Son, Ltd. | | | 47,760 | | | | 1,573,692 | |
| | | | | | | | | |
| Brazil (1.61%) | | | | | | | | |
| Fleury SA | | | 182,000 | | | | 1,149,044 | |
| Pagseguro Digital, Ltd., Class A(a) | | | 29,625 | | | | 1,098,495 | |
| Raia Drogasil SA | | | 27,800 | | | | 762,221 | |
| | | | | | | | 3,009,760 | |
| | | | | | | | | |
| Britain (12.47%) | | | | | | | | |
| Ascential PLC(b)(c) | | | 186,300 | | | | 842,705 | |
| B&M European Value Retail SA | | | 910,600 | | | | 4,367,870 | |
| boohoo Group PLC(a) | | | 486,600 | | | | 1,664,042 | |
| Close Brothers Group PLC | | | 39,455 | | | | 706,826 | |
| Dechra Pharmaceuticals PLC | | | 96,900 | | | | 3,301,170 | |
| Endava PLC, ADR(a) | | | 24,225 | | | | 1,041,917 | |
| Intermediate Capital Group PLC | | | 39,000 | | | | 750,709 | |
| Intertek Group PLC | | | 14,200 | | | | 984,448 | |
| Sanne Group PLC | | | 401,420 | | | | 2,745,499 | |
| Softcat PLC | | | 69,140 | | | | 842,319 | |
| St. James's Place PLC | | | 386,489 | | | | 5,211,661 | |
| Trainline PLC(a)(b)(c) | | | 161,100 | | | | 869,158 | |
| | | | | | | | 23,328,324 | |
| | | | | | | | | |
| Canada (3.44%) | | | | | | | | |
| Gildan Activewear, Inc. | | | 49,567 | | | | 1,266,365 | |
| Lululemon Athletica, Inc.(a) | | | 17,375 | | | | 3,549,191 | |
| Ritchie Bros Auctioneers, Inc. | | | 39,350 | | | | 1,618,072 | |
| | | | | | | | 6,433,628 | |
| | | | | | | | | |
| China (5.39%) | | | | | | | | |
| Baozun, Inc., Sponsored ADR(a) | | | 15,350 | | | | 668,032 | |
| | | Shares | | | Value (Note 2) | |
| China (continued) | | | | | | | | |
| CSPC Pharmaceutical Group, Ltd. | | | 297,000 | | | $ | 763,730 | |
| Ctrip.com International, Ltd., ADR(a) | | | 30,475 | | | | 1,005,370 | |
| Hangzhou Tigermed Consulting Co., Ltd., Class A | | | 70,700 | | | | 686,359 | |
| Silergy Corp. | | | 153,000 | | | | 4,312,478 | |
| Sonoscape Medical Corp., Class A | | | 34,400 | | | | 103,561 | |
| WuXi AppTec Co., Ltd., Class H(b)(c) | | | 87,400 | | | | 1,056,257 | |
| Yum China Holdings, Inc. | | | 34,875 | | | | 1,482,188 | |
| | | | | | | | 10,077,975 | |
| | | | | | | | | |
| Denmark (0.56%) | | | | | | | | |
| Ambu A/S, Class B | | | 67,021 | | | | 1,052,518 | |
| | | | | | | | | |
| France (2.62%) | | | | | | | | |
| Alten SA | | | 19,732 | | | | 2,166,598 | |
| BioMerieux | | | 11,793 | | | | 964,753 | |
| Bureau Veritas SA | | | 39,950 | | | | 1,019,892 | |
| Eurofins Scientific SE | | | 1,485 | | | | 752,255 | |
| | | | | | | | 4,903,498 | |
| | | | | | | | | |
| Georgia (0.54%) | | | | | | | | |
| Bank of Georgia Group PLC | | | 59,562 | | | | 1,002,229 | |
| | | | | | | | | |
| Germany (4.81%) | | | | | | | | |
| Dermapharm Holding SE | | | 53,600 | | | | 2,096,487 | |
| Grand City Properties SA | | | 75,300 | | | | 1,760,264 | |
| GRENKE AG | | | 12,100 | | | | 1,145,062 | |
| Norma Group SE | | | 35,590 | | | | 1,308,298 | |
| PATRIZIA AG | | | 78,815 | | | | 1,614,766 | |
| Puma SE | | | 14,200 | | | | 1,068,223 | |
| | | | | | | | 8,993,100 | |
| | | | | | | | | |
| Hong Kong (1.43%) | | | | | | | | |
| Value Partners Group, Ltd. | | | 2,548,900 | | | | 1,346,671 | |
| Vitasoy International Holdings, Ltd. | | | 325,500 | | | | 1,325,104 | |
| | | | | | | | 2,671,775 | |
| | | | | | | | | |
| India (4.63%) | | | | | | | | |
| Bajaj Finance, Ltd. | | | 52,570 | | | | 2,985,084 | |
| HDFC Bank, Ltd. | | | 59,500 | | | | 1,032,104 | |
| HDFC Life Insurance Co., Ltd.(b)(c) | | | 147,500 | | | | 1,302,215 | |
| L&T Technology Services, Ltd.(b)(c) | | | 34,757 | | | | 736,829 | |
| WNS Holdings, Ltd., ADR(a) | | | 42,125 | | | | 2,605,010 | |
| | | | | | | | 8,661,242 | |
See Notes to Financial Statements.
| 54 | 1.855.377.7325 | www.GrandeurPeakGlobal.com |
| Grandeur Peak Global Stalwarts Fund | Portfolio of Investments |
October 31, 2019 (Unaudited)
| | | Shares | | | Value (Note 2) | |
| Indonesia (0.49%) | | | | | | | | |
| Bank Central Asia Tbk PT | | | 410,500 | | | $ | 919,728 | |
| Israel (0.80%) | | | | | | | | |
| Wix.com, Ltd.(a) | | | 12,250 | | | | 1,495,358 | |
| Italy (3.28%) | | | | | | | | |
| DiaSorin SpA | | | 20,696 | | | | 2,331,307 | |
| FinecoBank Banca Fineco SpA | | | 138,996 | | | | 1,565,724 | |
| Freni Brembo SpA | | | 93,921 | | | | 998,792 | |
| Interpump Group SpA | | | 45,592 | | | | 1,248,845 | |
| | | | | | | | 6,144,668 | |
| | | | | | | | | |
| Japan (8.22%) | | | | | | | | |
| Cosmos Pharmaceutical Corp. | | | 3,500 | | | | 723,724 | |
| Create SD Holdings Co., Ltd. | | | 36,100 | | | | 900,244 | |
| Japan Lifeline Co., Ltd. | | | 93,900 | | | | 1,461,672 | |
| MISUMI Group, Inc. | | | 36,800 | | | | 935,079 | |
| MonotaRO Co., Ltd. | | | 41,800 | | | | 1,279,276 | |
| Nihon M&A Center, Inc. | | | 111,800 | | | | 3,426,780 | |
| Pigeon Corp. | | | 21,500 | | | | 1,059,172 | |
| Seria Co., Ltd. | | | 51,900 | | | | 1,310,116 | |
| Systena Corp. | | | 89,500 | | | | 1,294,555 | |
| Tokyo Century Corp. | | | 19,500 | | | | 910,084 | |
| Tsuruha Holdings, Inc. | | | 11,900 | | | | 1,347,690 | |
| Unicharm Corp. | | | 21,700 | | | | 741,284 | |
| | | | | | | | 15,389,676 | |
| | | | | | | | | |
| Mexico (0.55%) | | | | | | | | |
| Regional SAB de CV | | | 192,000 | | | | 1,022,257 | |
| | | | | | | | | |
| Netherlands (2.52%) | | | | | | | | |
| Aalberts NV | | | 80,585 | | | | 3,240,944 | |
| QIAGEN NV(a) | | | 26,975 | | | | 804,125 | |
| Takeaway.com NV(a)(b)(c) | | | 8,150 | | | | 663,547 | |
| | | | | | | | 4,708,616 | |
| | | | | | | | | |
| Philippines (0.84%) | | | | | | | | |
| Philippine Seven Corp. | | | 259,000 | | | | 760,489 | |
| Puregold Price Club, Inc. | | | 1,006,000 | | | | 809,835 | |
| | | | | | | | 1,570,324 | |
| | | | | | | | | |
| Poland (0.86%) | | | | | | | | |
| Dino Polska SA(a)(b)(c) | | | 41,334 | | | | 1,611,968 | |
| | | | | | | | | |
| South Korea (0.33%) | | | | | | | | |
| LG Household & Health Care, Ltd. | | | 575 | | | | 623,211 | |
| | | | | | | | | |
| Sweden (2.19%) | | | | | | | | |
| AddTech AB, Class B | | | 25,600 | | | | 711,870 | |
| EQT AB(a) | | | 85,500 | | | | 820,315 | |
| Hexpol AB | | | 89,600 | | | | 798,036 | |
| Nibe Industrier AB, Class B | | | 52,408 | | | | 716,453 | |
| | | Shares | | | Value (Note 2) | |
| Sweden (continued) | | | | | | | | |
| Sweco AB, Class B | | | 29,700 | | | $ | 1,044,577 | |
| | | | | | | | 4,091,251 | |
| | | | | | | | | |
| Switzerland (0.85%) | | | | | | | | |
| Partners Group Holding AG | | | 2,050 | | | | 1,598,439 | |
| | | | | | | | | |
| United Arab Emirates (0.80%) | | | | | | | | |
| Aramex PJSC | | | 757,000 | | | | 807,961 | |
| Network International Holdings PLC(a)(b)(c) | | | 99,200 | | | | 695,180 | |
| | | | | | | | 1,503,141 | |
| | | | | | | | | |
| United States (31.80%) | | | | | | | | |
| ABIOMED, Inc.(a) | | | 19,550 | | | | 4,058,189 | |
| Accenture PLC, Class A | | | 3,425 | | | | 635,064 | |
| Apollo Global Management, Inc., Class A | | | 36,350 | | | | 1,496,166 | |
| Axos Financial, Inc.(a) | | | 15,975 | | | | 464,074 | |
| Bank of Hawaii Corp. | | | 7,250 | | | | 632,997 | |
| Blackline, Inc.(a) | | | 15,975 | | | | 746,671 | |
| Burford Capital, Ltd. | | | 64,100 | | | | 730,268 | |
| CH Robinson Worldwide, Inc. | | | 11,575 | | | | 875,533 | |
| CoreSite Realty Corp. | | | 10,200 | | | | 1,198,500 | |
| Edwards Lifesciences Corp.(a) | | | 3,350 | | | | 798,573 | |
| EPAM Systems, Inc.(a) | | | 18,375 | | | | 3,233,265 | |
| ExlService Holdings, Inc.(a) | | | 16,225 | | | | 1,129,747 | |
| Fastenal Co. | | | 104,825 | | | | 3,767,410 | |
| First Republic Bank | | | 71,950 | | | | 7,652,602 | |
| Genpact, Ltd. | | | 60,402 | | | | 2,365,946 | |
| Goosehead Insurance, Inc., Class A | | | 14,750 | | | | 754,905 | |
| Hannon Armstrong Sustainable Infrastructure Capital, Inc. | | | 37,600 | | | | 1,122,736 | |
| HD Supply Holdings, Inc.(a) | | | 18,350 | | | | 725,559 | |
| HealthEquity, Inc.(a) | | | 20,557 | | | | 1,167,432 | |
| Inphi Corp.(a) | | | 23,500 | | | | 1,689,180 | |
| Kinsale Capital Group, Inc. | | | 6,825 | | | | 721,539 | |
| Knight-Swift Transportation Holdings, Inc. | | | 24,000 | | | | 875,040 | |
| LGI Homes, Inc.(a) | | | 10,375 | | | | 814,230 | |
| Littelfuse, Inc. | | | 3,725 | | | | 653,998 | |
| Microchip Technology, Inc. | | | 20,075 | | | | 1,892,872 | |
| Monro, Inc. | | | 35,250 | | | | 2,471,377 | |
| New Relic, Inc.(a) | | | 16,250 | | | | 1,040,975 | |
| NVIDIA Corp. | | | 2,075 | | | | 417,116 | |
| Old Dominion Freight Line, Inc. | | | 5,425 | | | | 987,784 | |
| Palo Alto Networks, Inc.(a) | | | 3,375 | | | | 767,441 | |
| Paycom Software, Inc.(a) | | | 9,975 | | | | 2,110,012 | |
| Pluralsight, Inc., Class A(a) | | | 125,134 | | | | 2,262,423 | |
| Power Integrations, Inc. | | | 45,150 | | | | 4,113,617 | |
| Qualys, Inc.(a) | | | 18,975 | | | | 1,619,137 | |
| Revolve Group, Inc.(a) | | | 30,150 | | | | 625,914 | |
| Silicon Laboratories, Inc.(a) | | | 8,175 | | | | 868,512 | |
See Notes to Financial Statements.
| Semi-Annual Report | October 31, 2019 | 55 |
| Grandeur Peak Global Stalwarts Fund | Portfolio of Investments |
October 31, 2019 (Unaudited)
| | | Shares | | | Value (Note 2) | |
| United States (continued) | | | | | | | | |
| STAAR Surgical Co.(a) | | | 325 | | | $ | 10,654 | |
| SVB Financial Group(a) | | | 9,010 | | | | 1,995,535 | |
| | | | | | | | 59,492,993 | |
| | | | | | | | | |
| Vietnam (1.63%) | | | | | | | | |
| Ho Chi Minh City Development Joint Stock Commercial Bank(a) | | | 544,106 | | | | 690,597 | |
| Vietnam Dairy Products JSC | | | 255,454 | | | | 1,431,238 | |
| Vietnam Technological & Commercial Joint Stock Bank(a) | | | 909,095 | | | | 928,568 | |
| | | | | | | | 3,050,403 | |
| | | | | | | | | |
| TOTAL COMMON STOCKS | | | | | | | | |
| (Cost $149,378,557) | | | | | | | 181,452,343 | |
| | | | | | | | | |
| PREFERRED STOCKS (0.26%) | | | | | | | | |
| United States (0.26%) | | | | | | | | |
| Dataminr, Inc.(a)(d) | | | 24,262 | | | | 482,814 | |
| | | | | | | | | |
| TOTAL PREFERRED STOCKS | | | | | | | | |
| (Cost $482,814) | | | | | | | 482,814 | |
| | | | | | | | | |
| TOTAL INVESTMENTS (97.24%) | | | | | | | | |
| (Cost $149,861,371) | | | | | | $ | 181,935,157 | |
| | | | | | | | | |
| Other Assets In Excess Of Liabilities (2.76%) | | | | | | | 5,162,798 | |
| | | | | | | | | |
| NET ASSETS (100.00%) | | | | | | $ | 187,097,955 | |
| (a) | Non-Income Producing Security. |
| (b) | Security exempt from registration under Rule 144A of the Securities Act of 1933. These securities may be resold in the ordinary course of business in transactions exempt from registration, normally to qualified institutional buyers. As of October 31, 2019, these securities had a total aggregate market value of $7,777,859 representing 4.16% of net assets. |
| (c) | Security was purchased pursuant to Regulation S under the Securities Act of 1933, which exempts securities offered and sold outside of the United States from registration. Such security cannot be sold in the United States without either an effective registration statement filed pursuant to the Securities Act of 1933, or pursuant to an exemption from registration. The security has been deemed liquid under guidelines approved by the Fund's Board of Trustees. As of October 31, 2019, the aggregate market value of these securities was $7,777,859, representing 4.16% of net assets. |
| (d) | As a result of the use of significant unobservable inputs to determine fair value, these investments have been classified as level 3 assets. See also Note 2 to the financial statements for additional information. |
For Fund compliance purposes, the Fund's geographical classifications refer to any one or more of the country sub-classifications used by one or more widely recognized market indexes or ratings group indexes, and/or as defined by Fund management. This definition may not apply for purposes of this report, which may combine sub-classifications for reporting ease. Geographical regions are shown as a percentage of net assets.
See Notes to Financial Statements.
| 56 | 1.855.377.7325 | www.GrandeurPeakGlobal.com |
| Grandeur Peak International Opportunities Fund | Portfolio of Investments |
October 31, 2019 (Unaudited)
| | | Shares | | | Value (Note 2) | |
| COMMON STOCKS (96.62%) | | | | | | |
| Argentina (0.49%) | | | | | | |
| Globant SA(a) | | | 33,625 | | | $ | 3,135,868 | |
| | | | | | | | | |
| Australia (3.00%) | | | | | | | | |
| Appen, Ltd. | | | 175,300 | | | | 2,642,841 | |
| Corporate Travel Management, Ltd. | | | 255,300 | | | | 3,102,726 | |
| Fiducian Group, Ltd. | | | 201,848 | | | | 751,378 | |
| Kogan.com, Ltd. | | | 842,722 | | | | 3,932,904 | |
| National Storage REIT | | | 3,563,717 | | | | 4,569,372 | |
| National Veterinary Care, Ltd. | | | 1,102,500 | | | | 1,748,022 | |
| PWR Holdings, Ltd. | | | 777,500 | | | | 2,545,859 | |
| | | | | | | | 19,293,102 | |
| Austria (0.40%) | | | | | | | | |
| Palfinger AG | | | 90,939 | | | | 2,596,460 | |
| | | | | | | | | |
| Bangladesh (0.61%) | | | | | | | | |
| Square Pharmaceuticals, Ltd. | | | 1,406,080 | | | | 3,899,604 | |
| | | | | | | | | |
| Belgium (0.81%) | | | | | | | | |
| Melexis NV | | | 74,368 | | | | 5,208,796 | |
| | | | | | | | | |
| Bermuda (1.25%) | | | | | | | | |
| Bank of NT Butterfield & Son, Ltd. | | | 243,209 | | | | 8,013,737 | |
| | | | | | | | | |
| Brazil (1.28%) | | | | | | | | |
| Arco Platform, Ltd., Class A(a) | | | 28,925 | | | | 1,200,387 | |
| Fleury SA | | | 521,100 | | | | 3,289,927 | |
| Pagseguro Digital, Ltd., Class A(a) | | | 100,000 | | | | 3,708,000 | |
| | | | | | | | 8,198,314 | |
| | | | | | | | | |
| Britain (13.89%) | | | | | | | | |
| Ascential PLC(b)(c) | | | 557,600 | | | | 2,522,234 | |
| B&M European Value Retail SA | | | 2,690,900 | | | | 12,907,425 | |
| boohoo Group PLC(a) | | | 2,121,900 | | | | 7,256,332 | |
| Clinigen Group PLC | | | 215,373 | | | | 2,318,359 | |
| CVS Group PLC | | | 728,400 | | | | 9,128,706 | |
| Dechra Pharmaceuticals PLC | | | 284,400 | | | | 9,688,882 | |
| Endava PLC, ADR(a) | | | 77,688 | | | | 3,341,361 | |
| FDM Group Holdings PLC | | | 236,800 | | | | 2,217,728 | |
| First Derivatives PLC | | | 77,400 | | | | 2,280,923 | |
| Impax Asset Management Group PLC | | | 770,147 | | | | 2,613,745 | |
| Intertek Group PLC | | | 32,900 | | | | 2,280,869 | |
| JTC PLC(b)(c) | | | 789,799 | | | | 3,693,279 | |
| K3 Capital Group PLC | | | 373,600 | | | | 696,879 | |
| On the Beach Group PLC(b)(c) | | | 675,850 | | | | 3,923,833 | |
| Oxford Immunotec Global PLC(a) | | | 340,440 | | | | 5,280,224 | |
| River & Mercantile Group PLC | | | 508,500 | | | | 1,626,958 | |
| Sanne Group PLC | | | 1,004,106 | | | | 6,867,550 | |
| | | Shares | | | Value (Note 2) | |
| Britain (continued) | | | | | | |
| Softcat PLC | | | 192,483 | | | $ | 2,344,982 | |
| St. James's Place PLC | | | 348,934 | | | | 4,705,246 | |
| Trainline PLC(a)(b)(c) | | | 175,200 | | | | 945,230 | |
| Volution Group PLC | | | 996,500 | | | | 2,575,185 | |
| | | | | | | | 89,215,930 | |
| | | | | | | | | |
| Canada (3.95%) | | | | | | | | |
| Biosyent, Inc.(a) | | | 239,100 | | | | 1,089,211 | |
| Gildan Activewear, Inc. | | | 114,200 | | | | 2,917,645 | |
| Lululemon Athletica, Inc.(a) | | | 32,850 | | | | 6,710,270 | |
| Richelieu Hardware, Ltd. | | | 301,050 | | | | 6,180,542 | |
| Ritchie Bros Auctioneers, Inc. | | | 124,400 | | | | 5,115,328 | |
| Stantec, Inc. | | | 159,110 | | | | 3,394,572 | |
| | | | | | | | 25,407,568 | |
| | | | | | | | | |
| China (5.08%) | | | | | | | | |
| BBI Life Sciences Corp.(c) | | | 15,551,500 | | | | 4,683,738 | |
| CSPC Pharmaceutical Group, Ltd. | | | 1,810,000 | | | | 4,654,381 | |
| Ctrip.com International, Ltd., ADR(a) | | | 105,425 | | | | 3,477,971 | |
| Man Wah Holdings, Ltd. | | | 6,824,000 | | | | 4,659,091 | |
| O2Micro International, Ltd., ADR(a) | | | 1,054,233 | | | | 1,307,249 | |
| Silergy Corp. | | | 396,199 | | | | 11,167,318 | |
| WuXi AppTec Co., Ltd., Class H(b)(c) | | | 221,200 | | | | 2,673,274 | |
| | | | | | | | 32,623,022 | |
| | | | | | | | | |
| Colombia (1.09%) | | | | | | | | |
| Amerisur Resources PLC(a) | | | 5,398,603 | | | | 1,334,283 | |
| Parex Resources, Inc.(a) | | | 419,301 | | | | 5,682,578 | |
| | | | | | | | 7,016,861 | |
| France (3.50%) | | | | | | | | |
| Alten SA | | | 41,900 | | | | 4,600,673 | |
| Bureau Veritas SA | | | 208,100 | | | | 5,312,629 | |
| Esker SA | | | 60,443 | | | | 5,548,012 | |
| Infotel SA | | | 16,113 | | | | 664,921 | |
| Neurones | | | 50,872 | | | | 1,185,814 | |
| Thermador Groupe | | | 83,436 | | | | 5,155,310 | |
| | | | | | | | 22,467,359 | |
| | | | | | | | | |
| Georgia (1.10%) | | | | | | | | |
| Bank of Georgia Group PLC | | | 144,411 | | | | 2,429,952 | |
| Georgia Capital PLC(a) | | | 163,711 | | | | 2,063,379 | |
| TBC Bank Group PLC | | | 155,946 | | | | 2,585,667 | |
| | | | | | | | 7,078,998 | |
| Germany (5.84%) | | | | | | | | |
| CANCOM SE | | | 109,400 | | | | 5,837,139 | |
| Dermapharm Holding SE | | | 185,500 | | | | 7,255,565 | |
| Grand City Properties SA | | | 236,056 | | | | 5,518,206 | |
| GRENKE AG | | | 28,800 | | | | 2,725,436 | |
| Nexus AG | | | 63,706 | | | | 2,259,431 | |
See Notes to Financial Statements.
| Semi-Annual Report | October 31, 2019 | 57 |
| Grandeur Peak International Opportunities Fund | Portfolio of Investments |
October 31, 2019 (Unaudited)
| | | Shares | | | Value (Note 2) | |
| Germany (continued) | | | | | | |
| Norma Group SE | | | 125,703 | | | $ | 4,620,877 | |
| PATRIZIA AG | | | 350,050 | | | | 7,171,844 | |
| Wirecard AG | | | 16,644 | | | | 2,107,834 | |
| | | | | | | | 37,496,332 | |
| Greece (0.14%) | | | | | | | | |
| Sarantis SA | | | 100,600 | | | | 888,617 | |
| | | | | | | | | |
| Hong Kong (1.89%) | | | | | | | | |
| Jacobson Pharma Corp., Ltd.(c) | | | 4,138,000 | | | | 623,133 | |
| TK Group Holdings, Ltd. | | | 4,684,000 | | | | 2,211,704 | |
| Value Partners Group, Ltd. | | | 11,454,000 | | | | 6,051,540 | |
| Vitasoy International Holdings, Ltd. | | | 804,338 | | | | 3,274,444 | |
| | | | | | | | 12,160,821 | |
| | | | | | | | | |
| | | | | | | | | |
| India (6.50%) | | | | | | | | |
| Bajaj Finance, Ltd. | | | 161,760 | | | | 9,185,224 | |
| Cyient, Ltd. | | | 615,912 | | | | 3,532,026 | |
| Gulf Oil Lubricants India, Ltd. | | | 131,478 | | | | 1,631,965 | |
| IndiaMart InterMesh, Ltd.(a)(b)(c) | | | 57,699 | | | | 1,511,971 | |
| L&T Technology Services, Ltd.(b)(c) | | | 105,618 | | | | 2,239,043 | |
| Metropolis Healthcare, Ltd.(a)(b)(c) | | | 398,000 | | | | 8,120,342 | |
| TCI Express, Ltd. | | | 217,000 | | | | 2,375,325 | |
| Time Technoplast, Ltd. | | | 3,187,734 | | | | 2,831,394 | |
| WNS Holdings, Ltd., ADR(a) | | | 166,975 | | | | 10,325,734 | |
| | | | | | | | 41,753,024 | |
| | | | | | | | | |
| Indonesia (2.44%) | | | | | | | | |
| Arwana Citramulia Tbk PT | | | 63,783,500 | | | | 2,262,890 | |
| Indonesia Pondasi Raya Tbk PT | | | 19,093,100 | | | | 522,316 | |
| Link Net Tbk PT | | | 8,897,400 | | | | 2,788,955 | |
| Panin Sekuritas Tbk PT | | | 8,494,000 | | | | 962,133 | |
| Selamat Sempurna Tbk PT | | | 63,313,800 | | | | 6,652,978 | |
| Ultrajaya Milk Industry & Trading Co. Tbk PT | | | 22,958,000 | | | | 2,486,012 | |
| | | | | | | | 15,675,284 | |
| | | | | | | | | |
| Ireland (2.18%) | | | | | | | | |
| Irish Residential Properties REIT PLC | | | 3,253,518 | | | | 6,371,905 | |
| Keywords Studios PLC | | | 256,446 | | | | 3,687,290 | |
| Uniphar PLC(a) | | | 2,939,700 | | | | 3,927,818 | |
| | | | | | | | 13,987,013 | |
| Israel (0.61%) | | | | | | | | |
| Wix.com, Ltd.(a) | | | 31,983 | | | | 3,904,165 | |
| | | | | | | | | |
| Italy (3.46%) | | | | | | | | |
| DiaSorin SpA | | | 50,201 | | | | 5,654,905 | |
| FinecoBank Banca Fineco SpA | | | 423,798 | | | | 4,773,884 | |
| | | Shares | | | Value (Note 2) | |
| Italy (continued) | | | | | | |
| Freni Brembo SpA | | | 418,082 | | | $ | 4,446,044 | |
| Interpump Group SpA | | | 169,144 | | | | 4,633,152 | |
| Piovan SpA(b)(c) | | | 445,548 | | | | 2,742,996 | |
| | | | | | | | 22,250,981 | |
| Japan (16.91%) | | | | | | | | |
| AIT Corp. | | | 446,600 | | | | 3,829,536 | |
| BayCurrent Consulting, Inc. | | | 98,700 | | | | 4,999,435 | |
| Cosmos Pharmaceutical Corp. | | | 11,300 | | | | 2,336,596 | |
| Create SD Holdings Co., Ltd. | | | 165,500 | | | | 4,127,155 | |
| eGuarantee, Inc. | | | 31,300 | | | | 442,588 | |
| Future Corp. | | | 362,200 | | | | 5,939,959 | |
| Japan Lifeline Co., Ltd. | | | 384,400 | | | | 5,983,669 | |
| M&A Capital Partners Co., Ltd.(a) | | | 37,300 | | | | 2,497,259 | |
| Macromill, Inc. | | | 164,100 | | | | 1,475,517 | |
| Matsumotokiyoshi Holdings Co., Ltd. | | | 21,000 | | | | 743,819 | |
| MISUMI Group, Inc. | | | 130,400 | | | | 3,313,433 | |
| MonotaRO Co., Ltd. | | | 128,400 | | | | 3,929,642 | |
| Naigai Trans Line, Ltd. | | | 88,500 | | | | 1,253,866 | |
| Nihon M&A Center, Inc. | | | 163,400 | | | | 5,008,371 | |
| Open Door, Inc.(a) | | | 173,600 | | | | 3,346,932 | |
| SBI FinTech Solutions Co., Ltd. | | | 233,500 | | | | 1,986,892 | |
| Seria Co., Ltd. | | | 337,500 | | | | 8,519,539 | |
| SMS Co., Ltd. | | | 211,100 | | | | 5,234,983 | |
| Strike Co., Ltd. | | | 97,200 | | | | 3,514,825 | |
| Sundrug Co., Ltd. | | | 81,200 | | | | 2,703,158 | |
| Synchro Food Co., Ltd.(a) | | | 556,500 | | | | 2,586,934 | |
| System Information Co., Ltd. | | | 381,800 | | | | 3,478,944 | |
| Systena Corp. | | | 300,000 | | | | 4,339,291 | |
| Syuppin Co., Ltd. | | | 274,300 | | | | 2,392,727 | |
| Tokyo Century Corp. | | | 194,300 | | | | 9,068,173 | |
| Trancom Co., Ltd. | | | 92,890 | | | | 6,158,833 | |
| Tsuruha Holdings, Inc. | | | 55,100 | | | | 6,240,143 | |
| YAKUODO Holdings Co., Ltd. | | | 131,400 | | | | 3,189,179 | |
| | | | | | | | 108,641,398 | |
| | | | | | | | | |
| Malaysia (0.91%) | | | | | | | | |
| AEON Credit Service M Bhd | | | 1,019,937 | | | | 3,734,603 | |
| My EG Services Bhd | | | 4,672,400 | | | | 1,274,748 | |
| Scicom MSC Bhd | | | 3,549,500 | | | | 857,962 | |
| | | | | | | | 5,867,313 | |
| | | | | | | | | |
| Mexico (0.55%) | | | | | | | | |
| Credito Real SAB de CV | | | | | | | | |
| SOFOM ER | | | 462,900 | | | | 573,196 | |
| Regional SAB de CV | | | 560,065 | | | | 2,981,928 | |
| | | | | | | | 3,555,124 | |
| | | | | | | | | |
| Netherlands (2.25%) | | | | | | | | |
| Aalberts NV | | | 267,576 | | | | 10,761,293 | |
| QIAGEN NV(a) | | | 123,000 | | | | 3,666,630 | |
| | | | | | | | 14,427,923 | |
See Notes to Financial Statements.
| 58 | 1.855.377.7325 | www.GrandeurPeakGlobal.com |
| Grandeur Peak International Opportunities Fund | Portfolio of Investments |
October 31, 2019 (Unaudited)
| | | Shares | | | Value (Note 2) | |
| New Zealand (0.00%)(d) | | | | | | |
| CBL Corp., Ltd.(a)(e) | | | 1,542,256 | | | $ | 1 | |
| | | | | | | | | |
| Norway (1.45%) | | | | | | | | |
| Medistim ASA | | | 103,811 | | | | 1,749,722 | |
| Sbanken ASA(b)(c) | | | 902,229 | | | | 6,406,546 | |
| Self Storage Group ASA(a) | | | 465,034 | | | | 1,178,242 | |
| | | | | | | 9,334,510 | |
| | | | | | | | | |
| Oman (0.29%) | | | | | | | | |
| Tethys Oil AB | | | 245,008 | | | | 1,862,484 | |
| | | | | | | | | |
| Philippines (1.21%) | | | | | | | | |
| Concepcion Industrial Corp. | | | 3,070,600 | | | | 1,845,567 | |
| Puregold Price Club, Inc. | | | 5,645,000 | | | | 4,544,256 | |
| Robinsons Retail Holdings, Inc. | | | 911,060 | | | | 1,361,787 | |
| | | | | | | | 7,751,610 | |
| | | | | | | | |
| Poland (0.82%) | | | | | | | | |
| Dino Polska SA(a)(b)(c) | | | 105,062 | | | | 4,097,271 | |
| LiveChat Software SA | | | 85,000 | | | | 843,181 | |
| PGS Software SA | | | 130,778 | | | | 342,293 | |
| | | | | | | | 5,282,745 | |
| | | | | | | | | |
| Singapore (0.68%) | | | | | | | | |
| Riverstone Holdings, Ltd./Singapore | | | 6,057,000 | | | | 4,340,898 | |
| | | | | | | | |
| South Africa (0.61%) | | | | | | | | |
| Italtile, Ltd. | | | 4,209,423 | | | | 3,900,064 | |
| | | | | | | | | |
| | | | | | | | |
| South Korea (1.05%) | | | | | | | | |
| Hy-Lok Corp. | | | 84,332 | | | | 1,243,108 | |
| Koh Young Technology, Inc. | | | 19,883 | | | | 1,608,140 | |
| | | | | | | | | |
| LEENO Industrial, Inc. | | | 85,000 | | | | 3,886,716 | |
| | | | | | | | 6,737,964 | |
| | | | | | | | |
| Sweden (1.62%) | | | | | | | | |
| Epiroc AB, Class B | | | 295,500 | | | | 3,213,387 | |
| EQT AB(a) | | | 8,900 | | | | 85,390 | |
| Hexpol AB | | | 304,600 | | | | 2,712,967 | |
| HIQ International AB | | | 124,653 | | | | 617,088 | |
| KNOW IT AB | | | 135,300 | | | | 2,662,365 | |
| Nibe Industrier AB, Class B | | | 82,700 | | | | 1,130,565 | |
| | | | | | | | 10,421,762 | |
| Taiwan (2.77%) | | | | | | | | |
| Bioteque Corp. | | | 908,000 | | | | 3,892,643 | |
| M31 Technology Corp. | | | 34,000 | | | | 427,227 | |
| Poya International Co., Ltd. | | | 24,000 | | | | 329,955 | |
| Sinmag Equipment Corp. | | | 796,158 | | | | 2,693,920 | |
| Sporton International, Inc. | | | 876,003 | | | | 5,467,735 | |
| Test Research, Inc. | | | 2,238,252 | | | | 3,749,966 | |
| | | Shares | | | Value (Note 2) | |
| Taiwan (continued) | | | | | | |
| TSC Auto ID Technology Co., Ltd. | | | 151,800 | | | $ | 1,241,708 | |
| | | | | | | | 17,803,154 | |
| | | | | | | | | |
| Turkey (0.09%) | | | | | | | | |
| DP Eurasia NV(a)(b)(c) | | | 635,340 | | | | 567,863 | |
| United Arab Emirates (1.01%) | | | | | | | | |
| Aramex PJSC | | | 4,066,125 | | | | 4,339,857 | |
| Network International Holdings PLC(a)(b)(c) | | | 307,300 | | | | 2,153,516 | |
| | | | | | | | 6,493,373 | |
| | | | | | | | | |
| United States (3.23%) | | | | | | | | |
| Core Laboratories NV | | | 69,100 | | | | 3,043,164 | |
| EPAM Systems, Inc.(a) | | | 64,375 | | | | 11,327,425 | |
| Genpact, Ltd. | | | 162,450 | | | | 6,363,166 | |
| | | | | | | | 20,733,755 | |
| | | | | | | | | |
| Vietnam (1.66%) | | | | | | | | |
| Ho Chi Minh City | | | | | | | | |
| Development Joint Stock | | | | | | | | |
| Commercial Bank(a) | | | 2,161,861 | | | | 2,743,904 | |
| Vietnam Dairy Products JSC | | | 758,516 | | | | 4,249,756 | |
| Vietnam Technological & | | | | | | | | |
| Commercial Joint Stock Bank(a) | | | 3,570,063 | | | | 3,646,532 | |
| | | | | | | | 10,640,192 | |
| | | | | | | | | |
| TOTAL COMMON STOCKS | | | | | | | | |
(Cost $498,560,480) | | | | | | | 620,633,989 | |
| | | | | | | | | |
| TOTAL INVESTMENTS (96.62%) | | | | | | | | |
(Cost $498,560,480) | | | | | | $ | 620,633,989 | |
| | | | | | | | | |
| Other Assets In Excess Of Liabilities (3.38%) | | | | | | | 21,730,758 | |
| | | | | | | | | |
| NET ASSETS (100.00%) | | | | | | $ | 642,364,747 | |
See Notes to Financial Statements.
| Semi-Annual Report | October 31, 2019 | 59 |
| Grandeur Peak International Opportunities Fund | Portfolio of Investments |
October 31, 2019 (Unaudited)
| (a) | Non-Income Producing Security. |
| (b) | Security exempt from registration under Rule 144A of the Securities Act of 1933. These securities may be resold in the ordinary course of business in transactions exempt from registration, normally to qualified institutional buyers. As of October 31, 2019, these securities had a total aggregate market value of $41,597,398 representing 6.48% of net assets. |
| (c) | Security was purchased pursuant to Regulation S under the Securities Act of 1933, which exempts securities offered and sold outside of the United States from registration. Such security cannot be sold in the United States without either an effective registration statement filed pursuant to the Securities Act of 1933, or pursuant to an exemption from registration. The security has been deemed liquid under guidelines approved by the Fund's Board of Trustees. As of October 31, 2019, the aggregate market value of these securities was $46,904,269, representing 7.30% of net assets. |
| (e) | As a result of the use of significant unobservable inputs to determine fair value, these investments have been classified as level 3 assets. See also Note 2 to the financial statements for additional information. |
For Fund compliance purposes, the Fund's geographical classifications refer to any one or more of the country sub-classifications used by one or more widely recognized market indexes or ratings group indexes, and/or as defined by Fund management. This definition may not apply for purposes of this report, which may combine sub-classifications for reporting ease. Geographical regions are shown as a percentage of net assets.
See Notes to Financial Statements.
| 60 | 1.855.377.7325 | www.GrandeurPeakGlobal.com |
| Grandeur Peak International Stalwarts Fund | Portfolio of Investments |
October 31, 2019 (Unaudited)
| | | Shares | | | Value (Note 2) | |
| COMMON STOCKS (95.65%) | | | | | | |
| Argentina (0.82%) | | | | | | | | |
| Globant SA(a) | | | 61,875 | | | $ | 5,770,463 | |
| | | | | | | | | |
| Australia (2.56%) | | | | | | | | |
| Appen, Ltd. | | | 250,400 | | | | 3,775,056 | |
| Corporate Travel | | | | | | | | |
| Management, Ltd. | | | 419,000 | | | | 5,092,214 | |
| Domino's Pizza Enterprises, Ltd. | | | 140,800 | | | | 4,951,062 | |
| Netwealth Group, Ltd. | | | 690,600 | | | | 4,198,900 | |
| | | | | | | | 18,017,232 | |
| Bangladesh (0.43%) | | | | | | | | |
| Square Pharmaceuticals, Ltd. | | | 1,098,613 | | | | 3,046,879 | |
| | | | | | | | | |
| Belgium (1.10%) | | | | | | | | |
| Melexis NV | | | 110,098 | | | | 7,711,354 | |
| | | | | | | | | |
| Bermuda (1.10%) | | | | | | | | |
| Bank of NT Butterfield & Son, Ltd. | | | 234,582 | | | | 7,729,477 | |
| | | | | | | | | |
| Brazil (2.35%) | | | | | | | | |
| Fleury SA | | | 955,100 | | | | 6,029,955 | |
| Pagseguro Digital, Ltd., Class A(a) | | | 155,550 | | | | 5,767,794 | |
| Raia Drogasil SA | | | 171,700 | | | | 4,707,675 | |
| | | | | | | | 16,505,424 | |
| Britain (16.56%) | | | | | | | | |
| Ascential PLC(b)(c) | | | 1,184,300 | | | | 5,357,033 | |
| B&M European Value Retail SA | | | 4,115,900 | | | | 19,742,714 | |
| boohoo Group PLC(a) | | | 2,527,314 | | | | 8,642,740 | |
| Close Brothers Group PLC | | | 244,588 | | | | 4,381,730 | |
| Dechra Pharmaceuticals PLC | | | 472,900 | | | | 16,110,662 | |
| Endava PLC, ADR(a) | | | 120,775 | | | | 5,194,533 | |
| Intermediate Capital Group PLC | | | 219,900 | | | | 4,232,845 | |
| Intertek Group PLC | | | 105,800 | | | | 7,334,831 | |
| Sanne Group PLC | | | 1,719,100 | | | | 11,757,727 | |
| Softcat PLC | | | 332,932 | | | | 4,056,044 | |
| St. James's Place PLC | | | 1,786,742 | | | | 24,093,556 | |
| Trainline PLC(a)(b)(c) | | | 1,051,600 | | | | 5,673,537 | |
| | | | | | | | 116,577,952 | |
| Canada (4.75%) | | | | | | | | |
| Gildan Activewear, Inc. | | | 272,434 | | | | 6,960,294 | |
| Lululemon Athletica, Inc.(a) | | | 79,725 | | | | 16,285,426 | |
| Ritchie Bros Auctioneers, Inc. | | | 164,175 | | | | 6,750,876 | |
| Stantec, Inc. | | | 160,889 | | | | 3,432,527 | |
| | | | | | | | 33,429,123 | |
| | | | | | | | | |
| China (8.50%) | | | | | | | | |
| 51job, Inc., ADR(a) | | | 28,225 | | | | 2,223,283 | |
| | | Shares | | | Value(Note 2) | |
| China (continued) | | | | | | |
| 58.com, Inc., ADR(a) | | | 37,475 | | | $ | 1,979,055 | |
| Baozun, Inc., Sponsored ADR(a) | | | 84,625 | | | | 3,682,880 | |
| CSPC Pharmaceutical Group, Ltd. | | | 1,599,000 | | | | 4,111,799 | |
| Ctrip.com International, Ltd., ADR(a) | | | 160,800 | | | | 5,304,792 | |
| Hangzhou Tigermed Consulting Co., Ltd., Class A | | | 418,950 | | | | 4,067,187 | |
| Silergy Corp. | | | 742,200 | | | | 20,919,748 | |
| Sonoscape Medical Corp., Class A | | | 200,000 | | | | 602,098 | |
| WuXi AppTec Co., Ltd., Class H(b)(c) | | | 444,400 | | | | 5,370,718 | |
| Wuxi Biologics Cayman, Inc.(a)(b)(c) | | | 241,000 | | | | 2,844,901 | |
| Yum China Holdings, Inc. | | | 205,700 | | | | 8,742,250 | |
| | | | | | | | 59,848,711 | |
| | | | | | | | | |
| Denmark (0.73%) | | | | | | | | |
| Ambu A/S, Class B | | | 325,736 | | | | 5,115,458 | |
| | | | | | | | | |
| France (3.89%) | | | | | | | | |
| Alten SA | | | 100,864 | | | | 11,074,994 | |
| BioMerieux | | | 64,800 | | | | 5,301,108 | |
| Bureau Veritas SA | | | 214,650 | | | | 5,479,845 | |
| Eurofins Scientific SE | | | 10,859 | | | | 5,500,834 | |
| | | | | | | | 27,356,781 | |
| | | | | | | | | |
| Georgia (0.86%) | | | | | | | | |
| Bank of Georgia Group PLC | | | 278,100 | | | | 4,679,490 | |
| Georgia Capital PLC(a) | | | 108,500 | | | | 1,367,511 | |
| | | | | | | | 6,047,001 | |
| | | | | | | | | |
| Germany (6.62%) | | | | | | | | |
| Dermapharm Holding SE | | | 229,634 | | | | 8,981,803 | |
| Grand City Properties SA | | | 411,500 | | | | 9,619,505 | |
| GRENKE AG | | | 57,650 | | | | 5,455,603 | |
| Norma Group SE | | | 190,750 | | | | 7,012,023 | |
| PATRIZIA AG | | | 450,380 | | | | 9,227,410 | |
| Puma SE | | | 84,200 | | | | 6,334,110 | |
| | | | | | | | 46,630,454 | |
| | | | | | | | | |
| Hong Kong (1.92%) | | | | | | | | |
| Value Partners Group, Ltd. | | | 12,701,000 | | | | 6,710,372 | |
| Vitasoy International Holdings, Ltd. | | | 1,677,000 | | | | 6,827,034 | |
| | | | | | | | 13,537,406 | |
| | | | | | | | | |
| India (6.09%) | | | | | | | | |
| Bajaj Finance, Ltd. | | | 234,930 | | | | 13,340,039 | |
| HDFC Bank, Ltd. | | | 330,000 | | | | 5,724,273 | |
| HDFC Life Insurance Co., Ltd.(b)(c) | | | 703,000 | | | | 6,206,490 | |
See Notes to Financial Statements.
| Semi-Annual Report | October 31, 2019 | 61 |
| Grandeur Peak International Stalwarts Fund | Portfolio of Investments |
October 31, 2019 (Unaudited)
| | | Shares | | | Value (Note 2) | |
| India (continued) | | | | | | | | |
| L&T Technology Services,Ltd.(b)(c) | | | 173,598 | | | $ | 3,680,181 | |
| WNS Holdings, Ltd., ADR(a) | | | 225,595 | | | | 13,950,795 | |
| | | | | | | | 42,901,778 | |
| | | | | | | | | |
| Indonesia (0.68%) | | | | | | | | |
| Bank Central Asia Tbk PT | | | 2,144,000 | | | | 4,803,647 | |
| | | | | | | | | |
| Israel (0.98%) | | | | | | | | |
| Wix.com, Ltd.(a) | | | 56,500 | | | | 6,896,955 | |
| | | | | | | | | |
| Italy (5.06%) | | | | | | | | |
| DiaSorin SpA | | | 119,720 | | | | 13,485,892 | |
| FinecoBank Banca Fineco SpA | | | 901,198 | | | | 10,151,569 | |
| Freni Brembo SpA | | | 600,857 | | | | 6,389,743 | |
| Interpump Group SpA | | | 204,827 | | | | 5,610,572 | |
| | | | | | | | 35,637,776 | |
| Japan (12.34%) | | | | | | | | |
| Cosmos Pharmaceutical Corp. | | | 16,900 | | | | 3,494,555 | |
| Create SD Holdings Co., Ltd. | | | 197,500 | | | | 4,925,155 | |
| Japan Lifeline Co., Ltd. | | | 552,700 | | | | 8,603,470 | |
| MISUMI Group, Inc. | | | 208,600 | | | | 5,300,476 | |
| MonotaRO Co., Ltd. | | | 312,500 | | | | 9,563,964 | |
| Nihon M&A Center, Inc. | | | 543,100 | | | | 16,646,551 | |
| Pigeon Corp. | | | 131,800 | | | | 6,492,972 | |
| Seria Co., Ltd. | | | 329,800 | | | | 8,325,167 | |
| Systena Corp. | | | 484,500 | | | | 7,007,954 | |
| Tokyo Century Corp. | | | 137,300 | | | | 6,407,927 | |
| Tsuruha Holdings, Inc. | | | 56,100 | | | | 6,353,394 | |
| Unicharm Corp. | | | 109,500 | | | | 3,740,582 | |
| | | | | | | | 86,862,167 | |
| Mexico (0.74%) | | | | | | | | |
| Regional SAB de CV | | | 982,150 | | | | 5,229,215 | |
| | | | | | | | | |
| Netherlands (3.37%) | | | | | | | | |
| Aalberts NV | | | 402,158 | | | | 16,173,872 | |
| QIAGEN NV(a) | | | 133,025 | | | | 3,965,475 | |
| Takeaway.com NV(a)(b)(c) | | | 44,000 | | | | 3,582,343 | |
| | | | | | | | 23,721,690 | |
| Philippines (0.60%) | | | | | | | | |
| Puregold Price Club, Inc. | | | 5,236,200 | | | | 4,215,169 | |
| | | | | | | | | |
| Poland (1.09%) | | | | | | | | |
| Dino Polska SA(a)(b)(c) | | | 196,772 | | | | 7,673,832 | |
| | | | | | | | | |
| South Korea (0.47%) | | | | | | | | |
| LG Household & Health Care, Ltd. | | | 3,050 | | | | 3,305,729 | |
| | | | | | | | | |
| Sweden (3.30%) | | | | | | | | |
| AddTech AB, Class B | | | 161,500 | | | | 4,490,897 | |
| EQT AB(a) | | | 494,100 | | | | 4,740,560 | |
| | | Shares | | | Value (Note 2) | |
| Sweden (continued) | | | | | | |
| Hexpol AB | | | 435,400 | | | $ | 3,877,958 | |
| Nibe Industrier AB, Class B | | | 301,800 | | | | 4,125,812 | |
| Sweco AB, Class B | | | 170,500 | | | | 5,996,644 | |
| | | | | | | | 23,231,871 | |
| | | | | | | | | |
| Switzerland (1.27%) | | | | | | | | |
| Partners Group Holding AG | | | 11,490 | | | | 8,959,055 | |
| | | | | | | | | |
| United Arab Emirates (0.96%) | | | | | | | | |
| Aramex PJSC | | | 2,889,000 | | | | 3,083,488 | |
| Network InternationalHoldings PLC(a)(b)(c) | | | 524,400 | | | | 3,674,923 | |
| | | | | | | | 6,758,411 | |
| | | | | | | | | |
| United States (4.70%) | | | | | | | | |
| Accenture PLC, Class A | | | 22,750 | | | | 4,218,305 | |
| Burford Capital, Ltd. | | | 341,900 | | | | 3,895,142 | |
| EPAM Systems, Inc.(a) | | | 79,725 | | | | 14,028,411 | |
| Genpact, Ltd. | | | 279,975 | | | | 10,966,621 | |
| | | | | | | | 33,108,479 | |
| | | | | | | | | |
| Vietnam (1.81%) | | | | | | | | |
| Ho Chi Minh City | | | | | | | | |
| Development Joint Stock | | | | | | | | |
| Commercial Bank(a) | | | 1,946,248 | | | | 2,470,241 | |
| Vietnam Dairy Products JSC | | | 1,148,910 | | | | 6,437,025 | |
| Vietnam Technological &Commercial Joint Stock Bank(a) | | | 3,771,617 | | | | 3,852,404 | |
| | | | | | | | 12,759,670 | |
| TOTAL COMMON STOCKS | | | | | | | | |
| (Cost $578,531,454) | | | | | | | 673,389,159 | |
| | | | | | | | | |
| TOTAL INVESTMENTS (95.65%) | | | | | | | | |
| (Cost $578,531,454) | | | | | | $ | 673,389,159 | |
| | | | | | | | | |
| Other Assets In Excess Of Liabilities (4.35%) | | | | | | | 30,659,117 | |
| | | | | | | | | |
| NET ASSETS (100.00%) | | | | | | $ | 704,048,276 | |
See Notes to Financial Statements.
| 62 | 1.855.377.7325 | www.GrandeurPeakGlobal.com |
| Grandeur Peak International Stalwarts Fund | Portfolio of Investments |
October 31, 2019 (Unaudited)
| (a) | Non-Income Producing Security. |
| (b) | Security exempt from registration under Rule 144A of the Securities Act of 1933. These securities may be resold in the ordinary course of business in transactions exempt from registration, normally to qualified institutional buyers. As of October 31, 2019, these securities had a total aggregate market value of $44,063,958 representing 6.26% of net assets. |
| (c) | Security was purchased pursuant to Regulation S under the Securities Act of 1933, which exempts securities offered and sold outside of the United States from registration. Such security cannot be sold in the United States without either an effective registration statement filed pursuant to the Securities Act of 1933, or pursuant to an exemption from registration. The security has been deemed liquid under guidelines approved by the Fund's Board of Trustees. As of October 31, 2019, the aggregate market value of these securities was $44,063,958, representing 6.26% of net assets. |
For Fund compliance purposes, the Fund's geographical classifications refer to any one or more of the country sub-classifications used by one or more widely recognized market indexes or ratings group indexes, and/or as defined by Fund management. This definition may not apply for purposes of this report, which may combine sub-classifications for reporting ease. Geographical regions are shown as a percentage of net assets.
See Notes to Financial Statements.
| Semi-Annual Report | October 31, 2019 | 63 |
| Grandeur Peak Funds® | Statements of Assets and Liabilities |
October 31, 2019 (Unaudited)
| | | Grandeur Peak Emerging Markets Opportunities Fund | | Grandeur Peak Global Contrarian Fund | | Grandeur Peak Global Micro Cap Fund | | Grandeur Peak Global Opportunities Fund |
| ASSETS | | | | | | | | |
| Investments, at value (Cost - see below) | | $ | 429,454,367 | | | $ | 4,670,352 | | | $ | 33,390,250 | | | $ | 640,514,069 | |
| Cash | | | 29,396,615 | | | | – | | | | 435,848 | | | | 18,940,434 | |
| Foreign cash, at value (Cost $1,617, $43,513, $9,385 and $28,222, respectively) | | | 1,619 | | | | 43,520 | | | | 9,454 | | | | 28,346 | |
| Dividends and interest receivable | | | 359,118 | | | | 6,604 | | | | 24,762 | | | | 802,204 | |
| Receivable for investments sold | | | – | | | | – | | | | 88,776 | | | | 522,458 | |
| Receivable for fund shares subscribed | | | 25,440 | | | | 976 | | | | 60 | | | | 45,655 | |
| Receivable due from advisor | | | – | | | | 18,213 | | | | – | | | | – | |
| Deferred offering cost | | | – | | | | 59,416 | | | | – | | | | – | |
| Prepaid and other assets | | | 11,708 | | | | 42 | | | | 1,419 | | | | 11,332 | |
| Total assets | | | 459,248,867 | | | | 4,799,123 | | | | 33,950,569 | | | | 660,864,498 | |
| | | | | | | | | | | | | | | | | |
| LIABILITIES | | | | | | | | | | | | | | | | |
| Payable to custodian | | | – | | | | 6,263 | | | | – | | | | – | |
| Payable for investments purchased | | | 12,405 | | | | – | | | | – | | | | 480,293 | |
| Foreign capital gains tax | | | 1,233,448 | | | | – | | | | 48,072 | | | | 647,374 | |
| Payable for fund shares redeemed | | | 13,207 | | | | 6,344 | | | | – | | | | 339,830 | |
| Advisory fees payable | | | 507,810 | | | | – | | | | 38,439 | | | | 662,800 | |
| Administration fees payable | | | 37,561 | | | | 6,057 | | | | 15,313 | | | | 47,774 | |
| Custodian fees payable | | | 115,159 | | | | 9,016 | | | | 12,897 | | | | 75,934 | |
| Payable for trustee fees and expenses | | | 8,238 | | | | 101 | | | | 656 | | | | 11,571 | |
| Payable for chief compliance officer fee | | | 1,473 | | | | 32 | | | | 122 | | | | 2,023 | |
| Payable for principal financial officer fees | | | 278 | | | | 7 | | | | 24 | | | | 383 | |
| Distribution and service fees payable | | | 2,714 | | | | – | | | | – | | | | 24,905 | |
| Payable for transfer agency fees | | | 7,146 | | | | 4,165 | | | | 7,047 | | | | 14,560 | |
| Accrued expenses and other liabilities | | | 41,332 | | | | 72,920 | | | | 28,117 | | | | 53,758 | |
| Total liabilities | | | 1,980,771 | | | | 104,905 | | | | 150,687 | | | | 2,361,205 | |
| NET ASSETS | | $ | 457,268,096 | | | $ | 4,694,218 | | | $ | 33,799,882 | | | $ | 658,503,293 | |
| | | | | | | | | | | | | | | | | |
| NET ASSETS CONSISTS OF | | | | | | | | | | | | | | | | |
| Paid-in capital (Note 5) | | $ | 392,195,529 | | | $ | 4,612,862 | | | $ | 28,754,190 | | | $ | 475,625,151 | |
| Total distributable earnings | | | 65,072,567 | | | | 81,356 | | | | 5,045,692 | | | | 182,878,142 | |
| NET ASSETS | | $ | 457,268,096 | | | $ | 4,694,218 | | | $ | 33,799,882 | | | $ | 658,503,293 | |
| | | | | | | | | | | | | | | | | |
| INVESTMENTS, AT COST | | $ | 352,282,793 | | | $ | 4,606,276 | | | $ | 28,385,793 | | | $ | 494,659,928 | |
| | | | | | | | | | | | | | | | | |
| PRICING OF SHARES | | | | | | | | | | | | | | | | |
| Investor Class | | | | | | | | | | | | | | | | |
| Net Assets | | $ | 13,109,405 | | | $ | – | | | $ | – | | | $ | 119,907,829 | |
| Net Asset Value, offering and redemption price per share | | $ | 12.26 | | | $ | – | | | $ | – | | | $ | 3.55 | |
| Shares of beneficial interest outstanding | | | 1,069,222 | | | | – | | | | – | | | | 33,778,003 | |
| Institutional Class | | | | | | | | | | | | | | | | |
| Net Assets | | $ | 444,158,691 | | | $ | 4,694,218 | | | $ | 33,799,882 | | | $ | 538,595,464 | |
| Net Asset Value, offering and redemption price per share | | $ | 12.34 | | | $ | 10.16 | | | $ | 11.63 | | | $ | 3.60 | |
| Shares of beneficial interest outstanding | | | 35,986,232 | | | | 461,898 | | | | 2,905,529 | | | | 149,575,959 | |
See Notes to Financial Statements.
| 64 | 1.855.377.7325 | www.GrandeurPeakGlobal.com |
| Grandeur Peak Funds® | Statements of Assets and Liabilities |
October 31, 2019 (Unaudited)
| | | Grandeur Peak Global Reach Fund | | Grandeur Peak Global Stalwarts Fund | | Grandeur Peak International Opportunities Fund | | Grandeur Peak International Stalwarts Fund |
| ASSETS | | | | | | | | |
| Investments, at value (Cost - see below) | | $ | 300,659,482 | | | $ | 181,935,157 | | | $ | 620,633,989 | | | $ | 673,389,159 | |
| Cash | | | 4,283,084 | | | | 6,353,279 | | | | 21,635,839 | | | | 31,859,736 | |
| Foreign cash, at value (Cost $5,316, $–, $12,298 and $–, respectively) | | | 5,318 | | | | | | | | 12,298 | | | | | |
| Dividends and interest receivable | | | 225,032 | | | | 188,218 | | | | 929,653 | | | | 811,814 | |
| Receivable for investments sold | | | 1,556,459 | | | | 103,982 | | | | 2,110,895 | | | | 527,757 | |
| Receivable for fund shares subscribed | | | 230,082 | | | | 380,280 | | | | 130,654 | | | | 558,781 | |
| Prepaid and other assets | | | 23,297 | | | | 21,162 | | | | 12,388 | | | | 32,790 | |
| Total assets | | | 306,982,754 | | | | 188,982,078 | | | | 645,465,716 | | | | 707,180,037 | |
| | | | | | | | | | | | | | | | | |
| LIABILITIES | | | | | | | | | | | | | | | | |
| Payable for investments purchased | | | 7,007 | | | | 1,316,614 | | | | 1,167,931 | | | | 860,785 | |
| Foreign capital gains tax | | | 295,419 | | | | 296,306 | | | | 666,418 | | | | 1,307,158 | |
| Payable for fund shares redeemed | | | 265,493 | | | | 33,060 | | | | 389,166 | | | | 282,810 | |
| Advisory fees payable | | | 283,474 | | | | 123,396 | | | | 656,604 | | | | 473,141 | |
| Administration fees payable | | | 37,392 | | | | 17,816 | | | | 48,518 | | | | 43,616 | |
| Custodian fees payable | | | 54,874 | | | | 26,343 | | | | 95,496 | | | | 61,762 | |
| Payable for trustee fees and expenses | | | 5,842 | | | | 3,479 | | | | 12,123 | | | | 11,113 | |
| Payable for chief compliance officer fee | | | 1,042 | | | | 632 | | | | 2,210 | | | | 1,850 | |
| Payable for principal financial officer fees | | | 196 | | | | 119 | | | | 413 | | | | 354 | |
| Distribution and service fees payable | | | 11,244 | | | | 17,782 | | | | 10,962 | | | | 15,390 | |
| Payable for transfer agency fees | | | 11,553 | | | | 13,163 | | | | 7,773 | | | | 25,613 | |
| Accrued expenses and other liabilities | | | 42,877 | | | | 35,413 | | | | 43,355 | | | | 48,169 | |
| Total liabilities | | | 1,016,413 | | | | 1,884,123 | | | | 3,100,969 | | | | 3,131,761 | |
| NET ASSETS | | $ | 305,966,341 | | | $ | 187,097,955 | | | $ | 642,364,747 | | | $ | 704,048,276 | |
| | | | | | | | | | | | | | | | | |
| NET ASSETS CONSISTS OF | | | | | | | | | | | | | | | | |
| Paid-in capital (Note 5) | | $ | 235,501,540 | | | $ | 152,134,993 | | | $ | 496,550,207 | | | $ | 610,867,492 | |
| Total distributable earnings | | | 70,464,801 | | | | 34,962,962 | | | | 145,814,540 | | | | 93,180,784 | |
| NET ASSETS | | $ | 305,966,341 | | | $ | 187,097,955 | | | $ | 642,364,747 | | | $ | 704,048,276 | |
| | | | | | | | | | | | | | | | | |
| INVESTMENTS, AT COST | | $ | 238,435,890 | | | $ | 149,861,371 | | | $ | 498,560,480 | | | $ | 578,531,454 | |
| | | | | | | | | | | | | | | | | |
| PRICING OF SHARES | | | | | | | | | | | | | | | | |
| Investor Class | | | | | | | | | | | | | | | | |
| Net Assets | | $ | 54,261,834 | | | $ | 86,313,443 | | | $ | 52,129,696 | | | $ | 74,794,319 | |
| Net Asset Value, offering and redemption price per share | | $ | 15.28 | | | $ | 14.86 | | | $ | 3.36 | | | $ | 14.81 | |
| Shares of beneficial interest outstanding | | | 3,550,504 | | | | 5,807,559 | | | | 15,515,619 | | | | 5,050,158 | |
| Institutional Class | | | | | | | | | | | | | | | | |
| Net Assets | | $ | 251,704,507 | | | $ | 100,784,512 | | | $ | 590,235,051 | | | $ | 629,253,957 | |
| Net Asset Value, offering and redemption price per share | | $ | 15.36 | | | $ | 14.97 | | | $ | 3.38 | | | $ | 14.87 | |
| Shares of beneficial interest outstanding | | | 16,388,190 | | | | 6,731,216 | | | | 174,445,354 | | | | 42,302,929 | |
See Notes to Financial Statements.
| Semi-Annual Report | October 31, 2019 | 65 |
| Grandeur Peak Funds® | Statements of Operations |
For the Six Months Ended October 31, 2019 (Unaudited)
| | | Grandeur Peak Emerging Markets Opportunities Fund | | Grandeur Peak Global Contrarian Fund | | Grandeur Peak Global Micro Cap Fund | | Grandeur Peak Global Opportunities Fund |
| INVESTMENT INCOME | | | | | | | | |
| Dividends | | $ | 5,878,408 | | | $ | 13,085 | | | $ | 474,467 | | | $ | 5,571,481 | |
| Interest | | | 7,377 | | | | – | | | | 2,178 | | | | 5,527 | |
| Foreign taxes withheld | | | (535,649 | ) | | | (1,048 | ) | | | (55,117 | ) | | | (477,194 | ) |
| Total investment income | | | 5,350,136 | | | | 12,037 | | | | 421,528 | | | | 5,099,814 | |
| EXPENSES | | | | | | | | | | | | | | | | |
| Investment advisor fees (Note 6) | | | 3,030,696 | | | | 4,470 | | | | 259,122 | | | | 4,027,621 | |
| Administrative fees | | | 87,745 | | | | 6,057 | | | | 20,237 | | | | 117,957 | |
| Distribution and service fees - Investor Class | | | 14,631 | | | | – | | | | – | | | | 145,264 | |
| Transfer agent fees | | | 19,511 | | | | 4,165 | | | | 18,882 | | | | 33,499 | |
| Professional fees | | | 22,608 | | | | 4,426 | | | | 16,388 | | | | 21,946 | |
| Printing fees | | | 5,834 | | | | 642 | | | | 1,241 | | | | 15,129 | |
| Registration fees | | | 17,559 | | | | – | | | | 9,918 | | | | 17,281 | |
| Custodian fees | | | 233,678 | | | | 9,016 | | | | 30,181 | | | | 143,779 | |
| Trustee fees and expenses | | | 8,019 | | | | 101 | | | | 637 | | | | 11,439 | |
| Chief compliance officer fees | | | 5,160 | | | | 32 | | | | 408 | | | | 7,314 | |
| Principal financial officer fees | | | 780 | | | | 7 | | | | 63 | | | | 1,105 | |
| Offering costs | | | – | | | | 7,868 | | | | – | | | | – | |
| Other expenses | | | 7,761 | | | | 436 | | | | 2,909 | | | | 11,143 | |
| Total expenses | | | 3,453,982 | | | | 37,220 | | | | 359,986 | | | | 4,553,477 | |
| Voluntary waiver of investment advisory fees (Note 6) | | | (35,105 | ) | | | – | | | | – | | | | (106,265 | ) |
| Less fees waived/ reimbursed by investment advisor (Note 6) | | | – | | | | (31,116 | ) | | | (14,605 | ) | | | – | |
| Total net expenses | | | 3,418,877 | | | | 6,104 | | | | 345,381 | | | | 4,447,212 | |
| NET INVESTMENT INCOME | | | 1,931,259 | | | | 5,933 | | | | 76,147 | | | | 652,602 | |
| REALIZED AND UNREALIZED GAIN/(LOSS) ON INVESTMENTS | | | | | | | | | | | | | | | | |
| Net realized gain/(loss) on investments | | | (3,165,857 | ) | | | 15,465 | | | | 192,816 | | | | 18,631,889 | |
| Net realized loss on foreign currency transactions | | | (102,485 | ) | | | (4,160 | ) | | | (8,878 | ) | | | (90,466 | ) |
| Net realized gain/(loss) | | | (3,268,342 | ) | | | 11,305 | | | | 183,938 | | | | 18,541,423 | |
| Net change in unrealized appreciation/(depreciation) on investments (net of change in foreign capital gains tax of $641,217, $0, $40,635 and $363,613, respectively) | | | 17,593,233 | | | | 64,076 | | | | 671,414 | | | | (5,575,644 | ) |
| Net change in unrealized appreciation on translation of assets and liabilities in foreign currencies | | | 8,171 | | | | 42 | | | | 574 | | | | 7,068 | |
| Net change in unrealized appreciation/(depreciation) | | | 17,601,404 | | | | 64,118 | | | | 671,988 | | | | (5,568,576 | ) |
| NET REALIZED AND UNREALIZED GAIN ON INVESTMENTS AND FOREIGN CURRENCY TRANSACTIONS | | | 14,333,062 | | | | 75,423 | | | | 855,926 | | | | 12,972,847 | |
| NET INCREASE IN NET ASSETS RESULTING FROM OPERATIONS | | $ | 16,264,321 | | | $ | 81,356 | | | $ | 932,073 | | | $ | 13,625,449 | |
See Notes to Financial Statements.
| 66 | 1.855.377.7325 | www.GrandeurPeakGlobal.com |
| Grandeur Peak Funds® | Statements of Operations |
For the Six Months Ended October 31, 2019 (Unaudited)
| | | Grandeur Peak Global Reach Fund | | Grandeur Peak Global Stalwarts Fund | | Grandeur Peak International Opportunities Fund | | Grandeur Peak International Stalwarts Fund |
| INVESTMENT INCOME | | | | | | | | |
| Dividends | | $ | 3,128,591 | | | $ | 1,418,518 | | | $ | 7,036,139 | | | $ | 5,558,657 | |
| Interest | | | 11,148 | | | | – | | | | 7,360 | | | | – | |
| Foreign taxes withheld | | | (289,353 | ) | | | (94,918 | ) | | | (720,805 | ) | | | (423,706 | ) |
| Total investment income | | | 2,850,386 | | | | 1,323,600 | | | | 6,322,694 | | | | 5,134,951 | |
| EXPENSES | | | | | | | | | | | | | | | | |
| Investment advisor fees (Note 6) | | | 1,767,140 | | | | 747,961 | | | | 4,131,302 | | | | 2,678,523 | |
| Administrative fees | | | 72,787 | | | | 40,982 | | | | 120,848 | | | | 116,157 | |
| Distribution and service fees - Investor Class | | | 65,888 | | | | 106,131 | | | | 65,338 | | | | 90,332 | |
| Transfer agent fees | | | 27,842 | | | | 31,391 | | | | 20,116 | | | | 57,408 | |
| Professional fees | | | 19,523 | | | | 18,700 | | | | 20,102 | | | | 22,465 | |
| Printing fees | | | 9,183 | | | | 5,753 | | | | 10,741 | | | | 13,467 | |
| Registration fees | | | 14,790 | | | | 17,454 | | | | 18,014 | | | | 22,341 | |
| Custodian fees | | | 118,691 | | | | 64,276 | | | | 189,186 | | | | 147,056 | |
| Trustee fees and expenses | | | 5,834 | | | | 3,402 | | | | 12,149 | | | | 11,465 | |
| Chief compliance officer fees | | | 3,716 | | | | 2,185 | | | | 7,760 | | | | 7,227 | |
| Principal financial officer fees | | | 561 | | | | 330 | | | | 1,171 | | | | 1,092 | |
| Other expenses | | | 7,955 | | | | 4,536 | | | | 11,297 | | | | 8,381 | |
| Total expenses | | | 2,113,910 | | | | 1,043,101 | | | | 4,608,024 | | | | 3,175,914 | |
| Voluntary waiver of investment advisory fees (Note 6) | | | – | | | | – | | | | (118,707 | ) | | | – | |
| Total net expenses | | | 2,113,910 | | | | 1,043,101 | | | | 4,489,317 | | | | 3,175,914 | |
| NET INVESTMENT INCOME | | | 736,476 | | | | 280,499 | | | | 1,833,377 | | | | 1,959,037 | |
| REALIZED AND UNREALIZED GAIN/(LOSS) ON INVESTMENTS | | | | | | | | | | | | | | | | |
| Net realized gain on investments | | | 5,243,634 | | | | 1,201,889 | | | | 20,105,067 | | | | 297,380 | |
| Net realized loss on foreign currency transactions | | | (64,228 | ) | | | (10,499 | ) | | | (103,085 | ) | | | (73,182 | ) |
| Net realized gain | | | 5,179,406 | | | | 1,191,390 | | | | 20,001,982 | | | | 224,198 | |
| Net change in unrealized appreciation/(depreciation) on investments (net of change in foreign capital gains tax of $133,095, $103,281, $518,619 and $578,337, respectively) | | | 332,962 | | | | (1,426,029 | ) | | | (18,127,163 | ) | | | 6,261,064 | |
| Net change in unrealized appreciation on translation of assets and liabilities in foreign currencies | | | 3,406 | | | | 4,677 | | | | 12,085 | | | | 16,912 | |
| Net change in unrealized appreciation/(depreciation) | | | 336,368 | | | | (1,421,352 | ) | | | (18,115,078 | ) | | | 6,277,976 | |
| NET REALIZED AND UNREALIZED GAIN/(LOSS) ON INVESTMENTS AND FOREIGN CURRENCY TRANSACTIONS | | | 5,515,774 | | | | (229,962 | ) | | | 1,886,904 | | | | 6,502,174 | |
| NET INCREASE IN NET ASSETS RESULTING FROM OPERATIONS | | $ | 6,252,250 | | | $ | 50,537 | | | $ | 3,720,281 | | | $ | 8,461,211 | |
See Notes to Financial Statements.
| Semi-Annual Report | October 31, 2019 | 67 |
| Grandeur Peak Emerging Markets Opportunities Fund | Statements of Changes in Net Assets |
| | | For the Six Months Ended October 31, 2019 (Unaudited) | | For the Year Ended April 30, 2019 |
| OPERATIONS | | | | |
| Net investment income | | $ | 1,931,259 | | | $ | 1,227,659 | |
| Net realized loss | | | (3,268,342 | ) | | | (9,273,234 | ) |
| Net change in unrealized appreciation/(depreciation) | | | 17,601,404 | | | | (30,664,882 | ) |
| Net increase/(decrease) in net assets resulting from operations | | | 16,264,321 | | | | (38,710,457 | ) |
| | | | | | | | | |
| DISTRIBUTIONS TO SHAREHOLDERS (NOTE 3) | | | | | | | | |
| Investor Class | | | – | | | | (127,582 | ) |
| Institutional Class | | | – | | | | (4,727,858 | ) |
| Net decrease in net assets from distributions | | | – | | | | (4,855,440 | ) |
| | | | | | | | | |
| CAPITAL SHARE TRANSACTIONS (NOTE 5) | | | | | | | | |
| Investor Class | | | | | | | | |
| Proceeds from sales of shares | | | 94,443 | | | | 1,059,350 | |
| Distributions reinvested | | | – | | | | 125,079 | |
| Cost of shares redeemed | | | (1,307,694 | ) | | | (4,014,777 | ) |
| Redemption fees | | | – | | | | 7 | |
| Net decrease from capital shares transactions | | | (1,213,251 | ) | | | (2,830,341 | ) |
| | | | | | | | | |
| Institutional Class | | | | | | | | |
| Proceeds from sales of shares | | | 17,347,099 | | | | 90,993,584 | |
| Distributions reinvested | | | – | | | | 4,442,600 | |
| Cost of shares redeemed | | | (41,528,871 | ) | | | (72,570,056 | ) |
| Redemption fees | | | 222 | | | | 668 | |
| Net increase/(decrease) from capital shares transactions | | | (24,181,550 | ) | | | 22,866,796 | |
| Net decrease in net assets | | | (9,130,480 | ) | | | (23,529,442 | ) |
| | | | | | | | | |
| NET ASSETS | | | | | | | | |
| Beginning of period | | | 466,398,576 | | | | 489,928,018 | |
| End of period | | $ | 457,268,096 | | | $ | 466,398,576 | |
| | | | | | | | | |
| OTHER INFORMATION | | | | | | | | |
| Shares Transactions | | | | | | | | |
| Investor Class | | | | | | | | |
| Issued | | | 8,005 | | | | 93,074 | |
| Issued to shareholders in reinvestment of distributions | | | – | | | | 12,299 | |
| Redeemed | | | (112,264 | ) | | | (362,466 | ) |
| Net decrease in share transactions | | | (104,259 | ) | | | (257,093 | ) |
| | | | | | | | | |
| Institutional Class | | | | | | | | |
| Issued | | | 1,468,411 | | | | 8,122,212 | |
| Issued to shareholders in reinvestment of distributions | | | – | | | | 434,697 | |
| Redeemed | | | (3,560,053 | ) | | | (6,406,798 | ) |
| Net increase/(decrease) in share transactions | | | (2,091,642 | ) | | | 2,150,111 | |
See Notes to Financial Statements.
| 68 | 1.855.377.7325 | www.GrandeurPeakGlobal.com |
| Grandeur Peak Global Contrarian Fund | Statements of Changes in Net Assets |
| | | For the Period September 17, 2019 (Inception) to October 31, 2019 |
| OPERATIONS | | |
| Net investment income | | $ | 5,933 | |
| Net realized gain | | | 11,305 | |
| Net change in unrealized appreciation | | | 64,118 | |
| Net increase in net assets resulting from operations | | | 81,356 | |
| | | | | |
| CAPITAL SHARE TRANSACTIONS (NOTE 5) | | | | |
| Institutional Class | | | | |
| Proceeds from sales of shares | | | 4,930,050 | |
| Cost of shares redeemed | | | (317,188 | ) |
| Net increase from capital shares transactions | | | 4,612,862 | |
| Net increase in net assets | | | 4,694,218 | |
| | | | | |
| NET ASSETS | | | | |
| Beginning of period | | | – | |
| End of period | | $ | 4,694,218 | |
| | | | | |
| OTHER INFORMATION | | | | |
| Shares Transactions | | | | |
| Institutional Class | | | | |
| Issued | | | 493,118 | |
| Redeemed | | | (31,220 | ) |
| Net increase in share transactions | | | 461,898 | |
See Notes to Financial Statements.
| Semi-Annual Report | October 31, 2019 | 69 |
| Grandeur Peak Global Micro Cap Fund | Statements of Changes in Net Assets |
| | | For the Six Months Ended October 31, 2019 (Unaudited) | | For the Year Ended April 30, 2019 |
| OPERATIONS | | | | |
| Net investment income/(loss) | | $ | 76,147 | | | $ | (22,768 | ) |
| Net realized gain | | | 183,938 | | | | 213,901 | |
| Net change in unrealized appreciation/(depreciation) | | | 671,988 | | | | (3,433,311 | ) |
| Net increase/(decrease) in net assets resulting from operations | | | 932,073 | | | | (3,242,178 | ) |
| | | | | | | | | |
| DISTRIBUTIONS TO SHAREHOLDERS (NOTE 3) | | | | | | | | |
| Institutional Class | | | – | | | | (2,218,023 | ) |
| Net decrease in net assets from distributions | | | – | | | | (2,218,023 | ) |
| | | | | | | | | |
| CAPITAL SHARE TRANSACTIONS (NOTE 5) | | | | | | | | |
| Institutional Class | | | | | | | | |
| Proceeds from sales of shares | | | 401,921 | | | | 1,235,898 | |
| Distributions reinvested | | | – | | | | 2,094,860 | |
| Cost of shares redeemed | | | (3,188,595 | ) | | | (3,925,444 | ) |
| Redemption fees | | | 2 | | | | 18 | |
| Net decrease from capital shares transactions | | | (2,786,672 | ) | | | (594,668 | ) |
| Net decrease in net assets | | | (1,854,599 | ) | | | (6,054,869 | ) |
| | | | | | | | | |
| NET ASSETS | | | | | | | | |
| Beginning of period | | | 35,654,481 | | | | 41,709,350 | |
| End of period | | $ | 33,799,882 | | | $ | 35,654,481 | |
| | | | | | | | | |
| OTHER INFORMATION | | | | | | | | |
| Shares Transactions | | | | | | | | |
| Institutional Class | | | | | | | | |
| Issued | | | 35,580 | | | | 107,279 | |
| Issued to shareholders in reinvestment of distributions | | | – | | | | 207,617 | |
| Redeemed | | | (282,904 | ) | | | (341,842 | ) |
| Net decrease in share transactions | | | (247,324 | ) | | | (26,946 | ) |
See Notes to Financial Statements.
| 70 | 1.855.377.7325 | www.GrandeurPeakGlobal.com |
| Grandeur Peak Global Opportunities Fund | Statements of Changes in Net Assets |
| | | For the Six Months Ended October 31, 2019 (Unaudited) | | For the Year Ended April 30, 2019 |
| OPERATIONS | | | | |
| Net investment income | | $ | 652,602 | �� | | $ | 535,030 | |
| Net realized gain | | | 18,541,423 | | | | 48,492,349 | |
| Net change in unrealized depreciation | | | (5,568,576 | ) | | | (76,714,505 | ) |
| Net increase/(decrease) in net assets resulting from operations | | | 13,625,449 | | | | (27,687,126 | ) |
| | | | | | | | | |
| DISTRIBUTIONS TO SHAREHOLDERS (NOTE 3) | | | | | | | | |
| Investor Class | | | – | | | | (13,296,063 | ) |
| Institutional Class | | | – | | | | (47,299,225 | ) |
| Net decrease in net assets from distributions | | | – | | | | (60,595,288 | ) |
| | | | | | | | | |
| CAPITAL SHARE TRANSACTIONS (NOTE 5) | | | | | | | | |
| Investor Class | | | | | | | | |
| Proceeds from sales of shares | | | 3,632,191 | | | | 12,071,234 | |
| Distributions reinvested | | | – | | | | 12,221,920 | |
| Cost of shares redeemed | | | (16,643,077 | ) | | | (60,190,701 | ) |
| Redemption fees | | | 60 | | | | 1,633 | |
| Net decrease from capital shares transactions | | | (13,010,826 | ) | | | (35,895,914 | ) |
| Institutional Class | | | | | | | | |
| Proceeds from sales of shares | | | 29,293,203 | | | | 44,492,723 | |
| Distributions reinvested | | | – | | | | 44,606,172 | |
| Cost of shares redeemed | | | (26,011,964 | ) | | | (90,165,710 | ) |
| Redemption fees | | | 1 | | | | 3,396 | |
| Net increase/(decrease) from capital shares transactions | | | 3,281,240 | | | | (1,063,419 | ) |
| Net increase/(decrease) in net assets | | | 3,895,863 | | | | (125,241,747 | ) |
| | | | | | | | | |
| NET ASSETS | | | | | | | | |
| Beginning of period | | | 654,607,430 | | | | 779,849,177 | |
| End of period | | $ | 658,503,293 | | | $ | 654,607,430 | |
| | | | | | | | | |
| OTHER INFORMATION | | | | | | | | |
| Shares Transactions | | | | | | | | |
| Investor Class | | | | | | | | |
| Issued | | | 1,061,202 | | | | 3,435,546 | |
| Issued to shareholders in reinvestment of distributions | | | – | | | | 4,243,722 | |
| Redeemed | | | (4,873,639 | ) | | | (17,770,409 | ) |
| Net decrease in share transactions | | | (3,812,437 | ) | | | (10,091,141 | ) |
| | | | | | | | | |
| Institutional Class | | | | | | | | |
| Issued | | | 8,392,248 | | | | 12,712,597 | |
| Issued to shareholders in reinvestment of distributions | | | – | | | | 15,328,581 | |
| Redeemed | | | (7,478,943 | ) | | | (27,328,207 | ) |
| Net increase in share transactions | | | 913,305 | | | | 712,971 | |
See Notes to Financial Statements.
| Semi-Annual Report | October 31, 2019 | 71 |
| Grandeur Peak Global Reach Fund | Statements of Changes in Net Assets |
| | | For the Six Months Ended October 31, 2019 (Unaudited) | | For the Year Ended April 30, 2019 |
| OPERATIONS | | | | |
| Net investment income | | $ | 736,476 | | | $ | 844,408 | |
| Net realized gain | | | 5,179,406 | | | | 20,115,164 | |
| Net change in unrealized appreciation/(depreciation) | | | 336,368 | | | | (30,255,494 | ) |
| Net increase/(decrease) in net assets resulting from operations | | | 6,252,250 | | | | (9,295,922 | ) |
| | | | | | | | | |
| DISTRIBUTIONS TO SHAREHOLDERS (NOTE 3) | | | | | | | | |
| Investor Class | | | – | | | | (5,034,062 | ) |
| Institutional Class | | | – | | | | (24,526,234 | ) |
| Net decrease in net assets from distributions | | | – | | | | (29,560,296 | ) |
| | | | | | | | | |
| CAPITAL SHARE TRANSACTIONS (NOTE 5) | | | | | | | | |
| Investor Class | | | | | | | | |
| Proceeds from sales of shares | | | 1,526,223 | | | | 6,349,549 | |
| Distributions reinvested | | | – | | | | 4,744,648 | |
| Cost of shares redeemed | | | (4,566,401 | ) | | | (13,942,928 | ) |
| Redemption fees | | | 4 | | | | 126 | |
| Net decrease from capital shares transactions | | | (3,040,174 | ) | | | (2,848,605 | ) |
| Institutional Class | | | | | | | | |
| Proceeds from sales of shares | | | 11,546,929 | | | | 16,753,765 | |
| Distributions reinvested | | | – | | | | 22,514,921 | |
| Cost of shares redeemed | | | (37,843,094 | ) | | | (36,706,628 | ) |
| Redemption fees | | | 559 | | | | 213 | |
| Net increase/(decrease) from capital shares transactions | | | (26,295,606 | ) | | | 2,562,271 | |
| Net decrease in net assets | | | (23,083,530 | ) | | | (39,142,552 | ) |
| | | | | | | | | |
| NET ASSETS | | | | | | | | |
| Beginning of period | | | 329,049,871 | | | | 368,192,423 | |
| End of period | | $ | 305,966,341 | | | $ | 329,049,871 | |
| | | | | | | | | |
| OTHER INFORMATION | | | | | | | | |
| Shares Transactions | | | | | | | | |
| Investor Class | | | | | | | | |
| Issued | | | 104,001 | | | | 410,809 | |
| Issued to shareholders in reinvestment of distributions | | | – | | | | 381,403 | |
| Redeemed | | | (311,656 | ) | | | (918,342 | ) |
| Net decrease in share transactions | | | (207,655 | ) | | | (126,130 | ) |
| Institutional Class | | | | | | | | |
| Issued | | | 781,973 | | | | 1,076,282 | |
| Issued to shareholders in reinvestment of distributions | | | – | | | | 1,804,077 | |
| Redeemed | | | (2,529,547 | ) | | | (2,500,050 | ) |
| Net increase/(decrease) in share transactions | | | (1,747,574 | ) | | | 380,309 | |
See Notes to Financial Statements.
| 72 | 1.855.377.7325 | www.GrandeurPeakGlobal.com |
| Grandeur Peak Global Stalwarts Fund | Statements of Changes in Net Assets |
| | | For the Six Months Ended October 31, 2019 (Unaudited) | | For the Year Ended April 30, 2019 |
| OPERATIONS | | | | |
| Net investment income | | $ | 280,499 | | | $ | 318,633 | |
| Net realized gain | | | 1,191,390 | | | | 4,096,782 | |
| Net change in unrealized depreciation | | | (1,421,352 | ) | | | (1,425,050 | ) |
| Net increase in net assets resulting from operations | | | 50,537 | | | | 2,990,365 | |
| | | | | | | | | |
| DISTRIBUTIONS TO SHAREHOLDERS (NOTE 3) | | | | | | | | |
| Investor Class | | | – | | | | (2,285,402 | ) |
| Institutional Class | | | – | | | | (2,952,434 | ) |
| Net decrease in net assets from distributions | | | – | | | | (5,237,836 | ) |
| | | | | | | | | |
| CAPITAL SHARE TRANSACTIONS (NOTE 5) | | | | | | | | |
| Investor Class | | | | | | | | |
| Proceeds from sales of shares | | | 5,322,282 | | | | 32,838,523 | |
| Distributions reinvested | | | – | | | | 2,227,413 | |
| Cost of shares redeemed | | | (9,458,555 | ) | | | (36,091,435 | ) |
| Redemption fees | | | 2,492 | | | | 10,751 | |
| Net decrease from capital shares transactions | | | (4,133,781 | ) | | | (1,014,748 | ) |
| Institutional Class | | | | | | | | |
| Proceeds from sales of shares | | | 8,409,414 | | | | 37,702,923 | |
| Distributions reinvested | | | – | | | | 2,636,334 | |
| Cost of shares redeemed | | | (16,562,316 | ) | | | (25,830,716 | ) |
| Redemption fees | | | 14 | | | | 3,063 | |
| Net increase/(decrease) from capital shares transactions | | | (8,152,888 | ) | | | 14,511,604 | |
| Net increase/(decrease) in net assets | | | (12,236,132 | ) | | | 11,249,385 | |
| | | | | | | | | |
| NET ASSETS | | | | | | | | |
| Beginning of period | | | 199,334,087 | | | | 188,084,702 | |
| End of period | | $ | 187,097,955 | | | $ | 199,334,087 | |
| | | | | | | | | |
| OTHER INFORMATION | | | | | | | | |
| Shares Transactions | | | | | | | | |
| Investor Class | | | | | | | | |
| Issued | | | 370,807 | | | | 2,290,756 | |
| Issued to shareholders in reinvestment of distributions | | | – | | | | 187,493 | |
| Redeemed | | | (657,294 | ) | | | (2,529,238 | ) |
| Net decrease in share transactions | | | (286,487 | ) | | | (50,989 | ) |
| Institutional Class | | | | | | | | |
| Issued | | | 581,408 | | | | 2,668,874 | |
| Issued to shareholders in reinvestment of distributions | | | – | | | | 220,614 | |
| Redeemed | | | (1,148,377 | ) | | | (1,899,776 | ) |
| Net increase/(decrease) in share transactions | | | (566,969 | ) | | | 989,712 | |
See Notes to Financial Statements.
| Semi-Annual Report | October 31, 2019 | 73 |
| Grandeur Peak International Opportunities Fund | Statements of Changes in Net Assets |
| | | For the Six Months Ended October 31, 2019 (Unaudited) | | For the Year Ended April 30, 2019 |
| OPERATIONS | | | | |
| Net investment income | | $ | 1,833,377 | | | $ | 2,792,585 | |
| Net realized gain | | | 20,001,982 | | | | 37,319,295 | |
| Net change in unrealized depreciation | | | (18,115,078 | ) | | | (114,461,975 | ) |
| Net increase/(decrease) in net assets resulting from operations | | | 3,720,281 | | | | (74,350,095 | ) |
| | | | | | | | | |
| DISTRIBUTIONS TO SHAREHOLDERS (NOTE 3) | | | | | | | | |
| Investor Class | | | – | | | | (6,654,430 | ) |
| Institutional Class | | | – | | | | (62,445,383 | ) |
| Net decrease in net assets from distributions | | | – | | | | (69,099,813 | ) |
| | | | | | | | | |
| CAPITAL SHARE TRANSACTIONS (NOTE 5) | | | | | | | | |
| Investor Class | | | | | | | | |
| Proceeds from sales of shares | | | 1,854,291 | | | | 13,888,009 | |
| Distributions reinvested | | | – | | | | 6,248,519 | |
| Cost of shares redeemed | | | (8,024,488 | ) | | | (27,708,151 | ) |
| Redemption fees | | | 7 | | | | 3,291 | |
| Net decrease from capital shares transactions | | | (6,170,190 | ) | | | (7,568,332 | ) |
| Institutional Class | | | | | | | | |
| Proceeds from sales of shares | | | 21,944,331 | | | | 98,259,521 | |
| Distributions reinvested | | | – | | | | 56,560,067 | |
| Cost of shares redeemed | | | (88,442,192 | ) | | | (184,500,982 | ) |
| Redemption fees | | | 882 | | | | 2,687 | |
| Net decrease from capital shares transactions | | | (66,496,979 | ) | | | (29,678,707 | ) |
| Net decrease in net assets | | | (68,946,888 | ) | | | (180,696,947 | ) |
| | | | | | | | | |
| NET ASSETS | | | | | | | | |
| Beginning of period | | | 711,311,635 | | | | 892,008,582 | |
| End of period | | $ | 642,364,747 | | | $ | 711,311,635 | |
| | | | | | | | | |
| OTHER INFORMATION | | | | | | | | |
| Shares Transactions | | | | | | | | |
| Investor Class | | | | | | | | |
| Issued | | | 566,677 | | | | 3,846,422 | |
| Issued to shareholders in reinvestment of distributions | | | – | | | | 2,231,614 | |
| Redeemed | | | (2,454,436 | ) | | | (7,851,116 | ) |
| Net decrease in share transactions | | | (1,887,759 | ) | | | (1,773,080 | ) |
| Institutional Class | | | | | | | | |
| Issued | | | 6,636,433 | | | | 29,904,063 | |
| Issued to shareholders in reinvestment of distributions | | | – | | | | 20,056,761 | |
| Redeemed | | | (26,835,543 | ) | | | (52,526,853 | ) |
| Net decrease in share transactions | | | (20,199,110 | ) | | | (2,566,029 | ) |
See Notes to Financial Statements.
| 74 | 1.855.377.7325 | www.GrandeurPeakGlobal.com |
| Grandeur Peak International Stalwarts Fund | Statements of Changes in Net Assets |
| | | For the Six Months Ended October 31, 2019 (Unaudited) | | For the Year Ended April 30, 2019 |
| OPERATIONS | | | | |
| Net investment income | | $ | 1,959,037 | | | $ | 2,724,996 | |
| Net realized gain/(loss) | | | 224,198 | | | | (306,903 | ) |
| Net change in unrealized appreciation/(depreciation) | | | 6,277,976 | | | | (17,935,986 | ) |
| Net increase/(decrease) in net assets resulting from operations | | | 8,461,211 | | | | (15,517,893 | ) |
| | | | | | | | | |
| DISTRIBUTIONS TO SHAREHOLDERS (NOTE 3) | | | | | | | | |
| Investor Class | | | – | | | | (1,361,964 | ) |
| Institutional Class | | | – | | | | (12,223,593 | ) |
| Net decrease in net assets from distributions | | | – | | | | (13,585,557 | ) |
| | | | | | | | | |
| CAPITAL SHARE TRANSACTIONS (NOTE 5) | | | | | | | | |
| Investor Class | | | | | | | | |
| Proceeds from sales of shares | | | 14,116,197 | | | | 35,814,499 | |
| Distributions reinvested | | | – | | | | 1,177,844 | |
| Cost of shares redeemed | �� | | (12,203,345 | ) | | | (15,609,386 | ) |
| Redemption fees | | | 1,361 | | | | 4,368 | |
| Net increase from capital shares transactions | | | 1,914,213 | | | | 21,387,325 | |
| Institutional Class | | | | | | | | |
| Proceeds from sales of shares | | | 127,125,718 | | | | 195,348,183 | |
| Distributions reinvested | | | – | | | | 11,176,627 | |
| Cost of shares redeemed | | | (66,759,940 | ) | | | (114,352,225 | ) |
| Redemption fees | | | 2,981 | | | | 11,165 | |
| Net increase from capital shares transactions | | | 60,368,759 | | | | 92,183,750 | |
| Net increase in net assets | | | 70,744,183 | | | | 84,467,625 | |
| | | | | | | | | |
| NET ASSETS | | | | | | | | |
| Beginning of period | | | 633,304,093 | | | | 548,836,468 | |
| End of period | | $ | 704,048,276 | | | $ | 633,304,093 | |
| | | | | | | | | |
| OTHER INFORMATION | | | | | | | | |
| Shares Transactions | | | | | | | | |
| Investor Class | | | | | | | | |
| Issued | | | 989,328 | | | | 2,579,877 | |
| Issued to shareholders in reinvestment of distributions | | | – | | | | 98,154 | |
| Redeemed | | | (851,905 | ) | | | (1,144,985 | ) |
| Net increase in share transactions | | | 137,423 | | | | 1,533,046 | |
| Institutional Class | | | | | | | | |
| Issued | | | 8,883,267 | | | | 13,577,287 | |
| Issued to shareholders in reinvestment of distributions | | | – | | | | 929,063 | |
| Redeemed | | | (4,638,104 | ) | | | (8,335,344 | ) |
| Net increase in share transactions | | | 4,245,163 | | | | 6,171,006 | |
See Notes to Financial Statements.
| Semi-Annual Report | October 31, 2019 | 75 |
| Grandeur Peak Emerging Markets Opportunities Fund | Financial Highlights |
For a Share Outstanding Throughout the Periods Presented
| Investor Class | | For the Six Months Ended October 31, 2019 (Unaudited) | | Year Ended April 30, 2019 | | Year Ended April 30, 2018 | | Year Ended April 30, 2017 | | Year Ended April 30, 2016 | | Year Ended April 30, 2015 |
| NET ASSET VALUE, BEGINNING OF PERIOD | | $ | 11.82 | | | $ | 13.05 | | | $ | 11.55 | | | $ | 9.82 | | | $ | 11.51 | | | $ | 10.53 | |
| | | | | | | | | | | | | | | | | | | | | | | | | |
| INCOME FROM INVESTMENT OPERATIONS | | | | | | | | | | | | | | | | | | | | | | | | |
| Net investment income(a) | | | 0.04 | | | | 0.01 | | | | 0.03 | | | | 0.02 | | | | 0.07 | | | | 0.02 | |
| Net realized and unrealized gain/(loss) on investments | | | 0.40 | | | | (1.13 | ) | | | 1.47 | | | | 1.75 | | | | (1.41 | ) | | | 1.22 | |
| Total income/(loss) from investment operations | | | 0.44 | | | | (1.12 | ) | | | 1.50 | | | | 1.77 | | | | (1.34 | ) | | | 1.24 | |
| | | | | | | | | | | | | | | | | | | | | | | | | |
| DISTRIBUTIONS | | | | | | | | | | | | | | | | | | | | | | | | |
| From net investment income | | | – | | | | (0.02 | ) | | | – | | | | (0.04 | ) | | | – | | | | (0.01 | ) |
| From net realized gain on investments | | | – | | | | (0.09 | ) | | | – | | | | – | | | | (0.35 | ) | | | (0.25 | ) |
| Total distributions | | | – | | | | (0.11 | ) | | | – | | | | (0.04 | ) | | | (0.35 | ) | | | (0.26 | ) |
| | | | | | | | | | | | | | | | | | | | | | | | | |
| REDEMPTION FEES ADDED TO PAID-IN CAPITAL | | | – | | | | 0.00 | (b) | | | – | | | | 0.00 | (b) | | | 0.00 | (b) | | | 0.00 | (b) |
| INCREASE/DECREASE IN NET ASSET VALUE | | | 0.44 | | | | (1.23 | ) | | | 1.50 | | | | 1.73 | | | | (1.69 | ) | | | 0.98 | |
| NET ASSET VALUE, END OF PERIOD | | $ | 12.26 | | | $ | 11.82 | | | $ | 13.05 | | | $ | 11.55 | | | $ | 9.82 | | | $ | 11.51 | |
| | | | | | | | | | | | | | | | | | | | | | | | | |
| TOTAL RETURN | | | 3.72 | %(c) | | | (8.48 | )% | | | 12.99 | % | | | 18.08 | % | | | (11.62 | )% | | | 12.06 | % |
| | | | | | | | | | | | | | | | | | | | | | | | | |
| RATIOS AND SUPPLEMENTAL DATA | | | | | | | | | | | | | | | | | | | | | | | | |
| Net assets, end of period (in 000s) | | $ | 13,109 | | | $ | 13,869 | | | $ | 18,668 | | | $ | 18,074 | | | $ | 20,548 | | | $ | 39,896 | |
| | | | | | | | | | | | | | | | | | | | | | | | | |
| RATIOS TO AVERAGE NET ASSETS | | | | | | | | | | | | | | | | | | | | | | | | |
| Expenses (excluding fees waived/reimbursed by investment advisor) | | | 1.75 | %(d) | | | 1.77 | % | | | 1.79 | % | | | 1.76 | % | | | 1.77 | % | | | 1.82 | % |
| Expenses (including fees waived/reimbursed by investment advisor) | | | 1.74 | %(d) | | | 1.76 | % | | | 1.78 | % | | | 1.76 | % | | | 1.77 | % | | | 1.82 | % |
| Net investment income | | | 0.66 | %(d) | | | 0.11 | % | | | 0.26 | % | | | 0.21 | % | | | 0.69 | % | | | 0.22 | % |
| PORTFOLIO TURNOVER RATE | | | 8 | %(c) | | | 34 | % | | | 33 | % | | | 42 | % | | | 40 | % | | | 53 | % |
| (a) | Per share numbers have been calculated using the average shares method. |
| (b) | Less than $0.005 or ($0.005) per share. |
See Notes to Financial Statements.
| 76 | 1.855.377.7325 | www.GrandeurPeakGlobal.com |
| Grandeur Peak Emerging Markets Opportunities Fund | Financial Highlights |
For a Share Outstanding Throughout the Periods Presented
| Institutional Class | | For the Six Months Ended October 31, 2019 (Unaudited) | | Year Ended April 30, 2019 | | Year Ended April 30, 2018 | | Year Ended April 30, 2017 | | Year Ended April 30, 2016 | | Year Ended April 30, 2015 |
| NET ASSET VALUE, BEGINNING OF PERIOD | | $ | 11.88 | | | $ | 13.12 | | | $ | 11.60 | | | $ | 9.85 | | | $ | 11.52 | | | $ | 10.54 | |
| INCOME FROM INVESTMENT OPERATIONS | | | | | | | | | | | | | | | | | | | | | | | | |
| Net investment income(a) | | | 0.05 | | | | 0.03 | | | | 0.06 | | | | 0.04 | | | | 0.08 | | | | 0.05 | |
| Net realized and unrealized gain/(loss) on investments | | | 0.41 | | | | (1.14 | ) | | | 1.48 | | | | 1.77 | | | | (1.40 | ) | | | 1.21 | |
| Total income/(loss) from investment operations | | | 0.46 | | | | (1.11 | ) | | | 1.54 | | | | 1.81 | | | | (1.32 | ) | | | 1.26 | |
| | | | | | | | | | | | | | | | | | | | | | | | | |
| DISTRIBUTIONS | | | | | | | | | | | | | | | | | | | | | | | | |
| From net investment income | | | – | | | | (0.04 | ) | | | (0.02 | ) | | | (0.06 | ) | | | – | | | | (0.03 | ) |
| From net realized gain on investments | | | – | | | | (0.09 | ) | | | – | | | | – | | | | (0.35 | ) | | | (0.25 | ) |
| Total distributions | | | – | | | | (0.13 | ) | | | (0.02 | ) | | | (0.06 | ) | | | (0.35 | ) | | | (0.28 | ) |
| | | | | | | | | | | | | | | | | | | | | | | | | |
| REDEMPTION FEES ADDED TO PAID-IN CAPITAL | | | 0.00 | (b) | | | 0.00 | (b) | | | 0.00 | (b) | | | 0.00 | (b) | | | 0.00 | (b) | | | 0.00 | (b) |
| | | | | | | | | | | | | | | | | | | | | | | | | |
| INCREASE/DECREASE IN NET ASSET VALUE | | | 0.46 | | | | (1.24 | ) | | | 1.52 | | | | 1.75 | | | | (1.67 | ) | | | 0.98 | |
| NET ASSET VALUE, END OF PERIOD | | $ | 12.34 | | | $ | 11.88 | | | $ | 13.12 | | | $ | 11.60 | | | $ | 9.85 | | | $ | 11.52 | |
| | | | | | | | | | | | | | | | | | | | | | | | | |
| TOTAL RETURN | | | 3.87 | %(c) | | | (8.32 | )% | | | 13.24 | % | | | 18.42 | % | | | (11.44 | )% | | | 12.22 | % |
| | | | | | | | | | | | | | | | | | | | | | | | | |
| RATIOS AND SUPPLEMENTAL DATA | | | | | | | | | | | | | | | | | | | | | | | | |
| Net assets, end of period (in 000s) | | $ | 444,159 | | | $ | 452,530 | | | $ | 471,260 | | | $ | 398,891 | | | $ | 349,493 | | | $ | 428,048 | |
| | | | | | | | | | | | | | | | | | | | | | | | | |
| RATIOS TO AVERAGE NET ASSETS | | | | | | | | | | | | | | | | | | | | | | | | |
| Expenses (excluding fees waived/reimbursed by investment advisor) | | | 1.53 | %(d) | | | 1.53 | % | | | 1.55 | % | | | 1.55 | % | | | 1.55 | % | | | 1.58 | % |
| Expenses (including fees waived/reimbursed by investment advisor) | | | 1.52 | %(d) | | | 1.52 | % | | | 1.54 | % | | | 1.55 | % | | | 1.55 | % | | | 1.58 | % |
| Net investment income | | | 0.87 | %(d) | | | 0.29 | % | | | 0.49 | % | | | 0.35 | % | | | 0.75 | % | | | 0.43 | % |
| PORTFOLIO TURNOVER RATE | | | 8 | %(c) | | | 34 | % | | | 33 | % | | | 42 | % | | | 40 | % | | | 53 | % |
| (a) | Per share numbers have been calculated using the average shares method. |
| (b) | Less than $0.005 or ($0.005) per share. |
See Notes to Financial Statements.
| Semi-Annual Report | October 31, 2019 | 77 |
| Grandeur Peak Global Contrarian Fund | Financial Highlights |
For a Share Outstanding Throughout the Period Presented
| Institutional Class | | For the Period September 17, 2019 (Inception) to October 31, 2019 |
| NET ASSET VALUE, BEGINNING OF PERIOD | | $ | 10.00 | |
| | | | | |
| INCOME FROM INVESTMENT OPERATIONS | | | | |
| Net investment income(a) | | | 0.02 | |
| Net realized and unrealized gain on investments | | | 0.14 | |
| Total income from investment operations | | | 0.16 | |
| | | | | |
| REDEMPTION FEES ADDED TO PAID-IN CAPITAL | | | – | |
| | | | | |
| INCREASE IN NET ASSET VALUE | | | 0.16 | |
| NET ASSET VALUE, END OF PERIOD | | $ | 10.16 | |
| | | | | |
| TOTAL RETURN | | | 1.60 | %(b) |
| | | | | |
| RATIOS AND SUPPLEMENTAL DATA | | | | |
| Net assets, end of period (in 000s) | | $ | 4,694 | |
| | | | | |
| RATIOS TO AVERAGE NET ASSETS | | | | |
| Expenses (excluding fees waived/ reimbursed by investment advisor) | | | 8.42 | %(c) |
| Expenses (including fees waived/ reimbursed by investment advisor) | | | 1.38 | %(c) |
| Net investment income | | | 1.34 | %(c) |
| | | | | |
| PORTFOLIO TURNOVER RATE | | | 9 | %(b) |
| (a) | Per share numbers have been calculated using the average shares method. |
See Notes to Financial Statements.
| 78 | 1.855.377.7325 | www.GrandeurPeakGlobal.com |
| Grandeur Peak Global Micro Cap Fund | Financial Highlights |
For a Share Outstanding Throughout the Periods Presented
| Institutional Class | | For the Six Months Ended October 31, 2019 (Unaudited) | | Year Ended April 30, 2019 | | Year Ended April 30, 2018 | | Year Ended April 30, 2017 | | For the Period October 21, 2015 (Commencement of Operations) to April 30, 2016 |
| NET ASSET VALUE, BEGINNING OF PERIOD | | $ | 11.31 | | | $ | 13.12 | | | $ | 11.98 | | | $ | 10.38 | | | $ | 10.00 | |
| | | | | | | | | | | | | | | | | | | | | |
| INCOME FROM INVESTMENT OPERATIONS | | | | | | | | | | | | | | | | | | | | |
| Net investment income/(loss)(a) | | | 0.03 | | | | (0.01 | ) | | | (0.00 | )(b) | | | 0.01 | | | | (0.02 | ) |
| Net realized and unrealized gain/(loss) on investments | | | 0.29 | | | | (1.08 | ) | | | 2.12 | | | | 1.72 | | | | 0.40 | |
| Total income/(loss) from investment operations | | | 0.32 | | | | (1.09 | ) | | | 2.12 | | | | 1.73 | | | | 0.38 | |
| | | | | | | | | | | | | | | | | | | | | |
| DISTRIBUTIONS | | | | | | | | | | | | | | | | | | | | |
| From net investment income | | | – | | | | – | | | | (0.06 | ) | | | (0.02 | ) | | | – | |
| From net realized gain on investments | | | – | | | | (0.72 | ) | | | (0.92 | ) | | | (0.11 | ) | | | – | |
| Total distributions | | | – | | | | (0.72 | ) | | | (0.98 | ) | | | (0.13 | ) | | | – | |
| | | | | | | | | | | | | | | | | | | | | |
| REDEMPTION FEES ADDED TO PAID-INCAPITAL | | | 0.00 | (b) | | | 0.00 | (b) | | | 0.00 | (b) | | | 0.00 | (b) | | | 0.00 | (b) |
| INCREASE/DECREASE IN NET ASSET VALUE | | | 0.32 | | | | (1.81 | ) | | | 1.14 | | | | 1.60 | | | | 0.38 | |
| NET ASSET VALUE, END OF PERIOD | | $ | 11.63 | | | $ | 11.31 | | | $ | 13.12 | | | $ | 11.98 | | | $ | 10.38 | |
| | | | | | | | | | | | | | | | | | | | | |
| TOTAL RETURN | | | 2.83 | %(c) | | | (7.67 | )% | | | 17.68 | % | | | 16.81 | % | | | 3.80 | %(c) |
| RATIOS AND SUPPLEMENTAL DATA | | | | | | | | | | | | | | | | | | | | |
| Net assets, end of period (in 000s) | | $ | 33,800 | | | $ | 35,654 | | | $ | 41,709 | | | $ | 36,620 | | | $ | 30,735 | |
| RATIOS TO AVERAGE NET ASSETS | | | | | | | | | | | | | | | | | | | | |
| Expenses (excluding fees waived/ reimbursed by investment advisor) | | | 2.08 | %(d) | | | 2.05 | % | | | 2.06 | % | | | 2.17 | % | | | 2.30 | %(d)(e) |
| Expenses (including fees waived/ reimbursed by investment advisor) | | | 2.00 | %(d) | | | 2.00 | % | | | 2.00 | % | | | 2.00 | % | | | 2.00 | %(d)(e) |
| Net investment income/(loss) | | | 0.44 | %(d) | | | (0.06 | )% | | | 0.00 | %(f) | | | 0.11 | % | | | (0.41 | )%(d) |
| PORTFOLIO TURNOVER RATE | | | 15 | %(c) | | | 37 | % | | | 46 | % | | | 37 | % | | | 8 | %(c) |
| (a) | Per share numbers have been calculated using the average shares method. |
| (b) | Less than $0.005 or ($0.005) per share. |
| (e) | Expense ratios during startup periods may not be representative of longer term operating periods. |
| (f) | Less than 0.005% of average net assets. |
See Notes to Financial Statements.
| Semi-Annual Report | October 31, 2019 | 79 |
| Grandeur Peak Global Opportunities Fund | Financial Highlights |
For a Share Outstanding Throughout the Periods Presented
| Investor Class | | For the Six Months Ended October 31, 2019 (Unaudited) | | Year Ended April 30, 2019 | | Year Ended April 30, 2018 | | Year Ended April 30, 2017 | | Year Ended April 30, 2016 | | Year Ended April 30, 2015 |
| NET ASSET VALUE, BEGINNING OF PERIOD | | $ | 3.48 | | | $ | 3.95 | | | $ | 3.52 | | | $ | 3.01 | | | $ | 3.43 | | | $ | 3.31 | |
| | | | | | | | | | | | | | | | | | | | | | | | | |
| INCOME FROM INVESTMENT | | | | | | | | | | | | | | | | | | | | | | | | |
| OPERATIONS | | | | | | | | | | | | | | | | | | | | | | | | |
| Net investment income/(loss)(a) | | | 0.00 | (b) | | | (0.00 | )(b) | | | 0.00 | (b) | | | (0.00 | )(b)(c) | | | 0.00 | (b) | | | 0.00 | (b) |
| Net realized and unrealized gain/(loss) on investments | | | 0.07 | | | | (0.14 | ) | | | 0.65 | | | | 0.51 | | | | (0.18 | ) | | | 0.35 | |
| Total income/(loss) from investment operations | | | 0.07 | | | | (0.14 | ) | | | 0.65 | | | | 0.51 | | | | (0.18 | ) | | | 0.35 | |
| | | | | | | | | | | | | | | | | | | | | | | | | |
| DISTRIBUTIONS | | | | | | | | | | | | | | | | | | | | | | | | |
| From net investment income | | | – | | | | (0.00 | )(b) | | | – | | | | – | | | | (0.00 | )(b) | | | (0.01 | ) |
| From net realized gain on investments | | | – | | | | (0.33 | ) | | | (0.22 | ) | | | (0.00 | )(b) | | | (0.24 | ) | | | (0.22 | ) |
| Total distributions | | | – | | | | (0.33 | ) | | | (0.22 | ) | | | (0.00 | )(b) | | | (0.24 | ) | | | (0.23 | ) |
| REDEMPTION FEES ADDED TO PAID-IN CAPITAL | | | 0.00 | (b) | | | 0.00 | (b) | | | 0.00 | (b) | | | 0.00 | (b) | | | 0.00 | (b) | | | 0.00 | (b) |
| INCREASE/DECREASE IN NET ASSET VALUE | | | 0.07 | | | | (0.47 | ) | | | 0.43 | | | | 0.51 | | | | (0.42 | ) | | | 0.12 | |
| NET ASSET VALUE, END OF PERIOD | | $ | 3.55 | | | $ | 3.48 | | | $ | 3.95 | | | $ | 3.52 | | | $ | 3.01 | | | $ | 3.43 | |
| TOTAL RETURN | | | 2.01 | %(d) | | | (1.83 | )% | | | 18.41 | % | | | 17.09 | % | | | (5.03 | )% | | | 11.09 | % |
| RATIOS AND SUPPLEMENTAL DATA | | | | | | | | | | | | | | | | | | | | | | | | |
| Net assets, end of period (in 000s) | | $ | 119,908 | | | $ | 130,745 | | | $ | 188,379 | | | $ | 166,284 | | | $ | 173,156 | | | $ | 201,462 | |
| RATIOS TO AVERAGE NET ASSETS | | | | | | | | | | | | | | | | | | | | | | | | |
| Expenses (excluding fees waived/ reimbursed by investment advisor) | | | 1.60 | %(e) | | | 1.61 | % | | | 1.61 | % | | | 1.61 | % | | | 1.62 | % | | | 1.62 | % |
| Expenses (including fees waived/ reimbursed by investment advisor) | | | 1.57 | %(e) | | | 1.57 | % | | | 1.55 | % | | | 1.59 | % | | | 1.62 | % | | | 1.62 | % |
| Net investment income/(loss) | | | 0.02 | %(e) | | | (0.12 | )% | | | 0.03 | % | | | (0.06 | )% | | | 0.06 | % | | | 0.12 | % |
| PORTFOLIO TURNOVER RATE | | | 20 | %(d) | | | 38 | % | | | 29 | % | | | 30 | % | | | 32 | % | | | 37 | % |
| (a) | Per share numbers have been calculated using the average shares method. |
| (b) | Less than $0.005 or ($0.005) per share. |
| (c) | The per share amount does not correspond to activity reflected in the Statement of Operations due to class specific expenses during the period. |
See Notes to Financial Statements.
| 80 | 1.855.377.7325 | www.GrandeurPeakGlobal.com |
| Grandeur Peak Global Opportunities Fund | Financial Highlights |
For a Share Outstanding Throughout the Periods Presented
| Institutional Class | | For the Six Months Ended October 31, 2019 (Unaudited) | | Year Ended April 30, 2019 | | Year Ended April 30, 2018 | | Year Ended April 30, 2017 | | Year Ended April 30, 2016 | | Year Ended April 30, 2015 |
| NET ASSET VALUE, BEGINNING OF PERIOD | | $ | 3.52 | | | $ | 4.00 | | | $ | 3.56 | | | $ | 3.03 | | | $ | 3.46 | | | $ | 3.34 | |
| | | | | | | | | | | | | | | | | | | | | | | | | |
| INCOME FROM INVESTMENT OPERATIONS | | | | | | | | | | | | | | | | | | | | | | | | |
| Net investment income(a) | | | 0.00 | (b) | | | 0.00 | (b) | | | 0.01 | | | | 0.01 | | | | 0.01 | | | | 0.01 | |
| Net realized and unrealized gain/(loss) on investments | | | 0.08 | | | | (0.14 | ) | | | 0.65 | | | | 0.52 | | | | (0.19 | ) | | | 0.34 | |
| Total income/(loss) from investment operations | | | 0.08 | | | | (0.14 | ) | | | 0.66 | | | | 0.53 | | | | (0.18 | ) | | | 0.35 | |
| | | | | | | | | | | | | | | | | | | | | | | | | |
| DISTRIBUTIONS | | | | | | | | | | | | | | | | | | | | | | | | |
| From net investment income | | | – | | | | (0.01 | ) | | | (0.00 | )(b) | | | (0.00 | )(b) | | | (0.01 | ) | | | (0.01 | ) |
| From net realized gain on investments | | | – | | | | (0.33 | ) | | | (0.22 | ) | | | (0.00 | )(b) | | | (0.24 | ) | | | (0.22 | ) |
| Total distributions | | | – | | | | (0.34 | ) | | | (0.22 | ) | | | (0.00 | )(a) | | | (0.25 | ) | | | (0.23 | ) |
| | | | | | | | | | | | | | | | | | | | | | | | | |
| REDEMPTION FEES ADDED TO PAID-IN CAPITAL | | | 0.00 | (b) | | | 0.00 | (b) | | | 0.00 | (b) | | | 0.00 | (b) | | | 0.00 | (b) | | | 0.00 | (b) |
| | | | | | | | | | | | | | | | | | | | | | | | | |
| INCREASE/DECREASE IN NET ASSET VALUE | | | 0.08 | | | | (0.48 | ) | | | 0.44 | | | | 0.53 | | | | (0.43 | ) | | | 0.12 | |
| NET ASSET VALUE, END OF PERIOD | | $ | 3.60 | | | $ | 3.52 | | | $ | 4.00 | | | $ | 3.56 | | | $ | 3.03 | | | $ | 3.46 | |
| | | | | | | | | | | | | | | | | | | | | | | | | |
| TOTAL RETURN | | | 2.27 | %(c) | | | (1.84 | )% | | | 18.62 | % | | | 17.81 | % | | | (5.12 | )% | | | 11.20 | % |
| | | | | | | | | | | | | | | | | | | | | | | | | |
| RATIOS AND SUPPLEMENTAL DATA | | | | | | | | | | | | | | | | | | | | | | | | |
| Net assets, end of period (in 000s) | | $ | 538,595 | | | $ | 523,862 | | | $ | 591,470 | | | $ | 532,946 | | | $ | 452,030 | | | $ | 526,394 | |
| | | | | | | | | | | | | | | | | | | | | | | | | |
| RATIOS TO AVERAGE NET ASSETS | | | | | | | | | | | | | | | | | | | | | | | | |
| Expenses (excluding fees waived/ reimbursed by investment advisor) | | | 1.37 | %(d) | | | 1.37 | % | | | 1.36 | % | | | 1.37 | % | | | 1.38 | % | | | 1.38 | % |
| Expenses (including fees waived/ reimbursed by investment advisor) | | | 1.34 | %(d) | | | 1.33 | % | | | 1.31 | % | | | 1.35 | % | | | 1.38 | % | | | 1.38 | % |
| Net investment income | | | 0.24 | %(d) | | | 0.13 | % | | | 0.28 | % | | | 0.18 | % | | | 0.30 | % | | | 0.35 | % |
| | | | | | | | | | | | | | | | | | | | | | | | | |
| PORTFOLIO TURNOVER RATE | | | 20 | %(c) | | | 38 | % | | | 29 | % | | | 30 | % | | | 32 | % | | | 37 | % |
| (a) | Per share numbers have been calculated using the average shares method. |
| (b) | Less than $0.005 or ($0.005) per share. |
See Notes to Financial Statements.
| Semi-Annual Report | October 31, 2019 | 81 |
| Grandeur Peak Global Reach Fund | Financial Highlights |
For a Share Outstanding Throughout the Periods Presented
| Investor Class | | For the Six Months Ended October 31, 2019 (Unaudited) | | Year Ended April 30, 2019 | | Year Ended April 30, 2018 | | Year Ended April 30, 2017 | | Year Ended April 30, 2016 | | Year Ended April 30, 2015 |
| NET ASSET VALUE, BEGINNING OF PERIOD | | $ | 14.98 | | | $ | 16.97 | | | $ | 14.52 | | | $ | 12.31 | | | $ | 13.65 | | | $ | 12.43 | |
| | | | | | | | | | | | | | | | | | | | | | | | | |
| INCOME FROM INVESTMENT OPERATIONS | | | | | | | | | | | | | | | | | | | | | | | | |
| Net investment income(a) | | | 0.02 | | | | 0.01 | | | | 0.01 | | | | 0.01 | | | | 0.01 | | | | 0.00 | (b) |
| Net realized and unrealized gain/(loss) on investments | | | 0.28 | | | | (0.58 | ) | | | 2.66 | | | | 2.22 | | | | (0.89 | ) | | | 1.37 | |
| Total income/(loss) from investment operations | | | 0.30 | | | | (0.57 | ) | | | 2.67 | | | | 2.23 | | | | (0.88 | ) | | | 1.37 | |
| | | | | | | | | | | | | | | | | | | | | | | | | |
| DISTRIBUTIONS | | | | | | | | | | | | | | | | | | | | | | | | |
| From net investment income | | | – | | | | (0.00 | ) | | | – | | | | (0.02 | ) | | | (0.01 | ) | | | (0.01 | ) |
| From net realized gain on investments | | | – | | | | (1.42 | ) | | | (0.22 | ) | | | – | | | | (0.45 | ) | | | (0.14 | ) |
| Total distributions | | | – | | | | (1.42 | ) | | | (0.22 | ) | | | (0.02 | ) | | | (0.46 | ) | | | (0.15 | ) |
| | | | | | | | | | | | | | | | | | | | | | | | | |
| REDEMPTION FEES ADDED TO PAID-IN CAPITAL | | | 0.00 | (b) | | | 0.00 | (b) | | | 0.00 | (b) | | | 0.00 | (b) | | | 0.00 | (b) | | | 0.00 | (b) |
| | | | | | | | | | | | | | | | | | | | | | | | | |
| INCREASE/DECREASE IN NET ASSET VALUE | | | 0.30 | | | | (1.99 | ) | | | 2.45 | | | | 2.21 | | | | (1.34 | ) | | | 1.22 | |
| NET ASSET VALUE, END OF PERIOD | | $ | 15.28 | | | $ | 14.98 | | | $ | 16.97 | | | $ | 14.52 | | | $ | 12.31 | | | $ | 13.65 | |
| | | | | | | | | | | | | | | | | | | | | | | | | |
| TOTAL RETURN | | | 2.00 | %(c) | | | (1.61 | )% | | | 18.44 | % | | | 18.11 | % | | | (6.45 | )% | | | 11.09 | % |
| | | | | | | | | | | | | | | | | | | | | | | | | |
| RATIOS AND SUPPLEMENTAL DATA | | | | | | | | | | | | | | | | | | | | | | | | |
| Net assets, end of period (in 000s) | | $ | 54,262 | | | $ | 56,307 | | | $ | 65,923 | | | $ | 67,574 | | | $ | 66,984 | | | $ | 87,354 | |
| | | | | | | | | | | | | | | | | | | | | | | | | |
| RATIOS TO AVERAGE NET ASSETS | | | | | | | | | | | | | | | | | | | | | | | | |
| Expenses (excluding fees waived/reimbursed by investment advisor) | | | 1.52 | %(d) | | | 1.52 | % | | | 1.52 | % | | | 1.52 | % | | | 1.60 | % | | | 1.60 | % |
| Expenses (including fees waived/reimbursed by investment advisor) | | | 1.52 | %(d) | | | 1.52 | % | | | 1.52 | % | | | 1.52 | % | | | 1.60 | % | | | 1.60 | % |
| Net investment income | | | 0.25 | %(d) | | | 0.05 | % | | | 0.06 | % | | | 0.07 | % | | | 0.10 | % | | �� | 0.03 | % |
| | | | | | | | | | | | | | | | | | | | | | | | | |
| PORTFOLIO TURNOVER RATE | | | 16 | %(c) | | | 50 | % | | | 43 | % | | | 42 | % | | | 46 | % | | | 46 | % |
| (a) | Per share numbers have been calculated using the average shares method. |
| (b) | Less than $0.005 or ($0.005) per share. |
See Notes to Financial Statements.
| 82 | 1.855.377.7325 | www.GrandeurPeakGlobal.com |
| Grandeur Peak Global Reach Fund | Financial Highlights |
For a Share Outstanding Throughout the Periods Presented
| Institutional Class | | For the Six Months Ended October 31, 2019 (Unaudited) | | Year Ended April 30, 2019 | | Year Ended April 30, 2018 | | Year Ended April 30, 2017 | | Year Ended April 30, 2016 | | Year Ended April 30, 2015 |
| NET ASSET VALUE, BEGINNING OF PERIOD | | $ | 15.04 | | | $ | 17.02 | | | $ | 14.55 | | | $ | 12.33 | | | $ | 13.66 | | | $ | 12.42 | |
| | | | | | | | | | | | | | | | | | | | | | | | | |
| INCOME FROM INVESTMENT OPERATIONS | | | | | | | | | | | | | | | | | | | | | | | | |
| Net investment income(a) | | | 0.04 | | | | 0.05 | | | | 0.04 | | | | 0.04 | | | | 0.04 | | | | 0.03 | |
| Net realized and unrealized gain/(loss) on investments | | | 0.28 | | | | (0.58 | ) | | | 2.67 | | | | 2.22 | | | | (0.89 | ) | | | 1.37 | |
| Total income/(loss) from investment operations | | | 0.32 | | | | (0.53 | ) | | | 2.71 | | | | 2.26 | | | | (0.85 | ) | | | 1.40 | |
| | | | | | | | | | | | | | | | | | | | | | | | | |
| DISTRIBUTIONS | | | | | | | | | | | | | | | | | | | | | | | | |
| From net investment income | | | – | | | | (0.03 | ) | | | (0.02 | ) | | | (0.04 | ) | | | (0.03 | ) | | | (0.02 | ) |
| From net realized gain on investments | | | – | | | | (1.42 | ) | | | (0.22 | ) | | | – | | | | (0.45 | ) | | | (0.14 | ) |
| Total distributions | | | – | | | | (1.45 | ) | | | (0.24 | ) | | | (0.04 | ) | | | (0.48 | ) | | | (0.16 | ) |
| | | | | | | | | | | | | | | | | | | | | | | | | |
| REDEMPTION FEES ADDED TO PAID-IN CAPITAL | | | 0.00 | (b) | | | 0.00 | (b) | | | 0.00 | (b) | | | 0.00 | (b) | | | 0.00 | (b) | | | 0.00 | (b) |
| | | | | | | | | | | | | | | | | | | | | | | | | |
| INCREASE/DECREASE IN NET ASSET VALUE | | | 0.32 | | | | (1.98 | ) | | | 2.47 | | | | 2.22 | | | | (1.33 | ) | | | 1.24 | |
| NET ASSET VALUE, END OF PERIOD | | $ | 15.36 | | | $ | 15.04 | | | $ | 17.02 | | | $ | 14.55 | | | $ | 12.33 | | | $ | 13.66 | |
| | | | | | | | | | | | | | | | | | | | | | | | | |
| TOTAL RETURN | | | 2.13 | %(c) | | | (1.33 | )% | | | 18.69 | % | | | 18.36 | % | | | (6.18 | )% | | | 11.41 | % |
| | | | | | | | | | | | | | | | | | | | | | | | | |
| RATIOS AND SUPPLEMENTAL DATA | | | | | | | | | | | | | | | | | | | | | | | | |
| Net assets, end of period (in 000s) | | $ | 251,705 | | | $ | 272,743 | | | $ | 302,269 | | | $ | 258,683 | | | $ | 221,759 | | | $ | 260,239 | |
| | | | | | | | | | | | | | | | | | | | | | | | | |
| RATIOS TO AVERAGE NET ASSETS | | | | | | | | | | | | | | | | | | | | | | | | |
| Expenses (excluding fees waived/reimbursed by investment advisor) | | | 1.28 | %(d) | | | 1.27 | % | | | 1.28 | % | | | 1.29 | % | | | 1.35 | % | | | 1.35 | % |
| Expenses (including fees waived/reimbursed by investment advisor) | | | 1.28 | %(d) | | | 1.27 | % | | | 1.28 | % | | | 1.29 | % | | | 1.35 | % | | | 1.35 | % |
| Net investment income | | | 0.50 | %(d) | | | 0.29 | % | | | 0.27 | % | | | 0.28 | % | | | 0.34 | % | | | 0.23 | % |
| | | | | | | | | | | | | | | | | | | | | | | | | |
| PORTFOLIO TURNOVER RATE | | | 16 | %(c) | | | 50 | % | | | 43 | % | | | 42 | % | | | 46 | % | | | 46 | % |
| (a) | Per share numbers have been calculated using the average shares method. |
| (b) | Less than $0.005 or ($0.005) per share. |
See Notes to Financial Statements.
| Semi-Annual Report | October 31, 2019 | 83 |
| Grandeur Peak Global Stalwarts Fund | Financial Highlights |
For a Share Outstanding Throughout the Periods Presented
| Investor Class | | For the Six Months Ended October 31, 2019 (Unaudited) | | Year Ended April 30, 2019 | | Year Ended April 30, 2018 | | Year Ended April 30, 2017 | | For the Period September 2, 2015 (Commencement of Operations) to April 30, 2016 |
| NET ASSET VALUE, BEGINNING OF PERIOD | | $ | 14.83 | | | $ | 15.06 | | | $ | 12.76 | | | $ | 10.85 | | | $ | 10.00 | |
| | | | | | | | | | | | | | | | | | | | | |
| INCOME FROM INVESTMENT OPERATIONS | | | | | | | | | | | | | | | | | | | | |
| Net investment income/(loss)(a) | | | 0.01 | | | | 0.01 | | | | (0.00 | )(b) | | | (0.03 | ) | | | 0.00 | (b) |
| Net realized and unrealized gain on investments | | | 0.02 | | | | 0.16 | | | | 2.52 | | | | 1.95 | | | | 0.85 | |
| Total income from investment operations | | | 0.03 | | | | 0.17 | | | | 2.52 | | | | 1.92 | | | | 0.85 | |
| | | | | | | | | | | | | | | | | | | | | |
| DISTRIBUTIONS | | | | | | | | | | | | | | | | | | | | |
| From net investment income | | | – | | | | – | | | | – | | | | (0.01 | ) | | | (0.00 | )(b) |
| From net realized gain on investments | | | – | | | | (0.40 | ) | | | (0.22 | ) | | | – | | | | (0.00 | )(b) |
| Total distributions | | | – | | | | (0.40 | ) | | | (0.22 | ) | | | (0.01 | ) | | | (0.00 | )(a) |
| | | | | | | | | | | | | | | | | | | | | |
| REDEMPTION FEES ADDED TO PAID-INCAPITAL | | | 0.00 | (b) | | | 0.00 | (b) | | | 0.00 | (b) | | | 0.00 | (b) | | | 0.00 | (b) |
| | | | | | | | | | | | | | | | | | | | | |
| INCREASE/DECREASE IN NET ASSET VALUE | | | 0.03 | | | | (0.23 | ) | | | 2.30 | | | | 1.91 | | | | 0.85 | |
| NET ASSET VALUE, END OF PERIOD | | $ | 14.86 | | | $ | 14.83 | | | $ | 15.06 | | | $ | 12.76 | | | $ | 10.85 | |
| | | | | | | | | | | | | | | | | | | | | |
| TOTAL RETURN | | | 0.20 | %(c) | | | 1.78 | % | | | 19.79 | % | | | 17.70 | % | | | 8.55 | %(c) |
| | | | | | | | | | | | | | | | | | | | | |
| RATIOS AND SUPPLEMENTAL DATA | | | | | | | | | | | | | | | | | | | | |
| Net assets, end of period (in 000s) | | $ | 86,313 | | | $ | 90,400 | | | $ | 92,552 | | | $ | 61,212 | | | $ | 19,131 | |
| | | | | | | | | | | | | | | | | | | | | |
| RATIOS TO AVERAGE NET ASSETS | | | | | | | | | | | | | | | | | | | | |
| Expenses (excluding fees waived/ reimbursed by investment advisor) | | | 1.25 | %(d) | | | 1.27 | % | | | 1.35 | % | | | 1.41 | % | | | 2.06 | %(d)(e) |
| Expenses (including fees waived/ reimbursed by investment advisor) | | | 1.25 | %(d) | | | 1.27 | % | | | 1.35 | % | | | 1.35 | % | | | 1.35 | %(d)(e) |
| Net investment income/(loss) | | | 0.16 | %(d) | | | 0.05 | % | | | (0.03 | )% | | | (0.23 | )% | | | 0.00 | %(d)(f) |
| | | | | | | | | | | | | | | | | | | | | |
| PORTFOLIO TURNOVER RATE | | | 21 | %(c) | | | 52 | % | | | 30 | % | | | 32 | % | | | 24 | %(c) |
| (a) | Per share numbers have been calculated using the average shares method. |
| (b) | Less than $0.005 or ($0.005) per share. |
| (e) | Expense ratios during startup periods may not be representative of longer term operating periods. |
| (f) | Less than 0.005% of average net assets. |
See Notes to Financial Statements.
| 84 | 1.855.377.7325 | www.GrandeurPeakGlobal.com |
| Grandeur Peak Global Stalwarts Fund | Financial Highlights |
For a Share Outstanding Throughout the Periods Presented
| Institutional Class | | For the Six Months Ended October 31, 2019 (Unaudited) | | Year Ended April 30, 2019 | | Year Ended April 30, 2018 | | Year Ended April 30, 2017 | | For the Period September 2, 2015 (Commencement of Operations) to April 30, 2016 |
| NET ASSET VALUE, BEGINNING OF PERIOD | | $ | 14.93 | | | $ | 15.14 | | | $ | 12.79 | | | $ | 10.87 | | | $ | 10.00 | |
| | | | | | | | | | | | | | | | | | | | | |
| INCOME FROM INVESTMENT OPERATIONS | | | | | | | | | | | | | | | | | | | | |
| Net investment income(a) | | | 0.03 | | | | 0.04 | | | | 0.03 | | | | 0.01 | (b) | | | 0.02 | |
| Net realized and unrealized gain on investments | | | 0.01 | | | | 0.17 | | | | 2.54 | | | | 1.93 | | | | 0.85 | |
| Total income from investment operations | | | 0.04 | | | | 0.21 | | | | 2.57 | | | | 1.94 | | | | 0.87 | |
| | | | | | | | | | | | | | | | | | | | | |
| DISTRIBUTIONS | | | | | | | | | | | | | | | | | | | | |
| From net investment income | | | – | | | | (0.02 | ) | | | – | | | | (0.02 | ) | | | (0.00 | )(c) |
| From net realized gain on investments | | | – | | | | (0.40 | ) | | | (0.22 | ) | | | – | | | | (0.00 | )(c) |
| Total distributions | | | – | | | | (0.42 | ) | | | (0.22 | ) | | | (0.02 | ) | | | (0.00 | )(a) |
| | | | | | | | | | | | | | | | | | | | | |
| REDEMPTION FEES ADDED TO PAID-INCAPITAL | | | 0.00 | (c) | | | 0.00 | (c) | | | 0.00 | (c) | | | 0.00 | (c) | | | 0.00 | (c) |
| | | | | | | | | | | | | | | | | | | | | |
| INCREASE/DECREASE IN NET ASSET VALUE | | | 0.04 | | | | (0.21 | ) | | | 2.35 | | | | 1.92 | | | | 0.87 | |
| NET ASSET VALUE, END OF PERIOD | | $ | 14.97 | | | $ | 14.93 | | | $ | 15.14 | | | $ | 12.79 | | | $ | 10.87 | |
| | | | | | | | | | | | | | | | | | | | | |
| TOTAL RETURN | | | 0.27 | %(d) | | | 2.08 | % | | | 20.14 | % | | | 17.92 | % | | | 8.76 | %(d) |
| | | | | | | | | | | | | | | | | | | | | |
| RATIOS AND SUPPLEMENTAL DATA | | | | | | | | | | | | | | | | | | | | |
| Net assets, end of period (in 000s) | | $ | 100,785 | | | $ | 108,934 | | | $ | 95,533 | | | $ | 47,811 | | | $ | 17,562 | |
| | | | | | | | | | | | | | | | | | | | | |
| RATIOS TO AVERAGE NET ASSETS | | | | | | | | | | | | | | | | | | | | |
| Expenses (excluding fees waived/ reimbursed by investment advisor) | | | 1.00 | %(e) | | | 1.02 | % | | | 1.10 | % | | | 1.17 | % | | | 1.86 | %(e)(f) |
| Expenses (including fees waived/ reimbursed by investment advisor) | | | 1.00 | %(e) | | | 1.02 | % | | | 1.10 | % | | | 1.10 | % | | | 1.10 | %(e)(f) |
| Net investment income | | | 0.42 | %(e) | | | 0.27 | % | | | 0.24 | % | | | 0.05 | % | | | 0.22 | %(e) |
| | | | | | | | | | | | | | | | | | | | | |
| PORTFOLIO TURNOVER RATE | | | 21 | %(d) | | | 52 | % | | | 30 | % | | | 32 | % | | | 24 | %(d) |
| (a) | Per share numbers have been calculated using the average shares method. |
| (b) | The per share amount does not correspond to activity reflected in the Statement of Operations due to class specific expenses during the period. |
| (c) | Less than $0.005 or ($0.005) per share. |
| (f) | Expense ratios during startup periods may not be representative of longer term operating periods. |
See Notes to Financial Statements.
| Semi-Annual Report | October 31, 2019 | 85 |
| Grandeur Peak International Opportunities Fund | Financial Highlights |
For a Share Outstanding Throughout the Periods Presented
| Investor Class | | For the Six Months Ended October 31, 2019 (Unaudited) | | Year Ended April 30, 2019 | | Year Ended April 30, 2018 | | Year Ended April 30, 2017 | | Year Ended April 30, 2016 | | Year Ended April 30, 2015 |
| NET ASSET VALUE, BEGINNING OF PERIOD | | $ | 3.34 | | | $ | 4.10 | | | $ | 3.55 | | | $ | 3.09 | | | $ | 3.42 | | | $ | 3.41 | |
| | | | | | | | | | | | | | | | | | | | | | | | | |
| INCOME FROM INVESTMENT OPERATIONS | | | | | | | | | | | | | | | | | | | | | | | | |
| Net investment income(a) | | | 0.01 | | | | 0.00 | (b) | | | 0.01 | | | | 0.01 | | | | 0.01 | | | | 0.01 | |
| Net realized and unrealized gain/(loss) on investments | | | 0.01 | | | | (0.38 | ) | | | 0.68 | | | | 0.52 | | | | (0.20 | ) | | | 0.21 | |
| Total income/(loss) from investment operations | | | 0.02 | | | | (0.38 | ) | | | 0.69 | | | | 0.53 | | | | (0.19 | ) | | | 0.22 | |
| | | | | | | | | | | | | | | | | | | | | | | | | |
| DISTRIBUTIONS | | | | | | | | | | | | | | | | | | | | | | | | |
| From net investment income | | | – | | | | (0.01 | ) | | | (0.01 | ) | | | (0.02 | ) | | | (0.01 | ) | | | (0.01 | ) |
| From net realized gain on investments | | | – | | | | (0.37 | ) | | | (0.13 | ) | | | (0.05 | ) | | | (0.13 | ) | | | (0.20 | ) |
| Total distributions | | | – | | | | (0.38 | ) | | | (0.14 | ) | | | (0.07 | ) | | | (0.14 | ) | | | (0.21 | ) |
| | | | | | | | | | | | | | | | | | | | | | | | | |
| REDEMPTION FEES ADDED TO PAID-IN CAPITAL | | | 0.00 | (b) | | | 0.00 | (b) | | | 0.00 | (b) | | | 0.00 | (b) | | | 0.00 | (b) | | | 0.00 | (b) |
| | | | | | | | | | | | | | | | | | | | | | | | | |
| INCREASE/DECREASE IN NET ASSET VALUE | | | 0.02 | | | | (0.76 | ) | | | 0.55 | | | | 0.46 | | | | (0.33 | ) | | | 0.01 | |
| NET ASSET VALUE, END OF PERIOD | | $ | 3.36 | | | $ | 3.34 | | | $ | 4.10 | | | $ | 3.55 | | | $ | 3.09 | | | $ | 3.42 | |
| | | | | | | | | | | | | | | | | | | | | | | | | |
| TOTAL RETURN | | | 0.60 | %(c) | | | (7.40 | )% | | | 19.30 | % | | | 17.50 | % | | | (5.53 | )% | | | 7.25 | % |
| | | | | | | | | | | | | | | | | | | | | | | | | |
| RATIOS AND SUPPLEMENTAL DATA | | | | | | | | | | | | | | | | | | | | | | | | |
| Net assets, end of period (in 000s) | | $ | 52,130 | | | $ | 58,070 | | | $ | 78,686 | | | $ | 78,403 | | | $ | 123,922 | | | $ | 173,842 | |
| | | | | | | | | | | | | | | | | | | | | | | | | |
| RATIOS TO AVERAGE NET ASSETS | | | | | | | | | | | | | | | | | | | | | | | | |
| Expenses (excluding fees waived/ reimbursed by investment advisor) | | | 1.61 | %(d) | | | 1.62 | % | | | 1.61 | % | | | 1.61 | % | | | 1.62 | % | | | 1.62 | % |
| Expenses (including fees waived/ reimbursed by investment advisor) | | | 1.58 | %(d) | | | 1.57 | % | | | 1.55 | % | | | 1.58 | % | | | 1.62 | % | | | 1.62 | % |
| Net investment income | | | 0.34 | %(d) | | | 0.11 | % | | | 0.31 | % | | | 0.16 | % | | | 0.45 | % | | | 0.37 | % |
| | | | | | | | | | | | | | | | | | | | | | | | | |
| PORTFOLIO TURNOVER RATE | | | 14 | %(c) | | | 34 | % | | | 26 | % | | | 30 | % | | | 34 | % | | | 36 | % |
| (a) | Per share numbers have been calculated using the average shares method. |
| (b) | Less than $0.005 or ($0.005) per share. |
See Notes to Financial Statements.
| 86 | 1.855.377.7325 | www.GrandeurPeakGlobal.com |
| Grandeur Peak International Opportunities Fund | Financial Highlights |
For a Share Outstanding Throughout the Periods Presented
| Institutional Class | | For the Six Months Ended October 31, 2019 (Unaudited) | | Year Ended April 30, 2019 | | Year Ended April 30, 2018 | | Year Ended April 30, 2017 | | Year Ended April 30, 2016 | | Year Ended April 30, 2015 |
| NET ASSET VALUE, BEGINNING OF PERIOD | | $ | 3.36 | | | $ | 4.12 | | | $ | 3.57 | | | $ | 3.11 | | | $ | 3.43 | | | $ | 3.42 | |
| | | | | | | | | | | | | | | | | | | | | | | | | |
| INCOME FROM INVESTMENT OPERATIONS | | | | | | | | | | | | | | | | | | | | | | | | |
| Net investment income(a) | | | 0.01 | | | | 0.01 | | | | 0.02 | | | | 0.01 | | | | 0.02 | | | | 0.02 | |
| Net realized and unrealized gain/(loss) on investments | | | 0.01 | | | | (0.38 | ) | | | 0.67 | | | | 0.52 | | | | (0.20 | ) | | | 0.21 | |
| Total income/(loss) from investment operations | | | 0.02 | | | | (0.37 | ) | | | 0.69 | | | | 0.53 | | | | (0.18 | ) | | | 0.23 | |
| | | | | | | | | | | | | | | | | | | | | | | | | |
| DISTRIBUTIONS | | | | | | | | | | | | | | | | | | | | | | | | |
| From net investment income | | | – | | | | (0.02 | ) | | | (0.01 | ) | | | (0.02 | ) | | | (0.01 | ) | | | (0.02 | ) |
| From net realized gain on investments | | | – | | | | (0.37 | ) | | | (0.13 | ) | | | (0.05 | ) | | | (0.13 | ) | | | (0.20 | ) |
| Total distributions | | | – | | | | (0.39 | ) | | | (0.14 | ) | | | (0.07 | ) | | | (0.14 | ) | | | (0.22 | ) |
| | | | | | | | | | | | | | | | | | | | | | | | | |
| REDEMPTION FEES ADDED TO PAID- IN CAPITAL | | | 0.00 | (b) | | | 0.00 | (b) | | | 0.00 | (b) | | | 0.00 | (b) | | | 0.00 | (b) | | | 0.00 | (b) |
| | | | | | | | | | | | | | | | | | | | | | | | | |
| INCREASE/DECREASE IN NET ASSET VALUE | | | 0.02 | | | | (0.76 | ) | | | 0.55 | | | | 0.46 | | | | (0.32 | ) | | | 0.01 | |
| NET ASSET VALUE, END OF PERIOD | | $ | 3.38 | | | $ | 3.36 | | | $ | 4.12 | | | $ | 3.57 | | | $ | 3.11 | | | $ | 3.43 | |
| | | | | | | | | | | | | | | | | | | | | | | | | |
| TOTAL RETURN | | | 0.60 | %(c) | | | (7.19 | )% | | | 19.38 | % | | | 17.59 | % | | | (5.02 | )% | | | 7.41 | % |
| | | | | | | | | | | | | | | | | | | | | | | | | |
| RATIOS AND SUPPLEMENTAL DATA | | | | | | | | | | | | | | | | | | | | | | | | |
| Net assets, end of period (in 000s) | | $ | 590,235 | | | $ | 653,241 | | | $ | 813,322 | | | $ | 698,504 | | | $ | 579,371 | | | $ | 682,364 | |
| | | | | | | | | | | | | | | | | | | | | | | | | |
| RATIOS TO AVERAGE NET ASSETS | | | | | | | | | | | | | | | | | | | | | | | | |
| Expenses (excluding fees waived/ reimbursed by investment advisor) | | | 1.38 | %(d) | | | 1.37 | % | | | 1.37 | % | | | 1.37 | % | | | 1.38 | % | | | 1.38 | % |
| Expenses (including fees waived/ reimbursed by investment advisor) | | | 1.34 | %(d) | | | 1.32 | % | | | 1.30 | % | | | 1.34 | % | | | 1.38 | % | | | 1.38 | % |
| Net investment income | | | 0.57 | %(d) | | | 0.41 | % | | | 0.54 | % | | | 0.42 | % | | | 0.65 | % | | | 0.61 | % |
| | | | | | | | | | | | | | | | | | | | | | | | | |
| PORTFOLIO TURNOVER RATE | | | 14 | %(c) | | | 34 | % | | | 26 | % | | | 30 | % | | | 34 | % | | | 36 | % |
| (a) | Per share numbers have been calculated using the average shares method. |
| (b) | Less than $0.005 or ($0.005) per share. |
See Notes to Financial Statements.
| Semi-Annual Report | October 31, 2019 | 87 |
| Grandeur Peak International Stalwarts Fund | Financial Highlights |
For a Share Outstanding Throughout the Periods Presented
| Investor Class | | For the Six Months Ended October 31, 2019 (Unaudited) | | Year Ended April 30, 2019 | | Year Ended April 30, 2018 | | Year Ended April 30, 2017 | | For the Period September 2, 2015 (Commencement of Operations) to April 30, 2016 |
| NET ASSET VALUE, BEGINNING OF PERIOD | | $ | 14.70 | | | $ | 15.53 | | | $ | 13.04 | | | $ | 11.02 | | | $ | 10.00 | |
| | | | | | | | | | | | | | | | | | | | | |
| INCOME FROM INVESTMENT OPERATIONS | | | | | | | | | | | | | | | | | | | | |
| Net investment income(a) | | | 0.03 | | | | 0.04 | | | | 0.05 | | | | 0.02 | | | | 0.03 | |
| Net realized and unrealized gain/(loss) on investments | | | 0.08 | | | | (0.53 | ) | | | 2.62 | | | | 2.03 | | | | 0.99 | |
| Total income/(loss) from investment operations | | | 0.11 | | | | (0.49 | ) | | | 2.67 | | | | 2.05 | | | | 1.02 | |
| | | | | | | | | | | | | | | | | | | | | |
| DISTRIBUTIONS | | | | | | | | | | | | | | | | | | | | |
| From net investment income | | | – | | | | (0.05 | ) | | | – | | | | (0.03 | ) | | | – | |
| From net realized gain on investments | | | – | | | | (0.29 | ) | | | (0.18 | ) | | | – | | | | – | |
| Total distributions | | | – | | | | (0.34 | ) | | | (0.18 | ) | | | (0.03 | ) | | | – | |
| | | | | | | | | | | | | | | | | | | | | |
| REDEMPTION FEES ADDED TO PAID-INCAPITAL | | | 0.00 | (b) | | | 0.00 | (b) | | | 0.00 | (b) | | | 0.00 | (b) | | | 0.00 | (b) |
| | | | | | | | | | | | | | | | | | | | | |
| INCREASE/DECREASE IN NET ASSET VALUE | | | 0.11 | | | | (0.83 | ) | | | 2.49 | | | | 2.02 | | | | 1.02 | |
| NET ASSET VALUE, END OF PERIOD | | $ | 14.81 | | | $ | 14.70 | | | $ | 15.53 | | | $ | 13.04 | | | $ | 11.02 | |
| | | | | | | | | | | | | | | | | | | | | |
| TOTAL RETURN | | | 0.75 | %(c) | | | (2.69 | )% | | | 20.50 | % | | | 18.68 | % | | | 10.20 | %(c) |
| | | | | | | | | | | | | | | | | | | | | |
| RATIOS AND SUPPLEMENTAL DATA | | | | | | | | | | | | | | | | | | | | |
| Net assets, end of period (in 000s) | | $ | 74,794 | | | $ | 72,204 | | | $ | 52,478 | | | $ | 31,045 | | | $ | 22,028 | |
| | | | | | | | | | | | | | | | | | | | | |
| RATIOS TO AVERAGE NET ASSETS | | | | | | | | | | | | | | | | | | | | |
| Expenses (excluding fees waived/ reimbursed by investment advisor) | | | 1.17 | %(d) | | | 1.19 | % | | | 1.19 | % | | | 1.27 | % | | | 1.45 | %(d)(e) |
| Expenses (including fees waived/ reimbursed by investment advisor) | | | 1.17 | %(d) | | | 1.19 | % | | | 1.19 | % | | | 1.27 | % | | | 1.35 | %(d)(e) |
| Net investment income | | | 0.37 | %(d) | | | 0.26 | % | | | 0.33 | % | | | 0.19 | % | | | 0.44 | %(d) |
| | | | | | | | | | | | | | | | | | | | | |
| PORTFOLIO TURNOVER RATE | | | 18 | %(c) | | | 42 | % | | | 24 | % | | | 37 | % | | | 59 | %(c) |
| (a) | Per share numbers have been calculated using the average shares method. |
| (b) | Less than $0.005 or ($0.005) per share. |
| (e) | Expense ratios during startup periods may not be representative of longer term operating periods. |
See Notes to Financial Statements.
| 88 | 1.855.377.7325 | www.GrandeurPeakGlobal.com |
| Grandeur Peak International Stalwarts Fund | Financial Highlights |
For a Share Outstanding Throughout the Periods Presented
| Institutional Class | | For the Six Months Ended October 31, 2019 (Unaudited) | | Year Ended April 30, 2019 | | Year Ended April 30, 2018 | | Year Ended April 30, 2017 | | For the Period September 2, 2015 (Commencement of Operations) to April 30, 2016 |
| NET ASSET VALUE, BEGINNING OF PERIOD | | $ | 14.74 | | | $ | 15.57 | | | $ | 13.06 | | | $ | 11.03 | | | $ | 10.00 | |
| | | | | | | | | | | | | | | | | | | | | |
| INCOME FROM INVESTMENT OPERATIONS | | | | | | | | | | | | | | | | | | | | |
| Net investment income(a) | | | 0.04 | | | | 0.07 | | | | 0.08 | | | | 0.04 | | | | 0.04 | |
| Net realized and unrealized gain/(loss) on investments | | | 0.09 | | | | (0.54 | ) | | | 2.63 | | | | 2.04 | | | | 0.99 | |
| Total income/(loss) from investment operations | | | 0.13 | | | | (0.47 | ) | | | 2.71 | | | | 2.08 | | | | 1.03 | |
| | | | | | | | | | | | | | | | | | | | | |
| DISTRIBUTIONS | | | | | | | | | | | | | | | | | | | | |
| From net investment income | | | – | | | | (0.07 | ) | | | (0.02 | ) | | | (0.05 | ) | | | (0.00 | )(b) |
| From net realized gain on investments | | | – | | | | (0.29 | ) | | | (0.18 | ) | | | – | | | | – | |
| Total distributions | | | – | | | | (0.36 | ) | | | (0.20 | ) | | | (0.05 | ) | | | (0.00 | )(b) |
| | | | | | | | | | | | | | | | | | | | | |
| REDEMPTION FEES ADDED TO PAID-INCAPITAL | | | 0.00 | (b) | | | 0.00 | (b) | | | 0.00 | (b) | | | 0.00 | (b) | | | 0.00 | (b) |
| | | | | | | | | | | | | | | | | | | | | |
| INCREASE/DECREASE IN NET ASSET VALUE | | | 0.13 | | | | (0.83 | ) | | | 2.51 | | | | 2.03 | | | | 1.03 | |
| NET ASSET VALUE, END OF PERIOD | | $ | 14.87 | | | $ | 14.74 | | | $ | 15.57 | | | $ | 13.06 | | | $ | 11.03 | |
| | | | | | | | | | | | | | | | | | | | | |
| TOTAL RETURN | | | 0.88 | %(c) | | | (2.50 | )% | | | 20.79 | % | | | 18.96 | % | | | 10.34 | %(c) |
| | | | | | | | | | | | | | | | | | | | | |
| RATIOS AND SUPPLEMENTAL DATA | | | | | | | | | | | | | | | | | | | | |
| Net assets, end of period (in 000s) | | $ | 629,254 | | | $ | 561,100 | | | $ | 496,358 | | | $ | 265,393 | | | $ | 119,070 | |
| | | | | | | | | | | | | | | | | | | | | |
| RATIOS TO AVERAGE NET ASSETS | | | | | | | | | | | | | | | | | | | | |
| Expenses (excluding fees waived/ reimbursed by investment advisor) | | | 0.92 | %(d) | | | 0.94 | % | | | 0.94 | % | | | 1.02 | % | | | 1.20 | %(d)(e) |
| Expenses (including fees waived/ reimbursed by investment advisor) | | | 0.92 | %(d) | | | 0.94 | % | | | 0.94 | % | | | 1.02 | % | | | 1.10 | %(d)(e) |
| Net investment income | | | 0.61 | %(d) | | | 0.51 | % | | | 0.57 | % | | | 0.37 | % | | | 0.60 | %(d) |
| | | | | | | | | | | | | | | | | | | | | |
| PORTFOLIO TURNOVER RATE | | | 18 | %(c) | | | 42 | % | | | 24 | % | | | 37 | % | | | 59 | %(c) |
| (a) | Per share numbers have been calculated using the average shares method. |
| (b) | Less than $0.005 or ($0.005) per share. |
| (e) | Expense ratios during startup periods may not be representative of longer term operating periods. |
See Notes to Financial Statements.
| Semi-Annual Report | October 31, 2019 | 89 |
| Grandeur Peak Funds® | Notes to Financial Statements |
October 31, 2019 (Unaudited)
1. ORGANIZATION
Financial Investors Trust (the “Trust”), a Delaware statutory trust, is an open-end management investment company registered under the Investment Company Act of 1940, as amended (“1940 Act”). As of October 31, 2019, the Trust consists of multiple separate portfolios or series. This semi-annual report describes the Grandeur Peak Emerging Markets Opportunities Fund, Grandeur Peak Global Contrarian Fund, Grandeur Peak Global Micro Cap Fund, Grandeur Peak Global Opportunities Fund, Grandeur Peak Global Reach Fund, Grandeur Peak Global Stalwarts Fund, Grandeur Peak International Opportunities Fund, and Grandeur Peak International Stalwarts Fund (individually a “Fund” and collectively, the “Funds”). The Funds seek long-term growth of capital. The Funds offer Investor Class (except the Grandeur Peak Global Contrarian Fund and Grandeur Peak Global Micro Cap Fund) and Institutional Class shares.
2. SIGNIFICANT ACCOUNTING POLICIES
The accompanying financial statements were prepared in accordance with accounting principles generally accepted in the United States of America (“U.S. GAAP”). The preparation of financial statements in conformity with U.S. GAAP requires management to make certain estimates and assumptions that affect the reported amounts of assets and liabilities and disclosures of contingent assets and liabilities at the date of the financial statements and the reported amounts of revenue and expenses during the period. Actual results could differ from those estimates. The Funds are considered an investment company for financial reporting purposes under U.S. GAAP and follows the accounting and reporting guidance applicable to investment companies in the Financial Accounting Standards Board Accounting Standards Codification Topic 946. The following is a summary of significant accounting policies consistently followed by the Funds in preparation of their financial statements.
Investment Valuation:The Funds generally value their securities based on market prices determined at the close of regular trading on the New York Stock Exchange (“NYSE”), normally 4:00 p.m. Eastern Time, on each day the NYSE is open for trading.
For equity securities and mutual funds that are traded on an exchange, the market price is usually the closing sale or official closing price on that exchange. In the case of equity securities not traded on an exchange, or if such closing prices are not otherwise available, the securities are valued at the mean of the most recent bid and ask prices on such day. Redeemable securities issued by open-end registered investment companies are valued at the investment company’s applicable net asset value, with the exception of exchange-traded open-end investment companies, which are priced as equity securities.
Equity securities that are primarily traded on foreign securities exchanges are valued at the closing values of such securities on their respective foreign exchanges, except when an event occurs subsequent to the close of the foreign exchange and the close of the NYSE that was likely to have changed such value. In such an event, the fair value of those securities are determined in good faith through consideration of other factors in accordance with procedures established by and under the general supervision of the Board of Trustees of the Trust (the “Board” or the “Trustees”). The Funds will use a fair valuation model provided by an independent pricing service, which is intended to reflect fair value when a security’s value or a meaningful portion of each Fund’s portfolio is believed to have been materially affected by a valuation event that has occurred between the close of the exchange or market on which the security is traded and the close of the regular trading day on the NYSE. The Funds’ valuation procedures set forth certain triggers which instruct when to use the fair valuation model.
Corporate bonds are valued using market models that consider trade data, quotations from dealers and active market makers, relevant yield curve and spread data, creditworthiness, trade data or market information on comparable securities, and other relevant security specific information.
Forward currency exchange contracts have a fair value determined by the prevailing foreign currency exchange daily rates and current foreign currency exchange forward rates. The foreign currency exchange forward rates are calculated using an automated system that estimates rates on the basis of the current day foreign currency exchange rates and forward foreign currency exchange rates supplied by a pricing service.
When such prices or quotations are not available, or when Grandeur Peak Global Advisors, LLC (the “Adviser” or “Grandeur Peak”) believes that they are unreliable, securities may be priced using fair value procedures approved by the Board.
Fair Value Measurements:The Funds disclose the classification of their fair value measurements following a three-tier hierarchy based on the inputs used to measure fair value. Inputs refer broadly to the assumptions that market participants would use in pricing the asset or liability, including assumptions about risk. Inputs may be observable or unobservable. Observable inputs reflect the assumptions market participants would use in pricing the asset or liability that are developed based on market data obtained from sources independent of the reporting entity. Unobservable inputs reflect the reporting entity’s own assumptions about the assumptions market participants would use in pricing the asset or liability that are developed based on the best information available.
| 90 | 1.855.377.7325 | www.GrandeurPeakGlobal.com |
| Grandeur Peak Funds® | Notes to Financial Statements |
October 31, 2019 (Unaudited)
Various inputs are used in determining the value of the Funds’ investments as of the end of the reporting period. When inputs used fall into different levels of the fair value hierarchy, the level in the hierarchy within which the fair value measurement falls is determined based on the lowest level input that is significant to the fair value measurement in its entirety. The designated input levels are not necessarily an indication of the risk or liquidity associated with these investments. These inputs are categorized in the following hierarchy under applicable financial accounting standards:
Level 1 – Unadjusted quoted prices in active markets for identical investments, unrestricted assets or liabilities that the Funds have the ability to access at the measurement date;
Level 2 – Quoted prices which are not active, quoted prices for similar assets or liabilities in active markets or inputs other than quoted prices that are observable (either directly or indirectly) for substantially the full term of the asset or liability; and
Level 3 – Significant unobservable prices or inputs (including the Funds’ own assumptions in determining the fair value of investments) where there is little or no market activity for the asset or liability at the measurement date.
The following is a summary of each Fund’s investments in the fair value hierarchy as of October 31, 2019:
| Investments in Securities at Value | | Level 1 - Quoted and Unadjusted Prices | | Level 2 - Other Significant Observable Inputs | | Level 3 - Significant Unobservable Inputs | | Total |
| Grandeur Peak Emerging Markets Opportunities Fund | | | | | | | | | | | | | | | | |
| Common Stocks | | | | | | | | | | | | | | | | |
| Philippines | | $ | 18,253,455 | | | $ | – | | | $ | 7,014 | | | $ | 18,260,469 | |
| Other* | | | 411,193,898 | | | | – | | | | – | | | | 411,193,898 | |
| Total | | $ | 429,447,353 | | | $ | – | | | $ | 7,014 | | | $ | 429,454,367 | |
| Investments in Securities at Value | | Level 1 - Quoted and Unadjusted Prices | | Level 2 - Other Significant Observable Inputs | | Level 3 - Significant Unobservable Inputs | | Total |
| Grandeur Peak Global Contrarian Fund | | | | | | | | |
| Common Stocks* | | $ | 4,670,352 | | | $ | – | | | $ | – | | | $ | 4,670,352 | |
| Total | | $ | 4,670,352 | | | $ | – | | | $ | – | | | $ | 4,670,352 | |
| Investments in Securities at Value | | Level 1 - Quoted and Unadjusted Prices | | Level 2 - Other Significant Observable Inputs | | Level 3 - Significant Unobservable Inputs | | Total |
| Grandeur Peak Global Micro Cap Fund | | | | | | | | |
| Common Stocks | | | | | | | | | | | | | | | | |
| New Zealand | | $ | 125,468 | | | $ | – | | | $ | – | | | $ | 125,468 | |
| Other* | | | 33,264,782 | | | | – | | | | – | | | | 33,264,782 | |
| Total | | $ | 33,390,250 | | | $ | – | | | $ | – | | | $ | 33,390,250 | |
| Investments in Securities at Value | | Level 1 - Quoted and Unadjusted Prices | | Level 2 - Other Significant Observable Inputs | | Level 3 - Significant Unobservable Inputs | | Total |
| Grandeur Peak Global Opportunities Fund | | | | | | | | |
| Common Stocks | | | | | | | | | | | | | | | | |
| New Zealand | | $ | – | | | $ | – | | | $ | 1 | | | $ | 1 | |
| Other* | | | 638,590,932 | | | | – | | | | – | | | | 638,590,932 | |
| Preferred Stocks* | | $ | – | | | $ | – | | | $ | 1,923,136 | | | $ | 1,923,136 | |
| Total | | $ | 638,590,932 | | | $ | – | | | $ | 1,923,137 | | | $ | 640,514,069 | |
| Semi-Annual Report | October 31, 2019 | 91 |
| Grandeur Peak Funds® | Notes to Financial Statements |
October 31, 2019 (Unaudited)
| Investments in Securities at Value | | Level 1 - Quoted and Unadjusted Prices | | Level 2 - Other Significant Observable Inputs | | Level 3 - Significant Unobservable Inputs | | Total |
| Grandeur Peak Global Reach Fund | | | | | | | | |
| Common Stocks | | | | | | | | | | | | | | | | |
| New Zealand | | $ | 1,017,619 | | | $ | – | | | $ | – | | | $ | 1,017,619 | |
| Spain | | | – | | | | – | | | | – | | | | – | |
| Other* | | | 298,729,786 | | | | – | | | | – | | | | 298,729,786 | |
| Preferred Stocks* | | $ | – | | | $ | – | | | $ | 912,077 | | | $ | 912,077 | |
| Total | | $ | 299,747,405 | | | $ | – | | | $ | 912,077 | | | $ | 300,659,482 | |
| Investments in Securities at Value | | Level 1 - Quoted and Unadjusted Prices | | Level 2 - Other Significant Observable Inputs | | Level 3 - Significant Unobservable Inputs | | Total |
| Grandeur Peak Global Stalwarts Fund | | | | | | | | |
| Common Stocks* | | $ | 181,452,343 | | | $ | – | | | $ | – | | | $ | 181,452,343 | |
| Preferred Stocks* | | | – | | | | – | | | | 482,814 | | | | 482,814 | |
| Total | | $ | 181,452,343 | | | $ | – | | | $ | 482,814 | | | $ | 181,935,157 | |
| Investments in Securities at Value | | Level 1 - Quoted and Unadjusted Prices | | Level 2 - Other Significant Observable Inputs | | Level 3 - Significant Unobservable Inputs | | Total |
| Grandeur Peak International Opportunities Fund | | | | | | | | | | | | | | | | |
| Common Stocks | | | | | | | | | | | | | | | | |
| New Zealand | | $ | – | | | $ | – | | | $ | 1 | | | $ | 1 | |
| Other* | | | 620,633,988 | | | | – | | | | – | | | | 620,633,988 | |
| Total | | $ | 620,633,988 | | | $ | – | | | $ | 1 | | | $ | 620,633,989 | |
| Investments in Securities at Value | | Level 1 - Quoted and Unadjusted Prices | | Level 2 - Other Significant Observable Inputs | | Level 3 - Significant Unobservable Inputs | | Total |
| Grandeur Peak International Stalwarts Fund | | | | | | | | | | | | | | | | |
| Common Stocks* | | $ | 673,389,159 | | | $ | – | | | $ | – | | | $ | 673,389,159 | |
| Total | | $ | 673,389,159 | | | $ | – | | | $ | – | | | $ | 673,389,159 | |
| * | For a detailed country breakdown, see the accompanying Portfolio of Investments. |
| 92 | 1.855.377.7325 | www.GrandeurPeakGlobal.com |
| Grandeur Peak Funds® | Notes to Financial Statements |
October 31, 2019 (Unaudited)
The following is a reconciliation of the investments in which significant unobservable inputs (Level 3) were used in determining fair value:
| Grandeur Peak Emerging Markets Opportunities | | Common Stocks | | Preferred Stocks | | Total |
| Balance as of April 30, 2019 | | $ | – | | | $ | – | | | $ | – | |
| Accrued Discount/Premium | | | – | | | | – | | | | – | |
| Return of Capital | | | – | | | | – | | | | – | |
| Realized Gain/(Loss) | | | – | | | | – | | | | – | |
| Change in Unrealized Appreciation/(Depreciation) | | | 7,014 | | | | – | | | | 7,014 | |
| Purchases | | | – | | | | – | | | | – | |
| Sales Proceeds | | | – | | | | – | | | | – | |
| Transfer into Level 3 | | | – | | | | – | | | | – | |
| Transfer out of Level 3 | | | – | | | | – | | | | – | |
| Balance as of October 31, 2019 | | $ | 7,014 | | | $ | – | | | $ | 7,014 | |
| Net change in unrealized Appreciation/(Depreciation) attributable to Level 3 investments held at October 31, 2019 | | $ | 7,014 | | | $ | - | | | $ | 7,014 | |
| Grandeur Peak Global Opportunities | | Common Stocks | | Preferred Stocks | | Total |
| Balance as of April 30, 2019 | | $ | 1 | | | $ | 1,923,136 | | | $ | 1,923,137 | |
| Accrued Discount/Premium | | | – | | | | – | | | | – | |
| Return of Capital | | | – | | | | – | | | | – | |
| Realized Gain/(Loss) | | | – | | | | – | | | | – | |
| Change in Unrealized Appreciation/(Depreciation) | | | – | | | | – | | | | – | |
| Purchases | | | – | | | | – | | | | – | |
| Sales Proceeds | | | – | | | | – | | | | – | |
| Transfer into Level 3 | | | – | | | | – | | | | – | |
| Transfer out of Level 3 | | | – | | | | – | | | | – | |
| Balance as of October 31, 2019 | | $ | 1 | | | $ | 1,923,136 | | | $ | 1,923,137 | |
| Net change in unrealized Appreciation/(Depreciation) attributable to Level 3 investments held at October 31, 2019 | | $ | – | | | $ | – | | | $ | – | |
| Grandeur Peak Global Reach Fund | | Common Stocks | | Preferred Stocks | | Total |
| Balance as of April 30, 2019 | | $ | 1 | | | $ | 912,077 | | | $ | 912,078 | |
| Accrued Discount/Premium | | | – | | | | – | | | | – | |
| Return of Capital | | | – | | | | – | | | | – | |
| Realized Gain/(Loss) | | | – | | | | – | | | | – | |
| Change in Unrealized Appreciation/(Depreciation) | | | 1 | | | | – | | | | 1 | |
| Purchases | | | – | | | | – | | | | – | |
| Sales Proceeds | | | (1 | ) | | | – | | | | (1 | ) |
| Transfer into Level 3 | | | – | | | | – | | | | – | |
| Transfer out of Level 3 | | | – | | | | – | | | | – | |
| Balance as of October 31, 2019 | | $ | 1 | | | $ | 912,077 | | | $ | 912,078 | |
| Net change in unrealized Appreciation/(Depreciation) attributable to Level 3 investments held at October 31, 2019 | | $ | 1 | | | $ | – | | | $ | 1 | |
| Grandeur Peak Global Stalwarts Fund | | Common Stocks | | Preferred Stocks | | Total |
| Balance as of April 30, 2019 | | $ | – | | | $ | 482,814 | | | $ | 482,814 | |
| Accrued Discount/Premium | | | – | | | | – | | | | – | |
| Return of Capital | | | – | | | | – | | | | – | |
| Realized Gain/(Loss) | | | – | | | | – | | | | – | |
| Change in Unrealized Appreciation/(Depreciation) | | | – | | | | – | | | | – | |
| Purchases | | | – | | | | – | | | | – | |
| Sales Proceeds | | | – | | | | – | | | | – | |
| Transfer into Level 3 | | | – | | | | – | | | | – | |
| Transfer out of Level 3 | | | – | | | | – | | | | – | |
| Balance as of October 31, 2019 | | $ | – | | | $ | 482,814 | | | $ | 482,814 | |
| Net change in unrealized Appreciation/(Depreciation) attributable to Level 3 investments held at October 31, 2019 | | $ | – | | | $ | – | | | $ | – | |
| Semi-Annual Report | October 31, 2019 | 93 |
| Grandeur Peak Funds® | Notes to Financial Statements |
October 31, 2019 (Unaudited)
| Grandeur Peak International Opportunities | | Common Stocks | | Preferred Stocks | | Total |
| Balance as of April 30, 2019 | | $ | 1 | | | $ | - | | | $ | 1 | |
| Accrued Discount/Premium | | | – | | | | – | | | | – | |
| Return of Capital | | | – | | | | – | | | | – | |
| Realized Gain/(Loss) | | | – | | | | – | | | | – | |
| Change in Unrealized Appreciation/(Depreciation) | | | – | | | | – | | | | – | |
| Purchases | | | – | | | | – | | | | – | |
| Sales Proceeds | | | – | | | | – | | | | – | |
| Transfer into Level 3 | | | – | | | | – | | | | – | |
| Transfer out of Level 3 | | | – | | | | – | | | | – | |
| Balance as of October 31, 2019 | | $ | 1 | | | $ | – | | | $ | 1 | |
| Net change in unrealized Appreciation/(Depreciation) attributable to Level 3 investments held at October 31, 2019 | | $ | – | | | $ | – | | | $ | – | |
Change in unrealized appreciation/depreciation on Level 3 securities is included on the Statements of Operations under Net change in unrealized appreciation/(depreciation) on investments. Realized gain/(loss) on Level 3 securities is included on the Statements of Operations under Net realized gain/(loss) on investments.
The table below provides additional information about the Level 3 Fair Value Measurements as of October 31, 2019:
Quantitative Information about Level 3 Fair Value Measurements
| Asset Class | | Fair Value (USD) at 10/31/2019 | | Valuation Technique | | Unobservable Inputs(a) | | Value (USD) |
| Common Stock | | $ | 7,014 | | | Recommended price | | Cost | | $ | 0.10 | |
Grandeur Peak Global Opportunities Fund
| Asset Class | | Fair Value (USD) at 10/31/2019 | | Valuation Technique | | Unobservable Inputs(a) | | Value (USD) |
| Preferred Stock | | $ | 1,923,136 | | | Purchase price | | Cost | | $ | 19.90 | |
Grandeur Peak Global Reach Fund
| Asset Class | | Fair Value (USD) at 10/31/2019 | | Valuation Technique | | Unobservable Inputs(a) | | Value (USD) |
| Preferred Stock | | $ | 912,077 | | | Purchase price | | Cost | | $ | 19.90 | |
Grandeur Peak Global Stalwarts Fund
| Asset Class | | Fair Value (USD) at 10/31/2019 | | Valuation Technique | | Unobservable Inputs(a) | | Value (USD) |
| Preferred Stock | | $ | 482,814 | | | Purchase price | | Cost | | $ | 19.90 | |
| (a) | A change to the unobservable input may result in a significant change to the value of the investment as follows: |
| Unobservable Input | Impact to Value if Input Increases | Impact to Value if Input Decreases |
| Discount | Decrease | Increase |
Investment Transactions and Investment Income:Investment transactions are accounted for on the date the investments are purchased or sold (trade date). Realized gains and losses from investment transactions are reported on an identified cost which is the same basis the Fund uses for federal income tax purposes. Interest income, which includes accretion of discounts and amortization of premiums, is accrued and recorded as earned. Dividend income is recognized on the ex-dividend date or for certain foreign securities, as soon as information is available to the Funds. All of the realized and unrealized gains and losses and net investment income, are allocated daily to each class in proportion to its average daily net assets.
| 94 | 1.855.377.7325 | www.GrandeurPeakGlobal.com |
| Grandeur Peak Funds® | Notes to Financial Statements |
October 31, 2019 (Unaudited)
Cash Management Transactions:The Funds subscribe to the Brown Brothers Harriman & Co. (“BBH”) Cash Management Service (“CMS”), whereby cash balances are automatically swept into overnight offshore demand deposits with either the BBH Grand Cayman branch or a branch of a pre-approved commercial bank. This fully automated program allows the Funds to earn interest on cash balances. Excess cash with deposit institutions domiciled outside of the U.S. are subject to sovereign actions in the jurisdiction of the deposit institution including, but not limited to, freeze, seizure or diminution. Cash balances in the BBH CMS are included on the Statements of Assets and Liabilities under Cash and Foreign Cash, at Value. As of October 31, 2019, the Funds had the following cash balances participating in the BBH CMS:
| Fund | | |
| Grandeur Peak Emerging Markets Opportunities Fund | | $ | 29,396,615 | |
| Grandeur Peak Global Contrarian Fund | | | – | |
| Grandeur Peak Global Micro Cap Fund | | | 435,848 | |
| Grandeur Peak Global Opportunities Fund | | | 18,940,434 | |
| Grandeur Peak Global Reach Fund | | | 4,283,084 | |
| Grandeur Peak Global Stalwarts Fund | | | 6,353,279 | |
| Grandeur Peak International Opportunities Fund | | | 21,635,839 | |
| Grandeur Peak International Stalwarts Fund | | | 31,859,736 | |
As of October 31, 2019, the Funds had the following foreign cash balances participating in the BBH CMS (cost and value of foreign cash balances are equal):
| Fund | | |
| Grandeur Peak Emerging Markets Opportunities Fund | | $ | – | |
| Grandeur Peak Global Contrarian Fund | | | 9,600 | |
| Grandeur Peak Global Micro Cap Fund | | | – | |
| Grandeur Peak Global Opportunities Fund | | | 11,310 | |
| Grandeur Peak Global Reach Fund | | | 2,177 | |
| Grandeur Peak Global Stalwarts Fund | | | – | |
| Grandeur Peak International Opportunities Fund | | | 12,298 | |
| Grandeur Peak International Stalwarts Fund | | | – | |
Foreign Securities:The Funds may directly purchase securities of foreign issuers. Investing in securities of foreign issuers involves special risks not typically associated with investing in securities of U.S. issuers. The risks include possible reevaluation of currencies, the inability to repatriate foreign currency, less complete financial information about companies and possible future adverse political and economic developments. Moreover, securities of many foreign issuers and their markets may be less liquid and their prices more volatile than those of securities of comparable U.S. issuers.
Foreign Currency Translation:The books and records of the Funds are maintained in U.S. dollars. Investment valuations and other assets and liabilities initially expressed in foreign currencies are converted each business day into U.S. dollars based upon current exchange rates. Prevailing foreign exchange rates may generally be obtained at the close of the NYSE (normally, 4:00 p.m. Eastern Time). The portion of realized and unrealized gains or losses on investments due to fluctuations in foreign currency exchange rates is not separately disclosed and is included in realized and unrealized gains or losses on investments, when applicable.
Foreign Currency Spot Contracts:The Funds may enter into foreign currency spot contracts to facilitate transactions in foreign securities or to convert foreign currency receipts into U.S. dollars. A foreign currency spot contract is an agreement between two parties to buy and sell currencies at the current market rate, for settlement generally within two business days. The U.S. dollar value of the contracts is determined using current currency exchange rates supplied by a pricing service.
The contract is marked-to-market daily for settlements beyond one day and any change in market value is recorded as an unrealized gain or loss. When the contract is closed, a realized gain or loss is recorded equal to the difference between the value on the open and close date. Losses may arise from changes in the value of the foreign currency, or if the counterparties do not perform under the contract’s terms. The maximum potential loss from such contracts is the aggregate face value in U.S. dollars at the time the contract was opened.
Trust Expenses:Some expenses of the Trust can be directly attributed to the Funds. Expenses which cannot be directly attributed to the Funds are apportioned among all funds in the Trust based on average net assets of each fund.
| Semi-Annual Report | October 31, 2019 | 95 |
| Grandeur Peak Funds® | Notes to Financial Statements |
October 31, 2019 (Unaudited)
Fund and Class Expenses:Expenses that are specific to a Fund or class of shares of a Fund, including distribution fees (Rule 12b-1 fees), are charged directly to that Fund or share class. Expenses that are common to all Funds generally are allocated among the Funds in proportion to their average daily net assets.
Federal Income Taxes:The Funds comply with the requirements under Subchapter M of the Internal Revenue Code of 1986, as amended, applicable to regulated investment companies and intend to distribute substantially all of their net taxable income and net capital gains, if any, each year so that it will not be subject to excise tax on undistributed income and gains. The Funds are not subject to income taxes to the extent such distributions are made.
As of and during the six months ended October 31, 2019, the Funds had a liability for unrecognized capital gains tax. These amounts are disclosed as Foreign Capital Gains Tax on the Statements of Assets and Liabilities. The Funds file U.S. federal, state, and local tax returns as required. The Funds’ tax returns are subject to examination by the relevant tax authorities until expiration of the applicable statute of limitations, which is generally three years after the filing of the tax return for federal purposes and four years for most state returns. Tax returns for open years have incorporated no uncertain tax positions that require a provision for income taxes.
Distributions to Shareholders:Each Fund normally pays dividends and distributes capital gains, if any, on an annual basis. Income dividend distributions are derived from dividends and other income each Fund receives from their investments, including short term capital gains. Long term capital gain distributions are derived from gains realized when each Fund sells a security it has owned for more than a year. Each Fund may make additional distributions and dividends at other times if the portfolio manager believes doing so may be necessary for each Fund to avoid or reduce taxes. The Funds intend to pass through foreign tax credits to shareholders.
Tax Basis of Investments:As of October 31, 2019, the aggregate cost of investments, gross unrealized appreciation/(depreciation) and net unrealized appreciation for Federal tax purposes was as follows:
| Fund | | Gross Appreciation (excess of value over tax cost) | | Gross Depreciation (excess of tax cost over value) | | Net Unrealized Appreciation/(Depreciation) | | Cost of Investments for Income Tax Purposes |
| Grandeur Peak Emerging Markets Opportunities Fund | | $ | 111,575,021 | | | $ | (34,616,507 | ) | | $ | 76,958,514 | | | $ | 352,495,853 | |
| Grandeur Peak Global Contrarian Fund | | | 163,598 | | | | (99,541 | ) | | | 64,057 | | | | 4,606,295 | |
| Grandeur Peak Global Micro Cap Fund | | | 7,702,811 | | | | (2,698,354 | ) | | | 5,004,457 | | | | 28,385,793 | |
| Grandeur Peak Global Opportunities Fund | | | 181,501,001 | | | | (36,175,705 | ) | | | 145,325,296 | | | | 495,188,773 | |
| Grandeur Peak Global Reach Fund | | | 81,215,451 | | | | (19,385,900 | ) | | | 61,829,551 | | | | 238,829,931 | |
| Grandeur Peak Global Stalwarts Fund | | | 40,684,214 | | | | (8,976,889 | ) | | | 31,707,325 | | | | 150,227,832 | |
| Grandeur Peak International Opportunities Fund | | | 163,325,406 | | | | (42,227,975 | ) | | | 121,097,431 | | | | 499,536,558 | |
| Grandeur Peak International Stalwarts Fund | | | 131,269,667 | | | | (37,800,444 | ) | | | 93,469,223 | | | | 579,919,936 | |
Tax Basis of Distributions to Shareholders:The character of distributions made during the year from net investment income or net realized gains may differ from its ultimate characterization for federal income tax purposes. Also, due to the timing of dividend distributions, the fiscal year in which amounts are distributed may differ from the fiscal year in which the income or realized gain were recorded by the Funds.
| 96 | 1.855.377.7325 | www.GrandeurPeakGlobal.com |
| Grandeur Peak Funds® | Notes to Financial Statements |
October 31, 2019 (Unaudited)
The tax character of distributions paid by the Funds for the fiscal year ended April 30, 2019 were as follows:
| Fund | | Ordinary Income | | Long-Term Capital Gain |
| Grandeur Peak Emerging Markets Opportunities Fund | | $ | 1,399,313 | | | $ | 3,456,127 | |
| Grandeur Peak Global Contrarian Fund | | | – | | | | – | |
| Grandeur Peak Global Micro Cap Fund | | | 10,964 | | | | 2,207,059 | |
| Grandeur Peak Global Opportunities Fund | | | 4,541,112 | | | | 56,054,176 | |
| Grandeur Peak Global Reach Fund | | | 2,440,188 | | | | 27,120,108 | |
| Grandeur Peak Global Stalwarts Fund | | | 150,604 | | | | 5,087,232 | |
| Grandeur Peak International Opportunities Fund | | | 6,846,633 | | | | 62,253,180 | |
| Grandeur Peak International Stalwarts Fund | | | 2,587,918 | | | | 10,997,639 | |
The amounts and characteristics of tax basis distributions and composition of distributable earnings/(accumulated losses) are finalized at fiscal year-end. Accordingly, tax basis balances have not been determined as of October 31, 2019.
4.SECURITIES TRANSACTIONS
The cost of purchases and proceeds from sales of securities (excluding short term securities) during the six months ended October 31, 2019 were as follows:
| Fund | | Purchases of Securities | | Proceeds From Sales of Securities |
| Grandeur Peak Emerging Markets Opportunities Fund | | $ | 35,514,610 | | | $ | 53,898,847 | |
| Grandeur Peak Global Contrarian Fund | | | 4,875,600 | | | | 281,998 | |
| Grandeur Peak Global Micro Cap Fund | | | 4,964,816 | | | | 7,897,871 | |
| Grandeur Peak Global Opportunities Fund | | | 122,324,301 | | | | 128,361,722 | |
| Grandeur Peak Global Reach Fund | | | 51,488,706 | | | | 82,710,696 | |
| Grandeur Peak Global Stalwarts Fund | | | 37,815,409 | | | | 50,010,494 | |
| Grandeur Peak International Opportunities Fund | | | 89,748,174 | | | | 123,892,480 | |
| Grandeur Peak International Stalwarts Fund | | | 173,177,860 | | | | 110,066,599 | |
5.SHARES OF BENEFICIAL INTEREST
The capitalization of the Trust consists of an unlimited number of shares of beneficial interest with no par value per share. Holders of the shares of the Funds of the Trust have one vote for each share held and a proportionate fraction of a vote for each fractional share. All shares issued and outstanding are fully paid and are transferable and redeemable at the option of the shareholder. Purchasers of the share do not have any obligation to make payments to the Trust or its creditors solely by reason of the purchasers’ ownership of the shares. Shares have no pre-emptive rights.
Shares redeemed within 60 days of purchase may incur a 2% short-term redemption fee deducted from the redemption amount. For the six months ended October 31, 2019 and the year ended April 30, 2019, the redemption fees charged by the Funds are presented in the Statements of Changes in Net Assets.
| Semi-Annual Report | October 31, 2019 | 97 |
| Grandeur Peak Funds® | Notes to Financial Statements |
October 31, 2019 (Unaudited)
6.MANAGEMENT AND RELATED-PARTY TRANSACTIONS
The Adviser, subject to the authority of the Board, is responsible for the overall management and administration of the Funds’ business affairs. The Adviser manages the investments of the Funds in accordance with the Funds’ investment objective, policies and limitations and investment guidelines established jointly by the Adviser and the Trustees. Pursuant to the Advisory Agreement, (the “Advisory Agreement”), each Fund pays the Adviser an annual management fee based on each Fund’s average daily net assets. The management fee is paid on a monthly basis. The following table reflects the Funds’ advisory fee rates.
| Fund | Advisory Fee |
| Grandeur Peak Emerging Markets Opportunities Fund | 1.35% |
| Grandeur Peak Global Contrarian Fund | 1.00% |
| Grandeur Peak Global Opportunities Fund | 1.25% |
| Grandeur Peak Global Reach Fund | 1.10% |
| Grandeur Peak Global Stalwarts Fund | 0.80% |
| Grandeur Peak International Opportunities Fund | 1.25% |
| Grandeur Peak International Stalwarts Fund | 0.80% |
The Adviser has contractually agreed to limit certain of each Fund’s expenses (excluding acquired fund fees and expenses, brokerage expenses, interest expenses, taxes and extraordinary expenses). The following table reflects the Funds’ expense cap.
| Fund | Expense Cap | Term of Expense Limit Agreements |
| Grandeur Peak Emerging Markets Opportunities Fund | | |
| Investor Class | 1.95% | September 1, 2019 – August 31, 2020 / |
| Institutional Class | 1.70% | September 1, 2018 – August 31, 2019 |
| | | |
| Grandeur Peak Global Contrarian Fund | | |
| Institutional Class | 1.35% | September 12, 2019 – August 31, 2021 |
| | | |
| Grandeur Peak Global Micro Cap Fund | | |
| Institutional Class | 2.00% | September 1, 2019 – August 31, 2020 / |
| | | September 1, 2018 – August 31, 2019 |
| Grandeur Peak Global Opportunities Fund | | |
| Investor Class | 1.75% | September 1, 2019 – August 31, 2020 / |
| Institutional Class | 1.50% | September 1, 2018 – August 31, 2019 |
| | | |
| Grandeur Peak Global Reach Fund | | |
| Investor Class | 1.60% | September 1, 2019 – August 31, 2020 / |
| Institutional Class | 1.35% | September 1, 2018 – August 31, 2019 |
| | | |
| Grandeur Peak Global Stalwarts Fund | | |
| Investor Class | 1.35% | September 1, 2019 – August 31, 2020 / |
| Institutional Class | 1.10% | September 1, 2018 – August 31, 2019 |
| | | |
| Grandeur Peak International Opportunities Fund | | |
| Investor Class | 1.75% | September 1, 2019 – August 31, 2020 / |
| Institutional Class | 1.50% | September 1, 2018 – August 31, 2019 |
| | | |
| Grandeur Peak International Stalwarts Fund | | |
| Investor Class | 1.35% | September 1, 2019 – August 31, 2020 / |
| Institutional Class | 1.10% | September 1, 2018 – August 31, 2019 |
| 98 | 1.855.377.7325 | www.GrandeurPeakGlobal.com |
| Grandeur Peak Funds® | Notes to Financial Statements |
October 31, 2019 (Unaudited)
Pursuant to these agreements, each Fund will reimburse the Adviser for any previous fee waivers and expense reimbursements made by the Adviser, provided that any such reimbursements made by the Funds to the Adviser will not cause the Funds’ expense limitation to exceed expense limitations in existence at the time the expense was incurred, or at the time of the reimbursement, whichever is lower, and the reimbursement is made within three years after the expenses were incurred. Fees waived/reimbursed by the Adviser for the six months ended October 31, 2019 are disclosed in the Statements of Operations.
In addition to the foregoing contractual arrangements, the Adviser has voluntarily agreed, effective September 1, 2016, to waive, with respect to the Grandeur Peak Global Opportunities Fund and the Grandeur Peak International Opportunities Fund, annual management fees to the extent such fees exceed 1.10% on assets above $500 million (the annual management fee rate with respect to such funds will remain 1.25% on the first $500 million in assets). The Adviser has also voluntarily agreed, effective January 1, 2018, to waive, with respect to the Grandeur Peak Emerging Markets Opportunities Fund, annual management fees to the extent such fees exceed 1.20% on all assets above $400 million (the annual management fee rate with respect to the Fund will remain 1.35% on the first $400 million in assets). These voluntary arrangements may be terminated at any time by the Adviser. Voluntary waivers are not subject to recoupment by the Adviser. Voluntary fees waived by the Adviser for the six months ended October 31, 2019 are disclosed in the Statements of Operations.
For the six months ended October 31, 2019, the fee waivers/reimbursements and/or recoupments were as follows:
| Fund | | Fees Waived/Reimbursed By Adviser | | Recoupment of Previously Waived Fees By Adviser |
| Grandeur Peak Emerging Markets Opportunities Fund | | | | |
| Investor Class | | $ | – | | | $ | – | |
| Institutional Class | | | – | | | | – | |
| Grandeur Peak Global Contrarian Fund | | | | | | | | |
| Institutional Class | | $ | 31,116 | | | $ | – | |
| Grandeur Peak Global Micro Cap Fund | | | | | | | | |
| Institutional Class | | $ | 14,605 | | | $ | – | |
| Grandeur Peak Global Opportunities Fund | | | | | | | | |
| Investor Class | | $ | – | | | $ | – | |
| Institutional Class | | | – | | | | – | |
| Grandeur Peak Global Reach Fund | | | | | | | | |
| Investor Class | | $ | – | | | $ | – | |
| Institutional Class | | | – | | | | – | |
| Grandeur Peak Global Stalwarts Fund | | | | | | | | |
| Investor Class | | $ | – | | | $ | – | |
| Institutional Class | | | – | | | | – | |
| Grandeur Peak International Opportunities Fund | | | | | | | | |
| Investor Class | | $ | – | | | $ | – | |
| Institutional Class | | | – | | | | – | |
| Grandeur Peak International Stalwarts Fund | | | | | | | | |
| Investor Class | | $ | – | | | $ | – | |
| Institutional Class | | | – | | | | – | |
| Semi-Annual Report | October 31, 2019 | 99 |
| Grandeur Peak Funds® | Notes to Financial Statements |
October 31, 2019 (Unaudited)
As of October 31, 2019, the balances of recoupable expenses for each Fund were as follows:
| Fund | | Expires 2020 | | Expires 2021 | | Expires 2022 | | Expires 2023 | | Total |
| Grandeur Peak Emerging Markets Opportunities Fund | | | | | | | | |
| Investor Class | | $ | – | | | $ | – | | | $ | – | | | $ | – | | | $ | – | |
| Institutional Class | | | – | | | | – | | | | – | | | | – | | | | – | |
| Grandeur Peak Global Contrarian Fund | | | | | | | | | | | | | | | | | | | | |
| Institutional Class | | $ | – | | | $ | – | | | $ | – | | | $ | 31,116 | | | $ | 31,116 | |
| Grandeur Peak Global Micro Cap Fund | | | | | | | | | | | | | | | | | | | | |
| Institutional Class | | $ | 55,827 | | | $ | 27,510 | | | $ | 25,568 | | | $ | 14,605 | | | $ | 123,510 | |
| Grandeur Peak Global Opportunities Fund | | | | | | | | | | | | | | | | | | | | |
| Investor Class | | $ | – | | | $ | – | | | $ | – | | | $ | – | | | $ | – | |
| Institutional Class | | | – | | | | – | | | | – | | | | – | | | | – | |
| Grandeur Peak Global Reach Fund | | | | | | | | | | | | | | | | | | | | |
| Investor Class | | $ | – | | | $ | – | | | $ | – | | | $ | – | | | $ | – | |
| Institutional Class | | | – | | | | – | | | | – | | | | – | | | | – | |
| Grandeur Peak Global Stalwarts Fund | | | | | | | | | | | | | | | | | | | | |
| Investor Class | | $ | – | | | $ | – | | | $ | – | | | $ | – | | | $ | – | |
| Institutional Class | | | – | | | | – | | | | – | | | | – | | | | – | |
| Grandeur Peak International Opportunities Fund | | | | | | | | | | | | | | | | | | | | |
| Investor Class | | $ | – | | | $ | – | | | $ | – | | | $ | – | | | $ | – | |
| Institutional Class | | | – | | | | – | | | | – | | | | – | | | | – | |
| Grandeur Peak International Stalwarts Fund | | | | | | | | | | | | | | | | | | | | |
| Investor Class | | $ | – | | | $ | – | | | $ | – | | | $ | – | | | $ | – | |
| Institutional Class | | | – | | | | – | | | | – | | | | – | | | | – | |
Administrator Fees and Expenses:ALPS Fund Services, Inc. (“ALPS”) serves as administrator to the Funds and the Funds have agreed to pay expenses incurred in connection with their administrative activities. Pursuant to an Administration Agreement, ALPS provides operational services to the Funds including, but not limited to, fund accounting and fund administration and generally assists in the Funds’ operations. Officers of the Trust are employees of ALPS. The Funds’ administration fee is accrued on a daily basis and paid monthly. Administration fees paid by the Funds for the six months ended October 31, 2019 are disclosed in the Statements of Operations.
ALPS is reimbursed by the Funds for certain out-of-pocket expenses.
Transfer Agent:ALPS serves as transfer, dividend paying and shareholder servicing agent for the Funds. ALPS receives an annual minimum fee, a fee based upon the number of shareholder accounts, and is also reimbursed by the Funds for certain out-of-pocket expenses. Transfer agent fees paid by the Funds for the six months ended October 31, 2019 are disclosed in the Statements of Operations.
Compliance Services:ALPS provides services that assist the Trust’s chief compliance officer in monitoring and testing the policies and procedures of the Trust in conjunction with requirements under Rule 38a-1 under the 1940 Act and receives an annual base fee. ALPS is reimbursed for certain out-of-pocket expenses by the Funds. Compliance service fees paid by the Funds for the six months ended October 31, 2019 are disclosed in the Statements of Operations.
Principal Financial Officer:ALPS receives an annual fee for providing principal financial officer services to the Funds. Principal financial officer fees paid by the Fund for the six months ended October 31, 2019 are disclosed in the Statements of Operations.
Trustees:The fees and expenses of the independent Trustees of the Board are presented in the Statements of Operations.
Distributor:ALPS Distributors, Inc. (“ADI” or the “Distributor”) (an affiliate of ALPS) acts as the distributor of the Funds’ shares pursuant to a Distribution Agreement with the Trust. Shares are sold on a continuous basis by ADI as agent for the Funds, and ADI has agreed to use its best efforts to solicit orders for the sale of Funds’ shares, although it is not obliged to sell any particular amount of shares. ADI is not entitled to any compensation for its services as Distributor. ADI is registered as a broker-dealer with the U.S. Securities and Exchange Commission.
| 100 | 1.855.377.7325 | www.GrandeurPeakGlobal.com |
| Grandeur Peak Funds® | Notes to Financial Statements |
October 31, 2019 (Unaudited)
Each Fund has adopted a Distribution and Services (Rule 12b-1) Plan pursuant to Rule 12b-1 of the 1940 Act (the “Plan”) for its Investor Class shares. The Plan allows the Funds to use Investor Class assets to pay fees in connection with the distribution and marketing of Investor Class shares and/or the provision of shareholder services to Investor Class shareholders. The Plan permits payment for services in connection with the administration of plans or programs that use Investor Class shares of each Fund as their funding medium and for related expenses. The recipients of such payments may include the Distributor, other affiliates of the Adviser, broker-dealers, financial institutions, plan sponsors and administrators and other financial intermediaries through which investors may purchase shares of the Fund. The Plan permits the Funds to make total payments at an annual rate of up to 0.25% of each Fund’s average daily net assets attributable to its Investor Class shares. The expenses of the Plan are reflected as distribution and service fees in the Statements of Operations.
7.INDEMNIFICATIONS
Under the Trust’s organizational documents, its officers and Trustees are indemnified against certain liability arising out of the performance of their duties to the Trust. Additionally, in the normal course of business, the Trust enters into contracts with service providers that may contain general indemnification clauses, which may permit indemnification to the extent permissible under applicable law. The Trust’s maximum exposure under these arrangements is unknown, as this would involve future claims that may be made against the Trust that have not yet occurred.
8.SUBSEQUENT EVENT
Subsequent events after the date of the Statements of Assets and Liabilities have been evaluated through the date the financial statements were issued.
| Semi-Annual Report | October 31, 2019 | 101 |
| Grandeur Peak Funds® | Disclosure Regarding Approval of
Fund Advisory Agreement |
On September 10, 2019, the Trustees met in person to discuss, among other things, the approval of the Investment Advisory Agreement between the Financial Investors Trust (the “Trust”), with respect to the Grandeur Peak Emerging Markets Opportunities Fund, the Grandeur Peak Global Micro Cap Fund, the Grandeur Peak Global Opportunities Fund, the Grandeur Peak Global Reach Fund, the Grandeur Peak Global Stalwarts Fund, the Grandeur Peak International Opportunities Fund, and the Grandeur Peak International Stalwarts Fund (collectively, the “Grandeur Peak Funds”) and Grandeur Peak Global Advisors, LLC (“Grandeur Peak”), in accordance with Section 15(c) of the 1940 Act. In renewing and approving the Investment Advisory Agreement with Grandeur Peak, on behalf of the Grandeur Peak Funds, the Trustees, including the Trustees, considered the following factors with respect to the Grandeur Peak Funds:
Investment Advisory Fee Rate:The Trustees reviewed and considered the contractual annual advisory fees paid by the Trust, on behalf of the Grandeur Peak Funds, to Grandeur Peak, of 1.25% of the Grandeur Peak Global Opportunities Fund’s and Grandeur Peak International Opportunities Fund’s daily net assets, 1.10% of the Grandeur Peak Global Reach Fund’s daily net assets, 1.35% of the Grandeur Peak Emerging Markets Opportunities Fund’s daily net assets, 0.80% of the Grandeur Peak Global Stalwarts Fund’s and Grandeur Peak International Stalwarts Fund’s daily net assets, and 1.50% of the Grandeur Peak Global Micro Cap Fund’s daily net assets, in light of the extent and quality of the advisory services provided by Grandeur Peak to each of the Grandeur Peak Funds.
The Board received and considered information including a comparison of the Investor Class and Institutional Class, as applicable, of each Grandeur Peak Fund’s contractual advisory fee rate with those of funds in the peer group and universe of funds provided by an independent provider of investment company data (the “Data Provider”). The Trustees noted that the contractual advisory fee rate of the Investor Class and Institutional Class, as applicable, of each of the Grandeur Peak Funds was above the Data Provider peer group and universe medians, except for the Grandeur Peak Global Stalwarts Fund and the Grandeur Peak International Stalwarts Fund.
Total Net Expense Ratios:The Trustees further reviewed and considered that the total net expense ratio of the Investor Class and Institutional Class, as applicable, of each of the Grandeur Peak Funds was above the Data Provider peer group and universe medians, except for the Grandeur Peak Global Stalwarts Fund and the Grandeur Peak International Stalwarts Fund.
Nature, Extent, and Quality of the Services under the Investment Advisory Agreement:The Trustees received and considered information regarding the nature, extent, and quality of services provided to the Grandeur Peak Funds under the Investment Advisory Agreement. The Trustees reviewed certain background materials supplied by Grandeur Peak in its presentation, including its Form ADV.
The Trustees reviewed and considered Grandeur Peak’s investment advisory personnel, its history as an asset manager, and its performance and the amount of assets currently under management by Grandeur Peak and its affiliated entities. The Trustees also reviewed the research and decision-making processes utilized by Grandeur Peak, including the methods adopted to seek to achieve compliance with the investment objectives, policies, and restrictions of the Grandeur Peak Funds.
The Trustees considered the background and experience of Grandeur Peak’s management in connection with the Grandeur Peak Funds, including reviewing the qualifications, backgrounds, and responsibilities of the management team primarily responsible for the day-to-day portfolio management of each Grandeur Peak Fund and the extent of the resources devoted to research and analysis of actual and potential investments. The Trustees also reviewed, among other things, Grandeur Peak’s insider trading policies and procedures and its Code of Ethics.
Performance:The Trustees reviewed performance information of the Investor Class and Institutional Class, as applicable, of each of the Grandeur Peak Funds for the 3-month, 1-year, 3-year, and 5-year periods, as applicable, ended June 30, 2019. That review included a comparison of each Grandeur Peak Fund’s performance to the performance of a group of comparable funds selected by the Data Provider. The Trustees noted that the performance of both classes of each of the Grandeur Peak Emerging Markets Opportunities Fund and the Grandeur Peak International Opportunities Fund was generally above the Data Provider universe median for the 3-month and 5-year periods and below the Data Provider universe median for the 1-year and 3-year periods, the performance of the Institutional Class of the Grandeur Peak Global Micro Cap Fund was at or above the Data Provider universe median for the 3-month and 3-year periods and below the Data Provider universe median for the 1-year period, the performance of both classes of each of the Grandeur Peak Global Opportunities Fund and the Grandeur Peak Global Reach Fund was at or above the Data Provider universe median for the 3-month, 3-year, and 5-year periods and below the Data Provider universe median for the 1-year period, the performance of both classes of the Grandeur Peak Global Stalwarts Fund was below the Data Provider universe median for the 3-month and 1-year periods and at or above the Data Provider universe median for the 3-year period, and the performance of both classes of the Grandeur Peak International Stalwarts Fund was above the Data Provider universe median for the 3-month, 1-year, and 3-year periods. The Trustees also considered Grandeur Peak’s discussion of its reputation generally and its investment techniques, risk management controls, and decision-making processes.
Comparable Accounts:The Trustees noted certain information provided by Grandeur Peak regarding fees charged to its other clients utilizing a strategy similar to that employed by the Grandeur Peak Funds.
| 102 | 1.855.377.7325 | www.GrandeurPeakGlobal.com |
| Grandeur Peak Funds® | Disclosure Regarding Approval of
Fund Advisory Agreement |
Profitability:The Trustees received and considered a retrospective and projected profitability analysis prepared by Grandeur Peak based on the fees payable under the Investment Advisory Agreement with respect to the Grandeur Peak Funds. The Trustees considered the profits, if any, anticipated to be realized by Grandeur Peak in connection with the operation of the Grandeur Peak Funds. The Board then reviewed Grandeur Peak’s income statement and balance sheet for the years ended December 31, 2011 through December 31, 2018 in order to analyze the financial condition, stability, and profitability of Grandeur Peak.
Economies of Scale:The Trustees considered whether economies of scale in the provision of services to the Grandeur Peak Funds will be passed along to the shareholders under the proposed agreements.
Other Benefits to the Adviser:The Trustees reviewed and considered any other incidental benefits derived or to be derived by Grandeur Peak from its relationship with the Grandeur Peak Funds, including whether soft dollar arrangements were used.
In renewing Grandeur Peak as the Grandeur Peak Funds’ investment adviser and renewing the Investment Advisory Agreement and the fees charged under the Investment Advisory Agreement, the Trustees concluded that no single factor reviewed by the Trustees was identified by the Trustees to be determinative as the principal factor in whether to renew the Investment Advisory Agreement. Further, the Independent Trustees were advised by separate independent legal counsel throughout the process. The Trustees, including all of the Independent Trustees, concluded that:
| ● | the contractual advisory fee rate of the Investor Class and Institutional Class, as applicable, of each of the Grandeur Peak Funds was above, but within an acceptable range of, the respective Data Provider peer group and universe medians, except for the Grandeur Peak Global Stalwarts Fund and the Grandeur Peak International Stalwarts Fund, whose contractual advisory fee rates were below their peer group and universe medians; |
| ● | the total net expense ratio of the Investor Class and Institutional Class, as applicable, of each of the Grandeur Peak Funds was above, but within an acceptable range of, the respective Data Provider peer group and universe medians, except for the Grandeur Peak Global Stalwarts Fund and the Grandeur Peak International Stalwarts Fund, whose total net expense ratios were below their peer group and universe medians; |
| ● | the nature, extent and quality of services rendered by Grandeur Peak under the Investment Advisory Agreement with respect to each Grandeur Peak Fund were adequate; |
| ● | for the period ended June 30, 2019, the performance of both classes of each of the Grandeur Peak Emerging Markets Opportunities Fund and the Grandeur Peak International Opportunities Fund was generally above the Data Provider universe median for the 3-month and 5-year periods and below the Data Provider universe median for the 1-year and 3-year periods, the performance of the Institutional Class of the Grandeur Peak Global Micro Cap Fund was at or above the Data Provider universe median for the 3-month and 3-year periods and below the Data Provider universe median for the 1-year period, the performance of both classes of each of the Grandeur Peak Global Opportunities Fund and the Grandeur Peak Global Reach Fund was at or above the Data Provider universe median for the 3-month, 3-year, and 5-year periods and below the Data Provider universe median for the 1-year period, the performance of both classes of the Grandeur Peak Global Stalwarts Fund was below the Data Provider universe median for the 3-month and 1-year periods and at or above the Data Provider universe median for the 3-year period, and the performance of both classes of the Grandeur Peak International Stalwarts Fund was above the Data Provider universe median for the 3-month, 1-year, and 3-year periods; |
| ● | bearing in mind the limitations of comparing different types of managed accounts and the different levels of service typically associated with such accounts, the fee structures applicable to Grandeur Peak’s other clients employing a comparable strategy to any of the Grandeur Peak Funds were not indicative of any unreasonableness with respect to the advisory fee payable by the Grandeur Peak Funds; |
| ● | the profit, if any, realized by Grandeur Peak in connection with the operation of any of the Grandeur Peak Funds is not unreasonable; and |
| ● | there were no material economies of scale or other incidental benefits accruing to Grandeur Peak in connection with its relationship with any of the Grandeur Peak Funds. |
Based on the Trustees’ deliberations and their evaluation of the information described above, the Trustees, including all of the Independent Trustees, concluded that Grandeur Peak’s compensation for investment advisory services is consistent with the best interests of each of the Grandeur Peak Funds and their shareholders.
| Semi-Annual Report | October 31, 2019 | 103 |
| Grandeur Peak Funds® | Disclosure Regarding Approval of
Fund Advisory Agreement |
New Grandeur Peak Fund
On September 10, 2019, the Trustees met in person to discuss, among other things, the approval of the Investment Advisory Agreement between the Financial Investors Trust (the “Trust”), with respect to the Grandeur Peak Global Contrarian Fund (the “New Grandeur Peak Fund”) and Grandeur Peak Global Advisors, LLC (“Grandeur Peak”), in accordance with Section 15(c) of the 1940 Act. In approving the Investment Advisory Agreement with Grandeur Peak, on behalf of the New Grandeur Peak Fund, the Trustees, including the Independent Trustees, considered the following factors with respect to the Fund:
Investment Advisory Fee Rate:The Trustees reviewed and considered the contractual annual advisory fee to be paid by the Trust, on behalf of the New Grandeur Peak Fund, of 1.00% of such Fund’s daily average net assets, to Grandeur Peak, in light of the extent and quality of the advisory services provided by Grandeur Peak to the New Grandeur Peak Fund.
The Board received and considered information including a comparison of the New Grandeur Peak Fund’s contractual advisory fees with those of funds in the peer group and universe of funds provided by an independent provider of investment company data (the “Data Provider”). The Trustees noted that the contractual advisory fee rate for Institutional Class shares of the New Grandeur Peak Fund was above its Data Provider peer group and universe medians.
Total Net Expense Ratios:The Trustees further reviewed and considered the total net expense ratio of 1.35% for the Institutional Class shares of the New Grandeur Peak Fund. The Trustees noted that the total net expense ratio of Institutional Class shares of the New Grandeur Peak Fund was above its Data Provider peer group and universe medians.
Nature, Extent, and Quality of the Services under the Investment Advisory Agreement:The Trustees received and considered information regarding the nature, extent, and quality of services to be provided to the New Grandeur Peak Fund under the Investment Advisory Agreement. The Trustees reviewed certain background materials supplied by Grandeur Peak in its presentation, including its Form ADV.
The Trustees reviewed and considered Grandeur Peak’s investment advisory personnel, history as an asset manager, performance, and the amount of assets currently under management. The Trustees also reviewed the research and decision-making processes utilized by Grandeur Peak, including the methods adopted to seek to achieve compliance with the investment objective, policies, and restrictions of the New Grandeur Peak Fund.
The Trustees considered the background and experience of Grandeur Peak’s management in connection with the New Grandeur Peak Fund, including reviewing the qualifications, backgrounds, and responsibilities of the management team primarily responsible for the day-to-day portfolio management of the Fund and the extent of the resources devoted to research and analysis of actual and potential investments.
The Trustees also reviewed, among other things, Grandeur Peak’s insider trading policy and procedures and Code of Ethics.
Performance:The Trustees noted that since the New Grandeur Peak Fund has not yet begun operations, there is no performance to be reviewed or analyzed at this time. The Trustees further considered the reputation of Grandeur Peak’s personnel generally and its investment techniques, risk management controls, and decision-making processes.
Comparable Accounts:The Trustees noted that Grandeur Peak has no other comparable clients to the New Grandeur Peak Fund.
Profitability:The Trustees received and considered a projected profitability analysis prepared by Grandeur Peak based on the fees to be paid under the Investment Advisory Agreement with respect to the New Grandeur Peak Fund. The Trustees considered the profits, if any, anticipated to be realized by Grandeur Peak in connection with the operation of the New Grandeur Peak Fund. The Board then reviewed Grandeur Peak’s income statement and balance sheet for the years ended December 31, 2011 through December 31, 2018 in order to analyze the financial condition, stability, and profitability of Grandeur Peak.
Economies of Scale:The Trustees considered whether economies of scale in the provision of services to the New Grandeur Peak Fund will be passed along to the shareholders under the agreement.
Other Benefits to the Adviser:The Trustees reviewed and considered any other incidental benefits to be derived by Grandeur Peak from its relationship with the New Grandeur Peak Fund, including whether soft dollar arrangements would be used.
In approving Grandeur Peak as the New Grandeur Peak Fund’s investment adviser and the fees to be charged under the Investment Advisory Agreement, the Trustees concluded that no single factor reviewed by the Trustees was identified by the Trustees to be determinative as the
| 104 | 1.855.377.7325 | www.GrandeurPeakGlobal.com |
| Grandeur Peak Funds® | Disclosure Regarding Approval of
Fund Advisory Agreement |
principal factor in whether to approve the Agreement. Further, the Independent Trustees were advised by separate independent legal counsel throughout the process. The Trustees, including all of the Independent Trustees, concluded that:
| ● | the contractual advisory fee rate for Institutional Class shares of the New Grandeur Peak Fund was above its Data Provider peer group and universe medians; |
| ● | the total net expense ratio of Institutional Class shares of the New Grandeur Peak Fund was above its Data Provider peer group and universe medians; |
| ● | the nature, extent and quality of services to be rendered by Grandeur Peak under the Investment Advisory Agreement with respect to the New Grandeur Peak Fund were adequate; |
| ● | since the New Grandeur Peak Fund had not yet begun operations, there was no performance to be reviewed or analyzed at this time; |
| ● | there were no directly comparable accounts managed by Grandeur Peak for the Board to consider; |
| ● | the profit, if any, anticipated to be realized by Grandeur Peak in connection with the operation of the New Grandeur Peak Fund is not unreasonable; and |
| ● | there were no material economies of scale or other incidental benefits accruing to Grandeur Peak in connection with its relationship with the New Grandeur Peak Fund. |
Based on the Trustees’ deliberations and their evaluation of the information described above, the Trustees, including all of the Independent Trustees, concluded that Grandeur Peak’s compensation for investment advisory services is consistent with the best interests of the New Grandeur Peak Fund and its shareholders.
| Semi-Annual Report | October 31, 2019 | 105 |
| Grandeur Peak Funds® | Additional Information |
October 31, 2019 (Unaudited)
1.FUND HOLDINGS
The Funds’ portfolio holdings are made available semi-annually in shareholder reports within 60 days after the close of the period for which the report is being made, as required by federal securities laws. The Funds also file monthly portfolio holdings on Form N-PORT on a quarterly basis, with the schedule of portfolio holdings filed on Form N-PORT for the third month of each Fund’s fiscal quarter made publicly available 60 days after the end of the Funds’ fiscal quarter.
2.FUND PROXY VOTING POLICIES, PROCEDURES AND SUMMARIES
The Funds’ policies and procedures used in determining how to vote proxies and information regarding how the Funds voted proxies relating to portfolio securities during the most recent prior 12-month period ending June 30 are available without charge, (1) upon request, by calling (toll-free) 855-377-PEAK(7325) and (2) on the SEC’s website at http://www.sec.gov.
| 106 | 1.855.377.7325 | www.GrandeurPeakGlobal.com |
| Grandeur Peak Funds® | Privacy Policy |
October 31, 2019 (Unaudited)
| Who We Are | |
| Who is providing this notice? | Grandeur Peak Global Opportunities Fund, Grandeur Peak International Opportunities Fund, Grandeur Peak Global Reach Fund, Grandeur Peak Emerging Markets Opportunities Fund, Grandeur Peak Global Micro Cap Fund, Grandeur Peak Global Stalwarts Fund, and Grandeur Peak International Stalwarts Fund. |
| What We Do | |
| How do the Funds protect my personal information? | To protect your personal information from unauthorized access and use, we use security measures that comply with federal law. These measures include computer safeguards and secured files and buildings. |
| How do the Funds collect my personal information? | We collect your personal information, for example, when you • open an account • provide account information or give us your contact information • make a wire transfer or deposit money |
| Why can't I limit all sharing? | Federal law gives you the right to limit only • sharing for affiliates’ everyday business purposes-information about your creditworthiness • affiliates from using your information to market to you • sharing for non-affiliates to market to you State laws and individual companies may give you additional rights to limit sharing. |
| Definitions | |
| Affiliates | Companies related by common ownership or control. They can be financial and nonfinancial companies. |
| Non-affiliates | Companies not related by common ownership or control. They can be financial and nonfinancial companies. • The Funds does not share with non-affiliates so they can market to you. |
| Joint marketing | A formal agreement between non-affiliated financial companies that together market financial products or services to you. • The Funds does not jointly market. |
| Other Important Information | |
| California Residents | If your account has a California home address, your personal information will not be disclosed to nonaffiliated third parties except as permitted by applicable California law, and we will limit sharing such personal information with our affiliates to comply with California privacy laws that apply to us. |
| Vermont Residents | The State of Vermont requires financial institutions to obtain your consent prior to sharing personal information that they collect about you with affiliated companies and nonaffiliated third parties other than in certain limited circumstances. Except as permitted by law, we will not share personal information we collect about you with nonaffiliated third parties or other affiliated companies unless you provide us with your written consent to share such information. |
| Semi-Annual Report | October 31, 2019 | 107 |
| Grandeur Peak Funds® | Privacy Policy |
October 31, 2019 (Unaudited)
| FACTS | WHAT DO THE FUNDS DO WITH YOUR PERSONAL INFORMATION? |
| Why? | Financial companies choose how they share your personal information. Federal law gives consumers the right to limit some but not all sharing. Federal law also requires us to tell you how we collect, share, and protect your personal information. Please read this notice carefully to understand what we do. |
| What? | The types of personal information we collect and share depend on the product or service you have with us. This information can include: • Social Security number and account transactions • Account balances and transaction history • Wire transfer instructions |
| How? | All financial companies need to share customers’ personal information to run their everyday business. In the section below, we list the reasons financial companies can share their customers’ personal information; the reasons the Funds choose to share; and whether you can limit this sharing. |
| Reasons we can share your personal information | Do the Funds share: | Can you limit this sharing? |
| For our everyday business purposes— such as to process your transactions, maintain your account(s), respond to court orders and legal investigations, or report to credit bureaus | Yes | No |
| For our marketing purposes— to offer our products and services to you | No | We do not share. |
| For joint marketing with other financial companies | No | We do not share. |
| For our affiliates’ everyday business purposes— information about your transactions and experiences | Yes | No |
| For our affiliates’ everyday business purposes— information about your creditworthiness | No | We do not share. |
| For nonaffiliates to market to you | No | We do not share. |
| 108 | 1.855.377.7325 | www.GrandeurPeakGlobal.com |

SEMI-ANNUALOctober 31, 2019
Highland Resolute Fund
Class I RMRGX
| Highland Resolute Fund | Table of Contents |
| | PAGE |
| Shareholder Letter | 2 |
| Performance Update | 7 |
| Consolidated Disclosure of Fund Expenses | 9 |
| Consolidated Schedule of Investments | 10 |
| Consolidated Statement of Assets and Liabilities | 23 |
| Consolidated Statement of Operations | 24 |
| Consolidated Statements of Changes in Net Assets | 25 |
| Consolidated Financial Highlights | 26 |
| Notes to Consolidated Financial Statements | 27 |
| Disclosure Regarding Approval of Fund Advisory Agreements | 37 |
| Additional Information | 39 |
| Shareholder Proxy Voting | 40 |
| Privacy Policy | 41 |
1
| Highland Resolute Fund | Shareholder Letter |
| | October 31, 2019 (Unaudited) |
PERFORMANCE:
October 31, 2019
The Highland Resolute Fund (the “Fund”) underperformed the HFRX Global Hedge Index(1)by about 81 basis points(2)YTD ending October 31, 2019. The Fund historically has strong up market capture with down market capture in line with the index. Since inception, the Fund has outperformed the HFRX Global Index by roughly 148 basis points annualized. This is due primarily to a higher level of net equity exposure than the benchmark to be able to keep up with strong equity markets.
When compared to the peer group (Morningstar Multi-Alternative Universe)(3), the Fund has underperformed the Universe over the last fiscal year but has outperformed the Universe materially over longer time horizons – by about 156 basis points annualized since inception. As with the HFRX Global Index, the Universe is very diverse and contains a number of market-neutral and other low net equity strategies that cause the average net equity exposure for the Universe to be considerably less than our Fund. So, we anticipate outperforming the Universe in up markets and underperforming in down markets - recent performance has been consistent with our expectations.
Long/Short Equity– Long/Short equity underperformed the HFRX Equity Hedge Index(4)for 2019. The best performer was a U.S. focused generalist, which was the worst performer in 2019. Our European manager also has contributed significantly year-to-date.
Macro– The sole Macro manager has underperformed the HFRX Macro Index(5)over the last 6 months. This sector is a small allocation and is held as a risk-off return contributor.
Credit/Global Tactical Asset Allocation– Our credit strategies outperformed the overall HFRX Fixed Income – Credit Index(6)year-to-date.
Relative Value– The Relative Value sleeve outperformed the HFRX Relative Value Arbitrage Index(7)year-to-date. The sole strategy is a multi- strategy manager that benefited to a position in risk parity.
Event Driven– The Event Driven sleeve underperformed the HFRX Event Driven Index(8)over the year-to-date time frame. A merger arbitrage focused manager has been the best performer in the sleeve with a few large mergers being responsible for most of the gains. A quantitative strategy struggled in many of its equity-oriented strategies and offset some of the outperformance in the sleeve.
Past performance is no guarantee of future results.
2
| Highland Resolute Fund | Shareholder Letter |
| | October 31, 2019 (Unaudited) |
HIGHLAND RESOLUTE FUND
Table 1notes the performance for the Fund as of quarter end under standard reporting (since inception) as well as of October 31st.
Table 1(1)(3)(9)(10)(11)
Performance(amounts greater than one year are annualized)
| | Standardized Performance Data | Non-Standardized Performance Data |
| | as of September 30, 2019 | as of October 31, 2019 |
| | | | | | Since Inception | | | | | Since Inception |
| | YTD | 1-Year | 3-Year | 5-Year | (12/30/11) | YTD | 1-Year | 3-Year | 5-Year | (12/30/11) |
| Highland Resolute Fund – II Class | 5.41% | -1.25% | 2.26% | 2.02% | 3.20% | 5.41% | 2.95% | 2.45% | 1.94% | 3.16% |
| Morningstar Multi-Alternative Universe | 5.80% | 0.90% | 2.00% | 1.00% | 1.60% | 6.00% | 3.90% | 2.40% | 1.00% | 1.60% |
| HFRX Global Hedge Fund Index | 5.90% | 0.01% | 1.93% | 0.32% | 1.66% | 6.22% | 3.53% | 2.23% | 0.65% | 1.68% |
| S&P 500® Index | 20.55% | 4.30% | 13.40% | 10.80% | 14.12% | 23.16% | 14.33% | 14.91% | 10.78% | 14.26% |
| | Gross Expense
Ratio | Less Expense
Waivers | Net Expense
Ratio | Net Ratio ex Dividend & Short Expense |
| Highland Resolute Fund | 2.38% | -0.95% | 1.43% | 1.24% |
Performance data quoted represents past performance. Past performance does not guarantee future results. Investment return and principal value of an investment will fluctuate so that an investor’s shares, when sold or redeemed, may be worth more or less than the original cost. Current performance data may be higher or lower than actual data quoted. For the most current month-end performance data please call 1-855-268-2242.
The Fund has a redemption fee of 2.00% for shares redeemed within the first 90 days of purchase. Performance shown at NAV does not include these sales charges and would have been lower had it been taken into account.
The Adviser has agreed to waive the portion of its 1.50% Management Fee in excess of any sub-advisory fees paid by the Adviser to sub-advisors in connection with the Fund (“Sub-Advisory Fees”). This agreement (the “Expense Agreement”) is in effect through August 31, 2020. The Adviser may not discontinue this agreement to waive fees prior to August 31, 2020 without the approval by the Fund’s Board of Trustees.
Net Ratio ex Dividend & Short Expense is the Net Expense Ratio less any Dividend and Interest Expense on Securities Sold Short.
Non-standardized performance is any performance period that doesn’t fall on a quarter end.
Portfolio Changes:
During the period, a credit fund was added.
Closing:
We continue to add value both in our allocation and manager selection decisions. We appreciate your investment in our Highland Resolute Fund, please feel free to contact us with any questions.
Sincerely,

R. Scott Graham, CFA & Michael T. Lytle, CFA
Portfolio Managers(12)
| Semi-Annual Report | October 31, 2019 | 3 |
| Highland Resolute Fund | Shareholder Letter |
| | October 31, 2019 (Unaudited) |
Underlying Allocation Weights:
Figure 1lists the long-term target asset allocation for the Fund as well as the allocation as of October 31st, 2019.

Holdings and allocations subject to change and may not reflect the current or future position of the portfolio.
4
| Highland Resolute Fund | Shareholder Letter |
| | October 31, 2019 (Unaudited) |
IMPORTANT NOTES AND DISCLOSURES
Past performance does not guarantee future results.
Fund prices fluctuate as the underlying assets have exposure to market fluctuations and other risks, as described in the Fund’s prospectus. Please call 1-855-268-2242 to obtain current performance information and for the current prospectus and statement of additional information. This material must be preceded or accompanied by a prospectus. Please read the prospectus carefully before investing.
The views of Highland Associates, Inc. and the information discussed in this commentary are as of the date of publication, are subject to change, and may not reflect the writers’ current views. The views expressed are those of the Fund’s adviser only, and represent an assessment of market conditions at a specific point in time, are opinions only and should not be relied upon as investment advice regarding a particular investment or markets in general. Such information does not constitute a recommendation to buy or sell specific securities or investment vehicles. It should not be assumed that any investment will be profitable or will equal the performance of the portfolios or any securities or any sectors mentioned in this letter. The subject matter contained in this letter has been derived from several sources believed to be reliable and accurate at the time of compilation. Neither Highland Associates, Inc. nor the Fund accepts any liability for losses either direct or consequential caused by the use of this information.
The Highland Resolute Fund is distributed by ALPS Distributors, Inc.
The Fund is subject to investment risks, including possible loss of the principal amount invested and therefore is not suitable for all investors. The Fund may not achieve its objectives.
Diversification does not eliminate the risk of experiencing investment losses.
RISKS:
The Fund’s strategy may expose it to the risks of investments in Swap Contracts and Other Investment Companies. These risks include, but are not limited to higher expenses, allocation risk, underlying fund risk, transparency risk, and underlying fund managed portfolio risk. Investments which focus on alternative strategies are subject to increased risk and loss of principal and are not suitable for all investors. Swap Risk involves swap agreements and are subject to counterparty default risk and may not perform as intended. Derivatives Risk involves the exercise of skill and judgment. Derivatives may expire worthless or not perform as expected. Equity risk may cause the value of the securities held by the Fund to fall due to general market and economic conditions, perceptions regarding the industries in which the issuers of securities held by the Fund participate, or factors relating to specific companies in which the Fund invest.
The Fund’s investments in non-U.S. issuers may be even more volatile and may present more risks than investments in U.S. issuers.
Commodity Risk may subject the Funds to greater volatility than traditional investments because of global supply and demand, changes in interest rates, commodity index volatility, and factors affecting a particular industry or commodity. Commodity-linked investments may not move in the same direction and to the same extent as the underlying commodities.
| (1) | The HFRX Global Hedge Fund Index is designed to be representative of the overall composition of the hedge fund universe, and includes convertible arbitrage, distressed securities, equity hedge, equity market neutral, event driven, macro, merger arbitrage, and relative value strategies. The index returns are updated periodically and are subject to change. The returns were accurate as of the date of this publication. Investors cannot invest directly in an index. |
| (2) | Basis point is a common unit of measure for interest rates and other percentages in finance. One basis point is equal to 1/100th of 1% or 0.01%(.0001). |
| (3) | The Morningstar Multi-Alternative Universe is designed to represent the exposure to alternative investment tactics. Funds in this category have the majority of their assets exposed to alternative strategies. An investor’s exposure to different tactics may change slightly over time in response to market movements. Funds in this category include both funds with static allocations to alternative strategies and funds tactically allocating among alternative strategies and asset classes. The gross short exposure is greater than 20%. |
| (4) | The HFRX Equity Hedge Index is designed to be representative of a subset of the overall composition of the hedge fund universe. Equity Hedge strategies maintain positions both long and short in primarily equity and equity derivative securities. The index returns are updated periodically and are subject to change. The returns were accurate as of the date of this publication. The index figures do not reflect any fees, expense, or taxes. Investors cannot invest directly in an index. |
| (5) | The HFRX Macro Index is designed to be representative of a subset of the overall composition of the hedge fund universe. Macro strategy managers trade a broad range of strategies in which the investment process is predicated on movements in underlying economic variables and the impact these have on equity, fixed income, hard currency and commodity markets. Managers employ a variety of techniques, both discretionary and systematic analysis, combinations of top down and bottom up theses, quantitative and fundamental approaches and long and short-term holding periods. The index returns are updated periodically and are subject to change. The returns were accurate as of the date of this publication. The index figures do not reflect any fees, expense, or taxes. Investors cannot invest directly in an index. |
| Semi-Annual Report | October 31, 2019 | 5 |
| Highland Resolute Fund | Shareholder Letter |
| | October 31, 2019 (Unaudited) |
| (6) | The HFRX Fixed Income – Credit Index is designed to be representative of a subset of the overall composition of the hedge fund universe. It includes strategies with exposure to credit across a broad continuum of credit sub-strategies, including Corporate, Sovereign, Distressed, Convertible, Asset Backed, Capital Structure Arbitrage, Multi-Strategy and other Relative Value and Event Driven sub-strategies. The index returns are updated periodically and are subject to change. The returns were accurate as of the date of this publication. The index figures do not reflect any fees, expense, or taxes. Investors cannot invest directly in an index. |
| (7) | The HFRX Relative Value Arbitrage Index is designed to be representative of a subset of the overall composition of the hedge fund universe. Relative Value investment managers who maintain positions in which the investment thesis is predicated on realization of a valuation discrepancy in the relationship between multiple securities. Managers employ a variety of fundamental and quantitative techniques to establish investment theses, and security types range broadly across equity, fixed income, derivative or other security types. The index returns are updated periodically and are subject to change. The returns were accurate as of the date of this publication. The index figures do not reflect any fees, expense, or taxes. Investors cannot invest directly in an index. |
| (8) | The HFRX Event Driven Index maintains positions in companies currently or prospectively involved in corporate transactions of a wide variety including but not limited to mergers, restructurings, financial distress, tender offers, shareholder buybacks, debt exchanges, security issuance or other capital structure adjustments. Security types can range from most senior in the capital structure to most junior or subordinated, and frequently involve additional derivative securities. Event Driven exposure includes a combination of sensitivities to equity markets, credit markets and idiosyncratic, company specific developments. The index returns are updated periodically and are subject to change. The returns were accurate as of the date of this publication. The index figures do not reflect any fees, expense, or taxes. Investors cannot invest directly in an index. |
| (9) | The S&P 500®Index is an unmanaged index of 500 common stocks chosen for market size, liquidity, and industry group representation. It is a market value weighted index. The S&P 500®Index figures do not reflect any fees, expenses, or taxes. Investors cannot invest directly in this index. |
| (10) | Highland Associates, Inc. has agreed to waive the portion of its 1.50% Management Fee in excess of any sub-advisory fees paid by the Adviser to sub-advisors in connection with the Highland Resolute Fund. This agreement is in effect through August 31, 2020. The Adviser may not discontinue this agreement to waive fees without the approval by the Fund’s Board of Trustees. |
| (11) | Ratios as of the Prospectus dated August 31, 2019 and may differ from the ratios presented in the Financial Highlights. |
| (12) | R. Scott Graham and Michael T. Lytle are registered representatives of ALPS Distributors, Inc. CFA Institute Marks are trademarks owned by the CFA Institute. |
6
| Highland Resolute Fund | Performance Update |
| | October 31, 2019 (Unaudited) |
Performance(for the period ended October 31, 2019)
Highland Resolute Fund
| Cumulative Total Return | | | | | | | |
| (for the period ended October 31, 2019) | 6 Months | 1 Year | 3 Year | 5 Year | Since Inception* | Gross Ratio(a) | Net Ratio(a) |
| Highland Resolute Fund - Class I - NAV | -1.65% | 2.95% | 2.45% | 1.94% | 3.16% | 2.38% | 1.43% |
| S&P 500® Index(b) | 4.16% | 14.33% | 14.91% | 10.78% | 14.26% | | |
| Dow Jones U.S. Select Dividend Index(c) | 2.97% | 10.67% | 10.73% | 9.47% | 12.58% | | |
| HFRX Global Hedge Fund Index(d) | 2.85% | 3.53% | 2.23% | 0.65% | 1.68% | | |
Performance data quoted represents past performance. Past performance does not guarantee future results. Investment return and principal value of an investment will fluctuate so that an investor’s shares, when sold or redeemed, may be worth more or less than the original cost. Current performance data may be higher or lower than actual data quoted. For the most current month-end performance data please call 1-855-268-2242.
The Fund has a redemption fee of 2.00% for shares redeemed within the first 90 days of purchase. Performance shown at NAV does not include these sales charges and would have been lower had it been taken into account.
The Adviser has agreed to waive the portion of its 1.50% Management Fee in excess of any sub-advisory fees paid by the Adviser to sub-advisors in connection with the Fund (“Sub-Advisory Fees”). This agreement (the “Expense Agreement”) is in effect through August 31, 2020. The Adviser may not discontinue this agreement to waive fees prior to August 31, 2020 without the approval by the Fund’s Board of Trustees.
| * | Fund inception date of 12/30/11. |
| (a) | Ratios as of the Prospectus dated August 31, 2019 and may differ from the ratios presented in the Financial Highlights. |
| (b) | The S&P 500®Index is the Standard & Poor's composite index of 500 stocks, a widely recognized, unmanaged index of common stock prices. The index is not actively managed and does not reflect any deduction of fees, expenses or taxes. An investor may not invest directly in an index. |
| (c) | The Dow Jones U.S. Select Dividend Index is an additional index, and represents the country’s top stocks by dividend yield, selected annually and subject to screening and buffering criteria. The index is not actively managed and does not reflect any deductions of fees, expenses or taxes. An investor may not invest directly in an index. |
| (d) | The HFRX Global Hedge Fund Index is an additional index, and is designed to be representative of the overall composition of the hedge fund universe and includes convertible arbitrage, distressed securities, equity hedge, equity market neutral, event driven, macro, merger arbitrage and relative value strategies. The index returns are updated periodically and are subject to change. The returns were accurate as of the date of this publication. The index is not actively managed and does not reflect any deduction of fees, expenses or taxes. An investor may not invest directly in an index. |
The table does not reflect the deduction of taxes that a shareholder would pay on Fund distributions or the redemption of Fund shares.
Top Ten Holdings**
(for the period ended October 31, 2019)
As a percentage of Net Assets
| PIMCO Short-Term Fund, | |
| Institutional Class | 30.68% |
| PSAM Highland | 16.55% |
| PIMCO Income Fund, | |
| Institutional Class | 12.42% |
| Long/Short Segregated Portfolio | 12.05% |
| WABR | 11.86% |
| Melchior Segregated Portfolio | 10.89% |
| BHDG Systematic Trading | |
| Segregated Portfolio | 5.60% |
| Harland Clarke Holdings Corp. | 2.18% |
| AQR Multi Strategy Alternative Fund | 2.02% |
| Mohegan Tribal Gaming | 1.32% |
| Top Ten Holdings | 104.57% |
| ** | Holdings are subject to change, and may not reflect the current or future position of the portfolio. |
| Semi-Annual Report | October 31, 2019 | 7 |
| Highland Resolute Fund | Performance Update |
| | October 31, 2019 (Unaudited) |
Performance of $10,000 Initial Investment(for the period ended October 31, 2019)
Comparison of change in value of a $10,000 investment

The chart represents historical performance of a hypothetical investment of $10,000 in the Fund since inception. Past performance does not guarantee future results. This chart does not reflect the deduction of taxes that a shareholder would pay on Fund distributions or the redemption of Fund shares.
Investing in the Fund is subject to investment risks, including possible loss of the principal amount invested.
8
| Highland Resolute Fund | Consolidated Disclosure of Fund Expenses |
| | October 31, 2019 (Unaudited) |
As a shareholder of the Fund, you incur two types of costs: (1) transaction costs, including applicable sales charges (loads), redemption fees; and (2) ongoing costs, including management fees, distribution and service (12b-1) fees, shareholder services fees and other Fund operating expenses. This example is intended to help you understand your ongoing costs (in dollars) of investing in the Fund and to compare these costs with the ongoing costs of investing in other mutual funds.
This example is based on an investment of $1,000 invested at the beginning of the period and held for the six-month period of May 1, 2019 to October 31, 2019.
Actual Expenses.The first line of the table below provides information about actual account values and actual expenses. You may use the information in this line, together with the amount you invested to estimate the expenses that you paid over the period. Simply divide your account value by $1,000 (for example, an $8,600 account value divided by $1,000 = 8.6), then multiply the result by the number in the first line of the table below under the heading titled “Expenses Paid During Period” to estimate the expenses you paid on your account during this period.
Hypothetical Example for Comparison Purposes.The second line of the table below provides information about hypothetical account values and hypothetical expenses based on the Fund’s actual expense ratio and an assumed rate of return of 5% per year before expenses, which is not the Fund’s actual return. The hypothetical account values and expenses may not be used to estimate the actual ending account balance or expenses you paid for the period. You may use this information to compare the ongoing costs of investing in the Fund and other mutual funds. To do so, compare this 5% hypothetical example with the 5% hypothetical examples that appear in the shareholder reports of the other funds.
Please note that the expenses shown in the table below are meant to highlight your ongoing costs only and do not reflect any transactional costs, such as applicable sales charges (loads), redemption fees, or exchange fees. Therefore, the second line of the table below is useful in comparing ongoing costs only and will not help you determine the relative total costs of owning different funds. In addition, if these transactional costs were included, your costs would have been higher.
| Highland Resolute Fund | BEGINNING
ACCOUNT VALUE
05/01/19 | ENDING
ACCOUNT VALUE
10/31/19 | EXPENSE
RATIO(a) | EXPENSES PAID
DURING THE
PERIOD
05/01/19-10/31/19(b) |
| Class I | | | | |
| Actual | $ 1,000.00 | $ 983.50 | 0.70% | $ 3.49 |
| Hypothetical (5% return before expenses) | $ 1,000.00 | $1,021.62 | 0.70% | $ 3.56 |
| (a) | Annualized, based on the Fund's most recent fiscal half year expenses. |
| (b) | Expenses are equal to the Fund's annualized expense ratio multiplied by the average account value over the period, multiplied by the number of days in the most recent fiscal half-year (184)/366 (to reflect the half-year period). |
| Semi-Annual Report | October 31, 2019 | 9 |
| Highland Resolute Fund | Consolidated Schedule of Investments |
| | October 31, 2019 (Unaudited) |
| | | | | | Value | |
| Description | | Shares | | | (Note 2) | |
| COMMON STOCKS (13.65%) | | | | | | | | |
| AEROSPACE & DEFENSE (0.83%) | | | | | | | | |
| The Boeing Co. | | | 7,349 | | | $ | 2,497,998 | |
| | | | | | | | | |
| COMMERCIAL SERVICES (1.61%) | | | | | | | | |
| ASGN, Inc.(a) | | | 21,233 | | | | 1,350,207 | |
| Global Payments, Inc. | | | 13,579 | | | | 2,297,295 | |
| Opal Acquisition(a) | | | 3,209 | | | | 384,930 | |
| PayPal Holdings, Inc.(a) | | | 8,001 | | | | 832,904 | |
| | | | | | | | 4,865,336 | |
| DIVERSIFIED FINANCIAL SERVICES (0.93%) | | | | | | | | |
| Mastercard, Inc., Class A | | | 3,460 | | | | 957,762 | |
| Visa, Inc., Class A(b) | | | 10,395 | | | | 1,859,250 | |
| | | | | | | | 2,817,012 | |
| ELECTRIC (0.26%) | | | | | | | | |
| PG&E Corp.(a) | | | 125,471 | | | | 774,156 | |
| | | | | | | | | |
| HOTELS, RESTAURANTS & LEISURE (0.86%) | | | | | | | | |
| Wyndham Hotels & Resorts, Inc. | | | 48,338 | | | | 2,608,802 | |
| | | | | | | | | |
| INTERNET (5.13%) | | | | | | | | |
| Alibaba Group Holding, Ltd., Sponsored ADR(a)(b) | | | 13,623 | | | | 2,406,776 | |
| Alphabet, Inc., Class A(a)(b) | | | 1,839 | | | | 2,314,933 | |
| Amazon.com, Inc.(a)(b) | | | 1,390 | | | | 2,469,557 | |
| ANGI Homeservices, Inc., Class A(a) | | | 124,746 | | | | 854,510 | |
| Facebook, Inc., Class A(a)(b) | | | 13,707 | | | | 2,626,947 | |
| IAC/InterActiveCorp(a) | | | 10,891 | | | | 2,474,980 | |
| TripAdvisor, Inc.(a) | | | 57,076 | | | | 2,305,870 | |
| | | | | | | | 15,453,573 | |
| PIPELINES (0.63%) | | | | | | | | |
| Energy Transfer LP | | | 150,886 | | | | 1,899,655 | |
| | | | | | | | | |
| SOFTWARE (3.40%) | | | | | | | | |
| Adobe Systems, Inc.(a) | | | 9,398 | | | | 2,611,986 | |
| Fidelity National Information Services, Inc.(b) | | | 18,864 | | | | 2,485,521 | |
| Fiserv, Inc.(a)(b) | | | 23,459 | | | | 2,489,938 | |
| SS&C Technologies Holdings, Inc.(b) | | | 50,890 | | | | 2,646,789 | |
| | | | | | | | 10,234,234 | |
| TOTAL COMMON STOCKS | | | | | | | | |
| (Cost $39,811,528) | | | | | | | 41,150,766 | |
| OPEN-END MUTUAL FUNDS (45.12%) | | | | | | | | |
| AQR Multi Strategy Alternative Fund, Class I(a) | | | 861,126 | | | | 6,088,161 | |
| PIMCO Income Fund, Institutional Class | | | 3,127,288 | | | | 37,433,632 | |
| PIMCO Short-Term Fund, Institutional Class | | | 9,452,780 | | | | 92,448,188 | |
| | | | | | | | 135,969,981 | |
| TOTAL OPEN-END MUTUAL FUNDS | | | | | | | | |
| (Cost $137,500,917) | | | | | | | 135,969,981 | |
See Notes to Financial Statements.
10
| Highland Resolute Fund | Consolidated Schedule of Investments |
| | October 31, 2019 (Unaudited) |
| | | | | | Value | |
| Description | | Shares | | | (Note 2) | |
| PREFERRED STOCK (0.77%) | | | | | | | |
| Opal Acquisition(a) | | 19,341 | | | $ | 2,320,175 | |
| TOTAL PREFERRED STOCK | | | | | | | |
| (Cost $906,621) | | | | | | | 2,320,175 | |
| Description | | | | Principal Amount | | | | Value
(Note 2) | |
| CORPORATE BONDS (7.50%) | | | | | | | |
| COMMERCIAL SERVICES (0.99%) | | | | | | | |
| RR Donnelley & Sons Co. | | | | | | | | |
| 6.00%, | 04/01/2024 | | $ | 1,291,000 | | | | 1,339,412 | |
| 6.50%, | 11/15/2023 | | | 920,000 | | | | 950,250 | |
| 7.00%, | 02/15/2022 | | | 680,000 | | | | 705,500 | |
| | | | | | | | | 2,995,162 | |
| COMPUTERS (2.59%) | | | | | | | | |
| Harland Clarke Holdings Corp. | | | | | | | |
| 8.38%, | 08/15/2022(c) | | | 1,568,000 | | | | 1,258,320 | |
| 9.25%, | 03/01/2021(c) | | | 7,021,500 | | | | 6,556,325 | |
| | | | | | | | | 7,814,645 | |
| | | | | | | | | | |
| DISTRIBUTION & WHOLESALE (0.27%) | | | | | | | |
| American News Co. LLC | | | | | | | | |
| 8.50% (10.00%), | 09/01/2026(c)(d) | | | 758,398 | | | | 806,746 | |
| | | | | | | | | | |
| ENTERTAINMENT (1.32%) | | | | | | | |
| Mohegan Tribal Gaming | | | | | | | | |
| 7.88%, | 10/15/2024(c) | | | 4,137,000 | | | | 3,966,349 | |
| | | | | | | | | | |
| HEALTHCARE-SERVICES (0.78%) | | | | | | | |
| One Call Corp. | | | | | | | | |
| 7.50%, | 07/01/2024(c) | | | 2,374,412 | | | | 2,350,668 | |
| | | | | | | | | | |
| PUBLISHING & BROADCASTING (1.55%) | | | | | | | |
| McClatchy Co. | | | | | | | | |
| 6.88%, | 07/15/2031(c) | | | 2,198,000 | | | | 2,005,675 | |
| 9.00%, | 07/15/2026 | | | 2,866,000 | | | | 2,672,545 | |
| | | | | | | | | 4,678,220 | |
| TOTAL CORPORATE BONDS | | | | | | | |
| (Cost $23,804,618) | | | | | | | 22,611,790 | |
See Notes to Financial Statements.
| Semi-Annual Report | October 31, 2019 | 11 |
| Highland Resolute Fund | Consolidated Schedule of Investments |
| | October 31, 2019 (Unaudited) |
| | | | | | Value | |
| Description | | Shares | | | (Note 2) | |
| Short-Term Investments (8.81%) | | | | | | | | |
| MONEY MARKET FUNDS (8.81%) | | | | | | | | |
| Dreyfus Treasury Cash Management Fund, Institutional Class, 7-day yield, 1.677%(b) | | | 26,551,301 | | | $ | 26,551,301 | |
| TOTAL SHORT-TERM INVESTMENTS | | | | | | | | |
| (Cost $26,551,301) | | | | | | | 26,551,301 | |
| TOTAL INVESTMENTS (75.85%) | | | | | | | | |
| (Cost $228,574,985) | | | | | | $ | 228,604,013 | |
| | | | | | | | | |
| SEGREGATED CASH WITH BROKERS (27.23%)(e) | | | | | | | 82,062,406 | |
| | | | | | | | | |
| SECURITIES SOLD SHORT (-3.17%) | | | | | | | | |
| (Proceeds $8,642,833) | | | | | | $ | (9,546,879 | ) |
| | | | | | | | | |
| OTHER ASSETS IN EXCESS OF LIABILITIES (0.09%) | | | | | | | 256,766 | |
| NET ASSETS (100.00%) | | | | | | $ | 301,376,306 | |
SCHEDULE OF SECURITIES SOLD SHORT
| Description | | Shares | | | Value
(Note 2) | |
| EXCHANGE TRADED FUNDS (-3.17%) | | | | | | | | |
| Consumer Discretionary Select Sector SPDR® Fund | | | (1,220 | ) | | $ | (147,437 | ) |
| Consumer Staples Select Sector SPDR® Fund | | | (4,946 | ) | | | (302,497 | ) |
| Health Care Select Sector SPDR® Fund | | | (15,405 | ) | | | (1,459,624 | ) |
| Industrial Select Sector SPDR® Fund | | | (11,702 | ) | | | (918,724 | ) |
| iShares® 20+ Year Treasury Bond ETF | | | (3,980 | ) | | | (562,135 | ) |
| iShares® MSCI United Kingdom ETF | | | (14,675 | ) | | | (477,378 | ) |
| SPDR® S&P Retail ETF | | | (44,118 | ) | | | (1,903,692 | ) |
| Utilities Select Sector SPDR® Fund | | | (9,524 | ) | | | (611,917 | ) |
| VanEck Vectors® Pharmaceutical ETF | | | (15,346 | ) | | | (909,711 | ) |
| Vanguard® FTSE Europe ETF | | | (23,953 | ) | | | (1,333,464 | ) |
| Vanguard® Total Stock Market ETF | | | (5,969 | ) | | | (920,300 | ) |
| | | | | | | | (9,546,879 | ) |
| TOTAL EXCHANGE TRADED FUNDS (-3.17%) | | | | | | | | |
| (Proceeds $8,642,833) | | | | | | | (9,546,879 | ) |
| TOTAL SECURITIES SOLD SHORT | | | | | | | | |
| (Proceeds $8,642,833) | | | | | | $ | (9,546,879 | ) |
| (a) | Non-income producing security. |
| (b) | Security position either entirely or partially held in a segregated account as collateral for securities sold short and total return swaps. Aggregate total fair value of $10,481,240. |
| (c) | Security exempt from registration under rule 144A of the Securities Act of 1933. This security may be resold in transactions exempt from registration, normally to qualified institutional buyers. At period end, the fair value of those securities held in long positions was $16,944,083, representing 5.62% of the Fund's net assets. |
| (d) | Pay-in-kind securities - Rate paid in-kind is shown in parenthesis. |
| (e) | Includes cash which is being held as collateral for securities sold short and total return swap contracts. |
See Notes to Financial Statements.
12
| Highland Resolute Fund | Consolidated Schedule of Investments |
| | October 31, 2019 (Unaudited) |
TOTAL RETURN SWAP CONTRACTS*
| Counterparty | | Reference Obligation | | Notional Amount | | | Value | | | Rate Paid by the Fund | | Termination Date | | Unrealized Appreciation/ (Depreciation) | |
| Morgan Stanley | | BHDG Systematic Trading Segregated Portfolio(a) | | $ | 16,862,464 | | | $ | 16,862,474 | | | 1-Month LIBOR BBA | | 09/13/2023 | | $ | 10 | |
| Morgan Stanley | | Long/Short SegregatedPortfolio(b) | | | 36,302,334 | | | | 36,302,336 | | | 1-Month LIBOR BBA | | 03/19/2021 | | | 2 | |
| Morgan Stanley | | Melchior Segregated Portfolio(c) | | | 32,806,954 | | | | 32,806,958 | | | 1-Month LIBOR BBA | | 03/19/2021 | | | 4 | |
| Morgan Stanley | | PSAM Highland(d) | | | 49,892,758 | | | | 49,892,756 | | | 1-Month EURIBOR | | 06/03/2021 | | | (2 | ) |
| Morgan Stanley | | WABR(e) | | | 35,746,666 | | | | 35,746,676 | | | 1-Month LIBOR BBA | | 09/01/2020 | | | 10 | |
| | | | | $ | 171,611,176 | | | $ | 171,611,200 | | | | | | | $ | 24 | |
| * | For the long positions, the Fund receives payments based on any positive return of the Reference Obligation less the rate paid by the Fund. The Fund makes payments on any negative return of such Reference Obligation plus the rate paid by the Fund. For short positions, the Fund receives payments based on any negative return of the Reference Obligation less the rate paid by the fund. The Fund makes payments on any positive return of such Reference Obligation plus the rate paid by the Fund. Payments are made monthly. |
| (a) | BHDG Systematic Trading Segregated Portfolio is a quantitative trend following strategy that uses futures. BHDG will employ some short, medium, and long term signals. Interest rate, commodity, equity, and sovereign debt futures will be used. Any asset class may have net long or short exposure, and exposures in aggregate may be net long or short. |
| (b) | Long/Short Segregated Portfolio is a European equity long/short strategy that employs a flexible, low-net strategy (0% to 50%), and long exposure will vary between 60% and 100%. The portfolio is primarily comprised of large and mid-cap stocks listed on European exchanges. |
| (c) | Melchior Segregated Portfolio is a global equity long/short strategy that uses a long-biased strategy that is focused on cyclical sectors. The strategy has a net exposure that ranges between 50% and 80%, and long exposure varies between 80% and 100%. The strategy is comprised of large cap stocks listed on exchanges of developed and emerging market countries. |
| (d) | PSAM Highland employs an event driven strategy. The fund will primarily make investments in equity special situations and merger arbitrage. The strategy will also opportunistically allocate to liquid high yield credit positions when trading at stressed levels. The strategy will employ gross long exposure of up to 120%, and net exposure will typically vary from 40% to 80%. |
| (e) | WABR incorporates an absolute return oriented approach within a risk parity framework. Active absolute return strategies include fundamental long/short equity, credit relative value, discretionary macro, and equity market neutral strategies. The strategy also maintains a passive risk weighted allocation to equities and fixed income, but each of the three allocations is equally risk weighted subject to a 40% limit on the absolute return allocation. Gross equity long exposure will typically be 140% or less, and net equity exposure will vary between 5% and 35%. |
See Notes to Financial Statements.
| Semi-Annual Report | October 31, 2019 | 13 |
| Highland Resolute Fund | Consolidated Schedule of Investments |
| | October 31, 2019 (Unaudited) |
BHDG SYSTEMATIC TRADING SEGREGATED PORTFOLIO
| | | | | | | | | Percentage | |
| Description | | Contracts/Shares | | | Value | | | of Value | |
| LONG SECURITIES | | | | | | | | | | | | |
| OUTSTANDING FORWARD FOREIGN CURRENCY CONTRACTS | | | | | | | | | | | | |
| AUD TO JPY FORWARD SD : 18-Dec-2019 | | | 3,269,044 | | | $ | 2,256,107 | | | | 13.39 | % |
| AUD TO USD FORWARD SD : 18-Dec-2019 | | | 4,605,524 | | | | 3,178,469 | | | | 18.86 | % |
| CAD TO USD FORWARD SD : 18-Dec-2019 | | | 5,816,513 | | | | 4,419,205 | | | | 26.23 | % |
| CHF TO USD FORWARD SD : 18-Dec-2019 | | | 2,723,157 | | | | 2,769,903 | | | | 16.44 | % |
| EUR TO USD FORWARD SD : 18-Dec-2019 | | | 4,442,386 | | | | 4,969,708 | | | | 29.49 | % |
| GBP TO USD FORWARD SD : 18-Dec-2019 | | | 2,315,311 | | | | 3,003,356 | | | | 17.82 | % |
| ILS TO USD FORWARD SD : 18-Dec-2019 | | | 5,502,786 | | | | 1,564,779 | | | | 9.29 | % |
| INR TO USD FORWARD SD : 18-Dec-2019 | | | 110,294,143 | | | | 1,547,389 | | | | 9.18 | % |
| JPY TO AUD FORWARD SD : 18-Dec-2019 | | | 208,243,766 | | | | 1,933,706 | | | | 11.48 | % |
| JPY TO USD FORWARD SD : 18-Dec-2019 | | | 296,196,684 | | | | 2,750,418 | | | | 16.32 | % |
| KRW TO USD FORWARD SD : 18-Dec-2019 | | | 2,800,654,287 | | | | 2,395,726 | | | | 14.22 | % |
| MXN TO USD FORWARD SD : 18-Dec-2019 | | | 49,230,165 | | | | 2,542,013 | | | | 15.09 | % |
| PLN TO EUR FORWARD SD : 18-Dec-2019 | | | 10,898,904 | | | | 2,853,565 | | | | 16.93 | % |
| PLN TO USD FORWARD SD : 18-Dec-2019 | | | 6,393,772 | | | | 1,674,026 | | | | 9.93 | % |
| SGD TO USD FORWARD SD : 18-Dec-2019 | | | 4,881,604 | | | | 3,589,763 | | | | 21.30 | % |
| USD TO AUD FORWARD SD : 18-Dec-2019 | | | 3,927,726 | | | | 3,927,726 | | | | 23.31 | % |
| USD TO CAD FORWARD SD : 18-Dec-2019 | | | 2,917,395 | | | | 2,917,395 | | | | 17.31 | % |
| USD TO CHF FORWARD SD : 18-Dec-2019 | | | 2,845,138 | | | | 2,845,138 | | | | 16.88 | % |
| USD TO EUR FORWARD SD : 18-Dec-2019 | | | 5,973,979 | | | | 5,973,979 | | | | 35.45 | % |
| USD TO GBP FORWARD SD : 18-Dec-2019 | | | 2,368,736 | | | | 2,368,736 | | | | 14.06 | % |
| USD TO JPY FORWARD SD : 18-Dec-2019 | | | 3,286,352 | | | | 3,286,352 | | | | 19.50 | % |
| USD TO KRW FORWARD SD : 18-Dec-2019 | | | 1,768,556 | | | | 1,768,556 | | | | 10.50 | % |
| USD TO NOK FORWARD SD : 18-Dec-2019 | | | 2,502,630 | | | | 2,502,630 | | | | 14.85 | % |
| USD TO SEK FORWARD SD : 18-Dec-2019 | | | 1,530,131 | | | | 1,530,131 | | | | 9.08 | % |
| USD TO SGD FORWARD SD : 18-Dec-2019 | | | 2,302,545 | | | | 2,302,545 | | | | 13.66 | % |
| OUTSTANDING FORWARD FOREIGN CURRENCY CONTRACTS Total | | | 3,544,891,234 | | | | 70,871,321 | | | | 420.57 | % |
| TOTAL LONG | | | 3,544,891,234 | | | $ | 70,871,321 | | | | 420.57 | % |
| | | | | | | | | | | | | |
| SECURITIES SOLD SHORT | | | | | | | | | | | | |
| OUTSTANDING FORWARD FOREIGN CURRENCY CONTRACTS | | | | | | | | | | | | |
| AUD TO JPY FORWARD SD : 18-Dec-2019 | | | (2,861,197 | ) | | | (1,974,635 | ) | | | -11.72 | % |
| AUD TO USD FORWARD SD : 18-Dec-2019 | | | (5,760,042 | ) | | | (3,975,251 | ) | | | -23.59 | % |
| CAD TO USD FORWARD SD : 18-Dec-2019 | | | (3,865,126 | ) | | | (2,936,602 | ) | | | -17.43 | % |
| CHF TO USD FORWARD SD : 18-Dec-2019 | | | (2,811,001 | ) | | | (2,859,255 | ) | | | -16.97 | % |
| EUR TO PLN FORWARD SD : 18-Dec-2019 | | | (2,519,056 | ) | | | (2,818,074 | ) | | | -16.72 | % |
| EUR TO USD FORWARD SD : 18-Dec-2019 | | | (5,389,843 | ) | | | (6,029,631 | ) | | | -35.78 | % |
| GBP TO USD FORWARD SD : 18-Dec-2019 | | | (1,913,740 | ) | | | (2,482,449 | ) | | | -14.73 | % |
| JPY TO AUD FORWARD SD : 18-Dec-2019 | | | (240,664,957 | ) | | | (2,234,762 | ) | | | -13.26 | % |
| JPY TO USD FORWARD SD : 18-Dec-2019 | | | (353,765,734 | ) | | | (3,284,992 | ) | | | -19.49 | % |
| KRW TO USD FORWARD SD : 18-Dec-2019 | | | (2,108,520,578 | ) | | | (1,803,664 | ) | | | -10.70 | % |
| NOK TO USD FORWARD SD : 18-Dec-2019 | | | (22,663,696 | ) | | | (2,465,113 | ) | | | -14.63 | % |
| SEK TO USD FORWARD SD : 18-Dec-2019 | | | (14,776,579 | ) | | | (1,534,186 | ) | | | -9.10 | % |
| SGD TO USD FORWARD SD : 18-Dec-2019 | | | (3,174,925 | ) | | | (2,334,730 | ) | | | -13.86 | % |
| USD TO AUD FORWARD SD : 18-Dec-2019 | | | (3,146,945 | ) | | | (3,146,945 | ) | | | -18.68 | % |
| USD TO CAD FORWARD SD : 18-Dec-2019 | | | (4,428,457 | ) | | | (4,428,457 | ) | | | -26.28 | % |
| USD TO CHF FORWARD SD : 18-Dec-2019 | | | (2,765,922 | ) | | | (2,765,922 | ) | | | -16.41 | % |
| USD TO EUR FORWARD SD : 18-Dec-2019 | | | (4,937,628 | ) | | | (4,937,628 | ) | | | -29.30 | % |
| USD TO GBP FORWARD SD : 18-Dec-2019 | | | (2,932,753 | ) | | | (2,932,753 | ) | | | -17.40 | % |
| USD TO ILS FORWARD SD : 18-Dec-2019 | | | (1,566,394 | ) | | | (1,566,394 | ) | | | -9.30 | % |
| USD TO INR FORWARD SD : 18-Dec-2019 | | | (1,540,191 | ) | | | (1,540,191 | ) | | | -9.14 | % |
| USD TO JPY FORWARD SD : 18-Dec-2019 | | | (2,771,009 | ) | | | (2,771,009 | ) | | | -16.44 | % |
See Notes to Financial Statements.
14
| Highland Resolute Fund | Consolidated Schedule of Investments |
| | October 31, 2019 (Unaudited) |
| | | | | | | | | Percentage | |
| Description | | Contracts/Shares | | | Value | | | of Value | |
| OUTSTANDING FORWARD FOREIGN CURRENCY CONTRACTS (CONTINUED) | | | | | | | | | | | | |
| USD TO KRW FORWARD SD : 18-Dec-2019 | | | (2,376,969 | ) | | | (2,376,969 | ) | | | -14.11 | % |
| USD TO MXN FORWARD SD : 18-Dec-2019 | | | (2,520,736 | ) | | | (2,520,736 | ) | | | -14.96 | % |
| USD TO PLN FORWARD SD : 18-Dec-2019 | | | (1,650,229 | ) | | | (1,650,229 | ) | | | -9.79 | % |
| USD TO SGD FORWARD SD : 18-Dec-2019 | | | (3,565,812 | ) | | | (3,565,812 | ) | | | -21.16 | % |
| OUTSTANDING FORWARD FOREIGN CURRENCY CONTRACTS Total | | | (2,802,889,520 | ) | | | (70,936,389 | ) | | | -420.95 | % |
| TOTAL SHORT | | | (2,802,889,520 | ) | | $ | (70,936,389 | ) | | | -420.95 | % |
| | | | | | | | | | | | | |
| REMAINING SECURITIES AND CASH | | | | | | $ | 16,927,542 | | | | 100.38 | % |
| TOTAL VALUE | | | | | | $ | 16,862,474 | | | | | |
LONG/SHORT SEGREGATED PORTFOLIO
| | | | | | | | | Percentage | |
| Description | | Contracts/Shares | | | Value | | | of Value | |
| LONG SECURITIES | | | | | | | | | | | | |
| COMMON STOCK | | | | | | | | | | | | |
| ADVANCED DRAINAGE SYSTEMS ORD (NYS) | | | 12,033 | | | $ | 445,462 | | | | 1.23 | % |
| BUZZI UNICEM SENZA VINCOLI ORD (MIL) | | | 22,432 | | | | 541,034 | | | | 1.49 | % |
| CATERPILLAR ORD (NYS) | | | 7,659 | | | | 1,055,410 | | | | 2.91 | % |
| D R HORTON ORD (NYS) | | | 22,268 | | | | 1,166,175 | | | | 3.21 | % |
| DELTA AIR LINES ORD (NYS) | | | 26,503 | | | | 1,459,785 | | | | 4.02 | % |
| DSV PANALPINA ORD (CPH) | | | 22,490 | | | | 2,181,133 | | | | 6.01 | % |
| FEDEX ORD (NYS) | | | 1,545 | | | | 235,860 | | | | 0.65 | % |
| FRENI BREMBO ORD (MIL) | | | 33,675 | | | | 357,872 | | | | 0.99 | % |
| GENERAL DYNAMICS ORD (NYS) | | | 14,540 | | | | 2,570,672 | | | | 7.08 | % |
| GREENBRIER ORD (NYS) | | | 16,396 | | | | 480,239 | | | | 1.32 | % |
| KANSAS CITY SOUTHERN ORD (NYS) | | | 10,494 | | | | 1,477,345 | | | | 4.07 | % |
| KB HOME ORD (NYS) | | | 38,881 | | | | 1,387,663 | | | | 3.82 | % |
| KION GROUP ORD (GER) | | | 19,523 | | | | 1,296,423 | | | | 3.57 | % |
| KIRBY ORD (NYS) | | | 18,975 | | | | 1,502,061 | | | | 4.14 | % |
| LOUISIANA PACIFIC ORD (NYS) | | | 93,845 | | | | 2,743,089 | | | | 7.56 | % |
| NORFOLK SOUTHERN ORD (NYS) | | | 9,263 | | | | 1,685,866 | | | | 4.64 | % |
| NVR ORD (NYS) | | | 0,405 | | | | 1,472,819 | | | | 4.05 | % |
| PACCAR ORD (NMS) | | | 16,734 | | | | 1,272,788 | | | | 3.51 | % |
| POLARIS INDUSTRIES ORD (NYS) | | | 8,335 | | | | 822,248 | | | | 2.27 | % |
| STAR BULK CARRIERS ORD (NMS) | | | 66,739 | | | | 710,770 | | | | 1.96 | % |
| TAKE TWO INTERACTIVE SOFTWARE ORD (NMS) | | | 3,853 | | | | 463,709 | | | | 1.28 | % |
| TECK RESOURCES CL B ORD (NYS) | | | 148,500 | | | | 2,350,755 | | | | 6.48 | % |
| UNITED PARCEL SERVICE CL B ORD (NYS) | | | 2,154 | | | | 248,076 | | | | 0.68 | % |
| VULCAN MATERIALS ORD (NYS) | | | 6,527 | | | | 932,512 | | | | 2.57 | % |
| COMMON STOCK Total | | | 623,769 | | | | 28,859,766 | | | | 79.51 | % |
See Notes to Financial Statements.
| Semi-Annual Report | October 31, 2019 | 15 |
| Highland Resolute Fund | Consolidated Schedule of Investments |
| | October 31, 2019 (Unaudited) |
| Description | | Contracts/
Shares | | | Value | | | Percentage
of Value | | | Swap Counterparty | | Floating Rate/
Fixed Rate
Amount paid by Fund | | Floating Rate
Index | | Termination
Date | | Unrealized
Gain
(Loss) | |
| EQUITY SWAP | | | | | | | | | | | | | | | | | | | | | | | | |
| KNIGHT SWIFT TRANSPRTATN CL A ORD (NYS) CF | | | 70,510 | | | | 313,594 | | | | 0.86 | % | | Morgan Stanley & Co. LLC | | 50 bps + 1D FEDEF | | 1D FEDEF | | 12/3/2019 | | | 314,782 | |
| NVR ORD (NYS) CFD | | | 0,406 | | | | 396,331 | | | | 1.09 | % | | Morgan Stanley & Co. LLC | | 50 bps + 1D FEDEF | | 1D FEDEF | | 12/3/2019 | | | 394,009 | |
| EQUITY SWAP Total | | | 70,916 | | | | 709,925 | | | | 1.95 | % | | | | | | | | | | | | |
| TOTAL LONG | | | 694,685 | | | $ | 29,569,691 | | | | 81.46 | % | | | | | | | | | | | | |
| SECURITIES SOLD SHORT | | | | | | | | | | | | | | | | | | | | | | | | |
| COMMON STOCK | | | | | | | | | | | | | | | | | | | | | | | | |
| APPLE ORD (NMS) | | | (1,613 | ) | | | (401,250 | ) | | | -1.11 | % | | | | | | | | | | | | |
| BOEING ORD (NYS) | | | (3,159 | ) | | | (1,073,776 | ) | | | -2.96 | % | | | | | | | | | | | | |
| CH ROBINSON | | | | | | | | | | | | | | | | | | | | | | | | |
| WORLDWIDE ORD | | | | | | | | | | | | | | | | | | | | | | | | |
| (NMS) | | | (5,600 | ) | | | (423,584 | ) | | | -1.17 | % | | | | | | | | | | | | |
| DOW ORD (NYS) | | | (4,779 | ) | | | (241,292 | ) | | | -0.66 | % | | | | | | | | | | | | |
| GATX ORD (NYS) | | | (4,096 | ) | | | (325,837 | ) | | | -0.90 | % | | | | | | | | | | | | |
| ILLINOIS TOOL ORD (NYS) | | | (1,935 | ) | | | (326,202 | ) | | | -0.90 | % | | | | | | | | | | | | |
| KENNAMETAL ORD (NYS) | | | (23,037 | ) | | | (712,995 | ) | | | -1.96 | % | | | | | | | | | | | | |
| LINCOLN ELECTRIC | | | | | | | | | | | | | | | | | | | | | | | | |
| HOLDINGS ORD (NMS) | | | (12,560 | ) | | | (1,125,000 | ) | | | -3.10 | % | | | | | | | | | | | | |
| MONDELEZ | | | | | | | | | | | | | | | | | | | | | | | | |
| INTERNATIONAL | | | | | | | | | | | | | | | | | | | | | | | | |
| CL A ORD (NMS) | | | (4,471 | ) | | | (234,504 | ) | | | -0.65 | % | | | | | | | | | | | | |
| PROCTER & GAMBLE | | | | | | | | | | | | | | | | | | | | | | | | |
| ORD (NYS) | | | (1,944 | ) | | | (242,047 | ) | | | -0.67 | % | | | | | | | | | | | | |
| SAIA ORD (NMS) | | | (2,528 | ) | | | (225,498 | ) | | | -0.62 | % | | | | | | | | | | | | |
| SIEMENS N ORD (GER) | | | (1,890 | ) | | | (217,601 | ) | | | -0.60 | % | | | | | | | | | | | | |
| SITEONE LANDSCAPE | | | | | | | | | | | | | | | | | | | | | | | | |
| SUPPLY ORD (NYS) | | | (4,746 | ) | | | (417,933 | ) | | | -1.15 | % | | | | | | | | | | | | |
| STADLER RAIL ORD (SWX) | | | (8,035 | ) | | | (390,306 | ) | | | -1.08 | % | | | | | | | | | | | | |
| STARBUCKS ORD (NMS) | | | (2,629 | ) | | | (222,308 | ) | | | -0.61 | % | | | | | | | | | | | | |
| TEREX ORD (NYS) | | | (27,279 | ) | | | (751,536 | ) | | | -2.07 | % | | | | | | | | | | | | |
| TRANSDIGM GROUP | | | | | | | | | | | | | | | | | | | | | | | | |
| ORD (NYS) | | | (610 | ) | | | (321,031 | ) | | | -0.88 | % | | | | | | | | | | | | |
| XPO LOGISTICS ORD (NYS) | | | (5,645 | ) | | | (431,278 | ) | | | -1.19 | % | | | | | | | | | | | | |
| COMMON STOCK Total | | | (116,556 | ) | | | (8,083,978 | ) | | | -22.28 | % | | | | | | | | | | | | |
| TOTAL SHORT | | | (116,556 | ) | | | (8,083,978 | ) | | | -22.28 | % | | | | | | | | | | | | |
| REMAINING SECURITIES AND CASH | | | | | | $ | 14,816,623 | | | | 40.82 | % | | | | | | | | | | | | |
| TOTAL VALUE | | | | | | $ | 36,302,336 | | | | | | | | | | | | | | | | | |
See Notes to Financial Statements.
16
| Highland Resolute Fund | Consolidated Schedule of Investments |
| | October 31, 2019 (Unaudited) |
MELCHIOR SEGREGATED PORTFOLIO
| Description | | Contracts/ Shares | | | Value | | | Percentage of Value | | | Swap Counterparty | | Floating Rate/Fixed Rate Amount paid by Fund | | Floating Rate Index | | Termination Date | | Unrealized Gain (Loss) | |
| LONG SECURITIES | | | | | | | | | | | | | | | | | | | | | | | | |
| COMMON STOCK | | | | | | | | | | | | | | | | | | | | | | | | |
| GRIFOLS SA-ADR | | | 31,233 | | | $ | 684,305 | | | | 2.09 | % | | | | | | | | | | | | |
| COMMON STOCK Total | | | 31,233 | | | | 684,305 | | | | 2.09 | % | | | | | | | | | | | | |
| | | | | | | | | | | | | | | | | | | | | | | | | |
| EQUITY SWAP | | | | | | | | | | | | | | | | | | | | | | | | |
| APPLUS SERVICES | | | | | | | | | | | | | | | | | | | | | | | | |
| SA(MAD) | | | 115,418 | | | | (66,044 | ) | | | -0.20 | % | | Morgan Stanley & Co. LLC | | 55 bps + 1M EURIB | | 1M EURIB | | 3/26/2020 | | | (154,956 | ) |
| ASCENTIAL PLC | | | 140,568 | | | | (31,661 | ) | | | -0.10 | % | | Morgan Stanley & Co. LLC | | 55 bps + 1M LIBOR | | 1M LIBOR | | 3/26/2020 | | | (64,400 | ) |
| ASML HOLDING NV (EOE) | | | 2,606 | | | | 183,592 | | | | 0.56 | % | | Morgan Stanley & Co. LLC | | 55 bps + 1M EURIB | | 1M EURIB | | 3/26/2020 | | | 426,785 | |
| ASR NEDERLAND NV | | | 19,384 | | | | (58,264 | ) | | | -0.18 | % | | Morgan Stanley & Co. LLC | | 55 bps + 1M EURIB | | 1M EURIB | | 3/26/2020 | | | (136,185 | ) |
| ASSOCIATED BRITISH FOODS PLC | | | 24,087 | | | | (48,845 | ) | | | -0.15 | % | | Morgan Stanley & Co. LLC | | 55 bps + 1M LIBOR | | 1M LIBOR | | 3/26/2020 | | | (98,415 | ) |
| AVAST PLC | | | 123,624 | | | | 69,028 | | | | 0.21 | % | | Morgan Stanley & Co. LLC | | 55 bps + 1M LIBOR | | 1M LIBOR | | 3/26/2020 | | | 138,556 | |
| CERVED GROUP SPA | | | 75,977 | | | | 59,663 | | | | 0.18 | % | | Morgan Stanley & Co. LLC | | 55 bps + 1M EURIB | | 1M EURIB | | 3/26/2020 | | | 138,411 | |
| COMPASS GROUP PLC | | | 35,280 | | | | 118,563 | | | | 0.36 | % | | Morgan Stanley & Co. LLC | | 55 bps + 1M LIBOR | | 1M LIBOR | | 3/26/2020 | | | 326,604 | |
| CRH PLC(ISE) | | | 14,604 | | | | 76,118 | | | | 0.23 | % | | Morgan Stanley & Co. LLC | | 55 bps + 1M EURIB | | 1M EURIB | | 3/26/2020 | | | 176,820 | |
| ERSTE GROUP BANK | | | | | | | | | | | | | | | | | | | | | | | | |
| AG(VIE) | | | 14,849 | | | | (26,001 | ) | | | -0.08 | % | | Morgan Stanley & Co. LLC | | 55 bps + 1M EURIB | | 1M EURIB | | 3/26/2020 | | | (79,231 | ) |
| FERGUSON PLC | | | 5,790 | | | | 86,333 | | | | 0.26 | % | | Morgan Stanley & Co. LLC | | 55 bps + 1M LIBOR | | 1M LIBOR | | 3/26/2020 | | | 172,725 | |
| FINECOBANK SPA(MIL) | | | 86,292 | | | | 75,009 | | | | 0.23 | % | | Morgan Stanley & Co. LLC | | 55 bps + 1M EURIB | | 1M EURIB | | 3/26/2020 | | | 173,835 | |
| FRANCE TELECOM SA | | | 38,205 | | | | 31,319 | | | | 0.10 | % | | Morgan Stanley & Co. LLC | | 55 bps + 1M EURIB | | 1M EURIB | | 3/26/2020 | | | 72,269 | |
| GOCO GROUP PLC | | | 330,901 | | | | 43,902 | | | | 0.13 | % | | Morgan Stanley & Co. LLC | | 55 bps + 1M LIBOR | | 1M LIBOR | | 3/26/2020 | | | 88,582 | |
| INFICON HOLDING AG-REG | | | 0,695 | | | | 111,297 | | | | 0.34 | % | | Morgan Stanley & Co. LLC | | 55 bps + 1M LIBOR | | 1M LIBOR | | 3/26/2020 | | | 284,578 | |
| INMOBILIARIA COLONIAL SOCIMI | | | 65,219 | | | | 156,124 | | | | 0.48 | % | | Morgan Stanley & Co. LLC | | 55 bps + 1M EURIB | | 1M EURIB | | 3/26/2020 | | | 362,873 | |
| INTERTRUST NV | | | 46,634 | | | | 35,256 | | | | 0.11 | % | | Morgan Stanley & Co. LLC | | 55 bps + 1M EURIB | | 1M EURIB | | 3/26/2020 | | | 102,220 | |
| JD SPORTS FASHION PLC | | | 33,453 | | | | 75,939 | | | | 0.23 | % | | Morgan Stanley & Co. LLC | | 55 bps + 1M LIBOR | | 1M LIBOR | | 3/26/2020 | | | 152,939 | |
| LONZA GROUP AG-REG | | | 2,431 | | | | 71,870 | | | | 0.22 | % | | Morgan Stanley & Co. LLC | | 55 bps + 1M LIBOR | | 1M LIBOR | | 3/26/2020 | | | 246,535 | |
| MAISONS DU MONDE SA | | | 13,911 | | | | (102,909 | ) | | | -0.31 | % | | Morgan Stanley & Co. LLC | | 55 bps + 1M EURIB | | 1M EURIB | | 3/26/2020 | | | (390,746 | ) |
| MTU AERO ENGINES AG(GER) | | | 2,006 | | | | 92,647 | | | | 0.28 | % | | Morgan Stanley & Co. LLC | | 55 bps + 1M EURIB | | 1M EURIB | | 3/25/2020 | | | 212,404 | |
| NESTLE SA-REG(VTX) | | | 12,663 | | | | 139,821 | | | | 0.43 | % | | Morgan Stanley & Co. LLC | | 55 bps + 1M LIBOR | | 1M LIBOR | | 3/26/2020 | | | 356,667 | |
| PIAGGIO & C. S.P.A. | | | 183,348 | | | | 54,551 | | | | 0.17 | % | | Morgan Stanley & Co. LLC | | 55 bps + 1M EURIB | | 1M EURIB | | 3/26/2020 | | | 140,504 | |
| PROSEGUR CASH SA | | | 360,589 | | | | (103,248 | ) | | | -0.31 | % | | Morgan Stanley & Co. LLC | | 55 bps + 1M EURIB | | 1M EURIB | | 3/26/2020 | | | (240,836 | ) |
| PRUDENTIAL PLC | | | 40,525 | | | | (89,233 | ) | | | -0.27 | % | | Morgan Stanley & Co. LLC | | 55 bps + 1M LIBOR | | 1M LIBOR | | 3/26/2020 | | | 48,472 | |
| ROBERTET SA | | | 2,092 | | | | 394,152 | | | | 1.20 | % | | Morgan Stanley & Co. LLC | | 55 bps + 1M EURIB | | 1M EURIB | | 3/26/2020 | | | 960,747 | |
| ROCHE HOLDING AG-GENUSSCHEIN(VTX) | | | 4,915 | | | | 148,455 | | | | 0.45 | % | | Morgan Stanley & Co. LLC | | 55 bps + 1M LIBOR | | 1M LIBOR | | 3/26/2020 | | | 378,413 | |
| RYANAIR HOLDINGS PLC(ISE) | | | 37,174 | | | | 51,458 | | | | 0.16 | % | | Morgan Stanley & Co. LLC | | 55 bps + 1M EURIB | | 1M EURIB | | 3/26/2020 | | | 119,262 | |
| SBANKEN ASA | | | 51,367 | | | | (68,291 | ) | | | -0.21 | % | | Morgan Stanley & Co. LLC | | 55 bps + 1M NIBOR | | 1M NIBOR | | 4/30/2021 | | | (2,026,226 | ) |
| SOFTWARE AG | | | 29,485 | | | | 52,550 | | | | 0.16 | % | | Morgan Stanley & Co. LLC | | 55 bps + 1M EURIB | | 1M EURIB | | 3/25/2020 | | | 131,648 | |
| TEAMVIEWER AG | | | 21,897 | | | | (40,193 | ) | | | -0.12 | % | | Morgan Stanley & Co. LLC | | 55 bps + 1M EURIB | | 1M EURIB | | 3/25/2020 | | | (96,375 | ) |
| VESTAS WIND SYSTEMS A/S(CPH) | | | 6,024 | | | | 38,299 | | | | 0.12 | % | | Morgan Stanley & Co. LLC | | 55 bps + 1M CIBOR | | 1M CIBOR | | 10/30/2020 | | | 668,931 | |
| WH SMITH PLC | | | 17,053 | | | | 28,711 | | | | 0.09 | % | | Morgan Stanley & Co. LLC | | 55 bps + 1M LIBOR | | 1M LIBOR | | 3/26/2020 | | | 57,295 | |
| EQUITY SWAP Total | | | 1,959,068 | | | | 1,559,968 | | | | 4.77 | % | | | | | | | | | | | | |
| TOTAL LONG | | | 1,990,301 | | | $ | 2,244,273 | | | | 6.86 | % | | | | | | | | | | | | |
See Notes to Financial Statements.
| Semi-Annual Report | October 31, 2019 | 17 |
| Highland Resolute Fund | Consolidated Schedule of Investments |
| | October 31, 2019 (Unaudited) |
| Description | | Contracts/ Shares | | | Value | | | Percentage of Value | | | Swap Counterparty | | Floating Rate/Fixed Rate Amount paid by Fund | | Floating Rate Index | | Termination Date | | Unrealized Gain (Loss) | |
| SECURITIES SOLD SHORT | | | | | | | | | | | | | | | | | | | | | | | | |
| EQUITY SWAP | | | | | | | | | | | | | | | | | | | | | | | | |
| ASTON MARTIN LAGONDA GLOBAL | | | (99,221 | ) | | | 85,273 | | | | 0.26 | % | | Morgan Stanley & Co. LLC | | 1D SONIA - 587.5 bps | | 1D SONIA | | 3/26/2020 | | | 189,618 | |
| AZIMUT HOLDING SPA | | | (21,975 | ) | | | (31,058 | ) | | | -0.09 | % | | Morgan Stanley & Co. LLC | | 1D EONIA - 50 bps | | 1D EONIA | | 3/26/2020 | | | (76,135 | ) |
| BEKAERT NV | | | (18,451 | ) | | | (27,845 | ) | | | -0.08 | % | | Morgan Stanley & Co. LLC | | 1D EONIA - 50 bps | | 1D EONIA | | 3/26/2020 | | | (76,150 | ) |
| BOOHOO GROUP PLC | | | (137,367 | ) | | | (37,487 | ) | | | -0.11 | % | | Morgan Stanley & Co. LLC | | 1D SONIA - 35 bps | | 1D SONIA | | 3/26/2020 | | | (75,281 | ) |
| BURFORD CAPITAL LTD | | | (31,050 | ) | | | (32,177 | ) | | | -0.10 | % | | Morgan Stanley & Co. LLC | | 1D SONIA - 35 bps | | 1D SONIA | | 3/26/2020 | | | (68,651 | ) |
| EUROFINS SCIENTIFIC(PAR) | | | (1,797 | ) | | | (31,103 | ) | | | -0.09 | % | | Morgan Stanley & Co. LLC | | 1D EONIA - 150 bps | | 1D EONIA | | 3/26/2020 | | | (73,402 | ) |
| FIRST DERIVATIVES PLC | | | (14,297 | ) | | | 128,925 | | | | 0.39 | % | | Morgan Stanley & Co. LLC | | 1D SONIA - 162.5 bps | | 1D SONIA | | 3/26/2020 | | | 257,824 | |
| LANDIS+GYR GROUP AG | | | (5,386 | ) | | | (90,954 | ) | | | -0.28 | % | | Morgan Stanley & Co. LLC | | 1D SARON - 40 bps | | 1D SARON | | 3/26/2020 | | | (233,417 | ) |
| LEARNING TECHNOLOGIES GROUP | | | (386,552 | ) | | | 44,338 | | | | 0.14 | % | | Morgan Stanley & Co. LLC | | 1D SONIA - 100 bps | | 1D SONIA | | 3/26/2020 | | | 85,895 | |
| NETCOMPANY GROUP AS | | | (13,623 | ) | | | (59,316 | ) | | | -0.18 | % | | Morgan Stanley & Co. LLC | | 1W CIBOR - 50 bps | | 1W CIBOR | | 10/30/2020 | | | (1,034,934 | ) |
| PUBLICIS GROUPE | | | (7,889 | ) | | | 50,082 | | | | 0.15 | % | | Morgan Stanley & Co. LLC | | 1D EONIA - 40 bps | | 1D EONIA | | 3/26/2020 | | | 116,252 | |
| RIB SOFTWARE SE | | | (11,486 | ) | | | (38,324 | ) | | | -0.12 | % | | Morgan Stanley & Co. LLC | | 1D EONIA - 212.5 bps | | 1D EONIA | | 3/25/2020 | | | (89,394 | ) |
| TATE & LYLE PLC | | | (53,813 | ) | | | 47,892 | | | | 0.15 | % | | Morgan Stanley & Co. LLC | | 1D SONIA - 35 bps | | 1D SONIA | | 3/26/2020 | | | 95,757 | |
| VARTA AG | | | (4,311 | ) | | | (58,551 | ) | | | -0.18 | % | | Morgan Stanley & Co. LLC | | 1D EONIA - 40 bps | | 1D EONIA | | 3/25/2020 | | | (142,144 | ) |
| WIRECARD AG | | | (5,693 | ) | | | 82,029 | | | | 0.25 | % | | Morgan Stanley & Co. LLC | | 1D EONIA - 115.5 bps | | 1D EONIA | | 3/25/2020 | | | 190,113 | |
| EQUITY SWAP Total | | | (812,910 | ) | | | 31,724 | | | | 0.11 | % | | | | | | | | | | | | |
| | | | | | | | | | | | | | | | | | | | | | | | | |
| FUTURE CONTRACT | | | | | | | | | | | | | | | | | | | | | | | | |
| FTSE/MIB IDX FUT DEC19 | | | (10 | ) | | | (48,984 | ) | | | -0.15 | % | | | | | | | | | | | | |
| FUTURE CONTRACT Total | | | (10 | ) | | | (48,984 | ) | | | -0.15 | % | | | | | | | | | | | | |
| TOTAL SHORT | | | (812,919 | ) | | $ | (17,260 | ) | | | -0.04 | % | | | | | | | | | | | | |
| | | | | | | | | | | | | | | | | | | | | | | | | |
| REMAINING SECURITIES AND CASH | | | | 30,579,945 | | | | 93.18 | % | | | | | | | | | | | | |
| TOTAL VALUE | | | | | | $ | 32,806,958 | | | | | | | | | | | | | | | | | |
See Notes to Financial Statements.
18
| Highland Resolute Fund | Consolidated Schedule of Investments |
| | October 31, 2019 (Unaudited) |
PSAM HIGHLAND
| Description | | Contracts/ Shares | | | Value | | | Percentage of Value | |
| LONG SECURITIES | | | | | | | | | | | | |
| COMMON STOCK | | | | | | | | | | | | |
| ALLERGAN PLC | | | 10,274 | | | $ | 1,809,403 | | | | 3.63 | % |
| CAESARS ENTERTAINMENT | | | | | | | | | | | | |
| CORP COM STK | | | 156,482 | | | | 1,921,598 | | | | 3.85 | % |
| CAMBREX CORP COM STK | | | 12,265 | | | | 732,571 | | | | 1.47 | % |
| CBS CORP NEW CL B COM STK | | | 13,420 | | | | 483,669 | | | | 0.97 | % |
| CELGENE CORP COM STK | | | 47,674 | | | | 5,150,168 | | | | 10.32 | % |
| CIRCOR INTL INC COM STK | | | 12,328 | | | | 472,048 | | | | 0.95 | % |
| EL PASO ELECTRIC CO COM STK | | | 12,458 | | | | 831,106 | | | | 1.67 | % |
| ENERGIAS DE PORTUGAL EUR5 REGD | | | 303,259 | | | | 1,248,049 | | | | 2.50 | % |
| FOX CORP - CLASS A | | | 21,288 | | | | 682,059 | | | | 1.37 | % |
| FREDDIE MAC 8.375%PERP PFD | | | 23,453 | | | | 272,052 | | | | 0.55 | % |
| GANNETT CO INC | | | 30,274 | | | | 333,320 | | | | 0.67 | % |
| GENESEE & WYO INC CL A COM STK | | | 21,833 | | | | 2,424,065 | | | | 4.86 | % |
| INTERXION HOLDING NV | | | 7,771 | | | | 685,572 | | | | 1.37 | % |
| MCKESSON EUROPE AG (GFR LISTING) | | | 66,912 | | | | 1,970,145 | | | | 3.95 | % |
| MELLANOX TECHNOLOGIES LTD | | | 2,956 | | | | 333,156 | | | | 0.67 | % |
| MILACRON HOLDINGS CORP CINCIN COM STK | | | 66,635 | | | | 1,114,141 | | | | 2.23 | % |
| OCCIDENTAL PETE CORP | | | 17,633 | | | | 714,130 | | | | 1.43 | % |
| OMNOVA SOLUTIONS INC COM STK | | | 37,264 | | | | 376,737 | | | | 0.76 | % |
| OSRAM LICHT AG NAMENS-AKTIEN (GFR LISTING) | | | 11,681 | | | | 521,104 | | | | 1.04 | % |
| PIVOTAL SOFTWARE INC - CL A | | | 45,022 | | | | 673,972 | | | | 1.35 | % |
| PRESIDIO INC | | | 16,755 | | | | 278,133 | | | | 0.56 | % |
| RIVIERA RESOURCES INC/LINN | | | 31,708 | | | | 413,468 | | | | 0.83 | % |
| SUNTRUST BKS INC COM STK | | | 36,544 | | | | 2,497,410 | | | | 5.01 | % |
| TALLGRASS ENERGY LP | | | 34,462 | | | | 662,022 | | | | 1.33 | % |
| TRINITY INDS INC COM STK | | | 18,236 | | | | 360,708 | | | | 0.72 | % |
| UNITED TECHNOLOGIES CORP | | | 7,629 | | | | 1,095,330 | | | | 2.20 | % |
| WABCO HOLDINGS INC | | | 17,303 | | | | 2,329,335 | | | | 4.67 | % |
| WELLCARE HEALTH PLANS INC COM STK | | | 7,330 | | | | 2,174,178 | | | | 4.36 | % |
| WESTJET AIRLINE COM STK CAD | | | 100,967 | | | | 2,349,129 | | | | 4.71 | % |
| ZAYO GROUP HOLDINGS INC | | | 66,268 | | | | 2,262,375 | | | | 4.53 | % |
| COMMON STOCK Total | | | 1,258,083 | | | | 37,171,155 | | | | 74.53 | % |
See Notes to Financial Statements.
| Semi-Annual Report | October 31, 2019 | 19 |
| Highland Resolute Fund | Consolidated Schedule of Investments |
| | October 31, 2019 (Unaudited) |
| Description | | Contracts/ Shares | | | Value | | | Percentage of Value | | | Swap Counterparty | | Floating Rate/Fixed Rate Amount paid by Fund | | Floating Rate Index | | Termination Date | | | Unrealized Gain (Loss) | |
| CORPORATE BONDS | | | | | | | | | | | | | | | | | | | | | | | | |
| CC 6.625 15MAY2023 | | | 318,906 | | | $ | 327,154 | | | | 0.66 | % | | | | | | | | | | | | |
| FE 6.85 01JUN2034 | | | 1,171,032 | | | | 689,647 | | | | 1.38 | % | | | | | | | | | | | | |
| GNW FRN 15NOV2036 | | | 648,078 | | | | 401,005 | | | | 0.80 | % | | | | | | | | | | | | |
| ISATLN CB 3.875 09SEP2023 | | | 513,329 | | | | 778,241 | | | | 1.56 | % | | | | | | | | | | | | |
| PCG 4.75 15FEB2044 | | | 877,151 | | | | 842,414 | | | | 1.69 | % | | | | | | | | | | | | |
| PCG 5.8 01MAR2037 | | | 734,702 | | | | 734,151 | | | | 1.47 | % | | | | | | | | | | | | |
| PUERTO RICO ELECTRIC POWER AUTH SER 2013 | | | 234,206 | | | | 181,509 | | | | 0.36 | % | | | | | | | | | | | | |
| PUERTO RICO ELECTRIC POWER AUTH SER WW-R | | | 256,664 | | | | 194,102 | | | | 0.39 | % | | | | | | | | | | | | |
| PUERTO RICO ELECTRIC | | | | | | | | | | | | | | | | | | | | | | | | |
| POWER AUTH SER XX-R | | | 988,158 | | | | 743,589 | | | | 1.49 | % | | | | | | | | | | | | |
| CORPORATE BONDS Total | | | 5,742,226 | | | | 4,891,813 | | | | 9.80 | % | | | | | | | | | | | | |
| TOTAL LONG | | | 7,000,309 | | | $ | 42,062,968 | | | | 84.33 | % | | | | | | | | | | | | |
| | | | | | | | | | | | | | | | | | | | | | | | | |
| SECURITIES SOLD SHORT | | | | | | | | | | | | | | | | | | | | | | | | |
| COMMON STOCK | | | | | | | | | | | | | | | | | | | | | | | | |
| ABBVIE INC | | | (9,146 | ) | | | (740,256 | ) | | | -1.48 | % | | | | | | | | | | | | |
| BB&T CORP COM STK | | | (47,283 | ) | | | (2,508,349 | ) | | | -5.03 | % | | | | | | | | | | | | |
| BRISTOL MYERS SQUIBB | | | (47,674 | ) | | | (2,758,430 | ) | | | -5.53 | % | | | | | | | | | | | | |
| CARNIVAL CORP | | | (11,019 | ) | | | (472,588 | ) | | | -0.95 | % | | | | | | | | | | | | |
| CENTENE CORP DEL COM STK | | | (24,774 | ) | | | (1,314,999 | ) | | | -2.64 | % | | | | | | | | | | | | |
| ELDORADO RESORTS LLC | | | (14,026 | ) | | | (627,947 | ) | | | -1.26 | % | | | | | | | | | | | | |
| GENWORTH FINANCIAL INC | | | (49,781 | ) | | | (213,061 | ) | | | -0.43 | % | | | | | | | | | | | | |
| HILLENBRAND | | | (11,114 | ) | | | (342,206 | ) | | | -0.69 | % | | | | | | | | | | | | |
| RAYTHEON COMPANY COM | | | (1,489 | ) | | | (316,044 | ) | | | -0.63 | % | | | | | | | | | | | | |
| CORPORATE BONDS Total | | | (216,305 | ) | | | (9,293,880 | ) | | | -18.64 | % | | | | | | | | | | | | |
| | | | | | | | | | | | | | | | | | | | | | | | | |
| CORPORATE BONDS CC 7 15MAY2025 | | | (318,906 | ) | | | (318,236 | ) | | | -0.64 | % | | | | | | | | | | | | |
| CORPORATE BONDS Total | | | (318,906 | ) | | | (318,236 | ) | | | -0.64 | % | | | | | | | | | | | | |
| | | | | | | | | | | | | | | | | | | | | | | | | |
| EQUITY SWAP | | | | | | | | | | | | | | | | | | | | | | | | |
| ABBVIE INC | | | (14,510 | ) | | | (197,767 | ) | | | -0.40 | % | | Morgan Stanley & Co. LLC | | 1D FEDEF - 35 bps | | 1D FEDEF | | 6/29/2021 | | | (306,135 | ) |
| EQUITY SWAP Total | | | (14,510 | ) | | | (197,767 | ) | | | -0.40 | % | | | | | | | | | | | | |
| TOTAL SHORT | | | (549,720 | ) | | $ | (9,809,884 | ) | | | -19.68 | % | | | | | | | | | | | | |
| | | | | | | | | | | | | | | | | | | | | | | | | |
| REMAINING SECURITIES AND CASH | | | | | | | 17,639,672 | | | | 35.35 | % | | | | | | | | | | | | |
| TOTAL VALUE | | | | | | $ | 49,892,756 | | | | | | | | | | | | | | | | | |
See Notes to Financial Statements.
20
| Highland Resolute Fund | Consolidated Schedule of Investments |
| | October 31, 2019 (Unaudited) |
WABR
| Description | | Contracts/Shares | | | Value | | | Percentage of Value | |
| LONG SECURITIES | | | | | | | | | | | | |
| COMMON STOCK | | | | | | | | | | | | |
| ALLERGAN ORD (NYS) | | | 2,032 | | | $ | 357,856 | | | | 1.00 | % |
| AMERICAN ASSETS REIT ORD (NYS) | | | 4,519 | | | | 221,250 | | | | 0.62 | % |
| AMERICAN ELECTRIC POWER ORD (NYS) | | | 2,688 | | | | 253,720 | | | | 0.71 | % |
| APARTMENT INVST MGT CL A REIT ORD (NYS) | | | 3,905 | | | | 214,306 | | | | 0.60 | % |
| CELGENE ORD (NMS) | | | 3,311 | | | | 357,687 | | | | 1.00 | % |
| DOUGLAS EMMETT REIT ORD (NYS) | | | 5,747 | | | | 248,960 | | | | 0.70 | % |
| DUKE REALTY REIT ORD (NYS) | | | 6,281 | | | | 220,714 | | | | 0.62 | % |
| EQUITY LIFESTYLE PROP REIT ORD (NYS) | | | 4,560 | | | | 318,926 | | | | 0.89 | % |
| FIRSTENERGY ORD (NYS) | | | 3,946 | | | | 190,671 | | | | 0.53 | % |
| FOUR CORNERS PROPERTY ORD (NYS) | | | 8,512 | | | | 243,869 | | | | 0.68 | % |
| HEALTHCAR TRST OF AM CL A REIT ORD (NYS) | | | 8,712 | | | | 270,072 | | | | 0.76 | % |
| HUDSON PACIFIC PROPERTIES REIT ORD (NYQ) | | | 7,882 | | | | 283,121 | | | | 0.79 | % |
| INVSC S P 500 EQUAL WEIGHT ETF (PSE) | | | 14,200 | | | | 1,553,622 | | | | 4.35 | % |
| ISHARES 7-10 YEAR TRSURY BOND ETF (NMS) | | | 1,592 | | | | 179,116 | | | | 0.50 | % |
| ISHARES IBOXX HIGH YIELD BOND ETF (PSE) | | | 48,321 | | | | 4,194,746 | | | | 11.73 | % |
| ISHARES IBOXX INVT GRADE BOND ETF (PSE) | | | 32,907 | | | | 4,202,553 | | | | 11.76 | % |
| NATIONAL HEALTH INVESTORS REIT ORD (NYS) | | | 3,595 | | | | 308,415 | | | | 0.86 | % |
| NATIONAL RETAIL PROPERTIES REIT ORD (NYS) | | | 6,686 | | | | 393,872 | | | | 1.10 | % |
| RPT REALTY ORD (NYS) | | | 18,458 | | | | 267,641 | | | | 0.75 | % |
| SPDR S&P MIDCAP 400 ETF (PSE) | | | 0,808 | | | | 287,834 | | | | 0.81 | % |
| SPIRIT REALTY CAPITAL REIT ORD (NYS) | | | 6,755 | | | | 336,669 | | | | 0.94 | % |
| UDR REIT ORD (NYS) | | | 6,741 | | | | 338,735 | | | | 0.95 | % |
| VICI PPTYS ORD (NYS) | | | 17,152 | | | | 403,930 | | | | 1.13 | % |
| VIRGIN GALACTIC HOLDINGS CL A ORD (NYS) | | | 29,141 | | | | 274,217 | | | | 0.77 | % |
| WABCO HOLDINGS ORD (NYS) | | | 1,491 | | | | 200,718 | | | | 0.56 | % |
| WEINGARTEN RLTY REIT ORD (NYS) | | | 12,481 | | | | 396,022 | | | | 1.11 | % |
| ZAYO GROUP HOLDINGS ORD (NYS) | | | 9,243 | | | | 315,556 | | | | 0.88 | % |
| COMMON STOCK Total | | | 271,666 | | | | 16,834,798 | | | | 47.10 | % |
| | | | | | | | | | | | | |
| CORPORATE BONDS | | | | | | | | | | | | |
| BESPL EMTN 0.0000% 2020-01-15 | | | 700,000 | | | | 203,653 | | | | 0.57 | % |
| CORPORATE BONDS Total | | | 700,000 | | | | 203,653 | | | | 0.57 | % |
| TOTAL LONG | | | 971,666 | | | $ | 17,038,451 | | | | 47.67 | % |
| | | | | | | | | | | | | |
| SECURITIES SOLD SHORT | | | | | | | | | | | | |
| COMMON STOCK | | | | | | | | | | | | |
| AMERICAN FIN CL A ORD (NMQ) | | | (12,723 | ) | | | (188,300 | ) | | | -0.53 | % |
| AMERICAN HOMES 4 RENT CL A REIT ORD (NYS) | | | (7,368 | ) | | | (195,031 | ) | | | -0.55 | % |
| BRANDYWINE REALTY REIT ORD (NYS) | | | (21,694 | ) | | | (331,484 | ) | | | -0.93 | % |
| BRISTOL MYERS SQUIBB ORD (NYS) | | | (3,311 | ) | | | (189,952 | ) | | | -0.53 | % |
| CAMDEN PROPERTY REIT ORD (NYS) | | | (2,906 | ) | | | (332,359 | ) | | | -0.93 | % |
| ESSEX PROPERTY REIT ORD (NYS) | | | (961 | ) | | | (314,372 | ) | | | -0.88 | % |
| GAMING AND LEISURE PROPERTIES REIT O (NMQ) | | | (4,680 | ) | | | (188,885 | ) | | | -0.53 | % |
| HEALTHCARE REAL REIT ORD (NYS) | | | (5,164 | ) | | | (179,552 | ) | | | -0.50 | % |
| INVSC QQQ TRUST SRS 1 ETF (NMS) | | | (1,014 | ) | | | (199,839 | ) | | | -0.56 | % |
| ISHARES US TECHNOLOGY ETF (PSE) | | | (1,144 | ) | | | (242,539 | ) | | | -0.68 | % |
| KIMCO REALTY REIT ORD (NYS) | | | (26,155 | ) | | | (563,902 | ) | | | -1.58 | % |
| MELLANOX TECHNOLOGIES ORD (NMQ) | | | (2,123 | ) | | | (239,262 | ) | | | -0.67 | % |
| MGM GROWTH PROPERTIES CL A ORD (NYS) | | | (7,896 | ) | | | (246,434 | ) | | | -0.69 | % |
| NEXTERA ENERGY ORD (NYS) | | | (866 | ) | | | (206,402 | ) | | | -0.58 | % |
| PROLOGIS REIT (NYS) | | | (2,554 | ) | | | (224,139 | ) | | | -0.63 | % |
See Notes to Financial Statements.
| Semi-Annual Report | October 31, 2019 | 21 |
| Highland Resolute Fund | Consolidated Schedule of Investments |
| | October 31, 2019 (Unaudited) |
| Description | | Contracts/Shares | | | Value | | | Percentage of Value | |
| COMMON STOCK (CONTINUED) | | | | | | | | | | | | |
| REALTY INCOME REIT ORD (NYS) | | | (4,898 | ) | | | (400,607 | ) | | | -1.12 | % |
| SL GREEN RLTY REIT ORD (NYS) | | | (2,395 | ) | | | (200,222 | ) | | | -0.56 | % |
| SPRINT ORD (NYS) | | | (36,100 | ) | | | (224,181 | ) | | | -0.63 | % |
| STORE CAPITAL ORD (NYS) | | | (10,778 | ) | | | (436,509 | ) | | | -1.22 | % |
| SUN COMMUNITIES REIT ORD (NYS) | | | (2,023 | ) | | | (329,041 | ) | | | -0.92 | % |
| TANGER FACTORY REIT ORD (NYS) | | | (10,981 | ) | | | (177,014 | ) | | | -0.50 | % |
| WEC ENERGY GROUP ORD (NYS) | | | (3,357 | ) | | | (316,901 | ) | | | -0.89 | % |
| COMMON STOCK Total | | | (171,091 | ) | | | (5,926,927 | ) | | | -16.61 | % |
| TOTAL SHORT | | | (171,091 | ) | | $ | (5,926,927 | ) | | | -16.61 | % |
| | | | | | | | | | | | | |
| REMAINING SECURITIES AND CASH | | | | | | $ | 24,635,152 | | | | 68.94 | % |
| TOTAL VALUE | | | | | | $ | 35,746,676 | | | | | |
Common Abbreviations:
AQR - AQR Capital Management LLC.
BBA - British Bankers Association.
EURIBOR - Euro Interbank Offered Rate.
LIBOR - London Interbank Offered Rate.
PIMCO - Pacific Investment Management Company.
S&P - Standard & Poor's.
SPDR - Standard & Poor's Depositary Receipt.
Currency Abbreviations:
AUD - Australian Dollar
CAD - Canada Dollar
CHF - Franc Switzerland
EUR - Euro
GBP - Great British Pound
INR - India Rupee
JPY - Japan Yen
KRW - South Korea Won
MXN - Mexico Peso
NOK - Norwegian Krone
PLN - Poland Zloty
SEK - Swedish Krona
SGD - Singapore Dollar
USD - United States Dollar
See Notes to Financial Statements.
22
| Highland Resolute Fund | Consolidated Statement of Assets and Liabilities |
| | October 31, 2019 (Unaudited) |
| ASSETS | | | |
| Investments, at value | | $ | 228,604,013 | |
| Unrealized appreciation on total return swap contracts | | | 26 | |
| Deposits with brokers for total return swap contracts | | | 82,062,406 | |
| Cash | | | 1,938 | |
| Foreign currency, at value (Cost $13) | | | 13 | |
| Receivable for investments sold | | | 1,038,264 | |
| Dividends receivable | | | 361,793 | |
| Interest receivable | | | 416,137 | |
| Receivable for interest on total return swap contracts | | | 1,340,730 | |
| Other assets | | | 15,653 | |
| Total assets | | | 313,840,973 | |
| LIABILITIES | | | | |
| Securities sold short (Proceeds $8,642,833) | | | 9,546,879 | |
| Unrealized depreciation on total return swap contracts | | | 2 | |
| Investment advisory fees payable | | | 72,359 | |
| Distributions and service fees payable | | | 68,450 | |
| Payable for interest expense on total return swap contracts | | | 1,785,174 | |
| Payable for investments purchased | | | 813,627 | |
| Trustee fees and expenses payable | | | 9,130 | |
| Chief compliance officer fee payable | | | 12,218 | |
| Principal financial officer fees payable | | | 1,694 | |
| Administration fees payable | | | 76,018 | |
| Transfer agent fees payable | | | 15,290 | |
| Professional fees payable | | | 44,566 | |
| Custody fees payable | | | 18,803 | |
| Accrued expenses and other liabilities | | | 457 | |
| Total liabilities | | | 12,464,667 | |
| NET ASSETS | | $ | 301,376,306 | |
| NET ASSETS CONSIST OF | | | | |
| Paid-in capital (Note 6) | | $ | 305,655,660 | |
| Total distributable earnings | | | (4,279,354 | ) |
| NET ASSETS | | $ | 301,376,306 | |
| INVESTMENTS, AT COST | | $ | 228,574,985 | |
| PRICING OF SHARES | | | | |
| Class I: | | | | |
| Net Asset Value, offering and redemption price per share | | $ | 10.13 | |
| Net Assets | | $ | 301,376,306 | |
| Shares of beneficial interest outstanding (unlimited number of shares, no par value common stock authorized) | | | 29,742,878 | |
See Notes to Financial Statements.
| Semi-Annual Report | October 31, 2019 | 23 |
| Highland Resolute Fund | Consolidated Statement of Operations |
| | For the Six Months Ended October 31, 2019 (Unaudited) |
| INVESTMENT INCOME | | | | |
| Dividends | | $ | 2,581,833 | |
| Interest | | | 1,551,966 | |
| Foreign taxes withheld | | | 777 | |
| Total investment income | | | 4,134,576 | |
| EXPENSES | | | | |
| Investment advisory fees (Note 7) | | | 2,293,416 | |
| Investment advisory fee-subsidiary | | | 139,179 | |
| Administration fees | | | 224,226 | |
| Transfer agency fees | | | 37,044 | |
| Distribution and service fees | | | | |
| Class I | | | 24,204 | |
| Professional fees | | | 37,349 | |
| Custody fees | | | 36,923 | |
| Reports to shareholders and printing fees | | | 2,634 | |
| Trustee fees and expenses | | | 9,460 | |
| Registration/filing fees | | | 12,190 | |
| Chief compliance officer fees | | | 41,051 | |
| Principal financial officer fees | | | 5,027 | |
| Dividend expense on securities sold short | | | 113,438 | |
| Interest expense on securities sold short | | | 26,525 | |
| Other | | | 8,208 | |
| Total expenses before waivers | | | 3,010,874 | |
| Less fees waived/reimbursed by investment adviser (Note 7) | | | | |
| Class I | | | (1,808,234 | ) |
| Waiver of investment advisory fees - subsidiary (Note 7) | | | (139,179 | ) |
| Total net expenses | | | 1,063,461 | |
| | | | | |
| NET INVESTMENT INCOME | | | 3,071,115 | |
| Net realized loss on investments | | | (4,931,966 | ) |
| Net realized gain on securities sold short | | | 91,514 | |
| Net realized loss on total return swap contracts | | | (2,544,565 | ) |
| Net realized loss on foreign currency transactions | | | (7,088 | ) |
| Total net realized loss | | | (7,392,105 | ) |
| Net change in unrealized depreciation on investments | | | (988,387 | ) |
| Net change in unrealized depreciation on securities sold short | | | (125,582 | ) |
| Net change in unrealized appreciation on total return swap contracts | | | 43,266 | |
| Net change in unrealized depreciation on translation of assets and liabilities in foreign currency transactions | | | (12,074 | ) |
| Total net change in unrealized depreciation | | | (1,082,777 | ) |
| NET REALIZED AND UNREALIZED LOSS ON INVESTMENTS | | | (8,474,882 | ) |
| NET DECREASE IN NET ASSETS RESULTING FROM OPERATIONS | | $ | (5,403,767 | ) |
See Notes to Financial Statements.
24
| Highland Resolute Fund | Consolidated Statements of Changes in Net Assets |
| | | Six Months Ended October 31, 2019 (Unaudited) | | | For the Year Ended April 30, 2019 | |
| OPERATIONS | | | | | | | | |
| Net investment income | | $ | 3,071,115 | | | $ | 6,846,351 | |
| Net realized loss | | | (7,392,105 | ) | | | (5,212,697 | ) |
| Net realized gain distributions from other investment companies | | | – | | | | 50,001 | |
| Net change in unrealized depreciation | | | (1,082,777 | ) | | | (2,199,323 | ) |
| Net decrease in net assets resulting from operations | | | (5,403,767 | ) | | | (515,668 | ) |
| TOTAL DISTRIBUTIONS (NOTE 4) | | | | | | | | |
| Class I | | | – | | | | (15,995,417 | ) |
| Net decrease in net assets from distributions | | | – | | | | (15,995,417 | ) |
| BENEFICIAL INTEREST TRANSACTIONS (NOTE 6) | | | | | | | | |
| Shares sold | | | | | | | | |
| Class I | | | 8,116,426 | | | | 9,834,051 | |
| Dividends reinvested | | | | | | | | |
| Class I | | | – | | | | 15,995,417 | |
| Shares redeemed, net of redemption fees | | | | | | | | |
| Class I | | | (33,771,290 | ) | | | (50,748,365 | ) |
| Net decrease in net assets derived from beneficial interest transactions | | | (25,654,864 | ) | | | (24,918,897 | ) |
| Net decrease in Net Assets | | | (31,058,631 | ) | | | (41,429,982 | ) |
| NET ASSETS: | | | | | | | | |
| Beginning of period | | | 332,434,937 | | | | 373,864,919 | |
| End of period | | $ | 301,376,306 | | | $ | 332,434,937 | |
See Notes to Financial Statements.
| Semi-Annual Report | October 31, 2019 | 25 |
| Highland Resolute Fund | Consolidated Financial Highlights |
| | For a share outstanding throughout the periods presented |
| | | | Class I |
| | | | For the Six Months Ended October 31, 2019 (Unaudited) | | | | For the Year Ended April 30, 2019 | | | | For the Year Ended April 30, 2018(a) | | | | For the Year Ended April 30, 2017(b) | | | | For the Year Ended April 30, 2016 | | | | For the Year Ended April 30, 2015 | |
| NET ASSET VALUE, BEGINNING OF PERIOD | | $ | 10.30 | | | $ | 10.81 | | | $ | 11.14 | | | $ | 10.75 | | | $ | 11.32 | | | $ | 11.18 | |
| INCOME/(LOSS) FROM OPERATIONS | | | | | | | | | | | | | | | | | | | | | | | | |
| Net investment income(c) | | | 0.10 | | | | 0.20 | | | | 0.25 | | | | 0.09 | | | | 0.16 | | | | 0.20 | |
| Net realized and unrealized gain/(loss) on investments | | | (0.27 | ) | | | (0.22 | ) | | | 0.38 | | | | 0.45 | | | | (0.39 | ) | | | 0.26 | |
| Total from Investment Operations | | | (0.17 | ) | | | (0.02 | ) | | | 0.63 | | | | 0.54 | | | | (0.23 | ) | | | 0.46 | |
| | | | | | | | | | | | | | | | | | | | | | | | | |
| LESS DISTRIBUTIONS | | | | | | | | | | | | | | | | | | | | | | | | |
| Net investment income | | | – | | | | (0.15 | ) | | | (0.77 | ) | | | (0.13 | ) | | | (0.18 | ) | | | (0.24 | ) |
| Net realized gain on investments | | | – | | | | (0.34 | ) | | | (0.19 | ) | | | (0.02 | ) | | | (0.16 | ) | | | (0.08 | ) |
| Total Distributions | | | – | | | | (0.49 | ) | | | (0.96 | ) | | | (0.15 | ) | | | (0.34 | ) | | | (0.32 | ) |
| NET INCREASE/(DECREASE) IN NET ASSET VALUE | | | (0.17 | ) | | | (0.51 | ) | | | (0.33 | ) | | | 0.39 | | | | (0.57 | ) | | | 0.14 | |
| NET ASSET VALUE, END OF PERIOD | | $ | 10.13 | | | $ | 10.30 | | | $ | 10.81 | | | $ | 11.14 | | | $ | 10.75 | | | $ | 11.32 | |
| TOTAL RETURN(d) | | | (1.65 | )% | | | 0.22 | % | | | 5.51 | % | | | 5.04 | % | | | (2.02 | )% | | | 4.16 | % |
| | | | | | | | | | | | | | | | | | | | | | | | | |
| RATIOS/SUPPLEMENTAL DATA | | | | | | | | | | | | | | | | | | | | | | | | |
| Net assets, End of Period (000s) | | $ | 301,376 | | | $ | 332,435 | | | $ | 373,865 | | | $ | 491,811 | | | $ | 686,659 | | | $ | 689,266 | |
| RATIOS TO AVERAGE NET ASSETS: | | | | | | | | | | | | | | | | | | | | | | | | |
| Operating expenses excluding reimbursement/waiver(e) | | | 1.88 | %(f)(g)(h) | | | 1.89 | %(g)(h) | | | 1.94 | %(g)(h) | | | 1.77 | %(g)(h) | | | 1.69 | %(g) | | | 1.68 | %(g) |
| Operating expenses including reimbursement/waiver(e) | | | 0.70 | %(f)(g) | | | 0.74 | %(g) | | | 0.82 | %(g) | | | 0.52 | %(g) | | | 0.35 | %(g) | | | 0.33 | %(g) |
| Net investment income including reimbursement/waiver(e) | | | 2.01 | %(f) | | | 1.95 | % | | | 2.24 | % | | | 0.86 | % | | | 1.49 | % | | | 1.79 | % |
| PORTFOLIO TURNOVER RATE | | | 39 | %(i) | | | 55 | % | | | 79 | % | | | 94 | % | | | 27 | % | | | 54 | % |
| (a) | Prior to August 31, 2017 the Highland Resolute Fund was known as the Redmont Resolute Fund. |
| (b) | Prior to August 31, 2016 the Highland Resolute Fund was known as the Redmont Resolute Fund II. |
| (c) | Calculated using the average shares method. |
| (d) | Total investment return is calculated assuming a purchase of a common share at the opening of the first day and a sale at closing on the last day of each period reported. Dividends and distributions, if any, are assumed for purposes of this calculation to be reinvested at prices obtained under the Fund's dividend reinvestment plan. Total returns would have been lower had certain expenses not been waived during the period. Total investment returns do not reflect brokerage commissions, if any, and are not annualized. |
| (e) | The ratios exclude the impact of expenses of the underlying funds in which the Fund invests as represented in the Schedule of Investments. |
| (g) | Dividend and interest expense on securities sold short totaled 0.09%, 0.19%, 0.25%, 0.10%, 0.08%, and 0.10% of average net assets for the six months ended October 31, 2019 and for the years ended April 30, 2019, 2018, 2017, 2016, and 2015, respectively. |
| (h) | The ratio of operating expenses excluding fee waiver/reimbursements to average net assets is calculated excluding the waived Subsidiary management fee (See Note 7 for additional detail). The ratio inclusive of that fee would be 1.97%, 1.97%, 2.01% and 1.81% for the six months ended October 31, 2019 and for the years ended April 30, 2019, 2018 and 2017, respectively. |
See Notes to Financial Statements.
26
| Highland Resolute Fund | Notes to Consolidated Financial Statements |
| | October 31, 2019 (Unaudited) |
1. ORGANIZATION
Financial Investors Trust (the “Trust”), a Delaware statutory trust, is an open-end management investment company registered under the Investment Company Act of 1940, as amended (“1940 Act”). The Trust consists of multiple separate portfolios or series. This semi-annual report describes the Highland Resolute Fund (the “Fund”). Effective August 31, 2017, the Fund changed its name from Redmont Resolute Fund. The Fund seeks to provide long-term total return with reduced volatility and reduced correlation to the conventional stock and bond markets. The Fund offers Class I shares.
Basis of Consolidation:Highland Resolute Cayman (the “Subsidiary”), a Cayman Islands exempted company, is a wholly owned subsidiary of the Fund. The Subsidiary’s investment objective is designed to enhance the ability of the Fund to obtain exposure to equities, financial, currency and commodities markets consistent with the limits of the U.S. federal tax law requirements applicable to registered investment companies. The Subsidiary is subject to substantially the same investment policies and investment restrictions as the Fund. The Subsidiary acts as an investment vehicle for the Fund in order to effect certain commodity-related investments on behalf of the Fund. Investments in the Subsidiary are expected to provide the Fund with exposure to the commodity markets within the limitations of Subchapter M of the Internal Revenue Code of 1986, as amended (the “Code”), and recent IRS revenue rulings, as discussed below under “Federal Income Taxes”. The Fund is the sole shareholder of the Subsidiary pursuant to a subscription agreement, and it is intended that the Fund will remain the sole shareholder and will continue to control the Subsidiary. Under the Articles of Association of the Subsidiary, shares issued by the Subsidiary confer upon a shareholder the right to wholly own and vote at general meetings of the Subsidiary and certain rights in connection with any winding-up or repayment of capital, as well as the right to participate in the profits or assets of the Subsidiary. The Fund may invest up to 25% of its total assets in shares of the Subsidiary. As a wholly owned subsidiary of the Fund, all assets and liabilities, income and expenses of the Subsidiary are consolidated in the financial statements and financial highlights of the Fund. All investments held by the Subsidiary are disclosed in the accounts of the Fund. As of October 31, 2019, net assets of the Fund were $301,376,306, of which $17,190,519 or 5.70%, represented the Fund’s ownership of all issued shares and voting rights of the Subsidiary.
2. SIGNIFICANT ACCOUNTING POLICIES
The accompanying financial statements were prepared in accordance with accounting principles generally accepted in the United States of America (“U.S. GAAP”). The preparation of financial statements in conformity with U.S. GAAP requires management to make certain estimates and assumptions that affect the reported amounts of assets and liabilities and disclosures of contingent assets and liabilities at the date of the financial statements and the reported amounts of revenue and expenses during the period. Actual results could differ from those estimates. The Fund is considered an investment company for financial reporting purposes under U.S. GAAP and follows the accounting and reporting guidance applicable to investment companies in the Financial Accounting Standards Board Accounting Standards Codification Topic 946. The following is a summary of significant accounting policies consistently followed by the Fund and Subsidiary in preparation of the financial statements.
Investment Valuation:The Fund generally values its securities based on market prices determined at the close of regular trading on the New York Stock Exchange (“NYSE”), normally 4:00 p.m. Eastern Time, on each day the NYSE is open for trading.
For equity securities and mutual funds that are traded on an exchange, the market price is usually the closing sale or official closing price on that exchange. In the case of equity securities not traded on an exchange, or if such closing prices are not otherwise available, the securities are valued at the mean of the most recent bid and ask prices on such day. Redeemable securities issued by open-end registered investment companies are valued at the investment company’s applicable net asset value, with the exception of exchange-traded open-end investment companies, which are priced as equity securities.
The market price for debt obligations is generally the price supplied by an independent third-party pricing service approved by the Board of Trustees of the Trust (the “Board”), which may use a matrix, formula or other objective method that takes into consideration quotations from dealers, market transactions in comparable investments, market indices and yield curves. If vendors are unable to supply a price, or if the price supplied is deemed to be unreliable, the market price may be determined using quotations received from one or more brokers–dealers that make a market in the security. Municipal securities having a remaining maturity of greater than 60 days, are typically valued at the evaluated bid price formulated by an independent pricing service. Corporate Bonds, U.S. Government & Agency, and U.S. Treasury Bonds & Notes are valued using market models that consider trade data, quotations from dealers and active market makers, relevant yield curve and spread data, creditworthiness, trade data or market information on comparable securities, and other relevant security specific information. Mortgage-related and asset-backed securities are valued based on models that consider trade data, prepayment and default projections, benchmark yield and spread data and estimated cash flows of each tranche of the issuer. Publicly traded foreign government debt securities are typically traded internationally in the over-the-counter market and are valued at the mean between the bid and asked prices as of the close of business of that market.
| Semi-Annual Report | October 31, 2019 | 27 |
| Highland Resolute Fund | Notes to Consolidated Financial Statements |
| | October 31, 2019 (Unaudited) |
Futures contracts that are listed or traded on a national securities exchange, commodities exchange, contract market or comparable over the counter market, and that are freely transferrable, are valued at their closing settlement price on the exchange on which they are primarily traded or based upon the current settlement price for a like instrument acquired on the day on which the instrument is being valued. A settlement price may not be used if the market makes a limit move with respect to a particular commodity. Over-the-counter swap contracts for which market quotations are readily available are valued based on quotes received from independent pricing services or one or more dealers that make markets in such securities. Options contracts listed for trading on a securities exchange or board of trade are valued at the last quoted sales price or, in the absence of a sale at the mean of the last bid and asked price.
Forward currency exchange contracts have a fair value determined by the current foreign currency exchange forward rates. The foreign currency exchange forward rates are calculated using an automated system that estimates rates on the basis of the current day foreign currency exchange rates and forward foreign currency exchange rates supplied by a pricing service. Foreign exchange rates and forward foreign currency exchange rates may generally be obtained at the close of the NYSE, normally 4:00 p.m. Eastern Time.
When such prices or quotations are not available, or when Highland Associates, Inc. (the “Adviser”) believes that they are unreliable, securities may be priced using fair value procedures approved by the Board.
Fair Value Measurements:The Fund discloses the classification of its fair value measurements following a three-tier hierarchy based on the inputs used to measure fair value. Inputs refer broadly to the assumptions that market participants would use in pricing the asset or liability, including assumptions about risk. Inputs may be observable or unobservable. Observable inputs reflect the assumptions market participants would use in pricing the asset or liability that are developed based on market data obtained from sources independent of the reporting entity. Unobservable inputs reflect the reporting entity’s own assumptions about the assumptions market participants would use in pricing the asset or liability that are developed based on the best information available.
Various inputs are used in determining the value of the Fund’s investments as of the end of the reporting period. When inputs used fall into different levels of the fair value hierarchy, the level in the hierarchy within which the fair value measurement falls is determined based on the lowest level input that is significant to the fair value measurement in its entirety. The designated input levels are not necessarily an indication of the risk or liquidity associated with these investments. These inputs are categorized in the following hierarchy under applicable financial accounting standards:
| Level 1 – | Unadjusted quoted prices in active markets for identical investments, unrestricted assets or liabilities that the Fund has the ability to access at the measurement date; |
| Level 2 – | Quoted prices which are not active, quoted prices for similar assets or liabilities in active markets or inputs other than quoted prices that are observable (either directly or indirectly) for substantially the full term of the asset or liability; and |
| Level 3 – | Significant unobservable prices or inputs (including the Fund’s own assumptions in determining the fair value of investments) where there is little or no market activity for the asset or liability at the measurement date. |
28
| Highland Resolute Fund | Notes to Consolidated Financial Statements |
| | October 31, 2019 (Unaudited) |
The following is a summary of the inputs used to value the Fund’s investments as of October 31, 2019:
Highland Resolute Fund
| Investments in Securities at Value | | Level 1 - Quoted Prices | | | Level 2 - Other Significant Observable Inputs | | | Level 3 - Significant Unobservable Inputs | | | Total | |
| Common Stocks | | | | | | | | | | | | | | | | |
| Commercial Services | | $ | 4,480,406 | | | $ | – | | | $ | 384,930 | | | $ | 4,865,336 | |
| Other* | | | 36,285,430 | | | | – | | | | – | | | | 36,285,430 | |
| Open-End Mutual Funds | | $ | 135,969,981 | | | $ | – | | | $ | – | | | $ | 135,969,981 | |
| Preferred Stock | | | – | | | | – | | | | 2,320,175 | | | | 2,320,175 | |
| Corporate Bonds* | | | – | | | | 22,611,790 | | | | – | | | | 22,611,790 | |
| Short-Term Investments | | | | | | | | | | | | | | | | |
| Money Market Fund | | | 26,551,301 | | | | – | | | | – | | | | 26,551,301 | |
| Total | | $ | 203,287,118 | | | $ | 22,611,790 | | | $ | 2,705,105 | | | $ | 228,604,013 | |
| | | | | | | | | | | | | | | | | |
| Other Financial Instruments** | | | | | | | | | | | | | | | | |
| Assets: | | | | | | | | | | | | | | | | |
| Total Return Swap Contracts | | $ | – | | | $ | 26 | | | $ | – | | | $ | 26 | |
| Liabilities: | | | | | | | | | | | | | | | | |
| Exchange Traded Funds Sold Short | | | (9,546,879 | ) | | | – | | | | – | | | | (9,546,879 | ) |
| Total Return Swap Contracts | | | – | | | | (2 | ) | | | – | | | | (2 | ) |
| Total | | $ | (9,546,879 | ) | | $ | 24 | | | $ | – | | | $ | (9,546,855 | ) |
| * | For detailed descriptions, see the accompanying Schedule of Investments. |
| ** | Other financial instruments are derivative instruments reflected in the Schedule of Investments. The derivatives shown in the table are reported at their unrealized appreciation/(depreciation) at measurement date, which represents the change in the contract’s value from trade date. |
The changes of the fair value of investments for which the Fund have used Level 3 inputs to determine the fair value are as follows:
| Asset Type | | Balance as of April 30, 2019 | | | Accrued Discount/ Premium | | | Return of Capital | | | Realized Gain/ (Loss) | | | Change in Unrealized Appreciation/ Depreciation | | | Purchases | | | Sales Proceeds | | | Transfer into Level 3 | | | Transfer Out of Level 3 | | | Balance as of October 31, 2019 | | | Net change in unrealized appreciation/ (depreciation) included in the Statements of Operations attributable to Level 3 investments held at October 31, 2019 | |
| Common Stocks | | $ | — | | | $ | — | | | $ | — | | | $ | — | | | $ | 234,516 | | | $ | 150,414 | | | $ | — | | | $ | — | | | $ | — | | | $ | 384,930 | | | $ | 234,516 | |
| Preferred Stocks | | | — | | | | — | | | | — | | | | — | | | | 1,413,554 | | | | 906,621 | | | | — | | | | — | | | | — | | | | 2,320,175 | | | | 1,413,554 | |
| | | $ | — | | | $ | — | | | $ | — | | | $ | — | | | $ | 1,648,070 | | | $ | 1,057,035 | | | $ | — | | | $ | — | | | $ | — | | | $ | 2,705,105 | | | $ | 1,648,070 | |
Trust Expenses:Some expenses of the Trust can be directly attributed to the Fund. Expenses which cannot be directly attributed to the Fund are apportioned among all funds in the Trust based on average net assets of the Fund.
Federal Income Taxes:The Fund complies with the requirements under Subchapter M of the Internal Revenue Code of 1986, as amended, applicable to regulated investment companies and intend to distribute substantially all of their net taxable income and net capital gains, if any, each year so that the Fund will not be subject to excise tax on undistributed income and gains. The Fund is not subject to income taxes to the extent such distributions are made.
As of and during the six months ended October 31, 2019, the Fund did not have a liability for any unrecognized tax benefits. The Fund files U.S. federal, state, and local tax returns as required. The Fund’s tax returns are subject to examination by the relevant tax authorities until expiration of the applicable statute of limitations, which is generally three years after the filing of the tax return for federal purposes and four years for most state returns. Tax returns for open years have incorporated no uncertain tax positions that require a provision for income taxes.
| Semi-Annual Report | October 31, 2019 | 29 |
| Highland Resolute Fund | Notes to Consolidated Financial Statements |
| | October 31, 2019 (Unaudited) |
Investment Transactions and Investment Income:Investment transactions are accounted for on the date the investments are purchased or sold (trade date basis). Net realized gains and losses from investment transactions are reported on an identified cost basis. Interest income, which includes accretion of discounts and amortization of premiums, is accrued and recorded as earned. Dividend income is recognized on the ex-dividend date or for certain foreign securities, as soon as information is available to the Fund. All of the realized and unrealized gains and losses and net investment income, are allocated daily to each class in proportion its average daily net assets.
Short Sales:The Fund may make short sales of securities consistent with its strategies. A short sale is a transaction in which a Fund sells a security it does not own in anticipation that the market price of that security will decline.
When a Fund makes a short sale, it must borrow the security sold short and deliver it to the broker dealer through which it made the short sale as collateral for its obligation to deliver the security upon conclusion of the sale. The Fund may have to pay a fee to borrow particular securities and is often obligated to pay over any accrued interest and dividends on such borrowed securities.
If the price of the security sold short increases between the time of the short sale and the time that a Fund replaces the borrowed security, the Fund will incur a loss; conversely, if the price declines, the Fund will realize a capital gain. Any gain will be decreased, and any loss increased, by the transaction costs described above. The successful use of short selling may be adversely affected by imperfect correlation between movements in the price of the security sold short and the securities being hedged.
To the extent that a Fund engages in short sales, it will provide collateral to the broker-dealer and (except in the case of short sales “against the box”) will maintain additional asset coverage in the form of segregated or “earmarked” assets determined to be liquid in accordance with procedures established by the Board and that is equal to the current market value of the securities sold short, or will ensure that such positions are covered by “offsetting” positions, until the Fund replaces the borrowed security. A short sale is “against the box” to the extent that the Fund contemporaneously owns, or has the right to obtain at no added cost, securities identical to those sold short. The Fund may engage in short selling to the extent permitted by the federal securities laws and rules and interpretations thereunder. To the extent a Fund engages in short selling in foreign (non-U.S.) jurisdictions, the Fund will do so to the extent permitted by the laws and regulations of such jurisdiction.
Distributions to Shareholders:The Fund normally pays dividends and distributes capital gains, if any, on an annual basis. Income dividend distributions are derived from interest and dividends and other income the Fund receives from their investments, including distributions of short term capital gains. Capital gain distributions are derived from gains realized when the Fund sells a security it has owned for more than a year. The Fund may make additional distributions and dividends at other times if its portfolio manager or managers believe doing so may be necessary for the Fund to avoid or reduce taxes.
3. DERIVATIVE INSTRUMENTS
Swap Contracts:The Fund may enter into swap transactions for hedging purposes or to seek to increase total return. At the present time, the Fund primarily enters into swap transactions for the purpose of increasing total return. Risks may arise as a result of the failure of the counterparty to the swap contract to comply with the terms of the swap contract. The loss incurred by the failure of a counterparty is generally limited to the net payment to be received by the Fund and/or the termination value at the end of the contract.
Therefore, the Fund considers the creditworthiness of each counterparty to a contract in evaluating potential credit risk. Additionally, risks may arise from unanticipated movements in interest rates or in the value of the underlying reference asset or index. Entering into these agreements involves, to varying degrees, market risk, liquidity risk and elements of credit, legal and documentation risk that are not directly reflected in the amounts recognized in the Statements of Assets and Liabilities.
The Fund invests in total return swaps to obtain exposure to a security or market without owning such security or investing directly in that market or to transfer the risk/return of one market (e.g., fixed income) to another market (e.g., equity) (equity risk and/or interest rate risk). Total return swaps are agreements in which there is an exchange of cash flows whereby one party commits to make payments based on the total return (coupons plus capital gains/losses) of an underlying instrument in exchange for fixed or floating rate interest payments. To the extent the total return of the instrument or index underlying the transaction exceeds or falls short of the offsetting interest rate obligation, the Fund will receive a payment from or make a payment to the counterparty. The Fund may pay or receive cash as collateral on these contracts which may be recorded as an asset and/or liability. The Fund must set aside liquid assets, or engage in other appropriate measures, to cover its obligations under these contracts. Swaps are marked to market daily using either pricing vendor quotations, counterparty prices or model prices and the change in value, if any, is recorded as an unrealized gain or loss. Upfront payments made and/or received by the Fund are recorded as an asset and/or liability and realized gains or losses are recognized ratably over the contract’s term/event, with the exception of forward starting interest rate swaps, whose realized gains or losses are recognized ratably from the effective start date. Periodic payments received or made on swap contracts are recorded as
30
| Highland Resolute Fund | Notes to Consolidated Financial Statements |
| | October 31, 2019 (Unaudited) |
realized gains or losses. Gains or losses are realized upon termination of a swap contract and are recorded on the Statement of Operations. Swap agreements held at October 31, 2019 are disclosed in the Consolidated Schedule of Investments.
International Swaps and Derivatives Association, Inc. Master Agreements (“ISDA Master Agreements”) govern OTC financial derivative transactions entered into by the Fund and those counterparties. The ISDA Master Agreements maintain provisions for general obligations, representations, agreements, collateral and events of default or termination. Events of termination include conditions that may entitle counterparties to elect to terminate early and cause settlement of all outstanding transactions under the applicable ISDA Master Agreement. Any election to early terminate could be material to the financial statements.
Option Contracts:The Fund may enter into options transactions for hedging purposes and for non-hedging purposes such as seeking to enhance return. The Fund may write covered put and call options on any stocks or stock indices, currencies traded on domestic and foreign securities exchanges, or futures contracts on stock indices, interest rates and currencies traded on domestic and, to the extent permitted by the CFTC, foreign exchanges. A call option on an asset written by the Fund obligates the Fund to sell the specified asset to the holder (purchaser) at a stated price (the exercise price) if the option is exercised before a specified date (the expiration date). A put option on an asset written by a Fund obligates the Fund to buy the specified asset from the purchaser at the exercise price if the option is exercised before the expiration date. Premiums received when writing options are recorded as liabilities and are subsequently adjusted to the current value of the options written. Premiums received from writing options that expire are treated as realized gains. Premiums received from writing options, which are either exercised or closed, are offset against the proceeds received or amount paid on the transaction to determine realized gains or losses which are recorded on the Statement of Operations.
Futures:The Fund may enter into futures contracts for hedging purposes. A futures contract represents a commitment for the future purchase or sale of an asset at a specified price on a specified date. Upon entering into a futures contract, the Fund is required to deposit an initial margin with the broker in an amount equal to a certain percentage of the contract amount. The Fund receives from or pays to the broker, on a daily basis, an amount of cash equal to the daily fluctuation in value of the contract. Such receipts or payments are known as “variation margin,” and are recorded by the Fund as unrealized gains or losses. When the futures contract is closed, the Fund records a gain or loss equal to the difference between the value of the contract at the time it was opened and the value at the time it was closed.
The Fund’s potential losses from the use of futures extend beyond its initial investment in such contracts. The use of futures contracts involves, to varying degrees, elements of market risk in excess of the amount recognized in the Statements of Assets and Liabilities. The predominant risk is that the movement of a futures contract’s price may result in a loss, which could render the Fund’s hedging strategy unsuccessful. There is minimal counterparty credit risk since futures contracts are exchange traded and the exchange’s clearinghouse, as counterparty to all exchange traded futures, guarantees the futures against default.
Risk Exposure:The following tables disclose the amounts related to the Fund’s use of derivative instruments.
The effect of derivatives instruments on the Statements of Assets and Liabilities as of October 31, 2019 was as follows:
| Risk Exposure | | Asset Derivatives Statements of Assets and Liabilities Location | | Fair Value | | | Liability Derivatives Statements of Assets and Liabilities Location | | Fair Value | |
| Highland Resolute Fund | | | | | | | | | | | | |
| Equity Contracts (Total Return Swap Contracts) | | Unrealized appreciation on total return swap contracts | | $ | 26 | | | Unrealized depreciation on total return swap contracts | | $ | 2 | |
| Total | | | | $ | 26 | | | | | $ | 2 | |
| Semi-Annual Report | October 31, 2019 | 31 |
| Highland Resolute Fund | Notes to Consolidated Financial Statements |
| | October 31, 2019 (Unaudited) |
The effect of derivatives instruments on the Statements of Operations for the six months ended October 31, 2019 was as follows:
| Risk Exposure | | Statement of Operations Location | | Realized Gain/(Loss) on Derivatives Recognized in Income | | | Change in Unrealized Appreciation/(Depreciation) on Derivatives Recognized in Income | |
| Highland Resolute Fund | | | | | | | | | | |
| Equity Contracts(Total Return Swap Contracts) | | Net realized gain on total return swap contracts/Net change in unrealized depreciation on total return swap contracts | | $ | (2,544,565 | ) | | $ | 43,266 | |
| | | | | | | | | | | |
| Equity Contracts(Purchased Options) | | Net realized loss on investments/Net change in unrealized depreciation on investments | | | (167,546 | ) | | | 46,741 | |
| Total | | | | $ | (2,712,111 | ) | | $ | 90,007 | |
Volume of Derivative Instruments for the Fund during the six months ended October 31, 2019 was as follows:
| Derivative Type | | Unit of Measurement | | Monthly Average | |
| Highland Resolute Fund | | | | | | |
| Equity Contracts (Total Return Swap Contracts) | | Notional Quantity | | | 172,087,439 | |
Certain derivative contracts and repurchase agreements are executed under either standardized netting agreements or, for exchange-traded derivatives, the relevant contracts for a particular exchange which contain enforceable netting provisions. A derivative netting arrangement creates an enforceable right of set-off that becomes effective, and affects the realization of settlement on individual assets, liabilities and collateral amounts, only following a specified event of default or early termination. Default events may include the failure to make payments or deliver securities timely, material adverse changes in financial condition or insolvency, the breach of minimum regulatory capital requirements, or loss of license, charter or other legal authorization necessary to perform under the contract.
32
| Highland Resolute Fund | Notes to Consolidated Financial Statements |
| | October 31, 2019 (Unaudited) |
The following table presents financial instruments that are subject to enforceable netting arrangements or other similar agreements as of October 31, 2019:
Highland Resolute Fund
Offsetting of Derivatives Assets
| | | | | | | | | | | | Gross Amounts Not Offset in the Statement of Assets and Liabilities | |
| | | Gross Amounts of Recognized Assets | | | Gross Amounts Offset in the Statement of Assets and Liabilities | | | Net Amounts Presented in the Statement of Assets and Liabilities | | | Financial Instruments Available for Offset(a) | | | Cash Collateral Received(a) | | | Net Receivable Amount | |
| Total Return Swap Contracts | | $ | 26 | | | $ | – | | | $ | 26 | | | $ | (26 | ) | | $ | – | | | $ | – | |
| Total | | $ | 26 | | | $ | – | | | $ | 26 | | | $ | (26 | ) | | $ | – | | | $ | – | |
Offsetting of Derivatives Liabilities
| | | | | | | | | | | | Gross Amounts Not Offset in the Statement of Assets and Liabilities | |
| | | Gross Amounts of Recognized Liabilities | | | Gross Amounts Offset in the Statement of Financial Position | | | Net Amounts Presented in the Statement of Financial Position | | | Financial Instruments Available for Offset(a) | | | Cash Collateral Pledged(a) | | | Net Payable Amount | |
| Total Return Swap Contracts | | $ | 2 | | | $ | – | | | $ | 2 | | | $ | (26 | ) | | $ | 24 | | | $ | – | |
| Total | | $ | 2 | | | $ | – | | | $ | 2 | | | $ | (26 | ) | | $ | 24 | | | $ | – | |
| (a) | These amounts are limited to the derivative asset/liability balance and, accordingly, do not include excess collateral received/pledged. |
4. TAX BASIS INFORMATION
Tax Basis of Investments:As of October 31, 2019, the aggregate cost of investments, gross unrealized appreciation/(depreciation) and net unrealized appreciation for Federal tax purposes were as follows:
| | | Gross Appreciation (excess of value over tax cost) | | | Gross Depreciation (excess of tax cost over value) | | | Net Unrealized Appreciation/(Depreciation) | | | Cost of Investments for Income Tax Purposes | |
| Highland Resolute Fund | | $ | 177,461,375 | | | $ | (178,739,161 | ) | | $ | (1,277,786 | ) | | $ | 228,977,777 | |
Tax Basis of Distributions to Shareholders:The character of distributions made during the year from net investment income or net realized gains may differ from its ultimate characterization for federal income tax purposes. Also, due to the timing of dividend distributions, the fiscal year in which amounts are distributed may differ from the fiscal year in which the income or realized gain were recorded by the Fund.
The tax character of distributions paid by the Fund for the fiscal year ended April 30, 2019, were as follows:
| | | Ordinary Income | | | Long-Term Capital Gains | |
| Highland Resolute Fund | | $ | 5,227,081 | | | $ | 10,768,336 | |
| Semi-Annual Report | October 31, 2019 | 33 |
| Highland Resolute Fund | Notes to Consolidated Financial Statements |
| | October 31, 2019 (Unaudited) |
The Fund elects to defer to the period ending April 29, 2020, capital losses recognized during the period November 1, 2018 through April 30, 2019 in the amount of $383,369.
The amounts and characteristics of tax basis distributions and composition of distributable earnings/(accumulated losses) are finalized at fiscal year-end. Accordingly, tax basis balances have not been determined as of October 31, 2019.
5. SECURITIES TRANSACTIONS
Purchases and sales of securities, excluding short-term securities and U.S. Government Obligations during the six months ended October 31, 2019 were as follows:
| Fund | | Purchases of Securities | | | Proceeds From Sales of Securities | |
| Highland Resolute Fund | | $ | 81,182,530 | | | $ | 111,078,101 | |
6. BENEFICIAL SHARE TRANSACTIONS
The capitalization of the Trust consists of an unlimited number of shares of beneficial interest with no par value per share. Holders of the shares of the Fund of the Trust have one vote for each share held and a proportionate fraction of a vote for each fractional share. All shares issued and outstanding are fully paid and are transferable and redeemable at the option of the shareholder. Purchasers of the shares do not have any obligation to make payments to the Trust or its creditors solely by reason of the purchasers’ ownership of the shares. Shares have no pre-emptive rights.
Transactions in common shares were as follows:
Highland Resolute Fund
| Class I: | | For the Six Months Ended October 31, 2019 (Unaudited) | | | For the Year Ended April 30, 2019 | |
| Common Shares Outstanding - Beginning of Period | | | 32,287,022 | | | | 34,589,249 | |
| Common Shares Sold | | | 800,042 | | | | 935,962 | |
| Common Shares Issued as Reinvestment of Dividends | | | – | | | | 1,669,668 | |
| Common Shares Redeemed | | | (3,344,186 | ) | | | (4,907,857 | ) |
| Common Shares Outstanding - End of Period | | | 29,742,878 | | | | 32,287,022 | |
Shares redeemed within 30 days of purchase may incur a 2% short-term redemption fee deducted from the redemption amount. Redemption fees are reflected in the “Shares redeemed, net of redemption fees” in the Statements of Changes in Net Assets. For the six months ended October 31, 2019 and the year ended April 30, 2019, the Fund retained fees as follows:
| Fund | | For the Six Months Ended October 31, 2019 (Unaudited) | | | For the Year Ended April 30, 2019 | |
| Highland Resolute Fund | | $ | 16 | | | $ | 337 | |
34
| Highland Resolute Fund | Notes to Consolidated Financial Statements |
| | October 31, 2019 (Unaudited) |
7. MANAGEMENT AND RELATED PARTY TRANSACTIONS
Investment Advisory
The Adviser, subject to the authority of the Board, is responsible for the overall management and administration of the Fund’s business affairs. Pursuant to the Investment Advisory Agreement (the “Advisory Agreement”), the Adviser is entitled to an investment advisory fee, computed daily and payable monthly of 1.50% of the average daily net assets for the Fund. The management fee is paid on a monthly basis.
The Subsidiary has entered into a separate advisory agreement (the “Subsidiary Advisory Agreement”) with the Adviser for the management of the Subsidiary’s portfolio pursuant to which the Subsidiary is obligated to pay the Adviser a management fee at the same rate that the Fund pays the Adviser for investment advisory services provided to the Fund. The Adviser has agreed to waive the advisory fee it receives from the Fund in an amount equal to the management fee paid by the Subsidiary. This waiver may not be terminated or modified without the consent of the Board. This agreement may not be terminated or modified prior to this date except with the approval of the Board. For the six months ended October 31, 2019, this amount equaled $139,179 and is disclosed in the Consolidated Statement of Operations.
The Adviser entered into an Investment Sub-Advisory Agreements with Incline Global Management, LLC. (“Incline”), Chatham Asset Management, LLC (“Chatham”) and Parametric Portfolio Associates, LLC (“Parametric”). The Investment Sub-Advisory Agreements are in accordance with the Fund’s investment objective, policies and limitations and investment guidelines established jointly by the Adviser and the Board. The Adviser determines the allocation of the Fund’s assets among Incline, Chatham and Parametric (collectively the “Sub-Advisers”) and other open-end investment companies. The Fund is not required to invest with any minimum number of sub-advisers or open-end investment companies, and does not have minimum or maximum limitations with respect to allocations of assets to the Sub-Advisers, investment strategy or market sector. Highland may change the allocation of the Fund’s assets among the available investment options, and may add or remove sub-advisers, at any time. Each Sub-Adviser is responsible for the day-to-day management of its allocated portion of Fund assets. Highland has ultimate responsibility, subject to the oversight of the Board of the Fund, to oversee the Sub-Advisers, and to recommend their hiring, termination and replacement.
Pursuant to each Investment Sub-Advisory Agreement, the Adviser pays the Sub-Advisers an annual sub-advisory management fee which is based on the Fund’s average quarterly market value of the assets managed by the Sub-Advisers. The Adviser is required to pay all fees due to Sub-Advisers out of the management fee the Adviser receives from the Fund. The following table reflects the Fund’s contractual sub-advisory fee rates.
| Sub-Advisers | | Contractual Sub-Advisory Fee |
| Incline Global Management, LLC | | | 1.25% |
| Chatham Asset Management, LLC | | | 1.00% |
| Parametric Portfolio Associates, LLC | | | 0.30% |
The Adviser has agreed, with respect to the Fund’s Class I shares, to waive the portion of its 1.50% management fee in excess of any sub-advisory fees (as defined in the Prospectus) less (ii) third-party administrative costs charged to the Adviser in connection with the non-recurring addition of a new investment sub-adviser for the Fund or removal of an existing investment sub-adviser to the Fund. This agreement is in effect September 1, 2019 through August 31, 2020. The prior agreement was in effect from September 1, 2018 through August 31, 2019. The Adviser may not discontinue this agreement to waive fees prior to August 31, 2020 without the approval of the Fund’s Board of Trustees. The Adviser is not permitted to recoup any amounts waived or reimbursed to the extent actual fees and expenses for a fiscal period are less than the expense limitation cap. Fees waived/reimbursed by adviser for the six months ended October 31, 2019 are disclosed in the Consolidated Statement of Operations.
For the six months ended October 31, 2019, the fee waivers and/or reimbursements were as follows:
| | | Fees Waived/ Reimbursed By Adviser | |
| Highland Resolute Fund - Class I | | $ | (1,808,234 | ) |
Administrator Fees and Expenses
ALPS Fund Services, Inc. (“ALPS”) serves as administrator to the Fund, and the Fund has agreed to pay expenses incurred in connection with its administrative activities. Pursuant to an Administration Agreement, ALPS provides operational services to the Fund including, but not limited to, fund accounting and fund administration and generally assists in the Fund’s operations. Officers of the Trust are employees of ALPS. The Fund’s administration fee is accrued on a daily basis and paid monthly. Administration fees paid by the Fund for the six months ended October 31, 2019 are disclosed in the Consolidated Statement of Operations.
ALPS is reimbursed by the Fund for certain out-of-pocket expenses.
| Semi-Annual Report | October 31, 2019 | 35 |
| Highland Resolute Fund | Notes to Consolidated Financial Statements |
| | October 31, 2019 (Unaudited) |
Transfer Agent
ALPS serves as transfer, dividend paying and shareholder servicing agent for the Fund. ALPS receives an annual minimum fee, a fee based upon the number of shareholder accounts and is also reimbursed by the Fund for certain out-of-pocket expenses. Transfer agent fees paid by the Fund for the six months ended October 31, 2019 are disclosed in the Consolidated Statement of Operations.
Compliance Services
ALPS provides services that assist the Fund’s chief compliance officer in monitoring and testing the policies and procedures of the Fund in conjunction with requirements under Rule 38a-1 under the 1940 Act and receives an annual base fee. ALPS is reimbursed for certain out-of-pocket expenses by the Fund. Compliance service fees paid by the Fund for the six months ended October 31, 2019 are disclosed in the Consolidated Statement of Operations.
Principal Financial Officer
ALPS receives an annual fee for providing principal financial officer services to the Fund. Principal financial officer fees paid by the Fund for the six months ended October 31, 2019 are disclosed in the Consolidated Statement of Operations.
Distributor
ALPS Distributors, Inc. (“ADI” or the “Distributor”) (an affiliate of ALPS) acts as the distributor of the Fund’s shares pursuant to a Distribution Agreement with the Trust on behalf of the Fund. Shares are sold on a continuous basis by ADI as agent for the Fund, and ADI has agreed to use its best efforts to solicit orders for the sale of Fund’s shares, although it is not obliged to sell any particular amount of shares. ADI is not entitled to any compensation for its services as Distributor. ADI is registered as a broker-dealer with the U.S. Securities and Exchange Commission.
Shareholder Services Plan
Effective December 12, 2017, the Fund has adopted a Shareholder Services Plan (the “Plan”) with respect to its Class I shares. Under the Plan, the Fund is authorized to pay banks and its affiliates and other institutions, including broker-dealers and Fund affiliates which may include the Distributor, Adviser and/or the transfer agent (“Participating Organizations”), an aggregate fee in an amount not to exceed on an annual basis 0.10% of the average daily net asset value of Class I shares of the Fund attributable to or held in the name of the Participating Organizations for its clients as compensation for providing shareholder service activities, which do not include distribution services pursuant to an agreement with Participating Organizations. Any amount of such payment not paid to the Participating Organizations during the Fund’s fiscal year for such service activities shall be reimbursed to the Fund as soon as practicable. Plan fees are included with distribution and service fees in the Statement of Operations. Fees recaptured pursuant to the Plan for the six months ended October 31, 2019 are included as an offset to distribution and service fees as disclosed in the Consolidated Statement of Operations.
Trustees
The fees and expenses of the independent Trustees of the Board are presented in the Consolidated Statement of Operations.
8. INDEMNIFICATIONS
Under the Trust’s organizational documents, its officers and Trustees are indemnified against certain liability arising out of the performance of their duties to the Trust. Additionally, in the normal course of business, the Trust enters into contracts with service providers that may contain general indemnification clauses which may permit indemnification to the extent permissible under applicable law. The Trust’s maximum exposure under these arrangements is unknown, as this would involve future claims that may be made against the Trust that have not yet occurred.
9. SUBSEQUENT EVENT
Effective December 10, 2019, the Board of Trustees appointed, upon recommendation of the Audit Committee, Cohen & Company, Ltd. (“Cohen”) as the Fund’s independent registered public accounting firm. Cohen provides audit services, tax return review and assistance. Cohen is located at 1350 Euclid Ave., Suite 800, Cleveland, Ohio 44115.
Subsequent events after the date of the Statement of Assets and Liabilities have been evaluated through the date the financial statements were issued.
36
| Highland Resolute Fund | Disclosure Regarding Approval of
Fund Advisory Agreements |
| | October 31, 2019 (Unaudited) |
On June 11-12, 2019, the Trustees met in person to discuss, among other things, the approval of an Interim Investment Advisory Agreement (the “Interim Highland Agreement”) and a new Investment Advisory Agreement between Financial Investors Trust (the “Trust”), with respect to the Highland Resolute Fund (the “Highland Fund”), and Highland Associates, Inc. (“Highland”) and new Investment Sub-Advisory Agreements with each of Chatham Asset Management, LLC (“Chatham”), Incline Global Management, LLC (“Incline”), and Parametric Portfolio Associates LLC (“Parametric”) in accordance with Section 15(c) of the 1940 Act. The Independent Trustees met with independent legal counsel during executive session and discussed the Interim Highland Agreement and the new Investment Advisory Agreement and new Investment Sub-Advisory Agreements (collectively, the “New Agreements”) and other related materials. In approving the agreements, the Trustees, including the Independent Trustees, considered the following factors with respect to the Highland Fund:
Nature, Extent, and Quality of the Services:The Trustees recalled their recent renewal of the current investment advisory and sub-advisory agreements during which they evaluated the nature, extent and quality of services provided to the Highland Fund. The Trustees reviewed and considered the personnel of Highland, Incline, Chatham, and Parametric (each, a “Highland Fund Adviser” and collectively, the “Highland Fund Advisers”), their history as asset managers and their performance. The Trustees discussed the research and decision-making processes utilized by them, including the methods adopted to seek to achieve compliance with the investment objectives, policies and restrictions of the Highland Fund.
The Trustees reviewed the background and experience of each of the Highland Fund Adviser’s management relating to the Highland Fund, including the qualifications, backgrounds and responsibilities of the management team primarily responsible for the day-to-day portfolio management of the Fund, and noted that Region Bank’s acquisition of Highland (the “Transaction”) would not result in a change in portfolio managers and that there is not expected to be any diminution in the nature, quality and extent of services provided to the Fund as a result of the Transaction. They also discussed the resources of each of the Highland Fund Advisers devoted to research and analysis of actual and potential investments. The Trustees also reviewed, among other things, Codes of Ethics of the Highland Fund Advisers.
Performance:The Trustees recalled their discussion of performance of the Highland Fund when the current investment advisory and sub-advisory agreements were recently renewed. The Trustees reviewed performance information for the Highland Fund for the 3-month, 1-year, 3-year, 5-year, and since inception periods ended September 30, 2018. That review included a comparison of the Highland Fund’s performance to the performance of a group of comparable funds selected by an independent provider of investment company data (the “Data Provider”). The Trustees noted that the performance of the Highland Fund was above its Data Provider universe median for the 1-year, 3-year, 5-year, and since inception periods ended September 30, 2018. The Trustees also considered Highland’s discussion of the Fund’s underlying portfolio diversification categories, its top contributors and top detractors, as well as each Highland Fund Adviser’s performance and reputation generally and their investment techniques, risk management controls, and decision-making processes. The Trustees also reviewed updated performance information provided by Highland regarding the Highland Fund’s performance since the last renewal.
Investment Advisory Fee Rate:The Trustees reviewed and considered the proposed annual advisory fee to be paid by the Trust on behalf of the Fund to Highland Fund of 1.50% of the Fund’s daily average net assets, in light of the extent and quality of the advisory services provided by Highland to the Fund, noting that the fees would not change as a result of the Transaction. The Trustees also reviewed and considered the contractual annual sub-advisory fee to be paid by Highland to Chatham of 1.00%, Incline of 1.25%, Parametric of 0.30%, and Solus of 1.50% of the Highland Fund’s daily average net assets allocated to each sub-adviser.
The Trustees considered the information they received when the current investment advisory and sub-advisory agreements were recently renewed, comparing the Highland Fund’s contractual annual advisory fee and overall expenses with those of funds in the peer group and universe of funds selected by the Data Provider. The Trustees noted that the Highland Fund’s contractual advisory fee rate was the same as the Data Provider peer group median contractual advisory fee rate.
Total Expense Ratios:The Trustees further reviewed and considered the total expense ratio (after waivers) of 0.48% for the Highland Fund. The Trustees noted that the total expense ratio (after waivers) for the Highland Fund was below the Data Provider peer group median total expense ratio (after waivers).
Comparable Accounts:The Trustees noted certain information provided by each of the Highland Fund Advisers regarding fees charged to their other clients utilizing a strategy similar to that employed by the portion of the Highland Fund for which such entity was responsible.
Profitability:The Trustees received and considered actual and estimated profitability analyses provided by the Highland Fund Advisers when the current investment advisory and sub-advisory agreements were recently renewed, as well as additional information regarding each of the Highland Fund Adviser’s profitability since the last renewal. The Trustees considered the profits, if any, realized and anticipated to be realized by each of the Highland Fund Advisers relating to the operation of the Highland Fund. The Trustees then considered the financial condition of each of the Highland Fund Advisers. They concluded that any profits were projected to remain reasonable in the short term after the Transaction.
| Semi-Annual Report | October 31, 2019 | 37 |
| Highland Resolute Fund | Disclosure Regarding Approval of
Fund Advisory Agreements |
| | October 31, 2019 (Unaudited) |
Economies of Scale:The Trustees considered whether economies of scale in the provision of services to the Highland Fund would be passed along to the shareholders under the New Agreements.
Other Benefits to the Adviser:The Trustees reviewed and considered any other incidental benefits derived or to be derived by Highland from its relationship with the Highland Fund, including whether soft dollar arrangements were used.
The Board summarized its deliberations with respect to the New Agreements with Highland. In evaluating the Highland Fund Advisers and the fees to be charged under each of the New Agreements, the Trustees concluded that no single factor reviewed by the Trustees was identified by the Trustees to be determinative as the principal factor in whether to approve the New Agreements. Further, the Independent Trustees were advised by independent legal counsel throughout the process.
The Trustees, including all the Independent Trustees, concluded that:
| • | the nature, extent, and quality of services to be rendered by Highland, Chatham, Incline, and Parametric under the New Agreements with respect to the Highland Fund were adequate; |
| • | the performance of the Fund was above its Data Provider universe median for the 1-year, 3-year, 5-year, and since inception periods; |
| | • | the contractual advisory fee rate was the same as the Data Provider peer group median contractual advisory fee rate; |
| • | Chatham’s, Incline’s, Parametric’s, and Solus’ fees under their respective new sub-advisory agreements are paid directly by Highland; |
| • | the total expense ratio (after waivers) for the Highland Fund was below the Data Provider peer group median total expense ratio (after waivers); |
| • | bearing in mind the limitations of comparing different types of managed accounts and the different levels of service typically associated with such accounts, the fee structures applicable to Highland’s, Chatham’s, Incline’s, Parametric’s and Solus’ other clients employing a comparable strategy to the Highland Fund, if applicable, were not indicative of any unreasonableness with respect to the advisory and sub-advisory fees to be paid by the Highland Fund; |
| • | the profit, if any, realized by each of the Highland Fund Advisers in connection with the operation of the Highland Fund is not unreasonable to the Fund; and |
| • | there were no material economies of scale or other incidental benefits accruing to any of the Highland Fund Advisers in connection with its relationship with the Highland Fund. |
Based on its evaluation of the considerations, the Board unanimously voted to approve the New Agreements, and to recommend to the shareholders of the Highland Fund that they approve the New Highland Agreement.
In approving the Interim Highland Agreement, the Trustees, including the Independent Trustees, considered the following factors with respect to the Highland Fund:
Compensation:The compensation to be received under the Interim Highland Agreement is the same compensation as is being received under the Highland Fund’s current investment advisory agreement; and
Scope and Quality of the Services:The scope and quality of services under the Interim Highland Agreement are the same as those under the current investment advisory agreement.
After further discussion, and based upon all of the above-mentioned factors and their related conclusions, with no single factor or conclusion being determinative and with each Trustee not necessarily attributing the same weight to each factor, the Board unanimously determined that entering into the Interim Highland Agreement was in the best interests of the Highland Fund and its shareholders.
38
| Highland Resolute Fund | Additional Information |
| | October 31, 2019 (Unaudited) |
1. FUND HOLDINGS
The Fund files its complete schedule of portfolio holdings with the SEC for the first and third quarters of each fiscal year on Form N-PORT. The Fund’s Form N-PORT is available on the SEC’s website at www.sec.gov and may be reviewed and copied at the SEC’s Public Reference Room in Washington, D.C. and information on the operation of the Public Reference Room may be obtained by calling 1-800-SEC-0330. Information included in the Fund’s N-PORT will also be available upon request by calling 1-866-759-5679.
2. FUND PROXY VOTING POLICIES, PROCEDURES AND SUMMARIES
Fund policies and procedures used in determining how to vote proxies and information regarding how each of the Fund voted proxies relating to portfolio securities during the most recent prior 12-month period ending June 30 are available without charge, (1) upon request, by calling (toll-free) (866) 759-5679 and (2) on the SEC’s website at http://www.sec.gov.
| Semi-Annual Report | October 31, 2019 | 39 |
| Highland Resolute Fund | Shareholder Proxy Voting |
| | October 31, 2019 (Unaudited) |
A Special Meeting of Shareholders of the Highland Resolute Fund was held on September 16, 2019. Shareholders of record as of the close of business on July 25, 2019 voted to approve the following proposal:
Proposal:To approve a new Advisory Agreement among Financial Investors Trust, on behalf of the Highland Resolute Fund, and Highland Associates, Inc..
| Shares Voted in Favor | Shares Voted Against or Abstentions |
| 21,745,598 | 7,689,690 |
40
| Highland Resolute Fund | Privacy Policy |
| | October 31, 2019 (Unaudited) |
| Who We Are | |
| Who is providing this notice? | Highland Resolute Fund |
| What We Do | |
| How does the Fund protect my personal information? | To protect your personal information from unauthorized access and use, we use security measures that comply with federal law. These measures include computer safeguards and secured files and buildings. |
| How does the Fund collect my personal information? | We collect your personal information, for example, when you |
| | • | open an account |
| | • | provide account information or give us your contact information |
| | • | make a wire transfer or deposit money |
| Why can't I limit all sharing? | Federal law gives you the right to limit only |
| | • | sharing for affiliates’ everyday business purposes-information about your creditworthiness |
| | • | affiliates from using your information to market to you |
| | • | sharing for non-affiliates to market to you |
| | State laws and individual companies may give you additional rights to limit sharing. |
| Definitions | |
| Affiliates | Companies related by common ownership or control. They can be financial and nonfinancial companies. |
| Non-affiliates | Companies not related by common ownership or control. They can be financial and nonfinancial companies. |
| | • | The Fund does not share with non-affiliates so they can market to you. |
| Joint marketing | A formal agreement between non-affiliated financial companies that together market financial products or services to you. |
| | • | The Fund does not jointly market. |
| Other Important Information | |
| California Residents | If your account has a California home address, your personal information will not be disclosed to nonaffiliated third parties except as permitted by applicable California law, and we will limit sharing such personal information with our affiliates to comply with California privacy laws that apply to us. |
| Vermont Residents | The State of Vermont requires financial institutions to obtain your consent prior to sharing personal information that they collect about you with affiliated companies and nonaffiliated third parties other than in certain limited circumstances. Except as permitted by law, we will not share personal information we collect about you with nonaffiliated third parties or other affiliated companies unless you provide us with your written consent to share such information. |
| Semi-Annual Report | October 31, 2019 | 41 |
| Highland Resolute Fund | Privacy Policy |
| | October 31, 2019 (Unaudited) |
| FACTS | WHAT DOES THE FUND DO WITH YOUR PERSONAL INFORMATION? |
| Why? | Financial companies choose how they share your personal information. Federal law gives consumers the right to limit some but not all sharing. Federal law also requires us to tell you how we collect, share, and protect your personal information. Please read this notice carefully to understand what we do. |
| What? | The types of personal information we collect and share depend on the product or service you have with us. This information can include: |
| | •Social Security number and account transactions |
| | •Account balances and transaction history |
| | •Wire transfer instructions |
| How? | All financial companies need to share customers’ personal information to run their everyday business. In the section below, we list the reasons financial companies can share their customers’ personal information; the reasons the Fund chooses to share; and whether you can limit this sharing. |
| Reasons we can share your personal information | Does the Fund share: | Can you limit this sharing? |
| For our everyday business purposes— such as to process your transactions, maintain your account(s), respond to court orders and legal investigations, or report to credit bureaus | Yes | No |
| For our marketing purposes— to offer our products and services to you | No | We do not share. |
| For joint marketing with other financial companies | No | We do not share. |
| For our affiliates’ everyday business purposes— information about your transactions and experiences | Yes | No |
| For our affiliates’ everyday business purposes— information about your creditworthiness | No | We do not share. |
| For nonaffiliates to market to you | No | We do not share. |
42
Page intentionally left blank

 | TABLE OF CONTENTS |
| Shareholder Letter | 1 |
| Performance Update | 6 |
| Disclosure of Fund Expenses | 12 |
| Portfolio of Investments | |
| Rondure New World Fund | 13 |
| Rondure Overseas Fund | 16 |
| Statements of Assets and Liabilities | 18 |
| Statements of Operations | 19 |
| Statement of Changes in Net Assets | |
| Rondure New World Fund | 20 |
| Rondure Overseas Fund | 21 |
| Financial Highlights | |
| Rondure New World Fund | 22 |
| Rondure Overseas Fund | 24 |
| Notes to Financial Statements | 26 |
| Disclosure Regarding Approval of Fund Advisory Agreement | 32 |
| Additional Information | 34 |
| Privacy Policy | 35 |
Beginning on January 1, 2021, as permitted by regulations adopted by the U.S. Securities and Exchange Commission, paper copies of the Fund’s annual and semi-annual shareholder reports will no longer be sent by mail, unless you specifically request paper copies of the reports. Instead, the reports will be made available on the Funds’ website at www.rondureglobal.com and you will be notified by mail each time a report is posted and provided with a website link to access the report.
You may, notwithstanding the availability of shareholder reports online, elect to receive all future shareholder reports in paper free of charge. If you invest through a financial intermediary, you can contact your financial intermediary to request that you continue to receive paper copies of your shareholder reports. If you invest directly with the Funds, you can call 1.855.775.3337 to let the Funds know you wish to continue receiving paper copies of your shareholder reports.
If you already elected to receive shareholder reports electronically, you will not be affected by this change and you need not take any action. You may elect to receive shareholder reports and other communications from the Funds electronically anytime by contacting your financial intermediary (such as a broker-dealer or bank) or, if you are a direct investor, by enrolling at www.rondureglobal.com.
| Rondure Funds | Shareholder Letter |
| | October 31, 2019 (Unaudited) |
All I Really Need to Know I Learned in Kindergarten
As many of you know, I don’t have children. I have a much younger sibling and my husband has two younger siblings. We both feel like we were parents to them, in a sense. We both love kids. My husband, who worked at a daycare center in college, is phenomenal with kids. I get to share in the joy of children through my nieces and nephews, who are incredible, as well as my work with the Utah Youth Village and the kids of my Rondure colleagues. Without fail, their parenting stories make me laugh or smile. But they often make me think, too.
A few weeks ago, my officemate Blake came in on a Monday morning and told me how his 9-year-old daughter had asked him what he does for work. He explained his job to her as best he could. She got it (my mom and dad still don’t get it, so I’ve given up there). Then he asked her, “If you had to pick one company to invest your money in, which would it be?” Pausing for a few seconds to think, she replied with confidence, “I’d invest in McDonald’s.” To which I told Blake: “She’s hired!”
The dialogue reminded me of the great book by Robert Fulghum,All I Really Need to Know I Learned in Kindergarten. Fulghum’s book of short essays sits prominently on my shelf. Published in 1986, its title comes from the first chapter of the book. It reflects on the timeless lessons we all learned in kindergarten and ruminates on how much better a place the world would be if adults adhered to the same basic rules that children do.
The power of simplicity resonates with me strongly. Lately I’ve been thinking about its relevance to investing as well as to corporate sustainability or what some people refer to as “responsible investing.” Whatever nomenclature you prefer, the concepts all relate.
When it comes to global value investing, the rules are simple. Many of them were said best by a Coke-drinking, McDonald’s-eating Warren Buffett. Here are a few that I cherish:
| • | “Pay a discount to intrinsic value.” |
| • | “Intrinsic value is easier to assess if the business has a moat.” (At Rondure, we call this CGP investing. CGP is an acronym for Club, Glue, and Platform businesses.) |
| • | “Find management teams whose interests and values align with yours.” |
| • | “Let compound returns work their magic.” Leave your portfolio alone and learn to sit still. |
That’s about it. Quite simple when you think about it. International investing requires tons of travel and some odd working hours, but the fundamental rules aren’t any different.
I recently discussed these rules with a group of MBA students as a guest speaker at NYU’s course on value investing, taught by James Rosenwald of Dalton Investments. One of the questions I was asked was, “If value investing is so simple, why doesn’t everyone do it?”
Here were my reasons:
| • | Too much noise in the market (ease of information flow), so it’s hard for people to sit still. |
| • | Humans love to solve for complexity—it shows others how smart they are. |
| • | Our industry loves complexity because it creates jobs. |
| • | Corporate bureaucracies can push passive replication to protect the business model (we won’t do this!). |
| • | Human emotion makes markets inefficient. The greed and fear pendulum swings widely. |
Those were a few of my reasons. It becomes more and more obvious to me over time just how true these basic premises are. Their utter simplicity amplifies their utility; it doesn’t undermine it. We at Rondure are fortunate to have great clients—partners—who I know believe these things as well.
Here’s a second story. It’s another Monday, this one a few months back. Blake told me how he and his wife Amy had been running errands that weekend with their young children. Driving past a strip mall, his daughter in the back seat spotted a man on the sidewalk dressed in a bright yellow chicken costume, dancing as he spun one of those arrow-shaped signs to advertise for payday loans or fast food or some other store nearby. She asked her parents what on earth the man in the chicken costume was doing. They told her this was the man’s job. She paused for a long time, trying to make sense of it. “Wow,” she said, “he looks so silly. They must be paying hima lot of money!”
I’ve been thinking hard lately about Rondure’s approach to responsible investing. The team and I have spent a considerable amount of time studying the topic. We’re codifying something we’re hoping to share with you all soon. We’re excited about it.
| Semi-Annual Report | October 31, 2019 | 1 |
| Rondure Funds | Shareholder Letter |
| | October 31, 2019 (Unaudited) |
The concept of social and environmental responsibility in investing is timely but hardly simple. It involves complex, interconnected systems of thought, belief, data and action: the opposite of the notion of keeping it simple in investing. Returns come first, but I deeply believe, especially after investing in emerging markets and frontier markets for years, that something isn’t right globally. I want to do something.
What fascinates me is to think about fairness through the eyes of a child. As I was chewing on this (and again this is not our philosophy – that will be forthcoming, I returned to Fulghum’s basic rules. Imagine if we applied them to the world of politics and business.
So here is what we learned in kindergarten, according to Fulghum:
| • | Share everything.(Social inclusion) |
| • | Play fair.(Social inclusion) |
| • | Don’t hit people.(Governance) |
| • | Put things back where you found them.(Governance, Environment) |
| • | Clean up your own mess.(Environment) |
| • | Don’t take things that aren’t yours.(Governance, Environment, Social Inclusion) |
| • | Warm cookies and cold milk are good for you.(Social) |
| • | Live a balanced life—learn some and think some and draw and paint and sing and dance and play and work every day some.(Social, Governance. I’ve learned so much about happiness and simplicity from the children in Bhutan, a country that embraces Gross National Happiness.) |
| • | Take a nap every afternoon.(Social. Science is continually recognizing the value of sleep.) |
| • | When you go out into the world, watch out for traffic, hold hands, and stick together.(Environment. An important lesson for India, Pakistan, Indonesia, Bangladesh, and increasingly the United States as it embraces bikes and scooters and walking and a focus on the environment. The extreme poor have strikingly low carbon footprints per capita.) |
| • | Be aware of wonder. Remember the little seed in the Styrofoam cup: The roots go down and the plant goes up and nobody really knows how or why, but we are all like that.(Environment) |
| • | Goldfish and hamsters and white mice and even the little seed in the Styrofoam cup—they all die. So do we.(Governance) |
| • | And then remember the Dick-and-Jane books and the first word you learned—the biggest word of all—LOOK.(Governance, Environment, Social. This piece of wisdom touches on all three.) |
Fulghum concludes his lessons by saying that “everything you need to know is in there somewhere. The Golden Rule and love and basic sanitation. Ecology and politics and equality and sane living.”
I’d add that none of these observations detract from our focus on returns for our clients, which are paramount—our fiduciary duty.
There is so much noise, so much cacophony in the market right now. This is a market that almost seems to be thriving on the noise, getting a sort of high off the continual to-and-fro of political headlines and made-for-TV moments.
Yet noise will only distract you from the kind of long-term investment success that invariably requires discipline, farsightedness, and above all, patience. Our focus is on detecting the signals within the noise. We’re striving to heed the simple lessons that have served us well in the past. That is not easy to do when analytical people meet complex systems. It’s not how we’re wired, but it is essential.
A noisy world, yet it’s almost as simple as our earliest lessons as kids. Investing and global responsibility—it’s everything we learned in kindergarten but how easy it can be to forget.
Rondure Overseas Fund
While near-term movements in interest rates could continue to prop up equity markets across much of the developed world, we remain defensively positioned. Few central banks have room to stimulate without driving rates even deeper into negative territory. Recent reports from the Wall Street Journal and others estimate that there is around $15 trillion in government debt globally with negative yields.iHigh levels of corporate debt suggest a private sector that has taken full advantage of low rates to potentially boost their growth rates (and buy back stock). Sovereign balance sheets are little better. While trade frictions may be the proximate cause of today’s slowing manufacturing data in major markets like the United States and Germany, the ultimate endgame—and the pace of this bull market’s finale—is beyond our ability to predict.
| i | Iosebashvili, Ira. “Investors Scramble for Yield as Growth Outlook Darkens.”The Wall Street Journal, Dow Jones & Company, 30 Sept. 2019, www.wsj.com/articles/investors-scramble-for-yield-as-growth-outlook-darkens-11569848400?mod=hp_lead_pos6. |
| 2 | 1.855.775.3337 | www.rondureglobal.com |
| Rondure Funds | Shareholder Letter |
| | October 31, 2019 (Unaudited) |
What we do know is that in these sorts of environments, quality counts. We’re looking to hold companies in our portfolio with the ability to sustain their dividends in an extended period of economic malaise and soften any downdraft in equity markets. We have many companies in our portfolios with enough cash on the balance sheet, in theory, to sustain their dividend payout for a number of years even if their free cash flow were to temporarily disappear.
We have recently been tilting our portfolios even further towards companies with dividend yields that have been 1) well-funded, 2) backed by stable cash flows, and 3) higher than what their home-region sovereign bonds offer. The theme here is dividend yield compression—in other words, as goes the bond market, so could go equity markets over time. Sustainable yield is a precious commodity in today’s capital markets. We believe that companies that offer such have the ability to thrive in the current environment. As a result, we have increased our weights in our high-conviction names that fit that description.
Japan has been one of the weaker markets globally this year, which has weighed on our performance. In addition to various macroeconomic pressures on the country, we suffered from stock specific issues with one of our large weights. Yamato Holdings, Co. Ltd. (9064 JP), a parcel delivery company, was hit by wage inflation issues, which ultimately led us to exit our position during the quarter. Over the past 12 months, we have also seen many of our consumer names impacted by severe weather in addition to soft tourist traffic. We believe they will be well positioned as we move into the latter part of 2019 and comparisons begin to ease.
We began to see improving prospects for our value-oriented holdings in Japan in recent months. At the portfolio level, Consumer Staples was our best performing sector and within this sector 7 of the top 10 contributing names being Japanese consumer staples companies. Many of these were retailers like the drugstores who were impacted in 2018 from the aforementioned weather and tourism issues. We are beginning to see them lap these headwinds and post better operational results. Also interesting are some early signs of consolidation in the drugstore landscape, something we have long felt is overdue. While we remain in the early innings, we are seeing some activity with one of our holdings, Matsumotokiyoshi Holdings Co. Ltd. (3088 JP) looking to acquire peer Cocokara Fine Holdings Inc. (3098 JP). We still see meaningful value in the Japanese stock market and remain heavily invested in the country, where yields and valuation metrics look relatively attractive to us.
On the negative side, we have struggled recently in the United Kingdom. Brexit has cast a shadow over the country with no easy resolution in sight. While we are underweight the benchmark, our stocks have been weak. In some instances this was due to strong performers taking a breather, as with Diageo PLC (DGE LN), a multinational beverage company. In other cases there was a more direct Brexit impact as with Whitbread PLC (WTB LN), a largely domestic hotel operator for which markets fret the implications of the looming political rupture on local business and tourism activity. Thematically, athleisure companies continue to benefit from the trend towards more casual workplace attire. This evolution has driven strong performance for companies who play into this theme both in the developed and emerging world. Across both of our funds our athleisure and sportswear holdings were many of our best performing lately. Our top performing name in the 3rdquarter, and the largest portfolio weight going into the quarter, was Puma SE (PUM GR), which specifically targets this trend.
Fundamentally, we continue to like what we see in the portfolio. The Fund’s quality metrics remain well ahead of the benchmark, which gives us comfort that we are conservatively positioned in a bull market that we believe continues to edge closer to the end of its run.
Rondure New World Fund
The Rondure New World Fund has benefited lately from good stock picking and exposure to sectors and countries with notable thematic tailwinds. We will comment on all of these but wanted to begin with a couple of thoughts on the Indian market.
In my Q2 letter, I discussed some of the headwinds in India. Consumers there have been under pressure, beset by demonetization, a new goods and services tax (GST) scheme, and a devastating 2018 monsoon season. Our consumer tilt has meant our holdings were not immune to these misfortunes, despite basic nature of the products they provide. In Q3 we saw an almost across-the-board improvement in our Indian holdings, particularly in the month of September, buoyed primarily by government stimulus. On recent trips to India, we have sensed palpable enthusiasm that the Modi administration, just beginning its 2ndterm, will be capable of sparking an acceleration in Gross Domestic Product (GDP) growth. While we are always cautious in reading political tea leaves, we continue to like the long-term opportunity for our companies and think we have some real gems in the portfolio. It has been nice to see several of our holdings begin to bounce off multi-year lows.
While our weighting for China is light relative to the benchmark, we have had some nice results. Nowhere is the global embrace of athleisure more apparent than in China, where athletic and sportswear companies are enjoying strong growth, driven partially by a broad push for fitness by the Chinese government. The companies have also benefitted from superb margin profiles thanks to the close proximity of their retail and manufacturing bases. We have direct exposure to this trend via our ownership of Li Ning Company Ltd. (2331 HK) and Anta Sports Products, Ltd. (2020 HK), two strong domestic brands. While Western brands like Nike, Adidas and Puma still have enormous clout in the local market, Chinese consumers are increasingly showing a preference for local brands.
| Semi-Annual Report | October 31, 2019 | 3 |
| Rondure Funds | Shareholder Letter |
| | October 31, 2019 (Unaudited) |
Li Ning typifies this trend. Founded in 1990, the company was named after its founder, a champion gymnast and national icon. In addition to sponsoring popular Chinese athletes like Yao Ming, Li Ning includes among its influencers international athletes like the NBA’s Dwayne Wade. The company is pushing the envelope on the premium, fashion-forward end of the market. All this has driven improving margins and growing prevalence with the Chinese consumer. On a recent trip to China we had the opportunity to visit several of the company’s retail locations (as well as those of competitors). We came away impressed by Li Ning’s foot traffic and product offering. The stock has performed well for us.
On the negative side, the Philippines has been a challenge for us recently, where we are meaningfully overweight the benchmark. The country has been caught in the cross-currents of China’s deteriorating economy. From a position perspective, we saw San Miguel Food & Beverage, Inc. (FB PM) take a pause in the third quarter after strong year-to-date performance. Jollibee Foods Corp. (JFC PM) stock was hurt by an unfavorable market reception to an acquisition announcement.
We remain confident in the long-term outlook for both companies. Jollibee is one of Asia’s most promising fast food success stories, expanding both regionally and globally, including by acquiring international brands. The company’s approach to international acquisitions has been to look for underperforming franchises where it can enhance operations and expand via its platform. Its recently announced acquisition of Coffee Bean & Tea Leaf gives it an interesting foothold from which to cater to the Pacific Rim’s growing taste for coffee concepts. The company’s ambition is impressive: it aims to be a top five quick service food retailer globally.
We remain underweight Information Technology. In the grand scheme of things, we are comfortable with that. We are bottom-up portfolio managers, and haven’t found the right Quality companies trading at good valuations, which is central to our process. We aren’t afraid to look different from the benchmark. What does cause us to lose sleep is when we miss opportunities to increase weights in some of our highest conviction holdings.
As with the Rondure Overseas Fund, we like how we are positioned in the New World Fund. We are conservatively positioned in companies where we believe there is real potential for long-term compounding of your capital, which is what we seek to do over time. As the now-historic U.S. bull market continues to run, we want to be able to sleep when the wind blows.
Laura Geritz, CFA
CEO and Portfolio Manager
Intrinsic Value is the value of a company based on fundamental analysis.
Moat is a type of sustainable competitive advantage that may pose barriers to entry for competitors.
Club, Glue Platform (CGP) is a proprietary research framework developed by Rondure Global Advisors designed to evaluate Quality on a qualitative basis. It is based on the time-tested research process of portfolio manager Laura Geritz, CFA.
Gross National Happiness is a phrase coined by the 4th King of Bhutan. The idea implies that non-economic aspects of well-being are just as important to the sustainable development of a nation as economic aspects.
Interest rates are generally tied to The Fed Funds Rate, which is the interest rate that U.S. banks charge other banks to lend for lending them money from their reserve balances on an overnight basis. Banks must retain reserves, equal to a certain percentage of their deposits, in an account at the Federal Reserve Bank.
A Central Bank is an entity responsible for overseeing the monetary system and policy of a nation(s), regulating its money supply and interest rates.
The Federal Reserve System (Fed) Funds Rate is the interest rate that U.S. banks charge other banks to lend for lending them money from their reserve balances on an overnight basis. Banks must retain reserves, equal to a certain percentage of their deposits, in an account at the Federal Reserve Bank.
Inflation is the general increase in prices of commonly used goods and services in an economy. It is a decrease in the purchasing power of money.
Yield is the percent return a company can give back to its shareholders for investing in the security.
Dividend yield is a company’s annual dividend payments to shareholders, as a percentage of the company’s current stock price.
Wage inflation is the general increase in wages over time.
| 4 | 1.855.775.3337 | www.rondureglobal.com |
| Rondure Funds | Shareholder Letter |
| | October 31, 2019 (Unaudited) |
Brexit is the process of withdrawal of the UK from the European Union.
Demonetization is a change in national currency that results in the removal of a currency unit as legal tender. There is often a replacement of the legal tender with new notes or coins.
Goods and Services Tax (GST) is an indirect tax on goods and services in India.
GDP Growth is a measure of the output of an economy, telling how fast a country is growing.
Bull Market is a condition in the financial markets where prices are rising, encouraging buying.
Free cash flow is the amount of cash a company generates after cash outflows used to maintain the business.
The CFA designation is owned by the CFA institute.
The objective of all Rondure Funds is long-term growth of capital.
RISKS: Mutual fund investing involves risks and loss of principal is possible. Investing in small and micro-cap funds will be more volatile and loss of principal could be greater than investing in large cap or more diversified funds. Investing in foreign securities entails special risks, such as currency fluctuations and political uncertainties, which are described in more detail in the prospectus. Investments in emerging markets are subject to the same risks as other foreign securities and may be subject to greater risks than investments in foreign countries with more established economies and securities markets.
Must be preceded or accompanied by a prospectus.
The views and information discussed in this commentary are as of the date of publication, are subject to change, and may not reflect the writer's current views. The views expressed represent an assessment of market conditions at a specific point in time, are opinions only and should not be relied upon as investment advice regarding a particular investment or markets in general. Such information does not constitute a recommendation to buy or sell specific securities or investment vehicles. It should not be assumed that any investment will be profitable or will equal the performance of the Funds or any securities or any sectors mentioned herein. The subject matter contained herein has been derived from several sources believed to be reliable and accurate at the time of compilation. The Funds do not accept any liability for losses either direct or consequential caused by the use of this information.
Past performance does not guarantee future results.
The Rondure Funds are distributed by ALPS Distributors Inc. (ADI). ADI is not affiliated with Rondure Global Advisors.
| Semi-Annual Report | October 31, 2019 | 5 |
| Rondure New World Fund | Performance Update |
| | October 31, 2019 (Unaudited) |
Annualized Total Return Performance for the periods ended October 31, 2019
| | | | | Expense Ratio(b) |
| | 6 Months | 1 Year | Since Inception(a) | Gross | Net(c) |
| Rondure New World Fund – Institutional (RNWIX) | 5.65% | 21.89% | 5.92% | 1.46% | 1.10% |
| Rondure New World Fund – Investor (RNWOX) | 5.57% | 21.72% | 5.67% | 1.76% | 1.35% |
| MSCI Emerging Markets USD Index(d) | -1.41% | 12.29% | 5.59% | | |
Performance data quoted represents past performance. Past performance does not guarantee future results. Investment return and principal value of an investment will fluctuate so that an investor’s shares, when sold or redeemed, may be worth more or less than the original cost. The Fund imposes a 2.00% redemption fee on shares held for less than 60 days. Current performance data may be higher or lower than actual data quoted. For the most current month-end performance data, please call 1-855-775-3337.
The table does not reflect the deduction of taxes a shareholder would pay on Fund distributions or redemption of Fund shares.
Subject to investment risks, including possible loss of the principal amount invested.
Returns for periods less than 1 year are cumulative.
| (a) | Fund inception date of May 1, 2017. |
| (b) | Ratios as of the Prospectus dated August 31, 2019 and may differ from the ratios presented in the Financial Highlights. |
| (c) | Rondure Global Advisors, LLC (the “Advisor”), has agreed to waive and/or reimburse fees or expenses in order to limit Total Annual Fund Operating Expenses After Fee Waiver/ Expense Reimbursement (excluding acquired fund fees and expenses, brokerage expenses, interest expenses, taxes and extraordinary expenses) to 1.35% and 1.10% of the Fund’s average daily net assets for the Fund’s Investor Class Shares and Institutional Class Shares, respectively. This agreement (the “Expense Agreement”) is in effect through August 31, 2020. The Advisor will be permitted to recover, on a class-by-class basis, expenses it has borne through the Expense Agreement to the extent that a Fund’s expenses in later periods fall below the expense cap in effect at the time of waiver or reimbursement. However, such recapture payments may not cause the Fund’s expense ratio (after recapture) to exceed the lesser of (i) the expense cap in effect at the time of the waiver and (ii) the expense cap in effect at the time of the recapture. Notwithstanding the foregoing, the Fund will not be obligated to pay any such deferred fees and expenses more than three years after the date of the waiver or reimbursement. The Expense Agreement may not be terminated or modified by the Advisor prior to August 31, 2020, except with the approval of the Fund’s Board of Trustees. |
| (d) | The MSCI Emerging Markets USD Index is an unmanaged total return index, reported in U.S. Dollars, based on share prices and reinvested dividends of approximately 800 companies from 24 emerging market countries. The Index is not actively managed and does not reflect any deductions for fees, expense, or taxes. An investor may not invest directly in the Index. |
| 6 | 1.855.775.3337 | www.rondureglobal.com |
| Rondure New World Fund | Performance Update |
| | October 31, 2019 (Unaudited) |
Growth of $10,000 for the period ended October 31, 2019
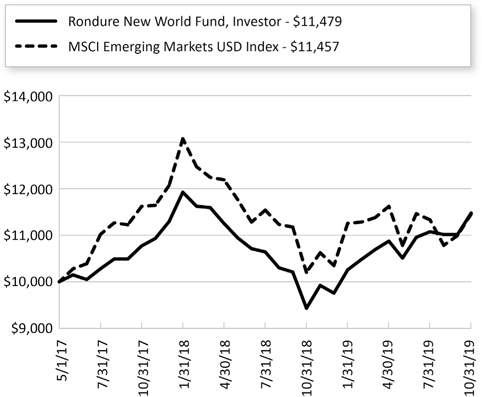
The chart shown above represent a hypothetical investment of $ 10,000 in the Fund’s Investor Class shares for the period from inception to October 31, 2019. All returns reflect reinvested dividends, but do not reflect the deduction of taxes that an investor would pay on distributions or redemptions.
Investing in the Fund is subject to investment risks, including possible loss of the principal amount invested.
The Fund also offers Institutional Class shares, performance for which is not reflected in the graphs above. The performance of Institutional Class shares may be higher or lower than the performance of the Investor Class shares shown in the graphs above based upon differences in fees paid by shareholders investing in the Investor Class shares and Institutional Class shares.
| Semi-Annual Report | October 31, 2019 | 7 |
| Rondure New World Fund | Performance Update |
| | October 31, 2019 (Unaudited) |
| Regional Allocation (as a % of Net Assets)* | |
| Asia ex Japan | 63.3% |
| North America | 9.0% |
| Africa/Middle East | 7.4% |
| Latin America | 7.0% |
| Europe | 3.0% |
| Australia/New Zealand | 1.8% |
| Cash, Cash Equivalents, & Other Net Assets | 8.5% |
| Total | 100.0% |
| Industry Sector Allocation (as a % of Net Assets)* | |
| Consumer | 64.9% |
| Technology | 7.5% |
| Financials | 6.2% |
| Industrials | 5.1% |
| Health Care | 4.0% |
| Energy & Materials | 3.8% |
| Cash, Cash Equivalents, & Other Net Assets | 8.5% |
| Total | 100.0% |
| Top 10 Holdings (as a % of Net Assets)* | |
| Li Ning Co., Ltd. | 3.7% |
| Philippine Seven Corp. | 3.4% |
| Taiwan Semiconductor Manufacturing Co., Ltd. | 3.2% |
| TOA Paint Thailand PCL | 2.6% |
| Carlsberg Brewery Malaysia Bhd | 2.6% |
| Heineken Malaysia Bhd | 2.5% |
| Aramex PJSC | 2.4% |
| Wal-Mart de Mexico SAB de CV | 2.3% |
| Vincom Retail JSC | 2.2% |
| Vietnam Dairy Products JSC | 2.2% |
| Total | 27.1% |
| * | Holdings are subject to change, and may not reflect the current or future position of the portfolio. |
| 8 | 1.855.775.3337 | www.rondureglobal.com |
| Rondure Overseas Fund | Performance Update |
| | October 31, 2019 (Unaudited) |
Annualized Total Return Performance for the periods ended October 31, 2019
| | | | | Expense Ratio(b) |
| | 6 Months | 1 Year | Since Inception(a) | Gross | Net(c) |
| Rondure Overseas Fund – Institutional (ROSIX) | 4.68% | 10.04% | 7.26% | 1.72% | 0.85% |
| Rondure Overseas Fund – Investor (ROSOX) | 4.68%(d) | 9.88% | 7.03% | 2.04% | 1.10% |
| MSCI EAFE Index(e) | 3.62% | 11.63% | 5.99% | | |
Performance data quoted represents past performance. Past performance does not guarantee future results. Investment return and principal value of an investment will fluctuate so that an investor’s shares, when sold or redeemed, may be worth more or less than the original cost. The Fund imposes a 2.00% redemption fee on shares held for less than 60 days. Current performance data may be higher or lower than actual data quoted. For the most current month-end performance data, please call 1-855-775-3337.
The table does not reflect the deduction of taxes a shareholder would pay on Fund distributions or redemption of Fund shares.
Subject to investment risks, including possible loss of the principal amount invested.
Returns for periods less than 1 year are cumulative.
| (a) | Fund inception date of May 1, 2017. |
| (b) | Ratios as of the Prospectus dated August 31, 2019 and may differ from the ratios presented in the Financial Highlights. |
| (c) | Rondure Global Advisors, LLC (the “Advisor”), has agreed to waive and/or reimburse fees or expenses in order to limit Total Annual Fund Operating Expenses After Fee Waiver/ Expense Reimbursement (excluding acquired fund fees and expenses, brokerage expenses, interest expenses, taxes and extraordinary expenses) to 1.10% and 0.85% of the Fund’s average daily net assets for the Fund’s Investor Class Shares and Institutional Class Shares, respectively. This agreement (the “Expense Agreement”) is in effect through August 31, 2020. The Advisor will be permitted to recover, on a class-by-class basis, expenses it has borne through the Expense Agreement to the extent that a Fund’s expenses in later periods fall below the expense cap in effect at the time of waiver or reimbursement. However, such recapture payments may not cause the Fund’s expense ratio (after recapture) to exceed the lesser of (i) the expense cap in effect at the time of the waiver and (ii) the expense cap in effect at the time of the recapture. Notwithstanding the foregoing, the Fund will not be obligated to pay any such deferred fees and expenses more than three years after the date of the waiver or reimbursement. The Expense Agreement may not be terminated or modified by the Advisor prior to August 31, 2020, except with the approval of the Fund’s Board of Trustees. |
| (d) | Excludes adjustments in accordance with accounting principles generally accepted in the United States of America and as such, the net asset value and total return for shareholder transactions reported to the market may differ from the net asset value for financial reporting purposes. |
| (e) | The MSCI EAFE Index is an unmanaged total return index, reported in U.S. dollars, based on share prices and reinvested net dividends of approximately 1,100 companies from 22 developed market countries excluding the US and Canada. The Index is not actively managed and does not reflect any deductions for fees, expense, or taxes. An investor may not invest directly in the Index. |
| Semi-Annual Report | October 31, 2019 | 9 |
| Rondure Overseas Fund | Performance Update |
| | October 31, 2019 (Unaudited) |
Growth of $10,000 for the period ended October 31, 2019

The chart shown above represent a hypothetical investment of $ 10,000 in the Fund’s Investor Class shares for the period from inception to October 31, 2019. All returns reflect reinvested dividends, but do not reflect the deduction of taxes that an investor would pay on distributions or redemptions.
Investing in the Fund is subject to investment risks, including possible loss of the principal amount invested.
The Fund also offers Institutional Class shares, performance for which is not reflected in the graphs above. The performance of Institutional Class shares may be higher or lower than the performance of the Investor Class shares shown in the graphs above based upon differences in fees paid by shareholders investing in the Investor Class shares and Institutional Class shares.
| 10 | 1.855.775.3337 | www.rondureglobal.com |
| Rondure Overseas Fund | Performance Update |
| | October 31, 2019 (Unaudited) |
| Regional Allocation (as a % of Net Assets)* | |
| Europe | 48.7% |
| Japan | 28.9% |
| Australia/New Zealand | 11.7% |
| North America | 2.9% |
| Asia ex Japan | 1.6% |
| Cash, Cash Equivalents, & Other Net Assets | 6.2% |
| Total | 100.0% |
| Industry Sector Allocation (as a % of Net Assets)* | |
| Consumer | 69.3% |
| Industrials | 13.2% |
| Technology | 4.1% |
| Financials | 3.5% |
| Energy & Materials | 2.3% |
| Health Care | 1.4% |
| Cash, Cash Equivalents, & Other Net Assets | 6.2% |
| Total | 100.0% |
| Top 10 Holdings (as a % of Net Assets)* | |
| Unilever NV | 4.2% |
| Nestle SA | 4.2% |
| Danone SA | 4.1% |
| Puma SE | 2.9% |
| Coca-Cola Amatil, Ltd. | 2.6% |
| Alimentation Couche-Tard, Inc. | 2.6% |
| Chocoladefabriken Lindt & Spruengli AG | 2.3% |
| Pernod Ricard SA | 2.1% |
| Asics Corp. | 2.0% |
| Diageo PLC | 2.0% |
| Total | 29.0% |
| * | Holdings are subject to change, and may not reflect the current or future position of the portfolio. |
| Semi-Annual Report | October 31, 2019 | 11 |
| Rondure Funds | Disclosure of Fund Expenses |
| | October 31, 2019 (Unaudited) |
As a shareholder of a Fund, you incur two types of costs: (1) transaction costs, including sales charges (loads) on purchase payments, reinvested dividends, or other distributions; redemption fees; and exchange fees; and (2) ongoing costs, including management fees; distribution and/or service (12b-1) fees; and other Fund expenses. This example is intended to help you understand your ongoing costs (in dollars) of investing in the Fund and to compare these costs with the ongoing costs of investing in other mutual funds.
This example is based on an investment of $1,000 invested at the beginning of the period and held for the entire six-month period of May 1, 2019 through October 31, 2019.
Actual ExpensesThe first line of the table provides information about actual account values and actual expenses. You may use the information in this line, together with the amount you invested, to estimate the expenses that you paid over the period. Simply divide your account value by $1,000 (for example, an $8,600 account value divided by $1,000 = 8.6), then multiply the result by the number in the first line under the heading “Expenses Paid During Period” to estimate the expenses you paid on your account during this period.
Hypothetical Example for Comparison PurposesThe second line of the table provides information about hypothetical account values and hypothetical expenses based on the Fund’s actual expense ratio and an assumed rate of return of 5% per year before expenses, which is not the Fund’s actual return. The hypothetical account values and expenses may not be used to estimate the actual ending account balance or expenses you paid for the period. You may use this information to compare the ongoing costs of investing in the Fund and other mutual funds. To do so, compare this 5% hypothetical example with the 5% hypothetical examples that appear in the shareholder reports of the other funds. Please note that the expenses shown in the table are meant to highlight your ongoing costs only and do not reflect any transactional costs, such as redemption fees or exchange fees. Therefore, the second line of the table is useful in comparing ongoing costs only and will not help you determine the relative total costs of owning different funds. In addition, if these transactional costs were included, your costs would have been higher.
| | Beginning Account
Value
May 1, 2019 | Ending Account
Value
October 31, 2019 | Expense Ratio(a) | Expenses Paid
During Period
May 1, 2019 - October
31, 2019(b) |
| Rondure New World Fund | | | | |
| Institutional Class | | | | |
| Actual | $ 1,000.00 | $ 1,056.50 | 1.10% | $ 5.69 |
| Hypothetical (5% return before expenses) | $ 1,000.00 | $ 1,019.61 | 1.10% | $ 5.58 |
| Investor Class | | | | |
| Actual | $ 1,000.00 | $ 1,055.70 | 1.35% | $ 6.98 |
| Hypothetical (5% return before expenses) | $ 1,000.00 | $ 1,018.35 | 1.35% | $ 6.85 |
| Rondure Overseas Fund | | | | |
| Institutional Class | | | | |
| Actual | $ 1,000.00 | $ 1,046.80 | 0.85% | $ 4.37 |
| Hypothetical (5% return before expenses) | $ 1,000.00 | $ 1,020.86 | 0.85% | $ 4.32 |
| Investor Class | | | | |
| Actual | $ 1,000.00 | $ 1,045.90 | 1.10% | $ 5.66 |
| Hypothetical (5% return before expenses) | $ 1,000.00 | $ 1,019.61 | 1.10% | $ 5.58 |
| (a) | The Fund's expense ratios have been annualized based on the Fund's most recent fiscal half-year expenses. |
| (b) | Expenses are equal to the Fund's annualized expense ratio multiplied by the average account value over the period, multiplied by the number of days in the most recent fiscal half-year (184)/366 (to reflect the half-year period). |
| 12 | 1.855.775.3337 | www.rondureglobal.com |
| Rondure New World Fund | Portfolio of Investments |
| | October 31, 2019 (Unaudited) |
| | | | | | Value | |
| | | Shares | | | (Note 2) | |
| COMMON STOCKS (91.52%) | | | | | | | | |
| Australia (1.77%) | | | | | | | | |
| Coca-Cola Amatil, Ltd. | | | 360,500 | | | $ | 2,522,387 | |
| | | | | | | | | |
| Bangladesh (0.76%) | | | | | | | | |
| Square Pharmaceuticals, Ltd. | | | 391,432 | | | | 1,085,592 | |
| | | | | | | | | |
| Brazil (5.61%) | | | | | | | | |
| Ambev SA | | | 402,200 | | | | 1,740,978 | |
| B3 SA - Brasil Bolsa Balcao | | | 229,600 | | | | 2,771,459 | |
| Hypera SA | | | 171,400 | | | | 1,471,036 | |
| M Dias Branco SA | | | 114,700 | | | | 1,081,363 | |
| Raia Drogasil SA | | | 33,300 | | | | 913,020 | |
| | | | | | | | 7,977,856 | |
| | | | | | | | | |
| Canada (1.15%) | | | | | | | | |
| Lululemon Athletica, Inc.(a) | | | 8,025 | | | | 1,639,267 | |
| | | | | | | | | |
| China (13.00%) | | | | | | | | |
| ANTA Sports Products, Ltd. | | | 223,000 | | | | 2,185,619 | |
| China Resources Beer Holdings Co., Ltd. | | | 140,000 | | | | 720,908 | |
| Chongqing Brewery Co., Ltd. | | | 111,100 | | | | 683,775 | |
| Haier Electronics Group Co., Ltd. | | | 233,000 | | | | 666,058 | |
| Hengan International Group Co., Ltd. | | | 79,000 | | | | 552,479 | |
| Kweichow Moutai Co., Ltd., Class A | | | 4,400 | | | | 737,989 | |
| Li Ning Co., Ltd. | | | 1,552,000 | | | | 5,278,339 | |
| Sichuan Swellfun Co., Ltd. | | | 153,900 | | | | 1,163,317 | |
| TravelSky Technology, Ltd., Class H | | | 409,000 | | | | 934,296 | |
| Tsingtao Brewery Co., Ltd., Class H | | | 381,000 | | | | 2,214,735 | |
| Want Want China Holdings, Ltd. | | | 590,000 | | | | 498,446 | |
| Yum China Holdings, Inc. | | | 67,175 | | | | 2,854,938 | |
| | | | | | | | 18,490,899 | |
| | | | | | | | | |
| Greece (1.68%) | | | | | | | | |
| JUMBO SA | | | 122,456 | | | | 2,390,065 | |
| | | | | | | | | |
| Hong Kong (3.82%) | | | | | | | | |
| Cafe de Coral Holdings, Ltd. | | | 214,000 | | | | 584,435 | |
| | | | | | Value | |
| | | Shares | | | (Note 2) | |
| Hong Kong (continued) | | | | | | | | |
| Hong Kong Exchanges & Clearing, Ltd. | | | 69,000 | | | $ | 2,157,364 | |
| Vitasoy International Holdings, Ltd. | | | 660,000 | | | | 2,686,847 | |
| | | | | | | | 5,428,646 | |
| | | | | | | | | |
| India (8.32%) | | | | | | | | |
| Asian Paints, Ltd. | | | 62,744 | | | | 1,600,783 | |
| Britannia Industries, Ltd. | | | 14,622 | | | | 673,411 | |
| Colgate-Palmolive India, Ltd. | | | 39,204 | | | | 856,279 | |
| Dabur India, Ltd. | | | 159,000 | | | | 1,035,547 | |
| HDFC Bank, Ltd. | | | 43,000 | | | | 745,890 | |
| Hero MotoCorp, Ltd. | | | 31,500 | | | | 1,200,956 | |
| Hindustan Unilever, Ltd. | | | 25,135 | | | | 770,878 | |
| Jubilant Foodworks, Ltd. | | | 93,500 | | | | 2,110,345 | |
| Marico, Ltd. | | | 14,900 | | | | 76,854 | |
| Maruti Suzuki India, Ltd. | | | 6,070 | | | | 646,925 | |
| Nestle India, Ltd. | | | 3,718 | | | | 783,504 | |
| Pidilite Industries, Ltd. | | | 6,385 | | | | 126,172 | |
| Tata Consultancy Services, Ltd. | | | 22,500 | | | | 719,978 | |
| United Breweries, Ltd. | | | 27,500 | | | | 494,780 | |
| | | | | | | | 11,842,302 | |
| | | | | | | | | |
| Indonesia (2.82%) | | | | | | | | |
| Ace Hardware Indonesia Tbk PT | | | 5,526,000 | | | | 665,309 | |
| Indofood CBP Sukses Makmur Tbk PT | | | 2,571,000 | | | | 2,129,221 | |
| Multi Bintang Indonesia Tbk PT | | | 515,000 | | | | 620,040 | |
| Unilever Indonesia Tbk PT | | | 193,000 | | | | 601,191 | |
| | | | | | | | 4,015,761 | |
| | | | | | | | | |
| Kenya (2.10%) | | | | | | | | |
| Safaricom PLC | | | 10,368,600 | | | | 2,986,117 | |
| | | | | | | | | |
| Malaysia (6.14%) | | | | | | | | |
| Carlsberg Brewery Malaysia Bhd | | | 558,000 | | | | 3,704,420 | |
| Hartalega Holdings Bhd | | | 776,000 | | | | 976,848 | |
| Heineken Malaysia Bhd | | | 588,000 | | | | 3,596,812 | |
| Top Glove Corp. Bhd | | | 432,000 | | | | 449,731 | |
| | | | | | | | 8,727,811 | |
See Notes to Financial Statements.
| Semi-Annual Report | October 31, 2019 | 13 |
| Rondure New World Fund | Portfolio of Investments |
| | October 31, 2019 (Unaudited) |
| | | | | | Value | |
| | | Shares | | | (Note 2) | |
| Mexico (4.42%) | | | | | | | | |
| Becle SAB de CV | | | 1,769,600 | | | $ | 3,047,688 | |
| Wal-Mart de Mexico SAB de CV | | | 1,082,400 | | | | 3,243,852 | |
| | | | | | | | 6,291,540 | |
| | | | | | | | | |
| Pakistan (0.13%) | | | | | | | | |
| Nestle Pakistan, Ltd. | | | 4,578 | | | | 188,359 | |
| | | | | | | | | |
| Peru (0.95%) | | | | | | | | |
| Alicorp SAA | | | 236,846 | | | | 649,349 | |
| InRetail Peru Corp.(b)(c) | | | 20,196 | | | | 706,860 | |
| | | | | | | | 1,356,209 | |
| | | | | | | | | |
| Philippines (7.11%) | | | | | | | | |
| International Container | | | | | | | | |
| Terminal Services, Inc. | | | 272,000 | | | | 636,248 | |
| Jollibee Foods Corp. | | | 247,000 | | | | 1,129,254 | |
| Philippine Seven Corp. | | | 1,631,447 | | | | 4,790,336 | |
| Puregold Price Club, Inc. | | | 1,288,000 | | | | 1,036,847 | |
| San Miguel Food and Beverage, Inc. | | | 1,393,000 | | | | 2,525,490 | |
| | | | | | | | 10,118,175 | |
| | | | | | | | | |
| Poland (1.35%) | | | | | | | | |
| AmRest Holdings SE(a) | | | 94,000 | | | | 1,163,729 | |
| Dino Polska SA(a)(b)(c) | | | 19,400 | | | | 756,573 | |
| | | | | | | | 1,920,302 | |
| | | | | | | | | |
| South Africa (2.62%) | | | | | | | | |
| Clicks Group, Ltd. | | | 115,400 | | | | 1,877,040 | |
| Distell Group Holdings, Ltd. | | | 69,900 | | | | 620,614 | |
| Shoprite Holdings, Ltd. | | | 137,200 | | | | 1,229,493 | |
| | | | | | | | 3,727,147 | |
| | | | | | | | | |
| South Korea (1.28%) | | | | | | | | |
| LG Household & Health Care, Ltd. | | | 650 | | | | 704,500 | |
| S-1 Corp. | | | 13,800 | | | | 1,111,401 | |
| | | | | | | | 1,815,901 | |
| | | | | | | | | |
| Sri Lanka (1.12%) | | | | | | | | |
| Lion Brewery Ceylon PLC | | | 472,256 | | | | 1,586,322 | |
| | | | | | | | | |
| Taiwan (7.47%) | | | | | | | | |
| President Chain Store Corp. | | | 284,000 | | | | 2,836,222 | |
| | | | | | Value | |
| | | Shares | | | (Note 2) | |
| Taiwan (continued) | | | | | | | | |
| Taiwan FamilyMart Co., Ltd. | | | 274,000 | | | $ | 1,971,255 | |
| Taiwan Semiconductor | | | | | | | | |
| Manufacturing Co., Ltd. | | | 471,000 | | | | 4,618,633 | |
| Uni-President Enterprises Corp. | | | 487,000 | | | | 1,203,081 | |
| | | | | | | | 10,629,191 | |
| | | | | | | | | |
| Tanzania (0.11%) | | | | | | | | |
| Tanzania Breweries, Ltd. | | | 34,234 | | | | 161,958 | |
| | | | | | | | | |
| Thailand (6.00%) | | | | | | | | |
| Airports of Thailand PCL | | | 263,000 | | | | 681,561 | |
| Bangkok Dusit Medical Services PCL | | | 1,574,000 | | | | 1,251,068 | |
| Bumrungrad Hospital PCL | | | 103,000 | | | | 411,045 | |
| CP ALL PCL | | | 129,000 | | | | 333,234 | |
| Home Product Center PCL | | | 1,238,000 | | | | 705,203 | |
| MK Restaurants Group PCL | | | 559,000 | | | | 1,439,386 | |
| TOA Paint Thailand PCL | | | 2,494,000 | | | | 3,716,840 | |
| | | | | | | | 8,538,337 | |
| | | | | | | | | |
| Turkey (0.63%) | | | | | | | | |
| BIM Birlesik Magazalar AS | | | 107,600 | | | | 890,574 | |
| | | | | | | | | |
| United Arab Emirates (2.44%) | | | | | | | | |
| Aramex PJSC | | | 3,253,000 | | | | 3,471,992 | |
| | | | | | | | | |
| United States (3.42%) | | | | | | | | |
| Kansas City Southern | | | 9,125 | | | | 1,284,617 | |
| Microsoft Corp. | | | 9,750 | | | | 1,397,858 | |
| Starbucks Corp. | | | 25,800 | | | | 2,181,648 | |
| | | | | | | | 4,864,123 | |
| | | | | | | | | |
| Uruguay (0.41%) | | | | | | | | |
| Arcos Dorados Holdings, Inc., Class A | | | 77,600 | | | | 579,672 | |
| | | | | | | | | |
| Vietnam (4.89%) | | | | | | | | |
| Saigon Beer Alcohol | | | | | | | | |
| Beverage Corp. | | | 64,520 | | | | 724,366 | |
| Vietnam Dairy Products JSC | | | 555,582 | | | | 3,112,773 | |
See Notes to Financial Statements.
| 14 | 1.855.775.3337 | www.rondureglobal.com |
| Rondure New World Fund | Portfolio of Investments |
| | October 31, 2019 (Unaudited) |
| | | | | | Value | |
| | | Shares | | | (Note 2) | |
| Vietnam (continued) | | | | | | | | |
| Vincom Retail JSC | | | 2,181,185 | | | $ | 3,120,947 | |
| | | | | | | | 6,958,086 | |
| | | | | | | | | |
| TOTAL COMMON STOCKS | | | | | | | | |
| (Cost $112,667,646) | | | | | | | 130,204,591 | |
| | | | | | | | | |
| TOTAL INVESTMENTS (91.52%) | | | | | | | | |
| (Cost $112,667,646) | | | | | | $ | 130,204,591 | |
| | | | | | | | | |
| Other Assets In Excess Of Liabilities (8.48%) | | | | | | | 12,058,982 | |
| | | | | | | | | |
| NET ASSETS (100.00%) | | | | | | $ | 142,263,573 | |
| (a) | Non-Income Producing Security. |
| (b) | Security exempt from registration under Rule 144A of the Securities Act of 1933. These securities may be resold in the ordinary course of business in transactions exempt from registration, normally to qualified institutional buyers. As of October 31, 2019, these securities had a total aggregate market value of $1,463,433 representing 1.03% of net assets. |
| (c) | Security was purchased pursuant to Regulation S under the Securities Act of 1933, which exempts securities offered and sold outside of the United States from registration. Such security cannot be sold in the United States without either an effective registration statement filed pursuant to the Securities Act of 1933, or pursuant to an exemption from registration. The security has been deemed liquid under guidelines approved by the Fund's Board of Trustees. As of October 31, 2019, the aggregate market value of those securities was $1,463,433, representing 1.03% of net assets. |
See Notes to Financial Statements.
| Semi-Annual Report | October 31, 2019 | 15 |
| Rondure Overseas Fund | Portfolio of Investments |
| | October 31, 2019 (Unaudited) |
| | | | | | Value | |
| | | Shares | | | (Note 2) | |
| COMMON STOCKS (93.84%) | | | | | | | | |
| Australia (7.54%) | | | | | | | | |
| ASX, Ltd. | | | 4,000 | | | $ | 226,989 | |
| Coca-Cola Amatil, Ltd. | | | 86,600 | | | | 605,933 | |
| REA Group, Ltd. | | | 5,946 | | | | 445,097 | |
| SEEK, Ltd. | | | 10,000 | | | | 156,345 | |
| Sydney Airport | | | 50,600 | | | | 306,257 | |
| | | | | | | | 1,740,621 | |
| | | | | | | | | |
| Austria (0.98%) | | | | | | | | |
| Mayr Melnhof Karton AG | | | 1,850 | | | | 227,376 | |
| | | | | | | | | |
| Belgium (0.27%) | | | | | | | | |
| Lotus Bakeries NV | | | 22 | | | | 62,078 | |
| | | | | | | | | |
| Britain (11.15%) | | | | | | | | |
| Compass Group PLC | | | 4,696 | | | | 125,066 | |
| Diageo PLC | | | 11,200 | | | | 459,104 | |
| Intertek Group PLC | | | 1,700 | | | | 117,857 | |
| J D Wetherspoon PLC | | | 13,488 | | | | 255,611 | |
| Rightmove PLC | | | 19,800 | | | | 153,529 | |
| Unilever NV | | | 16,400 | | | | 968,504 | |
| WH Smith PLC | | | 9,287 | | | | 263,215 | |
| Whitbread PLC | | | 4,400 | | | | 231,459 | |
| | | | | | | | 2,574,345 | |
| | | | | | | | | |
| Canada (2.90%) | | | | | | | | |
| Alimentation Couche-Tard, Inc., Class B | | | 20,000 | | | | 599,803 | |
| Dollarama, Inc. | | | 2,100 | | | | 70,648 | |
| | | | | | | | 670,451 | |
| | | | | | | | | |
| Denmark (2.25%) | | | | | | | | |
| Carlsberg A/S(a) | | | 2,272 | | | | 319,629 | |
| Royal Unibrew A/S | | | 2,440 | | | | 200,043 | |
| | | | | | | | 519,672 | |
| | | | | | | | | |
| Finland (2.62%) | | | | | | | | |
| Kone Oyj, Class B | | | 2,300 | | | | 146,318 | |
| Olvi Oyj, Class A | | | 10,805 | | | | 458,534 | |
| | | | | | | | 604,852 | |
| | | | | | | | | |
| France (10.56%) | | | | | | | | |
| Danone SA | | | 11,480 | | | | 952,079 | |
| EssilorLuxottica SA | | | 900 | | | | 137,316 | |
| Laurent-Perrier | | | 550 | | | | 54,594 | |
| | | | | | Value | |
| | | Shares | | | (Note 2) | |
| France (continued) | | | | | | | | |
| L'Oreal SA | | | 1,300 | | | $ | 379,581 | |
| LVMH Moet Hennessy Louis | | | | | | | | |
| Vuitton SE | | | 590 | | | | 251,695 | |
| Pernod Ricard SA | | | 2,582 | | | | 476,591 | |
| Remy Cointreau SA | | | 912 | | | | 121,957 | |
| Sodexo SA | | | 600 | | | | 65,981 | |
| | | | | | | | 2,439,794 | |
| | | | | | | | | |
| Germany (6.49%) | | | | | | | | |
| adidas AG | | | 1,130 | | | | 348,911 | |
| CTS Eventim AG & Co., KGaA | | | 3,745 | | | | 226,591 | |
| Deutsche Post AG | | | 3,505 | | | | 124,115 | |
| Puma SE | | | 8,860 | | | | 666,511 | |
| SAP SE | | | 1,000 | | | | 132,497 | |
| | | | | | | | 1,498,625 | |
| | | | | | | | | |
| Hong Kong (1.62%) | | | | | | | | |
| Hong Kong Exchanges & Clearing, Ltd. | | | 3,800 | | | | 118,811 | |
| Vitasoy International Holdings, Ltd. | | | 63,000 | | | | 256,472 | |
| | | | | | | | 375,283 | |
| | | | | | | | | |
| Italy (1.66%) | | | | | | | | |
| Davide Campari-Milano SpA | | | 10,509 | | | | 96,286 | |
| DiaSorin SpA | | | 383 | | | | 43,143 | |
| Ferrari NV | | | 1,525 | | | | 243,984 | |
| | | | | | | | 383,413 | |
| | | | | | | | | |
| Japan (28.91%) | | | | | | | | |
| ABC-Mart, Inc. | | | 3,600 | | | | 247,356 | |
| Asics Corp. | | | 26,600 | | | | 460,124 | |
| Calbee, Inc. | | | 6,800 | | | | 227,947 | |
| Cosmos Pharmaceutical Corp. | | | 1,200 | | | | 248,134 | |
| Create SD Holdings Co., Ltd. | | | 10,100 | | | | 251,869 | |
| Ezaki Glico Co., Ltd. | | | 5,400 | | | | 251,523 | |
| Kewpie Corp. | | | 9,900 | | | | 225,521 | |
| Kobayashi Pharmaceutical Co., Ltd. | | | 1,800 | | | | 144,847 | |
| Kusuri no Aoki Holdings Co., Ltd. | | | 2,500 | | | | 187,286 | |
| Matsumotokiyoshi Holdings Co., Ltd. | | | 7,500 | | | | 265,650 | |
| McDonald's Holdings Co. Japan, Ltd. | | | 1,800 | | | | 90,508 | |
See Notes to Financial Statements.
| 16 | 1.855.775.3337 | www.rondureglobal.com |
| Rondure Overseas Fund | Portfolio of Investments |
| | October 31, 2019 (Unaudited) |
| | | | | | Value | |
| | | Shares | | | (Note 2) | |
| Japan (continued) | | | | | | | | |
| MEIJI Holdings Co., Ltd. | | | 800 | | | $ | 57,931 | |
| MISUMI Group, Inc. | | | 5,100 | | | | 129,590 | |
| MonotaRO Co., Ltd. | | | 10,500 | | | | 321,349 | |
| Morinaga & Co., Ltd. | | | 3,900 | | | | 193,212 | |
| Nihon M&A Center, Inc. | | | 7,800 | | | | 239,078 | |
| Nippon Paint Holdings Co., Ltd. | | | 2,500 | | | | 137,744 | |
| Oriental Land Co., Ltd. | | | 2,500 | | | | 367,742 | |
| Pigeon Corp. | | | 5,200 | | | | 256,172 | |
| Secom Co., Ltd. | | | 4,500 | | | | 419,414 | |
| Seria Co., Ltd. | | | 4,700 | | | | 118,642 | |
| Seven & i Holdings Co., Ltd. | | | 11,200 | | | | 425,225 | |
| Shimano, Inc. | | | 700 | | | | 117,326 | |
| Ship Healthcare Holdings, Inc. | | | 6,400 | | | | 274,396 | |
| SK Kaken Co., Ltd. | | | 174 | | | | 75,246 | |
| Sundrug Co., Ltd. | | | 7,200 | | | | 239,689 | |
| Suntory Beverage & Food, Ltd. | | | 2,600 | | | | 111,232 | |
| Tsuruha Holdings, Inc. | | | 1,300 | | | | 147,227 | |
| Unicharm Corp. | | | 13,000 | | | | 444,087 | |
| | | | | | | | 6,676,067 | |
| | | | | | | | | |
| Netherlands (3.31%) | | | | | | | | |
| Akzo Nobel NV | | | 1,100 | | | | 101,275 | |
| Euronext NV(b)(c) | | | 5,690 | | | | 458,502 | |
| Heineken NV | | | 2,000 | | | | 204,011 | |
| | | | | | | | 763,788 | |
| | | | | | | | | |
| New Zealand (4.12%) | | | | | | | | |
| Air New Zealand, Ltd. | | | 156,402 | | | | 283,283 | |
| Auckland International | | | | | | | | |
| Airport, Ltd. | | | 51,800 | | | | 308,867 | |
| Mainfreight, Ltd. | | | 13,931 | | | | 359,060 | |
| | | | | | | | 951,210 | |
| | | | | | | | | |
| Sweden (2.47%) | | | | | | | | |
| Axfood AB | | | 19,844 | | | | 427,062 | |
| Loomis AB, Class B | | | 3,682 | | | | 142,236 | |
| | | | | | | | 569,298 | |
| | | | | | | | | |
| Switzerland (6.99%) | | | | | | | | |
| Chocoladefabriken Lindt & Spruengli AG | | | 73 | | | | 542,413 | |
| Cie Financiere Richemont SA | | | 1,425 | | | | 112,093 | |
| | | | | | Value | |
| | | Shares | | | (Note 2) | |
| Switzerland (continued) | | | | | | | | |
| Nestle SA | | | 8,980 | | | $ | 958,716 | |
| | | | | | | | 1,613,222 | |
| | | | | | | | | |
| TOTAL COMMON STOCKS | | | | | | | | |
| (Cost $19,157,611) | | | | | | | 21,670,095 | |
| | | | | | | | | |
| TOTAL INVESTMENTS (93.84%) | | | | | | | | |
| (Cost $19,157,611) | | | | | | $ | 21,670,095 | |
| | | | | | | | | |
| Other Assets In Excess Of Liabilities (6.16%) | | | | | | | 1,422,965 | |
| | | | | | | | | |
| NET ASSETS (100.00%) | | | | | | $ | 23,093,060 | |
| (a) | Non-Income Producing Security. |
| (b) | Security exempt from registration under Rule 144A of the Securities Act of 1933. These securities may be resold in the ordinary course of business in transactions exempt from registration, normally to qualified institutional buyers. As of October 31, 2019, these securities had a total aggregate market value of $458,502 representing 1.99% of net assets. |
| (c) | Security was purchased pursuant to Regulation S under the Securities Act of 1933, which exempts securities offered and sold outside of the United States from registration. Such security cannot be sold in the United States without either an effective registration statement filed pursuant to the Securities Act of 1933, or pursuant to an exemption from registration. The security has been deemed liquid under guidelines approved by the Fund's Board of Trustees. As of October 31, 2019, the aggregate market value of those securities was $458,502, representing 1.99% of net assets. |
See Notes to Financial Statements.
| Semi-Annual Report | October 31, 2019 | 17 |
| Rondure Funds | Statements of Assets and Liabilities |
| | October 31, 2019 (Unaudited) |
| | | Rondure New World | | | Rondure Overseas | |
| | | Fund | | | Fund | |
| ASSETS | | | | | | | | |
| Investments, at value (Cost - see below) | | $ | 130,204,591 | | | $ | 21,670,095 | |
| Foreign cash, at value (Cost $1,603,485 and $1, respectively) | | | 1,603,493 | | | | 1 | |
| Cash | | | 10,451,555 | | | | 1,326,305 | |
| Dividends and interest receivable | | | 39,188 | | | | 36,427 | |
| Receivable for investments sold | | | 674,673 | | | | 3,803 | |
| Receivable for fund shares subscribed | | | 39,826 | | | | 394,939 | |
| Receivable due from advisor | | | 38,303 | | | | 18,584 | |
| Prepaid and other assets | | | 19,881 | | | | 13,102 | |
| Total assets | | | 143,071,510 | | | | 23,463,256 | |
| | | | | | | | | |
| LIABILITIES | | | | | | | | |
| Payable for investments purchased | | | – | | | | 287,977 | |
| Foreign capital gains tax | | | 344,598 | | | | – | |
| Payable for fund shares redeemed | | | 184,632 | | | | – | |
| Advisory fees payable | | | 99,564 | | | | 13,205 | |
| Administration fees payable | | | 49,585 | | | | 25,992 | |
| Custodian fees payable | | | 47,877 | | | | 5,216 | |
| Payable for professional fees | | | 25,643 | | | | 19,446 | |
| Payable for trustee fees and expenses | | | 2,399 | | | | 430 | |
| Payable for chief compliance officer fee | | | 4,199 | | | | 806 | |
| Payable for principal financial officer fees | | | 1,485 | | | | 281 | |
| Distribution and service fees payable - Investor Class | | | 4,207 | | | | 779 | |
| Payable for transfer agency fees | | | 30,227 | | | | 12,575 | |
| Accrued expenses and other liabilities | | | 13,521 | | | | 3,489 | |
| Total liabilities | | | 807,937 | | | | 370,196 | |
| NET ASSETS | | $ | 142,263,573 | | | $ | 23,093,060 | |
| | | | | | | | | |
| NET ASSETS CONSISTS OF | | | | | | | | |
| Paid-in capital (Note 5) | | $ | 131,948,702 | | | $ | 21,502,849 | |
| Total distributable earnings | | | 10,314,871 | | | | 1,590,211 | |
| NET ASSETS | | $ | 142,263,573 | | | $ | 23,093,060 | |
| | | | | | | | | |
| INVESTMENTS, AT COST | | $ | 112,667,646 | | | $ | 19,157,611 | |
| | | | | | | | | |
| PRICING OF SHARES | | | | | | | | |
| Institutional Class | | | | | | | | |
| Net Assets | | $ | 121,424,775 | | | $ | 19,358,433 | |
| Net Asset Value, offering and redemption price per share | | $ | 11.41 | | | $ | 11.63 | |
| Shares of beneficial interest outstanding | | | 10,640,548 | | | | 1,664,336 | |
| Investor Class | | | | | | | | |
| Net Assets | | $ | 20,838,798 | | | $ | 3,734,627 | |
| Net Asset Value, offering and redemption price per share | | $ | 11.38 | | | $ | 11.63 | |
| Shares of beneficial interest outstanding | | | 1,831,405 | | | | 321,126 | |
See Notes to Financial Statements.
| 18 | 1.855.775.3337 | www.rondureglobal.com |
| Rondure Funds | Statements of Operations |
| | For the Six Months Ended October 31, 2019 (Unaudited) |
| | | Rondure New World
Fund | | | Rondure Overseas
Fund | |
| INVESTMENT INCOME | | | | | | | | |
| Dividends | | $ | 1,876,718 | | | $ | 234,202 | |
| Interest | | | 65 | | | | – | |
| Foreign taxes withheld | | | (143,152 | ) | | | (29,100 | ) |
| Other Income | | | 28,819 | | | | 3,215 | |
| Total investment income | | | 1,762,450 | | | | 208,317 | |
| EXPENSES | | | | | | | | |
| Investment advisor fees (Note 6) | | | 570,363 | | | | 78,885 | |
| Administrative fees | | | 123,476 | | | | 35,780 | |
| Distribution and service fees - Investor Class | | | 24,647 | | | | 4,744 | |
| Transfer agent fees | | | 89,501 | | | | 31,417 | |
| Professional fees | | | 16,340 | | | | 12,795 | |
| Printing fees | | | 9,481 | | | | 1,437 | |
| Registration fees | | | 20,286 | | | | 15,982 | |
| Custodian fees | | | 102,332 | | | | 15,604 | |
| Trustee fees and expenses | | | 2,349 | | | | 409 | |
| Chief compliance officer fees | | | 14,846 | | | | 2,611 | |
| Principal financial officer fees | | | 4,337 | | | | 763 | |
| Other expenses | | | 7,208 | | | | 4,423 | |
| Total expenses | | | 985,166 | | | | 204,850 | |
| Less fees waived/reimbursed by investment advisor (Note 6) | | | (222,066 | ) | | | (104,321 | ) |
| Total net expenses | | | 763,100 | | | | 100,529 | |
| NET INVESTMENT INCOME | | | 999,350 | | | | 107,788 | |
| REALIZED AND UNREALIZED GAIN/(LOSS) ON INVESTMENTS | | | | | | | | |
| Net realized gain/(loss) on investments | | | 104,545 | | | | (355,579 | ) |
| Net realized gain/(loss) on foreign currency transactions | | | (11,291 | ) | | | 8,119 | |
| Net realized gain/(loss) | | | 93,254 | | | | (347,460 | ) |
| Net change in unrealized appreciation on investments (net of change in foreign capital gains tax of $308,148 and $0, respectively) | | | 6,554,819 | | | | 1,277,041 | |
| Net change in unrealized appreciation/(depreciation) on translation of assets and liabilities in foreign currencies | | | 2,154 | | | | (207 | ) |
| Net change in unrealized appreciation | | | 6,556,973 | | | | 1,276,834 | |
| NET REALIZED AND UNREALIZED GAIN ON INVESTMENTS AND FOREIGN CURRENCY | | | | | | | | |
| TRANSACTIONS | | | 6,650,227 | | | | 929,374 | |
| NET INCREASE IN NET ASSETS RESULTING FROM OPERATIONS | | $ | 7,649,577 | | | $ | 1,037,162 | |
See Notes to Financial Statements.
| Semi-Annual Report | October 31, 2019 | 19 |
| Rondure New World Fund | Statement of Changes in Net Assets |
| | | For the
Six Months Ended October 31, 2019
(Unaudited) | | | For the
Year Ended
April 30, 2019 | |
| OPERATIONS | | | | | | | | |
| Net investment income | | $ | 999,350 | | | $ | 1,008,257 | |
| Net realized gain/(loss) | | | 93,254 | | | | (7,966,966 | ) |
| Net change in unrealized appreciation | | | 6,556,973 | | | | 2,660,191 | |
| Net increase/(decrease) in net assets resulting from operations | | | 7,649,577 | | | | (4,298,518 | ) |
| TOTAL DISTRIBUTIONS TO SHAREHOLDERS (NOTE 3) | | | | | | | | |
| From distributable earnings | | | | | | | | |
| Institutional Class | | | – | | | | (805,429 | ) |
| Investor Class | | | – | | | | (134,438 | ) |
| Net decrease in net assets from distributions | | | – | | | | (939,867 | ) |
| CAPITAL SHARE TRANSACTIONS (NOTE 5) | | | | | | | | |
| Institutional Class | | | | | | | | |
| Proceeds from sales of shares | | | 10,554,452 | | | | 45,561,068 | |
| Distributions reinvested | | | – | | | | 775,462 | |
| Cost of shares redeemed | | | (6,465,344 | ) | | | (32,437,400 | ) |
| Redemption fees | | | 6,941 | | | | 2,181 | |
| Net increase from capital shares transactions | | | 4,096,049 | | | | 13,901,311 | |
| Investor Class | | | | | | | | |
| Proceeds from sales of shares | | | 3,137,161 | | | | 10,226,719 | |
| Distributions reinvested | | | – | | | | 133,941 | |
| Cost of shares redeemed | | | (4,014,540 | ) | | | (12,623,048 | ) |
| Redemption fees | | | 585 | | | | 1,142 | |
| Net decrease from capital shares transactions | | | (876,794 | ) | | | (2,261,246 | ) |
| Net increase in net assets | | | 10,868,832 | | | | 6,401,680 | |
| | | | | | | | | |
| NET ASSETS | | | | | | | | |
| Beginning of period | | | 131,394,741 | | | | 124,993,061 | |
| End of period | | $ | 142,263,573 | | | $ | 131,394,741 | |
| | | | | | | | | |
| OTHER INFORMATION | | | | | | | | |
| Shares Transactions | | | | | | | | |
| Institutional Class | | | | | | | | |
| Issued | | | 973,672 | | | | 4,483,691 | |
| Issued to shareholders in reinvestment of distributions | | | – | | | | 81,115 | |
| Redeemed | | | (594,282 | ) | | | (3,256,312 | ) |
| Net increase in share transactions | | | 379,390 | | | | 1,308,494 | |
| Investor Class | | | | | | | | |
| Issued | | | 287,872 | | | | 1,005,992 | |
| Issued to shareholders in reinvestment of distributions | | | – | | | | 14,025 | |
| Redeemed | | | (366,826 | ) | | | (1,265,236 | ) |
| Net decrease in share transactions | | | (78,954 | ) | | | (245,219 | ) |
See Notes to Financial Statements.
| 20 | 1.855.775.3337 | www.rondureglobal.com |
| Rondure Overseas Fund | Statement of Changes in Net Assets |
| | | For the
Six Months Ended
October 31, 2019
(Unaudited) | | | For the
Year Ended
April 30, 2019 | |
| OPERATIONS | | | | | | | | |
| Net investment income | | $ | 107,788 | | | $ | 214,145 | |
| Net realized loss | | | (347,460 | ) | | | (711,512 | ) |
| Net change in unrealized appreciation/(depreciation) | | | 1,276,834 | | | | (30,254 | ) |
| Net increase/(decrease) in net assets resulting from operations | | | 1,037,162 | | | | (527,621 | ) |
| TOTAL DISTRIBUTIONS TO SHAREHOLDERS (NOTE 3)(a) | | | | | | | | |
| From distributable earnings | | | | | | | | |
| Institutional Class | | | – | | | | (239,395 | ) |
| Investor Class | | | – | | | | (49,787 | ) |
| Net decrease in net assets from distributions | | | – | | | | (289,182 | ) |
| CAPITAL SHARE TRANSACTIONS (NOTE 5) | | | | | | | | |
| Institutional Class | | | | | | | | |
| Proceeds from sales of shares | | | 943,727 | | | | 8,892,000 | |
| Distributions reinvested | | | – | | | | 229,107 | |
| Cost of shares redeemed | | | (1,295,874 | ) | | | (3,918,374 | ) |
| Redemption fees | | | 4 | | | | 1,619 | |
| Net increase/(decrease) from capital shares transactions | | | (352,143 | ) | | | 5,204,352 | |
| Investor Class | | | | | | | | |
| Proceeds from sales of shares | | | 248,353 | | | | 1,539,008 | |
| Distributions reinvested | | | – | | | | 49,575 | |
| Cost of shares redeemed | | | (608,761 | ) | | | (2,683,077 | ) |
| Redemption fees | | | 1,345 | | | | 1,670 | |
| Net decrease from capital shares transactions | | | (359,063 | ) | | | (1,092,824 | ) |
| Net increase in net assets | | | 325,956 | | | | 3,294,725 | |
| NET ASSETS | | | | | | | | |
| Beginning of period | | | 22,767,104 | | | | 19,472,379 | |
| End of period | | $ | 23,093,060 | | | $ | 22,767,104 | |
| OTHER INFORMATION | | | | | | | | |
| Shares Transactions | | | | | | | | |
| Institutional Class | | | | | | | | |
| Issued | | | 82,594 | | | | 787,230 | |
| Issued to shareholders in reinvestment of distributions | | | – | | | | 22,528 | |
| Redeemed | | | (114,980 | ) | | | (359,383 | ) |
| Net increase/(decrease) in share transactions | | | (32,386 | ) | | | 450,375 | |
| Investor Class | | | | | | | | |
| Issued | | | 22,183 | | | | 139,570 | |
| Issued to shareholders in reinvestment of distributions | | | – | | | | 4,865 | |
| Redeemed | | | (53,955 | ) | | | (243,574 | ) |
| Net decrease in share transactions | | | (31,772 | ) | | | (99,139 | ) |
See Notes to Financial Statements.
| Semi-Annual Report | October 31, 2019 | 21 |
| Rondure New World Fund – Institutional Class | Financial Highlights |
| | For a Share Outstanding Throughout the Period Presented |
| Institutional Class | | For the Six Months Ended October 31, 2019 (Unaudited) | | | Year Ended April 30, 2019 | | | For the Period May 2, 2017 (Commencement of Operations) to April 30, 2018 | |
| NET ASSET VALUE, BEGINNING OF PERIOD | | $ | 10.80 | | | $ | 11.25 | | | $ | 10.00 | |
| | | | | | | | | | | | | |
| INCOME FROM INVESTMENT OPERATIONS | | | | | | | | | | | | |
| Net investment income(a) | | | 0.08 | | | | 0.09 | | | | 0.05 | |
| Net realized and unrealized gain/(loss) on investments | | | 0.53 | | | | (0.45 | ) | | | 1.23 | |
| Total income/(loss) from investment operations | | | 0.61 | | | | (0.36 | ) | | | 1.28 | |
| | | | | | | | | | | | | |
| DISTRIBUTIONS | | | | | | | | | | | | |
| From net investment income | | | – | | | | (0.09 | ) | | | (0.03 | ) |
| From net realized gain on investments | | | – | | | | – | | | | (0.00 | )(b) |
| Total distributions | | | – | | | | (0.09 | ) | | | (0.03 | ) |
| | | | | | | | | | | | | |
| REDEMPTION FEES ADDED TO PAID-IN CAPITAL | | | 0.00 | (b) | | | 0.00 | (b) | | | 0.00 | (b) |
| | | | | | | | | | | | | |
| INCREASE/DECREASE IN NET ASSET VALUE | | | 0.61 | | | | (0.45 | ) | | | 1.25 | |
| NET ASSET VALUE, END OF PERIOD | | $ | 11.41 | | | $ | 10.80 | | | $ | 11.25 | |
| | | | | | | | | | | | | |
| TOTAL RETURN | | | 5.65 | %(c) | | | (3.09 | )% | | | 12.78 | %(c) |
| | | | | | | | | | | | | |
| RATIOS AND SUPPLEMENTAL DATA | | | | | | | | | | | | |
| Net assets, end of period (in 000s) | | $ | 121,425 | | | $ | 110,800 | | | $ | 100,760 | |
| | | | | | | | | | | | | |
| RATIOS TO AVERAGE NET ASSETS | | | | | | | | | | | | |
| Expenses (excluding fees waived/ reimbursed by investment advisor) | | | 1.42 | %(d) | | | 1.46 | % | | | 1.62 | %(d) |
| Expenses (including fees waived/ reimbursed by investment advisor) | | | 1.10 | %(d) | | | 1.10 | % | | | 1.10 | %(d) |
| Net investment income | | | 1.53 | %(d) | | | 0.87 | % | | | 0.43 | %(d) |
| | | | | | | | | | | | | |
| PORTFOLIO TURNOVER RATE | | | 11 | %(c) | | | 37 | % | | | 13 | %(c) |
| (a) | Per share numbers have been calculated using the average shares method. |
| (b) | Less than $0.005 or ($0.005) per share. |
See Notes to Financial Statements.
| 22 | 1.855.775.3337 | www.rondureglobal.com |
| Rondure New World Fund – Investor Class | Financial Highlights |
| | For a Share Outstanding Throughout the Period Presented |
| Investor Class | | For the Six Months Ended October 31, 2019 (Unaudited) | | | Year Ended April 30, 2019 | | | For the Period May 2, 2017 (Commencement of Operations) to April 30, 2018 | |
| NET ASSET VALUE, BEGINNING OF PERIOD | | $ | 10.78 | | | $ | 11.24 | | | $ | 10.00 | |
| | | | | | | | | | | | | |
| INCOME FROM INVESTMENT OPERATIONS | | | | | | | | | | | | |
| Net investment income(a) | | | 0.07 | | | | 0.07 | | | | 0.03 | |
| Net realized and unrealized gain/(loss) on investments | | | 0.53 | | | | (0.46 | ) | | | 1.22 | |
| Total income/(loss) from investment operations | | | 0.60 | | | | (0.39 | ) | | | 1.25 | |
| | | | | | | | | | | | | |
| DISTRIBUTIONS | | | | | | | | | | | | |
| From net investment income | | | – | | | | (0.07 | ) | | | (0.01 | ) |
| From net realized gain on investments | | | – | | | | – | | | | (0.00 | )(b) |
| Total distributions | | | – | | | | (0.07 | ) | | | (0.01 | ) |
| | | | | | | | | | | | | |
| REDEMPTION FEES ADDED TO PAID-IN CAPITAL | | | 0.00 | (b) | | | 0.00 | (b) | | | 0.00 | (b) |
| | | | | | | | | | | | | |
| INCREASE/DECREASE IN NET ASSET VALUE | | | 0.60 | | | | (0.46 | ) | | | 1.24 | |
| NET ASSET VALUE, END OF PERIOD | | $ | 11.38 | | | $ | 10.78 | | | $ | 11.24 | |
| | | | | | | | | | | | | |
| TOTAL RETURN | | | 5.57 | %(c) | | | (3.37 | )% | | | 12.53 | %(c) |
| | | | | | | | | | | | | |
| RATIOS AND SUPPLEMENTAL DATA | | | | | | | | | | | | |
| Net assets, end of period (in 000s) | | $ | 20,839 | | | $ | 20,595 | | | $ | 24,233 | |
| | | | | | | | | | | | | |
| RATIOS TO AVERAGE NET ASSETS | | | | | | | | | | | | |
| Expenses (excluding fees waived/ reimbursed by investment advisor) | | | 1.73 | %(d) | | | 1.76 | % | | | 1.91 | %(d) |
| Expenses (including fees waived/ reimbursed by investment advisor) | | | 1.35 | %(d) | | | 1.35 | % | | | 1.35 | %(d) |
| Net investment income | | | 1.27 | %(d) | | | 0.66 | % | | | 0.24 | %(d) |
| | | | | | | | | | | | | |
| PORTFOLIO TURNOVER RATE | | | 11 | %(c) | | | 37 | % | | | 13 | %(c) |
| (a) | Per share numbers have been calculated using the average shares method. |
| (b) | Less than $0.005 or ($0.005) per share. |
See Notes to Financial Statements.
| Semi-Annual Report | October 31, 2019 | 23 |
| Rondure Overseas Fund – Institutional Class | Financial Highlights |
| | For a Share Outstanding Throughout the Period Presented |
| Institutional Class | | For the Six Months Ended October 31, 2019 (Unaudited) | | | Year Ended April 30, 2019 | | | For the Period May 2, 2017 (Commencement of Operations) to April 30, 2018 | |
| NET ASSET VALUE, BEGINNING OF PERIOD | | $ | 11.11 | | | $ | 11.46 | | | $ | 10.00 | |
| | | | | | | | | | | | | |
| INCOME FROM INVESTMENT OPERATIONS | | | | | | | | | | | | |
| Net investment income(a) | | | 0.06 | | | | 0.10 | | | | 0.10 | |
| Net realized and unrealized gain/(loss) on investments | | | 0.46 | | | | (0.31 | ) | | | 1.48 | |
| Total income/(loss) from investment operations | | | 0.52 | | | | (0.21 | ) | | | 1.58 | |
| | | | | | | | | | | | | |
| DISTRIBUTIONS | | | | | | | | | | | | |
| From net investment income | | | – | | | | (0.11 | ) | | | (0.04 | ) |
| From net realized gain on investments | | | – | | | | (0.03 | ) | | | (0.08 | ) |
| Total distributions | | | – | | | | (0.14 | ) | | | (0.12 | ) |
| | | | | | | | | | | | | |
| REDEMPTION FEES ADDED TO PAID-IN CAPITAL | | | 0.00 | (b) | | | 0.00 | (b) | | | 0.00 | (b) |
| | | | | | | | | | | | | |
| INCREASE/DECREASE IN NET ASSET VALUE | | | 0.52 | | | | (0.35 | ) | | | 1.46 | |
| NET ASSET VALUE, END OF PERIOD | | $ | 11.63 | | | $ | 11.11 | | | $ | 11.46 | |
| | | | | | | | | | | | | |
| TOTAL RETURN | | | 4.68 | %(c) | | | (1.76 | )% | | | 15.88 | %(c) |
| | | | | | | | | | | | | |
| RATIOS AND SUPPLEMENTAL DATA | | | | | | | | | | | | |
| Net assets, end of period (in 000s) | | $ | 19,358 | | | $ | 18,845 | | | $ | 14,283 | |
| | | | | | | | | | | | | |
| RATIOS TO AVERAGE NET ASSETS | | | | | | | | | | | | |
| Expenses (excluding fees waived/ reimbursed by investment advisor) | | | 1.76 | %(d) | | | 1.72 | % | | | 2.57 | %(d) |
| Expenses (including fees waived/ reimbursed by investment advisor) | | | 0.85 | %(d) | | | 0.85 | % | | | 0.85 | %(d) |
| Net investment income | | | 1.00 | %(d) | | | 0.95 | % | | | 0.92 | %(d) |
| | | | | | | | | | | | | |
| PORTFOLIO TURNOVER RATE | | | 24 | %(c) | | | 40 | % | | | 14 | %(c) |
| (a) | Per share numbers have been calculated using the average shares method. |
| (b) | Less than $0.005 or ($0.005) per share. |
See Notes to Financial Statements.
| 24 | 1.855.775.3337 | www.rondureglobal.com |
| Rondure Overseas Fund – Investor Class | Financial Highlights |
| | For a Share Outstanding Throughout the Period Presented |
| Investor Class | | For the Six Months Ended October 31, 2019 (Unaudited) | | | Year Ended April 30, 2019 | | | For the Period May 2, 2017 (Commencement of Operations) to April 30, 2018 | |
| NET ASSET VALUE, BEGINNING OF PERIOD | | $ | 11.12 | | | $ | 11.48 | | | $ | 10.00 | |
| | | | | | | | | | | | | |
| INCOME FROM INVESTMENT OPERATIONS | | | | | | | | | | | | |
| Net investment income(a) | | | 0.04 | | | | 0.08 | | | | 0.09 | |
| Net realized and unrealized gain/(loss) on investments | | | 0.47 | | | | (0.32 | ) | | | 1.46 | |
| Total income/(loss) from investment operations | | | 0.51 | | | | (0.24 | ) | | | 1.55 | |
| | | | | | | | | | | | | |
| DISTRIBUTIONS | | | | | | | | | | | | |
| From net investment income | | | – | | | | (0.09 | ) | | | – | |
| From net realized gain on investments | | | – | | | | (0.03 | ) | | | (0.08 | ) |
| Total distributions | | | – | | | | (0.12 | ) | | | (0.08 | ) |
| | | | | | | | | | | | | |
| REDEMPTION FEES ADDED TO PAID-IN CAPITAL | | | 0.00 | (b) | | | 0.00 | (b) | | | 0.01 | |
| | | | | | | | | | | | | |
| INCREASE/DECREASE IN NET ASSET VALUE | | | 0.51 | | | | (0.36 | ) | | | 1.48 | |
| NET ASSET VALUE, END OF PERIOD | | $ | 11.63 | | | $ | 11.12 | | | $ | 11.48 | |
| | | | | | | | | | | | | |
| TOTAL RETURN | | | 4.59 | %(c) | | | (1.98 | )% | | | 15.63 | %(c) |
| | | | | | | | | | | | | |
| RATIOS AND SUPPLEMENTAL DATA | | | | | | | | | | | | |
| Net assets, end of period (in 000s) | | $ | 3,735 | | | $ | 3,922 | | | $ | 5,189 | |
| | | | | | | | | | | | | |
| RATIOS TO AVERAGE NET ASSETS | | | | | | | | | | | | |
| Expenses (excluding fees waived/ reimbursed by investment advisor) | | | 2.09 | %(d) | | | 2.04 | % | | | 2.45 | %(d) |
| Expenses (including fees waived/ reimbursed by investment advisor) | | | 1.10 | %(d) | | | 1.10 | % | | | 1.10 | %(d) |
| Net investment income | | | 0.76 | %(d) | | | 0.74 | % | | | 0.82 | %(d) |
| | | | | | | | | | | | | |
| PORTFOLIO TURNOVER RATE | | | 24 | %(c) | | | 40 | % | | | 14 | %(c) |
| (a) | Per share numbers have been calculated using the average shares method. |
| (b) | Less than $0.005 or ($0.005) per share. |
See Notes to Financial Statements.
| Semi-Annual Report | October 31, 2019 | 25 |
| Rondure Funds | Notes to Financial Statements |
| | October 31, 2019 (Unaudited) |
1. ORGANIZATION
Financial Investors Trust (the “Trust”), a Delaware statutory trust, is an open-end management investment company registered under the Investment Company Act of 1940, as amended (“1940 Act”). As of October 31, 2019, the Trust consists of multiple separate Portfolios or series. This semi-annual report describes the Rondure New World Fund and the Rondure Overseas Fund (individually a “Fund” and collectively, the “Funds”). The Funds seek long-term growth of capital. The Funds offer Investor Class and Institutional Class shares.
2. SIGNIFICANT ACCOUNTING POLICIES
The accompanying financial statements were prepared in accordance with accounting principles generally accepted in the United States of America (“U.S. GAAP”). The preparation of financial statements in conformity with U.S. GAAP requires management to make certain estimates and assumptions that affect the reported amounts of assets and liabilities and disclosures of contingent assets and liabilities at the date of the financial statements and the reported amounts of revenue and expenses during the period. Actual results could differ from those estimates. The Funds are considered an investment company for financial reporting purposes under U.S. GAAP and follows the accounting and reporting guidance applicable to investment companies in the Financial Accounting Standards Board Accounting Standards Codification Topic 946. The following is a summary of significant accounting policies consistently followed by the Funds in preparation of its financial statements.
Investment Valuation:The Funds generally value their securities based on market prices determined at the close of regular trading on the New York Stock Exchange (“NYSE”), normally 4:00 p.m. Eastern Time, on each day the NYSE is open for trading.
For equity securities and mutual funds that are traded on an exchange, the market price is usually the closing sale or official closing price on that exchange. In the case of equity securities not traded on an exchange, or if such closing prices are not otherwise available, the securities are valued at the mean of the most recent bid and ask prices on such day. Redeemable securities issued by open-end registered investment companies are valued at the investment company’s applicable net asset value, with the exception of exchange-traded open-end investment companies, which are priced as equity securities.
Equity securities that are primarily traded on foreign securities exchanges are valued at the closing values of such securities on their respective foreign exchanges, except when an event occurs subsequent to the close of the foreign exchange and the close of the NYSE that was likely to have changed such value. In such an event, the fair value of those securities are determined in good faith through consideration of other factors in accordance with procedures established by and under the general supervision of the Board of Trustees of the Trust (the “Board” or the “Trustees”). The Funds will use a fair valuation model provided by an independent pricing service, which is intended to reflect fair value when a security’s value or a meaningful portion of each Fund’s portfolio is believed to have been materially affected by a valuation event that has occurred between the close of the exchange or market on which the security is traded and the close of the regular trading day on the NYSE. The Funds’ valuation procedures set forth certain triggers which instruct when to use the fair valuation model.
Forward currency exchange contracts have a fair value determined by the prevailing foreign currency exchange daily rates and current foreign currency exchange forward rates. The foreign currency exchange forward rates are calculated using an automated system that estimates rates on the basis of the current day foreign currency exchange rates and forward foreign currency exchange rates supplied by a pricing service.
When such prices or quotations are not available, or when Rondure Global Advisors, LLC (the “Advisor” or “Rondure”) believes that they are unreliable, securities may be priced using fair value procedures approved by the Board.
Fair Value Measurements:The Funds disclose the classification of their fair value measurements following a three-tier hierarchy based on the inputs used to measure fair value. Inputs refer broadly to the assumptions that market participants would use in pricing the asset or liability, including assumptions about risk. Inputs may be observable or unobservable. Observable inputs reflect the assumptions market participants would use in pricing the asset or liability that are developed based on market data obtained from sources independent of the reporting entity. Unobservable inputs reflect the reporting entity’s own assumptions about the assumptions market participants would use in pricing the asset or liability that are developed based on the best information available.
Various inputs are used in determining the value of the Funds’ investments as of the end of the reporting period. When inputs used fall into different levels of the fair value hierarchy, the level in the hierarchy within which the fair value measurement falls is determined based on the lowest level input that is significant to the fair value measurement in its entirety. The designated input levels are not necessarily an indication of the risk or liquidity associated with these investments. These inputs are categorized in the following hierarchy under applicable financial accounting standards:
| 26 | 1.855.775.3337 |www.rondureglobal.com |
| Rondure Funds | Notes to Financial Statements |
| | October 31, 2019 (Unaudited) |
Level 1 – Unadjusted quoted prices in active markets for identical investments, unrestricted assets or liabilities that the Funds have the ability to access at the measurement date;
Level 2 – Quoted prices which are not active, quoted prices for similar assets or liabilities in active markets or inputs other than quoted prices that are observable (either directly or indirectly) for substantially the full term of the asset or liability; and
Level 3 – Significant unobservable prices or inputs (including the Funds’ own assumptions in determining the fair value of investments) where there is little or no market activity for the asset or liability at the measurement date.
The following is a summary of each Fund’s investments in the fair value hierarchy as of October 31, 2019:
| Investments in Securities at Value | | Level 1 - Quoted and Unadjusted Prices | | | Level 2 - Other Significant Observable Inputs | | | Level 3 - Significant Unobservable Inputs | | | Total | |
| Rondure New World Fund | | | | | | | | | | | | | | | | |
| Common Stocks | | | | | | | | | | | | | | | | |
| Tanzania | | $ | – | | | $ | 161,958 | | | $ | – | | | $ | 161,958 | |
| Other* | | | 130,042,633 | | | | – | | | | – | | | | 130,042,633 | |
| Total | | $ | 130,042,633 | | | $ | 161,958 | | | $ | – | | | $ | 130,204,591 | |
| | | | | | | | | | | | | |
| Investments in Securities at Value | | Level 1 - Quoted and Unadjusted Prices | | | Level 2 - Other Significant Observable Inputs | | | Level 3 - Significant Unobservable Inputs | | | Total | |
| Rondure Overseas Fund | | | | | | | | | | | | | | | | |
| Common Stocks* | | $ | 21,670,095 | | | $ | – | | | $ | – | | | $ | 21,670,095 | |
| Total | | $ | 21,670,095 | | | $ | – | | | $ | – | | | $ | 21,670,095 | |
| * | For a detailed country breakdown, see the accompanying Portfolio of Investments. |
For liabilities arising from overdrafts in the custody account, the carrying amount reported as payable to custodian in the Statement of Assets and Liabilities approximates fair value due to the relatively short-term maturity of these financial instruments. As of October 31, 2019, the liability related to custody overdrafts in the Rondure Overseas Fund are based on Level 2 inputs.
For the six months ended October 31, 2019, the Funds did not have any securities that used significant unobservable inputs (Level 3) in determining fair value.
Investment Transactions and Investment Income:Investment transactions are accounted for on the date the investments are purchased or sold (trade date). Realized gains and losses from investment transactions are reported on an identified cost which is the same basis the Fund uses for federal income tax purposes. Interest income, which includes accretion of discounts and amortization of premiums, is accrued and recorded as earned. Dividend income is recognized on the ex-dividend date or for certain foreign securities, as soon as information is available to the Funds. All of the realized and unrealized gains and losses and net investment income, are allocated daily to each class in proportion to its average daily net assets.
| Semi-Annual Report | October 31, 2019 | 27 |
| Rondure Funds | Notes to Financial Statements |
| | October 31, 2019 (Unaudited) |
Cash Management Transactions:The Funds subscribe to the Brown Brothers Harriman & Co. (“BBH”) Cash Management Service (“CMS”), whereby cash balances are automatically swept into overnight offshore demand deposits with either the BBH Grand Cayman branch or a branch of a pre-approved commercial bank. This fully automated program allows the Funds to earn interest on cash balances. Excess cash with deposit institutions domiciled outside of the U.S. are subject to sovereign actions in the jurisdiction of the deposit institution including, but not limited to, freeze, seizure or diminution. Cash balances in the BBH CMS are included on the Statements of Assets and Liabilities under Cash and Foreign Cash, at Value. As of October 31, 2019, the Funds had the following cash balances participating in the BBH CMS:
| Fund | | | |
| Rondure New World Fund | | $ | 10,451,555 | |
| Rondure Overseas Fund | | | 1,326,305 | |
As of October 31, 2019, the Funds had the following foreign cash balances participating in the BBH CMS (cost and value of foreign cash balances are equal):
| Fund | | | |
| Rondure New World Fund | | $ | 6 | |
| Rondure Overseas Fund | | | 1 | |
Foreign Securities:The Funds may directly purchase securities of foreign issuers. Investing in securities of foreign issuers involves special risks not typically associated with investing in securities of U.S. issuers. The risks include possible reevaluation of currencies, the inability to repatriate foreign currency, less complete financial information about companies and possible future adverse political and economic developments. Moreover, securities of many foreign issuers and their markets may be less liquid and their prices more volatile than those of securities of comparable U.S. issuers.
Foreign Currency Translation:The books and records of the Funds are maintained in U.S. dollars. Investment valuations and other assets and liabilities initially expressed in foreign currencies are converted each business day into U.S. dollars based upon current exchange rates. Prevailing foreign exchange rates may generally be obtained at the close of the NYSE (normally, 4:00 p.m. Eastern Time). The portion of realized and unrealized gains or losses on investments due to fluctuations in foreign currency exchange rates are separately disclosed.
Foreign Currency Spot Contracts:The Funds may enter into foreign currency spot contracts to facilitate transactions in foreign securities or to convert foreign currency receipts into U.S. dollars. A foreign currency spot contract is an agreement between two parties to buy and sell currencies at the current market rate, for settlement generally within two business days. The U.S. dollar value of the contracts is determined using current currency exchange rates supplied by a pricing service.
The contract is marked-to-market daily for settlements beyond one day and any change in market value is recorded as an unrealized gain or loss. When the contract is closed, a realized gain or loss is recorded equal to the difference between the value on the open and close date. Losses may arise from changes in the value of the foreign currency, or if the counterparties do not perform under the contract’s terms. The maximum potential loss from such contracts is the aggregate face value in U.S. dollars at the time the contract was opened.
Trust Expenses:Some expenses of the Trust can be directly attributed to the Funds. Expenses which cannot be directly attributed to the Funds are apportioned among all funds in the Trust based on average net assets of each fund.
Fund and Class Expenses:Expenses that are specific to a Fund or class of shares of a Fund, including distribution fees (Rule 12b-1 fees), are charged directly to that Fund or share class. Expenses that are common to all Funds generally are allocated among the Funds in proportion to their average daily net assets.
Federal Income Taxes:The Funds comply with the requirements under Subchapter M of the Internal Revenue Code of 1986, as amended, applicable to regulated investment companies and intend to distribute substantially all of their net taxable income and net capital gains, if any, each year so that it will not be subject to excise tax on undistributed income and gains. The Funds are not subject to income taxes to the extent such distributions are made.
Distributions to Shareholders:Each Fund normally pays dividends and distributes capital gains, if any, on an annual basis. Income dividend distributions are derived from dividends and other income each Fund receives from their investments, including short term capital gains. Long term capital gain distributions are derived from gains realized when each Fund sells a security it has owned for more than a year. Each Fund may make
| 28 | 1.855.775.3337 |www.rondureglobal.com |
| Rondure Funds | Notes to Financial Statements |
| | October 31, 2019 (Unaudited) |
additional distributions and dividends at other times if the portfolio manager believes doing so may be necessary for each Fund to avoid or reduce taxes. The Funds intend to pass through foreign tax credits to shareholders.
3. TAX BASIS INFORMATION
Tax Basis of Investments:As of October 31, 2019, the aggregate cost of investments, gross unrealized appreciation/(depreciation) and net unrealized appreciation for Federal tax purposes was as follows:
| Fund | | Gross Appreciation (excess of value over tax cost) | | | Gross Depreciation (excess of tax cost over value) | | | Net Unrealized Appreciation | | | Cost of Investments for Income Tax Purposes | |
| Rondure New World Fund | | $ | 23,244,032 | | | $ | (5,721,383 | ) | | $ | 17,522,649 | | | $ | 112,681,942 | |
| Rondure Overseas Fund | | | 2,960,993 | | | | (451,105 | ) | | | 2,509,888 | | | | 19,160,207 | |
Tax Basis of Distributions to Shareholders:The character of distributions made during the year from net investment income or net realized gains may differ from its ultimate characterization for federal income tax purposes. Also, due to the timing of dividend distributions, the fiscal year in which amounts are distributed may differ from the fiscal year in which the income or realized gain were recorded by the Funds.
The tax characters of distributions paid by the Funds for the year ended April 30, 2019 were as follows:
| Fund | | Ordinary Income | | | Long-Term Capital Gain | |
| Rondure New World Fund | | $ | 939,867 | | | $ | – | |
| Rondure Overseas Fund | | | 289,182 | | | | – | |
The amounts and characteristics of tax basis distributions and composition of distributable earnings/(accumulated losses) are finalized at fiscal year-end. Accordingly, tax basis balances have not been determined as of October 31, 2019.
4. SECURITIES TRANSACTIONS
The cost of purchases and proceeds from sales of securities (excluding short term securities) during the six months ended October 31, 2019 were as follows:
| Fund | | Purchases of Securities | | | Proceeds From Sales of Securities | |
| Rondure New World Fund | | $ | 14,810,470 | | | $ | 19,831,949 | |
| Rondure Overseas Fund | | | 5,154,825 | | | | 7,165,549 | |
5. SHARES OF BENEFICIAL INTEREST
The capitalization of the Trust consists of an unlimited number of shares of beneficial interest with no par value per share. Holders of the shares of the Funds of the Trust have one vote for each share held and a proportionate fraction of a vote for each fractional share. All shares issued and outstanding are fully paid and are transferable and redeemable at the option of the shareholder. Purchasers of the share do not have any obligation to make payments to the Trust or its creditors solely by reason of the purchasers’ ownership of the shares. Shares have no pre-emptive rights.
Shares redeemed within 60 days of purchase may incur a 2% short-term redemption fee deducted from the redemption amount. For the six months ended October 31, 2019, the redemption fees charged by the Funds are presented in the Statement of Changes in Net Assets.
| Semi-Annual Report | October 31, 2019 | 29 |
| Rondure Funds | Notes to Financial Statements |
| | October 31, 2019 (Unaudited) |
6. MANAGEMENT AND RELATED-PARTY TRANSACTIONS
The Advisor, subject to the authority of the Board, is responsible for the overall management and administration of the Funds’ business affairs. The Advisor manages the investments of the Funds in accordance with the Funds’ investment objective, policies and limitations and investment guidelines established jointly by the Advisor and the Trustees. Pursuant to the Advisory Agreement, (the “Advisory Agreement”), each Fund pays the Advisor an annual management fee based on each Fund’s average daily net assets. The management fee is paid on a monthly basis. The following table reflects the Funds’ advisory fee rates.
| Fund | Advisory Fee |
| Rondure New World Fund | 0.85% |
| Rondure Overseas Fund | 0.70% |
The Advisor has contractually agreed to limit certain of each Fund’s expenses (excluding acquired fund fees and expenses, brokerage expenses, interest expense, taxes and extraordinary expenses). The following table reflects the Funds’ expense cap.
| Fund | | Expense Cap | | | Term of Expense Limit Agreements |
| Rondure New World Fund | | | | | | |
| Institutional Class | | | 1.10% | | | September 1, 2019 – August 31, 2020/ |
| Investor Class | | | 1.35% | | | September 1, 2018 – August 31, 2019 |
| Rondure Overseas Fund | | | | | | |
| Institutional Class | | | 0.85% | | | September 1, 2019 – August 31, 2020/ |
| Investor Class | | | 1.10% | | | September 1, 2018 – August 31, 2019 |
Pursuant to these agreements, the Advisor may seek reimbursement from a Fund for any previous fee waivers and expense reimbursements made by the Advisor, provided that any such reimbursements made by the Funds to the Advisor will not cause the Funds’ expense limitation to exceed expense limitations in existence at the time the expense was incurred, or at the time of the reimbursement, whichever is lower, and the reimbursement is made within three years after the expenses were incurred. Fees waived/reimbursed by Advisor for the year ended April 30, 2019 are disclosed in the Statements of Operations.
For the six months ended October 31, 2019, the fee waivers/reimbursements and/or recoupments were as follows:
| Fund | | Fees Waived/Reimbursed By Adviser | |
| Rondure New World Fund Fund | | | |
| Institutional Class | | $ | 184,186 | |
| Investor Class | | | 37,880 | |
| Rondure Overseas Fund Fund | | | | |
| Institutional Class | | $ | 85,596 | |
| Investor Class | | | 18,725 | |
| Fund | | Expires 2021 | | | Expires 2022 | | | Expires 2023 | | | Total | |
| Rondure New World Fund | | | | | | | | | | | | |
| Institutional Class | | $ | 366,501 | | | $ | 357,945 | | | $ | 184,186 | | | $ | 908,632 | |
| Investor Class | | | 90,647 | | | | 90,396 | | | | 37,880 | | | | 218,923 | |
| Rondure Overseas Fund | | | | | | | | | | | | | | | | |
| Institutional Class | | $ | 186,581 | | | $ | 165,269 | | | $ | 85,596 | | | $ | 437,446 | |
| Investor Class | | | 33,311 | | | | 42,849 | | | | 18,725 | | | | 94,886 | |
| 30 | 1.855.775.3337 | www.rondureglobal.com |
| Rondure Funds | Notes to Financial Statements |
| | October 31, 2019 (Unaudited) |
Administrator Fees and Expenses
ALPS Fund Services, Inc. (“ALPS”) serves as administrator to the Funds and the Funds have agreed to pay expenses incurred in connection with their administrative activities. Pursuant to an Administration Agreement, ALPS provides operational services to the Funds including, but not limited to, fund accounting and fund administration and generally assists in the Funds’ operations. Officers of the Trust are employees of ALPS. The Funds’ administration fee is accrued on a daily basis and paid monthly. Administration fees paid by the Funds for the six months ended October 31, 2019 are disclosed in the Statements of Operations.
ALPS is reimbursed by the Funds for certain out-of-pocket expenses.
Transfer Agent
ALPS serves as transfer, dividend paying and shareholder servicing agent for the Funds. ALPS receives an annual minimum fee, a fee based upon the number of shareholder accounts, and is also reimbursed by the Funds for certain out-of-pocket expenses. Transfer agent fees paid by the Funds for the six months ended October 31, 2019 are disclosed in the Statements of Operations.
Compliance Services
ALPS provides services that assist the Trust’s chief compliance officer in monitoring and testing the policies and procedures of the Trust in conjunction with requirements under Rule 38a-1 under the 1940 Act and receives an annual base fee. ALPS is reimbursed for certain out-of-pocket expenses by the Funds. Compliance service fees paid by the Funds for the year ended April 30, 2019 are disclosed in the Statements of Operations.
Principal Financial Officer
ALPS receives an annual fee for providing principal financial officer services to the Funds. Principal financial officer fees paid by the Fund for the six months ended October 31, 2019 are disclosed in the Statements of Operations.
Distributor
ALPS Distributors, Inc. (“ADI” or the “Distributor”) (an affiliate of ALPS) acts as the distributor of the Funds’ shares pursuant to a Distribution Agreement with the Trust. Shares are sold on a continuous basis by ADI as agent for the Funds, and ADI has agreed to use its best efforts to solicit orders for the sale of each Fund’s shares, although it is not obliged to sell any particular amount of shares. ADI is not entitled to any compensation for its services as Distributor. ADI is registered as a broker-dealer with the U.S. Securities and Exchange Commission.
Each Fund has adopted a Distribution and Services (Rule 12b-1) Plan pursuant to Rule 12b-1 of the 1940 Act (the “Plan”) for its Investor Class shares. The Plan allows the Funds to use Investor Class assets to pay fees in connection with the distribution and marketing of Investor Class shares and/or the provision of shareholder services to Investor Class shareholders. The Plan permits payment for services in connection with the administration of plans or programs that use Investor Class shares of each Fund as their funding medium and for related expenses. The recipients of such payments may include the Distributor, other affiliates of the Advisor, broker-dealers, financial institutions, plan sponsors and administrators and other financial intermediaries through which investors may purchase shares of the Fund. The Plan permits the Funds to make total payments at an annual rate of up to 0.25% of each Fund’s average daily net assets attributable to its Investor Class shares. The expenses of the Plan are reflected as distribution and service fees in the Statements of Operations.
Trustees
The fees and expenses of the independent Trustees of the Board are presented in the Statements of Operations.
7. INDEMNIFICATIONS
Under the Trust’s organizational documents, its officers and Trustees are indemnified against certain liability arising out of the performance of their duties to the Trust. Additionally, in the normal course of business, the Trust enters into contracts with service providers that may contain general indemnification clauses, which may permit indemnification to the extent permissible under applicable law. The Trust’s maximum exposure under these arrangements is unknown, as this would involve future claims that may be made against the Trust that have not yet occurred.
8. SUBSEQUENT EVENT
Subsequent events after the date of the Statements of Assets and Liabilities have been evaluated through the date the financial statements were issued.
| Semi-Annual Report | October 31, 2019 | 31 |
| Rondure Funds | Disclosure Regarding Approval of Fund Advisory Agreement |
October 31, 2019 (Unaudited)
Rondure Funds
On September 10, 2019, the Trustees met in person to discuss, among other things, the approval of the Investment Advisory Agreement between the Trust, with respect to the Rondure New World Fund and the Rondure Overseas Fund (collectively, the “Rondure Funds”) and Rondure, in accordance with Section 15(c) of the 1940 Act. In renewing and approving the Investment Advisory Agreement with Rondure, on behalf of the Rondure Funds, the Trustees, including the independent Trustees, considered the following factors with respect to the Rondure Funds:
Investment Advisory Fee Rate:The Trustees reviewed and considered the contractual annual advisory fees paid by the Trust, on behalf of the Rondure Funds, to Rondure, of 0.85% of the Rondure New World Fund’s daily net assets and 0.70% of the Rondure Overseas Fund’s daily net assets, in light of the extent and quality of the advisory services provided by Rondure to each of the Rondure Funds.
The Board received and considered information including a comparison of the Investor Class and Institutional Class of each Rondure Fund’s contractual advisory fee rate with those of funds in the peer group and universe of funds provided by an independent provider of investment company data (the “Data Provider”). The Trustees noted that the contractual advisory fee rate of both classes of each of the Rondure Funds was below the Data Provider peer group and universe medians.
Total Net Expense Ratios:The Trustees further reviewed and considered that the total net expense ratios of both classes of each of the Rondure Funds was generally below the Data Provider peer group and universe medians.
Nature, Extent, and Quality of the Services under the Investment Advisory Agreement:The Trustees received and considered information regarding the nature, extent, and quality of services provided to the Rondure Funds under the Investment Advisory Agreement. The Trustees reviewed certain background materials supplied by Rondure in its presentation, including its Form ADV.
The Trustees reviewed and considered Rondure’s investment advisory personnel, its history as an asset manager, and its performance and the amount of assets currently under management by Rondure and its affiliated entities. The Trustees also reviewed the research and decision-making processes utilized by Rondure, including the methods adopted to seek to achieve compliance with the investment objectives, policies, and restrictions of the Rondure Funds.
The Trustees considered the background and experience of Rondure’s management in connection with the Rondure Funds, including reviewing the qualifications, backgrounds, and responsibilities of the management team primarily responsible for the day-to-day portfolio management of each Rondure Fund and the extent of the resources devoted to research and analysis of actual and potential investments.
The Trustees also reviewed, among other things, Rondure’s insider trading policies and procedures and its Code of Ethics.
Performance:The Trustees reviewed performance information for the Investor Class and Institutional Class shares of the Rondure Funds for the 3-month and 1-year periods ended June 30, 2019. That review included a comparison of each Rondure Fund’s performance to the performance of a group of comparable funds selected by the Data Provider. The Trustees noted that the performance of both classes of the Rondure New World Fund was above the Data Provider universe median for the 3-month and 1-year periods and that the performance of both classes of the Rondure Overseas Fund was below the Data Provider universe median for the 3-month and 1-year periods. The Trustees also considered Rondure’s discussion of its reputation generally and its investment techniques, risk management controls, and decision-making processes.
Comparable Accounts:The Trustees noted certain information provided by Rondure regarding fees charged to its other clients utilizing a strategy similar to that employed by the Rondure Funds.
Profitability:The Trustees received and considered a retrospective and projected profitability analysis prepared by Rondure based on the fees payable under the Investment Advisory Agreement with respect to the Rondure Funds. The Trustees considered the profits, if any, anticipated to be realized by Rondure in connection with the operation of the Rondure Funds. The Board then reviewed Rondure’s income statement and balance sheet for the years ended December 31, 2016 through December 31, 2018 in order to analyze the financial condition, stability, and profitability of Rondure.
Economies of Scale:The Trustees considered whether economies of scale in the provision of services to the Rondure Funds will be passed along to the shareholders under the proposed agreements.
Other Benefits to the Adviser:The Trustees reviewed and considered any other incidental benefits derived or to be derived by Rondure from its relationship with the Rondure Funds, including whether soft dollar arrangements were used.
| 32 | 1.855.775.3337 | www.rondureglobal.com |
| Rondure Funds | Disclosure Regarding Approval of Fund Advisory Agreement |
October 31, 2019 (Unaudited)
In renewing Rondure as the Rondure Funds’ investment adviser and renewing the Investment Advisory Agreement and the fees charged under the Investment Advisory Agreement, the Trustees concluded that no single factor reviewed by the Trustees was identified by the Trustees to be determinative as the principal factor in whether to renew the Investment Advisory Agreement. Further, the Independent Trustees were advised by separate independent legal counsel throughout the process. The Trustees, including all of the Independent Trustees, concluded that:
| ● | the contractual advisory fee rate of both classes of each of the Rondure Funds was below the Data Provider peer group and universe medians; |
| ● | the total net expense ratios of both classes of each of the Rondure Funds was below the Data Provider peer group and universe medians; |
| ● | the nature, extent, and quality of services rendered by Rondure under the Investment Advisory Agreement with respect to each Rondure Fund were adequate; |
| ● | for the period ended June 30, 2019, the performance of both classes of the Rondure New World Fund was above the Data Provider universe median for the 3-month and 1-year periods and the performance of both classes of the Rondure Overseas Fund was below the Data Provider universe median for the 3-month and 1-year periods; |
| ● | bearing in mind the limitations of comparing different types of managed accounts and the different levels of service typically associated with such accounts, the fee structures applicable to Rondure’s other clients employing a comparable strategy to any of the Rondure Funds were not indicative of any unreasonableness with respect to the advisory fee payable by the Rondure Funds; |
| ● | the profit, if any, realized by Rondure in connection with the operation of any of the Rondure Funds is not unreasonable; and |
| ● | there were no material economies of scale or other incidental benefits accruing to Rondure in connection with its relationship with any of the Rondure Funds. |
Based on the Trustees’ deliberations and their evaluation of the information described above, the Trustees, including all of the Independent Trustees, concluded that Rondure’s compensation for investment advisory services is consistent with the best interests of each of the Rondure Funds and their shareholders.
| Semi-Annual Report | October 31, 2019 | 33 |
| Rondure Funds | Additional Information |
| | October 31, 2019 (Unaudited) |
1. FUND HOLDINGS
The Funds’ portfolio holdings are made available semi-annually in shareholder reports within 60 days after the close of the period for which the report is being made, as required by federal securities laws. The Funds also file monthly portfolio holdings on Form N-PORT on a quarterly basis, with the schedule of portfolio holdings filed on Form N-PORT for the third month of each Fund’s fiscal quarter made publicly available 60 days after the end of the Funds’ fiscal quarter.
2. FUND PROXY VOTING POLICIES, PROCEDURES AND SUMMARIES
The Funds’ policies and procedures used in determining how to vote proxies and information regarding how the Funds voted proxies relating to portfolio securities during the most recent prior 12-month period ending June 30 are available without charge, (1) upon request, by calling (toll-free) 1-855-775-3337 and (2) on the SEC’s website at http://www.sec.gov.
| 34 | 1.855.775.3337 | www.rondureglobal.com |
| Rondure Funds | Privacy Policy |
| | October 31, 2019 (Unaudited) |
| Who We Are | |
| Who is providing this notice? | Rondure New World Fund and Rondure Overseas Fund. |
| What We Do | |
| How do the Funds protect my personal information? | To protect your personal information from unauthorized access and use, we use security measures that comply with federal law. These measures include computer safeguards and secured files and buildings. |
How do the Funds collect my personal information? | We collect your personal information, for example, when you • open an account • provide account information or give us your contact information • make a wire transfer or deposit money |
| Why can't I limit all sharing? | Federal law gives you the right to limit only • sharing for affiliates’ everyday business purposes-information about your creditworthiness • affiliates from using your information to market to you • sharing for non-affiliates to market to you State laws and individual companies may give you additional rights to limit sharing. |
| Definitions | |
| Affiliates | Companies related by common ownership or control. They can be financial and nonfinancial companies. |
| Non-affiliates | Companies not related by common ownership or control. They can be financial and nonfinancial companies. • The Funds does not share with non-affiliates so they can market to you. |
| Joint marketing | A formal agreement between non-affiliated financial companies that together market financial products or services to you. • The Funds does not jointly market. |
| Other Important Information | |
| California Residents | If your account has a California home address, your personal information will not be disclosed to nonaffiliated third parties except as permitted by applicable California law, and we will limit sharing such personal information with our affiliates to comply with California privacy laws that apply to us. |
| Vermont Residents | The State of Vermont requires financial institutions to obtain your consent prior to sharing personal information that they collect about you with affiliated companies and nonaffiliated third parties other than in certain limited circumstances. Except as permitted by law, we will not share personal information we collect about you with nonaffiliated third parties or other affiliated companies unless you provide us with your written consent to share such information. |
| Semi-Annual Report | October 31, 2019 | 35 |
| Rondure Funds | Privacy Policy |
| | October 31, 2019 (Unaudited) |
| FACTS | WHAT DO THE FUNDS DO WITH YOUR PERSONAL INFORMATION? |
| Why? | Financial companies choose how they share your personal information. Federal law gives consumers the right to limit some but not all sharing. Federal law also requires us to tell you how we collect, share, and protect your personal information. Please read this notice carefully to understand what we do. |
| What? | The types of personal information we collect and share depend on the product or service you have with us. This information can include: • Social Security number and account transactions • Account balances and transaction history • Wire transfer instructions |
| How? | All financial companies need to share customers’ personal information to run their everyday business. In the section below, we list the reasons financial companies can share their customers’ personal information; the reasons the Funds choose to share; and whether you can limit this sharing. |
| Reasons we can share your personal information | Do the Funds share: | Can you limit this sharing? |
| For our everyday business purposes— such as to process your transactions, maintain your account(s), respond to court orders and legal investigations, or report to credit bureaus | Yes | No |
| For our marketing purposes— to offer our products and services to you | No | We do not share. |
| For joint marketing with other financial companies | No | We do not share. |
| For our affiliates’ everyday business purposes— information about your transactions and experiences | Yes | No |
| For our affiliates’ everyday business purposes— information about your creditworthiness | No | We do not share. |
| For nonaffiliates to market to you | No | We do not share. |
| 36 | 1.855.775.3337 | www.rondureglobal.com |

Contact Us
| Mail: | Rondure Funds, P.O. Box 13664, Denver, CO 80201 | E-Mail: | rondureglobal@alpsinc.com |
| Phone: | 1.855.775.3337 | Web: | www.rondureglobal.com |

TABLE OF CONTENTS
| Letter to Shareholders | 1 |
| Performance Review | |
| Seafarer Overseas Growth and Income Fund | 4 |
| Seafarer Overseas Value Fund | 10 |
| Disclosure of Fund Expenses | 16 |
| Portfolio of Investments | 18 |
| Statements of Assets and Liabilities | 26 |
| Statements of Operations | 27 |
| Statements of Changes in Net Assets | 28 |
| Financial Highlights | 30 |
| Notes to Financial Statements | 38 |
| Additional Information | 47 |
| Privacy Policy | 48 |
Beginning on January 1, 2021, as permitted by regulations adopted by the U.S. Securities and Exchange Commission, paper copies of the Funds’ annual and semi-annual shareholder reports will no longer be sent by mail, unless you specifically request paper copies of the reports. Instead, the reports will be made available on the Funds’ website at seafarerfunds.com, and you will be notified by mail each time a report is posted and provided with a website link to access the report.
If you already elected to receive shareholder reports electronically, you will not be affected by this change, and you need not take any action. You may elect to receive shareholder reports and other communications from the Funds electronically by contacting your financial intermediary or, if you invest directly with the Funds, by logging into your Seafarer Funds account at seafarerfunds.com and enrolling in electronic delivery.
You may elect to receive future shareholder reports in paper format free of charge by contacting your financial intermediary or, if you invest directly with the Funds, by calling (855) 732-9220.
| Seafarer Funds | Letter to Shareholders |
October 31, 2019
LETTER TO SHAREHOLDERS
November 15, 2019
Dear Fellow Shareholders,
I appreciate the opportunity to address you on behalf of the Seafarer Funds. This semi-annual report covers the first half of the Funds’ 2019-2020 fiscal year (May 1, 2019 to October 31, 2019).
Team Update
The common practice at Seafarer Capital Partners, LLC (“Seafarer”), the adviser to the Funds, and my own personal preference, is to address issues head on. Thus, on October 11, 2019, Seafarer announced the departure of one of the Seafarer Overseas Growth and Income Fund’s portfolio managers, Inbok Song.1 An esteemed colleague and human being, Inbok and her work during her 13-month tenure as a Lead Manager of the Fund will be missed. The Fund continues to pursue its objective following Seafarer’s distinctive investment approach, which remains in the custody of the Seafarer team and does not go out the door with one person. As such, Andrew Foster and I continue our roles as Lead Managers of the Fund, working with the rest of the Seafarer investment team.
As an organization, Seafarer remains true to its founders’ vision: a small, employee-owned investment management firm, with employees that self-select to remain at the firm, attracted by the rare opportunity to create a distinctive investment approach to better serve the needs of savers, and to build an asset management firm with an equally unique ethos.
Navigating Challenges to Investors and to Seafarer – Common Cause, Common Solution
Seafarer’s investment approach and culture differentiate themselves not for the sake of doing so, but out of necessity, as these characteristics address the challenges faced by investors in the Funds and by Seafarer as an organization. The primary challenge to an investor’s objective of increasing the long-term purchasing power of savings is the ever-decreasing rate of return on capital promulgated by central banks around the globe, as this policy transfers value from savers to debtholders. At the same time, the primary long-term challenge to Seafarer as an active asset manager is the as-yet-unabated migration of savings from active investment strategies to passively managed ones. In my opinion, the primary cause of said migration shares the same root as the transfer of value from savers to debtholders: progressively lower rates of return on capital. Indeed, the result of ever-rising debt associated with its progressively lower cost is the apparent suspension of the business cycle, as demonstrated by the unprecedented longevity of the expansionary phases of gross domestic product (GDP) growth in recent economic cycles. The reason this effect is relevant to Seafarer is that active managers thrive on the changes in company business prospects associated with the natural business cycle. Now that central banks appear to have successfully suppressed the natural economic cycle, non-discriminating benchmark-oriented investment strategies have outperformed at the expense of active managers – for the same root cause that has transferred value from savers to debtholders.
Alas, shareholders and Seafarer find themselves on the same boat. Seafarer chooses to navigate the winds of change sticking to the sailboat it knows how to command best (a small and nimble asset management organization), with a crew that shares the same ethos (a small group of investment professionals committed to this type of vessel and who know what they are looking for on the investment horizon). While Seafarer has clarity of mind regarding the type of vessel and crew it employs, what deserves a more extended discussion is the waters it chooses to navigate. The Funds’ shareholders have good reason to question the captain’s choice of route. The MSCI Emerging Markets Index has underperformed the S&P 500 Index since the 2008 financial crisis, with its valuation on traditional multiples perennially cheaper than that of the S&P 500 with little prospect of revaluation.
My purpose in this letter is not to argue in favor of emerging markets or delve into an intricate explanation of the underperformance of the investment universe over the past decade. My objective is far more complex, thus requiring a simpler explanation: to explain how Seafarer thinks about the companies it invests in and why the Funds’ investors should care, given the foregoing headwinds to increasing the future purchasing power of present savings.
| Semi-annual Report – October 31, 2019 | 1 |
| Seafarer Funds | Letter to Shareholders |
October 31, 2019
The first hint as to why investors should care is in the name of the two strategies Seafarer manages at present: the Overseas Growth and Income strategy and the Overseas Value strategy. “Growth and Income” and “Value” point to the fact that in selecting securities, Seafarer’s crew prioritizes financial attributes over countries, sectors, or benchmarks. Furthermore, the use of the term “overseas” hints at the idea of diversifying U.S. dollar savings into securities denominated in other currencies. Thus, Seafarer’s frame of mind extends beyond the traditional approach of investing in the emerging markets because the countries that comprise said universe grow faster than the U.S. Seafarer approaches non-U.S. dollar overseas markets by searching for companies (not countries) that issue securities bearing “growth and income” and “value” characteristics.
It is difficult to overstate the importance of this difference in approach. It means that the Funds’ shareholders free themselves from the false premise that they must predict the relative performance of the S&P 500 Index versus the emerging markets over the next ten years before making an allocation. That quixotic prediction is something with which only investors in passive, benchmark-oriented strategies need to preoccupy themselves. Indexes do not add value to the world; individual companies do. The same way that Argentina and Turkey do not define the entire emerging markets, the fact that the latter has underperformed the S&P 500 Index over the past decade does not mean that all individual emerging market companies have also underperformed their U.S. counterparts. Therein lies the beauty of an active, bottom-up strategy that seeks to identify and invest in individual companies, thus obviating futile questions without answer, such as predicting stock indexes’ relative performance or the future path of benchmark interest rates.
From this perspective, the more meaningful allocation decision centers on savers’ allocation to U.S. dollar vs non-U.S. dollar investments. As explained in Seafarer’s Emerging Markets Briefing, one approach is as follows: investors measure the portion of their assets that are principally denominated in U.S. dollars versus those assets that are not.2 After matching U.S. dollar assets against U.S. dollar liabilities, a portion of the surplus capital could be allocated to the emerging markets.
In summary, both the Funds’ investors and Seafarer find themselves at the same crossroads. In Seafarer’s opinion, the answer to the challenge posed by the transfer of value from savers to debtholders, and to the shift from active management to passive strategies, is the same: to derive investment returns from individual companies (not indexes) that display specific Growth and Income or Value characteristics (as opposed to characteristics that relate to geography or sector). I find it important to convey to the Funds’ shareholders that Seafarer has the crew to stay the course because we have self-selected to man this type of vessel and know what we are pursuing on the investment horizon.
Thank you for entrusting us with your capital. We are honored to serve as your investment adviser in the emerging markets.
Sincerely,
Paul Espinosa
Portfolio Manager
Seafarer Capital Partners, LLC
| 2 | (855) 732-9220 seafarerfunds.com |
| Seafarer Funds | Letter to Shareholders |
October 31, 2019
The Funds are subject to investment risks, including possible loss of the principal amount invested and therefore are not suitable for all investors. The Funds may not achieve their objectives. Diversification does not ensure a profit or guarantee against loss.
Information on the Seafarer website is provided for textual reference only, and is not incorporated by reference into this report.
The MSCI Emerging Markets Total Return Index, Standard (Large+Mid Cap) Core, Gross (dividends reinvested), USD is a free float-adjusted market capitalization index designed to measure equity market performance of emerging markets. Index code: GDUEEGF.
The S&P 500 Total Return Index is a stock market index based on the market capitalizations of 500 large companies with common stock listed on the NYSE or NASDAQ.
It is not possible to invest directly in an index.
The views and information discussed in this commentary are as of the date of publication, are subject to change, and may not reflect Seafarer’s current views. The views expressed represent an assessment of market conditions at a specific point in time, are opinions only and should not be relied upon as investment advice regarding a particular investment or markets in general. Such information does not constitute a recommendation to buy or sell specific securities or investment vehicles. It should not be assumed that any investment will be profitable or will equal the performance of the portfolios or any securities or any sectors mentioned herein. The subject matter contained herein has been derived from several sources believed to be reliable and accurate at the time of compilation. Seafarer does not accept any liability for losses either direct or consequential caused by the use of this information.
| 1 | www.seafarerfunds.com/message-to-shareholders/2019/10/11 |
| 2 | www.seafarerfunds.com/commentary/emerging-markets-briefing/2019/10 |
| Semi-annual Report – October 31, 2019 | 3 |
| Seafarer Overseas Growth and Income Fund | Performance Review |
October 31, 2019
SEAFARER OVERSEAS GROWTH AND INCOME FUND
PERFORMANCE REVIEW
November 15, 2019
This report addresses the first half of the Seafarer Overseas Growth and Income Fund’s 2019-2020 fiscal year (May 1, 2019 to October 31, 2019).
During the semi-annual period, the Fund returned 4.23%, while the Fund’s benchmark, the MSCI Emerging Markets Total Return Index, declined -1.41%.1 By way of broader comparison, the S&P 500 Index gained 4.16%.
The Fund began the fiscal year with a net asset value (NAV) of $11.61 per share. In June, the Fund paid a semi-annual distribution of $0.181 per share. That payment brought the cumulative distribution per share, as measured from the Fund’s inception, to $2.860.2 The Fund finished the semi-annual period with a NAV of $11.91 per share.3
* * * * *
The small decline of the benchmark index in the semi-annual period belies what was a volatile period for emerging market equities. During the six month period, the benchmark fell by more than -8% in May, before recovering most of its losses by early July; next, it plummeted again, such that by late August, it had declined by more than 8%, but it recovered by the end of October to finish the period with a decline of -1.41%. The cause of such volatility is difficult to identify with certainty. However, we attribute the wild swings to two primary factors: first, confusion and rapidly shifting sentiments regarding the progress (or lack thereof) towards resolution of the trade disputes between the U.S. and China; and second, the sharp deterioration in earnings results for companies in the developing world.
The evidence suggest that the deterioration in projections for earnings growth was driven by Chinese companies, which have seen their prospects for 2019 fall sharply as growth in Mainland China decelerates regardless of the “trade war” (see the Outlook section of the Fund’s second quarter 2019 portfolio review for further discussion).4 Market participants appear to have been caught off guard by the sudden and sharp decline in corporate performance in China; the resulting “gap” between misplaced expectations and a more difficult reality likely induced the market gyrations mentioned above. The benchmark’s partial recovery at the end of the semi-annual period may indicate that stocks generally overreacted to the shock of anemic corporate performance of many companies.
The Fund’s substantial outperformance of the benchmark for the semi-annual period does not lend itself to any obvious explanation. The only common characteristic of the Fund’s holdings that might explain their resilience is that most companies presented very stable financial results – and some even modestly surpassed expectations. Normally, such “at par” performance would not lead to exuberance among stock prices; but when the broader market is undergoing a sharp deterioration in the quality of its underlying earnings, the favorable comparison can lend support to share prices. Essentially, the fundamental performance and earnings of the Fund’s holdings proved steadier than most other companies, and this led the holdings’ shares to be stable in a sinking market.
The largest contributor to the Fund’s total return during the semi-annual period was Qualicorp, a Brazil-based life insurance broker. Qualicorp’s stock appreciated over 100% during the period, recovering all the ground lost in the preceding quarters, and more. The company’s stock was propelled higher by: persistent and substantial free cash flow generation in spite of difficult operating conditions in Brazil; return of capital to shareholders; and business development potential following the acquisition of a ten percent stake in the company by a strategic shareholder. Qualicorp’s share price rose despite factors impinging on the performance of its home market equity index.
Another top contributor to the Fund’s NAV appreciation was China International Travel Service (CITS). CITS is listed in China’s domestic A-share market; it manages travel agencies, markets travel packages, and manages a range of duty-free stores in China.5 The company has produced strong results in 2019, allaying fears that surfaced in late 2018 that Chinese consumers’ demand to travel might soon plateau
| 4 | (855) 732-9220 seafarerfunds.com |
| Seafarer Overseas Growth and Income Fund | Performance Review |
October 31, 2019
amid a weak economy. Instead, the Chinese continue to travel with gusto – tourism is one of the leading reasons that China’s current account has swung from surplus to deficit. In addition, the company announced that it would open a duty-free shop in Beijing, boosting confidence in the company’s leadership within the tourism sector.
Other contributors to Fund performance include:Naver, a leading internet media company in Korea with a substantial holding in a Japanese internet subsidiary; andAspeed, a Taiwan-based maker of specialized chips in computer servers.
Sun Pharma Advanced Research Company (SPARC), a long-held position, continued to weigh on performance; as a result, the Fund exited the position during the semi-annual period. SPARC is an India-based company that specializes in the development of new pharmaceutical therapies and medical devices. During the past five years, SPARC has realized some success with the introduction of new generic therapies, particularly several that target glaucoma and various forms of ocular hypertension. However, the company’s financial performance has been lackluster due to poor licensing and operational decisions taken by its management. This placed severe strain on the company’s financial stability and necessitated repeated capital raising exercises. While SPARC arguably persists as an innovative leader, the Fund exited the position to reduce its exposure to such financial instability.
Thank you for entrusting us with your capital. We are honored to serve as your investment adviser in the emerging markets.
Andrew Foster and Paul Espinosa
Portfolio Managers, Seafarer Overseas Growth and Income Fund
Seafarer Capital Partners, LLC
The MSCI Emerging Markets Total Return Index, Standard (Large+Mid Cap) Core, Gross (dividends reinvested), USD is a free float-adjusted market capitalization index designed to measure equity market performance of emerging markets. Index code: GDUEEGF.
The S&P 500 Total Return Index is a stock market index based on the market capitalizations of 500 large companies with common stock listed on the NYSE or NASDAQ.
It is not possible to invest directly in an index.
The Fund is subject to investment risks, including possible loss of the principal amount invested and therefore is not suitable for all investors. The Fund may not achieve its objectives. Diversification does not ensure a profit or guarantee against loss.
Information on the Seafarer website is provided for textual reference only, and is not incorporated by reference into this report.
The views and information discussed in this commentary are as of the date of publication, are subject to change, and may not reflect Seafarer’s current views. The views expressed represent an assessment of market conditions at a specific point in time, are opinions only and should not be relied upon as investment advice regarding a particular investment or markets in general. Such information does not constitute a recommendation to buy or sell specific securities or investment vehicles. It should not be assumed that any investment will be profitable or will equal the performance of the portfolios or any securities or any sectors mentioned herein. The subject matter contained herein has been derived from several sources believed to be reliable and accurate at the time of compilation. Seafarer does not accept any liability for losses either direct or consequential caused by the use of this information.
| 1 | References to the “Fund” pertain to the Fund’s Institutional share class (ticker: SIGIX). The Investor share class (ticker: SFGIX) returned 4.14% during the semi-annual period. |
| 2 | The Fund’s inception date is February 15, 2012. |
| 3 | The Fund’s Investor share class began the fiscal year with a net asset value of $11.56 per share; it paid a semi-annual distribution of $0.179 per share in June; and it finished the semi-annual period with a value of $11.85 per share. |
| Semi-annual Report – October 31, 2019 | 5 |
| Seafarer Overseas Growth and Income Fund | Performance Review |
October 31, 2019
| 4 | The Outlook section of the Fund’s second quarter 2019 portfolio review is available at: www.seafarerfunds.com/funds/ogi/portfolio-review/2019/06/Q2/#outlook |
| 5 | Chinese A-Shares are a class of securitized common stock in Chinese companies, traded exclusively on Chinese stock exchanges (i.e., Shanghai and Shenzhen), and denominated in renminbi, China’s currency. If a Seafarer Fund is invested in Chinese A-Shares, please note the following: 1) any reduction or elimination of access to A-Shares could have a material adverse effect on the ability of the Fund to achieve its investment objective; and 2) uncertainties regarding China’s laws governing taxation of income and gains from investments in A-Shares could result in unexpected tax liabilities for the Fund, which could adversely impact Fund returns. |
| 6 | (855) 732-9220 seafarerfunds.com |
| Seafarer Overseas Growth and Income Fund | Performance Review |
October 31, 2019
Total Returns
| As of October 31, 2019 | 6 Month | 1 Year | 3 Year | 5 Year | Since Inception Annualized(1) | Gross Expense Ratio(2) |
| Investor Class (SFGIX) | 4.14% | 17.52% | 4.49% | 3.83% | 5.53% | 0.99% |
| Institutional Class (SIGIX) | 4.23% | 17.67% | 4.62% | 3.95% | 5.66% | 0.89% |
| MSCI Emerging Markets Total Return Index(3) | (1.41%) | 12.29% | 7.76% | 3.32% | 2.68% | |
All performance is in U.S. dollars with gross (pre-tax) dividends and/or distributions reinvested. The performance data quoted represents past performance and does not guarantee future results. Future returns may be lower or higher. The investment return and principal value will fluctuate so that an investor's shares, when redeemed, may be worth more or less than the original cost. Prior to August 31, 2016, shares of the Fund redeemed or exchanged within 90 days of purchase were subject to a 2% redemption fee. Performance does not reflect this fee, which if deducted would reduce an individual's return. To obtain the Fund’s most recent month-end performance, visit seafarerfunds.com or call (855) 732-9220.
| 1 | Inception Date: February 15, 2012. |
| 2 | Ratios as of Prospectus dated August 31, 2019. Seafarer Capital Partners, LLC has agreed contractually to waive and/or reimburse fees or expenses in order to limit Total Annual Fund Operating Expenses After Fee Waiver/Expense Reimbursements (inclusive of acquired fund fees and expenses, and exclusive of brokerage expenses, interest expenses, taxes and extraordinary expenses) to 1.15% and 1.05% of the Fund’s average daily net assets for the Investor and Institutional share classes, respectively. This agreement is in effect through August 31, 2020. |
| 3 | The MSCI Emerging Markets Total Return Index, Standard (Large+Mid Cap) Core, Gross (dividends reinvested), USD is a free float-adjusted market capitalization index designed to measure equity market performance of emerging markets. Index code: GDUEEGF. The index is not actively managed and does not reflect any deductions for fees, expense or taxes. An investor may not invest directly in an index. |
| Semi-annual Report – October 31, 2019 | 7 |
| Seafarer Overseas Growth and Income Fund | Performance Review |
October 31, 2019
Performance of a $10,000 Investment Since Inception
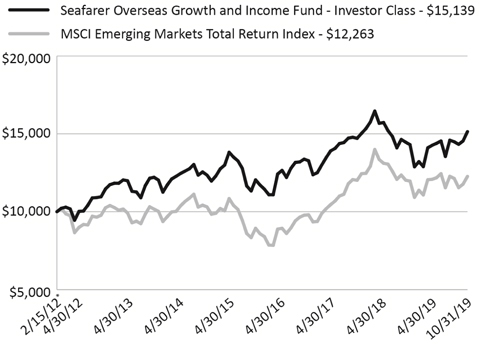
| * | Inception Date: February 15, 2012. |
The chart shown above represents historical performance of a hypothetical investment of $10,000 in the Fund’s Investor Class shares for the period from inception to October 31, 2019. All returns reflect reinvested dividends and/or distributions, but do not reflect the deduction of taxes that an investor would pay on distributions
or redemptions.
The Fund also offers Institutional Class shares, performance for which is not reflected in the chart above. The performance of Institutional Class shares may be higher or lower than the performance of the Investor Class shares shown above based upon differences in fees paid by shareholders investing in the Investor Class shares and Institutional Class shares.
Investment Objective
The Fund seeks to provide long-term capital appreciation along with some current income. The Fund seeks to mitigate adverse volatility in returns as a secondary objective.
Strategy
The Fund invests primarily in the securities of companies located in developing countries. The Fund invests in several asset classes including dividend-paying common stocks, preferred stocks, and fixed-income securities.
The Fund seeks to offer investors a relatively stable means of participating in developing countries’ growth prospects, while attempting to mitigate adverse volatility in returns.
| 8 | (855) 732-9220 seafarerfunds.com |
| Seafarer Overseas Growth and Income Fund | Performance Review |
October 31, 2019
| Portfolio Composition by Region | % Net Assets |
| East & South Asia | 76.3% |
| Emerging Europe | 4.5% |
| Latin America | 8.2% |
| Middle East & Africa | 5.3% |
| Cash & Other Assets, Less Liabilities | 3.9% |
| Government Bond, Short-term - USD and Foreign Currency | 1.8% |
| Total | 100.0% |
| Portfolio Composition by Sector | % Net Assets |
| Communication Services | 4.5% |
| Consumer Discretionary | 17.2% |
| Consumer Staples | 10.9% |
| Energy | 1.6% |
| Financials | 11.6% |
| Health Care | 12.0% |
| Industrials | 9.3% |
| Information Technology | 20.6% |
| Materials | 1.4% |
| Real Estate | 1.4% |
| Utilities | 3.8% |
| Cash & Other Assets, Less Liabilities | 3.9% |
| Government Bond, Short-term - USD and Foreign Currency | 1.8% |
| Total | 100.0% |
| Top 10 Holdings | % Net Assets |
| Samsung Electronics Co., Ltd. | 4.7% |
| Venture Corp., Ltd. | 4.4% |
| Hyundai Mobis Co., Ltd. | 3.9% |
| Alibaba Group Holding, Ltd., Sponsored ADR | 3.4% |
| Orion Corp. | 3.4% |
| NAVER Corp. | 3.3% |
| China Yangtze Power Co., Ltd., Class A | 3.1% |
| Richter Gedeon Nyrt | 3.0% |
| Qualicorp Consultoria e Corretora de Seguros SA | 2.9% |
| Sanlam, Ltd. | 2.4% |
| Total | 34.5% |
| | |
| Total Number of Holdings | 571 |
Holdings are subject to change, and may not reflect the current or future position of the portfolio. Source: ALPS Fund Services, Inc.
| 1 | Excludes short-term government bonds; includes medium- and long-term government bonds. |
| Semi-annual Report – October 31, 2019 | 9 |
| Seafarer Overseas Value Fund | Performance Review |
October 31, 2019
SEAFARER OVERSEAS VALUE FUND
PERFORMANCE REVIEW
November 14, 2019
This report addresses the first half of the Seafarer Overseas Value Fund’s 2019-2020 fiscal year (May 1, 2019 to October 31, 2019).
During the semi-annual period, the Fund gained 5.42%, while the Fund’s benchmark, the MSCI Emerging Markets Total Return Index, returned -1.41%.1 By way of broader comparison, the S&P 500 Index gained 4.16%.
The Fund began the fiscal year with a net asset value (NAV) of $11.43 per share. The Fund paid no distributions during the first half of the fiscal year, and it finished the period with a value of $12.05 per share.2
* * * * *
During this semi-annual period, the primary driver of the Value Fund’s performance was the resilience of portfolio holding valuations in the face of the Hong Kong protests and U.S.-China trade dispute. Importantly, the Fund offset the negative contributions to total return from its holdings in Hong Kong and China with positive contributions derived primarily from stocks that realized their value potential for company-specific reasons, and to a lesser extent through geographic diversification. More specifically, the Value strategy’s objective of seeking diversification across the seven categories of value identified in the white paperOn Value in the Emerging Markets proved not only effective, but in my opinion, was more beneficial than the traditional approach of diversification across geographies.3
The largest contributor to the Fund’s total return during the semi-annual period isAsia SatelliteTelecommunications Holdings(Deleveraging source of value; Seafarer’s seven sources of value,3 hereafter referenced using parenthesized italics, are defined in Figure 1). Ironically in the context of the recent Hong Kong protests, Asia Satellite is a Hong Kong-based company that owns and operates satellites. Contradicting the widespread belief that markets are efficient, the company’s share price languished since the Value Fund purchased the stock at the Fund’s inception. Market participants seemed to ignore the company’s cash flow from operations, which management used to reduce debt and restart a dividend. Attuned to this market oversight, the controlling shareholders tendered for the publicly traded shares of the company, which delisted in September of 2019, thus permanently locking in the Fund’s capital gain in the stock.
| 10 | (855) 732-9220 seafarerfunds.com |
| Seafarer Overseas Value Fund | Performance Review |
October 31, 2019
Figure 1. A Working Definition of Value
Seafarer has identified seven distinct sources of value in emerging markets that may give rise to viable opportunities for long-term, value-oriented investments.

Source: Seafarer
A second top contributor to the Fund’s NAV appreciation in the semi-annual period isQualicorp(Structural Shift),a Brazilian life insurance broker. The company’s stock was propelled higher by persistent and substantial free cash flow generation in spite of difficult operating conditions in Brazil; return of capital to shareholders; and business development potential following the acquisition of a ten percent stake in the company by a strategic shareholder. Qualicorp’s share price rose despite factors impinging on the performance of its home market equity index.
Another positive contributor to the Value Fund isQatar Gas Transport(Deleveraging), an owner and operator of liquefied natural gas (LNG) vessels. The company’s stock appreciated against the headwind of a mediocre performance of its home country stock market index. In the absence of significant company developments during the semi-annual period, I attribute the stock price appreciation to the divergence between a share price that had declined following the Gulf Cooperation Council (GCC) feud that begun in June of 2017, and the likely expansion of the company’s fleet as it seeks to accommodate an expected ramp up in Qatar’s gas output, the country’s primary national asset.
As I noted in the Fund’s third quarter 2019 portfolio review, it is unlikely that geographic diversification alone would have delivered a performance matching that of the foregoing cases of value realization.4 This observation is important when considering the meaningful impact on performance of the Fund’s exposure to Hong Kong-listed stocks, whose valuations suffered during the semi-annual period as a result of the prolongation and intensification of the Hong Kong protests and U.S.-China trade dispute.
In particular, the performance of portfolio holdingsShangri-La(Breakup Value), a hotel owner and operator, andGiordano(Structural Shift), an apparel manufacturer and retailer, declined meaningfully due to substantial profit derivation from Hong Kong. Similarly, the share price ofWH Group(Management Change),a Chinese meat processor and owner of U.S.-based Smithfield Foods, fluctuated with the sentiment around a potential resolution of the U.S.-China trade dispute. Neither geography nor speculation about the trade dispute motivate the Fund’s investment in these three companies. As their respective source of value designations indicate, each holding contributes different drivers and risks to the overall Value strategy, even if at present, each company’s stock price is besieged by the same geopolitical force.
| Semi-annual Report – October 31, 2019 | 11 |
| Seafarer Overseas Value Fund | Performance Review |
October 31, 2019
Thank you for entrusting us with your capital. We are honored to serve as your investment adviser in the emerging markets.
Paul Espinosa
Portfolio Manager, Seafarer Overseas Value Fund
Seafarer Capital Partners, LLC
The MSCI Emerging Markets Total Return Index, Standard (Large+Mid Cap) Core, Gross (dividends reinvested), USD is a free float-adjusted market capitalization index designed to measure equity market performance of emerging markets. Index code: GDUEEGF.
The S&P 500 Total Return Index is a stock market index based on the market capitalizations of 500 large companies with common stock listed on the NYSE or NASDAQ.
It is not possible to invest directly in an index.
The Fund is subject to investment risks, including possible loss of the principal amount invested and therefore is not suitable for all investors. The Fund may not achieve its objectives. Diversification does not ensure a profit or guarantee against loss.
Information on the Seafarer website is provided for textual reference only, and is not incorporated by reference into this report.
The views and information discussed in this commentary are as of the date of publication, are subject to change, and may not reflect Seafarer’s current views. The views expressed represent an assessment of market conditions at a specific point in time, are opinions only and should not be relied upon as investment advice regarding a particular investment or markets in general. Such information does not constitute a recommendation to buy or sell specific securities or investment vehicles. It should not be assumed that any investment will be profitable or will equal the performance of the portfolios or any securities or any sectors mentioned herein. The subject matter contained herein has been derived from several sources believed to be reliable and accurate at the time of compilation. Seafarer does not accept any liability for losses either direct or consequential caused by the use of this information.
As of October 31, 2019, the Fund did not own shares in Smithfield Foods, Inc.
| 1 | References to the “Fund” pertain to the Fund’s Institutional share class (ticker: SIVLX). The Investor share class (ticker: SFVLX) returned 5.43% during the semi-annual period. |
| 2 | The Fund’s Investor share class began the fiscal year with a net asset value of $11.41 per share. It finished the period with a value of $12.03 per share. |
| 3 | Additional information on Seafarer’s seven sources of value is available in the white paperOn Value in the Emerging Markets(www.seafarerfunds.com/value-in-em). |
| 4 | The Fund’s third quarter 2019 portfolio review is available at: www.seafarerfunds.com/funds/ovl/portfolio-review/2019/09/Q3 |
| 12 | (855) 732-9220 seafarerfunds.com |
| Seafarer Overseas Value Fund | Performance Review |
October 31, 2019
Total Returns
| | | | | Since Inception | Net Expense |
| As of October 31, 2019 | 6 Month | 1 Year | 3 Year | Annualized(1) | Ratio(2) |
| Investor Class (SFVLX) | 5.43% | 16.20% | 8.17% | 7.94% | 1.15% |
| Institutional Class (SIVLX) | 5.42% | 16.36% | 8.26% | 8.05% | 1.05% |
| MSCI Emerging Markets Total Return Index(3) | (1.41%) | 12.29% | 7.76% | 10.92% | |
Gross expense ratio: 1.60% for Investor Class; 1.50% for Institutional Class.2
All performance is in U.S. dollars with gross (pre-tax) dividends and/or distributions reinvested. The performance data quoted represents past performance and does not guarantee future results. Future returns may be lower or higher. The investment return and principal value will fluctuate so that an investor's shares, when redeemed, may be worth more or less than the original cost. Prior to August 31, 2016, shares of the Fund redeemed or exchanged within 90 days of purchase were subject to a 2% redemption fee. Performance does not reflect this fee, which if deducted would reduce an individual's return. To obtain the Fund’s most recent month-end performance, visit seafarerfunds.com or call (855) 732-9220.
| 1 | Inception Date: May 31, 2016. |
| 2 | Ratios as of Prospectus dated August 31, 2019. Seafarer Capital Partners, LLC has agreed contractually to waive and/or reimburse fees or expenses in order to limit Total Annual Fund Operating Expenses After Fee Waiver/Expense Reimbursements (inclusive of acquired fund fees and expenses, and exclusive of brokerage expenses, interest expenses, taxes and extraordinary expenses) to 1.15% and 1.05% of the Fund’s average daily net assets for the Investor and Institutional share classes, respectively. This agreement is in effect through August 31, 2020. |
| 3 | The MSCI Emerging Markets Total Return Index, Standard (Large+Mid Cap) Core, Gross (dividends reinvested), USD is a free float-adjusted market capitalization index designed to measure equity market performance of emerging markets. Index code: GDUEEGF. The index is not actively managed and does not reflect any deductions for fees, expense or taxes. An investor may not invest directly in an index. |
| Semi-annual Report – October 31, 2019 | 13 |
| Seafarer Overseas Value Fund | Performance Review |
October 31, 2019
Performance of a $10,000 Investment Since Inception
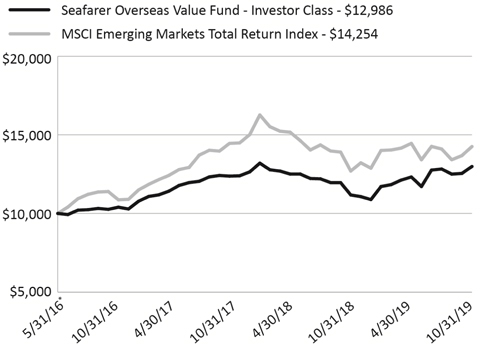
| * | Inception Date: May 31, 2016. |
The chart shown above represents historical performance of a hypothetical investment of $10,000 in the Fund’s Investor Class shares for the period from inception to October 31, 2019. All returns reflect reinvested dividends and/or distributions, but do not reflect the deduction of taxes that an investor would pay on distributions
or redemptions.
The Fund also offers Institutional Class shares, performance for which is not reflected in the chart above. The performance of Institutional Class shares may be higher or lower than the performance of the Investor Class shares shown above based upon differences in fees paid by shareholders investing in the Investor Class shares and Institutional Class shares.
Investment Objective
The Fund seeks to provide long-term capital appreciation.
Strategy
The Fund invests primarily in the securities of companies located in developing countries. The Fund invests in several asset classes including common stocks, preferred stocks, and fixed-income securities.
The Fund’s portfolio is comprised of securities identified through a bottom-up security selection process based on fundamental research. The Fund seeks to produce a minimum long-term rate of return by investing in securities priced at a discount to their intrinsic value.
| 14 | (855) 732-9220 seafarerfunds.com |
| Seafarer Overseas Value Fund | Performance Review |
October 31, 2019
| Portfolio Composition by Region | % Net Assets |
| East & South Asia | 57.2% |
| Emerging Europe | 13.2% |
| Latin America | 7.4% |
| Middle East & Africa | 7.6% |
| Cash & Other Assets, Less Liabilities | 14.6% |
| Total | 100.0% |
| Portfolio Composition by Sector | % Net Assets |
| Communication Services | 0.4% |
| Consumer Discretionary | 16.0% |
| Consumer Staples | 21.1% |
| Energy | 6.1% |
| Financials | 13.1% |
| Health Care | 5.0% |
| Industrials | 10.7% |
| Information Technology | 3.9% |
| Materials | 5.9% |
| Real Estate | 1.3% |
| Utilities | 1.9% |
| Cash & Other Assets, Less Liabilities | 14.6% |
| Total | 100.0% |
| Top 10 Holdings | % Net Assets |
| Qualicorp Consultoria e Corretora de Seguros SA | 4.9% |
| WH Group, Ltd. | 4.7% |
| First Pacific Co., Ltd. | 4.3% |
| Shangri-La Asia, Ltd. | 4.0% |
| Qatar Gas Transport Co., Ltd. | 4.0% |
| Samsung SDI Co., Ltd. | 3.9% |
| Wilmar International, Ltd. | 3.8% |
| National Central Cooling Co. PJSC | 3.6% |
| HRnetgroup, Ltd. | 3.4% |
| Philip Morris CR AS | 3.4% |
| Total | 40.0% |
| | |
| Total Number of Holdings | 31 |
Holdings are subject to change, and may not reflect the current or future position of the portfolio. Source: ALPS Fund Services, Inc.
| Semi-annual Report – October 31, 2019 | 15 |
| Seafarer Funds | Disclosure of Fund Expenses |
October 31, 2019 (Unaudited)
DISCLOSURE OF FUND EXPENSES
As a shareholder of a Fund you will incur two types of costs: (1) transaction costs; and (2) ongoing costs, including management fees and other Fund expenses. The following examples are intended to help you understand your ongoing costs (in dollars) of investing in a Fund and to compare these costs with the ongoing costs of investing in other mutual funds. The examples are based on an investment of $1,000 invested on May 1, 2019 and held until October 31, 2019.
Actual Expenses. For each Fund and share class, the first line of the following table provides information about actual account values and actual expenses. You may use the information in this line, together with the amount you invested, to estimate the expenses that you paid over the period. Simply divide your account value by $1,000 (for example, an $8,600 account value divided by $1,000 = 8.6), then multiply the result by the number in the first line under the heading “Expenses Paid During Period” to estimate the expenses you paid on your account during this period.
Hypothetical Example for Comparison Purposes. For each Fund and share class, the second line of the following table provides information about hypothetical account values and hypothetical expenses based on the Fund’s actual expense ratio and an assumed rate of return of 5% per year before expenses, which is not the Fund’s actual return. The hypothetical account values and expenses may not be used to estimate the actual ending account balance or expenses you paid for the period. You may use this information to compare the ongoing costs of investing in the Fund and other mutual funds. To do so, compare this 5% hypothetical example with the 5% hypothetical examples that appear in the shareholder reports of the other mutual funds.
Please note the expenses shown in the following table are meant to highlight your ongoing costs only and do not reflect transaction costs. Therefore, for each Fund and share class, the second line of the following table is useful in comparing ongoing costs only, and will not help you determine the relative total costs of owning different funds. In addition, if these transactional costs were included, your costs would have been higher.
| 16 | (855) 732-9220 seafarerfunds.com |
| Seafarer Funds | Disclosure of Fund Expenses |
October 31, 2019 (Unaudited)
| | Beginning Account Value 05/01/19 | Ending Account Value 10/31/19 | Expense Ratio(a) | Expenses Paid During Period 05/01/19 - 10/31/19(b) |
| SEAFARER OVERSEAS GROWTH AND INCOME FUND | |
| Investor Class | | | | |
| Actual | $ 1,000.00 | $ 1,041.40 | 1.01% | $ 5.20 |
| Hypothetical (5% return before expenses) | $ 1,000.00 | $ 1,020.11 | 1.01% | $ 5.14 |
| Institutional Class | | | | |
| Actual | $ 1,000.00 | $ 1,042.30 | 0.92% | $ 4.74 |
| Hypothetical (5% return before expenses) | $ 1,000.00 | $ 1,020.57 | 0.92% | $ 4.69 |
| | | | | |
| SEAFARER OVERSEAS VALUE FUND | |
| Investor Class | | | | |
| Actual | $ 1,000.00 | $ 1,054.30 | 1.15% | $ 5.95 |
| Hypothetical (5% return before expenses) | $ 1,000.00 | $ 1,019.41 | 1.15% | $ 5.85 |
| Institutional Class | | | | |
| Actual | $ 1,000.00 | $ 1,054.20 | 1.05% | $ 5.44 |
| Hypothetical (5% return before expenses) | $ 1,000.00 | $ 1,019.91 | 1.05% | $ 5.35 |
| (a) | Annualized, based on the Fund's most recent fiscal half year expenses. |
| (b) | Expenses are equal to the Fund's annualized expense ratio multiplied by the average account value over the period, multiplied by the number of days in the most recent fiscal half-year (184)/366 (to reflect the half-year period). |
| Semi-annual Report – October 31, 2019 | 17 |
| Seafarer Overseas Growth and Income Fund | Portfolio of Investments |
October 31, 2019 (Unaudited)
| | | Currency | | Shares | | Value |
| COMMON STOCKS (89.6%) | | | | | | | | | | | | |
| Brazil (5.0%) | | | | | | | | | | | | |
| Odontoprev SA | | | BRL | | | | 8,900,000 | | | $ | 33,087,894 | |
| Qualicorp Consultoria e Corretora de Seguros SA | | | BRL | | | | 5,600,000 | | | | 44,724,598 | |
| | | | | | | | | | | | | |
| Total Brazil | | | | | | | | | | | 77,812,492 | |
| | | | | | | | | | | | | |
| China / Hong Kong (31.3%) | | | | | | | | | | | | |
| Alibaba Group Holding, Ltd., Sponsored ADR(a) | | | USD | | | | 300,000 | | | | 53,001,000 | |
| China Foods, Ltd. | | | HKD | | | | 74,184,000 | | | | 30,488,938 | |
| China International Travel Service Corp., Ltd.,Class A | | | CNY | | | | 860,000 | | | | 11,034,229 | |
| China Resources Beer Holdings Co., Ltd. | | | HKD | | | | 3,900,000 | | | | 19,995,401 | |
| China Yangtze Power Co., Ltd., Class A | | | CNY | | | | 18,650,000 | | | | 47,318,441 | |
| First Pacific Co., Ltd. | | | HKD | | | | 83,000,000 | | | | 31,752,734 | |
| Foshan Haitian Flavouring & Food Co., Ltd., Class A | | | CNY | | | | 210,000 | | | | 3,332,459 | |
| Greatview Aseptic Packaging Co., Ltd. | | | HKD | | | | 42,357,000 | | | | 21,345,945 | |
| Hang Lung Properties, Ltd. | | | HKD | | | | 9,610,000 | | | | 21,124,735 | |
| Jiangsu Hengrui Medicine Co., Ltd., Class A | | | CNY | | | | 1,750,000 | | | | 22,577,104 | |
| Pacific Basin Shipping, Ltd. | | | HKD | | | | 110,000,000 | | | | 25,469,121 | |
| Pico Far East Holdings, Ltd. | | | HKD | | | | 52,296,000 | | | | 17,819,195 | |
| Shangri-La Asia, Ltd. | | | HKD | | | | 30,000,000 | | | | 30,792,371 | |
| Shenzhou International Group Holdings, Ltd. | | | HKD | | | | 2,250,000 | | | | 31,091,971 | |
| Techtronic Industries Co., Ltd. | | | HKD | | | | 4,500,000 | | | | 35,167,566 | |
| Texwinca Holdings, Ltd. | | | HKD | | | | 54,398,000 | | | | 12,342,337 | |
| WH Group, Ltd. | | | HKD | | | | 29,600,000 | | | | 31,244,084 | |
| Xinhua Winshare Publishing and Media Co., Ltd., Class H | | | HKD | | | | 27,000,000 | | | | 19,173,468 | |
| Xtep International Holdings, Ltd. | | | HKD | | | | 29,936,500 | | | | 17,381,424 | |
| | | | | | | | | | | | | |
| Total China / Hong Kong | | | | | | | | | | | 482,452,523 | |
| | | | | | | | | | | | | |
| Czech Republic (1.6%) | | | | | | | | | | | | |
| Moneta Money Bank AS | | | CZK | | | | 7,300,000 | | | | 24,236,899 | |
| | | | | | | | | | | | | |
| Total Czech Republic | | | | | | | | | | | 24,236,899 | |
| | | | | | | | | | | | | |
| Hungary (3.0%) | | | | | | | | | | | | |
| Richter Gedeon Nyrt | | | HUF | | | | 2,470,000 | | | | 45,776,940 | |
| | | | | | | | | | | | | |
| Total Hungary | | | | | | | | | | | 45,776,940 | |
| | | | | | | | | | | | | |
| India (2.6%) | | | | | | | | | | | | |
| Container Corp. Of India, Ltd. | | | INR | | | | 950,000 | | | | 7,880,197 | |
| 18 | (855) 732-9220 seafarerfunds.com |
| Seafarer Overseas Growth and Income Fund | Portfolio of Investments |
October 31, 2019 (Unaudited)
| | | Currency | | Shares | | Value |
| India (continued) | | | | | | | | | | | | |
| Infosys, Ltd., Sponsored ADR | | | USD | | | | 3,375,000 | | | $ | 32,366,250 | |
| | | | | | | | | | | | | |
| Total India | | | | | | | | | | | 40,246,447 | |
| | | | | | | | | | | | | |
| Indonesia (1.6%) | | | | | | | | | | | | |
| Bank Rakyat Indonesia Persero Tbk PT | | | IDR | | | | 80,000,000 | | | | 23,970,822 | |
| | | | | | | | | | | | | |
| Total Indonesia | | | | | | | | | | | 23,970,822 | |
| | | | | | | | | | | | | |
| Malaysia (1.2%) | | | | | | | | | | | | |
| Inari Amertron Bhd | | | MYR | | | | 40,000,000 | | | | 18,803,015 | |
| | | | | | | | | | | | | |
| Total Malaysia | | | | | | | | | | | 18,803,015 | |
| | | | | | | | | | | | | |
| Mexico (3.1%) | | | | | | | | | | | | |
| Bolsa Mexicana de Valores SAB de CV | | | MXN | | | | 14,500,000 | | | | 31,741,481 | |
| Credito Real SAB de CV SOFOM ER | | | MXN | | | | 13,290,238 | | | | 16,456,916 | |
| | | | | | | | | | | | | |
| Total Mexico | | | | | | | | | | | 48,198,397 | |
| | | | | | | | | | | | | |
| Philippines (1.5%) | | | | | | | | | | | | |
| Ayala Corp. | | | PHP | | | | 1,400,000 | | | | 23,703,750 | |
| | | | | | | | | | | | | |
| Total Philippines | | | | | | | | | | | 23,703,750 | |
| | | | | | | | | | | | | |
| Qatar (1.7%) | | | | | | | | | | | | |
| Qatar Gas Transport Co., Ltd. | | | QAR | | | | 37,613,950 | | | | 25,516,742 | |
| | | | | | | | | | | | | |
| Total Qatar | | | | | | | | | | | 25,516,742 | |
| | | | | | | | | | | | | |
| Singapore (6.4%) | | | | | | | | | | | | |
| Venture Corp., Ltd. | | | SGD | | | | 5,825,000 | | | | 67,567,838 | |
| Wilmar International, Ltd. | | | SGD | | | | 11,500,000 | | | | 31,619,028 | |
| | | | | | | | | | | | | |
| Total Singapore | | | | | | | | | | | 99,186,866 | |
| | | | | | | | | | | | | |
| South Africa (2.4%) | | | | | | | | | | | | |
| Sanlam, Ltd. | | | ZAR | | | | 7,000,000 | | | | 36,839,895 | |
| | | | | | | | | | | | | |
| Total South Africa | | | | | | | | | | | 36,839,895 | |
| | | | | | | | | | | | | |
| South Korea (19.1%) | | | | | | | | | | | | |
| Dentium Co., Ltd. | | | KRW | | | | 355,292 | | | | 18,166,514 | |
| Hyundai Mobis Co., Ltd. | | | KRW | | | | 292,500 | | | | 59,650,616 | |
| Koh Young Technology, Inc. | | | KRW | | | | 386,667 | | | | 31,269,588 | |
| Semi-annual Report – October 31, 2019 | 19 |
| Seafarer Overseas Growth and Income Fund | Portfolio of Investments |
October 31, 2019 (Unaudited)
| | | Currency | | Shares | | Value |
| South Korea (continued) | | | | | | | | | | | | |
| LEENO Industrial, Inc. | | | KRW | | | | 69,200 | | | $ | 3,155,708 | |
| NAVER Corp. | | | KRW | | | | 365,000 | | | | 51,463,712 | |
| Orion Corp. | | | KRW | | | | 575,000 | | | | 52,241,298 | |
| Samsung SDI Co., Ltd. | | | KRW | | | | 175,000 | | | | 34,150,508 | |
| Sindoh Co., Ltd. | | | KRW | | | | 390,000 | | | | 12,832,544 | |
| Woongjin Coway Co., Ltd. | | | KRW | | | | 400,000 | | | | 31,561,305 | |
| | | | | | | | | | | | | |
| Total South Korea | | | | | | | | | | | 294,491,793 | |
| | | | | | | | | | | | | |
| Taiwan (5.1%) | | | | | | | | | | | | |
| ASPEED Technology, Inc. | | | TWD | | | | 400,000 | | | | 10,452,887 | |
| Taiwan Semiconductor Manufacturing Co., Ltd. | | | TWD | | | | 3,525,000 | | | | 34,544,308 | |
| Voltronic Power Technology Corp. | | | TWD | | | | 1,500,000 | | | | 33,203,870 | |
| | | | | | | | | | | | | |
| Total Taiwan | | | | | | | | | | | 78,201,065 | |
| | | | | | | | | | | | | |
| Thailand (1.3%) | | | | | | | | | | | | |
| Bangkok Dusit Medical Services PCL, Class F | | | THB | | | | 25,000,000 | | | | 19,873,943 | |
| | | | | | | | | | | | | |
| Total Thailand | | | | | | | | | | | 19,873,943 | |
| | | | | | | | | | | | | |
| United Arab Emirates (1.2%) | | | | | | | | | | | | |
| National Central Cooling Co. PJSC | | | AED | | | | 38,200,000 | | | | 18,753,098 | |
| | | | | | | | | | | | | |
| Total United Arab Emirates | | | | | | | | | | | 18,753,098 | |
| | | | | | | | | | | | | |
| Vietnam (1.5%) | | | | | | | | | | | | |
| Bao Viet Holdings(a) | | | VND | | | | 4,206,880 | | | | 13,065,884 | |
| PetroVietnam Gas JSC | | | VND | | | | 2,283,720 | | | | 10,160,007 | |
| | | | | | | | | | | | | |
| Total Vietnam | | | | | | | | | | | 23,225,891 | |
| | | | | | | | | | | | | |
| TOTAL COMMON STOCKS | | | | | | | | | | | | |
| (Cost $1,341,038,518) | | | | | | | | | | | 1,381,290,578 | |
| | | | | | | | | | | | | |
| PREFERRED STOCKS (4.7%) | | | | | | | | | | | | |
| South Korea (4.7%) | | | | | | | | | | | | |
| Samsung Electronics Co., Ltd. | | | KRW | | | | 2,050,000 | | | | 72,161,689 | |
| | | | | | | | | | | | | |
| Total South Korea | | | | | | | | | | | 72,161,689 | |
| | | | | | | | | | | | | |
| TOTAL PREFERRED STOCKS | | | | | | | | | | | | |
| (Cost $47,297,213) | | | | | | | | | | | 72,161,689 | |
| 20 | (855) 732-9220 seafarerfunds.com |
| Seafarer Overseas Growth and Income Fund | Portfolio of Investments |
October 31, 2019 (Unaudited)
| | | Currency | | Rate | | Maturity Date | | Principal Amount | | Value |
| GOVERNMENT BOND, SHORT-TERM - USD AND FOREIGN CURRENCY (1.8%) | |
| Colombia (0.3%) | | | | | | | | | | | | | | | | | | |
| Colombia Government International Bond | | | USD | | | | 11.75 | % | | 02/25/20 | | | 5,000,000 | | | $ | 5,150,050 | |
| | | | | | | | | | | | | | | | | | | |
| Total Colombia | | | | | | | | | | | | | | | | | 5,150,050 | |
| | | | | | | | | | | | | | | | | | | |
| India (0.3%) | | | | | | | | | | | | | | | | | | |
| Export-Import Bank of India | | | USD | | | | 2.75 | % | | 08/12/20 | | | 5,000,000 | | | | 5,014,225 | |
| | | | | | | | | | | | | | | | | | | |
| Total India | | | | | | | | | | | | | | | | | 5,014,225 | |
| | | | | | | | | | | | | | | | | | | |
| Latvia (0.3%) | | | | | | | | | | | | | | | | | | |
| Republic of Latvia Government International Bond, Series REGS | | | USD | | | | 2.75 | % | | 01/12/20 | | | 4,000,000 | | | | 4,003,888 | |
| | | | | | | | | | | | | | | | | | | |
| Total Latvia | | | | | | | | | | | | | | | | | 4,003,888 | |
| | | | | | | | | | | | | | | | | | | |
| Lithuania (0.3%) | | | | | | | | | | | | | | | | | | |
| Lithuania Government International Bond, Series REGS | | | USD | | | | 7.38 | % | | 02/11/20 | | | 5,000,000 | | | | 5,075,710 | |
| | | | | | | | | | | | | | | | | | | |
| Total Lithuania | | | | | | | | | | | | | | | | | 5,075,710 | |
| | | | | | | | | | | | | | | | | | | |
| South Korea (0.6%) | | | | | | | | | | | | | | | | | | |
| Korea Development Bank | | | USD | | | | 2.25 | % | | 05/18/20 | | | 5,000,000 | | | | 5,003,817 | |
| | | | | | | | 3M US L | | | | | | | | | | | |
| Korea Development Bank(b) | | | USD | | | | +0.675 | % | | 09/19/20 | | | 4,000,000 | | | | 4,013,725 | |
| | | | | | | | | | | | | | | | | | | |
| Total South Korea | | | | | | | | | | | | | | | | | 9,017,542 | |
| | | | | | | | | | | | | | | | | | | |
| TOTAL GOVERNMENT BOND, SHORT-TERM - USD AND FOREIGN CURRENCY | |
| (Cost $28,212,825) | | | | | | | | | | | | | | | | | 28,261,415 | |
| | | | | | | | | | | | | | | | | | | |
| TOTAL INVESTMENTS | | | | | | | | | | | | | | | | | | |
| (Cost $1,416,548,556) (96.1%) | | | | | | | | | | | | | | | | $ | 1,481,713,682 | |
| | | | | | | | | | | | | | | | | | | |
| Cash and Other Assets, Less Liabilities (3.9%) | | | | | 60,606,814 | |
| NET ASSETS (100.0%) | | | | | | | | | | | | | | | | $ | 1,542,320,496 | |
| Semi-annual Report – October 31, 2019 | 21 |
| Seafarer Overseas Growth and Income Fund | Portfolio of Investments |
October 31, 2019 (Unaudited)
Principal Amount is stated in local currency unless otherwise noted.
| (a) | Non-income producing security. |
| (b) | Floating or variable rate security. The reference rate is the London Interbank Offered Rate (LIBOR). The rate in effect is based on the reference rate plus the displayed spread as of the security's last reset date. The 3 Month LIBOR (3M US L) as of October 31, 2019 was 1.90%. |
Currency Abbreviations
| AED | - | United Arab Emirates Dirham |
| BRL | - | Brazil Real |
| CNY | - | China Yuan |
| CZK | - | Czech Koruna |
| HKD | - | Hong Kong Dollar |
| HUF | - | Hungary Forint |
| IDR | - | Indonesia Rupiah |
| INR | - | India Rupee |
| KRW | - | South Korea Won |
| MXN | - | Mexico Peso |
| MYR | - | Malaysia Ringgit |
| PHP | - | Philippine Peso |
| QAR | - | Qatar Riyal |
| SGD | - | Singapore Dollar |
| THB | - | Thailand Baht |
| TWD | - | Taiwan New Dollar |
| USD | - | United States Dollar |
| VND | - | Vietnam Dong |
| ZAR | - | South Africa Rand |
For Fund compliance purposes, the Fund's geographical classifications refer to any one or more of the sub-classifications used by one or more widely recognized market indexes or ratings group indexes, and/or as defined by Fund management. This definition may not apply for purposes of this report, which may combine sub-classifications for reporting ease. Geographical regions are shown as a percentage of net assets.
See accompanying Notes to Financial Statements.
| 22 | (855) 732-9220 seafarerfunds.com |
| Seafarer Overseas Value Fund | Portfolio of Investments |
October 31, 2019 (Unaudited)
| | Currency | | Shares | | Value |
| COMMON STOCKS (85.4%) | | | | | | |
| Brazil (5.0%) | | | | | | |
| Qualicorp Consultoria e Corretora de Seguros SA | | | BRL | | | | 251,000 | | | $ | 2,004,620 | |
| | | | | | | | | | | | | |
| Total Brazil | | | | | | | | | | | 2,004,620 | |
| | | | | | | | | | | | | |
| China / Hong Kong (38.0%) | | | | | | | | | | | | |
| AMVIG Holdings, Ltd. | | | HKD | | | | 3,754,000 | | | | 967,729 | |
| China Foods, Ltd. | | | HKD | | | | 2,880,000 | | | | 1,183,653 | |
| China Resources Beer Holdings Co., Ltd. | | | HKD | | | | 224,000 | | | | 1,148,454 | |
| China Yangtze Power Co., Ltd., Class A | | | CNY | | | | 301,990 | | | | 766,204 | |
| First Pacific Co., Ltd. | | | HKD | | | | 4,590,000 | | | | 1,755,964 | |
| Giordano International, Ltd. | | | HKD | | | | 3,300,000 | | | | 1,047,556 | |
| Greatview Aseptic Packaging Co., Ltd. | | | HKD | | | | 1,120,000 | | | | 564,428 | |
| Hang Lung Properties, Ltd. | | | HKD | | | | 247,000 | | | | 542,956 | |
| Melco International Development, Ltd. | | | HKD | | | | 499,000 | | | | 1,322,522 | |
| Pacific Basin Shipping, Ltd. | | | HKD | | | | 4,099,000 | | | | 949,072 | |
| Pico Far East Holdings, Ltd. | | | HKD | | | | 538,000 | | | | 183,317 | |
| Shangri-La Asia, Ltd. | | | HKD | | | | 1,580,000 | | | | 1,621,732 | |
| Texwinca Holdings, Ltd. | | | HKD | | | | 1,470,000 | | | | 333,528 | |
| WH Group, Ltd. | | | HKD | | | | 1,798,000 | | | | 1,897,867 | |
| Xtep International Holdings, Ltd. | | | HKD | | | | 1,913,500 | | | | 1,110,996 | |
| | | | | | | | | | | | | |
| Total China / Hong Kong | | | | | | | | | | | 15,395,978 | |
| | | | | | | | | | | | | |
| Czech Republic (6.3%) | | | | | | | | | | | | |
| Moneta Money Bank AS | | | CZK | | | | 368,000 | | | | 1,221,805 | |
| Philip Morris CR AS | | | CZK | | | | 2,300 | | | | 1,372,982 | |
| | | | | | | | | | | | | |
| Total Czech Republic | | | | | | | | | | | 2,594,787 | |
| | | | | | | | | | | | | |
| Georgia (3.4%) | | | | | | | | | | | | |
| Georgia Capital PLC(a) | | | GBP | | | | 108,000 | | | | 1,361,209 | |
| | | | | | | | | | | | | |
| Total Georgia | | | | | | | | | | | 1,361,209 | |
| | | | | | | | | | | | | |
| Mexico (2.4%) | | | | | | | | | | | | |
| Credito Real SAB de CV SOFOM ER | | | MXN | | | | 789,609 | | | | 977,750 | |
| | | | | | | | | | | | | |
| Total Mexico | | | | | | | | | | | 977,750 | |
| | | | | | | | | | | | | |
| Philippines (1.4%) | | | | | | | | | | | | |
| Del Monte Pacific, Ltd. | | | SGD | | | | 5,700,000 | | | | 546,768 | |
| | | | | | | | | | | | | |
| Total Philippines | | | | | | | | | | | 546,768 | |
| Semi-annual Report – October 31, 2019 | 23 |
| Seafarer Overseas Value Fund | Portfolio of Investments |
October 31, 2019 (Unaudited)
| | Currency | | Shares | | Value |
| Qatar (4.0%) | | | | | | |
| Qatar Gas Transport Co., Ltd. | | | QAR | | | | 2,370,000 | | | $ | 1,607,773 | |
| | | | | | | | | | | | | |
| Total Qatar | | | | | | | | | | | 1,607,773 | |
| | | | | | | | | | | | | |
| Russia (3.5%) | | | | | | | | | | | | |
| Cherkizovo Group PJSC | | | RUB | | | | 30,000 | | | | 841,436 | |
| Global Ports Investments PLC, GDR(a) | | | USD | | | | 197,000 | | | | 563,420 | |
| | | | | | | | | | | | | |
| Total Russia | | | | | | | | | | | 1,404,856 | |
| | | | | | | | | | | | | |
| Singapore (9.7%) | | | | | | | | | | | | |
| Genting Singapore, Ltd. | | | SGD | | | | 1,500,000 | | | | 1,034,872 | |
| HRnetgroup, Ltd. | | | SGD | | | | 3,200,000 | | | | 1,387,242 | |
| Wilmar International, Ltd. | | | SGD | | | | 560,000 | | | | 1,539,709 | |
| | | | | | | | | | | | | |
| Total Singapore | | | | | | | | | | | 3,961,823 | |
| | | | | | | | | | | | | |
| South Korea (3.9%) | | | | | | | | | | | | |
| Samsung SDI Co., Ltd. | | | KRW | | | | 8,000 | | | | 1,561,166 | |
| | | | | | | | | | | | | |
| Total South Korea | | | | | | | | | | | 1,561,166 | |
| | | | | | | | | | | | | |
| United Arab Emirates (3.6%) | | | | | | | | | | | | |
| National Central Cooling Co. PJSC | | | AED | | | | 2,952,000 | | | | 1,449,192 | |
| | | | | | | | | | | | | |
| Total United Arab Emirates | | | | | | | | | | | 1,449,192 | |
| | | | | | | | | | | | | |
| Vietnam (4.2%) | | | | | | | | | | | | |
| Petrovietnam Fertilizer & Chemicals JSC | | | VND | | | | 1,432,000 | | | | 841,523 | |
| PetroVietnam Technical Services Corp. | | | VND | | | | 1,063,780 | | | | 846,827 | |
| | | | | | | | | | | | | |
| Total Vietnam | | | | | | | | | | | 1,688,350 | |
| | | | | | | | | | | | | |
| TOTAL COMMON STOCKS | | | | | | | | | | | | |
| (Cost $33,640,802) | | | | | | | | | | | 34,554,272 | |
| | | | | | | | | | | | | |
| TOTAL INVESTMENTS | | | | | | | | | | | | |
| (Cost $33,640,802) (85.4%) | | | | | | | | | | $ | 34,554,272 | |
| | | | | | | | | | | | | |
| Cash and Other Assets, Less Liabilities (14.6%) | | | | | | | | | | | 5,897,913 | |
| NET ASSETS (100.0%) | | | | | | | | | | $ | 40,452,185 | |
| (a) | Non-income producing security. |
| 24 | (855) 732-9220 seafarerfunds.com |
| Seafarer Overseas Value Fund | Portfolio of Investments |
October 31, 2019 (Unaudited)
Currency Abbreviations
| AED | - | United Arab Emirates Dirham |
| BRL | - | Brazil Real |
| CNY | - | China Yuan |
| CZK | - | Czech Koruna |
| GBP | - | Great British Pound |
| HKD | - | Hong Kong Dollar |
| KRW | - | South Korea Won |
| MXN | - | Mexico Peso |
| QAR | - | Qatar Riyal |
| RUB | - | Russia Ruble |
| SGD | - | Singapore Dollar |
| USD | - | United States Dollar |
| VND | - | Vietnam Dong |
| | | | |
For Fund compliance purposes, the Fund's geographical classifications refer to any one or more of the sub-classifications used by one or more widely recognized market indexes or ratings group indexes, and/or as defined by Fund management. This definition may not apply for purposes of this report, which may combine sub-classifications for reporting ease. Geographical regions are shown as a percentage of net assets.
See accompanying Notes to Financial Statements.
| Semi-annual Report – October 31, 2019 | 25 |
| Seafarer Funds | Statements of Assets and Liabilities | |
| | | October 31, 2019 (Unaudited) | |
| | Seafarer Overseas Growth and Income Fund | | Seafarer Overseas Value Fund |
| ASSETS: | | | | |
| Investments, at value | | $ | 1,481,713,682 | | | $ | 34,554,272 | |
| Cash | | | 43,672,161 | | | | 5,771,625 | |
| Foreign currency, at value (Cost $6,084,252 and $36,313) | | | 6,090,283 | | | | 36,311 | |
| Receivable for investments sold | | | 12,701,522 | | | | 3,334 | |
| Receivable for shares sold | | | 553,441 | | | | 5,496 | |
| Interest and dividends receivable | | | 5,855,659 | | | | 222,213 | |
| Prepaid expenses and other assets | | | 30,980 | | | | 14,717 | |
| Total Assets | | | 1,550,617,728 | | | | 40,607,968 | |
| LIABILITIES: | | | | | | | | |
| Payable for investments purchased | | | 5,740,250 | | | | 91,221 | |
| Foreign capital gains tax | | | 205,739 | | | | – | |
| Administrative fees payable | | | 86,726 | | | | 8,996 | |
| Shareholder service plan fees payable | | | 173,794 | | | | 3,083 | |
| Payable for shares redeemed | | | 752,039 | | | | – | |
| Investment advisory fees payable | | | 952,915 | | | | 16,876 | |
| Payable for chief compliance officer fees | | | 3,774 | | | | 3,774 | |
| Trustee fees and expenses payable | | | 27,177 | | | | 514 | |
| Payable for principal financial officer fees | | | 847 | | | | 847 | |
| Audit and tax fees payable | | | 18,321 | | | | 15,148 | |
| Accrued expenses and other liabilities | | | 335,650 | | | | 15,324 | |
| Total Liabilities | | | 8,297,232 | | | | 155,783 | |
| NET ASSETS | | $ | 1,542,320,496 | | | $ | 40,452,185 | |
| NET ASSETS CONSIST OF: | | | | | | | | |
| Paid-in capital (Note 5) | | $ | 1,520,469,914 | | | $ | 38,796,190 | |
| Total distributable earnings | | | 21,850,582 | | | | 1,655,995 | |
| NET ASSETS | | $ | 1,542,320,496 | | | $ | 40,452,185 | |
| INVESTMENTS, AT COST | | $ | 1,416,548,556 | | | $ | 33,640,802 | |
| PRICING OF SHARES | | | | | | | | |
| Investor Class: | | | | | | | | |
| Net Asset Value, offering and redemption price per share | | $ | 11.85 | | | $ | 12.03 | |
| Net Assets | | $ | 201,057,200 | | | $ | 324,586 | |
| Shares of beneficial interest outstanding | | | 16,962,384 | | | | 26,982 | |
| Institutional Class: | | | | | | | | |
| Net Asset Value, offering and redemption price per share | | $ | 11.91 | | | $ | 12.05 | |
| Net Assets | | $ | 1,341,263,296 | | | $ | 40,127,599 | |
| Shares of beneficial interest outstanding | | | 112,644,719 | | | | 3,330,868 | |
See accompanying Notes to Financial Statements.
| 26 | (855) 732-9220 seafarerfunds.com |
| Seafarer Funds | Statements of Operations |
Six Months Ended October 31, 2019 (Unaudited)
| | Seafarer Overseas Growth and Income Fund | | Seafarer Overseas Value Fund |
| INVESTMENT INCOME: | | | | |
| Dividends | | $ | 31,171,955 | | | $ | 915,055 | |
| Foreign taxes withheld | | | (1,618,849 | ) | | | (7,541 | ) |
| Interest and other income | | | 514,189 | | | | 24,326 | |
| Total investment income | | | 30,067,295 | | | | 931,840 | |
| | | | | | | | | |
| EXPENSES: | | | | | | | | |
| Investment advisory fees (Note 6) | | | 5,624,422 | | | | 126,078 | |
| Administrative and transfer agency fees | | | 282,928 | | | | 29,436 | |
| Trustee fees and expenses | | | 27,595 | | | | 533 | |
| Registration/filing fees | | | 19,355 | | | | 15,718 | |
| Shareholder service plan fees | | | | | | | | |
| Investor Class | | | 146,357 | | | | – | |
| Institutional Class | | | 280,894 | | | | 5,229 | |
| Recoupment of previously waived fees | | | | | | | | |
| Investor Class | | | – | | | | 37 | |
| Institutional Class | | | – | | | | – | |
| Legal fees | | | 8,221 | | | | 159 | |
| Audit fees | | | 17,281 | | | | 10,666 | |
| Reports to shareholders and printing fees | | | 43,769 | | | | 757 | |
| Custody fees | | | 514,059 | | | | 25,113 | |
| Chief compliance officer fees | | | 12,150 | | | | 12,150 | |
| Principal financial officer fees | | | 2,513 | | | | 2,513 | |
| Miscellaneous | | | 14,571 | | | | 2,449 | |
| Total expenses | | | 6,994,115 | | | | 230,838 | |
| Less fees waived/reimbursed by investment adviser (Note 6) | | | | | | | | |
| Investor Class | | | – | | | | (361 | ) |
| Institutional Class | | | – | | | | (53,244 | ) |
| Total net expenses | | | 6,994,115 | | | | 177,233 | |
| NET INVESTMENT INCOME: | | | 23,073,180 | | | | 754,607 | |
| Net realized gain on investments | | | 14,444,019 | | | | 200,409 | |
| Net realized loss on foreign currency transactions | | | (162,018 | ) | | | (2,654 | ) |
| Net realized gain | | | 14,282,001 | | | | 197,755 | |
| Net change in unrealized appreciation on investments | | | 27,082,932 | | | | 841,504 | |
| Net change in unrealized appreciation on translation of | | | | | | | | |
| assets and liabilities in foreign currency transactions | | | 158,575 | | | | 6,773 | |
| Net Change in unrealized foreign capital gains tax | | | (205,739 | ) | | | – | |
| Net unrealized appreciation | | | 27,035,768 | | | | 848,277 | |
| | | | | | | | | |
| NET REALIZED AND UNREALIZED GAIN ON | | | | | | | | |
| INVESTMENTS AND FOREIGN CURRENCY | | | | | | | | |
| TRANSLATIONS | | | 41,317,769 | | | | 1,046,032 | |
| NET INCREASE IN NET ASSETS RESULTING FROM | | | | | | | | |
| OPERATIONS | | $ | 64,390,949 | | | $ | 1,800,639 | |
See accompanying Notes to Financial Statements.
| Semi-annual Report – October 31, 2019 | 27 |
| Seafarer Overseas Growth and Income Fund | Statements of Changes in Net Assets |
| | | Six Months Ended October 31, 2019 (Unaudited) | | Year Ended April 30, 2019 |
| OPERATIONS: | | | | |
| Net investment income | | $ | 23,073,180 | | | $ | 50,058,210 | |
| Net realized gain/(loss) | | | 14,282,001 | | | | (78,375,229 | ) |
| Net change in unrealized appreciation/(depreciation) | | | 27,035,768 | | | | (157,770,194 | ) |
| Net increase/(decrease) in net assets resulting from operations | | | 64,390,949 | | | | (186,087,213 | ) |
| DISTRIBUTIONS TO SHAREHOLDERS (NOTE 3): | | | | | | | | |
| Total amount of distribution | | | | | | | | |
| Investor Class | | | (3,298,885 | ) | | | (24,164,869 | ) |
| Institutional Class | | | (21,066,969 | ) | | | (109,435,374 | ) |
| Net decrease in net assets from distributions | | | (24,365,854 | ) | | | (133,600,243 | ) |
| BENEFICIAL INTEREST TRANSACTIONS (NOTE 5): | | | | | | | | |
| Shares sold | | | | | | | | |
| Investor Class | | | 8,527,551 | | | | 44,452,361 | |
| Institutional Class | | | 180,264,849 | | | | 774,931,703 | |
| Dividends reinvested | | | | | | | | |
| Investor Class | | | 3,242,695 | | | | 23,834,890 | |
| Institutional Class | | | 16,023,988 | | | | 94,069,305 | |
| Shares Redeemed | | | | | | | | |
| Investor Class | | | (47,122,032 | ) | | | (652,824,161 | ) |
| Institutional Class | | | (196,204,665 | ) | | | (1,455,504,946 | ) |
| Net decrease in net assets derived from beneficial interest transactions | | | (35,267,614 | ) | | | (1,171,040,848 | ) |
| Net increase/(decrease) in net assets | | | 4,757,481 | | | | (1,490,728,304 | ) |
| NET ASSETS: | | | | | | | | |
| Beginning of period | | | 1,537,563,015 | | | | 3,028,291,319 | |
| End of period | | $ | 1,542,320,496 | | | $ | 1,537,563,015 | |
| Other Information: | | | | | | | | |
| SHARE TRANSACTIONS: | | | | | | | | |
| Investor Class | | | | | | | | |
| Sold | | | 756,945 | | | | 3,794,490 | |
| Distributions reinvested | | | 286,964 | | | | 2,179,970 | |
| Redeemed | | | (4,244,615 | ) | | | (54,038,510 | ) |
| Net decrease in shares outstanding | | | (3,200,706 | ) | | | (48,064,050 | ) |
| Institutional Class | | | | | | | | |
| Sold | | | 16,292,351 | | | | 65,086,770 | |
| Distributions reinvested | | | 1,413,050 | | | | 8,768,097 | |
| Redeemed | | | (17,435,329 | ) | | | (123,834,889 | ) |
| Net increase/(decrease) in shares outstanding | | | 270,072 | | | | (49,980,022 | ) |
See accompanying Notes to Financial Statements.
| 28 | (855) 732-9220 seafarerfunds.com |
| Seafarer Overseas Value Fund | Statements of Changes in Net Assets |
| | | Six Months Ended October 31, 2019 (Unaudited) | | Year Ended April 30, 2019 |
| OPERATIONS: | | | | | | | | |
| Net investment income | | $ | 754,607 | | | $ | 722,172 | |
| Net realized gain/(loss) | | | 197,755 | | | | (44,789 | ) |
| Net change in unrealized appreciation/(depreciation) | | | 848,277 | | | | (1,126,907 | ) |
| Net increase/(decrease) in net assets resulting from operations | | | 1,800,639 | | | | (449,524 | ) |
| DISTRIBUTIONS TO SHAREHOLDERS (NOTE 3): | | | | | | | | |
| Total amount of distribution | | | | | | | | |
| Investor Class | | | – | | | | (8,420 | ) |
| Institutional Class | | | – | | | | (806,121 | ) |
| Net decrease in net assets from distributions | | | – | | | | (814,541 | ) |
| BENEFICIAL INTEREST TRANSACTIONS (NOTE 5): | | | | | | | | |
| Shares sold | | | | | | | | |
| Investor Class | | | 8,300 | | | | 36,125 | |
| Institutional Class | | | 11,481,468 | | | | 11,105,956 | |
| Dividends reinvested | | | | | | | | |
| Investor Class | | | – | | | | 8,124 | |
| Institutional Class | | | – | | | | 777,710 | |
| Shares Redeemed | | | | | | | | |
| Investor Class | | | (27,398 | ) | | | (17,747 | ) |
| Institutional Class | | | (1,986,908 | ) | | | (7,072,100 | ) |
| Net increase in net assets derived from beneficial interest transactions | | | 9,475,462 | | | | 4,838,068 | |
| Net increase in net assets | | | 11,276,101 | | | | 3,574,003 | |
| NET ASSETS: | | | | | | | | |
| Beginning of period | | | 29,176,084 | | | | 25,602,081 | |
| End of period | | $ | 40,452,185 | | | $ | 29,176,084 | |
| Other Information: | | | | | | | | |
| SHARE TRANSACTIONS: | | | | | | | | |
| Investor Class | | | | | | | | |
| Sold | | | 716 | | | | 3,312 | |
| Distributions reinvested | | | – | | | | 789 | |
| Redeemed | | | (2,360 | ) | | | (1,530 | ) |
| Net increase/(decrease) in shares outstanding | | | (1,644 | ) | | | 2,571 | |
| Institutional Class | | | | | | | | |
| Sold | | | 978,930 | | | | 1,003,072 | |
| Distributions reinvested | | | – | | | | 75,506 | |
| Redeemed | | | (172,810 | ) | | | (668,216 | ) |
| Net increase in shares outstanding | | | 806,120 | | | | 410,362 | |
See accompanying Notes to Financial Statements
| Semi-annual Report – October 31, 2019 | 29 |
| Seafarer Overseas Growth and Income Fund |
| Investor Class |
| NET ASSET VALUE, BEGINNING OF PERIOD INCOME FROM OPERATIONS: |
| Net investment income(a) |
| Net realized and unrealized gain/(loss) on investments |
| Total from investment operations |
| |
| LESS DISTRIBUTIONS: |
| From net investment income |
| From net realized gains on investments |
| Total distributions |
| REDEMPTION FEES ADDED TO PAID IN CAPITAL |
| NET INCREASE/(DECREASE) IN NET ASSET VALUE |
| NET ASSET VALUE, END OF PERIOD |
| |
| TOTAL RETURN(d) |
| SUPPLEMENTAL DATA: |
| Net assets, end of period (in 000s) |
| RATIOS TO AVERAGE NET ASSETS: |
| Operating expenses excluding reimbursement/waiver |
| Operating expenses including reimbursement/waiver |
| Net investment income including reimbursement/waiver |
| PORTFOLIO TURNOVER RATE(i) |
| (a) | Calculated using the average shares method. |
| (b) | Less than $0.005 per share. |
| (c) | In preparing the financial statements in accordance with U.S. GAAP, management made certain adjustments as required by U.S. GAAP which caused the net asset value for purposes of these financial statements to differ from the net asset value used to process shareholder transactions as of the date of these financial statements. As a result, the net asset value increased from $12.50 to $12.51. |
| (d) | Total returns are for the periods indicated and have not been annualized. In some periods, total returns would have been lower had certain expenses not been waived during the periods. Returns shown do not reflect the deduction of taxes that a shareholder would pay on Fund distributions or the redemption of Fund shares. |
| (e) | Includes adjustments in accordance with U.S. GAAP and as such, the total return for shareholder transactions reported to the market may differ from the total return for financial reporting purposes. As a result, the total return decreased from 8.12% to 8.03%. |
| (f) | Includes adjustments in accordance with U.S. GAAP and as such, the total return for shareholder transactions reported to the market may differ from the total return for financial reporting purposes. As a result, the total return increased from 11.13% to 11.22%.(g) Annualized. |
| (h) | Effective September 1, 2015, the Adviser agreed to limit expenses to 1.15%. The Adviser agreed to limit expenses to 1.25% for the period September 1, 2014 through August 31, 2015. Prior to September 1, 2014, the Adviser agreed to limit expenses to 1.40%. (See Note 6.) |
| (i) | Portfolio turnover rate for periods less than one full year have not been annualized. |
| 30 | (855) 732-9220 seafarerfunds.com |
Financial Highlights
For a share outstanding through the periods presented
| Six Months Ended October 31, 2019 (Unaudited) | | | Year Ended April 30, 2019 | | | Year Ended April 30, 2018 | | | Year Ended April 30, 2017 | | | Year Ended April 30, 2016 | | | Year Ended April 30, 2015 | |
| $ | 11.56 | | | $ | 13.11 | | | $ | 12.51 | | | $ | 11.44 | | | $ | 12.64 | | | $ | 11.58 | |
| | | | | | | | | | | | | | | | | | | | | | | |
| | 0.17 | | | | 0.36 | | | | 0.28 | | | | 0.22 | | | | 0.16 | | | | 0.14 | |
| | 0.30 | | | | (1.02 | ) | | | 0.72 | | | | 1.04 | | | | (1.23 | ) | | | 1.26 | |
| | 0.47 | | | | (0.66 | ) | | | 1.00 | | | | 1.26 | | | | (1.07 | ) | | | 1.40 | |
| | | | | | | | | | | | | | | | | | | | | | | |
| | (0.18 | ) | | | (0.01 | ) | | | (0.37 | ) | | | (0.19 | ) | | | (0.11 | ) | | | (0.19 | ) |
| | – | | | | (0.88 | ) | | | (0.03 | ) | | | – | | | | (0.02 | ) | | | (0.15 | ) |
| | (0.18 | ) | | | (0.89 | ) | | | (0.40 | ) | | | (0.19 | ) | | | (0.13 | ) | | | (0.34 | ) |
| | – | | | | – | | | | – | | | | 0.00 | (b) | | | 0.00 | (b) | | | 0.00 | (b) |
| | 0.29 | | | | (1.55 | ) | | | 0.60 | | | | 1.07 | | | | (1.20 | ) | | | 1.06 | |
| $ | 11.85 | | | $ | 11.56 | | | $ | 13.11 | | | $ | 12.51 | (c) | | $ | 11.44 | | | $ | 12.64 | |
| | 4.14 | % | | | (4.36 | %) | | | 8.03 | %(e) | | | 11.22 | %(f) | | | (8.39 | %) | | | 12.55 | % |
| | | | | | | | | | | | | | | | | | | | | | | |
| $ | 201,057 | | | $ | 233,072 | | | $ | 894,241 | | | $ | 877,384 | | | $ | 613,795 | | | $ | 53,543 | |
| | | | | | | | | | | | | | | | | | | | | | | |
| | 1.02 | %(g) | | | 0.99 | % | | | 0.97 | % | | | 1.02 | % | | | 1.14 | % | | | 1.30 | % |
| | 1.02 | %(g) | | | 0.99 | % | | | 0.97 | % | | | 1.02 | % | | | 1.14 | %(h) | | | 1.30 | %(h) |
| | 3.03 | %(g) | | | 3.02 | % | | | 2.12 | % | | | 1.88 | % | | | 1.50 | % | | | 1.19 | % |
| | 13 | % | | | 52 | % | | | 23 | % | | | 14 | % | | | 7 | % | | | 28 | % |
See accompanying Notes to Financial Statements.
| Semi-annual Report – October 31, 2019 | 31 |
Seafarer Overseas Growth and Income Fund
| Institutional Class |
| NET ASSET VALUE, BEGINNING OF PERIOD |
| INCOME FROM OPERATIONS: |
| Net investment income(a) |
| Net realized and unrealized gain/(loss) on investments |
| Total from investment operations |
| |
| LESS DISTRIBUTIONS: |
| From net investment income |
| From net realized gains on investments |
| Total distributions |
| REDEMPTION FEES ADDED TO PAID IN CAPITAL |
| NET INCREASE/(DECREASE) IN NET ASSET VALUE |
| NET ASSET VALUE, END OF PERIOD |
| |
| TOTAL RETURN(c) |
| SUPPLEMENTAL DATA: |
| Net assets, end of period (in 000s) |
| RATIOS TO AVERAGE NET ASSETS: |
| Operating expenses excluding reimbursement/waiver |
| Operating expenses including reimbursement/waiver |
| Net investment income including reimbursement/waiver |
| PORTFOLIO TURNOVER RATE(f) |
| (a) | Calculated using the average shares method. |
| (b) | Less than $0.005 per share. |
| (c) | Total returns are for the periods indicated and have not been annualized. In some periods, total returns would have been lower had certain expenses not been waived during the periods. Returns shown do not reflect the deduction of taxes that a shareholder would pay on Fund distributions or the redemption of Fund shares. |
| (e) | Effective September 1, 2014, the Adviser agreed to limit expenses to 1.05%. Prior to September 1, 2014, the Adviser agreed to limit expenses to 1.25%. (See Note 6.) |
| (f) | Portfolio turnover rate for periods less than one full year have not been annualized. |
| 32 | (855) 732-9220 seafarerfunds.com |
Financial Highlights
For a share outstanding through the periods presented
| Six Months Ended October 31, 2019 (Unaudited) | | | Year Ended April 30, 2019 | | | Year Ended April 30, 2018 | | | Year Ended April 30, 2017 | | | Year Ended April 30, 2016 | | | Year Ended April 30, 2015 | |
| $ | 11.61 | | | $ | 13.14 | | | $ | 12.54 | | | $ | 11.46 | | | $ | 12.66 | | | $ | 11.59 | |
| | | | | | | | | | | | | | | | | | | | | | | |
| | 0.17 | | | | 0.29 | | | | 0.28 | | | | 0.21 | | | | 0.19 | | | | 0.15 | |
| | 0.31 | | | | (0.93 | ) | | | 0.73 | | | | 1.07 | | | | (1.26 | ) | | | 1.28 | |
| | 0.48 | | | | (0.64 | ) | | | 1.01 | | | | 1.28 | | | | (1.07 | ) | | | 1.43 | |
| | | | | | | | | | | | | | | | | | | | | | | |
| | (0.18 | ) | | | (0.01 | ) | | | (0.38 | ) | | | (0.20 | ) | | | (0.12 | ) | | | (0.21 | ) |
| | – | | | | (0.88 | ) | | | (0.03 | ) | | | – | | | | (0.02 | ) | | | (0.15 | ) |
| | (0.18 | ) | | | (0.89 | ) | | | (0.41 | ) | | | (0.20 | ) | | | (0.14 | ) | | | (0.36 | ) |
| | – | | | | – | | | | – | | | | 0.00 | (b) | | | 0.01 | | | | 0.00 | (b) |
| | 0.30 | | | | (1.53 | ) | | | 0.60 | | | | 1.08 | | | | (1.20 | ) | | | 1.07 | |
| $ | 11.91 | | | $ | 11.61 | | | $ | 13.14 | | | $ | 12.54 | | | $ | 11.46 | | | $ | 12.66 | |
| | 4.23 | % | | | (4.17 | %) | | | 8.08 | % | | | 11.37 | % | | | (8.32 | %) | | | 12.76 | % |
| | | | | | | | | | | | | | | | | | | | | | | |
| $ | 1,341,263 | | | $ | 1,304,491 | | | $ | 2,134,051 | | | $ | 1,500,310 | | | $ | 605,178 | | | $ | 129,714 | |
| | | | | | | | | | | | | | | | | | | | | | | |
| | 0.92 | %(d) | | | 0.90 | % | | | 0.87 | % | | | 0.92 | % | | | 1.03 | % | | | 1.18 | % |
| | 0.92 | %(d) | | | 0.90 | % | | | 0.87 | % | | | 0.92 | % | | | 1.03 | % | | | 1.10 | %(e) |
| | 3.08 | %(d) | | | 2.45 | % | | | 2.09 | % | | | 1.82 | % | | | 1.72 | % | | | 1.30 | % |
| | 13 | % | | | 52 | % | | | 23 | % | | | 14 | % | | | 7 | % | | | 28 | % |
See accompanying Notes to Financial Statements.
| Semi-annual Report – October 31, 2019 | 33 |
Seafarer Overseas Value Fund
| Investor Class |
| NET ASSET VALUE, BEGINNING OF PERIOD |
| INCOME FROM OPERATIONS: |
| Net investment income(a) |
| Net realized and unrealized gain/(loss) on investments |
| Total from investment operations |
| |
| LESS DISTRIBUTIONS: |
| From net investment income |
| From net realized gains on investments |
| Total distributions |
| NET INCREASE/(DECREASE) IN NET ASSET VALUE |
| NET ASSET VALUE, END OF PERIOD |
| |
| TOTAL RETURN(b) |
| SUPPLEMENTAL DATA: |
| Net assets, end of period (in 000s) |
| RATIOS TO AVERAGE NET ASSETS: |
| Operating expenses excluding reimbursement/waiver |
| Operating expenses including reimbursement/waiver |
| Net investment income including reimbursement/waiver |
| PORTFOLIO TURNOVER RATE(d) |
| (a) | Calculated using the average shares method. |
| (b) | Total returns are for the periods indicated and have not been annualized. In some periods, total returns would have been lower had certain expenses not been waived during the periods. Returns shown do not reflect the deduction of taxes that a shareholder would pay on Fund distributions or the redemption of Fund shares. |
| (d) | Portfolio turnover rate for a period less than one full year has not been annualized. |
| 34 | (855) 732-9220 seafarerfunds.com |
Financial Highlights
For a share outstanding through the periods presented
| Six Months Ended October 31, 2019 (Unaudited) | | | Year Ended April 30, 2019 | | | Year Ended April 30, 2018 | | | May 31, 2016 (Inception) to April 30, 2017 | |
| $ | 11.41 | | | $ | 11.95 | | | $ | 11.30 | | | $ | 10.00 | |
| | | | | | | | | | | | | | | |
| | 0.25 | | | | 0.29 | | | | 0.35 | | | | 0.12 | |
| | 0.37 | | | | (0.51 | ) | | | 0.72 | | | | 1.28 | |
| | 0.62 | | | | (0.22 | ) | | | 1.07 | | | | 1.40 | |
| | | | | | | | | | | | | | | |
| | – | | | | (0.29 | ) | | | (0.42 | ) | | | (0.10 | ) |
| | – | | | | (0.03 | ) | | | – | | | | – | |
| | – | | | | (0.32 | ) | | | (0.42 | ) | | | (0.10 | ) |
| | 0.62 | | | | (0.54 | ) | | | 0.65 | | | | 1.30 | |
| $ | 12.03 | | | $ | 11.41 | | | $ | 11.95 | | | $ | 11.30 | |
| | | | | | | | | | | | | | | |
| | 5.43 | % | | | (1.50 | %) | | | 9.55 | % | | | 14.15 | % |
| | | | | | | | | | | | | | | |
| $ | 325 | | | $ | 327 | | | $ | 311 | | | $ | 280 | |
| | | | | | | | | | | | | | | |
| | 1.38 | %(c) | | | 1.45 | % | | | 1.80 | % | | | 3.71 | %(c) |
| | 1.15 | %(c) | | | 1.15 | % | | | 1.15 | % | | | 1.15 | %(c) |
| | 4.35 | %(c) | | | 2.59 | % | | | 2.91 | % | | | 1.24 | %(c) |
| | 12 | % | | | 3 | % | | | 3 | % | | | 0 | % |
See accompanying Notes to Financial Statements.
| Semi-annual Report – October 31, 2019 | 35 |
Seafarer Overseas Value Fund
| Institutional Class |
| NET ASSET VALUE, BEGINNING OF PERIOD |
| INCOME FROM OPERATIONS: |
| Net investment income(a) |
| Net realized and unrealized gain/(loss) on investments |
| Total from investment operations |
| |
| LESS DISTRIBUTIONS: |
| From net investment income |
| From net realized gains on investments |
| Total distributions |
| NET INCREASE/(DECREASE) IN NET ASSET VALUE |
| NET ASSET VALUE, END OF PERIOD |
| |
| TOTAL RETURN(c) |
| SUPPLEMENTAL DATA: |
| Net assets, end of period (in 000s) |
| RATIOS TO AVERAGE NET ASSETS: |
| Operating expenses excluding reimbursement/waiver |
| Operating expenses including reimbursement/waiver |
| Net investment income including reimbursement/waiver |
| PORTFOLIO TURNOVER RATE(g) |
| (a) | Calculated using the average shares method. |
| (b) | In preparing the financial statements in accordance with U.S. GAAP, management made certain adjustments as required by U.S. GAAP which caused the net asset value for purposes of these financial statements to differ from the net asset value used to process shareholder transactions as of the date of these financial statements. As a result, the net asset value decreased from $11.29 to $11.28. |
| (c) | Total returns are for the periods indicated and have not been annualized. In some periods, total returns would have been lower had certain expenses not been waived during the periods. Returns shown do not reflect the deduction of taxes that a shareholder would pay on Fund distributions or the redemption of Fund shares. |
| (d) | Includes adjustments in accordance with U.S. GAAP and as such, the total return for shareholder transactions reported to the market may differ from the total return for financial reporting purposes. As a result, the total return increased from 9.64% to 9.74%. |
| (e) | Includes adjustments in accordance with U.S. GAAP and as such, the total return for shareholder transactions reported to the market may differ from the total return for financial reporting purposes. As a result, the total return decreased from 14.29% to 14.18%. |
| (g) | Portfolio turnover rate for a period less than one full year has not been annualized. |
| 36 | (855) 732-9220 seafarerfunds.com |
Financial Highlights
For a share outstanding through the periods presented
| Six Months Ended October 31, 2019 (Unaudited) | | | Year Ended April 30, 2019 | | | Year Ended April 30, 2018 | | | May 31, 2016 (Inception) to April 30, 2017 | |
| $ | 11.43 | | | $ | 11.96 | | | $ | 11.28 | | | $ | 10.00 | |
| | | | | | | | | | | | | | | |
| | 0.26 | | | | 0.30 | | | | 0.35 | | | | 0.13 | |
| | 0.36 | | | | (0.50 | ) | | | 0.74 | | | | 1.28 | |
| | 0.62 | | | | (0.20 | ) | | | 1.09 | | | | 1.41 | |
| | | | | | | | | | | | | | | |
| | – | | | | (0.30 | ) | | | (0.41 | ) | | | (0.13 | ) |
| | – | | | | (0.03 | ) | | | – | | | | – | |
| | – | | | | (0.33 | ) | | | (0.41 | ) | | | (0.13 | ) |
| | 0.62 | | | | (0.53 | ) | | | 0.68 | | | | 1.28 | |
| $ | 12.05 | | | $ | 11.43 | | | $ | 11.96 | | | $ | 11.28 | (b) |
| | | | | | | | | | | | | | | |
| | 5.42 | % | | | (1.34 | %) | | | 9.74 | %(d) | | | 14.18 | %(e) |
| | | | | | | | | | | | | | | |
| $ | 40,128 | | | $ | 28,849 | | | $ | 25,291 | | | $ | 9,846 | |
| | | | | | | | | | | | | | | |
| | 1.37 | %(f) | | | 1.48 | % | | | 1.76 | % | | | 3.63 | %(f) |
| | 1.05 | %(f) | | | 1.05 | % | | | 1.05 | % | | | 1.05 | %(f) |
| | 4.48 | %(f) | | | 2.65 | % | | | 2.90 | % | | | 1.36 | %(f) |
| | 12 | % | | | 3 | % | | | 3 | % | | | 0 | % |
See accompanying Notes to Financial Statements.
| Semi-annual Report – October 31, 2019 | 37 |
| Seafarer Funds | Notes to Financial Statements |
October 31, 2019 (Unaudited)
NOTES TO FINANCIAL STATEMENTS
1. Organization
Financial Investors Trust (the “Trust”), a Delaware statutory trust, is an open-end management investment company registered under the Investment Company Act of 1940, as amended (“1940 Act”). The Trust consists of multiple separate portfolios or series. This semi-annual report describes the Seafarer Overseas Growth and Income Fund and the Seafarer Overseas Value Fund (individually a “Fund” and collectively, the “Funds”). The Seafarer Overseas Growth and Income Fund seeks to provide long-term capital appreciation along with some current income; it also seeks to mitigate adverse volatility in returns as a secondary objective. The Seafarer Overseas Value Fund seeks to provide long-term capital appreciation. The Funds each offer Investor Class and Institutional Class shares.
2. Significant Accounting Policies
The accompanying financial statements were prepared in accordance with accounting principles generally accepted in the United States of America (“U.S. GAAP”). The preparation of financial statements in conformity with U.S. GAAP requires management to make certain estimates and assumptions that affect the reported amounts of assets and liabilities and disclosures of contingent assets and liabilities at the date of the financial statements and the reported amounts of revenue and expenses during the period. Actual results could differ from those estimates. The Funds are considered an investment company for financial reporting purposes under U.S. GAAP and follow the accounting and reporting guidance applicable to investment companies in the Financial Accounting Standards Board Accounting Standards Codification Topic 946.The following is a summary of significant accounting policies consistently followed by the Funds in preparation of their financial statements.
Investment Valuation
Each Fund generally values its securities based on market prices determined at the close of regular trading on the New York Stock Exchange (“NYSE”), normally 4:00 p.m. Eastern Time, on each day the NYSE is open for trading.
For equity securities and exchange traded funds, the market price is usually the closing sale or official closing price on that exchange. In the case of equity securities not traded on an exchange, or if such closing prices are not otherwise available, the securities are valued at the mean of the most recent bid and ask prices on such day. Redeemable securities issued by open-end registered investment companies are valued at the investment company’s applicable net asset value, with the exception of exchange-traded open-end investment companies, which are priced as equity securities.
Equity securities that are primarily traded on foreign securities exchanges are valued at the closing values of such securities on their respective foreign exchanges, except when an event occurs subsequent to the close of the foreign exchange but before the close of the NYSE, such that the securities’ value would likely change. In such an event, the fair values of those securities are determined in good faith through consideration of other factors in accordance with procedures established by and under the general supervision of the Board of Trustees of the Trust (the “Board” or the “Trustees”). Each Fund uses a fair valuation model provided by an independent pricing service, which is intended to reflect fair value when a security’s value or a meaningful portion of the Fund’s portfolio is believed to have been materially affected by a valuation event that has occurred between the close of the exchange or market on which the security is traded and the close of the regular trading day on the NYSE.
The market price for debt obligations is generally the price supplied by an independent third-party pricing service approved by the Board, which may use a matrix, formula or other objective method that takes into consideration quotations from dealers, market transactions in comparable investments, market indices and yield curves. If vendors are unable to supply a price, or if the price supplied is deemed to be unreliable, the market price may be determined using quotations received from one or more broker-dealers that make a market in the security. Corporate bonds and convertible bonds are valued using market models that consider trade data, quotations from dealers and active market makers, relevant yield curve and spread
| 38 | (855) 732-9220 seafarerfunds.com |
| Seafarer Funds | Notes to Financial Statements |
October 31, 2019 (Unaudited)
data, creditworthiness, trade data or market information on comparable securities, and other relevant security specific information. Publicly traded foreign government debt securities and foreign corporate bonds are typically traded internationally in the over -the-counter market and are valued at the mean between the bid and asked prices as of the close of business of that market.
Forward currency exchange contracts have a market value determined by the prevailing foreign currency exchange daily rates and current foreign currency exchange forward rates. The foreign currency exchange forward rates are calculated using an automated system that estimates rates on the basis of the current day foreign currency exchange rates and forward foreign currency exchange rates supplied by a pricing service.
When such prices or quotations are not available, or when the Trust’s Valuation Committee believes that they are unreliable, securities may be priced using fair value procedures approved by the Board.
Certain foreign countries impose a tax on capital gains which is accrued by each Fund based on unrealized appreciation, if any, on affected securities. The tax is paid when the gain is realized.
Fair Value Measurements
Each Fund discloses the classification of its fair value measurements following a three-tier hierarchy based on the inputs used to measure fair value. Inputs refer broadly to the assumptions that market participants would use in pricing the asset or liability, including assumptions about risk. Inputs may be observable or unobservable. Observable inputs reflect the assumptions market participants would use in pricing the asset or liability. Such inputs are developed based on market data obtained from sources independent of the reporting entity. Unobservable inputs reflect the reporting entity’s own assumptions about the assumptions market participants would use in pricing the asset or liability, which are developed based on the information available and the reporting entity’s best efforts to interpret such information.
Various inputs are used in determining the value of the Funds’ investments as of the end of the reporting period. When inputs used fall into different levels of the fair value hierarchy, the level in the hierarchy within which the fair value measurement falls is determined based on the lowest level input that is significant to the fair value measurement in its entirety. The designated input levels are not necessarily an indication of the risk or liquidity associated with these investments. These inputs are categorized in the following hierarchy under applicable financial accounting standards:
| Level 1 – | Unadjusted quoted prices in active markets for identical investments, unrestricted assets or liabilities that the Funds have the ability to access at the measurement date; |
| Level 2 – | Quoted prices which are not active, quoted prices for similar assets or liabilities in active markets or inputs other than quoted prices that are observable (either directly or indirectly) for substantially the full term of the asset or liability; and |
| Level 3 – | Significant unobservable prices or inputs (including the Funds’ own assumptions in determining the fair value of investments) where there is little or no market activity for the asset or liability at the measurement date. |
| Semi-annual Report – October 31, 2019 | 39 |
| Seafarer Funds | Notes to Financial Statements |
October 31, 2019 (Unaudited)
The following is a summary of the inputs used to value each Fund as of October 31, 2019:
| Investments in Securities at Value(a) | | Level 1 - Quoted Prices | | | Level 2 - Other Significant Observable Inputs | | | Level 3 - Significant Unobservable Inputs | | | Total | |
| Seafarer Overseas Growth and Income Fund | | | |
| Common Stocks | | | | | | | | | | | | | | | | |
| Brazil | | $ | 77,812,492 | | | $ | – | | | $ | – | | | $ | 77,812,492 | |
| China / Hong Kong | | | 70,820,195 | | | | 411,632,328 | | | | – | | | | 482,452,523 | |
| Czech Republic | | | – | | | | 24,236,899 | | | | – | | | | 24,236,899 | |
| Hungary | | | 45,776,940 | | | | – | | | | – | | | | 45,776,940 | |
| India | | | 40,246,447 | | | | – | | | | – | | | | 40,246,447 | |
| Indonesia | | | – | | | | 23,970,822 | | | | – | | | | 23,970,822 | |
| Malaysia | | | – | | | | 18,803,015 | | | | – | | | | 18,803,015 | |
| Mexico | | | 48,198,397 | | | | – | | | | – | | | | 48,198,397 | |
| Philippines | | | – | | | | 23,703,750 | | | | – | | | | 23,703,750 | |
| Qatar | | | 25,516,742 | | | | – | | | | – | | | | 25,516,742 | |
| Singapore | | | – | | | | 99,186,866 | | | | – | | | | 99,186,866 | |
| South Africa | | | – | | | | 36,839,895 | | | | – | | | | 36,839,895 | |
| South Korea | | | 31,561,305 | | | | 262,930,488 | | | | – | | | | 294,491,793 | |
| Taiwan | | | – | | | | 78,201,065 | | | | – | | | | 78,201,065 | |
| Thailand | | | – | | | | 19,873,943 | | | | – | | | | 19,873,943 | |
| United Arab Emirates | | | – | | | | 18,753,098 | | | | – | | | | 18,753,098 | |
| Vietnam | | | – | | | | 23,225,891 | | | | – | | | | 23,225,891 | |
| Preferred Stocks | | | – | | | | 72,161,689 | | | | – | | | | 72,161,689 | |
| Government Bond, Short-term - USD and Foreign Currency | | | – | | | | 28,261,415 | | | | – | | | | 28,261,415 | |
| Total | | $ | 339,932,518 | | | $ | 1,141,781,164 | | | $ | – | | | $ | 1,481,713,682 | |
| 40 | (855) 732-9220 seafarerfunds.com |
| Seafarer Funds | Notes to Financial Statements |
October 31, 2019 (Unaudited)
| Investments in Securities at Value(a) | | Level 1 - Quoted Prices | | | Level 2 - Other Significant Observable Inputs | | | Level 3 - Significant Unobservable Inputs | | | Total | |
| Seafarer Overseas Value Fund | | | | | | | | | | | | |
| Common Stocks | | | | | | | | | | | | | | | | |
| Brazil | | $ | 2,004,620 | | | $ | – | | | $ | – | | | $ | 2,004,620 | |
| China / Hong Kong | | | 1,151,046 | | | | 14,244,932 | | | | – | | | | 15,395,978 | |
| Czech Republic | | | 1,372,982 | | | | 1,221,805 | | | | – | | | | 2,594,787 | |
| Georgia | | | 1,361,209 | | | | – | | | | – | | | | 1,361,209 | |
| Mexico | | | 977,750 | | | | – | | | | – | | | | 977,750 | |
| Philippines | | | 546,768 | | | | – | | | | – | | | | 546,768 | |
| Qatar | | | 1,607,773 | | | | – | | | | – | | | | 1,607,773 | |
| Russia | | | 1,404,856 | | | | – | | | | – | | | | 1,404,856 | |
| Singapore | | | – | | | | 3,961,823 | | | | – | | | | 3,961,823 | |
| South Korea | | | – | | | | 1,561,166 | | | | – | | | | 1,561,166 | |
| United Arab Emirates | | | – | | | | 1,449,192 | | | | – | | | | 1,449,192 | |
| Vietnam | | | – | | | | 1,688,350 | | | | – | | | | 1,688,350 | |
| Total | | $ | 10,427,004 | | | $ | 24,127,268 | | | $ | – | | | $ | 34,554,272 | |
| (a) | For detailed descriptions of securities by country, see the accompanying Portfolio of Investments. |
For the six months ended October 31, 2019, the Funds did not have any securities that used significant unobservable inputs (Level 3) in determining fair value.
Investment Transactions and Investment Income
Investment transactions are accounted for on the date the investments are purchased or sold (trade date). Realized gains and losses from investment transactions are reported on an identified cost basis. Interest income, which includes accretion of discounts and amortization of premiums, is accrued and recorded as earned. Dividend income is recognized on the ex-dividend date or for certain foreign securities, as soon as information is available to the Funds. All of the realized and unrealized gains and losses and net investment income are allocated daily to each share class in proportion to its average daily net assets.
Cash Management Transactions
Each of the Funds subscribes to the Brown Brothers Harriman & Co. (“BBH”) Cash Management Service (“CMS”), whereby cash balances are automatically swept into overnight offshore demand deposits with either the BBH Grand Cayman branch or a branch of a pre-approved commercial bank. This fully automated program allows the Funds to earn interest on cash balances. Excess cash with deposit institutions domiciled outside of the U.S. are subject to sovereign actions in the jurisdiction of the deposit institution including, but not limited to, freeze, seizure or diminution. Cash balances in the BBH CMS are included on the Statements of Assets and Liabilities under Cash and Foreign currency, at value. As of October 31, 2019, the Funds had the following cash balances participating in the BBH CMS:
| Fund | | | |
| Seafarer Overseas Growth and Income Fund | | $ | 43,672,161 | |
| Seafarer Overseas Value Fund | | | 5,771,625 | |
| Semi-annual Report – October 31, 2019 | 41 |
| Seafarer Funds | Notes to Financial Statements |
October 31, 2019 (Unaudited)
As of October 31, 2019, the Funds had the following foreign cash balances participating in the BBH CMS (cost and value of foreign cash balances are equal):
| Fund | | | | |
| Seafarer Overseas Growth and Income Fund | | $ | – | |
| Seafarer Overseas Value Fund | | | – | |
Foreign Securities
The Funds may directly purchase securities of foreign issuers. Investing in securities of foreign issuers involves special risks not typically associated with investing in securities of U.S. issuers. The risks include possible revaluation of currencies, the inability to repatriate foreign currency, less complete financial information about companies, and possible future adverse political and economic developments. Moreover, securities of many foreign issuers and their markets may be less liquid and their prices more volatile than those of securities of comparable U.S. issuers.
Foreign Currency Translation
The books and records of the Funds are maintained in U.S. dollars. Investment valuations and other assets and liabilities initially expressed in foreign currencies are converted each business day into U.S. dollars based upon current exchange rates. Prevailing foreign exchange rates may generally be obtained at the close of the NYSE (normally, 4:00 p.m. Eastern Time). The portion of realized and unrealized gains or losses on investments due to fluctuations in foreign currency exchange rates is not separately disclosed and is included in realized and unrealized gains or losses on investments, when applicable.
Foreign Currency Spot Contracts
Each Fund may enter into foreign currency spot contracts to facilitate transactions in foreign securities or to convert foreign currency receipts into U.S. dollars. A foreign currency spot contract is an agreement between two parties to buy and sell currencies at the current market rate, for settlement generally within two business days. The U.S. dollar value of a contract is determined using current currency exchange rates supplied by a pricing service. The contract is marked-to-market daily for settlements beyond one day and any change in market value is recorded as an unrealized gain or loss. When the contract is closed, the Fund records a realized gain or loss equal to the difference between the value on the open and close date. Losses may arise from changes in the value of the foreign currency, or if the counterparties do not perform under the contract’s terms. The maximum potential loss from such contracts is the aggregate face value in U.S. dollars at the time the contract was opened.
Trust Expenses
Some expenses of the Trust can be directly attributed to the Funds. Expenses that cannot be directly attributed to the Funds are apportioned among all funds in the Trust based on the average daily net assets of each fund.
Fund and Class Expenses
Expenses that are specific to a Fund or class of shares of a Fund, including shareholder servicing fees, are charged directly to that Fund or share class. Expenses that are common to all Funds are generally allocated among the Funds in proportion to their average daily net assets.
Federal Income Taxes
Each Fund complies with the requirements under Subchapter M of the Internal Revenue Code of 1986, as amended, applicable to regulated investment companies and intends to distribute substantially all of its net taxable income and net capital gains, if any, each year so that it will not be subject to excise tax on undistributed income and gains. The Funds are not subject to income taxes to the extent such distributions are made.
As of and during the six months ended October 31, 2019, the Funds did not have a liability for any unrecognized tax benefits. The Funds file U.S. federal, state, and local tax returns as required. The
| 42 | (855) 732-9220 seafarerfunds.com |
| Seafarer Funds | Notes to Financial Statements |
October 31, 2019 (Unaudited)
Funds’ tax returns are subject to examination by the relevant tax authorities until expiration of the applicable statute of limitations, which is generally three years after the filing of the tax return for federal purposes and four years for most state returns. Tax returns for open years have incorporated no uncertain tax positions that require a provision for income taxes.
Distributions to Shareholders
In general, the Seafarer Overseas Growth and Income Fund’s policy is to distribute to its shareholders substantially all net investment income, paid out via two semi-annual dividends, in June and December. The Seafarer Overseas Value Fund’s policy is to distribute to its shareholders substantially all net investment income via one annual dividend in December. It is also each Fund’s policy to distribute annually all net realized short-term and long-term capital gains, if any, after offsetting any capital loss carryovers. Income dividend distributions are derived from dividends and other income each Fund receives from its investments, including short-term capital gains. Long-term capital gain distributions are derived from gains realized when a Fund sells a security it has owned for more than one year. Each Fund may make additional distributions if Seafarer Capital Partners, LLC (the “Adviser”) believes doing so may be necessary for the Fund to share tax obligations more ratably and more equitably across shareholders over time.
3. Tax Basis Information
Tax Basis of Investments
As of October 31, 2019, the aggregate cost of investments, gross unrealized appreciation/(depreciation), and net unrealized appreciation for Federal tax purposes were as follows:
| | | Cost of Investments | | | Gross Unrealized Appreciation | | | Gross Unrealized Depreciation | | | Net Unrealized Appreciation | |
| Seafarer Overseas Growth and Income Fund | | $ | 1,423,285,779 | | | $ | 178,057,351 | | | $ | (119,629,448 | ) | | $ | 58,427,903 | |
| Seafarer Overseas Value Fund | | | 33,640,802 | | | | 5,041,253 | | | | (4,127,783 | ) | | | 913,470 | |
Tax Basis of Distributions to Shareholders
The character of distributions made during the fiscal year from net investment income or net realized gains may differ from the ultimate characterization for federal income tax purposes. Also, due to the timing of dividend distributions, the fiscal year in which amounts are distributed may differ from the fiscal year in which the income or realized gain is recorded by a Fund.
The tax character of distributions paid by the Funds for the fiscal year ended April 30, 2019 was as follows:
| | | Ordinary Income | | | Long-Term Capital Gain | |
| Seafarer Overseas Growth and Income Fund | | $ | 2,805,129 | | | $ | 130,795,114 | |
| Seafarer Overseas Value Fund | | | 751,764 | | | | 62,777 | |
The amounts and characteristics of tax basis distributions and composition of distributable earnings/(accumulated losses) are finalized at fiscal year-end. Accordingly, tax basis balances have not been determined as of October 31, 2019.
| Semi-annual Report – October 31, 2019 | 43 |
| Seafarer Funds | Notes to Financial Statements |
October 31, 2019 (Unaudited)
4. Securities Transactions
The cost of purchases and proceeds from sales of securities excluding short-term securities during the six months ended October 31, 2019 were as follows:
| | | Purchases of Securities | | | Proceeds from Salesof Securities | |
| Seafarer Overseas Growth and Income Fund | | $ | 187,070,276 | | | $ | 262,601,536 | |
| Seafarer Overseas Value Fund | | | 9,685,408 | | | | 3,641,646 | |
5. Shares of Beneficial Interest
The capitalization of the Trust consists of an unlimited number of shares of beneficial interest with no par value per share. Holders of shares of the Funds of the Trust have one vote for each share held and a proportionate fraction of a vote for each fractional share. All shares issued and outstanding are fully paid and are transferable and redeemable at the option of the shareholder. Purchasers of the shares do not have any obligation to make payments to the Trust or its creditors solely by reason of the purchasers’ ownership of the shares. Shares have no pre-emptive rights.
6. Management and Related Party Transactions
The Adviser, subject to the authority of the Board, is responsible for the overall management and administration of the Funds’ business affairs. The Adviser manages the investments of the Funds in accordance with the Funds’ investment objectives, policies, limitations and investment guidelines established jointly by the Adviser and the Trustees. Pursuant to the investment advisory agreement, the Funds, in the aggregate, pay the Adviser an annual management fee of 0.75% of the aggregate average daily net assets of the Funds up to $1.5 billion and 0.70% of the aggregate average daily net assets of the Funds over $1.5 billion. Each Fund pays the Adviser a monthly fee at the annual rate using the applicable management fee calculated based on the Fund’s pro rata share of the Funds’ combined average daily net assets. Prior to August 31, 2016, the Funds paid the Adviser an annual management fee of 0.75% of the aggregate average daily net assets of the Funds.
Effective September 1, 2014, the Adviser contractually agreed to limit certain Fund expenses (excluding brokerage expenses, interest expenses, taxes and extraordinary expenses) to 1.25% and 1.05% of the Funds’ average daily net assets in the Investor and Institutional share classes, respectively, through August 31, 2015. Effective September 1, 2015, the Adviser contractually, through successive one-year agreements, agreed to waive and/or reimburse fees or expenses in order to limit Total Annual Fund Operating Expenses After Fee Waiver / Expense Reimbursements (excluding brokerage expenses, interest expenses, taxes and extraordinary expenses) to 1.15% and 1.05% of the Funds’ average daily net assets for the Investor and Institutional share classes, respectively. The current agreement (the “Expense Agreement”) is in effect through August 31, 2020. The Adviser will be permitted to recover, on a class-by-class basis, expenses it has borne through the Expense Agreement to the extent that the Funds’ expenses in later periods fall below the expense cap in effect at the time of waiver or reimbursement. The Funds will not be obligated to pay any such deferred fees and expenses more than three years after the date of the waiver. This agreement may not be terminated or modified prior to August 31, 2020, except with the approval of the Funds’ Board. During the six months ended October 31, 2019, the Adviser agreed that it will only seek to recoup waived management fees and will not recoup any reimbursed expenses. As of October 31, 2019, the Adviser has recouped all available waived management fees from the Seafarer Overseas Growth and Income Fund.
| 44 | (855) 732-9220 seafarerfunds.com |
| Seafarer Funds | Notes to Financial Statements |
October 31, 2019 (Unaudited)
For the six months ended October 31, 2019, the fee waivers and/or reimbursements were as follows for the Seafarer Overseas Value Fund:
| Fund | | Fees Waived/ Reimbursed By Adviser | | | Recoupment of Past Waived Fees By Adviser | |
| Seafarer Overseas Value Fund | | | | | | |
| Investor Class | | $ | 361 | | | $ | 37 | |
| Institutional Class | | | 53,244 | | | | – | |
As of October 31, 2019, the balances of recoupable expenses for each class were as follows for the Funds:
| Fund | | Expires 2020 | | | Expires 2021 | | | Expires 2022 | | | Expires 2023 | | | Total | |
| Seafarer Overseas Growth and Income Fund | | | | | | | | | | | | | |
| Investor Class | | $ | – | | | $ | – | | | $ | – | | | $ | – | | | $ | – | |
| Institutional Class | | | – | | | | – | | | | – | | | | – | | | | – | |
| Seafarer Overseas Value Fund | | | | | | | | | | | | | | | | | | | | |
| Investor Class | | $ | 777 | | | $ | 1,723 | | | $ | 897 | | | $ | 361 | | | $ | 3,758 | |
| Institutional Class | | | 22,162 | | | | 108,082 | | | | 115,259 | | | | 53,244 | | | | 298,747 | |
Fund Administrator
ALPS Fund Services, Inc. (“ALPS” and the “Administrator”) provides administrative, fund accounting and other services to the Funds under the Administration, Bookkeeping and Pricing Services Agreement with the Trust.
The Funds’ administrative fee is accrued on a daily basis and paid monthly. The Administrator is also reimbursed by the Funds for certain out-of-pocket expenses. Administration fees paid by the Funds for the six months ended October 31, 2019 are disclosed in the Statements of Operations.
Transfer Agent
ALPS serves as transfer, dividend paying and shareholder servicing agent for the Funds (“Transfer Agent”). ALPS is paid an annual base fee per Fund and a fee based on the number of shareholder accounts. The Transfer Agent is also reimbursed by the Funds for certain out-of-pocket expenses. Transfer agent fees paid by the Funds for the six months ended October 31, 2019 are disclosed in the Statements of Operations.
Compliance Services
ALPS provides compliance services to the Funds under the Chief Compliance Officer Services Agreement with the Trust. ALPS provides services that assist the Trust’s chief compliance officer in monitoring and testing the policies and procedures of the Trust in accordance with the requirements of Rule 38a-1 under the 1940 Act. ALPS is paid an annual base fee and is reimbursed for certain out-of-pocket expenses. Compliance service fees paid by the Funds for the six months ended October 31, 2019 are disclosed in the Statements of Operations.
Principal Financial Officer
ALPS provides principal financial officer services to the Funds under the Principal Financial Officer Services Agreement with the Trust. Under this Agreement, ALPS is paid an annual base fee and is reimbursed for certain out-of-pocket expenses. Principal financial officer fees paid by the Funds for the six months ended October 31, 2019 are disclosed in the Statements of Operations.
| Semi-annual Report – October 31, 2019 | 45 |
| Seafarer Funds | Notes to Financial Statements |
October 31, 2019 (Unaudited)
Distributor
ALPS Distributors, Inc. (“ADI” or the “Distributor”) (an affiliate of ALPS) acts as the distributor of the Funds’ shares pursuant to the Distribution Agreement with the Trust. Under a side letter agreement, the Adviser pays ADI an annual base fee of $12,420 per Fund for the distribution services. The Adviser also reimburses ADI for certain out-of-pocket expenses. Shares are sold on a continuous basis by ADI as agent for the Funds, and ADI has agreed to use its best efforts to solicit orders for the sale of the Funds’ shares, although it is not obliged to sell any particular amount of shares. ADI is registered as a broker-dealer with the U.S. Securities and Exchange Commission.
Shareholder Service Plan for Investor Class and Institutional Class Shares
Each Fund has adopted a Shareholder Services Plan (a “Services Plan”) for each of its share classes. Under the Services Plan, each Fund is authorized to enter into shareholder service agreements with investment advisers, financial institutions and other service providers (“Participating Organizations”) to maintain and provide certain administrative and servicing functions in relation to the accounts of shareholders. Shareholder service arrangements typically include processing orders for shares, generating account and confirmation statements, sub-accounting, account maintenance, tax reporting, and disbursing cash dividends as well as other investment or administrative services required for a particular Participating Organizations’ products, programs, platform and accounts. The Services Plan will cause each Fund to pay an aggregate fee, not to exceed on an annual basis 0.15% and 0.05% of the average daily net asset value of the Investor and Institutional share classes, respectively. Such payments will be made on assets attributable to or held in the name of a Participating Organization, on behalf of its clients as compensation for providing service activities pursuant to an agreement with the Participating Organization. Any amount of such payment not paid to a Participating Organization for such service activities shall be reimbursed to the Fund as soon as practicable. Shareholder Services Plan fees paid by the Funds for the six months ended October 31, 2019 are disclosed in the Statements of Operations.
Trustees
The fees and expenses of the independent Trustees of the Board are presented in the Statements of Operations.
7. Indemnifications
Under the Trust’s organizational documents, its officers and Trustees are indemnified against certain liability arising out of the performance of their duties to the Trust. Additionally, in the normal course of business, the Trust enters into contracts with service providers that may contain general indemnification clauses, which may permit indemnification to the extent permissible under the applicable law. The Trust’s maximum exposure under these arrangements is unknown, as this would involve future claims that may be made against the Trust that have not yet occurred.
| 46 | (855) 732-9220 seafarerfunds.com |
| Seafarer Funds | Additional Information |
October 31, 2019 (Unaudited)
ADDITIONAL INFORMATION
1. Fund Holdings
The Funds’ portfolio holdings are made available semi-annually in shareholder reports within 60 days after the close of the period for which the report is being made, as required by federal securities laws. The Funds also file monthly portfolio holdings on Form N-PORT on a quarterly basis, with the schedule of portfolio holdings filed on Form N-PORT for the third month of each Fund’s fiscal quarter made publicly available 60 days after the end of the Funds’ fiscal quarter.
2. Fund Proxy Voting Policies, Procedures and Summaries
The Funds’ policies and procedures used in determining how to vote proxies and information regarding how the Funds voted proxies relating to portfolio securities during the most recent prior 12-month period ending June 30 are available without charge, (1) upon request, by calling toll-free (855) 732-9220 and (2) on the SEC’s website at http://www.sec.gov.
| Semi-annual Report – October 31, 2019 | 47 |
| Seafarer Funds | Privacy Policy |
October 31, 2019 (Unaudited)
| FACTS | WHAT DO THE FUNDS DO WITH YOUR PERSONAL INFORMATION? |
| Why? | Financial companies choose how they share your personal information. Federal law gives consumers the right to limit some but not all sharing. Federal law also requires us to tell you how we collect, share, and protect your personal information. Please read this notice carefully to understand what we do. |
| What? | The types of personal information we collect and share depend on the product or service you have with us. This information can include: • Social Security number and account transactions • Account balances and transaction history • Wire transfer instructions |
| How? | All financial companies need to share customers’ personal information to run their everyday business. In the section below, we list the reasons financial companies can share their customers’ personal information; the reasons the Funds choose to share; and whether you can limit this sharing. |
| Reasons we can share your personal information | Do we share: | Can you limit this sharing? |
| For our everyday business purposes — such as to process your transactions, maintain your account(s), respond to court orders and legal investigations, or report to credit bureaus | Yes | No |
| For our marketing purposes — to offer our products and services to you | No | We do not share. |
| For joint marketing with other financial companies | No | We do not share. |
| For our affiliates’ everyday business purposes — information about your transactions and experiences | Yes | No |
| For our affiliates’ everyday business purposes — information about your creditworthiness | No | We do not share. |
| For nonaffiliates to market to you | No | We do not share. |
| 48 | (855) 732-9220 seafarerfunds.com |
| Seafarer Funds | Privacy Policy |
October 31, 2019 (Unaudited)
| Who We Are | |
| Who is providing this notice? | Seafarer Overseas Growth and Income Fund and Seafarer Overseas Value Fund. |
| What We Do | |
| How do the Funds protect my personal information? | To protect your personal information from unauthorized access and use, we use security measures that comply with federal law. These measures include computer safeguards and secured files and buildings. |
| How do the Funds collect my personal information? | We collect your personal information, for example, when you • open an account • provide account information or give us your contact information • make a wire transfer or deposit money |
| Why can’t I limit all sharing? | Federal law gives you the right to limit only • sharing for affiliates’ everyday business purposes-information about your creditworthiness • affiliates from using your information to market to you • sharing for non-affiliates to market to you State laws and individual companies may give you additional rights to limit sharing. |
| Definitions | |
| Affiliates | Companies related by common ownership or control. They can be financial and nonfinancial companies. |
| Non-affiliates | Companies not related by common ownership or control. They can be financial and nonfinancial companies. • The Funds do not share with non-affiliates so they can market to you. |
| Joint marketing | A formal agreement between non-affiliated financial companies that together market financial products or services to you. • The Funds do not jointly market. |
| Other Important Information | |
| California Residents | If your account has a California home address, your personal information will not be disclosed to nonaffiliated third parties except as permitted by applicable California law, and we will limit sharing such personal information with our affiliates to comply with California privacy laws that apply to us. |
| Vermont Residents | The State of Vermont requires financial institutions to obtain your consent prior to sharing personal information that they collect about you with affiliated companies and nonaffiliated third parties other than in certain limited circumstances. Except as permitted by law, we will not share personal information we collect about you with nonaffiliated third parties or other affiliated companies unless you provide us with your written consent to share such information. |
| Semi-annual Report – October 31, 2019 | 49 |

Table of Contents
| CONTENTS | PAGE |
| Shareholder Letter | 1 |
| Fund Overview | |
| Vulcan Value Partners Fund | 4 |
| Vulcan Value Partners Small Cap Fund | 8 |
| Disclosure of Fund Expenses | |
| Vulcan Value Partners Fund | 6 |
| Vulcan Value Partners Small Cap Fund | 10 |
| Statements of Investments | |
| Vulcan Value Partners Fund | 12 |
| Vulcan Value Partners Small Cap Fund | 15 |
| Statements of Assets and Liabilities | 18 |
| Statements of Operations | 20 |
| Statements of Changes in Net Assets | |
| Vulcan Value Partners Fund | 21 |
| Vulcan Value Partners Small Cap Fund | 22 |
| Financial Highlights | |
| Vulcan Value Partners Fund | 24 |
| Vulcan Value Partners Small Cap Fund | 28 |
| Notes to Financial Statements | 31 |
| Additional Information | 40 |
| Privacy Policy | 41 |
Beginning on January 1, 2021, as permitted by regulations adopted by the U.S. Securities and Exchange Commission, paper copies of the Funds’ annual and semi-annual shareholder reports will no longer be sent by mail, unless you specifically request paper copies of the reports. Instead, the reports will be made available on the Funds’ website at www.vulcanvaluepartners.com and you will be notified by mail each time a report is posted and provided with a website link to access the report.
You may, notwithstanding the availability of shareholder reports online, elect to receive all future shareholder reports in paper free of charge. If you invest through a financial intermediary, you can contact your financial intermediary to request that you continue to receive paper copies of your shareholder reports. If you invest directly with the Funds, you can call 1.877.421.5078 to let the Funds know you wish to continue receiving paper copies of your shareholder reports.
If you already elected to receive shareholder reports electronically, you will not be affected by this change and you need not take any action. You may elect to receive shareholder reports and other communications from the Funds electronically anytime by contacting your financial intermediary (such as a broker-dealer or bank) or, if you are a direct investor, by enrolling at www.vulcanvaluepartners.com.
www.vulcanvaluepartners.com
Shareholder Letter
October 31, 2019 (Unaudited)
Portfolio Review
General
For the six months ended October 31, 2019, Vulcan Value Partners Fund returned 7.84% and the Vulcan Value Partners Small Cap Fund returned 0.58%. As you know, we place no weight on short-term results, good or bad, and neither should you. In fact, we have and will continue to willingly make decisions that negatively impact short-term performance when we think we can lower risk and improve our long-term returns. We encourage you to place more weight on our longer term historical results and a great deal of weight on our long-term prospects.
Vulcan Value Partners Fund Review
In the discussion that follows, we highlight a few holdings in the Vulcan Value Partners Fund. There was one material contributor, CVS Health Corp. There were no material detractors.
CVS is a leader in the retail pharmacy, health insurance, and pharmacy benefits management services industries. It enjoys unmatched scale, a growing network effect, a large physical footprint, a strong brand, and is the only fully vertically integrated company in its industry. Its merger with Aetna is progressing, and we are optimistic about the long-term outlook for the combined entity. We believe that their combination has the potential to bend the healthcare cost curve in the future, which should allow us to experience further value compounding. Its recent stock price decline has allowed us to establish a position in this high quality business at a compelling discount to our estimate of its intrinsic worth.
National Oilwell Varco was the largest detractor from performance during the period. Despite the recent decline in stock price, the underlying value of the business remains stable. Its stock price can be affected by movements in oil prices, but the company’s long-term value is not. The products it provides to the oil industry are needed regardless of commodity price movements. We acknowledge that, in the near term, wide fluctuations in oil prices can impact demand at the margin. However, these short-term fluctuations in demand do not have bearing on the company’s value. We look forward to stock price volatility in stable value businesses because it allows us the opportunity to execute our discipline.
We purchased shares of Brookfield Asset Management during the period. Brookfield Asset Management is a Canadian alternative asset manager focusing on its own private equity funds, investing in listed partnerships, and managing public securities. Unlike other asset managers, Brookfield has two sources of capital: its limited partnership structure and its publicly traded vehicles. Brookfield earns recurring long-term base management fees and generates performance fees for managing investors’ capital. Its scale, robust free cash flow, and excellent capital allocation are just a few of the reasons we like this business. Brookfield’s management team intelligently utilizes its robust free cash flow to maximize its intrinsic value per share. Brookfield’s value is compounding faster than its stock price, which gave us a margin of safety and the opportunity to add it to our portfolio.
BlackRock is the world’s largest money manager with a vast array of offerings, which we like for its numerous competitive advantages. However, we had the opportunity to reallocate capital in other high quality companies at deeper discounts. We followed our discipline and sold BlackRock in order to lower the weighted average price to value ratio of the portfolio.
| Semi-Annual Report | October 31, 2019 | 1 |
Shareholder Letter
October 31, 2019 (Unaudited)
Vulcan Value Partners Small Cap Fund Review
In the discussion that follows, we highlight a few holdings in the Vulcan Value Partners Small Cap Fund. There were five material contributors including Sotheby’s, Sleep Number Corp., Avast plc, Sleep Country Canada Holdings, and Frontdoor Inc. Material detractors include Despegar.com Corp., Ituran Location and Control, and Resideo Technologies Inc.
Another name we exited during the period, Sotheby's, was also a material contributor and added over 3% to performance. Sotheby’s is an auctioneer of art, jewelry, wine and other expensive luxury collectables. Having been in operation since 1744, the Sotheby’s brand is irreplaceable and its heritage is impossible to duplicate. On June 17, the company announced an agreement to be acquired and taken private by billionaire Patrick Drahi. The stock price appreciated close to the deal price, and we exited our position for a considerable gain. We are grateful to Ted Smith and the management team for their excellent stewardship of capital. We are sad to see Sotheby’s leave the portfolio.
Sleep Number, the second largest contributor during the period, is a premium bedding company in a stable industry. Its value has compounded at a strong double-digit rate over the three years we have owned it. The management team has excelled at capital allocation and has used the company’s free cash flow to repurchase its stock at extremely discounted prices. To paraphrase Benjamin Graham, in the short run, the stock market is a voting machine but, in the long run, it's a weighing machine. Price can increase or decrease drastically based on popular sentiment, as demonstrated by Sleep Number’s stock price volatility over the years we have owned it. Following our discipline, we have raised and lowered Sleep Number’s weight in the portfolio according to its price to value ratio.
Resideo was a material detractor for the period. As this letter is being written, Resideo has lowered its guidance for the year. We are evaluating the company thoughtfully and will follow our investment discipline, as always.
We exited Despegar.com during the period. Despegar.com is a dominant Latin American online travel agent. There are many nice tailwinds for the business long term, including a transition from offline to online travel; however, Despegar.com faces volatile macro economies. We thought that the company’s business model was strong enough to withstand those macroeconomic headwinds. We were wrong. Following our investment discipline, Despegar.com no longer qualified, and we sold it.
Closing
We appreciate the confidence you have placed in us. Your capital, invested alongside our own capital provides a foundation that allows us to make sound, long-term investment decisions that can lower risk and provide the opportunity to achieve superior long-term results. You, our client-partners, are one of our most important competitive advantages.
C.T. Fitzpatrick
Chief Executive Officer
Vulcan Value Partners, LLC
| 2 | www.vulcanvaluepartners.com |
Shareholder Letter
October 31, 2019 (Unaudited)
Past performance does not guarantee future results. The Funds’ prices fluctuate as the underlying assets have exposure to market fluctuations and other risks, as described in the Funds’ prospectus. Please call 877.421.5078 to obtain current performance information and for the current prospectus and statement of additional information. This material must be preceded or accompanied by a prospectus. Please read the prospectus carefully before investing.
The views of the Vulcan Value Partners, LLC and information discussed in this commentary are as of the date of publication, are subject to change, and may not reflect the writer's current views. The views expressed represent an assessment of market conditions at a specific point in time, are opinions only and should not be relied upon as investment advice regarding a particular investment or markets in general. Such information does not constitute a recommendation to buy or sell specific securities or investment vehicles. It should not be assumed that any investment will be profitable or will equal the performance of the Funds or any securities or any sectors mentioned in this letter. The subject matter contained in this letter has been derived from several sources believed to be reliable and accurate at the time of compilation. Neither Vulcan Value Partners, LLC nor the Funds accept any liability for losses either direct or consequential caused by the use of this information.
The Funds are distributed by ALPS Distributors, Inc.
The Funds are subject to investment risks, including possible loss of the principal amount invested and therefore is not suitable for all investors. The Funds may not achieve their objectives.
Diversification does not eliminate the risk of experiencing investment losses.
Price to value ratio compares a firm's market to book value by dividing price per share by book value per share. It is also known as the price-equity ratio.
Margin of safety is a principle of investing in which an investor only purchases securities when their market price is significantly below their intrinsic value. In other words, when the market price of a security is significantly below your estimation of its intrinsic value, the difference is the margin of safety. Because investors may set a margin of safety in accordance with their own risk preferences, buying securities when this difference is present allows an investment to be made with minimal downside risk.
Intrinsic worth is a value or attribute that a person has that is internal which is a part of their makeup or being which is something that can be taken away.
Free cash flow is the cash a company produces through its operations, less the cost of expenditures on assets. In other words, free cash flow (FCF) is the cash left over after a company pays for its operating expenses and capital expenditures, also known as CAPEX.
Volume-weighted average price (VWAP) is the ratio of the value traded to total volume traded over a particular time horizon (usually one day). It is a measure of the average price at which a stock is traded over the trading horizon.
| Semi-Annual Report | October 31, 2019 | 3 |
Fund Overview
October 31, 2019 (Unaudited)
VULCAN VALUE PARTNERS FUND
Annualized Total Returns(as of 10/31/19)
| | | | | | | Expense Ratios(1) |
| | 6 Month | 1 Year | 3 Year | 5 Year | Since Inception* | Total | Net(2) |
| Vulcan Value Partners Fund - Investor Class(3) | 7.84% | 18.15% | 14.42% | 8.08% | 12.26% | 1.08% | 1.08% |
| Vulcan Value Partners Fund - Institutional Class | – | – | – | – | 8.09% | 1.08% | 0.85% |
| S&P 500® Total Return Index(4) | 4.16% | 14.33% | 14.91% | 10.78% | 12.93% | | |
| Russell 1000® Value Index(5) | 3.07% | 11.21% | 10.51% | 7.61% | 11.25% | | |
Performance data quoted represents past performance. Past performance does not guarantee future results. Investment return and principal value of an investment will fluctuate so that an investor’s shares, when sold or redeemed, may be worth more or less than the original cost. The Fund imposes a 2.00% redemption fee on shares held for less than 90 days. Current performance data may be higher or lower than actual data quoted. For the most current month-end performance data, please call 1-877-421-5078.
The table does not reflect the deduction of taxes that a shareholder would pay on Fund distributions or the redemption of Fund shares.
Subject to investment risks, including possible loss of the principal amount invested. Returns for periods less than 1 year are cumulative.
| * | Inception Dates – Investor Class: 12/30/09, Institutional Class: 5/01/19 |
| | |
| (1) | Ratios as of the Prospectus dated August 31, 2019 and may differ from the ratios presented in the Financial Highlights. |
| (2) | Vulcan Value Partners, LLC (“Vulcan” or the “Adviser”) has contractually agreed to limit the Fund’s total annual fund operating expenses (exclusive of Acquired Fund Fees and Expenses, brokerage expenses, interest expense, taxes and extraordinary expenses) to 1.25% and 0.85% of the Fund’s average daily net assets with respect to Investor Class shares and Institutional Class shares, respectively. This agreement (the “Expense Agreement”) is in effect through August 31, 2020. The Adviser will be permitted to recover, on a class-by-class basis, expenses it has borne through the Expense Agreement to the extent that the Fund’s expenses in later periods fall below the expense cap in effect at the time of waiver or reimbursement. Notwithstanding the foregoing, the Fund will not be obligated to pay any such fees and expenses more than three years after the end of the fiscal year in which the fees or expenses were foregone or reimbursed. The Adviser may not discontinue or modify this waiver prior to August 31, 2020 without the approval by the Fund’s Board of Trustees. |
| (3) | The initial share class of the Fund was redesignated as Investor Class shares effective April 23, 2019. |
| (4) | The S&P 500®Total Return Index is an unmanaged index of 500 common stocks chosen for market size, liquidity and industry group representation. It is a market-value weighted index. The Index is not actively managed and does not reflect any deductions for fees, expenses or taxes. An investor may not invest directly in the Index. |
| (5) | The Russell 1000®Value Index is presented here as an additional index, and measures the performance of the large-cap value segment of the U.S. equity universe. It includes those Russell 1000®companies with lower price-to-book ratios and lower expected growth values. The Index is not actively managed and does not reflect any deductions for fees, expenses or taxes. An investor may not invest directly in the Index. |
| 4 | www.vulcanvaluepartners.com |
Fund Overview
October 31, 2019 (Unaudited)
Growth of $10,000 Initial Investment(for the period ended October 31, 2019)
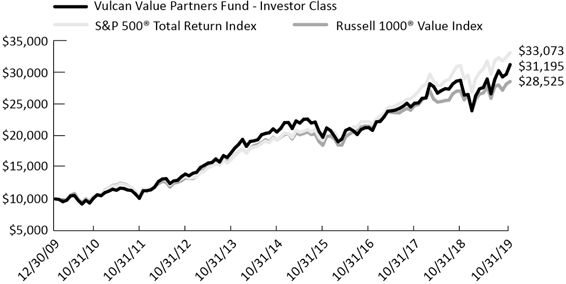
The chart above represents historical performance of a hypothetical investment of $10,000 in the Fund since inception. Past performance does not guarantee future results. This chart does not reflect the deduction of taxes that a shareholder would pay on Fund distributions or the redemption of Fund shares.
Investing in the Fund is subject to investment risks, including possible loss of the principal amount invested.
Industry Allocation(as a % of Net Assets)*
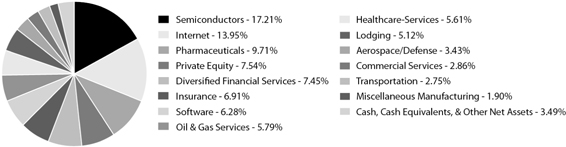
Top Ten Holdings(as a % of Net Assets)*
| Qorvo, Inc. | 6.61% |
| Skyworks Solutions, Inc. | 6.44% |
| National Oilwell Varco, Inc. | 5.79% |
| KKR & Co., Inc. | 5.45% |
| Anthem, Inc. | 4.63% |
| Alphabet, Inc. | 4.52% |
| NVIDIA Corp. | 4.16% |
| Mastercard, Inc. | 4.06% |
| CVS Health Corp. | 4.05% |
| Amazon.com, Inc. | 4.02% |
| Top Ten Holdings | 49.73% |
| * | Holdings are subject to change, and may not reflect the current or future position of the portfolio. |
| Semi-Annual Report | October 31, 2019 | 5 |
Disclosure of Fund Expenses
October 31, 2019 (Unaudited)
As a shareholder of the Vulcan Value Partners Fund (the “Fund”), you will incur two types of costs: (1) transaction costs, including applicable redemption fees; and (2) ongoing costs, including management fees and other fund operating expenses. The following examples are intended to help you understand your ongoing costs (in dollars) of investing in the Fund and to compare these costs with the ongoing costs of investing in other mutual funds. The examples are based on an investment of $1,000 invested on May 1, 2019 and held until October 31, 2019.
Actual Expenses.The first line of each table below provides information about actual account values and actual expenses. You may use the information in this line, together with the amount you invested, to estimate the expenses that you paid over the period. Simply divide your account value by $1,000 (for example, an $8,600 account value divided by $1,000 = 8.6), then multiply the result by the number in the first line under the heading “Expenses Paid During Period” to estimate the expenses you paid on your account during this period.
Hypothetical Example for Comparison Purposes.The second line of the table below provides information about hypothetical account values and hypothetical expenses based on the Fund’s actual expense ratio and an assumed rate of return of 5% per year before expenses, which is not the Fund’s actual return. The hypothetical account values and expenses may not be used to estimate the actual ending account balance or expenses you paid for the period. You may use this information to compare the ongoing costs of investing in the Fund and other mutual funds. To do so, compare this 5% hypothetical example with the 5% hypothetical examples that appear in the shareholder reports of the other mutual funds.
Please note the expenses shown in the table are meant to highlight ongoing Fund costs only and do not reflect transactional costs, such as redemption fees or exchange fees. Therefore, the second line of the table below is useful in comparing your ongoing costs only, and will not help you determine the relative total costs of owning different funds. In addition, if these transactional costs were included, your costs would have been higher.
Vulcan Value Partners Fund
| | Beginning Account Value 5/1/19 | Ending Account Value 10/31/19 | Expense Ratio(a) | Expenses Paid During period 5/1/19 - 10/31/19(b) |
| VULCAN VALUE PARTNERS FUND | | | | |
| Investor Class | | | | |
| Actual | $1,000.00 | $1,078.40 | 0.95% | $ 4.96 |
| Hypothetical (5% return before expenses) | $1,000.00 | $1,020.36 | 0.95% | $ 4.82 |
| Institutional Class | | | | |
| Actual | $1,000.00 | $1,080.90 | 0.85 | $ 4.45 |
| Hypothetical (5% return before expenses) | $1,000.00 | $1,020.86 | 0.85 | $ 4.32 |
| 6 | www.vulcanvaluepartners.com |
Disclosure of Fund Expenses
October 31, 2019 (Unaudited)
| (a) | The Fund's expense ratios have been annualized based on the Fund's most recent fiscal half-year expenses. |
| (b) | Expenses are equal to the Fund's annualized expense ratio multiplied by the average account value over the period, multiplied by the number of days in the most recent fiscal half-year (184)/366 (to reflect the half-year period). |
| Semi-Annual Report | October 31, 2019 | 7 |
Fund Overview
October 31, 2019 (Unaudited)
VULCAN VALUE PARTNERS SMALL CAP FUND
Annualized Total Returns(as of 10/31/19)
| | | | | | | Expense Ratios(1) |
| | 6 Month | 1 Year | 3 Year | 5 Year | Since Inception* | Total | Net(2) |
| Vulcan Value Partners Small Cap Fund – Investor Class(3) | 0.58% | 14.39% | 8.62% | 5.94% | 11.94% | 1.28% | 1.26% |
| Vulcan Value Partners Small Cap Fund – Institutional Class | – | – | – | – | 1.46% | 1.27% | 1.01% |
| Russell 2000® Value Index(4) | -0.53% | 3.22% | 8.60% | 6.24% | 9.94% | | |
| Russell 2000® Index(5) | -1.09% | 4.91% | 10.96% | 7.37% | 11.11% | | |
Performance data quoted represents past performance. Past performance does not guarantee future results. Investment return and principal value of an investment will fluctuate so that an investor’s shares, when sold or redeemed, may be worth more or less than the original cost. The Fund imposes a 2.00% redemption fee on shares held for less than 90 days. Current performance data may be higher or lower than actual data quoted. For the most current month-end performance data, please call 1-877-421-5078.
The table does not reflect the deduction of taxes that a shareholder would pay on Fund distributions or the redemption of Fund shares.
Subject to investment risks, including possible loss of the principal amount invested. Returns for periods less than 1 year are cumulative.
| * | Inception Dates – Investor Class: 12/30/09, Institutional Class: 5/01/19 |
| | |
| (1) | Ratios as of the Prospectus dated August 31, 2019 and may differ from the ratios presented in the Financial Highlights. |
| (2) | Vulcan Value Partners, LLC (“Vulcan” or the “Adviser”) has contractually agreed to limit the Fund’s total annual fund operating expenses (exclusive of Acquired Fund Fees and Expenses, brokerage expenses, interest expense, taxes and extraordinary expenses) to 1.25% and 1.00% of the Fund’s average daily net assets with respect to Investor Class shares and Institutional Class shares, respectively. This agreement (the “Expense Agreement”) is in effect through August 31, 2020. The Adviser will be permitted to recover, on a class-by-class basis, expenses it has borne through the Expense Agreement to the extent that the Fund’s expenses in later periods fall below the expense cap in effect at the time of waiver or reimbursement. Notwithstanding the foregoing, the Fund will not be obligated to pay any such fees and expenses more than three years after the end of the fiscal year in which the fees or expenses were foregone or reimbursed. The Adviser may not discontinue or modify this waiver prior to August 31, 2020 without the approval by the Fund’s Board of Trustees. |
| (3) | The initial share class of the Fund was redesignated as Investor Class shares effective April 23, 2019. |
| (4) | The Russell 2000® Value Index is presented here as an additional index, and measures the performance of small-cap value segment of the U.S.equity universe. It includes those Russell 2000® companies with lower price-to-book ratios and lower forecasted growth values. The Index is not actively managed and does not reflect any deductions for fees, expenses or taxes. An investor may not invest directly in the Index. |
| (5) | The Russell 2000® Index is presented here as an additional index, and measures the performance of the small-cap segment of the U.S. equity universe. The Russell 2000® Index is a subset of the Russell 3000® Index representing approximately 8% of the total market capitalization of that index. It includes approximately 2,000 of the smallest securities based on a combination of their market cap and current index membership. The Index is not actively managed and does not reflect any deductions for fees, expenses or taxes. An investor may not invest directly in the Index. |
| 8 | www.vulcanvaluepartners.com |
Fund Overview
October 31, 2019 (Unaudited)
Growth of $10,000 Initial Investment(for the period ended October 31, 2019)
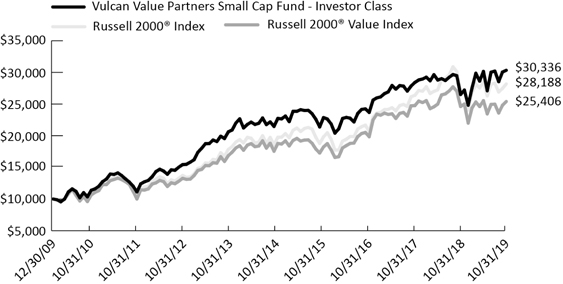
The chart above represents historical performance of a hypothetical investment of $10,000 in the Fund since inception. Past performance does not guarantee future results. This chart does not reflect the deduction of taxes that a shareholder would pay on Fund distributions or the redemption of Fund shares.
Investing in the Fund is subject to investment risks, including possible loss of the principal amount invested.
Industry Allocation(as a % of Net Assets)*

Top Ten Holdings(as a % of Net Assets)*
| Cushman & Wakefield PLC | 5.92% |
| Ibstock PLC | 5.47% |
| Coherent, Inc. | 5.24% |
| Jones Lang LaSalle, Inc. | 5.15% |
| Avast PLC | 4.57% |
| Savills PLC | 4.36% |
| EnerSys | 4.35% |
| WESCO International, Inc. | 4.24% |
| Sleep Country Canada Holdings, Inc. | 3.89% |
| CDK Global, Inc. | 3.71% |
| Top Ten Holdings | 46.90% |
| * | Holdings are subject to change, and may not reflect the current or future position of the portfolio. |
| Semi-Annual Report | October 31, 2019 | 9 |
Disclosure of Fund Expenses
October 31, 2019 (Unaudited)
As a shareholder of the Vulcan Value Partners Small Cap Fund (the “Fund”), you will incur two types of costs: (1) transaction costs, including applicable redemption fees; and (2) ongoing costs, including management fees and other fund operating expenses. The following examples are intended to help you understand your ongoing costs (in dollars) of investing in the Fund and to compare these costs with the ongoing costs of investing in other mutual funds. The examples are based on an investment of $1,000 invested on May 1, 2019 and held until October 31, 2019.
Actual Expenses.The first line of each table below provides information about actual account values and actual expenses. You may use the information in this line, together with the amount you invested, to estimate the expenses that you paid over the period. Simply divide your account value by $1,000 (for example, an $8,600 account value divided by $1,000 = 8.6), then multiply the result by the number in the first line under the heading “Expenses Paid During Period” to estimate the expenses you paid on your account during this period.
Hypothetical Example for Comparison Purposes.The second line of the table below provides information about hypothetical account values and hypothetical expenses based on the Fund’s actual expense ratio and an assumed rate of return of 5% per year before expenses, which is not the Fund’s actual return. The hypothetical account values and expenses may not be used to estimate the actual ending account balance or expenses you paid for the period. You may use this information to compare the ongoing costs of investing in the Fund and other mutual funds. To do so, compare this 5% hypothetical example with the 5% hypothetical examples that appear in the shareholder reports of the other mutual funds.
Please note the expenses shown in the table are meant to highlight ongoing Fund costs only and do not reflect transactional costs, such as redemption fees or exchange fees. Therefore, the second line of the table below is useful in comparing your ongoing costs only, and will not help you determine the relative total costs of owning different funds. In addition, if these transactional costs were included, your costs would have been higher.
Vulcan Value Partners Small Cap Fund
| | Beginning Account Value 5/1/19 | Ending Account Value 10/31/19 | Expense Ratio(a) | Expenses Paid During period 5/1/19 - 10/31/19(b) |
| VULCAN VALUE PARTNERS SMALL CAP FUND | | | | |
| Investor Class | | | | |
| Actual | $1,000.00 | $1,005.80 | 1.02% | $ 5.14 |
| Hypothetical (5% return before expenses) | $1,000.00 | $1,020.01 | 1.02% | $ 5.18 |
| Institutional Class | | | | |
| Actual | $1,000.00 | $1,014.60 | 0.99 | $ 5.01 |
| Hypothetical (5% return before expenses) | $1,000.00 | $1,020.16 | 0.99 | $ 5.03 |
| 10 | www.vulcanvaluepartners.com |
Disclosure of Fund Expenses
October 31, 2019 (Unaudited)
| (a) | The Fund's expense ratios have been annualized based on the Fund's most recent fiscal half-year expenses. |
| (b) | Expenses are equal to the Fund's annualized expense ratio multiplied by the average account value over the period, multiplied by the number of days in the most recent fiscal half-year (184)/366 (to reflect the half-year period). |
| Semi-Annual Report | October 31, 2019 | 11 |
| Statement of Investments | Vulcan Value Partners Fund |
October 31, 2019 (Unaudited)
| | | Shares | | | Value (Note 2) | |
| COMMON STOCKS (96.35%) | | | | | | | | |
| Communications (13.95%) | | | | | | | | |
| Internet (13.95%) | | | | | | | | |
| Alphabet, Inc., Class C(a) | | | 49,456 | | | $ | 62,320,000 | |
| Amazon.com, Inc.(a) | | | 31,213 | | | | 55,454,889 | |
| Booking Holdings, Inc.(a) | | | 16,296 | | | | 33,386,756 | |
| Facebook, Inc., Class A(a) | | | 215,888 | | | | 41,374,935 | |
| | | | | | | | 192,536,580 | |
| | | | | | | | | |
| TOTAL COMMUNICATIONS | | | | | | | 192,536,580 | |
| | | | | | | | | |
| Consumer, Cyclical (5.12%) | | | | | | | | |
| Lodging (5.12%) | | | | | | | | |
| Hilton Worldwide Holdings, Inc. | | | 470,343 | | | | 45,604,457 | |
| Marriott International, Inc., Class A | | | 197,898 | | | | 25,043,992 | |
| | | | | | | | 70,648,449 | |
| | | | | | | | | |
| TOTAL CONSUMER, CYCLICAL | | | | | | | 70,648,449 | |
| | | | | | | | | |
| Consumer, Non-cyclical (18.18%) | | | | | | | | |
| Commercial Services (2.86%) | | | | | | | | |
| S&P Global, Inc. | | | 153,154 | | | | 39,512,200 | |
| | | | | | | | | |
| Healthcare-Services (5.61%) | | | | | | | | |
| Anthem, Inc. | | | 237,471 | | | | 63,898,697 | |
| UnitedHealth Group, Inc. | | | 53,487 | | | | 13,516,165 | |
| | | | | | | | 77,414,862 | |
| | | | | | | | | |
| Pharmaceuticals (9.71%) | | | | | | | | |
| AmerisourceBergen Corp. | | | 437,473 | | | | 37,351,445 | |
| CVS Health Corp. | | | 841,780 | | | | 55,885,774 | |
| McKesson Corp. | | | 305,846 | | | | 40,677,518 | |
| | | | | | | | 133,914,737 | |
| | | | | | | | | |
| TOTAL CONSUMER, NON-CYCLICAL | | | | | | | 250,841,799 | |
| | | | | | | | | |
| Energy (5.79%) | | | | | | | | |
| Oil & Gas Services (5.79%) | | | | | | | | |
| National Oilwell Varco, Inc. | | | 3,529,379 | | | | 79,834,553 | |
| | | | | | | | | |
| TOTAL ENERGY | | | | | | | 79,834,553 | |
| | | | | | | | | |
| Financial (21.74%) | | | | | | | | |
| Diversified Financial Services (7.45%) | | | | | | | | |
| Mastercard, Inc., Class A | | | 202,541 | | | | 56,065,374 | |
| 12 | www.vulcanvaluepartners.com |
| Vulcan Value Partners Fund | Statement of Investments |
October 31, 2019 (Unaudited)
| | | Shares | | | Value (Note 2) | |
| Financial (continued) | | | | | | |
| Diversified Financial Services (continued) | | | | | | |
| Visa, Inc., Class A | | | 260,812 | | | $ | 46,648,835 | |
| | | | | | | | 102,714,209 | |
| | | | | | | | | |
| Insurance (6.91%) | | | | | | | | |
| Axis Capital Holdings, Ltd. | | | 159,192 | | | | 9,460,780 | |
| Everest Re Group, Ltd. | | | 123,364 | | | | 31,715,651 | |
| Swiss Re AG | | | 517,394 | | | | 54,178,206 | |
| | | | | | | | 95,354,637 | |
| | | | | | | | | |
| Private Equity (7.38%) | | | | | | | | |
| Brookfield Asset Management, Inc., Class A | | | 484,008 | | | | 26,741,442 | |
| KKR & Co., Inc., Class A | | | 2,605,598 | | | | 75,119,390 | |
| | | | | | | | 101,860,832 | |
| | | | | | | | | |
| TOTAL FINANCIAL | | | | | | | 299,929,678 | |
| | | | | | | | | |
| Industrial (8.08%) | | | | | | | | |
| Aerospace/Defense (3.43%) | | | | | | | | |
| Airbus SE | | | 330,340 | | | | 47,313,536 | |
| | | | | | | | | |
| Miscellaneous Manufacturing (1.90%) | | | | | | | | |
| Parker-Hannifin Corp. | | | 143,013 | | | | 26,241,456 | |
| | | | | | | | | |
| Transportation (2.75%) | | | | | | | | |
| United Parcel Service, Inc., Class B | | | 329,317 | | | | 37,927,439 | |
| | | | | | | | | |
| TOTAL INDUSTRIAL | | | | | | | 111,482,431 | |
| | | | | | | | | |
| Technology (23.49%) | | | | | | | | |
| Semiconductors (17.21%) | | | | | | | | |
| NVIDIA Corp. | | | 285,751 | | | | 57,441,666 | |
| Qorvo, Inc.(a) | | | 1,127,541 | | | | 91,172,966 | |
| Skyworks Solutions, Inc. | | | 975,471 | | | | 88,826,389 | |
| | | | | | | | 237,441,021 | |
| | | | | | | | | |
| Software (6.28%) | | | | | | | | |
| Microsoft Corp. | | | 322,872 | | | | 46,290,158 | |
| Oracle Corp. | | | 739,418 | | | | 40,290,887 | |
| | | | | | | | 86,581,045 | |
| | | | | | | | | |
| TOTAL TECHNOLOGY | | | | | | | 324,022,066 | |
| | | | | | | | | |
| TOTAL COMMON STOCKS | | | | | | | | |
| (Cost $1,048,914,786) | | | | | | | 1,329,295,556 | |
| Semi-Annual Report | October 31, 2019 | 13 |
| Statement of Investments | Vulcan Value Partners Fund |
October 31, 2019 (Unaudited)
| | | Shares | | | Value (Note 2) | |
| LIMITED PARTNERSHIPS (0.16%) | | | | | | |
| Financial (0.16%) | | | | | | |
| Private Equity (0.16%) | | | | | | |
| Carlyle Group LP | | | 80,333 | | | $ | 2,191,484 | |
| | | | | | | | | |
| TOTAL FINANCIAL | | | | | | | 2,191,484 | |
| | | | | | | | | |
| TOTAL LIMITED PARTNERSHIPS | | | | | | | | |
| (Cost $2,068,728) | | | | | | | 2,191,484 | |
| | | 7-Day Yield | | | Shares | | | Value (Note 2) | |
| SHORT TERM INVESTMENTS (4.10%) | | | | | | | | | |
| Money Market Fund (4.10%) | | | | | | | | | |
| Invesco Government & Agency Portfolio, Institutional Class | | | 1.721 | % | | | 56,571,077 | | | | 56,571,077 | |
| | | | | | | | | | | | | |
| TOTAL SHORT TERM INVESTMENTS | | | | | | | | | | | | |
| (Cost $56,571,077) | | | | | | | | | | | 56,571,077 | |
| | | | | | | | | | | | | |
| TOTAL INVESTMENTS (100.61%) | | | | | | | | | | | | |
| (Cost $1,107,554,591) | | | | | | | | | | $ | 1,388,058,117 | |
| | | | | | | | | | | | | |
| Liabilities In Excess Of Other Assets (-0.61%) | | | | | | | | | | | (8,471,007 | ) |
| | | | | | | | | | | | | |
| NET ASSETS (100.00%) | | | | | | | | | | $ | 1,379,587,110 | |
| (a) | Non-Income Producing Security. |
For Fund compliance purposes, the Fund's industry classifications refer to any one or more of the industry sub-classifications used by one or more widely recognized market indexes or ratings group indexes, and/or as defined by Fund management. This definition may not apply for purposes of this report, which may combine industry sub-classifications for reporting ease. Industries are shown as a percentage of net assets.
See Accompanying Notes to Financial Statements.
| 14 | www.vulcanvaluepartners.com |
| Vulcan Value Partners Small Cap Fund | Statement of Investments |
October 31, 2019 (Unaudited)
| | | Shares | | | Value (Note 2) | |
| COMMON STOCKS (96.38%) | | | | | | |
| Consumer, Cyclical (21.33%) | | | | | | |
| Distribution/Wholesale (6.77%) | | | | | | |
| Resideo Technologies, Inc.(a) | | | 1,274,755 | | | $ | 12,148,415 | |
| WESCO International, Inc.(a) | | | 407,213 | | | | 20,421,732 | |
| | | | | | | | 32,570,147 | |
| | | | | | | | | |
| Home Furnishings (6.05%) | | | | | | | | |
| Howden Joinery Group PLC | | | 1,745,738 | | | | 13,057,023 | |
| Sleep Number Corp.(a) | | | 333,411 | | | | 16,043,738 | |
| | | | | | | | 29,100,761 | |
| | | | | | | | | |
| Lodging (2.02%) | | | | | | | | |
| Wyndham Hotels & Resorts, Inc. | | | 180,296 | | | | 9,730,575 | |
| | | | | | | | | |
| Retail (6.49%) | | | | | | | | |
| MSC Industrial Direct Co., Inc., Class A | | | 170,953 | | | | 12,515,469 | |
| Sleep Country Canada Holdings, Inc. | | | 1,123,378 | | | | 18,721,545 | |
| | | | | | | | 31,237,014 | |
| | | | | | | | | |
| TOTAL CONSUMER, CYCLICAL | | | | | | | 102,638,497 | |
| | | | | | | | | |
| Consumer, Non-cyclical (7.72%) | | | | | | | | |
| Commercial Services (7.72%) | | | | | | | | |
| Sabre Corp. | | | 688,013 | | | | 16,154,545 | |
| Savills PLC | | | 1,765,441 | | | | 20,982,035 | |
| | | | | | | | 37,136,580 | |
| | | | | | | | | |
| TOTAL CONSUMER, NON-CYCLICAL | | | | | | | 37,136,580 | |
| | | | | | | | | |
| Financial (23.42%) | | | | | | | | |
| Diversified Financial Services (3.50%) | | | | | | | | |
| Virtus Investment Partners, Inc. | | | 155,498 | | | | 16,868,423 | |
| | | | | | | | | |
| Insurance (6.33%) | | | | | | | | |
| Axis Capital Holdings, Ltd. | | | 283,421 | | | | 16,843,710 | |
| Everest Re Group, Ltd. | | | 52,941 | | | | 13,610,601 | |
| | | | | | | | 30,454,311 | |
| | | | | | | | | |
| Real Estate (13.59%) | | | | | | | | |
| Cushman & Wakefield PLC(a) | | | 1,528,668 | | | | 28,509,658 | |
| Jones Lang LaSalle, Inc. | | | 169,025 | | | | 24,765,543 | |
| Marcus & Millichap, Inc.(a) | | | 338,848 | | | | 12,103,651 | |
| | | | | | | | 65,378,852 | |
| | | | | | | | | |
| TOTAL FINANCIAL | | | | | | | 112,701,586 | |
| Semi-Annual Report | October 31, 2019 | 15 |
| Statement of Investments | Vulcan Value Partners Small Cap Fund |
October 31, 2019 (Unaudited)
| | | Shares | | | Value (Note 2) | |
| Industrial (29.37%) | | | | | | | | |
| Building Materials (5.47%) | | | | | | | | |
| Ibstock PLC | | | 8,410,431 | | | $ | 26,342,857 | |
| | | | | | | | | |
| Electrical Components & Equipment (7.68%) | | | | | | | | |
| Acuity Brands, Inc. | | | 128,412 | | | | 16,024,533 | |
| EnerSys | | | 312,817 | | | | 20,914,945 | |
| | | | | | | | 36,939,478 | |
| | | | | | | | | |
| Electronics (8.54%) | | | | | | | | |
| Coherent, Inc.(a) | | | 169,428 | | | | 25,231,218 | |
| Ituran Location and Control, Ltd. | | | 646,636 | | | | 15,861,981 | |
| | | | | | | | 41,093,199 | |
| | | | | | | | | |
| Machinery-Diversified (2.29%) | | | | | | | | |
| Concentric AB | | | 826,651 | | | | 11,044,044 | |
| | | | | | | | | |
| Miscellaneous Manufacturing (5.39%) | | | | | | | | |
| Carlisle Cos., Inc. | | | 79,721 | | | | 12,139,117 | |
| Crane Co. | | | 180,089 | | | | 13,780,410 | |
| | | | | | | | 25,919,527 | |
| | | | | | | | | |
| TOTAL INDUSTRIAL | | | | | | | 141,339,105 | |
| | | | | | | | | |
| Technology (14.54%) | | | | | | | | |
| Computers (4.57%) | | | | | | | | |
| Avast PLC | | | 4,096,957 | | | | 22,013,469 | |
| | | | | | | | | |
| Software (9.97%) | | | | | | | | |
| ACI Worldwide, Inc.(a) | | | 512,659 | | | | 16,092,366 | |
| CDK Global, Inc. | | | 353,490 | | | | 17,865,385 | |
| Lectra | | | 599,911 | | | | 14,017,237 | |
| | | | | | | | 47,974,988 | |
| | | | | | | | | |
| TOTAL TECHNOLOGY | | | | | | | 69,988,457 | |
| | | | | | | | | |
| TOTAL COMMON STOCKS | | | | | | | | |
| (Cost $400,716,343) | | | | | | | 463,804,225 | |
| 16 | www.vulcanvaluepartners.com |
| Vulcan Value Partners Small Cap Fund | Statement of Investments |
October 31, 2019 (Unaudited)
| | | 7-Day Yield | | | Shares | | | Value (Note 2) | |
| SHORT TERM INVESTMENTS (3.56%) | | | | | | | | | |
| Money Market Fund (3.56%) | | | | | | | | | | | | |
| Invesco Government & Agency Portfolio, Institutional Class | | | 1.721 | % | | | 17,125,812 | | | $ | 17,125,812 | |
| | | | | | | | | | | | | |
| TOTAL SHORT TERM INVESTMENTS | | | | | | | | | | | | |
| (Cost $17,125,812) | | | | | | | | | | | 17,125,812 | |
| | | | | | | | | | | | | |
| TOTAL INVESTMENTS (99.94%) | | | | | | | | | | | | |
| (Cost $417,842,155) | | | | | | | | | | $ | 480,930,037 | |
| | | | | | | | | | | | | |
| Other Assets In Excess Of Liabilities (0.06%) | | | | | | | | | | | 272,596 | |
| | | | | | | | | | | | | |
| NET ASSETS (100.00%) | | | | | | | | | | $ | 481,202,633 | |
| (a) | Non-Income Producing Security. |
For Fund compliance purposes, the Fund's industry classifications refer to any one or more of the industry sub-classifications used by one or more widely recognized market indexes or ratings group indexes, and/or as defined by Fund management. This definition may not apply for purposes of this report, which may combine industry sub-classifications for reporting ease. Industries are shown as a percentage of net assets.
See Accompanying Notes to Financial Statements.
| Semi-Annual Report | October 31, 2019 | 17 |
Statements of Assets and Liabilities
October 31, 2019 (Unaudited)
| | | Vulcan Value Partners Fund | | | Vulcan Value Partners Small Cap Fund | |
| ASSETS: | | | | | | | | |
| Investments, at value | | $ | 1,388,058,117 | | | $ | 480,930,037 | |
| Receivable for investments sold | | | 8,761,706 | | | | 3,795,984 | |
| Receivable for shares sold | | | 6,329,480 | | | | 210,158 | |
| Dividends receivable | | | 2,890,266 | | | | 370,411 | |
| Other assets | | | 37,526 | | | | 21,359 | |
| Total assets | | | 1,406,077,095 | | | | 485,327,949 | |
| | | | | | | | | |
| LIABILITIES: | | | | | | | | |
| Payable for investments purchased | | | 18,864,656 | | | | 3,594,363 | |
| Payable for shares redeemed | | | 6,394,715 | | | | 13,638 | |
| Payable to adviser | | | 1,001,427 | | | | 402,412 | |
| Payable for administration fees | | | 72,202 | | | | 27,080 | |
| Payable for transfer agency fees | | | 18,933 | | | | 18,492 | |
| Payable for delegated transfer agent equivalent services fees | | | 7,426 | | | | 6,359 | |
| Payable for professional fees | | | 11,217 | | | | 11,513 | |
| Payable for trustee fees and expenses | | | 23,239 | | | | 9,158 | |
| Payable for principal financial officer fees | | | 1,182 | | | | 512 | |
| Accrued expenses and other liabilities | | | 94,988 | | | | 41,789 | |
| Total liabilities | | | 26,489,985 | | | | 4,125,316 | |
| NET ASSETS | | $ | 1,379,587,110 | | | $ | 481,202,633 | |
| | | | | | | | | |
| NET ASSETS CONSIST OF: | | | | | | | | |
| | | | | | | | | |
| Paid-in capital (Note 5) | | $ | 1,040,334,133 | | | $ | 401,171,796 | |
| Total distributable earnings | | | 339,252,977 | | | | 80,030,837 | |
| NET ASSETS | | $ | 1,379,587,110 | | | $ | 481,202,633 | |
| | | | | | | | | |
| INVESTMENTS, AT COST | | $ | 1,107,554,591 | | | $ | 417,842,155 | |
See Accompanying Notes to Financial Statements.
| 18 | www.vulcanvaluepartners.com |
Statements of Assets and Liabilities
October 31, 2019 (Unaudited)
| | | Vulcan Value Partners Fund | | | Vulcan Value Partners Small Cap Fund | |
| PRICING OF SHARES: | | | | | | |
| Investor Class: | | | | | | |
| Net Asset Value, offering and redemption price per share | | $ | 22.70 | | | $ | 17.41 | |
| Net Assets | | $ | 803,909,827 | | | $ | 264,691,203 | |
| Shares of beneficial interest outstanding (unlimited number of shares, no par value common stock authorized) | | | 35,420,500 | | | | 15,203,176 | |
| Institutional Class: | | | | | | | | |
| Net Asset Value, offering and redemption price per share | | | 22.72 | | | | 17.43 | |
| Net Assets | | | 575,677,283 | | | | 216,511,430 | |
| Shares of beneficial interest outstanding (unlimited number of shares, no par value common stock authorized) | | | 25,340,660 | | | | 12,419,260 | |
See Accompanying Notes to Financial Statements.
| Semi-Annual Report | October 31, 2019 | 19 |
Statements of Operations
For the Six Months Ended October 31, 2019 (Unaudited)
| | | Vulcan Value Partners Fund | | | Vulcan Value Partners Small Cap Fund | |
| INVESTMENT INCOME: | | | | | | |
| Dividends | | $ | 7,478,382 | | | $ | 5,165,062 | |
| Foreign taxes withheld | | | (12,549 | ) | | | (180,270 | ) |
| Total investment income | | | 7,465,833 | | | | 4,984,792 | |
| | | | | | | | | |
| EXPENSES: | | | | | | | | |
| Investment advisory fees (Note 6) | | | 6,599,767 | | | | 2,810,025 | |
| Administrative fees | | | 209,092 | | | | 80,453 | |
| Transfer agency fees | | | 48,402 | | | | 49,146 | |
| Delegated transfer agent equivalent services fees | | | | | | | | |
| Investor Class | | | 54,680 | | | | 23,314 | |
| Institutional Class(a) | | | 26,171 | | | | 10,652 | |
| Professional fees | | | 21,761 | | | | 15,081 | |
| Custodian fees | | | 93,827 | | | | 43,811 | |
| Principal financial officer fees | | | 3,594 | | | | 1,434 | |
| Trustee fees and expenses | | | 23,157 | | | | 9,151 | |
| ReFlow Fees (Note 2) | | | 32,023 | | | | 10,537 | |
| Other | | | 57,256 | | | | 40,420 | |
| Total expenses before waiver | | | 7,169,730 | | | | 3,094,024 | |
| Less fees waived/reimbursed by investment adviser (Note 6) Investor Class | | | – | | | | (30,587 | ) |
| Institutional Class | | | (402,955 | ) | | | (135,657 | ) |
| Total net expenses | | | 6,766,775 | | | | 2,927,780 | |
| NET INVESTMENT INCOME | | | 699,058 | | | | 2,057,012 | |
| | | | | | | | | |
| Net realized gain on investments(b) | | | 48,786,776 | | | | 8,215,851 | |
| Net realized gain/(loss) on foreign currency transactions | | | (89,478 | ) | | | 11,045 | |
| Net realized gain | | | 48,697,298 | | | | 8,226,896 | |
| Net change in unrealized appreciation/(depreciation) of investments | | | 53,500,551 | | | | (9,892,453 | ) |
| Net change in unrealized appreciation on translation of assets and liabilities denominated in foreign currencies | | | 77,347 | | | | 4,567 | |
| Net change in unrealized appreciation/(depreciation) | | | 53,577,898 | | | | (9,887,886 | ) |
| NET REALIZED AND UNREALIZED GAIN/(LOSS) ON INVESTMENTS | | | 102,275,196 | | | | (1,660,990 | ) |
| NET INCREASE IN NET ASSETS RESULTING FROM OPERATIONS | | $ | 102,974,254 | | | $ | 396,022 | |
| (a) | Institutional Class inception date was May 1, 2019. |
| (b) | See Note 2 for gain/(loss) on In-Kind transactions. |
See Accompanying Notes to Financial Statements.
| 20 | www.vulcanvaluepartners.com |
| Vulcan Value Partners Fund | Statements of Changes in Net Assets |
| | | For the Six Months Ended October 31, 2019 (Unaudited) | | | For the Year Ended April 30, 2019 | |
| OPERATIONS: | | | | | | |
| Net investment income | | $ | 699,058 | | | $ | 5,078,555 | |
| Net realized gain | | | 48,697,298 | | | | 72,617,855 | |
| Net change in unrealized appreciation/(depreciation) | | | 53,577,898 | | | | (3,680,794 | ) |
| Net increase in net assets resulting from operations | | | 102,974,254 | | | | 74,015,616 | |
| | | | | | | | | |
| DISTRIBUTIONS TO SHAREHOLDERS (Note 3): | | | | | | | | |
| Total amount of distribution | | | | | | | | |
| Investor Class(a) | | | – | | | | (98,666,500 | ) |
| Institutional Class(b) | | | – | | | | – | |
| Net decrease in net assets from distributions | | | – | | | | (98,666,500 | ) |
| | | | | | | | | |
| SHARE TRANSACTIONS (Note 5): | | | | | | | | |
| Investor Class(a) | | | | | | | | |
| Proceeds from sales of shares | | | 49,917,086 | | | | 257,281,793 | |
| Issued to shareholders in reinvestment of distributions | | | – | | | | 85,760,192 | |
| Cost of shares redeemed, net of redemption fees | | | (591,059,153 | ) | | | (348,353,451 | ) |
| Institutional Class(b) | | | | | | | | |
| Proceeds from sales of shares | | | 562,052,772 | | | | – | |
| Cost of shares redeemed, net of redemption fees | | | (28,854,087 | ) | | | – | |
| Net decrease from share transactions | | | (7,943,382 | ) | | | (5,311,466 | ) |
| | | | | | | | | |
| Net increase/(decrease) in net assets | | | 95,030,872 | | | | (29,962,350 | ) |
| | | | | | | | | |
| NET ASSETS: | | | | | | | | |
| Beginning of year | | | 1,284,556,238 | | | | 1,314,518,588 | |
| End of period | | $ | 1,379,587,110 | | | $ | 1,284,556,238 | |
| (a) | Prior to April 23, 2019, the Investor class was the initial share class. |
| (b) | Institutional Class inception date was May 1, 2019. |
See Accompanying Notes to Financial Statements.
| Semi-Annual Report | October 31, 2019 | 21 |
| Statements of Changes in Net Assets | Vulcan Value Partners Small Cap Fund |
| | | For the Six Months Ended October 31, 2019 (Unaudited) | | | For the Year Ended April 30, 2019 | |
| OPERATIONS: | | | | | | |
| Net investment income | | $ | 2,057,012 | | | $ | 4,412,446 | |
| Net realized gain | | | 8,226,896 | | | | 97,428,463 | |
| Net change in unrealized depreciation | | | (9,887,886 | ) | | | (99,582,592 | ) |
| Net increase in net assets resulting from operations | | | 396,022 | | | | 2,258,317 | |
| | | | | | | | | |
| DISTRIBUTIONS TO SHAREHOLDERS (Note 3): | | | | | | | | |
| Total amount of distribution | | | | | | | | |
| Investor Class(a) | | | – | | | | (91,839,425 | ) |
| Institutional Class(b) | | | – | | | | – | |
| Net decrease in net assets from distributions | | | – | | | | (91,839,425 | ) |
| | | | | | | | | |
| SHARE TRANSACTIONS (Note 5): | | | | | | | | |
| Investor Class(a) | | | | | | | | |
| Proceeds from sales of shares | | | 19,968,669 | | | | 162,197,866 | |
| Issued to shareholders in reinvestment of distributions | | | – | | | | 79,373,996 | |
| Cost of shares redeemed, net of redemption fees | | | (289,837,361 | ) | | | (805,375,212 | ) |
| Institutional Class(b) | | | | | | | | |
| Proceeds from sales of shares | | | 219,170,547 | | | | – | |
| Cost of shares redeemed, net of redemption fees | | | (11,669,030 | ) | | | – | |
| Net decrease from share transactions | | | (62,367,175 | ) | | | (563,803,350 | ) |
| | | | | | | | | |
| Net decrease in net assets | | | (61,971,153 | ) | | | (653,384,458 | ) |
| | | | | | | | | |
| NET ASSETS: | | | | | | | | |
| Beginning of year | | | 543,173,786 | | | | 1,196,558,244 | |
| End of period | | $ | 481,202,633 | | | $ | 543,173,786 | |
| (a) | Prior to April 23, 2019, the Investor class was the initial share class. |
| (b) | Institutional Class inception date was May 1, 2019. |
See Accompanying Notes to Financial Statements.
| 22 | www.vulcanvaluepartners.com |
Intentionally Left Blank
Financial Highlights
For a share outstanding throughout the years presented.
| Investor Class |
| NET ASSET VALUE, BEGINNING OF PERIOD |
| INCOME/(LOSS) FROM OPERATIONS: |
| Net investment income(a) |
| Net realized and unrealized gain/(loss) on investments |
| Total from investment operations |
| |
| LESS DISTRIBUTIONS TO SHAREHOLDERS: |
| From net investment income |
| From net realized gains on investments |
| Total distributions |
| |
| Redemption fees added to paid-in capital |
| Increase/(decrease) in net asset value |
| NET ASSET VALUE, END OF PERIOD |
| |
| Total return |
| |
| RATIOS AND SUPPLEMENTAL DATA: |
| Net assets, end of period (000's) |
| |
| Ratio of expenses to average net assets without fee waivers/reimbursements |
| Ratio of expenses to average net assets including fee waivers/reimbursements |
| |
| Net investment income to average net assets including fee waivers/reimbursements |
| |
| Portfolio turnover rate |
| (a) | Per share numbers have been calculated using the average shares method. |
| (b) | Less than $0.005 per share. |
See Accompanying Notes to Financial Statements.
| 24 | www.vulcanvaluepartners.com |
Vulcan Value Partners Fund
| For the Six Months Ended October 31, 2019 (Unaudited) | | | For the Year Ended April 30, 2019 | | | For the Year Ended April 30, 2018 | | | For the Year Ended April 30, 2017 | | | For the Year Ended April 30, 2016 | | | For the Year Ended April 30, 2015 | |
| $ | 21.05 | | | $ | 21.39 | | | $ | 19.30 | | | $ | 17.17 | | | $ | 19.97 | | | $ | 18.20 | |
| | 0.01 | | | | 0.08 | | | | 0.09 | | | | 0.18 | | | | 0.20 | | | | 0.22 | |
| | 1.64 | | | | 1.13 | | | | 2.35 | | | | 2.18 | | | | (1.51 | ) | | | 2.77 | |
| | 1.65 | | | | 1.21 | | | | 2.44 | | | | 2.36 | | | | (1.31 | ) | | | 2.99 | |
| | – | | | | (0.13 | ) | | | (0.12 | ) | | | (0.23 | ) | | | (0.13 | ) | | | (0.17 | ) |
| | – | | | | (1.42 | ) | | | (0.23 | ) | | | – | | | | (1.36 | ) | | | (1.05 | ) |
| | – | | | | (1.55 | ) | | | (0.35 | ) | | | (0.23 | ) | | | (1.49 | ) | | | (1.22 | ) |
| | 0.00 | (b) | | | 0.00 | (b) | | | 0.00 | (b) | | | 0.00 | (b) | | | 0.00 | (b) | | | 0.00 | (b) |
| | 1.65 | | | | (0.34 | ) | | | 2.09 | | | | 2.13 | | | | (2.80 | ) | | | 1.77 | |
| $ | 22.70 | | | $ | 21.05 | | | $ | 21.39 | | | $ | 19.30 | | | $ | 17.17 | | | $ | 19.97 | |
| | 7.84 | %(c) | | | 6.80 | % | | | 12.72 | % | | | 13.85 | % | | | (6.49% | ) | | | 16.61 | % |
| $ | 803,910 | | | $ | 1,284,556 | | | $ | 1,314,519 | | | $ | 1,284,669 | | | $ | 1,528,080 | | | $ | 1,770,104 | |
| | 0.95 | %(d) | | | 1.08 | % | | | 1.08 | % | | | 1.07 | % | | | 1.08 | % | | | 1.08 | % |
| | 0.95 | %(d) | | | 1.08 | % | | | 1.08 | % | | | 1.07 | % | | | 1.08 | % | | | 1.08 | % |
| | 0.07 | %(d) | | | 0.38 | % | | | 0.46 | % | | | 1.01 | % | | | 1.10 | % | | | 1.12 | % |
| | 22 | %(c) | | | 73 | % | | | 50 | % | | | 49 | % | | | 85 | % | | | 64 | % |
| Semi-Annual Report | October 31, 2019 | 25 |
| Financial Highlights | Vulcan Value Partners Fund |
For a share outstanding throughout the years presented.
| Institutional Class | | For the Period May 1, 2019 (Inception) to October 31, 2019 | |
| NET ASSET VALUE, BEGINNING OF PERIOD | | $ | 21.02 | |
| INCOME/(LOSS) FROM OPERATIONS: | | | | |
| Net investment income(a) | | | 0.02 | |
| Net realized and unrealized gain on investments | | | 1.68 | |
| Total from investment operations | | | 1.70 | |
| | | | | |
| Redemption fees added to paid-in capital | | | 0.00 | (b) |
| Increase in net asset value | | | 1.70 | |
| NET ASSET VALUE, END OF PERIOD | | $ | 22.72 | |
| | | | | |
| Total return | | | 8.09 | %(c) |
| | | | | |
| RATIOS AND SUPPLEMENTAL DATA: | | | | |
| Net assets, end of period (000's) | | $ | 575,677 | |
| | | | | |
| Ratio of expenses to average net assets without fee waivers/reimbursements | | | 1.09 | %(d) |
| Ratio of expenses to average net assets including fee waivers/reimbursements | | | 0.85 | %(d) |
| Net investment income to average net assets including fee waivers/reimbursements | | | 0.19 | %(d) |
| | | | | |
| Portfolio turnover rate | | | 22 | %(c) |
| (a) | Per share numbers have been calculated using the average shares method. |
| (b) | Less than $0.005 per share. |
See Accompanying Notes to Financial Statements.
| 26 | www.vulcanvaluepartners.com |
Intentionally Left Blank
Financial Highlights
For a share outstanding throughout the years presented.
| Investor Class | | |
| NET ASSET VALUE, BEGINNING OF PERIOD | | |
| INCOME/(LOSS) FROM OPERATIONS: | | |
| Net investment income(a) | | |
| Net realized and unrealized gain/(loss) on investments | | |
| Total from investment operations | | |
| | | |
| LESS DISTRIBUTIONS TO SHAREHOLDERS: | | |
| From net investment income | | |
| From net realized gains on investments | | |
| Total distributions | | |
| | | |
| Redemption fees added to paid-in capital | | |
| Increase/(decrease) in net asset value | | |
| NET ASSET VALUE, END OF PERIOD | | |
| | | |
| Total return | | |
| | | |
| RATIOS AND SUPPLEMENTAL DATA: | | |
| Net assets, end of period (000's) | | |
| | | |
| Ratio of expenses to average net assets without fee waivers/reimbursements | | |
| Ratio of expenses to average net assets including fee waivers/reimbursements | | |
| | | |
| Net investment income to average net assets including fee waivers/reimbursements | | |
| | | |
| Portfolio turnover rate | | |
| (a) | Per share numbers have been calculated using the average shares method. |
| (b) | Less than $0.005 per share. |
See Accompanying Notes to Financial Statements.
| 28 | www.vulcanvaluepartners.com |
Vulcan Value Partners Small Cap Fund
| For the Six Months Ended October 31, 2019 (Unaudited) | | | For the Year Ended April 30, 2019 | | | For the Year Ended April 30, 2018 | | | For the Year Ended April 30, 2017 | | | For the Year Ended April 30, 2016 | | | For the Year Ended April 30, 2015 | |
| $ | 17.31 | | | $ | 19.52 | | | $ | 20.16 | | | $ | 16.58 | | | $ | 18.61 | | | $ | 18.74 | |
| | | | | | | | | | | | | | | | | | | | | | | |
| | 0.08 | | | | 0.10 | | | | 0.02 | | | | 0.03 | | | | 0.10 | | | | 0.10 | |
| | 0.02 | | | | 0.38 | | | | 0.59 | | | | 3.61 | | | | (1.05 | ) | | | 1.77 | |
| | 0.10 | | | | 0.48 | | | | 0.61 | | | | 3.64 | | | | (0.95 | ) | | | 1.87 | |
| | | | | | | | | | | | | | | | | | | | | | | |
| | – | | | | (0.12 | ) | | | (0.03 | ) | | | (0.06 | ) | | | (0.06 | ) | | | (0.11 | ) |
| | – | | | | (2.57 | ) | | | (1.22 | ) | | | – | | | | (1.02 | ) | | | (1.89 | ) |
| | – | | | | (2.69 | ) | | | (1.25 | ) | | | (0.06 | ) | | | (1.08 | ) | | | (2.00 | ) |
| | | | | | | | | | | | | | | | | | | | | | | |
| | 0.00 | (b) | | | 0.00 | (b) | | | 0.00 | (b) | | | 0.00 | (b) | | | 0.00 | (b) | | | 0.00 | (b) |
| | 0.10 | | | | (2.21 | ) | | | (0.64 | ) | | | 3.58 | | | | (2.03 | ) | | | (0.13 | ) |
| $ | 17.41 | | | $ | 17.31 | | | $ | 19.52 | | | $ | 20.16 | | | $ | 16.58 | | | $ | 18.61 | |
| | | | | | | | | | | | | | | | | | | | | | | |
| | 0.58 | %(c) | | | 4.76 | % | | | 3.08 | % | | | 21.97 | % | | | (5.04% | ) | | | 10.74 | % |
| | | | | | | | | | | | | | | | | | | | | | | |
| $ | 264,691 | | | $ | 543,174 | | | $ | 1,196,558 | | | $ | 1,255,606 | | | $ | 1,147,007 | | | $ | 1,133,122 | |
| | | | | | | | | | | | | | | | | | | | | | | |
| | 1.03 | %(d) | | | 1.27 | % | | | 1.24 | % | | | 1.25 | % | | | 1.25 | % | | | 1.26 | % |
| | 1.02 | %(d) | | | 1.25 | % | | | 1.24 | % | | | 1.25 | % | | | 1.25 | % | | | 1.25 | % |
| | | | | | | | | | | | | | | | | | | | | | | |
| | 0.74 | %(d) | | | 0.54 | % | | | 0.08 | % | | | 0.18 | % | | | 0.61 | % | | | 0.56 | % |
| | | | | | | | | | | | | | | | | | | | | | | |
| | 34 | %(c) | | | 68 | % | | | 68 | % | | | 52 | % | | | 80 | % | | | 73 | % |
| Semi-Annual Report | October 31, 2019 | 29 |
| Financial Highlights | Vulcan Value Partners Small Cap Fund |
For a share outstanding throughout the years presented.
| Institutional Class | | For the Period May 1, 2019 (Inception) to October 31, 2019 | |
| NET ASSET VALUE, BEGINNING OF PERIOD | | $ | 17.18 | |
| INCOME/(LOSS) FROM OPERATIONS: | | | | |
| Net investment income(a) | | | 0.05 | |
| Net realized and unrealized gain on investments | | | 0.20 | |
| Total from investment operations | | | 0.25 | |
| | | | | |
| Redemption fees added to paid-in capital | | | 0.00 | (b) |
| Increase in net asset value | | | 0.25 | |
| NET ASSET VALUE, END OF PERIOD | | $ | 17.43 | |
| | | | | |
| Total return | | | 1.46 | %(c) |
| | | | | |
| RATIOS AND SUPPLEMENTAL DATA: | | | | |
| Net assets, end of period (000's) | | $ | 216,511 | |
| | | | | |
| Ratio of expenses to average net assets without fee waivers/reimbursements | | | 1.27 | %(d) |
| Ratio of expenses to average net assets including fee waivers/reimbursements | | | 0.99 | %(d) |
| Net investment income to average net assets including fee waivers/reimbursements | | | 0.57 | %(d) |
| | | | | |
| Portfolio turnover rate | | | 34 | %(c) |
| (a) | Per share numbers have been calculated using the average shares method. |
| (b) | Less than $0.005 per share. |
See Accompanying Notes to Financial Statements.
| 30 | www.vulcanvaluepartners.com |
Notes to Financial Statements
October 31, 2019 (Unaudited)
1. ORGANIZATION
Financial Investors Trust (the “Trust”) is organized as a Delaware statutory trust and is registered as an open-end management investment company under the Investment Company Act of 1940, as amended (“1940 Act”). The Trust consists of multiple separate portfolios or series. This semi-annual report describes the Vulcan Value Partners Fund and Vulcan Value Partners Small Cap Fund (each a “Fund” and collectively, the “Funds”). The Funds seek to achieve long-term capital appreciation. The Funds offer Investor Class and Institutional Class shares.
2. SIGNIFICANT ACCOUNTING POLICIES
The accompanying financial statements were prepared in accordance with accounting principles generally accepted in the United States of America (“U.S. GAAP”), including policies specific to investment companies. The preparation of financial statements in conformity with U.S. GAAP requires management to make certain estimates and assumptions that affect the reported amounts of assets and liabilities and disclosures of contingent assets and liabilities at the date of the financial statements and the reported amounts of revenue and expenses during the period. Actual results could differ from those estimates. The Funds are considered an investment company for financial reporting purposes under U.S. GAAP and follows the accounting and reporting guidance applicable to investment companies in the Financial Accounting Standards Board Accounting Standards Codification Topic 946. The following is a summary of significant accounting policies consistently followed by the Funds in preparation of their financial statements.
Investment Valuation:The Funds generally value their securities based on market prices determined at the close of regular trading on the New York Stock Exchange (“NYSE”), normally 4:00 p.m. Eastern Time, on each day the NYSE is open for trading.
For equity securities and mutual funds that are traded on an exchange, the market price is usually the closing sale or official closing price on that exchange. In the case of equity securities not traded on an exchange, or if such closing prices are not otherwise available, the securities are valued at the mean of the most recent bid and ask prices on such day. Redeemable securities issued by open-end registered investment companies are valued at the investment company’s applicable net asset value, with the exception of exchange-traded open-end investment companies, which are priced as equity securities.
The market price for debt obligations is generally the quote supplied by an independent third-party pricing service approved by the Board of Trustees of the Trust (the “Board” or the “Trustees”), which may use a matrix, formula or other objective method that takes into consideration quotations from dealers, market transactions in comparable investments, market indices and yield curves. If vendors are unable to supply a quote, or if the quote supplied is deemed to be unreliable, the market price may be determined using quotations received from one or more broker–dealers that make a market in the security.
Equity securities that are primarily traded on foreign securities exchanges are valued at the preceding closing values of such securities on their respective exchanges, except when an occurrence subsequent to the time a value was so established is likely to have changed such value. In such an event, the fair values of those securities are determined in good faith through consideration of other factors in accordance with procedures established by and under the general supervision of the Board.
| Semi-Annual Report | October 31, 2019 | 31 |
Notes to Financial Statements
October 31, 2019 (Unaudited)
When such prices or quotations are not available, or when Vulcan Value Partners, LLC (the “Adviser”) believes that they are unreliable, securities may be priced using fair value procedures approved by the Board.
Fair Value Measurements:A three-tier hierarchy has been established to classify fair value measurements for disclosure purposes. Inputs refer broadly to the assumptions that market participants would use in pricing the asset or liability, including assumptions about risk. Inputs may be observable or unobservable. Observable inputs are inputs that reflect the assumptions market participants would use in pricing the asset or liability that are developed based on market data obtained from sources independent of the reporting entity. Unobservable inputs are inputs that reflect the reporting entity’s own assumptions about the assumptions market participants would use in pricing the asset or liability that are developed based on the best information available. Various inputs are used in determining the value of each Fund’s investments as of the reporting period end. The designated input levels are not necessarily an indication of the risk or liquidity associated with these investments. These inputs are categorized in the following hierarchy under applicable financial accounting standards:
| Level 1 – | Unadjusted quoted prices in active markets for identical investments, unrestricted assets or liabilities that the Funds have the ability to access at the measurement date; |
| Level 2 – | Quoted prices which are not active, quoted prices for similar assets or liabilities in active markets or inputs other than quoted prices that are observable (either directly or indirectly) for substantially the full term of the asset or liability; and |
| Level 3 – | Significant unobservable prices or inputs (including the Funds’ own assumptions in determining the fair value of investments) where there is little or no market activity for the asset or liability at the measurement date. |
The following is a summary of each input used to value each Fund’s investments as of October 31, 2019:
Vulcan Value Partners Fund:
| Investments in Securities at Value | | Level 1 - Unadjusted Quoted Prices | | | Level 2 - Other Significant Observable Inputs | | | Level 3 - Significant Unobservable Inputs | | | Total | |
| Common Stocks(a) | | $ | 1,329,295,556 | | | $ | – | | | $ | – | | | $ | 1,329,295,556 | |
| Limited Partnerships(a) | | | 2,191,484 | | | | – | | | | – | | | | 2,191,484 | |
| Short Term Investments | | | 56,571,077 | | | | – | | | | – | | | | 56,571,077 | |
| TOTAL | | $ | 1,388,058,117 | | | $ | – | | | $ | – | | | $ | 1,388,058,117 | |
Vulcan Value Partners Small Cap Fund:
| Investments in Securities at Value | | Level 1 - Unadjusted Quoted Prices | | | Level 2 - Other Significant Observable Inputs | | | Level 3 - Significant Unobservable Inputs | | | Total | |
| Common Stocks(a) | | $ | 463,804,225 | | | $ | – | | | $ | – | | | $ | 463,804,225 | |
| Short Term Investments | | | 17,125,812 | | | | – | | | | – | | | | 17,125,812 | |
| TOTAL | | $ | 480,930,037 | | | $ | – | | | $ | – | | | $ | 480,930,037 | |
| (a) | For detailed descriptions, see the accompanying Statements of Investments. |
| 32 | www.vulcanvaluepartners.com |
Notes to Financial Statements
October 31, 2019 (Unaudited)
For the six months ended October 31, 2019, the Funds did not have any securities that used significant unobservable inputs (Level 3) in determining fair value.
Investment Transactions and Investment Income:Investment transactions are accounted for on the date the investments are purchased or sold (trade date). Realized gains and losses from investment transactions are reported on an identified cost basis, which is the same basis the Funds use for federal income tax purposes. Interest income, which includes accretion of discounts and amortization of premiums, is accrued and recorded as earned. Dividend income is recognized on the ex-dividend date or, for certain foreign securities, as soon as information is available to the Funds. All of the realized and unrealized gains and losses and net investment income, are allocated daily to each class in proportion to its average daily net assets.
ReFlow Liquidity Program:Each Fund may participate in the ReFlow liquidity program, which is designed to provide an alternative liquidity source for mutual funds experiencing net redemptions of their shares. Pursuant to the program, ReFlow Fund, LLC (“ReFlow”) provides participating mutual funds with a source of cash to meet net shareholder redemptions by standing ready each business day to purchase fund shares up to the value of the net shares redeemed by other shareholders that are to settle the next business day. ReFlow will purchase shares of the Fund at net asset value and will not be subject to any investment minimums. Following purchases of Fund shares, ReFlow then generally redeems those shares when the Fund experiences net subscriptions, at the end of a maximum holding period determined by ReFlow (currently 28 days), or at other times as the Fund may request. ReFlow may choose to redeem its position in the Fund with an in-kind transfer of securities, instead of cash, enabling the Fund to avoid a realization of capital gains on the securities it transfers. ReFlow will not be subject to any short-term redemption fees. While ReFlow holds Fund shares, it will have the same rights and privileges with respect to those shares as any other shareholder. For use of the ReFlow service, a Fund pays a fee to ReFlow each time it purchases Fund shares, calculated by applying to the purchase amount a fee rate determined through an automated daily auction among participating mutual funds. The current minimum fee rate is 0.20% of the value of the Fund shares purchased by ReFlow although the Fund may submit a bid at a higher fee rate if it determines that doing so is in the best interest of Fund shareholders. In accordance with federal securities laws, ReFlow is prohibited from acquiring more than 3% of the outstanding voting securities of a Fund. There is no assurance that ReFlow will have sufficient funds available to meet the Funds’ liquidity needs on a particular day. During the six months ended October 31, 2019, the Funds participated in ReFlow. Fees associated with ReFlow are disclosed in the Statements of Operations.
Real Estate Investment Trusts (“REITs”):The Funds may invest a portion of their assets in REITs and are subject to certain risks associated with direct investment in REITs. REITs may be affected by changes in the value of their underlying properties and by defaults by borrowers or tenants. REITs depend generally on their ability to generate cash flow to make distributions to shareowners, and certain REITs have self-liquidation provisions by which mortgages held may be paid in full and distributions of capital returns may be made at any time. In addition, the performance of a REIT may be affected by its failure to qualify for tax-free pass-through of income under the Internal Revenue Code of 1986, as amended (the “Code”), or its failure to maintain exemption from registration under the 1940 Act. A Fund’s investments in REITs may result in such Fund’s receipt of cash in excess of the REITs’ earnings. If the Fund receives such distributions all or a portion of these distributions will constitute a return of capital to such Fund. Receiving a return of capital distribution from REITs will reduce the amount of income available to be distributed to
| Semi-Annual Report | October 31, 2019 | 33 |
Notes to Financial Statements
October 31, 2019 (Unaudited)
Fund shareholders. Income from REITs generally will not be eligible for treatment as qualified dividend income. As the final character of the distributions is not known until reported by the REITs on their 1099s, the Funds utilize an average of the prior year’s reallocation information as an estimate for the current year character of distributions.
Foreign Securities:The Funds may directly purchase securities of foreign issuers. Investing in securities of foreign issuers involves special risks not typically associated with investing in securities of U.S. issuers. The risks include possible reevaluation of currencies, the inability to repatriate foreign currency, less complete financial information about companies and possible future adverse political and economic developments. Moreover, securities of many foreign issuers and their markets may be less liquid and their prices more volatile than those of securities of comparable U.S. issuers.
Foreign Currency Translation:The books and records of the Funds are maintained in U.S. dollars. Investment valuations and other assets and liabilities initially expressed in foreign currencies are converted each business day into U.S. dollars based upon current exchange rates. Prevailing foreign exchange rates may generally be obtained at the close of the NYSE (normally, 4:00 p.m. Eastern Time). The portion of realized and unrealized gains or losses on investments due to fluctuations in foreign currency exchange rates is not separately disclosed and is included in realized and unrealized gains or losses on investments, when applicable.
In-Kind Redemptions:During the six months ended October 31, 2019, the Vulcan Value Partners Fund and the Vulcan Value Partners Small Cap Fund distributed portfolio securities rather than cash as payment for certain redemptions of fund shares (in-kind redemptions) in the amount of $15,338,560 and $3,134,900, respectively. For financial reporting purposes, the Vulcan Value Partners Fund and the Vulcan Value Partners Small Cap Fund recognized gains on the in-kind redemptions in the amount of $1,421,373 and $3,283,370, respectively. For tax purposes, the gains are not recognized.
Trust Expenses:Some expenses of the Trust can be directly attributed to the Funds. Expenses which cannot be directly attributed are apportioned among all funds in the Trust based on average net assets of each fund.
Fund Expenses:Expenses that are specific to a Fund are charged directly to that Fund.
Federal Income Taxes:Each Fund complies with the requirements under Subchapter M of the Internal Revenue Code of 1986, as amended, applicable to regulated investment companies and intends to distribute substantially all of its net taxable income and net capital gains, if any, each year so that it will not be subject to excise tax on undistributed income and gains. The Funds are not subject to income taxes to the extent such distributions are made.
As of and during the six months ended October 31, 2019, the Funds did not have a liability for any unrecognized tax benefits. The Funds file U.S. federal, state, and local tax returns as required. The Fund’s tax returns are subject to examination by the relevant tax authorities until expiration of the applicable statute of limitations, which is generally three years after the filing of the tax return for federal purposes and four years for most state returns. Tax returns for open years have incorporated no uncertain tax positions that require a provision for income taxes.
| 34 | www.vulcanvaluepartners.com |
Notes to Financial Statements
October 31, 2019 (Unaudited)
Distributions to Shareholders:Each Fund normally pays dividends and distributes capital gains, if any, on an annual basis. Income dividend distributions are derived from dividends and other income each Fund receives from its investments, including short-term capital gains. Long term capital gain distributions are derived from gains realized when each Fund sells a security it has owned for more than a year. Each Fund may make additional distributions and dividends at other times if the portfolio manager believes doing so may be necessary for each Fund to avoid or reduce taxes.
3. TAX BASIS INFORMATION
Tax Basis of Investments:As of October 31, 2019, the aggregate cost of investments, gross unrealized appreciation/(depreciation) and net unrealized appreciation for federal tax purposes was as follows:
| | | Vulcan Value Partners Fund | | | Vulcan Value Partners Small Cap Fund | |
| Gross appreciation (excess of value over tax cost) | | $ | 286,591,244 | | | $ | 68,529,016 | |
| Gross depreciation (excess of tax cost over value) | | | (16,663,108 | ) | | | (13,364,199 | ) |
| Net unrealized appreciation | | $ | 269,928,136 | | | $ | 55,164,817 | |
| Cost of investments for income tax purposes | | $ | 1,118,129,980 | | | $ | 425,765,220 | |
Tax Basis of Distributions to Shareholders:The character of distributions made during the year from net investment income or net realized gains may differ from its ultimate characterization for federal income tax purposes. Also, due to the timing of dividend distributions, the fiscal year in which amounts are distributed may differ from the fiscal year in which the income or realized gain were recorded by each Fund.
The tax character of distributions paid by the Funds for the fiscal year ended April 30, 2019 were as follows:
| | | Ordinary Income | | | Long-Term Capital Gain | |
| 2019 | | | | | | | | |
| Vulcan Value Partners Fund | | $ | 56,597,050 | | | $ | 42,069,450 | |
| Vulcan Value Partners Small Cap Fund | | | 10,950,971 | | | | 80,888,454 | |
The amounts and characteristics of tax basis distributions and composition of distributable earnings/(accumulated losses) are finalized at fiscal year-end. Accordingly, tax basis balances have not been determined as of October 31, 2019.
| Semi-Annual Report | October 31, 2019 | 35 |
Notes to Financial Statements
October 31, 2019 (Unaudited)
4. SECURITIES TRANSACTIONS
The cost of purchases and proceeds from sales of securities (excluding short-term securities and in-kind redemptions) during the six months ended October 31, 2019 were as follows:
| Fund | | Purchases of Securities | | | Proceeds From Sales of Securities | |
| Vulcan Value Partners Fund | | $ | 283,297,966 | | | $ | 322,817,786 | |
| Vulcan Value Partners Small Cap Fund | | | 157,410,936 | | | | 225,256,568 | |
5. SHARES OF BENEFICIAL INTEREST
The capitalization of the Trust consists of an unlimited number of shares of beneficial interest with no par value per share. Holders of the shares of the Funds of the Trust have one vote for each share held and a proportionate fraction of a vote for each fractional share. All shares issued and outstanding are fully paid and are transferable and redeemable at the option of the shareholder. Purchasers of the shares do not have any obligation to make payments to the Trust or its creditors solely by reason of the purchasers’ ownership of the shares. Shares have no pre-emptive rights.
Shares redeemed within 90 days of purchase may incur a 2% short-term redemption fee deducted from the redemption amount. The Vulcan Value Partners Fund and the Vulcan Value Partners Small Cap Fund retained $9,694 and $33,890, respectively, for the six months ended October 31, 2019, and $16,120 and $22,728, respectively, for the year ended April 30, 2019, which is reflected in the “Cost of shares redeemed, net of redemption fees” in the Statements of Changes in Net Assets.
Transactions in shares of capital stock for the dates listed below were as follows:
Vulcan Value Partners Fund
| | | For the Six Months Ended October 31, 2019 (Unaudited) | | | For the Year Ended April 30, 2019 | |
| Shares Sold | | | | | | |
| Investor Class | | | 2,448,483 | | | | 12,191,768 | |
| Institutional Class | | | 26,655,935 | | | | – | |
| Shares Issued in Reinvestment of Dividends | | | | | | | | |
| Investor Class | | | – | | | | 4,689,102 | |
| Less Shares Redeemed | | | | | | | | |
| Investor Class | | | (28,050,753 | ) | | | (17,310,102 | ) |
| Institutional Class | | | (1,315,275 | ) | | | – | |
| Net Decrease | | | (261,610 | ) | | | (429,232 | ) |
| 36 | www.vulcanvaluepartners.com |
Notes to Financial Statements
October 31, 2019 (Unaudited)
Vulcan Value Partners Small Cap Fund
| | | For the Six Months Ended October 31, 2019 (Unaudited) | | | For the Year Ended April 30, 2019 | |
| Shares Sold | | | | | | |
| Investor Class | | | 1,196,172 | | | | 9,339,047 | |
| Institutional Class | | | 13,119,259 | | | | – | |
| Shares Issued in Reinvestment of Dividends | | | | | | | | |
| Investor Class | | | – | | | | 5,297,515 | |
| Less Shares Redeemed | | | | | | | | |
| Investor Class | | | (17,373,506 | ) | | | (44,554,915 | ) |
| Institutional Class | | | (699,999 | ) | | | – | |
| Net Decrease | | | (3,758,074 | ) | | | (29,918,353 | ) |
6. MANAGEMENT AND RELATED-PARTY TRANSACTIONS
The Adviser, subject to the authority of the Board, is responsible for the overall management and administration of the Funds’ business affairs. The Adviser manages the investments of the Funds in accordance with each Fund’s investment objective, policies and limitations and investment guidelines established jointly by the Adviser and the Board. Pursuant to the Investment Advisory Agreement (the “Advisory Agreement”), the Funds pay the Adviser an annual management fee of 1.00% and 1.15% for Vulcan Value Partners Fund and Vulcan Value Partners Small Cap Fund, respectively, based on each Fund’s average daily net assets. The management fee is paid on a monthly basis.
The Adviser has contractually agreed to limit the Vulcan Value Partners Fund’s total annual fund operating expenses (exclusive of Acquired Fund Fees and Expenses, brokerage expenses, interest expense, taxes and extraordinary expenses) to 1.25% and 0.85% of the Fund’s average daily net assets with respect to Investor Class shares and Institutional Class shares, respectively.
The Adviser has contractually agreed to limit the Vulcan Value Partners Small Cap Fund’s total annual fund operating expenses (exclusive of Acquired Fund Fees and Expenses, brokerage expenses, interest expense, taxes and extraordinary expenses) to 1.25% and 1.00% of the Fund’s average daily net assets with respect to Investor Class shares and Institutional Class shares, respectively.
These agreements (the “Expense Agreements”) are in effect from September 1, 2019 through August 31, 2020. The prior Expense Agreements were in effect from September 1, 2018 through August 31, 2019. The Adviser will be permitted to recover, on a class-by-class basis, expenses it has borne through the Expense Agreements to the extent that a Fund’s expenses in later periods fall below the expense cap in effect at the time of waiver or reimbursement. Notwithstanding the foregoing, the Funds will not be obligated to pay any such fees and expenses more than three years after the date of the waiver or reimbursement. The Adviser may not discontinue or modify this waiver prior to August 31, 2020 without the approval by the Funds’ Board.
| Semi-Annual Report | October 31, 2019 | 37 |
Notes to Financial Statements
October 31, 2019 (Unaudited)
Fund Administrator Fees and Expenses: ALPS Fund Services, Inc. (“ALPS”) serves as administrator to the Funds and the Funds have agreed to pay expenses incurred in connection with their administrative activities. Pursuant to an Administration Agreement, ALPS provides operational services to the Funds including, but not limited to fund accounting and fund administration and generally assist in each Fund’s operations. Officers of the Trust are employees of ALPS. The Funds’ administration fee is accrued on a daily basis and paid monthly. Administration fees paid by the Funds for the six months ended October 31, 2019 are disclosed in the Statements of Operations.
ALPS is reimbursed by the Funds for certain out-of-pocket expenses.
Transfer Agent:ALPS serves as transfer, dividend paying and shareholder servicing agent for the Funds. ALPS receives an annual minimum fee, a fee based upon the number of shareholder accounts, and is also reimbursed by the Funds for certain out-of-pocket expenses. Transfer agent fees paid by the Funds for the six months ended October 31, 2019 are disclosed in the Statements of Operations.
Compliance Services: ALPS provides services that assist the Trust’s chief compliance officer in monitoring and testing the policies and procedures of the Trust in conjunction with requirements under Rule 38a-1 under the 1940 Act and receives an annual base fee. ALPS is reimbursed for certain out-of-pocket expenses by the Funds. Vulcan pays this fee on behalf of the Funds.
Principal Financial Officer: ALPS receives an annual fee for providing principal financial officer services to the Funds. Principal financial officer fees paid by the Fund for the six months ended October 31, 2019 are disclosed in the Statements of Operations.
Distributor:ALPS Distributors, Inc. (“ADI” or the “Distributor”) (an affiliate of ALPS) acts as the distributor of each Fund’s shares pursuant to a Distribution Agreement with the Trust. Shares are sold on a continuous basis by ADI as agent for the Funds, and ADI has agreed to use its best efforts to solicit orders for the sale of each Fund’s shares, although it is not obliged to sell any particular amount of shares. ADI is not entitled to any compensation for its services as Distributor. ADI is registered as a broker-dealer with the U.S. Securities and Exchange Commission. Certain intermediaries may charge networking, omnibus account or other administrative fees with respect to transactions in shares of the Funds. Transactions may be processed through the National Securities Clearing Corporation (“NSCC”) or similar systems or processed on a manual basis. These fees are paid by the Funds to the Distributor, which uses such fees to reimburse intermediaries. In the event an intermediary receiving payments from the Distributor on behalf of the Funds converts from a networking structure to an omnibus account structure or otherwise experiences increased costs, fees borne by the Funds may increase. Fees are disclosed on the Statements of Operations as “Delegated transfer agent equivalent services fees”.
Trustees:The fees and expenses of the independent Trustees of the Board are presented in the Statement of Operations.
| 38 | www.vulcanvaluepartners.com |
Notes to Financial Statements
October 31, 2019 (Unaudited)
7. INDEMNIFICATIONS
Under the Trust’s organizational documents, its Officers and Trustees are indemnified against certain liability arising out of the performance of their duties to the Trust. Additionally, in the normal course of business, the Trust enters into contracts with service providers that may contain general indemnification clauses which may permit indemnification to the extent permissible under applicable law. The Trust’s maximum exposure under these arrangements is unknown, as this would involve future claims that may be made against the Trust that have not yet occurred.
8. SUBSEQUENT EVENT
Subsequent events after the date of the Statements of Assets and Liabilities have been evaluated through the date the financial statements were issued.
| Semi-Annual Report | October 31, 2019 | 39 |
Additional Information
October 31, 2019 (Unaudited)
1. FUND HOLDINGS
The Funds’ portfolio holdings are made available semi-annually in shareholder reports within 60 days after the close of the period for which the report is being made, as required by federal securities laws. The Funds also file monthly portfolio holdings on Form N-PORT on a quarterly basis, with the schedule of portfolio holdings filed on Form N-PORT for the third month of each Fund’s fiscal quarter made publicly available 60 days after the end of the Funds’ fiscal quarter.
2. FUND PROXY VOTING POLICIES, PROCEDURES AND SUMMARIES
The Funds’ policies and procedures used in determining how to vote proxies and information regarding how the Fund voted proxies relating to portfolio securities during the most recent prior 12-month period ending June 30 are available without charge, (1) upon request, by calling (toll-free) (866)-759-5679 and (2) on the SEC’s website at http://www.sec.gov.
| 40 | www.vulcanvaluepartners.com |
Privacy Policy
October 31, 2019 (Unaudited)
| WHO WE ARE | |
| Who is providing this notice? | Vulcan Value Partners Fund and Vulcan Value Partners Small Cap Fund. |
| WHAT WE DO | |
| How do the Funds protect my personal information? | To protect your personal information from unauthorized access and use, we use security measures that comply with federal law. These measures include computer safeguards and secured files and buildings. |
| How do the Funds collect my personal information? | We collect your personal information, for example, when you • open an account • provide account information or give us your contact information • make a wire transfer or deposit money |
| Why can’t I limit all sharing? | Federal law gives you the right to limit only • sharing for affiliates’ everyday business purposes-information about your creditworthiness • affiliates from using your information to market to you • sharing for non-affiliates to market to you State laws and individual companies may give you additional rights to limit sharing. |
| Semi-Annual Report | October 31, 2019 | 41 |
Privacy Policy
October 31, 2019 (Unaudited)
| FACTS | WHAT DO THE FUNDS DO WITH YOUR PERSONAL INFORMATION? |
| WHY? | Financial companies choose how they share your personal information. Federal law gives consumers the right to limit some but not all sharing. Federal law also requires us to tell you how we collect, share, and protect your personal information. Please read this notice carefully to understand what we do. |
| WHAT? | The types of personal information we collect and share depend on the product or service you have with us. This information can include: • Social Security number and account transactions • Account balances and transaction history • Wire transfer instructions |
| HOW? | All financial companies need to share customers’ personal information to run their everyday business. In the section below, we list the reasons financial companies can share their customers’ personal information; the reasons the Funds choose to share; and whether you can limit this sharing. |
| REASONS WE CAN SHARE YOUR PERSONAL INFORMATION | DO THE FUNDS SHARE: | CAN YOU LIMIT THIS SHARING? |
For our everyday business purposes –such as to process your transactions, maintain your account(s), respond to court orders and legal investigations, or report to credit bureaus | Yes | No |
For our marketing purposes –to offer our products and services to you | No | We do not share. |
| For joint marketing with other financial companies | No | We do not share. |
For our affiliates’ everyday business purposes –information about your transactions and experiences | Yes | No |
For our affiliates’ everyday business purposes –information about your creditworthiness | No | We do not share. |
| For non-affiliates to market to you | No | We do not share. |
| 42 | www.vulcanvaluepartners.com |
Intentionally Left Blank

Not applicable to this Report.
| Item 3. | Audit Committee Financial Expert. |
Not applicable to this Report.
| Item 4. | Principal Accountant Fees and Services. |
Not applicable to this Report.
| Item 5. | Audit Committee of Listed Registrants. |
Not applicable to the Registrant.
| (a) | Schedule of Investments is included as part of the Reports to Stockholders filed under Item 1 of this Form N-CSR. |
| Item 7. | Disclosure of Proxy Voting Policies and Procedures for Closed-End Management Investment Companies. |
Not applicable to the Registrant.
| Item 8. | Portfolio Managers of Closed-End Management Investment Companies. |
Not applicable to the Registrant.
| Item 9. | Purchases of Equity Securities by Closed-End Management Investment Company and Affiliated Purchasers. |
Not applicable to the Registrant.
| Item 10. | Submission of Matters to a Vote of Security Holders. |
There have been no material changes to the procedures by which shareholders may recommend nominees to the Registrant’s Board of Trustees, where those changes were implemented after the Registrant last provided disclosure in response to the requirements of Item 407(c)(2)(iv) of Regulation S-K, or this Item.
| Item 11. | Controls and Procedures. |
| (a) | The Registrant’s principal executive officer and principal financial officer have concluded that the Registrant’s disclosure controls and procedures (as defined in Rule 30a-3(c) under the Investment Company Act of 1940, as amended) are effective based on their evaluation of these controls and procedures as of a date within 90 days of the filing date of this report. |
| (b) | There was no change in the Registrant’s internal control over financial reporting (as defined in Rule 30a-3(d) under the Investment Company Act of 1940, as amended) that occurred during the period covered by this report that has materially affected, or is reasonably likely to materially affect, the Registrant’s internal control over financial reporting. |
| Item 12. | Disclosure of Securities Lending Activities for Closed-End Management Investment Companies. |
Not applicable to the Registrant.
| (a)(1) | Not applicable to this Report. |
| (a)(2) | The certifications required by Rule 30a-2(a) of the Investment Company Act of 1940, as amended, and Section 302 of the Sarbanes-Oxley Act of 2002 are attached hereto as Exhibit 99.Cert. |
| (a)(3) | Not applicable to the Registrant. |
| (a)(4) | The information regarding the change in the registrant’s independent public accountant pursuant to Item 4 of Form 8-K and Item 304 of Regulation S-K is filed herewith. |
| (b) | The certifications by the Registrant’s principal executive officer and principal financial officer, as required by Rule 30a-2(b) of the Investment Company Act of 1940, as amended, and Section 906 of the Sarbanes-Oxley Act of 2002 are attached hereto as Exhibit 99.906Cert. |
SIGNATURES
Pursuant to the requirements of the Securities Exchange Act of 1934 and the Investment Company Act of 1940, the Registrant has duly caused this report to be signed on its behalf by the undersigned, thereunto duly authorized.
FINANCIAL INVESTORS TRUST
| By: | /s/ Bradley J. Swenson | |
| | Bradley J. Swenson (Principal Executive Officer) | |
| | President | |
| | | |
| Date: | January 6, 2020 | |
Pursuant to the requirements of the Securities Exchange Act of 1934 and the Investment Company Act of 1940, this report has been signed below by the following persons on behalf of the Registrant and in the capacities and on the dates indicated.
FINANCIAL INVESTORS TRUST
| By: | /s/ Bradley J. Swenson | |
| | Bradley J. Swenson (Principal Executive Officer) | |
| | President | |
| | | |
| Date: | January 6, 2020 | |
| | | |
| By: | /s/ Kimberly R. Storms | |
| | Kimberly R. Storms (Principal Financial Officer) | |
| | Treasurer | |
| | | |
| Date: | January 6, 2020 | |