UNITED STATES
SECURITIES AND EXCHANGE COMMISSION
Washington, D.C. 20549
FORM N-CSR
CERTIFIED SHAREHOLDER REPORT OF REGISTERED
MANAGEMENT INVESTMENT COMPANIES
Investment Company Act file number: 811-08194
FINANCIAL INVESTORS TRUST
(Exact name of registrant as specified in charter)
1290 Broadway, Suite 1000, Denver, Colorado 80203
(Address of principal executive offices) (Zip code)
Karen Gilomen, Esq., Secretary
Financial Investors Trust
1290 Broadway, Suite 1000
Denver, Colorado 80203
(Name and address of agent for service)
Registrant’s telephone number, including area code: 303-623-2577
Date of fiscal year end: October 31
Date of reporting period: April 30, 2020
Item 1. Reports to Stockholders.

Table of Contents
| Disclosure of Fund Expenses | 1 |
| ALPS | CoreCommodity Management | |
| CompleteCommodities® Strategy Fund | |
| Management Commentary | 5 |
| Performance Update | 7 |
| Consolidated Statement of Investments | 9 |
| Consolidated Statement of Assets and Liabilities | 15 |
| Consolidated Statement of Operations | 16 |
| Consolidated Statements of Changes in Net Assets | 17 |
| Consolidated Financial Highlights | 18 |
| ALPS | Kotak India Growth Fund | |
| Management Commentary | 22 |
| Performance Update | 25 |
| Consolidated Statement of Investments | 27 |
| Consolidated Statement of Assets and Liabilities | 29 |
| Consolidated Statement of Operations | 30 |
| Consolidated Statements of Changes in Net Assets | 31 |
| Consolidated Financial Highlights | 32 |
| ALPS | Smith Funds | |
| Management Commentary | 37 |
| Performance Update | 39 |
| Statements of Investments | 44 |
| Statements of Assets and Liabilities | 72 |
| Statements of Operations | 73 |
| Statement of Changes in Net Assets | 74 |
| Financial Highlights | 76 |
| ALPS | Red Rocks Global Opportunity Fund | |
| Management Commentary | 84 |
| Performance Update | 86 |
| Statement of Investments | 89 |
| Statement of Assets and Liabilities | 91 |
| Statement of Operations | 92 |
| Statements of Changes in Net Assets | 93 |
| Financial Highlights | 94 |
| Clough China Fund | |
| Management Commentary | 99 |
| Performance Update | 101 |
| Statement of Investments | 103 |
| Statement of Assets and Liabilities | 106 |
| Statement of Operations | 107 |
| Statements of Changes in Net Assets | 108 |
| Financial Highlights | 109 |
| RiverFront Global Allocation Series | |
| Management Commentary | 113 |
| Performance Update | 115 |
| Statements of Investments | 121 |
| Statements of Assets and Liabilities | 124 |
| Statements of Operations | 126 |
| Statements of Changes in Net Assets | 127 |
| Financial Highlights | 130 |
| Notes to Financial Statements | 144 |
| Additional Information | 174 |
| Liquidity Risk Management Program | 175 |
Beginning on January 1, 2021, as permitted by regulations adopted by the U.S. Securities and Exchange Commission, paper copies of the Funds’ annual and semiannual shareholder reports will no longer be sent by mail, unless you specifically request paper copies of the reports from your financial intermediary (such as a broker-dealer or bank). Instead, the reports will be made available on the Funds’ website (www.alpsfunds.com), and you will be notified by mail each time a report is posted and provided with a website link to access the report.
If you already elected to receive shareholder reports electronically, you will not be affected by this change and you need not take any action. You may elect to receive shareholder reports and other communications from a Fund electronically anytime by contacting your financial intermediary.
You may elect to receive all future reports in paper free of charge. You can contact your financial intermediary to request that you continue to receive paper copies of your shareholder reports. Your election to receive reports in paper will apply to all funds held in your account with your financial intermediary.
alpsfunds.com
Disclosure of Fund Expenses
April 30, 2020 (Unaudited)
Board Examples. As a shareholder of the Funds, you incur two types of costs: (1) transaction costs, including applicable sales charges (loads) and redemption fees; and (2) ongoing costs, including management fees, distribution and service (12b-1) fees, shareholder service fees and other Fund expenses. The following examples are intended to help you understand your ongoing costs (in dollars) of investing in the Funds and to compare these costs with the ongoing costs of investing in other mutual funds. The examples are based on an investment of $1,000 invested on November 1, 2019 and held until April 30, 2020.
Actual Expenses. The first line under each class in the table below provides information about actual account values and actual expenses. You may use the information in this line, together with the amount you invested, to estimate the expenses that you paid over the period. Simply divide your account value by $1,000 (for example, an $8,600 account value divided by $1,000 = 8.6), then multiply the result by the number in the first line under the heading “Expenses Paid During Period November 1, 2019 – April 30, 2020” to estimate the expenses you paid on your account during this period.
Hypothetical Example for Comparison Purposes. The second line under each class in the table below provides information about hypothetical account values and hypothetical expenses based on the Fund’s actual expense ratio and an assumed rate of return of 5% per year before expenses, which is not the Fund’s actual return. The hypothetical account values and expenses may not be used to estimate the actual ending account balance or expenses you paid for the period. You may use this information to compare the ongoing costs of investing in the Funds and other mutual funds. To do so, compare these 5% hypothetical examples with the 5% hypothetical examples that appear in the shareholder reports of the other funds.
Please note that the expenses shown in the table are meant to highlight your ongoing costs only and do not reflect any transactional costs, such as sales charges or redemption fees. Therefore, the second line under each class in the table below is useful in comparing ongoing costs only, and will not help you determine the relative total costs of owning different funds. In addition, if these transactional costs were included, your costs would have been higher.
| 1 | | April 30, 2020 |
Disclosure of Fund Expenses
April 30, 2020 (Unaudited)
| Beginning Account Value November 1, 2019 | Ending Account Value April 30, 2020 | Expense Ratio(a) | Expenses Paid During Period November 1, 2019 - April 30, 2020(b) | |||||||||||||
| ALPS | CoreCommodity Management CompleteCommodities® Strategy Fund(c) | ||||||||||||||||
| Investor Class | ||||||||||||||||
| Actual | $ | 1,000.00 | $ | 766.10 | 1.40 | % | $ | 6.15 | ||||||||
| Hypothetical (5% return before expenses) | $ | 1,000.00 | $ | 1,017.90 | 1.40 | % | $ | 7.02 | ||||||||
| Class A | ||||||||||||||||
| Actual | $ | 1,000.00 | $ | 767.60 | 1.32 | % | $ | 5.80 | ||||||||
| Hypothetical (5% return before expenses) | $ | 1,000.00 | $ | 1,018.30 | 1.32 | % | $ | 6.62 | ||||||||
| Class C | ||||||||||||||||
| Actual | $ | 1,000.00 | $ | 764.10 | 2.05 | % | $ | 8.99 | ||||||||
| Hypothetical (5% return before expenses) | $ | 1,000.00 | $ | 1,014.67 | 2.05 | % | $ | 10.27 | ||||||||
| Class I | ||||||||||||||||
| Actual | $ | 1,000.00 | $ | 768.20 | 1.15 | % | $ | 5.06 | ||||||||
| Hypothetical (5% return before expenses) | $ | 1,000.00 | $ | 1,019.14 | 1.15 | % | $ | 5.77 | ||||||||
| ALPS | Kotak India Growth Fund(d) | ||||||||||||||||
| Investor Class | ||||||||||||||||
| Actual | $ | 1,000.00 | $ | 789.10 | 1.45 | % | $ | 6.45 | ||||||||
| Hypothetical (5% return before expenses) | $ | 1,000.00 | $ | 1,017.65 | 1.45 | % | $ | 7.27 | ||||||||
| Class A | ||||||||||||||||
| Actual | $ | 1,000.00 | $ | 789.40 | 1.36 | % | $ | 6.05 | ||||||||
| Hypothetical (5% return before expenses) | $ | 1,000.00 | $ | 1,018.10 | 1.36 | % | $ | 6.82 | ||||||||
| Class C | ||||||||||||||||
| Actual | $ | 1,000.00 | $ | 786.00 | 2.11 | % | $ | 9.37 | ||||||||
| Hypothetical (5% return before expenses) | $ | 1,000.00 | $ | 1,014.37 | 2.11 | % | $ | 10.57 | ||||||||
| Class I | ||||||||||||||||
| Actual | $ | 1,000.00 | $ | 790.30 | 1.12 | % | $ | 4.99 | ||||||||
| Hypothetical (5% return before expenses) | $ | 1,000.00 | $ | 1,019.29 | 1.12 | % | $ | 5.62 | ||||||||
| Class II | ||||||||||||||||
| Actual | $ | 1,000.00 | $ | 777.00 | 0.75 | % | $ | 2.42 | ||||||||
| Hypothetical (5% return before expenses) | $ | 1,000.00 | $ | 1,015.44 | 0.75 | % | $ | 2.75 | ||||||||
| ALPS | Smith Short Duration Bond Fund | ||||||||||||||||
| Investor Class | ||||||||||||||||
| Actual | $ | 1,000.00 | $ | 1,026.00 | 0.75 | % | $ | 3.78 | ||||||||
| Hypothetical (5% return before expenses) | $ | 1,000.00 | $ | 1,021.13 | 0.75 | % | $ | 3.77 | ||||||||
| Class A | ||||||||||||||||
| Actual | $ | 1,000.00 | $ | 1,026.00 | 0.75 | % | $ | 3.78 | ||||||||
| Hypothetical (5% return before expenses) | $ | 1,000.00 | $ | 1,021.13 | 0.75 | % | $ | 3.77 | ||||||||
| Class C | ||||||||||||||||
| Actual | $ | 1,000.00 | $ | 1,022.40 | 1.49 | % | $ | 7.49 | ||||||||
| Hypothetical (5% return before expenses) | $ | 1,000.00 | $ | 1,017.45 | 1.49 | % | $ | 7.47 | ||||||||
| Class I | ||||||||||||||||
| Actual | $ | 1,000.00 | $ | 1,027.40 | 0.49 | % | $ | 2.47 | ||||||||
| Hypothetical (5% return before expenses) | $ | 1,000.00 | $ | 1,022.43 | 0.49 | % | $ | 2.46 | ||||||||
| 2 | | April 30, 2020 |
Disclosure of Fund Expenses
April 30, 2020 (Unaudited)
| Beginning Account Value November 1, 2019 | Ending Account Value April 30, 2020 | Expense Ratio(a) | Expenses Paid During Period November 1, 2019 - April 30, 2020(b) | |||||||||||||
| ALPS | Smith Total Return Bond Fund | ||||||||||||||||
| Investor Class | ||||||||||||||||
| Actual | $ | 1,000.00 | $ | 1,031.70 | 0.95 | % | $ | 4.80 | ||||||||
| Hypothetical (5% return before expenses) | $ | 1,000.00 | $ | 1,020.14 | 0.95 | % | $ | 4.77 | ||||||||
| Class A | ||||||||||||||||
| Actual | $ | 1,000.00 | $ | 1,031.70 | 0.96 | % | $ | 4.85 | ||||||||
| Hypothetical (5% return before expenses) | $ | 1,000.00 | $ | 1,020.09 | 0.96 | % | $ | 4.82 | ||||||||
| Class C | ||||||||||||||||
| Actual | $ | 1,000.00 | $ | 1,028.20 | 1.67 | % | $ | 8.42 | ||||||||
| Hypothetical (5% return before expenses) | $ | 1,000.00 | $ | 1,016.56 | 1.67 | % | $ | 8.37 | ||||||||
| Class I | ||||||||||||||||
| Actual | $ | 1,000.00 | $ | 1,033.20 | 0.67 | % | $ | 3.39 | ||||||||
| Hypothetical (5% return before expenses) | $ | 1,000.00 | $ | 1,021.53 | 0.67 | % | $ | 3.37 | ||||||||
| ALPS | Red Rocks Global Opportunity Fund | ||||||||||||||||
| Investor Class | ||||||||||||||||
| Actual | $ | 1,000.00 | $ | 839.40 | 1.43 | % | $ | 6.54 | ||||||||
| Hypothetical (5% return before expenses) | $ | 1,000.00 | $ | 1,017.75 | 1.43 | % | $ | 7.17 | ||||||||
| Class A | ||||||||||||||||
| Actual | $ | 1,000.00 | $ | 839.90 | 1.41 | % | $ | 6.45 | ||||||||
| Hypothetical (5% return before expenses) | $ | 1,000.00 | $ | 1,017.85 | 1.41 | % | $ | 7.07 | ||||||||
| Class C | ||||||||||||||||
| Actual | $ | 1,000.00 | $ | 836.30 | 2.19 | % | $ | 10.00 | ||||||||
| Hypothetical (5% return before expenses) | $ | 1,000.00 | $ | 1,013.97 | 2.19 | % | $ | 10.97 | ||||||||
| Class I | ||||||||||||||||
| Actual | $ | 1,000.00 | $ | 840.00 | 1.20 | % | $ | 5.49 | ||||||||
| Hypothetical (5% return before expenses) | $ | 1,000.00 | $ | 1,018.90 | 1.20 | % | $ | 6.02 | ||||||||
| Class R | ||||||||||||||||
| Actual | $ | 1,000.00 | $ | 837.20 | 1.63 | % | $ | 7.45 | ||||||||
| Hypothetical (5% return before expenses) | $ | 1,000.00 | $ | 1,016.76 | 1.63 | % | $ | 8.17 | ||||||||
| Clough China Fund | ||||||||||||||||
| Investor Class | ||||||||||||||||
| Actual | $ | 1,000.00 | $ | 1,028.90 | 1.95 | % | $ | 9.84 | ||||||||
| Hypothetical (5% return before expenses) | $ | 1,000.00 | $ | 1,015.17 | 1.95 | % | $ | 9.77 | ||||||||
| Class A | ||||||||||||||||
| Actual | $ | 1,000.00 | $ | 1,028.80 | 1.95 | % | $ | 9.84 | ||||||||
| Hypothetical (5% return before expenses) | $ | 1,000.00 | $ | 1,015.17 | 1.95 | % | $ | 9.77 | ||||||||
| Class C | ||||||||||||||||
| Actual | $ | 1,000.00 | $ | 1,024.80 | 2.70 | % | $ | 13.59 | ||||||||
| Hypothetical (5% return before expenses) | $ | 1,000.00 | $ | 1,011.44 | 2.70 | % | $ | 13.50 | ||||||||
| Class I | ||||||||||||||||
| Actual | $ | 1,000.00 | $ | 1,030.30 | 1.70 | % | $ | 8.58 | ||||||||
| Hypothetical (5% return before expenses) | $ | 1,000.00 | $ | 1,016.41 | 1.70 | % | $ | 8.52 | ||||||||
| 3 | | April 30, 2020 |
Disclosure of Fund Expenses
April 30, 2020 (Unaudited)
| Beginning Account Value November 1, 2019 | Ending Account Value April 30, 2020 | Expense Ratio(a) | Expenses Paid During Period November 1, 2019 - April 30, 2020(b) | |||||||||||||
| RiverFront Asset Allocation Aggressive | ||||||||||||||||
| Investor Class | ||||||||||||||||
| Actual | $ | 1,000.00 | $ | 884.80 | 0.50 | % | $ | 2.34 | ||||||||
| Hypothetical (5% return before expenses) | $ | 1,000.00 | $ | 1,022.38 | 0.50 | % | $ | 2.51 | ||||||||
| Class A | ||||||||||||||||
| Actual | $ | 1,000.00 | $ | 884.80 | 0.50 | % | $ | 2.34 | ||||||||
| Hypothetical (5% return before expenses) | $ | 1,000.00 | $ | 1,022.38 | 0.50 | % | $ | 2.51 | ||||||||
| Class C | ||||||||||||||||
| Actual | $ | 1,000.00 | $ | 881.00 | 1.25 | % | $ | 5.85 | ||||||||
| Hypothetical (5% return before expenses) | $ | 1,000.00 | $ | 1,018.65 | 1.25 | % | $ | 6.27 | ||||||||
| Class I | ||||||||||||||||
| Actual | $ | 1,000.00 | $ | 885.60 | 0.25 | % | $ | 1.17 | ||||||||
| Hypothetical (5% return before expenses) | $ | 1,000.00 | $ | 1,023.62 | 0.25 | % | $ | 1.26 | ||||||||
| Investor Class II | ||||||||||||||||
| Actual | $ | 1,000.00 | $ | 884.60 | 0.50 | % | $ | 2.34 | ||||||||
| Hypothetical (5% return before expenses) | $ | 1,000.00 | $ | 1,022.38 | 0.50 | % | $ | 2.51 | ||||||||
| Class L | ||||||||||||||||
| Actual | $ | 1,000.00 | $ | 885.40 | 0.25 | % | $ | 1.17 | ||||||||
| Hypothetical (5% return before expenses) | $ | 1,000.00 | $ | 1,023.62 | 0.25 | % | $ | 1.26 | ||||||||
| RiverFront Asset Allocation Growth & Income | ||||||||||||||||
| Investor Class | ||||||||||||||||
| Actual | $ | 1,000.00 | $ | 921.70 | 0.50 | % | $ | 2.39 | ||||||||
| Hypothetical (5% return before expenses) | $ | 1,000.00 | $ | 1,022.38 | 0.50 | % | $ | 2.51 | ||||||||
| Class A | ||||||||||||||||
| Actual | $ | 1,000.00 | $ | 921.70 | 0.50 | % | $ | 2.39 | ||||||||
| Hypothetical (5% return before expenses) | $ | 1,000.00 | $ | 1,022.38 | 0.50 | % | $ | 2.51 | ||||||||
| Class C | ||||||||||||||||
| Actual | $ | 1,000.00 | $ | 917.70 | 1.25 | % | $ | 5.96 | ||||||||
| Hypothetical (5% return before expenses) | $ | 1,000.00 | $ | 1,018.65 | 1.25 | % | $ | 6.27 | ||||||||
| Class I | ||||||||||||||||
| Actual | $ | 1,000.00 | $ | 922.50 | 0.25 | % | $ | 1.19 | ||||||||
| Hypothetical (5% return before expenses) | $ | 1,000.00 | $ | 1,023.62 | 0.25 | % | $ | 1.26 | ||||||||
| RiverFront Asset Allocation Moderate | ||||||||||||||||
| Investor Class | ||||||||||||||||
| Actual | $ | 1,000.00 | $ | 964.60 | 0.50 | % | $ | 2.44 | ||||||||
| Hypothetical (5% return before expenses) | $ | 1,000.00 | $ | 1,022.38 | 0.50 | % | $ | 2.51 | ||||||||
| Class A | ||||||||||||||||
| Actual | $ | 1,000.00 | $ | 964.50 | 0.50 | % | $ | 2.44 | ||||||||
| Hypothetical (5% return before expenses) | $ | 1,000.00 | $ | 1,022.38 | 0.50 | % | $ | 2.51 | ||||||||
| Class C | ||||||||||||||||
| Actual | $ | 1,000.00 | $ | 960.60 | 1.25 | % | $ | 6.09 | ||||||||
| Hypothetical (5% return before expenses) | $ | 1,000.00 | $ | 1,018.65 | 1.25 | % | $ | 6.27 | ||||||||
| Class I | ||||||||||||||||
| Actual | $ | 1,000.00 | $ | 965.70 | 0.25 | % | $ | 1.22 | ||||||||
| Hypothetical (5% return before expenses) | $ | 1,000.00 | $ | 1,023.62 | 0.25 | % | $ | 1.26 | ||||||||
| (a) | Annualized, based on the Fund's most recent fiscal half year expenses. |
| (b) | Expenses are equal to the Fund's annualized expense ratio multiplied by the average account value over the period, multiplied by the number of days in the most recent fiscal half year (182), divided by 366. |
| (c) | Includes expenses of the CoreCommodity Management Cayman Commodity Fund Ltd. (wholly-owned subsidiary), exclusive of the subsidiary's management fee. |
| (d) | Includes expenses of the Kotak Mauritius Portfolio (wholly-owned subsidiary). |
| 4 | | April 30, 2020 |
ALPS | CoreCommodity Management
CompleteCommodities® Strategy Fund
| Management Commentary | April 30, 2020 (Unaudited) |
The six months ending April 30, 2020 were significantly negative for commodity returns. The Bloomberg Commodity Index Total Return (“BCOMTR”), the Fund’s benchmark, ended lower by 22.70% for the period. The ALPS | CoreCommodity Management CompleteCommodities® Strategy Fund (“I” Shares—“JCRIX” or the “Fund”) delivered a net negative return of 23.18% for the period (JCCSX was down 27.48% at MOP, JCRCX was down 24.35% at CDSC and JCRAX was down 23.39%). The Fund I Shares underperformed its benchmark, BCOMTR, by 48 basis points after fees during the period.
From a macro perspective, the six month slice of time under review was quite volatile for many asset classes. However, for certain commodities, the moves were historic in nature. Crude oil for example had over a $100 range in this time frame and the high price for the nearby futures contract topped out at just over $60 per barrel. At one point in April, the nearby futures contract for West Texas Intermediate crude oil traded over $40 below zero. That is not a misprint. The unprecedented price action occurred during the latter part of the period.
The primary reason for the extreme volatility was the outbreak of a global pandemic involving the novel virus, COVID-19, and the ensuing response. The virus first appeared in Wuhan, China in December 2019 and spread systematically to over 175 countries worldwide. The primary defense employed by most countries impacted by the virus was to restrict travel, limit almost all forms of mass transport, maintain social distancing, and order the virtual lockdown of non-essential workers in their homes. Most global commerce and the majority of domestic businesses were significantly and adversely affected. Demand for most commodities fell dramatically and supply lines were severely disrupted.
The monetary and fiscal responses to the shutdown measures were swift and massive. Central banks cut short-term interest rates, which were already at historically low levels, even further. The rate for US 2-year Treasury Notes fell from 1.52% at the end of October 2019 to 0.20% by the end of April. Government aid and rescue packages aimed at corporations and individuals hurt by the sudden deterioration in economic activity registered in the trillions of US Dollars. Deficit spending expanded at a record pace. The US Federal Reserve did not initiate these policies alone - other countries followed similar paths to address the pandemic-induced recession. The US Dollar appreciated in value by a moderate amount during this 6 month period, up 1.78% measured by the US Dollar Index.
Energy prices bore the brunt of the damage derived from the economic contraction concentrated in the first quarter of 2020 and into the month of April. As demand for fuel of all kinds abruptly cratered, crude oil and derived products were hit especially hard. Additionally, Saudi Arabia and Russia began a brief but ill-timed price war over crude oil resulting in an extremely negative environment for production. Road traffic almost disappeared. Commercial air, trains, and shipping were drastically cut back. West Texas Intermediate crude oil lost more than 70% of its value. Reformulated gasoline dropped just over 60% and heating oil declined in value by
just over 55%. For the six months ending in April, the BCOMTR energy sector (all futures exposure) lost 51.6%. The Fund’s performance in both futures-related exposure and energy equities outperformed BCOMTR, -45.1% and -42.5% respectively. Curve positioning helped to mitigate some of the losses. However, the Fund held a strategic overweight to energy resulting in a gross underperformance of approximately 170 basis points for the period.
Industrial metal prices suffered declines as construction projects were halted and future plans became unclear in the wake of the pandemic shutdowns. Nickel prices fell by 26.53%, copper prices declined by 11.72%, and aluminum prices went down by 17.22%. Within the Fund, our commodity futures dedicated to industrial metals declined by 17.3% vs BCOMTR’s decline of 19.3%. Our commodity producers (equities) in the industrial metals space underperformed by, 21.9% relative to BCOMTR. Our slight underweight allocation to the sector and our curve positioning helped maintain a roughly +1.1% (gross) outperformance compared to BCOMTR for our combined industrial metals portfolio.
Most agricultural products came under pressure as the economic lockdowns expanded, but not to the same degree as industrial metals or energy. BCOMTR’s agricultural sector fell by 14.3% for the six months ending April 30, 2020. The Fund’s agricultural futures declined by 10.4%, less than BCOMTR. Here again, the Fund’s curve positioning helped to cushion some of the losses. The inclusion of Frozen Concentrated Orange Juice increased by 5.20% and cocoa increased by 2.84%, two commodity futures not found within BCOMTR, also helped to drive some of the Fund’s outperformance. For the period, after adjusting for slight weighting differences and our agricultural equity sector performance, the Fund outpaced BCOMTR by about 1.50% (gross).
Precious metals were the only sector to post positive returns for the six months ending in April. Gold climbed by 11.29% during this time. The monetary easing and credit relaxation prescription unleashed in the United States and elsewhere lifted gold as a safe haven asset. The Fund expressed larger portions of its precious metals allocation in silver and platinum than BCOMTR. Those metals didn’t enjoy the same positive returns as gold. Silver fell 18.47% while platinum prices pulled back 13.25%. Their dual usage as industrial metal components weighed on prices. The Fund maintained a strategic underweight to the sector of nearly 5%. The combined effect resulted in an underperformance of about 90 basis points (gross) relative to BCOMTR for the time frame.
The Fund maintains a dynamic combination of commodity futures exposure and commodity equity (or producer) exposure. The composition of the Fund changes from time-to-time in response to structural and value opportunities identified by the Fund’s Policy Committee. The Fund was fully invested at the end of April. The allocation percentage of the Fund to commodity futures-related investments was around 78% at the end of April.
{The Fund’s top equity holdings at the six months ended April 30, 2020 included Boliden AB (BOL SS) -21.3%, Cleveland-Cliffs Inc
| 5 | | April 30, 2020 |
ALPS | CoreCommodity Management
CompleteCommodities® Strategy Fund
| Management Commentary | April 30, 2020 (Unaudited) |
(CLF US) -37.98%, Rio Tinto PLC (RIO US) -6.75%, John Deere (DE US) -15.89%, Kubota Corp (6326 JP) -20.61%, Fortescue Metals Group Ltd. (FMG AU) +42.19%, EOG Resources Inc (EOG US) -30.58%, BHP Group Ltd (BHP AU) -11.18%, Marathon Oil Corp (MRO US) -46.43%, CF Industries (CF US) -38.50%.}
U.S. Treasury Inflation Protected Securities (“TIPS”) and nominal US Treasuries are held by the Fund to invest excess cash and as collateral for commodity futures-related investments held in the Fund’s Cayman Island subsidiary. We continue to invest in TIPS and nominal US Treasuries with limited duration exposure. At the end of April, the Fund’s fixed income portfolio had a weighted average maturity of 0.5 years.
We believe that commodity fundamentals are poised to strengthen significantly after the self-induced economic shutdown. Producers have taken measures to preserve value and have been forced in certain cases to cut current and projected budgets decisively. Production of many commodities should respond by trending lower. On the other hand, demand from a global population emerging from the expiry of government restrictions should swing higher. The speed and vigor of the re-engagement of economic activity may determine the slope of the recovery in price for many commodities. Relatively speaking, commodities appear inexpensive to other assets that have enjoyed long term appreciation, before and after the virus effects. Many commodities are still trading at prices that are unsustainable for producers to continue to search for, gather, and distribute these basic materials to the global population. The opportunity for price appreciation in commodities as an asset class has rarely been higher, in our opinion. Ultimately, profitable prices induce producers to engage in future projects. In our view, higher commodity prices are both necessary and likely.
Bob Hyman
Portfolio Manager
CoreCommodity Management, LLC
Past performance if not indicative of future results. “Bloomberg®” and “Bloomberg Commodity IndexSM” are service marks of Bloomberg L.P. (“Bloomberg”) as the case may be. Source for all Index data: Bloomberg L.P. Global. Commodity Sectors and individual commodities are represented by the respective Bloomberg Commodity Sub-Index. This document does not constitute an offer of any commodities, securities or investment advisory services. Any such offer may be made only by means of a disclosure document or similar materials which contain a description of material terms and risks. All expressions of opinion are subject to change without notice in reaction to shifting market conditions. Data contained herein from third-party providers is obtained from what are considered reliable sources. However, its accuracy, completeness or reliability cannot be guaranteed. The economic statistics presented herein are subject to revision by the agencies that issue them. CoreCommodity Management assumes no obligation to provide this information in the future or to advise of changes in this information. Any indices and other financial benchmarks shown are provided for illustrative purposes only, are unmanaged, reflect reinvestment of income and do not reflect the
impact of advisory fees. Investors cannot invest directly in an index. All investments are subject to risk.
The views of the authors and information discussed in this commentary are as of the date of publication, are subject to change, and may not reflect the writer's current views. The views expressed are those of the authors only, and represent an assessment of market conditions at a specific point in time, are opinions only and should not be relied upon as investment advice regarding a particular investment or markets in general. Such information does not constitute a recommendation to buy or sell specific securities or investment vehicles. It should not be assumed that any investment will be profitable or will equal the performance of the fund(s) or any securities or any sectors mentioned in this letter. The subject matter contained in this letter has been derived from several sources believed to be reliable and accurate at the time of compilation. Neither ALPS, Advisors, Inc., CoreCommodity Management, LLC, nor the Fund accepts any liability for losses either direct or consequential caused by the use of this information.
Indices do not reflect deductions for fees, expenses, or taxes.
An investor may not invest directly in an index.
Diversification cannot guarantee gain or prevent losses.
Bob Hyman is a registered representative of ALPS Distributors, Inc.
ALPS Portfolio Solutions Distributor, Inc., ALPS Distributors, Inc. and ALPS Advisors Inc. are affiliated.
| 6 | | April 30, 2020 |
ALPS | CoreCommodity Management
CompleteCommodities® Strategy Fund
| Performance Update | April 30, 2020 (Unaudited) |
Performance of $10,000 Initial Investment (as of April 30, 2020)
Comparison of change in value of a $10,000 investment

The chart above represents historical performance of a hypothetical investment of $10,000 in the Fund since inception. Past performance does not guarantee future results. This chart does not reflect the deduction of taxes that a shareholder would pay on Fund distributions or the redemption of Fund shares.
Average Annual Total Returns (as of April 30, 2020)
| 6 Month | 1 Year | 3 Year | 5 Year | Since Inception^ | Total Expense Ratio | What You Pay* | |
| Investor# (NAV) | -23.39% | -27.21% | -9.43% | -8.64% | -4.73% | 1.45% | 1.45% |
| Class A (NAV) | -23.24% | -27.07% | -9.37% | -8.60% | -4.71% | 1.45% | 1.45% |
| Class A (MOP) | -27.48% | -31.08% | -11.05% | -9.62% | -5.26% | ||
| Class C (NAV) | -23.59% | -27.58% | -10.01% | -9.24% | -5.31% | 2.05% | 2.05% |
| Class C (CDSC) | -24.35% | -28.30% | -10.01% | -9.24% | -5.31% | ||
| Class I | -23.18% | -26.88% | -9.18% | -8.38% | -4.46% | 1.14% | 1.14% |
| TR/CC CRB Total Return Index1 | -33.36% | -35.35% | -12.11% | -11.57% | -7.08% | ||
| Bloomberg Commodity TR Index1 | -22.70% | -23.18% | -8.61% | -9.07% | -6.42% |
Performance data quoted represents past performance. Past performance does not guarantee future results. Investment return and principal value of an investment will fluctuate so that an investor's shares, when sold or redeemed, may be worth more or less than the original cost. Current performance data may be higher or lower than actual data quoted. For the most current month-end performance data, please call 1-866-759-5679.
Maximum Offering Price (MOP) for Class A shares includes the Fund’s maximum sales charge of 5.50%. Performance shown at NAV does not include these sales charges and would have been lower had it been taken into account. If you invest $1 million or more, either as a lump sum or through the Fund’s accumulation or letter of intent programs, you can purchase Class A shares without an initial sales charge (load). A Contingent Deferred Sales Charge (“CDSC”) of 1.00% may apply to Class C shares redeemed within the first 12 months after a purchase, and on Class A shares redeemed within the first 18 months after a purchase in excess of $1 million. The Fund imposes a 2.00% redemption fee on shares held for less than 30 days.
Performance less than 1 year is cumulative.
| 7 | | April 30, 2020 |
ALPS | CoreCommodity Management
CompleteCommodities® Strategy Fund
| Performance Update | April 30, 2020 (Unaudited) |
Performance shown for Class A shares prior to June 12, 2018 reflects the historical performance of the Fund’s Investor shares, calculated using the fees and expenses of Class A shares.
| 1 | Thomson Reuters/CC CRB Total Return Index and the Bloomberg Commodity TR Index (formerly the Dow Jones-UBS Commodity Index) are unmanaged indices used as a measurement of change in commodity market conditions based on the performance of a basket of different commodities. Each index is composed of a different basket of commodities, a different weighting of the commodities in the basket, and a different re-balancing schedule. The indices are not actively managed and do not reflect any deduction for fees, expenses or taxes. An investor may not invest directly in an index. Effective April 20, 2020 the Thomson Reuters/CoreCommodity CRB Index changed it’s name to Refinitv/Core Commodity CRB Index. |
| ^ | Fund Inception date of June 29, 2010 for Investor Class and Classes C and I; Fund Inception date of June 12, 2018 for Class A. |
| * | What You Pay reflects the Advisor’s decision to contractually limit expenses through February 28, 2021. Please see the prospectus dated February 28, 2020 for additional information. |
| # | Prior to December 1, 2017, Investor Class was known as Class A. |
Investments in securities of Master Limited Partnerships (MLPs) involve risks that differ from an investment in common stock. MLPs are controlled by their general partners, which generally have conflicts of interest and limited fiduciary duties to the MLP, which may permit the general partner to favor its own interests over the MLPs. The benefit you are expected to derive from the Fund’s investment in MLPs depends largely on the MLPs being treated as partnerships for federal income tax purposes. As a partnership, an MLP has no federal income tax liability at the entity level. Therefore, treatment of one or more MLPs as a corporation for federal income tax purposes could affect the Fund’s ability to meet its investment objective and would reduce the amount of cash available to pay or distribute to you. Legislative, judicial, or administrative changes and differing interpretations, possibly on a retroactive basis, could negatively impact the value of an investment in MLPs and therefore the value of your investment in the Fund.
Investing in commodity-related securities involves risk and considerations not present when investing in more conventional securities. The Fund may be more susceptible to high volatility of commodity markets.
Derivatives generally are more sensitive to changes in economic or market conditions than other types of investments; this could result in losses that significantly exceed the Fund's original investment.
The table does not reflect the deduction of taxes that a shareholder would pay on Fund distributions or the redemption of Fund shares.
This Fund is not suitable for all investors, and is subject to investment risks, including possible loss of the principal amount invested.
There is no guarantee that the Fund will continue to hold any one particular security or stay invested in any one particular company. The composition of the Fund's top holdings is subject to change. Performance figures are historical and reflect the change in share price, reinvested distributions, changes in net asset value, sales charges and capital gains distributions, if any.
Not FDIC Insured – No Bank Guarantee – May Lose Value
| Asset Type Allocation (as a % of Net Assets) † | |
| Common Stocks | 22.80% |
| Government Bonds | 50.18% |
| Master Limited Partnerships | 0.12% |
| Cash, Cash Equivalents, & Other Net Assets | 26.90% |
| Total | 100.00% |
| † | Holdings are subject to change, and may not reflect the current or future position of the portfolio. Table presents approximate values only. |
Industry Sector Allocation (as a % of Net Assets) ^

| ^ | Notional Value of Derivative Exposure included |
| 8 | | April 30, 2020 |
ALPS | CoreCommodity Management
CompleteCommodities® Strategy Fund
| Consolidated Statement of Investments | April 30, 2020 (Unaudited) |
| Shares | Value (Note 2) | |||||||
| COMMON STOCKS (22.80%) | ||||||||
| Argentina (0.09%) | ||||||||
| Transportadora de Gas del Sur SA, ADR | 36,500 | $ | 167,170 | |||||
| YPF SA Sponsored | 42,204 | 162,063 | ||||||
| 329,233 | ||||||||
| Australia (2.85%) | ||||||||
| Alumina, Ltd. | 310,907 | 351,515 | ||||||
| Beach Energy, Ltd. | 278,659 | 276,013 | ||||||
| BHP Group, Ltd. | 54,009 | 1,138,554 | ||||||
| BlueScope Steel, Ltd. | 131,780 | 880,211 | ||||||
| Costa Group Holdings, Ltd. | 104,343 | 196,505 | ||||||
| Fortescue Metals Group, Ltd. | 160,081 | 1,247,626 | ||||||
| GrainCorp, Ltd., Class A(a) | 85,256 | 196,672 | ||||||
| IGO, Ltd. | 132,309 | 408,678 | ||||||
| Iluka Resources, Ltd. | 100,615 | 503,544 | ||||||
| Incitec Pivot, Ltd. | 400,411 | 623,616 | ||||||
| Mineral Resources, Ltd. | 56,942 | 622,641 | ||||||
| Nufarm, Ltd.(a) | 147,504 | 505,595 | ||||||
| OceanaGold Corp.(a) | 204,900 | 312,072 | ||||||
| Oil Search, Ltd. | 73,894 | 146,866 | ||||||
| OZ Minerals, Ltd. | 108,804 | 635,990 | ||||||
| Regis Resources, Ltd. | 93,204 | 273,313 | ||||||
| Sandfire Resources NL | 78,872 | 231,800 | ||||||
| Santos, Ltd. | 70,593 | 227,249 | ||||||
| South32, Ltd. | 823,504 | 1,065,221 | ||||||
| St Barbara, Ltd. | 162,515 | 274,288 | ||||||
| Washington H Soul Pattinson & Co., Ltd. | 18,381 | 222,071 | ||||||
| Whitehaven Coal, Ltd. | 200,968 | 238,348 | ||||||
| Woodside Petroleum, Ltd. | 18,740 | 274,157 | ||||||
| 10,852,545 | ||||||||
| Austria (0.16%) | ||||||||
| OMV AG | 6,908 | 226,348 | ||||||
| voestalpine AG | 18,655 | 386,273 | ||||||
| 612,621 | ||||||||
| Brazil (0.49%) | ||||||||
| BRF SA, ADR(a) | 141,840 | 507,787 | ||||||
| Cia de Saneamento Basico do Estado de Sao Paulo, ADR | 56,688 | 434,230 | ||||||
| Gerdau SA, Sponsored ADR | 342,231 | 735,797 | ||||||
| Petroleo Brasileiro SA, Sponsored ADR | 16,177 | 111,783 | ||||||
| Vale SA, Sponsored ADR | 8,802 | 72,617 | ||||||
| 1,862,214 | ||||||||
| Canada (1.31%) | ||||||||
| Alamos Gold, Inc., Class A | 42,346 | 341,732 | ||||||
| B2Gold Corp. | 59,884 | 303,013 | ||||||
| Ballard Power Systems, Inc.(a) | 32,985 | 335,128 | ||||||
| Cameco Corp. | 50,010 | 498,100 | ||||||
| Canadian Solar, Inc.(a) | 19,387 | 345,864 | ||||||
| Centerra Gold, Inc. | 33,100 | 264,667 | ||||||
| First Quantum Minerals, Ltd. | 4,500 | 27,479 | ||||||
| Hudbay Minerals, Inc. | 180,500 | 440,892 | ||||||
| IAMGOLD Corp.(a) | 84,106 | 295,212 | ||||||
| Shares | Value (Note 2) | |||||||
| Canada (continued) | ||||||||
| Kinross Gold Corp.(a) | 28,621 | $ | 189,185 | |||||
| Lundin Mining Corp. | 25,300 | 123,960 | ||||||
| Osisko Gold Royalties, Ltd. | 14,719 | 134,679 | ||||||
| Parex Resources, Inc.(a) | 56,800 | 622,700 | ||||||
| Sandstorm Gold, Ltd.(a) | 36,048 | 280,453 | ||||||
| SEMAFO, Inc.(a) | 63,700 | 160,171 | ||||||
| SSR Mining, Inc.(a) | 18,657 | 326,311 | ||||||
| Torex Gold Resources, Inc.(a) | 21,700 | 308,831 | ||||||
| 4,998,377 | ||||||||
| Chile (0.14%) | ||||||||
| Antofagasta PLC | 53,247 | 545,232 | ||||||
| China (0.42%) | ||||||||
| China Petroleum & Chemical Corp., ADR | 5,780 | 287,150 | ||||||
| CNOOC, Ltd., Sponsored ADR | 3,146 | 353,516 | ||||||
| Daqo New Energy Corp., ADR(a) | 5,342 | 278,478 | ||||||
| JinkoSolar Holding Co., Ltd., ADR(a) | 23,496 | 371,708 | ||||||
| PetroChina Co., Ltd., ADR | 8,809 | 315,626 | ||||||
| 1,606,478 | ||||||||
| Colombia (0.10%) | ||||||||
| Ecopetrol SA, Sponsored ADR | 35,996 | 376,158 | ||||||
| Denmark (0.16%) | ||||||||
| FLSmidth & Co. A/S(a) | 9,925 | 261,416 | ||||||
| Vestas Wind Systems A/S | 3,927 | 338,071 | ||||||
| 599,487 | ||||||||
| Faroe Islands (0.09%) | ||||||||
| Bakkafrost P/F | 6,869 | 339,593 | ||||||
| Finland (0.12%) | ||||||||
| Outokumpu Oyj(a) | 104,738 | 282,008 | ||||||
| Outotec Oyj | 43,438 | 181,363 | ||||||
| 463,371 | ||||||||
| France (0.11%) | ||||||||
| TOTAL SA, Sponsored ADR | 11,457 | 402,714 | ||||||
| Germany (0.30%) | ||||||||
| K+S AG | 70,154 | 472,803 | ||||||
| Nordex SE(a) | 10,156 | 82,303 | ||||||
| Salzgitter AG | 10,429 | 139,258 | ||||||
| thyssenkrupp AG(a) | 17,747 | 118,245 | ||||||
| Varta AG(a) | 3,960 | 328,506 | ||||||
| 1,141,115 | ||||||||
| Great Britain (1.21%) | ||||||||
| Anglo American PLC | 17,974 | 320,375 | ||||||
| BP PLC, Sponsored ADR | 35,673 | 849,017 | ||||||
| CNH Industrial N.V.(a) | 64,438 | 402,093 | ||||||
| Kazakhmys PLC | 16,882 | 88,155 | ||||||
| Pentair PLC | 895 | 30,958 | ||||||
| Rio Tinto PLC, Sponsored ADR | 35,322 | 1,631,523 | ||||||
| 9 | | April 30, 2020 |
ALPS | CoreCommodity Management
CompleteCommodities® Strategy Fund
| Consolidated Statement of Investments | April 30, 2020 (Unaudited) |
| Shares | Value (Note 2) | |||||||
| Great Britain (continued) | ||||||||
| Severn Trent PLC | 16,661 | $ | 501,528 | |||||
| Subsea 7 SA(a) | 50,511 | 280,139 | ||||||
| United Utilities Group PLC | 43,789 | 497,581 | ||||||
| 4,601,369 | ||||||||
| India (0.03%) | ||||||||
| Vedanta, Ltd., ADR | 27,652 | 124,987 | ||||||
| Israel (0.07%) | ||||||||
| SolarEdge Technologies, Inc.(a) | 2,438 | 272,056 | ||||||
| Italy (0.10%) | ||||||||
| Eni SpA, Sponsored ADR | 10,981 | 206,224 | ||||||
| ERG SpA | 10,237 | 183,979 | ||||||
| 390,203 | ||||||||
| Japan (1.81%) | ||||||||
| Daido Steel Co., Ltd. | 6,200 | 207,697 | ||||||
| GS Yuasa Corp. | 21,600 | 310,972 | ||||||
| Hitachi Metals, Ltd. | 34,000 | 334,566 | ||||||
| Inpex Corp. | 153,933 | 991,317 | ||||||
| Japan Petroleum Exploration Co., Ltd. | 19,200 | 334,745 | ||||||
| JFE Holdings, Inc. | 10,200 | 68,814 | ||||||
| Kobe Steel, Ltd.(a) | 77,200 | 262,573 | ||||||
| Kubota Corp. | 99,700 | 1,251,419 | ||||||
| Kurita Water Industries, Ltd. | 10,016 | 282,798 | ||||||
| Maruha Nichiro Corp. | 5,600 | 118,142 | ||||||
| Maruichi Steel Tube, Ltd. | 5,300 | 120,159 | ||||||
| Morinaga Milk Industry Co., Ltd. | 6,500 | 253,180 | ||||||
| Nippon Steel Corp. | 8,890 | 75,542 | ||||||
| Nippon Suisan Kaisha, Ltd. | 65,500 | 292,969 | ||||||
| Sumitomo Forestry Co., Ltd. | 28,759 | 361,246 | ||||||
| Sumitomo Metal Mining Co., Ltd. | 35,700 | 904,351 | ||||||
| Toho Titanium Co., Ltd. | 17,800 | 103,169 | ||||||
| Tokyo Steel Manufacturing Co., Ltd. | 50,500 | 325,169 | ||||||
| Yamato Kogyo Co., Ltd. | 14,400 | 287,960 | ||||||
| 6,886,788 | ||||||||
| Luxembourg (0.26%) | ||||||||
| APERAM SA | 14,100 | 366,819 | ||||||
| ArcelorMittal | 13,403 | 147,165 | ||||||
| ArcelorMittal SA | 5,056 | 55,417 | ||||||
| Tenaris SA, ADR | 11,067 | 151,397 | ||||||
| Ternium SA, Sponsored ADR | 19,564 | 265,875 | ||||||
| 986,673 | ||||||||
| Malaysia (0.11%) | ||||||||
| Lynas Corp., Ltd.(a) | 361,944 | 411,576 | ||||||
| Mexico (0.15%) | ||||||||
| Grupo Mexico SAB de CV, Series B | 277,700 | 590,520 | ||||||
| Netherlands (0.33%) | ||||||||
| Core Laboratories N.V. | 24,311 | 476,738 | ||||||
| OCI N.V.(a) | 15,679 | 189,860 | ||||||
| Shares | Value (Note 2) | |||||||
| Netherlands (continued) | ||||||||
| Royal Dutch Shell PLC, Class A, Sponsored ADR | 6,115 | $ | 202,590 | |||||
| Royal Dutch Shell PLC, Class B | 2,551 | 41,332 | ||||||
| SBM Offshore N.V. | 27,872 | 352,932 | ||||||
| 1,263,452 | ||||||||
| Norway (1.39%) | ||||||||
| Aker BP ASA | 25,870 | 429,523 | ||||||
| DNO ASA | 516,958 | 234,989 | ||||||
| Equinor ASA | 79,410 | 1,111,889 | ||||||
| Leroy Seafood Group ASA | 70,514 | 374,559 | ||||||
| Mowi ASA | 54,411 | 932,072 | ||||||
| NEL ASA(a) | 476,921 | 587,711 | ||||||
| Norsk Hydro ASA | 310,183 | 792,333 | ||||||
| Salmar ASA | 12,666 | 494,522 | ||||||
| TGS NOPEC Geophysical Co. ASA | 21,048 | 323,474 | ||||||
| 5,281,072 | ||||||||
| Peru (0.07%) | ||||||||
| Cia de Minas Buenaventura SAA, ADR | 24,873 | 186,299 | ||||||
| Southern Copper Corp. | 3,044 | 98,747 | ||||||
| 285,046 | ||||||||
| Russia (0.02%) | ||||||||
| Evraz PLC | 18,181 | 60,728 | ||||||
| Singapore (0.09%) | ||||||||
| Wilmar International, Ltd. | 137,461 | 348,003 | ||||||
| South Africa (0.42%) | ||||||||
| Anglo Platinum, Ltd. | 4,780 | 251,831 | ||||||
| Exxaro Resources, Ltd. | 41,150 | 239,345 | ||||||
| Gold Fields, Ltd., Sponsored ADR | 31,055 | 227,944 | ||||||
| Impala Platinum Holdings, Ltd. | 54,000 | 326,875 | ||||||
| Kumba Iron Ore, Ltd. | 15,133 | 287,964 | ||||||
| Sasol, Ltd.(a) | 58,479 | 275,303 | ||||||
| 1,609,262 | ||||||||
| South Korea (0.07%) | ||||||||
| POSCO, Sponsored ADR | 6,691 | 248,972 | ||||||
| Spain (0.21%) | ||||||||
| Acerinox SA | 44,206 | 335,519 | ||||||
| Repsol SA | 21,441 | 195,348 | ||||||
| Siemens Gamesa Renewable Energy SA | 19,230 | 285,964 | ||||||
| 816,831 | ||||||||
| Sweden (1.14%) | ||||||||
| Boliden AB | 84,619 | 1,737,363 | ||||||
| Epiroc AB, Class A | 59,249 | 595,909 | ||||||
| Lundin Energy AB | 21,777 | 566,318 | ||||||
| PowerCell Sweden AB(a) | 11,159 | 288,706 | ||||||
| SSAB AB, A Shares(a) | 190,388 | 466,227 | ||||||
| Svenska Cellulosa AB SCA, Class B(a) | 65,044 | 701,731 | ||||||
| 4,356,254 | ||||||||
| 10 | | April 30, 2020 |
ALPS | CoreCommodity Management
CompleteCommodities® Strategy Fund
| Consolidated Statement of Investments | April 30, 2020 (Unaudited) |
| Shares | Value (Note 2) | |||||||
| Switzerland (0.07%) | ||||||||
| Glencore PLC | 151,895 | $ | 281,418 | |||||
| United States (8.91%) | ||||||||
| AGCO Corp. | 19,675 | 1,039,627 | ||||||
| Alacer Gold Corp.(a) | 49,600 | 254,423 | ||||||
| Alcoa Corp.(a) | 27,663 | 225,453 | ||||||
| Allegheny Technologies, Inc.(a) | 8,381 | 62,941 | ||||||
| American States Water Co. | 341 | 27,065 | ||||||
| American Water Works Co., Inc. | 201 | 24,460 | ||||||
| Andersons, Inc. | 13,546 | 229,876 | ||||||
| Archer-Daniels-Midland Co. | 26,061 | 967,906 | ||||||
| Archrock, Inc. | 15,155 | 72,896 | ||||||
| Baker Hughes Co. | 13,729 | 191,520 | ||||||
| Bunge, Ltd. | 21,871 | 867,623 | ||||||
| Cabot Oil & Gas Corp. | 14,309 | 309,361 | ||||||
| California Water Service Group | 8,661 | 389,052 | ||||||
| Cal-Maine Foods, Inc. | 14,471 | 600,691 | ||||||
| Century Aluminum Co.(a) | 5,584 | 24,290 | ||||||
| CF Industries Holdings, Inc. | 40,717 | 1,119,718 | ||||||
| Chevron Corp. | 3,272 | 301,024 | ||||||
| Cleveland-Cliffs, Inc. | 373,787 | 1,637,186 | ||||||
| Commercial Metals Co. | 29,628 | 472,270 | ||||||
| Compass Minerals International, Inc. | 7,430 | 365,259 | ||||||
| ConocoPhillips | 22,127 | 931,547 | ||||||
| Corteva, Inc. | 34,389 | 900,648 | ||||||
| Darling Ingredients, Inc.(a) | 30,000 | 617,700 | ||||||
| Deere & Co. | 10,293 | 1,493,103 | ||||||
| Devon Energy Corp. | 43,208 | 538,804 | ||||||
| Enphase Energy, Inc.(a) | 10,981 | 514,240 | ||||||
| EOG Resources, Inc. | 25,361 | 1,204,901 | ||||||
| Evoqua Water Technologies Corp.(a) | 30,618 | 491,419 | ||||||
| Exxon Mobil Corp. | 4,363 | 202,749 | ||||||
| First Solar, Inc.(a) | 7,288 | 320,745 | ||||||
| FMC Corp. | 9,431 | 866,709 | ||||||
| Fresh Del Monte Produce, Inc. | 10,904 | 310,873 | ||||||
| Halliburton Co. | 39,187 | 411,464 | ||||||
| Harsco Corp.(a) | 20,191 | 201,506 | ||||||
| Helmerich & Payne, Inc. | 26,722 | 528,294 | ||||||
| Hess Corp. | 1,266 | 61,578 | ||||||
| HollyFrontier Corp. | 22,080 | 729,523 | ||||||
| Hormel Foods Corp. | 13,604 | 637,347 | ||||||
| Ingredion, Inc. | 9,009 | 731,531 | ||||||
| Kinder Morgan, Inc. | 5,763 | 87,770 | ||||||
| Magnolia Oil & Gas Corp.(a) | 91,528 | 592,186 | ||||||
| Marathon Oil Corp. | 183,117 | 1,120,676 | ||||||
| Marathon Petroleum Corp. | 24,420 | 783,394 | ||||||
| Murphy Oil Corp. | 18,288 | 216,896 | ||||||
| National Oilwell Varco, Inc. | 3,499 | 44,227 | ||||||
| New WEI, Inc.(a) | 68,768 | 103 | ||||||
| Occidental Petroleum Corp. | 14,527 | 241,149 | ||||||
| Patterson-UTI Energy, Inc. | 36,009 | 132,873 | ||||||
| PDC Energy, Inc.(a) | 67,573 | 877,773 | ||||||
| Phillips 66 | 8,398 | 614,482 | ||||||
| Pilgrim's Pride Corp.(a) | 45,023 | 990,506 | ||||||
| Plug Power, Inc.(a) | 75,715 | 316,867 | ||||||
| PotlatchDeltic Corp., REIT | 16,439 | 577,173 | ||||||
| ProPetro Holding Corp.(a) | 49,120 | 208,269 | ||||||
| Shares | Value (Note 2) | |||||||
| United States (continued) | ||||||||
| Rayonier, Inc., REIT | 22,544 | $ | 541,732 | |||||
| Renewable Energy Group, Inc.(a) | 10,333 | 256,362 | ||||||
| RPC, Inc. | 140,085 | 477,690 | ||||||
| Sanderson Farms, Inc. | 1,169 | 159,148 | ||||||
| Schlumberger, Ltd. | 8,909 | 149,849 | ||||||
| Steel Dynamics, Inc. | 31,277 | 759,093 | ||||||
| SunPower Corp.(a) | 41,418 | 304,422 | ||||||
| Sunrun, Inc.(a) | 25,251 | 354,272 | ||||||
| TPI Composites, Inc.(a) | 13,921 | 244,035 | ||||||
| Tyson Foods, Inc., Class A | 16,630 | 1,034,220 | ||||||
| United States Steel Corp. | 63,401 | 486,920 | ||||||
| Valero Energy Corp. | 15,840 | 1,003,464 | ||||||
| Vivint Solar, Inc.(a) | 48,059 | 304,694 | ||||||
| Warrior Met Coal, Inc. | 10,153 | 127,420 | ||||||
| Williams Cos., Inc. | 1,855 | 35,931 | ||||||
| 33,920,918 | ||||||||
| TOTAL COMMON STOCKS | ||||||||
| (Cost $110,619,819) | 86,865,266 | |||||||
| MASTER LIMITED PARTNERSHIPS (0.12%) | ||||||||
| United States (0.12%) | ||||||||
| Alliance Resource Partners LP | 22,642 | 87,850 | ||||||
| Energy Transfer LP | 4,974 | 41,782 | ||||||
| Enterprise Products Partners LP | 10,676 | 187,470 | ||||||
| Magellan Midstream Partners LP | 2,054 | 84,481 | ||||||
| MPLX LP | 1,555 | 28,146 | ||||||
| Plains All American Pipeline LP | 3,090 | 27,285 | ||||||
| 457,014 | ||||||||
| TOTAL MASTER LIMITED PARTNERSHIPS | ||||||||
| (Cost $1,369,331) | 457,014 | |||||||
| Principal Amount | Value (Note 2) | |||||||
| GOVERNMENT BONDS (50.18%) | ||||||||
| U.S. Treasury Bonds (50.18%) | ||||||||
| United States Treasury Inflation Indexed Bonds | ||||||||
| 0.125%, 4/15/21(b) | $ | 20,189,790 | $ | 19,886,369 | ||||
| 0.625%, 7/15/21(b) | 117,464,645 | 117,331,645 | ||||||
| United States Treasury Notes | ||||||||
| 1.250%, 3/31/21(b) | 53,500,000 | 54,036,045 | ||||||
| 191,254,059 | ||||||||
| TOTAL GOVERNMENT BONDS | ||||||||
| (Cost $191,266,320) | 191,254,059 | |||||||
| Value (Note 2) | ||||
| TOTAL INVESTMENTS (73.10%) | ||||
| (Cost $303,255,470) | $ | 278,576,339 | ||
| Other Assets In Excess Of Liabilities (26.90%) | 102,490,128 | |||
| NET ASSETS -100.00% | $ | 381,066,467 | ||
| 11 | | April 30, 2020 |
ALPS | CoreCommodity Management
CompleteCommodities® Strategy Fund
| Consolidated Statement of Investments | April 30, 2020 (Unaudited) |
| (a) | Non-Income Producing Security. |
| (b) | Security, or portion of security, is being held as collateral for total return swap contracts and futures contracts aggregating a total market value of $32,365,569. |
For Fund compliance purposes, the Fund's industry and geographical classifications refer to any one or more of the industry sub-classifications used by one or more widely recognized market indexes or ratings group indexes, and/or as defined by Fund management. This definition may not apply for purposes of this report, which may combine sub-classifications for reporting ease. Industries and regions are shown as a percent of net assets.
See Notes to Financial Statements.
| 12 | | April 30, 2020 |
ALPS | CoreCommodity Management
CompleteCommodities® Strategy Fund
| Consolidated Statement of Investments | April 30, 2020 (Unaudited) |
FUTURES CONTRACTS
| Description | Counterparty | Position | Contracts | Expiration Date | Notional Amount/ Fair Value (Note 2) | Unrealized Appreciation | ||||||||||
| Cocoa Future | Morgan Stanley | Short | (139) | 07/16/20 | $ | (3,355,460 | ) | $ | 641,862 | |||||||
| Gasoline Robusta Future | Morgan Stanley | Long | 37 | 09/30/20 | 1,197,202 | 110,881 | ||||||||||
| Gold 100 Oz Future | Morgan Stanley | Long | 153 | 06/26/20 | 25,921,260 | 2,974,962 | ||||||||||
| Hard Red Winter Wheat Future | Morgan Stanley | Long | 70 | 07/14/20 | 1,708,000 | 40,077 | ||||||||||
| LME Aluminum Future | Morgan Stanley | Long | 411 | 05/18/20 | 15,070,856 | 98,882 | ||||||||||
| LME Aluminum Future | Morgan Stanley | Short | (411) | 09/14/20 | (15,497,269 | ) | 2,649,651 | |||||||||
| LME Copper Future | Morgan Stanley | Long | 209 | 05/18/20 | 27,014,556 | 1,526,346 | ||||||||||
| LME Nickel Future | Morgan Stanley | Long | 90 | 05/18/20 | 6,554,520 | 472,486 | ||||||||||
| LME Nickel Future | Morgan Stanley | Short | (38) | 09/14/20 | (2,787,756 | ) | 223,320 | |||||||||
| LME Zinc Future | Morgan Stanley | Long | 82 | 05/18/20 | 3,966,730 | 68,908 | ||||||||||
| Low Sulfur Gasoil Future | Morgan Stanley | Long | 192 | 06/11/20 | 4,891,200 | 64,311 | ||||||||||
| Natural Gas Future | Morgan Stanley | Long | 752 | 05/27/20 | 14,656,480 | 1,047,919 | ||||||||||
| NY Harbor ULSD Future | Morgan Stanley | Short | (9) | 06/30/20 | (334,341 | ) | 295,221 | |||||||||
| NY Harbor ULSD Future | Morgan Stanley | Short | (133) | 08/31/20 | (5,370,380 | ) | 716,065 | |||||||||
| Platinum Future | Morgan Stanley | Long | 225 | 07/29/20 | 9,146,250 | 1,780,356 | ||||||||||
| Soybean Future | Morgan Stanley | Long | 297 | 07/14/20 | 12,700,463 | 100,342 | ||||||||||
| Sugar #11 | Morgan Stanley | Short | (120) | 06/30/20 | (1,393,728 | ) | 619,384 | |||||||||
| WTI Crude Future | Morgan Stanley | Short | (425) | 06/22/20 | (9,286,250 | ) | 13,100,028 | |||||||||
| WTI Crude Future | Morgan Stanley | Short | (221) | 08/20/20 | (5,827,770 | ) | 1,445,325 | |||||||||
| WTI Crude Future | Morgan Stanley | Short | (37) | 09/22/20 | (1,023,790 | ) | 33,151 | |||||||||
| $ | 77,950,773 | $ | 28,009,477 | |||||||||||||
| Description | Counterparty | Position | Contracts | Expiration Date | Notional Amount/ Fair Value (Note 2) | Unrealized Depreciation | ||||||||||
| Brent Crude Future | Morgan Stanley | Long | 646 | 06/30/20 | $ | 18,288,260 | $ | (79,354 | ) | |||||||
| Copper Future | Morgan Stanley | Short | (439) | 07/29/20 | (25,725,400 | ) | (227,790 | ) | ||||||||
| Corn Future | Morgan Stanley | Long | 136 | 07/14/20 | 2,176,000 | (41,136 | ) | |||||||||
| Natural Gas Future | Morgan Stanley | Short | (207) | 06/26/20 | (4,491,900 | ) | (218,015 | ) | ||||||||
| Silver Future | Morgan Stanley | Long | 217 | 07/29/20 | 16,245,705 | (432,554 | ) | |||||||||
| Soybean Meal Future | Morgan Stanley | Long | 96 | 07/14/20 | 2,832,960 | (2,517 | ) | |||||||||
| Wheat Future | Morgan Stanley | Long | 64 | 07/14/20 | 1,677,600 | (51,358 | ) | |||||||||
| $ | 11,003,225 | $ | (1,052,724 | ) | ||||||||||||
See Notes to Financial Statements.
| 13 | | April 30, 2020 |
ALPS | CoreCommodity Management
CompleteCommodities® Strategy Fund
| Consolidated Statement of Investments | April 30, 2020 (Unaudited) |
TOTAL RETURN SWAP CONTRACTS(a)
| Swap Counterparty | Reference Obligation | Notional Amount | Floating Rate Paid by Fund | Termination Date | Value | Unrealized Appreciation | ||||||||||||
| UBS | CRB 3m Fwd TR Index ** | $ | 55,606,017 | USB3MTA + 25 bps * | 11/30/20 | $ | 55,606,019 | $ | 2 | |||||||||
| Citigroup | CRB 3m Fwd TR Index ** | 68,988,763 | USB3MTA + 24 bps * | 9/30/20 | 68,988,767 | 4 | ||||||||||||
| Societe Generale | CRB 3m Fwd TR Index ** | 32,585,166 | USB3MTA + 28 bps * | 11/30/20 | 32,585,168 | 2 | ||||||||||||
| $ | 157,179,946 | $ | 157,179,954 | $ | 8 | |||||||||||||
| Swap Counterparty | Reference Obligation | Notional Amount | Floating Rate Paid by Fund | Termination Date | Value | Unrealized Depreciation | ||||||||||||
| Bank of America - | ||||||||||||||||||
| Merrill Lynch | CRB 3m Fwd TR Index ** | $ | 49,290,994 | USB3MTA + 30 bps * | 6/29/20 | $ | 49,290,446 | $ | (548 | ) | ||||||||
| $ | 49,290,994 | $ | 49,290,446 | $ | (548 | ) | ||||||||||||
| (a) | For long positions in the total return swap, the Fund receives payments based on any positive return of the Reference Obligation less the rate paid by the Fund. The Fund makes payments on any negative return of such Reference Obligations plus the rate paid by the fund. For short positions in the total return swap, the Fund makes payments based on any positive return of the Reference Obligation less the rate paid by the Fund. The Fund receives payments on any negative return of such Reference Obligations plus the rate paid by the Fund. |
| * | United States Auction Results 3 Month Treasury Bill High Discount. Total return swap resets monthly. |
| ** | CRB - Commodity Research Bureau |
See Notes to Financial Statements.
| 14 | | April 30, 2020 |
ALPS | CoreCommodity Management
CompleteCommodities® Strategy Fund
| Consolidated Statement of Assets and Liabilities | April 30, 2020 (Unaudited) |
| ASSETS | ||||
| Investments, at value | $ | 278,576,339 | ||
| Cash | 101,043,308 | |||
| Foreign currency, at value (Cost $413,245) | 413,689 | |||
| Unrealized appreciation on total return swap contracts | 8 | |||
| Receivable for shares sold | 3,586,681 | |||
| Receivable for variation margin on futures contracts | 388,731 | |||
| Deposit with broker for futures contracts (Note 3) | 5,095,563 | |||
| Dividends and interest receivable | 546,307 | |||
| Prepaid expenses and other assets | 19,786 | |||
| Total Assets | 389,670,412 | |||
| LIABILITIES | ||||
| Payable due to broker for total return swap contracts | 4,886,623 | |||
| Payable for shares redeemed | 3,182,077 | |||
| Payable for foreign capital gains tax | 140 | |||
| Unrealized depreciation on total return swap contracts | 548 | |||
| Investment advisory fees payable | 241,501 | |||
| Administration and transfer agency fees payable | 183,619 | |||
| Distribution and services fees payable | 21,291 | |||
| Professional fees payable | 34,274 | |||
| Accrued expenses and other liabilities | 53,872 | |||
| Total Liabilities | 8,603,945 | |||
| NET ASSETS | $ | 381,066,467 | ||
| NET ASSETS CONSIST OF | ||||
| Paid-in capital | $ | 592,302,385 | ||
| Total distributable earnings | (211,235,918 | ) | ||
| NET ASSETS | $ | 381,066,467 | ||
| INVESTMENTS, AT COST | $ | 303,255,470 | ||
| PRICING OF SHARES | ||||
| Investor Class: | ||||
| Net Asset Value, offering and redemption price per share | $ | 5.07 | ||
| Net Assets | $ | 34,825,776 | ||
| Shares of beneficial interest outstanding (unlimited number of shares, no par value common stock authorized) | 6,865,596 | |||
| Class A: | ||||
| Net Asset Value, offering and redemption price per share | $ | 5.08 | ||
| Net Assets | $ | 557,759 | ||
| Shares of beneficial interest outstanding (unlimited number of shares, no par value common stock authorized) | 109,889 | |||
| Maximum offering price per share ((NAV/0.9450), based on maximum sales charge of 5.50% of the offering price) | $ | 5.37 | ||
| Class C: | ||||
| Net Asset Value, offering and redemption price per share(a) | $ | 4.81 | ||
| Net Assets | $ | 2,716,954 | ||
| Shares of beneficial interest outstanding (unlimited number of shares, no par value common stock authorized) | 564,899 | |||
| Class I: | ||||
| Net Asset Value, offering and redemption price per share | $ | 5.12 | ||
| Net Assets | $ | 342,965,978 | ||
| Shares of beneficial interest outstanding (unlimited number of shares, no par value common stock authorized) | 67,044,977 | |||
| (a) | Redemption price per share may be reduced for any applicable contingent deferred sales charge. For a description of a possible sales charge, please see the Fund's Prospectus. |
See Notes to Financial Statements.
| 15 | | April 30, 2020 |
ALPS | CoreCommodity Management
CompleteCommodities® Strategy Fund
| Consolidated Statement of Operations | For the Six Months Ended April 30, 2020 (Unaudited) |
| INVESTMENT INCOME | ||||
| Dividends | $ | 1,483,353 | ||
| Foreign taxes withheld on dividends | (76,280 | ) | ||
| Interest and other income, net of premium amortization and accretion of discount | 3,740,330 | |||
| Total Investment Income | 5,147,403 | |||
| EXPENSES | ||||
| Investment advisory fees | 2,124,954 | |||
| Investment advisory fees - subsidiary (Note 8) | 437,642 | |||
| Administrative fees | 305,721 | |||
| Transfer agency fees | 294,317 | |||
| Distribution and service fees | ||||
| Investor Class | 66,327 | |||
| Class A | 923 | |||
| Class C | 26,324 | |||
| Professional fees | 27,583 | |||
| Reports to shareholders and printing fees | 33,005 | |||
| State registration fees | 30,678 | |||
| Insurance fees | 4,288 | |||
| Custody fees | 33,716 | |||
| Trustees' fees and expenses | 12,521 | |||
| Miscellaneous expenses | 12,630 | |||
| Total Expenses | 3,410,629 | |||
| Less fees waived/reimbursed by investment advisor (Note 8) | ||||
| Waiver of investment advisory fees - subsidiary | (437,642 | ) | ||
| Investor Class | (812 | ) | ||
| Class A | (13 | ) | ||
| Class C | (194 | ) | ||
| Class I | (30,844 | ) | ||
| Net Expenses | 2,941,124 | |||
| Net Investment Income | 2,206,279 | |||
| Net realized loss on investments | (36,786,093 | ) | ||
| Net realized loss on futures contracts | (40,953,420 | ) | ||
| Net realized loss on total return swap contracts | (71,391,323 | ) | ||
| Net realized gain on foreign currency transactions | 2,221 | |||
| Net Realized Loss | (149,128,615 | ) | ||
| Net change in unrealized depreciation on investments | (936,173 | ) | ||
| Net change in unrealized appreciation on futures contracts | 28,156,856 | |||
| Net change in unrealized depreciation on total return swap contracts | (564 | ) | ||
| Net change in unrealized appreciation on translation of assets and liabilities denominated in foreign currencies | 2,001 | |||
| Net Change in Unrealized Appreciation | 27,222,120 | |||
| NET REALIZED AND UNREALIZED LOSS ON INVESTMENTS | (121,906,495 | ) | ||
| NET DECREASE IN NET ASSETS RESULTING FROM OPERATIONS | $ | (119,700,216 | ) | |
See Notes to Financial Statements.
| 16 | | April 30, 2020 |
ALPS | CoreCommodity Management
CompleteCommodities® Strategy Fund
Consolidated Statements of Changes in Net Assets
| For the Six Months Ended April 30, 2020 (Unaudited) | For the Year Ended October 31, 2019 | |||||||
| OPERATIONS | ||||||||
| Net investment income | $ | 2,206,279 | $ | 6,482,181 | ||||
| Net realized loss | (149,128,615 | ) | (53,250,171 | ) | ||||
| Net change in unrealized appreciation/(depreciation) | 27,222,120 | (16,691,224 | ) | |||||
| Net Decrease in Net Assets Resulting from Operations | (119,700,216 | ) | (63,459,214 | ) | ||||
| TOTAL DISTRIBUTIONS | ||||||||
| From distributable earnings | ||||||||
| Investor Class | (375,275 | ) | (1,405,470 | ) | ||||
| Class A | (7,077 | ) | (5,288 | ) | ||||
| Class C | (53,444 | ) | (261,410 | ) | ||||
| Class I | (4,950,473 | ) | (17,784,130 | ) | ||||
| Net Decrease in Net Assets from Distributions | (5,386,269 | ) | (19,456,298 | ) | ||||
| BENEFICIAL INTEREST TRANSACTIONS (NOTE 6) | ||||||||
| Shares sold | ||||||||
| Investor Class | 10,012,262 | 16,812,892 | ||||||
| Class A | 115,986 | 588,711 | ||||||
| Class C | 307,233 | 1,993,315 | ||||||
| Class I | 112,081,594 | 238,498,751 | ||||||
| Dividends reinvested | ||||||||
| Investor Class | 358,287 | 1,325,215 | ||||||
| Class A | 5,821 | 5,288 | ||||||
| Class C | 28,534 | 180,838 | ||||||
| Class I | 3,950,674 | 14,260,972 | ||||||
| Shares redeemed, net of redemption fees | ||||||||
| Investor Class | (4,716,317 | ) | (21,808,221 | ) | ||||
| Class A | (152,741 | ) | (3,256 | ) | ||||
| Class C | (2,777,747 | ) | (3,827,991 | ) | ||||
| Class I | (160,044,450 | ) | (323,750,425 | ) | ||||
| Net Decrease in Net Assets Derived from Beneficial Interest Transactions | (40,830,864 | ) | (75,723,911 | ) | ||||
| Net decrease in net assets | (165,917,349 | ) | (158,639,423 | ) | ||||
| NET ASSETS | ||||||||
| Beginning of period | 546,983,816 | 705,623,239 | ||||||
| End of period | $ | 381,066,467 | $ | 546,983,816 | ||||
See Notes to Financial Statements.
| 17 | | April 30, 2020 |
ALPS | CoreCommodity Management
CompleteCommodities® Strategy Fund – Investor Class
Consolidated Financial Highlights
Selected data for a share of beneficial interest outstanding throughout the periods indicated:
| For the Six Months Ended April 30, 2020 (Unaudited) | For the Year Ended October 31, 2019 | For the Year Ended October 31, 2018(a) | For the Year Ended October 31, 2017 | For the Year Ended October 31, 2016 | For the Year Ended October 31, 2015 | |||||||||||||||||||
| Net asset value, beginning of period(b) | $ | 6.68 | $ | 7.54 | $ | 7.64 | $ | 7.29 | $ | 7.15 | $ | 9.56 | ||||||||||||
| INCOME/(LOSS) FROM INVESTMENT OPERATIONS: | ||||||||||||||||||||||||
| Net investment income/(loss)(c) | 0.02 | 0.06 | 0.05 | (0.01 | )(d) | (0.03 | )(d) | (0.09 | )(d) | |||||||||||||||
| Net realized and unrealized gain/(loss) | (1.57 | ) | (0.71 | ) | 0.04 | 0.36 | 0.17 | (2.32 | ) | |||||||||||||||
| Total from investment operations | (1.55 | ) | (0.65 | ) | 0.09 | 0.35 | 0.14 | (2.41 | ) | |||||||||||||||
| DISTRIBUTIONS: | ||||||||||||||||||||||||
| From net investment income | (0.06 | ) | (0.21 | ) | (0.19 | ) | (0.00 | )(e) | – | – | ||||||||||||||
| Total distributions | (0.06 | ) | (0.21 | ) | (0.19 | ) | (0.00 | )(e) | – | – | ||||||||||||||
| REDEMPTION FEES ADDED TO PAID-IN CAPITAL (NOTE 6) | 0.00 | (e) | 0.00 | (e) | 0.00 | (e) | 0.00 | (e) | 0.00 | (e) | 0.00 | (e) | ||||||||||||
| Net increase/(decrease) in net asset value | (1.61 | ) | (0.86 | ) | (0.10 | ) | 0.35 | 0.14 | (2.41 | ) | ||||||||||||||
| Net asset value, end of period | $ | 5.07 | $ | 6.68 | $ | 7.54 | $ | 7.64 | $ | 7.29 | $ | 7.15 | ||||||||||||
| TOTAL RETURN(f) | (23.39 | )% | (8.71 | )% | 1.23 | % | 4.85 | % | 1.96 | % | (25.21 | )% | ||||||||||||
| RATIOS/SUPPLEMENTAL DATA: | ||||||||||||||||||||||||
| Net assets, end of period (000s) | $ | 34,826 | $ | 39,226 | $ | 48,728 | $ | 47,845 | $ | 29,468 | $ | 30,085 | ||||||||||||
| Ratio of expenses to average net assets excluding fee waivers and reimbursements | 1.40 | %(g)(h) | 1.39 | %(h) | 1.40 | %(h) | 1.38 | % | 1.41 | % | 1.47 | % | ||||||||||||
| Ratio of expenses to average net assets including fee waivers and reimbursements | 1.40 | %(g) | 1.39 | % | 1.40 | % | 1.38 | % | 1.41 | % | 1.45 | % | ||||||||||||
| Ratio of net investment income/(loss) to average net assets | 0.70 | %(g) | 0.82 | % | 0.66 | % | (0.10 | )% | (0.48 | )% | (1.12 | )% | ||||||||||||
| Portfolio turnover rate(i) | 90 | % | 81 | % | 42 | % | 66 | % | 50 | % | 52 | % | ||||||||||||
| (a) | Prior to December 1, 2017, Investor Class was known as Class A. |
| (b) | Per share amounts and ratios to average net assets include income and expenses of the CoreCommodity Management Cayman Commodity Fund Ltd. (wholly-owned subsidiary). |
| (c) | Calculated using the average shares method. |
| (d) | The per share amount does not correspond to activity reflected in the Statement of Operations due to class specific expenses during the period. |
| (e) | Less than $0.005 or ($0.005) per share. |
| (f) | Total returns are for the period indicated and have not been annualized. Total returns would have been lower had certain expenses not been waived during the period. Returns shown do not reflect the deduction of taxes that a shareholder would pay on Fund distributions or the redemption of Fund shares. Returns shown exclude any applicable sales charges. |
| (g) | Annualized. |
| (h) | The ratio of operating expenses excluding fee waiver/reimbursements to average net assets is calculated excluding the waived Subsidiary management fee (see Note 8 for additional detail). The ratio inclusive of that fee would be for the period ended April 30, 2020, October 31, 2019 and October 31, 2018, respectively, 1.58%, 1.54% and 1.56%. |
| (i) | Portfolio turnover rate for periods less than one full year have not been annualized. |
See Notes to Financial Statements.
| 18 | | April 30, 2020 |
ALPS | CoreCommodity Management
CompleteCommodities® Strategy Fund – Class A
Consolidated Financial Highlights
Selected data for a share of beneficial interest outstanding throughout the periods indicated:
| For the Six Months Ended April 30, 2020 (Unaudited) | For the Year Ended October 31, 2019 | For the Period June 12, 2018 (Commencement of Operations) to October 31, 2018 | ||||||||||
| Net asset value, beginning of period(a) | $ | 6.68 | $ | 7.54 | $ | 8.16 | ||||||
| INCOME FROM INVESTMENT OPERATIONS: | ||||||||||||
| Net investment income(b) | 0.02 | 0.07 | (0.00 | )(c) | ||||||||
| Net realized and unrealized loss | (1.56 | ) | (0.72 | ) | (0.62 | ) | ||||||
| Total from investment operations | (1.54 | ) | (0.65 | ) | (0.62 | ) | ||||||
| DISTRIBUTIONS: | ||||||||||||
| From net investment income | (0.06 | ) | (0.21 | ) | – | |||||||
| Total distributions | (0.06 | ) | (0.21 | ) | – | |||||||
| Net (decrease) in net asset value | (1.60 | ) | (0.86 | ) | (0.62 | ) | ||||||
| Net asset value, end of period | $ | 5.08 | $ | 6.68 | $ | 7.54 | ||||||
| TOTAL RETURN(d) | (23.24 | )% | (8.71 | )% | (7.60 | )% | ||||||
| RATIOS/SUPPLEMENTAL DATA: | ||||||||||||
| Net assets, end of period (000s) | $ | 558 | $ | 751 | $ | 191 | ||||||
| Ratio of expenses to average net assets excluding fee waivers and reimbursements | 1.33 | %(e)(f) | 1.40 | %(f) | 1.48 | %(e)(f) | ||||||
| Ratio of expenses to average net assets including fee waivers and reimbursements | 1.32 | %(e) | 1.40 | % | 1.45 | %(e) | ||||||
| Ratio of net investment income/(loss) to average net assets | 0.75 | %(e) | 0.99 | % | (0.10 | )%(e) | ||||||
| Portfolio turnover rate(g) | 90 | % | 81 | % | 42 | % | ||||||
| (a) | Per share amounts and ratios to average net assets include income and expenses of the CoreCommodity Management Cayman Commodity Fund Ltd. (wholly-owned subsidiary). |
| (b) | Calculated using the average shares method. |
| (c) | Less than $0.005 or ($0.005) per share. |
| (d) | Total returns are for the period indicated and have not been annualized. Total returns would have been lower had certain expenses not been waived during the period. Returns shown do not reflect the deduction of taxes that a shareholder would pay on Fund distributions or the redemption of Fund shares. |
| (e) | Annualized. |
| (f) | The ratio of operating expenses excluding fee waiver/reimbursements to average net assets is calculated excluding the waived Subsidiary management fee (see Note 8 for additional detail). The ratio inclusive of that fee would be for the period ended April 30, 2020, October 31, 2019 and October 31, 2018, respectively, 1.51%, 1.55 % and 1.64%. |
| (g) | Portfolio turnover rate for periods less than one full year have not been annualized. |
See Notes to Financial Statements.
| 19 | | April 30, 2020 |
ALPS | CoreCommodity Management
CompleteCommodities® Strategy Fund – Class C
Consolidated Financial Highlights
Selected data for a share of beneficial interest outstanding throughout the periods indicated:
| For the Six Months Ended April 30, 2020 (Unaudited) | For the Year Ended October 31, 2019 | For the Year Ended October 31, 2018 | For the Year Ended October 31, 2017 | For the Year Ended October 31, 2016 | For the Year Ended October 31, 2015 | |||||||||||||||||||
| Net asset value, beginning of period(a) | $ | 6.35 | $ | 7.22 | $ | 7.36 | $ | 7.07 | $ | 6.98 | $ | 9.39 | ||||||||||||
| INCOME/(LOSS) FROM INVESTMENT OPERATIONS: | ||||||||||||||||||||||||
| Net investment income/(loss)(b) | (0.00 | )(c)(d) | 0.01 | (0.00 | )(c)(d) | (0.06 | )(d) | (0.08 | )(d) | (0.14 | )(d) | |||||||||||||
| Net realized and unrealized gain/(loss) | (1.48 | ) | (0.68 | ) | 0.04 | 0.35 | 0.17 | (2.27 | ) | |||||||||||||||
| Total from investment operations | (1.48 | ) | (0.67 | ) | 0.04 | 0.29 | 0.09 | (2.41 | ) | |||||||||||||||
| DISTRIBUTIONS: | ||||||||||||||||||||||||
| From net investment income | (0.06 | ) | (0.20 | ) | (0.18 | ) | – | – | – | |||||||||||||||
| Total distributions | (0.06 | ) | (0.20 | ) | (0.18 | ) | – | – | – | |||||||||||||||
| REDEMPTION FEES ADDED TO PAID-IN CAPITAL (NOTE 6) | – | 0.00 | (c) | – | – | – | 0.00 | (c) | ||||||||||||||||
| Net increase/(decrease) in net asset value | (1.54 | ) | (0.87 | ) | (0.14 | ) | 0.29 | 0.09 | (2.41 | ) | ||||||||||||||
| Net asset value, end of period | $ | 4.81 | $ | 6.35 | $ | 7.22 | $ | 7.36 | $ | 7.07 | $ | 6.98 | ||||||||||||
| TOTAL RETURN(e) | (23.59 | )% | (9.35 | )% | 0.62 | % | 4.10 | % | 1.29 | % | (25.67 | )% | ||||||||||||
| RATIOS/SUPPLEMENTAL DATA: | ||||||||||||||||||||||||
| Net assets, end of period (000s) | $ | 2,717 | $ | 6,702 | $ | 9,510 | $ | 7,642 | $ | 7,260 | $ | 8,335 | ||||||||||||
| Ratio of expenses to average net assets excluding fee waivers and reimbursements | 2.06 | %(f)(g) | 2.05 | %(g) | 2.05 | %(g) | 2.05 | % | 2.05 | % | 2.07 | % | ||||||||||||
| Ratio of expenses to average net assets including fee waivers and reimbursements | 2.05 | %(f) | 2.05 | % | 2.05 | % | 2.05 | % | 2.05 | % | 2.05 | % | ||||||||||||
| Ratio of net investment income/(loss) to average net assets | (0.02 | )%(f) | 0.17 | % | (0.04 | )% | (0.81 | )% | (1.13 | )% | (1.74 | )% | ||||||||||||
| Portfolio turnover rate(h) | 90 | % | 81 | % | 42 | % | 66 | % | 50 | % | 52 | % | ||||||||||||
| (a) | Per share amounts and ratios to average net assets include income and expenses of the CoreCommodity Management Cayman Commodity Fund Ltd. (wholly-owned subsidiary). |
| (b) | Calculated using the average shares method. |
| (c) | Less than $0.005 or ($0.005) per share. |
| (d) | The per share amount does not correspond to activity reflected in the Statement of Operations due to class specific expenses during the period. |
| (e) | Total returns are for the period indicated and have not been annualized. Total returns would have been lower had certain expenses not been waived during the period. Returns shown do not reflect the deduction of taxes that a shareholder would pay on Fund distributions or the redemption of Fund shares. Returns shown exclude any applicable sales charges. |
| (f) | Annualized. |
| (g) | The ratio of operating expenses excluding fee waiver/reimbursements to average net assets is calculated excluding the waived Subsidiary management fee (see Note 8 for additional detail). The ratio inclusive of that fee would be for the period ended April 30, 2020, October 31, 2019 and October 31, 2018, respectively, 2.24%, 2.20% and 2.21%. |
| (h) | Portfolio turnover rate for periods less than one full year have not been annualized. |
See Notes to Financial Statements.
| 20 | | April 30, 2020 |
ALPS | CoreCommodity Management
CompleteCommodities® Strategy Fund – Class I
Consolidated Financial Highlights
Selected data for a share of beneficial interest outstanding throughout the periods indicated:
| For the Six Months Ended April 30, 2020 (Unaudited) | For the Year Ended October 31, 2019 | For the Year Ended October 31, 2018 | For the Year Ended October 31, 2017 | For the Year Ended October 31, 2016 | For the Year Ended October 31, 2015 | |||||||||||||||||||
| Net asset value, beginning of period(a) | $ | 6.73 | $ | 7.58 | $ | 7.67 | $ | 7.31 | $ | 7.15 | $ | 9.57 | ||||||||||||
| INCOME/(LOSS) FROM INVESTMENT OPERATIONS: | ||||||||||||||||||||||||
| Net investment income/(loss)(b) | 0.03 | 0.08 | 0.07 | 0.01 | (0.02 | ) | (0.06 | ) | ||||||||||||||||
| Net realized and unrealized gain/(loss) | (1.57 | ) | (0.72 | ) | 0.03 | 0.36 | 0.18 | (2.31 | ) | |||||||||||||||
| Total from investment operations | (1.54 | ) | (0.64 | ) | 0.10 | 0.37 | 0.16 | (2.37 | ) | |||||||||||||||
| DISTRIBUTIONS: | ||||||||||||||||||||||||
| From net investment income | (0.07 | ) | (0.21 | ) | (0.19 | ) | (0.01 | ) | – | (0.05 | ) | |||||||||||||
| Total distributions | (0.07 | ) | (0.21 | ) | (0.19 | ) | (0.01 | ) | – | (0.05 | ) | |||||||||||||
| REDEMPTION FEES ADDED TO PAID-IN CAPITAL (NOTE 6) | 0.00 | (c) | 0.00 | (c) | 0.00 | (c) | 0.00 | (c) | 0.00 | (c) | 0.00 | (c) | ||||||||||||
| Net increase/(decrease) in net asset value | (1.61 | ) | (0.85 | ) | (0.09 | ) | 0.36 | 0.16 | (2.42 | ) | ||||||||||||||
| Net asset value, end of period | $ | 5.12 | $ | 6.73 | $ | 7.58 | $ | 7.67 | $ | 7.31 | $ | 7.15 | ||||||||||||
| TOTAL RETURN(d) | (23.18 | )% | (8.48 | )% | 1.42 | % | 5.03 | % | 2.24 | % | (24.88 | )% | ||||||||||||
| RATIOS/SUPPLEMENTAL DATA: | ||||||||||||||||||||||||
| Net assets, end of period (000s) | $ | 342,966 | $ | 500,305 | $ | 647,195 | $ | 482,710 | $ | 463,741 | $ | 362,389 | ||||||||||||
| Ratio of expenses to average net assets excluding fee waivers and reimbursements | 1.16 | %(e)(f) | 1.14 | %(f) | 1.13 | %(f) | 1.15 | % | 1.15 | % | 1.17 | % | ||||||||||||
| Ratio of expenses to average net assets including fee waivers and reimbursements | 1.15 | %(e) | 1.14 | % | 1.13 | % | 1.15 | % | 1.15 | % | 1.15 | % | ||||||||||||
| Ratio of net investment income/(loss) to average net assets | 0.91 | %(e) | 1.09 | % | 0.90 | % | 0.08 | % | (0.22 | )% | (0.73 | )% | ||||||||||||
| Portfolio turnover rate(g) | 90 | % | 81 | % | 42 | % | 66 | % | 50 | % | 52 | % | ||||||||||||
| (a) | Per share amounts and ratios to average net assets include income and expenses of the CoreCommodity Management Cayman Commodity Fund Ltd. (wholly-owned subsidiary). |
| (b) | Calculated using the average shares method. |
| (c) | Less than $0.005 or ($0.005) per share. |
| (d) | Total returns are for the period indicated and have not been annualized. Total returns would have been lower had certain expenses not been waived during the period. Returns shown do not reflect the deduction of taxes that a shareholder would pay on Fund distributions or the redemption of Fund shares. |
| (e) | Annualized. |
| (f) | The ratio of operating expenses excluding fee waiver/reimbursements to average net assets is calculated excluding the waived Subsidiary management fee (see Note 8 for additional detail). The ratio inclusive of that fee would be for the period ended April 30, 2020, October 31, 2019 and October 31, 2018, respectively, 1.34%, 1.29% and 1.29%. |
| (g) | Portfolio turnover rate for periods less than one full year have not been annualized. |
See Notes to Financial Statements.
| 21 | | April 30, 2020 |
ALPS | Kotak India Growth Fund
| Management Commentary | April 30, 2020 (Unaudited) |
Performance
For the 6 month period ending April 30, 2020, the ALPS/Kotak India Growth Fund (the “Fund”) returned -20.97% compared to its benchmark the NSE500 Index, which returned -22.04% over the same period (all in USD term).
The global economy has been rattled by various geopolitical issues and 2020’s Black swan- COVID-19. Disruptions can be seen in sectors like tourism, global supply chains, exports as well as the broader financial markets. The market retracted from last year’s strong gains and has been reminiscent of the global financial crisis (GFC), with global equities plunging in their worst month in March while volatility, bonds and the dollar spiked. The market rebounded in April from March lows as various central banks expanded stimulus plans in response to the virus with the aim to mitigate liquidity and cash flow mismatches. While the frontline Nifty Index lost 21.57% during the period, the midcap index lost by 24.15% and the broad-based NSE500 Index fell 21.87% during the period (all in USD terms). Oil became a big area of focus in April with the West Texas Intermediate (WTI) May futures tumbling below zero for the first time in history.
Many Central Banks and Governments around the world are taking unprecedented measures in response to the virus. The Bank of Japan (BOJ) decided to retain the policy rate unchanged at -0.1% and to continue to guide the 10-year government bond yield at around 0%. While keeping policy rate unchanged, BOJ decided to buy an unlimited amount of government bonds (against earlier JPY80tn annually) and quadrupled its maximum amount of corporate paper and corporate debt purchases. The Bank of England (BoE) cut interest rates to a record low of 0.1% and boosted Quantitative Easing (QE) by £200bn to £645bn. The European Central Bank (ECB) launched a new €750bn QE fund, released more long term refinancing operations (LTROs) and a new targeted longer-term refinancing operation (TLTRO). ECB also loosened collateral rules to accept non-investment grade bonds as collateral to maintain banks’ access to its ultra-cheap liquidity during the pandemic. The move aims to limit financial turmoil and impact of expected wave of rating downgrades in response to the crisis.
In India, the Indian Government as well as the Reserve Bank of India (RBI) also announced a slew of measures via Fiscal and Monetary Policy stimulus. National lockdown was first announced in 25th March 2020 and further extended through April to stem the rate of proliferation and community transmission of COVID-19.
The Monetary Policy Committee (MPC) in total cut policy rates by 75bps from 5.15% to 4.4% and the Reverse Repo rate by 115bps to 3.75% to boost liquidity and announced loan moratorium and interest deferral. Additional liquidity of Rs3.74Trn (~US$50bn) has been created for banks via various policy instruments through (1) Rs1trn Repo window, (2) 100bps reduction in Cash Reverse Ratio (CRR) to 3% for a year and (3) additional Rs1.37trn additional liquidity for banks through Marginal Standing Facility (MSF). In April, RBI announced a second list of liquidity and regulatory related measures to support the economy and ensure the smooth functioning of the financial markets which include (1) further reducing repo rates, (2) reduction in Liquidity Coverage Ratio (LCR) from 100% to 80%, (3) opening up of a special
refinancing facility for All Indian Financial Institutions (AIFIs) at the repo rate, and (4) targeted longer-term refinancing operation (TLTRO) 2.0 targeted at Non-Bank Financial Companies (NBFCs) with 50% of the liquidity availed reserved for small and mid-sized NBFCs and Micro Finance Institutions (MFIs). Through these measures, the RBI aims to incentivize banks to lend to the sectors strongly in need of liquidity after being impacted by COVID-19 related disruptions.
The RBI MPC refrained from providing any estimates on GDP growth and inflation given the uncertain economic outlook. Real GDP growth moderated to 3.1% in 4QFY20 (for the purposes of the rest of this commentary, please note the fiscal year in India begins April 1 and ends on March 31) from a downward revised print of 4.1% in 3QFY20. On the production side, Real Gross Value Added (GVA) growth fell to 3% from 3.5% in 3QFY20 due to contraction in industrial activity by -0.6% (-0.3% in 3QFY20). Private consumption growth moderated to 5.3% and investment growth contracted 2.8%. Weak industrial and services sector led to GVA growth of 3.9% in FY2020.
The fiscal deficit in 1MFY21 was 35.1% of the FY2021 Budget Estimates. Gross tax collections for April fell by 44%, with direct taxes growth of -11% and indirect taxes growth of 70%. While corporate tax collections grew by 58%, income tax collections fell by 32%. The largest fall was seen across customs and GST collections, with both falling by 70%. GST collection was at Rs167bn with Central Goods & Services Tax (CGST) collection of Rs59bn, Integrated Goods & Services Tax (IGST) collection of Rs97bn, and compensation cess of Rs10bn.
Current Account Deficit (CAD) in 3QFY20 narrowed sharply to US$1.4bn (0.2% of GDP) against US$6.5bn in 2QFY20 (0.9% of GDP) and US$17.8bn in 3QFY19 (2.7% of GDP). The decrease was led by a lower trade deficit of US$34.6bn (US$38.1bn in 2QFY20) on the back of lower imports (US$116bn against US$118bn in 2QFY20); while non-oil imports fell to US$84bn, oil imports rose to US$31 bn. Trade deficit in April came in lower at US$6.8bn against US$9.8bn in March and US$15.3bn in April last year. April exports at US$10.4bn implied a growth of -60.3% against US$26.1bn in April 2019.
The National Statistical Office (NSO) did not release the provisional Consumer Price Index (CPI) data for April owing to data collection issues. However, data on food inflation rose to 10.5% in April (8.8% in March) led by increases across vegetables 23.6%, pulses and products 22.8%, and cereals and products 7.8%. Sequentially, CPI food inflation rose by 2.6% month over month, led by a sharp increase in prices of vegetables, pulses and fruits.
Wholesale Price Index (WPI) inflation was released in view of the limited transactions of products in the wholesale market in April 2020. WPI food inflation moderated to 2.6% (4.9% in March) led by softening seen across vegetables 2.2%, fruits -1.7%, eggs, meat and fish -1.7%. On a sequential basis, WPI inflation went by up 0.7% month-to-month (-2% in March) led by an increase across vegetables 3.7%, fruits 8.4%, and pulses 2.2%.
Infrastructure output, comprising eight core sectors of the India Industrial Production (IIP) (wt. 40.3% in IIP), fell by 38.1% in April as
| 22 | | April 30, 2020 |
ALPS | Kotak India Growth Fund
| Management Commentary | April 30, 2020 (Unaudited) |
against 9% in March and a rise of 5.2% in April last year. All the sectors contracted during April.
COVID-19 and a protracted trade war directed against China have revealed the fragility of modern supply chain and raise the possibility of a silver lining amid the turmoil: capitalise on the flight of companies from China and bring them into India. However, in order for more investments to happen, India needs many hard reforms, such as labour reform, as well as improve on the ease of doing business. This crisis exacerbate and reinforce the need for India to reflect on systemic actions that are needed to shore up its own economy.
Against a weak economic and fiscal backdrop, economic activity in the short to medium term will remain subdued and GDP growth will be limited. All in all, India’s outlook will depend on (1) the pace of economic recovery and spread of COVID-19, (2) success of structural policy reforms (such as labour reforms, reform of the Essential Commodity Act and agriculture marketing), (3) geopolitical developments, (4) rating agency responses and (4) oil price trajectory.
Market Outlook and Valuation
In the wake of the COVID-19 crisis, markets have been concerned on the gradual and slower opening of the economy with continued higher rate infections in some high economic activity zones. However, now with the opening of the economy except for the containment zones, the focus is likely to shift on economic recovery. Policy responses from governments and central banks have continued in response to the life and livelihood crisis. While there were a slew of such announcements in India, including the second phase of policy rate cut bringing the total rate cut to 250 bps since 2019, overall, the response still seems wanting given the scale and extent of the economic hurt.
In this turmoil, labour market pressure remains painfully high. US unemployment rate for instance in April reached 14.7% - highest level in post-war history. There has been general economic rebound in the month of May and the PMIs across the G4 DM economies in May rose to 33.1 from an all-time low of 22.3 in April. India too has seen some pickup on the high frequency data points but we are yet some months away for the recovery to really take hold as India reopens phase by phase.
As we look ahead, we see a possible unlock rally and then a headwind of the quarterly numbers of Apr-Jun quarter and the management commentary post that. While the markets expect weak numbers, given the extent of the lockdown, it’s possible that the numbers broadly may negatively surprise. We see economic activity normalising by end of July, with the key risk being the higher level of infections continuing in containment zones. After a very weak first quarter and a likely subdued July to September quarter, we expect growth to possibly come back around the festive season in the third quarter. The policy measures and more importantly, the rate transmission would have permeated the broader economy by then.
Businesses at the same time are relooking and rethinking on their cost structures, their business model, market access, technology
spends, and broadly trying to get their business model more variable. Additionally, many are also looking beyond survival and looking at now possible consolidation in the post COVID-19 world. We had seen the same outcomes in demonetisation where the initial worries on overall economy and banking in particular were very high and once the dust settled, most of the companies that as of April 30, 2020, we are invested in saw market share gains. In this crisis, the additional tail wind is commodity prices that can help mitigate the earnings risk. Broadly put, at current oil prices, the benefit to the Indian economy on just oil prices is $45-50 bn annually if the oil prices remain in the 30s. It’s good to remind everyone that the general tax rate was cut meaningfully last September and the current year will be the first full year of the new tax rate. We have seen renewed focus on further policy reforms around the theme of “ease of doing business” with an attempt to get Indian manufacturing into global supply chains. Additionally, many measures have been taken to optimise the agricultural sector which employs almost half of India’s work force but remains sub optimal with a contribution of just in mid-teens to the overall GDP. A crisis is being put to work to push through much needed reforms in land and labour along with the agricultural sector.
In this current turmoil, another very interesting observation is the large secondary and primary market transactions across varied sectors. We have seen several multi-billion-dollar deals and offerings in some names and at variance to the market conditions, these were very well accepted by the markets. It just highlights that long-term investors continue to be constructive on the Indian economy and are willing to take even larger exposures in well run businesses. In this uncertain time when the debate of continued rise in overall level of COVID-19 cases on one side and the restart of the economy on the other side, the markets will remain volatile and any news will have an exaggerated impact, and these volatile times will provide opportunities to add exposure.
Mr. Nitin Tejpal Jain
Fund Manager
Kotak Mahindra Asset Management (Singapore) Pte Ltd.
The views above are based on publicly available data, Kotak Group internal estimates and are based on the views of the research team at Kotak group.
The views of the author and information discussed in this commentary are as of the date of publication, are subject to change, and may not reflect the writer's current views. The views expressed are those of the author only, and represent an assessment of market conditions at a specific point in time, are opinions only and should not be relied upon as investment advice regarding a particular investment or markets in general. Such information does not constitute a recommendation to buy or sell specific securities or investment vehicles. It should not be assumed that any investment will be profitable or will equal the performance of the fund or any securities or any sectors mentioned in this letter. The subject matter contained in this letter has been derived from several sources believed to be reliable and accurate at the time of compilation. Neither ALPS Advisors, Inc., Kotak Mahindra Asset Management
| 23 | | April 30, 2020 |
ALPS | Kotak India Growth Fund
| Management Commentary | April 30, 2020 (Unaudited) |
(Singapore) Pte Ltd., nor the Fund accepts any liability for losses either direct or consequential caused by the use of this information.
Diversification cannot guarantee gain or prevent losses.
Past performance is no guarantee of future results. Dividends are not guaranteed and are subject to change or elimination. Investments in international and emerging markets securities include exposure to risks such as currency fluctuations, foreign taxes and regulations, and the potential for illiquid markets and political instability.
ALPS Portfolio Solutions Distributor, Inc., ALPS Distributors, Inc. and ALPS Advisors Inc. are affiliated.
| 24 | | April 30, 2020 |
ALPS | Kotak India Growth Fund
| Performance Update | April 30, 2020 (Unaudited) |
Performance of $10, 000 Initial Investment (as of April 30, 2020)
Comparison of change in value of a $10,000 investment

The chart above represents historical performance of a hypothetical investment of $10,000 in the Fund since inception. Past performance does not guarantee future results. This chart does not reflect the deduction of taxes that a shareholder would pay on Fund distributions or the redemption of Fund shares.
Average Annual Total Returns (as of April 30, 2020)
| 6 Month | 1 Year | 3 Year | 5 Year | Since Inception^ | Total Expense Ratio | What You Pay* | |
| Investor# (NAV) | -21.09% | -20.24% | -6.02% | 0.80% | 3.57% | 2.76% | 1.40% |
| Class A (NAV) | -21.06% | -20.27% | -6.08% | 0.76% | 3.55% | 2.70% | 1.40% |
| Class A (MOP) | -25.43% | -24.66% | -7.83% | -0.37% | 2.91% | ||
| Class C (NAV) | -21.40% | -20.88% | -6.73% | 0.08% | 2.85% | 3.37% | 2.00% |
| Class C (CDSC) | -22.18% | -21.66% | -6.73% | 0.08% | 2.85% | ||
| Class I | -20.97% | -20.02% | -5.76% | 1.08% | 3.89% | 2.33% | 1.00% |
| Class II | -20.89% | -19.94% | -5.73% | 1.10% | 3.90% | 2.33% | 0.75% |
| Nifty 500 Index1 | -21.43% | -22.36% | -5.05% | 0.45% | 2.04% | ||
| Morningstar India Index2 | -19.93% | -20.11% | -3.67% | 1.38% | 2.26% |
Performance data quoted represents past performance. Past performance does not guarantee future results. Investment return and principal value of an investment will fluctuate so that an investor’s shares, when sold or redeemed, may be worth more or less than the original cost. Current performance data may be higher or lower than actual data quoted. For the most current month-end performance data, please call 1-866-759-5679.
Maximum Offering Price (MOP) for Class A shares includes the Fund’s maximum sales charge of 5.50%. Performance shown at NAV does not include these sales charges and would have been lower had it been taken into account. If you invest $1 million or more, either as a lump sum or through the Fund’s accumulation or letter of intent programs, you can purchase Class A shares without an initial sales charge (load). A Contingent Deferred Sales Charge (“CDSC”) of 1.00% may apply to Class C shares redeemed within the first 12 months after a purchase, and on Class A shares redeemed within the first 18 months after a purchase in excess of $1 million. The Fund imposes a 2.00% redemption fee on shares held for less than 30 days.
| 25 | | April 30, 2020 |
ALPS | Kotak India Growth Fund
| Performance Update | April 30, 2020 (Unaudited) |
Performance shown for Class A shares prior to June 12, 2018 reflects the historical performance of the Fund’s Investor shares, calculated using the fees and expenses of Class A shares. Performance shown for Class II shares prior to December 19, 2019 reflects the historical performance of the Fund’s Class I shares, calculated using the fees and expenses of Class II shares.
| 1 | Nifty 500 Index (formerly the CNX 500 Index) - India's first broad based benchmark of the Indian capital market. The Nifty 500 companies are disaggregated into 72 industry indices. Industry weightages in the index reflect the industry weightages in the market. The index is not actively managed and does not reflect any deduction for fees, expenses or taxes. An investor may not invest directly in an index. |
| 2 | Morningstar India NR Index: measures the performance of India's equity markets targeting the top 97% of stocks by market capitalization. |
| ^ | Fund Inception date of February 14, 2011 for Investor Class and Classes C and I; Fund Inception date of June 12, 2018 for Class A; Fund Inception date of December 19, 2019 for Class II. |
| * | What You Pay reflects the Advisor's and Sub-Advisor’s decision to contractually limit expenses through February 28, 2021. Please see the prospectus dated February 28, 2020 for additional information. |
| # | Prior to December 1, 2017, Investor Class was known as Class A. |
The table does not reflect the deduction of taxes that a shareholder would pay on Fund distributions or the redemption of Fund shares.
This Fund is not suitable for all investors and is subject to investment risks, including possible loss of the principal amount invested.
There is no guarantee that the Fund will continue to hold any one particular security or stay invested in any one particular company. The composition of the Fund's top holdings is subject to change. Performance figures are historical and reflect the change in share price, reinvested distributions, changes in net asset value, sales charges and capital gains distributions, if any.
Not FDIC Insured – No Bank Guarantee – May Lose Value
Investing in India involves risk and considerations not present when investing in more established securities markets. The Fund may be more susceptible to economic, market, political and local risks of the region than a fund that is more geographically diversified. Investments in India are subject to a number of risks including, but not limited to, risk of losing some or all of the capital invested, high market volatility, variable market liquidity, geopolitical risks (including political instability), exchange rate fluctuations (between the currency of the fund’s share class and the Indian Rupee), changes in tax regime and restrictions on investment activities of foreign investors.
| Top Ten Holdings (as a % of Net Assets) † | |
| HDFC Bank, Ltd. | 7.16% |
| Reliance Industries, Ltd. | 5.86% |
| ICICI Bank, Ltd. | 4.88% |
| Housing Development Finance Corp., Ltd. | 4.33% |
| Infosys, Ltd. | 3.21% |
| Tata Consultancy Services, Ltd. | 3.13% |
| Axis Bank, Ltd. | 2.88% |
| Aavas Financiers, Ltd. | 2.69% |
| Bharti Airtel, Ltd. | 2.65% |
| Britannia Industries, Ltd. | 2.33% |
| Top Ten Holdings | 39.12% |
| † | Holdings are subject to change, and may not reflect the current or future position of the portfolio. Table presents approximate values only. |
Industry Sector Allocation (as a % of Net Assets)

| 26 | | April 30, 2020 |
ALPS | Kotak India Growth Fund
| Consolidated Statement of Investments | April 30, 2020 (Unaudited) |
| Shares | Value (Note 2) | |||||||
| COMMON STOCKS (91.87%) | ||||||||
| Communication Services (2.65%) | ||||||||
| Wireless Telecommunication Services (2.65%) | ||||||||
| Bharti Airtel, Ltd.(a) | 512,203 | $ | 3,488,167 | |||||
| TOTAL COMMUNICATION SERVICES | 3,488,167 | |||||||
| Consumer Discretionary (10.37%) | ||||||||
| Auto Components (1.66%) | ||||||||
| Motherson Sumi Systems, Ltd. | 524,184 | 604,013 | ||||||
| MRF, Ltd. | 1,965 | 1,581,170 | ||||||
| 2,185,183 | ||||||||
| Automobiles (2.97%) | ||||||||
| Hero MotoCorp, Ltd. | 23,977 | 683,906 | ||||||
| Maruti Suzuki India, Ltd. | 28,873 | 2,049,742 | ||||||
| TVS Motor Co., Ltd. | 272,418 | 1,170,187 | ||||||
| 3,903,835 | ||||||||
| Hotels, Restaurants & Leisure (1.32%) | ||||||||
| Jubilant Foodworks, Ltd. | 80,810 | 1,733,594 | ||||||
| Household Durables (1.30%) | ||||||||
| Crompton Greaves Consumer Electricals, Ltd. | 581,162 | 1,707,791 | ||||||
| Textiles, Apparel & Luxury Goods (3.12%) | ||||||||
| Page Industries, Ltd. | 8,470 | 2,040,805 | ||||||
| Titan Co., Ltd. | 161,401 | 2,064,058 | ||||||
| 4,104,863 | ||||||||
| TOTAL CONSUMER DISCRETIONARY | 13,635,266 | |||||||
| Consumer Staples (4.83%) | ||||||||
| Beverages (1.03%) | ||||||||
| United Breweries, Ltd. | 109,054 | 1,359,002 | ||||||
| Food Products (2.33%) | ||||||||
| Britannia Industries, Ltd. | 73,195 | 3,063,033 | ||||||
| Personal Products (1.47%) | ||||||||
| Dabur India, Ltd. | 298,398 | 1,930,424 | ||||||
| TOTAL CONSUMER STAPLES | 6,352,459 | |||||||
| Energy (9.27%) | ||||||||
| Oil, Gas & Consumable Fuels (9.27%) | ||||||||
| Bharat Petroleum Corp., Ltd. | 497,602 | 2,434,428 | ||||||
| Petronet LNG, Ltd. | 633,430 | 2,040,677 | ||||||
| Reliance Industries, Ltd. | 396,738 | 7,713,783 | ||||||
| 12,188,888 | ||||||||
| TOTAL ENERGY | 12,188,888 | |||||||
| Shares | Value (Note 2) | |||||||
| Financials (33.04%) | ||||||||
| Banks (17.92%) | ||||||||
| AU Small Finance Bank, Ltd.(b)(c) | 312,697 | $ | 2,242,334 | |||||
| Axis Bank, Ltd. | 648,313 | 3,787,739 | ||||||
| HDFC Bank, Ltd., ADR | 116,390 | 5,045,507 | ||||||
| HDFC Bank, Ltd. | 332,657 | 4,368,369 | ||||||
| ICICI Bank, Ltd., Sponsored ADR | 239,724 | 2,339,706 | ||||||
| ICICI Bank, Ltd. | 814,034 | 4,083,875 | ||||||
| State Bank of India(a) | 682,496 | 1,707,984 | ||||||
| 23,575,514 | ||||||||
| Capital Markets (0.74%) | ||||||||
| Nippon Life India Asset Management, Ltd.(b)(c) | 298,641 | 966,525 | ||||||
| Consumer Finance (3.78%) | ||||||||
| Bajaj Finance, Ltd. | 93,285 | 2,852,255 | ||||||
| SBI Cards & Payment Services, Ltd.(a) | 264,860 | 2,113,202 | ||||||
| 4,965,457 | ||||||||
| Insurance (3.59%) | ||||||||
| ICICI Lombard General Insurance Co., Ltd.(b)(c) | 113,976 | 1,948,337 | ||||||
| ICICI Prudential Life Insurance Co., Ltd.(b)(c) | 430,111 | 2,345,378 | ||||||
| SBI Life Insurance Co., Ltd.(b)(c) | 44,799 | 430,623 | ||||||
| 4,724,338 | ||||||||
| Thrifts & Mortgage Finance (7.01%) | ||||||||
| Aavas Financiers, Ltd.(a) | 225,591 | 3,531,876 | ||||||
| Housing Development Finance Corp., Ltd. | 225,076 | 5,693,253 | ||||||
| 9,225,129 | ||||||||
| TOTAL FINANCIALS | 43,456,963 | |||||||
| Health Care (4.82%) | ||||||||
| Health Care Providers & Services (0.06%) | ||||||||
| Apollo Hospitals Enterprise, Ltd. | 4,064 | 74,788 | ||||||
| Pharmaceuticals (4.76%) | ||||||||
| Aurobindo Pharma, Ltd. | 330,316 | 2,701,664 | ||||||
| Cadila Healthcare, Ltd. | 460,035 | 1,974,477 | ||||||
| Cipla, Ltd. | 203,879 | 1,586,713 | ||||||
| 6,262,854 | ||||||||
| TOTAL HEALTH CARE | 6,337,642 | |||||||
| Industrials (9.02%) | ||||||||
| Air Freight & Logistics (0.56%) | ||||||||
| Mahindra Logistics, Ltd.(b)(c) | 214,062 | 736,842 | ||||||
| 27 | | April 30, 2020 |
ALPS | Kotak India Growth Fund
| Consolidated Statement of Investments | April 30, 2020 (Unaudited) |
| Shares | Value (Note 2) | |||||||
| Building Products (2.38%) | ||||||||
| Astral Poly Technik, Ltd. | 111,779 | $ | 1,391,721 | |||||
| Kajaria Ceramics, Ltd. | 350,734 | 1,743,315 | ||||||
| 3,135,036 | ||||||||
| Construction & Engineering (3.04%) | ||||||||
| Ashoka Buildcon, Ltd.(a) | 833,112 | 705,176 | ||||||
| Kalpataru Power Transmission, Ltd. | 300,139 | 910,962 | ||||||
| Larsen & Toubro, Ltd. | 201,435 | 2,388,646 | ||||||
| 4,004,784 | ||||||||
| Electrical Equipment (1.46%) | ||||||||
| V-Guard Industries, Ltd. | 824,107 | 1,919,830 | ||||||
| Machinery (1.40%) | ||||||||
| Cummins India, Ltd. | 133,572 | 667,669 | ||||||
| Timken India, Ltd. | 98,419 | 1,168,105 | ||||||
| 1,835,774 | ||||||||
| Trading Companies & Distributors (0.18%) | ||||||||
| IndiaMart InterMesh, Ltd.(b)(c) | 7,998 | 236,467 | ||||||
| TOTAL INDUSTRIALS | 11,868,733 | |||||||
| Information Technology (7.61%) | ||||||||
| IT Services (7.61%) | ||||||||
| Infosys, Ltd. | 451,206 | 4,217,482 | ||||||
| Tata Consultancy Services, Ltd. | 155,503 | 4,116,529 | ||||||
| Tech Mahindra, Ltd. | 233,592 | 1,680,014 | ||||||
| 10,014,025 | ||||||||
| TOTAL INFORMATION TECHNOLOGY | 10,014,025 | |||||||
| Materials (8.45%) | ||||||||
| Chemicals (3.81%) | ||||||||
| Kansai Nerolac Paints, Ltd. | 312,263 | 1,714,018 | ||||||
| SRF, Ltd. | 44,033 | 2,163,243 | ||||||
| Supreme Industries, Ltd. | 79,236 | 1,141,074 | ||||||
| 5,018,335 | ||||||||
| Construction Materials (4.64%) | ||||||||
| JK Cement, Ltd. | 109,062 | 1,619,163 | ||||||
| Ramco Cements, Ltd. | 338,103 | 2,469,386 | ||||||
| Shree Cement, Ltd. | 7,711 | 2,013,288 | ||||||
| 6,101,837 | ||||||||
| TOTAL MATERIALS | 11,120,172 | |||||||
| Real Estate (1.18%) | ||||||||
| Real Estate Management & Development (1.18%) | ||||||||
| Brigade Enterprises, Ltd. | 641,375 | 1,008,034 | ||||||
| Shares | Value (Note 2) | |||||||
| Real Estate Management & Development (continued) | ||||||||
| Mahindra Lifespace Developers, Ltd. | 218,855 | $ | 536,980 | |||||
| 1,545,014 | ||||||||
| TOTAL REAL ESTATE | 1,545,014 | |||||||
| Utilities (0.63%) | ||||||||
| Gas Utilities (0.63%) | ||||||||
| Gujarat Gas, Ltd. | 242,287 | 830,455 | ||||||
| TOTAL UTILITIES | 830,455 | |||||||
| TOTAL COMMON STOCKS | ||||||||
| (Cost $143,509,731) | 120,837,784 | |||||||
| TOTAL INVESTMENTS (91.87%) | ||||||||
| (Cost $143,509,731) | $ | 120,837,784 | ||||||
| Other Assets In Excess Of Liabilities (8.13%) | 10,691,836 | |||||||
| NET ASSETS (100.00%) | $ | 131,529,620 | ||||||
| (a) | Non-Income Producing Security. |
| (b) | Security exempt from registration under Rule 144A of the Securities Act of 1933. This security may be resold in transactions exempt from registration, normally to qualified institutional buyers. As of April 30, 2020, the aggregate market value of those securities was $8,906,506, representing 6.77% of net assets. |
| (c) | Securities were purchased pursuant to Regulation S under the Securities Act of 1933, which exempts securities offered and sold outside of the United States from registration. Such securities cannot be sold in the United States without either an effective registration statement filed pursuant to the Securities Act of 1933, or pursuant to an exemption from registration. These securities have been deemed liquid under guidelines approved by the Fund's Board of Trustees. As of April 30, 2020 the aggregate market value of those securities was $8,906,506 representing 6.77% of net assets. |
For Fund compliance purposes, the Fund's industry classifications refer to any one or more of the industry sub-classifications used by one or more widely recognized market indexes or ratings group indexes, and/or as defined by Fund management. This definition may not apply for purposes of this report, which may combine industry sub-classifications for reporting ease. Industries are shown as a percent of net assets.
See Notes to Financial Statements.
| 28 | | April 30, 2020 |
ALPS | Kotak India Growth Fund
| Consolidated Statement of Assets and Liabilities | April 30, 2020 (Unaudited) |
| ASSETS | ||||
| Investments, at value | $ | 120,837,784 | ||
| Cash | 5,813,066 | |||
| Foreign currency, at value (Cost $4,525,644) | 4,276,241 | |||
| Receivable for investments sold | 1,081,498 | |||
| Receivable for shares sold | 20,121 | |||
| Dividends receivable | 26,701 | |||
| Prepaid expenses and other assets | 37,555 | |||
| Total Assets | 132,092,966 | |||
| LIABILITIES | ||||
| Payable for investments purchased | 396,324 | |||
| Payable for shares redeemed | 1,310 | |||
| Payable for foreign capital gains tax | 57,676 | |||
| Investment advisory fees payable | 30,350 | |||
| Administration and transfer agency fees payable | 65,868 | |||
| Distribution and services fees payable | 2,808 | |||
| Trustees' fees and expenses payable | 1,892 | |||
| Professional fees payable | 7,081 | |||
| Accrued expenses and other liabilities | 37 | |||
| Total Liabilities | 563,346 | |||
| NET ASSETS | $ | 131,529,620 | ||
| NET ASSETS CONSIST OF | ||||
| Paid-in capital | $ | 173,793,882 | ||
| Total distributable earnings | (42,264,262 | ) | ||
| NET ASSETS | $ | 131,529,620 | ||
| INVESTMENTS, AT COST | $ | 143,509,731 | ||
| PRICING OF SHARES | ||||
| Investor Class: | ||||
| Net Asset Value, offering and redemption price per share | $ | 10.14 | ||
| Net Assets | $ | 2,656,043 | ||
| Shares of beneficial interest outstanding (unlimited number of shares, no par value common stock authorized) | 261,909 | |||
| Class A: | ||||
| Net Asset Value, offering and redemption price per share | $ | 10.12 | ||
| Net Assets | $ | 56,330 | ||
| Shares of beneficial interest outstanding (unlimited number of shares, no par value common stock authorized) | 5,565 | |||
| Maximum offering price per share ((NAV/0.9450), based on maximum sales charge of 5.50% of the offering price) | $ | 10.71 | ||
| Class C: | ||||
| Net Asset Value, offering and redemption price per share(a) | $ | 9.44 | ||
| Net Assets | $ | 1,605,549 | ||
| Shares of beneficial interest outstanding (unlimited number of shares, no par value common stock authorized) | 170,005 | |||
| Class I: | ||||
| Net Asset Value, offering and redemption price per share | $ | 10.48 | ||
| Net Assets | $ | 18,014,761 | ||
| Shares of beneficial interest outstanding (unlimited number of shares, no par value common stock authorized) | 1,718,868 | |||
| Class II: | ||||
| Net Asset Value, offering and redemption price per share | $ | 10.49 | ||
| Net Assets | $ | 109,196,937 | ||
| Shares of beneficial interest outstanding (unlimited number of shares, no par value common stock authorized) | 10,405,718 | |||
| (a) | Redemption price per share may be reduced for any applicable contingent deferred sales charge. For a description of a possible sales charge, please see the Fund's Prospectus. |
See Notes to Financial Statements.
| 29 | | April 30, 2020 |
ALPS | Kotak India Growth Fund
| Consolidated Statement of Operations | For the Six Months Ended April 30, 2020 (Unaudited) |
| INVESTMENT INCOME | ||||
| Dividends | $ | 410,366 | ||
| Foreign taxes withheld on dividends | (8,423 | ) | ||
| Total Investment Income | 401,943 | |||
| EXPENSES | ||||
| Investment advisory fees | 315,285 | |||
| Administrative fees | 106,756 | |||
| Transfer agency fees | 1,389 | |||
| Distribution and service fees | ||||
| Investor Class | 6,087 | |||
| Class A | 101 | |||
| Class C | 9,803 | |||
| Professional fees | 25,571 | |||
| Reports to shareholders and printing fees | 5,220 | |||
| State registration fees | 38,694 | |||
| Insurance fees | 501 | |||
| Custody fees | 42,116 | |||
| Trustees' fees and expenses | 2,662 | |||
| Repayment of previously waived fees | ||||
| Investor Class | 24 | |||
| Class I | 151 | |||
| Miscellaneous expenses | 18,432 | |||
| Total Expenses | 572,792 | |||
| Less fees waived/reimbursed by investment advisor (Note 8) | ||||
| Investor Class | (7,540 | ) | ||
| Class A | (160 | ) | ||
| Class C | (3,729 | ) | ||
| Class I | (36,882 | ) | ||
| Class II(a) | (112,634 | ) | ||
| Net Expenses | 411,847 | |||
| Net Investment Loss | (9,904 | ) | ||
| Net realized loss on investments | (18,894,950 | ) | ||
| Net realized gain on foreign currency transactions | 4,839 | |||
| Net Realized Loss | (18,890,111 | ) | ||
| Net change in unrealized depreciation on investments | (26,563,101 | ) | ||
| Net change in unrealized depreciation on translation of assets and liabilities denominated in foreign currencies | (247,817 | ) | ||
| Net change in unrealized foreign capital gains tax | 138,048 | |||
| Net Change in Unrealized Depreciation | (26,672,870 | ) | ||
| NET REALIZED AND UNREALIZED LOSS ON INVESTMENTS | (45,562,981 | ) | ||
| NET DECREASE IN NET ASSETS RESULTING FROM OPERATIONS | $ | (45,572,885 | ) | |
| (a) | Class II commenced operations on December 19, 2019. |
See Notes to Financial Statements.
| 30 | | April 30, 2020 |
ALPS | Kotak India Growth Fund
Consolidated Statements of Changes in Net Assets
| For the Six Months Ended April 30, 2020 (Unaudited) | For the Year Ended October 31, 2019 | |||||||
| OPERATIONS | ||||||||
| Net investment loss | $ | (9,904 | ) | $ | (141,961 | ) | ||
| Net realized gain/(loss) | (18,890,111 | ) | 340,712 | |||||
| Net change in unrealized appreciation/(depreciation) | (26,672,870 | ) | 3,450,476 | |||||
| Net Increase/(Decrease) in Net Assets Resulting from Operations | (45,572,885 | ) | 3,649,227 | |||||
| TOTAL DISTRIBUTIONS | ||||||||
| From distributable earnings | ||||||||
| Investor Class | (59,531 | ) | (389,048 | ) | ||||
| Class A | (1,250 | ) | (573 | ) | ||||
| Class C | (30,127 | ) | (144,449 | ) | ||||
| Class I | (272,204 | ) | (895,310 | ) | ||||
| Net Decrease in Net Assets from Distributions | (363,112 | ) | (1,429,380 | ) | ||||
| BENEFICIAL INTEREST TRANSACTIONS (NOTE 6) | ||||||||
| Shares sold | ||||||||
| Investor Class | 184,364 | 1,146,850 | ||||||
| Class A | – | 84,832 | ||||||
| Class C | 5,047 | 76,000 | ||||||
| Class I | 5,028,130 | 10,742,843 | ||||||
| Class II(a) | 175,000,000 | – | ||||||
| Dividends reinvested | ||||||||
| Investor Class | 46,092 | 326,938 | ||||||
| Class A | 1,120 | 573 | ||||||
| Class C | 29,759 | 142,713 | ||||||
| Class I | 237,513 | 720,664 | ||||||
| Shares redeemed, net of redemption fees | ||||||||
| Investor Class | (1,317,060 | ) | (3,191,009 | ) | ||||
| Class A | (21,865 | ) | – | |||||
| Class C | (147,976 | ) | (253,018 | ) | ||||
| Class I | (5,463,217 | ) | (4,733,511 | ) | ||||
| Class II(a) | (25,000,000 | ) | – | |||||
| Net Increase in Net Assets Derived from Beneficial Interest Transactions | 148,581,907 | 5,063,875 | ||||||
| Net increase in net assets | 102,645,910 | 7,283,722 | ||||||
| NET ASSETS | ||||||||
| Beginning of period | 28,883,710 | 21,599,988 | ||||||
| End of period | $ | 131,529,620 | $ | 28,883,710 | ||||
| (a) | Class II commenced operations on December 19, 2019. |
See Notes to Financial Statements.
| 31 | | April 30, 2020 |
ALPS | Kotak India Growth Fund – Investor Class
Consolidated Financial Highlights
Selected data for a share of beneficial interest outstanding throughout the periods indicated:
| For the Six Months Ended April 30, 2020 (Unaudited) | For the Year Ended October 31, 2019 | For the Year Ended October 31, 2018(a) | For the Year Ended October 31, 2017 | For the Year Ended October 31, 2016 | For the Year Ended October 31, 2015 | |||||||||||||||||||
| Net asset value, beginning of period(b) | $ | 13.02 | $ | 11.73 | $ | 14.53 | $ | 12.32 | $ | 12.57 | $ | 13.20 | ||||||||||||
| INCOME/(LOSS) FROM INVESTMENT OPERATIONS: | ||||||||||||||||||||||||
| Net investment loss(c) | (0.05 | ) | (0.10 | ) | (0.13 | ) | (0.10 | ) | (0.09 | ) | (0.14 | ) | ||||||||||||
| Net realized and unrealized gain/(loss) | (2.66 | ) | 2.19 | (2.26 | ) | 2.45 | 1.45 | 0.06 | ||||||||||||||||
| Total from investment operations | (2.71 | ) | 2.09 | (2.39 | ) | 2.35 | 1.36 | (0.08 | ) | |||||||||||||||
| DISTRIBUTIONS: | ||||||||||||||||||||||||
| From net investment income | – | – | – | – | – | (0.17 | ) | |||||||||||||||||
| From net realized gains | (0.17 | ) | (0.80 | ) | (0.41 | ) | (0.14 | ) | (1.61 | ) | (0.38 | ) | ||||||||||||
| Total distributions | (0.17 | ) | (0.80 | ) | (0.41 | ) | (0.14 | ) | (1.61 | ) | (0.55 | ) | ||||||||||||
| REDEMPTION FEES ADDED TO PAID-IN CAPITAL (NOTE 6) | 0.00 | (d) | 0.00 | (d) | 0.00 | (d) | 0.00 | (d) | 0.00 | (d) | 0.00 | (d) | ||||||||||||
| Net increase/(decrease) in net asset value | (2.88 | ) | 1.29 | (2.80 | ) | 2.21 | (0.25 | ) | (0.63 | ) | ||||||||||||||
| Net asset value, end of period | $ | 10.14 | $ | 13.02 | $ | 11.73 | $ | 14.53 | $ | 12.32 | $ | 12.57 | ||||||||||||
| TOTAL RETURN(e) | (21.09 | )% | 18.58 | % | (16.91 | )% | 19.45 | % | 13.31 | % | (0.65 | )% | ||||||||||||
| RATIOS/SUPPLEMENTAL DATA: | ||||||||||||||||||||||||
| Net assets, end of period (000s) | $ | 2,656 | $ | 4,604 | $ | 5,821 | $ | 9,538 | $ | 5,772 | $ | 5,906 | ||||||||||||
| Ratio of expenses to average net assets excluding fee waivers and reimbursements | 1.85 | %(f) | 3.27 | % | 2.80 | % | 2.95 | % | 3.83 | % | 3.51 | % | ||||||||||||
| Ratio of expenses to average net assets including fee waivers and reimbursements | 1.45 | %(f)(g) | 1.91 | % | 1.93 | % | 1.90 | % | 1.90 | % | 1.96 | % | ||||||||||||
| Ratio of net investment loss to average net assets | (0.84 | )%(f) | (0.79 | )% | (0.91 | )% | (0.74 | )% | (0.86 | )% | (1.03 | )% | ||||||||||||
| Portfolio turnover rate(h) | 53 | % | 56 | % | 24 | % | 30 | % | 23 | % | 58 | % | ||||||||||||
| (a) | Prior to December 1, 2017, Investor Class was known as Class A. |
| (b) | Per share amounts and ratios to average net assets include income and expenses of the Kotak Mauritius Portfolio (wholly-owned subsidiary). |
| (c) | Calculated using the average shares method. |
| (d) | Less than $0.005 or ($0.005) per share. |
| (e) | Total returns are for the period indicated and have not been annualized. Total returns would have been lower had certain expenses not been waived during the period. Returns shown do not reflect the deduction of taxes that a shareholder would pay on Fund distributions or the redemption of Fund shares. Returns shown exclude any applicable sales charges. |
| (f) | Annualized. |
| (g) | Effective December 2, 2019, the net expense limitation agreement changed from 1.60% to 1.00%. Refer to Note 8. |
| (h) | Portfolio turnover rate for periods less than one full year have not been annualized. |
See Notes to Financial Statements.
| 32 | | April 30, 2020 |
ALPS | Kotak India Growth Fund – Class A
Consolidated Financial Highlights
Selected data for a share of beneficial interest outstanding throughout the periods indicated:
| For the Six Months Ended April 30, 2020 (Unaudited) | For the Year Ended October 31, 2019 | For the Period June 12, 2018 (Commencement of Operations) to October 31, 2018 | ||||||||||
| Net asset value, beginning of period(a) | $ | 12.99 | $ | 11.72 | $ | 13.90 | ||||||
| INCOME FROM INVESTMENT OPERATIONS: | ||||||||||||
| Net investment loss(b) | (0.05 | ) | (0.06 | ) | (0.04 | ) | ||||||
| Net realized and unrealized gain/(loss) | (2.65 | ) | 2.13 | (2.14 | ) | |||||||
| Total from investment operations | (2.70 | ) | 2.07 | (2.18 | ) | |||||||
| DISTRIBUTIONS: | ||||||||||||
| From net realized gains | (0.17 | ) | (0.80 | ) | – | |||||||
| Total distributions | (0.17 | ) | (0.80 | ) | – | |||||||
| Net increase/(decrease) in net asset value | (2.87 | ) | 1.27 | (2.18 | ) | |||||||
| Net asset value, end of period | $ | 10.12 | $ | 12.99 | $ | 11.72 | ||||||
| TOTAL RETURN(c) | (21.06 | )% | 18.41 | % | (15.68 | )% | ||||||
| RATIOS/SUPPLEMENTAL DATA: | ||||||||||||
| Net assets, end of period (000s) | $ | 56 | $ | 96 | $ | 8 | ||||||
| Ratio of expenses to average net assets excluding fee waivers and reimbursements | 1.74 | %(d) | 3.24 | % | 3.16 | %(d) | ||||||
| Ratio of expenses to average net assets including fee waivers and reimbursements | 1.36 | %(d)(e) | 1.94 | % | 2.00 | %(d) | ||||||
| Ratio of net investment loss to average net assets | (0.78 | )%(d) | (0.52 | )% | (0.79 | )%(d) | ||||||
| Portfolio turnover rate(f) | 53 | % | 56 | % | 24 | % | ||||||
| (a) | Per share amounts and ratios to average net assets include income and expenses of the Kotak Mauritius Portfolio (wholly-owned subsidiary). |
| (b) | Calculated using the average shares method. |
| (c) | Total returns are for the period indicated and have not been annualized. Total returns would have been lower had certain expenses not been waived during the period. Returns shown do not reflect the deduction of taxes that a shareholder would pay on Fund distributions or the redemption of Fund shares. |
| (d) | Annualized. |
| (e) | Effective December 2, 2019, the net expense limitation agreement changed from 1.60% to 1.00%. Refer to Note 8. |
| (f) | Portfolio turnover rate for periods less than one full year have not been annualized. |
See Notes to Financial Statements.
| 33 | | April 30, 2020 |
ALPS | Kotak India Growth Fund – Class C
Consolidated Financial Highlights
Selected data for a share of beneficial interest outstanding throughout the periods indicated:
| For the Six Months Ended April 30, 2020 (Unaudited) | For the Year Ended October 31, 2019 | For the Year Ended October 31, 2018 | For the Year Ended October 31, 2017 | For the Year Ended October 31, 2016 | For the Year Ended October 31, 2015 | |||||||||||||||||||
| Net asset value, beginning of period(a) | $ | 12.18 | $ | 11.10 | $ | 13.87 | $ | 11.85 | $ | 12.23 | $ | 12.88 | ||||||||||||
| INCOME/(LOSS) FROM INVESTMENT OPERATIONS: | ||||||||||||||||||||||||
| Net investment loss(b) | (0.08 | ) | (0.17 | ) | (0.21 | ) | (0.18 | ) | (0.16 | ) | (0.21 | ) | ||||||||||||
| Net realized and unrealized gain/(loss) | (2.49 | ) | 2.05 | (2.15 | ) | 2.34 | 1.39 | 0.05 | ||||||||||||||||
| Total from investment operations | (2.57 | ) | 1.88 | (2.36 | ) | 2.16 | 1.23 | (0.16 | ) | |||||||||||||||
| DISTRIBUTIONS: | ||||||||||||||||||||||||
| From net investment income | – | – | – | – | – | (0.11 | ) | |||||||||||||||||
| From net realized gains | (0.17 | ) | (0.80 | ) | (0.41 | ) | (0.14 | ) | (1.61 | ) | (0.38 | ) | ||||||||||||
| Total distributions | (0.17 | ) | (0.80 | ) | (0.41 | ) | (0.14 | ) | (1.61 | ) | (0.49 | ) | ||||||||||||
| REDEMPTION FEES ADDED TO PAID-IN CAPITAL (NOTE 6) | – | 0.00 | (c) | – | – | 0.00 | (c) | – | ||||||||||||||||
| Net increase/(decrease) in net asset value | (2.74 | ) | 1.08 | (2.77 | ) | 2.02 | (0.38 | ) | (0.65 | ) | ||||||||||||||
| Net asset value, end of period | $ | 9.44 | $ | 12.18 | $ | 11.10 | $ | 13.87 | $ | 11.85 | $ | 12.23 | ||||||||||||
| TOTAL RETURN(d) | (21.40 | )% | 17.69 | % | (17.52 | )% | 18.60 | % | 12.51 | % | (1.34 | )% | ||||||||||||
| RATIOS/SUPPLEMENTAL DATA: | ||||||||||||||||||||||||
| Net assets, end of period (000s) | $ | 1,606 | $ | 2,195 | $ | 2,024 | $ | 2,140 | $ | 1,925 | $ | 1,965 | ||||||||||||
| Ratio of expenses to average net assets excluding fee waivers and reimbursements | 2.50 | %(e) | 3.97 | % | 3.51 | % | 3.69 | % | 4.54 | % | 4.11 | % | ||||||||||||
| Ratio of expenses to average net assets including fee waivers and reimbursements | 2.11 | %(e)(f) | 2.60 | % | 2.60 | % | 2.60 | % | 2.60 | % | 2.60 | % | ||||||||||||
| Ratio of net investment loss to average net assets | (1.49 | )%(e) | (1.47 | )% | (1.57 | )% | (1.48 | )% | (1.56 | )% | (1.67 | )% | ||||||||||||
| Portfolio turnover rate(g) | 53 | % | 56 | % | 24 | % | 30 | % | 23 | % | 58 | % | ||||||||||||
| (a) | Per share amounts and ratios to average net assets include income and expenses of the Kotak Mauritius Portfolio (wholly-owned subsidiary). |
| (b) | Calculated using the average shares method. |
| (c) | Less than $0.005 or ($0.005) per share. |
| (d) | Total returns are for the period indicated and have not been annualized. Total returns would have been lower had certain expenses not been waived during the period. Returns shown do not reflect the deduction of taxes that a shareholder would pay on Fund distributions or the redemption of Fund shares. Returns shown exclude any applicable sales charges. |
| (e) | Annualized. |
| (f) | Effective December 2, 2019, the net expense limitation agreement changed from 1.60% to 1.00%. Refer to Note 8. |
| (g) | Portfolio turnover rate for periods less than one full year have not been annualized. |
See Notes to Financial Statements.
| 34 | | April 30, 2020 |
ALPS | Kotak India Growth Fund – Class I
Consolidated Financial Highlights
Selected data for a share of beneficial interest outstanding throughout the periods indicated:
| For the Six Months Ended April 30, 2020 (Unaudited) | For the Year Ended October 31, 2019 | For the Year Ended October 31, 2018 | For the Year Ended October 31, 2017 | For the Year Ended October 31, 2016 | For the Year Ended October 31, 2015 | |||||||||||||||||||
| Net asset value, beginning of period(a) | $ | 13.43 | $ | 12.05 | $ | 14.87 | $ | 12.58 | $ | 12.76 | $ | 13.29 | ||||||||||||
| INCOME/(LOSS) FROM INVESTMENT OPERATIONS: | ||||||||||||||||||||||||
| Net investment loss(b) | (0.03 | ) | (0.05 | ) | (0.08 | ) | (0.06 | ) | (0.06 | ) | (0.09 | ) | ||||||||||||
| Net realized and unrealized gain/(loss) | (2.75 | ) | 2.23 | (2.33 | ) | 2.48 | 1.49 | 0.06 | ||||||||||||||||
| Total from investment operations | (2.78 | ) | 2.18 | (2.41 | ) | 2.42 | 1.43 | (0.03 | ) | |||||||||||||||
| DISTRIBUTIONS: | ||||||||||||||||||||||||
| From net investment income | – | – | – | – | – | (0.13 | ) | |||||||||||||||||
| From net realized gains | (0.17 | ) | (0.80 | ) | (0.41 | ) | (0.14 | ) | (1.61 | ) | (0.38 | ) | ||||||||||||
| Total distributions | (0.17 | ) | (0.80 | ) | (0.41 | ) | (0.14 | ) | (1.61 | ) | (0.51 | ) | ||||||||||||
| REDEMPTION FEES ADDED TO PAID-IN CAPITAL (NOTE 6) | 0.00 | (c) | – | 0.00 | (c) | 0.01 | 0.00 | (c) | 0.01 | |||||||||||||||
| Net increase/(decrease) in net asset value | (2.95 | ) | 1.38 | (2.82 | ) | 2.29 | (0.18 | ) | (0.53 | ) | ||||||||||||||
| Net asset value, end of period | $ | 10.48 | $ | 13.43 | $ | 12.05 | $ | 14.87 | $ | 12.58 | $ | 12.76 | ||||||||||||
| TOTAL RETURN(d) | (20.97 | )% | 18.85 | % | (16.66 | )% | 19.68 | % | 13.70 | % | (0.23 | )% | ||||||||||||
| RATIOS/SUPPLEMENTAL DATA: | ||||||||||||||||||||||||
| Net assets, end of period (000s) | $ | 18,015 | $ | 21,989 | $ | 13,746 | $ | 19,891 | $ | 9,772 | $ | 8,567 | ||||||||||||
| Ratio of expenses to average net assets excluding fee waivers and reimbursements | 1.50 | %(e) | 2.93 | % | 2.48 | % | 2.65 | % | 3.54 | % | 3.10 | % | ||||||||||||
| Ratio of expenses to average net assets including fee waivers and reimbursements | 1.12 | %(e)(f) | 1.60 | % | 1.60 | % | 1.60 | % | 1.60 | % | 1.60 | % | ||||||||||||
| Ratio of net investment loss to average net assets | (0.52 | )%(e) | (0.39 | )% | (0.57 | )% | (0.45 | )% | (0.56 | )% | (0.67 | )% | ||||||||||||
| Portfolio turnover rate(g) | 53 | % | 56 | % | 24 | % | 30 | % | 23 | % | 58 | % | ||||||||||||
| (a) | Per share amounts and ratios to average net assets include income and expenses of the Kotak Mauritius Portfolio (wholly-owned subsidiary). |
| (b) | Calculated using the average shares method. |
| (c) | Less than $0.005 or ($0.005) per share. |
| (d) | Total returns are for the period indicated and have not been annualized. Total returns would have been lower had certain expenses not been waived during the period. Returns shown do not reflect the deduction of taxes that a shareholder would pay on Fund distributions or the redemption of Fund shares. |
| (e) | Annualized. |
| (f) | Effective December 2, 2019, the net expense limitation agreement changed from 1.60% to 1.00%. Refer to Note 8. |
| (g) | Portfolio turnover rate for periods less than one full year have not been annualized. |
See Notes to Financial Statements.
| 35 | | April 30, 2020 |
ALPS | Kotak India Growth Fund – Class II
Consolidated Financial Highlights
Selected data for a share of beneficial interest outstanding throughout the periods indicated:
| For the Period December 19, 2019 (Commencement of Operations) to April 30, 2020 | ||||
| Net asset value, beginning of period(a) | $ | 13.50 | ||
| INCOME FROM INVESTMENT OPERATIONS: | ||||
| Net investment income(b) | 0.01 | |||
| Net realized and unrealized loss | (3.02 | ) | ||
| Total from investment operations | (3.01 | ) | ||
| Net (decrease) in net asset value | (3.01 | ) | ||
| Net asset value, end of period | $ | 10.49 | ||
| TOTAL RETURN(c) | (22.30 | )% | ||
| RATIOS/SUPPLEMENTAL DATA: | ||||
| Net assets, end of period (000s) | $ | 109,197 | ||
| Ratio of expenses to average net assets excluding fee waivers and reimbursements | 1.08 | %(d) | ||
| Ratio of expenses to average net assets including fee waivers and reimbursements | 0.75 | %(d) | ||
| Ratio of net investment income to average net assets | 0.21 | %(d) | ||
| Portfolio turnover rate(e) | 53 | % | ||
| (a) | Per share amounts and ratios to average net assets include income and expenses of the Kotak Mauritius Portfolio (wholly-owned subsidiary). |
| (b) | Calculated using the average shares method. |
| (c) | Total returns are for the period indicated and have not been annualized. Total returns would have been lower had certain expenses not been waived during the period. Returns shown do not reflect the deduction of taxes that a shareholder would pay on Fund distributions or the redemption of Fund shares. |
| (d) | Annualized. |
| (e) | Portfolio turnover rate for periods less than one full year have not been annualized. |
See Notes to Financial Statements.
| 36 | | April 30, 2020 |
ALPS | Smith Funds
| Management Commentary | April 30, 2020 (Unaudited) |
Dear Shareholder,
Performance Commentary as of 04/30/2020
Total Return
The ALPS l Smith Total Return Bond Fund I Share underperformed the Bloomberg Barclays U.S. Aggregate Index by 163 bps in the six-months ended April 30, 2020, and outperformed by 53 bps since the inception of the Fund on June 29, 2018. The outperformance since inception was achieved by focusing on active portfolio positioning, duration management, security selection, and bottom-up fundamental credit analysis. Recent underperformance has been a result of the substantial revaluation in risk assets.
Short Duration
The ALPS l Smith Short Duration Bond Fund I Share outperformed the Bloomberg Barclays 1-3 Year U.S. Government/Credit Index by 16bps in the six-months ended April 30, 2020, and by 29 bps since the inception of the Fund on June 29, 2018. During the six-months ended April 30, 2020, the allocation to corporate and securitized assets allowed the Fund to out-yield the index. The Fund maintained its' focus on capital preservation as both U.S. Treasury interest rates and credit spreads marked extreme volatility due to multiple fear and risk-off moves followed by a return to risk.
Portfolio Positioning
In the short-term, we remain nimble regarding the Funds’ positioning in U.S. Treasuries as very low absolute yield levels, uncertain economic prospects, and the wildcard of the derivative impacts of the Federal Reserve’s new policies and facilities on the market are leading to unprecedented levels of volatility. We are also focused on the shape of the curve as the front-end is extremely flat but concerns about inflation due to Government Debt levels may be gathering and will eventually impact longer duration Treasuries.
Our corporate credit allocation increased from both a weighting and a duration standpoint in both Funds. This was focused during the latter part of March as volatility and global economic recession fears triggered substantial credit spread widening allowing for opportunities to invest in high-quality corporate paper at credit spreads not seen since the Great Finance Crises, if ever. As a part of this, we focused on increasing the credit quality, reducing the economic cyclicality, and increasing the trading liquidity profile of our credit exposure. We remain dedicated to finding risk-adjusted return profiles from specific bonds within individual companies who are focused on reducing leverage and debtholder friendly activity. We continue to see a large divergence in management team behavior and views amid the rapidly changing market and economic environment, surrounding the use of debt and what is a conservative capital allocation policy. However, we feel this volatility will bring Corporate Manager’s focus back to the quality of their balance sheets, leading to a renewed focus on deleveraging and other debtholder friendly activities as a way to potentially increase value for equity holders as well. The Federal Reserve’s support of credit markets is another tailwind for this positioning.
Within the securitized allocation in the Funds, we continue to allocate money to agency-mortgage-backed collateralized mortgage obligations (CMOs). We find that select CMOs provide better
convexity, exhibit less change in duration given changes in interest rates and prepayment speeds, and provide higher option-adjusted spreads and yield. In this current climate of uncertainty, mortgage prepayment and default assumptions are very uncertain, thus we focus on selecting securities that perform well through a wide band of underlying assumptions rather than a specific directional view.
Commentary:
The semi-annual period was marked by two completely different markets, beginning with a period of sustained, aggressive rallying for risk assets from November 2019 through the end of February and concluding with COVID-19 bringing global closures and now a global recession. The first half saw very low volatility with what was noted as a “supportive Federal Reserve” and the fading of many uncertainties plaguing 2019 including Trade, a recovery that was nearing exhaustion and global noise. The economic environment still looked resilient and the U.S. was in a position of strength globally. Domestic credit was the beneficiary of foreign flows as the U.S. was in a stronger position from a growth standpoint than other developed markets. U.S. companies had the advantage of still historically low rates and could refinance at attractive levels. The decline in volatility was a boon to mortgage securities as that in combination with a slower period of seasonal refinancing activity helped spreads reverse course from their widening in the previous period. Additionally, continued overseas flows into the U.S. fixed income market and the lower yield environment post the large rally in U.S. Treasuries in 3Q 2019 led to a large demand for most spread assets helping both securitized and credit spreads tighten. The Fund was able to benefit from this as the longer duration position in CMOs and overweight in credit added to the performance of the Fund.
The second half of the period has been marked by the COVID-19 Pandemic, extreme volatility, risk-off in markets, global recession and unprecedented economic uncertainty, a rotation to safe-haven assets, and what we are calling “The Great Reset.” It has not been enough to have a once in a lifetime global pandemic shutting the global economy; the markets faced a global oil price war at the same time. Due to the combination of COVID-19 and its impact on global economies and the repricing of oil, we have witnessed a dramatic and sharp repricing of risk assets. As of March, the Federal Reserve cut the Fed Funds Rates to a range of 0.00%-0.25% over two emergency meetings, restarted Quantitative Easing (QE) and brought $2.3 trillion of loans to the markets through an alphabet soup of programs implemented to calm the market, assist households, support credit market liquidity, aid small and mid-sized businesses as well as state and local governments during the COVID-19 pandemic. Chairman Powell clearly stated that the Fed will do everything in their power to support those that are most vulnerable. Congress has also passed three phases of emergency stimulus, pumping over $2 trillion into the economy. The largest economic relief package in the history of the U.S. will support direct payments to Americans, provide additional support for social safety programs, targeted industry relief, provide spending for additional medical support, and expand loans to small businesses.
Throughout the second half of this semi-annual period, U.S. Treasury interest rates saw the 2-yr yield collapse to ~20 bps, nearly aligned with the upper bound of the Fed Funds Rate. The 10-yr
| 37 | | April 30, 2020 |
ALPS | Smith Funds
| Management Commentary | April 30, 2020 (Unaudited) |
yield fell ~140 bps throughout the period while the 30-yr yield fell ~143 bps before the Fed stabilized the market. The Fed’s newly announced programs also stabilized credit markets: stemming outflows from fixed income exchange-traded funds (ETFs) as the Primary and Secondary Credit facilities established by the Fed were targeted to maintain liquidity and availability of credit to domestic issuers. Additionally, the Fed intervened in the securitized markets with direct QE purchases of Agency guaranteed Residential Mortgage-Backed Securities (RMBS) and Commercial Mortgage-Backed Securities (CMBS) as well as bringing the Term Asset-Backed Securities Loan (TALF) program back to life to spur investment in high-quality traditional segments of the Asset-Backed Security (ABS) market.
This intervention from the Federal Reserve helped stabilize fixed income markets globally as investors were able to look beyond contagion and quarantine fears. Risk assets staged a sharp recovery after the plunge in early March, but valuations remain much less expensive as opposed to where markets were trading the first two months of the year. For the first two months of the year, the fund saw a benefit from its long U.S. Treasury allocation, longer duration positioning in mortgages via CMOs, and overweight positioning in credit. However, March was a different story. The Fund’s short-term performance was hurt by an underweight in duration as risk-free assets rallied tremendously on the back of global contagion and economic fears and the resulting Central Bank support actions. Credit underwent significant weakness with macroeconomic uncertainty and despite the recovery in risk assets the last two weeks of the month, credit still exhibited significant underperformance vs. U.S. Treasuries, hurting the relative performance of the fund.
The unprecedented volatility, market and economic uncertainty, reopening efforts and eventual recovery force us into daily reevaluation and reconsideration of the outcomes. We continue to go back to our fundamentals, relying on our investment process which starts with bottom up analysis. Our two core tenets – risk adjusted returns and preservation of capital – have taken on an even more important meaning during this time. We thank you for the confidence you have placed with us as shareholders of the Funds and we look forward to continuing to serve you and to meet your fixed income needs.
Sincerely,
 |  |
| R. Gibson Smith | Eric C. Bernum, CFA |
| Portfolio Manager | Portfolio Manager |
Past performance is no guarantee of future results. Dividends are not guaranteed and are subject to change or elimination. Investments in international and emerging markets securities include exposure to risks such as currency fluctuations, foreign taxes and regulations, and the potential for illiquid markets and political instability.
The views of the author and information discussed in this commentary are as of the date of publication, are subject to change, and may not reflect the writer's current views. The views expressed are those of the author only, and represent an assessment of market conditions at a specific point in time, are opinions only and should not be relied upon as investment advice regarding a particular investment or markets in general. Such information does not constitute a recommendation to buy or sell specific securities or investment vehicles. It should not be assumed that any investment will be profitable or will equal the performance of the fund(s) or any securities or any sectors mentioned in this letter. The subject matter contained in this letter has been derived from several sources believed to be reliable and accurate at the time of compilation. Neither ALPS Advisors, Inc., Smith Capital Investors, LLC, nor the Funds accepts any liability for losses either direct or consequential caused by the use of this information.
Indices do not reflect deductions for fees, expenses, or taxes.
An investor may not invest directly in an index.
Diversification cannot guarantee gain or prevent losses.
Gibson Smith is a registered representative of ALPS Distributors, Inc.
Eric Bernum is a registered representative of ALPS Distributors, Inc.
ALPS Portfolio Solutions Distributor, Inc., ALPS Distributors, Inc. and ALPS Advisors Inc. are affiliated.
| 38 | | April 30, 2020 |
ALPS | Smith Short Duration Bond Fund
| Performance Update | April 30, 2020 (Unaudited) |
Performance of $100,000 Initial Investment (as of April 30, 2020)
Comparison of change in value of a $100,000 investment
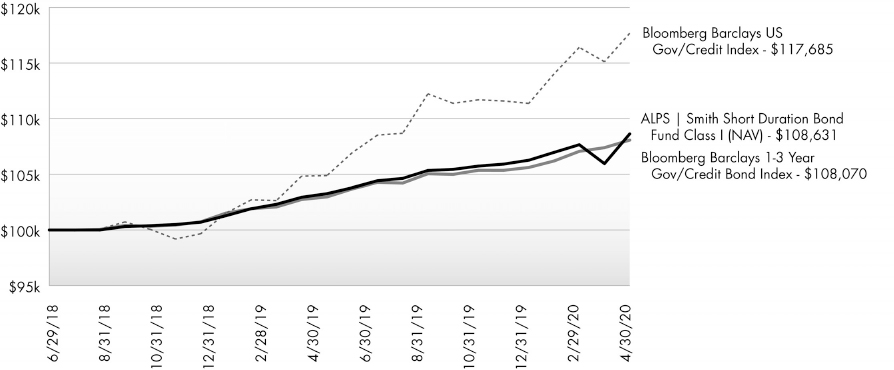
The chart above represents historical performance of a hypothetical investment of $100,000 in the Fund since inception. Past performance does not guarantee future results. This chart does not reflect the deduction of taxes that a shareholder would pay on Fund distributions or the redemption of Fund shares.
Average Annual Total Returns (as of April 30, 2020)
| 6 Month | 1 Year | Since Inception^ | Total Expense Ratio | What You Pay* | |
| Class I | 2.74% | 5.19% | 4.61% | 0.82% | 0.49% |
| Investor (NAV) | 2.60% | 4.90% | 4.30% | 1.13% | 0.79% |
| Class A (NAV) | 2.60% | 4.90% | 4.27% | 1.14% | 0.79% |
| Class A (MOP) | -3.08% | -0.88% | 1.12% | ||
| Class C (NAV) | 2.24% | 4.16% | 3.55% | 1.83% | 1.49% |
| Class C (CDSC) | 1.24% | 3.16% | 3.55% | ||
| Bloomberg Barclays U.S. Government/Credit Bond Index¹ | 5.36% | 12.21% | 9.28% | ||
| Bloomberg Barclays 1-3 Year Government/Credit Bond Index² | 2.58% | 4.95% | 4.32% |
Performance data quoted represents past performance. Past performance does not guarantee future results. Investment return and principal value of an investment will fluctuate so that an investor's shares, when sold or redeemed, may be worth more or less than the original cost. Current performance data may be higher or lower than actual data quoted. For the most current month-end performance data, please call 1-866-759-5679.
Maximum Offering Price (MOP) for Class A shares includes the Fund’s maximum sales charge of 5.50%. Performance shown at NAV does not include these sales charges and would have been lower had it been taken into account. If you invest $1 million or more, either as a lump sum or through the Fund’s accumulation or letter of intent programs, you can purchase Class A shares without an initial sales charge (load). A Contingent Deferred Sales Charge (“CDSC”) of 1.00% may apply to Class C shares redeemed within the first 12 months after a purchase, and on Class A shares redeemed within the first 18 months after a purchase in excess of $1 million.
Performance less than 1 year is cumulative.
| 39 | | April 30, 2020 |
ALPS | Smith Short Duration Bond Fund
| Performance Update | April 30, 2020 (Unaudited) |
| 1 | The Bloomberg Barclays US Government/Credit Index: composed of all publicly issued, fixed-rate, nonconvertible, investment-grade corporate debt. Issues are rated at least Baa by Moody's Investors Service or BBB by Standard & Poor's, if unrated by Moody's. Collateralized Mortgage Obligations (CMOs) are not included. Total return comprises price appreciation/depreciation and income as a percentage of the original investment. The index is not actively managed and does not reflect any deductions for fees, expenses or taxes. An investor may not invest directly in an index. |
| 2 | The Bloomberg Barclays 1-3 Yr US Gov/Credit TR Index Unhedged: an index that includes all medium and larger issues of U.S. government, investment-grade corporate, and investment-grade international dollar-denominated bonds that have maturities of between 1 and 3 years and are publicly issued. The index is not actively managed and does not reflect any deductions for fees, expenses or taxes. An investor may not invest directly in an index. |
| ^ | Fund Inception date of June 29, 2018. |
| * | What You Pay reflects the Advisor’s decision to contractually limit expenses through February 28, 2021. Please see the prospectus dated February 28, 2020 for additional information. |
The table does not reflect the deduction of taxes that a shareholder would pay on Fund distributions or the redemption of Fund shares.
This Fund is not suitable for all investors, and is subject to investment risks, including possible loss of the principal amount invested.
There is no guarantee that the Fund will continue to hold any one particular security or stay invested in any one particular company. The composition of the Fund's top holdings is subject to change. Performance figures are historical and reflect the change in share price, reinvested distributions, changes in net asset value, sales charges and capital gains distributions, if any.
Not FDIC Insured – No Bank Guarantee – May Lose Value
| Asset Type Allocation (as a % of Net Assets) † | |
| Corporate Bond | 72.64% |
| Government Bond | 14.30% |
| Collateralized Mortgage Obligations | 5.48% |
| Mortgage-Backed Securities | 5.48% |
| Commercial Mortgage-Backed Securities | 1.39% |
| Cash, Cash Equivalents, & Other Net Assets | 0.71% |
| Total | 100.00% |
| † | Holdings are subject to change, and may not reflect the current or future position of the portfolio. Table presents approximate values only. |
| Top Ten Holdings (as a % of Net Assets) † | |
| U.S. Treasury Note 0.375% 03/31/2022 | 5.37% |
| U.S. Treasury Note 1.375% 02/15/2023 | 3.84% |
| Fannie Mae Pool 2.71% 12/01/2023 | 2.94% |
| U.S. Treasury Note 1.125% 02/28/2022 | 2.23% |
| Microchip Technology, Inc. 3.922% 06/01/2021 | 1.83% |
| Edison International 4.95% 04/15/2025 | 1.78% |
| Goldman Sachs Group, Inc. 3.5% 04/01/2025 | 1.77% |
| State Street Corp. 1D US SOFR + 2.69% 03/30/2023 | 1.68% |
| JPMorgan Chase & Co. 1D US SOFR + 1.85% 04/22/2026 | 1.66% |
| VF Corp. 2.05% 04/23/2022 | 1.65% |
| Top Ten Holdings | 24.75% |
| † | Holdings are subject to change, and may not reflect the current or future position of the portfolio. Table presents approximate values only. |
| Industry Sector Allocation (as a % of Net Assets) | |
| Sovereign | 14.30% |
| Mortgage Securities | 12.35% |
| Financial Services | 11.92% |
| Banks | 10.09% |
| Utilities | 5.57% |
| Pharmaceuticals | 3.82% |
| Chemicals | 3.55% |
| Diversified Banks | 3.38% |
| Aerospace & Defense | 3.30% |
| Food & Beverage | 3.21% |
| Health Care Facilities & Services | 2.55% |
| Refining & Marketing | 2.53% |
| Consumer Finance | 2.34% |
| Pipeline | 2.27% |
| Semiconductors | 2.26% |
| Automobiles Manufacturing | 2.07% |
| Apparel & Textile Products | 1.65% |
| Airlines | 1.63% |
| Cable & Satellite | 1.60% |
| Integrated Oils | 1.48% |
| Department Stores | 1.40% |
| Electrical Equipment Manufacturing | 1.12% |
| Wireless Telecommunications Services | 1.01% |
| Retail - Consumer Discretionary | 0.89% |
| Biotechnology | 0.87% |
| Hardware | 0.87% |
| Entertainment Content | 0.42% |
| Medical Equipment & Devices Manufacturing | 0.36% |
| Consumer Products | 0.26% |
| Entertainment Resources | 0.17% |
| Transportation & Logistics | 0.05% |
| Cash Equivalents & Other Net Assets | 0.71% |
| Total | 100.00% |
| 40 | | April 30, 2020 |
ALPS | Smith Total Return Bond Fund
| Performance Update | April 30, 2020 (Unaudited) |
Performance of $100,000 Initial Investment (as of April 30, 2020)
Comparison of change in value of a $100,000 investment

The chart above represents historical performance of a hypothetical investment of $100,000 in the Fund since inception. Past performance does not guarantee future results. This chart does not reflect the deduction of taxes that a shareholder would pay on Fund distributions or the redemption of Fund shares.
Average Annual Total Returns (as of April 30, 2020)
| 6 Month+ | 1 Year | Since Inception^ | Total Expense Ratio | What You Pay* | |
| Class I | 3.23% | 9.02% | 8.96% | 0.76% | 0.67% |
| Investor (NAV) | 3.17% | 8.71% | 8.66% | 1.08% | 0.97% |
| Class A (NAV) | 3.17% | 8.71% | 8.69% | 1.07% | 0.97% |
| Class A (MOP) | -2.51% | 2.75% | 5.40% | ||
| Class C (NAV) | 2.82% | 7.94% | 7.92% | 1.79% | 1.67% |
| Class C (CDSC) | 1.82% | 6.94% | 7.92% | ||
| Bloomberg Barclays US Aggregate Bond Index1 | 4.86% | 10.84% | 8.43% |
Performance data quoted represents past performance. Past performance does not guarantee future results. Investment return and principal value of an investment will fluctuate so that an investor's shares, when sold or redeemed, may be worth more or less than the original cost. Current performance data may be higher or lower than actual data quoted. For the most current month-end performance data, please call 1-866-759-5679.
Maximum Offering Price (MOP) for Class A shares includes the Fund’s maximum sales charge of 5.50%. Performance shown at NAV does not include these sales charges and would have been lower had it been taken into account. If you invest $1 million or more, either as a lump sum or through the Fund’s accumulation or letter of intent programs, you can purchase Class A shares without an initial sales charge (load). A Contingent Deferred Sales Charge (“CDSC”) of 1.00% may apply to Class C shares redeemed within the first 12 months after a purchase, and on Class A shares redeemed within the first 18 months after a purchase in excess of $1 million.
Performance less than 1 year is cumulative.
| 41 | | April 30, 2020 |
ALPS | Smith Total Return Bond Fund
| Performance Update | April 30, 2020 (Unaudited) |
| 1 | The Bloomberg Barclays U.S. Aggregate Bond Index is a broad-based benchmark that measures the investment grade, U.S. dollar-denominated,fixed-rate taxable bond market, including Treasuries, government-related and corporate securities, MBS (agency fixed-rate and hybrid ARM passthroughs), ABS, and CMBS. The index is not actively managed and does not reflect any deductions for fees, expenses or taxes. An investor may not invest directly in an index. |
| ^ | Fund Inception date of June 29, 2018. |
| * | What You Pay reflects the Advisor’s decision to contractually limit expenses through February 28, 2021. Please see the prospectus dated February 28, 2020 for additional information. |
| + | Excludes adjustments in accordance with accounting principles generally accepted in the United States of America and as such, the net asset value and total return for shareholder transactions reported to the market may differ from the net asset value for financial reporting purposes. |
The table does not reflect the deduction of taxes that a shareholder would pay on Fund distributions or the redemption of Fund shares.
This Fund is not suitable for all investors, and is subject to investment risks, including possible loss of the principal amount invested.
There is no guarantee that the Fund will continue to hold any one particular security or stay invested in any one particular company. The composition of the Fund's top holdings is subject to change. Performance figures are historical and reflect the change in share price, reinvested distributions, changes in net asset value, sales charges and capital gains distributions, if any. Not FDIC Insured – No Bank Guarantee – May Lose Value
| Asset Type Allocation (as a % of Net Assets) † | |
| Corporate Bond | 55.83% |
| Government Bond | 29.25% |
| Collateralized Mortgage Obligations | 9.05% |
| Mortgage-Backed Securities | 2.49% |
| Preferred Stock | 1.40% |
| Commercial Mortgage-Backed Securities | 1.25% |
| Cash, Cash Equivalents, & Other Net Assets | 0.73% |
| Total | 100.00% |
| † | Holdings are subject to change, and may not reflect the current or future position of the portfolio. Table presents approximate values only. |
| Top Ten Holdings (as a % of Net Assets) † | |
| U.S. Treasury Bond 2% 02/15/2050 | 4.37% |
| U.S. Treasury Note 0.5% 03/31/2025 | 2.87% |
| U.S. Treasury Note 1.5% 02/15/2030 | 2.77% |
| U.S. Treasury Note 1.75% 12/31/2024 | 2.71% |
| U.S. Treasury Note 1.125% 02/28/2025 | 2.64% |
| U.S. Treasury Bond 2.375% 11/15/2049 | 1.97% |
| U.S. Treasury Note 2.125% 02/29/2024 | 1.94% |
| U.S. Treasury Note 1.625% 10/31/2023 | 1.94% |
| U.S. Treasury Note 0.375% 03/31/2022 | 1.87% |
| U.S. Treasury Note 0.5% 03/15/2023 | 1.67% |
| Top Ten Holdings | 24.75% |
| † | Holdings are subject to change, and may not reflect the current or future position of the portfolio. Table presents approximate values only. |
| 42 | | April 30, 2020 |
ALPS | Smith Total Return Bond Fund
| Performance Update | April 30, 2020 (Unaudited) |
| Industry Sector Allocation (as a % of Net Assets) | |
| Sovereign | 29.25% |
| Mortgage Securities | 12.79% |
| Financial Services | 6.22% |
| Banks | 5.79% |
| Diversified Banks | 3.68% |
| Utilities | 3.46% |
| Aerospace & Defense | 3.10% |
| Health Care Facilities & Services | 2.87% |
| Pharmaceuticals | 2.69% |
| Wireless Telecommunications Services | 2.60% |
| Consumer Finance | 2.21% |
| Food & Beverage | 2.12% |
| Pipeline | 2.08% |
| Cable & Satellite | 1.61% |
| Semiconductors | 1.58% |
| Refining & Marketing | 1.38% |
| Chemicals | 1.12% |
| Financials | 1.11% |
| Automobiles Manufacturing | 1.10% |
| Consumer Products | 1.08% |
| Electrical Equipment Manufacturing | 0.88% |
| Department Stores | 0.82% |
| Medical Equipment & Devices Manufacturing | 0.77% |
| Integrated Oils | 0.75% |
| Retail - Consumer Discretionary | 0.74% |
| Biotechnology | 0.71% |
| Software & Services | 0.67% |
| Apparel & Textile Products | 0.64% |
| Airlines | 0.63% |
| Forest & Paper Products Manufacturing | 0.63% |
| Exploration & Production | 0.61% |
| Mass Merchants | 0.58% |
| Hardware | 0.47% |
| Consumer Services | 0.33% |
| Property & Casualty Insurance | 0.33% |
| Wireline Telecommunications Services | 0.33% |
| Supermarkets & Pharmacies | 0.32% |
| Communications | 0.29% |
| Transportation & Logistics | 0.19% |
| Restaurants | 0.18% |
| Commercial Finance | 0.17% |
| Machinery Manufacturing | 0.16% |
| Waste & Environment Services & Equipment | 0.16% |
| Retail - Consumer Staples | 0.04% |
| Entertainment Content | 0.03% |
| Cash Equivalents & Other Net Assets | 0.73% |
| Total | 100.00% |
| 43 | | April 30, 2020 |
ALPS | Smith Short Duration Bond Fund
| Statement of Investments | April 30, 2020 (Unaudited) |
| Principal Amount | Value (Note 2) | |||||||
| COLLATERALIZED MORTGAGE OBLIGATIONS (5.48%) | ||||||||
| Fannie Mae | ||||||||
| Series 1992-180, Class F, | ||||||||
| 1M US L + 1.15%, 10/25/2022(a) | $ | 12,905 | $ | 12,889 | ||||
| Series 1992-49, Class L, | ||||||||
| 7.000%, 04/25/2022 | 39,446 | 41,019 | ||||||
| Series 1992-52, Class FD, | ||||||||
| 1M US L + 0.02%, 09/25/2022(a) | 12,777 | 12,662 | ||||||
| Series 1992-62, Class FA, | ||||||||
| 1M US L + 0.90%, 10/25/2022(a) | 51,685 | 51,593 | ||||||
| Series 1992-73, Class FC, | ||||||||
| 1M US L + 0.75%, 05/25/2022(a) | 2,252 | 2,243 | ||||||
| Series 1992-8, Class FA, | ||||||||
| 1M US L + 0.83%, 01/25/2022(a) | 11,147 | 11,127 | ||||||
| Series 1992-89, Class FB, | ||||||||
| 1M US L + 0.50%, 06/25/2022(a) | 1,835 | 1,824 | ||||||
| Series 1992-91, Class F, | ||||||||
| 1M US L + 0.50%, 05/25/2022(a) | 4,062 | 4,049 | ||||||
| Series 1993-184, Class M, | ||||||||
| –%, 09/25/2023(b) | 19,446 | 19,111 | ||||||
| Series 1993-189, Class FB, | ||||||||
| 10Y US TI + -0.65%, | ||||||||
| 10/25/2023(a) | 11,039 | 10,831 | ||||||
| Series 1993-230, Class FA, | ||||||||
| 1M US L + 0.60%, 12/25/2023(a) | 53,378 | 52,913 | ||||||
| Series 1993-255, Class E, | ||||||||
| 7.100%, 12/25/2023 | 77,863 | 84,105 | ||||||
| Series 1993-27, Class FC, | ||||||||
| 1M US L + 0.90%, 08/25/2023(a) | 5,735 | 5,715 | ||||||
| Series 1993-31, Class PN, | ||||||||
| 7.000%, 09/25/2023 | 163,213 | 175,484 | ||||||
| Series 1993-97, Class FA, | ||||||||
| 1M US L + 1.25%, 05/25/2023(a) | 11,532 | 11,407 | ||||||
| Series 1994-18, Class FA, | ||||||||
| 1M US L + 0.60%, 02/25/2024(a) | 20,196 | 20,014 | ||||||
| Series 1994-22, Class F, | ||||||||
| 1M US L + 1.20%, 01/25/2024(a) | 125,676 | 126,750 | ||||||
| Series 1994-3, Class FB, | ||||||||
| 1M US L + 0.65%, 01/25/2024(a) | 23,536 | 23,341 | ||||||
| Series 1994-3, Class FA, | ||||||||
| 1M US L + 0.65%, 03/25/2024(a) | 9,639 | 9,572 | ||||||
| Series 1994-61, Class E, | ||||||||
| 7.500%, 04/25/2024 | 69,195 | 74,724 | ||||||
| Series 1994-75, Class K, | ||||||||
| 7.000%, 04/25/2024 | 39,007 | 42,471 | ||||||
| Series 1994-77, Class FB, | ||||||||
| 1M US L + 1.50%, 04/25/2024(a) | 75,812 | 76,030 | ||||||
| Series 1997-12, Class FA, | ||||||||
| 1M US L + 1.00%, 04/18/2027(a) | 39,870 | 39,616 | ||||||
| Series 1997-49, Class F, | ||||||||
| 1M US L + 0.50%, 06/17/2027(a) | 53,719 | 52,849 | ||||||
| Series 2003-39, Class PG, | ||||||||
| 5.500%, 05/25/2023 | 63,820 | 66,660 | ||||||
| Series 2003-49, Class YC, | ||||||||
| 4.000%, 06/25/2023 | 36,626 | 37,805 | ||||||
| Principal Amount | Value (Note 2) | |||||||
| Series 2004-53, Class NC, | ||||||||
| 5.500%, 07/25/2024 | $ | 26,230 | $ | 27,691 | ||||
| Series 2004-95, Class AK, | ||||||||
| 5.500%, 01/25/2025 | 33,961 | 36,216 | ||||||
| Series 2005-121, Class DY, | ||||||||
| 5.500%, 01/25/2026 | 33,323 | 35,785 | ||||||
| Series 2006-22, Class CE, | ||||||||
| 4.500%, 08/25/2023 | 20,184 | 21,084 | ||||||
| Series 2009-90, Class BD, | ||||||||
| 3.500%, 11/25/2024 | 9,374 | 9,377 | ||||||
| Series 2010-112, Class GA, | ||||||||
| 2.000%, 06/25/2021 | 85 | 85 | ||||||
| Series 2010-145, Class MA, | ||||||||
| 2.000%, 12/25/2020 | 1,245 | 1,248 | ||||||
| Series 2010-87, Class HB, | ||||||||
| 3.000%, 03/25/2025 | 1,328 | 1,327 | ||||||
| Series 2011-104, Class DA, | ||||||||
| 2.000%, 10/25/2021 | 22,050 | 22,094 | ||||||
| Series 2011-40, Class KA, | ||||||||
| 3.500%, 03/25/2026 | 92,161 | 99,092 | ||||||
| Series 2011-44, Class EB, | ||||||||
| 3.000%, 05/25/2026 | 64,035 | 66,593 | ||||||
| Series 2011-5, Class PA, | ||||||||
| 4.000%, 10/25/2025 | 11,009 | 11,087 | ||||||
| Series 2011-66, Class QE, | ||||||||
| 2.000%, 07/25/2021 | 556 | 558 | ||||||
| Series 2012-1, Class GB, | ||||||||
| 2.000%, 02/25/2022 | 16,848 | 16,970 | ||||||
| 1,416,011 | ||||||||
| Freddie Mac | ||||||||
| Series 1991-1069, Class J, | ||||||||
| 6.950%, 04/15/2021 | 4,908 | 5,022 | ||||||
| Series 1991-1155, Class KZ, | ||||||||
| 7.000%, 10/15/2021 | 5,043 | 5,109 | ||||||
| Series 1992-1242, Class C, | ||||||||
| 1M US L + 0.55%, 04/15/2022(a) | 6,094 | 6,062 | ||||||
| Series 1993-1487, Class O, | ||||||||
| 1M US L + 0.75%, 03/15/2023(a) | 18,846 | 18,747 | ||||||
| Series 1993-1534, Class J, | ||||||||
| 1M US L + 0.90%, 06/15/2023(a) | 30,714 | 30,579 | ||||||
| Series 1993-1560, Class Z, | ||||||||
| 7.000%, 08/15/2023 | 24,010 | 25,411 | ||||||
| Series 1993-1567, Class A, | ||||||||
| 1M US L + 0.40%, 08/15/2023(a) | 84,821 | 83,892 | ||||||
| Series 1993-1584, Class L, | ||||||||
| 6.500%, 09/15/2023 | 40,337 | 43,220 | ||||||
| Series 1993-1602, Class PJ, | ||||||||
| 6.500%, 10/15/2023 | 52,724 | 55,925 | ||||||
| Series 1993-1611, Class Z, | ||||||||
| 6.500%, 11/15/2023 | 23,347 | 25,145 | ||||||
| Series 1993-1628, Class LZ, | ||||||||
| 6.500%, 12/15/2023 | 14,208 | 15,213 | ||||||
| Series 1993-1630, Class PK, | ||||||||
| 6.000%, 11/15/2023 | 28,536 | 30,409 | ||||||
| Series 1993-1632, Class FB, | ||||||||
| 1M US L + 1.20%, 11/15/2023(a) | 33,997 | 34,261 | ||||||
| 44 | | April 30, 2020 |
ALPS | Smith Short Duration Bond Fund
| Statement of Investments | April 30, 2020 (Unaudited) |
| Principal Amount | Value (Note 2) | |||||||
| Series 1993-1636, Class F, | ||||||||
| 1M US L + 0.65%, 11/15/2023(a) | $ | 11,445 | $ | 11,357 | ||||
| Series 1993-21, Class F, | ||||||||
| 1M US L + 0.50%, 10/25/2023(a) | 34,682 | 34,357 | ||||||
| Series 1993-24, Class FJ, | ||||||||
| 1M US L + 0.50%, 11/25/2023(a) | 154,757 | 153,278 | ||||||
| Series 1994-1673, Class FB, | ||||||||
| 10Y US TI + -0.50%, | ||||||||
| 02/15/2024(a) | 12,392 | 12,266 | ||||||
| Series 1994-1699, Class FB, | ||||||||
| 1M US L + 1.00%, 03/15/2024(a) | 18,983 | 18,936 | ||||||
| Series 1994-1707, Class F, | ||||||||
| 1M US L + 0.70%, 03/15/2024(a) | 26,709 | 26,510 | ||||||
| Series 1994-1744, Class FD, | ||||||||
| 1M US L + 1.98%, 08/15/2024(a) | 64,389 | 65,134 | ||||||
| Series 1994-32, Class PN, | ||||||||
| 7.500%, 04/25/2024 | 226,955 | 247,111 | ||||||
| Series 1994-43, Class PH, | ||||||||
| 6.500%, 10/17/2024 | 41,054 | 44,116 | ||||||
| Series 1996-1885, Class FA, | ||||||||
| 1M US L + 0.45%, 09/15/2026(a) | 13,008 | 12,792 | ||||||
| Series 1997-1983, Class Z, | ||||||||
| 6.500%, 12/15/2023 | 22,861 | 24,586 | ||||||
| Series 2002-2411, Class FT, | ||||||||
| 1M US L + 0.25%, 06/15/2021(a) | 2 | 2 | ||||||
| Series 2002-2528, Class KM, | ||||||||
| 5.500%, 11/15/2022 | 66,597 | 69,160 | ||||||
| Series 2003-2634, Class PT, | ||||||||
| 5.000%, 06/15/2023 | 22,446 | 23,445 | ||||||
| Series 2004-2877, Class AL, | ||||||||
| 5.000%, 10/15/2024 | 8,530 | 8,997 | ||||||
| Series 2005-3005, Class ED, | ||||||||
| 5.000%, 07/15/2025 | 48,086 | 51,397 | ||||||
| Series 2006-3104, Class DH, | ||||||||
| 5.000%, 01/15/2026 | 63,469 | 68,481 | ||||||
| Series 2009-3575, Class EB, | ||||||||
| 4.000%, 09/15/2024 | 17,423 | 18,331 | ||||||
| Series 2010-3645, Class EH, | ||||||||
| 3.000%, 12/15/2020 | 4,301 | 4,303 | ||||||
| Series 2010-3661, Class B, | ||||||||
| 4.000%, 04/15/2025 | 32,316 | 34,191 | ||||||
| Series 2010-3670, Class LX, | ||||||||
| 2.000%, 05/15/2025 | 11,587 | 11,594 | ||||||
| Series 2010-3710, Class MG, | ||||||||
| 4.000%, 08/15/2025(c) | 44,597 | 47,961 | ||||||
| Series 2010-3737, Class NA, | ||||||||
| 3.500%, 06/15/2025 | 25,329 | 25,916 | ||||||
| Series 2010-3766, Class HD, | ||||||||
| 2.500%, 11/15/2020 | 41,457 | 41,591 | ||||||
| Series 2010-3773, Class AK, | ||||||||
| 3.000%, 06/15/2025 | 44,530 | 44,619 | ||||||
| Series 2010-3779, Class KJ, | ||||||||
| 2.750%, 11/15/2025 | 91,249 | 93,953 | ||||||
| Series 2011-3829, Class BE, | ||||||||
| 3.500%, 03/15/2026 | 38,228 | 40,293 | ||||||
| Principal Amount | Value (Note 2) | |||||||
| Series 2011-3845, Class FQ, | ||||||||
| 1M US L + 0.25%, 02/15/2026(a) | $ | 17,457 | $ | 17,409 | ||||
| Series 2011-3872, Class ND, | ||||||||
| 2.000%, 12/15/2021 | 53,794 | 53,974 | ||||||
| Series 2011-3874, Class DW, | ||||||||
| 3.500%, 06/15/2021 | 61,169 | 61,798 | ||||||
| Series 2011-3907, Class FM, | ||||||||
| 1M US L + 0.35%, 05/15/2026(a) | 25,515 | 25,500 | ||||||
| Series 2012-4016, Class AB, | ||||||||
| 2.000%, 09/15/2025 | 58,753 | 58,995 | ||||||
| 1,831,348 | ||||||||
| Ginnie Mae | ||||||||
| Series 2010-101, Class GU, | ||||||||
| 4.000%, 08/20/2025(c) | 48,986 | 52,084 | ||||||
| Series 2013-53, Class KN, | ||||||||
| 1.500%, 08/20/2025 | 53,946 | 54,677 | ||||||
| 106,761 | ||||||||
| TOTAL COLLATERALIZED MORTGAGE OBLIGATIONS | ||||||||
| (Cost $3,306,310) | 3,354,120 | |||||||
| Principal Amount | Value (Note 2) | |||||||
| COMMERCIAL MORTGAGE-BACKED SECURITIES (1.39%) | ||||||||
| Fannie Mae-Aces | ||||||||
| Series 2012-M10, Class AFL, | ||||||||
| 1M US L + 0.45%, 09/25/2022(a) | 65,250 | 65,257 | ||||||
| Series 2013-M14, Class APT, | ||||||||
| 2.679%, 04/25/2023(a) | 14,300 | 14,795 | ||||||
| Series 2014-M12, Class FA, | ||||||||
| 1M US L + 0.30%, 10/25/2021(a) | 6,404 | 6,400 | ||||||
| Series 2016-M13, Class FA, | ||||||||
| 1M US L + 0.67%, 11/25/2023(a) | 46,048 | 46,080 | ||||||
| 132,532 | ||||||||
| Freddie Mac Multifamily | ||||||||
| Structured Pass Through | ||||||||
| Certificates | ||||||||
| Series 2011-K013, Class A1, | ||||||||
| 2.902%, 08/25/2020 | 12,200 | 12,218 | ||||||
| Series 2015-K721, Class A1, | ||||||||
| 2.610%, 01/25/2022 | 71,373 | 72,345 | ||||||
| Series 2015-KF07, Class A, | ||||||||
| 1M US L + 0.29%, 02/25/2025(a) | 39,258 | 38,986 | ||||||
| Series 2015-KF12, Class A, | ||||||||
| 1M US L + 0.70%, 09/25/2022(a) | 35,090 | 35,179 | ||||||
| Series 2016-KF14, Class A, | ||||||||
| 1M US L + 0.65%, 01/25/2023(a) | 19,419 | 19,447 | ||||||
| Series 2016-KJ08, Class A2, | ||||||||
| 2.356%, 08/25/2022 | 287,592 | 294,332 | ||||||
| Series 2017-J15L, Class AFL, | ||||||||
| 1M US L + 0.35%, 08/25/2025(a) | 26,681 | 26,311 | ||||||
| Series 2017-K728, Class A2, | ||||||||
| 3.064%, 08/25/2024(a) | 117,000 | 126,410 | ||||||
| 45 | | April 30, 2020 |
ALPS | Smith Short Duration Bond Fund
| Statement of Investments | April 30, 2020 (Unaudited) |
| Principal Amount | Value (Note 2) | |||||||
| Series 2018-KI02, Class A, | ||||||||
| 1M US L + 0.20%, 02/25/2021(a) | $ | 90,767 | $ | 90,674 | ||||
| 715,902 | ||||||||
| TOTAL COMMERCIAL MORTGAGE-BACKED SECURITIES | ||||||||
| (Cost $833,439) | 848,434 | |||||||
| Principal Amount | Value (Note 2) | |||||||
| MORTGAGE-BACKED SECURITIES (5.48%) | ||||||||
| Fannie Mae Pool | ||||||||
| Series 2010-465721, | ||||||||
| 4.040%, 10/01/2020 | 50,000 | 49,961 | ||||||
| Series 2010-466760, | ||||||||
| 3.810%, 12/01/2020 | 41,635 | 41,775 | ||||||
| Series 2011-468551, | ||||||||
| 3.980%, 07/01/2021 | 50,000 | 51,398 | ||||||
| Series 2011-469371, | ||||||||
| 3.250%, 12/01/2021 | 169,693 | 173,821 | ||||||
| Series 2011-AE0800, | ||||||||
| 3.677%, 12/01/2020(a) | 22,347 | 22,674 | ||||||
| Series 2011-AE0918, | ||||||||
| 3.760%, 10/01/2020(a) | 23,586 | 23,606 | ||||||
| Series 2011-FN0001, | ||||||||
| 3.780%, 12/01/2020(a) | 182,654 | 184,894 | ||||||
| Series 2011-MA0717, | ||||||||
| 3.500%, 04/01/2026 | 61,972 | 64,928 | ||||||
| Series 2012-470792, | ||||||||
| 2.850%, 03/01/2022 | 37,641 | 38,605 | ||||||
| Series 2012-471690, | ||||||||
| 2.790%, 07/01/2022 | 159,711 | 164,700 | ||||||
| Series 2012-471713, | ||||||||
| 2.850%, 06/01/2022 | 67,078 | 66,993 | ||||||
| Series 2014-AM7448, | ||||||||
| 2.730%, 12/01/2021 | 232,725 | 232,550 | ||||||
| Series 2016-AL8938, | ||||||||
| 2.753%, 04/01/2022(a) | 75,202 | 77,460 | ||||||
| Series 2016-AL8941, | ||||||||
| 2.819%, 01/01/2024(a) | 61,722 | 65,553 | ||||||
| Series 2016-AN2716, | ||||||||
| 2.150%, 07/01/2021 | 141,028 | 142,224 | ||||||
| Series 2017-AN6641, | ||||||||
| 2.710%, 12/01/2023 | 1,700,000 | 1,800,039 | ||||||
| Series 2019-BL2539, | ||||||||
| 3.050%, 05/01/2024 | 143,237 | 152,498 | ||||||
| 3,353,679 | ||||||||
| TOTAL MORTGAGE-BACKED SECURITIES | ||||||||
| (Cost $3,250,429) | 3,353,679 | |||||||
| CORPORATE BONDS (72.64%) | ||||||||
| Aerospace & Defense (3.30%) | ||||||||
| Boeing Co. | ||||||||
| 4.510%, 05/01/2023 | 600,000 | 600,000 | ||||||
| 4.880%, 05/01/2025 | 600,000 | 600,000 | ||||||
| Principal Amount | Value (Note 2) | |||||||
| Huntington Ingalls Industries, Inc. | ||||||||
| 5.000%, 11/15/2025(d) | $ | 791,000 | $ | 817,250 | ||||
| Total Aerospace & Defense | 2,017,250 | |||||||
| Airlines (1.63%) | ||||||||
| Southwest Airlines Co. | ||||||||
| 4.750%, 05/04/2023 | 500,000 | 496,844 | ||||||
| 5.250%, 05/04/2025 | 500,000 | 498,597 | ||||||
| Total Airlines | 995,441 | |||||||
| Apparel & Textile Products (1.65%) | ||||||||
| VF Corp. | ||||||||
| 2.050%, 04/23/2022 | 1,000,000 | 1,010,862 | ||||||
| Automobiles Manufacturing (2.07%) | ||||||||
| Ford Motor Co. | ||||||||
| 8.500%, 04/21/2023 | 500,000 | 496,874 | ||||||
| Ford Motor Credit Co. LLC | ||||||||
| 2.343%, 11/02/2020 | 60,000 | 58,696 | ||||||
| 2.425%, 06/12/2020 | 265,000 | 265,000 | ||||||
| 5.875%, 08/02/2021 | 250,000 | 248,750 | ||||||
| 3M US L + 0.79%, 06/12/2020(a) | 200,000 | 199,410 | ||||||
| Total Automobiles Manufacturing | 1,268,730 | |||||||
| Banks (10.09%) | ||||||||
| Associated Bank NA/Green Bay WI | ||||||||
| 3.500%, 08/13/2021 | 450,000 | 458,259 | ||||||
| Bank of New Zealand | ||||||||
| 2.000%, 02/21/2025(d) | 300,000 | 300,062 | ||||||
| CIT Group, Inc. | ||||||||
| 4.125%, 03/09/2021 | 251,000 | 247,750 | ||||||
| Citizens Bank NA | ||||||||
| 2.200%, 05/26/2020 | 33,000 | 33,015 | ||||||
| 3M US L + 0.57%, 05/26/2020(a) | 252,000 | 252,103 | ||||||
| Citizens Financial Group, Inc. | ||||||||
| 4.150%, 09/28/2022(d) | 400,000 | 413,328 | ||||||
| Cooperatieve Rabobank UA | ||||||||
| 3.950%, 11/09/2022 | 250,000 | 258,321 | ||||||
| Credit Suisse AG | ||||||||
| 2.800%, 04/08/2022 | 500,000 | 512,285 | ||||||
| Danske Bank A/S | ||||||||
| 5.000%, 01/12/2022(d) | 450,000 | 465,511 | ||||||
| 5.375%, 01/12/2024(d) | 250,000 | 270,334 | ||||||
| First Republic Bank | ||||||||
| 1D US SOFR + 0.62%, 02/12/2024(a) | 500,000 | 501,601 | ||||||
| FNB Corp. | ||||||||
| 2.200%, 02/24/2023 | 200,000 | 198,451 | ||||||
| Lloyds Banking Group PLC | ||||||||
| 1Y US TI + 1.00%, 02/05/2026(a) | 500,000 | 500,000 | ||||||
| Santander UK PLC | ||||||||
| 2.100%, 01/13/2023 | 250,000 | 252,450 | ||||||
| Synovus Bank/Columbus GA | ||||||||
| 1D US SOFR + 0.945%, 02/10/2023(a) | 500,000 | 494,418 | ||||||
| US Bank NA | ||||||||
| 3.450%, 11/16/2021 | 250,000 | 259,307 | ||||||
| 46 | | April 30, 2020 |
ALPS | Smith Short Duration Bond Fund
| Statement of Investments | April 30, 2020 (Unaudited) |
| Principal Amount | Value (Note 2) | |||||||
| Wells Fargo & Co. | ||||||||
| 3M US L + 0.825%, 10/30/2025(a) $ | 750,000 | $ | 762,590 | |||||
| Total Banks | 6,179,785 | |||||||
| Biotechnology (0.87%) | ||||||||
| Amgen, Inc. | ||||||||
| 1.900%, 02/21/2025 | 500,000 | 512,272 | ||||||
| Genzyme Corp. | ||||||||
| 5.000%, 06/15/2020 | 20,000 | 20,100 | ||||||
| Total Biotechnology | 532,372 | |||||||
| Cable & Satellite (1.60%) | ||||||||
| Charter Communications Operating | ||||||||
| LLC / Charter Communications | ||||||||
| Operating Capital | ||||||||
| Series WI | ||||||||
| 3.579%, 07/23/2020 | 120,000 | 120,176 | ||||||
| 3M US L + 1.65%, 02/01/2024(a) | 150,000 | 145,513 | ||||||
| Comcast Corp. | ||||||||
| 3M US L + 0.33%, 10/01/2020(a) | 200,000 | 200,126 | ||||||
| Time Warner Cable LLC | ||||||||
| 4.000%, 09/01/2021 | 500,000 | 510,022 | ||||||
| Total Cable & Satellite | 975,837 | |||||||
| Chemicals (3.55%) | ||||||||
| Albemarle Corp. | ||||||||
| 3M US L + 1.05%, 11/15/2022(a)(d) | 1,000,000 | 965,333 | ||||||
| DuPont de Nemours, Inc. | ||||||||
| 2.169%, 05/01/2023 | 1,000,000 | 1,005,959 | ||||||
| 3.766%, 11/15/2020 | 100,000 | 100,939 | ||||||
| International Flavors & Fragrances, Inc. | ||||||||
| 3.400%, 09/25/2020 | 100,000 | 100,178 | ||||||
| Total Chemicals | 2,172,409 | |||||||
| Consumer Finance (2.34%) | ||||||||
| Capital One Bank USA NA | ||||||||
| 1D US SOFR + 0.616%, 01/27/2023(a) | 300,000 | 297,517 | ||||||
| Fiserv, Inc. | ||||||||
| 2.750%, 07/01/2024 | 250,000 | 263,339 | ||||||
| Global Payments, Inc. | ||||||||
| 2.650%, 02/15/2025 | 250,000 | 257,405 | ||||||
| 3.800%, 04/01/2021 | 600,000 | 608,504 | ||||||
| Total Consumer Finance | 1,426,765 | |||||||
| Consumer Products (0.26%) | ||||||||
| Procter & Gamble Co. | ||||||||
| 2.450%, 03/25/2025 | 150,000 | 160,600 | ||||||
| Department Stores (1.40%) | ||||||||
| Nordstrom, Inc. | ||||||||
| 8.750%, 05/15/2025(d) | 800,000 | 859,155 | ||||||
| Diversified Banks (3.38%) | ||||||||
| JPMorgan Chase & Co. | ||||||||
| 1D US SOFR + 1.85%, 04/22/2026(a) | 1,000,000 | 1,014,668 | ||||||
| Principal Amount | Value (Note 2) | |||||||
| Royal Bank of Scotland Group PLC | ||||||||
| 6.125%, 12/15/2022 | $ | 515,000 | $ | 552,385 | ||||
| Standard Chartered PLC | ||||||||
| 3M US L + 1.209%, 01/30/2026(a)(d) | 500,000 | 499,872 | ||||||
| Total Diversified Banks | 2,066,925 | |||||||
| Electrical Equipment Manufacturing (1.12%) | ||||||||
| Otis Worldwide Corp. | ||||||||
| 3M US L + 0.45%, 04/05/2023(a)(d) | 100,000 | 97,367 | ||||||
| Roper Technologies, Inc. | ||||||||
| 2.350%, 09/15/2024 | 250,000 | 253,877 | ||||||
| Trimble, Inc. | ||||||||
| 4.750%, 12/01/2024 | 318,000 | 331,349 | ||||||
| Total Electrical Equipment Manufacturing | 682,593 | |||||||
| Entertainment Content (0.42%) | ||||||||
| Fox Corp. | ||||||||
| 3.666%, 01/25/2022 | 250,000 | 259,164 | ||||||
| Entertainment Resources (0.17%) | ||||||||
| Vail Resorts, Inc. | ||||||||
| 6.250%, 05/15/2025(d) | 100,000 | 103,750 | ||||||
| Financial Services (11.92%) | ||||||||
| Ameriprise Financial, Inc. | ||||||||
| 3.000%, 03/22/2022 | 250,000 | 258,322 | ||||||
| 3.000%, 04/02/2025 | 300,000 | 316,733 | ||||||
| Bank of New York Mellon Corp. | ||||||||
| 1.850%, 01/27/2023 | 300,000 | 305,486 | ||||||
| Goldman Sachs BDC, Inc. | ||||||||
| 3.750%, 02/10/2025 | 17,000 | 16,702 | ||||||
| Goldman Sachs Group, Inc. | ||||||||
| Series D | ||||||||
| 6.000%, 06/15/2020 | 70,000 | 70,375 | ||||||
| 3.500%, 04/01/2025 | 1,016,000 | 1,082,555 | ||||||
| LPL Holdings, Inc. | ||||||||
| 5.750%, 09/15/2025(d) | 600,000 | 599,250 | ||||||
| Morgan Stanley | ||||||||
| Series GMTN | ||||||||
| 3.125%, 01/23/2023 | 200,000 | 208,195 | ||||||
| 5.500%, 07/24/2020 | 550,000 | 555,326 | ||||||
| 2.750%, 05/19/2022 | 75,000 | 76,942 | ||||||
| National Securities Clearing Corp. | ||||||||
| 1.200%, 04/23/2023(d) | 400,000 | 400,280 | ||||||
| 1.500%, 04/23/2025(d) | 400,000 | 402,113 | ||||||
| State Street Corp. | ||||||||
| 1D US SOFR + 0.94%, 11/01/2025(a) | 250,000 | 257,665 | ||||||
| 1D US SOFR + 2.69%, 03/30/2023(a)(d) | 1,000,000 | 1,028,850 | ||||||
| TD Ameritrade Holding Corp. | ||||||||
| 3M US L + 0.43%, 11/01/2021(a) | 200,000 | 198,238 | ||||||
| UBS AG/London | ||||||||
| 1.750%, 04/21/2022(d) | 500,000 | 502,450 | ||||||
| 47 | | April 30, 2020 |
ALPS | Smith Short Duration Bond Fund
| Statement of Investments | April 30, 2020 (Unaudited) |
| Principal Amount | Value (Note 2) | |||||||
| USAA Capital Corp. | ||||||||
| 1.500%, 05/01/2023(d) | $ | 500,000 | $ | 504,332 | ||||
| 2.625%, 06/01/2021(d) | 500,000 | 508,934 | ||||||
| Total Financial Services | 7,292,748 | |||||||
| Food & Beverage (3.21%) | ||||||||
| Campbell Soup Co. | ||||||||
| 3M US L + 0.63%, 03/15/2021(a) | 75,000 | 74,351 | ||||||
| Cargill, Inc. | ||||||||
| 1.375%, 07/23/2023(d) | 500,000 | 502,720 | ||||||
| Conagra Brands, Inc. | ||||||||
| 3M US L + 0.75%, 10/22/2020(a) | 52,000 | 51,935 | ||||||
| Kraft Heinz Foods Co. | ||||||||
| 2.800%, 07/02/2020 | 309,000 | 308,418 | ||||||
| 4.875%, 02/15/2025(d) | 500,000 | 514,091 | ||||||
| Mondelez International, Inc. | ||||||||
| 2.125%, 04/13/2023 | 500,000 | 509,345 | ||||||
| Total Food & Beverage | 1,960,860 | |||||||
| Hardware (0.87%) | ||||||||
| EMC Corp. | ||||||||
| 2.650%, 06/01/2020 | 534,000 | 533,012 | ||||||
| Health Care Facilities & Services (2.55%) | ||||||||
| Cigna Corp. | ||||||||
| Series WI | ||||||||
| 3M US L + 0.65%, 09/17/2021(a) | 500,000 | 491,692 | ||||||
| 3.200%, 09/17/2020 | 300,000 | 302,037 | ||||||
| HCA, Inc. | ||||||||
| 4.750%, 05/01/2023 | 725,000 | 773,456 | ||||||
| Total Health Care Facilities & Services | 1,567,185 | |||||||
| Integrated Oils (1.48%) | ||||||||
| BP Capital Markets America, Inc. | ||||||||
| 2.937%, 04/06/2023 | 250,000 | 258,060 | ||||||
| Shell International Finance BV | ||||||||
| 3M US L + 0.45%, 05/11/2020(a) | 650,000 | 650,019 | ||||||
| Total Integrated Oils | 908,079 | |||||||
| Medical Equipment & Devices Manufacturing (0.36%) | ||||||||
| Baxter International, Inc. | ||||||||
| 3.750%, 10/01/2025(d) | 200,000 | 222,913 | ||||||
| Pharmaceuticals (3.82%) | ||||||||
| AbbVie, Inc. | ||||||||
| 2.150%, 11/19/2021(d) | 500,000 | 506,959 | ||||||
| 2.300%, 11/21/2022(d) | 500,000 | 513,109 | ||||||
| 2.500%, 05/14/2020 | 150,000 | 150,056 | ||||||
| 2.600%, 11/21/2024(d) | 500,000 | 522,172 | ||||||
| Elanco Animal Health, Inc. | ||||||||
| 4.662%, 08/27/2021 | 518,000 | 532,348 | ||||||
| 5.022%, 08/28/2023 | 100,000 | 106,000 | ||||||
| Total Pharmaceuticals | 2,330,644 | |||||||
| Pipeline (2.27%) | ||||||||
| Midwest Connector Capital Co. LLC | ||||||||
| 3.625%, 04/01/2022(d) | 320,000 | 307,319 | ||||||
| MPLX LP | ||||||||
| 5.250%, 01/15/2025(d) | 500,000 | 495,791 | ||||||
| 3M US L + 0.90%, 09/09/2021(a) | 100,000 | 94,103 | ||||||
| Principal Amount | Value (Note 2) | |||||||
| Western Midstream Operating LP | ||||||||
| 3M US L + 0.85%, 01/13/2023(a) | $ | 600,000 | $ | 489,254 | ||||
| Total Pipeline | 1,386,467 | |||||||
| Refining & Marketing (2.53%) | ||||||||
| Marathon Petroleum Corp. | ||||||||
| 4.500%, 05/01/2023 | 500,000 | 501,671 | ||||||
| Phillips 66 | ||||||||
| 3.700%, 04/06/2023 | 500,000 | 519,584 | ||||||
| 3.850%, 04/09/2025 | 500,000 | 524,564 | ||||||
| Total Refining & Marketing | 1,545,819 | |||||||
| Retail - Consumer Discretionary (0.89%) | ||||||||
| Gap, Inc. | ||||||||
| 8.375%, 05/15/2023(d) | 500,000 | 523,750 | ||||||
| Home Depot, Inc. | ||||||||
| 3M US L + 0.15%, 06/05/2020(a) | 20,000 | 20,000 | ||||||
| Total Retail - Consumer Discretionary | 543,750 | |||||||
| Semiconductors (2.26%) | ||||||||
| Analog Devices, Inc. | ||||||||
| 2.950%, 04/01/2025 | 250,000 | 260,940 | ||||||
| Microchip Technology, Inc. | ||||||||
| 3.922%, 06/01/2021 | 1,104,000 | 1,122,645 | ||||||
| Total Semiconductors | 1,383,585 | |||||||
| Transportation & Logistics (0.05%) | ||||||||
| Penske Truck Leasing Co. Lp / PTL | ||||||||
| Finance Corp. | ||||||||
| 3.375%, 02/01/2022(d) | 33,000 | 33,535 | ||||||
| Utilities (5.57%) | ||||||||
| Avangrid, Inc. | ||||||||
| 3.200%, 04/15/2025 | 500,000 | 527,948 | ||||||
| Dominion Energy, Inc. | ||||||||
| 2.715%, 08/15/2021(c) | 500,000 | 504,770 | ||||||
| 4.104%, 04/01/2021(c) | 400,000 | 406,383 | ||||||
| Edison International | ||||||||
| 4.950%, 04/15/2025 | 1,000,000 | 1,086,899 | ||||||
| Exelon Corp. | ||||||||
| 3.497%, 06/01/2022 | 435,000 | 448,468 | ||||||
| 5.150%, 12/01/2020 | 323,000 | 326,790 | ||||||
| Florida Power & Light Co. | ||||||||
| 2.850%, 04/01/2025 | 100,000 | 108,508 | ||||||
| Total Utilities | 3,409,766 | |||||||
| Wireless Telecommunications Services (1.01%) | ||||||||
| AT&T, Inc. | ||||||||
| 3M US L + 0.75%, 06/01/2021(a) | 66,000 | 65,777 | ||||||
| T-Mobile USA, Inc. | ||||||||
| 3.500%, 04/15/2025(d) | 525,000 | 553,744 | ||||||
| Total Wireless Telecommunications Services | 619,521 | |||||||
| TOTAL CORPORATE BONDS | ||||||||
| (Cost $43,942,525) | 44,449,522 | |||||||
| 48 | | April 30, 2020 |
ALPS | Smith Short Duration Bond Fund
| Statement of Investments | April 30, 2020 (Unaudited) |
| Principal Amount | Value (Note 2) | |||||||
| GOVERNMENT BONDS (14.30%) | ||||||||
| U.S. Treasury Bonds (14.30%) | ||||||||
| United States Treasury Notes | ||||||||
| 0.375%, 03/31/2022 | $ | 3,276,000 | $ | 3,287,708 | ||||
| 0.500%, 03/15/2023 | 592,000 | 596,313 | ||||||
| 1.125%, 02/28/2022 | 1,341,000 | 1,363,813 | ||||||
| 1.375%, 02/15/2023 | 2,275,000 | 2,347,293 | ||||||
| 1.375%, 09/30/2023 | 803,000 | 832,831 | ||||||
| 1.625%, 10/31/2023 | 195,000 | 204,080 | ||||||
| 1.750%, 06/15/2022 | 115,000 | 118,803 | ||||||
| Total U.S. Treasury Bonds | 8,750,841 | |||||||
| TOTAL GOVERNMENT BONDS | ||||||||
| (Cost $8,679,761) | 8,750,841 | |||||||
| 7-Day Yield | Shares | Value (Note 2) | ||||||||||
| SHORT TERM INVESTMENTS (3.42%) | ||||||||||||
| Money Market Fund (3.42%) | ||||||||||||
| Morgan Stanley Institutional Liquidity Funds - Government Portfolio | 0.159 | % | 2,093,993 | 2,093,993 | ||||||||
| TOTAL SHORT TERM INVESTMENTS | ||||||||||||
| (Cost $2,093,993) | 2,093,993 | |||||||||||
| TOTAL INVESTMENTS (102.71%) | ||||||||||||
| (Cost $62,106,457) | $ | 62,850,589 | ||||||||||
| Liabilities In Excess Of Other Assets (-2.71%) | (1,658,128 | ) | ||||||||||
| NET ASSETS (100.00%) | $ | 61,192,461 | ||||||||||
Investment Abbreviations:
LIBOR - London Interbank Offered Rate
SOFR - Secured Overnight Financing Rate
Reference Rates:
1M US L - 1 Month LIBOR as of April 30, 2020 was 0.33%
3M US L - 3 Month LIBOR as of April 30, 2020 was 0.56%
1Y US TI - 1 Year Treasury Yield as of April 30, 2020 was 0.16% 10Y US TI - 10 Year Treasury Yield as of April 30, 2020 was 0.64%
1D US SOFR - 1 Day SOFR as of April 30, 2020 was 0.04%
| (a) | Floating or variable rate security. The reference rate is described above. The rate in effect as of April 30, 2020 is based on the reference rate plus the displayed spread as of the security's last reset date. |
| (b) | Issued with zero coupon. |
| (c) | Step bond. Coupon changes periodically based upon a predetermined schedule. Interest rate disclosed is that which is in effect as of April 30, 2020. |
| (d) | Security exempt from registration under Rule 144A of the Securities Act of 1933. This security may be resold in transactions exempt from registration, normally to qualified institutional buyers. As of April 30, 2020, the aggregate market value of those securities was $13,434,274, representing 21.95% of net assets. |
See Notes to Financial Statements.
| 49 | | April 30, 2020 |
ALPS | Smith Total Return Bond Fund
| Statement of Investments | April 30, 2020 (Unaudited) |
| Principal Amount | Value (Note 2) | |||||||
| COLLATERALIZED MORTGAGE OBLIGATIONS (9.05%) | ||||||||
| Fannie Mae | ||||||||
| Series 1993-31, Class PN, | ||||||||
| 7.000%, 09/25/2023 | $ | 326,427 | $ | 350,967 | ||||
| Series 1997-22, Class F, | ||||||||
| 2.432%, 03/25/2027(a) | 52,729 | 53,132 | ||||||
| Series 1997-76, Class FO, | ||||||||
| 1M US L + 0.50%, 09/17/2027(a) | 31,764 | 31,246 | ||||||
| Series 1999-58, Class F, | ||||||||
| 1M US L + 0.40%, 11/18/2029(a) | 74,588 | 72,607 | ||||||
| Series 2000-40, Class FA, | ||||||||
| 1M US L + 0.50%, 07/25/2030(a) | 26,659 | 26,228 | ||||||
| Series 2000-45, Class F, | ||||||||
| 1M US L + 0.45%, 12/25/2030(a) | 27,224 | 26,534 | ||||||
| Series 2001-27, Class F, | ||||||||
| 1M US L + 0.50%, 06/25/2031(a) | 22,236 | 21,807 | ||||||
| Series 2001-29, Class Z, | ||||||||
| 6.500%, 07/25/2031 | 85,153 | 98,837 | ||||||
| Series 2001-51, Class OD, | ||||||||
| 6.500%, 10/25/2031 | 84,873 | 91,257 | ||||||
| Series 2001-52, Class XZ, | ||||||||
| 6.500%, 10/25/2031 | 55,638 | 65,836 | ||||||
| Series 2001-59, Class F, | ||||||||
| 1M US L + 0.60%, 11/25/2031(a) | 135,218 | 132,109 | ||||||
| Series 2001-60, Class OF, | ||||||||
| 1M US L + 0.95%, 10/25/2031(a) | 21,896 | 22,264 | ||||||
| Series 2001-63, Class FD, | ||||||||
| 1M US L + 0.60%, 12/18/2031(a) | 26,988 | 26,498 | ||||||
| Series 2001-63, Class TC, | ||||||||
| 6.000%, 12/25/2031 | 34,764 | 40,303 | ||||||
| Series 2001-68, Class PH, | ||||||||
| 6.000%, 12/25/2031 | 30,971 | 35,699 | ||||||
| Series 2001-71, Class FE, | ||||||||
| 1M US L + 0.65%, 11/25/2031(a) | 65,920 | 64,559 | ||||||
| Series 2001-81, Class GE, | ||||||||
| 6.000%, 01/25/2032 | 25,818 | 29,976 | ||||||
| Series 2002-11, Class JF, | ||||||||
| 1M US L + 0.73%, 03/25/2032(a) | 78,023 | 76,565 | ||||||
| Series 2002-12, Class FH, | ||||||||
| 1M US L + 1.05%, 01/25/2032(a) | 92,435 | 91,713 | ||||||
| Series 2002-13, Class FE, | ||||||||
| 1M US L + 0.90%, 03/25/2032(a) | 101,527 | 100,533 | ||||||
| Series 2002-16, Class TM, | ||||||||
| 7.000%, 04/25/2032 | 22,839 | 26,984 | ||||||
| Principal Amount | Value (Note 2) | |||||||
| Series 2002-17, Class JF, | ||||||||
| 1M US L + 1.00%, 04/25/2032(a) | $ | 46,602 | $ | 46,138 | ||||
| Series 2002-18, Class FD, | ||||||||
| 1M US L + 0.80%, 02/25/2032(a) | 81,776 | 80,533 | ||||||
| Series 2002-23, Class FA, | ||||||||
| 1M US L + 0.90%, 04/25/2032(a) | 69,435 | 70,477 | ||||||
| Series 2002-36, Class FS, | ||||||||
| 1M US L + 0.50%, 06/25/2032(a) | 88,957 | 87,523 | ||||||
| Series 2002-44, Class FJ, | ||||||||
| 1M US L + 1.00%, 04/25/2032(a) | 132,340 | 131,022 | ||||||
| Series 2002-47, Class FC, | ||||||||
| 1M US L + 0.60%, 11/25/2031(a) | 24,080 | 23,562 | ||||||
| Series 2002-48, Class F, | ||||||||
| 1M US L + 1.00%, 07/25/2032(a) | 79,145 | 78,349 | ||||||
| Series 2002-49, Class FC, | ||||||||
| 1M US L + 1.00%, 11/18/2031(a) | 49,879 | 49,408 | ||||||
| Series 2002-60, Class FV, | ||||||||
| 1M US L + 1.00%, 04/25/2032(a) | 155,417 | 153,869 | ||||||
| Series 2002-63, Class EZ, | ||||||||
| 6.000%, 10/25/2032 | 17,678 | 20,372 | ||||||
| Series 2002-68, Class AF, | ||||||||
| 1M US L + 1.00%, 10/25/2032(a) | 34,869 | 34,518 | ||||||
| Series 2002-7, Class FC, | ||||||||
| 1M US L + 0.75%, 01/25/2032(a) | 105,380 | 103,636 | ||||||
| Series 2002-71, Class AQ, | ||||||||
| 4.000%, 11/25/2032 | 105,573 | 114,487 | ||||||
| Series 2002-8, Class FA, | ||||||||
| 1M US L + 0.75%, 03/18/2032(a) | 30,185 | 30,503 | ||||||
| Series 2002-80, Class CZ, | ||||||||
| 4.500%, 09/25/2032 | 87,786 | 107,584 | ||||||
| Series 2002-9, Class FW, | ||||||||
| 1M US L + 0.55%, 03/25/2032(a) | 24,772 | 24,170 | ||||||
| Series 2002-91, Class F, | ||||||||
| 1M US L + 0.55%, 01/25/2033(a) | 39,432 | 38,410 | ||||||
| Series 2003-107, Class FD, | ||||||||
| 1M US L + 0.50%, 11/25/2033(a) | 26,132 | 26,079 | ||||||
| Series 2003-110, Class CK, | ||||||||
| 3.000%, 11/25/2033 | 43,731 | 46,181 | ||||||
| Series 2003-116, Class FA, | ||||||||
| 1M US L + 0.40%, 11/25/2033(a) | 50,385 | 50,177 | ||||||
| 50 | | April 30, 2020 |
ALPS | Smith Total Return Bond Fund
| Statement of Investments | April 30, 2020 (Unaudited) |
| Principal Amount | Value (Note 2) | |||||||
| Series 2003-119, Class ZP, | ||||||||
| 4.000%, 12/25/2033 | $ | 28,894 | $ | 32,665 | ||||
| Series 2003-119, Class FH, | ||||||||
| 1M US L + 0.50%, 12/25/2033(a) | 25,490 | 25,567 | ||||||
| Series 2003-128, Class MF, | ||||||||
| 1M US L + 0.60%, 01/25/2034(a) | 100,743 | 98,885 | ||||||
| Series 2003-131, Class CH, | ||||||||
| 5.500%, 01/25/2034 | 152,227 | 168,064 | ||||||
| Series 2003-134, Class FC, | ||||||||
| 1M US L + 0.60%, 12/25/2032(a) | 57,278 | 57,664 | ||||||
| Series 2003-14, Class AN, | ||||||||
| 3.500%, 03/25/2033 | 161,820 | 170,838 | ||||||
| Series 2003-19, Class MB, | ||||||||
| 4.000%, 05/25/2031 | 66,743 | 73,177 | ||||||
| Series 2003-21, Class OG, | ||||||||
| 4.000%, 01/25/2033 | 66,044 | 71,129 | ||||||
| Series 2003-22, Class BZ, | ||||||||
| 6.000%, 04/25/2033 | 30,452 | 35,087 | ||||||
| Series 2003-27, Class EK, | ||||||||
| 5.000%, 04/25/2033 | 48,249 | 55,754 | ||||||
| Series 2003-30, Class JQ, | ||||||||
| 5.500%, 04/25/2033 | 50,964 | 57,679 | ||||||
| Series 2003-32, Class UJ, | ||||||||
| 5.500%, 05/25/2033 | 46,878 | 53,914 | ||||||
| Series 2003-41, Class OZ, | ||||||||
| 3.750%, 05/25/2033 | 118,117 | 131,939 | ||||||
| Series 2003-42, Class JH, | ||||||||
| 5.500%, 05/25/2033 | 142,482 | 160,862 | ||||||
| Series 2003-46, Class PJ, | ||||||||
| 5.500%, 06/25/2033 | 56,311 | 63,374 | ||||||
| Series 2003-47, Class PE, | ||||||||
| 5.750%, 06/25/2033 | 59,389 | 70,182 | ||||||
| Series 2003-64, Class ZC, | ||||||||
| 5.000%, 07/25/2033 | 23,584 | 26,528 | ||||||
| Series 2003-64, Class JK, | ||||||||
| 3.500%, 07/25/2033 | 90,139 | 98,350 | ||||||
| Series 2003-71, Class HD, | ||||||||
| 5.500%, 08/25/2033 | 230,000 | 260,004 | ||||||
| Series 2003-76, Class EZ, | ||||||||
| 5.000%, 08/25/2033 | 128,419 | 147,920 | ||||||
| Series 2003-94, Class CE, | ||||||||
| 5.000%, 10/25/2033 | 23,946 | 26,184 | ||||||
| Series 2004-101, Class TB, | ||||||||
| 5.500%, 01/25/2035 | 171,482 | 191,651 | ||||||
| Series 2004-14, Class QB, | ||||||||
| 5.250%, 03/25/2034 | 192,000 | 223,177 | ||||||
| Series 2004-17, Class BA, | ||||||||
| 6.000%, 04/25/2034 | 112,264 | 144,532 | ||||||
| Series 2004-17, Class DZ, | ||||||||
| 5.500%, 04/25/2034 | 49,318 | 54,605 | ||||||
| Series 2004-26, Class CG, | ||||||||
| 4.500%, 08/25/2033 | 32,575 | 34,007 | ||||||
| Principal Amount | Value (Note 2) | |||||||
| Series 2004-36, Class FA, | ||||||||
| 1M US L + 0.40%, 05/25/2034(a) | $ | 53,351 | $ | 53,185 | ||||
| Series 2004-36, Class CB, | ||||||||
| 5.000%, 05/25/2034 | 135,438 | 155,206 | ||||||
| Series 2004-53, Class FC, | ||||||||
| 1M US L + 0.45%, 07/25/2034(a) | 223,459 | 217,467 | ||||||
| Series 2004-54, Class FL, | ||||||||
| 1M US L + 0.40%, 07/25/2034(a) | 232,914 | 232,297 | ||||||
| Series 2004-60, Class AC, | ||||||||
| 5.500%, 04/25/2034 | 56,000 | 63,009 | ||||||
| Series 2004-68, Class LC, | ||||||||
| 5.000%, 09/25/2029 | 73,380 | 80,314 | ||||||
| Series 2004-77, Class AY, | ||||||||
| 4.500%, 10/25/2034 | 33,291 | 37,227 | ||||||
| Series 2004-82, Class HK, | ||||||||
| 5.500%, 11/25/2034 | 87,858 | 102,534 | ||||||
| Series 2004-92, Class TB, | ||||||||
| 5.500%, 12/25/2034 | 108,687 | 127,494 | ||||||
| Series 2005-110, Class MP, | ||||||||
| 5.500%, 12/25/2035 | 47,683 | 53,367 | ||||||
| Series 2005-120, Class FE, | ||||||||
| 1M US L + 0.52%, 01/25/2036(a) | 37,992 | 38,050 | ||||||
| Series 2005-122, Class PY, | ||||||||
| 6.000%, 01/25/2036 | 324,000 | 384,986 | ||||||
| Series 2005-17, Class EX, | ||||||||
| 5.250%, 03/25/2035 | 25,000 | 30,148 | ||||||
| Series 2005-17, Class EZ, | ||||||||
| 4.500%, 03/25/2035 | 138,341 | 154,218 | ||||||
| Series 2005-22, Class DA, | ||||||||
| 5.500%, 12/25/2034 | 22,453 | 23,070 | ||||||
| Series 2005-29, Class ZA, | ||||||||
| 5.500%, 04/25/2035 | 105,861 | 124,322 | ||||||
| Series 2005-3, Class CP, | ||||||||
| 5.500%, 10/25/2034 | 1,268 | 1,264 | ||||||
| Series 2005-3, Class CH, | ||||||||
| 5.250%, 02/25/2035 | 91,837 | 105,053 | ||||||
| Series 2005-35, Class DZ, | ||||||||
| 5.000%, 04/25/2035 | 261,516 | 297,267 | ||||||
| Series 2005-48, Class TD, | ||||||||
| 5.500%, 06/25/2035 | 190,752 | 216,322 | ||||||
| Series 2005-59, Class DF, | ||||||||
| 1M US L + 0.20%, 05/25/2035(a) | 7,671 | 7,667 | ||||||
| Series 2005-62, Class ZD, | ||||||||
| 5.000%, 06/25/2035 | 104,810 | 115,518 | ||||||
| Series 2005-62, Class JC, | ||||||||
| 5.000%, 05/25/2035 | 16,263 | 16,976 | ||||||
| Series 2005-62, Class JE, | ||||||||
| 5.000%, 06/25/2035 | 8,700 | 9,103 | ||||||
| Series 2005-64, Class PL, | ||||||||
| 5.500%, 07/25/2035 | 138,659 | 151,680 | ||||||
| 51 | | April 30, 2020 |
ALPS | Smith Total Return Bond Fund
| Statement of Investments | April 30, 2020 (Unaudited) |
| Principal Amount | Value (Note 2) | |||||||
| Series 2005-68, Class CZ, | ||||||||
| 5.500%, 08/25/2035 | $ | 558,768 | $ | 639,645 | ||||
| Series 2005-68, Class BE, | ||||||||
| 5.250%, 08/25/2035 | 97,000 | 114,156 | ||||||
| Series 2005-68, Class PG, | ||||||||
| 5.500%, 08/25/2035 | 61,505 | 70,100 | ||||||
| Series 2005-69, Class GZ, | ||||||||
| 4.500%, 08/25/2035 | 57,800 | 62,803 | ||||||
| Series 2005-7, Class MZ, | ||||||||
| 4.750%, 02/25/2035 | 158,692 | 168,994 | ||||||
| Series 2005-70, Class KP, | ||||||||
| 5.000%, 06/25/2035 | 59,301 | 68,420 | ||||||
| Series 2005-70, Class NA, | ||||||||
| 5.500%, 08/25/2035 | 25,359 | 28,386 | ||||||
| Series 2005-72, Class FB, | ||||||||
| 1M US L + 0.25%, 08/25/2035(a) | 36,763 | 36,537 | ||||||
| Series 2005-79, Class DB, | ||||||||
| 5.500%, 09/25/2035 | 93,888 | 110,332 | ||||||
| Series 2005-84, Class XM, | ||||||||
| 5.750%, 10/25/2035 | 110,144 | 124,721 | ||||||
| Series 2005-89, Class F, | ||||||||
| 1M US L + 0.30%, 10/25/2035(a) | 24,910 | 24,174 | ||||||
| Series 2005-99, Class ZA, | ||||||||
| 5.500%, 12/25/2035 | 99,262 | 129,957 | ||||||
| Series 2005-99, Class FA, | ||||||||
| 1M US L + 0.30%, 11/25/2035(a) | 72,720 | 72,427 | ||||||
| Series 2006-112, Class QC, | ||||||||
| 5.500%, 11/25/2036 | 38,270 | 44,921 | ||||||
| Series 2006-114, Class HE, | ||||||||
| 5.500%, 12/25/2036 | 159,768 | 187,305 | ||||||
| Series 2006-115, Class EF, | ||||||||
| 1M US L + 0.36%, 12/25/2036(a) | 28,631 | 27,839 | ||||||
| Series 2006-39, Class EF, | ||||||||
| 1M US L + 0.40%, | ||||||||
| 05/25/2036(a) | 30,230 | 29,412 | ||||||
| Series 2006-46, Class UD, | ||||||||
| 5.500%, 06/25/2036 | 33,000 | 40,094 | ||||||
| Series 2006-48, Class TF, | ||||||||
| 1M US L + 0.40%, 06/25/2036(a) | 64,236 | 64,024 | ||||||
| Series 2006-48, Class DZ, | ||||||||
| 6.000%, 06/25/2036 | 73,601 | 110,182 | ||||||
| Series 2006-56, Class F, | ||||||||
| 1M US L + 0.30%, 07/25/2036(a) | 22,595 | 22,406 | ||||||
| Series 2006-63, Class QH, | ||||||||
| 5.500%, 07/25/2036 | 31,786 | 36,635 | ||||||
| Series 2006-71, Class ZH, | ||||||||
| 6.000%, 07/25/2036 | 81,244 | 96,267 | ||||||
| Series 2006-95, Class FH, | ||||||||
| 1M US L + 0.45%, 10/25/2036(a) | 51,371 | 50,144 | ||||||
| Principal Amount | Value (Note 2) | |||||||
| Series 2007-100, Class YF, | ||||||||
| 1M US L + 0.55%, 10/25/2037(a) | $ | 28,583 | $ | 28,017 | ||||
| Series 2007-111, Class FC, | ||||||||
| 1M US L + 0.60%, 12/25/2037(a) | 63,087 | 63,335 | ||||||
| Series 2007-117, Class FM, | ||||||||
| 1M US L + 0.70%, 01/25/2038(a) | 92,588 | 93,325 | ||||||
| Series 2007-12, Class ZA, | ||||||||
| 6.000%, 03/25/2037 | 133,411 | 173,662 | ||||||
| Series 2007-30, Class MB, | ||||||||
| 4.250%, 04/25/2037 | 119,087 | 130,245 | ||||||
| Series 2007-33, Class HE, | ||||||||
| 5.500%, 04/25/2037 | 56,253 | 64,382 | ||||||
| Series 2007-34, Class F, | ||||||||
| 1M US L + 0.39%, 04/25/2037(a) | 47,639 | 47,470 | ||||||
| Series 2007-41, Class FA, | ||||||||
| 1M US L + 0.40%, 05/25/2037(a) | 39,605 | 39,396 | ||||||
| Series 2007-51, Class PB, | ||||||||
| 5.500%, 06/25/2037 | 32,000 | 37,505 | ||||||
| Series 2007-51, Class CP, | ||||||||
| 5.500%, 06/25/2037 | 48,138 | 58,457 | ||||||
| Series 2007-57, Class FA, | ||||||||
| 1M US L + 0.23%, 06/25/2037(a) | 45,182 | 44,723 | ||||||
| Series 2007-6, Class FC, | ||||||||
| 1M US L + 0.42%, 02/25/2037(a) | 60,404 | 60,124 | ||||||
| Series 2007-63, Class FC, | ||||||||
| 1M US L + 0.35%, 07/25/2037(a) | 25,466 | 25,279 | ||||||
| Series 2007-65, Class KF, | ||||||||
| 1M US L + 0.38%, 07/25/2037(a) | 81,883 | 79,700 | ||||||
| Series 2007-70, Class FA, | ||||||||
| 1M US L + 0.35%, 07/25/2037(a) | 51,908 | 50,355 | ||||||
| Series 2007-85, Class FC, | ||||||||
| 1M US L + 0.54%, 09/25/2037(a) | 169,126 | 169,258 | ||||||
| Series 2007-85, Class FL, | ||||||||
| 1M US L + 0.54%, 09/25/2037(a) | 68,513 | 68,676 | ||||||
| Series 2007-86, Class FA, | ||||||||
| 1M US L + 0.45%, 09/25/2037(a) | 60,596 | 60,506 | ||||||
| Series 2007-9, Class FB, | ||||||||
| 1M US L + 0.35%, 03/25/2037(a) | 23,325 | 22,658 | ||||||
| Series 2008-18, Class FA, | ||||||||
| 1M US L + 0.90%, 03/25/2038(a) | 164,262 | 162,853 | ||||||
| 52 | | April 30, 2020 |
ALPS | Smith Total Return Bond Fund
| Statement of Investments | April 30, 2020 (Unaudited) |
| Principal Amount | Value (Note 2) | |||||||
| Series 2008-25, Class EF, | ||||||||
| 1M US L + 0.95%, 04/25/2038(a) | $ | 86,351 | $ | 87,885 | ||||
| Series 2008-46, Class LA, | ||||||||
| 5.500%, 06/25/2038 | 21,339 | 23,867 | ||||||
| Series 2008-66, Class FT, | ||||||||
| 1M US L + 0.95%, 08/25/2038(a) | 47,101 | 47,859 | ||||||
| Series 2008-86, Class FC, | ||||||||
| 1M US L + 1.10%, 12/25/2038(a) | 356,008 | 354,210 | ||||||
| Series 2009-10, Class AB, | ||||||||
| 5.000%, 03/25/2024 | 133,268 | 139,256 | ||||||
| Series 2009-103, Class FM, | ||||||||
| 1M US L + 0.70%, 11/25/2039(a) | 89,183 | 89,795 | ||||||
| Series 2009-104, Class FA, | ||||||||
| 1M US L + 0.80%, 12/25/2039(a) | 71,244 | 69,849 | ||||||
| Series 2009-11, Class MP, | ||||||||
| 7.000%, 03/25/2049 | 217,234 | 258,011 | ||||||
| Series 2009-110, Class FG, | ||||||||
| 1M US L + 0.75%, 01/25/2040(a) | 199,615 | 201,806 | ||||||
| Series 2009-111, Class CY, | ||||||||
| 5.000%, 03/25/2038 | 133,000 | 153,278 | ||||||
| Series 2009-3, Class JK, | ||||||||
| 5.000%, 01/25/2049 | 24,162 | 24,312 | ||||||
| Series 2009-36, Class MX, | ||||||||
| 5.000%, 06/25/2039 | 58,000 | 70,614 | ||||||
| Series 2009-47, Class BN, | ||||||||
| 4.500%, 07/25/2039 | 74,845 | 82,667 | ||||||
| Series 2009-62, Class WA, | ||||||||
| 5.570%, 08/25/2039(a) | 126,039 | 141,940 | ||||||
| Series 2009-68, Class FD, | ||||||||
| 1M US L + 1.25%, 09/25/2039(a) | 85,874 | 88,671 | ||||||
| Series 2009-70, Class FA, | ||||||||
| 1M US L + 1.20%, | ||||||||
| 09/25/2039(a) | 39,226 | 39,726 | ||||||
| Series 2009-86, Class OT, | ||||||||
| –%, 10/25/2037(b) | 61,155 | 56,392 | ||||||
| Series 2009-90, Class UZ, | ||||||||
| 4.500%, 11/25/2039 | 560,904 | 679,777 | ||||||
| Series 2010-1, Class WA, | ||||||||
| 6.213%, 02/25/2040(a) | 40,366 | 46,235 | ||||||
| Series 2010-102, Class HA, | ||||||||
| 4.000%, 09/25/2050 | 77,364 | 84,531 | ||||||
| Series 2010-103, Class PJ, | ||||||||
| 4.500%, 09/25/2040 | 50,000 | 57,088 | ||||||
| Series 2010-103, Class DZ, | ||||||||
| 4.500%, 09/25/2040 | 188,332 | 229,086 | ||||||
| Series 2010-118, Class LZ, | ||||||||
| 4.750%, 10/25/2040 | 63,367 | 77,128 | ||||||
| Principal Amount | Value (Note 2) | |||||||
| Series 2010-118, Class GF, | ||||||||
| 1M US L + 0.55%, 10/25/2039(a) | $ | 82,859 | $ | 83,061 | ||||
| Series 2010-122, Class JA, | ||||||||
| 7.000%, 07/25/2040 | 64,890 | 73,618 | ||||||
| Series 2010-123, Class FL, | ||||||||
| 1M US L + 0.43%, 11/25/2040(a) | 42,653 | 42,557 | ||||||
| Series 2010-123, Class KU, | ||||||||
| 4.500%, 11/25/2040 | 228,503 | 263,871 | ||||||
| Series 2010-129, Class PZ, | ||||||||
| 4.500%, 11/25/2040 | 100,380 | 114,963 | ||||||
| Series 2010-137, Class XP, | ||||||||
| 4.500%, 10/25/2040 | 131,823 | 139,865 | ||||||
| Series 2010-14, Class FJ, | ||||||||
| 1M US L + 0.60%, 03/25/2040(a) | 96,701 | 96,969 | ||||||
| Series 2010-141, Class AL, | ||||||||
| 4.000%, 12/25/2040 | 103,728 | 112,969 | ||||||
| Series 2010-141, Class FB, | ||||||||
| 1M US L + 0.47%, 12/25/2040(a) | 77,119 | 77,072 | ||||||
| Series 2010-141, Class MN, | ||||||||
| 4.000%, 12/25/2040 | 75,000 | 86,956 | ||||||
| Series 2010-142, Class FM, | ||||||||
| 1M US L + 0.47%, 12/25/2040(a) | 28,565 | 28,244 | ||||||
| Series 2010-158, Class KF, | ||||||||
| 1M US L + 0.50%, 04/25/2040(a) | 81,364 | 81,480 | ||||||
| Series 2010-16, Class PL, | ||||||||
| 5.000%, 03/25/2040 | 71,000 | 89,179 | ||||||
| Series 2010-37, Class CY, | ||||||||
| 5.000%, 04/25/2040 | 71,998 | 82,243 | ||||||
| Series 2010-38, Class KD, | ||||||||
| 4.500%, 09/25/2039 | 49,112 | 50,948 | ||||||
| Series 2010-39, Class EF, | ||||||||
| 1M US L + 0.52%, 06/25/2037(a) | 74,762 | 74,884 | ||||||
| Series 2010-45, Class WD, | ||||||||
| 5.000%, 05/25/2040 | 173,000 | 226,814 | ||||||
| Series 2010-54, Class LX, | ||||||||
| 5.000%, 06/25/2040 | 272,000 | 308,639 | ||||||
| Series 2010-58, Class FY, | ||||||||
| 1M US L + 0.73%, 06/25/2040(a) | 81,779 | 82,495 | ||||||
| Series 2010-64, Class DM, | ||||||||
| 5.000%, 06/25/2040 | 65,726 | 74,094 | ||||||
| Series 2010-68, Class DA, | ||||||||
| 4.500%, 10/25/2037 | 189,703 | 193,103 | ||||||
| Series 2010-68, Class WB, | ||||||||
| 4.500%, 07/25/2040 | 45,000 | 57,091 | ||||||
| Series 2010-72, Class NK, | ||||||||
| 4.000%, 11/25/2039 | 15,423 | 15,659 | ||||||
| Series 2010-82, Class WZ, | ||||||||
| 5.000%, 08/25/2040 | 325,318 | 390,849 | ||||||
| 53 | | April 30, 2020 |
ALPS | Smith Total Return Bond Fund
| Statement of Investments | April 30, 2020 (Unaudited) |
| Principal Amount | Value (Note 2) | |||||||
| Series 2010-9, Class ME, | ||||||||
| 5.000%, 02/25/2040 | $ | 1,167,000 | $ | 1,401,269 | ||||
| Series 2010-93, Class AH, | ||||||||
| 2.500%, 08/25/2020 | 7,280 | 7,274 | ||||||
| Series 2011-104, Class KH, | ||||||||
| 2.000%, 03/25/2039 | 15,857 | 16,066 | ||||||
| Series 2011-114, Class B, | ||||||||
| 3.500%, 11/25/2041 | 246,506 | 267,567 | ||||||
| Series 2011-121, Class JP, | ||||||||
| 4.500%, 12/25/2041 | 244,141 | 251,962 | ||||||
| Series 2011-130, Class KB, | ||||||||
| 4.000%, 12/25/2041 | 100,000 | 109,651 | ||||||
| Series 2011-132, Class PE, | ||||||||
| 4.500%, 12/25/2041 | 78,806 | 87,272 | ||||||
| Series 2011-145, Class JA, | ||||||||
| 4.500%, 12/25/2041 | 71,560 | 75,263 | ||||||
| Series 2011-15, Class AF, | ||||||||
| 1M US L + 0.51%, 03/25/2041(a) | 41,222 | 41,201 | ||||||
| Series 2011-17, Class PD, | ||||||||
| 4.000%, 03/25/2041 | 33,825 | 35,344 | ||||||
| Series 2011-22, Class MA, | ||||||||
| 6.500%, 04/25/2038 | 61,955 | 63,406 | ||||||
| Series 2011-26, Class PA, | ||||||||
| 4.500%, 04/25/2041 | 213,223 | 236,176 | ||||||
| Series 2011-27, Class ZD, | ||||||||
| 2.500%, 09/25/2040 | 153,066 | 162,748 | ||||||
| Series 2011-3, Class FA, | ||||||||
| 1M US L + 0.68%, 02/25/2041(a) | 347,269 | 341,057 | ||||||
| Series 2011-43, Class B, | ||||||||
| 3.500%, 05/25/2031 | 49,656 | 53,975 | ||||||
| Series 2011-45, Class ZA, | ||||||||
| 4.000%, 05/25/2031 | 37,244 | 40,941 | ||||||
| Series 2011-47, Class GF, | ||||||||
| 1M US L + 0.57%, 06/25/2041(a) | 118,462 | 116,266 | ||||||
| Series 2011-5, Class PO, | ||||||||
| –%, 09/25/2040(b) | 21,648 | 18,445 | ||||||
| Series 2011-55, Class BZ, | ||||||||
| 3.500%, 06/25/2041 | 294,980 | 328,522 | ||||||
| Series 2011-75, Class HP, | ||||||||
| 2.500%, 07/25/2040 | 54,599 | 55,614 | ||||||
| Series 2011-86, Class AF, | ||||||||
| 1M US L + 0.50%, 02/25/2040(a) | 75,074 | 75,112 | ||||||
| Series 2011-86, Class NF, | ||||||||
| 1M US L + 0.55%, 09/25/2041(a) | 49,504 | 49,674 | ||||||
| Series 2011-93, Class GA, | ||||||||
| 4.000%, 04/25/2039 | 52,752 | 55,849 | ||||||
| Series 2011-93, Class ST, | ||||||||
| 4.000%, 09/25/2041 | 38,467 | 42,270 | ||||||
| Series 2011-98, Class AE, | ||||||||
| 2.500%, 11/25/2037 | 33,526 | 33,553 | ||||||
| Principal Amount | Value (Note 2) | |||||||
| Series 2012-120, Class AH, | ||||||||
| 2.500%, 02/25/2032 | $ | 119,793 | $ | 123,399 | ||||
| Series 2012-128, Class NP, | ||||||||
| 2.500%, 11/25/2042 | 24,998 | 25,479 | ||||||
| Series 2012-129, Class HT, | ||||||||
| 2.000%, 12/25/2032 | 81,672 | 81,591 | ||||||
| Series 2012-13, Class JP, | ||||||||
| 4.500%, 02/25/2042 | 1,194,614 | 1,261,421 | ||||||
| Series 2012-131, Class FG, | ||||||||
| 1M US L + 0.35%, 09/25/2042(a) | 41,202 | 39,941 | ||||||
| Series 2012-137, Class CF, | ||||||||
| 1M US L + 0.30%, 08/25/2041(a) | 95,854 | 95,182 | ||||||
| Series 2012-139, Class GB, | ||||||||
| 2.500%, 12/25/2042 | 210,538 | 227,953 | ||||||
| Series 2012-14, Class MH, | ||||||||
| 2.000%, 12/25/2040 | 85,366 | 86,719 | ||||||
| Series 2012-14, Class FL, | ||||||||
| 1M US L + 0.45%, 12/25/2040(a) | 21,404 | 21,373 | ||||||
| Series 2012-144, Class JT, | ||||||||
| 2.500%, 06/25/2042 | 23,614 | 23,293 | ||||||
| Series 2012-149, Class DA, | ||||||||
| 1.750%, 01/25/2043 | 62,354 | 63,269 | ||||||
| Series 2012-149, Class KB, | ||||||||
| 3.000%, 01/25/2043 | 144,000 | 152,580 | ||||||
| Series 2012-152, Class PB, | ||||||||
| 3.500%, 01/25/2043 | 55,000 | 60,621 | ||||||
| Series 2012-20, Class AF, | ||||||||
| 1M US L + 0.40%, 07/25/2039(a) | 20,055 | 20,055 | ||||||
| Series 2012-33, Class F, | ||||||||
| 1M US L + 0.52%, 04/25/2042(a) | 70,546 | 68,948 | ||||||
| Series 2012-37, Class BF, | ||||||||
| 1M US L + 0.50%, 12/25/2035(a) | 50,458 | 50,492 | ||||||
| Series 2012-46, Class YB, | ||||||||
| 3.500%, 05/25/2042 | 100,000 | 105,635 | ||||||
| Series 2012-47, Class HF, | ||||||||
| 1M US L + 0.40%, 05/25/2027(a) | 142,068 | 141,411 | ||||||
| Series 2012-70, Class WC, | ||||||||
| 3.000%, 07/25/2042 | 100,000 | 112,044 | ||||||
| Series 2012-83, Class AC, | ||||||||
| 3.000%, 08/25/2042 | 50,000 | 54,121 | ||||||
| Series 2012-94, Class KF, | ||||||||
| 1M US L + 0.35%, 05/25/2038(a) | 56,959 | 56,848 | ||||||
| Series 2012-96, Class CB, | ||||||||
| 1.500%, 04/25/2039 | 27,811 | 27,408 | ||||||
| Series 2013-104, Class CY, | ||||||||
| 5.000%, 10/25/2043 | 50,000 | 62,245 | ||||||
| Series 2013-108, Class GU, | ||||||||
| 3.000%, 10/25/2033 | 55,000 | 59,409 | ||||||
| 54 | | April 30, 2020 |
ALPS | Smith Total Return Bond Fund
| Statement of Investments | April 30, 2020 (Unaudited) |
| Principal Amount | Value (Note 2) | |||||||
| Series 2013-114, Class LM, | ||||||||
| 4.000%, 03/25/2042 | $ | 300,000 | $ | 338,920 | ||||
| Series 2013-129, Class WL, | ||||||||
| 2.000%, 12/25/2027 | 32,281 | 32,782 | ||||||
| Series 2013-13, Class WA, | ||||||||
| 2.500%, 07/25/2042 | 155,217 | 154,415 | ||||||
| Series 2013-130, Class FB, | ||||||||
| 1M US L + 0.45%, 01/25/2044(a) | 95,289 | 94,892 | ||||||
| Series 2013-136, Class QB, | ||||||||
| 3.500%, 03/25/2042 | 300,000 | 325,371 | ||||||
| Series 2013-17, Class YM, | ||||||||
| 4.000%, 03/25/2033 | 30,832 | 34,065 | ||||||
| Series 2013-2, Class QF, | ||||||||
| 1M US L + 0.50%, 02/25/2043(a) | 30,223 | 30,088 | ||||||
| Series 2013-35, Class CV, | ||||||||
| 3.000%, 02/25/2043 | 100,000 | 110,622 | ||||||
| Series 2013-40, Class KD, | ||||||||
| 1.750%, 04/25/2042 | 97,575 | 96,871 | ||||||
| Series 2013-52, Class GM, | ||||||||
| 5.000%, 06/25/2043 | 89,000 | 103,875 | ||||||
| Series 2013-53, Class CV, | ||||||||
| 3.500%, 05/25/2030 | 105,433 | 111,860 | ||||||
| Series 2013-56, Class HB, | ||||||||
| 2.500%, 06/25/2043 | 40,000 | 39,996 | ||||||
| Series 2013-6, Class KJ, | ||||||||
| 3.000%, 02/25/2043 | 77,613 | 80,891 | ||||||
| Series 2013-68, Class P, | ||||||||
| 3.500%, 10/25/2042 | 272,926 | 280,689 | ||||||
| Series 2013-72, Class YA, | ||||||||
| 3.000%, 06/25/2033 | 55,022 | 55,384 | ||||||
| Series 2013-72, Class AF, | ||||||||
| 1M US L + 0.25%, 11/25/2042(a) | 27,308 | 27,183 | ||||||
| Series 2013-9, Class CB, | ||||||||
| 5.500%, 04/25/2042 | 23,398 | 26,965 | ||||||
| Series 2014-12, Class GV, | ||||||||
| 3.500%, 03/25/2027 | 144,957 | 154,612 | ||||||
| Series 2014-26, Class YW, | ||||||||
| 3.500%, 04/25/2044 | 50,538 | 57,086 | ||||||
| Series 2014-3, Class BM, | ||||||||
| 2.500%, 06/25/2043 | 50,000 | 53,043 | ||||||
| Series 2014-73, Class FA, | ||||||||
| 1M US L + 0.35%, 11/25/2044(a) | 35,566 | 34,526 | ||||||
| Series 2014-88, Class ER, | ||||||||
| 2.500%, 02/25/2036 | 44,221 | 45,928 | ||||||
| Series 2015-72, Class PC, | ||||||||
| 3.000%, 10/25/2043 | 95,338 | 96,022 | ||||||
| Series 2016-27, Class HK, | ||||||||
| 3.000%, 01/25/2041 | 515,039 | 551,827 | ||||||
| Series 2016-33, Class LE, | ||||||||
| 2.500%, 11/25/2033 | 86,744 | 90,983 | ||||||
| Principal Amount | Value (Note 2) | |||||||
| Series 2016-48, Class UF, | ||||||||
| 1M US L + 0.40%, 08/25/2046(a) | $ | 119,987 | $ | 116,653 | ||||
| Series 2016-75, Class FC, | ||||||||
| 1M US L + 0.40%, 10/25/2046(a) | 37,235 | 37,115 | ||||||
| Series 2016-85, Class BA, | ||||||||
| 2.500%, 11/25/2046 | 58,604 | 59,115 | ||||||
| Series 2016-9, Class D, | ||||||||
| 3.000%, 03/25/2046 | 74,984 | 80,114 | ||||||
| Series 2017-10, Class FA, | ||||||||
| 1M US L + 0.40%, 03/25/2047(a) | 55,727 | 55,404 | ||||||
| Series 2017-15, Class PE, | ||||||||
| 3.500%, 04/25/2046 | 28,436 | 29,980 | ||||||
| Series 2017-35, Class AH, | ||||||||
| 3.500%, 04/25/2053 | 64,926 | 68,664 | ||||||
| Series 2017-40, Class GL, | ||||||||
| 3.500%, 03/25/2043 | 70,437 | 73,501 | ||||||
| Series 2017-46, Class AB, | ||||||||
| 3.500%, 07/25/2049 | 138,811 | 143,993 | ||||||
| Series 2017-9, Class GB, | ||||||||
| 3.000%, 05/25/2039 | 146,523 | 150,358 | ||||||
| Series 2018-39, Class FG, | ||||||||
| 1M US L + 0.25%, 11/25/2033(a) | 136,354 | 134,740 | ||||||
| Series 2018-41, Class PZ, | ||||||||
| 4.000%, 06/25/2048 | 843,124 | 1,018,377 | ||||||
| Series 2018-43, Class FE, | ||||||||
| 1M US L + 0.25%, 09/25/2038(a) | 46,712 | 45,193 | ||||||
| Series 2018-45, Class GA, | �� | |||||||
| 3.000%, 06/25/2048 | 190,288 | 198,950 | ||||||
| Series 2018-56, Class CH, | ||||||||
| 3.000%, 08/25/2048 | 138,117 | 144,059 | ||||||
| Series 2019-13, Class MH, | ||||||||
| 3.000%, 03/25/2049 | 1,529,602 | 1,584,486 | ||||||
| Series 2019-60, Class BF, | ||||||||
| 1M US L + 0.45%, 10/25/2049(a) | 82,833 | 82,723 | ||||||
| 31,965,782 | ||||||||
| Freddie Mac | ||||||||
| Series 1994-1665, Class KZ, | ||||||||
| 6.500%, 01/15/2024 | 8,973 | 9,678 | ||||||
| Series 1996-1863, Class Z, | ||||||||
| 6.500%, 07/15/2026 | 18,940 | 20,357 | ||||||
| Series 1997-1935, Class FK, | ||||||||
| 1M US L + 0.70%, 02/15/2027(a) | 23,154 | 22,890 | ||||||
| Series 1997-1980, Class Z, | ||||||||
| 7.000%, 07/15/2027 | 25,810 | 29,638 | ||||||
| Series 1998-2034, Class Z, | ||||||||
| 6.500%, 02/15/2028 | 33,485 | 37,151 | ||||||
| Series 1998-2035, Class PC, | ||||||||
| 6.950%, 03/15/2028 | 9,425 | 10,713 | ||||||
| 55 | | April 30, 2020 |
ALPS | Smith Total Return Bond Fund
| Statement of Investments | April 30, 2020 (Unaudited) |
| Principal Amount | Value (Note 2) | |||||||
| Series 1998-2053, Class Z, | ||||||||
| 6.500%, 04/15/2028 | $ | 32,806 | $ | 36,979 | ||||
| Series 1998-2060, Class Z, | ||||||||
| 6.500%, 05/15/2028 | 19,025 | 21,738 | ||||||
| Series 1998-2079, Class FA, | ||||||||
| 1M US L + 0.50%, 07/17/2028(a) | 10,061 | 9,962 | ||||||
| Series 1998-2095, Class PE, | ||||||||
| 6.000%, 11/15/2028 | 32,467 | 36,713 | ||||||
| Series 1998-2102, Class Z, | ||||||||
| 6.000%, 12/15/2028 | 70,351 | 79,662 | ||||||
| Series 1999-2115, Class FB, | ||||||||
| 1M US L + 0.45%, 01/15/2029(a) | 62,337 | 61,169 | ||||||
| Series 1999-2126, Class CB, | ||||||||
| 6.250%, 02/15/2029 | 50,376 | 56,429 | ||||||
| Series 1999-2137, Class TH, | ||||||||
| 6.500%, 03/15/2029 | 11,336 | 13,001 | ||||||
| Series 1999-2154, Class PL, | ||||||||
| 6.500%, 05/15/2029 | 49,909 | 57,608 | ||||||
| Series 2000-2224, Class CB, | ||||||||
| 8.000%, 03/15/2030 | 9,562 | 11,574 | ||||||
| Series 2001-2274, Class ZM, | ||||||||
| 6.500%, 01/15/2031 | 19,094 | 21,475 | ||||||
| Series 2001-2279, Class Z, | ||||||||
| 6.000%, 01/15/2031 | 23,631 | 26,194 | ||||||
| Series 2001-2320, Class FI, | ||||||||
| 1M US L + 0.50%, 09/15/2029(a) | 55,854 | 54,648 | ||||||
| Series 2001-2322, Class FV, | ||||||||
| 1M US L + 0.50%, 06/15/2030(a) | 41,866 | 41,189 | ||||||
| Series 2001-2324, Class PZ, | ||||||||
| 6.500%, 06/15/2031 | 214,849 | 254,686 | ||||||
| Series 2001-2334, Class KB, | ||||||||
| 6.500%, 05/15/2028 | 165,007 | 186,789 | ||||||
| Series 2001-2341, Class FP, | ||||||||
| 1M US L + 0.90%, 07/15/2031(a) | 53,094 | 52,441 | ||||||
| Series 2001-2367, Class FA, | ||||||||
| 1M US L + 0.525%, 06/15/2031(a) | 51,669 | 50,423 | ||||||
| Series 2001-2372, Class F, | ||||||||
| 1M US L + 0.50%, 10/15/2031(a) | 44,088 | 43,218 | ||||||
| Series 2001-2388, Class FR, | ||||||||
| 1M US L + 0.65%, 06/15/2031(a) | 34,378 | 33,683 | ||||||
| Series 2001-2388, Class FB, | ||||||||
| 1M US L + 0.60%, 01/15/2029(a) | 39,386 | 38,659 | ||||||
| Series 2001-2391, Class HF, | ||||||||
| 1M US L + 0.55%, 06/15/2031(a) | 17,730 | 17,321 | ||||||
| Principal Amount | Value (Note 2) | |||||||
| Series 2001-2396, Class FM, | ||||||||
| 1M US L + 0.45%, 12/15/2031(a) | $ | 82,912 | $ | 81,425 | ||||
| Series 2001-2396, Class FN, | ||||||||
| 1M US L + 0.65%, 12/15/2031(a) | 166,503 | 167,920 | ||||||
| Series 2002-2411, Class F, | ||||||||
| 1M US L + 0.55%, 02/15/2032(a) | 46,015 | 45,168 | ||||||
| Series 2002-2412, Class OF, | ||||||||
| 1M US L + 0.95%, 12/15/2031(a) | 56,877 | 57,846 | ||||||
| Series 2002-2417, Class FY, | ||||||||
| 1M US L + 0.60%, 12/15/2031(a) | 17,035 | 16,277 | ||||||
| Series 2002-2424, Class FY, | ||||||||
| 1M US L + 0.45%, 03/15/2032(a) | 84,381 | 82,153 | ||||||
| Series 2002-2430, Class WF, | ||||||||
| 6.500%, 03/15/2032 | 15,556 | 18,496 | ||||||
| Series 2002-2433, Class FA, | ||||||||
| 1M US L + 0.95%, 02/15/2032(a) | 61,548 | 62,616 | ||||||
| Series 2002-2460, Class FA, | ||||||||
| 1M US L + 1.00%, 03/15/2032(a) | 118,533 | 117,368 | ||||||
| Series 2002-2466, Class FV, | ||||||||
| 1M US L + 0.55%, 03/15/2032(a) | 110,487 | 107,749 | ||||||
| Series 2002-2470, Class EF, | ||||||||
| 1M US L + 1.00%, 03/15/2032(a) | 127,073 | 125,824 | ||||||
| Series 2002-2478, Class FD, | ||||||||
| 1M US L + 1.00%, 02/15/2032(a) | 35,503 | 35,152 | ||||||
| Series 2002-2481, Class FE, | ||||||||
| 1M US L + 1.00%, 03/15/2032(a) | 35,906 | 35,553 | ||||||
| Series 2002-2488, Class FU, | ||||||||
| 1M US L + 0.60%, 03/15/2032(a) | 107,833 | 106,202 | ||||||
| Series 2002-2494, Class F, | ||||||||
| 1M US L + 1.05%, 06/15/2031(a) | 68,640 | 68,111 | ||||||
| Series 2002-2495, Class ZB, | ||||||||
| 4.500%, 09/15/2032 | 55,072 | 61,517 | ||||||
| Series 2002-2510, Class FE, | ||||||||
| 1M US L + 0.40%, 10/15/2032(a) | 64,345 | 63,268 | ||||||
| Series 2002-2513, Class AF, | ||||||||
| 1M US L + 1.00%, 02/15/2032(a) | 77,788 | 77,020 | ||||||
| Series 2002-2516, Class FD, | ||||||||
| 1M US L + 1.00%, 02/15/2032(a) | 90,184 | 89,294 | ||||||
| 56 | | April 30, 2020 |
ALPS | Smith Total Return Bond Fund
| Statement of Investments | April 30, 2020 (Unaudited) |
| Principal Amount | Value (Note 2) | |||||||
| Series 2002-2517, Class FR, | ||||||||
| 1M US L + 0.35%, 10/15/2032(a) | $ | 24,160 | $ | 23,399 | ||||
| Series 2002-2524, Class DH, | ||||||||
| 6.000%, 11/15/2032 | 27,000 | 32,564 | ||||||
| Series 2002-2535, Class AW, | ||||||||
| 5.500%, 12/15/2032 | 20,527 | 23,905 | ||||||
| Series 2002-2538, Class F, | ||||||||
| 1M US L + 0.60%, 12/15/2032(a) | 272,598 | 274,600 | ||||||
| Series 2002-2541, Class BL, | ||||||||
| 5.500%, 12/15/2032 | 70,000 | 80,198 | ||||||
| Series 2003-2557, Class WF, | ||||||||
| 1M US L + 0.40%, 01/15/2033(a) | 53,173 | 51,406 | ||||||
| Series 2003-2557, Class NU, | ||||||||
| 5.250%, 03/15/2032 | 83,350 | 95,311 | ||||||
| Series 2003-2557, Class HL, | ||||||||
| 5.300%, 01/15/2033 | 177,949 | 200,879 | ||||||
| Series 2003-2568, Class D, | ||||||||
| 5.500%, 02/15/2033 | 61,018 | 68,457 | ||||||
| Series 2003-2571, Class FY, | ||||||||
| 1M US L + 0.75%, 12/15/2032(a) | 36,819 | 37,254 | ||||||
| Series 2003-2587, Class FW, | ||||||||
| 1M US L + 0.47%, 03/15/2033(a) | 103,452 | 100,206 | ||||||
| Series 2003-2590, Class OZ, | ||||||||
| 4.000%, 03/15/2033 | 227,495 | 256,746 | ||||||
| Series 2003-2590, Class QY, | ||||||||
| 3.750%, 04/15/2028 | 26,424 | 27,663 | ||||||
| Series 2003-2614, Class FV, | ||||||||
| 1M US L + 1.50%, 05/15/2033(a) | 442,676 | 453,446 | ||||||
| Series 2003-2624, Class QH, | ||||||||
| 5.000%, 06/15/2033 | 24,777 | 27,851 | ||||||
| Series 2003-2626, Class ZX, | ||||||||
| 5.000%, 06/15/2033 | 174,878 | 227,467 | ||||||
| Series 2003-2627, Class CN, | ||||||||
| 5.000%, 06/15/2033 | 69,347 | 77,974 | ||||||
| Series 2003-2631, Class DB, | ||||||||
| 5.000%, 06/15/2033 | 80,000 | 91,609 | ||||||
| Series 2003-2647, Class A, | ||||||||
| 3.250%, 04/15/2032 | 117,747 | 125,619 | ||||||
| Series 2003-2648, Class WZ, | ||||||||
| 5.000%, 07/15/2033 | 230,657 | 283,664 | ||||||
| Series 2003-2668, Class LH, | ||||||||
| 5.000%, 09/15/2033 | 33,425 | 37,836 | ||||||
| Series 2003-2707, Class FH, | ||||||||
| 1M US L + 0.65%, 04/15/2032(a) | 67,278 | 67,604 | ||||||
| Series 2003-2717, Class LH, | ||||||||
| 5.500%, 12/15/2033 | 10,826 | 12,337 | ||||||
| Series 2003-2725, Class TA, | ||||||||
| 4.500%, 12/15/2033 | 97,000 | 112,997 | ||||||
| Principal Amount | Value (Note 2) | |||||||
| Series 2004-2750, Class TC, | ||||||||
| 5.250%, 02/15/2034 | $ | 19,825 | $ | 21,638 | ||||
| Series 2004-2763, Class FC, | ||||||||
| 1M US L + 0.35%, 04/15/2032(a) | 8,520 | 8,321 | ||||||
| Series 2004-2768, Class PW, | ||||||||
| 4.250%, 03/15/2034 | 226,496 | 253,259 | ||||||
| Series 2004-2802, Class OH, | ||||||||
| 6.000%, 05/15/2034 | 13,769 | 15,461 | ||||||
| Series 2004-2835, Class KZ, | ||||||||
| 5.500%, 08/15/2034 | 68,610 | 80,069 | ||||||
| Series 2004-2893, Class PE, | ||||||||
| 5.000%, 11/15/2034 | 24,604 | 28,065 | ||||||
| Series 2004-2901, Class KB, | ||||||||
| 5.000%, 12/15/2034 | 65,343 | 73,064 | ||||||
| Series 2005-2927, Class EZ, | ||||||||
| 5.500%, 02/15/2035 | 72,641 | 78,268 | ||||||
| Series 2005-2929, Class PG, | ||||||||
| 5.000%, 02/15/2035 | 50,212 | 57,127 | ||||||
| Series 2005-2933, Class HD, | ||||||||
| 5.500%, 02/15/2035 | 67,745 | 76,143 | ||||||
| Series 2005-2953, Class PG, | ||||||||
| 5.500%, 03/15/2035 | 35,114 | 40,725 | ||||||
| Series 2005-2962, Class KF, | ||||||||
| 1M US L + 0.20%, 04/15/2035(a) | 32,304 | 32,035 | ||||||
| Series 2005-2980, Class QA, | ||||||||
| 6.000%, 05/15/2035 | 72,487 | 83,934 | ||||||
| Series 2005-2996, Class GX, | ||||||||
| 5.500%, 06/15/2035 | 72,000 | 85,392 | ||||||
| Series 2005-3012, Class ZE, | ||||||||
| 5.750%, 08/15/2035 | 45,868 | 55,272 | ||||||
| Series 2005-3028, Class FM, | ||||||||
| 1M US L + 0.25%, 09/15/2035(a) | 23,940 | 23,753 | ||||||
| Series 2005-3028, Class PG, | ||||||||
| 5.500%, 09/15/2035 | 31,920 | 36,126 | ||||||
| Series 2005-3028, Class ZE, | ||||||||
| 5.500%, 09/15/2035 | 735,441 | 878,066 | ||||||
| Series 2005-3033, Class WY, | ||||||||
| 5.500%, 09/15/2035 | 89,052 | 101,912 | ||||||
| Series 2005-3042, Class PZ, | ||||||||
| 5.750%, 09/15/2035 | 64,634 | 93,222 | ||||||
| Series 2005-3052, Class WH, | ||||||||
| 5.500%, 10/15/2035 | 25,248 | 28,814 | ||||||
| Series 2005-3059, Class ZM, | ||||||||
| 5.000%, 02/15/2035 | 167,518 | 188,965 | ||||||
| Series 2005-3070, Class FT, | ||||||||
| 1M US L + 0.35%, 11/15/2035(a) | 33,073 | 32,941 | ||||||
| Series 2005-3072, Class NF, | ||||||||
| 1M US L + 0.50%, 11/15/2035(a) | 66,234 | 64,722 | ||||||
| Series 2005-3085, Class FE, | ||||||||
| 1M US L + 0.80%, 08/15/2035(a) | 86,927 | 87,954 | ||||||
| 57 | | April 30, 2020 |
ALPS | Smith Total Return Bond Fund
| Statement of Investments | April 30, 2020 (Unaudited) |
| Principal Amount | Value (Note 2) | |||||||
| Series 2006-3098, Class PG, | ||||||||
| 5.000%, 01/15/2036 | $ | 133,379 | $ | 152,716 | ||||
| Series 2006-3122, Class OH, | ||||||||
| –%, 03/15/2036(b) | 26,797 | 25,423 | ||||||
| Series 2006-3123, Class HT, | ||||||||
| 5.000%, 03/15/2026 | 68,005 | 73,356 | ||||||
| Series 2006-3136, Class KF, | ||||||||
| 1M US L + 0.30%, 04/15/2036(a) | 50,614 | 50,378 | ||||||
| Series 2006-3137, Class XP, | ||||||||
| 6.000%, 04/15/2036 | 36,167 | 42,936 | ||||||
| Series 2006-3143, Class BC, | ||||||||
| 5.500%, 02/15/2036 | 170,404 | 198,938 | ||||||
| Series 2006-3145, Class FN, | ||||||||
| 1M US L + 0.43%, 04/15/2036(a) | 23,188 | 23,132 | ||||||
| Series 2006-3148, Class CY, | ||||||||
| 6.000%, 04/15/2036 | 33,690 | 39,228 | ||||||
| Series 2006-3153, Class UG, | ||||||||
| 1M US L + 0.45%, 05/15/2036(a) | 37,074 | 36,984 | ||||||
| Series 2006-3154, Class PN, | ||||||||
| 5.500%, 05/15/2036 | 119,215 | 137,069 | ||||||
| Series 2006-3201, Class FL, | ||||||||
| 1M US L + 0.60%, 08/15/2036(a) | 140,531 | 137,825 | ||||||
| Series 2006-3202, Class HF, | ||||||||
| 1M US L + 0.35%, 08/15/2036(a) | 77,476 | 76,279 | ||||||
| Series 2006-3236, Class EF, | ||||||||
| 1M US L + 0.30%, 11/15/2036(a) | 20,754 | 20,094 | ||||||
| Series 2006-3237, Class CD, | ||||||||
| 5.500%, 09/15/2036 | 118,000 | 134,679 | ||||||
| Series 2006-3237, Class CE, | ||||||||
| 5.500%, 11/15/2036 | 59,000 | 75,547 | ||||||
| Series 2006-3249, Class CB, | ||||||||
| 4.250%, 12/15/2036 | 429,502 | 456,937 | ||||||
| Series 2007-3262, Class FT, | ||||||||
| 1M US L + 0.27%, 01/15/2037(a) | 78,746 | 76,097 | ||||||
| Series 2007-3279, Class FB, | ||||||||
| 1M US L + 0.32%, 02/15/2037(a) | 126,895 | 123,133 | ||||||
| Series 2007-3284, Class AZ, | ||||||||
| 4.500%, 03/15/2037 | 86,897 | 93,510 | ||||||
| Series 2007-3301, Class FY, | ||||||||
| 1M US L + 0.42%, 04/15/2037(a) | 42,321 | 42,227 | ||||||
| Series 2007-3311, Class DF, | ||||||||
| 1M US L + 0.34%, 05/15/2037(a) | 185,760 | 184,555 | ||||||
| Series 2007-3312, Class PA, | ||||||||
| 5.500%, 05/15/2037 | 22,339 | 25,796 | ||||||
| Principal Amount | Value (Note 2) | |||||||
| Series 2007-3316, Class FB, | ||||||||
| 1M US L + 0.30%, 08/15/2035(a) | $ | 61,642 | $ | 59,817 | ||||
| Series 2007-3349, Class HG, | ||||||||
| 5.500%, 07/15/2037 | 33,552 | 38,911 | ||||||
| Series 2007-3361, Class AF, | ||||||||
| 1M US L + 0.35%, 11/15/2036(a) | 132,037 | 128,358 | ||||||
| Series 2007-3367, Class YF, | ||||||||
| 1M US L + 0.55%, 09/15/2037(a) | 28,654 | 28,085 | ||||||
| Series 2007-3368, Class AF, | ||||||||
| 1M US L + 0.72%, 09/15/2037(a) | 106,088 | 106,772 | ||||||
| Series 2007-3378, Class FA, | ||||||||
| 1M US L + 0.58%, 06/15/2037(a) | 53,215 | 53,384 | ||||||
| Series 2007-3380, Class FM, | ||||||||
| 1M US L + 0.59%, 10/15/2037(a) | 37,003 | 37,113 | ||||||
| Series 2007-3382, Class FG, | ||||||||
| 1M US L + 0.60%, 11/15/2037(a) | 57,540 | 57,812 | ||||||
| Series 2007-3382, Class FL, | ||||||||
| 1M US L + 0.70%, 11/15/2037(a) | 78,643 | 79,301 | ||||||
| Series 2007-3387, Class PF, | ||||||||
| 1M US L + 0.42%, 11/15/2037(a) | 47,883 | 47,769 | ||||||
| Series 2007-3388, Class FJ, | ||||||||
| 1M US L + 0.83%, 11/15/2037(a) | 209,589 | 211,231 | ||||||
| Series 2008-3404, Class DC, | ||||||||
| 5.500%, 01/15/2038 | 72,000 | 88,228 | ||||||
| Series 2008-3411, Class FL, | ||||||||
| 1M US L + 0.70%, 02/15/2038(a) | 45,257 | 44,529 | ||||||
| Series 2008-3415, Class PC, | ||||||||
| 5.000%, 12/15/2037 | 55,439 | 62,306 | ||||||
| Series 2008-3415, Class TF, | ||||||||
| 1M US L + 0.74%, 08/15/2035(a) | 89,372 | 90,286 | ||||||
| Series 2008-3415, Class DF, | ||||||||
| 1M US L + 0.70%, 08/15/2035(a) | 164,511 | 165,836 | ||||||
| Series 2008-3469, Class CF, | ||||||||
| 1M US L + 0.79%, 07/15/2038(a) | 111,266 | 107,776 | ||||||
| Series 2009-3536, Class FM, | ||||||||
| 1M US L + 1.00%, 05/15/2039(a) | 42,560 | 43,411 | ||||||
| Series 2009-3539, Class B, | ||||||||
| 4.500%, 06/15/2029 | 44,000 | 51,359 | ||||||
| Series 2009-3545, Class FA, | ||||||||
| 1M US L + 0.85%, 06/15/2039(a) | 164,841 | 163,047 | ||||||
| 58 | | April 30, 2020 |
ALPS | Smith Total Return Bond Fund
| Statement of Investments | April 30, 2020 (Unaudited) |
| Principal Amount | Value (Note 2) | |||||||
| Series 2009-3548, Class ZE, | ||||||||
| 5.500%, 12/15/2032 | $ | 101,736 | $ | 117,778 | ||||
| Series 2009-3549, Class FA, | ||||||||
| 1M US L + 1.20%, 07/15/2039(a) | 37,378 | 37,879 | ||||||
| Series 2009-3564, Class NB, | ||||||||
| 5.000%, 08/15/2039 | 132,000 | 154,943 | ||||||
| Series 2009-3574, Class D, | ||||||||
| 5.000%, 09/15/2039 | 142,022 | 162,710 | ||||||
| Series 2009-3584, Class FA, | ||||||||
| 1M US L + 0.70%, 12/15/2036(a) | 51,702 | 52,185 | ||||||
| Series 2009-3587, Class DA, | ||||||||
| 4.500%, 10/15/2039 | 270,809 | 297,867 | ||||||
| Series 2009-3605, Class BF, | ||||||||
| 1M US L + 0.86%, 11/15/2039(a) | 228,302 | 231,969 | ||||||
| Series 2009-3611, Class FH, | ||||||||
| 1M US L + 0.75%, 07/15/2034(a) | 22,191 | 22,461 | ||||||
| Series 2010-3620, Class EL, | ||||||||
| 4.000%, 01/15/2030 | 56,476 | 60,818 | ||||||
| Series 2010-3626, Class ME, | ||||||||
| 5.000%, 01/15/2040 | 372,000 | 440,561 | ||||||
| Series 2010-3631, Class PA, | ||||||||
| 4.000%, 02/15/2040 | 220,536 | 242,416 | ||||||
| Series 2010-3645, Class DV, | ||||||||
| 5.000%, 04/15/2029 | 86,400 | 86,715 | ||||||
| Series 2010-3653, Class B, | ||||||||
| 4.500%, 04/15/2030 | 152,144 | 167,056 | ||||||
| Series 2010-3662, Class PJ, | ||||||||
| 5.000%, 04/15/2040 | 150,991 | 172,811 | ||||||
| Series 2010-3664, Class DA, | ||||||||
| 4.000%, 11/15/2037 | 186,374 | 197,943 | ||||||
| Series 2010-3704, Class DC, | ||||||||
| 4.000%, 11/15/2036 | 117,195 | 122,061 | ||||||
| Series 2010-3735, Class AL, | ||||||||
| 1.500%, 10/15/2020 | 5,236 | 5,239 | ||||||
| Series 2010-3737, Class GB, | ||||||||
| 4.500%, 04/15/2039 | 105,000 | 111,500 | ||||||
| Series 2010-3747, Class CY, | ||||||||
| 4.500%, 10/15/2040 | 400,000 | 471,947 | ||||||
| Series 2010-3762, Class WP, | ||||||||
| 4.000%, 12/15/2039 | 56,884 | 61,333 | ||||||
| Series 2011-3790, Class AP, | ||||||||
| 4.500%, 01/15/2037 | 10,228 | 10,384 | ||||||
| Series 2011-3792, Class DF, | ||||||||
| 1M US L + 0.40%, 11/15/2040(a) | 61,741 | 61,381 | ||||||
| Series 2011-3798, Class PJ, | ||||||||
| 4.000%, 01/15/2041 | 105,471 | 115,801 | ||||||
| Series 2011-3799, Class GK, | ||||||||
| 2.750%, 01/15/2021 | 269 | 270 | ||||||
| Series 2011-3800, Class AF, | ||||||||
| 1M US L + 0.50%, 02/15/2041(a) | 37,005 | 37,043 | ||||||
| Principal Amount | Value (Note 2) | |||||||
| Series 2011-3807, Class WF, | ||||||||
| 1M US L + 0.55%, 08/15/2038(a) | $ | 35,149 | $ | 35,174 | ||||
| Series 2011-3819, Class ZQ, | ||||||||
| 6.000%, 04/15/2036 | 30,179 | 35,853 | ||||||
| Series 2011-3822, Class FY, | ||||||||
| 1M US L + 0.40%, 02/15/2033(a) | 27,990 | 27,995 | ||||||
| Series 2011-3830, Class NB, | ||||||||
| 4.500%, 02/15/2039 | 84,470 | 88,382 | ||||||
| Series 2011-3843, Class FE, | ||||||||
| 1M US L + 0.55%, 04/15/2041(a) | 82,222 | 82,486 | ||||||
| Series 2011-3843, Class PZ, | ||||||||
| 5.000%, 04/15/2041 | 595,402 | 715,256 | ||||||
| Series 2011-3852, Class TP, | ||||||||
| 5.500%, 05/15/2041(a) | 72,664 | 81,929 | ||||||
| Series 2011-3857, Class ZP, | ||||||||
| 5.000%, 05/15/2041 | 870,582 | 1,048,169 | ||||||
| Series 2011-3873, Class MJ, | ||||||||
| 4.000%, 06/15/2041 | 166,623 | 178,463 | ||||||
| Series 2011-3891, Class BF, | ||||||||
| 1M US L + 0.55%, 07/15/2041(a) | 74,497 | 74,581 | ||||||
| Series 2011-3905, Class BZ, | ||||||||
| 3.000%, 08/15/2041 | 155,581 | 175,585 | ||||||
| Series 2011-3910, Class JG, | ||||||||
| 2.750%, 12/15/2037 | 110,718 | 112,536 | ||||||
| Series 2011-3919, Class AF, | ||||||||
| 1M US L + 0.35%, 03/15/2030(a) | 28,503 | 28,500 | ||||||
| Series 2011-3919, Class BD, | ||||||||
| 2.500%, 08/15/2039 | 109,817 | 111,153 | ||||||
| Series 2011-3919, Class DL, | ||||||||
| 4.000%, 08/15/2030 | 298,000 | 350,996 | ||||||
| Series 2011-3935, Class JZ, | ||||||||
| 4.500%, 10/15/2041 | 936,069 | 1,144,487 | ||||||
| Series 2011-3939, Class BZ, | ||||||||
| 4.500%, 06/15/2041 | 1,539,466 | 1,626,150 | ||||||
| Series 2011-3946, Class KB, | ||||||||
| 3.000%, 11/15/2029 | 125,109 | 125,598 | ||||||
| Series 2011-3951, Class JB, | ||||||||
| 4.000%, 08/15/2041 | 39,937 | 41,988 | ||||||
| Series 2011-3958, Class PJ, | ||||||||
| 4.500%, 09/15/2041 | 363,057 | 378,148 | ||||||
| Series 2011-3959, Class MB, | ||||||||
| 4.500%, 11/15/2041 | 44,199 | 56,590 | ||||||
| Series 2011-3962, Class FB, | ||||||||
| 1M US L + 0.50%, 10/15/2039(a) | 58,684 | 58,760 | ||||||
| Series 2011-3963, Class JB, | ||||||||
| 4.500%, 11/15/2041 | 150,000 | 171,292 | ||||||
| Series 2011-3969, Class JP, | ||||||||
| 4.500%, 09/15/2041 | 158,700 | 171,081 | ||||||
| Series 2011-3970, Class HA, | ||||||||
| 3.000%, 02/15/2026 | 24,110 | 24,358 | ||||||
| 59 | | April 30, 2020 |
ALPS | Smith Total Return Bond Fund
| Statement of Investments | April 30, 2020 (Unaudited) |
| Principal Amount | Value (Note 2) | |||||||
| Series 2011-3976, Class A, | ||||||||
| 3.500%, 08/15/2029 | $ | 136,447 | $ | 137,907 | ||||
| Series 2012-3979, Class GA, | ||||||||
| 3.500%, 05/15/2030 | 59,120 | 60,578 | ||||||
| Series 2012-3984, Class DF, | ||||||||
| 1M US L + 0.55%, 01/15/2042(a) | 78,767 | 77,226 | ||||||
| Series 2012-3989, Class JW, | ||||||||
| 3.500%, 01/15/2042 | 255,000 | 285,181 | ||||||
| Series 2012-3996, Class GN, | ||||||||
| 3.000%, 11/15/2038 | 17,431 | 17,428 | ||||||
| Series 2012-3997, Class EB, | ||||||||
| 3.500%, 12/15/2041 | 94,654 | 104,604 | ||||||
| Series 2012-3997, Class EC, | ||||||||
| 3.500%, 02/15/2042 | 124,000 | 143,078 | ||||||
| Series 2012-3997, Class FQ, | ||||||||
| 1M US L + 0.50%, 02/15/2042(a) | 84,667 | 84,487 | ||||||
| Series 2012-4001, Class FM, | ||||||||
| 1M US L + 0.50%, 02/15/2042(a) | 55,504 | 54,201 | ||||||
| Series 2012-4011, Class DB, | ||||||||
| 4.000%, 09/15/2041 | 256,455 | 289,876 | ||||||
| Series 2012-4012, Class GC, | ||||||||
| 3.500%, 06/15/2040 | 46,000 | 49,088 | ||||||
| Series 2012-4012, Class GJ, | ||||||||
| 2.500%, 06/15/2038 | 64,956 | 65,531 | ||||||
| Series 2012-4012, Class NF, | ||||||||
| 1M US L + 0.45%, 12/15/2038(a) | 32,437 | 32,497 | ||||||
| Series 2012-4020, Class PG, | ||||||||
| 2.500%, 03/15/2027 | 29,084 | 30,032 | ||||||
| Series 2012-4037, Class CA, | ||||||||
| 3.000%, 04/15/2027 | 67,369 | 73,361 | ||||||
| Series 2012-4039, Class LT, | ||||||||
| 3.500%, 05/15/2042 | 62,000 | 68,952 | ||||||
| Series 2012-4062, Class MZ, | ||||||||
| 3.500%, 06/15/2042 | 131,109 | 142,621 | ||||||
| Series 2012-4064, Class AY, | ||||||||
| 3.000%, 06/15/2027 | 48,000 | 52,430 | ||||||
| Series 2012-4068, Class PE, | ||||||||
| 3.000%, 06/15/2042 | 224,000 | 244,662 | ||||||
| Series 2012-4075, Class PB, | ||||||||
| 3.000%, 07/15/2042 | 42,000 | 46,920 | ||||||
| Series 2012-4076, Class MV, | ||||||||
| 3.000%, 04/15/2031 | 69,000 | 74,329 | ||||||
| Series 2012-4097, Class CU, | ||||||||
| 1.500%, 08/15/2027 | 25,000 | 24,967 | ||||||
| Series 2012-4097, Class UF, | ||||||||
| 1M US L + 0.35%, 08/15/2032(a) | 90,720 | 90,208 | ||||||
| Series 2012-4102, Class DA, | ||||||||
| 3.000%, 08/15/2041 | 181,764 | 180,478 | ||||||
| Series 2012-4104, Class AJ, | ||||||||
| 1.500%, 09/15/2027 | 60,457 | 61,481 | ||||||
| Principal Amount | Value (Note 2) | |||||||
| Series 2012-4109, Class KD, | ||||||||
| 3.000%, 05/15/2032 | $ | 7,423 | $ | 7,428 | ||||
| Series 2012-4120, Class TC, | ||||||||
| 1.500%, 10/15/2027 | 21,695 | 21,922 | ||||||
| Series 2012-4122, Class BA, | ||||||||
| 3.131%, 05/15/2040 | 293,141 | 306,922 | ||||||
| Series 2012-4141, Class PL, | ||||||||
| 2.500%, 12/15/2042 | 100,000 | 92,075 | ||||||
| Series 2013-4160, Class HB, | ||||||||
| 2.500%, 12/15/2032 | 55,823 | 57,500 | ||||||
| Series 2013-4170, Class FW, | ||||||||
| 1M US L + 0.95%, 01/15/2033(a) | 66,261 | 66,479 | ||||||
| Series 2013-4176, Class YD, | ||||||||
| 3.000%, 03/15/2043 | 50,000 | 51,752 | ||||||
| Series 2013-4185, Class PB, | ||||||||
| 3.000%, 03/15/2043 | 150,000 | 162,459 | ||||||
| Series 2013-4203, Class DJ, | ||||||||
| 2.500%, 04/15/2033 | 109,706 | 111,785 | ||||||
| Series 2013-4231, Class FD, | ||||||||
| 1M US L + 0.35%, 10/15/2032(a) | 31,198 | 30,782 | ||||||
| Series 2013-4257, Class A, | ||||||||
| 2.500%, 10/15/2027 | 95,442 | 97,768 | ||||||
| Series 2013-4259, Class MG, | ||||||||
| 3.000%, 08/15/2041 | 23,240 | 24,119 | ||||||
| Series 2013-4265, Class FD, | ||||||||
| 1M US L + 0.40%, 01/15/2035(a) | 40,920 | 40,773 | ||||||
| Series 2014-4293, Class NM, | ||||||||
| 4.500%, 06/15/2043 | 72,920 | 79,091 | ||||||
| Series 2014-4294, Class PF, | ||||||||
| 1M US L + 0.40%, 01/15/2044(a) | 36,604 | 36,511 | ||||||
| Series 2014-4301, Class U, | ||||||||
| 3.500%, 07/15/2032 | 189,979 | 200,680 | ||||||
| Series 2014-4324, Class AY, | ||||||||
| 3.000%, 04/15/2029 | 568,738 | 623,859 | ||||||
| Series 2014-4337, Class VJ, | ||||||||
| 3.500%, 06/15/2027 | 36,049 | 37,642 | ||||||
| Series 2014-4374, Class NC, | ||||||||
| 3.750%, 02/15/2046(c) | 26,818 | 27,025 | ||||||
| Series 2015-4452, Class AK, | ||||||||
| 3.500%, 09/15/2039 | 40,001 | 39,985 | ||||||
| Series 2015-4459, Class CA, | ||||||||
| 5.000%, 12/15/2034 | 57,136 | 62,715 | ||||||
| Series 2016-4590, Class AK, | ||||||||
| 3.500%, 08/15/2027 | 98,949 | 106,955 | ||||||
| Series 2016-4594, Class JD, | ||||||||
| 3.000%, 12/15/2042 | 31,000 | 32,254 | ||||||
| Series 2016-4604, Class CG, | ||||||||
| 2.500%, 06/15/2046 | 39,428 | 38,983 | ||||||
| Series 2016-4639, Class HZ, | ||||||||
| 3.250%, 04/15/2053(c) | 466,161 | 521,373 | ||||||
| Series 2018-4766, Class GD, | ||||||||
| 3.500%, 03/15/2044 | 27,719 | 28,714 | ||||||
| 60 | | April 30, 2020 |
ALPS | Smith Total Return Bond Fund
| Statement of Investments | April 30, 2020 (Unaudited) |
| Principal Amount | Value (Note 2) | |||||||
| Series 2018-4767, Class Z, | ||||||||
| 3.000%, 12/15/2047 | $ | 33,079 | $ | 35,176 | ||||
| Series 2018-4778, Class ED, | ||||||||
| 3.500%, 10/15/2042 | 24,703 | 25,247 | ||||||
| Series 2018-4784, Class BP, | ||||||||
| 3.500%, 04/15/2048 | 207,000 | 214,306 | ||||||
| Series 2018-4784, Class EA, | ||||||||
| 4.500%, 11/15/2042 | 421,859 | 429,704 | ||||||
| Series 2018-4794, Class DC, | ||||||||
| 4.250%, 08/15/2044 | 100,796 | 104,503 | ||||||
| Series 2018-4796, Class A, | ||||||||
| 3.000%, 10/15/2047 | 56,806 | 56,795 | ||||||
| Series 2018-4830, Class DA, | ||||||||
| 4.500%, 11/15/2044 | 390,510 | 402,484 | ||||||
| Series 2019-4863, Class AJ, | ||||||||
| 3.500%, 07/15/2038 | 91,268 | 96,988 | ||||||
| Series 2019-4868, Class A, | ||||||||
| 4.000%, 07/15/2044 | 316,376 | 320,366 | ||||||
| Series 2019-4870, Class GA, | ||||||||
| 4.000%, 12/15/2042 | 224,944 | 228,214 | ||||||
| 29,665,395 | ||||||||
| Ginnie Mae | ||||||||
| Series 2002-72, Class FB, | ||||||||
| 1M US L + 0.40%, 10/20/2032(a) | 67,455 | 67,061 | ||||||
| Series 2003-23, Class F, | ||||||||
| 1M US L + 0.45%, 12/16/2029(a) | 67,226 | 67,322 | ||||||
| Series 2003-25, Class FC, | ||||||||
| 1M US L + 0.40%, 08/26/2023(a) | 254,447 | 254,306 | ||||||
| Series 2003-42, Class FE, | ||||||||
| 1M US L + 0.40%, 01/16/2030(a) | 41,587 | 41,606 | ||||||
| Series 2003-98, Class FY, | ||||||||
| 1M US L + 0.35%, 09/20/2033(a) | 96,751 | 96,513 | ||||||
| Series 2004-1, Class TE, | ||||||||
| 5.000%, 06/20/2033 | 49,366 | 55,766 | ||||||
| Series 2004-15, Class AY, | ||||||||
| 5.500%, 02/20/2034 | 157,089 | 175,724 | ||||||
| Series 2004-26, Class ED, | ||||||||
| 5.500%, 04/16/2034 | 108,028 | 121,446 | ||||||
| Series 2004-34, Class QL, | ||||||||
| 5.500%, 05/16/2034 | 64,000 | 76,112 | ||||||
| Series 2004-55, Class MC, | ||||||||
| 5.500%, 07/20/2034 | 62,564 | 70,380 | ||||||
| Series 2004-7, Class Z, | ||||||||
| 5.500%, 01/16/2034 | 1,219,646 | 1,462,150 | ||||||
| Series 2004-87, Class BC, | ||||||||
| 4.500%, 10/20/2034 | 28,186 | 30,445 | ||||||
| Series 2005-11, Class PL, | ||||||||
| 5.000%, 02/20/2035 | 66,177 | 73,648 | ||||||
| Series 2005-13, Class NB, | ||||||||
| 5.000%, 02/20/2035 | 24,679 | 27,363 | ||||||
| Principal Amount | Value (Note 2) | |||||||
| Series 2005-13, Class AE, | ||||||||
| 5.000%, 09/20/2034 | $ | 13,732 | $ | 14,009 | ||||
| Series 2005-13, Class BG, | ||||||||
| 5.000%, 02/20/2035 | 261,000 | 292,774 | ||||||
| Series 2005-13, Class BE, | ||||||||
| 5.000%, 09/20/2034 | 13,723 | 13,986 | ||||||
| Series 2005-3, Class JL, | ||||||||
| 5.000%, 12/16/2034 | 200,000 | 224,936 | ||||||
| Series 2005-3, Class JM, | ||||||||
| 4.750%, 01/20/2035 | 120,998 | 135,345 | ||||||
| Series 2005-3, Class OC, | ||||||||
| 5.000%, 01/20/2035 | 215,000 | 240,796 | ||||||
| Series 2005-3, Class QB, | ||||||||
| 5.000%, 01/16/2035 | 211,213 | 233,856 | ||||||
| Series 2005-45, Class BF, | ||||||||
| 1M US L + 0.30%, 06/20/2035(a) | 44,329 | 42,984 | ||||||
| Series 2005-49, Class B, | ||||||||
| 5.500%, 06/20/2035 | 55,520 | 62,719 | ||||||
| Series 2005-51, Class DC, | ||||||||
| 5.000%, 07/20/2035 | 242,298 | 270,581 | ||||||
| Series 2005-56, Class BD, | ||||||||
| 5.000%, 07/20/2035 | 79,157 | 90,816 | ||||||
| Series 2005-56, Class JA, | ||||||||
| 5.000%, 05/17/2035 | 30,516 | 34,711 | ||||||
| Series 2005-69, Class WD, | ||||||||
| 5.000%, 05/18/2035 | 103,887 | 114,980 | ||||||
| Series 2005-73, Class PH, | ||||||||
| 5.000%, 09/20/2035 | 142,000 | 159,566 | ||||||
| Series 2005-92, Class PB, | ||||||||
| 6.000%, 12/20/2035 | 75,891 | 88,868 | ||||||
| Series 2006-33, Class NA, | ||||||||
| 5.000%, 01/20/2036 | 206,000 | 209,170 | ||||||
| Series 2006-38, Class OH, | ||||||||
| 6.500%, 08/20/2036 | 28,000 | 33,803 | ||||||
| Series 2007-18, Class PH, | ||||||||
| 5.500%, 03/20/2035 | 137,000 | 164,934 | ||||||
| Series 2007-18, Class B, | ||||||||
| 5.500%, 05/20/2035 | 103,696 | 121,276 | ||||||
| Series 2007-35, Class NE, | ||||||||
| 6.000%, 06/16/2037 | 80,000 | 94,353 | ||||||
| Series 2007-35, Class TE, | ||||||||
| 6.000%, 06/20/2037 | 212,568 | 249,043 | ||||||
| Series 2007-40, Class FY, | ||||||||
| 1M US L + 0.33%, 07/16/2037(a) | 74,034 | 73,689 | ||||||
| Series 2007-44, Class PH, | ||||||||
| 6.000%, 07/20/2037 | 158,131 | 180,988 | ||||||
| Series 2007-6, Class LE, | ||||||||
| 5.500%, 02/20/2037 | 76,874 | 88,052 | ||||||
| Series 2007-7, Class PG, | ||||||||
| 5.000%, 02/16/2037 | 54,149 | 60,193 | ||||||
| Series 2007-79, Class FC, | ||||||||
| 1M US L + 0.44%, 12/20/2037(a) | 240,488 | 234,851 | ||||||
| 61 | | April 30, 2020 |
ALPS | Smith Total Return Bond Fund
| Statement of Investments | April 30, 2020 (Unaudited) |
| Principal Amount | Value (Note 2) | |||||||
| Series 2008-13, Class FB, | ||||||||
| 1M US L + 0.50%, 02/20/2038(a) | $ | 28,020 | $ | 27,417 | ||||
| Series 2008-20, Class CE, | ||||||||
| 5.500%, 06/16/2037 | 100,000 | 118,577 | ||||||
| Series 2008-31, Class PC, | ||||||||
| 5.500%, 04/20/2038 | 56,168 | 63,603 | ||||||
| Series 2008-33, Class PB, | ||||||||
| 5.500%, 04/20/2038 | 79,711 | 92,095 | ||||||
| Series 2008-37, Class L, | ||||||||
| 6.000%, 04/20/2038 | 74,070 | 86,113 | ||||||
| Series 2008-38, Class BG, | ||||||||
| 5.000%, 05/16/2038 | 72,166 | 79,914 | ||||||
| Series 2008-38, Class PN, | ||||||||
| 5.500%, 05/20/2038 | 65,561 | 75,759 | ||||||
| Series 2008-38, Class PL, | ||||||||
| 5.500%, 05/20/2038 | 78,001 | 88,225 | ||||||
| Series 2008-40, Class PL, | ||||||||
| 5.250%, 05/16/2038 | 100,000 | 127,618 | ||||||
| Series 2008-41, Class PE, | ||||||||
| 5.500%, 05/20/2038 | 110,893 | 125,486 | ||||||
| Series 2008-47, Class ML, | ||||||||
| 5.250%, 06/16/2038 | 49,731 | 56,116 | ||||||
| Series 2008-49, Class PB, | ||||||||
| 4.750%, 06/20/2038 | 56,119 | 62,739 | ||||||
| Series 2008-50, Class KB, | ||||||||
| 6.000%, 06/20/2038 | 272,512 | 314,060 | ||||||
| Series 2008-51, Class FG, | ||||||||
| 1M US L + 0.77%, 06/16/2038(a) | 31,326 | 30,948 | ||||||
| Series 2008-51, Class PH, | ||||||||
| 5.250%, 06/20/2038 | 93,562 | 106,085 | ||||||
| Series 2008-55, Class PL, | ||||||||
| 5.500%, 06/20/2038 | 51,913 | 59,443 | ||||||
| Series 2008-58, Class PE, | ||||||||
| 5.500%, 07/16/2038 | 26,315 | 30,377 | ||||||
| Series 2008-60, Class JN, | ||||||||
| 5.500%, 07/20/2038 | 188,843 | 216,274 | ||||||
| Series 2008-65, Class PG, | ||||||||
| 6.000%, 08/20/2038 | 139,348 | 161,832 | ||||||
| Series 2008-66, Class FN, | ||||||||
| 1M US L + 0.95%, 08/20/2038(a) | 103,166 | 104,868 | ||||||
| Series 2008-7, Class PQ, | ||||||||
| 5.000%, 02/20/2038 | 130,000 | 150,637 | ||||||
| Series 2008-76, Class QE, | ||||||||
| 5.750%, 09/20/2038 | 58,000 | 71,112 | ||||||
| Series 2008-77, Class FC, | ||||||||
| 1M US L + 0.70%, 09/20/2038(a) | 91,759 | 92,448 | ||||||
| Series 2008-85, Class PG, | ||||||||
| 5.250%, 10/20/2038 | 66,411 | 70,775 | ||||||
| Series 2008-89, Class JC, | ||||||||
| 5.500%, 08/20/2038 | 81,575 | 92,780 | ||||||
| Series 2008-89, Class JD, | ||||||||
| 6.000%, 08/20/2038 | 33,283 | 38,363 | ||||||
| Principal Amount | Value (Note 2) | |||||||
| Series 2008-9, Class FA, | ||||||||
| 1M US L + 0.50%, 02/20/2038(a) | $ | 33,131 | $ | 33,163 | ||||
| Series 2009-1, Class FA, | ||||||||
| 1M US L + 1.05%, 01/20/2039(a) | 87,047 | 88,818 | ||||||
| Series 2009-10, Class PH, | ||||||||
| 4.500%, 02/20/2039 | 30,000 | 34,395 | ||||||
| Series 2009-10, Class NB, | ||||||||
| 5.000%, 02/16/2039 | 127,000 | 142,383 | ||||||
| Series 2009-118, Class PY, | ||||||||
| 5.000%, 12/16/2039 | 43,707 | 49,701 | ||||||
| Series 2009-12, Class NB, | ||||||||
| 5.000%, 03/20/2039 | 97,352 | 111,022 | ||||||
| Series 2009-13, Class E, | ||||||||
| 4.500%, 03/16/2039 | 177,777 | 197,149 | ||||||
| Series 2009-15, Class FM, | ||||||||
| 1M US L + 1.04%, 03/20/2039(a) | 117,089 | 119,317 | ||||||
| Series 2009-24, Class WB, | ||||||||
| 5.000%, 03/20/2039 | 171,000 | 195,000 | ||||||
| Series 2009-40, Class AD, | ||||||||
| 4.500%, 06/20/2039 | 258,000 | 308,664 | ||||||
| Series 2009-47, Class LT, | ||||||||
| 5.000%, 06/20/2039 | 134,235 | 149,851 | ||||||
| Series 2009-55, Class FN, | ||||||||
| 1M US L + 1.00%, 07/20/2039(a) | 48,803 | 49,702 | ||||||
| Series 2009-61, Class MP, | ||||||||
| 5.000%, 08/20/2039 | 54,840 | 61,739 | ||||||
| Series 2009-65, Class QM, | ||||||||
| 3.500%, 12/20/2038 | 41,380 | 42,846 | ||||||
| Series 2009-66, Class HQ, | ||||||||
| 4.500%, 06/16/2039 | 10,599 | 10,662 | ||||||
| Series 2009-69, Class PH, | ||||||||
| 5.500%, 08/16/2039 | 82,000 | 100,105 | ||||||
| Series 2009-76, Class PC, | ||||||||
| 4.000%, 03/16/2039 | 65,171 | 66,002 | ||||||
| Series 2009-76, Class JB, | ||||||||
| 4.500%, 07/20/2039 | 60,233 | 64,562 | ||||||
| Series 2009-83, Class TF, | ||||||||
| 1M US L + 0.90%, 08/20/2039(a) | 63,810 | 64,840 | ||||||
| Series 2009-94, Class FA, | ||||||||
| 1M US L + 0.70%, 10/16/2039(a) | 85,690 | 86,424 | ||||||
| Series 2010-111, Class FA, | ||||||||
| 1M US L + 0.35%, 09/20/2040(a) | 84,388 | 81,983 | ||||||
| Series 2010-130, Class PE, | ||||||||
| 3.500%, 08/16/2039 | 28,239 | 28,750 | ||||||
| Series 2010-14, Class HA, | ||||||||
| 4.500%, 02/16/2040 | 122,300 | 137,659 | ||||||
| Series 2010-14, Class A, | ||||||||
| 4.500%, 06/16/2039 | 24,745 | 26,290 | ||||||
| 62 | | April 30, 2020 |
ALPS | Smith Total Return Bond Fund
| Statement of Investments | April 30, 2020 (Unaudited) |
| Principal Amount | Value (Note 2) | |||||||
| Series 2010-157, Class OP, | ||||||||
| –%, 12/20/2040(b) | $ | 23,789 | $ | 22,281 | ||||
| Series 2010-167, Class WL, | ||||||||
| 4.500%, 09/20/2040 | 140,000 | 159,721 | ||||||
| Series 2010-169, Class JZ, | ||||||||
| 4.000%, 12/20/2040 | 834,416 | 871,097 | ||||||
| Series 2010-19, Class GW, | ||||||||
| 4.750%, 02/20/2040 | 108,305 | 131,668 | ||||||
| Series 2010-24, Class MQ, | ||||||||
| 4.250%, 12/20/2038 | 415 | 410 | ||||||
| Series 2010-62, Class AF, | ||||||||
| 1M US L + 0.45%, 04/16/2034(a) | 52,045 | 52,072 | ||||||
| Series 2010-76, Class NC, | ||||||||
| 4.500%, 06/20/2040 | 156,000 | 165,164 | ||||||
| Series 2010-84, Class YB, | ||||||||
| 4.000%, 07/20/2040 | 30,000 | 32,106 | ||||||
| Series 2010-H01, Class FA, | ||||||||
| 1M US L + 0.82%, 01/20/2060(a) | 66,439 | 66,723 | ||||||
| Series 2010-H10, Class FC, | ||||||||
| 1M US L + 1.00%, 05/20/2060(a) | 185,555 | 187,219 | ||||||
| Series 2010-H20, Class AF, | ||||||||
| 1M US L + 0.33%, 10/20/2060(a) | 300,845 | 298,775 | ||||||
| Series 2010-H22, Class FE, | ||||||||
| 1M US L + 0.35%, 05/20/2059(a) | 17,860 | 17,806 | ||||||
| Series 2010-H27, Class FA, | ||||||||
| 1M US L + 0.38%, 12/20/2060(a) | 78,173 | 77,887 | ||||||
| Series 2011-111, Class CD, | ||||||||
| 4.000%, 12/20/2039 | 24,721 | 24,834 | ||||||
| Series 2011-128, Class MD, | ||||||||
| 4.000%, 10/20/2040 | 140,000 | 151,559 | ||||||
| Series 2011-19, Class MG, | ||||||||
| 3.000%, 06/16/2040 | 12,391 | 12,672 | ||||||
| Series 2011-43, Class ZQ, | ||||||||
| 5.500%, 01/16/2033 | 124,074 | 138,125 | ||||||
| Series 2011-59, Class QC, | ||||||||
| 4.000%, 12/20/2040 | 154,805 | 166,264 | ||||||
| Series 2011-66, Class UA, | ||||||||
| 4.000%, 05/16/2041 | 179,563 | 191,990 | ||||||
| Series 2011-71, Class ZC, | ||||||||
| 5.500%, 07/16/2034 | 276,410 | 316,664 | ||||||
| Series 2011-97, Class WA, | ||||||||
| 6.126%, 11/20/2038(a) | 46,902 | 55,179 | ||||||
| Series 2011-H01, Class AF, | ||||||||
| 1M US L + 0.45%, 11/20/2060(a) | 309,437 | 308,243 | ||||||
| Series 2011-H02, Class BA, | ||||||||
| 4.450%, 02/20/2061(a) | 19,456 | 20,197 | ||||||
| Series 2011-H11, Class FB, | ||||||||
| 1M US L + 0.50%, 04/20/2061(a) | 183,382 | 182,962 | ||||||
| Principal Amount | Value (Note 2) | |||||||
| Series 2011-H11, Class FA, | ||||||||
| 1M US L + 0.50%, 03/20/2061(a) | $ | 47,103 | $ | 46,985 | ||||
| Series 2011-H15, Class FA, | ||||||||
| 1M US L + 0.45%, 06/20/2061(a) | 80,785 | 80,481 | ||||||
| Series 2012-12, Class NA, | ||||||||
| 2.500%, 05/20/2038 | 3,935 | 3,935 | ||||||
| Series 2012-17, Class KX, | ||||||||
| 3.500%, 07/20/2039 | 14,541 | 14,923 | ||||||
| Series 2012-32, Class PE, | ||||||||
| 3.500%, 03/16/2042 | 80,000 | 89,817 | ||||||
| Series 2012-38, Class PL, | ||||||||
| 3.250%, 01/20/2041 | 100,000 | 106,060 | ||||||
| Series 2012-48, Class DA, | ||||||||
| 3.500%, 05/20/2040 | 47,609 | 48,274 | ||||||
| Series 2012-51, Class VM, | ||||||||
| 3.500%, 04/16/2025 | 131,634 | 140,275 | ||||||
| Series 2012-68, Class GE, | ||||||||
| 3.000%, 05/20/2042 | 25,000 | 25,554 | ||||||
| Series 2012-76, Class GF, | ||||||||
| 1M US L + 0.30%, 06/16/2042(a) | 23,457 | 23,255 | ||||||
| Series 2012-84, Class YC, | ||||||||
| 2.500%, 07/20/2042 | 20,000 | 19,060 | ||||||
| Series 2012-H14, Class FK, | ||||||||
| 1M US L + 0.58%, 07/20/2062(a) | 292,610 | 292,341 | ||||||
| Series 2012-H20, Class PT, | ||||||||
| 3.190%, 07/20/2062(a) | 122,785 | 122,712 | ||||||
| Series 2012-H24, Class FE, | ||||||||
| 1M US L + 0.60%, 10/20/2062(a) | 4,607 | 4,608 | ||||||
| Series 2013-115, Class PM, | ||||||||
| 4.000%, 08/20/2043 | 400,000 | 438,661 | ||||||
| Series 2013-168, Class KA, | ||||||||
| 4.500%, 05/16/2039 | 33,210 | 33,205 | ||||||
| Series 2013-22, Class GB, | ||||||||
| 2.500%, 08/20/2042 | 85,000 | 88,250 | ||||||
| Series 2013-69, Class NA, | ||||||||
| 2.000%, 09/20/2042 | 199,464 | 199,668 | ||||||
| Series 2013-98, Class KF, | ||||||||
| 1M US L + 0.30%, 11/20/2041(a) | 23,717 | 23,619 | ||||||
| Series 2013-99, Class MF, | ||||||||
| 1M US L + 0.30%, 07/20/2043(a) | 134,919 | 130,791 | ||||||
| Series 2013-H18, Class EA, | ||||||||
| 1M US L + 0.50%, 07/20/2063(a) | 147,139 | 146,866 | ||||||
| Series 2014-53, Class JM, | ||||||||
| 7.108%, 04/20/2039(a) | 460,057 | 545,402 | ||||||
| Series 2014-98, Class HE, | ||||||||
| 3.000%, 07/20/2044 | 53,984 | 58,301 | ||||||
| 63 | | April 30, 2020 |
ALPS | Smith Total Return Bond Fund
| Statement of Investments | April 30, 2020 (Unaudited) |
| Principal Amount | Value (Note 2) | |||||||
| Series 2014-H10, Class TA, | ||||||||
| 1M US L + 0.60%, 04/20/2064(a) | $ | 231,937 | $ | 231,852 | ||||
| Series 2014-H15, Class FA, | ||||||||
| 1M US L + 0.50%, 07/20/2064(a) | 30,496 | 30,367 | ||||||
| Series 2014-H16, Class FL, | ||||||||
| 1M US L + 0.47%, 07/20/2064(a) | 582,343 | 569,462 | ||||||
| Series 2015-63, Class KA, | ||||||||
| 3.000%, 04/20/2040 | 33,494 | 36,993 | ||||||
| Series 2015-H09, Class FA, | ||||||||
| 1M US L + 0.62%, 04/20/2065(a) | 186,525 | 181,747 | ||||||
| Series 2015-H12, Class FB, | ||||||||
| 1M US L + 0.60%, 05/20/2065(a) | 127,510 | 127,036 | ||||||
| Series 2015-H15, Class FC, | ||||||||
| 1M US L + 0.58%, 06/20/2065(a) | 167,692 | 163,093 | ||||||
| Series 2015-H22, Class FC, | ||||||||
| 1M US L + 0.60%, 09/20/2065(a) | 70,545 | 70,249 | ||||||
| Series 2015-H26, Class FA, | ||||||||
| 1M US L + 0.52%, 10/20/2065(a) | 72,093 | 71,833 | ||||||
| Series 2015-H26, Class FG, | ||||||||
| 1M US L + 0.52%, 10/20/2065(a) | 370,110 | 368,809 | ||||||
| Series 2015-H30, Class FE, | ||||||||
| 1M US L + 0.60%, 11/20/2065(a) | 76,218 | 76,186 | ||||||
| Series 2015-H31, Class FT, | ||||||||
| 1M US L + 0.65%, 11/20/2065(a) | 151,190 | 151,964 | ||||||
| Series 2015-H32, Class FH, | ||||||||
| 1M US L + 0.66%, 12/20/2065(a) | 267,304 | 267,825 | ||||||
| Series 2016-116, Class GV, | ||||||||
| 3.000%, 05/20/2026 | 66,030 | 69,141 | ||||||
| Series 2016-120, Class KA, | ||||||||
| 2.000%, 09/20/2046 | 20,292 | 20,576 | ||||||
| Series 2016-H06, Class FC, | ||||||||
| 1M US L + 0.92%, 02/20/2066(a) | 143,960 | 145,028 | ||||||
| Series 2016-H11, Class F, | ||||||||
| 1M US L + 0.80%, 05/20/2066(a) | 802,234 | 805,000 | ||||||
| Series 2016-H13, Class FT, | ||||||||
| 1M US L + 0.58%, 05/20/2066(a) | 61,759 | 61,761 | ||||||
| Series 2016-H14, Class FA, | ||||||||
| 1M US L + 0.80%, 06/20/2066(a) | 210,177 | 210,913 | ||||||
| Principal Amount | Value (Note 2) | |||||||
| Series 2016-H15, Class FA, | ||||||||
| 1M US L + 0.80%, 07/20/2066(a) | $ | 889,639 | $ | 892,647 | ||||
| Series 2016-H17, Class FC, | ||||||||
| 1M US L + 0.83%, 08/20/2066(a) | 176,961 | 177,794 | ||||||
| Series 2016-H19, Class FE, | ||||||||
| 1M US L + 0.37%, 06/20/2061(a) | 579 | 579 | ||||||
| Series 2016-H20, Class PT, | ||||||||
| 4.882%, 09/20/2066(a) | 841,532 | 920,870 | ||||||
| Series 2016-H23, Class F, | ||||||||
| 1M US L + 0.75%, 10/20/2066(a) | 234,630 | 234,997 | ||||||
| Series 2016-H24, Class FG, | ||||||||
| 1M US L + 0.75%, 10/20/2066(a) | 159,826 | 156,463 | ||||||
| Series 2017-56, Class AZ, | ||||||||
| 3.000%, 04/20/2047 | 104,518 | 111,665 | ||||||
| Series 2017-H06, Class FE, | ||||||||
| 1M US L + 0.55%, 02/20/2067(a) | 70,188 | 70,056 | ||||||
| Series 2017-H15, Class FC, | ||||||||
| 1M US L + 0.47%, 06/20/2067(a) | 146,187 | 142,234 | ||||||
| Series 2017-H17, Class FG, | ||||||||
| 1M US L + 0.50%, 08/20/2067(a) | 66,573 | 66,396 | ||||||
| Series 2018-36, Class CZ, | ||||||||
| 4.000%, 03/20/2048 | 241,494 | 282,506 | ||||||
| Series 2018-37, Class C, | ||||||||
| 2.500%, 01/20/2046 | 56,543 | 59,008 | ||||||
| 24,055,523 | ||||||||
| TOTAL COLLATERALIZED MORTGAGE OBLIGATIONS | ||||||||
| (Cost $82,835,943) | 85,686,700 | |||||||
| Principal Amount | Value (Note 2) | |||||||
| COMMERCIAL MORTGAGE-BACKED SECURITIES (1.25%) | ||||||||
| Fannie Mae-Aces | ||||||||
| Series 2013-M6, Class 1AC, | ||||||||
| 3.555%, 02/25/2043(a) | 9,833,121 | 10,985,133 | ||||||
| Series 2016-M3, Class ASQ2, | ||||||||
| 2.263%, 02/25/2023 | 130,809 | 133,423 | ||||||
| 11,118,556 | ||||||||
| Freddie Mac Multifamily Structured Pass Through Certificates | ||||||||
| Series 2014-KF05, Class A, | ||||||||
| 1M US L + 0.35%, 09/25/2021(a) | 352,602 | 352,729 | ||||||
| 64 | | April 30, 2020 |
ALPS | Smith Total Return Bond Fund
| Statement of Investments | April 30, 2020 (Unaudited) |
| Principal Amount | Value (Note 2) | |||||||
| Series 2018-J19L, Class AFL, | ||||||||
| 1M US L + 0.23%, 11/25/2027(a) | $ | 376,449 | $ | 374,589 | ||||
| 727,318 | ||||||||
| TOTAL COMMERCIAL MORTGAGE- BACKED SECURITIES | ||||||||
| (Cost $11,231,583) | 11,845,874 | |||||||
| Principal Amount | Value (Note 2) | |||||||
| MORTGAGE-BACKED SECURITIES (2.49%) | ||||||||
| Fannie Mae Pool | ||||||||
| Series 2003-386375, | ||||||||
| 4.790%, 08/01/2028 | 467,346 | 466,908 | ||||||
| Series 2009-463331, | ||||||||
| 5.250%, 08/01/2029 | 710,884 | 847,718 | ||||||
| Series 2010-466566, | ||||||||
| 4.270%, 11/01/2025 | 254,913 | 290,194 | ||||||
| Series 2011-468477, | ||||||||
| 4.590%, 08/01/2026 | 427,906 | 486,433 | ||||||
| Series 2011-AH9290, | ||||||||
| 4.000%, 04/01/2041 | 108,627 | 114,123 | ||||||
| Series 2013-AM 4236, | ||||||||
| 3.940%, 08/01/2025 | 229,583 | 259,579 | ||||||
| Series 2013-AM3162, | ||||||||
| 3.000%, 04/01/2025 | 789,486 | 827,243 | ||||||
| Series 2014-AM4198, | ||||||||
| 3.550%, 03/01/2024 | 99,939 | 108,850 | ||||||
| Series 2014-AM7274, | ||||||||
| 3.000%, 12/01/2024 | 250,000 | 254,990 | ||||||
| Series 2015-AM8666, | ||||||||
| 2.960%, 06/01/2030 | 187,509 | 202,234 | ||||||
| Series 2015-AM8918, | ||||||||
| 3.250%, 09/01/2030 | 731,000 | 853,921 | ||||||
| Series 2015-AM9173, | ||||||||
| 3.110%, 06/01/2027 | 252,588 | 281,466 | ||||||
| Series 2015-AM9830, | ||||||||
| 3.190%, 09/01/2027 | 371,240 | 406,191 | ||||||
| Series 2016-AN0665, | ||||||||
| 3.070%, 02/01/2026 | 200,000 | 220,843 | ||||||
| Series 2016-AN0774, | ||||||||
| 3.210%, 01/01/2026 | 184,706 | 203,668 | ||||||
| Series 2017-AN4431, | ||||||||
| 3.220%, 01/01/2027 | 85,000 | 95,279 | ||||||
| Series 2017-AN4833, | ||||||||
| 3.320%, 04/01/2027 | 95,000 | 107,438 | ||||||
| Series 2017-AN5279, | ||||||||
| 3.340%, 04/01/2029 | 476,206 | 534,421 | ||||||
| Series 2017-AN5742, | ||||||||
| 3.190%, 05/01/2030 | 143,600 | 163,406 | ||||||
| Series 2017-AN7060, | ||||||||
| 2.930%, 10/01/2027 | 1,630,000 | 1,744,189 | ||||||
| Series 2017-AN7384, | ||||||||
| 2.880%, 12/01/2027 | 50,000 | 55,507 | ||||||
| Series 2017-AN7823, | ||||||||
| 2.890%, 12/01/2027 | 235,000 | 261,010 | ||||||
| Principal Amount | Value (Note 2) | |||||||
| Series 2018-109435, | ||||||||
| 3.890%, 08/01/2028 | $ | 1,955,681 | $ | 2,214,421 | ||||
| Series 2018-387770, | ||||||||
| 3.625%, 07/01/2028 | 160,000 | 179,308 | ||||||
| Series 2018-387904, | ||||||||
| 3.840%, 08/01/2028 | 694,437 | 818,949 | ||||||
| Series 2018-387905, | ||||||||
| 3.600%, 01/01/2027 | 749,574 | 849,951 | ||||||
| Series 2018-AN7269, | ||||||||
| 3.110%, 01/01/2028 | 249,064 | 260,512 | ||||||
| Series 2018-AN8198, | ||||||||
| 3.140%, 01/01/2028 | 300,000 | 324,736 | ||||||
| Series 2018-AN8486, | ||||||||
| 3.330%, 04/01/2030 | 338,954 | 389,477 | ||||||
| Series 2018-AN8493, | ||||||||
| 3.300%, 02/01/2030 | 441,920 | 493,616 | ||||||
| Series 2018-AN9038, | ||||||||
| 3.460%, 05/01/2028 | 83,000 | 89,769 | ||||||
| Series 2018-AN9354, | ||||||||
| 3.640%, 06/01/2028 | 65,000 | 72,864 | ||||||
| Series 2018-BI0404, | ||||||||
| 4.100%, 11/01/2028 | 4,024,035 | 4,610,606 | ||||||
| Series 2018-BL0119, | ||||||||
| 4.090%, 11/01/2026 | 801,735 | 924,262 | ||||||
| Series 2018-BL0550, | ||||||||
| 3.770%, 11/01/2028 | 660,000 | 779,445 | ||||||
| Series 2018-BL0907, | ||||||||
| 3.880%, 12/01/2028 | 175,000 | 209,172 | ||||||
| Series 2019-BI2928, | ||||||||
| 3.410%, 07/01/2027 | 846,317 | 956,466 | ||||||
| Series 2019-BL1451, | ||||||||
| 3.760%, 02/01/2029 | 685,000 | 777,269 | ||||||
| Series 2019-BL1596, | ||||||||
| 3.480%, 03/01/2029 | 73,766 | 85,325 | ||||||
| Series 2019-BL3182, | ||||||||
| 2.980%, 07/01/2029 | 261,819 | 281,698 | ||||||
| Series 2019-BM6011, | ||||||||
| 3.354%, 11/01/2026(a) | 174,241 | 187,301 | ||||||
| 23,290,758 | ||||||||
| Freddie Mac Gold Pool | ||||||||
| Series 2013-G80393, | ||||||||
| 5.000%, 08/20/2036 | 240,981 | 275,069 | ||||||
| Freddie Mac Pool | ||||||||
| Series 2005-002936, Class FC, | ||||||||
| 2.725%, 03/01/2029(a) | 37,752 | 37,646 | ||||||
| TOTAL MORTGAGE-BACKED SECURITIES | ||||||||
| (Cost $22,352,830) | 23,603,473 | |||||||
| CORPORATE BONDS (55.83%) | ||||||||
| Aerospace & Defense (3.10%) | ||||||||
| BAE Systems PLC | ||||||||
| 3.400%, 04/15/2030(d) | 2,000,000 | 2,175,992 | ||||||
| 65 | | April 30, 2020 |
ALPS | Smith Total Return Bond Fund
| Statement of Investments | April 30, 2020 (Unaudited) |
| Principal Amount | Value (Note 2) | |||||||
| Boeing Co. | ||||||||
| 4.510%, 05/01/2023 | $ | 4,400,000 | $ | 4,400,000 | ||||
| 4.880%, 05/01/2025 | 4,400,000 | 4,400,000 | ||||||
| 5.150%, 05/01/2030 | 1,000,000 | 1,000,000 | ||||||
| 5.810%, 05/01/2030 | 1,000,000 | 1,000,000 | ||||||
| General Dynamics Corp. | ||||||||
| 3.250%, 04/01/2025 | 2,000,000 | 2,184,568 | ||||||
| 3.625%, 04/01/2030 | 1,000,000 | 1,152,116 | ||||||
| 4.250%, 04/01/2050 | 2,000,000 | 2,591,120 | ||||||
| Huntington Ingalls Industries, Inc. | ||||||||
| 4.200%, 05/01/2030(d) | 1,000,000 | 1,057,997 | ||||||
| 5.000%, 11/15/2025(d) | 2,281,000 | 2,356,698 | ||||||
| L3Harris Technologies, Inc. | ||||||||
| 3.850%, 12/15/2026(d) | 3,544,000 | 3,873,074 | ||||||
| Precision Castparts Corp. | ||||||||
| 3.250%, 06/15/2025 | 615,000 | 669,301 | ||||||
| TransDigm, Inc. | ||||||||
| 6.250%, 03/15/2026(d) | 2,500,000 | 2,458,625 | ||||||
| Total Aerospace & Defense | 29,319,491 | |||||||
| Airlines (0.63%) | ||||||||
| Southwest Airlines Co. | ||||||||
| 4.750%, 05/04/2023 | 2,500,000 | 2,484,222 | ||||||
| 5.250%, 05/04/2025 | 3,500,000 | 3,490,179 | ||||||
| Total Airlines | 5,974,401 | |||||||
| Apparel & Textile Products (0.64%) | ||||||||
| Hanesbrands, Inc. | ||||||||
| 5.375%, 05/15/2025(d) | 2,000,000 | 2,015,000 | ||||||
| VF Corp. | ||||||||
| 2.400%, 04/23/2025 | 1,000,000 | 1,015,637 | ||||||
| 2.800%, 04/23/2027 | 2,000,000 | 2,044,209 | ||||||
| 2.950%, 04/23/2030 | 1,000,000 | 1,034,058 | ||||||
| Total Apparel & Textile Products | 6,108,904 | |||||||
| Automobiles Manufacturing (1.10%) | ||||||||
| Ford Motor Co. | ||||||||
| 6.625%, 10/01/2028 | 4,500,000 | 3,768,750 | ||||||
| 8.500%, 04/21/2023 | 500,000 | 496,875 | ||||||
| 9.000%, 04/22/2025 | 1,000,000 | 977,500 | ||||||
| 9.625%, 04/22/2030 | 500,000 | 492,500 | ||||||
| Ford Motor Credit Co. LLC | ||||||||
| 2.343%, 11/02/2020 | 777,000 | 760,108 | ||||||
| 3.813%, 10/12/2021 | 2,500,000 | 2,365,625 | ||||||
| 5.875%, 08/02/2021 | 700,000 | 696,500 | ||||||
| 3M US L + 0.79%, 06/12/2020(a) | 850,000 | 847,492 | ||||||
| Total Automobiles Manufacturing | 10,405,350 | |||||||
| Banks (5.79%) | ||||||||
| Associated Bank NA/Green Bay WI | ||||||||
| 3.500%, 08/13/2021 | 1,800,000 | 1,833,037 | ||||||
| 4.250%, 01/15/2025 | 934,000 | 965,518 | ||||||
| Bank of New Zealand | ||||||||
| 2.000%, 02/21/2025(d) | 7,375,000 | 7,376,515 | ||||||
| Citizens Financial Group, Inc. | ||||||||
| 3.750%, 07/01/2024 | 385,000 | 398,820 | ||||||
| 4.150%, 09/28/2022(d) | 5,254,000 | 5,429,070 | ||||||
| Principal Amount | Value (Note 2) | |||||||
| Cooperatieve Rabobank UA | ||||||||
| 3.750%, 07/21/2026 | $ | 4,500,000 | $ | 4,745,163 | ||||
| 3.950%, 11/09/2022 | 675,000 | 697,468 | ||||||
| Credit Suisse AG | ||||||||
| 2.800%, 04/08/2022 | 1,500,000 | 1,536,854 | ||||||
| Danske Bank A/S | ||||||||
| 5.000%, 01/12/2022(d) | 4,125,000 | 4,267,185 | ||||||
| 5.375%, 01/12/2024(d) | 1,000,000 | 1,081,337 | ||||||
| 3M US L + 1.249%, 09/20/2022(a)(d) | 1,000,000 | 1,002,754 | ||||||
| 3M US L + 1.591%, 12/20/2025(a)(d) | 1,750,000 | 1,752,762 | ||||||
| First Republic Bank | ||||||||
| 1D US SOFR + 0.62%, 02/12/2024(a) | 5,500,000 | 5,517,606 | ||||||
| FNB Corp. | ||||||||
| 2.200%, 02/24/2023 | 1,800,000 | 1,786,055 | ||||||
| Lloyds Banking Group PLC | ||||||||
| 1Y US TI + 1.00%, 02/05/2026(a) | 500,000 | 500,000 | ||||||
| Synovus Bank/Columbus GA | ||||||||
| 1D US SOFR + 0.945%, 02/10/2023(a) | 5,500,000 | 5,438,593 | ||||||
| Truist Bank | ||||||||
| 5Y US TI + 1.15%, 09/17/2029(a) | 4,750,000 | 4,581,905 | ||||||
| Wells Fargo & Co. | ||||||||
| 3M US L + 1.17%, 06/17/2027(a) | 3,750,000 | 3,969,028 | ||||||
| 3M US L + 3.77%, 04/04/2031(a) | 1,750,000 | 2,040,926 | ||||||
| Total Banks | 54,920,596 | |||||||
| Biotechnology (0.71%) | ||||||||
| Amgen, Inc. | ||||||||
| 1.900%, 02/21/2025 | 1,500,000 | 1,536,813 | ||||||
| 2.200%, 02/21/2027 | 2,000,000 | 2,060,213 | ||||||
| 2.450%, 02/21/2030 | 3,000,000 | 3,104,132 | ||||||
| Total Biotechnology | 6,701,158 | |||||||
| Cable & Satellite (1.61%) | ||||||||
| CCO Holdings LLC / CCO Holdings | ||||||||
| Capital Corp. | ||||||||
| 4.500%, 08/15/2030(d) | 2,000,000 | 2,019,400 | ||||||
| Charter Communications | ||||||||
| Operating LLC / Charter | ||||||||
| Communications Operating | ||||||||
| Capital | ||||||||
| 3.750%, 02/15/2028 | 6,250,000 | 6,735,782 | ||||||
| 4.800%, 03/01/2050 | 500,000 | 566,948 | ||||||
| 3M US L + 1.65%, 02/01/2024(a) | 500,000 | 485,043 | ||||||
| Cox Communications, Inc. | ||||||||
| 4.700%, 12/15/2042(d) | 500,000 | 545,613 | ||||||
| Time Warner Cable LLC | ||||||||
| 4.000%, 09/01/2021 | 4,797,000 | 4,893,162 | ||||||
| Total Cable & Satellite | 15,245,948 | |||||||
| 66 | | April 30, 2020 |
ALPS | Smith Total Return Bond Fund
| Statement of Investments | April 30, 2020 (Unaudited) |
| Principal Amount | Value (Note 2) | |||||||
| Chemicals (1.12%) | ||||||||
| 3M Co. | ||||||||
| 2.650%, 04/15/2025 | $ | 1,000,000 | $ | 1,066,285 | ||||
| 3.050%, 04/15/2030 | 1,000,000 | 1,092,543 | ||||||
| DuPont de Nemours, Inc. | ||||||||
| 2.169%, 05/01/2023 | 3,000,000 | 3,017,877 | ||||||
| Ecolab, Inc. | ||||||||
| 4.800%, 03/24/2030 | 250,000 | 308,168 | ||||||
| LYB International Finance III LLC | ||||||||
| 2.875%, 05/01/2025 | 3,000,000 | 3,033,910 | ||||||
| 4.200%, 05/01/2050 | 2,000,000 | 2,036,536 | ||||||
| Total Chemicals | 10,555,319 | |||||||
| Commercial Finance (0.17%) | ||||||||
| Park Aerospace Holdings, Ltd. | ||||||||
| 4.500%, 03/15/2023(d) | 1,850,000 | 1,638,902 | ||||||
| Consumer Finance (2.21%) | ||||||||
| Ally Financial, Inc. | ||||||||
| 4.250%, 04/15/2021 | 1,043,000 | 1,052,961 | ||||||
| 7.500%, 09/15/2020 | 785,000 | 802,663 | ||||||
| American Express Co. | ||||||||
| Series B | ||||||||
| 3M US L + 3.428%, 05/15/2049(a)(e) | 7,877,000 | 6,882,529 | ||||||
| Fiserv, Inc. | ||||||||
| 2.750%, 07/01/2024 | 1,200,000 | 1,264,029 | ||||||
| 3.500%, 07/01/2029 | 1,500,000 | 1,647,495 | ||||||
| Global Payments, Inc. | ||||||||
| 3.200%, 08/15/2029 | 1,000,000 | 1,031,862 | ||||||
| 3.800%, 04/01/2021 | 217,000 | 220,076 | ||||||
| 4.450%, 06/01/2028 | 3,000,000 | 3,352,742 | ||||||
| Synchrony Financial | ||||||||
| 3.700%, 08/04/2026 | 3,192,000 | 2,967,137 | ||||||
| 4.250%, 08/15/2024 | 1,700,000 | 1,663,641 | ||||||
| Total Consumer Finance | 20,885,135 | |||||||
| Consumer Products (1.08%) | ||||||||
| Estee Lauder Cos., Inc. | ||||||||
| 2.600%, 04/15/2030 | 4,000,000 | 4,169,946 | ||||||
| Kimberly-Clark Corp. | ||||||||
| 3.100%, 03/26/2030 | 1,000,000 | 1,115,011 | ||||||
| Procter & Gamble Co. | ||||||||
| 2.450%, 03/25/2025 | 1,850,000 | 1,980,737 | ||||||
| 3.000%, 03/25/2030 | 2,000,000 | 2,273,853 | ||||||
| 3.600%, 03/25/2050 | 500,000 | 621,328 | ||||||
| Total Consumer Products | 10,160,875 | |||||||
| Consumer Services (0.33%) | ||||||||
| Aramark Services, Inc. | ||||||||
| 6.375%, 05/01/2025(d) | 3,000,000 | 3,127,500 | ||||||
| Department Stores (0.82%) | ||||||||
| Nordstrom, Inc. | ||||||||
| 8.750%, 05/15/2025(d) | 7,200,000 | 7,732,382 | ||||||
| Principal Amount | Value (Note 2) | |||||||
| Diversified Banks (3.68%) | ||||||||
| Bank of America Corp. | ||||||||
| 4.450%, 03/03/2026 | $ | 5,532,000 | $ | 6,111,697 | ||||
| 1D US SOFR + 2.15%, 04/29/2031(a) | 3,000,000 | 3,077,730 | ||||||
| 3M US L + 3.15%, 03/20/2051(a) | 2,000,000 | 2,408,352 | ||||||
| Citigroup, Inc. | ||||||||
| 4.300%, 11/20/2026 | 6,021,000 | 6,544,937 | ||||||
| 1D US SOFR + 3.914%, 03/31/2031(a) | 2,000,000 | 2,301,620 | ||||||
| JPMorgan Chase & Co. | ||||||||
| 1D US SOFR + 2.04%, 04/22/2031(a) | 1,000,000 | 1,023,002 | ||||||
| 1D US SOFR + 2.44%, 04/22/2051(a) | 1,000,000 | 1,036,280 | ||||||
| 1D US SOFR + 2.46%, 04/22/2041(a) | 1,000,000 | 1,038,808 | ||||||
| 1D US SOFR + 3.79%, 03/24/2031(a) | 1,500,000 | 1,777,957 | ||||||
| Royal Bank of Scotland Group PLC | ||||||||
| 6.125%, 12/15/2022 | 6,465,000 | 6,934,302 | ||||||
| Standard Chartered PLC | ||||||||
| 3M US L + 1.209%, 01/30/2026(a)(d) | 2,500,000 | 2,499,359 | ||||||
| Total Diversified Banks | 34,754,044 | |||||||
| Electrical Equipment Manufacturing (0.88%) | ||||||||
| General Electric Co. | ||||||||
| 3.625%, 05/01/2030 | 1,000,000 | 1,005,204 | ||||||
| 4.250%, 05/01/2040 | 1,000,000 | 999,959 | ||||||
| Otis Worldwide Corp. | ||||||||
| 3M US L + 0.45%, 04/05/2023(a)(d) | 900,000 | 876,299 | ||||||
| Roper Technologies, Inc. | ||||||||
| 2.950%, 09/15/2029 | 2,000,000 | 2,095,425 | ||||||
| Trimble, Inc. | ||||||||
| 4.750%, 12/01/2024 | 3,254,000 | 3,390,606 | ||||||
| Total Electrical Equipment Manufacturing | 8,367,493 | |||||||
| Entertainment Content (0.03%) | ||||||||
| Fox Corp. | ||||||||
| 4.030%, 01/25/2024 | 250,000 | 270,165 | ||||||
| Exploration & Production (0.61%) | ||||||||
| Concho Resources, Inc. | ||||||||
| 3.750%, 10/01/2027 | 2,000,000 | 1,952,790 | ||||||
| EOG Resources, Inc. | ||||||||
| 4.375%, 04/15/2030 | 3,500,000 | 3,823,481 | ||||||
| Total Exploration & Production | 5,776,271 | |||||||
| Financial Services (6.22%) | ||||||||
| Ameriprise Financial, Inc. | ||||||||
| 3.000%, 04/02/2025 | 5,000,000 | 5,278,882 | ||||||
| Bank of New York Mellon Corp. | ||||||||
| 3M US L + 1.05%, 10/30/2023(a) | 264,000 | 262,725 | ||||||
| BlackRock, Inc. | ||||||||
| 1.900%, 01/28/2031 | 2,000,000 | 1,994,250 | ||||||
| 67 | | April 30, 2020 |
ALPS | Smith Total Return Bond Fund
| Statement of Investments | April 30, 2020 (Unaudited) |
| Principal Amount | Value (Note 2) | |||||||
| Carlyle Finance Subsidiary LLC | ||||||||
| 3.500%, 09/19/2029(d) | $ | 2,000,000 | $ | 1,986,842 | ||||
| Charles Schwab Corp. | ||||||||
| Series G | ||||||||
| 5Y US TI + 4.971%, 12/31/2049(a)(e) | 1,000,000 | 1,040,000 | ||||||
| Goldman Sachs BDC, Inc. | ||||||||
| 3.750%, 02/10/2025 | 448,000 | 440,148 | ||||||
| Goldman Sachs Group, Inc. | ||||||||
| 3.500%, 04/01/2025 | 5,006,000 | 5,333,935 | ||||||
| 3.800%, 03/15/2030 | 3,750,000 | 4,106,524 | ||||||
| LPL Holdings, Inc. | ||||||||
| 4.625%, 11/15/2027(d) | 1,000,000 | 961,250 | ||||||
| 5.750%, 09/15/2025(d) | 6,873,000 | 6,864,409 | ||||||
| Morgan Stanley | ||||||||
| Series GMTN | ||||||||
| 3.125%, 01/23/2023 | 2,000,000 | 2,081,949 | ||||||
| 1D US SOFR + 1.143%, 01/22/2031(a) | 2,000,000 | 2,054,097 | ||||||
| 2.750%, 05/19/2022 | 75,000 | 76,942 | ||||||
| 1D US SOFR + 3.12%, 04/01/2031(a) | 4,000,000 | 4,406,159 | ||||||
| Nasdaq, Inc. | ||||||||
| 3.250%, 04/28/2050 | 2,000,000 | 1,990,445 | ||||||
| National Securities Clearing Corp. | ||||||||
| 1.200%, 04/23/2023(d) | 2,600,000 | 2,601,822 | ||||||
| 1.500%, 04/23/2025(d) | 1,600,000 | 1,608,453 | ||||||
| Raymond James Financial, Inc. | ||||||||
| 4.650%, 04/01/2030 | 9,000,000 | 10,139,163 | ||||||
| State Street Corp. | ||||||||
| 1D US SOFR + 0.94%, 11/01/2025(a) | 1,500,000 | 1,545,989 | ||||||
| UBS AG/London | ||||||||
| 1.750%, 04/21/2022(d) | 1,500,000 | 1,507,350 | ||||||
| USAA Capital Corp. | ||||||||
| 2.125%, 05/01/2030(d) | 2,500,000 | 2,579,136 | ||||||
| Total Financial Services | 58,860,470 | |||||||
| Food & Beverage (2.12%) | ||||||||
| Anheuser-Busch InBev Worldwide, Inc. | ||||||||
| 3.650%, 02/01/2026 | 500,000 | 545,862 | ||||||
| 4.000%, 01/17/2043 | 1,920,000 | 1,967,583 | ||||||
| 4.900%, 02/01/2046 | 1,000,000 | 1,150,619 | ||||||
| Campbell Soup Co. | ||||||||
| 2.375%, 04/24/2030 | 1,000,000 | 1,012,181 | ||||||
| 3.125%, 04/24/2050 | 2,000,000 | 1,996,359 | ||||||
| 3.300%, 03/19/2025 | 2,850,000 | 3,041,555 | ||||||
| 3.800%, 08/02/2042 | 321,000 | 330,910 | ||||||
| Keurig Dr Pepper, Inc. | ||||||||
| 3.200%, 05/01/2030 | 1,000,000 | 1,068,963 | ||||||
| 3.800%, 05/01/2050 | 1,000,000 | 1,065,089 | ||||||
| Kraft Heinz Foods Co. | ||||||||
| 2.800%, 07/02/2020 | 3,334,000 | 3,327,721 | ||||||
| 4.875%, 02/15/2025(d) | 4,015,000 | 4,128,150 | ||||||
| Principal Amount | Value (Note 2) | |||||||
| Mondelez International, Inc. | ||||||||
| 2.750%, 04/13/2030 | $ | 500,000 | $ | 530,512 | ||||
| Total Food & Beverage | 20,165,504 | |||||||
| Forest & Paper Products Manufacturing (0.63%) | ||||||||
| Georgia-Pacific LLC | ||||||||
| 2.100%, 04/30/2027(d) | 1,000,000 | 999,898 | ||||||
| 2.300%, 04/30/2030(d) | 5,000,000 | 5,001,100 | ||||||
| Total Forest & Paper Products Manufacturing | 6,000,998 | |||||||
| Hardware (0.47%) | ||||||||
| EMC Corp. | ||||||||
| 2.650%, 06/01/2020 | 4,481,000 | 4,472,710 | ||||||
| Health Care Facilities & Services (2.87%) | ||||||||
| Cigna Corp. | ||||||||
| Series WI | ||||||||
| 3M US L + 0.65%, 09/17/2021(a) | 2,895,000 | 2,846,895 | ||||||
| 2.400%, 03/15/2030 | 1,000,000 | 1,009,778 | ||||||
| 3.400%, 03/15/2050 | 3,000,000 | 3,124,809 | ||||||
| 3.875%, 10/15/2047(d) | 2,728,000 | 3,007,604 | ||||||
| 4.125%, 09/15/2020(d) | 500,000 | 505,081 | ||||||
| HCA, Inc. | ||||||||
| 3.500%, 09/01/2030 | 3,500,000 | 3,344,585 | ||||||
| 4.125%, 06/15/2029 | 3,000,000 | 3,234,154 | ||||||
| 4.500%, 02/15/2027 | 3,680,000 | 3,986,587 | ||||||
| 5.250%, 04/15/2025 | 1,737,000 | 1,938,084 | ||||||
| 5.250%, 06/15/2049 | 3,500,000 | 4,127,098 | ||||||
| Total Health Care Facilities & Services | 27,124,675 | |||||||
| Integrated Oils (0.75%) | ||||||||
| BP Capital Markets America, Inc. | ||||||||
| 2.937%, 04/06/2023 | 1,750,000 | 1,806,423 | ||||||
| 3.543%, 04/06/2027 | 5,000,000 | 5,250,591 | ||||||
| Total Integrated Oils | 7,057,014 | |||||||
| Machinery Manufacturing (0.16%) | ||||||||
| Dover Corp. | ||||||||
| 2.950%, 11/04/2029 | 500,000 | 525,049 | ||||||
| Oshkosh Corp. | ||||||||
| 3.100%, 03/01/2030 | 1,000,000 | 970,324 | ||||||
| Total Machinery Manufacturing | 1,495,373 | |||||||
| Mass Merchants (0.58%) | ||||||||
| Costco Wholesale Corp. | ||||||||
| 1.375%, 06/20/2027 | 2,000,000 | 2,012,815 | ||||||
| 1.600%, 04/20/2030 | 3,000,000 | 2,971,037 | ||||||
| 1.750%, 04/20/2032 | 500,000 | 498,578 | ||||||
| Total Mass Merchants | 5,482,430 | |||||||
| Medical Equipment & Devices Manufacturing (0.77%) | ||||||||
| Alcon Finance Corp. | ||||||||
| 3.000%, 09/23/2029(d) | 1,000,000 | 1,042,986 | ||||||
| 3.800%, 09/23/2049(d) | 1,000,000 | 1,092,179 | ||||||
| Baxter International, Inc. | ||||||||
| 3.750%, 10/01/2025(d) | 1,800,000 | 2,006,215 | ||||||
| 3.950%, 04/01/2030(d) | 1,000,000 | 1,160,655 | ||||||
| Zimmer Biomet Holdings, Inc. | ||||||||
| 3.050%, 01/15/2026 | 2,000,000 | 2,020,408 | ||||||
| Total Medical Equipment & Devices Manufacturing | 7,322,443 | |||||||
| 68 | | April 30, 2020 |
ALPS | Smith Total Return Bond Fund
| Statement of Investments | April 30, 2020 (Unaudited) |
| Principal Amount | Value (Note 2) | |||||||
| Pharmaceuticals (2.69%) | ||||||||
| AbbVie, Inc. | ||||||||
| 2.150%, 11/19/2021(d) | $ | 3,250,000 | $ | 3,295,230 | ||||
| 2.950%, 11/21/2026(d) | 4,000,000 | 4,241,060 | ||||||
| 3.200%, 11/21/2029(d) | 1,000,000 | 1,062,047 | ||||||
| 3.600%, 05/14/2025 | 600,000 | 652,300 | ||||||
| 4.050%, 11/21/2039(d) | 1,250,000 | 1,383,909 | ||||||
| 4.250%, 11/21/2049(d) | 3,000,000 | 3,480,862 | ||||||
| Elanco Animal Health, Inc. | ||||||||
| 4.662%, 08/27/2021 | 2,919,000 | 2,999,856 | ||||||
| 5.022%, 08/28/2023 | 2,787,000 | 2,954,220 | ||||||
| 5.650%, 08/28/2028 | 2,003,000 | 2,228,338 | ||||||
| Pfizer, Inc. | ||||||||
| 2.625%, 04/01/2030 | 3,000,000 | 3,238,242 | ||||||
| Total Pharmaceuticals | 25,536,064 | |||||||
| Pipeline (2.08%) | ||||||||
| Enable Midstream Partners LP | ||||||||
| 4.150%, 09/15/2029 | 500,000 | 374,634 | ||||||
| 4.400%, 03/15/2027 | 1,000,000 | 775,683 | ||||||
| 4.950%, 05/15/2028 | 900,000 | 692,114 | ||||||
| Energy Transfer Operating LP | ||||||||
| 4.200%, 04/15/2027 | 2,215,000 | 2,093,067 | ||||||
| Series B | ||||||||
| 3M US L + 4.155%, 12/31/2049(a)(e) | 1,256,000 | 901,877 | ||||||
| Series F | ||||||||
| 5Y US TI + 5.134%, 12/31/2049(a)(e) | 1,000,000 | 762,500 | ||||||
| Midwest Connector Capital Co. LLC | ||||||||
| 3.625%, 04/01/2022(d) | 3,145,000 | 3,020,366 | ||||||
| 3.900%, 04/01/2024(d) | 300,000 | 298,215 | ||||||
| MPLX LP | ||||||||
| 4.875%, 12/01/2024 | 2,800,000 | 2,784,508 | ||||||
| 5.250%, 01/15/2025(d) | 2,378,000 | 2,357,987 | ||||||
| 3M US L + 0.90%, 09/09/2021(a) | 400,000 | 376,411 | ||||||
| Western Midstream Operating LP | ||||||||
| 3.100%, 02/01/2025 | 4,000,000 | 3,670,001 | ||||||
| 5.250%, 02/01/2050 | 1,500,000 | 1,188,750 | ||||||
| 3M US L + 0.85%, 01/13/2023(a) | 500,000 | 407,711 | ||||||
| Total Pipeline | 19,703,824 | |||||||
| Property & Casualty Insurance (0.33%) | ||||||||
| Berkshire Hathaway Finance Corp. | ||||||||
| 1.850%, 03/12/2030 | 1,000,000 | 1,027,421 | ||||||
| Fairfax US, Inc. | ||||||||
| 4.875%, 08/13/2024(d) | 2,000,000 | 2,068,086 | ||||||
| Total Property & Casualty Insurance | 3,095,507 | |||||||
| Refining & Marketing (1.38%) | ||||||||
| Marathon Petroleum Corp. | ||||||||
| 4.500%, 05/01/2023 | 1,500,000 | 1,505,012 | ||||||
| 4.700%, 05/01/2025 | 1,000,000 | 1,006,726 | ||||||
| 5.125%, 12/15/2026 | 1,713,000 | 1,737,740 | ||||||
| Principal Amount | Value (Note 2) | |||||||
| Phillips 66 | ||||||||
| 3.700%, 04/06/2023 | $ | 3,500,000 | $ | 3,637,086 | ||||
| 3.850%, 04/09/2025 | 5,000,000 | 5,245,638 | ||||||
| Total Refining & Marketing | 13,132,202 | |||||||
| Restaurants (0.18%) | ||||||||
| McDonald's Corp. | ||||||||
| 2.125%, 03/01/2030 | 1,700,000 | 1,702,391 | ||||||
| Retail - Consumer Discretionary (0.74%) | ||||||||
| Gap, Inc. | ||||||||
| 8.375%, 05/15/2023(d) | 500,000 | 523,750 | ||||||
| 8.625%, 05/15/2025(d) | 2,000,000 | 2,080,000 | ||||||
| 8.875%, 05/15/2027(d) | 1,000,000 | 1,040,000 | ||||||
| TJX Cos., Inc. | ||||||||
| 3.875%, 04/15/2030 | 3,000,000 | 3,351,688 | ||||||
| Total Retail - Consumer Discretionary | 6,995,438 | |||||||
| Retail - Consumer Staples (0.04%) | ||||||||
| Sysco Corp. | ||||||||
| 3.300%, 07/15/2026 | 355,000 | 356,353 | ||||||
| Semiconductors (1.58%) | ||||||||
| Lam Research Corporation | ||||||||
| 1.900%, 06/15/2030 | 500,000 | 498,350 | ||||||
| 2.875%, 06/15/2050 | 1,000,000 | 997,370 | ||||||
| Microchip Technology, Inc. | ||||||||
| 3.922%, 06/01/2021 | 13,279,000 | 13,503,261 | ||||||
| Total Semiconductors | 14,998,981 | |||||||
| Software & Services (0.67%) | ||||||||
| Adobe, Inc. | ||||||||
| 2.300%, 02/01/2030 | 1,000,000 | 1,052,870 | ||||||
| Broadridge Financial Solutions, Inc. | ||||||||
| 2.900%, 12/01/2029 | 3,000,000 | 3,095,526 | ||||||
| IHS Markit, Ltd. | ||||||||
| 4.250%, 05/01/2029 | 2,000,000 | 2,166,940 | ||||||
| Total Software & Services | 6,315,336 | |||||||
| Supermarkets & Pharmacies (0.32%) | ||||||||
| Kroger Co. | ||||||||
| 2.650%, 10/15/2026 | 2,860,000 | 2,996,703 | ||||||
| Transportation & Logistics (0.19%) | ||||||||
| Penske Truck Leasing Co. Lp / PTL | ||||||||
| Finance Corp. | ||||||||
| 3.200%, 07/15/2020(d) | 992,000 | 992,306 | ||||||
| 3.375%, 02/01/2022(d) | 767,000 | 779,427 | ||||||
| Total Transportation & Logistics | 1,771,733 | |||||||
| Utilities (3.46%) | ||||||||
| Avangrid, Inc. | ||||||||
| 3.200%, 04/15/2025 | 2,500,000 | 2,639,739 | ||||||
| Berkshire Hathaway Energy Co. | ||||||||
| 3.700%, 07/15/2030(d) | 1,000,000 | 1,139,988 | ||||||
| 4.250%, 10/15/2050(d) | 500,000 | 625,567 | ||||||
| Dominion Energy, Inc. | ||||||||
| 2.715%, 08/15/2021(c) | 2,300,000 | 2,321,942 | ||||||
| 3.071%, 08/15/2024(c) | 1,500,000 | 1,578,555 | ||||||
| 4.104%, 04/01/2021(c) | 5,505,000 | 5,592,850 | ||||||
| 69 | | April 30, 2020 |
ALPS | Smith Total Return Bond Fund
| Statement of Investments | April 30, 2020 (Unaudited) |
| Principal Amount | Value (Note 2) | |||||||
| Edison International | ||||||||
| 4.950%, 04/15/2025 | $ | 3,800,000 | $ | 4,130,218 | ||||
| Exelon Corp. | ||||||||
| 3.497%, 06/01/2022 | 2,673,000 | 2,755,758 | ||||||
| 5.150%, 12/01/2020 | 100,000 | 101,173 | ||||||
| Florida Power & Light Co. | ||||||||
| 2.850%, 04/01/2025 | 900,000 | 976,570 | ||||||
| Nevada Power Co. | ||||||||
| Series DD | ||||||||
| 2.400%, 05/01/2030 | 2,000,000 | 2,097,204 | ||||||
| NextEra Energy Capital Holdings, Inc. | ||||||||
| 2.403%, 09/01/2021 | 1,000,000 | 1,017,234 | ||||||
| 2.750%, 11/01/2029 | 3,000,000 | 3,232,435 | ||||||
| Oncor Electric Delivery Co. LLC | ||||||||
| 2.750%, 05/15/2030(d) | 1,000,000 | 1,099,458 | ||||||
| 3.700%, 05/15/2050(d) | 1,000,000 | 1,247,759 | ||||||
| Xcel Energy, Inc. | ||||||||
| 3.400%, 06/01/2030 | 2,000,000 | 2,228,247 | ||||||
| Total Utilities | 32,784,697 | |||||||
| Waste & Environment Services & Equipment (0.16%) | ||||||||
| GFL Environmental, Inc. | ||||||||
| 4.250%, 06/01/2025(d) | 1,500,000 | 1,511,250 | ||||||
| Wireless Telecommunications Services (2.60%) | ||||||||
| AT&T, Inc. | ||||||||
| 3.875%, 01/15/2026 | 378,000 | 411,009 | ||||||
| 4.300%, 02/15/2030 | 6,500,000 | 7,339,149 | ||||||
| 4.300%, 12/15/2042 | 1,500,000 | 1,632,525 | ||||||
| 4.350%, 03/01/2029 | 1,100,000 | 1,238,064 | ||||||
| Sprint Communications, Inc. | ||||||||
| 7.000%, 08/15/2020 | 355,000 | 359,136 | ||||||
| T-Mobile USA, Inc. | ||||||||
| 3.500%, 04/15/2025(d) | 4,625,000 | 4,878,219 | ||||||
| 3.875%, 04/15/2030(d) | 4,000,000 | 4,395,400 | ||||||
| 4.375%, 04/15/2040(d) | 1,000,000 | 1,134,560 | ||||||
| 4.500%, 04/15/2050(d) | 1,000,000 | 1,170,150 | ||||||
| Verizon Communications, Inc. | ||||||||
| 3.150%, 03/22/2030 | 1,000,000 | 1,109,280 | ||||||
| 4.016%, 12/03/2029 | 806,000 | 942,357 | ||||||
| Total Wireless Telecommunications Services | 24,609,849 | |||||||
| Wireline Telecommunications Services (0.33%) | ||||||||
| CenturyLink, Inc. | ||||||||
| Series S | ||||||||
| 6.450%, 06/15/2021 | 3,000,000 | 3,089,100 | ||||||
| TOTAL CORPORATE BONDS | ||||||||
| (Cost $519,342,664) | 528,524,979 | |||||||
| GOVERNMENT BONDS (29.25%) | ||||||||
| U.S. Treasury Bonds (29.25%) | ||||||||
| United States Treasury Bonds | ||||||||
| 2.000%, 02/15/2050 | 35,240,000 | 41,415,259 | ||||||
| 2.375%, 11/15/2049 | 14,738,000 | 18,651,630 | ||||||
| 3.000%, 05/15/2042 | 2,000,000 | 2,700,000 | ||||||
| Principal Amount | Value (Note 2) | |||||||
| United States Treasury Notes | ||||||||
| 0.375%, 03/31/2022 | $ | 17,640,000 | $ | 17,703,049 | ||||
| 0.500%, 03/15/2023 | 15,704,000 | 15,818,406 | ||||||
| 0.500%, 03/31/2025 | 26,959,000 | 27,146,448 | ||||||
| 1.125%, 02/28/2025 | 24,127,000 | 25,031,763 | ||||||
| 1.125%, 02/28/2027 | 1,680,000 | 1,747,988 | ||||||
| 1.250%, 08/31/2024 | 1,719,000 | 1,786,753 | ||||||
| 1.375%, 01/31/2025 | 8,374,000 | 8,776,345 | ||||||
| 1.500%, 01/15/2023 | 4,300,000 | 4,446,385 | ||||||
| 1.500%, 10/31/2024 | 8,100,000 | 8,517,023 | ||||||
| 1.500%, 02/15/2030 | 24,277,000 | 26,253,300 | ||||||
| 1.625%, 12/15/2022 | 8,850,000 | 9,172,714 | ||||||
| 1.625%, 10/31/2023 | 17,506,000 | 18,321,123 | ||||||
| 1.625%, 10/31/2026 | 5,000,000 | 5,357,617 | ||||||
| 1.750%, 12/31/2024 | 24,050,000 | 25,607,613 | ||||||
| 2.125%, 02/29/2024 | 17,210,000 | 18,395,877 | ||||||
| Total U.S. Treasury Bonds | 276,849,293 | |||||||
| TOTAL GOVERNMENT BONDS | ||||||||
| (Cost $269,937,533) | 276,849,293 | |||||||
| Shares | Value (Note 2) | |||||||
| PREFERRED STOCK (1.40%) | ||||||||
| Communications (0.29%) | ||||||||
| Wireless Telecommunications Services (0.29%) | ||||||||
| AT&T, Inc.(e) | 120,000 | 2,761,200 | ||||||
| TOTAL Communications | 2,761,200 | |||||||
| Financials (1.11%) | ||||||||
| Banks (0.51%) | ||||||||
| CIT Group, Inc.(e) | 160,000 | 3,347,200 | ||||||
| Wells Fargo & Co.(e) | 60,000 | 1,432,800 | ||||||
| 4,780,000 | ||||||||
| Consumer Finance (0.28%) | ||||||||
| Capital One Financial Corp.(e) | 80,000 | 1,856,000 | ||||||
| Synchrony Financial(e) | 40,000 | 833,600 | ||||||
| 2,689,600 | ||||||||
| Life Insurance (0.21%) | ||||||||
| MetLife, Inc.(e)(f) | 80,000 | 1,980,000 | ||||||
| Property & Casualty Insurance(0.11%) | ||||||||
| Allstate Corp.(e) | 40,000 | 1,024,000 | ||||||
| TOTAL Financials | 10,473,600 | |||||||
| TOTAL PREFERRED STOCK | ||||||||
| (Cost $14,500,000) | 13,234,800 | |||||||
| 70 | | April 30, 2020 |
ALPS | Smith Total Return Bond Fund
| Statement of Investments | April 30, 2020 (Unaudited) |
| 7-Day Yield | Shares | Value (Note 2) | ||||||||||
| SHORT TERM INVESTMENTS (3.13%) | ||||||||||||
| Money Market Fund (3.13%) | ||||||||||||
| Morgan Stanley Institutional Liquidity Funds - Government Portfolio | 0.159 | % | 29,658,815 | $ | 29,658,815 | |||||||
| TOTAL SHORT TERM INVESTMENTS | ||||||||||||
| (Cost $29,658,815) | 29,658,815 | |||||||||||
| Value (Note 2) | ||||
| TOTAL INVESTMENTS (102.40%) | ||||
| (Cost $949,859,368) | $ | 969,403,934 | ||
| Liabilities In Excess Of Other Assets (-2.40%) | (22,758,828 | ) | ||
| NET ASSETS (100.00%) | $ | 946,645,106 | ||
Investment Abbreviations:
LIBOR - London Interbank Offered Rate
SOFR - Secured Overnight Financing Rate
Reference Rates:
1M US L - 1 Month LIBOR as of April 30, 2020 was 0.33%
3M US L - 3 Month LIBOR as of April 30, 2020 was 0.56%
1Y US TI - 1 Year Treasury Yield as of April 30, 2020 was 0.16%
5Y US TI - 5 Year Treasury Yield as of April 30, 2020 was 0.36%
1D US SOFR - 1 Day SOFR as of April 30, 2020 was 0.04%
| (a) | Floating or variable rate security. The reference rate is described above. The rate in effect as of April 30, 2020 is based on the reference rate plus the displayed spread as of the security's last reset date. |
| (b) | Issued with zero coupon. |
| (c) | Step bond. Coupon changes periodically based upon a predetermined schedule. Interest rate disclosed is that which is in effect as of April 30, 2020. |
| (d) | Security exempt from registration under Rule 144A of the Securities Act of 1933. This security may be resold in transactions exempt from registration, normally to qualified institutional buyers. As of April 30, 2020, the aggregate market value of those securities was $134,165,190, representing 14.17% of net assets. |
| (e) | Perpetual. |
| (f) | Non-Income Producing Security. |
See Notes to Financial Statements.
| 71 | | April 30, 2020 |
ALPS | Smith Funds
| Statements of Assets and Liabilities | April 30, 2020 (Unaudited) |
| ALPS | Smith Short Duration Bond Fund | ALPS | Smith Total Return Bond Fund | |||||||
| ASSETS | ||||||||
| Investments, at value | $ | 62,850,589 | $ | 969,403,934 | ||||
| Receivable for investments sold | 2,598,151 | 12,570,002 | ||||||
| Receivable for shares sold | 292,556 | 10,688,057 | ||||||
| Interest receivable | 304,340 | 4,565,309 | ||||||
| Prepaid expenses and other assets | 10,014 | 24,002 | ||||||
| Total Assets | 66,055,650 | 997,251,304 | ||||||
| LIABILITIES | ||||||||
| Payable for investments purchased | 4,795,430 | 45,463,027 | ||||||
| Payable for shares redeemed | 2,002 | 4,527,070 | ||||||
| Investment advisory fees payable | 4,372 | 362,164 | ||||||
| Administration and transfer agency fees payable | 39,792 | 188,475 | ||||||
| Distribution and services fees payable | 856 | 7,831 | ||||||
| Trustees' fees and expenses payable | 807 | 9,662 | ||||||
| Professional fees payable | 13,068 | 18,652 | ||||||
| Custody fees payable | 2,914 | 6,324 | ||||||
| Accrued expenses and other liabilities | 3,948 | 22,993 | ||||||
| Total Liabilities | 4,863,189 | 50,606,198 | ||||||
| NET ASSETS | $ | 61,192,461 | $ | 946,645,106 | ||||
| NET ASSETS CONSIST OF | ||||||||
| Paid-in capital | $ | 59,891,799 | $ | 922,017,959 | ||||
| Total distributable earnings | 1,300,662 | 24,627,147 | ||||||
| NET ASSETS | $ | 61,192,461 | $ | 946,645,106 | ||||
| INVESTMENTS, AT COST | $ | 62,106,457 | $ | 949,859,368 | ||||
| PRICING OF SHARES | ||||||||
| Investor Class: | ||||||||
| Net Asset Value, offering and redemption price per share | $ | 10.35 | $ | 11.15 | ||||
| Net Assets | $ | 500,329 | $ | 5,068,646 | ||||
| Shares of beneficial interest outstanding (unlimited number of shares, no par value common stock authorized) | 48,363 | 454,589 | ||||||
| Class A: | ||||||||
| Net Asset Value, offering and redemption price per share | $ | 10.34 | $ | 11.15 | ||||
| Net Assets | $ | 671,125 | $ | 10,374,742 | ||||
| Shares of beneficial interest outstanding (unlimited number of shares, no par value common stock authorized) | 64,898 | 930,514 | ||||||
| Maximum offering price per share ((NAV/0.9450), based on maximum sales charge of 5.50% of the offering price) | $ | 10.94 | $ | 11.80 | ||||
| Class C: | ||||||||
| Net Asset Value, offering and redemption price per share(a) | $ | 10.34 | $ | 11.13 | ||||
| Net Assets | $ | 585,924 | $ | 3,566,220 | ||||
| Shares of beneficial interest outstanding (unlimited number of shares, no par value common stock authorized) | 56,684 | 320,403 | ||||||
| Class I: | ||||||||
| Net Asset Value, offering and redemption price per share | $ | 10.35 | $ | 11.15 | ||||
| Net Assets | $ | 59,435,083 | $ | 927,635,498 | ||||
| Shares of beneficial interest outstanding (unlimited number of shares, no par value common stock authorized) | 5,741,206 | 83,226,467 | ||||||
| (a) | Redemption price per share may be reduced for any applicable contingent deferred sales charge. For a description of a possible sales charge, please see the Fund's Prospectus. |
See Notes to Financial Statements.
| 72 | | April 30, 2020 |
ALPS | Smith Funds
| Statements of Operations | For the Six Months Ended April 30, 2020 (Unaudited) |
| ALPS | Smith Short Duration Bond Fund | ALPS | Smith Total Return Bond Fund | |||||||
| INVESTMENT INCOME | ||||||||
| Dividends | $ | 4,320 | $ | 269,672 | ||||
| Foreign taxes withheld on dividends | (113 | ) | (2,837 | ) | ||||
| Interest | 691,994 | 7,884,907 | ||||||
| Total Investment Income | 696,201 | 8,151,742 | ||||||
| EXPENSES | ||||||||
| Investment advisory fees | 105,001 | 1,731,173 | ||||||
| Administrative fees | 46,570 | 305,348 | ||||||
| Transfer agency fees | 2,767 | 6,461 | ||||||
| Distribution and service fees | ||||||||
| Investor Class | 688 | 6,371 | ||||||
| Class A | 676 | 12,558 | ||||||
| Class C | 2,733 | 12,875 | ||||||
| Professional fees | 12,920 | 18,289 | ||||||
| Reports to shareholders and printing fees | 2,750 | 14,522 | ||||||
| State registration fees | 32,088 | 43,129 | ||||||
| Insurance fees | 323 | 2,548 | ||||||
| Custody fees | 4,033 | 16,572 | ||||||
| Trustees' fees and expenses | 954 | 10,773 | ||||||
| Repayment of previously waived fees | ||||||||
| Investor Class | – | 43 | ||||||
| Class A | – | 59 | ||||||
| Class C | – | 25 | ||||||
| Class I | – | 4,348 | ||||||
| Miscellaneous expenses | 4,607 | 9,200 | ||||||
| Total Expenses | 216,110 | 2,194,294 | ||||||
| Less fees waived/reimbursed by investment advisor (Note 8) | ||||||||
| Investor Class | (645 | ) | (176 | ) | ||||
| Class A | (640 | ) | (324 | ) | ||||
| Class C | (674 | ) | (56 | ) | ||||
| Class I | (68,895 | ) | (23,158 | ) | ||||
| Net Expenses | 145,256 | 2,170,580 | ||||||
| Net Investment Income | 550,945 | 5,981,162 | ||||||
| Net realized gain on investments | 576,407 | 5,694,751 | ||||||
| Net Realized Gain | 576,407 | 5,694,751 | ||||||
| Net change in unrealized appreciation on investments | 358,282 | 13,015,214 | ||||||
| Net Change in Unrealized Appreciation | 358,282 | 13,015,214 | ||||||
| NET REALIZED AND UNREALIZED GAIN ON INVESTMENTS | 934,689 | 18,709,965 | ||||||
| NET INCREASE IN NET ASSETS RESULTING FROM OPERATIONS | $ | 1,485,634 | $ | 24,691,127 | ||||
See Notes to Financial Statements.
| 73 | | April 30, 2020 |
ALPS | Smith Short Duration Bond Fund
Statement of Changes in Net Assets
| For the Six Months Ended April 30, 2020 (Unaudited) | For the Year Ended October 31, 2019 | |||||||
| OPERATIONS | ||||||||
| Net investment income | $ | 550,945 | $ | 814,781 | ||||
| Net realized gain | 576,407 | 426,249 | ||||||
| Net change in unrealized appreciation | 358,282 | 421,108 | ||||||
| Net Increase in Net Assets Resulting from Operations | 1,485,634 | 1,662,138 | ||||||
| DISTRIBUTIONS | ||||||||
| From distributable earnings | ||||||||
| Investor Class | (8,355 | ) | (10,717 | ) | ||||
| Class A | (8,325 | ) | (4,962 | ) | ||||
| Class C | (6,677 | ) | (6,391 | ) | ||||
| Class I | (964,615 | ) | (813,500 | ) | ||||
| Net Decrease in Net Assets from Distributions | (987,972 | ) | (835,570 | ) | ||||
| BENEFICIAL INTEREST TRANSACTIONS (NOTE 6) | ||||||||
| Shares sold | ||||||||
| Investor Class | 39,669 | 258,218 | ||||||
| Class A | 223,795 | 369,919 | ||||||
| Class C | 86,504 | 131,126 | ||||||
| Class I | 34,041,038 | 41,853,588 | ||||||
| Dividends reinvested | ||||||||
| Investor Class | 6,063 | 10,000 | ||||||
| Class A | 5,949 | 4,473 | ||||||
| Class C | 6,044 | 5,616 | ||||||
| Class I | 591,851 | 440,376 | ||||||
| Shares redeemed | ||||||||
| Investor Class | (68,646 | ) | (252,456 | ) | ||||
| Class A | (35,759 | ) | (18,487 | ) | ||||
| Class C | (9,405 | ) | (20,155 | ) | ||||
| Class I | (20,595,820 | ) | (11,777,876 | ) | ||||
| Net Increase in Net Assets Derived from Beneficial Interest Transactions | 14,291,283 | 31,004,342 | ||||||
| Net increase in net assets | 14,788,945 | 31,830,910 | ||||||
| NET ASSETS | ||||||||
| Beginning of period | 46,403,516 | 14,572,606 | ||||||
| End of period | $ | 61,192,461 | $ | 46,403,516 | ||||
See Notes to Financial Statements.
| 74 | | April 30, 2020 |
ALPS | Smith Total Return Bond Fund
Statement of Changes in Net Assets
| For the Six Months Ended April 30, 2020 (Unaudited) | For the Year Ended October 31, 2019 | |||||||
| OPERATIONS | ||||||||
| Net investment income | $ | 5,981,162 | $ | 3,139,972 | ||||
| Net realized gain | 5,694,751 | 4,027,836 | ||||||
| Net change in unrealized appreciation | 13,015,214 | 6,559,219 | ||||||
| Net Increase in Net Assets Resulting from Operations | 24,691,127 | 13,727,027 | ||||||
| DISTRIBUTIONS | ||||||||
| From distributable earnings | ||||||||
| Investor Class | (61,489 | ) | (58,353 | ) | ||||
| Class A | (142,665 | ) | (42,792 | ) | ||||
| Class C | (32,644 | ) | (5,589 | ) | ||||
| Class I | (10,294,356 | ) | (3,126,201 | ) | ||||
| Net Decrease in Net Assets from Distributions | (10,531,154 | ) | (3,232,935 | ) | ||||
| BENEFICIAL INTEREST TRANSACTIONS (NOTE 6) | ||||||||
| Shares sold | ||||||||
| Investor Class | 2,843,398 | 7,455,767 | ||||||
| Class A | 2,868,118 | 8,877,480 | ||||||
| Class C | 1,919,835 | 1,700,810 | ||||||
| Class I | 635,432,800 | 358,733,093 | ||||||
| Dividends reinvested | ||||||||
| Investor Class | 56,344 | 56,025 | ||||||
| Class A | 137,258 | 40,890 | ||||||
| Class C | 32,288 | 5,571 | ||||||
| Class I | 7,434,906 | 2,384,296 | ||||||
| Shares redeemed | ||||||||
| Investor Class | (2,037,532 | ) | (3,982,563 | ) | ||||
| Class A | (690,278 | ) | (1,263,173 | ) | ||||
| Class C | (160,968 | ) | (111,542 | ) | ||||
| Class I | (95,058,434 | ) | (15,780,343 | ) | ||||
| Net Increase in Net Assets Derived from Beneficial Interest Transactions | 552,777,735 | 358,116,311 | ||||||
| Net increase in net assets | 566,937,708 | 368,610,403 | ||||||
| NET ASSETS | ||||||||
| Beginning of period | 379,707,398 | 11,096,995 | ||||||
| End of period | $ | 946,645,106 | $ | 379,707,398 | ||||
See Notes to Financial Statements.
| 75 | | April 30, 2020 |
ALPS | Smith Short Duration Bond Fund – Investor Class
Financial Highlights
Selected data for a share of beneficial interest outstanding throughout the periods indicated:
| For the Six Months Ended April 30, 2020 (Unaudited) | For the Year Ended October 31, 2019 | For the Period July 2, 2018 (Commencement of Operations) to October 31, 2018 | ||||||||||
| Net asset value, beginning of period | $ | 10.25 | $ | 9.98 | $ | 10.00 | ||||||
| INCOME FROM INVESTMENT OPERATIONS: | ||||||||||||
| Net investment income(a) | 0.08 | 0.23 | 0.07 | |||||||||
| Net realized and unrealized gain/(loss) | 0.19 | 0.27 | (0.04 | ) | ||||||||
| Total from investment operations | 0.27 | 0.50 | 0.03 | |||||||||
| DISTRIBUTIONS: | ||||||||||||
| From net investment income | (0.09 | ) | (0.22 | ) | (0.05 | ) | ||||||
| From net realized gains | (0.08 | ) | (0.01 | ) | – | |||||||
| Total distributions | (0.17 | ) | (0.23 | ) | (0.05 | ) | ||||||
| Net increase/(decrease) in net asset value | 0.10 | 0.27 | (0.02 | ) | ||||||||
| Net asset value, end of period | $ | 10.35 | $ | 10.25 | $ | 9.98 | ||||||
| TOTAL RETURN(b) | 2.60 | % | 5.04 | % | 0.25 | % | ||||||
| RATIOS/SUPPLEMENTAL DATA: | ||||||||||||
| Net assets, end of period (000s) | $ | 500 | $ | 519 | $ | 491 | ||||||
| Ratio of expenses to average net assets excluding fee waivers and reimbursements | 1.00 | %(c) | 1.10 | % | 2.79 | %(c) | ||||||
| Ratio of expenses to average net assets including fee waivers and reimbursements | 0.75 | %(c) | 0.76 | % | 0.89 | %(c) | ||||||
| Ratio of net investment income to average net assets | 1.67 | %(c) | 2.22 | % | 1.93 | %(c) | ||||||
| Portfolio turnover rate(d) | 353 | % | 639 | % | 266 | % | ||||||
| (a) | Calculated using the average shares method. |
| (b) | Total returns are for the period indicated and have not been annualized. Total returns would have been lower had certain expenses not been waived during the period. Returns shown do not reflect the deduction of taxes that a shareholder would pay on Fund distributions or the redemption of Fund shares. Returns shown exclude any applicable sales charges. |
| (c) | Annualized. |
| (d) | Portfolio turnover rate for periods less than one full year have not been annualized. |
See Notes to Financial Statements.
| 76 | | April 30, 2020 |
ALPS | Smith Short Duration Bond Fund – Class A
Financial Highlights
Selected data for a share of beneficial interest outstanding throughout the periods indicated:
| For the Six Months Ended April 30, 2020 (Unaudited) | For the Year Ended October 31, 2019 | For the Period July 2, 2018 (Commencement of Operations) to October 31, 2018 | ||||||||||
| Net asset value, beginning of period | $ | 10.24 | $ | 9.98 | $ | 10.00 | ||||||
| INCOME FROM INVESTMENT OPERATIONS: | ||||||||||||
| Net investment income(a) | 0.08 | 0.22 | 0.06 | |||||||||
| Net realized and unrealized gain/(loss) | 0.19 | 0.27 | (0.03 | ) | ||||||||
| Total from investment operations | 0.27 | 0.49 | 0.03 | |||||||||
| DISTRIBUTIONS: | ||||||||||||
| From net investment income | (0.09 | ) | (0.22 | ) | (0.05 | ) | ||||||
| From net realized gains | (0.08 | ) | (0.01 | ) | – | |||||||
| Total distributions | (0.17 | ) | (0.23 | ) | (0.05 | ) | ||||||
| REDEMPTION FEES ADDED TO PAID-IN CAPITAL (NOTE 6) | – | 0.00 | (b) | – | ||||||||
| Net increase/(decrease) in net asset value | 0.10 | 0.26 | (0.02 | ) | ||||||||
| Net asset value, end of period | $ | 10.34 | $ | 10.24 | $ | 9.98 | ||||||
| TOTAL RETURN(c) | 2.60 | % | 4.96 | % | 0.27 | % | ||||||
| RATIOS/SUPPLEMENTAL DATA: | ||||||||||||
| Net assets, end of period (000s) | $ | 671 | $ | 471 | $ | 110 | ||||||
| Ratio of expenses to average net assets excluding fee waivers and reimbursements | 1.00 | %(d) | 1.09 | % | 4.28 | %(d) | ||||||
| Ratio of expenses to average net assets including fee waivers and reimbursements | 0.75 | %(d) | 0.74 | % | 0.89 | %(d) | ||||||
| Ratio of net investment income to average net assets | 1.67 | %(d) | 2.17 | % | 1.86 | %(d) | ||||||
| Portfolio turnover rate(e) | 353 | % | 639 | % | 266 | % | ||||||
| (a) | Calculated using the average shares method. |
| (b) | Less than $0.005 or ($0.005) per share. |
| (c) | Total returns are for the period indicated and have not been annualized. Total returns would have been lower had certain expenses not been waived during the period. Returns shown do not reflect the deduction of taxes that a shareholder would pay on Fund distributions or the redemption of Fund shares. |
| (d) | Annualized. |
| (e) | Portfolio turnover rate for periods less than one full year have not been annualized. |
See Notes to Financial Statements.
| 77 | | April 30, 2020 |
ALPS | Smith Short Duration Bond Fund – Class C
Financial Highlights
Selected data for a share of beneficial interest outstanding throughout the periods indicated:
| For the Six Months Ended April 30, 2020 (Unaudited) | For the Year Ended October 31, 2019 | For the Period July 2, 2018 (Commencement of Operations) to October 31, 2018 | ||||||||||
| Net asset value, beginning of period | $ | 10.24 | $ | 9.98 | $ | 10.00 | ||||||
| INCOME FROM INVESTMENT OPERATIONS: | ||||||||||||
| Net investment income(a) | 0.05 | 0.15 | 0.05 | |||||||||
| Net realized and unrealized gain/(loss) | 0.18 | 0.27 | (0.04 | ) | ||||||||
| Total from investment operations | 0.23 | 0.42 | 0.01 | |||||||||
| DISTRIBUTIONS: | ||||||||||||
| From net investment income | (0.05 | ) | (0.15 | ) | (0.03 | ) | ||||||
| From net realized gains | (0.08 | ) | (0.01 | ) | – | |||||||
| Total distributions | (0.13 | ) | (0.16 | ) | (0.03 | ) | ||||||
| Net increase/(decrease) in net asset value | 0.10 | 0.26 | (0.02 | ) | ||||||||
| Net asset value, end of period | $ | 10.34 | $ | 10.24 | $ | 9.98 | ||||||
| TOTAL RETURN(b) | 2.24 | % | 4.19 | % | 0.09 | % | ||||||
| RATIOS/SUPPLEMENTAL DATA: | ||||||||||||
| Net assets, end of period (000s) | $ | 586 | $ | 497 | $ | 370 | ||||||
| Ratio of expenses to average net assets excluding fee waivers and reimbursements | 1.74 | %(c) | 1.83 | % | 3.54 | %(c) | ||||||
| Ratio of expenses to average net assets including fee waivers and reimbursements | 1.49 | %(c) | 1.49 | % | 1.48 | %(c) | ||||||
| Ratio of net investment income to average net assets | 0.93 | %(c) | 1.48 | % | 1.35 | %(c) | ||||||
| Portfolio turnover rate(d) | 353 | % | 639 | % | 266 | % | ||||||
| (a) | Calculated using the average shares method. |
| (b) | Total returns are for the period indicated and have not been annualized. Total returns would have been lower had certain expenses not been waived during the period. Returns shown do not reflect the deduction of taxes that a shareholder would pay on Fund distributions or the redemption of Fund shares. Returns shown exclude any applicable sales charges. |
| (c) | Annualized. |
| (d) | Portfolio turnover rate for periods less than one full year have not been annualized. |
See Notes to Financial Statements.
| 78 | | April 30, 2020 |
ALPS | Smith Short Duration Bond Fund – Class I
Financial Highlights
Selected data for a share of beneficial interest outstanding throughout the periods indicated:
| For the Six Months Ended April 30, 2020 (Unaudited) | For the Year Ended October 31, 2019 | For the Period July 2, 2018 (Commencement of Operations) to October 31, 2018 | ||||||||||
| Net asset value, beginning of period | $ | 10.25 | $ | 9.99 | $ | 10.00 | ||||||
| INCOME FROM INVESTMENT OPERATIONS: | ||||||||||||
| Net investment income(a) | 0.10 | 0.25 | 0.08 | |||||||||
| Net realized and unrealized gain/(loss) | 0.18 | 0.26 | (0.03 | ) | ||||||||
| Total from investment operations | 0.28 | 0.51 | 0.05 | |||||||||
| DISTRIBUTIONS: | ||||||||||||
| From net investment income | (0.10 | ) | (0.25 | ) | (0.06 | ) | ||||||
| From net realized gains | (0.08 | ) | (0.01 | ) | – | |||||||
| Total distributions | (0.18 | ) | (0.26 | ) | (0.06 | ) | ||||||
| REDEMPTION FEES ADDED TO PAID-IN CAPITAL (NOTE 6) | 0.00 | (b) | 0.01 | 0.00 | (b) | |||||||
| Net increase/(decrease) in net asset value | 0.10 | 0.26 | (0.01 | ) | ||||||||
| Net asset value, end of period | $ | 10.35 | $ | 10.25 | $ | 9.99 | ||||||
| TOTAL RETURN(c) | 2.74 | % | 5.21 | % | 0.50 | % | ||||||
| RATIOS/SUPPLEMENTAL DATA: | ||||||||||||
| Net assets, end of period (000s) | $ | 59,435 | $ | 44,916 | $ | 13,601 | ||||||
| Ratio of expenses to average net assets excluding fee waivers and reimbursements | 0.74 | %(d) | 0.82 | % | 1.70 | %(d) | ||||||
| Ratio of expenses to average net assets including fee waivers and reimbursements | 0.49 | %(d) | 0.49 | % | 0.49 | %(d) | ||||||
| Ratio of net investment income to average net assets | 1.93 | %(d) | 2.46 | % | 2.36 | %(d) | ||||||
| Portfolio turnover rate(e) | 353 | % | 639 | % | 266 | % | ||||||
| (a) | Calculated using the average shares method. |
| (b) | Less than $0.005 or ($0.005) per share. |
| (c) | Total returns are for the period indicated and have not been annualized. Total returns would have been lower had certain expenses not been waived during the period. Returns shown do not reflect the deduction of taxes that a shareholder would pay on Fund distributions or the redemption of Fund shares. |
| (d) | Annualized. |
| (e) | Portfolio turnover rate for periods less than one full year have not been annualized. |
See Notes to Financial Statements.
| 79 | | April 30, 2020 |
ALPS | Smith Total Return Bond Fund – Investor Class
Financial Highlights
Selected data for a share of beneficial interest outstanding throughout the periods indicated:
| For the Six Months Ended April 30, 2020 (Unaudited) | For the Year Ended October 31, 2019 | For the Period July 2, 2018 (Commencement of Operations) to October 31, 2018 | ||||||||||
| Net asset value, beginning of period | $ | 10.99 | $ | 10.05 | $ | 10.00 | ||||||
| INCOME FROM INVESTMENT OPERATIONS: | ||||||||||||
| Net investment income(a) | 0.09 | 0.22 | 0.07 | |||||||||
| Net realized and unrealized gain | 0.26 | 0.95 | 0.03 | |||||||||
| Total from investment operations | 0.35 | 1.17 | 0.10 | |||||||||
| DISTRIBUTIONS: | ||||||||||||
| From net investment income | (0.09 | ) | (0.21 | ) | (0.05 | ) | ||||||
| From net realized gains | (0.10 | ) | (0.02 | ) | – | |||||||
| Total distributions | (0.19 | ) | (0.23 | ) | (0.05 | ) | ||||||
| REDEMPTION FEES ADDED TO PAID-IN CAPITAL (NOTE 6) | 0.00 | (b) | 0.00 | (b) | – | |||||||
| Net increase in net asset value | 0.16 | 0.94 | 0.05 | |||||||||
| Net asset value, end of period | $ | 11.15 | $ | 10.99 | $ | 10.05 | ||||||
| TOTAL RETURN(c) | 3.17 | % | 11.77 | % | 1.00 | % | ||||||
| RATIOS/SUPPLEMENTAL DATA: | ||||||||||||
| Net assets, end of period (000s) | $ | 5,069 | $ | 4,121 | $ | 345 | ||||||
| Ratio of expenses to average net assets excluding fee waivers and reimbursements | 0.96 | %(d) | 1.07 | % | 2.97 | %(d) | ||||||
| Ratio of expenses to average net assets including fee waivers and reimbursements | 0.95 | %(d) | 0.96 | % | 1.07 | %(d) | ||||||
| Ratio of net investment income to average net assets | 1.61 | %(d) | 2.05 | % | 2.20 | %(d) | ||||||
| Portfolio turnover rate(e) | 195 | % | 489 | % | 345 | % | ||||||
| (a) | Calculated using the average shares method. |
| (b) | Less than $0.005 or ($0.005) per share. |
| (c) | Total returns are for the period indicated and have not been annualized. Total returns would have been lower had certain expenses not been waived during the period. Returns shown do not reflect the deduction of taxes that a shareholder would pay on Fund distributions or the redemption of Fund shares. Returns shown exclude any applicable sales charges. |
| (d) | Annualized. |
| (e) | Portfolio turnover rate for periods less than one full year have not been annualized. |
See Notes to Financial Statements.
| 80 | | April 30, 2020 |
ALPS | Smith Total Return Bond Fund – Class A
Financial Highlights
Selected data for a share of beneficial interest outstanding throughout the periods indicated:
| For the Six Months Ended April 30, 2020 (Unaudited) | For the Year Ended October 31, 2019 | For the Period July 2, 2018 (Commencement of Operations) to October 31, 2018 | ||||||||||
| Net asset value, beginning of period | $ | 10.99 | $ | 10.05 | $ | 10.00 | ||||||
| INCOME FROM INVESTMENT OPERATIONS: | ||||||||||||
| Net investment income(a) | 0.09 | 0.21 | 0.07 | |||||||||
| Net realized and unrealized gain | 0.26 | 0.97 | 0.03 | |||||||||
| Total from investment operations | 0.35 | 1.18 | 0.10 | |||||||||
| DISTRIBUTIONS: | ||||||||||||
| From net investment income | (0.09 | ) | (0.22 | ) | (0.05 | ) | ||||||
| From net realized gains | (0.10 | ) | (0.02 | ) | – | |||||||
| Total distributions | (0.19 | ) | (0.24 | ) | (0.05 | ) | ||||||
| REDEMPTION FEES ADDED TO PAID-IN CAPITAL (NOTE 6) | 0.00 | (b) | 0.00 | (b) | – | |||||||
| Net increase in net asset value | 0.16 | 0.94 | 0.05 | |||||||||
| Net asset value, end of period | $ | 11.15 | $ | 10.99 | $ | 10.05 | ||||||
| TOTAL RETURN(c) | 3.17 | % | 11.79 | % | 1.04 | % | ||||||
| RATIOS/SUPPLEMENTAL DATA: | ||||||||||||
| Net assets, end of period (000s) | $ | 10,375 | $ | 7,929 | $ | 136 | ||||||
| Ratio of expenses to average net assets excluding fee waivers and reimbursements | 0.96 | %(d) | 1.05 | % | 3.96 | %(d) | ||||||
| Ratio of expenses to average net assets including fee waivers and reimbursements | 0.96 | %(d) | 0.95 | % | 1.07 | %(d) | ||||||
| Ratio of net investment income to average net assets | 1.61 | %(d) | 1.91 | % | 2.10 | %(d) | ||||||
| Portfolio turnover rate(e) | 195 | % | 489 | % | 345 | % | ||||||
| (a) | Calculated using the average shares method. |
| (b) | Less than $0.005 or ($0.005) per share. |
| (c) | Total returns are for the period indicated and have not been annualized. Total returns would have been lower had certain expenses not been waived during the period. Returns shown do not reflect the deduction of taxes that a shareholder would pay on Fund distributions or the redemption of Fund shares. |
| (d) | Annualized. |
| (e) | Portfolio turnover rate for periods less than one full year have not been annualized. |
See Notes to Financial Statements.
| 81 | | April 30, 2020 |
ALPS | Smith Total Return Bond Fund – Class C
Financial Highlights
Selected data for a share of beneficial interest outstanding throughout the periods indicated:
| For the Six Months Ended April 30, 2020 (Unaudited) | For the Year Ended October 31, 2019 | For the Period July 2, 2018 (Commencement of Operations) to October 31, 2018 | ||||||||||
| Net asset value, beginning of period | $ | 10.97 | $ | 10.04 | $ | 10.00 | ||||||
| INCOME FROM INVESTMENT OPERATIONS: | ||||||||||||
| Net investment income(a) | 0.05 | 0.13 | 0.05 | |||||||||
| Net realized and unrealized gain | 0.26 | 0.97 | 0.03 | |||||||||
| Total from investment operations | 0.31 | 1.10 | 0.08 | |||||||||
| DISTRIBUTIONS: | ||||||||||||
| From net investment income | (0.05 | ) | (0.15 | ) | (0.04 | ) | ||||||
| From net realized gains | (0.10 | ) | (0.02 | ) | – | |||||||
| Total distributions | (0.15 | ) | (0.17 | ) | (0.04 | ) | ||||||
| Net increase in net asset value | 0.16 | 0.93 | 0.04 | |||||||||
| Net asset value, end of period | $ | 11.13 | $ | 10.97 | $ | 10.04 | ||||||
| TOTAL RETURN(b) | 2.82 | % | 10.98 | % | 0.79 | % | ||||||
| RATIOS/SUPPLEMENTAL DATA: | ||||||||||||
| Net assets, end of period (000s) | $ | 3,566 | $ | 1,727 | $ | 121 | ||||||
| Ratio of expenses to average net assets excluding fee waivers and reimbursements | 1.67 | %(c) | 1.79 | % | 4.69 | %(c) | ||||||
| Ratio of expenses to average net assets including fee waivers and reimbursements | 1.67 | %(c) | 1.67 | % | 1.67 | %(c) | ||||||
| Ratio of net investment income to average net assets | 0.88 | %(c) | 1.20 | % | 1.49 | %(c) | ||||||
| Portfolio turnover rate(d) | 195 | % | 489 | % | 345 | % | ||||||
| (a) | Calculated using the average shares method. |
| (b) | Total returns are for the period indicated and have not been annualized. Total returns would have been lower had certain expenses not been waived during the period. Returns shown do not reflect the deduction of taxes that a shareholder would pay on Fund distributions or the redemption of Fund shares. Returns shown exclude any applicable sales charges. |
| (c) | Annualized. |
| (d) | Portfolio turnover rate for periods less than one full year have not been annualized. |
See Notes to Financial Statements.
| 82 | | April 30, 2020 |
ALPS | Smith Total Return Bond Fund – Class I
Financial Highlights
Selected data for a share of beneficial interest outstanding throughout the periods indicated:
| For the Six Months Ended April 30, 2020 (Unaudited) | For the Year Ended October 31, 2019 | For the Period July 2, 2018 (Commencement of Operations) to October 31, 2018 | ||||||||||
| Net asset value, beginning of period | $ | 10.99 | $ | 10.04 | $ | 10.00 | ||||||
| INCOME FROM INVESTMENT OPERATIONS: | ||||||||||||
| Net investment income(a) | 0.10 | 0.24 | 0.09 | |||||||||
| Net realized and unrealized gain | 0.26 | 0.97 | 0.02 | |||||||||
| Total from investment operations | 0.36 | 1.21 | 0.11 | |||||||||
| DISTRIBUTIONS: | ||||||||||||
| From net investment income | (0.10 | ) | (0.24 | ) | (0.07 | ) | ||||||
| From net realized gains | (0.10 | ) | (0.02 | ) | – | |||||||
| Total distributions | (0.20 | ) | (0.26 | ) | (0.07 | ) | ||||||
| REDEMPTION FEES ADDED TO PAID-IN CAPITAL (NOTE 6) | 0.00 | (b) | 0.00 | (b) | – | |||||||
| Net increase in net asset value | 0.16 | 0.95 | 0.04 | |||||||||
| Net asset value, end of period | $ | 11.15 | $ | 10.99 | $ | 10.04 | ||||||
| TOTAL RETURN(c) | 3.32 | % | 12.19 | % | 1.09 | % | ||||||
| RATIOS/SUPPLEMENTAL DATA: | ||||||||||||
| Net assets, end of period (000s) | $ | 927,635 | $ | 365,930 | $ | 10,495 | ||||||
| Ratio of expenses to average net assets excluding fee waivers and reimbursements | 0.68 | %(d) | 0.76 | % | 2.18 | %(d) | ||||||
| Ratio of expenses to average net assets including fee waivers and reimbursements | 0.67 | %(d) | 0.67 | % | 0.67 | %(d) | ||||||
| Ratio of net investment income to average net assets | 1.88 | %(d) | 2.22 | % | 2.64 | %(d) | ||||||
| Portfolio turnover rate(e) | 195 | % | 489 | % | 345 | % | ||||||
| (a) | Calculated using the average shares method. |
| (b) | Less than $0.005 or ($0.005) per share. |
| (c) | Total returns are for the period indicated and have not been annualized. Total returns would have been lower had certain expenses not been waived during the period. Returns shown do not reflect the deduction of taxes that a shareholder would pay on Fund distributions or the redemption of Fund shares. |
| (d) | Annualized. |
| (e) | Portfolio turnover rate for periods less than one full year have not been annualized. |
See Notes to Financial Statements.
| 83 | | April 30, 2020 |
ALPS | Red Rocks Global Opportunity Fund
| Management Commentary | April 30, 2020 (Unaudited) |
2020 – H1 Commentary and Outlook
We begin our commentary for this period with an announcement that we have changed the name of the fund to the ALPS | Red Rocks Global Opportunity Fund, (the “Fund”). The investment team, process, philosophy, and objective of the Fund will remain the same.
In seeking to appeal to a broader base of investors we identified several issues with the “Listed Private Equity” moniker:
| · | Listed private equity is not a widely recognized investment modality. | |
| · | The name “listed private equity” has provided significant confusion for investors and research analysts on the nature and characteristics of the Fund, objective, return expectations, liquidity, among others, and has limited the inclusion of the fund in investment models and recommended lists. | |
| · | Morningstar has classified the fund in global small-medium (SMID) category, and the characteristics of the Fund reflect a strategy that owns global equities with unique characteristics, providing investors with exposure to small and mid-sized growth companies. |
Perhaps most importantly, listed private equity describes an asset structure but neglects to describe the value creation efforts undertaken by the company’s managers.
Unconstrained Capital Allocation
From a broad perspective, companies in the Fund’s portfolio (and investment universe) since inception have pursued a highly disciplined and flexible capital allocation process, choosing investment projects that provide a significantly high return on invested capital (ROIC). This approach utilizes a longer term investment horizon and capital return assumptions and is not restricted to any particular industry, geography, or business function. In addition, companies in the portfolio have often used M&A to enhance the competitive position of their businesses.
We have coined the term “unconstrained capital allocation” to describe these companies and believe that it is this capital allocation process, and not the structure of the investment, which can provide attractive risk-adjusted returns for investors.
As we mentioned above, the investment team, process, philosophy, and objective of the Fund will remain the same. We will continue to seek out companies globally who utilize an unconstrained capital allocation process and have a track record of high ROIC.
We believe that changing the name provides more clarity on the investment nature and objective and better positions the fund for broader access and inclusion, which we believe will ultimately benefit investors.
COVID-19
The COVID-19 pandemic represents an exogenous shock to global markets. The situation is far from resolved and the global economic outlook is uncertain for the foreseeable future.
Our team is safe, working remotely, and fully operational; they have been able to leverage the resources, capabilities, and technology of our parent company.
The team is closely monitoring the portfolio and has increased the frequency of communication with company management teams. As we did in 2008, we are focusing on the financial health and capital structure of portfolio companies and closely monitoring developments in M&A activity, credit markets, and the potential impact of COVID-19 on the business ecosystems of each of our portfolio companies.
There have been a number of attractive companies in our investment universe which have been sold off due to COVID-19 fears, many of which have little economic exposure to the effects of the pandemic. We believe this represents an opportunity to selectively to add to positions that have been sold off. Conversely, we are also reducing exposures where warranted.
This pandemic is unprecedented due to the global scale and negative economic impact. Both the duration and severity are unknown. There is some possibility that the outlook and financial performance of our portfolio will need to be recalibrated.
What has not changed is our focus on fundamental valuations and the effectiveness of capital allocation programs, operational improvement initiatives, and shareholder value-creation within our portfolio companies.
H1 2020 Portfolio Review
In January 2020, we started our 13th year of managing the Fund.
Although we are not particularly superstitious and don’t believe the number 13 represents bad luck, the events of this past several months may be enough for us to re-examine this mindset, as both global equity and fixed income markets collapsed in the wake of the COVID-19 pandemic, the Saudi Arabia-Russia oil price war, and a literal shut down of the global economy.
We expect that much of the damage from this period will bleed over into the rest of the year as it will take some time to fully understand the impact to almost every sector of the global economy.
For the six-month period ending April 30, 2020, the Fund’s Investor shares (LPEFX) returned -16.06% compared with -7.90% and -18.92% for the Morningstar Developed Markets Index (the Fund’s primary benchmark) and the Global Listed Private Equity Index, respectively.
| 84 | | April 30, 2020 |
ALPS | Red Rocks Global Opportunity Fund
| Management Commentary | April 30, 2020 (Unaudited) |
We exited four names, added nine, and ended the period with 44 holdings.
Net Contributors to performance included:
| · | Danaher Corp | |
| · | Liberty Broadband-C | |
| · | HBM Healthcare IVST-A |
Net detractors from performance included:
| · | 3I Group PLC | |
| · | AURELIUS Equity Opportunities SE & Co. KGaA | |
| · | FS KKR Capital Corp |
Over the past several periods, we have frequently mentioned our efforts to prepare for the end of this long bull market. While we could not have foreseen a worldwide pandemic, we saw many reasons to consider caution - including high valuations, the yield curve inversion, slowing growth, and the emergence of zero (and even negative) interest rates.
Due to these preparations, our portfolio was positioned in largely cash rich, broadly diversified firms. Unfortunately, we invest in stocks that get lumped in the levered financials bucket, and in drawdowns we see the baby often gets thrown out with the bathwater. This does not reflect the fundamental soundness of our holdings, nor the resilience they have to battle any economic conditions. Historically, our stocks have tended to rebound quickly as cooler minds prevail and the underlying value becomes recognized.
Outlook
We remind our shareholders that we are patient investors with a time horizon measured in years, not months or quarters. Our research and investment process, honed over the past decade, focuses on economic fundamentals of the companies in the portfolio, and it takes time for business transformations to be completed and an investment thesis to become fully realized.
We have managed through several periods of dislocation over the past decade. If history is a guide, there will be attractive opportunities to invest at significant discounts, reaping the benefits of unconstrained capital allocation and significant cash reserves at companies in the portfolio. Through the last bear market, our portfolio holdings were able to deploy capital effectively and exit a stronger entity. Although we do not plan material changes to the portfolio, some adjustments are likely as more vulnerable positions are trimmed to enable flexibility and opportunistic purchases.
While we are beginning to see government-funded relief for struggling economies, the full scope of the damage is not yet fully understood. With unemployment reaching all-time highs, consumer confidence plummeting, oil prices hovering just over $20, and a global recession looming, it is possible that we will experience a deflationary cycle in which higher risk companies struggle to obtain financing as weak demand for their products diminish revenue and margins. In such a scenario, we expect defaults and unexpected market gyrations.
Our portfolio is positioned well to thrive in this scenario, as our managers will have the cash, options, and experience to keep their investments funded and/or take on new investments as other companies struggle. While we do not know what the future will bring, we continue to leverage our investment process to invest in high quality, flexible, cash rich companies with strong track records and prospects.
We would like to thank every one of our investors who have held in there with us. Please stay safe and well!
| Andrew Drummond | Kirk McCown |
| Portfolio Manager | Portfolio Manager |
The views of the authors and information discussed in this commentary are as of the date of publication, are subject to change, and may not reflect the writer's current views. The views expressed are those of the authors only, and represent an assessment of market conditions at a specific point in time, are opinions only and should not be relied upon as investment advice regarding a particular investment or markets in general. Such information does not constitute a recommendation to buy or sell specific securities or investment vehicles. It should not be assumed that any investment will be profitable or will equal the performance of the fund(s) or any securities or any sectors mentioned in this letter. The subject matter contained in this letter has been derived from several sources believed to be reliable and accurate at the time of compilation. Neither ALPS, Advisors, Inc., Red Rocks Capital, LLC, nor the Fund accepts any liability for losses either direct or consequential caused by the use of this information.
Diversification cannot guarantee gain or prevent losses.
Past performance is no guarantee of future results. Dividends are not guaranteed and are subject to change or elimination. Investments in international and emerging markets securities include exposure to risks such as currency fluctuations, foreign taxes and regulations, and the potential for illiquid markets and political instability.
ALPS Portfolio Solutions Distributor, Inc., ALPS Distributors, Inc. and ALPS Advisors Inc. are affiliated.
| 85 | | April 30, 2020 |
ALPS | Red Rocks Global Opportunity Fund
| Performance Update | April 30, 2020 (Unaudited) |
Performance of $10,000 Initial Investment (as of April 30, 2020)
Comparison of change in value of a $10,000 investment

The chart above represents historical performance of a hypothetical investment of $10,000 in the Fund. Past performance does not guarantee future results. This chart does not reflect the deduction of taxes that a shareholder would pay on Fund distributions or the redemption of Fund shares.
Average Annual Total Returns (as of April 30, 2020)
| 6 Month | 1 Year | 3 Year | 5 Year | 10 Year | Total Expense Ratio | What You Pay* | |
| Investor# (NAV) | -16.06% | -9.40% | 2.29% | 3.70% | 8.11% | 2.31% | 2.31% |
| Class A (NAV) | -16.01% | -9.43% | 2.28% | 3.69% | 8.10% | 2.30% | 2.30% |
| Class A (MOP) | -20.67% | -14.37% | 0.36% | 2.52% | 7.49% | ||
| Class C (NAV) | -16.37% | -10.09% | 1.53% | 2.95% | 7.28% | 2.95% | 2.95% |
| Class C (CDSC) | -17.09% | -10.86% | 1.53% | 2.95% | 7.28% | ||
| Class I | -16.00% | -9.20% | 2.54% | 3.96% | 8.39% | 1.98% | 1.98% |
| Class R | -16.28% | -9.75% | 2.07% | 3.47% | 7.92% | 2.40% | 2.40% |
| Morningstar Developed Markets Index1 | -7.90% | -4.57% | 4.99% | 5.23% | 8.29% | ||
| MSCI World Index2 | -7.03% | -3.46% | 5.58% | 5.52% | 8.29% | ||
| Red Rocks Global Listed Private Equity Index3 | -18.92% | -15.47% | -0.56% | 2.16% | 7.38% |
Performance data quoted represents past performance. Past performance does not guarantee future results. Investment return and principal value of an investment will fluctuate so that an investor’s shares, when sold or redeemed, may be worth more or less than the original cost. Current performance data may be higher or lower than actual data quoted. For the most current month-end performance data, please call 1-866-759-5679.
Maximum Offering Price (MOP) for Class A shares includes the Fund’s maximum sales charge of 5.50%. Performance shown at NAV does not include these sales charges and would have been lower had it been taken into account. If you invest $1 million or more, either as a lump sum or through the Fund’s accumulation or letter of intent programs, you can purchase Class A shares without an initial sales charge (load). A Contingent Deferred Sales Charge (“CDSC”) of 1.00% may apply to Class C shares redeemed within the first 12 months after a purchase, and on Class A shares redeemed within the first 18 months after a purchase in excess of $1 million. The Fund imposes a 2.00% redemption fee on shares held for less than 90 days.
Performance less than 1 year is cumulative.
| 86 | | April 30, 2020 |
ALPS | Red Rocks Global Opportunity Fund
| Performance Update | April 30, 2020 (Unaudited) |
Performance shown for Class A shares prior to June 12, 2018 reflects the historical performance of the Fund’s Investor shares, calculated using the fees and expenses of Class A shares.
Performance shown for Class C shares prior to June 30, 2010 reflects the historical performance of the Fund’s Investor shares, calculated using the fees and expenses of Class C shares.
Fund Inception date of December 31, 2007 for Investor Class, Class I, and Class R; Fund Inception date June 30, 2010 for Class C; Fund Inception date June 12, 2018 for Class A.
| 1 | The Morningstar Developed Markets Index replaced the MSCI World Index as the Fund’s primary index effective December 18, 2019. The Morningstar Developed Market Index measures the performance of developed regional markets targeting the top 97% of stocks by market capitalization. The Adviser and Sub-Adviser made this recommendation to the Board because the new index closely aligns to the Fund’s investment strategies and investment restrictions. The index is not actively managed and does not reflect any deduction for fees, expenses or taxes. An investor may not invest directly in an index. |
| 2 | MSCI World Index: Morgan Stanley Capital International’s market capitalization weighted index is composed of companies representative of the market structure of 22 developed market countries in North America, Europe and the Asia/Pacific Region. The index is not actively managed and does not reflect any deduction for fees, expenses or taxes. An investor may not invest directly in an index. |
| 3 | The Red Rocks Global Listed Private Equity Index includes securities, ADRs and GDRs of 40 to 75 private equity companies, including business development companies, master limited partnerships and other vehicles whose principal business is to invest in, lend capital to or provide services to privately held companies. The Red Rocks Global Listed Private Equity Index is managed by the Fund’s Sub-Advisor. An investor may not invest directly in an index. |
| * | What You Pay reflects the Advisor's and Sub-Advisor’s decision to contractually limit expenses through February 28, 2021, and Acquired Fund Fees and Expenses of 0.79%. Please see the current prospectus dated February 28, 2020 for additional information. |
| # | Prior to December 1, 2017, Investor Class was known as Class A. |
Prior to March 31, 2020, the ALPS | Red Rocks Global Opportunity Fund was known as the ALPS | Red Rocks Listed Private Equity Fund.
The table does not reflect the deduction of taxes that a shareholder would pay on Fund distributions or the redemption of Fund shares.
This Fund is not suitable for all investors and is subject to investment risks, including possible loss of the principal amount invested.
Listed Private Equity Companies are subject to various risks depending on their underlying investments, which could include, but are not limited to, additional liquidity risk, industry risk, non-U.S. security risk, currency risk, credit risk, managed portfolio risk and derivatives risk (derivatives risk is the risk that the value of the Listed Private Equity Companies’ derivative investments will fall because of pricing difficulties or lack of correlation with the underlying investment).
There are inherent risks in investing in private equity companies, which encompass financial institutions or vehicles whose principal business is to invest in and lend capital to privately held companies. Generally, little public information exists for private and thinly traded companies, and there is a risk that investors may not be able to make a fully informed investment decision.
Listed Private Equity Companies may have relatively concentrated investment portfolios, consisting of a relatively small number of holdings. A consequence of this limited number of investments is that the aggregate returns realized may be adversely impacted by the poor performance of a small number of investments, or even a single investment, particularly if a company experiences the need to write down the value of an investment.
Certain of the Fund’s investments may be exposed to liquidity risk due to low trading volume, lack of a market maker or legal restrictions limiting the ability of the Fund to sell particular securities at an advantageous price and/or time. As a result, these securities may be more difficult to value. Foreign investing involves special risks, such as currency fluctuations and political uncertainty. The Fund invests in derivatives and is subject to the risk that the value of those derivative investments will fall because of pricing difficulties or lack of correlation with the underlying investment.
There is no guarantee that the Fund will continue to hold any one particular security or stay invested in any one particular company. The composition of the Fund's top holdings is subject to change. Performance figures are historical and reflect the change in share price, reinvested distributions, changes in net asset value, sales charges and capital gains distributions, if any.
Not FDIC Insured – No Bank Guarantee – May Lose Value
| 87 | | April 30, 2020 |
ALPS | Red Rocks Global Opportunity Fund
| Performance Update | April 30, 2020 (Unaudited) |
Top Ten Holdings (as a % of Net Assets) †
| HarbourVest Global Private Equity, Ltd. | 6.13% |
| IAC/interactivecorp | 5.56% |
| Pantheon International PLC Fund | 5.43% |
| Liberty Broadband Corp. | 4.32% |
| Berkshire Hathaway, Inc. | 4.23% |
| Brookfield Asset Management, Inc. | 4.22% |
| Blackstone Group, Inc. | 4.21% |
| KKR & Co. LP | 3.85% |
| HBM Healthcare Investments AG | 3.75% |
| Brederode SA | 3.04% |
| Top Ten Holdings | 44.74% |
| † | Holdings are subject to change and my not reflect the current or future position of the portfolio. Table presents indicative values only. |
Industry Sector Allocation (as a % of Net Assets)
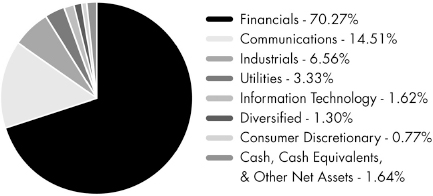
| 88 | | April 30, 2020 |
ALPS | Red Rocks Global Opportunity Fund
| Statement of Investments | April 30, 2020 (Unaudited) |
| Shares | Value (Note 2) | |||||||
| CLOSED-END FUNDS (24.16%) | ||||||||
| HarbourVest Global Private Equity, Ltd.(a) | 398,000 | $ | 7,241,058 | |||||
| HBM Healthcare Investments AG, Class A | 19,700 | 4,432,784 | ||||||
| HgCapital Trust PLC | 1,152,000 | 3,257,254 | ||||||
| ICG Enterprise Trust PLC | 212,000 | 1,956,925 | ||||||
| NB Private Equity Partners, Ltd. | 252,096 | 2,823,990 | ||||||
| Pantheon International PLC Fund(a) | 256,000 | 6,409,950 | ||||||
| Princess Private Equity Holding, Ltd. | 238,500 | 2,429,722 | ||||||
| TOTAL CLOSED-END FUNDS | ||||||||
| (Cost $26,676,350) | 28,551,683 | |||||||
| COMMON STOCKS (73.96%) | ||||||||
| Communications (14.51%) | ||||||||
| Media (14.51%) | ||||||||
| GCI Liberty, Inc., Class A(a) | 11,600 | 705,628 | ||||||
| IAC/interactivecorp(a) | 29,400 | 6,570,312 | ||||||
| Liberty Broadband Corp., Class C(a) | 41,600 | 5,103,488 | ||||||
| Liberty Media Corp.-Liberty SiriusXM, Class A(a) | 77,000 | 2,595,670 | ||||||
| Naspers, Ltd., Class N | 13,900 | 2,163,515 | ||||||
| 17,138,613 | ||||||||
| TOTAL COMMUNICATIONS | 17,138,613 | |||||||
| Consumer Discretionary (0.77%) | ||||||||
| Internet (0.77%) | ||||||||
| Rocket Internet SE(a)(b)(c) | 43,500 | 915,051 | ||||||
| TOTAL CONSUMER DISCRETIONARY | 915,051 | |||||||
| Diversified (1.30%) | ||||||||
| Holding Companies-Diversified Operations (1.30%) | ||||||||
| Schouw & Co. A/S | 21,500 | 1,542,051 | ||||||
| TOTAL DIVERSIFIED | 1,542,051 | |||||||
| Financials (45.87%) | ||||||||
| Diversified Financial Services (25.00%) | ||||||||
| Apollo Global Management, Inc. | 48,000 | 1,943,520 | ||||||
| Berkshire Hathaway, Inc., Class B(a) | 26,700 | 5,002,512 | ||||||
| Blackstone Group, Inc., Class A | 95,300 | 4,978,472 | ||||||
| Cannae Holdings, Inc.(a) | 86,000 | 2,713,300 | ||||||
| Carlyle Group, Inc. | 82,000 | 1,922,080 | ||||||
| EXOR N.V. | 28,900 | 1,576,054 | ||||||
| Intermediate Capital Group PLC | 185,000 | 2,617,144 | ||||||
| KKR & Co., Inc., Class A | 180,300 | 4,545,363 | ||||||
| Pargesa Holding SA | 13,000 | 924,775 | ||||||
| Partners Group Holding AG | 4,200 | 3,309,770 | ||||||
| 29,532,990 | ||||||||
| Shares | Value (Note 2) | |||||||
| Investment Companies (10.13%) | ||||||||
| 3i Group PLC | 268,000 | $ | 2,632,782 | |||||
| Ares Capital Corp. | 207,000 | 2,657,880 | ||||||
| Eurazeo SE | 12,100 | 579,510 | ||||||
| FS KKR Capital Corp. | 666,000 | 2,291,040 | ||||||
| Investor AB, B Shares | 57,500 | 2,857,647 | ||||||
| New Mountain Finance Corp. | 124,000 | 948,600 | ||||||
| 11,967,459 | ||||||||
| Private Equity (6.52%) | ||||||||
| Altamir | 29,600 | 494,085 | ||||||
| Brederode SA | 45,026 | 3,595,406 | ||||||
| Clairvest Group, Inc. | 12,700 | 417,418 | ||||||
| Standard Life Private Equity Trust PLC | 864,000 | 3,202,721 | ||||||
| 7,709,630 | ||||||||
| Real Estate (4.22%) | ||||||||
| Brookfield Asset Management, Inc., Class A | 147,299 | 4,981,652 | ||||||
| TOTAL FINANCIALS | 54,191,731 | |||||||
| Industrials (6.56%) | ||||||||
| Commercial Services (1.36%) | ||||||||
| Brookfield Business Partners LP | 51,100 | 1,603,173 | ||||||
| Electrical Equipment (0.86%) | ||||||||
| Melrose Industries PLC | 808,000 | 1,009,917 | ||||||
| Electronics (0.77%) | ||||||||
| Fortive Corp. | 14,300 | 915,200 | ||||||
| Miscellaneous Manufacturers (3.57%) | ||||||||
| Colfax Corp.(a) | 68,500 | 1,766,615 | ||||||
| Danaher Corp. | 15,000 | 2,451,900 | ||||||
| 4,218,515 | ||||||||
| TOTAL INDUSTRIALS | 7,746,805 | |||||||
| Information Technology (1.62%) | ||||||||
| IT Services (1.62%) | ||||||||
| Leidos Holdings, Inc. | 19,400 | 1,916,914 | ||||||
| TOTAL INFORMATION TECHNOLOGY | 1,916,914 | |||||||
| Utilities (3.33%) | ||||||||
| Electric (2.95%) | ||||||||
| Brookfield Infrastructure Partners LP | 88,800 | 3,480,072 | ||||||
| 89 | | April 30, 2020 |
ALPS | Red Rocks Global Opportunity Fund
| Statement of Investments | April 30, 2020 (Unaudited) |
| Shares | Value (Note 2) | |||||||
| Investment Companies (0.38%) | ||||||||
| Brookfield Infrastructure Corp.(a) | 10,788 | $ | 451,586 | |||||
| TOTAL UTILITIES | 3,931,658 | |||||||
| TOTAL COMMON STOCKS | ||||||||
| (Cost $86,477,568) | 87,382,823 | |||||||
| PREFERRED STOCK (0.24%) | ||||||||
| Financials (0.24%) | ||||||||
| Investment Companies (0.24%) | ||||||||
| Compass Diversified Holdings(d) | 12,500 | 290,000 | ||||||
| TOTAL FINANCIALS | 290,000 | |||||||
| TOTAL PREFERRED STOCK | ||||||||
| (Cost $201,897) | 290,000 | |||||||
| 7-Day Yield | Shares | Value (Note 2) | ||||||||||
| SHORT-TERM INVESTMENTS (2.11%) | ||||||||||||
| Money Market Fund (2.11%) | ||||||||||||
| State Street Institutional Treasury Plus Money Market Fund | 0.276 | % | 2,488,151 | 2,488,151 | ||||||||
| TOTAL MONEY MARKET FUND | 2,488,151 | |||||||||||
| TOTAL SHORT-TERM INVESTMENTS | ||||||||||||
| (Cost $2,488,151) | 2,488,151 | |||||||||||
| TOTAL INVESTMENTS (100.47%) | ||||||||||||
| (Cost $115,843,966) | $ | 118,712,657 | ||||||||||
| Liabilities In Excess Of Other Assets (-0.47%) | (558,891 | ) | ||||||||||
| NET ASSETS (100.00%) | $ | 118,153,766 | ||||||||||
| (a) | Non-Income Producing Security |
| (b) | Security exempt from registration under Rule 144A of the Securities Act of 1933. This security may be resold in transactions exempt from registration, normally to qualified institutional buyers. As of April 30, 2020, the aggregate market value of those securities was $915,051, representing 0.77% of net assets |
| (c) | Securities were purchased pursuant to Regulation S under the Securities Act of 1933, which exempts securities offered and sold outside of the United States from registration. Such securities cannot be sold in the United States without either an effective registration statement filed pursuant to the Securities Act of 1933, or pursuant to an exemption from registration. These securities have been deemed liquid under guidelines approved by the Fund's Board of Trustees. As of April 30, 2020 the aggregate market value of those securities was $915,051 representing 0.77% of net assets. |
| (d) | Perpetual maturity. This security has no contractual maturity date, is not redeemable and contractually pays an indefinite stream of interest. |
For Fund compliance purposes, the Fund's industry classifications refer to any one or more of the industry sub-classifications used by one or more widely recognized market indexes or ratings group indexes, and/or as defined by Fund management. This definition may not apply for purposes of this report, which may combine industry sub-classifications for reporting ease. Industries are shown as a percent of net assets.
See Notes to Financial Statements.
| 90 | | April 30, 2020 |
ALPS | Red Rocks Global Opportunity Fund
| Statement of Assets and Liabilities | April 30, 2020 (Unaudited) |
| ASSETS | ||||
| Investments, at value | $ | 118,712,657 | ||
| Receivable for investments sold | 1,196,719 | |||
| Receivable for shares sold | 130,142 | |||
| Dividends receivable | 561,473 | |||
| Prepaid expenses and other assets | 28,756 | |||
| Total Assets | 120,629,747 | |||
| LIABILITIES | ||||
| Payable for investments purchased | 3,274 | |||
| Payable for shares redeemed | 2,260,709 | |||
| Investment advisory fees payable | 82,962 | |||
| Administration and transfer agency fees payable | 56,737 | |||
| Distribution and services fees payable | 21,724 | |||
| Trustees' fees and expenses payable | 17 | |||
| Professional fees payable | 23,782 | |||
| Custody fees payable | 12,708 | |||
| Accrued expenses and other liabilities | 14,068 | |||
| Total Liabilities | 2,475,981 | |||
| NET ASSETS | $ | 118,153,766 | ||
| NET ASSETS CONSIST OF | ||||
| Paid-in capital | $ | 126,179,858 | ||
| Total distributable earnings | (8,026,092 | ) | ||
| NET ASSETS | $ | 118,153,766 | ||
| INVESTMENTS, AT COST | $ | 115,843,966 | ||
| PRICING OF SHARES | ||||
| Investor Class: | ||||
| Net Asset Value, offering and redemption price per share | $ | 5.61 | ||
| Net Assets | $ | 17,747,514 | ||
| Shares of beneficial interest outstanding (unlimited number of shares, no par value common stock authorized) | 3,163,521 | |||
| Class A: | ||||
| Net Asset Value, offering and redemption price per share | $ | 5.58 | ||
| Net Assets | $ | 1,117,969 | ||
| Shares of beneficial interest outstanding (unlimited number of shares, no par value common stock authorized) | 200,426 | |||
| Maximum offering price per share ((NAV/0.9450), based on maximum sales charge of 5.50% of the offering price) | $ | 5.90 | ||
| Class C: | ||||
| Net Asset Value, offering and redemption price per share(a) | $ | 5.21 | ||
| Net Assets | $ | 11,380,680 | ||
| Shares of beneficial interest outstanding (unlimited number of shares, no par value common stock authorized) | 2,185,943 | |||
| Class I: | ||||
| Net Asset Value, offering and redemption price per share | $ | 5.72 | ||
| Net Assets | $ | 83,023,865 | ||
| Shares of beneficial interest outstanding (unlimited number of shares, no par value common stock authorized) | 14,523,341 | |||
| Class R: | ||||
| Net Asset Value, offering and redemption price per share | $ | 4.54 | ||
| Net Assets | $ | 4,883,738 | ||
| Shares of beneficial interest outstanding (unlimited number of shares, no par value common stock authorized) | 1,075,252 | |||
| (a) | Redemption price per share may be reduced for any applicable contingent deferred sales charge. For a description of a possible sales charge, please see the Fund's Prospectus. |
See Notes to Financial Statements.
| 91 | | April 30, 2020 |
ALPS | Red Rocks Global Opportunity Fund
| Statement of Operations | For the Six Months Ended April 30, 2020 (Unaudited) |
| INVESTMENT INCOME | ||||
| Dividends | $ | 2,048,503 | ||
| Foreign taxes withheld on dividends | (18,125 | ) | ||
| Total Investment Income | 2,030,378 | |||
| EXPENSES | ||||
| Investment advisory fees | 720,262 | |||
| Administrative fees | 77,139 | |||
| Transfer agency fees | 104,232 | |||
| Distribution and service fees | ||||
| Investor Class | 36,862 | |||
| Class A | 1,489 | |||
| Class C | 73,855 | |||
| Class R | 14,050 | |||
| Professional fees | 17,214 | |||
| Reports to shareholders and printing fees | 14,123 | |||
| State registration fees | 34,553 | |||
| Insurance fees | 1,474 | |||
| Custody fees | 20,081 | |||
| Trustees' fees and expenses | 4,960 | |||
| Miscellaneous expenses | 7,209 | |||
| Total Expenses | 1,127,503 | |||
| Net Investment Income | 902,875 | |||
| Net realized gain on investments | 3,467,850 | |||
| Net realized loss on foreign currency transactions | (22,888 | ) | ||
| Net Realized Gain | 3,444,962 | |||
| Net change in unrealized depreciation on investments | (30,486,325 | ) | ||
| Net change in unrealized depreciation on translation of assets and liabilities denominated in foreign currencies | (369 | ) | ||
| Net Change in Unrealized Depreciation | (30,486,694 | ) | ||
| NET REALIZED AND UNREALIZED LOSS ON INVESTMENTS | (27,041,732 | ) | ||
| NET DECREASE IN NET ASSETS RESULTING FROM OPERATIONS | $ | (26,138,857 | ) | |
See Notes to Financial Statements.
| 92 | | April 30, 2020 |
ALPS | Red Rocks Global Opportunity Fund
Statements of Changes in Net Assets
| For the Six Months Ended April 30, 2020 (Unaudited)(a) | For the Year Ended October 31, 2019 | |||||||
| OPERATIONS | ||||||||
| Net investment income | $ | 902,875 | $ | 3,375,093 | ||||
| Net realized gain | 3,444,962 | 16,601,165 | ||||||
| Net change in unrealized appreciation/(depreciation) | (30,486,694 | ) | 11,422,494 | |||||
| Net Increase/(Decrease) in Net Assets Resulting from Operations | (26,138,857 | ) | 31,398,752 | |||||
| TOTAL DISTRIBUTIONS | ||||||||
| From distributable earnings | ||||||||
| Investor Class | (3,586,004 | ) | (1,366,268 | ) | ||||
| Class A | (115,589 | ) | (1,424 | ) | ||||
| Class C | (2,358,134 | ) | (682,401 | ) | ||||
| Class I | (19,020,392 | ) | (7,051,747 | ) | ||||
| Class R | (961,289 | ) | (235,847 | ) | ||||
| Net Decrease in Net Assets from Distributions | (26,041,408 | ) | (9,337,687 | ) | ||||
| BENEFICIAL INTEREST TRANSACTIONS (NOTE 6) | ||||||||
| Shares sold | ||||||||
| Investor Class | 4,690,408 | 6,040,727 | ||||||
| Class A | 779,687 | 1,245,481 | ||||||
| Class C | 530,523 | 797,221 | ||||||
| Class I | 20,263,389 | 45,545,121 | ||||||
| Class R | 539,904 | 1,188,158 | ||||||
| Dividends reinvested | ||||||||
| Investor Class | 2,760,858 | 1,088,789 | ||||||
| Class A | 79,919 | 1,283 | ||||||
| Class C | 1,803,296 | 523,242 | ||||||
| Class I | 15,657,972 | 5,458,126 | ||||||
| Class R | 959,137 | 235,270 | ||||||
| Shares redeemed, net of redemption fees | ||||||||
| Investor Class | (7,082,353 | ) | (21,243,636 | ) | ||||
| Class A | (177,826 | ) | (572,568 | ) | ||||
| Class C | (2,350,700 | ) | (5,843,300 | ) | ||||
| Class I | (56,782,778 | ) | (99,688,970 | ) | ||||
| Class R | (512,905 | ) | (1,010,240 | ) | ||||
| Net Decrease in Net Assets Derived from Beneficial Interest Transactions | (18,841,469 | ) | (66,235,296 | ) | ||||
| Net decrease in net assets | (71,021,734 | ) | (44,174,231 | ) | ||||
| NET ASSETS | ||||||||
| Beginning of period | 189,175,500 | 233,349,731 | ||||||
| End of period | $ | 118,153,766 | $ | 189,175,500 | �� | |||
| (a) | Prior to March 31, 2020, the ALPS/Red Rocks Global Opportunity Fund was known as the ALPS/Red Rocks Listed Private Equity Fund. |
See Notes to Financial Statements.
| 93 | | April 30, 2020 |
ALPS | Red Rocks Global Opportunity Fund – Investor Class
Financial Highlights
Selected data for a share of beneficial interest outstanding throughout the periods indicated:
| For the Six Months Ended April 30, 2020 (Unaudited)(a) | For the Year Ended October 31, 2019 | For the Year Ended October 31, 2018(b) | For the Year Ended October 31, 2017 | For the Year Ended October 31, 2016 | For the Year Ended October 31, 2015 | |||||||||||||||||||
| Net asset value, beginning of period | $ | 7.71 | $ | 6.79 | $ | 8.05 | $ | 6.29 | $ | 6.76 | $ | 6.61 | ||||||||||||
| INCOME/(LOSS) FROM INVESTMENT OPERATIONS: | ||||||||||||||||||||||||
| Net investment income(c) | 0.03 | 0.12 | 0.06 | 0.12 | 0.06 | 0.05 | ||||||||||||||||||
| Net realized and unrealized gain/(loss) | (1.06 | ) | 1.09 | (0.37 | ) | 1.74 | (0.04 | ) | 0.34 | |||||||||||||||
| Total from investment operations | (1.03 | ) | 1.21 | (0.31 | ) | 1.86 | 0.02 | 0.39 | ||||||||||||||||
| DISTRIBUTIONS: | ||||||||||||||||||||||||
| From net investment income | (0.62 | ) | (0.06 | ) | (0.70 | ) | (0.10 | ) | (0.22 | ) | (0.22 | ) | ||||||||||||
| From net realized gains | (0.45 | ) | (0.23 | ) | (0.25 | ) | – | (0.27 | ) | (0.02 | ) | |||||||||||||
| Total distributions | (1.07 | ) | (0.28 | ) | (0.95 | ) | (0.10 | ) | (0.49 | ) | (0.24 | ) | ||||||||||||
| REDEMPTION FEES ADDED TO PAID-IN CAPITAL (NOTE 6) | 0.00 | (d) | 0.00 | (d) | 0.00 | (d) | 0.00 | (d) | 0.00 | (d) | 0.00 | (d) | ||||||||||||
| Net increase/(decrease) in net asset value | (2.10 | ) | 0.92 | (1.26 | ) | 1.76 | (0.47 | ) | 0.15 | |||||||||||||||
| Net asset value, end of period | $ | 5.61 | $ | 7.71 | $ | 6.79 | $ | 8.05 | $ | 6.29 | $ | 6.76 | ||||||||||||
| TOTAL RETURN(e) | (16.06 | )% | 18.77 | % | (4.23 | )% | 29.97 | % | 0.76 | % | 6.01 | % | ||||||||||||
| RATIOS/SUPPLEMENTAL DATA: | ||||||||||||||||||||||||
| Net assets, end of period (000s) | $ | 17,748 | $ | 25,061 | $ | 35,775 | $ | 55,538 | $ | 128,920 | $ | 193,561 | ||||||||||||
| Ratio of expenses to average net assets excluding fee waivers and reimbursements(f) | 1.43 | %(g) | 1.44 | % | 1.40 | % | 1.38 | % | 1.47 | % | 1.47 | % | ||||||||||||
| Ratio of expenses to average net assets including fee waivers and reimbursements(f) | 1.43 | %(g) | 1.44 | % | 1.40 | % | 1.38 | % | 1.47 | % | 1.47 | % | ||||||||||||
| Ratio of net investment income to average net assets(f) | 0.98 | %(g) | 1.71 | % | 0.86 | % | 1.63 | % | 1.07 | % | 0.72 | % | ||||||||||||
| Portfolio turnover rate(h) | 14 | % | 28 | % | 29 | % | 31 | % | 30 | % | 37 | % | ||||||||||||
| (a) | Prior to March 31, 2020, the ALPS/Red Rocks Global Opportunity Fund was known as the ALPS/Red Rocks Listed Private Equity Fund. |
| (b) | Prior to December 1, 2017, Investor Class was known as Class A. |
| (c) | Calculated using the average shares method. |
| (d) | Less than $0.005 or ($0.005) per share. |
| (e) | Total returns are for the period indicated and have not been annualized. Total returns would have been lower had certain expenses not been waived during the period. Returns shown do not reflect the deduction of taxes that a shareholder would pay on Fund distributions or the redemption of Fund shares. Returns shown exclude any applicable sales charges. |
| (f) | The ratios exclude the impact of expenses of the underlying funds in which the Fund invests as represented in the Statement of Investments. |
| (g) | Annualized. |
| (h) | Portfolio turnover rate for periods less than one full year have not been annualized. |
See Notes to Financial Statements.
| 94 | | April 30, 2020 |
ALPS | Red Rocks Global Opportunity Fund – Class A
Financial Highlights
Selected data for a share of beneficial interest outstanding throughout the periods indicated:
| For the Six Months Ended April 30, 2020 (Unaudited)(a) | For the Year Ended October 31, 2019 | For the Period June 12, 2018 (Commencement of Operations) to October 31, 2018 | ||||||||||
| Net asset value, beginning of period | $ | 7.67 | $ | 6.79 | $ | 7.23 | ||||||
| INCOME FROM INVESTMENT OPERATIONS: | ||||||||||||
| Net investment income(b) | 0.03 | 0.20 | 0.01 | |||||||||
| Net realized and unrealized gain/(loss) | (1.05 | ) | 0.99 | (0.45 | ) | |||||||
| Total from investment operations | (1.02 | ) | 1.19 | (0.44 | ) | |||||||
| DISTRIBUTIONS: | ||||||||||||
| From net investment income | (0.62 | ) | (0.08 | ) | – | |||||||
| From net realized gains | (0.45 | ) | (0.23 | ) | – | |||||||
| Total distributions | (1.07 | ) | (0.31 | ) | – | |||||||
| REDEMPTION FEES ADDED TO PAID-IN CAPITAL (NOTE 6) | 0.00 | (c) | – | – | ||||||||
| Net increase/(decrease) in net asset value | (2.09 | ) | 0.88 | (0.44 | ) | |||||||
| Net asset value, end of period | $ | 5.58 | $ | 7.67 | $ | 6.79 | ||||||
| TOTAL RETURN(d) | (16.01 | )% | 18.64 | % | (6.09 | )% | ||||||
| RATIOS/SUPPLEMENTAL DATA: | ||||||||||||
| Net assets, end of period (000s) | $ | 1,118 | $ | 790 | $ | 9 | ||||||
| Ratio of expenses to average net assets excluding fee waivers and reimbursements(e) | 1.41 | %(f) | 1.48 | % | 1.48 | %(f) | ||||||
| Ratio of expenses to average net assets including fee waivers and reimbursements(e) | 1.41 | %(f) | 1.48 | % | 1.48 | %(f) | ||||||
| Ratio of net investment income to average net assets(e) | 0.87 | %(f) | 2.74 | % | 0.37 | %(f) | ||||||
| Portfolio turnover rate(g) | 14 | % | 28 | % | 29 | % | ||||||
| (a) | Prior to March 31, 2020, the ALPS/Red Rocks Global Opportunity Fund was known as the ALPS/Red Rocks Listed Private Equity Fund. |
| (b) | Calculated using the average shares method. |
| (c) | Less than $0.005 or ($0.005) per share. |
| (d) | Total returns are for the period indicated and have not been annualized. Total returns would have been lower had certain expenses not been waived during the period. Returns shown do not reflect the deduction of taxes that a shareholder would pay on Fund distributions or the redemption of Fund shares. |
| (e) | The ratios exclude the impact of expenses of the underlying funds in which the Fund invests as represented in the Statement of Investments. |
| (f) | Annualized. |
| (g) | Portfolio turnover rate for periods less than one full year have not been annualized. |
See Notes to Financial Statements.
| 95 | | April 30, 2020 |
ALPS | Red Rocks Global Opportunity Fund – Class C
Financial Highlights
Selected data for a share of beneficial interest outstanding throughout the periods indicated:
| For the Six Months Ended April 30, 2020 (Unaudited)(a) | For the Year Ended October 31, 2019 | For the Year Ended October 31, 2018 | For the Year Ended October 31, 2017 | For the Year Ended October 31, 2016 | For the Year Ended October 31, 2015 | |||||||||||||||||||
| Net asset value, beginning of period | $ | 7.25 | $ | 6.41 | $ | 7.66 | $ | 6.04 | $ | 6.53 | $ | 6.43 | ||||||||||||
| INCOME/(LOSS) FROM INVESTMENT OPERATIONS: | ||||||||||||||||||||||||
| Net investment income(b) | 0.01 | 0.06 | 0.01 | 0.06 | 0.03 | 0.00 | (c) | |||||||||||||||||
| Net realized and unrealized gain/(loss) | (0.99 | ) | 1.03 | (0.34 | ) | 1.65 | (0.03 | ) | 0.32 | |||||||||||||||
| Total from investment operations | (0.98 | ) | 1.09 | (0.33 | ) | 1.71 | – | 0.32 | ||||||||||||||||
| DISTRIBUTIONS: | ||||||||||||||||||||||||
| From net investment income | (0.61 | ) | (0.02 | ) | (0.67 | ) | (0.09 | ) | (0.22 | ) | (0.20 | ) | ||||||||||||
| From net realized gains | (0.45 | ) | (0.23 | ) | (0.25 | ) | – | (0.27 | ) | (0.02 | ) | |||||||||||||
| Total distributions | (1.06 | ) | (0.25 | ) | (0.92 | ) | (0.09 | ) | (0.49 | ) | (0.22 | ) | ||||||||||||
| REDEMPTION FEES ADDED TO PAID-IN CAPITAL (NOTE 6) | 0.00 | (c) | 0.00 | (c) | – | 0.00 | (c) | 0.00 | (c) | 0.00 | (c) | |||||||||||||
| Net increase/(decrease) in net asset value | (2.04 | ) | 0.84 | (1.25 | ) | 1.62 | (0.49 | ) | 0.10 | |||||||||||||||
| Net asset value, end of period | $ | 5.21 | $ | 7.25 | $ | 6.41 | $ | 7.66 | $ | 6.04 | $ | 6.53 | ||||||||||||
| TOTAL RETURN(d) | (16.37 | )% | 17.83 | % | (4.88 | )% | 28.79 | % | 0.34 | % | 5.14 | % | ||||||||||||
| RATIOS/SUPPLEMENTAL DATA: | ||||||||||||||||||||||||
| Net assets, end of period (000s) | $ | 11,381 | $ | 16,256 | $ | 18,847 | $ | 18,981 | $ | 14,784 | $ | 19,300 | ||||||||||||
| Ratio of expenses to average net assets excluding fee waivers and reimbursements(e) | 2.19 | %(f) | 2.16 | % | 2.12 | % | 2.13 | % | 2.16 | % | 2.12 | % | ||||||||||||
| Ratio of expenses to average net assets including fee waivers and reimbursements(e) | 2.19 | %(f) | 2.16 | % | 2.12 | % | 2.13 | % | 2.16 | % | 2.12 | % | ||||||||||||
| Ratio of net investment income to average net assets(e) | 0.24 | %(f) | 0.86 | % | 0.15 | % | 0.83 | % | 0.49 | % | 0.06 | % | ||||||||||||
| Portfolio turnover rate(g) | 14 | % | 28 | % | 29 | % | 31 | % | 30 | % | 37 | % | ||||||||||||
| (a) | Prior to March 31, 2020, the ALPS/Red Rocks Global Opportunity Fund was known as the ALPS/Red Rocks Listed Private Equity Fund. |
| (b) | Calculated using the average shares method. |
| (c) | Less than $0.005 or ($0.005) per share. |
| (d) | Total returns are for the period indicated and have not been annualized. Total returns would have been lower had certain expenses not been waived during the period. Returns shown do not reflect the deduction of taxes that a shareholder would pay on Fund distributions or the redemption of Fund shares. Returns shown exclude any applicable sales charges. |
| (e) | The ratios exclude the impact of expenses of the underlying funds in which the Fund invests as represented in the Statement of Investments. |
| (f) | Annualized. |
| (g) | Portfolio turnover rate for periods less than one full year have not been annualized. |
See Notes to Financial Statements.
| 96 | | April 30, 2020 |
ALPS | Red Rocks Global Opportunity Fund – Class I
Financial Highlights
Selected data for a share of beneficial interest outstanding throughout the periods indicated:
| For the Six Months Ended April 30, 2020 (Unaudited)(a) | For the Year Ended October 31, 2019 | For the Year Ended October 31, 2018 | For the Year Ended October 31, 2017 | For the Year Ended October 31, 2016 | For the Year Ended October 31, 2015 | |||||||||||||||||||
| Net asset value, beginning of period | $ | 7.84 | $ | 6.92 | $ | 8.18 | $ | 6.39 | $ | 6.83 | $ | 6.67 | ||||||||||||
| INCOME/(LOSS) FROM INVESTMENT OPERATIONS: | ||||||||||||||||||||||||
| Net investment income(b) | 0.04 | 0.13 | 0.09 | 0.13 | 0.09 | 0.07 | ||||||||||||||||||
| Net realized and unrealized gain/(loss) | (1.09 | ) | 1.10 | (0.37 | ) | 1.76 | (0.03 | ) | 0.34 | |||||||||||||||
| Total from investment operations | (1.05 | ) | 1.23 | (0.28 | ) | 1.89 | 0.06 | 0.41 | ||||||||||||||||
| DISTRIBUTIONS: | ||||||||||||||||||||||||
| From net investment income | (0.62 | ) | (0.08 | ) | (0.73 | ) | (0.10 | ) | (0.23 | ) | (0.23 | ) | ||||||||||||
| From net realized gains | (0.45 | ) | (0.23 | ) | (0.25 | ) | – | (0.27 | ) | (0.02 | ) | |||||||||||||
| Total distributions | (1.07 | ) | (0.31 | ) | (0.98 | ) | (0.10 | ) | (0.50 | ) | (0.25 | ) | ||||||||||||
| REDEMPTION FEES ADDED TO PAID-IN CAPITAL (NOTE 6) | 0.00 | (c) | 0.00 | (c) | 0.00 | (c) | 0.00 | (c) | 0.00 | (c) | 0.00 | (c) | ||||||||||||
| Net increase/(decrease) in net asset value | (2.12 | ) | 0.92 | (1.26 | ) | 1.79 | (0.44 | ) | 0.16 | |||||||||||||||
| Net asset value, end of period | $ | 5.72 | $ | 7.84 | $ | 6.92 | $ | 8.18 | $ | 6.39 | $ | 6.83 | ||||||||||||
| TOTAL RETURN(d) | (16.00 | )% | 18.98 | % | (3.87 | )% | 30.09 | % | 1.27 | % | 6.30 | % | ||||||||||||
| RATIOS/SUPPLEMENTAL DATA: | ||||||||||||||||||||||||
| Net assets, end of period (000s) | $ | 83,024 | $ | 141,286 | $ | 174,034 | $ | 138,572 | $ | 180,892 | $ | 287,741 | ||||||||||||
| Ratio of expenses to average net assets excluding fee waivers and reimbursements(e) | 1.20 | %(f) | 1.19 | % | 1.15 | % | 1.16 | % | 1.18 | % | 1.16 | % | ||||||||||||
| Ratio of expenses to average net assets including fee waivers and reimbursements(e) | 1.20 | %(f) | 1.19 | % | 1.15 | % | 1.16 | % | 1.18 | % | 1.16 | % | ||||||||||||
| Ratio of net investment income to average net assets(e) | 1.20 | %(f) | 1.80 | % | 1.15 | % | 1.85 | % | 1.48 | % | 1.02 | % | ||||||||||||
| Portfolio turnover rate(g) | 14 | % | 28 | % | 29 | % | 31 | % | 30 | % | 37 | % | ||||||||||||
| (a) | Prior to March 31, 2020, the ALPS/Red Rocks Global Opportunity Fund was known as the ALPS/Red Rocks Listed Private Equity Fund. |
| (b) | Calculated using the average shares method. |
| (c) | Less than $0.005 or ($0.005) per share. |
| (d) | Total returns are for the period indicated and have not been annualized. Total returns would have been lower had certain expenses not been waived during the period. Returns shown do not reflect the deduction of taxes that a shareholder would pay on Fund distributions or the redemption of Fund shares. |
| (e) | The ratios exclude the impact of expenses of the underlying funds in which the Fund invests as represented in the Statement of Investments. |
| (f) | Annualized. |
| (g) | Portfolio turnover rate for periods less than one full year have not been annualized. |
See Notes to Financial Statements.
| 97 | | April 30, 2020 |
ALPS | Red Rocks Global Opportunity Fund – Class R
Financial Highlights
Selected data for a share of beneficial interest outstanding throughout the periods indicated:
| For the Six Months Ended April 30, 2020 (Unaudited)(a) | For the Year Ended October 31, 2019 | For the Year Ended October 31, 2018 | For the Year Ended October 31, 2017 | For the Year Ended October 31, 2016 | For the Year Ended October 31, 2015 | |||||||||||||||||||
| Net asset value, beginning of period | $ | 6.45 | $ | 5.75 | $ | 6.97 | $ | 5.48 | $ | 5.96 | $ | 5.87 | ||||||||||||
| INCOME/(LOSS) FROM INVESTMENT OPERATIONS: | ||||||||||||||||||||||||
| Net investment income(b) | 0.02 | 0.09 | 0.04 | 0.09 | 0.06 | 0.03 | ||||||||||||||||||
| Net realized and unrealized gain/(loss) | (0.86 | ) | 0.90 | (0.30 | ) | 1.50 | (0.05 | ) | 0.31 | |||||||||||||||
| Total from investment operations | (0.84 | ) | 0.99 | (0.26 | ) | 1.59 | 0.01 | 0.34 | ||||||||||||||||
| DISTRIBUTIONS: | ||||||||||||||||||||||||
| From net investment income | (0.62 | ) | (0.06 | ) | (0.71 | ) | (0.10 | ) | (0.22 | ) | (0.23 | ) | ||||||||||||
| From net realized gains | (0.45 | ) | (0.23 | ) | (0.25 | ) | – | (0.27 | ) | (0.02 | ) | |||||||||||||
| Total distributions | (1.07 | ) | (0.29 | ) | (0.96 | ) | (0.10 | ) | (0.49 | ) | (0.25 | ) | ||||||||||||
| REDEMPTION FEES ADDED TO PAID-IN CAPITAL (NOTE 6) | – | – | – | – | – | 0.00 | (c) | |||||||||||||||||
| Net increase/(decrease) in net asset value | (1.91 | ) | 0.70 | (1.22 | ) | 1.49 | (0.48 | ) | 0.09 | |||||||||||||||
| Net asset value, end of period | $ | 4.54 | $ | 6.45 | $ | 5.75 | $ | 6.97 | $ | 5.48 | $ | 5.96 | ||||||||||||
| TOTAL RETURN(d) | (16.28 | )% | 18.47 | % | (4.31 | )% | 29.51 | % | 0.67 | % | 5.87 | % | ||||||||||||
| RATIOS/SUPPLEMENTAL DATA: | ||||||||||||||||||||||||
| Net assets, end of period (000s) | $ | 4,884 | $ | 5,782 | $ | 4,684 | $ | 4,236 | $ | 2,852 | $ | 3,068 | ||||||||||||
| Ratio of expenses to average net assets excluding fee waivers and reimbursements(e) | 1.63 | %(f) | 1.61 | % | 1.57 | % | 1.56 | % | 1.63 | % | 1.60 | % | ||||||||||||
| Ratio of expenses to average net assets including fee waivers and reimbursements(e) | 1.63 | %(f) | 1.61 | % | 1.57 | % | 1.56 | % | 1.63 | % | 1.60 | % | ||||||||||||
| Ratio of net investment income to average net assets(e) | 0.76 | %(f) | 1.51 | % | 0.70 | % | 1.43 | % | 1.05 | % | 0.52 | % | ||||||||||||
| Portfolio turnover rate(g) | 14 | % | 28 | % | 29 | % | 31 | % | 30 | % | 37 | % | ||||||||||||
| (a) | Prior to March 31, 2020, the ALPS/Red Rocks Global Opportunity Fund was known as the ALPS/Red Rocks Listed Private Equity Fund. |
| (b) | Calculated using the average shares method. |
| (c) | Less than $0.005 or ($0.005) per share. |
| (d) | Total returns are for the period indicated and have not been annualized. Total returns would have been lower had certain expenses not been waived during the period. Returns shown do not reflect the deduction of taxes that a shareholder would pay on Fund distributions or the redemption of Fund shares. |
| (e) | The ratios exclude the impact of expenses of the underlying funds in which the Fund invests as represented in the Statement of Investments. |
| (f) | Annualized. |
| (g) | Portfolio turnover rate for periods less than one full year have not been annualized. |
See Notes to Financial Statements.
| 98 | | April 30, 2020 |
Clough China Fund
| Management Commentary | April 30, 2020 (Unaudited) |
We at Clough Capital Partners L.P. extend our best wishes to you all during this extraordinary time and hope that this update finds you safe and healthy. Our investment team, along with our in-house trading, legal, finance, IT, distribution and compliance colleagues are all operating remotely thanks to the important investments we have made in our infrastructure over our 20-year history.
The Clough China Fund (the “Fund”) had a net return of 3.08% for the semiannual period from November 1, 2019 to April 30, 2020, compared to 5.31% for the Morningstar China Index. From an individual stock perspective over the period, our investments in Tencent Holdings Ltd., Alibaba Group Holding Ltd., Sun Art Retail Group Ltd., NetEase Inc. and Zai Lab Ltd. contributed most positively to performance, while investments in China Life Insurance Co Ltd., ANTA Sports Products Ltd., Applied Materials Inc., CNOOC Ltd. and Xtep International Holdings Ltd. detracted the most from performance.
Over the semi-annual period, the market experienced volatility, rallying through January and then selling off sharply through March due to the COVID-19 pandemic. The COVID-19 pandemic, which started in Wuhan, quickly spread to the rest of China and then globally. China was able to implement a program of strict quarantining to slow down the spread of the virus. However, this was accomplished at a significant cost to the economy as businesses were forced to shut down to contain the spread of the virus. As China started to recover in March and April, other countries around the world (e.g., Italy, Spain and the United States, among many others) started to experience increasing infections. Many of those countries then had to shut down their economies to control the spread of the virus thereby impacting Chinese businesses which export to those countries. That said, while we continue to carefully monitor any potential second wave, currently our view is that the Chinese economy is likely to emerge from its trough very quickly, especially due to its support from the Chinese government.
We also continue to view the trade war as a lingering concern between China and the United States. As we have said before, it is difficult to take an unequivocal position on the outcome of the trade situation between the U.S. and China, but there are some facts that are irrefutable. The U.S. has a large trade deficit with China, hitting $375bn in 2017, and China’s “Made in 2025” policy objectives, which were laid out in a speech made by China’s President Xi Jinping in May 2015, are deeply ingrained in China’s state-directed industries. Quick changes to industrial policy do not happen easily and thus it is difficult to see an immediate solution to the U.S.’s demand for a reduction in China’s trade surplus. In our view, an all-out trade war is not likely, because it would be detrimental to not only these two economies, but the global economy. Given our view of the most likely outcome, we have primarily focused the Fund’s portfolio exposure to domestically oriented consumption stocks where we see structural opportunities for growth. These also include companies in sectors like technology and healthcare where we see specific trends driving growth (e.g., deployment of 5G technologies). This focus can be seen in some of our top five performers over the last six months.
Both Tencent Holdings Ltd. and Alibaba Group Holdings Ltd. experienced tailwinds in their core franchises of online gaming and e-commerce during COVID-19. Tencent is a stock that we have talked about frequently over the past years. The company’s dominance as a gaming and social media platform continues to help them generate strong revenue and income growth. Unlike some of its competitors in the Internet sector, Tencent has been able to sustain growth without compromising margins. It currently remains a core holding for the Fund. Alibaba is another core position for the Fund. We have talked about the dynamics and the strength of the Chinese consumer over the years, and in our view, we are still in the relatively early innings of this story. We believe the expected initial public offering (IPO) for its financial services arm, Ant Financial Services Co Ltd., should provide an additional catalyst for the stock.
Sun Art Retail Group Ltd. is an omni-channel retailer which has a partnership with Alibaba Group Holdings Ltd. We like Sun Art’s execution which came to fore during the COVID-19 pandemic when it was used to solve the bottlenecks in last mile delivery. Like Amazon has done through Whole Foods Market, we feel that the Sun Art partnership will be critical to driving Alibaba’s growth going forward.
As the second largest gaming platform in China, NetEase Inc. is, in our view, very well placed especially during the COVID-19 pandemic which has acted as a tailwind to gaming companies worldwide. NetEase is also expected to list on the Hong Kong stock exchange which should be a catalyst for the name.
Our view on Zai Lab Ltd., a Chinese healthcare company, remains positive. They are building an R&D (research & development) and commercial pipeline in China with an oncology focused pipeline with 3-5 potential blockbuster drugs, a commercial team of 240 and a strong management team.
Now onto those stocks that have detracted most from performance for the Fund over the semiannual period.
China Life Insurance Co Ltd.’s agency business was negatively impacted by the COVID-19 pandemic and subsequent economic shutdown. The company had anticipated high growth this year, given the low base from last year, but was unable to reach clients during the shutdown. We continue to like the growth the business offers and look to build our position on weakness.
ANTA Sports Products Ltd. is a company that currently we like for its long-term prospects. However, near-term the stock has been exposed to weaker sales in the foreign markets. We have instead increased exposure in Li Ning Co Ltd., which is a domestic play in the same category.
Applied Materials Inc. is a key supplier to Chinese semiconductors and display companies such as BOE Technology Group Co Ltd. and Semiconductor Manufacturing International Corp as they ramp up technologies like OLED (organic light-emitting diode) display and leading-edge foundry production. However, the stock got caught up
| 99 | | April 30, 2020 |
Clough China Fund
| Management Commentary | April 30, 2020 (Unaudited) |
in the volatility of the markets and remains exposed to potential escalations of the trade war.
CNOOC Ltd., an oil and natural gas company, was caught up in the stress that the global energy sector experienced in the beginning of the year. Demand fell as economies shut down and supply did not reduce in time. We like the company and continue to monitor the risk/reward but have temporarily exited the position.
Xtep International Holdings Ltd. is a similar story to ANTA Sports but at a cheaper valuation. While we continue to see value in the category, execution has not been up to expectations and we have exited the position.
As always, please don’t hesitate to reach out to us with any questions.
Anupam Bose, Portfolio Manager
Chuck Clough, Portfolio Manager
Investments in international and emerging markets securities include exposure to risks such as currency fluctuations, foreign taxes and regulations, and the potential for illiquid markets and political instability.
The views of the authors and information discussed in this commentary are as of the date of publication, are subject to change, and may not reflect the writer's current views. The views expressed are those of the authors only, and represent an assessment of market conditions at a specific point in time, are opinions only and should not be relied upon as investment advice regarding a particular investment or markets in general. Such information does not constitute a recommendation to buy or sell specific securities or investment vehicles. It should not be assumed that any investment will be profitable or will equal the performance of the fund(s) or any securities or any sectors mentioned in this letter. The subject matter contained in this letter has been derived from several sources believed to be reliable and accurate at the time of compilation. Neither ALPS, Advisors, Inc., Clough Capital Partners, LP, nor the Fund accepts any liability for losses either direct or consequential caused by the use of this information.
Past performance is no guarantee of future results. Dividends are not guaranteed and are subject to change or elimination. Investments in international and emerging markets securities include exposure to risks such as currency fluctuations, foreign taxes and regulations, and the potential for illiquid markets and political instability.
ALPS Portfolio Solutions Distributor, Inc., ALPS Distributors, Inc. and ALPS Advisors Inc. are affiliated.
| 100 | | April 30, 2020 |
Clough China Fund
| Performance Update | April 30, 2020 (Unaudited) |
Performance of $100,000 Initial Investment (as of April 30, 2020)
Comparison of change in value of a $100,000 investment
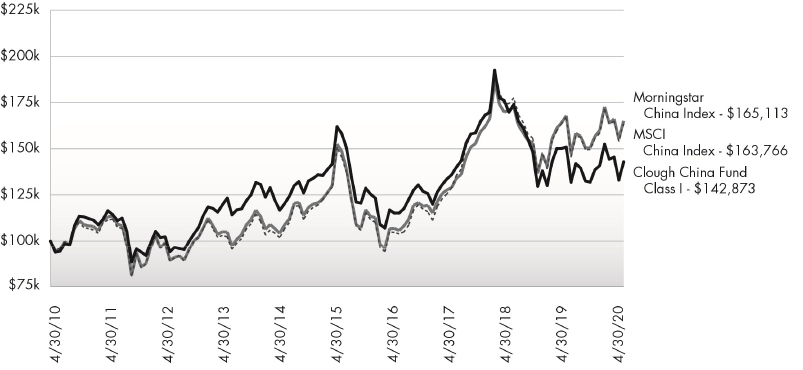
The chart above represents historical performance of a hypothetical investment of $100,000 in the Fund. Past performance does not guarantee future results. This chart does not reflect the deduction of taxes that a shareholder would pay on Fund distributions or the redemption of Fund shares.
Average Annual Total Returns (as of April 30, 2020)
| 6 Month7 | 1 Year | 3 Year | 5 Year | 10 Year | Since Inception2 | Total Expense Ratio | What You Pay3 | |
| Class I 1 (NAV) | 3.08% | -5.34% | 1.67% | -2.47% | 3.63% | 8.92% | 2.01% | 1.72% |
| Investor 4 (NAV) | 2.94% | -5.58% | 1.40% | -2.78% | 3.32% | 8.52% | 2.25% | 1.97% |
| Class A (NAV) | 2.88% | -5.63% | 1.38% | -2.79% | 3.31% | 8.51% | 2.24% | 1.97% |
| Class A (MOP) | -2.78% | -10.82% | -0.52% | -3.89% | 2.73% | 8.08% | ||
| Class C (NAV) | 2.54% | -6.25% | 0.67% | -3.49% | 2.54% | 7.71% | 3.00% | 2.72% |
| Class C (CDSC) | 1.61% | -7.10% | 0.67% | -3.49% | 2.54% | 7.71% | ||
| Morningstar China Index5 | 5.31% | -1.66% | 8.58% | 1.60% | 5.14% | 10.32% | ||
| MSCI China Index6 | 5.25% | -2.05% | 8.31% | 1.66% | 5.06% | 9.96% |
Performance data quoted represents past performance. Past performance does not guarantee future results. Investment return and principal value of an investment will fluctuate so that an investor’s shares, when sold or redeemed, may be worth more or less than the original cost. Current performance data may be higher or lower than actual data quoted. For the most current month-end performance data, please call 1-866-759-5679.
Maximum Offering Price (MOP) for Class A shares includes the Fund’s maximum sales charge of 5.50%. Performance shown at NAV does not include these sales charges and would have been lower had it been taken into account. If you invest $1 million or more, either as a lump sum or through the Fund’s accumulation or letter of intent programs, you can purchase Class A shares without an initial sales charge (load). A Contingent Deferred Sales Charge (“CDSC”) of 1.00% may apply to Class C shares redeemed within the first 12 months after a purchase, and on Class A shares redeemed within the first 18 months after a purchase in excess of $1 million. The Fund imposes a 2.00% redemption fee on shares held for less than 30 days.
The performance shown for the Clough China Fund for periods prior to January 15, 2010, reflects the performance of the Old Mutual China Fund, a series of Old Mutual Funds I (as a result of a prior reorganization of the Old Mutual China Fund into the Clough China Fund).
Performance shown for Class A shares prior to June 12, 2018 reflects the historical performance of the Fund’s Investor shares, calculated using the fees and expenses of Class A shares.
| 101 | | April 30, 2020 |
Clough China Fund
| Performance Update | April 30, 2020 (Unaudited) |
Performance less than 1 year is cumulative.
| 1 | Prior to close of business on January 15, 2010, Class I was known as Institutional Class of the Old Mutual China Fund. |
| 2 | Fund Inception date of December 30, 2005 for Investor Class and Classes C and I; Fund Inception date of June 12, 2018 for Class A. |
| 3 | What You Pay reflects the Advisor’s decision to contractually limit expenses through February 28, 2021. Please see the prospectus dated February 28, 2020 for additional information. |
| 4 | Prior to December 1, 2017, Investor Class was known as Class A. |
| 5 | The Morningstar China Index replaced the Morgan Stanley Capital International (“MSCI”) China Index as the Fund’s primary index effective December 18, 2019. The Morningstar China Index measures the performance of China's equity markets targeting the top 97% of stocks by market capitalization. The Advisor and Sub-Advisor made this recommendation to the Board because the new index closely aligns to the Fund’s investment strategies and investment restrictions. The index is not actively managed and does not reflect any deduction for fees, expenses or taxes. An investor may not invest directly in an index. |
| 6 | The MSCI China Index is constructed according to the MSCI Global Investable Market Index (GIMI) family. The MSCI China Index is part of the MSCI Emerging Markets Index. The index is not actively managed and does not reflect any deduction for fees, expenses or taxes. An investor may not invest directly in an index. The MSCI information may only be used for your internal use, may not be reproduced or redisseminated in any form and may not be used as a basis for or a component of any financial instruments or products or indices. None of the MSCI information is intended to constitute investment advice or a recommendation to make (or refrain from making) any kind of investment decision and may not be relied on as such. Historical data and analysis should not be taken as an indication or guarantee of any future performance analysis, forecast or prediction. The MSCI information is provided on an “as is” basis and the user of this information assumes the entire risk of any use made of this information. MSCI, each of its affiliates and each other person involved in or related to compiling, computing or creating any MSCI information (collectively, the “MSCI Parties”) expressly disclaims all warranties (including, without limitation, any warranties of originality, accuracy, completeness, timeliness, non-infringement, merchantability and fitness for a particular purpose) with respect to this information. Without limiting any of the foregoing, in no event shall any MSCI Party have any liability for any direct, indirect, special, incidental, punitive, consequential (including, without limitation, lost profits) or any other damages (www.msci.com). |
| 7 | Excludes adjustments in accordance with accounting principles generally accepted in the United States of America and as such, the net asset value and total return for shareholder transactions reported to the market may differ from the net asset value for financial reporting purposes. |
The Fund is “non-diversified” and will generally be more volatile than diversified funds.
The table does not reflect the deduction of taxes that a shareholder would pay on Fund distributions or the redemption of Fund shares.
This Fund is not suitable for all investors and is subject to investment risks, including possible loss of the principal amount invested.
There is no guarantee that the Fund will continue to hold any one particular security or stay invested in any one particular company. The composition of the Fund's top holdings is subject to change. Performance figures are historical and reflect the change in share price, reinvested distributions, changes in net asset value, sales charges and capital gains distributions, if any.
Not FDIC Insured – No Bank Guarantee – May Lose Value
Investing in China and Hong Kong involves risk and considerations not present when investing in more established securities markets. The Fund may be more susceptible to the economic, market, political and local risks of these regions than a fund that is more geographically diversified.
Top Ten Holdings (as a % of Net Assets) †
| Tencent Holdings, Ltd. | 12.08% |
| Alibaba Group Holding, Ltd. | 11.80% |
| JD.com, Inc. | 4.37% |
| China Construction Bank Corp. | 4.16% |
| Sun Art Retail Group, Ltd. | 3.87% |
| AIA Group, Ltd. | 3.23% |
| NetEase, Inc. | 2.91% |
| Guangdong Investment, Ltd. | 2.72% |
| Ping An Insurance Group Co. of China, Ltd. | 2.69% |
| KWG Property Holdings, Ltd. | 2.64% |
| Top Ten Holdings | 50.47% |
| † | Holdings are subject to change. Calculated as a percent of net assets. Exposure figures reported include the notional value of total return swaps and exclude cash and cash equivalents. |
Sector Allocation^ (as a % of Net Assets)
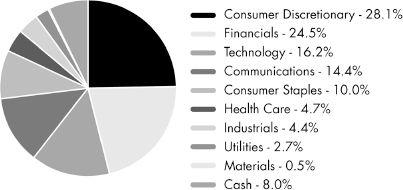
| ^ | Holdings are subject to change. Calculated as a percent of net assets. Exposure figures reported include the notional value of total return swaps. |
| 102 | | April 30, 2020 |
Clough China Fund
| Statement of Investments | April 30, 2020 (Unaudited) |
| Shares | Value (Note 2) | |||||||
| COMMON STOCKS (92.01%) | ||||||||
| Communications (14.45%) | ||||||||
| Media (13.15%) | ||||||||
| Hong Kong Television Network, Ltd.(a) | 585,000 | $ | 361,445 | |||||
| Tencent Holdings, Ltd. | 77,500 | 4,074,131 | ||||||
| 4,435,576 | ||||||||
| Telecommunications (1.30%) | ||||||||
| China Telecom Corp., Ltd., Class H | 248,400 | 85,798 | ||||||
| China Unicom Hong Kong, Ltd. | 85,000 | 54,972 | ||||||
| GDS Holdings, Ltd., ADR(a) | 5,200 | 298,064 | ||||||
| 438,834 | ||||||||
| TOTAL COMMUNICATIONS | 4,874,410 | |||||||
| Consumer Discretionary (26.30%) | ||||||||
| Apparel & Textile Products (0.27%) | ||||||||
| Shenzhou International Group Holdings, Ltd. | 7,900 | 91,179 | ||||||
| Consumer Services (3.50%) | ||||||||
| Koolearn Technology Holding, Ltd.(a) | 53,000 | 254,388 | ||||||
| New Oriental Education & Technology Group, Inc., Sponsored ADR, ADR(a)(b) | 5,300 | 676,598 | ||||||
| TAL Education Group, ADR(a)(b) | 4,600 | 249,274 | ||||||
| 1,180,260 | ||||||||
| Gaming, Lodging & Restaurants (2.34%) | ||||||||
| Melco Resorts & Entertainment, Ltd., ADR | 22,900 | 362,278 | ||||||
| Sands China, Ltd. | 105,600 | 427,521 | ||||||
| 789,799 | ||||||||
| Retail - Consumer Discretionary (20.19%) | ||||||||
| Alibaba Group Holding, Ltd., Sponsored ADR(a)(b) | 19,647 | 3,981,858 | ||||||
| ANTA Sports Products, Ltd. | 37,400 | 318,500 | ||||||
| JD.com, Inc., ADR(a) | 34,200 | 1,474,020 | ||||||
| Li Ning Co., Ltd. | 130,000 | 410,472 | ||||||
| Meituan Dianping(a) | 46,700 | 625,270 | ||||||
| 6,810,120 | ||||||||
| TOTAL CONSUMER DISCRETIONARY | 8,871,358 | |||||||
| Consumer Staples (5.22%) | ||||||||
| Consumer Products (1.35%) | ||||||||
| Nissin Foods Co., Ltd. | 553,000 | 454,488 | ||||||
| Shares | Value (Note 2) | |||||||
| Retail - Consumer Staples (3.87%) | ||||||||
| Sun Art Retail Group, Ltd. | 783,500 | $ | 1,304,434 | |||||
| TOTAL CONSUMER STAPLES | 1,758,922 | |||||||
| Financials (24.53%) | ||||||||
| Banking (6.53%) | ||||||||
| Bank of China, Ltd., Class H | 466,437 | 177,574 | ||||||
| China Construction Bank Corp., Class H | 1,750,080 | 1,404,726 | ||||||
| Industrial & Commercial Bank of China, Ltd., Class H | 925,967 | 620,869 | ||||||
| 2,203,169 | ||||||||
| Insurance (6.98%) | ||||||||
| AIA Group, Ltd. | 118,800 | 1,090,319 | ||||||
| China Life Insurance Co., Ltd., Class H | 167,000 | 356,161 | ||||||
| Ping An Insurance Group Co. of China, Ltd., Class H | 89,265 | 908,384 | ||||||
| 2,354,864 | ||||||||
| Real Estate (11.02%) | ||||||||
| A-Living Services Co., Ltd. | 68,000 | 375,897 | ||||||
| KWG Property Holdings, Ltd. | 601,500 | 889,796 | ||||||
| Longfor Group Holdings, Ltd. | 64,000 | 325,378 | ||||||
| Midea Real Estate Holding, Ltd. | 146,000 | 375,088 | ||||||
| Powerlong Commercial Management Holdings, Ltd.(a) | 45,500 | 74,765 | ||||||
| Shimao Property Holdings, Ltd. | 148,500 | 603,634 | ||||||
| Sunac China Holdings, Ltd. | 126,100 | 564,077 | ||||||
| Times China Holdings, Ltd. | 164,482 | 275,923 | ||||||
| Times Neighborhood Holdings, Ltd.(a) | 273,246 | 232,658 | ||||||
| TOTAL FINANCIALS | 8,275,249 | |||||||
| Health Care (4.25%) | ||||||||
| Biotechnology & Pharmaceuticals (3.97%) | ||||||||
| Alphamab Oncology(a)(c) | 297,398 | 644,855 | ||||||
| BeiGene, Ltd., ADR(a) | 880 | 134,490 | ||||||
| CanSino Biologics, Inc.(a) | 4,200 | 88,618 | ||||||
| Gilead Sciences, Inc.(b) | 1,800 | 151,200 | ||||||
| Zai Lab, Ltd., ADR(a) | 5,120 | 321,126 | ||||||
| 1,340,289 | ||||||||
| Health Care Facilities & Services (0.28%) | ||||||||
| Wuxi Biologics Cayman, Inc.(a) | 6,000 | 93,399 | ||||||
| TOTAL HEALTH CARE | 1,433,688 | |||||||
| 103 | | April 30, 2020 |
Clough China Fund
| Statement of Investments | April 30, 2020 (Unaudited) |
| Shares | Value (Note 2) | |||||||
| Materials (0.48%) | ||||||||
| Metals & Mining (0.48%) | ||||||||
| Zhaojin Mining Industry Co., Ltd., Class H | 144,000 | $ | 161,787 | |||||
| TOTAL MATERIALS | 161,787 | |||||||
| Technology (14.05%) | ||||||||
| Hardware (2.96%) | ||||||||
| Apple, Inc. | 1,200 | 352,560 | ||||||
| Samsung Electronics Co., Ltd. | 4,071 | 167,390 | ||||||
| Silergy Corp. | 12,000 | 476,740 | ||||||
| 996,690 | ||||||||
| Semiconductors (8.18%) | ||||||||
| Infineon Technologies AG | 4,637 | 86,131 | ||||||
| Inphi Corp.(a) | 1,800 | 173,772 | ||||||
| Intel Corp.(b) | 5,600 | 335,888 | ||||||
| Lam Research Corp.(b) | 935 | 238,687 | ||||||
| MediaTek, Inc. | 14,000 | 193,318 | ||||||
| Microchip Technology, Inc. | 3,600 | 315,828 | ||||||
| Micron Technology, Inc.(a)(b) | 11,676 | 559,164 | ||||||
| NVIDIA Corp. | 1,220 | 356,581 | ||||||
| Qorvo, Inc.(a) | 1,720 | 168,612 | ||||||
| Taiwan Semiconductor Manufacturing Co., Ltd., Sponsored ADR | 3,200 | 170,016 | ||||||
| Teradyne, Inc. | 2,600 | 162,604 | ||||||
| 2,760,601 | ||||||||
| Software (2.91%) | ||||||||
| NetEase, Inc., ADR(b) | 2,850 | 983,136 | ||||||
| TOTAL TECHNOLOGY | 4,740,427 | |||||||
| Utilities (2.73%) | ||||||||
| Utilities (2.73%) | ||||||||
| Guangdong Investment, Ltd. | 442,000 | 918,682 | ||||||
| TOTAL UTILITIES | 918,682 | |||||||
| TOTAL COMMON STOCKS | ||||||||
| (Cost $25,200,493) | 31,034,523 | |||||||
| SHORT TERM INVESTMENTS (1.79%) | ||||||||
| Money Market Fund (1.79%) | ||||||||
| Blackrock Liquidity Funds, T-Fund 0.116% | 604,878 | 604,878 | ||||||
| TOTAL SHORT TERM INVESTMENTS | ||||||||
| (Cost $604,878) | 604,878 | |||||||
| Shares | Value (Note 2) | |||||||
| TOTAL INVESTMENTS (93.80%) | ||||||||
| (Cost $25,805,371) | $ | 31,639,401 | ||||||
| Other Assets In Excess Of Liabilities (6.20%)(d) | 2,092,287 | |||||||
| NET ASSETS (100.00%) | $ | 33,731,688 | ||||||
| (a) | Non-Income Producing Security. |
| (b) | Security, or portion of security, is being held as collateral for total return swap contracts aggregating a total market value of $2,037,172. |
| (c) | Security, or a portion of security, is exempt from registration under Rule 144A of the Securities Act of 1933. This security may be resold in transactions exempt from registration, normally to qualified institutional buyers. As of April 30, 2020, the aggregate market value of those securities was $7,368, representing 0.02% of net assets. |
| (d) | Includes cash which is being held as collateral for total return swap contracts in the amount of $1,021,128. |
| 104 | | April 30, 2020 |
Clough China Fund
| Statement of Investments | April 30, 2020 (Unaudited) |
TOTAL RETURN SWAP CONTRACTS(a)
| Swap Counterparty | Reference Obligation | Notional Amount | Floating Rate/Fixed Amount Paid by Fund* | Termination Date | Value | Unrealized Appreciation | ||||||||||||
| Morgan Stanley | C&S Paper Co., Ltd. | $ | 487,706 | 255 bps + 1D FEDEF | 9/28/2020 | $ | 575,896 | $ | 88,190 | |||||||||
| Morgan Stanley | Kweichow Moutai Co., Ltd. | 731,679 | 250 bps + 1D FEDEF | 5/26/2020 | 760,450 | 28,771 | ||||||||||||
| Morgan Stanley | Luxshare Precision Industry Co., Ltd. | 243,523 | 250 bps + 1D FEDEF | 5/26/2020 | 273,807 | 30,284 | ||||||||||||
| Morgan Stanley | Sany Heavy Industry Co., Ltd. | 324,901 | 250 bps + 1D FEDEF | 5/26/2020 | 334,369 | 9,468 | ||||||||||||
| Morgan Stanley | Shengyi Technology Co., Ltd. | 99,589 | 255 bps + 1D FEDEF | 9/28/2020 | 102,184 | 2,595 | ||||||||||||
| Morgan Stanley | Shennan Circuits Co., Ltd. | 60,203 | 255 bps + 1D FEDEF | 9/28/2020 | 66,194 | 5,991 | ||||||||||||
| Morgan Stanley | Zoomlion Heavy Industry Science & Tech, Ltd. | 565,952 | 255 bps + 1D FEDEF | 9/28/2020 | 600,605 | 34,653 | ||||||||||||
| $ | 2,513,553 | $ | 2,713,505 | $ | 199,952 | |||||||||||||
| Swap Counterparty | Reference Obligation | Notional Amount | Floating Rate/Fixed Amount Paid by Fund* | Termination Date | Value | Unrealized Depreciation | ||||||||||||
| Morgan Stanley | Boe Technology Group Co., Ltd. | $ | 368,516 | 70 bps + 1D FEDEF | 9/16/2020 | $ | 316,402 | $ | (52,114 | ) | ||||||||
| Morgan Stanley | China Railway Construction Co. | 142,687 | 255 bps + 1D FEDEF | 9/28/2020 | 129,529 | (13,158 | ) | |||||||||||
| Morgan Stanley | China Railway Group, Ltd. | 139,264 | 255 bps + 1D FEDEF | 9/28/2020 | 137,274 | (1,990 | ) | |||||||||||
| Morgan Stanley | Gree Electric Appliances, Inc. | 647,885 | 250 bps + 1D FEDEF | 2/11/2020 | 615,789 | (32,096 | ) | |||||||||||
| Morgan Stanley | Jiangsu Yuyue Medical Equipment & Supply Co., Ltd. | 96,750 | 250 bps + 1D FEDEF | 5/26/2020 | 88,077 | (8,673 | ) | |||||||||||
| Morgan Stanley | Shenzhen Mindray Bio-Med Electronics Co., Ltd. | 82,223 | 250 bps + 1D FEDEF | 5/26/2020 | 79,956 | (2,267 | ) | |||||||||||
| Morgan Stanley | Venustech Group | 259,444 | 255 bps + 1D FEDEF | 9/28/2020 | 238,947 | (20,497 | ) | |||||||||||
| Morgan Stanley | Wuliangye Yibin Co., Ltd. | 289,682 | 255 bps + 1D FEDEF | 9/28/2020 | 281,085 | (8,597 | ) | |||||||||||
| $ | 2,026,451 | $ | 1,887,059 | $ | (139,392 | ) | ||||||||||||
| (a) | For long positions in the total return swap, the Fund receives payments based on any positive return of the Reference Obligation less the rate paid by the Fund. The Fund makes payments on any negative return of such Reference Obligations plus the rate paid by the Fund. For the short positions in the total return swap, the Fund makes payments based on any positive return of the Reference Obligation less the rate received by the Fund. The Fund receives payments on any negative return of such Reference Obligations plus the rate received by the Fund. |
| * | Payments made when swap contract closes. |
Investment Abbreviations:
1D FEDEF - Federal Funds Effective Rate (Daily)
For Fund compliance purposes, the Fund's industry classifications refer to any one or more of the industry sub-classifications used by one or more widely recognized market indexes or ratings group indexes, and/or as defined by Fund management. This definition may not apply for purposes of this report, which may combine industry sub-classifications for reporting ease. Industries are shown as a percent of net assets.
See Notes to Financial Statements.
| 105 | | April 30, 2020 |
Clough China Fund
| Statement of Assets and Liabilities | April 30, 2020 (Unaudited) |
| ASSETS | ||||
| Investments, at value | $ | 31,639,401 | ||
| Foreign currency, at value (Cost $1,354,023) | 1,353,671 | |||
| Unrealized appreciation on total return swap contracts | 199,952 | |||
| Receivable for investments sold | 25,504 | |||
| Receivable due from broker for total return swap contracts | 19 | |||
| Cash collateral pledged for total return swap contracts (Note 3) | 1,021,108 | |||
| Dividends receivable | 290 | |||
| Prepaid expenses and other assets | 24,636 | |||
| Total Assets | 34,264,581 | |||
| LIABILITIES | ||||
| Payable for investments purchased | 254,123 | |||
| Payable for interest expense on total return swap contracts | 63,507 | |||
| Unrealized depreciation on total return swap contracts | 139,392 | |||
| Investment advisory fees payable | 25,777 | |||
| Administration and transfer agency fees payable | 19,612 | |||
| Distribution and services fees payable | 3,268 | |||
| Trustees' fees and expenses payable | 34 | |||
| Professional fees payable | 19,128 | |||
| Accrued expenses and other liabilities | 8,052 | |||
| Total Liabilities | 532,893 | |||
| NET ASSETS | $ | 33,731,688 | ||
| NET ASSETS CONSIST OF | ||||
| Paid-in capital | $ | 29,047,285 | ||
| Total distributable earnings | 4,684,403 | |||
| NET ASSETS | $ | 33,731,688 | ||
| INVESTMENTS, AT COST | $ | 25,805,371 | ||
| PRICING OF SHARES | ||||
| Investor Class: | ||||
| Net Asset Value, offering and redemption price per share | $ | 19.67 | ||
| Net Assets | $ | 8,645,124 | ||
| Shares of beneficial interest outstanding (unlimited number of shares, no par value common stock authorized) | 439,504 | |||
| Class A: | ||||
| Net Asset Value, offering and redemption price per share | $ | 19.66 | ||
| Net Assets | $ | 1,161,374 | ||
| Shares of beneficial interest outstanding (unlimited number of shares, no par value common stock authorized) | 59,072 | |||
| Maximum offering price per share ((NAV/0.9450), based on maximum sales charge of 5.50% of the offering price) | $ | 20.80 | ||
| Class C: | ||||
| Net Asset Value, offering and redemption price per share(a) | $ | 18.14 | ||
| Net Assets | $ | 1,630,492 | ||
| Shares of beneficial interest outstanding (unlimited number of shares, no par value common stock authorized) | 89,869 | |||
| Class I: | ||||
| Net Asset Value, offering and redemption price per share | $ | 20.34 | ||
| Net Assets | $ | 22,294,698 | ||
| Shares of beneficial interest outstanding (unlimited number of shares, no par value common stock authorized) | 1,095,911 | |||
| (a) | Redemption price per share may be reduced for any applicable contingent deferred sales charge. For a description of a possible sales charge, please see the Fund's Prospectus. |
See Notes to Financial Statements.
| 106 | | April 30, 2020 |
Clough China Fund
| Statement of Operations | For the Six Months Ended April 30, 2020 (Unaudited) |
| INVESTMENT INCOME | ||||
| Dividends | $ | 71,726 | ||
| Foreign taxes withheld on dividends | (2,696 | ) | ||
| Total Investment Income | 69,030 | |||
| EXPENSES | ||||
| Investment advisory fees | 241,378 | |||
| Administrative fees | 39,784 | |||
| Transfer agency fees | 11,779 | |||
| Distribution and service fees | ||||
| Investor Class | 12,407 | |||
| Class A | 1,683 | |||
| Class C | 8,907 | |||
| Professional fees | 13,763 | |||
| Reports to shareholders and printing fees | 2,821 | |||
| State registration fees | 26,196 | |||
| Insurance fees | 273 | |||
| Custody fees | 17,166 | |||
| Trustees' fees and expenses | 898 | |||
| Miscellaneous expenses | 6,166 | |||
| Total Expenses | 383,221 | |||
| Less fees waived/reimbursed by investment advisor (Note 8) | ||||
| Investor Class | (15,286 | ) | ||
| Class A | (1,708 | ) | ||
| Class C | (2,903 | ) | ||
| Class I | (36,483 | ) | ||
| Net Expenses | 326,841 | |||
| Net Investment Loss | (257,811 | ) | ||
| Net realized loss on investments | (538,097 | ) | ||
| Net realized gain on total return swap contracts | 342,084 | |||
| Net realized gain on foreign currency transactions | 7,174 | |||
| Net Realized Loss | (188,839 | ) | ||
| Net change in unrealized appreciation on investments | 1,898,741 | |||
| Net change in unrealized depreciation on total return swap contracts | (272,183 | ) | ||
| Net change in unrealized depreciation on translation of assets and liabilities denominated in foreign currencies | (108 | ) | ||
| Net Change in Unrealized Appreciation | 1,626,450 | |||
| NET REALIZED AND UNREALIZED GAIN ON INVESTMENTS | 1,437,611 | |||
| NET INCREASE IN NET ASSETS RESULTING FROM OPERATIONS | $ | 1,179,800 | ||
See Notes to Financial Statements.
| 107 | | April 30, 2020 |
Clough China Fund
Statements of Changes in Net Assets
| For the Six Months Ended April 30, 2020 (Unaudited) | For the Year Ended October 31, 2019 | |||||||
| OPERATIONS | ||||||||
| Net investment income/(loss) | $ | (257,811 | ) | $ | 278,785 | |||
| Net realized gain/(loss) | (188,839 | ) | 3,563,330 | |||||
| Net change in unrealized appreciation/(depreciation) | 1,626,450 | (1,382,314 | ) | |||||
| Net Increase in Net Assets Resulting from Operations | 1,179,800 | 2,459,801 | ||||||
| TOTAL DISTRIBUTIONS | ||||||||
| From distributable earnings | ||||||||
| Investor Class | (1,009,421 | ) | (924,319 | ) | ||||
| Class A | (138,882 | ) | (563 | ) | ||||
| Class C | (187,446 | ) | (340,281 | ) | ||||
| Class I | (2,056,111 | ) | (1,650,937 | ) | ||||
| Net Decrease in Net Assets from Distributions | (3,391,860 | ) | (2,916,100 | ) | ||||
| BENEFICIAL INTEREST TRANSACTIONS (NOTE 6) | ||||||||
| Shares sold | ||||||||
| Investor Class | 352,722 | 419,226 | ||||||
| Class A | 111,192 | 1,592,398 | ||||||
| Class C | 39,644 | 91,411 | ||||||
| Class I | 805,782 | 611,542 | ||||||
| Dividends reinvested | ||||||||
| Investor Class | 566,209 | 545,342 | ||||||
| Class A | 74,412 | 563 | ||||||
| Class C | 107,944 | 184,852 | ||||||
| Class I | 1,967,974 | 1,573,403 | ||||||
| Shares redeemed, net of redemption fees | ||||||||
| Investor Class | (2,277,548 | ) | (2,071,339 | ) | ||||
| Class A | (322,238 | ) | (115,254 | ) | ||||
| Class C | (360,202 | ) | (2,553,148 | ) | ||||
| Class I | (1,321,485 | ) | (1,409,415 | ) | ||||
| Net Decrease in Net Assets Derived from Beneficial Interest Transactions | (255,594 | ) | (1,130,419 | ) | ||||
| Net decrease in net assets | (2,467,654 | ) | (1,586,718 | ) | ||||
| NET ASSETS | ||||||||
| Beginning of period | 36,199,342 | 37,786,060 | ||||||
| End of period | $ | 33,731,688 | $ | 36,199,342 | ||||
See Notes to Financial Statements.
| 108 | | April 30, 2020 |
Clough China Fund – Investor Class
Financial Highlights
Selected data for a share of beneficial interest outstanding throughout the periods indicated:
| For the Six Months Ended April 30, 2020 (Unaudited) | For the Year Ended October 31, 2019 | For the Year Ended October 31, 2018(a) | For the Year Ended October 31, 2017 | For the Year Ended October 31, 2016 | For the Year Ended October 31, 2015 | |||||||||||||||||||
| Net asset value, beginning of period | $ | 20.96 | $ | 21.36 | $ | 27.22 | $ | 21.07 | $ | 21.74 | $ | 23.50 | ||||||||||||
| INCOME/(LOSS) FROM INVESTMENT OPERATIONS: | ||||||||||||||||||||||||
| Net investment income/(loss)(b) | (0.16 | ) | 0.13 | (0.08 | ) | 0.08 | 0.04 | 0.12 | ||||||||||||||||
| Net realized and unrealized gain/(loss) | 0.88 | 1.16 | (5.71 | ) | 6.09 | (0.40 | ) | (0.92 | ) | |||||||||||||||
| Total from investment operations | 0.72 | 1.29 | (5.79 | ) | 6.17 | (0.36 | ) | (0.80 | ) | |||||||||||||||
| DISTRIBUTIONS: | ||||||||||||||||||||||||
| From net investment income | (0.38 | ) | – | (0.07 | ) | (0.02 | ) | (0.31 | ) | (0.50 | ) | |||||||||||||
| From net realized gains | (1.63 | ) | (1.69 | ) | – | – | – | (0.46 | ) | |||||||||||||||
| Total distributions | (2.01 | ) | (1.69 | ) | (0.07 | ) | (0.02 | ) | (0.31 | ) | (0.96 | ) | ||||||||||||
| REDEMPTION FEES ADDED TO PAID-IN CAPITAL (NOTE 6) | 0.00 | (c) | – | 0.00 | (c) | – | 0.00 | (c) | 0.00 | (c) | ||||||||||||||
| Net increase/(decrease) in net asset value | (1.29 | ) | (0.40 | ) | (5.86 | ) | 6.15 | (0.67 | ) | (1.76 | ) | |||||||||||||
| Net asset value, end of period | $ | 19.67 | $ | 20.96 | $ | 21.36 | $ | 27.22 | $ | 21.07 | $ | 21.74 | ||||||||||||
| TOTAL RETURN(d) | 2.89 | % | 6.61 | % | (21.32 | )% | 29.32 | % | (1.61 | )% | (3.49 | )% | ||||||||||||
| RATIOS/SUPPLEMENTAL DATA: | ||||||||||||||||||||||||
| Net assets, end of period (000s) | $ | 8,645 | $ | 10,633 | $ | 11,879 | $ | 17,523 | $ | 18,358 | $ | 25,276 | ||||||||||||
| Ratio of expenses to average net assets excluding fee waivers and reimbursements | 2.26 | %(e) | 2.23 | % | 2.10 | % | 2.05 | % | 2.04 | % | 1.98 | % | ||||||||||||
| Ratio of expenses to average net assets including fee waivers and reimbursements | 1.95 | %(e) | 1.95 | % | 1.95 | % | 1.95 | % | 1.95 | % | 1.95 | % | ||||||||||||
| Ratio of net investment income/(loss) to average net assets | (1.56 | )%(e) | 0.61 | % | (0.30 | )% | 0.34 | % | 0.18 | % | 0.50 | % | ||||||||||||
| Portfolio turnover rate(f) | 65 | % | 344 | % | 131 | % | 71 | % | 126 | % | 193 | % | ||||||||||||
| (a) | Prior to December 1, 2017, Investor Class was known as Class A. |
| (b) | Calculated using the average shares method. |
| (c) | Less than $0.005 or ($0.005) per share. |
| (d) | Total returns are for the period indicated and have not been annualized. Total returns would have been lower had certain expenses not been waived during the period. Returns shown do not reflect the deduction of taxes that a shareholder would pay on Fund distributions or the redemption of Fund shares. Returns shown exclude any applicable sales charges. |
| (e) | Annualized. |
| (f) | Portfolio turnover rate for periods less than one full year have not been annualized. |
See Notes to Financial Statements.
| 109 | | April 30, 2020 |
Clough China Fund – Class A
Financial Highlights
Selected data for a share of beneficial interest outstanding throughout the periods indicated:
| For the Six Months Ended April 30, 2020 (Unaudited) | For the Year Ended October 31, 2019 | For the Period June 12, 2018 (Commencement of Operations) to October 31, 2018 | ||||||||||
| Net asset value, beginning of period | $ | 20.95 | $ | 21.36 | $ | 29.95 | ||||||
| INCOME FROM INVESTMENT OPERATIONS: | ||||||||||||
| Net investment income/(loss)(a) | (0.16 | ) | 0.56 | 0.14 | ||||||||
| Net realized and unrealized gain/(loss) | 0.88 | 0.72 | (8.73 | ) | ||||||||
| Total from investment operations | 0.72 | 1.28 | (8.59 | ) | ||||||||
| DISTRIBUTIONS: | ||||||||||||
| From net investment income | (0.38 | ) | – | – | ||||||||
| From net realized gains | (1.63 | ) | (1.69 | ) | – | |||||||
| Total distributions | (2.01 | ) | (1.69 | ) | – | |||||||
| Net (decrease) in net asset value | (1.29 | ) | (0.41 | ) | (8.59 | ) | ||||||
| Net asset value, end of period | $ | 19.66 | $ | 20.95 | $ | 21.36 | ||||||
| TOTAL RETURN(b) | 2.88 | % | 6.56 | % | (28.68 | )% | ||||||
| RATIOS/SUPPLEMENTAL DATA: | ||||||||||||
| Net assets, end of period (000s) | $ | 1,161 | $ | 1,404 | $ | 7 | ||||||
| Ratio of expenses to average net assets excluding fee waivers and reimbursements | 2.20 | %(c) | 2.22 | % | 2.22 | %(c) | ||||||
| Ratio of expenses to average net assets including fee waivers and reimbursements | 1.95 | %(c) | 1.95 | % | 1.95 | %(c) | ||||||
| Ratio of net investment income/(loss) to average net assets | (1.55 | )%(c) | 2.68 | % | 1.47 | %(c) | ||||||
| Portfolio turnover rate(d) | 65 | % | 344 | % | 131 | % | ||||||
| (a) | Calculated using the average shares method. |
Total returns are for the period indicated and have not been annualized. Total returns would have been lower had certain expenses not been waived during the period. Returns shown do not reflect the deduction of taxes that a shareholder would pay on Fund distributions or the
| (b) | redemption of Fund shares. |
| (c) | Annualized. |
| (d) | Portfolio turnover rate for periods less than one full year have not been annualized. |
See Notes to Financial Statements.
| 110 | | April 30, 2020 |
Clough China Fund – Class C
Financial Highlights
Selected data for a share of beneficial interest outstanding throughout the periods indicated:
| For the Six Months Ended April 30, 2020 (Unaudited) | For the Year Ended October 31, 2019 | For the Year Ended October 31, 2018 | For the Year Ended October 31, 2017 | For the Year Ended October 31, 2016 | For the Year Ended October 31, 2015 | |||||||||||||||||||
| Net asset value, beginning of period | $ | 19.52 | $ | 20.14 | $ | 25.80 | $ | 20.10 | $ | 20.72 | $ | 22.53 | ||||||||||||
| INCOME/(LOSS) FROM INVESTMENT OPERATIONS: | ||||||||||||||||||||||||
| Net investment loss(a) | (0.22 | ) | (0.14 | ) | (0.28 | ) | (0.12 | )(b) | (0.10 | ) | (0.04 | ) | ||||||||||||
| Net realized and unrealized gain/(loss) | 0.82 | 1.21 | (5.38 | ) | 5.82 | (0.39 | ) | (0.89 | ) | |||||||||||||||
| Total from investment operations | 0.60 | 1.07 | (5.66 | ) | 5.70 | (0.49 | ) | (0.93 | ) | |||||||||||||||
| DISTRIBUTIONS: | ||||||||||||||||||||||||
| From net investment income | (0.35 | ) | – | – | – | (0.13 | ) | (0.42 | ) | |||||||||||||||
| From net realized gains | (1.63 | ) | (1.69 | ) | – | – | – | (0.46 | ) | |||||||||||||||
| Total distributions | (1.98 | ) | (1.69 | ) | – | – | (0.13 | ) | (0.88 | ) | ||||||||||||||
| REDEMPTION FEES ADDED TO PAID-IN CAPITAL (NOTE 6) | – | – | – | 0.00 | (c) | 0.00 | (c) | 0.00 | (c) | |||||||||||||||
| Net increase/(decrease) in net asset value | (1.38 | ) | (0.62 | ) | (5.66 | ) | 5.70 | (0.62 | ) | (1.81 | ) | |||||||||||||
| Net asset value, end of period | $ | 18.14 | $ | 19.52 | $ | 20.14 | $ | 25.80 | $ | 20.10 | $ | 20.72 | ||||||||||||
| TOTAL RETURN(d) | 2.48 | % | 5.85 | % | (21.94 | )% | 28.36 | % | (2.34 | )% | (4.25 | )% | ||||||||||||
| RATIOS/SUPPLEMENTAL DATA: | ||||||||||||||||||||||||
| Net assets, end of period (000s) | $ | 1,630 | $ | 1,968 | $ | 4,245 | $ | 6,610 | $ | 8,352 | $ | 10,395 | ||||||||||||
| Ratio of expenses to average net assets excluding fee waivers and reimbursements | 3.03 | %(e) | 2.98 | % | 2.85 | % | 2.85 | % | 2.83 | % | 2.78 | % | ||||||||||||
| Ratio of expenses to average net assets including fee waivers and reimbursements | 2.70 | %(e) | 2.70 | % | 2.70 | % | 2.70 | % | 2.70 | % | 2.70 | % | ||||||||||||
| Ratio of net investment loss to average net assets | (2.30 | )%(e) | (0.69 | )% | (1.07 | )% | (0.54 | )% | (0.52 | )% | (0.18 | )% | ||||||||||||
| Portfolio turnover rate(f) | 65 | % | 344 | % | 131 | % | 71 | % | 126 | % | 193 | % | ||||||||||||
| (a) | Calculated using the average shares method. |
| (b) | The per share amount does not correspond to activity reflected in the Statement of Operations due to class specific expenses during the period. |
| (c) | Less than $0.005 or ($0.005) per share. |
| (d) | Total returns are for the period indicated and have not been annualized. Total returns would have been lower had certain expenses not been waived during the period. Returns shown do not reflect the deduction of taxes that a shareholder would pay on Fund distributions or the redemption of Fund shares. Returns shown exclude any applicable sales charges. |
| (e) | Annualized. |
| (f) | Portfolio turnover rate for periods less than one full year have not been annualized. |
See Notes to Financial Statements.
| 111 | | April 30, 2020 |
Clough China Fund – Class I
Financial Highlights
Selected data for a share of beneficial interest outstanding throughout the periods indicated:
| For the Six Months Ended April 30, 2020 (Unaudited) | For the Year Ended October 31, 2019 | For the Year Ended October 31, 2018 | For the Year Ended October 31, 2017 | For the Year Ended October 31, 2016 | For the Year Ended October 31, 2015 | |||||||||||||||||||
| Net asset value, beginning of period | $ | 21.59 | $ | 21.90 | $ | 27.92 | $ | 21.60 | $ | 22.28 | $ | 23.97 | ||||||||||||
| INCOME/(LOSS) FROM INVESTMENT OPERATIONS: | ||||||||||||||||||||||||
| Net investment income/(loss)(a) | (0.14 | ) | 0.20 | (0.05 | ) | 0.15 | 0.09 | 0.23 | ||||||||||||||||
| Net realized and unrealized gain/(loss) | 0.91 | 1.18 | (5.83 | ) | 6.23 | (0.39 | ) | (1.00 | ) | |||||||||||||||
| Total from investment operations | 0.77 | 1.38 | (5.88 | ) | 6.38 | (0.30 | ) | (0.77 | ) | |||||||||||||||
| DISTRIBUTIONS: | ||||||||||||||||||||||||
| From net investment income | (0.39 | ) | – | (0.14 | ) | (0.06 | ) | (0.38 | ) | (0.53 | ) | |||||||||||||
| From net realized gains | (1.63 | ) | (1.69 | ) | – | – | – | (0.46 | ) | |||||||||||||||
| Total distributions | (2.02 | ) | (1.69 | ) | (0.14 | ) | (0.06 | ) | (0.38 | ) | (0.99 | ) | ||||||||||||
| REDEMPTION FEES ADDED TO PAID-IN CAPITAL (NOTE 6) | – | – | – | 0.00 | (b) | 0.00 | (b) | 0.07 | ||||||||||||||||
| Net increase/(decrease) in net asset value | (1.25 | ) | (0.31 | ) | (6.02 | ) | 6.32 | (0.68 | ) | (1.69 | ) | |||||||||||||
| Net asset value, end of period | $ | 20.34 | $ | 21.59 | $ | 21.90 | $ | 27.92 | $ | 21.60 | $ | 22.28 | ||||||||||||
| TOTAL RETURN(c) | 3.03 | % | 6.87 | % | (21.17 | )% | 29.64 | % | (1.31 | )% | (2.99 | )% | ||||||||||||
| RATIOS/SUPPLEMENTAL DATA: | ||||||||||||||||||||||||
| Net assets, end of period (000s) | $ | 22,295 | $ | 22,195 | $ | 21,655 | $ | 35,191 | $ | 33,605 | $ | 37,772 | ||||||||||||
| Ratio of expenses to average net assets excluding fee waivers and reimbursements | 2.02 | %(d) | 1.99 | % | 1.86 | % | 1.83 | % | 1.82 | % | 1.77 | % | ||||||||||||
| Ratio of expenses to average net assets including fee waivers and reimbursements | 1.70 | %(d) | 1.70 | % | 1.70 | % | 1.70 | % | 1.70 | % | 1.70 | % | ||||||||||||
| Ratio of net investment income/(loss) to average net assets | (1.32 | )%(d) | 0.93 | % | (0.17 | )% | 0.61 | % | 0.46 | % | 0.95 | % | ||||||||||||
| Portfolio turnover rate(e) | 65 | % | 344 | % | 131 | % | 71 | % | 126 | % | 193 | % | ||||||||||||
| (a) | Calculated using the average shares method. |
| (b) | Less than $0.005 or ($0.005) per share. |
| (c) | Total returns are for the period indicated and have not been annualized. Total returns would have been lower had certain expenses not been waived during the period. Returns shown do not reflect the deduction of taxes that a shareholder would pay on Fund distributions or the redemption of Fund shares. |
| (d) | Annualized. |
| (e) | Portfolio turnover rate for periods less than one full year have not been annualized. |
See Notes to Financial Statements.
| 112 | | April 30, 2020 |
RiverFront Global Allocation Series
| Management Commentary | April 30, 2020 (Unaudited) |
Six Months in Review:
The six months that encompassed November 2019 to April 2020 experienced one of the most volatile market regimes that we have ever encountered as portfolio managers. In mid-March, implied volatility, CBOE Volatility Index (VIX), touched a closing all-time high, even briefly surpassing the implied volatility experienced during the financial crisis in 2008. Equity markets around the world faltered, including markets in the United States which were down over 30% from peak to trough. High yield spreads blew out and the travel, energy and hospitality segments were particularly hard hit. There was a downward shock in the demand for oil, which was paired with an ill-timed supply-side price war between Saudi Arabia, Russia and other oil producing states. These dynamics sent oil prices and energy company valuations into a downward spiral. On April 20, the West Texas Intermediate (WTI) May futures contract plunged into negative territory as storage capacity was scarce and speculators were forced to exit long positions.
At the heart of these economic and market shocks has been the COVID-19 pandemic. While the world has grappled with previous outbreaks of contagious diseases, such as SARS, H1N1, and MERS, COVID-19 has proven uniquely difficult to address given its relative ease of transmissibility and high mortality rate. Given these features of COVID-19, nations around the world have scrambled to increase production of personal protective equipment and hospital capacity while also enacting other containment measures. In the United States, these containment measures, such as social distancing, wearing masks and forced closure of certain businesses, have helped “flatten the curve” of the outbreak but have not eradicated the virus. Abroad, preventive measures seem to have had relative success in countries like Korea and Taiwan, but the virus continues to ravage certain other countries like Brazil. Political uncertainty around a potential socialist Democratic presidential candidate also had markets worried in mid-February; however, those concerns seemed to have abated after Joe Biden won the South Carolina primary on February 29th and other key primaries afterward.
From November 1, 2019 through the trough of the equity markets on March 23, 2020, US equities were off ~26%, Developed International equities were off ~31% and Emerging Market equities were off ~28%. Since March 23, 2020, equities have rebounded nicely. Swift Fed action to buoy markets and ensure liquidity, coupled with unprecedented fiscal stimulus out of Washington, have so far supported valuations considerably. For instance, US markets were only off about 9% YTD at the end of April.
Outlook:
We see the investment world today being divided between two camps: those that cannot understand the market rebound (the Bears) and those that think the rebound is entirely justifiable (the Bulls). RiverFront’s investment team lies somewhere in between these two extremes, but leans cautiously optimistic about equities after historic amounts of stimulus were provided to dampen the economic effects of COVID-19.
Many unknowns surround COVID-19, making it hard to predict the duration and magnitude of its economic impact. According to the Wall Street Journal, some leading medical experts suggest the US needs to be testing at least 6 million people a week in order to allow the country to safely lift restrictions – this is roughly three times the testing the US is currently doing. We also do not yet know if the virus will taper in the summer as some other pandemics have done, or whether a ‘second wave’ may emerge. Unlike off-the-shelf antivirals, COVID-19 will require a novel vaccine that will be administered to otherwise healthy people and thus requires long trials and scrutiny before approval. While considerable progress has been made on a vaccine, these reports must be taken with a grain of salt given the early nature of testing. Even once a vaccine is approved, manufacturing for widespread usage will also create a lag. Even optimistic forecasts suggest no vaccine will be able to be widely distributed in 2020.
Counterbalancing these concerns are: 1. another full-blown economic shutdown is unlikely in our view; 2. both political parties seem to have become more friendly to bailouts (note that the 2020 election is upcoming); and 3. the US economy was very strong going into the pandemic.
Given the current investment environment (which could change rapidly), we believe US equities will outperform both Developed International and Emerging Markets. Tactically, we believe fixed income will outperform equities in the short run, but believe low current yields are a substantial impediment to being a long-term investor in bonds. We believe equities will outperform bonds over the medium to long time horizon.
RiverFront Asset Allocation Moderate
The portfolio underperformed relative to its benchmark (40% S&P 500/10% EFA/50% Bloomberg Barclays Agg) for the six months. The top themes that contributed to/detracted from performance during the period are listed below:
Contributors:
| · | Allocation to developed international stocks, particularly in the financial and industrial sectors, helped relative returns. | |
| · | Selection within fixed income – treasuries – supported relative returns. | |
| · | Selection within domestic consumer cyclical stocks was a positive contributor. |
Detractors:
| · | Overall selection within domestic equities was a large detractor with selection within financials being particularly hard-hit. | |
| · | Overall allocation and overall selection within Fixed Income hurt returns; an underweight to treasuries and selection within corporate bonds negatively impacted returns. | |
| · | Allocation to domestic equities, including an overweight to the energy sector, was a drag on performance. |
| 113 | | April 30, 2020 |
RiverFront Global Allocation Series
| Management Commentary | April 30, 2020 (Unaudited) |
RiverFront Asset Allocation Growth and Income
The portfolio underperformed relative to its benchmark (70% ACWI and 30% Bloomberg Barclays US Aggregate) for the six months. The top themes that contributed to/detracted from performance during the period are listed below:
Contributors:
| · | Allocation to and selection within developed international stocks, particularly in the financial sector, helped relative returns. | |
| · | Selection within fixed income – treasuries – supported relative returns. | |
| · | Allocation to domestic equities, including an overweight to the technology sector, was a positive contributor. |
Detractors:
| · | Overall selection within domestic equities was a large detractor with selection within financials being particularly hard-hit. | |
| · | Overall allocation and overall selection within Fixed Income hurt returns; an underweight to treasuries and selection within corporate bonds negatively impacted returns. | |
| · | An overweight to the domestic energy sector hurt returns. |
RiverFront Asset Allocation Aggressive
The portfolio underperformed relative to its benchmark (MSCI All Country World Index – NR) for the six months. The top themes that contributed to/detracted from performance during the period are listed below:
Contributors:
| · | Allocation to and selection within developed international stocks, particularly in reference to the financial sector, helped relative returns. | |
| · | Allocation to domestic stocks, particularly in the technology and financial sectors, supported relative returns. | |
| · | An underweight to emerging market stocks was a positive contributor. |
Detractors:
| · | Overall selection within domestic equities was a large detractor with selection within financials being particularly hard-hit. | |
| · | Selection within domestic technology, non-energy materials and consumer cyclicals negatively impacted returns. | |
| · | An overweight to the domestic energy sector was a drag on performance. |
Scott Hays, CFA
Portfolio Manager
Past performance is no guarantee of future results. Dividends are not guaranteed and are subject to change or elimination. Investments in international and emerging markets securities include exposure to risks such as currency fluctuations, foreign taxes and regulations, and the potential for illiquid markets and political instability.
The views of the author and information discussed in this commentary are as of the date of publication, are subject to change, and may not reflect the writer's current views. The views expressed are those of the author only, and represent an assessment of market conditions at a specific point in time, are opinions only and should not be relied upon as investment advice regarding a particular investment or markets in general. Such information does not constitute a recommendation to buy or sell specific securities or investment vehicles. It should not be assumed that any investment will be profitable or will equal the performance of the fund(s) or any securities or any sectors mentioned in this letter. The subject matter contained in this letter has been derived from several sources believed to be reliable and accurate at the time of compilation. Neither ALPS Advisors, Inc., RiverFront Investment Group, LLC, nor the Funds accepts any liability for losses either direct or consequential caused by the use of this information.
The MSCI EAFE Index is recognized as the pre-eminent benchmark in the United States to measure international equity performance. It comprises the MSCI country indices that represent developed markets outside of North America: Europe, Australasia and the Far East.
The MSCI Emerging Markets Index is a free float-adjusted market capitalization index that is designed to measure equity market performance in the global emerging markets.
The Barclays U.S. Short Treasury Index is composed of bonds of investment grade with a maturity between one and three years.
Indices do not reflect deductions for fees, expenses, or taxes.
An investor may not invest directly in an index.
Diversification cannot guarantee gain or prevent losses.
ALPS Portfolio Solutions Distributor, Inc., ALPS Distributors, Inc. and ALPS Advisors Inc. are affiliated.
| 114 | | April 30, 2020 |
RiverFront Asset Allocation Aggressive
| Performance Update | April 30, 2020 (Unaudited) |
Performance of $10,000 Initial Investment (as of April 30, 2020)
Comparison of change in value of a $10,000 investment
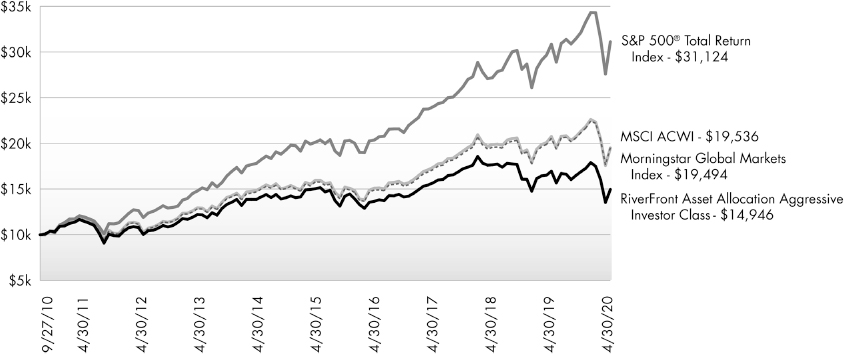
The chart above represents historical performance of a hypothetical investment of $10,000 in the Fund since inception. Past performance does not guarantee future results. This chart does not reflect the deduction of taxes that a shareholder would pay on Fund distributions or the redemption of Fund shares.
Average Annual Total Returns (as of April 30, 2020)
| 6 Month | 1 Year | 3 Years | 5 Years | 10 Years | Since Inception^ | Total Expense Ratio | What You Pay* | |
| Investor# (NAV) | -11.52% | -11.83% | -1.60% | -0.12% | 3.92% | 6.51% | 1.16% | 1.16% |
| Class A (NAV) | -11.52% | -11.83% | -1.61% | -0.12% | 3.92% | 6.50% | 1.16% | 1.16% |
| Class A (MOP) | -16.40% | -16.68% | -3.45% | -1.24% | 3.33% | 5.98% | ||
| Class C (NAV) | -11.90% | -12.54% | -2.35% | -0.87% | 3.15% | 5.72% | 1.91% | 1.91% |
| Class C (CDSC) | -12.76% | -13.40% | -2.35% | -0.87% | 3.15% | 5.72% | ||
| Class I (NAV) | -11.44% | -11.66% | -1.38% | 0.11% | 4.17% | 6.77% | 0.91% | 0.91% |
| Investor II (NAV) | -11.54% | -11.84% | -1.63% | -0.13% | 3.91% | 6.49% | 1.16% | 1.16% |
| Class L1 (NAV) | -11.46% | -11.61% | -1.36% | 0.12% | 4.17% | 6.77% | 0.91% | 0.91% |
| Morningstar Global Markets Index2 | -8.57% | -6.01% | 3.89% | 4.09% | 6.94% | 9.79% | ||
| S&P 500® Total Return Index3 | -3.16% | 0.86% | 9.04% | 9.12% | 11.69% | 12.70% | ||
| MSCI All Country World Index4 | -7.68% | -4.96% | 4.46% | 4.37% | 6.94% | 9.53% |
Performance data quoted represents past performance. Past performance does not guarantee future results. Investment return and principal value of an investment will fluctuate so that an investor's shares, when sold or redeemed, may be worth more or less than the original cost. Current performance data may be higher or lower than actual data quoted. For the most current month-end performance data, please call 1-866-759-5679.
Maximum Offering Price (MOP) for Class A shares includes the Fund’s maximum sales charge of 5.50%. Performance shown at NAV does not include these sales charges and would have been lower had it been taken into account. If you invest $1 million or more, either as a lump sum or through the Fund’s accumulation or letter of intent programs, you can purchase Class A shares without an initial sales charge (load). A Contingent Deferred Sales Charge (“CDSC”) of 1.00% may apply to Class C shares redeemed within the first 12 months after a purchase, and on Class A shares redeemed within the first 18 months after a purchase in excess of $1 million.
Performance less than 1 year is cumulative.
| 115 | | April 30, 2020 |
RiverFront Asset Allocation Aggressive
| Performance Update | April 30, 2020 (Unaudited) |
Performance shown for Class A shares prior to June 12, 2018 reflects the historical performance of the Fund’s Investor shares, calculated using the fees and expenses of Class A shares.
The Investor Class, Class A, Class C, I and L shares performance shown for periods prior to September 27, 2010 reflects the performance of the Baird Funds, Inc. – RiverFront Long-Term Growth Fund’s Institutional Class shares (as result of the reorganization of the Baird Funds, Inc. – RiverFront Long-Term Growth Fund into the Fund).
The Investor II Class performance shown for periods prior to September 27, 2010 reflects the performance of the Baird Funds, Inc. – RiverFront Long-Term Growth Fund’s Investor Class shares (as result of the reorganization of the Baird Funds, Inc. – RiverFront Long-Term Growth Fund into the Fund).
| 1 | Prior to close of business on September 24, 2010, Class L was known as Institutional Class of the Baird Funds, Inc. - RiverFront Long-Term Growth Fund. |
| 2 | The Morningstar Global Markets Index replaced the MSCI All Country World Index as the Fund’s primary index effective December 18, 2019. The Morningstar Global Market Index measures the performance of performance of the stocks located in the developed and emerging countries across the world. Stocks in the index are weighted by their float capital, which removes corporate cross ownership, government holdings and other locked-in shares. The Adviser and Sub-Adviser made this recommendation to the Board because the new index closely aligns to the Fund’s investment strategies and investment restrictions. The index is not actively managed and does not reflect any deduction for fees, expenses or taxes. An investor may not invest directly in an index. |
| 3 | S&P 500® Total Return Index is the Standard & Poor's composite index of 500 stocks, a widely recognized, unmanaged index of common stock prices. The index is not actively managed and does not reflect any deduction for fees, expenses or taxes. An investor may not invest directly in an index. |
| 4 | The MSCI ACWI (All Country World Index) is a free float-adjusted market capitalization weighted index that is designed to measure the equity market performance of developed and emerging markets. The MSCI ACWI consists of 45 country indices comprising 24 developed and 21 emerging market country indices. The index includes reinvestment of dividends, net of foreign withholding taxes. The index is not actively managed and does not reflect any deductions for fees, expenses or taxes. An investor may not invest directly in an index. |
| ^ | Fund Inception date of October 28, 2008 for Investor Class II and Class L; Fund Inception date September 27, 2010 for Investor Class and Classes C and I; Fund Inception date June 12, 2018 for Class A. |
| * | What You Pay reflects Acquired Fund Fees and Expenses of 0.66%. Please see the prospectus dated February 28, 2020 for additional information. |
| # | Prior to December 1, 2017, Investor Class was known as Class A. |
Prior to February 28, 2018, the RiverFront Asset Allocation Aggressive was known as the RiverFront Global Growth Fund.
The table does not reflect the deduction of taxes that a shareholder would pay on Fund distributions or the redemption of Fund shares.
This Fund is not suitable for all investors and is subject to investment risks, including possible loss of the principal amount invested.
There is no guarantee that the Fund will continue to hold any one particular security or stay invested in any one particular company. The composition of the Fund's top holdings is subject to change. Performance figures are historical and reflect the change in share price, reinvested distributions, changes in net asset value, sales charges and capital gains distributions, if any.
Not FDIC Insured – No Bank Guarantee – May Lose Value
Top Ten Holdings (as a % of Net Assets) †
| RiverFront Dynamic US Flex-Cap ETF | 30.64% |
| RiverFront Dynamic US Dividend Advantage ETF | 30.39% |
| First Trust RiverFront Dynamic Developed International ETF | 14.96% |
| First Trust RiverFront Dynamic Emerging Markets ETF | 11.43% |
| First Trust RiverFront Dynamic Europe ETF | 6.50% |
| First Trust RiverFront Dynamic Asia Pacific ETF | 3.46% |
| RiverFront Dynamic Core Income ETF | 1.36% |
| Top Ten Holdings | 98.74% |
| † | Holdings are subject to change, and may not reflect the current or future position of the portfolio. Table presents indicative values only. Excludes cash & cash equivalents. |
Portfolio Composition (as a % of Net Assets)

| 116 | | April 30, 2020 |
RiverFront Asset Allocation Growth & Income
| Performance Update | April 30, 2020 (Unaudited) |
Performance of $10,000 Initial Investment (as of April 30, 2020)
Comparison of change in value of a $10,000 investment

The chart above represents historical performance of a hypothetical investment of $10,000 in the Fund since inception. Past performance does not guarantee future results. This chart does not reflect the deduction of taxes that a shareholder would pay on Fund distributions or the redemption of Fund shares.
Average Annual Total Returns (as of April 30, 2020)
| 6 Month | 1 Year | 3 Years | 5 Years | Since Inception^ | Total Expense Ratio | What You Pay* | |
| Investor# (NAV) | -7.83% | -6.82% | 0.71% | 1.77% | 5.38% | 1.10% | 1.10% |
| Class A (NAV) | -7.83% | -6.81% | 0.71% | 1.77% | 5.38% | 1.10% | 1.10% |
| Class A (MOP) | -12.91% | -11.95% | -1.17% | 0.63% | 4.77% | ||
| Class C (NAV) | -8.23% | -7.60% | -0.07% | 0.99% | 4.58% | 1.85% | 1.85% |
| Class C (CDSC) | -9.14% | -8.51% | -0.07% | 0.99% | 4.58% | ||
| Class I (NAV) | -7.75% | -6.63% | 0.96% | 2.02% | 5.64% | 0.85% | 0.85% |
| Morningstar Global Markets Index1 | -8.57% | -6.01% | 3.89% | 4.09% | 7.45% | ||
| Bloomberg Barclays US Aggregate Bond Index2 | 4.86% | 10.84% | 5.17% | 3.80% | 3.72% | ||
| 70% Morningstar Global Markets Index / 30% Bloomberg Barclays US Aggregate Bond1,2 | -4.31% | -0.67% | 4.58% | 4.25% | 6.56% | ||
| MSCI All Country World Index3 | -7.68% | -4.96% | 4.46% | 4.37% | 7.45% | ||
| 70% ACWI and 30% Bloomberg Barclays U.S. Aggregate Bond2,3 | -3.68% | 0.08% | 4.98% | 4.43% | 6.56% |
Performance data quoted represents past performance. Past performance does not guarantee future results. Investment return and principal value of an investment will fluctuate so that an investor's shares, when sold or redeemed, may be worth more or less than the original cost. Current performance data may be higher or lower than actual data quoted. For the most current month-end performance data, please call 1-866-759-5679.
Maximum Offering Price (MOP) for Class A shares includes the Fund’s maximum sales charge of 5.50%. Performance shown at NAV does not include these sales charges and would have been lower had it been taken into account. If you invest $1 million or more, either as a lump sum or through the Fund’s accumulation or letter of intent programs, you can purchase Class A shares without an initial sales charge (load). A Contingent Deferred Sales Charge (“CDSC”) of 1.00% may apply to Class C shares redeemed within the first 12 months after a purchase, and on Class A shares redeemed within the first 18 months after a purchase in excess of $1 million.
| 117 | | April 30, 2020 |
RiverFront Asset Allocation Growth & Income
| Performance Update | April 30, 2020 (Unaudited) |
Performance shown for Class A shares prior to June 12, 2018 reflects the historical performance of the Fund’s Investor shares, calculated using the fees and expenses of Class A shares.
| 1 | The Morningstar Global Markets Index replaced the MSCI All Country World Index as the Fund’s primary index effective December 18, 2019. The Morningstar Global Market Index measures the performance of performance of the stocks located in the developed and emerging countries across the world. Stocks in the index are weighted by their float capital, which removes corporate cross ownership, government holdings and other locked-in shares. The Adviser and Sub-Adviser made this recommendation to the Board because the new index closely aligns to the Fund’s investment strategies and investment restrictions. The index is not actively managed and does not reflect any deduction for fees, expenses or taxes. An investor may not invest directly in an index. |
| 2 | The Barclays U.S. Aggregate Bond Index is a broad-based benchmark that measures the investment grade, U.S. dollar-denominated, fixed-rate taxable bond market, including Treasuries, government-related and corporate securities, MBS (agency fixed-rate and hybrid ARM passthroughs), ABS, and CMBS. The index is not actively managed and does not reflect any deductions for fees, expenses or taxes. An investor may not invest directly in an index. |
| 3 | The MSCI ACWI (All Country World Index) is a free float-adjusted market capitalization weighted index that is designed to measure the equity market performance of developed and emerging markets. The MSCI ACWI consists of 45 country indices comprising 24 developed and 21 emerging market country indices. The index includes reinvestment of dividends, net of foreign withholding taxes. The index is not actively managed and does not reflect any deductions for fees, expenses or taxes. An investor may not invest directly in an index. |
| ^ | Fund Inception date of August 2, 2010 for Investor Class and Classes C and I; Fund Inception date of June 12, 2018 for Class A. |
| * | What You Pay reflects Acquired Fund Fees and Expenses of 0.60%. Please see the prospectus dated February 28, 2020 for additional information. |
| # | Prior to December 1, 2017, Investor Class was known as Class A. |
Prior to February 28, 2018, the RiverFront Asset Allocation Growth & Income was known as the RiverFront Dynamic Equity Income Fund.
The table does not reflect the deduction of taxes that a shareholder would pay on Fund distributions or the redemption of Fund shares.
This Fund is not suitable for all investors and is subject to investment risks, including possible loss of the principal amount invested.
There is no guarantee that the Fund will continue to hold any one particular security or stay invested in any one particular company. The composition of the Fund's top holdings is subject to change. Performance figures are historical and reflect the change in share price, reinvested distributions, changes in net asset value, sales charges and capital gains distributions, if any.
Not FDIC Insured – No Bank Guarantee – May Lose Value
Top Ten Holdings (as a % of Net Assets) †
| RiverFront Dynamic US Dividend Advantage ETF | 30.66% |
| RiverFront Dynamic Core Income ETF | 29.72% |
| First Trust RiverFront Dynamic Developed International ETF | 15.19% |
| RiverFront Dynamic US Flex-Cap ETF | 12.34% |
| First Trust RiverFront Dynamic Emerging Markets ETF | 7.79% |
| RiverFront Dynamic Unconstrained Income ETF | 2.00% |
| Riverfront Strategic Income Fund | 1.00% |
| Top Ten Holdings | 98.70% |
| † | Holdings are subject to change, and may not reflect the current or future position of the portfolio. Table presents indicative values only. Excludes cash & cash equivalents. |
Portfolio Composition (as a % of Net Assets)

| 118 | | April 30, 2020 |
RiverFront Asset Allocation Moderate
| Performance Update | April 30, 2020 (Unaudited) |
Performance of $10,000 Initial Investment (as of April 30, 2020)
Comparison of change in value of a $10,000 investment

The chart above represents historical performance of a hypothetical investment of $10,000 in the Fund since inception. Past performance does not guarantee future results. This chart does not reflect the deduction of taxes that a shareholder would pay on Fund distributions or the redemption of Fund shares.
Average Annual Total Returns (as of April 30, 2020)
| 6 Month | 1 Year | 3 Years | 5 Years | Since Inception^ | Total Expense Ratio | What You Pay* | |
| Investor# (NAV) | -3.54% | -1.18% | 2.81% | 2.87% | 5.11% | 1.03% | 1.03% |
| Class A (NAV) | -3.55% | -1.25% | 2.80% | 2.87% | 5.10% | 1.03% | 1.03% |
| Class A (MOP) | -8.87% | -6.68% | 0.88% | 1.71% | 4.50% | ||
| Class C (NAV) | -3.94% | -2.02% | 2.00% | 2.09% | 4.32% | 1.78% | 1.78% |
| Class C (CDSC) | -4.90% | -2.99% | 2.00% | 2.09% | 4.32% | ||
| Class I (NAV) | -3.43% | -0.94% | 3.07% | 3.12% | 5.37% | 0.78% | 0.78% |
| S&P 500® Total Return Index1 | -3.16% | 0.86% | 9.04% | 9.12% | 12.57% | ||
| Bloomberg Barclays US Aggregate Bond Index2 | 4.86% | 10.84% | 5.17% | 3.80% | 3.72% | ||
| Morningstar Developed Markets ex-North America Index3 | -14.16% | -11.24% | -0.64% | 0.03% | 4.04% | ||
| 10% Mstar Developed ex-NA / 40% S&P 500 / 50% Bbg Barclay US Agg | 0.06% | 5.09% | 6.49% | 5.82% | 7.50% |
Performance data quoted represents past performance. Past performance does not guarantee future results. Investment return and principal value of an investment will fluctuate so that an investor's shares, when sold or redeemed, may be worth more or less than the original cost. Current performance data may be higher or lower than actual data quoted. For the most current month-end performance data, please call 1-866-759-5679.
Maximum Offering Price (MOP) for Class A shares includes the Fund’s maximum sales charge of 5.50%. Performance shown at NAV does not include these sales charges and would have been lower had it been taken into account. If you invest $1 million or more, either as a lump sum or through the Fund’s accumulation or letter of intent programs, you can purchase Class A shares without an initial sales charge (load). A Contingent Deferred Sales Charge (“CDSC”) of 1.00% may apply to Class C shares redeemed within the first 12 months after a purchase, and on Class A shares redeemed within the first 18 months after a purchase in excess of $1 million.
| 119 | | April 30, 2020 |
RiverFront Asset Allocation Moderate
| Performance Update | April 30, 2020 (Unaudited) |
Performance shown for Class A shares prior to June 12, 2018 reflects the historical performance of the Fund’s Investor shares, calculated using the fees and expenses of Class A shares.
| 1 | S&P 500® Total Return Index is the Standard & Poor's composite index of 500 stocks, a widely recognized, unmanaged index of common stock prices. The index is not actively managed and does not reflect any deduction for fees, expenses or taxes. An investor may not invest directly in an index. |
| 2 | The Barclays U.S. Aggregate Bond Index is a broad-based benchmark that measures the investment grade, U.S. dollar-denominated, fixed-rate taxable bond market, including Treasuries, government-related and corporate securities, MBS (agency fixed-rate and hybrid ARM passthroughs), ABS, and CMBS. The index is not actively managed and does not reflect any deductions for fees, expenses or taxes. An investor may not invest directly in an index. |
| 3 | The Morningstar Developed Markets ex-North America Index measures the performance of companies in developed markets ex-North America. It covers approximately 97% of the full market capitalization in the Developed Markets ex-North America. The index is not actively managed and does not reflect any deductions for fees, expenses or taxes. An investor may not invest directly in an index. |
| ^ | Fund Inception date of August 2, 2010 for Investor Class and Classes C and I; Fund Inception date of June 12, 2018 for Class A. |
| * | What You Pay reflects Acquired Fund Fees and Expenses of 0.53%. Please see the prospectus dated February 28, 2020 for additional information. |
| # | Prior to December 1, 2017, Investor Class was known as Class A. |
Prior to February 28, 2018, the RiverFront Asset Allocation Moderate was known as the RiverFront Moderate Growth & Income Fund.
The table does not reflect the deduction of taxes that a shareholder would pay on Fund distributions or the redemption of Fund shares.
This Fund is not suitable for all investors and is subject to investment risks, including possible loss of the principal amount invested.
There is no guarantee that the Fund will continue to hold any one particular security or stay invested in any one particular company. The composition of the Fund's top holdings is subject to change. Performance figures are historical and reflect the change in share price, reinvested distributions, changes in net asset value, sales charges and capital gains distributions, if any.
Not FDIC Insured – No Bank Guarantee – May Lose Value
Top Ten Holdings (as a % of Net Assets) †
| RiverFront Dynamic Core Income ETF | 49.32% |
| RiverFront Dynamic US Dividend Advantage ETF | 30.87% |
| RiverFront Dynamic US Flex-Cap ETF | 10.37% |
| First Trust RiverFront Dynamic Developed International ETF | 5.07% |
| RiverFront Dynamic Unconstrained Income ETF | 1.88% |
| Riverfront Strategic Income Fund | 0.98% |
| Top Ten Holdings | 98.49% |
| † | Holdings are subject to change, and may not reflect the current or future position of the portfolio. Table presents indicative values only. Excludes cash & cash equivalents. |
Portfolio Composition (as a % of Net Assets)

| 120 | | April 30, 2020 |
RiverFront Asset Allocation Aggressive
| Statement of Investments | April 30, 2020 (Unaudited) |
| Shares | Value (Note 2) | |||||||
| EXCHANGE TRADED FUNDS (98.74%) | ||||||||
| Debt (1.36%) | ||||||||
| RiverFront Dynamic Core Income ETF(a) | 12,462 | $ | 325,231 | |||||
| Equity (97.38%) | ||||||||
| First Trust RiverFront Dynamic Asia Pacific ETF(a) | 18,650 | 825,061 | ||||||
| First Trust RiverFront Dynamic Developed International ETF(a) | 73,274 | 3,571,763 | ||||||
| First Trust RiverFront Dynamic Emerging Markets ETF(a) | 53,135 | 2,729,726 | ||||||
| First Trust RiverFront Dynamic Europe ETF(a) | 30,799 | 1,551,841 | ||||||
| RiverFront Dynamic US Dividend Advantage ETF(a) | 238,556 | 7,253,939 | ||||||
| RiverFront Dynamic US Flex-Cap ETF(a) | 242,006 | 7,312,986 | ||||||
| 23,245,316 | ||||||||
| TOTAL EXCHANGE TRADED FUNDS | ||||||||
| (Cost $26,091,651) | 23,570,547 | |||||||
| 7-Day Yield | Shares | Value (Note 2) | ||||||||||
| SHORT-TERM INVESTMENTS (1.48%) | ||||||||||||
| Money Market Fund (1.48%) | ||||||||||||
| State Street Institutional Treasury Plus Money Market Fund | 0.276 | % | 353,492 | 353,492 | ||||||||
| TOTAL MONEY MARKET FUND | 353,492 | |||||||||||
| TOTAL SHORT-TERM INVESTMENTS | ||||||||||||
| (Cost $353,492) | 353,492 | |||||||||||
| TOTAL INVESTMENTS (100.22%) | ||||||||||||
| (Cost $26,445,143) | $ | 23,924,039 | ||||||||||
| Liabilities In Excess Of Other Assets (-0.22%) | (52,297 | ) | ||||||||||
| NET ASSETS (100.00%) | $ | 23,871,742 | ||||||||||
| (a) | Affiliated Company. See Note 7 in Notes to Financial Statements. |
For Fund compliance purposes, the Fund's industry classifications refer to any one or more of the industry sub-classifications used by one or more widely recognized market indexes or ratings group indexes, and/or as defined by Fund management. This definition may not apply for purposes of this report, which may combine industry sub-classifications for reporting ease. Industries are shown as a percent of net assets.
See Notes to Financial Statements.
| 121 | | April 30, 2020 |
RiverFront Asset Allocation Growth & Income
| Statement of Investments | April 30, 2020 (Unaudited) |
| Shares | Value (Note 2) | |||||||
| EXCHANGE TRADED FUNDS (98.70%) | ||||||||
| Debt (32.72%) | ||||||||
| RiverFront Dynamic Core Income ETF(a) | 672,286 | $ | 17,545,186 | |||||
| RiverFront Dynamic Unconstrained Income ETF(a) | 48,985 | 1,185,412 | ||||||
| Riverfront Strategic Income Fund(a) | 25,169 | 587,444 | ||||||
| 19,318,042 | ||||||||
| Equity (65.98%) | ||||||||
| First Trust RiverFront Dynamic Developed International ETF(a) | 183,932 | 8,965,821 | ||||||
| First Trust RiverFront Dynamic Emerging Markets ETF(a) | 89,517 | 4,598,793 | ||||||
| RiverFront Dynamic US Dividend Advantage ETF(a) | 595,252 | 18,100,244 | ||||||
| RiverFront Dynamic US Flex-Cap ETF(a) | 241,110 | 7,285,910 | ||||||
| 38,950,768 | ||||||||
| TOTAL EXCHANGE TRADED FUNDS | ||||||||
| (Cost $59,822,431) | 58,268,810 | |||||||
| 7-Day Yield | Shares | Value (Note 2) | ||||||||||
| SHORT-TERM INVESTMENTS (1.71%) | ||||||||||||
| Money Market Fund (1.71%) | ||||||||||||
| State Street Institutional Treasury Plus Money Market Fund | 0.276 | % | 1,011,951 | 1,011,951 | ||||||||
| TOTAL MONEY MARKET FUND | 1,011,951 | |||||||||||
| TOTAL SHORT-TERM INVESTMENTS | ||||||||||||
| (Cost $1,011,951) | 1,011,951 | |||||||||||
| TOTAL INVESTMENTS (100.41%) | ||||||||||||
| (Cost $60,834,382) | $ | 59,280,761 | ||||||||||
| Liabilities In Excess Of Other Assets (-0.41%) | (243,191 | ) | ||||||||||
| NET ASSETS (100.00%) | $ | 59,037,570 | ||||||||||
| (a) | Affiliated Company. See Note 7 in Notes to Financial Statements. |
For Fund compliance purposes, the Fund's industry classifications refer to any one or more of the industry sub-classifications used by one or more widely recognized market indexes or ratings group indexes, and/or as defined by Fund management. This definition may not apply for purposes of this report, which may combine industry sub-classifications for reporting ease. Industries are shown as a percent of net assets.
See Notes to Financial Statements.
| 122 | | April 30, 2020 |
RiverFront Asset Allocation Moderate
| Statement of Investments | April 30, 2020 (Unaudited) |
| Shares | Value (Note 2) | |||||||
| EXCHANGE TRADED FUNDS (98.49%) | ||||||||
| Debt (52.18%) | ||||||||
| RiverFront Dynamic Core Income ETF(a) | 975,244 | $ | 25,451,723 | |||||
| RiverFront Dynamic Unconstrained Income ETF(a) | 40,010 | 968,222 | ||||||
| Riverfront Strategic Income Fund(a) | 21,775 | 508,228 | ||||||
| 26,928,173 | ||||||||
| Equity (46.31%) | ||||||||
| First Trust RiverFront Dynamic Developed International ETF(a) | 53,639 | 2,614,649 | ||||||
| RiverFront Dynamic US Dividend Advantage ETF(a) | 524,001 | 15,933,666 | ||||||
| RiverFront Dynamic US Flex-Cap ETF(a) | 177,173 | 5,353,849 | ||||||
| 23,902,164 | ||||||||
| TOTAL EXCHANGE TRADED FUNDS | ||||||||
| (Cost $50,348,670) | 50,830,337 | |||||||
| 7-Day Yield | Shares | Value (Note 2) | ||||||||||
| SHORT-TERM INVESTMENTS (1.63%) | ||||||||||||
| Money Market Fund (1.63%) | ||||||||||||
| State Street Institutional Treasury Plus Money Market Fund | 0.276 | % | 838,707 | 838,707 | ||||||||
| TOTAL MONEY MARKET FUND | 838,707 | |||||||||||
| TOTAL SHORT-TERM INVESTMENTS | ||||||||||||
| (Cost $838,707) | 838,707 | |||||||||||
| TOTAL INVESTMENTS (100.12%) | ||||||||||||
| (Cost $51,187,377) | $ | 51,669,044 | ||||||||||
| Liabilities In Excess Of Other Assets (-0.12%) | (60,877 | ) | ||||||||||
| NET ASSETS (100.00%) | $ | 51,608,167 | ||||||||||
| (a) | Affiliated Company. See Note 7 in Notes to Financial Statements. |
For Fund compliance purposes, the Fund's industry classifications refer to any one or more of the industry sub-classifications used by one or more widely recognized market indexes or ratings group indexes, and/or as defined by Fund management. This definition may not apply for purposes of this report, which may combine industry sub-classifications for reporting ease. Industries are shown as a percent of net assets.
See Notes to Financial Statements.
| 123 | | April 30, 2020 |
RiverFront Global Allocation Series
| Statements of Assets and Liabilities | April 30, 2020 (Unaudited) |
| RiverFront Asset Allocation Aggressive | RiverFront Asset Allocation Growth & Income | RiverFront Asset Allocation Moderate | ||||||||||
| ASSETS | ||||||||||||
| Investments, at value | $ | 353,492 | $ | 1,011,951 | $ | 838,707 | ||||||
| Investments in affiliates, at value | 23,570,547 | 58,268,810 | 50,830,337 | |||||||||
| Receivable for shares sold | 150 | 27,100 | – | |||||||||
| Dividends and interest receivable | 120 | 242 | 207 | |||||||||
| Total Assets | 23,924,309 | 59,308,103 | 51,669,251 | |||||||||
| LIABILITIES | ||||||||||||
| Payable for investments purchased | – | 674 | 99 | |||||||||
| Payable for shares redeemed | 39,132 | 230,645 | 21,570 | |||||||||
| Unitary administrative fees payable | 9,943 | 24,864 | 21,071 | |||||||||
| Distribution and services fees payable | 3,492 | 14,350 | 18,344 | |||||||||
| Total Liabilities | 52,567 | 270,533 | 61,084 | |||||||||
| NET ASSETS | $ | 23,871,742 | $ | 59,037,570 | $ | 51,608,167 | ||||||
| NET ASSETS CONSIST OF | ||||||||||||
| Paid-in capital | $ | 29,521,308 | $ | 68,044,863 | $ | 53,400,887 | ||||||
| Total distributable earnings | (5,649,566 | ) | (9,007,293 | ) | (1,792,720 | ) | ||||||
| NET ASSETS | $ | 23,871,742 | $ | 59,037,570 | $ | 51,608,167 | ||||||
| INVESTMENTS, AT COST | $ | 353,492 | $ | 1,011,951 | $ | 838,707 | ||||||
| INVESTMENTS IN AFFILIATES, AT COST | $ | 26,091,651 | $ | 59,822,431 | $ | 50,348,670 | ||||||
See Notes to Financial Statements.
| 124 | | April 30, 2020 |
RiverFront Global Allocation Series
| Statements of Assets and Liabilities (continued) | April 30, 2020 (Unaudited) |
| RiverFront Asset Allocation Aggressive | RiverFront Asset Allocation Growth & Income | RiverFront Asset Allocation Moderate | ||||||||||
| PRICING OF SHARES | ||||||||||||
| Investor Class: | ||||||||||||
| Net Asset Value, offering and redemption price per share | $ | 10.04 | $ | 10.93 | $ | 10.00 | ||||||
| Net Assets | $ | 2,099,832 | $ | 7,016,298 | $ | 4,311,636 | ||||||
| Shares of beneficial interest outstanding (unlimited number of shares, no par value common stock authorized) | 209,233 | 642,133 | 431,120 | |||||||||
| Class A: | ||||||||||||
| Net Asset Value, offering and redemption price per share | $ | 9.96 | $ | 10.92 | $ | 9.99 | ||||||
| Net Assets | $ | 755,707 | $ | 3,631,464 | $ | 5,696,508 | ||||||
| Shares of beneficial interest outstanding (unlimited number of shares, no par value common stock authorized) | 75,890 | 332,659 | 570,206 | |||||||||
| Maximum offering price per share ((NAV/0.9450), based on maximum sales charge of 5.50% of the offering price) | $ | 10.54 | $ | 11.56 | $ | 10.57 | ||||||
| Class C: | ||||||||||||
| Net Asset Value, offering and redemption price per share(a) | $ | 9.41 | $ | 10.58 | $ | 9.84 | ||||||
| Net Assets | $ | 3,484,733 | $ | 15,177,571 | $ | 20,404,302 | ||||||
| Shares of beneficial interest outstanding (unlimited number of shares, no par value common stock authorized) | 370,228 | 1,433,910 | 2,072,592 | |||||||||
| Class I: | ||||||||||||
| Net Asset Value, offering and redemption price per share | $ | 10.24 | $ | 10.88 | $ | 10.01 | ||||||
| Net Assets | $ | 3,066,140 | $ | 33,212,237 | $ | 21,195,721 | ||||||
| Shares of beneficial interest outstanding (unlimited number of shares, no par value common stock authorized) | 299,420 | 3,052,843 | 2,118,387 | |||||||||
| Investor Class II: | ||||||||||||
| Net Asset Value, offering and redemption price per share | $ | 9.95 | N/A | N/A | ||||||||
| Net Assets | $ | 963,513 | N/A | N/A | ||||||||
| Shares of beneficial interest outstanding (unlimited number of shares, no par value common stock authorized) | 96,850 | N/A | N/A | |||||||||
| Class L: | ||||||||||||
| Net Asset Value, offering and redemption price per share | $ | 10.22 | N/A | N/A | ||||||||
| Net Assets | $ | 13,501,817 | N/A | N/A | ||||||||
| Shares of beneficial interest outstanding (unlimited number of shares, no par value common stock authorized) | 1,321,105 | N/A | N/A | |||||||||
| (a) | Redemption price per share may be reduced for any applicable contingent deferred sales charge. For a description of a possible sales charge, please see the Fund's Prospectus. |
See Notes to Financial Statements.
| 125 | | April 30, 2020 |
RiverFront Global Allocation Series
| Statements of Operations | For the Six Months Ended April 30, 2020 (Unaudited) |
| RiverFront Asset Allocation Aggressive | RiverFront Asset Allocation Growth & Income | RiverFront Asset Allocation Moderate | ||||||||||
| INVESTMENT INCOME | ||||||||||||
| Dividends | $ | 3,502 | $ | 7,992 | $ | 5,862 | ||||||
| Dividends from affiliated securities | 322,023 | 836,686 | 625,730 | |||||||||
| Total Investment Income | 325,525 | 844,678 | 631,592 | |||||||||
| EXPENSES | ||||||||||||
| Unitary administrative fees | 38,363 | 92,212 | 72,023 | |||||||||
| Distribution and service fees | ||||||||||||
| Investor Class | 4,312 | 10,097 | 5,892 | |||||||||
| Class A | 1,002 | 4,767 | 7,615 | |||||||||
| Class C | 20,880 | 88,748 | 115,879 | |||||||||
| Investor Class II | 1,402 | – | – | |||||||||
| Total Expenses | 65,959 | 195,824 | 201,409 | |||||||||
| Net Expenses | 65,959 | 195,824 | 201,409 | |||||||||
| Net Investment Income | 259,566 | 648,854 | 430,183 | |||||||||
| Net realized loss on investments - affiliated securities | (1,663,224 | ) | (3,540,857 | ) | (528,674 | ) | ||||||
| Net realized loss | (1,663,224 | ) | (3,540,857 | ) | (528,674 | ) | ||||||
| Net change in unrealized depreciation on investments - affiliated securities | (2,140,429 | ) | (2,952,276 | ) | (1,844,374 | ) | ||||||
| Net change in unrealized depreciation | (2,140,429 | ) | (2,952,276 | ) | (1,844,374 | ) | ||||||
| NET REALIZED AND UNREALIZED LOSS ON INVESTMENTS | (3,803,653 | ) | (6,493,133 | ) | (2,373,048 | ) | ||||||
| NET DECREASE IN NET ASSETS RESULTING FROM OPERATIONS | $ | (3,544,087 | ) | $ | (5,844,279 | ) | $ | (1,942,865 | ) | |||
See Notes to Financial Statements.
| 126 | | April 30, 2020 |
RiverFront Asset Allocation Aggressive
Statements of Changes in Net Assets
| For the Six Months Ended April 30, 2020 (Unaudited) | For the Year Ended October 31, 2019 | |||||||
| OPERATIONS | ||||||||
| Net investment income | $ | 259,566 | $ | 621,156 | ||||
| Net realized loss | (1,663,224 | ) | (1,523,400 | ) | ||||
| Net realized gain distributions from affiliated securities | – | 5 | ||||||
| Net change in unrealized appreciation/(depreciation) | (2,140,429 | ) | 2,847,100 | |||||
| Net Increase/(Decrease) in Net Assets Resulting from Operations | (3,544,087 | ) | 1,944,861 | |||||
| TOTAL DISTRIBUTIONS | ||||||||
| From distributable earnings | ||||||||
| Investor Class(a) | (79,044 | ) | (978,331 | ) | ||||
| Class A | (16,860 | ) | (1,998 | ) | ||||
| Class C | (89,159 | ) | (1,852,942 | ) | ||||
| Class I | (101,058 | ) | (2,155,224 | ) | ||||
| Investor Class II(b) | (24,038 | ) | (458,057 | ) | ||||
| Class L | (358,374 | ) | (4,257,390 | ) | ||||
| Net Decrease in Net Assets from Distributions | (668,533 | ) | (9,703,942 | ) | ||||
| BENEFICIAL INTEREST TRANSACTIONS (NOTE 6) | ||||||||
| Shares sold | ||||||||
| Investor Class(a) | 27,937 | 1,351,202 | ||||||
| Class A(c) | 143,289 | 922,531 | ||||||
| Class C | 81,345 | 445,318 | ||||||
| Class I | 280,742 | 1,734,905 | ||||||
| Investor Class II(b) | 12,988 | 79,701 | ||||||
| Class L | 873,289 | 2,056,278 | ||||||
| Dividends reinvested | ||||||||
| Investor Class(a) | 76,357 | 945,702 | ||||||
| Class A(c) | 16,860 | 1,998 | ||||||
| Class C | 88,963 | 1,813,092 | ||||||
| Class I | 99,066 | 1,923,202 | ||||||
| Investor Class II(b) | 17,702 | 360,676 | ||||||
| Class L | 357,175 | 4,241,732 | ||||||
| Shares redeemed | ||||||||
| Investor Class(a) | (1,368,403 | ) | (2,121,927 | ) | ||||
| Class A(c) | (41,294 | ) | (195,850 | ) | ||||
| Class C | (879,294 | ) | (4,449,881 | ) | ||||
| Class I | (3,701,248 | ) | (7,645,415 | ) | ||||
| Investor Class II(b) | (177,281 | ) | (806,515 | ) | ||||
| Class L | (3,536,564 | ) | (4,474,200 | ) | ||||
| Net Decrease in Net Assets Derived from Beneficial Interest Transactions | (7,628,371 | ) | (3,817,451 | ) | ||||
| Net decrease in net assets | (11,840,991 | ) | (11,576,532 | ) | ||||
| NET ASSETS | ||||||||
| Beginning of period | 35,712,733 | 47,289,265 | ||||||
| End of period | $ | 23,871,742 | $ | 35,712,733 | ||||
| (a) | Prior to December 1, 2017, Investor Class was known as Class A. |
| (b) | Prior to December 1, 2017, Investor Class II was known as Investor Class. |
| (c) | Class A commenced operations on June 12, 2018. |
See Notes to Financial Statements.
| 127 | | April 30, 2020 |
RiverFront Asset Allocation Growth & Income
Statements of Changes in Net Assets
| For the Six Months Ended April 30, 2020 (Unaudited) | For the Year Ended October 31, 2019 | |||||||
| OPERATIONS | ||||||||
| Net investment income | $ | 648,854 | $ | 1,388,831 | ||||
| Net realized loss | (3,540,857 | ) | (2,958,678 | ) | ||||
| Net realized gain distributions from affiliated securities | – | 786 | ||||||
| Net change in unrealized appreciation/(depreciation) | (2,952,276 | ) | 5,839,705 | |||||
| Net Increase/(Decrease) in Net Assets Resulting from Operations | (5,844,279 | ) | 4,270,644 | |||||
| TOTAL DISTRIBUTIONS | ||||||||
| From distributable earnings | ||||||||
| Investor Class(a) | (104,579 | ) | (1,336,549 | ) | ||||
| Class A(b) | (48,386 | ) | (33,358 | ) | ||||
| Class C | (178,551 | ) | (3,170,284 | ) | ||||
| Class I | (597,922 | ) | (6,987,237 | ) | ||||
| Net Decrease in Net Assets from Distributions | (929,438 | ) | (11,527,428 | ) | ||||
| BENEFICIAL INTEREST TRANSACTIONS (NOTE 6) | ||||||||
| Shares sold | ||||||||
| Investor Class(a) | 98,610 | 203,942 | ||||||
| Class A(b) | 675,806 | 3,685,066 | ||||||
| Class C | 583,140 | 922,731 | ||||||
| Class I | 2,090,678 | 7,460,165 | ||||||
| Dividends reinvested | ||||||||
| Investor Class(a) | 100,959 | 1,290,905 | ||||||
| Class A(b) | 48,319 | 33,151 | ||||||
| Class C | 176,705 | 3,042,112 | ||||||
| Class I | 588,012 | 6,707,400 | ||||||
| Shares redeemed | ||||||||
| Investor Class(a) | (1,329,644 | ) | (4,107,208 | ) | ||||
| Class A(b) | (563,087 | ) | (868,285 | ) | ||||
| Class C | (3,705,809 | ) | (10,941,786 | ) | ||||
| Class I | (15,062,673 | ) | (22,189,473 | ) | ||||
| Acquisition (Note 10) | ||||||||
| Investor Class | – | 3,260,538 | ||||||
| Class A | – | 913,417 | ||||||
| Class C | – | 5,789,388 | ||||||
| Class I | – | 10,230,419 | ||||||
| Net Increase/(Decrease) in Net Assets Derived from Beneficial Interest Transactions | (16,298,984 | ) | 5,432,482 | |||||
| Net decrease in net assets | (23,072,701 | ) | (1,824,302 | ) | ||||
| NET ASSETS | ||||||||
| Beginning of period | 82,110,271 | 83,934,573 | ||||||
| End of period | $ | 59,037,570 | $ | 82,110,271 | ||||
| (a) | Prior to December 1, 2017, Investor Class was known as Class A. |
| (b) | Class A commenced operations on June 12, 2018. |
See Notes to Financial Statements.
| 128 | | April 30, 2020 |
RiverFront Asset Allocation Moderate
Statements of Changes in Net Assets
| For the Six Months Ended April 30, 2020 (Unaudited) | For the Year Ended October 31, 2019 | |||||||
| OPERATIONS | ||||||||
| Net investment income | $ | 430,183 | $ | 1,119,403 | ||||
| Net realized loss | (528,674 | ) | (1,302,960 | ) | ||||
| Net realized gain distributions from affiliated securities | – | 561 | ||||||
| Net change in unrealized appreciation/(depreciation) | (1,844,374 | ) | 4,563,442 | |||||
| Net Increase/(Decrease) in Net Assets Resulting from Operations | (1,942,865 | ) | 4,380,446 | |||||
| TOTAL DISTRIBUTIONS | ||||||||
| From distributable earnings | ||||||||
| Investor Class(a) | (40,253 | ) | (1,178,333 | ) | ||||
| Class A(b) | (52,310 | ) | (62,602 | ) | ||||
| Class C | (120,484 | ) | (5,595,843 | ) | ||||
| Class I | (223,060 | ) | (4,146,360 | ) | ||||
| Net Decrease in Net Assets from Distributions | (436,107 | ) | (10,983,138 | ) | ||||
| BENEFICIAL INTEREST TRANSACTIONS (NOTE 6) | ||||||||
| Shares sold | ||||||||
| Investor Class(a) | 34,569 | 18,686 | ||||||
| Class A(b) | 1,315,708 | 7,241,268 | ||||||
| Class C | 212,807 | 1,162,855 | ||||||
| Class I | 1,197,805 | 2,661,508 | ||||||
| Dividends reinvested | ||||||||
| Investor Class(a) | 40,009 | 1,125,741 | ||||||
| Class A(b) | 51,641 | 62,095 | ||||||
| Class C | 116,263 | 5,348,120 | ||||||
| Class I | 213,635 | 3,834,901 | ||||||
| Shares redeemed | ||||||||
| Investor Class(a) | (734,030 | ) | (3,626,295 | ) | ||||
| Class A(b) | (1,339,799 | ) | (1,836,224 | ) | ||||
| Class C | (5,804,621 | ) | (21,627,177 | ) | ||||
| Class I | (4,786,585 | ) | (9,782,890 | ) | ||||
| Acquisition (Note 10) | ||||||||
| Investor Class | – | 151,471 | ||||||
| Class A | – | 302,618 | ||||||
| Class C | – | 4,827,033 | ||||||
| Class I | – | 2,934,669 | ||||||
| Net Decrease in Net Assets Derived from Beneficial Interest Transactions | (9,482,598 | ) | (7,201,621 | ) | ||||
| Net decrease in net assets | (11,861,570 | ) | (13,804,313 | ) | ||||
| NET ASSETS | ||||||||
| Beginning of period | 63,469,737 | 77,274,050 | ||||||
| End of period | $ | 51,608,167 | $ | 63,469,737 | ||||
| (a) | Prior to December 1, 2017, Investor Class was known as Class A. |
| (b) | Class A commenced operations on June 12, 2018. |
See Notes to Financial Statements.
| 129 | | April 30, 2020 |
RiverFront Asset Allocation Aggressive – Investor Class
Financial Highlights
Selected data for a share of beneficial interest outstanding throughout the periods indicated:
| For the Six Months Ended April 30, 2020 (Unaudited) | For the Year Ended October 31, 2019 | For the Year Ended October 31, 2018(a)(b) | For the Year Ended October 31, 2017 | For the Year Ended October 31, 2016 | For the Year Ended October 31, 2015 | |||||||||||||||||||
| Net asset value, beginning of period | $ | 11.57 | $ | 14.59 | $ | 16.27 | $ | 13.54 | $ | 13.95 | $ | 15.44 | ||||||||||||
| INCOME/(LOSS) FROM INVESTMENT OPERATIONS: | ||||||||||||||||||||||||
| Net investment income(c) | 0.09 | 0.17 | 0.25 | 0.16 | 0.23 | 0.24 | ||||||||||||||||||
| Net realized and unrealized gain/(loss) | (1.38 | ) | 0.08 | (1.27 | ) | 2.76 | (0.31 | ) | (0.04 | ) | ||||||||||||||
| Total from investment operations | (1.29 | ) | 0.25 | (1.02 | ) | 2.92 | (0.08 | ) | 0.20 | |||||||||||||||
| DISTRIBUTIONS: | ||||||||||||||||||||||||
| From net investment income | (0.24 | ) | (0.19 | ) | (0.21 | ) | (0.19 | ) | (0.20 | ) | (0.25 | ) | ||||||||||||
| From net realized gains | – | (3.08 | ) | (0.45 | ) | – | (0.13 | ) | (1.44 | ) | ||||||||||||||
| Total distributions | (0.24 | ) | (3.27 | ) | (0.66 | ) | (0.19 | ) | (0.33 | ) | (1.69 | ) | ||||||||||||
| Net increase/(decrease) in net asset value | (1.53 | ) | (3.02 | ) | (1.68 | ) | 2.73 | (0.41 | ) | (1.49 | ) | |||||||||||||
| Net asset value, end of period | $ | 10.04 | $ | 11.57 | $ | 14.59 | $ | 16.27 | $ | 13.54 | $ | 13.95 | ||||||||||||
| TOTAL RETURN(d) | (11.52 | )% | 5.05 | % | (6.62 | )% | 21.81 | % | (0.57 | )% | 1.34 | % | ||||||||||||
| RATIOS/SUPPLEMENTAL DATA: | ||||||||||||||||||||||||
| Net assets, end of period (000s) | $ | 2,100 | $ | 3,914 | $ | 4,491 | $ | 8,935 | $ | 9,618 | $ | 18,308 | ||||||||||||
| Ratio of expenses to average net assets excluding fee waivers and reimbursements | 0.50 | %(e) | 0.50 | % | 0.93 | % | 1.45 | % | 1.40 | % | 1.38 | % | ||||||||||||
| Ratio of expenses to average net assets including fee waivers and reimbursements | 0.50 | %(e) | 0.50 | % | 0.75 | %(f) | 1.15 | % | 1.15 | % | 1.15 | % | ||||||||||||
| Ratio of net investment income to average net assets | 1.62 | %(e) | 1.47 | % | 1.56 | % | 1.09 | % | 1.77 | % | 1.67 | % | ||||||||||||
| Portfolio turnover rate(g) | 19 | % | 18 | % | 200 | % | 60 | % | 113 | % | 71 | % | ||||||||||||
| (a) | Prior to December 1, 2017, Investor Class was known as Class A. |
| (b) | Prior to February 28, 2018, the RiverFront Asset Allocation Aggressive was known as the RiverFront Global Growth Fund. |
| (c) | Calculated using the average shares method. |
| (d) | Total returns are for the period indicated and have not been annualized. Total returns would have been lower had certain expenses not been waived during the period. Returns shown do not reflect the deduction of taxes that a shareholder would pay on Fund distributions or the redemption of Fund shares. Returns shown exclude any applicable sales charges. |
| (e) | Annualized. |
| (f) | Effective February 28, 2018, pursuant to the Administrative Services Agreement, the Fund pays an annual unitary administrative fee, which is based on the Fund’s average daily net assets, and will no longer pay a management fee or contractually limit the Fund’s total annual expenses. Refer to Note 8. |
| (g) | Portfolio turnover rate for periods less than one full year have not been annualized. |
See Notes to Financial Statements.
| 130 | | April 30, 2020 |
RiverFront Asset Allocation Aggressive – Class A
Financial Highlights
Selected data for a share of beneficial interest outstanding throughout the periods indicated:
| For the Six Months Ended April 30, 2020 (Unaudited) | For the Year Ended October 31, 2019 | For the Period June 12, 2018 (Commencement of Operations) to October 31, 2018 | ||||||||||
| Net asset value, beginning of period | $ | 11.48 | $ | 14.51 | $ | 16.35 | ||||||
| INCOME FROM INVESTMENT OPERATIONS: | ||||||||||||
| Net investment income(a) | 0.09 | 0.21 | 0.16 | |||||||||
| Net realized and unrealized gain/(loss) | (1.37 | ) | 0.03 | (2.00 | ) | |||||||
| Total from investment operations | (1.28 | ) | 0.24 | (1.84 | ) | |||||||
| DISTRIBUTIONS: | ||||||||||||
| From net investment income | (0.24 | ) | (0.19 | ) | – | |||||||
| From net realized gains | – | (3.08 | ) | – | ||||||||
| Total distributions | (0.24 | ) | (3.27 | ) | – | |||||||
| Net (decrease) in net asset value | (1.52 | ) | (3.03 | ) | (1.84 | ) | ||||||
| Net asset value, end of period | $ | 9.96 | $ | 11.48 | $ | 14.51 | ||||||
| TOTAL RETURN(b) | (11.52 | )% | 5.01 | % | (11.25 | )% | ||||||
| RATIOS/SUPPLEMENTAL DATA: | ||||||||||||
| Net assets, end of period (000s) | $ | 756 | $ | 756 | $ | 9 | ||||||
| Ratio of expenses to average net assets excluding fee waivers and reimbursements | 0.50 | %(c) | 0.50 | % | 0.50 | %(c) | ||||||
| Ratio of expenses to average net assets including fee waivers and reimbursements | 0.50 | %(c) | 0.50 | % | 0.50 | %(c) | ||||||
| Ratio of net investment income to average net assets | 1.59 | %(c) | 1.88 | % | 2.66 | %(c) | ||||||
| Portfolio turnover rate(d) | 19 | % | 18 | % | 200 | % | ||||||
| (a) | Calculated using the average shares method. |
| (b) | Total returns are for the period indicated and have not been annualized. Total returns would have been lower had certain expenses not been waived during the period. Returns shown do not reflect the deduction of taxes that a shareholder would pay on Fund distributions or the redemption of Fund shares. |
| (c) | Annualized. |
| (d) | Portfolio turnover rate for periods less than one full year have not been annualized. |
See Notes to Financial Statements.
| 131 | | April 30, 2020 |
RiverFront Asset Allocation Aggressive – Class C
Financial Highlights
Selected data for a share of beneficial interest outstanding throughout the periods indicated:
| For the Six Months Ended April 30, 2020 (Unaudited) | For the Year Ended October 31, 2019 | For the Year Ended October 31, 2018(a) | For the Year Ended October 31, 2017 | For the Year Ended October 31, 2016 | For the Year Ended October 31, 2015 | |||||||||||||||||||
| Net asset value, beginning of period | $ | 10.89 | $ | 14.01 | $ | 15.73 | $ | 13.18 | $ | 13.67 | $ | 15.19 | ||||||||||||
| INCOME/(LOSS) FROM INVESTMENT OPERATIONS: | ||||||||||||||||||||||||
| Net investment income(b) | 0.05 | 0.08 | 0.12 | 0.04 | 0.12 | 0.13 | ||||||||||||||||||
| Net realized and unrealized gain/(loss) | (1.31 | ) | 0.05 | (1.20 | ) | 2.68 | (0.30 | ) | (0.04 | ) | ||||||||||||||
| Total from investment operations | (1.26 | ) | 0.13 | (1.08 | ) | 2.72 | (0.18 | ) | 0.09 | |||||||||||||||
| DISTRIBUTIONS: | ||||||||||||||||||||||||
| From net investment income | (0.22 | ) | (0.17 | ) | (0.19 | ) | (0.17 | ) | (0.18 | ) | (0.17 | ) | ||||||||||||
| From net realized gains | – | (3.08 | ) | (0.45 | ) | – | (0.13 | ) | (1.44 | ) | ||||||||||||||
| Total distributions | (0.22 | ) | (3.25 | ) | (0.64 | ) | (0.17 | ) | (0.31 | ) | (1.61 | ) | ||||||||||||
| Net increase/(decrease) in net asset value | (1.48 | ) | (3.12 | ) | (1.72 | ) | 2.55 | (0.49 | ) | (1.52 | ) | |||||||||||||
| Net asset value, end of period | $ | 9.41 | $ | 10.89 | $ | 14.01 | $ | 15.73 | $ | 13.18 | $ | 13.67 | ||||||||||||
| TOTAL RETURN(c) | (11.90 | )% | 4.23 | % | (7.24 | )% | 20.87 | % | (1.31 | )% | 0.59 | % | ||||||||||||
| RATIOS/SUPPLEMENTAL DATA: | ||||||||||||||||||||||||
| Net assets, end of period (000s) | $ | 3,485 | $ | 4,758 | $ | 8,597 | $ | 10,408 | $ | 11,447 | $ | 12,908 | ||||||||||||
| Ratio of expenses to average net assets excluding fee waivers and reimbursements | 1.25 | %(d) | 1.25 | % | 1.63 | % | 2.20 | % | 2.16 | % | 2.13 | % | ||||||||||||
| Ratio of expenses to average net assets including fee waivers and reimbursements | 1.25 | %(d) | 1.25 | % | 1.47 | %(e) | 1.90 | % | 1.90 | % | 1.90 | % | ||||||||||||
| Ratio of net investment income to average net assets | 0.89 | %(d) | 0.71 | % | 0.80 | % | 0.29 | % | 0.92 | % | 0.88 | % | ||||||||||||
| Portfolio turnover rate(f) | 19 | % | 18 | % | 200 | % | 60 | % | 113 | % | 71 | % | ||||||||||||
| (a) | Prior to February 28, 2018, the RiverFront Asset Allocation Aggressive was known as the RiverFront Global Growth Fund. |
| (b) | Calculated using the average shares method. |
| (c) | Total returns are for the period indicated and have not been annualized. Total returns would have been lower had certain expenses not been waived during the period. Returns shown do not reflect the deduction of taxes that a shareholder would pay on Fund distributions or the redemption of Fund shares. Returns shown exclude any applicable sales charges. |
| (d) | Annualized. |
| (e) | Effective February 28, 2018, pursuant to the Administrative Services Agreement, the Fund pays an annual unitary administrative fee, which is based on the Fund’s average daily net assets, and will no longer pay a management fee or contractually limit the Fund’s total annual expenses. Refer to Note 8. |
| (f) | Portfolio turnover rate for periods less than one full year have not been annualized. |
See Notes to Financial Statements.
| 132 | | April 30, 2020 |
RiverFront Asset Allocation Aggressive – Class I
Financial Highlights
Selected data for a share of beneficial interest outstanding throughout the periods indicated:
| For the Six Months Ended April 30, 2020 (Unaudited) | For the Year Ended October 31, 2019 | For the Year Ended October 31, 2018(a) | For the Year Ended October 31, 2017 | For the Year Ended October 31, 2016 | For the Year Ended October 31, 2015 | |||||||||||||||||||
| Net asset value, beginning of period | $ | 11.79 | $ | 14.78 | $ | 16.43 | $ | 13.65 | $ | 14.03 | $ | 15.52 | ||||||||||||
| INCOME/(LOSS) FROM INVESTMENT OPERATIONS: | ||||||||||||||||||||||||
| Net investment income(b) | 0.11 | 0.21 | 0.29 | 0.19 | 0.26 | 0.26 | ||||||||||||||||||
| Net realized and unrealized gain/(loss) | (1.42 | ) | 0.07 | (1.27 | ) | 2.78 | (0.30 | ) | (0.03 | ) | ||||||||||||||
| Total from investment operations | (1.31 | ) | 0.28 | (0.98 | ) | 2.97 | (0.04 | ) | 0.23 | |||||||||||||||
| DISTRIBUTIONS: | ||||||||||||||||||||||||
| From net investment income | (0.24 | ) | (0.19 | ) | (0.22 | ) | (0.19 | ) | (0.21 | ) | (0.28 | ) | ||||||||||||
| From net realized gains | – | (3.08 | ) | (0.45 | ) | – | (0.13 | ) | (1.44 | ) | ||||||||||||||
| Total distributions | (0.24 | ) | (3.27 | ) | (0.67 | ) | (0.19 | ) | (0.34 | ) | (1.72 | ) | ||||||||||||
| Net increase/(decrease) in net asset value | (1.55 | ) | (2.99 | ) | (1.65 | ) | 2.78 | (0.38 | ) | (1.49 | ) | |||||||||||||
| Net asset value, end of period | $ | 10.24 | $ | 11.79 | $ | 14.78 | $ | 16.43 | $ | 13.65 | $ | 14.03 | ||||||||||||
| TOTAL RETURN(c) | (11.44 | )% | 5.29 | % | (6.33 | )% | 22.05 | % | (0.31 | )% | 1.51 | % | ||||||||||||
| RATIOS/SUPPLEMENTAL DATA: | ||||||||||||||||||||||||
| Net assets, end of period (000s) | $ | 3,066 | $ | 7,003 | $ | 12,701 | $ | 13,873 | $ | 10,140 | $ | 16,412 | ||||||||||||
| Ratio of expenses to average net assets excluding fee waivers and reimbursements | 0.25 | %(d) | 0.25 | % | 0.62 | % | 1.20 | % | 1.15 | % | 1.29 | % | ||||||||||||
| Ratio of expenses to average net assets including fee waivers and reimbursements | 0.25 | %(d) | 0.25 | % | 0.46 | %(e) | 0.90 | % | 0.90 | % | 0.90 | % | ||||||||||||
| Ratio of net investment income to average net assets | 1.90 | %(d) | 1.77 | % | 1.79 | % | 1.29 | % | 1.98 | % | 1.77 | % | ||||||||||||
| Portfolio turnover rate(f) | 19 | % | 18 | % | 200 | % | 60 | % | 113 | % | 71 | % | ||||||||||||
| (a) | Prior to February 28, 2018, the RiverFront Asset Allocation Aggressive was known as the RiverFront Global Growth Fund. |
| (b) | Calculated using the average shares method. |
| (c) | Total returns are for the period indicated and have not been annualized. Total returns would have been lower had certain expenses not been waived during the period. Returns shown do not reflect the deduction of taxes that a shareholder would pay on Fund distributions or the redemption of Fund shares. |
| (d) | Annualized. |
| (e) | Effective February 28, 2018, pursuant to the Administrative Services Agreement, the Fund pays an annual unitary administrative fee, which is based on the Fund’s average daily net assets, and will no longer pay a management fee or contractually limit the Fund’s total annual expenses. Refer to Note 8. |
| (f) | Portfolio turnover rate for periods less than one full year have not been annualized. |
See Notes to Financial Statements.
| 133 | | April 30, 2020 |
RiverFront Asset Allocation Aggressive – Investor Class II
Financial Highlights
Selected data for a share of beneficial interest outstanding throughout the periods indicated:
| For the Six Months Ended April 30, 2020 (Unaudited) | For the Year Ended October 31, 2019 | For the Year Ended October 31, 2018(a)(b) | For the Year Ended October 31, 2017 | For the Year Ended October 31, 2016 | For the Year Ended October 31, 2015 | |||||||||||||||||||
| Net asset value, beginning of period | $ | 11.47 | $ | 14.50 | $ | 16.18 | $ | 13.47 | $ | 13.87 | $ | 15.37 | ||||||||||||
| INCOME/(LOSS) FROM INVESTMENT OPERATIONS: | ||||||||||||||||||||||||
| Net investment income(c) | 0.09 | 0.18 | 0.25 | 0.15 | 0.23 | 0.26 | ||||||||||||||||||
| Net realized and unrealized gain/(loss) | (1.37 | ) | 0.06 | (1.27 | ) | 2.75 | (0.30 | ) | (0.07 | ) | ||||||||||||||
| Total from investment operations | (1.28 | ) | 0.24 | (1.02 | ) | 2.90 | (0.07 | ) | 0.19 | |||||||||||||||
| DISTRIBUTIONS: | ||||||||||||||||||||||||
| From net investment income | (0.24 | ) | (0.19 | ) | (0.21 | ) | (0.19 | ) | (0.20 | ) | (0.25 | ) | ||||||||||||
| From net realized gains | – | (3.08 | ) | (0.45 | ) | – | (0.13 | ) | (1.44 | ) | ||||||||||||||
| Total distributions | (0.24 | ) | (3.27 | ) | (0.66 | ) | (0.19 | ) | (0.33 | ) | (1.69 | ) | ||||||||||||
| Net increase/(decrease) in net asset value | (1.52 | ) | (3.03 | ) | (1.68 | ) | 2.71 | (0.40 | ) | (1.50 | ) | |||||||||||||
| Net asset value, end of period | $ | 9.95 | $ | 11.47 | $ | 14.50 | $ | 16.18 | $ | 13.47 | $ | 13.87 | ||||||||||||
| TOTAL RETURN(d) | (11.54 | )% | 5.02 | % | (6.66 | )% | 21.77 | % | (0.51 | )% | 1.28 | % | ||||||||||||
| RATIOS/SUPPLEMENTAL DATA: | ||||||||||||||||||||||||
| Net assets, end of period (000s) | $ | 964 | $ | 1,255 | $ | 2,043 | $ | 3,451 | $ | 4,667 | $ | 6,924 | ||||||||||||
| Ratio of expenses to average net assets excluding fee waivers and reimbursements | 0.50 | %(e) | 0.50 | % | 0.91 | % | 1.45 | % | 1.40 | % | 1.38 | % | ||||||||||||
| Ratio of expenses to average net assets including fee waivers and reimbursements | 0.50 | %(e) | 0.50 | % | 0.74 | %(f) | 1.15 | % | 1.15 | % | 1.15 | % | ||||||||||||
| Ratio of net investment income to average net assets | 1.59 | %(e) | 1.53 | % | 1.58 | % | 1.04 | % | 1.75 | % | 1.78 | % | ||||||||||||
| Portfolio turnover rate(g) | 19 | % | 18 | % | 200 | % | 60 | % | 113 | % | 71 | % | ||||||||||||
| (a) | Prior to February 28, 2018, the RiverFront Asset Allocation Aggressive was known as the RiverFront Global Growth Fund. |
| (b) | Prior to December 1, 2017, Investor Class II was known as Investor Class. |
| (c) | Calculated using the average shares method. |
| (d) | Total returns are for the period indicated and have not been annualized. Total returns would have been lower had certain expenses not been waived during the period. Returns shown do not reflect the deduction of taxes that a shareholder would pay on Fund distributions or the redemption of Fund shares. |
| (e) | Annualized. |
| (f) | Effective February 28, 2018, pursuant to the Administrative Services Agreement, the Fund pays an annual unitary administrative fee, which is based on the Fund’s average daily net assets, and will no longer pay a management fee or contractually limit the Fund’s total annual expenses. Refer to Note 8. |
| (g) | Portfolio turnover rate for periods less than one full year have not been annualized. |
See Notes to Financial Statements.
| 134 | | April 30, 2020 |
RiverFront Asset Allocation Aggressive – Class L
Financial Highlights
Selected data for a share of beneficial interest outstanding throughout the periods indicated:
| For the Six Months Ended April 30, 2020 (Unaudited) | For the Year Ended October 31, 2019 | For the Year Ended October 31, 2018(a) | For the Year Ended October 31, 2017 | For the Year Ended October 31, 2016 | For the Year Ended October 31, 2015 | |||||||||||||||||||
| Net asset value, beginning of period | $ | 11.77 | $ | 14.76 | $ | 16.41 | $ | 13.63 | $ | 14.01 | $ | 15.49 | ||||||||||||
| INCOME/(LOSS) FROM INVESTMENT OPERATIONS: | ||||||||||||||||||||||||
| Net investment income(b) | 0.11 | 0.21 | 0.30 | 0.19 | 0.25 | 0.27 | ||||||||||||||||||
| Net realized and unrealized gain/(loss) | (1.42 | ) | 0.07 | (1.28 | ) | 2.78 | (0.29 | ) | (0.03 | ) | ||||||||||||||
| Total from investment operations | (1.31 | ) | 0.28 | (0.98 | ) | 2.97 | (0.04 | ) | 0.24 | |||||||||||||||
| DISTRIBUTIONS: | ||||||||||||||||||||||||
| From net investment income | (0.24 | ) | (0.19 | ) | (0.22 | ) | (0.19 | ) | (0.21 | ) | (0.28 | ) | ||||||||||||
| From net realized gains | – | (3.08 | ) | (0.45 | ) | – | (0.13 | ) | (1.44 | ) | ||||||||||||||
| Total distributions | (0.24 | ) | (3.27 | ) | (0.67 | ) | (0.19 | ) | (0.34 | ) | (1.72 | ) | ||||||||||||
| Net increase/(decrease) in net asset value | (1.55 | ) | (2.99 | ) | (1.65 | ) | 2.78 | (0.38 | ) | (1.48 | ) | |||||||||||||
| Net asset value, end of period | $ | 10.22 | $ | 11.77 | $ | 14.76 | $ | 16.41 | $ | 13.63 | $ | 14.01 | ||||||||||||
| TOTAL RETURN(c) | (11.46 | )% | 5.30 | % | (6.34 | )% | 22.08 | % | (0.31 | )% | 1.59 | % | ||||||||||||
| RATIOS/SUPPLEMENTAL DATA: | ||||||||||||||||||||||||
| Net assets, end of period (000s) | $ | 13,502 | $ | 18,026 | $ | 19,449 | $ | 25,309 | $ | 22,552 | $ | 26,109 | ||||||||||||
| Ratio of expenses to average net assets excluding fee waivers and reimbursements | 0.25 | %(d) | 0.25 | % | 0.63 | % | 1.20 | % | 1.16 | % | 1.04 | % | ||||||||||||
| Ratio of expenses to average net assets including fee waivers and reimbursements | 0.25 | %(d) | 0.25 | % | 0.47 | %(e) | 0.90 | % | 0.90 | % | 0.90 | % | ||||||||||||
| Ratio of net investment income to average net assets | 1.87 | %(d) | 1.77 | % | 1.82 | % | 1.27 | % | 1.90 | % | 1.86 | % | ||||||||||||
| Portfolio turnover rate(f) | 19 | % | 18 | % | 200 | % | 60 | % | 113 | % | 71 | % | ||||||||||||
| (a) | Prior to February 28, 2018, the RiverFront Asset Allocation Aggressive was known as the RiverFront Global Growth Fund. |
| (b) | Calculated using the average shares method. |
| (c) | Total returns are for the period indicated and have not been annualized. Total returns would have been lower had certain expenses not been waived during the period. Returns shown do not reflect the deduction of taxes that a shareholder would pay on Fund distributions or the redemption of Fund shares. |
| (d) | Annualized. |
| (e) | Effective February 28, 2018, pursuant to the Administrative Services Agreement, the Fund pays an annual unitary administrative fee, which is based on the Fund’s average daily net assets, and will no longer pay a management fee or contractually limit the Fund’s total annual expenses. Refer to Note 8. |
| (f) | Portfolio turnover rate for periods less than one full year have not been annualized. |
See Notes to Financial Statements.
| 135 | | April 30, 2020 |
RiverFront Asset Allocation Growth & Income – Investor Class
Financial Highlights
Selected data for a share of beneficial interest outstanding throughout the periods indicated:
| For the Six Months Ended April 30, 2020 (Unaudited) | For the Year Ended October 31, 2019 | For the Year Ended October 31, 2018(a)(b) | For the Year Ended October 31, 2017 | For the Year Ended October 31, 2016 | For the Year Ended October 31, 2015 | |||||||||||||||||||
| Net asset value, beginning of period | $ | 12.02 | $ | 13.37 | $ | 14.48 | $ | 12.38 | $ | 12.63 | $ | 13.10 | ||||||||||||
| INCOME/(LOSS) FROM INVESTMENT OPERATIONS: | ||||||||||||||||||||||||
| Net investment income(c) | 0.11 | 0.23 | 0.25 | 0.17 | 0.21 | 0.25 | ||||||||||||||||||
| Net realized and unrealized gain/(loss) | (1.05 | ) | 0.41 | (0.80 | ) | 2.09 | (0.00 | )(d) | (0.04 | ) | ||||||||||||||
| Total from investment operations | (0.94 | ) | 0.64 | (0.55 | ) | 2.26 | 0.21 | 0.21 | ||||||||||||||||
| DISTRIBUTIONS: | ||||||||||||||||||||||||
| From net investment income | (0.15 | ) | (0.21 | ) | (0.24 | ) | (0.16 | ) | (0.21 | ) | (0.22 | ) | ||||||||||||
| From net realized gains | – | (1.78 | ) | (0.32 | ) | – | (0.25 | ) | (0.46 | ) | ||||||||||||||
| Total distributions | (0.15 | ) | (1.99 | ) | (0.56 | ) | (0.16 | ) | (0.46 | ) | (0.68 | ) | ||||||||||||
| Net increase/(decrease) in net asset value | (1.09 | ) | (1.35 | ) | (1.11 | ) | 2.10 | (0.25 | ) | (0.47 | ) | |||||||||||||
| Net asset value, end of period | $ | 10.93 | $ | 12.02 | $ | 13.37 | $ | 14.48 | $ | 12.38 | $ | 12.63 | ||||||||||||
| TOTAL RETURN(e) | (7.83 | )% | 6.71 | % | (4.03 | )% | 18.37 | % | 1.80 | % | 1.64 | % | ||||||||||||
| RATIOS/SUPPLEMENTAL DATA: | ||||||||||||||||||||||||
| Net assets, end of period (000s) | $ | 7,016 | $ | 8,864 | $ | 9,062 | $ | 19,123 | $ | 20,227 | $ | 19,769 | ||||||||||||
| Ratio of expenses to average net assets excluding fee waivers and reimbursements | 0.50 | %(f) | 0.50 | % | 0.85 | % | 1.37 | % | 1.35 | % | 1.35 | % | ||||||||||||
| Ratio of expenses to average net assets including fee waivers and reimbursements | 0.50 | %(f) | 0.50 | % | 0.74 | %(g) | 1.15 | % | 1.15 | % | 1.15 | % | ||||||||||||
| Ratio of net investment income to average net assets | 1.80 | %(f) | 1.91 | % | 1.70 | % | 1.24 | % | 1.74 | % | 1.98 | % | ||||||||||||
| Portfolio turnover rate(h) | 26 | % | 62 | % | 224 | % | 63 | % | 129 | % | 75 | % | ||||||||||||
| (a) | Prior to December 1, 2017, Investor Class was known as Class A. |
| (b) | Prior to February 28, 2018, the RiverFront Asset Allocation Growth & Income was known as the RiverFront Dynamic Equity Income Fund. |
| (c) | Calculated using the average shares method. |
| (d) | Less than $0.005 or ($0.005) per share. |
| (e) | Total returns are for the period indicated and have not been annualized. Total returns would have been lower had certain expenses not been waived during the period. Returns shown do not reflect the deduction of taxes that a shareholder would pay on Fund distributions or the redemption of Fund shares. Returns shown exclude any applicable sales charges. |
| (f) | Annualized. |
| (g) | Effective February 28, 2018, pursuant to the Administrative Services Agreement, the Fund pays an annual unitary administrative fee, which is based on the Fund’s average daily net assets, and will no longer pay a management fee or contractually limit the Fund’s total annual expenses. Refer to Note 8. |
| (h) | Portfolio turnover rate for periods less than one full year have not been annualized. |
See Notes to Financial Statements.
| 136 | | April 30, 2020 |
RiverFront Asset Allocation Growth & Income – Class A
Financial Highlights
Selected data for a share of beneficial interest outstanding throughout the periods indicated:
| For the Six Months Ended April 30, 2020 (Unaudited) | For the Year Ended October 31, 2019 | For the Period June 12, 2018 (Commencement of Operations) to October 31, 2018 | ||||||||||
| Net asset value, beginning of period | $ | 12.01 | $ | 13.36 | $ | 14.70 | ||||||
| INCOME FROM INVESTMENT OPERATIONS: | ||||||||||||
| Net investment income(a) | 0.10 | 0.25 | 0.15 | |||||||||
| Net realized and unrealized gain/(loss) | (1.04 | ) | 0.39 | (1.34 | ) | |||||||
| Total from investment operations | (0.94 | ) | 0.64 | (1.19 | ) | |||||||
| DISTRIBUTIONS: | ||||||||||||
| From net investment income | (0.15 | ) | (0.21 | ) | (0.15 | ) | ||||||
| From net realized gains | – | (1.78 | ) | – | ||||||||
| Total distributions | (0.15 | ) | (1.99 | ) | (0.15 | ) | ||||||
| Net (decrease) in net asset value | (1.09 | ) | (1.35 | ) | (1.34 | ) | ||||||
| Net asset value, end of period | $ | 10.92 | $ | 12.01 | $ | 13.36 | ||||||
| TOTAL RETURN(b) | (7.83 | )% | 6.78 | % | (8.13 | )% | ||||||
| RATIOS/SUPPLEMENTAL DATA: | ||||||||||||
| Net assets, end of period (000s) | $ | 3,631 | $ | 3,839 | $ | 13 | ||||||
| Ratio of expenses to average net assets excluding fee waivers and reimbursements | 0.50 | %(c) | 0.50 | % | 0.50 | %(c) | ||||||
| Ratio of expenses to average net assets including fee waivers and reimbursements | 0.50 | %(c) | 0.50 | % | 0.50 | %(c) | ||||||
| Ratio of net investment income to average net assets | 1.76 | %(c) | 2.13 | % | 2.65 | %(c) | ||||||
| Portfolio turnover rate(d) | 26 | % | 62 | % | 224 | % | ||||||
| (a) | Calculated using the average shares method. |
| (b) | Total returns are for the period indicated and have not been annualized. Total returns would have been lower had certain expenses not been waived during the period. Returns shown do not reflect the deduction of taxes that a shareholder would pay on Fund distributions or the redemption of Fund shares. |
| (c) | Annualized. |
| (d) | Portfolio turnover rate for periods less than one full year have not been annualized. |
See Notes to Financial Statements.
| 137 | | April 30, 2020 |
RiverFront Asset Allocation Growth & Income – Class C
Financial Highlights
Selected data for a share of beneficial interest outstanding throughout the periods indicated:
| For the Six Months Ended April 30, 2020 (Unaudited) | For the Year Ended October 31, 2019 | For the Year Ended October 31, 2018(a) | For the Year Ended October 31, 2017 | For the Year Ended October 31, 2016 | For the Year Ended October 31, 2015 | |||||||||||||||||||
| Net asset value, beginning of period | $ | 11.65 | $ | 13.03 | $ | 14.16 | $ | 12.15 | $ | 12.44 | $ | 12.97 | ||||||||||||
| INCOME/(LOSS) FROM INVESTMENT OPERATIONS: | ||||||||||||||||||||||||
| Net investment income(b) | 0.06 | 0.13 | 0.14 | 0.07 | 0.13 | 0.15 | ||||||||||||||||||
| Net realized and unrealized gain/(loss) | (1.02 | ) | 0.40 | (0.78 | ) | 2.05 | (0.02 | ) | (0.04 | ) | ||||||||||||||
| Total from investment operations | (0.96 | ) | 0.53 | (0.64 | ) | 2.12 | 0.11 | 0.11 | ||||||||||||||||
| DISTRIBUTIONS: | ||||||||||||||||||||||||
| From net investment income | (0.11 | ) | (0.13 | ) | (0.17 | ) | (0.11 | ) | (0.15 | ) | (0.18 | ) | ||||||||||||
| From net realized gains | – | (1.78 | ) | (0.32 | ) | – | (0.25 | ) | (0.46 | ) | ||||||||||||||
| Total distributions | (0.11 | ) | (1.91 | ) | (0.49 | ) | (0.11 | ) | (0.40 | ) | (0.64 | ) | ||||||||||||
| Net increase/(decrease) in net asset value | (1.07 | ) | (1.38 | ) | (1.13 | ) | 2.01 | (0.29 | ) | (0.53 | ) | |||||||||||||
| Net asset value, end of period | $ | 10.58 | $ | 11.65 | $ | 13.03 | $ | 14.16 | $ | 12.15 | $ | 12.44 | ||||||||||||
| TOTAL RETURN(c) | (8.23 | )% | 5.91 | % | (4.74 | )% | 17.53 | % | 0.97 | % | 0.86 | % | ||||||||||||
| RATIOS/SUPPLEMENTAL DATA: | ||||||||||||||||||||||||
| Net assets, end of period (000s) | $ | 15,178 | $ | 19,798 | $ | 23,111 | $ | 26,514 | $ | 32,217 | $ | 34,766 | ||||||||||||
| Ratio of expenses to average net assets excluding fee waivers and reimbursements | 1.25 | %(d) | 1.25 | % | 1.57 | % | 2.12 | % | 2.10 | % | 2.10 | % | ||||||||||||
| Ratio of expenses to average net assets including fee waivers and reimbursements | 1.25 | %(d) | 1.25 | % | 1.47 | %(e) | 1.90 | % | 1.90 | % | 1.90 | % | ||||||||||||
| Ratio of net investment income to average net assets | 1.04 | %(d) | 1.15 | % | 1.01 | % | 0.51 | % | 1.08 | % | 1.18 | % | ||||||||||||
| Portfolio turnover rate(f) | 26 | % | 62 | % | 224 | % | 63 | % | 129 | % | 75 | % | ||||||||||||
| (a) | Prior to February 28, 2018, the RiverFront Asset Allocation Growth & Income was known as the RiverFront Dynamic Equity Income Fund. |
| (b) | Calculated using the average shares method. |
| (c) | Total returns are for the period indicated and have not been annualized. Total returns would have been lower had certain expenses not been waived during the period. Returns shown do not reflect the deduction of taxes that a shareholder would pay on Fund distributions or the redemption of Fund shares. Returns shown exclude any applicable sales charges. |
| (d) | Annualized. |
| (e) | Effective February 28, 2018, pursuant to the Administrative Services Agreement, the Fund pays an annual unitary administrative fee, which is based on the Fund’s average daily net assets, and will no longer pay a management fee or contractually limit the Fund’s total annual expenses. Refer to Note 8. |
| (f) | Portfolio turnover rate for periods less than one full year have not been annualized. |
See Notes to Financial Statements.
| 138 | | April 30, 2020 |
RiverFront Asset Allocation Growth & Income – Class I
Financial Highlights
Selected data for a share of beneficial interest outstanding throughout the periods indicated:
| For the Six Months Ended April 30, 2020 (Unaudited) | For the Year Ended October 31, 2019 | For the Year Ended October 31, 2018(a) | For the Year Ended October 31, 2017 | For the Year Ended October 31, 2016 | For the Year Ended October 31, 2015 | |||||||||||||||||||
| Net asset value, beginning of period | $ | 11.97 | $ | 13.31 | $ | 14.42 | $ | 12.31 | $ | 12.56 | $ | 13.02 | ||||||||||||
| INCOME/(LOSS) FROM INVESTMENT OPERATIONS: | ||||||||||||||||||||||||
| Net investment income(b) | 0.12 | 0.26 | 0.29 | 0.20 | 0.25 | 0.28 | ||||||||||||||||||
| Net realized and unrealized gain/(loss) | (1.05 | ) | 0.41 | (0.82 | ) | 2.09 | (0.01 | ) | (0.05 | ) | ||||||||||||||
| Total from investment operations | (0.93 | ) | 0.67 | (0.53 | ) | 2.29 | 0.24 | 0.23 | ||||||||||||||||
| DISTRIBUTIONS: | ||||||||||||||||||||||||
| From net investment income | (0.16 | ) | (0.23 | ) | (0.26 | ) | (0.18 | ) | (0.24 | ) | (0.23 | ) | ||||||||||||
| From net realized gains | – | (1.78 | ) | (0.32 | ) | – | (0.25 | ) | (0.46 | ) | ||||||||||||||
| Total distributions | (0.16 | ) | (2.01 | ) | (0.58 | ) | (0.18 | ) | (0.49 | ) | (0.69 | ) | ||||||||||||
| Net increase/(decrease) in net asset value | (1.09 | ) | (1.34 | ) | (1.11 | ) | 2.11 | (0.25 | ) | (0.46 | ) | |||||||||||||
| Net asset value, end of period | $ | 10.88 | $ | 11.97 | $ | 13.31 | $ | 14.42 | $ | 12.31 | $ | 12.56 | ||||||||||||
| TOTAL RETURN(c) | (7.75 | )% | 7.07 | % | (3.88 | )% | 18.75 | % | 2.01 | % | 1.83 | % | ||||||||||||
| RATIOS/SUPPLEMENTAL DATA: | ||||||||||||||||||||||||
| Net assets, end of period (000s) | $ | 33,212 | $ | 49,610 | $ | 51,749 | $ | 33,484 | $ | 28,833 | $ | 22,780 | ||||||||||||
| Ratio of expenses to average net assets excluding fee waivers and reimbursements | 0.25 | %(d) | 0.25 | % | 0.53 | % | 1.12 | % | 1.10 | % | 1.10 | % | ||||||||||||
| Ratio of expenses to average net assets including fee waivers and reimbursements | 0.25 | %(d) | 0.25 | % | 0.44 | %(e) | 0.90 | % | 0.90 | % | 0.90 | % | ||||||||||||
| Ratio of net investment income to average net assets | 2.05 | %(d) | 2.17 | % | 2.04 | % | 1.50 | % | 2.06 | % | 2.21 | % | ||||||||||||
| Portfolio turnover rate(f) | 26 | % | 62 | % | 224 | % | 63 | % | 129 | % | 75 | % | ||||||||||||
| (a) | Prior to February 28, 2018, the RiverFront Asset Allocation Growth & Income was known as the RiverFront Dynamic Equity Income Fund. |
| (b) | Calculated using the average shares method. |
| (c) | Total returns are for the period indicated and have not been annualized. Total returns would have been lower had certain expenses not been waived during the period. Returns shown do not reflect the deduction of taxes that a shareholder would pay on Fund distributions or the redemption of Fund shares. |
| (d) | Annualized. |
| (e) | Effective February 28, 2018, pursuant to the Administrative Services Agreement, the Fund pays an annual unitary administrative fee, which is based on the Fund’s average daily net assets, and will no longer pay a management fee or contractually limit the Fund’s total annual expenses. Refer to Note 8. |
| (f) | Portfolio turnover rate for periods less than one full year have not been annualized. |
See Notes to Financial Statements.
| 139 | | April 30, 2020 |
RiverFront Asset Allocation Moderate – Investor Class
Financial Highlights
Selected data for a share of beneficial interest outstanding throughout the periods indicated:
| For the Six Months Ended April 30, 2020 (Unaudited) | For the Year Ended October 31, 2019 | For the Year Ended October 31, 2018(a)(b) | For the Year Ended October 31, 2017 | For the Year Ended October 31, 2016 | For the Year Ended October 31, 2015 | |||||||||||||||||||
| Net asset value, beginning of period | $ | 10.46 | $ | 11.54 | $ | 12.47 | $ | 11.22 | $ | 11.48 | $ | 12.15 | ||||||||||||
| INCOME/(LOSS) FROM INVESTMENT OPERATIONS: | ||||||||||||||||||||||||
| Net investment income(c) | 0.09 | 0.21 | 0.22 | 0.18 | 0.21 | 0.23 | ||||||||||||||||||
| Net realized and unrealized gain/(loss) | (0.46 | ) | 0.49 | (0.36 | ) | 1.23 | (0.01 | ) | (0.06 | ) | ||||||||||||||
| Total from investment operations | (0.37 | ) | 0.70 | (0.14 | ) | 1.41 | 0.20 | 0.17 | ||||||||||||||||
| DISTRIBUTIONS: | ||||||||||||||||||||||||
| From net investment income | (0.09 | ) | (0.20 | ) | (0.22 | ) | (0.16 | ) | (0.21 | ) | (0.20 | ) | ||||||||||||
| From net realized gains | – | (1.58 | ) | (0.57 | ) | – | (0.25 | ) | (0.64 | ) | ||||||||||||||
| Total distributions | (0.09 | ) | (1.78 | ) | (0.79 | ) | (0.16 | ) | (0.46 | ) | (0.84 | ) | ||||||||||||
| Net increase/(decrease) in net asset value | (0.46 | ) | (1.08 | ) | (0.93 | ) | 1.25 | (0.26 | ) | (0.67 | ) | |||||||||||||
| Net asset value, end of period | $ | 10.00 | $ | 10.46 | $ | 11.54 | $ | 12.47 | $ | 11.22 | $ | 11.48 | ||||||||||||
| TOTAL RETURN(d) | (3.54 | )% | 7.99 | % | (1.32 | )% | 12.67 | % | 1.81 | % | 1.33 | % | ||||||||||||
| RATIOS/SUPPLEMENTAL DATA: | ||||||||||||||||||||||||
| Net assets, end of period (000s) | $ | 4,312 | $ | 5,162 | $ | 8,244 | $ | 13,311 | $ | 22,679 | $ | 24,402 | ||||||||||||
| Ratio of expenses to average net assets excluding fee waivers and reimbursements | 0.50 | %(e) | 0.50 | % | 0.84 | % | 1.33 | % | 1.31 | % | 1.30 | % | ||||||||||||
| Ratio of expenses to average net assets including fee waivers and reimbursements | 0.50 | %(e) | 0.50 | % | 0.74 | %(f) | 1.15 | % | 1.15 | % | 1.15 | % | ||||||||||||
| Ratio of net investment income to average net assets | 1.69 | %(e) | 2.00 | % | 1.78 | % | 1.49 | % | 1.87 | % | 1.97 | % | ||||||||||||
| Portfolio turnover rate(g) | 14 | % | 41 | % | 209 | % | 56 | % | 132 | % | 110 | % | ||||||||||||
| (a) | Prior to December 1, 2017, Investor Class was known as Class A. |
| (b) | Prior to February 28, 2018, the RiverFront Asset Allocation Moderate was known as the RiverFront Moderate Growth & Income Fund. |
| (c) | Calculated using the average shares method. |
| (d) | Total returns are for the period indicated and have not been annualized. Total returns would have been lower had certain expenses not been waived during the period. Returns shown do not reflect the deduction of taxes that a shareholder would pay on Fund distributions or the redemption of Fund shares. Returns shown exclude any applicable sales charges. |
| (e) | Annualized. |
| (f) | Effective February 28, 2018, pursuant to the Administrative Services Agreement, the Fund pays an annual unitary administrative fee, which is based on the Fund’s average daily net assets, and will no longer pay a management fee or contractually limit the Fund’s total annual expenses. Refer to Note 8. |
| (g) | Portfolio turnover rate for periods less than one full year have not been annualized. |
See Notes to Financial Statements.
| 140 | | April 30, 2020 |
RiverFront Asset Allocation Moderate – Class A
Financial Highlights
Selected data for a share of beneficial interest outstanding throughout the periods indicated:
| For the Six Months Ended April 30, 2020 (Unaudited) | For the Year Ended October 31, 2019 | For the Period June 12, 2018 (Commencement of Operations) to October 31, 2018 | ||||||||||
| Net asset value, beginning of period | $ | 10.45 | $ | 11.53 | $ | 12.28 | ||||||
| INCOME FROM INVESTMENT OPERATIONS: | ||||||||||||
| Net investment income(a) | 0.09 | 0.20 | 0.11 | |||||||||
| Net realized and unrealized gain/(loss) | (0.46 | ) | 0.51 | (0.74 | ) | |||||||
| Total from investment operations | (0.37 | ) | 0.71 | (0.63 | ) | |||||||
| DISTRIBUTIONS: | ||||||||||||
| From net investment income | (0.09 | ) | (0.21 | ) | (0.12 | ) | ||||||
| From net realized gains | – | (1.58 | ) | – | ||||||||
| Total distributions | (0.09 | ) | (1.79 | ) | (0.12 | ) | ||||||
| Net (decrease) in net asset value | (0.46 | ) | (1.08 | ) | (0.75 | ) | ||||||
| Net asset value, end of period | $ | 9.99 | $ | 10.45 | $ | 11.53 | ||||||
| TOTAL RETURN(b) | (3.55 | )% | 8.07 | % | (5.15 | )% | ||||||
| RATIOS/SUPPLEMENTAL DATA: | ||||||||||||
| Net assets, end of period (000s) | $ | 5,697 | $ | 5,933 | $ | 9 | ||||||
| Ratio of expenses to average net assets excluding fee waivers and reimbursements | 0.50 | %(c) | 0.50 | % | 0.50 | %(c) | ||||||
| Ratio of expenses to average net assets including fee waivers and reimbursements | 0.50 | %(c) | 0.50 | % | 0.50 | %(c) | ||||||
| Ratio of net investment income to average net assets | 1.70 | %(c) | 1.92 | % | 2.44 | %(c) | ||||||
| Portfolio turnover rate(d) | 14 | % | 41 | % | 209 | % | ||||||
| (a) | Calculated using the average shares method. |
| (b) | Total returns are for the period indicated and have not been annualized. Total returns would have been lower had certain expenses not been waived during the period. Returns shown do not reflect the deduction of taxes that a shareholder would pay on Fund distributions or the redemption of Fund shares. |
| (c) | Annualized. |
| (d) | Portfolio turnover rate for periods less than one full year have not been annualized. |
See Notes to Financial Statements.
| 141 | | April 30, 2020 |
RiverFront Asset Allocation Moderate – Class C
Financial Highlights
Selected data for a share of beneficial interest outstanding throughout the periods indicated:
| For the Six Months Ended April 30, 2020 (Unaudited) | For the Year Ended October 31, 2019 | For the Year Ended October 31, 2018(a) | For the Year Ended October 31, 2017 | For the Year Ended October 31, 2016 | For the Year Ended October 31, 2015 | |||||||||||||||||||
| Net asset value, beginning of period | $ | 10.30 | $ | 11.39 | $ | 12.34 | $ | 11.12 | $ | 11.39 | $ | 12.10 | ||||||||||||
| INCOME/(LOSS) FROM INVESTMENT OPERATIONS: | ||||||||||||||||||||||||
| Net investment income(b) | 0.05 | 0.13 | 0.12 | 0.08 | 0.13 | 0.13 | ||||||||||||||||||
| Net realized and unrealized gain/(loss) | (0.46 | ) | 0.49 | (0.36 | ) | 1.24 | (0.02 | ) | (0.06 | ) | ||||||||||||||
| Total from investment operations | (0.41 | ) | 0.62 | (0.24 | ) | 1.32 | 0.11 | 0.07 | ||||||||||||||||
| DISTRIBUTIONS: | ||||||||||||||||||||||||
| From net investment income | (0.05 | ) | (0.13 | ) | (0.14 | ) | (0.10 | ) | (0.13 | ) | (0.14 | ) | ||||||||||||
| From net realized gains | – | (1.58 | ) | (0.57 | ) | – | (0.25 | ) | (0.64 | ) | ||||||||||||||
| Total distributions | (0.05 | ) | (1.71 | ) | (0.71 | ) | (0.10 | ) | (0.38 | ) | (0.78 | ) | ||||||||||||
| Net increase/(decrease) in net asset value | (0.46 | ) | (1.09 | ) | (0.95 | ) | 1.22 | (0.27 | ) | (0.71 | ) | |||||||||||||
| Net asset value, end of period | $ | 9.84 | $ | 10.30 | $ | 11.39 | $ | 12.34 | $ | 11.12 | $ | 11.39 | ||||||||||||
| TOTAL RETURN(c) | (3.94 | )% | 7.23 | % | (2.16 | )% | 11.94 | % | 1.03 | % | 0.52 | % | ||||||||||||
| RATIOS/SUPPLEMENTAL DATA: | ||||||||||||||||||||||||
| Net assets, end of period (000s) | $ | 20,404 | $ | 26,831 | $ | 40,792 | $ | 51,231 | $ | 63,480 | $ | 70,771 | ||||||||||||
| Ratio of expenses to average net assets excluding fee waivers and reimbursements | 1.25 | %(d) | 1.25 | % | 1.56 | % | 2.08 | % | 2.06 | % | 2.05 | % | ||||||||||||
| Ratio of expenses to average net assets including fee waivers and reimbursements | 1.25 | %(d) | 1.25 | % | 1.47 | %(e) | 1.90 | % | 1.90 | % | 1.90 | % | ||||||||||||
| Ratio of net investment income to average net assets | 0.94 | %(d) | 1.27 | % | 1.03 | % | 0.70 | % | 1.14 | % | 1.14 | % | ||||||||||||
| Portfolio turnover rate(f) | 14 | % | 41 | % | 209 | % | 56 | % | 132 | % | 110 | % | ||||||||||||
| (a) | Prior to February 28, 2018, the RiverFront Asset Allocation Moderate was known as the RiverFront Moderate Growth & Income Fund. |
| (b) | Calculated using the average shares method. |
| (c) | Total returns are for the period indicated and have not been annualized. Total returns would have been lower had certain expenses not been waived during the period. Returns shown do not reflect the deduction of taxes that a shareholder would pay on Fund distributions or the redemption of Fund shares. Returns shown exclude any applicable sales charges. |
| (d) | Annualized. |
| (e) | Effective February 28, 2018, pursuant to the Administrative Services Agreement, the Fund pays an annual unitary administrative fee, which is based on the Fund’s average daily net assets, and will no longer pay a management fee or contractually limit the Fund’s total annual expenses. Refer to Note 8. |
| (f) | Portfolio turnover rate for periods less than one full year have not been annualized. |
See Notes to Financial Statements.
| 142 | | April 30, 2020 |
RiverFront Asset Allocation Moderate – Class I
Financial Highlights
Selected data for a share of beneficial interest outstanding throughout the periods indicated:
| For the Six Months Ended April 30, 2020 (Unaudited) | For the Year Ended October 31, 2019 | For the Year Ended October 31, 2018(a) | For the Year Ended October 31, 2017 | For the Year Ended October 31, 2016 | For the Year Ended October 31, 2015 | |||||||||||||||||||
| Net asset value, beginning of period | $ | 10.47 | $ | 11.54 | $ | 12.48 | $ | 11.21 | $ | 11.47 | $ | 12.14 | ||||||||||||
| INCOME/(LOSS) FROM INVESTMENT OPERATIONS: | ||||||||||||||||||||||||
| Net investment income(b) | 0.10 | 0.23 | 0.25 | 0.20 | 0.24 | 0.25 | ||||||||||||||||||
| Net realized and unrealized gain/(loss) | (0.46 | ) | 0.50 | (0.37 | ) | 1.25 | (0.01 | ) | (0.06 | ) | ||||||||||||||
| Total from investment operations | (0.36 | ) | 0.73 | (0.12 | ) | 1.45 | 0.23 | 0.19 | ||||||||||||||||
| DISTRIBUTIONS: | ||||||||||||||||||||||||
| From net investment income | (0.10 | ) | (0.22 | ) | (0.25 | ) | (0.18 | ) | (0.24 | ) | (0.22 | ) | ||||||||||||
| From net realized gains | – | (1.58 | ) | (0.57 | ) | – | (0.25 | ) | (0.64 | ) | ||||||||||||||
| Total distributions | (0.10 | ) | (1.80 | ) | (0.82 | ) | (0.18 | ) | (0.49 | ) | (0.86 | ) | ||||||||||||
| Net increase/(decrease) in net asset value | (0.46 | ) | (1.07 | ) | (0.94 | ) | 1.27 | (0.26 | ) | (0.67 | ) | |||||||||||||
| Net asset value, end of period | $ | 10.01 | $ | 10.47 | $ | 11.54 | $ | 12.48 | $ | 11.21 | $ | 11.47 | ||||||||||||
| TOTAL RETURN(c) | (3.43 | )% | 8.36 | % | (1.16 | )% | 13.05 | % | 2.05 | % | 1.50 | % | ||||||||||||
| RATIOS/SUPPLEMENTAL DATA: | ||||||||||||||||||||||||
| Net assets, end of period (000s) | $ | 21,196 | $ | 25,544 | $ | 28,228 | $ | 30,913 | $ | 43,056 | $ | 46,350 | ||||||||||||
| Ratio of expenses to average net assets excluding fee waivers and reimbursements | 0.25 | %(d) | 0.25 | % | 0.56 | % | 1.08 | % | 1.06 | % | 1.05 | % | ||||||||||||
| Ratio of expenses to average net assets including fee waivers and reimbursements | 0.25 | %(d) | 0.25 | % | 0.47 | %(e) | 0.90 | % | 0.90 | % | 0.90 | % | ||||||||||||
| Ratio of net investment income to average net assets | 1.95 | %(d) | 2.25 | % | 2.02 | % | 1.71 | % | 2.16 | % | 2.16 | % | ||||||||||||
| Portfolio turnover rate(f) | 14 | % | 41 | % | 209 | % | 56 | % | 132 | % | 110 | % | ||||||||||||
| (a) | Prior to February 28, 2018, the RiverFront Asset Allocation Moderate was known as the RiverFront Moderate Growth & Income Fund. |
| (b) | Calculated using the average shares method. |
| (c) | Total returns are for the period indicated and have not been annualized. Total returns would have been lower had certain expenses not been waived during the period. Returns shown do not reflect the deduction of taxes that a shareholder would pay on Fund distributions or the redemption of Fund shares. |
| (d) | Annualized. |
| (e) | Effective February 28, 2018, pursuant to the Administrative Services Agreement, the Fund pays an annual unitary administrative fee, which is based on the Fund’s average daily net assets, and will no longer pay a management fee or contractually limit the Fund’s total annual expenses. Refer to Note 8. |
| (f) | Portfolio turnover rate for periods less than one full year have not been annualized. |
See Notes to Financial Statements.
| 143 | | April 30, 2020 |
Notes to Financial Statements
April 30, 2020 (Unaudited)
1. ORGANIZATION
Financial Investors Trust (the “Trust”), a Delaware statutory trust, is an open-end management investment company registered under the Investment Company Act of 1940, as amended (“1940 Act”). The Trust consists of multiple separate portfolios or series. This annual report includes the financial statements and financial highlights of the following 9 funds: ALPS | CoreCommodity Management CompleteCommodities® Strategy Fund, ALPS | Kotak India Growth Fund, ALPS | Red Rocks Global Opportunity Fund, Clough China Fund, RiverFront Asset Allocation Aggressive, RiverFront Asset Allocation Growth & Income, RiverFront Asset Allocation Moderate, ALPS | Smith Total Return Bond Fund and ALPS | Smith Short Duration Bond Fund (each, a “Fund” and collectively, the “Funds”). Prior to March 31, 2020, the ALPS | Red Rocks Global Opportunity Fund was known as the ALPS | Red Rocks Listed Private Equity Fund.
The ALPS | CoreCommodity Management CompleteCommodities® Strategy Fund seeks to maximize real returns (returns after inflation), consistent with prudent investment management. ALPS | Kotak India Growth Fund’s investment goal is long-term capital appreciation. ALPS | Red Rocks Global Opportunity Fund seeks to maximize total return, which consists of appreciation on its investments and a variable income stream. The Clough China Fund seeks to provide investors with long-term capital appreciation. Effective February 28, 2018, the RiverFront Asset Allocation Aggressive seeks to achieve long-term capital appreciation, RiverFront Asset Allocation Growth & Income seeks to achieve long-term growth and income, the RiverFront Asset Allocation Moderate has two primary investment objectives- it seeks (1) to provide a level of current income that exceeds the average yield on U.S. stocks, and (2) growth of capital. The ALPS | Smith Total Return Bond Fund seeks to obtain maximum total return, consistent with preservation of capital. The ALPS | Smith Short Duration Bond Fund seeks as high a level of current income as is consistent with preservation of capital.
The classes of each Fund differ principally in the applicable distribution and shareholder service fees. Shareholders of each class also bear certain expenses that pertain to that particular class. All shareholders bear the common expenses of the Fund and earn income and realized gains/losses from the Fund pro rata based on the average daily net assets of each class, without distinction between share classes. Dividends to shareholders are determined separately for each class based on income and expenses allocable to each class. Realized gain distributions to shareholders are allocated to each class pro rata based on the shares outstanding of each class on the date of distribution. Differences in per share dividend rates generally result from differences in separate class expenses, including distribution and shareholder service fees, if applicable.
Basis of Consolidation for the ALPS | CoreCommodity Management CompleteCommodities® Strategy Fund
CoreCommodity Management Cayman Commodity Fund Ltd. (the “Subsidiary”), a Cayman Islands exempted company, was incorporated on April 23, 2010 and is a wholly owned subsidiary of the ALPS | CoreCommodity Management CompleteCommodities® Strategy Fund (the “CoreCommodity Fund”). The Subsidiary acts as an investment vehicle for the CoreCommodity Fund in order to effect certain commodity-related investments on behalf of the CoreCommodity Fund. CoreCommodity Fund is the sole shareholder of the Subsidiary pursuant to a subscription agreement dated as of June 14, 2010, and it is intended that the CoreCommodity Fund will remain the sole shareholder and will continue to wholly own and control the Subsidiary. Under the Articles of Association of the Subsidiary, shares issued by the Subsidiary confer upon a shareholder the right to vote at general meetings of the Subsidiary and certain rights in connection with any winding-up or repayment of capital, as well as the right to participate in the profits or assets of the Subsidiary. The CoreCommodity Fund may invest up to 25% of its total assets in shares of the Subsidiary. As a wholly owned subsidiary of the CoreCommodity Fund, the financial statements of the Subsidiary are included in the consolidated financial statements and financial highlights of the CoreCommodity Fund. All investments held by the Subsidiary are disclosed in the accounts of the CoreCommodity Fund. As of April 30, 2020, net assets of the CoreCommodity Fund were $381,066,467 of which $88,859,561 or 23.32%, represented the CoreCommodity Fund’s ownership of all issued shares and voting rights of the Subsidiary.
Basis of Consolidation for the ALPS | Kotak India Growth Fund
ALPS | Kotak India Growth Fund, (the “Kotak Fund”) invests in the equity securities of Indian companies through its wholly owned, collective investment vehicle, the India Premier Equity Portfolio (the “Portfolio”). The Portfolio is registered with and regulated by the Mauritius Financial Services Commission. The Portfolio was formed for the purpose of facilitating the Kotak Fund’s purchase of securities of a wide selection of Indian companies, consistent with the Kotak Fund’s investment strategies. The Portfolio is a private company limited by shares incorporated under the Mauritius Companies Act 2001. As a wholly owned subsidiary of the Kotak Fund, financial statements of the Portfolio are included in the consolidated financial statements and financial highlights of the Kotak Fund. All investments held by the Portfolio are disclosed in the accounts of the Kotak Fund. As of April 30, 2020, net assets of the Kotak Fund were $131,529,620 of which $6,131,821 or 4.66%, represented the Kotak Fund’s ownership of all issued shares and voting rights of the Portfolio.
The Portfolio is a tax resident of Mauritius enabling it to claim beneficial tax treatment provided under the tax treaty between India and Mauritius. Prior to April 1, 2017, the tax treaty allowed the portfolio to claim full exemption from capital gains on sale of Indian securities. However, pursuant to the changes to the tax treaty between India and Mauritius effective April 1, 2017, the gains arising to the portfolio from sale of shares of Indian companies are taxable in India except for gains arising from sale of shares which were purchased prior to April 1, 2017. The tax treaty still allows the portfolio to claim exemption on capital gains arising from securities other than shares. Further, India enacted the General Anti-Avoidance Rule (GAAR) in its tax law effective April 1, 2017 which contains treaty override provisions whereby the Indian tax authorities could deny treaty benefits
| 144 | | April 30, 2020 |
Notes to Financial Statements
April 30, 2020 (Unaudited)
to the portfolio if it is established that the main purpose of the investments made through the portfolio is to benefit from the tax treaty and the portfolio does not have sufficient commercial substance in Mauritius or one of the other GAAR test is satisfied.
2. SIGNIFICANT ACCOUNTING POLICIES
The following is a summary of significant accounting policies consistently followed by each Fund in the preparation of its financial statements. Each Fund is considered an investment company for financial reporting purposes, and follows accounting policies in conformity with accounting principles generally accepted in the United States of America (“U.S. GAAP”), including policies specific to investment companies. The preparation of financial statements in conformity with U.S. GAAP requires management to make certain estimates and assumptions that affect the reported amounts of assets and liabilities and disclosures of contingent assets and liabilities at the date of the financial statements and the reported amounts of revenue and expenses during the period. Actual results could differ from those estimates. The following is a summary of significant accounting policies consistently followed by the Funds and subsidiaries, as applicable, in preparation of their financial statements. The Funds are considered investment companies under U.S. GAAP and follows the accounting and reporting guidance applicable to investment companies in the Financial Accounting Standards Board Accounting Standards Codification Topic 946.
Investment Valuation: The Funds generally value their securities based on market prices determined at the close of regular trading on the New York Stock Exchange (“NYSE”), normally 4:00 p.m. Eastern Time, on each day the NYSE is open for trading. For equity securities and mutual funds that are traded on an exchange, the market price is usually the closing sale or official closing price on that exchange.
The market price for debt obligations is generally the price supplied by an independent third-party pricing service approved by the Board, which may use a matrix, formula or other objective method that takes into consideration quotations from dealers, market transactions in comparable investments, market indices and yield curves. If vendors are unable to supply a price, or if the price supplied is deemed to be unreliable, the market price may be determined using quotations received from one or more brokers-dealers that make a market in the security. Investments in non-exchange traded funds are fair valued at their respective net asset values. Bonds may be purchased and held as odd lots. Pricing vendors generally value securities assuming orderly transactions of institutional round lot sizes, but a Fund may hold or transact in such securities in smaller, odd lot sizes. Special valuation considerations may apply with respect to a Fund’s odd-lot positions, as the Fund may receive different prices when it sells such positions than it would receive for sales of institutional round lot positions. The ALPS | Smith Total Return Bond Fund and the ALPS | Smith Short Duration Bond Fund have odd lot pricing policies it employs to value odd lot securities.
Futures contracts that are listed or traded on a national securities exchange, commodities exchange, contract market or comparable over the counter market, and that are freely transferable, are valued at their closing settlement price on the exchange on which they are primarily traded or based upon the current settlement price for a like instrument acquired on the day on which the instrument is being valued. A settlement price may not be used if the market makes a limit move with respect to a particular commodity. Over-the-counter swap contracts are valued based on quotes received from independent pricing services or one or more dealers that make markets in such investments.
Option contracts are valued using the National Best Bid and Offer price (“NBBO”). In the event there is no NBBO price available, option contracts are valued at the mean between the last bid and ask.
For ALPS | Kotak India Growth Fund, ALPS | Red Rocks Global Opportunity Fund, and Clough China Fund, who hold equity securities that are primarily traded on foreign securities exchanges, such securities are valued at the closing values of such securities on their respective foreign exchanges, except when an event occurs subsequent to the close of the foreign exchange and the close of the NYSE that was likely to have changed such value. In such an event, the fair value of those securities are determined in good faith through consideration of other factors in accordance with procedures established by and under the general supervision of the Board. The Funds will use a fair valuation model provided by an independent pricing service, which is intended to reflect fair value when a security’s value or a meaningful portion of the Fund’s portfolio is believed to have been materially affected by an valuation event that has occurred between the close of the exchange or market on which the security is traded and the close of the regular trading day on the NYSE.
Forward currency exchange contracts have a value determined by the current foreign currency exchange forward rates. The foreign currency exchange forward rates are calculated using an automated system that estimates rates on the basis of the current day foreign currency exchange rates and forward foreign currency exchange rates supplied by a pricing service. Foreign exchange rates and forward foreign currency exchange rates may generally be obtained at the close of the NYSE, normally 4:00 p.m. Eastern Time.
When such prices or quotations are not available, or when the Fair Value Committee appointed by the Board believes that they are unreliable, securities may be priced using fair value procedures approved by the Board. The fair valuation policies and procedures (“FV Procedures”) have been adopted by the Board for the fair valuation of portfolio assets held by the Fund(s) in the event that (1) market quotations for the current price of a portfolio security or asset are not readily available, or (2) available market quotations that would otherwise be used to value a portfolio security or asset in accordance with the Fund’s Pricing Procedures appear to be unreliable. The Pricing Procedures reflect certain pricing methodologies (or
| 145 | | April 30, 2020 |
Notes to Financial Statements
April 30, 2020 (Unaudited)
“logics”) that are not “readily available market quotations” and thus are viewed and treated as fair valuations. The Fair Value Committee routinely meets to discuss fair valuations of portfolio securities and other instruments held by the Fund(s).
Fair Value Measurements: The Funds disclose the classification of their fair value measurements following a three-tier hierarchy based on the inputs used to measure fair value. Inputs refer broadly to the assumptions that market participants would use in pricing the asset or liability, including assumptions about risk. Inputs may be observable or unobservable. Observable inputs reflect the assumptions market participants would use in pricing the asset or liability that are developed based on market data obtained from sources independent of the reporting entity. Unobservable inputs reflect the reporting entity’s own assumptions about the assumptions market participants would use in pricing the asset or liability that are developed based on the best information available.
Various inputs are used in determining the value of each Fund’s investments as of the end of the reporting period. When inputs used fall into different levels of the fair value hierarchy, the level in the hierarchy within which the fair value measurement falls is determined based on the lowest level input that is significant to the fair value measurement in its entirety. The designated input levels are not necessarily an indication of the risk or liquidity associated with these investments. These inputs are categorized in the following hierarchy under applicable financial accounting standards:
| Level 1 – | Unadjusted quoted prices in active markets for identical investments, unrestricted assets or liabilities that a Fund has the ability to access at the measurement date; |
| Level 2 – | Quoted prices which are not active, quoted prices for similar assets or liabilities in active markets or inputs other than quoted prices that are observable (either directly or indirectly) for substantially the full term of the asset or liability; and |
| Level 3 – | Significant unobservable prices or inputs (including the Fund’s own assumptions in determining the fair value of investments) where there is little or no market activity for the asset or liability at the measurement date. |
The following is a summary of each Fund’s investments/financial instruments in the fair value hierarchy as of April 30, 2020:
| Investments in Securities at Value | Level 1 - Unadjusted Quoted Prices | Level 2 - Other Significant Observable Inputs | Level 3 - Significant Unobservable Inputs | Total | ||||||||||||
| ALPS | CoreCommodity Management CompleteCommodities® Strategy Fund | ||||||||||||||||
| Common Stocks(a) | ||||||||||||||||
| United States | $ | 33,920,815 | $ | 103 | $ | – | $ | 33,920,918 | ||||||||
| Other | 52,944,348 | – | – | 52,944,348 | ||||||||||||
| Master Limited Partnerships(a) | 457,014 | – | – | 457,014 | ||||||||||||
| Government Bonds | – | 191,254,059 | – | 191,254,059 | ||||||||||||
| Total | $ | 87,322,177 | $ | 191,254,162 | $ | – | $ | 278,576,339 | ||||||||
| Other Financial Instruments | ||||||||||||||||
| Assets | ||||||||||||||||
| Total Return Swap Contracts | $ | – | $ | 8 | $ | – | $ | 8 | ||||||||
| Futures Contracts | 28,009,477 | – | – | 28,009,477 | ||||||||||||
| Liabilities | ||||||||||||||||
| Total Return Swap Contracts | – | (548 | ) | – | (548 | ) | ||||||||||
| Futures Contracts | (1,052,724 | ) | – | – | (1,052,724 | ) | ||||||||||
| Total | $ | 26,956,753 | $ | (540 | ) | $ | – | $ | 26,956,213 | |||||||
| 146 | | April 30, 2020 |
Notes to Financial Statements
April 30, 2020 (Unaudited)
| Investments in Securities at Value | Level 1 - Unadjusted Quoted Prices | Level 2 - Other Significant Observable Inputs | Level 3 - Significant Unobservable Inputs | Total | ||||||||||||
| ALPS | Kotak India Growth Fund | ||||||||||||||||
| Common Stocks | ||||||||||||||||
| Communication Services | $ | – | $ | 3,488,167 | $ | – | $ | 3,488,167 | ||||||||
| Consumer Discretionary | – | 13,635,266 | – | 13,635,266 | ||||||||||||
| Consumer Staples | – | 6,352,459 | – | 6,352,459 | ||||||||||||
| Energy | – | 12,188,888 | – | 12,188,888 | ||||||||||||
| Financials | 9,498,415 | 33,958,548 | – | 43,456,963 | ||||||||||||
| Health Care | – | 6,337,642 | – | 6,337,642 | ||||||||||||
| Industrials | – | 11,868,733 | – | 11,868,733 | ||||||||||||
| Information Technology | – | 10,014,025 | – | 10,014,025 | ||||||||||||
| Materials | – | 11,120,172 | – | 11,120,172 | ||||||||||||
| Real Estate | – | 1,545,014 | – | 1,545,014 | ||||||||||||
| Utilities | – | 830,455 | – | 830,455 | ||||||||||||
| Total | $ | 9,498,415 | $ | 111,339,369 | $ | – | $ | 120,837,784 | ||||||||
| Investments in Securities at Value | Level 1 - Unadjusted Quoted Prices | Level 2 - Other Significant Observable Inputs | Level 3 - Significant Unobservable Inputs | Total | ||||||||||||
| ALPS | Smith Short Duration Bond Fund | ||||||||||||||||
| Collateralized Mortgage Obligations | $ | – | $ | 3,354,120 | $ | – | $ | 3,354,120 | ||||||||
| Commercial Mortgage-Backed Securities | – | 848,434 | – | 848,434 | ||||||||||||
| Mortgage-Backed Securities | – | 3,353,679 | – | 3,353,679 | ||||||||||||
| Corporate Bonds | – | 44,449,522 | – | 44,449,522 | ||||||||||||
| Government Bonds | – | 8,750,841 | – | 8,750,841 | ||||||||||||
| Short Term Investments | 2,093,993 | – | – | 2,093,993 | ||||||||||||
| Total | $ | 2,093,993 | $ | 60,756,596 | $ | – | $ | 62,850,589 | ||||||||
| Investments in Securities at Value | Level 1 - Unadjusted Quoted Prices | Level 2 - Other Significant Observable Inputs | Level 3 - Significant Unobservable Inputs | Total | ||||||||||||
| ALPS | Smith Total Return Bond Fund | ||||||||||||||||
| Collateralized Mortgage Obligations | $ | – | $ | 85,686,700 | $ | – | $ | 85,686,700 | ||||||||
| Commercial Mortgage-Backed Securities | – | 11,845,874 | – | 11,845,874 | ||||||||||||
| Mortgage-Backed Securities | – | 23,603,473 | – | 23,603,473 | ||||||||||||
| Corporate Bonds | – | 528,524,979 | – | 528,524,979 | ||||||||||||
| Government Bonds | – | 276,849,293 | – | 276,849,293 | ||||||||||||
| Preferred Stock | 13,234,800 | – | – | 13,234,800 | ||||||||||||
| Short Term Investments | 29,658,815 | – | – | 29,658,815 | ||||||||||||
| Total | $ | 42,893,615 | $ | 926,510,319 | $ | – | $ | 969,403,934 | ||||||||
| 147 | | April 30, 2020 |
Notes to Financial Statements
April 30, 2020 (Unaudited)
| Investments in Securities at Value | Level 1 - Unadjusted Quoted Prices | Level 2 - Other Significant Observable Inputs | Level 3 - Significant Unobservable Inputs | Total | ||||||||||||
| ALPS | Red Rocks Global Opportunity Fund | ||||||||||||||||
| Closed-End Funds | – | 28,551,683 | – | 28,551,683 | ||||||||||||
| Common Stocks | ||||||||||||||||
| Communications | $ | 14,975,098 | $ | 2,163,515 | $ | – | $ | 17,138,613 | ||||||||
| Consumer Discretionary | – | 915,051 | – | 915,051 | ||||||||||||
| Diversified | – | 1,542,051 | – | 1,542,051 | ||||||||||||
| Financials | 32,895,922 | 21,295,809 | – | 54,191,731 | ||||||||||||
| Industrials | 6,736,888 | 1,009,917 | – | 7,746,805 | ||||||||||||
| Information Technology | 1,916,914 | – | – | 1,916,914 | ||||||||||||
| Utilities | 3,931,658 | – | – | 3,931,658 | ||||||||||||
| Preferred Stock | 290,000 | – | – | 290,000 | ||||||||||||
| Short-Term Investments | 2,488,151 | – | – | 2,488,151 | ||||||||||||
| Total | $ | 63,234,631 | $ | 55,478,026 | $ | – | $ | 118,712,657 | ||||||||
| Investments in Securities at Value | Level 1 - Unadjusted Quoted Prices | Level 2 - Other Significant Observable Inputs | Level 3 - Significant Unobservable Inputs | Total | ||||||||||||
| Clough China Fund | ||||||||||||||||
| Common Stocks | ||||||||||||||||
| Communications | $ | 298,064 | $ | 4,576,346 | $ | – | $ | 4,874,410 | ||||||||
| Consumer Discretionary | 6,744,028 | 2,127,330 | – | 8,871,358 | ||||||||||||
| Consumer Staples | – | 1,758,922 | – | 1,758,922 | ||||||||||||
| Financials | – | 8,275,249 | – | 8,275,249 | ||||||||||||
| Health Care | 606,816 | 826,872 | – | 1,433,688 | ||||||||||||
| Materials | – | 161,787 | – | 161,787 | ||||||||||||
| Technology | 3,902,979 | 837,448 | – | 4,740,427 | ||||||||||||
| Utilities | – | 918,682 | – | 918,682 | ||||||||||||
| Short Term Investments | 604,878 | – | – | 604,878 | ||||||||||||
| Total | $ | 12,156,765 | $ | 19,482,636 | $ | – | $ | 31,639,401 | ||||||||
| Other Financial Instruments | ||||||||||||||||
| Assets: | ||||||||||||||||
| Total Return Swap Contracts | $ | – | $ | 199,952 | $ | – | $ | 199,952 | ||||||||
| Liabilities: | ||||||||||||||||
| Total Return Swap Contracts | – | (139,392 | ) | – | (139,392 | ) | ||||||||||
| Total | $ | – | $ | 60,560 | $ | – | $ | 60,560 | ||||||||
| Investments in Securities at Value | Level 1 - Unadjusted Quoted Prices | Level 2 - Other Significant Observable Inputs | Level 3 - Significant Unobservable Inputs | Total | ||||||||||||
| RiverFront Asset Allocation Aggressive | ||||||||||||||||
| Exchange Traded Funds | $ | 23,570,547 | $ | – | $ | – | $ | 23,570,547 | ||||||||
| Short-Term Investments | 353,492 | – | – | 353,492 | ||||||||||||
| Total | $ | 23,924,039 | $ | – | $ | – | $ | 23,924,039 | ||||||||
| Investments in Securities at Value | Level 1 - Unadjusted Quoted Prices | Level 2 - Other Significant Observable Inputs | Level 3 - Significant Unobservable Inputs | Total | ||||||||||||
| RiverFront Asset Allocation Growth & Income | ||||||||||||||||
| Exchange Traded Funds | $ | 58,268,810 | $ | – | $ | – | $ | 58,268,810 | ||||||||
| Short-Term Investments | 1,011,951 | – | – | 1,011,951 | ||||||||||||
| Total | $ | 59,280,761 | $ | – | $ | – | $ | 59,280,761 | ||||||||
| 148 | | April 30, 2020 |
Notes to Financial Statements
April 30, 2020 (Unaudited)
| Investments in Securities at Value | Level 1 - Unadjusted Quoted Prices | Level 2 - Other Significant Observable Inputs | Level 3 - Significant Unobservable Inputs | Total | ||||||||||||
| RiverFront Asset Allocation Moderate | ||||||||||||||||
| Exchange Traded Funds | $ | 50,830,337 | $ | – | $ | – | $ | 50,830,337 | ||||||||
| Short-Term Investments | 838,707 | – | – | 838,707 | ||||||||||||
| Total | $ | 51,669,044 | $ | – | $ | – | $ | 51,669,044 | ||||||||
| (a) | For detailed descriptions of country, sector and/or industry, see the accompanying Statement of Investments or Consolidated Statement of Investments. |
Fund and Class Expenses: Some expenses of the Trust can be directly attributed to a Fund or a specific share class of a Fund. Expenses which cannot be directly attributed are apportioned among all Funds in the Trust based on average net assets of each share class within a Fund.
Federal Income Taxes: The Funds comply with the requirements under Subchapter M of the Internal Revenue Code of 1986, as amended (the “Code”) applicable to regulated investment companies and intend to distribute substantially all of their net taxable income and net capital gains, if any, each year. The Funds are not subject to income taxes to the extent such distributions are made.
The Funds file U.S. federal, state, and local tax returns as required. The Funds’ tax returns are subject to examination by the relevant tax authorities until expiration of the applicable statute of limitations which is generally three years after the filing of the tax return, but may extend to four years in certain jurisdictions. Tax returns for open years have incorporated no uncertain tax positions that require a provision for income taxes.
Distributions to Shareholders: Each Fund, except, RiverFront Asset Allocation Growth & Income, RiverFront Asset Allocation Moderate, ALPS | Smith Total Return Bond Fund and ALPS | Smith Short Duration Bond Fund, normally pays dividends and distributes capital gains, if any, on an annual basis. RiverFront Asset Allocation Growth & Income and RiverFront Asset Allocation Moderate normally pay dividends, if any, on a quarterly basis and distribute capital gains annually. ALPS | Smith Total Return Bond Fund and ALPS | Smith Short Duration Bond Fund declare and distribute dividends, if any, on a monthly basis and capital gains, if any, on at least an annual basis. Income dividend distributions are derived from interest, dividends, and other income a Fund receives from its investments, including distributions of short-term capital gains. Capital gain distributions are derived from gains realized when a Fund sells a security it has owned for more than a year or from long-term capital gain distributions from underlying investments. Each Fund may make additional distributions and dividends at other times if its portfolio manager or managers believe doing so may be necessary for the Fund to avoid or reduce taxes.
Commodity-Linked Notes: The ALPS | CoreCommodity Management CompleteCommodities® Strategy Fund may invest in commodity-linked notes which are derivative instruments that have characteristics of a debt security and of a commodity-linked derivative. A commodity-linked note typically provides for interest payments and a principal payment at maturity linked to the price movement of the underlying commodity, commodity index or commodity futures or option contract. Commodity-linked notes may be principal protected, partially protected, or offer no principal protection. The value of these notes will rise and fall in response to changes in the underlying commodity or related index or investment. These notes are often leveraged, increasing the volatility of each note’s value relative to the change in the underlying linked index. Commodity index-linked investments may be more volatile and less liquid than the underlying index and their value may be affected by the performance of the commodities as well as other factors, including liquidity, quality, maturity and other economic variables. Commodity-linked notes are typically issued by a bank or other financial institution and are sometimes referred to as structured notes because the terms of the notes may be structured by the issuer and the purchaser of the notes to accommodate the specific investment requirements of the purchaser.
Exchange Traded Funds (ETFs): Each Fund may invest in shares of ETFs and other similar instruments if the investment manager chooses to adjust a Fund’s exposure to the general market or industry sectors and to manage a Fund’s risk exposure. ETFs differ from traditional index funds in that their shares are listed on a securities exchange and can be traded intraday. ETF shares are shares of exchange traded investment companies that are registered under the 1940 Act and hold a portfolio of common stocks designed to track the performance of a particular index. Limitations of the 1940 Act may prohibit a Fund from acquiring more than 3% of the outstanding shares of certain ETFs. Instruments that are similar to ETFs represent beneficial ownership interests in specific “baskets” of stocks of companies within a particular industry sector or group. These securities may also be exchange traded, but unlike ETFs, the issuers of these securities are not registered as investment companies.
The portfolio manager may decide to purchase or sell short ETF shares or options on ETF shares for the same reasons it would purchase or sell (and as an alternative to purchasing or selling) futures contracts – to obtain exposure to the stock market or a particular segment of the stock market, or to hedge a Fund’s portfolio against such exposures. Depending on the market, the holding period and other factors, the use of ETF shares and options thereon can be less costly than the use of index options or stock index futures. In addition, ETF shares and options thereon can typically be
| 149 | | April 30, 2020 |
Notes to Financial Statements
April 30, 2020 (Unaudited)
purchased in smaller amounts than are available for futures contracts and can offer exposure to market sectors and styles for which there is no suitable or liquid futures contract.
Investment Transactions and Investment Income: Investment transactions are accounted for on the date the investments are purchased or sold (trade date basis). Net realized gains and losses from investment transactions are reported on an identified cost basis. Interest income, which includes accretion of discounts and amortization of premiums, is accrued and recorded as earned. Dividend income is recognized on the ex-dividend date or for certain foreign securities, as soon as information is available to each Fund.
Foreign Securities: Each Fund may directly purchase securities of foreign issuers. Investing in securities of foreign issuers involves special risks not typically associated with investing in securities of U.S. issuers. The risks include possible reevaluation of currencies, the inability to repatriate foreign currency, less complete financial information about companies and possible future adverse political and economic developments.
Moreover, securities of many foreign issuers and their markets may be less liquid and their prices more volatile than those of securities of comparable U.S. issuers.
Foreign Currency Translation: The books and records of the Funds are maintained in U.S. dollars. Investment valuations and other assets and liabilities initially expressed in foreign currencies are converted each business day into U.S. dollars based upon current exchange rates. The portion of realized and unrealized gains or losses on investments due to fluctuations in foreign currency exchange rates is not separately disclosed and is included in realized and unrealized gains or losses on investments, when applicable.
Foreign Currency Spot Contracts: The Funds may enter into foreign currency spot contracts to facilitate transactions in foreign securities or to convert foreign currency receipts into U.S. dollars. A foreign currency spot contract is an agreement between two parties to buy and sell currencies at the current market rate, for settlement generally within two business days. The U.S. dollar value of the contracts is determined using current currency exchange rates supplied by a pricing service. The contract is marked-to-market daily for settlements beyond one day and any change in market value is recorded as an unrealized gain or loss. When the contract is closed, the Fund records a realized gain or loss equal to the difference between the value on the open and close date. Losses may arise from changes in the value of the foreign currency, or if the counterparties do not perform under the contract’s terms. The maximum potential loss from such contracts is the aggregate face value in U.S. dollars at the time the contract was opened.
Real Estate Investment Trusts (“REITs”): The Funds may invest a portion of their assets in REITs and are subject to certain risks associated with direct investment in REITs. REITs may be affected by changes in the value of their underlying properties and by defaults by borrowers or tenants. REITs depend generally on their ability to generate cash flow to make distributions to shareowners, and certain REITs have self-liquidation provisions by which mortgages held may be paid in full and distributions of capital returns may be made at any time. In addition, the performance of a REIT may be affected by its failure to qualify for tax-free pass-through of income under the Code, or its failure to maintain exemption from registration under the 1940 Act. Distributions that the Fund receives from REITs can be classified as ordinary income, capital gain income or return of capital by the REITs that make these distributions to the Fund. However, it is not possible for the Fund to characterize distributions received from REITs during interim periods because the REIT issuers do not report their tax characterizations until subsequent to year end. During interim periods, the REIT distributions are accounted for as ordinary income until the re characterizations are made subsequent to year end.
Treasury Inflation Protected-Securities (“TIPS”): The Funds may invest in TIPS, including structured bonds in which the principal amount is adjusted daily to keep pace with inflation, as measured by the U.S. Consumer Pricing Index for Urban Consumers. The adjustments to principal due to inflation/deflation are reflected as increases/decreases to interest income with a corresponding adjustment to cost. Such adjustments may have a significant impact on a Fund’s distributions and may result in a return of capital to shareholders. The repayment of the original bond principal upon maturity is guaranteed by the full faith and credit of the U.S. Government.
Loan Participations and Assignments: Certain Funds may invest in loan participations and assignments. The Fund considers loan participations and assignments to be investments in debt securities. Loan participations typically will result in the Fund having a contractual relationship only with the lender, not with the borrower. The Fund will have the right to receive payments of principal, interest and any fees to which it is entitled only from the lender selling the participation and only upon receipt by the lender of the payments from the borrower. Under a loan participation, the Fund generally will have no right to enforce compliance by the borrower with the terms of the loan agreement relating to the loan, nor any rights of set-off against the borrower, and the Fund may not benefit directly from any collateral supporting the loan in which it has purchased the participation. As a result, the Fund will assume the credit risk of both the borrower and the lender that is selling the participation. In the event of the insolvency of the lender selling a participation, the Fund may be treated as a general creditor of the lender and may not benefit from any set-off between the lender and the borrower. When the Fund purchases assignments of loans from lenders, the Fund will acquire direct rights against the borrower on the loan, except that under certain circumstances such rights may be more limited than those held by the assigning lender.
| 150 | | April 30, 2020 |
Notes to Financial Statements
April 30, 2020 (Unaudited)
Master Limited Partnerships: Certain Funds may invest in MLPs, which are publicly traded partnerships engaged in the transportation, storage and processing of minerals and natural resources. By confining their operations to these specific activities, their interests, or units, are able to trade on public securities exchanges exactly like the shares of a corporation, without entity level taxation. To qualify as a MLP and to not be taxed as a corporation, a partnership must receive at least 90% of its income from qualifying sources as set forth in Section 7704(d) of the Code. These qualifying sources include natural resource based activities such as the processing, transportation and storage of mineral or natural resources. MLPs generally have two classes of owners, the general partner and limited partners. The general partner of an MLP is typically owned by a major energy company, an investment fund, the direct management of the MLP, or is an entity owned by one or more of such parties. The general partner may be structured as a private or publicly traded corporation or other entity. The general partner typically controls the operations and management of the MLP through an up to 2% equity interest in the MLP plus, in many cases, ownership of common units and subordinated units. Limited partners typically own the remainder of the partnership, through ownership of common units, and have a limited role in the partnership’s operations and management. MLPs are typically structured such that common units and general partner interests have first priority to receive quarterly cash distributions up to an established minimum amount (“minimum quarterly distributions” or “MQD”). Common and general partner interests also accrue arrearages in distributions to the extent the MQD is not paid. Once common and general partner interests have been paid, subordinated units receive distributions of up to the MQD; however, subordinated units do not accrue arrearages. Distributable cash in excess of the MQD is paid to both common and subordinated units and is distributed to both common and subordinated units generally on a pro rata basis. The general partner is also eligible to receive incentive distributions if the general partner operates the business in a manner which results in distributions paid per common unit surpassing specified target levels. As the general partner increases cash distributions to the limited partners, the general partner receives an increasingly higher percentage of the incremental cash distributions.
COVID-19 Risks. A recent outbreak of respiratory disease caused by a novel coronavirus was first detected in China in December 2019 and has now been detected internationally. This coronavirus has resulted in closing borders, enhanced health screenings, healthcare service preparation and delivery, quarantines, cancellations, disruptions to supply chains and customer activity, as well as general concern and uncertainty. The impact of this coronavirus, and other epidemics and pandemics that may arise in the future, could affect the economies of many nations, individual companies, their securities (including equity and debt), and the market in general in ways that cannot necessarily be foreseen at the present time. In addition, the impact of infectious diseases in developing or emerging market countries may be greater due to less established health care systems. Health crises caused by the recent coronavirus outbreak may exacerbate other pre-existing political, social and economic risks in certain countries. The impact of the outbreak may be short term or may last for an extended period of time.
3. DERIVATIVE INSTRUMENTS
As a part of their investment strategy, the Funds are permitted to enter in various types of derivatives contracts. In doing so, the Funds employ strategies in differing combinations to permit them to increase, decrease, or change the level or types of exposure to market factors. Central to those strategies are features inherent in derivatives that make them more attractive for this purpose than equity or debt securities; they require little or no initial cash investment, they focus exposure on only certain selected risk factors, and they may not require the ultimate receipt or delivery of the underlying security (or securities) to the contract. This may allow the Funds to pursue their objectives more quickly and efficiently than if they were to make direct purchases or sales of securities capable of affecting a similar response to market factors.
Cash collateral is being pledged to cover derivative obligations of the Funds and cash collateral received from the counterparty, if any, is reported separately on the Statements of Assets and Liabilities as cash pledged as collateral and cash received as collateral, respectively. Non-cash collateral pledged by the Funds, if any, is noted in the Statements of Investments.
Risk of Investing in Derivatives: The Funds’ use of derivatives can result in losses due to unanticipated changes in the market risk factors and the overall market. In instances where the Funds are using derivatives to decrease, or hedge, exposures to market risk factors for securities held by the Funds, there are also risks that those derivatives may not perform as expected resulting in losses for the combined or hedged positions.
Derivatives may have little or no initial cash investment relative to their market value exposure and therefore can produce significant gains or losses in excess of their cost. This use of embedded leverage allows the Fund to increase its market value exposure relative to its net assets and can substantially increase the volatility of the Funds’ performance.
Additional associated risks from investing in derivatives also exist and potentially could have significant effects on the valuation of the derivative and the Funds. Typically, the associated risks are not the risks that the Funds are attempting to increase or decrease exposure to, per their investment objectives, but are the additional risks from investing in derivatives.
| 151 | | April 30, 2020 |
Notes to Financial Statements
April 30, 2020 (Unaudited)
Examples of these associated risks are liquidity risk, which is the risk that the Funds will not be able to sell or close out the derivative in a timely manner, and counterparty credit risk, which is the risk that the counterparty will not fulfill its obligation to the Funds. In addition, use of derivatives may increase or decrease exposure to the following risk factors:
Equity Risk: Equity risk relates to the change in value of equity securities as they relate to increases or decreases in the general market. Associated risks can be different for each type of derivative and are discussed by each derivative type in the notes that follow.
Commodity Risk: Exposure to the commodities markets may subject the Funds to greater volatility than investments in traditional securities. Prices of various commodities may also be affected by factors, such as drought, floods, weather, livestock disease, embargoes, tariffs and other regulatory developments, which are unpredictable. The prices of commodities can also fluctuate widely due to supply and demand disruptions in major producing or consuming regions.
Foreign Currency Risk: Currency trading involves significant risks, including market risk, interest rate risk, country risk, counterparty credit risk and short sale risk. Market risk results from the price movement of foreign currency values in response to shifting market supply and demand. Interest rate risk arises whenever a country changes its stated interest rate target associated with its currency. Country risk arises because virtually every country has interfered with international transactions in its currency.
Interest Rate Risk: Interest rate risk is the risk that fixed income securities will decline in value because of changes in interest rates. As nominal interest rates rise, the value of fixed income securities held by the Funds are likely to decrease. Securities with longer durations tend to be more sensitive to changes in interest rates, and are usually more volatile than securities.
Swap Contracts: Each Fund may enter into swap transactions for hedging purposes or to seek to increase total return. At the present time, the CoreCommodity Fund and Clough China Fund primarily enter into swap transactions for the purpose of increasing total return. Swap agreements may be executed in a multilateral or other trade facility program, such as a registered exchange (“centrally cleared swaps”) or may be privately negotiated in the over-the counter market. The duration of a swap agreement typically ranges from a few weeks to more than one year. In a centrally cleared swap, immediately following execution of the swap agreement, the swap agreement is novated to a central counterparty (the “CCP”) and the Fund’s counterparty on the swap agreement becomes the CCP. Risks may arise as a result of the failure of the counterparty to the swap contract to comply with the terms of the swap contract. The loss incurred by the failure of a counterparty is generally limited to the net payment to be received by the Funds and/or the termination value at the end of the contract. Therefore, the Funds consider the creditworthiness of each counterparty to a contract in evaluating potential credit risk. Although centrally cleared swaps typically present less counterparty risk than non-centrally cleared swaps, a Fund that has entered into centrally cleared swaps is subject to the risk of the failure of the CCP.
Additionally, risks may arise from unanticipated movements in interest rates or in the value of the underlying reference asset or index. Entering into these agreements involves, to varying degrees, market risk, liquidity risk and elements of credit, legal and documentation risk that are not directly reflected in the amounts recognized in the Statements of Assets and Liabilities.
The Funds may pay or receive cash as collateral on these contracts which may be recorded as an asset and/or liability. The Funds must set aside liquid assets, or engage in other appropriate measures, to cover its obligations under these contracts. Swaps are marked to market daily using either pricing vendor quotations, counterparty prices or model prices and the change in value, if any, is recorded as an unrealized gain or loss. Upfront payments made and/or received by the Funds are recorded as an asset and/or liability and realized gains or losses are recognized ratably over the contract’s term/event, with the exception of forward starting interest rate swaps, whose realized gains or losses are recognized ratably from the effective start date. Periodic payments received or made on swap contracts are recorded as realized gains or losses. Gains or losses are realized upon termination of a swap contract and are recorded on the Statement of Operations.
Total return swaps are agreements in which there is an exchange of cash flows whereby one party commits to make payments based on the total return (coupons plus capital gains/losses) of an underlying instrument in exchange for fixed or floating rate interest payments. To the extent the total return of the instrument or index underlying the transaction exceeds or falls short of the offsetting interest rate obligation, the Fund will receive a payment from or make a payment to the counterparty. Credit default swaps are a type of swap agreement in which the protection “buyer” is generally obligated to pay the protection “seller” an upfront and/ or a periodic stream of payments over the term of the contract provided that no credit event, such as a default, on a reference obligation has occurred. Credit default swaps (“CDS”) are typically two-party financial contracts that transfer credit exposure between the two parties. Under a typical CDS, one party (the “seller”) receives pre-determined periodic payments from the other party (the “buyer”). The seller agrees to make compensating specific payments to the buyer if a negative credit event occurs, such as the bankruptcy or default by the issuer of the underlying debt instrument. Swap agreements held at April 30, 2020 are disclosed after the Statement of Investments.
| 152 | | April 30, 2020 |
Notes to Financial Statements
April 30, 2020 (Unaudited)
The average notional amount of the swap positions held in the ALPS | CoreCommodity Management CompleteCommodities® Strategy Fund for the six-month period ended April 30, 2020 was $276,739,562. The average notional amount of the swap positions held in the Clough China Fund for the six-month period ended April 30, 2020 was $4,235,671.
Futures: Each Fund may invest in futures contracts in accordance with their investment objectives. Each Fund does so for a variety of reasons including for cash management, hedging or non-hedging purposes in an attempt to achieve the Fund’s investment objective. A futures contract provides for the future sale by one party and purchase by another party of a specified quantity of the security or other financial instrument at a specified price and time. A futures contract on an index is an agreement pursuant to which two parties agree to take or make delivery of an amount of cash equal to the difference between the value of the index at the close of the last trading day of the contract and the price at which the index contract was originally written. Futures transactions may result in losses in excess of the amount invested in the futures contract. There can be no guarantee that there will be a correlation between price movements in the hedging vehicle and in the portfolio securities being hedged. An incorrect correlation could result in a loss on both the hedged securities in a Fund and the hedging vehicle so that the portfolio return might have been greater had hedging not been attempted. There can be no assurance that a liquid market will exist at a time when a Fund seeks to close out a futures contract or a futures option position. Lack of a liquid market for any reason may prevent a Fund from liquidating an unfavorable position, and the Fund would remain obligated to meet margin requirements until the position is closed. In addition, a Fund could be exposed to risk if the counterparties to the contracts are unable to meet the terms of their contracts. With exchange traded futures, there is minimal counterparty credit risk to the Funds since futures are exchange traded and the exchange’s clearinghouse, as counterparty to all exchange traded futures, guarantees the futures against default.
When a purchase or sale of a futures contract is made by a Fund, the Fund is required to deposit with its custodian (or broker, if legally permitted) a specified amount of liquid assets (“initial margin”). The margin required for a futures contract is set by the exchange on which the contract is traded and may be modified during the term of the contract. The initial margin is in the nature of a performance bond or good faith deposit on the futures contract that is returned to a Fund upon termination of the contract, assuming all contractual obligations have been satisfied. These amounts are included in Deposit with broker for futures contracts on the Statement of Assets and Liabilities. Each day a Fund may pay or receive cash, called “variation margin,” equal to the daily change in value of the futures contract. Such payments or receipts are recorded for financial statement purposes as unrealized gains or losses by a Fund. Variation margin does not represent a borrowing or loan by a Fund but is instead a settlement between a Fund and the broker of the amount one would owe the other if the futures contract expired. When the contract is closed, a Fund records a realized gain or loss equal to the difference between the value of the contract at the time it was opened and the value at the time it was closed.
The average value of futures contracts held in the ALPS | CoreCommodity Management CompleteCommodities® Strategy Fund for the six-month period ended April 30, 2020, was $176,142,492 for long futures and $84,164,737 for short futures.
Option Contracts: Each Fund may enter into options transactions for hedging purposes and for non-hedging purposes such as seeking to enhance return. Each Fund may write covered put and call options on any stocks or stock indices, currencies traded on domestic and foreign securities exchanges, or futures contracts on stock indices, interest rates and currencies traded on domestic and, to the extent permitted by the CFTC, foreign exchanges. A call option on an asset written by a Fund obligates the Fund to sell the specified asset to the holder (purchaser) at a stated price (the exercise price) if the option is exercised before a specified date (the expiration date). A put option on an asset written by a Fund obligates the Fund to buy the specified asset from the purchaser at the exercise price if the option is exercised before the expiration date. Premiums received when writing options are recorded as liabilities and are subsequently adjusted to the current value of the options written. Premiums received from writing options that expire are treated as realized gains. Premiums received from writing options, which are either exercised or closed, are offset against the proceeds received or amount paid on the transaction to determine realized gains or losses which are recorded on the Statement of Operations.
| 153 | | April 30, 2020 |
Notes to Financial Statements
April 30, 2020 (Unaudited)
Derivatives Instruments: The following tables disclose the amounts related to each Fund’s use of derivative instruments.
The effect of derivatives instruments on the Statement of Assets and Liabilities for the six-month period ended April 30, 2020:
| Risk Exposure | Asset Location | Fair Value | Liability Location | Fair Value | ||||||||
| ALPS | CoreCommodity Management CompleteCommodities® Strategy Fund(a) | ||||||||||||
| Commodity Contracts (Futures Contracts) | Unrealized appreciation on futures contracts(b) | $ | 28,009,477 | Unrealized depreciation on futures contracts(b) | $ | (1,052,724 | ) | |||||
| Commodity Contracts (Total Return Swap Contracts) | Unrealized appreciation on total return swap contracts | 8 | Unrealized depreciation on total return swap contracts | (548 | ) | |||||||
| Total | $ | 28,009,485 | $ | (1,053,272 | ) | |||||||
| Risk Exposure | Asset Location | Fair Value | Liability Location | Fair Value | ||||||||
| Clough China Fund | ||||||||||||
| Equity Contracts (Total Return Swap Contracts) | Unrealized appreciation on total return swap contracts | $ | 199,952 | Unrealized depreciation on total return swap contracts | $ | (139,392 | ) | |||||
| Total | $ | 199,952 | $ | (139,392 | ) | |||||||
| (a) | The ALPS | CoreCommodity Management CompleteCommodities® Strategy Fund consolidates the statements of assets and liabilities. |
| (b) | Represents cumulative appreciation (depreciation) of futures contracts as reported in the Consolidated Statement of Investments. Only the current day's net variation margin is reported within the Consolidated Statement of Assets and Liabilities. |
The effect of derivatives instruments on the Statement of Operations for the Fiscal Year Ended April 30, 2020:
| Risk Exposure | Statement of Operations Location | Realized Gain/(Loss) on Derivatives Recognized in Income | Change in Unrealized Appreciation/(Depreciation) on Derivatives Recognized in Income | |||||||
| ALPS | CoreCommodity Management CompleteCommodities® Strategy Fund(a) | ||||||||||
| Equity and Commodity Contracts (Futures Contracts) | Net realized gain on futures contracts/ Net change in unrealized depreciation on futures contracts | $ | (40,953,420 | ) | $ | 28,156,856 | ||||
| Commodity Contracts (Total Return Swap Contracts) | Net realized gain on total return swap contracts/ Net change in unrealized depreciation on total return swap contracts | (71,391,323 | ) | (564 | ) | |||||
| Total | $ | (112,344,743 | ) | $ | 28,156,292 | |||||
| Clough China Fund | ||||||||||
| Equity Contracts (Total Return Swap Contracts) | Net realized gain on total return swap contracts/Net change in unrealized depreciation on total return swap contracts | $ | 342,084 | $ | (272,183 | ) | ||||
| Total | $ | 342,084 | $ | (272,183 | ) | |||||
| (a) | The ALPS | CoreCommodity Management CompleteCommodities® Strategy Fund consolidates the statements of operations. |
Certain derivative contracts are executed under either standardized netting agreements or, for exchange-traded derivatives, the relevant contracts for a particular exchange which contain enforceable netting provisions. A derivative netting arrangement creates an enforceable right of set-off that becomes effective, and affects the realization of settlement on individual assets, liabilities and collateral amounts, only following a specified event of default or early termination. Default events may include the failure to make payments or deliver securities timely, material adverse changes in financial condition or insolvency, the breach of minimum regulatory capital requirements, or loss of license, charter or other legal authorization necessary to perform under the contract.
| 154 | | April 30, 2020 |
Notes to Financial Statements
April 30, 2020 (Unaudited)
The following table presents financial instruments that are subject to enforceable netting arrangements or other similar agreements as of April 30, 2020:
Offsetting of Derivatives Asset
April 30, 2020
| Gross Amounts Not Offset in the Statement of Financial Position | ||||||||||||||||||||||||
| Gross Amounts of Recognized Assets | Gross Amounts Offset in the Statement of Assets and Liabilities | Net Amounts Presented in the Statement of Assets and Liabilities | Financial Instruments | Cash Collateral Received(a) | Net Amount | |||||||||||||||||||
| ALPS | CoreCommodity Management CompleteCommodities® Strategy Fund | ||||||||||||||||||||||||
| Total Return Swap Contracts | $ | 8 | $ | – | $ | 8 | $ | – | $ | – | $ | 8 | ||||||||||||
| Total | $ | 8 | $ | – | $ | 8 | $ | – | $ | – | $ | 8 | ||||||||||||
| Clough China Fund | ||||||||||||||||||||||||
| Total Return Swap Contracts | $ | 199,952 | $ | – | $ | 199,952 | $ | (139,392 | ) | $ | – | $ | 60,560 | |||||||||||
| Total | $ | 199,952 | $ | – | $ | 199,952 | $ | (139,392 | ) | $ | – | $ | 60,560 | |||||||||||
| (a) | These amounts are limited to the derivative asset/liability balance and, accordingly, do not include excess collateral received/pledged. |
Offsetting of Derivatives Liability
April 30, 2020
| Gross Amounts Not Offset in the Statement of Financial Position | ||||||||||||||||||||||||
| Gross Amounts of Recognized Liabilities | Gross Amounts Offset in the Statement of Assets and Liabilities | Net Amounts Presented in the Statement of Assets and Liabilities | Financial Instruments(a) | Cash Collateral Pledged(a) | Net Amount | |||||||||||||||||||
| ALPS | CoreCommodity Management CompleteCommodities® Strategy Fund | ||||||||||||||||||||||||
| Total Return Swap Contracts | $ | 548 | $ | – | $ | 548 | $ | – | $ | – | $ | 548 | ||||||||||||
| Total | $ | 548 | $ | – | $ | 548 | $ | – | $ | – | $ | 548 | ||||||||||||
| Clough China Fund | ||||||||||||||||||||||||
| Total Return Swap Contracts | $ | 139,392 | $ | – | $ | 139,392 | $ | (139,392 | ) | $ | – | $ | – | |||||||||||
| Total | $ | 139,392 | $ | – | $ | 139,392 | $ | (139,392 | ) | $ | – | $ | – | |||||||||||
4. TAX BASIS INFORMATION
Tax Basis of Distributions to Shareholders: The character of distributions made during the year from net investment income or net realized gains may differ from its ultimate characterization for federal income tax purposes. Also, due to the timing of dividend distributions, the fiscal year in which amounts are distributed may differ from the fiscal year in which the income or realized gain were recorded by a Fund. The amounts and characteristics of tax basis distributions and composition of distributable earnings/ (accumulated losses) are finalized at fiscal year-end. Accordingly, tax basis balances have not been determined as of April 30, 2020.
| 155 | | April 30, 2020 |
Notes to Financial Statements
April 30, 2020 (Unaudited)
The tax character of distributions paid by the Funds for the Fiscal Year Ended October 31, 2019 were as follows:
| Fund | Ordinary Income | Long-Term Capital Gain | ||||||
| ALPS | CoreCommodity Management CompleteCommodities® Strategy Fund | $ | 19,456,298 | $ | – | ||||
| ALPS | Kotak India Growth Fund | – | 1,429,380 | ||||||
| ALPS | Smith Short Duration Bond Fund | 835,570 | – | ||||||
| ALPS | Smith Total Return Bond Fund | 3,232,935 | – | ||||||
| ALPS | Red Rocks Global Opportunity Fund | 2,264,528 | 7,073,159 | ||||||
| Clough China Fund | – | 2,916,100 | ||||||
| RiverFront Asset Allocation Moderate | 1,521,039 | 9,462,099 | ||||||
| RiverFront Asset Allocation Aggressive | 552,519 | 9,151,423 | ||||||
| RiverFront Asset Allocation Growth & Income | 1,245,975 | 10,281,453 | ||||||
Unrealized Appreciation and Depreciation on Investments: As of April 30, 2020, the costs of investments for federal income tax purposes and accumulated net unrealized appreciation/(depreciation) on investments were as follows:
| Fund | Gross Appreciation (excess of value over tax cost) | Gross Depreciation (excess of tax cost over value) | Net Unrealized Appreciation/ (Depreciation) | Cost of Investments for Income Tax Purposes | ||||||||||||
| ALPS | CoreCommodity Management CompleteCommodities® | ||||||||||||||||
| Strategy Fund | $ | 241,825,117 | $ | (241,190,267 | )$ | 634,850 | $ | 304,897,702 | ||||||||
| ALPS | Kotak India Growth Fund | – | (33,766,541 | ) | (33,766,541 | ) | 154,546,647 | ||||||||||
| ALPS | Smith Short Duration Bond Fund | 1,016,725 | (272,593 | ) | �� | 744,132 | 62,106,457 | ||||||||||
| ALPS | Smith Total Return Bond Fund | 25,544,278 | (9,140,351 | ) | 16,403,927 | 953,000,007 | |||||||||||
| ALPS | Red Rocks Global Opportunity Fund | 14,979,459 | (12,298,597 | ) | 2,680,862 | 116,031,795 | |||||||||||
| Clough China Fund | 10,344,076 | (4,882,776 | ) | 5,461,300 | 26,238,662 | |||||||||||
| RiverFront Asset Allocation Moderate | 1,691,616 | (1,651,610 | ) | 40,006 | 51,629,038 | |||||||||||
| RiverFront Asset Allocation Aggressive | – | (2,834,003 | ) | (2,834,003 | ) | 26,758,042 | ||||||||||
| RiverFront Asset Allocation Growth & Income | 566,454 | (2,849,870 | ) | (2,283,416 | ) | 61,564,177 | ||||||||||
| 156 | | April 30, 2020 |
Notes to Financial Statements
April 30, 2020 (Unaudited)
5. SECURITIES TRANSACTIONS
Purchases and sales of securities, excluding short-term securities and U.S. Government Obligations during the six-month period ended April 30, 2020 were as follows:
| Fund | Purchases of Securities | Proceeds from Sales of Securities | ||||||
| ALPS | CoreCommodity Management CompleteCommodities® Strategy Fund(a) | $ | 33,224,442 | $ | 54,340,549 | ||||
| ALPS | Kotak India Growth Fund(b) | 179,130,146 | 40,929,206 | ||||||
| ALPS | Smith Short Duration Bond Fund | 158,628,158 | 137,041,087 | ||||||
| ALPS | Smith Total Return Bond Fund | 885,701,337 | 469,931,910 | ||||||
| ALPS | Red Rocks Global Opportunity Fund | 22,334,154 | 63,674,658 | ||||||
| Clough China Fund | 20,853,005 | 25,903,757 | ||||||
| RiverFront Asset Allocation Moderate | 8,081,754 | 17,280,003 | ||||||
| RiverFront Asset Allocation Aggressive | 5,704,799 | 13,381,306 | ||||||
| RiverFront Asset Allocation Growth & Income | 18,815,074 | 34,390,934 | ||||||
Purchases and sales of U.S. Government Obligations during the six-month period ended April 30, 2020 were as follows:
| Fund | Purchases of Securities | Proceeds from Sales of Securities | ||||||
| ALPS | CoreCommodity Management CompleteCommodities® Strategy Fund(a) | $ | 190,948,867 | $ | 390,492,484 | ||||
| ALPS | Smith Short Duration Bond Fund | 53,641,955 | 61,904,678 | ||||||
| ALPS | Smith Total Return Bond Fund | 898,773,288 | 769,433,763 | ||||||
| (a) | Purchases and sales for ALPS | CoreCommodity Management CompleteCommodities® Strategy Fund are consolidated and include the balances of CoreCommodity Management Cayman Commodity Fund, Ltd. (wholly owned subsidiary). |
| (b) | Purchases and sales for ALPS | Kotak India Growth Fund are consolidated and include the balances of Kotak Mauritius Portfolio (wholly owned subsidiary). |
| 157 | | April 30, 2020 |
Notes to Financial Statements
April 30, 2020 (Unaudited)
6. BENEFICIAL INTEREST TRANSACTIONS
Shares redeemed within 90 days of purchase for ALPS | Red Rocks Global Opportunity Fund, ALPS | Smith Total Return Bond Fund, and ALPS | Smith Short Duration Bond Fund and 30 days of purchase for ALPS | CoreCommodity Management CompleteCommodities® Strategy Fund, ALPS | Kotak India Growth Fund, and Clough China Fund, may incur a 2% short-term redemption fee deducted from the redemption amount. RiverFront Asset Allocation Growth & Income and RiverFront Asset Allocation Moderate shares do not incur redemption fees. Effective December 20, 2019 the ALPS | Smith Total Return Bond Fund, and ALPS | Smith Short Duration Bond Fund do not incur redemption fees.
Effective December 1, 2017, Class A shares were renamed Investor Class shares for all Funds. Such shares will be offered without an initial sales charge or a contingent deferred sales charge. The RiverFront Asset Allocation Aggressive existing Investor shares were renamed Investor Class II shares.
For the sixth-month period ended April 30, 2020, the amounts listed below were retained by the Funds. These amounts are reflected in “Shares redeemed” in the Statements of Changes in Net Assets.
| Redemption Fee Retained | ||||||||
| Fund | For the Six Months Ended April 30, 2020 (Unaudited) | For the Year Ended October 31, 2019 | ||||||
| ALPS | CoreCommodity Management CompleteCommodities® Strategy Fund - Investor Class(a) | $ | 3,320 | $ | 2,604 | ||||
| ALPS | CoreCommodity Management CompleteCommodities® Strategy Fund - Class C | – | 1,039 | ||||||
| ALPS | CoreCommodity Management CompleteCommodities® Strategy Fund - Class I | 4,794 | 6,458 | ||||||
| ALPS | Kotak India Growth Fund - Investor Class(a) | 4 | 100 | ||||||
| ALPS | Kotak India Growth Fund - Class C | – | 21 | ||||||
| ALPS | Kotak India Growth Fund - Class I | 4 | – | ||||||
| ALPS | Smith Short Duration Bond Fund - Class A | – | 6 | ||||||
| ALPS | Smith Short Duration Bond Fund - Class I | 2,157 | 18,679 | ||||||
| ALPS | Smith Total Return Bond Fund - Investor Class(a) | 20 | 51 | ||||||
| ALPS | Smith Total Return Bond Fund - Class A | 1,436 | 120 | ||||||
| ALPS | Smith Total Return Bond Fund - Class I | 29,306 | 34,809 | ||||||
| ALPS | Red Rocks Global Opportunity Fund - Investor Class(a) | 12,263 | 1,691 | ||||||
| ALPS | Red Rocks Global Opportunity Fund - Class A | 55 | – | ||||||
| ALPS | Red Rocks Global Opportunity Fund - Class C | 367 | 73 | ||||||
| ALPS | Red Rocks Global Opportunity Fund - Class I | 9,172 | 10,842 | ||||||
| Clough China Fund - Investor Class(a) | 133 | – | ||||||
| (a) | Prior to December 1, 2017, Investor Class was known as Class A. |
| 158 | | April 30, 2020 |
Notes to Financial Statements
April 30, 2020 (Unaudited)
Transactions in shares of capital stock were as follows:
| ALPS | CoreCommodity Management CompleteCommodities® Strategy Fund | ||||||||
| For the Six Months Ended April 30, 2020 (Unaudited) | For the Year Ended October 31, 2019 | |||||||
| Investor Class | ||||||||
| Shares sold | 1,725,765 | 2,446,483 | ||||||
| Dividends reinvested | 52,689 | 192,619 | ||||||
| Shares redeemed | (788,006 | ) | (3,226,399 | ) | ||||
| Net increase/(decrease) in shares outstanding | 990,448 | (587,297 | ) | |||||
| Class A | ||||||||
| Shares sold | 19,991 | 86,944 | ||||||
| Dividends reinvested | 855 | 769 | ||||||
| Shares redeemed | (23,468 | ) | (488 | ) | ||||
| Net increase/(decrease) in shares outstanding | (2,622 | ) | 87,225 | |||||
| Class C | ||||||||
| Shares sold | 50,197 | 302,846 | ||||||
| Dividends reinvested | 4,410 | 27,483 | ||||||
| Shares redeemed | (545,284 | ) | (591,807 | ) | ||||
| Net decrease in shares outstanding | (490,677 | ) | (261,478 | ) | ||||
| Class I | ||||||||
| Shares sold | 18,368,113 | 34,629,454 | ||||||
| Dividends reinvested | 575,900 | 2,060,834 | ||||||
| Shares redeemed | (26,259,070 | ) | (47,684,063 | ) | ||||
| Net decrease in shares outstanding | (7,315,057 | ) | (10,993,775 | ) | ||||
| 159 | | April 30, 2020 |
Notes to Financial Statements
April 30, 2020 (Unaudited)
| ALPS | Kotak India Growth Fund | ||||||||
| For the Six Months Ended April 30, 2020 (Unaudited) | For the Year Ended October 31, 2019 | |||||||
| Investor Class | ||||||||
| Shares sold | 14,647 | 90,140 | ||||||
| Dividends reinvested | 3,593 | 28,015 | ||||||
| Shares redeemed | (109,954 | ) | (260,791 | ) | ||||
| Net decrease in shares outstanding | (91,714 | ) | (142,636 | ) | ||||
| Class A | ||||||||
| Shares sold | – | 6,622 | ||||||
| Dividends reinvested | 88 | 49 | ||||||
| Shares redeemed | (1,914 | ) | – | |||||
| Net increase/(decrease) in shares outstanding | (1,826 | ) | 6,671 | |||||
| Class C | ||||||||
| Shares sold | 414 | 6,702 | ||||||
| Dividends reinvested | 2,484 | 12,986 | ||||||
| Shares redeemed | (13,141 | ) | (21,708 | ) | ||||
| Net decrease in shares outstanding | (10,243 | ) | (2,020 | ) | ||||
| Class I | ||||||||
| Shares sold | 482,276 | 820,197 | ||||||
| Dividends reinvested | 17,939 | 60,005 | ||||||
| Shares redeemed | (418,786 | ) | (383,177 | ) | ||||
| Net increase in shares outstanding | 81,429 | 497,025 | ||||||
| Class II(a) | ||||||||
| Shares sold | 13,368,944 | – | ||||||
| Shares redeemed | (2,963,226 | ) | – | |||||
| Net increase in shares outstanding | 10,405,718 | – | ||||||
| ALPS | Smith Short Duration Bond Fund | ||||||||
| For the Six Months Ended April 30, 2020 (Unaudited) | For the Year Ended October 31, 2019 | |||||||
| Investor Class | ||||||||
| Shares sold | 3,890 | 25,637 | ||||||
| Dividends reinvested | 595 | 988 | ||||||
| Shares redeemed | (6,804 | ) | (25,150 | ) | ||||
| Net increase/(decrease) in shares outstanding | (2,319 | ) | 1,475 | |||||
| Class A | ||||||||
| Shares sold | 21,868 | 36,264 | ||||||
| Dividends reinvested | 584 | 441 | ||||||
| Shares redeemed | (3,503 | ) | (1,808 | ) | ||||
| Net increase in shares outstanding | 18,949 | 34,897 | ||||||
| Class C | ||||||||
| Shares sold | 8,455 | 12,866 | ||||||
| Dividends reinvested | 594 | 555 | ||||||
| Shares redeemed | (918 | ) | (1,978 | ) | ||||
| Net increase in shares outstanding | 8,131 | 11,443 | ||||||
| Class I | ||||||||
| Shares sold | 3,331,582 | 4,134,450 | ||||||
| Dividends reinvested | 58,038 | 43,420 | ||||||
| Shares redeemed | (2,028,557 | ) | (1,159,658 | ) | ||||
| Net increase in shares outstanding | 1,361,063 | 3,018,212 | ||||||
| 160 | | April 30, 2020 |
Notes to Financial Statements
April 30, 2020 (Unaudited)
| ALPS | Smith Total Return Bond Fund | ||||||||
| For the Six Months Ended April 30, 2020 (Unaudited) | For the Year Ended October 31, 2019 | |||||||
| Investor Class | ||||||||
| Shares sold | 260,127 | 703,752 | ||||||
| Dividends reinvested | 5,158 | 5,233 | ||||||
| Shares redeemed | (185,750 | ) | (368,244 | ) | ||||
| Net increase in shares outstanding | 79,535 | 340,741 | ||||||
| Class A | ||||||||
| Shares sold | 259,917 | 823,752 | ||||||
| Dividends reinvested | 12,588 | 3,772 | ||||||
| Shares redeemed | (63,619 | ) | (119,436 | ) | ||||
| Net increase in shares outstanding | 208,886 | 708,088 | ||||||
| Class C | ||||||||
| Shares sold | 174,897 | 155,015 | ||||||
| Dividends reinvested | 2,968 | 517 | ||||||
| Shares redeemed | (14,863 | ) | (10,168 | ) | ||||
| Net increase in shares outstanding | 163,002 | 145,364 | ||||||
| Class I | ||||||||
| Shares sold | 57,996,295 | 33,518,918 | ||||||
| Dividends reinvested | 681,343 | 220,509 | ||||||
| Shares redeemed | (8,759,433 | ) | (1,476,356 | ) | ||||
| Net increase in shares outstanding | 49,918,205 | 32,263,071 | ||||||
| ALPS | Red Rocks Global Opportunity Fund | ||||||||
| For the Six Months Ended April 30, 2020 (Unaudited) | For the Year Ended October 31, 2019 | |||||||
| Investor Class | ||||||||
| Shares sold | 658,517 | 890,646 | ||||||
| Dividends reinvested | 396,106 | 178,286 | ||||||
| Shares redeemed | (1,142,123 | ) | (3,085,473 | ) | ||||
| Net decrease in shares outstanding | (87,500 | ) | (2,016,541 | ) | ||||
| Class A | ||||||||
| Shares sold | 118,149 | 179,366 | ||||||
| Dividends reinvested | 11,532 | 186 | ||||||
| Shares redeemed | (32,276 | ) | (77,914 | ) | ||||
| Net increase in shares outstanding | 97,405 | 101,638 | ||||||
| Class C | ||||||||
| Shares sold | 80,610 | 125,206 | ||||||
| Dividends reinvested | 277,858 | 90,579 | ||||||
| Shares redeemed | (415,313 | ) | (914,084 | ) | ||||
| Net decrease in shares outstanding | (56,845 | ) | (698,299 | ) | ||||
| Class I | ||||||||
| Shares sold | 2,966,902 | 6,594,931 | ||||||
| Dividends reinvested | 2,205,348 | 881,354 | ||||||
| Shares redeemed | (8,681,512 | ) | (14,608,996 | ) | ||||
| Net decrease in shares outstanding | (3,509,262 | ) | (7,132,711 | ) | ||||
| Class R | ||||||||
| Shares sold | 104,010 | 210,457 | ||||||
| Dividends reinvested | 169,759 | 45,988 | ||||||
| Shares redeemed | (95,579 | ) | (174,673 | ) | ||||
| Net increase in shares outstanding | 178,190 | 81,772 | ||||||
| 161 | | April 30, 2020 |
Notes to Financial Statements
April 30, 2020 (Unaudited)
| Clough China Fund | ||||||||
| For the Six Months Ended April 30, 2020 (Unaudited) | For the Year Ended October 31, 2019 | |||||||
| Investor Class | ||||||||
| Shares sold | 16,905 | 20,658 | ||||||
| Dividends reinvested | 27,169 | 27,938 | ||||||
| Shares redeemed | (111,939 | ) | (97,477 | ) | ||||
| Net decrease in shares outstanding | (67,865 | ) | (48,881 | ) | ||||
| Class A | ||||||||
| Shares sold | 5,140 | 72,214 | ||||||
| Dividends reinvested | 3,571 | 29 | ||||||
| Shares redeemed | �� | (16,631 | ) | (5,585 | ) | |||
| Net increase/(decrease) in shares outstanding | (7,920 | ) | 66,658 | |||||
| Class C | ||||||||
| Shares sold | 2,059 | 4,859 | ||||||
| Dividends reinvested | 5,598 | 10,101 | ||||||
| Shares redeemed | (18,611 | ) | (124,862 | ) | ||||
| Net decrease in shares outstanding | (10,954 | ) | (109,902 | ) | ||||
| Class I | ||||||||
| Shares sold | 39,028 | 26,978 | ||||||
| Dividends reinvested | 91,364 | 78,396 | ||||||
| Shares redeemed | (62,301 | ) | (66,184 | ) | ||||
| Net increase in shares outstanding | 68,091 | 39,190 | ||||||
| 162 | | April 30, 2020 |
Notes to Financial Statements
April 30, 2020 (Unaudited)
| RiverFront Asset Allocation Aggressive | ||||||||
| For the Six Months Ended April 30, 2020 (Unaudited) | For the Year Ended October 31, 2019 | |||||||
| Investor Class | ||||||||
| Shares sold | 2,440 | 125,608 | ||||||
| Dividends reinvested | 6,342 | 94,006 | ||||||
| Shares redeemed | (137,800 | ) | (189,124 | ) | ||||
| Net increase/(decrease) in shares outstanding | (129,018 | ) | 30,490 | |||||
| Class A | ||||||||
| Shares sold | 12,554 | 82,909 | ||||||
| Dividends reinvested | 1,412 | 200 | ||||||
| Shares redeemed | (3,938 | ) | (17,859 | ) | ||||
| Net increase in shares outstanding | 10,028 | 65,250 | ||||||
| Class C | ||||||||
| Shares sold | 7,928 | 40,125 | ||||||
| Dividends reinvested | 7,859 | 190,251 | ||||||
| Shares redeemed | (82,336 | ) | (407,276 | ) | ||||
| Net decrease in shares outstanding | (66,549 | ) | (176,900 | ) | ||||
| Class I | ||||||||
| Shares sold | 25,838 | 149,895 | ||||||
| Dividends reinvested | 8,074 | 187,996 | ||||||
| Shares redeemed | (328,346 | ) | (603,425 | ) | ||||
| Net decrease in shares outstanding | (294,434 | ) | (265,534 | ) | ||||
| Investor II | ||||||||
| Shares sold | 1,154 | 7,818 | ||||||
| Dividends reinvested | 1,484 | 36,176 | ||||||
| Shares redeemed | (15,187 | ) | (75,492 | ) | ||||
| Net decrease in shares outstanding | (12,549 | ) | (31,498 | ) | ||||
| Class L | ||||||||
| Shares sold | 73,114 | 179,272 | ||||||
| Dividends reinvested | 29,157 | 415,449 | ||||||
| Shares redeemed | (312,544 | ) | (381,451 | ) | ||||
| Net increase/(decrease) in shares outstanding | (210,273 | ) | 213,270 | |||||
| 163 | | April 30, 2020 |
Notes to Financial Statements
April 30, 2020 (Unaudited)
| RiverFront Asset Allocation Growth & Income | ||||||||
| For the Six Months Ended April 30, 2020 (Unaudited) | For the Year Ended October 31, 2019 | |||||||
| Investor Class | ||||||||
| Shares sold | 8,330 | 17,283 | ||||||
| Dividends reinvested | 9,005 | 120,109 | ||||||
| Shares redeemed | (112,676 | ) | (351,316 | ) | ||||
| Acquisition (Note 10) | – | 273,339 | ||||||
| Net increase/(decrease) in shares outstanding | (95,341 | ) | 59,415 | |||||
| Class A | ||||||||
| Shares sold | 57,499 | 313,306 | ||||||
| Dividends reinvested | 4,342 | 2,838 | ||||||
| Shares redeemed | (48,920 | ) | (73,986 | ) | ||||
| Acquisition (Note 10) | – | 76,643 | ||||||
| Net increase in shares outstanding | 12,921 | 318,801 | ||||||
| Class C | ||||||||
| Shares sold | 50,173 | 82,129 | ||||||
| Dividends reinvested | 16,082 | 292,273 | ||||||
| Shares redeemed | (331,699 | ) | (950,068 | ) | ||||
| Acquisition (Note 10) | – | 500,915 | ||||||
| Net decrease in shares outstanding | (265,444 | ) | (74,751 | ) | ||||
| Class I | ||||||||
| Shares sold | 172,392 | 638,382 | ||||||
| Dividends reinvested | 52,467 | 625,708 | ||||||
| Shares redeemed | (1,317,620 | ) | (1,866,300 | ) | ||||
| Acquisition (Note 10) | – | 861,187 | ||||||
| Net increase/(decrease) in shares outstanding | (1,092,761 | ) | 258,977 | |||||
| 164 | | April 30, 2020 |
Notes to Financial Statements
April 30, 2020 (Unaudited)
| RiverFront Asset Allocation Moderate | ||||||||
| For the Six Months Ended April 30, 2020 (Unaudited) | For the Year Ended October 31, 2019 | |||||||
| Investor Class | ||||||||
| Shares sold | 3,443 | 1,837 | ||||||
| Dividends reinvested | 4,033 | 119,729 | ||||||
| Shares redeemed | (69,687 | ) | (357,459 | ) | ||||
| Acquisition (Note 10) | – | 14,598 | ||||||
| Net decrease in shares outstanding | (62,211 | ) | (221,295 | ) | ||||
| Class A | ||||||||
| Shares sold | 124,770 | 711,679 | ||||||
| Dividends reinvested | 5,222 | 6,082 | ||||||
| Shares redeemed | (127,349 | ) | (180,214 | ) | ||||
| Acquisition (Note 10) | – | 29,193 | ||||||
| Net increase in shares outstanding | 2,643 | 566,740 | ||||||
| Class C | ||||||||
| Shares sold | 21,007 | 116,728 | ||||||
| Dividends reinvested | 11,786 | 577,863 | ||||||
| Shares redeemed | (564,192 | ) | (2,143,904 | ) | ||||
| Acquisition (Note 10) | – | 472,697 | ||||||
| Net decrease in shares outstanding | (531,399 | ) | (976,616 | ) | ||||
| Class I | ||||||||
| Shares sold | 114,007 | 256,077 | ||||||
| Dividends reinvested | 21,564 | 406,794 | ||||||
| Shares redeemed | (457,535 | ) | (951,196 | ) | ||||
| Acquisition (Note 10) | – | 282,639 | ||||||
| Net decrease in shares outstanding | (321,964 | ) | (5,686 | ) | ||||
| (a) | Class II commenced operations on December 19, 2019. |
| 165 | | April 30, 2020 |
Notes to Financial Statements
April 30, 2020 (Unaudited)
7. AFFILIATED COMPANIES
The Funds may invest in certain securities that are considered securities issued by affiliated companies. As defined by the Investment Company Act of 1940, an affiliated person, including an affiliated company, is one in which a Fund owns 5% or more of the outstanding voting securities, or a company which is under common ownership or control with the Fund. The purchases, sales, dividend income, realized gains or losses, change in unrealized gains or losses, shares and value of investments in affiliated companies for the six-month period ended April 30, 2020 were as follows:
| RiverFront Asset Allocation Aggressive | Market Value as of October 31, 2019 | Purchases | Sales | Market Value as of April 30, 2020 | Share Balance as of April 30, 2020 | Dividends | Change in Unrealized Gain (Loss) | Realized Gain/Loss | ||||||||||||||||||||||||
| First Trust RiverFront Dynamic Asia Pacific ETF | $ | 1,811,145 | $ | 134,205 | $ | (891,435 | ) | $ | 825,061 | 18,650 | $ | 22,466 | $ | 56,865 | $ | (285,719 | ) | |||||||||||||||
| First Trust RiverFront Dynamic Developed International ETF | 7,983,054 | – | (3,351,498 | ) | 3,571,763 | 73,274 | 63,141 | (484,760 | ) | (575,033 | ) | |||||||||||||||||||||
| First Trust RiverFront Dynamic Emerging Markets ETF | 3,061,672 | 1,042,382 | (801,439 | ) | 2,729,726 | 53,135 | 63,314 | (474,013 | ) | (98,876 | ) | |||||||||||||||||||||
| First Trust RiverFront Dynamic Europe ETF | 2,155,285 | 607,444 | (1,060,023 | ) | 1,551,841 | 30,799 | 13,608 | (37,887 | ) | (112,978 | ) | |||||||||||||||||||||
| RiverFront Dynamic Core Income ETF | – | 331,620 | (6,073 | ) | 325,231 | 12,462 | 543 | (277 | ) | (39 | ) | |||||||||||||||||||||
| RiverFront Dynamic US Dividend Advantage ETF | 5,518,661 | 3,589,148 | (1,443,296 | ) | 7,253,939 | 238,556 | 58,363 | (315,854 | ) | (94,720 | ) | |||||||||||||||||||||
| RiverFront Dynamic US Flex-Cap ETF | 14,520,890 | – | (5,827,542 | ) | 7,312,986 | 242,006 | 100,588 | (884,503 | ) | (495,859 | ) | |||||||||||||||||||||
| 35,050,707 | 5,704,799 | (13,381,306 | ) | 23,570,547 | 322,023 | (2,140,429 | ) | (1,663,224 | ) | |||||||||||||||||||||||
| RiverFront Asset Allocation Growth & Income | Market Value as of October 31, 2019 | Purchases | Sales | Market Value as of April 30, 2020 | Share Balance as of April 30, 2020 | Dividends | Change in Unrealized Gain (Loss) | Realized Gain/Loss | ||||||||||||||||||||||||
| First Trust RiverFront Dynamic Asia Pacific ETF | $ | 827,482 | – | $ | (722,547 | ) | – | – | $ | 10,654 | $ | 109,629 | $ | (214,564 | ) | |||||||||||||||||
| First Trust RiverFront Dynamic Developed International ETF | 11,891,781 | 4,298,877 | (5,710,838 | ) | 8,965,821 | 183,932 | 92,737 | (516,475 | ) | (997,524 | ) | |||||||||||||||||||||
| First Trust RiverFront Dynamic Emerging Markets ETF | 6,012,392 | 1,003,078 | (1,452,364 | ) | 4,598,793 | 89,517 | 130,489 | (826,802 | ) | (137,511 | ) | |||||||||||||||||||||
| First Trust RiverFront Dynamic Europe ETF | 3,430,593 | – | (3,121,377 | ) | – | – | 23,032 | 207,534 | (516,750 | ) | ||||||||||||||||||||||
| RiverFront Dynamic Core Income ETF | 15,798,220 | 5,506,464 | (4,123,047 | ) | 17,545,186 | 672,286 | 173,445 | 290,512 | 73,037 | |||||||||||||||||||||||
| RiverFront Dynamic Unconstrained Income ETF | 1,571,631 | 92,896 | (414,515 | ) | 1,185,412 | 48,985 | 33,078 | (55,104 | ) | (9,496 | ) | |||||||||||||||||||||
| RiverFront Dynamic US Dividend Advantage ETF | 18,147,419 | 5,164,820 | (3,813,033 | ) | 18,100,244 | 595,252 | 181,546 | (1,241,869 | ) | (157,093 | ) | |||||||||||||||||||||
| RiverFront Dynamic US Flex-Cap ETF | 19,189,665 | 2,748,939 | (12,357,549 | ) | 7,285,910 | 241,110 | 140,443 | (800,543 | ) | (1,494,602 | ) | |||||||||||||||||||||
| Riverfront Strategic Income Fund | 3,468,620 | – | (2,675,664 | ) | 587,444 | 25,169 | 51,262 | (119,158 | ) | (86,354 | ) | |||||||||||||||||||||
| 80,337,803 | 18,815,074 | (34,390,934 | ) | 58,268,810 | 836,686 | (2,952,276 | ) | (3,540,857 | ) | |||||||||||||||||||||||
| 166 | | April 30, 2020 |
Notes to Financial Statements
April 30, 2020 (Unaudited)
| RiverFront Asset Allocation Moderate | Market Value as of October 31, 2019 | Purchases | Sales | Market Value as of April 30, 2020 | Share Balance as of April 30, 2020 | Dividends | Change in Unrealized Gain (Loss) | Realized Gain/Loss | ||||||||||||||||||||||||
| First Trust RiverFront Dynamic Developed International ETF | $ | 3,128,156 | $ | 321,341 | $ | (422,701 | ) | $ | 2,614,649 | 53,639 | $ | 27,059 | $ | (392,658 | ) | $ | (19,489 | ) | ||||||||||||||
| First Trust RiverFront Dynamic Emerging Markets ETF | – | 610,529 | (509,448 | ) | – | – | – | – | (101,081 | ) | ||||||||||||||||||||||
| RiverFront Dynamic Core Income ETF | 25,091,122 | 3,287,940 | (3,634,608 | ) | 25,451,723 | 975,244 | 277,945 | 573,991 | 133,278 | |||||||||||||||||||||||
| RiverFront Dynamic Unconstrained Income ETF | 1,207,998 | 41,617 | (234,050 | ) | 968,222 | 40,010 | 25,740 | (43,490 | ) | (3,953 | ) | |||||||||||||||||||||
| RiverFront Dynamic US Dividend Advantage ETF | 19,202,692 | 3,820,327 | (5,797,272 | ) | 15,933,666 | 524,001 | 178,659 | (1,239,800 | ) | (52,281 | ) | |||||||||||||||||||||
| Riverfront Strategic Income Fund | 2,552,574 | – | (1,897,861 | ) | 508,228 | 21,775 | 37,908 | (90,486 | ) | (55,999 | ) | |||||||||||||||||||||
| RiverFront Dynamic US Flex-Cap ETF | 11,218,993 | – | (4,784,064 | ) | 5,353,849 | 177,173 | 78,419 | (651,931 | ) | (429,149 | ) | |||||||||||||||||||||
| 62,401,535 | 8,081,754 | (17,280,004 | ) | 50,830,337 | 625,730 | (1,844,374 | ) | (528,674 | ) | |||||||||||||||||||||||
8. MANAGEMENT AND RELATED-PARTY TRANSACTIONS
ALPS Advisors, Inc. (the “AAI”) acts as the Portfolios’ investment adviser. AAI is an indirect wholly owned subsidiary of DST Systems, Inc. (“DST”). DST is a wholly-owned subsidiary of SS&C Technologies Holdings, Inc. (“SS&C”), a publicly traded company listed on the NASDAQ Global Select Market.
AAI has delegated daily management of the Funds listed below to the corresponding Sub-Advisor(s) listed in the table below. Each Sub-Advisor manages the investments of the Fund in accordance with its investment objective, policies and limitations and investment guidelines established jointly by AAI and the Board.
| Fund | Sub-Advisor(s) |
| ALPS | CoreCommodity Management CompleteCommodities® | |
| Strategy Fund | CoreCommodity Management, LLC |
| ALPS | Kotak India Growth Fund | Kotak Mahindra Asset Management (Singapore) Pte. Ltd |
| ALPS | Smith Short Duration Bond Fund | Smith Capital Investors, LLC |
| ALPS | Smith Total Return Bond Fund | Smith Capital Investors, LLC |
| ALPS | Red Rocks Global Opportunity Fund | Red Rocks Capital, LLC(a) |
| Clough China Fund | Clough Capital Partners, LP |
| RiverFront Asset Allocation Aggressive | RiverFront Investment Group, LLC |
| RiverFront Asset Allocation Growth & Income | RiverFront Investment Group, LLC |
| RiverFront Asset Allocation Moderate | RiverFront Investment Group, LLC |
| (a) | Red Rocks Capital, LLC is a subsidiary of ALPS Advisors, Inc. |
| 167 | | April 30, 2020 |
Notes to Financial Statements
April 30, 2020 (Unaudited)
Pursuant to the Investment Advisory Agreement (the “Advisory Agreement”), the Funds listed below pay AAI an annual management fee which is based on each Fund’s average daily net assets. The management fee is paid on a monthly basis. The following table reflects the Funds’ contractual management fee rates (expressed as an annual rate).
| Fund | Contractual Management Fee |
| ALPS | CoreCommodity Management CompleteCommodities® Strategy Fund | 0.85% |
| ALPS | Kotak India Growth Fund | 0.65%(a) |
| ALPS | Smith Short Duration Bond Fund | 0.37% |
| ALPS | Smith Total Return Bond Fund | 0.55% |
| ALPS | Red Rocks Global Opportunity Fund | 0.85% |
| Clough China Fund | 1.35% |
| (a) | Effective December 2, 2019, the contractual management fee is 0.65% Prior to December 2, 20219, the contractual management fee was 1.25%. |
Pursuant to the Administrative Services Agreement, the Riverfront Funds listed below pay an annual unitary administrative fee which is based on each Fund’s average daily net assets. The unitary administrative fee is paid on a monthly basis. The following table reflects the Funds’ contractual unitary administrative fee rates (expressed as an annual rate).
| Fund | Contractual Unitary Fee |
| RiverFront Asset Allocation Aggressive | 0.25% |
| RiverFront Asset Allocation Growth & Income | 0.25% |
| RiverFront Asset Allocation Moderate | 0.25% |
Pursuant to an Investment Sub-advisory Agreement, AAI pays the Sub-Advisors of the Funds listed below an annual sub-advisory management fee which is based on each Fund’s average daily assets. AAI is required to pay all fees due to each Sub-Advisor out of the management fee AAI receives from each Fund listed below. The following table reflects the Funds’ contractual sub-advisory fee rates.
| Fund | Average Daily Net Assets of the Fund | Contractual Sub-Advisory Fee |
| ALPS | CoreCommodity Management CompleteCommodities® Strategy Fund | All Asset Levels | 0.75% |
| ALPS | Kotak India Growth Fund | All Asset Levels | 0.56%(a) |
| ALPS | Smith Short Duration Bond Fund | All Asset Levels | 0.29% |
| ALPS | Smith Total Return Bond Fund | All Asset Levels | 0.42% |
| ALPS | Red Rocks Global Opportunity Fund | All Asset Levels | 0.57% |
| Clough China Fund | All Asset Levels | 0.90% |
| (a) | Effective December 2, 2019, the contractual Sub-Advisory fee is 0.56%. Prior to December 2, 2019, the contractual Sub-Advisory fee was 1.15% for the first $50 million and 1.05% for over $50 million. |
ALPS | CoreCommodity Management CompleteCommodities® Strategy Fund
AAI and CoreCommodity Management LLC have contractually agreed to limit the amount of the Fund’s total annual expenses, exclusive of distribution and service (12b-1) fees, shareholder services fees, acquired fund fees and expenses, brokerage commissions, interest expense, taxes and extraordinary expenses that exceed the following annual rates below. The fee waiver agreement is in effect through February 28, 2021 and is reevaluated on an annual basis.
ALPS | Kotak India Growth Fund
AAI and Kotak Mahindra Asset Management (Singapore) Pte. Ltd have contractually agreed to limit the amount of the Fund’s total annual expenses, exclusive of distribution and service (12b-1) fees, shareholder services fees, acquired fund fees and expenses, brokerage expenses, interest expenses, taxes and extraordinary expenses that exceed the following annual rates below. The fee waiver agreement is in effect through February 28, 2021 and is reevaluated on an annual basis.
| 168 | | April 30, 2020 |
Notes to Financial Statements
April 30, 2020 (Unaudited)
ALPS | Smith Short Duration Bond Fund
AAI and Smith Capital Investors, LLC have agreed contractually to limit the amount of the Fund’s total annual expenses, exclusive of distribution and service (12b-1) fees, shareholder service fees, acquired fund fees and expenses, brokerage expenses, interest expenses, taxes and extraordinary expenses that exceed the following annual rates below. The fee waiver agreement is in effect through February 28, 2021 and is reevaluated on an annual basis.
ALPS | Smith Total Return Bond Fund
AAI and Smith Capital Investors, LLC have agreed contractually to limit the amount of the Fund’s total annual expenses, exclusive of distribution and service (12b-1) fees, shareholder service fees, acquired fund fees and expenses, brokerage expenses, interest expenses, taxes and extraordinary expenses that exceed the following annual rates below. The fee waiver agreement is in effect through February 28, 2021 and is reevaluated on an annual basis.
ALPS | Red Rocks Global Opportunity Fund
AAI and Red Rocks Capital LLC have contractually agreed to limit the amount of the Fund’s total annual expenses, exclusive of distribution and service (12b-1) fees, acquired fund fees and expenses, shareholder service fees, brokerage expenses, interest expense, taxes and extraordinary expenses that exceed the following annual rates below. The fee waiver agreement is in effect through February 28, 2021 and is reevaluated on an annual basis.
Clough China Fund
AAI has contractually agreed to limit the amount of the Fund’s total annual expenses, exclusive of acquired fund fees and expenses, interest, taxes, brokerage costs and commissions, dividend and interest expense on short sales, litigation, indemnification and extraordinary expenses as determined under generally accepted accounting principles that exceed the following annual rates below. The fee waiver agreement is in effect through February 28, 2021 and is reevaluated on an annual basis.
Expense limitation ratios from the current agreements are listed below. Fees waived or reimbursed for the six-month period ended April 30, 2020 are disclosed on the Statement of Operations or Consolidated Statement of Operations.
| Fund* | Investor Class | Class A | Class C | Class I | Class II | Class R |
| ALPS | CoreCommodity Management CompleteCommodities® Strategy Fund | 1.05% | 1.05% | 1.05% | 1.15% | N/A | N/A |
| ALPS | Kotak India Growth Fund | 1.00%(a) | 1.00%(a) | 1.00%(a) | 1.00%(a) | 0.75% | N/A |
| ALPS | Smith Short Duration Bond Fund | 0.49% | 0.49% | 0.49% | 0.49% | N/A | N/A |
| ALPS | Smith Total Return Bond Fund | 0.67% | 0.67% | 0.67% | 0.67% | N/A | N/A |
| ALPS | Red Rocks Global Opportunity Fund | 1.25% | 1.25% | 1.25% | 1.25% | N/A | 1.25% |
| Clough China Fund | 1.95% | 1.95% | 2.70% | 1.70% | N/A | N/A |
| (a) | Effective December 2, 2019, the expense limitation changed from 1.60% to 1.00%, excluding, among other fees and expenses, 12b-1 fees and shareholder service fees. |
| 169 | | April 30, 2020 |
Notes to Financial Statements
April 30, 2020 (Unaudited)
The Advisor and each Sub-Advisor are permitted to recover expenses they have waived or reimbursed, on a class-by-class basis, through the agreements described above to the extent that expenses in later periods fall below the annual limits set forth in these agreements. The ALPS | CoreCommodity Management CompleteCommodities® Strategy Fund, ALPS | Kotak India Growth Fund, ALPS | Smith Short Duration Bond Fund, ALPS | Smith Total Return Bond Fund, ALPS | Red Rocks Global Opportunity Fund, and Clough China Fund are not obligated to pay any deferred fees and expenses more than thirty-six months after the date on which the fees was waived or expenses were deferred, as calculated on a monthly basis. As of the six-month period ended April 30, 2020, the Advisor and Sub-Advisor(s) may seek reimbursement of previously waived and reimbursed fees as follows:
| Fund | Expires 10/31/20 | Expires 10/31/21 | Expires 10/31/22 | Expires 10/31/23 | Total | |||||||||||||||
| ALPS | CoreCommodity Mgmt CompleteCommoditiesSM Strategy Fund - Investor Class | N/A | N/A | N/A | 812 | 812 | |||||||||||||||
| ALPS | CoreCommodity Mgmt CompleteCommoditiesSM Strategy Fund - Class A | N/A | N/A | 6 | 13 | 19 | |||||||||||||||
| ALPS | CoreCommodity Mgmt CompleteCommoditiesSM Strategy Fund - Class C | N/A | N/A | N/A | 194 | 194 | |||||||||||||||
| ALPS | CoreCommodity Mgmt CompleteCommoditiesSM Strategy Fund - Class I | N/A | N/A | N/A | 30,844 | 30,844 | |||||||||||||||
| ALPS | Kotak India Growth Fund - Investor Class | 42,310 | 75,758 | 74,543 | 7,540 | 200,151 | |||||||||||||||
| ALPS | Kotak India Growth Fund - Class A | N/A | 42 | 536 | 160 | 738 | |||||||||||||||
| ALPS | Kotak India Growth Fund - Class C | 9,626 | 20,620 | 29,613 | 3,729 | 63,588 | |||||||||||||||
| ALPS | Kotak India Growth Fund - Class I | 86,007 | 171,092 | 229,275 | 36,882 | 523,256 | |||||||||||||||
| ALPS | Kotak India Growth Fund - Class II | N/A | N/A | N/A | 112,634 | 112,634 | |||||||||||||||
| ALPS | Smith Short Duration Bond Fund - Investor Class | N/A | 2,130 | 1,603 | 645 | 4,378 | |||||||||||||||
| ALPS | Smith Short Duration Bond Fund - Class A | N/A | 1,214 | 752 | 640 | 2,606 | |||||||||||||||
| ALPS | Smith Short Duration Bond Fund - Class C | N/A | 1,236 | 1,398 | 674 | 3,308 | |||||||||||||||
| ALPS | Smith Short Duration Bond Fund - Class I | N/A | 33,418 | 105,940 | 68,895 | 208,253 | |||||||||||||||
| ALPS | Smith Total Return Bond Fund - Investor Class | N/A | 1,018 | 2,913 | 176 | 4,107 | |||||||||||||||
| ALPS | Smith Total Return Bond Fund - Class A | N/A | 1,138 | 1,933 | 324 | 3,395 | |||||||||||||||
| ALPS | Smith Total Return Bond Fund - Class C | N/A | 1,162 | 458 | 56 | 1,676 | |||||||||||||||
| ALPS | Smith Total Return Bond Fund - Class I | N/A | 33,310 | 128,360 | 23,158 | 184,828 | |||||||||||||||
| Clough China Fund - Investor Class | N/A | 22,462 | 31,929 | 15,286 | 69,677 | |||||||||||||||
| Clough China Fund - Class A | N/A | 9 | 1,835 | 1,708 | 3,552 | |||||||||||||||
| Clough China Fund - Class C | N/A | 8,014 | 8,760 | 2,903 | 19,677 | |||||||||||||||
| Clough China Fund - Class I | N/A | 42,718 | 66,102 | 36,483 | 145,303 | |||||||||||||||
The CoreCommodity Management Cayman Commodity Fund Ltd. (the “Subsidiary”) has each entered into a separate advisory agreement (, the “Subsidiary Advisory Agreement”) with CoreCommodity Management, LLC for the management of the Subsidiary’s portfolio pursuant to which the Subsidiary is obligated to pay the CoreCommodity Management, LLC a management fee at the same rate that the Fund pays the Adviser for investment advisory services provided to the Funds. CoreCommodity Management, LLC has agreed to waive the advisory fee it receives from the Fund in an amount equal to the management fee paid by the Subsidiary. This agreement may be terminated based on the terms of the Subsidiary Advisory Agreement. For the six-months ended April 30, 2020, this amount equaled $437,462 and is disclosed in the Consolidated Statements of Operations. These waivers are not subject to reimbursement/recoupment.
ALPS | Smith Total Return Bond Fund recovered $4,475 during the period ended April 30, 2020.
The Riverfront Funds do not pay a management fee or contractually limit the amount of each Fund’s total annual expenses.
Kotak Mahindra Asset Management (Singapore) Pte. Ltd. executed purchase and sale trades in the ALPS/Kotak India Growth Fund with the sub-adviser’s affiliated broker-dealer, Kotak Securities, (the “affiliate broker”). Fund commissions paid to the affiliate broker were $12,630 during the period ended April 30, 2020.
ALPS Portfolio Solutions Distributor, Inc. (the “Distributor”) acts as the distributor of the Funds’ shares pursuant to a Distribution Agreement with the Trust. Shares are sold on a continuous basis by the Distributor, as agent for the Funds, and the Distributor has agreed to use its best efforts to solicit orders for the sale of Funds’ shares, although it is not obliged to sell any particular amount of shares. The Distributor is not entitled to any compensation for its services. The Distributor is registered as a broker -dealer with the Securities and Exchange Commission.
Distribution and Services (12b-1) Plans
Each Fund has adopted Distribution and Services Plans (the “Plans”) pursuant to Rule 12b-1 of the 1940 Act for its Investor Class, Class A, Class C and Class R (ALPS | Red Rocks Global Opportunity Fund only) and Investor Class II (Asset Allocation Aggressive Fund only) shares. The Plans allows a
| 170 | | April 30, 2020 |
Notes to Financial Statements
April 30, 2020 (Unaudited)
Fund to use Investor Class, Class A, Class C, Class R and Investor Class II assets to pay fees in connection with the distribution and marketing of Investor Class, Class A, Class C, Class R and Investor Class II shares and/or the provision of shareholder services to Investor Class, Class A, Class C, Class R and Investor Class II shareholders. The Plans permit payment for services in connection with the administration of plans or programs that use Investor Class, Class A, Class C, Class R and Investor Class II shares of a Fund, if any, as their funding medium and for related expenses. The Plans permit a Fund to make total payments at an annual rate of up to 0.25% of a Fund’s average daily net assets attributable to its Investor Class, Class A and Investor Class II shares, 0.75% of a Fund’s average daily net assets attributable to its Class C shares and 0.50% of the ALPS | Red Rocks Global Opportunity Fund’s average daily net assets attributable to its Class R shares.
Under the terms of the Plans, the Trust is authorized to make payments to the Distributor for remittance to financial intermediaries, as compensation for distribution and/or shareholder ongoing services performed by such entities for beneficial shareholders of the Fund. The Distributor is entitled to retain some or all fees payable under the Plans in certain circumstances, including when there is no broker of record or when certain qualification standards have not been met by the broker of record.
Shareholder Services Plans
Each Fund has adopted a shareholder services plan with respect to their Investor Class shares (the “Investor Class Shareholder Services Plan”). Under the Investor Class Shareholder Services Plan, the Funds are authorized to compensate certain financial intermediaries, including broker dealers and Fund affiliates (“Participating Organizations”), an aggregate fee in an amount not to exceed on an annual basis 0.15% of the average daily net asset value of Investor Class shares of the Funds attributable to or held in the name of the Participating Organizations pursuant to an agreement with a such Participating Organizations (the “Agreement”). Each Agreement will set forth the non-distribution related shareholder services to be performed by the Participating Organizations for the benefit of a Fund’s shareholders who have elected to have such Participating Organizations service their accounts. Any amount of such payment not paid to Participating Organizations during a Fund’s fiscal year for such service activities shall be reimbursed to the Fund as soon as practicable. Shareholder Services Plan fees are included with distribution and service fees in the Statements of Operations. Investor Class Shareholder Services Plan fees recaptured pursuant to the Services Plan for the six-month period ended April 30, 2020 are included as an offset to distribution and service fees as disclosed in the Statements of Operations.
Each Fund has adopted a shareholder services plan with respect to their Class A shares (the “Class A Shareholder Services Plan”). Under the Class A Shareholder Services Plan, the Funds are authorized to compensate certain financial intermediaries, including broker dealers and Fund affiliates, an aggregate fee in an amount not to exceed on an annual basis 0.15% of the average daily net asset value of Class A shares of the Funds attributable to or held in the name of the Participating Organizations pursuant to an agreement with a such Participating Organizations. Each Agreement will set forth the non-distribution related shareholder services to be performed by the Participating Organizations for the benefit of a Fund’s shareholders who have elected to have such Participating Organizations service their accounts. Any amount of such payment not paid to Participating Organizations during a Fund’s fiscal year for such service activities shall be reimbursed to the Fund as soon as practicable. Shareholder Services Plan fees are included with distribution and service fees in the Statements of Operations. Class A Shareholder Services Plan fees recaptured pursuant to the Services Plan for the six-month ended April 30, 2020 are included as an offset to distribution and service fees as disclosed in the Statements of Operations.
Each Fund has adopted a shareholder services plan with respect to its Class C shares (the “Class C Shareholder Services Plan”). Under the Class C Shareholder Services Plan, the Funds are authorized to pay banks and their affiliates and other institutions, including broker-dealers and Fund affiliates (“Participating Organizations”), an aggregate fee in an amount not to exceed on an annual basis 0.25% for Class C shares of the average daily net asset value of the Class C shares attributable to or held in the name of a Participating Organization for its clients as compensation for providing shareholder service activities, which do not include distribution services, pursuant to an agreement with a Participating Organization. Any amount of such payment not paid to Participating Organizations during a Fund’s fiscal year for such service activities shall be reimbursed to the Fund as soon as practicable after the end of the fiscal year. Class C Shareholder Services Plan fees are included with distribution and service fees on the Statements of Operations.
Certain intermediaries may charge networking, omnibus account or other administrative fees with respect to transactions in shares of each Fund. Transactions may be processed through the National Securities Clearing Corporation or similar systems or processed on a manual basis. These fees generally are paid by the Fund to the Distributor, which uses such fees to reimburse intermediaries. In the event an intermediary receiving payments from the Distributor on behalf of the Fund converts from a networking structure to an omnibus account structure or otherwise experiences increased costs, fees borne by the Fund may increase. Networking fees are shown in the Statements of Operations, if applicable to the Fund.
ALPS Fund Services, Inc. (“ALPS”) an affiliate of the Distributor serves as administrator to the Funds and the Funds have agreed to pay expenses incurred in connection with their administrative activities. Pursuant to an Administrative Agreement, ALPS provides operational services to the Funds including, but not limited to, fund accounting and fund administration and generally assists in the Funds’ operations. Officers of the Trust are employees of ALPS. The Funds’ administration fee is accrued on a daily basis and paid monthly. Administration fees paid by the Funds for the six-month period ended April 30, 2020 are disclosed in the Statement of Operations.
| 171 | | April 30, 2020 |
Notes to Financial Statements
April 30, 2020 (Unaudited)
ALPS is reimbursed by the Funds for certain out-of-pocket expenses.
Trustees
The fees and expenses of the Trustees of the Board are presented in the Statements of Operations.
9. INDEMNIFICATIONS
Under the Trust’s organizational documents, its officers and Trustees are indemnified against certain liability arising out of the performance of their duties to the Trust. Additionally, in the normal course of business, the Trust enters into contracts with service providers that may contain general indemnification clauses which may permit indemnification to the extent permissible under applicable law. The Trust’s maximum exposure under these arrangements is unknown, as this would involve future claims that may be made against the Trust that have not yet occurred.
10. FUND REORGANIZATIONS
At a regular meeting of the Board of Trustees held on June 11-12, 2019, the Trustees of the Riverfront Asset Allocation Growth Fund (the “Acquired Fund”), a former series of the Trust, approved the reorganization, pursuant to an Agreement and Plan of Reorganization (the “Plan”), of the Acquired Fund into the Riverfront Asset Allocation Growth & Income Fund (“Acquiring Fund”). For accounting and financial reporting purposes, the Acquiring Fund is the accounting survivor.
At a regular meeting of the Board of Trustees held on June 11-12, 2019, the Trustees of the Riverfront Asset Allocation Income & Growth (the “Acquired Fund”), a former series of the Trust, approved the reorganization, pursuant to an Agreement and Plan of Reorganization (the “Plan”), of the Acquired Fund into the Riverfront Asset Allocation Moderate (“Acquiring Fund”). For accounting and financial reporting purposes, the Acquiring Fund is the accounting survivor.
The purpose of the Reorganizations was to combine two funds with substantially identical investment objectives and similar principal investment strategies and policies.
Following the completion of the reorganization on September 13, 2019, and pursuant to the terms of the Plan, shareholders of the Acquired Fund became shareholders of the Acquiring Fund and received their respective class shares. The reorganizations qualified as tax-free “reorganizations” under the Internal Revenue Code of 1986, as amended (the “Code”) for U.S. federal income tax purposes.
As of the close of business on September 13, 2019, assets of the Acquired Fund were acquired by the Acquiring Fund in exchange for shares of the Acquiring Fund and the assumption by the Acquiring Fund of the liabilities of the Acquired Fund. On the Reorganization date, the Acquiring Fund and the Acquired Fund reported the following financial information:
| Acquiring Fund | Shares Outstanding of Acquiring Fund | Net Assets of Acquiring Fund | Acquired Fund | Acquired Fund Shares Exchanged | Net Assets of Acquired Fund Exchanged | |||||||||||||
| Moderate Fund | 5,562,515 | $ | 57,347,121 | Income & Growth | 794,393 | $ | 8,215,791 | |||||||||||
| Acquiring Fund | Shares Outstanding of Acquiring Fund | Net Assets of Acquiring Fund | Acquired Fund | Acquired Fund Shares Exchanged | Net Assets of Acquired Fund Exchanged | |||||||||||||
| Growth & Income Fund | 5,621,165 | $ | 66,383,356 | Growth Fund | 1,887,723 | $ | 20,193,762 | |||||||||||
The investment portfolio value and unrealized appreciation/ (depreciation) as of the Reorganization Date of the Acquired Funds were as follows:
| Acquired Fund | Portfolio Value | Unrealized Appreciation of Acquired Fund | ||||||
| Income & Growth | $ | 8,219,930 | $ | 322,079 | ||||
| Acquired Fund | Portfolio Value | Unrealized (Deprecation) of Acquired Fund | ||||||
| Growth Fund | $ | 20,257,358 | $ | (116,123 | ) | |||
Immediately following the Reorganizations the net assets of the Riverfront Asset Allocation Moderate and the Riverfront Asset Allocation Growth & Income were $65,562,912 and $86,577,118, respectively.
| 172 | | April 30, 2020 |
Notes to Financial Statements
April 30, 2020 (Unaudited)
As a result of the Reorganizations, 799,127 Shares were issued in the Riverfront Asset Allocation Moderate Fund and 1,712,084 Shares were issued in the Riverfront Asset Allocation Growth & Income Fund.
Assuming the acquisition had been completed on November 1, 2019, the Acquiring Fund’s pro forma results of operations for the period November 1, 2018 to October 31, 2019, are as follows:
| Moderate Fund Pro Forma (unaudited) | ||||
| Net Investment Income | $ | 1,260,193 | ||
| Net Realized and Unrealized Gain on Investments | 3,727,022 | |||
| Net Increase in Net Assets Resulting from Operations | $ | 4,987,215 | ||
| Growth & Income Fund Pro Forma (unaudited) | ||||
| Net Investment Income | $ | 1,742,852 | ||
| Net Realized and Unrealized Gain on Investments | 3,374,876 | |||
| Net Increase in Net Assets Resulting from Operations | $ | 5,117,728 | ||
11. SUBSEQUENT EVENTS
Subsequent events after the date of Statement of Assets and Liabilities have been evaluated through the date the financial statements were issued. Management has determined that there were no subsequent events to report through the issuance of these financial statements.
| 173 | | April 30, 2020 |
Additional Information
April 30, 2020 (Unaudited)
1. FUND HOLDINGS
Each Fund files its complete schedule of portfolio holdings with the Commission for the first and third quarters of each fiscal year as an exhibit to its reports on Form N-PORT. The Funds’ Form N-PORT reports are available on the Commission’s Web site at http://www.sec.gov. The Funds’ Form N-PORTs are also available upon request by calling 1-866-759-5679.
2. FUND PROXY VOTING POLICIES, PROCEDURES AND SUMMARIES
Fund policies and procedures used in determining how to vote proxies and information regarding how each of the Funds voted proxies relating to portfolio securities during the most recent prior 12-month period ending June 30 are available without charge, (1) upon request, by calling (toll-free) (866) 759-5679 and (2) on the SEC’s website at http://www.sec.gov.
| 174 | | April 30, 2020 |
Liquidity Risk Management Program
April 30, 2020 (Unaudited)
The Financial Investors Trust (the “Trust”) has established a liquidity risk management program (the “Program”) to govern the Trust’s approach to managing liquidity risk for each fund in the Trust (each a “Fund”). The Program is overseen by the Liquidity Committee (the “Committee”), a committee comprised of representatives of the Trust’s investment advisers, sub-advisers, and Officers of the Trust. The Trust’s Board of Trustees (the “Board”) has approved the designation of the Committee to oversee the Program.
The Program’s principal objectives include supporting each Fund’s compliance with limits on investments in illiquid assets and mitigating the risk that a Fund will be unable to meet its redemption obligations in a timely manner. The Program also includes a number of elements that support the management and assessment of liquidity risk, including a periodic assessment of factors that influence a Fund’s liquidity and the periodic classification and re-classification of the Fund’s investments into groupings that reflect the Committee’s assessment of their relative liquidity under current market conditions.
At a meeting of the Board held on March 10, 2020, the Trustees received a report from the Committee regarding the design and operational effectiveness of the Program since its implementation on December 1, 2018. The Committee determined, and reported to the Board, that the Program is reasonably designed to assess and manage each Fund’s liquidity risk and has operated adequately and effectively to manage each Fund’s liquidity risk since implementation.
The Committee reported that during the period covered by the report, there were no liquidity events that impacted the Funds or their ability to timely meet redemptions without dilution to existing shareholders. Among other things, the Board noted that the Funds are not required to have a highly liquid investment minimum based on their liquidity classifications. The Board further noted that no material changes have been made to the Program since its implementation.
| 175 | | April 30, 2020 |

| Item 2. | Code of Ethics. |
Not applicable to this report.
| Item 3. | Audit Committee Financial Expert. |
Not applicable to this report.
| Item 4. | Principal Accountant Fees and Services. |
Not applicable to this report.
| Item 5. | Audit Committee of Listed Registrants. |
Not applicable to the Registrant.
| Item 6. | Investments. |
| (a) | Schedule of Investments is included as part of the Reports to Stockholders filed under Item 1 of this Form N-CSR. |
| (b) | Not applicable. |
| Item 7. | Disclosure of Proxy Voting Policies and Procedures for Closed-End Management Investment Companies. |
Not applicable to the Registrant.
| Item 8. | Portfolio Managers of Closed-End Management Investment Companies. |
Not applicable to the Registrant.
| Item 9. | Purchases of Equity Securities by Closed-End Management Investment Company and Affiliated Purchasers. |
Not applicable to the Registrant.
| Item 10. | Submission of Matters to a Vote of Security Holders. |
There have been no material changes to the procedures by which shareholders may recommend nominees to the Registrant’s Board of Trustees, where those changes were implemented after the Registrant last provided disclosure in response to the requirements of Item 407(c)(2)(iv) of Regulation S-K, or this Item.
| Item 11. | Controls and Procedures. |
| (a) | The Registrant’s principal executive officer and principal financial officer have concluded that the Registrant’s disclosure controls and procedures (as defined in Rule 30a-3(c) under the Investment Company Act of 1940, as amended) are effective based on their evaluation of these controls and procedures as of a date within 90 days of the filing date of this report. |
| (b) | There was no change in the Registrant’s internal control over financial reporting (as defined in Rule 30a-3(d) under the Investment Company Act of 1940, as amended) that occurred during the period covered by this report that has materially affected, or is reasonably likely to materially affect, the Registrant’s internal control over financial reporting. |
| Item 12. | Disclosure of Securities Lending Activities for Closed-End Management Investment Companies. |
Not applicable to the Registrant.
| Item 13. | Exhibits. |
SIGNATURES
Pursuant to the requirements of the Securities Exchange Act of 1934 and the Investment Company Act of 1940, the Registrant has duly caused this report to be signed on its behalf by the undersigned, thereunto duly authorized.
FINANCIAL INVESTORS TRUST
| By: | /s/ Bradley J. Swenson | |
| Bradley J. Swenson (Principal Executive Officer) | ||
| President | ||
| Date: | July 6, 2020 |
Pursuant to the requirements of the Securities Exchange Act of 1934 and the Investment Company Act of 1940, this report has been signed below by the following persons on behalf of the Registrant and in the capacities and on the dates indicated.
FINANCIAL INVESTORS TRUST
| By: | /s/ Bradley J. Swenson | |
| Bradley J. Swenson (Principal Executive Officer) | ||
| President | ||
| Date: | July 6, 2019 | |
| By: | /s/ Kimberly R. Storms | |
| Kimberly R. Storms (Principal Financial Officer) | ||
| Treasurer | ||
| Date: | July 6, 2020 |