UNITED STATES
SECURITIES AND EXCHANGE COMMISSION
Washington, D.C. 20549
FORM N-CSR
CERTIFIED SHAREHOLDER REPORT OF REGISTERED
MANAGEMENT INVESTMENT COMPANIES
Investment Company Act file number: 811-08194
FINANCIAL INVESTORS TRUST
(Exact name of Registrant as specified in charter)
1290 Broadway, Suite 1000, Denver, Colorado 80203
(Address of principal executive offices) (Zip code)
Brendan Hamill, Esq., Secretary
Financial Investors Trust
1290 Broadway, Suite 1000
Denver, Colorado 80203
(Name and address of agent for service)
Registrant’s telephone number, including area code: 303-623-2577
Date of fiscal year end: April 30
Date of reporting period: April 30, 2021 – October 31, 2021
Item 1. Reports to Stockholders.
(a) Report to Stockholders

TABLE OF CONTENTS
| Manager Commentary | |
| Emerald Growth Fund | 1 |
| Emerald Insights Fund | 7 |
| Emerald Finance & Banking Innovation Fund | 11 |
| Disclosure of Fund Expenses | 18 |
| Schedule of Investments | |
| Emerald Growth Fund | 20 |
| Emerald Insights Fund | 22 |
| Emerald Finance & Banking Innovation Fund | 24 |
| Statements of Assets and Liabilities | 26 |
| Statements of Operations | 27 |
| Statements of Changes in Net Assets | |
| Emerald Growth Fund | 28 |
| Emerald Insights Fund | 30 |
| Emerald Finance & Banking Innovation Fund | 32 |
| Financial Highlights | |
| Emerald Growth Fund | 33 |
| Emerald Insights Fund | 37 |
| Emerald Finance & Banking Innovation Fund | 41 |
| Notes to Financial Statements | 45 |
| Additional Information | 52 |
| Privacy Policy | 53 |
| Emerald Growth Fund | Manager Commentary |
| October 31, 2021 (Unaudited) |
Dear Shareholder:
Investment Results
The performance of the Emerald Growth Fund’s Class A shares (without sales load), for the six months ended October 31, 2021, advanced by +1.19% outpacing the Russell 2000 Growth Index, the Growth Fund’s primary benchmark, which advanced by +0.44%. After a robust start to 2021, domestic economic growth decelerated through the third quarter as the surge in Delta variant cases and supply chain headwinds (labor and materials) constrained demand and output. Inflationary pressures accelerated in tandem with the tightening in the supply chain, exerting upward pressure on both producer prices and consumer prices. The durability of these pressures, however, remains a meaningful source of debate as witnessed in the tug of war in treasury yields and the volatility in the slope of the yield curve.
Over the last six months, the uncertainty created by the aforementioned factors has driven a sizeable divergence in performance between the Russell 2000 Index, which gained +1.4%, and the S&P 500 Index which gained +10.1%. For the year-to-date period through October the Russell 2000 Index (+17.19%) now trails the Russell 1000 Index (+23.18%) by 599 basis points (or “bps”) and the S&P 500 Index (+22.6%) by 630 bps. Notably, according to an October 5, 2021 report from Furey Research Partners, the S&P 500 hit its 54th new all-time high of the year on September 2nd, which is the fourth highest total of new all-time highs in a year going back to 1928. Conversely, the Russell 2000 has achieved only 13 new all-time highs this year (last accomplished on 3/15/21) marking the largest divergence between the number of Russell 2000 and S&P 500 new all-time highs since 2014 when the S&P 500 hit 53 new highs and the Russell 2000 made only ten. According to the same report, if this pattern holds, this would make the third consecutive year that the Russell 2000 is posting fewer new all-time highs than the S&P 500, which would be unprecedented in the over 40-year history of the Russell 2000 Index.
The noteworthy divergences in performance extend beyond capitalization to style as value stocks have continued to lead the market, with the Russell 2000 Value Index and Russell 2000 Growth Index gaining +3.22% and +0.44% respectively for the trailing 6-month period ended October 31, 2021. Year-to-date through October 31, 2021, the Russell 2000 Growth (+7.64%) has lagged the Russell 2000 Value (+27.60%) by approximately 1996 bps.
Investment Analysis
On a relative basis, the Emerald Growth Fund outpaced the Russell 2000 Growth benchmark for the trailing period ended October 31, 2021 driven largely by allocation effect. At the sector level, the portfolio experienced relative outperformance within the financials, technology, and consumer discretionary sectors, which more than offset relative underperformance within the healthcare, utilities and real estate sectors.
The financial sector was the largest contributor to return for the trailing period driven largely by allocation effect (the allocation effect refers to the returns generated by allocating portfolio weights to specific segments, sectors, or industries). At the industry level, holdings within the diversified financial services, property and casualty insurance, full line insurance and banking industries were the most notable contributors to return. Performance within the technology sector also contributed positively to return driven by stock selection within the software, semiconductor and computer services industries. Holdings within the consumer discretionary sector also contributed to the portfolio’s relative outperformance for the period, driven by stock selection within the specialty retail, casinos and gambling, and apparel retailers industries.
The positive contribution from the aforementioned sectors, was partially offset by the relative underperformance within the healthcare, utilities and real estate sectors driven by a combination of allocation effect and stock selection. Of the aforementioned underperforming sectors, performance within the healthcare sector proved most challenging, due primarily to challenging stock selection within the medical supplies industry. Within the utilities sector, the portfolio’s underweighting was the largest detractor to return, as Emerald elected to deploy the Fund’s assets to higher growth businesses which fell outside of the utilities sector.
As of October 31, 2021, the Growth Fund’s portfolio held the largest active exposures in the financials, consumer discretionary, industrials and consumer staples sectors. Thoughts on those sectors and other notable areas of exposure are highlighted below.
| · | The financial services sector, comprised of holdings within the bank, full line insurance, investment services, property and casualty insurance and life industries, was the portfolio’s largest relative overweight position at period-end. Emerald maintained the Growth Fund’s exposure to holdings within the banking industry as we currently anticipate a resumption in the steepening of the yield curve and a better credit backdrop with the aid of stimulus should be beneficial to earnings growth. In addition, Emerald has placed specific emphasis on those banks that we believe are positioned to drive a meaningful improvement in their efficiency ratios. |
| · | The Fund also held an overweight position within the consumer discretionary sector. The overweight is comprised of a diverse subset of holdings within the educational services, specialty retail, recreational services, recreational products, restaurants, casinos and gambling, and auto parts industries among others. With the economy now open, vaccines widely distributed, the labor market recovering and |
| Semi-Annual Report | October 31, 2021 | 1 |
| Emerald Growth Fund | Manager Commentary |
| October 31, 2021 (Unaudited) |
consumer net worth continuing to rise, we believe the outlook for consumer spending remains attractive and believe there remains meaningful opportunity for share gains for those companies offering differentiated products/services with strong value propositions.
| · | The Fund’s portfolio exited October with an overweight position to the consumer staples sector. The overweight primarily consists of select niche opportunities in what we believe to be disruptive category leaders with innovative product offerings and above average growth prospects that are aligned with emerging consumer trends in the food and beverage industries. Specific areas include pet food, nutritional snacking, active nutrition and “better-for-you” beverages. |
| · | The Fund also exited the period with an overweight position to the industrials sector. The overweight was comprised of a diverse subset of holdings within the professional business support services, building materials, industrial machinery, engineering and contracting services and transportations services aerospace industries, among others, that, in our opinion, are poised to benefit from a combination of the cyclical recovery in the economy and company specific business initiatives that we believe will collectively translate to industry leading growth in revenue and earnings. |
| · | As it relates to the technology sector, the Fund’s portfolio exited October with technology sector positioning largely in-line with the Russell Index benchmark. The technology sector weighting on an absolute basis remained the second largest nominal portfolio weight behind the healthcare sector. Within the technology sector, the computer software industry remained the Fund portfolio’s largest total and active exposure. The global pandemic accelerated the adoption of ecommerce, digital forms of entertainment (video games, streaming, etc…), technology infrastructure upgrades, and a diverse array of cybersecurity and cloud-related software opportunities that are enabling digital transformation. We also believe that industry fundamentals for both hardware and software will continue to benefit from a number of tailwinds including 1) an improving economic environment, 2) healthy IT spending by corporations and 3) investment in large digital transformation projects by medium and large enterprises. In addition, we continue to see a strong rebound in industrial and automotive production, though significant supply constraints are now manifest in the global tech supply chain. With demand still significantly outstripping supply, we continue to monitor the nuanced supply side dynamics including geopolitical and supply chain risk. |
| · | The healthcare sector, while underweight relative to the benchmark, also remained an area of considerable nominal exposure within the Fund’s portfolio as of October 31, 2021. The portfolio’s underweight to the healthcare sector is driven largely by the portfolio’s relative underweight position to the biotechnology industry. Emerald believes performance within the biotech industry has been challenged on a year-to-date basis for a number of reasons including: rare disease niches getting crowded with competition, risks around governments recognizing intellectual property, record setting IPO and secondary offerings, fear of rising interest rates, lack of leadership at the FDA, uncertainty regarding the FDA’s willingness to approve new drugs given the agency’s recent issuance of several high profile complete response letters or delayed regulatory actions, less M&A activity possibly driven by a tougher FTC, and the seemingly never ending discussion of drug pricing. In addition to the issue of so much supply, we believe that the small cap biotech industry has surpassed peak return on investment. Further, we continue to look for differentiated opportunities with moats to protect the business from competition. We believe M&A is required to get the sector moving in the right direction. While all of these factors have been gating factors to the Fund portfolio’s relative positioning, the biotechnology industry remained an area of considerable nominal exposure within the portfolio. We continue to look for innovative therapeutics that can command premium pricing, driven by their unequivocal clinical data, and we are seeing opportunities in innovative therapeutic areas including cell therapy and gene editing. Rounding out the portfolio’s healthcare sector exposure are niche opportunities within the pharmaceutical, medical equipment, medical services, health care services and medical supplies industries. |
Market Outlook
Looking to the balance of the year 2021 and beyond, Emerald remains confident that above trend domestic economic growth is poised to continue into 2022. Although third quarter GDP growth weakened more meaningfully than anticipated, we believe high frequency economic indicators are demonstrating a strong sequential acceleration with the Atlanta Fed GDPNow forecast for 4Q2021 GDP growth currently tracking at 8.2% as of November 10, 2021. While supply chain bottlenecks are likely to continue to present headwinds to growth, with inventory to sales ratios tracking at near historic lows we believe the rebuilding of inventory levels will ultimately contribute to GDP growth as supply chain pressures ease throughout 2022.
Further, while there have been some concerns regarding the sustainability of consumer spending as the benefits from stimulus subside, we believe consumer spending should remain supportive of above trend economic growth throughout 2022. Consumer net worth is surging, wages are on the rise, unemployment continues to trend lower, U.S job openings are tracking at historical highs and cumulative excess savings stands at approximately $2.4 trillion, according to a September 15, 2021 report from Dubravko Lakos-Bujas of JP Morgan, leaving the consumer with plenty of dry powder to support further spending growth. Our view is that the outlook for business investment remains similarly encouraging given the strong growth in corporate earnings and profitability, rising cash levels and easy lending conditions, all of which should be supportive of ongoing strength in capital expenditures.
| 2 | www.emeraldmutualfunds.com |
| Emerald Growth Fund | Manager Commentary |
| October 31, 2021 (Unaudited) |
Forecasted earnings growth for 2021 continues to move higher with estimates for Russell 2000 earnings growth relative to 2019 now at +47.8%, according to a November 2, 2021 report from Steve DeSanctis of Jefferies. The Jefferies outlook for 2022 remains similarly encouraging with small capitalization earnings projected to grow by +17.2% year over year, substantially better than the +10.1% and +8.0% growth projected for mid-cap and large capitalization stocks respectively. Valuations continue to remain supportive with the relative valuation of the Russell 2000 standing in the 33rd percentile relative to the Russell 1000, trading at a discount to the long-term averages when measuring trailing P/E and price to book.
Further, while there continues to be much discussion around the level of absolute valuations, M&A activity remains at a record setting pace. According to an October 4, 2021 report from Goldman Sachs, the year to date strength in merger and acquisition activity continued through the third quarter with more than $1.11 trillion of combined strategic and sponsor M&A announced by North American and European acquirers. Notably, this was the most active quarter since the second quarter of 2007. On a year-to-date basis, with more than $3.24 trillion of M&A announced, 2021 has already exceeded the post-Global Financial Crisis full-year record set in 2015 of $2.9 trillion, and appears to be on track to surpass the record high $3.4 trillion in M&A volume set in 2007. We expect a robust M&A backdrop to remain supportive of valuations.
That being said, while we continue to be optimistic regarding the durability of above trend growth and the opportunity we are seeing in the small capitalization universe, risks to this outlook remain. Specifically, we believe there remains residual uncertainty in the market as it relates to the evolution of COVID-19, the pace and durability of price inflation, the path of monetary policy, the resolution of the debt ceiling extension, the ultimate size and scope of infrastructure spend and related tax policy, the steady stream of initial public offerings, slowing economic momentum in China as well as rising geopolitical uncertainty across the globe.
Notwithstanding the risk outlined above, Emerald remains vigilant and focused on utilizing our fundamental bottom up research process to identify what we see as the most attractive growth opportunities within the small capitalization universe.
| Top Contributors | Top Detractors | |
| Rapid7 Inc. | Organogenesis Holdings Inc. | |
| Perficient Inc. | Chegg Inc. | |
| Tetra Tech Inc. | MediaAlpha Inc. | |
| Moelis & Co. | Freshpet Inc. | |
| Dick’s Sporting Goods Inc. | Voyager Digital Ltd. | |
| Kenneth G. Mertz II, CFA | Stacey L. Sears | Joseph W. Garner |
| Chief Investment Officer | Portfolio Manager | Portfolio Manager |
| Portfolio Manager |
Emerald Mutual Fund Advisers Trust
Past performance does not guarantee future results. Fund prices fluctuate as the underlying assets have exposure to market fluctuations and other risks, as described in the Fund’s prospectus. Please visit www.emeraldmutualfunds.com to obtain current performance information and for the current prospectus and statement of additional information. This material must be preceded or accompanied by a prospectus. Please read the prospectus carefully before investing.
The views of Emerald Mutual Fund Advisers Trust and information discussed in this commentary are as of the date of publication, are subject to change, and may not reflect the writer's current views. The views expressed are those of the author only, and represent an assessment of market conditions at a specific point in time, are opinions only and should not be relied upon as investment advice regarding a particular investment or markets in general. Such information does not constitute a recommendation to buy or sell specific securities or investment vehicles. It should not be assumed that any investment will be profitable or will equal the performance of the Fund or any securities or any sectors mentioned in this letter. The subject matter contained in this letter has been derived from several sources believed to be reliable and accurate at the time of compilation. Neither Emerald Mutual Fund Advisers Trust nor the Fund accepts any liability for losses either direct or consequential caused by the use of this information.
The Emerald Growth Fund is distributed by ALPS Distributors, Inc.
The Fund is subject to investment risks, including possible loss of the principal amount invested and therefore is not suitable for all investors. The Fund may not achieve its objectives.
Diversification does not eliminate the risk of experiencing investment losses.
| Semi-Annual Report | October 31, 2021 | 3 |
| Emerald Growth Fund | Manager Commentary |
| October 31, 2021 (Unaudited) |
The Russell 2000® Growth Index measures the performance of the small-cap growth segment of the U.S. equity universe. It includes those Russell 2000® Index companies with higher price-to-value ratios and higher forecasted growth values. The Index is not actively managed and does not reflect any deductions for fees, expenses or taxes. An investor may not invest directly into the Index.
The Russell 2000® Value Index measures the performance of small-cap value segment of the U.S. equity universe. It includes those Russell 2000 companies with lower price-to-book ratios (A ratio used to compare a stock's market value to its book value. It is calculated by dividing the current closing price of the stock by the latest quarter's book value per share.) and lower forecasted growth values. The Index is not actively managed and does not reflect any deductions for fees, expenses or taxes. An investor may not invest directly into the Index.
Basis points refers to a common unit of measure for interest rates and other percentages in finance. One basis point is equal to 1/100th of 1%, or 0.01%, or 0.0001, and is used to denote the percentage change in a financial instrument. The relationship between percentage changes and basis points can be summarized as follows: 1% change = 100 basis points and 0.01% = 1 basis point.
The S&P 500® Total Return Index is an unmanaged index of 500 common stocks chosen for market size, liquidity and industry group representation. It is a market-value weighted index. The Index is not actively managed and does not reflect any deductions for fees, expenses or taxes. An investor may not invest directly in the Index.
| 4 | www.emeraldmutualfunds.com |
| Emerald Growth Fund | Manager Commentary |
| October 31, 2021 (Unaudited) |
TOP TEN HOLDINGS
(as a % of Net Assets)*
| Rapid7, Inc. | 3.17% |
| Chart Industries, Inc. | 2.54% |
| MACOM Technology Solutions Holdings, Inc. | 2.50% |
| Freshpet, Inc. | 2.46% |
| Varonis Systems, Inc. | 2.33% |
| Tetra Tech, Inc. | 2.28% |
| Perficient, Inc. | 1.94% |
| Churchill Downs, Inc. | 1.94% |
| Moelis & Co. | 1.92% |
| Simply Good Foods Co. | 1.86% |
| Top Ten Holdings | 22.94% |
INDUSTRY SECTOR ALLOCATION
(as a % of Net Assets)
| Technology | 21.49% |
| Health Care | 19.25% |
| Consumer Discretionary | 18.67% |
| Industrials | 16.62% |
| Financials | 13.40% |
| Consumer Staples | 4.85% |
| Basic Materials | 1.61% |
| Telecommunications | 1.34% |
| Real Estate | 1.07% |
| Energy | 0.96% |
| Utilities | 0.29% |
| Cash, Cash Equivalents, & Other Net Assets | 0.45% |
| Total | 100.00% |
| * | Holdings are subject to change, and may not reflect the current or future position of the portfolio. |
ANNUALIZED TOTAL RETURN (for the period ended October 31, 2021)
| 6 Month | 1 Year | 3 Year | 5 Year | 10 Year | Since Inception(1) | Expense Gross(2) | Ratio Net(2) | |
| Class A (NAV) | 1.19% | 35.53% | 20.21% | 19.50% | 16.40% | 12.06% | 1.01% | 1.01% |
| Class A (LOAD) | -3.62% | 29.08% | 18.27% | 18.35% | 15.83% | 11.88% | 1.01% | 1.01% |
| Russell 2000® Growth Index(3) | 0.44% | 38.45% | 18.64% | 17.90% | 14.57% | 9.29% | ||
| Class C (NAV) | 0.86% | 34.64% | 19.44% | 18.72% | 15.65% | 7.99% | 1.66% | 1.66% |
| Class C (LOAD) | -0.14% | 33.64% | 19.44% | 18.72% | 15.65% | 7.99% | 1.66% | 1.66% |
| Russell 2000® Growth Index(3) | 0.44% | 38.45% | 18.64% | 17.90% | 14.57% | 9.29% | ||
| Investor Class | 1.16% | 35.49% | 20.17% | 19.45% | 16.36% | 13.73% | 1.06% | 1.06% |
| Russell 2000® Growth Index(3) | 0.44% | 38.45% | 18.64% | 17.90% | 14.57% | 9.29% | ||
| Institutional Class | 1.36% | 35.98% | 20.60% | 19.88% | 16.77% | 16.21% | 0.71% | 0.71% |
| Russell 2000® Growth Index(3) | 0.44% | 38.45% | 18.64% | 17.90% | 14.57% | 9.29% |
Performance quoted represents past performance, does not guarantee future results and current performance may be lower or higher than the data quoted. The investment return and principal value of an investment will fluctuate so that shares, when redeemed, may be worth more or less than their original cost. Performance data current to the most recent month end may be obtained at www.emeraldmutualfunds.com.
Performance shown for periods prior to March 16, 2012, reflects the performance of the Forward Growth Fund, a series of Forward Funds (as a result of a reorganization of the Forward Growth Fund into the Emerald Growth Fund).
Returns for periods less than 1 year are cumulative.
The table does not reflect the deduction of taxes that a shareholder would pay on Fund distributions or the redemption of Fund shares.
Subject to investment risks, including possible loss of the principal amount invested.
Maximum Offering Price (MOP) for Class A shares includes the Fund's maximum sales charge of 4.75%. Performance shown at NAV does not include these sales charges and would have been lower had it been taken into account.
A Contingent Deferred Sales Charge (CDSC) of 1.00% may apply to Class C shares redeemed within the first 12 months after a purchase.
| (1) | Inception Dates - Class A: 10/01/1992, Class C: 07/01/2000, Institutional Class: 10/21/2008, Investor Class: 05/01/2011 |
| (2) | Emerald Mutual Fund Advisers Trust ("Emerald" or the "Adviser") has agreed contractually to waive a portion of its fees and reimburse other expenses in amounts necessary to limit the Fund's operating expenses (exclusive of Acquired Fund Fees and Expenses, brokerage expenses, interest expense, taxes and extraordinary expense) for Class A, Class C, Institutional Class, and Investor Class shares to an annual rate (as percentage of the Fund's average daily net assets) of 1.29%, 1.94%, 0.99% and 1.34% respectively. This agreement (the "Expense Agreement") shall continue at least through August 31, 2022. The Adviser will be permitted to recapture, on a class-by-class basis, expenses it has borne through the Expense Agreement to the extent that the Fund's expenses in later periods fall below the annual rates set forth in the Expense Agreement; provided, however, that such recapture payments do not cause the Fund's expense ratio (after recapture) to exceed the lesser of (i) the expense cap in effect at the time of the waiver and (ii) the expense cap in effect at the time of the recapture. Notwithstanding the foregoing, the Fund will not be obligated to pay any such deferred fees and expenses more than three years after the date on which the fee and expenses were deferred. The Adviser may not discontinue this waiver, prior to August 31, 2022, without the approval by the Fund's Board of Trustees. Ratios as of the Prospectus dated August 31, 2021 and may differ from the ratios presented in the Financial Highlights. |
| (3) | The Russell 2000® Growth Index measures the performance of the small-cap growth segment of the U.S. equity universe. It includes those Russell 2000® Index companies with higher price-to-value ratios and higher forecasted growth values. The Index is not actively managed and does not reflect any deduction for fees, expenses or taxes. An investor may not invest directly into the Index. |
| Semi-Annual Report | October 31, 2021 | 5 |
| Emerald Growth Fund | Manager Commentary |
| October 31, 2021 (Unaudited) |
GROWTH OF $10,000 INVESTMENT IN THE FUND (for the period ended October 31, 2021)
Comparison of change in value of a $10,000 investment (includes applicable sales loads)
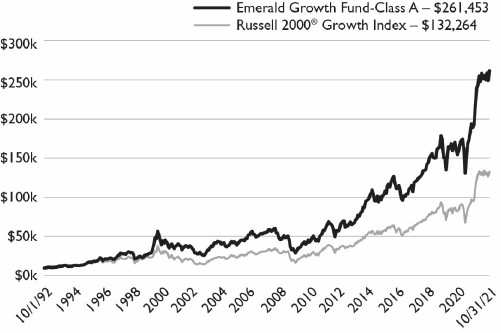
The chart represents historical performance of a hypothetical investment of $10,000 in the Fund since inception. Past performance does not guarantee future results. This chart does not reflect the deduction of taxes that a shareholder would pay on Fund distributions or the redemption of Fund shares.
Investing in the Fund is subject to investment risks, including possible loss of the principal amount invested.
| 6 | www.emeraldmutualfunds.com |
| Emerald Insights Fund | Manager Commentary |
| October 31, 2021 (Unaudited) |
Dear Shareholder:
Investment Results
The performance of the Emerald Insights Fund Class A Shares (without the sales load) for the six months ended October 31, 2021 reflected a return of +9.27%, falling short of the Russell 3000 Growth Index (the “Index”), the Insights Fund’s primary benchmark return of +14.17% by 490 basis points. Performance was driven by strength in Energy, Technology, and Consumer Staples and offset by weakness in Consumer Discretionary, Healthcare, and Materials.
Investment Analysis
After posting a 12 month return for the period ended April 30, 2021 which outperformed the benchmark by 2,976 basis points, the Insights Fund gave back some performance during this reporting period for the six months ended October 31, 2021. A number of fast-growing small-cap holdings detracted from performance as the small-cap universe, and growth stocks in general, underperformed the Index.
As we have discussed previously [in prior shareholder communications], our “Flexible Barbell” approach to portfolio construction allowed us to adjust as the period progressed and the Fund outpaced the Russell 3000 Growth Index benchmark in the second half of this six-month reporting period while remaining consistent with our core strategy.
Over the past one-and-one-half years, we have attempted to position the Insights Fund’s portfolio with several theses in mind: 1) the impact of COVID-19 would be transitory and selected reopening plays with under-appreciated operating and financial leverage would outperform; 2) Inflation would be higher and of longer duration than expected; 3) Interest rates would be hard pressed to stay at extreme low levels; and 4) the strong IPO market, coupled with high liquidity would have an impact on lower quality non-earning securities. Accordingly, we increased our exposure to reopening plays, energy, and cyclicals, with a bias towards small caps and decreased our exposure to non-earners such as smaller biotech names. Throughout all of this, we have worked within the parameters of our benchmark index by investing in some of our favorite secular growth themes and megacap names.
Market Outlook
Currently, we continue to project earnings, especially for small caps and cyclicals, will be at elevated levels coming off the pandemic lows. Our view is that earnings projections for 2022 also favor small caps and earnings revision tends for cyclicals continue to accelerate vs. secular growers. Areas of concern are a globally stressed supply chain and labor force availability, with few companies immune to these issues which may last well into 2022 and beyond. While valuations tend to be a secondary concern for us when building portfolios – expected durable growth being the primary factor of focus -- valuations do matter related to both positioning and dispersions. We continue to seek to structure our portfolio such that the Insights Fund trades at valuation levels lower than the benchmark on a forward P/E, P/S, P/B, and P/CF* level and we believe valuation will continue to matter, as it has over the past two years.
Since the inception of the Insights Fund, we have employed what we believe is a simple, yet effective strategy: Invest in innovative companies with strong management teams that are number one or two in their respective industries, with disruptive business models, significant competitive moats and durable, often under-appreciated expected growth rates. At the same time, we seek industries and companies with wide valuation dispersions that are unfairly discounted by the market.
By using our “Flexible Barbell” approach to portfolio construction, coupled with Emerald’s long-standing fundamental research focus, we believe the portfolio should withstand short-term volatility and, over time, perform well vs. the Fund’s Russell 3000 Growth Index benchmark. We remain optimistic that this tumultuous period of external-factor-influenced investor behavior will eventually subside and valuation and investment performance dispersion will persist. We continue to seek to manage risks with a consistent view toward fundamental growth and remind ourselves that successful investing is a marathon, not a sprint.
| Semi-Annual Report | October 31, 2021 | 7 |
| Emerald Insights Fund | Manager Commentary |
| October 31, 2021 (Unaudited) |
| Top Contributors | Top Detractors | |
| NVIDIA Corporation | Voyager Digital, Ltd. | |
| Microsoft Corporation | Chegg, Inc. | |
| Alphabet Inc. | Scotts Miracle-Gro Company | |
| Apple Inc. | EverQuote, Inc. | |
| HubSpot, Inc. | Atea Pharmaceuticals, Inc. | |
| David A. Volpe, CFA | Stephen L. Amsterdam | Joseph Hovorka |
| Deputy Chief Investment Officer | Associate Portfolio Manager | Associate Portfolio Manager |
| Portfolio Manager |
Emerald Mutual Fund Advisers Trust
| * | P/E Ratio: The Price/Earnings (P/E) ratio is a valuation metric that assesses how many dollars investors are willing to pay for one dollar of a company’s earnings. It is calculated by dividing a stock’s price by the company’s trailing 12-month earnings per share from continuous operations. |
Price/Book Ratio: The price/book (P/B) ratio of a fund is the weighted average of the price/book ratios of all the stocks in a fund's portfolio. Book value is the total assets of a company, less total liabilities (sometimes referred to as carrying value). A company's book value is calculated by dividing the market price of its outstanding stock by the company's book value, and then adjusting for the number of shares outstanding (Stocks with negative book values are excluded from this calculation.).
Price-to-Sales Ratio: The price-to-sales (P/S) ratio is a valuation metric that compares a company’s stock price to its revenues. It is an indicator of the value that financial markets have placed on each dollar of a company’s sales or revenues. The ratio shows how much investors are willing to pay per dollar of sales. It can be calculated either by dividing the company’s market capitalization by its total sales over a designated period or on a per-share basis by dividing the stock price by sales per share.
Price-to-Cash Flow Ratio: The price-to-cash flow (P/CF) ratio is a stock valuation indicator or multiple that measures the value of a stock’s price relative to its operating cash flow per share. The ratio uses operating cash flow (OCF), which adds back non-cash expenses such as depreciation and amortization to net income.
Past performance does not guarantee future results. Fund prices fluctuate as the underlying assets have exposure to market fluctuations and other risks, as described in the Fund’s prospectus. Please visit www.emeraldmutualfunds.com to obtain current performance information and for the current prospectus and statement of additional information. This material must be preceded or accompanied by a prospectus. Please read the prospectus carefully before investing.
The views of Emerald Mutual Fund Advisers Trust and information discussed in this commentary are as of the date of publication, are subject to change, and may not reflect the writer's current views. The views expressed are those of the author only, and represent an assessment of market conditions at a specific point in time, are opinions only and should not be relied upon as investment advice regarding a particular investment or markets in general. Such information does not constitute a recommendation to buy or sell specific securities or investment vehicles. It should not be assumed that any investment will be profitable or will equal the performance of the Fund or any securities or any sectors mentioned in this letter. The subject matter contained in this letter has been derived from several sources believed to be reliable and accurate at the time of compilation. Neither Emerald Mutual Fund Advisers Trust nor the Fund accepts any liability for losses either direct or consequential caused by the use of this information.
The Emerald Insights Fund is distributed by ALPS Distributors, Inc.
The Fund is subject to investment risks, including possible loss of the principal amount invested and therefore is not suitable for all investors. The Fund may not achieve its objectives.
Diversification does not eliminate the risk of experiencing investment losses.
The Russell 3000® Growth Index is a market capitalization weighted index based on the Russell 3000® index. The Russell 3000® Growth Index includes companies that display signs of above average growth. The index is used to provide a gauge of the performance of growth stocks in the United States. The Index is not actively managed and does not reflect any deductions for fees, expenses or taxes. An investor may not invest directly into the Index.
Basis points refers to a common unit of measure for interest rates and other percentages in finance. One basis point is equal to 1/100th of 1%, or 0.01%, or 0.0001, and is used to denote the percentage change in a financial instrument.
| 8 | www.emeraldmutualfunds.com |
| Emerald Insights Fund | Manager Commentary |
| October 31, 2021 (Unaudited) |
| TOP TEN HOLDINGS |
| (as a % of Net Assets)* |
| Microsoft Corp. | 8.14% |
| Apple, Inc. | 8.02% |
| Alphabet, Inc. | 5.19% |
| Amazon.com, Inc. | 4.97% |
| NVIDIA Corp. | 4.91% |
| Meta Platforms, Inc. | 2.94% |
| SeaWorld Entertainment, Inc. | 2.29% |
| Varonis Systems, Inc. | 2.05% |
| HubSpot, Inc. | 1.97% |
| Horizon Therapeutics PLC | 1.93% |
| Top Ten Holdings | 42.41% |
INDUSTRY SECTOR ALLOCATION
(as a % of Net Assets)
| Technology | 42.64% |
| Consumer Discretionary | 22.07% |
| Industrials | 11.81% |
| Health Care | 7.09% |
| Financial Services | 6.91% |
| Energy | 4.68% |
| Basic Materials | 1.84% |
| Consumer Staples | 1.75% |
| Real Estate | 0.85% |
| Cash, Cash Equivalents, & Other Net Assets | 0.36% |
| Total | 100.00% |
| * | Holdings are subject to change, and may not reflect the current or future position of the portfolio. |
ANNUALIZED TOTAL RETURN (for the period ended October 31, 2021)
| 6 Month | 1 Year | 3 Year | 5 Year | Since Inception(1) | Expense Gross(2) | Ratio Net(2) | |
| Class A (NAV) | 9.27% | 53.89% | 32.70% | 25.10% | 16.70% | 1.93% | 1.36% |
| Class A (LOAD) | 4.06% | 46.60% | 30.58% | 23.88% | 15.92% | 1.93% | 1.36% |
| Russell 3000® Growth Index(3) | 14.17% | 42.81% | 28.66% | 24.96% | 19.27% | ||
| Class C (NAV) | 8.94% | 52.84% | 31.85% | 24.28% | 15.92% | 2.58% | 2.01% |
| Class C (LOAD) | 7.94% | 51.84% | 31.85% | 24.28% | 15.92% | 2.58% | 2.01% |
| Russell 3000® Growth Index(3) | 14.17% | 42.81% | 28.66% | 24.96% | 19.27% | ||
| Investor Class | 9.22% | 53.77% | 32.66% | 25.03% | 16.62% | 1.99% | 1.41% |
| Russell 3000® Growth Index(3) | 14.17% | 42.81% | 28.66% | 24.96% | 19.27% | ||
| Institutional Class | 9.43% | 54.31% | 33.10% | 25.46% | 17.03% | 1.62% | 1.06% |
| Russell 3000® Growth Index(3) | 14.17% | 42.81% | 28.66% | 24.96% | 19.27% |
The performance quoted represents past performance, does not guarantee future results and current performance may be lower or higher than the data quoted. The investment return and principal value of an investment will fluctuate so that shares, when redeemed, may be worth more or less than their original cost. Performance data current to the most recent month end may be obtained at www.emeraldmutualfunds.com.
Returns for periods less than 1 year are cumulative.
The table does not reflect the deduction of taxes that a shareholder would pay on Fund distributions or the redemption of Fund shares.
Subject to investment risks, including possible loss of the principal amount invested.
Maximum Offering Price (MOP) for Class A shares includes the Fund's maximum sales charge of 4.75%. Performance shown at NAV does not include these sales charges and would have been lower had it been taken into account.
A Contingent Deferred Sales Charge (CDSC) of 1.00% may apply to Class C shares redeemed within the first 12 months after a purchase.
| (1) | Inception Date – August 1, 2014. |
| (2) | Emerald Mutual Fund Advisers Trust ("Emerald" or the "Adviser") has agreed contractually to waive a portion of its fees and reimburse other expenses in amounts necessary to limit the Fund's operating expenses (exclusive of Acquired Fund Fees and Expenses, brokerage expenses, interest expenses, taxes and extraordinary expense) for Class A, Class C, Institutional Class, and Investor Class shares to an annual rate (as percentage of the Fund's average daily net assets) of 1.35%, 2.00%, 1.05% and 1.40% respectively. This agreement (the "Expense Agreement") shall continue at least through August 31, 2022. The Adviser will be permitted to recapture, on a class-by-class basis, expenses it has borne through the Expense Agreement to the extent that the Fund's expenses in later periods fall below the annual rates set forth in the Expense Agreement; provided, however, that such recapture payments do not cause the Fund's expense ratio (after recapture) to exceed the lesser of (i) the expense cap in effect at the time of the waiver and (ii) the expense cap in effect at the time of the recapture. Notwithstanding the foregoing, the Fund will not be obligated to pay any such deferred fees and expenses more than three years after the date on which the fee and expenses were deferred. The Adviser may not discontinue this waiver, prior to August 31, 2022, without the approval by the Fund's Board of Trustees. Ratios as of the Prospectus dated August 31, 2021 and may differ from the ratios presented in the Financial Highlights. |
| (3) | The Russell 3000® Growth Index is a market capitalization weighted index based on the Russell 3000® index. The Russell 3000® Growth Index includes companies that display signs of above average growth. The index is used to provide a gauge of the performance of growth stocks in the United States. The Index is not actively managed and does not reflect any deductions for fees, expenses or taxes. An investor may not invest directly into the Index. |
Important Risks
Investing in smaller companies generally will present greater investment risks, including: greater price volatility, greater sensitivity to changing economic conditions and less liquidity than the securities of larger, more mature companies.
| Semi-Annual Report | October 31, 2021 | 9 |
| Emerald Insights Fund | Manager Commentary |
| October 31, 2021 (Unaudited) |
GROWTH OF $10,000 INVESTMENT IN THE FUND (for the period ended October 31, 2021)
Comparison of change in value of a $10,000 investment (includes applicable sales loads)

The chart represents historical performance of a hypothetical investment of $10,000 in the Fund since inception. Past performance does not guarantee future results. This chart does not reflect the deduction of taxes that a shareholder would pay on Fund distributions or the redemption of Fund shares. Investing in the Fund is subject to investment risks, including possible loss of the principal amount invested.
| 10 | www.emeraldmutualfunds.com |
| Emerald Finance & Banking Innovation Fund | Manager Commentary |
| October 31, 2021 (Unaudited) |
Dear Shareholder:
This is our first letter to shareholders since the name change of the Fund to the Emerald Finance & Banking Innovation Fund in September. The Fund’s investment adviser believes that the banking and financial services industries are undergoing a period of dynamic change as newer technologies spur consolidation, disruption, consumer disintermediation and an upending of the traditional retail business model. We believe this creates a compelling opportunity to identify and invest in the innovators leading this structural transformation.
As a result, the Fund has increased its investment in companies the Adviser sees as at the forefront of these disruptive technologies, many of which center around the broad themes of Distributed Ledger Technology (DLT) and Decentralized Finance (DeFi). Some observers mistakenly label these investments as “cryptocurrency” – which they are not. Cryptocurrency is a very specific product based on DLT – but DLT is a much broader and diverse technology that is being adopted and adapted across the banking and financial services industries.
Importantly, the Fund continues follow its investment strategy of investing a minimum of 80% of its net assets in companies principally engaged in the banking and financial services industries. On the other hand, as our new name suggests, we are now focused on a number of banking and financial services companies spurring innovation in specific themes and industry groups, such as Asset Managers, Digital Exchanges and Wallets, Banking-as-a-Service and Technology-Focused Banks, as discussed in greater detail below.
Investment Results
The performance of the Emerald Finance and Banking Innovation Fund Class A Shares (without the sales load) for the six months ended October 31, 2021 reflected a return of +22.62%, surpassing the Russell 2000 Index benchmark return of +1.85% and the Russell 2000 Financial Services Index benchmark return of +6.15%.
Investment Analysis
While essentially shutting the economy down during the pandemic did not lead to the increased loan losses that we expected, we believe that the six months ended October 31, 2021 have shown investors that the steps taken by the government to avoid the expected credit deterioration will have lingering effects on the banking industry.
We believe that the U.S. government’s efforts to flood the markets with cash in the aftermath of the COVID-19 pandemic has indeed kept many borrowers afloat but it has also resulted in the banks being “flush” with excess liquidity. We believe this excess liquidity will be a drag on net interest margins for the next six months. Excess liquidity however, is not the only long lasting pandemic effect on banks.
We also believe the homebound aspect of the pandemic accelerated the trend of banking customers moving to conduct business through digital channels, including those offered by financial technology companies, or “fintechs”. We believe that banks must invest in technology beyond the technology offerings provided by the “big three” core banking system providers to remain competitive with these cutting edge financial services companies. Banks must create an offering that is as frictionless as the fintechs while providing multiple payment and financial services capabilities in one “super app,” as we believe future interactions with banks and other financial services providers will take place more on your phone or other device than in a bank branch or office.
Bank M&A activity has outpaced pre-pandemic levels over the last six months and we believe M&A will continue to heat up as institutions seek scale to combat not only the need to invest a higher percentage of revenue in technology but also the “lower longer” rate environment that we have been in since the Great Financial Crisis of 2007-08.
According to S&P Global, U.S. bank M&A deal value has already surpassed 2019's full-year level and has become the biggest year for U.S. bank M&A since 2007. As of November 3, 2021, sixteen deals have been announced since the beginning of October for a combined value of $6.63 billion, driving 2021's total to $58.58 billion. The median deal value-to-tangible book value ratio for 2021 deal announcements rose to 152.5%, up from 136.3% for all of 2020.
According to S&P Global, bank mergers as measured by deal value are now tracking at the highest levels since the Great Financial Crisis. In fact, 2021 year-to-date deal value on both an absolute and annualized basis is tracking substantially ahead of 2020; furthermore, deal value on an annualized basis is tracking ahead of deal value levels for the last 13 years, from 2008-2020. While we are not suggesting that we will go back to 2007 pricing levels, we note that 2007 recorded $73.3B in deal value, median 228% price-to-tangible book value, median 25.2x P/E multiple and a 15.5% deal-core deposit premium. We continue to believe that deal value will ramp higher as stock prices, which are acquisition currencies, remain strong.
| Semi-Annual Report | October 31, 2021 | 11 |
| Emerald Finance & Banking Innovation Fund | Manager Commentary |
| October 31, 2021 (Unaudited) |
Reduced credit concerns have serial acquirers active once again. We believe that potential sellers see transactions as a way to mitigate revenue headwinds from excess liquidity and low interest rates by cutting costs, including through branch rationalization. As branch traffic continues its multi-year decline, digital channels have become the preferred method of banking. We believe many management teams will see M&A as a way to right size their costly branch networks while making necessary technology investments that enable more effective competition with fintechs.
It appears that the pandemic accelerated digital finance adoption. Several fintech companies saw major spikes in new users early in the pandemic as customers shifted toward digital channels to handle transactions and obtain stimulus payments. Mobile payment platforms built on the momentum by adding nonpayment services like direct deposit or stock trading, hoping to transform themselves more rapidly into mobile financial hubs or “super apps.” The goal is to increase user engagement, especially into higher-margin products and services.
Fintechs hope that if consumers see utility in the wider array of products and services, consumers will store larger amounts of money within the platforms for longer periods of time. Larger account balances should boost profitability by driving greater engagement with the platforms’ expanding suites of payment and banking products and should lower the cost of facilitating transactions for payment providers. Transactions that occur within a bank’s network are generally cheaper to facilitate than wire and ACH transactions or those backed by credit and debit cards.
We believe the fintechs will continue to build payment platforms, provide more banking-like services, and upgrade apps to rebrand them as mobile financial hubs, which should augment the perceived value of these apps and support engagement. These efforts should translate into higher dollar amounts being stored therein, putting fintechs more firmly in competition with traditional banks.
We also believe a relevant question is whether the growth potential of fintech could be, in part, the consequence of lighter regulatory requirements compared with those for incumbent players such as banks. The banking industry has frequently stressed that regulation could promote a level playing field through the adoption of an activity-based approach, as opposed to an entity-based one. That would mean imposing similar requirements upon all active players in a particular market segment, regardless of the legal nature or other characteristics of those entities and, in particular, whether or not they hold a banking license.
Market Outlook
While banks appear to have successfully navigated the “pandemic” to date and have outperformed the “broader market” in 2021, we believe the future of “banking” as we know it remains challenging. We believe the banking sector as a whole will need to increase their rate of adoption of new technologies and look to technology as an investment rather than an expense. We believe banks must move beyond the a-la-carte technology offerings provided by the big three core banking system providers (Fiserv, FIS and Jack Henry), and look to create a differentiated experience driven by technology. In fact, it is even possible that every bank designed for success in the twentieth century will be designed to fail in the twenty-first century without significant changes.
It is a rare exception in history when a monopoly company or institutions that are not allowed to fail respond by doing what is necessary to stay relevant in the future. Transition requires long-term thinking. It requires going against the grain of where the current market and profits are. Bets on the future are invariably bets against where the market is today. To make such a bet in light of immediate short-term demands of investors and stakeholders requires bold leadership, and time.
We believe Emerald’s research process will allow us to identify and invest in those banks that are making the necessary strategic decisions for the future. There will be winners and losers. We are focused on those financial innovation companies driving what we believe will be a “sea change” in the financial services industry. Moving forward we will dedicate more of our commentary to our “call to action” for banks and financial innovation companies and what we see as the requisites for future success.
The portfolio’s recent movement toward cutting edge innovation in the banking and financial services industry has included greater interest in the digital asset mining industry. We believe digital miners are the distributed ledger technology (DLT) equivalents of Visa or MasterCard in traditional banking markets, as the “transaction rails” for DLT comparable to Visa and MasterCard as the “payment rails” for most credit card transactions. We also believe that the digital asset mining industry is in the midst of a change in leadership that has provided significant upside opportunities to miners based in the United States.
China’s digital mining exodus this year represents a significant opportunity for bitcoin miners around the world. As China-based digital miners were forced offline, hash rates plummeted (hash rate is the measuring unit of the processing power of the Bitcoin network). Before the ban, China was by far the largest digital mining country in the world, with an estimated 65% of the world’s hash rate, and this was reflected in subsequent data. Hash rate dropped as much as 55% from its spring peak. It has now recovered to 75% of its original value driven primarily by new miner deployments in regions such as the United States. Not only have we seen the network hash rate continue its aggressive recovery over the last few months, but also we have seen large growth in public bitcoin miner production with major mining opportunities unfolding, especially in the United States. According to the Luxor Mining Hashrate Index Report for Q32021, "Collectively in Q3, these miners (U.S. Miners) mined 79% more bitcoin
| 12 | www.emeraldmutualfunds.com |
| Emerald Finance & Banking Innovation Fund | Manager Commentary |
| October 31, 2021 (Unaudited) |
than they did in Q2 and 155% more than they mined in Q1." Luxor also expects global hashrate to reach previous all-time high levels in Q4 of 185 exahashes per second, which would be a 215% increase from July lows. Currently we are around 143 EH/s.
Data from Foundry USA, one of the largest digital mining pools in the world with 9-10% of hash rate, shows the United States has nearly a third of global hash rate with New York, Texas, Kentucky and Georgia amongst the top digital mining states in their mining pool. Foundry’s latest data roughly estimates a doubling in U.S. hash rate using the Cambridge Bitcoin Electricity Consumption Index’s data from April 2021. We believe that significant upside to earnings estimates exist throughout 2022 for U.S. based digital asset miners that successfully capture hash rate.
We believe that there is a lack of sell side research focused on distributed ledger technology and the digital asset industry thus creating an inefficient market with most publicly traded companies followed by one analyst – or none. We believe this lack of “Wall Street” knowledge presents an opportunity for Emerald’s research process to provide unique opportunities for the Emerald Financial & Banking Innovation Fund.
| Top Contributors | Top Detractors |
| LendingClub Corp. | Voyager Digital Ltd. (CAN) |
| Support.com Inc. | Cipher Mining Inc. |
| Silvergate Capital Corp. | Defi Technologies Inc. |
| Applied Blockchain Inc.. | SoFi Technologies Inc. |
| The Bancorp Inc. | Voyager Digital Ltd. (US) |
| Kenneth G. Mertz II, CFA | Steven E. Russell, Esq. |
| Chief Investment Officer | Portfolio Manager |
| Portfolio Manager |
Emerald Mutual Fund Advisers Trust
Past performance does not guarantee future results. Fund prices fluctuate as the underlying assets have exposure to market fluctuations and other risks, as described in the Fund’s prospectus. Please visit www.emeraldmutualfunds.com to obtain current performance information and for the current prospectus and statement of additional information. This material must be preceded or accompanied by a prospectus. Please read the prospectus carefully before investing.
The views of Emerald Mutual Fund Advisers Trust and information discussed in this commentary are as of the date of publication, are subject to change, and may not reflect the writer's current views. The views expressed are those of the author only, and represent an assessment of market conditions at a specific point in time, are opinions only and should not be relied upon as investment advice regarding a particular investment or markets in general. Such information does not constitute a recommendation to buy or sell specific securities or investment vehicles. It should not be assumed that any investment will be profitable or will equal the performance of the Fund or any securities or any sectors mentioned in this letter. The subject matter contained in this letter has been derived from several sources believed to be reliable and accurate at the time of compilation. Neither Emerald Mutual Fund Advisers Trust nor the Fund accepts any liability for losses either direct or consequential caused by the use of this information.
The Emerald Finance & Banking Innovation Fund is distributed by ALPS Distributors, Inc.
The Fund is subject to investment risks, including possible loss of the principal amount invested and therefore is not suitable for all investors. The Fund may not achieve its objectives.
Diversification does not eliminate the risk of experiencing investment losses.
The Russell 2000® Index measures the performance of the small-cap segment of the U.S. equity universe. The Russell 2000® Index is a subset of the Russell 3000® Index representing approximately 10% of the total market capitalization of that index. It includes approximately 2000 of the smallest securities based on a combination of their market cap and current index membership. The Index is not actively managed and does not reflect any deduction of fees, expenses or taxes. An investor may not invest directly into the Index.
The Russell 2000® Financial Services Index – is comprised of the smallest financial services companies in the Russell 3000 Index. The Index is not actively managed and does not reflect any deductions for fees, expense, or taxes. An investor may not invest directly in the Index.
SNL Small Cap Bank & Thrift Index: Includes all publicly traded (NYSE, NYSE Amex, NASDAQ, OTC BB, Pink Sheets) Banks and Thrifts in SNL's coverage universe with $250M to $1B Total Common Market Capitalization as of most recent pricing data. Source: SNL Financial, data as of April 30, 2019.
| Semi-Annual Report | October 31, 2021 | 13 |
| Emerald Finance & Banking Innovation Fund | Manager Commentary |
| October 31, 2021 (Unaudited) |
The Standard & Poor’s 500® Index is an unmanaged index of 500 common stocks chosen for the market size, liquidity and industry group representation. It is a market-value weighted index. The Index is not actively managed and does not reflect any deduction for fees, expenses or taxes. An investor may not invest directly into the Index
The Russell 2000® Value Index measures the performance of small-cap value segment of the U.S. equity universe. It includes those Russell 2000 companies with lower price-to-book ratios (A ratio used to compare a stock's market value to its book value. It is calculated by dividing the current closing price of the stock by the latest quarter's book value per share.) and lower forecasted growth values. The Index is not actively managed and does not reflect any deductions for fees, expenses or taxes. An investor may not invest directly into the Index.
| 14 | www.emeraldmutualfunds.com |
| Emerald Finance & Banking Innovation Fund | Manager Commentary |
| October 31, 2021 (Unaudited) |
TOP TEN HOLDINGS
(as a % of Net Assets)*
| LendingClub Corp. | 4.96% |
| Triumph Bancorp, Inc. | 4.12% |
| Bancorp, Inc. | 3.91% |
| Silvergate Capital Corp. | 3.80% |
| Galaxy Digital Holdings, Ltd. | 3.51% |
| Signature Bank | 3.46% |
| ECN Capital Corp. | 3.17% |
| Live Oak Bancshares, Inc. | 2.87% |
| Voyager Digital, Ltd. | 2.87% |
| Marathon Digital Holdings, Inc. | 2.85% |
| Top Ten Holdings | 35.52% |
INDUSTRY SECTOR ALLOCATION
(as a % of Net Assets)
| Banks | 38.47% |
| Investment Services | 21.19% |
| Consumer Lending | 8.62% |
| Asset Managers And Custodians | 5.91% |
| Transaction Processing Services | 5.76% |
| Financial Data Providers | 5.32% |
| Other Specialty REITs | 2.41% |
| Property And Casualty Insurance | 1.90% |
| Software | 1.60% |
| Technology | 1.48% |
| Diversified Financial Services | 1.42% |
| SPAC | 1.25% |
| Mortgage Reits: Diversified | 0.97% |
| Electronic Equipment: Gauges And Meters | 0.22% |
| Warrants | 0.54% |
| Cash, Cash Equivalents, & Other Net Assets | 2.94% |
| Total | 100.00% |
| * | Holdings are subject to change, and may not reflect the current or future position of the portfolio. |
ANNUALIZED TOTAL RETURN (for the period ended October 31, 2021)
| 6 Month | 1 Year | 3 Year | 5 Year | 10 Year | Since Inception(1) | Expense Ratio Gross(2) | Net(2) | |
| Class A (NAV) | 22.62% | 126.64% | 23.42% | 20.31% | 18.71% | 10.71% | 1.59% | 1.59% |
| Class A (LOAD) | 16.80% | 115.88% | 21.43% | 19.15% | 18.14% | 10.49% | 1.59% | 1.59% |
| Russell 2000® Index(3) | 1.85% | 50.80% | 16.47% | 15.52% | 13.50% | 9.10% | ||
| Russell 2000® Financial Services Index(4) | 6.15% | 60.14% | 12.89% | 12.07% | 13.33% | 9.00% | ||
| Class C (NAV) | 22.21% | 125.16% | 22.62% | 19.53% | 17.96% | 10.96% | 2.24% | 2.24% |
| Class C (LOAD) | 21.21% | 124.16% | 22.62% | 19.53% | 17.96% | 10.96% | 2.24% | 2.24% |
| Russell 2000® Index(3) | 1.85% | 50.80% | 16.47% | 15.52% | 13.50% | 9.10% | ||
| Russell 2000® Financial Services Index(4) | 6.15% | 60.14% | 12.89% | 12.07% | 13.33% | 9.00% | ||
| Investor Class | 22.61% | 126.57% | 23.38% | 20.32% | 18.74% | 15.35% | 1.63% | 1.63% |
| Russell 2000® Index(3) | 1.85% | 50.80% | 16.47% | 15.52% | 13.50% | 9.10% | ||
| Russell 2000® Financial Services Index(4) | 6.15% | 60.14% | 12.89% | 12.07% | 13.33% | 9.00% | ||
| Institutional Class | 22.83% | 127.46% | 23.86% | 20.73% | — | 18.22% | 1.28% | 1.28% |
| Russell 2000® Index(3) | 1.85% | 50.80% | 16.47% | 15.52% | 13.50% | 9.10% | ||
| Russell 2000® Financial Services Index(4) | 6.15% | 60.14% | 12.89% | 12.07% | 13.33% | 9.00% |
The performance quoted represents past performance, does not guarantee future results and current performance may be lower or higher than the data quoted. The investment return and principal value of an investment will fluctuate so that shares, when redeemed, may be worth more or less than their original cost. Performance data current to the most recent month end may be obtained at www.emeraldmutualfunds.com.
Performance shown for periods prior to March 16, 2012, reflects the performance of the Forward Banking & Finance Fund, a series of Forward Funds (as a result of a reorganization of the Forward Banking & Finance Fund into the Emerald Banking & Finance Fund).
Returns for periods less than 1 year are cumulative.
The table does not reflect the deduction of taxes that a shareholder would pay on Fund distributions or the redemption of Fund shares.
Subject to investment risks, including possible loss of the principal amount invested.
Maximum Offering Price (MOP) for Class A shares includes the Fund's maximum sales charge of 4.75%. Performance shown at NAV does not include these sales charges and would have been lower had it been taken into account.
A Contingent Deferred Sales Charge (CDSC) of 1.00% may apply to Class C shares redeemed within the first 12 months after a purchase.
| (1) | Inception Dates - Class A: 02/18/1997, Class C: 07/01/2000, Institutional Class: 03/19/2012, Investor Class: 03/16/2010 |
| (2) | Emerald Mutual Fund Advisers Trust ("Emerald" or the "Adviser") has agreed contractually to waive a portion of its fees and reimburse other expenses in amounts necessary to limit the Fund's operating expenses (exclusive of Acquired Fund Fees and Expenses, brokerage expenses, interest expense, taxes and extraordinary expense) for Class A, Class C, Institutional Class, and Investor Class shares to an annual rate (as percentage of the Fund's average daily net assets) of 1.84%, 2.49%, 1.54% and 1.89% respectively. This agreement (the "Expense Agreement") shall continue at least through August 31, 2022. The Adviser will be permitted to recapture, on a class-by-class basis, expenses it has borne through the Expense Agreement to the extent that the Fund's expenses |
| Semi-Annual Report | October 31, 2021 | 15 |
| Emerald Finance & Banking Innovation Fund | Manager Commentary |
| October 31, 2021 (Unaudited) |
in later periods fall below the annual rates set forth in the Expense Agreement; provided, however, that such recapture payments do not cause the Fund's expense ratio (after recapture) to exceed the lesser of (i) the expense cap in effect at the time of the waiver and (ii) the expense cap in effect at the time of the recapture. Notwithstanding the foregoing, the Fund will not be obligated to pay any such deferred fees and expenses more than three years after the date on which the fee and expenses were deferred. The Adviser may not discontinue this waiver, prior to August 31, 2022, without the approval by the Fund's Board of Trustees. Ratios as of the Prospectus dated August 31, 2021 and may differ from the ratios presented in the Financial Highlights.
| (3) | The Russell 2000® Index measures the performance of the small-cap segment of the U.S. equity universe. The Russell 2000® is a subset of the Russell 3000® Index representing approximately 8% of the total market capitalization of that index. It includes approximately 2000 of the smallest securities based on a combination of their market cap and current index membership. The index is not actively managed and does not reflect any deductions for fees, expenses or taxes. An investor may not invest directly into an index. |
| (4) | The Russell 2000® Financial Services Index is an additional index, and is comprised of the smallest financial services companies in the Russell 3000® Index. The Index is not actively managed and does not reflect any deductions for fees, expense, or taxes. An investor may not invest directly in the Index. |
Important Risks
A fund that concentrates in a particular industry will involve a greater degree of risk than a fund with a more diversified portfolio. Investing in smaller companies generally will present greater investment risks, including: greater price volatility, greater sensitivity to changing economic conditions and less liquidity than the securities of larger, more mature companies.
| 16 | www.emeraldmutualfunds.com |
| Emerald Finance & Banking Innovation Fund | Manager Commentary |
| October 31, 2021 (Unaudited) |
GROWTH OF $10,000 INVESTMENT IN THE FUND (for the period ended October 31, 2021)
Comparison of change in value of a $10,000 investment (includes applicable sales loads)
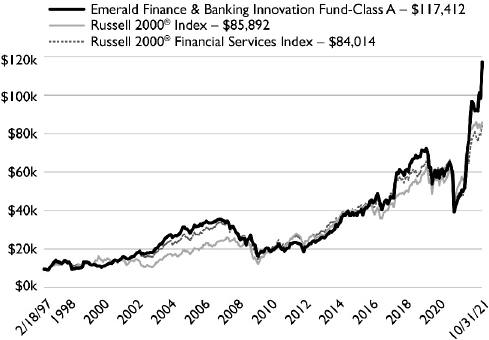
The chart represents historical performance of a hypothetical investment of $10,000 in the Fund since inception. Past performance does not guarantee future results. This chart does not reflect the deduction of taxes that a shareholder would pay on Fund distributions or the redemption of Fund shares.
Investing in the Fund is subject to investment risks, including possible loss of the principal amount invested.
| Semi-Annual Report | October 31, 2021 | 17 |
| Emerald Funds | Disclosure of Fund Expenses |
| October 31, 2021 (Unaudited) |
As a shareholder of the Funds, you incur two types of costs: (1) transaction costs, including applicable sales charges (loads); and (2) ongoing costs, including management fees, distribution and service (12b-1) fees, shareholder services fees and other Fund expenses. This example is intended to help you understand your ongoing costs (in dollars) of investing in the Funds and to compare these costs with the ongoing costs of investing in other mutual funds. The example is based on an investment of $1,000 invested at the beginning of the (six-month) period and held for the entire period May 1, 2021 through October 31, 2021.
Actual Expenses
The first line for each share class of the Fund in the table below provides information about actual account values and actual expenses. You may use this information, together with the amount you invested, to estimate the expenses that you paid over the period. Simply divide your account value by $1,000 (for example, an $8,600 account value divided by $1,000 = 8.6), then multiply the result by the number in the applicable line under the heading titled “Expenses Paid During Period” to estimate the expenses you paid on your account during this period.
Hypothetical Example For Comparison Purposes
The second line for each share class of each Fund in the table below provides information about hypothetical account values and hypothetical expenses based on the Fund’s actual expense ratio and an assumed rate of return of 5% per year before expenses, which is not the Fund’s actual return. The hypothetical account values and expenses may not be used to estimate the actual ending account balance or expenses you paid for the period. You may use this information to compare the ongoing costs of investing in the Funds and other funds. To do so, compare this 5% hypothetical example with the 5% hypothetical examples that appear in the shareholder reports of other mutual funds.
Please note that the expenses shown in the table below are meant to highlight your ongoing costs only and do not reflect any transactional costs, such as sales charges (loads), redemption fees or exchange fees. Therefore, the second line for each share class of the Fund within the table is useful in comparing ongoing costs only, and will not help you determine the relative total costs of owning different funds. If these transactional costs were included, your costs would have been higher.
Beginning Account Value 05/01/21 | Ending Account Value 10/31/21 | Expense Ratio(a) | Expense Paid During Period 5/01/21 - 10/31/21(b) | |||||||||||||
| Emerald Growth Fund | ||||||||||||||||
| Class A | ||||||||||||||||
| Actual | $ | 1,000.00 | $ | 1,010.70 | 1.00 | % | $ | 5.07 | ||||||||
| Hypothetical (5% return before expenses) | $ | 1,000.00 | $ | 1,020.16 | 1.00 | % | $ | 5.09 | ||||||||
| Class C | ||||||||||||||||
| Actual | $ | 1,000.00 | $ | 1,007.60 | 1.66 | % | $ | 8.40 | ||||||||
| Hypothetical (5% return before expenses) | $ | 1,000.00 | $ | 1,016.84 | 1.66 | % | $ | 8.44 | ||||||||
| Institutional Class | ||||||||||||||||
| Actual | $ | 1,000.00 | $ | 1,012.50 | 0.68 | % | $ | 3.45 | ||||||||
| Hypothetical (5% return before expenses) | $ | 1,000.00 | $ | 1,021.78 | 0.68 | % | $ | 3.47 | ||||||||
| Investor Class | ||||||||||||||||
| Actual | $ | 1,000.00 | $ | 1,010.50 | 1.04 | % | $ | 5.27 | ||||||||
| Hypothetical (5% return before expenses) | $ | 1,000.00 | $ | 1,019.96 | 1.04 | % | $ | 5.30 | ||||||||
| 18 | www.emeraldmutualfunds.com |
| Emerald Funds | Disclosure of Fund Expenses |
| October 31, 2021 (Unaudited) |
| Beginning Account Value 05/01/21 | Ending Account Value 10/31/21 | Expense Ratio(a) | Expense Paid During Period 5/01/21 - 10/31/21(b) | |||||||||||||
| Emerald Insights Fund | ||||||||||||||||
| Class A | ||||||||||||||||
| Actual | $ | 1,000.00 | $ | 1,092.70 | 1.35 | % | $ | 7.12 | ||||||||
| Hypothetical (5% return before expenses) | $ | 1,000.00 | $ | 1,018.40 | 1.35 | % | $ | 6.87 | ||||||||
| Class C | ||||||||||||||||
| Actual | $ | 1,000.00 | $ | 1,089.40 | 2.00 | % | $ | 10.53 | ||||||||
| Hypothetical (5% return before expenses) | $ | 1,000.00 | $ | 1,015.12 | 2.00 | % | $ | 10.16 | ||||||||
| Institutional Class | ||||||||||||||||
| Actual | $ | 1,000.00 | $ | 1,094.30 | 1.05 | % | $ | 5.54 | ||||||||
| Hypothetical (5% return before expenses) | $ | 1,000.00 | $ | 1,019.91 | 1.05 | % | $ | 5.35 | ||||||||
| Investor Class | ||||||||||||||||
| Actual | $ | 1,000.00 | $ | 1,092.20 | 1.40 | % | $ | 7.38 | ||||||||
| Hypothetical (5% return before expenses) | $ | 1,000.00 | $ | 1,018.15 | 1.40 | % | $ | 7.12 | ||||||||
| Emerald Finance and Banking Innovation Fund | ||||||||||||||||
| Class A | ||||||||||||||||
| Actual | $ | 1,000.00 | $ | 1,226.00 | 1.45 | % | $ | 8.14 | ||||||||
| Hypothetical (5% return before expenses) | $ | 1,000.00 | $ | 1,017.90 | 1.45 | % | $ | 7.38 | ||||||||
| Class C | ||||||||||||||||
| Actual | $ | 1,000.00 | $ | 1,222.10 | 2.10 | % | $ | 11.76 | ||||||||
| Hypothetical (5% return before expenses) | $ | 1,000.00 | $ | 1,014.62 | 2.10 | % | $ | 10.66 | ||||||||
| Institutional Class | ||||||||||||||||
| Actual | $ | 1,000.00 | $ | 1,228.30 | 1.11 | % | $ | 6.23 | ||||||||
| Hypothetical (5% return before expenses) | $ | 1,000.00 | $ | 1,019.61 | 1.11 | % | $ | 5.65 | ||||||||
| Investor Class | ||||||||||||||||
| Actual | $ | 1,000.00 | $ | 1,225.80 | 1.48 | % | $ | 8.30 | ||||||||
| Hypothetical (5% return before expenses) | $ | 1,000.00 | $ | 1,017.74 | 1.48 | % | $ | 7.53 | ||||||||
| (a) | The Fund's expense ratios have been based on the Fund's most recent fiscal half-year expenses. |
| (b) | Expenses are equal to the Fund's annualized expense ratio multiplied by the average account value over the period, multiplied by the number of days in the most recent fiscal half-year (184)/365 (to reflect the half-year period). |
| Semi-Annual Report | October 31, 2021 | 19 |
| Emerald Growth Fund | Schedule of Investments |
| October 31, 2021 (Unaudited) |
| Shares | Value (Note 2) | |||||||
| COMMON STOCKS: 99.55% | ||||||||
| Basic Materials: 1.61% | ||||||||
| 460,545 | Avient Corp. | $ | 24,814,165 | |||||
| Consumer Discretionary: 18.67% | ||||||||
| 80,021 | BJ's Restaurants, Inc.(a) | 2,666,300 | ||||||
| 304,570 | Chegg, Inc.(a) | 18,103,641 | ||||||
| 130,024 | Churchill Downs, Inc. | 29,905,520 | ||||||
| 262,829 | Chuy's Holdings, Inc.(a) | 7,664,094 | ||||||
| 76,010 | Cinemark Holdings, Inc.(a) | 1,428,988 | ||||||
| 165,737 | Dick's Sporting Goods, Inc. | 20,586,193 | ||||||
| 1,058,579 | Everi Holdings, Inc.(a) | 25,405,896 | ||||||
| 92,734 | Five Below, Inc.(a) | 18,296,418 | ||||||
| 216,082 | Jack in the Box, Inc. | 21,381,314 | ||||||
| 400,758 | National Vision Holdings, Inc.(a) | 24,702,723 | ||||||
| 603,214 | Noodles & Co.(a) | 7,329,050 | ||||||
| 105,480 | Petco Health & Wellness Company(a) | 2,608,520 | ||||||
| 199,002 | Planet Fitness, Inc., Class A(a) | 15,830,609 | ||||||
| 840,092 | PlayAGS, Inc.(a) | 7,409,611 | ||||||
| 124,580 | Portillo's, Inc.(a) | 4,734,040 | ||||||
| 358,531 | SeaWorld Entertainment, Inc.(a) | 22,766,719 | ||||||
| 400,257 | Tilly's, Inc., Class A | 5,555,567 | ||||||
| 172,310 | Udemy Inc(a) | 4,738,525 | ||||||
| 125,546 | Visteon Corp.(a) | 14,209,296 | ||||||
| 156,910 | Winnebago Industries, Inc. | 10,621,238 | ||||||
| 224,096 | YETI Holdings, Inc.(a) | 22,035,360 | ||||||
| 287,979,622 | ||||||||
| Consumer Staples: 4.85% | ||||||||
| 304,826 | BellRing Brands, Inc., Class A(a) | 8,175,433 | ||||||
| 243,555 | Freshpet, Inc.(a) | 37,972,660 | ||||||
| 722,996 | Simply Good Foods Co.(a) | 28,666,792 | ||||||
| 74,814,885 | ||||||||
| Energy: 0.96% | ||||||||
| 150,753 | Ameresco, Inc., Class A(a) | 12,381,344 | ||||||
| 53,970 | Cactus, Inc. | 2,347,695 | ||||||
| 14,729,039 | ||||||||
| Financial Services: 13.40% | ||||||||
| 730,176 | BRP Group, Inc., Class A(a) | 26,651,424 | ||||||
| 38,347 | Customers Bancorp, Inc.(a) | 2,043,512 | ||||||
| 1,182,409 | Eastern Bankshares, Inc. | 24,558,635 | ||||||
| 86,775 | Enterprise Financial Services Corp. | 4,080,160 | ||||||
| 176,547 | Houlihan Lokey, Inc. | 19,787,388 | ||||||
| 255,736 | Live Oak Bancshares, Inc. | 22,806,536 | ||||||
| 180,500 | Mid Penn Bancorp, Inc. | 5,057,610 | ||||||
| 406,204 | Moelis & Co., Class A | 29,547,279 | ||||||
| 586,542 | Pacific Premier Bancorp, Inc. | 24,628,899 | ||||||
| 251,212 | Palomar Holdings, Inc.(a) | 22,973,337 | ||||||
| 73,992 | Silvergate Capital Corp., Class A(a) | 11,588,627 | ||||||
| 311,670 | Trinity Capital, Inc. | 5,033,470 | ||||||
| Shares | Value (Note 2) | |||||||
| Financial Services (continued) | ||||||||
| 66,962 | Triumph Bancorp, Inc.(a) | $ | 7,854,643 | |||||
| 206,611,520 | ||||||||
| Health Care: 19.25% | ||||||||
| 52,247 | 908 Devices, Inc.(a) | 1,718,926 | ||||||
| 87,710 | ACADIA Pharmaceuticals, Inc.(a) | 1,574,395 | ||||||
| 578,032 | Alkermes PLC(a) | 17,508,589 | ||||||
| 350,741 | Applied Therapeutics, Inc.(a) | 5,145,370 | ||||||
| 415,210 | Arrhythmia Research(a) | 7,162,373 | ||||||
| 157,050 | Arvinas, Inc.(a) | 13,597,389 | ||||||
| 304,060 | AtriCure, Inc.(a) | 22,822,744 | ||||||
| 126,860 | Biohaven Pharmaceutical Holding Co., Ltd.(a) | 18,054,715 | ||||||
| 140,919 | Blueprint Medicines Corp.(a) | 15,851,978 | ||||||
| 445,807 | Collegium Pharmaceutical, Inc.(a) | 8,751,191 | ||||||
| 1,106,553 | Curis, Inc.(a) | 7,192,595 | ||||||
| 307,237 | CVRx, Inc.(a) | 5,195,378 | ||||||
| 223,213 | Dicerna Pharmaceuticals, Inc.(a) | 4,645,063 | ||||||
| 900,250 | Gossamer Bio, Inc.(a) | 11,181,105 | ||||||
| 274,568 | Imago Biosciences, Inc.(a) | 7,309,000 | ||||||
| 139,177 | Integer Holdings Corp.(a) | 12,528,714 | ||||||
| 25,514 | Karuna Therapeutics, Inc.(a) | 3,581,655 | ||||||
| 1,570,220 | MannKind Corp.(a) | 7,395,736 | ||||||
| 268,798 | Merit Medical Systems, Inc.(a) | 18,079,353 | ||||||
| 575,523 | NeoGenomics, Inc.(a) | 26,474,058 | ||||||
| 915,940 | Organogenesis Holdings, Inc.(a) | 10,057,021 | ||||||
| 133,889 | Reata Pharmaceuticals, Inc., Class A(a) | 12,854,683 | ||||||
| 598,407 | Replimune Group, Inc.(a) | 17,658,991 | ||||||
| 409,014 | SeaSpine Holdings Corp.(a) | 6,118,849 | ||||||
| 258,120 | Thorne HealthTech, Inc.(a) | 2,111,422 | ||||||
| 226,253 | TransMedics Group, Inc.(a) | 6,206,120 | ||||||
| 118,078 | Treace Medical Concepts, Inc.(a) | 2,722,879 | ||||||
| 26,698 | Twist Bioscience Corp.(a) | 3,171,722 | ||||||
| 106,024 | United Therapeutics Corp.(a) | 20,225,138 | ||||||
| 296,897,152 | ||||||||
| Industrials: 16.62% | ||||||||
| 328,558 | AZEK Co., Inc.(a) | 12,054,793 | ||||||
| 175,000 | Babcock & Wilcox Enterprises, Inc.(a) | 1,195,250 | ||||||
| 221,062 | Chart Industries, Inc.(a) | 39,242,926 | ||||||
| 353,518 | Echo Global Logistics, Inc.(a) | 17,050,173 | ||||||
| 138,548 | FARO Technologies, Inc.(a) | 10,192,976 | ||||||
| 408,175 | First Advantage Corp.(a) | 7,632,873 | ||||||
| 132,719 | Forward Air Corp. | 13,346,223 | ||||||
| 334,829 | Hayward Holdings, Inc.(a) | 7,764,685 | ||||||
| 8,282 | Herc Holdings, Inc. | 1,507,655 | ||||||
| 878,394 | Kratos Defense & Security Solutions, Inc.(a) | 18,788,848 | ||||||
| 112,502 | Masonite International Corp.(a) | 13,501,365 | ||||||
| 313,591 | Montrose Environmental Group, Inc.(a) | 21,496,663 | ||||||
| 69,041 | NV5 Global, Inc.(a) | 7,189,239 | ||||||
| 20 | www.emeraldmutualfunds.com |
| Emerald Growth Fund | Schedule of Investments |
| October 31, 2021 (Unaudited) |
| Shares | Value (Note 2) | |||||||
| Industrials (continued) | ||||||||
| 197,020 | Sterling Check Corp.(a) | $ | 4,226,079 | |||||
| 100,285 | Summit Materials, Inc., Class A(a) | 3,575,160 | ||||||
| 200,489 | Tetra Tech, Inc. | 35,217,898 | ||||||
| 170,021 | Trex Co., Inc.(a) | 18,090,234 | ||||||
| 239,913 | TriNet Group, Inc.(a) | 24,291,191 | ||||||
| 256,364,231 | ||||||||
| Real Estate: 1.07% | ||||||||
| 160,424 | Hannon Armstrong Sustainable Infrastructure Capital, Inc. | 9,689,609 | ||||||
| 78,761 | Ryman Hospitality Properties, Inc.(a) | 6,737,216 | ||||||
| 16,426,825 | ||||||||
| Technology: 21.49% | ||||||||
| 460,336 | Cohu, Inc.(a) | 14,749,166 | ||||||
| 185,551 | Diodes, Inc.(a) | 17,829,596 | ||||||
| 106,612 | DoubleVerify Holdings, Inc.(a) | 4,214,372 | ||||||
| 250,730 | FormFactor, Inc.(a) | 9,974,039 | ||||||
| 75,657 | Jamf Holding Corp.(a) | 3,605,056 | ||||||
| 224,158 | Lattice Semiconductor Corp.(a) | 15,565,532 | ||||||
| 113,185 | LiveRamp Holdings, Inc.(a) | 6,056,529 | ||||||
| 551,483 | MACOM Technology Solutions Holdings, Inc.(a) | 38,504,543 | ||||||
| 351,203 | Model N, Inc.(a) | 11,382,489 | ||||||
| 287,099 | Onto Innovation, Inc.(a) | 22,741,112 | ||||||
| 242,004 | Perficient, Inc.(a) | 29,911,694 | ||||||
| 125,839 | Q2 Holdings, Inc.(a) | 9,873,328 | ||||||
| 379,905 | Rapid7, Inc.(a) | 48,912,769 | ||||||
| 393,329 | Sailpoint Technologies Holdings, Inc.(a) | 18,871,926 | ||||||
| 241,564 | Semtech Corp.(a) | 20,540,187 | ||||||
| 354,497 | SkyWater Technology, Inc.(a) | 12,137,977 | ||||||
| 296,775 | Super Micro Computer, Inc.(a) | 10,502,867 | ||||||
| 555,810 | Varonis Systems, Inc.(a) | 35,983,139 | ||||||
| 331,356,321 | ||||||||
| Telecommunications: 1.34% | ||||||||
| 150,223 | Cogent Communications Holdings, Inc. | 11,505,579 | ||||||
| 74,867 | Shenandoah Telecommunications Co. | 2,069,324 | ||||||
| 464,835 | Viavi Solutions, Inc.(a) | 7,158,459 | ||||||
| 20,733,362 | ||||||||
| Utilities: 0.29% | ||||||||
| 332,010 | Aris Water Solution, Inc.(a) | 4,538,577 | ||||||
| Total Common Stocks | ||||||||
| (Cost $821,967,432) | 1,535,265,699 | |||||||
| Shares | Value (Note 2) | |||||||
| SHORT TERM INVESTMENTS: 0.67% | ||||||||
| First American Government | ||||||||
| Obligations Fund | ||||||||
| 10,285,214 | 0.040% (12/31/49) | $ | 10,285,214 | |||||
| Total Short Term Investments | ||||||||
| (Cost $10,285,214) | 10,285,214 | |||||||
| Total Investments: 100.22% | ||||||||
| (Cost $832,252,646) | 1,545,550,913 | |||||||
| Liabilities In Excess Of Other Assets: (0.22)% | (3,356,293 | ) | ||||||
| Net Assets: 100.00% | $ | 1,542,194,620 | ||||||
| (a) | Non-income producing security. |
For Fund compliance purposes, the Fund's industry classifications refer to any one or more of the industry sub-classifications used by one or more widely recognized market indexes or ratings group indexes, and/or as defined by Fund management. This definition may not apply for purposes of this report, which may combine industry sub-classifications for reporting ease. Industries are shown as a percentage of net assets.
See Notes to Financial Statements.
| Semi-Annual Report | October 31, 2021 | 21 |
| Emerald Insights Fund | Schedule of Investments |
| October 31, 2021 (Unaudited) |
| Shares | Value (Note 2) | |||||||
| COMMON STOCKS: 99.64% | ||||||||
| Basic Materials: 1.84% | ||||||||
| 4,164 | MP Materials Corp.(a) | $ | 140,951 | |||||
| 2,106 | Scotts Miracle-Gro Co. | 312,657 | ||||||
| 453,608 | ||||||||
| Consumer Discretionary: 22.07% | ||||||||
| 364 | Amazon.com, Inc.(a) | 1,227,565 | ||||||
| 107 | Booking Holdings, Inc.(a) | 259,023 | ||||||
| 6,272 | Chegg, Inc.(a) | 372,808 | ||||||
| 928 | Churchill Downs, Inc. | 213,440 | ||||||
| 17,757 | Cinemark Holdings, Inc.(a) | 333,832 | ||||||
| 3,560 | Dick's Sporting Goods, Inc. | 442,188 | ||||||
| 15,086 | Everi Holdings, Inc.(a) | 362,064 | ||||||
| 418 | Home Depot, Inc. | 155,387 | ||||||
| 1,791 | Hyatt Hotels Corp., Class A(a) | 152,593 | ||||||
| 915 | NIKE, Inc., Class B | 153,070 | ||||||
| 17,430 | Petco Health & Wellness Company(a) | 431,044 | ||||||
| 32,001 | PlayAGS, Inc.(a) | 282,249 | ||||||
| 8,915 | SeaWorld Entertainment, Inc.(a) | 566,102 | ||||||
| 1,236 | TJX Cos., Inc. | 80,946 | ||||||
| 1,445 | Williams-Sonoma, Inc. | 268,380 | ||||||
| 2,212 | Winnebago Industries, Inc. | 149,730 | ||||||
| 5,450,421 | ||||||||
| Consumer Staples: 1.75% | ||||||||
| 741 | Freshpet, Inc.(a) | 115,529 | ||||||
| 4,576 | Olaplex Holdings, Inc.(a) | 127,716 | ||||||
| 3,206 | Simply Good Foods Co.(a) | 127,118 | ||||||
| 5,498 | Zevia PBC, Class A(a) | 61,523 | ||||||
| 431,886 | ||||||||
| Energy: 4.68% | ||||||||
| 3,420 | Cheniere Energy, Inc. | 353,628 | ||||||
| 2,256 | Diamondback Energy, Inc. | 241,821 | ||||||
| 14,590 | Gevo, Inc.(a) | 105,486 | ||||||
| 2,818 | Hess Corp. | 232,682 | ||||||
| 68,652 | TETRA Technologies, Inc.(a) | 221,746 | ||||||
| 1,155,363 | ||||||||
| Financial Services: 6.91% | ||||||||
| 1,814 | Blackstone, Inc. | 251,094 | ||||||
| 508 | S&P Global, Inc. | 240,873 | ||||||
| 2,528 | Silvergate Capital Corp., Class A(a) | 395,935 | ||||||
| 8,890 | Stronghold Digital Mining, Inc.(a) | 244,119 | ||||||
| 23,380 | Voyager Digital, Ltd.(a) | 361,221 | ||||||
| 1,839 | Western Alliance Bancorp | 213,490 | ||||||
| 1,706,732 | ||||||||
| Health Care: 7.09% | ||||||||
| 6,740 | ACADIA Pharmaceuticals, Inc.(a) | 120,983 | ||||||
| 3,976 | Atea Pharmaceuticals, Inc.(a) | 46,281 | ||||||
| 11,876 | Curis, Inc.(a) | 77,194 | ||||||
| 3,967 | Horizon Therapeutics PLC(a) | 475,683 | ||||||
| Shares | Value (Note 2) | |||||||
| Health Care (continued) | ||||||||
| 1,768 | Integer Holdings Corp.(a) | $ | 159,155 | |||||
| 2,311 | Reata Pharmaceuticals, Inc., Class A(a) | 221,879 | ||||||
| 2,278 | United Therapeutics Corp.(a) | 434,551 | ||||||
| 677 | Veeva Systems, Inc., Class A(a) | 214,616 | ||||||
| 1,750,342 | ||||||||
| Industrials: 11.81% | ||||||||
| 40,327 | Babcock & Wilcox Enterprises, Inc.(a) | 275,433 | ||||||
| 5,427 | Byrna Technologies, Inc.(a) | 91,445 | ||||||
| 2,471 | Chart Industries, Inc.(a) | 438,652 | ||||||
| 1,501 | Crown Holdings, Inc. | 156,089 | ||||||
| 6,076 | First Advantage Corp.(a) | 113,621 | ||||||
| 694 | Generac Holdings, Inc.(a) | 346,001 | ||||||
| 2,393 | GXO Logistics, Inc.(a) | 212,498 | ||||||
| 4,673 | Kratos Defense & Security Solutions, Inc.(a) | 99,956 | ||||||
| 1,995 | PayPal Holdings, Inc.(a) | 464,017 | ||||||
| 170 | Square, Inc., Class A(a) | 43,265 | ||||||
| 3,560 | Sterling Check Corp.(a) | 76,362 | ||||||
| 1,927 | Trex Co., Inc.(a) | 205,033 | ||||||
| 1,148 | Visa, Inc., Class A | 243,112 | ||||||
| 1,784 | XPO Logistics, Inc.(a) | 153,067 | ||||||
| 2,918,551 | ||||||||
| Real Estate: 0.85% | ||||||||
| 2,451 | CoStar Group, Inc.(a) | 210,908 | ||||||
| Technology: 42.64% | ||||||||
| 255 | Adobe, Inc.(a) | 165,842 | ||||||
| 843 | Advanced Micro Devices, Inc.(a) | 101,354 | ||||||
| 433 | Alphabet, Inc., Class A(a) | 1,282,078 | ||||||
| 13,220 | Apple, Inc. | 1,980,356 | ||||||
| 5,771 | Cohu, Inc.(a) | 184,903 | ||||||
| 628 | Crowdstrike Holdings, Inc., Class A(a) | 176,970 | ||||||
| 1,195 | DocuSign, Inc.(a) | 332,557 | ||||||
| 9,676 | Ebix, Inc. | 317,470 | ||||||
| 601 | HubSpot, Inc.(a) | 486,948 | ||||||
| 2,242 | Meta Platforms, Inc., Class A(a) | 725,444 | ||||||
| 6,065 | Microsoft Corp. | 2,011,275 | ||||||
| 306 | Mongodb Inc(a) | 159,515 | ||||||
| 4,744 | NVIDIA Corp. | 1,212,899 | ||||||
| 9,034 | Pure Storage, Inc., Class A(a) | 242,653 | ||||||
| 6,893 | SkyWater Technology, Inc.(a) | 236,016 | ||||||
| 1,020 | Teradyne, Inc. | 141,005 | ||||||
| 917 | UiPath, Inc., Class A(a) | �� | 46,079 | |||||
| 7,833 | Varonis Systems, Inc.(a) | 507,108 | ||||||
| 8,027 | ZipRecruiter, Inc., Class A(a) | 222,990 | ||||||
| 10,533,462 | ||||||||
| Total Common Stocks | ||||||||
| (Cost $14,670,805) | 24,611,273 | |||||||
| 22 | www.emeraldmutualfunds.com |
| Emerald Insights Fund | Schedule of Investments |
| October 31, 2021 (Unaudited) |
| Shares | Value (Note 2) | |||||||
| SHORT TERM INVESTMENTS: 0.95% | ||||||||
| 236,045 | First American Government Obligations Fund 0.040% (12/31/49) | $ | 236,045 | |||||
| Total Short Term Investments | ||||||||
| (Cost $236,045) | 236,045 | |||||||
| Total Investments: 100.59% | ||||||||
| (Cost $14,906,850) | 24,847,318 | |||||||
| Liabilities In Excess Of Other Assets: (0.59)% | (146,175 | ) | ||||||
| Net Assets: 100.00% | $ | 24,701,143 | ||||||
| (a) | Non-income producing security. |
For Fund compliance purposes, the Fund's industry classifications refer to any one or more of the industry sub-classifications used by one or more widely recognized market indexes or ratings group indexes, and/or as defined by Fund management. This definition may not apply for purposes of this report, which may combine industry sub-classifications for reporting ease. Industries are shown as a percentage of net assets.
See Notes to Financial Statements.
| Semi-Annual Report | October 31, 2021 | 23 |
| Emerald Finance & Banking Innovation Fund | Schedule of Investments |
| October 31, 2021 (Unaudited) |
| Shares | Value (Note 2) | |||||||
| COMMON STOCKS: 92.92% | ||||||||
| Financial Services: 80.20% | ||||||||
| Asset Managers And Custodians: 2.31% | ||||||||
| 328,500 | Blue Owl Capital, Inc. | $ | 5,663,340 | |||||
| 387,930 | Ether Capital Corp.(a) | 1,502,569 | ||||||
| 32,300 | Trinity Capital, Inc. | 521,645 | ||||||
| 7,687,554 | ||||||||
| Banks: 38.47% | ||||||||
| 62,003 | Axos Financial, Inc.(a) | 3,286,159 | ||||||
| 426,754 | Bancorp, Inc.(a) | 13,037,335 | ||||||
| 91,895 | Coastal Financial Corp.(a) | 3,496,605 | ||||||
| 26,842 | Community Heritage Financial, Inc. | 651,589 | ||||||
| 145,181 | Customers Bancorp, Inc.(a) | 7,736,695 | ||||||
| 98,840 | Eastern Bankshares, Inc. | 2,052,907 | ||||||
| 40,740 | First Financial Bankshares, Inc. | 2,066,333 | ||||||
| 80,030 | First Foundation, Inc. | 2,129,598 | ||||||
| 29,795 | First Republic Bank | 6,445,552 | ||||||
| 102,736 | Flagstar Bancorp, Inc. | 4,848,112 | ||||||
| 107,294 | Live Oak Bancshares, Inc. | 9,568,479 | ||||||
| 53 | Mechanics Bank/Walnut Creek CA | 1,669,500 | ||||||
| 50,200 | Meta Financial Group, Inc. | 2,783,088 | ||||||
| 64,755 | Metropolitan Bank Holding Corp.(a) | 5,883,639 | ||||||
| 73,048 | National Bank Holdings Corp. | 3,168,092 | ||||||
| 83,280 | Pacific Premier Bancorp, Inc. | 3,496,927 | ||||||
| 73,480 | Provident Bancorp, Inc. | 1,324,110 | ||||||
| 32,928 | ServisFirst Bancshares, Inc. | 2,644,448 | ||||||
| 38,785 | Signature Bank | 11,550,949 | ||||||
| 80,966 | Silvergate Capital Corp., Class A(a) | 12,680,895 | ||||||
| 10,776 | SVB Financial Group(a) | 7,730,702 | ||||||
| 117,206 | Triumph Bancorp, Inc.(a) | 13,748,264 | ||||||
| 54,030 | Western Alliance Bancorp | 6,272,343 | ||||||
| 128,272,321 | ||||||||
| Consumer Lending: 8.62% | ||||||||
| 1,216,580 | ECN Capital Corp. | 10,577,247 | ||||||
| 360,092 | LendingClub Corp.(a) | 16,549,828 | ||||||
| 198,077 | OppFi, Inc.(a) | 1,267,693 | ||||||
| 16,297 | SoFi Technologies, Inc.(a) | 327,407 | ||||||
| 28,722,175 | ||||||||
| Diversified Financial Services: 1.42% | ||||||||
| 922,950 | Bitfarms, Ltd.(a) | 4,725,504 | ||||||
| Financial Data Providers: 5.32% | ||||||||
| 66,877 | Bakkt Holdings, Inc.(a) | 2,843,610 | ||||||
| 772,040 | Banxa Holdings, Inc.(a) | 2,231,196 | ||||||
| 77,691 | BTCS, Inc.(a) | 525,968 | ||||||
| 95,027 | Open Lending Corp., Class A(a) | 2,995,251 | ||||||
| 295,840 | Stronghold Digital Mining, Inc.(a) | 8,123,766 | ||||||
| 852,869 | Tokens.com Corp.(a) | 1,023,443 | ||||||
| 17,743,234 | ||||||||
| Shares | Value (Note 2) | |||||||
| Investment Services: 21.19% | ||||||||
| 1,451,521 | Applied Blockchain, Inc.(a) | $ | 6,807,633 | |||||
| 47,362 | Cipher Mining, Inc.(a) | 372,265 | ||||||
| 1,004 | Coinbase Global, Inc., Class A(a) | 320,698 | ||||||
| 431,020 | Galaxy Digital Holdings, Ltd.(a) | 11,693,573 | ||||||
| 2,172,827 | Hive Blockchain Technologies, Ltd.(a) | 7,691,807 | ||||||
| 615,442 | Hut 8 Mining Corp.(a) | 8,246,923 | ||||||
| 2,970,079 | ISW Holdings, Inc.(a) | 7,870,709 | ||||||
| 182,140 | Marathon Digital Holdings, Inc.(a) | 9,514,994 | ||||||
| 314,970 | Riot Blockchain, Inc.(a) | 8,573,483 | ||||||
| 618,737 | Voyager Digital, Ltd.(a) | 9,559,487 | ||||||
| 70,651,572 | ||||||||
| Mortgage REITs: Diversified: 0.97% | ||||||||
| 107,990 | Newtek Business Services Corp. | 3,244,020 | ||||||
| Property And Casualty Insurance: 1.90% | ||||||||
| 6,153 | Kinsale Capital Group, Inc. | 1,151,534 | ||||||
| 138,780 | Porch Group, Inc.(a) | 2,918,543 | ||||||
| 66,960 | Trisura Group, Ltd.(a) | 2,263,583 | ||||||
| 6,333,660 | ||||||||
| Industrials: 7.46% | ||||||||
| Electronic Equipment: Guages And Meters: 0.22% | ||||||||
| 63,000 | Mechanical Technology, Inc.(a) | 737,730 | ||||||
| Technology: 1.48% | ||||||||
| 110,710 | Bit Digital, Inc.(a) | 1,577,618 | ||||||
| 123,736 | Greenidge Generation Holdings, Inc.(a) | 3,364,378 | ||||||
| 4,941,996 | ||||||||
| Transaction Processing Services: 5.76% | ||||||||
| 93,600 | Ikonics Corp.(a) | 2,484,144 | ||||||
| 55,020 | Nuvei Corp.(a) | 6,625,508 | ||||||
| 7,504 | PayPal Holdings, Inc.(a) | 1,745,355 | ||||||
| 904,912 | Sphere 3D Corp.(a) | 5,827,633 | ||||||
| 9,875 | Square, Inc., Class A(a) | 2,513,188 | ||||||
| 19,195,828 | ||||||||
| Real Estate: 2.41% | ||||||||
| Other Specialty REITs: 2.41% | ||||||||
| 164,638 | Power REIT(a) | 8,050,798 | ||||||
| SPAC: 1.25% | ||||||||
| SPAC: 1.25% | ||||||||
| 60,267 | Concord Acquisition Corp., Class A(a) | 661,732 | ||||||
| 23,900 | Fintech Acquisition Corp. V, Class A(a) | 271,265 | ||||||
| Power & Digital Infrastructure | ||||||||
| 257,502 | Acquisition Corp., Class A(a) | 3,218,775 | ||||||
| 4,151,772 | ||||||||
| 24 | www.emeraldmutualfunds.com |
| Emerald Finance & Banking Innovation Fund | Schedule of Investments |
| October 31, 2021 (Unaudited) |
| Shares | Value (Note 2) | |||||||
| Technology: 1.60% | ||||||||
| Software: 1.60% | ||||||||
| 264,038 | Cleanspark, Inc.(a) | $ | 5,349,410 | |||||
| Total Common Stocks | ||||||||
| (Cost $185,508,225) | 309,807,574 | |||||||
| MUTUAL FUNDS: 3.60% | ||||||||
| Financial Services: 3.60% | ||||||||
| Asset Managers And Custodians: 3.60% | ||||||||
| 89,600 | Grayscale Bitcoin Trust BTC(a) | 4,452,224 | ||||||
| 114,120 | Grayscale Ethereum Trust(a) | 4,855,806 | ||||||
| Millennium Investment & Acquisition | ||||||||
| 280,980 | Co., Inc.(a) | 2,683,359 | ||||||
| 11,991,389 | ||||||||
| Total Mutual Funds | ||||||||
| (Cost $4,751,464) | 11,991,389 | |||||||
| WARRANTS: 0.54% | ||||||||
| Blue Owl Capital, Inc., Strike Price | ||||||||
| $11.50, Expiration Date | ||||||||
| 109,500 | 12/31/2025 | $ | 669,045 | |||||
| Paysafe, Ltd., Strike Price $11.50, | ||||||||
| 62,749 | Expiration Date 12/31/2028 | 125,498 | ||||||
| SoFi Technologies, Inc., Strike Price | ||||||||
| $11.50, Expiration Date | ||||||||
| 115,815 | 12/31/2025 | 1,005,274 | ||||||
| 1,799,817 | ||||||||
| Total Warrants | ||||||||
| (Cost $1,235,915) | 1,799,817 | |||||||
| SHORT TERM INVESTMENTS: 2.91% | ||||||||
| First American Government Obligations | ||||||||
| Fund | ||||||||
| 9,705,123 | 0.040% (12/31/2049) | 9,705,123 | ||||||
| Total Short Term Investments | ||||||||
| (Cost $9,705,123) | 9,705,123 | |||||||
| Total Investments: 99.97% | ||||||||
| (Cost $201,200,727) | 333,303,903 | |||||||
| Other Assets In Excess Of Liabilities: 0.03% | 86,672 | |||||||
| Net Assets: 100.00% | $ | 333,390,575 | ||||||
| (a) | Non-income producing security. |
For Fund compliance purposes, the Fund's industry classifications refer to any one or more of the industry sub-classifications used by one or more widely recognized market indexes or ratings group indexes, and/or as defined by Fund management. This definition may not apply for purposes of this report, which may combine industry sub-classifications for reporting ease. Industries are shown as a percentage of net assets.
See Notes to Financial Statements.
| Semi-Annual Report | October 31, 2021 | 25 |
| Emerald Funds | Statements of Assets and Liabilities |
| October 31, 2021 (Unaudited) |
| Emerald Growth Fund | Emerald Insights Fund | Emerald Finance and Banking Innovation Fund | ||||||||||
| ASSETS: | ||||||||||||
| Investments, at value | $ | 1,545,550,913 | $ | 24,847,318 | $ | 333,303,903 | ||||||
| Cash | 391 | 13 | 406 | |||||||||
| Receivable for investments sold | 9,964,637 | – | 1,959,022 | |||||||||
| Receivable for shares sold | 1,626,266 | 7,946 | 1,019,676 | |||||||||
| Interest and dividends receivable | 195,700 | 3,003 | 55,191 | |||||||||
| Other assets | 35,792 | 5,135 | 28,087 | |||||||||
| Total Assets | 1,557,373,699 | 24,863,415 | 336,366,285 | |||||||||
| LIABILITIES: | ||||||||||||
| Payable for investments purchased | 12,885,980 | 71,049 | 2,474,181 | |||||||||
| Payable for shares redeemed | 965,809 | 31,773 | 52,455 | |||||||||
| Investment advisory fees payable | 703,931 | 9,368 | 222,155 | |||||||||
| Payable to fund accounting and administration | 163,213 | 11,082 | 35,833 | |||||||||
| Payable for distribution and service fees | 215,361 | 6,527 | 106,116 | |||||||||
| Payable for trustee fees and expenses | 65,074 | 867 | 9,895 | |||||||||
| Payable for transfer agency fees | 62,955 | 10,164 | 28,921 | |||||||||
| Payable for chief compliance officer fee | 8,569 | 217 | 1,273 | |||||||||
| Payable for principal financial officer fee | 1,882 | 47 | 275 | |||||||||
| Payable for professional fees | 33,568 | 11,705 | 16,744 | |||||||||
| Accrued expenses and other liabilities | 72,737 | 9,473 | 27,862 | |||||||||
| Total Liabilities | 15,179,079 | 162,272 | 2,975,710 | |||||||||
| NET ASSETS | $ | 1,542,194,620 | $ | 24,701,143 | $ | 333,390,575 | ||||||
| NET ASSETS CONSIST OF: | ||||||||||||
| Paid-in capital (Note 5) | $ | 656,753,167 | $ | 11,784,664 | $ | 194,730,472 | ||||||
| Total distributable earnings | 885,441,453 | 12,916,479 | 138,660,103 | |||||||||
| NET ASSETS | $ | 1,542,194,620 | $ | 24,701,143 | $ | 333,390,575 | ||||||
| INVESTMENTS, AT COST | $ | 832,252,646 | $ | 14,906,850 | $ | 201,200,727 | ||||||
| PRICING OF SHARES | ||||||||||||
| Class A: (a) | ||||||||||||
| Net Asset Value, offering and redemption price per share | $ | 36.68 | $ | 22.05 | $ | 63.21 | ||||||
| Net Assets | $ | 158,211,421 | $ | 19,240,351 | $ | 83,728,963 | ||||||
| Shares of beneficial interest outstanding | 4,312,920 | 872,745 | 1,324,583 | |||||||||
| Maximum offering price per share (NAV/.9525, based on maximum sales charge of 4.75% of the offering price) | $ | 38.51 | $ | 23.15 | $ | 66.36 | ||||||
| Class C: (a) | ||||||||||||
| Net Asset Value, offering and redemption price per share | $ | 29.31 | $ | 20.72 | $ | 52.98 | ||||||
| Net Assets | $ | 19,340,737 | $ | 224,126 | $ | 23,983,263 | ||||||
| Shares of beneficial interest outstanding | 659,934 | 10,819 | 452,673 | |||||||||
| Institutional Class: | ||||||||||||
| Net Asset Value, offering and redemption price per share | $ | 38.80 | $ | 22.62 | $ | 65.69 | ||||||
| Net Assets | $ | 1,264,686,989 | $ | 4,360,534 | $ | 159,860,196 | ||||||
| Shares of beneficial interest outstanding | 32,593,102 | 192,807 | 2,433,687 | |||||||||
| Investor Class: | ||||||||||||
| Net Asset Value, offering and redemption price per share | $ | 36.45 | $ | 21.91 | $ | 59.77 | ||||||
| Net Assets | $ | 99,955,473 | $ | 876,132 | $ | 65,818,153 | ||||||
| Shares of beneficial interest outstanding | 2,742,055 | 39,991 | 1,101,194 | |||||||||
| (a) | Redemption price per share may be reduced for any applicable contingent deferred sales charge. For a description of a possible sales charge, please see the Funds' Prospectus. |
See Notes to Financial Statements
| 26 | www.emeraldmutualfunds.com |
| Emerald Funds | Statements of Operations |
| For the Six Months Ended October 31, 2021 (Unaudited) |
| Emerald Growth Fund | Emerald Insights Fund | Emerald Finance and Banking Innovation Fund | ||||||||||
| INVESTMENT INCOME: | ||||||||||||
| Dividends | $ | 7,062,204 | $ | 54,160 | $ | 688,961 | ||||||
| Foreign taxes withheld | – | – | (11,783 | ) | ||||||||
| Total Investment Income | 7,062,204 | 54,160 | 677,178 | |||||||||
| EXPENSES: | ||||||||||||
| Investment advisory fee (Note 6) | 4,320,085 | 87,124 | 1,181,527 | |||||||||
| Administration fee | 312,328 | 12,870 | 56,907 | |||||||||
| Custodian fee | 69,439 | 2,547 | 13,328 | |||||||||
| Professional fees | 35,078 | 9,400 | 14,551 | |||||||||
| Transfer agent fee | 115,697 | 18,691 | 58,669 | |||||||||
| Delegated transfer agent equivalent services fees | ||||||||||||
| Class A | 1,591 | 21 | 1,884 | |||||||||
| Class C | 805 | – | 260 | |||||||||
| Institutional Class | 518 | – | 1,397 | |||||||||
| Investor Class | 418 | – | – | |||||||||
| Trustee fees and expenses | 43,252 | 586 | 6,193 | |||||||||
| Registration/filing fees | 39,490 | 18,351 | 27,403 | |||||||||
| Reports to shareholder and printing fees | 149,641 | 1,856 | 13,311 | |||||||||
| Distribution and service fees | ||||||||||||
| Class A | 276,840 | 31,989 | 120,341 | |||||||||
| Class C | 103,645 | 1,157 | 103,036 | |||||||||
| Institutional Class | 224,896 | 594 | 5,961 | |||||||||
| Investor Class | 191,641 | 996 | 59,309 | |||||||||
| Chief compliance officer fee | 24,437 | 442 | 3,579 | |||||||||
| Principal financial officer fee | 5,246 | 95 | 765 | |||||||||
| Other | 24,142 | 4,332 | 6,308 | |||||||||
| Total expenses before waiver | 5,939,189 | 191,051 | 1,674,729 | |||||||||
| Less fees waived/reimbursed by investment advisor (Note 6) | – | (39,114 | ) | – | ||||||||
| Total Net Expenses | 5,939,189 | 151,937 | 1,674,729 | |||||||||
| NET INVESTMENT INCOME/(LOSS): | 1,123,015 | (97,777 | ) | (997,551 | ) | |||||||
| REALIZED AND UNREALIZED GAIN/(LOSS) | ||||||||||||
| Net realized gain/(loss) | (45,084,101 | ) | 1,069,501 | 5,140,353 | ||||||||
| Net realized loss on foreign currency transactions | – | – | (529 | ) | ||||||||
| Net change in unrealized appreciation | 58,598,694 | 1,112,331 | 50,571,538 | |||||||||
| NET REALIZED AND UNREALIZED GAIN | 13,514,593 | 2,181,832 | 55,711,362 | |||||||||
| NET INCREASE IN NET ASSETS RESULTING FROM OPERATIONS | $ | 14,637,608 | $ | 2,084,055 | $ | 54,713,811 | ||||||
See Notes to Financial Statements.
| Semi-Annual Report | October 31, 2021 | 27 |
| Emerald Growth Fund | Statements of Changes in Net Assets |
| For the Six Months Ended October 31, 2021 (Unaudited) | Year Ended April 30, 2021 | |||||||
| OPERATIONS: | ||||||||
| Net investment income/(loss) | $ | 1,123,015 | $ | (6,852,765 | ) | |||
| Net realized gain/(loss) | (45,084,101 | ) | 296,899,426 | |||||
| Net change in unrealized appreciation | 58,598,694 | 444,268,855 | ||||||
| Net increase in net assets resulting from operations | 14,637,608 | 734,315,516 | ||||||
| DISTRIBUTIONS TO SHAREHOLDERS (NOTE 3): | ||||||||
| Total distributable earnings | ||||||||
| Class A | – | (13,666,137 | ) | |||||
| Class C | – | (2,194,199 | ) | |||||
| Institutional Class | – | (96,602,401 | ) | |||||
| Investor Class | – | (8,118,942 | ) | |||||
| Net decrease in net assets from distributions | – | (120,581,679 | ) | |||||
| SHARE TRANSACTIONS (NOTE 5): | ||||||||
| Class A | ||||||||
| Proceeds from sale of shares | 8,128,692 | 19,352,881 | ||||||
| Issued to shareholders in reinvestment of distributions | – | 12,626,754 | ||||||
| Cost of shares redeemed | (19,776,628 | ) | (69,910,425 | ) | ||||
| Net decrease from share transactions | (11,647,936 | ) | (37,930,790 | ) | ||||
| Class C | ||||||||
| Proceeds from sale of shares | 180,194 | 864,961 | ||||||
| Issued to shareholders in reinvestment of distributions | – | 2,054,599 | ||||||
| Cost of shares redeemed | (3,337,416 | ) | (6,483,354 | ) | ||||
| Net decrease from share transactions | (3,157,222 | ) | (3,563,794 | ) | ||||
| Institutional Class | ||||||||
| Proceeds from sale of shares | 92,133,614 | 274,404,200 | ||||||
| Issued to shareholders in reinvestment of distributions | – | 85,932,473 | ||||||
| Cost of shares redeemed | (215,342,411 | ) | (341,152,693 | ) | ||||
| Net increase/(decrease) from share transactions | (123,208,797 | ) | 19,183,980 | |||||
| Investor Class | ||||||||
| Proceeds from sale of shares | 9,734,073 | 31,009,012 | ||||||
| Issued to shareholders in reinvestment of distributions | – | 2,575,557 | ||||||
| Cost of shares redeemed | (14,023,196 | ) | (51,437,226 | ) | ||||
| Net decrease from share transactions | (4,289,123 | ) | (17,852,657 | ) | ||||
| Net increase/(decrease) in net assets | $ | (127,665,470 | ) | $ | 573,570,576 | |||
| NET ASSETS: | ||||||||
| Beginning of year | 1,669,860,090 | 1,096,289,514 | ||||||
| End of year | $ | 1,542,194,620 | $ | 1,669,860,090 | ||||
| 28 | www.emeraldmutualfunds.com |
| Emerald Growth Fund | Statements of Changes in Net Assets |
| For the Six Months Ended October 31, 2021 (Unaudited) | Year Ended April 30, 2021 | |||||||
| Other Information: | ||||||||
| SHARE TRANSACTIONS: | ||||||||
| Class A | ||||||||
| Sold | 231,267 | 605,025 | ||||||
| Distributions reinvested | – | 378,160 | ||||||
| Redeemed | (556,756 | ) | (2,187,314 | ) | ||||
| Net decrease in shares outstanding | (325,489 | ) | (1,204,129 | ) | ||||
| Class C | ||||||||
| Sold | 6,339 | 32,566 | ||||||
| Distributions reinvested | – | 76,578 | ||||||
| Redeemed | (118,109 | ) | (256,636 | ) | ||||
| Net decrease in shares outstanding | (111,770 | ) | (147,492 | ) | ||||
| Institutional Class | ||||||||
| Sold | 2,503,402 | 8,102,545 | ||||||
| Distributions reinvested | – | 2,439,877 | ||||||
| Redeemed | (5,808,765 | ) | (10,344,813 | ) | ||||
| Net increase/(decrease) in shares outstanding | (3,305,363 | ) | 197,609 | |||||
| Investor Class | ||||||||
| Sold | 278,564 | 970,483 | ||||||
| Distributions reinvested | – | 77,600 | ||||||
| Redeemed | (401,331 | ) | (1,702,349 | ) | ||||
| Net decrease in shares outstanding | (122,767 | ) | (654,266 | ) | ||||
See Notes to Financial Statements.
| Semi-Annual Report | October 31, 2021 | 29 |
| Emerald Insights Fund | Statements of Changes in Net Assets |
| For the Six Months Ended October 31, 2021 (Unaudited) | Year Ended April 30, 2021 | |||||||
| OPERATIONS: | ||||||||
| Net investment loss | $ | (97,777 | ) | $ | (141,030 | ) | ||
| Net realized gain | 1,069,501 | 3,762,905 | ||||||
| Net change in unrealized appreciation | 1,112,331 | 6,280,656 | ||||||
| Net increase in net assets resulting from operations | 2,084,055 | 9,902,531 | ||||||
| DISTRIBUTIONS TO SHAREHOLDERS (NOTE 3): | ||||||||
| Total distributable earnings | ||||||||
| Class A | – | (1,316,553 | ) | |||||
| Class C | – | (19,060 | ) | |||||
| Institutional Class | – | (242,920 | ) | |||||
| Investor Class | – | (39,637 | ) | |||||
| Net decrease in net assets from distributions | – | (1,618,170 | ) | |||||
| SHARE TRANSACTIONS (NOTE 5): | ||||||||
| Class A | ||||||||
| Proceeds from sale of shares | 1,185,650 | 618,119 | ||||||
| Issued to shareholders in reinvestment of distributions | – | 1,312,730 | ||||||
| Cost of shares redeemed | (1,187,982 | ) | (1,327,067 | ) | ||||
| Net increase/(decrease) from share transactions | (2,332 | ) | 603,782 | |||||
| Class C | ||||||||
| Proceeds from sale of shares | 9,000 | 5,190 | ||||||
| Issued to shareholders in reinvestment of distributions | – | 19,060 | ||||||
| Cost of shares redeemed | (50,562 | ) | (8,947 | ) | ||||
| Net increase/(decrease) from share transactions | (41,562 | ) | 15,303 | |||||
| Institutional Class | ||||||||
| Proceeds from sale of shares | 402,040 | 948,567 | ||||||
| Issued to shareholders in reinvestment of distributions | – | 242,920 | ||||||
| Cost of shares redeemed | (65,436 | ) | (148,881 | ) | ||||
| Net increase from share transactions | 336,604 | 1,042,606 | ||||||
| Investor Class | ||||||||
| Proceeds from sale of shares | 305,527 | 145,128 | ||||||
| Issued to shareholders in reinvestment of distributions | – | 39,637 | ||||||
| Cost of shares redeemed | (140,905 | ) | (19,070 | ) | ||||
| Net increase from share transactions | 164,622 | 165,695 | ||||||
| Net increase in net assets | $ | 2,541,387 | $ | 10,111,747 | ||||
| NET ASSETS: | ||||||||
| Beginning of year | 22,159,756 | 12,048,009 | ||||||
| End of year | $ | 24,701,143 | $ | 22,159,756 | ||||
| 30 | www.emeraldmutualfunds.com |
| Emerald Insights Fund | Statements of Changes in Net Assets |
| For the Six Months Ended October 31, 2021 (Unaudited) | Year Ended April 30, 2021 | |||||||
| Other Information: | ||||||||
| SHARE TRANSACTIONS: | ||||||||
| Class A | ||||||||
| Sold | 57,758 | 36,650 | ||||||
| Distributions reinvested | – | 77,630 | ||||||
| Redeemed | (58,085 | ) | (79,668 | ) | ||||
| Net increase/(decrease) in shares outstanding | (327 | ) | 34,612 | |||||
| Class C | ||||||||
| Sold | 477 | 408 | ||||||
| Distributions reinvested | – | 1,193 | ||||||
| Redeemed | (2,602 | ) | (564 | ) | ||||
| Net increase/(decrease) in shares outstanding | (2,125 | ) | 1,037 | |||||
| Institutional Class | ||||||||
| Sold | 18,863 | 54,085 | ||||||
| Distributions reinvested | – | 14,042 | ||||||
| Redeemed | (3,049 | ) | (9,331 | ) | ||||
| Net increase in shares outstanding | 15,814 | 58,796 | ||||||
| Investor Class | ||||||||
| Sold | 15,012 | 7,913 | ||||||
| Distributions reinvested | – | 2,358 | ||||||
| Redeemed | (6,806 | ) | (1,166 | ) | ||||
| Net increase in shares outstanding | 8,206 | 9,105 | ||||||
See Notes to Financial Statements.
| Semi-Annual Report | October 31, 2021 | 31 |
| Emerald Finance & Banking Innovation Fund | Statements of Changes in Net Assets |
| For the Six Months Ended October 31, 2021 (Unaudited) | Year Ended April 30, 2021 | |||||||
| OPERATIONS: | ||||||||
| Net investment income/(loss) | $ | (997,551 | ) | $ | 320,341 | |||
| Net realized gain | 5,140,353 | 39,052,840 | ||||||
| Net realized loss on foreign currency transactions | (529 | ) | (813 | ) | ||||
| Net change in unrealized appreciation | 50,571,538 | 84,018,127 | ||||||
| Net increase in net assets resulting from operations | 54,713,811 | 123,390,495 | ||||||
| SHARE TRANSACTIONS (NOTE 5): | ||||||||
| Class A | ||||||||
| Proceeds from sale of shares | 10,113,218 | 19,739,265 | ||||||
| Cost of shares redeemed | (10,051,607 | ) | (28,351,210 | ) | ||||
| Net increase/(decrease) from share transactions | 61,611 | (8,611,945 | ) | |||||
| Class C | ||||||||
| Proceeds from sale of shares | 728,728 | 1,144,104 | ||||||
| Cost of shares redeemed | (3,518,019 | ) | (9,871,670 | ) | ||||
| Net decrease from share transactions | (2,789,291 | ) | (8,727,566 | ) | ||||
| Institutional Class | ||||||||
| Proceeds from sale of shares | 26,833,836 | 56,961,177 | ||||||
| Cost of shares redeemed | (29,213,506 | ) | (45,515,680 | ) | ||||
| Net increase/(decrease) from share transactions | (2,379,670 | ) | 11,445,497 | |||||
| Investor Class | ||||||||
| Proceeds from sale of shares | 34,944,594 | 18,972,772 | ||||||
| Cost of shares redeemed | (8,299,308 | ) | (16,898,004 | ) | ||||
| Net increase from share transactions | 26,645,286 | 2,074,768 | ||||||
| Net increase in net assets | $ | 76,251,747 | $ | 119,571,249 | ||||
| NET ASSETS: | ||||||||
| Beginning of year | 257,138,828 | 137,567,579 | ||||||
| End of year | $ | 333,390,575 | $ | 257,138,828 | ||||
| Other Information: | ||||||||
| SHARE TRANSACTIONS: | ||||||||
| Class A | ||||||||
| Sold | 185,778 | 461,760 | ||||||
| Redeemed | (195,240 | ) | (784,736 | ) | ||||
| Net decrease in shares outstanding | (9,462 | ) | (322,976 | ) | ||||
| Class C | ||||||||
| Sold | 16,214 | 33,095 | ||||||
| Redeemed | (81,324 | ) | (382,608 | ) | ||||
| Net decrease in shares outstanding | (65,110 | ) | (349,513 | ) | ||||
| Institutional Class | ||||||||
| Sold | 481,646 | 1,239,715 | ||||||
| Redeemed | (567,818 | ) | (1,565,944 | ) | ||||
| Net decrease in shares outstanding | (86,172 | ) | (326,229 | ) | ||||
| Investor Class | ||||||||
| Sold | 636,581 | 413,529 | ||||||
| Redeemed | (174,198 | ) | (489,082 | ) | ||||
| Net increase/(decrease) in shares outstanding | 462,383 | (75,553 | ) | |||||
See Notes to Financial Statements.
| 32 | www.emeraldmutualfunds.com |
| Emerald Growth Fund | Financial Highlights |
| For a share outstanding throughout the years presented |
| CLASS A | ||||||||||||||||||||||||
| For the Six Months Ended October 31, 2021 (Unaudited) | Year Ended April 30, 2021 | Year Ended April 30, 2020 | Year Ended April 30, 2019 | Year Ended April 30, 2018 | Year Ended April 30, 2017 | |||||||||||||||||||
| NET ASSET VALUE, BEGINNING OF PERIOD | $ | 36.29 | $ | 23.06 | $ | 26.00 | $ | 25.99 | $ | 21.83 | $ | 17.52 | ||||||||||||
| INCOME/(LOSS) FROM OPERATIONS: | ||||||||||||||||||||||||
| Net investment loss(a) | (0.02 | ) | (0.22 | ) | (0.16 | ) | (0.13 | ) | (0.16 | ) | (0.11 | ) | ||||||||||||
| Net realized and unrealized gain/(loss) on investments | 0.41 | 16.30 | (2.40 | ) | 2.61 | 4.32 | 4.42 | |||||||||||||||||
| Total from Investment Operations | 0.39 | 16.08 | (2.56 | ) | 2.48 | 4.16 | 4.31 | |||||||||||||||||
| LESS DISTRIBUTIONS: | ||||||||||||||||||||||||
| From capital gains | – | (2.85 | ) | (0.38 | ) | (2.47 | ) | – | – | |||||||||||||||
| Total Distributions | – | (2.85 | ) | (0.38 | ) | (2.47 | ) | – | – | |||||||||||||||
| NET INCREASE/(DECREASE) IN NET ASSET VALUE | 0.39 | 13.23 | (2.94 | ) | 0.01 | 4.16 | 4.31 | |||||||||||||||||
| NET ASSET VALUE, END OF PERIOD | $ | 36.68 | $ | 36.29 | $ | 23.06 | $ | 26.00 | $ | 25.99 | $ | 21.83 | ||||||||||||
| TOTAL RETURN(b) | 1.07 | %(c) | 70.77 | % | (10.00 | )% | 11.79 | % | 19.06 | % | 24.60 | % | ||||||||||||
| RATIOS/SUPPLEMENTAL DATA: | ||||||||||||||||||||||||
| Net Assets, End of Period (000s) | $ | 158,211 | $ | 168,322 | $ | 134,755 | $ | 188,883 | $ | 239,316 | $ | 270,389 | ||||||||||||
| RATIOS TO AVERAGE NET ASSETS: | ||||||||||||||||||||||||
| Net Investment loss | (0.11 | )%(d) | (0.72 | )% | (0.64 | )% | (0.50 | )% | (0.64 | )% | (0.57 | )% | ||||||||||||
| Operating expenses excluding reimbursement/waiver | 1.00 | %(d) | 1.01 | % | 1.02 | % | 1.01 | % | 1.03 | % | 1.08 | % | ||||||||||||
| Operating expenses including reimbursement/waiver | 1.00 | %(d) | 1.01 | % | 1.02 | % | 1.01 | % | 1.03 | % | 1.08 | % | ||||||||||||
| PORTFOLIO TURNOVER RATE | 14 | %(c) | 66 | % | 48 | % | 64 | % | 66 | % | 54 | % | ||||||||||||
| (a) | Per share amounts are based upon average shares outstanding. |
| (b) | Total return does not reflect the effect of sales charges. |
| (c) | Not Annualized. |
| (d) | Annualized. |
See Notes to Financial Statements.
| Semi-Annual Report | October 31, 2021 | 33 |
| Emerald Growth Fund | Financial Highlights |
| For a share outstanding throughout the years presented |
| CLASS C | ||||||||||||||||||||||||
| For the Six Months Ended October 31, 2021 (Unaudited) | Year Ended April 30, 2021 | Year Ended April 30, 2020 | Year Ended April 30, 2019 | Year Ended April 30, 2018 | Year Ended April 30, 2017 | |||||||||||||||||||
| NET ASSET VALUE, BEGINNING OF PERIOD | $ | 29.09 | $ | 18.97 | $ | 21.59 | $ | 22.18 | $ | 18.75 | $ | 15.14 | ||||||||||||
| INCOME/(LOSS) FROM OPERATIONS: | ||||||||||||||||||||||||
| Net investment loss(a) | (0.11 | ) | (0.35 | ) | (0.27 | ) | (0.26 | ) | (0.27 | ) | (0.21 | ) | ||||||||||||
| Net realized and unrealized gain/(loss) on investments | 0.33 | 13.32 | (1.97 | ) | 2.14 | 3.70 | 3.82 | |||||||||||||||||
| Total from Investment Operations | 0.22 | 12.97 | (2.24 | ) | 1.88 | 3.43 | 3.61 | |||||||||||||||||
| LESS DISTRIBUTIONS: | ||||||||||||||||||||||||
| From capital gains | – | (2.85 | ) | (0.38 | ) | (2.47 | ) | – | – | |||||||||||||||
| Total Distributions | – | (2.85 | ) | (0.38 | ) | (2.47 | ) | – | – | |||||||||||||||
| NET INCREASE/(DECREASE) IN NET ASSET VALUE | 0.22 | 10.12 | (2.62 | ) | (0.59 | ) | 3.43 | 3.61 | ||||||||||||||||
| NET ASSET VALUE, END OF PERIOD | $ | 29.31 | $ | 29.09 | $ | 18.97 | $ | 21.59 | $ | 22.18 | $ | 18.75 | ||||||||||||
| TOTAL RETURN(b) | 0.76 | %(c) | 69.60 | % | (10.57 | )% | 11.08 | % | 18.29 | % | 23.84 | % | ||||||||||||
| RATIOS/SUPPLEMENTAL DATA: | ||||||||||||||||||||||||
| Net Assets, End of Period (000s) | $ | 19,341 | $ | 22,447 | $ | 17,434 | $ | 29,975 | $ | 33,197 | $ | 34,642 | ||||||||||||
| RATIOS TO AVERAGE NET ASSETS: | ||||||||||||||||||||||||
| Net Investment loss | (0.76 | )%(d) | (1.37 | )% | (1.29 | )% | (1.15 | )% | (1.30 | )% | (1.22 | )% | ||||||||||||
| Operating expenses excluding reimbursement/waiver | 1.66 | %(d) | 1.66 | % | 1.68 | % | 1.66 | % | 1.68 | % | 1.73 | % | ||||||||||||
| Operating expenses including reimbursement/waiver | 1.66 | %(d) | 1.66 | % | 1.68 | % | 1.66 | % | 1.68 | % | 1.73 | % | ||||||||||||
| PORTFOLIO TURNOVER RATE | 14 | %(c) | 66 | % | 48 | % | 64 | % | 66 | % | 54 | % | ||||||||||||
| (a) | Per share amounts are based upon average shares outstanding. |
| (b) | Total return does not reflect the effect of sales charges. |
| (c) | Not Annualized. |
| (d) | Annualized. |
See Notes to Financial Statements.
| 34 | www.emeraldmutualfunds.com |
| Emerald Growth Fund | Financial Highlights |
| For a share outstanding throughout the years presented |
| INSTITUTIONAL CLASS | ||||||||||||||||||||||||
| For the Six Months Ended October 31, 2021 (Unaudited) | Year Ended April 30, 2021 | Year Ended April 30, 2020 | Year Ended April 30, 2019 | Year Ended April 30, 2018 | Year Ended April 30, 2017 | |||||||||||||||||||
| NET ASSET VALUE, BEGINNING OF PERIOD | $ | 38.32 | $ | 24.18 | $ | 27.16 | $ | 26.94 | $ | 22.56 | $ | 18.04 | ||||||||||||
| INCOME/(LOSS) FROM OPERATIONS: | ||||||||||||||||||||||||
| Net investment income/(loss)(a) | 0.04 | (0.13 | ) | (0.08 | ) | (0.05 | ) | (0.09 | ) | (0.05 | ) | |||||||||||||
| Net realized and unrealized gain/(loss) on investments | 0.44 | 17.12 | (2.52 | ) | 2.74 | 4.47 | 4.57 | |||||||||||||||||
| Total from Investment Operations | 0.48 | 16.99 | (2.60 | ) | 2.69 | 4.38 | 4.52 | |||||||||||||||||
| LESS DISTRIBUTIONS: | ||||||||||||||||||||||||
| From capital gains | – | (2.85 | ) | (0.38 | ) | (2.47 | ) | – | – | |||||||||||||||
| Total Distributions | – | (2.85 | ) | (0.38 | ) | (2.47 | ) | – | – | |||||||||||||||
| NET INCREASE/(DECREASE) IN NET ASSET VALUE | 0.48 | 14.14 | (2.98 | ) | 0.22 | 4.38 | 4.52 | |||||||||||||||||
| NET ASSET VALUE, END OF PERIOD | $ | 38.80 | $ | 38.32 | $ | 24.18 | $ | 27.16 | $ | 26.94 | $ | 22.56 | ||||||||||||
| TOTAL RETURN | 1.25 | %(b) | 71.27 | % | (9.72 | )% | 12.17 | % | 19.41 | % | 25.06 | % | ||||||||||||
| RATIOS/SUPPLEMENTAL DATA: | ||||||||||||||||||||||||
| Net Assets, End of Period (000s) | $ | 1,264,687 | $ | 1,375,765 | $ | 863,360 | $ | 1,050,538 | $ | 839,076 | $ | 596,550 | ||||||||||||
| RATIOS TO AVERAGE NET ASSETS: | ||||||||||||||||||||||||
| Net Investment income/(loss) | 0.21 | %(c) | (0.41 | )% | (0.32 | )% | (0.18 | )% | (0.33 | )% | (0.26 | )% | ||||||||||||
| Operating expenses excluding reimbursement/waiver | 0.68 | %(c) | 0.70 | % | 0.70 | % | 0.69 | % | 0.72 | % | 0.77 | % | ||||||||||||
| Operating expenses including reimbursement/waiver | 0.68 | %(c) | 0.70 | % | 0.70 | % | 0.69 | % | 0.72 | % | 0.77 | % | ||||||||||||
| PORTFOLIO TURNOVER RATE | 14 | %(b) | 66 | % | 48 | % | 64 | % | 66 | % | 54 | % | ||||||||||||
| (a) | Per share amounts are based upon average shares outstanding. |
| (b) | Not Annualized. |
| (c) | Annualized. |
See Notes to Financial Statements.
| Semi-Annual Report | October 31, 2021 | 35 |
| Emerald Growth Fund | Financial Highlights |
| For a share outstanding throughout the years presented |
| INVESTOR CLASS | ||||||||||||||||||||||||
| For the Six Months Ended October 31, 2021 (Unaudited) | Year Ended April 30, 2021 | Year Ended April 30, 2020 | Year Ended April 30, 2019 | Year Ended April 30, 2018 | Year Ended April 30, 2017 | |||||||||||||||||||
| NET ASSET VALUE, BEGINNING OF PERIOD | $ | 36.07 | $ | 22.94 | $ | 25.88 | $ | 25.88 | $ | 21.75 | $ | 17.46 | ||||||||||||
| INCOME/(LOSS) FROM OPERATIONS: | ||||||||||||||||||||||||
| Net investment loss(a) | (0.03 | ) | (0.23 | ) | (0.17 | ) | (0.14 | ) | (0.17 | ) | (0.12 | ) | ||||||||||||
| Net realized and unrealized gain/(loss) on investments | 0.41 | 16.21 | (2.39 | ) | 2.61 | 4.30 | 4.41 | |||||||||||||||||
| Total from Investment Operations | 0.38 | 15.98 | (2.56 | ) | 2.47 | 4.13 | 4.29 | |||||||||||||||||
| LESS DISTRIBUTIONS: | ||||||||||||||||||||||||
| From capital gains | – | (2.85 | ) | (0.38 | ) | (2.47 | ) | – | – | |||||||||||||||
| Total Distributions | – | (2.85 | ) | (0.38 | ) | (2.47 | ) | – | – | |||||||||||||||
| NET INCREASE/(DECREASE) IN NET ASSET VALUE | 0.38 | 13.13 | (2.94 | ) | 0.00 | 4.13 | 4.29 | |||||||||||||||||
| NET ASSET VALUE, END OF PERIOD | $ | 36.45 | $ | 36.07 | $ | 22.94 | $ | 25.88 | $ | 25.88 | $ | 21.75 | ||||||||||||
| TOTAL RETURN | 1.05 | %(b) | 70.71 | % | (10.05 | )% | 11.81 | % | 18.99 | % | 24.57 | % | ||||||||||||
| RATIOS/SUPPLEMENTAL DATA: | ||||||||||||||||||||||||
| Net Assets, End of Period (000s) | $ | 99,955 | $ | 103,326 | $ | 80,740 | $ | 104,403 | $ | 107,629 | $ | 114,033 | ||||||||||||
| RATIOS TO AVERAGE NET ASSETS: | ||||||||||||||||||||||||
| Net Investment loss | (0.15 | )%(c) | (0.75 | )% | (0.68 | )% | (0.53 | )% | (0.68 | )% | (0.61 | )% | ||||||||||||
| Operating expenses excluding reimbursement/waiver | 1.04 | %(c) | 1.05 | % | 1.06 | % | 1.04 | % | 1.07 | % | 1.12 | % | ||||||||||||
| Operating expenses including reimbursement/waiver | 1.04 | %(c) | 1.05 | % | 1.06 | % | 1.04 | % | 1.07 | % | 1.12 | % | ||||||||||||
| PORTFOLIO TURNOVER RATE | 14 | %(b) | 66 | % | 48 | % | 64 | % | 66 | % | 54 | % | ||||||||||||
| (a) | Per share amounts are based upon average shares outstanding. |
| (b) | Not Annualized. |
| (c) | Annualized. |
See Notes to Financial Statements.
| 36 | www.emeraldmutualfunds.com |
| Emerald Insights Fund | Financial Highlights |
| For a share outstanding throughout the years presented |
| CLASS A | ||||||||||||||||||||||||
| For the Six Months Ended October 31, 2021 (Unaudited) | Year Ended April 30, 2021 | Year Ended April 30, 2020 | Year Ended April 30, 2019 | Year Ended April 30, 2018 | Year Ended April 30, 2017 | |||||||||||||||||||
| NET ASSET VALUE, BEGINNING OF PERIOD | $ | 20.18 | $ | 12.13 | $ | 11.51 | $ | 13.09 | $ | 11.33 | $ | 9.69 | ||||||||||||
| INCOME/(LOSS) FROM OPERATIONS: | ||||||||||||||||||||||||
| Net investment loss(a) | (0.09 | ) | (0.14 | ) | (0.10 | ) | (0.09 | ) | (0.07 | ) | (0.06 | ) | ||||||||||||
| Net realized and unrealized gain on investments | 1.96 | 9.80 | 0.72 | 1.04 | 1.83 | 1.70 | ||||||||||||||||||
| Total from Investment Operations | 1.87 | 9.66 | 0.62 | 0.95 | 1.76 | 1.64 | ||||||||||||||||||
| LESS DISTRIBUTIONS: | ||||||||||||||||||||||||
| From capital gains | – | (1.61 | ) | 0.00 | (b) | (2.53 | ) | – | – | |||||||||||||||
| Total Distributions | – | (1.61 | ) | – | (2.53 | ) | – | – | ||||||||||||||||
| NET INCREASE/(DECREASE) IN NET ASSET VALUE | 1.87 | 8.05 | 0.62 | (1.58 | ) | 1.76 | 1.64 | |||||||||||||||||
| NET ASSET VALUE, END OF PERIOD | $ | 22.05 | $ | 20.18 | $ | 12.13 | $ | 11.51 | $ | 13.09 | $ | 11.33 | ||||||||||||
| TOTAL RETURN(c) | 9.27 | %(d) | 82.17 | % | 5.43 | % | 11.53 | % | 15.53 | % | 16.92 | % | ||||||||||||
| RATIOS/SUPPLEMENTAL DATA: | ||||||||||||||||||||||||
| Net Assets, End of Period (000s) | $ | 19,240 | $ | 17,618 | $ | 10,174 | $ | 9,397 | $ | 9,321 | $ | 10,127 | ||||||||||||
| RATIOS TO AVERAGE NET ASSETS: | ||||||||||||||||||||||||
| Net Investment loss | (0.89 | )%(e) | (0.86 | )% | (0.83 | )% | (0.71 | )% | (0.58 | )% | (0.57 | )% | ||||||||||||
| Operating expenses excluding reimbursement/waiver | 1.69 | %(e) | 1.92 | % | 2.25 | % | 2.18 | % | 2.10 | % | 2.10 | % | ||||||||||||
| Operating expenses including reimbursement/waiver | 1.35 | %(e) | 1.35 | % | 1.35 | % | 1.35 | % | 1.35 | % | 1.35 | % | ||||||||||||
| PORTFOLIO TURNOVER RATE | 29 | %(d) | 89 | % | 94 | % | 63 | % | 138 | % | 75 | % | ||||||||||||
| (a) | Per share amounts are based upon average shares outstanding. |
| (b) | Less than $(0.005) per share. |
| (c) | Total return does not reflect the effect of sales charges. |
| (d) | Not Annualized. |
| (e) | Annualized. |
See Notes to Financial Statements.
| Semi-Annual Report | October 31, 2021 | 37 |
| Emerald Insights Fund | Financial Highlights |
| For a share outstanding throughout the years presented |
| CLASS C | ||||||||||||||||||||||||
| For the Six Months Ended October 31, 2021 (Unaudited) | Year Ended April 30, 2021 | Year Ended April 30, 2020 | Year Ended April 30, 2019 | Year Ended April 30, 2018 | Year Ended April 30, 2017 | |||||||||||||||||||
| NET ASSET VALUE, BEGINNING OF PERIOD | $ | 19.02 | $ | 11.57 | $ | 11.04 | $ | 12.75 | $ | 11.11 | $ | 9.56 | ||||||||||||
| INCOME/(LOSS) FROM OPERATIONS: | ||||||||||||||||||||||||
| Net investment loss(a) | (0.15 | ) | (0.24 | ) | (0.16 | ) | (0.16 | ) | (0.15 | ) | (0.13 | ) | ||||||||||||
| Net realized and unrealized gain on investments | 1.85 | 9.30 | 0.69 | 0.98 | 1.79 | 1.68 | ||||||||||||||||||
| Total from Investment Operations | 1.70 | 9.06 | 0.53 | 0.82 | 1.64 | 1.55 | ||||||||||||||||||
| LESS DISTRIBUTIONS: | ||||||||||||||||||||||||
| From capital gains | – | (1.61 | ) | 0.00 | (b) | (2.53 | ) | – | – | |||||||||||||||
| Total Distributions | – | (1.61 | ) | – | (2.53 | ) | – | – | ||||||||||||||||
| NET INCREASE/(DECREASE) IN NET ASSET VALUE | 1.70 | 7.45 | 0.53 | (1.71 | ) | 1.64 | 1.55 | |||||||||||||||||
| NET ASSET VALUE, END OF PERIOD | $ | 20.72 | $ | 19.02 | $ | 11.57 | $ | 11.04 | $ | 12.75 | $ | 11.11 | ||||||||||||
| TOTAL RETURN(c) | 8.94 | %(d) | 80.92 | % | 4.84 | % | 10.75 | % | 14.76 | % | 16.21 | % | ||||||||||||
| RATIOS/SUPPLEMENTAL DATA: | ||||||||||||||||||||||||
| Net Assets, End of Period (000s) | $ | 224 | $ | 246 | $ | 138 | $ | 141 | $ | 129 | $ | 112 | ||||||||||||
| RATIOS TO AVERAGE NET ASSETS: | ||||||||||||||||||||||||
| Net Investment loss | (1.55 | )%(e) | (1.51 | )% | (1.48 | )% | (1.36 | )% | (1.24 | )% | (1.22 | )% | ||||||||||||
| Operating expenses excluding reimbursement/waiver | 2.35 | %(e) | 2.57 | % | 2.90 | % | 2.84 | % | 2.75 | % | 2.76 | % | ||||||||||||
| Operating expenses including reimbursement/waiver | 2.00 | %(e) | 2.00 | % | 2.00 | % | 2.00 | % | 2.00 | % | 2.00 | % | ||||||||||||
| PORTFOLIO TURNOVER RATE | 29 | %(d) | 89 | % | 94 | % | 63 | % | 138 | % | 75 | % | ||||||||||||
| (a) | Per share amounts are based upon average shares outstanding. |
| (b) | Less than $(0.005) per share. |
| (c) | Total return does not reflect the effect of sales charges. |
| (d) | Not Annualized. |
| (e) | Annualized. |
See Notes to Financial Statements.
| 38 | www.emeraldmutualfunds.com |
| Emerald Insights Fund | Financial Highlights |
| For a share outstanding throughout the years presented |
| INSTITUTIONAL CLASS | ||||||||||||||||||||||||
| For the Six Months Ended October 31, 2021 (Unaudited) | Year Ended April 30, 2021 | Year Ended April 30, 2020 | Year Ended April 30, 2019 | Year Ended April 30, 2018 | Year Ended April 30, 2017 | |||||||||||||||||||
| NET ASSET VALUE, BEGINNING OF PERIOD | $ | 20.67 | $ | 12.37 | $ | 11.69 | $ | 13.22 | $ | 11.41 | $ | 9.73 | ||||||||||||
| INCOME/(LOSS) FROM OPERATIONS: | ||||||||||||||||||||||||
| Net investment loss(a) | (0.06 | ) | (0.10 | ) | (0.06 | ) | (0.05 | ) | (0.04 | ) | (0.03 | ) | ||||||||||||
| Net realized and unrealized gain on investments | 2.01 | 10.01 | 0.74 | 1.05 | 1.85 | 1.71 | ||||||||||||||||||
| Total from Investment Operations | 1.95 | 9.91 | 0.68 | 1.00 | 1.81 | 1.68 | ||||||||||||||||||
| LESS DISTRIBUTIONS: | ||||||||||||||||||||||||
| From capital gains | – | (1.61 | ) | 0.00 | (b) | (2.53 | ) | – | – | |||||||||||||||
| Total Distributions | – | (1.61 | ) | – | (2.53 | ) | – | – | ||||||||||||||||
| NET INCREASE/(DECREASE) IN NET ASSET VALUE | 1.95 | 8.30 | 0.68 | (1.53 | ) | 1.81 | 1.68 | |||||||||||||||||
| NET ASSET VALUE, END OF PERIOD | $ | 22.62 | $ | 20.67 | $ | 12.37 | $ | 11.69 | $ | 13.22 | $ | 11.41 | ||||||||||||
| TOTAL RETURN | 9.43 | %(c) | 82.62 | % | 5.85 | % | 11.81 | % | 15.86 | % | 17.27 | % | ||||||||||||
| RATIOS/SUPPLEMENTAL DATA: | ||||||||||||||||||||||||
| Net Assets, End of Period (000s) | $ | 4,361 | $ | 3,658 | $ | 1,462 | $ | 1,383 | $ | 1,228 | $ | 1,048 | ||||||||||||
| RATIOS TO AVERAGE NET ASSETS: | ||||||||||||||||||||||||
| Net Investment loss | (0.58 | )%(d) | (0.57 | ) | (0.53 | )% | (0.41 | )% | (0.29 | )% | (0.28 | )% | ||||||||||||
| Operating expenses excluding reimbursement/waiver | 1.37 | %(d) | 1.60 | % | 1.93 | % | 1.87 | % | 1.77 | % | 1.78 | % | ||||||||||||
| Operating expenses including reimbursement/waiver | 1.05 | %(d) | 1.05 | % | 1.05 | % | 1.05 | % | 1.05 | % | 1.05 | % | ||||||||||||
| PORTFOLIO TURNOVER RATE | 29 | %(c) | 89 | % | 94 | % | 63 | % | 138 | % | 75 | % | ||||||||||||
| (a) | Per share amounts are based upon average shares outstanding. |
| (b) | Less than $(0.005) per share. |
| (c) | Not Annualized. |
| (d) | Annualized. |
See Notes to Financial Statements.
| Semi-Annual Report | October 31, 2021 | 39 |
| Emerald Insights Fund | Financial Highlights |
| For a share outstanding throughout the years presented |
| INVESTOR CLASS | ||||||||||||||||||||||||
| For the Six Months Ended October 31, 2021 (Unaudited) | Year Ended April 30, 2021 | Year Ended April 30, 2020 | Year Ended April 30, 2019 | Year Ended April 30, 2018 | Year Ended April 30, 2017 | |||||||||||||||||||
| NET ASSET VALUE, BEGINNING OF PERIOD | $ | 20.06 | $ | 12.07 | $ | 11.45 | $ | 13.05 | $ | 11.29 | $ | 9.67 | ||||||||||||
| INCOME/(LOSS) FROM OPERATIONS: | ||||||||||||||||||||||||
| Net investment loss(a) | (0.10 | ) | (0.15 | ) | (0.09 | ) | (0.10 | ) | (0.08 | ) | (0.07 | ) | ||||||||||||
| Net realized and unrealized gain on investments | 1.95 | 9.75 | 0.71 | 1.03 | 1.84 | 1.69 | ||||||||||||||||||
| Total from Investment Operations | 1.85 | 9.60 | 0.62 | 0.93 | 1.76 | 1.62 | ||||||||||||||||||
| LESS DISTRIBUTIONS: | ||||||||||||||||||||||||
| From capital gains | – | (1.61 | ) | 0.00 | (b) | (2.53 | ) | – | – | |||||||||||||||
| Total Distributions | – | (1.61 | ) | – | (2.53 | ) | – | – | ||||||||||||||||
| NET INCREASE/(DECREASE) IN NET ASSET VALUE | 1.85 | 7.99 | 0.62 | (1.60 | ) | 1.76 | 1.62 | |||||||||||||||||
| NET ASSET VALUE, END OF PERIOD | $ | 21.91 | $ | 20.06 | $ | 12.07 | $ | 11.45 | $ | 13.05 | $ | 11.29 | ||||||||||||
| TOTAL RETURN | 9.22 | %(c) | 82.08 | % | 5.45 | % | 11.41 | % | 15.59 | % | 16.75 | % | ||||||||||||
| RATIOS/SUPPLEMENTAL DATA: | ||||||||||||||||||||||||
| Net Assets, End of Period (000s) | $ | 876 | $ | 638 | $ | 274 | $ | 174 | $ | 126 | $ | 88 | ||||||||||||
| RATIOS TO AVERAGE NET ASSETS: | ||||||||||||||||||||||||
| Net Investment loss | (0.92 | )%(d) | (0.91 | )% | (0.82 | )% | (0.77 | )% | (0.65 | )% | (0.63 | )% | ||||||||||||
| Operating expenses excluding reimbursement/waiver | 1.60 | %(d) | 1.86 | % | 2.17 | % | 2.08 | % | 2.07 | % | 2.09 | % | ||||||||||||
| Operating expenses including reimbursement/waiver | 1.40 | %(d) | 1.40 | % | 1.40 | % | 1.40 | % | 1.40 | % | 1.40 | % | ||||||||||||
| PORTFOLIO TURNOVER RATE | 29 | %(c) | 89 | % | 94 | % | 63 | % | 138 | % | 75 | % | ||||||||||||
| (a) | Per share amounts are based upon average shares outstanding. |
| (b) | Less than $(0.005) per share. |
| (c) | Not Annualized. |
| (d) | Annualized. |
See Notes to Financial Statements.
| 40 | www.emeraldmutualfunds.com |
| Emerald Finance & Banking Innovation Fund | Financial Highlights |
| For a share outstanding throughout the years presented | |
| CLASS A | ||||||||||||||||||||||||
| For the Six Months Ended October 31, 2021 (Unaudited) | Year Ended April 30, 2021 | Year Ended April 30, 2020 | Year Ended April 30, 2019 | Year Ended April 30, 2018 | Year Ended April 30, 2017 | |||||||||||||||||||
| NET ASSET VALUE, BEGINNING OF PERIOD | $ | 51.56 | $ | 22.89 | $ | 32.71 | $ | 46.01 | $ | 41.61 | $ | 31.27 | ||||||||||||
| INCOME/(LOSS) FROM OPERATIONS: | ||||||||||||||||||||||||
| Net investment income/(loss)(a) | (0.24 | ) | 0.06 | (0.03 | ) | (0.24 | ) | (0.29 | ) | (0.17 | ) | |||||||||||||
| Net realized and unrealized gain/(loss) on investments | 11.89 | 28.61 | (9.79 | ) | (5.35 | ) | 5.98 | 10.51 | ||||||||||||||||
| Total from Investment Operations | 11.65 | 28.67 | (9.82 | ) | (5.59 | ) | 5.69 | 10.34 | ||||||||||||||||
| LESS DISTRIBUTIONS: | ||||||||||||||||||||||||
| From capital gains | – | – | – | (7.71 | ) | (1.29 | ) | – | ||||||||||||||||
| Total Distributions | – | – | – | (7.71 | ) | (1.29 | ) | – | ||||||||||||||||
| NET INCREASE/(DECREASE) IN NET ASSET VALUE | 11.65 | 28.67 | (9.82 | ) | (13.30 | ) | 4.40 | 10.34 | ||||||||||||||||
| NET ASSET VALUE, END OF PERIOD | $ | 63.21 | $ | 51.56 | $ | 22.89 | $ | 32.71 | $ | 46.01 | $ | 41.61 | ||||||||||||
| TOTAL RETURN(b) | 22.60 | %(c) | 125.21 | % | (30.02 | )% | (10.65 | )% | 13.59 | % | 33.07 | % | ||||||||||||
| RATIOS/SUPPLEMENTAL DATA: | ||||||||||||||||||||||||
| Net Assets, End of Period (000s) | $ | 83,729 | $ | 68,778 | $ | 37,933 | $ | 87,267 | $ | 172,338 | $ | 172,106 | ||||||||||||
| RATIOS TO AVERAGE NET ASSETS: | ||||||||||||||||||||||||
| Net Investment income/(loss) | (0.91 | )%(d) | 0.18 | % | (0.10 | )% | (0.58 | )% | (0.65 | )% | (0.46 | )% | ||||||||||||
| Operating expenses excluding reimbursement/waiver | 1.45 | %(d) | 1.53 | % | 1.48 | % | 1.42 | % | 1.41 | % | 1.43 | % | ||||||||||||
| Operating expenses including reimbursement/waiver | 1.45 | %(d) | 1.53 | % | 1.48 | % | 1.42 | % | 1.41 | % | 1.43 | % | ||||||||||||
| PORTFOLIO TURNOVER RATE | 47 | %(c) | 171 | % | 46 | % | 55 | % | 62 | % | 36 | % | ||||||||||||
| (a) | Per share amounts are based upon average shares outstanding. |
| (b) | Total return does not reflect the effect of sales charges. |
| (c) | Not Annualized. |
| (d) | Annualized. |
See Notes to Financial Statements.
| Semi-Annual Report | October 31, 2021 | 41 |
| Emerald Finance & Banking Innovation Fund | Financial Highlights |
| For a share outstanding throughout the years presented | |
| CLASS C | ||||||||||||||||||||||||
| For the Six Months Ended October 31, 2021 (Unaudited) | Year Ended April 30, 2021 | Year Ended April 30, 2020 | Year Ended April 30, 2019 | Year Ended April 30, 2018 | Year Ended April 30, 2017 | |||||||||||||||||||
| NET ASSET VALUE, BEGINNING OF PERIOD | $ | 43.35 | $ | 19.38 | $ | 27.87 | $ | 40.83 | $ | 37.29 | $ | 28.20 | ||||||||||||
| INCOME/(LOSS) FROM OPERATIONS: | ||||||||||||||||||||||||
| Net investment loss(a) | (0.34 | ) | (0.11 | ) | (0.20 | ) | (0.44 | ) | (0.51 | ) | (0.36 | ) | ||||||||||||
| Net realized and unrealized gain/(loss) on investments | 9.97 | 24.08 | (8.29 | ) | (4.81 | ) | 5.34 | 9.45 | ||||||||||||||||
| Total from Investment Operations | 9.63 | 23.97 | (8.49 | ) | (5.25 | ) | 4.83 | 9.09 | ||||||||||||||||
| LESS DISTRIBUTIONS: | ||||||||||||||||||||||||
| From capital gains | – | – | – | (7.71 | ) | (1.29 | ) | – | ||||||||||||||||
| Total Distributions | – | – | – | (7.71 | ) | (1.29 | ) | – | ||||||||||||||||
| NET INCREASE/(DECREASE) IN NET ASSET VALUE | 9.63 | 23.97 | (8.49 | ) | (12.96 | ) | 3.54 | 9.09 | ||||||||||||||||
| NET ASSET VALUE, END OF PERIOD | $ | 52.98 | $ | 43.35 | $ | 19.38 | $ | 27.87 | $ | 40.83 | $ | 37.29 | ||||||||||||
| TOTAL RETURN(b) | 22.21 | %(c) | 123.68 | % | (30.46 | )% | (11.21 | )% | 12.85 | % | 32.23 | % | ||||||||||||
| RATIOS/SUPPLEMENTAL DATA: | ||||||||||||||||||||||||
| Net Assets, End of Period (000s) | $ | 23,983 | $ | 22,447 | $ | 16,804 | $ | 50,079 | $ | 78,988 | $ | 76,072 | ||||||||||||
| RATIOS TO AVERAGE NET ASSETS: | ||||||||||||||||||||||||
| Net Investment loss | (1.56 | )%(d) | (0.40 | )% | (0.73 | )% | (1.23 | )% | (1.30 | )% | (1.11 | )% | ||||||||||||
| Operating expenses excluding reimbursement/waiver | 2.10 | %(d) | 2.18 | % | 2.13 | % | 2.07 | % | 2.06 | % | 2.08 | % | ||||||||||||
| Operating expenses including reimbursement/waiver | 2.10 | %(d) | 2.18 | % | 2.13 | % | 2.07 | % | 2.06 | % | 2.08 | % | ||||||||||||
| PORTFOLIO TURNOVER RATE | 47 | %(c) | 171 | % | 46 | % | 55 | % | 62 | % | 36 | % | ||||||||||||
| (a) | Per share amounts are based upon average shares outstanding. |
| (b) | Total return does not reflect the effect of sales charges. |
| (c) | Not Annualized. |
| (d) | Annualized. |
See Notes to Financial Statements.
| 42 | www.emeraldmutualfunds.com |
| Emerald Finance & Banking Innovation Fund | Financial Highlights |
| For a share outstanding throughout the years presented | |
| INSTITUTIONAL CLASS | ||||||||||||||||||||||||
| For the Six Months Ended October 31, 2021 (Unaudited) | Year Ended April 30, 2021 | Year Ended April 30, 2020 | Year Ended April 30, 2019 | Year Ended April 30, 2018 | Year Ended April 30, 2017 | |||||||||||||||||||
| NET ASSET VALUE, BEGINNING OF PERIOD | $ | 53.48 | $ | 23.67 | $ | 33.70 | $ | 46.95 | $ | 42.30 | $ | 31.69 | ||||||||||||
| INCOME/(LOSS) FROM OPERATIONS: | ||||||||||||||||||||||||
| Net investment income/(loss)(a) | (0.16 | ) | 0.14 | 0.09 | (0.09 | ) | (0.15 | ) | (0.05 | ) | ||||||||||||||
| Net realized and unrealized gain/(loss) on investments | 12.37 | 29.67 | (10.12 | ) | (5.45 | ) | 6.09 | 10.66 | ||||||||||||||||
| Total from Investment Operations | 12.21 | 29.81 | (10.03 | ) | (5.54 | ) | 5.94 | 10.61 | ||||||||||||||||
| LESS DISTRIBUTIONS: | ||||||||||||||||||||||||
| From capital gains | – | – | – | (7.71 | ) | (1.29 | ) | – | ||||||||||||||||
| Total Distributions | – | – | – | (7.71 | ) | (1.29 | ) | – | ||||||||||||||||
| NET INCREASE/(DECREASE) IN NET ASSET VALUE | 12.21 | 29.81 | (10.03 | ) | (13.25 | ) | 4.65 | 10.61 | ||||||||||||||||
| NET ASSET VALUE, END OF PERIOD | $ | 65.69 | $ | 53.48 | $ | 23.67 | $ | 33.70 | $ | 46.95 | $ | 42.30 | ||||||||||||
| TOTAL RETURN | 22.83 | %(b) | 125.94 | % | (29.76 | )% | (10.30 | )% | 13.97 | % | 33.48 | % | ||||||||||||
| RATIOS/SUPPLEMENTAL DATA: | ||||||||||||||||||||||||
| Net Assets, End of Period (000s) | $ | 159,860 | $ | 134,767 | $ | 67,358 | $ | 162,910 | $ | 221,638 | $ | 134,027 | ||||||||||||
| RATIOS TO AVERAGE NET ASSETS: | ||||||||||||||||||||||||
| Net Investment income/(loss) | (0.57 | )%(c) | 0.39 | % | 0.28 | % | (0.23 | )% | (0.34 | )% | (0.14 | )% | ||||||||||||
| Operating expenses excluding reimbursement/waiver | 1.11 | %(c) | 1.18 | % | 1.13 | % | 1.06 | % | 1.09 | % | 1.11 | % | ||||||||||||
| Operating expenses including reimbursement/waiver | 1.11 | %(c) | 1.18 | % | 1.13 | % | 1.06 | % | 1.09 | % | 1.11 | % | ||||||||||||
| PORTFOLIO TURNOVER RATE | 47 | %(b) | 171 | % | 46 | % | 55 | % | 62 | % | 36 | % | ||||||||||||
| (a) | Per share amounts are based upon average shares outstanding. |
| (b) | Not Annualized. |
| (c) | Annualized. |
See Notes to Financial Statements.
| Semi-Annual Report | October 31, 2021 | 43 |
| Emerald Finance & Banking Innovation Fund | Financial Highlights |
| For a share outstanding throughout the years presented | |
| INVESTOR CLASS | ||||||||||||||||||||||||
| For the Six Months Ended October 31, 2021 (Unaudited) | Year Ended April 30, 2021 | Year Ended April 30, 2020 | Year Ended April 30, 2019 | Year Ended April 30, 2018 | Year Ended April 30, 2017 | |||||||||||||||||||
| NET ASSET VALUE, BEGINNING OF PERIOD | $ | 48.76 | $ | 21.66 | $ | 30.96 | $ | 44.05 | $ | 39.86 | $ | 29.95 | ||||||||||||
| INCOME/(LOSS) FROM OPERATIONS: | ||||||||||||||||||||||||
| Net investment income/(loss)(a) | (0.24 | ) | 0.03 | (0.04 | ) | (0.23 | ) | (0.25 | ) | (0.16 | ) | |||||||||||||
| Net realized and unrealized gain/(loss) on investments | 11.25 | 27.07 | (9.26 | ) | (5.15 | ) | 5.73 | 10.07 | ||||||||||||||||
| Total from Investment Operations | 11.01 | 27.10 | (9.30 | ) | (5.38 | ) | 5.48 | 9.91 | ||||||||||||||||
| LESS DISTRIBUTIONS: | ||||||||||||||||||||||||
| From capital gains | – | – | – | (7.71 | ) | (1.29 | ) | – | ||||||||||||||||
| Total Distributions | – | – | – | (7.71 | ) | (1.29 | ) | – | ||||||||||||||||
| NET INCREASE/(DECREASE) IN NET ASSET VALUE | 11.01 | 27.10 | (9.30 | ) | (13.09 | ) | 4.19 | 9.91 | ||||||||||||||||
| NET ASSET VALUE, END OF PERIOD | $ | 59.77 | $ | 48.76 | $ | 21.66 | $ | 30.96 | $ | 44.05 | $ | 39.86 | ||||||||||||
| TOTAL RETURN | 22.58 | %(b) | 125.07 | % | (30.04 | )% | (10.64 | )% | 13.67 | % | 33.09 | % | ||||||||||||
| RATIOS/SUPPLEMENTAL DATA: | ||||||||||||||||||||||||
| Net Assets, End of Period (000s) | $ | 65,818 | $ | 31,147 | $ | 15,472 | $ | 41,410 | $ | 71,236 | $ | 85,557 | ||||||||||||
| RATIOS TO AVERAGE NET ASSETS: | ||||||||||||||||||||||||
| Net Investment income/(loss) | (0.95 | )%(c) | 0.11 | % | (0.12 | )% | (0.60 | )% | (0.60 | )% | (0.46 | )% | ||||||||||||
| Operating expenses excluding reimbursement/waiver | 1.48 | %(c) | 1.56 | % | 1.51 | % | 1.43 | % | 1.37 | % | 1.43 | % | ||||||||||||
| Operating expenses including reimbursement/waiver | 1.48 | %(c) | 1.56 | % | 1.51 | % | 1.43 | % | 1.37 | % | 1.43 | % | ||||||||||||
| PORTFOLIO TURNOVER RATE | 47 | %(b) | 171 | % | 46 | % | 55 | % | 62 | % | 36 | % | ||||||||||||
| (a) | Per share amounts are based upon average shares outstanding. |
| (b) | Not Annualized. |
| (c) | Annualized. |
See Notes to Financial Statements.
| 44 | www.emeraldmutualfunds.com |
| Emerald Funds | Notes to Financial Statements |
| October 31, 2021 (Unaudited) |
1. ORGANIZATION
Financial Investors Trust (the “Trust”), a Delaware statutory trust, is an open-end management investment company registered under the Investment Company Act of 1940, as amended (the “1940 Act”). The Trust consists of multiple separate portfolios or series. This semi-annual report describes the Emerald Growth Fund, Emerald Insights Fund, and Emerald Finance & Banking Innovation Fund (each a “Fund” and collectively, the “Funds”).
The Emerald Growth Fund and Emerald Insights Fund seek to achieve long-term growth through capital appreciation. The Emerald Finance & Banking Innovation Fund seeks to achieve long-term growth through capital appreciation with income as a secondary objective.
2. SIGNIFICANT ACCOUNTING POLICIES
The accompanying financial statements were prepared in accordance with accounting principles generally accepted in the United States of America (“U.S. GAAP”). The preparation of financial statements in conformity with U.S. GAAP requires management to make certain estimates and assumptions that affect the reported amounts of assets and liabilities and disclosures of contingent assets and liabilities at the date of the financial statements and the reported amounts of revenue and expenses during the period. Actual results could differ from those estimates. The Funds are considered an investment company for financial reporting purposes under U.S. GAAP and follows the accounting and reporting guidance applicable to investment companies in the Financial Accounting Standards Board Accounting Standards Codification Topic 946. The following is a summary of significant accounting policies consistently followed by the Funds in preparation of their financial statements.
Investment Valuation: The Funds generally value their securities based on market prices determined at the close of regular trading on the New York Stock Exchange (“NYSE”), normally, 4:00 p.m. Eastern Time, on each business day the NYSE is open for trading.
For equity securities and mutual funds that are traded on an exchange, the market price is usually the closing sale or official closing price on that exchange. In the case of equity securities not traded on an exchange, or if such closing prices are not otherwise available, the securities are valued at the mean of the most recent bid and ask prices on such day. Redeemable securities issued by open-end registered investment companies are valued at the investment company’s applicable net asset value, with the exception of exchange-traded open-end investment companies, which are priced as equity securities.
The market price for debt obligations is generally the price supplied by an independent third-party pricing service approved by the Board of Trustees of the Trust (the “Board” or the “Trustees”), which may use a matrix, formula or other objective method that takes into consideration quotations from dealers, market transactions in comparable investments, market indices and yield curves. If vendors are unable to supply a price, or if the price supplied is deemed to be unreliable, the market price may be determined using quotations received from one or more brokers–dealers that make a market in the security.
Equity securities that are primarily traded on foreign securities exchanges are valued at the preceding closing values of such securities on their respective exchanges, except when an occurrence subsequent to the time a value was so established is likely to have changed such value. In such an event, the fair values of those securities are determined in good faith through consideration of other factors in accordance with procedures established by and under the general supervision of the Board.
When such prices or quotations are not available, or when Emerald Mutual Fund Advisers Trust, (the “Adviser”), believes that they are unreliable, securities may be priced using fair value procedures approved by the Board.
Fair Value Measurements: A three-tier hierarchy has been established to classify fair value measurements for disclosure purposes. Inputs refer broadly to the assumptions that market participants would use in pricing the asset or liability, including assumptions about risk. Inputs may be observable or unobservable. Observable inputs are inputs that reflect the assumptions market participants would use in pricing the asset or liability that are developed based on market data obtained from sources independent of the reporting entity. Unobservable inputs are inputs that reflect the reporting entity’s own assumptions about the assumptions market participants would use in pricing the asset or liability that are developed based on the best information available. Various inputs are used in determining the value of each Fund’s investments as of the reporting period end. The designated input levels are not necessarily an indication of the risk or liquidity associated with these investments.
These inputs are categorized in the following hierarchy under applicable financial accounting standards:
| Level 1 – | Unadjusted quoted prices in active markets for identical investments, unrestricted assets or liabilities that the Funds have the ability to access at the measurement date; | |
| Level 2 – | Quoted prices which are not active, quoted prices for similar assets or liabilities in active markets or inputs other than quoted prices that are observable (either directly or indirectly) for substantially the full term of the asset or liability; and | |
| Level 3 – | Significant unobservable prices or inputs (including the Funds’ own assumptions in determining the fair value of investments) where there is little or no market activity for the asset or liability at the measurement date. |
| Semi-Annual Report | October 31, 2021 | 45 |
| Emerald Funds | Notes to Financial Statements |
| October 31, 2021 (Unaudited) |
The following is a summary of each input used to value the Funds as of October 31, 2021:
| Investments in Securities at Value(a) | Level 1 - Quoted Prices | Level 2 - Other Significant Observable Inputs | Level 3 - Significant Unobservable Inputs | Total | ||||||||||||
| Emerald Growth Fund | ||||||||||||||||
| Common Stocks | $ | 1,535,265,699 | $ | – | $ | – | $ | 1,535,265,699 | ||||||||
| Short Term Investments | 10,285,214 | – | – | 10,285,214 | ||||||||||||
| TOTAL | $ | 1,545,550,913 | $ | – | $ | – | $ | 1,545,550,913 | ||||||||
| Investments in Securities at Value(a) | Level 1 - Quoted Prices | Level 2 - Other Significant Observable Inputs | Level 3 - Significant Unobservable Inputs | Total | ||||||||||||
| Emerald Insights Fund | ||||||||||||||||
| Common Stocks | $ | 24,611,273 | $ | – | $ | – | $ | 24,611,273 | ||||||||
| Short Term Investments | 236,045 | – | – | 236,045 | ||||||||||||
| TOTAL | $ | 24,847,318 | $ | – | $ | – | $ | 24,847,318 | ||||||||
| Investments in Securities at Value(a) | Level 1 - Quoted Prices | Level 2 - Other Significant Observable Inputs | Level 3 - Significant Unobservable Inputs | Total | ||||||||||||
| Emerald Finance & Banking Innovation Fund | ||||||||||||||||
| Common Stocks | $ | 309,807,574 | $ | – | $ | – | $ | 309,807,574 | ||||||||
| Short Term Investments | 9,705,123 | – | – | 9,705,123 | ||||||||||||
| Mutual Funds | 11,991,389 | – | – | 11,991,389 | ||||||||||||
| Warrants | 1,799,817 | – | – | 1,799,817 | ||||||||||||
| TOTAL | $ | 333,303,903 | $ | – | $ | – | $ | 333,303,903 | ||||||||
| (a) | For detailed descriptions of sector and industry, see the accompanying Schedule of Investments. |
For the six months ended October 31, 2021, the Funds did not have any securities that used significant unobservable inputs (Level 3) in determining fair value.
Investment Transactions and Investment Income: Investment transactions are accounted for on the date the investments are purchased or sold (trade date). Realized gains and losses from investment transactions are reported on an identified cost basis, which is the same basis the Funds use for federal income tax purposes. Interest income, which includes accretion of discounts, is accrued and recorded as earned. Dividend income is recognized on the ex-dividend date or for certain foreign securities, as soon as information is available to the Funds. All of the realized and unrealized gains and losses and net investment income, are allocated daily to each class in proportion to its average daily net assets.
Real Estate Investment Trusts (“REITs”): The Funds may invest a portion of their assets in REITs and are subject to certain risks associated with direct investment in REITs. REITs may be affected by changes in the value of their underlying properties and by defaults by borrowers or tenants. REITs depend generally on their ability to generate cash flow to make distributions to shareowners, and certain REITs have self-liquidation provisions by which mortgages held may be paid in full and distributions of capital returns may be made at any time. In addition, the performance of a REIT may be affected by its failure to qualify for tax-free pass-through of income under the Internal Revenue Code of 1986, as amended (the “Code”), or its failure to maintain exemption from registration under the 1940 Act. A Fund’s investments in REITs may result in such Fund’s receipt of cash in excess of the REITs’ earnings. If the Fund receives such distributions all or a portion of these distributions will constitute a return of capital to such Fund. Receiving a return of capital distribution from REITs will reduce the amount of income available to be distributed to Fund shareholders. Income from REITs generally will not be eligible for treatment as qualified dividend income. As the final character of the distributions is not known until reported by the REITs on their 1099s, the Funds utilize an average of the prior year’s reallocation information as an estimate for the current year character of distributions.
Trust Expenses: Some expenses of the Trust can be directly attributed to the Funds. Expenses which cannot be directly attributed to the Funds are apportioned among all funds in the Trust based on average net assets of each fund.
| 46 | www.emeraldmutualfunds.com |
| Emerald Funds | Notes to Financial Statements |
| October 31, 2021 (Unaudited) |
Fund and Class Expenses: Expenses that are specific to a Fund or class of shares of a Fund, including distribution fees (Rule 12b-1 fees) and shareholder servicing fees, are charged directly to that Fund or share class. All expenses of a Fund, other than class specific expenses, are allocated daily to each class in proportion to its average daily net assets. Expenses that are common to the Funds generally are allocated among the Funds in proportion to their average daily net assets.
Federal Income Taxes: Each Fund complies with the requirements under Subchapter M of the Code, applicable to regulated investment companies and intends to distribute substantially all of its net taxable income and net capital gains, if any, each year so that the Funds will not be subject to excise tax on undistributed income and gains. The Funds are not subject to income taxes to the extent such distributions are made.
As of and during the six months ended October 31, 2021, the Funds did not have a liability for any unrecognized tax benefits. The Funds file U.S. federal, state, and local tax returns as required. The Funds’ tax returns are subject to examination by the relevant tax authorities until expiration of the applicable statute of limitations, which is generally three years after the filing of the tax return for federal purposes and four years for most state returns. Tax returns for open years have incorporated no uncertain tax positions that require a provision for income taxes.
Distributions to Shareholders: Each Fund normally pays dividends and distributes capital gains, if any, on an annual basis. Income dividend distributions are derived from dividends and other income each Fund receives from its investments, including short-term capital gains. Long term capital gain distributions are derived from gains realized when each Fund sells a security it has owned for more than a year. Each Fund may make additional distributions and dividends at other times if the portfolio manager believes doing so may be necessary for each Fund to avoid or reduce taxes.
Epidemic and Pandemic Risk: Certain countries have been susceptible to epidemics, most recently COVID-19, which has been designated as a pandemic by world health authorities. The outbreak of such epidemics, together with any resulting restrictions on travel or quarantines imposed, could have a negative impact on the economy and business activity globally (including in the countries in which we invest), and thereby could adversely affect the performance of our investments. Furthermore, the rapid development of epidemics could preclude prediction as to their ultimate adverse impact on economic and market conditions, and, as a result, present material uncertainty and risk with respect to us and the performance of our investments.
Libor Risk: In March 2020, the Financial Accounting Standards Board (FASB) issued Accounting Standards Update (“ASU”) No. 2020-04, Reference Rate Reform (Topic 848): Facilitation of the Effects of Reference Rate Reform on Financial Reporting. The Funds’ investments, payment obligations, and financing terms may be based on floating rates, such as the London Interbank Offered Rate, or “LIBOR,” which is the offered rate for short-term Eurodollar deposits between major international banks. On November 30, 2020, the administrator of LIBOR announced its intention to delay the phase out of the majority of the U.S. dollar LIBOR publications until June 30, 2023, with the remainder of LIBOR publications to still end at the end of 2021. There remains uncertainty regarding the nature of any replacement rate and the impact of the transition from LIBOR on the Funds’ transactions and the financial markets generally. As such, the potential effect of a transition away from LIBOR on the Funds or the Funds’ investments cannot yet be determined.
3. TAX BASIS INFORMATION
Tax Basis of Investments: As of October 31, 2021, the aggregate cost of investments, gross unrealized appreciation/(depreciation) and net unrealized appreciation/(depreciation) for Federal tax purposes was as follows:
| Gross Appreciation (excess of value over tax cost) | Gross Depreciation (excess of tax cost over value) | Net Unrealized Appreciation/(Depreciation) | Cost of Investments for Income Tax Purposes | |||||||||||||
| Emerald Growth Fund | $ | 729,994,360 | $ | (20,041,731 | ) | $ | 709,952,629 | $ | 835,598,284 | |||||||
| Emerald Insights Fund | 10,244,960 | (493,892 | ) | 9,751,068 | 15,096,250 | |||||||||||
| Emerald Finance & Banking Innovation Fund | 136,904,166 | (5,075,638 | ) | 131,828,528 | 201,475,375 | |||||||||||
| Semi-Annual Report | October 31, 2021 | 47 |
| Emerald Funds | Notes to Financial Statements |
| October 31, 2021 (Unaudited) |
During the fiscal year ended April 30, 2021, Emerald Finance & Banking Innovation Fund utilized capital losses carried forward from prior fiscal year in the amount of $3,900,205.
Tax Basis of Distributions to Shareholders: The character of distributions made during the year from net investment income or net realized gains may differ from its ultimate characterization for federal income tax purposes. Also, due to the timing of dividend distributions, the fiscal year in which amounts are distributed may differ from the fiscal year in which the income or realized gain were recorded by each Fund.
The tax characters of distributions paid by the Funds for the fiscal year ended April 30, 2021 were as follows:
| Ordinary Income | Long-Term Capital Gain | |||||||
| Emerald Growth Fund | $ | 13,844,336 | $ | 106,737,343 | ||||
| Emerald Insights Fund | 756,049 | 862,121 | ||||||
| Emerald Finance & Banking Innovation Fund | – | – | ||||||
The amounts and characteristics of tax basis distributions and composition of distributable earnings/(accumulated losses) are finalized at fiscal year-end. Accordingly, tax basis balances have not been determined as of October 31, 2021.
4. SECURITIES TRANSACTIONS
The cost of purchases and proceeds from sales of securities (excluding short-term securities) during the six months ended October 31, 2021 was as follows:
| Funds | Cost of Investments Purchased | Proceeds from Investments Sold | ||||||
| Emerald Growth Fund | $ | 222,450,887 | $ | 354,658,178 | ||||
| Emerald Insights Fund | 7,144,195 | 6,749,449 | ||||||
| Emerald Finance & Banking Innovation Fund | 134,059,830 | 118,340,003 | ||||||
5. SHARES OF BENEFICIAL INTEREST
The capitalization of the Trust consists of an unlimited number of shares of beneficial interest with no par value per share. Holders of the shares of the Funds of the Trust have one vote for each share held and a proportionate fraction of a vote for each fractional share. All shares issued and outstanding are fully paid and are transferable and redeemable at the option of the shareholder. Purchasers of the shares do not have any obligation to make payments to the Trust or its creditors (other than the purchase price for the shares) or make contributions to the Trust or its creditors solely by reason of the purchaser’s ownership of the shares. Shares have no pre-emptive rights.
| 48 | www.emeraldmutualfunds.com |
| Emerald Funds | Notes to Financial Statements |
| October 31, 2021 (Unaudited) |
6. MANAGEMENT AND RELATED-PARTY TRANSACTIONS
The Adviser, subject to the authority of the Board, is responsible for the overall management and administration of the Funds’ business affairs. The Adviser manages the investments of the Funds in accordance with the Funds’ investment objective, policies and limitations and investment guidelines established jointly by the Adviser and the Trustees. Pursuant to the Advisory Agreement, the Funds pay the Adviser fees for the services and facilities it provides payable on a monthly basis at the annual rate set forth below of the Funds’ average daily net assets. The management fee is paid on a monthly basis.
| Emerald Growth Fund | |
| Average Total Net Assets | Contractual Fee |
| Up to and including $250M | 0.75% |
| Over $250M and including $500M | 0.65% |
| Over $500M and including $750M | 0.55% |
| Over $750M | 0.45% |
| Emerald Insights Fund | |
| Average Total Net Assets | Contractual Fee |
| Up to and including $250M | 0.75% |
| Over $250M and including $500M | 0.65% |
| Over $500M and including $750M | 0.55% |
| Over $750M | 0.45% |
| Emerald Finance & Banking Innovation Fund | |
| Average Total Net Assets | Contractual Fee |
| Up to and including $100M | 1.00% |
| Over $100M | 0.90% |
The Adviser has contractually agreed to limit each Fund’s total annual operating expenses (exclusive of acquired fund fees and expenses, brokerage expenses, interest expenses, taxes and extraordinary expense) set forth to the annual shares (as percentages of a Funds average daily net assets) in the following table for Class A, Class C, Institutional Class, and Investor Class shares. This agreement (the “Expense Agreement”) is in effect from September 1, 2021 through August 31, 2022, for all Funds. The prior Expense Agreement was in effect from September 1, 2020 through August 31, 2021 for all Funds. The Adviser will be permitted to recapture, on a class-by-class basis, expenses it has borne through the Expense Agreement to the extent that the Fund's expenses in later periods fall below the annual rates set forth in the Expense Agreement; provided, however, that such recapture payments do not cause the Fund's expense ratio (after recapture) to exceed the lesser of (i) the expense cap in effect at the time of the waiver and (ii) the expense cap in effect at the time of the recapture. Notwithstanding the foregoing, the Fund will not be obligated to pay any such deferred fees and expenses more than three years after the date on which the fee and expenses were deferred. The Adviser may not discontinue this waiver, prior to August 31, 2022, without the approval by the Funds Board, for all Funds. Fees waived/reimbursed by the Adviser for the six months ended October 31, 2021 are disclosed in the Statements of Operations.
| Emerald Growth Fund | |||
| Class A | Class C | Institutional Class | Investor Class |
| 1.29% | 1.94% | 0.99% | 1.34% |
| Emerald Insights Fund | |||
| Class A | Class C | Institutional Class | Investor Class |
| 1.35% | 2.00% | 1.05% | 1.40% |
| Emerald Finance & Banking Innovation Fund | |||
| Class A | Class C | Institutional Class | Investor Class |
| 1.84% | 2.49% | 1.54% | 1.89% |
| Semi-Annual Report | October 31, 2021 | 49 |
| Emerald Funds | Notes to Financial Statements |
| October 31, 2021 (Unaudited) |
For the six months ended October 31, 2021, the fee waivers/reimbursements and recoupments of past waived fees were as follows:
| Fund | Fees Waived/ Reimbursed By Adviser | Recoupment of Past Waived Fees By Adviser | ||||||
| Emerald Insights Fund | ||||||||
| Class A | $ | 31,539 | $ | – | ||||
| Class C | 405 | – | ||||||
| Institutional Class | 6,397 | – | ||||||
| Investor Class | 942 | 169 | ||||||
As of October 31, 2021, the balances of recoupable expenses for each Fund were as follows:
| Fund | Expires 2022 | Expires 2023 | Expires 2024 | Expires 2025 | Total | |||||||||||||||
| Emerald Insights Fund | ||||||||||||||||||||
| Class A | $ | 39,929 | $ | 88,177 | $ | 80,330 | $ | 31,539 | $ | 239,975 | ||||||||||
| Class C | 559 | 1,283 | 1,121 | 405 | 3,368 | |||||||||||||||
| Institutional Class | 6,058 | 12,318 | 13,352 | 6,397 | 38,125 | |||||||||||||||
| Investor Class | 560 | 1,098 | 1,874 | 773 | 4,305 | |||||||||||||||
Fund Administrator Fees and Expenses: ALPS Fund Services, Inc. (“ALPS”) serves as administrator to the Funds and the Funds have agreed to pay expenses incurred in connection with their administrative activities. Pursuant to an Administration Agreement, ALPS provides operational services to the Funds including, but not limited to, fund accounting and fund administration and generally assist in the Funds’ operations. Officers of the Trust are employees of ALPS. The Funds’ administration fee is accrued on a daily basis and paid monthly. Administration fees paid by the Funds for the six months ended October 31, 2021 are disclosed in the Statements of Operations.
The Administrator is also reimbursed by the Funds for certain out-of-pocket expenses.
Transfer Agent: ALPS serves as transfer, dividend paying and shareholder servicing agent for the Funds. ALPS receives an annual minimum fee, a fee based upon the number of shareholder accounts, and is also reimbursed by the Funds for certain out-of-pocket expenses. Transfer agent fees paid by the Funds for the six months ended October 31, 2021 are disclosed in the Statements of Operations.
Compliance Services: ALPS provides services that assist the Trust’s chief compliance officer in monitoring and testing the policies and procedures of the Trust in conjunction with requirements under Rule 38a-1 under the 1940 Act and receives an annual base fee. ALPS is reimbursed for certain out-of-pocket expenses by the Funds. Compliance service fees paid by the Funds for the six months ended October 31, 2021 are disclosed in the Statements of Operations.
Principal Financial Officer: ALPS receives an annual fee for providing principal financial officer services to the Funds. Principal financial officer fees paid by the Funds for the six months ended October 31, 2021 are disclosed in the Statements of Operations.
Distributor: ALPS Distributors, Inc. (“ADI” or the “Distributor”) (an affiliate of ALPS) acts as the distributor of the Funds’ shares pursuant to a Distribution Agreement with the Trust. Shares are sold on a continuous basis by ADI as agent for the Funds, and ADI has agreed to use its best efforts to solicit orders for the sale of Funds’ shares, although it is not obliged to sell any particular amount of shares. ADI is not entitled to any compensation for its services as Distributor. ADI is registered as a broker-dealer with the U.S. Securities and Exchange Commission.
Each Fund has adopted a separate Distribution and Services Plan (each a “Plan” and collectively, the “Plans”) pursuant to Rule 12b-1 of the 1940 Act. The Plans allow each Fund, as applicable, to use each Fund’s assets to pay fees in connection with the distribution and marketing of the Funds’ shares and/or the provision of shareholder services to the Funds’ shareholders. The Plan permits payment for services in connection with the administration of plans or programs that use shares of each Fund as their funding medium and for related expenses. The recipients of such payments may include other affiliates of the Adviser, broker-dealers, financial institutions, plan sponsors and administrators and other financial intermediaries through which investors may purchase shares of the Fund. The Plans permit each Fund to make total payments at an annual rate of up to 0.35%, 0.75% and 0.25% of the average daily net asset value of Class A, Class C and Investor Class, respectively. Because these fees are paid out of the Funds’ assets on an ongoing basis, over time they will increase the cost of an investment in the Funds, and Plan fees may cost an investor more than other types of sales charges.
Each Fund, has adopted a Shareholder Services Plan (a “Shareholder Services Plan”) with respect to its Class C, Institutional Class and Investor Class shares. Under the Shareholder Services Plan, a Fund is authorized to compensate certain financial intermediaries, including broker-dealers and Fund affiliates which may include the Distributor, Adviser and/or the transfer agent (the “Participating Organizations”), an aggregate fee in an amount not
| 50 | www.emeraldmutualfunds.com |
| Emerald Funds | Notes to Financial Statements |
| October 31, 2021 (Unaudited) |
to exceed on an annual basis 0.25%, 0.05% and 0.15% of the average daily net asset value of Class C, Institutional Class and Investor Class, respectively, of the Funds attributable to or held in the name of the Participating Organizations pursuant to an agreement with such Participating Organizations (the “Agreement”). Each Agreement will set forth the non-distribution related shareholder services to be performed by the Participating Organizations for the benefit of a Fund’s shareholders who have elected to have such Participating Organizations service their accounts. Any amount of such payment not paid to Participating Organizations during a Fund’s fiscal year for such service activities shall be reimbursed to the Fund as soon as practicable. Shareholder Services Plan fees are included with distribution and service fees in the Statements of Operations. Fees recaptured pursuant to the Shareholder Services Plan for the six months ended October 31, 2021, are included as an offset to distribution and service fees as disclosed in the Statements of Operations.
Trustees
The fees and expenses of the Trustees of the Board are presented in the Statements of Operations.
7. INDEMNIFICATIONS
Under the Trust’s organizational documents, its officers and Trustees are indemnified against certain liability arising out of the performance of their duties to the Trust. Additionally, in the normal course of business, the Trust enters into contracts with service providers that may contain general indemnification clauses, which may permit indemnification to the extent permissible under applicable law. The Trust’s maximum exposure under these arrangements is unknown, as this would involve future claims that may be made against the Trust that have not yet occurred.
8. SUBSEQUENT EVENTS
Subsequent events after the date of the Statements of Assets and Liabilities have been evaluated through the date the financial statements were issued.
| Semi-Annual Report | October 31, 2021 | 51 |
| Emerald Funds | Additional Information |
| October 31, 2021 (Unaudited) |
1. FUND HOLDINGS
The Funds file their complete schedule of portfolio holdings with the Securities and Exchange Commission (SEC) for the first and third quarters of each fiscal year as an exhibit to its reports on Form N-PORT. The Funds’ Form N-PORT reports are available on the SEC's Web site at http://www.sec.gov. The Funds’ Form N-PORT reports are also available upon request by calling (toll-free) (855) 828-9909.
2. FUND PROXY VOTING POLICIES, PROCEDURES AND SUMMARIES
Each Fund’s policies and procedures used in determining how to vote proxies and information regarding how the Funds voted proxies relating to portfolio securities during the most recent prior 12-month period ending June 30 are available without charge, (1) upon request, by calling (toll-free) (855) 828-9909 and (2) on the SEC’s website at http://www.sec.gov.
| 52 | www.emeraldmutualfunds.com |
| Emerald Funds | Privacy Policy |
| Who We Are | |
| Who is providing this notice? | Emerald Finance & Banking Innovation Fund, Emerald Growth Fund, Emerald Insights Fund |
| What We Do | |
| How do the Funds protect my personal information? | To protect your personal information from unauthorized access and use, we use security measures that comply with federal law. These measures include computer safeguards and secured files and buildings. |
| How do the Funds collect my personal information? | We collect your personal information, for example, when you
• open an account • provide account information or give us your contact information • make a wire transfer or deposit money |
| Why can’t I limit all sharing? | Federal law gives you the right to limit only
• sharing for affiliates’ everyday business purposes-information about your creditworthiness • affiliates from using your information to market to you • sharing for non-affiliates to market to you
State laws and individual companies may give you additional rights to limit sharing. |
| Definitions | |
| Affiliates | Companies related by common ownership or control. They can be financial and nonfinancial companies. |
| Non-affiliates | Companies not related by common ownership or control. They can be financial and nonfinancial companies.
• The Funds do not share with non-affiliates so they can market to you. |
| Joint marketing | A formal agreement between non-affiliated financial companies that together market financial products or services to you.
• The Funds do not jointly market. |
| Other Important Information | |
| California residents | If your account has a California home address, your personal information will not be disclosed to nonaffiliated third parties except as permitted by applicable California law, and we will limit sharing such personal information with our affiliates to comply with California privacy laws that apply to us. |
| Vermont residents | The State of Vermont requires financial institutions to obtain your consent prior to sharing personal information that they collect about you with affiliated companies and nonaffiliated third parties other than in certain limited circumstances. Except as permitted by law, we will not share personal information we collect about you with nonaffiliated third parties or other affiliated companies unless you provide us with your written consent to share such information. |
| Semi-Annual Report | October 31, 2021 | 53 |
| Emerald Funds | Privacy Policy |
| FACTS | WHAT DO THE FUNDS DO WITH YOUR PERSONAL INFORMATION? |
| WHY? | Financial companies choose how they share your personal information. Federal law gives consumers the right to limit some but not all sharing. Federal law also requires us to tell you how we collect, share, and protect your personal information. Please read this notice carefully to understand what we do. |
| WHAT? | The types of personal information we collect and share depend on the product or service you have with us. This information can include:
• Social Security number and account transactions • Account balances and transaction history • Wire transfer instructions |
| HOW? | All financial companies need to share customers’ personal information to run their everyday business. In the section below, we list the reasons financial companies can share their customers’ personal information; the reasons the Funds choose to share; and whether you can limit this sharing. |
| Reasons we can share your personal information | Do the funds share: | Can you limit this sharing? |
| For our everyday business purposes – such as to process your transactions, maintain your account(s), respond to court orders and legal investigations, or report to credit bureaus | Yes | No |
| For our marketing purposes – to offer our products and services to you | No | We do not share. |
| For joint marketing with other financial companies | No | We do not share. |
| For our affiliates’ everyday business purposes – information about your transactions and experiences | Yes | No |
| For our affiliates’ everyday business purposes – information about your creditworthiness | No | We do not share. |
| For non-affiliates to market to you | No | We do not share. |
| 54 | www.emeraldmutualfunds.com |
Intentionally Left Blank


TABLE OF CONTENTS
| Shareholder Letter | 1 |
| Performance Update | 6 |
| Disclosure of Fund Expenses | 33 |
| Portfolio of Investments | |
| Grandeur Peak Emerging Markets Opportunities Fund | 35 |
| Grandeur Peak Global Contrarian Fund | 38 |
| Grandeur Peak Global Micro Cap Fund | 41 |
| Grandeur Peak Global Opportunities Fund | 45 |
| Grandeur Peak Global Reach Fund | 49 |
| Grandeur Peak Global Stalwarts Fund | 55 |
| Grandeur Peak International Opportunities Fund | 58 |
| Grandeur Peak International Stalwarts Fund | 62 |
| Grandeur Peak US Stalwarts Fund | 65 |
| Statements of Assets and Liabilities | 67 |
| Statements of Operations | 70 |
| Statements of Changes in Net Assets | |
| Grandeur Peak Emerging Markets Opportunities Fund | 73 |
| Grandeur Peak Global Contrarian Fund | 74 |
| Grandeur Peak Global Micro Cap Fund | 75 |
| Grandeur Peak Global Opportunities Fund | 76 |
| Grandeur Peak Global Reach Fund | 77 |
| Grandeur Peak Global Stalwarts Fund | 78 |
| Grandeur Peak International Opportunities Fund | 79 |
| Grandeur Peak International Stalwarts Fund | 80 |
| Grandeur Peak US Stalwarts Fund | 81 |
| Financial Highlights | |
| Grandeur Peak Emerging Markets Opportunities Fund | 82 |
| Grandeur Peak Global Contrarian Fund | 84 |
| Grandeur Peak Global Micro Cap Fund | 85 |
| Grandeur Peak Global Opportunities Fund | 86 |
| Grandeur Peak Global Reach Fund | 88 |
| Grandeur Peak Global Stalwarts Fund | 90 |
| Grandeur Peak International Opportunities Fund | 92 |
| Grandeur Peak International Stalwarts Fund | 94 |
| Grandeur Peak US Stalwarts Fund | 96 |
| Notes to Financial Statements | 97 |
| Disclosure Regarding Approval of Fund Advisory Agreement | 112 |
| Additional Information | 114 |
| Privacy Policy | 115 |
| Grandeur Peak Funds® | Shareholder Letter |
October 31, 2021 (Unaudited)
Dear Fellow Shareholders,
As you may know, this year Grandeur Peak Global Advisors, the investment adviser to the Grandeur Peak Funds, hit our 10-year anniversary as a firm on July 1, and the first 2 funds we launched (Global and International Opportunities), achieved their 10-year return a couple of weeks before this report. Time flies when you’re having fun. Grandeur Peak Global Advisors officially began operations on July 1, 2011. At that time we were managing $16 million of partner capital in two separate portfolios. Fast forward 10 years to July 1, 2021 and we were managing $8.4 billion in 9 mutual funds, 2 LPs, and 4 separate accounts. We’ve been surprised, and extremely grateful, to have achieved this in ten short years. If any of you are thinking about starting an investment management firm and want a little advice: start your firm just as the market is poised to deliver a compounded annual growth rate north of 10% for the next decade (a nice tailwind). Exhibit 1 shows the cumulative monthly returns of the MSCI All-Country World Investible Market Index (ACWI IMI)1 from our inception as a firm through June 30, 2021, ten years later.
Exhibit 1: Cumulative Monthly Returns - ACWI IMI

Source: MSCI; data from 6/30/2011 – 6/30/2021.
Past performance does not guarantee future results.
It’s been a great time to be managing global portfolios. Market returns have been strong, but as you can see from the solid line, there has also been some volatility. And as we’ve said before, for us Volatility = Opportunity. As the chart shows, although the overall annualized return over the period was 10.5%, the actual market return remained almost consistently below trend. That is, the solid line is almost always below the dotted trend line. The market has been in “stop-and-go” mode: periods where the market is in “drawdown”, or losing ground against the long-term trend, followed by periods where the market is in “catch-up” or accelerating stronger than trend in order to catch back up. We believe this type of market volatility can lead to excess returns for truly active managers. We’ll demonstrate why this is below, but first we need to adjust the data a bit because we didn’t end up launching our first funds and begin taking in outside capital until October 17, 2011, about 3 ½ months after launching the firm.
| 1 | The MSCI ACWI Investable Market Index (IMI) captures large, mid and small cap representation across 23 Developed Markets (DM) and 27 Emerging Markets (EM) countries. The index is comprehensive, covering approximately 99% of the global equity investment opportunity set. |
| Semi-Annual Report | October 31, 2021 | 1 |
| Grandeur Peak Funds® | Shareholder Letter |
October 31, 2021 (Unaudited)
Exhibit 2 shows the cumulative monthly returns of the ACWI IMI for the ten-year period from the inception of our first two funds on October 17, 2011 through October 18, 2021.
Exhibit 2: Cumulative Monthly Returns - ACWI IMI
Source: MSCI data from 10/17/2011 – 10/18/2021.
Past performance does not guarantee future results.
What has been fortuitous for our original shareholders, is that over this 10-year period market returns have been even higher, due to a better starting point (the market was down -12.6% from our July 1 start to October 17th when we launched our first funds).
In looking at an aggregation of market index data starting in 1871 through March 2020, the data showed that for the known history of market return data, the market has delivered a compounded average growth rate (CAGR) of 8.5%. So to have started investing client capital at a time when the market was about to deliver a CAGR of 12.2% for the next 10 years has been a huge gift.
We’ve been able to add nicely to the market returns, and would be happy to expound on our process, our culture, and our people, and how we think all of that comes together to help deliver excess returns, but we’ve clearly had the wind at our backs, and for that we are grateful.
If we break down the past ten years of market returns into five different sub-periods, we get Exhibit 3, which helps demonstrate the volatility we’ve seen in the markets over the past ten years.
| 2 | 1.855.377.7325 | www.GrandeurPeakGlobal.com |
| Grandeur Peak Funds® | Shareholder Letter |
October 31, 2021 (Unaudited)
Exhibit 3: Cumulative Monthly Returns – ACWI IMI
Source: MSCI; data from 10/17/2011 – 10/18/2021.
Past performance does not guarantee future results.
The trick to truly active management is to take advantage of the periods when the market is moving from below trend to above trend (i.e. capture those above-trend returns) and then protect on the downside when the market moves into drawdown. This is (obviously) way harder to accomplish in reality, but we feel like we’ve done a pretty good job at this over the past ten years.
Our Global Opportunities Fund (GO) outperformed in 4 of the 5 periods shown in Exhibit 32. We think this level of outperformance over the past ten years speaks to our disciplined process, dedicated team, and enduring investment philosophy. Looking forward to the next ten years, we are optimistic that our team will continue to get better through experience, and our process will become stronger as we learn from mistakes and make slight course corrections.
Reflecting on the first ten years, we want to take the opportunity to thank you, our fellow shareholders, for the faith and interest you have shown in us over the years. Getting to this point as a firm doesn’t come without a lot of hard work and sacrifice, but it also requires the support and confidence shown by you along the way. We express our sincere gratitude for allowing us the opportunity to do what we love and for keeping us honest when we’ve fallen short of your expectations. We’ve taken time to pause and reflect and enjoyed a small celebration, and are back to work as we know we still have a lot to improve.
As Robert Gardiner shared in his 2021 Chairman Message, he is planning to take a three-year sabbatical beginning July 1, 2022, to become a mission president for the Church of Jesus Christ of Latter-day Saints. He will remain Chairman of the Grandeur Peak Board and maintain his financial interest in the firm but will be removed from the day-to-day stock picking that has been his passion for many decades. We anticipate his return to full-time work beginning in July 2025, when he plans to take up his role as Guardian Portfolio Manager to several funds and Research Analyst on his companies. We believe that Robert’s willingness to take this time with his wife, Susie, is a vote of confidence in the capable team and strong foundation created at Grandeur Peak Global Advisors.
| 2 | We had very strong outperformance in Periods 1 (28.6% for GO vs. 18.6% for the benchmark) and 5 (67.9% for GO vs. 38.8%), slight outperformance in Periods 2 (-1.1% for GO vs. -2.0%) and 3 (18.4% for GO vs. 18.0%), but underperformed in period 4 by about -2.5% (-11.7% for GO vs. -9.2%). |
| Semi-Annual Report | October 31, 2021 | 3 |
| Grandeur Peak Funds® | Shareholder Letter |
October 31, 2021 (Unaudited)
We are pleased to announce the promotion of a number of our well-seasoned analysts, to the role of Portfolio Manager as of August 31, 2021. Each has earned a master’s degree in recent years form schools around the globe.
| · | Benjamin Gardiner (MBA) was named a co-Portfolio Manager of the Global Opportunities Fund, joining Blake Walker, CEO, who has managed the Fund with Robert since its inception. Ben has been an analyst focused on the Global Opportunities Fund since 2015. |
| · | Spencer Hackett (MSF) was named a co-Portfolio Manager of the Global Micro Cap Fund, joining Amy Sunderland who has managed the Fund since its inception. Spencer has been an analyst on the Fund since its inception. |
| · | Conner Whipple (MBA) was named a co-Portfolio Manager of the Global Reach Fund (GPROX/GPRIX), focusing on the Financials sector. |
Conner has worked on the financials team since joining Grandeur Peak in 2012. He and Brad Barth jointly manage the Financials sector for Grandeur Peak.
| · | Phil Naylor (MBA) was named a co-Portfolio Manager of the Global Reach Fund, focusing on the Technology sector. Phil has been a key member of the technology team since 2014. He and Stuart Rigby will collaboratively manage the Technology sector for the firm. |
| · | Tyler Glauser (MBA) was named a co-Portfolio Manager of the Global Reach Fund, focusing on the Consumer sector. Tyler has worked with Amy Hu Sunderland on the Consumer sector since 2014. They will continue to jointly manage our Consumer holdings. |
Looking ahead, we’ve outlined a road map that builds on our original goals:
From our founding, we set out to become a world-class global manager; a firm with a collaborative culture, global analysts, a unique team structure, and a disciplined, active investment process. Our focus has been on the micro- to mid-cap space where we feel the markets are less efficient and have better opportunities for growth. Along the way, we committed to keeping our asset base nimble as we sought to build something special for our clients, our team and our community.
We are striving to become world-class in every aspect of our firm. Our Research team has gone broad in mapping out the companies of the world. We need to go deeper, and know our companies even better. We plan to build our team’s geographic efforts. We believe it will be increasingly important to recognize the long-term sustainability of companies. We hope to enhance our multiple minds approach to investing by supporting more access and opportunity for underrepresented groups in our industry. As the road map for the next ten years unfolds, we know we’ll have challenges ahead, taking in lessons from the past so we can be better in the future. We hope you will remain along for the journey with us for our second decade.
As always, please feel free to reach out any time with any questions, requests or comments. We appreciate the opportunity to work on your behalf.
Sincerely,
Your Grandeur Peak Team
The objective of all Grandeur Peak Funds is long-term growth of capital.
RISKS: Investing in small and micro-cap funds will be more volatile and loss of principal could be greater than investing in large cap or more diversified funds. Investing in foreign securities entails special risks, such as currency fluctuations and political uncertainties, which are described in more detail in the prospectus. Investments in emerging markets are subject to the same risks as other foreign securities and may be subject to greater risks than investments in foreign countries with more established economies and securities markets.
An investor should consider investment objectives, risks, charges, and expenses carefully before investing. To obtain a Grandeur Peak Funds prospectus, containing this and other information, visit www.grandeurpeakglobal.com or call 1-855-377-7325. Please read it carefully before investing.
The views and information discussed in this commentary are as of the date of publication, are subject to change, and may not reflect the writer's current views. The views expressed represent an assessment of market conditions at a specific point in time, are opinions only and should not be relied upon as investment advice regarding a particular investment or markets in general. Such information does not constitute a recommendation to buy or sell specific securities or investment vehicles. It should not be assumed that any investment will be profitable or will equal the performance of the Funds or any securities or any sectors mentioned herein. The subject matter contained herein has been derived from several sources believed to be reliable and accurate at the time of compilation. The Funds do not accept any liability for losses either direct or consequential caused by the use of this information.
Past performance does not guarantee future results.
Grandeur Peak Funds are distributed by ALPS Distributors, Inc. (ADI). ADI is not affiliated with Grandeur Peak Global Advisors.
| 4 | 1.855.377.7325 | www.GrandeurPeakGlobal.com |
| Grandeur Peak Funds® | Shareholder Letter |
October 31, 2021 (Unaudited)
A mortgage-backed security is a type of asset-backed security which is secured by a mortgage or collection of mortgages. The mortgages are aggregated and sold to a group of individuals that securitizes, or packages, the loans together into a security that investors can buy.
The term "high-yield funds" generally refers to mutual funds or exchange-traded funds (ETFs) that hold stocks that pay above-average dividends, bonds with above-average interest payments, or a combination of both.
Investing in securities that meet ESG criteria may result in the Funds forgoing otherwise attractive opportunities, which may result in underperformance when compared to funds that do not consider ESG factors.
Quantitative easing is a monetary policy whereby a central bank purchases at scale government bonds or other financial assets in order to inject money into the economy to expand economic activity.
The S&P 500® Index is an unmanaged index of 500 common stocks chosen for market size, liquidity and industry group representation. It is a market-value weighted index. The Index is not actively managed and does not reflect any deductions for fees, expenses or taxes. An investor may not invest directly in the Index.
| Semi-Annual Report | October 31, 2021 | 5 |
| Grandeur Peak Emerging Markets Opportunities Fund | Performance Update |
October 31, 2021 (Unaudited)
Annualized Total Return Performance for the periods ended October 31, 2021
| Since | Expense Ratio(b) | ||||||
| 6 Months | 1 Year | 3 Years | 5 Years | Inception(a) | Gross | Net(c) | |
| Grandeur Peak Emerging Markets Opportunities Fund – Investor (GPEOX) | 4.92% | 33.14% | 21.70% | 11.75% | 9.22% | 1.77% | 1.77% |
| Grandeur Peak Emerging Markets Opportunities Fund – Institutional (GPEIX) | 4.99% | 33.35% | 21.94% | 11.99% | 9.45% | 1.52% | 1.52% |
| MSCI Emerging Markets SMID Cap Index(d) | 1.32% | 37.73% | 14.97% | 9.41% | 5.93% | ||
| MSCI Emerging Markets IMI Index(e) | -3.77% | 20.11% | 13.28% | 9.86% | 6.10% | ||
Performance data quoted represents past performance. Past performance does not guarantee future results. Investment return and principal value of an investment will fluctuate so that an investor’s shares, when sold or redeemed, may be worth more or less than the original cost. The Fund imposes a 2.00% redemption fee on shares held for less than 60 days. Current performance data may be higher or lower than actual data quoted. For the most current month-end performance data, please call 1-855-377-PEAK (7325).
The table does not reflect the deduction of taxes a shareholder would pay on Fund distributions or redemption of Fund shares.
Subject to investment risks, including possible loss of the principal amount invested.
Returns for periods less than 1 year are cumulative.
| (a) | Fund inception date of December 16, 2013. |
| (b) | Ratios as of the Prospectus dated August 31, 2021 and may differ from the ratios presented in the Financial Highlights. |
| (c) | Grandeur Peak Global Advisors, LLC (the “Adviser”), has agreed to waive and/or reimburse fees or expenses in order to limit Total Annual Fund Operating Expenses After Fee Waiver/Expense Reimbursement (excluding acquired fund fees and expenses, brokerage expenses, interest expenses, taxes and extraordinary expenses) to 1.95% and 1.70% of the Fund’s average daily net assets for the Fund’s Investor Class Shares and Institutional Class Shares, respectively. This agreement (the “Expense Agreement”) is in effect through August 31, 2022. The Adviser will be permitted to recover, on a class- by-class basis, expenses it has borne through the Expense Agreement to the extent that a Fund’s expenses in later periods fall below annual rates set forth in the Expense Agreement; provided, however, that such recapture payments do not cause the Fund’s expense ratio (after recapture) to exceed the lesser of (i) the expense cap in effect at the time of the waiver and (ii) the expense cap in effect at the time of the recapture. Notwithstanding the foregoing, the Fund will not be obligated to pay any such deferred fees and expenses more than three years after the date on which the fee and expenses was deferred. The Expense Agreement may not be terminated or modified prior to August 31, 2022 except with the approval of the Fund’s Board of Trustees. |
| (d) | The MSCI Emerging Markets SMID Cap Index is designed to measure the equity market performance of small and mid-cap companies across emerging markets. MSCI makes no express or implied warranties or representations and shall have no liability whatsoever with respect to any MSCI data contained herein. The MSCI data may not be further redistributed or used to create indices or financial products. The Index is not actively managed and does not reflect any deductions for fees, expenses or taxes. An investor may not invest directly into the Index. |
| (e) | The MSCI Emerging Markets IMI Index is designed to measure the equity market performance of large, mid, and small-cap companies across emerging markets. The Index is not actively managed and does not reflect any deductions for fees, expenses or taxes. An investor may not invest directly into the Index. |
| 6 | 1.855.377.7325 | www.GrandeurPeakGlobal.com |
| Grandeur Peak Emerging Markets Opportunities Fund | Performance Update |
October 31, 2021 (Unaudited)
Growth of $10,000 for the period ended October 31, 2021

The chart shown above represents a hypothetical investment of $10,000 in the Fund’s Investor Class shares for the period from inception to October 31, 2021. All returns reflect reinvested dividends, but do not reflect the deduction of taxes that an investor would pay on distributions or redemptions.
Investing in the Fund is subject to investment risks, including possible loss of the principal amount invested.
The Fund also offers Institutional Class shares, performance for which is not reflected in the graphs above. The performance of Institutional Class shares may be higher or lower than the performance of the Investor Class shares shown in the graphs above based upon differences in fees paid by shareholders investing in the Investor Class shares and Institutional Class shares.
| Semi-Annual Report | October 31, 2021 | 7 |
| Grandeur Peak Emerging Markets Opportunities Fund | Performance Update |
October 31, 2021 (Unaudited)
| Regional Allocation (as a % of Net Assets)* | |
| Asia ex Japan | 70.4% |
| Europe | 9.5% |
| North America | 4.3% |
| Latin America | 8.6% |
| Africa/Middle East | 3.1% |
| Cash, Cash Equivalents, & Other Net Assets | 4.1% |
| Total | 100.0% |
| Top 10 Holdings (as a % of Net Assets)* | |
| Silergy Corp. | 4.4% |
| WNS Holdings, Ltd. | 3.3% |
| Dino Polska SA | 2.4% |
| Metropolis Healthcare, Ltd. | 2.1% |
| Genpact, Ltd. | 1.8% |
| momo.com, Inc. | 1.6% |
| Wilcon Depot, Inc. | 1.6% |
| Poya International Co., Ltd. | 1.4% |
| Techtronic Industries Co., Ltd. | 1.3% |
| Voltronic Power Technology Corp. | 1.2% |
| Total | 21.1% |
| * | Holdings are subject to change, and may not reflect the current or future position of the portfolio. |
| 8 | 1.855.377.7325 | www.GrandeurPeakGlobal.com |
| Grandeur Peak Global Contrarian Fund | Performance Update |
October 31, 2021 (Unaudited)
Annualized Total Return Performance for the periods ended October 31, 2021
| Since | Expense Ratio(b) | ||||
| 6 Months | 1 Year | Inception(a) | Gross | Net(c) | |
| Grandeur Peak Global Contrarian Fund – Institutional (GPGCX) | 7.20% | 53.17% | 27.89% | 1.87% | 1.35% |
| MSCI All Country World Index Small Cap Value(d) | 3.07% | 51.73% | 15.80% | ||
| MSCI All Country World Index Small Cap(e) | 3.37% | 45.78% | 20.56% | ||
Performance data quoted represents past performance. Past performance does not guarantee future results. Investment return and principal value of an investment will fluctuate so that an investor’s shares, when sold or redeemed, may be worth more or less than the original cost. The Fund imposes a 2.00% redemption fee on shares held for less than 60 days. Current performance data may be higher or lower than actual data quoted. For the most current month-end performance data, please call 1-855-377-PEAK (7325).
The table does not reflect the deduction of taxes a shareholder would pay on Fund distributions or redemption of Fund shares.
Subject to investment risks, including possible loss of the principal amount invested.
Returns for periods less than 1 year are cumulative.
| (a) | Fund inception date of September 17, 2019. |
| (b) | Ratios as of the Prospectus dated August 31, 2021 and may differ from the ratios presented in the Financial Highlights. |
| (c) | Grandeur Peak Global Advisors, LLC (the “Adviser”), has agreed to waive and/or reimburse fees or expenses in order to limit Total Annual Fund Operating Expenses After Fee Waiver/Expense Reimbursement (excluding acquired fund fees and expenses, brokerage expenses, interest expenses, taxes and extraordinary expenses) to 1.35% of the Fund’s average daily net assets for the Fund’s Institutional Class Shares. This agreement (the “Expense Agreement”) is in effect through August 31, 2022. The Adviser will be permitted to recover, on a class- by-class basis, expenses it has borne through the Expense Agreement to the extent that a Fund’s expenses in later periods fall below annual rates set forth in the Expense Agreement; provided, however, that such recapture payments do not cause the Fund’s expense ratio (after recapture) to exceed the lesser of (i) the expense cap in effect at the time of the waiver and (ii) the expense cap in effect at the time of the recapture. Notwithstanding the foregoing, the Fund will not be obligated to pay any such deferred fees and expenses more than three years after the date on which the fee and expenses was deferred. The Expense Agreement may not be terminated or modified prior to August 31, 2022 except with the approval of the Fund’s Board of Trustees. |
| (d) | The MSCI ACWI Small Cap Value Index is designed to measure small cap companies exhibiting overall value style characteristics across developed and emerging markets globally. The Index is not actively managed and does not reflect any deductions for fees, expenses or taxes. An investor may not invest directly into the Index. |
| (e) | The MSCI ACWI Small Cap Index is designed to measure the equity market performance of performance of small-cap companies across developed and emerging markets globally. MSCI makes no express or implied warranties or representations and shall have no liability whatsoever with respect to any MSCI data contained herein. The MSCI data may not be further redistributed or used to create indices or financial products. The Index is not actively managed and does not reflect any deductions for fees, expenses or taxes. An investor may not invest directly into the Index. |
| Semi-Annual Report | October 31, 2021 | 9 |
| Grandeur Peak Global Contrarian Fund | Performance Update |
October 31, 2021 (Unaudited)
Growth of $10,000 for the period ended October 31, 2021
The chart shown above represents a hypothetical investment of $10,000 in the Fund’s Institutional Class shares for the period from inception to October 31, 2021. All returns reflect reinvested dividends, but do not reflect the deduction of taxes that an investor would pay on distributions or redemptions.
Investing in the Fund is subject to investment risks, including possible loss of the principal amount invested.
| 10 | 1.855.377.7325 | www.GrandeurPeakGlobal.com |
| Grandeur Peak Global Contrarian Fund | Performance Update |
October 31, 2021 (Unaudited)
| Regional Allocation (as a % of Net Assets)* | |
| North America | 28.9% |
| Asia ex Japan | 27.7% |
| Europe | 18.5% |
| Japan | 13.1% |
| Australia/New Zealand | 5.6% |
| Latin America | 3.0% |
| Africa/Middle East | 2.3% |
| Cash, Cash Equivalents, & Other Net Assets | 0.9% |
| Total | 100.0% |
| Top 10 Holdings (as a % of Net Assets)* | |
| Hackett Group, Inc. | 3.9% |
| Plumas Bancorp | 3.0% |
| Seria Co., Ltd. | 2.6% |
| Plover Bay Technologies, Ltd. | 2.5% |
| Barrett Business Services, Inc. | 2.5% |
| Bank of NT Butterfield & Son, Ltd. | 2.4% |
| Fiducian Group, Ltd. | 2.2% |
| Japan Lifeline Co., Ltd. | 2.2% |
| Guardian Capital Group, Ltd. | 2.1% |
| QANTM Intellectual Property, Ltd. | 2.1% |
| Total | 25.5% |
| * | Holdings are subject to change, and may not reflect the current or future position of the portfolio. |
| Semi-Annual Report | October 31, 2021 | 11 |
| Grandeur Peak Global Micro Cap Fund | Performance Update |
October 31, 2021 (Unaudited)
Annualized Total Return Performance for the periods ended October 31, 2021
| Since | Expense Ratio(b) | ||||||
| 6 Months | 1 Year | 3 Years | 5 Years | Inception(a) | Gross | Net(c) | |
| Grandeur Peak Global Micro Cap Fund – Institutional (GPMCX) | 5.28% | 49.23% | 30.00% | 20.09% | 18.35% | 2.02% | 2.00% |
| MSCI All Country World Index Small Cap(d) | 3.37% | 45.78% | 16.80% | 14.18% | 12.50% | ||
| MSCI World Micro Cap Index(e) | 2.69% | 51.51% | 17.52% | 14.32% | 13.27% | ||
Performance data quoted represents past performance. Past performance does not guarantee future results. Investment return and principal value of an investment will fluctuate so that an investor’s shares, when sold or redeemed, may be worth more or less than the original cost. The Fund imposes a 2.00% redemption fee on shares held for less than 60 days. Current performance data may be higher or lower than actual data quoted. For the most current month-end performance data, please call 1-855-377-PEAK (7325).
The table does not reflect the deduction of taxes a shareholder would pay on Fund distributions or redemption of Fund shares.
Subject to investment risks, including possible loss of the principal amount invested.
Returns for periods less than 1 year are cumulative.
| (a) | Fund inception date of October 20, 2015. |
| (b) | Ratios as of the Prospectus dated August 31, 2021 and may differ from the ratios presented in the Financial Highlights. |
| (c) | Grandeur Peak Global Advisors, LLC (the “Adviser”), has agreed to waive and/or reimburse fees or expenses in order to limit Total Annual Fund Operating Expenses After Fee Waiver/ Expense Reimbursement (excluding acquired fund fees and expenses, brokerage expenses, interest expenses, taxes and extraordinary expenses) to 2.00% of the Fund’s average daily net assets for the Fund’s Institutional Class Shares. This agreement is in effect through August 31, 2022. The Adviser will be permitted to recover expenses it has borne through this agreement to the extent that a Fund’s expenses in later periods fall below annual rates set forth in the Expense Agreement; provided, however, that such recapture payments do not cause the Fund’s expense ratio (after recapture) to exceed the lesser of (i) the expense cap in effect at the time of the waiver and (ii) the expense cap in effect at the time of the recapture. Notwithstanding the foregoing, the Fund will not be obligated to pay any such deferred fees and expenses more than three years after the date on which the fee and expenses was deferred. This agreement may not be terminated or modified prior to August 31, 2022 except with the approval of the Fund’s Board of Trustees. |
| (d) | The MSCI ACWI Small Cap Index is designed to measure the equity market performance of performance of small-cap companies across developed and emerging markets globally. MSCI makes no express or implied warranties or representations and shall have no liability whatsoever with respect to any MSCI data contained herein. The MSCI data may not be further redistributed or used to create indices or financial products. The Index is not actively managed and does not reflect any deductions for fees, expenses or taxes. An investor may not invest directly into the Index. |
| (e) | The MSCI World Micro Cap Index is designed to measure the equity market performance of micro-cap companies across developed markets globally. It does not include emerging markets. The Index is not actively managed and does not reflect any deductions for fees, expenses or taxes. An investor may not invest directly into the Index. |
| 12 | 1.855.377.7325 | www.GrandeurPeakGlobal.com |
| Grandeur Peak Global Micro Cap Fund | Performance Update |
October 31, 2021 (Unaudited)
Growth of $10,000 for the period ended October 31, 2021
The chart shown above represents a hypothetical investment of $10,000 in the Fund’s Institutional Class shares for the period from inception to October 31, 2021. All returns reflect reinvested dividends, but do not reflect the deduction of taxes that an investor would pay on distributions or redemptions.
Investing in the Fund is subject to investment risks, including possible loss of the principal amount invested.
| Semi-Annual Report | October 31, 2021 | 13 |
| Grandeur Peak Global Micro Cap Fund | Performance Update |
October 31, 2021 (Unaudited)
| Regional Allocation (as a % of Net Assets)* | |
| Europe | 41.9% |
| Asia ex Japan | 19.5% |
| North America | 16.4% |
| Japan | 15.7% |
| Australia/New Zealand | 5.5% |
| Africa/Middle East | 0.5% |
| Latin America | 0.2% |
| Cash, Cash Equivalents, & Other Net Assets | 0.3% |
| Total | 100.0% |
| Top 10 Holdings (as a % of Net Assets)* | |
| SwedenCare AB | 3.9% |
| Joint Corp. | 3.3% |
| Musti Group Oyj | 2.1% |
| Nordhealth AS | 2.0% |
| Alpha Teknova, Inc. | 1.9% |
| Beenos, Inc. | 1.9% |
| K3 Capital Group PLC | 1.7% |
| Kogan.com, Ltd. | 1.6% |
| Sarantis SA | 1.6% |
| Fiducian Group, Ltd. | 1.5% |
| Total | 21.5% |
| * | Holdings are subject to change, and may not reflect the current or future position of the portfolio. |
| 14 | 1.855.377.7325 | www.GrandeurPeakGlobal.com |
| Grandeur Peak Global Opportunities Fund | Performance Update |
October 31, 2021 (Unaudited)
Annualized Total Return Performance for the periods ended October 31, 2021
| Since | Expense Ratio(b) | |||||||
| 6 Months | 1 Year | 3 Years | 5 Years | 10 Years | Inception(a) | Gross | Net(c) | |
| Grandeur Peak Global Opportunities Fund – Investor (GPGOX) | 8.89% | 50.45% | 29.56% | 20.55% | 16.86% | 17.24% | 1.60% | 1.60% |
| Grandeur Peak Global Opportunities Fund – Institutional (GPGIX) | 9.09% | 51.01% | 29.95% | 20.86% | 17.17% | 17.56% | 1.35% | 1.35% |
| MSCI All Country World Index Small Cap(d) | 3.37% | 45.78% | 16.80% | 14.18% | 11.93% | 12.44% | ||
| MSCI All Country World Index IMI(e) | 6.74% | 38.76% | 17.89% | 15.16% | 11.91% | 12.33% | ||
Performance data quoted represents past performance. Past performance does not guarantee future results. Investment return and principal value of an investment will fluctuate so that an investor’s shares, when sold or redeemed, may be worth more or less than the original cost. The Fund imposes a 2.00% redemption fee on shares held for less than 60 days. Current performance data may be higher or lower than actual data quoted. For the most current month-end performance data, please call 1-855-377-PEAK (7325).
The table does not reflect the deduction of taxes a shareholder would pay on Fund distributions or redemption of Fund shares.
Subject to investment risks, including possible loss of the principal amount invested.
Returns for periods less than 1 year are cumulative.
| (a) | Fund inception date of October 17, 2011. |
| (b) | Ratios as of the Prospectus dated August 31, 2021 and may differ from the ratios presented in the Financial Highlights. |
| (c) | Grandeur Peak Global Advisors, LLC (the “Adviser”), has agreed to waive and/or reimburse fees or expenses in order to limit Total Annual Fund Operating Expenses After Fee Waiver/ Expense Reimbursement (excluding acquired fund fees and expenses, brokerage expenses, interest expenses, taxes and extraordinary expenses) to 1.75% and 1.50% of the Fund’s average daily net assets for the Fund’s Investor Class Shares and Institutional Class Shares, respectively. This agreement (the “Expense Agreement”) is in effect through August 31, 2022. The Adviser will be permitted to recover, on a class- by-class basis, expenses it has borne the Expense Agreement to the extent that a Fund’s expenses in later periods fall below annual rates set forth in the Expense Agreement; provided, however, that such recapture payments do not cause the Fund’s expense ratio (after recapture) to exceed the lesser of (i) the expense cap in effect at the time of the waiver and (ii) the expense cap in effect at the time of the recapture. Notwithstanding the foregoing, the Fund will not be obligated to pay any such deferred fees and expenses more than three years after the date on which the fee and expenses was deferred. The Expense Agreement may not be terminated or modified prior to August 31, 2022 except with the approval of the Fund’s Board of Trustees. |
| (d) | The MSCI ACWI Small Cap Index is designed to measure the equity market performance of performance of small-cap companies across developed and emerging markets globally. MSCI makes no express or implied warranties or representations and shall have no liability whatsoever with respect to any MSCI data contained herein. The MSCI data may not be further redistributed or used to create indices or financial products. The Index is not actively managed and does not reflect any deductions for fees, expenses or taxes. An investor may not invest directly into the Index. |
| (e) | The MSCI ACWI IMI Index is designed to measure the equity market performance of large, mid, and small-cap companies across developed and emerging markets globally. The Index is not actively managed and does not reflect any deductions for fees, expenses or taxes. An investor may not invest directly into the Index. |
| Semi-Annual Report | October 31, 2021 | 15 |
| Grandeur Peak Global Opportunities Fund | Performance Update |
October 31, 2021 (Unaudited)
Growth of $10,000 for the period ended October 31, 2021
The chart shown above represents a hypothetical investment of $10,000 in the Fund’s Investor Class shares for the period from inception to October 31, 2021. All returns reflect reinvested dividends, but do not reflect the deduction of taxes that an investor would pay on distributions or redemptions.
Investing in the Fund is subject to investment risks, including possible loss of the principal amount invested.
The Fund also offers Institutional Class shares, performance for which is not reflected in the graphs above. The performance of Institutional Class shares may be higher or lower than the performance of the Investor Class shares shown in the graphs above based upon differences in fees paid by shareholders investing in the Investor Class shares and Institutional Class shares.
| 16 | 1.855.377.7325 | www.GrandeurPeakGlobal.com |
| Grandeur Peak Global Opportunities Fund | Performance Update |
October 31, 2021 (Unaudited)
| Regional Allocation (as a % of Net Assets)* | |
| Europe | 42.9% |
| North America | 27.4% |
| Asia ex Japan | 17.4% |
| Japan | 8.7% |
| Latin America | 2.2% |
| Africa/Middle East | 0.8% |
| Australia/New Zealand | 0.5% |
| Cash, Cash Equivalents, & Other Net Assets | 0.1% |
| Total | 100.0% |
| Top 10 Holdings (as a % of Net Assets)* | |
| Endava PLC | 3.1% |
| Dechra Pharmaceuticals PLC | 2.6% |
| Silergy Corp. | 2.5% |
| B&M European Value Retail SA | 2.2% |
| WNS Holdings, Ltd. | 2.1% |
| EPAM Systems, Inc. | 2.1% |
| Littelfuse, Inc. | 1.9% |
| CVS Group PLC | 1.8% |
| Virbac SA | 1.7% |
| Metropolis Healthcare, Ltd. | 1.5% |
| Total | 21.5% |
| * | Holdings are subject to change, and may not reflect the current or future position of the portfolio. |
| Semi-Annual Report | October 31, 2021 | 17 |
| Grandeur Peak Global Reach Fund | Performance Update |
October 31, 2021 (Unaudited)
Annualized Total Return Performance for the periods ended October 31, 2021
| Since | Expense Ratio(b) | ||||||
| 6 Months | 1 Year | 3 Years | 5 Years | Inception(a) | Gross | Net(c) | |
| Grandeur Peak Global Reach Fund – Investor (GPROX) | 10.32% | 48.87% | 28.04% | 19.88% | 15.72% | 1.52% | 1.52% |
| Grandeur Peak Global Reach Fund – Institutional (GPRIX) | 10.47% | 49.21% | 28.37% | 20.17% | 15.99% | 1.27% | 1.27% |
| MSCI All Country World Small Cap Index(d) | 3.37% | 45.78% | 16.80% | 14.18% | 11.18% | ||
| MSCI All Country World IMI Index(e) | 6.74% | 38.76% | 17.89% | 15.16% | 11.50% | ||
Performance data quoted represents past performance. Past performance does not guarantee future results. Investment return and principal value of an investment will fluctuate so that an investor’s shares, when sold or redeemed, may be worth more or less than the original cost. The Fund imposes a 2.00% redemption fee on shares held for less than 60 days. Current performance data may be higher or lower than actual data quoted. For the most current month-end performance data, please call 1-855-377-PEAK (7325).
The table does not reflect the deduction of taxes a shareholder would pay on Fund distributions or redemption of Fund shares.
Subject to investment risks, including possible loss of the principal amount invested.
Returns for periods less than 1 year are cumulative.
| (a) | Fund inception date of June 19, 2013. |
| (b) | Ratios as of the Prospectus dated August 31, 2021 and may differ from the ratios presented in the Financial Highlights. |
| (c) | Grandeur Peak Global Advisors, LLC (the “Adviser”), has agreed to waive and/or reimburse fees or expenses in order to limit Total Annual Fund Operating Expenses After Fee Waiver/Expense Reimbursement (excluding acquired fund fees and expenses, brokerage expenses, interest expenses, taxes and extraordinary expenses) to 1.60% and 1.35% of the Fund’s average daily net assets for the Fund’s Investor Class Shares and Institutional Class Shares, respectively. This agreement (the “Expense Agreement”) is in effect through August 31, 2022. The Adviser will be permitted to recover, on a class- by-class basis, expenses it has borne through the Expense Agreement to the extent that a Fund’s expenses in later periods fall below annual rates set forth in the Expense Agreement; provided, however, that such recapture payments do not cause the Fund’s expense ratio (after recapture) to exceed the lesser of (i) the expense cap in effect at the time of the waiver and (ii) the expense cap in effect at the time of the recapture. Notwithstanding the foregoing, the Fund will not be obligated to pay any such deferred fees and expenses more than three years after the date on which the fee and expenses was deferred. The Expense Agreement may not be terminated or modified prior to August 31, 2022 except with the approval of the Fund’s Board of Trustees. |
| (d) | The MSCI ACWI Small Cap Index is designed to measure the equity market performance of performance of small-cap companies across developed and emerging markets globally. MSCI makes no express or implied warranties or representations and shall have no liability whatsoever with respect to any MSCI data contained herein. The MSCI data may not be further redistributed or used to create indices or financial products. The Index is not actively managed and does not reflect any deductions for fees, expenses or taxes. An investor may not invest directly into the Index. |
| (e) | The MSCI ACWI IMI Index is designed to measure the equity market performance of large, mid, and small-cap companies across developed and emerging markets globally. The Index is not actively managed and does not reflect any deductions for fees, expenses or taxes. An investor may not invest directly into the Index. |
| 18 | 1.855.377.7325 | www.GrandeurPeakGlobal.com |
| Grandeur Peak Global Reach Fund | Performance Update |
October 31, 2021 (Unaudited)
Growth of $10,000 for the period ended October 31, 2021
The chart shown above represents a hypothetical investment of $10,000 in the Fund’s Investor Class shares for the period from inception to October 31, 2021. All returns reflect reinvested dividends, but do not reflect the deduction of taxes that an investor would pay on distributions or redemptions.
Investing in the Fund is subject to investment risks, including possible loss of the principal amount invested.
The Fund also offers Institutional Class shares, performance for which is not reflected in the graphs above. The performance of Institutional Class shares may be higher or lower than the performance of the Investor Class shares shown in the graphs above based upon differences in fees paid by shareholders investing in the Investor Class shares and Institutional Class shares.
| Semi-Annual Report | October 31, 2021 | 19 |
| Grandeur Peak Global Reach Fund | Performance Update |
October 31, 2021 (Unaudited)
| Regional Allocation (as a % of Net Assets)* | |
| Europe | 34.2% |
| North America | 31.6% |
| Asia ex Japan | 18.3% |
| Japan | 7.6% |
| Latin America | 3.1% |
| Australia/New Zealand | 3.1% |
| Africa/Middle East | 1.9% |
| Cash, Cash Equivalents, & Other Net Assets | 0.2% |
| Total | 100.0% |
| Top 10 Holdings (as a % of Net Assets)* | |
| Endava PLC | 1.7% |
| EQT AB | 1.6% |
| Silergy Corp. | 1.5% |
| First Republic Bank | 1.5% |
| Impax Asset Management Group PLC | 1.5% |
| Esker SA | 1.3% |
| EPAM Systems, Inc. | 1.3% |
| WNS Holdings, Ltd. | 1.2% |
| Vietnam Technological & Commercial Joint Stock Bank | 1.1% |
| Dino Polska SA | 1.0% |
| Total | 13.7% |
| * | Holdings are subject to change, and may not reflect the current or future position of the portfolio. |
| 20 | 1.855.377.7325 | www.GrandeurPeakGlobal.com |
| Grandeur Peak Global Stalwarts Fund | Performance Update |
October 31, 2021 (Unaudited)
Annualized Total Return Performance for the periods ended October 31, 2021
| Since | Expense Ratio(b) | ||||||
| 6 Months | 1 Year | 3 Years | 5 Years | Inception(a) | Gross | Net(c) | |
| Grandeur Peak Global Stalwarts Fund – Investor (GGSOX)* | 15.78% | 50.57% | 29.77% | 21.22% | 19.29% | 1.21% | 1.21% |
| Grandeur Peak Global Stalwarts Fund – Institutional (GGSYX)* | 15.91% | 50.95% | 30.09% | 21.51% | 19.59% | 0.96% | 0.96% |
| MSCI All Country World Mid Cap Index(d) | 5.57% | 40.13% | 16.99% | 13.67% | 12.40% | ||
| MSCI All Country World Small Cap Index(e) | 3.37% | 45.78% | 16.80% | 14.18% | 12.94% | ||
Performance data quoted represents past performance. Past performance does not guarantee future results. Investment return and principal value of an investment will fluctuate so that an investor’s shares, when sold or redeemed, may be worth more or less than the original cost. The Fund imposes a 2.00% redemption fee on shares held for less than 60 days. Current performance data may be higher or lower than actual data quoted. For the most current month-end performance data, please call 1-855-377-PEAK (7325).
The table does not reflect the deduction of taxes a shareholder would pay on Fund distributions or redemption of Fund shares.
Subject to investment risks, including possible loss of the principal amount invested.
Returns for periods less than 1 year are cumulative.
| * | Excludes adjustments in accordance with accounting principles generally accepted in the United States of America and as such, the net asset value and total return for shareholder transactions reported to the market may differ from the net asset value for financial reporting purposes. |
| (a) | Fund inception date of September 1, 2015. |
| (b) | Ratios as of the Prospectus dated August 31, 2021 and may differ from the ratios presented in the Financial Highlights. |
| (c) | Grandeur Peak Global Advisors, LLC (the “Adviser”), has agreed to waive and/or reimburse fees or expenses in order to limit Total Annual Fund Operating Expenses After Fee Waiver/ Expense Reimbursement (excluding acquired fund fees and expenses, brokerage expenses, interest expenses, taxes and extraordinary expenses) to 1.35% and 1.10% of the Fund’s average daily net assets for the Fund’s Investor Class Shares and Institutional Class Shares, respectively. This agreement is in effect through August 31, 2022. The Adviser will be permitted to recover, on a class-by-class basis, expenses it has borne through this agreement to the extent that a Fund’s expenses in later periods fall below annual rates set forth in the Expense Agreement; provided, however, that such recapture payments do not cause the Fund’s expense ratio (after recapture) to exceed the lesser of (i) the expense cap in effect at the time of the waiver and (ii) the expense cap in effect at the time of the recapture. Notwithstanding the foregoing, the Fund will not be obligated to pay any such deferred fees and expenses more than three years after the date on which the fee and expenses was deferred. This agreement may not be terminated or modified prior to August 31, 2022 except with the approval of the Fund’s Board of Trustees. |
| (d) | The MSCI ACWI Mid Cap Index is designed to measure the equity market performance of performance of mid-cap companies across developed and emerging markets globally. MSCI makes no express or implied warranties or representations and shall have no liability whatsoever with respect to any MSCI data contained herein. The MSCI data may not be further redistributed or used to create indices or financial products. The Index is not actively managed and does not reflect any deductions for fees, expenses or taxes. An investor may not invest directly into the Index. |
| (e) | The MSCI ACWI Small Cap Index is designed to measure the equity market performance of small-cap companies across developed and emerging markets globally. The Index is not actively managed and does not reflect any deductions for fees, expenses or taxes. An investor may not invest directly into the Index. |
| Semi-Annual Report | October 31, 2021 | 21 |
| Grandeur Peak Global Stalwarts Fund | Performance Update |
October 31, 2021 (Unaudited)
Growth of $10,000 for the period ended October 31, 2021

The chart shown above represents a hypothetical investment of $10,000 in the Fund’s Investor Class shares for the period from inception to October 31, 2021. All returns reflect reinvested dividends, but do not reflect the deduction of taxes that an investor would pay on distributions or redemptions.
Investing in the Fund is subject to investment risks, including possible loss of the principal amount invested.
The Fund also offers Institutional Class shares, performance for which is not reflected in the graphs above. The performance of Institutional Class shares may be higher or lower than the performance of the Investor Class shares shown in the graphs above based upon differences in fees paid by shareholders investing in the Investor Class shares and Institutional Class shares.
| 22 | 1.855.377.7325 | www.GrandeurPeakGlobal.com |
| Grandeur Peak Global Stalwarts Fund | Performance Update |
October 31, 2021 (Unaudited)
| Regional Allocation (as a % of Net Assets)* | |
| North America | 42.8% |
| Europe | 26.9% |
| Asia ex Japan | 17.4% |
| Japan | 7.8% |
| Latin America | 1.6% |
| Australia/New Zealand | 0.7% |
| Africa/Middle East | 0.5% |
| Cash, Cash Equivalents, & Other Net Assets | 2.3% |
| Total | 100.0% |
| Top 10 Holdings (as a % of Net Assets)* | |
| Silergy Corp. | 4.0% |
| First Republic Bank | 3.0% |
| WNS Holdings, Ltd. | 2.6% |
| Dechra Pharmaceuticals PLC | 2.6% |
| Endava PLC | 2.5% |
| EPAM Systems, Inc. | 2.4% |
| B&M European Value Retail SA | 2.2% |
| St. James's Place PLC | 1.6% |
| Littelfuse, Inc. | 1.5% |
| Intertek Group PLC | 1.3% |
| Total | 23.7% |
| * | Holdings are subject to change, and may not reflect the current or future position of the portfolio. |
| Semi-Annual Report | October 31, 2021 | 23 |
| Grandeur Peak International Opportunities Fund | Performance Update |
October 31, 2021 (Unaudited)
Annualized Total Return Performance for the periods ended October 31, 2021
| Since | Expense Ratio(b) | |||||||
| 6 Months | 1 Year | 3 Years | 5 Years | 10 Years | Inception(a) | Gross | Net(c) | |
| Grandeur Peak International Opportunities Fund – Investor (GPIOX) | 7.35% | 41.72% | 24.85% | 16.89% | 14.86% | 15.25% | 1.61% | 1.61% |
| Grandeur Peak International Opportunities Fund – Institutional (GPIIX) | 7.49% | 42.11% | 25.02% | 17.18% | 15.11% | 15.50% | 1.36% | 1.36% |
| MSCI All Country World Index ex USA Small Cap Index(d) | 3.48% | 39.36% | 15.20% | 11.63% | 9.12% | 9.39% | ||
| MSCI All Country World IMI ex USA Index(e) | 2.23% | 31.46% | 12.88% | 10.47% | 7.41% | 7.78% | ||
Performance data quoted represents past performance. Past performance does not guarantee future results. Investment return and principal value of an investment will fluctuate so that an investor’s shares, when sold or redeemed, may be worth more or less than the original cost. The Fund imposes a 2.00% redemption fee on shares held for less than 60 days. Current performance data may be higher or lower than actual data quoted. For the most current month-end performance data, please call 1-855-377-PEAK (7325).
The table does not reflect the deduction of taxes a shareholder would pay on Fund distributions or redemption of Fund shares.
Subject to investment risks, including possible loss of the principal amount invested.
Returns for periods less than 1 year are cumulative.
| (a) | Fund inception date of October 17, 2011. |
| (b) | Ratios as of the Prospectus dated August 31, 2021 and may differ from the ratios presented in the Financial Highlights. |
| (c) | Grandeur Peak Global Advisors, LLC (the “Adviser”), has agreed to waive and/or reimburse fees or expenses in order to limit Total Annual Fund Operating Expenses After Fee Waiver/Expense Reimbursements (excluding acquired fund fees and expenses, brokerage expenses, interest expenses, taxes and extraordinary expenses) to 1.75% and 1.50% of the Fund’s average daily net assets for the Fund’s Investor Class Shares and Institutional Class Shares, respectively. This agreement (the “Expense Agreement”) is in effect through August 31, 2022. The Adviser will be permitted to recover, on a class- by-class basis, expenses it has borne through the Expense Agreement to the extent that a Fund’s expenses in later periods fall below annual rates set forth in the Expense Agreement; provided, however, that such recapture payments do not cause the Fund’s expense ratio (after recapture) to exceed the lesser of (i) the expense cap in effect at the time of the waiver and (ii) the expense cap in effect at the time of the recapture. Notwithstanding the foregoing, the Funds will not be obligated to pay any such deferred fees and expenses more than three years after the date on which the fee and expenses was deferred. The Expense Agreement may not be terminated or modified prior to August 31, 2022 except with the approval of the Fund’s Board of Trustees. |
| (d) | The MSCI ACWI ex USA Small Cap Index is designed to measure the equity market performance of small-cap companies across developed and emerging markets globally, excluding the United States. MSCI makes no express or implied warranties or representations and shall have no liability whatsoever with respect to any MSCI data contained herein. The MSCI data may not be further redistributed or used to create indices or financial products. The Index is not actively managed and does not reflect any deductions for fees, expenses or taxes. An investor may not invest directly into the Index. |
| (e) | The MSCI ACWI ex USA IMI Index is designed to measure the equity market performance of large, mid, and small-cap companies across developed and emerging markets globally, excluding the United States. The Index is not actively managed and does not reflect any deductions for fees, expenses or taxes. An investor may not invest directly into the Index. |
| 24 | 1.855.377.7325 | www.GrandeurPeakGlobal.com |
| Grandeur Peak International Opportunities Fund | Performance Update |
October 31, 2021 (Unaudited)
Growth of $10,000 for the period ended October 31, 2021

The chart shown above represents a hypothetical investment of $10,000 in the Fund’s Investor Class shares for the period from inception to October 31, 2021. All returns reflect reinvested dividends, but do not reflect the deduction of taxes that an investor would pay on distributions or redemptions.
Investing in the Fund is subject to investment risks, including possible loss of the principal amount invested.
The Fund also offers Institutional Class shares, performance for which is not reflected in the graphs above. The performance of Institutional Class shares may be higher or lower than the performance of the Investor Class shares shown in the graphs above based upon differences in fees paid by shareholders investing in the Investor Class shares and Institutional Class shares.
| Semi-Annual Report | October 31, 2021 | 25 |
| Grandeur Peak International Opportunities Fund | Performance Update |
October 31, 2021 (Unaudited)
| Regional Allocation (as a % of Net Assets)* | |
| Europe | 50.6% |
| Asia ex Japan | 22.4% |
| Japan | 13.6% |
| North America | 7.0% |
| Latin America | 2.9% |
| Australia/New Zealand | 1.9% |
| Africa/Middle East | 1.0% |
| Cash, Cash Equivalents, & Other Net Assets | 0.6% |
| Total | 100.0% |
| Top 10 Holdings (as a % of Net Assets)* | |
| Endava PLC | 2.5% |
| Silergy Corp. | 2.4% |
| Dechra Pharmaceuticals PLC | 2.4% |
| EPAM Systems, Inc. | 2.1% |
| WNS Holdings, Ltd. | 2.0% |
| CVS Group PLC | 2.0% |
| Virbac SA | 1.8% |
| B&M European Value Retail SA | 1.7% |
| Esker SA | 1.5% |
| Uniphar PLC | 1.5% |
| Total | 19.9% |
| * | Holdings are subject to change, and may not reflect the current or future position of the portfolio. |
| 26 | 1.855.377.7325 | www.GrandeurPeakGlobal.com |
| Grandeur Peak International Stalwarts Fund | Performance Update |
October 31, 2021 (Unaudited)
Annualized Total Return Performance for the periods ended October 31, 2021
| Since | Expense Ratio(b) | ||||||
| 6 Months | 1 Year | 3 Years | 5 Years | Inception(a) | Gross | Net(c) | |
| Grandeur Peak International Stalwarts Fund – Investor (GISOX)* | 16.17% | 50.13% | 28.96% | 20.15% | 19.02% | 1.15% | 1.15% |
| Grandeur Peak International Stalwarts Fund – Institutional (GISYX)* | 16.29% | 50.44% | 29.28% | 20.45% | 19.30% | 0.90% | 0.90% |
| MSCI All Country World ex USA Mid Cap Index(d) | 1.93% | 31.75% | 12.34% | 10.01% | 9.26% | ||
| MSCI All Country World ex USA Small Index(e) | 3.48% | 39.36% | 15.20% | 11.63% | 10.99% | ||
Performance data quoted represents past performance. Past performance does not guarantee future results. Investment return and principal value of an investment will fluctuate so that an investor’s shares, when sold or redeemed, may be worth more or less than the original cost. The Fund imposes a 2.00% redemption fee on shares held for less than 60 days. Current performance data may be higher or lower than actual data quoted. For the most current month-end performance data, please call 1-855-377-PEAK (7325).
The table does not reflect the deduction of taxes a shareholder would pay on Fund distributions or redemption of Fund shares.
Subject to investment risks, including possible loss of the principal amount invested.
Returns for periods less than 1 year are cumulative.
| * | Excludes adjustments in accordance with accounting principles generally accepted in the United States of America and as such, the net asset value and total return for shareholder transactions reported to the market may differ from the net asset value for financial reporting purposes. |
| (a) | Fund inception date of September 1, 2015. |
| (b) | Ratios as of the Prospectus dated August 31, 2021 and may differ from the ratios presented in the Financial Highlights. |
| (c) | Grandeur Peak Global Advisors, LLC (the “Adviser”), has agreed to waive and/or reimburse fees or expenses in order to limit Total Annual Fund Operating Expenses After Fee Waiver/ Expense Reimbursements (excluding acquired fund fees and expenses, brokerage expenses, interest expenses, taxes and extraordinary expenses) to 1.35% and 1.10% of the Fund’s average daily net assets for the Fund’s Investor Class Shares and Institutional Class Shares, respectively. This agreement is in effect through August 31, 2022. The Adviser will be permitted to recover, on a class-by-class basis, expenses it has borne through this agreement to the extent that a Fund’s expenses in later periods fall below annual rates set forth in the Expense Agreement; provided, however, that such recapture payments do not cause the Fund’s expense ratio (after recapture) to exceed the lesser of (i) the expense cap in effect at the time of the waiver and (ii) the expense cap in effect at the time of the recapture. Notwithstanding the foregoing, the Funds will not be obligated to pay any such deferred fees and expenses more than three years after the date on which the fee and expenses was deferred This agreement may not be terminated or modified prior to August 31, 2022 except with the approval of the Fund’s Board of Trustees. |
| (d) | The MSCI ACWI ex USA Mid Cap Index is designed to measure the equity market performance of midcap companies across developed and emerging markets globally, excluding the United States. MSCI makes no express or implied warranties or representations and shall have no liability whatsoever with respect to any MSCI data contained herein. The MSCI data may not be further redistributed or used to create indices or financial products. The Index is not actively managed and does not reflect any deductions for fees, expenses or taxes. An investor may not invest directly into the Index. |
| (e) | The MSCI ACWI ex USA Small Cap Index is designed to measure the equity market performance of small-cap companies across developed and emerging markets globally, excluding the United States. The Index is not actively managed and does not reflect any deductions for fees, expenses or taxes. An investor may not invest directly into the Index. |
| Semi-Annual Report | October 31, 2021 | 27 |
| Grandeur Peak International Stalwarts Fund | Performance Update |
October 31, 2021 (Unaudited)
Growth of $10,000 for the period ended October 31, 2021
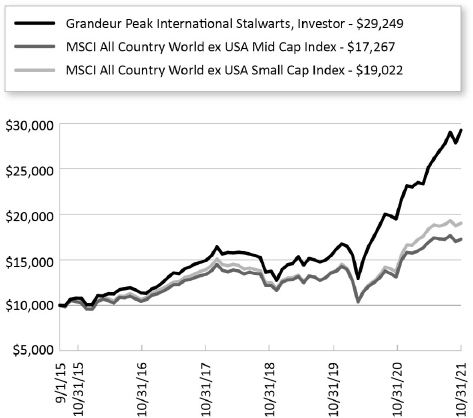
The chart shown above represents a hypothetical investment of $10,000 in the Fund’s Investor Class shares for the period from inception to October 31, 2021. All returns reflect reinvested dividends, but do not reflect the deduction of taxes that an investor would pay on distributions or redemptions.
Investing in the Fund is subject to investment risks, including possible loss of the principal amount invested.
The Fund also offers Institutional Class shares, performance for which is not reflected in the graphs above. The performance of Institutional Class shares may be higher or lower than the performance of the Investor Class shares shown in the graphs above based upon differences in fees paid by shareholders investing in the Investor Class shares and Institutional Class shares.
| 28 | 1.855.377.7325 | www.GrandeurPeakGlobal.com |
| Grandeur Peak International Stalwarts Fund | Performance Update |
October 31, 2021 (Unaudited)
| Regional Allocation (as a % of Net Assets)* | |
| Europe | 44.3% |
| Asia ex Japan | 26.5% |
| North America | 11.9% |
| Japan | 11.6% |
| Latin America | 2.7% |
| Australia/New Zealand | 1.0% |
| Africa/Middle East | 0.9% |
| Cash, Cash Equivalents, & Other Net Assets | 1.1% |
| Total | 100.0% |
| Top 10 Holdings (as a % of Net Assets)* | |
| Silergy Corp. | 5.6% |
| Dechra Pharmaceuticals PLC | 3.9% |
| WNS Holdings, Ltd. | 3.7% |
| B&M European Value Retail SA | 3.7% |
| EPAM Systems, Inc. | 3.5% |
| Endava PLC | 3.1% |
| EQT AB | 2.3% |
| St. James's Place PLC | 2.2% |
| Alten SA | 1.8% |
| Intertek Group PLC | 1.7% |
| Total | 31.5% |
| * | Holdings are subject to change, and may not reflect the current or future position of the portfolio. |
| Semi-Annual Report | October 31, 2021 | 29 |
| Grandeur Peak US Stalwarts Fund | Performance Update |
October 31, 2021 (Unaudited)
Annualized Total Return Performance for the periods ended October 31, 2021
| Since | Expense Ratio(b) | ||||
| 6 Months | 1 Year | Inception(a) | Gross | Net(c) | |
| Grandeur Peak US Stalwarts Fund – Institutional (GUSYX) | 15.85% | 54.37% | 82.38% | 1.11% | 1.00% |
| MSCI USA Mid Cap Index(d) | 8.91% | 48.68% | 63.32% | ||
| MSCI USA Small Cap Index(e) | 3.21% | 52.01% | 66.85% | ||
Performance data quoted represents past performance. Past performance does not guarantee future results. Investment return and principal value of an investment will fluctuate so that an investor’s shares, when sold or redeemed, may be worth more or less than the original cost. The Fund imposes a 2.00% redemption fee on shares held for less than 60 days. Current performance data may be higher or lower than actual data quoted. For the most current month-end performance data, please call 1-855-377-PEAK (7325).
The table does not reflect the deduction of taxes a shareholder would pay on Fund distributions or redemption of Fund shares.
Subject to investment risks, including possible loss of the principal amount invested.
Returns for periods less than 1 year are cumulative.
| (a) | Fund inception date of March 19, 2020. |
| (b) | Ratios as of the Prospectus dated August 31, 2021 and may differ from the ratios presented in the Financial Highlights. |
| (c) | Grandeur Peak Global Advisors, LLC (the “Adviser”), has agreed to waive and/or reimburse fees or expenses in order to limit Total Annual Fund Operating Expenses After Fee Waiver/Expense Reimbursement (excluding acquired fund fees and expenses, brokerage expenses, interest expenses, taxes and extraordinary expenses) to 1.00% of the Fund’s average daily net assets for the Fund’s Institutional Class Shares. This agreement (the “Expense Agreement”) is in effect through August 31, 2022. The Adviser will be permitted to recover, on a class- by-class basis, expenses it has borne through the Expense Agreement to the extent that a Fund’s expenses in later periods fall below annual rates set forth in the Expense Agreement; provided, however, that such recapture payments do not cause the Fund’s expense ratio (after recapture) to exceed the lesser of (i) the expense cap in effect at the time of the waiver and (ii) the expense cap in effect at the time of the recapture. Notwithstanding the foregoing, the Fund will not be obligated to pay any such deferred fees and expenses more than three years after the date on which the fee and expenses was deferred. The Expense Agreement may not be terminated or modified prior to August 31, 2022 except with the approval of the Fund’s Board of Trustees. |
| (d) | The MSCI USA Mid Cap Index is designed to measure the performance of the mid cap segments of the US market. With 339 constituents, the index covers approximately 15% of the free float-adjusted market capitalization in the US. The Index is not actively managed and does not reflect any deductions for fees, expenses or taxes. An investor may not invest directly into the Index. |
| (e) | The MSCI USA Small Cap Index is designed to measure the performance of the small cap segment of the US equity market. With 1,740 constituents, the index represents approximately 14% of the free float-adjusted market capitalization in the US. The Index is not actively managed and does not reflect any deductions for fees, expenses or taxes. An investor may not invest directly into the Index. |
| 30 | 1.855.377.7325 | www.GrandeurPeakGlobal.com |
| Grandeur Peak US Stalwarts Fund | Performance Update |
October 31, 2021 (Unaudited)
Growth of $10,000 for the period ended October 31, 2021

The chart shown above represent a hypothetical investment of $10,000 in the Fund’s Institutional Class shares for the period from inception to October 31, 2021. All returns reflect reinvested dividends, but do not reflect the deduction of taxes that an investor would pay on distributions or redemptions.
Investing in the Fund is subject to investment risks, including possible loss of the principal amount invested.
| Semi-Annual Report | October 31, 2021 | 31 |
| Grandeur Peak US Stalwarts Fund | Performance Update |
October 31, 2021 (Unaudited)
| Regional Allocation (as a % of Net Assets)* | |
| North America | 86.2% |
| Europe | 3.7% |
| Asia ex Japan | 3.5% |
| Latin America | 1.5% |
| Africa/Middle East | 0.9% |
| Cash, Cash Equivalents, & Other Net Assets | 4.2% |
| Total | 100.0% |
| Top 10 Holdings (as a % of Net Assets)* | |
| First Republic Bank | 3.4% |
| EPAM Systems, Inc. | 3.1% |
| Paycom Software, Inc. | 2.9% |
| Endava PLC | 2.8% |
| PJT Partners, Inc. | 2.6% |
| Heska Corp. | 2.4% |
| Pool Corp. | 2.4% |
| Littelfuse, Inc. | 2.2% |
| WNS Holdings, Ltd. | 2.1% |
| LGI Homes, Inc. | 1.9% |
| Total | 25.8% |
| * | Holdings are subject to change, and may not reflect the current or future position of the portfolio. |
| 32 | 1.855.377.7325 | www.GrandeurPeakGlobal.com |
| Grandeur Peak Funds® | Disclosure of Fund Expenses |
October 31, 2021 (Unaudited)
As a shareholder of a Fund, you incur two types of costs: (1) transaction costs, including sales charges (loads) on purchase payments, reinvested dividends, or other distributions; redemption fees; and exchange fees; and (2) ongoing costs, including management fees; distribution and/or service (12b-1) fees; and other Fund expenses. This example is intended to help you understand your ongoing costs (in dollars) of investing in the Fund and to compare these costs with the ongoing costs of investing in other mutual funds.
This example is based on an investment of $1,000 invested at the beginning of the period and held for the entire six-month period of May 1, 2021 through October 31, 2021.
Actual Expenses The first line of the table provides information about actual account values and actual expenses. You may use the information in this line, together with the amount you invested, to estimate the expenses that you paid over the period. Simply divide your account value by $1,000 (for example, an $8,600 account value divided by $1,000 = 8.6), then multiply the result by the number in the first line under the heading “Expenses Paid During Period” to estimate the expenses you paid on your account during this period.
Hypothetical Example for Comparison Purposes The second line of the table provides information about hypothetical account values and hypothetical expenses based on the Fund’s actual expense ratio and an assumed rate of return of 5% per year before expenses, which is not the Fund’s actual return. The hypothetical account values and expenses may not be used to estimate the actual ending account balance or expenses you paid for the period. You may use this information to compare the ongoing costs of investing in the Fund and other mutual funds. To do so, compare this 5% hypothetical example with the 5% hypothetical examples that appear in the shareholder reports of the other funds.
Please note that the expenses shown in the table are meant to highlight your ongoing costs only and do not reflect any transactional costs, such as redemption fees or exchange fees. Therefore, the second line of the table is useful in comparing ongoing costs only and will not help you determine the relative total costs of owning different funds. In addition, if these transactional costs were included, your costs would have been higher.
| Semi-Annual Report | October 31, 2021 | 33 |
| Grandeur Peak Funds® | Disclosure of Fund Expenses |
October 31, 2021 (Unaudited)
| Beginning Account Value May 1, 2021 | Ending Account Value October 31, 2021 | Expense Ratio(a) | Expenses Paid During period May 1, 2021 - October 31, 2021(b) | |
| Grandeur Peak Emerging Markets Opportunities Fund | ||||
| Investor Class | ||||
| Actual | $ 1,000.00 | $ 1,049.20 | 1.56% | $ 8.06 |
| Hypothetical (5% return before expenses) | $ 1,000.00 | $ 1,017.34 | 1.56% | $ 7.93 |
| Institutional Class | ||||
| Actual | $ 1,000.00 | $ 1,049.90 | 1.34% | $ 6.92 |
| Hypothetical (5% return before expenses) | $ 1,000.00 | $ 1,018.45 | 1.34% | $ 6.82 |
| Grandeur Peak Global Contrarian Fund | ||||
| Institutional Class | ||||
| Actual | $ 1,000.00 | $ 1,072.00 | 1.35% | $ 7.05 |
| Hypothetical (5% return before expenses) | $ 1,000.00 | $ 1,018.40 | 1.35% | $ 6.87 |
| Grandeur Peak Global Micro Cap Fund | ||||
| Institutional Class | ||||
| Actual | $ 1,000.00 | $ 1,052.80 | 1.88% | $ 9.73 |
| Hypothetical (5% return before expenses) | $ 1,000.00 | $ 1,015.73 | 1.88% | $ 9.55 |
| Grandeur Peak Global Opportunities Fund | ||||
| Investor Class | ||||
| Actual | $ 1,000.00 | $ 1,088.90 | 1.42% | $ 7.48 |
| Hypothetical (5% return before expenses) | $ 1,000.00 | $ 1,018.05 | 1.42% | $ 7.22 |
| Institutional Class | ||||
| Actual | $ 1,000.00 | $ 1,090.90 | 1.20% | $ 6.32 |
| Hypothetical (5% return before expenses) | $ 1,000.00 | $ 1,019.16 | 1.20% | $ 6.11 |
| Grandeur Peak Global Reach Fund | ||||
| Investor Class | ||||
| Actual | $ 1,000.00 | $ 1,103.20 | 1.47% | $ 7.79 |
| Hypothetical (5% return before expenses) | $ 1,000.00 | $ 1,017.80 | 1.47% | $ 7.48 |
| Institutional Class | ||||
| Actual | $ 1,000.00 | $ 1,104.70 | 1.23% | $ 6.53 |
| Hypothetical (5% return before expenses) | $ 1,000.00 | $ 1,019.00 | 1.23% | $ 6.26 |
| Grandeur Peak Global Stalwarts Fund | ||||
| Investor Class | ||||
| Actual | $ 1,000.00 | $ 1,157.80 | 1.16% | $ 6.31 |
| Hypothetical (5% return before expenses) | $ 1,000.00 | $ 1,019.36 | 1.16% | $ 5.90 |
| Institutional Class | ||||
| Actual | $ 1,000.00 | $ 1,159.10 | 0.91% | $ 4.95 |
| Hypothetical (5% return before expenses) | $ 1,000.00 | $ 1,020.62 | 0.91% | $ 4.63 |
| Grandeur Peak International Opportunities Fund | ||||
| Investor Class | ||||
| Actual | $ 1,000.00 | $ 1,073.50 | 1.46% | $ 7.63 |
| Hypothetical (5% return before expenses) | $ 1,000.00 | $ 1,017.85 | 1.46% | $ 7.43 |
| Institutional Class | ||||
| Actual | $ 1,000.00 | $ 1,074.90 | 1.21% | $ 6.33 |
| Hypothetical (5% return before expenses) | $ 1,000.00 | $ 1,019.11 | 1.21% | $ 6.16 |
| Grandeur Peak International Stalwarts Fund | ||||
| Investor Class | ||||
| Actual | $ 1,000.00 | $ 1,161.70 | 1.13% | $ 6.16 |
| Hypothetical (5% return before expenses) | $ 1,000.00 | $ 1,019.51 | 1.13% | $ 5.75 |
| Institutional Class | ||||
| Actual | $ 1,000.00 | $ 1,162.90 | 0.88% | $ 4.80 |
| Hypothetical (5% return before expenses) | $ 1,000.00 | $ 1,020.77 | 0.88% | $ 4.48 |
| Grandeur Peak US Stalwarts Fund | ||||
| Institutional Class | ||||
| Actual | $ 1,000.00 | $ 1,158.50 | 0.96% | $ 5.22 |
| Hypothetical (5% return before expenses) | $ 1,000.00 | $ 1,020.37 | 0.96% | $ 4.89 |
| (a) | The Fund's expense ratios have been annualized based on the Fund's most recent fiscal half-year expenses. |
| (b) | Expenses are equal to the Fund's annualized expense ratio multiplied by the average account value over the period, multiplied by the number of days in the most recent fiscal half-year (184)/365 (to reflect the half-year period). |
| 34 | 1.855.377.7325 | www.GrandeurPeakGlobal.com |
| Grandeur Peak Emerging Markets Opportunities Fund | Portfolio of Investments |
October 31, 2021 (Unaudited)
| Shares | Value (Note 2) | |||||||
| COMMON STOCKS (95.89%) | ||||||||
| Argentina (1.16%) | ||||||||
| Globant SA(a) | 24,517 | $ | 7,825,581 | |||||
| Bangladesh (0.67%) | ||||||||
| Square Pharmaceuticals, Ltd. | 1,759,296 | 4,472,456 | ||||||
| Brazil (6.52%) | ||||||||
| Arco Platform, Ltd., Class A(a) | 110,316 | 1,880,888 | ||||||
| Blau Farmaceutica SA(a) | 476,200 | 3,222,311 | ||||||
| Fleury SA | 1,112,300 | 3,697,287 | ||||||
| Hypera SA | 680,200 | 3,377,016 | ||||||
| Instituto Hermes Pardini SA | 1,092,400 | 4,206,005 | ||||||
| Locaweb Servicos de Internet SA(b)(c) | 1,267,900 | 4,129,133 | ||||||
| Magazine Luiza SA | 996,200 | 1,909,863 | ||||||
| Neogrid Participacoes SA | 2,019,000 | 1,284,278 | ||||||
| Pagseguro Digital, Ltd., Class A(a) | 202,774 | 7,340,419 | ||||||
| Patria Investments, Ltd. | 334,840 | 5,745,855 | ||||||
| Pet Center Comercio e Participacoes SA | 322,300 | 1,074,752 | ||||||
| Raia Drogasil SA | 507,000 | 2,102,094 | ||||||
| TOTVS SA | 607,700 | 3,532,839 | ||||||
| Westwing Comercio Varejista Ltda(a) | 563,000 | 338,171 | ||||||
| 43,840,911 | ||||||||
| China (17.64%) | ||||||||
| Alibaba Group Holding, Ltd.(a) | 101,800 | 2,132,691 | ||||||
| ANTA Sports Products, Ltd. | 232,000 | 3,625,885 | ||||||
| Baozun, Inc.(a) | 440,500 | 2,547,715 | ||||||
| Chaoju Eye Care Holdings, Ltd.(a) | 2,624,500 | 2,766,005 | ||||||
| CSPC Pharmaceutical Group, Ltd. | 4,336,720 | 4,537,099 | ||||||
| Fu Shou Yuan International Group, Ltd. | 4,638,000 | 3,987,947 | ||||||
| Guangzhou KDT Machinery Co., Ltd. | 728,171 | 3,396,607 | ||||||
| Hangzhou Robam Appliances Co., Ltd., Class A | 1,123,400 | 5,499,996 | ||||||
| Hangzhou Tigermed Consulting Co., Ltd., Class A | 125,050 | 3,329,820 | ||||||
| JD.com, Inc., Class A(a) | 91,900 | 3,666,314 | ||||||
| Jiangsu Hengrui Medicine Co., Ltd., Class A | 210,096 | 1,616,603 | ||||||
| Li Ning Co., Ltd. | 576,200 | 6,405,925 | ||||||
| Man Wah Holdings, Ltd. | 2,750,000 | 4,276,717 | ||||||
| ManpowerGroup Greater China, Ltd.(c) | 2,266,500 | 2,680,008 | ||||||
| O2Micro International, Ltd., ADR(a) | 592,156 | 3,635,838 | ||||||
| Silergy Corp. | 179,422 | 29,550,417 | ||||||
| Suofeiya Home Collection Co., Ltd., Class A | 2,584,559 | 6,833,675 | ||||||
| Shares | Value (Note 2) | |||||||
| China (continued) | ||||||||
| TK Group Holdings, Ltd. | 10,499,117 | $ | 3,980,772 | |||||
| Trip.com Group, Ltd.(a) | 188,700 | 5,466,613 | ||||||
| WuXi AppTec Co., Ltd., Class H(c) | 320,600 | 6,852,488 | ||||||
| Wuxi Biologics Cayman, Inc.(a)(b)(c) | 462,000 | 7,030,499 | ||||||
| Yum China Holdings, Inc. | 83,200 | 4,876,190 | ||||||
| 118,695,824 | ||||||||
| Colombia (0.91%) | ||||||||
| Parex Resources, Inc. | 315,631 | 6,128,485 | ||||||
| Egypt (0.48%) | ||||||||
| African Export-Import Bank, GDR | 500,000 | 1,400,000 | ||||||
| Integrated Diagnostics Holdings PLC(b)(c) | 1,484,400 | 1,836,945 | ||||||
| 3,236,945 | ||||||||
| Georgia (1.28%) | ||||||||
| Bank of Georgia Group PLC | 166,212 | 3,452,988 | ||||||
| TBC Bank Group PLC | 240,293 | 5,162,994 | ||||||
| 8,615,982 | ||||||||
| Greece (1.52%) | ||||||||
| JUMBO SA | 277,659 | 4,121,313 | ||||||
| Sarantis SA | 603,670 | 6,092,178 | ||||||
| 10,213,491 | ||||||||
| Hong Kong (1.80%) | ||||||||
| Plover Bay Technologies, Ltd.(c) | 8,956,000 | 3,269,075 | ||||||
| Techtronic Industries Co., Ltd. | 429,100 | 8,829,627 | ||||||
| 12,098,702 | ||||||||
| India (19.01%) | ||||||||
| Avenue Supermarts, Ltd.(a)(b)(c) | 44,900 | 2,779,490 | ||||||
| Cartrade Tech, Ltd.(a) | 93,429 | 1,494,115 | ||||||
| Castrol India, Ltd. | 2,727,212 | 5,031,491 | ||||||
| Cera Sanitaryware, Ltd. | 69,031 | 4,778,114 | ||||||
| City Union Bank, Ltd. | 1,756,435 | 3,944,172 | ||||||
| Computer Age Management Services, Ltd. | 203,629 | 8,190,981 | ||||||
| EPL, Ltd. | 1,135,862 | 3,258,268 | ||||||
| FSN E-Commerce Ventures, Ltd.(a) | 66,552 | 999,863 | ||||||
| Gufic Biosciences, Ltd. | 926,488 | 2,347,732 | ||||||
| Gulf Oil Lubricants India, Ltd. | 264,757 | 2,046,281 | ||||||
| Happiest Minds Technologies, Ltd. | 57,500 | 978,589 | ||||||
| HCL Technologies, Ltd. | 372,289 | 5,686,411 | ||||||
| HDFC Asset Management Co., Ltd.(b)(c) | 86,800 | 3,068,551 | ||||||
| HDFC Bank, Ltd. | 304,435 | 6,435,188 | ||||||
See Notes to Financial Statements.
| Semi-Annual Report | October 31, 2021 | 35 |
| Grandeur Peak Emerging Markets Opportunities Fund | Portfolio of Investments |
October 31, 2021 (Unaudited)
| Shares | Value (Note 2) | |||||||
| India (continued) | ||||||||
| Home First Finance Co. India, Ltd.(a)(b)(c) | 502,237 | $ | 4,730,191 | |||||
| IndiaMart InterMesh, Ltd.(b)(c) | 70,513 | 6,729,604 | ||||||
| L&T Technology Services, Ltd.(b)(c) | 96,897 | 6,114,192 | ||||||
| Larsen & Toubro Infotech, Ltd.(b)(c) | 64,573 | 5,762,406 | ||||||
| Marico, Ltd. | 345,835 | 2,625,356 | ||||||
| Metropolis Healthcare, Ltd.(b)(c) | 356,837 | 14,115,985 | ||||||
| Nippon Life India Asset Management, Ltd.(b)(c) | 925,070 | 5,168,224 | ||||||
| Polycab India, Ltd. | 224,513 | 6,780,251 | ||||||
| Vaibhav Global, Ltd. | 338,118 | 2,594,769 | ||||||
| WNS Holdings, Ltd., ADR(a) | 250,494 | 22,246,372 | ||||||
| 127,906,596 | ||||||||
| Indonesia (3.58%) | ||||||||
| Ace Hardware Indonesia Tbk PT | 37,757,000 | 3,757,711 | ||||||
| Arwana Citramulia Tbk PT | 45,188,500 | 2,758,994 | ||||||
| Bank Central Asia Tbk PT | 9,100,500 | 4,801,570 | ||||||
| Bank Tabungan Pensiunan Nasional Syariah | 14,450,300 | 3,886,052 | ||||||
| Selamat Sempurna Tbk PT | 47,545,800 | 5,336,003 | ||||||
| Ultrajaya Milk Industry & Trading Co. Tbk PT | 30,552,300 | 3,515,105 | ||||||
| 24,055,435 | ||||||||
| Kenya (0.63%) | ||||||||
| Safaricom PLC | 11,096,600 | 4,267,156 | ||||||
| Malaysia (0.15%) | ||||||||
| Scicom MSC Bhd | 3,545,500 | 984,623 | ||||||
| Mexico (0.81%) | ||||||||
| Regional SAB de CV | 1,048,200 | 5,470,109 | ||||||
| Philippines (4.20%) | ||||||||
| AllHome Corp.(a) | 20,298,765 | 4,147,536 | ||||||
| Concepcion Industrial Corp. | 1,861,792 | 847,612 | ||||||
| Philippine Seven Corp.(a) | 1,023,000 | 1,846,717 | ||||||
| Puregold Price Club, Inc. | 8,060,000 | 6,755,307 | ||||||
| Robinsons Land Corp. | 11,011,600 | 3,713,493 | ||||||
| Wilcon Depot, Inc. | 17,692,900 | 10,950,575 | ||||||
| 28,261,240 | ||||||||
| Poland (3.94%) | ||||||||
| Allegro.eu SA(a)(b)(c) | 191,735 | 2,168,381 | ||||||
| Dino Polska SA(a)(b)(c) | 181,551 | 16,218,159 | ||||||
| LiveChat Software SA | 221,945 | 6,786,884 | ||||||
| Mo-BRUK SA | 15,025 | 1,355,758 | ||||||
| 26,529,182 | ||||||||
| Shares | Value (Note 2) | |||||||
| Russia (2.73%) | ||||||||
| HeadHunter Group PLC, ADR | 141,100 | $ | 7,458,546 | |||||
| TCS Group Holding PLC, GDR(c) | 47,816 | 4,896,358 | ||||||
| Yandex NV, Class A(a) | 72,377 | 5,995,711 | ||||||
| 18,350,615 | ||||||||
| Singapore (0.48%) | ||||||||
| Riverstone Holdings, | ||||||||
| Ltd./Singapore | 5,069,200 | 3,232,860 | ||||||
| South Africa (1.95%) | ||||||||
| Clicks Group, Ltd. | 216,900 | 3,959,437 | ||||||
| Italtile, Ltd. | 3,636,472 | 4,204,262 | ||||||
| Transaction Capital, Ltd. | 1,710,220 | 4,935,286 | ||||||
| 13,098,985 | ||||||||
| South Korea (4.50%) | ||||||||
| Douzone Bizon Co., Ltd. | 93,149 | 6,480,693 | ||||||
| Hyundai Ezwel Co., Ltd. | 363,272 | 3,062,110 | ||||||
| LEENO Industrial, Inc. | 19,622 | 2,874,748 | ||||||
| LG Household & Health Care, Ltd. | 7,618 | 7,633,972 | ||||||
| Orion Corp./Republic of Korea | 39,289 | 3,967,397 | ||||||
| Suprema, Inc.(a) | 80,278 | 1,703,731 | ||||||
| Tokai Carbon Korea Co., Ltd. | 42,454 | 4,541,312 | ||||||
| 30,263,963 | ||||||||
| Taiwan (11.52%) | ||||||||
| ASPEED Technology, Inc. | 54,000 | 5,378,931 | ||||||
| Bioteque Corp. | 1,036,000 | 4,079,400 | ||||||
| Brighten Optix Corp. | 268,000 | 3,604,366 | ||||||
| eMemory Technology, Inc. | 74,000 | 6,120,431 | ||||||
| FineTek Co., Ltd. | 683,970 | 2,107,853 | ||||||
| GEM Services, Inc./Tw | 1,064,000 | 3,810,864 | ||||||
| M3 Technology, Inc. | 497,000 | 4,405,505 | ||||||
| momo.com, Inc. | 172,400 | 11,097,183 | ||||||
| Poya International Co., Ltd. | 543,840 | 9,719,635 | ||||||
| Realtek Semiconductor Corp. | 209,000 | 3,750,328 | ||||||
| Sinbon Electronics Co., Ltd. | 401,000 | 3,316,612 | ||||||
| Sporton International, Inc. | 869,148 | 7,047,948 | ||||||
| Voltronic Power Technology Corp. | 143,108 | 8,362,569 | ||||||
| Wistron Information Technology & Services Corp. | 1,552,400 | 4,733,931 | ||||||
| 77,535,556 | ||||||||
| Thailand (1.76%) | ||||||||
| Humanica PCL | 9,664,000 | 3,116,245 | ||||||
| Muangthai Capital PCL | 1,779,000 | 3,243,562 | ||||||
| Netbay PCL | 2,654,200 | 1,999,699 | ||||||
| TQM Corp. PCL | 1,098,000 | 3,474,422 | ||||||
| 11,833,928 | ||||||||
See Notes to Financial Statements.
| 36 | 1.855.377.7325 | www.GrandeurPeakGlobal.com |
| Grandeur Peak Emerging Markets Opportunities Fund | Portfolio of Investments |
October 31, 2021 (Unaudited)
| Shares | Value (Note 2) | |||||||
| Turkey (0.30%) | ||||||||
| DP Eurasia NV(a) | 1,646,300 | $ | 2,050,271 | |||||
| United States (3.51%) | ||||||||
| Bizlink Holding, Inc. | 578,000 | 5,331,355 | ||||||
| Frontage Holdings Corp.(a)(b)(c) | 10,056,400 | 5,880,936 | ||||||
| Genpact, Ltd. | 251,246 | 12,398,990 | ||||||
| 23,611,281 | ||||||||
| Vietnam (4.84%) | ||||||||
| FPT Corp. | 1,917,857 | 8,168,268 | ||||||
| Lix Detergent JSC | 437,310 | 1,066,774 | ||||||
| Orient Commercial Joint Stock Bank(a) | 4,016,750 | 4,696,198 | ||||||
| Vietnam Dairy Products JSC | 1,899,622 | 7,572,939 | ||||||
| Vietnam Technological & Commercial Joint Stock Bank(a) | 3,440,269 | 7,802,469 | ||||||
| Vincom Retail JSC(a) | 2,386,220 | 3,272,314 | ||||||
| 32,578,962 | ||||||||
| TOTAL COMMON STOCKS | ||||||||
| (Cost $429,337,190) | 645,159,139 | |||||||
| TOTAL INVESTMENTS (95.89%) | ||||||||
| (Cost $429,337,190) | $ | 645,159,139 | ||||||
| Other Assets In Excess Of Liabilities (4.11%) | 27,637,812 | |||||||
| NET ASSETS (100.00%) | $ | 672,796,951 | ||||||
| (a) | Non-Income Producing Security. |
| (b) | Security exempt from registration under Rule 144A of the Securities Act of 1933. These securities may be resold in the ordinary course of business in transactions exempt from registration, normally to qualified institutional buyers. As of October 31, 2021, these securities had a total aggregate market value of $92,585,184, representing 13.76% of net assets. |
| (c) | Security was purchased pursuant to Regulation S under the Securities Act of 1933, which exempts securities offered and sold outside of the United States from registration. Such security cannot be sold in the United States without either an effective registration statement filed pursuant to the Securities Act of 1933, or pursuant to an exemption from registration. As of October 31, 2021, the aggregate market value of these securities was $103,430,625, representing 15.37% of net assets. |
For Fund compliance purposes, the Fund's geographical classifications refer to any one or more of the country sub-classifications used by one or more widely recognized market indexes or ratings group indexes, and/or as defined by Fund management. This definition may not apply for purposes of this report, which may combine sub-classifications for reporting ease. Geographical regions are shown as a percentage of net assets.
| Sector Composition (October 31, 2021) (Unaudited) | |
| Technology | 29.4% |
| Consumer | 27.0% |
| Financials | 13.6% |
| Health Care | 12.0% |
| Industrials | 11.5% |
| Energy & Materials | 2.4% |
| Cash, Cash Equivalents, & Other Net Assets | 4.1% |
| Total | 100% |
| Industry Composition (October 31, 2021) (Unaudited) | |
| IT Services | 13.1% |
| Semiconductors & Semiconductor Equipment | 8.9% |
| Banks | 7.6% |
| Food & Staples Retailing | 5.0% |
| Specialty Retail | 4.2% |
| Software | 4.0% |
| Health Care Providers & Services | 3.9% |
| Life Sciences Tools & Services | 3.5% |
| Internet & Direct Marketing Retail | 3.5% |
| Professional Services | 3.4% |
| Electrical Equipment | 3.3% |
| Pharmaceuticals | 2.5% |
| Personal Products | 2.4% |
| Household Durables | 2.4% |
| Machinery | 2.4% |
| Capital Markets | 2.2% |
| Food Products | 2.2% |
| Textiles, Apparel & Luxury Goods | 1.9% |
| Hotels, Restaurants & Leisure | 1.8% |
| Multiline Retail | 1.7% |
| Health Care Equipment & Supplies | 1.6% |
| Electronic Equipment, Instruments & Components | 1.4% |
| Consumer Finance | 1.3% |
| Building Products | 1.2% |
| Real Estate Management & Development | 1.1% |
| Trading Companies & Distributors | 1.0% |
| Diversified Consumer Services | 1.0% |
| Chemicals | 1.0% |
| Other Industries (each less than 1%) | 6.4% |
| Cash and Other Assets, Less Liabilities | 4.1% |
| Total | 100.0% |
See Notes to Financial Statements.
| Semi-Annual Report | October 31, 2021 | 37 |
| Grandeur Peak Global Contrarian Fund | Portfolio of Investments |
October 31, 2021 (Unaudited)
| Shares | Value (Note 2) | |||||||
| COMMON STOCKS (99.08%) | ||||||||
| Australia (4.97%) | ||||||||
| Fiducian Group, Ltd. | 322,731 | $ | 2,121,840 | |||||
| Kogan.com, Ltd. | 87,200 | 652,024 | ||||||
| QANTM Intellectual Property, Ltd. | 2,170,745 | 2,008,513 | ||||||
| 4,782,377 | ||||||||
| Bangladesh (0.52%) | ||||||||
| Square Pharmaceuticals, Ltd. | 197,390 | 501,802 | ||||||
| Belgium (0.37%) | ||||||||
| X-Fab Silicon Foundries SE(a)(b)(c) | 35,756 | 355,473 | ||||||
| Brazil (1.53%) | ||||||||
| Patria Investments, Ltd. | 85,643 | 1,469,634 | ||||||
| Britain (9.77%) | ||||||||
| B&M European Value Retail SA | 169,055 | 1,464,974 | ||||||
| boohoo Group PLC(a) | 310,000 | 771,076 | ||||||
| City of London Investment Group PLC | 125,784 | 912,351 | ||||||
| Clinigen Group PLC | 42,443 | 356,063 | ||||||
| De La Rue PLC(a) | 529,782 | 1,212,256 | ||||||
| K3 Capital Group PLC | 132,654 | 630,864 | ||||||
| Manolete Partners PLC | 203,050 | 861,441 | ||||||
| On the Beach Group PLC(a)(b)(c) | 230,299 | 940,800 | ||||||
| Premier Miton Group PLC | 567,200 | 1,397,237 | ||||||
| Ultra Electronics Holdings PLC | 19,251 | 854,136 | ||||||
| 9,401,198 | ||||||||
| Canada (2.79%) | ||||||||
| BioSyent, Inc.(a) | 113,187 | 644,771 | ||||||
| Guardian Capital Group, Ltd. | 72,892 | 2,037,277 | ||||||
| 2,682,048 | ||||||||
| China (5.97%) | ||||||||
| ManpowerGroup Greater China, Ltd.(c) | 1,290,000 | 1,525,352 | ||||||
| O2Micro International, Ltd., ADR(a) | 198,180 | 1,216,825 | ||||||
| TK Group Holdings, Ltd. | 3,635,283 | 1,378,328 | ||||||
| Xin Point Holdings, Ltd.(c) | 4,281,000 | 1,628,657 | ||||||
| 5,749,162 | ||||||||
| Colombia (1.51%) | ||||||||
| Parex Resources, Inc. | 74,614 | 1,448,751 | ||||||
| France (1.73%) | ||||||||
| Neurones | 16,588 | 682,657 | ||||||
| Rothschild & Co. | 11,143 | 490,135 | ||||||
| Shares | Value (Note 2) | |||||||
| France (continued) | ||||||||
| Thermador Groupe | 4,347 | $ | 494,474 | |||||
| 1,667,266 | ||||||||
| Georgia (0.92%) | ||||||||
| Bank of Georgia Group PLC | 18,357 | 381,359 | ||||||
| TBC Bank Group PLC | 23,293 | 500,479 | ||||||
| 881,838 | ||||||||
| Germany (1.26%) | ||||||||
| Deutsche Industrie REIT AG | 30,000 | 780,302 | ||||||
| Norma Group SE | 10,141 | 436,096 | ||||||
| 1,216,398 | ||||||||
| Greece (1.81%) | ||||||||
| Kri-Kri Milk Industry SA | 120,527 | 1,111,850 | ||||||
| Sarantis SA | 61,973 | 625,425 | ||||||
| 1,737,275 | ||||||||
| Hong Kong (2.49%) | ||||||||
| Plover Bay Technologies, Ltd.(c) | 6,553,000 | 2,391,944 | ||||||
| India (3.00%) | ||||||||
| Gulf Oil Lubricants India, Ltd. | 56,213 | 434,465 | ||||||
| Mahanagar Gas, Ltd.(c) | 69,237 | 927,537 | ||||||
| Time Technoplast, Ltd. | 1,649,146 | 1,525,126 | ||||||
| 2,887,128 | ||||||||
| Indonesia (1.62%) | ||||||||
| Map Aktif Adiperkasa PT(a) | 4,543,100 | 1,042,179 | ||||||
| Selamat Sempurna Tbk PT | 4,625,200 | 519,080 | ||||||
| 1,561,259 | ||||||||
| Ireland (0.56%) | ||||||||
| Irish Residential Properties REIT PLC | 286,406 | 539,670 | ||||||
| Italy (1.44%) | ||||||||
| Banca Sistema SpA(b)(c) | 297,583 | 779,176 | ||||||
| Piovan SpA(b)(c) | 58,717 | 609,535 | ||||||
| 1,388,711 | ||||||||
| Japan (13.08%) | ||||||||
| AIT Corp. | 54,000 | 526,379 | ||||||
| Amuse, Inc. | 36,800 | 715,174 | ||||||
| Beenos, Inc. | 68,700 | 1,992,134 | ||||||
| Copro-Holdings Co., Ltd. | 67,800 | 728,712 | ||||||
| Japan Lifeline Co., Ltd. | 192,500 | 2,068,984 | ||||||
| Medikit Co., Ltd. | 38,500 | 958,320 | ||||||
| Naigai Trans Line, Ltd. | 42,800 | 824,644 | ||||||
| Seria Co., Ltd. | 74,600 | 2,461,031 | ||||||
| Synchro Food Co., Ltd.(a) | 173,000 | 591,972 | ||||||
| Trancom Co., Ltd. | 10,600 | 740,303 | ||||||
See Notes to Financial Statements.
| 38 | 1.855.377.7325 | www.GrandeurPeakGlobal.com |
| Grandeur Peak Global Contrarian Fund | Portfolio of Investments |
October 31, 2021 (Unaudited)
| Shares | Value (Note 2) | |||||||
| Japan (continued) | ||||||||
| YAMADA Consulting Group Co., Ltd. | 95,900 | $ | 975,198 | |||||
| 12,582,851 | ||||||||
| Mexico (0.58%) | ||||||||
| Regional SAB de CV | 106,900 | 557,866 | ||||||
| New Zealand (0.65%) | ||||||||
| a2 Milk Co., Ltd.(a) | 132,584 | 624,213 | ||||||
| Oman (0.80%) | ||||||||
| Tethys Oil AB | 105,922 | 770,858 | ||||||
| Philippines (2.69%) | ||||||||
| AllHome Corp.(a) | 2,800,000 | 572,109 | ||||||
| Concepcion Industrial Corp. | 1,126,400 | 512,813 | ||||||
| Pryce Corp. | 7,013,600 | 765,220 | ||||||
| Robinsons Land Corp. | 2,185,400 | 736,993 | ||||||
| 2,587,135 | ||||||||
| Poland (0.67%) | ||||||||
| Mo-BRUK SA | 7,145 | 644,718 | ||||||
| Singapore (0.87%) | ||||||||
| Riverstone Holdings, Ltd./Singapore | 1,319,800 | 841,697 | ||||||
| South Africa (0.54%) | ||||||||
| Italtile, Ltd. | 453,471 | 524,275 | ||||||
| South Korea (0.46%) | ||||||||
| HCT Co., Ltd. | 32,644 | 438,587 | ||||||
| Taiwan (6.41%) | ||||||||
| Bioteque Corp. | 423,000 | 1,665,623 | ||||||
| FineTek Co., Ltd. | 218,024 | 671,905 | ||||||
| Fuzetec Technology Co., Ltd. | 269,363 | 665,453 | ||||||
| GEM Services, Inc./Tw | 148,000 | 530,083 | ||||||
| Tehmag Foods Corp. | 44,000 | 473,093 | ||||||
| Tofu Restaurant Co., Ltd. | 154,000 | 869,446 | ||||||
| Wistron Information Technology & Services Corp. | 424,600 | 1,294,786 | ||||||
| 6,170,389 | ||||||||
| United Arab Emirates (0.92%) | ||||||||
| Aramex PJSC | 746,338 | 887,929 | ||||||
| United States (25.52%) | ||||||||
| Bank of NT Butterfield & Son, Ltd. | 63,481 | 2,278,968 | ||||||
| Barrett Business Services, Inc. | 28,826 | 2,363,732 | ||||||
| Bizlink Holding, Inc. | 107,000 | 986,946 | ||||||
| Shares | Value (Note 2) | |||||||
| United States (continued) | ||||||||
| Bowman Consulting Group, Ltd.(a) | 67,775 | $ | 1,043,735 | |||||
| Esquire Financial Holdings, Inc.(a) | 45,907 | 1,468,106 | ||||||
| Evolution Petroleum Corp. | 304,508 | 1,808,778 | ||||||
| First Hawaiian, Inc. | 21,850 | 602,842 | ||||||
| Global Industrial Co. | 17,446 | 707,959 | ||||||
| Hackett Group, Inc. | 178,270 | 3,768,628 | ||||||
| Healthcare Services Group, Inc. | 49,922 | 958,003 | ||||||
| Hingham Institution For Savings The | 1,831 | 661,430 | ||||||
| Kimball International, Inc., Class B | 128,250 | 1,394,078 | ||||||
| LGI Homes, Inc.(a) | 8,490 | 1,267,557 | ||||||
| Ollie's Bargain Outlet Holdings, Inc.(a) | 14,582 | 986,618 | ||||||
| Plumas Bancorp | 77,090 | 2,847,704 | ||||||
| Samsonite International SA(a)(b)(c) | 234,300 | 504,706 | ||||||
| TriMas Corp. | 27,531 | 918,159 | ||||||
| 24,567,949 | ||||||||
| Vietnam (3.63%) | ||||||||
| FPT Corp. | 167,489 | 713,346 | ||||||
| Lix Detergent JSC | 200,000 | 487,880 | ||||||
| Orient Commercial Joint Stock Bank(a) | 1,073,775 | 1,255,407 | ||||||
| Vietnam Technological & Commercial Joint Stock Bank(a) | 455,100 | 1,032,159 | ||||||
| 3,488,792 | ||||||||
| TOTAL COMMON STOCKS | ||||||||
| (Cost $86,573,675) | 95,349,193 | |||||||
| TOTAL INVESTMENTS (99.08%) | ||||||||
| (Cost $86,573,675) | $ | 95,349,193 | ||||||
| Other Assets In Excess Of Liabilities (0.92%) | 880,823 | |||||||
| NET ASSETS (100.00%) | $ | 96,230,016 | ||||||
| (a) | Non-Income Producing Security. |
| (b) | Security exempt from registration under Rule 144A of the Securities Act of 1933. These securities may be resold in the ordinary course of business in transactions exempt from registration, normally to qualified institutional buyers. As of October 31, 2021, these securities had a total aggregate market value of $3,189,690, representing 3.31% of net assets. |
See Notes to Financial Statements.
| Semi-Annual Report | October 31, 2021 | 39 |
| Grandeur Peak Global Contrarian Fund | Portfolio of Investments |
October 31, 2021 (Unaudited)
| (c) | Security was purchased pursuant to Regulation S under the Securities Act of 1933, which exempts securities offered and sold outside of the United States from registration. Such security cannot be sold in the United States without either an effective registration statement filed pursuant to the Securities Act of 1933, or pursuant to an exemption from registration. As of October 31, 2021, the aggregate market value of these securities was $9,663,180, representing 10.04% of net assets. |
For Fund compliance purposes, the Fund's geographical classifications refer to any one or more of the country sub-classifications used by one or more widely recognized market indexes or ratings group indexes, and/or as defined by Fund management. This definition may not apply for purposes of this report, which may combine sub-classifications for reporting ease. Geographical regions are shown as a percentage of net assets.
| Sector Composition (October 31, 2021) (Unaudited) | |
| Industrials | 24.6% |
| Financials | 24.6% |
| Consumer | 20.2% |
| Technology | 13.4% |
| Energy & Materials | 8.0% |
| Health Care | 7.3% |
| Utilities | 1.0% |
| Cash, Cash Equivalents, & Other Net Assets | 0.9% |
| Total | 100% |
| Industry Composition (October 31, 2021) (Unaudited) | |
| Banks | 12.2% |
| Capital Markets | 9.5% |
| Professional Services | 9.2% |
| IT Services | 6.6% |
| Health Care Equipment & Supplies | 5.7% |
| Multiline Retail | 5.1% |
| Oil, Gas & Consumable Fuels | 5.0% |
| Commercial Services & Supplies | 4.4% |
| Internet & Direct Marketing Retail | 3.6% |
| Containers & Packaging | 2.5% |
| Communications Equipment | 2.5% |
| Machinery | 2.5% |
| Semiconductors & Semiconductor Equipment | 2.3% |
| Food Products | 2.3% |
| Specialty Retail | 2.2% |
| Auto Components | 2.2% |
| Hotels, Restaurants & Leisure | 1.9% |
| Electrical Equipment | 1.7% |
| Equity Real Estate Investment Trusts (REITs) | 1.4% |
| Air Freight & Logistics | 1.4% |
| Household Durables | 1.3% |
| Trading Companies & Distributors | 1.2% |
| Pharmaceuticals | 1.2% |
| Construction & Engineering | 1.1% |
| Gas Utilities | 1.0% |
| Other Industries (each less than 1%) | 9.1% |
| Cash and Other Assets, Less Liabilities | 0.9% |
| Total | 100.0% |
See Notes to Financial Statements.
| 40 | 1.855.377.7325 | www.GrandeurPeakGlobal.com |
| Grandeur Peak Global Micro Cap Fund | Portfolio of Investments |
October 31, 2021 (Unaudited)
| Shares | Value (Note 2) | |||||||
| COMMON STOCKS (99.74%) | ||||||||
| Australia (5.21%) | ||||||||
| Australian Ethical Investment, Ltd. | 57,454 | $ | 591,677 | |||||
| Fiducian Group, Ltd. | 172,647 | 1,135,092 | ||||||
| Kogan.com, Ltd. | 161,497 | 1,207,568 | ||||||
| People Infrastructure, Ltd. | 77,970 | 259,245 | ||||||
| Redbubble, Ltd.(a) | 60,900 | 190,119 | ||||||
| Temple & Webster Group, Ltd.(a) | 27,368 | 260,844 | ||||||
| Whispir, Ltd.(a) | 168,579 | 291,670 | ||||||
| 3,936,215 | ||||||||
| Belgium (0.46%) | ||||||||
| X-Fab Silicon Foundries SE(a)(b)(c) | 34,819 | 346,157 | ||||||
| Brazil (0.19%) | ||||||||
| Neogrid Participacoes SA | 220,300 | 140,132 | ||||||
| Britain (12.30%) | ||||||||
| AB Dynamics PLC | 13,514 | 338,451 | ||||||
| Bytes Technology Group PLC | 15,079 | 110,198 | ||||||
| City of London Investment Group PLC | 46,732 | 338,962 | ||||||
| CVS Group PLC | 14,441 | 493,093 | ||||||
| dotdigital group PLC | 117,100 | 385,419 | ||||||
| Elixirr International PLC(a) | 51,240 | 504,897 | ||||||
| Foresight Group Holdings, Ltd. | 65,647 | 404,286 | ||||||
| Impax Asset Management Group PLC | 59,855 | 897,784 | ||||||
| JTC PLC(b)(c) | 60,251 | 640,687 | ||||||
| K3 Capital Group PLC | 277,632 | 1,320,338 | ||||||
| Keystone Law Group PLC | 67,090 | 729,938 | ||||||
| On the Beach Group PLC(a)(b)(c) | 163,775 | 669,041 | ||||||
| Pensionbee Group PLC(a) | 306,740 | 620,029 | ||||||
| Premier Miton Group PLC | 385,142 | 948,756 | ||||||
| Tristel PLC | 12,810 | 85,903 | ||||||
| Volution Group PLC | 69,601 | 470,547 | ||||||
| XPS Pensions Group PLC(c) | 173,192 | 327,090 | ||||||
| 9,285,419 | ||||||||
| Canada (0.83%) | ||||||||
| Guardian Capital Group, Ltd. | 22,300 | 623,268 | ||||||
| China (1.86%) | ||||||||
| O2Micro International, Ltd., ADR(a) | 94,424 | 579,763 | ||||||
| TK Group Holdings, Ltd. | 2,166,600 | 821,473 | ||||||
| 1,401,236 | ||||||||
| Denmark (0.13%) | ||||||||
| Trifork AS(a) | 2,455 | 97,666 | ||||||
| Shares | Value (Note 2) | |||||||
| Finland (2.09%) | ||||||||
| Musti Group Oyj | 40,126 | $ | 1,576,188 | |||||
| France (3.15%) | ||||||||
| Esker SA | 2,222 | 759,032 | ||||||
| Neurones | 9,400 | 386,845 | ||||||
| Sidetrade | 1,250 | 257,211 | ||||||
| Thermador Groupe | 5,874 | 668,171 | ||||||
| Wavestone | 5,647 | 310,730 | ||||||
| 2,381,989 | ||||||||
| Georgia (0.31%) | ||||||||
| TBC Bank Group PLC | 11,050 | 237,423 | ||||||
| Germany (3.99%) | ||||||||
| Bike24 Holding AG(a) | 19,625 | 454,185 | ||||||
| Deutsche Industrie REIT AG | 9,460 | 246,055 | ||||||
| Exasol AG(a) | 32,465 | 329,510 | ||||||
| Fashionette AG(a) | 10,926 | 218,508 | ||||||
| hGears AG(a) | 7,851 | 186,961 | ||||||
| Home24 SE(a) | 44,218 | 577,101 | ||||||
| Nexus AG | 3,900 | 339,934 | ||||||
| Westwing Group AG(a) | 21,139 | 661,258 | ||||||
| 3,013,512 | ||||||||
| Greece (2.58%) | ||||||||
| Kri-Kri Milk Industry SA | 83,721 | 772,318 | ||||||
| Sarantis SA | 116,542 | 1,176,130 | ||||||
| 1,948,448 | ||||||||
| Hong Kong (0.75%) | ||||||||
| Plover Bay Technologies, Ltd.(c) | 1,544,000 | 563,583 | ||||||
| India (4.72%) | ||||||||
| Amrutanjan Health Care, Ltd. | 48,853 | 595,125 | ||||||
| Cera Sanitaryware, Ltd. | 4,721 | 326,773 | ||||||
| EPL, Ltd. | 72,500 | 207,969 | ||||||
| Gufic Biosciences, Ltd. | 212,187 | 537,685 | ||||||
| Gulf Oil Lubricants India, Ltd. | 63,717 | 492,463 | ||||||
| Metropolis Healthcare, Ltd.(b)(c) | 18,316 | 724,556 | ||||||
| Vaibhav Global, Ltd. | 29,230 | 224,315 | ||||||
| Westlife Development, Ltd.(a) | 59,223 | 458,955 | ||||||
| 3,567,841 | ||||||||
| Indonesia (1.58%) | ||||||||
| Arwana Citramulia Tbk PT | 7,920,100 | 483,564 | ||||||
| Map Aktif Adiperkasa PT(a) | 1,249,100 | 286,541 | ||||||
| Selamat Sempurna Tbk PT | 3,749,200 | 420,768 | ||||||
| 1,190,873 | ||||||||
| Ireland (0.95%) | ||||||||
| Irish Residential Properties REIT PLC | 137,000 | 258,147 | ||||||
See Notes to Financial Statements.
| Semi-Annual Report | October 31, 2021 | 41 |
| Grandeur Peak Global Micro Cap Fund | Portfolio of Investments |
October 31, 2021 (Unaudited)
| Shares | Value (Note 2) | |||||||
| Ireland (continued) | ||||||||
| Uniphar PLC | 90,411 | $ | 460,913 | |||||
| 719,060 | ||||||||
| Israel (0.22%) | ||||||||
| Max Stock, Ltd. | 41,382 | 168,570 | ||||||
| Italy (0.65%) | ||||||||
| Piovan SpA(b)(c) | 47,181 | 489,781 | ||||||
| Japan (15.72%) | ||||||||
| AIT Corp. | 35,400 | 345,070 | ||||||
| Beenos, Inc. | 48,500 | 1,406,383 | ||||||
| Central Automotive Products, Ltd. | 10,900 | 283,366 | ||||||
| Charm Care Corp. | 58,400 | 874,655 | ||||||
| Creema, Ltd.(a) | 17,900 | 269,344 | ||||||
| eGuarantee, Inc. | 26,000 | 577,600 | ||||||
| ENECHANGE, Ltd.(a) | 15,700 | 734,205 | ||||||
| geechs, Inc. | 19,700 | 252,181 | ||||||
| GMO Pepabo, Inc. | 9,300 | 221,862 | ||||||
| gremz, Inc. | 21,300 | 490,194 | ||||||
| Kinjiro Co., Ltd. | 12,200 | 181,113 | ||||||
| M&A Capital Partners Co., Ltd.(a) | 18,700 | 1,051,696 | ||||||
| MarkLines Co., Ltd. | 9,100 | 257,091 | ||||||
| Medikit Co., Ltd. | 9,800 | 243,936 | ||||||
| Meinan M&A Co., Ltd. | 21,500 | 246,550 | ||||||
| Naigai Trans Line, Ltd. | 15,700 | 302,498 | ||||||
| Open Door, Inc.(a) | 21,600 | 477,010 | ||||||
| Strike Co., Ltd. | 11,000 | 415,003 | ||||||
| Sun*, Inc.(a) | 26,600 | 568,758 | ||||||
| Synchro Food Co., Ltd.(a) | 110,900 | 379,478 | ||||||
| System Information Co., Ltd. | 22,000 | 181,057 | ||||||
| Syuppin Co., Ltd. | 31,700 | 349,611 | ||||||
| Trancom Co., Ltd. | 2,700 | 188,568 | ||||||
| User Local, Inc. | 6,600 | 105,797 | ||||||
| Vega Corp. Co., Ltd. | 63,000 | 758,930 | ||||||
| YAKUODO Holdings Co., Ltd. | 33,600 | 708,998 | ||||||
| 11,870,954 | ||||||||
| Luxembourg (0.46%) | ||||||||
| Sword Group | 7,123 | 347,895 | ||||||
| New Zealand (0.27%) | ||||||||
| CBL Corp., Ltd.(d) | 159,993 | 0 | ||||||
| NZX, Ltd. | 165,854 | 205,612 | ||||||
| 205,612 | ||||||||
| Norway (4.85%) | ||||||||
| 24SevenOffice Group AB(a) | 99,164 | 195,141 | ||||||
| Bouvet ASA | 35,333 | 282,734 | ||||||
| Medistim ASA | 7,989 | 359,358 | ||||||
| Nordhealth AS(a) | 282,797 | 1,539,869 | ||||||
| Self Storage Group ASA(a) | 268,416 | 911,888 | ||||||
| Shares | Value (Note 2) | |||||||
| Norway (continued) | ||||||||
| SmartCraft ASA(a) | 149,273 | $ | 371,067 | |||||
| 3,660,057 | ||||||||
| Oman (0.29%) | ||||||||
| Tethys Oil AB | 30,300 | 220,511 | ||||||
| Philippines (2.02%) | ||||||||
| AllHome Corp.(a) | 3,615,398 | 738,714 | ||||||
| Concepcion Industrial Corp. | 334,770 | 152,410 | ||||||
| Pryce Corp. | 3,937,000 | 429,548 | ||||||
| Wilcon Depot, Inc. | 335,000 | 207,340 | ||||||
| 1,528,012 | ||||||||
| Poland (1.04%) | ||||||||
| Answear.com SA(a) | 42,071 | 369,076 | ||||||
| LiveChat Software SA | 6,400 | 195,706 | ||||||
| Mo-BRUK SA | 2,474 | 223,238 | ||||||
| 788,020 | ||||||||
| Singapore (0.29%) | ||||||||
| Riverstone Holdings, Ltd./Singapore | 343,600 | 219,129 | ||||||
| South Korea (0.78%) | ||||||||
| Hyundai Ezwel Co., Ltd. | 25,910 | 218,402 | ||||||
| MegaStudyEdu Co., Ltd. | 2,818 | 185,688 | ||||||
| Suprema, Inc.(a) | 8,703 | 184,703 | ||||||
| 588,793 | ||||||||
| Sweden (8.60%) | ||||||||
| KNOW IT AB | 18,289 | 734,712 | ||||||
| Lyko Group AB(a)(c) | 16,174 | 537,689 | ||||||
| OEM International AB, Class B | 40,455 | 909,154 | ||||||
| SwedenCare AB | 176,576 | 2,909,351 | ||||||
| Teqnion AB(a) | 53,700 | 844,143 | ||||||
| Vitec Software Group AB, Class B | 9,515 | 561,726 | ||||||
| 6,496,775 | ||||||||
| Taiwan (6.46%) | ||||||||
| Bioteque Corp. | 130,000 | 511,894 | ||||||
| Brighten Optix Corp. | 81,000 | 1,089,379 | ||||||
| FineTek Co., Ltd. | 100,942 | 311,082 | ||||||
| Fuzetec Technology Co., Ltd. | 246,955 | 610,094 | ||||||
| GEM Services, Inc./Tw | 182,000 | 651,858 | ||||||
| Poya International Co., Ltd. | 12,360 | 220,901 | ||||||
| Sporton International, Inc. | 98,761 | 800,856 | ||||||
| Tehmag Foods Corp. | 14,630 | 157,303 | ||||||
| Tofu Restaurant Co., Ltd. | 48,050 | 271,279 | ||||||
| Wistron Information Technology & Services Corp. | 83,000 | 253,103 | ||||||
| 4,877,749 | ||||||||
See Notes to Financial Statements.
| 42 | 1.855.377.7325 | www.GrandeurPeakGlobal.com |
| Grandeur Peak Global Micro Cap Fund | Portfolio of Investments |
October 31, 2021 (Unaudited)
| Shares | Value (Note 2) | |||||||
| Thailand (0.52%) | ||||||||
| Humanica PCL | 935,000 | $ | 301,500 | |||||
| Netbay PCL | 125,000 | 94,176 | ||||||
| 395,676 | ||||||||
| United States (15.94%) | ||||||||
| 4imprint Group PLC | 21,364 | 836,199 | ||||||
| Acacia Pharma Group PLC(a) | 128,911 | 247,376 | ||||||
| Alpha Teknova, Inc.(a) | 62,826 | 1,444,370 | ||||||
| Barrett Business Services, Inc. | 8,530 | 699,460 | ||||||
| Better Choice Co., Inc.(a) | 84,612 | 328,294 | ||||||
| Bowman Consulting Group, Ltd.(a) | 27,300 | 420,420 | ||||||
| Castle Biosciences, Inc.(a) | 3,300 | 205,755 | ||||||
| Coastal Financial Corp.(a) | 12,400 | 471,820 | ||||||
| Esquire Financial Holdings, Inc.(a) | 25,349 | 810,661 | ||||||
| Evolution Petroleum Corp. | 84,120 | 499,673 | ||||||
| Global Industrial Co. | 12,150 | 493,047 | ||||||
| Hackett Group, Inc. | 24,299 | 513,681 | ||||||
| Heska Corp.(a) | 2,387 | 533,566 | ||||||
| Joint Corp.(a) | 28,544 | 2,497,029 | ||||||
| LeMaitre Vascular, Inc. | 10,200 | 530,502 | ||||||
| MaxCyte, Inc.(a) | 74,400 | 769,760 | ||||||
| Plumas Bancorp | 9,900 | 365,706 | ||||||
| ProntoForms Corp.(a) | 432,000 | 366,516 | ||||||
| 12,033,835 | ||||||||
| Vietnam (0.53%) | ||||||||
| Lix Detergent JSC | 163,520 | 398,891 | ||||||
| TOTAL COMMON STOCKS | ||||||||
| (Cost $50,574,833) | 75,319,270 | |||||||
| TOTAL INVESTMENTS (99.74%) | ||||||||
| (Cost $50,574,833) | $ | 75,319,270 | ||||||
| Other Assets In Excess Of Liabilities (0.26%) | 194,171 | |||||||
| NET ASSETS (100.00%) | $ | 75,513,441 | ||||||
| (a) | Non-Income Producing Security. |
| (b) | Security exempt from registration under Rule 144A of the Securities Act of 1933. These securities may be resold in the ordinary course of business in transactions exempt from registration, normally to qualified institutional buyers. As of October 31, 2021, these securities had a total aggregate market value of $2,870,222, representing 3.80% of net assets. |
| (c) | Security was purchased pursuant to Regulation S under the Securities Act of 1933, which exempts securities offered and sold outside of the United States from registration. Such security cannot be sold in the United States without either an effective registration statement filed pursuant to the Securities Act of 1933, or pursuant to an exemption from registration. As of October 31, 2021, the aggregate market value of these securities was $4,298,584, representing 5.69% of net assets. |
| (d) | As a result of the use of significant unobservable inputs to determine fair value, these investments have been classified as level 3 assets. See also Note 2 to the financial statements for additional information. |
For Fund compliance purposes, the Fund's geographical classifications refer to any one or more of the country sub-classifications used by one or more widely recognized market indexes or ratings group indexes, and/or as defined by Fund management. This definition may not apply for purposes of this report, which may combine sub-classifications for reporting ease. Geographical regions are shown as a percentage of net assets.
| Sector Composition (October 31, 2021) (Unaudited) | |
| Consumer | 23.4% |
| Health Care | 22.9% |
| Technology | 18.5% |
| Industrials | 17.4% |
| Financials | 15.1% |
| Energy & Materials | 2.4% |
| Cash, Cash Equivalents, & Other Net Assets | 0.3% |
| Total | 100% |
See Notes to Financial Statements.
| Semi-Annual Report | October 31, 2021 | 43 |
| Grandeur Peak Global Micro Cap Fund | Portfolio of Investments |
October 31, 2021 (Unaudited)
| Industry Composition (October 31, 2021) (Unaudited) | |
| Capital Markets | 11.1% |
| Internet & Direct Marketing Retail | 9.1% |
| Health Care Providers & Services | 7.1% |
| Software | 6.3% |
| IT Services | 6.1% |
| Professional Services | 5.8% |
| Pharmaceuticals | 5.7% |
| Health Care Equipment & Supplies | 4.7% |
| Specialty Retail | 4.5% |
| Trading Companies & Distributors | 3.8% |
| Life Sciences Tools & Services | 2.9% |
| Health Care Technology | 2.5% |
| Banks | 2.5% |
| Hotels, Restaurants & Leisure | 2.5% |
| Semiconductors & Semiconductor Equipment | 2.2% |
| Commercial Services & Supplies | 2.1% |
| Personal Products | 2.0% |
| Building Products | 1.8% |
| Machinery | 1.7% |
| Oil, Gas & Consumable Fuels | 1.5% |
| Food Products | 1.2% |
| Auto Components | 1.2% |
| Media | 1.1% |
| Electronic Equipment, Instruments & Components | 1.0% |
| Other Industries (each less than 1%) | 9.3% |
| Cash and Other Assets, Less Liabilities | 0.3% |
| Total | 100.0% |
See Notes to Financial Statements.
| 44 | 1.855.377.7325 | www.GrandeurPeakGlobal.com |
| Grandeur Peak Global Opportunities Fund | Portfolio of Investments |
October 31, 2021 (Unaudited)
| Shares | Value (Note 2) | |||||||
| COMMON STOCKS (99.48%) | ||||||||
| Argentina (0.72%) | ||||||||
| Globant SA(a) | 24,775 | $ | 7,907,932 | |||||
| Australia (0.50%) | ||||||||
| Fiducian Group, Ltd. | 182,850 | 1,202,173 | ||||||
| Kogan.com, Ltd. | 581,275 | 4,346,390 | ||||||
| 5,548,563 | ||||||||
| Bangladesh (0.24%) | ||||||||
| Square Pharmaceuticals, Ltd. | 1,038,829 | 2,640,895 | ||||||
| Belgium (1.19%) | ||||||||
| Melexis NV | 62,854 | 7,236,875 | ||||||
| X-Fab Silicon Foundries SE(a)(b)(c) | 592,237 | 5,887,796 | ||||||
| 13,124,671 | ||||||||
| Brazil (1.49%) | ||||||||
| Fleury SA | 1,000,200 | 3,324,666 | ||||||
| Instituto Hermes Pardini SA | 708,600 | 2,728,282 | ||||||
| Neogrid Participacoes SA | 2,355,500 | 1,498,325 | ||||||
| Pagseguro Digital, Ltd., Class A(a) | 149,438 | 5,409,656 | ||||||
| Patria Investments, Ltd. | 200,658 | 3,443,291 | ||||||
| 16,404,220 | ||||||||
| Britain (18.76%) | ||||||||
| AB Dynamics PLC | 67,600 | 1,693,007 | ||||||
| Ascential PLC(a) | 1,826,939 | 10,101,045 | ||||||
| B&M European Value Retail SA | 2,841,817 | 24,626,229 | ||||||
| Bytes Technology Group PLC | 256,480 | 1,874,371 | ||||||
| City of London Investment Group PLC | 393,420 | 2,853,601 | ||||||
| CVS Group PLC | 568,598 | 19,414,972 | ||||||
| Dechra Pharmaceuticals PLC | 402,522 | 28,204,634 | ||||||
| Diploma PLC | 129,290 | 5,315,275 | ||||||
| Endava PLC, ADR(a) | 213,213 | 33,785,732 | ||||||
| Gamma Communications PLC | 206,400 | 5,118,336 | ||||||
| Impax Asset Management Group PLC | 324,362 | 4,865,208 | ||||||
| Intertek Group PLC | 106,243 | 7,117,278 | ||||||
| JTC PLC(b)(c) | 498,762 | 5,303,655 | ||||||
| K3 Capital Group PLC | 1,023,251 | 4,866,289 | ||||||
| Made.com Group PLC(a)(b)(c) | 384,457 | 826,054 | ||||||
| On the Beach Group PLC(a)(b)(c) | 1,126,330 | 4,601,197 | ||||||
| Pensionbee Group PLC(a) | 888,523 | 1,796,015 | ||||||
| Premier Miton Group PLC | 1,939,173 | 4,776,942 | ||||||
| Sabre Insurance Group PLC(b)(c) | 974,131 | 2,623,635 | ||||||
| Softcat PLC | 185,363 | 4,928,976 | ||||||
| St. James's Place PLC | 445,740 | 9,635,231 | ||||||
| Team17 Group PLC(a) | 431,396 | 4,191,750 | ||||||
| Tristel PLC | 95,917 | 643,210 | ||||||
| Ultra Electronics Holdings PLC | 245,553 | 10,894,797 | ||||||
| Shares | Value (Note 2) | |||||||
| Britain (continued) | ||||||||
| Victorian Plumbing Group PLC(a) | 310,995 | $ | 772,912 | |||||
| Volution Group PLC | 885,051 | 5,983,512 | ||||||
| 206,813,863 | ||||||||
| Canada (1.68%) | ||||||||
| Gildan Activewear, Inc. | 240,200 | 8,823,119 | ||||||
| Guardian Capital Group, Ltd. | 126,800 | 3,543,966 | ||||||
| Richelieu Hardware, Ltd. | 175,965 | 6,211,951 | ||||||
| 18,579,036 | ||||||||
| China (4.59%) | ||||||||
| CSPC Pharmaceutical Group, Ltd. | 3,090,320 | 3,233,109 | ||||||
| Hangzhou Robam Appliances Co., Ltd., Class A | 1,028,800 | 5,036,848 | ||||||
| Man Wah Holdings, Ltd. | 3,380,900 | 5,257,874 | ||||||
| O2Micro International, Ltd., ADR(a) | 681,084 | 4,181,856 | ||||||
| Silergy Corp. | 167,552 | 27,595,453 | ||||||
| Suofeiya Home Collection Co., Ltd., Class A | 2,000,100 | 5,288,343 | ||||||
| 50,593,483 | ||||||||
| Denmark (0.13%) | ||||||||
| Trifork AS(a) | 35,415 | 1,408,895 | ||||||
| Egypt (0.13%) | ||||||||
| Integrated Diagnostics Holdings PLC(b)(c) | 1,127,045 | 1,394,718 | ||||||
| Finland (1.15%) | ||||||||
| Musti Group Oyj | 323,530 | 12,708,571 | ||||||
| France (5.87%) | ||||||||
| Alten SA | 65,856 | 10,597,255 | ||||||
| BioMerieux | 27,694 | 3,523,178 | ||||||
| Esker SA | 35,947 | 12,279,450 | ||||||
| Neurones | 110,960 | 4,566,413 | ||||||
| Rothschild & Co. | 85,510 | 3,761,234 | ||||||
| Thermador Groupe | 73,248 | 8,332,008 | ||||||
| Virbac SA | 36,354 | 18,386,076 | ||||||
| Wavestone | 58,543 | 3,221,371 | ||||||
| 64,666,985 | ||||||||
| Georgia (0.48%) | ||||||||
| Bank of Georgia Group PLC | 66,483 | 1,381,158 | ||||||
| Georgia Capital PLC(a) | 242,266 | 2,002,582 | ||||||
| TBC Bank Group PLC | 87,542 | 1,880,949 | ||||||
| 5,264,689 | ||||||||
| Germany (4.72%) | ||||||||
| Atoss Software AG | 13,100 | 2,962,095 | ||||||
| Bike24 Holding AG(a) | 45,365 | 1,049,890 | ||||||
| Dermapharm Holding SE | 113,975 | 11,462,719 | ||||||
See Notes to Financial Statements.
| Semi-Annual Report | October 31, 2021 | 45 |
| Grandeur Peak Global Opportunities Fund | Portfolio of Investments |
October 31, 2021 (Unaudited)
| Shares | Value (Note 2) | |||||||
| Germany (continued) | ||||||||
| Exasol AG(a) | 208,200 | $ | 2,113,168 | |||||
| Fashionette AG(a) | 157,013 | 3,140,078 | ||||||
| Friedrich Vorwerk Group SE(a) | 60,903 | 2,709,147 | ||||||
| Nagarro SE(a) | 27,170 | 5,465,095 | ||||||
| Nexus AG | 82,624 | 7,201,722 | ||||||
| QIAGEN NV(a) | 225,370 | 12,566,631 | ||||||
| Westwing Group AG(a) | 108,845 | 3,404,827 | ||||||
| 52,075,372 | ||||||||
| India (5.31%) | ||||||||
| Cera Sanitaryware, Ltd. | 17,049 | 1,180,079 | ||||||
| Computer Age Management Services, Ltd. | 164,350 | 6,610,982 | ||||||
| EPL, Ltd. | 481,054 | 1,379,924 | ||||||
| Gulf Oil Lubricants India, Ltd. | 200,637 | 1,550,704 | ||||||
| IndiaMart InterMesh, Ltd.(b)(c) | 43,675 | 4,168,245 | ||||||
| L&T Technology Services, Ltd.(b)(c) | 35,937 | 2,267,621 | ||||||
| Metropolis Healthcare, Ltd.(b)(c) | 425,953 | 16,850,119 | ||||||
| Nippon Life India Asset Management, Ltd.(b)(c) | 255,000 | 1,424,646 | ||||||
| WNS Holdings, Ltd., ADR(a) | 260,407 | 23,126,746 | ||||||
| 58,559,066 | ||||||||
| Indonesia (1.37%) | ||||||||
| Ace Hardware Indonesia Tbk PT | 38,665,400 | 3,848,118 | ||||||
| Arwana Citramulia Tbk PT | 58,214,800 | 3,554,318 | ||||||
| Selamat Sempurna Tbk PT | 49,648,300 | 5,571,964 | ||||||
| Ultrajaya Milk Industry & Trading Co. Tbk PT | 18,240,200 | 2,098,573 | ||||||
| 15,072,973 | ||||||||
| Ireland (1.44%) | ||||||||
| Irish Residential Properties | ||||||||
| REIT PLC | 4,378,205 | 8,249,782 | ||||||
| Keywords Studios PLC | 197,885 | 7,680,332 | ||||||
| 15,930,114 | ||||||||
| Israel (0.44%) | ||||||||
| Wix.com, Ltd.(a) | 25,847 | 4,806,508 | ||||||
| Italy (1.79%) | ||||||||
| DiaSorin SpA | 15,959 | 3,603,943 | ||||||
| GVS SpA(b)(c) | 286,376 | 4,254,010 | ||||||
| Interpump Group SpA | 140,451 | 10,350,559 | ||||||
| Piovan SpA(b)(c) | 144,291 | 1,497,871 | ||||||
| 19,706,383 | ||||||||
| Japan (8.67%) | ||||||||
| AIT Corp. | 366,700 | 3,574,501 | ||||||
| BayCurrent Consulting, Inc. | 15,300 | 6,295,854 | ||||||
| Charm Care Corp. | 252,000 | 3,774,196 | ||||||
| Create SD Holdings Co., Ltd. | 182,700 | 5,610,441 | ||||||
| Shares | Value (Note 2) | |||||||
| Japan (continued) | ||||||||
| IR Japan Holdings, Ltd. | 27,900 | $ | 2,572,748 | |||||
| Japan Lifeline Co., Ltd. | 566,600 | 6,089,800 | ||||||
| Kinjiro Co., Ltd. | 81,900 | 1,215,835 | ||||||
| M&A Capital Partners Co., Ltd.(a) | 190,800 | 10,730,669 | ||||||
| MarkLines Co., Ltd. | 45,200 | 1,276,982 | ||||||
| Medikit Co., Ltd. | 83,700 | 2,083,412 | ||||||
| MonotaRO Co., Ltd. | 244,100 | 5,525,580 | ||||||
| Naigai Trans Line, Ltd. | 98,500 | 1,897,837 | ||||||
| Open Door, Inc.(a) | 250,100 | 5,523,156 | ||||||
| Seria Co., Ltd. | 413,200 | 13,631,340 | ||||||
| Strike Co., Ltd. | 129,300 | 4,878,175 | ||||||
| Sun*, Inc.(a) | 116,700 | 2,495,266 | ||||||
| Synchro Food Co., Ltd.(a) | 449,300 | 1,537,416 | ||||||
| Trancom Co., Ltd. | 75,370 | 5,263,832 | ||||||
| User Local, Inc. | 260,900 | 4,182,183 | ||||||
| Visional, Inc.(a) | 12,100 | 940,610 | ||||||
| YAKUODO Holdings Co., Ltd. | 305,700 | 6,450,612 | ||||||
| 95,550,445 | ||||||||
| Luxembourg (0.18%) | ||||||||
| Sword Group | 41,691 | 2,036,235 | ||||||
| Mexico (0.70%) | ||||||||
| Grupo Herdez SAB de CV | 2,096,680 | 3,851,585 | ||||||
| Regional SAB de CV | 738,427 | 3,853,536 | ||||||
| 7,705,121 | ||||||||
| Netherlands (1.36%) | ||||||||
| Aalberts NV | 143,153 | 7,918,469 | ||||||
| Shop Apotheke Europe NV(a)(b)(c) | 46,456 | 7,035,126 | ||||||
| 14,953,595 | ||||||||
| New Zealand (0.00%)(d) | ||||||||
| CBL Corp., Ltd.(e) | 1,107,672 | 1 | ||||||
| Norway (0.99%) | ||||||||
| Bouvet ASA | 196,547 | 1,572,767 | ||||||
| Nordhealth AS(a) | 1,049,587 | 5,715,148 | ||||||
| SmartCraft ASA(a) | 1,457,082 | 3,622,051 | ||||||
| 10,909,966 | ||||||||
| Philippines (1.06%) | ||||||||
| AllHome Corp.(a) | 3,534,674 | 722,221 | ||||||
| Concepcion Industrial Corp. | 1,035,152 | 471,270 | ||||||
| Puregold Price Club, Inc. | 8,009,700 | 6,713,149 | ||||||
| Wilcon Depot, Inc. | 6,158,500 | 3,811,648 | ||||||
| 11,718,288 | ||||||||
| Poland (0.82%) | ||||||||
| Dino Polska SA(a)(b)(c) | 100,797 | 9,004,311 | ||||||
See Notes to Financial Statements.
| 46 | 1.855.377.7325 | www.GrandeurPeakGlobal.com |
| Grandeur Peak Global Opportunities Fund | Portfolio of Investments |
October 31, 2021 (Unaudited)
| Shares | Value (Note 2) | |||||||
| Singapore (0.37%) | ||||||||
| Riverstone Holdings, Ltd./Singapore | 6,398,200 | $ | 4,080,424 | |||||
| South Africa (0.25%) | ||||||||
| Italtile, Ltd. | 2,394,999 | 2,768,948 | ||||||
| South Korea (0.66%) | ||||||||
| LEENO Industrial, Inc. | 21,162 | 3,100,368 | ||||||
| Tokai Carbon Korea Co., Ltd. | 38,780 | 4,148,303 | ||||||
| 7,248,671 | ||||||||
| Sweden (3.97%) | ||||||||
| Beijer Alma AB | 329,010 | 8,255,899 | ||||||
| Boozt AB(a)(b)(c) | 223,837 | 3,771,450 | ||||||
| Byggfakta Group Nordic Holdco AB(a) | 643,406 | 5,057,045 | ||||||
| Cint Group AB(a)(e) | 224,379 | 3,386,064 | ||||||
| Hexpol AB | 473,017 | 5,524,407 | ||||||
| KNOW IT AB | 183,715 | 7,380,260 | ||||||
| Lyko Group AB(a)(c) | 50,031 | 1,663,234 | ||||||
| OEM International AB, Class B | 155,695 | 3,498,968 | ||||||
| SwedenCare AB | 320,596 | 5,282,293 | ||||||
| 43,819,620 | ||||||||
| Taiwan (2.25%) | ||||||||
| Bioteque Corp. | 1,193,000 | 4,697,610 | ||||||
| Brighten Optix Corp. | 289,000 | 3,886,797 | ||||||
| FineTek Co., Ltd. | 173,223 | 533,837 | ||||||
| Fuzetec Technology Co., Ltd. | 278,482 | 687,981 | ||||||
| M3 Technology, Inc. | 237,000 | 2,100,815 | ||||||
| Poya International Co., Ltd. | 301,790 | 5,393,661 | ||||||
| Sporton International, Inc. | 784,954 | 6,365,217 | ||||||
| Tofu Restaurant Co., Ltd. | 205,000 | 1,157,380 | ||||||
| 24,823,298 | ||||||||
| United States (24.64%) | ||||||||
| 4imprint Group PLC | 173,279 | 6,782,235 | ||||||
| Bank of NT Butterfield & Son, Ltd. | 209,104 | 7,506,834 | ||||||
| Barrett Business Services, Inc. | 47,990 | 3,935,180 | ||||||
| Bizlink Holding, Inc. | 573,900 | 5,293,538 | ||||||
| Cardiovascular Systems, Inc.(a) | 190,812 | 6,693,685 | ||||||
| Castle Biosciences, Inc.(a) | 91,161 | 5,683,888 | ||||||
| EPAM Systems, Inc.(a) | 33,668 | 22,666,644 | ||||||
| Esquire Financial Holdings, Inc.(a) | 25,886 | 827,834 | ||||||
| First Republic Bank | 67,631 | 14,630,614 | ||||||
| Five Below, Inc.(a) | 21,252 | 4,193,020 | ||||||
| Frontage Holdings Corp.(a)(b)(c) | 2,564,100 | 1,499,474 | ||||||
| FTI Consulting, Inc.(a) | 38,104 | 5,483,928 | ||||||
| Genpact, Ltd. | 224,300 | 11,069,205 | ||||||
| Glacier Bancorp, Inc. | 219,739 | 12,149,369 | ||||||
| Global Industrial Co. | 143,866 | 5,838,082 | ||||||
| Hackett Group, Inc. | 123,408 | 2,608,845 | ||||||
| Heska Corp.(a) | 64,501 | 14,417,909 | ||||||
| Shares | Value (Note 2) | |||||||
| United States (continued) | ||||||||
| Houlihan Lokey, Inc. | 30,750 | $ | 3,446,460 | |||||
| Insperity, Inc. | 40,139 | 5,017,375 | ||||||
| LeMaitre Vascular, Inc. | 169,968 | 8,840,036 | ||||||
| LGI Homes, Inc.(a) | 51,733 | 7,723,737 | ||||||
| Littelfuse, Inc. | 72,591 | 21,381,679 | ||||||
| Marcus & Millichap, Inc.(a) | 216,305 | 10,187,965 | ||||||
| MaxCyte, Inc.(a) | 286,500 | 2,964,199 | ||||||
| NV5 Global, Inc.(a) | 54,534 | 5,678,625 | ||||||
| Ollie's Bargain Outlet Holdings, Inc.(a) | 86,466 | 5,850,290 | ||||||
| P10, Inc.(a) | 510,700 | 6,383,750 | ||||||
| Paylocity Holding Corp.(a) | 9,281 | 2,832,004 | ||||||
| PJT Partners, Inc., Class A | 103,160 | 8,437,456 | ||||||
| Plumas Bancorp | 43,088 | 1,591,671 | ||||||
| Power Integrations, Inc. | 37,854 | 3,906,911 | ||||||
| Qualys, Inc.(a) | 95,894 | 11,936,885 | ||||||
| Rapid7, Inc.(a) | 76,739 | 9,880,146 | ||||||
| Silicon Laboratories, Inc.(a) | 21,139 | 3,990,198 | ||||||
| Squarespace, Inc.(a) | 65,338 | 2,544,262 | ||||||
| Traeger, Inc.(a) | 262,417 | 4,957,057 | ||||||
| TriMas Corp. | 252,331 | 8,415,239 | ||||||
| Ulta Beauty, Inc.(a) | 11,927 | 4,381,503 | ||||||
| 271,627,732 | ||||||||
| Vietnam (1.56%) | ||||||||
| Vietnam Dairy Products JSC | 914,196 | 3,644,488 | ||||||
| Vietnam Technological & Commercial Joint Stock Bank(a) | 5,964,004 | 13,526,256 | ||||||
| 17,170,744 | ||||||||
| TOTAL COMMON STOCKS | ||||||||
| (Cost $671,862,190) | 1,096,624,336 | |||||||
| PREFERRED STOCKS (0.39%) | ||||||||
| United States (0.39%) | ||||||||
| Dataminr Inc -Private Placement(a)(e) | 96,640 | 4,252,160 | ||||||
| TOTAL PREFERRED STOCKS | ||||||||
| (Cost $1,923,136) | 4,252,160 | |||||||
| TOTAL INVESTMENTS (99.87%) | ||||||||
| (Cost $673,785,326) | $ | 1,100,876,496 | ||||||
| Other Assets In Excess Of Liabilities (0.13%) | 1,468,267 | |||||||
| NET ASSETS (100.00%) | $ | 1,102,344,763 | ||||||
| (a) | Non-Income Producing Security. |
See Notes to Financial Statements.
| Semi-Annual Report | October 31, 2021 | 47 |
| Grandeur Peak Global Opportunities Fund | Portfolio of Investments |
October 31, 2021 (Unaudited)
| (b) | Security exempt from registration under Rule 144A of the Securities Act of 1933. These securities may be resold in the ordinary course of business in transactions exempt from registration, normally to qualified institutional buyers. As of October 31, 2021, these securities had a total aggregate market value of $72,409,928, representing 6.57% of net assets. |
| (c) | Security was purchased pursuant to Regulation S under the Securities Act of 1933, which exempts securities offered and sold outside of the United States from registration. Such security cannot be sold in the United States without either an effective registration statement filed pursuant to the Securities Act of 1933, or pursuant to an exemption from registration. As of October 31, 2021, the aggregate market value of these securities was $74,073,162, representing 6.72% of net assets. |
| (d) | Less than 0.005%. |
| (e) | As a result of the use of significant unobservable inputs to determine fair value, these investments have been classified as level 3 assets. See also Note 2 to the financial statements for additional information. |
For Fund compliance purposes, the Fund's geographical classifications refer to any one or more of the country sub-classifications used by one or more widely recognized market indexes or ratings group indexes, and/or as defined by Fund management. This definition may not apply for purposes of this report, which may combine sub-classifications for reporting ease. Geographical regions are shown as a percentage of net assets.
| Sector Composition (October 31, 2021) (Unaudited) | |
| Technology | 32.1% |
| Health Care | 19.5% |
| Consumer | 18.2% |
| Financials | 14.2% |
| Industrials | 14.1% |
| Energy & Materials | 1.8% |
| Cash, Cash Equivalents, & Other Net Assets | 0.1% |
| Total | 100% |
| Industry Composition (October 31, 2021) (Unaudited) | |
| IT Services | 16.0% |
| Capital Markets | 7.2% |
| Pharmaceuticals | 6.3% |
| Software | 5.8% |
| Health Care Equipment & Supplies | 5.7% |
| Semiconductors & Semiconductor Equipment | 5.5% |
| Banks | 5.2% |
| Health Care Providers & Services | 4.8% |
| Multiline Retail | 4.4% |
| Professional Services | 4.1% |
| Trading Companies & Distributors | 3.6% |
| Specialty Retail | 3.2% |
| Food & Staples Retailing | 2.5% |
| Machinery | 2.5% |
| Household Durables | 2.5% |
| Internet & Direct Marketing Retail | 2.3% |
| Electronic Equipment, Instruments & Components | 2.2% |
| Life Sciences Tools & Services | 1.5% |
| Media | 1.5% |
| Health Care Technology | 1.2% |
| Hotels, Restaurants & Leisure | 1.0% |
| Aerospace & Defense | 1.0% |
| Other Industries (each less than 1%) | 9.9% |
| Cash and Other Assets, Less Liabilities | 0.1% |
| Total | 100.0% |
See Notes to Financial Statements.
| 48 | 1.855.377.7325 | www.GrandeurPeakGlobal.com |
| Grandeur Peak Global Reach Fund | Portfolio of Investments |
October 31, 2021 (Unaudited)
| Shares | Value (Note 2) | |||||||
| COMMON STOCKS (99.05%) | ||||||||
| Argentina (0.46%) | ||||||||
| Globant SA(a) | 6,105 | $ | 1,948,655 | |||||
| Australia (2.75%) | ||||||||
| Appen, Ltd. | 54,722 | 442,518 | ||||||
| Australian Ethical Investment, Ltd. | 373,810 | 3,849,595 | ||||||
| Bravura Solutions, Ltd. | 122,268 | 255,693 | ||||||
| EQT Holdings, Ltd. | 45,913 | 970,516 | ||||||
| Kogan.com, Ltd. | 163,531 | 1,222,777 | ||||||
| Netwealth Group, Ltd. | 89,313 | 1,162,308 | ||||||
| People Infrastructure, Ltd. | 337,412 | 1,121,872 | ||||||
| Redbubble, Ltd.(a) | 504,142 | 1,573,844 | ||||||
| Whispir, Ltd.(a) | 648,231 | 1,121,549 | ||||||
| 11,720,672 | ||||||||
| Bangladesh (0.12%) | ||||||||
| Square Pharmaceuticals, Ltd. | 202,545 | 514,907 | ||||||
| Belgium (0.71%) | ||||||||
| Melexis NV | 10,126 | 1,165,886 | ||||||
| Warehouses De Pauw CVA | 30,732 | 1,399,735 | ||||||
| X-Fab Silicon Foundries SE(a)(b)(c) | 44,047 | 437,899 | ||||||
| 3,003,520 | ||||||||
| Brazil (1.71%) | ||||||||
| Arco Platform, Ltd., Class A(a) | 11,542 | 196,791 | ||||||
| Diagnosticos da America SA(a) | 52,000 | 322,017 | ||||||
| Fleury SA | 371,700 | 1,235,532 | ||||||
| Hypera SA | 81,800 | 406,116 | ||||||
| Instituto Hermes Pardini SA | 198,300 | 763,503 | ||||||
| Locaweb Servicos de Internet SA(b)(c) | 271,068 | 882,779 | ||||||
| Neogrid Participacoes SA | 702,600 | 446,921 | ||||||
| Pagseguro Digital, Ltd., Class A(a) | 35,475 | 1,284,195 | ||||||
| Patria Investments, Ltd. | 77,699 | 1,333,315 | ||||||
| Pet Center Comercio e Participacoes SA | 127,400 | 424,832 | ||||||
| 7,296,001 | ||||||||
| Britain (13.09%) | ||||||||
| AB Dynamics PLC | 46,291 | 1,159,334 | ||||||
| Abcam PLC(a) | 65,482 | 1,482,239 | ||||||
| Ascential PLC(a) | 67,756 | 374,619 | ||||||
| B&M European Value Retail SA | 485,966 | 4,211,218 | ||||||
| Bytes Technology Group PLC | 77,553 | 566,762 | ||||||
| CVS Group PLC | 65,858 | 2,248,744 | ||||||
| Dechra Pharmaceuticals PLC | 47,180 | 3,305,893 | ||||||
| Diploma PLC | 18,786 | 772,316 | ||||||
| dotdigital group PLC | 595,084 | 1,958,638 | ||||||
| Elixirr International PLC(a) | 238,300 | 2,348,105 | ||||||
| Endava PLC, ADR(a) | 46,905 | 7,432,566 | ||||||
| Shares | Value (Note 2) | |||||||
| Britain (continued) | ||||||||
| Foresight Group Holdings, Ltd. | 216,892 | $ | 1,335,725 | |||||
| Gamma Communications PLC | 74,969 | 1,859,092 | ||||||
| GlobalData PLC | 26,497 | 498,609 | ||||||
| Impax Asset Management Group PLC | 416,513 | 6,247,410 | ||||||
| Intertek Group PLC | 20,231 | 1,355,286 | ||||||
| JTC PLC(b)(c) | 369,856 | 3,932,915 | ||||||
| K3 Capital Group PLC | 595,428 | 2,831,685 | ||||||
| Keystone Law Group PLC | 149,151 | 1,622,760 | ||||||
| Made.com Group PLC(a)(b)(c) | 188,500 | 405,016 | ||||||
| Ocado Group PLC(a) | 18,958 | 467,788 | ||||||
| On the Beach Group PLC(a)(b)(c) | 600,673 | 2,453,824 | ||||||
| Pensionbee Group PLC(a) | 815,693 | 1,648,800 | ||||||
| Rotork PLC | 140,010 | 678,685 | ||||||
| Softcat PLC | 15,408 | 409,713 | ||||||
| St. James's Place PLC | 19,136 | 413,649 | ||||||
| Team17 Group PLC(a) | 58,966 | 572,955 | ||||||
| Tristel PLC | 47,600 | 319,201 | ||||||
| Ultra Electronics Holdings PLC | 25,770 | 1,143,374 | ||||||
| Victorian Plumbing Group PLC(a) | 178,529 | 443,696 | ||||||
| Volution Group PLC | 121,147 | 819,031 | ||||||
| XPS Pensions Group PLC(c) | 214,043 | 404,242 | ||||||
| 55,723,890 | ||||||||
| Canada (0.90%) | ||||||||
| Gildan Activewear, Inc. | 36,300 | 1,333,386 | ||||||
| Guardian Capital Group, Ltd. | 16,000 | 447,188 | ||||||
| Richelieu Hardware, Ltd. | 17,100 | 603,668 | ||||||
| Ritchie Bros Auctioneers, Inc. | 21,401 | 1,462,758 | ||||||
| 3,847,000 | ||||||||
| China (4.57%) | ||||||||
| Chaoju Eye Care Holdings, Ltd.(a) | 651,500 | 686,627 | ||||||
| CSPC Pharmaceutical Group, Ltd. | 769,520 | 805,076 | ||||||
| Guangzhou KDT Machinery Co., Ltd. | 196,840 | 918,175 | ||||||
| Hangzhou Robam Appliances Co., Ltd., Class A | 102,700 | 502,804 | ||||||
| Li Ning Co., Ltd. | 73,800 | 820,474 | ||||||
| Man Wah Holdings, Ltd. | 1,319,200 | 2,051,580 | ||||||
| ManpowerGroup Greater China, Ltd.(c) | 578,000 | 683,452 | ||||||
| O2Micro International, Ltd., ADR(a) | 150,009 | 921,055 | ||||||
| Shenzhen Mindray Bio-Medical Electronics Co., Ltd. | 7,400 | 434,902 | ||||||
| Silergy Corp. | 39,925 | 6,575,561 | ||||||
| Suofeiya Home Collection Co., Ltd., Class A | 134,100 | 354,566 | ||||||
| TK Group Holdings, Ltd. | 1,830,000 | 693,850 | ||||||
See Notes to Financial Statements.
| Semi-Annual Report | October 31, 2021 | 49 |
| Grandeur Peak Global Reach Fund | Portfolio of Investments |
October 31, 2021 (Unaudited)
| Shares | Value (Note 2) | |||||||
| China (continued) | ||||||||
| WuXi AppTec Co., Ltd., Class H(c) | 135,012 | $ | 2,885,739 | |||||
| Wuxi Biologics Cayman, Inc.(a)(b)(c) | 28,500 | 433,700 | ||||||
| Yum China Holdings, Inc. | 12,143 | 698,012 | ||||||
| 19,465,573 | ||||||||
| Colombia (0.97%) | ||||||||
| Parex Resources, Inc. | 212,661 | 4,129,156 | ||||||
| Denmark (0.23%) | ||||||||
| Ringkjoebing Landbobank A/S | 3,693 | 468,870 | ||||||
| Trifork AS(a) | 13,239 | 526,680 | ||||||
| 995,550 | ||||||||
| Egypt (0.22%) | ||||||||
| African Export-Import Bank, GDR | 200,000 | 560,000 | ||||||
| Integrated Diagnostics Holdings PLC(b)(c) | 291,972 | 361,315 | ||||||
| 921,315 | ||||||||
| Finland (0.81%) | ||||||||
| Musti Group Oyj | 87,566 | 3,439,677 | ||||||
| France (3.50%) | ||||||||
| Alten SA | 10,400 | 1,673,522 | ||||||
| Antin Infrastructure Partners SA(a) | 21,394 | 813,667 | ||||||
| BioMerieux | 3,595 | 457,349 | ||||||
| Bureau Veritas SA | 25,629 | 813,563 | ||||||
| Esker SA | 16,637 | 5,683,179 | ||||||
| Neurones | 17,282 | 711,218 | ||||||
| Sidetrade | 2,745 | 564,834 | ||||||
| Thermador Groupe | 17,757 | 2,019,870 | ||||||
| Virbac SA | 4,283 | 2,166,132 | ||||||
| 14,903,334 | ||||||||
| Germany (3.34%) | ||||||||
| Atoss Software AG | 1,800 | 407,005 | ||||||
| Bike24 Holding AG(a) | 32,976 | 763,169 | ||||||
| Dermapharm Holding SE | 17,100 | 1,719,785 | ||||||
| Exasol AG(a) | 58,735 | 596,143 | ||||||
| Fashionette AG(a) | 41,523 | 830,412 | ||||||
| Friedrich Vorwerk Group SE(a) | 21,968 | 977,202 | ||||||
| hGears AG(a) | 42,149 | 1,003,722 | ||||||
| Home24 SE(a) | 37,498 | 489,397 | ||||||
| Nagarro SE(a) | 10,311 | 2,074,000 | ||||||
| Nexus AG | 11,031 | 961,491 | ||||||
| Puma SE | 5,149 | 638,677 | ||||||
| QIAGEN NV(a) | 36,953 | 2,060,499 | ||||||
| Westwing Group AG(a) | 53,706 | �� | 1,680,000 | |||||
| 14,201,502 | ||||||||
| Shares | Value (Note 2) | |||||||
| Greece (0.61%) | ||||||||
| Kri-Kri Milk Industry SA | 61,300 | $ | 565,487 | |||||
| Sarantis SA | 199,040 | 2,008,692 | ||||||
| 2,574,179 | ||||||||
| Hong Kong (1.11%) | ||||||||
| Jacobson Pharma Corp., Ltd.(c) | 2,583,300 | 192,573 | ||||||
| Plover Bay Technologies, Ltd.(c) | 3,254,000 | 1,187,759 | ||||||
| Techtronic Industries Co., Ltd. | 94,500 | 1,944,534 | ||||||
| Vitasoy International Holdings, Ltd. | 576,300 | 1,386,587 | ||||||
| 4,711,453 | ||||||||
| India (4.80%) | ||||||||
| Avenue Supermarts, Ltd.(a)(b)(c) | 15,385 | 952,393 | ||||||
| Cera Sanitaryware, Ltd. | 15,069 | 1,043,030 | ||||||
| Computer Age Management Services, Ltd. | 28,000 | 1,126,301 | ||||||
| EPL, Ltd. | 307,821 | 882,997 | ||||||
| Gufic Biosciences, Ltd. | 249,687 | 632,710 | ||||||
| Gulf Oil Lubricants India, Ltd. | 100,176 | 774,251 | ||||||
| HCL Technologies, Ltd. | 43,536 | 664,977 | ||||||
| HDFC Bank, Ltd. | 32,137 | 679,316 | ||||||
| IndiaMart InterMesh, Ltd.(b)(c) | 12,391 | 1,182,569 | ||||||
| L&T Technology Services, Ltd.(b)(c) | 19,343 | 1,220,542 | ||||||
| Metropolis Healthcare, Ltd.(b)(c) | 83,581 | 3,306,350 | ||||||
| Poly Medicure, Ltd. | 33,085 | 408,099 | ||||||
| Polycab India, Ltd. | 37,092 | 1,120,172 | ||||||
| Time Technoplast, Ltd. | 990,247 | 915,778 | ||||||
| Westlife Development, Ltd.(a) | 75,255 | 583,196 | ||||||
| WNS Holdings, Ltd., ADR(a) | 55,697 | 4,946,451 | ||||||
| 20,439,132 | ||||||||
| Indonesia (1.18%) | ||||||||
| Ace Hardware Indonesia Tbk PT | 6,860,000 | 682,732 | ||||||
| Arwana Citramulia Tbk PT | 25,137,200 | 1,534,757 | ||||||
| Bank Central Asia Tbk PT | 1,464,000 | 772,430 | ||||||
| Selamat Sempurna Tbk PT | 11,923,000 | 1,338,103 | ||||||
| Ultrajaya Milk Industry & Trading Co. Tbk PT | 6,163,200 | 709,089 | ||||||
| 5,037,111 | ||||||||
| Ireland (0.99%) | ||||||||
| Keywords Studios PLC | 39,519 | 1,533,816 | ||||||
| Uniphar PLC | 523,697 | 2,669,792 | ||||||
| 4,203,608 | ||||||||
| Israel (0.54%) | ||||||||
| Wix.com, Ltd.(a) | 12,427 | 2,310,925 | ||||||
| Italy (0.65%) | ||||||||
| GVS SpA(b)(c) | 30,729 | 456,468 | ||||||
See Notes to Financial Statements.
| 50 | 1.855.377.7325 | www.GrandeurPeakGlobal.com |
| Grandeur Peak Global Reach Fund | Portfolio of Investments |
October 31, 2021 (Unaudited)
| Shares | Value (Note 2) | |||||||
| Italy (continued) | ||||||||
| Interpump Group SpA | 11,647 | $ | 858,328 | |||||
| Piovan SpA(b)(c) | 138,608 | 1,438,876 | ||||||
| 2,753,672 | ||||||||
| Japan (7.63%) | ||||||||
| AIT Corp. | 98,400 | 959,179 | ||||||
| Appier Group, Inc.(a) | 12,100 | 128,458 | ||||||
| BASE, Inc.(a) | 39,100 | 319,044 | ||||||
| BayCurrent Consulting, Inc. | 8,900 | 3,662,294 | ||||||
| Beenos, Inc. | 40,700 | 1,180,202 | ||||||
| Charm Care Corp. | 68,600 | 1,027,420 | ||||||
| Coconala, Inc.(a) | 19,100 | 315,554 | ||||||
| Creema, Ltd.(a) | 23,400 | 352,103 | ||||||
| eGuarantee, Inc. | 6,400 | 142,179 | ||||||
| ENECHANGE, Ltd.(a) | 12,800 | 598,587 | ||||||
| Funai Soken Holdings, Inc. | 51,600 | 1,428,366 | ||||||
| geechs, Inc. | 52,900 | 677,176 | ||||||
| gremz, Inc. | 99,200 | 2,282,971 | ||||||
| Industrial & Infrastructure Fund Investment Corp. | 409 | 748,204 | ||||||
| Japan Lifeline Co., Ltd. | 79,700 | 856,613 | ||||||
| M&A Capital Partners Co., Ltd.(a) | 8,200 | 461,171 | ||||||
| MarkLines Co., Ltd. | 24,800 | 700,645 | ||||||
| Medikit Co., Ltd. | 29,300 | 729,319 | ||||||
| MonotaRO Co., Ltd. | 36,200 | 819,443 | ||||||
| Naigai Trans Line, Ltd. | 65,750 | 1,266,830 | ||||||
| Nihon M&A Center Holdings, Inc. | 50,400 | 1,541,075 | ||||||
| Open Door, Inc.(a) | 49,600 | 1,095,356 | ||||||
| Seria Co., Ltd. | 33,000 | 1,088,660 | ||||||
| Strike Co., Ltd. | 10,600 | 399,912 | ||||||
| Sun*, Inc.(a) | 42,100 | 900,177 | ||||||
| Synchro Food Co., Ltd.(a) | 113,400 | 388,032 | ||||||
| System Information Co., Ltd. | 71,800 | 590,905 | ||||||
| Systena Corp. | 29,700 | 546,183 | ||||||
| Syuppin Co., Ltd. | 53,300 | 587,831 | ||||||
| TeamSpirit, Inc.(a) | 22,800 | 189,442 | ||||||
| Trancom Co., Ltd. | 16,000 | 1,117,438 | ||||||
| User Local, Inc. | 60,700 | 973,011 | ||||||
| Vega Corp. Co., Ltd. | 81,000 | 975,767 | ||||||
| Visional, Inc.(a) | 4,500 | 349,814 | ||||||
| WDB coco Co., Ltd. | 11,900 | 491,766 | ||||||
| WealthNavi, Inc.(a) | 42,300 | 1,156,082 | ||||||
| YAKUODO Holdings Co., Ltd. | 36,200 | 763,860 | ||||||
| YAMADA Consulting Group Co., Ltd. | 66,000 | 671,147 | ||||||
| 32,482,216 | ||||||||
| Luxembourg (0.06%) | ||||||||
| Sword Group | 5,128 | 250,457 | ||||||
| Netherlands (0.66%) | ||||||||
| Aalberts NV | 25,244 | 1,396,365 | ||||||
| Shares | Value (Note 2) | |||||||
| Netherlands (continued) | ||||||||
| Shop Apotheke Europe NV(a)(b)(c) | 9,426 | $ | 1,427,439 | |||||
| 2,823,804 | ||||||||
| New Zealand (0.32%) | ||||||||
| CBL Corp., Ltd.(d) | 819,006 | 1 | ||||||
| NZX, Ltd. | 1,080,898 | 1,340,007 | ||||||
| 1,340,008 | ||||||||
| Norway (1.63%) | ||||||||
| 24SevenOffice Group AB(a) | 71,303 | 140,314 | ||||||
| Bouvet ASA | 101,257 | 810,257 | ||||||
| CSAM Health Group AS(a) | 91,191 | 892,707 | ||||||
| Medistim ASA | 12,841 | 577,609 | ||||||
| Nordhealth AS(a) | 190,069 | 1,034,952 | ||||||
| Self Storage Group ASA(a) | 694,169 | 2,358,296 | ||||||
| SmartCraft ASA(a) | 455,526 | 1,132,358 | ||||||
| 6,946,493 | ||||||||
| Oman (0.39%) | ||||||||
| Tethys Oil AB | 230,724 | 1,679,116 | ||||||
| Philippines (1.45%) | ||||||||
| AllHome Corp.(a) | 3,899,617 | 796,787 | ||||||
| Concepcion Industrial Corp. | 1,793,920 | 816,712 | ||||||
| Pryce Corp. | 6,894,800 | 752,260 | ||||||
| Puregold Price Club, Inc. | 490,700 | 411,269 | ||||||
| Wilcon Depot, Inc. | 5,464,600 | 3,382,177 | ||||||
| 6,159,205 | ||||||||
| Poland (1.19%) | ||||||||
| Dino Polska SA(a)(b)(c) | 47,357 | 4,230,455 | ||||||
| LiveChat Software SA | 27,929 | 854,044 | ||||||
| 5,084,499 | ||||||||
| Singapore (0.14%) | ||||||||
| Riverstone Holdings, Ltd./Singapore | 916,300 | 584,366 | ||||||
| South Africa (0.41%) | ||||||||
| Clicks Group, Ltd. | 54,372 | 992,543 | ||||||
| Italtile, Ltd. | 665,000 | 768,831 | ||||||
| 1,761,374 | ||||||||
| South Korea (0.55%) | ||||||||
| Douzone Bizon Co., Ltd. | 4,900 | 340,909 | ||||||
| Hyundai Ezwel Co., Ltd. | 33,500 | 282,380 | ||||||
| LEENO Industrial, Inc. | 3,790 | 555,259 | ||||||
| Suprema, Inc.(a) | 8,000 | 169,783 | ||||||
| Tokai Carbon Korea Co., Ltd. | 9,297 | 994,502 | ||||||
| 2,342,833 | ||||||||
See Notes to Financial Statements.
| Semi-Annual Report | October 31, 2021 | 51 |
| Grandeur Peak Global Reach Fund | Portfolio of Investments |
October 31, 2021 (Unaudited)
| Shares | Value (Note 2) | |||||||
| Spain (0.00%)(e) | ||||||||
| Let's GOWEX SA(a)(d) | 10,700 | $ | 0 | |||||
| Sweden (6.43%) | ||||||||
| Beijer Alma AB | 72,706 | 1,824,423 | ||||||
| Boozt AB(a)(b)(c) | 87,256 | 1,470,184 | ||||||
| Byggfakta Group Nordic Holdco AB(a) | 119,987 | 943,074 | ||||||
| Cint Group AB(a)(d) | 43,467 | 655,953 | ||||||
| EQT AB | 126,813 | 6,683,228 | ||||||
| Hexpol AB | 70,200 | 819,872 | ||||||
| KNOW IT AB | 58,064 | 2,332,566 | ||||||
| Lyko Group AB(a)(c) | 24,598 | 817,737 | ||||||
| Nordnet AB publ | 34,622 | 663,777 | ||||||
| OEM International AB, Class B | 28,492 | 640,307 | ||||||
| Rvrc Holding AB | 123,284 | 1,146,995 | ||||||
| Sagax AB, Class A | 38,732 | 1,510,855 | ||||||
| Sagax AB B | 24,922 | 975,057 | ||||||
| SwedenCare AB | 191,998 | 3,163,451 | ||||||
| Teqnion AB(a) | 163,624 | 2,572,105 | ||||||
| Vitec Software Group AB, Class B | 19,425 | 1,146,772 | ||||||
| 27,366,356 | ||||||||
| Switzerland (0.40%) | ||||||||
| Partners Group Holding AG | 986 | 1,720,331 | ||||||
| Taiwan (2.64%) | ||||||||
| Bioteque Corp. | 284,000 | 1,118,291 | ||||||
| Brighten Optix Corp. | 125,000 | 1,681,141 | ||||||
| FineTek Co., Ltd. | 163,145 | 502,779 | ||||||
| Fuzetec Technology Co., Ltd. | 227,519 | 562,078 | ||||||
| GEM Services, Inc./Tw | 122,000 | 436,960 | ||||||
| M3 Technology, Inc. | 79,000 | 700,271 | ||||||
| momo.com, Inc. | 12,100 | 778,863 | ||||||
| Pacific Hospital Supply Co., Ltd. | 356,317 | 891,802 | ||||||
| Poya International Co., Ltd. | 47,380 | 846,786 | ||||||
| Sporton International, Inc. | 262,351 | 2,127,412 | ||||||
| Voltronic Power Technology Corp. | 17,247 | 1,007,835 | ||||||
| Wistron Information Technology & Services Corp. | 194,000 | 591,589 | ||||||
| 11,245,807 | ||||||||
| Thailand (0.10%) | ||||||||
| Humanica PCL | 1,325,700 | 427,484 | ||||||
| United Arab Emirates (0.14%) | ||||||||
| Aramex PJSC | 499,154 | 593,851 | ||||||
| United States (30.05%) | ||||||||
| 4imprint Group PLC | 25,771 | 1,008,691 | ||||||
| Align Technology, Inc.(a) | 1,741 | 1,087,028 | ||||||
| Alpha Teknova, Inc.(a) | 89,601 | 2,059,927 | ||||||
| Shares | Value (Note 2) | |||||||
| United States (continued) | ||||||||
| Apollo Global Management, Inc. | 14,082 | $ | 1,083,610 | |||||
| Array Technologies, Inc.(a) | 57,490 | 1,227,411 | ||||||
| Bank of Hawaii Corp. | 16,705 | 1,411,572 | ||||||
| Bank of NT Butterfield & Son, Ltd. | 80,059 | 2,874,118 | ||||||
| Barrett Business Services, Inc. | 27,037 | 2,217,034 | ||||||
| Berkeley Lights, Inc.(a) | 18,215 | 423,499 | ||||||
| Bizlink Holding, Inc. | 170,000 | 1,568,046 | ||||||
| Blackline, Inc.(a) | 17,005 | 2,157,424 | ||||||
| Blackstone, Inc. | 22,489 | 3,112,927 | ||||||
| Bowman Consulting Group, Ltd.(a) | 39,482 | 608,023 | ||||||
| Bright Health Group, Inc.(a) | 32,039 | 280,341 | ||||||
| Cactus, Inc., Class A | 22,821 | 992,713 | ||||||
| Cardiovascular Systems, Inc.(a) | 33,485 | 1,174,654 | ||||||
| Castle Biosciences, Inc.(a) | 25,097 | 1,564,798 | ||||||
| Chewy, Inc.(a) | 9,433 | 715,021 | ||||||
| Coastal Financial Corp.(a) | 12,606 | 479,658 | ||||||
| Cross Creek Lucid LP/Partnership Interest(a)(d) | 1,000,000 | 1,000,000 | ||||||
| Digital Realty Trust, Inc. | 4,875 | 769,324 | ||||||
| EPAM Systems, Inc.(a) | 8,198 | 5,519,222 | ||||||
| Equinix, Inc. | 2,375 | 1,988,041 | ||||||
| Esquire Financial Holdings, Inc.(a) | 16,687 | 533,650 | ||||||
| Etsy, Inc.(a) | 2,749 | 689,147 | ||||||
| Evolution Petroleum Corp. | 236,554 | 1,405,131 | ||||||
| Exact Sciences Corp.(a) | 17,020 | 1,620,644 | ||||||
| ExlService Holdings, Inc.(a) | 14,541 | 1,783,163 | ||||||
| Fastenal Co. | 15,916 | 908,485 | ||||||
| Figs, Inc.(a) | 26,909 | 904,411 | ||||||
| First Hawaiian, Inc. | 43,436 | 1,198,399 | ||||||
| First Republic Bank | 29,265 | 6,330,897 | ||||||
| Five Below, Inc.(a) | 2,945 | 581,048 | ||||||
| Freshpet, Inc.(a) | 4,702 | 733,089 | ||||||
| Frontage Holdings Corp.(a)(b)(c) | 3,016,000 | 1,763,743 | ||||||
| FTI Consulting, Inc.(a) | 8,680 | 1,249,226 | ||||||
| Genpact, Ltd. | 50,816 | 2,507,770 | ||||||
| Glacier Bancorp, Inc. | 28,526 | 1,577,203 | ||||||
| Global Industrial Co. | 43,395 | 1,760,969 | ||||||
| Goosehead Insurance, Inc., Class A | 11,088 | 1,599,998 | ||||||
| Hackett Group, Inc. | 32,020 | 676,903 | ||||||
| Healthcare Services Group, Inc. | 52,267 | 1,003,004 | ||||||
| Heska Corp.(a) | 9,418 | 2,105,206 | ||||||
| Houlihan Lokey, Inc. | 18,111 | 2,029,881 | ||||||
| HubSpot, Inc.(a) | 725 | 587,417 | ||||||
| I3 Verticals, Inc., Class A(a) | 20,080 | 449,591 | ||||||
| Insperity, Inc. | 18,697 | 2,337,125 | ||||||
| JFrog, Ltd.(a) | 19,300 | 630,917 | ||||||
| Joint Corp.(a) | 4,664 | 408,007 | ||||||
| Kinsale Capital Group, Inc. | 2,339 | 437,744 | ||||||
| LeMaitre Vascular, Inc. | 23,085 | 1,200,651 | ||||||
| LGI Homes, Inc.(a) | 10,319 | 1,540,627 | ||||||
See Notes to Financial Statements.
| 52 | 1.855.377.7325 | www.GrandeurPeakGlobal.com |
| Grandeur Peak Global Reach Fund | Portfolio of Investments |
October 31, 2021 (Unaudited)
| Shares | Value (Note 2) | |||||||
| United States (continued) | ||||||||
| Littelfuse, Inc. | 5,299 | $ | 1,560,820 | |||||
| Lululemon Athletica, Inc.(a) | 2,592 | 1,207,898 | ||||||
| MaxCyte, Inc.(a) | 147,600 | 1,527,106 | ||||||
| Medpace Holdings, Inc.(a) | 7,942 | 1,799,260 | ||||||
| Microchip Technology, Inc. | 9,426 | 698,372 | ||||||
| Mimecast, Ltd.(a) | 21,695 | 1,636,671 | ||||||
| Monolithic Power Systems, Inc. | 1,100 | 578,006 | ||||||
| Morningstar, Inc. | 2,550 | 807,712 | ||||||
| MSCI, Inc. | 1,145 | 761,288 | ||||||
| New Relic, Inc.(a) | 21,925 | 1,779,433 | ||||||
| NV5 Global, Inc.(a) | 6,730 | 700,795 | ||||||
| NVIDIA Corp. | 3,900 | 997,113 | ||||||
| Ollie's Bargain Outlet Holdings, Inc.(a) | 31,892 | 2,157,813 | ||||||
| P10, Inc.(a) | 176,600 | 2,207,500 | ||||||
| PagerDuty, Inc.(a) | 27,702 | 1,156,559 | ||||||
| Paycom Software, Inc.(a) | 1,608 | 880,943 | ||||||
| Paylocity Holding Corp.(a) | 7,394 | 2,256,205 | ||||||
| PJT Partners, Inc., Class A | 38,783 | 3,172,062 | ||||||
| Plumas Bancorp | 12,600 | 465,444 | ||||||
| Poshmark, Inc.(a) | 25,043 | 609,296 | ||||||
| Power Integrations, Inc. | 8,289 | 855,508 | ||||||
| ProntoForms Corp.(a) | 365,500 | 310,096 | ||||||
| Qualtrics International, Inc.(a) | 10,725 | 496,782 | ||||||
| Qualys, Inc.(a) | 15,492 | 1,928,444 | ||||||
| Rapid7, Inc.(a) | 21,039 | 2,708,771 | ||||||
| Revolve Group, Inc.(a) | 17,795 | 1,335,337 | ||||||
| Rexford Industrial Realty, Inc. | 19,272 | 1,295,078 | ||||||
| Samsonite International SA(a)(b)(c) | 755,700 | 1,627,856 | ||||||
| ServiceNow, Inc.(a) | 675 | 470,988 | ||||||
| Shoals Technologies Group, Inc.(a) | 40,406 | 1,252,182 | ||||||
| Silicon Laboratories, Inc.(a) | 4,725 | 891,891 | ||||||
| Squarespace, Inc.(a) | 36,740 | 1,430,656 | ||||||
| SVB Financial Group(a) | 3,721 | 2,669,445 | ||||||
| Tabula Rasa HealthCare, Inc.(a) | 27,798 | 754,716 | ||||||
| Teladoc Health, Inc.(a) | 3,775 | 564,702 | ||||||
| Terreno Realty Corp. | 20,508 | 1,499,750 | ||||||
| Traeger, Inc.(a) | 105,800 | 1,998,562 | ||||||
| TriMas Corp. | 22,010 | 734,034 | ||||||
| Ulta Beauty, Inc.(a) | 1,825 | 670,432 | ||||||
| Unity Software, Inc.(a) | 2,378 | 359,815 | ||||||
| YETI Holdings, Inc.(a) | 7,095 | 697,651 | ||||||
| Zendesk, Inc.(a) | 4,966 | 505,539 | ||||||
| 127,895,659 | ||||||||
| Vietnam (1.60%) | ||||||||
| FPT Corp. | 167,900 | 715,096 | ||||||
| Vietnam Dairy Products JSC | 308,062 | 1,228,105 | ||||||
| Shares | Value (Note 2) | |||||||
| Vietnam (continued) | ||||||||
| Vietnam Technological & Commercial Joint Stock Bank(a) | 2,138,281 | $ | 4,849,583 | |||||
| 6,792,784 | ||||||||
| TOTAL COMMON STOCKS | ||||||||
| (Cost $249,120,582) | 421,637,475 | |||||||
| PREFERRED STOCKS (0.76%) | ||||||||
| United States (0.76%) | ||||||||
| Dataminr Inc -Private Placement(a)(d) | 45,833 | 2,016,652 | ||||||
| Gusto Inc Series E Preferred(a)(d) | 32,241 | 1,201,622 | ||||||
| 3,218,274 | ||||||||
| TOTAL PREFERRED STOCKS | ||||||||
| (Cost $1,892,053) | 3,218,274 | |||||||
| TOTAL INVESTMENTS (99.81%) | ||||||||
| (Cost $251,012,635) | $ | 424,855,749 | ||||||
| Other Assets In Excess Of Liabilities (0.19%) | 823,234 | |||||||
| NET ASSETS (100.00%) | $ | 425,678,983 | ||||||
| (a) | Non-Income Producing Security. |
| (b) | Security exempt from registration under Rule 144A of the Securities Act of 1933. These securities may be resold in the ordinary course of business in transactions exempt from registration, normally to qualified institutional buyers. As of October 31, 2021, these securities had a total aggregate market value of $30,870,062, representing 7.25% of net assets. |
| (c) | Security was purchased pursuant to Regulation S under the Securities Act of 1933, which exempts securities offered and sold outside of the United States from registration. Such security cannot be sold in the United States without either an effective registration statement filed pursuant to the Securities Act of 1933, or pursuant to an exemption from registration. As of October 31, 2021, the aggregate market value of these securities was $34,155,825, representing 8.02% of net assets. |
| (d) | As a result of the use of significant unobservable inputs to determine fair value, these investments have been classified as level 3 assets. See also Note 2 to the financial statements for additional information. |
| (e) | Less than 0.005%. |
See Notes to Financial Statements.
| Semi-Annual Report | October 31, 2021 | 53 |
| Grandeur Peak Global Reach Fund | Portfolio of Investments |
October 31, 2021 (Unaudited)
For Fund compliance purposes, the Fund's geographical classifications refer to any one or more of the country sub-classifications used by one or more widely recognized market indexes or ratings group indexes, and/or as defined by Fund management. This definition may not apply for purposes of this report, which may combine sub-classifications for reporting ease. Geographical regions are shown as a percentage of net assets.
| Sector Composition (October 31, 2021) (Unaudited) | |
| Technology | 26.3% |
| Financials | 20.4% |
| Consumer | 17.7% |
| Industrials | 17.3% |
| Health Care | 14.8% |
| Energy & Materials | 3.3% |
| Cash, Cash Equivalents, & Other Net Assets | 0.2% |
| Total | 100% |
| Industry Composition (October 31, 2021) (Unaudited) | |
| Capital Markets | 11.6% |
| IT Services | 11.2% |
| Software | 9.2% |
| Professional Services | 6.3% |
| Banks | 5.7% |
| Internet & Direct Marketing Retail | 4.2% |
| Health Care Equipment & Supplies | 3.6% |
| Health Care Providers & Services | 3.5% |
| Semiconductors & Semiconductor Equipment | 3.4% |
| Life Sciences Tools & Services | 3.2% |
| Specialty Retail | 3.0% |
| Pharmaceuticals | 2.9% |
| Trading Companies & Distributors | 2.6% |
| Machinery | 2.3% |
| Oil, Gas & Consumable Fuels | 2.1% |
| Multiline Retail | 1.9% |
| Equity Real Estate Investment Trusts (REITs) | 1.8% |
| Food & Staples Retailing | 1.8% |
| Commercial Services & Supplies | 1.7% |
| Household Durables | 1.6% |
| Electrical Equipment | 1.6% |
| Textiles, Apparel & Luxury Goods | 1.4% |
| Hotels, Restaurants & Leisure | 1.2% |
| Food Products | 1.1% |
| Building Products | 1.0% |
| Other Industries (each less than 1%) | 9.9% |
| Cash and Other Assets, Less Liabilities | 0.2% |
| Total | 100.0% |
See Notes to Financial Statements.
| 54 | 1.855.377.7325 | www.GrandeurPeakGlobal.com |
| Grandeur Peak Global Stalwarts Fund | Portfolio of Investments |
October 31, 2021 (Unaudited)
| Shares | Value (Note 2) | |||||||
| COMMON STOCKS (97.16%) | ||||||||
| Argentina (0.81%) | ||||||||
| Globant SA(a) | 12,064 | $ | 3,850,708 | |||||
| Australia (0.66%) | ||||||||
| Netwealth Group, Ltd. | 240,269 | 3,126,832 | ||||||
| Belgium (1.51%) | ||||||||
| Melexis NV | 41,511 | 4,779,487 | ||||||
| Warehouses De Pauw CVA | 52,142 | 2,374,886 | ||||||
| 7,154,373 | ||||||||
| Brazil (0.74%) | ||||||||
| Locaweb Servicos de Internet SA(b)(c) | 346,400 | 1,128,111 | ||||||
| Patria Investments, Ltd. | 139,108 | 2,387,093 | ||||||
| 3,515,204 | ||||||||
| Britain (12.82%) | ||||||||
| B&M European Value Retail SA | 1,219,889 | 10,571,147 | ||||||
| CVS Group PLC | 41,936 | 1,431,919 | ||||||
| Dechra Pharmaceuticals PLC | 174,734 | 12,243,576 | ||||||
| Diploma PLC | 47,364 | 1,947,194 | ||||||
| Endava PLC, ADR(a) | 73,367 | 11,625,735 | ||||||
| Gamma Communications PLC | 103,603 | 2,569,161 | ||||||
| Impax Asset Management Group PLC | 199,358 | 2,990,234 | ||||||
| Intertek Group PLC | 93,208 | 6,244,056 | ||||||
| JTC PLC(b)(c) | 99,443 | 1,057,441 | ||||||
| Sanne Group PLC | 58,856 | 728,149 | ||||||
| Softcat PLC | 70,424 | 1,872,640 | ||||||
| St. James's Place PLC | 342,824 | 7,410,572 | ||||||
| 60,691,824 | ||||||||
| Canada (0.91%) | ||||||||
| Gildan Activewear, Inc. | 53,899 | 1,979,839 | ||||||
| Ritchie Bros Auctioneers, Inc. | 34,200 | 2,337,570 | ||||||
| 4,317,409 | ||||||||
| China (7.06%) | ||||||||
| Hangzhou Tigermed Consulting Co., Ltd., Class A | 75,900 | 2,021,059 | ||||||
| Li Ning Co., Ltd. | 204,000 | 2,267,978 | ||||||
| Man Wah Holdings, Ltd. | 1,508,400 | 2,345,818 | ||||||
| Silergy Corp. | 114,000 | 18,775,554 | ||||||
| WuXi AppTec Co., Ltd., Class H(c) | 168,492 | 3,601,339 | ||||||
| Wuxi Biologics Cayman, Inc.(a)(b)(c) | 164,500 | 2,503,284 | ||||||
| Yum China Holdings, Inc. | 33,575 | 1,921,809 | ||||||
| 33,436,841 | ||||||||
| Shares | Value (Note 2) | |||||||
| Finland (0.25%) | ||||||||
| Musti Group Oyj | 29,800 | $ | 1,170,573 | |||||
| France (3.28%) | ||||||||
| Alten SA | 33,361 | 5,368,304 | ||||||
| Antin Infrastructure Partners SA(a) | 33,888 | 1,288,845 | ||||||
| BioMerieux | 18,910 | 2,405,694 | ||||||
| Bureau Veritas SA | 70,887 | 2,250,225 | ||||||
| Esker SA | 3,227 | 1,102,339 | ||||||
| Virbac SA | 6,183 | 3,127,059 | ||||||
| 15,542,466 | ||||||||
| Germany (2.70%) | ||||||||
| Atoss Software AG | 8,446 | 1,909,760 | ||||||
| Dermapharm Holding SE | 46,600 | 4,686,665 | ||||||
| Nagarro SE(a) | 7,200 | 1,448,240 | ||||||
| Puma SE | 12,248 | 1,519,231 | ||||||
| QIAGEN NV(a) | 58,032 | 3,235,864 | ||||||
| 12,799,760 | ||||||||
| Hong Kong (1.18%) | ||||||||
| Techtronic Industries Co., Ltd. | 271,900 | 5,594,909 | ||||||
| India (6.22%) | ||||||||
| Avenue Supermarts, Ltd.(a)(b)(c) | 41,500 | 2,569,016 | ||||||
| Computer Age Management Services, Ltd. | 44,899 | 1,806,063 | ||||||
| HCL Technologies, Ltd. | 142,510 | 2,176,724 | ||||||
| HDFC Asset Management Co., Ltd.(b)(c) | 40,451 | 1,430,023 | ||||||
| IndiaMart InterMesh, Ltd.(b)(c) | 21,988 | 2,098,486 | ||||||
| Marico, Ltd. | 192,487 | 1,461,237 | ||||||
| Metropolis Healthcare, Ltd.(b)(c) | 101,966 | 4,033,636 | ||||||
| Nippon Life India Asset Management, Ltd.(b)(c) | 278,192 | 1,554,216 | ||||||
| WNS Holdings, Ltd., ADR(a) | 138,777 | 12,324,785 | ||||||
| 29,454,186 | ||||||||
| Indonesia (0.38%) | ||||||||
| Bank Tabungan Pensiunan Nasional Syariah | 6,659,400 | 1,790,881 | ||||||
| Ireland (0.95%) | ||||||||
| Keywords Studios PLC | 115,807 | 4,494,713 | ||||||
| Israel (0.51%) | ||||||||
| Wix.com, Ltd.(a) | 13,025 | 2,422,129 | ||||||
| Japan (7.83%) | ||||||||
| BASE, Inc.(a) | 158,800 | 1,295,758 | ||||||
| BayCurrent Consulting, Inc. | 10,800 | 4,444,132 | ||||||
| Freee KK(a) | 23,500 | 1,678,351 | ||||||
| GMO Payment Gateway, Inc. | 13,800 | 1,748,383 | ||||||
| IR Japan Holdings, Ltd. | 40,000 | 3,688,528 | ||||||
See Notes to Financial Statements.
| Semi-Annual Report | October 31, 2021 | 55 |
| Grandeur Peak Global Stalwarts Fund | Portfolio of Investments |
October 31, 2021 (Unaudited)
| Shares | Value (Note 2) | |||||||
| Japan (continued) | ||||||||
| M&A Capital Partners Co., Ltd.(a) | 88,600 | $ | 4,982,900 | |||||
| M3, Inc. | 26,900 | 1,583,200 | ||||||
| MonotaRO Co., Ltd. | 202,200 | 4,577,109 | ||||||
| Nihon M&A Center Holdings, Inc. | 148,100 | 4,528,436 | ||||||
| Seria Co., Ltd. | 100,400 | 3,312,165 | ||||||
| Systena Corp. | 179,300 | 3,297,327 | ||||||
| Visional, Inc.(a) | 6,500 | 505,286 | ||||||
| WealthNavi, Inc.(a) | 52,100 | 1,423,922 | ||||||
| 37,065,497 | ||||||||
| Netherlands (0.99%) | ||||||||
| Aalberts NV | 28,284 | 1,564,522 | ||||||
| Shop Apotheke Europe NV(a)(b)(c) | 20,489 | 3,102,779 | ||||||
| 4,667,301 | ||||||||
| Philippines (0.36%) | ||||||||
| Wilcon Depot, Inc. | 2,768,400 | 1,713,431 | ||||||
| Poland (1.07%) | ||||||||
| Dino Polska SA(a)(b)(c) | 56,853 | 5,078,743 | ||||||
| South Korea (0.31%) | ||||||||
| LEENO Industrial, Inc. | 9,828 | 1,439,864 | ||||||
| Sweden (2.73%) | ||||||||
| AddTech AB, Class B | 57,100 | 1,276,572 | ||||||
| Byggfakta Group Nordic Holdco AB(a) | 277,725 | 2,182,864 | ||||||
| Cint Group AB(a)(d) | 38,521 | 581,314 | ||||||
| EQT AB | 108,283 | 5,706,670 | ||||||
| Sagax AB B | 47,868 | 1,872,805 | ||||||
| SwedenCare AB | 78,656 | 1,295,974 | ||||||
| 12,916,199 | ||||||||
| Switzerland (0.58%) | ||||||||
| Partners Group Holding AG | 1,569 | 2,737,525 | ||||||
| Taiwan (1.26%) | ||||||||
| momo.com, Inc. | 46,200 | 2,973,839 | ||||||
| Voltronic Power Technology Corp. | 50,975 | 2,978,743 | ||||||
| 5,952,582 | ||||||||
| United States (41.46%) | ||||||||
| Align Technology, Inc.(a) | 6,200 | 3,871,094 | ||||||
| Apollo Global Management, Inc. | 43,888 | 3,377,182 | ||||||
| Bank of Hawaii Corp. | 28,620 | 2,418,390 | ||||||
| Bank of NT Butterfield & Son, Ltd. | 91,631 | 3,289,553 | ||||||
| Blackline, Inc.(a) | 28,269 | 3,586,488 | ||||||
| Blackstone, Inc. | 32,100 | 4,443,282 | ||||||
| Shares | Value (Note 2) | |||||||
| United States (continued) | ||||||||
| Cardiovascular Systems, Inc.(a) | 63,939 | $ | 2,242,980 | |||||
| Castle Biosciences, Inc.(a) | 52,110 | 3,249,058 | ||||||
| Chewy, Inc.(a) | 44,342 | 3,361,124 | ||||||
| Cross Creek Lucid LP/Partnership Interest(a)(d) | 1,300,000 | 1,300,000 | ||||||
| Elastic NV(a) | 9,281 | 1,610,346 | ||||||
| EPAM Systems, Inc.(a) | 16,943 | 11,406,705 | ||||||
| Equinix, Inc. | 2,900 | 2,427,503 | ||||||
| Etsy, Inc.(a) | 14,785 | 3,706,452 | ||||||
| Exact Sciences Corp.(a) | 28,533 | 2,716,912 | ||||||
| ExlService Holdings, Inc.(a) | 9,558 | 1,172,098 | ||||||
| Fastenal Co. | 41,714 | 2,381,035 | ||||||
| Figs, Inc.(a) | 47,357 | 1,591,669 | ||||||
| First Hawaiian, Inc. | 67,768 | 1,869,719 | ||||||
| First Republic Bank | 64,600 | 13,974,918 | ||||||
| Five Below, Inc.(a) | 16,827 | 3,319,967 | ||||||
| Freshpet, Inc.(a) | 11,325 | 1,765,681 | ||||||
| Frontage Holdings Corp.(a)(b)(c) | 1,920,900 | 1,123,333 | ||||||
| Genpact, Ltd. | 92,002 | 4,540,299 | ||||||
| Glacier Bancorp, Inc. | 64,450 | 3,563,440 | ||||||
| Global Industrial Co. | 75,835 | 3,077,384 | ||||||
| Goosehead Insurance, Inc., Class A | 28,000 | 4,040,400 | ||||||
| Heska Corp.(a) | 20,348 | 4,548,388 | ||||||
| HubSpot, Inc.(a) | 3,392 | 2,748,300 | ||||||
| IDEXX Laboratories, Inc.(a) | 2,700 | 1,798,578 | ||||||
| LGI Homes, Inc.(a) | 31,954 | 4,770,732 | ||||||
| Littelfuse, Inc. | 24,852 | 7,320,157 | ||||||
| Lululemon Athletica, Inc.(a) | 10,037 | 4,677,342 | ||||||
| MaxCyte, Inc.(a) | 155,725 | 1,750,349 | ||||||
| Medpace Holdings, Inc.(a) | 16,575 | 3,755,066 | ||||||
| Microchip Technology, Inc. | 30,550 | 2,263,449 | ||||||
| Monolithic Power Systems, Inc. | 5,525 | 2,903,167 | ||||||
| MSCI, Inc. | 2,900 | 1,928,152 | ||||||
| Ollie's Bargain Outlet Holdings, Inc.(a) | 48,277 | 3,266,422 | ||||||
| P10, Inc.(a) | 224,000 | 2,800,000 | ||||||
| PagerDuty, Inc.(a) | 30,150 | 1,258,763 | ||||||
| Paycom Software, Inc.(a) | 10,066 | 5,514,658 | ||||||
| Paylocity Holding Corp.(a) | 9,950 | 3,036,143 | ||||||
| PJT Partners, Inc., Class A | 69,250 | 5,663,958 | ||||||
| Pool Corp. | 9,375 | 4,829,625 | ||||||
| Power Integrations, Inc. | 31,625 | 3,264,016 | ||||||
| Qualtrics International, Inc.(a) | 71,537 | 3,313,594 | ||||||
| Qualys, Inc.(a) | 25,238 | 3,141,626 | ||||||
| Rapid7, Inc.(a) | 33,200 | 4,274,500 | ||||||
| Shoals Technologies Group, Inc.(a) | 75,216 | 2,330,944 | ||||||
| Silicon Laboratories, Inc.(a) | 11,143 | 2,103,353 | ||||||
| Squarespace, Inc.(a) | 51,731 | 2,014,405 | ||||||
| SVB Financial Group(a) | 6,289 | 4,511,729 | ||||||
| Teladoc Health, Inc.(a) | 14,605 | 2,184,762 | ||||||
| Terreno Realty Corp. | 30,271 | 2,213,718 | ||||||
| Traeger, Inc.(a) | 80,515 | 1,520,928 | ||||||
| Ulta Beauty, Inc.(a) | 5,387 | 1,978,968 | ||||||
See Notes to Financial Statements.
| 56 | 1.855.377.7325 | www.GrandeurPeakGlobal.com |
| Grandeur Peak Global Stalwarts Fund | Portfolio of Investments |
October 31, 2021 (Unaudited)
| Shares | Value (Note 2) | |||||||
| United States (continued) | ||||||||
| YETI Holdings, Inc.(a) | 20,575 | $ | 2,023,140 | |||||
| Zendesk, Inc.(a) | 11,171 | 1,137,208 | ||||||
| 196,273,152 | ||||||||
| Vietnam (0.59%) | ||||||||
| Vietnam Technological & Commercial Joint Stock Bank(a) | 1,239,305 | 2,810,722 | ||||||
| TOTAL COMMON STOCKS | ||||||||
| (Cost $286,399,681) | 460,017,824 | |||||||
| PREFERRED STOCKS (0.52%) | ||||||||
| United States (0.52%) | ||||||||
| Dataminr Inc - Private Placement(a)(d) | 24,262 | 1,067,528 | ||||||
| Gusto Inc Series E Preferred(a)(d) | 37,637 | 1,402,731 | ||||||
| 2,470,259 | ||||||||
| TOTAL PREFERRED STOCKS | ||||||||
| (Cost $1,626,803) | 2,470,259 | |||||||
| TOTAL INVESTMENTS (97.68%) | ||||||||
| (Cost $288,026,484) | $ | 462,488,083 | ||||||
| Other Assets In Excess Of Liabilities (2.32%) | 10,977,483 | |||||||
| NET ASSETS (100.00%) | $ | 473,465,566 | ||||||
| (a) | Non-Income Producing Security. |
| (b) | Security exempt from registration under Rule 144A of the Securities Act of 1933. These securities may be resold in the ordinary course of business in transactions exempt from registration, normally to qualified institutional buyers. As of October 31, 2021, these securities had a total aggregate market value of $29,280,407, representing 6.18% of net assets. |
| (c) | Security was purchased pursuant to Regulation S under the Securities Act of 1933, which exempts securities offered and sold outside of the United States from registration. Such security cannot be sold in the United States without either an effective registration statement filed pursuant to the Securities Act of 1933, or pursuant to an exemption from registration. As of October 31, 2021, the aggregate market value of these securities was $29,280,407, representing 6.18% of net assets. |
| (d) | As a result of the use of significant unobservable inputs to determine fair value, these investments have been classified as level 3 assets. See also Note 2 to the financial statements for additional information. |
For Fund compliance purposes, the Fund's geographical classifications refer to any one or more of the country sub-classifications used by one or more widely recognized market indexes or ratings group indexes, and/or as defined by Fund management. This definition may not apply for purposes of this report, which may combine sub-classifications for reporting ease. Geographical regions are shown as a percentage of net assets.
| Sector Composition (October 31, 2021) (Unaudited) | |
| Technology | 33.3% |
| Financials | 22.0% |
| Consumer | 16.2% |
| Health Care | 15.2% |
| Industrials | 11.0% |
| Cash, Cash Equivalents, & Other Net Assets | 2.3% |
| Total | 100% |
| Industry Composition (October 31, 2021) (Unaudited) | |
| IT Services | 14.9% |
| Capital Markets | 11.9% |
| Software | 8.9% |
| Semiconductors & Semiconductor Equipment | 7.5% |
| Banks | 7.3% |
| Pharmaceuticals | 4.6% |
| Professional Services | 4.6% |
| Life Sciences Tools & Services | 3.8% |
| Multiline Retail | 3.6% |
| Health Care Equipment & Supplies | 3.5% |
| Trading Companies & Distributors | 3.2% |
| Internet & Direct Marketing Retail | 2.8% |
| Textiles, Apparel & Luxury Goods | 2.2% |
| Health Care Providers & Services | 1.9% |
| Household Durables | 1.8% |
| Specialty Retail | 1.7% |
| Food & Staples Retailing | 1.6% |
| Equity Real Estate Investment Trusts (REITs) | 1.5% |
| Machinery | 1.5% |
| Electronic Equipment, Instruments & Components | 1.5% |
| Electrical Equipment | 1.2% |
| Distributors | 1.0% |
| Other Industries (each less than 1%) | 5.2% |
| Cash and Other Assets, Less Liabilities | 2.3% |
| Total | 100.0% |
See Notes to Financial Statements.
| Semi-Annual Report | October 31, 2021 | 57 |
| Grandeur Peak International Opportunities Fund | Portfolio of Investments |
October 31, 2021 (Unaudited)
| Shares | Value (Note 2) | |||||||
| COMMON STOCKS (99.44%) | ||||||||
| Argentina (0.62%) | ||||||||
| Globant SA(a) | 20,248 | $ | 6,462,959 | |||||
| Australia (1.89%) | ||||||||
| Fiducian Group, Ltd. | 215,640 | 1,417,756 | ||||||
| HUB24, Ltd. | 225,392 | 5,371,361 | ||||||
| Kogan.com, Ltd. | 662,167 | 4,951,247 | ||||||
| Netwealth Group, Ltd. | 290,554 | 3,781,234 | ||||||
| People Infrastructure, Ltd. | 1,251,553 | 4,161,330 | ||||||
| 19,682,928 | ||||||||
| Bangladesh (0.39%) | ||||||||
| Square Pharmaceuticals, Ltd. | 1,579,730 | 4,015,966 | ||||||
| Belgium (1.34%) | ||||||||
| Melexis NV | 49,162 | 5,660,407 | ||||||
| Warehouses De Pauw CVA | 126,310 | 5,752,979 | ||||||
| X-Fab Silicon Foundries SE(a)(b)(c) | 261,964 | 2,604,347 | ||||||
| 14,017,733 | ||||||||
| Brazil (1.79%) | ||||||||
| Fleury SA | 826,000 | 2,745,625 | ||||||
| Locaweb Servicos de Internet SA(b)(c) | 1,135,700 | 3,698,602 | ||||||
| Neogrid Participacoes SA | 3,003,700 | 1,910,642 | ||||||
| Pagseguro Digital, Ltd., Class A(a) | 140,444 | 5,084,073 | ||||||
| Patria Investments, Ltd. | 305,618 | 5,244,405 | ||||||
| 18,683,347 | ||||||||
| Britain (19.46%) | ||||||||
| Ascential PLC(a) | 1,004,600 | 5,554,378 | ||||||
| B&M European Value Retail SA | 2,016,893 | 17,477,715 | ||||||
| boohoo Group PLC(a) | 1,740,718 | 4,329,759 | ||||||
| Bytes Technology Group PLC | 339,088 | 2,478,076 | ||||||
| Clinigen Group PLC | 442,273 | 3,710,324 | ||||||
| CVS Group PLC | 595,836 | 20,345,023 | ||||||
| Dechra Pharmaceuticals PLC | 350,970 | 24,592,396 | ||||||
| Diploma PLC | 140,774 | 5,787,397 | ||||||
| Endava PLC, ADR(a) | 163,670 | 25,935,148 | ||||||
| Foresight Group Holdings, Ltd. | 1,289,723 | 7,942,731 | ||||||
| Gamma Communications PLC | 287,224 | 7,122,621 | ||||||
| GlobalData PLC | 50,520 | 950,664 | ||||||
| Impax Asset Management Group PLC | 886,589 | 13,298,228 | ||||||
| JTC PLC(b)(c) | 711,979 | 7,570,928 | ||||||
| K3 Capital Group PLC | 1,011,260 | 4,809,263 | ||||||
| Made.com Group PLC(a)(b)(c) | 1,760,262 | 3,782,142 | ||||||
| On the Beach Group PLC(a)(b)(c) | 1,628,381 | 6,652,138 | ||||||
| Pensionbee Group PLC(a) | 1,259,004 | 2,544,887 | ||||||
| Premier Miton Group PLC | 1,478,390 | 3,641,853 | ||||||
| Softcat PLC | 190,709 | 5,071,132 | ||||||
| Shares | Value (Note 2) | |||||||
| Britain (continued) | ||||||||
| St. James's Place PLC | 285,329 | $ | 6,167,745 | |||||
| Team17 Group PLC(a) | 506,179 | 4,918,394 | ||||||
| Ultra Electronics Holdings PLC | 225,161 | 9,990,036 | ||||||
| Victorian Plumbing Group PLC(a) | 482,878 | 1,200,091 | ||||||
| Volution Group PLC | 1,038,460 | 7,020,655 | ||||||
| 202,893,724 | ||||||||
| Canada (1.65%) | ||||||||
| Gildan Activewear, Inc. | 197,000 | 7,236,280 | ||||||
| Guardian Capital Group, Ltd. | 48,800 | 1,363,924 | ||||||
| Pivotree, Inc.(a) | 218,800 | 795,572 | ||||||
| Richelieu Hardware, Ltd. | 159,350 | 5,625,405 | ||||||
| Ritchie Bros Auctioneers, Inc. | 31,900 | 2,180,365 | ||||||
| 17,201,546 | ||||||||
| China (5.56%) | ||||||||
| Baozun, Inc.(a) | 775,200 | 4,483,517 | ||||||
| CSPC Pharmaceutical Group, Ltd. | 3,247,480 | 3,397,531 | ||||||
| Hangzhou Robam Appliances Co., Ltd., Class A | 1,297,700 | 6,353,342 | ||||||
| Man Wah Holdings, Ltd. | 3,512,600 | 5,462,690 | ||||||
| O2Micro International, Ltd., ADR(a) | 227,944 | 1,399,576 | ||||||
| Silergy Corp. | 152,199 | 25,066,847 | ||||||
| Suofeiya Home Collection Co., Ltd., Class A | 2,251,000 | 5,951,732 | ||||||
| TK Group Holdings, Ltd. | 7,310,000 | 2,771,609 | ||||||
| WuXi AppTec Co., Ltd., Class H(c) | 146,016 | 3,120,938 | ||||||
| 58,007,782 | ||||||||
| Colombia (0.51%) | ||||||||
| Parex Resources, Inc. | 273,275 | 5,306,075 | ||||||
| Denmark (0.13%) | ||||||||
| Trifork AS(a) | 33,206 | 1,321,016 | ||||||
| Finland (1.15%) | ||||||||
| Musti Group Oyj | 306,030 | 12,021,154 | ||||||
| France (6.28%) | ||||||||
| Alten SA | 68,075 | 10,954,326 | ||||||
| Antin Infrastructure Partners SA(a) | 45,889 | 1,745,273 | ||||||
| Bureau Veritas SA | 185,383 | 5,884,767 | ||||||
| Esker SA | 44,897 | 15,336,759 | ||||||
| Neurones | 77,697 | 3,197,518 | ||||||
| Thermador Groupe | 83,436 | 9,490,899 | ||||||
| Virbac SA | 37,419 | 18,924,701 | ||||||
| 65,534,243 | ||||||||
| Georgia (0.42%) | ||||||||
| Bank of Georgia Group PLC | 65,283 | 1,356,228 | ||||||
See Notes to Financial Statements.
| 58 | 1.855.377.7325 | www.GrandeurPeakGlobal.com |
| Grandeur Peak International Opportunities Fund | Portfolio of Investments |
October 31, 2021 (Unaudited)
| Shares | Value (Note 2) | |||||||
| Georgia (continued) | ||||||||
| TBC Bank Group PLC | 141,262 | $ | 3,035,190 | |||||
| 4,391,418 | ||||||||
| Germany (6.38%) | ||||||||
| Atoss Software AG | 26,667 | 6,029,785 | ||||||
| Dermapharm Holding SE | 141,707 | 14,251,788 | ||||||
| Exasol AG(a) | 294,269 | 2,986,743 | ||||||
| Fashionette AG(a) | 132,020 | 2,640,247 | ||||||
| Friedrich Vorwerk Group SE(a) | 94,554 | 4,206,044 | ||||||
| Mensch und Maschine Software SE | 38,174 | 2,727,187 | ||||||
| Nagarro SE(a) | 55,164 | 11,095,932 | ||||||
| Nexus AG | 63,706 | 5,552,780 | ||||||
| PATRIZIA AG | 300,526 | 8,303,071 | ||||||
| QIAGEN NV(a) | 157,148 | 8,762,572 | ||||||
| 66,556,149 | ||||||||
| Greece (0.10%) | ||||||||
| Sarantis SA | 100,600 | 1,015,245 | ||||||
| India (7.18%) | ||||||||
| Castrol India, Ltd. | 3,506,788 | 6,469,747 | ||||||
| Computer Age Management Services, Ltd. | 201,157 | 8,091,545 | ||||||
| EPL, Ltd. | 1,115,229 | 3,199,081 | ||||||
| Gulf Oil Lubricants India, Ltd. | 203,478 | 1,572,662 | ||||||
| IndiaMart InterMesh, Ltd.(b)(c) | 53,544 | 5,110,120 | ||||||
| L&T Technology Services, Ltd.(b)(c) | 69,366 | 4,376,988 | ||||||
| Metropolis Healthcare, Ltd.(b)(c) | 367,832 | 14,550,932 | ||||||
| Nippon Life India Asset Management, Ltd.(b)(c) | 695,602 | 3,886,221 | ||||||
| Polycab India, Ltd. | 144,073 | 4,350,978 | ||||||
| Time Technoplast, Ltd. | 2,560,734 | 2,368,161 | ||||||
| WNS Holdings, Ltd., ADR(a) | 235,269 | 20,894,240 | ||||||
| 74,870,675 | ||||||||
| Indonesia (1.81%) | ||||||||
| Ace Hardware Indonesia Tbk PT | 36,790,700 | 3,661,541 | ||||||
| Arwana Citramulia Tbk PT | 63,783,500 | 3,894,317 | ||||||
| Bank Tabungan Pensiunan Nasional Syariah | 13,982,700 | 3,760,303 | ||||||
| Selamat Sempurna Tbk PT | 43,415,300 | 4,872,442 | ||||||
| Ultrajaya Milk Industry & Trading Co. Tbk PT | 22,958,000 | 2,641,365 | ||||||
| 18,829,968 | ||||||||
| Ireland (3.03%) | ||||||||
| Irish Residential Properties | ||||||||
| REIT PLC | 4,766,689 | 8,981,796 | ||||||
| Keywords Studios PLC | 189,679 | 7,361,840 | ||||||
| Shares | Value (Note 2) | |||||||
| Ireland (continued) | ||||||||
| Uniphar PLC | 2,993,109 | $ | 15,258,784 | |||||
| 31,602,420 | ||||||||
| Israel (0.54%) | ||||||||
| Wix.com, Ltd.(a) | 30,251 | 5,625,476 | ||||||
| Italy (2.09%) | ||||||||
| DiaSorin SpA | 15,943 | 3,600,329 | ||||||
| GVS SpA(b)(c) | 272,063 | 4,041,396 | ||||||
| Interpump Group SpA | 130,321 | 9,604,027 | ||||||
| Piovan SpA(b)(c) | 437,003 | 4,536,486 | ||||||
| 21,782,238 | ||||||||
| Japan (13.58%) | ||||||||
| AIT Corp. | 392,300 | 3,824,043 | ||||||
| BayCurrent Consulting, Inc. | 25,400 | 10,451,941 | ||||||
| Beenos, Inc. | 193,100 | 5,599,434 | ||||||
| Charm Care Corp. | 480,900 | 7,202,424 | ||||||
| Create SD Holdings Co., Ltd. | 115,500 | 3,546,830 | ||||||
| eGuarantee, Inc. | 200,900 | 4,463,073 | ||||||
| Funai Soken Holdings, Inc. | 196,700 | 5,444,953 | ||||||
| gremz, Inc. | 286,100 | 6,584,254 | ||||||
| Japan Lifeline Co., Ltd. | 533,500 | 5,734,043 | ||||||
| Kinjiro Co., Ltd. | 119,300 | 1,771,052 | ||||||
| M&A Capital Partners Co., Ltd.(a) | 175,800 | 9,887,063 | ||||||
| MarkLines Co., Ltd. | 72,100 | 2,036,955 | ||||||
| MonotaRO Co., Ltd. | 129,400 | 2,929,169 | ||||||
| Naigai Trans Line, Ltd. | 93,700 | 1,805,354 | ||||||
| Nihon M&A Center Holdings, Inc. | 180,200 | 5,509,954 | ||||||
| Open Door, Inc.(a) | 262,400 | 5,794,787 | ||||||
| Seria Co., Ltd. | 306,000 | 10,094,845 | ||||||
| SMS Co., Ltd. | 147,100 | 5,704,602 | ||||||
| Strike Co., Ltd. | 178,300 | 6,726,826 | ||||||
| Sun*, Inc.(a) | 177,100 | 3,786,731 | ||||||
| Synchro Food Co., Ltd.(a) | 644,400 | 2,205,010 | ||||||
| System Information Co., Ltd. | 410,500 | 3,378,364 | ||||||
| Systena Corp. | 205,600 | 3,780,984 | ||||||
| Syuppin Co., Ltd. | 219,300 | 2,418,601 | ||||||
| Trancom Co., Ltd. | 88,990 | 6,215,051 | ||||||
| Tsuruha Holdings, Inc. | 37,200 | 4,585,742 | ||||||
| User Local, Inc. | 222,200 | 3,561,828 | ||||||
| Visional, Inc.(a) | 17,200 | 1,337,065 | ||||||
| YAKUODO Holdings Co., Ltd. | 250,200 | 5,279,500 | ||||||
| 141,660,478 | ||||||||
| Luxembourg (0.34%) | ||||||||
| Sword Group | 73,022 | 3,566,475 | ||||||
| Malaysia (0.10%) | ||||||||
| Scicom MSC Bhd | 3,549,500 | 985,734 | ||||||
| Netherlands (1.37%) | ||||||||
| Aalberts NV | 146,718 | 8,115,666 | ||||||
See Notes to Financial Statements.
| Semi-Annual Report | October 31, 2021 | 59 |
| Grandeur Peak International Opportunities Fund | Portfolio of Investments |
October 31, 2021 (Unaudited)
| Shares | Value (Note 2) | |||||||
| Netherlands (continued) | ||||||||
| Shop Apotheke Europe NV(a)(b)(c) | 40,992 | $ | 6,207,678 | |||||
| 14,323,344 | ||||||||
| New Zealand (0.00%)(d) | ||||||||
| CBL Corp., Ltd.(e) | 1,542,256 | 1 | ||||||
| Norway (1.58%) | ||||||||
| 24SevenOffice Group AB(a) | 285,193 | 561,221 | ||||||
| Bouvet ASA | 187,344 | 1,499,125 | ||||||
| Nordhealth AS(a) | 985,229 | 5,364,710 | ||||||
| Nordic Semiconductor ASA(a) | 76,983 | 2,278,170 | ||||||
| Self Storage Group ASA(a) | 1,016,072 | 3,451,895 | ||||||
| SmartCraft ASA(a) | 1,335,830 | 3,320,639 | ||||||
| 16,475,760 | ||||||||
| Philippines (1.49%) | ||||||||
| Puregold Price Club, Inc. | 9,710,100 | 8,138,300 | ||||||
| Robinsons Land Corp. | 11,279,400 | 3,803,805 | ||||||
| Wilcon Depot, Inc. | 5,738,600 | 3,551,762 | ||||||
| 15,493,867 | ||||||||
| Poland (1.15%) | ||||||||
| Dino Polska SA(a)(b)(c) | 105,634 | 9,436,406 | ||||||
| LiveChat Software SA | 85,000 | 2,599,226 | ||||||
| 12,035,632 | ||||||||
| Singapore (0.47%) | ||||||||
| Riverstone Holdings, Ltd./Singapore | 7,661,900 | 4,886,343 | ||||||
| South Africa (0.47%) | ||||||||
| Italtile, Ltd. | 4,209,423 | 4,866,672 | ||||||
| South Korea (1.83%) | ||||||||
| Douzone Bizon Co., Ltd. | 82,416 | 5,733,962 | ||||||
| Hyundai Ezwel Co., Ltd. | 317,661 | 2,677,644 | ||||||
| LEENO Industrial, Inc. | 23,508 | 3,444,071 | ||||||
| Suprema, Inc.(a) | 111,542 | 2,367,243 | ||||||
| Tokai Carbon Korea Co., Ltd. | 45,455 | 4,862,329 | ||||||
| 19,085,249 | ||||||||
| Sweden (5.84%) | ||||||||
| AddTech AB, Class B | 195,436 | 4,369,319 | ||||||
| Beijer Alma AB | 330,809 | 8,301,041 | ||||||
| Boozt AB(a)(b)(c) | 211,733 | 3,567,509 | ||||||
| Byggfakta Group Nordic Holdco AB(a) | 912,520 | 7,172,229 | ||||||
| Cint Group AB(a)(e) | 471,716 | 7,118,583 | ||||||
| Hexpol AB | 439,674 | 5,134,991 | ||||||
| KNOW IT AB | 224,508 | 9,019,010 | ||||||
| Lyko Group AB(a)(c) | 99,618 | 3,311,707 | ||||||
| OEM International AB, Class B | 147,234 | 3,308,822 | ||||||
| Sagax AB B | 117,372 | 4,592,104 | ||||||
| Shares | Value (Note 2) | |||||||
| Sweden (continued) | ||||||||
| SwedenCare AB | 304,045 | $ | 5,009,591 | |||||
| 60,904,906 | ||||||||
| Taiwan (2.25%) | ||||||||
| Bioteque Corp. | 932,000 | 3,669,885 | ||||||
| Poya International Co., Ltd. | 211,974 | 3,788,449 | ||||||
| Sporton International, Inc. | 1,085,703 | 8,804,000 | ||||||
| Voltronic Power Technology Corp. | 74,850 | 4,373,887 | ||||||
| Wistron Information Technology & Services Corp. | 929,000 | 2,832,918 | ||||||
| 23,469,139 | ||||||||
| United States (5.36%) | ||||||||
| Bank of NT Butterfield & Son, Ltd. | 287,043 | 10,304,844 | ||||||
| Bizlink Holding, Inc. | 504,900 | 4,657,096 | ||||||
| EPAM Systems, Inc.(a) | 31,945 | 21,506,652 | ||||||
| Frontage Holdings Corp.(a)(b)(c) | 11,082,900 | 6,481,228 | ||||||
| Genpact, Ltd. | 202,618 | 9,999,198 | ||||||
| Lululemon Athletica, Inc.(a) | 6,361 | 2,964,289 | ||||||
| 55,913,307 | ||||||||
| Vietnam (1.29%) | ||||||||
| Vietnam Dairy Products JSC | 1,224,917 | 4,883,193 | ||||||
| Vietnam Technological & Commercial Joint Stock Bank(a) | 3,772,473 | 8,555,902 | ||||||
| 13,439,095 | ||||||||
| TOTAL COMMON STOCKS | ||||||||
| (Cost $637,586,471) | 1,036,928,064 | |||||||
| TOTAL INVESTMENTS (99.44%) | ||||||||
| (Cost $637,586,471) | $ | 1,036,928,064 | ||||||
| Other Assets In Excess Of Liabilities (0.56%) | 5,880,881 | |||||||
| NET ASSETS (100.00%) | $ | 1,042,808,945 | ||||||
| (a) | Non-Income Producing Security. |
| (b) | Security exempt from registration under Rule 144A of the Securities Act of 1933. These securities may be resold in the ordinary course of business in transactions exempt from registration, normally to qualified institutional buyers. As of October 31, 2021, these securities had a total aggregate market value of $89,624,059, representing 8.59% of net assets. |
See Notes to Financial Statements.
| 60 | 1.855.377.7325 | www.GrandeurPeakGlobal.com |
| Grandeur Peak International Opportunities Fund | Portfolio of Investments |
October 31, 2021 (Unaudited)
| (c) | Security was purchased pursuant to Regulation S under the Securities Act of 1933, which exempts securities offered and sold outside of the United States from registration. Such security cannot be sold in the United States without either an effective registration statement filed pursuant to the Securities Act of 1933, or pursuant to an exemption from registration. As of October 31, 2021, the aggregate market value of these securities was $92,935,766, representing 8.91% of net assets. |
| (d) | Less than 0.005%. |
| (e) | As a result of the use of significant unobservable inputs to determine fair value, these investments have been classified as level 3 assets. See also Note 2 to the financial statements for additional information. |
For Fund compliance purposes, the Fund's geographical classifications refer to any one or more of the country sub-classifications used by one or more widely recognized market indexes or ratings group indexes, and/or as defined by Fund management. This definition may not apply for purposes of this report, which may combine sub-classifications for reporting ease. Geographical regions are shown as a percentage of net assets.
| Sector Composition (October 31, 2021) (Unaudited) | |
| Technology | 30.1% |
| Health Care | 17.9% |
| Industrials | 17.7% |
| Consumer | 17.3% |
| Financials | 13.7% |
| Energy & Materials | 2.7% |
| Cash, Cash Equivalents, & Other Net Assets | 0.6% |
| Total | 100% |
| Industry Composition (October 31, 2021) (Unaudited) | |
| IT Services | 16.6% |
| Capital Markets | 7.7% |
| Software | 6.9% |
| Pharmaceuticals | 6.8% |
| Health Care Providers & Services | 5.8% |
| Professional Services | 5.5% |
| Semiconductors & Semiconductor Equipment | 4.3% |
| Internet & Direct Marketing Retail | 3.6% |
| Trading Companies & Distributors | 3.4% |
| Machinery | 3.2% |
| Multiline Retail | 3.1% |
| Food & Staples Retailing | 2.9% |
| Banks | 2.6% |
| Specialty Retail | 2.5% |
| Health Care Equipment & Supplies | 2.2% |
| Life Sciences Tools & Services | 2.1% |
| Household Durables | 1.7% |
| Real Estate Management & Development | 1.6% |
| Equity Real Estate Investment Trusts (REITs) | 1.4% |
| Chemicals | 1.3% |
| Hotels, Restaurants & Leisure | 1.2% |
| Electrical Equipment | 1.2% |
| Building Products | 1.1% |
| Commercial Services & Supplies | 1.1% |
| Aerospace & Defense | 1.0% |
| Health Care Technology | 1.0% |
| Textiles, Apparel & Luxury Goods | 1.0% |
| Other Industries (each less than 1%) | 6.6% |
| Cash and Other Assets, Less Liabilities | 0.6% |
| Total | 100.0% |
See Notes to Financial Statements.
| Semi-Annual Report | October 31, 2021 | 61 |
| Grandeur Peak International Stalwarts Fund | Portfolio of Investments |
October 31, 2021 (Unaudited)
| Shares | Value (Note 2) | |||||||
| COMMON STOCKS (98.91%) | ||||||||
| Argentina (1.56%) | ||||||||
| Globant SA(a) | 113,875 | $ | 36,347,761 | |||||
| Australia (0.97%) | ||||||||
| Netwealth Group, Ltd. | 1,728,376 | 22,492,876 | ||||||
| Belgium (2.36%) | ||||||||
| Melexis NV | 297,417 | 34,243,955 | ||||||
| Warehouses De Pauw CVA | 450,296 | 20,509,407 | ||||||
| 54,753,362 | ||||||||
| Brazil (1.14%) | ||||||||
| Locaweb Servicos de Internet SA(b)(c) | 2,905,400 | 9,461,932 | ||||||
| Patria Investments, Ltd. | 999,452 | 17,150,596 | ||||||
| 26,612,528 | ||||||||
| Britain (19.72%) | ||||||||
| Abcam PLC(a) | 831,735 | 18,827,011 | ||||||
| B&M European Value Retail SA | 9,888,391 | 85,689,465 | ||||||
| boohoo Group PLC(a) | 2,203,853 | 5,481,734 | ||||||
| CVS Group PLC | 296,479 | 10,123,376 | ||||||
| Dechra Pharmaceuticals PLC | 1,308,485 | 91,685,277 | ||||||
| Diploma PLC | 393,793 | 16,189,328 | ||||||
| Endava PLC, ADR(a) | 448,544 | 71,076,282 | ||||||
| Gamma Communications PLC | 718,856 | 17,826,291 | ||||||
| Impax Asset Management Group PLC | 1,235,435 | 18,530,679 | ||||||
| Intertek Group PLC | 606,414 | 40,624,012 | ||||||
| JTC PLC(b)(c) | 626,750 | 6,664,633 | ||||||
| Sanne Group PLC | 430,700 | 5,328,490 | ||||||
| Softcat PLC | 700,308 | 18,621,848 | ||||||
| St. James's Place PLC | 2,392,835 | 51,724,140 | ||||||
| 458,392,566 | ||||||||
| Canada (1.82%) | ||||||||
| Gildan Activewear, Inc. | 509,684 | 18,721,909 | ||||||
| Ritchie Bros Auctioneers, Inc. | 344,174 | 23,524,293 | ||||||
| 42,246,202 | ||||||||
| China (10.38%) | ||||||||
| Hangzhou Tigermed Consulting Co., Ltd., Class A | 514,550 | 13,701,392 | ||||||
| Li Ning Co., Ltd. | 1,478,500 | 16,437,279 | ||||||
| Man Wah Holdings, Ltd. | 11,256,700 | 17,506,082 | ||||||
| Silergy Corp. | 787,200 | 129,650,143 | ||||||
| WuXi AppTec Co., Ltd., Class H(c) | 1,372,312 | 29,331,725 | ||||||
| Wuxi Biologics Cayman, Inc.(a)(b)(c) | 1,097,400 | 16,699,719 | ||||||
| Yum China Holdings, Inc. | 313,814 | 17,939,015 | ||||||
| 241,265,355 | ||||||||
| Shares | Value (Note 2) | |||||||
| Finland (0.31%) | ||||||||
| Musti Group Oyj | 184,700 | $ | 7,255,195 | |||||
| France (4.92%) | ||||||||
| Alten SA | 257,717 | 41,470,674 | ||||||
| Antin Infrastructure Partners SA(a) | 242,001 | 9,203,899 | ||||||
| BioMerieux | 130,258 | 16,571,173 | ||||||
| Bureau Veritas SA | 612,012 | 19,427,605 | ||||||
| Esker SA | 23,321 | 7,966,424 | ||||||
| Virbac SA | 38,985 | 19,716,707 | ||||||
| 114,356,482 | ||||||||
| Germany (4.61%) | ||||||||
| Atoss Software AG | 59,351 | 13,420,098 | ||||||
| Dermapharm Holding SE | 352,064 | 35,407,859 | ||||||
| Nagarro SE(a) | 54,800 | 11,022,715 | ||||||
| PATRIZIA AG | 339,180 | 9,371,021 | ||||||
| Puma SE | 123,122 | 15,271,939 | ||||||
| QIAGEN NV(a) | 407,879 | 22,743,333 | ||||||
| 107,236,965 | ||||||||
| Hong Kong (1.69%) | ||||||||
| Techtronic Industries Co., Ltd. | 1,903,500 | 39,168,479 | ||||||
| India (9.94%) | ||||||||
| Avenue Supermarts, Ltd.(a)(b)(c) | 314,500 | 19,468,813 | ||||||
| Bajaj Finance, Ltd. | 105,029 | 10,379,576 | ||||||
| Computer Age Management Services, Ltd. | 263,209 | 10,587,588 | ||||||
| HCL Technologies, Ltd. | 980,061 | 14,969,632 | ||||||
| HDFC Asset Management Co., Ltd.(b)(c) | 306,419 | 10,832,516 | ||||||
| HDFC Bank, Ltd. | 714,291 | 15,098,780 | ||||||
| IndiaMart InterMesh, Ltd.(b)(c) | 159,101 | 15,184,246 | ||||||
| Marico, Ltd. | 1,372,658 | 10,420,331 | ||||||
| Metropolis Healthcare, Ltd.(b)(c) | 703,405 | 27,825,741 | ||||||
| Nippon Life India Asset Management, Ltd.(b)(c) | 1,905,720 | 10,646,964 | ||||||
| WNS Holdings, Ltd., ADR(a) | 965,495 | 85,745,611 | ||||||
| 231,159,798 | ||||||||
| Indonesia (0.51%) | ||||||||
| Bank Tabungan Pensiunan Nasional Syariah | 44,140,900 | 11,870,607 | ||||||
| Ireland (1.31%) | ||||||||
| Keywords Studios PLC | 786,040 | 30,507,862 | ||||||
| Israel (0.91%) | ||||||||
| Wix.com, Ltd.(a) | 113,379 | 21,083,959 | ||||||
| Italy (0.70%) | ||||||||
| Interpump Group SpA | 221,829 | 16,347,724 | ||||||
See Notes to Financial Statements.
| 62 | 1.855.377.7325 | www.GrandeurPeakGlobal.com |
| Grandeur Peak International Stalwarts Fund | Portfolio of Investments |
October 31, 2021 (Unaudited)
| Shares | Value (Note 2) | |||||||
| Japan (11.65%) | ||||||||
| BASE, Inc.(a) | 1,029,300 | $ | 8,398,763 | |||||
| BayCurrent Consulting, Inc. | 73,800 | 30,368,239 | ||||||
| Freee KK(a) | 155,600 | 11,112,823 | ||||||
| GMO Payment Gateway, Inc. | 90,200 | 11,427,839 | ||||||
| IR Japan Holdings, Ltd. | 260,500 | 24,021,540 | ||||||
| M&A Capital Partners Co., Ltd.(a) | 597,200 | 33,586,769 | ||||||
| M3, Inc. | 218,900 | 12,883,362 | ||||||
| MonotaRO Co., Ltd. | 1,508,500 | 34,147,225 | ||||||
| Nihon M&A Center Holdings, Inc. | 1,181,900 | 36,138,816 | ||||||
| Seria Co., Ltd. | 843,500 | 27,826,804 | ||||||
| Systena Corp. | 1,537,000 | 28,265,427 | ||||||
| Visional, Inc.(a) | 35,800 | 2,782,961 | ||||||
| WealthNavi, Inc.(a) | 357,700 | 9,776,139 | ||||||
| 270,736,707 | ||||||||
| Netherlands (1.86%) | ||||||||
| Aalberts NV | 398,758 | 22,057,188 | ||||||
| Shop Apotheke Europe NV(a)(b)(c) | 139,939 | 21,191,849 | ||||||
| 43,249,037 | ||||||||
| Norway (0.71%) | ||||||||
| Nordic Semiconductor ASA(a) | 558,592 | 16,530,499 | ||||||
| Philippines (0.61%) | ||||||||
| Wilcon Depot, Inc. | 23,051,800 | 14,267,331 | ||||||
| Poland (1.74%) | ||||||||
| Dino Polska SA(a)(b)(c) | 453,272 | 40,491,306 | ||||||
| South Korea (0.48%) | ||||||||
| LEENO Industrial, Inc. | 76,428 | 11,197,188 | ||||||
| Sweden (4.62%) | ||||||||
| AddTech AB, Class B | 564,900 | 12,629,343 | ||||||
| Byggfakta Group Nordic Holdco AB(a) | 1,999,452 | 15,715,301 | ||||||
| Cint Group AB(a)(d) | 286,802 | 4,328,079 | ||||||
| EQT AB | 1,011,133 | 53,288,169 | ||||||
| Sagax AB B | 359,696 | 14,072,876 | ||||||
| SwedenCare AB | 446,192 | 7,351,673 | ||||||
| 107,385,441 | ||||||||
| Switzerland (1.39%) | ||||||||
| Partners Group Holding AG | 18,534 | 32,337,336 | ||||||
| Taiwan (2.12%) | ||||||||
| momo.com, Inc. | 360,700 | 23,217,829 | ||||||
| Voltronic Power Technology Corp. | 447,490 | 26,149,244 | ||||||
| 49,367,073 | ||||||||
| Shares | Value (Note 2) | |||||||
| United States (10.09%) | ||||||||
| Ashtead Group PLC | 232,501 | $ | 19,485,919 | |||||
| Bank of NT Butterfield & Son, Ltd. | 821,853 | 29,504,523 | ||||||
| EPAM Systems, Inc.(a) | 121,714 | 81,942,733 | ||||||
| Frontage Holdings Corp.(a)(b)(c) | 10,275,300 | 6,008,947 | ||||||
| Genpact, Ltd. | 714,850 | 35,277,848 | ||||||
| Lululemon Athletica, Inc.(a) | 84,889 | 39,559,123 | ||||||
| Monolithic Power Systems, Inc. | 43,150 | 22,673,599 | ||||||
| 234,452,692 | ||||||||
| Vietnam (0.79%) | ||||||||
| Vietnam Technological & Commercial Joint Stock Bank(a) | 8,084,926 | 18,336,469 | ||||||
| TOTAL COMMON STOCKS | ||||||||
| (Cost $1,385,650,058) | 2,299,448,800 | |||||||
| TOTAL INVESTMENTS (98.91%) | ||||||||
| (Cost $1,385,650,058) | $ | 2,299,448,800 | ||||||
| Other Assets In Excess Of Liabilities (1.09%) | 25,222,836 | |||||||
| NET ASSETS (100.00%) | $ | 2,324,671,636 | ||||||
| (a) | Non-Income Producing Security. |
| (b) | Security exempt from registration under Rule 144A of the Securities Act of 1933. These securities may be resold in the ordinary course of business in transactions exempt from registration, normally to qualified institutional buyers. As of October 31, 2021, these securities had a total aggregate market value of $213,808,391, representing 9.20% of net assets. |
| (c) | Security was purchased pursuant to Regulation S under the Securities Act of 1933, which exempts securities offered and sold outside of the United States from registration. Such security cannot be sold in the United States without either an effective registration statement filed pursuant to the Securities Act of 1933, or pursuant to an exemption from registration. As of October 31, 2021, the aggregate market value of these securities was $213,808,391, representing 9.20% of net assets. |
| (d) | As a result of the use of significant unobservable inputs to determine fair value, these investments have been classified as level 3 assets. See also Note 2 to the financial statements for additional information. |
For Fund compliance purposes, the Fund's geographical classifications refer to any one or more of the country sub-classifications used by one or more widely recognized market indexes or ratings group indexes, and/or as defined by Fund management. This definition may not apply for purposes of this report, which may combine sub-classifications for reporting ease. Geographical regions are shown as a percentage of net assets.
See Notes to Financial Statements.
| Semi-Annual Report | October 31, 2021 | 63 |
| Grandeur Peak International Stalwarts Fund | Portfolio of Investments |
October 31, 2021 (Unaudited)
| Sector Composition (October 31, 2021) (Unaudited) | |
| Technology | 34.7% |
| Financials | 17.6% |
| Industrials | 16.3% |
| Consumer | 16.1% |
| Health Care | 14.2% |
| Cash, Cash Equivalents, & Other Net Assets | 1.1% |
| Total | 100% |
| Industry Composition (October 31, 2021) (Unaudited) | |
| IT Services | 21.1% |
| Capital Markets | 12.1% |
| Semiconductors & Semiconductor Equipment | 9.3% |
| Pharmaceuticals | 6.6% |
| Professional Services | 6.6% |
| Multiline Retail | 4.9% |
| Trading Companies & Distributors | 4.2% |
| Life Sciences Tools & Services | 3.9% |
| Textiles, Apparel & Luxury Goods | 3.8% |
| Software | 3.5% |
| Machinery | 3.4% |
| Banks | 3.2% |
| Food & Staples Retailing | 2.5% |
| Internet & Direct Marketing Retail | 2.1% |
| Health Care Providers & Services | 1.6% |
| Electrical Equipment | 1.1% |
| Real Estate Management & Development | 1.0% |
| Commercial Services & Supplies | 1.0% |
| Other Industries (each less than 1%) | 7.0% |
| Cash and Other Assets, Less Liabilities | 1.1% |
| Total | 100.0% |
See Notes to Financial Statements.
| 64 | 1.855.377.7325 | www.GrandeurPeakGlobal.com |
| Grandeur Peak US Stalwarts Fund | Portfolio of Investments |
October 31, 2021 (Unaudited)
| Shares | Value (Note 2) | |||||||
| COMMON STOCKS (95.40%) | ||||||||
| Argentina (1.54%) | ||||||||
| Globant SA(a) | 8,450 | $ | 2,697,156 | |||||
| Britain (2.77%) | ||||||||
| Endava PLC, ADR(a) | 30,610 | 4,850,460 | ||||||
| Canada (1.25%) | ||||||||
| Gildan Activewear, Inc. | 23,394 | 859,317 | ||||||
| Ritchie Bros Auctioneers, Inc. | 19,550 | 1,336,243 | ||||||
| 2,195,560 | ||||||||
| China (0.23%) | ||||||||
| O2Micro International, Ltd., ADR(a) | 66,758 | 409,894 | ||||||
| Germany (0.92%) | ||||||||
| QIAGEN NV(a) | 28,908 | 1,611,910 | ||||||
| Hong Kong (1.23%) | ||||||||
| Techtronic Industries Co., Ltd. | 105,000 | 2,160,594 | ||||||
| India (2.05%) | ||||||||
| WNS Holdings, Ltd., ADR(a) | 40,450 | 3,592,364 | ||||||
| Israel (0.91%) | ||||||||
| Wix.com, Ltd.(a) | 8,587 | 1,596,839 | ||||||
| United States (84.50%) | ||||||||
| 4imprint Group PLC | 19,600 | 767,155 | ||||||
| Align Technology, Inc.(a) | 3,950 | 2,466,261 | ||||||
| Alpha Teknova, Inc.(a) | 38,830 | 892,702 | ||||||
| Apollo Global Management, Inc. | 29,719 | 2,286,877 | ||||||
| Bank of Hawaii Corp. | 21,991 | 1,858,240 | ||||||
| Bank of NT Butterfield & Son, Ltd. | 63,936 | 2,295,302 | ||||||
| Blackline, Inc.(a) | 25,475 | 3,232,013 | ||||||
| Blackstone, Inc. | 23,425 | 3,242,489 | ||||||
| Cardiovascular Systems, Inc.(a) | 45,698 | 1,603,086 | ||||||
| Castle Biosciences, Inc.(a) | 31,585 | 1,969,325 | ||||||
| Chewy, Inc.(a) | 28,343 | 2,148,399 | ||||||
| Cross Creek Lucid LP/Partnership Interest(a)(b) | 700,000 | 700,000 | ||||||
| Dexcom, Inc.(a) | 1,763 | 1,098,719 | ||||||
| Elastic NV(a) | 5,708 | 990,395 | ||||||
| EPAM Systems, Inc.(a) | 8,175 | 5,503,736 | ||||||
| Equinix, Inc. | 3,400 | 2,846,038 | ||||||
| Etsy, Inc.(a) | 12,293 | 3,081,733 | ||||||
| Exact Sciences Corp.(a) | 26,025 | 2,478,101 | ||||||
| ExlService Holdings, Inc.(a) | 8,975 | 1,100,604 | ||||||
| Fastenal Co. | 30,972 | 1,767,881 | ||||||
| Figs, Inc.(a) | 28,057 | 942,996 | ||||||
| First Hawaiian, Inc. | 41,134 | 1,134,887 | ||||||
| First Republic Bank | 27,250 | 5,894,992 | ||||||
| Shares | Value (Note 2) | |||||||
| United States (continued) | ||||||||
| Five Below, Inc.(a) | 7,225 | $ | 1,425,493 | |||||
| Freshpet, Inc.(a) | 7,150 | 1,114,757 | ||||||
| Frontage Holdings Corp.(a)(c)(d) | 1,873,000 | 1,095,322 | ||||||
| Genpact, Ltd. | 60,700 | 2,995,545 | ||||||
| Glacier Bancorp, Inc. | 31,650 | 1,749,929 | ||||||
| Global Industrial Co. | 67,475 | 2,738,135 | ||||||
| Goosehead Insurance, Inc., Class A | 23,213 | 3,349,636 | ||||||
| Heska Corp.(a) | 18,950 | 4,235,893 | ||||||
| Houlihan Lokey, Inc. | 24,628 | 2,760,306 | ||||||
| HubSpot, Inc.(a) | 2,136 | 1,730,651 | ||||||
| IDEXX Laboratories, Inc.(a) | 1,335 | 889,297 | ||||||
| Joint Corp.(a) | 16,883 | 1,476,925 | ||||||
| LeMaitre Vascular, Inc. | 36,550 | 1,900,965 | ||||||
| LGI Homes, Inc.(a) | 22,626 | 3,378,061 | ||||||
| Littelfuse, Inc. | 13,345 | 3,930,770 | ||||||
| Lululemon Athletica, Inc.(a) | 6,103 | 2,844,059 | ||||||
| Marcus & Millichap, Inc.(a) | 19,700 | 927,870 | ||||||
| MaxCyte, Inc.(a) | 76,700 | 862,108 | ||||||
| Medpace Holdings, Inc.(a) | 11,675 | 2,644,971 | ||||||
| Microchip Technology, Inc. | 13,400 | 992,806 | ||||||
| Monolithic Power Systems, Inc. | 4,224 | 2,219,544 | ||||||
| Morningstar, Inc. | 1,750 | 554,313 | ||||||
| MSCI, Inc. | 1,550 | 1,030,564 | ||||||
| NV5 Global, Inc.(a) | 8,401 | 874,796 | ||||||
| Old Dominion Freight Line, Inc. | 1,900 | 648,565 | ||||||
| Ollie's Bargain Outlet Holdings, Inc.(a) | 36,432 | 2,464,989 | ||||||
| P10, Inc.(a) | 82,000 | 1,025,000 | ||||||
| PagerDuty, Inc.(a) | 18,795 | 784,691 | ||||||
| Paycom Software, Inc.(a) | 9,204 | 5,042,412 | ||||||
| Paylocity Holding Corp.(a) | 9,450 | 2,883,573 | ||||||
| PJT Partners, Inc., Class A | 54,650 | 4,469,823 | ||||||
| Pool Corp. | 8,025 | 4,134,159 | ||||||
| Power Integrations, Inc. | 20,669 | 2,133,247 | ||||||
| Qualtrics International, Inc.(a) | 50,387 | 2,333,926 | ||||||
| Qualys, Inc.(a) | 22,388 | 2,786,858 | ||||||
| Rapid7, Inc.(a) | 15,975 | 2,056,781 | ||||||
| Rexford Industrial Realty, Inc. | 17,500 | 1,176,000 | ||||||
| Shoals Technologies Group, Inc.(a) | 46,647 | 1,445,591 | ||||||
| Silicon Laboratories, Inc.(a) | 6,953 | 1,312,448 | ||||||
| Squarespace, Inc.(a) | 27,390 | 1,066,567 | ||||||
| SVB Financial Group(a) | 4,355 | 3,124,277 | ||||||
| Teladoc Health, Inc.(a) | 9,704 | 1,451,621 | ||||||
| Terreno Realty Corp. | 23,999 | 1,755,047 | ||||||
| Traeger, Inc.(a) | 42,376 | 800,483 | ||||||
| TriMas Corp. | 25,591 | 853,460 | ||||||
| Ulta Beauty, Inc.(a) | 7,000 | 2,571,520 | ||||||
| WW Grainger, Inc. | 3,625 | 1,678,774 | ||||||
| YETI Holdings, Inc.(a) | 12,500 | 1,229,125 | ||||||
See Notes to Financial Statements.
| Semi-Annual Report | October 31, 2021 | 65 |
| Grandeur Peak US Stalwarts Fund | Portfolio of Investments |
October 31, 2021 (Unaudited)
| Shares | Value (Note 2) | |||||||
| United States (continued) | ||||||||
| Zendesk, Inc.(a) | 5,666 | $ | 576,799 | |||||
| 147,830,383 | ||||||||
| TOTAL COMMON STOCKS | ||||||||
| (Cost $124,655,708) | 166,945,160 | |||||||
| PREFERRED STOCKS (0.44%) | ||||||||
| United States (0.44%) | ||||||||
| Gusto Inc Series E Preferred(a)(b) | 20,595 | 767,576 | ||||||
| TOTAL PREFERRED STOCKS | ||||||||
| (Cost $625,992) | 767,576 | |||||||
| TOTAL INVESTMENTS (95.84%) | ||||||||
| (Cost $125,281,700) | $ | 167,712,736 | ||||||
| Other Assets In Excess Of Liabilities (4.16%) | 7,281,893 | |||||||
| NET ASSETS (100.00%) | $ | 174,994,629 | ||||||
| (a) | Non-Income Producing Security. |
| (b) | As a result of the use of significant unobservable inputs to determine fair value, these investments have been classified as level 3 assets. See also Note 2 to the financial statements for additional information. |
| (c) | Security exempt from registration under Rule 144A of the Securities Act of 1933. These securities may be resold in the ordinary course of business in transactions exempt from registration, normally to qualified institutional buyers. As of October 31, 2021, these securities had a total aggregate market value of $1,095,322, representing 0.63% of net assets. |
| (d) | Security was purchased pursuant to Regulation S under the Securities Act of 1933, which exempts securities offered and sold outside of the United States from registration. Such security cannot be sold in the United States without either an effective registration statement filed pursuant to the Securities Act of 1933, or pursuant to an exemption from registration. As of October 31, 2021, the aggregate market value of these securities was $1,095,322, representing 0.63% of net assets. |
For Fund compliance purposes, the Fund's geographical classifications refer to any one or more of the country sub-classifications used by one or more widely recognized market indexes or ratings group indexes, and/or as defined by Fund management. This definition may not apply for purposes of this report, which may combine sub-classifications for reporting ease. Geographical regions are shown as a percentage of net assets.
| Sector Composition (October 31, 2021) (Unaudited) | |
| Technology | 33.3% |
| Financials | 24.1% |
| Health Care | 15.8% |
| Consumer | 14.9% |
| Industrials | 7.2% |
| Energy & Materials | 0.5% |
| Cash, Cash Equivalents, & Other Net Assets | 4.2% |
| Total | 100% |
| Industry Composition (October 31, 2021) (Unaudited) | |
| IT Services | 13.5% |
| Software | 13.2% |
| Capital Markets | 9.2% |
| Banks | 9.2% |
| Health Care Equipment & Supplies | 7.5% |
| Life Sciences Tools & Services | 4.1% |
| Semiconductors & Semiconductor Equipment | 4.0% |
| Trading Companies & Distributors | 3.5% |
| Equity Real Estate Investment Trusts (REITs) | 3.3% |
| Internet & Direct Marketing Retail | 3.0% |
| Household Durables | 2.4% |
| Distributors | 2.4% |
| Specialty Retail | 2.3% |
| Electronic Equipment, Instruments & Components | 2.2% |
| Textiles, Apparel & Luxury Goods | 2.1% |
| Health Care Providers & Services | 2.0% |
| Insurance | 1.9% |
| Biotechnology | 1.4% |
| Multiline Retail | 1.4% |
| Machinery | 1.2% |
| Other Industries (each less than 1%) | 6.0% |
| Cash and Other Assets, Less Liabilities | 4.2% |
| Total | 100.0% |
See Notes to Financial Statements.
| 66 | 1.855.377.7325 | www.GrandeurPeakGlobal.com |
| Grandeur Peak Funds® | Statements of Assets and Liabilities |
October 31, 2021 (Unaudited)
| Grandeur Peak Emerging Markets Opportunities Fund | Grandeur Peak Global Contrarian Fund | Grandeur Peak Global Micro Cap Fund | ||||||||||
| ASSETS | ||||||||||||
| Investments, at value (Cost - see below) | $ | 645,159,139 | $ | 95,349,193 | $ | 75,319,270 | ||||||
| Cash | 32,569,807 | 1,503,785 | 571,757 | |||||||||
| Foreign cash, at value (Cost $604,209, $457,041 and $26,494, respectively) | 604,545 | 457,044 | 26,470 | |||||||||
| Dividends and interest receivable | 268,657 | 80,106 | 26,886 | |||||||||
| Receivable for investments sold | 868,605 | 157,170 | 511,510 | |||||||||
| Receivable for fund shares subscribed | 4,281 | 45,332 | 9,816 | |||||||||
| Deferred offering cost | – | 2 | – | |||||||||
| Prepaid and other assets | 6,357 | 15,149 | 16,764 | |||||||||
| Total assets | 679,481,391 | 97,607,781 | 76,482,473 | |||||||||
| LIABILITIES | ||||||||||||
| Payable for investments purchased | 62,702 | 1,242,204 | 672,650 | |||||||||
| Foreign capital gains tax | 5,700,072 | 9,116 | 137,865 | |||||||||
| Advisory fees payable | 692,880 | 79,039 | 94,791 | |||||||||
| Administration fees payable | 51,549 | 18,891 | 22,743 | |||||||||
| Custodian fees payable | 107,521 | 12,066 | 10,640 | |||||||||
| Payable for trustee fees and expenses | 13,322 | 983 | 1,439 | |||||||||
| Payable for chief compliance officer fee | 1,670 | 255 | 327 | |||||||||
| Payable for principal financial officer fees | 401 | 16 | 36 | |||||||||
| Distribution and service fees payable | 3,303 | – | – | |||||||||
| Payable for transfer agency fees | 7,265 | 5,296 | 6,405 | |||||||||
| Accrued expenses and other liabilities | 43,755 | 9,899 | 22,136 | |||||||||
| Total liabilities | 6,684,440 | 1,377,765 | 969,032 | |||||||||
| NET ASSETS | $ | 672,796,951 | $ | 96,230,016 | $ | 75,513,441 | ||||||
| NET ASSETS CONSISTS OF | ||||||||||||
| Paid-in capital (Note 5) | $ | 393,559,635 | $ | 81,918,429 | $ | 41,305,427 | ||||||
| Total distributable earnings | 279,237,316 | 14,311,587 | 34,208,014 | |||||||||
| NET ASSETS | $ | 672,796,951 | $ | 96,230,016 | $ | 75,513,441 | ||||||
| INVESTMENTS, AT COST | $ | 429,337,191 | $ | 86,573,675 | $ | 50,574,833 | ||||||
| PRICING OF SHARES | ||||||||||||
| Investor Class | ||||||||||||
| Net Assets | $ | 15,547,083 | $ | – | $ | – | ||||||
| Net Asset Value, offering and redemption price per share | $ | 18.57 | $ | – | $ | – | ||||||
| Shares of beneficial interest outstanding | 837,328 | – | – | |||||||||
| Institutional Class | ||||||||||||
| Net Assets | $ | 657,249,868 | $ | 96,230,016 | $ | 75,513,441 | ||||||
| Net Asset Value, offering and redemption price per share | $ | 18.72 | $ | 16.52 | $ | 21.74 | ||||||
| Shares of beneficial interest outstanding | 35,101,941 | 5,824,363 | 3,473,387 | |||||||||
See Notes to Financial Statements.
| Semi-Annual Report | October 31, 2021 | 67 |
| Grandeur Peak Funds® | Statements of Assets and Liabilities |
October 31, 2021 (Unaudited)
| Grandeur Peak Global Opportunities Fund | Grandeur Peak Global Reach Fund | Grandeur Peak Global Stalwarts Fund | ||||||||||
| ASSETS | ||||||||||||
| Investments, at value (Cost - see below) | $ | 1,100,876,496 | $ | 424,855,749 | $ | 462,488,083 | ||||||
| Cash | 4,763,565 | 2,228,690 | 11,666,288 | |||||||||
| Foreign cash, at value (Cost $378,973, $290,769 and $7,390, respectively) | 379,431 | 290,663 | 7,390 | |||||||||
| Dividends and interest receivable | 768,388 | 236,818 | 296,777 | |||||||||
| Receivable for investments sold | 28,924 | 1,107,046 | 2,405,302 | |||||||||
| Receivable for fund shares subscribed | 402,118 | 329,879 | 1,043,977 | |||||||||
| Prepaid and other assets | 34,949 | 18,725 | 15,069 | |||||||||
| Total assets | 1,107,253,871 | 429,067,570 | 477,922,886 | |||||||||
| LIABILITIES | ||||||||||||
| Payable for investments purchased | 1,222,626 | 1,879,162 | 3,103,716 | |||||||||
| Foreign capital gains tax | 2,297,334 | 856,153 | 628,396 | |||||||||
| Payable for fund shares redeemed | 120,467 | 108,601 | 288,685 | |||||||||
| Advisory fees payable | 1,025,700 | 387,795 | 308,908 | |||||||||
| Administration fees payable | 67,119 | 50,714 | 33,682 | |||||||||
| Custodian fees payable | 64,681 | 34,193 | 25,452 | |||||||||
| Payable for trustee fees and expenses | 21,373 | 7,760 | 7,581 | |||||||||
| Payable for chief compliance officer fee | 2,534 | 1,005 | 955 | |||||||||
| Payable for principal financial officer fees | 492 | 175 | 162 | |||||||||
| Distribution and service fees payable | 28,219 | 11,141 | 17,132 | |||||||||
| Payable for transfer agency fees | 9,891 | 8,137 | 10,896 | |||||||||
| Accrued expenses and other liabilities | 48,672 | 43,751 | 31,755 | |||||||||
| Total liabilities | 4,909,108 | 3,388,587 | 4,457,320 | |||||||||
| NET ASSETS | $ | 1,102,344,763 | $ | 425,678,983 | $ | 473,465,566 | ||||||
| NET ASSETS CONSISTS OF | ||||||||||||
| Paid-in capital (Note 5) | $ | 501,861,523 | $ | 194,389,578 | $ | 256,272,358 | ||||||
| Total distributable earnings | 600,483,240 | 231,289,405 | 217,193,208 | |||||||||
| NET ASSETS | $ | 1,102,344,763 | $ | 425,678,983 | $ | 473,465,566 | ||||||
| INVESTMENTS, AT COST | $ | 673,785,326 | $ | 251,012,634 | $ | 288,086,469 | ||||||
| PRICING OF SHARES | ||||||||||||
| Investor Class | ||||||||||||
| Net Assets | $ | 135,162,337 | $ | 53,538,971 | $ | 84,109,987 | ||||||
| Net Asset Value, offering and redemption price per share | $ | 6.00 | $ | 25.55 | $ | 26.93 | ||||||
| Shares of beneficial interest outstanding | 22,529,745 | 2,095,257 | 3,123,747 | |||||||||
| Institutional Class | ||||||||||||
| Net Assets | $ | 967,182,426 | $ | 372,140,012 | $ | 389,355,579 | ||||||
| Net Asset Value, offering and redemption price per share | $ | 6.12 | $ | 25.75 | $ | 27.24 | ||||||
| Shares of beneficial interest outstanding | 158,096,356 | 14,454,793 | 14,295,222 | |||||||||
See Notes to Financial Statements.
| 68 | 1.855.377.7325 | www.GrandeurPeakGlobal.com |
| Grandeur Peak Funds® | Statements of Assets and Liabilities |
October 31, 2021 (Unaudited)
| Grandeur Peak International Opportunities Fund | Grandeur Peak International Stalwarts Fund | Grandeur Peak US Stalwarts Fund | ||||||||||
| ASSETS | ||||||||||||
| Investments, at value (Cost - see below) | $ | 1,036,928,064 | $ | 2,299,448,800 | $ | 167,712,736 | ||||||
| Cash | 11,002,331 | 35,390,618 | 6,594,325 | |||||||||
| Foreign cash, at value (Cost $183,573, $197,970 and $–, respectively) | 182,960 | 197,973 | – | |||||||||
| Dividends and interest receivable | 830,213 | 1,802,519 | 40,771 | |||||||||
| Receivable for investments sold | 142,028 | 4,292,211 | 1,419,737 | |||||||||
| Receivable for fund shares subscribed | 154,907 | 1,227,143 | 54,829 | |||||||||
| Deferred offering cost | – | – | 8,469 | |||||||||
| Prepaid and other assets | 9,710 | 24,628 | 281 | |||||||||
| Total assets | 1,049,250,213 | 2,342,383,892 | 175,831,148 | |||||||||
| LIABILITIES | ||||||||||||
| Payable for investments purchased | 1,942,852 | 8,129,671 | 678,382 | |||||||||
| Foreign capital gains tax | 3,267,615 | 5,675,350 | – | |||||||||
| Payable for fund shares redeemed | 16,412 | 2,023,665 | – | |||||||||
| Advisory fees payable | 976,364 | 1,535,080 | 106,329 | |||||||||
| Administration fees payable | 65,263 | 109,848 | 17,636 | |||||||||
| Custodian fees payable | 64,596 | 119,491 | 8,191 | |||||||||
| Payable for trustee fees and expenses | 20,259 | 42,633 | 2,294 | |||||||||
| Payable for chief compliance officer fee | 2,421 | 4,773 | 344 | |||||||||
| Payable for principal financial officer fees | 469 | 959 | 37 | |||||||||
| Distribution and service fees payable | 12,544 | 16,125 | – | |||||||||
| Payable for transfer agency fees | 6,501 | 28,492 | 5,971 | |||||||||
| Accrued expenses and other liabilities | 65,972 | 26,169 | 17,335 | |||||||||
| Total liabilities | 6,441,268 | 17,712,256 | 836,519 | |||||||||
| NET ASSETS | $ | 1,042,808,945 | $ | 2,324,671,636 | $ | 174,994,629 | ||||||
| NET ASSETS CONSISTS OF | ||||||||||||
| Paid-in capital (Note 5) | $ | 526,453,718 | $ | 1,233,030,032 | $ | 129,700,726 | ||||||
| Total distributable earnings | 516,355,227 | 1,091,641,604 | 45,293,903 | |||||||||
| NET ASSETS | $ | 1,042,808,945 | $ | 2,324,671,636 | $ | 174,994,629 | ||||||
| INVESTMENTS, AT COST | $ | 637,586,472 | $ | 1,385,650,058 | $ | 125,301,873 | ||||||
| PRICING OF SHARES | ||||||||||||
| Investor Class | ||||||||||||
| Net Assets | $ | 59,998,410 | $ | 78,540,932 | $ | – | ||||||
| Net Asset Value, offering and redemption price per share | $ | 5.55 | $ | 27.94 | $ | – | ||||||
| Shares of beneficial interest outstanding | 10,810,269 | 2,811,513 | – | |||||||||
| Institutional Class | ||||||||||||
| Net Assets | $ | 982,810,535 | $ | 2,246,130,704 | $ | 174,994,629 | ||||||
| Net Asset Value, offering and redemption price per share | $ | 5.60 | $ | 28.13 | $ | 26.31 | ||||||
| Shares of beneficial interest outstanding | 175,478,742 | 79,847,847 | 6,651,110 | |||||||||
See Notes to Financial Statements.
| Semi-Annual Report | October 31, 2021 | 69 |
| Grandeur Peak Funds® | Statements of Operations |
For the Six Months Ended October 31, 2021 (Unaudited)
| Grandeur Peak Emerging Markets Opportunities Fund | Grandeur Peak Global Contrarian Fund | Grandeur Peak Global Micro Cap Fund | ||||||||||
| INVESTMENT INCOME | ||||||||||||
| Dividends | $ | 6,938,110 | $ | 1,124,273 | $ | 602,641 | ||||||
| Foreign taxes withheld | (783,106 | ) | (82,721 | ) | (59,449 | ) | ||||||
| Total investment income | 6,155,004 | 1,041,552 | 543,192 | |||||||||
| EXPENSES | ||||||||||||
| Investment advisor fees (Note 6) | 4,599,170 | 353,030 | 548,070 | |||||||||
| Administrative fees | 102,209 | 21,496 | 23,846 | |||||||||
| Distribution and service fees - Investor Class | 17,831 | – | – | |||||||||
| Transfer agent fees | 21,216 | 16,724 | 20,006 | |||||||||
| Recoupment of previously waived fees | – | 24,190 | 38,463 | |||||||||
| Professional fees | 4,068 | 8,103 | 9,338 | |||||||||
| Printing fees | 4,966 | 1,430 | 804 | |||||||||
| Registration fees | 27,479 | 9,052 | 6,284 | |||||||||
| Custodian fees | 235,888 | 37,317 | 29,620 | |||||||||
| Trustee fees and expenses | 17,622 | 1,453 | 1,857 | |||||||||
| Chief compliance officer fees | 4,854 | 559 | 666 | |||||||||
| Principal financial officer fees | 984 | 71 | 98 | |||||||||
| Other expenses | 22,710 | 8,274 | 9,477 | |||||||||
| Total expenses | 5,058,997 | 481,699 | 688,529 | |||||||||
| Voluntary waiver of investment advisory fees (Note 6) | (486,624 | ) | – | – | ||||||||
| Total net expenses | 4,572,373 | 481,699 | 688,529 | |||||||||
| NET INVESTMENT INCOME/(LOSS) | 1,582,631 | 559,853 | (145,337 | ) | ||||||||
| REALIZED AND UNREALIZED GAIN/(LOSS) ON INVESTMENTS | ||||||||||||
| Net realized gain on investments | 34,092,021 | 2,448,192 | 5,871,378 | |||||||||
| Net realized loss on foreign currency transactions | (79,211 | ) | (22,675 | ) | (13,406 | ) | ||||||
| Net realized gain | 34,012,810 | 2,425,517 | 5,857,972 | |||||||||
| Net change in unrealized appreciation/(depreciation) on investments (net of change in foreign capital gains tax of $923,489, $(57,350) and $(155,268), respectively) | (2,971,406 | ) | 2,106,639 | (1,970,644 | ) | |||||||
| Net change in unrealized depreciation on translation of assets and liabilities in foreign currencies | (6,241 | ) | (1,983 | ) | (1,186 | ) | ||||||
| Net change in unrealized appreciation/(depreciation) | (2,977,647 | ) | 2,104,656 | (1,971,830 | ) | |||||||
| NET REALIZED AND UNREALIZED GAIN ON INVESTMENTS AND FOREIGN CURRENCY TRANSACTIONS | 31,035,163 | 4,530,173 | 3,886,142 | |||||||||
| NET INCREASE IN NET ASSETS RESULTING FROM OPERATIONS | $ | 32,617,794 | $ | 5,090,026 | $ | 3,740,805 | ||||||
See Notes to Financial Statements.
| 70 | 1.855.377.7325 | www.GrandeurPeakGlobal.com |
| Grandeur Peak Funds® | Statements of Operations |
For the Six Months Ended October 31, 2021 (Unaudited)
| Grandeur Peak Global Opportunities Fund | Grandeur Peak Global Reach Fund | Grandeur Peak Global Stalwarts Fund | ||||||||||
| INVESTMENT INCOME | ||||||||||||
| Dividends | $ | 7,211,160 | $ | 2,609,338 | $ | 2,064,314 | ||||||
| Foreign taxes withheld | (649,788 | ) | (224,540 | ) | (148,286 | ) | ||||||
| Total investment income | 6,561,372 | 2,384,798 | 1,916,028 | |||||||||
| EXPENSES | ||||||||||||
| Investment advisor fees (Note 6) | 6,770,332 | 2,228,037 | 1,660,921 | |||||||||
| Administrative fees | 152,143 | 73,658 | 64,977 | |||||||||
| Distribution and service fees - Investor Class | 153,975 | 65,089 | 106,258 | |||||||||
| Transfer agent fees | 32,780 | 26,819 | 37,099 | |||||||||
| Professional fees | 7,754 | 5,162 | 11,891 | |||||||||
| Printing fees | 11,234 | 6,898 | 4,471 | |||||||||
| Registration fees | 16,419 | 22,653 | 31,113 | |||||||||
| Custodian fees | 150,156 | 83,782 | 55,151 | |||||||||
| Trustee fees and expenses | 27,703 | 10,137 | 9,992 | |||||||||
| Chief compliance officer fees | 7,579 | 2,880 | 2,835 | |||||||||
| Principal financial officer fees | 1,415 | 518 | 506 | |||||||||
| Other expenses | 23,073 | 25,444 | 15,872 | |||||||||
| Total expenses | 7,354,563 | 2,551,077 | 2,001,086 | |||||||||
| Voluntary waiver of investment advisory fees (Note 6) | (723,929 | ) | – | – | ||||||||
| Total net expenses | 6,630,634 | 2,551,077 | 2,001,086 | |||||||||
| NET INVESTMENT LOSS | (69,262 | ) | (166,279 | ) | (85,058 | ) | ||||||
| REALIZED AND UNREALIZED GAIN/(LOSS) ON INVESTMENTS | ||||||||||||
| Net realized gain on investments | 73,347,818 | 22,145,529 | 21,395,656 | |||||||||
| Net realized loss on foreign currency transactions | (43,844 | ) | (44,083 | ) | (31,228 | ) | ||||||
| Net realized gain | 73,303,974 | 22,101,446 | 21,364,428 | |||||||||
| Net change in unrealized appreciation on investments (net of change in foreign capital gains tax of $13,994, $90,579 and $115,963, respectively) | 19,133,035 | 17,871,652 | 38,613,948 | |||||||||
| Net change in unrealized depreciation on translation of assets and liabilities in foreign currencies | (15,350 | ) | (5,442 | ) | (4,025 | ) | ||||||
| Net change in unrealized appreciation | 19,117,685 | 17,866,210 | 38,609,923 | |||||||||
| NET REALIZED AND UNREALIZED GAIN ON INVESTMENTS AND FOREIGN CURRENCY TRANSACTIONS | 92,421,659 | 39,967,656 | 59,974,351 | |||||||||
| NET INCREASE IN NET ASSETS RESULTING FROM OPERATIONS | $ | 92,352,397 | $ | 39,801,377 | $ | 59,889,293 | ||||||
See Notes to Financial Statements.
| Semi-Annual Report | October 31, 2021 | 71 |
| Grandeur Peak Funds® | Statements of Operations |
For the Six Months Ended October 31, 2021 (Unaudited)
| Grandeur Peak International Opportunities Fund | Grandeur Peak International Stalwarts Fund | Grandeur Peak US Stalwarts Fund | ||||||||||
| INVESTMENT INCOME | ||||||||||||
| Dividends | $ | 6,677,051 | $ | 12,349,633 | $ | 625,033 | ||||||
| Foreign taxes withheld | (776,503 | ) | (1,337,523 | ) | (3,480 | ) | ||||||
| Total investment income | 5,900,548 | 11,012,110 | 621,553 | |||||||||
| EXPENSES | ||||||||||||
| Investment advisor fees (Note 6) | 6,388,553 | 8,930,819 | 573,563 | |||||||||
| Administrative fees | 144,331 | 293,544 | 29,244 | |||||||||
| Distribution and service fees - Investor Class | 75,311 | 92,727 | – | |||||||||
| Transfer agent fees | 19,384 | 77,624 | 18,048 | |||||||||
| Recoupment of previously waived fees | – | – | 82,434 | |||||||||
| Professional fees | 7,604 | 14,349 | 9,164 | |||||||||
| Printing fees | 7,942 | 51,190 | 830 | |||||||||
| Registration fees | 69,521 | 57,696 | 136 | |||||||||
| Custodian fees | 151,909 | 260,192 | 12,346 | |||||||||
| Trustee fees and expenses | 26,177 | 56,123 | 3,405 | |||||||||
| Chief compliance officer fees | 7,165 | 15,126 | 1,061 | |||||||||
| Principal financial officer fees | 1,337 | 2,853 | 169 | |||||||||
| Other expenses | 27,582 | 33,500 | 2,209 | |||||||||
| Total expenses | 6,926,816 | 9,885,743 | 732,609 | |||||||||
| Voluntary waiver of investment advisory fees (Note 6) | (647,574 | ) | – | – | ||||||||
| Total net expenses | 6,279,242 | 9,885,743 | 732,609 | |||||||||
| NET INVESTMENT INCOME/(LOSS) | (378,694 | ) | 1,126,367 | (111,056 | ) | |||||||
| REALIZED AND UNREALIZED GAIN/(LOSS) ON INVESTMENTS | ||||||||||||
| Net realized gain on investments | 53,894,817 | 121,670,998 | 1,427,776 | |||||||||
| Net realized loss on foreign currency transactions | (78,509 | ) | (178,520 | ) | (1,052 | ) | ||||||
| Net realized gain | 53,816,308 | 121,492,478 | 1,426,724 | |||||||||
| Net change in unrealized appreciation on investments (net of change in foreign capital gains tax of $1,142,733, $1,960,382 and $0, respectively) | 18,770,303 | 207,333,469 | 21,944,459 | |||||||||
| Net change in unrealized appreciation/(depreciation) on translation of assets and liabilities in foreign currencies | (21,659 | ) | (32,170 | ) | 5 | |||||||
| Net change in unrealized appreciation | 18,748,644 | 207,301,299 | 21,944,464 | |||||||||
| NET REALIZED AND UNREALIZED GAIN ON INVESTMENTS AND FOREIGN CURRENCY TRANSACTIONS | 72,564,952 | 328,793,777 | 23,371,188 | |||||||||
| NET INCREASE IN NET ASSETS RESULTING FROM OPERATIONS | $ | 72,186,258 | $ | 329,920,144 | $ | 23,260,132 | ||||||
See Notes to Financial Statements.
| 72 | 1.855.377.7325 | www.GrandeurPeakGlobal.com |
| Grandeur Peak Emerging Markets Opportunities Fund | Statements of Changes in Net Assets |
| For the Six Months Ended October 31, 2021 (Unaudited) | For the Year Ended April 30, 2021 | |||||||
| OPERATIONS | ||||||||
| Net investment income/(loss) | $ | 1,582,631 | $ | (1,404,176 | ) | |||
| Net realized gain | 34,012,810 | 46,750,517 | ||||||
| Net change in unrealized appreciation/(depreciation) | (2,977,647 | ) | 182,572,895 | |||||
| Net increase in net assets resulting from operations | 32,617,794 | 227,919,236 | ||||||
| DISTRIBUTIONS TO SHAREHOLDERS (NOTE 3) | ||||||||
| Investor Class | – | (2,571 | ) | |||||
| Institutional Class | – | (794,820 | ) | |||||
| Net decrease in net assets from distributions | – | (797,391 | ) | |||||
| CAPITAL SHARE TRANSACTIONS (NOTE 5) | ||||||||
| Investor Class | ||||||||
| Proceeds from sales of shares | 520,108 | 1,984,236 | ||||||
| Distributions reinvested | – | 2,543 | ||||||
| Cost of shares redeemed | (712,471 | ) | (2,636,891 | ) | ||||
| Redemption fees | – | 485 | ||||||
| Net decrease from capital shares transactions | (192,363 | ) | (649,627 | ) | ||||
| Institutional Class | ||||||||
| Proceeds from sales of shares | 24,908,649 | 110,127,902 | ||||||
| Distributions reinvested | – | 730,183 | ||||||
| Cost of shares redeemed | (23,086,466 | ) | (98,220,322 | ) | ||||
| Redemption fees | 1 | 9,739 | ||||||
| Net increase from capital shares transactions | 1,822,184 | 12,647,502 | ||||||
| Net increase in net assets | 34,247,615 | 239,119,720 | ||||||
| NET ASSETS | ||||||||
| Beginning of period | 638,549,336 | 399,429,616 | ||||||
| End of period | $ | 672,796,951 | $ | 638,549,336 | ||||
| OTHER INFORMATION | ||||||||
| Shares Transactions | ||||||||
| Investor Class | ||||||||
| Issued | 28,277 | 122,035 | ||||||
| Issued to shareholders in reinvestment of distributions | – | 156 | ||||||
| Redeemed | (39,077 | ) | (182,150 | ) | ||||
| Net decrease in share transactions | (10,800 | ) | (59,959 | ) | ||||
| Institutional Class | ||||||||
| Issued | 1,349,986 | 6,753,337 | ||||||
| Issued to shareholders in reinvestment of distributions | – | 44,496 | ||||||
| Redeemed | (1,223,338 | ) | (6,761,873 | ) | ||||
| Net increase in share transactions | 126,648 | 35,960 | ||||||
See Notes to Financial Statements.
| Semi-Annual Report | October 31, 2021 | 73 |
| Grandeur Peak Global Contrarian Fund | Statements of Changes in Net Assets |
| For the Six Months Ended October 31, 2021 (Unaudited) | For the Year Ended April 30, 2021 | |||||||
| OPERATIONS | ||||||||
| Net investment income | $ | 559,853 | $ | 401,180 | ||||
| Net realized gain | 2,425,517 | 3,087,368 | ||||||
| Net change in unrealized appreciation | 2,104,656 | 7,660,143 | ||||||
| Net increase in net assets resulting from operations | 5,090,026 | 11,148,691 | ||||||
| DISTRIBUTIONS TO SHAREHOLDERS (NOTE 3) | ||||||||
| Institutional Class | – | (409,394 | ) | |||||
| Net decrease in net assets from distributions | – | (409,394 | ) | |||||
| CAPITAL SHARE TRANSACTIONS (NOTE 5) | ||||||||
| Institutional Class | ||||||||
| Proceeds from sales of shares | 44,576,847 | 31,456,092 | ||||||
| Distributions reinvested | – | 403,668 | ||||||
| Cost of shares redeemed | (2,843,362 | ) | (2,063,549 | ) | ||||
| Redemption fees | 3,461 | 6,119 | ||||||
| Net increase from capital shares transactions | 41,736,946 | 29,802,330 | ||||||
| Net increase in net assets | 46,826,972 | 40,541,627 | ||||||
| NET ASSETS | ||||||||
| Beginning of period | 49,403,044 | 8,861,417 | ||||||
| End of period | $ | 96,230,016 | $ | 49,403,044 | ||||
| OTHER INFORMATION | ||||||||
| Shares Transactions | ||||||||
| Institutional Class | ||||||||
| Issued | 2,798,870 | 2,350,442 | ||||||
| Issued to shareholders in reinvestment of distributions | – | 30,237 | ||||||
| Redeemed | (179,699 | ) | (184,812 | ) | ||||
| Net increase in share transactions | 2,619,171 | 2,195,867 | ||||||
See Notes to Financial Statements.
| 74 | 1.855.377.7325 | www.GrandeurPeakGlobal.com |
| Grandeur Peak Global Micro Cap Fund | Statements of Changes in Net Assets |
| For the Six Months Ended October 31, 2021 (Unaudited) | For the Year Ended April 30, 2021 | |||||||
| OPERATIONS | ||||||||
| Net investment loss | $ | (145,337 | ) | $ | (293,387 | ) | ||
| Net realized gain | 5,857,972 | 8,082,924 | ||||||
| Net change in unrealized appreciation/(depreciation) | (1,971,830 | ) | 23,350,176 | |||||
| Net increase in net assets resulting from operations | 3,740,805 | 31,139,713 | ||||||
| DISTRIBUTIONS TO SHAREHOLDERS (NOTE 3) | ||||||||
| Institutional Class | – | (4,057,924 | ) | |||||
| Net decrease in net assets from distributions | – | (4,057,924 | ) | |||||
| CAPITAL SHARE TRANSACTIONS (NOTE 5) | ||||||||
| Institutional Class | ||||||||
| Proceeds from sales of shares | 2,948,580 | 13,038,427 | ||||||
| Distributions reinvested | – | 3,771,469 | ||||||
| Cost of shares redeemed | (1,550,713 | ) | (3,150,855 | ) | ||||
| Redemption fees | 12 | – | ||||||
| Net increase from capital shares transactions | 1,397,879 | 13,659,041 | ||||||
| Net increase in net assets | 5,138,684 | 40,740,830 | ||||||
| NET ASSETS | ||||||||
| Beginning of period | 70,374,757 | 29,633,927 | ||||||
| End of period | $ | 75,513,441 | $ | 70,374,757 | ||||
| OTHER INFORMATION | ||||||||
| Shares Transactions | ||||||||
| Institutional Class | ||||||||
| Issued | 137,869 | 706,934 | ||||||
| Issued to shareholders in reinvestment of distributions | – | 213,802 | ||||||
| Redeemed | (73,012 | ) | (195,217 | ) | ||||
| Net increase in share transactions | 64,857 | 725,519 | ||||||
See Notes to Financial Statements.
| Semi-Annual Report | October 31, 2021 | 75 |
| Grandeur Peak Global Opportunities Fund | Statements of Changes in Net Assets |
| For the Six Months Ended October 31, 2021 (Unaudited) | For the Year Ended April 30, 2021 | |||||||
| OPERATIONS | ||||||||
| Net investment loss | $ | (69,262 | ) | $ | (934,355 | ) | ||
| Net realized gain | 73,303,974 | 168,229,592 | ||||||
| Net change in unrealized appreciation | 19,117,685 | 299,109,843 | ||||||
| Net increase in net assets resulting from operations | 92,352,397 | 466,405,080 | ||||||
| DISTRIBUTIONS TO SHAREHOLDERS (NOTE 3) | ||||||||
| Investor Class | – | (9,200,642 | ) | |||||
| Institutional Class | – | (54,763,378 | ) | |||||
| Net decrease in net assets from distributions | – | (63,964,020 | ) | |||||
| CAPITAL SHARE TRANSACTIONS (NOTE 5) | ||||||||
| Investor Class | ||||||||
| Proceeds from sales of shares | 6,223,308 | 13,573,747 | ||||||
| Distributions reinvested | – | 8,906,996 | ||||||
| Cost of shares redeemed | (14,485,566 | ) | (43,809,498 | ) | ||||
| Redemption fees | 1,378 | 581 | ||||||
| Net decrease from capital shares transactions | (8,260,880 | ) | (21,328,174 | ) | ||||
| Institutional Class | ||||||||
| Proceeds from sales of shares | 34,926,566 | 105,694,563 | ||||||
| Distributions reinvested | – | 50,942,882 | ||||||
| Cost of shares redeemed | (38,235,230 | ) | (79,175,222 | ) | ||||
| Redemption fees | 157 | 1,131 | ||||||
| Net increase/(decrease) from capital shares transactions | (3,308,507 | ) | 77,463,354 | |||||
| Net increase in net assets | 80,783,010 | 458,576,240 | ||||||
| NET ASSETS | ||||||||
| Beginning of period | 1,021,561,753 | 562,985,513 | ||||||
| End of period | $ | 1,102,344,763 | $ | 1,021,561,753 | ||||
| OTHER INFORMATION | ||||||||
| Shares Transactions | ||||||||
| Investor Class | ||||||||
| Issued | 1,068,417 | 2,966,817 | ||||||
| Issued to shareholders in reinvestment of distributions | – | 1,840,288 | ||||||
| Redeemed | (2,462,975 | ) | (9,575,738 | ) | ||||
| Net decrease in share transactions | (1,394,558 | ) | (4,768,633 | ) | ||||
| Institutional Class | ||||||||
| Issued | 5,935,138 | 22,648,748 | ||||||
| Issued to shareholders in reinvestment of distributions | – | 10,333,242 | ||||||
| Redeemed | (6,485,594 | ) | (17,308,856 | ) | ||||
| Net increase/(decrease) in share transactions | (550,456 | ) | 15,673,134 | |||||
See Notes to Financial Statements.
| 76 | 1.855.377.7325 | www.GrandeurPeakGlobal.com |
| Grandeur Peak Global Reach Fund | Statements of Changes in Net Assets |
| For the Six Months Ended October 31, 2021 (Unaudited) | For the Year Ended April 30, 2021 | |||||||
| OPERATIONS | ||||||||
| Net investment loss | $ | (166,279 | ) | $ | (558,805 | ) | ||
| Net realized gain | 22,101,446 | 61,926,416 | ||||||
| Net change in unrealized appreciation | 17,866,210 | 109,192,289 | ||||||
| Net increase in net assets resulting from operations | �� | 39,801,377 | 170,559,900 | |||||
| DISTRIBUTIONS TO SHAREHOLDERS (NOTE 3) | ||||||||
| Investor Class | – | (4,512,695 | ) | |||||
| Institutional Class | – | (21,062,660 | ) | |||||
| Net decrease in net assets from distributions | – | (25,575,355 | ) | |||||
| CAPITAL SHARE TRANSACTIONS (NOTE 5) | ||||||||
| Investor Class | ||||||||
| Proceeds from sales of shares | 2,926,872 | 5,613,392 | ||||||
| Distributions reinvested | – | 4,404,465 | ||||||
| Cost of shares redeemed | (13,846,917 | ) | (15,781,767 | ) | ||||
| Redemption fees | 493 | 922 | ||||||
| Net decrease from capital shares transactions | (10,919,552 | ) | (5,762,988 | ) | ||||
| Institutional Class | ||||||||
| Proceeds from sales of shares | 33,618,635 | 33,269,428 | ||||||
| Distributions reinvested | – | 17,988,818 | ||||||
| Cost of shares redeemed | (13,814,411 | ) | (54,802,889 | ) | ||||
| Redemption fees | 243 | 20,130 | ||||||
| Net increase/(decrease) from capital shares transactions | 19,804,467 | (3,524,513 | ) | |||||
| Net increase in net assets | 48,686,292 | 135,697,044 | ||||||
| NET ASSETS | ||||||||
| Beginning of period | 376,992,691 | 241,295,647 | ||||||
| End of period | $ | 425,678,983 | $ | 376,992,691 | ||||
| OTHER INFORMATION | ||||||||
| Shares Transactions | ||||||||
| Investor Class | ||||||||
| Issued | 120,107 | 274,610 | ||||||
| Issued to shareholders in reinvestment of distributions | – | 212,776 | ||||||
| Redeemed | (579,311 | ) | (787,437 | ) | ||||
| Net decrease in share transactions | (459,204 | ) | (300,051 | ) | ||||
| Institutional Class | ||||||||
| Issued | 1,376,882 | 1,595,452 | ||||||
| Issued to shareholders in reinvestment of distributions | – | 864,016 | ||||||
| Redeemed | (557,478 | ) | (2,989,136 | ) | ||||
| Net increase/(decrease) in share transactions | 819,404 | (529,668 | ) | |||||
See Notes to Financial Statements.
| Semi-Annual Report | October 31, 2021 | 77 |
| Grandeur Peak Global Stalwarts Fund | Statements of Changes in Net Assets |
| For the Six Months Ended October 31, 2021 (Unaudited) | For the Year Ended April 30, 2021 | |||||||
| OPERATIONS | ||||||||
| Net investment loss | $ | (85,058 | ) | $ | (111,391 | ) | ||
| Net realized gain | 21,364,428 | 36,550,876 | ||||||
| Net change in unrealized appreciation | 38,609,923 | 103,499,300 | ||||||
| Net increase in net assets resulting from operations | 59,889,293 | 139,938,785 | ||||||
| DISTRIBUTIONS TO SHAREHOLDERS (NOTE 3) | ||||||||
| Investor Class | – | (2,718,511 | ) | |||||
| Institutional Class | – | (6,931,888 | ) | |||||
| Net decrease in net assets from distributions | – | (9,650,399 | ) | |||||
| CAPITAL SHARE TRANSACTIONS (NOTE 5) | ||||||||
| Investor Class | ||||||||
| Proceeds from sales of shares | 13,572,164 | 27,358,183 | ||||||
| Distributions reinvested | – | 2,592,184 | ||||||
| Cost of shares redeemed | (45,813,087 | ) | (57,966,121 | ) | ||||
| Redemption fees | 2,260 | 6,566 | ||||||
| Net decrease from capital shares transactions | (32,238,663 | ) | (28,009,188 | ) | ||||
| Institutional Class | ||||||||
| Proceeds from sales of shares | 98,233,318 | 94,505,187 | ||||||
| Distributions reinvested | – | 6,307,636 | ||||||
| Cost of shares redeemed | (20,023,006 | ) | (40,407,995 | ) | ||||
| Redemption fees | 3,429 | 6,702 | ||||||
| Net increase from capital shares transactions | 78,213,741 | 60,411,530 | ||||||
| Net increase in net assets | 105,864,371 | 162,690,728 | ||||||
| NET ASSETS | ||||||||
| Beginning of period | 367,601,195 | 204,910,467 | ||||||
| End of period | $ | 473,465,566 | $ | 367,601,195 | ||||
| OTHER INFORMATION | ||||||||
| Shares Transactions | ||||||||
| Investor Class | ||||||||
| Issued | 536,335 | 1,379,187 | ||||||
| Issued to shareholders in reinvestment of distributions | – | 122,043 | ||||||
| Redeemed | (1,879,047 | ) | (3,017,181 | ) | ||||
| Net decrease in share transactions | (1,342,712 | ) | (1,515,951 | ) | ||||
| Institutional Class | ||||||||
| Issued | 3,853,538 | 4,690,459 | ||||||
| Issued to shareholders in reinvestment of distributions | – | 294,199 | ||||||
| Redeemed | (781,122 | ) | (2,087,109 | ) | ||||
| Net increase in share transactions | 3,072,416 | 2,897,549 | ||||||
See Notes to Financial Statements.
| 78 | 1.855.377.7325 | www.GrandeurPeakGlobal.com |
| Grandeur Peak International Opportunities Fund | Statements of Changes in Net Assets |
| For the Six Months Ended October 31, 2021 (Unaudited) | For the Year Ended April 30, 2021 | |||||||
| OPERATIONS | ||||||||
| Net investment loss | $ | (378,694 | ) | $ | (321,291 | ) | ||
| Net realized gain | 53,816,308 | 103,268,609 | ||||||
| Net change in unrealized appreciation | 18,748,644 | 297,660,032 | ||||||
| Net increase in net assets resulting from operations | 72,186,258 | 400,607,350 | ||||||
| DISTRIBUTIONS TO SHAREHOLDERS (NOTE 3) | ||||||||
| Investor Class | – | (1,935,548 | ) | |||||
| Institutional Class | – | (27,434,147 | ) | |||||
| Net decrease in net assets from distributions | – | (29,369,695 | ) | |||||
| CAPITAL SHARE TRANSACTIONS (NOTE 5) | ||||||||
| Investor Class | ||||||||
| Proceeds from sales of shares | 3,356,978 | 12,647,959 | ||||||
| Distributions reinvested | – | 1,833,688 | ||||||
| Cost of shares redeemed | (16,857,269 | ) | (14,427,792 | ) | ||||
| Redemption fees | 16 | 3,332 | ||||||
| Net increase/(decrease) from capital shares transactions | (13,500,275 | ) | 57,187 | |||||
| Institutional Class | ||||||||
| Proceeds from sales of shares | 38,048,163 | 159,401,438 | ||||||
| Distributions reinvested | – | 25,008,654 | ||||||
| Cost of shares redeemed | (27,025,745 | ) | (97,776,649 | ) | ||||
| Redemption fees | – | 740 | ||||||
| Net increase from capital shares transactions | 11,022,418 | 86,634,183 | ||||||
| Net increase in net assets | 69,708,401 | 457,929,025 | ||||||
| NET ASSETS | ||||||||
| Beginning of period | 973,100,544 | 515,171,519 | ||||||
| End of period | $ | 1,042,808,945 | $ | 973,100,544 | ||||
| OTHER INFORMATION | ||||||||
| Shares Transactions | ||||||||
| Investor Class | ||||||||
| Issued | 624,578 | 2,822,461 | ||||||
| Issued to shareholders in reinvestment of distributions | – | 395,191 | ||||||
| Redeemed | (3,167,189 | ) | (3,455,829 | ) | ||||
| Net decrease in share transactions | (2,542,611 | ) | (238,177 | ) | ||||
| Institutional Class | ||||||||
| Issued | 7,052,881 | 36,023,156 | ||||||
| Issued to shareholders in reinvestment of distributions | – | 5,355,172 | ||||||
| Redeemed | (5,034,769 | ) | (22,601,463 | ) | ||||
| Net increase in share transactions | 2,018,112 | 18,776,865 | ||||||
See Notes to Financial Statements.
| Semi-Annual Report | October 31, 2021 | 79 |
| Grandeur Peak International Stalwarts Fund | Statements of Changes in Net Assets |
| For the Six Months Ended October 31, 2021 (Unaudited) | For the Year Ended April 30, 2021 | |||||||
| OPERATIONS | ||||||||
| Net investment income | $ | 1,126,367 | $ | 4,320,430 | ||||
| Net realized gain | 121,492,478 | 78,044,169 | ||||||
| Net change in unrealized appreciation | 207,301,299 | 628,501,005 | ||||||
| Net increase in net assets resulting from operations | 329,920,144 | 710,865,604 | ||||||
| DISTRIBUTIONS TO SHAREHOLDERS (NOTE 3) | ||||||||
| Investor Class | – | (134,760 | ) | |||||
| Institutional Class | – | (5,483,373 | ) | |||||
| Net decrease in net assets from distributions | – | (5,618,133 | ) | |||||
| CAPITAL SHARE TRANSACTIONS (NOTE 5) | ||||||||
| Investor Class | ||||||||
| Proceeds from sales of shares | 3,517,381 | 25,400,324 | ||||||
| Distributions reinvested | – | 132,026 | ||||||
| Cost of shares redeemed | (3,596,719 | ) | (84,393,412 | ) | ||||
| Redemption fees | 20 | 3,667 | ||||||
| Net decrease from capital shares transactions | (79,318 | ) | (58,857,395 | ) | ||||
| Institutional Class | ||||||||
| Proceeds from sales of shares | 165,497,503 | 682,871,722 | ||||||
| Distributions reinvested | – | 5,168,335 | ||||||
| Cost of shares redeemed | (204,406,687 | ) | (253,915,683 | ) | ||||
| Redemption fees | 9,162 | 10,688 | ||||||
| Net increase/(decrease) from capital shares transactions | (38,900,022 | ) | 434,135,062 | |||||
| Net increase in net assets | 290,940,804 | 1,080,525,138 | ||||||
| NET ASSETS | ||||||||
| Beginning of period | 2,033,730,832 | 953,205,694 | ||||||
| End of period | $ | 2,324,671,636 | $ | 2,033,730,832 | ||||
| OTHER INFORMATION | ||||||||
| Shares Transactions | ||||||||
| Investor Class | ||||||||
| Issued | 134,312 | 1,403,607 | ||||||
| Issued to shareholders in reinvestment of distributions | – | 6,001 | ||||||
| Redeemed | (136,818 | ) | (4,309,298 | ) | ||||
| Net decrease in share transactions | (2,506 | ) | (2,899,690 | ) | ||||
| Institutional Class | ||||||||
| Issued | 6,264,853 | 33,619,349 | ||||||
| Issued to shareholders in reinvestment of distributions | – | 233,756 | ||||||
| Redeemed | (7,689,286 | ) | (12,798,649 | ) | ||||
| Net increase/(decrease) in share transactions | (1,424,433 | ) | 21,054,456 | |||||
See Notes to Financial Statements.
| 80 | 1.855.377.7325 | www.GrandeurPeakGlobal.com |
| Grandeur Peak US Stalwarts Fund | Statements of Changes in Net Assets |
| For the Six Months Ended October 31, 2021 (Unaudited) | For the Year Ended April 30, 2021 | |||||||
| OPERATIONS | ||||||||
| Net investment loss | $ | (111,056 | ) | $ | (140,023 | ) | ||
| Net realized gain | 1,426,724 | 2,016,352 | ||||||
| Net change in unrealized appreciation | 21,944,464 | 18,985,161 | ||||||
| Net increase in net assets resulting from operations | 23,260,132 | 20,861,490 | ||||||
| DISTRIBUTIONS TO SHAREHOLDERS (NOTE 3) | ||||||||
| Institutional Class | – | (267,844 | ) | |||||
| Net decrease in net assets from distributions | – | (267,844 | ) | |||||
| CAPITAL SHARE TRANSACTIONS (NOTE 5) | ||||||||
| Institutional Class | ||||||||
| Proceeds from sales of shares | 28,206,447 | 100,478,541 | ||||||
| Distributions reinvested | – | 195,265 | ||||||
| Cost of shares redeemed | (2,578,137 | ) | (4,590,003 | ) | ||||
| Redemption fees | 246 | 7,731 | ||||||
| Net increase from capital shares transactions | 25,628,556 | 96,091,534 | ||||||
| Net increase in net assets | 48,888,688 | 116,685,180 | ||||||
| NET ASSETS | ||||||||
| Beginning of period | 126,105,941 | 9,420,761 | ||||||
| End of period | $ | 174,994,629 | $ | 126,105,941 | ||||
| OTHER INFORMATION | ||||||||
| Shares Transactions | ||||||||
| Institutional Class | ||||||||
| Issued | 1,203,984 | 5,055,779 | ||||||
| Issued to shareholders in reinvestment of distributions | – | 9,700 | ||||||
| Redeemed | (106,552 | ) | (228,376 | ) | ||||
| Net increase in share transactions | 1,097,432 | 4,837,103 | ||||||
See Notes to Financial Statements.
| Semi-Annual Report | October 31, 2021 | 81 |
| Grandeur Peak Emerging Markets Opportunities Fund | Financial Highlights |
For a Share Outstanding Throughout the Years Presented
| Investor Class | For the Six Months Ended October 31, 2021 (Unaudited) | Year Ended April 30, 2021 | Year Ended April 30, 2020 | Year Ended April 30, 2019 | Year Ended April 30, 2018 | Year Ended April 30, 2017 | ||||||||||||||||||
| NET ASSET VALUE, BEGINNING OF PERIOD | $ | 17.70 | $ | 11.07 | $ | 11.82 | $ | 13.05 | $ | 11.55 | $ | 9.82 | ||||||||||||
| INCOME FROM INVESTMENT OPERATIONS | ||||||||||||||||||||||||
| Net investment income/(loss)(a) | 0.02 | (0.08 | ) | 0.01 | 0.01 | 0.03 | 0.02 | |||||||||||||||||
| Net realized and unrealized gain/(loss) on investments | 0.85 | 6.71 | (0.75 | ) | (1.13 | ) | 1.47 | 1.75 | ||||||||||||||||
| Total income/(loss) from investment operations | 0.87 | 6.63 | (0.74 | ) | (1.12 | ) | 1.50 | 1.77 | ||||||||||||||||
| DISTRIBUTIONS | ||||||||||||||||||||||||
| From net investment income | – | (0.00 | )(b) | (0.01 | ) | (0.02 | ) | – | (0.04 | ) | ||||||||||||||
| From net realized gain on investments | – | – | – | (0.09 | ) | – | – | |||||||||||||||||
| Total distributions | – | 0.00 | (0.01 | ) | (0.11 | ) | – | (0.04 | ) | |||||||||||||||
| REDEMPTION FEES ADDED TO PAID-IN CAPITAL | – | 0.00 | (b) | – | 0.00 | (b) | – | 0.00 | (b) | |||||||||||||||
| INCREASE/DECREASE IN NET ASSET VALUE | 0.87 | 6.63 | (0.75 | ) | (1.23 | ) | 1.50 | 1.73 | ||||||||||||||||
| NET ASSET VALUE, END OF PERIOD | $ | 18.57 | $ | 17.70 | $ | 11.07 | $ | 11.82 | $ | 13.05 | $ | 11.55 | ||||||||||||
| TOTAL RETURN | 4.92 | %(c) | 59.92 | % | (6.29 | )% | (8.48 | )% | 12.99 | % | 18.08 | % | ||||||||||||
| RATIOS AND SUPPLEMENTAL DATA | ||||||||||||||||||||||||
| Net assets, end of period (in 000s) | $ | 15,547 | $ | 15,011 | $ | 10,056 | $ | 13,869 | $ | 18,668 | $ | 18,074 | ||||||||||||
| RATIOS TO AVERAGE NET ASSETS | ||||||||||||||||||||||||
| Expenses (excluding fees waived/reimbursed by investment advisor) | 1.71 | %(d) | 1.75 | % | 1.76 | % | 1.77 | % | 1.79 | % | 1.76 | % | ||||||||||||
| Expenses (including fees waived/reimbursed by investment advisor) | 1.56 | %(d) | 1.68 | % | 1.74 | % | 1.76 | % | 1.78 | % | 1.76 | % | ||||||||||||
| Net investment income/(loss) | 0.24 | %(d) | (0.50 | )% | 0.09 | % | 0.11 | % | 0.26 | % | 0.21 | % | ||||||||||||
| PORTFOLIO TURNOVER RATE | 16 | %(c) | 35 | % | 24 | % | 34 | % | 33 | % | 42 | % | ||||||||||||
| (a) | Per share numbers have been calculated using the average shares method. |
| (b) | Less than $0.005 or ($0.005) per share. |
| (c) | Not Annualized. |
| (d) | Annualized. |
See Notes to Financial Statements.
| 82 | 1.855.377.7325 | www.GrandeurPeakGlobal.com |
| Grandeur Peak Emerging Markets Opportunities Fund | Financial Highlights |
For a Share Outstanding Throughout the Years Presented
| Institutional Class | For the Six Months Ended October 31, 2021 (Unaudited) | Year Ended April 30, 2021 | Year Ended April 30, 2020 | Year Ended April 30, 2019 | Year Ended April 30, 2018 | Year Ended April 30, 2017 | ||||||||||||||||||
| NET ASSET VALUE, BEGINNING OF PERIOD | $ | 17.83 | $ | 11.14 | $ | 11.88 | $ | 13.12 | $ | 11.60 | $ | 9.85 | ||||||||||||
| INCOME FROM INVESTMENT OPERATIONS | ||||||||||||||||||||||||
| Net investment income/(loss)(a) | 0.04 | (0.04 | ) | 0.04 | 0.03 | 0.06 | 0.04 | |||||||||||||||||
| Net realized and unrealized gain/(loss) on investments | 0.85 | 6.76 | (0.75 | ) | (1.14 | ) | 1.48 | 1.77 | ||||||||||||||||
| Total income/(loss) from investment operations | 0.89 | 6.72 | (0.71 | ) | (1.11 | ) | 1.54 | 1.81 | ||||||||||||||||
| DISTRIBUTIONS | ||||||||||||||||||||||||
| From net investment income | – | (0.03 | ) | (0.03 | ) | (0.04 | ) | (0.02 | ) | (0.06 | ) | |||||||||||||
| From net realized gain on investments | – | – | – | (0.09 | ) | – | – | |||||||||||||||||
| Total distributions | – | (0.03 | ) | (0.03 | ) | (0.13 | ) | (0.02 | ) | (0.06 | ) | |||||||||||||
| REDEMPTION FEES ADDED TO PAID-IN CAPITAL | 0.00 | (b) | 0.00 | (b) | 0.00 | (b) | 0.00 | (b) | 0.00 | (b) | 0.00 | (b) | ||||||||||||
| INCREASE/DECREASE IN NET ASSET VALUE | 0.89 | 6.69 | (0.74 | ) | (1.24 | ) | 1.52 | 1.75 | ||||||||||||||||
| NET ASSET VALUE, END OF PERIOD | $ | 18.72 | $ | 17.83 | $ | 11.14 | $ | 11.88 | $ | 13.12 | $ | 11.60 | ||||||||||||
| TOTAL RETURN | 4.99 | %(c) | 60.30 | % | (6.03 | )% | (8.32 | )% | 13.24 | % | 18.42 | % | ||||||||||||
| RATIOS AND SUPPLEMENTAL DATA | ||||||||||||||||||||||||
| Net assets, end of period (in 000s) | $ | 657,250 | $ | 623,538 | $ | 389,373 | $ | 452,530 | $ | 471,260 | $ | 398,891 | ||||||||||||
| RATIOS TO AVERAGE NET ASSETS | ||||||||||||||||||||||||
| Expenses (excluding fees waived/reimbursed by investment advisor) | 1.48 | %(d) | 1.52 | % | 1.53 | % | 1.53 | % | 1.55 | % | 1.55 | % | ||||||||||||
| Expenses (including fees waived/reimbursed by investment advisor) | 1.34 | %(d) | 1.45 | % | 1.51 | % | 1.52 | % | 1.54 | % | 1.55 | % | ||||||||||||
| Net investment income/(loss) | 0.47 | %(d) | (0.27 | )% | 0.29 | % | 0.29 | % | 0.49 | % | 0.35 | % | ||||||||||||
| PORTFOLIO TURNOVER RATE | 16 | %(c) | 35 | % | 24 | % | 34 | % | 33 | % | 42 | % | ||||||||||||
| (a) | Per share numbers have been calculated using the average shares method. |
| (b) | Less than $0.005 or ($0.005) per share. |
| (c) | Not Annualized. |
| (d) | Annualized. |
See Notes to Financial Statements.
| Semi-Annual Report | October 31, 2021 | 83 |
| Grandeur Peak Global Contrarian Fund | Financial Highlights |
For a Share Outstanding Throughout the Periods Presented
| Institutional Class | For the Six Months Ended October 31, 2021 (Unaudited) | Year Ended April 30, 2021 | For the Period September 18, 2019 (Commencement of Operations) to April 30, 2020 | |||||||||
| NET ASSET VALUE, BEGINNING OF PERIOD | $ | 15.41 | $ | 8.78 | $ | 10.00 | ||||||
| INCOME FROM INVESTMENT OPERATIONS | ||||||||||||
| Net investment income(a) | 0.13 | 0.25 | 0.06 | |||||||||
| Net realized and unrealized gain/(loss) on investments | 0.98 | 6.61 | (1.25 | ) | ||||||||
| Total income/(loss) from investment operations | 1.11 | 6.86 | (1.19 | ) | ||||||||
| DISTRIBUTIONS | ||||||||||||
| From net investment income | – | (0.23 | ) | (0.01 | ) | |||||||
| From net realized gain on investments | – | – | (0.02 | ) | ||||||||
| Total distributions | – | (0.23 | ) | (0.03 | ) | |||||||
| REDEMPTION FEES ADDED TO PAID-IN CAPITAL | 0.00 | (b) | 0.00 | (b) | 0.00 | (b) | ||||||
| INCREASE/DECREASE IN NET ASSET VALUE | 1.11 | 6.63 | (1.22 | ) | ||||||||
| NET ASSET VALUE, END OF PERIOD | $ | 16.52 | $ | 15.41 | $ | 8.78 | ||||||
| TOTAL RETURN | 7.20 | %(c) | 78.51 | % | (11.96 | )%(c) | ||||||
| RATIOS AND SUPPLEMENTAL DATA | ||||||||||||
| Net assets, end of period (in 000s) | $ | 96,230 | $ | 49,403 | $ | 8,861 | ||||||
| RATIOS TO AVERAGE NET ASSETS | ||||||||||||
| Expenses (excluding fees waived/ reimbursed by investment advisor) | 1.35 | %(d) | 1.87 | % | 4.69 | %(d)(e) | ||||||
| Expenses (including fees waived/ reimbursed by investment advisor) | 1.35 | %(d) | 1.35 | % | 1.35 | %(d)(e) | ||||||
| Net investment income | 1.57 | %(d) | 1.91 | % | 1.05 | %(d) | ||||||
| PORTFOLIO TURNOVER RATE | 22 | %(c) | 54 | % | 34 | %(c) | ||||||
| (a) | Per share numbers have been calculated using the average shares method. |
| (b) | Less than $0.005 or ($0.005) per share. |
| (c) | Not Annualized. |
| (d) | Annualized. |
| (e) | Expense ratios during startup periods may not be representative of longer term operating periods. |
See Notes to Financial Statements.
| 84 | 1.855.377.7325 | www.GrandeurPeakGlobal.com |
| Grandeur Peak Global Micro Cap Fund | Financial Highlights |
For a Share Outstanding Throughout the Period or Years Presented
| Institutional Class | For the Six Months Ended October 31, 2021 (Unaudited) | Year Ended April 30, 2021 | Year Ended April 30, 2020 | Year Ended April 30, 2019 | Year Ended April 30, 2018 | Year Ended April 30, 2017 | ||||||||||||||||||
| NET ASSET VALUE, BEGINNING OF PERIOD | $ | 20.65 | $ | 11.05 | $ | 11.31 | $ | 13.12 | $ | 11.98 | $ | 10.38 | ||||||||||||
| INCOME FROM INVESTMENT OPERATIONS | ||||||||||||||||||||||||
| Net investment income/(loss)(a) | (0.04 | ) | (0.10 | ) | 0.01 | (0.01 | ) | (0.00 | )(b) | 0.01 | ||||||||||||||
| Net realized and unrealized gain/(loss) on investments | 1.13 | 11.17 | (0.19 | ) | (1.08 | ) | 2.12 | 1.72 | ||||||||||||||||
| Total income/(loss) from investment operations | 1.09 | 11.07 | (0.18 | ) | (1.09 | ) | 2.12 | 1.73 | ||||||||||||||||
| DISTRIBUTIONS | ||||||||||||||||||||||||
| From net investment income | – | (0.18 | ) | (0.03 | ) | – | (0.06 | ) | (0.02 | ) | ||||||||||||||
| From net realized gain on investments | – | (1.29 | ) | (0.05 | ) | (0.72 | ) | (0.92 | ) | (0.11 | ) | |||||||||||||
| Total distributions | – | (1.47 | ) | (0.08 | ) | (0.72 | ) | (0.98 | ) | (0.13 | ) | |||||||||||||
| REDEMPTION FEES ADDED TO PAID-IN CAPITAL | 0.00 | (b) | – | 0.00 | (b) | 0.00 | (b) | 0.00 | (b) | 0.00 | (b) | |||||||||||||
| INCREASE/DECREASE IN NET ASSET VALUE | 1.09 | 9.60 | (0.26 | ) | (1.81 | ) | 1.14 | 1.60 | ||||||||||||||||
| NET ASSET VALUE, END OF PERIOD | $ | 21.74 | $ | 20.65 | $ | 11.05 | $ | 11.31 | $ | 13.12 | $ | 11.98 | ||||||||||||
| TOTAL RETURN | 5.28 | %(c) | 102.43 | % | (1.62 | )% | (7.67 | )% | 17.68 | % | 16.81 | % | ||||||||||||
| RATIOS AND SUPPLEMENTAL DATA | ||||||||||||||||||||||||
| Net assets, end of period (in 000s) | $ | 75,513 | $ | 70,375 | $ | 29,634 | $ | 35,654 | $ | 41,709 | $ | 36,620 | ||||||||||||
| RATIOS TO AVERAGE NET ASSETS | ||||||||||||||||||||||||
| Expenses (excluding fees waived/ reimbursed by investment advisor) | 1.88 | %(d) | 2.06 | % | 2.06 | % | 2.05 | % | 2.06 | % | 2.17 | % | ||||||||||||
| Expenses (including fees waived/ reimbursed by investment advisor) | 1.88 | %(d) | 2.00 | % | 2.00 | % | 2.00 | % | 2.00 | % | 2.00 | % | ||||||||||||
| Net investment income/(loss) | (0.40 | )%(d) | (0.62 | )% | 0.09 | % | (0.06 | )% | 0.00 | %(e) | 0.11 | % | ||||||||||||
| PORTFOLIO TURNOVER RATE | 19 | %(c) | 36 | % | 33 | % | 37 | % | 46 | % | 37 | % | ||||||||||||
| (a) | Per share numbers have been calculated using the average shares method. |
| (b) | Less than $0.005 or ($0.005) per share. |
| (c) | Not Annualized. |
| (d) | Annualized. |
| (e) | Less than 0.005% of average net assets. |
See Notes to Financial Statements.
| Semi-Annual Report | October 31, 2021 | 85 |
| Grandeur Peak Global Opportunities Fund | Financial Highlights |
For a Share Outstanding Throughout the Years Presented
| Investor Class | For the Six Months Ended October 31, 2021 (Unaudited) | Year Ended April 30, 2021 | Year Ended April 30, 2020 | Year Ended April 30, 2019 | Year Ended April 30, 2018 | Year Ended April 30, 2017 | ||||||||||||||||||
| NET ASSET VALUE, BEGINNING OF PERIOD | $ | 5.51 | $ | 3.24 | $ | 3.48 | $ | 3.95 | $ | 3.52 | $ | 3.01 | ||||||||||||
| INCOME FROM INVESTMENT OPERATIONS | ||||||||||||||||||||||||
| Net investment income/(loss)(a) | (0.01 | ) | (0.02 | ) | (0.01 | )(b) | (0.00 | )(c) | 0.00 | (c) | (0.00 | )(b)(c) | ||||||||||||
| Net realized and unrealized gain/(loss) on investments | 0.50 | 2.66 | (0.03 | ) | (0.14 | ) | 0.65 | 0.51 | ||||||||||||||||
| Total income/(loss) from investment operations | 0.49 | 2.64 | (0.04 | ) | (0.14 | ) | 0.65 | 0.51 | ||||||||||||||||
| DISTRIBUTIONS | ||||||||||||||||||||||||
| From net investment income | – | (0.00 | )(c) | – | (0.00 | )(c) | – | – | ||||||||||||||||
| From net realized gain on investments | – | (0.37 | ) | (0.20 | ) | (0.33 | ) | (0.22 | ) | (0.00 | )(c) | |||||||||||||
| Total distributions | – | (0.37 | ) | (0.20 | ) | (0.33 | ) | (0.22 | ) | (0.00 | )(c) | |||||||||||||
| REDEMPTION FEES ADDED TO PAID-IN CAPITAL | 0.00 | (c) | 0.00 | (c) | 0.00 | (c) | 0.00 | (c) | 0.00 | (c) | 0.00 | (c) | ||||||||||||
| INCREASE/DECREASE IN NET ASSET VALUE | 0.49 | 2.27 | (0.24 | ) | (0.47 | ) | 0.43 | 0.51 | ||||||||||||||||
| NET ASSET VALUE, END OF PERIOD | $ | 6.00 | $ | 5.51 | $ | 3.24 | $ | 3.48 | $ | 3.95 | $ | 3.52 | ||||||||||||
| TOTAL RETURN | 8.89 | %(d) | 82.94 | % | (1.73 | )% | (1.83 | )% | 18.41 | % | 17.09 | % | ||||||||||||
| RATIOS AND SUPPLEMENTAL DATA | ||||||||||||||||||||||||
| Net assets, end of period (in 000s) | $ | 135,162 | $ | 131,739 | $ | 92,843 | $ | 130,745 | $ | 188,379 | $ | 166,284 | ||||||||||||
| RATIOS TO AVERAGE NET ASSETS | ||||||||||||||||||||||||
| Expenses (excluding fees waived/ reimbursed by investment advisor) | 1.55 | %(e) | 1.60 | % | 1.61 | % | 1.61 | % | 1.61 | % | 1.61 | % | ||||||||||||
| Expenses (including fees waived/ reimbursed by investment advisor) | 1.42 | %(e) | 1.51 | % | 1.57 | % | 1.57 | % | 1.55 | % | 1.59 | % | ||||||||||||
| Net investment income/(loss) | (0.21 | )%(e) | (0.34 | )% | (0.17 | )% | (0.12 | )% | 0.03 | % | (0.06 | )% | ||||||||||||
| PORTFOLIO TURNOVER RATE | 15 | %(d) | 47 | % | 41 | % | 38 | % | 29 | % | 30 | % | ||||||||||||
| (a) | Per share numbers have been calculated using the average shares method. |
| (b) | The per share amount does not correspond to activity reflected in the Statement of Operations due to class specific expenses during the period. |
| (c) | Less than $0.005 or ($0.005) per share. |
| (d) | Not Annualized. |
| (e) | Annualized. |
See Notes to Financial Statements.
| 86 | 1.855.377.7325 | www.GrandeurPeakGlobal.com |
| Grandeur Peak Global Opportunities Fund | Financial Highlights |
For a Share Outstanding Throughout the Years Presented
| Institutional Class | For the Six Months Ended October 31, 2021 (Unaudited) | Year Ended April 30, 2021 | Year Ended April 30, 2020 | Year Ended April 30, 2019 | Year Ended April 30, 2018 | Year Ended April 30, 2017 | ||||||||||||||||||
| NET ASSET VALUE, BEGINNING OF PERIOD | $ | 5.61 | $ | 3.29 | $ | 3.52 | $ | 4.00 | $ | 3.56 | $ | 3.03 | ||||||||||||
| INCOME FROM INVESTMENT OPERATIONS | ||||||||||||||||||||||||
| Net investment income/(loss)(a) | 0.00 | (b) | (0.00 | )(b) | 0.00 | (b) | 0.00 | (b) | 0.01 | 0.01 | ||||||||||||||
| Net realized and unrealized gain/(loss) on investments | 0.51 | 2.70 | (0.03 | ) | (0.14 | ) | 0.65 | 0.52 | ||||||||||||||||
| Total income/(loss) from investment operations | 0.51 | 2.70 | (0.03 | ) | (0.14 | ) | 0.66 | 0.53 | ||||||||||||||||
| DISTRIBUTIONS | ||||||||||||||||||||||||
| From net investment income | – | (0.01 | ) | – | (0.01 | ) | (0.00 | )(b) | (0.00 | )(b) | ||||||||||||||
| From net realized gain on investments | – | (0.37 | ) | (0.20 | ) | (0.33 | ) | (0.22 | ) | (0.00 | )(b) | |||||||||||||
| Total distributions | – | (0.37 | ) | (0.20 | ) | (0.34 | ) | (0.22 | ) | (0.01 | ) | |||||||||||||
| REDEMPTION FEES ADDED TO PAID-IN CAPITAL | 0.00 | (b) | 0.00 | (b) | 0.00 | (b) | 0.00 | (b) | 0.00 | (b) | 0.00 | (b) | ||||||||||||
| INCREASE/DECREASE IN NET ASSET VALUE | 0.51 | 2.32 | (0.23 | ) | (0.48 | ) | 0.44 | 0.53 | ||||||||||||||||
| NET ASSET VALUE, END OF PERIOD | $ | 6.12 | $ | 5.61 | $ | 3.29 | $ | 3.52 | $ | 4.00 | $ | 3.56 | ||||||||||||
| TOTAL RETURN | 9.09 | %(c) | 83.44 | % | (1.42 | )% | (1.84 | )% | 18.62 | % | 17.81 | % | ||||||||||||
| RATIOS AND SUPPLEMENTAL DATA | ||||||||||||||||||||||||
| Net assets, end of period (in 000s) | $ | 967,182 | $ | 889,823 | $ | 470,142 | $ | 523,862 | $ | 591,470 | $ | 532,946 | ||||||||||||
| RATIOS TO AVERAGE NET ASSETS | ||||||||||||||||||||||||
| Expenses (excluding fees waived/ reimbursed by investment advisor) | 1.33 | %(d) | 1.35 | % | 1.37 | % | 1.37 | % | 1.36 | % | 1.37 | % | ||||||||||||
| Expenses (including fees waived/ reimbursed by investment advisor) | 1.20 | %(d) | 1.27 | % | 1.33 | % | 1.33 | % | 1.31 | % | 1.35 | % | ||||||||||||
| Net investment income/(loss) | 0.02 | %(d) | (0.08 | )% | 0.05 | % | 0.13 | % | 0.28 | % | 0.18 | % | ||||||||||||
| PORTFOLIO TURNOVER RATE | 15 | %(c) | 47 | % | 41 | % | 38 | % | 29 | % | 30 | % | ||||||||||||
| (a) | Per share numbers have been calculated using the average shares method. |
| (b) | Less than $0.005 or ($0.005) per share. |
| (c) | Not Annualized. |
| (d) | Annualized. |
See Notes to Financial Statements.
| Semi-Annual Report | October 31, 2021 | 87 |
| Grandeur Peak Global Reach Fund | Financial Highlights |
For a Share Outstanding Throughout the Years Presented
| Investor Class | For the Six Months Ended October 31, 2021 (Unaudited) | Year Ended April 30, 2021 | Year Ended April 30, 2020 | Year Ended April 30, 2019 | Year Ended April 30, 2018 | Year Ended April 30, 2017 | ||||||||||||||||||
| NET ASSET VALUE, BEGINNING OF PERIOD | $ | 23.16 | $ | 14.12 | $ | 14.98 | $ | 16.97 | $ | 14.52 | $ | 12.31 | ||||||||||||
| INCOME FROM INVESTMENT OPERATIONS | ||||||||||||||||||||||||
| Net investment income/(loss)(a) | (0.03 | ) | (0.07 | ) | (0.01 | )(b) | 0.01 | 0.01 | 0.01 | |||||||||||||||
| Net realized and unrealized gain/(loss) on investments | 2.42 | 10.79 | (0.44 | ) | (0.58 | ) | 2.66 | 2.22 | ||||||||||||||||
| Total income/(loss) from investment operations | 2.39 | 10.72 | (0.45 | ) | (0.57 | ) | 2.67 | 2.23 | ||||||||||||||||
| DISTRIBUTIONS | ||||||||||||||||||||||||
| From net investment income | – | (0.02 | ) | – | (0.00 | )(c) | – | (0.02 | ) | |||||||||||||||
| From net realized gain on investments | – | (1.66 | ) | (0.41 | ) | (1.42 | ) | (0.22 | ) | – | ||||||||||||||
| Total distributions | – | (1.69 | ) | (0.41 | ) | (1.42 | ) | (0.22 | ) | (0.02 | ) | |||||||||||||
| REDEMPTION FEES ADDED TO PAID-IN CAPITAL | 0.00 | (c) | 0.00 | (c) | 0.00 | (c) | 0.00 | (c) | 0.00 | (c) | 0.00 | (c) | ||||||||||||
| INCREASE/DECREASE IN NET ASSET VALUE | 2.39 | 9.04 | (0.86 | ) | (1.99 | ) | 2.45 | 2.21 | ||||||||||||||||
| NET ASSET VALUE, END OF PERIOD | $ | 25.55 | $ | 23.16 | $ | 14.12 | $ | 14.98 | $ | 16.97 | $ | 14.52 | ||||||||||||
| TOTAL RETURN | 10.32 | %(d) | 77.38 | % | (3.31 | )% | (1.61 | )% | 18.44 | % | 18.11 | % | ||||||||||||
| RATIOS AND SUPPLEMENTAL DATA | ||||||||||||||||||||||||
| Net assets, end of period (in 000s) | $ | 53,539 | $ | 59,164 | $ | 40,307 | $ | 56,307 | $ | 65,923 | $ | 67,574 | ||||||||||||
| RATIOS TO AVERAGE NET ASSETS | ||||||||||||||||||||||||
| Expenses (excluding fees waived/reimbursed by investment advisor) | 1.47 | %(e) | 1.52 | % | 1.52 | % | 1.52 | % | 1.52 | % | 1.52 | % | ||||||||||||
| Expenses (including fees waived/reimbursed by investment advisor) | 1.47 | %(e) | 1.52 | % | 1.52 | % | 1.52 | % | 1.52 | % | 1.52 | % | ||||||||||||
| Net investment income/(loss) | (0.27 | )%(e) | (0.38 | )% | (0.04 | )% | 0.05 | % | 0.06 | % | 0.07 | % | ||||||||||||
| PORTFOLIO TURNOVER RATE | 17 | %(d) | 41 | % | 32 | % | 50 | % | 43 | % | 42 | % | ||||||||||||
| (a) | Per share numbers have been calculated using the average shares method. |
| (b) | The per share amount does not correspond to activity reflected in the Statement of Operations due to class specific expenses during the period. |
| (c) | Less than $0.005 or ($0.005) per share. |
| (d) | Not Annualized. |
| (e) | Annualized. |
See Notes to Financial Statements.
| 88 | 1.855.377.7325 | www.GrandeurPeakGlobal.com |
| Grandeur Peak Global Reach Fund | Financial Highlights |
For a Share Outstanding Throughout the Years Presented
| Institutional Class | For the Six Months Ended October 31, 2021 (Unaudited) | Year Ended April 30, 2021 | Year Ended April 30, 2020 | Year Ended April 30, 2019 | Year Ended April 30, 2018 | Year Ended April 30, 2017 | ||||||||||||||||||
| NET ASSET VALUE, BEGINNING OF PERIOD | $ | 23.31 | $ | 14.19 | $ | 15.04 | $ | 17.02 | $ | 14.55 | $ | 12.33 | ||||||||||||
| INCOME FROM INVESTMENT OPERATIONS | ||||||||||||||||||||||||
| Net investment income/(loss)(a) | (0.01 | ) | (0.03 | ) | 0.03 | 0.05 | 0.04 | 0.04 | ||||||||||||||||
| Net realized and unrealized gain/(loss) on investments | 2.45 | 10.86 | (0.45 | ) | (0.58 | ) | 2.67 | 2.22 | ||||||||||||||||
| Total income/(loss) from investment operations | 2.44 | 10.83 | (0.42 | ) | (0.53 | ) | 2.71 | 2.26 | ||||||||||||||||
| DISTRIBUTIONS | ||||||||||||||||||||||||
| From net investment income | – | (0.05 | ) | (0.02 | ) | (0.03 | ) | (0.02 | ) | (0.04 | ) | |||||||||||||
| From net realized gain on investments | – | (1.66 | ) | (0.41 | ) | (1.42 | ) | (0.22 | ) | – | ||||||||||||||
| Total distributions | – | (1.72 | ) | (0.43 | ) | (1.45 | ) | (0.24 | ) | (0.04 | ) | |||||||||||||
| REDEMPTION FEES ADDED TO PAID-IN CAPITAL | 0.00 | (b) | 0.00 | (b) | 0.00 | (b) | 0.00 | (b) | 0.00 | (b) | 0.00 | (b) | ||||||||||||
| INCREASE/DECREASE IN NET ASSET VALUE | 2.44 | 9.12 | (0.85 | ) | (1.98 | ) | 2.47 | 2.22 | ||||||||||||||||
| NET ASSET VALUE, END OF PERIOD | $ | 25.75 | $ | 23.31 | $ | 14.19 | $ | 15.04 | $ | 17.02 | $ | 14.55 | ||||||||||||
| TOTAL RETURN | 10.47 | %(c) | 77.81 | % | (3.09 | )% | (1.33 | )% | 18.69 | % | 18.36 | % | ||||||||||||
| RATIOS AND SUPPLEMENTAL DATA | ||||||||||||||||||||||||
| Net assets, end of period (in 000s) | $ | 372,140 | $ | 317,828 | $ | 200,988 | $ | 272,743 | $ | 302,269 | $ | 258,683 | ||||||||||||
| RATIOS TO AVERAGE NET ASSETS | ||||||||||||||||||||||||
| Expenses (excluding fees waived/reimbursed by investment advisor) | 1.23 | %(d) | 1.27 | % | 1.27 | % | 1.27 | % | 1.28 | % | 1.29 | % | ||||||||||||
| Expenses (including fees waived/reimbursed by investment advisor) | 1.23 | %(d) | 1.27 | % | 1.27 | % | 1.27 | % | 1.28 | % | 1.29 | % | ||||||||||||
| Net investment income/(loss) | (0.05 | )%(d) | (0.14 | )% | 0.21 | % | 0.29 | % | 0.27 | % | 0.28 | % | ||||||||||||
| PORTFOLIO TURNOVER RATE | 17 | %(c) | 41 | % | 32 | % | 50 | % | 43 | % | 42 | % | ||||||||||||
| (a) | Per share numbers have been calculated using the average shares method. |
| (b) | Less than $0.005 or ($0.005) per share. |
| (c) | Not Annualized. |
| (d) | Annualized. |
See Notes to Financial Statements.
| Semi-Annual Report | October 31, 2021 | 89 |
| Grandeur Peak Global Stalwarts Fund | Financial Highlights |
For a Share Outstanding Throughout the Years Presented
| Investor Class | For the Six Months Ended October 31, 2021 (Unaudited) | Year Ended April 30, 2021 | Year Ended April 30, 2020 | Year Ended April 30, 2019 | Year Ended April 30, 2018 | Year Ended April 30, 2017 | ||||||||||||||||||
| NET ASSET VALUE, BEGINNING OF PERIOD | $ | 23.26 | $ | 14.26 | $ | 14.83 | $ | 15.06 | $ | 12.76 | $ | 10.85 | ||||||||||||
| INCOME FROM INVESTMENT OPERATIONS | ||||||||||||||||||||||||
| Net investment income/(loss)(a) | (0.03 | ) | (0.04 | ) | (0.01 | )(b) | 0.01 | (0.00 | )(c) | (0.03 | ) | |||||||||||||
| Net realized and unrealized gain/(loss) on investments | 3.70 | 9.72 | (0.31 | ) | 0.16 | 2.52 | 1.95 | |||||||||||||||||
| Total income/(loss) from investment operations | 3.67 | 9.68 | (0.32 | ) | 0.17 | 2.52 | 1.92 | |||||||||||||||||
| DISTRIBUTIONS | ||||||||||||||||||||||||
| From net investment income | – | – | (0.00 | )(c) | – | – | (0.01 | ) | ||||||||||||||||
| From net realized gain on investments | – | (0.68 | ) | (0.25 | ) | (0.40 | ) | (0.22 | ) | – | ||||||||||||||
| Total distributions | – | (0.68 | ) | (0.25 | ) | (0.40 | ) | (0.22 | ) | (0.01 | ) | |||||||||||||
| REDEMPTION FEES ADDED TO PAID-IN CAPITAL | 0.00 | (c) | 0.00 | (c) | 0.00 | (c) | 0.00 | (c) | 0.00 | (c) | 0.00 | (c) | ||||||||||||
| INCREASE/DECREASE IN NET ASSET VALUE | 3.67 | 9.00 | (0.57 | ) | (0.23 | ) | 2.30 | 1.91 | ||||||||||||||||
| NET ASSET VALUE, END OF PERIOD | $ | 26.93 | $ | 23.26 | $ | 14.26 | $ | 14.83 | $ | 15.06 | $ | 12.76 | ||||||||||||
| TOTAL RETURN | 15.78 | %(d) | 68.36 | % | (2.22 | )% | 1.78 | % | 19.79 | % | 17.70 | % | ||||||||||||
| RATIOS AND SUPPLEMENTAL DATA | ||||||||||||||||||||||||
| Net assets, end of period (in 000s) | $ | 84,110 | $ | 103,891 | $ | 85,310 | $ | 90,400 | $ | 92,552 | $ | 61,212 | ||||||||||||
| RATIOS TO AVERAGE NET ASSETS | ||||||||||||||||||||||||
| Expenses (excluding fees waived/ reimbursed by investment advisor) | 1.16 | %(e) | 1.21 | % | 1.24 | % | 1.27 | % | 1.35 | % | 1.41 | % | ||||||||||||
| Expenses (including fees waived/ reimbursed by investment advisor) | 1.16 | %(e) | 1.21 | % | 1.24 | % | 1.27 | % | 1.35 | % | 1.35 | % | ||||||||||||
| Net investment income/(loss) | (0.22 | )%(e) | (0.23 | )% | (0.10 | )% | 0.05 | % | (0.03 | )% | (0.23 | )% | ||||||||||||
| PORTFOLIO TURNOVER RATE | 18 | %(d) | 50 | % | 50 | % | 52 | % | 30 | % | 32 | % | ||||||||||||
| (a) | Per share numbers have been calculated using the average shares method. |
| (b) | The per share amount does not correspond to activity reflected in the Statement of Operations due to class specific expenses during the period. |
| (c) | Less than $0.005 or ($0.005) per share. |
| (d) | Not Annualized. |
| (e) | Annualized. |
See Notes to Financial Statements.
| 90 | 1.855.377.7325 | www.GrandeurPeakGlobal.com |
| Grandeur Peak Global Stalwarts Fund | Financial Highlights |
For a Share Outstanding Throughout the Years Presented
| Institutional Class | For the Six Months Ended October 31, 2021 (Unaudited) | Year Ended April 30, 2021 | Year Ended April 30, 2020 | Year Ended April 30, 2019 | Year Ended April 30, 2018 | Year Ended April 30, 2017 | ||||||||||||||||||
| NET ASSET VALUE, BEGINNING OF PERIOD | $ | 23.50 | $ | 14.37 | $ | 14.93 | $ | 15.14 | $ | 12.79 | $ | 10.87 | ||||||||||||
| INCOME FROM INVESTMENT OPERATIONS | ||||||||||||||||||||||||
| Net investment income(a) | 0.00 | (b) | 0.01 | 0.03 | 0.04 | 0.03 | 0.01 | (c) | ||||||||||||||||
| Net realized and unrealized gain/(loss) on investments | 3.74 | 9.80 | (0.31 | ) | 0.17 | 2.54 | 1.93 | |||||||||||||||||
| Total income/(loss) from investment operations | 3.74 | 9.81 | (0.28 | ) | 0.21 | 2.57 | 1.94 | |||||||||||||||||
| DISTRIBUTIONS | ||||||||||||||||||||||||
| From net investment income | – | – | (0.03 | ) | (0.02 | ) | – | (0.02 | ) | |||||||||||||||
| From net realized gain on investments | – | (0.68 | ) | (0.25 | ) | (0.40 | ) | (0.22 | ) | – | ||||||||||||||
| Total distributions | – | (0.68 | ) | (0.28 | ) | (0.42 | ) | (0.22 | ) | (0.02 | ) | |||||||||||||
| REDEMPTION FEES ADDED TO PAID-IN CAPITAL | 0.00 | (b) | 0.00 | (b) | 0.00 | (b) | 0.00 | (b) | 0.00 | (b) | 0.00 | (b) | ||||||||||||
| INCREASE/DECREASE IN NET ASSET VALUE | 3.74 | 9.13 | (0.56 | ) | (0.21 | ) | 2.35 | 1.92 | ||||||||||||||||
| NET ASSET VALUE, END OF PERIOD | $ | 27.24 | $ | 23.50 | $ | 14.37 | $ | 14.93 | $ | 15.14 | $ | 12.79 | ||||||||||||
| TOTAL RETURN | 15.91 | %(d) | 68.74 | % | (2.05 | )% | 2.08 | % | 20.14 | % | 17.92 | % | ||||||||||||
| RATIOS AND SUPPLEMENTAL DATA | ||||||||||||||||||||||||
| Net assets, end of period (in 000s) | $ | 389,356 | $ | 263,711 | $ | 119,600 | $ | 108,934 | $ | 95,533 | $ | 47,811 | ||||||||||||
| RATIOS TO AVERAGE NET ASSETS | ||||||||||||||||||||||||
| Expenses (excluding fees waived/ reimbursed by investment advisor) | 0.91 | %(e) | 0.96 | % | 0.99 | % | 1.02 | % | 1.10 | % | 1.17 | % | ||||||||||||
| Expenses (including fees waived/ reimbursed by investment advisor) | 0.91 | %(e) | 0.96 | % | 0.99 | % | 1.02 | % | 1.10 | % | 1.10 | % | ||||||||||||
| Net investment income | 0.01 | %(e) | 0.06 | % | 0.17 | % | 0.27 | % | 0.24 | % | 0.05 | % | ||||||||||||
| PORTFOLIO TURNOVER RATE | 18 | %(d) | 50 | % | 50 | % | 52 | % | 30 | % | 32 | % | ||||||||||||
| (a) | Per share numbers have been calculated using the average shares method. |
| (b) | Less than $0.005 or ($0.005) per share. |
| (c) | The per share amount does not correspond to activity reflected in the Statement of Operations due to class specific expenses during the period. |
| (d) | Not Annualized. |
| (e) | Annualized. |
See Notes to Financial Statements.
| Semi-Annual Report | October 31, 2021 | 91 |
| Grandeur Peak International Opportunities Fund | Financial Highlights |
For a Share Outstanding Throughout the Years Presented
| Investor Class | For the Six Months Ended October 31, 2021 (Unaudited) | Year Ended April 30, 2021 | Year Ended April 30, 2020 | Year Ended April 30, 2019 | Year Ended April 30, 2018 | Year Ended April 30, 2017 | ||||||||||||||||||
| NET ASSET VALUE, BEGINNING OF PERIOD | $ | 5.17 | $ | 3.04 | $ | 3.34 | $ | 4.10 | $ | 3.55 | $ | 3.09 | ||||||||||||
| INCOME FROM INVESTMENT OPERATIONS | ||||||||||||||||||||||||
| Net investment income/(loss)(a) | (0.01 | ) | (0.01 | ) | 0.00 | (b) | 0.00 | (b) | 0.01 | 0.01 | ||||||||||||||
| Net realized and unrealized gain/(loss) on investments | 0.39 | 2.30 | (0.18 | ) | (0.38 | ) | 0.68 | 0.52 | ||||||||||||||||
| Total income/(loss) from investment operations | 0.38 | 2.29 | (0.18 | ) | (0.38 | ) | 0.69 | 0.53 | ||||||||||||||||
| DISTRIBUTIONS | ||||||||||||||||||||||||
| From net investment income | – | (0.01 | ) | (0.00 | )(b) | (0.01 | ) | (0.01 | ) | (0.02 | ) | |||||||||||||
| From net realized gain on investments | – | (0.15 | ) | (0.12 | ) | (0.37 | ) | (0.13 | ) | (0.05 | ) | |||||||||||||
| Total distributions | – | (0.16 | ) | (0.12 | ) | (0.38 | ) | (0.14 | ) | (0.07 | ) | |||||||||||||
| REDEMPTION FEES ADDED TO PAID-IN CAPITAL | 0.00 | (b) | 0.00 | (b) | 0.00 | (b) | 0.00 | (b) | 0.00 | (b) | 0.00 | (b) | ||||||||||||
| INCREASE/DECREASE IN NET ASSET VALUE | 0.38 | 2.13 | (0.30 | ) | (0.76 | ) | 0.55 | 0.46 | ||||||||||||||||
| NET ASSET VALUE, END OF PERIOD | $ | 5.55 | $ | 5.17 | $ | 3.04 | $ | 3.34 | $ | 4.10 | $ | 3.55 | ||||||||||||
| TOTAL RETURN | 7.35 | %(c) | 75.87 | % | (5.79 | )% | (7.40 | )% | 19.30 | % | 17.50 | % | ||||||||||||
| RATIOS AND SUPPLEMENTAL DATA | ||||||||||||||||||||||||
| Net assets, end of period (in 000s) | $ | 59,998 | $ | 69,041 | $ | 41,351 | $ | 58,070 | $ | 78,686 | $ | 78,403 | ||||||||||||
| RATIOS TO AVERAGE NET ASSETS | ||||||||||||||||||||||||
| Expenses (excluding fees waived/ reimbursed by investment advisor) | 3.41 | %(d) | 1.60 | % | 1.61 | % | 1.62 | % | 1.61 | % | 1.61 | % | ||||||||||||
| Expenses (including fees waived/ reimbursed by investment advisor) | 1.46 | %(d) | 1.53 | % | 1.58 | % | 1.57 | % | 1.55 | % | 1.58 | % | ||||||||||||
| Net investment income/(loss) | (0.27 | )%(d) | (0.27 | )% | 0.01 | % | 0.11 | % | 0.31 | % | 0.16 | % | ||||||||||||
| PORTFOLIO TURNOVER RATE | 13 | %(c) | 36 | % | 27 | % | 34 | % | 26 | % | 30 | % | ||||||||||||
| (a) | Per share numbers have been calculated using the average shares method. |
| (b) | Less than $0.005 or ($0.005) per share. |
| (c) | Not Annualized. |
| (d) | Annualized. |
See Notes to Financial Statements.
| 92 | 1.855.377.7325 | www.GrandeurPeakGlobal.com |
| Grandeur Peak International Opportunities Fund | Financial Highlights |
For a Share Outstanding Throughout the Years Presented
| Institutional Class | For the Six Months Ended October 31, 2021 (Unaudited) | Year Ended April 30, 2021 | Year Ended April 30, 2020 | Year Ended April 30, 2019 | Year Ended April 30, 2018 | Year Ended April 30, 2017 | ||||||||||||||||||
| NET ASSET VALUE, BEGINNING OF PERIOD | $ | 5.21 | $ | 3.06 | $ | 3.36 | $ | 4.12 | $ | 3.57 | $ | 3.11 | ||||||||||||
| INCOME FROM INVESTMENT OPERATIONS | ||||||||||||||||||||||||
| Net investment income/(loss)(a) | (0.00 | )(b) | (0.00 | )(b) | 0.01 | 0.01 | 0.02 | 0.01 | ||||||||||||||||
| Net realized and unrealized gain/(loss) on investments | 0.39 | 2.31 | (0.18 | ) | (0.38 | ) | 0.67 | 0.52 | ||||||||||||||||
| Total income/(loss) from investment operations | 0.39 | 2.31 | (0.17 | ) | (0.37 | ) | 0.69 | 0.53 | ||||||||||||||||
| DISTRIBUTIONS | ||||||||||||||||||||||||
| From net investment income | – | (0.01 | ) | (0.01 | ) | (0.02 | ) | (0.01 | ) | (0.02 | ) | |||||||||||||
| From net realized gain on investments | – | (0.15 | ) | (0.12 | ) | (0.37 | ) | (0.13 | ) | (0.05 | ) | |||||||||||||
| Total distributions | – | (0.17 | ) | (0.13 | ) | (0.39 | ) | (0.14 | ) | (0.07 | ) | |||||||||||||
| REDEMPTION FEES ADDED TO PAID-IN CAPITAL | – | 0.00 | (b) | 0.00 | (b) | 0.00 | (b) | 0.00 | (b) | 0.00 | (b) | |||||||||||||
| INCREASE/DECREASE IN NET ASSET VALUE | 0.39 | 2.15 | (0.30 | ) | (0.76 | ) | 0.55 | 0.46 | ||||||||||||||||
| NET ASSET VALUE, END OF PERIOD | $ | 5.60 | $ | 5.21 | $ | 3.06 | $ | 3.36 | $ | 4.12 | $ | 3.57 | ||||||||||||
| TOTAL RETURN | 7.49 | %(c) | 76.29 | % | (5.60 | )% | (7.19 | )% | 19.38 | % | 17.59 | % | ||||||||||||
| RATIOS AND SUPPLEMENTAL DATA | ||||||||||||||||||||||||
| Net assets, end of period (in 000s) | $ | 982,811 | $ | 904,059 | $ | 473,820 | $ | 653,241 | $ | 813,322 | $ | 698,504 | ||||||||||||
| RATIOS TO AVERAGE NET ASSETS | ||||||||||||||||||||||||
| Expenses (excluding fees waived/ reimbursed by investment advisor) | 1.22 | %(d) | 1.36 | % | 1.37 | % | 1.37 | % | 1.37 | % | 1.37 | % | ||||||||||||
| Expenses (including fees waived/ reimbursed by investment advisor) | 1.21 | %(d) | 1.28 | % | 1.34 | % | 1.32 | % | 1.30 | % | 1.34 | % | ||||||||||||
| Net investment income/(loss) | (0.06 | )%(d) | (0.02 | )% | 0.24 | % | 0.41 | % | 0.54 | % | 0.42 | % | ||||||||||||
| PORTFOLIO TURNOVER RATE | 13 | %(c) | 36 | % | 27 | % | 34 | % | 26 | % | 30 | % | ||||||||||||
| (a) | Per share numbers have been calculated using the average shares method. |
| (b) | Less than $0.005 or ($0.005) per share. |
| (c) | Not Annualized. |
| (d) | Annualized. |
See Notes to Financial Statements.
| Semi-Annual Report | October 31, 2021 | 93 |
| Grandeur Peak International Stalwarts Fund | Financial Highlights |
For a Share Outstanding Throughout the Years Presented
| Investor Class | For the Six Months Ended October 31, 2021 (Unaudited) | Year Ended April 30, 2021 | Year Ended April 30, 2020 | Year Ended April 30, 2019 | Year Ended April 30, 2018 | Year Ended April 30, 2017 | ||||||||||||||||||
| NET ASSET VALUE, BEGINNING OF PERIOD | $ | 24.05 | $ | 14.40 | $ | 14.70 | $ | 15.53 | $ | 13.04 | $ | 11.02 | ||||||||||||
| INCOME FROM INVESTMENT OPERATIONS | ||||||||||||||||||||||||
| Net investment income/(loss)(a) | (0.02 | ) | (0.00 | )(b) | 0.01 | 0.04 | 0.05 | 0.02 | ||||||||||||||||
| Net realized and unrealized gain/(loss) on investments | 3.91 | 9.70 | (0.29 | ) | (0.53 | ) | 2.62 | 2.03 | ||||||||||||||||
| Total income/(loss) from investment operations | 3.89 | 9.70 | (0.28 | ) | (0.49 | ) | 2.67 | 2.05 | ||||||||||||||||
| DISTRIBUTIONS | ||||||||||||||||||||||||
| From net investment income | – | – | (0.02 | ) | (0.05 | ) | – | (0.03 | ) | |||||||||||||||
| From net realized gain on investments | – | (0.05 | ) | – | (0.29 | ) | (0.18 | ) | – | |||||||||||||||
| Total distributions | – | (0.05 | ) | (0.02 | ) | (0.34 | ) | (0.18 | ) | (0.03 | ) | |||||||||||||
| REDEMPTION FEES ADDED TO PAID-IN CAPITAL | 0.00 | (b) | 0.00 | (b) | 0.00 | (b) | 0.00 | (b) | 0.00 | (b) | 0.00 | (b) | ||||||||||||
| INCREASE/DECREASE IN NET ASSET VALUE | 3.89 | 9.65 | (0.30 | ) | (0.83 | ) | 2.49 | 2.02 | ||||||||||||||||
| NET ASSET VALUE, END OF PERIOD | $ | 27.94 | $ | 24.05 | $ | 14.40 | $ | 14.70 | $ | 15.53 | $ | 13.04 | ||||||||||||
| TOTAL RETURN | 16.17 | %(c) | 67.36 | % | (1.91 | )% | (2.69 | )% | 20.50 | % | 18.68 | % | ||||||||||||
| RATIOS AND SUPPLEMENTAL DATA | ||||||||||||||||||||||||
| Net assets, end of period (in 000s) | $ | 78,541 | $ | 67,688 | $ | 82,289 | $ | 72,204 | $ | 52,478 | $ | 31,045 | ||||||||||||
| RATIOS TO AVERAGE NET ASSETS | ||||||||||||||||||||||||
| Expenses (excluding fees waived/ reimbursed by investment advisor) | 1.13 | %(d) | 1.15 | % | 1.17 | % | 1.19 | % | 1.19 | % | 1.27 | % | ||||||||||||
| Expenses (including fees waived/ reimbursed by investment advisor) | 1.13 | %(d) | 1.15 | % | 1.17 | % | 1.19 | % | 1.19 | % | 1.27 | % | ||||||||||||
| Net investment income/(loss) | (0.14 | )%(d) | (0.01 | )% | 0.04 | % | 0.26 | % | 0.33 | % | 0.19 | % | ||||||||||||
| PORTFOLIO TURNOVER RATE | 17 | %(c) | 33 | % | 32 | % | 42 | % | 24 | % | 37 | % | ||||||||||||
| (a) | Per share numbers have been calculated using the average shares method. |
| (b) | Less than $0.005 or ($0.005) per share. |
| (c) | Not Annualized. |
| (d) | Annualized. |
See Notes to Financial Statements.
| 94 | 1.855.377.7325 | www.GrandeurPeakGlobal.com |
| Grandeur Peak International Stalwarts Fund | Financial Highlights |
For a Share Outstanding Throughout the Years Presented
| Institutional Class | For the Six Months Ended October 31, 2021 (Unaudited) | Year Ended April 30, 2021 | Year Ended April 30, 2020 | Year Ended April 30, 2019 | Year Ended April 30, 2018 | Year Ended April 30, 2017 | ||||||||||||||||||
| NET ASSET VALUE, BEGINNING OF PERIOD | $ | 24.19 | $ | 14.46 | $ | 14.74 | $ | 15.57 | $ | 13.06 | $ | 11.03 | ||||||||||||
| INCOME FROM INVESTMENT OPERATIONS | ||||||||||||||||||||||||
| Net investment income(a) | 0.01 | 0.06 | 0.05 | 0.07 | 0.08 | 0.04 | ||||||||||||||||||
| Net realized and unrealized gain/(loss) on investments | 3.93 | 9.75 | (0.29 | ) | (0.54 | ) | 2.63 | 2.04 | ||||||||||||||||
| Total income/(loss) from investment operations | 3.94 | 9.81 | (0.24 | ) | (0.47 | ) | 2.71 | 2.08 | ||||||||||||||||
| DISTRIBUTIONS | ||||||||||||||||||||||||
| From net investment income | – | (0.03 | ) | (0.04 | ) | (0.07 | ) | (0.02 | ) | (0.05 | ) | |||||||||||||
| From net realized gain on investments | – | (0.05 | ) | – | (0.29 | ) | (0.18 | ) | – | |||||||||||||||
| Total distributions | – | (0.07 | ) | (0.04 | ) | (0.36 | ) | (0.20 | ) | (0.05 | ) | |||||||||||||
| REDEMPTION FEES ADDED TO PAID-IN CAPITAL | 0.00 | (b) | 0.00 | (b) | 0.00 | (b) | 0.00 | (b) | 0.00 | (b) | 0.00 | (b) | ||||||||||||
| INCREASE/DECREASE IN NET ASSET VALUE | 3.94 | 9.73 | (0.28 | ) | (0.83 | ) | 2.51 | 2.03 | ||||||||||||||||
| NET ASSET VALUE, END OF PERIOD | $ | 28.13 | $ | 24.19 | $ | 14.46 | $ | 14.74 | $ | 15.57 | $ | 13.06 | ||||||||||||
| TOTAL RETURN | 16.29 | %(c) | 67.84 | % | (1.63 | )% | (2.50 | )% | 20.79 | % | 18.96 | % | ||||||||||||
| RATIOS AND SUPPLEMENTAL DATA | ||||||||||||||||||||||||
| Net assets, end of period (in 000s) | $ | 2,246,131 | $ | 1,966,043 | $ | 870,916 | $ | 561,100 | $ | 496,358 | $ | 265,393 | ||||||||||||
| RATIOS TO AVERAGE NET ASSETS | ||||||||||||||||||||||||
| Expenses (excluding fees waived/ reimbursed by investment advisor) | 0.88 | %(d) | 0.90 | % | 0.92 | % | 0.94 | % | 0.94 | % | 1.02 | % | ||||||||||||
| Expenses (including fees waived/ reimbursed by investment advisor) | 0.88 | %(d) | 0.90 | % | 0.92 | % | 0.94 | % | 0.94 | % | 1.02 | % | ||||||||||||
| Net investment income | 0.11 | %(d) | 0.31 | % | 0.32 | % | 0.51 | % | 0.57 | % | 0.37 | % | ||||||||||||
| PORTFOLIO TURNOVER RATE | 17 | %(c) | 33 | % | 32 | % | 42 | % | 24 | % | 37 | % | ||||||||||||
| (a) | Per share numbers have been calculated using the average shares method. |
| (b) | Less than $0.005 or ($0.005) per share. |
| (c) | Not Annualized. |
| (d) | Annualized. |
See Notes to Financial Statements.
| Semi-Annual Report | October 31, 2021 | 95 |
| Grandeur Peak US Stalwarts Fund | Financial Highlights |
For a Share Outstanding Throughout the Periods Presented
| Institutional Class | For the Six Months Ended October 31, 2021 (Unaudited) | Year Ended April 30, 2021 | For the Period March 20, 2020 (Commencement of Operations) to April 30, 2020 | |||||||||
| NET ASSET VALUE, BEGINNING OF PERIOD | $ | 22.71 | $ | 13.15 | $ | 10.00 | ||||||
| INCOME FROM INVESTMENT OPERATIONS | ||||||||||||
| Net investment income/(loss)(a) | (0.02 | ) | 0.06 | (0.01 | ) | |||||||
| Net realized and unrealized gain on investments | 3.62 | 9.61 | 3.16 | |||||||||
| Total income from investment operations | 3.60 | 9.67 | 3.15 | |||||||||
| DISTRIBUTIONS | ||||||||||||
| From net investment income | – | (0.00 | )(b) | – | ||||||||
| From net realized gain on investments | – | (0.11 | ) | – | ||||||||
| Total distributions | – | (0.11 | ) | – | ||||||||
| REDEMPTION FEES ADDED TO PAID-IN CAPITAL | 0.00 | (b) | 0.00 | (b) | 0.00 | (b) | ||||||
| INCREASE IN NET ASSET VALUE | 3.60 | 9.56 | 3.15 | |||||||||
| NET ASSET VALUE, END OF PERIOD | $ | 26.31 | $ | 22.71 | $ | 13.15 | ||||||
| TOTAL RETURN | 15.85 | %(c) | 73.67 | % | 31.50 | %(c) | ||||||
| RATIOS AND SUPPLEMENTAL DATA | ||||||||||||
| Net assets, end of period (in 000s) | $ | 174,995 | $ | 126,106 | $ | 9,421 | ||||||
| RATIOS TO AVERAGE NET ASSETS | ||||||||||||
| Expenses (excluding fees waived/ reimbursed by investment advisor) | 0.96 | %(d) | 1.11 | % | 6.23 | %(d)(e) | ||||||
| Expenses (including fees waived/ reimbursed by investment advisor) | 0.96 | %(d) | 1.00 | % | 1.00 | %(d)(e) | ||||||
| Net investment income/(loss) | (0.14 | )%(d) | 0.31 | % | (0.53 | )%(d) | ||||||
| PORTFOLIO TURNOVER RATE | 13 | %(c) | 24 | % | 2 | %(c) | ||||||
| (a) | Per share numbers have been calculated using the average shares method. |
| (b) | Less than $0.005 or ($0.005) per share. |
| (c) | Not Annualized. |
| (d) | Annualized. |
| (e) | Expense ratios during startup periods may not be representative of longer term operating periods. |
See Notes to Financial Statements.
| 96 | 1.855.377.7325 | www.GrandeurPeakGlobal.com |
| Grandeur Peak Funds® | Notes to Financial Statements |
October 31, 2021 (Unaudited)
1. ORGANIZATION
Financial Investors Trust (the “Trust”), a Delaware statutory trust, is an open-end management investment company registered under the Investment Company Act of 1940, as amended (“1940 Act”). As of October 31, 2021, the Trust consists of multiple separate portfolios or series. This semi-annual report describes the Grandeur Peak Emerging Markets Opportunities Fund, Grandeur Peak Global Contrarian Fund, Grandeur Peak Global Micro Cap Fund, Grandeur Peak Global Opportunities Fund, Grandeur Peak Global Reach Fund, Grandeur Peak Global Stalwarts Fund, Grandeur Peak International Opportunities Fund, Grandeur Peak International Stalwarts Fund and Grandeur Peak US Stalwarts Fund (individually a “Fund” and collectively, the “Funds”). The Funds seek long-term growth of capital. The Funds offer Investor Class (except the Grandeur Peak Global Contrarian Fund, Grandeur Peak Global Micro Cap Fund and Grandeur Peak US Stalwarts Fund) and Institutional Class shares.
2. SIGNIFICANT ACCOUNTING POLICIES
The accompanying financial statements were prepared in accordance with accounting principles generally accepted in the United States of America (“U.S. GAAP”). The preparation of financial statements in conformity with U.S. GAAP requires management to make certain estimates and assumptions that affect the reported amounts of assets and liabilities and disclosures of contingent assets and liabilities at the date of the financial statements and the reported amounts of revenue and expenses during the period. Actual results could differ from those estimates. The Funds are considered an investment company for financial reporting purposes under U.S. GAAP and follows the accounting and reporting guidance applicable to investment companies in the Financial Accounting Standards Board Accounting Standards Codification Topic 946. The following is a summary of significant accounting policies consistently followed by the Funds in preparation of their financial statements.
Investment Valuation: The Funds generally value their securities based on market prices determined at the close of regular trading on the New York Stock Exchange (“NYSE”), normally 4:00 p.m. Eastern Time, on each day the NYSE is open for trading.
For equity securities and mutual funds that are traded on an exchange, the market price is usually the closing sale or official closing price on that exchange. In the case of equity securities not traded on an exchange, or if such closing prices are not otherwise available, the securities are valued at the mean of the most recent bid and ask prices on such day. Redeemable securities issued by open-end registered investment companies are valued at the investment company’s applicable net asset value, with the exception of exchange-traded open-end investment companies, which are priced as equity securities.
Equity securities that are primarily traded on foreign securities exchanges are valued at the closing values of such securities on their respective foreign exchanges, except when an event occurs subsequent to the close of the foreign exchange and the close of the NYSE that was likely to have changed such value. In such an event, the fair value of those securities are determined in good faith through consideration of other factors in accordance with procedures established by and under the general supervision of the Board of Trustees of the Trust (the “Board” or the “Trustees”). The Funds will use a fair valuation model provided by an independent pricing service, which is intended to reflect fair value when a security’s value or a meaningful portion of each Fund’s portfolio is believed to have been materially affected by a valuation event that has occurred between the close of the exchange or market on which the security is traded and the close of the regular trading day on the NYSE. The Funds’ valuation procedures set forth certain triggers which instruct when to use the fair valuation model.
Corporate bonds are valued using market models that consider trade data, quotations from dealers and active market makers, relevant yield curve and spread data, creditworthiness, trade data or market information on comparable securities, and other relevant security specific information.
Forward currency exchange contracts have a fair value determined by the prevailing foreign currency exchange daily rates and current foreign currency exchange forward rates. The foreign currency exchange forward rates are calculated using an automated system that estimates rates on the basis of the current day foreign currency exchange rates and forward foreign currency exchange rates supplied by a pricing service.
When such prices or quotations are not available, or when Grandeur Peak Global Advisors, LLC (the “Adviser” or “Grandeur Peak”) believes that they are unreliable, securities may be priced using fair value procedures approved by the Board.
Fair Value Measurements: The Funds disclose the classification of their fair value measurements following a three-tier hierarchy based on the inputs used to measure fair value. Inputs refer broadly to the assumptions that market participants would use in pricing the asset or liability, including assumptions about risk. Inputs may be observable or unobservable. Observable inputs reflect the assumptions market participants would use in pricing the asset or liability that are developed based on market data obtained from sources independent of the reporting entity. Unobservable inputs reflect the reporting entity’s own assumptions about the assumptions market participants would use in pricing the asset or liability that are developed based on the best information available.
| Semi-Annual Report | October 31, 2021 | 97 |
| Grandeur Peak Funds® | Notes to Financial Statements |
October 31, 2021 (Unaudited)
Various inputs are used in determining the value of the Funds’ investments as of the end of the reporting period. When inputs used fall into different levels of the fair value hierarchy, the level in the hierarchy within which the fair value measurement falls is determined based on the lowest level input that is significant to the fair value measurement in its entirety. The designated input levels are not necessarily an indication of the risk or liquidity associated with these investments. These inputs are categorized in the following hierarchy under applicable financial accounting standards:
Level 1 – Unadjusted quoted prices in active markets for identical investments, unrestricted assets or liabilities that the Funds have the ability to access at the measurement date;
Level 2 – Quoted prices which are not active, quoted prices for similar assets or liabilities in active markets or inputs other than quoted prices that are observable (either directly or indirectly) for substantially the full term of the asset or liability; and
Level 3 – Significant unobservable prices or inputs (including the Funds’ own assumptions in determining the fair value of investments) where there is little or no market activity for the asset or liability at the measurement date.
The following is a summary of each Fund’s investments in the fair value hierarchy as of October 31, 2021:
| Investments in Securities at Value | Level 1 - Quoted and Unadjusted Prices | Level 2 - Other Significant Observable Inputs | Level 3 - Significant Unobservable Inputs | Total | ||||||||||||
| Grandeur Peak Emerging Markets Opportunities Fund | ||||||||||||||||
| Common Stocks | ||||||||||||||||
| India | $ | 126,906,733 | $ | 999,863 | $ | – | $ | 127,906,596 | ||||||||
| Other* | 517,252,543 | – | – | 517,252,543 | ||||||||||||
| Total | $ | 644,159,276 | $ | 999,863 | $ | – | $ | 645,159,139 | ||||||||
| * | For a detailed country breakdown, see the accompanying Portfolio of Investments. |
| Investments in Securities at Value | Level 1 - Quoted and Unadjusted Prices | Level 2 - Other Significant Observable Inputs | Level 3 - Significant Unobservable Inputs | Total | ||||||||||||
| Grandeur Peak Global Contrarian Fund | ||||||||||||||||
| Common Stocks* | 95,349,193 | – | – | 95,349,193 | ||||||||||||
| Total | $ | 95,349,193 | $ | – | $ | – | $ | 95,349,193 | ||||||||
| * | For a detailed country breakdown, see the accompanying Portfolio of Investments. |
| Investments in Securities at Value | Level 1 - Quoted and Unadjusted Prices | Level 2 - Other Significant Observable Inputs | Level 3 - Significant Unobservable Inputs | Total | ||||||||||||
| Grandeur Peak Global Micro Cap Fund | ||||||||||||||||
| Common Stocks | ||||||||||||||||
| New Zealand | $ | 205,612 | $ | – | $ | – | $ | 205,612 | ||||||||
| Other* | 75,113,658 | – | – | 75,113,658 | ||||||||||||
| Total | $ | 75,319,270 | $ | – | $ | – | $ | 75,319,270 | ||||||||
| * | For a detailed country breakdown, see the accompanying Portfolio of Investments. |
| 98 | 1.855.377.7325 | www.GrandeurPeakGlobal.com |
| Grandeur Peak Funds® | Notes to Financial Statements |
October 31, 2021 (Unaudited)
| Investments in Securities at Value | Level 1 - Quoted and Unadjusted Prices | Level 2 - Other Significant Observable Inputs | Level 3 - Significant Unobservable Inputs | Total | ||||||||||||
| Grandeur Peak Global Opportunities Fund | ||||||||||||||||
| Common Stocks | ||||||||||||||||
| New Zealand | $ | – | $ | – | $ | 1 | $ | 1 | ||||||||
| Sweden | 40,433,556 | – | 3,386,064 | 43,819,620 | ||||||||||||
| Other* | 1,052,804,715 | – | – | 1,052,804,715 | ||||||||||||
| Preferred Stocks* | – | – | 4,252,160 | 4,252,160 | ||||||||||||
| Total | $ | 1,093,238,271 | $ | – | $ | 7,638,225 | $ | 1,100,876,496 | ||||||||
| * | For a detailed country breakdown, see the accompanying Portfolio of Investments. |
| Investments in Securities at Value | Level 1 - Quoted and Unadjusted Prices | Level 2 - Other Significant Observable Inputs | Level 3 - Significant Unobservable Inputs | Total | ||||||||||||
| Grandeur Peak Global Reach Fund | ||||||||||||||||
| Common Stocks | ||||||||||||||||
| New Zealand | $ | 1,340,007 | $ | – | $ | 1 | $ | 1,340,008 | ||||||||
| Spain | – | – | – | – | ||||||||||||
| Sweden | 26,710,403 | – | 655,953 | 27,366,356 | ||||||||||||
| United States | 126,264,742 | – | 1,000,000 | 127,264,742 | ||||||||||||
| Other* | 265,666,369 | – | – | 265,666,369 | ||||||||||||
| Preferred Stocks* | – | – | 3,218,274 | 3,218,274 | ||||||||||||
| Total | $ | 419,981,521 | $ | – | $ | 4,874,228 | $ | 424,855,749 | ||||||||
| * | For a detailed country breakdown, see the accompanying Portfolio of Investments. |
| Investments in Securities at Value | Level 1 - Quoted and Unadjusted Prices | Level 2 - Other Significant Observable Inputs | Level 3 - Significant Unobservable Inputs | Total | ||||||||||||
| Grandeur Peak Global Stalwarts Fund | ||||||||||||||||
| Common Stocks | ||||||||||||||||
| Sweden | $ | 12,334,885 | $ | – | $ | 581,314 | $ | 12,916,199 | ||||||||
| United States | 194,973,152 | – | 1,300,000 | 196,273,152 | ||||||||||||
| Other* | 250,828,473 | – | – | 250,828,473 | ||||||||||||
| Preferred Stocks* | – | – | 2,470,259 | 2,470,259 | ||||||||||||
| Total | $ | 458,136,510 | $ | – | $ | 4,351,573 | $ | 462,488,083 | ||||||||
| * | For a detailed country breakdown, see the accompanying Portfolio of Investments. |
| Investments in Securities at Value | Level 1 - Quoted and Unadjusted Prices | Level 2 - Other Significant Observable Inputs | Level 3 – Significant Unobservable Inputs | Total | ||||||||||||
| Grandeur Peak International Opportunities Fund | ||||||||||||||||
| Common Stocks | ||||||||||||||||
| New Zealand | $ | – | $ | – | $ | 1 | $ | 1 | ||||||||
| Sweden | 53,786,323 | – | 7,118,583 | 60,904,906 | ||||||||||||
| Other* | 976,023,157 | – | – | 976,023,157 | ||||||||||||
| Total | $ | 1,029,809,480 | $ | – | $ | 7,118,584 | $ | 1,036,928,064 | ||||||||
| * | For a detailed country breakdown, see the accompanying Portfolio of Investments. |
| Semi-Annual Report | October 31, 2021 | 99 |
| Grandeur Peak Funds® | Notes to Financial Statements |
October 31, 2021 (Unaudited)
| Investments in Securities at Value | Level 1 - Quoted and Unadjusted Prices | Level 2 - Other Significant Observable Inputs | Level 3 - Significant Unobservable Inputs | Total | ||||||||||||
| Grandeur Peak International Stalwarts Fund | ||||||||||||||||
| Common Stocks | ||||||||||||||||
| Sweden | $ | 103,057,362 | $ | – | $ | 4,328,079 | $ | 107,385,441 | ||||||||
| Other* | 2,192,063,359 | – | – | 2,192,063,359 | ||||||||||||
| Total | $ | 2,295,120,721 | $ | – | $ | 4,328,079 | $ | 2,299,448,800 | ||||||||
| * | For a detailed country breakdown, see the accompanying Portfolio of Investments. |
| Investments in Securities at Value | Level 1 - Quoted and Unadjusted Prices | Level 2 - Other Significant Observable Inputs | Level 3 - Significant Unobservable Inputs | Total | ||||||||||||
| Grandeur Peak US Stalwarts Fund | ||||||||||||||||
| Common Stocks | ||||||||||||||||
| United States | $ | 147,130,383 | $ | – | $ | 700,000 | $ | 147,830,383 | ||||||||
| Other* | 19,114,777 | – | – | 19,114,777 | ||||||||||||
| Preferred Stocks* | – | – | 767,576 | 767,576 | ||||||||||||
| Total | $ | 166,245,160 | $ | – | $ | 1,467,576 | $ | 167,712,736 | ||||||||
| * | For a detailed country breakdown, see the accompanying Portfolio of Investments. |
The following is a reconciliation of the investments in which significant unobservable inputs (Level 3) were used in determining fair value:
| Grandeur Peak Global Micro Cap Fund | Common Stock | Total | ||||||
| Balance as of April 30, 2021 | $ | – | $ | – | ||||
| Accrued discount/ premium | – | – | ||||||
| Realized Gain/(Loss) | – | – | ||||||
| Change in Unrealized Appreciation/(Depreciation) | – | – | ||||||
| Purchases | – | – | ||||||
| Sales Proceeds | – | – | ||||||
| Transfer into Level 3 | – | – | ||||||
| Transfer out of Level 3 | – | – | ||||||
| Balance as of October 31, 2021 | $ | – | $ | – | ||||
| Net change in unrealized appreciation/(depreciation) included in the Statements of Operations attributable to Level 3 investments held at October 31, 2021 | $ | – | $ | – | ||||
| 100 | 1.855.377.7325 | www.GrandeurPeakGlobal.com |
| Grandeur Peak Funds® | Notes to Financial Statements |
October 31, 2021 (Unaudited)
| Grandeur Peak Global Opportunities Fund | Common Stock | Preferred Stocks | Total | |||||||||
| Balance as of April 30, 2021 | $ | 1 | $ | 2,022,675 | $ | 2,022,676 | ||||||
| Accrued discount/ premium | – | – | – | |||||||||
| Realized Gain/(Loss) | – | – | – | |||||||||
| Change in Unrealized Appreciation/(Depreciation) | – | 2,229,485 | 2,229,485 | |||||||||
| Purchases | – | – | – | |||||||||
| Sales Proceeds | – | – | – | |||||||||
| Transfer into Level 3 | – | – | – | |||||||||
| Transfer out of Level 3 | – | – | – | |||||||||
| Balance as of October 31, 2021 | $ | 1 | $ | 4,252,160 | $ | 4,252,161 | ||||||
| Net change in unrealized appreciation/(depreciation) included in the Statements of Operations attributable to Level 3 investments held at October 31, 2021 | $ | – | $ | 2,329,024 | $ | 2,329,024 | ||||||
| Grandeur Peak Global Reach Fund | Common Stock | Preferred Stocks | Total | |||||||||
| Balance as of April 30, 2021 | $ | – | $ | 959,285 | $ | 959,285 | ||||||
| Accrued discount/ premium | – | – | – | |||||||||
| Realized Gain/(Loss) | – | – | – | |||||||||
| Change in Unrealized Appreciation/(Depreciation) | – | 1,057,367 | 1,057,367 | |||||||||
| Purchases | 1,000,000 | – | 1,000,000 | |||||||||
| Sales Proceeds | – | – | – | |||||||||
| Transfer into Level 3 | – | – | – | |||||||||
| Transfer out of Level 3 | – | – | – | |||||||||
| Balance as of October 31, 2021 | $ | 1,000,000 | $ | 2,016,652 | $ | 3,016,652 | ||||||
| Net change in unrealized appreciation/(depreciation) included in the Statements of Operations attributable to Level 3 investments held at October 31, 2021 | $ | – | $ | 1,104,575 | $ | 1,104,575 | ||||||
| Grandeur Peak Global Stalwarts Fund | Common Stock | Preferred Stocks | Total | |||||||||
| Balance as of April 30, 2021 | $ | – | $ | 507,803 | $ | 507,803 | ||||||
| Accrued discount/ premium | – | – | – | |||||||||
| Realized Gain/(Loss) | – | – | – | |||||||||
| Change in Unrealized Appreciation/(Depreciation) | – | 559,725 | 559,725 | |||||||||
| Purchases | 1,300,000 | – | 1,300,000 | |||||||||
| Sales Proceeds | – | – | – | |||||||||
| Transfer into Level 3 | – | – | – | |||||||||
| Transfer out of Level 3 | – | – | – | |||||||||
| Balance as of October 31, 2021 | $ | 1,300,000 | $ | 1,067,528 | $ | 2,367,528 | ||||||
| Net change in unrealized appreciation/(depreciation) included in the Statements of Operations attributable to Level 3 investments held at October 31, 2021 | $ | – | $ | 584,715 | $ | 584,715 | ||||||
| Semi-Annual Report | October 31, 2021 | 101 |
| Grandeur Peak Funds® | Notes to Financial Statements |
October 31, 2021 (Unaudited)
| Grandeur Peak International Opportunities Fund | Common Stock | Total | ||||||
| Balance as of April 30, 2021 | $ | 1 | $ | 1 | ||||
| Accrued discount/ premium | – | – | ||||||
| Realized Gain/(Loss) | – | – | ||||||
| Change in Unrealized Appreciation/(Depreciation) | – | – | ||||||
| Purchases | – | – | ||||||
| Sales Proceeds | – | – | ||||||
| Transfer into Level 3 | – | – | ||||||
| Transfer out of Level 3 | – | – | ||||||
| Balance as of October 31, 2021 | $ | 1 | $ | 1 | ||||
| Net change in unrealized appreciation/(depreciation) included in the Statements of Operations attributable to Level 3 investments held at October 31, 2021 | $ | – | $ | – | ||||
| Grandeur Peak US Stalwarts Fund | Common Stock | Total | ||||||
| Balance as of April 30, 2021 | $ | – | $ | |||||
| Accrued discount/ premium | – | – | ||||||
| Realized Gain/(Loss) | – | – | ||||||
| Change in Unrealized Appreciation/(Depreciation) | – | – | ||||||
| Purchases | 700,000 | 700,000 | ||||||
| Sales Proceeds | – | – | ||||||
| Transfer into Level 3 | – | – | ||||||
| Transfer out of Level 3 | – | – | ||||||
| Balance as of October 31, 2021 | $ | 700,000 | $ | 700,000 | ||||
| Net change in unrealized appreciation/(depreciation) included in the Statements of Operations attributable to Level 3 investments held at October 31, 2021 | $ | – | $ | – | ||||
Change in unrealized appreciation/depreciation on Level 3 securities is included on the Statements of Operations under Net change in unrealized appreciation/(depreciation) on investments. Realized gain/(loss) on Level 3 securities is included on the Statements of Operations under Net realized gain/(loss) on investments.
| 102 | 1.855.377.7325 | www.GrandeurPeakGlobal.com |
| Grandeur Peak Funds® | Notes to Financial Statements |
October 31, 2021 (Unaudited)
The table below provides additional information about the Level 3 Fair Value Measurements as of October 31, 2021:
Quantitative Information about Level 3 Fair Value Measurements
Grandeur Peak Global Opportunities Fund
| Asset Class | Fair Value (USD) at 10/31/2021 | Valuation Technique | Unobservable Inputs(a) | Value/Range |
| Preferred Stocks | $4,252,160 | Market Approach | Enterprise Value-to-Sales Multiple | 16.56x |
Grandeur Peak Global Reach Fund
| Asset Class | Fair Value (USD) at 10/31/2021 | Valuation Technique | Unobservable Inputs(a) | Value/Range |
| Private Investment Funds | $1,000,000 | Cost/Third-Party Valuation | Third-Party Valuation | Cost |
| Preferred Stocks | $2,016,652 | Market Approach | Enterprise Value-to-Sales Multiple | 16.56x |
| Preferred Stocks | $1,201,622 | Market Approach | Enterprise Value-to-Sales Multiple | 27.04x |
Grandeur Peak Global Stalwarts Fund
| Asset Class | Fair Value (USD) at 10/31/2021 | Valuation Technique | Unobservable Inputs(a) | Value/Range |
| Private Investment Funds | $1,000,000 | Cost/Third-Party Valuation | Third-Party Valuation | Cost |
| Preferred Stocks | $1,067,528 | Market Approach | Enterprise Value-to-Sales Multiple | 16.56x |
| Preferred Stocks | $1,402,731 | Market Approach | Enterprise Value-to-Sales Multiple | 27.04x |
Grandeur Peak US Stalwarts Fund
| Asset Class | Fair Value (USD) at 10/31/2021 | Valuation Technique | Unobservable Inputs(a) | Value/Range |
| Private Investment Funds | $1,000,000 | Cost/Third-Party Valuation | Third-Party Valuation | Cost |
| Preferred Stocks | $767,576 | Market Approach | Enterprise Value-to-Sales Multiple | 27.04x |
| (a) | A change to the unobservable input may result in a significant change to the value of the investment as follows: |
| Unobservable Input | Impact to Value if Input Increases | Impact to Value if Input Decreases |
| Enterprise Value-to-Sales Multiple | Increase | Decrease |
| Third-Party Valuation | Increase | Decrease |
Investment Transactions and Investment Income: Investment transactions are accounted for on the date the investments are purchased or sold (trade date). Realized gains and losses from investment transactions are reported on an identified cost which is the same basis the Fund uses for federal income tax purposes. Interest income, which includes accretion of discounts and amortization of premiums, is accrued and recorded as earned. Dividend income is recognized on the ex-dividend date or for certain foreign securities, as soon as information is available to the Funds. All of the realized and unrealized gains and losses and net investment income, are allocated daily to each class in proportion to its average daily net assets.
| Semi-Annual Report | October 31, 2021 | 103 |
| Grandeur Peak Funds® | Notes to Financial Statements |
October 31, 2021 (Unaudited)
Cash Management Transactions: The Funds subscribe to the Brown Brothers Harriman & Co. (“BBH”) Cash Management Service (“CMS”), whereby cash balances are automatically swept into overnight offshore demand deposits with either the BBH Grand Cayman branch or a branch of a pre-approved commercial bank. This fully automated program allows the Funds to earn interest on cash balances. Excess cash with deposit institutions domiciled outside of the U.S. are subject to sovereign actions in the jurisdiction of the deposit institution including, but not limited to, freeze, seizure or diminution. Cash balances in the BBH CMS are included on the Statements of Assets and Liabilities under Cash and Foreign Cash, at Value. As of October 31, 2021, the Funds had the following cash balances participating in the BBH CMS:
| Fund | ||||
| Grandeur Peak Emerging Markets Opportunities Fund | $ | 32,568,520 | ||
| Grandeur Peak Global Contrarian Fund | 1,503,785 | |||
| Grandeur Peak Global Micro Cap Fund | 571,757 | |||
| Grandeur Peak Global Opportunities Fund | 4,673,565 | |||
| Grandeur Peak Global Reach Fund | 2,228,690 | |||
| Grandeur Peak Global Stalwarts Fund | 11,666,288 | |||
| Grandeur Peak International Opportunities Fund | 11,002,331 | |||
| Grandeur Peak International Stalwarts Fund | 35,390,618 | |||
| Grandeur Peak US Stalwarts Fund | 6,594,325 | |||
As of October 31, 2021, the Funds had the following foreign cash balances participating in the BBH CMS (cost and value of foreign cash balances are equal):
| Fund | ||||
| Grandeur Peak Emerging Markets Opportunities Fund | $ | – | ||
| Grandeur Peak Global Contrarian Fund | 28,077 | |||
| Grandeur Peak Global Micro Cap Fund | 26,470 | |||
| Grandeur Peak Global Opportunities Fund | 77,580 | |||
| Grandeur Peak Global Reach Fund | 15,458 | |||
| Grandeur Peak Global Stalwarts Fund | 6,390 | |||
| Grandeur Peak International Opportunities Fund | 94,791 | |||
| Grandeur Peak International Stalwarts Fund | 49,715 | |||
| Grandeur Peak US Stalwarts Fund | – | |||
Short Sales: The Funds may make short sales of securities consistent with their strategies. A short sale is a transaction in which a Fund sells a security it does not own in anticipation that the market price of that security will decline.
When a Fund makes a short sale, it must borrow the security sold short and deliver it to the broker dealer through which it made the short sale as collateral for its obligation to deliver the security upon conclusion of the sale. The Fund may have to pay a fee to borrow particular securities and is often obligated to pay over any accrued interest and dividends on such borrowed securities.
If the price of the security sold short increases between the time of the short sale and the time that a Fund replaces the borrowed security, the Fund will incur a loss; conversely, if the price declines, the Fund will realize a capital gain. Any gain will be decreased, and any loss increased, by the transaction costs described above. The successful use of short selling may be adversely affected by imperfect correlation between movements in the price of the security sold short and the securities being hedged.
To the extent that a Fund engages in short sales, it will provide collateral to the broker-dealer and (except in the case of short sales “against the box”) will maintain additional asset coverage in the form of segregated or “earmarked” assets determined to be liquid in accordance with procedures established by the Board and that is equal to the current market value of the securities sold short, or will ensure that such positions are covered by “offsetting” positions, until the Fund replaces the borrowed security. A short sale is “against the box” to the extent that the Fund contemporaneously owns, or has the right to obtain at no added cost, securities identical to those sold short. The Fund may engage in short selling to the extent permitted by the federal securities laws and rules and interpretations thereunder. To the extent a Fund engages in short selling in foreign (non-U.S.) jurisdictions, the Fund will do so to the extent permitted by the laws and regulations of such jurisdiction.
Foreign Securities: The Funds may directly purchase securities of foreign issuers. Investing in securities of foreign issuers involves special risks not typically associated with investing in securities of U.S. issuers. The risks include possible reevaluation of currencies, the inability to repatriate foreign currency, less complete financial information about companies and possible future adverse political and economic developments. Moreover,
| 104 | 1.855.377.7325 | www.GrandeurPeakGlobal.com |
| Grandeur Peak Funds® | Notes to Financial Statements |
October 31, 2021 (Unaudited)
securities of many foreign issuers and their markets may be less liquid and their prices more volatile than those of securities of comparable U.S. issuers.
Foreign Currency Translation: The books and records of the Funds are maintained in U.S. dollars. Investment valuations and other assets and liabilities initially expressed in foreign currencies are converted each business day into U.S. dollars based upon current exchange rates. Prevailing foreign exchange rates may generally be obtained at the close of the NYSE (normally, 4:00 p.m. Eastern Time). The portion of realized and unrealized gains or losses on investments due to fluctuations in foreign currency exchange rates is not separately disclosed and is included in realized and unrealized gains or losses on investments, when applicable.
Foreign Currency Spot Contracts: The Funds may enter into foreign currency spot contracts to facilitate transactions in foreign securities or to convert foreign currency receipts into U.S. dollars. A foreign currency spot contract is an agreement between two parties to buy and sell currencies at the current market rate, for settlement generally within two business days. The U.S. dollar value of the contracts is determined using current currency exchange rates supplied by a pricing service.
The contract is marked-to-market daily for settlements beyond one day and any change in market value is recorded as an unrealized gain or loss. When the contract is closed, a realized gain or loss is recorded equal to the difference between the value on the open and close date. Losses may arise from changes in the value of the foreign currency, or if the counterparties do not perform under the contract’s terms. The maximum potential loss from such contracts is the aggregate face value in U.S. dollars at the time the contract was opened.
Special Purpose Vehicle: The Funds may invest in a Special Purpose Vehicle (a “SPV”). A SPV is a separate legal entity created by an organization. The SPV is a distinct company with its own assets and liabilities, as well as its own legal status. Usually, they are created for a specific objective, often to isolate financial risk. As it is a separate legal entity, if the parent company goes bankrupt, the special purpose vehicle can carry on.
Trust Expenses: Some expenses of the Trust can be directly attributed to the Funds. Expenses which cannot be directly attributed to the Funds are apportioned among all funds in the Trust based on average net assets of each fund.
Fund and Class Expenses: Expenses that are specific to a Fund or class of shares of a Fund, including distribution fees (Rule 12b-1 fees), are charged directly to that Fund or share class. Expenses that are common to all Funds generally are allocated among the Funds in proportion to their average daily net assets.
Federal Income Taxes: The Funds comply with the requirements under Subchapter M of the Internal Revenue Code of 1986, as amended, applicable to regulated investment companies and intend to distribute substantially all of their net taxable income and net capital gains, if any, each year so that it will not be subject to excise tax on undistributed income and gains. The Funds are not subject to income taxes to the extent such distributions are made.
As of and during the six months ended October 31, 2021, the Funds had a liability for unrecognized capital gains tax. These amounts are disclosed as Foreign Capital Gains Tax on the Statements of Assets and Liabilities. The Funds file U.S. federal, state, and local tax returns as required. The Funds’ tax returns are subject to examination by the relevant tax authorities until expiration of the applicable statute of limitations, which is generally three years after the filing of the tax return for federal purposes and four years for most state returns. Tax returns for open years have incorporated no uncertain tax positions that require a provision for income taxes.
Distributions to Shareholders: Each Fund normally pays dividends and distributes capital gains, if any, on an annual basis. Income dividend distributions are derived from dividends and other income each Fund receives from their investments, including short term capital gains. Long term capital gain distributions are derived from gains realized when each Fund sells a security it has owned for more than a year. Each Fund may make additional distributions and dividends at other times if the portfolio manager believes doing so may be necessary for each Fund to avoid or reduce taxes. The Funds intend to pass through foreign tax credits to shareholders.
Epidemic and Pandemic Risk: Certain countries have been susceptible to epidemics, most recently COVID-19, which has been designated as a pandemic by world health authorities. The outbreak of such epidemics, together with any resulting restrictions on travel or quarantines imposed, could have a negative impact on the economy and business activity globally (including in the countries in which we invest), and thereby could adversely affect the performance of our investments. Furthermore, the rapid development of epidemics could preclude prediction as to their ultimate adverse impact on economic and market conditions, and, as a result, present material uncertainty and risk with respect to us and the performance of our investments.
| Semi-Annual Report | October 31, 2021 | 105 |
| Grandeur Peak Funds® | Notes to Financial Statements |
October 31, 2021 (Unaudited)
Libor Risk: In March 2020, the Financial Accounting Standards Board (FASB) issued Accounting Standards Update (“ASU”) No. 2020-04, Reference Rate Reform (Topic 848): Facilitation of the Effects of Reference Rate Reform on Financial Reporting. The Funds' investments, payment obligations, and financing terms may be based on floating rates, such as the London Interbank Offered Rate, or “LIBOR,” which is the offered rate for short-term Eurodollar deposits between major international banks. On November 30, 2020, the administrator of LIBOR announced its intention to delay the phase out of the majority of the U.S. dollar LIBOR publications until June 30, 2023, with the remainder of LIBOR publications to still end at the end of 2021. There remains uncertainty regarding the nature of any replacement rate and the impact of the transition from LIBOR on the Funds' transactions and the financial markets generally. As such, the potential effect of a transition away from LIBOR on the Funds or the Funds' investments cannot yet be determined.
3. TAX BASIS INFORMATION
Tax Basis of Investments: As of October 31, 2021, the aggregate cost of investments, gross unrealized appreciation/(depreciation) and net unrealized appreciation/(depreciation) for Federal tax purposes was as follows:
| Fund | Gross Appreciation (excess of value over tax cost) | Gross Depreciation (excess of tax cost over value) | Net Unrealized Appreciation/(Depreciation) | Cost of Investments for Income Tax Purposes | ||||||||||||
| Grandeur Peak Emerging Markets Opportunities Fund | $ | 250,164,526 | $ | (34,530,801 | ) | $ | 215,633,725 | $ | 429,525,414 | |||||||
| Grandeur Peak Global Contrarian Fund | 12,549,099 | (3,803,669 | ) | 8,745,430 | 86,603,763 | |||||||||||
| Grandeur Peak Global Micro Cap Fund | 28,976,387 | (4,233,393 | ) | 24,742,994 | 50,576,276 | |||||||||||
| Grandeur Peak Global Opportunities Fund | 458,086,815 | (31,775,784 | ) | 426,311,031 | 674,565,465 | |||||||||||
| Grandeur Peak Global Reach Fund | 189,728,744 | (16,073,522 | ) | 173,655,222 | 251,200,527 | |||||||||||
| Grandeur Peak Global Stalwarts Fund | 183,600,923 | (9,607,774 | ) | 173,993,149 | 288,494,934 | |||||||||||
| Grandeur Peak International Opportunities Fund | 438,534,173 | (40,001,447 | ) | 398,532,726 | 638,395,338 | |||||||||||
| Grandeur Peak International Stalwarts Fund | 963,427,441 | (52,661,686 | ) | 910,765,755 | 1,388,683,045 | |||||||||||
| Grandeur Peak US Stalwarts Fund | 45,845,896 | (3,466,577 | ) | 42,379,319 | 125,333,417 | |||||||||||
Tax Basis of Distributions to Shareholders: The character of distributions made during the year from net investment income or net realized gains may differ from its ultimate characterization for federal income tax purposes. Also, due to the timing of dividend distributions, the fiscal year in which amounts are distributed may differ from the fiscal year in which the income or realized gain were recorded by the Funds.
The tax character of distributions paid by the Funds for the fiscal year ended April 30, 2021 were as follows:
| Fund | Ordinary Income | Long-Term Capital Gain | ||||||
| Grandeur Peak Emerging Markets Opportunities Fund | $ | 208,905 | $ | 588,486 | ||||
| Grandeur Peak Global Contrarian Fund | 409,394 | – | ||||||
| Grandeur Peak Global Micro Cap Fund | 870,224 | 3,187,700 | ||||||
| Grandeur Peak Global Opportunities Fund | 7,761,520 | 56,202,500 | ||||||
| Grandeur Peak Global Reach Fund | 2,560,410 | 23,014,944 | ||||||
| Grandeur Peak Global Stalwarts Fund | 1,116,972 | 8,533,427 | ||||||
| Grandeur Peak International Opportunities Fund | 3,394,873 | 25,974,822 | ||||||
| Grandeur Peak International Stalwarts Fund | 2,036,831 | 3,581,302 | ||||||
| Grandeur Peak US Stalwarts Fund | 267,443 | 401 | ||||||
The amounts and characteristics of tax basis distributions and composition of distributable earnings/(accumulated losses) are finalized at fiscal year-end. Accordingly, tax basis balances have not been determined as of October 31, 2021.
| 106 | 1.855.377.7325 | www.GrandeurPeakGlobal.com |
| Grandeur Peak Funds® | Notes to Financial Statements |
October 31, 2021 (Unaudited)
4. SECURITIES TRANSACTIONS
The cost of purchases and proceeds from sales of securities (excluding short term securities) during the six months ended October 31, 2021 were as follows:
| Fund | Purchases of Securities | Proceeds From Sales of Securities | ||||||
| Grandeur Peak Emerging Markets Opportunities Fund | $ | 103,398,871 | $ | 112,240,137 | ||||
| Grandeur Peak Global Contrarian Fund | 58,351,782 | 15,523,891 | ||||||
| Grandeur Peak Global Micro Cap Fund | 13,860,406 | 12,647,662 | ||||||
| Grandeur Peak Global Opportunities Fund | 157,569,566 | 169,521,890 | ||||||
| Grandeur Peak Global Reach Fund | 76,438,285 | 66,441,449 | ||||||
| Grandeur Peak Global Stalwarts Fund | 115,876,118 | 78,497,604 | ||||||
| Grandeur Peak International Opportunities Fund | 147,525,760 | 128,864,273 | ||||||
| Grandeur Peak International Stalwarts Fund | 388,095,886 | 432,501,284 | ||||||
| Grandeur Peak US Stalwarts Fund | 39,285,646 | 19,505,263 | ||||||
5. SHARES OF BENEFICIAL INTEREST
The capitalization of the Trust consists of an unlimited number of shares of beneficial interest with no par value per share. Holders of the shares of the Funds of the Trust have one vote for each share held and a proportionate fraction of a vote for each fractional share. All shares issued and outstanding are fully paid and are transferable and redeemable at the option of the shareholder. Purchasers of the share do not have any obligation to make payments to the Trust or its creditors solely by reason of the purchasers’ ownership of the shares. Shares have no pre-emptive rights.
Shares redeemed within 60 days of purchase may incur a 2% short-term redemption fee deducted from the redemption amount. For the year ended October 31, 2021 and the year ended April 30, 2021, the redemption fees charged by the Funds are presented in the Statements of Changes in Net Assets.
6. MANAGEMENT AND RELATED-PARTY TRANSACTIONS
The Adviser, subject to the authority of the Board, is responsible for the overall management and administration of the Funds’ business affairs. The Adviser manages the investments of the Funds in accordance with the Funds’ investment objective, policies and limitations and investment guidelines established jointly by the Adviser and the Trustees. Pursuant to the Advisory Agreement, (the “Advisory Agreement”), each Fund pays the Adviser an annual management fee based on each Fund’s average daily net assets. The management fee is paid on a monthly basis. The following table reflects the Funds’ advisory fee rates.
| Fund | Advisory Fee |
| Grandeur Peak Emerging Markets Opportunities Fund | 1.35% |
| Grandeur Peak Global Contrarian Fund | 1.00% |
| Grandeur Peak Global Opportunities Fund | 1.25% |
| Grandeur Peak Global Micro Cap Fund | 1.50% |
| Grandeur Peak Global Reach Fund | 1.10% |
| Grandeur Peak Global Stalwarts Fund | 0.80% |
| Grandeur Peak International Opportunities Fund | 1.25% |
| Grandeur Peak International Stalwarts Fund | 0.80% |
| Grandeur Peak US Stalwarts Fund | 0.75% |
| Semi-Annual Report | October 31, 2021 | 107 |
| Grandeur Peak Funds® | Notes to Financial Statements |
October 31, 2021 (Unaudited)
The Advisor has agreed to waive and/or reimburse fees or expenses in order to limit Total Annual Fund Operating Expenses After Fee Waiver/Expense Reimbursement (excluding acquired fund fees and expenses, brokerage expenses, interest expense, taxes and extraordinary expenses) of the Funds' average daily net assets. This agreement (the “Expense Agreement”) shall continue at least through August 31, 2022. The Expense Agreement may not be terminated or modified prior to August 31, 2022 except with the approval of the Fund’s Board. The following table reflects the Funds’ expense cap.
| Fund | Expense Cap | Term of Expense Limit Agreements |
| Grandeur Peak Emerging Markets Opportunities Fund | September 1, 2020 – August 31, 2021 / September 1, 2021 – August 31, 2022 | |
| Investor Class | 1.95% | |
| Institutional Class | 1.70% | |
| Grandeur Peak Global Contrarian Fund | September 12, 2019 – August 31, 2021 / September 1, 2021 – August 31, 2022 | |
| Institutional Class | 1.35% | |
| Grandeur Peak Global Micro Cap Fund | September 1, 2020 – August 31, 2021 / September 1, 2021 – August 31, 2022 | |
| Institutional Class | 2.00% | |
| Grandeur Peak Global Opportunities Fund | September 1, 2020 – August 31, 2021 / September 1, 2021 – August 31, 2022 | |
| Investor Class | 1.75% | |
| Institutional Class | 1.50% | |
| Grandeur Peak Global Reach Fund | September 1, 2020 – August 31, 2021 / September 1, 2021 – August 31, 2022 | |
| Investor Class | 1.60% | |
| Institutional Class | 1.35% | |
| Grandeur Peak Global Stalwarts Fund | September 1, 2020 – August 31, 2021 / September 1, 2021 – August 31, 2022 | |
| Investor Class | 1.35% | |
| Institutional Class | 1.10% | |
| Grandeur Peak International Opportunities Fund | September 1, 2020 – August 31, 2021 / September 1, 2021 – August 31, 2022 | |
| Investor Class | 1.75% | |
| Institutional Class | 1.50% | |
| Grandeur Peak International Stalwarts Fund | September 1, 2020 – August 31, 2021 / September 1, 2021 – August 31, 2022 | |
| Investor Class | 1.35% | |
| Institutional Class | 1.10% | |
| Grandeur Peak US Stalwarts Fund | December 23, 2019 - August 31, 2021 / September 1, 2021 – August 31, 2022 | |
| Institutional Class | 1.00% |
The Advisor will be permitted to recapture expenses it has borne through the Expense Agreement to the extent that the Fund’s' expenses in later periods fall below annual rates set forth in the Expense Agreement or in previous letter agreements; provided, however, that such recapture payments do not cause the Funds’ expense ratio (after recapture) to exceed the lesser of (i) the expense cap in effect at the time of the waiver and (ii) the expense cap in effect at the time of the recapture. Notwithstanding the foregoing, the Funds will not be obligated to pay any such deferred fees and expenses more than three years after the date on which the fee and expenses were deferred. Fees waived/reimbursed by the Adviser for the year ended October 31, 2021 are disclosed in the Statements of Operations.
In addition to the foregoing contractual arrangements, the Adviser has voluntarily agreed, effective September 1, 2020, to waive, with respect to the Grandeur Peak Global Opportunities Fund and the Grandeur Peak International Opportunities Fund, annual management fees to the extent such fees exceed 1.00% on assets above $500 million (the annual management fee rate with respect to such funds will remain 1.25% on the first $500 million in assets). Previously, the Adviser had voluntarily agreed, effective September 1, 2016, to waive, with respect to the Grandeur Peak Global Opportunities Fund and the Grandeur Peak International Opportunities Fund, annual management fees to the extent such fees exceed 1.10% on assets above $500 million (the annual management fee rate with respect to such funds will remain 1.25% on the first $500 million in assets). The Adviser has also voluntarily agreed, effective September 1, 2020, to waive, with respect to the Grandeur Peak Emerging Markets Opportunities Fund, annual management fees to the extent such fees exceed 1.00% on all assets above $400 million (the annual management fee rate with respect to
| 108 | 1.855.377.7325 | www.GrandeurPeakGlobal.com |
| Grandeur Peak Funds® | Notes to Financial Statements |
October 31, 2021 (Unaudited)
the Fund will remain 1.35% on the first $400 million in assets). Previously, the Adviser had voluntarily agreed, effective January 1, 2018, to waive, with respect to the Grandeur Peak Emerging Markets Opportunities Fund, annual management fees to the extent such fees exceed 1.20% on all assets above $400 million (the annual management fee rate with respect to the Fund will remain 1.35% on the first $400 million in assets). These voluntary arrangements may be terminated at any time by the Adviser. Voluntary waivers are not subject to recoupment by the Adviser. Voluntary fees waived by the Adviser for the six months ended October 31, 2021 are disclosed in the Statements of Operations.
For the six months ended October 31, 2021, the fee waivers/reimbursements and/or recoupments, excluding voluntary waivers, were as follows:
| Fund | Fees Waived/Reimbursed By Adviser | Recoupment of Previously Waived Fees By Adviser | ||||||
| Grandeur Peak Emerging Markets Opportunities Fund | ||||||||
| Investor Class | $ | – | $ | – | ||||
| Institutional Class | 486,624 | – | ||||||
| Grandeur Peak Global Contrarian Fund | ||||||||
| Institutional Class | $ | – | $ | 24,190 | ||||
| Grandeur Peak Global Micro Cap Fund | ||||||||
| Institutional Class | $ | – | $ | 38,463 | ||||
| Grandeur Peak Global Opportunities Fund | ||||||||
| Investor Class | $ | – | $ | – | ||||
| Institutional Class | 723,929 | – | ||||||
| Grandeur Peak Global Reach Fund | ||||||||
| Investor Class | $ | – | $ | – | ||||
| Institutional Class | – | – | ||||||
| Grandeur Peak Global Stalwarts Fund | ||||||||
| Investor Class | $ | – | $ | – | ||||
| Institutional Class | – | – | ||||||
| Grandeur Peak International Opportunities Fund | ||||||||
| Investor Class | $ | – | $ | – | ||||
| Institutional Class | 647,574 | – | ||||||
| Grandeur Peak International Stalwarts Fund | ||||||||
| Investor Class | $ | – | $ | – | ||||
| Institutional Class | – | – | ||||||
| Grandeur Peak US Stalwarts Fund | ||||||||
| Institutional Class | $ | – | $ | 82,434 | ||||
| Semi-Annual Report | October 31, 2021 | 109 |
| Grandeur Peak Funds® | Notes to Financial Statements |
October 31, 2021 (Unaudited)
As of October 31, 2021, the balances of recoupable expenses for each Fund were as follows:
| Fund | Expires 2022 | Expires 2023 | Expires 2024 | Total | ||||||||||||
| Grandeur Peak Emerging Markets Opportunities Fund | ||||||||||||||||
| Investor Class | $ | – | $ | – | $ | – | $ | – | ||||||||
| Institutional Class | – | – | – | – | ||||||||||||
| Grandeur Peak Global Contrarian Fund | ||||||||||||||||
| Institutional Class | $ | – | $ | – | $ | – | $ | – | ||||||||
| Grandeur Peak Global Micro Cap Fund | ||||||||||||||||
| Institutional Class | $ | – | $ | – | $ | – | $ | – | ||||||||
| Grandeur Peak Global Opportunities Fund | ||||||||||||||||
| Investor Class | $ | – | $ | – | $ | – | $ | – | ||||||||
| Institutional Class | – | – | – | – | ||||||||||||
| Grandeur Peak Global Reach Fund | ||||||||||||||||
| Investor Class | $ | – | $ | – | $ | – | $ | – | ||||||||
| Institutional Class | – | – | – | – | ||||||||||||
| Grandeur Peak Global Stalwarts Fund | ||||||||||||||||
| Investor Class | $ | – | $ | – | $ | – | $ | – | ||||||||
| Institutional Class | – | – | – | – | ||||||||||||
| Grandeur Peak International Opportunities Fund | ||||||||||||||||
| Investor Class | $ | – | $ | – | $ | – | $ | – | ||||||||
| Institutional Class | – | – | – | – | ||||||||||||
| Grandeur Peak International Stalwarts Fund | ||||||||||||||||
| Investor Class | $ | – | $ | – | $ | – | $ | – | ||||||||
| Institutional Class | – | – | – | – | ||||||||||||
| Grandeur Peak US Stalwarts Fund | ||||||||||||||||
| Institutional Class | $ | – | $ | – | $ | – | $ | – | ||||||||
Administrator Fees and Expenses: ALPS Fund Services, Inc. (“ALPS”) serves as administrator to the Funds and the Funds have agreed to pay expenses incurred in connection with their administrative activities. Pursuant to an Administration Agreement, ALPS provides operational services to the Funds including, but not limited to, fund accounting and fund administration and generally assists in the Funds’ operations. Officers of the Trust are employees of ALPS. The Funds’ administration fee is accrued on a daily basis and paid monthly. Administration fees paid by the Funds for the six months ended October 31, 2021 are disclosed in the Statements of Operations.
ALPS is reimbursed by the Funds for certain out-of-pocket expenses.
Transfer Agent: ALPS serves as transfer, dividend paying and shareholder servicing agent for the Funds. ALPS receives an annual minimum fee, a fee based upon the number of shareholder accounts, and is also reimbursed by the Funds for certain out-of-pocket expenses. Transfer agent fees paid by the Funds for the six months ended October 31, 2021 are disclosed in the Statements of Operations.
Compliance Services: ALPS provides services that assist the Trust’s chief compliance officer in monitoring and testing the policies and procedures of the Trust in conjunction with requirements under Rule 38a-1 under the 1940 Act and receives an annual base fee. ALPS is reimbursed for certain out-of-pocket expenses by the Funds. Compliance service fees paid by the Funds for the six months ended October 31, 2021 are disclosed in the Statements of Operations.
Principal Financial Officer: ALPS receives an annual fee for providing principal financial officer services to the Funds. Principal financial officer fees paid by the Fund for the six months ended October 31, 2021 are disclosed in the Statements of Operations.
Trustees: The fees and expenses of the Trustees of the Board are presented in the Statements of Operations.
| 110 | 1.855.377.7325 | www.GrandeurPeakGlobal.com |
| Grandeur Peak Funds® | Notes to Financial Statements |
October 31, 2021 (Unaudited)
Distributor: ALPS Distributors, Inc. (“ADI” or the “Distributor”) (an affiliate of ALPS) acts as the distributor of the Funds’ shares pursuant to a Distribution Agreement with the Trust. Shares are sold on a continuous basis by ADI as agent for the Funds, and ADI has agreed to use its best efforts to solicit orders for the sale of Funds’ shares, although it is not obliged to sell any particular amount of shares. ADI is not entitled to any compensation for its services as Distributor. ADI is registered as a broker-dealer with the U.S. Securities and Exchange Commission.
Each Fund has adopted a Distribution and Services (Rule 12b-1) Plan pursuant to Rule 12b-1 of the 1940 Act (the “Plan”) for its Investor Class shares. The Plan allows the Funds to use Investor Class assets to pay fees in connection with the distribution and marketing of Investor Class shares and/or the provision of shareholder services to Investor Class shareholders. The Plan permits payment for services in connection with the administration of plans or programs that use Investor Class shares of each Fund as their funding medium and for related expenses. The recipients of such payments may include the Distributor, other affiliates of the Adviser, broker-dealers, financial institutions, plan sponsors and administrators and other financial intermediaries through which investors may purchase shares of the Fund. The Plan permits the Funds to make total payments at an annual rate of up to 0.25% of each Fund’s average daily net assets attributable to its Investor Class shares. The expenses of the Plan are reflected as distribution and service fees in the Statements of Operations.
7. INDEMNIFICATIONS
Under the Trust’s organizational documents, its officers and Trustees are indemnified against certain liability arising out of the performance of their duties to the Trust. Additionally, in the normal course of business, the Trust enters into contracts with service providers that may contain general indemnification clauses, which may permit indemnification to the extent permissible under applicable law. The Trust’s maximum exposure under these arrangements is unknown, as this would involve future claims that may be made against the Trust that have not yet occurred.
8. SUBSEQUENT NOTE
On December 16, 2021, the Grandeur Peak Global Explorer Fund launched.
| Semi-Annual Report | October 31, 2021 | 111 |
| Grandeur Peak Funds® | Disclosure Regarding Approval of Fund Advisory Agreement |
Grandeur Peak Funds
On September 14, 2021, the Trustees met via electronic means (videoconference)1 to discuss, among other things, the approval of the Investment Advisory Agreement between the Financial Investors Trust (the “Trust”), with respect to the Grandeur Peak Emerging Markets Opportunities Fund, the Grandeur Peak Global Micro Cap Fund, the Grandeur Peak Global Opportunities Fund, the Grandeur Peak Global Reach Fund, the Grandeur Peak Global Stalwarts Fund, the Grandeur Peak International Opportunities Fund, the Grandeur Peak International Stalwarts Fund, and the Grandeur Peak US Stalwarts Fund (collectively, the “Grandeur Peak Funds”) and Grandeur Peak Global Advisors, LLC (“Grandeur Peak”), in accordance with Section 15(c) of the 1940 Act. In renewing and approving the Investment Advisory Agreement with Grandeur Peak, on behalf of the Grandeur Peak Funds, the Trustees, including the Independent Trustees, considered the following factors with respect to the Grandeur Peak Funds:
Investment Advisory Fee Rate: The Trustees reviewed and considered the contractual annual advisory fees paid by the Trust, on behalf of the Grandeur Peak Funds, to Grandeur Peak, of 1.50% for the Grandeur Peak Global Micro Cap Fund, 1.35% for the Grandeur Peak Emerging Markets Opportunities Fund, 1.25% for the Grandeur Peak Global Opportunities Fund and for the Grandeur Peak International Opportunities Fund, 1.10% for the Grandeur Peak Global Reach Fund, 1.00% for the Grandeur Peak Global Contrarian Fund, 0.80% for the Grandeur Peak Global Stalwarts Fund, for the Grandeur Peak US Stalwarts Fund, and for the Grandeur Peak International Stalwarts Fund, in light of the extent and quality of the advisory services provided by Grandeur Peak to each such Grandeur Peak Fund.
The Board received and considered information including a comparison of the Investor Class and Institutional Class, as applicable, of each Grandeur Peak Fund’s contractual advisory fee rate with those of funds in the peer group and universe of funds provided by an independent provider of investment company data (the “Data Provider”). The Trustees noted that the contractual advisory fee rate of each class of the Grandeur Peak Global Stalwarts Fund and the Grandeur Peak International Stalwarts Fund was significantly lower than the Data Provider peer group median; the Institutional Class of the Grandeur Peak US Stalwarts Fund was lower than the Data Provider peer group median; the Investor Class of the Grandeur Peak Emerging Markets Opportunities Fund was higher than the Data Provider peer group median; and each remaining class of each Grandeur Peak Fund was significantly higher than the Data Provider peer group median.
Total Net Expense Ratios: The Trustees reviewed and considered that the total net expense ratio of each class of the Grandeur Peak Global Stalwarts Fund and the Grandeur Peak International Stalwarts Fund was significantly lower than the Data Provider peer group median; the Institutional Class of the Grandeur Peak US Stalwarts Fund was lower than the Data Provider peer group median; each class of the Grandeur Peak Emerging Markets Opportunities Fund and the Grandeur Peak Global Opportunities Fund, and the Investor Class of the Grandeur Peak Global Reach Fund, was equal to the Data Provider peer group median; the Investor Class of the Grandeur Peak International Opportunities Fund and the Grandeur Peak Global Contrarian Fund, and the Institutional Class of the Grandeur Peak Global Reach Fund, was higher than the Data Provider peer group median; and the Institutional Class of the Grandeur Peak Global Micro Cap Fund and the Grandeur Peak International Opportunities Fund was significantly higher than the Data Provider peer group median.
Nature, Extent, and Quality of the Services under the Investment Advisory Agreement: The Trustees received and considered information regarding the nature, extent, and quality of services provided to the Grandeur Peak Funds under the Grandeur Peak Investment Advisory Agreement. The Trustees reviewed certain background materials supplied by Grandeur Peak in its presentation, including its Form ADV.
The Trustees reviewed and considered Grandeur Peak’s investment advisory personnel, its history as an asset manager, and its performance and the amount of assets currently under management by Grandeur Peak and its affiliated entities. The Trustees also reviewed the research and decision-making processes utilized by Grandeur Peak, including the methods adopted to seek to achieve compliance with the investment objectives, policies, and restrictions of the Grandeur Peak Funds.
The Trustees considered the background and experience of Grandeur Peak’s management in connection with the Grandeur Peak Funds, including reviewing the qualifications, backgrounds, and responsibilities of the management team primarily responsible for the day-to-day portfolio management of each Grandeur Peak Fund and the extent of the resources devoted to research and analysis of actual and potential investments.
The Trustees also reviewed, among other things, Grandeur Peak’s Code of Ethics.
Performance: The Trustees reviewed performance information of the Investor Class and Institutional Class, as applicable, of each Grandeur Peak Fund for the 3-month, 1-year, 3-year, 5-year, and since inception periods, as applicable, ended June 30, 2021. That review included a comparison of each Grandeur Peak Fund’s performance to the performance of a group of comparable funds selected by the Data Provider.
The Trustees noted that for the 3-month period, the Institutional Class of the Grandeur Peak Emerging Markets Opportunities Fund, the Global Micro Cap Fund and the Global Contrarian Fund outperformed the Data Provider peer group median; and each remaining class of each Grandeur Peak Fund significantly outperformed the Data Provider peer group median during the period.
For the 1-year period, the Trustees noted that each class of the Grandeur Peak Emerging Markets Opportunities Fund outperformed the Data Provider peer group median and each other class of the Grandeur Peak Funds significantly outperformed the Data Provider peer group median.
| 112 | 1.855.377.7325 | www.GrandeurPeakGlobal.com |
| Grandeur Peak Funds® | Disclosure Regarding Approval of Fund Advisory Agreement |
The Trustees noted that for each Grandeur Peak Fund with a 3-year period, each class of each Grandeur Peak Fund, significantly outperformed the Data Provider peer group median.
The Trustees noted that for each Grandeur Peak Fund with a 5-year period, each class of the Grandeur Peak Emerging Markets Opportunities Fund and the Institutional Class of the Grandeur Peak International Opportunities Fund outperformed the Data Provider peer group median, and each class of each other Grandeur Peak Fund significantly outperformed the Data Provider peer group median.
Finally, the Trustees noted that for the relevant period since the inception of each Grandeur Peak Fund, each class of each Grandeur Peak Fund significantly outperformed the Data Provider peer group median.
The Trustees also considered Grandeur Peak’s discussion of its reputation generally and its investment techniques, risk management controls, and decision-making processes.
Comparable Accounts: The Trustees noted certain information provided by Grandeur Peak regarding fees charged to its other clients utilizing a strategy similar to that employed by the Grandeur Peak Funds.
Profitability: The Trustees received and considered a profitability analysis prepared by Grandeur Peak based on the fees payable under the Grandeur Peak Investment Advisory Agreement with respect to the Grandeur Peak Funds.
Economies of Scale: The Trustees considered whether economies of scale in the provision of services to the Grandeur Peak Funds will be passed along to the shareholders under the proposed agreements.
Other Benefits to the Adviser: The Trustees reviewed and considered any other incidental benefits derived or to be derived by Grandeur Peak from its relationship with the Grandeur Peak Funds, including whether soft dollar arrangements were used.
The Trustees, including all of the Independent Trustees, concluded that:
| ● | the contractual advisory fee rate of each class of the Grandeur Peak Global Stalwarts Fund and the Grandeur Peak International Stalwarts Fund was significantly lower than the Data Provider peer group median; the Institutional Class of the Grandeur Peak US Stalwarts Fund was lower than the Data Provider peer group median; the Investor Class of the Grandeur Peak Emerging Markets Opportunities Fund was higher than the Data Provider peer group median; and each remaining class of each Grandeur Peak Fund was significantly higher than the Data Provider peer group median; |
| ● | the total net expense ratio of each class of the Grandeur Peak Global Stalwarts Fund and the Grandeur Peak International Stalwarts Fund was significantly lower than the Data Provider peer group median; the Institutional Class of the Grandeur Peak US Stalwarts Fund was lower than the Data Provider peer group median; each class of the Grandeur Peak Emerging Markets Opportunities Fund and the Grandeur Peak Global Opportunities Fund, and the Investor Class of the Grandeur Peak Global Reach Fund, was equal to the Data Provider peer group median; the Investor Class of the Grandeur Peak International Opportunities Fund and the Grandeur Peak Global Contrarian Fund, and the Institutional Class of the Grandeur Peak Global Reach Fund, was higher than the Data Provider peer group median; and the Institutional Class of the Grandeur Peak Global Micro Cap Fund and the Grandeur Peak International Opportunities Fund was significantly higher than the Data Provider peer group median; |
| ● | the nature, extent, and quality of services rendered by Grandeur Peak under the Grandeur Peak Investment Advisory Agreement with respect to each Grandeur Peak Fund were adequate; |
| ● | for the period ended June 30, 2021, each class of each of the Grandeur Peak Funds outperformed or significantly outperformed the Data Provider peer group median for the 3-month, 1-year, 3-year, 5-year (as applicable), and since inception periods; |
| ● | bearing in mind the limitations of comparing different types of managed accounts and the different levels of service typically associated with such accounts, the fee structures applicable to Grandeur Peak’s other clients employing a comparable strategy to any of the Grandeur Peak Funds were not indicative of any unreasonableness with respect to the advisory fee payable by the Grandeur Peak Funds; |
| ● | the profit, if any, realized by Grandeur Peak in connection with the operation of any of the Grandeur Peak Funds is not unreasonable; and |
| ● | there were no material economies of scale or other incidental benefits accruing to Grandeur Peak in connection with its relationship with any of the Grandeur Peak Funds. |
Based on the Trustees’ deliberations and their evaluation of the information described above, the Trustees, including all of the Independent Trustees, concluded that Grandeur Peak’s compensation for investment advisory services is consistent with the best interests of each of the Grandeur Peak Funds and their shareholders.
| 1 | This meeting was intended to qualify as an "in-person" meeting of the Board pursuant to relief granted by the SEC in response to the COVID-19 outbreak for the purposes of fulfilling the in-person investment advisory agreement approval requirements under Section 15(c) of the 1940 Act (see Investment Company Act Release No. 33817 (Mar. 13, 2020), Investment Company Act Release No. 33824 (Mar. 25, 2020) and Investment Company Act Release No. 33897 (June 19, 2020)). |
| Semi-Annual Report | October 31, 2021 | 113 |
| Grandeur Peak Funds® | Additional Information |
October 31, 2021 (Unaudited)
1. FUND HOLDINGS
The Funds file their complete schedule of portfolio holdings with the Securities and Exchange Commission (SEC) for the first and third quarters of each fiscal year as an exhibit to its reports on Form N-PORT. The Funds’ Form N-PORT reports are available on the SEC's Web site at http://www.sec.gov. The Funds’ Form N-PORT reports are also available upon request by calling 1-855-377-PEAK (7325).
2. FUND PROXY VOTING POLICIES, PROCEDURES AND SUMMARIES
The Funds’ policies and procedures used in determining how to vote proxies and information regarding how the Funds voted proxies relating to portfolio securities during the most recent prior 12-month period ending June 30 are available without charge, (1) upon request, by calling 1-855-377-PEAK (7325) and (2) on the SEC’s website at http://www.sec.gov.
| 114 | 1.855.377.7325 | www.GrandeurPeakGlobal.com |
| Grandeur Peak Funds® | Privacy Policy |
October 31, 2021 (Unaudited)
| Who We Are | ||
| Who is providing this notice? | Grandeur Peak Global Opportunities Fund, Grandeur Peak International Opportunities Fund, Grandeur Peak Global Reach Fund, Grandeur Peak Emerging Markets Opportunities Fund, Grandeur Peak Global Micro Cap Fund, Grandeur Peak Global Stalwarts Fund, and Grandeur Peak International Stalwarts Fund. | |
| What We Do | ||
| How do the Funds protect my personal information? | To protect your personal information from unauthorized access and use, we use security measures that comply with federal law. These measures include computer safeguards and secured files and buildings. | |
| How do the Funds collect my personal information? | We collect your personal information, for example, when you | |
| · | open an account | |
| · | provide account information or give us your contact information | |
| · | make a wire transfer or deposit money | |
| Why can't I limit all sharing? | Federal law gives you the right to limit only | |
| · | sharing for affiliates’ everyday business purposes-information about your creditworthiness | |
| · | affiliates from using your information to market to you | |
| · | sharing for non-affiliates to market to you | |
| State laws and individual companies may give you additional rights to limit sharing. | ||
| Definitions | ||
| Affiliates | Companies related by common ownership or control. They can be financial and nonfinancial companies. | |
| Non-affiliates | Companies not related by common ownership or control. They can be financial and nonfinancial companies. | |
| · | The Funds does not share with non-affiliates so they can market to you. | |
| Joint marketing | A formal agreement between non-affiliated financial companies that together market financial products or services to you. | |
| · | The Funds does not jointly market. | |
| Other Important Information | ||
| California Residents | If your account has a California home address, your personal information will not be disclosed to nonaffiliated third parties except as permitted by applicable California law, and we will limit sharing such personal information with our affiliates to comply with California privacy laws that apply to us. | |
| Vermont Residents | The State of Vermont requires financial institutions to obtain your consent prior to sharing personal information that they collect about you with affiliated companies and nonaffiliated third parties other than in certain limited circumstances. Except as permitted by law, we will not share personal information we collect about you with nonaffiliated third parties or other affiliated companies unless you provide us with your written consent to share such information. | |
| Semi-Annual Report | October 31, 2021 | 115 |
| Grandeur Peak Funds® | Privacy Policy |
October 31, 2021 (Unaudited)
| FACTS | WHAT DO THE FUNDS DO WITH YOUR PERSONAL INFORMATION? |
| Why? | Financial companies choose how they share your personal information. Federal law gives consumers the right to limit some but not all sharing. Federal law also requires us to tell you how we collect, share, and protect your personal information. Please read this notice carefully to understand what we do. |
| What? | The types of personal information we collect and share depend on the product or service you have with us. This information can include: |
| · Social Security number and account transactions | |
| · Account balances and transaction history | |
| · Wire transfer instructions | |
| How? | All financial companies need to share customers’ personal information to run their everyday business. In the section below, we list the reasons financial companies can share their customers’ personal information; the reasons the Funds choose to share; and whether you can limit this sharing. |
| Reasons we can share your personal information | Do the Funds share: | Can you limit this sharing? |
| For our everyday business purposes — such as to process your transactions, maintain your account(s), respond to court orders and legal investigations, or report to credit bureaus | Yes | No |
| For our marketing purposes — to offer our products and services to you | No | We do not share. |
| For joint marketing with other financial companies | No | We do not share. |
| For our affiliates’ everyday business purposes — information about your transactions and experiences | Yes | No |
| For our affiliates’ everyday business purposes — information about your creditworthiness | No | We do not share. |
| For nonaffiliates to market to you | No | We do not share. |
| 116 | 1.855.377.7325 | www.GrandeurPeakGlobal.com |

SEMI-ANNUAL October 31, 2021
Highland Resolute Fund
Class I RMRGX
| Highland Resolute Fund | Table of Contents |
| PAGE | |
| Shareholder Letter | 2 |
| Performance Update | 6 |
| Consolidated Disclosure of Fund Expenses | 8 |
| Consolidated Schedule of Investments | 9 |
| Consolidated Statement of Assets and Liabilities | 16 |
| Consolidated Statement of Operations | 17 |
| Consolidated Statements of Changes in Net Assets | 18 |
| Consolidated Financial Highlights | 19 |
| Notes to Consolidated Financial Statements | 20 |
| Additional Information | 31 |
| Disclosure Regarding Approval of Fund Advisory Agreements | 32 |
| Privacy Policy | 34 |
| | 1 |
| Highland Resolute Fund | Shareholder Letter |
October 31, 2021 (Unaudited)
PERFORMANCE:
October 31, 2021
The lingering effects of the pandemic continue to be felt throughout the world. Supply chains are constrained on a global scale and ports are overwhelmed with ships and truck drivers waiting days to load/deliver goods. The calls for a transitory bout of inflation have moderated and the concerns of a longer inflationary cycle loom over the Federal Reserve. As inflation numbers have increased, the Fed is now in a complicated situation of trying to raise interest rates to constrain inflation, while also keeping monetary conditions easy enough for continued growth. Through the end of October 2021, the Bloomberg Commodity Index has risen 14.4%, with energy being a large component of the increase. Shortages of natural gas took hold of Asia and Europe during the winter months and sent natural gas prices 85% higher while oil rose 38%. Bond markets, as measured by the Bloomberg Barclays U.S. Aggregate Bond Index, have returned approximately 1% since the end of April. A majority of the returns have come from spread compression and longer maturities, as rates rose faster at the shorter end of the curve.
Highland Resolute returned 6.65% during the six months ending October 31, 2021, resulting in an excess return of approximately 5.1% relative to the HFRX Global Hedge Index (the “Index”)(1). Since inception the Fund has outperformed the Index by approximately 201 basis points(2) annualized. The Fund’s performance during the trailing six months was primarily driven by the Beta Sleeve(3). The passive funds within the Beta Sleeve were additive, while the Parametric VRP strategy captured approximately 80.3% of the S&P 500 Index total return. Within the Alpha Sleeve(4) the commodity strategy was the primary driver of performance over the prior six months. The commodity trading strategy was added with the objective of providing an uncorrelated return stream that would benefit from volatility in commodities as global supply chains were reconfigured. The relative value multi-strategy and European long/short strategy also produced positive absolute performance, but captured less than a quarter of U.S. equity returns during the prior six months.
Looking ahead to next year, Highland is monitoring the current supply chain to determine if bottlenecks ease as new capacity comes online. While company fundamentals remain strong, rising wage pressures and falling consumer sentiment present near-term headwinds to the economy as companies determine their ability to pass along costs to consumers. Government spending may provide a tailwind, with a bi-partisan infrastructure bill that is anticipated to increase spending by $1.6 trillion over the next ten years. As these uncertainties unfold, we will continue to navigate the market with caution.
Beta Sleeve(3) – A portfolio consisting of the Vanguard Institutional Index Fund, Eaton Vance Parametric Volatility Risk Premium, Rydex S&P 500 2x, and Direxion 2x NASDAQ 100. The sleeve is constructed to generate returns similar to those of U.S. hedged equity. During the six months ending October 31, 2021, the sleeve returned 9.9% versus the S&P 500 Index total return of 10.9%.
Liquidity Sleeve(5) –The sole mutual fund within this sleeve, PIMCO Income Fund, outperformed the Bloomberg Barclays U.S. Aggregate Bond Index by two basis points during the period.
Alpha Sleeve(4) – The alpha sleeve consists of approximately equal allocations to a European long/short strategy, a relative value multi-strategy, and a commodity trading strategy. The sleeve generated positive absolute performance during the period, but lagged broader U.S. equity markets.
Past performance is not indicative of future results.
The Bloomberg Commodity Index is a broadly diversified commodity price index distributed by Bloomberg Index Services Limited.
The Bloomberg Barclays U.S. Aggregate Bond Index is a broad base, market capitalization-weighted bond market index representing intermediate term investment grade bonds traded in the United States.
| 2 |
| Highland Resolute Fund | Shareholder Letter |
October 31, 2021 (Unaudited)
HIGHLAND RESOLUTE FUND
Table 1 notes the performance for the Fund as of quarter end under standard reporting (since inception) as well as of October 31, 2021.
Table 1
Performance (amounts greater than one year are annualized)
| Standardized Performance Data as of September 30, 2021 | Non-Standardized Performance Data as of October 31, 2021 | |||||||||
| YTD | 1-Year | 3-Year | 5-Year | Since Inception (12/30/11) | YTD | 1-Year | 3-Year | 5-Year | Since Inception (12/30/11) | |
| Highland Resolute Fund – Class I | 10.74% | 18.77% | 5.66% | 5.02% | 4.42% | 14.35% | 23.87% | 8.29% | 5.81% | 4.72% |
| HFRX Global Hedge Fund Index | 3.58% | 8.87% | 4.28% | 3.75% | 2.64% | 4.51% | 10.09% | 5.73% | 4.05% | 2.71% |
| Gross Expense Ratio | Less Expense Waivers | Net Expense Ratio | Net Ratio ex Dividend & Short Expense | |
| Highland Resolute Fund – Class I | 2.15% | 1.65% | 0.50% | 0.42% |
Performance data quoted represents past performance. Past performance does not guarantee future results. Investment return and principal value of an investment will fluctuate so that an investor’s shares, when sold or redeemed, may be worth more or less than the original cost. Current performance data may be higher or lower than actual data quoted. For the most current month-end performance data please call 1-855-268-2242.
The Fund has a redemption fee of 2.00% for shares redeemed within the first 90 days of purchase. Performance shown at NAV does not include these sales charges and would have been lower had it been taken into account.
Ratios as of the Prospectus dated August 31, 2021 and may differ from the ratios presented in the Financial Highlights
The Adviser has agreed to waive (i) the portion of its 1.50% Management Fee in excess of any sub-advisory fees less (ii) third-party administrative costs charged to the Adviser in connection with the non-recurring addition of a new investment sub-advisor for the Fund or the removal of an existing investment sub-adviser to the Fund (“Sub-Advisory Fees”). Such fee waivers and reimbursements for the Fund (the “Expense Agreement”) shall continue through at least August 31, 2022. The Adviser may not discontinue this agreement to waive fees prior to August 31, 2022 without the approval of the Board of Trustees.
Net Ratio ex Dividend & Short Expense is the Net Expense Ratio less any Dividend and Interest Expense on Securities Sold Short.
Non-standardized performance is any performance period that doesn’t fall on a quarter end.
Closing:
We are excited to continue the progress we've made into 2022. Highland is currently in process of onboarding Passaic Partners to enhance the Beta Sleeve, and expects to complete the process early in the year.
We continue to seek to add value both in our allocation and manager selection decisions. We appreciate your investment in the Highland Resolute Fund, please feel free to contact us with any questions.
Sincerely,

Matthew W. Sampson, CFA & Jason T. Copeland, CFA, CAIA
Portfolio Managers(6)
| (1) | Representative of the overall composition of the hedge fund universe. |
| (2) | Basis Point = 0.01%, 100 basis points would equal 1.0% |
| (3) | Beta Sleeve is in place to create sensitivity to the overall equity market. |
| (4) | Alpha Sleeve is to provide market outperformance. |
| (5) | Liquidity Sleeve is in place to have liquidity for rebalancing and redemptions. |
| (6) | Jason T. Copeland is a registered representative of ALPS Distributors, Inc. CFA Institute Marks are trademarks owned by the CFA Institute. CAIA Association grants the right to use the CAIA Certification and Collective Marks to those individuals who have been granted the status of either Full Member or Retired Member by CAIAA. |
| Semi-Annual Report | October 31, 2021 | 3 |
| Highland Resolute Fund | Shareholder Letter |
October 31, 2021 (Unaudited)
Underlying Allocation Weights:
Figure 1 lists the long-term target asset allocation for the Fund as well as the allocation as of October 31, 2021.
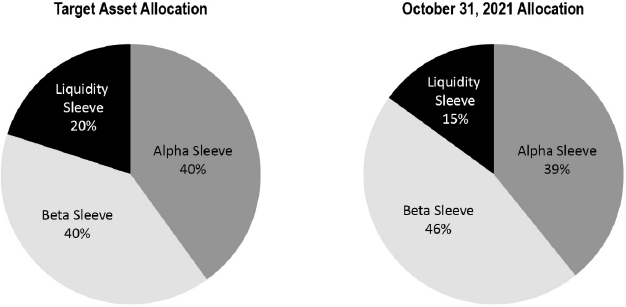
Holdings and allocations subject to change and may not reflect the current or future position of the portfolio.
| 4 |
| Highland Resolute Fund | Shareholder Letter |
October 31, 2021 (Unaudited)
IMPORTANT NOTES AND DISCLOSURES
Past performance does not guarantee future results.
Fund prices fluctuate as the underlying assets have exposure to market fluctuations and other risks, as described in the Fund’s prospectus. Please call 1-855-268-2242 to obtain current performance information and for the current prospectus and statement of additional information. This material must be preceded or accompanied by a prospectus. Please read the prospectus carefully before investing.
The views of Highland Associates, Inc. and the information discussed in this commentary are as of the date of publication, are subject to change, and may not reflect the writers’ current views. The views expressed are those of the Fund’s adviser only, and represent an assessment of market conditions at a specific point in time, are opinions only and should not be relied upon as investment advice regarding a particular investment or markets in general. Such information does not constitute a recommendation to buy or sell specific securities or investment vehicles. It should not be assumed that any investment will be profitable or will equal the performance of the portfolios or any securities or any sectors mentioned in this letter. The subject matter contained in this letter has been derived from several sources believed to be reliable and accurate at the time of compilation. Neither Highland Associates, Inc. nor the Fund accepts any liability for losses either direct or consequential caused by the use of this information.
The Highland Resolute Fund is distributed by ALPS Distributors, Inc.
The Fund is subject to investment risks, including possible loss of the principal amount invested and therefore is not suitable for all investors. The Fund may not achieve its objectives.
Diversification does not eliminate the risk of experiencing investment losses.
RISKS:
The Fund’s strategy may expose it to the risks of investments in Swap Contracts and Other Investment Companies. These risks include, but are not limited to higher expenses, allocation risk, underlying fund risk, transparency risk, and underlying fund managed portfolio risk. Investments which focus on alternative strategies are subject to increased risk and loss of principal and are not suitable for all investors. Swap Risk involves swap agreements and are subject to counterparty default risk and may not perform as intended. Derivatives Risk involves the exercise of skill and judgment. Derivatives may expire worthless or not perform as expected. Equity Risk may cause the value of the securities held by the Fund to fall due to general market and economic conditions, perceptions regarding the industries in which the issuers of securities held by the Fund participate, or factors relating to specific companies in which the Fund invest.
The Fund’s investments in non-U.S. issuers may be even more volatile and may present more risks than investments in U.S. issuers.
Commodity Risk may subject the Fund to greater volatility than traditional investments because of global supply and demand, changes in interest rates, commodity index volatility, and factors affecting a particular industry or commodity. Commodity-linked investments may not move in the same direction and to the same extent as the underlying commodities.
Beta is a measure of the volatility–or systematic risk–of a security or portfolio compared to the market as a whole. Beta is used in the capital asset pricing model (CAPM), which describes the relationship between systematic risk and expected return for assets (usually stocks).
Alpha is referred to as “excess return” or “abnormal rate of return,” which refers to the idea that markets are efficient, and so there is no way to systematically earn returns that exceed the broad market as a whole.
The HFRX Global Hedge Fund Index is designed to be representative of the overall composition of the hedge fund universe, and includes convertible arbitrage, distressed securities, equity hedge, equity market neutral, event driven, macro, merger arbitrage, and relative value strategies. The index returns are updated periodically and are subject to change. The returns were accurate as of the date of this publication. Investors cannot invest directly in an index.
The S&P 500® Index is the Standard & Poor's composite index of 500 stocks, a widely recognized, unmanaged index of common stock prices. The index is not actively managed and does not reflect any deduction of fees, expenses or taxes. An investor may not invest directly in an index.
| Semi-Annual Report | October 31, 2021 | 5 |
| Highland Resolute Fund | Performance Update |
October 31, 2021 (Unaudited)
Performance (for the year ended October 31, 2021)
Highland Resolute Fund
Cumulative Total Return (for the period ended October 31, 2021) | 6 Months | 1 Year | 3 Year | 5 Year | Since Inception* | Gross Ratio(a) | Net Ratio(a) |
| Highland Resolute Fund - Class I - NAV | 6.65% | 23.87% | 8.29% | 5.81% | 4.72% | 2.15% | 0.50% |
| HFRX Global Hedge Fund Index(b) | 1.53% | 10.09% | 5.73% | 4.05% | 2.71% | ||
| S&P 500® Index(c) | 10.91% | 42.91% | 21.48% | 18.93% | 16.41% | ||
| Dow Jones U.S. Select Dividend Index(d) | 1.55% | 47.99% | 11.72% | 11.33% | 12.52% |
Performance data quoted represents past performance. Past performance does not guarantee future results. Investment return and principal value of an investment will fluctuate so that an investor’s shares, when sold or redeemed, may be worth more or less than the original cost. Current performance data may be higher or lower than actual data quoted. For the most current month-end performance data please call 1-855-268-2242.
The Fund has a redemption fee of 2.00% for shares redeemed within the first 90 days of purchase. Performance shown at NAV does not include these sales charges and would have been lower had it been taken into account.
The Adviser has agreed to waive (i) the portion of its 1.50% Management Fee in excess of any sub-advisory fees less (ii) third-party administrative costs charged to the Adviser in connection with the non-recurring addition of a new investment sub-advisor for the Fund or the removal of an existing investment sub-adviser to the Fund (“Sub-Advisory Fees”). Such fee waivers and reimbursements for the Fund (the “Expense Agreement”) shall continue through at least August 31, 2022. The Adviser may not discontinue this agreement to waive fees prior to August 31, 2022 without the approval of the Board of Trustees.
| * | Fund inception date of 12/30/11. |
| (a) | Ratios as of the Prospectus dated August 31, 2021 and may differ from the ratios presented in the Financial Highlights. |
| (b) | The HFRX Global Hedge Fund Index is an additional index, and is designed to be representative of the overall composition of the hedge fund universe and includes convertible arbitrage, distressed securities, equity hedge, equity market neutral, event driven, macro, merger arbitrage and relative value strategies. The index returns are updated periodically and are subject to change. The returns were accurate as of the date of this publication. The index is not actively managed and does not reflect any deduction of fees, expenses or taxes. An investor may not invest directly in an index. |
| (c) | The S&P 500® Index is the Standard & Poor's composite index of 500 stocks, a widely recognized, unmanaged index of common stock prices. The index is not actively managed and does not reflect any deduction of fees, expenses or taxes. An investor may not invest directly in an index. |
| (d) | The Dow Jones U.S. Select Dividend Index is an additional index, and represents the country’s top stocks by dividend yield, selected annually and subject to screening and buffering criteria. The index is not actively managed and does not reflect any deductions of fees, expenses or taxes. An investor may not invest directly in an index. |
The table does not reflect the deduction of taxes that a shareholder would pay on Fund distributions or the redemption of Fund shares.
Top Ten Holdings**
(For the period ended October 31, 2021)
| As a percentage of Net Assets | |
| Vanguard Institutional Index Fund, Institutional Class | 23.76% |
| Parametric Volatility Risk Premium - Defensive Fund | 23.56% |
| Dalton Melchior Trs | 16.50% |
| WABR25 | 15.36% |
| Typhon Capital | 13.48% |
| PIMCO Short-Term Fund, Institutional Class | 11.42% |
| PIMCO Income Fund, Institutional Class | 5.74% |
| Direxion Monthly NASDAQ 100 Bull 2x Fund | 3.12% |
| Rydex S&P 500 2x Strategy Fund | 2.78% |
| Top Ten Holdings | 115.72% |
| ** | Holdings are subject to change, and may not reflect the current or future position of the portfolio. |
| 6 |
| Highland Resolute Fund | Performance Update |
October 31, 2021 (Unaudited)
Performance of $10, 000 Initial Investment (for the year ended October 31, 2021)
Comparison of change in value of a $10,000 investment
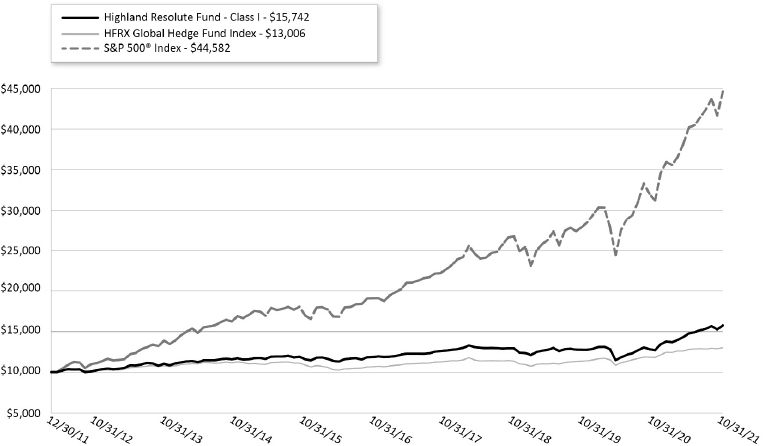
The chart represents historical performance of a hypothetical investment of $10,000 in the Fund since inception. Past performance does not guarantee future results. This chart does not reflect the deduction of taxes that a shareholder would pay on Fund distributions or the redemption of Fund shares.
Investing in the Fund is subject to investment risks, including possible loss of the principal amount invested.
| Semi-Annual Report | October 31, 2021 | 7 |
| Highland Resolute Fund | Consolidated Disclosure of Fund Expenses |
October 31, 2021 (Unaudited)
As a shareholder of the Fund, you incur two types of costs: (1) transaction costs, including applicable sales charges (loads), redemption fees; and (2) ongoing costs, including management fees, shareholder service fees and other Fund operating expenses. This example is intended to help you understand your ongoing costs (in dollars) of investing in the Fund and to compare these costs with the ongoing costs of investing in other mutual funds.
This example is based on an investment of $1,000 invested at the beginning of the period and held for the six-month period of May 1, 2021 to October 31, 2021.
Actual Expenses. The first line of the table below provides information about actual account values and actual expenses. You may use the information in this line, together with the amount you invested to estimate the expenses that you paid over the period. Simply divide your account value by $1,000 (for example, an $8,600 account value divided by $1,000 = 8.6), then multiply the result by the number in the first line of the table below under the heading titled “Expenses Paid During Period” to estimate the expenses you paid on your account during this period.
Hypothetical Example for Comparison Purposes. The second line of the table below provides information about hypothetical account values and hypothetical expenses based on the Fund’s actual expense ratio and an assumed rate of return of 5% per year before expenses, which is not the Fund’s actual return. The hypothetical account values and expenses may not be used to estimate the actual ending account balance or expenses you paid for the period. You may use this information to compare the ongoing costs of investing in the Fund and other mutual funds. To do so, compare this 5% hypothetical example with the 5% hypothetical examples that appear in the shareholder reports of the other funds.
Please note that the expenses shown in the table below are meant to highlight your ongoing costs only and do not reflect any transactional costs, such as applicable sales charges (loads), redemption fees, or exchange fees. Therefore, the second line of the table below is useful in comparing ongoing costs only and will not help you determine the relative total costs of owning different funds. In addition, if these transactional costs were included, your costs would have been higher.
| Highland Resolute Fund | BEGINNING ACCOUNT VALUE 05/01/21 | ENDING ACCOUNT VALUE 10/31/21 | EXPENSE RATIO(a) | EXPENSES PAID DURING THE PERIOD 05/01/21-10/31/21(b) |
| Class I | ||||
| Actual | $ 1,000.00 | $ 1,066.50 | 0.53% | $ 2.76 |
| Hypothetical (5% return before expenses) | $ 1,000.00 | $ 1,022.53 | 0.53% | $ 2.70 |
| (a) | Annualized, based on the Fund's most recent fiscal half year expenses. |
| (b) | Expenses are equal to the Fund's annualized expense ratio multiplied by the average account value over the period, multiplied by the number of days in the most recent fiscal half-year (184)/365 (to reflect the half-year period). |
| 8 |
| Highland Resolute Fund | Consolidated Schedule of Investments |
October 31, 2021 (Unaudited)
| Description | Shares | Value (Note 2) | ||||||
| OPEN-END MUTUAL FUNDS (70.38%) | ||||||||
| Direxion Monthly NASDAQ 100 Bull 2x Fund(a) | 77,245 | $ | 6,476,125 | |||||
| Parametric Volatility Risk Premium - Defensive Fund | 3,426,899 | 48,901,853 | ||||||
| PIMCO Income Fund, Institutional Class | 997,301 | 11,917,747 | ||||||
| PIMCO Short-Term Fund, Institutional Class | 2,421,402 | 23,705,528 | ||||||
| Rydex S&P 500 2x Strategy Fund(a) | 22,144 | 5,770,054 | ||||||
| Vanguard Institutional Index Fund, Institutional Class | 122,468 | 49,311,569 | ||||||
| 146,082,876 | ||||||||
| TOTAL OPEN-END MUTUAL FUNDS | ||||||||
| (Cost 127,502,400) | 146,082,876 | |||||||
| Description | Shares | Value (Note 2) | ||||||
| Open-End Mutual Funds (6.92%) | ||||||||
| FUNDS (6.92%) | ||||||||
| First American Government Obligations Fund, 7-day yield, 0.040% | 14,369,528 | 14,369,528 | ||||||
| TOTAL OPEN-END MUTUAL FUNDS | ||||||||
| (Cost $14,369,528) | 14,369,528 | |||||||
| TOTAL INVESTMENTS (77.30%) | ||||||||
| (Cost $141,871,928) | $ | 160,452,404 | ||||||
| SEGREGATED CASH WITH BROKERS (21.58%)(b) | 44,790,000 | |||||||
| OTHER ASSETS IN EXCESS OF LIABILITIES (1.12%) | 2,335,550 | |||||||
| NET ASSETS (100.00%) | $ | 207,577,954 | ||||||
| (a) | Non-income producing security. |
| (b) | Includes cash which is being held as collateral for total return swap contracts. |
See Notes to Financial Statements.
| Semi-Annual Report | October 31, 2021 | 9 |
| Highland Resolute Fund | Consolidated Schedule of Investments |
October 31, 2021 (Unaudited)
TOTAL RETURN SWAP CONTRACTS*
| Counterparty | Reference Obligation | Notional Amount | Value | Rate Paid by the Fund | Reference Rate | Termination Date | Unrealized Appreciation/ (Depreciation) | |||||||||||||
| Morgan Stanley | Dalton Melchior Segregated Portfolio(a) | $ | 34,221,748 | $ | 34,241,263 | 95 bps | 03/20/2023 | $ | 19,515 | |||||||||||
| Morgan Stanley | Typhon Argos Capital(b) | 27,995,225 | 27,978,489 | 85 bps | N/A | 09/08/2025 | (16,736 | ) | ||||||||||||
| Morgan Stanley | WABR(c) | 31,884,837 | 31,884,392 | 05 bps | N/A | 06/30/2022 | (445 | ) | ||||||||||||
| $ | 94,101,810 | $ | 94,104,144 | $ | 2,334 | |||||||||||||||
| * | For the long positions, the Fund receives payments based on any positive return of the Reference Obligation less the rate paid by the Fund. The Fund makes payments on any negative return of such Reference Obligation plus the rate paid by the Fund. For short positions, the Fund receives payments based on any negative return of the Reference Obligation less the rate paid by the Fund. The Fund makes payments on any positive return of such Reference Obligation plus the rate paid by the Fund. Payments are made monthly. |
| (a) | Dalton Melchior Segregated Portfolio is a global equity long/short strategy that uses a long-biased strategy that is focused on cyclical sectors. The strategy has a net exposure that ranges between 50% and 80%, and long exposure varies between 80% and 100%. The strategy is comprised of large cap stocks listed on exchanges of developed and emerging market countries. |
| (b) | Typhon Argos is a discretionary multi-manager futures strategy with a bias to relative value strategies and commodity focused teams. The manager utilizes seven sub-strategies including four physical commodities specialists across metals, energy, livestock, and grain categories. The remaining strategies trade multiple commodity or financial futures with various quantitative mean reverting or trend following approaches. No single sub-strategy makes up more than 25% of the total portfolio. |
| (c) | WABR incorporates an absolute return oriented approach within a risk parity framework. Active absolute return strategies include fundamental long/short equity, credit relative value, discretionary macro, and equity market neutral strategies. The strategy also maintains a passive risk weighted allocation to equities and fixed income, but each of the three allocations is equally risk weighted subject to a 40% limit on the absolute return allocation. Gross equity long exposure will typically be 140% or less, and net equity exposure will vary between 5% and 35%. |
See Notes to Financial Statements.
| 10 |
| Highland Resolute Fund | Consolidated Schedule of Investments |
October 31, 2021 (Unaudited)
TYPHON ARGOS CAPITAL
| Description | Contracts/Shares | Notional Value | Expiration Date | Value | Percentage of Value | Counterparty | ||||||||||||
| LONG SECURITIES | ||||||||||||||||||
| COMMODITY FUTURE CONTRACTS | ||||||||||||||||||
| SILVER CMX | 19 | 2,270,500 | December 2021 | $ | 4,655 | 0.02 | % | Morgan Stanley & Co. LLC | ||||||||||
| MINI SILVER | 19 | 457,995 | December 2021 | (2,964 | ) | -0.01 | % | Morgan Stanley & Co. LLC | ||||||||||
| HI GR. COPPER | 19 | 2,185,713 | March 2022 | (124,226 | ) | -0.44 | % | Morgan Stanley & Co. LLC | ||||||||||
| HI GR. COPPER | 19 | 2,070,675 | December 2021 | (150 | ) | 0.00 | % | |||||||||||
| COMMODITY FUTURE CONTRACTS Total | 6,984,882 | (122,685 | ) | -0.44 | % | |||||||||||||
| OPTIONS | ||||||||||||||||||
| LEAN HOGS | 60 | 11,280 | December 2021 | 300 | 0.00 | % | Morgan Stanley & Co. LLC | |||||||||||
| LEAN HOGS | 60 | 11,280 | December 2021 | 600 | 0.00 | % | Morgan Stanley & Co. LLC | |||||||||||
| OPTIONS Total | 22,560 | 900 | 0.00 | % | ||||||||||||||
| TOTAL LONG | 7,007,442 | (121,785 | ) | -0.44 | % | |||||||||||||
| SECURITIES SOLD SHORT | ||||||||||||||||||
| COMMODITY FUTURE CONTRACTS COMMODITIES | ||||||||||||||||||
| HI GR. COPPER | -19 | (2,192,125 | ) | 117,321 | 0.42 | % | Morgan Stanley & Co. LLC | |||||||||||
| HI GR. COPPER | -19 | (2,208,464 | ) | December 2021 | 133,664 | 0.48 | % | Morgan Stanley & Co. LLC | ||||||||||
| CORN | -86 | (2,399,400 | ) | December 2021 | (44,075 | ) | -0.16 | % | Morgan Stanley & Co. LLC | |||||||||
| COMMODITY FUTURE CONTRACTS Total | (6,799,989 | ) | 206,910 | 0.74 | % | |||||||||||||
| TOTAL SHORT | (9,199,389 | ) | 206,910 | 0.74 | % | |||||||||||||
| REMAINING SECURITIES AND CASH | 28,016,048 | 99.7 | % | |||||||||||||||
| Grand Total | $ | 27,978,489 | ||||||||||||||||
See Notes to Financial Statements.
| Semi-Annual Report | October 31, 2021 | 11 |
| Highland Resolute Fund | Consolidated Schedule of Investments |
October 31, 2021 (Unaudited)
DALTON MELCHIOR SEGREGATED PORTFOLIO
| Description | Contracts /Shares | Notional Value | Value | Percentage of Value | Counterparty | Floating Rate/ Fixed Rate Amount Paid by Fund | Reference Rate | Termination Date | Unrealized Gain (Loss) | |||||||||||||||||
| LONG SECURITIES | ||||||||||||||||||||||||||
| EQUITY SWAPS | ||||||||||||||||||||||||||
| Applus Services SA | $ | 617,778 | $ | 579,305 | 1.69 | % | Morgan Stanley & Co. LLC | 55 bps + 1M EURIB | -56 bps | 03/28/22 | $ | (38,473 | ) | |||||||||||||
| Arjo AB - B Share | 283,464 | 392,489 | 1.15 | % | Morgan Stanley & Co. LLC | 55 bps + 1M STIBO | -6 bps | 09/09/22 | 109,025 | |||||||||||||||||
| Asml Holding NV | 1,005,060 | 1,194,684 | 3.49 | % | Morgan Stanley & Co. LLC | 55 bps + 1M EURIB | -56 bps | 03/28/22 | 189,624 | |||||||||||||||||
| Asr Nederland NV | 918,032 | 1,122,162 | 3.28 | % | Morgan Stanley & Co. LLC | 55 bps + 1M EURIB | -56 bps | 03/28/22 | 204,130 | |||||||||||||||||
| Avast PLC | 353,999 | 402,638 | 1.18 | % | Morgan Stanley & Co. LLC | 59 bps + 1D SONIA | 5 bps | 03/28/22 | 48,639 | |||||||||||||||||
| Bankinter SA | 438,801 | 482,849 | 1.41 | % | Morgan Stanley & Co. LLC | 55 bps + 1M EURIB | -56 bps | 03/28/22 | 44,048 | |||||||||||||||||
| Befesa SA | 598,409 | 633,899 | 1.85 | % | Morgan Stanley & Co. LLC | 55 bps + 1M EURIB | -56 bps | 03/25/22 | 35,490 | |||||||||||||||||
| Boohoo Group PLC | 2,027,562 | 1,575,702 | 4.60 | % | Morgan Stanley & Co. LLC | 59 bps + 1D SONIA | 5 bps | 03/28/22 | (451,860 | ) | ||||||||||||||||
| Breedon Group PLC | 652,927 | 599,028 | 1.75 | % | Morgan Stanley & Co. LLC | 59 bps + 1D SONIA | 5 bps | 03/28/22 | (53,899 | ) | ||||||||||||||||
| Cie Financiere Richemo-A Reg | 742,003 | 759,950 | 2.22 | % | Morgan Stanley & Co. LLC | 49 bps + 1D SARON | -71 bps | 03/28/22 | 17,947 | |||||||||||||||||
| Corticeira Amorim SA | 554,320 | 638,829 | 1.87 | % | Morgan Stanley & Co. LLC | 55 bps + 1M EURIB | -56 bps | 03/28/22 | 84,509 | |||||||||||||||||
| Daetwyler Holding AG-BR | 611,799 | 664,773 | 1.94 | % | Morgan Stanley & Co. LLC | 49 bps + 1D SARON | -71 bps | 03/28/22 | 52,974 | |||||||||||||||||
| Erste Group Bank AG | 435,334 | 505,032 | 1.47 | % | Morgan Stanley & Co. LLC | 55 bps + 1M EURIB | -56 bps | 03/28/22 | 69,698 | |||||||||||||||||
| Ferguson PLC | 477,288 | 533,311 | 1.56 | % | Morgan Stanley & Co. LLC | 59 bps + 1D SONIA | 5 bps | 03/28/22 | 56,023 | |||||||||||||||||
| Finecobank SPA | 927,302 | 1,041,955 | 3.04 | % | Morgan Stanley & Co. LLC | 55 bps + 1M EURIB | -56 bps | 03/28/22 | 114,653 | |||||||||||||||||
| Fluidra SA | 919,402 | 888,653 | 2.60 | % | Morgan Stanley & Co. LLC | 55 bps + 1M EURIB | -56 bps | 03/28/22 | (30,749 | ) | ||||||||||||||||
| Games Workshop Group PLC | 719,916 | 636,799 | 1.86 | % | Morgan Stanley & Co. LLC | 59 bps + 1D SONIA | 5 bps | 03/28/22 | (83,117 | ) | ||||||||||||||||
| Grafton Group PLC-UTS | 863,715 | 979,071 | 2.86 | % | Morgan Stanley & Co. LLC | 59 bps + 1D SONIA | 5 bps | 03/28/22 | 115,356 | |||||||||||||||||
| Howden Joinery Group PLC | 777,850 | 865,109 | 2.53 | % | Morgan Stanley & Co. LLC | 59 bps + 1D SONIA | 5 bps | 03/28/22 | 87,259 | |||||||||||||||||
| Inficon Holding AG-Reg | 462,365 | 501,993 | 1.47 | % | Morgan Stanley & Co. LLC | 49 bps + 1D SARON | -71 bps | 03/28/22 | 39,628 | |||||||||||||||||
| Inmobiliaria Colonial Socimi | 908,381 | 888,935 | 2.60 | % | Morgan Stanley & Co. LLC | 55 bps + 1M EURIB | -56 bps | 03/28/22 | (19,446 | ) | ||||||||||||||||
| Intertrust NV | 393,173 | 342,834 | 1.00 | % | Morgan Stanley & Co. LLC | 55 bps + 1M EURIB | -56 bps | 03/28/22 | (50,339 | ) | ||||||||||||||||
| Johnson Service Group PLC | 519,129 | 486,194 | 1.42 | % | Morgan Stanley & Co. LLC | 59 bps + 1D SONIA | 5 bps | 03/28/22 | (32,935 | ) | ||||||||||||||||
| Laboratorios Farmaceuticos R | 967,715 | 1,081,290 | 3.16 | % | Morgan Stanley & Co. LLC | 55 bps + 1M EURIB | -56 bps | 03/28/22 | 113,575 | |||||||||||||||||
| Lamda Development SA | 455,492 | 418,405 | 1.22 | % | Morgan Stanley & Co. LLC | 175 bps + 1M EURIB | -56 bps | 02/23/22 | (37,087 | ) | ||||||||||||||||
| Lonza Group AG-Reg | 797,382 | 926,494 | 2.71 | % | Morgan Stanley & Co. LLC | 49 bps + 1D SARON | -71 bps | 03/28/22 | 129,112 | |||||||||||||||||
| Lotus Bakeries | 579,569 | 664,548 | 1.94 | % | Morgan Stanley & Co. LLC | 55 bps + 1M EURIB | -56 bps | 03/28/22 | 84,979 | |||||||||||||||||
| Merck Kgaa | 944,251 | 1,215,371 | 3.55 | % | Morgan Stanley & Co. LLC | 55 bps + 1M EURIB | -56 bps | 03/25/22 | 271,120 | |||||||||||||||||
| Musti Group Oy | 430,783 | 470,836 | 1.38 | % | Morgan Stanley & Co. LLC | 55 bps + 1M EURIB | -56 bps | 03/28/22 | 40,053 | |||||||||||||||||
| Nestle SA-Reg | 1,249,129 | 1,307,198 | 3.82 | % | Morgan Stanley & Co. LLC | 49 bps + 1D SARON | -71 bps | 03/28/22 | 58,069 | |||||||||||||||||
| Piaggio & C. S.P.A. | 379,759 | 331,917 | 0.97 | % | Morgan Stanley & Co. LLC | 55 bps + 1M EURIB | -56 bps | 03/28/22 | (47,842 | ) | ||||||||||||||||
| Reckitt Benckiser Group PLC | 759,808 | 705,367 | 2.06 | % | Morgan Stanley & Co. LLC | 59 bps + 1D SONIA | 5 bps | 03/28/22 | (54,441 | ) | ||||||||||||||||
| Robertet SA | 1,257,981 | 1,210,749 | 3.54 | % | Morgan Stanley & Co. LLC | 55 bps + 1M EURIB | -56 bps | 03/28/22 | (47,232 | ) | ||||||||||||||||
| Roche Holding Ag-Genusschein | 948,987 | 986,303 | 2.88 | % | Morgan Stanley & Co. LLC | 49 bps + 1D SARON | -71 bps | 03/28/22 | 37,316 | |||||||||||||||||
| Sanoma Oyj | 742,136 | 684,670 | 2.00 | % | Morgan Stanley & Co. LLC | 55 bps + 1M EURIB | -56 bps | 03/28/22 | (57,466 | ) | ||||||||||||||||
| Sbanken ASA | 620,934 | 584,859 | 1.71 | % | Morgan Stanley & Co. LLC | 55 bps + 1M NIBOR | 44 bps | 05/02/22 | (36,075 | ) | ||||||||||||||||
| Scor SE | 74,105 | 87,212 | 0.25 | % | Morgan Stanley & Co. LLC | 55 bps + 1M EURIB | -56 bps | 03/28/22 | 13,107 | |||||||||||||||||
| Thule Group AB/The | 542,488 | 710,736 | 2.08 | % | Morgan Stanley & Co. LLC | 55 bps + 1M STIBO | -6 bps | 09/09/22 | 168,248 | |||||||||||||||||
| Vivendi | 1,449,410 | 1,551,675 | 4.53 | % | Morgan Stanley & Co. LLC | 55 bps + 1M EURIB | -56 bps | 03/28/22 | 102,265 | |||||||||||||||||
| Volution Group PLC | 356,227 | 411,159 | 1.20 | % | Morgan Stanley & Co. LLC | 59 bps + 1D SONIA | 5 bps | 03/28/22 | 54,932 | |||||||||||||||||
| EQUITY SWAPS Total | 28,764,165 | 30,064,983 | 87.80 | % | ||||||||||||||||||||||
| TOTAL LONG | 28,764,165 | 30,064,983 | 87.80 | % | ||||||||||||||||||||||
See Notes to Financial Statements.
| 12 |
| Highland Resolute Fund | Consolidated Schedule of Investments |
October 31, 2021 (Unaudited)
| Description | Contracts /Shares | Notional Value | Value | Percentage of Value | Counterparty | Floating Rate/ Fixed Rate Amount Paid by Fund | Reference Rate | Termination Date | Unrealized Gain (Loss) | |||||||||||||||||
| SECURITIES SOLD SHORT | ||||||||||||||||||||||||||
| EQUITY SWAPS | ||||||||||||||||||||||||||
| Aixtron SE SE | $ | (283,188 | ) | $ | (267,640 | ) | -0.78 | % | Morgan Stanley & Co. LLC | 1D EONIA -40 bps | -49 bps | 03/25/22 | $ | (15,548 | ) | |||||||||||
| Alstrom | (477,797 | ) | (464,537 | ) | -1.36 | % | Morgan Stanley & Co. LLC | 1D EONIA -40 bps | -49 bps | 03/28/22 | (13,260 | ) | ||||||||||||||
| DJS Mid 200 PR | (4,781,604 | ) | (4,885,729 | ) | -14.27 | % | Morgan Stanley & Co. LLC | 1D EONIA -44 bps | -49 bps | 07/29/22 | 104,125 | |||||||||||||||
| Dow Jones Stoxx Insurance | (293,537 | ) | (314,513 | ) | -0.92 | % | Morgan Stanley & Co. LLC | 1D EONIA -45 bps | -49 bps | 07/29/22 | 20,976 | |||||||||||||||
| Gerresheimer AG | (238,101 | ) | (215,524 | ) | -0.63 | % | Morgan Stanley & Co. LLC | 1D EONIA -40 bps | -49 bps | 03/25/22 | (22,577 | ) | ||||||||||||||
| Melexis NV | (455,930 | ) | (477,998 | ) | -1.40 | % | Morgan Stanley & Co. LLC | 1D EONIA -50 bps | -49 bps | 03/28/22 | 22,068 | |||||||||||||||
| Stoxx-DJ Small 200 Price | (4,916,523 | ) | (5,180,184 | ) | -15.13 | % | Morgan Stanley & Co. LLC | 1D EONIA -50 bps | -49 bps | 07/29/22 | 263,661 | |||||||||||||||
| Technogym SPA | (667,006 | ) | (608,265 | ) | -1.78 | % | Morgan Stanley & Co. LLC | 1D EONIA -50 bps | -49 bps | 03/28/22 | (58,741 | ) | ||||||||||||||
| Varta AG | (512,430 | ) | (468,053 | ) | -1.37 | % | Morgan Stanley & Co. LLC | 1D EONIA -425 bps | -49 bps | 03/25/22 | (44,377 | ) | ||||||||||||||
| EQUITY SWAPS Total | (12,626,116 | ) | (12,882,443 | ) | -37.62 | % | ||||||||||||||||||||
| INDEX FUTURE CONTRACTS | ||||||||||||||||||||||||||
| EURO STOXX 50 DEC21 | (170) | (3,535,660 | ) | (284,055 | ) | -0.83 | % | Morgan Stanley & Co. LLC | ||||||||||||||||||
| INDEX FUTURE CONTRACTS Total | (284,055 | ) | -0.83 | % | ||||||||||||||||||||||
| TOTAL SHORT | (16,161,776 | ) | (13,166,498 | ) | -38.45 | % | ||||||||||||||||||||
| REMAINING SECURITIES AND CASH | 17,342,778 | 50.65 | % | |||||||||||||||||||||||
| Grand Total | $ | 34,241,263 | ||||||||||||||||||||||||
See Notes to Financial Statements.
| Semi-Annual Report | October 31, 2021 | 13 |
| Highland Resolute Fund | Consolidated Schedule of Investments |
October 31, 2021 (Unaudited)
WABR
| Description | Contracts/Shares | Notional Value | Value | Percentage of Value | Counterparty | |||||||||||||
| LONG SECURITIES | ||||||||||||||||||
| COMMON STOCKS | ||||||||||||||||||
| Alexandria Real Estate EQ REIT | 403 | $ | 82,186 | 0.26 | % | |||||||||||||
| Alphabet Class A | 27 | 79,470 | 0.25 | % | ||||||||||||||
| Americold Realty | 5,395 | 158,984 | 0.50 | % | ||||||||||||||
| Commscope Holding | 8,049 | 86,201 | 0.27 | % | ||||||||||||||
| Comscore Inc. | 19,796 | 77,402 | 0.24 | % | ||||||||||||||
| Daimler N Ord | 881 | 87,359 | 0.27 | % | ||||||||||||||
| Equity Residential REIT | 1,070 | 92,470 | 0.29 | % | ||||||||||||||
| Facebook Class A | 290 | 93,751 | 0.29 | % | ||||||||||||||
| Federal REIT | 769 | 92,525 | 0.29 | % | ||||||||||||||
| First Industrial Realty Trust | 1,540 | 89,676 | 0.28 | % | ||||||||||||||
| IHS Markit | 943 | 123,220 | 0.39 | % | ||||||||||||||
| JPMorgan Chase | 477 | 80,959 | 0.25 | % | ||||||||||||||
| Kansas City Southern | 404 | 125,352 | 0.39 | % | ||||||||||||||
| Microsoft | 390 | 129,208 | 0.41 | % | ||||||||||||||
| Mid America Apartment Communities REIT | 499 | 101,967 | 0.32 | % | ||||||||||||||
| Netstreit | 4,562 | 110,579 | 0.35 | % | ||||||||||||||
| Nuance Communications | 1,438 | 79,181 | 0.25 | % | ||||||||||||||
| Piedmont Office REIT Class A | 4,643 | 82,453 | 0.26 | % | ||||||||||||||
| PNM Resources | 2,369 | 117,840 | 0.37 | % | ||||||||||||||
| Salesforce.com | 290 | 86,832 | 0.27 | % | ||||||||||||||
| Somalogic Class A | 6,178 | 78,644 | 0.25 | % | ||||||||||||||
| Swedish Orphan Biovitrum | 3,278 | 88,940 | 0.28 | % | ||||||||||||||
| Terreno Realty REIT | 1,130 | 82,608 | 0.26 | % | ||||||||||||||
| Ventas REIT | 1,504 | 80,284 | 0.25 | % | ||||||||||||||
| W P Carey REIT | 1,718 | 132,489 | 0.42 | % | ||||||||||||||
| Xilinx | 906 | 163,123 | 0.51 | % | ||||||||||||||
| COMMON STOCKS Total | 2,603,703 | 8.17 | % | |||||||||||||||
| INTEREST RATE FUTURE CONTRACTS | ||||||||||||||||||
| 10 YR US Government Treasury Note Dec-21 | 43 | 5,633,000 | (93,409 | ) | -0.29 | % | Morgan Stanley & Co. LLC | |||||||||||
| INTEREST RATE FUTURE CONTRACTS Total | (93,409 | ) | -0.29 | % | ||||||||||||||
| INDEX FUTURE CONTRACTS | ||||||||||||||||||
| E-mini S&P 500 Stock Index Dec-21 | 24 | 5,563,752 | 152,168 | 0.48 | % | Morgan Stanley & Co. LLC | ||||||||||||
| INDEX FUTURE CONTRACTS Total | 152,168 | 0.48 | % | |||||||||||||||
| TOTAL LONG | 11,196,752 | 2,662,462 | 8.35 | % | ||||||||||||||
See Notes to Financial Statements.
| 14 |
| Highland Resolute Fund | Consolidated Schedule of Investments |
October 31, 2021 (Unaudited)
| Description | Contracts/Shares | Notional Value | Value | Percentage of Value | Counterparty | |||||||||||||
| SECURITIES SOLD SHORT | ||||||||||||||||||
| COMMON STOCKS | ||||||||||||||||||
| 3M | (638 | ) | $ | (113,956 | ) | -0.36 | % | |||||||||||
| Advanced Micro Devices | (1,138 | ) | (136,809 | ) | -0.43 | % | ||||||||||||
| Brandywine Realty REIT | (7,810 | ) | (103,476 | ) | -0.32 | % | ||||||||||||
| Broadstone Net Lease | (4,405 | ) | (117,130 | ) | -0.37 | % | ||||||||||||
| Camden Property REIT | (588 | ) | (95,865 | ) | -0.30 | % | ||||||||||||
| Canadian Pacific Railway | (1,477 | ) | (114,284 | ) | -0.36 | % | ||||||||||||
| Essential Properties Realty Trust | (2,829 | ) | (84,275 | ) | -0.26 | % | ||||||||||||
| Invesco QQQ Trust ETF | (569 | ) | (219,710 | ) | -0.69 | % | ||||||||||||
| Ishares Expanded Tech ETF | (289 | ) | (127,016 | ) | -0.40 | % | ||||||||||||
| Ishares Russell 2000 ETF | (437 | ) | (99,679 | ) | -0.31 | % | ||||||||||||
| Ishares US Technology ETF | (952 | ) | (105,022 | ) | -0.33 | % | ||||||||||||
| Mondelez International CLass A | (1,404 | ) | (85,281 | ) | -0.27 | % | ||||||||||||
| Prologis REIT | (965 | ) | (139,934 | ) | -0.44 | % | ||||||||||||
| Regency Centers REIT | (1,552 | ) | (109,277 | ) | -0.34 | % | ||||||||||||
| Rexford Industrial Realty REIT | (1,154 | ) | (77,538 | ) | -0.24 | % | ||||||||||||
| S&P Global | (268 | ) | (126,921 | ) | -0.40 | % | ||||||||||||
| Site Centers | (6,105 | ) | (97,016 | ) | -0.30 | % | ||||||||||||
| SPDR Fund Consumer Staples ETF | (1,894 | ) | (134,967 | ) | -0.42 | % | ||||||||||||
| SPDR S&P 500 ETF | (782 | ) | (359,151 | ) | -1.13 | % | ||||||||||||
| Vaneck Vectors Semiconductor ETF | (381 | ) | (104,349 | ) | -0.33 | % | ||||||||||||
| Vanguard Real Estate ETF | (3,690 | ) | (402,406 | ) | -1.26 | % | ||||||||||||
| Welltower | (992 | ) | (79,785 | ) | -0.25 | % | ||||||||||||
| COMMON STOCKS Total | (3,033,847 | ) | -9.52 | % | ||||||||||||||
| TOTAL SHORT | (3,033,847 | ) | -9.52 | % | ||||||||||||||
| REMAINING SECURITIES AND CASH | 32,255,777 | 101.16 | % | |||||||||||||||
| Grand Total | 31,884,392 | |||||||||||||||||
Common Abbreviations:
ETF - Exchange Traded Fund.
EURIBOR - Euro Interbank Offered Rate.
LIBOR - London Interbank Offered Rate.
PIMCO - Pacific Investment Management Company.
REIT - Real Estate Investment Trust
S&P - Standard & Poor's.
SPDR - Standard & Poor's Depositary Receipt.
Currency Abbreviations:
EUR - Euro
See Notes to Financial Statements.
| Semi-Annual Report | October 31, 2021 | 15 |
| Highland Resolute Fund | Consolidated Statement of Assets and Liabilities |
October 31, 2021 (Unaudited)
| ASSETS | ||||
| Investments, at value | $ | 160,452,404 | ||
| Unrealized appreciation on total return swap contracts | 19,515 | |||
| Deposits with brokers for total return swap contracts and written options | 44,790,001 | |||
| Cash | 2,119,208 | |||
| Dividends receivable | 45,131 | |||
| Interest receivable | 14 | |||
| Receivable for total return swap reset | 653,409 | |||
| Other assets | 6,438 | |||
| Total assets | 208,086,120 | |||
| LIABILITIES | ||||
| Unrealized depreciation on total return swap contracts | 17,181 | |||
| Investment advisory fees payable | 1 | |||
| Shareholder service fees payable | 103,380 | |||
| Payable for interest expense on total return swap contracts | 171,159 | |||
| Payable for shares redeemed | 708 | |||
| Trustee fees and expenses payable | 16,429 | |||
| Chief compliance officer fees payable | 13,449 | |||
| Principal financial officer fees payable | 2,644 | |||
| Administration fees payable | 79,111 | |||
| Transfer agency fees payable | 15,341 | |||
| Professional fees payable | 43,104 | |||
| Custody fees payable | 20,565 | |||
| Accrued expenses and other liabilities | 27,747 | |||
| Total liabilities | 510,819 | |||
| NET ASSETS | $ | 207,575,301 | ||
| NET ASSETS CONSIST OF | ||||
| Paid-in capital (Note 6) | $ | 185,470,005 | ||
| Total distributable earnings/(loss) | 22,105,296 | |||
| NET ASSETS | $ | 207,575,301 | ||
| INVESTMENTS, AT COST | $ | 141,871,928 | ||
| PRICING OF SHARES | ||||
| Class I: | ||||
| Net Asset Value, offering and redemption price per share | $ | 12.35 | ||
| Net Assets | $ | 207,575,301 | ||
| Shares of beneficial interest outstanding (unlimited number of shares, no par value common stock authorized) | 16,809,118 | |||
See Notes to Financial Statements.
| 16 |
| Highland Resolute Fund | Consolidated Statement of Operations |
For the Six Months Ended October 31, 2021 (Unaudited)
| INVESTMENT INCOME | ||||
| Dividends | $ | 475,956 | ||
| Interest | 1,762 | |||
| Foreign taxes withheld | (5,692 | ) | ||
| Total investment income | 472,026 | |||
| EXPENSES | ||||
| Investment advisory fees (Note 7) | 1,424,483 | |||
| Investment advisory fees-subsidiary | 141,373 | |||
| Administration fees | 222,001 | |||
| Transfer agency fees | 37,631 | |||
| Shareholder service fees | ||||
| Class I | 99,736 | |||
| Professional fees | 36,905 | |||
| Custody fees | 16,586 | |||
| Reports to shareholders and printing fees | 3,240 | |||
| Trustee fees and expenses | 7,209 | |||
| Registration/filing fees | 13,383 | |||
| Chief compliance officer fees | 38,678 | |||
| Principal financial officer fees | 7,846 | |||
| Other | 15,373 | |||
| Total expenses before waivers | 2,064,444 | |||
| Less fees waived/reimbursed by investment adviser (Note 7) | ||||
| Class I | (1,422,055 | ) | ||
| Waiver of investment advisory fees - subsidiary (Note 7) | (141,373 | ) | ||
| Total net expenses | 501,016 | |||
| NET INVESTMENT LOSS | (28,990 | ) | ||
| Net realized gain on investments | 9,542,572 | |||
| Net realized gain on futures contracts | 139,290 | |||
| Net realized gain on written options | 135,466 | |||
| Net realized gain on total return swap contracts | 1,789,613 | |||
| Net realized gain on foreign currency transactions | 467 | |||
| Total net realized gain | 11,607,408 | |||
| Net change in unrealized appreciation on investments | 1,224,959 | |||
| Net change in unrealized depreciation on written options | (51,060 | ) | ||
| Net change in unrealized depreciation on futures contracts | (765,320 | ) | ||
| Net change in unrealized appreciation on total return swap contracts | 33,390 | |||
| Net change in unrealized depreciation on translation of assets and liabilities in foreign currency transactions | (226 | ) | ||
| Total net change in unrealized appreciation | 441,743 | |||
| NET REALIZED AND UNREALIZED GAIN ON INVESTMENTS | 12,049,151 | |||
| NET INCREASE IN NET ASSETS RESULTING FROM OPERATIONS | $ | 12,020,161 | ||
See Notes to Financial Statements.
| Semi-Annual Report | October 31, 2021 | 17 |
| Highland Resolute Fund | Consolidated Statements of Changes in Net Assets |
| Six Months Ended October 31, 2021 (Unaudited) | For the Year Ended April 30, 2021 | |||||||
| OPERATIONS | ||||||||
| Net investment income/(loss) | $ | (28,990 | ) | $ | 2,736,909 | |||
| Net realized gain | 11,607,408 | 23,515,819 | ||||||
| Net change in unrealized appreciation | 441,743 | 16,061,220 | ||||||
| Net increase in net assets resulting from operations | 12,020,161 | 42,313,948 | ||||||
| BENEFICIAL INTEREST TRANSACTIONS (NOTE 6) | ||||||||
| Shares sold | ||||||||
| Class I | 37,568,870 | 28,612,421 | ||||||
| Shares redeemed, net of redemption fees | ||||||||
| Class I | (1,455,906 | ) | (91,284,334 | ) | ||||
| Net increase/(decrease) in net assets derived from beneficial interest transactions | 36,112,964 | (62,671,913 | ) | |||||
| Net increase/(decrease) in Net Assets | 48,133,125 | (20,357,965 | ) | |||||
| NET ASSETS: | ||||||||
| Beginning of period | 159,442,176 | 179,800,141 | ||||||
| End of period | $ | 207,575,301 | $ | 159,442,176 | ||||
See Notes to Financial Statements.
| 18 |
| Highland Resolute Fund | Consolidated Financial Highlights |
For a share outstanding throughout the periods presented
| Class I | ||||||||||||||||||||||||
| For the Six Months Ended October 31, 2021 (Unaudited) | For the Year Ended April 30, 2021 | For the Year Ended April 30, 2020 | For the Year Ended April 30, 2019 | For the Year Ended April 30, 2018(a) | For the Year Ended April 30, 2017(b) | |||||||||||||||||||
| NET ASSET VALUE, BEGINNING OF PERIOD | $ | 11.58 | $ | 9.28 | $ | 10.30 | $ | 10.81 | $ | 11.14 | $ | 10.75 | ||||||||||||
| INCOME/(LOSS) FROM OPERATIONS | ||||||||||||||||||||||||
| Net investment income/(loss)(c) | (0.00 | )(d) | 0.14 | 0.19 | 0.20 | 0.25 | 0.09 | |||||||||||||||||
| Net realized and unrealized gain/(loss) on investments | 0.77 | 2.16 | (1.09 | ) | (0.22 | ) | 0.38 | 0.45 | ||||||||||||||||
| Total from Investment Operations | 0.77 | 2.30 | (0.90 | ) | (0.02 | ) | 0.63 | 0.54 | ||||||||||||||||
| LESS DISTRIBUTIONS | ||||||||||||||||||||||||
| Net investment income | – | – | (0.12 | ) | (0.15 | ) | (0.77 | ) | (0.13 | ) | ||||||||||||||
| Net realized gain on investments | – | – | – | (0.34 | ) | (0.19 | ) | (0.02 | ) | |||||||||||||||
| Total Distributions | – | – | (0.12 | ) | (0.49 | ) | (0.96 | ) | (0.15 | ) | ||||||||||||||
| NET INCREASE/(DECREASE) IN NET ASSET VALUE | 0.77 | 2.30 | (1.02 | ) | (0.51 | ) | (0.33 | ) | 0.39 | |||||||||||||||
| NET ASSET VALUE, END OF PERIOD | $ | 12.35 | $ | 11.58 | $ | 9.28 | $ | 10.30 | $ | 10.81 | $ | 11.14 | ||||||||||||
| TOTAL RETURN(e) | 6.65 | % | 24.78 | % | (8.65 | )% | 0.22 | % | 5.51 | % | 5.04 | % | ||||||||||||
| RATIOS/SUPPLEMENTAL DATA | ||||||||||||||||||||||||
| Net assets, End of Period (000s) | $ | 207,575 | $ | 159,442 | $ | 179,800 | $ | 332,435 | $ | 373,865 | $ | 491,811 | ||||||||||||
| RATIOS TO AVERAGE NET ASSETS: | ||||||||||||||||||||||||
| Operating expenses excluding reimbursement/waiver(f) | 2.17 | %(g) | 1.94 | %(h)(i) | 1.90 | %(h)(i) | 1.89 | %(h)(i) | 1.94 | %(h)(i) | 1.77 | %(h)(i) | ||||||||||||
| Operating expenses including reimbursement/waiver(f) | 0.53 | %(g) | 0.50 | %(h) | 0.69 | %(h) | 0.74 | %(h) | 0.82 | %(h) | 0.52 | %(h) | ||||||||||||
| Net investment income/(loss) including reimbursement/waiver(f) | (0.03 | )%(g) | 1.37 | % | 1.89 | % | 1.95 | % | 2.24 | % | 0.86 | % | ||||||||||||
| PORTFOLIO TURNOVER RATE | 35 | %(j) | 42 | % | 103 | % | 55 | % | 79 | % | 94 | % | ||||||||||||
| (a) | Prior to August 31, 2017 the Highland Resolute Fund was known as the Redmont Resolute Fund. |
| (b) | Prior to August 31, 2016 the Highland Resolute Fund was known as the Redmont Resolute Fund II. |
| (c) | Calculated using the average shares method. |
| (d) | Less than $0.005 per share. |
| (e) | Total investment return is calculated assuming a purchase of a common share at the opening of the first day and a sale at closing on the last day of each period reported. Dividends and distributions, if any, are assumed for purposes of this calculation to be reinvested at prices obtained under the Fund's dividend reinvestment plan. Total returns would have been lower had certain expenses not been waived during the period. Total investment returns do not reflect brokerage commissions, if any, and are not annualized. |
| (f) | The ratios exclude the impact of expenses of the underlying funds in which the Fund invests as represented in the Consolidated Schedule of Investments. |
| (g) | Annualized. |
| (h) | Dividend and interest expense on securities sold short totaled 0.00%, 0.00%, 0.09%, 0.19%, 0.25%, and 0.10% of average net assets for the six months ended October 31, 2021 and for the years ended April 30, 2021, 2020, 2019, 2018, and 2017, respectively. |
| (i) | The ratio of operating expenses excluding fee waiver/reimbursements to average net assets is calculated excluding the waived Subsidiary management fee (See Note 7 for additional detail). The ratio inclusive of that fee would be 2.17%, 2.06%, 1.99%, 1.97%, 2.01% and 1.81% for the six months ended October 31, 2021 and for the years ended April 30, 2021, 2020, 2019, 2018 and 2017, respectively. |
| (j) | Not Annualized. |
See Notes to Financial Statements.
| Semi-Annual Report | October 31, 2021 | 19 |
| Highland Resolute Fund | Notes to Consolidated Financial Statements |
October 31, 2021 (Unaudited)
1. ORGANIZATION
Financial Investors Trust (the “Trust”), a Delaware statutory trust, is an open-end management investment company registered under the Investment Company Act of 1940, as amended (“1940 Act”). The Trust consists of multiple separate portfolios or series. This semi-annual report describes the Highland Resolute Fund (the “Fund”). Effective August 31, 2017, the Fund changed its name from Redmont Resolute Fund. The Fund seeks to provide long-term total return with reduced volatility and reduced correlation to the conventional stock and bond markets. The Fund offers Class I shares.
Basis of Consolidation: Highland Resolute Cayman (the “Subsidiary”), a Cayman Islands exempted company, is a wholly owned subsidiary of the Fund. The Subsidiary’s investment objective is designed to enhance the ability of the Fund to obtain exposure to equities, financial, currency and commodities markets consistent with the limits of the U.S. federal tax law requirements applicable to registered investment companies. The Subsidiary is subject to substantially the same investment policies and investment restrictions as the Fund. The Subsidiary acts as an investment vehicle for the Fund in order to effect certain commodity-related investments on behalf of the Fund. Investments in the Subsidiary are expected to provide the Fund with exposure to the commodity markets within the limitations of Subchapter M of the Internal Revenue Code of 1986, as amended (the “Code”), and recent IRS revenue rulings, as discussed below under “Federal Income Taxes”. The Fund is the sole shareholder of the Subsidiary pursuant to a subscription agreement, and it is intended that the Fund will remain the sole shareholder and will continue to control the Subsidiary. Under the Articles of Association of the Subsidiary, shares issued by the Subsidiary confer upon a shareholder the right to wholly own and vote at general meetings of the Subsidiary and certain rights in connection with any winding-up or repayment of capital, as well as the right to participate in the profits or assets of the Subsidiary. The Fund may invest up to 25% of its total assets in shares of the Subsidiary. As a wholly owned subsidiary of the Fund, all assets and liabilities, income and expenses of the Subsidiary are consolidated in the financial statements and financial highlights of the Fund collectively referred to as the "financial statements" in these notes to the consolidated financial statements. All investments held by the Subsidiary are disclosed in the accounts of the Fund. As of October 31, 2021, net assets of the Fund were $207,575,301, of which $20,554,388 or 9.90%, represented the Fund’s ownership of all issued shares and voting rights of the Subsidiary. The Fund and the Subsidiary are "commodity pools" under the U.S. Commodity Exchange Act, and Highland Associates, Inc. (the "Adviser") is a "commodity pool operator" registered with and regulated by the Commodities Futures Trading Commission (CFTC).
2. SIGNIFICANT ACCOUNTING POLICIES
The accompanying financial statements were prepared in accordance with accounting principles generally accepted in the United States of America (“U.S. GAAP”). The preparation of financial statements in conformity with U.S. GAAP requires management to make certain estimates and assumptions that affect the reported amounts of assets and liabilities and disclosures of contingent assets and liabilities at the date of the financial statements and the reported amounts of increases and decreases in net assets from operations during the reporting period. Actual results could differ from those estimates. The Fund is considered an investment company for financial reporting purposes under U.S. GAAP and follows the accounting and reporting guidance applicable to investment companies in the Financial Accounting Standards Board ("FASB") Accounting Standards Codification (ASU) Topic 946 Financial Services – Investment Companies. The following is a summary of significant accounting policies consistently followed by the Fund and Subsidiary in preparation of the financial statements.
Investment Valuation: The Fund generally values its securities based on market prices determined at the close of regular trading on the New York Stock Exchange (“NYSE”), normally 4:00 p.m. Eastern Time, on each day the NYSE is open for trading.
For equity securities and mutual funds that are traded on an exchange, the market price is usually the closing sale or official closing price on that exchange. In the case of equity securities not traded on an exchange, or if such closing prices are not otherwise available, the securities are valued at the mean of the most recent bid and ask prices on such day. Redeemable securities issued by open-end registered investment companies are valued at the investment company’s applicable net asset value, with the exception of exchange-traded open-end investment companies, which are priced as equity securities.
The market price for debt obligations is generally the price supplied by an independent third-party pricing service approved by the Board of Trustees of the Trust (the “Board”), which may use a matrix, formula or other objective method that takes into consideration quotations from dealers, market transactions in comparable investments, market indices and yield curves. If vendors are unable to supply a price, or if the price supplied is deemed to be unreliable, the market price may be determined using quotations received from one or more brokers–dealers that make a market in the security. Municipal securities having a remaining maturity of greater than 60 days, are typically valued at the evaluated bid price formulated by an independent pricing service. Corporate Bonds, U.S. Government & Agency, and U.S. Treasury Bonds & Notes are valued using market models that consider trade data, quotations from dealers and active market makers, relevant yield curve and spread data, creditworthiness, trade data or market information on comparable securities, and other relevant security specific information. Mortgage-related and asset-backed securities are valued based on models that consider trade data, prepayment and default projections, benchmark yield and spread data and estimated cash flows of each tranche of the issuer. Publicly traded foreign government debt securities are typically traded internationally in the over-the-counter market and are valued at the mean between the bid and asked prices as of the close of business of that market.
| 20 |
| Highland Resolute Fund | Notes to Consolidated Financial Statements |
October 31, 2021 (Unaudited)
Futures contracts that are listed or traded on a national securities exchange, commodities exchange, contract market or comparable over the counter market, and that are freely transferrable, are valued at their closing settlement price on the exchange on which they are primarily traded or based upon the current settlement price for a like instrument acquired on the day on which the instrument is being valued. A settlement price may not be used if the market moves with respect to a particular commodity. Over-the-counter swap contracts for which market quotations are readily available are valued based on quotes received from independent pricing services or one or more dealers that make markets in such securities. When an available price is not obtainable, the last traded priced is utilized to value the swap contracts, or price is provided by the swap provider or prime broker. Options contracts listed for trading on a securities exchange or board of trade are valued at the last quoted sales price or, in the absence of a sale at the mean of the last bid and asked price.
Forward currency exchange contracts have a fair value determined by the current foreign currency exchange forward rates. The foreign currency exchange forward rates are calculated using an automated system that estimates rates on the basis of the current day foreign currency exchange rates and forward foreign currency exchange rates supplied by a pricing service. Foreign exchange rates and forward foreign currency exchange rates may generally be obtained at the close of the NYSE, normally 4:00 p.m. Eastern Time.
When such prices or quotations are not available, or when the Adviser believes that they are unreliable, securities may be priced using fair value procedures approved by the Board.
Fair Value Measurements: The Fund discloses the classification of its fair value measurements following a three-tier hierarchy based on the inputs used to measure fair value. Inputs refer broadly to the assumptions that market participants would use in pricing the asset or liability, including assumptions about risk. Inputs may be observable or unobservable. Observable inputs reflect the assumptions market participants would use in pricing the asset or liability that are developed based on market data obtained from sources independent of the reporting entity. Unobservable inputs reflect the reporting entity’s own assumptions about the assumptions market participants would use in pricing the asset or liability that are developed based on the best information available.
Various inputs are used in determining the value of the Fund’s investments as of the end of the reporting period. When inputs used fall into different levels of the fair value hierarchy, the level in the hierarchy within which the fair value measurement falls is determined based on the lowest level input that is significant to the fair value measurement in its entirety. The designated input levels are not necessarily an indication of the risk or liquidity associated with these investments. These inputs are categorized in the following hierarchy under applicable financial accounting standards:
| Level 1 – | Unadjusted quoted prices in active markets for identical investments, unrestricted assets or liabilities that the Fund has the ability to access at the measurement date; |
| Level 2 – | Quoted prices which are not active, quoted prices for similar assets or liabilities in active markets or inputs other than quoted prices that are observable (either directly or indirectly) for substantially the full term of the asset or liability; and |
| Level 3 – | Significant unobservable prices or inputs (including the Fund’s own assumptions in determining the fair value of investments) where there is little or no market activity for the asset or liability at the measurement date. |
| Semi-Annual Report | October 31, 2021 | 21 |
| Highland Resolute Fund | Notes to Consolidated Financial Statements |
October 31, 2021 (Unaudited)
The following is a summary of the inputs used to value the Fund’s investments as of October 31, 2021:
Highland Resolute Fund
| Investments in Securities at Value* | Level 1 - Quoted Prices | Level 2 - Other Significant Observable Inputs | Level 3 - Significant Unobservable Inputs | Total | ||||||||||||
| Open-End Mutual Funds | $ | 146,082,876 | $ | – | $ | – | $ | 146,082,876 | ||||||||
| Open-End Mutual Funds | ||||||||||||||||
| Funds | 14,369,528 | – | – | 14,369,528 | ||||||||||||
| Total | $ | 160,452,404 | $ | – | $ | – | $ | 160,452,404 | ||||||||
| Other Financial Instruments** | ||||||||||||||||
| Assets: | ||||||||||||||||
| Total Return Swap Contracts | $ | – | $ | 19,515 | $ | – | $ | 19,515 | ||||||||
| Liabilities: | ||||||||||||||||
| Total Return Swap Contracts | – | (17,181 | ) | – | (17,181 | ) | ||||||||||
| Total | $ | – | $ | 2,334 | $ | – | $ | 2,334 | ||||||||
| * | For detailed descriptions, see the accompanying Consolidated Schedule of Investments. |
| ** | Other financial instruments are derivative instruments reflected in the Consolidated Schedule of Investments. The Total Return Swap Contracts and Futures shown in the table are reported at their unrealized appreciation/(depreciation) at the measurement date, which represents the change in the contract’s value from trade date. |
As of October 31, 2021 the Fund did not have any securities that used significant unobservable inputs (Level 3) in determining fair value.
Trust Expenses: Some expenses of the Trust can be directly attributed to the Fund. Expenses which cannot be directly attributed to the Fund are apportioned among all funds in the Trust based on average net assets of the Fund.
Federal Income Taxes: The Fund complies with the requirements under Subchapter M of the Internal Revenue Code of 1986, as amended, applicable to regulated investment companies and intends to distribute substantially all of its net taxable income and net capital gains, if any, each year so that the Fund will not be subject to excise tax on undistributed income and gains. The Fund is not subject to income taxes to the extent such distributions are made.
As of and during the six months ended October 31, 2021, the Fund did not have a liability for any unrecognized tax benefits. The Fund files U.S. federal, state, and local tax returns as required. The Fund’s tax returns are subject to examination by the relevant tax authorities until expiration of the applicable statute of limitations, which is generally three years after the filing of the tax return for federal purposes and four years for most state returns. Tax returns for open years have incorporated no uncertain tax positions that require a provision for income taxes. For tax purposes, the Subsidiary is an exempt Cayman Islands investment company and has received an undertaking from the Government of the Cayman Islands exempting it from all local income, profits, and capital gains taxes. No such taxes are levied in the Cayman Islands at the present time. For U.S. income tax purposes, the Subsidiary is a controlled foreign corporation ("CFC") and as such is not subject to U.S. income tax. However, as a wholly-owned CFC, the net income and capital gain of the CFC, to the extent of its earnings and profits, will be included each year in the Fund's taxable income. The Fund recognizes interest and penalties, if any, related to tax liabilities as income tax expense in the Consolidated Statement of Operations.
Concentration of Credit Risk: The Fund places its cash with a banking institution, which is insured by the FDIC. The FDIC limit is $250,000. At various times throughout the year, the amount on deposit may exceed the FDIC limit and subject the Fund to a credit risk. The Fund does not believe that such deposits are subject to any unusual risk associated with investment activities.
Investment Transactions and Investment Income: Investment transactions are accounted for on the date the investments are purchased or sold (trade date basis). Net realized gains and losses from investment transactions are reported on an identified cost basis. Interest income, which includes accretion of discounts and amortization of premiums, is accrued and recorded as earned using the effective yield method. Dividend income is recognized on the ex-dividend date or for withholding taxes or certain foreign securities, as soon as information is available to the Fund. Withholding taxes on foreign dividends are paid (a portion of which may be reclaimable) or provided for in accordance with the applicable country’s tax rules and rates and are disclosed in the Consolidated Statement of Operations.
| 22 |
| Highland Resolute Fund | Notes to Consolidated Financial Statements |
October 31, 2021 (Unaudited)
Foreign Securities: The Fund may directly purchase securities of foreign issuers. Investing in securities of foreign issuers involves special risks not typically associated with investing in securities of U.S. issuers. The risks include possible re-evaluation of currencies, the inability to repatriate foreign currency, less complete financial information about companies and possible future adverse political and economic developments. Moreover, securities of many foreign issuers and their markets may be less liquid and their prices more volatile than those of securities of comparable U.S. issuers.
Foreign Currency Translation: Values of investments denominated in foreign currencies are converted into U.S. dollars using the current exchange rates each business day (generally 4:00 p.m. Eastern Time). Purchases and sales of investments and dividend income are translated into U.S. dollars using the current prevailing exchange rate on the transaction date. The effect of changes in foreign exchange rates on realized and unrealized gains or losses on securities is reflected as a component of such gains or losses. Transactions in foreign denominated assets may involve greater risks than domestic transactions.
Short Sales: The Fund may make short sales of securities consistent with its strategies. A short sale is a transaction in which a Fund sells a security it does not own in anticipation that the market price of that security will decline.
When a Fund makes a short sale, it must borrow the security sold short and deliver it to the broker dealer through which it made the short sale as collateral for its obligation to deliver the security upon conclusion of the sale. The Fund may have to pay a fee to borrow particular securities and is often obligated to pay over any accrued interest and dividends on such borrowed securities.
If the price of the security sold short increases between the time of the short sale and the time that a Fund replaces the borrowed security, the Fund will incur a loss; conversely, if the price declines, the Fund will realize a capital gain. Any gain will be decreased, and any loss increased, by the transaction costs described above. The successful use of short selling may be adversely affected by imperfect correlation between movements in the price of the security sold short and the securities being hedged. Losses incurred from engaging in short sales may be unlimited.
To the extent that a Fund engages in short sales, it will provide collateral to the broker-dealer and (except in the case of short sales “against the box”) will maintain additional asset coverage in the form of segregated or “earmarked” assets determined to be liquid in accordance with procedures established by the Board and that is equal to the current market value of the securities sold short, or will ensure that such positions are covered by “offsetting” positions, until the Fund replaces the borrowed security. A short sale is “against the box” to the extent that the Fund contemporaneously owns, or has the right to obtain at no added cost, securities identical to those sold short. The Fund may engage in short selling to the extent permitted by the federal securities laws and rules and interpretations thereunder. To the extent a Fund engages in short selling in foreign (non-U.S.) jurisdictions, the Fund will do so to the extent permitted by the laws and regulations of such jurisdiction.
Distributions to Shareholders: The Fund normally pays dividends and distributes capital gains, if any, on an annual basis. Income dividend distributions are derived from interest and dividends and other income the Fund receives from their investments, including distributions of short term capital gains. Capital gain distributions are derived from gains realized when the Fund sells a security it has owned for more than a year. The Fund may make additional distributions and dividends at other times if its portfolio manager or managers believe doing so may be necessary for the Fund to avoid or reduce taxes.
Epidemic and Pandemic Risk: Certain countries have been susceptible to epidemics, most recently COVID-19, which has been designated as a pandemic by world health authorities. The outbreak of such epidemics, together with any resulting restrictions on travel or quarantines imposed, could have a negative impact on the economy and business activity globally (including in the countries in which we invest), and thereby could adversely affect the performance of our investments. Furthermore, the rapid development of epidemics could preclude prediction as to their ultimate adverse impact on economic and market conditions, and, as a result, present material uncertainty and risk with respect to us and the performance of our investments.
Libor Risk: In March 2020, the Financial Accounting Standards Board (FASB) issued Accounting Standards Update (“ASU”) No. 2020 04, Reference Rate Reform (Topic 848): Facilitation of the Effects of Reference Rate Reform on Financial Reporting. The Funds' investments, payment obligations, and financing terms may be based on floating rates, such as the London Interbank Offered Rate, or “LIBOR,” which is the offered rate for short term Eurodollar deposits between major international banks. On November 30, 2020, the administrator of LIBOR announced its intention to delay the phase out of the majority of the U.S. dollar LIBOR publications until June 30, 2023, with the remainder of LIBOR publications to still end at the end of 2021. There remains uncertainty regarding the nature of any replacement rate and the impact of the transition from LIBOR on the Funds' transactions and the financial markets generally. As such, the potential effect of a transition away from LIBOR on the Funds or the Funds' investments cannot yet be determined.
| Semi-Annual Report | October 31, 2021 | 23 |
| Highland Resolute Fund | Notes to Consolidated Financial Statements |
October 31, 2021 (Unaudited)
3. DERIVATIVE INSTRUMENTS
Swap Contracts: The Fund may enter into swap transactions for hedging purposes or to seek to increase total return. At the present time, the Fund primarily enters into swap transactions for the purpose of increasing total return. Risks may arise as a result of the failure of the counterparty to the swap contract to comply with the terms of the swap contract. The loss incurred by the failure of a counterparty is generally limited to the net payment to be received by the Fund and/or the termination value at the end of the contract.
Therefore, the Fund considers the creditworthiness of each counterparty to a contract in evaluating potential credit risk. Additionally, risks may arise from unanticipated movements in interest rates or in the value of the underlying reference asset or index. Entering into these agreements involves, to varying degrees, market risk, liquidity risk and elements of credit, legal and documentation risk that are not directly reflected in the amounts recognized in the Consolidated Statement of Assets and Liabilities.
The Fund invests in total return swaps to obtain exposure to a security or market without owning such security or investing directly in that market or to transfer the risk/return of one market (e.g., fixed income) to another market (e.g., equity) (equity risk and/or interest rate risk). Total return swaps are agreements in which there is an exchange of cash flows whereby one party commits to make payments based on the total return (coupons plus capital gains/losses) of an underlying instrument in exchange for fixed or floating rate interest payments. To the extent the total return of the instrument or index underlying the transaction exceeds or falls short of the offsetting interest rate obligation, the Fund will receive a payment from or make a payment to the counterparty. The Fund may pay or receive cash as collateral on these contracts which may be recorded as an asset and/or liability. The Fund must set aside liquid assets, or engage in other appropriate measures, to cover its obligations under these contracts. Swaps are marked to market daily using either pricing vendor quotations, counterparty prices or model prices and the change in value, if any, is recorded as an unrealized gain or loss. Upfront payments made and/or received by the Fund are recorded as an asset and/or liability and realized gains or losses are recognized ratably over the contract’s term/event, with the exception of forward starting interest rate swaps, whose realized gains or losses are recognized ratably from the effective start date. Periodic payments received or made on swap contracts are recorded as realized gains or losses. Gains or losses are realized upon termination of a swap contract and are recorded on the Consolidated Statement of Operations. Swap agreements held at October 31, 2021 are disclosed in the Consolidated Schedule of Investments.
International Swaps and Derivatives Association, Inc. Master Agreements (“ISDA Master Agreements”) govern OTC financial derivative transactions entered into by the Fund and those counterparties. The ISDA Master Agreements maintain provisions for general obligations, representations, agreements, collateral and events of default or termination. Events of termination include conditions that may entitle counterparties to elect to terminate early and cause settlement of all outstanding transactions under the applicable ISDA Master Agreement. Any election to early terminate could be material to the financial statements.
Option Contracts: The Fund may enter into options transactions for hedging purposes and for non-hedging purposes such as seeking to enhance return. The Fund may write covered put and call options on any stocks or stock indices, currencies traded on domestic and foreign securities exchanges, or futures contracts on stock indices, interest rates and currencies traded on domestic and, to the extent permitted by the CFTC, foreign exchanges. A call option on an asset written by the Fund obligates the Fund to sell the specified asset to the holder (purchaser) at a stated price (the exercise price) if the option is exercised before a specified date (the expiration date). A put option on an asset written by a Fund obligates the Fund to buy the specified asset from the purchaser at the exercise price if the option is exercised before the expiration date. Premiums received when writing options are recorded as liabilities and are subsequently adjusted to the current value of the options written. Premiums received from writing options that expire are treated as realized gains. Premiums received from writing options, which are either exercised or closed, are offset against the proceeds received or amount paid on the transaction to determine realized gains or losses which are recorded on the Consolidated Statement of Operations.
Futures: The Fund may enter into futures contracts for hedging purposes. A futures contract represents a commitment for the future purchase or sale of an asset at a specified price on a specified date. Upon entering into a futures contract, the Fund is required to deposit an initial margin with the broker in an amount equal to a certain percentage of the contract amount. The Fund receives from or pays to the broker, on a daily basis, an amount of cash equal to the daily fluctuation in value of the contract. Such receipts or payments are known as “variation margin,” and are recorded by the Fund as unrealized gains or losses. When the futures contract is closed, the Fund records a gain or loss equal to the difference between the value of the contract at the time it was opened and the value at the time it was closed.
| 24 |
| Highland Resolute Fund | Notes to Consolidated Financial Statements |
October 31, 2021 (Unaudited)
The Fund’s potential losses from the use of futures extend beyond its initial investment in such contracts. The use of futures contracts involves, to varying degrees, elements of market risk in excess of the amount recognized in the Consolidated Statement of Assets and Liabilities. The predominant risk is that the movement of a futures contract’s price may result in a loss, which could render the Fund’s hedging strategy unsuccessful. There is minimal counterparty credit risk since futures contracts are exchange traded and the exchange’s clearinghouse, as counterparty to all exchange traded futures, guarantees the futures against default.
Risk Exposure: The following tables disclose the amounts related to the Fund’s use of derivative instruments.
The effect of derivative instruments on the Consolidated Statement of Assets and Liabilities as of October 31, 2021 was as follows:
| Risk Exposure | Asset Derivatives Statement of Assets and Liabilities Location | Fair Value | Liability Derivatives Statement of Assets and Liabilities Location | Fair Value | ||||||||
| Highland Resolute Fund | ||||||||||||
| Equity Risk (Total Return Swap Contracts) | Unrealized appreciation on total return swap contracts | $ | 19,515 | Unrealized depreciation on total return swap contracts | $ | (445 | ) | |||||
| Commodity Risk (Total Return Swap Contracts) | Unrealized appreciation on total return swap contracts | – | Unrealized depreciation on total return swap contracts | (16,736 | ) | |||||||
| Credit Risk (Total Return Swap Contracts) | Unrealized appreciation on total return swap contracts | – | Unrealized depreciation on total return swap contracts | – | ||||||||
| Equity Risk (Written Options) | N/A | N/A | Written options, at value | – | ||||||||
| Equity Risk (Futures Contracts) | Unrealized appreciation on futures contracts | N/A | (a) | N/A | N/A | |||||||
| Total | $ | 19,515 | $ | (17,181 | ) | |||||||
| (a) | Reflects cumulative unrealized appreciation of futures contracts as reported in the Consolidated Schedule of Investments. The value reflected on the accompanying Consolidated Statement of Assets and Liabilities is only the unsettled variation margin payable as of October 31, 2021. |
| Semi-Annual Report | October 31, 2021 | 25 |
| Highland Resolute Fund | Notes to Consolidated Financial Statements |
October 31, 2021 (Unaudited)
The effect of derivative instruments on the Consolidated Statements of Operations for the six months ended October 31, 2021 was as follows:
| Risk Exposure | Statement of Operations Location | Realized Gain/(Loss) on Derivatives Recognized in Income | Change in Unrealized Appreciation/(Depreciation) on Derivatives Recognized in Income | |||||||
| Highland Resolute Fund | ||||||||||
| Equity Risk (Total Return Swap Contracts) | Net realized gain/(loss) on total return swap contracts/Net change in unrealized appreciation/(depreciation) on total return swap contracts | $ | 1,277,921 | $ | 1,716 | |||||
| Commodity Risk (Total Return Swap Contracts) | Net realized gain/(loss) on total return swap contracts/Net change in unrealized appreciation/(depreciation) on total return swap contracts | $ | 873,115 | $ | 29,860 | |||||
| Credit Risk (Total Return Swap Contracts) | Net realized gain/(loss) on total return swap contracts/Net change in unrealized appreciation/(depreciation) on total return swap contracts. | $ | (38,479 | ) | $ | 1,814 | ||||
| Foreign Exchange Rate Risk (Total Return Swap Contracts) | Net realized gain/(loss) on total return swap contracts/Net change in unrealized appreciation/(depreciation) on total return swap contracts | N/A | – | |||||||
| Equity Risk (Written Options) | Net realized gain/(loss) on written options/Net change in unrealized appreciation/(depreciation) on written options | 135,466 | (51,060 | ) | ||||||
| Equity Risk (Futures Contracts) | Net realized gain/(loss) on futures contracts/Net change in unrealized appreciation/(depreciation) futures contracts | 139,290 | (765,320 | ) | ||||||
| Total | $ | 2,387,313 | $ | (782,990 | ) | |||||
Volume of Derivative Instruments for the Fund during the six months ended October 31, 2021 was as follows:
| Derivative Type | Unit of Measurement | Monthly Average |
| Equity Risk (Total Return Swap Contracts) | Notional Quantity | 123,704,471 |
| Commodity Risk (Total Return Swap Contracts) | Notional Quantity | 150,456,931 |
| Credit Risk (Total Return Swap Contracts) | Notional Quantity | 131,198 |
| Foreign Exchange Rate Risk (Total Return Swap Contracts) | Notional Quantity | – |
| Equity Risk (Written Options) | Value | – |
| Equity Risk (Futures Contracts) | Notional Quantity | – |
Certain derivative contracts are executed under either standardized netting agreements or, for exchange-traded derivatives, the relevant contracts for a particular exchange which contain enforceable netting provisions. A derivative netting arrangement creates an enforceable right of off-set that becomes effective, and affects the realization of settlement on individual assets, liabilities and collateral amounts, only following a specified event of default or early termination. Default events may include the failure to make payments or deliver securities timely, material adverse changes in financial condition or insolvency, the breach of minimum regulatory capital requirements, or loss of license, charter or other legal authorization necessary to perform under the contract.
| 26 |
| Highland Resolute Fund | Notes to Consolidated Financial Statements |
October 31, 2021 (Unaudited)
The following table presents financial instruments that are subject to enforceable netting arrangements or other similar agreements as of October 31, 2021:
Highland Resolute Fund
Offsetting of Derivatives Assets
Gross Amounts Not Offset in the Statement of Assets and Liabilities | ||||||||||||||||||||||||
| Gross Amounts of Recognized Assets | Gross Amounts Offset in the Statement of Assets and Liabilities | Net Amounts Presented in the Statement of Assets and Liabilities | Financial Instruments Available for Offset(a) | Cash Collateral Received(a) | Net Receivable Amount | |||||||||||||||||||
| Total Return Swap Contracts | $ | 19,515 | $ | – | $ | 19,515 | $ | (19,515 | ) | $ | – | $ | – | |||||||||||
| Total | $ | 19,515 | $ | – | $ | 19,515 | $ | (19,515 | ) | $ | – | $ | – | |||||||||||
Highland Resolute Fund
Offsetting of Derivatives Liabilities
Gross Amounts Not Offset in the Statement of Assets and Liabilities | ||||||||||||||||||||||||
| Gross Amounts of Recognized Liabilities | Gross Amounts Offset in the Statement of Assets and Liabilities | Net Amounts Presented in the Statement of Assets and Liabilities | Financial Instruments Available for Offset(a) | Cash Collateral Pledged(a) | Net Payable Amount | |||||||||||||||||||
| Total Return Swap Contracts | $ | (17,181 | ) | $ | – | $ | (17,181 | ) | $ | 17,181 | $ | – | $ | – | ||||||||||
| Total | $ | (17,181 | ) | $ | – | $ | (17,181 | ) | $ | 17,181 | $ | – | $ | – | ||||||||||
| (a) | These amounts are limited to the derivative asset/liability balance and, accordingly, do not include excess collateral received/pledged. |
4. TAX BASIS INFORMATION
Tax Basis of Investments: As of October 31, 2021, the aggregate cost of investments, gross unrealized appreciation/(depreciation) and net unrealized appreciation for Federal tax purposes were as follows:
| Gross Appreciation (excess of value over tax cost) | Gross Depreciation (excess of tax cost over value) | Net Unrealized Appreciation/(Depreciation) | Cost of Investments for Income Tax Purposes | |||||||||||||
| Highland Resolute Fund | $ | 112,222,170 | $ | (94,169,423 | ) | $ | 18,052,747 | $ | 142,401,990 | |||||||
| Semi-Annual Report | October 31, 2021 | 27 |
| Highland Resolute Fund | Notes to Consolidated Financial Statements |
October 31, 2021 (Unaudited)
Tax Basis of Distributions to Shareholders: The character of distributions made during the year from net investment income or net realized gains may differ from its ultimate characterization for federal income tax purposes. Also, due to the timing of dividend distributions, the fiscal year in which amounts are distributed may differ from the fiscal year in which the income or realized gain were recorded by the Fund.
The tax character of distributions paid by the Fund for the fiscal year ended April 30, 2021, were as follows:
| Ordinary Income | Long-Term Capital Gains | |||||||
| Highland Resolute Fund | $ | – | $ | – | ||||
Under current law, capital losses maintain their character as short-term or long-term and are carried forward to the next tax year without expiration. As of April 30, 2021, the Fund elects to carry forward $8,963,754 in long-term capital losses and $7,968,307 in short-term capital losses to the next tax year.
The amounts and characteristics of tax basis distributions and composition of distributable earnings/(accumulated losses) are finalized at fiscal year-end. Accordingly, tax basis balances have not been determined as of October 31, 2021.
5. SECURITIES TRANSACTIONS
Purchases and sales of securities, excluding short-term securities and U.S. Government Obligations during the six months ended October 31, 2021 were as follows:
| Fund | Purchases of Securities | Proceeds From Sales of Securities | ||||||
| Highland Resolute Fund | $ | 89,755,951 | $ | 44,564,582 | ||||
6. BENEFICIAL SHARE TRANSACTIONS
The capitalization of the Trust consists of an unlimited number of shares of beneficial interest with no par value per share. Holders of the shares of the Fund of the Trust have one vote for each share held and a proportionate fraction of a vote for each fractional share. All shares issued and outstanding are fully paid and are transferable and redeemable at the option of the shareholder. Purchasers of the shares do not have any obligation to make payments to the Trust or its creditors solely by reason of the purchasers’ ownership of the shares. Shares have no pre-emptive rights.
Transactions in common shares were as follows:
Highland Resolute Fund
| Class I: | For the Six Months Ended October 31, 2021 (Unaudited) | For the Year Ended April 30, 2021 | ||||||
| Common Shares Outstanding - Beginning of Period | 13,771,457 | 19,374,899 | ||||||
| Common Shares Sold | 3,158,729 | 2,863,529 | ||||||
| Common Shares Redeemed | (121,068 | ) | (8,466,971 | ) | ||||
| Common Shares Outstanding - End of Period | 16,809,118 | 13,771,457 | ||||||
Shares redeemed within 90 days of purchase may incur a 2% short-term redemption fee deducted from the redemption amount. Redemption fees are reflected in the “Shares redeemed, net of redemption fees” in the Consolidated Statements of Changes in Net Assets. For the six months ended October 31, 2021 and the year ended April 30, 2021, the Fund retained fees as follows:
| Fund | For the Six Months Ended October 31, 2021 (Unaudited) | For the Year Ended April 30, 2021 | ||||||
| Highland Resolute Fund | $ | 59 | $ | – | ||||
| 28 |
| Highland Resolute Fund | Notes to Consolidated Financial Statements |
October 31, 2021 (Unaudited)
7. MANAGEMENT AND RELATED PARTY TRANSACTIONS
Investment Advisory
The Adviser, subject to the authority of the Board, is responsible for the overall management and administration of the Fund’s business affairs. Pursuant to the Investment Advisory Agreement (the “Advisory Agreement”), the Adviser is entitled to an investment advisory fee, computed daily and payable monthly of 1.50% of the average daily net assets for the Fund. The management fee is paid on a quarterly basis.
The Subsidiary has entered into a separate advisory agreement (the “Subsidiary Advisory Agreement”) with the Adviser for the management of the Subsidiary’s portfolio pursuant to which the Subsidiary is obligated to pay the Adviser a management fee at the same rate that the Fund pays the Adviser for investment advisory services provided to the Fund. The Adviser has agreed to waive the advisory fee it receives from the Fund in an amount equal to the management fee paid by the Subsidiary. This waiver may not be terminated or modified without the consent of the Board. This agreement may not be terminated or modified prior to this date except with the approval of the Board. For the six months ended October 31, 2021, this amount equaled $141,373 and is disclosed in the Consolidated Statement of Operations. Fees under the Subsidiary Advisory Agreement are not permitted to be recouped.
The Adviser entered into Investment Sub-Advisory Agreements with Parametric Portfolio Associates, LLC (“Parametric”). The Adviser determines the allocation of the Fund’s assets with Parametric (the “Sub-Adviser”) and other open-end investment companies. The Fund is not required to invest with any minimum number of sub-advisers or open-end investment companies, and does not have minimum or maximum limitations with respect to allocations of assets to the Sub-Advisers, investment strategy or market sector. The Adviser may change the allocation of the Fund’s assets among the available investment options, and may add or remove sub-advisers, at any time. Each Sub-Adviser is responsible for the day-to-day management of its allocated portion of Fund assets. The Adviser has ultimate responsibility, subject to the oversight of the Board of the Fund, to oversee the Sub-Advisers, and to recommend their hiring, termination and replacement.
Pursuant to each Investment Sub-Advisory Agreement, the Adviser pays the Sub-Adviser an annual sub-advisory management fee which is based on the Fund’s average quarterly market value of the assets managed by the Sub-Adviser. The Adviser is required to pay all fees due to Sub-Adviser out of the management fee the Adviser receives from the Fund. The following table reflects the Fund’s contractual sub-advisory fee rate.
| Sub-Advisers | Contractual Sub-Advisory Fee |
| Parametric Portfolio Associates, LLC | 0.30% |
| (a) | Effective May 13, 2021, Parametric Portfolio Associates, LLC, ceased serving as an investment Sub-Adviser to the Fund. |
The Adviser has agreed to waive (i) the portion of its 1.50% Management Fee in excess of any sub-advisory fees less (ii) third-party administrative costs charged to the Adviser in connection with the non-recurring addition of a new investment sub-advisor for the Fund or the removal of an existing investment sub-adviser to the Fund (“Sub-Advisory Fees”). Such fee waivers and reimbursements for the Fund (the “Expense Agreement”) shall continue through at least August 31, 2022. The Adviser may not discontinue this agreement to waive fees prior to August 31, 2022 without the approval of the Board. The Adviser is not permitted to recoup any amounts waived or reimbursed in any prior fiscal period. Fees waived/reimbursed by the Adviser for the six months ended October 31, 2021 are disclosed in the Consolidated Statement of Operations.
For the six months ended October 31, 2021, the fee waivers and/or reimbursements were as follows:
| Fees Waived/ Reimbursed By Adviser | |
| Highland Resolute Fund - Class I | $ (1,422,055) |
Administrator Fees and Expenses
ALPS Fund Services, Inc. (“ALPS”) serves as administrator to the Fund, and the Fund has agreed to pay expenses incurred in connection with its administrative activities. Pursuant to an Administration Agreement, ALPS provides operational services to the Fund including, but not limited to, fund accounting and fund administration and generally assists in the Fund’s operations. Officers of the Trust are employees of ALPS. The Fund’s administration fee is accrued on a daily basis and paid monthly. Administration fees paid by the Fund for the six months ended October 31, 2021 are disclosed in the Consolidated Statement of Operations.
ALPS is reimbursed by the Fund for certain out-of-pocket expenses.
| Semi-Annual Report | October 31, 2021 | 29 |
| Highland Resolute Fund | Notes to Consolidated Financial Statements |
October 31, 2021 (Unaudited)
Transfer Agent
ALPS serves as transfer, dividend paying and shareholder servicing agent for the Fund. ALPS receives an annual minimum fee, a fee based upon the number of shareholder accounts and is also reimbursed by the Fund for certain out-of-pocket expenses. Transfer agent fees paid by the Fund for the six months ended October 31, 2021 are disclosed in the Consolidated Statement of Operations.
Compliance Services
ALPS provides services that assist the Fund’s chief compliance officer in monitoring and testing the policies and procedures of the Fund in conjunction with requirements under Rule 38a-1 under the 1940 Act and receives an annual base fee. ALPS is reimbursed for certain out-of-pocket expenses by the Fund. Compliance service fees paid by the Fund for the six months ended October 31, 2021 are disclosed in the Consolidated Statement of Operations.
Principal Financial Officer
ALPS receives an annual fee for providing principal financial officer services to the Fund. Principal financial officer fees paid by the Fund for the six months ended October 31, 2021 are disclosed in the Consolidated Statement of Operations.
Distributor
ALPS Distributors, Inc. (“ADI” or the “Distributor”) (an affiliate of ALPS) acts as the distributor of the Fund’s shares pursuant to a Distribution Agreement with the Trust on behalf of the Fund. Shares are sold on a continuous basis by ADI as agent for the Fund, and ADI has agreed to use its best efforts to solicit orders for the sale of Fund’s shares, although it is not obliged to sell any particular amount of shares. ADI is not entitled to any compensation for its services as Distributor. ADI is registered as a broker-dealer with the U.S. Securities and Exchange Commission.
Shareholder Services Plan
Effective December 12, 2017, the Fund has adopted a Shareholder Services Plan (the “Plan”) with respect to its Class I shares. Under the Plan, the Fund is authorized to pay banks and its affiliates and other institutions, including broker-dealers and Fund affiliates which may include the Distributor, Adviser and/or the transfer agent (“Participating Organizations”), an aggregate fee in an amount not to exceed on an annual basis 0.10% of the average daily net asset value of Class I shares of the Fund attributable to or held in the name of the Participating Organizations for its clients as compensation for providing shareholder service activities, which do not include distribution services pursuant to an agreement with Participating Organizations. Any amount of such payment not paid to the Participating Organizations during the Fund’s fiscal year for such service activities shall be reimbursed to the Fund as soon as practicable. Plan fees are included with shareholder service fees in the Consolidated Statement of Operations. Fees recaptured pursuant to the Plan for the six months ended October 31, 2021 are included as an offset to shareholder service fees as disclosed in the Consolidated Statement of Operations.
Trustees
The fees and expenses of the Trustees of the Board are presented in the Consolidated Statement of Operations.
8. INDEMNIFICATIONS
Under the Trust’s organizational documents, its officers and Trustees are indemnified against certain liability arising out of the performance of their duties to the Trust. Additionally, in the normal course of business, the Trust enters into contracts with service providers that may contain general indemnification clauses which may permit indemnification to the extent permissible under applicable law. The Trust’s maximum exposure under these arrangements is unknown, as this would involve future claims that may be made against the Trust that have not yet occurred.
9. SUBSEQUENT EVENT
Subsequent events after the date of the Consolidated Statement of Assets and Liabilities have been evaluated through the date the financial statements were issued.
| 30 |
| Highland Resolute Fund | Additional Information |
October 31, 2021 (Unaudited)
1. FUND HOLDINGS
The Fund files its complete schedule of portfolio holdings with the Securities and Exchange Commission (SEC) for the first and third quarters of each fiscal year on Form N-PORT. The Fund files its complete schedule of portfolio holdings with the SEC for the first and third quarters of each fiscal year as an exhibit to its reports on Form N-PORT. The Fund’s Form N-PORT reports are available on the SEC’s Web site at http://www.sec.gov. The Fund's Form N-PORT reports are also available upon request by calling toll-free (855) 268-2242.
2. FUND PROXY VOTING POLICIES, PROCEDURES AND SUMMARIES
Fund policies and procedures used in determining how to vote proxies and information regarding how each of the Fund voted proxies relating to portfolio securities during the most recent prior 12-month period ending June 30 are available without charge, (1) upon request, by calling (toll-free) (855) 268-2242 and (2) on the SEC’s website at http://www.sec.gov.
| Semi-Annual Report | October 31, 2021 | 31 |
| Highland Resolute Fund | Disclosure Regarding Approval of Fund Advisory Agreements |
October 31, 2021 (Unaudited)
Passaic
On September 29, 2021, the Trustees met via electronic means (videoconference)1 to discuss, among other things, the approval of the new Sub-Advisory Agreement between the Financial Investors Trust (the “Trust”), with respect to the Highland Resolute Fund (the “Highland Fund”), Highland Associates, Inc. (“Highland”) and Passaic Partners LLC (“Passaic”), in accordance with Section 15(c) of the 1940 Act. In approving the new Sub-Advisory Agreement with Passaic Partners, on behalf of the Highland Fund, the Trustees, including the Independent Trustees, considered the following factors with respect to the Highland Fund:
Nature, Extent, and Quality of the Services under the Investment Sub-Advisory Agreements: The Trustees received and considered information regarding the nature, extent, and quality of services to be provided to the Highland Fund under the Investment Sub-Advisory Agreement. The Trustees also reviewed certain background materials supplied by Passaic in its presentation, including its Form ADV.
The Trustees reviewed and considered Passaic’s investment sub-advisory personnel, their history as asset managers, their performance, and the amount of assets currently under management by them and their affiliated entities. The Trustees also reviewed the research and decision-making processes utilized by Passaic, including the methods adopted to seek to achieve compliance with the investment objectives, policies, and restrictions of the Highland Fund.
The Trustees considered the background and experience of Passaic’s management in connection with the Highland Fund, including reviewing the qualifications, backgrounds, and responsibilities of the management team primarily responsible for the day-to-day portfolio management of the Highland Fund and the extent of the resources devoted to research and analysis of actual and potential investments.
The Trustees also reviewed, among other things, Passaic’s insider trading policies and procedures and its Code of Ethics.
Performance: The Trustees noted that since Passaic had not begun to manage its portion of the Highland Fund, there was no relevant fund performance generated by Passaic to be reviewed or analyzed at this time. The Trustees also considered Passaic’s discussion of their reputation generally and their investment techniques, risk management controls, and decision-making processes.
Investment Sub-Advisory Fee Rate: The Trustees reviewed and considered the contractual annual sub-advisory fees to be paid by Highland, on behalf of the Highland Fund, to Passaic of 0.50% of the Highland Fund’s daily average net assets allocated to Passaic, in light of the extent and quality of the sub-advisory services to be provided by Passaic to the Highland Fund. The Board also received and considered information provided by Passaic with respect to its operating expense structure.
The Board received and considered information including a comparison of the Highland Fund’s contractual and actual advisory fees and overall expenses with those of funds in the peer group and universe of funds provided by an independent provider of investment company data (the “Data Provider”). The Trustees noted that the contractual advisory fee rate for the Highland Fund of 1.50% of the Fund’s daily net assets was above the Data Provider peer group and universe medians.
Total Expense Ratios: Based on such information, the Trustees further reviewed and considered the total expense ratio (net of waivers) of 0.69% for the Highland Fund. The Trustees noted that the Highland Fund’s total expense ratio (net of waivers) was below the Data Provider peer group and universe medians.
Comparable Accounts: The Trustees noted that Passaic provided information regarding fees charged to other clients utilizing a strategy similar to its investment mandate for the Highland Fund.
Profitability: The Trustees received and considered Passaic’s statements regarding projected profitability based on the fees payable under the Investment Sub-Advisory Agreement. The Trustees considered the profits, if any, anticipated to be realized by Passaic with respect to the Highland Fund. The Board then reviewed the financial information provided by Passaic.
| 32 |
| Highland Resolute Fund | Disclosure Regarding Approval of Fund Advisory Agreements |
October 31, 2021 (Unaudited)
Economies of Scale: The Trustees considered whether economies of scale in the provision of services to the Highland Fund will be passed along to the shareholders under the proposed agreement.
Other Benefits to the Sub-Adviser: The Trustees reviewed and considered any other incidental benefits derived or to be derived by Passaic from its relationship with the Highland Fund, including whether soft dollar arrangements would be used.
In approving Passaic as an investment sub-adviser for the Highland Fund and approving the Investment Sub-Advisory Agreement and the fees to be paid to Passaic by Highland under the Investment Sub-Advisory Agreement the Trustees concluded that no single factor reviewed by the Trustees was identified by the Trustees to be determinative as the principal factor in whether to approve the Investment Sub-Advisory Agreement. Further, the Independent Trustees were advised by separate independent legal counsel throughout the process. The Trustees, including all of the Independent Trustees, concluded that:
| · | the nature, extent, and quality of services to be rendered by Passaic under the Investment Sub-Advisory Agreement with respect to the Highland Fund were adequate; |
| · | since Passaic has not yet begun to manage its portion of the Highland Fund, there is no relevant fund performance generated by Passaic to be reviewed or analyzed at this time; |
| · | the investment sub-advisory fees to be paid to Passaic by Highland are fair and competitive when considered in light of particular services to be provided by Passaic to the Highland Fund; |
| · | Bearing in mind the limitations of comparing different types of managed accounts and the different levels of service typically associated with such accounts, the fee structures applicable to Passaic’s other clients employing a comparable strategy to Passaic’s investment mandate for the Highland Fund was not indicative of any unreasonableness with respect to the sub-advisory fees proposed to be payable to Passaic by Highland; |
| · | the profit, if any, anticipated to be realized by Passaic in connection with the operation of its portion of the Highland Fund is not unreasonable to the Highland Fund; and |
| · | there were no material economies of scale or other incidental benefits accruing to Passaic in connection with its relationship with the Highland Fund. |
Based on the Trustees’ deliberations and their evaluation of the information described above, the Trustees, including all of the Independent Trustees, concluded that Passaic’s compensation for investment sub-advisory services is consistent with the best interests of the Highland Fund and its shareholders.
| 1 | This meeting was intended to qualify as an "in-person" meeting of the Board pursuant to relief granted by the SEC in response to the COVID-19 outbreak for the purposes of fulfilling the in-person investment advisory agreement approval requirements under Section 15(c) of the 1940 Act (see Investment Company Act Release No. 33817 (Mar. 13, 2020), Investment Company Act Release No. 33824 (Mar. 25, 2020) and Investment Company Act Release No. 33897 (June 19, 2020)). |
| Semi-Annual Report | October 31, 2021 | 33 |
| Highland Resolute Fund | Privacy Policy |
October 31, 2021 (Unaudited)
| Who We Are | |
| Who is providing this notice? | Highland Resolute Fund |
| What We Do | |
| How does the Fund protect my personal information? | To protect your personal information from unauthorized access and use, we use security measures that comply with federal law. These measures include computer safeguards and secured files and buildings. |
| How does the Fund collect my personal information? | We collect your personal information, for example, when you
· open an account · provide account information or give us your contact information · make a wire transfer or deposit money |
| Why can't I limit all sharing? | Federal law gives you the right to limit only
· sharing for affiliates’ everyday business purposes-information about your creditworthiness · affiliates from using your information to market to you · sharing for non-affiliates to market to you
State laws and individual companies may give you additional rights to limit sharing. |
| Definitions | |
| Affiliates | Companies related by common ownership or control. They can be financial and nonfinancial companies. |
| Non-affiliates | Companies not related by common ownership or control. They can be financial and nonfinancial companies.
· The Fund does not share with non-affiliates so they can market to you. |
| Joint marketing | A formal agreement between non-affiliated financial companies that together market financial products or services to you.
· The Fund does not jointly market. |
| Other Important Information | |
| California Residents | If your account has a California home address, your personal information will not be disclosed to nonaffiliated third parties except as permitted by applicable California law, and we will limit sharing such personal information with our affiliates to comply with California privacy laws that apply to us. |
| Vermont Residents | The State of Vermont requires financial institutions to obtain your consent prior to sharing personal information that they collect about you with affiliated companies and nonaffiliated third parties other than in certain limited circumstances. Except as permitted by law, we will not share personal information we collect about you with nonaffiliated third parties or other affiliated companies unless you provide us with your written consent to share such information. |
| 34 |
| Highland Resolute Fund | Privacy Policy |
October 31, 2021 (Unaudited)
| FACTS | WHAT DOES THE FUND DO WITH YOUR PERSONAL INFORMATION? |
| Why? | Financial companies choose how they share your personal information. Federal law gives consumers the right to limit some but not all sharing. Federal law also requires us to tell you how we collect, share, and protect your personal information. Please read this notice carefully to understand what we do. |
| What? | The types of personal information we collect and share depend on the product or service you have with us. This information can include:
· Social Security number and account transactions · Account balances and transaction history · Wire transfer instructions |
| How? | All financial companies need to share customers’ personal information to run their everyday business. In the section below, we list the reasons financial companies can share their customers’ personal information; the reasons the Fund chooses to share; and whether you can limit this sharing. |
| Reasons we can share your personal information | Does the Fund share: | Can you limit this sharing? |
| For our everyday business purposes — such as to process your transactions, maintain your account(s), respond to court orders and legal investigations, or report to credit bureaus | Yes | No |
| For our marketing purposes — to offer our products and services to you | No | We do not share. |
| For joint marketing with other financial companies | No | We do not share. |
| For our affiliates’ everyday business purposes — information about your transactions and experiences | Yes | No |
| For our affiliates’ everyday business purposes — information about your creditworthiness | No | We do not share. |
| For nonaffiliates to market to you | No | We do not share. |
| Semi-Annual Report | October 31, 2021 | 35 |

 | TABLE OF CONTENTS |
| Shareholder Letter | 1 |
| Performance Update | 5 |
| Disclosure of Fund Expenses | 11 |
| Portfolio of Investments | |
| Rondure New World Fund | 12 |
| Rondure Overseas Fund | 15 |
| Statements of Assets and Liabilities | 18 |
| Statements of Operations | 19 |
| Statement of Changes in Net Assets | |
| Rondure New World Fund | 20 |
| Rondure Overseas Fund | 21 |
| Financial Highlights | |
| Rondure New World Fund | 22 |
| Rondure Overseas Fund | 24 |
| Notes to Financial Statements | 26 |
| Additional Information | 33 |
| Disclosure Regarding Approval of Fund Advisory Agreement | 34 |
| Privacy Policy | 36 |
| Rondure Funds | Shareholder Letter |
| October 31, 2021 (Unaudited) |
Dear Fellow Shareholders,
“Global investors are shocked to have discovered that China is run by Communists.” – Matthew Brooker, Bloomberg Opinion, 4 Aug 2021
Coming off a recent week of client calls, one topic has dominated our conversations: China. As in, “What in the world is going on in Chinese markets?” “How worried should I be?” And “Could Evergrande be the next Lehman Brothers?”
As is the case in markets (and life), the most important questions about the future can’t be answered definitively. Yet mental models for assessing the China situation can gauge risk and guide action.
First, one overarching observation: While it’s true that China’s economy is radically different from the United States, investors in both countries must grapple with the same question today—How much of today’s economy is real (durable, lasting), and how much is fantasy (and likely unsustainable)?
Real Estate Dreams at Home and Abroad
As we write this, the latest shoe to drop in the Chinese real estate debt drama is the failure of the prophetically-named Fantasia Holdings, a developer, to repay the $206-million principal of a bond that matured October 4. Rating agencies downgraded the issuer accordingly. The poor creditors of Fantasia are now left to wonder whether their capital has disappeared to Fantasyland, never to return. (You can’t make these names up.)
Of course, Americans are no strangers to real estate fantasy lands. We are in one of our own. In July, the leading measure of U.S. home prices, the Case-Shiller Index, reported a record 19.7% annual gain. That jump is especially astounding considering it is the 14th consecutive month of acceleration. The Fed now faces an unenviable dilemma. Its laudable goal of maintaining a dovish policy long enough “to help the lives of low and moderate-income communities,” as Chairman Powell put it, has unwittingly caused a spike in rental costs, borne disproportionately by these same groups. One index shows rental prices leaped by 12% this summer, after a minor Covid dip, with some metros up 20%.
The extent to which debt-fueled real estate investment underpins China’s growth is staggering. A recent study by scholars at Harvard and Tsinghua Universities found that China’s property sector contributed 29% of Gross Domestic Product (GDP) in 2016, a level matched only by Spain and Ireland at the height of the 2000s bubble. “Despite the repeated arguments that China is different,” they argue, “it shares striking similarities with other boom episodes in the run-up of housing prices, the scale of the construction sector, the debt accumulation, etc.” This ill-grounded real estate boom may be what recently prompted Xi Jinping to call on the Party to pursue “genuine rather than inflated GDP growth.”
HGTV should consider a Beijing satellite office—the American dream and Chinese dream may be merging. Home ownership has long been a status symbol in China, hardly a foreign notion to Americans. Real estate investment in China is popular partly due to a lack of alternative investment options. Housing constitutes an eye-popping 78% of all Chinese assets compared to 35% in the United States. That both cultures share an infatuation with real estate is no surprise given rapid urbanization and growth in China coupled with falling interest rates on both sides of the Pacific.
Before drawing investing conclusions, let’s sort through what we do and don’t know about China’s property sector.
In our view, we can be fairly certain that:
| 1. | A massive property boom has taken place in China since 1988, when Beijing undertook urban planning reforms that commercialized development to support the Party’s economic growth objectives. Fueled by easy money and real estate being declared a “pillar industry,” property prices have surged over the last 35 years. |
| 2. | A gargantuan amount of leverage has been accumulated during the boom. Household debt has risen from 26% to 61% of GDP between 2010 and 2021, with non-financial corporate debt up from 118% to 159% of GDP over that time. |
| 3. | Problematic incentives, cross-collateralizations, and moral hazard are rife. Local Chinese Communist Party (CCP) leaders are often promoted or demoted by economic growth in their jurisdiction; State-Owned Enterprise (SOE) lenders, for whom real estate has been a linchpin, are also woefully entangled. |
| 4. | Housing is likely overbuilt given slowing demand for homes. Housing demand has fallen as a) the country ages, b) price-to-income ratios in Tier 1 cities are among the highest in the world, c) urbanization rates are high (60%) as is home ownership (90%), and d) borrowing capacity is dwindling as household leverage approaches U.S. levels. Vacancy rates in Tier 2 and 3 cities are shockingly high.1 |
| 1 | Cities in China are often segmented into tiers based on population. Tier 1 = 15+ million, Tier 2 = 3-15 million, Tier 3 = 0.15 - 3 million. |
| Semi-Annual Report | October 31, 2021 | 1 |
| Rondure Funds | Shareholder Letter |
| October 31, 2021 (Unaudited) |
| 5. | Housing has become an increasingly speculative asset. Roughly 2/3 of home purchases were made by first-time buyers from 2008 to 2015. That number had cratered to 1/8 by 2018. |
| 6. | Home improvement likely won’t make up the gap. Most housing in China was built after the 1990s, and nearly all since the 1990s, so renovation needs are limited. |
| 7. | A slowdown in property investment would weigh on economic growth. Because real estate is entwined with other facets of an economy—lending, construction, public finances—roaring development has had an outsized impact in China. One study finds a 20% fall in real estate activity would lead to a 5-10% contraction in GDP, “even without amplification from a banking crisis.” Housing’s high share of wealth in China amplifies consumer ripple effects. |
What we feel is harder to discern:
| 1. | What action Beijing will take with upcoming defaults. Gearing levels at Chinese property giants is likely far higher than assumed due to the role of off-balance sheet debt. This story does not appear to be over. Yet the role that the Party will play in forestalling future defaults remains unclear. What is certain is that Beijing will take a special role overseeing any corporate reorganizations that prove necessary. The fact that masses of everyday citizens own Evergrande’s securities and homes magnifies the political sensitivity. |
| 2. | The extent to which the CCP can backstop the whole mess. The government’s control over the nation’s financial system bolsters its ability to prevent a debt crisis compared to Western peers. Land sales and nationalization of Evergrande’s assets, on a regional basis, would be one path to resolution. It appears likely that the current pace of property investment and appreciation are unsustainable and likely to plateau or reverse, knocking household wealth and spending in China. This is bearish but not damning—it’s cyclical. |
| 3. | Whether this will lead to a broader contagion in Chinese financial markets. This is an obvious question but not an answerable one. Hemingway famously said that bankruptcy happens slowly at first, then suddenly. So too banking crises and financial contagion. Because of the real estate sector’s close links to the banking sector, and the banking sector’s proclivity for sparking financial crises, history has taught us to take seriously incendiary conditions in property markets, but not to presume they will end in utter meltdown. |
All told, China’s macro economy doesn’t inspire confidence right now, but we still consider the country eminently investible. We are emphatically not writing it off. Yet we don’t advocate a shotgun approach to going long Chinese equities. We are picking our spots.
What China Wants
We believe the world is witnessing the emergence of a new political chapter in China’s history. Seldom do such transitions happen before our eyes. This is one of them.
Like other General Secretaries of the CCP before him, President Xi Jinping has begun to imprint his vision and values onto the Party. In so doing he joins predecessors who, since Mao’s death in 1976, have each struck their own balance in the competing tensions of Chinese Marxism: economic liberalization vs. planned economics, wealth inequality vs. shared prosperity, coastal China vs lesser-tiered cities. Xi’s early tenure saw him consolidate power. Now, having overturned the term-limit rule in place that Deng Xiaoping put in place in 1982 to avoid the authoritarian excesses of Mao’s reign, Xi has positioned himself to rule unbound by the reform-minded restraints of the last 40 years.
What will he do with the power? We are beginning to see.
First, Xi is returning to a more populist vision of economic equality—even if it means trampling on some of the country’s mightiest corporations. This course of action is a throwback to an era when Marxist-style socialism trumped market-based growth as the CCP’s playbook. Where Deng Xiaoping once praised economic pragmatism, we believe Xi has made clear he will prioritize a socialistic vision over capitalistic success, damn the costs. Corporations beware: this is not Beijing, Inc.
Second, Xi appears far more willing to tussle with wealthy elites and reshape entire sectors of the economy than his immediate predecessors. In echoes of Putin’s Russia, not only is Xi unafraid of the billionaire class, his continual anti-corruption campaigns and laying low of the country’s highest-profile capitalists, such as Alibaba’s Jack Ma, suggest that he sees this as good politics. In recent months, Xi has targeted a broad range of industries, imposing game-changing regulations, preventing IPOs, and soliciting eye-popping donations for social causes.
Third, Xi has reasserted geopolitical grand strategy as the Party’s North Star. Priorities that were dear to Mao but sublimated in modern times, such as reuniting Hong Kong and Taiwan with the Motherland, are being elevated. Hong Kong’s reversion is largely fait accompli. Xi’s actions suggest an
| 2 | 1.855.775.3337 | www.rondureglobal.com |
| Rondure Funds | Shareholder Letter |
October 31, 2021 (Unaudited)
emboldened belief that China has grown powerful enough to assert itself internationally. This is foreboding for the Pax Americana, yet the implications for equities are highly uncertain.
What This Means for Investing in China
Our confidence in our financial models of Chinese companies is at an all-time low. The reason is simple: The structural step-change in political uncertainty jeopardizes our earnings estimates and throws into doubt historical market multiples. We don’t like to buy companies we can’t model. We worry about companies whose earnings power is hard to gauge due to moving regulatory goal posts.
The conundrum we face in Chinese equity markets is not without international parallels. Korean equities have long been under a cloud due to rampant corporate governance failings. Russian equities likewise trade optically cheap, victims of sanctions-driven macroeconomic instability, market distrust of local rule of law, and a poorly diversified economy.
Seen through that lens, how do Chinese equities look to us today? Yes, relative to their U.S. peers they appear cheap. Yet relative to their Russian or Korean peers they do not. Yes, relative to history Chinese equities look undervalued. But viewed as quasi-state-owned enterprises, they do not look like a bargain. Chinese equities as a class looked like good value when the real economy there was buoyant as the rest of the world struggled to buck Covid. Yet that is hardly the case today. Indeed, concerns over the efficacy of Chinese vaccines as well as rolling local lockdowns give the impression of a country whose recovery is looking shakier than ever, even as the rest of the world vaccinates!
Here is our playbook in China:
| 1. | As always, stick to companies that meet our disciplined criteria for financial excellence as well as our assessment of a competitive moat, using our Club-Glue-Platform framework. |
| 2. | Try to avoid Beijing’s crosshairs. We are eschewing those that may run afoul of Party sensibilities or enjoy profitability the CCP finds exorbitant. Adverse regulation is painful. |
| 3. | Invest with the Party. Industries like sportswear are direct beneficiaries of Xi’s vision of a healthier, more active China. Seek to position ourselves on the right side of that where possible. |
| 4. | Avoid the real estate and banking sectors. We are fearful enough about the permanent capital loss in China that we are shying away from troubled sectors, despite distressed valuations. |
| 5. | Err on the side of defense. Our stock picking style tends toward simple, everyday businesses with an all-weather aspect. We like this approach in China today. |
Conclusion: Real Growth, False Growth, or Liquidity-Drenched “Fantasia”?
One of the biggest risks we see to stocks is that the rich earnings-growth environment of the last 12 months will not be repeated. Earnings growth from a wide variety of businesses that benefited from Covid-era conditions may prove to be more ephemeral than the market expects. We believe that stocks ultimately reflect earnings and that prices in the short run reflect changes in expectations about future earnings. The tech crash of 1999 emblazoned in our memory that when stocks trade on earnings revisions, they can get cheaper than you ever think.
Seen through that light, how much can online shopping accelerate around the world versus what occurred during the Covid lockdowns? How much growth in pet food consumption can happen after the world spent the last year going “Covid puppy” crazy? After a year where old-school energy stocks were back in vogue, what are the chances they can “beat and raise” after their recent run if the underlying commodity prices stagnate or revert to means?
We would note, too, that in an environment where a smattering of central banks globally have started to raise interest rates (the Fed’s winding down of QE is part of this), we see the need to be positioned cautiously relative to the boom times of the last decade to be as acute as ever.
Sincerely,
The Rondure Global Advisors Research Team
| Semi-Annual Report | October 31, 2021 | 3 |
| Rondure Funds | Shareholder Letter |
October 31, 2021 (Unaudited)
The objective of all Rondure Funds is long-term growth of capital.
RISKS: Investing in foreign securities entails special risks, such as currency fluctuations and political uncertainties, which are described in more detail in the prospectus. Investments in emerging and frontier markets are subject to the same risks as other foreign securities and may be subject to greater risks than investments in foreign countries with more established economies and securities markets. Diversification does not eliminate the risk of experiencing investment loses.
Must be preceded or accompanied by a prospectus.
An investor should consider investment objectives, risks, charges, and expenses carefully before investing. To obtain a Rondure Funds prospectus, containing this and other information, visit www.rondureglobal.com or call 1-855-775-3337. Please read it carefully before investing.
The views and information discussed in this commentary are as of the date of publication, are subject to change, and may not reflect the writer's current views. The views expressed represent an assessment of market conditions at a specific point in time, are opinions only and should not be relied upon as investment advice regarding a particular investment or markets in general. Such information does not constitute a recommendation to buy or sell specific securities or investment vehicles. It should not be assumed that any investment will be profitable or will equal the performance of the Funds or any securities or any sectors mentioned herein. The subject matter contained herein has been derived from several sources believed to be reliable and accurate at the time of compilation. The Funds do not accept any liability for losses either direct or consequential caused by the use of this information.
Past performance does not guarantee future results.
Rondure Funds are distributed by ALPS Distributors, Inc. (ADI). ADI is not affiliated with Rondure Global Advisors.
| 4 | 1.855.775.3337 | www.rondureglobal.com |
| Rondure New World Fund | Performance Update |
October 31, 2021 (Unaudited)
Annualized Total Return Performance for the periods ended October 31, 2021
| Expense Ratio(b) | ||||||
| 6 Month | 1 Year | 3 Year | Since Inception(a) | Gross | Net(c) | |
| Rondure New World Fund – Institutional (RNWIX) | 3.24% | 20.14% | 14.82% | 8.34% | 1.32% | 1.10% |
| Rondure New World Fund – Investor (RNWOX) | 3.11% | 19.89% | 14.56% | 8.07% | 1.63% | 1.35% |
| MSCI Emerging Markets Index(d) | -4.68% | 17.33% | 12.69% | 8.77% | ||
Performance data quoted represents past performance. Past performance does not guarantee future results. Investment return and principal value of an investment will fluctuate so that an investor’s shares, when sold or redeemed, may be worth more or less than the original cost. The Fund imposes a 2.00% redemption fee on shares held for less than 60 days. Current performance data may be higher or lower than actual data quoted. For the most current month-end performance data, please call 1-855-775-3337.
The table does not reflect the deduction of taxes a shareholder would pay on Fund distributions or redemption of Fund shares.
Subject to investment risks, including possible loss of the principal amount invested.
Returns for periods less than 1 year are cumulative.
| (a) | Fund inception date of May 1, 2017. |
| (b) | Ratios as of the Prospectus dated August 31, 2021 and may differ from the ratios presented in the Financial Highlights. |
| (c) | Rondure Global Advisors, LLC (the "Advisor"), has agreed to waive and/or reimburse fees or expenses in order to limit Total Annual Fund Operating Expenses After Fee Waiver/ Expense Reimbursement (excluding acquired fund fees and expenses, brokerage expenses, interest expense, taxes and extraordinary expenses) to 1.35% and 1.10% of the Fund's average daily net assets for the Fund's Investor Class Shares and Institutional Class Shares, respectively. This agreement (the "Expense Agreement") shall continue at least through August 31, 2022. The Advisor will be permitted to recapture, on a class- by-class basis, expenses it has borne through the Expense Agreement to the extent that the Fund's expenses in later periods fall below the annual rates set forth in the Expense Agreement or in previous letter agreements; provided, however, that such recapture payments do not cause the Fund's expense ratio (after recapture) to exceed the lesser of (i) the expense cap in effect at the time of the waiver and (ii) the expense cap in effect at the time of the recapture. Notwithstanding the foregoing, the Fund will not be obligated to pay any such deferred fees and expenses more than three years after the date on which the fee and expenses were deferred. The Expense Agreement may not be terminated or modified by the Advisor prior to August 31, 2022, except with the approval of the Fund's Board of Trustees. |
| (d) | The MSCI Emerging Markets Index is an unmanaged total return index, reported in U.S. Dollars, based on share prices and reinvested dividends of approximately 800 companies from 24 emerging market countries. The Index is not actively managed and does not reflect any deductions for fees, expense, or taxes. An investor may not invest directly in the Index. |
| Semi-Annual Report | October 31, 2021 | 5 |
| Rondure New World Fund | Performance Update |
October 31, 2021 (Unaudited)
Growth of $10,000 for the period ended October 31, 2021

The chart shown above represent a hypothetical investment of $10,000 in the Fund’s Investor Class shares for the period from inception to October 31, 2021. All returns reflect reinvested dividends, but do not reflect the deduction of taxes that an investor would pay on distributions or redemptions.
Investing in the Fund is subject to investment risks, including possible loss of the principal amount invested.
The Fund also offers Institutional Class shares, performance for which is not reflected in the graphs above. The performance of Institutional Class shares may be higher or lower than the performance of the Investor Class shares shown in the graphs above based upon differences in fees paid by shareholders investing in the Investor Class shares and Institutional Class shares.
| 6 | 1.855.775.3337 | www.rondureglobal.com |
| Rondure New World Fund | Performance Update |
October 31, 2021 (Unaudited)
| Regional Allocation (as a % of Net Assets)* | |
| Asia ex Japan | 80.7% |
| North America | 7.1% |
| Africa/Middle East | 3.8% |
| Europe | 3.3% |
| Latin America | 1.3% |
| Cash, Cash Equivalents, & Other Net Assets | 3.8% |
| Total | 100.0% |
| Top 10 Holdings (as a % of Net Assets)* | |
| Taiwan Semiconductor Manufacturing Co., Ltd. | 5.0% |
| Samsung Electronics Co., Ltd. | 3.1% |
| Tata Consultancy Services, Ltd. | 3.0% |
| Li Ning Co., Ltd. | 2.7% |
| HDFC Bank, Ltd. | 2.7% |
| ANTA Sports Products, Ltd. | 2.5% |
| Hong Kong Exchanges & Clearing, Ltd. | 2.3% |
| LONGi Green Energy Technology Co., Ltd. | 2.1% |
| HCL Technologies, Ltd. | 2.0% |
| Yum China Holdings, Inc. | 2.0% |
| Total | 27.4% |
| * | Holdings are subject to change, and may not reflect the current or future position of the portfolio. |
| Semi-Annual Report | October 31, 2021 | 7 |
| Rondure Overseas Fund | Performance Update |
October 31, 2021 (Unaudited)
Annualized Total Return Performance for the periods ended October 31, 2021
| Expense Ratio(b) | ||||||
| 6 Month | 1 Year | 3 Year | Since Inception(a) | Gross | Net(c) | |
| Rondure Overseas Fund – Institutional (ROSIX)(d) | 6.49% | 27.32% | 13.14% | 10.51% | 1.70% | 0.85% |
| Rondure Overseas Fund – Investor (ROSOX) | 6.36% | 26.92% | 12.88% | 10.25% | 2.01% | 1.10% |
| MSCI EAFE Index(e) | 4.39% | 34.80% | 12.07% | 8.74% | ||
Performance data quoted represents past performance. Past performance does not guarantee future results. Investment return and principal value of an investment will fluctuate so that an investor’s shares, when sold or redeemed, may be worth more or less than the original cost. The Fund imposes a 2.00% redemption fee on shares held for less than 60 days. Current performance data may be higher or lower than actual data quoted. For the most current month-end performance data, please call 1-855-775-3337.
The table does not reflect the deduction of taxes a shareholder would pay on Fund distributions or redemption of Fund shares.
Subject to investment risks, including possible loss of the principal amount invested.
Returns for periods less than 1 year are cumulative.
| (a) | Fund inception date of May 1, 2017. |
| (b) | Ratios as of the Prospectus dated August 31, 2021 and may differ from the ratios presented in the Financial Highlights. |
| (c) | Rondure Global Advisors, LLC (the "Advisor"), has agreed to waive and/or reimburse fees or expenses in order to limit Total Annual Fund Operating Expenses After Fee Waiver/ Expense Reimbursement (excluding acquired fund fees and expenses, brokerage expenses, interest expense, taxes and extraordinary expenses) to 1.10% and 0.85% of the Fund's average daily net assets for the Fund's Investor Class Shares and Institutional Class Shares, respectively. This agreement (the "Expense Agreement") shall continue at least through August 31, 2022. The Advisor will be permitted to recapture, on a class- by-class basis, expenses it has borne through the Expense Agreement to the extent that the Fund's expenses in later periods fall below the annual rates set forth in the Expense Agreement or in previous letter agreements; provided, however, that such recapture payments do not cause the Fund's expense ratio (after recapture) to exceed the lesser of (i) the expense cap in effect at the time of the waiver and (ii) the expense cap in effect at the time of the recapture. Notwithstanding the foregoing, the Fund will not be obligated to pay any such deferred fees and expenses more than three years after the date on which the fee and expenses were deferred. The Expense Agreement may not be terminated or modified by the Advisor prior to August 31, 2022, except with the approval of the Fund's Board of Trustees. |
| (d) | Excludes adjustments in accordance with accounting principles generally accepted in the United States of America and as such, the net asset value and total return for shareholder transactions reported to the market may differ from the net asset value for financial reporting purposes. |
| (e) | The MSCI EAFE Index is an unmanaged total return index, reported in U.S. dollars, based on share prices and reinvested net dividends of approximately 1,100 companies from 22 developed market countries excluding the US and Canada. The Index is not actively managed and does not reflect any deductions for fees, expense, or taxes. An investor may not invest directly in the Index. |
| 8 | 1.855.775.3337 | www.rondureglobal.com |
| Rondure Overseas Fund | Performance Update |
October 31, 2021 (Unaudited)
Growth of $10,000 for the period ended October 31, 2021
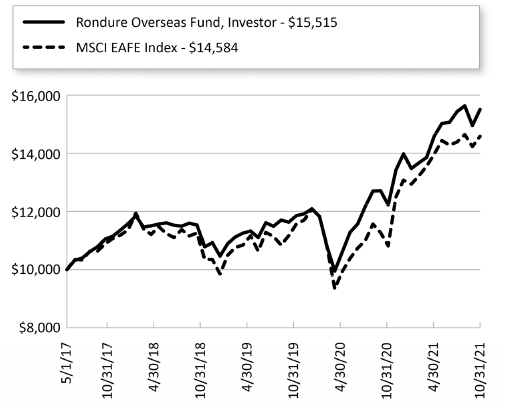
The chart shown above represent a hypothetical investment of $10,000 in the Fund’s Investor Class shares for the period from inception to October 31, 2021. All returns reflect reinvested dividends, but do not reflect the deduction of taxes that an investor would pay on distributions or redemptions.
Investing in the Fund is subject to investment risks, including possible loss of the principal amount invested.
The Fund also offers Institutional Class shares, performance for which is not reflected in the graphs above. The performance of Institutional Class shares may be higher or lower than the performance of the Investor Class shares shown in the graphs above based upon differences in fees paid by shareholders investing in the Investor Class shares and Institutional Class shares.
| Semi-Annual Report | October 31, 2021 | 9 |
| Rondure Overseas Fund | Performance Update |
October 31, 2021 (Unaudited)
| Regional Allocation (as a % of Net Assets)* | |
| Europe | 65.6% |
| North America | 13.9% |
| Japan | 12.7% |
| Australia/New Zealand | 5.1% |
| Asia ex Japan | 0.7% |
| Cash, Cash Equivalents, & Other Net Assets | 2.0% |
| Total | 100.0% |
| Top 10 Holdings (as a % of Net Assets)* | |
| Nestle SA | 3.7% |
| Diageo PLC | 2.3% |
| adidas AG | 2.1% |
| Ferrari NV | 2.0% |
| Chocoladefabriken Lindt & Spruengli AG | 1.9% |
| Heineken NV | 1.8% |
| Coca-Cola HBC AG | 1.8% |
| B&M European Value Retail SA | 1.8% |
| Puma SE | 1.6% |
| Oriental Land Co., Ltd. | 1.6% |
| Total | 20.6% |
| * | Holdings are subject to change, and may not reflect the current or future position of the portfolio. |
| 10 | 1.855.775.3337 | www.rondureglobal.com |
| Rondure Funds | Disclosure of Fund Expenses |
October 31, 2021 (Unaudited)
As a shareholder of a Fund, you incur two types of costs: (1) transaction costs, including sales charges (loads) on purchase payments, reinvested dividends, or other distributions; redemption fees; and exchange fees; and (2) ongoing costs, including management fees; distribution and/or service (12b-1) fees; and other Fund expenses. This example is intended to help you understand your ongoing costs (in dollars) of investing in the Fund and to compare these costs with the ongoing costs of investing in other mutual funds.
This example is based on an investment of $1,000 invested at the beginning of the period and held for the entire six-month period of May 1, 2021 through October 31, 2021.
Actual Expenses The first line of the table provides information about actual account values and actual expenses. You may use the information in this line, together with the amount you invested, to estimate the expenses that you paid over the period. Simply divide your account value by $1,000 (for example, an $8,600 account value divided by $1,000 = 8.6), then multiply the result by the number in the first line under the heading “Expenses Paid During Period” to estimate the expenses you paid on your account during this period.
Hypothetical Example for Comparison Purposes The second line of the table provides information about hypothetical account values and hypothetical expenses based on the Fund’s actual expense ratio and an assumed rate of return of 5% per year before expenses, which is not the Fund’s actual return. The hypothetical account values and expenses may not be used to estimate the actual ending account balance or expenses you paid for the period. You may use this information to compare the ongoing costs of investing in the Fund and other mutual funds. To do so, compare this 5% hypothetical example with the 5% hypothetical examples that appear in the shareholder reports of the other funds. Please note that the expenses shown in the table are meant to highlight your ongoing costs only and do not reflect any transactional costs, such as redemption fees or exchange fees. Therefore, the second line of the table is useful in comparing ongoing costs only and will not help you determine the relative total costs of owning different funds. In addition, if these transactional costs were included, your costs would have been higher.
| Beginning Account Value May 1, 2021 | Ending Account Value October 31, 2021 | Expense Ratio(a) | Expenses Paid During Period May 1, 2021 - October 31, 2021(b) | |
| Rondure New World Fund | ||||
| Institutional Class | ||||
| Actual | $ 1,000.00 | $ 1,032.40 | 1.10% | $ 5.64 |
| Hypothetical (5% return before expenses) | $ 1,000.00 | $ 1,019.66 | 1.10% | $ 5.60 |
| Investor Class | ||||
| Actual | $ 1,000.00 | $ 1,031.10 | 1.35% | $ 6.91 |
| Hypothetical (5% return before expenses) | $ 1,000.00 | $ 1,018.40 | 1.35% | $ 6.87 |
| Rondure Overseas Fund | ||||
| Institutional Class | ||||
| Actual | $ 1,000.00 | $ 1,064.90 | 0.85% | $ 4.42 |
| Hypothetical (5% return before expenses) | $ 1,000.00 | $ 1,020.92 | 0.85% | $ 4.33 |
| Investor Class | ||||
| Actual | $ 1,000.00 | $ 1,063.60 | 1.10% | $ 5.72 |
| Hypothetical (5% return before expenses) | $ 1,000.00 | $ 1,019.66 | 1.10% | $ 5.60 |
| (a) | The Fund's expense ratios have been annualized based on the Fund's most recent fiscal half-year expenses. |
| (b) | Expenses are equal to the Fund's annualized expense ratio multiplied by the average account value over the period, multiplied by the number of days in the most recent fiscal half-year (181)/365 (to reflect the half-year period). |
| Semi-Annual Report | October 31, 2021 | 11 |
| Rondure New World Fund | Portfolio of Investments |
October 31, 2021 (Unaudited)
| Shares | Value (Note 2) | |||||||
| COMMON STOCKS (96.20%) | ||||||||
| Bangladesh (0.45%) | ||||||||
| Square Pharmaceuticals, Ltd. | 439,773 | $ | 1,117,984 | |||||
| Brazil (1.31%) | ||||||||
| B3 SA - Brasil Bolsa Balcao | 1,400,800 | 2,963,527 | ||||||
| TOTVS SA | 54,600 | 317,415 | ||||||
| 3,280,942 | ||||||||
| China (17.16%) | ||||||||
| Airtac International Group | 53,857 | 1,607,469 | ||||||
| ANTA Sports Products, Ltd. | 397,000 | 6,204,640 | ||||||
| China Resources Beer Holdings Co., Ltd. | 140,000 | 1,160,594 | ||||||
| Country Garden Services Holdings Co., Ltd. | 195,300 | 1,518,623 | ||||||
| JD.com, Inc., Class A(a) | 99,800 | 3,981,482 | ||||||
| Kweichow Moutai Co., Ltd., Class A | 4,400 | 1,255,567 | ||||||
| Li Ning Co., Ltd. | 610,800 | 6,790,592 | ||||||
| LONGi Green Energy Technology Co., Ltd., Class A | 351,540 | 5,366,516 | ||||||
| Shenzhen Mindray Bio- Medical Electronics Co., Ltd. | 25,000 | 1,469,262 | ||||||
| Sichuan Swellfun Co., Ltd., Class A | 132,500 | 2,622,545 | ||||||
| Tencent Holdings, Ltd. | 21,300 | 1,316,792 | ||||||
| Tsingtao Brewery Co., Ltd., Class H | 322,000 | 2,799,730 | ||||||
| WuXi AppTec Co., Ltd., Class H(b)(c) | 37,440 | 800,241 | ||||||
| Yifeng Pharmacy Chain Co., Ltd. | 155,900 | 1,163,287 | ||||||
| Yum China Holdings, Inc. | 85,300 | 4,915,988 | ||||||
| 42,973,328 | ||||||||
| Hong Kong (2.90%) | ||||||||
| Hong Kong Exchanges & Clearing, Ltd. | 96,400 | 5,833,188 | ||||||
| Vitasoy International Holdings, Ltd. | 599,000 | 1,441,203 | ||||||
| 7,274,391 | ||||||||
| Shares | Value (Note 2) | |||||||
| India (23.08%) | ||||||||
| 3M India, Ltd.(a) | 1,575 | $ | 534,260 | |||||
| Asian Paints, Ltd. | 36,352 | 1,504,981 | ||||||
| Castrol India, Ltd. | 594,500 | 1,096,806 | ||||||
| Colgate-Palmolive India, Ltd. | 46,704 | 962,131 | ||||||
| Crompton Greaves Consumer Electricals, Ltd. | 271,846 | 1,690,296 | ||||||
| Dabur India, Ltd. | 180,000 | 1,408,270 | ||||||
| Divi's Laboratories, Ltd. | 56,020 | 3,852,919 | ||||||
| HCL Technologies, Ltd. | 335,640 | 5,126,627 | ||||||
| HDFC Asset Management Co., Ltd.(b)(c) | 86,153 | 3,045,679 | ||||||
| HDFC Bank, Ltd. | 317,001 | 6,700,810 | ||||||
| Honeywell Automation India, Ltd. | 355 | 198,804 | ||||||
| Jubilant Foodworks, Ltd. | 33,441 | 1,647,594 | ||||||
| Marico, Ltd. | 31,400 | 238,368 | ||||||
| Nestle India, Ltd. | 7,995 | 2,028,628 | ||||||
| Nippon Life India Asset Management, Ltd.(b)(c) | 681,352 | 3,806,608 | ||||||
| Oracle Financial Services Software, Ltd. | 20,000 | 1,181,738 | ||||||
| Pidilite Industries, Ltd. | 13,575 | 419,435 | ||||||
| Reliance Industries, Ltd. | 102,078 | 3,457,412 | ||||||
| Schaeffler India, Ltd. | 23,500 | 2,322,893 | ||||||
| SKF India, Ltd. | 46,424 | 2,058,853 | ||||||
| Tata Consultancy Services, Ltd. | 165,665 | 7,517,079 | ||||||
| Tech Mahindra, Ltd. | 199,853 | 3,944,282 | ||||||
| United Breweries, Ltd. | 66,362 | 1,469,856 | ||||||
| United Spirits, Ltd.(a) | 127,406 | 1,611,860 | ||||||
| 57,826,189 | ||||||||
| Indonesia (3.25%) | ||||||||
| Ace Hardware Indonesia Tbk PT | 25,621,900 | 2,549,982 | ||||||
| Bank Central Asia Tbk PT | 2,078,000 | 1,096,386 | ||||||
| Indofood CBP Sukses Makmur Tbk PT | 4,499,100 | 2,794,571 | ||||||
| Unilever Indonesia Tbk PT | 5,453,100 | 1,701,267 | ||||||
| 8,142,206 | ||||||||
| Kenya (1.90%) | ||||||||
| Safaricom PLC | 12,374,200 | 4,758,452 | ||||||
See Notes to Financial Statements.
| 12 | 1.855.775.3337 | www.rondureglobal.com |
| Rondure New World Fund | Portfolio of Investments |
October 31, 2021 (Unaudited)
| Shares | Value (Note 2) | |||||||
| Malaysia (4.12%) | ||||||||
| Carlsberg Brewery Malaysia Bhd | 631,000 | $ | 3,379,758 | |||||
| Genting Bhd | 2,597,800 | 3,249,603 | ||||||
| Heineken Malaysia Bhd | 663,000 | 3,682,444 | ||||||
| 10,311,805 | ||||||||
| Mexico (5.60%) | ||||||||
| Becle SAB de CV | 924,500 | 2,110,526 | ||||||
| Grupo Aeroportuario del Centro Norte SAB de CV, Class B(a) | 110,133 | 666,051 | ||||||
| Grupo Aeroportuario del Pacifico SAB de CV, Class B(a) | 256,300 | 3,236,740 | ||||||
| Grupo Aeroportuario del Sureste SAB de CV | 156,490 | 3,161,192 | ||||||
| Wal-Mart de Mexico SAB de CV | 1,392,900 | 4,852,959 | ||||||
| 14,027,468 | ||||||||
| Philippines (3.55%) | ||||||||
| International Container Terminal Services, Inc. | 547,700 | 1,955,684 | ||||||
| Philippine Seven Corp.(a) | 1,678,447 | 3,029,928 | ||||||
| Wilcon Depot, Inc. | 6,319,700 | 3,911,419 | ||||||
| 8,897,031 | ||||||||
| Poland (0.50%) | ||||||||
| Dino Polska SA(a)(b)(c) | 13,912 | 1,242,775 | ||||||
| Russia (2.83%) | ||||||||
| LUKOIL PJSC, Sponsored ADR | 22,777 | 2,323,254 | ||||||
| Moscow Exchange MICEX-RTS PJSC | 1,945,750 | 4,771,235 | ||||||
| 7,094,489 | ||||||||
| South Africa (0.84%) | ||||||||
| Clicks Group, Ltd. | 115,400 | 2,106,588 | ||||||
| South Korea (5.06%) | ||||||||
| Kangwon Land, Inc.(a) | 78,128 | 1,858,678 | ||||||
| LG Household & Health Care, Ltd. | 1,664 | 1,667,489 | ||||||
| NAVER Corp. | 3,858 | 1,343,722 | ||||||
| Shares | Value (Note 2) | |||||||
| South Korea (continued) | ||||||||
| Samsung Electronics Co., Ltd. | 130,751 | $ | 7,810,038 | |||||
| 12,679,927 | ||||||||
| Sri Lanka (0.53%) | ||||||||
| Lion Brewery Ceylon PLC | 472,256 | 1,336,110 | ||||||
| Taiwan (12.93%) | ||||||||
| Chroma ATE, Inc. | 153,000 | 995,847 | ||||||
| MediaTek, Inc. | 86,000 | 2,823,525 | ||||||
| momo.com, Inc. | 75,400 | 4,853,408 | ||||||
| Poya International Co., Ltd. | 57,680 | 1,030,870 | ||||||
| President Chain Store Corp. | 486,000 | 4,910,944 | ||||||
| Sinbon Electronics Co., Ltd. | 330,700 | 2,735,171 | ||||||
| Taiwan FamilyMart Co., Ltd. | 274,000 | 2,551,954 | ||||||
| Taiwan Semiconductor Manufacturing Co., Ltd. | 589,000 | 12,496,539 | ||||||
| 32,398,258 | ||||||||
| Thailand (5.33%) | ||||||||
| Airports of Thailand PCL | 721,000 | 1,401,477 | ||||||
| Bangkok Dusit Medical Services PCL | 1,685,000 | 1,193,325 | ||||||
| Bumrungrad Hospital PCL | 1,046,300 | 4,587,859 | ||||||
| CP ALL PCL | 1,116,800 | 2,154,003 | ||||||
| Home Product Center PCL | 1,620,000 | 712,785 | ||||||
| TOA Paint Thailand PCL | 3,321,000 | 3,302,735 | ||||||
| 13,352,184 | ||||||||
| United Arab Emirates (1.01%) | ||||||||
| Aramex PJSC | 2,133,000 | 2,537,661 | ||||||
| United States (1.53%) | ||||||||
| Starbucks Corp. | 13,475 | 1,429,293 | ||||||
| The Walt Disney Co.(a) | 14,150 | 2,392,341 | ||||||
| 3,821,634 | ||||||||
| Vietnam (2.32%) | ||||||||
| Saigon Beer Alcohol Beverage Corp. | 92,120 | 649,859 | ||||||
| Vietnam Dairy Products JSC | 846,878 | 3,376,122 | ||||||
See Notes to Financial Statements.
| Semi-Annual Report | October 31, 2021 | 13 |
| Rondure New World Fund | Portfolio of Investments |
October 31, 2021 (Unaudited)
| Shares | Value (Note 2) | |||||||
| Vietnam (continued) | ||||||||
| Vincom Retail JSC(a) | 1,305,705 | $ | 1,790,563 | |||||
| 5,816,544 | ||||||||
| TOTAL COMMON STOCKS | ||||||||
| (Cost $184,806,593) | 240,995,966 | |||||||
| TOTAL INVESTMENTS (96.20%) | ||||||||
| (Cost $184,806,593) | $ | 240,995,966 | ||||||
| Other Assets In Excess Of Liabilities (3.80%) | 9,517,804 | |||||||
| NET ASSETS (100.00%) | $ | 250,513,770 | ||||||
| (a) | Non-Income Producing Security. |
| (b) | Security exempt from registration under Rule 144A of the Securities Act of 1933. These securities may be resold in the ordinary course of business in transactions exempt from registration, normally to qualified institutional buyers. As of October 31, 2021, these securities had a total aggregate market value of $8,895,303 representing 3.55% of net assets. |
| (c) | Security was purchased pursuant to Regulation S under the Securities Act of 1933, which exempts securities offered and sold outside of the United States from registration. Such security cannot be sold in the United States without either an effective registration statement filed pursuant to the Securities Act of 1933, or pursuant to an exemption from registration. As of October 31, 2021, the aggregate market value of those securities was $8,895,303, representing 3.55% of net assets. |
Sector Composition (October 31, 2021) (Unaudited)
| Consumer | 42.0% |
| Technology | 23.9% |
| Financials | 12.6% |
| Industrials | 7.7% |
| Health Care | 5.2% |
| Energy & Materials | 4.8% |
| Cash, Cash Equivalents, & Other Net Assets | 3.8% |
| Total | 100% |
| Industry Composition (October 31, 2021) | |
| Beverages | 8.8% |
| Food & Staples Retailing | 8.8% |
| Semiconductors & Semiconductor Equipment | 8.3% |
| Capital Markets | 8.2% |
| IT Services | 6.6% |
| Hotels, Restaurants & Leisure | 5.2% |
| Textiles, Apparel & Luxury Goods | 5.2% |
| Transportation Infrastructure | 4.2% |
| Food Products | 3.8% |
| Internet & Direct Marketing Retail | 3.5% |
| Technology Hardware, Storage & Peripherals | 3.1% |
| Banks | 3.1% |
| Specialty Retail | 2.9% |
| Chemicals | 2.5% |
| Machinery | 2.4% |
| Health Care Providers & Services | 2.3% |
| Oil, Gas & Consumable Fuels | 2.3% |
| Wireless Telecommunication Services | 1.9% |
| Life Sciences Tools & Services | 1.9% |
| Personal Products | 1.7% |
| Electronic Equipment, Instruments & Components | 1.6% |
| Real Estate Management & Development | 1.3% |
| Interactive Media & Services | 1.1% |
| Air Freight & Logistics | 1.0% |
| Other Industries (each less than 1%) | 3.6% |
| Cash and Other Assets, Less Liabilities | 3.6% |
| Total | 100% |
See Notes to Financial Statements.
| 14 | 1.855.775.3337 | www.rondureglobal.com |
| Rondure Overseas Fund | Portfolio of Investments |
October 31, 2021 (Unaudited)
| Shares | Value (Note 2) | |||||||
| COMMON STOCKS (97.98%) | ||||||||
| Australia (3.73%) | ||||||||
| Cochlear, Ltd. | 1,806 | $ | 299,481 | |||||
| CSL, Ltd. | 1,100 | 248,647 | ||||||
| Domino's Pizza Enterprises, Ltd. | 2,104 | 214,396 | ||||||
| REA Group, Ltd. | 2,927 | 352,601 | ||||||
| 1,115,125 | ||||||||
| Belgium (2.22%) | ||||||||
| Lotus Bakeries NV | 38 | 252,147 | ||||||
| Melexis NV | 2,072 | 238,566 | ||||||
| Warehouses De Pauw CVA | 3,813 | 173,669 | ||||||
| 664,382 | ||||||||
| Britain (15.91%) | ||||||||
| Abcam PLC(a) | 13,305 | 301,170 | ||||||
| B&M European Value Retail SA | 60,743 | 526,378 | ||||||
| Compass Group PLC(a) | 13,808 | 292,903 | ||||||
| Diageo PLC | 13,745 | 683,205 | ||||||
| Diploma PLC | 4,133 | 169,913 | ||||||
| Experian PLC | 3,192 | 146,211 | ||||||
| Greggs PLC | 7,096 | 296,678 | ||||||
| Halma PLC | 3,650 | 147,958 | ||||||
| Intertek Group PLC | 5,729 | 383,789 | ||||||
| J D Wetherspoon PLC(a) | 18,570 | 259,985 | ||||||
| Linde PLC | 475 | 152,925 | ||||||
| London Stock Exchange Group PLC | 4,314 | 419,179 | ||||||
| Rightmove PLC | 25,493 | 241,219 | ||||||
| Softcat PLC | 10,937 | 290,825 | ||||||
| Spirax-Sarco Engineering PLC | 717 | 153,124 | ||||||
| Unilever PLC | 5,474 | 293,048 | ||||||
| 4,758,510 | ||||||||
| Canada (8.91%) | ||||||||
| Alimentation Couche-Tard, Inc., Class B | 11,116 | 416,940 | ||||||
| Canadian National Railway Co. | 3,404 | 452,400 | ||||||
| Canadian Pacific Railway, Ltd. | 2,400 | 185,759 | ||||||
| Dollarama, Inc. | 8,391 | 379,276 | ||||||
| Fortis, Inc. | 5,897 | 262,497 | ||||||
| Gildan Activewear, Inc. | 7,066 | 259,551 | ||||||
| Shares | Value (Note 2) | |||||||
| Canada (continued) | ||||||||
| Metro, Inc./CN | 9,130 | $ | 459,377 | |||||
| Ritchie Bros Auctioneers, Inc. | 3,613 | 246,949 | ||||||
| 2,662,749 | ||||||||
| Denmark (4.53%) | ||||||||
| Carlsberg A/S | 1,541 | 254,199 | ||||||
| Coloplast A/S, Class B | 2,189 | 356,840 | ||||||
| Novo Nordisk A/S, Class B | 4,165 | 455,852 | ||||||
| Royal Unibrew A/S | 2,325 | 288,466 | ||||||
| 1,355,357 | ||||||||
| Finland (1.81%) | ||||||||
| Kone Oyj, Class B | 2,099 | 143,063 | ||||||
| Olvi Oyj, Class A | 6,573 | 397,397 | ||||||
| 540,460 | ||||||||
| France (11.80%) | ||||||||
| Air Liquide SA | 2,534 | 422,524 | ||||||
| BioMerieux | 1,354 | 172,253 | ||||||
| Bureau Veritas SA | 10,490 | 332,993 | ||||||
| Dassault Systemes SE | 5,415 | 315,366 | ||||||
| EssilorLuxottica SA | 2,155 | 445,673 | ||||||
| Hermes International | 204 | 323,198 | ||||||
| L'Oreal SA | 1,021 | 466,151 | ||||||
| LVMH Moet Hennessy Louis Vuitton SE | 390 | 305,310 | ||||||
| Pernod Ricard SA | 2,043 | 469,272 | ||||||
| Sartorius Stedim Biotech | 160 | 88,078 | ||||||
| Sodexo SA(a) | 1,941 | 188,479 | ||||||
| 3,529,297 | ||||||||
| Germany (6.04%) | ||||||||
| adidas AG | 1,888 | 618,312 | ||||||
| CTS Eventim AG & Co., KGaA(a) | 4,742 | 344,584 | ||||||
| Puma SE | 3,947 | 489,582 | ||||||
| SAP SE | 1,414 | 204,846 | ||||||
| Symrise AG | 1,080 | 149,256 | ||||||
| 1,806,580 | ||||||||
| Hong Kong (0.75%) | ||||||||
| Hong Kong Exchanges & Clearing, Ltd. | 3,700 | 223,888 | ||||||
See Notes to Financial Statements.
| Semi-Annual Report | October 31, 2021 | 15 |
| Rondure Overseas Fund | Portfolio of Investments |
October 31, 2021 (Unaudited)
| Shares | Value (Note 2) | |||||||
| Ireland (1.41%) | ||||||||
| ICON PLC, ADR(a) | 1,016 | $ | 291,359 | |||||
| Kerry Group PLC, Class A | 959 | 128,709 | ||||||
| 420,068 | ||||||||
| Italy (4.17%) | ||||||||
| Davide Campari-Milano NV | 17,220 | 244,450 | ||||||
| DiaSorin SpA | 506 | 114,267 | ||||||
| Ferrari NV | 2,473 | 586,053 | ||||||
| Recordati Industria Chimica e Farmaceutica SpA | 4,850 | 303,430 | ||||||
| 1,248,200 | ||||||||
| Japan (12.71%) | ||||||||
| Benefit One, Inc. | 6,100 | 307,743 | ||||||
| Create SD Holdings Co., Ltd. | 4,500 | 138,188 | ||||||
| GMO Payment Gateway, Inc. | 1,200 | 152,033 | ||||||
| IR Japan Holdings, Ltd. | 1,500 | 138,320 | ||||||
| Kotobuki Spirits Co., Ltd. | 3,300 | 220,048 | ||||||
| M3, Inc. | 2,500 | 147,137 | ||||||
| MatsukiyoCocokara & Co. | 5,100 | 225,076 | ||||||
| MonotaRO Co., Ltd. | 13,300 | 301,066 | ||||||
| Nihon M&A Center Holdings, Inc. | 11,300 | 345,519 | ||||||
| OBIC Business Consultants Co., Ltd. | 4,300 | 211,652 | ||||||
| Oriental Land Co., Ltd. | 3,000 | 472,209 | ||||||
| Recruit Holdings Co., Ltd. | 3,100 | 205,950 | ||||||
| Seria Co., Ltd. | 8,700 | 287,010 | ||||||
| Shiseido Co., Ltd. | 3,400 | 225,971 | ||||||
| Unicharm Corp. | 10,500 | 423,040 | ||||||
| 3,800,962 | ||||||||
| Netherlands (5.06%) | ||||||||
| Aalberts NV | 3,278 | 181,322 | ||||||
| Akzo Nobel NV | 1,617 | 185,841 | ||||||
| ASML Holding NV | 345 | 279,374 | ||||||
| Euronext NV(b)(c) | 2,827 | 318,305 | ||||||
| Heineken NV | 4,951 | 548,413 | ||||||
| 1,513,255 | ||||||||
| New Zealand (1.39%) | ||||||||
| Mainfreight, Ltd. | 6,463 | 416,361 | ||||||
| Sweden (2.24%) | ||||||||
| Assa Abloy AB, Class B | 12,952 | 379,300 | ||||||
| Shares | Value (Note 2) | |||||||
| Sweden (continued) | ||||||||
| Axfood AB | 11,800 | $ | 289,229 | |||||
| 668,529 | ||||||||
| Switzerland (10.27%) | ||||||||
| Chocoladefabriken Lindt & Spruengli AG | 49 | 577,446 | ||||||
| Coca-Cola HBC AG | 15,363 | 532,564 | ||||||
| Flughafen Zurich AG(a) | 1,524 | 274,640 | ||||||
| Givaudan SA | 28 | 131,774 | ||||||
| Nestle SA | 8,272 | 1,091,550 | ||||||
| Partners Group Holding AG | 181 | 315,801 | ||||||
| Schindler Holding AG | 569 | 145,917 | ||||||
| 3,069,692 | ||||||||
| United States (5.03%) | ||||||||
| Accenture PLC, Class A | 685 | 245,771 | ||||||
| Estee Lauder Cos., Inc., Class A | 792 | 256,869 | ||||||
| Mastercard, Inc., Class A | 1,224 | 410,677 | ||||||
| MSCI, Inc. | 287 | 190,821 | ||||||
| Visa, Inc., Class A | 1,881 | 398,339 | ||||||
| 1,502,477 | ||||||||
| TOTAL COMMON STOCKS | ||||||||
| (Cost $21,557,642) | 29,295,892 | |||||||
| TOTAL INVESTMENTS (97.98%) | ||||||||
| (Cost $21,557,642) | $ | 29,295,892 | ||||||
| Other Assets In Excess Of Liabilities (2.02%) | 605,050 | |||||||
| NET ASSETS (100.00%) | $ | 29,900,942 | ||||||
| (a) | Non-Income Producing Security. |
| (b) | Security exempt from registration under Rule 144A of the Securities Act of 1933. These securities may be resold in the ordinary course of business in transactions exempt from registration, normally to qualified institutional buyers. As of October 31, 2021, these securities had a total aggregate market value of $318,305 representing 1.06% of net assets. |
See Notes to Financial Statements.
| 16 | 1.855.775.3337 | www.rondureglobal.com |
| Rondure Overseas Fund | Portfolio of Investments |
October 31, 2021 (Unaudited)
| (c) | Security was purchased pursuant to Regulation S under the Securities Act of 1933, which exempts securities offered and sold outside of the United States from registration. Such security cannot be sold in the United States without either an effective registration statement filed pursuant to the Securities Act of 1933, or pursuant to an exemption from registration. As of October 31, 2021, the aggregate market value of those securities was $318,305, representing 1.06% of net assets. |
| Sector Composition (October 31, 2021) (Unaudited) | |
| Consumer | 49.6% |
| Industrials | 16.3% |
| Technology | 12.9% |
| Health Care | 9.3% |
| Financials | 5.6% |
| Energy & Materials | 3.4% |
| Utilities | 0.9% |
| Cash, Cash Equivalents, & Other Net Assets | 2.0% |
| Total | 100% |
| Industry Composition (October 31, 2021) | |
| Beverages | 11.4% |
| Textiles, Apparel & Luxury Goods | 8.2% |
| Food Products | 7.6% |
| Professional Services | 6.2% |
| Hotels, Restaurants & Leisure | 5.8% |
| Food & Staples Retailing | 5.1% |
| IT Services | 5.0% |
| Capital Markets | 4.9% |
| Personal Products | 4.2% |
| Multiline Retail | 4.0% |
| Chemicals | 3.5% |
| Health Care Equipment & Supplies | 3.2% |
| Pharmaceuticals | 2.5% |
| Software | 2.5% |
| Road & Rail | 2.1% |
| Machinery | 2.1% |
| Interactive Media & Services | 2.0% |
| Automobiles | 2.0% |
| Biotechnology | 1.8% |
| Semiconductors & Semiconductor Equipment | 1.7% |
| Trading Companies & Distributors | 1.6% |
| Household Products | 1.4% |
| Air Freight & Logistics | 1.4% |
| Building Products | 1.3% |
| Life Sciences Tools & Services | 1.3% |
| Entertainment | 1.2% |
| Other Industries (each less than 1%) | 4.1% |
| Cash and Other Assets, Less Liabilities | 1.9% |
| Total | 100% |
See Notes to Financial Statements.
| Semi-Annual Report | October 31, 2021 | 17 |
| Rondure Funds | Statements of Assets and Liabilities |
October 31, 2021 (Unaudited)
| Rondure New World Fund | Rondure Overseas Fund | |||||||
| ASSETS | ||||||||
| Investments, at value (Cost - see below) | $ | 240,995,966 | $ | 29,295,892 | ||||
| Foreign cash, at value (Cost $209,150 and $921, respectively) | 209,215 | 921 | ||||||
| Cash | 10,276,338 | 613,943 | ||||||
| Dividends and interest receivable | 107,726 | 54,023 | ||||||
| Receivable for investments sold | 1,956,334 | – | ||||||
| Receivable for fund shares subscribed | 28,694 | 14,976 | ||||||
| Receivable due from advisor | – | 2,274 | ||||||
| Prepaid and other assets | 14,113 | 11,471 | ||||||
| Total assets | 253,588,386 | 29,993,500 | ||||||
| LIABILITIES | ||||||||
| Payable for investments purchased | 208,749 | – | ||||||
| Foreign capital gains tax | 2,466,889 | – | ||||||
| Payable for fund shares redeemed | 700 | 400 | ||||||
| Advisory fees payable | 149,419 | – | ||||||
| Administration fees payable | 65,758 | 32,600 | ||||||
| Custodian fees payable | 81,795 | 18,016 | ||||||
| Payable for professional fees | 20,708 | 19,879 | ||||||
| Payable for trustee fees and expenses | 3,484 | 753 | ||||||
| Payable for chief compliance officer fee | 5,852 | 998 | ||||||
| Payable for principal financial officer fees | 3,641 | 472 | ||||||
| Distribution and service fees payable - Investor Class | 5,114 | 952 | ||||||
| Payable for transfer agency fees | 48,746 | 13,336 | ||||||
| Accrued expenses and other liabilities | 13,761 | 5,152 | ||||||
| Total liabilities | 3,074,616 | 92,558 | ||||||
| NET ASSETS | $ | 250,513,770 | $ | 29,900,942 | ||||
| NET ASSETS CONSISTS OF | ||||||||
| Paid-in capital (Note 5) | $ | 199,368,404 | $ | 21,069,806 | ||||
| Total distributable earnings | 51,145,366 | 8,831,136 | ||||||
| NET ASSETS | $ | 250,513,770 | $ | 29,900,942 | ||||
| INVESTMENTS, AT COST | $ | 184,806,593 | $ | 21,557,642 | ||||
| PRICING OF SHARES | ||||||||
| Institutional Class | ||||||||
| Net Assets | $ | 226,646,958 | $ | 25,317,350 | ||||
| Net Asset Value, offering and redemption price per share | $ | 14.00 | $ | 15.10 | ||||
| Shares of beneficial interest outstanding | 16,186,472 | 1,677,006 | ||||||
| Investor Class | ||||||||
| Net Assets | $ | 23,866,812 | $ | 4,583,592 | ||||
| Net Asset Value, offering and redemption price per share | $ | 13.93 | $ | 15.06 | ||||
| Shares of beneficial interest outstanding | 1,713,069 | 304,320 | ||||||
See Notes to Financial Statements.
| 18 | 1.855.775.3337 | www.rondureglobal.com |
| Rondure Funds | Statements of Operations |
For the Six Months Ended October 31, 2021 (Unaudited)
| Rondure New World Fund | Rondure Overseas Fund | |||||||
| INVESTMENT INCOME | ||||||||
| Dividends | $ | 2,725,805 | $ | 192,903 | ||||
| Foreign taxes withheld | (362,589 | ) | (17,735 | ) | ||||
| Other Income | 272 | – | ||||||
| Total investment income | 2,363,488 | 175,168 | ||||||
| EXPENSES | ||||||||
| Investment advisor fees (Note 6) | 1,047,613 | 103,313 | ||||||
| Administrative fees | 137,103 | 32,889 | ||||||
| Distribution and service fees - Investor Class | 31,050 | 5,542 | ||||||
| Transfer agent fees | 145,426 | 35,705 | ||||||
| Professional fees | 20,589 | 13,533 | ||||||
| Printing fees | 11,411 | 283 | ||||||
| Registration fees | 19,427 | 17,842 | ||||||
| Custodian fees | 125,037 | 25,910 | ||||||
| Trustee fees and expenses | 5,024 | 947 | ||||||
| Chief compliance officer fees | 16,855 | 2,349 | ||||||
| Principal financial officer fees | 7,151 | 892 | ||||||
| Other expenses | 10,499 | 4,603 | ||||||
| Total expenses | 1,577,185 | 243,808 | ||||||
| Less fees waived/reimbursed by investment advisor (Note 6) | (189,808 | ) | (112,858 | ) | ||||
| Total net expenses | 1,387,377 | 130,950 | ||||||
| NET INVESTMENT INCOME | 976,111 | 44,218 | ||||||
| REALIZED AND UNREALIZED GAIN/(LOSS) ON INVESTMENTS | ||||||||
| Net realized gain on investments | 538,378 | 1,236,502 | ||||||
| Net realized loss on foreign currency transactions | (38,370 | ) | (107 | ) | ||||
| Net realized gain | 500,008 | 1,236,395 | ||||||
| Net change in unrealized appreciation on investments (net of change in foreign capital gains tax of $1,618,384 and $0, respectively) | 6,364,005 | 632,610 | ||||||
| Net change in unrealized appreciation/(depreciation) on translation of assets and liabilities in foreign currencies | 55 | (1,061 | ) | |||||
| Net change in unrealized appreciation | 6,364,060 | 631,549 | ||||||
| NET REALIZED AND UNREALIZED GAIN ON INVESTMENTS AND FOREIGN CURRENCY TRANSACTIONS | 6,864,068 | 1,867,944 | ||||||
| NET INCREASE IN NET ASSETS RESULTING FROM OPERATIONS | $ | 7,840,179 | $ | 1,912,162 | ||||
See Notes to Financial Statements.
| Semi-Annual Report | October 31, 2021 | 19 |
| Rondure New World Fund | Statement of Changes in Net Assets |
| For the Six Months Ended October 31, 2021 (Unaudited) | For the Year Ended April 30, 2021 | |||||||
| OPERATIONS | ||||||||
| Net investment income | $ | 976,111 | $ | 837,536 | ||||
| Net realized gain | 500,008 | 5,215,541 | ||||||
| Net change in unrealized appreciation | 6,364,060 | 47,959,807 | ||||||
| Net increase in net assets resulting from operations | 7,840,179 | 54,012,884 | ||||||
| TOTAL DISTRIBUTIONS TO SHAREHOLDERS (NOTE 3) | ||||||||
| From distributable earnings | ||||||||
| Institutional Class | – | (724,741 | ) | |||||
| Investor Class | – | (67,304 | ) | |||||
| Net decrease in net assets from distributions | – | (792,045 | ) | |||||
| CAPITAL SHARE TRANSACTIONS (NOTE 5) | ||||||||
| Institutional Class | ||||||||
| Proceeds from sales of shares | 19,202,874 | 58,214,092 | ||||||
| Distributions reinvested | – | 707,032 | ||||||
| Cost of shares redeemed | (9,139,941 | ) | (14,561,301 | ) | ||||
| Redemption fees | 350 | 10,421 | ||||||
| Net increase from capital shares transactions | 10,063,283 | 44,370,244 | ||||||
| Investor Class | ||||||||
| Proceeds from sales of shares | 1,266,384 | 8,807,686 | ||||||
| Distributions reinvested | – | 67,123 | ||||||
| Cost of shares redeemed | (4,088,903 | ) | (8,100,996 | ) | ||||
| Redemption fees | 160 | 1,084 | ||||||
| Net increase/(decrease) from capital shares transactions | (2,822,359 | ) | 774,897 | |||||
| Net increase in net assets | 15,081,103 | 98,365,980 | ||||||
| NET ASSETS | ||||||||
| Beginning of period | 235,432,667 | 137,066,687 | ||||||
| End of period | $ | 250,513,770 | $ | 235,432,667 | ||||
| OTHER INFORMATION | ||||||||
| Shares Transactions | ||||||||
| Institutional Class | ||||||||
| Issued | 1,386,535 | 4,615,909 | ||||||
| Issued to shareholders in reinvestment of distributions | – | 53,604 | ||||||
| Redeemed | (652,395 | ) | (1,173,436 | ) | ||||
| Net increase in share transactions | 734,140 | 3,496,077 | ||||||
| Investor Class | ||||||||
| Issued | 91,249 | 687,756 | ||||||
| Issued to shareholders in reinvestment of distributions | – | 5,104 | ||||||
| Redeemed | (295,547 | ) | (632,251 | ) | ||||
| Net increase/(decrease) in share transactions | (204,298 | ) | 60,609 | |||||
See Notes to Financial Statements.
| 20 | 1.855.775.3337 | www.rondureglobal.com |
| Rondure Overseas Fund | Statement of Changes in Net Assets |
| For the Six Months Ended October 31, 2021 (Unaudited) | For the Year Ended April 30, 2021 | |||||||
| OPERATIONS | ||||||||
| Net investment income | $ | 44,218 | $ | 118,898 | ||||
| Net realized gain | 1,236,395 | 1,760,791 | ||||||
| Net change in unrealized appreciation | 631,549 | 6,012,881 | ||||||
| Net increase in net assets resulting from operations | 1,912,162 | 7,892,570 | ||||||
| TOTAL DISTRIBUTIONS TO SHAREHOLDERS (NOTE 3) | ||||||||
| From distributable earnings | ||||||||
| Institutional Class | – | (110,149 | ) | |||||
| Investor Class | – | (11,833 | ) | |||||
| Net decrease in net assets from distributions | – | (121,982 | ) | |||||
| CAPITAL SHARE TRANSACTIONS (NOTE 5) | ||||||||
| Institutional Class | ||||||||
| Proceeds from sales of shares | 1,933,933 | 6,502,316 | ||||||
| Distributions reinvested | – | 108,604 | ||||||
| Cost of shares redeemed | (5,957,295 | ) | (2,409,017 | ) | ||||
| Redemption fees | 162 | 8 | ||||||
| Net increase/(decrease) from capital shares transactions | (4,023,200 | ) | 4,201,911 | |||||
| Investor Class | ||||||||
| Proceeds from sales of shares | 598,654 | 1,766,564 | ||||||
| Distributions reinvested | – | 11,832 | ||||||
| Cost of shares redeemed | (451,659 | ) | (1,270,752 | ) | ||||
| Redemption fees | 507 | 167 | ||||||
| Net increase from capital shares transactions | 147,502 | 507,811 | ||||||
| Net increase/(decrease) in net assets | (1,963,536 | ) | 12,480,310 | |||||
| NET ASSETS | ||||||||
| Beginning of period | 31,864,478 | 19,384,168 | ||||||
| End of period | $ | 29,900,942 | $ | 31,864,478 | ||||
| OTHER INFORMATION | ||||||||
| Shares Transactions | ||||||||
| Institutional Class | ||||||||
| Issued | 130,447 | 520,727 | ||||||
| Issued to shareholders in reinvestment of distributions | – | 7,968 | ||||||
| Redeemed | (406,421 | ) | (196,876 | ) | ||||
| Net increase/(decrease) in share transactions | (275,974 | ) | 331,819 | |||||
| Investor Class | ||||||||
| Issued | 40,492 | 140,115 | ||||||
| Issued to shareholders in reinvestment of distributions | – | 868 | ||||||
| Redeemed | (30,774 | ) | (100,434 | ) | ||||
| Net increase in share transactions | 9,718 | 40,549 | ||||||
See Notes to Financial Statements.
| Semi-Annual Report | October 31, 2021 | 21 |
| Rondure New World Fund – Institutional Class | Financial Highlights |
For a Share Outstanding Throughout the Years or Periods Presented
| Institutional Class | For the Six Months Ended October 31, 2021 (Unaudited) | Year Ended April 30, 2021 | Year Ended April 30, 2020 | Year Ended April 30, 2019 | For the Period May 2, 2017 (Commencement of Operations) to April 30, 2018 | |||||||||||||||
| NET ASSET VALUE, BEGINNING OF PERIOD | $ | 13.56 | $ | 9.93 | $ | 10.80 | $ | 11.25 | $ | 10.00 | ||||||||||
| INCOME FROM INVESTMENT OPERATIONS | ||||||||||||||||||||
| Net investment income(a) | 0.06 | 0.06 | 0.09 | 0.09 | 0.05 | |||||||||||||||
| Net realized and unrealized gain/(loss) on investments | 0.38 | 3.62 | (0.87 | ) | (0.45 | ) | 1.23 | |||||||||||||
| Total income/(loss) from investment operations | 0.44 | 3.68 | (0.78 | ) | (0.36 | ) | 1.28 | |||||||||||||
| DISTRIBUTIONS | ||||||||||||||||||||
| From net investment income | – | (0.05 | ) | (0.09 | ) | (0.09 | ) | (0.03 | ) | |||||||||||
| From net realized gain on investments | – | – | – | – | (0.00 | )(b) | ||||||||||||||
| Total distributions | – | (0.05 | ) | (0.09 | ) | (0.09 | ) | (0.03 | ) | |||||||||||
| REDEMPTION FEES ADDED TO PAID-IN CAPITAL | 0.00 | (b) | 0.00 | (b) | 0.00 | (b) | 0.00 | (b) | 0.00 | (b) | ||||||||||
| INCREASE/DECREASE IN NET ASSET VALUE | 0.44 | 3.63 | (0.87 | ) | (0.45 | ) | 1.25 | |||||||||||||
| NET ASSET VALUE, END OF PERIOD | $ | 14.00 | $ | 13.56 | $ | 9.93 | $ | 10.80 | $ | 11.25 | ||||||||||
| TOTAL RETURN | 3.24 | %(c) | 37.11 | % | (7.31 | )% | (3.09 | )% | 12.78 | %(c) | ||||||||||
| RATIOS AND SUPPLEMENTAL DATA | ||||||||||||||||||||
| Net assets, end of period (in 000s) | $ | 226,647 | $ | 209,531 | $ | 118,685 | $ | 110,800 | $ | 100,760 | ||||||||||
| RATIOS TO AVERAGE NET ASSETS | ||||||||||||||||||||
| Expenses (excluding fees waived/ reimbursed by investment advisor) | 1.25 | %(d) | 1.32 | % | 1.43 | % | 1.46 | % | 1.62 | %(d) | ||||||||||
| Expenses (including fees waived/ reimbursed by investment advisor) | 1.10 | %(d) | 1.10 | % | 1.10 | % | 1.10 | % | 1.10 | %(d) | ||||||||||
| Net investment income | 0.81 | %(d) | 0.48 | % | 0.83 | % | 0.87 | % | 0.43 | %(d) | ||||||||||
| PORTFOLIO TURNOVER RATE | 9 | %(c) | 36 | % | 27 | % | 37 | % | 13 | %(c) | ||||||||||
| (a) | Per share numbers have been calculated using the average shares method. |
| (b) | Less than $0.005 or ($0.005) per share. |
| (c) | Not Annualized. |
| (d) | Annualized. |
See Notes to Financial Statements.
| 22 | 1.855.775.3337 | www.rondureglobal.com |
| Rondure New World Fund – Investor Class | Financial Highlights |
For a Share Outstanding Throughout the Years or Periods Presented
| Investor Class | For the Six Months Ended October 31, 2021 (Unaudited) | Year Ended April 30, 2021 | Year Ended April 30, 2020 | Year Ended April 30, 2019 | For the Period May 2, 2017 (Commencement of Operations) to April 30, 2018 | |||||||||||||||
| NET ASSET VALUE, BEGINNING OF PERIOD | $ | 13.51 | $ | 9.90 | $ | 10.78 | $ | 11.24 | $ | 10.00 | ||||||||||
| INCOME FROM INVESTMENT OPERATIONS | ||||||||||||||||||||
| Net investment income(a) | 0.04 | 0.03 | 0.06 | 0.07 | 0.03 | |||||||||||||||
| Net realized and unrealized gain/(loss) on investments | 0.38 | 3.61 | (0.87 | ) | (0.46 | ) | 1.22 | |||||||||||||
| Total income/(loss) from investment operations | 0.42 | 3.64 | (0.81 | ) | (0.39 | ) | 1.25 | |||||||||||||
| DISTRIBUTIONS | ||||||||||||||||||||
| From net investment income | – | (0.03 | ) | (0.07 | ) | (0.07 | ) | (0.01 | ) | |||||||||||
| From net realized gain on investments | – | – | – | – | (0.00 | )(b) | ||||||||||||||
| Total distributions | – | (0.03 | ) | (0.07 | ) | (0.07 | ) | (0.01 | ) | |||||||||||
| REDEMPTION FEES ADDED TO PAID-IN CAPITAL | 0.00 | (b) | 0.00 | (b) | 0.00 | (b) | 0.00 | (b) | 0.00 | (b) | ||||||||||
| INCREASE/DECREASE IN NET ASSET VALUE | 0.42 | 3.61 | (0.88 | ) | (0.46 | ) | 1.24 | |||||||||||||
| NET ASSET VALUE, END OF PERIOD | $ | 13.93 | $ | 13.51 | $ | 9.90 | $ | 10.78 | $ | 11.24 | ||||||||||
| TOTAL RETURN | 3.11 | %(c) | 36.83 | % | (7.56 | )% | (3.37 | )% | 12.53 | %(c) | ||||||||||
| RATIOS AND SUPPLEMENTAL DATA | ||||||||||||||||||||
| Net assets, end of period (in 000s) | $ | 23,867 | $ | 25,901 | $ | 18,382 | $ | 20,595 | $ | 24,233 | ||||||||||
| RATIOS TO AVERAGE NET ASSETS | ||||||||||||||||||||
| Expenses (excluding fees waived/ reimbursed by investment advisor) | 1.57 | %(d) | 1.63 | % | 1.72 | % | 1.76 | % | 1.91 | %(d) | ||||||||||
| Expenses (including fees waived/ reimbursed by investment advisor) | 1.35 | %(d) | 1.35 | % | 1.35 | % | 1.35 | % | 1.35 | %(d) | ||||||||||
| Net investment income | 0.59 | %(d) | 0.25 | % | 0.59 | % | 0.66 | % | 0.24 | %(d) | ||||||||||
| PORTFOLIO TURNOVER RATE | 9 | %(c) | 36 | % | 27 | % | 37 | % | 13 | %(c) | ||||||||||
| (a) | Per share numbers have been calculated using the average shares method. |
| (b) | Less than $0.005 or ($0.005) per share. |
| (c) | Not Annualized. |
| (d) | Annualized. |
See Notes to Financial Statements.
| Semi-Annual Report | October 31, 2021 | 23 |
| Rondure Overseas Fund – Institutional Class | Financial Highlights |
For a Share Outstanding Throughout the Years or Periods Presented
| Institutional Class | For the Six Months Ended October 31, 2021 (Unaudited) | Year Ended April 30, 2021 | Year Ended April 30, 2020 | Year Ended April 30, 2019 | For the Period May 2, 2017 (Commencement of Operations) to April 30, 2018 | |||||||||||||||
| NET ASSET VALUE, BEGINNING OF PERIOD | $ | 14.18 | $ | 10.34 | $ | 11.11 | $ | 11.46 | $ | 10.00 | ||||||||||
| INCOME FROM INVESTMENT OPERATIONS | ||||||||||||||||||||
| Net investment income(a) | 0.03 | 0.06 | 0.10 | 0.10 | 0.10 | |||||||||||||||
| Net realized and unrealized gain/(loss) on investments | 0.89 | 3.84 | (0.76 | ) | (0.31 | ) | 1.48 | |||||||||||||
| Total income/(loss) from investment operations | 0.92 | 3.90 | (0.66 | ) | (0.21 | ) | 1.58 | |||||||||||||
| DISTRIBUTIONS | ||||||||||||||||||||
| From net investment income | – | (0.06 | ) | (0.11 | ) | (0.11 | ) | (0.04 | ) | |||||||||||
| From net realized gain on investments | – | – | – | (0.03 | ) | (0.08 | ) | |||||||||||||
| Total distributions | – | (0.06 | ) | (0.11 | ) | (0.14 | ) | (0.12 | ) | |||||||||||
| REDEMPTION FEES ADDED TO PAID-IN CAPITAL | 0.00 | (b) | 0.00 | (b) | 0.00 | (b) | 0.00 | (b) | 0.00 | (b) | ||||||||||
| INCREASE/DECREASE IN NET ASSET VALUE | 0.92 | 3.84 | (0.77 | ) | (0.35 | ) | 1.46 | |||||||||||||
| NET ASSET VALUE, END OF PERIOD | $ | 15.10 | $ | 14.18 | $ | 10.34 | $ | 11.11 | $ | 11.46 | ||||||||||
| TOTAL RETURN | 6.49 | %(c) | 37.71 | % | (6.06 | )% | (1.76 | )% | 15.88 | %(c) | ||||||||||
| RATIOS AND SUPPLEMENTAL DATA | ||||||||||||||||||||
| Net assets, end of period (in 000s) | $ | 25,317 | $ | 27,692 | $ | 16,758 | $ | 18,845 | $ | 14,283 | ||||||||||
| RATIOS TO AVERAGE NET ASSETS | ||||||||||||||||||||
| Expenses (excluding fees waived/ reimbursed by investment advisor) | 1.61 | %(d) | 1.70 | % | 1.73 | % | 1.72 | % | 2.57 | %(d) | ||||||||||
| Expenses (including fees waived/ reimbursed by investment advisor) | 0.85 | %(d) | 0.85 | % | 0.85 | % | 0.85 | % | 0.85 | %(d) | ||||||||||
| Net investment income | 0.34 | %(d) | 0.49 | % | 0.89 | % | 0.95 | % | 0.92 | %(d) | ||||||||||
| PORTFOLIO TURNOVER RATE | 16 | %(c) | 51 | % | 66 | % | 40 | % | 14 | %(c) | ||||||||||
| (a) | Per share numbers have been calculated using the average shares method. |
| (b) | Less than $0.005 or ($0.005) per share. |
| (c) | Not Annualized. |
| (d) | Annualized. |
See Notes to Financial Statements.
| 24 | 1.855.775.3337 | www.rondureglobal.com |
| Rondure Overseas Fund – Investor Class | Financial Highlights |
For a Share Outstanding Throughout the Years or Periods Presented
| Investor Class | For the Six Months Ended October 31, 2021 (Unaudited) | Year Ended April 30, 2021 | Year Ended April 30, 2020 | Year Ended April 30, 2019 | For the Period May 2, 2017 (Commencement of Operations) to April 30, 2018 | |||||||||||||||
| NET ASSET VALUE, BEGINNING OF PERIOD | $ | 14.16 | $ | 10.34 | $ | 11.12 | $ | 11.48 | $ | 10.00 | ||||||||||
| INCOME FROM INVESTMENT OPERATIONS | ||||||||||||||||||||
| Net investment income(a) | 0.00 | (b) | 0.03 | 0.07 | 0.08 | 0.09 | ||||||||||||||
| Net realized and unrealized gain/(loss) on investments | 0.90 | 3.83 | (0.76 | ) | (0.32 | ) | 1.46 | |||||||||||||
| Total income/(loss) from investment operations | 0.90 | 3.86 | (0.69 | ) | (0.24 | ) | 1.55 | |||||||||||||
| DISTRIBUTIONS | ||||||||||||||||||||
| From net investment income | – | (0.04 | ) | (0.09 | ) | (0.09 | ) | – | ||||||||||||
| From net realized gain on investments | – | – | – | (0.03 | ) | (0.08 | ) | |||||||||||||
| Total distributions | – | (0.04 | ) | (0.09 | ) | (0.12 | ) | (0.08 | ) | |||||||||||
| REDEMPTION FEES ADDED TO PAID-IN CAPITAL | 0.00 | (b) | 0.00 | (b) | 0.00 | (b) | 0.00 | (b) | 0.01 | |||||||||||
| INCREASE/DECREASE IN NET ASSET VALUE | 0.90 | 3.82 | (0.78 | ) | (0.36 | ) | 1.48 | |||||||||||||
| NET ASSET VALUE, END OF PERIOD | $ | 15.06 | $ | 14.16 | $ | 10.34 | $ | 11.12 | $ | 11.48 | ||||||||||
| TOTAL RETURN | 6.36 | %(c) | 37.34 | % | (6.28 | )% | (1.98 | )% | 15.63 | %(c) | ||||||||||
| RATIOS AND SUPPLEMENTAL DATA | ||||||||||||||||||||
| Net assets, end of period (in 000s) | $ | 4,584 | $ | 4,173 | $ | 2,626 | $ | 3,922 | $ | 5,189 | ||||||||||
| RATIOS TO AVERAGE NET ASSETS | ||||||||||||||||||||
| Expenses (excluding fees waived/ reimbursed by investment advisor) | 1.91 | %(d) | 2.01 | % | 2.06 | % | 2.04 | % | 2.45 | %(d) | ||||||||||
| Expenses (including fees waived/ reimbursed by investment advisor) | 1.10 | %(d) | 1.10 | % | 1.10 | % | 1.10 | % | 1.10 | %(d) | ||||||||||
| Net investment income | 0.05 | %(d) | 0.23 | % | 0.61 | % | 0.74 | % | 0.82 | %(d) | ||||||||||
| PORTFOLIO TURNOVER RATE | 16 | %(c) | 51 | % | 66 | % | 40 | % | 14 | %(c) | ||||||||||
| (a) | Per share numbers have been calculated using the average shares method. |
| (b) | Less than $0.005 or ($0.005) per share. |
| (c) | Not Annualized. |
| (d) | Annualized. |
See Notes to Financial Statements.
| Semi-Annual Report | October 31, 2021 | 25 |
| Rondure Funds | Notes to Financial Statements |
October 31, 2021 (Unaudited)
1. ORGANIZATION
Financial Investors Trust (the “Trust”), a Delaware statutory trust, is an open-end management investment company registered under the Investment Company Act of 1940, as amended (“1940 Act”). As of October 31, 2021, the Trust consists of multiple separate Portfolios or series. This semi-annual report describes the Rondure New World Fund and the Rondure Overseas Fund (individually a “Fund” and collectively, the “Funds”). The Funds seek long-term growth of capital. The Funds offer Investor Class and Institutional Class shares.
2. SIGNIFICANT ACCOUNTING POLICIES
The accompanying financial statements were prepared in accordance with accounting principles generally accepted in the United States of America (“U.S. GAAP”). The preparation of financial statements in conformity with U.S. GAAP requires management to make certain estimates and assumptions that affect the reported amounts of assets and liabilities and disclosures of contingent assets and liabilities at the date of the financial statements and the reported amounts of revenue and expenses during the period. Actual results could differ from those estimates. The Funds are considered an investment company for financial reporting purposes under U.S. GAAP and follows the accounting and reporting guidance applicable to investment companies in the Financial Accounting Standards Board Accounting Standards Codification Topic 946. The following is a summary of significant accounting policies consistently followed by the Funds in preparation of its financial statements.
Investment Valuation: The Funds generally value their securities based on market prices determined at the close of regular trading on the New York Stock Exchange (“NYSE”), normally 4:00 p.m. Eastern Time, on each day the NYSE is open for trading.
For equity securities and mutual funds that are traded on an exchange, the market price is usually the closing sale or official closing price on that exchange. In the case of equity securities not traded on an exchange, or if such closing prices are not otherwise available, the securities are valued at the mean of the most recent bid and ask prices on such day. Redeemable securities issued by open-end registered investment companies are valued at the investment company’s applicable net asset value, with the exception of exchange-traded open-end investment companies, which are priced as equity securities.
Equity securities that are primarily traded on foreign securities exchanges are valued at the closing values of such securities on their respective foreign exchanges, except when an event occurs subsequent to the close of the foreign exchange and the close of the NYSE that was likely to have changed such value. In such an event, the fair value of those securities are determined in good faith through consideration of other factors in accordance with procedures established by and under the general supervision of the Board of Trustees of the Trust (the “Board” or the “Trustees”). The Funds will use a fair valuation model provided by an independent pricing service, which is intended to reflect fair value when a security’s value or a meaningful portion of each Fund’s portfolio is believed to have been materially affected by a valuation event that has occurred between the close of the exchange or market on which the security is traded and the close of the regular trading day on the NYSE. The Funds’ valuation procedures set forth certain triggers which instruct when to use the fair valuation model.
The Funds may invest in warrants to participate in an anticipated increase in the market value of the security. A warrant entitles the holder to buy a security at a set price during a set period of time. If such market value increases, the warrant may be exercised and sold at a gain. A loss will be incurred if the market value decreases or if the term of the warrant expires before it is exercised. Warrants convey no rights to dividends or voting. An implied pricing method is used to value the rights.
When such prices or quotations are not available, or when Rondure Global Advisors, LLC (the “Advisor” or “Rondure”) believes that they are unreliable, securities may be priced using fair value procedures approved by the Board.
Fair Value Measurements: The Funds disclose the classification of their fair value measurements following a three-tier hierarchy based on the inputs used to measure fair value. Inputs refer broadly to the assumptions that market participants would use in pricing the asset or liability, including assumptions about risk. Inputs may be observable or unobservable. Observable inputs reflect the assumptions market participants would use in pricing the asset or liability that are developed based on market data obtained from sources independent of the reporting entity. Unobservable inputs reflect the reporting entity’s own assumptions about the assumptions market participants would use in pricing the asset or liability that are developed based on the best information available.
| 26 | 1.855.775.3337 | www.rondureglobal.com |
| Rondure Funds | Notes to Financial Statements |
October 31, 2021 (Unaudited)
Various inputs are used in determining the value of the Funds’ investments as of the end of the reporting period. When inputs used fall into different levels of the fair value hierarchy, the level in the hierarchy within which the fair value measurement falls is determined based on the lowest level input that is significant to the fair value measurement in its entirety. The designated input levels are not necessarily an indication of the risk or liquidity associated with these investments. These inputs are categorized in the following hierarchy under applicable financial accounting standards:
Level 1 – Unadjusted quoted prices in active markets for identical investments, unrestricted assets or liabilities that the Funds have the ability to access at the measurement date;
Level 2 – Quoted prices which are not active, quoted prices for similar assets or liabilities in active markets or inputs other than quoted prices that are observable (either directly or indirectly) for substantially the full term of the asset or liability; and
Level 3 – Significant unobservable prices or inputs (including the Funds’ own assumptions in determining the fair value of investments) where there is little or no market activity for the asset or liability at the measurement date.
The following is a summary of each Fund’s investments in the fair value hierarchy as of October 31, 2021:
| Investments in Securities at Value | Level 1 - Quoted and Unadjusted Prices | Level 2 - Other Significant Observable Inputs | Level 3 - Significant Unobservable Inputs | Total | ||||||||||||
| Rondure New World Fund | ||||||||||||||||
| Common Stocks* | $ | 240,995,966 | $ | – | $ | – | $ | 240,995,966 | ||||||||
| Total | $ | 240,995,966 | $ | – | $ | – | $ | 240,995,966 | ||||||||
| Investments in Securities at Value | Level 1 - Quoted and Unadjusted Prices | Level 2 - Other Significant Observable Inputs | Level 3 - Significant Unobservable Inputs | Total | ||||||||||||
| Rondure Overseas Fund | ||||||||||||||||
| Common Stocks* | $ | 29,295,892 | $ | – | $ | – | $ | 29,295,892 | ||||||||
| Total | $ | 29,295,892 | $ | – | $ | – | $ | 29,295,892 | ||||||||
| * | For a detailed country breakdown, see the accompanying Portfolio of Investments. |
For the six months ended October 31, 2021, the Funds did not have any securities that used significant unobservable inputs (Level 3) in determining fair value.
Investment Transactions and Investment Income: Investment transactions are accounted for on the date the investments are purchased or sold (trade date). Realized gains and losses from investment transactions are reported on an identified cost which is the same basis the Fund uses for federal income tax purposes. Interest income, which includes accretion of discounts and amortization of premiums, is accrued and recorded as earned. Dividend income is recognized on the ex-dividend date or for certain foreign securities, as soon as information is available to the Funds. All of the realized and unrealized gains and losses and net investment income, are allocated daily to each class in proportion to its average daily net assets.
| Semi-Annual Report | October 31, 2021 | 27 |
| Rondure Funds | Notes to Financial Statements |
October 31, 2021 (Unaudited)
Cash Management Transactions: The Funds subscribe to the Brown Brothers Harriman & Co. (“BBH”) Cash Management Service (“CMS”), whereby cash balances are automatically swept into overnight offshore demand deposits with either the BBH Grand Cayman branch or a branch of a pre-approved commercial bank. This fully automated program allows the Funds to earn interest on cash balances. Excess cash with deposit institutions domiciled outside of the U.S. are subject to sovereign actions in the jurisdiction of the deposit institution including, but not limited to, freeze, seizure or diminution. Cash balances in the BBH CMS are included on the Statements of Assets and Liabilities under Cash and Foreign Cash, at Value. As of October 31, 2021, the Funds had the following cash balances participating in the BBH CMS:
| Fund | ||||
| Rondure New World Fund | $ | 10,276,338 | ||
| Rondure Overseas Fund | 613,943 | |||
As of October 31, 2021, the Funds had the following foreign cash balances participating in the BBH CMS (cost and value of foreign cash balances are equal):
| Fund | ||||
| Rondure New World Fund | $ | – | ||
| Rondure Overseas Fund | 30,677 | |||
Foreign Securities: The Funds may directly purchase securities of foreign issuers. Investing in securities of foreign issuers involves special risks not typically associated with investing in securities of U.S. issuers. The risks include possible reevaluation of currencies, the inability to repatriate foreign currency, less complete financial information about companies and possible future adverse political and economic developments. Moreover, securities of many foreign issuers and their markets may be less liquid and their prices more volatile than those of securities of comparable U.S. issuers.
Foreign Currency Translation: The books and records of the Funds are maintained in U.S. dollars. Investment valuations and other assets and liabilities initially expressed in foreign currencies are converted each business day into U.S. dollars based upon current exchange rates. Prevailing foreign exchange rates may generally be obtained at the close of the NYSE (normally, 4:00 p.m. Eastern Time). The portion of realized and unrealized gains or losses on investments due to fluctuations in foreign currency exchange rates are separately disclosed.
Foreign Currency Spot Contracts: The Funds may enter into foreign currency spot contracts to facilitate transactions in foreign securities or to convert foreign currency receipts into U.S. dollars. A foreign currency spot contract is an agreement between two parties to buy and sell currencies at the current market rate, for settlement generally within two business days. The U.S. dollar value of the contracts is determined using current currency exchange rates supplied by a pricing service.
The contract is marked-to-market daily for settlements beyond one day and any change in market value is recorded as an unrealized gain or loss. When the contract is closed, a realized gain or loss is recorded equal to the difference between the value on the open and close date. Losses may arise from changes in the value of the foreign currency, or if the counterparties do not perform under the contract’s terms. The maximum potential loss from such contracts is the aggregate face value in U.S. dollars at the time the contract was opened.
Trust Expenses: Some expenses of the Trust can be directly attributed to the Funds. Expenses which cannot be directly attributed to the Funds are apportioned among all funds in the Trust based on average net assets of each fund.
Fund and Class Expenses: Expenses that are specific to a Fund or class of shares of a Fund, including distribution fees (Rule 12b-1 fees), are charged directly to that Fund or share class. Expenses that are common to all Funds generally are allocated among the Funds in proportion to their average daily net assets.
Federal Income Taxes: The Funds comply with the requirements under Subchapter M of the Internal Revenue Code of 1986, as amended, applicable to regulated investment companies and intend to distribute substantially all of their net taxable income and net capital gains, if any, each year so that it will not be subject to excise tax on undistributed income and gains. The Funds are not subject to income taxes to the extent such distributions are made.
| 28 | 1.855.775.3337 | www.rondureglobal.com |
| Rondure Funds | Notes to Financial Statements |
October 31, 2021 (Unaudited)
Distributions to Shareholders: Each Fund normally pays dividends and distributes capital gains, if any, on an annual basis. Income dividend distributions are derived from dividends and other income each Fund receives from their investments, including short term capital gains. Long term capital gain distributions are derived from gains realized when each Fund sells a security it has owned for more than a year. Each Fund may make additional distributions and dividends at other times if the portfolio manager believes doing so may be necessary for each Fund to avoid or reduce taxes. The Funds intend to pass through foreign tax credits to shareholders.
Epidemic and Pandemic Risk: Certain countries have been susceptible to epidemics, most recently COVID-19, which has been designated as a pandemic by world health authorities. The outbreak of such epidemics, together with any resulting restrictions on travel or quarantines imposed, could have a negative impact on the economy and business activity globally (including in the countries in which we invest), and thereby could adversely affect the performance of our investments. Furthermore, the rapid development of epidemics could preclude prediction as to their ultimate adverse impact on economic and market conditions, and, as a result, present material uncertainty and risk with respect to us and the performance of our investments.
Libor Risk: In March 2020, the Financial Accounting Standards Board (FASB) issued Accounting Standards Update (“ASU”) No. 2020-04, Reference Rate Reform (Topic 848): Facilitation of the Effects of Reference Rate Reform on Financial Reporting. The Funds' investments, payment obligations, and financing terms may be based on floating rates, such as the London Interbank Offered Rate, or “LIBOR,” which is the offered rate for short-term Eurodollar deposits between major international banks. On November 30, 2020, the administrator of LIBOR announced its intention to delay the phase out of the majority of the U.S. dollar LIBOR publications until June 30, 2023, with the remainder of LIBOR publications to still end at the end of 2021. There remains uncertainty regarding the nature of any replacement rate and the impact of the transition from LIBOR on the Funds' transactions and the financial markets generally. As such, the potential effect of a transition away from LIBOR on the Funds or the Funds' investments cannot yet be determined.
3. TAX BASIS INFORMATION
Tax Basis of Investments: As of October 31, 2021, the aggregate cost of investments, gross unrealized appreciation/(depreciation) and net unrealized appreciation/(depreciation) for Federal tax purposes was as follows:
| Fund | Gross Appreciation (excess of value over tax cost) | Gross Depreciation (excess of tax cost over value) | Net Unrealized Appreciation | Cost of Investments for Income Tax Purposes | ||||||||||||
| Rondure New World Fund | $ | 63,582,876 | $ | (7,555,596 | ) | $ | 56,027,280 | $ | 184,968,685 | |||||||
| Rondure Overseas Fund | 8,038,839 | (359,547 | ) | 7,679,292 | 21,616,600 | |||||||||||
Tax Basis of Distributions to Shareholders: The character of distributions made during the year from net investment income or net realized gains may differ from its ultimate characterization for federal income tax purposes. Also, due to the timing of dividend distributions, the fiscal year in which amounts are distributed may differ from the fiscal year in which the income or realized gain were recorded by the Funds.
The tax characters of distributions paid by the Funds for the year ended April 30, 2021 were as follows:
| Fund | Ordinary Income | Long-Term Capital Gain | ||||||
| Rondure New World Fund | $ | 792,045 | $ | – | ||||
| Rondure Overseas Fund | 121,982 | – | ||||||
The amounts and characteristics of tax basis distributions and composition of distributable earnings/(accumulated losses) are finalized at fiscal year-end. Accordingly, tax basis balances have not been determined as of October 31, 2021.
| Semi-Annual Report | October 31, 2021 | 29 |
| Rondure Funds | Notes to Financial Statements |
October 31, 2021 (Unaudited)
4. SECURITIES TRANSACTIONS
The cost of purchases and proceeds from sales of securities (excluding short term securities) during the six months ended October 31, 2021 were as follows:
| Fund | Purchases of Securities | Proceeds From Sales of Securities | ||||||
| Rondure New World Fund | $ | 31,436,564 | $ | 22,735,205 | ||||
| Rondure Overseas Fund | 4,517,112 | 8,771,883 | ||||||
5. SHARES OF BENEFICIAL INTEREST
The capitalization of the Trust consists of an unlimited number of shares of beneficial interest with no par value per share. Holders of the shares of the Funds of the Trust have one vote for each share held and a proportionate fraction of a vote for each fractional share. All shares issued and outstanding are fully paid and are transferable and redeemable at the option of the shareholder. Purchasers of the share do not have any obligation to make payments to the Trust or its creditors solely by reason of the purchasers’ ownership of the shares. Shares have no pre-emptive rights.
Shares redeemed within 60 days of purchase may incur a 2% short-term redemption fee deducted from the redemption amount. For the six months ended October 31, 2021, the redemption fees charged by the Funds are presented in the Statement of Changes in Net Assets.
6. MANAGEMENT AND RELATED-PARTY TRANSACTIONS
The Advisor, subject to the authority of the Board, is responsible for the overall management and administration of the Funds’ business affairs. The Advisor manages the investments of the Funds in accordance with the Funds’ investment objective, policies and limitations and investment guidelines established jointly by the Advisor and the Trustees. Pursuant to the Advisory Agreement, (the “Advisory Agreement”), each Fund pays the Advisor an annual management fee based on each Fund’s average daily net assets. The management fee is paid on a monthly basis. The following table reflects the Funds’ advisory fee rates.
| Fund | Advisory Fee |
| Rondure New World Fund | 0.85% |
| Rondure Overseas Fund | 0.70% |
The Advisor has agreed to waive and/or reimburse fees or expenses in order to limit Total Annual Fund Operating Expenses After Fee Waiver/ Expense Reimbursement (excluding acquired fund fees and expenses, brokerage expenses, interest expense, taxes and extraordinary expenses) to 1.35% and 1.10% of the Rondure New World Fund's average daily net assets for the Investor Class Shares and Institutional Class Shares, respectively, and 1.10% and 0.85% of the Rondure Overseas Fund's average daily net assets for the Investor Class Shares and Institutional Class Shares, respectively. This agreement (the "Expense Agreement") shall continue at least through August 31, 2022. The Advisor will be permitted to recapture, on a class- by class basis, expenses it has borne through the Expense Agreement to the extent that the Fund's expenses in later periods fall below the annual rates set forth in the Expense Agreement or in previous letter agreements; provided, however, that such recapture payments do not cause the Fund's expense ratio (after recapture) to exceed the lesser of (i) the expense cap in effect at the time of the waiver and (ii) the expense cap in effect at the time of the recapture. Notwithstanding the foregoing, the Fund will not be obligated to pay any such deferred fees and expenses more than three years after the date on which the fee and expenses were deferred. The Expense Agreement may not be terminated or modified by the Advisor prior to August 31, 2022, except with the approval of the Fund's Board of Trustees. Fees waived/reimbursed by Advisor for the six months ended October 31, 2021 are disclosed in the Statements of Operations.
| Fund | Term of Expense Limit Agreements |
| Rondure New World Fund | September 1, 2021-August 31, 2022/September 1, 2020-August 31, 2021 |
| Institutional Class | |
| Investor Class | |
| Rondure Overseas Fund | September 1, 2021-August 31, 2022/September 1, 2020-August 31, 2021 |
| Institutional Class | |
| Investor Class |
| 30 | 1.855.775.3337 | www.rondureglobal.com |
| Rondure Funds | Notes to Financial Statements |
October 31, 2021 (Unaudited)
For the six months ended October 31, 2021, the fee waivers/reimbursements and/or recoupments were as follows:
| Fund | Fees Waived/Reimbursed By Adviser | |||
| Rondure New World Fund | ||||
| Institutional Class | $ | 162,874 | ||
| Investor Class | 26,934 | |||
| Rondure Overseas Fund | ||||
| Institutional Class | $ | 94,959 | ||
| Investor Class | 17,899 | |||
| Fund | Expires 2022 | Expires 2023 | Expires 2024 | Expires 2025 | Total | |||||||||||||||
| Rondure New World Fund | ||||||||||||||||||||
| Institutional Class | $ | 174,716 | $ | 385,786 | $ | 364,149 | $ | 162,874 | $ | 1,087,525 | ||||||||||
| Investor Class | 49,242 | 73,814 | 66,219 | 26,934 | 216,209 | |||||||||||||||
| Rondure Overseas Fund | ||||||||||||||||||||
| Institutional Class | $ | 71,441 | $ | 162,555 | $ | 192,733 | $ | 94,959 | $ | 521,688 | ||||||||||
| Investor Class | 21,961 | 33,740 | 32,020 | 17,899 | 105,620 | |||||||||||||||
Administrator Fees and Expenses
ALPS Fund Services, Inc. (“ALPS”) serves as administrator to the Funds and the Funds have agreed to pay expenses incurred in connection with their administrative activities. Pursuant to an Administration Agreement, ALPS provides operational services to the Funds including, but not limited to, fund accounting and fund administration and generally assists in the Funds’ operations. Officers of the Trust are employees of ALPS. The Funds’ administration fee is accrued on a daily basis and paid monthly. Administration fees paid by the Funds for the six months ended October 31, 2021 are disclosed in the Statements of Operations.
ALPS is reimbursed by the Funds for certain out-of-pocket expenses.
Transfer Agent
ALPS serves as transfer, dividend paying and shareholder servicing agent for the Funds. ALPS receives an annual minimum fee, a fee based upon the number of shareholder accounts, and is also reimbursed by the Funds for certain out-of-pocket expenses. Transfer agent fees paid by the Funds for the six months ended October 31, 2021 are disclosed in the Statements of Operations.
Compliance Services
ALPS provides services that assist the Trust’s chief compliance officer in monitoring and testing the policies and procedures of the Trust in conjunction with requirements under Rule 38a-1 under the 1940 Act and receives an annual base fee. ALPS is reimbursed for certain out-of-pocket expenses by the Funds. Compliance service fees paid by the Funds for the six months ended October 31, 2021 are disclosed in the Statements of Operations.
Principal Financial Officer
ALPS receives an annual fee for providing principal financial officer services to the Funds. Principal financial officer fees paid by the Fund for the six months ended October 31, 2021 are disclosed in the Statements of Operations.
| Semi-Annual Report | October 31, 2021 | 31 |
| Rondure Funds | Notes to Financial Statements |
October 31, 2021 (Unaudited)
Distributor
ALPS Distributors, Inc. (“ADI” or the “Distributor”) (an affiliate of ALPS) acts as the distributor of the Funds’ shares pursuant to a Distribution Agreement with the Trust. Shares are sold on a continuous basis by ADI as agent for the Funds, and ADI has agreed to use its best efforts to solicit orders for the sale of each Fund’s shares, although it is not obliged to sell any particular amount of shares. ADI is not entitled to any compensation for its services as Distributor. ADI is registered as a broker-dealer with the U.S. Securities and Exchange Commission.
Each Fund has adopted a Distribution and Services (Rule 12b-1) Plan pursuant to Rule 12b-1 of the 1940 Act (the “Plan”) for its Investor Class shares. The Plan allows the Funds to use Investor Class assets to pay fees in connection with the distribution and marketing of Investor Class shares and/or the provision of shareholder services to Investor Class shareholders. The Plan permits payment for services in connection with the administration of plans or programs that use Investor Class shares of each Fund as their funding medium and for related expenses. The recipients of such payments may include the Distributor, other affiliates of the Advisor, broker-dealers, financial institutions, plan sponsors and administrators and other financial intermediaries through which investors may purchase shares of the Fund. The Plan permits the Funds to make total payments at an annual rate of up to 0.25% of each Fund’s average daily net assets attributable to its Investor Class shares. The expenses of the Plan are reflected as distribution and service fees in the Statements of Operations.
Trustees
The fees and expenses of the Trustees of the Board are presented in the Statements of Operations.
7. INDEMNIFICATIONS
Under the Trust’s organizational documents, its officers and Trustees are indemnified against certain liability arising out of the performance of their duties to the Trust. Additionally, in the normal course of business, the Trust enters into contracts with service providers that may contain general indemnification clauses, which may permit indemnification to the extent permissible under applicable law. The Trust’s maximum exposure under these arrangements is unknown, as this would involve future claims that may be made against the Trust that have not yet occurred.
| 32 | 1.855.775.3337 | www.rondureglobal.com |
| Rondure Funds | Additional Information |
October 31, 2021 (Unaudited)
1. FUND HOLDINGS
The Funds file their complete schedule of portfolio holdings with the Securities and Exchange Commission for the first and third quarters of each fiscal year as an exhibit to its reports on Form N-PORT. The Funds’ Form N-PORT reports are available on the Commission’s Web site at http://www.sec.gov. The Funds’ Form N-PORT reports are also available upon request by calling toll-free (855) 775-3337.
2. FUND PROXY VOTING POLICIES, PROCEDURES AND SUMMARIES
The Funds’ policies and procedures used in determining how to vote proxies and information regarding how the Funds voted proxies relating to portfolio securities during the most recent prior 12-month period ending June 30 are available without charge, (1) upon request, by calling (toll-free) 1-855-775-3337 and (2) on the SEC’s website at http://www.sec.gov.
| Semi-Annual Report | October 31, 2021 | 33 |
| Rondure Funds | Disclosure Regarding Approval of Fund Advisory Agreement |
October 31, 2021 (Unaudited)
Rondure Funds
On September 14, 2021, the Trustees via electronic means (videoconference)1 to discuss, among other things, the approval of the Investment Advisory Agreement between the Financial Investors Trust (the “Trust”), with respect to the Rondure New World Fund and the Rondure Overseas Fund (collectively, the “Rondure Funds”) and Rondure Global Advisors, LLC (“Rondure”), in accordance with Section 15(c) of the 1940 Act. In renewing and approving the Investment Advisory Agreement with Rondure, on behalf of the Rondure Funds, the Trustees, including the Independent Trustees, considered the following factors with respect to the Rondure Funds:
Investment Advisory Fee Rate: The Trustees reviewed and considered the contractual annual advisory fees paid by the Trust, on behalf of the Rondure Funds, to Rondure, of 0.85% for the Rondure New World Fund and 0.70% for the Rondure Overseas Fund, in light of the extent and quality of the advisory services provided by Rondure to each of the Rondure Funds.
The Board received and considered information including a comparison of the Investor Class and Institutional Class of each Rondure Fund’s contractual advisory fee rate with those of funds in the peer group of funds provided by an independent provider of investment company data (the “Data Provider”). The Trustees noted that the contractual advisory fee rate of both classes of the Rondure New World Fund was lower than the Data Provider peer group median, and both classes of the Rondure Overseas Fund was significantly lower than the Data Provider peer group medians.
Total Net Expense Ratios: The Trustees reviewed and considered that the total net expense ratios of each class of each Fund were significantly lower than the Data Provider peer group medians.
Nature, Extent, and Quality of the Services under the Investment Advisory Agreement: The Trustees received and considered information regarding the nature, extent, and quality of services provided to the Rondure Funds under the Rondure Investment Advisory Agreement. The Trustees reviewed certain background materials supplied by Rondure in its presentation, including its Form ADV.
The Trustees reviewed and considered Rondure’s investment advisory personnel, its history as an asset manager, and its performance and the amount of assets currently under management by Rondure and its affiliated entities. The Trustees also reviewed the research and decision-making processes utilized by Rondure, including the methods adopted to seek to achieve compliance with the investment objectives, policies, and restrictions of the Rondure Funds.
The Trustees considered the background and experience of Rondure’s management in connection with the Rondure Funds, including reviewing the qualifications, backgrounds, and responsibilities of the management team primarily responsible for the day-to-day portfolio management of each Rondure Fund and the extent of the resources devoted to research and analysis of actual and potential investments.
The Trustees also reviewed, among other things, Rondure’s Code of Ethics.
Performance: The Trustees reviewed performance information for the Investor Class and Institutional Class shares of the Rondure Funds for the 3-month, 1-year, 3-year, and since inception periods ended June 30, 2021. That review included a comparison of each Rondure Fund’s performance to the performance of a group of comparable funds selected by the Data Provider. The Trustees noted that both classes of the Rondure New World Fund significantly outperformed the Data Provider peer group median for the 3-month period; underperformed the Data Provider peer group median for the 3-year period; and significantly underperformed the Data Provider peer group median for the 1-year and since inception periods. The Trustees also noted that the that each class of the Rondure Overseas Fund Significantly outperformed the Data Provider peer group median for the 3-month period; the Institutional Class of the Rondure Overseas Fund underperformed the Data Provider peer group median for the 1-year period, and significantly underperformed the Data Provider peer group median for the 3-year and since inception periods, and that the Investor Class of the Rondure Overseas Fund significantly underperformed the Data Provider peer group median for the 1-year, 3-year, and since inception periods. The Trustees also considered Rondure’s discussion of its reputation generally and its investment techniques, risk management controls, and decision-making processes.
Comparable Accounts: The Trustees noted certain information provided by Rondure regarding fees charged to its other clients utilizing a strategy similar to that employed by the Rondure Funds.
Profitability: The Trustees received and considered a retrospective and projected profitability analysis prepared by Rondure based on the fees payable under the Rondure Investment Advisory Agreement with respect to the Rondure Funds. The Trustees considered the profits, if any, realized by Rondure in connection with the operation of the Rondure Funds.
| 34 | 1.855.775.3337 | www.rondureglobal.com |
| Rondure Funds | Disclosure Regarding Approval of Fund Advisory Agreement |
October 31, 2021 (Unaudited)
Economies of Scale: The Trustees considered whether economies of scale in the provision of services to the Rondure Funds will be passed along to the shareholders under the proposed agreements.
Other Benefits to the Adviser: The Trustees reviewed and considered any other incidental benefits derived or to be derived by Rondure from its relationship with the Rondure Funds, including whether soft dollar arrangements were used.
The Trustees, including all of the Independent Trustees, concluded that:
| ● | the contractual advisory fee rate of both classes of each of the Rondure Funds was lower than or significantly lower than the Data Provider peer group medians; |
| ● | the total net expense ratios of both classes of each of the Rondure Funds was significantly lower than the Data Provider peer group medians; |
| ● | the nature, extent, and quality of services rendered by Rondure under the Rondure Investment Advisory Agreement with respect to each Rondure Fund were adequate; |
| ● | for the periods ended June 30, 2021, both classes of the Rondure New World Fund significantly outperformed the Data Provider peer group median for the 3-month period; underperformed the Data Provider peer group median for the 3-year period; and significantly underperformed the Data Provider peer group median for the 1-year and since inception periods. |
| ● | for the periods ended June 30, 2021, each class of the Rondure Overseas Fund Significantly outperformed the Data Provider peer group median for the 3-month period; the Institutional Class of the Rondure Overseas Fund underperformed the Data Provider peer group median for the 1-year period, and significantly underperformed the Data Provider peer group median for the 3-year and since inception periods, and that the Investor Class of the Rondure Overseas Fund significantly underperformed the Data Provider peer group median for the 1-year, 3-year, and since inception periods;; |
| ● | bearing in mind the limitations of comparing different types of managed accounts and the different levels of service typically associated with such accounts, the fee structures applicable to Rondure’s other clients employing a comparable strategy to any of the Rondure Funds were not indicative of any unreasonableness with respect to the advisory fee payable by the Rondure Funds; |
| ● | the profit, if any, realized by Rondure in connection with the operation of any of the Rondure Funds is not unreasonable; and |
| ● | there were no material economies of scale or other incidental benefits accruing to Rondure in connection with its relationship with any of the Rondure Funds |
Based on the Trustees’ deliberations and their evaluation of the information described above, the Trustees, including all of the Independent Trustees, concluded that Rondure’s compensation for investment advisory services is consistent with the best interests of each of the Rondure Funds and their shareholders.
| 1 | This meeting was intended to qualify as an "in-person" meeting of the Board pursuant to relief granted by the SEC in response to the COVID-19 outbreak for the purposes of fulfilling the in-person investment advisory agreement approval requirements under Section 15(c) of the 1940 Act (see Investment Company Act Release No. 33817 (Mar. 13, 2020), Investment Company Act Release No. 33824 (Mar. 25, 2020) and Investment Company Act Release No. 33897 (June 19, 2020)). |
| Semi-Annual Report | October 31, 2021 | 35 |
| Rondure Funds | Privacy Policy |
October 31, 2021 (Unaudited)
| Who We Are | |
| Who is providing this notice? | Rondure New World Fund and Rondure Overseas Fund. |
| What We Do | |
| How do the Funds protect my personal information? | To protect your personal information from unauthorized access and use, we use security measures that comply with federal law. These measures include computer safeguards and secured files and buildings. |
| How do the Funds collect my personal information? | We collect your personal information, for example, when you
· open an account · provide account information or give us your contact information · make a wire transfer or deposit money |
| Why can't I limit all sharing? | Federal law gives you the right to limit only
· sharing for affiliates’ everyday business purposes-information about your creditworthiness · affiliates from using your information to market to you · sharing for non-affiliates to market to you
State laws and individual companies may give you additional rights to limit sharing. |
| Definitions | |
| Affiliates | Companies related by common ownership or control. They can be financial and nonfinancial companies. |
| Non-affiliates | Companies not related by common ownership or control. They can be financial and nonfinancial companies.
· The Funds does not share with non-affiliates so they can market to you. |
| Joint marketing | A formal agreement between non-affiliated financial companies that together market financial products or services to you.
· The Funds does not jointly market. |
| Other Important Information | |
| California Residents | If your account has a California home address, your personal information will not be disclosed to nonaffiliated third parties except as permitted by applicable California law, and we will limit sharing such personal information with our affiliates to comply with California privacy laws that apply to us. |
| Vermont Residents | The State of Vermont requires financial institutions to obtain your consent prior to sharing personal information that they collect about you with affiliated companies and nonaffiliated third parties other than in certain limited circumstances. Except as permitted by law, we will not share personal information we collect about you with nonaffiliated third parties or other affiliated companies unless you provide us with your written consent to share such information. |
| 36 | 1.855.775.3337 | www.rondureglobal.com |
| Rondure Funds | Privacy Policy |
October 31, 2021 (Unaudited)
| FACTS | WHAT DO THE FUNDS DO WITH YOUR PERSONAL INFORMATION? |
| Why? | Financial companies choose how they share your personal information. Federal law gives consumers the right to limit some but not all sharing. Federal law also requires us to tell you how we collect, share, and protect your personal information. Please read this notice carefully to understand what we do. |
| What? | The types of personal information we collect and share depend on the product or service you have with us. This information can include:
· Social Security number and account transactions · Account balances and transaction history · Wire transfer instructions |
| How? | All financial companies need to share customers’ personal information to run their everyday business. In the section below, we list the reasons financial companies can share their customers’ personal information; the reasons the Funds choose to share; and whether you can limit this sharing. |
| Reasons we can share your personal information | Do the Funds share: | Can you limit this sharing? |
| For our everyday business purposes — such as to process your transactions, maintain your account(s), respond to court orders and legal investigations, or report to credit bureaus | Yes | No |
| For our marketing purposes — to offer our products and services to you | No | We do not share. |
| For joint marketing with other financial companies | No | We do not share. |
| For our affiliates’ everyday business purposes — information about your transactions and experiences | Yes | No |
| For our affiliates’ everyday business purposes — information about your creditworthiness | No | We do not share. |
| For nonaffiliates to market to you | No | We do not share. |
| Semi-Annual Report | October 31, 2021 | 37 |
Contact Us
| Mail: | Rondure Funds, P.O. Box 13664, Denver, CO 80201 | E-Mail: | rondureglobal@alpsinc.com |
| Phone: | 1.855.775.3337 | Web: | www.rondureglobal.com |
TABLE OF CONTENTS
| Letter to Shareholders | 1 |
| Performance Review | |
| Seafarer Overseas Growth and Income Fund | 7 |
| Seafarer Overseas Value Fund | 12 |
| Disclosure of Fund Expenses | 18 |
| Portfolio of Investments | 20 |
| Statements of Assets and Liabilities | 29 |
| Statements of Operations | 30 |
| Statements of Changes in Net Assets | 31 |
| Financial Highlights | 34 |
| Notes to Financial Statements | 42 |
| Additional Information | 51 |
| Privacy Policy | 52 |
| Seafarer Funds | Letter to Shareholders |
October 31, 2021
LETTER TO SHAREHOLDERS
Dear Fellow Shareholders,
I am pleased to address you on behalf of Seafarer Capital Partners (“Seafarer”), the adviser to the Seafarer Funds (the "Funds"). This semi-annual report covers the first half of the Funds’ 2021-2022 fiscal year (May 1, 2021 to October 31, 2021).
Investors’ Wants Versus Investors’ Needs
What do investors want? Judging by the popularity of passive index funds and the benchmarking of active manager performance, one may surmise that many investors seek to do no worse than the market.
What do investors need? In my opinion, at a minimum most investors need the preservation of the purchasing power of their savings, which would otherwise erode over time if accumulated in a savings account. However, many investors seek to grow their capital in real terms, i.e. after the cumulative impact of inflation, to retire in comfort.
While investors may feel comforted by the thought of their investment return not falling behind the market during their working lives, the question of whether the market will deliver what they need requires a leap of faith.
The reason I draw attention to the distinction between wants and needs is that, in my opinion, a decade of extraordinary returns for the S&P 500 Index (16.20% annual rate of return between October 31, 2011 and October 29, 2021) has afforded some investors the luxury of avoiding the question.1 For those that confronted the issue, this past decade of returns has left many with the presumption that the equity market will fulfill their future needs.
Similarly, over the same decade, the Morningstar Emerging Markets Index delivered a 5.45% annual rate of return, leaving the same investors wondering if an allocation to the emerging markets (EM) can fulfill their future needs even if they performed in-line with that index.2
I find it interesting to share with U.S.-based investors that in other countries, equity markets are referred to as “variable return markets,” in contrast to fixed income markets, a useful and timely reminder of the nature of equity investments.
A Shifting Foundation Supporting Prospective Investment Returns
This reminder is timely because the foundation supporting prospective investment returns, both for the S&P 500 and for the emerging markets, is visibly shifting. To put it in technical terms, the risk-free rate underlying global allocations to variable return markets may rise relative to the past decade as the Federal Reserve has already announced the tapering of Quantitative Easing and has guided to likely interest rate increases thereafter, even if not for the first time.3,4 Likewise, the discount rate for global emerging market equities is already rising as many EM central banks, such as those of Mexico, Brazil, the Czech Republic, Poland, and South Korea, have begun raising interest rates ahead of the Federal Reserve, itself a rare occurrence.5 Furthermore, even if the People’s Bank of China (PBOC) has not increased official rates for the largest country in the EM universe, in my opinion, the Chinese discount rate for equities is effectively rising as of the date of this letter, as the country struggles with the consequences of slowing the rate of debt growth.6
One recent measure to accomplish this goal is the “three red lines” borrowing regulation conceived of by the PBOC to control financial leverage in the real estate sector, which has resulted in several developers missing debt payments.7 The same way that the absence of market-determined interest rates encouraged irresponsible debt growth at Chinese developers, the arbitrary manner in which bankruptcy rules are implemented has reminded equity investors of the difference between official interest rates for the country and the effective risk embedded in Chinese equity discount rates.
| Semi-annual Report – October 31, 2021 | 1 |
| Seafarer Funds | Letter to Shareholders |
October 31, 2021
The seemingly arbitrary policy (the three red lines) for managing the financial leverage of a particular sector (real estate) and its consequences (missed debt payments) extended to other sectors during 2021 with new public policies aimed at private after-school tutoring companies (banning profits) and at corporates operating in the internet space (largely focused on anti-trust, data security, and financial risk). It is this extension that is arguably raising the effective discount rate for Chinese equities during 2021.
As important as it is to highlight the real time increases in the effective equity discount rates for the largest country in the EM universe (China) and for the global emerging markets (central banks raising rates in many countries) – and the increase in the global risk-free rate (determined by the Federal Reserve) – this idea is a preamble to a more important one.
How Investable is China?
Consider that as arbitrary as Chinese public policy may seem at any given point in time, said policy changes are arguably unsurprising, if not necessarily predictable, from a medium-to-long-term perspective. Over the past decade, Beijing has clamped down on the most polluting industries (as it has on the internet industry recently); issued policy dictates to reduce overcapacity in industries reticent to do so given their dependence on political interests over market prices to regulate themselves (as it has done to control financial leverage at property developers); and taken measures to reduce the cost of healthcare (the same way the PBOC controls the cost of money). Thus, the risk of rule by edict in China is not a new phenomenon. In my view, China remains as investable as ever. The fact that the effective discount rate for the country’s equities appears to be rising at present does not mean that something has suddenly changed in China making its markets uninvestable. What has changed is investor awareness and willingness to price the risks that were ever-present in the country.
That change is the most important lesson of the current Chinese zeitgeist. Why? Because it means that during periods of time when investors blindly bid up the price of high-growth Chinese companies, a more risk-aware investor had a better chance of avoiding the denouement faced by Chinese ADR investors during 2021, who were exposed to education and internet corporates, which tend to list shares offshore.8 Conversely, when the general market tenor questions the investability of Chinese equities – as it is doing now – one may search for opportunities in the country, not for the sake of being contrarian, but on the basis of a more considered awareness of the risks involved and the valuations paid for such risks.
Seafarer’s Chief Investment Officer, Andrew Foster, has for years written about his evolving thoughts regarding China in his market commentaries and portfolio reviews. Despite his generally negative assessment of China’s policy evolution throughout the years, Seafarer remained continuously invested in the country. At the risk of coming across as self-serving, I would characterize Seafarer’s approach to China investments as being perhaps more risk-aware than industry average over the past few years. Conversely, now that investors appear to question allocations to the country, I would argue that from Seafarer’s perspective, the market perception of the country has shifted more than our own assessment of the risk. As always, China is selectively investable. There may be sharp drawbacks to investing in the country on a passive basis, since in our estimation, diversification alone is probably insufficient to minimize the risks previously discussed. Rather than own everything in China (index funds) or own nothing (write off China as uninvestable), Seafarer believes a selective approach to investing in the country is more likely to build lasting wealth for clients over time.
If selectivity is more effective than diversification to manage equity risk in China, is the country the exception that proves the rule that in the rest of the world diversification (passive investing) is more effective than selectivity (active strategies)?
| 2 | (855) 732-9220 seafarerfunds.com |
| Seafarer Funds | Letter to Shareholders |
October 31, 2021
Should China Be Separated Into Its Own Asset Class?
The first part of the question, whether China is an exception within global markets, dovetails to a recent topic that has gathered traction within the general emerging market (EM) discourse of whether China should be treated as its own asset class, separate from the emerging markets. The only argument I have encountered in support of such a view relates to size, as the country’s equity market capitalization represents approximately a third of the EM universe. Let me opine on the issue by asking a question: since when does size determine anything, much less investment return considerations? Remember that the investment return measure is unitless; it is a percentage figure. Size itself does not come into the equation at all. The parallel with the story of David and Goliath comes to mind.
While I have yet to hear a sensible reason for segregating China into its own asset class, I will offer my own fundamentally-based possible reason for doing so. As a hybrid of a command economy9 with pockets of free market pricing, and with a President self-appointed to the role for life and intent on regulating the economy and individual behavior according to his personal beliefs (Xi Jinping Thought10), investment risk must be managed actively, in contrast to the rest of the world where investors have already demonstrated a preference for a passive approach. In other words, one could argue that China should be separated from the rest of the EM universe because the nature of the risk it represents is sufficiently unique to warrant a different approach, not because it is “large.”
In spite of the above, I would argue that China belongs within the EM universe. In my opinion, the term “emerging markets” partially refers to the emergence of socialist command economies to the realm of economies regulating themselves through the price mechanism (as opposed to ideology), with prices determined by each individual actor who participates in the economy (as opposed to a group of individuals in a room). On this basis, China is clearly still emerging, with Xi Jinping having regressed the country on this scale. Not only are there more developed economies than China within the EM universe, but safer ones with regards to property rights and the rule of law. In my opinion, the recent travails of Chinese private education investors who were suddenly, if not unpredictably, expropriated of their right to profit, brought these long-ignored risks to the fore.
Likewise, the uncertainty surrounding the potentially differing treatment of onshore and offshore bond holders of China Evergrande, a real estate developer in the midst of a liquidity crisis, serves to question the rule of law and property rights in the country. In short, risk determines whether a country belongs in the emerging or developed market universe. On this basis, China belongs squarely in the EM category, is much farther from graduating to developed market status than other countries, and – in my view – the idea that it deserves its own asset class demonstrates an underappreciation of the underlying investment risks.
In effect, the argument that China deserves its own asset class due to its size is the equivalent of passive funds buying more of a security the larger its market capitalization grows. I will leave it to the proponents of scaling up exposure to a country or security as its price rises to explain how that will yield attractive future investment returns.
Is China the Exception to the Rule?
Coming back to the second part of the question above, whether China is the exception that proves the rule that in the rest of the world passive strategies appear to deliver higher risk-adjusted investment returns relative to active strategies, I will answer with a question once again. Does the investor shift to passive strategies over the past decade mean that index-based investing will prove more effective than an active approach over the next ten years? Has the previously noted underperformance of the EM universe relative to the S&P 500 Index over the past decade mean that investors will better meet their needs by allocating more to the S&P 500 at the expense of the emerging markets over the next ten years?
Based on my own experience, these two questions lay at the core of investor concerns.
| Semi-annual Report – October 31, 2021 | 3 |
| Seafarer Funds | Letter to Shareholders |
October 31, 2021
The same way Chinese public policy developments during 2021 exposed the lack of risk awareness of investors in specific Chinese ADRs – as well as that of proponents of larger and independent allocations to the country within global portfolios – there is a strong probability that those arguing for the continued relative underperformance of the emerging markets over the next ten years may be forced to reassess their views.
Rather than stake my argument on macroeconomic or strategist-type predictions about the future, I prefer to focus on the foundation of future EM investment returns to answer the question. In my opinion, the realm of macro / strategist predictions is a graveyard of failed prognostications that suffered a miserable death at the hands of the grim reaper known as reality. I find it much more useful to focus on bottom-up stock analysis, Seafarer’s specialty, to address the next decade’s prospects (not the final outcome) for EM investment returns.
As a matter of the historical record of cumulative earnings over the recent decade ended December 31, 2020, the constituents of the MSCI Emerging Markets Index grew earnings at a modest 3.74% annually versus the prior decade ended December 31, 2010. This fact may go a long way to explain the paltry 3.99% annual rate of return of said index over the decade ended December 31, 2020.11 Even if many investors got what they wanted in terms of not underperforming the benchmark, in my view they did not get what they needed. Subtracting the 1.72% average annual rate of U.S. inflation (as measured by the Consumer Price Index) over the recent decade, the real rate of return for U.S.-based EM investors was 2.23%.12,13
The issue with arguing that the future will differ from the past is that EM economists / strategists always resort to the same arguments: the rate of gross domestic product (GDP) growth is higher in the emerging markets than in developed ones, as is the rate of population growth, and the rate of productivity growth can be higher as well.14 The problem with these arguments is that they were equally true and valid over the last decade as well, and yet here we are. Furthermore, bottom-up investors are keenly aware of the difference between GDP growth and corporate profit growth, a distinction that strategists seldom acknowledge.
A “Lost Decade” for EM Investors, but Not for EM Corporates
The reason Seafarer continues to invest in the emerging market universe as it aims to deliver what investors need is that, based on our stock research, we realize EM corporates have not been complacent over the past decade of modest earnings growth. As Figure 1 below shows, between 2010 and 2019, while EM corporates may not have grown earnings rapidly, they have accumulated them in the form of retained earnings, while concurrently growing dividends relative to the previous decade.15 In other words, while the investment community wallows in the “lost decade” of emerging markets, Seafarer seeks valuable gems within the rough in the form of strengthened balance sheets (retained earnings) and improved corporate governance (higher dividends). In hindsight, I believe this emphasis on stronger book values and dividends makes sense from the perspectives of many EM corporates having lost access to U.S. dollar funding after the 2008 Great Financial Crisis and facing challenging growth prospects.16
Said corporate experience stands in stark contrast to that of U.S. corporates, which as Figure 1 shows, focused on dividends and buybacks at the expense of strengthening their balance sheets through retained earnings. In hindsight, this behavior may explain the attractive returns of the S&P 500 Index over the period.
| 4 | (855) 732-9220 seafarerfunds.com |
| Seafarer Funds | Letter to Shareholders |
October 31, 2021
Figure 1. Return to Shareholders
MSCI EM Index and MSCI USA Index
Filtered for companies trading above a $500 million market capitalization as of year-end. Sources: Bloomberg, Seafarer.
In my opinion, based on the above, the past decade was far from lost for EM corporates. On the contrary, instead of making macroeconomic guesses regarding growth over the next decade, it is more valuable to ask how companies will deploy their strengthened balance sheets to fund and create their own growth path over the next ten years (independently of GDP growth), and to place a value on the possibility of even further corporate governance improvements.
In summary, the past ten years may have been a “lost decade” for EM investors, but not for EM corporates. In my view, understanding the implications of that idea, and only that, is more than enough to warrant consideration of investing in the universe for the next decade. Now the work of finding the individual EM corporates that will deliver the investment return needs of investors begins.
Thank you for entrusting us with your capital during these difficult times. We are, as always, honored to serve as your investment adviser in the developing world.
Paul Espinosa
Portfolio Manager
Seafarer Capital Partners, LLC
The S&P 500 Total Return Index is a stock market index based on the market capitalizations of 500 large companies with common stock listed on the NYSE or NASDAQ. The Morningstar Emerging Markets Net Return USD Index measures the performance of emerging markets targeting the top 97% of stocks by market capitalization. The index does not incorporate Morningstar’s environmental, social, or governance (ESG) criteria. Index code: MEMMN. The MSCI Emerging Markets Index is a free float-adjusted market capitalization index designed to measure equity market performance of emerging markets. Index code: MXEF. The MSCI USA Index is designed to measure the performance of the large- and mid-capitalization segments of the U.S. market. Index code: MXUS. It is not possible to invest directly in an index.
| Semi-annual Report – October 31, 2021 | 5 |
| Seafarer Funds | Letter to Shareholders |
October 31, 2021
The Funds are subject to investment risks, including possible loss of the principal amount invested and therefore are not suitable for all investors. The Funds may not achieve their objectives. Diversification does not ensure a profit or guarantee against loss.
As of October 31, 2021, the Seafarer Funds did not own shares in China Evergrande Group.
The views and information discussed in this commentary are as of the date of publication, are subject to change, and may not reflect Seafarer’s current views. The views expressed represent an assessment of market conditions at a specific point in time, are opinions only and should not be relied upon as investment advice regarding a particular investment or markets in general. Such information does not constitute a recommendation to buy or sell specific securities or investment vehicles. It should not be assumed that any investment will be profitable or will equal the performance of the portfolios or any securities or any sectors mentioned herein. The subject matter contained herein has been derived from several sources believed to be reliable and accurate at the time of compilation. Seafarer does not accept any liability for losses either direct or consequential caused by the use of this information.
| 1 | Source: Bloomberg. Data as of 8 November 2021. |
| 2 | Source: Bloomberg. Data as of 8 November 2021. |
| 3 | The risk-free rate of return is the theoretical rate of return of an investment with zero risk. |
| 4 | Quantitative Easing is the attempt by a central bank to inject more money into the economy and to keep long- term interest rates low through the purchase of large amounts of assets, often held by financial institutions. |
| 5 | A discount rate is a financing rate that measures the prospective time value of money; it can also account for the risk or uncertainty associated with future cash flows. |
| 6 | The People’s Bank of China (PBOC) is the central bank of the People’s Republic of China, located in Beijing. |
| 7 | “What China’s Three Red Lines Mean for Property Firms” (www.bloomberg.com/news/articles/2020-10-08/what-china-s-three-red-lines-mean-for-property-firms-quicktake), Bloomberg, 8 October 2020. |
| 8 | An American Depositary Receipt (ADR) is a receipt for the shares of a foreign-based corporation held by a U.S. bank. The receipt usually entitles the shareholder to all dividends (excluding withholding) and capital gains. |
| 9 | A command economy is an economic structure in which a central governmental authority dictates the levels of production that are permissible and the prices that may be charged for goods and services. |
| 10 | Xi Jinping Thought, officially known as Xi Jinping Thought on Socialism with Chinese Characteristics for a New Era, is a set of policies and ideas derived from the writings and speeches of Chinese Communist Party General Secretary Xi Jinping. |
| 11 | Sources: Bloomberg, Seafarer. Data as of 8 November 2021. |
| 12 | The Consumer Price Index (CPI) is a measure of the average change over time in the prices paid by urban consumers for a market basket of consumer goods and services. |
| 13 | Sources: Bloomberg, U.S. Bureau of Labor Statistics, Seafarer. Real rate of return calculated using geometric mean calculation. Data as of 8 November 2021. |
| 14 | Gross domestic product (GDP) is a macroeconomic measure of the value of a country’s economic output. |
| 15 | Retained earnings are net profits kept to accumulate in a business after dividends are paid. |
| 16 | Book value is the value of an asset as represented in the accounts of a balance sheet. The book value of a company is typically determined by the value of the company’s assets, less its liabilities. |
| 6 | (855) 732-9220 seafarerfunds.com |
| Seafarer Overseas Growth and Income Fund | Performance Review |
October 31, 2021
SEAFARER OVERSEAS GROWTH AND INCOME FUND
PERFORMANCE REVIEW
This report addresses the first half of the 2021-2022 fiscal year (May 1, 2021 to October 31, 2021) for the Seafarer Overseas Growth and Income Fund (the “Growth and Income Fund” or the “Fund”).
During the semi-annual period, the Fund returned -3.65%, while the Fund’s benchmark indices, the Morningstar Emerging Markets Net Return USD Index and the MSCI Emerging Markets Total Return USD Index, returned -4.11% and -4.68%, respectively.1 By way of broader comparison, the S&P 500 Index gained 10.91%.
The Fund began the fiscal year with a net asset value (NAV) of $15.39 per share. In June, the Fund paid a semi-annual distribution of $0.213 per share. That payment brought the cumulative distribution per share, as measured from the Fund’s inception, to $3.542.2 The Fund finished the semi-annual period with a value of $14.63 per share.3
* * *
The semi-annual period was a tumultuous one, and a disappointing one for both the Growth and Income Fund and the benchmark indexes – albeit for different reasons.
Starting in July, Chinese stocks collapsed as the Xi administration enacted major policy interventions across a swathe of industries. Pundits, caught off guard, sought to describe the interventions as little more than the ordinary activity of a “regulatory cycle.” They advised not to think ill of the administration’s intent – and they assured that any unwelcome effects would recede, as authorities would surely ease off in a predictable manner in the event of unwanted economic damage.
What a gross and costly mischaracterization of events! The policy interventions bore no semblance to regulation, which is ordinarily the domain of a deliberative rulemaking body, authorized to enact practical governance in accordance with the intent of written law. Instead, China’s leadership undertook interventions by executive fiat that were capricious and sweeping in scope, rewriting the fortunes of selected industries and individual companies overnight. Further, there’s been no respite, as was supposed: the “regulatory” environment in China remains precarious, responsive only to the opaque impulses of the Xi administration.
For several years now, Seafarer has been wary of the policy environment in China: while we are not “macro” analysts, we have observed increasing and problematic intervention by the state in corporate affairs, manifest throughout many industries within the economy. As such, the Fund has been wary of its exposure to Chinese stocks, and as of the date of this report, has had less exposure than the Morningstar benchmark, and little direct exposure to this so-called “regulatory cycle.”
Despite this, the Fund was not spared during the semi-annual period. During September, the Fund suffered a rout in its holdings in South Korea – the dominant country exposure of the portfolio – and the Fund finished the period in negative territory, but slightly ahead of its benchmarks. At this time, it is unclear why South Korean stocks and the country’s currency (the won) collapsed in such a fashion. Possible causes include investors’ fear of prospective interest rate increases (at the end of August, the South Korean central bank raised its policy rate by 0.75%, ahead of the U.S. Federal Reserve), or incipient component and supply shortages that might weigh on future profits. Yet the movements of the Korean equities and currency seem an overreaction, as neither cost pressures nor shortages have yet posed material problems for most of the Fund’s Korean positions.
One notable detractor to Fund performance in the semi-annual period was Ping An Insurance Group, one of China’s largest insurers. Ping An’s share price declined on news that it will participate in a deal to restructure the business venture associated with the prestigious Peking University. We are sorely disappointed by this development, as this investment is outside of Ping An’s core competencies, perhaps indicating some level of suasion by the Chinese authorities. The Fund exited Ping An during the period, spurred in part by this event.
| Semi-annual Report – October 31, 2021 | 7 |
| Seafarer Overseas Growth and Income Fund | Performance Review |
October 31, 2021
Jiangsu Hengrui, one of China’s largest and, in our view, most innovative chemical pharmaceutical companies, also detracted from Fund performance. Hengrui’s shares ostensibly declined not so much due to the aforementioned Xi administration policy interventions, but rather because one of its key anti-cancer therapies had undergone a scheduled price renegotiation. Some investors, apparently fearing the worst, sold the shares in anticipation of lower profits. As of the date of this report, we remain confident that Hengrui has sufficient cost control to substantially blunt the impact of renegotiated prices.
On the positive side of the ledger, one of the Fund’s top contributors to total return was Pacific Basin, a dry bulk shipping company based in Hong Kong. Pacific Basin performed strongly as shipping rates hit multi-year highs.
Contrary to some of the most extreme market views circulated, we believe that China remains “investable,” albeit only very selectively – as has always been the case. Among all the countries in the developing world, China remains uniquely qualified to produce more competitive companies capable of succeeding globally – and as long as China remains capable of producing such companies, the Fund will seek to discover and invest in them.
Thank you for entrusting us with your capital. We are honored to serve as your investment adviser in the emerging markets.
Andrew Foster and Paul Espinosa
Portfolio Managers, Seafarer Overseas Growth and Income Fund
Seafarer Capital Partners, LLC
The Morningstar Emerging Markets Net Return USD Index measures the performance of emerging markets targeting the top 97% of stocks by market capitalization. The index does not incorporate Morningstar’s environmental, social, or governance (ESG) criteria. Index code: MEMMN. The MSCI Emerging Markets Total Return Index, Standard (Large+Mid Cap) Core, Gross (dividends reinvested), USD is a free float-adjusted market capitalization index designed to measure equity market performance of emerging markets. Index code: GDUEEGF. The S&P 500 Total Return Index is a stock market index based on the market capitalizations of 500 large companies with common stock listed on the NYSE or NASDAQ. It is not possible to invest directly in an index.
The Fund is subject to investment risks, including possible loss of the principal amount invested and therefore is not suitable for all investors. The Fund may not achieve its objectives. Diversification does not ensure a profit or guarantee against loss.
As of October 31, 2021, the Fund did not own shares in Ping An Insurance Group.
The views and information discussed in this commentary are as of the date of publication, are subject to change, and may not reflect Seafarer’s current views. The views expressed represent an assessment of market conditions at a specific point in time, are opinions only and should not be relied upon as investment advice regarding a particular investment or markets in general. Such information does not constitute a recommendation to buy or sell specific securities or investment vehicles. It should not be assumed that any investment will be profitable or will equal the performance of the portfolios or any securities or any sectors mentioned herein. The subject matter contained herein has been derived from several sources believed to be reliable and accurate at the time of compilation. Seafarer does not accept any liability for losses either direct or consequential caused by the use of this information.
| 1 | References to the “Fund” pertain to the Fund’s Institutional share class (ticker: SIGIX). The Investor share class (ticker: SFGIX) returned -3.68% during the semi-annual period. |
| 2 | The Fund’s inception date is February 15, 2012. |
| 3 | The Fund’s Investor share class began the fiscal year with a net asset value of $15.31 per share; it paid a semi-annual distribution of $0.211 per share in June; and it finished the semi-annual period with a value of $14.55 per share. |
| 8 | (855) 732-9220 seafarerfunds.com |
| Seafarer Overseas Growth and Income Fund | Performance Review |
October 31, 2021
Total Returns
| As of October 31, 2021 | 6 Month | 1 Year | 3 Year | 5 Year | 7 Year | Since Inception Annualized1 | Gross Expense Ratio2 |
| Investor Class (SFGIX) | -3.68% | 21.97% | 14.83% | 8.01% | 6.51% | 7.12% | 1.02% |
| Institutional Class (SIGIX) | -3.65% | 22.00% | 14.94% | 8.12% | 6.62% | 7.25% | 0.92% |
| Morningstar Emerging Markets | |||||||
| Net Return USD Index3 | -4.11% | 19.59% | 13.21% | 9.74% | 6.09% | 4.90% | |
| MSCI Emerging Markets | |||||||
| Total Return USD Index4 | -4.68% | 17.33% | 12.69% | 9.79% | 5.97% | 4.71% |
Fund performance is presented in U.S. dollar terms, with U.S. jurisdiction distributions reinvested on a gross (pre-tax) basis. For the Morningstar index, performance is calculated to reflect the reinvestment of dividends, capital gains, and other corporate actions net of foreign jurisdiction withholding taxes. For the MSCI index, performance is calculated to reflect the reinvestment of dividends, capital gains, and other corporate actions gross of foreign jurisdiction withholding taxes (i.e., such taxes are ignored). The performance data quoted represents past performance and does not guarantee future results. Future returns may be lower or higher. The investment return and principal value will fluctuate so that an investor's shares, when redeemed, may be worth more or less than the original cost. Prior to August 31, 2016, shares of the Fund redeemed or exchanged within 90 days of purchase were subject to a 2% redemption fee. Performance does not reflect this fee, which if deducted would reduce an individual's return. To obtain the Fund’s most recent month-end performance, visit seafarerfunds.com or call (855) 732-9220.
| 1 | Inception Date: February 15, 2012. |
| 2 | Ratios as of Prospectus dated August 31, 2021. Seafarer Capital Partners, LLC has agreed contractually to waive and/or reimburse fees or expenses in order to limit Total Annual Fund Operating Expenses After Fee Waiver/Expense Reimbursements (inclusive of acquired fund fees and expenses, and exclusive of brokerage expenses, interest expenses, taxes and extraordinary expenses) to 1.15% and 1.05% of the Fund’s average daily net assets for the Investor and Institutional share classes, respectively. This agreement is in effect through August 31, 2022. |
| 3 | The Morningstar Emerging Markets Net Return USD Index measures the performance of emerging markets targeting the top 97% of stocks by market capitalization. The index does not incorporate Morningstar’s environmental, social, or governance (ESG) criteria. Index code: MEMMN. The index is not actively managed and does not reflect any deductions for fees, expense or taxes. An investor may not invest directly in an index. |
| 4 | The MSCI Emerging Markets Total Return Index, Standard (Large+Mid Cap) Core, Gross (dividends reinvested), USD is a free float-adjusted market capitalization index designed to measure equity market performance of emerging markets. Index code: GDUEEGF. The index is not actively managed and does not reflect any deductions for fees, expense or taxes. An investor may not invest directly in an index. |
| Semi-annual Report – October 31, 2021 | 9 |
| Seafarer Overseas Growth and Income Fund | Performance Review |
October 31, 2021
Performance of a $10,000 Investment Since Inception
| * | Inception Date: February 15, 2012. |
The chart shown above represents historical performance of a hypothetical investment of $10,000 in the Fund’s Investor Class shares for the period from inception to October 31, 2021. All returns reflect reinvested dividends and/or distributions, but do not reflect the deduction of taxes that an investor would pay on distributions or redemptions.
The Fund also offers Institutional Class shares, performance of which is not reflected in the chart above. The performance of Institutional Class shares may be higher or lower than the performance of the Investor Class shares shown above based upon differences in fees paid by shareholders investing in the Investor Class shares and Institutional Class shares.
Investment Objective
The Seafarer Overseas Growth and Income Fund seeks to provide long-term capital appreciation along with some current income. The Fund seeks to mitigate adverse volatility in returns as a secondary objective.
Strategy
The Fund invests primarily in the securities of companies located in developing countries. The Fund invests in several asset classes including dividend-paying common stocks, preferred stocks, and fixed-income securities.
The Fund seeks to offer investors a relatively stable means of participating in developing countries’ growth prospects, while attempting to mitigate adverse volatility in returns.
| 10 | (855) 732-9220 seafarerfunds.com |
| Seafarer Overseas Growth and Income Fund | Performance Review |
October 31, 2021
| Portfolio Composition by Region | % Net Assets |
| East & South Asia | 70.6% |
| Emerging Europe | 7.8% |
| Latin America | 9.9% |
| Middle East & Africa | 7.5% |
| Other | 2.3% |
| Cash & Other Assets, Less Liabilities | 1.9% |
| Total | 100.0% |
| Portfolio Composition by Sector | % Net Assets |
| Communication Services | 6.2% |
| Consumer Discretionary | 12.0% |
| Consumer Staples | 16.3% |
| Energy | 1.6% |
| Financials | 9.4% |
| Health Care | 13.1% |
| Industrials | 10.6% |
| Information Technology | 23.2% |
| Materials | 3.0% |
| Utilities | 2.7% |
| Cash & Other Assets, Less Liabilities | 1.9% |
| Total | 100.0% |
| Top 10 Holdings | % Net Assets |
| Hyundai Mobis Co., Ltd. | 4.9% |
| Samsung Electronics Co., Ltd. | 4.6% |
| Rohm Co., Ltd. | 4.3% |
| Sanlam, Ltd. | 4.1% |
| Venture Corp., Ltd. | 4.0% |
| Richter Gedeon Nyrt | 4.0% |
| Samsung SDI Co., Ltd. | 3.9% |
| Samsung Biologics Co., Ltd. | 3.8% |
| Coway Co., Ltd. | 3.6% |
| China Literature, Ltd. | 3.2% |
| Total | 40.4% |
| Total Number of Holdings | 47 |
Holdings are subject to change, and may not reflect the current or future position of the portfolio. Source: ALPS Fund Services, Inc.
| Semi-annual Report – October 31, 2021 | 11 |
| Seafarer Overseas Value Fund | Performance Review |
October 31, 2021
SEAFARER OVERSEAS VALUE FUND
PERFORMANCE REVIEW
This report addresses the first half of the 2021-2022 fiscal year (May 1, 2021 to October 31, 2021) for the Seafarer Overseas Value Fund (the “Value Fund” or the “Fund”).
During the semi-annual period, the Fund returned 4.63%, while the Fund’s benchmark indices, the Morningstar Emerging Markets Net Return USD Index and the MSCI Emerging Markets Total Return USD Index, returned -4.11% and -4.68%, respectively.1 By way of broader comparison, the S&P 500 Index gained 10.91%.
The Fund began the fiscal year with a net asset value (NAV) of $13.18 per share. The Fund paid no distributions during the first half of the fiscal year, and it finished the period with a value of $13.79 per share.2
* * *
During the semi-annual period, the Value Fund delivered a positive rate of return while the emerging market benchmark indexes declined. I would attribute the positive performance mostly to stock selection. While market discourse during the period considered a possible market rotation into value stocks, in my opinion, the relative performance of the Fund’s top contributors and detractors to return gives little credence to this theory.
Indeed, as the following examples will show, idiosyncratic factors drove the performance of the Fund’s positive contributors to return. The top contributor to the Fund’s performance during the period was PetroVietnam Fertilizer and Chemical, a Vietnamese fertilizer manufacturer (Management Change and Asset Productivity sources of value; Seafarer’s seven sources of value,3 hereafter referenced using parenthesized italics, are defined in Figure 1). Higher capacity utilization at its new plant, as well as higher urea prices, drove a newfound earnings acceleration and the prospect of significantly higher dividends at this positive net cash company whose capital expenditure has peaked.4
Pacific Basin (Asset Productivity), a dry bulk shipping company headquartered in Hong Kong, established itself as another top contributor. This stock continued its long-running positive contribution to the Fund’s NAV by reporting strong first half 2021 results as the Baltic Handysize Index (BHSI), the spot rate at which small dry bulk sea vessels may be chartered, reached a thirteen year high. Indeed, the dry bulk shipping industry’s recession since 2008 has finally relented, driving the decade-long negative consensus view on the stock into its own recession.
A third positive contributor to Fund performance during this period was HRnetGroup (Balance Sheet Liquidity), a Singapore-based recruitment and staffing firm operating in Asia. This holding stood out – despite its small market capitalization – with a strong stock price performance in the midst of the pandemic’s resurgence, which, all else equal, one would have expected to delay corporate hiring plans.5 As usual, all else is rarely equal in the real world, and this company demonstrated incipient signs of a business recovery in the first half of the year, in my view.
On the other side of the ledger, the Covid-19 resurgence was at the epicenter of two of the top detractors to fund performance – both of which exhibit classic value attributes. Shangri-La (Breakup Value and Asset Productivity), a hotel owner and operator in Asia, saw its share price decline as the resurgent pandemic delayed a recovery in hotel occupancy. Similarly, Melco International (Breakup Value and Asset Productivity), a casino owner and operator in Macao whose revenue growth also depends on its customers’ ability and willingness to travel, detracted from performance.
| 12 | (855) 732-9220 seafarerfunds.com |
| Seafarer Overseas Value Fund | Performance Review |
October 31, 2021
Figure 1. Sources of Value
Seafarer has identified seven distinct sources of value in emerging markets that may give rise to viable opportunities for long-term, value-oriented investments.
Overall, I was satisfied with the Fund’s performance during the review period as it proved less impacted by external factors, such as the pandemic’s resurgence, and more dependent on stock-specific developments.
Thank you for entrusting us with your capital. We are honored to serve as your investment adviser in the emerging markets.
Paul Espinosa
Portfolio Manager, Seafarer Overseas Value Fund
Seafarer Capital Partners, LLC
The Morningstar Emerging Markets Net Return USD Index measures the performance of emerging markets targeting the top 97% of stocks by market capitalization. The index does not incorporate Morningstar’s environmental, social, or governance (ESG) criteria. Index code: MEMMN. The MSCI Emerging Markets Total Return Index, Standard (Large+Mid Cap) Core, Gross (dividends reinvested), USD is a free float-adjusted market capitalization index designed to measure equity market performance of emerging markets. Index code: GDUEEGF. The S&P 500 Total Return Index is a stock market index based on the market capitalizations of 500 large companies with common stock listed on the NYSE or NASDAQ. The Baltic Handysize Index is the spot rate at which small dry bulk sea vessels may be chartered. Index code: BHSI. It is not possible to invest directly in an index.
The Fund is subject to investment risks, including possible loss of the principal amount invested and therefore is not suitable for all investors. The Fund may not achieve its objectives. Diversification does not ensure a profit or guarantee against loss.
The views and information discussed in this commentary are as of the date of publication, are subject to change, and may not reflect Seafarer’s current views. The views expressed represent an assessment of market conditions at a specific point in time, are opinions only and should not be relied upon as investment advice regarding a particular investment or markets in general. Such information does not constitute a recommendation to buy or sell specific securities or investment vehicles. It should not be assumed that any investment will be profitable or will equal the performance of the portfolios or any securities or any sectors mentioned herein. The subject matter contained herein has been derived from several sources believed to be
| Semi-annual Report – October 31, 2021 | 13 |
| Seafarer Overseas Value Fund | Performance Review |
October 31, 2021
reliable and accurate at the time of compilation. Seafarer does not accept any liability for losses either direct or consequential caused by the use of this information.
| 1 | References to the “Fund” pertain to the Fund’s Institutional share class (ticker: SIVLX). The Investor share class (ticker: SFVLX) returned 4.48% during the semi-annual period. |
| 2 | The Fund’s Investor share class began the fiscal year with a net asset value of $13.16 per share. It finished the period with a value of $13.75 per share. |
| 3 | Additional information on Seafarer’s seven sources of value is available in the white paper On Value in the Emerging Markets (www.seafarerfunds.com/value-in-em). |
| 4 | Net cash is a company’s cash position, calculated by subtracting the company’s total debt from its total cash. |
| 5 | Market capitalization is the value of a corporation as determined by the market price of its issued and outstanding common stock. |
| 14 | (855) 732-9220 seafarerfunds.com |
| Seafarer Overseas Value Fund | Performance Review |
October 31, 2021
Total Returns
| As of October 31, 2021 | 6 Month | 1 Year | 3 Year | 5 Year | Since Inception Annualized1 | Net Expense Ratio2 |
| Investor Class (SFVLX) | 4.48% | 34.23% | 11.53% | 8.61% | 8.43% | 1.15% |
| Institutional Class (SIVLX) | 4.63% | 34.46% | 11.67% | 8.71% | 8.55% | 1.05% |
| Morningstar Emerging Markets | ||||||
| Net Return USD Index3 | -4.11% | 19.59% | 13.21% | 9.74% | 11.48% | |
| MSCI Emerging Markets | ||||||
| Total Return USD Index4 | -4.68% | 17.33% | 12.69% | 9.79% | 11.65% |
Gross expense ratio: 1.57% for Investor Class; 1.47% for Institutional Class.2
Fund performance is presented in U.S. dollar terms, with U.S. jurisdiction distributions reinvested on a gross (pre-tax) basis. For the Morningstar index, performance is calculated to reflect the reinvestment of dividends, capital gains, and other corporate actions net of foreign jurisdiction withholding taxes. For the MSCI index, performance is calculated to reflect the reinvestment of dividends, capital gains, and other corporate actions gross of foreign jurisdiction withholding taxes (i.e., such taxes are ignored). The performance data quoted represents past performance and does not guarantee future results. Future returns may be lower or higher. The investment return and principal value will fluctuate so that an investor's shares, when redeemed, may be worth more or less than the original cost. Prior to August 31, 2016, shares of the Fund redeemed or exchanged within 90 days of purchase were subject to a 2% redemption fee. Performance does not reflect this fee, which if deducted would reduce an individual's return. To obtain the Fund’s most recent month-end performance, visit seafarerfunds.com or call (855) 732-9220.
| 1 | Inception Date: May 31, 2016. |
| 2 | Ratios as of Prospectus dated August 31, 2021. Seafarer Capital Partners, LLC has agreed contractually to waive and/or reimburse fees or expenses in order to limit Total Annual Fund Operating Expenses After Fee Waiver/Expense Reimbursements (inclusive of acquired fund fees and expenses, and exclusive of brokerage expenses, interest expenses, taxes and extraordinary expenses) to 1.15% and 1.05% of the Fund’s average daily net assets for the Investor and Institutional share classes, respectively. This agreement is in effect through August 31, 2022. |
| 3 | The Morningstar Emerging Markets Net Return USD Index measures the performance of emerging markets targeting the top 97% of stocks by market capitalization. The index does not incorporate Morningstar’s environmental, social, or governance (ESG) criteria. Index code: MEMMN. The index is not actively managed and does not reflect any deductions for fees, expense or taxes. An investor may not invest directly in an index |
| 4 | The MSCI Emerging Markets Total Return Index, Standard (Large+Mid Cap) Core, Gross (dividends reinvested), USD is a free float-adjusted market capitalization index designed to measure equity market performance of emerging markets. Index code: GDUEEGF. The index is not actively managed and does not reflect any deductions for fees, expense or taxes. An investor may not invest directly in an index. |
| Semi-annual Report – October 31, 2021 | 15 |
| Seafarer Overseas Value Fund | Performance Review |
October 31, 2021
Performance of a $10,000 Investment Since Inception

| * | Inception Date: May 31, 2016. |
The chart shown above represents historical performance of a hypothetical investment of $10,000 in the Fund’s Investor Class shares for the period from inception to October 31, 2021. All returns reflect reinvested dividends and/or distributions, but do not reflect the deduction of taxes that an investor would pay on distributions or redemptions.
The Fund also offers Institutional Class shares, performance of which is not reflected in the chart above. The performance of Institutional Class shares may be higher or lower than the performance of the Investor Class shares shown above based upon differences in fees paid by shareholders investing in the Investor Class shares and Institutional Class shares.
Investment Objective
The Seafarer Overseas Value Fund seeks to provide long-term capital appreciation.
Strategy
The Fund invests primarily in the securities of companies located in developing countries. The Fund invests in several asset classes including common stocks, preferred stocks, and fixed-income securities.
The Fund’s portfolio is comprised of securities identified through a bottom-up security selection process based on fundamental research. The Fund seeks to produce a minimum long-term rate of return by investing in securities priced at a discount to their intrinsic value.
| 16 | (855) 732-9220 seafarerfunds.com |
| Seafarer Overseas Value Fund | Performance Review |
October 31, 2021
| Portfolio Composition by Region | % Net Assets |
| East & South Asia | 62.5% |
| Emerging Europe | 9.5% |
| Latin America | 9.7% |
| Middle East & Africa | 9.4% |
| Other | 3.6% |
| Cash & Other Assets, Less Liabilities | 5.3% |
| Total | 100.0% |
| Portfolio Composition by Sector | % Net Assets |
| Communication Services | 5.3% |
| Consumer Discretionary | 11.1% |
| Consumer Staples | 23.6% |
| Energy | 7.1% |
| Financials | 11.8% |
| Industrials | 20.2% |
| Information Technology | 3.6% |
| Materials | 9.3% |
| Utilities | 2.7% |
| Cash & Other Assets, Less Liabilities | 5.3% |
| Total | 100.0% |
| Top 10 Holdings | % Net Assets |
| First Pacific Co., Ltd. | 5.6% |
| National Central Cooling Co. PJSC | 5.0% |
| Moneta Money Bank AS | 4.5% |
| Qatar Gas Transport Co., Ltd. | 4.5% |
| Pacific Basin Shipping, Ltd. | 4.2% |
| HRnetgroup, Ltd. | 4.1% |
| Georgia Capital PLC | 3.9% |
| Wilmar International, Ltd. | 3.6% |
| Shangri-La Asia, Ltd. | 3.6% |
| Mondi PLC | 3.6% |
| Total | 42.6% |
| Total Number of Holdings | 32 |
Holdings are subject to change, and may not reflect the current or future position of the portfolio. Source: ALPS Fund Services, Inc.
| Semi-annual Report – October 31, 2021 | 17 |
| Seafarer Funds | Disclosure of Fund Expenses |
October 31, 2021 (Unaudited)
DISCLOSURE OF FUND EXPENSES
As a shareholder of a Fund you will incur two types of costs: (1) transaction costs; and (2) ongoing costs, including management fees and other Fund expenses. The following examples are intended to help you understand your ongoing costs (in dollars) of investing in a Fund and to compare these costs with the ongoing costs of investing in other mutual funds. The examples are based on an investment of $1,000 invested on May 1, 2021 and held until October 31, 2021.
Actual Expenses. For each Fund and share class, the first line of the following table provides information about actual account values and actual expenses. You may use the information in this line, together with the amount you invested, to estimate the expenses that you paid over the period. Simply divide your account value by $1,000 (for example, an $8,600 account value divided by $1,000 = 8.6), then multiply the result by the number in the first line under the heading “Expenses Paid During Period” to estimate the expenses you paid on your account during this period.
Hypothetical Example for Comparison Purposes. For each Fund and share class, the second line of the following table provides information about hypothetical account values and hypothetical expenses based on the Fund’s actual expense ratio and an assumed rate of return of 5% per year before expenses, which is not the Fund’s actual return. The hypothetical account values and expenses may not be used to estimate the actual ending account balance or expenses you paid for the period. You may use this information to compare the ongoing costs of investing in the Fund and other mutual funds. To do so, compare this 5% hypothetical example with the 5% hypothetical examples that appear in the shareholder reports of the other mutual funds.
Please note the expenses shown in the following table are meant to highlight your ongoing costs only and do not reflect transaction costs. Therefore, for each Fund and share class, the second line of the following table is useful in comparing ongoing costs only, and will not help you determine the relative total costs of owning different funds. In addition, if these transactional costs were included, your costs would have been higher.
| 18 | (855) 732-9220 seafarerfunds.com |
| Seafarer Funds | Disclosure of Fund Expenses |
October 31, 2021 (Unaudited)
| Beginning Account Value 05/01/21 | Ending Account Value 10/31/21 | Expense Ratio(a) | Expenses Paid During Period 05/01/21 - 10/31/21(b) | |||||||||||||
| SEAFARER OVERSEAS GROWTH AND INCOME FUND | ||||||||||||||||
| Investor Class | ||||||||||||||||
| Actual | $ | 1,000.00 | $ | 963.20 | 0.99 | % | $ | 4.90 | ||||||||
| Hypothetical (5% return before expenses) | $ | 1,000.00 | $ | 1,020.21 | 0.99 | % | $ | 5.04 | ||||||||
| Institutional Class | ||||||||||||||||
| Actual | $ | 1,000.00 | $ | 963.50 | 0.90 | % | $ | 4.45 | ||||||||
| Hypothetical (5% return before expenses) | $ | 1,000.00 | $ | 1,020.67 | 0.90 | % | $ | 4.58 | ||||||||
| SEAFARER OVERSEAS VALUE FUND | ||||||||||||||||
| Investor Class | ||||||||||||||||
| Actual | $ | 1,000.00 | $ | 1,044.80 | 1.15 | % | $ | 5.93 | ||||||||
| Hypothetical (5% return before expenses) | $ | 1,000.00 | $ | 1,019.41 | 1.15 | % | $ | 5.85 | ||||||||
| Institutional Class | ||||||||||||||||
| Actual | $ | 1,000.00 | $ | 1,046.30 | 1.05 | % | $ | 5.42 | ||||||||
| Hypothetical (5% return before expenses) | $ | 1,000.00 | $ | 1,019.91 | 1.05 | % | $ | 5.35 | ||||||||
| (a) | Annualized, based on the Fund's most recent fiscal half year expenses. |
| (b) | Expenses are equal to the Fund's annualized expense ratio multiplied by the average account value over the period, multiplied by the number of days in the most recent fiscal half-year (184)/365 (to reflect the half-year period). |
| Semi-annual Report – October 31, 2021 | 19 |
| Seafarer Overseas Growth and Income Fund | Portfolio of Investments |
October 31, 2021 (Unaudited)
| Currency | Shares | Value | ||||||||
| COMMON STOCKS (93.3%) | ||||||||||
| Brazil (6.3%) | ||||||||||
| Ambev SA, ADR | USD | 18,800,000 | $ | 55,648,000 | ||||||
| Itau Unibanco Holding SA, ADR | USD | 11,200,000 | 45,584,000 | |||||||
| Odontoprev SA | BRL | 8,000,000 | 18,880,896 | |||||||
| XP, Inc.(a) | USD | 258,583 | 8,484,108 | |||||||
| Total Brazil | 128,597,004 | |||||||||
| China / Hong Kong (21.8%) | ||||||||||
| China Foods, Ltd. | HKD | 90,314,000 | 34,506,878 | |||||||
| China Literature, Ltd.(a) | HKD | 9,500,000 | 65,915,519 | |||||||
| Dairy Farm International Holdings, Ltd. | USD | 9,000,000 | 32,155,380 | |||||||
| First Pacific Co., Ltd. | HKD | 92,000,000 | 36,773,986 | |||||||
| Greatview Aseptic Packaging Co., Ltd. | HKD | 35,000,000 | 14,394,962 | |||||||
| Jardine Matheson Holdings, Ltd. | USD | 867,700 | 50,398,754 | |||||||
| Jiangsu Hengrui Medicine Co., Ltd., Class A | CNY | 7,749,934 | 59,534,976 | |||||||
| Pacific Basin Shipping, Ltd. | HKD | 107,000,000 | 49,381,218 | |||||||
| Pico Far East Holdings, Ltd. | HKD | 53,796,000 | 8,919,329 | |||||||
| Shangri-La Asia, Ltd.(a) | HKD | 44,000,000 | 35,853,737 | |||||||
| Shenzhou International Group Holdings, Ltd. | HKD | 609,800 | 13,137,655 | |||||||
| Want Want China Holdings, Ltd. | HKD | 3,167,000 | 2,454,471 | |||||||
| WH Group, Ltd. | HKD | 32,440,407 | 22,741,190 | |||||||
| Xinhua Winshare Publishing and Media Co., Ltd., Class H | HKD | 30,002,000 | 21,933,639 | |||||||
| Total China / Hong Kong | 448,101,694 | |||||||||
| Czech Republic (3.8%) | ||||||||||
| Avast PLC | GBP | 5,500,000 | 42,121,254 | |||||||
| Moneta Money Bank AS(a) | CZK | 9,062,815 | 35,428,885 | |||||||
| Total Czech Republic | 77,550,139 | |||||||||
| Hungary (4.0%) | ||||||||||
| Richter Gedeon Nyrt | HUF | 2,950,000 | 82,640,486 | |||||||
| Total Hungary | 82,640,486 | |||||||||
| India (0.9%) | ||||||||||
| Infosys, Ltd., Sponsored ADR | USD | 825,000 | 18,381,000 | |||||||
| Total India | 18,381,000 | |||||||||
| 20 | (855) 732-9220 seafarerfunds.com |
| Seafarer Overseas Growth and Income Fund | Portfolio of Investments |
October 31, 2021 (Unaudited)
| Currency | Shares | Value | ||||||||
| Japan (4.3%) | ||||||||||
| Rohm Co., Ltd. | JPY | 960,000 | $ | 87,780,065 | ||||||
| Total Japan | 87,780,065 | |||||||||
| Mexico (3.7%) | ||||||||||
| Bolsa Mexicana de Valores SAB de CV | MXN | 10,500,000 | 20,094,230 | |||||||
| Coca-Cola Femsa SAB de CV, ADR | USD | 1,030,000 | 55,362,500 | |||||||
| Total Mexico | 75,456,730 | |||||||||
| Qatar (1.6%) | ||||||||||
| Qatar Gas Transport Co., Ltd. | QAR | 37,613,950 | 33,639,330 | |||||||
| Total Qatar | 33,639,330 | |||||||||
| Singapore (6.0%) | ||||||||||
| Venture Corp., Ltd. | SGD | 5,975,000 | 83,460,661 | |||||||
| Wilmar International, Ltd. | SGD | 12,800,000 | 40,923,437 | |||||||
| Total Singapore | 124,384,098 | |||||||||
| South Africa (4.1%) | ||||||||||
| Sanlam, Ltd. | ZAR | 20,500,000 | 84,214,402 | |||||||
| Total South Africa | 84,214,402 | |||||||||
| South Korea (24.6%) | ||||||||||
| Coway Co., Ltd. | KRW | 1,100,000 | 74,585,490 | |||||||
| Hyundai Mobis Co., Ltd. | KRW | 465,000 | 100,518,629 | |||||||
| Innocean Worldwide, Inc. | KRW | 540,000 | 27,182,413 | |||||||
| Koh Young Technology, Inc. | KRW | 670,000 | 10,587,317 | |||||||
| NAVER Corp. | KRW | 75,000 | 26,076,202 | |||||||
| Orion Corp. | KRW | 547,500 | 55,370,817 | |||||||
| Samsung Biologics Co., Ltd.(a) | KRW | 106,000 | 78,968,741 | |||||||
| Samsung C&T Corp. | KRW | 482,552 | 47,248,317 | |||||||
| Samsung SDI Co., Ltd. | KRW | 126,000 | 79,496,953 | |||||||
| Sindoh Co., Ltd.(a) | KRW | 237,400 | 6,693,262 | |||||||
| Total South Korea | 506,728,141 | |||||||||
| Taiwan (4.1%) | ||||||||||
| Accton Technology Corp. | TWD | 6,150,000 | 53,768,501 | |||||||
| Semi-annual Report – October 31, 2021 | 21 |
| Seafarer Overseas Growth and Income Fund | Portfolio of Investments |
October 31, 2021 (Unaudited)
| Currency | Shares | Value | ||||||||
| Taiwan (continued) | ||||||||||
| Bizlink Holding, Inc. | TWD | 3,250,000 | $ | 30,041,943 | ||||||
| Total Taiwan | 83,810,444 | |||||||||
| Thailand (1.4%) | ||||||||||
| Bangkok Dusit Medical Services PCL, Class F | THB | 40,000,000 | 28,365,576 | |||||||
| Total Thailand | 28,365,576 | |||||||||
| United Arab Emirates (1.7%) | ||||||||||
| National Central Cooling Co. PJSC | AED | 47,022,222 | 35,972,515 | |||||||
| Total United Arab Emirates | 35,972,515 | |||||||||
| United Kingdom (2.3%) | ||||||||||
| Mondi PLC | GBP | 1,900,000 | 47,450,143 | |||||||
| Total United Kingdom | 47,450,143 | |||||||||
| Vietnam (2.7%) | ||||||||||
| PetroVietnam Gas JSC | VND | 10,250,000 | 56,220,661 | |||||||
| Total Vietnam | 56,220,661 | |||||||||
| TOTAL COMMON STOCKS | ||||||||||
| (Cost $1,762,881,427) | 1,919,292,428 | |||||||||
| PREFERRED STOCKS (4.8%) | ||||||||||
| South Korea (4.8%) | ||||||||||
| Samsung C&T Corp. | KRW | 39,000 | 3,678,240 | |||||||
| Samsung Electronics Co., Ltd. | KRW | 1,710,000 | 93,940,616 | |||||||
| Total South Korea | 97,618,856 | |||||||||
| TOTAL PREFERRED STOCKS | ||||||||||
| (Cost $65,238,894) | 97,618,856 | |||||||||
| TOTAL INVESTMENTS | ||||||||||
| (Cost $1,828,120,321) (98.1%) | $ | 2,016,911,284 | ||||||||
| Cash and Other Assets, Less Liabilities (1.9%) | 39,891,051 | |||||||||
| NET ASSETS (100.0%) | $ | 2,056,802,335 | ||||||||
| 22 | (855) 732-9220 seafarerfunds.com |
| Seafarer Overseas Growth and Income Fund | Portfolio of Investments |
October 31, 2021 (Unaudited)
Principal Amount is stated in local currency unless otherwise noted.
| (a) | Non-income producing security. |
Currency Abbreviations
| AED | - | United Arab Emirates Dirham |
| BRL | - | Brazil Real |
| CNY | - | China Yuan |
| CZK | - | Czech Republic Koruna |
| HKD | - | Hong Kong Dollar |
| HUF | - | Hungary Forint |
| GBP | - | United Kingdom Pound |
| JPY | - | Japan Yen |
| KRW | - | South Korea Won |
| MXN | - | Mexico Peso |
| QAR | - | Qatar Riyal |
| SGD | - | Singapore Dollar |
| THB | - | Thailand Baht |
| TWD | - | Taiwan New Dollar |
| USD | - | United States Dollar |
| VND | - | Vietnam Dong |
| ZAR | - | South Africa Rand |
For Fund compliance purposes, the Fund's geographical classifications refer to any one or more of the sub-classifications used by one or more widely recognized market indexes or ratings group indexes, and/or as defined by Fund management. This definition may not apply for purposes of this report, which may combine sub-classifications for reporting ease. Geographical regions are shown as a percentage of net assets.
| Semi-annual Report – October 31, 2021 | 23 |
| Seafarer Overseas Growth and Income Fund | Portfolio of Investments |
October 31, 2021 (Unaudited)
| Industry Composition | |
| Electronic Equipment, Instruments & Components | 8.0% |
| Food Products | 7.7% |
| Beverages | 7.1% |
| Pharmaceuticals | 6.9% |
| Industrial Conglomerates | 5.0% |
| Beverages | 4.9% |
| Media | 4.9% |
| Technology Hardware, Storage & Peripherals | 4.9% |
| Semiconductors & Semiconductor Equipment | 4.8% |
| Insurance | 4.1% |
| Banks | 3.9% |
| Life Sciences Tools & Services | 3.8% |
| Household Durables | 3.6% |
| Gas Utilities | 2.7% |
| Communications Equipment | 2.6% |
| Marine | 2.4% |
| Health Care Providers & Services | 2.3% |
| Paper & Forest Products | 2.3% |
| Software | 2.1% |
| Building Products | 1.8% |
| Hotels, Restaurants & Leisure | 1.7% |
| Food & Staples Retailing | 1.6% |
| Oil, Gas & Consumable Fuels | 1.6% |
| Electrical Equipment | 1.5% |
| Capital Markets | 1.4% |
| Interactive Media & Services | 1.3% |
| Distributors | 1.1% |
| IT Services | 0.9% |
| Containers & Packaging | 0.7% |
| Textiles, Apparel & Luxury Goods | 0.5% |
| Cash and Other Assets, Less Liabilities | 1.9% |
| Total | 100% |
See accompanying Notes to Financial Statements.
| 24 | (855) 732-9220 seafarerfunds.com |
| Seafarer Overseas Value Fund | Portfolio of Investments |
October 31, 2021 (Unaudited)
| Currency | Shares | Value | ||||||||
| COMMON STOCKS (94.4%) | ||||||||||
| Brazil (6.8%) | ||||||||||
| Ambev SA, ADR | USD | 435,000 | $ | 1,287,600 | ||||||
| Itau Unibanco Holding SA, ADR | USD | 259,000 | 1,054,130 | |||||||
| XP, Inc.(a) | USD | 5,979 | 196,171 | |||||||
| Total Brazil | 2,537,901 | |||||||||
| China / Hong Kong (37.7%) | ||||||||||
| China Foods, Ltd. | HKD | 3,391,000 | 1,295,622 | |||||||
| China Yangtze Power Co., Ltd., Class A | CNY | 301,990 | 1,002,811 | |||||||
| Dairy Farm International Holdings, Ltd. | USD | 240,000 | 857,477 | |||||||
| First Pacific Co., Ltd. | HKD | 5,190,000 | 2,074,532 | |||||||
| Giordano International, Ltd. | HKD | 5,200,000 | 1,014,592 | |||||||
| Greatview Aseptic Packaging Co., Ltd. | HKD | 2,000,000 | 822,569 | |||||||
| Jardine Matheson Holdings, Ltd. | USD | 22,000 | 1,277,829 | |||||||
| Melco International Development, Ltd.(a) | HKD | 776,000 | 1,007,875 | |||||||
| Pacific Basin Shipping, Ltd. | HKD | 3,400,000 | 1,569,123 | |||||||
| Pico Far East Holdings, Ltd. | HKD | 5,538,000 | 918,195 | |||||||
| Shangri-La Asia, Ltd.(a) | HKD | 1,650,000 | 1,344,515 | |||||||
| Want Want China Holdings, Ltd. | HKD | 58,000 | 44,951 | |||||||
| WH Group, Ltd. | HKD | 1,159,245 | 812,647 | |||||||
| Total China / Hong Kong | 14,042,738 | |||||||||
| Czech Republic (4.6%) | ||||||||||
| Moneta Money Bank AS(a) | CZK | 433,257 | 1,693,714 | |||||||
| Total Czech Republic | 1,693,714 | |||||||||
| Georgia (3.9%) | ||||||||||
| Georgia Capital PLC(a) | GBP | 174,174 | 1,439,730 | |||||||
| Total Georgia | 1,439,730 | |||||||||
| Mexico (2.9%) | ||||||||||
| Coca-Cola Femsa SAB de CV, ADR | USD | 19,700 | 1,058,875 | |||||||
| Total Mexico | 1,058,875 | |||||||||
| Qatar (4.5%) | ||||||||||
| Qatar Gas Transport Co., Ltd. | QAR | 1,860,000 | 1,663,456 | |||||||
| Total Qatar | 1,663,456 | |||||||||
| Semi-annual Report – October 31, 2021 | 25 |
| Seafarer Overseas Value Fund | Portfolio of Investments |
October 31, 2021 (Unaudited)
| Currency | Shares | Value | ||||||||
| Russia (1.1%) | ||||||||||
| Global Ports Investments PLC, GDR(a) | USD | 100,000 | $ | 394,189 | ||||||
| Total Russia | 394,189 | |||||||||
| Singapore (9.7%) | ||||||||||
| Genting Singapore, Ltd. | SGD | 1,300,000 | 751,664 | |||||||
| HRnetgroup, Ltd. | SGD | 2,500,000 | 1,510,938 | |||||||
| Wilmar International, Ltd. | SGD | 422,000 | 1,349,195 | |||||||
| Total Singapore | 3,611,797 | |||||||||
| South Korea (8.5%) | ||||||||||
| Innocean Worldwide, Inc. | KRW | 21,000 | 1,057,094 | |||||||
| Samsung C&T Corp. | KRW | 7,910 | 774,495 | |||||||
| Samsung SDI Co., Ltd. | KRW | 2,100 | 1,324,949 | |||||||
| Total South Korea | 3,156,538 | |||||||||
| United Arab Emirates (5.0%) | ||||||||||
| National Central Cooling Co. PJSC | AED | 2,420,622 | 1,851,802 | |||||||
| Total United Arab Emirates | 1,851,802 | |||||||||
| United Kingdom (3.6%) | ||||||||||
| Mondi PLC | GBP | 53,600 | 1,338,594 | |||||||
| Total United Kingdom | 1,338,594 | |||||||||
| Vietnam (6.1%) | ||||||||||
| Petrovietnam Fertilizer & Chemicals JSC | VND | 600,000 | 1,292,223 | |||||||
| PetroVietnam Technical Services Corp. | VND | 743,080 | 987,974 | |||||||
| Total Vietnam | 2,280,197 | |||||||||
| TOTAL COMMON STOCKS | ||||||||||
| (Cost $31,733,377) | 35,069,531 | |||||||||
| 26 | (855) 732-9220 seafarerfunds.com |
| Seafarer Overseas Value Fund | Portfolio of Investments |
October 31, 2021 (Unaudited)
| Currency | Shares | Value | ||||||||
| PREFERRED STOCKS (0.3%) | ||||||||||
| South Korea (0.3%) | ||||||||||
| Samsung C&T Corp. | KRW | 1,296 | $ | 122,231 | ||||||
| Total South Korea | 122,231 | |||||||||
| TOTAL PREFERRED STOCKS | ||||||||||
| (Cost $140,136) | 122,231 | |||||||||
| TOTAL INVESTMENTS | ||||||||||
| (Cost $31,873,513) (94.7%) | $ | 35,191,762 | ||||||||
| Cash and Other Assets, Less Liabilities (5.3%) | 1,954,769 | |||||||||
| NET ASSETS (100.0%) | $ | 37,146,531 | ||||||||
Principal Amount is stated in local currency unless otherwise noted.
| (a) | Non-income producing security. |
Currency Abbreviations
| AED | - | United Arab Emirates Dirham |
| CNY | - | China Yuan |
| CZK | - | Czech Republic Koruna |
| GBP | - | United Kingdom Pound |
| HKD | - | Hong Kong Dollar |
| KRW | - | South Korea Won |
| QAR | - | Qatar Riyal |
| SGD | - | Singapore Dollar |
| USD | - | United States Dollar |
| VND | - | Vietnam Dong |
For Fund compliance purposes, the Fund's geographical classifications refer to any one or more of the sub-classifications used by one or more widely recognized market indexes or ratings group indexes, and/or as defined by Fund management. This definition may not apply for purposes of this report, which may combine sub-classifications for reporting ease. Geographical regions are shown as a percentage of net assets.
| Semi-annual Report – October 31, 2021 | 27 |
| Seafarer Overseas Value Fund | Portfolio of Investments |
October 31, 2021 (Unaudited)
| Industry Composition | |
| Food Products | 11.5% |
| Beverages | 9.8% |
| Hotels, Restaurants & Leisure | 8.3% |
| Banks | 7.4% |
| Industrial Conglomerates | 5.8% |
| Media | 5.4% |
| Building Products | 5.0% |
| Oil, Gas & Consumable Fuels | 4.5% |
| Capital Markets | 4.4% |
| Marine | 4.2% |
| Professional Services | 4.1% |
| Electronic Equipment, Instruments & Components | 3.6% |
| Paper & Forest Products | 3.6% |
| Chemicals | 3.5% |
| Energy Equipment & Services | 2.7% |
| Independent Power and Renewable Electricity Producers | 2.7% |
| Specialty Retail | 2.7% |
| Food & Staples Retailing | 2.3% |
| Containers & Packaging | 2.2% |
| Transportation Infrastructure | 1.0% |
| Cash and Other Assets, Less Liabilities | 5.3% |
| Total | 100% |
See accompanying Notes to Financial Statements.
| 28 | (855) 732-9220 seafarerfunds.com |
| Seafarer Funds | Statements of Assets and Liabilities |
October 31, 2021 (Unaudited)
| Seafarer Overseas Growth and Income Fund | Seafarer Overseas Value Fund | |||||||
| ASSETS: | ||||||||
| Investments, at value | $ | 2,016,911,284 | $ | 35,191,762 | ||||
| Cash | 30,470,080 | 2,000,647 | ||||||
| Foreign currency, at value (Cost $1,984,532 and $32,656) | 1,985,779 | 32,661 | ||||||
| Receivable for investments sold | 12,531,615 | – | ||||||
| Receivable for shares sold | 1,751,673 | – | ||||||
| Interest and dividends receivable | 2,164,324 | 29,789 | ||||||
| Prepaid expenses and other assets | 33,786 | 9,283 | ||||||
| Total Assets | 2,065,848,541 | 37,264,142 | ||||||
| LIABILITIES: | ||||||||
| Payable for investments purchased | 2,718,011 | 44,948 | ||||||
| Administrative fees payable | 97,045 | 10,234 | ||||||
| Shareholder service plan fees payable | 328,330 | 4,312 | ||||||
| Payable for shares redeemed | 4,249,003 | – | ||||||
| Investment advisory fees payable | 1,280,041 | 13,755 | ||||||
| Payable for chief compliance officer fees | 4,377 | 4,377 | ||||||
| Trustee fees and expenses payable | 37,711 | 904 | ||||||
| Payable for principal financial officer fees | 1,324 | 1,324 | ||||||
| Audit and tax fees payable | 34,218 | 17,570 | ||||||
| Accrued expenses and other liabilities | 296,146 | 20,187 | ||||||
| Total Liabilities | 9,046,206 | 117,611 | ||||||
| NET ASSETS | $ | 2,056,802,335 | $ | 37,146,531 | ||||
| NET ASSETS CONSIST OF: | ||||||||
| Paid-in capital (Note 5) | $ | 1,760,286,121 | $ | 32,894,344 | ||||
| Total distributable earnings | 296,516,214 | 4,252,187 | ||||||
| NET ASSETS | $ | 2,056,802,335 | $ | 37,146,531 | ||||
| INVESTMENTS, AT COST | $ | 1,828,120,321 | $ | 31,873,513 | ||||
| PRICING OF SHARES | ||||||||
| Investor Class: | ||||||||
| Net Asset Value, offering and redemption price per share | $ | 14.55 | $ | 13.75 | ||||
| Net Assets | $ | 225,375,428 | $ | 472,523 | ||||
| Shares of beneficial interest outstanding | 15,493,041 | 34,353 | ||||||
| Institutional Class: | ||||||||
| Net Asset Value, offering and redemption price per share | $ | 14.63 | $ | 13.79 | ||||
| Net Assets | $ | 1,831,426,907 | $ | 36,674,008 | ||||
| Shares of beneficial interest outstanding | 125,208,743 | 2,659,466 | ||||||
See accompanying Notes to Financial Statements.
| Semi-annual Report – October 31, 2021 | 29 |
| Seafarer Funds | Statements of Operations |
Six Months Ended October 31, 2021 (Unaudited)
| Seafarer Overseas Growth and Income Fund | Seafarer Overseas Value Fund | |||||||
| INVESTMENT INCOME: | ||||||||
| Dividends | $ | 37,868,270 | $ | 845,585 | ||||
| Foreign taxes withheld | (1,486,446 | ) | (18,568 | ) | ||||
| Total investment income | 36,381,824 | 827,017 | ||||||
| EXPENSES: | ||||||||
| Investment advisory fees (Note 6) | 7,777,824 | 135,386 | ||||||
| Administrative and transfer agency fees | 308,993 | 30,929 | ||||||
| Trustee fees and expenses | 39,335 | 909 | ||||||
| Registration/filing fees | 22,873 | 14,848 | ||||||
| Shareholder service plan fees | ||||||||
| Investor Class | 173,702 | – | ||||||
| Institutional Class | 489,791 | 8,193 | ||||||
| Legal fees | 15,128 | 265 | ||||||
| Audit and tax fees | 15,069 | 12,561 | ||||||
| Reports to shareholders and printing fees | 32,849 | 381 | ||||||
| Custody fees | 665,997 | 23,989 | ||||||
| Chief compliance officer fees | 12,940 | 12,940 | ||||||
| Principal financial officer fees | 3,925 | 3,925 | ||||||
| Insurance expense | 9,137 | 153 | ||||||
| Miscellaneous | 20,907 | 5,489 | ||||||
| Total expenses | 9,588,470 | 249,968 | ||||||
| Less fees waived/reimbursed by investment adviser (Note 6) | ||||||||
| Investor Class | – | (714 | ) | |||||
| Institutional Class | – | (55,589 | ) | |||||
| Total net expenses | 9,588,470 | 193,665 | ||||||
| NET INVESTMENT INCOME: | 26,793,354 | 633,352 | ||||||
| Net realized gain/(loss) on investments | (5,387,925 | ) | 618,291 | |||||
| Net realized loss on foreign currency transactions | (111,231 | ) | (4,238 | ) | ||||
| Net realized gain/(loss) | (5,499,156 | ) | 614,053 | |||||
| Net change in unrealized appreciation/(depreciation) on investments | (99,513,716 | ) | 371,186 | |||||
| Net change in unrealized appreciation/(depreciation) on translation of assets and liabilities in foreign currency transactions | (38,573 | ) | 170 | |||||
| Net unrealized appreciation/(depreciation) | (99,552,289 | ) | 371,356 | |||||
| NET REALIZED AND UNREALIZED GAIN/(LOSS) ON | ||||||||
| INVESTMENTS AND FOREIGN CURRENCY TRANSLATIONS | (105,051,445 | ) | 985,409 | |||||
| NET INCREASE/(DECREASE) IN NET ASSETS RESULTING FROM OPERATIONS | $ | (78,258,091 | ) | $ | 1,618,761 | |||
See accompanying Notes to Financial Statements.
| 30 | (855) 732-9220 seafarerfunds.com |
| Seafarer Overseas Growth and Income Fund | Statements of Changes in Net Assets |
| Six Months Ended October 31, 2021 (Unaudited) | Year Ended April 30, 2021 | |||||||
| OPERATIONS: | ||||||||
| Net investment income | $ | 26,793,354 | $ | 23,431,458 | ||||
| Net realized gain/(loss) | (5,499,156 | ) | 239,124,481 | |||||
| Net change in unrealized appreciation/(depreciation) | (99,552,289 | ) | 375,324,236 | |||||
| Net increase/(decrease) in net assets resulting from operations | (78,258,091 | ) | 637,880,175 | |||||
| DISTRIBUTIONS TO SHAREHOLDERS (NOTE 3): | ||||||||
| Total amount of distribution | ||||||||
| Investor Class | (3,182,177 | ) | (4,680,063 | ) | ||||
| Institutional Class | (25,704,613 | ) | (34,813,314 | ) | ||||
| Net decrease in net assets from distributions | (28,886,790 | ) | (39,493,377 | ) | ||||
| BENEFICIAL INTEREST TRANSACTIONS (NOTE 5): | ||||||||
| Shares sold | ||||||||
| Investor Class | 17,559,652 | 38,474,164 | ||||||
| Institutional Class | 195,770,024 | 464,212,754 | ||||||
| Dividends reinvested | ||||||||
| Investor Class | 3,104,065 | 4,604,440 | ||||||
| Institutional Class | 17,075,647 | 25,200,873 | ||||||
| Shares redeemed | ||||||||
| Investor Class | (12,177,830 | ) | (40,379,453 | ) | ||||
| Institutional Class | (113,698,991 | ) | (289,743,396 | ) | ||||
| Net increase in net assets derived from beneficial interest transactions | 107,632,567 | 202,369,382 | ||||||
| Net increase in net assets | 487,686 | 800,756,180 | ||||||
| NET ASSETS: | ||||||||
| Beginning of period | 2,056,314,649 | 1,255,558,469 | ||||||
| End of period | $ | 2,056,802,335 | $ | 2,056,314,649 | ||||
| Other Information: | ||||||||
| SHARE TRANSACTIONS: | ||||||||
| Investor Class | ||||||||
| Sold | 1,160,837 | 2,871,389 | ||||||
| Distributions reinvested | 198,470 | 345,067 | ||||||
| Redeemed | (802,908 | ) | (3,215,757 | ) | ||||
| Net increase in shares outstanding | 556,399 | 699 | ||||||
| Institutional Class | ||||||||
| Sold | 12,851,880 | 33,422,168 | ||||||
| Distributions reinvested | 1,085,547 | 1,872,812 | ||||||
| Redeemed | (7,490,675 | ) | (22,867,042 | ) | ||||
| Net increase in shares outstanding | 6,446,752 | 12,427,938 | ||||||
See accompanying Notes to Financial Statements.
| Semi-annual Report – October 31, 2021 | 31 |
| Seafarer Overseas Value Fund | Statements of Changes in Net Assets |
| Six Months Ended October 31, 2021 (Unaudited) | Year Ended April 30, 2021 | |||||||
| OPERATIONS: | ||||||||
| Net investment income | $ | 633,352 | $ | 651,551 | ||||
| Net realized gain | 614,053 | 519,942 | ||||||
| Net change in unrealized appreciation | 371,356 | 8,930,496 | ||||||
| Net increase in net assets resulting from operations | 1,618,761 | 10,101,989 | ||||||
| DISTRIBUTIONS TO SHAREHOLDERS (NOTE 3): | ||||||||
| Total amount of distribution | ||||||||
| Investor Class | – | (5,163 | ) | |||||
| Institutional Class | – | (422,933 | ) | |||||
| Net decrease in net assets from distributions | – | (428,096 | ) | |||||
| BENEFICIAL INTEREST TRANSACTIONS (NOTE 5): | ||||||||
| Shares sold | ||||||||
| Investor Class | 29,485 | 79,650 | ||||||
| Institutional Class | 2,094,214 | 5,691,263 | ||||||
| Dividends reinvested | ||||||||
| Investor Class | – | 4,809 | ||||||
| Institutional Class | – | 417,800 | ||||||
| Shares redeemed | ||||||||
| Investor Class | (8,070 | ) | (49,983 | ) | ||||
| Institutional Class | (1,733,594 | ) | (10,506,690 | ) | ||||
| Net increase/(decrease) in net assets derived from beneficial interest transactions | 382,035 | (4,363,151 | ) | |||||
| Net increase in net assets | 2,000,796 | 5,310,742 | ||||||
| NET ASSETS: | ||||||||
| Beginning of period | 35,145,735 | 29,834,993 | ||||||
| End of period | $ | 37,146,531 | $ | 35,145,735 | ||||
| Other Information: | ||||||||
| SHARE TRANSACTIONS: | ||||||||
| Investor Class | ||||||||
| Sold | 2,163 | 7,441 | ||||||
| Distributions reinvested | – | 401 | ||||||
| Redeemed | (591 | ) | (4,480 | ) | ||||
| Net increase in shares outstanding | 1,572 | 3,362 | ||||||
| Institutional Class | ||||||||
| Sold | 153,261 | 481,808 | ||||||
| Distributions reinvested | – | 34,759 | ||||||
| Redeemed | (126,995 | ) | (1,002,045 | ) | ||||
| Net increase/(decrease) in shares outstanding | 26,266 | (485,478 | ) | |||||
See accompanying Notes to Financial Statements.
| 32 | (855) 732-9220 seafarerfunds.com |
Page Intentionally Left Blank
Seafarer Overseas Growth and Income Fund
| Investor Class |
| NET ASSET VALUE, BEGINNING OF PERIOD |
| INCOME FROM OPERATIONS: |
| Net investment income(a) |
| Net realized and unrealized gain/(loss) on investments |
| Total from investment operations |
| LESS DISTRIBUTIONS: |
| From net investment income |
| From net realized gains on investments |
| Total distributions |
| REDEMPTION FEES ADDED TO PAID IN CAPITAL |
| NET INCREASE/(DECREASE) IN NET ASSET VALUE |
| NET ASSET VALUE, END OF PERIOD |
| TOTAL RETURN(d) |
| SUPPLEMENTAL DATA: |
| Net assets, end of period (in 000s) |
| RATIOS TO AVERAGE NET ASSETS: |
| Operating expenses excluding reimbursement/waiver |
| Operating expenses including reimbursement/waiver |
| Net investment income including reimbursement/waiver |
| PORTFOLIO TURNOVER RATE(h) |
| (a) | Calculated using the average shares method. |
| (b) | Less than $0.005 per share. |
| (c) | In preparing the financial statements in accordance with U.S. GAAP, management made certain adjustments as required by U.S. GAAP which caused the net asset value for purposes of these financial statements to differ from the net asset value used to process shareholder transactions as of the date of these financial statements. As a result, the net asset value increased from $12.50 to $12.51. |
| (d) | Total returns are for the periods indicated and have not been annualized. Returns shown do not reflect the deduction of taxes that a shareholder would pay on Fund distributions or the redemption of Fund shares. |
| (e) | Includes adjustments in accordance with U.S. GAAP and as such, the total return for shareholder transactions reported to the market may differ from the total return for financial reporting purposes. As a result, the total return decreased from 8.12% to 8.03%. |
| (f) | Includes adjustments in accordance with U.S. GAAP and as such, the total return for shareholder transactions reported to the market may differ from the total return for financial reporting purposes. As a result, the total return increased from 11.13% to 11.22%. |
| (g) | Annualized. |
| (h) | Portfolio turnover rate for periods less than one full year have not been annualized. |
| 34 | (855) 732-9220 seafarerfunds.com |
Financial Highlights
For a share outstanding through the periods or years presented
| Six Months Ended October 31, 2021 (Unaudited) | Year Ended April 30, 2021 | Year Ended April 30, 2020 | Year Ended April 30, 2019 | Year Ended April 30, 2018 | Year Ended April 30, 2017 | |||||||||||||||||
| $ | 15.31 | $ | 10.31 | $ | 11.56 | $ | 13.11 | $ | 12.51 | $ | 11.44 | |||||||||||
| 0.19 | 0.18 | 0.21 | 0.36 | 0.28 | 0.22 | |||||||||||||||||
| (0.74 | ) | 5.14 | (1.15 | ) | (1.02 | ) | 0.72 | 1.04 | ||||||||||||||
| (0.55 | ) | 5.32 | (0.94 | ) | (0.66 | ) | 1.00 | 1.26 | ||||||||||||||
| (0.21 | ) | (0.17 | ) | (0.31 | ) | (0.01 | ) | (0.37 | ) | (0.19 | ) | |||||||||||
| – | (0.15 | ) | – | (0.88 | ) | (0.03 | ) | – | ||||||||||||||
| (0.21 | ) | (0.32 | ) | (0.31 | ) | (0.89 | ) | (0.40 | ) | (0.19 | ) | |||||||||||
| – | – | – | – | – | 0.00 | (b) | ||||||||||||||||
| (0.76 | ) | 5.00 | (1.25 | ) | (1.55 | ) | 0.60 | 1.07 | ||||||||||||||
| $ | 14.55 | $ | 15.31 | $ | 10.31 | $ | 11.56 | $ | 13.11 | $ | 12.51 | (c) | ||||||||||
| (3.68 | %) | 52.15 | % | (8.44 | %) | (4.36 | %) | 8.03 | %(e) | 11.22 | %(f) | |||||||||||
| $ | 225,375 | $ | 228,690 | $ | 154,017 | $ | 233,072 | $ | 894,241 | $ | 877,384 | |||||||||||
| 0.99 | %(g) | 1.02 | % | 1.02 | % | 0.99 | % | 0.97 | % | 1.02 | % | |||||||||||
| 0.99 | %(g) | 1.02 | % | 1.02 | % | 0.99 | % | 0.97 | % | 1.02 | % | |||||||||||
| 2.44 | %(g) | 1.35 | % | 1.88 | % | 3.02 | % | 2.12 | % | 1.88 | % | |||||||||||
| 9 | % | 47 | % | 29 | % | 52 | % | 23 | % | 14 | % | |||||||||||
See accompanying Notes to Financial Statements.
| Semi-annual Report – October 31, 2021 | 35 |
Seafarer Overseas Growth and Income Fund
| Institutional Class |
| NET ASSET VALUE, BEGINNING OF PERIOD |
| INCOME FROM OPERATIONS: |
| Net investment income(a) |
| Net realized and unrealized gain/(loss) on investments |
| Total from investment operations |
| LESS DISTRIBUTIONS: |
| From net investment income |
| From net realized gains on investments |
| Total distributions |
| REDEMPTION FEES ADDED TO PAID IN CAPITAL |
| NET INCREASE/(DECREASE) IN NET ASSET VALUE |
| NET ASSET VALUE, END OF PERIOD |
| TOTAL RETURN(c) |
| SUPPLEMENTAL DATA: |
| Net assets, end of period (in 000s) |
| RATIOS TO AVERAGE NET ASSETS: |
| Operating expenses excluding reimbursement/waiver |
| Operating expenses including reimbursement/waiver |
| Net investment income including reimbursement/waiver |
| PORTFOLIO TURNOVER RATE(e) |
| (a) | Calculated using the average shares method. |
| (b) | Less than $0.005 per share. |
| (c) | Total returns are for the periods indicated and have not been annualized. Returns shown do not reflect the deduction of taxes that a shareholder would pay on Fund distributions or the redemption of Fund shares. |
| (d) | Annualized. |
| (e) | Portfolio turnover rate for periods less than one full year have not been annualized. |
| 36 | (855) 732-9220 seafarerfunds.com |
Financial Highlights
For a share outstanding through the periods or years presented
| Six Months Ended October 31, 2021 (Unaudited) | Year Ended April 30, 2021 | Year Ended April 30, 2020 | Year Ended April 30, 2019 | Year Ended April 30, 2018 | Year Ended April 30, 2017 | |||||||||||||||||
| $ | 15.39 | $ | 10.36 | $ | 11.61 | $ | 13.14 | $ | 12.54 | $ | 11.46 | |||||||||||
| 0.20 | 0.20 | 0.22 | 0.29 | 0.28 | 0.21 | |||||||||||||||||
| (0.75 | ) | 5.16 | (1.16 | ) | (0.93 | ) | 0.73 | 1.07 | ||||||||||||||
| (0.55 | ) | 5.36 | (0.94 | ) | (0.64 | ) | 1.01 | 1.28 | ||||||||||||||
| (0.21 | ) | (0.18 | ) | (0.31 | ) | (0.01 | ) | (0.38 | ) | (0.20 | ) | |||||||||||
| – | (0.15 | ) | – | (0.88 | ) | (0.03 | ) | – | ||||||||||||||
| (0.21 | ) | (0.33 | ) | (0.31 | ) | (0.89 | ) | (0.41 | ) | (0.20 | ) | |||||||||||
| – | 0.00 | (b) | – | – | – | 0.00 | (b) | |||||||||||||||
| (0.76 | ) | 5.03 | (1.25 | ) | (1.53 | ) | 0.60 | 1.08 | ||||||||||||||
| $ | 14.63 | $ | 15.39 | $ | 10.36 | $ | 11.61 | $ | 13.14 | $ | 12.54 | |||||||||||
| (3.65 | %) | 52.28 | % | (8.34 | %) | (4.17 | %) | 8.08 | % | 11.37 | % | |||||||||||
| $ | 1,831,427 | $ | 1,827,624 | $ | 1,101,542 | $ | 1,304,491 | $ | 2,134,051 | $ | 1,500,310 | |||||||||||
| 0.90 | %(d) | 0.92 | % | 0.92 | % | 0.90 | % | 0.87 | % | 0.92 | % | |||||||||||
| 0.90 | %(d) | 0.92 | % | 0.92 | % | 0.90 | % | 0.87 | % | 0.92 | % | |||||||||||
| 2.54 | %(d) | 1.47 | % | 1.91 | % | 2.45 | % | 2.09 | % | 1.82 | % | |||||||||||
| 9 | % | 47 | % | 29 | % | 52 | % | 23 | % | 14 | % | |||||||||||
See accompanying Notes to Financial Statements.
| Semi-annual Report – October 31, 2021 | 37 |
Seafarer Overseas Value Fund
| Investor Class |
| NET ASSET VALUE, BEGINNING OF PERIOD |
| INCOME FROM OPERATIONS: |
| Net investment income(a) |
| Net realized and unrealized gain/(loss) on investments |
| Total from investment operations |
| LESS DISTRIBUTIONS: |
| From net investment income |
| From net realized gains on investments |
| Total distributions |
| NET INCREASE/(DECREASE) IN NET ASSET VALUE |
| NET ASSET VALUE, END OF PERIOD |
| TOTAL RETURN(b) |
| SUPPLEMENTAL DATA: |
| Net assets, end of period (in 000s) |
| RATIOS TO AVERAGE NET ASSETS: |
Operating expenses excluding reimbursement/waiver |
| Operating expenses including reimbursement/waiver |
| Net investment income including reimbursement/waiver |
| PORTFOLIO TURNOVER RATE(d) |
| (a) | Calculated using the average shares method. |
| (b) | Total returns are for the periods indicated and have not been annualized. In some periods, total returns would have been lower had certain expenses not been waived during the periods. Returns shown do not reflect the deduction of taxes that a shareholder would pay on Fund distributions or the redemption of Fund shares. |
| (c) | Annualized. |
| (d) | Portfolio turnover rate for periods less than one full year have not been annualized. |
| 38 | (855) 732-9220 seafarerfunds.com |
Financial Highlights
For a share outstanding through the periods or years presented
| Six Months Ended October 31, 2021 (Unaudited) | Year Ended April 30, 2021 | Year Ended April 30, 2020 | Year Ended April 30, 2019 | Year Ended April 30, 2018 | May 31, 2016 (Inception) to April 30, 2017 | |||||||||||||||||
| $ | 13.16 | $ | 9.46 | $ | 11.41 | $ | 11.95 | $ | 11.30 | $ | 10.00 | |||||||||||
| 0.23 | 0.22 | 0.29 | 0.29 | 0.35 | 0.12 | |||||||||||||||||
| 0.36 | 3.64 | (1.88 | ) | (0.51 | ) | 0.72 | 1.28 | |||||||||||||||
| 0.59 | 3.86 | (1.59 | ) | (0.22 | ) | 1.07 | 1.40 | |||||||||||||||
| – | (0.16 | ) | (0.31 | ) | (0.29 | ) | (0.42 | ) | (0.10 | ) | ||||||||||||
| – | – | (0.05 | ) | (0.03 | ) | – | – | |||||||||||||||
| – | (0.16 | ) | (0.36 | ) | (0.32 | ) | (0.42 | ) | (0.10 | ) | ||||||||||||
| 0.59 | 3.70 | (1.95 | ) | (0.54 | ) | 0.65 | 1.30 | |||||||||||||||
| $ | 13.75 | $ | 13.16 | $ | 9.46 | $ | 11.41 | $ | 11.95 | $ | 11.30 | |||||||||||
| 4.48 | % | 40.96 | % | (14.54 | %) | (1.50 | %) | 9.55 | % | 14.15 | % | |||||||||||
| $ | 473 | $ | 431 | $ | 278 | $ | 327 | $ | 311 | $ | 280 | |||||||||||
| 1.46 | %(c) | 1.49 | % | 1.44 | % | 1.45 | % | 1.80 | % | 3.71 | %(c) | |||||||||||
| 1.15 | %(c) | 1.15 | % | 1.15 | % | 1.15 | % | 1.15 | % | 1.15 | %(c) | |||||||||||
| 3.36 | %(c) | 1.99 | % | 2.61 | % | 2.59 | % | 2.91 | % | 1.24 | %(c) | |||||||||||
| 10 | % | 24 | % | 25 | % | 3 | % | 3 | % | 0 | % | |||||||||||
See accompanying Notes to Financial Statements.
| Semi-annual Report – October 31, 2021 | 39 |
Seafarer Overseas Value Fund
| Institutional Class |
| NET ASSET VALUE, BEGINNING OF PERIOD |
| INCOME FROM OPERATIONS: |
| Net investment income(a) |
| Net realized and unrealized gain/(loss) on investments |
| Total from investment operations |
| LESS DISTRIBUTIONS: |
| From net investment income |
| From net realized gains on investments |
| Total distributions |
| NET INCREASE/(DECREASE) IN NET ASSET VALUE |
| NET ASSET VALUE, END OF PERIOD |
| TOTAL RETURN(c) |
| SUPPLEMENTAL DATA: |
| Net assets, end of period (in 000s) |
| RATIOS TO AVERAGE NET ASSETS: |
| Operating expenses excluding reimbursement/waiver |
| Operating expenses including reimbursement/waiver |
| Net investment income including reimbursement/waiver |
| PORTFOLIO TURNOVER RATE(g) |
| (a) | Calculated using the average shares method. |
| (b) | In preparing the financial statements in accordance with U.S. GAAP, management made certain adjustments as required by U.S. GAAP which caused the net asset value for purposes of these financial statements to differ from the net asset value used to process shareholder transactions as of the date of these financial statements. As a result, the net asset value decreased from $11.29 to $11.28. |
| (c) | Total returns are for the periods indicated and have not been annualized. In some periods, total returns would have been lower had certain expenses not been waived during the periods. Returns shown do not reflect the deduction of taxes that a shareholder would pay on Fund distributions or the redemption of Fund shares. |
| (d) | Includes adjustments in accordance with U.S. GAAP and as such, the total return for shareholder transactions reported to the market may differ from the total return for financial reporting purposes. As a result, the total return increased from 9.64% to 9.74%. |
| (e) | Includes adjustments in accordance with U.S. GAAP and as such, the total return for shareholder transactions reported to the market may differ from the total return for financial reporting purposes. As a result, the total return decreased from 14.29% to 14.18%. |
| (f) | Annualized. |
| (g) | Portfolio turnover rate for periods less than one full year have not been annualized. |
| 40 | (855) 732-9220 seafarerfunds.com |
Financial Highlights
For a share outstanding through the periods or years presented
| Six Months Ended October 31, 2021 (Unaudited) | Year Ended April 30, 2021 | Year Ended April 30, 2020 | Year Ended April 30, 2019 | Year Ended April 30, 2018 | May 31, 2016 (Inception) to April 30, 2017 | |||||||||||||||||
| $ | 13.18 | $ | 9.48 | $ | 11.43 | $ | 11.96 | $ | 11.28 | $ | 10.00 | |||||||||||
| 0.24 | 0.25 | 0.30 | 0.30 | 0.35 | 0.13 | |||||||||||||||||
| 0.37 | 3.62 | (1.88 | ) | (0.50 | ) | 0.74 | 1.28 | |||||||||||||||
| 0.61 | 3.87 | (1.58 | ) | (0.20 | ) | 1.09 | 1.41 | |||||||||||||||
| – | (0.17 | ) | (0.32 | ) | (0.30 | ) | (0.41 | ) | (0.13 | ) | ||||||||||||
| – | – | (0.05 | ) | (0.03 | ) | – | – | |||||||||||||||
| – | (0.17 | ) | (0.37 | ) | (0.33 | ) | (0.41 | ) | (0.13 | ) | ||||||||||||
| 0.61 | 3.70 | (1.95 | ) | (0.53 | ) | 0.68 | 1.28 | |||||||||||||||
| $ | 13.79 | $ | 13.18 | $ | 9.48 | $ | 11.43 | $ | 11.96 | $ | 11.28 | (b) | ||||||||||
| 4.63 | % | 40.98 | % | (14.47 | %) | (1.34 | %) | 9.74 | %(d) | 14.18 | %(e) | |||||||||||
| $ | 36,674 | $ | 34,714 | $ | 29,557 | $ | 28,849 | $ | 25,291 | $ | 9,846 | |||||||||||
| 1.36 | %(f) | 1.51 | % | 1.42 | % | 1.48 | % | 1.76 | % | 3.63 | %(f) | |||||||||||
| 1.05 | %(f) | 1.05 | % | 1.05 | % | 1.05 | % | 1.05 | % | 1.05 | %(f) | |||||||||||
| 3.44 | %(f) | 2.19 | % | 2.63 | % | 2.65 | % | 2.90 | % | 1.36 | %(f) | |||||||||||
| 10 | % | 24 | % | 25 | % | 3 | % | 3 | % | 0 | % | |||||||||||
See accompanying Notes to Financial Statements.
| Semi-annual Report – October 31, 2021 | 41 |
| Seafarer Funds | Notes to Financial Statements |
October 31, 2021 (Unaudited)
NOTES TO FINANCIAL STATEMENTS
1. Organization
Financial Investors Trust (the “Trust”), a Delaware statutory trust, is an open-end management investment company registered under the Investment Company Act of 1940, as amended (“1940 Act”). The Trust consists of multiple separate portfolios or series. This annual report describes the Seafarer Overseas Growth and Income Fund and the Seafarer Overseas Value Fund (individually a “Fund” and collectively, the “Funds”). The Seafarer Overseas Growth and Income Fund seeks to provide long-term capital appreciation along with some current income; it also seeks to mitigate adverse volatility in returns as a secondary objective. The Seafarer Overseas Value Fund seeks to provide long-term capital appreciation. The Funds each offer Investor Class and Institutional Class shares.
2. Significant Accounting Policies
The accompanying financial statements were prepared in accordance with accounting principles generally accepted in the United States of America (“U.S. GAAP”). The preparation of financial statements in conformity with U.S. GAAP requires management to make certain estimates and assumptions that affect the reported amounts of assets and liabilities and disclosures of contingent assets and liabilities at the date of the financial statements and the reported amounts of revenue and expenses during the period. Actual results could differ from those estimates. The Funds are considered an investment company for financial reporting purposes under U.S. GAAP and follow the accounting and reporting guidance applicable to investment companies in the Financial Accounting Standards Board Accounting Standards Codification Topic 946.The following is a summary of significant accounting policies consistently followed by the Funds in preparation of their financial statements.
Investment Valuation
Each Fund generally values its securities based on market prices determined at the close of regular trading on the New York Stock Exchange (“NYSE”), normally 4:00 p.m. Eastern Time, on each day the NYSE is open for trading.
For equity securities and exchange traded funds, the market price is usually the closing sale or official closing price on that exchange. In the case of equity securities not traded on an exchange, or if such closing prices are not otherwise available, the securities are valued at the mean of the most recent bid and ask prices on such day. Redeemable securities issued by open-end registered investment companies are valued at the investment company’s applicable net asset value, with the exception of exchange-traded open-end investment companies, which are priced as equity securities.
Equity securities that are primarily traded on foreign securities exchanges are valued at the closing values of such securities on their respective foreign exchanges, except when an event occurs subsequent to the close of the foreign exchange but before the close of the NYSE, such that the securities’ value would likely change. In such an event, the fair values of those securities are determined in good faith through consideration of other factors in accordance with procedures established by and under the general supervision of the Board of Trustees of the Trust (the “Board” or the “Trustees”). Each Fund uses a fair valuation model provided by an independent pricing service, which is intended to reflect fair value when a security’s value or a meaningful portion of the Fund’s portfolio is believed to have been materially affected by a valuation event that has occurred between the close of the exchange or market on which the security is traded and the close of the regular trading day on the NYSE.
The market price for debt obligations is generally the price supplied by an independent third-party pricing service approved by the Board, which may use a matrix, formula or other objective method that takes into consideration quotations from dealers, market transactions in comparable investments, market indices and yield curves. If vendors are unable to supply a price, or if the price supplied is deemed to be unreliable, the market price may be determined using quotations received from one or more broker-dealers that make a market in the security. Corporate bonds and convertible bonds are valued using market models that consider trade data, quotations from dealers and active market
| 42 | (855) 732-9220 seafarerfunds.com |
| Seafarer Funds | Notes to Financial Statements |
October 31, 2021 (Unaudited)
makers, relevant yield curve and spread data, creditworthiness, trade data or market information on comparable securities, and other relevant security specific information. Publicly traded foreign government debt securities and foreign corporate bonds are typically traded internationally in the over-the-counter market and are valued at the mean between the bid and asked prices as of the close of business of that market.
Forward currency exchange contracts have a market value determined by the prevailing foreign currency exchange daily rates and current foreign currency exchange forward rates. The foreign currency exchange forward rates are calculated using an automated system that estimates rates on the basis of the current day foreign currency exchange rates and forward foreign currency exchange rates supplied by a pricing service.
When such prices or quotations are not available, or when the Trust’s Valuation Committee believes that they are unreliable, securities may be priced using fair value procedures approved by the Board.
Certain foreign countries impose a tax on capital gains which is accrued by each Fund based on unrealized appreciation, if any, on affected securities. The tax is paid when the gain is realized.
Fair Value Measurements
Each Fund discloses the classification of its fair value measurements following a three-tier hierarchy based on the inputs used to measure fair value. Inputs refer broadly to the assumptions that market participants would use in pricing the asset or liability, including assumptions about risk. Inputs may be observable or unobservable. Observable inputs reflect the assumptions market participants would use in pricing the asset or liability. Such inputs are developed based on market data obtained from sources independent of the reporting entity. Unobservable inputs reflect the reporting entity’s own assumptions about the assumptions market participants would use in pricing the asset or liability, which are developed based on the information available and the reporting entity’s best efforts to interpret such information.
Various inputs are used in determining the value of the Funds’ investments as of the end of the reporting period. When inputs used fall into different levels of the fair value hierarchy, the level in the hierarchy within which the fair value measurement falls is determined based on the lowest level input that is significant to the fair value measurement in its entirety. The designated input levels are not necessarily an indication of the risk or liquidity associated with these investments. These inputs are categorized in the following hierarchy under applicable financial accounting standards:
| Level 1 | – | Unadjusted quoted prices in active markets for identical investments, unrestricted assets or liabilities that the Funds have the ability to access at the measurement date; |
| Level 2 | – | Quoted prices which are not active, quoted prices for similar assets or liabilities in active markets or inputs other than quoted prices that are observable (either directly or indirectly) for substantially the full term of the asset or liability; and |
| Level 3 | – | Significant unobservable prices or inputs (including the Funds’ own assumptions in determining the fair value of investments) where there is little or no market activity for the asset or liability at the measurement date. |
| Semi-annual Report – October 31, 2021 | 43 |
| Seafarer Funds | Notes to Financial Statements |
October 31, 2021 (Unaudited)
The following is a summary of the inputs used to value each Fund as of October 31, 2021:
| Investments in Securities at Value(a) | Level 1 - Quoted Prices | Level 2 - Other Significant Observable Inputs | Level 3 - Significant Unobservable Inputs | Total | ||||||||||||
| Seafarer Overseas Growth and Income Fund | ||||||||||||||||
| Common Stocks | ||||||||||||||||
| Brazil | $ | 128,597,004 | $ | – | $ | – | $ | 128,597,004 | ||||||||
| China / Hong Kong | 98,396,485 | 349,705,209 | – | 448,101,694 | ||||||||||||
| Czech Republic | 77,550,139 | – | – | 77,550,139 | ||||||||||||
| Hungary | 82,640,486 | – | – | 82,640,486 | ||||||||||||
| India | 18,381,000 | – | – | 18,381,000 | ||||||||||||
| Japan | – | 87,780,065 | – | 87,780,065 | ||||||||||||
| Mexico | 75,456,730 | – | – | 75,456,730 | ||||||||||||
| Qatar | – | 33,639,330 | – | 33,639,330 | ||||||||||||
| Singapore | – | 124,384,098 | – | 124,384,098 | ||||||||||||
| South Africa | 84,214,402 | – | – | 84,214,402 | ||||||||||||
| South Korea | – | 506,728,141 | – | 506,728,141 | ||||||||||||
| Taiwan | – | 83,810,444 | – | 83,810,444 | ||||||||||||
| Thailand | – | 28,365,576 | – | 28,365,576 | ||||||||||||
| United Arab Emirates | 35,972,515 | – | – | 35,972,515 | ||||||||||||
| United Kingdom | – | 47,450,143 | – | 47,450,143 | ||||||||||||
| Vietnam | – | 56,220,661 | – | 56,220,661 | ||||||||||||
| Preferred Stocks | – | 97,618,856 | – | 97,618,856 | ||||||||||||
| Total | $ | 601,208,761 | $ | 1,415,702,523 | $ | – | $ | 2,016,911,284 | ||||||||
| 44 | (855) 732-9220 seafarerfunds.com |
| Seafarer Funds | Notes to Financial Statements |
October 31, 2021 (Unaudited)
| Investments in Securities at Value(a) | Level 1 - Quoted Prices | Level 2 - Other Significant Observable Inputs | Level 3 - Significant Unobservable Inputs | Total | ||||||||||||
| Seafarer Overseas Value Fund | ||||||||||||||||
| Common Stocks | ||||||||||||||||
| Brazil | $ | 2,537,901 | $ | – | $ | – | $ | 2,537,901 | ||||||||
| China / Hong Kong | 6,207,573 | �� | 7,835,165 | – | 14,042,738 | |||||||||||
| Czech Republic | 1,693,714 | – | – | 1,693,714 | ||||||||||||
| Georgia | 1,439,730 | – | – | 1,439,730 | ||||||||||||
| Mexico | 1,058,875 | – | – | 1,058,875 | ||||||||||||
| Qatar | – | 1,663,456 | – | 1,663,456 | ||||||||||||
| Russia | – | 394,189 | – | 394,189 | ||||||||||||
| Singapore | 1,510,938 | 2,100,859 | – | 3,611,797 | ||||||||||||
| South Korea | – | 3,156,538 | – | 3,156,538 | ||||||||||||
| United Arab Emirates | 1,851,802 | – | – | 1,851,802 | ||||||||||||
| United Kingdom | – | 1,338,594 | – | 1,338,594 | ||||||||||||
| Vietnam | 1,292,223 | 987,974 | – | 2,280,197 | ||||||||||||
| Preferred Stocks | – | 122,231 | – | 122,231 | ||||||||||||
| Total | $ | 17,592,756 | $ | 17,599,006 | $ | – | $ | 35,191,762 | ||||||||
| (a) | For detailed descriptions of securities by country, see the accompanying Portfolio of Investments. |
For the six months ended October 31, 2021, the Funds did not have any securities that used significant unobservable inputs (Level 3) in determining fair value.
Investment Transactions and Investment Income
Investment transactions are accounted for on the date the investments are purchased or sold (trade date). Realized gains and losses from investment transactions are reported on an identified cost basis. Interest income, which includes accretion of discounts and amortization of premiums, is accrued and recorded as earned. Dividend income is recognized on the ex-dividend date or for certain foreign securities, as soon as information is available to the Funds. All of the realized and unrealized gains and losses and net investment income are allocated daily to each share class in proportion to its average daily net assets.
Cash Management Transactions
Each of the Funds subscribes to the Brown Brothers Harriman & Co. (“BBH”) Cash Management Service (“CMS”), whereby cash balances are automatically swept into overnight offshore demand deposits with either the BBH Grand Cayman branch or a branch of a pre-approved commercial bank. This fully automated program allows the Funds to earn interest on cash balances. Excess cash with deposit institutions domiciled outside of the U.S. are subject to sovereign actions in the jurisdiction of the deposit institution including, but not limited to, freeze, seizure or diminution. Cash balances in the BBH CMS are included on the Statements of Assets and Liabilities under Cash and Foreign currency, at value. As of October 31, 2021, the Funds had the following cash balances participating in the BBH CMS:
| Fund | ||||
| Seafarer Overseas Growth and Income Fund | $ | 30,469,619 | ||
| Seafarer Overseas Value Fund | 2,000,622 | |||
| Semi-annual Report – October 31, 2021 | 45 |
| Seafarer Funds | Notes to Financial Statements |
October 31, 2021 (Unaudited)
As of October 31, 2021, the Funds had the following foreign cash balances participating in the BBH CMS (cost and value of foreign cash balances are equal):
| Fund | ||||
| Seafarer Overseas Growth and Income Fund | $ | – | ||
| Seafarer Overseas Value Fund | – |
Foreign Securities
The Funds may directly purchase securities of foreign issuers. Investing in securities of foreign issuers involves special risks not typically associated with investing in securities of U.S. issuers. The risks include possible revaluation of currencies, the inability to repatriate foreign currency, less complete financial information about companies, and possible future adverse political and economic developments. Moreover, securities of many foreign issuers and their markets may be less liquid and their prices more volatile than those of securities of comparable U.S. issuers.
Foreign Currency Translation
The books and records of the Funds are maintained in U.S. dollars. Investment valuations and other assets and liabilities initially expressed in foreign currencies are converted each business day into U.S. dollars based upon current exchange rates. Prevailing foreign exchange rates may generally be obtained at the close of the NYSE (normally, 4:00 p.m. Eastern Time). The portion of realized and unrealized gains or losses on investments due to fluctuations in foreign currency exchange rates is not separately disclosed and is included in realized and unrealized gains or losses on investments, when applicable.
Foreign Currency Spot Contracts
Each Fund may enter into foreign currency spot contracts to facilitate transactions in foreign securities or to convert foreign currency receipts into U.S. dollars. A foreign currency spot contract is an agreement between two parties to buy and sell currencies at the current market rate, for settlement generally within two business days. The U.S. dollar value of a contract is determined using current currency exchange rates supplied by a pricing service. The contract is marked-to-market daily for settlements beyond one day and any change in market value is recorded as an unrealized gain or loss. When the contract is closed, the Fund records a realized gain or loss equal to the difference between the value on the open and close date. Losses may arise from changes in the value of the foreign currency, or if the counterparties do not perform under the contract’s terms. The maximum potential loss from such contracts is the aggregate face value in U.S. dollars at the time the contract was opened.
Trust Expenses
Some expenses of the Trust can be directly attributed to the Funds. Expenses that cannot be directly attributed to the Funds are apportioned among all funds in the Trust based on the average daily net assets of each fund.
Fund and Class Expenses
Expenses that are specific to a Fund or class of shares of a Fund, including shareholder servicing fees, are charged directly to that Fund or share class. Expenses that are common to all Funds are generally allocated among the Funds in proportion to their average daily net assets.
Income Taxes
Each Fund complies with the requirements under Subchapter M of the Internal Revenue Code of 1986, as amended, applicable to regulated investment companies and intends to distribute substantially all of its net taxable income and net capital gains, if any, each year so that it will not be subject to excise tax on undistributed income and gains. The Funds are not subject to income taxes to the extent such distributions are made.
| 46 | (855) 732-9220 seafarerfunds.com |
| Seafarer Funds | Notes to Financial Statements |
October 31, 2021 (Unaudited)
As of and during the six months ended October 31, 2021, the Funds did not have a liability for any unrecognized tax benefits. The Funds file U.S. federal, state, and local tax returns as required. The Funds’ tax returns are subject to examination by the relevant tax authorities until expiration of the applicable statute of limitations, which is generally three years after the filing due date of the tax return for federal purposes and four years for most state returns. Tax returns for open years have incorporated no uncertain tax positions that require a provision for income taxes.
Distributions to Shareholders
In general, the Seafarer Overseas Growth and Income Fund’s policy is to distribute to its shareholders substantially all net investment income paid out via semi-annual dividends, in June and December. The Seafarer Overseas Value Fund’s policy is to distribute to its shareholders substantially all net investment income via one annual dividend in December. It is also each Fund’s policy to distribute annually all net realized short-term and long-term capital gains, if any, after offsetting any capital loss carryovers. Income dividend distributions are derived from dividends and other income each Fund receives from its investments, including short-term capital gains. Long-term capital gain distributions are derived from gains realized when a Fund sells a security it has owned for more than one year. Each Fund may make additional distributions at other times if the Fund believes doing so may be necessary for the Fund to share tax obligations more ratably and more equitably across shareholders over time.
Epidemic and Pandemic Risk
Certain countries have been susceptible to epidemics, most recently Covid-19, which has been designated as a pandemic by world health authorities. The outbreak of such epidemics, together with any resulting restrictions on travel or quarantines imposed, could have a negative impact on the economy and business activity globally (including in the countries in which the Funds invest), and thereby could adversely affect the performance of the Funds’ investments. Furthermore, the rapid development of epidemics could preclude prediction as to their ultimate adverse impact on economic and market conditions, and, as a result, presents material uncertainty and risk with respect to the performance of the Funds’ investments.
3. Tax Basis Information
Tax Basis of Investments
As of October 31, 2021, the aggregate cost of investments, gross unrealized appreciation/(depreciation), and net unrealized appreciation/(depreciation) for federal income tax purposes were as follows:
| Fund | Cost of Investments | Gross Unrealized Appreciation | Gross Unrealized Depreciation | Net Unrealized Appreciation/ (Depreciation) | ||||||||||||
| Seafarer Overseas Growth and Income Fund | ||||||||||||||||
| $ | 1,866,297,840 | $ | 312,764,863 | $ | (131,681,646 | ) | $ | 181,083,217 | ||||||||
| Seafarer Overseas Value Fund | ||||||||||||||||
| 33,884,856 | 7,213,833 | (3,906,296 | ) | 3,307,537 | ||||||||||||
Tax Basis of Distributions to Shareholders
The character of distributions made during the fiscal year from net investment income or net realized gains may differ from the ultimate characterization for federal income tax purposes. Also, due to the timing of dividend distributions, the fiscal year in which amounts are distributed may differ from the fiscal year in which the income or realized gain is recorded by a Fund.
| Semi-annual Report – October 31, 2021 | 47 |
| Seafarer Funds | Notes to Financial Statements |
October 31, 2021 (Unaudited)
The tax character of distributions paid by the Funds for the fiscal year ended April 30, 2021 was as follows:
| Fund | Ordinary Income | Long-Term Capital Gain | ||||||
| Seafarer Overseas Growth and Income Fund | $ | 21,456,087 | $ | 18,037,291 | ||||
| Seafarer Overseas Value Fund | 428,096 | – | ||||||
The amounts and characteristics of tax basis distributions and composition of distributable earnings/(accumulated losses) are finalized at fiscal year-end. Accordingly, tax basis balances have not been determined as of October 31, 2021.
4. Securities Transactions
The cost of purchases and proceeds from sales of securities excluding short-term securities during the six months ended October 31, 2021 were as follows:
| Fund | Purchases of Securities | Proceeds from Sales of Securities | ||||||
| Seafarer Overseas Growth and Income Fund | $ | 282,288,618 | $ | 132,677,631 | ||||
| Seafarer Overseas Value Fund | 3,490,050 | 2,638,203 | ||||||
5. Shares of Beneficial Interest
The capitalization of the Trust consists of an unlimited number of shares of beneficial interest with no par value per share. Holders of shares of the Funds of the Trust have one vote for each share held and a proportionate fraction of a vote for each fractional share. All shares issued and outstanding are fully paid and are transferable and redeemable at the option of the shareholder. Purchasers of the shares do not have any obligation to make payments to the Trust or its creditors solely by reason of the purchasers’ ownership of the shares. Shares have no pre-emptive rights.
6. Management and Related Party Transactions
The Adviser, subject to the authority of the Board, is responsible for the overall management and administration of the Funds’ business affairs. The Adviser manages the investments of the Funds in accordance with the Funds’ investment objectives, policies, limitations and investment guidelines established jointly by the Adviser and the Trustees. Pursuant to the investment advisory agreement, the Funds, in the aggregate, pay the Adviser an annual management fee of 0.75% of the aggregate average daily net assets of the Funds up to $1.5 billion and 0.70% of the aggregate average daily net assets of the Funds over $1.5 billion. Each Fund pays the Adviser a monthly fee at the annual rate using the applicable management fee calculated based on the Fund’s pro rata share of the Funds’ combined average daily net assets.
Effective September 1, 2015, the Adviser contractually, through successive one-year agreements, agreed to waive and/or reimburse fees or expenses in order to limit Total Annual Fund Operating Expenses After Fee Waiver / Expense Reimbursements (excluding brokerage expenses, interest expenses, taxes and extraordinary expenses) to 1.15% and 1.05% of the Funds’ average daily net assets for the Investor and Institutional share classes, respectively. The current agreement (the “Expense Agreement”) is in effect through August 31, 2022. The Adviser will be permitted to recover, on a class-by-class basis, expenses it has borne through the Expense Agreement to the extent that the Funds’ expenses in later periods fall below the expense cap in effect at the time of waiver or reimbursement. The Funds will not be obligated to pay any such deferred fees and expenses more than three years after the date of the waiver. This agreement may not be terminated or modified prior to August 31, 2022, except with the approval of the Funds’ Board. During the six months ended October 31, 2021, the Adviser agreed that it will only seek to recoup waived management fees and will not recoup any
| 48 | (855) 732-9220 seafarerfunds.com |
| Seafarer Funds | Notes to Financial Statements |
October 31, 2021 (Unaudited)
reimbursed expenses. As of October 31, 2021, the Adviser had recouped all available waived management fees from the Seafarer Overseas Growth and Income Fund.
For the six months ended October 31, 2021, the fee waivers and/or reimbursements were as follows for the Seafarer Overseas Value Fund:
| Fund | Fees Waived/ Reimbursed By Adviser | Recoupment of Past Waived Fees By Adviser | ||||||
| Seafarer Overseas Value Fund | ||||||||
| Investor Class | $ | 714 | $ | – | ||||
| Institutional Class | 55,589 | – | ||||||
As of October 31, 2021 the balances of recoupable expenses for each class were as follows for the Funds:
| Fund | Expires 2022 | Expires 2023 | Expires 2024 | Expires 2025 | Total | |||||||||||||||
| Seafarer Overseas Growth and Income Fund | ||||||||||||||||||||
| Investor Class | $ | – | $ | – | $ | – | $ | – | $ | – | ||||||||||
| Institutional Class | – | – | – | – | – | |||||||||||||||
| Seafarer Overseas Value Fund | ||||||||||||||||||||
| Investor Class | $ | 505 | $ | 912 | $ | 1,259 | $ | 714 | $ | 3,390 | ||||||||||
| Institutional Class | 61,185 | 129,046 | 134,851 | 55,589 | 380,671 | |||||||||||||||
Fund Administrator
ALPS Fund Services, Inc. (“ALPS” and the “Administrator”) provides administrative, fund accounting and other services to the Funds under the Administration, Bookkeeping and Pricing Services Agreement with the Trust. The Funds’ administrative fee is accrued on a daily basis and paid monthly. The Administrator is also reimbursed by the Funds for certain out-of-pocket expenses. Administration fees paid by the Funds for the six months ended October 31, 2021 are disclosed in the Statements of Operations.
Transfer Agent
ALPS serves as transfer, dividend paying and shareholder servicing agent for the Funds (“Transfer Agent”). ALPS is paid an annual base fee per Fund and a fee based on the number of shareholder accounts. The Transfer Agent is also reimbursed by the Funds for certain out-of-pocket expenses. Transfer agent fees paid by the Funds for the six months ended October 31, 2021 are disclosed in the Statements of Operations.
Compliance Services
ALPS provides compliance services to the Funds under the Chief Compliance Officer Services Agreement with the Trust. ALPS provides services that assist the Trust’s chief compliance officer in monitoring and testing the policies and procedures of the Trust in accordance with the requirements of Rule 38a-1 under the 1940 Act. ALPS is paid an annual base fee and is reimbursed for certain out-of-pocket expenses. Compliance service fees paid by the Funds for the six months ended October 31, 2021 are disclosed in the Statements of Operations.
Principal Financial Officer
ALPS provides principal financial officer services to the Funds under the Principal Financial Officer Services Agreement with the Trust. Under this Agreement, ALPS is paid an annual base fee and is
| Semi-annual Report – October 31, 2021 | 49 |
| Seafarer Funds | Notes to Financial Statements |
October 31, 2021 (Unaudited)
reimbursed for certain out-of-pocket expenses. Principal financial officer fees paid by the Funds for the six months ended October 31, 2021 are disclosed in the Statements of Operations.
Distributor
ALPS Distributors, Inc. (“ADI” or the “Distributor”) (an affiliate of ALPS) acts as the distributor of the Funds’ shares pursuant to the Distribution Agreement with the Trust. Under a side letter agreement, the Adviser pays ADI an annual base fee per Fund for the distribution services. The Adviser also reimburses ADI for certain out-of-pocket expenses. Shares are sold on a continuous basis by ADI as agent for the Funds, and ADI has agreed to use its best efforts to solicit orders for the sale of the Funds’ shares, although it is not obliged to sell any particular amount of shares. ADI is registered as a broker-dealer with the U.S. Securities and Exchange Commission.
Shareholder Service Plan for Investor Class and Institutional Class Shares
Each Fund has adopted a Shareholder Services Plan (a “Services Plan”) for each of its share classes. Under the Services Plan, each Fund is authorized to enter into shareholder service agreements with investment advisers, financial institutions and other service providers (“Participating Organizations”) to maintain and provide certain administrative and servicing functions in relation to the accounts of shareholders. Shareholder service arrangements typically include processing orders for shares, generating account and confirmation statements, sub-accounting, account maintenance, tax reporting, and disbursing cash dividends as well as other investment or administrative services required for a particular Participating Organizations’ products, programs, platform and accounts. The Services Plan will cause each Fund to pay an aggregate fee, not to exceed on an annual basis 0.15% and 0.05% of the average daily net asset value of the Investor and Institutional share classes, respectively. Such payments will be made on assets attributable to or held in the name of a Participating Organization, on behalf of its clients as compensation for providing service activities pursuant to an agreement with the Participating Organization. Any amount of such payment not paid to a Participating Organization for such service activities shall be reimbursed to the Fund as soon as practicable. Shareholder Services Plan fees paid by the Funds for the six months ended October 31, 2021 are disclosed in the Statements of Operations.
Trustees
The fees and expenses of the Trustees of the Board are presented in the Statements of Operations.
7. Indemnifications
Under the Trust’s organizational documents, its officers and Trustees are indemnified against certain liability arising out of the performance of their duties to the Trust. Additionally, in the normal course of business, the Trust enters into contracts with service providers that may contain general indemnification clauses, which may permit indemnification to the extent permissible under the applicable law. The Trust’s maximum exposure under these arrangements is unknown, as this would involve future claims that may be made against the Trust that have not yet occurred.
| 50 | (855) 732-9220 seafarerfunds.com |
| Seafarer Funds | Additional Information |
October 31, 2021 (Unaudited)
ADDITIONAL INFORMATION
1. Fund Holdings
The Funds file their complete schedule of portfolio holdings with the U.S. Securities and Exchange Commission for the first and third quarters of each fiscal year as an exhibit to their reports on Form N-PORT. The Funds’ Form N-PORT reports are available on the Commission’s Web site at http://www.sec.gov. The Funds’ Form N-PORT reports are also available upon request by calling toll-free (855) 732-9220.
2. Fund Proxy Voting Policies, Procedures and Summaries
The Funds’ policies and procedures used in determining how to vote proxies and information regarding how the Funds voted proxies relating to portfolio securities during the most recent prior 12-month period ended June 30 are available without charge, (1) upon request, by calling toll-free (855) 732-9220 and (2) on the SEC’s website at http://www.sec.gov.
3. Index Provider Disclosure
The Seafarer Funds are not sponsored, endorsed, sold, or promoted by Morningstar, Inc. Morningstar, Inc. makes no representation or warranty, express or implied, to the shareholders of the Funds or any member of the public regarding the advisability of investing in the Funds or the ability of the Morningstar Emerging Markets Net Return U.S. Dollar Index to track general equity market performance of emerging markets.
| Semi-annual Report – October 31, 2021 | 51 |
| Seafarer Funds | Privacy Policy |
October 31, 2021 (Unaudited)
| FACTS | WHAT DO THE FUNDS DO WITH YOUR PERSONAL INFORMATION? |
| Why? | Financial companies choose how they share your personal information. Federal law gives consumers the right to limit some but not all sharing. Federal law also requires us to tell you how we collect, share, and protect your personal information. Please read this notice carefully to understand what we do. |
| What? | The types of personal information we collect and share depend on the product or service you have with us. This information can include: |
| · Social Security number and account transactions | |
| · Account balances and transaction history | |
| · Wire transfer instructions | |
| How? | All financial companies need to share customers’ personal information to run their everyday business. In the section below, we list the reasons financial companies can share their customers’ personal information; the reasons the Funds choose to share; and whether you can limit this sharing. |
| Reasons we can share your personal information | Do we share: | Can you limit this sharing? |
| For our everyday business purposes — such as to process your transactions, maintain your account(s), respond to court orders and legal investigations, or report to credit bureaus | Yes | No |
| For our marketing purposes — to offer our products and services to you | No | We do not share. |
| For joint marketing with other financial companies | No | We do not share. |
| For our affiliates’ everyday business purposes — information about your transactions and experiences | Yes | No |
| For our affiliates’ everyday business purposes — information about your creditworthiness | No | We do not share. |
| For nonaffiliates to market to you | No | We do not share. |
| 52 | (855) 732-9220 seafarerfunds.com |
| Seafarer Funds | Privacy Policy |
October 31, 2021 (Unaudited)
| Who We Are | |
| Who is providing this notice? | Seafarer Overseas Growth and Income Fund and Seafarer Overseas Value Fund. |
| What We Do | |
| How do the Funds protect my personal information? | To protect your personal information from unauthorized access and use, we use security measures that comply with federal law. These measures include computer safeguards and secured files and buildings. |
| How do the Funds collect my personal information? | We collect your personal information, for example, when you |
| · open an account | |
| · provide account information or give us your contact information | |
| · make a wire transfer or deposit money | |
| Why can’t I limit all sharing? | Federal law gives you the right to limit only |
| · sharing for affiliates’ everyday business purposes-information about your creditworthiness | |
| · affiliates from using your information to market to you | |
| · sharing for non-affiliates to market to you | |
| State laws and individual companies may give you additional rights to limit sharing. | |
| Definitions | |
| Affiliates | Companies related by common ownership or control. They can be financial and nonfinancial companies. |
| Non-affiliates | Companies not related by common ownership or control. They can be financial and nonfinancial companies. |
| · The Funds do not share with non-affiliates so they can market to you. | |
| Joint marketing | A formal agreement between non-affiliated financial companies that together market financial products or services to you. |
| · The Funds do not jointly market. | |
| Other Important Information | |
| California Residents | If your account has a California home address, your personal information will not be disclosed to nonaffiliated third parties except as permitted by applicable California law, and we will limit sharing such personal information with our affiliates to comply with California privacy laws that apply to us. |
| Vermont Residents | The State of Vermont requires financial institutions to obtain your consent prior to sharing personal information that they collect about you with affiliated companies and nonaffiliated third parties other than in certain limited circumstances. Except as permitted by law, we will not share personal information we collect about you with nonaffiliated third parties or other affiliated companies unless you provide us with your written consent to share such information. |
| Semi-annual Report – October 31, 2021 | 53 |

Table of Contents
| CONTENTS | PAGE |
| Shareholder Letter | 1 |
| Fund Overview | |
| Vulcan Value Partners Fund | 4 |
| Vulcan Value Partners Small Cap Fund | 8 |
| Disclosure of Fund Expenses | |
| Vulcan Value Partners Fund | 6 |
| Vulcan Value Partners Small Cap Fund | 10 |
| Statements of Investments | |
| Vulcan Value Partners Fund | 12 |
| Vulcan Value Partners Small Cap Fund | 14 |
| Statements of Assets and Liabilities | 17 |
| Statements of Operations | 19 |
| Statements of Changes in Net Assets | |
| Vulcan Value Partners Fund | 20 |
| Vulcan Value Partners Small Cap Fund | 21 |
| Financial Highlights | |
| Vulcan Value Partners Fund | 22 |
| Vulcan Value Partners Small Cap Fund | 26 |
| Notes to Financial Statements | 29 |
| Additional Information | 39 |
| Privacy Policy | 40 |
Shareholder Letter
October 31, 2021 (Unaudited)
PORTFOLIO REVIEW
General
For the six months ended October 31, 2021, Vulcan Value Partners Fund returned 10.18% and the Vulcan Value Partners Small Cap Fund returned 21.71%. As you know, we place no weight on short-term results, good or bad, and neither should you. In fact, we have and will continue to willingly make decisions that negatively impact short-term performance when we think we can lower risk and improve our long-term returns. We encourage you to place more weight on our longer term historical results and a great deal of weight on our long-term prospects.
Vulcan Value Partners Fund Review
In the discussion that follows, we highlight a few holdings in the Vulcan Value Partners Fund. There were six material contributors including Upstart Holdings, Inc., NVIDIA Corporation, KKR & Co. Inc., Salesforce.com Inc., Carlyle Group Inc., and Microsoft Corporation. There were no material detractors.
We purchased Upstart Holdings Inc., and it was also a material contributor during the period. Upstart is an artificial intelligence (AI) and cloud-based lending platform. Upstart’s customers, banks and institutional investors, are able to make more profitable loans utilizing Upstart's software. The company has stated that i uses over 1600 variables in its AI models, and its platform underwrites superior loans with higher approval rates, lower default rates, and lower interest rates for consumers compared to alternative lending sources. We previously owned FICO in our Vulcan Value Partners Small Cap Fund, and we believe Upstart has the potential to be the FICO of the 21st century. The company has a virtuous circle that is constantly strengthening its competitive position. Upstart’s AI based methodology is more accurate than conventional underwriting and FICO scores alone, and it is expanding financial services profitably to the underbanked and the unbanked. In turn, Upstart states that their customers are sourcing more loans through Upstart's platform. Increased loan volume creates more data which improves the AI-based lending platforms' accuracy, resulting in even more volume flowing to Upstart. We purchased Upstart in the Vulcan Value Partners Small Cap Fund in the fourth quarter of 2020, and since then it has grown into a large cap company with a current market cap of approximately $26 billion. Its value has compounded more rapidly than we ever could have modeled. We are pleased to purchase Upstart in our Vulcan Value Partners Fund, and we are pleased with the initial results; however, we are more excited about its long-term prospects.
We purchased Applied Materials Inc. during the period. Applied Materials provides materials engineering solutions for semiconductor fabrication equipment and manufacturing tools for advanced displays. The industry has consolidated, leaving five companies that make up approximately 70% of the market. Applied Materials is the largest of the five. Key shifts in the industry are driving demand for more complex capital equipment. Among these shifts are the acceleration in digital transformation of the global economy, the slowing of Moore's law*, and increased application of artificial intelligence (AI). Growth in the company’s services segment creates a predictable revenue stream, enduring customer relationships, and better visibility into future technologies and client needs.
General Electric is a company we followed for a long time. In the past, we removed GE from the MVP list, Vulcan's list of companies that qualify for investment, due to management’s poor capital allocation decisions which resulted in value instability. Larry Culp, the former CEO of Danaher, became CEO of General Electric in 2018. The company implemented a vast restructuring program to
| Semi-Annual Report | October 31, 2021 | 1 |
Shareholder Letter
October 31, 2021 (Unaudited)
simplify the industrial side of its business, sold off non-core assets, paid down debt with the proceeds, and drastically shrunk GE Capital. These restructuring activities allowed its world-class jet engine and healthcare businesses to shine through, and improved value stability. As a result, we added the company back to the MVP list. While the pandemic negatively impacted General Electric’s aviation business in the short run, it also gave us the opportunity to buy General Electric in the second quarter of 2020 with a substantial margin of safety. GE is a good example of a competitively entrenched, yet slower growing MVP business. As its stock price rose rapidly over the last year, its value growth did not keep up, and the price to value gap closed quickly. As our margin of safety diminished, we sold the Fund's position in GE and allocated to more discounted companies.
Vulcan Value Partners Small Cap Fund Review
In the discussion that follows, we highlight a few holdings in the Vulcan Value Partners Small Cap Fund. There were five material contributors including Upstart Holdings Inc., Meggitt plc, Colliers International Group, Jones Lang LaSalle Inc., and Cerence, Inc. There were no material detractors.
Upstart Holdings Inc., the largest contributor during the period, was previously discussed in the Vulcan Value Partners Fund section above. Meggitt plc was also a material contributor during the period. Meggitt is a U.K.-based aerospace manufacturer with four business segments: airframe systems, engine systems, energy and equipment, and services and support. Its products are essential to aviation safety and reliability. In August, Parker-Hannifin announced it would acquire Meggitt for a price higher than our estimate of its fair value. Following our discipline, we sold the Fund's position in Meggitt because it no longer had a margin of safety.
Medpace Holdings Inc., a purchase during the period, is a top ten global clinical contract research organization (CRO) providing outsourced drug development services. Medpace provides a full-service model attractive to small- and mid-sized biotechnology firms who lack the infrastructure needed to navigate the development process. This customer base is typically less price sensitive and relies on Medpace to perform end-to-end contract services for drug development.
We sold the Fund's position in Knoll during the period. On April 19th, Herman Miller announced it would acquire Knoll. This acquisition joins two industry leaders, creating one of the leading residential and commercial furniture companies globally. Although we sold the Fund's position, during the period the Fund continued to own Knoll indirectly through its ownership of Herman Miller.
Closing
We are pleased to say, yet again, that despite a strong rise in stock prices, we believe our price to value ratios remain extremely attractive. The Vulcan Team continues to seek excellence, and the substantial investments we have made in people and technology are paying off. We encourage you to re-read our annual letter as it remains relevant and applicable to today’s environment. Your stable capital, combined with ours, and our shared long-term time horizon enables us to mitigate risk and improve our long-term prospects. We are grateful for you, our client partners, and appreciate the confidence you have placed in us. We look forward to updating you again soon.
C.T. Fitzpatrick
Chief Executive Officer
Vulcan Value Partners, LLC
| 2 | www.vulcanvaluepartners.com |
Shareholder Letter
October 31, 2021 (Unaudited)
| * | Moore's Law states that the number of transistors on a microchip doubles about every two years, though the cost of computers is halved. |
Past performance does not guarantee future results. The Funds’ prices fluctuate as the underlying assets have exposure to market fluctuations and other risks, as described in the Funds’ prospectus. Please call 877.421.5078 to obtain current performance information and for the current prospectus and statement of additional information. This material must be preceded or accompanied by a prospectus. Please read the prospectus carefully before investing.
The views of the Vulcan Value Partners, LLC and information discussed in this commentary are as of the date of publication, are subject to change, and may not reflect the writer's current views. The views expressed represent an assessment of market conditions at a specific point in time, are opinions only and should not be relied upon as investment advice regarding a particular investment or markets in general. Such information does not constitute a recommendation to buy or sell specific securities or investment vehicles. It should not be assumed that any investment will be profitable or will equal the performance of the Funds or any securities or any sectors mentioned in this letter. The subject matter contained in this letter has been derived from several sources believed to be reliable and accurate at the time of compilation. Neither Vulcan Value Partners, LLC nor the Funds accept any liability for losses either direct or consequential caused by the use of this information.
The Funds are distributed by ALPS Distributors, Inc.
The Funds are subject to investment risks, including possible loss of the principal amount invested and therefore is not suitable for all investors. The Funds may not achieve their objectives.
Margin of Safety is a favorable difference between the price of a company’s shares and the estimated fair value of those shares.
The price to value ratio is a calculation that compares the price of a company’s stock to our appraisal of the company’s intrinsic value.
Fair, or intrinsic, value is our estimate of the price a willing buyer would pay and a willing seller would accept, assuming neither was compelled to enter into a transaction.
| Semi-Annual Report | October 31, 2021 | 3 |
Fund Overview
October 31, 2021 (Unaudited)
VULCAN VALUE PARTNERS FUND
Annualized Total Returns (as of 10/31/21)
| Since | Expense Ratios(1) | |||||||
| 6 Month | 1 Year | 3 Year | 5 Year | 10 Year | Inception* | Total | Net(2) | |
| Vulcan Value Partners Fund - Investor Class(3) | 10.18% | 50.06% | 22.86% | 18.65% | 15.79% | 14.36% | 1.08% | 1.08% |
| Vulcan Value Partners Fund - Institutional Class | 10.29% | 50.35% | – | – | – | 23.75% | 1.12% | 0.85% |
| S&P 500® Total Return Index(4) | 10.91% | 42.91% | 21.48% | 18.93% | 16.21% | 14.92% | ||
| Russell 1000® Value Index(5) | 5.47% | 43.76% | 13.90% | 12.39% | 12.85% | 11.92% | ||
Performance data quoted represents past performance. Past performance does not guarantee future results. Investment return and principal value of an investment will fluctuate so that an investor’s shares, when sold or redeemed, may be worth more or less than the original cost. Current performance data may be higher or lower than actual data quoted. For the most current month-end performance data, please call 1.877-421-5078.
The table does not reflect the deduction of taxes that a shareholder would pay on Fund distributions or the redemption of Fund shares.
Subject to investment risks, including possible loss of the principal amount invested.
Returns for periods less than 1 year are cumulative.
| * | Inception Dates – Investor Class: 12/30/09, Institutional Class: 5/01/19 |
| (1) | Ratios as of the Prospectus dated August 31, 2021 and may differ from the ratios presented in the Financial Highlights. |
| (2) | Vulcan Value Partners, LLC (“Vulcan” or the “Adviser”) has contractually agreed to limit the Fund’s total annual fund operating expenses (exclusive of Acquired Fund Fees and Expenses, brokerage expenses, interest expense, taxes and extraordinary expenses) to 1.25% and 0.85% of the Fund’s average daily net assets with respect to Investor Class shares and Institutional Class shares, respectively. This agreement (the “Expense Agreement”) is in effect through August 31, 2022. The Adviser will be permitted to recapture expenses it has borne through the Expense Agreements to the extent that the Fund's expenses in later periods fall below the annual rates set forth in the Expense Agreements or in previous letter agreements; provided, however, that such recapture payments do not cause the Fund's expense ratio (after recapture) to exceed the lesser of (i) the expense cap in effect at the time of the waiver and (ii) the expense cap in effect at the time of the recapture. Notwithstanding the foregoing, the Fund will not be obligated to pay any such deferred fees and expenses more than three years after the date on which the fee and expenses were deferred. The Adviser may not discontinue or modify this waiver prior to August 31, 2022 without the approval by the Fund's Board of Trustees. |
| (3) | The initial share class of the Fund was redesignated as Investor Class shares effective April 23, 2019. |
| (4) | The S&P 500® Total Return Index is an unmanaged index of 500 common stocks chosen for market size, liquidity and industry group representation. It is a market-value weighted index. The Index is not actively managed and does not reflect any deductions for fees, expenses or taxes. An investor may not invest directly in the Index. |
| (5) | The Russell 1000® Value Index is presented here as an additional index, and measures the performance of the large-cap value segment of the U.S. equity universe. It includes those Russell 1000® companies with lower price-to-book ratios and lower expected growth values. The Index is not actively managed and does not reflect any deductions for fees, expenses or taxes. An investor may not invest directly in the Index. |
| 4 | www.vulcanvaluepartners.com |
Fund Overview
October 31, 2021 (Unaudited)
Growth of $10,000 Initial Investment (for the period ended October 31, 2021)

The chart above represents historical performance of a hypothetical investment of $10,000 in the Fund since inception. Past performance does not guarantee future results. This chart does not reflect the deduction of taxes that a shareholder would pay on Fund distributions or the redemption of Fund shares.
Investing in the Fund is subject to investment risks, including possible loss of the principal amount invested.
Industry Allocation (as a % of Net Assets)*
Top Ten Holdings (as a % of Net Assets)*
| Mastercard, Inc. | 6.62% |
| Amazon.com, Inc. | 6.35% |
| KKR & Co., Inc. | 6.23% |
| TransDigm Group, Inc. | 5.73% |
| Applied Materials, Inc. | 5.04% |
| salesforce.com, Inc. | 4.97% |
| Wayfair, Inc. | 4.90% |
| Meta Platforms, Inc. | 4.85% |
| Lam Research Corp. | 4.63% |
| Carlyle Group, Inc. | 4.57% |
| Top Ten Holdings | 53.89% |
| * | Holdings are subject to change, and may not reflect the current or future position of the portfolio. |
| Semi-Annual Report | October 31, 2021 | 5 |
Disclosure of Fund Expenses
October 31, 2021 (Unaudited)
As a shareholder of the Vulcan Value Partners Fund (the “Fund”), you will incur two types of costs: (1) transaction costs, and (2) ongoing costs, including management fees and other fund operating expenses. The following examples are intended to help you understand your ongoing costs (in dollars) of investing in the Fund and to compare these costs with the ongoing costs of investing in other mutual funds. The examples are based on an investment of $1,000 invested on May 1, 2021 and held until October 31, 2021.
Actual Expenses. The first line of each table below provides information about actual account values and actual expenses. You may use the information in this line, together with the amount you invested, to estimate the expenses that you paid over the period. Simply divide your account value by $1,000 (for example, an $8,600 account value divided by $1,000 = 8.6), then multiply the result by the number in the first line under the heading “Expenses Paid During Period” to estimate the expenses you paid on your account during this period.
Hypothetical Example for Comparison Purposes. The second line of the table below provides information about hypothetical account values and hypothetical expenses based on the Fund’s actual expense ratio and an assumed rate of return of 5% per year before expenses, which is not the Fund’s actual return. The hypothetical account values and expenses may not be used to estimate the actual ending account balance or expenses you paid for the period. You may use this information to compare the ongoing costs of investing in the Fund and other mutual funds. To do so, compare this 5% hypothetical example with the 5% hypothetical examples that appear in the shareholder reports of the other mutual funds.
Please note the expenses shown in the table are meant to highlight ongoing Fund costs only and do not reflect transactional costs, such as redemption fees or exchange fees. Therefore, the second line of the table below is useful in comparing your ongoing costs only, and will not help you determine the relative total costs of owning different funds. In addition, if these transactional costs were included, your costs would have been higher.
| 6 | www.vulcanvaluepartners.com |
Disclosure of Fund Expenses
October 31, 2021 (Unaudited)
Vulcan Value Partners Fund
| Beginning Account Value 5/1/21 | Ending Account Value 10/31/21 | Expense Ratio(a) | Expenses Paid During period 5/1/21 - 10/31/21(b) | |||||||||||||
| VULCAN VALUE | ||||||||||||||||
| PARTNERS FUND | ||||||||||||||||
| Investor Class | ||||||||||||||||
| Actual | $ | 1,000.00 | $ | 1,101.80 | 1.06 | % | $ | 5.62 | ||||||||
| Hypothetical (5% return before expenses) | $ | 1,000.00 | $ | 1,019.86 | 1.06 | % | $ | 5.40 | ||||||||
| Institutional Class | ||||||||||||||||
| Actual | $ | 1,000.00 | $ | 1,102.90 | 0.85 | % | $ | 4.51 | ||||||||
| Hypothetical (5% return before expenses) | $ | 1,000.00 | $ | 1,020.92 | 0.85 | % | $ | 4.33 | ||||||||
| (a) | The Fund's expense ratios have been annualized based on the Fund's most recent fiscal half-year expenses. |
| (b) | Expenses are equal to the Fund's annualized expense ratio multiplied by the average account value over the period, multiplied by the number of days in the most recent fiscal half-year (184)/365 (to reflect the half-year period). |
| Semi-Annual Report | October 31, 2021 | 7 |
Fund Overview
October 31, 2021 (Unaudited)
VULCAN VALUE PARTNERS SMALL CAP FUND
Annualized Total Returns (as of 10/31/21)
| Since | Expense Ratios(1) | |||||||
| 6 Month | 1 Year | 3 Year | 5 Year | 10 Year | Inception* | Total | Net(2) | |
| Vulcan Value Partners Small Cap Fund – Investor Class(3) | 21.71% | 107.33% | 23.80% | 16.28% | 15.04% | 14.63% | 1.26% | 1.26% |
| Vulcan Value Partners Small Cap Fund – Institutional Class | 21.85% | 107.92% | – | – | – | 23.40% | 1.30% | 1.01% |
| Russell 2000® Value Index(4) | 3.22% | 64.30% | 13.44% | 12.61% | 12.12% | 11.41% | ||
| Russell 2000® Index(5) | 1.85% | 50.80% | 16.47% | 15.52% | 13.50% | 12.99% | ||
Performance data quoted represents past performance. Past performance does not guarantee future results. Investment return and principal value of an investment will fluctuate so that an investor’s shares, when sold or redeemed, may be worth more or less than the original cost. Current performance data may be higher or lower than actual data quoted. For the most current month-end performance data, please call 1.877-421-5078.
The table does not reflect the deduction of taxes that a shareholder would pay on Fund distributions or the redemption of Fund shares. Subject to investment risks, including possible loss of the principal amount invested. Returns for periods less than 1 year are cumulative.
| * | Inception Dates – Investor Class: 12/30/09, Institutional Class: 5/01/19 |
| (1) | Ratios as of the Prospectus dated August 31, 2021 and may differ from the ratios presented in the Financial Highlights. |
| (2) | Vulcan Value Partners, LLC (“Vulcan” or the “Adviser”) has contractually agreed to limit the Fund’s total annual fund operating expenses (exclusive of Acquired Fund Fees and Expenses, brokerage expenses, interest expense, taxes and extraordinary expenses) to 1.25% and 1.00% of the Fund’s average daily net assets with respect to Investor Class shares and Institutional Class shares, respectively. This agreement (the “Expense Agreement”) is in effect through August 31, 2022. The Adviser will be permitted to recapture expenses it has borne through the Expense Agreements to the extent that the Fund's expenses in later periods fall below the annual rates set forth in the Expense Agreements or in previous letter agreements; provided, however, that such recapture payments do not cause the Fund's expense ratio (after recapture) to exceed the lesser of (i) the expense cap in effect at the time of the waiver and (ii) the expense cap in effect at the time of the recapture. Notwithstanding the foregoing, the Fund will not be obligated to pay any such deferred fees and expenses more than three years after the date on which the fee and expenses were deferred. The Adviser may not discontinue or modify this waiver prior to August 31, 2022 without the approval by the Fund's Board of Trustees. |
| (3) | The initial share class of the Fund was redesignated as Investor Class shares effective April 23, 2019. |
| (4) | The Russell 2000® Value Index is presented here as the primary index, and measures the performance of small-cap value segment of the U.S.equity universe. It includes those Russell 2000® companies with lower price-to-book ratios and lower forecasted growth values. The Index is not actively managed and does not reflect any deductions for fees, expenses or taxes. An investor may not invest directly in the Index. |
| (5) | The Russell 2000® Index is presented here as an additional index, and measures the performance of the small-cap segment of the U.S. equity universe. The Russell 2000® Index is a subset of the Russell 3000® Index representing approximately 8% of the total market capitalization of that index. It includes approximately 2,000 of the smallest securities based on a combination of their market cap and current index membership. The Index is not actively managed and does not reflect any deductions for fees, expenses or taxes. An investor may not invest directly in the Index. |
| 8 | www.vulcanvaluepartners.com |
Fund Overview
October 31, 2021 (Unaudited)
Growth of $10,000 Initial Investment (for the period ended October 31, 2021)

The chart above represents historical performance of a hypothetical investment of $10,000 in the Fund since inception. Past performance does not guarantee future results. This chart does not reflect the deduction of taxes that a shareholder would pay on Fund distributions or the redemption of Fund shares.
Investing in the Fund is subject to investment risks, including possible loss of the principal amount invested. Industry Allocation (as a % of Net Assets)*
Industry Allocation (as a % of Net Assets)*
Top Ten Holdings (as a % of Net Assets)*
| Cerence, Inc. | 6.50% |
| Cushman & Wakefield PLC | 6.01% |
| Sdiptech AB | 4.89% |
| Virtus Investment Partners, Inc. | 4.76% |
| Colliers International Group, Inc. | 4.71% |
| SmartRent, Inc. | 4.59% |
| Ibstock PLC | 4.33% |
| Victoria PLC | 4.31% |
| Park Hotels & Resorts, Inc. | 3.92% |
| Littelfuse, Inc. | 3.90% |
| Top Ten Holdings | 47.92% |
| * | Holdings are subject to change, and may not reflect the current or future position of the portfolio. |
| Semi-Annual Report | October 31, 2021 | 9 |
Disclosure of Fund Expenses
October 31, 2021 (Unaudited)
As a shareholder of the Vulcan Value Partners Small Cap Fund (the “Fund”), you will incur two types of costs: (1) transaction costs, and (2) ongoing costs, including management fees and other fund operating expenses. The following examples are intended to help you understand your ongoing costs (in dollars) of investing in the Fund and to compare these costs with the ongoing costs of investing in other mutual funds. The examples are based on an investment of $1,000 invested on May 1, 2021 and held until October 31, 2021.
Actual Expenses. The first line of each table below provides information about actual account values and actual expenses. You may use the information in this line, together with the amount you invested, to estimate the expenses that you paid over the period. Simply divide your account value by $1,000 (for example, an $8,600 account value divided by $1,000 = 8.6), then multiply the result by the number in the first line under the heading “Expenses Paid During Period” to estimate the expenses you paid on your account during this period.
Hypothetical Example for Comparison Purposes. The second line of the table below provides information about hypothetical account values and hypothetical expenses based on the Fund’s actual expense ratio and an assumed rate of return of 5% per year before expenses, which is not the Fund’s actual return. The hypothetical account values and expenses may not be used to estimate the actual ending account balance or expenses you paid for the period. You may use this information to compare the ongoing costs of investing in the Fund and other mutual funds. To do so, compare this 5% hypothetical example with the 5% hypothetical examples that appear in the shareholder reports of the other mutual funds.
Please note the expenses shown in the table are meant to highlight ongoing Fund costs only and do not reflect transactional costs, such as redemption fees or exchange fees. Therefore, the second line of the table below is useful in comparing your ongoing costs only, and will not help you determine the relative total costs of owning different funds. In addition, if these transactional costs were included, your costs would have been higher.
| 10 | www.vulcanvaluepartners.com |
Disclosure of Fund Expenses
October 31, 2021 (Unaudited)
Vulcan Value Partners Small Cap Fund
| Beginning Account Value 5/1/21 | Ending Account Value 10/31/21 | Expense Ratio(a) | Expenses Paid During period 5/1/21 - 10/31/21(b) | |||||||||||||
| VULCAN VALUE PARTNERS SMALL CAP FUND | ||||||||||||||||
| Investor Class | ||||||||||||||||
| Actual | $ | 1,000.00 | $ | 1,217.10 | 1.25 | % | $ | 6.99 | ||||||||
| Hypothetical (5% return before expenses) | $ | 1,000.00 | $ | 1,018.90 | 1.25 | % | $ | 6.36 | ||||||||
| Institutional Class | ||||||||||||||||
| Actual | $ | 1,000.00 | $ | 1,218.50 | 1.00 | % | $ | 5.59 | ||||||||
| Hypothetical (5% return before expenses) | $ | 1,000.00 | $ | 1,020.16 | 1.00 | % | $ | 5.09 | ||||||||
| (a) | The Fund's expense ratios have been annualized based on the Fund's most recent fiscal half-year expenses. |
| (b) | Expenses are equal to the Fund's annualized expense ratio multiplied by the average account value over the period, multiplied by the number of days in the most recent fiscal half-year (184)/365 (to reflect the half-year period). |
| Semi-Annual Report | October 31, 2021 | 11 |
| Statement of Investments | Vulcan Value Partners Fund |
October 31, 2021 (Unaudited)
| Shares | Value (Note 2) | |||||||
| COMMON STOCKS (99.56%) | ||||||||
| Communications (20.11%) | ||||||||
| Internet (20.11%) | ||||||||
| Alphabet, Inc., Class C(a) | 27,701 | $ | 82,144,822 | |||||
| Amazon.com, Inc.(a) | 38,477 | 129,760,989 | ||||||
| Meta Platforms, Inc., Class A(a) | 306,273 | 99,100,755 | ||||||
| Wayfair, Inc., Class A(a) | 401,857 | 100,102,579 | ||||||
| 411,109,145 | ||||||||
| TOTAL COMMUNICATIONS | 411,109,145 | |||||||
| Consumer, Non-cyclical (4.26%) | ||||||||
| Commercial Services (4.26%) | ||||||||
| CoStar Group, Inc.(a) | 1,011,709 | 87,057,559 | ||||||
| TOTAL CONSUMER, NON-CYCLICAL | 87,057,559 | |||||||
| Financial (28.15%) | ||||||||
| Diversified Financial Services (14.11%) | ||||||||
| Mastercard, Inc., Class A | 403,112 | 135,252,138 | ||||||
| Upstart Holdings, Inc.(a) | 258,602 | 83,280,188 | ||||||
| Visa, Inc., Class A | 329,575 | 69,794,098 | ||||||
| 288,326,424 | ||||||||
| Private Equity (14.04%) | ||||||||
| Carlyle Group, Inc. | 1,661,678 | 93,303,220 | ||||||
| KKR & Co., Inc., Class A | 1,597,709 | 127,289,476 | ||||||
| Partners Group Holding AG | 38,115 | 66,501,433 | ||||||
| 287,094,129 | ||||||||
| TOTAL FINANCIAL | 575,420,553 | |||||||
| Industrial (9.26%) | ||||||||
| Aerospace/Defense (9.26%) | ||||||||
| HEICO Corp., Class A | 573,481 | 72,075,092 | ||||||
| TransDigm Group, Inc.(a) | 187,731 | 117,110,353 | ||||||
| 189,185,445 | ||||||||
| TOTAL INDUSTRIAL | 189,185,445 | |||||||
| Technology (37.78%) | ||||||||
| Semiconductors (21.54%) | ||||||||
| Applied Materials, Inc. | 754,090 | 103,046,398 | ||||||
| Lam Research Corp. | 167,827 | 94,582,262 | ||||||
| NVIDIA Corp. | 285,746 | 73,056,680 | ||||||
| Qorvo, Inc.(a) | 550,785 | 92,658,561 | ||||||
| 12 | www.vulcanvaluepartners.com |
| Vulcan Value Partners Fund | Statement of Investments |
October 31, 2021 (Unaudited)
| Shares | Value (Note 2) | |||||||
| Technology (continued) | ||||||||
| Semiconductors (continued) | ||||||||
| Skyworks Solutions, Inc. | 460,393 | $ | 76,945,482 | |||||
| 440,289,383 | ||||||||
| Software (16.24%) | ||||||||
| AppLovin Corp., Class A(a) | 740,529 | 72,756,974 | ||||||
| Microsoft Corp. | 257,622 | 85,432,608 | ||||||
| salesforce.com, Inc.(a) | 338,804 | 101,536,171 | ||||||
| Splunk, Inc.(a) | 437,522 | 72,112,376 | ||||||
| 331,838,129 | ||||||||
| TOTAL TECHNOLOGY | 772,127,512 | |||||||
| TOTAL COMMON STOCKS | ||||||||
| (Cost $1,383,816,797) | 2,034,900,214 | |||||||
| 7-Day Yield | Shares | Value (Note 2) | ||||||||||
| SHORT TERM INVESTMENTS (1.41%) | ||||||||||||
| Money Market Fund (1.41%) | ||||||||||||
| Invesco Government & Agency Portfolio, Institutional Class | 0.030 | % | 28,735,495 | 28,735,495 | ||||||||
| TOTAL SHORT TERM INVESTMENTS | ||||||||||||
| (Cost $28,735,495) | 28,735,495 | |||||||||||
| TOTAL INVESTMENTS (100.97%) | ||||||||||||
| (Cost $1,412,552,292) | $ | 2,063,635,709 | ||||||||||
| Liabilities In Excess Of Other Assets (-0.97%) | (19,791,939 | ) | ||||||||||
| NET ASSETS (100.00%) | $ | 2,043,843,770 | ||||||||||
| (a) | Non-Income Producing Security. |
For Fund compliance purposes, the Fund's industry classifications refer to any one or more of the industry sub-classifications used by one or more widely recognized market indexes or ratings group indexes, and/or as defined by Fund management. This definition may not apply for purposes of this report, which may combine industry sub-classifications for reporting ease. Industries are shown as a percentage of net assets.
See Accompanying Notes to Financial Statements.
| Semi-Annual Report | October 31, 2021 | 13 |
| Statement of Investments | Vulcan Value Partners Small Cap Fund |
October 31, 2021 (Unaudited)
| Shares | Value (Note 2) | |||||||
| COMMON STOCKS (96.77%) | ||||||||
| Consumer, Cyclical (3.90%) | ||||||||
| Home Furnishings (3.90%) | ||||||||
| MillerKnoll, Inc.(a) | 1,401,544 | $ | 54,548,093 | |||||
| TOTAL CONSUMER, CYCLICAL | 54,548,093 | |||||||
| Consumer, Non-cyclical (31.25%) | ||||||||
| Commercial Services (24.03%) | ||||||||
| ABM Industries, Inc. | 1,198,295 | 52,736,963 | ||||||
| Boyd Group Services, Inc. | 107,743 | 20,911,335 | ||||||
| Colliers International Group, Inc. | 453,487 | 65,923,405 | ||||||
| ISS A/S(a) | 2,665,299 | 53,057,467 | ||||||
| PROG Holdings, Inc. | 1,080,801 | 43,718,401 | ||||||
| Savills PLC | 1,635,756 | 31,743,561 | ||||||
| Sdiptech AB, Class B(a) | 1,312,964 | 68,415,392 | ||||||
| 336,506,524 | ||||||||
| Food (3.71%) | ||||||||
| Premium Brands Holdings Corp. | 480,079 | 51,883,134 | ||||||
| Healthcare-Services (3.51%) | ||||||||
| Medpace Holdings, Inc.(a) | 216,969 | 49,154,327 | ||||||
| TOTAL CONSUMER, NON-CYCLICAL | 437,543,985 | |||||||
| Financial (20.30%) | ||||||||
| Diversified Financial Services (8.42%) | ||||||||
| Upstart Holdings, Inc.(a) | 158,986 | 51,199,851 | ||||||
| Virtus Investment Partners, Inc. | 208,298 | 66,655,360 | ||||||
| 117,855,211 | ||||||||
| Real Estate (7.96%) | ||||||||
| Cushman & Wakefield PLC(a) | 4,578,927 | 84,206,468 | ||||||
| Jones Lang LaSalle, Inc.(a) | 105,574 | 27,262,374 | ||||||
| 111,468,842 | ||||||||
| REITS (3.92%) | ||||||||
| Park Hotels & Resorts, Inc.(a) | 2,963,528 | 54,914,174 | ||||||
| TOTAL FINANCIAL | 284,238,227 | |||||||
| Industrial (34.48%) | ||||||||
| Building Materials (19.44%) | ||||||||
| Curtiss-Wright Corp. | 352,575 | 45,016,776 | ||||||
| Forterra PLC | 11,819,461 | 41,894,627 | ||||||
| Ibstock PLC | 22,177,873 | 60,581,681 | ||||||
| 14 | www.vulcanvaluepartners.com |
| Vulcan Value Partners Small Cap Fund | Statement of Investments |
October 31, 2021 (Unaudited)
| Shares | Value (Note 2) | |||||||
| Industrial (continued) | ||||||||
| Building Materials (continued) | ||||||||
| SmartRent, Inc.(a) | 4,899,611 | $ | 64,331,892 | |||||
| Victoria PLC(a) | 4,082,475 | 60,340,400 | ||||||
| 272,165,376 | ||||||||
| Electrical Components & Equipment (9.26%) | ||||||||
| Acuity Brands, Inc. | 124,635 | 25,603,768 | ||||||
| EnerSys | 616,787 | 49,367,632 | ||||||
| Littelfuse, Inc. | 185,539 | 54,650,512 | ||||||
| 129,621,912 | ||||||||
| Electronics (3.80%) | ||||||||
| Ituran Location and Control, Ltd. | 2,046,978 | 53,241,898 | ||||||
| Miscellaneous Manufacturing (1.98%) | ||||||||
| Carlisle Cos., Inc. | 124,135 | 27,672,174 | ||||||
| TOTAL INDUSTRIAL | 482,701,360 | |||||||
| Technology (6.84%) | ||||||||
| Software (6.84%) | ||||||||
| Cerence, Inc.(a) | 865,933 | 91,035,536 | ||||||
| Porch Group, Inc.(a) | 228,253 | 4,800,161 | ||||||
| 95,835,697 | ||||||||
| TOTAL TECHNOLOGY | 95,835,697 | |||||||
| TOTAL COMMON STOCKS | ||||||||
| (Cost $1,041,708,130) | 1,354,867,362 | |||||||
| 7-Day Yield | Shares | Value (Note 2) | ||||||||||
| SHORT TERM INVESTMENTS (2.74%) | ||||||||||||
| Money Market Fund (2.74%) | ||||||||||||
| Invesco Government & Agency Portfolio, Institutional Class | 0.030 | % | 38,402,552 | 38,402,552 | ||||||||
| TOTAL SHORT TERM INVESTMENTS | ||||||||||||
| (Cost $38,402,552) | 38,402,552 | |||||||||||
| TOTAL INVESTMENTS (99.51%) | ||||||||||||
| (Cost $1,080,110,682) | $ | 1,393,269,914 | ||||||||||
| Other Assets In Excess Of Liabilities (0.49%) | 6,858,860 | |||||||||||
| NET ASSETS (100.00%) | $ | 1,400,128,774 | ||||||||||
| Semi-Annual Report | October 31, 2021 | 15 |
| Statement of Investments | Vulcan Value Partners Small Cap Fund |
October 31, 2021 (Unaudited)
| (a) | Non-Income Producing Security. |
For Fund compliance purposes, the Fund's industry classifications refer to any one or more of the industry sub-classifications used by one or more widely recognized market indexes or ratings group indexes, and/or as defined by Fund management. This definition may not apply for purposes of this report, which may combine industry sub-classifications for reporting ease. Industries are shown as a percentage of net assets.
See Accompanying Notes to Financial Statements.
| 16 | www.vulcanvaluepartners.com |
Statements of Assets and Liabilities
October 31, 2021 (Unaudited)
| Vulcan Value Partners Fund | Vulcan Value Partners Small Cap Fund | |||||||
| ASSETS: | ||||||||
| Investments, at value | $ | 2,063,635,709 | $ | 1,393,269,914 | ||||
| Cash | 2,424 | 1,182 | ||||||
| Receivable for investments sold | 13,576,051 | 15,267,566 | ||||||
| Receivable for shares sold | 743,319 | 1,122,977 | ||||||
| Dividends receivable | 604,317 | 592,853 | ||||||
| Other assets | 28,257 | 24,643 | ||||||
| Total assets | 2,078,590,077 | 1,410,279,135 | ||||||
| LIABILITIES: | ||||||||
| Payable for investments purchased | 13,085,039 | 8,617,891 | ||||||
| Payable for shares redeemed | 20,065,815 | 280,878 | ||||||
| Payable to adviser | 1,419,959 | 1,112,611 | ||||||
| Payable for administration fees | 48,088 | 33,339 | ||||||
| Payable for transfer agency fees | 9,685 | 10,320 | ||||||
| Payable for delegated transfer agent equivalent services fees | 47,395 | 39,222 | ||||||
| Payable for professional fees | 27,748 | 20,785 | ||||||
| Payable for trustee fees and expenses | 38,942 | 22,053 | ||||||
| Payable for principal financial officer fees | 1,071 | 268 | ||||||
| Accrued expenses and other liabilities | 2,565 | 12,994 | ||||||
| Total liabilities | 34,746,307 | 10,150,361 | ||||||
| NET ASSETS | $ | 2,043,843,770 | $ | 1,400,128,774 | ||||
| NET ASSETS CONSIST OF: | ||||||||
| Paid-in capital (Note 5) | $ | 1,184,739,961 | $ | 845,434,501 | ||||
| Total distributable earnings | 859,103,809 | 554,694,273 | ||||||
| NET ASSETS | $ | 2,043,843,770 | $ | 1,400,128,774 | ||||
| INVESTMENTS, AT COST | $ | 1,412,552,292 | $ | 1,080,110,682 | ||||
See Accompanying Notes to Financial Statements.
| Semi-Annual Report | October 31, 2021 | 17 |
Statements of Assets and Liabilities
October 31, 2021 (Unaudited)
| Vulcan Value Partners Fund | Vulcan Value Partners Small Cap Fund | |||||||
| PRICING OF SHARES: | ||||||||
| Investor Class: | ||||||||
| Net Asset Value, offering and redemption price per share | $ | 32.91 | $ | 27.53 | ||||
| Net Assets | $ | 679,402,922 | $ | 360,967,309 | ||||
| Shares of beneficial interest outstanding (unlimited number of shares, no par value common stock authorized) | 20,646,039 | 13,112,185 | ||||||
| Institutional Class: | ||||||||
| Net Asset Value, offering and redemption price per share | 33.01 | 27.66 | ||||||
| Net Assets | 1,364,440,848 | 1,039,161,465 | ||||||
| Shares of beneficial interest outstanding (unlimited number of shares, no par value common stock authorized) | 41,334,388 | 37,572,177 | ||||||
See Accompanying Notes to Financial Statements.
| 18 | www.vulcanvaluepartners.com |
Statements of Operations
For the Six Months Ended October 31, 2021 (Unaudited)
| Vulcan Value Partners Fund | Vulcan Value Partners Small Cap Fund | |||||||
| INVESTMENT INCOME: | ||||||||
| Dividends | $ | 6,437,078 | $ | 4,050,890 | ||||
| Foreign taxes withheld | (420,503 | ) | (159,610 | ) | ||||
| Total investment income | 6,016,575 | 3,891,280 | ||||||
| EXPENSES: | ||||||||
| Investment advisory fees (Note 6) | 9,665,381 | 6,889,760 | ||||||
| Administrative fees | 262,496 | 165,532 | ||||||
| Transfer agency fees | 43,181 | 46,960 | ||||||
| Delegated transfer agent equivalent services fees | ||||||||
| Investor Class | 15,819 | 12,362 | ||||||
| Institutional Class | 280,526 | 179,754 | ||||||
| Professional fees | 21,357 | 16,912 | ||||||
| Custodian fees | 61,425 | 52,098 | ||||||
| Principal financial officer fees | 5,124 | 2,744 | ||||||
| Trustee fees and expenses | 48,225 | 28,428 | ||||||
| Recoupment of previously waived fees | ||||||||
| Investor Class | – | 58,496 | ||||||
| ReFlow Fees (Note 2) | 30,304 | – | ||||||
| Other | 57,952 | 45,711 | ||||||
| Total expenses before waiver | 10,491,790 | 7,498,757 | ||||||
| Less fees waived/reimbursed by | ||||||||
| investment adviser (Note 6) | ||||||||
| Institutional Class | (1,593,191 | ) | (1,078,163 | ) | ||||
| Total net expenses | 8,898,599 | 6,420,594 | ||||||
| NET INVESTMENT LOSS | (2,882,024 | ) | (2,529,314 | ) | ||||
| Net realized gain on investments(a) | 148,735,802 | 220,086,942 | ||||||
| Net realized loss on foreign currency transactions | (14,027 | ) | (206,426 | ) | ||||
| Net realized gain | 148,721,775 | 219,880,516 | ||||||
| Net change in unrealized appreciation of investments | 44,025,641 | 16,657,285 | ||||||
| Net change in unrealized depreciation on translation of assets and liabilities denominated in foreign currencies | (10,112 | ) | (10,287 | ) | ||||
| Net change in unrealized appreciation | 44,015,529 | 16,646,998 | ||||||
| NET REALIZED AND UNREALIZED GAIN ON INVESTMENTS | 192,737,304 | 236,527,514 | ||||||
| NET INCREASE IN NET ASSETS RESULTING FROM OPERATIONS | $ | 189,855,280 | $ | 233,998,200 | ||||
| (a) | See Note 2 for gain/(loss) on In-Kind transactions. |
See Accompanying Notes to Financial Statements.
| Semi-Annual Report | October 31, 2021 | 19 |
| Statements of Changes in Net Assets | Vulcan Value Partners Fund |
For the Six Months Ended October 31, 2021 (Unaudited) | For the Year Ended April 30, 2021 | |||||||
| OPERATIONS: | ||||||||
| Net investment loss | $ | (2,882,024 | ) | $ | (6,230,774 | ) | ||
| Net realized gain | 148,721,775 | 192,779,278 | ||||||
| Net change in unrealized appreciation | 44,015,529 | 470,301,214 | ||||||
| Net increase in net assets resulting from operations | 189,855,280 | 656,849,718 | ||||||
| DISTRIBUTIONS TO SHAREHOLDERS (Note 3): | ||||||||
| From distributable earnings | ||||||||
| Investor Class | – | (19,870,128 | ) | |||||
| Institutional Class | – | (31,231,578 | ) | |||||
| Net decrease in net assets from distributions | – | (51,101,706 | ) | |||||
| SHARE TRANSACTIONS (Note 5): | ||||||||
| Investor Class | ||||||||
| Proceeds from sales of shares | 54,065,932 | 45,405,149 | ||||||
| Issued to shareholders in reinvestment of distributions | – | 16,646,680 | ||||||
| Cost of shares redeemed, net of redemption fees | (61,665,630 | ) | (170,166,165 | ) | ||||
| Institutional Class | ||||||||
| Proceeds from sales of shares | 208,090,146 | 334,177,937 | ||||||
| Issued to shareholders in reinvestment of distributions | – | 28,723,974 | ||||||
| Cost of shares redeemed, net of redemption fees | (118,466,378 | ) | (357,606,665 | ) | ||||
| Net increase/(decrease) from share transactions | 82,024,070 | (102,819,090 | ) | |||||
| Net increase in net assets | 271,879,350 | 502,928,922 | ||||||
| NET ASSETS: | ||||||||
| Beginning of year | 1,771,964,420 | 1,269,035,498 | ||||||
| End of period | $ | 2,043,843,770 | $ | 1,771,964,420 | ||||
See Accompanying Notes to Financial Statements.
| 20 | www.vulcanvaluepartners.com |
| Vulcan Value Partners Small Cap Fund | Statements of Changes in Net Assets |
For the Six Months Ended October 31, 2021 (Unaudited) | For the Year Ended April 30, 2021 | |||||||
| OPERATIONS: | ||||||||
| Net investment loss | $ | (2,529,314 | ) | $ | (2,999,731 | ) | ||
| Net realized gain | 219,880,516 | 75,767,413 | ||||||
| Net change in unrealized appreciation | 16,646,998 | 341,624,279 | ||||||
| Net increase in net assets resulting from operations | 233,998,200 | 414,391,961 | ||||||
| DISTRIBUTIONS TO SHAREHOLDERS (Note 3): | ||||||||
| From distributable earnings | ||||||||
| Investor Class | – | (230,257 | ) | |||||
| Institutional Class | – | (806,241 | ) | |||||
| Net decrease in net assets from distributions | – | (1,036,498 | ) | |||||
| SHARE TRANSACTIONS (Note 5): | ||||||||
| Investor Class | ||||||||
| Proceeds from sales of shares | 14,777,668 | 79,124,618 | ||||||
| Issued to shareholders in reinvestment of distributions | – | 178,374 | ||||||
| Cost of shares redeemed, net of redemption fees | (29,805,120 | ) | (73,500,292 | ) | ||||
| Institutional Class | ||||||||
| Proceeds from sales of shares | 223,677,225 | 337,038,134 | ||||||
| Issued to shareholders in reinvestment of distributions | – | 690,932 | ||||||
| Cost of shares redeemed, net of redemption fees | (63,798,764 | ) | (136,486,323 | ) | ||||
| Net increase from share transactions | 144,851,009 | 207,045,443 | ||||||
| Net increase in net assets | 378,849,209 | 620,400,906 | ||||||
| NET ASSETS: | ||||||||
| Beginning of year | 1,021,279,565 | 400,878,659 | ||||||
| End of period | $ | 1,400,128,774 | $ | 1,021,279,565 | ||||
See Accompanying Notes to Financial Statements.
| Semi-Annual Report | October 31, 2021 | 21 |
Financial Highlights
For a share outstanding throughout the period or years presented.
| Investor Class |
| NET ASSET VALUE, BEGINNING OF PERIOD |
| INCOME/(LOSS) FROM OPERATIONS: |
| Net investment income/(loss)(a) |
| Net realized and unrealized gain/(loss) on investments |
| Total from investment operations |
| LESS DISTRIBUTIONS TO SHAREHOLDERS: |
| From net investment income |
| From net realized gains on investments |
| Total distributions |
| Redemption fees added to paid-in capital |
| Increase/(decrease) in net asset value |
| NET ASSET VALUE, END OF PERIOD |
| Total return |
| RATIOS AND SUPPLEMENTAL DATA: |
| Net assets, end of period (000's) |
| Ratio of expenses to average net assets without fee waivers/reimbursements |
| Ratio of expenses to average net assets including fee waivers/reimbursements |
Net investment income/(loss) to average net assets including fee waivers/reimbursements |
Portfolio turnover rate |
| (a) | Per share numbers have been calculated using the average shares method. |
| (b) | Less than $0.005 per share. |
| (c) | Not Annualized. |
| (d) | Annualized. |
See Accompanying Notes to Financial Statements.
| 22 | www.vulcanvaluepartners.com |
Vulcan Value Partners Fund
For the Six Months Ended October 31, 2021 (Unaudited) | For the Year Ended April 30, 2021 | For the Year Ended April 30, 2020 | For the Year Ended April 30, 2019 | For the Year Ended April 30, 2018 | For the Year Ended April 30, 2017 | |||||||||||||||||
| $ | 29.87 | $ | 19.50 | $ | 21.05 | $ | 21.39 | $ | 19.30 | $ | 17.17 | |||||||||||
| (0.07 | ) | (0.14 | ) | 0.03 | 0.08 | 0.09 | 0.18 | |||||||||||||||
| 3.11 | 11.42 | (0.53 | ) | 1.13 | 2.35 | 2.18 | ||||||||||||||||
| 3.04 | 11.28 | (0.50 | ) | 1.21 | 2.44 | 2.36 | ||||||||||||||||
| – | 0.00 | (b) | 0.00 | (b) | (0.13 | ) | (0.12 | ) | (0.23 | ) | ||||||||||||
| – | (0.91 | ) | (1.05 | ) | (1.42 | ) | (0.23 | ) | – | |||||||||||||
| – | (0.92 | ) | (1.05 | ) | (1.55 | ) | (0.35 | ) | (0.23 | ) | ||||||||||||
| – | 0.00 | (b) | 0.00 | (b) | 0.00 | (b) | 0.00 | (b) | 0.00 | (b) | ||||||||||||
| 3.04 | 10.37 | (1.55 | ) | (0.34 | ) | 2.09 | 2.13 | |||||||||||||||
| $ | 32.91 | $ | 29.87 | $ | 19.50 | $ | 21.05 | $ | 21.39 | $ | 19.30 | |||||||||||
| 10.18 | %(c) | 58.62 | % | (3.15 | %) | 6.80 | % | 12.72 | % | 13.85 | % | |||||||||||
| $ | 679,403 | $ | 624,789 | $ | 500,309 | $ | 1,284,556 | $ | 1,314,519 | $ | 1,284,669 | |||||||||||
| 1.06 | %(d) | 1.08 | % | 1.09 | % | 1.08 | % | 1.08 | % | 1.07 | % | |||||||||||
| 1.06 | %(d) | 1.08 | % | 1.09 | % | 1.08 | % | 1.08 | % | 1.07 | % | |||||||||||
| (0.43 | %)(d) | (0.57 | %) | 0.12 | % | 0.38 | % | 0.46 | % | 1.01 | % | |||||||||||
| 30 | %(c) | 67 | % | 80 | % | 73 | % | 50 | % | 49 | % | |||||||||||
See Accompanying Notes to Financial Statements.
| Semi-Annual Report | October 31, 2021 | 23 |
| Financial Highlights | Vulcan Value Partners Fund |
| For a share outstanding throughout the periods presented. |
| Institutional Class | For the Six Months Ended October 31, 2021 (Unaudited) | For the Year Ended April 30, 2021 | For the Period May 1, 2019 (Inception) to April 30, 2020 | |||||||||
| NET ASSET VALUE, BEGINNING OF PERIOD | $ | 29.93 | $ | 19.52 | $ | 21.02 | ||||||
| INCOME/(LOSS) FROM OPERATIONS: | ||||||||||||
| Net investment income/(loss)(a) | (0.04 | ) | (0.09 | ) | 0.09 | |||||||
| Net realized and unrealized gain/(loss) on investments | 3.12 | 11.46 | (0.51 | ) | ||||||||
| Total from investment operations | 3.08 | 11.37 | (0.42 | ) | ||||||||
| LESS DISTRIBUTIONS TO SHAREHOLDERS: | ||||||||||||
| From net investment income | – | (0.05 | ) | (0.03 | ) | |||||||
| From net realized gains on investments | – | (0.91 | ) | (1.05 | ) | |||||||
| Total distributions | – | (0.96 | ) | (1.08 | ) | |||||||
| Redemption fees added to paid-in capital | – | 0.00 | (b) | 0.00 | (b) | |||||||
| Increase/(decrease) in net asset value | 3.08 | 10.41 | (1.50 | ) | ||||||||
| NET ASSET VALUE, END OF PERIOD | $ | 33.01 | $ | 29.93 | $ | 19.52 | ||||||
| Total return | 10.29 | %(c) | 59.02 | % | (2.83 | %)(c) | ||||||
| RATIOS AND SUPPLEMENTAL DATA: | ||||||||||||
| Net assets, end of period (000's) | $ | 1,364,441 | $ | 1,147,175 | $ | 768,726 | ||||||
| Ratio of expenses to average net assets without fee waivers/reimbursements | 1.10 | %(d) | 1.12 | % | 1.14 | %(d) | ||||||
| Ratio of expenses to average net assets including fee waivers/reimbursements | 0.85 | %(d) | 0.85 | % | 0.85 | %(d) | ||||||
| Net investment income/(loss) to average net assets including fee waivers/reimbursements | (0.23 | %)(d) | (0.36 | %) | 0.40 | %(d) | ||||||
| Portfolio turnover rate | 30 | %(c) | 67 | % | 80 | %(c) | ||||||
| (a) | Per share numbers have been calculated using the average shares method. |
| (b) | Less than $0.005 per share. |
| (c) | Not Annualized. |
| (d) | Annualized. |
See Accompanying Notes to Financial Statements.
| 24 | www.vulcanvaluepartners.com |
Intentionally Left Blank
Financial Highlights
For a share outstanding throughout the years presented.
| Investor Class |
| NET ASSET VALUE, BEGINNING OF PERIOD |
| INCOME/(LOSS) FROM OPERATIONS: |
| Net investment income/(loss)(a) |
| Net realized and unrealized gain/(loss) on investments |
| Total from investment operations |
| LESS DISTRIBUTIONS TO SHAREHOLDERS: |
| From net investment income |
| From net realized gains on investments |
| Total distributions |
| Redemption fees added to paid-in capital |
| Increase/(decrease) in net asset value |
| NET ASSET VALUE, END OF PERIOD |
| Total return |
| RATIOS AND SUPPLEMENTAL DATA: |
| Net assets, end of period (000's) |
| Ratio of expenses to average net assets without fee waivers/reimbursements |
| Ratio of expenses to average net assets including fee waivers/reimbursements |
| Net investment income/(loss) to average net assets including fee waivers/reimbursements |
| Portfolio turnover rate |
| (a) | Per share numbers have been calculated using the average shares method. |
| (b) | Less than $0.005 per share. |
| (c) | Not Annualized. |
| (d) | Annualized. |
See Accompanying Notes to Financial Statements.
| 26 | www.vulcanvaluepartners.com |
Vulcan Value Partners Small Cap Fund
For the Six Months Ended October 31, 2021 (Unaudited) | For the Year Ended April 30, 2021 | For the Year Ended April 30, 2020 | For the Year Ended April 30, 2019 | For the Year Ended April 30, 2018 | For the Year Ended April 30, 2017 | |||||||||||||||||
| $ | 22.62 | $ | 12.01 | $ | 17.31 | $ | 19.52 | $ | 20.16 | $ | 16.58 | |||||||||||
| (0.08 | ) | (0.10 | ) | 0.12 | 0.10 | 0.02 | 0.03 | |||||||||||||||
| 4.99 | 10.73 | (4.57 | ) | 0.38 | 0.59 | 3.61 | ||||||||||||||||
| 4.91 | 10.63 | (4.45 | ) | 0.48 | 0.61 | 3.64 | ||||||||||||||||
| – | (0.02 | ) | (0.08 | ) | (0.12 | ) | (0.03 | ) | (0.06 | ) | ||||||||||||
| – | – | (0.77 | ) | (2.57 | ) | (1.22 | ) | – | ||||||||||||||
| – | (0.02 | ) | (0.85 | ) | (2.69 | ) | (1.25 | ) | (0.06 | ) | ||||||||||||
| – | 0.00 | (b) | 0.00 | (b) | 0.00 | (b) | 0.00 | (b) | 0.00 | (b) | ||||||||||||
| 4.91 | 10.61 | (5.30 | ) | (2.21 | ) | (0.64 | ) | 3.58 | ||||||||||||||
| $ | 27.53 | $ | 22.62 | $ | 12.01 | $ | 17.31 | $ | 19.52 | $ | 20.16 | |||||||||||
| 21.71 | %(c) | 88.51 | % | (27.28 | %) | 4.76 | % | 3.08 | % | 21.97 | % | |||||||||||
| $ | 360,967 | $ | 310,600 | $ | 153,249 | $ | 543,174 | $ | 1,196,558 | $ | 1,255,606 | |||||||||||
| 1.25 | %(d) | 1.25 | % | 1.26 | % | 1.27 | % | 1.24 | % | 1.25 | % | |||||||||||
| 1.25 | %(d) | 1.25 | % | 1.25 | % | 1.25 | % | 1.24 | % | 1.25 | % | |||||||||||
| (0.61 | %)(d) | (0.65 | %) | 0.75 | % | 0.54 | % | 0.08 | % | 0.18 | % | |||||||||||
| 37 | %(c) | 75 | % | 102 | % | 68 | % | 68 | % | 52 | % | |||||||||||
| Semi-Annual Report | October 31, 2021 | 27 |
| Financial Highlights | Vulcan Value Partners Small Cap Fund |
For a share outstanding throughout the periods presented.
| Institutional Class | For the Six Months Ended October 31, 2021 (Unaudited) | For the Year Ended April 30, 2021 | For the Period May 1, 2019 (Inception) to April 30, 2020 | |||||||||
| NET ASSET VALUE, BEGINNING OF PERIOD | $ | 22.70 | $ | 12.03 | $ | 17.18 | ||||||
| INCOME/(LOSS) FROM OPERATIONS: | ||||||||||||
| Net investment income/(loss)(a) | (0.04 | ) | (0.06 | ) | 0.12 | |||||||
| Net realized and unrealized gain/(loss) on investments | 5.00 | 10.77 | (4.41 | ) | ||||||||
| Total from investment operations | 4.96 | 10.71 | (4.29 | ) | ||||||||
| LESS DISTRIBUTIONS TO SHAREHOLDERS: | ||||||||||||
| From net investment income | – | (0.04 | ) | (0.09 | ) | |||||||
| From net realized gains on investments | – | – | (0.77 | ) | ||||||||
| Total distributions | – | (0.04 | ) | (0.86 | ) | |||||||
| Redemption fees added to paid-in capital | – | 0.00 | (b) | 0.00 | (b) | |||||||
| Increase/(decrease) in net asset value | 4.96 | 10.67 | (5.15 | ) | ||||||||
| NET ASSET VALUE, END OF PERIOD | $ | 27.66 | $ | 22.70 | $ | 12.03 | ||||||
| Total return | 21.85 | %(c) | 89.07 | % | (26.56 | %)(c) | ||||||
| RATIOS AND SUPPLEMENTAL DATA: | ||||||||||||
| Net assets, end of period (000's) | $ | 1,039,161 | $ | 710,679 | $ | 247,629 | ||||||
| Ratio of expenses to average net assets without fee waivers/reimbursements | 1.25 | %(d) | 1.29 | % | 1.32 | %(d) | ||||||
| Ratio of expenses to average net assets including fee waivers/reimbursements | 1.00 | %(d) | 1.00 | % | 1.00 | %(d) | ||||||
| Net investment income/(loss) to average net assets including fee waivers/reimbursements | (0.35 | %)(d) | (0.39 | %) | 0.76 | %(d) | ||||||
| Portfolio turnover rate | 37 | %(c) | 75 | % | 102 | %(c) | ||||||
| (a) | Per share numbers have been calculated using the average shares method. |
| (b) | Less than $0.005 per share. |
| (c) | Not Annualized. |
| (d) | Annualized. |
See Accompanying Notes to Financial Statements.
| 28 | www.vulcanvaluepartners.com |
| Notes to Financial Statements |
October 31, 2021 (Unaudited)
1. ORGANIZATION
Financial Investors Trust (the “Trust”) is organized as a Delaware statutory trust and is registered as an open-end management investment company under the Investment Company Act of 1940, as amended (“1940 Act”). The Trust consists of multiple separate portfolios or series. This semi-annual report describes the Vulcan Value Partners Fund and Vulcan Value Partners Small Cap Fund (each a “Fund” and collectively, the “Funds”). The Funds seek to achieve long-term capital appreciation. The Funds offer Investor Class and Institutional Class shares.
2. SIGNIFICANT ACCOUNTING POLICIES
The accompanying financial statements were prepared in accordance with accounting principles generally accepted in the United States of America (“U.S. GAAP”), including policies specific to investment companies. The preparation of financial statements in conformity with U.S. GAAP requires management to make certain estimates and assumptions that affect the reported amounts of assets and liabilities and disclosures of contingent assets and liabilities at the date of the financial statements and the reported amounts of revenue and expenses during the period. Actual results could differ from those estimates. The Funds are considered an investment company for financial reporting purposes under U.S. GAAP and follows the accounting and reporting guidance applicable to investment companies in the Financial Accounting Standards Board Accounting Standards Codification Topic 946. The following is a summary of significant accounting policies consistently followed by the Funds in preparation of their financial statements.
Investment Valuation: The Funds generally value their securities based on market prices determined at the close of regular trading on the New York Stock Exchange (“NYSE”), normally 4:00 p.m. Eastern Time, on each day the NYSE is open for trading.
For equity securities and mutual funds that are traded on an exchange, the market price is usually the closing sale or official closing price on that exchange. In the case of equity securities not traded on an exchange, or if such closing prices are not otherwise available, the securities are valued at the mean of the most recent bid and ask prices on such day. Redeemable securities issued by open-end registered investment companies are valued at the investment company’s applicable net asset value, with the exception of exchange-traded open-end investment companies, which are priced as equity securities.
The market price for debt obligations is generally the quote supplied by an independent third-party pricing service approved by the Board of Trustees of the Trust (the “Board” or the “Trustees”), which may use a matrix, formula or other objective method that takes into consideration quotations from dealers, market transactions in comparable investments, market indices and yield curves. If vendors are unable to supply a quote, or if the quote supplied is deemed to be unreliable, the market price may be determined using quotations received from one or more broker–dealers that make a market in the security.
Equity securities that are primarily traded on foreign securities exchanges are valued at the preceding closing values of such securities on their respective exchanges, except when an occurrence subsequent to the time a value was so established is likely to have changed such value. In such an event, the fair values of those securities are determined in good faith through consideration of other factors in accordance with procedures established by and under the general supervision of the Board.
| Semi-Annual Report | October 31, 2021 | 29 |
| Notes to Financial Statements |
October 31, 2021 (Unaudited)
When such prices or quotations are not available, or when Vulcan Value Partners, LLC (the “Adviser”) believes that they are unreliable, securities may be priced using fair value procedures approved by the Board.
Fair Value Measurements: A three-tier hierarchy has been established to classify fair value measurements for disclosure purposes. Inputs refer broadly to the assumptions that market participants would use in pricing the asset or liability, including assumptions about risk. Inputs may be observable or unobservable. Observable inputs are inputs that reflect the assumptions market participants would use in pricing the asset or liability that are developed based on market data obtained from sources independent of the reporting entity. Unobservable inputs are inputs that reflect the reporting entity’s own assumptions about the assumptions market participants would use in pricing the asset or liability that are developed based on the best information available. Various inputs are used in determining the value of each Fund’s investments as of the reporting period end. The designated input levels are not necessarily an indication of the risk or liquidity associated with these investments. These inputs are categorized in the following hierarchy under applicable financial accounting standards:
Level 1 – Unadjusted quoted prices in active markets for identical investments, unrestricted assets or liabilities that the Funds have the ability to access at the measurement date;
Level 2 – Quoted prices which are not active, quoted prices for similar assets or liabilities in active markets or inputs other than quoted prices that are observable (either directly or indirectly) for substantially the full term of the asset or liability; and
Level 3 – Significant unobservable prices or inputs (including the Funds’ own assumptions in determining the fair value of investments) where there is little or no market activity for the asset or liability at the measurement date.
| 30 | www.vulcanvaluepartners.com |
| Notes to Financial Statements |
October 31, 2021 (Unaudited)
The following is a summary of each input used to value each Fund’s investments as of October 31, 2021:
Vulcan Value Partners Fund:
| Investments in Securities at Value | Level 1 - Unadjusted Quoted Prices | Level 2 - Other Significant Observable Inputs | Level 3 - Significant Unobservable Inputs | Total | ||||||||||||
| Common Stocks(a) | $ | 2,034,900,214 | $ | – | $ | – | $ | 2,034,900,214 | ||||||||
| Short Term Investments | 28,735,495 | – | – | 28,735,495 | ||||||||||||
| TOTAL | $ | 2,063,635,709 | $ | – | $ | – | $ | 2,063,635,709 | ||||||||
Vulcan Value Partners Small Cap Fund:
| Investments in Securities at Value | Level 1 - Unadjusted Quoted Prices | Level 2 - Other Significant Observable Inputs | Level 3 - Significant Unobservable Inputs | Total | ||||||||||||
| Common Stocks(a) | $ | 1,354,867,362 | $ | – | $ | – | $ | 1,354,867,362 | ||||||||
| Short Term Investments | 38,402,552 | – | – | 38,402,552 | ||||||||||||
| TOTAL | $ | 1,393,269,914 | $ | – | $ | – | $ | 1,393,269,914 | ||||||||
| (a) | For detailed descriptions, see the accompanying Statements of Investments. |
For the six months ended October 31, 2021, the Funds did not have any securities that used significant unobservable inputs (Level 3) in determining fair value.
Investment Transactions and Investment Income: Investment transactions are accounted for on the date the investments are purchased or sold (trade date). Realized gains and losses from investment transactions are reported on an identified cost basis, which is the same basis the Funds use for federal income tax purposes. Interest income, which includes accretion of discounts and amortization of premiums, is accrued and recorded as earned. Dividend income is recognized on the ex-dividend date or, for certain foreign securities, as soon as information is available to the Funds. All of the realized and unrealized gains and losses and net investment income, are allocated daily to each class in proportion to its average daily net assets.
ReFlow Liquidity Program: Each Fund may participate in the ReFlow liquidity program, which is designed to provide an alternative liquidity source for mutual funds experiencing net redemptions of their shares. Pursuant to the program, ReFlow Fund, LLC (“ReFlow”) provides participating mutual funds with a source of cash to meet net shareholder redemptions by standing ready each business day to purchase fund shares up to the value of the net shares redeemed by other shareholders that are to settle the next business day. ReFlow will purchase shares of the Fund at net asset value and will not be subject to any investment minimums. Following purchases of Fund shares, ReFlow then generally redeems those shares when the Fund experiences net subscriptions, at the end of a maximum holding period determined by ReFlow (currently 28 days), or at other times as the Fund may request. ReFlow may choose to redeem its position in the Fund with an in-kind transfer of securities, instead of cash, enabling the Fund to avoid a realization of capital gains on the securities it transfers. ReFlow will not be subject to any short-term redemption fees. While ReFlow holds Fund shares, it will have the same rights and privileges with respect to those shares as any other
| Semi-Annual Report | October 31, 2021 | 31 |
Notes to Financial Statements
October 31, 2021 (Unaudited)
shareholder. For use of the ReFlow service, a Fund pays a fee to ReFlow each time it purchases Fund shares, calculated by applying to the purchase amount a fee rate determined through an automated daily auction among participating mutual funds. The current minimum fee rate is 0.20% of the value of the Fund shares purchased by ReFlow although the Fund may submit a bid at a higher fee rate if it determines that doing so is in the best interest of Fund shareholders. In accordance with federal securities laws, ReFlow is prohibited from acquiring more than 3% of the outstanding voting securities of a Fund. There is no assurance that ReFlow will have sufficient funds available to meet the Funds’ liquidity needs on a particular day. During the six months ended October 31, 2021, only the Vulcan Value Partners Fund participated in ReFlow. Fees associated with ReFlow are disclosed in the Statements of Operations.
Real Estate Investment Trusts (“REITs”): The Funds may invest a portion of their assets in REITs and are subject to certain risks associated with direct investment in REITs. REITs may be affected by changes in the value of their underlying properties and by defaults by borrowers or tenants. REITs depend generally on their ability to generate cash flow to make distributions to shareowners, and certain REITs have self-liquidation provisions by which mortgages held may be paid in full and distributions of capital returns may be made at any time. In addition, the performance of a REIT may be affected by its failure to qualify for tax-free pass-through of income under the Internal Revenue Code of 1986, as amended (the “Code”), or its failure to maintain exemption from registration under the 1940 Act. A Fund’s investments in REITs may result in such Fund’s receipt of cash in excess of the REITs’ earnings. If the Fund receives such distributions all or a portion of these distributions will constitute a return of capital to such Fund. Receiving a return of capital distribution from REITs will reduce the amount of income available to be distributed to Fund shareholders. Income from REITs generally will not be eligible for treatment as qualified dividend income. As the final character of the distributions is not known until reported by the REITs on their 1099s, the Funds utilize an average of the prior year’s reallocation information as an estimate for the current year character of distributions.
Foreign Securities: The Funds may directly purchase securities of foreign issuers. Investing in securities of foreign issuers involves special risks not typically associated with investing in securities of U.S. issuers. The risks include possible reevaluation of currencies, the inability to repatriate foreign currency, less complete financial information about companies and possible future adverse political and economic developments. Moreover, securities of many foreign issuers and their markets may be less liquid and their prices more volatile than those of securities of comparable U.S. issuers.
Foreign Currency Translation: The books and records of the Funds are maintained in U.S. dollars. Investment valuations and other assets and liabilities initially expressed in foreign currencies are converted each business day into U.S. dollars based upon current exchange rates. Prevailing foreign exchange rates may generally be obtained at the close of the NYSE (normally, 4:00 p.m. Eastern Time). The portion of realized and unrealized gains or losses on investments due to fluctuations in foreign currency exchange rates is not separately disclosed and is included in realized and unrealized gains or losses on investments, when applicable.
In-Kind Redemptions: During the six months ended October 31, 2021, the Vulcan Value Partners Fund distributed portfolio securities rather than cash as payment for certain redemptions of fund shares (in-kind redemptions) in the amount of $30,711,991. For financial reporting purposes, the Vulcan Value Partners Fund recognized gains on the in-kind redemptions in the amount of
| 32 | www.vulcanvaluepartners.com |
Notes to Financial Statements
October 31, 2021 (Unaudited)
$16,517,087. The Vulcan Value Partners Small Cap Fund did not have any in-kind transactions during the six months ended October 31, 2021. For tax purposes, the gains are not recognized.
Trust Expenses: Some expenses of the Trust can be directly attributed to the Funds. Expenses which cannot be directly attributed are apportioned among all funds in the Trust based on average net assets of each fund.
Fund Expenses: Expenses that are specific to a Fund are charged directly to that Fund.
Federal Income Taxes: Each Fund complies with the requirements under Subchapter M of the Internal Revenue Code of 1986, as amended, applicable to regulated investment companies and intends to distribute substantially all of its net taxable income and net capital gains, if any, each year so that it will not be subject to excise tax on undistributed income and gains. The Funds are not subject to income taxes to the extent such distributions are made.
As of and during the six months ended October 31, 2021, the Funds did not have a liability for any unrecognized tax benefits. The Funds file U.S. federal, state, and local tax returns as required. The Fund’s tax returns are subject to examination by the relevant tax authorities until expiration of the applicable statute of limitations, which is generally three years after the filing of the tax return for federal purposes and four years for most state returns. Tax returns for open years have incorporated no uncertain tax positions that require a provision for income taxes.
Distributions to Shareholders: Each Fund normally pays dividends and distributes capital gains, if any, on an annual basis. Income dividend distributions are derived from dividends and other income each Fund receives from its investments, including short-term capital gains. Long term capital gain distributions are derived from gains realized when each Fund sells a security it has owned for more than a year. Each Fund may make additional distributions and dividends at other times if the portfolio manager believes doing so may be necessary for each Fund to avoid or reduce taxes.
Epidemic and Pandemic Risk: Certain countries have been susceptible to epidemics, most recently COVID-19, which has been designated as a pandemic by world health authorities. The outbreak of such epidemics, together with any resulting restrictions on travel or quarantines imposed, could have a negative impact on the economy and business activity globally (including in the countries in which we invest), and thereby could adversely affect the performance of our investments. Furthermore, the rapid development of epidemics could preclude prediction as to their ultimate adverse impact on economic and market conditions, and, as a result, present material uncertainty and risk with respect to us and the performance of our investments.
Libor Risk: In March 2020, the Financial Accounting Standards Board (FASB) issued Accounting Standards Update (“ASU”) No. 2020-04, Reference Rate Reform (Topic 848): Facilitation of the Effects of Reference Rate Reform on Financial Reporting. The Funds’ investments, payment obligations, and financing terms may be based on floating rates, such as the London Interbank Offered Rate, or “LIBOR,” which is the offered rate for short-term Eurodollar deposits between major international banks. On November 30, 2020, the administrator of LIBOR announced its intention to delay the phase out of the majority of the U.S. dollar LIBOR publications until June 30, 2023, with the remainder of LIBOR publications to still end at the end of 2021. There remains uncertainty regarding the nature of any replacement rate and the impact of the transition from
| Semi-Annual Report | October 31, 2021 | 33 |
Notes to Financial Statements
October 31, 2021 (Unaudited)
LIBOR on the Funds’ transactions and the financial markets generally. As such, the potential effect of a transition away from LIBOR on the Funds or the Funds’ investments cannot yet be determined.
3. TAX BASIS INFORMATION
Tax Basis of Investments: As of October 31, 2021, the aggregate cost of investments, gross unrealized appreciation/(depreciation) and net unrealized appreciation for federal tax purposes was as follows:
| Vulcan Value Partners Fund | Vulcan Value Partners Small Cap Fund | |||||||
| Gross appreciation | ||||||||
| (excess of value over tax cost) | $ | 671,536,169 | $ | 328,762,593 | ||||
| Gross depreciation | ||||||||
| (excess of tax cost over value) | (22,278,437 | ) | (22,072,639 | ) | ||||
| Net unrealized appreciation | $ | 649,257,732 | $ | 306,689,954 | ||||
| Cost of investments for income tax purposes | $ | 1,414,377,977 | $ | 1,086,579,960 | ||||
Tax Basis of Distributions to Shareholders: The character of distributions made during the year from net investment income or net realized gains may differ from its ultimate characterization for federal income tax purposes. Also, due to the timing of dividend distributions, the fiscal year in which amounts are distributed may differ from the fiscal year in which the income or realized gain were recorded by each Fund.
The tax character of distributions paid by the Funds for the fiscal year ended April 30, 2021 were as follows:
| Ordinary Income | Long-Term Capital Gain | |||||||
| 2021 | ||||||||
| Vulcan Value Partners Fund | $ | 1,593,194 | $ | 49,508,512 | ||||
| Vulcan Value Partners Small Cap Fund | 1,036,498 | – | ||||||
The amounts and characteristics of tax basis distributions and composition of distributable earnings/(accumulated losses) are finalized at fiscal year-end. Accordingly, tax basis balances have not been determined as of October 31, 2021.
| 34 | www.vulcanvaluepartners.com |
Notes to Financial Statements
October 31, 2021 (Unaudited)
4. SECURITIES TRANSACTIONS
The cost of purchases and proceeds from sales of securities (excluding short-term securities and in-kind redemptions) during the six months ended October 31, 2021 were as follows:
| Fund | Purchases of Securities | Proceeds From Sales of Securities | ||||||
| Vulcan Value Partners Fund | $ | 653,354,306 | $ | 565,165,635 | ||||
| Vulcan Value Partners Small Cap Fund | 578,968,620 | 424,888,851 | ||||||
5. SHARES OF BENEFICIAL INTEREST
The capitalization of the Trust consists of an unlimited number of shares of beneficial interest with no par value per share. Holders of the shares of the Funds of the Trust have one vote for each share held and a proportionate fraction of a vote for each fractional share. All shares issued and outstanding are fully paid and are transferable and redeemable at the option of the shareholder. Purchasers of the shares do not have any obligation to make payments to the Trust or its creditors solely by reason of the purchasers’ ownership of the shares. Shares have no pre-emptive rights.
Transactions in shares of capital stock for the dates listed below were as follows:
Vulcan Value Partners Fund
For the Six Months Ended October 31, 2021 (Unaudited) | For the Year Ended April 30, 2021 | |||||||
| Shares Sold | ||||||||
| Investor Class | 1,714,236 | 1,913,376 | ||||||
| Institutional Class | 6,702,894 | 13,337,480 | ||||||
| Shares Issued in Reinvestment of Dividends | ||||||||
| Investor Class | – | 644,471 | ||||||
| Institutional Class | – | 1,110,749 | ||||||
| Less Shares Redeemed | ||||||||
| Investor Class | (1,984,777 | ) | (7,304,502 | ) | ||||
| Institutional Class | (3,694,033 | ) | (15,501,238 | ) | ||||
| Net Increase/(Decrease) | 2,738,320 | (5,799,664 | ) | |||||
| Semi-Annual Report | October 31, 2021 | 35 |
Notes to Financial Statements
October 31, 2021 (Unaudited)
Vulcan Value Partners Small Cap Fund
For the Six Months Ended October 31, 2021 (Unaudited) | For the Year Ended April 30, 2021 | |||||||
| Shares Sold | ||||||||
| Investor Class | 583,319 | 5,516,025 | ||||||
| Institutional Class | 8,818,438 | 19,908,018 | ||||||
| Shares Issued in Reinvestment of Dividends | ||||||||
| Investor Class | – | 10,164 | ||||||
| Institutional Class | – | 39,257 | ||||||
| Less Shares Redeemed | ||||||||
| Investor Class | (1,203,080 | ) | (4,556,028 | ) | ||||
| Institutional Class | (2,559,806 | ) | (9,214,837 | ) | ||||
| Net Increase | 5,638,871 | 11,702,599 | ||||||
6. MANAGEMENT AND RELATED-PARTY TRANSACTIONS
The Adviser, subject to the authority of the Board, is responsible for the overall management and administration of the Funds’ business affairs. The Adviser manages the investments of the Funds in accordance with each Fund’s investment objective, policies and limitations and investment guidelines established jointly by the Adviser and the Board. Pursuant to the Investment Advisory Agreement (the “Advisory Agreement”), the Funds pay the Adviser an annual management fee of 1.00% and 1.15% for Vulcan Value Partners Fund and Vulcan Value Partners Small Cap Fund, respectively, based on each Fund’s average daily net assets. The management fee is paid on a monthly basis.
With respect to the Funds’ Investor Class, to the extent the Total Annual Fund Operating Expenses with respect to either Fund (exclusive of Acquired Fund Fees and Expenses (if any), brokerage expenses, interest expense, taxes and extraordinary expenses) (“Designated Annual Fund Operating Expenses”) exceed 1.25% of such Fund’s average daily net assets for a particular fiscal year of the Fund, the Adviser will reduce the Management Fee and/or Other Expenses otherwise payable to the Adviser with respect to such Fund for such fiscal year by an amount equal to such excess, and/or the Adviser shall reimburse the Fund by the amount of such excess.
With respect to the Funds’ Institutional Class, to the extent the Total Annual Fund Operating Expenses with respect to either Fund (exclusive of Acquired Fund Fees and Expenses (if any), brokerage expenses, interest expense, taxes and extraordinary expenses) (“Designated Annual Fund Operating Expenses”) exceed 0.85% and 1.00% of the Vulcan Value Partners Fund’s and the Vulcan Value Partners Small Cap Fund’s average daily net assets, respectively, for a particular fiscal year of the Fund, the Adviser will reduce the Management Fee and/or Other Expenses otherwise payable to the Adviser with respect to such Fund for such fiscal year by an amount equal to such excess, and/or the Adviser shall reimburse the Fund by the amount of such excess.
| 36 | www.vulcanvaluepartners.com |
Notes to Financial Statements
October 31, 2021 (Unaudited)
The Adviser agrees that the foregoing fee waiver and reimbursement agreement for each Fund are effective as of September 1, 2021 and shall continue through August 31, 2022.
The Adviser will be permitted to recapture expenses it has borne through this letter agreement to the extent that a Fund’s expenses in later periods fall below the annual rates set forth in this letter agreement or in previous letter agreements; provided, however, that such recapture payments do not cause the Fund’s expense ratio (after recapture) to exceed the lesser of (i) the expense cap in effect at the time of the waiver and (ii) the expense cap in effect at the time of the recapture. Notwithstanding the foregoing, the Funds will not be obligated to pay any such deferred fees and expenses more than three years after the date on which the fee and expenses were deferred. For the six months ended October 31, 2021, the fee waivers and/or reimbursements and recoupment amounts were as follows:
| Fund | Fees Waived/Reimbursed By Adviser | Recoupment of Previously Waived Fees by Adviser | ||||||
| Vulcan Value Partners Fund | ||||||||
| Investor | $ | – | $ | – | ||||
| Institutional | (1,593,191 | ) | – | |||||
| Vulcan Value Partners Small Cap Fund | ||||||||
| Investor | – | 58,496 | ||||||
| Institutional | (1,078,163 | ) | – | |||||
As of October 31, 2021, the balances of recoupable expenses for each Fund were as follows:
| Fund | Expires 2022 | Expires 2023 | Expires 2024 | Expires 2025 | Total | |||||||||||||||
| Vulcan Value Partners Fund | ||||||||||||||||||||
| Investor | $ | – | $ | – | $ | – | $ | – | $ | – | ||||||||||
| Institutional | – | 1,571,670 | 2,373,402 | 1,593,191 | 5,538,263 | |||||||||||||||
| Vulcan Value Partners Small Cap Fund | ||||||||||||||||||||
| Investor | – | 35,722 | 9,343 | – | 45,065 | |||||||||||||||
| Institutional | – | 594,605 | 1,148,576 | 1,078,163 | 2,821,344 | |||||||||||||||
Fund Administrator Fees and Expenses: ALPS Fund Services, Inc. (“ALPS”) serves as administrator to the Funds and the Funds have agreed to pay expenses incurred in connection with their administrative activities. Pursuant to an Administration Agreement, ALPS provides operational services to the Funds including, but not limited to fund accounting and fund administration and generally assist in each Fund’s operations. Officers of the Trust are employees of ALPS. The Funds’ administration fee is accrued on a daily basis and paid monthly. Administration fees paid by the Funds for the six months ended October 31, 2021 are disclosed in the Statements of Operations.
ALPS is reimbursed by the Funds for certain out-of-pocket expenses.
| Semi-Annual Report | October 31, 2021 | 37 |
Notes to Financial Statements
October 31, 2021 (Unaudited)
Transfer Agent: ALPS serves as transfer, dividend paying and shareholder servicing agent for the Funds. ALPS receives an annual minimum fee, a fee based upon the number of shareholder accounts, and is also reimbursed by the Funds for certain out-of-pocket expenses. Transfer agent fees paid by the Funds for the six months ended October 31, 2021 are disclosed in the Statements of Operations.
Compliance Services: ALPS provides services that assist the Trust’s chief compliance officer in monitoring and testing the policies and procedures of the Trust in conjunction with requirements under Rule 38a-1 under the 1940 Act and receives an annual base fee. ALPS is reimbursed for certain out-of-pocket expenses by the Funds. Vulcan pays this fee on behalf of the Funds.
Principal Financial Officer: ALPS receives an annual fee for providing principal financial officer services to the Funds. Principal financial officer fees paid by the Fund for the six months ended October 31, 2021 are disclosed in the Statements of Operations.
Distributor: ALPS Distributors, Inc. (“ADI” or the “Distributor”) (an affiliate of ALPS) acts as the distributor of each Fund’s shares pursuant to a Distribution Agreement with the Trust. Shares are sold on a continuous basis by ADI as agent for the Funds, and ADI has agreed to use its best efforts to solicit orders for the sale of each Fund’s shares, although it is not obliged to sell any particular amount of shares. ADI is not entitled to any compensation for its services as Distributor. ADI is registered as a broker-dealer with the U.S. Securities and Exchange Commission. Certain intermediaries may charge networking, omnibus account or other administrative fees with respect to transactions in shares of the Funds. Transactions may be processed through the National Securities Clearing Corporation (“NSCC”) or similar systems or processed on a manual basis. These fees are paid by the Funds to the Distributor, which uses such fees to reimburse intermediaries. In the event an intermediary receiving payments from the Distributor on behalf of the Funds converts from a networking structure to an omnibus account structure or otherwise experiences increased costs, fees borne by the Funds may increase. Fees are disclosed on the Statements of Operations as “Delegated transfer agent equivalent services fees”.
Trustees: The fees and expenses of the Trustees of the Board are presented in the Statements of Operations.
7. INDEMNIFICATIONS
Under the Trust’s organizational documents, its Officers and Trustees are indemnified against certain liability arising out of the performance of their duties to the Trust. Additionally, in the normal course of business, the Trust enters into contracts with service providers that may contain general indemnification clauses which may permit indemnification to the extent permissible under applicable law. The Trust’s maximum exposure under these arrangements is unknown, as this would involve future claims that may be made against the Trust that have not yet occurred.
8. SUBSEQUENT EVENT
Subsequent events after the date of the Statements of Assets and Liabilities have been evaluated through the date the financial statements were issued.
| 38 | www.vulcanvaluepartners.com |
Additional Information
October 31, 2021 (Unaudited)
1. FUND HOLDINGS
The Funds file its complete schedule of portfolio holdings with the Securities and Exchange Commission (SEC) for the first and third quarters of each fiscal year as an exhibit to its reports on Form N-PORT. The Funds’ Form N-PORT reports are available on the SEC's Web site at http://www.sec.gov. The Funds’ Form N-PORT reports are also available upon request by calling (toll-free) (866) 759-5679.
2. FUND PROXY VOTING POLICIES, PROCEDURES AND SUMMARIES
The Funds’ policies and procedures used in determining how to vote proxies and information regarding how the Fund voted proxies relating to portfolio securities during the most recent prior
12-month period ending June 30 are available without charge, (1) upon request, by calling (toll-free) (866)-759-5679 and (2) on the SEC’s website at http://www.sec.gov.
| Semi-Annual Report | October 31, 2021 | 39 |
Privacy Policy
October 31, 2021 (Unaudited)
| WHO WE ARE | |
| Who is providing this notice? | Vulcan Value Partners Fund and Vulcan Value Partners Small Cap Fund. |
| WHAT WE DO | |
| How do the Funds protect my personal information? | To protect your personal information from unauthorized access and use, we use security measures that comply with federal law. These measures include computer safeguards and secured files and buildings. |
| How do the Funds collect my personal information? | We collect your personal information, for example, when you
• open an account • provide account information or give us your contact information • make a wire transfer or deposit money |
| Why can’t I limit all sharing? | Federal law gives you the right to limit only
• sharing for affiliates’ everyday business purposes-information about your creditworthiness • affiliates from using your information to market to you • sharing for non-affiliates to market to you
State laws and individual companies may give you additional rights to limit sharing. |
| 40 | www.vulcanvaluepartners.com |
Privacy Policy
October 31, 2021 (Unaudited)
| FACTS | WHAT DO THE FUNDS DO WITH YOUR PERSONAL INFORMATION? |
| WHY? | Financial companies choose how they share your personal information. Federal law gives consumers the right to limit some but not all sharing. Federal law also requires us to tell you how we collect, share, and protect your personal information. Please read this notice carefully to understand what we do. |
| WHAT? | The types of personal information we collect and share depend on the product or service you have with us. This information can include: • Social Security number and account transactions • Account balances and transaction history • Wire transfer instructions |
| HOW? | All financial companies need to share customers’ personal information to run their everyday business. In the section below, we list the reasons financial companies can share their customers’ personal information; the reasons the Funds choose to share; and whether you can limit this sharing. |
| REASONS WE CAN SHARE YOUR PERSONAL INFORMATION | DO THE FUNDS SHARE: | CAN YOU LIMIT THIS SHARING? |
| For our everyday business purposes – such as to process your transactions, maintain your account(s), respond to court orders and legal investigations, or report to credit bureaus | Yes | No |
| For our marketing purposes – to offer our products and services to you | No | We do not share. |
| For joint marketing with other financial companies | No | We do not share. |
| For our affiliates’ everyday business purposes – information about your transactions and experiences | Yes | No |
| For our affiliates’ everyday business purposes – information about your creditworthiness | No | We do not share. |
| For non-affiliates to market to you | No | We do not share. |
| Semi-Annual Report | October 31, 2021 | 41 |
 | |
| The Funds are neither insured nor guaranteed by the U.S. Government, the FDIC, the Federal Reserve Board or any other governmental agency or insurer. | |
| This material must be accompanied or preceded by a prospectus. | |
| Managed Accounts are available only for institutional and private clients of Vulcan Value Partners, LLC, a federally registered investment advisor. Vulcan Value Partners Funds are distributed by ALPS Distributors, Inc. Separately Managed Accounts and related investment advisory services are provided by Vulcan Value Partners, LLC, a federally regulated investment advisor. ALPS Distributors, Inc. is not affiliated with Vulcan Value Partners, LLC. | |
(b) Not applicable.
Item 2. Code of Ethics.
Not applicable to this Report.
Item 3. Audit Committee Financial Expert.
Not applicable to this Report.
Item 4. Principal Accountant Fees and Services.
Not applicable to this Report.
Item 5. Audit Committee of Listed Registrants.
Not applicable to the Registrant.
Item 6. Investments.
| (a) | Schedule of Investments is included as part of the Reports to Stockholders filed under Item 1 of this Form N-CSR. |
| (b) | Not applicable. |
Item 7. Disclosure of Proxy Voting Policies and Procedures for Closed-End Management Investment Companies.
Not applicable to the Registrant.
Item 8. Portfolio Managers of Closed-End Management Investment Companies.
Not applicable to the Registrant.
Item 9. Purchases of Equity Securities by Closed-End Management Investment Company and Affiliated Purchasers.
Not applicable to the Registrant.
Item 10. Submission of Matters to a Vote of Security Holders.
There have been no material changes to the procedures by which shareholders may recommend nominees to the Registrant’s Board of Trustees, where those changes were implemented after the Registrant last provided disclosure in response to the requirements of Item 407(c)(2)(iv) of Regulation S-K, or this Item.
Item 11. Controls and Procedures.
| (a) | The Registrant’s principal executive officer and principal financial officer have concluded that the Registrant’s disclosure controls and procedures (as defined in Rule 30a-3(c) under |
| the Investment Company Act of 1940, as amended) are effective based on their evaluation of these controls and procedures as of a date within 90 days of the filing date of this report. | ||
| (b) | There was no change in the Registrant’s internal control over financial reporting (as defined in Rule 30a-3(d) under the Investment Company Act of 1940, as amended) that occurred during the period covered by this report that has materially affected, or is reasonably likely to materially affect, the Registrant’s internal control over financial reporting. |
Item 12. Disclosure of Securities Lending Activities for Closed-End Management Investment Companies.
Not applicable to the Registrant.
Item 13. Exhibits.
(a)(1) Not applicable to this Report.
(a)(3) Not applicable to the Registrant.
(a)(4) Not applicable to the Registrant.
SIGNATURES
Pursuant to the requirements of the Securities Exchange Act of 1934 and the Investment Company Act of 1940, the Registrant has duly caused this report to be signed on its behalf by the undersigned, thereunto duly authorized.
FINANCIAL INVESTORS TRUST
| By: | /s/ Dawn Cotten | |
| Dawn Cotten (Principal Executive Officer) | ||
| President | ||
| Date: | January 7, 2022 |
Pursuant to the requirements of the Securities Exchange Act of 1934 and the Investment Company Act of 1940, this report has been signed below by the following persons on behalf of the Registrant and in the capacities and on the dates indicated.
FINANCIAL INVESTORS TRUST
| By: | /s/ Dawn Cotten | |
| Dawn Cotten (Principal Executive Officer) | ||
| President | ||
| Date: | January 7, 2022 | |
| By: | /s/ Jennell Panella | |
| Jennell Panella (Principal Financial Officer) | ||
| Treasurer | ||
| Date: | January 7, 2022 |