UNITED STATES
SECURITIES AND EXCHANGE COMMISSION
Washington, D.C. 20549
FORM N-CSR
CERTIFIED SHAREHOLDER REPORT OF REGISTERED
MANAGEMENT INVESTMENT COMPANIES
Investment Company Act file number: 811-08194
FINANCIAL INVESTORS TRUST
(Exact name of Registrant as specified in charter)
1290 Broadway, Suite 1000, Denver, Colorado 80203
(Address of principal executive offices) (Zip code)
Karen Gilomen, Esq., Secretary
Financial Investors Trust
1290 Broadway, Suite 1000
Denver, Colorado 80203
(Name and address of agent for service)
Registrant’s telephone number, including area code: 303-623-2577
Date of fiscal year end: April 30
Date of reporting period: April 30, 2020 – October 31, 2020
Item 1. Reports to Stockholders.
TABLE OF CONTENTS
SEMI-ANNUAL REPORT
| SHAREHOLDER LETTER | 1 |
| PERFORMANCE UPDATE | 4 |
| DISCLOSURE OF FUND EXPENSES | 6 |
| PORTFOLIO OF INVESTMENTS | 7 |
| STATEMENT OF ASSETS AND LIABILITIES | 18 |
| STATEMENT OF OPERATIONS | 19 |
| STATEMENTS OF CHANGES IN NET ASSETS | 20 |
| FINANCIAL HIGHLIGHTS | 22 |
| NOTES TO FINANCIAL STATEMENTS | 24 |
| ADDITIONAL INFORMATION | 31 |
| PRIVACY POLICY | 32 |
Beginning on January 1, 2021, as permitted by regulations adopted by the U.S. Securities and Exchange Commission, paper copies of the Fund’s annual and semi-annual shareholder reports will no longer be sent by mail, unless you specifically request paper copies of the reports. Instead, the reports will be made available on the Fund’s website at www.dgifund.com, and you will be notified by mail each time a report is posted and provided with a website link to access the report.
You may, notwithstanding the availability of shareholder reports online, elect to receive all future shareholder reports in paper free of charge. If you invest through a financial intermediary, you can contact your financial intermediary to request that you continue to receive paper copies of your shareholder reports. If you invest directly with the Fund, you can call 1.855.DGI. FUND (1-855-344-3863) to let the Fund know you wish to continue receiving paper copies of your shareholder reports.
If you already elected to receive shareholder reports electronically, you will not be affected by this change and you need not take any action. You may elect to receive shareholder reports and other communications from the Fund electronically anytime by contacting your financial intermediary (such as a broker-dealer or bank) or, if you are a direct investor, by enrolling at www.dgifund.com.
Disciplined Growth Investors’ goal is to communicate clearly and transparently with our clients and mutual fund shareholders. It is mutually beneficial when our shareholders understand how we invest, what we are currently thinking and forecasting, and the specific investment decisions we have made. Our views and opinions regarding the investment prospects of our portfolio holdings and the Fund are “forward looking statements” which may or may not be accurate over the long term. While we believe we have a reasonable basis for these forecasts and have confidence in our investment team’s views, actual results may differ materially from those we anticipate. Information provided in this report should not be considered a recommendation to purchase or sell any particular security.
You can identify forward looking statements as those including words such as “believe”, “expect”, “anticipate”, “forecast”, and similar statement. We cannot assure future performance. These forward-looking statements are made only as-of the date of this report. Following the publication of this report, we will not update any of the forward-looking statements included here.
This material must be preceded or accompanied by a prospectus. Please read the prospectus carefully before investing.
| OCTOBER 31, 2020 | DGINV.COM |
| The Disciplined Growth Investors Fund | Shareholder Letter |
October 31, 2020 (Unaudited)
Fund Performance and Asset Mix:
For the first half of the Disciplined Growth Investors Fund's (the "DGI Fund" or the "Fund") fiscal year (5/1/20-10/31/20), The DGI Fund returned 15.35%. Stocks in the Fund increased by 19.80% and bonds increased 6.22%. As of 10/31, the Fund’s asset mix was 72.9% stocks and 27.1% bonds and cash.
In these six months, The DGI Fund outperformed the S&P 500 index, which increased 13.29%. The DGI Fund held 39 stocks that increased in value and 14 stocks that declined in value. The ten largest equity holdings in The DGI Fund combined to add 5.8% to the Fund’s total performance. Performance in this time was broad-based, with a wide variety of holdings contributing, and not only the stocks we’ve allocated the most towards.
The Fund’s bond portfolio outperformed the Barclays Government & Corporate Credit index, which gained 1.63%.
The initial weeks and months of the COVID-19 pandemic caught every company off guard. It has been the dominant story of 2020, of course. The market sell-off in March was just one manifestation of the dark days following the global spread of the virus and the impacts it had to businesses, clients, and employees.
In the months since, we have been extremely encouraged at the response and progress of the companies in The DGI Fund. As we talk with management teams and monitor what these companies are doing, their instinctive commitment to clients and employees has resulted in what we see as excellent decision making. That is not to say things have been easy for them. What’s impressed us is their decision framework and fundamental progress despite the unprecedented circumstances. To us, it seems clear this has shown up in the performance of several stocks. Eleven stocks in the Fund returned over 30% in the last six months. Other companies are in industries that put them closer to the economic epicenter of the pandemic. While their stock prices may not have recovered or have done so more gradually, we still feel they’re making good business decisions and have positioned themselves well.
We have repositioned the portfolio, allocating away from companies with lower expected returns and toward those with higher expected returns. This is always our process, and occasionally extreme circumstances allow us to make these allocation changes more rapidly. Our process is not only the same, but we believe it is thriving in this environment and that the portfolio is positioned well for the future.
You can find additional performance information and a full list of the Fund’s holdings in this Semi Annual report and at www.dgifund.com.
Portfolio Activity:
Since we last wrote to you last (4/30/20), we added three new stocks to The DGI Fund and sold the remaining position in three others.
New Stocks:
Cullen Frost Bankers, Inc. (CFR) is a Texas-based bank which is characterized by a conservative lending culture, long-tenured employees, and a commitment to technology-enabled, high-touch customer service. It is frequently counted as one of the most admired banks in the country as judged by their customers. And because it operates in one of the most dynamic state economies in the country, we believe the potential for organic growth is strong. We have monitored CFR for many years, but could not add it to the portfolio since the stock was too expensive for us -- it did not meet our expected return hurdle rate. However, we were recently given the chance to make
| Semi-Annual Report | October 31, 2020 | 1 |
| The Disciplined Growth Investors Fund | Shareholder Letter |
October 31, 2020 (Unaudited)
an initial investment as a result of a broad downturn in traditional banking stocks which also included CFR.
SnapOn, Inc. (SNA) manufactures and markets tools, equipment, and systems solutions for professional users performing critical tasks in many different industries. Its products and services include hand and power tools, tool storage, diagnostics software, information and management systems, and shop equipment. The company, through its franchise network, develops close relationships with customers so that they can understand their customers’ work and develop the best tools for the job. As a result, users of their products are more productive and end up becoming extremely passionate fans of the Snap-On brand. In our view, Snap-On is in the initial stages of growing beyond their strong position within the automotive industry and into other industries where reliable tools are critical such as aerospace, military, mining, and power generation; both in the U.S. and abroad. As a result, we took an initial position in the stock.
Strategic Education, Inc. (STRA) is a leading online provider of post-secondary education offering doctoral, master's and bachelor's programs in a variety of disciplines to approximately 100,000 enrolled students. The company designs its curriculum specifically to capitalize on the strengths of an online delivery model. We have been long-time investors in Capella University in a portfolio that invests in smaller companies than The DGI Fund. Capella merged with Strayer University to form Strategic Education in August 2018. After evaluating the merits of the merger and the resulting business model, we decided the new, combined company would be a good fit for The DGI Fund, and took an initial position in the stock.
Complete Sales:
We sold the remaining position in Urban Outfitters and TripAdvisor.
Urban Outfitters (URBN) is a leading specialty retailer of fashion apparel, accessories, and home goods to highly defined customer niches across four successful brands: Urban Outfitters, Anthropologie, Free People and Nuuly. We modestly added to our position in URBN earlier this year as a result of our initial analysis that it offered an attractive expected return and possessed a strong balance sheet for a clothing retailer. However, subsequent conversations with management did not provide the investment team with confidence of a clear long-term strategy. As a result, we completely sold our position and allocated capital to what we think are better opportunities within the Fund.
TripAdvisor, Inc. (TRIP) is an online travel company which owns and operates a portfolio of online travel brands. When we took an initial position in TripAdvisor five years ago, the company was in the early stages of transitioning its business model which we believed would enable it to leverage its hundreds of millions of proprietary user-generated reviews and eventually set the company up for reaccelerating revenue growth. Unfortunately, as sometimes happens with our investments, that investment thesis did not materialize as we would have liked. We completely sold the stock due to increased competition from Google and other online travel agencies and the resulting erosion of TRIP's market share.
Acquisitions:
Varian Medical Systems, Inc. (VAR) was acquired by Siemens Healthineers.
Sincerely,

Frederick K. Martin, CFA -- Portfolio Manager
| 2 | 1-855-DGI-FUND (344-3863) | www.DGIfund.com |
| The Disciplined Growth Investors Fund | Shareholder Letter |
October 31, 2020 (Unaudited)
The Barclay’s Government & Corporate Credit index includes both corporate (publicly-issued, fixed-rate, nonconvertible, investment grade, dollar-denominated, SEC-registered, corporate dept.) and government (Treasury Bond index, Agency Bond index, 1-3 Year Government index, and the 20+-Year treasury) indexes, including bonds with maturities up to ten years.
The S&P 500® Total Return Index is an unmanaged index of 500 common stocks chosen for market size, liquidity and industry group representation. It is a market-value weighted index. The Index is not actively managed and does not reflect any deductions for fees, expenses or taxes. An investor may not invest directly in the Index.
Asset class-specific performance is before fees. The Fund’s single fee – the management fee – is paid from the Fund’s holding of cash. Total Fund net-of-fees performance is presented in this letter, later in this annual report, and is updated monthly on the Fund’s website, www.dgifund.com.
The views of Disciplined Growth Investors, Inc. and information discussed in this commentary are as of the date of publication, are subject to change, and may not reflect the writers’ current views.
The views expressed are those of the Fund’s adviser only, and represent an assessment of market conditions at a specific point in time, are opinions only and should not be relied upon as investment advice regarding a particular investment or markets in general. Such information does not constitute a recommendation to buy or sell specific securities or investment vehicles. It should not be assumed that any investment will be profitable or will equal the performance of the portfolios or any securities or any sectors mentioned in this letter. The subject matter contained in this letter has been derived from several sources believed to be reliable and accurate at the time of compilation. Neither Disciplined Growth Investors, Inc. nor the Fund accepts any liability for losses either direct or consequential caused by the use of this information.
The Fund is distributed by ALPS Distributors, Inc.
The Fund is subject to investment risks, including possible loss of the principal amount invested and therefore is not suitable for all investors. The Fund may not achieve its objectives.
Diversification does not eliminate the risk of experiencing investment losses.
Fred Martin is a registered representative of ALPS Distributors, Inc. CFA Institute Marks are trademarks owned by the CFA Institute.
| Semi-Annual Report | October 31, 2020 | 3 |
| The Disciplined Growth Investors Fund | Performance Update |
October 31, 2020 (Unaudited)
Annualized Total Return Performance (for the period ended October 31, 2020)
| | 6 month | 1 Year | 3 Year | 5 Year | Since Inception* |
| The Disciplined Growth Investors Fund | 15.35% | 8.79% | 9.54% | 10.02% | 11.39% |
| S&P 500® Total Return Index(1) | 13.29% | 9.71% | 10.42% | 11.71% | 14.04% |
Performance data quoted represents past performance. Past performance does not guarantee future results. Investment return and principal value of an investment will fluctuate so that an investor’s shares, when sold or redeemed, may be worth more or less than the original cost. Current performance data may be higher or lower than actual data quoted. For the most current month-end performance data please call 1.855.DGI.FUND.
The table does not reflect the deductions of taxes a shareholder would pay on Fund distributions or redemptions of Fund shares.
Subject to investment risks, including possible loss of the principal amount invested.
Returns for periods less than 1 year are cumulative.
| * | Fund Inception date of August 12, 2011. |
| (1) | The S&P 500® Total Return Index is an unmanaged index of 500 common stocks chosen for market size, liquidity and industry group representation. It is a market-value weighted index. The Index is not actively managed and does not reflect any deductions for fees, expenses or taxes. An investor may not invest directly in the Index. |
| 4 | 1-855-DGI-FUND (344-3863) | www.DGIfund.com |
| The Disciplined Growth Investors Fund | Performance Update |
October 31, 2020 (Unaudited)
Growth of $10,000 Investment in the Fund (for the period ended October 31, 2020)
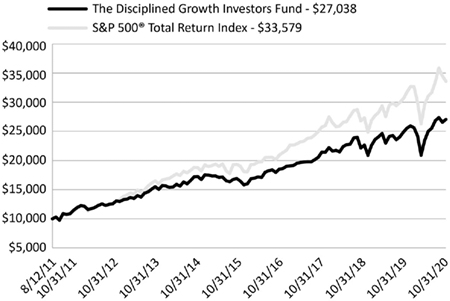
The chart above represents historical performance of a hypothetical investment of $10,000 in the Fund since inception. Past performance does not guarantee future results. This chart does not reflect the deduction of taxes that a shareholder would pay on Fund distributions or the redemption of Fund shares.
Investing in the Fund is subject to investment risks, including possible loss of the principal amount invested.
| Industry Sector Allocation | |
| (as a % of Net Assets)* | |
| | |
| Technology | 34.26% |
| Consumer Discretionary | 12.23% |
| Industrials | 11.14% |
| Health Care | 7.82% |
| Energy | 3.43% |
| Communications | 2.72% |
| Financials | 0.79% |
| Consumer Cyclical | 0.57% |
| Corporate Bonds | 21.02% |
| Foreign Corporate Bonds | 0.91% |
| Foreign Government Bonds | 0.30% |
| Government & Agency Obligations | 3.08% |
| Other Assets in Excess of Liabilities | 1.73% |
| Top Ten Holdings | |
| (as a % of Net Assets)* | |
| | |
| Align Technology, Inc. | 4.14% |
| Autodesk, Inc. | 3.15% |
| Garmin, Ltd. | 3.02% |
| Dolby Laboratories, Inc. | 2.79% |
| Stamps.com, Inc. | 2.72% |
| Cognex Corp. | 2.67% |
| Gentex Corp. | 2.62% |
| TJX Cos., Inc. | 2.53% |
| Akamai Technologies, Inc. | 2.44% |
| Intuit, Inc. | 2.44% |
| Top Ten Holdings | 28.52% |
| * | Holdings are subject to change, and may not reflect the current or future position of the portfolio. |
| Semi-Annual Report | October 31, 2020 | 5 |
| The Disciplined Growth Investors Fund | Disclosure of Fund Expenses |
October 31, 2020 (Unaudited)
As a shareholder of the Fund, you incur two types of costs: (1) transaction costs, including sales charges (loads) on purchase payments, reinvested dividends, or other distributions; redemption fees; and exchange fees; and (2) ongoing costs, including management fees; distribution and/or service (12b-1) fees; and other fund operating expenses. This example is intended to help you understand your ongoing costs (in dollars), of investing in the Fund and to compare these costs with the ongoing costs of investing in other mutual funds.
This example is based on an investment of $1,000 invested at the beginning of the period and held for the entire six-month period of May 1, 2020 through October 31, 2020.
Actual Expenses The first line of the table below provides information about actual account values and actual expenses. You may use the information in this line, together with the amount you invested, to estimate the expenses that you paid over the period. Simply divide your account value by $1,000 (for example, an $8,600 account value divided by $1,000 = 8.6), then multiply the result by the number in the first line under the heading “Expenses Paid During Period” to estimate the expenses you paid on your account during this period.
Hypothetical Example for Comparison Purposes The second line of the table below provides information about hypothetical account values and hypothetical expenses based on the Fund’s actual expense ratio and an assumed rate of return of 5% per year before expenses, which is not the Fund’s actual return. The hypothetical account values and expenses may not be used to estimate the actual ending account balance or expenses you paid for the period. You may use this information to compare the ongoing costs of investing in the Fund and other mutual funds. To do so, compare this 5% hypothetical example with the 5% hypothetical examples that appear in the shareholder reports of the other funds.
Please note that the expenses shown in the table are meant to highlight your ongoing costs only and do not reflect transactional costs, such as sales charges (loads), redemption fees or exchange fees. Therefore, the second line of the table is useful in comparing ongoing costs only and will not help you determine the relative total costs of owning different funds. In addition, if these transactional costs were included, your costs would have been higher.
| | Beginning
Account Value
5/1/2020 | Ending
Account Value
10/31/2020 | Expense Ratio(a) | Expenses Paid
During period
5/1/2020 - 10/31/2020(b) |
| Actual | $1,000.00 | $1,153.50 | 0.78% | $4.23 |
| Hypothetical (5% return before expenses) | $1,000.00 | $1,021.27 | 0.78% | $3.97 |
| (a) | The Fund's expense ratios have been annualized based on the Fund's most recent fiscal half-year expenses. |
| (b) | Expenses are equal to the Fund's annualized expense ratio, multiplied by the average account value over the period, multiplied by the number of days in the most recent fiscal half-year (184)/365 (to reflect the half-year period). |
| 6 | 1-855-DGI-FUND (344-3863) | www.DGIfund.com |
| The Disciplined Growth Investors Fund | Portfolio of Investments |
October 31, 2020 (Unaudited)
| | | Shares | | | Value
(Note 2) | |
| COMMON STOCKS (72.96%) | | | | | | | | |
| COMMUNICATIONS (2.72%) | | | | | | | | |
| Media (2.72%) | | | | | | | | |
| Stamps.com, Inc. (a) | | | 30,694 | | | $ | 6,852,128 | |
| | | | | | | | | |
| TOTAL COMMUNICATIONS | | | | | | | 6,852,128 | |
| | | | | | | | | |
| CONSUMER DISCRETIONARY (12.23%) | | | | | | | | |
| Consumer Discretionary Products (4.26%) | | | | | | | | |
| Gentex Corp. | | | 238,479 | | | | 6,598,714 | |
| Gentherm, Inc. (a) | | | 35,826 | | | | 1,658,385 | |
| Under Armour, Inc. , Class A(a) | | | 177,046 | | | | 2,450,317 | |
| | | | | | | | 10,707,416 | |
| | | | | | | | | |
| Consumer Discretionary Services (1.70%) | | | | | | | | |
| Royal Caribbean Cruises, Ltd. | | | 58,077 | | | | 3,276,704 | |
| Strategic Education, Inc. | | | 12,029 | | | | 999,129 | |
| | | | | | | | 4,275,833 | |
| | | | | | | | | |
| Retail & Whsle - Discretionary (6.27%) | | | | | | | | |
| Nordstrom, Inc. | | | 71,346 | | | | 863,286 | |
| Sleep Number Corp. (a) | | | 72,325 | | | | 4,582,512 | |
| Stitch Fix, Inc. , Class A(a) | | | 115,702 | | | | 3,983,620 | |
| TJX Cos., Inc. | | | 125,042 | | | | 6,352,134 | |
| | | | | | | | 15,781,552 | |
| | | | | | | | | |
| TOTAL CONSUMER DISCRETIONARY | | | | | | | 30,764,801 | |
| | | | | | | | | |
| CONSUMER, CYCLICAL (0.57%) | | | | | | | | |
| Retail (0.57%) | | | | | | | | |
| MSC Industrial Direct Co., Inc. , Class A | | | 20,443 | | | | 1,424,059 | |
| | | | | | | | | |
| TOTAL CONSUMER, CYCLICAL | | | | | | | 1,424,059 | |
| | | | | | | | | |
| ENERGY (3.43%) | | | | | | | | |
| Oil & Gas (3.43%) | | | | | | | | |
| Cabot Oil & Gas Corp. | | | 322,602 | | | | 5,739,090 | |
| Core Laboratories NV | | | 28,475 | | | | 411,464 | |
| Southwestern Energy Co. (a) | | | 924,720 | | | | 2,469,002 | |
| | | | | | | | 8,619,556 | |
| | | | | | | | | |
| TOTAL ENERGY | | | | | | | 8,619,556 | |
| Semi-Annual Report | October 31, 2020 | 7 |
| The Disciplined Growth Investors Fund | Portfolio of Investments |
October 31, 2020 (Unaudited)
| | | Shares | | | Value
(Note 2) | |
| FINANCIALS (0.79%) | | | | | | |
| Banking (0.41%) | | | | | | |
| Cullen/Frost Bankers, Inc. | | | 7,215 | | | $ | 506,998 | |
| TCF Financial Corp. | | | 19,378 | | | | 527,275 | |
| | | | | | | | 1,034,273 | |
| | | | | | | | | |
| Specialty Finance (0.38%) | | | | | | | | |
| Deluxe Corp. | | | 44,206 | | | | 947,777 | |
| | | | | | | | | |
| TOTAL FINANCIALS | | | | | | | 1,982,050 | |
| | | | | | | | | |
| HEALTH CARE (7.82%) | | | | | | | | |
| Health Care (7.82%) | | | | | | | | |
| Align Technology, Inc. (a) | | | 24,449 | | | | 10,417,230 | |
| Edwards Lifesciences Corp. (a) | | | 41,121 | | | | 2,947,965 | |
| Intuitive Surgical, Inc. (a) | | | 7,537 | | | | 5,027,782 | |
| Myriad Genetics, Inc. (a) | | | 102,968 | | | | 1,279,892 | |
| | | | | | | | 19,672,869 | |
| | | | | | | | | |
| TOTAL HEALTH CARE | | | | | | | 19,672,869 | |
| | | | | | | | | |
| INDUSTRIALS (11.14%) | | | | | | | | |
| Industrial Products (8.75%) | | | | | | | | |
| Alarm.com Holdings, Inc. (a) | | | 64,433 | | | | 3,758,377 | |
| Cognex Corp. | | | 101,947 | | | | 6,718,307 | |
| Graco, Inc. | | | 43,386 | | | | 2,685,594 | |
| Middleby Corp. (a) | | | 38,044 | | | | 3,786,900 | |
| Proto Labs, Inc. (a) | | | 26,215 | | | | 3,095,467 | |
| Snap-on, Inc. | | | 12,480 | | | | 1,965,974 | |
| | | | | | | | 22,010,619 | |
| | | | | | | | | |
| Industrial Services (2.39%) | | | | | | | | |
| JetBlue Airways Corp. (a) | | | 180,992 | | | | 2,166,474 | |
| Landstar System, Inc. | | | 30,964 | | | | 3,861,211 | |
| | | | | | | | 6,027,685 | |
| | | | | | | | | |
| TOTAL INDUSTRIALS | | | | | | | 28,038,304 | |
| 8 | 1-855-DGI-FUND (344-3863) | www.DGIfund.com |
| The Disciplined Growth Investors Fund | Portfolio of Investments |
October 31, 2020 (Unaudited)
| | | Shares | | | Value
(Note 2) | |
| TECHNOLOGY (34.26%) | | | | | | |
| Software & Tech Services (14.40%) | | | | | | | | |
| Akamai Technologies, Inc. (a) | | | 64,543 | | | $ | 6,139,330 | |
| Autodesk, Inc. (a) | | | 33,657 | | | | 7,927,570 | |
| FactSet Research Systems, Inc. | | | 9,550 | | | | 2,927,075 | |
| IHS Markit, Ltd. | | | 27,705 | | | | 2,240,503 | |
| Intuit, Inc. | | | 19,496 | | | | 6,135,001 | |
| Manhattan Associates, Inc. (a) | | | 31,915 | | | | 2,728,733 | |
| Open Text Corp. | | | 92,927 | | | | 3,413,209 | |
| Paychex, Inc. | | | 16,838 | | | | 1,384,926 | |
| RealPage, Inc. (a) | | | 59,502 | | | | 3,313,666 | |
| | | | | | | | 36,210,013 | |
| | | | | | | | | |
| Tech Hardware & Semiconductors (19.86%) | | | | | | | | |
| Arista Networks, Inc. (a) | | | 3,982 | | | | 831,840 | |
| Dolby Laboratories, Inc. , Class A | | | 93,629 | | | | 7,029,665 | |
| Garmin, Ltd. | | | 72,972 | | | | 7,590,547 | |
| IPG Photonics Corp. (a) | | | 12,927 | | | | 2,403,905 | |
| Microchip Technology, Inc. | | | 31,555 | | | | 3,315,799 | |
| Plantronics, Inc. | | | 114,633 | | | | 2,237,636 | |
| Plexus Corp. (a) | | | 82,161 | | | | 5,713,476 | |
| Power Integrations, Inc. | | | 99,650 | | | | 5,999,927 | |
| Pure Storage, Inc. , Class A(a) | | | 228,017 | | | | 3,671,074 | |
| Super Micro Computer, Inc. (a) | | | 176,951 | | | | 4,020,327 | |
| Ubiquiti, Inc. | | | 18,031 | | | | 3,346,734 | |
| ViaSat, Inc. (a) | | | 112,319 | | | | 3,807,614 | |
| | | | | | | | 49,968,544 | |
| | | | | | | | | |
| TOTAL TECHNOLOGY | | | | | | | 86,178,557 | |
| | | | | | | | | |
| TOTAL COMMON STOCKS | | | | | | | | |
| (Cost $127,433,886) | | | | | | $ | 183,532,324 | |
| | | Principal
Amount | | | Value
(Note 2) | |
| CORPORATE BONDS (21.02%) | | | | | | | | |
| COMMUNICATIONS (1.23%) | | | | | | | | |
| Cable & Satellite (0.30%) | | | | | | | | |
| Comcast Corp. | | | | | | | | |
| 4.150% 10/15/2028 | | $ | 640,000 | | | $ | 761,878 | |
| | | | | | | | | |
| Entertainment Content (0.32%) | | | | | | | | |
| ViacomCBS, Inc. | | | | | | | | |
| 3.700% 06/01/2028 | | | 720,000 | | | | 799,751 | |
| Semi-Annual Report | October 31, 2020 | 9 |
| The Disciplined Growth Investors Fund | Portfolio of Investments |
October 31, 2020 (Unaudited)
| | | Principal
Amount | | | Value
(Note 2) | |
| COMMUNICATIONS (continued) | | | | | | | | |
| Wireless Telecommunications Services (0.61%) | | | | | | | | |
| AT&T, Inc. | | | | | | | | |
| 4.350% 03/01/2029 | | $ | 677,000 | | | $ | 787,345 | |
| 4.450% 04/01/2024 | | | 4,000 | | | | 4,466 | |
| Verizon Communications, Inc. | | | | | | | | |
| 4.329% 09/21/2028 | | | 618,000 | | | | 741,562 | |
| | | | | | | | 1,533,373 | |
| | | | | | | | | |
| TOTAL COMMUNICATIONS | | | | | | | 3,095,002 | |
| | | | | | | | | |
| CONSUMER DISCRETIONARY (2.36%) | | | | | | | | |
| Airlines (0.30%) | | | | | | | | |
| Southwest Airlines Co. | | | | | | | | |
| 3.000% 11/15/2026 | | | 756,000 | | | | 763,860 | |
| | | | | | | | | |
| Automobiles Manufacturing (0.32%) | | | | | | | | |
| General Motors Financial Co., Inc. | | | | | | | | |
| 5.250% 03/01/2026 | | | 695,000 | | | | 792,583 | |
| | | | | | | | | |
| Consumer Services (0.32%) | | | | | | | | |
| Cintas Corp. No 2 | | | | | | | | |
| 3.700% 04/01/2027 | | | 710,000 | | | | 810,692 | |
| | | | | | | | | |
| Restaurants (0.36%) | | | | | | | | |
| McDonald's Corp., Series MTN | | | | | | | | |
| 6.300% 03/01/2038 | | | 604,000 | | | | 891,522 | |
| | | | | | | | | |
| Retail - Consumer Discretionary (1.06%) | | | | | | | | |
| Advance Auto Parts, Inc. | | | | | | | | |
| 1.750% 10/01/2027 | | | 750,000 | | | | 744,953 | |
| Amazon.com, Inc. | | | | | | | | |
| 5.200% 12/03/2025 | | | 885,000 | | | | 1,069,760 | |
| Lowe's Cos., Inc. | | | | | | | | |
| 3.650% 04/05/2029 | | | 742,000 | | | | 853,591 | |
| | | | | | | | 2,668,304 | |
| | | | | | | | | |
| TOTAL CONSUMER DISCRETIONARY | | | | | | | 5,926,961 | |
| | | | | | | | | |
| CONSUMER STAPLES (0.63%) | | | | | | | | |
| Food & Beverage (0.31%) | | | | | | | | |
| Anheuser-Busch InBev Worldwide, Inc. | | | | | | | | |
| 4.000% 04/13/2028 | | | 670,000 | | | | 771,509 | |
| 10 | 1-855-DGI-FUND (344-3863) | www.DGIfund.com |
| The Disciplined Growth Investors Fund | Portfolio of Investments |
October 31, 2020 (Unaudited)
| | | Principal
Amount | | | Value
(Note 2) | |
| CONSUMER STAPLES (continued) | | | | | | | | |
| Mass Merchants (0.32%) | | | | | | | | |
| Costco Wholesale Corp. | | | | | | | | |
| 2.750% 05/18/2024 | | $ | 760,000 | | | $ | 819,452 | |
| | | | | | | | | |
| TOTAL CONSUMER STAPLES | | | | | | | 1,590,961 | |
| | | | | | | | | |
| CONSUMER, NON-CYCLICAL (0.64%) | | | | | | | | |
| Pharmaceuticals (0.64%) | | | | | | | | |
| AbbVie, Inc. | | | | | | | | |
| 4.250% 11/14/2028 | | | 695,000 | | | | 820,489 | |
| CVS Health Corp. | | | | | | | | |
| 4.300% 03/25/2028 | | | 685,000 | | | | 794,333 | |
| | | | | | | | 1,614,822 | |
| | | | | | | | | |
| TOTAL CONSUMER, NON-CYCLICAL | | | | | | | 1,614,822 | |
| | | | | | | | | |
| ENERGY (1.82%) | | | | | | | | |
| Exploration & Production (0.29%) | | | | | | | | |
| Burlington Resources LLC | | | | | | | | |
| 7.400% 12/01/2031 | | | 500,000 | | | | 731,485 | |
| | | | | | | | | |
| Pipeline (1.53%) | | | | | | | | |
| Boardwalk Pipelines LP | | | | | | | | |
| 5.950% 06/01/2026 | | �� | 670,000 | | | | 774,871 | |
| Enbridge Energy Partners LP | | | | | | | | |
| 4.200% 09/15/2021 | | | 4,000 | | | | 4,092 | |
| 5.875% 10/15/2025 | | | 643,000 | | | | 768,014 | |
| Enterprise Products Operating LLC | | | | | | | | |
| 3.125% 07/31/2029 | | | 685,000 | | | | 739,083 | |
| MPLX LP | | | | | | | | |
| 4.125% 03/01/2027 | | | 748,000 | | | | 817,898 | |
| ONEOK, Inc. | | | | | | | | |
| 4.550% 07/15/2028 | | | 694,000 | | | | 739,238 | |
| | | | | | | | 3,843,196 | |
| | | | | | | | | |
| TOTAL ENERGY | | | | | | | 4,574,681 | |
| | | | | | | | | |
| FINANCIALS (4.12%) | | | | | | | | |
| Banks (0.95%) | | | | | | | | |
| Truist Financial Corp., Series MTN | | | | | | | | |
| 3.875% 03/19/2029 | | | 695,000 | | | | 801,889 | |
| US Bancorp, Series DMTN | | | | | | | | |
| 3.000% 07/30/2029 | | | 689,000 | | | | 760,754 | |
| Semi-Annual Report | October 31, 2020 | 11 |
| The Disciplined Growth Investors Fund | Portfolio of Investments |
October 31, 2020 (Unaudited)
| | | Principal
Amount | | | Value
(Note 2) | |
| FINANCIALS (continued) | | | | | | | | |
| Banks (continued) | | | | | | | | |
| Wells Fargo & Co., Series GMTN | | | | | | | | |
| 4.300% 07/22/2027 | | $ | 710,000 | | | $ | 815,122 | |
| | | | | | | | 2,377,765 | |
| | | | | | | | | |
| Consumer Finance (0.31%) | | | | | | | | |
| American Express Co. | | | | | | | | |
| 3.625% 12/05/2024 | | | 708,000 | | | | 781,867 | |
| | | | | | | | | |
| Diversified Banks (0.97%) | | | | | | | | |
| Bank of America Corp., Series L | | | | | | | | |
| 4.183% 11/25/2027 | | | 715,000 | | | | 818,967 | |
| Citigroup, Inc. | | | | | | | | |
| 4.300% 11/20/2026 | | | 720,000 | | | | 826,877 | |
| JPMorgan Chase & Co. | | | | | | | | |
| 4.125% 12/15/2026 | | | 690,000 | | | | 799,822 | |
| | | | | | | | 2,445,666 | |
| | | | | | | | | |
| Financial Services (0.62%) | | | | | | | | |
| Morgan Stanley, Series GMTN | | | | | | | | |
| 3.700% 10/23/2024 | | | 690,000 | | | | 767,366 | |
| Northern Trust Corp. | | | | | | | | |
| 3.950% 10/30/2025 | | | 693,000 | | | | 796,368 | |
| | | | | | | | 1,563,734 | |
| | | | | | | | | |
| Life Insurance (0.32%) | | | | | | | | |
| Principal Financial Group, Inc. | | | | | | | | |
| 3.100% 11/15/2026 | | | 726,000 | | | | 805,341 | |
| | | | | | | | | |
| Property & Casualty Insurance (0.33%) | | | | | | | | |
| American International Group, Inc. | | | | | | | | |
| 4.250% 03/15/2029 | | | 700,000 | | | | 826,270 | |
| | | | | | | | | |
| Real Estate (0.62%) | | | | | | | | |
| Simon Property Group LP | | | | | | | | |
| 2.450% 09/13/2029 | | | 750,000 | | | | 742,357 | |
| Welltower, Inc. | | | | | | | | |
| 4.250% 04/01/2026 | | | 712,000 | | | | 818,310 | |
| | | | | | | | 1,560,667 | |
| | | | | | | | | |
| TOTAL FINANCIALS | | | | | | | 10,361,310 | |
| 12 | 1-855-DGI-FUND (344-3863) | www.DGIfund.com |
| The Disciplined Growth Investors Fund | Portfolio of Investments |
October 31, 2020 (Unaudited)
| | | Principal
Amount | | | Value
(Note 2) | |
| HEALTH CARE (0.64%) | | | | | | | | |
| Managed Care (0.64%) | | | | | | | | |
| Anthem, Inc. | | | | | | | | |
| 3.650% 12/01/2027 | | $ | 731,000 | | | $ | 826,219 | |
| UnitedHealth Group, Inc. | | | | | | | | |
| 3.750% 07/15/2025 | | | 691,000 | | | | 785,042 | |
| | | | | | | | 1,611,261 | |
| | | | | | | | | |
| TOTAL HEALTH CARE | | | | | | | 1,611,261 | |
| | | | | | | | | |
| INDUSTRIALS (3.16%) | | | | | | | | |
| Aerospace & Defense (0.58%) | | | | | | | | |
| Lockheed Martin Corp. | | | | | | | | |
| 3.100% 01/15/2023 | | | 680,000 | | | | 717,607 | |
| Raytheon Technologies Corp. | | | | | | | | |
| 4.125% 11/16/2028 | | | 640,000 | | | | 750,236 | |
| | | | | | | | 1,467,843 | |
| | | | | | | | | |
| Engineering & Construction (0.26%) | | | | | | | | |
| Fluor Corp. | | | | | | | | |
| 4.250% 09/15/2028 | | | 725,000 | | | | 649,633 | |
| | | | | | | | | |
| Industrial Other (0.31%) | | | | | | | | |
| General Electric Co., Series MTN | | | | | | | | |
| 5.875% 01/14/2038 | | | 653,000 | | | | 785,576 | |
| | | | | | | | | |
| Railroad (0.68%) | | | | | | | | |
| Burlington Northern Santa Fe LLC | | | | | | | | |
| 3.000% 03/15/2023 | | | 2,000 | | | | 2,104 | |
| 3.400% 09/01/2024 | | | 875,000 | | | | 959,919 | |
| Union Pacific Corp. | | | | | | | | |
| 3.950% 09/10/2028 | | | 637,000 | | | | 746,844 | |
| | | | | | | | 1,708,867 | |
| | | | | | | | | |
| Transportation & Logistics (0.67%) | | | | | | | | |
| FedEx Corp. | | | | | | | | |
| 3.300% 03/15/2027 | | | 756,000 | | | | 838,872 | |
| United Parcel Service, Inc. | | | | | | | | |
| 6.200% 01/15/2038 | | | 558,000 | | | | 835,776 | |
| | | | | | | | 1,674,648 | |
| | | | | | | | | |
| Waste & Environment Services & Equipment (0.66%) | | | | | | | | |
| Republic Services, Inc. | | | | | | | | |
| 3.375% 11/15/2027 | | | 735,000 | | | | 824,901 | |
| Semi-Annual Report | October 31, 2020 | 13 |
| The Disciplined Growth Investors Fund | Portfolio of Investments |
October 31, 2020 (Unaudited)
| | | Principal
Amount | | | Value
(Note 2) | |
| INDUSTRIALS (continued) | | | | | | | | |
| Waste & Environment Services & Equipment (continued) | | | | | | | | |
| Waste Management, Inc. | | | | | | | | |
| 3.150% 11/15/2027 | | $ | 745,000 | | | $ | 837,381 | |
| | | | | | | | 1,662,282 | |
| | | | | | | | | |
| TOTAL INDUSTRIALS | | | | | | | 7,948,849 | |
| | | | | | | | | |
| MATERIALS (0.32%) | | | | | | | | |
| Chemicals (0.32%) | | | | | | | | |
| DuPont de Nemours, Inc. | | | | | | | | |
| 4.725% 11/15/2028 | | | 666,000 | | | | 797,679 | |
| | | | | | | | | |
| TOTAL MATERIALS | | | | | | | 797,679 | |
| | | | | | | | | |
| TECHNOLOGY (0.32%) | | | | | | | | |
| Semiconductors (0.32%) | | | | | | | | |
| Analog Devices, Inc. | | | | | | | | |
| 3.900% 12/15/2025 | | | 711,000 | | | | 811,484 | |
| | | | | | | | | |
| TOTAL TECHNOLOGY | | | | | | | 811,484 | |
| | | | | | | | | |
| UTILITIES (5.78%) | | | | | | | | |
| Utilities (5.78%) | | | | | | | | |
| American Electric Power Co., Inc. | | | | | | | | |
| 3.200% 11/13/2027 | | | 731,000 | | | | 798,157 | |
| Black Hills Corp. | | | | | | | | |
| 3.150% 01/15/2027 | | | 700,000 | | | | 754,428 | |
| CenterPoint Energy, Inc. | | | | | | | | |
| 4.250% 11/01/2028 | | | 685,000 | | | | 808,594 | |
| CMS Energy Corp. | | | | | | | | |
| 3.450% 08/15/2027 | | | 700,000 | | | | 781,776 | |
| Dominion Energy Gas Holdings LLC, Series B | | | | | | | | |
| 3.000% 11/15/2029 | | | 755,000 | | | | 821,790 | |
| DTE Energy Co. | | | | | | | | |
| 3.800% 03/15/2027 | | | 680,000 | | | | 768,883 | |
| Duke Energy Corp. | | | | | | | | |
| 3.400% 06/15/2029 | | | 660,000 | | | | 738,971 | |
| Edison International | | | | | | | | |
| 2.400% 09/15/2022 | | | 745,000 | | | | 756,764 | |
| Interstate Power and Light Co. | | | | | | | | |
| 3.400% 08/15/2025 | | | 723,000 | | | | 792,956 | |
| ITC Holdings Corp. | | | | | | | | |
| 4.050% 07/01/2023 | | | 540,000 | | | | 582,002 | |
| 14 | 1-855-DGI-FUND (344-3863) | www.DGIfund.com |
| The Disciplined Growth Investors Fund | Portfolio of Investments |
October 31, 2020 (Unaudited)
| | | Principal
Amount | | | Value
(Note 2) | |
| UTILITIES (continued) | | | | | | | | |
| Utilities (continued) | | | | | | | | |
| National Rural Utilities Cooperative Finance Corp. | | | | | | | | |
| 3.400% 02/07/2028 | | $ | 680,000 | | | $ | 778,827 | |
| NiSource, Inc. | | | | | | | | |
| 2.950% 09/01/2029 | | | 680,000 | | | | 735,920 | |
| PacifiCorp | | | | | | | | |
| 5.250% 06/15/2035 | | | 592,000 | | | | 811,333 | |
| Potomac Electric Power Co. | | | | | | | | |
| 3.600% 03/15/2024 | | | 698,000 | | | | 758,898 | |
| PPL Capital Funding, Inc. | | | | | | | | |
| 4.125% 04/15/2030 | | | 665,000 | | | | 780,879 | |
| PSEG Power LLC | | | | | | | | |
| 4.300% 11/15/2023 | | | 675,000 | | | | 739,247 | |
| Puget Energy, Inc. | | | | | | | | |
| 3.650% 05/15/2025 | | | 725,000 | | | | 806,700 | |
| Sempra Energy | | | | | | | | |
| 3.750% 11/15/2025 | | | 699,000 | | | | 784,067 | |
| WEC Energy Group, Inc. | | | | | | | | |
| 1.375% 10/15/2027 | | | 740,000 | | | | 738,780 | |
| | | | | | | | 14,538,972 | |
| | | | | | | | | |
| TOTAL UTILITIES | | | | | | | 14,538,972 | |
| | | | | | | | | |
| TOTAL CORPORATE BONDS | | | | | | | | |
| (Cost $49,047,683) | | | | | | $ | 52,871,982 | |
| | | | | | | | | |
| FOREIGN CORPORATE BONDS (0.91%) | | | | | | | | |
| ENERGY (0.62%) | | | | | | | | |
| Exploration & Production (0.29%) | | | | | | | | |
| Canadian Natural Resources, Ltd. | | | | | | | | |
| 3.850% 06/01/2027 | | | 690,000 | | | | 729,865 | |
| | | | | | | | | |
| Pipeline (0.33%) | | | | | | | | |
| TransCanada PipeLines, Ltd. | | | | | | | | |
| 7.250% 08/15/2038 | | | 572,000 | | | | 830,835 | |
| | | | | | | | | |
| TOTAL ENERGY | | | | | | | 1,560,700 | |
| Semi-Annual Report | October 31, 2020 | 15 |
| The Disciplined Growth Investors Fund | Portfolio of Investments |
October 31, 2020 (Unaudited)
| | | Principal
Amount | | | Value
(Note 2) | |
| FINANCIALS (0.29%) | | | | | | |
| Diversified Banks (0.29%) | | | | | | | | |
| Royal Bank of Canada, Series GMTN | | | | | | | | |
| 4.650% 01/27/2026 | | $ | 635,000 | | | $ | 746,454 | |
| | | | | | | | | |
| TOTAL FINANCIALS | | | | | | | 746,454 | |
| | | | | | | | | |
| TOTAL FOREIGN CORPORATE BONDS | | | | | | | | |
| (Cost $2,232,922) | | | | | | $ | 2,307,154 | |
| | | | | | | | | |
| FOREIGN GOVERNMENT BONDS (0.30%) | | | | | | | | |
| Corp Andina de Fomento | | | | | | | | |
| 4.375% 06/15/2022 | | | 712,000 | | | | 751,523 | |
| | | | | | | | | |
| TOTAL FOREIGN GOVERNMENT BONDS | | | | | | | | |
| (Cost $731,376) | | | | | | $ | 751,523 | |
| | | | | | | | | |
| GOVERNMENT & AGENCY OBLIGATIONS (3.08%) | | | | | | | | |
| U.S. Treasury Notes | | | | | | | | |
| 1.375% 01/31/2021 | | | 3,550,000 | | | | 3,560,627 | |
| 2.000% 10/31/2021 | | | 545,000 | | | | 555,039 | |
| 2.500% 01/31/2021 | | | 3,610,000 | | | | 3,630,732 | |
| | | | | | | | 7,746,398 | |
| | | | | | | | | |
| TOTAL GOVERNMENT & AGENCY OBLIGATIONS | | | | | | | | |
| (Cost $7,722,638) | | | | | | $ | 7,746,398 | |
| | | Yield | | | Shares | | | Value
(Note 2) | |
| SHORT TERM INVESTMENTS (2.40%) | | | | | | | | | | | | |
| MONEY MARKET FUND (2.40%) | | | | | | | | | | | | |
| Fidelity Investments Money Market Government Portfolio - Class I | | | 0.010 | %(b) | | | 6,047,482 | | | | 6,047,482 | |
| | | | | | | | | | | | | |
| TOTAL SHORT TERM INVESTMENTS | | | | | | | | | | | | |
| (Cost $6,047,482) | | | | | | | | | | $ | 6,047,482 | |
| | | | | | | | | | | | | |
| TOTAL INVESTMENTS (100.67%) | | | | | | | | | | | | |
| (Cost $193,215,987) | | | | | | | | | | $ | 253,256,863 | |
| | | | | | | | | | | | | |
| Liabilities In Excess Of Other Assets (-0.67%) | | | | | | | | | | | (1,695,510 | ) |
| | | | | | | | | | | | | |
| NET ASSETS (100.00%) | | | | | | | | | | $ | 251,561,353 | |
| 16 | 1-855-DGI-FUND (344-3863) | www.DGIfund.com |
| The Disciplined Growth Investors Fund | Portfolio of Investments |
October 31, 2020 (Unaudited)
| (a) | Non-Income Producing Security. |
| (b) | Represents the 7-day yield. |
For Fund compliance purposes, the Fund's industry classifications refer to any one or more of the industry sub-classifications used by one or more widely recognized market indexes or ratings group indexes, and/or as defined by Fund management. This definition may not apply for purposes of this report, which may combine industry sub-classifications for reporting ease. Industries are shown as a percent of net assets.
See Notes to Financial Statements.
| Semi-Annual Report | October 31, 2020 | 17 |
| The Disciplined Growth Investors Fund | Statement of Assets and Liabilities |
| | October 31, 2020 (Unaudited) |
| ASSETS | | |
| Investments, at value | | $ | 253,256,863 | |
| Cash | | | 19,137 | |
| Receivable for investments sold | | | 1,624,548 | |
| Receivable for shares sold | | | 15,700 | |
| Dividends and interest receivable | | | 599,626 | |
| Total assets | | | 255,515,874 | |
| | | | | |
| LIABILITIES | | | | |
| Payable for investments purchased | | | 3,730,019 | |
| Payable for shares redeemed | | | 54,100 | |
| Payable to adviser | | | 170,402 | |
| Total liabilities | | | 3,954,521 | |
| NET ASSETS | | $ | 251,561,353 | |
| | | | | |
| NET ASSETS CONSIST OF | | | | |
| Paid-in capital (Note 5) | | $ | 165,490,496 | |
| Distributable Earnings | | | 86,070,857 | |
| NET ASSETS | | $ | 251,561,353 | |
| | | | | |
| INVESTMENTS, AT COST | | $ | 193,215,987 | |
| | | | | |
| PRICING OF SHARES | | | | |
| Net Asset Value, offering and redemption price per share | | $ | 22.35 | |
| Shares of beneficial interest outstanding | | | 11,257,872 | |
See Notes to Financial Statements.
| 18 | 1-855-DGI-FUND (344-3863) | www.DGIfund.com |
| The Disciplined Growth Investors Fund | Statement of Operations |
| | | For the Six
Months Ended
October 31, 2020 (Unaudited) |
| INVESTMENT INCOME | | | | |
| Dividends | | $ | 533,180 | |
| Foreign taxes withheld | | | (6,042 | ) |
| Interest | | | 921,380 | |
| Total investment income | | | 1,448,518 | |
| | | | | |
| EXPENSES | | | | |
| Investment advisory fees (Note 6) | | | 963,030 | |
| Total expenses | | | 963,030 | |
| NET INVESTMENT INCOME | | | 485,488 | |
| | | | | |
| REALIZED AND UNREALIZED GAIN ON INVESTMENTS | | | | |
| Net realized gain on investments | | | 11,682,999 | |
| Net change in unrealized appreciation on investments | | | 21,610,788 | |
| NET REALIZED AND UNREALIZED GAIN ON INVESTMENTS | | | 33,293,787 | |
| NET INCREASE IN NET ASSETS RESULTING FROM OPERATIONS | | $ | 33,779,275 | |
See Notes to Financial Statements.
| Semi-Annual Report | October 31, 2020 | 19 |
| The Disciplined Growth Investors Fund | Statements of Changes in Net Assets |
| | | For the Six
Months Ended
October 31, 2020 (Unaudited) | | For the
Year Ended
April 30, 2020 |
| OPERATIONS | | | | |
| Net investment income | | $ | 485,488 | | | $ | 2,036,023 | |
| Net realized gain | | | 11,682,999 | | | | 18,009,670 | |
| Net change in unrealized appreciation/(depreciation) | | | 21,610,788 | | | | (31,274,719 | ) |
| Net increase/(decrease) in net assets resulting from operations | | | 33,779,275 | | | | (11,229,026 | ) |
| | | | | | | | | |
| DISTRIBUTIONS (Note 3) | | | | | | | | |
| Total distributions to shareholders | | | (539,543 | ) | | | (8,714,331 | ) |
| Net decrease in net assets from distributions | | | (539,543 | ) | | | (8,714,331 | ) |
| | | | | | | | | |
| CAPITAL SHARE TRANSACTIONS (Note 5) | | | | | | | | |
| Proceeds from sales of shares | | | 7,929,163 | | | | 16,029,109 | |
| Issued to shareholders in reinvestment of distributions | | | 524,734 | | | | 8,634,679 | |
| Cost of shares redeemed | | | (16,723,276 | ) | | | (18,300,955 | ) |
| Net increase/(decrease) from capital share transactions | | | (8,269,379 | ) | | | 6,362,833 | |
| | | | | | | | | |
| Net increase/(decrease) in net assets | | | 24,970,353 | | | | (13,580,524 | ) |
| | | | | | | | | |
| NET ASSETS | | | | | | | | |
| Beginning of period | | | 226,591,000 | | | | 240,171,524 | |
| End of period | | $ | 251,561,353 | | | $ | 226,591,000 | |
| | | | | | | | | |
| OTHER INFORMATION | | | | | | | | |
| Share Transactions | | | | | | | | |
| Issued | | | 363,555 | | | | 786,466 | |
| Issued to shareholders in reinvestment of distributions | | | 24,920 | | | | 411,132 | |
| Redeemed | | | (799,191 | ) | | | (882,364 | ) |
| Net increase/(decrease) in share transactions | | | (410,716 | ) | | | 315,234 | |
See Notes to Financial Statements.
| 20 | 1-855-DGI-FUND (344-3863) | www.DGIfund.com |
Page Intentionally Left Blank
The Disciplined Growth Investors Fund
| NET ASSET VALUE, BEGINNING OF PERIOD |
| |
| INCOME FROM OPERATIONS |
| Net investment income(a) |
| Net realized and unrealized gain/(loss) on investments |
| Total from investment operations |
| |
| DISTRIBUTIONS |
| From net investment income |
| From net realized gain on investments |
| Total distributions |
| |
| INCREASE/(DECREASE) IN NET ASSET VALUE |
| NET ASSET VALUE, END OF PERIOD |
| |
| TOTAL RETURN |
| |
| RATIOS AND SUPPLEMENTAL DATA |
| Net assets, end of period (000's) |
| |
| RATIOS TO AVERAGE NET ASSETS |
| Expenses |
| Net investment income |
| |
| PORTFOLIO TURNOVER RATE |
| (a) | Per share numbers have been calculated using the average shares method. |
| (c) | In 2018 the Fund's total return consists of a voluntary reimbursement by the advisor for a realized investment loss. Excluding this item, total return would not have been impacted. |
See Notes to Financial Statements.
| 22 | 1-855-DGI-FUND (344-3863) | www.DGIfund.com |
| For a share outstanding during the years presented |
For the Six
Months Ended
October 31, 2020
(Unaudited) | | For the
Year Ended
April 30, 2020 | | For the
Year Ended
April 30, 2019 | | For the
Year Ended
April 30, 2018 | | For the
Year Ended
April 30, 2017 | | For the
Year Ended
April 30, 2016 |
| $ | 19.42 | | | $ | 21.15 | | | $ | 19.12 | | | $ | 18.20 | | | $ | 15.96 | | | $ | 16.75 | |
| | | | | | | | | | | | | | | | | | | | | | | |
| | 0.04 | | | | 0.18 | | | | 0.16 | | | | 0.12 | | | | 0.09 | | | | 0.09 | |
| | 2.94 | | | | (1.14 | ) | | | 2.55 | | | | 1.64 | | | | 2.29 | | | | (0.44 | ) |
| | 2.98 | | | | (0.96 | ) | | | 2.71 | | | | 1.76 | | | | 2.38 | | | | (0.35 | ) |
| | | | | | | | | | | | | | | | | | | | | | | |
| | (0.05 | ) | | | (0.17 | ) | | | (0.12 | ) | | | (0.12 | ) | | | (0.09 | ) | | | (0.10 | ) |
| | – | | | | (0.60 | ) | | | (0.56 | ) | | | (0.72 | ) | | | (0.05 | ) | | | (0.34 | ) |
| | (0.05 | ) | | | (0.77 | ) | | | (0.68 | ) | | | (0.84 | ) | | | (0.14 | ) | | | (0.44 | ) |
| | | | | | | | | | | | | | | | | | | | | | | |
| | 2.93 | | | | (1.73 | ) | | | 2.03 | | | | 0.92 | | | | 2.24 | | | | (0.79 | ) |
| $ | 22.35 | | | $ | 19.42 | | | $ | 21.15 | | | $ | 19.12 | | | $ | 18.20 | | | $ | 15.96 | |
| | | | | | | | | | | | | | | | | | | | | | | |
| | 15.35 | %(b) | | | (4.79 | %) | | | 14.74 | % | | | 9.75 | %(c) | | | 14.96 | % | | | (2.05 | %) |
| | | | | | | | | | | | | | | | | | | | | | | |
| $ | 251,561 | | | $ | 226,591 | | | $ | 240,172 | | | $ | 204,068 | | | $ | 159,774 | | | $ | 119,857 | |
| | | | | | | | | | | | | | | | | | | | | | | |
| | 0.78 | %(d) | | | 0.78 | % | | | 0.78 | % | | | 0.78 | % | | | 0.78 | % | | | 0.78 | % |
| | 0.39 | %(d) | | | 0.86 | % | | | 0.80 | % | | | 0.64 | % | | | 0.50 | % | | | 0.59 | % |
| | | | | | | | | | | | | | | | | | | | | | | |
| | 13 | %(b) | | | 29 | % | | | 22 | % | | | 18 | % | | | 16 | % | | | 13 | % |
| Semi-Annual Report | October 31, 2020 | 23 |
| The Disciplined Growth Investors Fund | Notes to Financial Statements |
| | October 31, 2020 (Unaudited) |
1. ORGANIZATION
Financial Investors Trust (the “Trust”), a Delaware statutory trust, is an open-end management investment company registered under the Investment Company Act of 1940, as amended (“1940 Act”). The Trust consists of multiple separate portfolios or series. This semi-annual report describes The Disciplined Growth Investors Fund (the “Fund”). The Fund seeks long-term capital growth and as a secondary objective, modest income with reasonable risk.
2. SIGNIFICANT ACCOUNTING POLICIES
The accompanying financial statements were prepared in accordance with accounting principles generally accepted in the United States of America (“U.S. GAAP”). The preparation of financial statements in conformity with U.S. GAAP requires management to make certain estimates and assumptions that affect the reported amounts of assets and liabilities and disclosures of contingent assets and liabilities at the date of the financial statements and the reported amounts of revenue and expenses during the period. Actual results could differ from those estimates. The Fund is considered an investment company for financial reporting purposes under U.S. GAAP and follows the accounting and reporting guidance applicable to investment companies in the Financial Accounting Standards Board Accounting Standards Codification Topic 946. The following is a summary of significant accounting policies consistently followed by the Fund in preparation of its financial statements.
Investment Valuation: The Fund generally values its securities based on market prices determined at the close of regular trading on the New York Stock Exchange (“NYSE”), normally 4:00 p.m. Eastern Time, on each day the NYSE is open for trading.
For equity securities and mutual funds that are traded on an exchange, the market price is usually the closing sale or official closing price on that exchange. In the case of equity securities not traded on an exchange, or if such closing prices are not otherwise available, the securities are valued at the mean of the most recent bid and ask prices on such day. Redeemable securities issued by open-end registered investment companies are valued at the investment company’s applicable net asset value, with the exception of exchange-traded open-end investment companies, which are priced as equity securities.
The market price for debt obligations is generally the price supplied by an independent third-party pricing service approved by the Board of Trustees of the Trust (the “Board” or the “Trustees”), which may use a matrix, formula or other objective method that takes into consideration quotations from dealers, market transactions in comparable investments, market indices and yield curves. If vendors are unable to supply a price, or if the price supplied is deemed to be unreliable, the market price may be determined using quotations received from one or more broker–dealers that make a market in the security. Fixed-income obligations, excluding municipal securities, having a remaining maturity of greater than 60 days, are typically valued at the mean between the evaluated bid and ask prices formulated by an independent pricing service. Corporate Bonds, U.S. Government & Agency, and U.S. Treasury Bonds & Notes are valued using market models that consider trade data, quotations from dealers and active market makers, relevant yield curve and spread data, creditworthiness, trade data or market information on comparable securities, and other relevant security specific information. Publicly traded Foreign Government Debt securities and Foreign Corporate Bonds are
| 24 | 1-855-DGI-FUND (344-3863) | www.DGIfund.com |
| The Disciplined Growth Investors Fund | Notes to Financial Statements |
| | October 31, 2020 (Unaudited) |
typically traded internationally in the over-the-counter market and are valued at the mean between the bid and asked prices as of the close of business of that market. Mortgage-related and asset-backed securities are valued based on models that consider trade data, prepayment and default projections, benchmark yield and spread data and estimated cash flows of each tranche of the issuer. Publicly traded foreign government debt securities are typically traded internationally in the over-the-counter market and are valued at the mean between the bid and asked prices as of the close of business of that market.
When such prices or quotations are not available, or when Disciplined Growth Investors, Inc. (the “Adviser”) believes that they are unreliable, securities may be priced using fair value procedures approved by the Board.
Fair Value Measurements: The Fund discloses the classification of its fair value measurements following a three-tier hierarchy based on the inputs used to measure fair value. Inputs refer broadly to the assumptions that market participants would use in pricing the asset or liability, including assumptions about risk. Inputs may be observable or unobservable. Observable inputs reflect the assumptions market participants would use in pricing the asset or liability that are developed based on market data obtained from sources independent of the reporting entity. Unobservable inputs reflect the reporting entity’s own assumptions about the assumptions market participants would use in pricing the asset or liability that are developed based on the best information available.
Various inputs are used in determining the value of the Fund’s investments as of the end of the reporting period. When inputs used fall into different levels of the fair value hierarchy, the level in the hierarchy within which the fair value measurement falls is determined based on the lowest level input that is significant to the fair value measurement in its entirety. The designated input levels are not necessarily an indication of the risk or liquidity associated with these investments. These inputs are categorized in the following hierarchy under applicable financial accounting standards:
| Level 1 – | Unadjusted quoted prices in active markets for identical investments, unrestricted assets or liabilities that the Fund has the ability to access at the measurement date; |
| Level 2 – | Quoted prices which are not active, quoted prices for similar assets or liabilities in active markets or inputs other than quoted prices that are observable (either directly or indirectly) for substantially the full term of the asset or liability; and |
| Level 3 – | Significant unobservable prices or inputs (including the Fund’s own assumptions in determining the fair value of investments) where there is little or no market activity for the asset or liability at the measurement date. |
| Semi-Annual Report | October 31, 2020 | 25 |
| The Disciplined Growth Investors Fund | Notes to Financial Statements |
| | October 31, 2020 (Unaudited) |
The following is a summary of each input used to value the Fund as of October 31, 2020:
| Investments in Securities at Value | | Level 1 -
Unadjusted
Quoted
Prices | | | Level 2 - Other Significant
Observable
Inputs | | | Level 3 -
Significant
Unobservable
Inputs | | | Total | |
| Common Stocks(a) | | $ | 183,532,324 | | | $ | – | | | $ | – | | | $ | 183,532,324 | |
| Corporate Bonds(a) | | | – | | | | 52,871,982 | | | | – | | | | 52,871,982 | |
| Foreign Corporate Bonds(a) | | | – | | | | 2,307,154 | | | | – | | | | 2,307,154 | |
| Foreign Government Bonds | | | – | | | | 751,523 | | | | – | | | | 751,523 | |
| Government & Agency Obligations | | | – | | | | 7,746,398 | | | | – | | | | 7,746,398 | |
| Short Term Investments | | | 6,047,482 | | | | – | | | | – | | | | 6,047,482 | |
| TOTAL | | $ | 189,579,806 | | | $ | 63,677,057 | | | $ | – | | | $ | 253,256,863 | |
| (a) | For detailed descriptions of the underlying industries, see the accompanying Portfolio of Investments. |
For the six months ended October 31, 2020 the Fund did not have any securities that used significant unobservable inputs (Level 3) in determining fair value.
Investment Transactions and Investment Income: Investment transactions are accounted for on the date the investments are purchased or sold (trade date). Realized gains and losses from investment transactions are reported on an identified cost basis, which is the same basis the Fund uses for federal income tax purposes. Interest income, which includes accretion of discounts, is accrued and recorded as earned. Dividend income is recognized on the ex-dividend date or for certain foreign securities, as soon as information is available to the Fund.
Trust Expenses: Some expenses of the Trust can be directly attributed to the Fund. Expenses which cannot be directly attributed to the Fund are apportioned among all funds in the Trust based on average net assets of each fund.
Fund Expenses: Expenses that are specific to the Fund are charged directly to the Fund.
Federal Income Taxes: The Fund complies with the requirements under Subchapter M of the Internal Revenue Code of 1986, as amended, applicable to regulated investment companies and intends to distribute substantially all of their net taxable income and net capital gains, if any, each year so that it will not be subject to excise tax on undistributed income and gains. The Fund is not subject to income taxes to the extent such distributions are made.
As of and during the six months ended October 31, 2020, the Fund did not have a liability for any unrecognized tax benefits. The Fund files U.S. federal, state, and local tax returns as required. The Fund’s tax returns are subject to examination by the relevant tax authorities until expiration of the applicable statute of limitations, which is generally three years after the filing of the tax return for federal purposes and four years for most state returns. Tax returns for open years have incorporated no uncertain tax positions that require a provision for income taxes.
| 26 | 1-855-DGI-FUND (344-3863) | www.DGIfund.com |
| The Disciplined Growth Investors Fund | Notes to Financial Statements |
| | October 31, 2020 (Unaudited) |
Distributions to Shareholders: The Fund normally pays dividends, if any, quarterly and distributes capital gains, if any, on an annual basis. Income dividend distributions are derived from dividends and other income the Fund receives from its investments, including short term capital gains. Long term capital gain distributions are derived from gains realized when the Fund sells a security it has owned for more than a year. The Fund may make additional distributions and dividends at other times if the portfolio manager believes doing so may be necessary for the Fund to avoid or reduce taxes.
Epidemic and Pandemic Risk: Certain countries have been susceptible to epidemics, most recently COVID-19, which has been designated as a pandemic by world health authorities. The outbreak of such epidemics, together with any resulting restrictions on travel or quarantines imposed, could have a negative impact on the economy and business activity globally (including in the countries in which we invest), and thereby could adversely affect the performance of our investments. Furthermore, the rapid development of epidemics could preclude prediction as to their ultimate adverse impact on economic and market conditions, and, as a result, present material uncertainty and risk with respect to us and the performance of our investments.
Libor Risk: In March 2020, the Financial Accounting Standards Board (FASB) issued Accounting Standards Update (“ASU”) No. 2020-04, Reference Rate Reform (Topic 848): Facilitation of the Effects of Reference Rate Reform on Financial Reporting. The Fund’s investments, payment obligations, and financing terms may be based on floating rates, such as the London Interbank Offered Rate, or “LIBOR,” which is the offered rate for short-term Eurodollar deposits between major international banks. Plans are underway to phase out the use of LIBOR by the end of 2021. There remains uncertainty regarding the nature of any replacement rate and the impact of the transition from LIBOR on the Fund’s transactions and the financial markets generally. As such, the potential effect of a transition away from LIBOR on the Fund or the Fund’s investments cannot yet be determined.
3. TAX BASIS INFORMATION
Reclassifications: As of October 31, 2020, permanent differences in book and tax accounting were reclassified. These differences had no effect on net assets. The reclassifications were as follows:
| Fund | | Paid-in Capital | | Distributable earnings | |
| The Disciplined Growth Investors Fund | | $ | – | | | $ | – | |
| Semi-Annual Report | October 31, 2020 | 27 |
| The Disciplined Growth Investors Fund | Notes to Financial Statements |
| | October 31, 2020 (Unaudited) |
Tax Basis of Investments: As of October 31, 2020, the aggregate cost of investments, gross unrealized appreciation/ (depreciation) and net unrealized appreciation for Federal tax purposes was as follows:
| | | The Disciplined Growth Investors Fund | |
| Gross appreciation (excess of value over tax cost) | | $ | 75,713,308 | |
| Gross depreciation (excess of tax cost over value) | | | (15,672,432 | ) |
| Net unrealized appreciation | | $ | 60,040,876 | |
| Cost of investments for income tax purposes | | $ | 193,215,987 | |
Tax Basis of Distributions to Shareholders: The character of distributions made during the year from net investment income or net realized gains may differ from its ultimate characterization for federal income tax purposes. Also, due to the timing of dividend distributions, the fiscal year in which amounts are distributed may differ from the fiscal year in which the income or realized gain was recorded by the Fund.
The tax character of distributions paid during the year ended April 30, 2020, were as follows:
| | | Ordinary Income | | | Long-Term Capital Gain | |
| The Disciplined Growth Investors Fund | | $ | 2,197,979 | | | $ | 6,516,352 | |
The amounts and characteristics of tax basis distributions and composition of distributable earnings/(accumulated losses) are finalized at fiscal year-end. Accordingly, tax basis balances have not been determined as of October 31, 2020.
4. SECURITIES TRANSACTIONS
The cost of purchases and proceeds from sales of securities (excluding short-term securities, and U.S. Government Obligations) during the six months ended October 31, 2020, were as follows:
| Fund | | Purchases of
Securities | | | Proceeds From
Sales of Securities | |
| The Disciplined Growth Investors Fund | | $ | 29,122,529 | | | $ | 35,426,250 | |
Investment transactions in U.S. Government Obligations during the six months ended October 31, 2020 were as follows:
| Fund | | Purchases of
Securities | | | Proceeds From
Sales of Securities | |
| The Disciplined Growth Investors Fund | | $ | 556,560 | | | $ | – | |
| 28 | 1-855-DGI-FUND (344-3863) | www.DGIfund.com |
| The Disciplined Growth Investors Fund | Notes to Financial Statements |
| | October 31, 2020 (Unaudited) |
5. SHARES OF BENEFICIAL INTEREST
The capitalization of the Trust consists of an unlimited number of shares of beneficial interest with no par value per share. Holders of the shares of the Fund of the Trust have one vote for each share held and a proportionate fraction of a vote for each fractional share. All shares issued and outstanding are fully paid and are transferable and redeemable at the option of the shareholder. Purchasers of the shares do not have any obligation to make payments to the Trust or its creditors (other than the purchase price for the shares or make contributions to the Trust or its creditors solely by reason of the purchasers’ ownership of the shares. Shares have no pre-emptive rights.
6. MANAGEMENT AND RELATED-PARTY TRANSACTIONS
The Adviser, subject to the authority of the Board, is responsible for the overall management and administration of the Fund’s business affairs. The Adviser manages the investments of the Fund in accordance with the Fund’s investment objective, policies and limitations and investment guidelines established jointly by the Adviser and the Trustees. Pursuant to the Advisory Agreement, the Fund pays the Adviser a unitary management fee for the services and facilities it provides payable on a monthly basis at the annual rate of 0.78% of the Fund’s average daily net assets. The management fee is paid on a monthly basis.
Out of the unitary management fee, the Adviser pays substantially all expenses of the Fund, including the cost of transfer agency, custody, fund administration, bookkeeping and pricing services, legal, audit and other services, except for interest expenses, brokerage expenses, taxes and extraordinary expenses not incurred in the ordinary course of the Fund’s business. Also included are Trustee fees which were $7,551 for the six months ended October 31, 2020.
Fund Administrator Fees and Expenses
ALPS Fund Services, Inc. (“ALPS”) serves as administrator to the Fund. Pursuant to an Administration Agreement, ALPS provides operational services to the Fund including, but not limited to, fund accounting and fund administration and generally assists in the Fund’s operations. Officers of the Trust are employees of ALPS. The Fund’s administration fee is accrued on a daily basis and paid monthly. The Administrator is also reimbursed for certain out-of-pocket expenses. The administrative fee and out-of-pocket expenses are included in the unitary management fee paid to the Adviser.
Transfer Agent
ALPS serves as transfer, dividend paying and shareholder servicing agent for the Fund. ALPS receives an annual minimum fee, a fee based upon the number of shareholder accounts, and is also reimbursed for certain out-of-pocket expenses. The fee and out-of-pocket expenses are included in the unitary management fee paid to the Adviser.
Compliance Services
ALPS provides services that assist the Trust’s chief compliance officer in monitoring and testing the policies and procedures of the Trust in conjunction with requirements under Rule 38a-1 under the 1940 Act and receives an annual base fee. ALPS is reimbursed for certain out-of-pocket expenses. The fee and out-of-pocket expenses are included in the unitary management fee paid to the Adviser.
| Semi-Annual Report | October 31, 2020 | 29 |
| The Disciplined Growth Investors Fund | Notes to Financial Statements |
| | October 31, 2020 (Unaudited) |
Principal Financial Officer
ALPS receives an annual fee for providing principal financial officer services to the Fund. The fee is included in the unitary management fee paid to the Adviser.
Distributor
ALPS Distributors, Inc. (“ADI” or the “Distributor”) (an affiliate of ALPS) acts as the distributor of the Fund’s shares pursuant to a Distribution Agreement with the Trust. Shares are sold on a continuous basis by ADI as agent for the Fund, and ADI has agreed to use its best efforts to solicit orders for the sale of the Fund’s shares, although it is not obliged to sell any particular amount of shares. ADI is not entitled to any compensation for its services as Distributor. ADI is registered as a broker-dealer with the Securities and Exchange Commission.
7. INDEMNIFICATIONS
Under the Trust’s organizational documents, its officers and Trustees are indemnified against certain liability arising out of the performance of their duties to the Trust. Additionally, in the normal course of business, the Trust enters into contracts with service providers that may contain general indemnification clauses, which may permit indemnification to the extent permissible under applicable law. The Trust’s maximum exposure under these arrangements is unknown, as this would involve future claims that may be made against the Trust that have not yet occurred.
| 30 | 1-855-DGI-FUND (344-3863) | www.DGIfund.com |
| The Disciplined Growth Investors Fund | Additional Information |
| | October 31, 2020 (Unaudited) |
1. FUND HOLDINGS
The Fund files its complete schedule of portfolio holdings with the Securities and Exchange Commission (SEC) for the first and third quarters of each fiscal year as an exhibit to its reports on Form N-PORT. The Fund’s FormN-PORT reports are available on the SEC’s Web site at http://www.sec.gov. The Fund’s Form N-PORT reports are also available upon request by calling toll-free (855) 344-3863.
2. FUND PROXY VOTING POLICIES, PROCEDURES AND SUMMARIES
The Fund’s policies and procedures used in determining how to vote proxies and information regarding how the Fund voted proxies relating to portfolio securities during the most recent prior 12-month period ending June 30 are available without charge, (1) upon request, by calling (toll-free) 855-DGI-Fund and (2) on the SEC’s website at http://www.sec.gov.
| Semi-Annual Report | October 31, 2020 | 31 |
| The Disciplined Growth Investors Fund | Privacy Policy |
| WHO WE ARE |
| Who is providing this notice? | The Disciplined Growth Investors Fund |
| WHAT WE DO |
| How does the Fund protect my personal information? | To protect your personal information from unauthorized access and use, we use security measures that comply with federal law. These measures include computer safeguards and secured files and buildings. |
| How does the Fund collect my personal information? | We collect your personal information, for example, when you • open an account • provide account information or give us your contact information • make a wire transfer or deposit money |
| Why can’t I limit all sharing? | Federal law gives you the right to limit only • sharing for affiliates’ everyday business purposes-information about your creditworthiness • affiliates from using your information to market to you • sharing for non-affiliates to market to you State laws and individual companies may give you additional rights to limit sharing. |
| DEFINITIONS |
| Affiliates | Companies related by common ownership or control. They can be financial and nonfinancial companies. |
| Non-affiliates | Companies not related by common ownership or control. They can be financial and nonfinancial companies. • The Fund does not share with non-affiliates so they can market to you. |
| Joint marketing | A formal agreement between non-affiliated financial companies that together market financial products or services to you. • The Fund does not jointly market. |
| 32 | 1-855-DGI-FUND (344-3863) | www.DGIfund.com |
| The Disciplined Growth Investors Fund | Privacy Policy |
| FACTS | WHAT DOES THE FUND DO WITH YOUR PERSONAL INFORMATION? |
| WHY? | Financial companies choose how they share your personal information. Federal law gives consumers the right to limit some but not all sharing. Federal law also requires us to tell you how we collect, share, and protect your personal information. Please read this notice carefully to understand what we do. |
| WHAT? | The types of personal information we collect and share depend on the product or service you have with us. This information can include: • Social Security number and account transactions • Account balances and transaction history • Wire transfer instructions |
| HOW? | All financial companies need to share customers’ personal information to run their everyday business. In the section below, we list the reasons financial companies can share their customers’ personal information; the reasons the Fund chooses to share; and whether you can limit this sharing. |
| REASONS WE CAN SHARE YOUR PERSONAL INFORMATION | DOES THE FUND SHARE: | CAN YOU LIMIT THIS SHARING? |
For our everyday business purposes –
such as to process your transactions, maintain your account(s), respond to court orders and legal investigations, or report to credit bureaus | Yes | No |
For our marketing purposes – to offer our products and services to you | No | We do not share. |
| For joint marketing with other financial companies | No | We do not share. |
For our affiliates’ everyday business purposes – information about your transactions and experiences | Yes | No |
For our affiliates’ everyday business purposes – information about your creditworthiness | No | We do not share. |
| For non-affiliates to market to you | No | We do not share. |
| | | | |
| Semi-Annual Report | October 31, 2020 | 33 |
| The Disciplined Growth Investors Fund | Privacy Policy |
| OTHER IMPORTANT INFORMATION |
| California Residents | If your account has a California home address, your personal information will not be disclosed to nonaffiliated third parties except as permitted by applicable California law, and we will limit sharing such personal information with our affiliates to comply with California privacy laws that apply to us. |
| Vermont Residents | The State of Vermont requires financial institutions to obtain your consent prior to sharing personal information that they collect about you with affiliated companies and nonaffiliated third parties other than in certain limited circumstances. Except as permitted by law, we will not share personal information we collect about you with nonaffiliated third parties or other affiliated companies unless you provide us with your written consent to share such information. |
| 34 | 1-855-DGI-FUND (344-3863) | www.DGIfund.com |
Page Intentionally Left Blank

THIS MATERIAL MUST BE PRECEDED OR ACCOMPANIED BY A PROSPECTUS.
THE DISCIPLINED GROWTH INVESTORS FUND IS DISTRIBUTED BY ALPS DISTRIBUTORS, INC.
TABLE OF CONTENTS
| Manager Commentary | |
| Emerald Growth Fund | 1 |
| Emerald Small Cap Value Fund | 6 |
| Emerald Insights Fund | 12 |
| Emerald Banking and Finance Fund | 16 |
| Emerald Select trueLiberty Income Fund | 25 |
| Disclosure of Fund Expenses | 29 |
| Schedule of Investments | |
| Emerald Growth Fund | 31 |
| Emerald Small Cap Value Fund | 33 |
| Emerald Insights Fund | 35 |
| Emerald Banking and Finance Fund | 37 |
| Emerald Select trueLiberty Income Fund | 39 |
| Statements of Assets and Liabilities | 41 |
| Statements of Operations | 43 |
| Statements of Changes in Net Assets | |
| Emerald Growth Fund | 45 |
| Emerald Small Cap Value Fund | 47 |
| Emerald Insights Fund | 48 |
| Emerald Banking and Finance Fund | 50 |
| Emerald Select trueLiberty Income Fund | 51 |
| Financial Highlights | |
| Emerald Growth Fund | 52 |
| Emerald Small Cap Value Fund | 56 |
| Emerald Insights Fund | 60 |
| Emerald Banking and Finance Fund | 64 |
| Emerald Select trueLiberty Income Fund | 68 |
| Notes to Financial Statements | 70 |
| Additional Information | 80 |
| Privacy Policy | 81 |
| Emerald Growth Fund | Manager Commentary |
October 31, 2020 (Unaudited)
October 31, 2020
Dear Shareholder:
Investment Results
The performance of the Emerald Growth Fund’s Class A shares (without sales load), for the six months ended October 31, 2020, advanced by 27.49% outpacing the Russell 2000® Growth Index which advanced by 22.72%.
The domestic discovery of the COVID-19 virus and its rapid spread across the U.S. was the catalyst for one of the most vicious market declines and subsequent rebounds in the history of the U.S. stock market. Sentiment from the market low has continued to improve reflecting the strong and broad U.S. monetary and fiscal response, signs of meaningful medical progress in addressing the virus, and strong upward momentum in key economic statistics (jobs, retail sales, home sales, auto sales, ISM manufacturing and non-manufacturing survey results) which has translated into significant upward revisions to both domestic economic growth and corporate earnings. The ratio of positive to negative earnings revisions hit a new high in October for the Russell 2000® Growth Index reflecting a broad based recovery across economic sectors.
From a style perspective, growth stocks maintained their relative dominance, with the Russell 1000® Growth Index and Russell 2000® Growth Index gaining 21.81% and 22.72% respectively for trailing 6-month period, with each outpacing their value counterpart. Year-to-date within the Russell 2000® Index, the Russell 2000® Growth Index 4.67% has outperformed the Russell 2000® Value Index -13.92% by approximately 1859 basis points (or “bps”). This strong streak of relative outperformance on a year-to-date basis through October has pushed the performance dispersion between growth and value to near record levels. Equally notable we believe is the similarly wide dispersion of performance between large capitalization and small capitalization stocks. The delta on a year-to-date basis through October stands at approximately 1544 basis points, with the Russell 1000® Growth Index advancing by 20.11% for the period versus the much more modest 4.67% gain recorded by Russell 2000® Growth Index.
Investment Analysis
On a relative basis, the Emerald Growth Fund outpaced the Russell 2000® Growth Index benchmark for the trailing period driven largely by the positive contribution from stock selection. At the sector level, the portfolio experienced relative outperformance within the consumer discretionary, consumer staples, industrials and financial sectors.
The consumer discretionary sector was the largest contributor to return for the trailing period driven by a combination of stock selection and allocation effect. At the industry level, education services, home construction and specialty retail were the most notable contributors to return. Performance within the consumer staples sector also contributed positively to return driven by relative outperformance within the food products and brewer industries. Holdings within the industrials and financial sectors also contributed to the portfolio’s relative outperformance for the period, driven by stock selection within the building materials, industrial machinery, full line insurance and property casualty insurance industries.
The positive contribution from the aforementioned, was partially offset by the relative underperformance within the utilities, real estate and basic materials sectors, driven by a combination of allocation effect and stock selection. Of the aforementioned, the portfolio’s underweighting to the utilities sector was the largest detractor to return, as Emerald elected to deploy assets to higher growth businesses which fell outside of the utilities sector. Exposure to the real estate sector was also a headwind to performance for the period, driven largely by stock selection as the portfolio holdings within the infrastructure REIT industry underperformed other categories of real estate investment trusts held within the benchmark.
As of October 31, 2020, the portfolio held the largest active exposures in the consumer discretionary, consumer staples, industrial and technology sectors. Thoughts on those sectors and other notable areas of exposure as of October 31, 2020 are highlighted below.
| | ● | Emerald continued to build on the portfolio’s relative overweight within the consumer discretionary sector over the course of the last six months through a combination of new and existing positions within the auto parts, consumer services, home construction, specialty retail, recreational products and services, restaurants, and recreational vehicle industries. While the consumer backdrop in aggregate remains somewhat uncertain in the near-term given the level of unemployment and the recent resurgence in the virus, as the virus abates and consumer behavior normalizes Emerald believes there are meaningful opportunities for share gains for those companies offering differentiated products/services with strong value propositions amidst a consolidating retail, restaurant and leisure backdrop. |
| | ● | The portfolio exited the period with an overweight position to the consumer staples sector. As of October 31, 2020, the overweight primarily consists of select niche opportunities in disruptive category leaders with innovative product offerings and above average growth prospects that are aligned with emerging consumer trends in the food and beverage industries. Specific areas include pet food, nutritional snacking, active nutrition and personal care products. |
| | ● | The technology sector was also overweight relative to the benchmark at period end. Within the sector, as of October 31, 2020, the software industry remains the portfolio’s largest total and active exposure as we continue to believe that secular themes such as digital transformation, cybersecurity, the shift to cloud-based architecture and the more recent shift to a work-from-home/remote environment should continue to garner an ever increasing share of enterprise technology spend. Outside of software, we also continue to be optimistic |
| Semi-Annual Report | October 31, 2020 | 1 |
| Emerald Growth Fund | Manager Commentary |
October 31, 2020 (Unaudited)
regarding select opportunities within the semiconductor industry. Particularly in those companies poised to benefit from network infrastructure spending/upgrades, the rebound in industrial and automotive production, and the growing penetration of 5G and industrial IoT (internet of things). In addition, the portfolio holds positions in other niche growth opportunities within the consumer digital services, production technology equipment, and computer services industries.
| | ● | The portfolio also held an overweight to the industrials sector at the end of October. The overweight was comprised of a diverse subset of holdings within the building materials, industrial machinery, professional business services, engineering and contracting, trucking, delivery services and defense industries that are poised to benefit from the resurgence in the housing market, the broad inventory replenishment cycle, the shift toward natural gas and hydrogen, and other niche company specific opportunities. |
| | ● | As of October 31, 2020 the healthcare sector, while underweight relative to the benchmark, also remains an area of meaningful exposure within the portfolio. At the industry level, the biotechnology industry remains the largest aggregate exposure as of October 31, 2020. We continue to look for innovative therapeutics that can command premium pricing, with an emphasis on drugs that patients can take from their homes or are for diseases so severe that missing doses of medication is higher risk than SARS-CoV-2 infection. Rounding out the portfolio’s healthcare sector exposure are niche opportunities within the healthcare services, medical equipment, medical supplies and pharmaceutical industries. |
Market Outlook:
After a choppy end to the reporting period, the 4th quarter of 2020 is off to a strong start as the domestic political landscape and economic recovery continue to crystallize. While the outcome of the Presidential election remains contested, the market is viewing the prospect of a divided government, regardless of candidate as favorable (disciplined spending, limited tax increases). Further, on the economic front, the economy is continuing its torrid pace of recovery as exemplified by the recently announced October jobs report which substantially better than expected across all metrics. Encouragingly, the participation rate rose at the same time the unemployment rate dropped to 6.9%, demonstrating continued progress on the path to economic recovery. Adding further to the market’s advance was the recent release of better than expected efficacy data from the COVID-19 vaccine trials being conducted by both Pfizer and Moderna, which fueled incremental optimism as the market looked toward the prospect of a full and unencumbered reopening of the domestic economy. All of these factors, in conjunction with a rapidly recovering corporate earnings outlook appear to be setting the stage for an improving economic backdrop as we move into 2021.
Within that construct, Emerald continues to believe that small capitalization stocks will be particularly well positioned for mean reverting outperformance. 2021 earnings growth is set to improve meaningfully for the Russell 2000® Index, expanding by 21% year over year versus the 12.7% earnings growth currently expected for the S&P 500, according to an October 7, 2020 report from Furey Research Partners. Valuations are also looking increasingly attractive based on historic precedent with the Russell 2000, now trading at the cheapest level relative to the Russell 1000® Index since 2003, according to an October 5, 2020 report from Steven DeSanctis. Further, according to the same report from Steven DeSanctis referenced above, when valuations have reached this level, small capitalization stocks have demonstrated strong relative outperformance in the forward six month and 12 month periods, with a batting average of 65.9 and 78.0 for the respective periods.
Emerald, as always, remains vigilant and focused on utilizing our fundamental bottom up research process to identify the most attractive growth opportunities within the small capitalization universe. At the close of October, the portfolio held the largest relative overweight positions in the consumer discretionary, consumer staples, industrials and technology sectors. The portfolio had the most significant underweight positions within the healthcare and utilities sectors. Please note that as a fundamental bottom-up manager the aforementioned sector weights are a fall-out of the stock selection process.
| Top Contributors | Top Detractors | |
| Chegg Inc. | Tabula Rasa Healthcare Inc. | |
| Horizon Therapeutics | Cogent Communications Holdings Inc. | |
| Freshpet Inc. | Mercury Systems Inc. | |
| Mirati Therapeutics Inc. | Karyopharm Therapeutics Inc. | |
| Varonis Systems Inc. | Applied Therapeutics Inc. | |
| | | |
| Kenneth G. Mertz II, CFA | Stacey L. Sears | Joseph W. Garner |
| Chief Investment Officer | Portfolio Manager | Portfolio Manager |
| Portfolio Manager | | |
| | | |
| Emerald Mutual Fund Advisers Trust | | |
| 2 | www.emeraldmutualfunds.com |
| Emerald Growth Fund | Manager Commentary |
October 31, 2020 (Unaudited)
Past performance does not guarantee future results. Fund prices fluctuate as the underlying assets have exposure to market fluctuations and other risks, as described in the Fund’s prospectus. Please visit www.emeraldmutualfunds.com to obtain current performance information and for the current prospectus and statement of additional information. This material must be preceded or accompanied by a prospectus. Please read the prospectus carefully before investing.
The views of Emerald Mutual Fund Advisers Trust and information discussed in this commentary are as of the date of publication, are subject to change, and may not reflect the writer's current views. The views expressed are those of the author only, and represent an assessment of market conditions at a specific point in time, are opinions only and should not be relied upon as investment advice regarding a particular investment or markets in general. Such information does not constitute a recommendation to buy or sell specific securities or investment vehicles. It should not be assumed that any investment will be profitable or will equal the performance of the Fund or any securities or any sectors mentioned in this letter. The subject matter contained in this letter has been derived from several sources believed to be reliable and accurate at the time of compilation. Neither Emerald Mutual Fund Advisers Trust nor the Fund accepts any liability for losses either direct or consequential caused by the use of this information.
The Emerald Growth Fund is distributed by ALPS Distributors, Inc.
The Fund is subject to investment risks, including possible loss of the principal amount invested and therefore is not suitable for all investors. The Fund may not achieve its objectives.
Diversification does not eliminate the risk of experiencing investment losses.
The Russell 2000® Growth Index measures the performance of the small-cap growth segment of the U.S. equity universe. It includes those Russell 2000® Index companies with higher price-to-value ratios and higher forecasted growth values. The Index is not actively managed and does not reflect any deductions for fees, expenses or taxes. An investor may not invest directly into the Index.
The Russell 2000® Value Index measures the performance of small-cap value segment of the U.S. equity universe. It includes those Russell 2000 companies with lower price-to-book ratios (A ratio used to compare a stock's market value to its book value. It is calculated by dividing the current closing price of the stock by the latest quarter's book value per share.) and lower forecasted growth values. The Index is not actively managed and does not reflect any deductions for fees, expenses or taxes. An investor may not invest directly into the Index.
Basis points refers to a common unit of measure for interest rates and other percentages in finance. One basis point is equal to 1/100th of 1%, or 0.01%, or 0.0001, and is used to denote the percentage change in a financial instrument. The relationship between percentage changes and basis points can be summarized as follows: 1% change = 100 basis points and 0.01% = 1 basis point.
The S&P 500® Total Return Index is an unmanaged index of 500 common stocks chosen for market size, liquidity and industry group representation. It is a market-value weighted index. The Index is not actively managed and does not reflect any deductions for fees, expenses or taxes. An investor may not invest directly in the Index.
| Semi-Annual Report | October 31, 2020 | 3 |
| Emerald Growth Fund | Manager Commentary |
October 31, 2020 (Unaudited)
TOP TEN HOLDINGS
(as a % of Net Assets)* |
| | | |
| Freshpet, Inc. | | 3.34% |
| Chegg, Inc. | | 2.72% |
| NeoGenomics, Inc. | | 2.42% |
| Varonis Systems, Inc. | | 2.12% |
| Churchill Downs, Inc. | | 2.09% |
| Rapid7, Inc. | | 2.00% |
| Mirati Therapeutics, Inc. | | 1.94% |
| Horizon Therapeutics PLC | | 1.90% |
| Kratos Defense & Security Solutions, Inc. | | 1.79% |
| Palomar Holdings, Inc. | | 1.73% |
| Top Ten Holdings | | 22.05% |
INDUSTRY SECTOR ALLOCATION
(as a % of Net Assets) |
| | | |
| Health Care | | 26.14% |
| Technology | | 19.59% |
| Consumer Discretionary | | 19.08% |
| Producer Durables | | 10.10% |
| Financial Services | | 7.92% |
| Consumer Staples | | 6.91% |
| Materials & Processing | | 6.63% |
| Energy | | 1.51% |
| Utilities | | 1.22% |
| Cash, Cash Equivalents, & Other Net Assets | | 0.90% |
| Total | | 100.00% |
| * | Holdings are subject to change, and may not reflect the current or future position of the portfolio. |
ANNUALIZED TOTAL RETURN (for the period ended October 31, 2020)
| | | | | | | Since | Expense Ratio |
| | 6 Month | 1 Year | 3 Year | 5 Year | 10 Year | Inception(1) | Gross(2) | Net(2) |
| Class A (NAV) | 27.49% | 19.81% | 10.16% | 11.64% | 14.08% | 11.31% | 1.02% | 1.02% |
| Class A (MOP) | 21.44% | 14.13% | 8.39% | 10.56% | 13.53% | 11.11% | 1.02% | 1.02% |
| Russell 2000® Growth Index(3) | 22.72% | 13.37% | 7.90% | 10.36% | 11.95% | 8.37% | | |
| Class C (NAV) | 27.04% | 19.08% | 9.45% | 10.92% | 13.35% | 6.82% | 1.67% | 1.67% |
| Class C (CDSC) | 26.04% | 18.08% | 9.45% | 10.92% | 13.35% | 6.82% | 1.67% | 1.67% |
| Russell 2000® Growth Index(3) | 22.72% | 13.37% | 7.90% | 10.36% | 11.95% | 8.37% | | |
| Investor Class | 27.46% | 19.79% | 10.13% | 11.59% | – | 11.65% | 1.07% | 1.07% |
| Russell 2000® Growth Index(3) | 22.72% | 13.37% | 7.90% | 10.36% | 11.95% | 8.37% | | |
| Institutional Class | 27.67% | 20.17% | 10.51% | 12.00% | 14.43% | 14.70% | 0.72% | 0.72% |
| Russell 2000® Growth Index(3) | 22.72% | 13.37% | 7.90% | 10.36% | 11.95% | 8.37% | | |
Performance quoted represents past performance, does not guarantee future results and current performance may be lower or higher than the data quoted. The investment return and principal value of an investment will fluctuate so that shares, when redeemed, may be worth more or less than their original cost. Performance data current to the most recent month end may be obtained at www.emeraldmutualfunds.com.
Performance shown for periods prior to March 16, 2012, reflects the performance of the Forward Growth Fund, a series of Forward Funds (as a result of a reorganization of the Forward Growth Fund into the Emerald Growth Fund).
Returns for periods less than 1 year are cumulative.
The table does not reflect the deduction of taxes that a shareholder would pay on Fund distributions or the redemption of Fund shares.
Subject to investment risks, including possible loss of the principal amount invested.
Maximum Offering Price (MOP) for Class A shares includes the Fund's maximum sales charge of 4.75%. Performance shown at NAV does not include these sales charges and would have been lower had it been taken into account.
A Contingent Deferred Sales Charge (CDSC) of 1.00% may apply to Class C shares redeemed within the first 12 months after a purchase.
| (1) | Inception Dates - Class A: 10/01/1992, Class C: 07/01/2000, Institutional Class: 10/21/2008, Investor Class: 05/01/2011 |
| (2) | Emerald Mutual Fund Advisers Trust ("Emerald" or the "Adviser") has agreed contractually to waive a portion of its fees and reimburse other expenses until August 31, 2021 in amounts necessary to limit the Fund's operating expenses (exclusive of Acquired Fund Fees and Expenses, brokerage expenses, interest expenses, taxes and extraordinary expense) for Class A, Class C, Institutional Class, and Investor Class shares to an annual rate (as percentage of the Fund's average daily net assets) of 1.29%, 1.94%, 0.99% and 1.34% respectively. The Adviser will be permitted to recover, on a class-by-class basis, expenses it has borne through the agreement described above to the extent that the Fund's expenses in later periods fall below the annual rates set forth in the relevant agreement. The Fund will not be obligated to pay any such deferred fees and expenses more than three years after the year(s) in which the fees and expense were incurred. The Adviser may not discontinue this waiver prior to August 31, 2021, without the approval by the Fund's Board of Trustees. Ratios as of the Prospectus dated August 31, 2020 and may differ from the ratios presented in the Financial Highlights. |
| (3) | The Russell 2000® Growth Index measures the performance of the small-cap growth segment of the U.S. equity universe. It includes those Russell 2000® Index companies with higher price-to-value ratios and higher forecasted growth values. The Index is not actively managed and does not reflect any deduction for fees, expenses or taxes. An investor may not invest directly into the Index. |
| 4 | www.emeraldmutualfunds.com |
| Emerald Growth Fund | Manager Commentary |
October 31, 2020 (Unaudited)
GROWTH OF $10,000 INVESTMENT IN THE FUND (for the period ended October 31, 2020)
Comparison of change in value of a $10,000 investment (includes applicable sales loads)

The chart represents historical performance of a hypothetical investment of $10,000 in the Fund since inception. Past performance does not guarantee future results. This chart does not reflect the deduction of taxes that a shareholder would pay on Fund distributions or the redemption of Fund shares.
Investing in the Fund is subject to investment risks, including possible loss of the principal amount invested.
| Semi-Annual Report | October 31, 2020 | 5 |
| Emerald Small Cap Value Fund | Manager Commentary |
October 31, 2020 (Unaudited)
October 31, 2020
Dear Shareholder:
Investment Results
The performance of the Emerald Small Cap Value Fund Investor Class, for the six months ended October 31, 2020, reflected a gain of 16.82% (without sales load) outperforming the Russell 2000® Value Index which was up 12.44%.
In the month of October, value outperformed growth as financial stocks moved up significantly in anticipation of higher inflation, a large stimulus bill, and a steepening yield curve. This was a welcomed reversal for small cap value managers from the prevailing trend in the past twelve months. Overall, in the past six months we have seen a “V” shape stock market recovery; however, many industries are still feeling the pain from the ongoing pandemic. The rally in the stock market since the lows in mid-March was enabled by a super-accommodative monetary policy pursued by the Federal Reserve, and massive fiscal stimulus programs passed by the government, early in the pandemic, to support the economy.
Investment Analysis
The Emerald Small Cap Value Fund (without sales load) outperformed its benchmark for the 6-month period ended October 31, 2020. At the sector level, relative outperformance was driven by stock selection within the real estate, financials, and utilities sectors. Relative underperformance was observed within the health care sector.
Banks and thrifts represent over 20% of the Russell 2000® Value Index (the Emerald Small Cap Value Fund's benchmark) holdings by weight, and therefore, an important industry that we follow very closely. As mentioned above, banks tallied a strong performance in the month of October, yet they are still down significantly for the year, with broad underperformance for all size segments.
We started to reduce the Emerald Small Cap Value Fund's exposure to banks within the portfolio due to several lingering concerns about their outlook. The pandemic and subsequent economic decline introduced many challenges and variables to banks’ future performance.
Our approach has been to evaluate community banks during the coronavirus pandemic through a spectrum that views the pandemic as having a four stage process. We believe that the four stage process includes the original lockdown, pre-therapy/vaccine, post-therapy/vaccine, and the rebuilding of the economy. While no one knows with certainty the timing of phases three and four, what we do know is that the community banking sector has transitioned from stage one into stage two, pre-therapy/vaccine in better shape than even the most optimistic investors and management teams could have expected. We believe that the plethora of governments aid and transfer payments have been beneficial to the community banking sector to date. However, we remain cautious as we move forward into stage three, post-therapy/ vaccine. Our abundance of caution exists due to the uncertainty around credit migration and the low interest rate environment.
As banks dust off their game plans used after the great financial crisis of 2007-2008 (the “GFC”), we expect community bank management teams to turn their focus to reducing expenses and we believe the low hanging fruit to be branch reductions. We believe the first stage of the pandemic, the lockdown, has led to an accelerated adoption of digital banking tools by both retail and business customers and we believe this adoption will lead to another wave of branch closures. We believe banks of all sizes are re-evaluating their branch footprints, and some have announced plans to close up to 20% of their networks. Over the last year, U.S. banks and thrifts have closed 2,303 branches and opened 1,110, leaving 85,143 active branches in the U.S. as of the end of August.
Following the GFC game plan we have seen community banks shore-up capital levels with inexpensive funding. According to S&P Global, dozens of banks have taken advantage of the subordinated debt markets in recent months. Total capital issuance peaked in May and the demand has remained steady with over a dozen issuances each month. From May through August, there have been 85 issuances of subordinated debt in the banking sector, totaling $4.48 billion. In the year ago period, there were 19 issuances totaling $923.3 million.
As community bank management teams began to feel more comfortable with future cumulative loan loss rates ahead of the potential third stage, post-therapy/vaccine, but not yet confident enough to acquire another bank’s loan portfolio, bankers have felt the best use of their capital to be share buybacks given the reduced valuations in the bank sector. While the Federal Reserve has prohibited the nation’s largest banks from stock repurchases, many community banks have either not suspended buybacks or have reintroduced them in recent weeks. We believe that with many community bank stocks trading below tangible book values, community bank management teams see buybacks as a prudent use of capital since it is immediately accretive to book value. Eventually, management teams will return to mergers and acquisitions as a priority over share buybacks. We believe that amid the COVID-19 outbreak in the U.S., banks were forced to shift their attention to internal operations, pausing M&A discussions and terminating pending deals. But as banks gain more clarity around the coronavirus' economic impact, discussions are starting to pick back up to the point that bankers and deal advisers believe next year could turn out to be a banner year for M&A. As deferment rates decreased at community banks during the third quarter bank M&A activity began to return. According to S&P Global, U.S. banks and thrifts announced 14 deals in
| 6 | www.emeraldmutualfunds.com |
| Emerald Small Cap Value Fund | Manager Commentary |
October 31, 2020 (Unaudited)
September, the highest monthly tally in 2020 after January. During the first three quarters of this year, the industry saw 81 deal announcements worth an aggregate $7.75 billion, compared to 200 deals worth $47.05 billion over the same period in 2019. The median deal value to tangible common equity ratio for deals announced in 2020 was 134.2%, down from 157.7% in all of 2019. We believe that as management teams get more clarity into credit quality, M&A activity will return to 2019 levels in 2021.
Our expectations for the upcoming earning season are for margins to remain under pressure. Deposits have flooded into the banking system, leaving bank managers with few attractive options to put the cash to work. Since late February, commercial bank deposits have jumped by about $2.3 trillion, or 18%, with a large amount of the inflows landing directly in consumer and business accounts because of direct government payments, including checks to households of $1,200 each and PPP loans. Business accounts also reflect the cash reserves accumulated during the pandemic, first through borrowing against credit lines and then through bond issuance. The buildup in deposits helped banks cut deposit rates pretty substantially in the second quarter and the trend has continued in the third quarter. Banks' cost of interest-bearing deposits dropped to 0.45% in the second quarter, down 40 basis points from the linked quarter and 57 basis points from a year earlier. Even with the substantial declines in deposit costs, earning-asset yields dropped at a quicker pace, leading to margin pressure.
Given the most recent disclosures from community bank management teams that we have met with, credit quality has been a bright spot in the quarter as community banks generally have indicated that loan deferrals are down significantly since the end of the second quarter and we anticipate a positive yet cautious narrative as it relates to credit when the community banks report. However, as we look forward to the third phase of the pandemic, we anticipate we will return to a more traditional credit pipeline, exhibited by measures of early-stage delinquencies, accruing TDRs, risk rating downgrades, criticized and classified loans, nonaccrual loans, and Other Real Estate Owned (OREO).
We believe the decline in lending that began in May appears to have continued throughout the third quarter, with community bank management teams indicating that they have tightened underwriting amid weak loan demand.
As a result of the strong deposit growth and slower loan growth, management teams have been forced to look to their investment portfolio for yield, no matter how small, and are investing in bank sub debt and corporate bonds in an effort to partially unwind the cash stockpiles accumulated during the early months of the pandemic. Banks’ securities portfolios increased rapidly, growing by $197.14 billion, or 4.7% from June 24 to $4.396 trillion at Sept. 23. Average securities during that period jumped $278.45 billion, or 6.9%, from the month prior according to the FDIC.
At the same time, cash at commercial banks fell $49.64 billion, or 1.6% from June 24 to $2.976 trillion at Sept. 23, and average cash balances over that time fell $240.19 billion, or 7.7%, from the month prior.
Given the uncertainty around the economy, government transfer payments, forbearance and credit quality in the second half of 2020 many bank management teams were not giving formal guidance for 3Q and 4Q of 2020 on their 2Q earnings calls. We believe that management teams are now more optimistic and have better clarity into future credit deterioration. As a result, we believe management teams will attempt to reinstate guidance. Given the updated guidance we would expect sell side estimates to reset post bank earnings. However, we will continue to rely on our fundamental research driven investment process at Emerald combined with our proprietary earnings model which we believe will provide us with clarity as we navigate the bank sector for investment opportunities that will allow us to outperform the sector as a whole.
In addition, we continue to invest in high quality companies that generate prodigious amounts of free cash flow, as well as in financial services enterprises that trade significantly below their terminal value. We think these companies should outperform their peers and the market, as the economy continues to recover from the short but deep recession brought by the COVID-19 pandemic.
Market Outlook
A very accommodative Federal Reserve coupled with trillions of dollars in federal aid to households and businesses have allowed the U.S. economy to emerge from the first six months of the coronavirus pandemic in far better shape than anticipated. However, many uncertainties still exist and several important industries are still reeling from the economic and psychological damage caused by the virus and the ongoing mandates of social distancing. We believe it will take several quarters for the U.S. economy to get to pre-COVID-19 levels, and absent additional fiscal stimulus, the recovery could be measured in years.
On the positive side, domestic industrial metrics bounced back from their historical 2Q20 declines as much of the nation continued to reopen in 3Q20. Industrial manufacturing and materials processing can be carried out safely at a social distance, and there was plenty of pent up demand from 2Q20 to be satisfied. Businesses became used to working with enhanced sanitary, disinfection, and personal protection protocols. After having reduced expenses through layoffs and furloughs, production curtailments, and maintenance outages, the industrial economy began to recover during the quarter aided by the Federal Reserve’s measures to support consumers, businesses, and the economy.
| Semi-Annual Report | October 31, 2020 | 7 |
| Emerald Small Cap Value Fund | Manager Commentary |
October 31, 2020 (Unaudited)
We believe that housing construction will be robust for the foreseeable future, and given extremely tight inventories and constrained supply chains, autos, boats, and RVs sales should remain strong as should many other categories of recreational products. Both Presidential candidates campaigned on bringing manufacturing, including pharmaceuticals, back to the US. All of this could provide a meaningful boost to capital investment over the next few years. There also remains the possibility for an infrastructure spending bill post-election. These are all potential tailwinds for domestic small cap companies.
The industrial economy is recovering earlier than the services economy as social distancing is more safely and easily implemented in a structured manufacturing or assembly environment. Air travel has recovered to only 52% of previous year’s levels. Many restaurants are forced to operate at less than 50% capacity, and theaters are mostly shuttered. Hotels are seeing occupancy levels and rates slowly inching higher but still well below normal levels as both business and leisure travel are mostly on hold. The unemployment rate improved significantly since the peak in 2Q20, and currently stands at 7.9% as of September 30, 2020. However, without the enhanced unemployment benefits that people had been receiving, we could soon see a meaningful impact on consumer spending.
The markets have reached new highs during 3Q20, and we continue to believe investors already priced-in a sharp rebound in revenues and profits. We now expect companies to once again start giving guidance, at least qualitatively if not quantitatively. Executives had enough time to reconfigure their operations and evaluate their end-markets demand and supply chains deficiencies. We believe investors will gravitate towards companies that have not participated in the recent rally off the bottom, but were able to adjust their business model to meet potential increase in demand while holding on to or improving their margins. As value investors, we see many such investment opportunities at this point in time, and will continue to focus on high-quality companies identified and evaluated by our fundamental research and active portfolio management.
| Top Contributors | Top Detractors |
| Cerence Inc | Varex Imaging Corporation |
| Turtle Beach Corporation | Luther Burbank Corporation |
| BRP Group Inc Class A | Trean Insurance Group, Inc. |
| Aarons Holdings Company, Inc. | Photronics, Inc. |
| Atlas Air Worldwide Holdings, Inc. | Social Capital Hedosophia Holdings Corp. II Class A |
| | |
| Sincerely, | |
| | |
| Ori Elan | Steven E. Russell, Esq. |
| Vice President | Vice President |
| Portfolio Manager | Portfolio Manager |
| | |
| Emerald Mutual Fund Advisers Trust | |
| 8 | www.emeraldmutualfunds.com |
| Emerald Small Cap Value Fund | Manager Commentary |
| | October 31, 2020 (Unaudited) |
Past performance does not guarantee future results. Fund prices fluctuate as the underlying assets have exposure to market fluctuations and other risks, as described in the Fund’s prospectus. Please visit www.emeraldmutualfunds.com to obtain current performance information and for the current prospectus and statement of additional information. This material must be preceded or accompanied by a prospectus. Please read the prospectus carefully before investing.
The views of Emerald Mutual Fund Advisers Trust and information discussed in this commentary are as of the date of publication, are subject to change, and may not reflect the writer's current views. The views expressed are those of the author only, and represent an assessment of market conditions at a specific point in time, are opinions only and should not be relied upon as investment advice regarding a particular investment or markets in general. Such information does not constitute a recommendation to buy or sell specific securities or investment vehicles. It should not be assumed that any investment will be profitable or will equal the performance of the Fund or any securities or any sectors mentioned in this letter. The subject matter contained in this letter has been derived from several sources believed to be reliable and accurate at the time of compilation. Neither Emerald Mutual Fund Advisers Trust nor the Fund accepts any liability for losses either direct or consequential caused by the use of this information.
The Emerald Small Cap Value Fund is distributed by ALPS Distributors, Inc.
The Fund is subject to investment risks, including possible loss of the principal amount invested and therefore is not suitable for all investors. The Fund may not achieve its objectives.
Diversification does not eliminate the risk of experiencing investment losses.
The term Russell 2000® Value Index refers to a composite of small cap companies located in the United States that also exhibit a value probability. The Russell 2000® Value is published does not reflect any deductions for fees, expenses or taxes. An investor may not invest directly into the Index.
A yield curve is a line that plots the interest rates, at a set point in time, of bonds having equal credit quality but differing maturity dates. The most frequently reported yield curve compares the three-month, two-year, five-year and 30-year U.S. Treasury debt. This yield curve is used as a benchmark for other debt in the market, such as mortgage rates or bank lending rates, and it is also used to predict changes in economic output and growth.
The ISM Report On Business®, popularly known as the ISM Report, is the collective name for two monthly reports, the Manufacturing ISM Report On Business® and the Non-Manufacturing ISM Report On Business®, published by Institute for Supply Management.
Tangible book value (TBV) is a valuation ratio expressing the price of a security compared to its hard, or tangible, book value as reported in the company's balance sheet. The tangible book value number is equal to the company's total book value less the value of any intangible assets.
Net interest margin is a metric that examines how successful a firm's investment decisions are compared to its debt situations.
The ISM Manufacturing Index is a widely-watched indicator of recent U.S. economic activity. The index is often referred to as the Purchasing Manager's Index (PMI).
| Semi-Annual Report | October 31, 2020 | 9 |
| Emerald Small Cap Value Fund | Manager Commentary |
| | October 31, 2020 (Unaudited) |
TOP TEN HOLDINGS
(as a % of Net Assets)* | |
| | |
| Cubic Corp. | 2.80% |
| MasTec, Inc. | 2.69% |
| Cannae Holdings, Inc. | 2.64% |
| Aaron's Holdings Co., Inc. | 2.59% |
| Smith & Wesson Brands, Inc. | 2.58% |
| Gray Television, Inc. | 2.52% |
| Everi Holdings, Inc. | 2.48% |
| Atlas Air Worldwide Holdings, Inc. | 2.38% |
| Vonage Holdings Corp. | 2.32% |
| Photronics, Inc. | 2.24% |
| Top Ten Holdings | 25.24% |
INDUSTRY SECTOR ALLOCATION
(as a % of Net Assets) | |
| | |
| Financial Services | 33.00% |
| Consumer Discretionary | 24.32% |
| Technology | 13.24% |
| Producer Durables | 11.80% |
| Health Care | 6.50% |
| Materials & Processing | 5.08% |
| Utilites | 2.32% |
| Consumer Staples | 1.62% |
| Cash, Cash Equivalents, & Other Net Assets | 2.12% |
| Total | 100.00% |
| * | Holdings are subject to change, and may not reflect the current or future position of the portfolio. |
ANNUALIZED TOTAL RETURN (for the period ended October 31, 2020)(1)
| | | | | | Since | Expense Ratio
|
| | 6 Month | 1 Year | 3 Years | 5 Years | Inception(2) | Gross(3) | Net(3) |
| Class A (NAV) | 16.95% | -17.58% | -7.10% | 1.42% | 5.56% | 5.35% | 1.35% |
| Class A (MOP) | 11.43% | -21.48% | -8.60% | 0.43% | 4.92% | 5.35% | 1.35% |
| Russell 2000® Value Index(4) | 12.44% | -13.92% | -4.05% | 3.71% | 6.52% | | |
| Class C (NAV) | 16.47% | -18.19% | -7.73% | 0.74% | 4.86% | 6.20% | 2.00% |
| Class C (CDSC) | 15.47% | -19.01% | -7.73% | 0.74% | 4.86% | 6.20% | 2.00% |
| Russell 2000® Value Index(4) | 12.44% | -13.92% | -4.05% | 3.71% | 6.52% | | |
| Investor Class | 16.82% | -17.49% | -6.97% | 1.55% | 5.71% | 5.39% | 1.25% |
| Russell 2000® Value Index(4) | 12.44% | -13.92% | -4.05% | 3.71% | 6.52% | | |
| Institutional Class | 17.07% | -17.41% | -6.79% | 1.75% | 5.91% | 5.12% | 1.00% |
| Russell 2000® Value Index(4) | 12.44% | -13.92% | -4.05% | 3.71% | 6.52% | | |
Performance quoted represents past performance, does not guarantee future results and current performance may be lower or higher than the data quoted. The investment return and principal value of an investment will fluctuate so that shares, when redeemed, may be worth more or less than their original cost. Performance data current to the most recent month end may be obtained at www.emeraldmutualfunds.com.
Returns for periods less than 1 year are cumulative.
The table does not reflect the deduction of taxes that a shareholder would pay on Fund distributions or the redemption of Fund shares.
Subject to investment risks, including possible loss of the principal amount invested.
Maximum Offering Price (MOP) for Class A shares includes the Fund's maximum sales charge of 4.75%. Performance shown at NAV does not include these sales charges and would have been lower had it been taken into account.
A Contingent Deferred Sales Charge (CDSC) of 1.00% may apply to Class C shares redeemed within the first 12 months after a purchase.
| (1) | As of June 26, 2015, the Emerald Small Cap Value Fund was reorganized as a successor to the Elessar Small Cap Value Fund (the Predecessor Fund), a series of Elessar Investment Trust. The performance shown for periods prior to June 26, 2015 reflects the performance of the Predecessor Fund's Institutional Class and Investor Class shares. The Predecessor Fund did not offer Class A or Class C shares. The performance shown for Class A and C shares prior to June 30, 2015 reflect the historical performance of the Predecessor Fund’s Institutional and Investor Shares since inception on October 15, 2012, calculated using the fees and expenses of Class A and C shares, respectively. |
| (2) | Commencement Dates - Class A: 06/30/2015, Class C: 06/30/2015, Institutional Class: 10/15/2012, Investor Class:10/15/2012 |
| (3) | Emerald Mutual Fund Advisers Trust (“Emerald” or the “Adviser”) has agreed contractually to waive a portion of its fees and reimburse other expenses until August 31, 2021 in amounts necessary to limit the Fund’s operating expenses (exclusive of Acquired Fund Fees and Expenses, brokerage expenses, interest expenses, taxes and extraordinary expense) for Class A, Class C, Institutional Class, and Investor Class shares to an annual rate (as percentage of the Fund’s average daily net assets) of 1.35%, 2.00%, 1.00% and 1.25% respectively. The Adviser will be permitted to recover, on a class-by-class basis, expenses it has borne through the agreement described above to the extent that the Fund's expenses in later periods fall below the annual rates set forth in the relevant agreement. The Fund will not be obligated to pay any such deferred fees and expenses more than three years after the year(s) in which the fees and expense were incurred. The Adviser may not discontinue this waiver prior to August 31, 2021, without the approval by the Fund's Board of Trustees. Ratios as of the Prospectus dated August 31, 2020 and may differ from the ratios presented in the Financial Highlights. |
| (4) | The Russell 2000® Value Index measures the performance of small-cap value segment of the U.S. equity universe. It includes those Russell 2000 companies with lower price-to-book ratios and lower forecasted growth values. The Index is not actively managed and does not reflect any deductions for fees, expenses or taxes. An investor may not invest directly into the Index. |
Important Risks
Investing in smaller companies generally will present greater investment risks, including: greater price volatility, greater sensitivity to changing economic conditions and less liquidity than the securities of larger, more mature companies.
| 10 | www.emeraldmutualfunds.com |
| Emerald Small Cap Value Fund | Manager Commentary |
| | October 31, 2020 (Unaudited) |
GROWTH OF $10,000 INVESTMENT IN THE FUND (for the period ended October 31, 2020)
Comparison of change in value of a $10,000 investment (includes applicable sales loads)
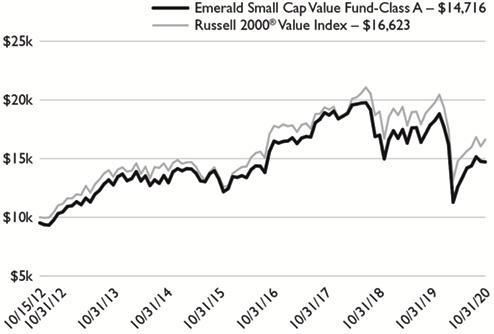
The chart represents historical performance of a hypothetical investment of $10,000 in the Fund since inception. Past performance does not guarantee future results. This chart does not reflect the deduction of taxes that a shareholder would pay on Fund distributions or the redemption of Fund shares.
Investing in the Fund is subject to investment risks, including possible loss of the principal amount invested.
| Semi-Annual Report | October 31, 2020 | 11 |
| Emerald Insights Fund | Manager Commentary |
| | October 31, 2020 (Unaudited) |
October 31, 2020
Dear Shareholder:
Investment Results
The performance of the Emerald Insights Fund (the Fund) Class A Shares (without the sales load) for the six months ended October 31, 2020 reflected a return of 29.35%, surpassing the Russell 3000® Growth Index benchmark return of 21.85% by 841 basis points. Performance was driven by strength in Healthcare, Energy, Materials, and Consumer offset by weakness in Producer Durables and Technology.
Investment Analysis
The majority of the reporting period was dominated by the performance of stocks leveraged to the “work-from-home” trend, as well as stocks bolstered by reports of improving economic activity, continued positive virus trends, and repeated dovish statements from Fed officials. Economic indicators weakened somewhat in the latter half of the reporting period, but overall employment, manufacturing and non-manufacturing date continued to be generally better than anticipated.
The Fund benefitted from our “Flexible Barbell” approach to portfolio construction, wherein we maintained modestly underweight positions in the FAANGM names (less Netflix) and at the same time had significant exposure to some of our favorite small- and mid-cap names, composed of a mixture of cyclical and secular growers, companies benefitting from COVID-19 related dynamics and firms benefitting from reopening activity.
As in prior periods, the Fund was materially growthier than the benchmark, with an estimated 3-5 year Earning per Shares (EPS) growth rate of 20.08% vs 17.45% for the index. Portfolios continue to trade at or below the benchmark on every valuation metric that we track including Price/Earnings, Price/Sales, and Price/Book, with less debt and literally twice the historical earnings growth.
Market Outlook
No one would have guessed that seven months after equity markets suffered one of their sharpest declines ever, indices would be fully recovered, with strategists predicting substantial gains ahead. Nor would they have guessed that a highly contentious election, with the prospects of massive increases in Federal spending and taxes, would barely put a crimp in the equity market advance.
The Fund has outperformed for the trailing six month period based on our approach to portfolio construction mentioned above, however the current state of the economic recovery is uncertain. Risks surrounding a contentious Presidential transition, Chinese trade, a resurgent virus and regional lockdowns, and the timing of a vaccine create volatility and uncertainty throughout equity markets and society in general. This uncertainty can rapidly alter assumptions regarding economic growth, interest rates, inflation, credit conditions and valuations. Our primary method for portfolio construction, since 1992, remains fundamental, bottom-up research, which we steadfastly believe identifies those companies with the best prospects for strong revenue and earnings growth, regardless of changing market conditions.
A pre-condition for active management outperformance is wide dispersions of earnings estimates and results. We think that this condition is a good proxy highlighting under-researched, under-followed companies. As of October 31, 2020, the Fund continues to have substantially more expected earnings growth than its index, yet trades at a discount on almost every measure – a situation that we think bodes well for future returns assuming a rational market and reasonable execution. After half a decade of fighting a very difficult battle against the Fund’s benchmark due to high correlations and very low dispersion, we believe we are finally entering a stock-picker’s market.
| Top Contributors | Top Detractors | |
| Apple Inc. | Tabula Rasa Healthcare, Inc. | |
| Horizon Therapeutics Public Limited Company | Karyopharm Therapeutics, Inc. | |
| New Fortress Energy Inc. Class A | Proofpoint, Inc. | |
| Chegg, Inc. | L3Harris Technologies Inc | |
| NVIDIA Corporation | Winnebago Industries, Inc. | |
| Chart Industries, Inc. | Varex Imaging Corporation | |
| Amazon.com, Inc. | Mercury Systems, Inc. | |
| iShares Expanded Tech-Software Sector ETF | Integer Holdings Corporation | |
| Immunomedics, Inc. | Western Alliance Bancorp | |
| Varonis Systems, Inc. | Applied Therapeutics, Inc. | |
| | | |
| David A. Volpe, CFA | Stephen L. Amsterdam | Joseph Hovorka |
| Deputy Chief Investment Officer | Associate Portfolio Manager | Associate Portfolio Manager |
| Portfolio Manager | | |
Emerald Mutual Fund Advisers Trust
| 12 | www.emeraldmutualfunds.com |
| Emerald Insights Fund | Manager Commentary |
| | October 31, 2020 (Unaudited) |
Past performance does not guarantee future results. Fund prices fluctuate as the underlying assets have exposure to market fluctuations and other risks, as described in the Fund’s prospectus. Please visit www.emeraldmutualfunds.com to obtain current performance information and for the current prospectus and statement of additional information. This material must be preceded or accompanied by a prospectus. Please read the prospectus carefully before investing.
The views of Emerald Mutual Fund Advisers Trust and information discussed in this commentary are as of the date of publication, are subject to change, and may not reflect the writer's current views. The views expressed are those of the author only, and represent an assessment of market conditions at a specific point in time, are opinions only and should not be relied upon as investment advice regarding a particular investment or markets in general. Such information does not constitute a recommendation to buy or sell specific securities or investment vehicles. It should not be assumed that any investment will be profitable or will equal the performance of the Fund or any securities or any sectors mentioned in this letter. The subject matter contained in this letter has been derived from several sources believed to be reliable and accurate at the time of compilation. Neither Emerald Mutual Fund Advisers Trust nor the Fund accepts any liability for losses either direct or consequential caused by the use of this information.
The Emerald Insights Fund is distributed by ALPS Distributors, Inc.
The Fund is subject to investment risks, including possible loss of the principal amount invested and therefore is not suitable for all investors. The Fund may not achieve its objectives.
Diversification does not eliminate the risk of experiencing investment losses.
The Russell 3000® Growth Index is a market capitalization weighted index based on the Russell 3000® index. The Russell 3000® Growth Index includes companies that display signs of above average growth. The index is used to provide a gauge of the performance of growth stocks in the United States. The Index is not actively managed and does not reflect any deductions for fees, expenses or taxes. An investor may not invest directly into the Index.
Basis points refers to a common unit of measure for interest rates and other percentages in finance. One basis point is equal to 1/100th of 1%, or 0.01%, or 0.0001, and is used to denote the percentage change in a financial instrument.
| Semi-Annual Report | October 31, 2020 | 13 |
| Emerald Insights Fund | Manager Commentary |
| | October 31, 2020 (Unaudited) |
| TOP TEN HOLDINGS | |
| (as a % of Net Assets)* | |
| | |
| Apple, Inc. | 8.21% |
| Microsoft Corp. | 7.93% |
| Amazon.com, Inc. | 7.24% |
| Alphabet, Inc. | 3.44% |
| NVIDIA Corp. | 3.39% |
| Facebook, Inc. | 2.93% |
| Horizon Therapeutics PLC | 2.90% |
| Chart Industries, Inc. | 2.41% |
| PayPal Holdings, Inc. | 2.32% |
| Chegg, Inc. | 2.23% |
| Top Ten Holdings | 43.00% |
| INDUSTRY SECTOR ALLOCATION |
| (as a % of Net Assets) | |
| | |
| Technology | 38.91% |
| Consumer Discretionary | 24.59% |
| Health Care | 16.71% |
| Financial Services | 6.77% |
| Producer Durables | 5.75% |
| Energy | 2.98% |
| Consumer Staples | 1.96% |
| Materials & Processing | 1.90% |
| Cash, Cash Equivalents, & Other Net Assets | 0.43% |
| Total | 100.00% |
| * | Holdings are subject to change, and may not reflect the current or future position of the portfolio. |
ANNUALIZED TOTAL RETURN (for the period ended October 31, 2020)
| | | | | | Since | Expense Ratio |
| | 6 Month | 1 Year | 3 Year | 5 Year | Inception(1) | Gross(2) | Net(2) |
| Class A (NAV) | 29.35% | 36.01% | 17.22% | 13.71% | 11.65% | 2.25% | 1.35% |
| Class A (MOP) | 23.25% | 29.50% | 15.32% | 12.62% | 10.78% | 2.25% | 1.35% |
| Russell MidCap® Growth Index(3) | 23.33% | 21.14% | 15.21% | 14.15% | 12.96% | | |
| Russell 3000® Growth Index(4) | 21.85% | 28.20% | 18.01% | 16.84% | 15.88% | | |
| Class C (NAV) | 28.95% | 35.20% | 16.48% | 12.98% | 10.90% | 2.90% | 2.00% |
| Class C (CDSC) | 27.95% | 34.20% | 16.48% | 12.98% | 10.90% | 2.90% | 2.00% |
| Russell MidCap® Growth Index(3) | 23.33% | 21.14% | 15.21% | 14.15% | 12.96% | | |
| Russell 3000® Growth Index(4) | 21.85% | 28.20% | 18.01% | 16.84% | 15.88% | | |
| Investor Class | 29.33% | 35.91% | 17.19% | 13.67% | 11.58% | 2.30% | 1.40% |
| Russell MidCap® Growth Index(3) | 23.33% | 21.14% | 15.21% | 14.15% | 12.96% | | |
| Russell 3000® Growth Index(4) | 21.85% | 28.20% | 18.01% | 16.84% | 15.88% | | |
| Institutional Class | 29.51% | 36.51% | 17.57% | 14.07% | 11.96% | 1.95% | 1.05% |
| Russell MidCap® Growth Index(3) | 23.33% | 21.14% | 15.21% | 14.15% | 12.96% | | |
| Russell 3000® Growth Index(4) | 21.85% | 28.20% | 18.01% | 16.84% | 15.88% | | |
The performance quoted represents past performance, does not guarantee future results and current performance may be lower or higher than the data quoted. The investment return and principal value of an investment will fluctuate so that shares, when redeemed, may be worth more or less than their original cost. Performance data current to the most recent month end may be obtained at www.emeraldmutualfunds.com.
Returns for periods less than 1 year are cumulative.
The table does not reflect the deduction of taxes that a shareholder would pay on Fund distributions or the redemption of Fund shares.
Subject to investment risks, including possible loss of the principal amount invested.
Maximum Offering Price (MOP) for Class A shares includes the Fund's maximum sales charge of 4.75%. Performance shown at NAV does not include these sales charges and would have been lower had it been taken into account.
A Contingent Deferred Sales Charge (CDSC) of 1.00% may apply to Class C shares redeemed within the first 12 months after a purchase.
| (1) | Inception Date – August 1, 2014. |
| (2) | Emerald Mutual Fund Advisers Trust ("Emerald" or the "Adviser") has agreed contractually to waive a portion of its fees and reimburse other expenses until August 31, 2021 in amounts necessary to limit the Fund's operating expenses (exclusive of Acquired Fund Fees and Expenses, brokerage expenses, interest expenses, taxes and extraordinary expense) for Class A, Class C, Institutional Class, and Investor Class shares to an annual rate (as percentage of the Fund's average daily net assets) of 1.35%, 2.00%, 1.05% and 1.40% respectively. The Adviser will be permitted to recover, on a class-by-class basis, expenses it has borne through the agreement described above to the extent that the Fund's expenses in later periods fall below the annual rates set forth in the relevant agreement. The Fund will not be obligated to pay any such deferred fees and expenses more than three years after the year(s) in which the fees and expense were incurred. The Adviser may not discontinue this waiver prior to August 31, 2021, without the approval by the Fund's Board of Trustees. Ratios as of the Prospectus dated August 31, 2020 and may differ from the ratios presented in the Financial Highlights. |
| (3) | The Russell MidCap® Growth Index measures the performance of the mid-cap growth segment of the U.S. equity universe. It includes those Russell Midcap Index companies with higher price-to-book ratios and higher forecasted growth values. The Index is not actively managed and does not reflect any deductions for fees, expenses or taxes. An investor may not invest directly into the Index. |
| (4) | The Russell 3000® Growth Index is a market capitalization weighted index based on the Russell 3000® index. The Russell 3000® Growth Index includes companies that display signs of above average growth. The index is used to provide a gauge of the performance of growth stocks in the United States. The Index is not actively managed and does not reflect any deductions for fees, expenses or taxes. An investor may not invest directly into the Index. |
Important Risks
Investing in smaller companies generally will present greater investment risks, including: greater price volatility, greater sensitivity to changing economic conditions and less liquidity than the securities of larger, more mature companies.
| 14 | www.emeraldmutualfunds.com |
| Emerald Insights Fund | Manager Commentary |
| | October 31, 2020 (Unaudited) |
GROWTH OF $10,000 INVESTMENT IN THE FUND (for the period ended October 31, 2020)
Comparison of change in value of a $10,000 investment (includes applicable sales loads)
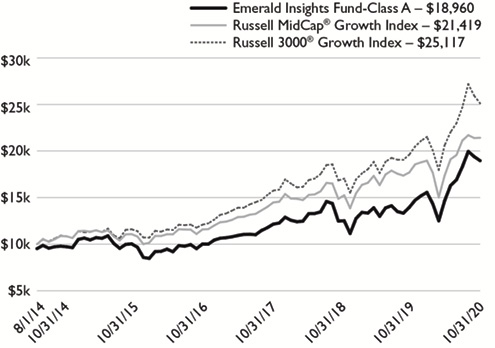
The chart represents historical performance of a hypothetical investment of $10,000 in the Fund since inception. Past performance does not guarantee future results. This chart does not reflect the deduction of taxes that a shareholder would pay on Fund distributions or the redemption of Fund shares.
Investing in the Fund is subject to investment risks, including possible loss of the principal amount invested.
| Semi-Annual Report | October 31, 2020 | 15 |
| Emerald Banking and Finance Fund | Manager Commentary |
| | October 31, 2020 (Unaudited) |
October 31, 2020
Dear Shareholder:
Investment Results
The performance of the Emerald Banking & Finance Fund Class A Shares (without the sales load) for the six months ended October 31, 2020 reflected a return of 21.84%, surpassing the Russell 2000®Index benchmark return of 18.13% and the Russell 2000® Financial Services Index benchmark return of 11.53%.
Investment Analysis
Over the past six months, economic turmoil associated with the COVID-19 pandemic has had wide-ranging and severe impacts upon financial markets, including stock, bond, and commodity markets. Additionally, we believe the COVID-19 pandemic and its related confinement measures caused an unprecedented contraction in economic activity and a collapse in demand for oil and oil products. The result is one of the biggest price shocks the energy market experienced since the first oil shock of 1973. Oil prices dipped below $20 (Brent crude) a barrel, losing nearly 70% in value, with storage capacity approaching its limits. On 20 April 2020, the futures price of West Texas Intermediate crude to be delivered in May became negative, an unprecedented event. This was a result of uninterrupted supply and a much reduced demand, as oil storage facilities reached their maximum capacity.
During the 2020 stock market crash that began the week of March 9th, bond prices unexpectedly moved in the same direction as stock prices. Along with the unexpected movement of bonds in concert with stocks, bond desks reported that it had become difficult to trade many different types of bonds, including municipal bonds, corporate bonds, and even U.S. Treasury bonds. As banks were unable to sell the bonds they were holding, they also stopped buying bonds. Market depth in Treasuries, a measure of liquidity, fell to its lowest level since the 2008 crisis, according to The New York Times on March 14th. Over the week of March 9th, investors pulled a weekly record of $15.9 billion from investment-grade bond funds, as well as $11.2 billion from high-yield bond funds, the second-highest on record, according to MarketWatch. Also, prices for bond exchange-traded funds began dropping below their net asset values.
On March 12th, the U.S. Fed took stepped in to provide unprecedented support, to address the highly unusual disruptions in Treasury financing markets associated with the coronavirus outbreak. The Federal Reserve Bank of New York (Fed) announced that it would offer $1.5 trillion in repurchase agreements in U.S. Treasury securities to smooth the functioning of the short-term market that banks use to lend to each other. The New York Fed further announced that it would buy $60 billion of Treasury bonds over the next month to keep the bond market functioning. The seizing up of markets was a critical step in the subprime mortgage crisis that led to the financial crisis of 2007–08 and the Fed appeared to want to act quickly. On March 15th, the Fed announced it would buy at least $500 billion in Treasuries and at least $200 billion in government-backed mortgage securities over the next few months.
Additionally, On March 17th, the Fed announced that they would utilize the Commercial Paper Funding Facility (CPFF). The CPFF was first used in the 2007-08 financial crisis to buy about $350 billion of commercial paper (CP), thereby increasing the amount of cash in the CP market, used by business to pay bills and other short-term demands. CP most directly affects the mortgage and auto loan markets, as well as credit to small and medium-sized businesses. The U.S. Treasury Department authorized $10 billion to backstop any losses incurred by the Fed using the Treasury's Exchange Stabilization Fund.
On March 27, 2020, the Coronavirus Aid, Relief, and Economic Security Act (CARES Act) was signed into law. Under the CARES Act, a forbearance program for federally backed mortgage loans was created to protect borrowers from negative credit reporting due to loan accommodations related to the COVID 19. The forbearance program provided financial institutions the option to temporarily suspend certain requirements under U.S. generally accepted accounting principles (GAAP) related to troubled debt restructurings (TDR) through the end of 2020 to account for the effects of COVID.
The New York Times reported on April 19th that U.S. corporations had drawn more than $200 billion from existing credit lines during the COVID-19 crisis as they prepared for the worst. Banks saw credit line usage that was far greater than had been extended in the 2008 crisis.
Following passage of the CARES act, the Fed announced that it would buy up to $2.3 trillion in debt from the U.S. market, including from companies that were downgraded from investment-grade to junk during the chaos of March.
We believe the more important aspect of the CARES Act was the Paycheck Protection Program (PPP). The Paycheck Protection Program is a $669 billion program to help certain businesses, self-employed workers, sole proprietors, certain nonprofit organizations, and tribal businesses to continue paying their workers. PPP allowed entities to apply for low-interest private loans to pay for their payroll and certain other costs. The amount of a PPP loan was approximately equal to 2.5 times the applicant's average monthly payroll costs. The loan proceeds could be used to
| 16 | www.emeraldmutualfunds.com |
| Emerald Banking and Finance Fund | Manager Commentary |
| | October 31, 2020 (Unaudited) |
cover payroll costs, rent, interest, and utilities. The loan could be partially or fully forgiven if the business kept its employee counts and employee wages stable.
The CARES Act also provided Economic Impact Payments to American households of up to $1,200 per adult for individuals whose income was less than $99,000 (or $198,000 for joint filers) and $500 per child under 17 years old – or up to $3,400 for a family of four.
Additionally, the CARES Act added $600 per week to regular unemployment benefits, providing recipients with levels of income closer to regular paychecks than under the normal system. An additional 13 weeks of benefits were also added to the traditional 26 weeks of unemployment, as a result, those in need of benefits received up to 39 weeks of coverage.
On May 12th, the Fed began buying corporate bond ETFs for the first time in its history. We believe the guarantee of a Fed backstop appears to have ensured market liquidity.
A Federal eviction moratorium was issued by the Centers for Disease Control (CDC) that remains in effect from September 4, 2020 to December 31, 2020. The temporary moratorium on evictions extends vital protections to tens of millions of renters at risk of eviction for nonpayment of rent during the global pandemic.
On top of all of the challenges noted above, the country endured a hard-fought Presidential election that highlighted the growing divide amongst citizens in our great country.
So what damage to the economy is apparent as a result of COVID? While voluntary social distancing and lockdowns that took effect in March 2020 worked initially to isolate and drive down infections, those actions precipitated a severe economic downturn. The demand shock resulting from quarantine, unemployment, and business closures dealt a blow to consumer services. Lockdown measures and social distancing reduced the economy’s capacity to produce goods and services.
The National Bureau of Economic Research (NBER) determined that a peak in monthly economic activity occurred in the U.S. economy in February 2020, marking the end of the longest recorded U.S. expansion, which began in June 2009. From the most recent peak in the fourth quarter of 2019, the United States experienced two consecutive quarters of declines in Gross Domestic Product (GDP); it even recorded its steepest quarterly drop in economic output on record, a decrease of 9.1 percent in the second quarter of 2020. To put this contraction into historical context, quarterly GDP had never experienced a drop greater than 3 percent (at a quarterly, nonannualized rate) since record keeping began in 1947. COVID-19–related job losses wiped out 113 straight months of job growth, with total nonfarm employment falling by 20.5 million jobs in April.
The COVID-19 crisis also led to dramatic swings in household spending. Retail sales, which primarily tracks sales of consumer goods, declined 8.7 percent from February to March 2020, the largest month-to-month decrease since the Census Bureau started tracking the data (U.S. Census Bureau 2020). Although some areas (e.g., grocery stores, pharmacies, and non-store retailers) saw increases in demand as lockdown measures began, others (e.g., clothing stores, furniture and appliances stores, food services and drinking places, sporting and hobby stores, and gasoline stations) saw declines. In early May, as some states lifted social distancing restrictions, sales began to recover in most goods sectors (U.S. Census Bureau 2020). Overall, U.S. retail sales increased 17.7 percent from April to May, the largest monthly jump on record, recouping 63 percent of March and April’s losses (U.S. Census Bureau 2020). Growth in retail sales continued through the summer: by August, retail sales were 2.6 percent above their August 2019 level (U.S. Census Bureau 2020a).
In addition to consumer spending, we believe the COVID-19 crisis has damaged the nation’s industrial production (i.e., output in the manufacturing, mining, and utility sectors). U.S. industrial production dropped sharply in March and has since only partially rebounded. We believe this decline poses a host of challenges for the U.S. manufacturing sector, which employs nearly 13 million workers (Federal Reserve Bank of St. Louis [FRED] 2020), especially those that depend on workers whose jobs cannot be carried out remotely.
The effects of the crisis vary by industry subsector, with the construction machinery subsector having experienced less-severe effects than it faced during the 2007–09 financial crisis due to expected government infrastructure stimuli and an increase in e-commerce, while companies in the machine tools, plastics machinery, and steel production equipment sectors have been more negatively affected. In addition, the partial rebound in industrial production was boosted by a 107 percent increase in auto production in June 2020 (Board of Governors of the Federal Reserve System 2020).
We believe the COVID-19 related lockdown has also had an effect on the commercial real estate markets in certain geographies and the pandemic effect continues into the third quarter as the lack of demand for commercial real estate in the third quarter resulted in rising vacancy rates and slowing or falling rents and property prices. The impact was uneven across property types, however, with greater effects on office and retail property markets, but smaller or little impact on multifamily and industrial properties.
| Semi-Annual Report | October 31, 2020 | 17 |
| Emerald Banking and Finance Fund | Manager Commentary |
| | October 31, 2020 (Unaudited) |
Demand for office space fell sharply in the third quarter, as total occupied space declined 33 million square feet. According to Nareit, this is a larger decline than in any quarter during the financial crisis 2008-2009, and the largest decline since 2001. Retail property markets also saw a sharp drop in occupied space due to store closures and retailer bankruptcies. Total leased space fell 17 million square feet. Vacancy rates moved up in most major property markets due to weaker demand. Office markets experienced the largest increase, with vacancy rates 60 bps higher than at mid-year and 90 bps higher than the end of 2019. Retail vacancy rates were 20 bps higher than last quarter and 50 bps higher than end of 2019. There was a slight in increase in industrial vacancies, rising 10 bps, while apartment vacancies were little changed from last quarter, according to Nareit.
Rent growth slowed or turned negative due to the weakness in demand for leased space. Office rents dropped 0.5%, the second consecutive decline after a 0.3% decrease in the second quarter of 2020. Retail rents were down 0.6%, while apartment rents slipped 0.2%. Industrial was the only major property sector with a quarterly rise in rents, posting a 0.8% increase. For office, retail, and apartments, declines since the start of the pandemic reversed the gains late last year, leaving rents little changed from one year earlier. Industrial rents, in contrast, are 3.5% higher than in the third quarter of 2019.
Property prices reflect these trends in demand and rents. For office and retail properties, prices as measured by the CoStar commercial repeat sales index show declines of 3.8% and 3.2%, respectively, from one year ago. Prices of industrial and apartment properties, in contrast, continued rising, and are 7.1% and 6.3% higher, respectively, than the third quarter of 2019.
Market Outlook
So what does all this mean for community banks and financial services companies? While we have generally subscribed to a more cautious and selective view of bank stocks since the COVID-19 pandemic, we are warming to the group overall, as recent news around the availability of a vaccine and improved treatments as well as improvements in economic and credit trends give us greater comfort that tail risk has diminished over time for the community bank sector.
We also are encouraged by the historically attractive bank valuations. Mid cap banks are trading at 12.4x/11.3x FY20/21E EPS and at 1.23x TBV, vs. the historical medians of 13.2x FY2 EPS and 1.91x, respectively. For context, the FactSet consensus FY20/21 EPS growth estimates are now -23%/+7%, vs. the historical 10%-12% growth rates expected. The mid cap bank P/E on FY20/21 is 48%/53% of the S&P P/E, vs. a 86% median and a range of 82%-101% since 2000.
What we are most concerned about near-term is the potential risk of implementation of localized lockdowns in certain markets over the next several months aimed at containing the pandemic, just as the CARES Act deferral window closes at year end. The end of many of the benefits to individuals and small businesses we believe will likely stress the financial outlook for borrowers requiring additional assistance to remain solvent, while desperate consumers/ businesses needing more stimulus are forced to carry on without help, all of which could adversely impact bank fundamentals, expectations on fundamentals, and valuations.
That said, we expect these potential adverse impacts could prove short lived, and we believe banks will be substantially done with navigating the worst of this cycle by the second half of 2021, when we expect a greater likelihood for a prevailing constructive near term economic outlook taking shape that will prove positive for bank valuations in general, which could translate into healthy relative upside potential over the next year as expectations shift to stronger earnings growth for community banks.
While we remain “cautious” on credit deterioration we must take note that community banks have already reported much lower re-deferral rates on loans coming off their initial 90/180 day deferral periods in the last three months, increasing our comfort level that credit deterioration could be less than anticipated. Given the material reserves taken by the banking sector in the second quarter of 2020 by some banks it is possible that select banks may see those reserves flow back into earnings in 2021.
In the near term, we believe that community bank stocks could benefit from the announcement of additional fiscal stimulus providing a longer duration of financial support for struggling businesses and individuals. We believe that once we are clear of the “noise” of the Presidential election a stimulus package in the $1.5 trillion range will hit over the next three months, which should drive continued strong deposit growth at banks. We believe the resulting deposit growth would likely support continued liquidity growth, providing cover to run off higher cost deposits. We also believe an additional stimulus plan will result in an improved credit outlook at banks which we expect could translate into lower provisions.
As previously stated, our approach has been to evaluate community banks during the coronavirus pandemic through a spectrum that views the pandemic as having a four stage process. We believe that four stage process includes the original lockdown, pre-therapy/vaccine, post-therapy/vaccine, and the rebuilding of the economy. While no one knows with certainty the timing of phases three and four, what we do know is that the community banking sector has transitioned from stage one into stage two, pre-therapy/vaccine in better shape than even the most optimistic investors and management teams could have expected. Given the recent announcement by Pfizer around their vaccine trials and a potential 90% plus efficacy rate, investors may soon be focused on phase three, post-therapy/vaccine, in the first quarter of 2021 and the fourth
| 18 | www.emeraldmutualfunds.com |
| Emerald Banking and Finance Fund | Manager Commentary |
| | October 31, 2020 (Unaudited) |
phase, the rebuilding of the economy in the second half of 2021. We believe that the plethora of governments aid and transfer payments have been beneficial to the community banking sector to date.
Update on Credit Quality
According to S&P Global Market Intelligence, U.S. banks have continued to report steep declines in loans granted payment deferrals as special COVID-19 borrower relief programs approach their end. In fact, community banks have reported that most borrowers have returned to making payments and noted relatively mild pressure on traditional measures of credit performance such as nonperforming assets and charge-offs. That includes modest increases, and in some cases declines, in criticized assets in the third quarter.
According to S&P Global, deferrals at community banks now range from 0.6% of loans to 9.7%, significantly below the range of 1.7% to 28.3% given in reports after the second quarter.
Bank Margins Remain Under Pressure
According to S&P Global Market Intelligence, U.S. bank margins dove further in the third quarter, reaching another record low as excess liquidity continued to weigh on institutions' balance sheets. Bank margins dropped another 11 basis points in the third quarter, with the industry's taxable equivalent net interest margin falling to 2.63%, from 2.74% in the prior quarter, a record low.
Margins are under pressure as deposit growth exploded in the second quarter, and balances inched higher in the third quarter. Meanwhile, loan growth remained hard to come by as banks tightened underwriting standards in many asset classes, while borrower demand remained weak. Through the third quarter, deposits rose 19.9% from a year earlier. Loan balances increased nearly 5% year over year, with growth driven by loans made through the Paycheck Protection Program, or PPP, in the prior quarter, according to S&P Global.
As banks failed to put deposits to work, the industry's loan-to-deposit ratio fell to 63.7% in the third quarter from 72.8% a year earlier.
In the absence of loan demand, banks put more cash to work in securities in the third quarter, growing those portfolios 6.1% from prior-quarter and 21.7% from year-ago levels.
Low interest rates have weighed on banks' loan yields as well, but the pressure has been heightened by the presence of roughly $500 billion in PPP loans, which carry rates of just 1%.
S&P Global stated that the presence of low-yielding PPP loans helped drive down the industry’s loan yield, which fell to 4.39% in the third quarter from 4.46% in the second quarter and 5.48% a year ago. The decline in commercial and industrial loan yields was greatest, plunging to 3.48% from 3.63% in the second quarter and 4.94% in the year-ago period.
Deposit growth has been aided by government stimulus, which boosted consumers' incomes and sent U.S. savings rates to 33.6% in April, the highest level on record. From May through September, the metric remained near historic highs over the last 60 years, coming in above 14% in every month. Before the COVID-19 pandemic began, the monthly savings rate exceeded 14% just nine times since January 1959 and had previously peaked at 17.3% in May 1975.
While the buildup in deposits has certainly weighed on margins, banks have reacted by cutting deposit rates significantly. Banks' cost of interest-bearing deposits dropped to 0.28% in the third quarter, down 72 basis points from a year earlier.
But earning-asset yields have fallen at a quicker pace, pushing margins down. While long-term rates have recently risen modestly, they remain near historical lows, suggesting that bank margins could remain under pressure.
Community Banks Buyback Shares As They Appear Cheap
U.S. community banks continued to announce share buyback programs into the fourth quarter, as the Federal Reserve extends its restriction on larger banks from making repurchases.
In total, banks announced 22 new buyback plans in October; three banks extended existing plans; and 11 banks reinstated previously suspended repurchase programs.
M&A Activity Remains a Multi-Year Theme
S&P Global indicated that U.S. banks and thrifts announced 11 deals in October, marking the first three-month stretch of 2020 in which deal announcements hit double figures. During the first 10 months of this year, the industry saw 92 deal announcements worth an aggregate $9.97 billion, compared to 219 deals worth $49.02 billion over the same period in 2019. The median deal value to tangible common equity ratio for deals
| Semi-Annual Report | October 31, 2020 | 19 |
| Emerald Banking and Finance Fund | Manager Commentary |
| | October 31, 2020 (Unaudited) |
announced in 2020 was 131.7%, down from 158.1% in all of 2019. We believe that acquisition activity will resume in 2021 and we would expect 4% to 6% of the community bank market to be absorbed in 2021.
Our Outlook Remains Favorable
We believe that community banks have avoided the deterioration in credit that most bank investors anticipated as a result of the U.S. economy coming to a virtual stand-still in response to the COVID pandemic. We believe that community banks are trading at attractive valuations and that loan growth will return to recent levels in the second half of 2021. We believe that 8% to 10% earnings growth will follow in 2022. We continue to focus on our fundamental bottom-up research process that we believe will allow us to identify investment opportunities in growth oriented community banks as banks return to an offensive strategy in 2021.
| Top Contributors | Top Detractors |
| Open Lending Corporation Class A | Esquire Financial Holdings, Inc. |
| Live Oak Bancshares, Inc. | Meta Financial Group, Inc. |
| PennyMac Financial Services, Inc. | Bank7 Corp. |
| The Bancorp Inc | TriState Capital Holdings, Inc. |
| Mr. Cooper Group, Inc. | Trean Insurance Group, Inc. |
| ECN Capital Corp. | Amerant Bancorp Inc. Class A |
| OneMain Holdings, Inc. | Signature Bank |
| Triumph Bancorp, Inc. | Southern First Bancshares, Inc. |
| Silvergate Capital Corp. Class A | Amerant Bancorp Inc. Class B |
| Repay Holdings Corp. Class A | GoHealth Inc Class A |
| | |
| Kenneth G. Mertz II, CFA | Steven E. Russell, Esq. |
| Chief Investment Officer | Portfolio Manager |
| Portfolio Manager | |
| | |
| Emerald Mutual Fund Advisers Trust | |
| 20 | www.emeraldmutualfunds.com |
| Emerald Banking and Finance Fund | Manager Commentary |
| | October 31, 2020 (Unaudited) |
Past performance does not guarantee future results. Fund prices fluctuate as the underlying assets have exposure to market fluctuations and other risks, as described in the Fund’s prospectus. Please visit www.emeraldmutualfunds.com to obtain current performance information and for the current prospectus and statement of additional information. This material must be preceded or accompanied by a prospectus. Please read the prospectus carefully before investing.
The views of Emerald Mutual Fund Advisers Trust and information discussed in this commentary are as of the date of publication, are subject to change, and may not reflect the writer's current views. The views expressed are those of the author only, and represent an assessment of market conditions at a specific point in time, are opinions only and should not be relied upon as investment advice regarding a particular investment or markets in general. Such information does not constitute a recommendation to buy or sell specific securities or investment vehicles. It should not be assumed that any investment will be profitable or will equal the performance of the Fund or any securities or any sectors mentioned in this letter. The subject matter contained in this letter has been derived from several sources believed to be reliable and accurate at the time of compilation. Neither Emerald Mutual Fund Advisers Trust nor the Fund accepts any liability for losses either direct or consequential caused by the use of this information.
The Emerald Banking and Finance Fund is distributed by ALPS Distributors, Inc.
The Fund is subject to investment risks, including possible loss of the principal amount invested and therefore is not suitable for all investors. The Fund may not achieve its objectives.
Diversification does not eliminate the risk of experiencing investment losses.
The Russell 2000® Index measures the performance of the small-cap segment of the U.S. equity universe. The Russell 2000® Index is a subset of the Russell 3000® Index representing approximately 10% of the total market capitalization of that index. It includes approximately 2000 of the smallest securities based on a combination of their market cap and current index membership. The Index is not actively managed and does not reflect any deduction of fees, expenses or taxes. An investor may not invest directly into the Index.
The Russell 2000® Financial Services Index – is comprised of the smallest financial services companies in the Russell 3000 Index. The Index is not actively managed and does not reflect any deductions for fees, expense, or taxes. An investor may not invest directly in the Index.
SNL Small Cap Bank & Thrift Index: Includes all publicly traded (NYSE, NYSE Amex, NASDAQ, OTC BB, Pink Sheets) Banks and Thrifts in SNL's coverage universe with $250M to $1B Total Common Market Capitalization as of most recent pricing data. Source: SNL Financial, data as of April 30, 2019.
The Standard & Poor’s 500® Index is an unmanaged index of 500 common stocks chosen for the market size, liquidity and industry group representation. It is a market-value weighted index. The Index is not actively managed and does not reflect any deduction for fees, expenses or taxes. An investor may not invest directly into the Index
The Russell 2000® Value Index measures the performance of small-cap value segment of the U.S. equity universe. It includes those Russell 2000 companies with lower price-to-book ratios (A ratio used to compare a stock's market value to its book value. It is calculated by dividing the current closing price of the stock by the latest quarter's book value per share.) and lower forecasted growth values. The Index is not actively managed and does not reflect any deductions for fees, expenses or taxes. An investor may not invest directly into the Index.
| Semi-Annual Report | October 31, 2020 | 21 |
| Emerald Banking and Finance Fund | Manager Commentary |
October 31, 2020 (Unaudited)
TOP TEN HOLDINGS
(as a % of Net Assets)*
| Triumph Bancorp, Inc. | 4.35% |
| Silvergate Capital Corp. | 4.18% |
| ECN Capital Corp. | 4.17% |
| Bancorp, Inc. | 3.98% |
| OneMain Holdings, Inc. | 3.88% |
| Open Lending Corp. | 3.75% |
| Live Oak Bancshares, Inc. | 3.38% |
| Colony Capital, Inc. | 3.31% |
| Cannae Holdings, Inc. | 3.09% |
| Subversive Real Estate Acquisition REIT LP | 3.03% |
| Top Ten Holdings | 37.12% |
INDUSTRY SECTOR ALLOCATION
(as a % of Net Assets)
| Banks | 25.54% |
| Transaction Processing Services | 10.73% |
| Consumer Lending | 9.89% |
| Asset Managers And Custodians | 9.13% |
| Mortgage Reits: Commercial | 6.12% |
| Mortgage Reits: Residential | 5.66% |
| Property And Casualty Insurance | 5.57% |
| Mortgage Finance | 3.84% |
| Diversified REITs | 3.50% |
| Diversified Financial Services | 3.08% |
| Mortgage Reits: Diversified | 2.60% |
| Reinsurance | 2.14% |
| Diversified Retailers | 1.92% |
| Office REITs | 1.85% |
| Infrastructure Reits | 1.52% |
| Life Insurance | 1.33% |
| Full Line Insurance | 1.22% |
| Software | 1.22% |
| Computer Services | 1.10% |
| Retail REITs | 0.71% |
| Residential REITs | 0.41% |
| Real Estate Holding And Development | 0.23% |
| Cash, Cash Equivalents, & Other Net Assets | 0.69% |
| Total | 100.00% |
| * | Holdings are subject to change, and may not reflect the current or future position of the portfolio. |
ANNUALIZED TOTAL RETURN (for the period ended October 31, 2020)
| | | | | | | Since | Expense Ratio |
| | 6 Month | 1 Year | 3 Year | 5 Year | 10 Year | Inception(1) | Gross(2) | Net(2) |
| Class A (NAV) | 21.84% | -15.18% | -7.42% | 2.16% | 9.77% | 7.41% | 1.48% | 1.48% |
| Class A (MOP) | 16.06% | -19.21% | -8.91% | 1.17% | 9.23% | 7.19% | 1.48% | 1.48% |
| Russell 2000® Index(3) | 18.13% | -0.14% | 2.19% | 7.27% | 9.64% | 7.62% | | |
| Russell 2000® Financial Services Index(4) | 11.53% | -17.93% | -4.19% | 3.62% | 8.44% | 7.24% | | |
| Class C (NAV) | 21.41% | -15.69% | -8.02% | 1.50% | 9.07% | 7.17% | 2.13% | 2.13% |
| Class C (CDSC) | 20.41% | -16.54% | -8.02% | 1.50% | 9.07% | 7.17% | 2.13% | 2.13% |
| Russell 2000® Index(3) | 18.13% | -0.14% | 2.19% | 7.27% | 9.64% | 7.62% | | |
| Russell 2000® Financial Services Index(4) | 11.53% | -17.93% | -4.19% | 3.62% | 8.44% | 7.24% | | |
| Investor Class | 21.79% | -15.20% | -7.42% | 2.16% | 9.29% | 8.25% | 1.53% | 1.53% |
| Russell 2000® Index(3) | 18.13% | -0.14% | 2.19% | 7.27% | 9.64% | 7.62% | | |
| Russell 2000® Financial Services Index(4) | 11.53% | -17.93% | -4.19% | 3.62% | 8.44% | 7.24% | | |
| Institutional Class | 22.01% | -14.86% | -7.09% | 2.51% | – | 9.57% | 1.18% | 1.18% |
| Russell 2000® Index(3) | 18.13% | -0.14% | 2.19% | 7.27% | 9.64% | 7.62% | | |
| Russell 2000® Financial Services Index(4) | 11.53% | -17.93% | -4.19% | 3.62% | 8.44% | 7.24% | | |
The performance quoted represents past performance, does not guarantee future results and current performance may be lower or higher than the data quoted. The investment return and principal value of an investment will fluctuate so that shares, when redeemed, may be worth more or less than their original cost. Performance data current to the most recent month end may be obtained at www.emeraldmutualfunds.com.
Performance shown for periods prior to March 16, 2012, reflects the performance of the Forward Banking & Finance Fund, a series of Forward Funds (as a result of a reorganization of the Forward Banking & Finance Fund into the Emerald Banking & Finance Fund).
Returns for periods less than 1 year are cumulative.
The table does not reflect the deduction of taxes that a shareholder would pay on Fund distributions or the redemption of Fund shares.
Subject to investment risks, including possible loss of the principal amount invested.
Maximum Offering Price (MOP) for Class A shares includes the Fund's maximum sales charge of 4.75%. Performance shown at NAV does not include these sales charges and would have been lower had it been taken into account.
A Contingent Deferred Sales Charge (CDSC) of 1.00% may apply to Class C shares redeemed within the first 12 months after a purchase.
| (1) | Inception Dates - Class A: 02/18/1997, Class C: 07/01/2000, Institutional Class: 03/19/2012, Investor Class: 03/16/2010 |
| (2) | Emerald Mutual Fund Advisers Trust ("Emerald" or the "Adviser") has agreed contractually to waive a portion of its fees and reimburse other expenses until August 31, 2021 in amounts necessary to limit the Fund's operating expenses (exclusive of Acquired Fund Fees and Expenses, brokerage expenses, interest expenses, taxes and extraordinary expense) for Class A, Class C, Institutional Class, and Investor Class shares to an annual rate (as percentage of the Fund's average daily net assets) of 1.84%, 2.49%, 1.54% and 1.89% respectively. The Adviser will be permitted to recover, on a class-by-class basis, expenses it has borne through the agreement described above to the extent that the Fund's expenses in later periods fall below the annual rates |
| 22 | www.emeraldmutualfunds.com |
| Emerald Banking and Finance Fund | Manager Commentary |
October 31, 2020 (Unaudited)
set forth in the relevant agreement. The Fund will not be obligated to pay any such deferred fees and expenses more than three years after the year(s) in which the fees and expense were incurred. The Adviser may not discontinue this waiver prior to August 31, 2021, without the approval by the Fund's Board of Trustees. Ratios as of the Prospectus dated August 31, 2020 and may differ from the ratios presented in the Financial Highlights.
| (3) | The Russell 2000® Index measures the performance of the small-cap segment of the U.S. equity universe. The Russell 2000® is a subset of the Russell 3000® Index representing approximately 8% of the total market capitalization of that index. It includes approximately 2000 of the smallest securities based on a combination of their market cap and current index membership. The index is not actively managed and does not reflect any deductions for fees, expenses or taxes. An investor may not invest directly into an index. |
| (4) | The Russell 2000® Financial Services Index is an additional index, and is comprised of the smallest financial services companies in the Russell 3000® Index. The Index is not actively managed and does not reflect any deductions for fees, expense, or taxes. An investor may not invest directly in the Index. |
Important Risks
A fund that concentrates in a particular industry will involve a greater degree of risk than a fund with a more diversified portfolio. Investing in smaller companies generally will present greater investment risks, including: greater price volatility, greater sensitivity to changing economic conditions and less liquidity than the securities of larger, more mature companies.
| Semi-Annual Report | October 31, 2020 | 23 |
| Emerald Banking and Finance Fund | Manager Commentary |
October 31, 2020 (Unaudited)
GROWTH OF $10,000 INVESTMENT IN THE FUND (for the period ended October 31, 2020)
Comparison of change in value of a $10,000 investment (includes applicable sales loads)
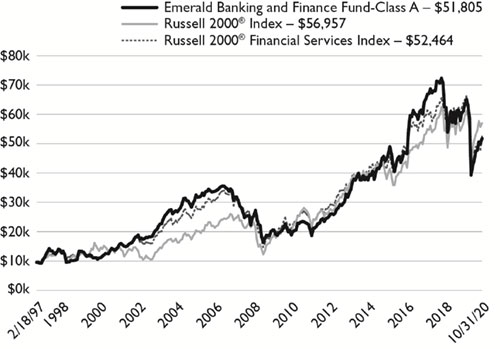
The chart represents historical performance of a hypothetical investment of $10,000 in the Fund since inception. Past performance does not guarantee future results. This chart does not reflect the deduction of taxes that a shareholder would pay on Fund distributions or the redemption of Fund shares.
Investing in the Fund is subject to investment risks, including possible loss of the principal amount invested.
| 24 | www.emeraldmutualfunds.com |
| Emerald Select trueLiberty Income Fund | Manager Commentary |
October 31, 2020 (Unaudited)
October 31, 2020
Dear Shareholder:
Investment Results
The performance of the Emerald Select trueLiberty Income Fund (the Fund) Institutional Class, for the six months ended October 31, 2020, reflected a loss of -13.09% (without sales load) underperforming the benchmark Alerian MLP Infrastructure Total Return Index which declined by 12.74% and the Alerian MLP Total Return Index which declined by 12.26%. Part of the difference in performance between the Fund and the benchmark indices is attributable to the Fund’s operating expenses.
During the period, the Fund paid two distributions with record dates of July 28, 2020 and October 28, 2020; and payable dates of July 30, 2020 and October 29, 2020.
Investment Analysis and Market Outlook
As we stated in our last report, gaining meaningful and efficient exposure to MLPs through 1940-Act Funds has been a difficult, longstanding challenge for investors. Many funds are structured as C-corporations, subjecting investors to Fund-level corporate tax. Other funds cap their MLP exposure to less than 25% to retain their statuses as Regulated Investment Companies (RIC). The Emerald Select trueLiberty Income Fund began operations on January 2, 2020, with the goal of solving many of these longstanding challenges. Specifically, the Fund employs an innovative strategy that seeks to provide broad exposure to MLP markets, while intending to comply with RIC-related requirements to retain its pass-through tax status.
That being said, when we launched the Fund in January, we could not have anticipated the tumultuous and turbulent conditions that the Russia- Saudi price war and COVID-19 coronavirus and associated responses would soon unleash on financial markets, and the subsequent off-again / on-again tentative rally back from the bottom.
The Fund performed as expected during the six months ended October 31, 2020, providing broad exposure to the MLP market, and thus reflecting the market drop as experienced by the Alerian MLP Infrastructure Total Return Index which declined by 12.74%. We believe that performance will continue to be volatile as the economy, the energy markets and the stock market weigh optimism for a sustained post-COVID recovery versus ongoing doubts related to virus surges and lingering unemployment.
The Fund’s infrastructure (inclusive of the offshore fund and associated swaps) operated as expected throughout the period and the Fund continues to seek to provide investors with tax efficient exposure with no Fund level corporate tax.
We thank you for your investment and wish you a healthy and prosperous remainder of 2020.
| Brian Chen, PhD | Mathew Jensen, CFA |
| Principal and Portfolio Manager, Liberty Cove, LLC | Portfolio Manager, Liberty Cove, LLC |
| Semi-Annual Report | October 31, 2020 | 25 |
| Emerald Select trueLiberty Income Fund | Manager Commentary |
October 31, 2020 (Unaudited)
Past performance does not guarantee future results. Fund prices fluctuate as the underlying assets have exposure to market fluctuations and other risks, as described in the Fund’s prospectus. Please visit www.emeraldmutualfunds.com to obtain current performance information and for the current prospectus and statement of additional information. This material must be preceded or accompanied by a prospectus. Please read the prospectus carefully before investing.
The views of Emerald Mutual Fund Advisers Trust and information discussed in this commentary are as of the date of publication, are subject to change, and may not reflect the writer's current views. The views expressed are those of the author only, and represent an assessment of market conditions at a specific point in time, are opinions only and should not be relied upon as investment advice regarding a particular investment or markets in general. Such information does not constitute a recommendation to buy or sell specific securities or investment vehicles. It should not be assumed that any investment will be profitable or will equal the performance of the Fund or any securities or any sectors mentioned in this letter. The subject matter contained in this letter has been derived from several sources believed to be reliable and accurate at the time of compilation. Neither Emerald Mutual Fund Advisers Trust nor the Fund accepts any liability for losses either direct or consequential caused by the use of this information.
The Emerald Select trueLiberty Fund is distributed by ALPS Distributors, Inc.
The Fund is subject to investment risks, including possible loss of the principal amount invested and therefore is not suitable for all investors. The Fund may not achieve its objectives.
Diversification does not eliminate the risk of experiencing investment losses.
| 26 | www.emeraldmutualfunds.com |
| Emerald Select trueLiberty Income Fund | Manager Commentary |
October 31, 2020 (Unaudited)
TOP TEN HOLDINGS
(as a % of Net Assets)*
| MPLX LP | 1.75% |
| Enterprise Products Partners LP | 1.71% |
| Magellan Midstream Partners LP | 1.70% |
| Plains All American Pipeline LP | 1.66% |
| Energy Transfer LP | 1.53% |
| Phillips 66 Partners LP | 1.10% |
| Western Midstream Partners LP | 1.06% |
| TC PipeLines LP | 0.99% |
| Cheniere Energy Partners LP | 0.95% |
| DCP Midstream LP | 0.75% |
| Top Ten Holdings | 13.20% |
INDUSTRY SECTOR ALLOCATION
(as a % of Net Assets)
| Pipeline Transportation | Petroleum | 8.37% |
| Pipeline Transportation | Natural Gas | 4.23% |
| Gathering & Processing | 3.19% |
| Liquefaction | 0.95% |
| Cash, Cash Equivalents, & Other Net Assets | 83.26% |
| Total | 100.00% |
| * | Holdings are subject to change, and may not reflect the current or future position of the portfolio. |
ANNUALIZED TOTAL RETURN (for the period ended October 31, 2020)
| | | Since | Expense Ratio |
| | 6 Month | Inception(1) | Gross(2) | Net(2) |
| Class A (NAV) | -13.22% | -49.06% | 102.87% | 1.06% |
| Class A (MOP) | -17.30% | -51.48% | 102.87% | 1.06% |
| Alerian MLP Infrastructure Total Return Index(3) | -12.74% | -46.67% | | |
| Institutional Class | -13.09% | -48.99% | 52.48% | 0.76% |
| Alerian MLP Infrastructure Total Return Index(3) | -12.74% | -46.67% | | |
The performance quoted represents past performance, does not guarantee future results and current performance may be lower or higher than the data quoted. The investment return and principal value of an investment will fluctuate so that shares, when redeemed, may be worth more or less than their original cost. Performance data current to the most recent month end may be obtained at www.emeraldmutualfunds.com.
Returns for periods less than 1 year are cumulative.
The table does not reflect the deduction of taxes that a shareholder would pay on Fund distributions or the redemption of Fund shares.
Subject to investment risks, including possible loss of the principal amount invested.
Maximum Offering Price (MOP) for Class A shares includes the Fund's maximum sales charge of 4.75%. Performance shown at NAV does not include these sales charges and would have been lower had it been taken into account.
| (1) | Inception Date - 01/02/2020 |
| (2) | Emerald Mutual Fund Advisers Trust ("Emerald" or the "Adviser") has agreed contractually to waive a portion of its fees and reimburse other expenses until August 31, 2021 in amounts necessary to limit the Fund's operating expenses (exclusive of Acquired Fund Fees and Expenses, brokerage expenses, interest expenses, taxes and extraordinary expense) for Class A and Institutional Class shares to an annual rate (as percentage of the Fund's average daily net assets) of 0.76% and 1.06%, respectively. The Adviser will be permitted to recover, on a class-by-class basis, expenses it has borne through the agreement described above to the extent that the Fund's expenses in later periods fall below the annual rates set forth in the relevant agreement. The Fund will not be obligated to pay any such deferred fees and expenses more than three years after the year(s) in which the fees and expense were incurred. The Adviser may not discontinue this waiver prior to August 31, 2021, without the approval by the Fund's Board of Trustees. |
| (3) | The Alerian MLP Infrastructure Total Return Index is a composite of energy infrastructure Master Limited Partnerships (MLPs). The capped, float-adjusted, capitalization-weighted index, whose constituents earn the majority of their cash flow from midstream activities involving energy commodities, is disseminated real-time on a price-return basis (AMZI) and on a total-return basis (AMZIX). The index is not actively managed and does not reflect any deductions for fees, expenses or taxes. An investor may not invest directly into an index. |
Important Risks
A fund that concentrates in a particular industry will involve a greater degree of risk than a fund with a more diversified portfolio. Investing in smaller companies generally will present greater investment risks, including: greater price volatility, greater sensitivity to changing economic conditions and less liquidity than the securities of larger, more mature companies.
| Semi-Annual Report | October 31, 2020 | 27 |
| Emerald Select trueLiberty Income Fund | Manager Commentary |
October 31, 2020 (Unaudited)
GROWTH OF $10,000 INVESTMENT IN THE FUND (for the period ended October 31, 2020)
Comparison of change in value of a $10,000 investment (includes applicable sales loads)
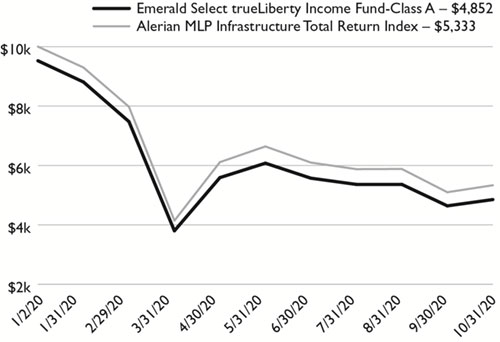
The chart represents historical performance of a hypothetical investment of $10,000 in the Fund since inception. Past performance does not guarantee future results. This chart does not reflect the deduction of taxes that a shareholder would pay on Fund distributions or the redemption of Fund shares.
Investing in the Fund is subject to investment risks, including possible loss of the principal amount invested.
| 28 | www.emeraldmutualfunds.com |
| Emerald Funds | Disclosure of Fund Expenses |
October 31, 2020 (Unaudited)
As a shareholder of the Funds, you incur two types of costs: (1) transaction costs, including applicable sales charges (loads); and (2) ongoing costs, including management fees, distribution and service (12b-1) fees, shareholder services fees and other Fund expenses. This example is intended to help you understand your ongoing costs (in dollars) of investing in the Funds and to compare these costs with the ongoing costs of investing in other mutual funds. The example is based on an investment of $1,000 invested at the beginning of the (six-month) period and held for the entire period May 1, 2020 through October 31, 2020.
Actual Expenses
The first line for each share class of the Fund in the table below provides information about actual account values and actual expenses. You may use this information, together with the amount you invested, to estimate the expenses that you paid over the period. Simply divide your account value by $1,000 (for example, an $8,600 account value divided by $1,000 = 8.6), then multiply the result by the number in the applicable line under the heading titled “Expenses Paid During Period” to estimate the expenses you paid on your account during this period.
Hypothetical Example For Comparison Purposes
The second line for each share class of each Fund in the table below provides information about hypothetical account values and hypothetical expenses based on the Fund’s actual expense ratio and an assumed rate of return of 5% per year before expenses, which is not the Fund’s actual return. The hypothetical account values and expenses may not be used to estimate the actual ending account balance or expenses you paid for the period. You may use this information to compare the ongoing costs of investing in the Funds and other funds. To do so, compare this 5% hypothetical example with the 5% hypothetical examples that appear in the shareholder reports of other mutual funds.
Please note that the expenses shown in the table below are meant to highlight your ongoing costs only and do not reflect any transactional costs, such as sales charges (loads), redemption fees or exchange fees. Therefore, the second line for each share class of the Fund within the table is useful in comparing ongoing costs only, and will not help you determine the relative total costs of owning different funds. If these transactional costs were included, your costs would have been higher.
| | Beginning Account Value 05/01/20 | Ending Account Value 10/31/20 | Expense Ratio(a) | Expense Paid During Period 5/01/20 - 10/31/20(b) |
| Emerald Growth Fund | | | | |
| Class A | | | | |
| Actual | $1,000.00 | $1,274.90 | 1.02% | $5.85 |
| Hypothetical (5% return before expenses) | $1,000.00 | $1,020.06 | 1.02% | $5.19 |
| Class C | | | | |
| Actual | $1,000.00 | $1,270.40 | 1.67% | $9.56 |
| Hypothetical (5% return before expenses) | $1,000.00 | $1,016.79 | 1.67% | $8.49 |
| Institutional Class | | | | |
| Actual | $1,000.00 | $1,276.70 | 0.71% | $4.07 |
| Hypothetical (5% return before expenses) | $1,000.00 | $1,021.63 | 0.71% | $3.62 |
| Investor Class | | | | |
| Actual | $1,000.00 | $1,274.60 | 1.06% | $6.08 |
| Hypothetical (5% return before expenses) | $1,000.00 | $1,019.86 | 1.06% | $5.40 |
| | | | | |
| Emerald Small Cap Value Fund | | | | |
| Class A | | | | |
| Actual | $1,000.00 | $1,169.50 | 1.35% | $7.38 |
| Hypothetical (5% return before expenses) | $1,000.00 | $1,018.40 | 1.35% | $6.87 |
| Class C | | | | |
| Actual | $1,000.00 | $1,164.70 | 2.00% | $10.91 |
| Hypothetical (5% return before expenses) | $1,000.00 | $1,015.12 | 2.00% | $10.16 |
| Institutional Class | | | | |
| Actual | $1,000.00 | $1,170.70 | 1.00% | $5.47 |
| Hypothetical (5% return before expenses) | $1,000.00 | $1,020.16 | 1.00% | $5.09 |
| Investor Class | | | | |
| Actual | $1,000.00 | $1,168.20 | 1.25% | $6.83 |
| Hypothetical (5% return before expenses) | $1,000.00 | $1,018.90 | 1.25% | $6.36 |
| Semi-Annual Report | October 31, 2020 | 29 |
| Emerald Funds | Disclosure of Fund Expenses |
October 31, 2020 (Unaudited)
| | Beginning Account Value 05/01/20 | Ending Account Value 10/31/20 | Expense Ratio(a) | Expense Paid During Period 5/01/20 - 10/31/20(b) |
| Emerald Insights Fund | | | | |
| Class A | | | | |
| Actual | $1,000.00 | $1,293.50 | 1.35% | $7.80 |
| Hypothetical (5% return before expenses) | $1,000.00 | $1,018.40 | 1.35% | $6.87 |
| Class C | | | | |
| Actual | $1,000.00 | $1,289.50 | 2.00% | $11.54 |
| Hypothetical (5% return before expenses) | $1,000.00 | $1,015.12 | 2.00% | $10.16 |
| Institutional Class | | | | |
| Actual | $1,000.00 | $1,295.10 | 1.05% | $6.07 |
| Hypothetical (5% return before expenses) | $1,000.00 | $1,019.91 | 1.05% | $5.35 |
| Investor Class | | | | |
| Actual | $1,000.00 | $1,293.30 | 1.40% | $8.09 |
| Hypothetical (5% return before expenses) | $1,000.00 | $1,018.15 | 1.40% | $7.12 |
| | | | | |
| Emerald Banking and Finance Fund | | | | |
| Class A | | | | |
| Actual | $1,000.00 | $1,218.40 | 1.62% | $9.06 |
| Hypothetical (5% return before expenses) | $1,000.00 | $1,017.04 | 1.62% | $8.24 |
| Class C | | | | |
| Actual | $1,000.00 | $1,214.10 | 2.27% | $12.67 |
| Hypothetical (5% return before expenses) | $1,000.00 | $1,013.76 | 2.27% | $11.52 |
| Institutional Class | | | | |
| Actual | $1,000.00 | $1,220.10 | 1.28% | $7.16 |
| Hypothetical (5% return before expenses) | $1,000.00 | $1,018.75 | 1.28% | $6.51 |
| Investor Class | | | | |
| Actual | $1,000.00 | $1,217.90 | 1.66% | $9.28 |
| Hypothetical (5% return before expenses) | $1,000.00 | $1,016.84 | 1.66% | $8.44 |
| | | | | |
| Emerald Select trueLiberty Income Fund | | | | |
| Class A | | | | |
| Actual | $1,000.00 | $867.80 | 1.06% | $4.99 |
| Hypothetical (5% return before expenses) | $1,000.00 | $1,019.86 | 1.06% | $5.40 |
| Institutional Class | | | | |
| Actual | $1,000.00 | $869.10 | 0.76% | $3.58 |
| Hypothetical (5% return before expenses) | $1,000.00 | $1,021.37 | 0.76% | $3.87 |
| (a) | The Fund's expense ratios have been based on the Fund's most recent fiscal half-year expenses. |
| (b) | Expenses are equal to the Fund's annualized expense ratio multiplied by the average account value over the period, multiplied by the number of days in the most recent fiscal half-year (184)/365 (to reflect the half-year period). |
| 30 | www.emeraldmutualfunds.com |
| Emerald Growth Fund | Schedule of Investments |
October 31, 2020 (Unaudited)
Shares | | | | | Value (Note 2) | |
| COMMON STOCKS: 99.10% |
| Consumer Discretionary: 19.08% |
| | 361,941 | | | CarParts.com, Inc.(a) | | $ | 4,593,031 | |
| | 480,545 | | | Chegg, Inc.(a) | | | 35,291,225 | |
| | 181,982 | | | Churchill Downs, Inc. | | | 27,142,615 | |
| | 262,829 | | | Chuy's Holdings, Inc.(a) | | | 5,516,781 | |
| | 205,890 | | | Dick's Sporting Goods, Inc. | | | 11,663,668 | |
| | 1,126,950 | | | Everi Holdings, Inc.(a) | | | 9,703,039 | |
| | 108,824 | | | Five Below, Inc.(a) | | | 14,510,592 | |
| | 83,544 | | | Fox Factory Holding Corp.(a) | | | 7,024,380 | |
| | 723,083 | | | Glu Mobile, Inc.(a) | | | 5,177,274 | |
| | 216,082 | | | Jack in the Box, Inc. | | | 17,299,525 | |
| | 56,140 | | | Leslie's, Inc.(a) | | | 1,233,396 | |
| | 198,422 | | | Meritage Homes Corp.(a) | | | 17,280,572 | |
| | 400,758 | | | National Vision Holdings, Inc.(a) | | | 16,162,570 | |
| | 576,604 | | | Noodles & Co.(a) | | | 3,724,862 | |
| | 254,701 | | | Planet Fitness, Inc., Class A(a) | | | 15,096,128 | |
| | 237,130 | | | SeaWorld Entertainment, Inc.(a) | | | 5,221,603 | |
| | 42,554 | | | Stamps.com, Inc.(a) | | | 9,499,755 | |
| | 557,446 | | | Taylor Morrison Home Corp., Class A(a) | | | 12,040,834 | |
| | 380,574 | | | Tilly's, Inc., Class A | | | 2,336,724 | |
| | 92,062 | | | Visteon Corp.(a) | | | 8,253,358 | |
| | 156,910 | | | Winnebago Industries, Inc. | | | 7,366,925 | |
| | 224,096 | | | YETI Holdings, Inc.(a) | | | 11,088,270 | |
| | | | | | | | 247,227,127 | |
| | | | | | | | | |
| Consumer Staples: 6.91% |
| | 925,198 | | | BellRing Brands, Inc., Class A(a) | | | 16,921,871 | |
| | 378,137 | | | Freshpet, Inc.(a) | | | 43,296,687 | |
| | 42,227 | | | Helen of Troy, Ltd.(a) | | | 8,006,239 | |
| | 33,539 | | | National Beverage Corp.(a) | | | 2,625,768 | |
| | 994,796 | | | Simply Good Foods Co.(a) | | | 18,702,165 | |
| | | | | | | | 89,552,730 | |
| | | | | | | | | |
| Energy: 1.51% |
| | 105,372 | | | Arcosa, Inc. | | | 4,865,026 | |
| | 406,786 | | | New Fortress Energy, Inc. | | | 14,697,178 | |
| | | | | | | | 19,562,204 | |
| | | | | | | | | |
| Financial Services: 7.92% |
| | 671,170 | | | BRP Group, Inc., Class A(a) | | | 17,114,835 | |
| | 40,653 | | | Bryn Mawr Bank Corp. | | | 1,091,940 | |
| | 70,000 | | | Cannae Holdings, Inc.(a) | | | 2,588,600 | |
| | 75,711 | | | CrossFirst Bankshares, Inc.(a) | | | 632,187 | |
| | 122,502 | | | First Choice Bancorp | | | 1,724,828 | |
| | 101,932 | | | Green Dot Corp., Class A(a) | | | 5,435,014 | |
| | 126,247 | | | Houlihan Lokey, Inc. | | | 7,915,687 | |
| | 24,851 | | | Lemonade, Inc.(a) | | | 1,249,757 | |
| | 406,204 | | | Moelis & Co., Class A | | | 15,110,789 | |
| | 551,871 | | | Pacific Premier Bancorp, Inc. | | | 14,072,710 | |
| | 251,212 | | | Palomar Holdings, Inc.(a) | | | 22,400,574 | |
| Shares | | | | | Value (Note 2) | |
| Financial Services (continued) |
| | 216,944 | | | QTS Realty Trust, Inc., REIT, Class A | | $ | 13,344,225 | |
| | | | | | | | 102,681,146 | |
| | | | | | | | | |
| Health Care: 26.14% |
| | 66,727 | | | Accolade, Inc.(a) | | | 2,336,780 | |
| | 178,894 | | | AdaptHealth Corp.(a) | | | 4,883,806 | |
| | 127,224 | | | Addus HomeCare Corp.(a) | | | 12,413,246 | |
| | 115,369 | | | American Well Corp.(a) | | | 2,977,674 | |
| | 301,163 | | | Applied Therapeutics, Inc.(a) | | | 4,899,922 | |
| | 119,400 | | | Arena Pharmaceuticals, Inc.(a) | | | 10,234,968 | |
| | 286,960 | | | AtriCure, Inc.(a) | | | 9,917,338 | |
| | 455,960 | | | Avrobio, Inc.(a) | | | 6,511,109 | |
| | 111,485 | | | Biohaven Pharmaceutical Holding Co., Ltd.(a) | | | 8,635,628 | |
| | 216,763 | | | Blueprint Medicines Corp.(a) | | | 22,170,520 | |
| | 387,145 | | | Cardiff Oncology, Inc.(a) | | | 6,124,634 | |
| | 220,987 | | | ChemoCentryx, Inc.(a) | | | 10,607,376 | |
| | 398,925 | | | Collegium Pharmaceutical, Inc.(a) | | | 7,112,833 | |
| | 181,234 | | | Deciphera Pharmaceuticals, Inc.(a) | | | 10,524,258 | |
| | 223,213 | | | Dicerna Pharmaceuticals, Inc.(a) | | | 4,685,241 | |
| | 370,661 | | | Exicure, Inc.(a) | | | 555,991 | |
| | 75,781 | | | Global Blood Therapeutics, Inc.(a) | | | 4,007,299 | |
| | 328,702 | | | Horizon Therapeutics PLC(a) | | | 24,629,641 | |
| | 305,222 | | | Immunovant, Inc.(a) | | | 13,313,784 | |
| | 731,837 | | | Karyopharm Therapeutics, Inc.(a) | | | 10,845,824 | |
| | 1,735,814 | | | MannKind Corp.(a) | | | 3,488,986 | |
| | 115,572 | | | Mirati Therapeutics, Inc.(a) | | | 25,095,304 | |
| | 799,013 | | | NeoGenomics, Inc.(a) | | | 31,345,280 | |
| | 538,240 | | | Ocular Therapeutix, Inc.(a) | | | 5,113,280 | |
| | 175,973 | | | ORIC Pharmaceuticals, Inc.(a) | | | 3,783,420 | |
| | 275,000 | | | Praxis Precision Medicines, Inc.(a) | | | 9,625,000 | |
| | 7,930 | | | Pulmonx Corp.(a) | | | 333,536 | |
| | 494,059 | | | Replimune Group, Inc.(a) | | | 20,656,607 | |
| | 239,565 | | | SeaSpine Holdings Corp.(a) | | | 3,056,849 | |
| | 280,844 | | | TransMedics Group, Inc.(a) | | | 3,364,511 | |
| | 192,523 | | | Turning Point Therapeutics, Inc.(a) | | | 17,748,695 | |
| | 228,153 | | | Twist Bioscience Corp.(a) | | | 17,485,646 | |
| | 63,160 | | | Ultragenyx Pharmaceutical, Inc.(a) | | | 6,347,580 | |
| | 104,476 | | | United Therapeutics Corp.(a) | | | 14,023,813 | |
| | | | | | | | 338,856,379 | |
| | | | | | | | | |
| Materials & Processing: 6.63% |
| | 321,807 | | | Avient Corp. | | | 9,998,544 | |
| | 365,784 | | | AZEK Co., Inc.(a) | | | 12,231,817 | |
| | 213,246 | | | Griffon Corp. | | | 4,571,994 | |
| | 112,058 | | | Installed Building Products, Inc.(a) | | | 10,145,731 | |
| | 112,502 | | | Masonite International Corp.(a) | | | 9,900,176 | |
| | 120,381 | | | TopBuild Corp.(a) | | | 18,443,573 | |
| | 297,002 | | | Trex Co., Inc.(a) | | | 20,653,519 | |
| | | | | | | | 85,945,354 | |
| | | | | | | | | |
| Producer Durables: 10.10% |
| | 258,510 | | | Air Transport Services Group, Inc.(a) | | | 7,248,620 | |
| Semi-Annual Report | October 31, 2020 | 31 |
| Emerald Growth Fund | Schedule of Investments |
October 31, 2020 (Unaudited)
| Shares | | | | | Value (Note 2) | |
| Producer Durables (continued) |
| | 272,010 | | | American Superconductor Corp.(a) | | $ | 3,783,659 | |
| | 221,062 | | | Chart Industries, Inc.(a) | | | 18,668,686 | |
| | 353,518 | | | Echo Global Logistics, Inc.(a) | | | 9,534,381 | |
| | 39,766 | | | FARO Technologies, Inc.(a) | | | 2,395,504 | |
| | 90,386 | | | Forward Air Corp. | | | 5,691,607 | |
| | 1,226,616 | | | Kratos Defense & Security Solutions, Inc.(a) | | | 23,170,776 | |
| | 246,506 | | | Montrose Environmental Group, Inc.(a) | | | 6,663,057 | |
| | 558,874 | | | Pluralsight, Inc., Class A(a) | | | 8,774,322 | |
| | 212,509 | | | Tetra Tech, Inc. | | | 21,444,283 | |
| | 233,963 | | | TriNet Group, Inc.(a) | | | 16,124,730 | |
| | 94,528 | | | Vicor Corp.(a) | | | 7,373,184 | |
| | | | | | | | 130,872,809 | |
| | | | | | | | | |
| Technology: 19.59% |
| | 112,250 | | | Allegro MicroSystems, Inc.(a) | | | 2,054,175 | |
| | 78,537 | | | Covetrus, Inc.(a) | | | 1,939,079 | |
| | 119,177 | | | Diodes, Inc.(a) | | | 6,892,006 | |
| | 244,365 | | | EverQuote, Inc., Class A(a) | | | 8,183,784 | |
| | 96,872 | | | FormFactor, Inc.(a) | | | 2,746,321 | |
| | 193,624 | | | II-VI, Inc.(a) | | | 8,804,083 | |
| | 108,447 | | | Jamf Holding Corp.(a) | | | 3,535,372 | |
| | 317,531 | | | Lattice Semiconductor Corp.(a) | | | 11,081,832 | |
| | 178,485 | | | LiveRamp Holdings, Inc.(a) | | | 11,796,074 | |
| | 551,483 | | | MACOM Technology Solutions Holdings,
Inc.(a) | | | 20,129,129 | |
| | 252,117 | | | Mediaalpha Inc(a) | | | 8,529,118 | |
| | 197,056 | | | Mercury Systems, Inc.(a) | | | 13,573,217 | |
| | 437,659 | | | Model N, Inc.(a) | | | 15,418,727 | |
| | 226,157 | | | Onto Innovation, Inc.(a) | | | 7,252,855 | |
| | 182,710 | | | Perficient, Inc.(a) | | | 7,154,924 | |
| | 212,061 | | | Ping Identity Holding Corp.(a) | | | 5,871,969 | |
| | 125,839 | | | Q2 Holdings, Inc.(a) | | | 11,481,550 | |
| | 419,395 | | | Rapid7, Inc.(a) | | | 25,973,132 | |
| | 393,329 | | | Sailpoint Technologies Holdings, Inc.(a) | | | 16,327,087 | |
| | 182,487 | | | Semtech Corp.(a) | | | 10,016,711 | |
| | 80,316 | | | Super Micro Computer, Inc.(a) | | | 1,824,780 | |
| | 742,295 | | | SVMK, Inc.(a) | | | 15,536,234 | |
| | 696,516 | | | USA Technologies, Inc.(a) | | | 5,788,048 | |
| | 238,210 | | | Varonis Systems, Inc.(a) | | | 27,529,930 | |
| | 365,876 | | | Viavi Solutions, Inc.(a) | | | 4,518,569 | |
| | | | | | | | 253,958,706 | |
| | | | | | | | | |
| Utilities: 1.22% |
| | 194,296 | | | Cogent Communications Holdings, Inc. | | | 10,841,717 | |
| Shares | | | | | Value (Note 2) | |
| Utilities (continued) |
| | 112,917 | | | Shenandoah Telecommunications Co. | | $ | 4,925,439 | |
| | | | | | | | 15,767,156 | |
| | | | | | | | | |
| | | | | Total Common Stocks | | | | |
| | | | | (Cost $842,711,630) | | | 1,284,423,611 | |
| | | | | | | | | |
| SHORT TERM INVESTMENTS: 0.47% |
| | 6,073,121 | | | Dreyfus Government Cash Management Fund - Institutional Class 0.027% (7-Day Yield) | | | 6,073,121 | |
| | | | | | | | | |
| | | | | Total Short Term Investments | | | | |
| | | | | (Cost $6,073,121) | | | 6,073,121 | |
| | | | | | | | | |
| Total Investments: 99.57% |
| (Cost $848,784,751) | | | 1,290,496,732 | |
| | | | | | | | | |
| Other Assets In Excess Of Liabilities: 0.43% | | | 5,532,610 | |
| Net Assets: 100.00% | | $ | 1,296,029,342 | |
| (a) | Non-income producing security. |
For Fund compliance purposes, the Fund's industry classifications refer to any one or more of the industry sub-classifications used by one or more widely recognized market indexes or ratings group indexes, and/or as defined by Fund management. This definition may not apply for purposes of this report, which may combine industry sub-classifications for reporting ease. Industries are shown as a percentage of net assets.
See Notes to Financial Statements.
| 32 | www.emeraldmutualfunds.com |
| Emerald Small Cap Value Fund | Schedule of Investments |
October 31, 2020 (Unaudited)
| Shares | | | | | Value (Note 2) | |
| COMMON STOCKS: 97.88% | |
| Consumer Discretionary: 24.32% |
| | 716 | | | Aaron's Holdings Co., Inc. | | $ | 37,418 | |
| | 4,160 | | | Everi Holdings, Inc.(a) | | | 35,818 | |
| | 276 | | | Fox Factory Holding Corp.(a) | | | 23,206 | |
| | 3,081 | | | GameStop Corp., Class A(a) | | | 32,258 | |
| | 12,799 | | | Gannett Co., Inc. | | | 14,719 | |
| | 2,946 | | | Glu Mobile, Inc.(a) | | | 21,093 | |
| | 2,877 | | | Gray Television, Inc.(a) | | | 36,480 | |
| | 1,087 | | | OneWater Marine, Inc.(a) | | | 20,251 | |
| | 488 | | | Penske Automotive Group, Inc. | | | 24,966 | |
| | 806 | | | Selectquote, Inc.(a) | | | 13,879 | |
| | 2,252 | | | Smith & Wesson Brands, Inc. | | | 37,361 | |
| | 1,438 | | | Turtle Beach Corp.(a) | | | 25,913 | |
| | 606 | | | Winnebago Industries, Inc. | | | 28,452 | |
| | | | | | | | 351,814 | |
| | | | | | | | | |
| Consumer Staples: 1.62% |
| | 299 | | | National Beverage Corp.(a) | | | 23,409 | |
| | | | | | | | | |
| Financial Services: 33.00% |
| | 3,069 | | | Bancorp, Inc.(a) | | | 29,462 | |
| | 1,031 | | | Cannae Holdings, Inc.(a) | | | 38,126 | |
| | 4,979 | | | Colony Capital, Inc. | | | 17,725 | |
| | 289 | | | eHealth, Inc.(a) | | | 19,395 | |
| | 2,387 | | | Heritage Insurance Holdings, Inc. | | | 22,533 | |
| | 240 | | | Innovative Industrial Properties, Inc. | | | 27,991 | |
| | 1,860 | | | iStar, Inc. | | | 21,948 | |
| | 1,481 | | | LF Capital Acquisition Corp., Class A(a) | | | 15,490 | |
| | 2,764 | | | Navient Corp. | | | 22,140 | |
| | 1,305 | | | Netfin Acquisition Corp.(a) | | | 13,442 | |
| | 1,335 | | | Nexpoint Real Estate Finance, Inc. | | | 18,303 | |
| | 666 | | | OneMain Holdings, Inc. | | | 23,236 | |
| | 847 | | | Open Lending Corp.(a) | | | 21,988 | |
| | 2,209 | | | Paya Holdings, Inc.(a) | | | 24,234 | |
| | 1,828 | | | PennyMac Mortgage Investment Trust | | | 27,365 | |
| | 2,065 | | | Postal Realty Trust, Inc., Class A | | | 28,662 | |
| | 1,435 | | | Silvergate Capital Corp.(a) | | | 32,088 | |
| | 590 | | | Social Capital Hedosophia Holdings Corp. II(a) | | | 9,700 | |
| | 402 | | | StoneX Group, Inc.(a) | | | 21,298 | |
| | 1,648 | | | Trean Insurance Group, Inc.(a) | | | 17,881 | |
| | 580 | | | Triumph Bancorp, Inc.(a) | | | 24,435 | |
| | | | | | | | 477,442 | |
| | | | | | | | | |
| Health Care: 6.50% |
| | 342 | | | Global Blood Therapeutics, Inc.(a) | | | 18,084 | |
| | 2,775 | | | Invacare Corp. | | | 22,505 | |
| | 1,769 | | | Ocular Therapeutix, Inc.(a) | | | 16,806 | |
| | 1,477 | | | SeaSpine Holdings Corp.(a) | | | 18,847 | |
| | 193 | | | Turning Point Therapeutics, Inc.(a) | | | 17,793 | |
| | | | | | | | 94,035 | |
| Shares | | | | | Value (Note 2) | |
| Materials & Processing: 5.08% |
| | 726 | | | Avient Corp. | | $ | 22,557 | |
| | 1,667 | | | Glatfelter Corp. | | | 23,788 | |
| | 543 | | | UFP Industries, Inc. | | | 27,101 | |
| | | | | | | | 73,446 | |
| | | | | | | | | |
| Producer Durables: 11.80% |
| | 1,013 | | | Air Lease Corp. | | | 27,594 | |
| | 583 | | | Atlas Air Worldwide Holdings, Inc.(a) | | | 34,490 | |
| | 686 | | | Cubic Corp. | | | 40,550 | |
| | 446 | | | ICF International, Inc. | | | 29,164 | |
| | 783 | | | MasTec, Inc.(a) | | | 38,868 | |
| | | | | | | | 170,666 | |
| | | | | | | | | |
| Technology: 13.24% |
| | 1,051 | | | Ebix, Inc. | | | 18,981 | |
| | 853 | | | MACOM Technology Solutions Holdings, Inc.(a) | | | 31,135 | |
| | 240 | | | Mediaalpha Inc(a) | | | 8,119 | |
| | 1,312 | | | NCR Corp.(a) | | | 26,660 | |
| | 889 | | | Onto Innovation, Inc.(a) | | | 28,510 | |
| | 3,330 | | | Photronics, Inc.(a) | | | 32,467 | |
| | 244 | | | Science Applications International Corp. | | | 18,634 | |
| | 2,179 | | | Xperi Corp. | | | 27,020 | |
| | | | | | | | 191,526 | |
| | | | | | | | | |
| Utilites: 2.32% |
| | 3,178 | | | Vonage Holdings Corp.(a) | | | 33,623 | |
| | | | | | | | | |
| | | | | Total Common Stocks | | | | |
| | | | | (Cost $1,331,551) | | | 1,415,961 | |
| | | | | | | | | |
| | | | | | | | | |
| SHORT TERM INVESTMENTS: 0.13% |
| | 1,879 | | | Dreyfus Government Cash Management Fund - Institutional Class 0.027% (7-Day Yield) | | | 1,879 | |
| | | | | | | | | |
| | | | | Total Short Term Investments | | | | |
| | | | | (Cost $1,879) | | | 1,879 | |
| | | | | | | | | |
| Total Investments: 98.01% |
| (Cost $1,333,430) | | | 1,417,840 | |
| | | | | | | | | |
| Other Assets In Excess Of Liabilities: 1.99% | | | 28,758 | |
| Net Assets: 100.00% | | $ | 1,446,598 | |
| (a) | Non-income producing security. |
| Semi-Annual Report | October 31, 2020 | 33 |
| Emerald Small Cap Value Fund | Schedule of Investments |
October 31, 2020 (Unaudited)
For Fund compliance purposes, the Fund's industry classifications refer to any one or more of the industry sub-classifications used by one or more widely recognized market indexes or ratings group indexes, and/or as defined by Fund management. This definition may not apply for purposes of this report, which may combine industry sub-classifications for reporting ease. Industries are shown as a percentage of net assets.
See Notes to Financial Statements.
| 34 | www.emeraldmutualfunds.com |
| Emerald Insights Fund | Schedule of Investments |
October 31, 2020 (Unaudited)
| Shares | | | | | Value (Note 2) | |
| COMMON STOCKS: 97.58% | |
| Consumer Discretionary: 24.59% |
| | 365 | | | Amazon.com, Inc.(a) | | $ | 1,108,195 | |
| | 1,419 | | | Best Buy Co., Inc. | | | 158,289 | |
| | 67 | | | Booking Holdings, Inc.(a) | | | 108,708 | |
| | 4,653 | | | Chegg, Inc.(a) | | | 341,716 | |
| | 100 | | | Chipotle Mexican Grill, Inc.(a) | | | 120,148 | |
| | 1,052 | | | Churchill Downs, Inc. | | | 156,906 | |
| | 3,748 | | | Dick's Sporting Goods, Inc. | | | 212,324 | |
| | 33,315 | | | Everi Holdings, Inc.(a) | | | 286,842 | |
| | 22,796 | | | Glu Mobile, Inc.(a) | | | 163,219 | |
| | 764 | | | Home Depot, Inc. | | | 203,766 | |
| | 1,987 | | | Overstock.com, Inc.(a) | | | 111,471 | |
| | 2,565 | | | Polaris, Inc. | | | 233,056 | |
| | 5,878 | | | SeaWorld Entertainment, Inc.(a) | | | 129,434 | |
| | 736 | | | Take-Two Interactive Software, Inc.(a) | | | 114,021 | |
| | 6,720 | | | Winnebago Industries, Inc. | | | 315,504 | |
| | | | | | | | 3,763,599 | |
| | | | | | | | | |
| Consumer Staples: 1.96% |
| | 751 | | | Freshpet, Inc.(a) | | | 85,989 | |
| | 2,733 | | | National Beverage Corp.(a) | | | 213,967 | |
| | | | | | | | 299,956 | |
| | | | | | | | | |
| Energy: 2.98% |
| | 3,277 | | | Cheniere Energy, Inc.(a) | | | 156,870 | |
| | 8,295 | | | New Fortress Energy, Inc. | | | 299,698 | |
| | | | | | | | 456,568 | |
| | | | | | | | | |
| Financial Services: 6.77% |
| | 105 | | | Equinix, Inc., REIT | | | 76,780 | |
| | 1,545 | | | JPMorgan Chase & Co. | | | 151,472 | |
| | 141 | | | MarketAxess Holdings, Inc. | | | 75,978 | |
| | 1,910 | | | PayPal Holdings, Inc.(a) | | | 355,508 | |
| | 654 | | | SBA Communications Corp., REIT | | | 189,902 | |
| | 1,023 | | | Visa, Inc., Class A | | | 185,890 | |
| | | | | | | | 1,035,530 | |
| | | | | | | | | |
| Health Care: 16.71% |
| | 832 | | | Alnylam Pharmaceuticals, Inc.(a) | | | 102,311 | |
| | 4,932 | | | Avrobio, Inc.(a) | | | 70,429 | |
| | 1,001 | | | Blueprint Medicines Corp.(a) | | | 102,382 | |
| | 2,426 | | | Cantel Medical Corp. | | | 116,060 | |
| | 5,034 | | | Cardiff Oncology, Inc.(a) | | | 79,638 | |
| | 2,157 | | | Collegium Pharmaceutical, Inc.(a) | | | 38,459 | |
| | 741 | | | Deciphera Pharmaceuticals, Inc.(a) | | | 43,030 | |
| | 8,396 | | | Dicerna Pharmaceuticals, Inc.(a) | | | 176,232 | |
| | 5,917 | | | Horizon Therapeutics PLC(a) | | | 443,361 | |
| | 1,587 | | | Integer Holdings Corp.(a) | | | 92,760 | |
| | 14,238 | | | Karyopharm Therapeutics, Inc.(a) | | | 211,007 | |
| | 153 | | | Regeneron Pharmaceuticals, Inc.(a) | | | 83,165 | |
| | 1,287 | | | Sarepta Therapeutics, Inc.(a) | | | 174,916 | |
| | 4,225 | | | SeaSpine Holdings Corp.(a) | | | 53,911 | |
| | 3,635 | | | Tabula Rasa HealthCare, Inc.(a) | | | 125,553 | |
| Shares | | | | | Value (Note 2) | |
| Health Care (continued) |
| | 5,651 | | | TransMedics Group, Inc.(a) | | $ | 67,699 | |
| | 1,089 | | | Turning Point Therapeutics, Inc.(a) | | | 100,395 | |
| | 2,164 | | | United Therapeutics Corp.(a) | | | 290,474 | |
| | 687 | | | Veeva Systems, Inc., Class A(a) | | | 185,524 | |
| | | | | | | | 2,557,306 | |
| | | | | | | | | |
| Materials & Processing: 1.90% |
| | 1,881 | | | Owens Corning | | | 123,149 | |
| | 530 | | | Royal Gold, Inc. | | | 62,969 | |
| | 683 | | | TopBuild Corp.(a) | | | 104,643 | |
| | | | | | | | 290,761 | |
| | | | | | | | | |
| Producer Durables: 5.75% |
| | 8,110 | | | American Superconductor Corp.(a) | | | 112,810 | |
| | 4,360 | | | Chart Industries, Inc.(a) | | | 368,202 | |
| | 186 | | | CoStar Group, Inc.(a) | | | 153,191 | |
| | 13,012 | | | Kratos Defense & Security Solutions, Inc.(a) | | | 245,797 | |
| | | | | | | | 880,000 | |
| | | | | | | | | |
| Technology: 36.92% |
| | 159 | | | Adobe, Inc.(a) | | | 71,089 | |
| | 326 | | | Alphabet, Inc., Class A(a) | | | 526,852 | |
| | 2,239 | | | Anaplan, Inc.(a) | | | 123,929 | |
| | 11,540 | | | Apple, Inc. | | | 1,256,244 | |
| | 1,093 | | | Crowdstrike Holdings, Inc.(a) | | | 135,357 | |
| | 1,704 | | | Facebook, Inc., Class A(a) | | | 448,339 | |
| | 641 | | | L3Harris Technologies, Inc. | | | 103,271 | |
| | 1,099 | | | Lumentum Holdings, Inc.(a) | | | 90,876 | |
| | 2,620 | | | Mediaalpha Inc(a) | | | 88,635 | |
| | 1,552 | | | Mercury Systems, Inc.(a) | | | 106,902 | |
| | 5,997 | | | Microsoft Corp. | | | 1,214,214 | |
| | 1,036 | | | NVIDIA Corp. | | | 519,409 | |
| | 2,121 | | | Proofpoint, Inc.(a) | | | 203,065 | |
| | 9,661 | | | Pure Storage, Inc., Class A(a) | | | 155,542 | |
| | 227 | | | ServiceNow, Inc.(a) | | | 112,948 | |
| | 7,546 | | | SVMK, Inc.(a) | | | 157,938 | |
| | 2,899 | | | Varonis Systems, Inc.(a) | | | 335,037 | |
| | | | | | | | 5,649,647 | |
| | | | | | | | | |
| | | | | Total Common Stocks | | | | |
| | | | | (Cost $10,267,581) | | | 14,933,367 | |
| | | | | | | | | |
| EXCHANGE TRADED FUNDS: 1.99% |
| Technology: 1.99% |
| | 1,000 | | | iShares Expanded Tech-Software Sector ETF | | | 304,640 | |
| | | | | | | | | |
| | | | | Total Exchange Traded Funds | | | | |
| | | | | (Cost $212,394) | | | 304,640 | |
| Semi-Annual Report | October 31, 2020 | 35 |
| Emerald Insights Fund | Schedule of Investments |
October 31, 2020 (Unaudited)
| Shares | | | | | Value (Note 2) | |
| Technology (continued) |
| SHORT TERM INVESTMENTS: 0.56% |
| | 85,430 | | | Dreyfus Government Cash Management Fund - Institutional Class 0.027% (7-Day Yield) | | $ | 85,430 | |
| | | | | | | | | |
| | | | | Total Short Term Investments | | | | |
| | | | | (Cost $85,430) | | | 85,430 | |
| | | | | | | | | |
| Total Investments: 100.13% | | | | |
| (Cost $10,565,405) | | | 15,323,437 | |
| | | | | | | | | |
| Liabilities In Excess Of Other Assets: (0.13)% | | | (19,760 | ) |
| Net Assets: 100.00% | | $ | 15,303,677 | |
| (a) | Non-income producing security. |
For Fund compliance purposes, the Fund's industry classifications refer to any one or more of the industry sub-classifications used by one or more widely recognized market indexes or ratings group indexes, and/or as defined by Fund management. This definition may not apply for purposes of this report, which may combine industry sub-classifications for reporting ease. Industries are shown as a percentage of net assets.
See Notes to Financial Statements.
| 36 | www.emeraldmutualfunds.com |
| Emerald Banking and Finance Fund | Schedule of Investments |
October 31, 2020 (Unaudited)
| Shares | | | | | Value (Note 2) | |
| COMMON STOCKS: 97.36% | |
| Consumer Discretionary: 1.92% | |
| Diversified Retailers: 1.92% |
| | 43,590 | | | Aaron's Holdings Co., Inc. | | $ | 2,278,013 | |
| | | | | | | | | |
| Financial Services: 94.22% |
| Asset Managers And Custodians: 9.13% |
| | 67,430 | | | CF Finance Acquisition Corp.(a) | | | 697,900 | |
| | 44,418 | | | Focus Financial Partners, Inc., Class A(a) | | | 1,621,701 | |
| | 106,747 | | | LF Capital Acquisition Corp., Class A(a) | | | 1,116,574 | |
| | 226,500 | | | Netfin Acquisition Corp.(a) | | | 2,332,950 | |
| | 88,758 | | | PropTech Acquisition Corp.(a) | | | 906,219 | |
| | 69,200 | | | Social Capital Hedosophia Holdings Corp. II(a) | | | 1,137,648 | |
| | 299,795 | | | Social Capital Hedosophia Holdings Corp. III(a) | | | 3,003,946 | |
| | | | | | | | 10,816,938 | |
| | | | | | | | | |
| Banks: 25.54% |
| | 190,534 | | | Amerant Bancorp, Inc.(a) | | | 1,587,148 | |
| | 491,696 | | | Bancorp, Inc.(a) | | | 4,720,282 | |
| | 69,557 | | | Bank7 Corp. | | | 630,882 | |
| | 26,842 | | | Community Heritage Financial, Inc. | | | 450,275 | |
| | 33,741 | | | CrossFirst Bankshares, Inc.(a) | | | 281,737 | |
| | 21,610 | | | Fifth Third Bancorp | | | 501,784 | |
| | 107,294 | | | Live Oak Bancshares, Inc. | | | 3,999,920 | |
| | 53 | | | Mechanics Bank/Walnut Creek CA(a) | | | 978,115 | |
| | 25,267 | | | MVB Financial Corp. | | | 403,009 | |
| | 17,270 | | | Pacific Premier Bancorp, Inc. | | | 440,385 | |
| | 4,706 | | | Potomac Bancshares, Inc. | | | 46,307 | |
| | 83,618 | | | ServisFirst Bancshares, Inc. | | | 3,085,504 | |
| | 221,529 | | | Silvergate Capital Corp.(a) | | | 4,953,389 | |
| | 240,975 | | | TriState Capital Holdings, Inc.(a) | | | 3,033,875 | |
| | 122,206 | | | Triumph Bancorp, Inc.(a) | | | 5,148,539 | |
| | | | | | | | 30,261,151 | |
| | | | | | | | | |
| Computer Services: 1.10% |
| | 50,370 | | | Dun & Bradstreet Holdings, Inc.(a) | | | 1,301,561 | |
| | | | | | | | | |
| Consumer Lending: 9.89% |
| | 81,700 | | | Ally Financial, Inc. | | | 2,179,756 | |
| | 1,232,440 | | | ECN Capital Corp. | | | 4,942,084 | |
| | 131,710 | | | OneMain Holdings, Inc. | | | 4,595,362 | |
| | | | | | | | 11,717,202 | |
| | | | | | | | | |
| Diversified Financial Services: 3.08% |
| | 98,840 | | | Cannae Holdings, Inc.(a) | | | 3,655,103 | |
| | | | | | | | | |
| Diversified REITs: 3.50% |
| | 1,102,905 | | | Colony Capital, Inc. | | | 3,926,342 | |
| | 42,335 | | | Colony Credit Real Estate, Inc. | | | 221,835 | |
| | | | | | | | 4,148,177 | |
| Shares | | | | | Value (Note 2) | |
| Full Line Insurance: 1.22% |
| | 28,854 | | | Lemonade, Inc.(a) | | $ | 1,451,068 | |
| | | | | | | | | |
| Infrastructure REITs: 1.52% |
| | 16,210 | | | Hannon Armstrong Sustainable Infrastructure Capital, Inc. | | | 678,388 | |
| | 47,707 | | | Power Reit(a) | | | 1,121,115 | |
| | | | | | | | 1,799,503 | |
| | | | | | | | | |
| Life Insurance: 1.33% |
| | 16,080 | | | eHealth, Inc.(a) | | | 1,079,129 | |
| | 6,900 | | | Trupanion, Inc.(a) | | | 493,626 | |
| | | | | | | | 1,572,755 | |
| | | | | | | | | |
| Mortgage Finance: 3.84% |
| | 57,122 | | | PennyMac Financial Services, Inc., Class A | | | 2,902,940 | |
| | 41,970 | | | Radian Group, Inc. | | | 753,361 | |
| | 49,068 | | | Rocket Cos., Inc.(a) | | | 894,510 | |
| | | | | | | | 4,550,811 | |
| | | | | | | | | |
| Mortgage REITs: Commercial: 6.12% |
| | 39,190 | | | Granite Point Mortgage Trust, Inc. | | | 264,141 | |
| | 129,090 | | | Ladder Capital Corp., REIT | | | 968,175 | |
| | 176,443 | | | Nexpoint Real Estate Finance, Inc. | | | 2,419,033 | |
| | 355,630 | | | Subversive Real Estate Acquisition REIT LP(a) | | | 3,595,419 | |
| | | | | | | | 7,246,768 | |
| | | | | | | | | |
| Mortgage REITs: Diversified: 2.60% |
| | 53,600 | | | AGNC Investment Corp. | | | 748,792 | |
| | 65,510 | | | Ellington Financial, Inc. | | | 801,843 | |
| | 73,930 | | | Great Ajax Corp. | | | 567,782 | |
| | 112,560 | | | Redwood Trust, Inc. | | | 956,760 | |
| | | | | | | | 3,075,177 | |
| | | | | | | | | |
| Mortgage REITs: Residential: 5.66% |
| | 150,100 | | | Annaly Capital Management, Inc. | | | 1,064,209 | |
| | 80,410 | | | ARMOUR Residential REIT, Inc. | | | 767,112 | |
| | 100,270 | | | Cherry Hill Mortgage Investment Corp. | | | 918,473 | |
| | 68,430 | | | Dynex Capital, Inc. | | | 1,120,883 | |
| | 71,470 | | | Ellington Residential Mortgage REIT | | | 759,726 | |
| | 70,030 | | | PennyMac Mortgage Investment Trust | | | 1,048,349 | |
| | 25,460 | | | Starwood Property Trust, Inc. | | | 355,676 | |
| | 133,050 | | | Two Harbors Investment Corp. | | | 673,233 | |
| | | | | | | | 6,707,661 | |
| | | | | | | | | |
| Office REITs: 1.85% |
| | 35,460 | | | Ares Commercial Real Estate Corp. | | | 330,133 | |
| | 134,007 | | | Postal Realty Trust, Inc., Class A | | | 1,860,017 | |
| | | | | | | | 2,190,150 | |
| | | | | | | | | |
| Property And Casualty Insurance: 5.57% |
| | 34,350 | | | Essent Group, Ltd. | | | 1,368,848 | |
| | 13,870 | | | Fidelity National Financial, Inc. | | | 433,992 | |
| Semi-Annual Report | October 31, 2020 | 37 |
| Emerald Banking and Finance Fund | Schedule of Investments |
October 31, 2020 (Unaudited)
| Shares | | | | | Value (Note 2) | |
| Property And Casualty Insurance (continued) |
| | 18,648 | | | James River Group Holdings, Ltd. | | $ | 871,421 | |
| | 10,353 | | | Kinsale Capital Group, Inc. | | | 1,940,877 | |
| | 52,130 | | | NMI Holdings, Inc., Class A(a) | | | 1,120,274 | |
| | 79,070 | | | Trean Insurance Group, Inc.(a) | | | 857,909 | |
| | | | | | | | 6,593,321 | |
| | | | | | | | | |
| Real Estate Holding And Development: 0.23% |
| | 4,310 | | | Howard Hughes Corp.(a) | | | 268,039 | |
| | | | | | | | | |
| Reinsurance: 2.14% |
| | 120,221 | | | Mr Cooper Group, Inc.(a) | | | 2,534,259 | |
| | | | | | | | | |
| Residential REITs: 0.41% |
| | 11,069 | | | NexPoint Residential Trust, Inc. | | | 490,578 | |
| | | | | | | | | |
| Retail REITs: 0.71% |
| | 20,210 | | | Brixmor Property Group, Inc., REIT | | | 221,502 | |
| | 29,850 | | | Kimco Realty Corp. | | | 306,261 | |
| | 29,770 | | | Kite Realty Group Trust | | | 308,417 | |
| | | | | | | | 836,180 | |
| | | | | | | | | |
| Transaction Processing Services: 8.78% |
| | 42,690 | | | Nuvei Corp.(a) | | | 1,577,835 | |
| | 170,942 | | | Open Lending Corp.(a) | | | 4,437,654 | |
| | 124,210 | | | Paya Holdings, Inc.(a) | | | 1,362,584 | |
| | 134,441 | | | Repay Holdings Corp.(a) | | | 3,028,956 | |
| | | | | | | | 10,407,029 | |
| | | | | | | | | |
| Technology: 1.22% |
| Software: 1.22% |
| | 23,320 | | | Duck Creek Technologies, Inc.(a) | | | 1,011,389 | |
| | 6,160 | | | nCino, Inc.(a) | | | 434,403 | |
| | | | | | | | 1,445,792 | |
| | | | | | | | | |
| | | | | Total Common Stocks | | | | |
| | | | | (Cost $93,199,316) | | | 115,347,236 | |
| MUTUAL FUND: 1.95% |
| Transaction Processing Services: 1.95% |
| | 78,090 | | | Bitcoin Investment Trust(a) | | | 1,201,024 | |
| | 19,740 | | | Grayscale Ethereum Trust(a) | | | 1,105,045 | |
| | | | | | | | 2,306,069 | |
| | | | | | | | | |
| | | | | Total Mutual Fund | | | | |
| | | | | (Cost $2,280,230) | | | 2,306,069 | |
| SHORT TERM INVESTMENTS: 4.03% |
| | 4,775,407 | | | Dreyfus Government Cash Management Fund - Institutional Class 0.027% (7-Day Yield) | | | 4,775,407 | |
| | | | | | | | | |
| | | | | Total Short Term Investments | | | | |
| | | | | (Cost $4,775,407) | | | 4,775,407 | |
| Shares | | Value (Note 2) | |
| SHORT TERM INVESTMENTS | | | | |
| Total Investments: 103.34% | | | | |
| (Cost $100,254,953) | | $ | 122,428,712 | |
| | | | | |
| Liabilities In Excess Of Other Assets: (3.34)% | | | (3,954,223 | ) |
| Net Assets: 100.00% | | $ | 118,474,489 | |
| (a) | Non-income producing security. |
For Fund compliance purposes, the Fund's industry classifications refer to any one or more of the industry sub-classifications used by one or more widely recognized market indexes or ratings group indexes, and/or as defined by Fund management. This definition may not apply for purposes of this report, which may combine industry sub-classifications for reporting ease. Industries are shown as a percentage of net assets.
See Notes to Financial Statements.
| 38 | www.emeraldmutualfunds.com |
| Emerald Select trueLiberty Income Fund | Consolidated Schedule of Investments |
October 31, 2020 (Unaudited)
| Shares | | | | | Value (Note 2) | |
| COMMON STOCKS: 16.74% | |
| Gathering & Processing: 3.19% |
| | 341 | | | Crestwood Equity Partners LP | | $ | 5,108 | |
| | 609 | | | DCP Midstream LP | | | 7,777 | |
| | 601 | | | Enable Midstream Partners LP | | | 2,674 | |
| | 1,762 | | | EnLink Midstream LLC | | | 4,775 | |
| | 228 | | | Noble Midstream Partners LP | | | 1,817 | |
| | 1,357 | | | Western Midstream Partners LP | | | 11,060 | |
| | | | | | | | 33,211 | |
| | | | | | | | | |
| Liquefaction: 0.95% |
| | 274 | | | Cheniere Energy Partners LP | | | 9,878 | |
| | | | | | | | | |
| Pipeline Transportation | Natural Gas: 4.23% |
| | 3,092 | | | Energy Transfer LP | | | 15,924 | |
| | 1,076 | | | Enterprise Products Partners LP | | | 17,829 | |
| | 365 | | | TC PipeLines LP | | | 10,275 | |
| | | | | | | | 44,028 | |
| | | | | | | | | |
| Pipeline Transportation | Petroleum: 8.37% |
| | 735 | | | Genesis Energy LP | | | 3,087 | |
| | 308 | | | Holly Energy Partners LP | | | 3,530 | |
| | 499 | | | Magellan Midstream Partners LP | | | 17,734 | |
| | 1,061 | | | MPLX LP | | | 18,260 | |
| | 803 | | | NGL Energy Partners LP | | | 1,927 | |
| | 666 | | | NuStar Energy LP | | | 6,587 | |
| | 486 | | | Phillips 66 Partners LP | | | 11,406 | |
| | 2,759 | | | Plains All American Pipeline LP | | | 17,244 | |
| | 833 | | | Shell Midstream Partners LP | | | 7,289 | |
| | | | | | | | 87,064 | |
| | | | | | | | | |
| | | | | Total Common Stocks | | | | |
| | | | | (Cost $192,707) | | | 174,181 | |
| | | | | | | | | |
| Total Investments: 16.74% |
| (Cost $192,707) | | | 174,181 | |
| | | | | | | | | |
| Other Assets In Excess Of Liabilities: 83.26% | | | 866,432 | |
| Net Assets: 100.00% | | $ | 1,040,613 | |
For Fund compliance purposes, the Fund's industry classifications refer to any one or more of the industry sub-classifications used by one or more widely recognized market indexes or ratings group indexes, and/or as defined by Fund management. This definition may not apply for purposes of this report, which may combine industry sub-classifications for reporting ease. Industries are shown as a percentage of net assets.
See Notes to Financial Statements.
| Semi-Annual Report | October 31, 2020 | 39 |
| Emerald Select trueLiberty Income Fund | Consolidated Schedule of Investments |
| | October 31, 2020 (Unaudited) |
| TOTAL RETURN SWAP CONTRACT(a) | | | | | | |
| Swap Counterparty | | Reference Obligation | | | Notional Amount | | | Floating Rate/Fixed Amount Paid by the Fund* | | Termination Date | | | Value | | | | Unrealized Appreciation | |
| J.P. Morgan | | Alerian MLP Infrastructure Index | | $ | – | | | 1M LIBOR + 75 BPS | | 03/02/2021 | | $ | (865,425 | ) | | $ | – | |
| | | | | $ | – | | | | | | | $ | (865,425 | ) | | $ | – | |
| (a) | For long positions in the total return swap, the Fund receives payments based on any positive return of the Reference Obligation less the rate paid by the Fund. The Fund makes payments on any negative return of such Reference Obligations plus the rate paid by the Fund. For the short positions in the total return swap, the Fund makes payments based on any positive return of the Reference Obligation less the rate received by the Fund. The Fund receives payments on any negative return of such Reference Obligations plus the rate received by the Fund. |
| * | Payments made when swap contract closes. |
Investment Abbreviations:
LIBOR - London Interbank Offered Rate
Reference Rates:
1M US L - 1 Month LIBOR as of October 31, 2020 was 0.14%
| 40 | www.emeraldmutualfunds.com |
| Emerald Funds | Statements of Assets and Liabilities |
| | October 31, 2020 (Unaudited) |
| | | Emerald Growth Fund | | | Emerald Small Cap Value Fund | | | Emerald Insights Fund | | | Emerald Banking and Finance Fund | |
| ASSETS: | | | | | | | | | | | | |
| Investments, at value | | $ | 1,290,496,732 | | | $ | 1,417,840 | | | $ | 15,323,437 | | | $ | 122,428,712 | |
| Cash | | | 390 | | | | – | | | | 1,393 | | | | 19 | |
| Receivable for investments sold | | | 16,267,211 | | | | 23,393 | | | | 70,150 | | | | 4,650,754 | |
| Receivable for shares sold | | | 688,032 | | | | 64 | | | | – | | | | 52,846 | |
| Receivable due from advisor | | | – | | | | 15,620 | | | | – | | | | – | |
| Interest and dividends receivable | | | 10,979 | | | | 198 | | | | 266 | | | | 38,445 | |
| Other assets | | | 46,192 | | | | 27,439 | | | | 26,317 | | | | 21,467 | |
| Total Assets | | | 1,307,509,536 | | | | 1,484,554 | | | | 15,421,563 | | | | 127,192,243 | |
| LIABILITIES: | | | | | | | | | | | | | | | | |
| Payable for investments purchased | | | 9,030,706 | | | | – | | | | 85,363 | | | | 8,017,352 | |
| Payable for shares redeemed | | | 1,408,968 | | | | 13,667 | | | | – | | | | 442,927 | |
| Investment advisory fees payable | | | 648,316 | | | | – | | | | 3,378 | | | | 103,491 | |
| Payable to fund accounting and administration | | | 55,584 | | | | 3,565 | | | | 4,748 | | | | 8,828 | |
| Payable for distribution and service fees | | | 176,128 | | | | 301 | | | | 4,643 | | | | 78,220 | |
| Payable for trustee fees and expenses | | | 29,568 | | | | 52 | | | | 379 | | | | 4,366 | |
| Payable for transfer agency fees | | | 28,595 | | | | 5,581 | | | | 5,841 | | | | 18,609 | |
| Payable for chief compliance officer fee | | | 4,699 | | | | 19 | | | | 37 | | | | 1,685 | |
| Payable for principal financial officer fee | | | 802 | | | | 6 | | | | 6 | | | | 334 | |
| Payable for professional fees | | | 7,613 | | | | 7,238 | | | | 7,214 | | | | 9,525 | |
| Accrued expenses and other liabilities | | | 89,215 | | | | 7,527 | | | | 6,277 | | | | 32,417 | |
| Total Liabilities | | | 11,480,194 | | | | 37,956 | | | | 117,886 | | | | 8,717,754 | |
| NET ASSETS | | $ | 1,296,029,342 | | | $ | 1,446,598 | | | $ | 15,303,677 | | | $ | 118,474,489 | |
| NET ASSETS CONSIST OF: | | | | | | | | | | | | | | | | |
| Paid-in capital (Note 6) | | $ | 742,975,236 | | | $ | 1,781,756 | | | $ | 9,233,901 | | | $ | 133,201,946 | |
| Total distributable earnings | | | 553,054,106 | | | | (335,158 | ) | | | 6,069,776 | | | | (14,727,457 | ) |
| NET ASSETS | | $ | 1,296,029,342 | | | $ | 1,446,598 | | | $ | 15,303,677 | | | $ | 118,474,489 | |
| INVESTMENTS, AT COST | | $ | 848,784,751 | | | $ | 1,333,430 | | | $ | 10,565,405 | | | $ | 100,254,953 | |
| PRICING OF SHARES | | | | | | | | | | | | | | | | |
| Class A: (a) | | | | | | | | | | | | | | | | |
| Net Asset Value, offering and redemption price per share | | $ | 29.40 | | | $ | 6.14 | | | $ | 15.69 | | | $ | 27.89 | |
| Net Assets | | $ | 149,291,161 | | | $ | 602,233 | | | $ | 12,842,020 | | | $ | 37,799,556 | |
| Shares of beneficial interest outstanding | | | 5,078,186 | | | | 98,105 | | | | 818,300 | | | | 1,355,362 | |
| Maximum offering price per share (NAV/.9525, based on maximum sales charge of 4.75% of the offering price) | | $ | 30.86 | | | $ | 6.44 | | | $ | 16.48 | | | $ | 29.28 | |
| Class C: (a) | | | | | | | | | | | | | | | | |
| Net Asset Value, offering and redemption price per share | | $ | 24.10 | | | $ | 5.80 | | | $ | 14.92 | | | $ | 23.53 | |
| Net Assets | | $ | 19,244,151 | | | $ | 26,823 | | | $ | 179,957 | | | $ | 14,420,517 | |
| Shares of beneficial interest outstanding | | | 798,624 | | | | 4,623 | | | | 12,063 | | | | 612,937 | |
| Institutional Class: | | | | | | | | | | | | | | | | |
| Net Asset Value, offering and redemption price per share | | $ | 30.87 | | | $ | 6.31 | | | $ | 16.02 | | | $ | 28.88 | |
| Net Assets | | $ | 1,043,088,713 | | | $ | 452,769 | | | $ | 1,914,438 | | | $ | 52,692,327 | |
| Shares of beneficial interest outstanding | | | 33,787,126 | | | | 71,728 | | | | 119,502 | | | | 1,824,309 | |
| Investor Class: | | | | | | | | | | | | | | | | |
| Net Asset Value, offering and redemption price per share | | $ | 29.24 | | | $ | 6.18 | | | $ | 15.61 | | | $ | 26.38 | |
| Net Assets | | $ | 84,405,317 | | | $ | 364,773 | | | $ | 367,262 | | | $ | 13,562,089 | |
| Shares of beneficial interest outstanding | | | 2,886,811 | | | | 59,047 | | | | 23,525 | | | | 514,103 | |
| (a) | Redemption price per share may be reduced for any applicable contingent deferred sales charge. For a description of a possible sales charge, please see the Funds' Prospectus. |
See Notes to Financial Statements.
| Semi-Annual Report | October 31, 2020 | 41 |
| | Consolidated Statement |
| Emerald Select trueLiberty Income Fund | of Assets and Liabilities |
| | October 31, 2020 (Unaudited) |
| ASSETS: | | | |
| Investments, at value | | $ | 174,181 | |
| Cash | | | 922,033 | |
| Deposits with brokers for total return swap contracts | | | 25,000 | |
| Receivable due from broker for total return swap contracts | | | 38,144 | |
| Receivable due from advisor | | | 33,274 | |
| Interest and dividends receivable | | | 2,738 | |
| Prepaid offering costs | | | 8,732 | |
| Other assets | | | 6,506 | |
| Total Assets | | | 1,210,608 | |
| LIABILITIES: | | | | |
| Payable to broker for total return swap contracts | | | 30,000 | |
| Payable to fund accounting and administration | | | 10,228 | |
| Payable for distribution and service fees | | | 78 | |
| Payable for trustee fees and expenses | | | 19,081 | |
| Payable for transfer agency fees | | | 7,205 | |
| Payable for chief compliance officer fee | | | 598 | |
| Payable for principal financial officer fee | | | 136 | |
| Payable for professional fees | | | 13,690 | |
| Accrued expenses and other liabilities | | | 88,979 | |
| Total Liabilities | | | 169,995 | |
| NET ASSETS | | $ | 1,040,613 | |
| NET ASSETS CONSIST OF: | | | | |
| Paid-in capital (Note 6) | | $ | 1,498,803 | |
| Total distributable earnings | | | (458,190 | ) |
| NET ASSETS | | $ | 1,040,613 | |
| INVESTMENTS, AT COST | | $ | 192,707 | |
| PRICING OF SHARES | | | | |
| Class A: (a) | | | | |
| Net Asset Value, offering and redemption price per share | | $ | 4.44 | |
| Net Assets | | $ | 56,474 | |
| Shares of beneficial interest outstanding | | | 12,728 | |
| Maximum offering price per share (NAV/.9525, based on maximum sales charge of 4.75% of the offering price) | | $ | 4.66 | |
| Institutional Class: | | | | |
| Net Asset Value, offering and redemption price per share | | $ | 4.44 | |
| Net Assets | | $ | 984,139 | |
| Shares of beneficial interest outstanding | | | 221,531 | |
| (a) | Redemption price per share may be reduced for any applicable contingent deferred sales charge. For a description of a possible sales charge, please see the Funds' Prospectus. |
See Notes to Financial Statements.
| 42 | www.emeraldmutualfunds.com |
| Emerald Funds | Statements of Operations |
| | For the Six Months Ended October 31, 2020 (Unaudited) |
| | | Emerald Growth Fund | | | Emerald Small Cap Value Fund | | | Emerald Insights Fund | | | Emerald Banking and Finance Fund | |
| INVESTMENT INCOME: | | | | | | | | | | | | | | | | |
| Dividends | | $ | 1,861,488 | | | $ | 17,871 | | | $ | 32,914 | | | $ | 2,060,305 | |
| Foreign taxes withheld | | | – | | | | – | | | | – | | | | (7,493 | ) |
| Total Investment Income | | | 1,861,488 | | | | 17,871 | | | | 32,914 | | | | 2,052,812 | |
| | | | | | | | | | | | | | | | | |
| EXPENSES: | | | | | | | | | | | | | | | | |
| Investment advisory fee (Note 7) | | | 3,617,550 | | | | 6,564 | | | | 55,145 | | | | 615,650 | |
| Administration fee | | | 283,083 | | | | 8,945 | | | | 12,442 | | | | 36,996 | |
| Custodian fee | | | 50,337 | | | | 2,523 | | | | 2,539 | | | | 11,133 | |
| Professional fees | | | 26,467 | | | | 9,443 | | | | 9,581 | | | | 13,617 | |
| Transfer agent fee | | | 105,928 | | | | 15,890 | | | | 17,285 | | | | 57,408 | |
| Delegated transfer agent equivalent services fees | | | | | | | | | | | | | | | | |
| Class A | | | 988 | | | | – | | | | 8 | | | | 977 | |
| Class C | | | 333 | | | | – | | | | – | | | | 447 | |
| Institutional Class | | | 558 | | | | 2 | | | | – | | | | 487 | |
| Investor Class | | | 252 | | | | – | | | | – | | | | 2 | |
| Trustee fees and expenses | | | 30,899 | | | | 51 | | | | 377 | | | | 4,074 | |
| Registration/filing fees | | | 34,208 | | | | 19,761 | | | | 16,563 | | | | 27,833 | |
| Reports to shareholder and printing fees | | | 48,272 | | | | 406 | | | | 828 | | | | 14,536 | |
| Distribution and service fees | | | | | | | | | | | | | | | | |
| Class A | | | 270,940 | | | | 1,484 | | | | 21,618 | | | | 71,730 | |
| Class C | | | 98,281 | | | | 141 | | | | 869 | | | | 79,315 | |
| Institutional Class | | | 227,003 | | | | – | | | | 392 | | | | 2,304 | |
| Investor Class | | | 170,445 | | | | 428 | | | | 465 | | | | 29,011 | |
| Chief compliance officer fee | | | 32,464 | | | | 59 | | | | 355 | | | | 4,378 | |
| Principal financial officer fee | | | 6,566 | | | | 14 | | | | 73 | | | | 872 | |
| Other | | | 25,397 | | | | 5,027 | | | | 4,903 | | | | 8,261 | |
| Total expenses before waiver | | | 5,029,971 | | | | 70,738 | | | | 143,443 | | | | 979,031 | |
| Less fees waived/reimbursed by investment advisor (Note 7) | | | – | | | | (59,950 | ) | | | (46,180 | ) | | | – | |
| Total Net Expenses | | | 5,029,971 | | | | 10,788 | | | | 97,263 | | | | 979,031 | |
| NET INVESTMENT INCOME/(LOSS): | | | (3,168,483 | ) | | | 7,083 | | | | (64,349 | ) | | | 1,073,781 | |
| | | | | | | | | | | | | | | | | |
| REALIZED AND UNREALIZED GAIN/(LOSS) | | | | | | | | | | | | | | | | |
| Net realized gain/(loss) | | | 67,871,318 | | | | (91,392 | ) | | | 1,375,511 | | | | (1,016,769 | ) |
| Net realized loss on foreign currency transactions | | | – | | | | – | | | | – | | | | (514 | ) |
| Net change in unrealized appreciation | | | 231,281,263 | | | | 368,692 | | | | 2,210,551 | | | | 24,660,248 | |
| NET REALIZED AND UNREALIZED GAIN | | | 299,152,581 | | | | 277,300 | | | | 3,586,062 | | | | 23,642,965 | |
| NET INCREASE IN NET ASSETS RESULTING FROM OPERATIONS | | $ | 295,984,098 | | | $ | 284,383 | | | $ | 3,521,713 | | | $ | 24,716,746 | |
See Notes to Financial Statements.
| Semi-Annual Report | October 31, 2020 | 43 |
| | Consolidated Statement |
| Emerald Select trueLiberty Income Fund | of Operations |
| | For the Six Months Ended October 31, 2020 (Unaudited) |
| INVESTMENT INCOME: | | | |
| Interest | | $ | 91 | |
| Dividends | | $ | 15,922 | |
| Total Investment Income | | | 16,013 | |
| | | | | |
| EXPENSES: | | | | |
| Investment advisory fee (Note 7) | | | 4,202 | |
| Investment advisory fee-subsidiary | | | 375 | |
| Administration fee | | | 33,649 | |
| Custodian fee | | | 7,671 | |
| Professional fees | | | 11,135 | |
| Transfer agent fee | | | 15,276 | |
| Delegated transfer agent equivalent services fees | | | | |
| Trustee fees and expenses | | | 7,713 | |
| Registration/filing fees | | | 5,734 | |
| Reports to shareholder and printing fees | | | 202 | |
| Distribution and service fees | | | | |
| Class A | | | 113 | |
| Institutional Class | | | 130 | |
| Offering costs | | | 49,012 | |
| Other | | | 6,725 | |
| Total expenses before waiver | | | 141,937 | |
| Less fees waived/reimbursed by investment advisor (Note 7) | | | (136,772 | ) |
| Waiver of investment advisory fees - subsidiary (Note 7) | | | (375 | ) |
| Total Net Expenses | | | 4,790 | |
| NET INVESTMENT INCOME: | | | 11,223 | |
| | | | | |
| REALIZED AND UNREALIZED LOSS | | | | |
| Net realized loss | | | (262,078 | ) |
| Net realized gain on total return swap contracts | | | 67,281 | |
| Net change in unrealized appreciation | | | 14,654 | |
| NET REALIZED AND UNREALIZED LOSS | | | (180,143 | ) |
| NET DECREASE IN NET ASSETS RESULTING FROM OPERATIONS | | $ | (168,920 | ) |
See Notes to Financial Statements.
| 44 | www.emeraldmutualfunds.com |
| Emerald Growth Fund | Statements of Changes in Net Assets |
| | | For the Six Months Ended October 31, 2020 (Unaudited) | | | Year Ended April 30, 2020 | |
| OPERATIONS: | | | | | | |
| Net investment loss | | $ | (3,168,483 | ) | | $ | (5,075,445 | ) |
| Net realized gain | | | 67,871,318 | | | | 52,160,088 | |
| Net change in unrealized appreciation/(depreciation) | | | 231,281,263 | | | | (170,182,635 | ) |
| Net increase/(decrease) in net assets resulting from operations | | | 295,984,098 | | | | (123,097,992 | ) |
| | | | | | | | | |
| DISTRIBUTIONS TO SHAREHOLDERS (NOTE 4): | | | | | | | | |
| Total amount of distributions | | | | | | | | |
| Class A | | | – | | | | (2,412,695 | ) |
| Class C | | | – | | | | (414,806 | ) |
| Institutional Class | | | – | | | | (14,304,031 | ) |
| Investor Class | | | – | | | | (1,302,690 | ) |
| Net decrease in net assets from distributions | | | – | | | | (18,434,222 | ) |
| SHARE TRANSACTIONS (NOTE 6): | | | | | | | | |
| Class A | | | | | | | | |
| Proceeds from sale of shares | | | 6,596,145 | | | | 18,378,097 | |
| Issued to shareholders in reinvestment of distributions | | | – | | | | 2,248,340 | |
| Cost of shares redeemed | | | (28,695,617 | ) | | | (56,197,235 | ) |
| Net decrease from share transactions | | | (22,099,472 | ) | | | (35,570,798 | ) |
| Class C | | | | | | | | |
| Proceeds from sale of shares | | | 357,781 | | | | 210,912 | |
| Issued to shareholders in reinvestment of distributions | | | – | | | | 371,070 | |
| Cost of shares redeemed | | | (3,087,490 | ) | | | (10,036,851 | ) |
| Net decrease from share transactions | | | (2,729,709 | ) | | | (9,454,869 | ) |
| Institutional Class | | | | | | | | |
| Proceeds from sale of shares | | | 90,808,236 | | | | 179,007,496 | |
| Issued to shareholders in reinvestment of distributions | | | – | | | | 12,854,869 | |
| Cost of shares redeemed | | | (145,368,292 | ) | | | (268,196,365 | ) |
| Net decrease from share transactions | | | (54,560,056 | ) | | | (76,334,000 | ) |
| Investor Class | | | | | | | | |
| Proceeds from sale of shares | | | 8,294,931 | | | | 32,115,129 | |
| Issued to shareholders in reinvestment of distributions | | | – | | | | 421,168 | |
| Cost of shares redeemed | | | (25,149,964 | ) | | | (47,153,166 | ) |
| Net decrease from share transactions | | | (16,855,033 | ) | | | (14,616,869 | ) |
| Net increase/(decrease) in net assets | | $ | 199,739,828 | | | $ | (277,508,750 | ) |
| NET ASSETS: | | | | | | | | |
| Beginning of year | | | 1,096,289,514 | | | | 1,373,798,264 | |
| End of year | | $ | 1,296,029,342 | | | $ | 1,096,289,514 | |
| Semi-Annual Report | October 31, 2020 | 45 |
| Emerald Growth Fund | Statements of Changes in Net Assets |
| | | For the Six Months Ended October 31, 2020 (Unaudited) | | | Year Ended April 30, 2020 | |
| Other Information: | | | | | | | | |
| SHARE TRANSACTIONS: | | | | | | | | |
| Class A | | | | | | | | |
| Sold | | | 241,137 | | | | 759,108 | |
| Distributions reinvested | | | – | | | | 86,708 | |
| Redeemed | | | (1,005,489 | ) | | | (2,267,968 | ) |
| Net decrease in shares outstanding | | | (764,352 | ) | | | (1,422,152 | ) |
| Class C | | | | | | | | |
| Sold | | | 14,944 | | | | 10,641 | |
| Distributions reinvested | | | – | | | | 17,356 | |
| Redeemed | | | (135,516 | ) | | | (497,436 | ) |
| Net decrease in shares outstanding | | | (120,572 | ) | | | (469,439 | ) |
| Institutional Class | | | | | | | | |
| Sold | | | 3,107,053 | | | | 7,079,612 | |
| Distributions reinvested | | | – | | | | 473,301 | |
| Redeemed | | | (5,020,783 | ) | | | (10,537,250 | ) |
| Net decrease in shares outstanding | | | (1,913,730 | ) | | | (2,984,337 | ) |
| Investor Class | | | | | | | | |
| Sold | | | 311,967 | | | | 1,422,635 | |
| Distributions reinvested | | | – | | | | 16,324 | |
| Redeemed | | | (944,244 | ) | | | (1,954,727 | ) |
| Net decrease in shares outstanding | | | (632,277 | ) | | | (515,768 | ) |
See Notes to Financial Statements.
| 46 | www.emeraldmutualfunds.com |
| Emerald Small Cap Value Fund | Statements of Changes in Net Assets |
| | | For the Six Months Ended October 31, 2020 (Unaudited) | | | Year Ended April 30, 2020 | |
| OPERATIONS: | | | | | | |
| Net investment income/(loss) | | $ | 7,083 | | | $ | (928 | ) |
| Net realized gain/(loss) | | | (91,392 | ) | | | 68,956 | |
| Net realized gain on foreign currency transactions | | | – | | | | 1 | |
| Net change in unrealized appreciation/(depreciation) | | | 368,692 | | | | (829,367 | ) |
| Net increase/(decrease) in net assets resulting from operations | | | 284,383 | | | | (761,338 | ) |
| | | | | | | | | |
| SHARE TRANSACTIONS (NOTE 6): | | | | | | | | |
| Class A | | | | | | | | |
| Proceeds from sale of shares | | | 8,317 | | | | 81,565 | |
| Cost of shares redeemed | | | (622,431 | ) | | | (1,250,904 | ) |
| Net decrease from share transactions | | | (614,114 | ) | | | (1,169,339 | ) |
| Class C | | | | | | | | |
| Proceeds from sale of shares | | | – | | | | 2,800 | |
| Cost of shares redeemed | | | (4,998 | ) | | | (2,426 | ) |
| Net increase/(decrease) from share transactions | | | (4,998 | ) | | | 374 | |
| Institutional Class | | | | | | | | |
| Proceeds from sale of shares | | | 9,476 | | | | 28,051 | |
| Cost of shares redeemed | | | (140,349 | ) | | | (206,696 | ) |
| Net decrease from share transactions | | | (130,873 | ) | | | (178,645 | ) |
| Investor Class | | | | | | | | |
| Proceeds from sale of shares | | | 29,963 | | | | 65,473 | |
| Cost of shares redeemed | | | (47,338 | ) | | | (111,875 | ) |
| Net decrease from share transactions | | | (17,375 | ) | | | (46,402 | ) |
| Net decrease in net assets | | $ | (482,977 | ) | | $ | (2,155,350 | ) |
| NET ASSETS: | | | | | | | | |
| Beginning of year | | | 1,929,575 | | | | 4,084,925 | |
| End of year | | $ | 1,446,598 | | | $ | 1,929,575 | |
| | | | | | | | | |
| Other Information: | | | | | | | | |
| SHARE TRANSACTIONS: | | | | | | | | |
| Class A | | | | | | | | |
| Sold | | | 1,448 | | | | 12,034 | |
| Redeemed | | | (106,563 | ) | | | (174,261 | ) |
| Net decrease in shares outstanding | | | (105,115 | ) | | | (162,227 | ) |
| Class C | | | | | | | | |
| Sold | | | – | | | | 422 | |
| Redeemed | | | (913 | ) | | | (331 | ) |
| Net increase/(decrease) in shares outstanding | | | (913 | ) | | | 91 | |
| Institutional Class | | | | | | | | |
| Sold | | | 1,534 | | | | 4,134 | |
| Redeemed | | | (22,634 | ) | | | (28,477 | ) |
| Net decrease in shares outstanding | | | (21,100 | ) | | | (24,343 | ) |
| Investor Class | | | | | | | | |
| Sold | | | 4,646 | | | | 9,620 | |
| Redeemed | | | (8,679 | ) | | | (16,025 | ) |
| Net decrease in shares outstanding | | | (4,033 | ) | | | (6,405 | ) |
See Notes to Financial Statements.
| Semi-Annual Report | October 31, 2020 | 47 |
| Emerald Insights Fund | Statements of Changes in Net Assets |
| | | For the Six Months Ended October 31, 2020 (Unaudited) | | | Year Ended April 30, 2020 | |
| OPERATIONS: | | | | | | |
| Net investment loss | | $ | (64,349 | ) | | $ | (91,605 | ) |
| Net realized gain | | | 1,375,511 | | | | 364,684 | |
| Net change in unrealized appreciation | | | 2,210,551 | | | | 362,126 | |
| Net increase in net assets resulting from operations | | | 3,521,713 | | | | 635,205 | |
| | | | | | | | | |
| DISTRIBUTIONS TO SHAREHOLDERS (NOTE 4): | | | | | | | | |
| Total amount of distributions | | | | | | | | |
| Class A | | | – | | | | (3,964 | ) |
| Class C | | | – | | | | (58 | ) |
| Institutional Class | | | – | | | | (533 | ) |
| Investor Class | | | – | | | | (23 | ) |
| Net decrease in net assets from distributions | | | – | | | | (4,578 | ) |
| SHARE TRANSACTIONS (NOTE 6): | | | | | | | | |
| Class A | | | | | | | | |
| Proceeds from sale of shares | | | 264,774 | | | | 1,751,000 | |
| Issued to shareholders in reinvestment of distributions | | | – | | | | 3,951 | |
| Cost of shares redeemed | | | (555,251 | ) | | | (1,534,181 | ) |
| Net increase/(decrease) from share transactions | | | (290,477 | ) | | | 220,770 | |
| Class C | | | | | | | | |
| Proceeds from sale of shares | | | 5,190 | | | | 5,000 | |
| Issued to shareholders in reinvestment of distributions | | | – | | | | 58 | |
| Cost of shares redeemed | | | (3,782 | ) | | | (14,558 | ) |
| Net increase/(decrease) from share transactions | | | 1,408 | | | | (9,500 | ) |
| Institutional Class | | | | | | | | |
| Proceeds from sale of shares | | | 119,006 | | | | 91,854 | |
| Issued to shareholders in reinvestment of distributions | | | – | | | | 533 | |
| Cost of shares redeemed | | | (111,038 | ) | | | (95,563 | ) |
| Net increase/(decrease) from share transactions | | | 7,968 | | | | (3,176 | ) |
| Investor Class | | | | | | | | |
| Proceeds from sale of shares | | | 34,126 | | | | 230,200 | |
| Issued to shareholders in reinvestment of distributions | | | – | | | | 23 | |
| Cost of shares redeemed | | | (19,070 | ) | | | (117,483 | ) |
| Net increase from share transactions | | | 15,056 | | | | 112,740 | |
| Net increase in net assets | | $ | 3,255,668 | | | $ | 951,461 | |
| NET ASSETS: | | | | | | | | |
| Beginning of year | | | 12,048,009 | | | | 11,096,548 | |
| End of year | | $ | 15,303,677 | | | $ | 12,048,009 | |
| 48 | www.emeraldmutualfunds.com |
| Emerald Insights Fund | Statements of Changes in Net Assets |
| | | For the Six Months Ended October 31, 2020 (Unaudited) | | | Year Ended April 30, 2020 | |
| Other Information: | | | | | | | | |
| SHARE TRANSACTIONS: | | | | | | | | |
| Class A | | | | | | | | |
| Sold | | | 17,109 | | | | 154,193 | |
| Distributions reinvested | | | – | | | | 320 | |
| Redeemed | | | (37,269 | ) | | | (132,867 | ) |
| Net increase/(decrease) in shares outstanding | | | (20,160 | ) | | | 21,646 | |
| Class C | | | | | | | | |
| Sold | | | 408 | | | | 457 | |
| Distributions reinvested | | | – | | | | 5 | |
| Redeemed | | | (252 | ) | | | (1,352 | ) |
| Net increase/(decrease) in shares outstanding | | | 156 | | | | (890 | ) |
| Institutional Class | | | | | | | | |
| Sold | | | 8,546 | | | | 7,672 | |
| Distributions reinvested | | | – | | | | 42 | |
| Redeemed | | | (7,241 | ) | | | (7,842 | ) |
| Net increase/(decrease) in shares outstanding | | | 1,305 | | | | (128 | ) |
| Investor Class | | | | | | | | |
| Sold | | | 2,011 | | | | 17,898 | |
| Distributions reinvested | | | – | | | | 2 | |
| Redeemed | | | (1,166 | ) | | | (10,453 | ) |
| Net increase in shares outstanding | | | 845 | | | | 7,447 | |
See Notes to Financial Statements.
| Semi-Annual Report | October 31, 2020 | 49 |
| Emerald Banking and Finance Fund | Statements of Changes in Net Assets |
| | | For the Six Months Ended October 31, 2020 (Unaudited) | | | Year Ended April 30, 2020 | |
| OPERATIONS: | | | | | | |
| Net investment income | | $ | 1,073,781 | | | $ | 10 | |
| Net realized loss | | | (1,016,769 | ) | | | (28,209,958 | ) |
| Net realized gain/(loss) on foreign currency transactions | | | (514 | ) | | | 359 | |
| Net change in unrealized appreciation/(depreciation) | | | 24,660,248 | | | | (43,340,341 | ) |
| Net increase/(decrease) in net assets resulting from operations | | | 24,716,746 | | | | (71,549,930 | ) |
| | | | | | | | | |
| SHARE TRANSACTIONS (NOTE 6): | | | | | | | | |
| Class A | | | | | | | | |
| Proceeds from sale of shares | | | 2,167,853 | | | | 9,924,216 | |
| Cost of shares redeemed | | | (10,481,905 | ) | | | (43,496,877 | ) |
| Net decrease from share transactions | | | (8,314,052 | ) | | | (33,572,661 | ) |
| Class C | | | | | | | | |
| Proceeds from sale of shares | | | 231,755 | | | | 848,614 | |
| Cost of shares redeemed | | | (5,687,553 | ) | | | (23,404,122 | ) |
| Net decrease from share transactions | | | (5,455,798 | ) | | | (22,555,508 | ) |
| Institutional Class | | | | | | | | |
| Proceeds from sale of shares | | | 7,154,811 | | | | 18,571,845 | |
| Cost of shares redeemed | | | (32,369,469 | ) | | | (76,465,031 | ) |
| Net decrease from share transactions | | | (25,214,658 | ) | | | (57,893,186 | ) |
| Investor Class | | | | | | | | |
| Proceeds from sale of shares | | | 571,409 | | | | 2,109,542 | |
| Cost of shares redeemed | | | (5,396,737 | ) | | | (20,635,594 | ) |
| Net decrease from share transactions | | | (4,825,328 | ) | | | (18,526,052 | ) |
| Net decrease in net assets | | $ | (19,093,090 | ) | | $ | (204,097,337 | ) |
| NET ASSETS: | | | | | | | | |
| Beginning of year | | | 137,567,579 | | | | 341,664,916 | |
| End of year | | $ | 118,474,489 | | | $ | 137,567,579 | |
| | | | | | | | | |
| Other Information: | | | | | | | | |
| SHARE TRANSACTIONS: | | | | | | | | |
| Class A | | | | | | | | |
| Sold | | | 87,324 | | | | 381,365 | |
| Redeemed | | | (388,983 | ) | | | (1,392,033 | ) |
| Net decrease in shares outstanding | | | (301,659 | ) | | | (1,010,668 | ) |
| Class C | | | | | | | | |
| Sold | | | 10,480 | | | | 33,899 | |
| Redeemed | | | (264,839 | ) | | | (963,709 | ) |
| Net decrease in shares outstanding | | | (254,359 | ) | | | (929,810 | ) |
| Institutional Class | | | | | | | | |
| Sold | | | 253,964 | | | | 578,457 | |
| Redeemed | | | (1,275,743 | ) | | | (2,567,059 | ) |
| Net decrease in shares outstanding | | | (1,021,779 | ) | | | (1,988,602 | ) |
| Investor Class | | | | | | | | |
| Sold | | | 23,493 | | | | 75,069 | |
| Redeemed | | | (223,754 | ) | | | (698,446 | ) |
| Net decrease in shares outstanding | | | (200,261 | ) | | | (623,377 | ) |
See Notes to Financial Statements.
| 50 | www.emeraldmutualfunds.com |
| | Consolidated Statement |
| Emerald Select trueLiberty Income Fund | of Changes in Net Assets |
| | | For the Six Months Ended October 31, 2020 (Unaudited) | | | For the Period January 2, 2020 (Inception) to April 30, 2020 | |
| OPERATIONS: | | | | | | |
| Net investment income | | $ | 11,223 | | | $ | 3,408 | |
| Net realized loss | | | (262,078 | ) | | | (104,640 | ) |
| Net realized gain/(loss) on swap contracts | | | 67,281 | | | | (538,379 | ) |
| Net change in unrealized appreciation/(depreciation) | | | 14,654 | | | | (33,180 | ) |
| Net decrease in net assets resulting from operations | | | (168,920 | ) | | | (672,791 | ) |
| | | | | | | | | |
| DISTRIBUTIONS TO SHAREHOLDERS (NOTE 4): | | | | | | | | |
| Total amount of distributions | | | | | | | | |
| Class A | | | (7,994 | ) | | | – | |
| Institutional Class | | | (147,006 | ) | | | – | |
| Net decrease in net assets from distributions | | | (155,000 | ) | | | – | |
| SHARE TRANSACTIONS (NOTE 6): | | | | | | | | |
| Class A | | | | | | | | |
| Proceeds from sale of shares | | | – | | | | 111,000 | |
| Issued to shareholders in reinvestment of distributions | | | 7,993 | | | | – | |
| Cost of shares redeemed | | | (524 | ) | | | – | |
| Net increase from share transactions | | | 7,469 | | | | 111,000 | |
| Institutional Class | | | | | | | | |
| Proceeds from sale of shares | | | – | | | | 2,018,800 | |
| Issued to shareholders in reinvestment of distributions | | | 98,956 | | | | – | |
| Cost of shares redeemed | | | (86,416 | ) | | | (112,485 | ) |
| Net increase from share transactions | | | 12,540 | | | | 1,906,315 | |
| Net increase/(decrease) in net assets | | $ | (303,911 | ) | | $ | 1,344,524 | |
| NET ASSETS: | | | | | | | | |
| Beginning of year | | | 1,344,524 | | | | – | |
| End of year | | $ | 1,040,613 | | | $ | 1,344,524 | |
| | | | | | | | | |
| Other Information: | | | | | | | | |
| SHARE TRANSACTIONS: | | | | | | | | |
| Class A | | | | | | | | |
| Sold | | | – | | | | 11,192 | |
| Distributions reinvested | | | 1,641 | | | | – | |
| Redeemed | | | (105 | ) | | | – | |
| Net increase in shares outstanding | | | 1,536 | | | | 11,192 | |
| Institutional Class | | | | | | | | |
| Sold | | | – | | | | 246,814 | |
| Distributions reinvested | | | 19,221 | | | | – | |
| Redeemed | | | (15,487 | ) | | | (29,016 | ) |
| Net increase in shares outstanding | | | 3,734 | | | | 217,798 | |
See Notes to Financial Statements.
| Semi-Annual Report | October 31, 2020 | 51 |
| Emerald Growth Fund | Financial Highlights |
For a share outstanding throughout the years presented
| | | CLASS A | |
| | | For the Six Months Ended October 31, 2020 (Unaudited) | | | Year Ended April 30, 2020 | | | Year Ended April 30, 2019 | | | Year Ended April 30, 2018 | | | Year Ended April 30, 2017 | | | Year Ended April 30, 2016 | |
| NET ASSET VALUE, BEGINNING OF PERIOD | | $ | 23.06 | | | $ | 26.00 | | | $ | 25.99 | | | $ | 21.83 | | | $ | 17.52 | | | $ | 20.02 | |
| INCOME/(LOSS) FROM OPERATIONS: | | | | | | | | | | | | | | | | | | | | | | | | |
| Net investment loss(a) | | | (0.10 | ) | | | (0.16 | ) | | | (0.13 | ) | | | (0.16 | ) | | | (0.11 | ) | | | (0.15 | ) |
| Net realized and unrealized gain/(loss) on investments | | | 6.44 | | | | (2.40 | ) | | | 2.61 | | | | 4.32 | | | | 4.42 | | | | (1.88 | ) |
| Total from Investment Operations | | | 6.34 | | | | (2.56 | ) | | | 2.48 | | | | 4.16 | | | | 4.31 | | | | (2.03 | ) |
| | | | | | | | | | | | | | | | | | | | | | | | | |
| LESS DISTRIBUTIONS: | | | | | | | | | | | | | | | | | | | | | | | | |
| From capital gains | | | – | | | | (0.38 | ) | | | (2.47 | ) | | | – | | | | – | | | | (0.47 | ) |
| Total Distributions | | | – | | | | (0.38 | ) | | | (2.47 | ) | | | – | | | | – | | | | (0.47 | ) |
| NET INCREASE/(DECREASE) IN NET ASSET VALUE | | | 6.34 | | | | (2.94 | ) | | | 0.01 | | | | 4.16 | | | | 4.31 | | | | (2.50 | ) |
| NET ASSET VALUE, END OF PERIOD | | $ | 29.40 | | | $ | 23.06 | | | $ | 26.00 | | | $ | 25.99 | | | $ | 21.83 | | | $ | 17.52 | |
| | | | | | | | | | | | | | | | | | | | | | | | | |
| TOTAL RETURN(b) | | | 27.49 | %(c) | | | (10.00 | )% | | | 11.79 | % | | | 19.06 | % | | | 24.60 | % | | | (10.28 | )% |
| RATIOS/SUPPLEMENTAL DATA: | | | | | | | | | | | | | | | | | | | | | | | | |
| Net Assets, End of Period (000s) | | $ | 149,291 | | | $ | 134,755 | | | $ | 188,883 | | | $ | 239,316 | | | $ | 270,389 | | | $ | 323,603 | |
| RATIOS TO AVERAGE NET ASSETS: | | | | | | | | | | | | | | | | | | | | | | | | |
| Net Investment loss | | | (0.73 | )%(d) | | | (0.64 | )% | | | (0.50 | )% | | | (0.64 | )% | | | (0.57 | )% | | | (0.81 | )% |
| Operating expenses excluding reimbursement/waiver | | | 1.02 | %(d) | | | 1.02 | % | | | 1.01 | % | | | 1.03 | % | | | 1.08 | % | | | 1.17 | % |
| Operating expenses including reimbursement/waiver | | | 1.02 | %(d) | | | 1.02 | % | | | 1.01 | % | | | 1.03 | % | | | 1.08 | % | | | 1.17 | % |
| PORTFOLIO TURNOVER RATE | | | 32 | %(c) | | | 48 | % | | | 64 | % | | | 66 | % | | | 54 | % | | | 45 | % |
| (a) | Per share amounts are based upon average shares outstanding. |
| (b) | Total return does not reflect the effect of sales charges. |
See Notes to Financial Statements.
| 52 | www.emeraldmutualfunds.com |
| Emerald Growth Fund | Financial Highlights |
For a share outstanding throughout the years presented
| | | CLASS C | |
| | | For the Six Months Ended October 31, 2020 (Unaudited) | | | Year Ended April 30, 2020 | | | Year Ended April 30, 2019 | | | Year Ended April 30, 2018 | | | Year Ended April 30, 2017 | | | Year Ended April 30, 2016 | |
| NET ASSET VALUE, BEGINNING OF PERIOD | | $ | 18.97 | | | $ | 21.59 | | | $ | 22.18 | | | $ | 18.75 | | | $ | 15.14 | | | $ | 17.48 | |
| INCOME/(LOSS) FROM OPERATIONS: | | | | | | | | | | | | | | | | | | | | | | | | |
| Net investment loss(a) | | | (0.16 | ) | | | (0.27 | ) | | | (0.26 | ) | | | (0.27 | ) | | | (0.21 | ) | | | (0.24 | ) |
| Net realized and unrealized gain/(loss) on investments | | | 5.29 | | | | (1.97 | ) | | | 2.14 | | | | 3.70 | | | | 3.82 | | | | (1.63 | ) |
| Total from Investment Operations | | | 5.13 | | | | (2.24 | ) | | | 1.88 | | | | 3.43 | | | | 3.61 | | | | (1.87 | ) |
| | | | | | | | | | | | | | | | | | | | | | | | | |
| LESS DISTRIBUTIONS: | | | | | | | | | | | | | | | | | | | | | | | | |
| From capital gains | | | – | | | | (0.38 | ) | | | (2.47 | ) | | | – | | | | – | | | | (0.47 | ) |
| Total Distributions | | | – | | | | (0.38 | ) | | | (2.47 | ) | | | – | | | | – | | | | (0.47 | ) |
| NET INCREASE/(DECREASE) IN NET ASSET VALUE | | | 5.13 | | | | (2.62 | ) | | | (0.59 | ) | | | 3.43 | | | | 3.61 | | | | (2.34 | ) |
| NET ASSET VALUE, END OF PERIOD | | $ | 24.10 | | | $ | 18.97 | | | $ | 21.59 | | | $ | 22.18 | | | $ | 18.75 | | | $ | 15.14 | |
| | | | | | | | | | | | | | | | | | | | | | | | | |
| TOTAL RETURN(b) | | | 27.04 | %(c) | | | (10.57 | )% | | | 11.08 | % | | | 18.29 | % | | | 23.84 | % | | | (10.87 | )% |
| RATIOS/SUPPLEMENTAL DATA: | | | | | | | | | | | | | | | | | | | | | | | | |
| Net Assets, End of Period (000s) | | $ | 19,244 | | | $ | 17,434 | | | $ | 29,975 | | | $ | 33,197 | | | $ | 34,642 | | | $ | 42,075 | |
| RATIOS TO AVERAGE NET ASSETS: | | | | | | | | | | | | | | | | | | | | | | | | |
| Net Investment loss | | | (1.38 | )%(d) | | | (1.29 | )% | | | (1.15 | )% | | | (1.30 | )% | | | (1.22 | )% | | | (1.46 | )% |
| Operating expenses excluding reimbursement/waiver | | | 1.67 | %(d) | | | 1.68 | % | | | 1.66 | % | | | 1.68 | % | | | 1.73 | % | | | 1.81 | % |
| Operating expenses including reimbursement/waiver | | | 1.67 | %(d) | | | 1.68 | % | | | 1.66 | % | | | 1.68 | % | | | 1.73 | % | | | 1.81 | % |
| PORTFOLIO TURNOVER RATE | | | 32 | %(c) | | | 48 | % | | | 64 | % | | | 66 | % | | | 54 | % | | | 45 | % |
| (a) | Per share amounts are based upon average shares outstanding. |
| (b) | Total return does not reflect the effect of sales charges. |
See Notes to Financial Statements.
| Semi-Annual Report | October 31, 2020 | 53 |
| Emerald Growth Fund | Financial Highlights |
For a share outstanding throughout the years presented
| | | INSTITUTIONAL CLASS | |
| | | For the Six Months Ended October 31, 2020 (Unaudited) | | | Year Ended April 30, 2020 | | | Year Ended April 30, 2019 | | | Year Ended April 30, 2018 | | | Year Ended April 30, 2017 | | | Year Ended April 30, 2016 | |
| NET ASSET VALUE, BEGINNING OF PERIOD | | $ | 24.18 | | | $ | 27.16 | | | $ | 26.94 | | | $ | 22.56 | | | $ | 18.04 | | | $ | 20.54 | |
| INCOME/(LOSS) FROM OPERATIONS: | | | | | | | | | | | | | | | | | | | | | | | | |
| Net investment loss(a) | | | (0.06 | ) | | | (0.08 | ) | | | (0.05 | ) | | | (0.09 | ) | | | (0.05 | ) | | | (0.10 | ) |
| Net realized and unrealized gain/(loss) on investments | | | 6.75 | | | | (2.52 | ) | | | 2.74 | | | | 4.47 | | | | 4.57 | | | | (1.93 | ) |
| Total from Investment Operations | | | 6.69 | | | | (2.60 | ) | | | 2.69 | | | | 4.38 | | | | 4.52 | | | | (2.03 | ) |
| | | | | | | | | | | | | | | | | | | | | | | | | |
| LESS DISTRIBUTIONS: | | | | | | | | | | | | | | | | | | | | | | | | |
| From capital gains | | | – | | | | (0.38 | ) | | | (2.47 | ) | | | – | | | | – | | | | (0.47 | ) |
| Total Distributions | | | – | | | | (0.38 | ) | | | (2.47 | ) | | | – | | | | – | | | | (0.47 | ) |
| NET INCREASE/(DECREASE) IN NET ASSET VALUE | | | 6.69 | | | | (2.98 | ) | | | 0.22 | | | | 4.38 | | | | 4.52 | | | | (2.50 | ) |
| NET ASSET VALUE, END OF PERIOD | | $ | 30.87 | | | $ | 24.18 | | | $ | 27.16 | | | $ | 26.94 | | | $ | 22.56 | | | $ | 18.04 | |
| | | | | | | | | | | | | | | | | | | | | | | | | |
| TOTAL RETURN | | | 27.67 | %(b) | | | (9.72 | )% | | | 12.17 | % | | | 19.41 | % | | | 25.06 | % | | | (9.97 | )% |
| RATIOS/SUPPLEMENTAL DATA: | | | | | | | | | | | | | | | | | | | | | | | | |
| Net Assets, End of Period (000s) | | $ | 1,043,089 | | | $ | 863,360 | | | $ | 1,050,538 | | | $ | 839,076 | | | $ | 596,550 | | | $ | 453,190 | |
| RATIOS TO AVERAGE NET ASSETS: | | | | | | | | | | | | | | | | | | | | | | | | |
| Net Investment loss | | | (0.42 | )%(c) | | | (0.32 | )% | | | (0.18 | )% | | | (0.33 | )% | | | (0.26 | )% | | | (0.51 | )% |
| Operating expenses excluding reimbursement/waiver | | | 0.71 | %(c) | | | 0.70 | % | | | 0.69 | % | | | 0.72 | % | | | 0.77 | % | | | 0.87 | % |
| Operating expenses including reimbursement/waiver | | | 0.71 | %(c) | | | 0.70 | % | | | 0.69 | % | | | 0.72 | % | | | 0.77 | % | | | 0.87 | % |
| PORTFOLIO TURNOVER RATE | | | 32 | %(b) | | | 48 | % | | | 64 | % | | | 66 | % | | | 54 | % | | | 45 | % |
| (a) | Per share amounts are based upon average shares outstanding. |
See Notes to Financial Statements.
| 54 | www.emeraldmutualfunds.com |
| Emerald Growth Fund | Financial Highlights |
For a share outstanding throughout the years presented
| | | INVESTOR CLASS | |
| | | For the Six Months Ended October 31, 2020 (Unaudited) | | | Year Ended April 30, 2020 | | | Year Ended April 30, 2019 | | | Year Ended April 30, 2018 | | | Year Ended April 30, 2017 | | | Year Ended April 30, 2016 | |
| NET ASSET VALUE, BEGINNING OF PERIOD | | $ | 22.94 | | | $ | 25.88 | | | $ | 25.88 | | | $ | 21.75 | | | $ | 17.46 | | | $ | 19.97 | |
| INCOME/(LOSS) FROM OPERATIONS: | | | | | | | | | | | | | | | | | | | | | | | | |
| Net investment loss(a) | | | (0.11 | ) | | | (0.17 | ) | | | (0.14 | ) | | | (0.17 | ) | | | (0.12 | ) | | | (0.16 | ) |
| Net realized and unrealized gain/(loss) on investments | | | 6.41 | | | | (2.39 | ) | | | 2.61 | | | | 4.30 | | | | 4.41 | | | | (1.88 | ) |
| Total from Investment Operations | | | 6.30 | | | | (2.56 | ) | | | 2.47 | | | | 4.13 | | | | 4.29 | | | | (2.04 | ) |
| | | | | | | | | | | | | | | | | | | | | | | | | |
| LESS DISTRIBUTIONS: | | | | | | | | | | | | | | | | | | | | | | | | |
| From capital gains | | | – | | | | (0.38 | ) | | | (2.47 | ) | | | – | | | | – | | | | (0.47 | ) |
| Total Distributions | | | – | | | | (0.38 | ) | | | (2.47 | ) | | | – | | | | – | | | | (0.47 | ) |
| NET INCREASE/(DECREASE) IN NET ASSET VALUE | | | 6.30 | | | | (2.94 | ) | | | 0.00 | | | | 4.13 | | | | 4.29 | | | | (2.51 | ) |
| NET ASSET VALUE, END OF PERIOD | | $ | 29.24 | | | $ | 22.94 | | | $ | 25.88 | | | $ | 25.88 | | | $ | 21.75 | | | $ | 17.46 | |
| | | | | | | | | | | | | | | | | | | | | | | | | |
| TOTAL RETURN | | | 27.46 | %(b) | | | (10.05 | )% | | | 11.81 | % | | | 18.99 | % | | | 24.57 | % | | | (10.36 | )% |
| RATIOS/SUPPLEMENTAL DATA: | | | | | | | | | | | | | | | | | | | | | | | | |
| Net Assets, End of Period (000s) | | $ | 84,405 | | | $ | 80,740 | | | $ | 104,403 | | | $ | 107,629 | | | $ | 114,033 | | | $ | 112,526 | |
| RATIOS TO AVERAGE NET ASSETS: | | | | | | | | | | | | | | | | | | | | | | | | |
| Net Investment loss | | | (0.77 | )%(c) | | | (0.68 | )% | | | (0.53 | )% | | | (0.68 | )% | | | (0.61 | )% | | | (0.84 | )% |
| Operating expenses excluding reimbursement/waiver | | | 1.06 | %(c) | | | 1.06 | % | | | 1.04 | % | | | 1.07 | % | | | 1.12 | % | | | 1.19 | % |
| Operating expenses including reimbursement/waiver | | | 1.06 | %(c) | | | 1.06 | % | | | 1.04 | % | | | 1.07 | % | | | 1.12 | % | | | 1.19 | % |
| PORTFOLIO TURNOVER RATE | | | 32 | %(b) | | | 48 | % | | | 64 | % | | | 66 | % | | | 54 | % | | | 45 | % |
| (a) | Per share amounts are based upon average shares outstanding. |
See Notes to Financial Statements.
| Semi-Annual Report | October 31, 2020 | 55 |
| Emerald Small Cap Value Fund | Financial Highlights |
For a share outstanding throughout the years presented
| | | CLASS A | |
| | | For the Six Months Ended October 31, 2020 (Unaudited) | | | Year Ended
April 30,
2020 | | | Year Ended
April 30,
2019 | | | Year Ended
April 30,
2018 | | | Year Ended
April 30,
2017 | | | For the Period October 1, 2015 to April 30, 2016(a) | |
| NET ASSET VALUE, BEGINNING OF PERIOD | | $ | 5.25 | | | $ | 7.29 | | | $ | 10.45 | | | $ | 16.27 | | | $ | 13.00 | | | $ | 12.70 | |
| INCOME/(LOSS) FROM OPERATIONS: | | | | | | | | | | | | | | | | | | | | | | | | |
| Net investment income/(loss)(b) | | | 0.02 | | | | (0.01 | ) | | | (0.02 | ) | | | (0.06 | )(c) | | | (0.07 | )(c) | | | (0.09 | ) |
| Net realized and unrealized gain/(loss) on investments | | | 0.87 | | | | (2.03 | ) | | | (1.06 | ) | | | 2.13 | | | | 3.34 | | | | 0.44 | |
| Total from Investment Operations | | | 0.89 | | | | (2.04 | ) | | | (1.08 | ) | | | 2.07 | | | | 3.27 | | | | 0.35 | |
| | | | | | | | | | | | | | | | | | | | | | | | | |
| LESS DISTRIBUTIONS: | | | | | | | | | | | | | | | | | | | | | | | | |
| From investment income | | | – | | | | – | | | | – | | | | – | | | | – | | | | (0.05 | ) |
| From capital gains | | | – | | | | – | | | | (2.08 | ) | | | (7.89 | ) | | | – | | | | – | |
| Total Distributions | | | – | | | | – | | | | (2.08 | ) | | | (7.89 | ) | | | – | | | | (0.05 | ) |
| NET INCREASE/(DECREASE) IN NET ASSET VALUE | | | 0.89 | | | | (2.04 | ) | | | (3.16 | ) | | | (5.82 | ) | | | 3.27 | | | | 0.30 | |
| NET ASSET VALUE, END OF PERIOD | | $ | 6.14 | | | $ | 5.25 | | | $ | 7.29 | | | $ | 10.45 | | | $ | 16.27 | | | $ | 13.00 | |
| | | | | | | | | | | | | | | | | | | | | | | | | |
| TOTAL RETURN(d) | | | 16.95 | %(e) | | | (27.98 | )% | | | (7.30 | )% | | | 12.41 | % | | | 25.15 | % | | | 2.77 | %(e) |
| RATIOS/SUPPLEMENTAL DATA: | | | | | | | | | | | | | | | | | | | | | | | | |
| Net Assets, End of Period (000s) | | $ | 602 | | | $ | 1,068 | | | $ | 2,664 | | | $ | 3,959 | | | $ | 1,909 | | | $ | 340 | |
| RATIOS TO AVERAGE NET ASSETS: | | | | | | | | | | | | | | | | | | | | | | | | |
| Net Investment income/(loss) | | | 0.70 | %(f) | | | (0.13 | )% | | | (0.19 | )% | | | (0.42 | )% | | | (0.46 | )% | | | (1.13 | )%(f) |
| Operating expenses excluding reimbursement/waiver | | | 8.23 | %(f) | | | 5.35 | % | | | 2.89 | % | | | 2.56 | % | | | 2.26 | % | | | 2.69 | %(f) |
| Operating expenses including reimbursement/waiver | | | 1.35 | %(f) | | | 1.35 | % | | | 1.35 | % | | | 1.35 | % | | | 1.35 | % | | | 1.35 | %(f) |
| PORTFOLIO TURNOVER RATE | | | 73 | %(e) | | | 79 | % | | | 101 | % | | | 71 | % | | | 66 | % | | | 31 | %(e) |
| (a) | Effective March 3, 2015 the Board approved changing the fiscal year-end of the Fund from September 30 to April 30. |
| (b) | Per share amounts are based upon average shares outstanding. |
| (c) | The amount shown for a share outstanding throughout the period may not correlate with the Statement of Operations for the period due to the timing of sales and redemptions of Fund shares in relation to income earned and/or fluctuating market value of the investments of the Fund. |
| (d) | Total return does not reflect the effect of sales charges. |
See Notes to Financial Statements.
| 56 | www.emeraldmutualfunds.com |
| Emerald Small Cap Value Fund | Financial Highlights |
For a share outstanding throughout the years presented
| | | CLASS C | |
| | | For the Six Months Ended October 31, 2020 (Unaudited) | | | Year Ended
April 30,
2020 | | | Year Ended
April 30,
2019 | | | Year Ended
April 30,
2018 | | | Year Ended
April 30,
2017 | | | For the Period October 1, 2015 to April 30, 2016(a) | |
| NET ASSET VALUE, BEGINNING OF PERIOD | | $ | 4.98 | | | $ | 6.96 | | | $ | 10.15 | | | $ | 16.10 | | | $ | 12.94 | | | $ | 12.68 | |
| INCOME/(LOSS) FROM OPERATIONS: | | | | | | | | | | | | | | | | | | | | | | | | |
| Net investment income/(loss)(b) | | | 0.00 | (c) | | | (0.05 | ) | | | (0.08 | ) | | | (0.13 | )(d) | | | (0.13 | )(d) | | | (0.14 | ) |
| Net realized and unrealized gain/(loss) on investments | | | 0.82 | | | | (1.93 | ) | | | (1.03 | ) | | | 2.07 | | | | 3.29 | | | | 0.43 | |
| Total from Investment Operations | | | 0.82 | | | | (1.98 | ) | | | (1.11 | ) | | | 1.94 | | | | 3.16 | | | | 0.29 | |
| | | | | | | | | | | | | | | | | | | | | | | | | |
| LESS DISTRIBUTIONS: | | | | | | | | | | | | | | | | | | | | | | | | |
| From investment income | | | – | | | | – | | | | – | | | | – | | | | – | | | | (0.03 | ) |
| From capital gains | | | – | | | | – | | | | (2.08 | ) | | | (7.89 | ) | | | – | | | | – | |
| Total Distributions | | | – | | | | – | | | | (2.08 | ) | | | (7.89 | ) | | | – | | | | (0.03 | ) |
| NET INCREASE/(DECREASE) IN NET ASSET VALUE | | | 0.82 | | | | (1.98 | ) | | | (3.19 | ) | | | (5.95 | ) | | | 3.16 | | | | 0.26 | |
| NET ASSET VALUE, END OF PERIOD | | $ | 5.80 | | | $ | 4.98 | | | $ | 6.96 | | | $ | 10.15 | | | $ | 16.10 | | | $ | 12.94 | |
| | | | | | | | | | | | | | | | | | | | | | | | | |
| TOTAL RETURN(e) | | | 16.47 | %(f) | | | (28.45 | )% | | | (7.88 | )% | | | 11.63 | % | | | 24.42 | % | | | 2.28 | %(f) |
| RATIOS/SUPPLEMENTAL DATA: | | | | | | | | | | | | | | | | | | | | | | | | |
| Net Assets, End of Period (000s) | | $ | 27 | | | $ | 28 | | | $ | 38 | | | $ | 108 | | | $ | 211 | | | $ | 566 | |
| RATIOS TO AVERAGE NET ASSETS: | | | | | | | | | | | | | | | | | | | | | | | | |
| Net Investment income/(loss) | | | 0.04 | %(g) | | | (0.76 | )% | | | (0.88 | )% | | | (0.98 | )% | | | (0.93 | )% | | | (2.06 | )%(g) |
| Operating expenses excluding reimbursement/waiver | | | 8.85 | %(g) | | | 6.20 | % | | | 3.44 | % | | | 3.20 | % | | | 2.70 | % | | | 3.37 | %(g) |
| Operating expenses including reimbursement/waiver | | | 2.00 | %(g) | | | 2.00 | % | | | 2.00 | % | | | 2.00 | % | | | 2.00 | % | | | 2.00 | %(g) |
| PORTFOLIO TURNOVER RATE | | | 73 | %(f) | | | 79 | % | | | 101 | % | | | 71 | % | | | 66 | % | | | 31 | %(f) |
| (a) | Effective March 3, 2015 the Board approved changing the fiscal year-end of the Fund from September 30 to April 30. |
| (b) | Per share amounts are based upon average shares outstanding. |
| (c) | Less than $0.005 per share. |
| (d) | The amount shown for a share outstanding throughout the period may not correlate with the Statement of Operations for the period due to the timing of sales and redemptions of Fund shares in relation to income earned and/or fluctuating market value of the investments of the Fund. |
| (e) | Total return does not reflect the effect of sales charges. |
See Notes to Financial Statements.
| Semi-Annual Report | October 31, 2020 | 57 |
| Emerald Small Cap Value Fund | Financial Highlights |
For a share outstanding throughout the years presented
| | | INSTITUTIONAL CLASS | |
| | | For the Six Months Ended October 31, 2020 (Unaudited) | | | Year Ended
April 30,
2020 | | | Year Ended
April 30,
2019 | | | Year Ended
April 30,
2018 | | | Year Ended
April 30,
2017 | | | For the Period October 1, 2015 to April 30, 2016(a) | |
| NET ASSET VALUE, BEGINNING OF PERIOD | | $ | 5.39 | | | $ | 7.46 | | | $ | 10.59 | | | $ | 16.35 | | | $ | 13.02 | | | $ | 12.71 | |
| INCOME FROM OPERATIONS: | | | | | | | | | | | | | | | | | | | | | | | | |
| Net investment income/(loss)(b) | | | 0.03 | | | | 0.02 | | | | 0.01 | (c) | | | 0.00 | (d) | | | 0.02 | | | | (0.01 | ) |
| Net realized and unrealized gain/(loss) on investments | | | 0.89 | | | | (2.09 | ) | | | (1.06 | ) | | | 2.13 | | | | 3.31 | | | | 0.38 | |
| Total from Investment Operations | | | 0.92 | | | | (2.07 | ) | | | (1.05 | ) | | | 2.13 | | | | 3.33 | | | | 0.37 | |
| | | | | | | | | | | | | | | | | | | | | | | | | |
| LESS DISTRIBUTIONS: | | | | | | | | | | | | | | | | | | | | | | | | |
| From investment income | | | – | | | | – | | | | – | | | | – | | | | – | | | | (0.06 | ) |
| From capital gains | | | – | | | | – | | | | (2.08 | ) | | | (7.89 | ) | | | – | | | | – | |
| Total Distributions | | | – | | | | – | | | | (2.08 | ) | | | (7.89 | ) | | | – | | | | (0.06 | ) |
| NET INCREASE/(DECREASE) IN NET ASSET VALUE | | | 0.92 | | | | (2.07 | ) | | | (3.13 | ) | | | (5.76 | ) | | | 3.33 | | | | 0.31 | |
| NET ASSET VALUE, END OF PERIOD | | $ | 6.31 | | | $ | 5.39 | | | $ | 7.46 | | | $ | 10.59 | | | $ | 16.35 | | | $ | 13.02 | |
| | | | | | | | | | | | | | | | | | | | | | | | | |
| TOTAL RETURN | | | 17.07 | %(e) | | | (27.75 | )% | | | (6.90 | )% | | | 12.76 | % | | | 25.58 | % | | | 2.94 | %(e) |
| SUPPLEMENTAL DATA: | | | | | | | | | | | | | | | | | | | | | | | | |
| Net Assets, End of Period (000s) | | $ | 453 | | | $ | 501 | | | $ | 874 | | | $ | 3,177 | | | $ | 4,989 | | | $ | 13,691 | |
| RATIOS TO AVERAGE NET ASSETS: | | | | | | | | | | | | | | | | | | | | | | | | |
| Net Investment income/(loss) | | | 1.05 | %(f) | | | 0.23 | % | | | 0.13 | % | | | 0.02 | % | | | 0.13 | % | | | (0.07 | )%(f) |
| Operating expenses excluding reimbursement/waiver | | | 7.84 | %(f) | | | 5.12 | % | | | 2.44 | % | | | 2.20 | % | | | 1.56 | % | | | 1.75 | %(f) |
| Operating expenses including reimbursement/waiver | | | 1.00 | %(f) | | | 1.00 | % | | | 1.00 | % | | | 1.00 | % | | | 1.00 | % | | | 1.00 | %(f) |
| PORTFOLIO TURNOVER RATE | | | 73 | %(e) | | | 79 | % | | | 101 | % | | | 71 | % | | | 66 | % | | | 31 | %(e) |
| (a) | Effective March 3, 2015 the Board approved changing the fiscal year-end of the Fund from September 30 to April 30. |
| (b) | Per share amounts are based upon average shares outstanding. |
| (c) | The amount shown for a share outstanding throughout the period may not correlate with the Statement of Operations for the period due to the timing of sales and redemptions of Fund shares in relation to income earned and/or fluctuating market value of the investments of the Fund. |
| (d) | Less than $0.005 per share. |
See Notes to Financial Statements.
| 58 | www.emeraldmutualfunds.com |
| Emerald Small Cap Value Fund | Financial Highlights |
For a share outstanding throughout the years presented
| | | INVESTOR CLASS | |
| | | For the Six Months Ended October 31, 2020 (Unaudited) | | | Year Ended
April 30,
2020 | | | Year Ended
April 30,
2019 | | | Year Ended
April 30,
2018 | | | Year Ended
April 30,
2017 | | | For the Period October 1, 2015 to April 30, 2016(a) | |
| NET ASSET VALUE, BEGINNING OF PERIOD | | $ | 5.29 | | | $ | 7.33 | | | $ | 10.46 | | | $ | 16.26 | | | $ | 12.98 | | | $ | 12.68 | |
| INCOME FROM OPERATIONS: | | | | | | | | | | | | | | | | | | | | | | | | |
| Net investment income/(loss)(b) | | | 0.02 | | | | (0.00 | )(c) | | | (0.01 | ) | | | (0.04 | )(d) | | | (0.02 | )(d) | | | (0.02 | ) |
| Net realized and unrealized gain/(loss) on investments | | | 0.87 | | | | (2.04 | ) | | | (1.04 | ) | | | 2.13 | | | | 3.30 | | | | 0.37 | |
| Total from Investment Operations | | | 0.89 | | | | (2.04 | ) | | | (1.05 | ) | | | 2.09 | | | | 3.28 | | | | 0.35 | |
| | | | | | | | | | | | | | | | | | | | | | | | | |
| LESS DISTRIBUTIONS: | | | | | | | | | | | | | | | | | | | | | | | | |
| From investment income | | | – | | | | – | | | | – | | | | – | | | | – | | | | (0.05 | ) |
| From capital gains | | | – | | | | – | | | | (2.08 | ) | | | (7.89 | ) | | | – | | | | – | |
| Total Distributions | | | – | | | | – | | | | (2.08 | ) | | | (7.89 | ) | | | – | | | | (0.05 | ) |
| NET INCREASE/(DECREASE) IN NET ASSET VALUE | | | 0.89 | | | | (2.04 | ) | | | (3.13 | ) | | | (5.80 | ) | | | 3.28 | | | | 0.30 | |
| NET ASSET VALUE, END OF PERIOD | | $ | 6.18 | | | $ | 5.29 | | | $ | 7.33 | | | $ | 10.46 | | | $ | 16.26 | | | $ | 12.98 | |
| | | | | | | | | | | | | | | | | | | | | | | | | |
| TOTAL RETURN | | | 16.82 | %(e) | | | (27.83 | )% | | | (6.99 | )% | | | 12.54 | % | | | 25.27 | % | | | 2.80 | %(e) |
| SUPPLEMENTAL DATA: | | | | | | | | | | | | | | | | | | | | | | | | |
| Net Assets, End of Period (000s) | | $ | 365 | | | $ | 333 | | | $ | 509 | | | $ | 556 | | | $ | 614 | | | $ | 1,946 | |
| RATIOS TO AVERAGE NET ASSETS: | | | | | | | | | | | | | | | | | | | | | | | | |
| Net Investment income/(loss) | | | 0.77 | %(f) | | | (0.02 | )% | | | (0.10 | )% | | | (0.25 | )% | | | (0.11 | )% | | | (0.25 | )%(f) |
| Operating expenses excluding reimbursement/waiver | | | 8.09 | %(f) | | | 5.39 | % | | | 2.83 | % | | | 2.44 | % | | | 1.83 | % | | | 2.14 | %(f) |
| Operating expenses including reimbursement/waiver | | | 1.25 | %(f) | | | 1.25 | % | | | 1.25 | % | | | 1.25 | % | | | 1.25 | % | | | 1.25 | %(f) |
| PORTFOLIO TURNOVER RATE | | | 73 | %(e) | | | 79 | % | | | 101 | % | | | 71 | % | | | 66 | % | | | 31 | %(e) |
| (a) | Effective March 3, 2015 the Board approved changing the fiscal year-end of the Fund from September 30 to April 30. |
| (b) | Per share amounts are based upon average shares outstanding. |
| (c) | Less than $0.005 per share. |
| (d) | The amount shown for a share outstanding throughout the period may not correlate with the Statement of Operations for the period due to the timing of sales and redemptions of Fund shares in relation to income earned and/or fluctuating market value of the investments of the Fund. |
See Notes to Financial Statements.
| Semi-Annual Report | October 31, 2020 | 59 |
| Emerald Insights Fund | Financial Highlights |
For a share outstanding throughout the years presented
| | | CLASS A | |
| | | For the Six Months Ended October 31, 2020 (Unaudited) | | | Year Ended
April 30,
2020 | | | Year Ended
April 30,
2019 | | | Year Ended
April 30,
2018 | | | Year Ended
April 30,
2017 | | | Year Ended
April 30,
2016 | |
| NET ASSET VALUE, BEGINNING OF PERIOD | | $ | 12.13 | | | $ | 11.51 | | | $ | 13.09 | | | $ | 11.33 | | | $ | 9.69 | | | $ | 10.98 | |
| INCOME/(LOSS) FROM OPERATIONS: | | | | | | | | | | | | | | | | | | | | | | | | |
| Net investment loss(a) | | | (0.07 | ) | | | (0.10 | ) | | | (0.09 | ) | | | (0.07 | ) | | | (0.06 | ) | | | (0.05 | ) |
| Net realized and unrealized gain/(loss) on investments | | | 3.63 | | | | 0.72 | | | | 1.04 | | | | 1.83 | | | | 1.70 | | | | (1.24 | ) |
| Total from Investment Operations | | | 3.56 | | | | 0.62 | | | | 0.95 | | | | 1.76 | | | | 1.64 | | | | (1.29 | ) |
| | | | | | | | | | | | | | | | | | | | | | | | | |
| LESS DISTRIBUTIONS: | | | | | | | | | | | | | | | | | | | | | | | | |
| From capital gains | | | – | | | | 0.00 | (b) | | | (2.53 | ) | | | – | | | | – | | | | – | |
| Total Distributions | | | – | | | | – | | | | (2.53 | ) | | | – | | | | – | | | | – | |
| NET INCREASE/(DECREASE) IN NET ASSET VALUE | | | 3.56 | | | | 0.62 | | | | (1.58 | ) | | | 1.76 | | | | 1.64 | | | | (1.29 | ) |
| NET ASSET VALUE, END OF PERIOD | | $ | 15.69 | | | $ | 12.13 | | | $ | 11.51 | | | $ | 13.09 | | | $ | 11.33 | | | $ | 9.69 | |
| | | | | | | | | | | | | | | | | | | | | | | | | |
| TOTAL RETURN(c) | | | 29.35 | %(d) | | | 5.43 | % | | | 11.53 | % | | | 15.53 | % | | | 16.92 | % | | | (11.75 | %) |
| RATIOS/SUPPLEMENTAL DATA: | | | | | | | | | | | | | | | | | | | | | | | | |
| Net Assets, End of Period (000s) | | $ | 12,842 | | | $ | 10,174 | | | $ | 9,397 | | | $ | 9,321 | | | $ | 10,127 | | | $ | 11,388 | |
| RATIOS TO AVERAGE NET ASSETS: | | | | | | | | | | | | | | | | | | | | | | | | |
| Net Investment loss | | | (0.90 | %)(e) | | | (0.83 | %) | | | (0.71 | %) | | | (0.58 | %) | | | (0.57 | %) | | | (0.54 | %) |
| Operating expenses excluding reimbursement/waiver | | | 1.98 | %(e) | | | 2.25 | % | | | 2.18 | % | | | 2.10 | % | | | 2.10 | % | | | 2.01 | % |
| Operating expenses including reimbursement/waiver | | | 1.35 | %(e) | | | 1.35 | % | | | 1.35 | % | | | 1.35 | % | | | 1.35 | % | | | 1.35 | % |
| PORTFOLIO TURNOVER RATE | | | 47 | %(d) | | | 94 | % | | | 63 | % | | | 138 | % | | | 75 | % | | | 99 | % |
| (a) | Per share amounts are based upon average shares outstanding. |
| (b) | Less than $(0.005) per share. |
| (c) | Total return does not reflect the effect of sales charges. |
See Notes to Financial Statements.
| 60 | www.emeraldmutualfunds.com |
| Emerald Insights Fund | Financial Highlights |
For a share outstanding throughout the years presented
| | | CLASS C |
| | | For the Six Months Ended October 31, 2020 (Unaudited) | | | Year Ended
April 30,
2020 | | | Year Ended
April 30,
2019 | | | Year Ended
April 30,
2018 | | | Year Ended
April 30,
2017 | | | Year Ended
April 30,
2016 | |
| NET ASSET VALUE, BEGINNING OF PERIOD | | $ | 11.57 | | | $ | 11.04 | | | $ | 12.75 | | | $ | 11.11 | | | $ | 9.56 | | | $ | 10.92 | |
| INCOME/(LOSS) FROM OPERATIONS: | | | | | | | | | | | | | | | | | | | | | | | | |
| Net investment loss(a) | | | (0.11 | ) | | | (0.16 | ) | | | (0.16 | ) | | | (0.15 | ) | | | (0.13 | ) | | | (0.11 | ) |
| Net realized and unrealized gain/(loss) on investments | | | 3.46 | | | | 0.69 | | | | 0.98 | | | | 1.79 | | | | 1.68 | | | | (1.25 | ) |
| Total from Investment Operations | | | 3.35 | | | | 0.53 | | | | 0.82 | | | | 1.64 | | | | 1.55 | | | | (1.36 | ) |
| | | | | | | | | | | | | | | | | | | | | | | | | |
| LESS DISTRIBUTIONS: | | | | | | | | | | | | | | | | | | | | | | | | |
| From capital gains | | | – | | | | 0.00 | (b) | | | (2.53 | ) | | | – | | | | – | | | | – | |
| Total Distributions | | | – | | | | – | | | | (2.53 | ) | | | – | | | | – | | | | – | |
| NET INCREASE/(DECREASE) IN NET ASSET VALUE | | | 3.35 | | | | 0.53 | | | | (1.71 | ) | | | 1.64 | | | | 1.55 | | | | (1.36 | ) |
| NET ASSET VALUE, END OF PERIOD | | $ | 14.92 | | | $ | 11.57 | | | $ | 11.04 | | | $ | 12.75 | | | $ | 11.11 | | | $ | 9.56 | |
| | | | | | | | | | | | | | | | | | | | | | | | | |
| TOTAL RETURN(c) | | | 28.95 | %(d) | | | 4.84 | % | | | 10.75 | % | | | 14.76 | % | | | 16.21 | % | | | (12.45 | %) |
| RATIOS/SUPPLEMENTAL DATA: | | | | | | | | | | | | | | | | | | | | | | | | |
| Net Assets, End of Period (000s) | | $ | 180 | | | $ | 138 | | | $ | 141 | | | $ | 129 | | | $ | 112 | | | $ | 101 | |
| RATIOS TO AVERAGE NET ASSETS: | | | | | | | | | | | | | | | | | | | | | | | | |
| Net Investment loss | | | (1.55 | %)(e) | | | (1.48 | %) | | | (1.36 | %) | | | (1.24 | %) | | | (1.22 | %) | | | (1.17 | %) |
| Operating expenses excluding reimbursement/waiver | | | 2.63 | %(e) | | | 2.90 | % | | | 2.84 | % | | | 2.75 | % | | | 2.76 | % | | | 2.70 | % |
| Operating expenses including reimbursement/waiver | | | 2.00 | %(e) | | | 2.00 | % | | | 2.00 | % | | | 2.00 | % | | | 2.00 | % | | | 2.00 | % |
| PORTFOLIO TURNOVER RATE | | | 47 | %(d) | | | 94 | % | | | 63 | % | | | 138 | % | | | 75 | % | | | 99 | % |
| (a) | Per share amounts are based upon average shares outstanding. |
| (b) | Less than $(0.005) per share. |
| (c) | Total return does not reflect the effect of sales charges. |
See Notes to Financial Statements.
| Semi-Annual Report | October 31, 2020 | 61 |
| Emerald Insights Fund | Financial Highlights |
For a share outstanding throughout the years presented
| | | INSTITUTIONAL CLASS |
| | | For the Six Months Ended October 31, 2020 (Unaudited) | | | Year Ended April 30, 2020 | | | Year Ended April 30, 2019 | | | Year Ended April 30, 2018 | | | Year Ended April 30, 2017 | | | Year Ended April 30, 2016 | |
| NET ASSET VALUE, BEGINNING OF PERIOD | | $ | 12.37 | | | $ | 11.69 | | | $ | 13.22 | | | $ | 11.41 | | | $ | 9.73 | | | $ | 10.99 | |
| INCOME/(LOSS) FROM OPERATIONS: | | | | | | | | | | | | | | | | | | | | | | | | |
| Net investment loss(a) | | | (0.05 | ) | | | (0.06 | ) | | | (0.05 | ) | | | (0.04 | ) | | | (0.03 | ) | | | (0.00 | )(b) |
| Net realized and unrealized gain/(loss) on investments | | | 3.70 | | | | 0.74 | | | | 1.05 | | | | 1.85 | | | | 1.71 | | | | (1.26 | ) |
| Total from Investment Operations | | | 3.65 | | | | 0.68 | | | | 1.00 | | | | 1.81 | | | | 1.68 | | | | (1.26 | ) |
| | | | | | | | | | | | | | | | | | | | | | | | | |
| LESS DISTRIBUTIONS: | | | | | | | | | | | | | | | | | | | | | | | | |
| From capital gains | | | – | | | | 0.00 | (c) | | | (2.53 | ) | | | – | | | | – | | | | – | |
| Total Distributions | | | – | | | | – | | | | (2.53 | ) | | | – | | | | – | | | | – | |
| NET INCREASE/(DECREASE) IN NET ASSET VALUE | | | 3.65 | | | | 0.68 | | | | (1.53 | ) | | | 1.81 | | | | 1.68 | | | | (1.26 | ) |
| NET ASSET VALUE, END OF PERIOD | | $ | 16.02 | | | $ | 12.37 | | | $ | 11.69 | | | $ | 13.22 | | | $ | 11.41 | | | $ | 9.73 | |
| | | | | | | | | | | | | | | | | | | | | | | | | |
| TOTAL RETURN | | | 29.51 | %(d) | | | 5.85 | % | | | 11.81 | % | | | 15.86 | % | | | 17.27 | % | | | (11.46 | %) |
| RATIOS/SUPPLEMENTAL DATA: | | | | | | | | | | | | | | | | | | | | | | | | |
| Net Assets, End of Period (000s) | | $ | 1,914 | | | $ | 1,462 | | | $ | 1,383 | | | $ | 1,228 | | | $ | 1,048 | | | $ | 1,729 | |
| RATIOS TO AVERAGE NET ASSETS: | | | | | | | | | | | | | | | | | | | | | | | | |
| Net Investment loss | | | (0.60 | %)(e) | | | (0.53 | %) | | | (0.41 | %) | | | (0.29 | %) | | | (0.28 | %) | | | (0.05 | %) |
| Operating expenses excluding reimbursement/waiver | | | 1.67 | %(e) | | | 1.93 | % | | | 1.87 | % | | | 1.77 | % | | | 1.78 | % | | | 1.90 | % |
| Operating expenses including reimbursement/waiver | | | 1.05 | %(e) | | | 1.05 | % | | | 1.05 | % | | | 1.05 | % | | | 1.05 | % | | | 1.05 | % |
| PORTFOLIO TURNOVER RATE | | | 47 | %(d) | | | 94 | % | | | 63 | % | | | 138 | % | | | 75 | % | | | 99 | % |
| (a) | Per share amounts are based upon average shares outstanding. |
| (b) | Less than $0.005 per share. |
| (c) | Less than $(0.005) per share. |
See Notes to Financial Statements.
| 62 | www.emeraldmutualfunds.com |
| Emerald Insights Fund | Financial Highlights |
For a share outstanding throughout the years presented
| | | INVESTOR CLASS |
| | | For the Six Months Ended October 31, 2020 (Unaudited) | | | Year Ended April 30, 2020 | | | Year Ended April 30, 2019 | | | Year Ended April 30, 2018 | | | Year Ended April 30, 2017 | | | Year Ended April 30, 2016 | |
| NET ASSET VALUE, BEGINNING OF PERIOD | | $ | 12.07 | | | $ | 11.45 | | | $ | 13.05 | | | $ | 11.29 | | | $ | 9.67 | | | $ | 10.96 | |
| INCOME/(LOSS) FROM OPERATIONS: | | | | | | | | | | | | | | | | | | | | | | | | |
| Net investment loss(a) | | | (0.13 | ) | | | (0.09 | ) | | | (0.10 | ) | | | (0.08 | ) | | | (0.07 | ) | | | (0.08 | ) |
| Net realized and unrealized gain/(loss) on investments | | | 3.67 | | | | 0.71 | | | | 1.03 | | | | 1.84 | | | | 1.69 | | | | (1.21 | ) |
| Total from Investment Operations | | | 3.54 | | | | 0.62 | | | | 0.93 | | | | 1.76 | | | | 1.62 | | | | (1.29 | ) |
| | | | | | | | | | | | | | | | | | | | | | | | | |
| LESS DISTRIBUTIONS: | | | | | | | | | | | | | | | | | | | | | | | | |
| From capital gains | | | – | | | | 0.00 | (b) | | | (2.53 | ) | | | – | | | | – | | | | – | |
| Total Distributions | | | – | | | | – | | | | (2.53 | ) | | | – | | | | – | | | | – | |
| NET INCREASE/(DECREASE) IN NET ASSET VALUE | | | 3.54 | | | | 0.62 | | | | (1.60 | ) | | | 1.76 | | | | 1.62 | | | | (1.29 | ) |
| NET ASSET VALUE, END OF PERIOD | | $ | 15.61 | | | $ | 12.07 | | | $ | 11.45 | | | $ | 13.05 | | | $ | 11.29 | | | $ | 9.67 | |
| | | | | | | | | | | | | | | | | | | | | | | | | |
| TOTAL RETURN | | | 29.33 | %(c) | | | 5.45 | % | | | 11.41 | % | | | 15.59 | % | | | 16.75 | % | | | (11.77 | %) |
| RATIOS/SUPPLEMENTAL DATA: | | | | | | | | | | | | | | | | | | | | | | | | |
| Net Assets, End of Period (000s) | | $ | 367 | | | $ | 274 | | | $ | 174 | | | $ | 126 | | | $ | 88 | | | $ | 86 | |
| RATIOS TO AVERAGE NET ASSETS: | | | | | | | | | | | | | | | | | | | | | | | | |
| Net Investment loss | | | (0.95 | %)(d) | | | (0.82 | %) | | | (0.77 | %) | | | (0.65 | %) | | | (0.63 | %) | | | (0.72 | %) |
| Operating expenses excluding reimbursement/waiver | | | 1.91 | %(d) | | | 2.17 | % | | | 2.08 | % | | | 2.07 | % | | | 2.09 | % | | | 1.91 | % |
| Operating expenses including reimbursement/waiver | | | 1.40 | %(d) | | | 1.40 | % | | | 1.40 | % | | | 1.40 | % | | | 1.40 | % | | | 1.40 | % |
| PORTFOLIO TURNOVER RATE | | | 47 | %(c) | | | 94 | % | | | 63 | % | | | 138 | % | | | 75 | % | | | 99 | % |
| (a) | Per share amounts are based upon average shares outstanding. |
| (b) | Less than $(0.005) per share. |
See Notes to Financial Statements.
| Semi-Annual Report | October 31, 2020 | 63 |
| Emerald Banking and Finance Fund | Financial Highlights |
For a share outstanding throughout the years presented
| | | CLASS A |
| | | For the Six Months Ended October 31, 2020 (Unaudited) | | | Year Ended April 30, 2020 | | | Year Ended April 30, 2019 | | | Year Ended April 30, 2018 | | | Year Ended April 30, 2017 | | | Year Ended April 30, 2016 | |
| NET ASSET VALUE, BEGINNING OF PERIOD | | $ | 22.89 | | | $ | 32.71 | | | $ | 46.01 | | | $ | 41.61 | | | $ | 31.27 | | | $ | 28.85 | |
| INCOME/(LOSS) FROM OPERATIONS: | | | | | | | | | | | | | | | | | | | | | | | | |
| Net investment income/(loss)(a) | | | 0.22 | | | | (0.03 | ) | | | (0.24 | ) | | | (0.29 | ) | | | (0.17 | ) | | | (0.06 | ) |
| Net realized and unrealized gain/(loss) on investments | | | 4.78 | | | | (9.79 | ) | | | (5.35 | ) | | | 5.98 | | | | 10.51 | | | | 2.48 | |
| Total from Investment Operations | | | 5.00 | | | | (9.82 | ) | | | (5.59 | ) | | | 5.69 | | | | 10.34 | | | | 2.42 | |
| | | | | | | | | | | | | | | | | | | | | | | | | |
| LESS DISTRIBUTIONS: | | | | | | | | | | | | | | | | | | | | | | | | |
| From capital gains | | | – | | | | – | | | | (7.71 | ) | | | (1.29 | ) | | | – | | | | – | |
| Total Distributions | | | – | | | | – | | | | (7.71 | ) | | | (1.29 | ) | | | – | | | | – | |
| NET INCREASE/(DECREASE) IN NET ASSET VALUE | | | 5.00 | | | | (9.82 | ) | | | (13.30 | ) | | | 4.40 | | | | 10.34 | | | | 2.42 | |
| NET ASSET VALUE, END OF PERIOD | | $ | 27.89 | | | $ | 22.89 | | | $ | 32.71 | | | $ | 46.01 | | | $ | 41.61 | | | $ | 31.27 | |
| | | | | | | | | | | | | | | | | | | | | | | | | |
| TOTAL RETURN(b) | | | 21.84 | %(c) | | | (30.02 | )% | | | (10.65 | )% | | | 13.59 | % | | | 33.07 | % | | | 8.39 | % |
| RATIOS/SUPPLEMENTAL DATA: | | | | | | | | | | | | | | | | | | | | | | | | |
| Net Assets, End of Period (000s) | | $ | 37,800 | | | $ | 37,933 | | | $ | 87,267 | | | $ | 172,338 | | | $ | 172,106 | | | $ | 110,601 | |
| RATIOS TO AVERAGE NET ASSETS: | | | | | | | | | | | | | | | | | | | | | | | | |
| Net Investment income/(loss) | | | 1.69 | %(d) | | | (0.10 | )% | | | (0.58 | )% | | | (0.65 | )% | | | (0.46 | )% | | | (0.21 | )% |
| Operating expenses excluding reimbursement/waiver | | | 1.62 | %(d) | | | 1.48 | % | | | 1.42 | % | | | 1.41 | % | | | 1.43 | % | | | 1.48 | % |
| Operating expenses including reimbursement/waiver | | | 1.62 | %(d) | | | 1.48 | % | | | 1.42 | % | | | 1.41 | % | | | 1.43 | % | | | 1.48 | % |
| PORTFOLIO TURNOVER RATE | | | 62 | %(c) | | | 46 | % | | | 55 | % | | | 62 | % | | | 36 | % | | | 30 | % |
| (a) | Per share amounts are based upon average shares outstanding. |
| (b) | Total return does not reflect the effect of sales charges. |
See Notes to Financial Statements.
| 64 | www.emeraldmutualfunds.com |
| Emerald Banking and Finance Fund | Financial Highlights |
For a share outstanding throughout the years presented
| | | CLASS C |
| | | For the Six Months Ended October 31, 2020 (Unaudited) | | | Year Ended April 30, 2020 | | | Year Ended April 30, 2019 | | | Year Ended April 30, 2018 | | | Year Ended April 30, 2017 | | | Year Ended April 30, 2016 | |
| NET ASSET VALUE, BEGINNING OF PERIOD | | $ | 19.38 | | | $ | 27.87 | | | $ | 40.83 | | | $ | 37.29 | | | $ | 28.20 | | | $ | 26.19 | |
| INCOME/(LOSS) FROM OPERATIONS: | | | | | | | | | | | | | | | | | | | | | | | | |
| Net investment income/(loss)(a) | | | 0.11 | | | | (0.20 | ) | | | (0.44 | ) | | | (0.51 | ) | | | (0.36 | ) | | | (0.24 | ) |
| Net realized and unrealized gain/(loss) on investments | | | 4.04 | | | | (8.29 | ) | | | (4.81 | ) | | | 5.34 | | | | 9.45 | | | | 2.25 | |
| Total from Investment Operations | | | 4.15 | | | | (8.49 | ) | | | (5.25 | ) | | | 4.83 | | | | 9.09 | | | | 2.01 | |
| | | | | | | | | | | | | | | | | | | | | | | | | |
| LESS DISTRIBUTIONS: | | | | | | | | | | | | | | | | | | | | | | | | |
| From capital gains | | | – | | | | – | | | | (7.71 | ) | | | (1.29 | ) | | | – | | | | – | |
| Total Distributions | | | – | | | | – | | | | (7.71 | ) | | | (1.29 | ) | | | – | | | | – | |
| NET INCREASE/(DECREASE) IN NET ASSET VALUE | | | 4.15 | | | | (8.49 | ) | | | (12.96 | ) | | | 3.54 | | | | 9.09 | | | | 2.01 | |
| NET ASSET VALUE, END OF PERIOD | | $ | 23.53 | | | $ | 19.38 | | | $ | 27.87 | | | $ | 40.83 | | | $ | 37.29 | | | $ | 28.20 | |
| | | | | | | | | | | | | | | | | | | | | | | | | |
| TOTAL RETURN(b) | | | 21.41 | %(c) | | | (30.46 | )% | | | (11.21 | )% | | | 12.85 | % | | | 32.23 | % | | | 7.67 | % |
| RATIOS/SUPPLEMENTAL DATA: | | | | | | | | | | | | | | | | | | | | | | | | |
| Net Assets, End of Period (000s) | | $ | 14,421 | | | $ | 16,804 | | | $ | 50,079 | | | $ | 78,988 | | | $ | 76,072 | | | $ | 52,366 | |
| RATIOS TO AVERAGE NET ASSETS: | | | | | | | | | | | | | | | | | | | | | | | | |
| Net Investment income/(loss) | | | 1.02 | %(d) | | | (0.73 | )% | | | (1.23 | )% | | | (1.30 | )% | | | (1.11 | )% | | | (0.87 | )% |
| Operating expenses excluding reimbursement/waiver | | | 2.27 | %(d) | | | 2.13 | % | | | 2.07 | % | | | 2.06 | % | | | 2.08 | % | | | 2.13 | % |
| Operating expenses including reimbursement/waiver | | | 2.27 | %(d) | | | 2.13 | % | | | 2.07 | % | | | 2.06 | % | | | 2.08 | % | | | 2.13 | % |
| PORTFOLIO TURNOVER RATE | | | 62 | %(c) | | | 46 | % | | | 55 | % | | | 62 | % | | | 36 | % | | | 30 | % |
| (a) | Per share amounts are based upon average shares outstanding. |
| (b) | Total return does not reflect the effect of sales charges. |
See Notes to Financial Statements.
| Semi-Annual Report | October 31, 2020 | 65 |
| Emerald Banking and Finance Fund | Financial Highlights |
For a share outstanding throughout the years presented
| | | INSTITUTIONAL CLASS |
| | | For the Six Months Ended October 31, 2020 (Unaudited) | | | Year Ended April 30, 2020 | | | Year Ended April 30, 2019 | | | Year Ended April 30, 2018 | | | Year Ended April 30, 2017 | | | Year Ended April 30, 2016 | |
| NET ASSET VALUE, BEGINNING OF PERIOD | | $ | 23.67 | | | $ | 33.70 | | | $ | 46.95 | | | $ | 42.30 | | | $ | 31.69 | | | $ | 29.15 | |
| INCOME/(LOSS) FROM OPERATIONS: | | | | | | | | | | | | | | | | | | | | | | | | |
| Net investment income/(loss)(a) | | | 0.26 | | | | 0.09 | | | | (0.09 | ) | | | (0.15 | ) | | | (0.05 | ) | | | 0.03 | |
| Net realized and unrealized gain/(loss) on investments | | | 4.95 | | | | (10.12 | ) | | | (5.45 | ) | | | 6.09 | | | | 10.66 | | | | 2.51 | |
| Total from Investment Operations | | | 5.21 | | | | (10.03 | ) | | | (5.54 | ) | | | 5.94 | | | | 10.61 | | | | 2.54 | |
| | | | | | | | | | | | | | | | | | | | | | | | | |
| LESS DISTRIBUTIONS: | | | | | | | | | | | | | | | | | | | | | | | | |
| From capital gains | | | – | | | | – | | | | (7.71 | ) | | | (1.29 | ) | | | – | | | | – | |
| Total Distributions | | | – | | | | – | | | | (7.71 | ) | | | (1.29 | ) | | | – | | | | – | |
| NET INCREASE/(DECREASE) IN NET ASSET VALUE | | | 5.21 | | | | (10.03 | ) | | | (13.25 | ) | | | 4.65 | | | | 10.61 | | | | 2.54 | |
| NET ASSET VALUE, END OF PERIOD | | $ | 28.88 | | | $ | 23.67 | | | $ | 33.70 | | | $ | 46.95 | | | $ | 42.30 | | | $ | 31.69 | |
| | | | | | | | | | | | | | | | | | | | | | | | | |
| TOTAL RETURN | | | 22.01 | %(b) | | | (29.76 | )% | | | (10.30 | )% | | | 13.97 | % | | | 33.48 | % | | | 8.71 | % |
| RATIOS/SUPPLEMENTAL DATA: | | | | | | | | | | | | | | | | | | | | | | | | |
| Net Assets, End of Period (000s) | | $ | 52,692 | | | $ | 67,358 | | | $ | 162,910 | | | $ | 221,638 | | | $ | 134,027 | | | $ | 61,654 | |
| RATIOS TO AVERAGE NET ASSETS: | | | | | | | | | | | | | | | | | | | | | | | | |
| Net Investment income/(loss) | | | 1.95 | %(c) | | | 0.28 | % | | | (0.23 | )% | | | (0.34 | )% | | | (0.14 | )% | | | 0.11 | % |
| Operating expenses excluding reimbursement/waiver | | | 1.28 | %(c) | | | 1.13 | % | | | 1.06 | % | | | 1.09 | % | | | 1.11 | % | | | 1.15 | % |
| Operating expenses including reimbursement/waiver | | | 1.28 | %(c) | | | 1.13 | % | | | 1.06 | % | | | 1.09 | % | | | 1.11 | % | | | 1.15 | % |
| PORTFOLIO TURNOVER RATE | | | 62 | %(b) | | | 46 | % | | | 55 | % | | | 62 | % | | | 36 | % | | | 30 | % |
| (a) | Per share amounts are based upon average shares outstanding. |
See Notes to Financial Statements.
| 66 | www.emeraldmutualfunds.com |
| Emerald Banking and Finance Fund | Financial Highlights |
For a share outstanding throughout the years presented
| | | INVESTOR CLASS |
| | | For the Six Months Ended October 31, 2020 (Unaudited) | | | Year Ended April 30, 2020 | | | Year Ended April 30, 2019 | | | Year Ended April 30, 2018 | | | Year Ended April 30, 2017 | | | Year Ended April 30, 2016 | |
| NET ASSET VALUE, BEGINNING OF PERIOD | | $ | 21.66 | | | $ | 30.96 | | | $ | 44.05 | | | $ | 39.86 | | | $ | 29.95 | | | $ | 27.64 | |
| INCOME/(LOSS) FROM OPERATIONS: | | | | | | | | | | | | | | | | | | | | | | | | |
| Net investment income/(loss)(a) | | | 0.20 | | | | (0.04 | ) | | | (0.23 | ) | | | (0.25 | ) | | | (0.16 | ) | | | (0.07 | ) |
| Net realized and unrealized gain/(loss) on investments | | | 4.52 | | | | (9.26 | ) | | | (5.15 | ) | | | 5.73 | | | | 10.07 | | | | 2.38 | |
| Total from Investment Operations | | | 4.72 | | | | (9.30 | ) | | | (5.38 | ) | | | 5.48 | | | | 9.91 | | | | 2.31 | |
| | | | | | | | | | | | | | | | | | | | | | | | | |
| LESS DISTRIBUTIONS: | | | | | | | | | | | | | | | | | | | | | | | | |
| From capital gains | | | – | | | | – | | | | (7.71 | ) | | | (1.29 | ) | | | – | | | | – | |
| Total Distributions | | | – | | | | – | | | | (7.71 | ) | | | (1.29 | ) | | | – | | | | – | |
| NET INCREASE/(DECREASE) IN NET ASSET VALUE | | | 4.72 | | | | (9.30 | ) | | | (13.09 | ) | | | 4.19 | | | | 9.91 | | | | 2.31 | |
| NET ASSET VALUE, END OF PERIOD | | $ | 26.38 | | | $ | 21.66 | | | $ | 30.96 | | | $ | 44.05 | | | $ | 39.86 | | | $ | 29.95 | |
| | | | | | | | | | | | | | | | | | | | | | | | | |
| TOTAL RETURN | | | 21.79 | %(b) | | | (30.04 | )% | | | (10.64 | )% | | | 13.67 | % | | | 33.09 | % | | | 8.36 | % |
| RATIOS/SUPPLEMENTAL DATA: | | | | | | | | | | | | | | | | | | | | | | | | |
| Net Assets, End of Period (000s) | | $ | 13,562 | | | $ | 15,472 | | | $ | 41,410 | | | $ | 71,236 | | | $ | 85,557 | | | $ | 80,404 | |
| RATIOS TO AVERAGE NET ASSETS: | | | | | | | | | | | | | | | | | | | | | | | | |
| Net Investment income/(loss) | | | 1.65 | %(c) | | | (0.12 | )% | | | (0.60 | )% | | | (0.60 | )% | | | (0.46 | )% | | | (0.23 | )% |
| Operating expenses excluding reimbursement/waiver | | | 1.66 | %(c) | | | 1.51 | % | | | 1.43 | % | | | 1.37 | % | | | 1.43 | % | | | 1.48 | % |
| Operating expenses including reimbursement/waiver | | | 1.66 | %(c) | | | 1.51 | % | | | 1.43 | % | | | 1.37 | % | | | 1.43 | % | | | 1.48 | % |
| PORTFOLIO TURNOVER RATE | | | 62 | %(b) | | | 46 | % | | | 55 | % | | | 62 | % | | | 36 | % | | | 30 | % |
| (a) | Per share amounts are based upon average shares outstanding. |
See Notes to Financial Statements.
| Semi-Annual Report | October 31, 2020 | 67 |
| Emerald Select trueLiberty Income Fund | Consolidated Financial Highlights |
| | For a share outstanding throughout the period presented |
CLASS A
| | | For the
Six Months Ended
October 31, 2020
(Unaudited) | | | For the Period
January 2, 2020
(Inception) to
April 30, 2020 | |
| NET ASSET VALUE, BEGINNING OF PERIOD | | $ | 5.87 | | | $ | 10.00 | |
| INCOME/(LOSS) FROM OPERATIONS: | | | | | | | | |
| Net investment income(a) | | | 0.04 | | | | 0.04 | |
| Net realized and unrealized loss on investments | | | (0.77 | ) | | | (4.17 | ) |
| Total from Investment Operations | | | (0.73 | ) | | | (4.13 | ) |
| | | | | | | | | |
| LESS DISTRIBUTIONS: | | | | | | | | |
| From investment income | | | (0.70 | ) | | | – | |
| Total Distributions | | | (0.70 | ) | | | – | |
| NET DECREASE IN NET ASSET VALUE | | | (1.43 | ) | | | (4.13 | ) |
| NET ASSET VALUE, END OF PERIOD | | $ | 4.44 | | | $ | 5.87 | |
| | | | | | | | | |
| TOTAL RETURN | | | (13.22 | )%(b) | | | (41.30 | )% |
| RATIOS/SUPPLEMENTAL DATA: | | | | | | | | |
| Net Assets, End of Period (000s) | | $ | 56 | | | $ | 66 | |
| RATIOS TO AVERAGE NET ASSETS: | | | | | | | | |
| Net Investment income | | | 1.53 | %(c) | | | 1.92 | %(c) |
| Operating expenses excluding reimbursement/waiver | | | 23.22 | %(c) | | | 95.87 | %(c)(d) |
| Operating expenses including reimbursement/waiver | | | 1.06 | %(c) | | | 1.06 | %(c)(d) |
| PORTFOLIO TURNOVER RATE | | | 94 | %(b) | | | 439 | %(b) |
| (a) | Per share amounts are based upon average shares outstanding. |
| (d) | Expense ratios before reductions for startup costs may not be representative of longer term operating period. |
See Notes to Financial Statements.
| 68 | www.emeraldmutualfunds.com |
| Emerald Select trueLiberty Income Fund | Consolidated Financial Highlights |
| | For a share outstanding throughout the period presented |
INSTITUTIONAL CLASS
| | | For the
Six Months Ended
October 31, 2020
(Unaudited) | | | For the Period
January 2, 2020
(Inception) to
April 30, 2020 | |
| NET ASSET VALUE, BEGINNING OF PERIOD | | $ | 5.87 | | | $ | 10.00 | |
| INCOME/(LOSS) FROM OPERATIONS: | | | | | | | | |
| Net investment income(a) | | | 0.05 | | | | 0.02 | |
| Net realized and unrealized loss on investments | | | (0.78 | ) | | | (4.15 | ) |
| Total from Investment Operations | | | (0.73 | ) | | | (4.13 | ) |
| | | | | | | | | |
| LESS DISTRIBUTIONS: | | | | | | | | |
| From investment income | | | (0.70 | ) | | | – | |
| Total Distributions | | | (0.70 | ) | | | – | |
| NET DECREASE IN NET ASSET VALUE | | | (1.43 | ) | | | (4.13 | ) |
| NET ASSET VALUE, END OF PERIOD | | $ | 4.44 | | | $ | 5.87 | |
| | | | | | | | | |
| TOTAL RETURN | | | (13.09 | )%(b) | | | (41.30 | )% |
| RATIOS/SUPPLEMENTAL DATA: | | | | | | | | |
| Net Assets, End of Period (000s) | | $ | 984 | | | $ | 1,279 | |
| RATIOS TO AVERAGE NET ASSETS: | | | | | | | | |
| Net Investment income | | | 1.83 | %(c) | | | 1.33 | %(c) |
| Operating expenses excluding reimbursement/waiver | | | 22.90 | %(c) | | | 45.48 | %(c)(d) |
| Operating expenses including reimbursement/waiver | | | 0.76 | %(c) | | | 0.76 | %(c)(d) |
| PORTFOLIO TURNOVER RATE | | | 94 | %(b) | | | 439 | %(b) |
| (a) | Per share amounts are based upon average shares outstanding. |
| (d) | Expense ratios before reductions for startup costs may not be representative of longer term operating period. |
See Notes to Financial Statements.
| Semi-Annual Report | October 31, 2020 | 69 |
| Emerald Funds | Notes to Financial Statements |
| | October 31, 2020 (Unaudited) |
1. ORGANIZATION
Financial Investors Trust (the “Trust”), a Delaware statutory trust, is an open-end management investment company registered under the Investment Company Act of 1940, as amended (the “1940 Act”). The Trust consists of multiple separate portfolios or series. This semi-annual report describes the Emerald Growth Fund, Emerald Small Cap Value Fund, Emerald Insights Fund, Emerald Banking and Finance Fund and Emerald Select trueLiberty Income Fund (each a “Fund” and collectively, the “Funds”). The Emerald Small Cap Value Fund is a successor to a previously operational fund which was a series of Elessar Funds Investment Trust, a Delaware statutory trust, and was organized into a series of the Trust effective as of the close of business on June 26, 2015. Effective March 3, 2015, the Board approved changing the fiscal year end of the Emerald Small Cap Value Fund from September 30 to April 30.
The Emerald Growth Fund and Emerald Insights Fund seek to achieve long-term growth through capital appreciation. The Emerald Small Cap Value Fund seeks long-term capital appreciation. The Emerald Banking and Finance Fund seeks to achieve long-term growth through capital appreciation with income as a secondary objective. The Emerald Select trueLiberty Income Fund seeks to provide current income with capital appreciation as a secondary investment objective.
Basis of Consolidation for the Emerald Select trueLiberty Income Fund: Emerald Select trueMLP Strategy Offshore Fund, Ltd. (the “Subsidiary”), a Cayman Islands exempted company, is a wholly owned subsidiary of the Emerald Select trueLiberty Income Fund (the "Select Fund"). The investment objective of the Subsidiary is designed to enhance the ability of the Select Fund to obtain exposure to equities, financial, currency and commodities markets consistent with the limits of the U.S. federal tax law requirements applicable to registered investment companies. The Subsidiary is subject to substantially the same investment policies and investment restrictions as the Select Fund. The Subsidiary acts as an investment vehicle for the Select Fund in order to effect certain commodity-related investments on behalf of the Fund. Investments in the Subsidiary are expected to provide the Fund with exposure to the commodity markets within the limitations of Subchapter M of the Internal Revenue Code of 1986, as amended (the “Code”), and recent IRS revenue rulings, as discussed below under “Federal Income Taxes”. The Select Fund is the sole shareholder of the Subsidiary pursuant to a subscription agreement, and it is intended that the Select Fund will remain the sole shareholder and will continue to control the Subsidiary. Under the Articles of Association of the Subsidiary, shares issued by the Subsidiary confer upon a shareholder the right to wholly own and vote at general meetings of the Subsidiary and certain rights in connection with any winding-up or repayment of capital, as well as the right to participate in the profits or assets of the Subsidiary. The Select Fund may invest up to 25% of its total assets in shares of the Subsidiary. As a wholly owned subsidiary of the Select Fund, the financial statements of the Subsidiary are included in the Consolidated financial statements and financial highlights of the Select Fund. All investments held by the Subsidiary are disclosed in the accounts of the Select Fund. As of October 31, 2020, net assets of the Select Fund were $1,040,613 of which $164,395 or 15.80%, represented the Select Fund's ownership of all issued shares and voting rights of the Subsidiary.
2. SIGNIFICANT ACCOUNTING POLICIES
The accompanying financial statements were prepared in accordance with accounting principles generally accepted in the United States of America (“U.S. GAAP”). The preparation of financial statements in conformity with U.S. GAAP requires management to make certain estimates and assumptions that affect the reported amounts of assets and liabilities and disclosures of contingent assets and liabilities at the date of the financial statements and the reported amounts of revenue and expenses during the period. Actual results could differ from those estimates. The Funds are considered an investment company for financial reporting purposes under U.S. GAAP and follows the accounting and reporting guidance applicable to investment companies in the Financial Accounting Standards Board Accounting Standards Codification Topic 946. The following is a summary of significant accounting policies consistently followed by the Funds in preparation of their financial statements.
Investment Valuation: The Funds generally value their securities based on market prices determined at the close of regular trading on the New York Stock Exchange (“NYSE”), normally, 4:00 p.m. Eastern Time, on each business day the NYSE is open for trading.
For equity securities and mutual funds that are traded on an exchange, the market price is usually the closing sale or official closing price on that exchange. In the case of equity securities not traded on an exchange, or if such closing prices are not otherwise available, the securities are valued at the mean of the most recent bid and ask prices on such day. Redeemable securities issued by open-end registered investment companies are valued at the investment company’s applicable net asset value, with the exception of exchange-traded open-end investment companies, which are priced as equity securities.
The market price for debt obligations is generally the price supplied by an independent third-party pricing service approved by the Board of Trustees of the Trust (the “Board” or the “Trustees”), which may use a matrix, formula or other objective method that takes into consideration quotations from dealers, market transactions in comparable investments, market indices and yield curves. If vendors are unable to supply a price, or if the price supplied is deemed to be unreliable, the market price may be determined using quotations received from one or more brokers–dealers that make a market in the security.
| 70 | www.emeraldmutualfunds.com |
| Emerald Funds | Notes to Financial Statements |
| | October 31, 2020 (Unaudited) |
Equity securities that are primarily traded on foreign securities exchanges are valued at the preceding closing values of such securities on their respective exchanges, except when an occurrence subsequent to the time a value was so established is likely to have changed such value. In such an event, the fair values of those securities are determined in good faith through consideration of other factors in accordance with procedures established by and under the general supervision of the Board.
When such prices or quotations are not available, or when Emerald Mutual Fund Advisers Trust, (the “Adviser”), believes that they are unreliable, securities may be priced using fair value procedures approved by the Board.
Fair Value Measurements: A three-tier hierarchy has been established to classify fair value measurements for disclosure purposes. Inputs refer broadly to the assumptions that market participants would use in pricing the asset or liability, including assumptions about risk. Inputs may be observable or unobservable. Observable inputs are inputs that reflect the assumptions market participants would use in pricing the asset or liability that are developed based on market data obtained from sources independent of the reporting entity. Unobservable inputs are inputs that reflect the reporting entity’s own assumptions about the assumptions market participants would use in pricing the asset or liability that are developed based on the best information available. Various inputs are used in determining the value of each Fund’s investments as of the reporting period end. The designated input levels are not necessarily an indication of the risk or liquidity associated with these investments.
These inputs are categorized in the following hierarchy under applicable financial accounting standards:
| Level 1 – | Unadjusted quoted prices in active markets for identical investments, unrestricted assets or liabilities that the Funds have the ability to access at the measurement date; |
| Level 2 – | Quoted prices which are not active, quoted prices for similar assets or liabilities in active markets or inputs other than quoted prices that are observable (either directly or indirectly) for substantially the full term of the asset or liability; and |
| Level 3 – | Significant unobservable prices or inputs (including the Funds’ own assumptions in determining the fair value of investments) where there is little or no market activity for the asset or liability at the measurement date. |
The following is a summary of each input used to value the Funds as of October 31, 2020:
| Investments in Securities at Value(a) | | Level 1 -
Quoted Prices | | | Level 2 -
Other Significant Observable Inputs | | | Level 3 -
Significant
Unobservable
Inputs | | | Total | |
| Emerald Growth Fund | | | | | | | | | | | | |
| Common Stocks | | $ | 1,284,423,611 | | | $ | – | | | $ | – | | | $ | 1,284,423,611 | |
| Short Term Investments | | | 6,073,121 | | | | – | | | | – | | | | 6,073,121 | |
| TOTAL | | $ | 1,290,496,732 | | | $ | – | | | $ | – | | | $ | 1,290,496,732 | |
| Investments in Securities at Value(a) | | Level 1 -
Quoted Prices | | | Level 2 -
Other Significant Observable Inputs | | | Level 3 -
Significant
Unobservable
Inputs | | | Total | |
| Emerald Small Cap Value Fund | | | | | | | | | | | | |
| Common Stocks | | $ | 1,415,961 | | | $ | – | | | $ | – | | | $ | 1,415,961 | |
| Short Term Investments | | | 1,879 | | | | – | | | | – | | | | 1,879 | |
| TOTAL | | $ | 1,417,840 | | | $ | – | | | $ | – | | | $ | 1,417,840 | |
| Investments in Securities at Value(a) | | Level 1 -
Quoted Prices | | | Level 2 -
Other Significant Observable Inputs | | | Level 3 -
Significant
Unobservable
Inputs | | | Total | |
| Emerald Insights Fund | | | | | | | | | | | | |
| Common Stocks | | $ | 14,933,367 | | | $ | – | | | $ | – | | | $ | 14,933,367 | |
| Exchange Traded Funds | | | 304,640 | | | | – | | | | – | | | | 304,640 | |
| Short Term Investments | | | 85,430 | | | | – | | | | – | | | | 85,430 | |
| TOTAL | | $ | 15,323,437 | | | $ | – | | | $ | – | | | $ | 15,323,437 | |
| Semi-Annual Report | October 31, 2020 | 71 |
| Emerald Funds | Notes to Financial Statements |
| | October 31, 2020 (Unaudited) |
| Investments in Securities at Value(a) | | Level 1 -
Quoted Prices | | | Level 2 -
Other Significant Observable Inputs | | | Level 3 -
Significant
Unobservable
Inputs | | | Total | |
| Emerald Banking and Finance Fund | | | | | | | | | | | | | | | | |
| Common Stocks | | $ | 115,347,236 | | | $ | – | | | $ | – | | | $ | 115,347,236 | |
| Short Term Investments | | | 4,775,407 | | | | – | | | | – | | | | 4,775,407 | |
| Mutual Fund | | | 2,306,069 | | | | – | | | | – | | | | 2,306,069 | |
| TOTAL | | $ | 122,428,712 | | | $ | – | | | $ | – | | | $ | 122,428,712 | |
| Investments in Securities at Value(a) | | Level 1 -
Quoted Prices | | | Level 2 -
Other Significant Observable Inputs | | | Level 3 -
Significant
Unobservable
Inputs | | | Total | |
| Emerald Select trueLiberty Income Fund | | | | | | | | | | | | | | | | |
| Common Stocks | | $ | 174,181 | | | $ | – | | | $ | – | | | $ | 174,181 | |
| TOTAL | | $ | 174,181 | | | $ | – | | | $ | – | | | $ | 174,181 | |
| (a) | For detailed descriptions of sector and industry, see the accompanying Schedule of Investments. |
For the six months ended October 31, 2020, the Funds did not have any securities that used significant unobservable inputs (Level 3) in determining fair value.
Investment Transactions and Investment Income: Investment transactions are accounted for on the date the investments are purchased or sold (trade date). Realized gains and losses from investment transactions are reported on an identified cost basis, which is the same basis the Funds use for federal income tax purposes. Interest income, which includes accretion of discounts, is accrued and recorded as earned. Dividend income is recognized on the ex-dividend date or for certain foreign securities, as soon as information is available to the Funds. All of the realized and unrealized gains and losses and net investment income, are allocated daily to each class in proportion to its average daily net assets.
Real Estate Investment Trusts (“REITs”): The Funds may invest a portion of their assets in REITs and are subject to certain risks associated with direct investment in REITs. REITs may be affected by changes in the value of their underlying properties and by defaults by borrowers or tenants. REITs depend generally on their ability to generate cash flow to make distributions to shareowners, and certain REITs have self-liquidation provisions by which mortgages held may be paid in full and distributions of capital returns may be made at any time. In addition, the performance of a REIT may be affected by its failure to qualify for tax-free pass-through of income under the Internal Revenue Code of 1986, as amended (the “Code”), or its failure to maintain exemption from registration under the 1940 Act. A Fund’s investments in REITs may result in such Fund’s receipt of cash in excess of the REITs’ earnings. If the Fund receives such distributions all or a portion of these distributions will constitute a return of capital to such Fund. Receiving a return of capital distribution from REITs will reduce the amount of income available to be distributed to Fund shareholders. Income from REITs generally will not be eligible for treatment as qualified dividend income. As the final character of the distributions is not known until reported by the REITs on their 1099s, the Funds utilize an average of the prior year’s reallocation information as an estimate for the current year character of distributions.
Trust Expenses: Some expenses of the Trust can be directly attributed to the Funds. Expenses which cannot be directly attributed to the Funds are apportioned among all funds in the Trust based on average net assets of each fund.
Fund and Class Expenses: Expenses that are specific to a Fund or class of shares of a Fund, including distribution fees (Rule 12b-1 fees) and shareholder servicing fees, are charged directly to that Fund or share class. All expenses of a Fund, other than class specific expenses, are allocated daily to each class in proportion to its average daily net assets. Expenses that are common to the Funds generally are allocated among the Funds in proportion to their average daily net assets.
Offering Costs: Offering costs, including costs of printing initial prospectuses, legal and registration fees, are being amortized over twelve months from the inception date of the Select Fund. Amounts amortized during the six months ended October 31, 2020 for the Select Fund are shown on the Consolidated Statement of Operations.
Federal Income Taxes: Each Fund complies with the requirements under Subchapter M of the Code, applicable to regulated investment companies and intends to distribute substantially all of its net taxable income and net capital gains, if any, each year so that the Funds will not be subject to excise tax on undistributed income and gains. The Funds are not subject to income taxes to the extent such distributions are made.
| 72 | www.emeraldmutualfunds.com |
| Emerald Funds | Notes to Financial Statements |
| | October 31, 2020 (Unaudited) |
As of and during the six months ended October 31, 2020, the Funds did not have a liability for any unrecognized tax benefits. The Funds file U.S. federal, state, and local tax returns as required. The Funds’ tax returns are subject to examination by the relevant tax authorities until expiration of the applicable statute of limitations, which is generally three years after the filing of the tax return for federal purposes and four years for most state returns. Tax returns for open years have incorporated no uncertain tax positions that require a provision for income taxes.
Distributions to Shareholders: Each Fund normally pays dividends and distributes capital gains, if any, on an annual basis. Income dividend distributions are derived from dividends and other income each Fund receives from its investments, including short-term capital gains. Long term capital gain distributions are derived from gains realized when each Fund sells a security it has owned for more than a year. Each Fund may make additional distributions and dividends at other times if the portfolio manager believes doing so may be necessary for each Fund to avoid or reduce taxes.
Epidemic and Pandemic Risk: Certain countries have been susceptible to epidemics, most recently COVID-19, which has been designated as a pandemic by world health authorities. The outbreak of such epidemics, together with any resulting restrictions on travel or quarantines imposed, could have a negative impact on the economy and business activity globally (including in the countries in which we invest), and thereby could adversely affect the performance of our investments. Furthermore, the rapid development of epidemics could preclude prediction as to their ultimate adverse impact on economic and market conditions, and, as a result, present material uncertainty and risk with respect to us and the performance of our investments.
Libor Risk: In March 2020, the Financial Accounting Standards Board (FASB) issued Accounting Standards Update (“ASU”) No. 2020-04, Reference Rate Reform (Topic 848): Facilitation of the Effects of Reference Rate Reform on Financial Reporting. The Funds’ investments, payment obligations, and financing terms may be based on floating rates, such as the London Interbank Offered Rate, or “LIBOR,” which is the offered rate for short-term Eurodollar deposits between major international banks. Plans are underway to phase out the use of LIBOR by the end of 2021. There remains uncertainty regarding the nature of any replacement rate and the impact of the transition from LIBOR on the Funds’ transactions and the financial markets generally. As such, the potential effect of a transition away from LIBOR on the Funds or the Funds’ investments cannot yet be determined.
3. DERIVATIVE INSTRUMENTS
Swap Contracts: The Select Fund may enter into swap transactions for hedging purposes or to seek to increase total return. At the present time, the Select Fund primarily enters into swap transactions for the purpose of increasing total return. Risks may arise as a result of the failure of the counterparty to the swap contract to comply with the terms of the swap contract. The loss incurred by the failure of a counterparty is generally limited to the net payment to be received by the Select Fund and/or the termination value at the end of the contract.
Additionally, risks may arise from unanticipated movements in interest rates or in the value of the underlying reference asset or index. Entering into these agreements involves, to varying degrees, market risk, liquidity risk and elements of credit, legal and documentation risk that are not directly reflected in the amounts.
Risk of Investing in Derivatives: Additional associated risks from investing in derivatives also exist and potentially could have significant effects on the valuation of the derivative and the Select Fund. Typically, the associated risks are not the risks that the Select Fund is attempting to increase or decrease exposure to, per its investment objectives, but are the additional risks from investing in derivatives.
Examples of these associated risks are liquidity risk, which is the risk that the Select Fund will not be able to sell or close out the derivative in a timely manner, and counterparty credit risk, which is the risk that the counterparty will not fulfill its obligation to the Select Fund. In addition, use of derivatives may increase or decrease exposure equity risk. Equity risk relates to the change in value of equity securities as they relate to increases or decreases in the general market. Associated risks can be different for each type of derivative and are discussed by each derivative type in the notes that follow.
The Select Fund invests in total return swaps to obtain exposure to a security or market without owning such security or investing directly in that market or to transfer the risk/return of one market (e.g., fixed income) to another market (e.g., equity) (equity risk and/or interest rate risk). Total return swaps are agreements in which there is an exchange of cash flows whereby one party commits to make payments based on the total return (coupons plus capital gains/losses) of an underlying instrument in exchange for fixed or floating rate interest payments. To the extent the total return of the instrument or index underlying the transaction exceeds or falls short of the offsetting interest rate obligation, the Select Fund will receive a payment from or make a payment to the counterparty. The Select Fund must set aside liquid assets, or engage in other appropriate measures, to cover its obligations under these contracts. Swaps are marked to market daily using either pricing vendor quotations, counterparty prices, or model prices and the change in value, if any, is recorded as an unrealized gain or loss. Upfront payments made and/or received by the Select Fund are recorded as an asset and/or liability and realized gains or losses are recognized ratably over the contract’s term/event, with the exception of forward starting interest rate swaps, whose realized gains or losses are recognized ratably from the effective start date. Periodic payments received or made on swap contracts are recorded as realized gains or losses. Gains or losses are realized upon reset of a swap contract. Swap agreements held as of October 31, 2020 are disclosed in the Consolidated Schedule of Investments.
| Semi-Annual Report | October 31, 2020 | 73 |
| Emerald Funds | Notes to Financial Statements |
| | October 31, 2020 (Unaudited) |
Cash collateral is being pledged to cover derivative obligations of the Select Fund and cash collateral received from the counterparty, if any, is reported separately on the Consolidated Statement of Assets and Liabilities as deposits with brokers for total return swap contracts and payable to broker for total return swap contracts, respectively. Non-cash collateral pledged by the Select Fund, if any, is noted in the Consolidated Statement of Investments.
| Risk Exposure | | Statement of Operations Location | | Realized Gain/(Loss)
on Derivatives
Recognized in Income | | | Change in Unrealized
Appreciation/(Depreciation)
on Derivatives
Recognized in Income | |
| Emerald Select trueLiberty Income Fund | | | | | | | | |
| Equity Contracts (Total Return Swap Contracts) | | Net realized gain on total return swap contracts/Net change in unrealized depreciation on total return swap contracts | | $ | 67,281 | | | $ | – | |
| Total | | | | $ | 67,281 | | | $ | – | |
Volume of Derivative Instruments for the Fund during the period ended October 31, 2020 was as follows:
| Derivative Type | Unit of Measurement | Monthly Average |
| Emerald Select trueLiberty Income Fund | | |
| Equity Contracts (Total Return Swap Contract) | Notional Quantity | 764,752 |
4. TAX BASIS INFORMATION
Tax Basis of Investments: As of October 31, 2020, the aggregate cost of investments, gross unrealized appreciation/(depreciation) and net unrealized appreciation/(depreciation) for Federal tax purposes was as follows:
| | | Gross Appreciation
(excess of value over tax cost) | | | Gross Depreciation (excess of tax cost over value) | | | Net Unrealized Appreciation/(Depreciation) | | | Cost of Investments for Income Tax Purposes | |
| Emerald Growth Fund | | $ | 471,104,248 | | | $ | (35,367,344 | ) | | $ | 435,736,904 | | | $ | 854,759,828 | |
| Emerald Small Cap Value Fund | | | 186,696 | | | | (123,631 | ) | | | 63,065 | | | | 1,354,775 | |
| Emerald Insights Fund | | | 4,905,499 | | | | (387,932 | ) | | | 4,517,567 | | | | 10,805,869 | |
| Emerald Banking and Finance Fund | | | 28,296,859 | | | | (6,179,484 | ) | | | 22,117,375 | | | | 100,311,337 | |
| Emerald Select trueLiberty Income Fund | | | 763,197 | | | | (904,293 | ) | | | (141,096 | ) | | | 315,277 | |
The Emerald Small Cap Value Fund and Emerald Banking and Finance Fund elected to defer to the period ending April 30, 2021, capital losses recognized during the period November 1, 2019 to April 30, 2020 in the amount of $1,545 and $32,899,245, respectively.
Ordinary Losses: As of April 30, 2020, the Emerald Growth Fund and Emerald Insights Fund elected to defer to the period ending April 30, 2021, late year ordinary losses in the amount of $1,610,654 and $34,605, respectively.
Tax Basis of Distributions to Shareholders: The character of distributions made during the year from net investment income or net realized gains may differ from its ultimate characterization for federal income tax purposes. Also, due to the timing of dividend distributions, the fiscal year in which amounts are distributed may differ from the fiscal year in which the income or realized gain were recorded by each Fund.
The tax characters of distributions paid by the Funds for the fiscal year or period ended April 30, 2020 were as follows:
| | | Ordinary Income | | | Long-Term Capital Gain | |
| Emerald Growth Fund | | $ | – | | | $ | 18,434,222 | |
| Emerald Small Cap Value Fund | | | – | | | | – | |
| Emerald Insights Fund | | | – | | | | 4,578 | |
| Emerald Banking and Finance Fund | | | – | | | | – | |
| Emerald Select trueLiberty Income Fund | | | – | | | | – | |
| 74 | www.emeraldmutualfunds.com |
| Emerald Funds | Notes to Financial Statements |
| | October 31, 2020 (Unaudited) |
The amounts and characteristics of tax basis distributions and composition of distributable earnings/(accumulated losses) are finalized at fiscal year-end. Accordingly, tax basis balances have not been determined as of October 31, 2020.
5. SECURITIES TRANSACTIONS
The cost of purchases and proceeds from sales of securities (excluding short-term securities) during the year ended October 31, 2020 was as follows:
| Funds | | Cost of Investments
Purchased | | | Proceeds from
Investments Sold | |
| Emerald Growth Fund | | $ | 389,248,823 | | | $ | 479,835,046 | |
| Emerald Small Cap Value Fund | | | 1,198,532 | | | | 1,899,986 | |
| Emerald Insights Fund | | | 6,609,167 | | | | 6,655,572 | |
| Emerald Banking and Finance Fund | | | 76,352,730 | | | | 115,781,863 | |
| Emerald Select trueLiberty Income Fund | | | 301,809 | | | | 220,618 | |
6. SHARES OF BENEFICIAL INTEREST
The capitalization of the Trust consists of an unlimited number of shares of beneficial interest with no par value per share. Holders of the shares of the Funds of the Trust have one vote for each share held and a proportionate fraction of a vote for each fractional share. All shares issued and outstanding are fully paid and are transferable and redeemable at the option of the shareholder. Purchasers of the shares do not have any obligation to make payments to the Trust or its creditors (other than the purchase price for the shares) or make contributions to the Trust or its creditors solely by reason of the purchaser’s ownership of the shares. Shares have no pre-emptive rights.
7. MANAGEMENT AND RELATED-PARTY TRANSACTIONS
The Adviser, subject to the authority of the Board, is responsible for the overall management and administration of the Funds’ business affairs. The Adviser manages the investments of the Funds in accordance with the Funds’ investment objective, policies and limitations and investment guidelines established jointly by the Adviser and the Trustees. Pursuant to the Advisory Agreement, the Funds pay the Adviser fees for the services and facilities it provides payable on a monthly basis at the annual rate set forth below of the Funds’ average daily net assets. The management fee is paid on a monthly basis.
| Emerald Growth Fund | |
| Average Total Net Assets | Contractual Fee |
| Up to and including $250M | 0.75% |
| Over $250M and including $500M | 0.65% |
| Over $500M and including $750M | 0.55% |
| Over $750M | 0.45% |
| Emerald Small Cap Value Fund | |
| Average Total Net Assets | Contractual Fee |
| Up to and including $250M | 0.75% |
| Over $250M and including $500M | 0.65% |
| Over $500M and including $750M | 0.55% |
| Over $750M | 0.45% |
| Emerald Insights Fund | |
| Average Total Net Assets | Contractual Fee |
| Up to and including $250M | 0.75% |
| Over $250M and including $500M | 0.65% |
| Over $500M and including $750M | 0.55% |
| Over $750M | 0.45% |
| Semi-Annual Report | October 31, 2020 | 75 |
| Emerald Funds | Notes to Financial Statements |
| | October 31, 2020 (Unaudited) |
| Emerald Banking and Finance Fund | |
| Average Total Net Assets | Contractual Fee |
| Up to and including $100M | 1.00% |
| Over $100M | 0.90% |
| Emerald Select trueLiberty Income Fund | |
| Average Total Net Assets | Contractual Fee |
| Up to and including $1B | 0.68% |
| Over $1B | 0.64% |
The Subsidiary has entered into a separate advisory agreement (the “Subsidiary Advisory Agreement”) with the Adviser for the management of the Subsidiary’s portfolio pursuant to which the Subsidiary is obligated to pay the Adviser a management fee at the same rate that the Fund pays the Adviser for investment advisory services provided to the Fund. The Adviser has agreed to waive the advisory fee it receives from the Fund in an amount equal to the management fee paid by the Subsidiary. This waiver may not be terminated or modified without the consent of the Board. This agreement may not be terminated or modified prior to this date except with the approval of the Board. For the six months ended October 31, 2020, this amount equaled $375 and is disclosed in the Consolidated Statement of Operations for the Select Fund.
The Adviser has contractually agreed to limit each Fund’s total annual operating expenses (exclusive of acquired fund fees and expenses, brokerage expenses, interest expenses, taxes and extraordinary expense) set forth to the annual shares (as percentages of a Fund’s average daily net assets) in the following table for Class A, Class C, Institutional Class, and Investor Class shares. This agreement (the “Expense Agreement”) is in effect from September 1, 2020 through August 31, 2021, for all Fund's except the Select Fund, which is in effect from September 20, 2019 through August 31, 2021. The prior Expense Agreement was in effect from September 1, 2019 through August 31, 2020 for all Fund's except the Select Fund. The Adviser will be permitted to recover, on a class-by-class basis, expenses it has borne through the expense agreement to the extent that a Fund’s expenses in later periods fall below the expense cap in effect at the time of the waiver or reimbursement. Notwithstanding the foregoing, the Funds will not be obligated to pay any such fees and expenses more than three years after the date of the waiver or reimbursement. The Adviser may not discontinue this waiver, prior to August 31, 2021, without the approval by the Fund’s Board, for all Fund's except the Select Fund, which is August 31, 2021. Fees waived/reimbursed by the Adviser for the six months ended October 31, 2020 are disclosed in the Statements of Operations and the Consolidated Statement of Operations.
| Emerald Growth Fund |
| Class A | Class C | Institutional Class | Investor Class |
| 1.29% | 1.94% | 0.99% | 1.34% |
| Emerald Small Cap Value Fund |
| Class A | Class C | Institutional Class | Investor Class |
| 1.35% | 2.00% | 1.00% | 1.25% |
| Emerald Insights Fund |
| Class A | Class C | Institutional Class | Investor Class |
| 1.35% | 2.00% | 1.05% | 1.40% |
| Emerald Banking and Finance Fund |
| Class A | Class C | Institutional Class | Investor Class |
| 1.84% | 2.49% | 1.54% | 1.89% |
| Emerald Select trueLiberty Fund |
| Class A | | Institutional Class | |
| 1.06% | | 0.76% | |
| 76 | www.emeraldmutualfunds.com |
| Emerald Funds | Notes to Financial Statements |
| | October 31, 2020 (Unaudited) |
For the six months ended October 31, 2020, the fee waivers/reimbursements and recoupments of past waived fees were as follows:
| Fund | | Fees Waived/ Reimbursed By Adviser | | | Recoupment of Past Waived Fees By Adviser | |
| Emerald Growth Fund | | | | | | |
| Class A | | $ | – | | | $ | – | |
| Class C | | | – | | | | – | |
| Institutional Class | | | – | | | | – | |
| Investor Class | | | – | | | | – | |
| Emerald Small Cap Value Fund | | | | | | | | |
| Class A | | $ | 29,061 | | | $ | – | |
| Class C | | | 966 | | | | – | |
| Institutional Class | | | 18,185 | | | | – | |
| Investor Class | | | 11,738 | | | | – | |
| Emerald Insights Fund | | | | | | | | |
| Class A | | $ | 39,024 | | | $ | – | |
| Class C | | | 548 | | | | – | |
| Institutional Class | | | 5,754 | | | | – | |
| Investor Class | | | 854 | | | | – | |
| Emerald Banking and Finance Fund | | | | | | | | |
| Class A | | $ | – | | | $ | – | |
| Class C | | | – | | | | – | |
| Institutional Class | | | – | | | | – | |
| Investor Class | | | – | | | | – | |
| Emerald Select trueLiberty Income Fund | | | | | | | | |
| Class A | | $ | 7,146 | | | $ | – | |
| Class C | | | – | | | | – | |
| Institutional Class | | | 129,626 | | | | – | |
| Investor Class | | | – | | | | – | |
| Semi-Annual Report | October 31, 2020 | 77 |
| Emerald Funds | Notes to Financial Statements |
October 31, 2020 (Unaudited)
As of October 31, 2020, the balances of recoupable expenses for each Fund were as follows:
| Fund | | Expires 2021 | | | Expires 2022 | | | Expires 2023 | | | Expires 2024 | | | Total | |
| Emerald Growth Fund | | | | | | | | | | | | | | | |
| Class A | | $ | – | | | $ | – | | | $ | – | | | $ | – | | | $ | – | |
| Class C | | | – | | | | – | | | | – | | | | – | | | | – | |
| Institutional Class | | | – | | | | – | | | | – | | | | – | | | | – | |
| Investor Class | | | – | | | | – | | | | – | | | | – | | | | – | |
| Emerald Small Cap Value Fund | | | | | | | | | | | | | | | | | | | | |
| Class A | | $ | 19,439 | | | $ | 63,581 | | | $ | 72,647 | | | $ | 29,061 | | | $ | 184,728 | |
| Class C | | | 1,410 | | | | 936 | | | | 1,556 | | | | 966 | | | | 4,868 | |
| Institutional Class | | | 25,158 | | | | 27,060 | | | | 30,474 | | | | 18,185 | | | | 100,876 | |
| Investor Class | | | 3,595 | | | | 8,872 | | | | 18,986 | | | | 11,738 | | | | 43,191 | |
| Emerald Insights Fund | | | | | | | | | | | | | | | | | | | | |
| Class A | | $ | 35,575 | | | $ | 77,413 | | | $ | 88,177 | | | $ | 39,024 | | | $ | 240,190 | |
| Class C | | | 473 | | | | 1,019 | | | | 1,283 | | | | 548 | | | | 3,323 | |
| Institutional Class | | | 4,128 | | | | 11,141 | | | | 12,318 | | | | 5,754 | | | | 33,340 | |
| Investor Class | | | 339 | | | | 1,004 | | | | 1,098 | | | | 854 | | | | 3,295 | |
| Emerald Banking and Finance Fund | | | | | | | | | | | | | | | | | | | | |
| Class A | | $ | – | | | $ | – | | | $ | – | | | $ | – | | | $ | – | |
| Class C | | | – | | | | – | | | | – | | | | – | | | | – | |
| Institutional Class | | | – | | | | – | | | | – | | | | – | | | | – | |
| Investor Class | | | – | | | | – | | | | – | | | | – | | | | – | |
| Emerald Select trueLiberty Income Fund | | | | | | | | | | | | | | | | | | | | |
| Class A | | $ | – | | | $ | – | | | $ | 22,352 | | | $ | 7,146 | | | $ | 29,499 | |
| Institutional Class | | | – | | | | – | | | | 89,728 | | | | 129,626 | | | | 219,354 | |
Fund Administrator Fees and Expenses: ALPS Fund Services, Inc. (“ALPS”) serves as administrator to the Funds and the Funds have agreed to pay expenses incurred in connection with their administrative activities. Pursuant to an Administration Agreement, ALPS provides operational services to the Funds including, but not limited to, fund accounting and fund administration and generally assist in the Funds’ operations. Officers of the Trust are employees of ALPS. The Funds’ administration fee is accrued on a daily basis and paid monthly. Administration fees paid by the Funds for the six months ended October 31, 2020 are disclosed in the Statements of Operations or Consolidated Statement of Operations.
The Administrator is also reimbursed by the Funds for certain out-of-pocket expenses.
Transfer Agent: ALPS serves as transfer, dividend paying and shareholder servicing agent for the Funds. ALPS receives an annual minimum fee, a fee based upon the number of shareholder accounts, and is also reimbursed by the Funds for certain out-of-pocket expenses. Transfer agent fees paid by the Funds for the six months ended October 31, 2020 are disclosed in the Statements of Operations or Consolidated Statement of Operations.
Compliance Services: ALPS provides services that assist the Trust’s chief compliance officer in monitoring and testing the policies and procedures of the Trust in conjunction with requirements under Rule 38a-1 under the 1940 Act and receives an annual base fee. ALPS is reimbursed for certain out-of-pocket expenses by the Funds. Compliance service fees paid by the Funds for the period or year ended October 31, 2020 are disclosed in the Statements of Operations or Consolidated Statement of Operations.
Principal Financial Officer: ALPS receives an annual fee for providing principal financial officer services to the Funds. Principal financial officer fees paid by the Funds for the six months ended October 31, 2020 are disclosed in the Statements of Operations or Consolidated Statement of Operations.
Distributor: ALPS Distributors, Inc. (“ADI” or the “Distributor”) (an affiliate of ALPS) acts as the distributor of the Funds’ shares pursuant to a Distribution Agreement with the Trust. Shares are sold on a continuous basis by ADI as agent for the Funds, and ADI has agreed to use its best efforts to solicit orders for the sale of Funds’ shares, although it is not obliged to sell any particular amount of shares. ADI is not entitled to any compensation for its services as Distributor. ADI is registered as a broker-dealer with the U.S. Securities and Exchange Commission.
Each Fund has adopted a separate Distribution and Services Plan (each a “Plan” and collectively, the “Plans”) pursuant to Rule 12b-1 of the 1940 Act. The Plans allow each Fund, as applicable, to use each Fund’s assets to pay fees in connection with the distribution and marketing of the Funds’
| 78 | www.emeraldmutualfunds.com |
| Emerald Funds | Notes to Financial Statements |
| | October 31, 2020 (Unaudited) |
shares and/or the provision of shareholder services to the Funds’ shareholders. The Plan permits payment for services in connection with the administration of plans or programs that use shares of each Fund as their funding medium and for related expenses. The recipients of such payments may include other affiliates of the Adviser, broker-dealers, financial institutions, plan sponsors and administrators and other financial intermediaries through which investors may purchase shares of the Fund. The Plans permit each Fund to make total payments at an annual rate of up to 0.35%, 0.75% and 0.25% of the average daily net asset value of Class A, Class C and Investor Class, respectively. Because these fees are paid out of the Funds’ assets on an ongoing basis, over time they will increase the cost of an investment in the Funds, and Plan fees may cost an investor more than other types of sales charges.
Each Fund, except the Emerald Small Cap Value Fund, has adopted a Shareholder Services Plan (a “Shareholder Services Plan”) with respect to its Class C, Institutional Class and Investor Class shares. Under the Shareholder Services Plan, a Fund is authorized to compensate certain financial intermediaries, including broker-dealers and Fund affiliates which may include the Distributor, Adviser and/or the transfer agent (the “Participating Organizations”), an aggregate fee in an amount not to exceed on an annual basis 0.25%, 0.05% and 0.15% of the average daily net asset value of Class C, Institutional Class and Investor Class, respectively, of the Funds attributable to or held in the name of the Participating Organizations pursuant to an agreement with such Participating Organizations (the “Agreement”). Each Agreement will set forth the non-distribution related shareholder services to be performed by the Participating Organizations for the benefit of a Fund’s shareholders who have elected to have such Participating Organizations service their accounts. Any amount of such payment not paid to Participating Organizations during a Fund’s fiscal year for such service activities shall be reimbursed to the Fund as soon as practicable. Shareholder Services Plan fees are included with distribution and service fees in the Statements of Operations. Fees recaptured pursuant to the Shareholder Services Plan for the six months ended October 31, 2020, are included as an offset to distribution and service fees as disclosed in the Statements of Operations.
The Emerald Small Cap Value Fund has adopted a Shareholder Services Plan (the “Plan”) with respect to its Class C shares. Under the Plan, the Fund is authorized to pay banks and its affiliates and other institutions, including broker-dealers and Fund affiliates which may include the Distributor, Adviser and/or the transfer agent (“Class C Participating Organizations”), an aggregate fee in an amount not to exceed on an annual basis 0.25% of the average daily net asset value of Class C shares of the Fund attributable to or held in the name of the Participating Organizations for its clients as compensation for providing shareholder service activities, which do not include distribution services pursuant to an agreement with Participating Organizations. Any amount of such payment not paid to the Participating Organizations during the Fund’s fiscal year for such service activities shall be reimbursed to the Fund as soon as practicable. Plan fees are included with distribution and service fees in the Statements of Operations. Fees recaptured pursuant to the Plan for the six months ended October 31, 2020 are included as an offset to distribution and service fees as disclosed in the Statements of Operations.
Trustees
The fees and expenses of the Trustees of the Board are presented in the Statements of Operations or Consolidated Statement of Operations.
8. INDEMNIFICATIONS
Under the Trust’s organizational documents, its officers and Trustees are indemnified against certain liability arising out of the performance of their duties to the Trust. Additionally, in the normal course of business, the Trust enters into contracts with service providers that may contain general indemnification clauses, which may permit indemnification to the extent permissible under applicable law. The Trust’s maximum exposure under these arrangements is unknown, as this would involve future claims that may be made against the Trust that have not yet occurred.
9. SUBSEQUENT EVENTS
Subsequent events after the date of the Statements of Assets and Liabilities have been evaluated through the date the financial statements were issued.
| Semi-Annual Report | October 31, 2020 | 79 |
| Emerald Funds | Additional Information |
October 31, 2020 (Unaudited)
1. FUND HOLDINGS
The Funds file their complete schedule of portfolio holdings with the Securities and Exchange Commission (SEC) for the first and third quarters of each fiscal year as an exhibit to its reports on Form N-PORT. The Funds’ Form N-PORT reports are available on the SEC's Web site at http://www.sec.gov. The Funds’ Form N-PORT reports are also available upon request by calling (toll-free) (855) 828-9909.
2. FUND PROXY VOTING POLICIES, PROCEDURES AND SUMMARIES
Each Fund’s policies and procedures used in determining how to vote proxies and information regarding how the Funds voted proxies relating to portfolio securities during the most recent prior 12-month period ending June 30 are available without charge, (1) upon request, by calling (toll-free) (855) 828-9909 and (2) on the SEC’s website at http://www.sec.gov.
| 80 | www.emeraldmutualfunds.com |
| Emerald Funds | Privacy Policy |
| Who We Are | | |
| Who is providing this notice? | Emerald Banking and Finance Fund, Emerald Growth Fund, Emerald Insights Fund and Emerald Small Cap Value Fund |
| What We Do | | |
| How do the Funds protect my personal information? | To protect your personal information from unauthorized access and use, we use security measures that comply with federal law. These measures include computer safeguards and secured files and buildings. |
| How do the Funds collect my personal information? | We collect your personal information, for example, when you |
| | • | open an account |
| | • | provide account information or give us your contact information |
| | • | make a wire transfer or deposit money |
| Why can’t I limit all sharing? | Federal law gives you the right to limit only |
| | • | sharing for affiliates’ everyday business purposes-information about your creditworthiness |
| | • | affiliates from using your information to market to you |
| | • | sharing for non-affiliates to market to you |
| | State laws and individual companies may give you additional rights to limit sharing. |
| Definitions | | |
| Affiliates | Companies related by common ownership or control. They can be financial and nonfinancial companies. |
| Non-affiliates | Companies not related by common ownership or control. They can be financial and nonfinancial companies. |
| | • | The Funds do not share with non- affiliates so they can market to you. |
| Joint marketing | A formal agreement between non-affiliated financial companies that together market financial products or services to you. |
| | • | The Funds do not jointly market. |
| Other Important Information | |
| California residents | If your account has a California home address, your personal information will not be disclosed to nonaffiliated third parties except as permitted by applicable California law, and we will limit sharing such personal information with our affiliates to comply with California privacy laws that apply to us. |
| Vermont residents | The State of Vermont requires financial institutions to obtain your consent prior to sharing personal information that they collect about you with affiliated companies and nonaffiliated third parties other than in certain limited circumstances. Except as permitted by law, we will not share personal information we collect about you with nonaffiliated third parties or other affiliated companies unless you provide us with your written consent to share such information. |
| Semi-Annual Report | October 31, 2020 | 81 |
| Emerald Funds | Privacy Policy |
| WHAT DO THE FUNDS DO WITH YOUR PERSONAL INFORMATION? |
| WHY? | Financial companies choose how they share your personal information. Federal law gives consumers the right to limit some but not all sharing. Federal law also requires us to tell you how we collect, share, and protect your personal information. |
| | Please read this notice carefully to understand what we do. |
| WHAT? | The types of personal information we collect and share depend on the product or service you have with us. This information can include: |
| | • | Social Security number and account transactions |
| | • | Account balances and transaction history |
| | • | Wire transfer instructions |
| HOW? | All financial companies need to share customers’ personal information to run their everyday business. In the section below, we list the reasons financial companies can share their customers’ personal information; the reasons the Funds choose to share; and whether you can limit this sharing. |
| Reasons we can share your personal information | Do the funds share: | Can you limit this sharing? |
| For our everyday business purposes – | | |
| such as to process your transactions, maintain your account(s), respond to court orders and legal investigations, or report to credit bureaus | Yes | No |
For our marketing purposes –
to offer our products and services to you | No | We do not share. |
| For joint marketing with other financial companies | No | We do not share. |
For our affiliates’ everyday business purposes –
information about your transactions and experiences | Yes | No |
For our affiliates’ everyday business purposes –
information about your creditworthiness | No | We do not share. |
| For non-affiliates to market to you | No | We do not share. |
| 82 | www.emeraldmutualfunds.com |
| | |
Intentionally Left Blank


Beginning on January 1, 2021, as permitted by regulations adopted by the U.S. Securities and Exchange Commission, paper copies of the Funds’ annual and semi-annual shareholder reports will no longer be sent by mail, unless you specifically request paper copies of the reports. Instead, the reports will be made available on the Funds’ website at www.GrandeurPeakGlobal.com and you will be notified by mail each time a report is posted and provided with a website link to access the report.
You may, notwithstanding the availability of shareholder reports online, elect to receive all future shareholder reports in paper free of charge. If you invest through a financial intermediary, you can contact your financial intermediary to request that you continue to receive paper copies of your shareholder reports. If you invest directly with the Funds, you can call 1-855-377-PEAK (7325) to let the Funds know you wish to continue receiving paper copies of your shareholder reports.
If you already elected to receive shareholder reports electronically, you will not be affected by this change and you need not take any action. You may elect to receive shareholder reports and other communications from the Funds electronically anytime by contacting your financial intermediary (such as a broker-dealer or bank) or, if you are a direct investor, by enrolling at www.GrandeurPeakGlobal.com.

TABLE OF CONTENTS
| Shareholder Letter | 2 |
| Performance Update | 7 |
| Disclosure of Fund Expenses | 34 |
| Portfolio of Investments | |
| Grandeur Peak Emerging Markets Opportunities Fund | 37 |
| Grandeur Peak Global Contrarian Fund | 40 |
| Grandeur Peak Global Micro Cap Fund | 43 |
| Grandeur Peak Global Opportunities Fund | 46 |
| Grandeur Peak Global Reach Fund | 50 |
| Grandeur Peak Global Stalwarts Fund | 55 |
| Grandeur Peak International Opportunities Fund | 58 |
| Grandeur Peak International Stalwarts Fund | 62 |
| Grandeur Peak US Stalwarts Fund | 65 |
| Statements of Assets and Liabilities | 67 |
| Statements of Operations | 70 |
| Statements of Changes in Net Assets | |
| Grandeur Peak Emerging Markets Opportunities Fund | 73 |
| Grandeur Peak Global Contrarian Fund | 74 |
| Grandeur Peak Global Micro Cap Fund | 75 |
| Grandeur Peak Global Opportunities Fund | 76 |
| Grandeur Peak Global Reach Fund | 77 |
| Grandeur Peak Global Stalwarts Fund | 78 |
| Grandeur Peak International Opportunities Fund | 79 |
| Grandeur Peak International Stalwarts Fund | 80 |
| Grandeur Peak US Stalwarts Fund | 81 |
| Financial Highlights | |
| Grandeur Peak Emerging Markets Opportunities Fund | 82 |
| Grandeur Peak Global Contrarian Fund | 84 |
| Grandeur Peak Global Micro Cap Fund | 85 |
| Grandeur Peak Global Opportunities Fund | 86 |
| Grandeur Peak Global Reach Fund | 88 |
| Grandeur Peak Global Stalwarts Fund | 90 |
| Grandeur Peak International Opportunities Fund | 92 |
| Grandeur Peak International Stalwarts Fund | 94 |
| Grandeur Peak US Stalwarts Fund | 96 |
| Notes to Financial Statements | 97 |
| Disclosure Regarding Approval of Fund Advisory Agreement | 117 |
| Additional Information | 119 |
| Privacy Policy | 120 |
| Grandeur Peak Funds® | Shareholder Letter |
October 31, 2020 (Unaudited)
Dear Fellow Shareholders,
After another surprisingly strong period of stock market performance, the thought that strikes us is: “Don’t fight the Fed.” The Federal Reserve Bank (aka: The Fed, aka: The Central Bank, aka: The Most Powerful Financial Institution on the Planet), was founded by the US Congress in 1913. Its creation was precipitated by repeated financial panics culminating in a crisis in 1907 known as “The Knickerbocker Crisis”1.
Over a 3-week period in (you guessed it) October, the Knickerbocker Crisis began with a fascinating (to us market historians) scheme to pump up the shares of the United Copper Company by Otto Heinze, whose family controlled the company. When the scheme failed and the shares of the company plummeted, Otto Heinze was ruined, which then set off a chain of events that rippled through the banking system. Unable to collect on his debts, Otto’s brokerage firm failed. Next, the State Savings Bank of Butte Montana (which was owned by Otto’s brother Augustus), failed due to its large holdings of United Copper shares that it held as collateral against some of its loans. Augustus Heinze was also the president of the Mercantile National Bank in New York, and as news of the collapse of the Montana bank spread, there was a run on the New York bank.
From there, many other financial institutions that were associated with Augustus started to topple, including the Knickerbocker Trust Company, the third largest Trust Company in New York. On October 22, in less than three hours, $8 million (about $220 million in 2020 dollars) was withdrawn and by noon the Knickerbocker was forced to suspend operations. (Where was George Bailey when they needed him?) Of course the panic kept spreading from there: stock prices plummeted, the US economy entered a lengthy contraction, industrial production dropped, bankruptcies skyrocketed, unemployment jumped, and yada, yada, yada.
In May 1908, Congress passed the Aldrich–Vreeland Act, which established the National Monetary Commission to investigate the panic and to propose legislation to regulate banking. Finally, after five years of study (Senator Nelson Aldrich, the chairman of the National Monetary Commission, actually moved to Europe for two years to study Europe’s banking systems), hearings, proposals, amendments and debates, Congress passed the Federal Reserve Act in December, 1913. And with the newly established Federal Reserve System (aka: The Fed, aka: the Central Bank, aka: The Most Powerful Financial Institution on the Planet), the US Economy lived happily ever after, and there was never another Financial Crisis ever again.
In an essay published in December 2011 by the Federal Reserve Bank of Richmond, Aaron Steelman (who at the time was the Director of Publications in the Research Dept. at the Fed Richmond)2 describes the evolution of the Fed’s mandate from Congress to “promote effectively the dual goals of maximum employment and stable prices” (what is now known as the famous “Dual Mandate”). During its 100-year-plus history, the Federal Reserve has evolved considerably regarding both the scope of its duties and the actions it has taken to meet them. More recently, it seems the Fed’s main role has been the “buyer of last resort” for all kinds of financial instruments. At this point, it seems that the “stable prices” bit of the Dual Mandate no longer refers to the common view of Inflation, but rather to the stability of the US Stock Market.
Remember the ‘80s? Remember how everyone was freaking out because Reagan turned on the Debt spigot and grew the Total National Debt from $964 billion at January 1981 to $3.5 Trillion ten years later (January 1991), as shown in Exhibit 1.
| 1 | This was the first Knickerbocker crisis. Many more Knickerbocker crises would befall the NBA over the ensuing years, culminating in a horrendous 2013 season as documented by Ohm Youngmisuk, and ESPN Staff Writer (https://www.espn.com/new-york/nba/story/_/id/9991756/new-york-knicks-fallen-apart) |
| 2 | Federal Reserve Bank of Richmond: December 2011, EB11-12, The Federal Reserve’s “Dual Mandate”: The Evolution of an Idea (https://www.richmondfed.org/-/media/richmondfedorg/publications/research/economic_brief/2011/pdf/eb_11-12.pdf) |
| 2 | 1.855.377.7325 | www.GrandeurPeakGlobal.com |
| Grandeur Peak Funds® | Shareholder Letter |
October 31, 2020 (Unaudited)
Exhibit 1: Federal Debt: Total Public Debt (GFDEBTN): Jan 1966 – Jan 1991
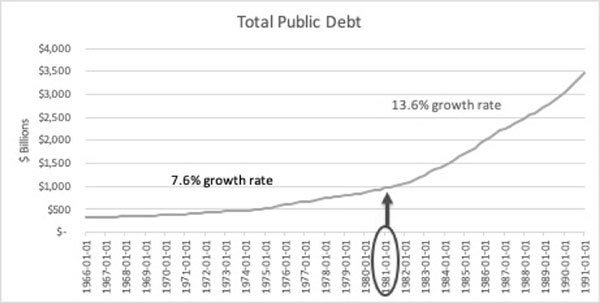
Source: Federal Reserve Economic Data (FRED); Federal Reserve Bank of St. Louis
The data for Exhibit 1 only go back to January 1966, from that period through January 1981, the Federal debt grew at a 7.6% cumulative annualized growth rate (CAGR). Over the decade of the 1980s, the rate of growth jumped to 13.6%. It’s hard to track down what all that debt was spent on -- the Federal Reserve Economic Data (FRED) set only publishes data on the Assets side of the Fed’s balance sheet back to December 2002 -- but we’re pretty sure the government was buying tanks, nuclear warheads, ships, and guns, and not toxic Mortgage Backed Securities and High Yield Bond ETFs.
In December 2002, the assets on the Fed’s balance sheet stood at $720 billion, while Total Public Debt at that time was $6,461 billion. You are no doubt aware of what happened to the US Balance sheet post the 2008 Crisis as the Fed pulled out all the stops to save the Global Economy. But just as a quick reminder we present Exhibit 2.
| Semi-Annual Report | October 31, 2020 | 3 |
| Grandeur Peak Funds® | Shareholder Letter |
October 31, 2020 (Unaudited)
Exhibit 2: Total Public Debt (GFDEBTN) vs. Total Assets (WALCL): Dec 2002 – Jan 2010
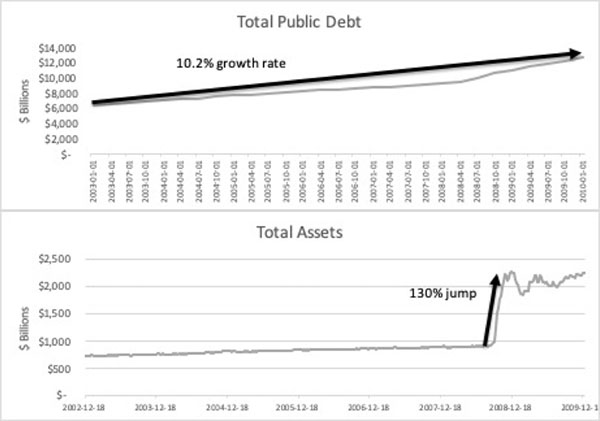
Source: Federal Reserve Economic Data (FRED); Federal Reserve Bank of St. Louis
Over the period shown, Total Public Debt grew from $6,461 billion to $12,773, a CAGR of 10.2%. But over just a 12-week period in September and October of 2008, the Fed grew its Assets by 130% to $2.3 Trillion. And guess what? Their “Quantitative Easing” (QE) strategy worked. After having fallen by 50% from October 2008 to February 2009, the US Stock Market (as measured by the S&P 500) began a steady climb out of its deep, dark hole, reaching its previous high by March 2012, as shown in Exhibit 3.
Exhibit 3: S&P 500 Index Total Return: Oct 2007 – Mar 2012
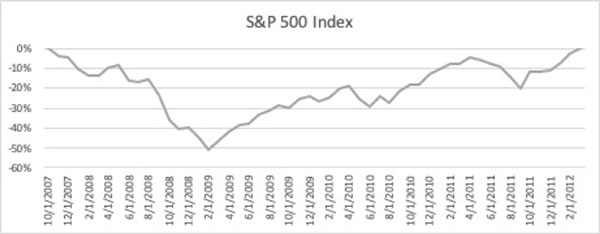
Source: S&P Dow Jones Indices
And thus a new era of Fed Policy was born and its Dual Mandate was effectively changed to “promote effectively the dual goals of maximum employment and maximum Retirement Account balances”. Over the past 8-plus years, since the S&P 500 regained its High Watermark, the Fed has just kept buying and buying, sending the Stock Market to ever dizzying heights and valuation. Exhibit 4 shows the growth in the Fed’s Assets since Oct 2008.
| 4 | 1.855.377.7325 | www.GrandeurPeakGlobal.com |
| Grandeur Peak Funds® | Shareholder Letter |
October 31, 2020 (Unaudited)
Exhibit 4: Total Assets (WALCL): Oct 2008 – Sep 2020
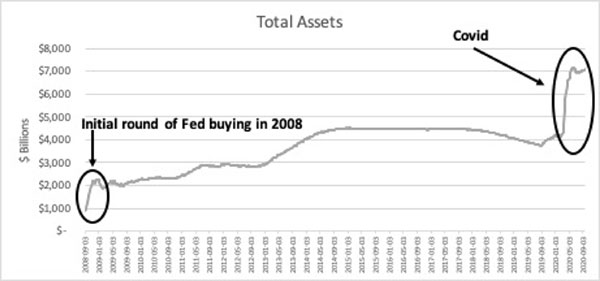
Source: Federal Reserve Economic Data (FRED); Federal Reserve Bank of St. Louis
This year’s round of buying, beginning in February 2020, makes the 2008 round of QE look like a Kardashian’s weekend spree to Vegas. So if you’re sitting here pouring over the horrendous economic data coming out of the US Bureau of Economic Analysis (BEA)3 and scratching your head trying to understand why the S&P 500 is once again hitting all-time highs, just smile and nod at your good old pal The Fed, and take Bobby McFerrin’s advice: “Don’t Worry, Be Happy.”4
Business Update
Five months into our work-from-home approach, we were optimistic that cautiously returning the team back to our office in Salt Lake City was possible. However, shortly after Labor Day, the COVID-19 cases began to rise in the local community and so we postponed our transition. Instead, team members may coordinate with their respective officemates and utilize our offices by request. We remain committed to doing our part to reduce the potential impact of the pandemic on our communities, as we are fortunate to be able to be equally effective working from our home offices.
Juliette Douglas has been named a co-Portfolio Manager of the Grandeur Peak International Opportunities Fund (GPIOX/GPIIX), joining Blake Walker, CEO who has managed the Fund since its inception. Mark Madsen (CFA, MAcc), who has been serving as a co-Portfolio Manager will now be a Guardian Portfolio Manager of the Fund, along with Robert Gardiner (CFA).
Ms. Douglas is Deputy Director of Research and a Portfolio Manager on the International Opportunities Fund and Global Reach Fund. Ms. Douglas joined Grandeur Peak in 2013 from Adidas, where she was a financial analyst. Prior to Adidas, Ms. Douglas had worked at Wasatch Advisors. Ms. Douglas graduated with honors from Westminster College where she earned a Bachelor of Science in Business, with a concentration in Finance.
Effective September 1, 2020, we modified the fee waivers on the following funds as follows:
| ● | Grandeur Peak Global Opportunities Fund (GPGOX/GPGIX): management fee lowered to 1.00% on assets above $500 million |
| ● | Grandeur Peak Internationals Opportunities Fund (GPIOX/GPIIX): management fee lowered to 1.00% on assets above $500 million |
| ● | Grandeur Peak Emerging Markets Opportunities Fund (GPEOX/GPEIX): management fee lowered to 1.00% on assets above $400 million |
Our intent in offering these fee waivers is to share the economic success of these funds with shareholders. It has been our stated intent from the founding of the firm to share economic success with our team, our clients, and our local and global community.
In addition, we have lowered our account minimums to $1,000 for direct investors to make it easier for young investors to begin investing. The account minimum for minors remains just $100.
We continue to monitor our fund flows as part of our responsibility to control asset levels. The majority of our funds remain open to new investors with two exceptions: the International Stalwarts and Global Micro Cap Funds are Soft Closed meaning they are available to existing investors who
| 3 | Real GDP down -31.4% in Q2; Personal Consumption down -33.2%; Unemployment Rate at 8.4% after hitting 15% in April; yada, yada, yada (https://www.bea.gov/news/glance) |
| 4 | https://www.youtube.com/watch?v=d-diB65scQU |
| Semi-Annual Report | October 31, 2020 | 5 |
| Grandeur Peak Funds® | Shareholder Letter |
October 31, 2020 (Unaudited)
make additional purchases or to new investors who make direct purchases. We will seek to be transparent and maintain open communication on product status as market conditions evolve.
Recently, we were pleased to mark the very successful 5-year anniversary of our Global Stalwarts and International Stalwarts Funds, as well as the 1-year anniversary of the Global Contrarian Fund. From their inception, the Stalwarts Funds have set out to find what we believe are the highest quality companies (primarily small- and mid-cap) with sustainable competitive advantages and nice growth opportunities. The team has been led by Randy Pearce, Chief Investment Officer and Portfolio Manager, and Brad Barth, Deputy CIO and Portfolio Manager. Our hope was that having these strategies which focus on companies larger than $1.5B in market cap, we’d be able to enhance and improve our research process. The team’s focus on quality has had a lasting impact across all of our strategies and has generated meaningful performance for our shareholders over the past five years.
We are happy to have Conner Whipple and Spencer Hackett join us again full time after completing advanced degrees. Conner received an MBA from Oxford University and Spencer completed a Masters in Finance at the University of Utah. We support the ongoing educational and development goals of our team and look forward to the additional value they bring to our process and we expect, in turn, to our shareholders.
We are grateful for you, our partners, for choosing to take this journey with us. Despite the volatility or uncertainty that may exist in either the markets or the world broadly, we take comfort in the relationships we’ve been able to develop with you over the years and appreciate your interest in us.
As always, please feel free to reach out any time with any questions, requests or comments. We appreciate the opportunity to work on your behalf
Sincerely,
Your Grandeur Peak Team
The objective of all Grandeur Peak Funds is long-term growth of capital.
RISKS: Investing in small and micro-cap funds will be more volatile and loss of principal could be greater than investing in large cap or more diversified funds. Investing in foreign securities entails special risks, such as currency fluctuations and political uncertainties, which are described in more detail in the prospectus. Investments in emerging markets are subject to the same risks as other foreign securities and may be subject to greater risks than investments in foreign countries with more established economies and securities markets.
An investor should consider investment objectives, risks, charges, and expenses carefully before investing. To obtain a Grandeur Peak Funds prospectus, containing this and other information, visit www.grandeurpeakglobal.com or call 1-855-377-7325. Please read it carefully before investing.
The views and information discussed in this commentary are as of the date of publication, are subject to change, and may not reflect the writer's current views. The views expressed represent an assessment of market conditions at a specific point in time, are opinions only and should not be relied upon as investment advice regarding a particular investment or markets in general. Such information does not constitute a recommendation to buy or sell specific securities or investment vehicles. It should not be assumed that any investment will be profitable or will equal the performance of the Funds or any securities or any sectors mentioned herein. The subject matter contained herein has been derived from several sources believed to be reliable and accurate at the time of compilation. The Funds do not accept any liability for losses either direct or consequential caused by the use of this information.
Past performance does not guarantee future results.
Grandeur Peak Funds are distributed by ALPS Distributors, Inc. (ADI). ADI is not affiliated with Grandeur Peak Global Advisors.
A mortgage-backed security is a type of asset-backed security which is secured by a mortgage or collection of mortgages. The mortgages are aggregated and sold to a group of individuals that securitizes, or packages, the loans together into a security that investors can buy.
The term "high-yield funds" generally refers to mutual funds or exchange-traded funds (ETFs) that hold stocks that pay above-average dividends, bonds with above-average interest payments, or a combination of both.
Quantitative easing is a monetary policy whereby a central bank purchases at scale government bonds or other financial assets in order to inject money into the economy to expand economic activity.
The S&P 500® Index is an unmanaged index of 500 common stocks chosen for market size, liquidity and industry group representation. It is a market-value weighted index. The Index is not actively managed and does not reflect any deductions for fees, expenses or taxes. An investor may not invest directly in the Index.
| 6 | 1.855.377.7325 | www.GrandeurPeakGlobal.com |
| Grandeur Peak Emerging Markets Opportunities Fund | Performance Update |
October 31, 2020 (Unaudited)
Annualized Total Return Performance for the periods ended October 31, 2020
| | | | | | Since | Expense Ratio(b) |
| | 6 Months | 1 Year | 3 Years | 5 Years | Inception(a) | Gross | Net(c) |
| Grandeur Peak Emerging Markets Opportunities Fund – Investor (GPEOX) | 26.02% | 13.85% | 4.58% | 7.58% | 6.11% | 1.78% | 1.78% |
| Grandeur Peak Emerging Markets Opportunities Fund – Institutional (GPEIX) | 26.21% | 14.18% | 4.85% | 7.82% | 6.35% | 1.53% | 1.53% |
| MSCI Emerging Markets SMID Cap Index(d) | 19.94% | -0.46% | -1.81% | 3.75% | 1.96% | | |
| MSCI Emerging Markets IMI Index(e) | 21.54% | 8.00% | 1.84% | 7.75% | 4.20% | | |
Performance data quoted represents past performance. Past performance does not guarantee future results. Investment return and principal value of an investment will fluctuate so that an investor’s shares, when sold or redeemed, may be worth more or less than the original cost. The Fund imposes a 2.00% redemption fee on shares held for less than 60 days. Current performance data may be higher or lower than actual data quoted. For the most current month-end performance data, please call 1-855-377-PEAK (7325).
The table does not reflect the deduction of taxes a shareholder would pay on Fund distributions or redemption of Fund shares.
Subject to investment risks, including possible loss of the principal amount invested.
Returns for periods less than 1 year are cumulative.
| (a) | Fund inception date of December 16, 2013. |
| (b) | Ratios as of the Prospectus dated August 31, 2020 and may differ from the ratios presented in the Financial Highlights. |
| (c) | Grandeur Peak Global Advisors, LLC (the “Adviser”), has agreed to waive and/or reimburse fees or expenses in order to limit Total Annual Fund Operating Expenses After Fee Waiver/Expense Reimbursement (excluding acquired fund fees and expenses, brokerage expenses, interest expenses, taxes and extraordinary expenses) to 1.95% and 1.70% of the Fund’s average daily net assets for the Fund’s Investor Class Shares and Institutional Class Shares, respectively. This agreement (the “Expense Agreement”) is in effect through August 31, 2021. The Adviser will be permitted to recover, on a class- by-class basis, expenses it has borne through the Expense Agreement to the extent that a Fund’s expenses in later periods fall below annual rates set forth in the Expense Agreement; provided, however, that such recapture payments do not cause the Fund’s expense ratio (after recapture) to exceed the lesser of (i) the expense cap in effect at the time of the waiver and (ii) the expense cap in effect at the time of the recapture. Notwithstanding the foregoing, the Fund will not be obligated to pay any such deferred fees and expenses more than three years after the date on which the fee and expenses was deferred. The Expense Agreement may not be terminated or modified prior to August 31, 2021 except with the approval of the Fund’s Board of Trustees. |
| (d) | The MSCI Emerging Markets SMID Cap Index is designed to measure the equity market performance of small and mid-cap companies across emerging markets. MSCI makes no express or implied warranties or representations and shall have no liability whatsoever with respect to any MSCI data contained herein. The MSCI data may not be further redistributed or used to create indices or financial products. The Index is not actively managed and does not reflect any deductions for fees, expenses or taxes. An investor may not invest directly into the Index. |
| (e) | The MSCI Emerging Markets IMI Index is designed to measure the equity market performance of large, mid, and small-cap companies across emerging markets. The Index is not actively managed and does not reflect any deductions for fees, expenses or taxes. An investor may not invest directly into the Index. |
| Semi-Annual Report | October 31, 2020 | 7 |
| Grandeur Peak Emerging Markets Opportunities Fund | Performance Update |
October 31, 2020 (Unaudited)
Growth of $10,000 for the period ended October 31, 2020
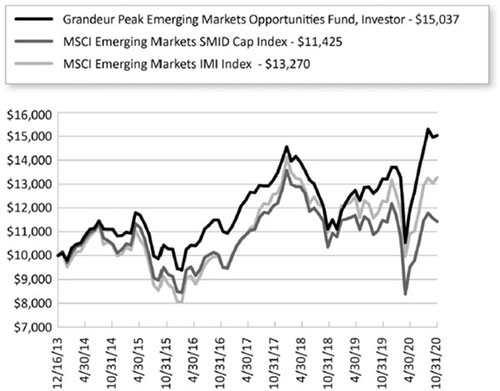
The chart shown above represents a hypothetical investment of $10,000 in the Fund’s Investor Class shares for the period from inception to October 31, 2020. All returns reflect reinvested dividends, but do not reflect the deduction of taxes that an investor would pay on distributions or redemptions.
Investing in the Fund is subject to investment risks, including possible loss of the principal amount invested.
The Fund also offers Institutional Class shares, performance for which is not reflected in the graphs above. The performance of Institutional Class shares may be higher or lower than the performance of the Investor Class shares shown in the graphs above based upon differences in fees paid by shareholders investing in the Investor Class shares and Institutional Class shares.
| 8 | 1.855.377.7325 | www.GrandeurPeakGlobal.com |
| Grandeur Peak Emerging Markets Opportunities Fund | Performance Update |
October 31, 2020 (Unaudited)
| Regional Allocation (as a % of Net Assets)* | |
| Asia ex Japan | 74.2% |
| Latin America | 9.3% |
| Europe | 8.9% |
| North America | 3.7% |
| Africa/Middle East | 4.0% |
| Cash, Cash Equivalents, & Other Net Assets | -0.1% |
| Total | 100.0% |
| Top 10 Holdings (as a % of Net Assets)* | |
| Silergy Corp. | 3.6% |
| WNS Holdings, Ltd. | 2.6% |
| Metropolis Healthcare, Ltd. | 2.2% |
| Poya International Co., Ltd. | 2.2% |
| Dino Polska SA | 2.0% |
| Voltronic Power Technology Corp. | 1.8% |
| Pagseguro Digital, Ltd. | 1.8% |
| Bajaj Finance, Ltd. | 1.6% |
| Locaweb Servicos de Internet SA | 1.6% |
| Man Wah Holdings, Ltd. | 1.6% |
| Total | 21.0% |
| * | Holdings are subject to change, and may not reflect the current or future position of the portfolio. |
| Semi-Annual Report | October 31, 2020 | 9 |
| Grandeur Peak Global Contrarian Fund | Performance Update |
October 31, 2020 (Unaudited)
Annualized Total Return Performance for the periods ended October 31, 2020
| | | | Since | Expense Ratio(b) |
| | 6 Months | 1 Year | Inception(a) | Gross | Net(c) |
| Grandeur Peak Global Contrarian Fund – Institutional (GPGCX) | 24.94% | 8.27% | 10.00% | 4.08% | 1.36% |
| MSCI All Country World Index Small Cap Value(d) | 13.40% | -11.66% | -10.04% | | |
| MSCI All Country World Index Small Cap(e) | 18.88% | 0.69% | 1.97% | | |
Performance data quoted represents past performance. Past performance does not guarantee future results. Investment return and principal value of an investment will fluctuate so that an investor’s shares, when sold or redeemed, may be worth more or less than the original cost. The Fund imposes a 2.00% redemption fee on shares held for less than 60 days. Current performance data may be higher or lower than actual data quoted. For the most current month-end performance data, please call 1-855-377-PEAK (7325).
The table does not reflect the deduction of taxes a shareholder would pay on Fund distributions or redemption of Fund shares.
Subject to investment risks, including possible loss of the principal amount invested.
Returns for periods less than 1 year are cumulative.
| (a) | Fund inception date of September 17, 2019. |
| (b) | Ratios as of the Prospectus dated August 31, 2020 and may differ from the ratios presented in the Financial Highlights. |
| (c) | Grandeur Peak Global Advisors, LLC (the “Adviser”), has agreed to waive and/or reimburse fees or expenses in order to limit Total Annual Fund Operating Expenses After Fee Waiver/Expense Reimbursement (excluding acquired fund fees and expenses, brokerage expenses, interest expenses, taxes and extraordinary expenses) to 1.35% of the Fund’s average daily net assets for the Fund’s Institutional Class Shares. This agreement (the “Expense Agreement”) is in effect through August 31, 2021. The Adviser will be permitted to recover, on a class- by-class basis, expenses it has borne through the Expense Agreement to the extent that a Fund’s expenses in later periods fall below annual rates set forth in the Expense Agreement; provided, however, that such recapture payments do not cause the Fund’s expense ratio (after recapture) to exceed the lesser of (i) the expense cap in effect at the time of the waiver and (ii) the expense cap in effect at the time of the recapture. Notwithstanding the foregoing, the Fund will not be obligated to pay any such deferred fees and expenses more than three years after the date on which the fee and expenses was deferred. The Expense Agreement may not be terminated or modified prior to August 31, 2021 except with the approval of the Fund’s Board of Trustees. |
| (d) | The MSCI ACWI Small Cap Value Index is designed to measure small cap companies exhibiting overall value style characteristics across developed and emerging markets globally. The Index is not actively managed and does not reflect any deductions for fees, expenses or taxes. An investor may not invest directly into the Index. |
| (e) | The MSCI ACWI Small Cap Index is designed to measure the equity market performance of performance of small-cap companies across developed and emerging markets globally. MSCI makes no express or implied warranties or representations and shall have no liability whatsoever with respect to any MSCI data contained herein. The MSCI data may not be further redistributed or used to create indices or financial products. The Index is not actively managed and does not reflect any deductions for fees, expenses or taxes. An investor may not invest directly into the Index. |
| 10 | 1.855.377.7325 | www.GrandeurPeakGlobal.com |
| Grandeur Peak Global Contrarian Fund | Performance Update |
October 31, 2020 (Unaudited)
Growth of $10,000 for the period ended October 31, 2020
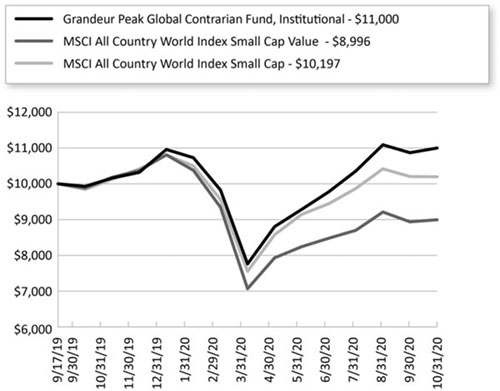
The chart shown above represents a hypothetical investment of $10,000 in the Fund’s Institutional Class shares for the period from inception to October 31, 2020. All returns reflect reinvested dividends, but do not reflect the deduction of taxes that an investor would pay on distributions or redemptions.
Investing in the Fund is subject to investment risks, including possible loss of the principal amount invested.
| Semi-Annual Report | October 31, 2020 | 11 |
| Grandeur Peak Global Contrarian Fund | Performance Update |
October 31, 2020 (Unaudited)
| Regional Allocation (as a % of Net Assets)* | |
| Asia ex Japan | 32.6% |
| Europe | 28.5% |
| North America | 19.1% |
| Japan | 12.0% |
| Australia/New Zealand | 4.2% |
| Latin America | 1.8% |
| Africa/Middle East | 1.0% |
| Cash, Cash Equivalents, & Other Net Assets | 0.8% |
| Total | 100.0% |
| Top 10 Holdings (as a % of Net Assets)* | |
| Systemax, Inc. | 2.9% |
| Fiducian Group, Ltd. | 2.2% |
| Bioteque Corp. | 2.1% |
| Xin Point Holdings, Ltd. | 2.0% |
| Trancom Co., Ltd. | 1.8% |
| Selamat Sempurna Tbk PT | 1.7% |
| Barrett Business Services, Inc. | 1.7% |
| Hackett Group, Inc. | 1.7% |
| Tokai Carbon Korea Co., Ltd. | 1.5% |
| Kri-Kri Milk Industry SA | 1.5% |
| Total | 19.1% |
| * | Holdings are subject to change, and may not reflect the current or future position of the portfolio. |
| 12 | 1.855.377.7325 | www.GrandeurPeakGlobal.com |
| Grandeur Peak Global Micro Cap Fund | Performance Update |
October 31, 2020 (Unaudited)
Annualized Total Return Performance for the periods ended October 31, 2020
| | 6 Months | 1 Year | 3 Years | 5 Years | Since Inception(a) | Expense Ratio(b) |
| Gross | Net(c) |
Grandeur Peak Global Micro Cap Fund – Institutional (GPMCX) | 42.81% | 36.63% | 10.54% | 13.33% | 13.02% | 2.06% | 2.00% |
MSCI All Country World Index Small Cap(d) | 18.88% | 0.69% | 1.83% | 6.88% | 6.85% | | |
MSCI World Micro Cap Index(e) | 22.64% | 5.63% | 0.30% | 7.08% | 6.90% | | |
Performance data quoted represents past performance. Past performance does not guarantee future results. Investment return and principal value of an investment will fluctuate so that an investor’s shares, when sold or redeemed, may be worth more or less than the original cost. The Fund imposes a 2.00% redemption fee on shares held for less than 60 days. Current performance data may be higher or lower than actual data quoted. For the most current month-end performance data, please call 1-855-377-PEAK (7325).
The table does not reflect the deduction of taxes a shareholder would pay on Fund distributions or redemption of Fund shares.
Subject to investment risks, including possible loss of the principal amount invested.
Returns for periods less than 1 year are cumulative.
| (a) | Fund inception date of October 20, 2015. |
| (b) | Ratios as of the Prospectus dated August 31, 2020 and may differ from the ratios presented in the Financial Highlights. |
| (c) | Grandeur Peak Global Advisors, LLC (the “Adviser”), has agreed to waive and/or reimburse fees or expenses in order to limit Total Annual Fund Operating Expenses After Fee Waiver/ Expense Reimbursement (excluding acquired fund fees and expenses, brokerage expenses, interest expenses, taxes and extraordinary expenses) to 2.00% of the Fund’s average daily net assets for the Fund’s Institutional Class Shares. This agreement is in effect through August 31, 2021. The Adviser will be permitted to recover expenses it has borne through this agreement to the extent that a Fund’s expenses in later periods fall below annual rates set forth in the Expense Agreement; provided, however, that such recapture payments do not cause the Fund’s expense ratio (after recapture) to exceed the lesser of (i) the expense cap in effect at the time of the waiver and (ii) the expense cap in effect at the time of the recapture. Notwithstanding the foregoing, the Fund will not be obligated to pay any such deferred fees and expenses more than three years after the date on which the fee and expenses was deferred . This agreement may not be terminated or modified prior to August 31, 2021 except with the approval of the Fund’s Board of Trustees. |
| (d) | The MSCI ACWI Small Cap Index is designed to measure the equity market performance of performance of small-cap companies across developed and emerging markets globally. MSCI makes no express or implied warranties or representations and shall have no liability whatsoever with respect to any MSCI data contained herein. The MSCI data may not be further redistributed or used to create indices or financial products. The Index is not actively managed and does not reflect any deductions for fees, expenses or taxes. An investor may not invest directly into the Index. |
| (e) | The MSCI World Micro Cap Index is designed to measure the equity market performance of micro-cap companies across developed markets globally. It does not include emerging markets. The Index is not actively managed and does not reflect any deductions for fees, expenses or taxes. An investor may not invest directly into the Index. |
| Semi-Annual Report | October 31, 2020 | 13 |
| Grandeur Peak Global Micro Cap Fund | Performance Update |
October 31, 2020 (Unaudited)
Growth of $10,000 for the period ended October 31, 2020
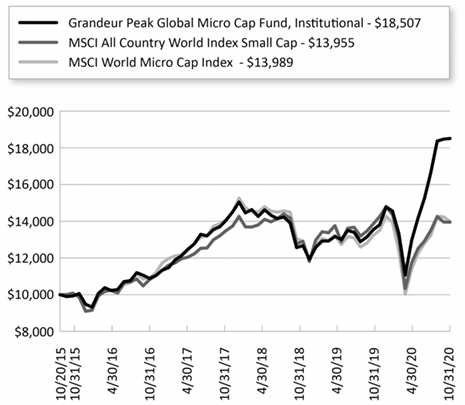
The chart shown above represents a hypothetical investment of $10,000 in the Fund’s Institutional Class shares for the period from inception to October 31, 2020. All returns reflect reinvested dividends, but do not reflect the deduction of taxes that an investor would pay on distributions or redemptions.
Investing in the Fund is subject to investment risks, including possible loss of the principal amount invested.
| 14 | 1.855.377.7325 | www.GrandeurPeakGlobal.com |
| Grandeur Peak Global Micro Cap Fund | Performance Update |
October 31, 2020 (Unaudited)
| Regional Allocation (as a % of Net Assets)* | |
| Europe | 39.8% |
| Asia ex Japan | 24.8% |
| Japan | 16.2% |
| North America | 10.1% |
| Australia/New Zealand | 8.3% |
| Latin America | 0.8% |
| Africa/Middle East | 0.4% |
| Cash, Cash Equivalents, & Other Net Assets | -0.4% |
| Total | 100.0% |
| Top 10 Holdings (as a % of Net Assets)* | |
| Sarantis SA | 2.7% |
| Kogan.com, Ltd. | 2.7% |
| Musti Group Oyj | 2.5% |
| M&A Capital Partners Co., Ltd. | 2.4% |
| Joint Corp. | 2.4% |
| SwedenCare AB | 2.3% |
| Vaibhav Global, Ltd. | 2.1% |
| Fiducian Group, Ltd. | 1.7% |
| Vega Corp. Co., Ltd. | 1.6% |
| Westwing Group AG | 1.6% |
| Total | 22.0% |
| * | Holdings are subject to change, and may not reflect the current or future position of the portfolio. |
| Semi-Annual Report | October 31, 2020 | 15 |
| Grandeur Peak Global Opportunities Fund | Performance Update |
October 31, 2020 (Unaudited)
Annualized Total Return Performance for the periods ended October 31, 2020
| | 6 Months | 1 Year | 3 Years | 5 Years | Since Inception(a) | Expense Ratio(b) |
| Gross | Net(c) |
Grandeur Peak Global Opportunities Fund – Investor (GPGOX) | 32.41% | 27.55% | 10.09% | 12.44% | 14.05% | 1.62% | 1.62% |
Grandeur Peak Global Opportunities Fund – Institutional (GPGIX) | 32.52% | 27.74% | 10.35% | 12.67% | 14.35% | 1.37% | 1.37% |
MSCI All Country World Index Small Cap(d) | 18.88% | 0.69% | 1.83% | 6.88% | 9.26% | | |
MSCI All Country World Index IMI(e) | 14.43% | 4.84% | 5.54% | 8.47% | 9.74% | | |
Performance data quoted represents past performance. Past performance does not guarantee future results. Investment return and principal value of an investment will fluctuate so that an investor’s shares, when sold or redeemed, may be worth more or less than the original cost. The Fund imposes a 2.00% redemption fee on shares held for less than 60 days. Current performance data may be higher or lower than actual data quoted. For the most current month-end performance data, please call 1-855-377-PEAK (7325).
The table does not reflect the deduction of taxes a shareholder would pay on Fund distributions or redemption of Fund shares.
Subject to investment risks, including possible loss of the principal amount invested.
Returns for periods less than 1 year are cumulative.
| (a) | Fund inception date of October 17, 2011. |
| (b) | Ratios as of the Prospectus dated August 31, 2020 and may differ from the ratios presented in the Financial Highlights. |
| (c) | Grandeur Peak Global Advisors, LLC (the “Adviser”), has agreed to waive and/or reimburse fees or expenses in order to limit Total Annual Fund Operating Expenses After Fee Waiver/ Expense Reimbursement (excluding acquired fund fees and expenses, brokerage expenses, interest expenses, taxes and extraordinary expenses) to 1.75% and 1.50% of the Fund’s average daily net assets for the Fund’s Investor Class Shares and Institutional Class Shares, respectively. This agreement (the “Expense Agreement”) is in effect through August 31, 2021. The Adviser will be permitted to recover, on a class- by-class basis, expenses it has borne the Expense Agreement to the extent that a Fund’s expenses in later periods fall below annual rates set forth in the Expense Agreement; provided, however, that such recapture payments do not cause the Fund’s expense ratio (after recapture) to exceed the lesser of (i) the expense cap in effect at the time of the waiver and (ii) the expense cap in effect at the time of the recapture .. Notwithstanding the foregoing, the Fund will not be obligated to pay any such deferred fees and expenses more than three years after the date on which the fee and expenses was deferred. The Expense Agreement may not be terminated or modified prior to August 31, 2021 except with the approval of the Fund’s Board of Trustees. |
| (d) | The MSCI ACWI Small Cap Index is designed to measure the equity market performance of performance of small-cap companies across developed and emerging markets globally. MSCI makes no express or implied warranties or representations and shall have no liability whatsoever with respect to any MSCI data contained herein. The MSCI data may not be further redistributed or used to create indices or financial products. The Index is not actively managed and does not reflect any deductions for fees, expenses or taxes. An investor may not invest directly into the Index. |
| (e) | The MSCI ACWI IMI Index is designed to measure the equity market performance of large, mid, and small-cap companies across developed and emerging markets globally. The Index is not actively managed and does not reflect any deductions for fees, expenses or taxes. An investor may not invest directly into the Index. |
| 16 | 1.855.377.7325 | www.GrandeurPeakGlobal.com |
| Grandeur Peak Global Opportunities Fund | Performance Update |
| | October 31, 2020 (Unaudited) |
Growth of $10,000 for the period ended October 31, 2020
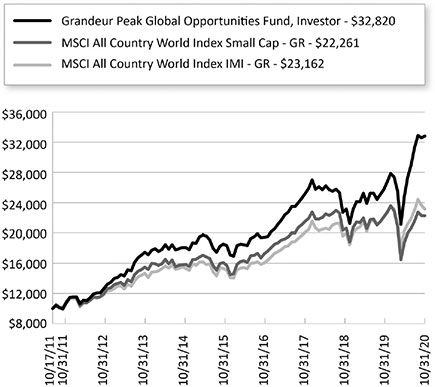
The chart shown above represents a hypothetical investment of $10,000 in the Fund’s Investor Class shares for the period from inception to October 31, 2020. All returns reflect reinvested dividends, but do not reflect the deduction of taxes that an investor would pay on distributions or redemptions.
Investing in the Fund is subject to investment risks, including possible loss of the principal amount invested.
The Fund also offers Institutional Class shares, performance for which is not reflected in the graphs above. The performance of Institutional Class shares may be higher or lower than the performance of the Investor Class shares shown in the graphs above based upon differences in fees paid by shareholders investing in the Investor Class shares and Institutional Class shares.
| Semi-Annual Report | October 31, 2020 | 17 |
| Grandeur Peak Global Opportunities Fund | Performance Update |
| | October 31, 2020 (Unaudited) |
| Regional Allocation (as a % of Net Assets)* | |
| Europe | 36.7% |
| North America | 28.3% |
| Asia ex Japan | 21.3% |
| Japan | 9.3% |
| Latin America | 2.3% |
| Australia/New Zealand | 1.4% |
| Africa/Middle East | 0.9% |
| Cash, Cash Equivalents, & Other Net Assets | -0.2% |
| Total | 100.0% |
| Top 10 Holdings (as a % of Net Assets)* | |
| Dechra Pharmaceuticals PLC | 2.6% |
| Silergy Corp. | 2.4% |
| EPAM Systems, Inc. | 2.2% |
| B&M European Value Retail SA | 2.0% |
| Endava PLC | 1.9% |
| Heska Corp. | 1.7% |
| CVS Group PLC | 1.5% |
| WNS Holdings, Ltd. | 1.5% |
| Metropolis Healthcare, Ltd. | 1.4% |
| Power Integrations, Inc. | 1.4% |
| Total | 18.6% |
| * | Holdings are subject to change, and may not reflect the current or future position of the portfolio. |
| 18 | 1.855.377.7325 | www.GrandeurPeakGlobal.com |
| Grandeur Peak Global Reach Fund | Performance Update |
| | October 31, 2020 (Unaudited) |
Annualized Total Return Performance for the periods ended October 31, 2020
| | | | | | Since
Inception(a) | Expense Ratio(b) |
| | 6 Months | 1 Year | 3 Years | 5 Years | Gross | Net(c) |
| Grandeur Peak Global Reach Fund – Investor (GPROX) | 31.44% | 24.60% | 10.06% | 12.26% | 11.82% | 1.52% | 1.52% |
| Grandeur Peak Global Reach Fund – Institutional (GPRIX) | 31.64% | 24.91% | 10.34% | 12.54% | 12.09% | 1.27% | 1.27% |
| MSCI All Country World Small Cap Index(d) | 18.88% | 0.69% | 1.83% | 6.88% | 7.16% | | |
| MSCI All Country World IMI Index(e) | 14.43% | 4.84% | 5.54% | 8.47% | 8.24% | | |
Performance data quoted represents past performance. Past performance does not guarantee future results. Investment return and principal value of an investment will fluctuate so that an investor’s shares, when sold or redeemed, may be worth more or less than the original cost. The Fund imposes a 2.00% redemption fee on shares held for less than 60 days. Current performance data may be higher or lower than actual data quoted. For the most current month-end performance data, please call 1-855-377-PEAK (7325).
The table does not reflect the deduction of taxes a shareholder would pay on Fund distributions or redemption of Fund shares.
Subject to investment risks, including possible loss of the principal amount invested.
Returns for periods less than 1 year are cumulative.
| (a) | Fund inception date of June 19, 2013. |
| (b) | Ratios as of the Prospectus dated August 31, 2020 and may differ from the ratios presented in the Financial Highlights. |
| (c) | Grandeur Peak Global Advisors, LLC (the “Adviser”), has agreed to waive and/or reimburse fees or expenses in order to limit Total Annual Fund Operating Expenses After Fee Waiver/Expense Reimbursement (excluding acquired fund fees and expenses, brokerage expenses, interest expenses, taxes and extraordinary expenses) to 1.60% and 1.35% of the Fund’s average daily net assets for the Fund’s Investor Class Shares and Institutional Class Shares, respectively. This agreement (the “Expense Agreement”) is in effect through August 31, 2021. The Adviser will be permitted to recover, on a class- by-class basis, expenses it has borne through the Expense Agreement to the extent that a Fund’s expenses in later periods fall below annual rates set forth in the Expense Agreement; provided, however, that such recapture payments do not cause the Fund’s expense ratio (after recapture) to exceed the lesser of (i) the expense cap in effect at the time of the waiver and (ii) the expense cap in effect at the time of the recapture . Notwithstanding the foregoing, the Fund will not be obligated to pay any such deferred fees and expenses more than three years after the date on which the fee and expenses was deferred. The Expense Agreement may not be terminated or modified prior to August 31, 2021 except with the approval of the Fund’s Board of Trustees. |
| (d) | The MSCI ACWI Small Cap Index is designed to measure the equity market performance of performance of small-cap companies across developed and emerging markets globally. MSCI makes no express or implied warranties or representations and shall have no liability whatsoever with respect to any MSCI data contained herein. The MSCI data may not be further redistributed or used to create indices or financial products. The Index is not actively managed and does not reflect any deductions for fees, expenses or taxes. An investor may not invest directly into the Index. |
| (e) | The MSCI ACWI IMI Index is designed to measure the equity market performance of large, mid, and small-cap companies across developed and emerging markets globally. The Index is not actively managed and does not reflect any deductions for fees, expenses or taxes. An investor may not invest directly into the Index. |
| Semi-Annual Report | October 31, 2020 | 19 |
| Grandeur Peak Global Reach Fund | Performance Update |
| | October 31, 2020 (Unaudited) |
Growth of $10,000 for the period ended October 31, 2020
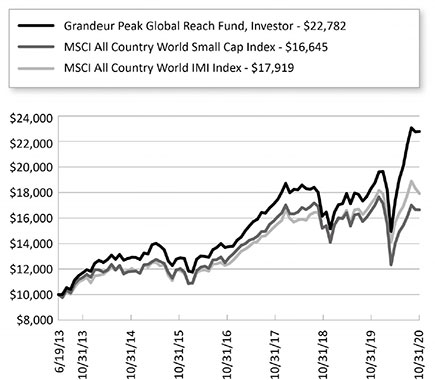
The chart shown above represents a hypothetical investment of $10,000 in the Fund’s Investor Class shares for the period from inception to October 31, 2020. All returns reflect reinvested dividends, but do not reflect the deduction of taxes that an investor would pay on distributions or redemptions.
Investing in the Fund is subject to investment risks, including possible loss of the principal amount invested.
The Fund also offers Institutional Class shares, performance for which is not reflected in the graphs above. The performance of Institutional Class shares may be higher or lower than the performance of the Investor Class shares shown in the graphs above based upon differences in fees paid by shareholders investing in the Investor Class shares and Institutional Class shares.
| 20 | 1.855.377.7325 | www.GrandeurPeakGlobal.com |
| Grandeur Peak Global Reach Fund | Performance Update |
| | October 31, 2020 (Unaudited) |
| Regional Allocation (as a % of Net Assets)* | |
| Europe | 33.4% |
| North America | 28.6% |
| Asia ex Japan | 20.5% |
| Japan | 7.6% |
| Australia/New Zealand | 4.0% |
| Latin America | 3.2% |
| Africa/Middle East | 2.4% |
| Cash, Cash Equivalents, & Other Net Assets | 0.3% |
| Total | 100.0% |
| Top 10 Holdings (as a % of Net Assets)* | |
| Silergy Corp. | 1.8% |
| Endava PLC | 1.4% |
| EPAM Systems, Inc. | 1.2% |
| First Republic Bank | 1.2% |
| Wix.com, Ltd. | 1.2% |
| Esker SA | 1.1% |
| WNS Holdings, Ltd. | 1.1% |
| B&M European Value Retail SA | 1.1% |
| BayCurrent Consulting, Inc. | 1.0% |
| Impax Asset Management Group PLC | 1.0% |
| Total | 12.1% |
| * | Holdings are subject to change, and may not reflect the current or future position of the portfolio. |
| Semi-Annual Report | October 31, 2020 | 21 |
| Grandeur Peak Global Stalwarts Fund | Performance Update |
| | October 31, 2020 (Unaudited) |
Annualized Total Return Performance for the periods ended October 31, 2020
| | | | | | Since
Inception(a) | Expense Ratio(b) |
| | 6 Months | 1 Year | 3 Years | 5 Years | Gross | Net(c) |
| Grandeur Peak Global Stalwarts Fund – Investor (GGSOX) | 29.36% | 26.24% | 11.39% | 13.40% | 14.04% | 1.24% | 1.24% |
| Grandeur Peak Global Stalwarts Fund – Institutional (GGSYX) | 29.49% | 26.58% | 11.66% | 13.69% | 14.32% | 0.99% | 0.99% |
| MSCI All Country World Mid Cap Index(d) | 16.72% | 1.34% | 3.41% | 6.82% | 7.70% | | |
| MSCI All Country World Small Cap Index(e) | 18.88% | 0.69% | 1.83% | 6.88% | 7.50% | | |
Performance data quoted represents past performance. Past performance does not guarantee future results. Investment return and principal value of an investment will fluctuate so that an investor’s shares, when sold or redeemed, may be worth more or less than the original cost. The Fund imposes a 2.00% redemption fee on shares held for less than 60 days. Current performance data may be higher or lower than actual data quoted. For the most current month-end performance data, please call 1-855-377-PEAK (7325).
The table does not reflect the deduction of taxes a shareholder would pay on Fund distributions or redemption of Fund shares.
Subject to investment risks, including possible loss of the principal amount invested.
Returns for periods less than 1 year are cumulative.
| * | Excludes adjustments in accordance with accounting principles generally accepted in the United States of America and as such, the net asset value and total return for shareholder transactions reported to the market may differ from the net asset value for financial reporting purposes. |
| (a) | Fund inception date of September 1, 2015. |
| (b) | Ratios as of the Prospectus dated August 31, 2020 and may differ from the ratios presented in the Financial Highlights. |
| (c) | Grandeur Peak Global Advisors, LLC (the “Adviser”), has agreed to waive and/or reimburse fees or expenses in order to limit Total Annual Fund Operating Expenses After Fee Waiver/ Expense Reimbursement (excluding acquired fund fees and expenses, brokerage expenses, interest expenses, taxes and extraordinary expenses) to 1.35% and 1.10% of the Fund’s average daily net assets for the Fund’s Investor Class Shares and Institutional Class Shares, respectively. This agreement is in effect through August 31, 2021. The Adviser will be permitted to recover, on a class-by-class basis, expenses it has borne through this agreement to the extent that a Fund’s expenses in later periods fall below annual rates set forth in the Expense Agreement; provided, however, that such recapture payments do not cause the Fund’s expense ratio (after recapture) to exceed the lesser of (i) the expense cap in effect at the time of the waiver and (ii) the expense cap in effect at the time of the recapture . Notwithstanding the foregoing, the Fund will not be obligated to pay any such deferred fees and expenses more than three years after the date on which the fee and expenses was deferred. This agreement may not be terminated or modified prior to August 31, 2021 except with the approval of the Fund’s Board of Trustees. |
| (d) | The MSCI ACWI Mid Cap Index is designed to measure the equity market performance of performance of mid-cap companies across developed and emerging markets globally. MSCI makes no express or implied warranties or representations and shall have no liability whatsoever with respect to any MSCI data contained herein. The MSCI data may not be further redistributed or used to create indices or financial products. The Index is not actively managed and does not reflect any deductions for fees, expenses or taxes. An investor may not invest directly into the Index. |
| (e) | The MSCI ACWI Small Cap Index is designed to measure the equity market performance of small-cap companies across developed and emerging markets globally. The Index is not actively managed and does not reflect any deductions for fees, expenses or taxes. An investor may not invest directly into the Index. |
| 22 | 1.855.377.7325 | www.GrandeurPeakGlobal.com |
| Grandeur Peak Global Stalwarts Fund | Performance Update |
| | October 31, 2020 (Unaudited) |
Growth of $10,000 for the period ended October 31, 2020

The chart shown above represents a hypothetical investment of $10,000 in the Fund’s Investor Class shares for the period from inception to October 31, 2020. All returns reflect reinvested dividends, but do not reflect the deduction of taxes that an investor would pay on distributions or redemptions.
Investing in the Fund is subject to investment risks, including possible loss of the principal amount invested.
The Fund also offers Institutional Class shares, performance for which is not reflected in the graphs above. The performance of Institutional Class shares may be higher or lower than the performance of the Investor Class shares shown in the graphs above based upon differences in fees paid by shareholders investing in the Investor Class shares and Institutional Class shares.
| Semi-Annual Report | October 31, 2020 | 23 |
| Grandeur Peak Global Stalwarts Fund | Performance Update |
| | October 31, 2020 (Unaudited) |
| Regional Allocation (as a % of Net Assets)* | |
| North America | 41.7% |
| Europe | 27.5% |
| Asia ex Japan | 18.8% |
| Japan | 5.7% |
| Australia/New Zealand | 1.9% |
| Latin America | 1.7% |
| Africa/Middle East | 0.9% |
| Cash, Cash Equivalents, & Other Net Assets | 1.8% |
| Total | 100.0% |
| Top 10 Holdings (as a % of Net Assets)* | |
| Silergy Corp. | 3.3% |
| First Republic Bank | 3.3% |
| WNS Holdings, Ltd. | 3.0% |
| EPAM Systems, Inc. | 2.8% |
| Dechra Pharmaceuticals PLC | 2.6% |
| B&M European Value Retail SA | 2.2% |
| Power Integrations, Inc. | 2.1% |
| Pluralsight, Inc. | 2.1% |
| Bajaj Finance, Ltd. | 1.9% |
| Endava PLC | 1.7% |
| Total | 25.0% |
| * | Holdings are subject to change, and may not reflect the current or future position of the portfolio. |
| 24 | 1.855.377.7325 | www.GrandeurPeakGlobal.com |
| Grandeur Peak International Opportunities Fund | Performance Update |
| | October 31, 2020 (Unaudited) |
Annualized Total Return Performance for the periods ended October 31, 2020
| | | | | | Since
Inception(a) | Expense Ratio(b) |
| | 6 Months | 1 Year | 3 Years | 5 Years | Gross | Net(c) |
| Grandeur Peak International Opportunities Fund – Investor (GPIOX) | 33.22% | 24.76% | 6.80% | 10.74% | 12.64% | 1.62% | 1.62% |
| Grandeur Peak International Opportunities Fund – Institutional (GPIIX) | 33.33% | 25.12% | 7.03% | 11.00% | 12.88% | 1.37% | 1.37% |
| MSCI All Country World Index ex USA Small Cap Index(d) | 18.02% | 0.44% | -0.20% | 5.41% | 6.50% | | |
| MSCI All Country World IMI ex USA Index(e) | 13.17% | -1.85% | 0.22% | 4.85% | 5.44% | | |
Performance data quoted represents past performance. Past performance does not guarantee future results. Investment return and principal value of an investment will fluctuate so that an investor’s shares, when sold or redeemed, may be worth more or less than the original cost. The Fund imposes a 2.00% redemption fee on shares held for less than 60 days. Current performance data may be higher or lower than actual data quoted. For the most current month-end performance data, please call 1-855-377-PEAK (7325).
The table does not reflect the deduction of taxes a shareholder would pay on Fund distributions or redemption of Fund shares.
Subject to investment risks, including possible loss of the principal amount invested.
Returns for periods less than 1 year are cumulative.
| (a) | Fund inception date of October 17, 2011. |
| (b) | Ratios as of the Prospectus dated August 31, 2020 and may differ from the ratios presented in the Financial Highlights. |
| (c) | Grandeur Peak Global Advisors, LLC (the “Adviser”), has agreed to waive and/or reimburse fees or expenses in order to limit Total Annual Fund Operating Expenses After Fee Waiver/Expense Reimbursements (excluding acquired fund fees and expenses, brokerage expenses, interest expenses, taxes and extraordinary expenses) to 1.75% and 1.50% of the Fund’s average daily net assets for the Fund’s Investor Class Shares and Institutional Class Shares, respectively. This agreement (the “Expense Agreement”) is in effect through August 31, 2021. The Adviser will be permitted to recover, on a class- by-class basis, expenses it has borne through the Expense Agreement to the extent that a Fund’s expenses in later periods fall below annual rates set forth in the Expense Agreement; provided, however, that such recapture payments do not cause the Fund’s expense ratio (after recapture) to exceed the lesser of (i) the expense cap in effect at the time of the waiver and (ii) the expense cap in effect at the time of the recapture . Notwithstanding the foregoing, the Funds will not be obligated to pay any such deferred fees and expenses more than three years after the date on which the fee and expenses was deferred. The Expense Agreement may not be terminated or modified prior to August 31, 2021 except with the approval of the Fund’s Board of Trustees. |
| (d) | The MSCI ACWI ex USA Small Cap Index is designed to measure the equity market performance of small-cap companies across developed and emerging markets globally, excluding the United States. MSCI makes no express or implied warranties or representations and shall have no liability whatsoever with respect to any MSCI data contained herein. The MSCI data may not be further redistributed or used to create indices or financial products. The Index is not actively managed and does not reflect any deductions for fees, expenses or taxes. An investor may not invest directly into the Index. |
| (e) | The MSCI ACWI ex USA IMI Index is designed to measure the equity market performance of large, mid, and small-cap companies across developed and emerging markets globally, excluding the United States. The Index is not actively managed and does not reflect any deductions for fees, expenses or taxes. An investor may not invest directly into the Index. |
| Semi-Annual Report | October 31, 2020 | 25 |
| Grandeur Peak International Opportunities Fund | Performance Update |
| | October 31, 2020 (Unaudited) |
Growth of $10,000 for the period ended October 31, 2020
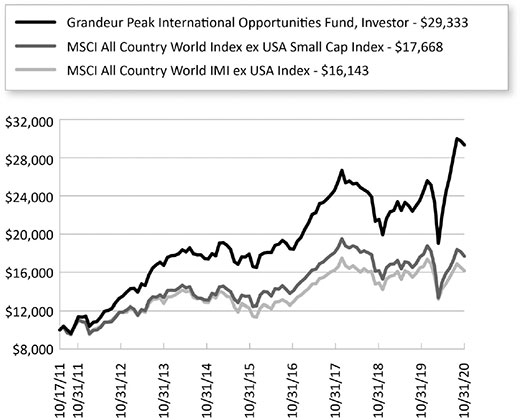
The chart shown above represents a hypothetical investment of $10,000 in the Fund’s Investor Class shares for the period from inception to October 31, 2020. All returns reflect reinvested dividends, but do not reflect the deduction of taxes that an investor would pay on distributions or redemptions.
Investing in the Fund is subject to investment risks, including possible loss of the principal amount invested.
The Fund also offers Institutional Class shares, performance for which is not reflected in the graphs above. The performance of Institutional Class shares may be higher or lower than the performance of the Investor Class shares shown in the graphs above based upon differences in fees paid by shareholders investing in the Investor Class shares and Institutional Class shares.
| 26 | 1.855.377.7325 | www.GrandeurPeakGlobal.com |
| Grandeur Peak International Opportunities Fund | Performance Update |
| | October 31, 2020 (Unaudited) |
| Regional Allocation (as a % of Net Assets)* | |
| Europe | 39.6% |
| Asia ex Japan | 26.8% |
| Japan | 14.2% |
| North America | 6.9% |
| Australia/New Zealand | 4.1% |
| Latin America | 3.8% |
| Africa/Middle East | 1.6% |
| Cash, Cash Equivalents, & Other Net Assets | 3.0% |
| Total | 100.0% |
| Top 10 Holdings (as a % of Net Assets)* | |
| EPAM Systems, Inc. | 2.4% |
| Dechra Pharmaceuticals PLC | 2.4% |
| Silergy Corp. | 2.3% |
| WNS Holdings, Ltd. | 1.8% |
| B&M European Value Retail SA | 1.8% |
| CVS Group PLC | 1.7% |
| Metropolis Healthcare, Ltd. | 1.5% |
| Endava PLC | 1.4% |
| Riverstone Holdings, Ltd./Singapore | 1.4% |
| BayCurrent Consulting, Inc. | 1.3% |
| Total | 18.0% |
| * | Holdings are subject to change, and may not reflect the current or future position of the portfolio. |
| Semi-Annual Report | October 31, 2020 | 27 |
| Grandeur Peak International Stalwarts Fund | Performance Update |
| | October 31, 2020 (Unaudited) |
Annualized Total Return Performance for the periods ended October 31, 2020
| | | | | | Since Inception(a) | Expense Ratio(b) |
| | 6 Months | 1 Year | 3 Years | 5 Years | Gross | Net(c) |
| Grandeur Peak International Stalwarts Fund – Investor (GISOX) | 29.33% | 26.10% | 9.79% | 12.82% | 13.79% | 1.17% | 1.17% |
| Grandeur Peak International Stalwarts Fund – Institutional (GISYX) | 29.56% | 26.51% | 10.07% | 13.10% | 14.06% | 0.92% | 0.92% |
| MSCI All Country World ex USA Mid Cap Index(d) | 14.10% | -3.24% | -0.44% | 4.46% | 5.38% | | |
| MSCI All Country World ex USA Small Index(e) | 18.02% | 0.44% | -0.20% | 5.41% | 6.21% | | |
Performance data quoted represents past performance. Past performance does not guarantee future results. Investment return and principal value of an investment will fluctuate so that an investor’s shares, when sold or redeemed, may be worth more or less than the original cost. The Fund imposes a 2.00% redemption fee on shares held for less than 60 days. Current performance data may be higher or lower than actual data quoted. For the most current month-end performance data, please call 1-855-377-PEAK (7325).
The table does not reflect the deduction of taxes a shareholder would pay on Fund distributions or redemption of Fund shares.
Subject to investment risks, including possible loss of the principal amount invested.
Returns for periods less than 1 year are cumulative.
| * | Excludes adjustments in accordance with accounting principles generally accepted in the United States of America and as such, the net asset value and total return for shareholder transactions reported to the market may differ from the net asset value for financial reporting purposes. |
| (a) | Fund inception date of September 1, 2015. |
| (b) | Ratios as of the Prospectus dated August 31, 2020 and may differ from the ratios presented in the Financial Highlights. |
| (c) | Grandeur Peak Global Advisors, LLC (the “Adviser”), has agreed to waive and/or reimburse fees or expenses in order to limit Total Annual Fund Operating Expenses After Fee Waiver/ Expense Reimbursements (excluding acquired fund fees and expenses, brokerage expenses, interest expenses, taxes and extraordinary expenses) to 1.35% and 1.10% of the Fund’s average daily net assets for the Fund’s Investor Class Shares and Institutional Class Shares, respectively. This agreement is in effect through August 31, 2021. The Adviser will be permitted to recover, on a class-by-class basis, expenses it has borne through this agreement to the extent that a Fund’s expenses in later periods fall below annual rates set forth in the Expense Agreement; provided, however, that such recapture payments do not cause the Fund’s expense ratio (after recapture) to exceed the lesser of (i) the expense cap in effect at the time of the waiver and (ii) the expense cap in effect at the time of the recapture . Notwithstanding the foregoing, the Funds will not be obligated to pay any such deferred fees and expenses more than three years after the date on which the fee and expenses was deferred This agreement may not be terminated or modified prior to August 31, 2021 except with the approval of the Fund’s Board of Trustees. |
| (d) | The MSCI ACWI ex USA Mid Cap Index is designed to measure the equity market performance of midcap companies across developed and emerging markets globally, excluding the United States. MSCI makes no express or implied warranties or representations and shall have no liability whatsoever with respect to any MSCI data contained herein. The MSCI data may not be further redistributed or used to create indices or financial products. The Index is not actively managed and does not reflect any deductions for fees, expenses or taxes. An investor may not invest directly into the Index. |
| (e) | The MSCI ACWI ex USA Small Cap Index is designed to measure the equity market performance of small-cap companies across developed and emerging markets globally, excluding the United States. The Index is not actively managed and does not reflect any deductions for fees, expenses or taxes. An investor may not invest directly into the Index. |
| 28 | 1.855.377.7325 | www.GrandeurPeakGlobal.com |
| Grandeur Peak International Stalwarts Fund | Performance Update |
October 31, 2020 (Unaudited)
Growth of $10,000 for the period ended October 31, 2020
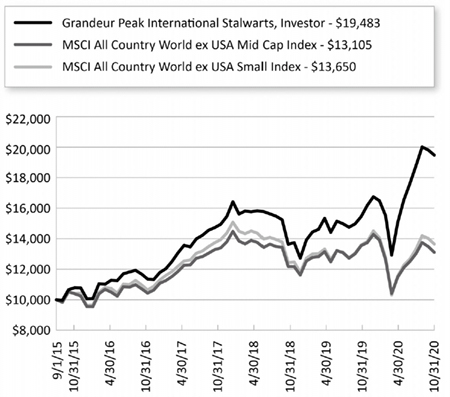
The chart shown above represents a hypothetical investment of $10,000 in the Fund’s Investor Class shares for the period from inception to October 31, 2020. All returns reflect reinvested dividends, but do not reflect the deduction of taxes that an investor would pay on distributions or redemptions.
Investing in the Fund is subject to investment risks, including possible loss of the principal amount invested.
The Fund also offers Institutional Class shares, performance for which is not reflected in the graphs above. The performance of Institutional Class shares may be higher or lower than the performance of the Investor Class shares shown in the graphs above based upon differences in fees paid by shareholders investing in the Investor Class shares and Institutional Class shares.
| Semi-Annual Report | October 31, 2020 | 29 |
| Grandeur Peak International Stalwarts Fund | Performance Update |
October 31, 2020 (Unaudited)
| Regional Allocation (as a % of Net Assets)* | |
| Europe | 43.8% |
| Asia ex Japan | 25.7% |
| North America | 11.5% |
| Japan | 9.2% |
| Latin America | 3.1% |
| Australia/New Zealand | 2.9% |
| Africa/Middle East | 1.5% |
| Cash, Cash Equivalents, & Other Net Assets | 2.3% |
| Total | 100.0% |
| Top 10 Holdings (as a % of Net Assets)* | |
| Silergy Corp. | 4.1% |
| EPAM Systems, Inc. | 3.6% |
| WNS Holdings, Ltd. | 3.6% |
| B&M European Value Retail SA | 3.5% |
| Dechra Pharmaceuticals PLC | 3.4% |
| Nihon M&A Center, Inc. | 2.5% |
| Bajaj Finance, Ltd. | 2.2% |
| Endava PLC | 2.0% |
| St. James's Place PLC | 2.0% |
| Systena Corp. | 1.8% |
| Total | 28.7% |
| * | Holdings are subject to change, and may not reflect the current or future position of the portfolio. |
| 30 | 1.855.377.7325 | www.GrandeurPeakGlobal.com |
| Grandeur Peak US Stalwarts Fund | Performance Update |
October 31, 2020 (Unaudited)
Annualized Total Return Performance for the periods ended October 31, 2020
| | | Since | Expense Ratio(b) |
| | 6 Month | Inception(a) | Gross | Net(c) |
| Grandeur Peak US Stalwarts Fund – Institutional (GUSYX) | 30.34% | 71.40% | 6.10% | 1.00% |
| MSCI USA Mid Cap Index(d) | 19.51% | 48.87% | | |
| MSCI USA Small Cap Index(e) | 19.71% | 50.69% | | |
Performance data quoted represents past performance. Past performance does not guarantee future results. Investment return and principal value of an investment will fluctuate so that an investor’s shares, when sold or redeemed, may be worth more or less than the original cost. The Fund imposes a 2.00% redemption fee on shares held for less than 60 days. Current performance data may be higher or lower than actual data quoted. For the most current month-end performance data, please call 1-855-377-PEAK (7325).
The table does not reflect the deduction of taxes a shareholder would pay on Fund distributions or redemption of Fund shares.
Subject to investment risks, including possible loss of the principal amount invested.
Returns for periods less than 1 year are cumulative.
| (a) | Fund inception date of March 19, 2020. |
| (b) | Ratios as of the Prospectus dated August 31, 2020 and may differ from the ratios presented in the Financial Highlights. |
| (c) | Grandeur Peak Global Advisors, LLC (the “Adviser”), has agreed to waive and/or reimburse fees or expenses in order to limit Total Annual Fund Operating Expenses After Fee Waiver/Expense Reimbursement (excluding acquired fund fees and expenses, brokerage expenses, interest expenses, taxes and extraordinary expenses) to 1.00% of the Fund’s average daily net assets for the Fund’s Institutional Class Shares. This agreement (the “Expense Agreement”) is in effect through August 31, 2021. The Adviser will be permitted to recover, on a class- by-class basis, expenses it has borne through the Expense Agreement to the extent that a Fund’s expenses in later periods fall below annual rates set forth in the Expense Agreement; provided, however, that such recapture payments do not cause the Fund’s expense ratio (after recapture) to exceed the lesser of (i) the expense cap in effect at the time of the waiver and (ii) the expense cap in effect at the time of the recapture. Notwithstanding the foregoing, the Fund will not be obligated to pay any such deferred fees and expenses more than three years after the date on which the fee and expenses was deferred. The Expense Agreement may not be terminated or modified prior to August 31, 2021 except with the approval of the Fund’s Board of Trustees. |
| (d) | The MSCI USA Mid Cap Index is designed to measure the performance of the mid cap segments of the US market. With 339 constituents, the index covers approximately 15% of the free float-adjusted market capitalization in the US. The Index is not actively managed and does not reflect any deductions for fees, expenses or taxes. An investor may not invest directly into the Index. |
| (e) | The MSCI USA Small Cap Index is designed to measure the performance of the small cap segment of the US equity market. With 1,740 constituents, the index represents approximately 14% of the free float-adjusted market capitalization in the US. The Index is not actively managed and does not reflect any deductions for fees, expenses or taxes. An investor may not invest directly into the Index. |
| Semi-Annual Report | October 31, 2020 | 31 |
| Grandeur Peak US Stalwarts Fund | Performance Update |
October 31, 2020 (Unaudited)
Growth of $10,000 for the period ended October 31, 2020
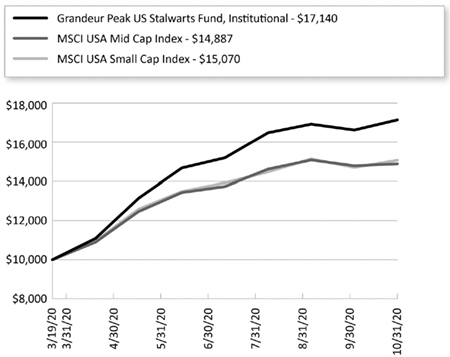
The chart shown above represent a hypothetical investment of $10,000 in the Fund’s Institutional Class shares for the period from inception to October 31, 2020. All returns reflect reinvested dividends, but do not reflect the deduction of taxes that an investor would pay on distributions or redemptions.
Investing in the Fund is subject to investment risks, including possible loss of the principal amount invested.
| 32 | 1.855.377.7325 | www.GrandeurPeakGlobal.com |
| Grandeur Peak US Stalwarts Fund | Performance Update |
October 31, 2020 (Unaudited)
| Regional Allocation (as a % of Net Assets)* | |
| North America | 83.3% |
| Europe | 6.0% |
| Asia ex Japan | 4.3% |
| Latin America | 1.7% |
| Africa/Middle East | 1.4% |
| Cash, Cash Equivalents, & Other Net Assets | 3.3% |
| Total | 100.0% |
| Top 10 Holdings (as a % of Net Assets)* | |
| First Republic Bank | 4.0% |
| EPAM Systems, Inc. | 3.7% |
| WNS Holdings, Ltd. | 3.1% |
| Heska Corp. | 3.1% |
| Paycom Software, Inc. | 2.7% |
| Pluralsight, Inc. | 2.6% |
| Qualys, Inc. | 2.5% |
| Endava PLC | 2.5% |
| Power Integrations, Inc. | 2.3% |
| Goosehead Insurance, Inc. | 2.0% |
| Total | 28.5% |
| * | Holdings are subject to change, and may not reflect the current or future position of the portfolio. |
| Semi-Annual Report | October 31, 2020 | 33 |
| Grandeur Peak Funds® | Disclosure of Fund Expenses |
October 31, 2020 (Unaudited)
As a shareholder of a Fund, you incur two types of costs: (1) transaction costs, including sales charges (loads) on purchase payments, reinvested dividends, or other distributions; redemption fees; and exchange fees; and (2) ongoing costs, including management fees; distribution and/or service (12b-1) fees; and other Fund expenses. This example is intended to help you understand your ongoing costs (in dollars) of investing in the Fund and to compare these costs with the ongoing costs of investing in other mutual funds.
This example is based on an investment of $1,000 invested at the beginning of the period and held for the entire six-month period of May 1, 2020 through October 31, 2020.
Actual Expenses The first line of the table provides information about actual account values and actual expenses. You may use the information in this line, together with the amount you invested, to estimate the expenses that you paid over the period. Simply divide your account value by $1,000 (for example, an $8,600 account value divided by $1,000 = 8.6), then multiply the result by the number in the first line under the heading “Expenses Paid During Period” to estimate the expenses you paid on your account during this period.
Hypothetical Example for Comparison Purposes The second line of the table provides information about hypothetical account values and hypothetical expenses based on the Fund’s actual expense ratio and an assumed rate of return of 5% per year before expenses, which is not the Fund’s actual return. The hypothetical account values and expenses may not be used to estimate the actual ending account balance or expenses you paid for the period. You may use this information to compare the ongoing costs of investing in the Fund and other mutual funds. To do so, compare this 5% hypothetical example with the 5% hypothetical examples that appear in the shareholder reports of the other funds.
Please note that the expenses shown in the table are meant to highlight your ongoing costs only and do not reflect any transactional costs, such as redemption fees or exchange fees. Therefore, the second line of the table is useful in comparing ongoing costs only and will not help you determine the relative total costs of owning different funds. In addition, if these transactional costs were included, your costs would have been higher.
| 34 | 1.855.377.7325 | www.GrandeurPeakGlobal.com |
| Grandeur Peak Funds® | Disclosure of Fund Expenses |
October 31, 2020 (Unaudited)
| | Beginning
Account Value
May 1, 2020 | Ending
Account Value
October 31, 2020 | Expense
Ratio(a) | Expenses Paid
During period
May 1, 2020 -
October 31, 2020(b) |
| Grandeur Peak Emerging Markets Opportunities Fund | | | | |
| Investor Class | | | | |
| Actual | $1,000.00 | $1,260.20 | 1.74% | $9.91 |
| Hypothetical (5% return before expenses) | $1,000.00 | $1,016.43 | 1.74% | $8.84 |
| Institutional Class | | | | |
| Actual | $1,000.00 | $1,262.10 | 1.50% | $8.55 |
| Hypothetical (5% return before expenses) | $1,000.00 | $1,017.64 | 1.50% | $7.63 |
| Grandeur Peak Global Contrarian Fund | | | | |
| Institutional Class | | | | |
| Actual | $1,000.00 | $1,249.40 | 1.35% | $7.65 |
| Hypothetical (5% return before expenses) | $1,000.00 | $1,018.40 | 1.35% | $6.87 |
| Grandeur Peak Global Micro Cap Fund | | | | |
| Institutional Class | | | | |
| Actual | $1,000.00 | $1,428.10 | 2.00% | $12.24 |
| Hypothetical (5% return before expenses) | $1,000.00 | $1,015.12 | 2.00% | $10.16 |
| Grandeur Peak Global Opportunities Fund | | | | |
| Investor Class | | | | |
| Actual | $1,000.00 | $1,324.10 | 1.56% | $9.14 |
| Hypothetical (5% return before expenses) | $1,000.00 | $1,017.34 | 1.56% | $7.93 |
| Institutional Class | | | | |
| Actual | $1,000.00 | $1,325.20 | 1.31% | $7.68 |
| Hypothetical (5% return before expenses) | $1,000.00 | $1,018.60 | 1.31% | $6.67 |
| Grandeur Peak Global Reach Fund | | | | |
| Investor Class | | | | |
| Actual | $1,000.00 | $1,314.40 | 1.53% | $8.93 |
| Hypothetical (5% return before expenses) | $1,000.00 | $1,017.49 | 1.53% | $7.78 |
| Institutional Class | | | | |
| Actual | $1,000.00 | $1,316.40 | 1.29% | $7.53 |
| Hypothetical (5% return before expenses) | $1,000.00 | $1,018.70 | 1.29% | $6.56 |
| Grandeur Peak Global Stalwarts Fund | | | | |
| Investor Class | | | | |
| Actual | $1,000.00 | $1,294.50 | 1.22% | $7.06 |
| Hypothetical (5% return before expenses) | $1,000.00 | $1,019.06 | 1.22% | $6.21 |
| Institutional Class | | | | |
| Actual | $1,000.00 | $1,295.80 | 0.97% | $5.61 |
| Hypothetical (5% return before expenses) | $1,000.00 | $1,020.32 | 0.97% | $4.94 |
| Grandeur Peak International Opportunities Fund | | | | |
| Investor Class | | | | |
| Actual | $1,000.00 | $1,332.20 | 1.57% | $9.23 |
| Hypothetical (5% return before expenses) | $1,000.00 | $1,017.29 | 1.57% | $7.98 |
| Institutional Class | | | | |
| Actual | $1,000.00 | $1,333.30 | 1.32% | $7.76 |
| Hypothetical (5% return before expenses) | $1,000.00 | $1,018.55 | 1.32% | $6.72 |
| Grandeur Peak International Stalwarts Fund | | | | |
| Investor Class | | | | |
| Actual | $1,000.00 | $1,295.10 | 1.15% | $6.65 |
| Hypothetical (5% return before expenses) | $1,000.00 | $1,019.41 | 1.15% | $5.85 |
| Institutional Class | | | | |
| Actual | $1,000.00 | $1,297.40 | 0.90% | $5.21 |
| Hypothetical (5% return before expenses) | $1,000.00 | $1,020.67 | 0.90% | $4.58 |
| Grandeur Peak US Stalwarts Fund | | | | |
| Institutional Class | | | | |
| Actual | $1,000.00 | $1,303.40 | 1.00% | $5.81 |
| Hypothetical (5% return before expenses) | $1,000.00 | $1,020.16 | 1.00% | $5.09 |
| Semi-Annual Report | October 31, 2020 | 35 |
| Grandeur Peak Funds® | Disclosure of Fund Expenses |
October 31, 2020 (Unaudited)
| (a) | The Fund's expense ratios have been annualized based on the Fund's most recent fiscal half-year expenses. |
| (b) | Expenses are equal to the Fund's annualized expense ratio multiplied by the average account value over the period, multiplied by the number of days in the most recent fiscal half-year (184)/365 (to reflect the half-year period). |
| 36 | 1.855.377.7325 | www.GrandeurPeakGlobal.com |
| Grandeur Peak Emerging Markets Opportunities Fund | Portfolio of Investments |
October 31, 2020 (Unaudited)
| | | Shares | | | Value
(Note 2) | |
| COMMON STOCKS (100.06%) | | | | | | | | |
| Argentina (1.25%) | | | | | | | | |
| Globant SA(a) | | | 31,692 | | | $ | 5,723,892 | |
| | | | | | | | | |
| Bangladesh (0.79%) | | | | | | | | |
| Square Pharmaceuticals, Ltd. | | | 1,557,448 | | | | 3,645,990 | |
| | | | | | | | | |
| Brazil (7.41%) | | | | | | | | |
| Arco Platform, Ltd., Class A(a) | | | 110,316 | | | | 3,759,569 | |
| Fleury SA | | | 720,300 | | | | 3,449,637 | |
| Hypera SA | | | 466,300 | | | | 2,266,508 | |
| Locaweb Servicos de Internet SA(a)(b)(c) | | | 623,500 | | | | 7,493,366 | |
| Magazine Luiza SA | | | 544,000 | | | | 2,325,625 | |
| Pagseguro Digital, Ltd., Class A(a) | | | 220,100 | | | | 8,057,861 | |
| Raia Drogasil SA | | | 507,000 | | | | 2,132,988 | |
| TOTVS SA | | | 607,700 | | | | 2,856,363 | |
| Vasta Platform(a) | | | 147,200 | | | | 1,701,632 | |
| | | | | | | | 34,043,549 | |
| | | | | | | | | |
| China (23.85%) | | | | | | | | |
| AK Medical Holdings, Ltd.(b)(c) | | | 978,000 | | | | 2,188,361 | |
| Alibaba Group Holding, Ltd., Sponsored ADR(a) | | | 24,000 | | | | 7,312,560 | |
| ANTA Sports Products, Ltd. | | | 337,000 | | | | 3,741,088 | |
| Autohome, Inc., ADR | | | 15,775 | | | | 1,507,301 | |
| Baozun, Inc., Sponsored ADR(a) | | | 91,975 | | | | 3,365,365 | |
| CSPC Pharmaceutical Group, Ltd. | | | 3,774,720 | | | | 4,008,473 | |
| Fu Shou Yuan International Group, Ltd. | | | 2,332,000 | | | | 2,402,113 | |
| Hangzhou Robam Appliances Co., Ltd., Class A | | | 840,700 | | | | 4,602,456 | |
| Hangzhou Tigermed Consulting Co., Ltd., Class A | | | 176,250 | | | | 3,273,693 | |
| HUYA, Inc., ADR(a) | | | 130,177 | | | | 2,915,965 | |
| Jiangsu Hengrui Medicine Co., Ltd., Class A | | | 175,080 | | | | 2,328,657 | |
| Koolearn Technology Holding, Ltd.(a)(b)(c) | | | 869,000 | | | | 2,813,617 | |
| Li Ning Co., Ltd. | | | 819,000 | | | | 4,268,579 | |
| Man Wah Holdings, Ltd. | | | 5,360,400 | | | | 7,481,178 | |
| ManpowerGroup Greater China, Ltd.(c) | | | 2,043,000 | | | | 3,655,189 | |
| New Oriental Education & Technology Group, Inc., Sponsored ADR(a) | | | 35,425 | | | | 5,681,462 | |
| O2Micro International, Ltd., ADR(a) | | | 403,566 | | | | 2,590,894 | |
| Silergy Corp. | | | 267,422 | | | | 16,487,336 | |
| Suofeiya Home Collection Co., Ltd., Class A | | | 1,113,400 | | | | 4,700,285 | |
| Tencent Holdings, Ltd. | | | 61,900 | | | | 4,729,510 | |
| TK Group Holdings, Ltd. | | | 7,805,000 | | | | 2,318,101 | |
| | | Shares | | | Value
(Note 2) | |
| China (continued) | | | | | | | | |
| Trip.com Group, Ltd., ADR(a) | | | 178,200 | | | $ | 5,125,032 | |
| WuXi AppTec Co., Ltd., Class H(b)(c) | | | 334,000 | | | | 5,340,092 | |
| Wuxi Biologics Cayman, Inc.(a)(b)(c) | | | 137,000 | | | | 3,847,471 | |
| Yum China Holdings, Inc. | | | 53,475 | | | | 2,846,474 | |
| | | | | | | | 109,531,252 | |
| | | | | | | | | |
| Colombia (0.69%) | | | | | | | | |
| Parex Resources, Inc.(a) | | | 324,731 | | | | 3,161,271 | |
| | | | | | | | | |
| Egypt (0.64%) | | | | | | | | |
| African Export-Import Bank, GDR | | | 500,000 | | | | 1,640,000 | |
| Integrated Diagnostics Holdings PLC(b)(c) | | | 371,100 | | | | 1,304,416 | |
| | | | | | | | 2,944,416 | |
| | | | | | | | | |
| Georgia (1.29%) | | | | | | | | |
| Bank of Georgia Group PLC(a) | | | 185,712 | | | | 2,159,665 | |
| Georgia Capital PLC(a) | | | 186,468 | | | | 889,015 | |
| TBC Bank Group PLC(a) | | | 240,293 | | | | 2,862,795 | |
| | | | | | | | 5,911,475 | |
| | | | | | | | | |
| Greece (2.09%) | | | | | | | | |
| JUMBO SA | | | 262,100 | | | | 3,673,670 | |
| Sarantis SA | | | 603,670 | | | | 5,940,873 | |
| | | | | | | | 9,614,543 | |
| | | | | | | | | |
| Hong Kong (3.25%) | | | | | | | | |
| Jacobson Pharma Corp., Ltd.(c) | | | 11,362,000 | | | | 1,674,742 | |
| Plover Bay Technologies, Ltd.(c) | | | 8,956,000 | | | | 937,386 | |
| Techtronic Industries Co., Ltd. | | | 351,000 | | | | 4,727,739 | |
| Value Partners Group, Ltd. | | | 6,626,800 | | | | 2,903,624 | |
| Vitasoy International Holdings, Ltd. | | | 1,156,383 | | | | 4,677,461 | |
| | | | | | | | 14,920,952 | |
| | | | | | | | | |
| India (15.58%) | | | | | | | | |
| Avenue Supermarts, Ltd.(a)(b)(c) | | | 62,000 | | | | 1,874,428 | |
| Bajaj Finance, Ltd. | | | 169,370 | | | | 7,555,335 | |
| City Union Bank, Ltd. | | | 1,468,575 | | | | 2,921,814 | |
| Computer Age Management Services, Ltd.(a) | | | 81,312 | | | | 1,422,926 | |
| Cyient, Ltd. | | | 668,095 | | | | 3,559,786 | |
| EPL, Ltd. | | | 646,464 | | | | 2,163,555 | |
| Gulf Oil Lubricants India, Ltd. | | | 213,607 | | | | 1,900,458 | |
| Happiest Minds Technologies, Ltd.(a) | | | 659,147 | | | | 3,014,781 | |
| HCL Technologies, Ltd. | | | 83,500 | | | | 950,030 | |
| HDFC Bank, Ltd.(a) | | | 324,635 | | | | 5,184,401 | |
| IndiaMart InterMesh, Ltd.(b)(c) | | | 112,613 | | | | 7,377,498 | |
| L&T Technology Services, Ltd.(b)(c) | | | 172,763 | | | | 3,884,102 | |
See Notes to Financial Statements.
| Semi-Annual Report | October 31, 2020 | 37 |
| Grandeur Peak Emerging Markets Opportunities Fund | Portfolio of Investments |
October 31, 2020 (Unaudited)
| | | Shares | | | Value
(Note 2) | |
| India (continued) | | | | | | | | |
| Marico, Ltd. | | | 345,835 | | | $ | 1,665,316 | |
| Metropolis Healthcare, Ltd.(b)(c) | | | 384,201 | | | | 10,195,529 | |
| Mindtree, Ltd. | | | 85,500 | | | | 1,535,501 | |
| Time Technoplast, Ltd. | | | 403,339 | | | | 203,301 | |
| Vaibhav Global, Ltd. | | | 163,761 | | | | 4,310,668 | |
| WNS Holdings, Ltd., ADR(a) | | | 204,975 | | | | 11,814,759 | |
| | | | | | | | 71,534,188 | |
| | | | | | | | | |
| Indonesia (3.55%) | | | | | | | | |
| Ace Hardware Indonesia Tbk PT | | | 26,020,300 | | | | 2,774,691 | |
| Arwana Citramulia Tbk PT | | | 45,188,500 | | | | 1,532,393 | |
| Bank Central Asia Tbk PT | | | 1,271,500 | | | | 2,501,874 | |
| Bank Tabungan Pensiunan Nasional Syariah | | | 8,128,000 | | | | 2,029,633 | |
| Selamat Sempurna Tbk PT | | | 52,028,900 | | | | 4,931,989 | |
| Ultrajaya Milk Industry & Trading Co. Tbk PT | | | 22,365,800 | | | | 2,520,400 | |
| | | | | | | | 16,290,980 | |
| | | | | | | | | |
| Kenya (0.68%) | | | | | | | | |
| Safaricom PLC | | | 11,096,600 | | | | 3,146,054 | |
| | | | | | | | | |
| Malaysia (0.47%) | | | | | | | | |
| AEON Credit Service M Bhd | | | 648,114 | | | | 1,422,800 | |
| Scicom MSC Bhd | | | 3,545,500 | | | | 751,406 | |
| | | | | | | | 2,174,206 | |
| | | | | | | | | |
| Mexico (1.14%) | | | | | | | | |
| Grupo Herdez SAB de CV | | | 1,339,560 | | | | 2,385,271 | |
| Regional SAB de CV(a) | | | 1,048,200 | | | | 2,845,902 | |
| | | | | | | | 5,231,173 | |
| | | | | | | | | |
| Philippines (3.39%) | | | | | | | | |
| Concepcion Industrial Corp. | | | 1,861,792 | | | | 833,514 | |
| D&L Industries, Inc. | | | 11,306,000 | | | | 1,454,114 | |
| Philippine Seven Corp. | | | 1,023,000 | | | | 2,346,136 | |
| Puregold Price Club, Inc. | | | 5,288,200 | | | | 4,506,951 | |
| Wilcon Depot, Inc. | | | 21,691,900 | | | | 6,414,821 | |
| | | | | | | | 15,555,536 | |
| | | | | | | | | |
| Poland (3.79%) | | | | | | | | |
| Allegro.eu SA(a)(b)(c) | | | 75,754 | | | | 1,539,537 | |
| Dino Polska SA(a)(b)(c) | | | 168,413 | | | | 9,259,252 | |
| LiveChat Software SA | | | 229,374 | | | | 5,527,782 | |
| PGS Software SA | | | 426,467 | | | | 1,082,704 | |
| | | | | | | | 17,409,275 | |
| | | | | | | | | |
| Russia (1.72%) | | | | | | | | |
| HeadHunter Group PLC, ADR | | | 141,100 | | | | 3,236,834 | |
| TCS Group Holding PLC, GDR(c) | | | 64,357 | | | | 1,535,426 | |
| Yandex NV, Class A(a) | | | 54,625 | | | | 3,144,761 | |
| | | | | | | | 7,917,021 | |
| | | Shares | | | Value
(Note 2) | |
| Singapore (0.28%) | | | | | | |
| Riverstone Holdings, Ltd./Singapore | | | 467,900 | | | $ | 1,303,517 | |
| | | | | | | | | |
| South Africa (2.49%) | | | | | | | | |
| Capitec Bank Holdings, Ltd.(a) | | | 23,200 | | | | 1,630,488 | |
| Clicks Group, Ltd. | | | 216,900 | | | | 3,144,792 | |
| Italtile, Ltd. | | | 3,636,472 | | | | 2,916,105 | |
| Transaction Capital, Ltd. | | | 3,071,128 | | | | 3,750,580 | |
| | | | | | | | 11,441,965 | |
| | | | | | | | | |
| South Korea (7.02%) | | | | | | | | |
| Douzone Bizon Co., Ltd. | | | 44,000 | | | | 3,879,304 | |
| LEENO Industrial, Inc. | | | 60,700 | | | | 6,529,096 | |
| LG Household & Health Care, Ltd. | | | 5,325 | | | | 7,060,309 | |
| NAVER Corp. | | | 13,560 | | | | 3,469,611 | |
| Ray Co. Ltd/KR(a) | | | 43,000 | | | | 1,493,072 | |
| Settle Bank, Inc./Korea | | | 81,000 | | | | 2,015,834 | |
| Suprema, Inc.(a) | | | 68,000 | | | | 1,644,728 | |
| Tokai Carbon Korea Co., Ltd. | | | 75,124 | | | | 6,143,792 | |
| | | | | | | | 32,235,746 | |
| | | | | | | | | |
| Taiwan (10.33%) | | | | | | | | |
| ASPEED Technology, Inc. | | | 106,000 | | | | 5,130,348 | |
| Bioteque Corp. | | | 810,000 | | | | 3,898,939 | |
| eMemory Technology, Inc. | | | 80,000 | | | | 1,600,133 | |
| FineTek Co., Ltd. | | | 409,500 | | | | 1,024,293 | |
| M31 Technology Corp. | | | 51,000 | | | | 541,889 | |
| Pacific Hospital Supply Co., Ltd. | | | 500,384 | | | | 1,207,903 | |
| Poya International Co., Ltd. | | | 470,000 | | | | 10,151,251 | |
| Rafael Microelectronics, Inc. | | | 312,000 | | | | 1,333,489 | |
| Realtek Semiconductor Corp. | | | 273,000 | | | | 3,400,881 | |
| Sporton International, Inc. | | | 805,760 | | | | 6,441,972 | |
| Tehmag Foods Corp. | | | 145,200 | | | | 1,245,254 | |
| Test Research, Inc. | | | 886,000 | | | | 1,722,950 | |
| TSC Auto ID Technology Co., Ltd. | | | 228,800 | | | | 1,434,720 | |
| Voltronic Power Technology Corp. | | | 241,608 | | | | 8,287,444 | |
| | | | | | | | 47,421,466 | |
| | | | | | | | | |
| Thailand (1.56%) | | | | | | | | |
| Muangthai Capital PCL | | | 1,779,000 | | | | 3,121,890 | |
| Netbay PCL | | | 1,489,000 | | | | 1,190,212 | |
| TOA Paint Thailand PCL | | | 2,776,000 | | | | 2,868,755 | |
| | | | | | | | 7,180,857 | |
| | | | | | | | | |
| Turkey (0.16%) | | | | | | | | |
| DP Eurasia NV(a)(b)(c) | | | 1,646,300 | | | | 713,399 | |
| | | | | | | | | |
| United Arab Emirates (0.15%) | | | | | | | | |
| Network International Holdings PLC(a)(b)(c) | | | 236,400 | | | | 678,331 | |
See Notes to Financial Statements.
| 38 | 1.855.377.7325 | www.GrandeurPeakGlobal.com |
| Grandeur Peak Emerging Markets Opportunities Fund | Portfolio of Investments |
October 31, 2020 (Unaudited)
| | | Shares | | | Value
(Note 2) | |
| United States (2.58%) | | | | | | | | |
| FirstCash, Inc. | | | 33,570 | | | $ | 1,746,983 | |
| Frontage Holdings Corp.(a)(b)(c) | | | 7,883,000 | | | | 3,472,279 | |
| Genpact, Ltd. | | | 192,575 | | | | 6,618,803 | |
| | | | | | | | 11,838,065 | |
| | | | | | | | | |
| Vietnam (3.91%) | | | | | | | | |
| FPT Corp. | | | 1,569,302 | | | | 3,492,532 | |
| Ho Chi Minh City Development Joint Stock Commercial Bank(a) | | | 2,912,263 | | | | 3,048,667 | |
| Lix Detergent JSC | | | 437,310 | | | | 1,056,144 | |
| Vietnam Dairy Products JSC | | | 1,153,242 | | | | 5,388,300 | |
| Vietnam Technological & Commercial Joint Stock Bank(a) | | | 3,340,269 | | | | 3,084,722 | |
| Vincom Retail JSC(a) | | | 1,699,320 | | | | 1,869,311 | |
| | | | | | | | 17,939,676 | |
| | | | | | | | | |
| TOTAL COMMON STOCKS | | | | | | | | |
| (Cost $329,736,823) | | | | | | | 459,508,795 | |
| | | | | | | | | |
| TOTAL INVESTMENTS (100.06%) | | | | | | | | |
| (Cost $329,736,823) | | | | | | $ | 459,508,795 | |
| | | | | | | | | |
| Liabilities In Excess Of Other Assets (-0.06%) | | | | | | | (252,992 | ) |
| | | | | | | | | |
| NET ASSETS (100.00%) | | | | | | $ | 459,255,803 | |
| (a) | Non-Income Producing Security. |
| (b) | Security exempt from registration under Rule 144A of the Securities Act of 1933. These securities may be resold in the ordinary course of business in transactions exempt from registration, normally to qualified institutional buyers. As of October 31, 2020, these securities had a total aggregate market value of $61,981,678, representing 13.50% of net assets. |
| (c) | Security was purchased pursuant to Regulation S under the Securities Act of 1933, which exempts securities offered and sold outside of the United States from registration. Such security cannot be sold in the United States without either an effective registration statement filed pursuant to the Securities Act of 1933, or pursuant to an exemption from registration. As of October 31, 2020, the aggregate market value of these securities was $69,784,421, representing 15.20% of net assets. |
For Fund compliance purposes, the Fund's geographical classifications refer to any one or more of the country sub-classifications used by one or more widely recognized market indexes or ratings group indexes, and/or as defined by Fund management. This definition may not apply for purposes of this report, which may combine sub-classifications for reporting ease. Geographical regions are shown as a percentage of net assets.
Sector Composition (October 31, 2020) (Unaudited)
| Consumer | | | 33.6 | % |
| Technology | | | 30.5 | % |
| Health Care | | | 12.2 | % |
| Financials | | | 11.9 | % |
| Industrials | | | 9.4 | % |
| Energy & Materials | | | 2.5 | % |
| Cash, Cash Equivalents, & Other Net Assets | | | -0.1 | % |
| Total | | | 100 | % |
Industry Composition (October 31, 2020) (Unaudited)
| IT Services | | | 9.7 | % |
| Semiconductors & Semiconductor Equipment | | | 9.5 | % |
| Banks | | | 6.5 | % |
| Software | | | 5.2 | % |
| Food & Staples Retailing | | | 5.1 | % |
| Consumer Finance | | | 3.8 | % |
| Internet & Direct Marketing Retail | | | 3.8 | % |
| Professional Services | | | 3.8 | % |
| Household Durables | | | 3.7 | % |
| Diversified Consumer Services | | | 3.6 | % |
| Food Products | | | 3.5 | % |
| Life Sciences Tools & Services | | | 3.5 | % |
| Specialty Retail | | | 3.4 | % |
| Health Care Providers & Services | | | 3.3 | % |
| Personal Products | | | 3.2 | % |
| Pharmaceuticals | | | 3.0 | % |
| Interactive Media & Services | | | 2.8 | % |
| Multiline Retail | | | 2.7 | % |
| Textiles, Apparel & Luxury Goods | | | 2.7 | % |
| Health Care Equipment & Supplies | | | 2.2 | % |
| Electrical Equipment | | | 2.0 | % |
| Trading Companies & Distributors | | | 1.6 | % |
| Machinery | | | 1.5 | % |
| Electronic Equipment, Instruments & Components | | | 1.5 | % |
| Chemicals | | | 1.4 | % |
| Auto Components | | | 1.1 | % |
| Other Industries (each less than 1%) | | | 6.2 | % |
| Cash and Other Assets, Less Liabilities | | | -0.1 | % |
| Total | | | 100 | % |
See Notes to Financial Statements.
| Semi-Annual Report | October 31, 2020 | 39 |
| Grandeur Peak Global Contrarian Fund | Portfolio of Investments |
October 31, 2020 (Unaudited)
| | | Shares | | | Value
(Note 2) | |
| COMMON STOCKS (99.21%) | | | | | | | | |
| Australia (4.20%) | | | | | | | | |
| Fiducian Group, Ltd. | | | 85,509 | | | $ | 326,380 | |
| Lycopodium, Ltd. | | | 27,700 | | | | 80,800 | |
| National Storage REIT | | | 58,824 | | | | 74,655 | |
| QANTM Intellectual Property, Ltd. | | | 206,869 | | | | 145,280 | |
| | | | | | | | 627,115 | |
| | | | | | | | | |
| Bangladesh (0.78%) | | | | | | | | |
| Square Pharmaceuticals, Ltd. | | | 49,896 | | | | 116,807 | |
| | | | | | | | | |
| Belgium (1.25%) | | | | | | | | |
| X-Fab Silicon Foundries SE(a)(b)(c) | | | 50,256 | | | | 187,056 | |
| | | | | | | | | |
| Brazil (0.74%) | | | | | | | | |
| Smiles Fidelidade SA | | | 44,400 | | | | 111,040 | |
| | | | | | | | | |
| Britain (10.05%) | | | | | | | | |
| Ascential PLC(a) | | | 24,600 | | | | 88,100 | |
| B&M European Value Retail SA | | | 25,845 | | | | 162,201 | |
| City of London Investment Group PLC | | | 24,894 | | | | 129,645 | |
| Clinigen Group PLC | | | 11,700 | | | | 91,281 | |
| Close Brothers Group PLC | | | 4,663 | | | | 65,022 | |
| CVS Group PLC | | | 7,997 | | | | 127,948 | |
| K3 Capital Group PLC | | | 107,654 | | | | 204,318 | |
| On the Beach Group PLC(b)(c) | | | 30,000 | | | | 83,607 | |
| Oxford Immunotec Global PLC(a) | | | 20,165 | | | | 226,655 | |
| Premier Miton Group PLC | | | 83,787 | | | | 119,178 | |
| Sabre Insurance Group PLC(b)(c) | | | 29,797 | | | | 88,498 | |
| Volution Group PLC | | | 44,729 | | | | 112,416 | |
| | | | | | | | 1,498,869 | |
| | | | | | | | | |
| Canada (3.94%) | | | | | | | | |
| BioSyent, Inc.(a) | | | 43,000 | | | | 225,925 | |
| Guardian Capital Group, Ltd. | | | 12,925 | | | | 216,823 | |
| Kirkland Lake Gold, Ltd. | | | 3,200 | | | | 145,793 | |
| | | | | | | | 588,541 | |
| | | | | | | | | |
| China (5.27%) | | | | | | | | |
| Hangzhou Robam Appliances Co., Ltd., Class A | | | 25,000 | | | | 136,863 | |
| Man Wah Holdings, Ltd. | | | 62,000 | | | | 86,530 | |
| O2Micro International, Ltd., ADR(a) | | | 26,839 | | | | 172,306 | |
| TK Group Holdings, Ltd. | | | 336,000 | | | | 99,793 | |
| Xin Point Holdings, Ltd.(c) | | | 859,000 | | | | 291,846 | |
| | | | | | | | 787,338 | |
| | | Shares | | | Value
(Note 2) | |
| Colombia (1.02%) | | | | | | | | |
| Parex Resources, Inc.(a) | | | 15,614 | | | $ | 152,003 | |
| | | | | | | | | |
| France (4.73%) | | | | | | | | |
| Alten SA(a) | | | 1,400 | | | | 112,096 | |
| Neurones | | | 5,662 | | | | 154,304 | |
| Rothschild & Co.(a) | | | 5,547 | | | | 142,377 | |
| Thermador Groupe | | | 1,709 | | | | 115,027 | |
| Wavestone(a) | | | 6,814 | | | | 182,319 | |
| | | | | | | | 706,123 | |
| | | | | | | | | |
| Georgia (1.33%) | | | | | | | | |
| Bank of Georgia Group PLC(a) | | | 4,920 | | | | 57,215 | |
| Georgia Capital PLC(a) | | | 17,849 | | | | 85,098 | |
| TBC Bank Group PLC(a) | | | 4,744 | | | | 56,519 | |
| | | | | | | | 198,832 | |
| | | | | | | | | |
| Germany (2.59%) | | | | | | | | |
| Aroundtown SA(a) | | | 21,361 | | | | 102,461 | |
| Grand City Properties SA | | | 6,173 | | | | 140,118 | |
| Norma Group SE | | | 4,641 | | | | 143,992 | |
| | | | | | | | 386,571 | |
| | | | | | | | | |
| Greece (2.19%) | | | | | | | | |
| Kri-Kri Milk Industry SA | | | 31,795 | | | | 228,707 | |
| Sarantis SA | | | 10,000 | | | | 98,413 | |
| | | | | | | | 327,120 | |
| | | | | | | | | |
| Hong Kong (3.03%) | | | | | | | | |
| Jacobson Pharma Corp., Ltd.(c) | | | 1,112,000 | | | | 163,907 | |
| Plover Bay Technologies, Ltd.(c) | | | 2,073,000 | | | | 216,972 | |
| Value Partners Group, Ltd. | | | 162,000 | | | | 70,983 | |
| | | | | | | | 451,862 | |
| | | | | | | | | |
| India (5.58%) | | | | | | | | |
| City Union Bank, Ltd. | | | 79,500 | | | | 158,170 | |
| Cyient, Ltd. | | | 18,000 | | | | 95,909 | |
| Gulf Oil Lubricants India, Ltd. | | | 13,817 | | | | 122,930 | |
| HCL Technologies, Ltd. | | | 12,488 | | | | 142,084 | |
| Time Technoplast, Ltd. | | | 176,811 | | | | 89,121 | |
| WNS Holdings, Ltd., ADR(a) | | | 3,894 | | | | 224,449 | |
| | | | | | | | 832,663 | |
| | | | | | | | | |
| Indonesia (3.53%) | | | | | | | | |
| Selamat Sempurna Tbk PT | | | 2,624,700 | | | | 248,803 | |
| Ultrajaya Milk Industry & Trading Co. Tbk PT | | | 1,030,000 | | | | 116,071 | |
| Uni-Charm Indonesia Tbk PT | | | 1,541,500 | | | | 162,099 | |
| | | | | | | | 526,973 | |
| | | | | | | | | |
| Ireland (0.90%) | | | | | | | | |
| Irish Residential Properties REIT PLC | | | 84,263 | | | | 134,447 | |
See Notes to Financial Statements.
| 40 | 1.855.377.7325 | www.GrandeurPeakGlobal.com |
| Grandeur Peak Global Contrarian Fund | Portfolio of Investments |
October 31, 2020 (Unaudited)
| | | Shares | | | Value
(Note 2) | |
| Italy (1.52%) | | | | | | | | |
| Banca Sistema SpA(a)(b)(c) | | | 57,271 | | | $ | 94,533 | |
| Piovan SpA(b)(c) | | | 27,704 | | | | 131,755 | |
| | | | | | | | 226,288 | |
| | | | | | | | | |
| Japan (11.99%) | | | | | | | | |
| Beenos, Inc. | | | 13,000 | | | | 200,397 | |
| Central Automotive Products, Ltd. | | | 10,100 | | | | 196,737 | |
| GMO Financial Holdings, Inc. | | | 18,500 | | | | 106,365 | |
| Japan Lifeline Co., Ltd. | | | 11,600 | | | | 149,688 | |
| Medikit Co., Ltd. | | | 3,800 | | | | 111,656 | |
| Naigai Trans Line, Ltd. | | | 16,000 | | | | 184,738 | |
| Open Door, Inc.(a) | | | 10,000 | | | | 114,013 | |
| Seria Co., Ltd. | | | 3,800 | | | | 146,411 | |
| Sundrug Co., Ltd. | | | 2,900 | | | | 107,682 | |
| Synchro Food Co., Ltd.(a) | | | 35,500 | | | | 96,898 | |
| Trancom Co., Ltd. | | | 3,800 | | | | 273,045 | |
| YAMADA Consulting Group Co., Ltd. | | | 10,400 | | | | 100,106 | |
| | | | | | | | 1,787,736 | |
| | | | | | | | | |
| Mexico (0.80%) | | | | | | | | |
| Regional SAB de CV(a) | | | 43,900 | | | | 119,190 | |
| | | | | | | | | |
| Netherlands (0.98%) | | | | | | | | |
| Aalberts NV | | | 4,371 | | | | 146,643 | |
| | | | | | | | | |
| Norway (0.59%) | | | | | | | | |
| Sbanken ASA(a)(b)(c) | | | 13,924 | | | | 88,788 | |
| | | | | | | | | |
| Philippines (1.62%) | | | | | | | | |
| Concepcion Industrial Corp. | | | 281,800 | | | | 126,161 | |
| Pryce Corp. | | | 1,367,700 | | | | 116,141 | |
| | | | | | | | 242,302 | |
| | | | | | | | | |
| Poland (0.44%) | | | | | | | | |
| PGS Software SA | | | 26,156 | | | | 66,404 | |
| | | | | | | | | |
| Singapore (1.42%) | | | | | | | | |
| Riverstone Holdings, Ltd./Singapore | | | 76,300 | | | | 212,563 | |
| | | | | | | | | |
| South Africa (0.64%) | | | | | | | | |
| Italtile, Ltd. | | | 118,471 | | | | 95,002 | |
| | | | | | | | | |
| South Korea (2.06%) | | | | | | | | |
| LEENO Industrial, Inc. | | | 721 | | | | 77,553 | |
| Tokai Carbon Korea Co., Ltd. | | | 2,814 | | | | 230,135 | |
| | | | | | | | 307,688 | |
| | | | | | | | | |
| Sweden (1.89%) | | | | | | | | |
| Beijer Alma AB | | | 8,400 | | | | 109,581 | |
| | | Shares | | | Value
(Note 2) | |
| Sweden (continued) | | | | | | | | |
| KNOW IT AB(a) | | | 6,312 | | | $ | 172,691 | |
| | | | | | | | 282,272 | |
| | | | | | | | | |
| Taiwan (5.10%) | | | | | | | | |
| Bioteque Corp. | | | 66,000 | | | | 317,691 | |
| FineTek Co., Ltd. | | | 33,000 | | | | 82,544 | |
| Pacific Hospital Supply Co., Ltd. | | | 61,000 | | | | 147,251 | |
| Tehmag Foods Corp. | | | 25,000 | | | | 214,403 | |
| | | | | | | | 761,889 | |
| | | | | | | | | |
| United Arab Emirates (0.41%) | | | | | | | | |
| Aramex PJSC | | | 57,000 | | | | 61,166 | |
| | | | | | | | | |
| United States (14.33%) | | | | | | | | |
| 4imprint Group PLC(a) | | | 2,465 | | | | 66,085 | |
| Bank of NT Butterfield & Son, Ltd. | | | 6,874 | | | | 181,886 | |
| Barrett Business Services, Inc. | | | 4,175 | | | | 247,369 | |
| Esquire Financial Holdings, Inc.(a) | | | 9,139 | | | | 142,477 | |
| Hackett Group, Inc. | | | 19,070 | | | | 246,384 | |
| HD Supply Holdings, Inc.(a) | | | 3,727 | | | | 148,558 | |
| Hingham Institution For Savings The | | | 616 | | | | 124,414 | |
| Kimball International, Inc., Class B | | | 13,874 | | | | 142,902 | |
| NV5 Global, Inc.(a) | | | 1,964 | | | | 110,141 | |
| Systemax, Inc. | | | 15,074 | | | | 428,554 | |
| TriMas Corp.(a) | | | 6,167 | | | | 150,043 | |
| WW Grainger, Inc. | | | 427 | | | | 149,459 | |
| | | | | | | | 2,138,272 | |
| | | | | | | | | |
| Vietnam (4.29%) | | | | | | | | |
| FPT Corp. | | | 45,643 | | | | 101,580 | |
| Hoa Phat Group JSC | | | 111,880 | | | | 147,831 | |
| Vietnam Dairy Products JSC | | | 42,648 | | | | 199,265 | |
| Vietnam Technological & Commercial Joint Stock Bank(a) | | | 208,000 | | | | 192,087 | |
| | | | | | | | 640,763 | |
| | | | | | | | | |
| TOTAL COMMON STOCKS | | | | | | | | |
| (Cost $14,017,327) | | | | | | | 14,810,326 | |
| | | | | | | | | |
| TOTAL INVESTMENTS (99.21%) | | | | | | | | |
| (Cost $14,017,327) | | | | | | $ | 14,810,326 | |
| | | | | | | | | |
| Other Assets In Excess Of Liabilities (0.79%) | | | | | | | 118,161 | |
| | | | | | | | | |
| NET ASSETS (100.00%) | | | | | | $ | 14,928,487 | |
See Notes to Financial Statements.
| Semi-Annual Report | October 31, 2020 | 41 |
| Grandeur Peak Global Contrarian Fund | Portfolio of Investments |
October 31, 2020 (Unaudited)
| (a) | Non-Income Producing Security. |
| (b) | Security exempt from registration under Rule 144A of the Securities Act of 1933. These securities may be resold in the ordinary course of business in transactions exempt from registration, normally to qualified institutional buyers. As of October 31, 2020, these securities had a total aggregate market value of $674,237, representing 4.52% of net assets. |
| (c) | Security was purchased pursuant to Regulation S under the Securities Act of 1933, which exempts securities offered and sold outside of the United States from registration. Such security cannot be sold in the United States without either an effective registration statement filed pursuant to the Securities Act of 1933, or pursuant to an exemption from registration. As of October 31, 2020, the aggregate market value of these securities was $1,346,962, representing 9.02% of net assets. |
For Fund compliance purposes, the Fund’s geographical classifications refer to any one or more of the country sub-classifications used by one or more widely recognized market indexes or ratings group indexes, and/or as defined by Fund management. This definition may not apply for purposes of this report, which may combine sub-classifications for reporting ease. Geographical regions are shown as a percentage of net assets.
| Sector Composition (October 31, 2020) (Unaudited) | |
| Industrials | 23.7% |
| Financials | 20.2% |
| Consumer | 19.3% |
| Technology | 18.3% |
| Health Care | 12.5% |
| Energy & Materials | 5.2% |
| Cash, Cash Equivalents, & Other Net Assets | 0.8% |
| Total | 100% |
| Industry Composition (October 31, 2020) (Unaudited) | |
| IT Services | 8.3% |
| Capital Markets | 8.0% |
| Health Care Equipment & Supplies | 7.8% |
| Banks | 7.7% |
| Trading Companies & Distributors | 5.6% |
| Machinery | 5.2% |
| Food Products | 5.1% |
| Professional Services | 4.7% |
| Semiconductors & Semiconductor Equipment | 4.5% |
| Auto Components | 3.6% |
| Pharmaceuticals | 3.4% |
| Internet & Direct Marketing Retail | 2.7% |
| Multiline Retail | 2.1% |
| Metals & Mining | 2.0% |
| Road & Rail | 1.8% |
| Oil, Gas & Consumable Fuels | 1.8% |
| Media | 1.8% |
| Real Estate Management & Development | 1.6% |
| Building Products | 1.6% |
| Household Durables | 1.5% |
| Communications Equipment | 1.5% |
| Equity Real Estate Investment Trusts (REITs) | 1.4% |
| Distributors | 1.3% |
| Construction & Engineering | 1.3% |
| Marine | 1.2% |
| Household Products | 1.1% |
| Software | 1.1% |
| Other Industries (each less than 1%) | 9.6% |
| Cash and Other Assets, Less Liabilities | 0.8% |
| Total | 100% |
See Notes to Financial Statements.
| 42 | 1.855.377.7325 | www.GrandeurPeakGlobal.com |
| Grandeur Peak Global Micro Cap Fund | Portfolio of Investments |
October 31, 2020 (Unaudited)
| | | Shares | | | Value
(Note 2) | |
| COMMON STOCKS (100.40%) | | | | | | | | |
| Australia (7.90%) | | | | | | | | |
| Australian Ethical Investment, Ltd. | | | 57,454 | | | $ | 172,436 | |
| Fiducian Group, Ltd. | | | 190,828 | | | | 728,373 | |
| Kogan.com, Ltd. | | | 79,111 | | | | 1,145,211 | |
| Mainstream Group Holdings, Ltd. | | | 411,253 | | | | 276,053 | |
| National Storage REIT | | | 346,787 | | | | 440,118 | |
| People Infrastructure, Ltd. | | | 76,774 | | | | 180,256 | |
| Redbubble, Ltd.(a) | | | 38,500 | | | | 116,716 | |
| Temple & Webster Group, Ltd.(a) | | | 33,868 | | | | 248,693 | |
| | | | | | | | 3,307,856 | |
| | | | | | | | | |
| Belgium (0.37%) | | | | | | | | |
| X-Fab Silicon Foundries SE(a)(b)(c) | | | 41,319 | | | | 153,792 | |
| | | | | | | | | |
| Brazil (0.79%) | | | | | | | | |
| Locaweb Servicos de Internet SA(a)(b)(c) | | | 27,500 | | | | 330,501 | |
| | | | | | | | | |
| Britain (11.17%) | | | | | | | | |
| AB Dynamics PLC | | | 13,514 | | | | 346,972 | |
| City of London Investment Group PLC | | | 43,608 | | | | 227,107 | |
| Curtis Banks Group PLC | | | 78,479 | | | | 203,340 | |
| CVS Group PLC | | | 31,500 | | | | 503,984 | |
| dotdigital group PLC | | | 129,000 | | | | 247,745 | |
| Impax Asset Management Group PLC | | | 93,518 | | | | 657,244 | |
| JTC PLC(b)(c) | | | 60,251 | | | | 420,048 | |
| K3 Capital Group PLC | | | 277,632 | | | | 526,922 | |
| Keystone Law Group PLC | | | 23,672 | | | | 141,744 | |
| On the Beach Group PLC(b)(c) | | | 65,000 | | | | 181,148 | |
| Oxford Immunotec Global PLC(a) | | | 50,683 | | | | 569,677 | |
| Premier Miton Group PLC | | | 110,898 | | | | 157,740 | |
| Tracsis PLC | | | 19,300 | | | | 128,767 | |
| Volution Group PLC | | | 86,601 | | | | 217,652 | |
| XPS Pensions Group PLC(c) | | | 90,380 | | | | 148,803 | |
| | | | | | | | 4,678,893 | |
| | | | | | | | | |
| Canada (0.54%) | | | | | | | | |
| Guardian Capital Group, Ltd. | | | 8,400 | | | | 140,914 | |
| Pivotree, Inc.(a) | | | 10,800 | | | | 85,116 | |
| | | | | | | | 226,030 | |
| | | | | | | | | |
| China (2.93%) | | | | | | | | |
| O2Micro International, Ltd., ADR(a) | | | 94,916 | | | | 609,361 | |
| TK Group Holdings, Ltd. | | | 2,086,000 | | | | 619,546 | |
| | | | | | | | 1,228,907 | |
| | | Shares | | | Value
(Note 2) | |
| Finland (2.46%) | | | | | | |
| Musti Group Oyj(a) | | | 44,964 | | | $ | 1,029,070 | |
| | | | | | | | | |
| France (3.00%) | | | | | | | | |
| Esker SA | | | 3,700 | | | | 616,642 | |
| Neurones | | | 6,900 | | | | 188,043 | |
| Thermador Groupe | | | 5,874 | | | | 395,359 | |
| Wavestone(a) | | | 2,147 | | | | 57,446 | |
| | | | | | | | 1,257,490 | |
| | | | | | | | | |
| Georgia (0.31%) | | | | | | | | |
| TBC Bank Group PLC(a) | | | 11,050 | | | | 131,647 | |
| | | | | | | | | |
| Germany (6.36%) | | | | | | | | |
| Deutsche Industrie REIT AG | | | 6,360 | | | | 120,772 | |
| Exasol AG(a) | | | 27,265 | | | | 523,288 | |
| Fashionette AG(a) | | | 8,944 | | | | 307,029 | |
| Home24 SE(a) | | | 20,239 | | | | 385,455 | |
| Marley Spoon AG(a) | | | 111,136 | | | | 196,108 | |
| Nexus AG | | | 3,900 | | | | 217,293 | |
| PharmaSGP Holding SE(a) | | | 7,300 | | | | 250,857 | |
| Westwing Group AG(a) | | | 21,739 | | | | 664,365 | |
| | | | | | | | 2,665,167 | |
| | | | | | | | | |
| Greece (4.18%) | | | | | | | | |
| Kri-Kri Milk Industry SA | | | 83,721 | | | | 602,222 | |
| Sarantis SA | | | 116,542 | | | | 1,146,920 | |
| | | | | | | | 1,749,142 | |
| | | | | | | | | |
| Hong Kong (0.84%) | | | | | | | | |
| Jacobson Pharma Corp., Ltd.(c) | | | 968,000 | | | | 142,682 | |
| Plover Bay Technologies, Ltd.(c) | | | 2,008,000 | | | | 210,169 | |
| | | | | | | | 352,851 | |
| | | | | | | | | |
| India (8.08%) | | | | | | | | |
| Amrutanjan Health Care, Ltd. | | | 33,115 | | | | 186,917 | |
| Cyient, Ltd. | | | 23,640 | | | | 125,960 | |
| EPL, Ltd. | | | 72,500 | | | | 242,640 | |
| Gulf Oil Lubricants India, Ltd. | | | 26,217 | | | | 233,252 | |
| Happiest Minds Technologies, Ltd.(a) | | | 43,552 | | | | 199,196 | |
| IndiaMart InterMesh, Ltd.(b)(c) | | | 9,465 | | | | 620,071 | |
| Metropolis Healthcare, Ltd.(b)(c) | | | 18,316 | | | | 486,051 | |
| Vaibhav Global, Ltd. | | | 33,320 | | | | 877,080 | |
| Westlife Development, Ltd.(a) | | | 80,521 | | | | 410,548 | |
| | | | | | | | 3,381,715 | |
| | | | | | | | | |
| Indonesia (1.84%) | | | | | | | | |
| Arwana Citramulia Tbk PT | | | 7,920,100 | | | | 268,580 | |
| Selamat Sempurna Tbk PT | | | 5,271,800 | | | | 499,731 | |
| | | | | | | | 768,311 | |
See Notes to Financial Statements.
| Semi-Annual Report | October 31, 2020 | 43 |
| Grandeur Peak Global Micro Cap Fund | Portfolio of Investments |
October 31, 2020 (Unaudited)
| | | Shares | | | Value
(Note 2) | |
| Ireland (1.11%) | | | | | | | | |
| Irish Residential Properties REIT PLC | | | 137,000 | | | $ | 218,592 | |
| Uniphar PLC | | | 90,411 | | | | 247,448 | |
| | | | | | | | 466,040 | |
| | | | | | | | | |
| Israel (0.38%) | | | | | | | | |
| Max Stock, Ltd.(a) | | | 41,382 | | | | 159,364 | |
| | | | | | | | | |
| Italy (0.54%) | | | | | | | | |
| Piovan SpA(b)(c) | | | 47,181 | | | | 224,384 | |
| | | | | | | | | |
| Japan (16.17%) | | | | | | | | |
| Atrae, Inc.(a) | | | 3,700 | | | | 95,842 | |
| BayCurrent Consulting, Inc. | | | 1,300 | | | | 168,207 | |
| Beenos, Inc. | | | 9,500 | | | | 146,443 | |
| Central Automotive Products, Ltd. | | | 10,900 | | | | 212,320 | |
| Charm Care Corp. | | | 35,700 | | | | 383,598 | |
| eGuarantee, Inc. | | | 18,800 | | | | 418,684 | |
| Future Corp. | | | 9,500 | | | | 162,619 | |
| gremz, Inc. | | | 12,200 | | | | 214,040 | |
| M&A Capital Partners Co., Ltd.(a) | | | 22,400 | | | | 1,013,778 | |
| MarkLines Co., Ltd. | | | 9,100 | | | | 196,655 | |
| Medikit Co., Ltd. | | | 4,000 | | | | 117,533 | |
| Meinan M&A Co., Ltd. | | | 3,400 | | | | 231,550 | |
| Naigai Trans Line, Ltd. | | | 12,600 | | | | 145,481 | |
| Open Door, Inc.(a) | | | 41,300 | | | | 470,874 | |
| Strike Co., Ltd. | | | 4,000 | | | | 214,879 | |
| Synchro Food Co., Ltd.(a) | | | 54,800 | | | | 149,578 | |
| System Information Co., Ltd. | | | 17,600 | | | | 198,694 | |
| Syuppin Co., Ltd. | | | 26,700 | | | | 217,849 | |
| TeamSpirit, Inc.(a) | | | 6,600 | | | | 146,718 | |
| TerraSky Co., Ltd.(a) | | | 2,400 | | | | 100,929 | |
| Trancom Co., Ltd. | | | 2,700 | | | | 194,005 | |
| User Local, Inc.(a) | | | 2,400 | | | | 100,105 | |
| Vega Corp. Co., Ltd.(a) | | | 31,300 | | | | 670,081 | |
| WDB coco Co., Ltd. | | | 5,700 | | | | 210,527 | |
| YAKUODO Holdings Co., Ltd. | | | 24,100 | | | | 590,617 | |
| | | | | | | | 6,771,606 | |
| | | | | | | | | |
| Netherlands (0.95%) | | | | | | | | |
| Shop Apotheke Europe NV(a)(b)(c) | | | 2,402 | | | | 398,571 | |
| | | | | | | | | |
| New Zealand (0.43%) | | | | | | | | |
| CBL Corp., Ltd.(a)(d) | | | 159,993 | | | | 0 | |
| NZX, Ltd. | | | 159,502 | | | | 181,292 | |
| | | | | | | | 181,292 | |
| | | | | | | | | |
| Norway (2.25%) | | | | | | | | |
| Infront ASA(a) | | | 72,633 | | | | 136,865 | |
| Medistim ASA | | | 7,989 | | | | 173,823 | |
| Sbanken ASA(a)(b)(c) | | | 16,631 | | | | 106,049 | |
| | | Shares | | | Value
(Note 2) | |
| Norway (continued) | | | | | | | | |
| Self Storage Group ASA(a) | | | 227,748 | | | $ | 524,500 | |
| | | | | | | | 941,237 | |
| | | | | | | | | |
| Philippines (1.34%) | | | | | | | | |
| Concepcion Industrial Corp. | | | 334,770 | | | | 149,875 | |
| Pryce Corp. | | | 3,697,000 | | | | 313,939 | |
| Wilcon Depot, Inc. | | | 335,000 | | | | 99,068 | |
| | | | | | | | 562,882 | |
| | | | | | | | | |
| Poland (0.96%) | | | | | | | | |
| LiveChat Software SA | | | 11,300 | | | | 272,323 | |
| PGS Software SA | | | 51,047 | | | | 129,597 | |
| | | | | | | | 401,920 | |
| | | | | | | | | |
| Singapore (1.14%) | | | | | | | | |
| Riverstone Holdings, Ltd./Singapore | | | 171,800 | | | | 478,616 | |
| | | | | | | | | |
| South Korea (1.66%) | | | | | | | | |
| LEENO Industrial, Inc. | | | 2,000 | | | | 215,127 | |
| MegaStudyEdu Co., Ltd. | | | 2,818 | | | | 86,147 | |
| Ray Co. Ltd/KR(a) | | | 3,800 | | | | 131,946 | |
| Suprema, Inc.(a) | | | 3,500 | | | | 84,655 | |
| Tokai Carbon Korea Co., Ltd. | | | 2,181 | | | | 178,366 | |
| | | | | | | | 696,241 | |
| | | | | | | | | |
| Sweden (6.14%) | | | | | | | | |
| KNOW IT AB(a) | | | 19,882 | | | | 543,956 | |
| Lyko Group AB(a)(c) | | | 5,800 | | | | 221,613 | |
| OEM International AB, Class B(a) | | | 10,485 | | | | 318,945 | |
| Sdiptech AB(a) | | | 8,000 | | | | 143,931 | |
| SwedenCare AB | | | 38,574 | | | | 949,351 | |
| Vitec Software Group AB, Class B | | | 12,599 | | | | 391,725 | |
| | | | | | | | 2,569,521 | |
| | | | | | | | | |
| Taiwan (5.25%) | | | | | | | | |
| Bioteque Corp. | | | 130,000 | | | | 625,756 | |
| FineTek Co., Ltd. | | | 59,150 | | | | 147,953 | |
| Pacific Hospital Supply Co., Ltd. | | | 58,286 | | | | 140,700 | |
| Poya International Co., Ltd. | | | 21,000 | | | | 453,567 | |
| Sporton International, Inc. | | | 43,725 | | | | 349,577 | |
| Tehmag Foods Corp. | | | 13,300 | | | | 114,062 | |
| Tofu Restaurant Co., Ltd. | | | 36,050 | | | | 204,104 | |
| TSC Auto ID Technology Co., Ltd. | | | 25,700 | | | | 161,155 | |
| | | | | | | | 2,196,874 | |
| | | | | | | | | |
| Thailand (0.82%) | | | | | | | | |
| Humanica PCL | | | 935,000 | | | | 241,428 | |
| Netbay PCL | | | 125,000 | | | | 99,917 | |
| | | | | | | | 341,345 | |
See Notes to Financial Statements.
| 44 | 1.855.377.7325 | www.GrandeurPeakGlobal.com |
| Grandeur Peak Global Micro Cap Fund | Portfolio of Investments |
October 31, 2020 (Unaudited)
| | | Shares | | | Value
(Note 2) | |
| United States (9.55%) | | | | | | | | |
| 4imprint Group PLC(a) | | | 5,674 | | | $ | 152,115 | |
| Barrett Business Services, Inc. | | | 2,725 | | | | 161,456 | |
| Castle Biosciences, Inc.(a) | | | 3,300 | | | | 153,219 | |
| Coastal Financial Corp.(a) | | | 12,400 | | | | 184,264 | |
| Esquire Financial Holdings, Inc.(a) | | | 14,010 | | | | 218,416 | |
| Hackett Group, Inc. | | | 11,842 | | | | 152,999 | |
| Heska Corp.(a) | | | 3,666 | | | | 430,132 | |
| Joint Corp.(a) | | | 54,024 | | | | 1,012,410 | |
| LeMaitre Vascular, Inc. | | | 10,200 | | | | 331,296 | |
| MaxCyte, Inc.(a) | | | 74,400 | | | | 393,253 | |
| Systemax, Inc. | | | 23,125 | | | | 657,444 | |
| Transcat, Inc.(a) | | | 4,993 | | | | 154,333 | |
| | | | | | | | 4,001,337 | |
| | | | | | | | | |
| Vietnam (0.94%) | | | | | | | | |
| Lix Detergent JSC | | | 163,520 | | | | 394,916 | |
| | | | | | | | | |
| TOTAL COMMON STOCKS | | | | | | | | |
| (Cost $29,470,362) | | | | | | | 42,047,518 | |
| | | | | | | | | |
| TOTAL INVESTMENTS (100.40%) | | | | | | | | |
| (Cost $29,470,362) | | | | | | $ | 42,047,518 | |
| | | | | | | | | |
| Liabilities In Excess Of Other Assets (-0.40%) | | | | | | | (167,153 | ) |
| | | | | | | | | |
| NET ASSETS (100.00%) | | | | | | $ | 41,880,365 | |
| (a) | Non-Income Producing Security. |
| (b) | Security exempt from registration under Rule 144A of the Securities Act of 1933. These securities may be resold in the ordinary course of business in transactions exempt from registration, normally to qualified institutional buyers. As of October 31, 2020, these securities had a total aggregate market value of $2,920,615, representing 6.97% of net assets. |
| (c) | Security was purchased pursuant to Regulation S under the Securities Act of 1933, which exempts securities offered and sold outside of the United States from registration. Such security cannot be sold in the United States without either an effective registration statement filed pursuant to the Securities Act of 1933, or pursuant to an exemption from registration. As of October 31, 2020, the aggregate market value of these securities was $3,643,882, representing 8.70% of net assets. |
| (d) | As a result of the use of significant unobservable inputs to determine fair value, these investments have been classified as level 3 assets. See also Note 2 to the financial statements for additional information. |
For Fund compliance purposes, the Fund’s geographical classifications refer to any one or more of the country sub-classifications used by one or more widely recognized market indexes or ratings group indexes, and/or as defined by Fund management. This definition may not apply for purposes of this report, which may combine sub-classifications for reporting ease. Geographical regions are shown as a percentage of net assets.
| Sector Composition (October 31, 2020) (Unaudited) | |
| Consumer | 29.4% |
| Health Care | 19.3% |
| Technology | 17.6% |
| Industrials | 16.5% |
| Financials | 15.1% |
| Energy & Materials | 1.8% |
| Communications | 0.7% |
| Cash, Cash Equivalents, & Other Net Assets | -0.4% |
| Total | 100% |
| Industry Composition (October 31, 2020) (Unaudited) | |
| Internet & Direct Marketing Retail | 11.1% |
| Capital Markets | 10.2% |
| Software | 7.5% |
| Health Care Equipment & Supplies | 7.2% |
| Health Care Providers & Services | 6.3% |
| Trading Companies & Distributors | 5.1% |
| Professional Services | 4.7% |
| IT Services | 4.4% |
| Pharmaceuticals | 3.7% |
| Specialty Retail | 3.2% |
| Semiconductors & Semiconductor Equipment | 2.8% |
| Personal Products | 2.7% |
| Commercial Services & Supplies | 2.1% |
| Textiles, Apparel & Luxury Goods | 2.1% |
| Auto Components | 2.0% |
| Machinery | 2.0% |
| Hotels, Restaurants & Leisure | 1.9% |
| Equity Real Estate Investment Trusts (REITs) | 1.9% |
| Food Products | 1.7% |
| Building Products | 1.5% |
| Banks | 1.5% |
| Diversified Financial Services | 1.5% |
| Food & Staples Retailing | 1.4% |
| Biotechnology | 1.3% |
| Multiline Retail | 1.1% |
| Interactive Media & Services | 1.1% |
| Other Industries (each less than 1%) | 8.5% |
| Cash and Other Assets, Less Liabilities | -0.4% |
| Total | 100% |
See Notes to Financial Statements.
| Semi-Annual Report | October 31, 2020 | 45 |
| Grandeur Peak Global Opportunities Fund | Portfolio of Investments |
October 31, 2020 (Unaudited)
| | | Shares | | | Value
(Note 2) | |
| COMMON STOCKS (99.84%) | | | | | | | | |
| Argentina (0.64%) | | | | | | | | |
| Globant SA(a) | | | 26,300 | | | $ | 4,750,043 | |
| | | | | | | | | |
| Australia (1.38%) | | | | | | | | |
| Fiducian Group, Ltd. | | | 182,850 | | | | 697,921 | |
| Kogan.com, Ltd. | | | 384,707 | | | | 5,569,020 | |
| National Storage REIT | | | 3,150,556 | | | | 3,998,468 | |
| | | | | | | | 10,265,409 | |
| | | | | | | | | |
| Bangladesh (0.25%) | | | | | | | | |
| Square Pharmaceuticals, Ltd. | | | 788,790 | | | | 1,846,560 | |
| | | | | | | | | |
| Belgium (1.42%) | | | | | | | | |
| Melexis NV | | | 62,394 | | | | 4,749,346 | |
| Warehouses De Pauw CVA | | | 118,567 | | | | 3,972,369 | |
| X-Fab Silicon Foundries SE(a)(b)(c) | | | 498,917 | | | | 1,857,003 | |
| | | | | | | | 10,578,718 | |
| | | | | | | | | |
| Brazil (1.67%) | | | | | | | | |
| Fleury SA | | | 835,400 | | | | 4,000,870 | |
| Locaweb Servicos de Internet SA(a)(b)(c) | | | 226,400 | | | | 2,720,927 | |
| Pagseguro Digital, Ltd., Class A(a) | | | 156,148 | | | | 5,716,578 | |
| | | | | | | | 12,438,375 | |
| | | | | | | | | |
| Britain (15.06%) | | | | | | | | |
| AB Dynamics PLC | | | 67,600 | | | | 1,735,630 | |
| Ascential PLC(a) | | | 1,724,239 | | | | 6,174,992 | |
| B&M European Value Retail SA | | | 2,334,828 | | | | 14,653,231 | |
| boohoo Group PLC(a) | | | 1,140,898 | | | | 3,998,525 | |
| City of London Investment Group PLC | | | 305,827 | | | | 1,592,725 | |
| Curtis Banks Group PLC | | | 388,399 | | | | 1,006,345 | |
| CVS Group PLC | | | 689,662 | | | | 11,034,235 | |
| Dechra Pharmaceuticals PLC | | | 421,523 | | | | 19,068,824 | |
| Endava PLC, ADR(a) | | | 226,518 | | | | 14,474,500 | |
| FDM Group Holdings PLC | | | 177,400 | | | | 2,290,364 | |
| Impax Asset Management Group PLC | | | 222,943 | | | | 1,566,843 | |
| JTC PLC(b)(c) | | | 482,638 | | | | 3,364,778 | |
| K3 Capital Group PLC | | | 865,551 | | | | 1,642,742 | |
| On the Beach Group PLC(b)(c) | | | 960,284 | | | | 2,676,208 | |
| Oxford Immunotec Global PLC(a) | | | 719,929 | | | | 8,092,002 | |
| Premier Miton Group PLC | | | 1,113,250 | | | | 1,583,473 | |
| Sabre Insurance Group PLC(b)(c) | | | 837,100 | | | | 2,486,216 | |
| Sanne Group PLC | | | 448,674 | | | | 3,525,766 | |
| Softcat PLC | | | 267,337 | | | | 3,897,158 | |
| St. James’s Place PLC | | | 425,095 | | | | 4,954,353 | |
| | | Shares | | | Value
(Note 2) | |
| Britain (continued) | | | | | | | | |
| Volution Group PLC | | | 968,971 | | | $ | 2,435,294 | |
| | | | | | | | 112,254,204 | |
| | | | | | | | | |
| Canada (1.55%) | | | | | | | | |
| Gildan Activewear, Inc. | | | 269,500 | | | | 5,582,977 | |
| Guardian Capital Group, Ltd. | | | 42,100 | | | | 706,248 | |
| Pivotree, Inc.(a) | | | 91,100 | | | | 717,969 | |
| Richelieu Hardware, Ltd. | | | 168,565 | | | | 4,532,011 | |
| | | | | | | | 11,539,205 | |
| | | | | | | | | |
| China (6.41%) | | | | | | | | |
| CSPC Pharmaceutical Group, Ltd. | | | 1,345,920 | | | | 1,429,267 | |
| Hangzhou Robam Appliances Co., Ltd., Class A | | | 555,500 | | | | 3,041,113 | |
| Li Ning Co., Ltd. | | | 422,000 | | | | 2,199,439 | |
| Man Wah Holdings, Ltd. | | | 4,146,000 | | | | 5,786,315 | |
| O2Micro International, Ltd., ADR(a) | | | 864,812 | | | | 5,552,093 | |
| Silergy Corp. | | | 290,352 | | | | 17,901,037 | |
| Suofeiya Home Collection Co., Ltd., Class A | | | 841,800 | | | | 3,553,710 | |
| Trip.com Group, Ltd., ADR(a) | | | 127,708 | | | | 3,672,882 | |
| WuXi AppTec Co., Ltd., Class H(b)(c) | | | 291,480 | | | | 4,660,270 | |
| | | | | | | | 47,796,126 | |
| | | | | | | | | |
| Egypt (0.11%) | | | | | | | | |
| Integrated Diagnostics Holdings PLC(b)(c) | | | 233,400 | | | | 820,401 | |
| | | | | | | | | |
| Finland (0.85%) | | | | | | | | |
| Musti Group Oyj(a) | | | 276,174 | | | | 6,320,667 | |
| | | | | | | | | |
| France (3.10%) | | | | | | | | |
| Alten SA(a) | | | 60,082 | | | | 4,810,662 | |
| BioMerieux | | | 24,847 | | | | 3,699,683 | |
| Esker SA | | | 35,947 | | | | 5,990,923 | |
| Neurones | | | 59,573 | | | | 1,623,520 | |
| Rothschild & Co.(a) | | | 44,200 | | | | 1,134,502 | |
| Thermador Groupe | | | 72,678 | | | | 4,891,712 | |
| Wavestone(a) | | | 34,347 | | | | 919,007 | |
| | | | | | | | 23,070,009 | |
| | | | | | | | | |
| Georgia (0.56%) | | | | | | | | |
| Bank of Georgia Group PLC(a) | | | 92,641 | | | | 1,077,332 | |
| Georgia Capital PLC(a) | | | 287,505 | | | | 1,370,724 | |
| TBC Bank Group PLC(a) | | | 142,785 | | | | 1,701,108 | |
| | | | | | | | 4,149,164 | |
| | | | | | | | | |
| Germany (6.43%) | | | | | | | | |
| Dermapharm Holding SE | | | 113,975 | | | | 5,535,280 | |
| Exasol AG(a) | | | 213,200 | | | | 4,091,879 | |
| Fashionette AG(a) | | | 160,243 | | | | 5,500,812 | |
| Grand City Properties SA | | | 148,367 | | | | 3,367,709 | |
See Notes to Financial Statements.
| 46 | 1.855.377.7325 | www.GrandeurPeakGlobal.com |
| Grandeur Peak Global Opportunities Fund | Portfolio of Investments |
October 31, 2020 (Unaudited)
| | | Shares | | | Value
(Note 2) | |
| Germany (continued) | | | | | | | | |
| Home24 SE(a) | | | 129,187 | | | $ | 2,460,386 | |
| Nexus AG | | | 85,824 | | | | 4,781,793 | |
| Norma Group SE | | | 213,223 | | | | 6,615,493 | |
| PATRIZIA AG | | | 131,095 | | | | 2,983,849 | |
| PharmaSGP Holding SE(a) | | | 159,300 | | | | 5,474,179 | |
| QIAGEN NV(a) | | | 78,938 | | | | 3,744,819 | |
| Westwing Group AG(a) | | | 108,845 | | | | 3,326,408 | |
| | | | | | | | 47,882,607 | |
| | | | | | | | | |
| Hong Kong (0.95%) | | | | | | | | |
| Jacobson Pharma Corp., Ltd.(c) | | | 6,534,000 | | | | 963,102 | |
| Value Partners Group, Ltd. | | | 8,569,000 | | | | 3,754,626 | |
| Vitasoy International Holdings, Ltd. | | | 584,000 | | | | 2,362,225 | |
| | | | | | | | 7,079,953 | |
| | | | | | | | | |
| India (5.45%) | | | | | | | | |
| Bajaj Finance, Ltd. | | | 159,600 | | | | 7,119,510 | |
| EPL, Ltd. | | | 222,500 | | | | 744,653 | |
| Gulf Oil Lubricants India, Ltd. | | | 173,167 | | | | 1,540,664 | |
| HCL Technologies, Ltd. | | | 294,138 | | | | 3,346,587 | |
| IndiaMart InterMesh, Ltd.(b)(c) | | | 49,575 | | | | 3,247,755 | |
| L&T Technology Services, Ltd.(b)(c) | | | 116,268 | | | | 2,613,967 | |
| Metropolis Healthcare, Ltd.(b)(c) | | | 398,409 | | | | 10,572,566 | |
| Time Technoplast, Ltd. | | | 906,520 | | | | 456,927 | |
| WNS Holdings, Ltd., ADR(a) | | | 190,925 | | | | 11,004,917 | |
| | | | | | | | 40,647,546 | |
| | | | | | | | | |
| Indonesia (1.17%) | | | | | | | | |
| Arwana Citramulia Tbk PT | | | 58,214,800 | | | | 1,974,129 | |
| Selamat Sempurna Tbk PT | | | 56,561,200 | | | | 5,361,620 | |
| Ultrajaya Milk Industry & Trading Co. Tbk PT | | | 12,304,000 | | | | 1,386,537 | |
| | | | | | | | 8,722,286 | |
| | | | | | | | | |
| Ireland (2.01%) | | | | | | | | |
| ICON PLC, ADR(a) | | | 13,790 | | | | 2,486,337 | |
| Irish Residential Properties REIT PLC | | | 4,642,865 | | | | 7,407,993 | |
| Keywords Studios PLC | | | 185,207 | | | | 5,087,740 | |
| | | | | | | | 14,982,070 | |
| | | | | | | | | |
| Israel (0.61%) | | | | | | | | |
| Wix.com, Ltd.(a) | | | 18,287 | | | | 4,522,741 | |
| | | | | | | | | |
| Italy (1.64%) | | | | | | | | |
| DiaSorin SpA | | | 17,164 | | | | 3,767,977 | |
| GVS SpA(a)(b)(c) | | | 113,537 | | | | 1,599,988 | |
| Interpump Group SpA | | | 163,595 | | | | 6,179,204 | |
| Piovan SpA(b)(c) | | | 144,291 | | | | 686,220 | |
| | | | | | | | 12,233,389 | |
| | | Shares | | | Value
(Note 2) | |
| Japan (9.28%) | | | | | | | | |
| AIT Corp. | | | 223,100 | | | $ | 2,141,682 | |
| BayCurrent Consulting, Inc. | | | 50,900 | | | | 6,585,966 | |
| Charm Care Corp. | | | 190,300 | | | | 2,044,784 | |
| Create SD Holdings Co., Ltd. | | | 144,600 | | | | 4,663,340 | |
| Future Corp. | | | 163,400 | | | | 2,797,045 | |
| gremz, Inc. | | | 108,000 | | | | 1,894,776 | |
| Japan Lifeline Co., Ltd. | | | 424,000 | | | | 5,471,366 | |
| M&A Capital Partners Co., Ltd.(a) | | | 71,300 | | | | 3,226,892 | |
| MarkLines Co., Ltd. | | | 45,200 | | | | 976,794 | |
| Medikit Co., Ltd. | | | 58,300 | | | | 1,713,038 | |
| MonotaRO Co., Ltd. | | | 73,300 | | | | 4,054,350 | |
| Naigai Trans Line, Ltd. | | | 98,900 | | | | 1,141,910 | |
| Nihon M&A Center, Inc. | | | 68,300 | | | | 4,010,685 | |
| Open Door, Inc.(a) | | | 161,700 | | | | 1,843,590 | |
| Seria Co., Ltd. | | | 116,600 | | | | 4,492,496 | |
| Strike Co., Ltd. | | | 35,400 | | | | 1,901,680 | |
| Synchro Food Co., Ltd.(a) | | | 407,900 | | | | 1,113,377 | |
| Systena Corp. | | | 213,200 | | | | 3,868,619 | |
| Syuppin Co., Ltd. | | | 164,600 | | | | 1,342,994 | |
| Trancom Co., Ltd. | | | 70,470 | | | | 5,063,539 | |
| Tsuruha Holdings, Inc. | | | 30,600 | | | | 4,284,766 | |
| YAKUODO Holdings Co., Ltd. | | | 185,600 | | | | 4,548,483 | |
| | | | | | | | 69,182,172 | |
| | | | | | | | | |
| Mexico (0.82%) | | | | | | | | |
| Grupo Herdez SAB de CV | | | 2,224,900 | | | | 3,961,741 | |
| Regional SAB de CV(a) | | | 781,527 | | | | 2,121,875 | |
| | | | | | | | 6,083,616 | |
| | | | | | | | | |
| Netherlands (1.93%) | | | | | | | | |
| Aalberts NV | | | 160,272 | | | | 5,376,965 | |
| Shop Apotheke Europe NV(a)(b)(c) | | | 54,161 | | | | 8,987,102 | |
| | | | | | | | 14,364,067 | |
| | | | | | | | | |
| New Zealand (0.00%)(d) | | | | | | | | |
| CBL Corp., Ltd.(a)(e) | | | 1,107,672 | | | | 1 | |
| | | | | | | | | |
| Norway (0.82%) | | | | | | | | |
| Medistim ASA | | | 64,055 | | | | 1,393,694 | |
| Nordic Semiconductor ASA(a) | | | 114,100 | | | | 1,200,169 | |
| Sbanken ASA(a)(b)(c) | | | 546,550 | | | | 3,485,128 | |
| | | | | | | | 6,078,991 | |
| | | | | | | | | |
| Philippines (0.89%) | | | | | | | | |
| Concepcion Industrial Corp. | | | 1,035,152 | | | | 463,432 | |
| Puregold Price Club, Inc. | | | 5,399,800 | | | | 4,602,064 | |
| Wilcon Depot, Inc. | | | 5,410,500 | | | | 1,600,016 | |
| | | | | | | | 6,665,512 | |
| | | | | | | | | |
| Poland (0.80%) | | | | | | | | |
| Allegro.eu SA(a)(b)(c) | | | 2,295 | | | | 46,641 | |
| Dino Polska SA(a)(b)(c) | | | 100,797 | | | | 5,541,762 | |
See Notes to Financial Statements.
| Semi-Annual Report | October 31, 2020 | 47 |
| Grandeur Peak Global Opportunities Fund | Portfolio of Investments |
October 31, 2020 (Unaudited)
| | | Shares | | | Value
(Note 2) | |
| Poland (continued) | | | | | | | | |
| PGS Software SA | | | 138,443 | | | $ | 351,476 | |
| | | | | | | | 5,939,879 | |
| | | | | | | | | |
| Singapore (0.92%) | | | | | | | | |
| Riverstone Holdings, Ltd./Singapore | | | 2,469,000 | | | | 6,878,356 | |
| | | | | | | | | |
| South Africa (0.23%) | | | | | | | | |
| Italtile, Ltd. | | | 2,148,741 | | | | 1,723,086 | |
| | | | | | | | | |
| South Korea (1.30%) | | | | | | | | |
| LEENO Industrial, Inc. | | | 42,801 | | | | 4,603,819 | |
| Tokai Carbon Korea Co., Ltd. | | | 61,811 | | | | 5,055,028 | |
| | | | | | | | 9,658,847 | |
| | | | | | | | | |
| Sweden (1.67%) | | | | | | | | |
| Beijer Alma AB | | | 203,771 | | | | 2,658,267 | |
| EQT AB | | | 101,324 | | | | 1,925,274 | |
| Hexpol AB(a) | | | 168,568 | | | | 1,484,642 | |
| KNOW IT AB(a) | | | 183,884 | | | | 5,030,922 | |
| OEM International AB, Class B(a) | | | 29,667 | | | | 902,447 | |
| SwedenCare AB | | | 19,326 | | | | 475,635 | |
| | | | | | | | 12,477,187 | |
| | | | | | | | | |
| Switzerland (0.34%) | | | | | | | | |
| Partners Group Holding AG | | | 2,850 | | | | 2,565,873 | |
| | | | | | | | | |
| Taiwan (2.52%) | | | | | | | | |
| ASPEED Technology, Inc. | | | 53,500 | | | | 2,589,373 | |
| Bioteque Corp. | | | 1,150,000 | | | | 5,535,531 | |
| Poya International Co., Ltd. | | | 208,000 | | | | 4,492,469 | |
| Sporton International, Inc. | | | 672,671 | | | | 5,377,939 | |
| Voltronic Power Technology Corp. | | | 23,100 | | | | 792,358 | |
| | | | | | | | 18,787,670 | |
| | | | | | | | | |
| Turkey (0.02%) | | | | | | | | |
| DP Eurasia NV(a)(b)(c) | | | 403,911 | | | | 175,029 | |
| | | | | | | | | |
| United States (25.63%) | | | | | | | | |
| 4imprint Group PLC(a) | | | 27,645 | | | | 741,139 | |
| Bank of NT Butterfield & Son, Ltd. | | | 122,225 | | | | 3,234,074 | |
| Cardiovascular Systems, Inc.(a) | | | 129,773 | | | | 4,626,407 | |
| EPAM Systems, Inc.(a) | | | 53,068 | | | | 16,395,359 | |
| Esquire Financial Holdings, Inc.(a) | | | 21,936 | | | | 341,982 | |
| Etsy, Inc.(a) | | | 25,850 | | | | 3,143,101 | |
| ExlService Holdings, Inc.(a) | | | 66,543 | | | | 5,039,967 | |
| Fastenal Co. | | | 66,250 | | | | 2,863,988 | |
| First Republic Bank | | | 77,826 | | | | 9,816,972 | |
| Five Below, Inc.(a) | | | 33,067 | | | | 4,409,154 | |
| FTI Consulting, Inc.(a) | | | 38,574 | | | | 3,797,996 | |
| Genpact, Ltd. | | | 191,300 | | | | 6,574,981 | |
| | | Shares | | | Value
(Note 2) | |
| United States (continued) | | | | | | | | |
| Heska Corp.(a) | | | 109,763 | | | $ | 12,878,493 | |
| Houlihan Lokey, Inc. | | | 42,250 | | | | 2,649,075 | |
| IDEXX Laboratories, Inc.(a) | | | 6,575 | | | | 2,793,192 | |
| Inphi Corp.(a) | | | 35,678 | | | | 4,986,357 | |
| Joint Corp.(a) | | | 50,342 | | | | 943,409 | |
| LeMaitre Vascular, Inc. | | | 142,800 | | | | 4,638,144 | |
| LGI Homes, Inc.(a) | | | 38,318 | | | | 4,095,428 | |
| Littelfuse, Inc. | | | 42,864 | | | | 8,484,500 | |
| Lululemon Athletica, Inc.(a) | | | 6,905 | | | | 2,204,697 | |
| MaxCyte, Inc.(a) | | | 286,500 | | | | 1,514,341 | |
| Microchip Technology, Inc. | | | 41,970 | | | | 4,410,208 | |
| Moelis & Co., Class A | | | 34,569 | | | | 1,285,967 | |
| Monolithic Power Systems, Inc. | | | 7,275 | | | | 2,325,090 | |
| New Relic, Inc.(a) | | | 55,250 | | | | 3,351,465 | |
| NV5 Global, Inc.(a) | | | 54,375 | | | | 3,049,350 | |
| Ollie’s Bargain Outlet Holdings, Inc.(a) | | | 55,000 | | | | 4,789,950 | |
| Paycom Software, Inc.(a) | | | 12,212 | | | | 4,446,267 | |
| Paylocity Holding Corp.(a) | | | 10,445 | | | | 1,937,756 | |
| PJT Partners, Inc., Class A | | | 61,350 | | | | 4,150,941 | |
| Pluralsight, Inc., Class A(a) | | | 406,211 | | | | 6,377,513 | |
| Power Integrations, Inc. | | | 172,906 | | | | 10,410,670 | |
| PPD, Inc.(a) | | | 42,750 | | | | 1,405,620 | |
| Qualys, Inc.(a) | | | 86,719 | | | | 7,618,264 | |
| Rapid7, Inc.(a) | | | 32,950 | | | | 2,040,594 | |
| Silicon Laboratories, Inc.(a) | | | 50,664 | | | | 5,191,033 | |
| STAAR Surgical Co.(a) | | | 31,073 | | | | 2,252,793 | |
| Sumo Logic, Inc.(a) | | | 43,976 | | | | 759,905 | |
| SVB Financial Group(a) | | | 11,849 | | | | 3,444,504 | |
| Systemax, Inc. | | | 208,901 | | | | 5,939,055 | |
| Terreno Realty Corp. | | | 64,381 | | | | 3,623,363 | |
| TriMas Corp.(a) | | | 154,914 | | | | 3,769,058 | |
| Ulta Beauty, Inc.(a) | | | 10,968 | | | | 2,267,853 | |
| | | | | | | | 191,019,975 | |
| | | | | | | | | |
| Vietnam (1.41%) | | | | | | | | |
| Vietnam Dairy Products JSC | | | 914,196 | | | | 4,271,404 | |
| Vietnam Technological & Commercial Joint Stock Bank(a) | | | 5,964,004 | | | | 5,507,729 | |
| Vincom Retail JSC(a) | | | 638,220 | | | | 702,064 | |
| | | | | | | | 10,481,197 | |
| | | | | | | | | |
| TOTAL COMMON STOCKS | | | | | | | | |
| (Cost $509,637,899) | | | | | | | 743,980,931 | |
See Notes to Financial Statements.
| 48 | 1.855.377.7325 | www.GrandeurPeakGlobal.com |
| Grandeur Peak Global Opportunities Fund | Portfolio of Investments |
October 31, 2020 (Unaudited)
| | | Shares | | | Value
(Note 2) | |
| PREFERRED STOCKS (0.35%) | | | | | | | | |
| United States (0.35%) | | | | | | | | |
| Dataminr Inc - Private Placement(a)(e) | | | 96,640 | | | $ | 2,573,523 | |
| | | | | | | | | |
| TOTAL PREFERRED STOCKS | | | | | | | | |
| (Cost $1,923,136) | | | | | | | 2,573,523 | |
| | | | | | | | | |
| TOTAL INVESTMENTS (100.19%) | | | | | | | | |
| (Cost $511,561,035) | | | | | | $ | 746,554,454 | |
| | | | | | | | | |
| Liabilities In Excess Of Other Assets (-0.19%) | | | | | | | (1,412,058 | ) |
| | | | | | | | | |
| NET ASSETS (100.00%) | | | | | | $ | 745,142,396 | |
| (a) | Non-Income Producing Security. |
| (b) | Security exempt from registration under Rule 144A of the Securities Act of 1933. These securities may be resold in the ordinary course of business in transactions exempt from registration, normally to qualified institutional buyers. As of October 31, 2020, these securities had a total aggregate market value of $55,541,961, representing 7.45% of net assets. |
| (c) | Security was purchased pursuant to Regulation S under the Securities Act of 1933, which exempts securities offered and sold outside of the United States from registration. Such security cannot be sold in the United States without either an effective registration statement filed pursuant to the Securities Act of 1933, or pursuant to an exemption from registration. As of October 31, 2020, the aggregate market value of these securities was $56,505,063, representing 7.58% of net assets. |
| (d) | Less than 0.005%. |
| (e) | As a result of the use of significant unobservable inputs to determine fair value, these investments have been classified as level 3 assets. See also Note 2 to the financial statements for additional information. |
For Fund compliance purposes, the Fund's geographical classifications refer to any one or more of the country sub-classifications used by one or more widely recognized market indexes or ratings group indexes, and/or as defined by Fund management. This definition may not apply for purposes of this report, which may combine sub-classifications for reporting ease. Geographical regions are shown as a percentage of net assets.
| Sector Composition (October 31, 2020) (Unaudited) | |
| Technology | 31.5% |
| Consumer | 20.2% |
| Health Care | 19.6% |
| Financials | 14.4% |
| Industrials | 13.2% |
| Communications | 0.7% |
| Energy & Materials | 0.6% |
| Cash, Cash Equivalents, & Other Net Assets | -0.2% |
| Total | 100% |
| Industry Composition (October 31, 2020) (Unaudited) | |
| IT Services | 12.9% |
| Semiconductors & Semiconductor Equipment | 9.5% |
| Health Care Equipment & Supplies | 8.8% |
| Software | 6.5% |
| Capital Markets | 5.1% |
| Internet & Direct Marketing Retail | 5.0% |
| Pharmaceuticals | 4.7% |
| Banks | 4.1% |
| Health Care Providers & Services | 4.0% |
| Multiline Retail | 3.8% |
| Professional Services | 3.7% |
| Trading Companies & Distributors | 3.5% |
| Machinery | 3.4% |
| Food & Staples Retailing | 3.2% |
| Equity Real Estate Investment Trusts (REITs) | 2.6% |
| Household Durables | 2.2% |
| Specialty Retail | 2.2% |
| Life Sciences Tools & Services | 1.7% |
| Food Products | 1.6% |
| Textiles, Apparel & Luxury Goods | 1.3% |
| Electronic Equipment, Instruments & Components | 1.1% |
| Other Industries (each less than 1%) | 9.3% |
| Cash and Other Assets, Less Liabilities | -0.2% |
| Total | 100% |
See Notes to Financial Statements.
| Semi-Annual Report | October 31, 2020 | 49 |
| Grandeur Peak Global Reach Fund | Portfolio of Investments |
October 31, 2020 (Unaudited)
| | | | Shares | | | | Value
(Note 2) | |
| COMMON STOCKS (99.28%) | | | | | | | | |
| Argentina (0.44%) | | | | | | | | |
| Globant SA(a) | | | 6,828 | | | $ | 1,233,205 | |
| | | | | | | | | |
| Australia (3.62%) | | | | | | | | |
| Appen, Ltd. | | | 54,722 | | | | 1,246,372 | |
| Australian Ethical Investment, Ltd. | | | 373,810 | | | | 1,121,913 | |
| Domino's Pizza Enterprises, Ltd. | | | 7,200 | | | | 428,843 | |
| EQT Holdings, Ltd. | | | 44,375 | | | | 779,820 | |
| Kogan.com, Ltd. | | | 108,173 | | | | 1,565,913 | |
| Lycopodium, Ltd. | | | 48,726 | | | | 142,132 | |
| Mainstream Group Holdings, Ltd. | | | 887,635 | | | | 595,824 | |
| National Storage REIT | | | 1,086,807 | | | | 1,379,300 | |
| Netwealth Group, Ltd. | | | 90,626 | | | | 1,100,702 | |
| People Infrastructure, Ltd. | | | 299,959 | | | | 704,265 | |
| Redbubble, Ltd.(a) | | | 114,777 | | | | 347,956 | |
| Temple & Webster Group, Ltd.(a) | | | 91,637 | | | | 672,892 | |
| | | | | | | | 10,085,932 | |
| | | | | | | | | |
| Bangladesh (0.16%) | | | | | | | | |
| Square Pharmaceuticals, Ltd. | | | 192,900 | | | | 451,579 | |
| | | | | | | | | |
| Belgium (0.52%) | | | | | | | | |
| Melexis NV | | | 6,709 | | | | 510,680 | |
| Warehouses De Pauw CVA | | | 27,832 | | | | 932,460 | |
| | | | | | | | 1,443,140 | |
| | | | | | | | | |
| Brazil (2.05%) | | | | | | | | |
| Arco Platform, Ltd., Class A(a) | | | 11,542 | | | | 393,351 | |
| Fleury SA | | | 257,500 | | | | 1,233,210 | |
| Locaweb Servicos de Internet SA(a)(b)(c) | | | 99,667 | | | | 1,197,821 | |
| Pagseguro Digital, Ltd., Class A(a) | | | 51,287 | | | | 1,877,617 | |
| Pet Center Comercio e Participacoes SA(a) | | | 40,000 | | | | 124,086 | |
| Raia Drogasil SA | | | 140,000 | | | | 588,991 | |
| Vasta Platform(a) | | | 26,251 | | | | 303,462 | |
| | | | | | | | 5,718,538 | |
| | | | | | | | | |
| Britain (13.45%) | | | | | | | | |
| AB Dynamics PLC | | | 51,876 | | | | 1,331,916 | |
| Abcam PLC | | | 46,649 | | | | 889,955 | |
| Ascential PLC(a) | | | 78,656 | | | | 281,690 | |
| B&M European Value Retail SA | | | 487,900 | | | | 3,062,029 | |
| Big Yellow Group PLC | | | 61,600 | | | | 877,861 | |
| Clinigen Group PLC | | | 91,173 | | | | 711,314 | |
| Curtis Banks Group PLC | | | 117,600 | | | | 304,703 | |
| CVS Group PLC | | | 85,400 | | | | 1,366,356 | |
| Dechra Pharmaceuticals PLC | | | 62,014 | | | | 2,805,384 | |
| Diploma PLC | | | 18,500 | | | | 532,718 | |
| | | Shares | | | Value
(Note 2) | |
| Britain (continued) | | | | | | | | |
| dotdigital group PLC | | | 896,848 | | | $ | 1,722,398 | |
| Endava PLC, ADR(a) | | | 59,753 | | | | 3,818,217 | |
| FDM Group Holdings PLC | | | 28,231 | | | | 364,483 | |
| First Derivatives PLC | | | 14,850 | | | | 564,584 | |
| FRP Advisory Group PLC | | | 585,941 | | | | 785,657 | |
| Gamma Communications PLC | | | 49,317 | | | | 1,066,970 | |
| Horizon Discovery Group PLC(a) | | | 281,550 | | | | 323,897 | |
| Impax Asset Management Group PLC | | | 411,548 | | | | 2,892,359 | |
| Intertek Group PLC | | | 17,014 | | | | 1,225,537 | |
| JTC PLC(b)(c) | | | 325,942 | | | | 2,272,350 | |
| K3 Capital Group PLC | | | 532,428 | | | | 1,010,503 | |
| Keystone Law Group PLC | | | 119,151 | | | | 713,457 | |
| On the Beach Group PLC(b)(c) | | | 388,500 | | | | 1,082,708 | |
| Oxford Immunotec Global PLC(a) | | | 117,500 | | | | 1,320,700 | |
| Rotork PLC | | | 140,010 | | | | 510,122 | |
| Sabre Insurance Group PLC(b)(c) | | | 139,371 | | | | 413,937 | |
| Sanne Group PLC | | | 278,378 | | | | 2,187,548 | |
| Softcat PLC | | | 55,938 | | | | 815,447 | |
| St. James's Place PLC | | | 23,127 | | | | 269,538 | |
| Volution Group PLC | | | 244,347 | | | | 614,112 | |
| XPS Pensions Group PLC(c) | | | 819,328 | | | | 1,348,954 | |
| | | | | | | | 37,487,404 | |
| | | | | | | | | |
| Canada (1.52%) | | | | | | | | |
| Gildan Activewear, Inc. | | | 32,300 | | | | 669,129 | |
| Guardian Capital Group, Ltd. | | | 7,100 | | | | 119,106 | |
| Pivotree, Inc.(a) | | | 36,500 | | | | 287,660 | |
| Richelieu Hardware, Ltd. | | | 19,400 | | | | 521,585 | |
| Ritchie Bros Auctioneers, Inc. | | | 21,401 | | | | 1,297,543 | |
| StorageVault Canada, Inc. | | | 531,600 | | | | 1,336,681 | |
| | �� | | | | | | 4,231,704 | |
| | | | | | | | | |
| China (5.25%) | | | | | | | | |
| CSPC Pharmaceutical Group, Ltd. | | | 683,520 | | | | 725,848 | |
| Hangzhou Robam Appliances Co., Ltd., Class A | | | 76,200 | | | | 417,161 | |
| HUYA, Inc., ADR(a) | | | 21,488 | | | | 481,331 | |
| Koolearn Technology Holding, Ltd.(a)(b)(c) | | | 82,000 | | | | 265,497 | |
| Man Wah Holdings, Ltd. | | | 1,031,600 | | | | 1,439,740 | |
| O2Micro International, Ltd., ADR(a) | | | 210,012 | | | | 1,348,277 | |
| Shenzhen Mindray Bio-Medical Electronics Co., Ltd. | | | 7,600 | | | | 439,933 | |
| Silergy Corp. | | | 80,925 | | | | 4,989,259 | |
| Suofeiya Home Collection Co., Ltd., Class A | | | 176,000 | | | | 742,995 | |
| TK Group Holdings, Ltd. | | | 1,830,000 | | | | 543,514 | |
| Trip.com Group, Ltd., ADR(a) | | | 13,250 | | | | 381,070 | |
See Notes to Financial Statements.
| 50 | 1.855.377.7325 | www.GrandeurPeakGlobal.com |
| Grandeur Peak Global Reach Fund | Portfolio of Investments |
October 31, 2020 (Unaudited)
| | | Shares | | | Value
(Note 2) | |
| China (continued) | | | | | | | | |
| WuXi AppTec Co., Ltd., Class H(b)(c) | | | 134,760 | | | $ | 2,154,583 | |
| Yum China Holdings, Inc. | | | 13,411 | | | | 713,867 | |
| | | | | | | | 14,643,075 | |
| | | | | | | | | |
| Colombia (0.75%) | | | | | | | | |
| Parex Resources, Inc.(a) | | | 213,361 | | | | 2,077,079 | |
| | | | | | | | | |
| Egypt (0.33%) | | | | | | | | |
| African Export-Import Bank, GDR | | | 200,000 | | | | 656,000 | |
| Integrated Diagnostics Holdings PLC(b)(c) | | | 72,993 | | | | 256,570 | |
| | | | | | | | 912,570 | |
| | | | | | | | | |
| Finland (0.62%) | | | | | | | | |
| Musti Group Oyj(a) | | | 75,531 | | | | 1,728,643 | |
| | | | | | | | | |
| France (2.58%) | | | | | | | | |
| Alten SA(a) | | | 10,400 | | | | 832,710 | |
| BioMerieux | | | 2,676 | | | | 398,453 | |
| Bureau Veritas SA(a) | | | 35,351 | | | | 775,186 | |
| Esker SA | | | 19,148 | | | | 3,191,203 | |
| Neurones | | | 17,282 | | | | 470,980 | |
| Thermador Groupe | | | 22,413 | | | | 1,508,544 | |
| | | | | | | | 7,177,076 | |
| | | | | | | | | |
| Germany (4.92%) | | | | | | | | |
| CANCOM SE | | | 11,600 | | | | 458,590 | |
| Dermapharm Holding SE | | | 17,100 | | | | 830,474 | |
| Deutsche Industrie REIT AG | | | 18,300 | | | | 347,503 | |
| Exasol AG(a) | | | 36,300 | | | | 696,694 | |
| Fashionette AG(a) | | | 59,848 | | | | 2,054,459 | |
| Grand City Properties SA | | | 46,277 | | | | 1,050,419 | |
| Home24 SE(a) | | | 47,096 | | | | 896,951 | |
| Nexus AG | | | 14,531 | | | | 809,613 | |
| Norma Group SE | | | 13,460 | | | | 417,612 | |
| PATRIZIA AG | | | 65,604 | | | | 1,493,210 | |
| PharmaSGP Holding SE(a) | | | 49,924 | | | | 1,715,586 | |
| Puma SE(a) | | | 11,124 | | | | 973,827 | |
| QIAGEN NV(a) | | | 8,334 | | | | 395,365 | |
| Westwing Group AG(a) | | | 51,400 | | | | 1,570,834 | |
| | | | | | | | 13,711,137 | |
| | | | | | | | | |
| Greece (0.86%) | | | | | | | | |
| Kri-Kri Milk Industry SA | | | 61,300 | | | | 440,943 | |
| Sarantis SA | | | 199,040 | | | | 1,958,804 | |
| | | | | | | | 2,399,747 | |
| | | | | | | | | |
| Hong Kong (1.48%) | | | | | | | | |
| Jacobson Pharma Corp., Ltd.(c) | | | 5,484,000 | | | | 808,334 | |
| Plover Bay Technologies, Ltd.(c) | | | 3,254,000 | | | | 340,582 | |
| Techtronic Industries Co., Ltd. | | | 121,000 | | | | 1,629,790 | |
| | | Shares | | | Value
(Note 2) | |
| Hong Kong (continued) | | | | | | | | |
| Vitasoy International Holdings, Ltd. | | | 336,000 | | | $ | 1,359,089 | |
| | | | | | | | 4,137,795 | |
| | | | | | | | | |
| India (5.46%) | | | | | | | | |
| Avenue Supermarts, Ltd.(a)(b)(c) | | | 15,385 | | | | 465,130 | |
| Bajaj Finance, Ltd. | | | 21,671 | | | | 966,710 | |
| EPL, Ltd. | | | 276,258 | | | | 924,567 | |
| Gulf Oil Lubricants India, Ltd. | | | 100,176 | | | | 891,264 | |
| HDFC Bank, Ltd.(a) | | | 104,533 | | | | 1,669,386 | |
| IndiaMart InterMesh, Ltd.(b)(c) | | | 24,969 | | | | 1,635,768 | |
| L&T Technology Services, Ltd.(b)(c) | | | 37,748 | | | | 848,660 | |
| Metropolis Healthcare, Ltd.(b)(c) | | | 90,081 | | | | 2,390,476 | |
| Poly Medicure, Ltd. | | | 100,791 | | | | 654,114 | |
| Time Technoplast, Ltd. | | | 712,756 | | | | 359,262 | |
| Vaibhav Global, Ltd. | | | 31,161 | | | | 820,249 | |
| Westlife Development, Ltd.(a) | | | 91,619 | | | | 467,133 | |
| WNS Holdings, Ltd., ADR(a) | | | 54,325 | | | | 3,131,293 | |
| | | | | | | | 15,224,012 | |
| | | | | | | | | |
| Indonesia (1.66%) | | | | | | | | |
| Arwana Citramulia Tbk PT | | | 26,137,200 | | | | 886,342 | |
| Bank Central Asia Tbk PT | | | 332,700 | | | | 654,639 | |
| Bank Tabungan Pensiunan Nasional Syariah | | | 2,669,000 | | | | 666,473 | |
| Selamat Sempurna Tbk PT | | | 19,027,700 | | | | 1,803,698 | |
| Ultrajaya Milk Industry & Trading Co. Tbk PT | | | 5,474,800 | | | | 616,954 | |
| | | | | | | | 4,628,106 | |
| | | | | | | | | |
| Ireland (1.82%) | | | | | | | | |
| ICON PLC, ADR(a) | | | 8,915 | | | | 1,607,375 | |
| Irish Residential Properties REIT PLC | | | 687,226 | | | | 1,096,514 | |
| Keywords Studios PLC | | | 34,411 | | | | 945,289 | |
| Uniphar PLC | | | 523,697 | | | | 1,433,316 | |
| | | | | | | | 5,082,494 | |
| | | | | | | | | |
| Israel (1.30%) | | | | | | | | |
| Max Stock, Ltd.(a) | | | 85,618 | | | | 329,720 | |
| Wix.com, Ltd.(a) | | | 13,302 | | | | 3,289,850 | |
| | | | | | | | 3,619,570 | |
| | | | | | | | | |
| Italy (0.90%) | | | | | | | | |
| DiaSorin SpA | | | 2,083 | | | | 457,277 | |
| GVS SpA(a)(b)(c) | | | 28,240 | | | | 397,964 | |
| Interpump Group SpA | | | 26,191 | | | | 989,270 | |
| Piovan SpA(b)(c) | | | 138,608 | | | | 659,192 | |
| | | | | | | | 2,503,703 | |
| | | | | | | | | |
| Japan (7.58%) | | | | | | | | |
| AIT Corp. | | | 42,400 | | | | 407,025 | |
| BASE, Inc.(a) | | | 3,600 | | | | 385,869 | |
See Notes to Financial Statements.
| Semi-Annual Report | October 31, 2020 | 51 |
| Grandeur Peak Global Reach Fund | Portfolio of Investments |
October 31, 2020 (Unaudited)
| | | Shares | | | Value
(Note 2) | |
| Japan (continued) | | | | | | | | |
| BayCurrent Consulting, Inc. | | | 22,400 | | | $ | 2,898,343 | |
| Charm Care Corp. | | | 32,700 | | | | 351,363 | |
| eGuarantee, Inc. | | | 6,400 | | | | 142,531 | |
| Funai Soken Holdings, Inc. | | | 15,500 | | | | 335,287 | |
| Future Corp. | | | 58,000 | | | | 992,831 | |
| gremz, Inc. | | | 90,400 | | | | 1,585,998 | |
| Japan Lifeline Co., Ltd. | | | 69,000 | | | | 890,387 | |
| MarkLines Co., Ltd. | | | 24,800 | | | | 535,940 | |
| Medikit Co., Ltd. | | | 20,700 | | | | 608,231 | |
| MonotaRO Co., Ltd. | | | 21,800 | | | | 1,205,796 | |
| Naigai Trans Line, Ltd. | | | 68,150 | | | | 786,867 | |
| Nihon M&A Center, Inc. | | | 26,600 | | | | 1,561,994 | |
| Open Door, Inc.(a) | | | 83,700 | | | | 954,289 | |
| Seria Co., Ltd. | | | 12,300 | | | | 473,908 | |
| Synchro Food Co., Ltd.(a) | | | 113,400 | | | | 309,529 | |
| System Information Co., Ltd. | | | 43,600 | | | | 492,220 | |
| Systena Corp. | | | 42,300 | | | | 767,554 | |
| Syuppin Co., Ltd. | | | 53,200 | | | | 434,066 | |
| TeamSpirit, Inc.(a) | | | 14,500 | | | | 322,334 | |
| TerraSky Co., Ltd.(a) | | | 6,600 | | | | 277,554 | |
| Trancom Co., Ltd. | | | 18,100 | | | | 1,300,554 | |
| Tsuruha Holdings, Inc. | | | 3,800 | | | | 532,095 | |
| User Local, Inc.(a) | | | 900 | | | | 37,540 | |
| Vega Corp. Co., Ltd.(a) | | | 38,600 | | | | 826,362 | |
| WDB coco Co., Ltd. | | | 11,900 | | | | 439,521 | |
| YAKUODO Holdings Co., Ltd. | | | 36,200 | | | | 887,150 | |
| YAMADA Consulting Group Co., Ltd. | | | 40,200 | | | | 386,950 | |
| | | | | | | | 21,130,088 | |
| | | | | | | | | |
| Netherlands (1.09%) | | | | | | | | |
| Aalberts NV | | | 41,402 | | | | 1,388,996 | |
| Shop Apotheke Europe NV(a)(b)(c) | | | 9,849 | | | | 1,634,275 | |
| | | | | | | | 3,023,271 | |
| | | | | | | | | |
| New Zealand (0.42%) | | | | | | | | |
| CBL Corp., Ltd.(a)(d) | | | 819,006 | | | | 1 | |
| NZX, Ltd. | | | 1,039,491 | | | | 1,181,494 | |
| | | | | | | | 1,181,495 | |
| | | | | | | | | |
| Norway (1.26%) | | | | | | | | |
| CSAM Health Group AS(a) | | | 115,071 | | | | 988,391 | |
| Infront ASA(a) | | | 116,166 | | | | 218,896 | |
| Medistim ASA | | | 12,841 | | | | 279,391 | |
| Nordic Semiconductor ASA(a) | | | 11,845 | | | | 124,592 | |
| Sbanken ASA(a)(b)(c) | | | 45,900 | | | | 292,686 | |
| Self Storage Group ASA(a) | | | 694,169 | | | | 1,598,661 | |
| | | | | | | | 3,502,617 | |
| | | | | | | | | |
| Philippines (1.31%) | | | | | | | | |
| Concepcion Industrial Corp. | | | 1,793,920 | | | | 803,128 | |
| Pryce Corp. | | | 6,894,800 | | | | 585,488 | |
| Puregold Price Club, Inc. | | | 490,700 | | | | 418,207 | |
| | | Shares | | | Value
(Note 2) | |
| Philippines (continued) | | | | | | | | |
| Wilcon Depot, Inc. | | | 6,270,400 | | | $ | 1,854,309 | |
| | | | | | | | 3,661,132 | |
| | | | | | | | | |
| Poland (1.40%) | | | | | | | | |
| Allegro.eu SA(a)(b)(c) | | | 21,109 | | | | 428,995 | |
| Dino Polska SA(a)(b)(c) | | | 50,653 | | | | 2,784,873 | |
| LiveChat Software SA | | | 27,929 | | | | 673,073 | |
| | | | | | | | 3,886,941 | |
| | | | | | | | | |
| South Africa (0.57%) | | | | | | | | |
| Clicks Group, Ltd. | | | 73,588 | | | | 1,066,938 | |
| Italtile, Ltd. | | | 665,000 | | | | 533,267 | |
| | | | | | | | 1,600,205 | |
| | | | | | | | | |
| South Korea (0.91%) | | | | | | | | |
| LEENO Industrial, Inc. | | | 6,000 | | | | 645,380 | |
| LG Household & Health Care, Ltd. | | | 383 | | | | 507,812 | |
| Ray Co. Ltd/KR(a) | | | 11,000 | | | | 381,949 | |
| Suprema, Inc.(a) | | | 8,000 | | | | 193,497 | |
| Tokai Carbon Korea Co., Ltd. | | | 10,000 | | | | 817,820 | |
| | | | | | | | 2,546,458 | |
| | | | | | | | | |
| Spain (0.00%)(e) | | | | | | | | |
| Let's GOWEX SA(a)(d) | | | 10,700 | | | | 0 | |
| | | | | | | | | |
| Sweden (3.39%) | | | | | | | | |
| Beijer Alma AB | | | 64,700 | | | | 844,035 | |
| EQT AB | | | 126,813 | | | | 2,409,595 | |
| KNOW IT AB(a) | | | 63,801 | | | | 1,745,545 | |
| OEM International AB, Class B(a) | | | 21,424 | | | | 651,701 | |
| Sagax AB, Class A | | | 47,309 | | | | 748,739 | |
| Sagax AB B | | | 19,522 | | | | 306,630 | |
| SwedenCare AB | | | 80,704 | | | | 1,986,220 | |
| Vitec Software Group AB, Class B | | | 24,320 | | | | 756,152 | |
| | | | | | | | 9,448,617 | |
| | | | | | | | | |
| Switzerland (0.47%) | | | | | | | | |
| Partners Group Holding AG | | | 1,467 | | | | 1,320,749 | |
| | | | | | | | | |
| Taiwan (2.90%) | | | | | | | | |
| ASPEED Technology, Inc. | | | 6,000 | | | | 290,397 | |
| Bioteque Corp. | | | 220,000 | | | | 1,058,971 | |
| FineTek Co., Ltd. | | | 155,400 | | | | 388,706 | |
| Pacific Hospital Supply Co., Ltd. | | | 356,317 | | | | 860,132 | |
| Poya International Co., Ltd. | | | 86,000 | | | | 1,857,463 | |
| Sporton International, Inc. | | | 234,859 | | | | 1,877,675 | |
| Test Research, Inc. | | | 321,440 | | | | 625,085 | |
| TSC Auto ID Technology Co., Ltd. | | | 52,060 | | | | 326,449 | |
See Notes to Financial Statements.
| 52 | 1.855.377.7325 | www.GrandeurPeakGlobal.com |
| Grandeur Peak Global Reach Fund | Portfolio of Investments |
October 31, 2020 (Unaudited)
| | | Shares | | | Value
(Note 2) | |
| Taiwan (continued) | | | | | | | | |
| Voltronic Power Technology Corp. | 23,047 | | | $ | 790,540 | |
| | | | | | | | 8,075,418 | |
| | | | | | | | | |
| Thailand (0.15%) | | | | | | | | |
| TOA Paint Thailand PCL | | | 413,300 | | | | 427,110 | |
| | | | | | | | | |
| United Arab Emirates (0.21%) | | | | | | | | |
| Aramex PJSC | | | 550,033 | | | | 590,232 | |
| | | | | | | | | |
| United States (26.68%) | | | | | | | | |
| 4imprint Group PLC(a) | | | 17,642 | | | | 472,967 | |
| 8x8, Inc.(a) | | | 44,703 | | | | 772,468 | |
| Accenture PLC, Class A | | | 1,163 | | | | 252,266 | |
| Amazon.com, Inc.(a) | | | 279 | | | | 847,086 | |
| Array Technologies, Inc.(a) | | | 2,437 | | | | 89,803 | |
| Bank of NT Butterfield & Son, Ltd. | | | 11,750 | | | | 310,905 | |
| Barrett Business Services, Inc. | | | 15,630 | | | | 926,077 | |
| Blackline, Inc.(a) | | | 15,275 | | | | 1,492,062 | |
| Blackstone Group, Inc., Class A | | | 31,683 | | | | 1,597,457 | |
| Cactus, Inc., Class A | | | 27,025 | | | | 459,425 | |
| Cardiovascular Systems, Inc.(a) | | | 11,902 | | | | 424,306 | |
| Castle Biosciences, Inc.(a) | | | 5,519 | | | | 256,247 | |
| CDW Corp. | | | 2,400 | | | | 294,240 | |
| CoreSite Realty Corp. | | | 13,425 | | | | 1,602,408 | |
| EPAM Systems, Inc.(a) | | | 11,224 | | | | 3,467,655 | |
| Equinix, Inc. | | | 2,425 | | | | 1,773,257 | |
| Esquire Financial Holdings, Inc.(a) | | | 15,712 | | | | 244,950 | |
| Etsy, Inc.(a) | | | 20,643 | | | | 2,509,982 | |
| Exact Sciences Corp.(a) | | | 8,225 | | | | 1,018,502 | |
| ExlService Holdings, Inc.(a) | | | 16,950 | | | | 1,283,793 | |
| Fastenal Co. | | | 30,832 | | | | 1,332,867 | |
| Fastly, Inc., Class A(a) | | | 2,333 | | | | 148,169 | |
| First Republic Bank | | | 27,200 | | | | 3,431,008 | |
| Five Below, Inc.(a) | | | 3,170 | | | | 422,688 | |
| Freshpet, Inc.(a) | | | 3,986 | | | | 456,397 | |
| Frontage Holdings Corp.(a)(b)(c) | | | 2,058,000 | | | | 906,501 | |
| FTI Consulting, Inc.(a) | | | 8,680 | | | | 854,633 | |
| Genpact, Ltd. | | | 44,639 | | | | 1,534,242 | |
| Goosehead Insurance, Inc., Class A | | | 10,685 | | | | 1,309,340 | |
| HD Supply Holdings, Inc.(a) | | | 34,700 | | | | 1,383,142 | |
| Heska Corp.(a) | | | 15,075 | | | | 1,768,750 | |
| Houlihan Lokey, Inc. | | | 18,111 | | | | 1,135,560 | |
| I3 Verticals, Inc., Class A(a) | | | 19,550 | | | | 403,317 | |
| IDEXX Laboratories, Inc.(a) | | | 1,066 | | | | 452,858 | |
| Inphi Corp.(a) | | | 10,525 | | | | 1,470,974 | |
| Insperity, Inc. | | | 15,299 | | | | 1,171,597 | |
| Intersect ENT, Inc.(a) | | | 46,850 | | | | 726,175 | |
| Joint Corp.(a) | | | 21,075 | | | | 394,946 | |
| Kinsale Capital Group, Inc. | | | 4,425 | | | | 829,555 | |
| LeMaitre Vascular, Inc. | | | 24,525 | | | | 796,572 | |
| Lemonade, Inc.(a) | | | 2,489 | | | | 125,172 | |
| | | Shares | | | Value
(Note 2) | |
| United States (continued) | | | | | | | | |
| LGI Homes, Inc.(a) | | | 11,975 | | | $ | 1,279,888 | |
| Littelfuse, Inc. | | | 2,334 | | | | 461,992 | |
| Lululemon Athletica, Inc.(a) | | | 4,767 | | | | 1,522,055 | |
| MaxCyte, Inc.(a) | | | 120,600 | | | | 637,450 | |
| Medallia, Inc.(a) | | | 22,134 | | | | 629,712 | |
| Medpace Holdings, Inc.(a) | | | 7,942 | | | | 881,085 | |
| Microchip Technology, Inc. | | | 6,788 | | | | 713,283 | |
| Mimecast, Ltd.(a) | | | 10,160 | | | | 388,214 | |
| Monolithic Power Systems, Inc. | | | 1,414 | | | | 451,914 | |
| Morningstar, Inc. | | | 2,550 | | | | 485,469 | |
| MSCI, Inc. | | | 1,145 | | | | 400,567 | |
| New Relic, Inc.(a) | | | 24,425 | | | | 1,481,621 | |
| NV5 Global, Inc.(a) | | | 15,171 | | | | 850,790 | |
| NVIDIA Corp. | | | 1,075 | | | | 538,962 | |
| Ollie's Bargain Outlet Holdings, Inc.(a) | | | 4,726 | | | | 411,587 | |
| Paycom Software, Inc.(a) | | | 5,021 | | | | 1,828,096 | |
| Paylocity Holding Corp.(a) | | | 7,750 | | | | 1,437,780 | |
| PJT Partners, Inc., Class A | | | 34,653 | | | | 2,344,622 | |
| Pluralsight, Inc., Class A(a) | | | 108,264 | | | | 1,699,745 | |
| Power Integrations, Inc. | | | 18,996 | | | | 1,143,749 | |
| PPD, Inc.(a) | | | 9,450 | | | | 310,716 | |
| Qualys, Inc.(a) | | | 22,000 | | | | 1,932,700 | |
| Rapid7, Inc.(a) | | | 14,350 | | | | 888,696 | |
| Revolve Group, Inc.(a) | | | 42,655 | | | | 771,202 | |
| Rexford Industrial Realty, Inc. | | | 20,400 | | | | 947,784 | |
| Silicon Laboratories, Inc.(a) | | | 5,800 | | | | 594,268 | |
| STAAR Surgical Co.(a) | | | 5,074 | | | | 367,865 | |
| StepStone Group, Inc.(a) | | | 11,112 | | | | 285,690 | |
| Sumo Logic, Inc.(a) | | | 31,342 | | | | 541,590 | |
| SVB Financial Group(a) | | | 3,435 | | | | 998,555 | |
| Systemax, Inc. | | | 68,563 | | | | 1,949,246 | |
| Terreno Realty Corp. | | | 21,825 | | | | 1,228,311 | |
| Transcat, Inc.(a) | | | 24,352 | | | | 752,720 | |
| Ulta Beauty, Inc.(a) | | | 1,825 | | | | 377,355 | |
| Veracyte, Inc.(a) | | | 8,560 | | | | 296,690 | |
| WW Grainger, Inc. | | | 3,978 | | | | 1,392,380 | |
| | | | | | | | 74,374,668 | |
| | | | | | | | | |
| Vietnam (1.25%) | | | | | | | | |
| FPT Corp. | | | 33,000 | | | | 73,443 | |
| Vietnam Dairy Products JSC | | | 308,062 | | | | 1,439,360 | |
| Vietnam Technological & Commercial Joint Stock Bank(a) | | | 2,138,281 | | | | 1,974,692 | |
| | | | | | | | 3,487,495 | |
| | | | | | | | | |
| TOTAL COMMON STOCKS | | | | | | | | |
| (Cost $180,434,903) | | | | | | | 276,753,005 | |
See Notes to Financial Statements.
| Semi-Annual Report | October 31, 2020 | 53 |
| Grandeur Peak Global Reach Fund | Portfolio of Investments |
October 31, 2020 (Unaudited)
| | | Shares | | | Value
(Note 2) | |
| PREFERRED STOCKS (0.44%) | | | | | | | | |
| United States (0.44%) | | | | | | | | |
| Dataminr Inc - Private Placement(a)(d) | | | 45,833 | | | $ | 1,220,533 | |
| | | | | | | | | |
| TOTAL PREFERRED STOCKS | | | | | | | | |
| (Cost $912,077) | | | | | | | 1,220,533 | |
| | | | | | | | | |
| TOTAL INVESTMENTS (99.72%) | | | | | | | | |
| (Cost $181,346,980) | | | | | | $ | 277,973,538 | |
| | | | | | | | | |
| Other Assets In Excess Of Liabilities (0.28%)(f) | | | | | | | 780,347 | |
| | | | | | | | | |
| NET ASSETS (100.00%) | | | | | | $ | 278,753,885 | |
| (a) | Non-Income Producing Security. |
| (b) | Security exempt from registration under Rule 144A of the Securities Act of 1933. These securities may be resold in the ordinary course of business in transactions exempt from registration, normally to qualified institutional buyers. As of October 31, 2020, these securities had a total aggregate market value of $20,087,986, representing 7.21% of net assets. |
| (c) | Security was purchased pursuant to Regulation S under the Securities Act of 1933, which exempts securities offered and sold outside of the United States from registration. Such security cannot be sold in the United States without either an effective registration statement filed pursuant to the Securities Act of 1933, or pursuant to an exemption from registration. As of October 31, 2020, the aggregate market value of these securities was $22,585,856, representing 8.10% of net assets. |
| (d) | As a result of the use of significant unobservable inputs to determine fair value, these investments have been classified as level 3 assets. See also Note 2 to the financial statements for additional information. |
| (e) | Less than 0.005%. |
| (f) | Includes cash which is being held as collateral for securities sold short. See also Note 2 to the financial statements for additional information. |
| Sector Composition (October 31, 2020) (Unaudited) | |
| Technology | 26.2% |
| Consumer | 19.3% |
| Financials | 18.8% |
| Industrials | 17.8% |
| Health Care | 14.9% |
| Energy & Materials | 2.0% |
| Communications | 0.7% |
| Cash, Cash Equivalents, & Other Net Assets | 0.3% |
| Total | 100% |
| Industry Composition (October 31, 2020) (Unaudited) |
| IT Services | 10.4% |
| Software | 8.9% |
| Capital Markets | 8.1% |
| Professional Services | 6.0% |
| Internet & Direct Marketing Retail | 5.4% |
| Semiconductors & Semiconductor Equipment | 4.9% |
| Trading Companies & Distributors | 4.6% |
| Health Care Equipment & Supplies | 4.1% |
| Banks | 3.7% |
| Equity Real Estate Investment Trusts (REITs) | 3.7% |
| Pharmaceuticals | 3.6% |
| Life Sciences Tools & Services | 2.8% |
| Health Care Providers & Services | 2.7% |
| Machinery | 2.5% |
| Food & Staples Retailing | 2.4% |
| Multiline Retail | 2.1% |
| Specialty Retail | 1.8% |
| Real Estate Management & Development | 1.8% |
| Commercial Services & Supplies | 1.6% |
| Food Products | 1.6% |
| Textiles, Apparel & Luxury Goods | 1.4% |
| Household Durables | 1.4% |
| Auto Components | 1.1% |
| Biotechnology | 1.1% |
| Other Industries (each less than 1%) | 12.2% |
| Cash and Other Assets, Less Liabilities | 0.3% |
| Total | 100% |
See Notes to Financial Statements.
| 54 | 1.855.377.7325 | www.GrandeurPeakGlobal.com |
| Grandeur Peak Global Stalwarts Fund | Portfolio of Investments |
October 31, 2020 (Unaudited)
| | | Shares | | | Value
(Note 2) | |
| COMMON STOCKS (98.00%) | | | | | | | | |
| Argentina (0.95%) | | | | | | | | |
| Globant SA(a) | | | 13,625 | | | $ | 2,460,811 | |
| | | | | | | | | |
| Australia (1.87%) | | | | | | | | |
| Appen, Ltd. | | | 65,200 | | | | 1,485,023 | |
| Domino's Pizza Enterprises, Ltd. | | | 14,800 | | | | 881,511 | |
| Kogan.com, Ltd. | | | 47,302 | | | | 684,744 | |
| Netwealth Group, Ltd. | | | 148,500 | | | | 1,803,614 | |
| | | | | | | | 4,854,892 | |
| | | | | | | | | |
| Belgium (1.39%) | | | | | | | | |
| Melexis NV | | | 26,174 | | | | 1,992,329 | |
| Warehouses De Pauw CVA | | | 48,412 | | | | 1,621,955 | |
| | | | | | | | 3,614,284 | |
| | | | | | | | | |
| Brazil (0.72%) | | | | | | | | |
| Pagseguro Digital, Ltd., Class A(a) | | | 29,125 | | | | 1,066,266 | |
| Raia Drogasil SA | | | 190,000 | | | | 799,345 | |
| | | | | | | | 1,865,611 | |
| | | | | | | | | |
| Britain (13.11%) | | | | | | | | |
| Abcam PLC | | | 81,700 | | | | 1,558,648 | |
| Ascential PLC(a) | | | 192,635 | | | | 689,881 | |
| B&M European Value Retail SA | | | 917,700 | | | | 5,759,426 | |
| Big Yellow Group PLC | | | 67,479 | | | | 961,642 | |
| boohoo Group PLC(a) | | | 386,500 | | | | 1,354,573 | |
| Dechra Pharmaceuticals PLC | | | 150,640 | | | | 6,814,640 | |
| Diploma PLC | | | 5,078 | | | | 146,224 | |
| Endava PLC, ADR(a) | | | 70,898 | | | | 4,530,382 | |
| Gamma Communications PLC | | | 35,700 | | | | 772,367 | |
| Intertek Group PLC | | | 30,600 | | | | 2,204,152 | |
| Sanne Group PLC | | | 375,620 | | | | 2,951,694 | |
| Softcat PLC | | | 151,418 | | | | 2,207,326 | |
| St. James's Place PLC | | | 356,593 | | | | 4,155,983 | |
| | | | | | | | 34,106,938 | |
| | | | | | | | | |
| Canada (1.42%) | | | | | | | | |
| Gildan Activewear, Inc. | | | 87,533 | | | | 1,813,338 | |
| Ritchie Bros Auctioneers, Inc. | | | 31,050 | | | | 1,882,562 | |
| | | | | | | | 3,695,900 | |
| | | | | | | | | |
| China (6.80%) | | | | | | | | |
| Baozun, Inc., Sponsored ADR(a) | | | 27,225 | | | | 996,163 | |
| CSPC Pharmaceutical Group, Ltd. | | | 976,680 | | | | 1,037,162 | |
| Hangzhou Tigermed Consulting Co., Ltd., Class A | | | 52,000 | | | | 965,856 | |
| Jiangsu Hengrui Medicine Co., Ltd., Class A | | | 53,300 | | | | 708,918 | |
| Li Ning Co., Ltd. | | | 182,000 | | | | 948,573 | |
| | | Shares | | | Value
(Note 2) | |
| China (continued) | | | | | | | | |
| Silergy Corp. | | | 139,000 | | | $ | 8,569,750 | |
| Trip.com Group, Ltd., ADR(a) | | | 34,125 | | | | 981,435 | |
| WuXi AppTec Co., Ltd., Class H(b)(c) | | | 106,560 | | | | 1,703,713 | |
| Yum China Holdings, Inc. | | | 33,300 | | | | 1,772,559 | |
| | | | | | | | 17,684,129 | |
| | | | | | | | | |
| Denmark (0.13%) | | | | | | | | |
| Ambu A/S, Class B | | | 11,381 | | | | 345,190 | |
| | | | | | | | | |
| France (1.71%) | | | | | | | | |
| Alten SA(a) | | | 24,036 | | | | 1,924,521 | |
| BioMerieux | | | 8,193 | | | | 1,219,926 | |
| Bureau Veritas SA(a) | | | 58,980 | | | | 1,293,330 | |
| | | | | | | | 4,437,777 | |
| | | | | | | | | |
| Germany (3.15%) | | | | | | | | |
| CANCOM SE | | | 15,300 | | | | 604,864 | |
| Dermapharm Holding SE | | | 37,700 | | | | 1,830,928 | |
| Grand City Properties SA | | | 84,411 | | | | 1,916,004 | |
| PATRIZIA AG | | | 71,715 | | | | 1,632,303 | |
| Puma SE(a) | | | 14,200 | | | | 1,243,109 | |
| QIAGEN NV(a) | | | 20,225 | | | | 959,474 | |
| | | | | | | | 8,186,682 | |
| | | | | | | | | |
| Hong Kong (1.44%) | | | | | | | | |
| Techtronic Industries Co., Ltd. | | | 147,000 | | | | 1,979,993 | |
| Vitasoy International Holdings, Ltd. | | | 434,500 | | | | 1,757,512 | |
| | | | | | | | 3,737,505 | |
| | | | | | | | | |
| India (7.02%) | | | | | | | | |
| Avenue Supermarts, Ltd.(a)(b)(c) | | | 40,500 | | | | 1,224,425 | |
| Bajaj Finance, Ltd. | | | 110,493 | | | | 4,928,922 | |
| HDFC Bank, Ltd.(a) | | | 136,000 | | | | 2,171,912 | |
| Marico, Ltd. | | | 182,487 | | | | 878,739 | |
| Metropolis Healthcare, Ltd.(b)(c) | | | 11,582 | | | | 307,351 | |
| Titan Co., Ltd. | | | 64,516 | | | | 1,015,429 | |
| WNS Holdings, Ltd., ADR(a) | | | 134,250 | | | | 7,738,170 | |
| | | | | | | | 18,264,948 | |
| | | | | | | | | |
| Indonesia (0.40%) | | | | | | | | |
| Bank Tabungan Pensiunan Nasional Syariah | | | 4,202,200 | | | | 1,049,326 | |
| | | | | | | | | |
| Ireland (1.33%) | | | | | | | | |
| ICON PLC, ADR(a) | | | 9,550 | | | | 1,721,865 | |
| Keywords Studios PLC | | | 63,207 | | | | 1,736,332 | |
| | | | | | | | 3,458,197 | |
See Notes to Financial Statements.
| Semi-Annual Report | October 31, 2020 | 55 |
| Grandeur Peak Global Stalwarts Fund | Portfolio of Investments |
October 31, 2020 (Unaudited)
| | | Shares | | | Value
(Note 2) | |
| Israel (0.91%) | | | | | | |
| Wix.com, Ltd.(a) | | | 9,575 | | | $ | 2,368,089 | |
| | | | | | | | | |
| Interpump Group SpA | | | 27,592 | | | | 1,042,187 | |
| | | | | | | | 3,091,676 | |
| | | | | | | | | |
| Japan (5.71%) | | | | | | | | |
| BayCurrent Consulting, Inc. | | | 14,800 | | | | 1,914,977 | |
| Japan Lifeline Co., Ltd. | | | 17,500 | | | | 225,823 | |
| MonotaRO Co., Ltd. | | | 41,800 | | | | 2,312,030 | |
| Nihon M&A Center, Inc. | | | 71,300 | | | | 4,186,849 | |
| Seria Co., Ltd. | | | 39,400 | | | | 1,518,048 | |
| Systena Corp. | | | 186,400 | | | | 3,382,320 | |
| Tsuruha Holdings, Inc. | | | 9,400 | | | | 1,316,235 | |
| | | | | | | | 14,856,282 | |
| | | | | | | | | |
| Netherlands (1.16%) | | | | | | | | |
| Aalberts NV | | | 33,485 | | | | 1,123,388 | |
| Shop Apotheke Europe NV(a)(b)(c) | | | 11,440 | | | | 1,898,275 | |
| | | | | | | | 3,021,663 | |
| | | | | | | | | |
| Philippines (0.33%) | | | | | | | | |
| Wilcon Depot, Inc. | | | 2,924,400 | | | | 864,816 | |
| | | | | | | | | |
| Poland (1.42%) | | | | | | | | |
| Allegro.eu SA(a)(b)(c) | | | 52,107 | | | | 1,058,962 | |
| Dino Polska SA(a)(b)(c) | | | 48,030 | | | | 2,640,663 | |
| | | | | | | | 3,699,625 | |
| | | | | | | | | |
| South Korea (0.32%) | | | | | | | | |
| LEENO Industrial, Inc. | | | 7,828 | | | | 842,006 | |
| | | | | | | | | |
| Sweden (2.11%) | | | | | | | | |
| AddTech AB, Class B | | | 68,100 | | | | 752,578 | |
| EQT AB | | | 102,300 | | | | 1,943,819 | |
| Nibe Industrier AB, Class B(a) | | | 32,708 | | | | 787,570 | |
| Sagax AB B | | | 75,651 | | | | 1,188,242 | |
| Sweco AB, Class B | | | 16,502 | | | | 830,383 | |
| | | | | | | | 5,502,592 | |
| | | | | | | | | |
| Switzerland (0.81%) | | | | | | | | |
| Partners Group Holding AG | | | 2,350 | | | | 2,115,720 | |
| | | | | | | | | |
| Taiwan (1.34%) | | | | | | | | |
| ASPEED Technology, Inc. | | | 21,000 | | | | 1,016,390 | |
| momo.com, Inc. | | | 42,000 | | | | 1,005,119 | |
| Voltronic Power Technology Corp. | | | 42,875 | | | | 1,470,664 | |
| | | | | | | | 3,492,173 | |
| | | | | | | | | |
| United States (40.13%) | | | | | | | | |
| ABIOMED, Inc.(a) | | | 2,515 | | | | 633,478 | |
| Array Technologies, Inc.(a) | | | 2,278 | | | | 83,944 | |
| | | Shares | | | Value
(Note 2) | |
| United States (continued) | | | | | | | | |
| Blackstone Group, Inc., Class A | | | 17,200 | | | $ | 867,224 | |
| Cardiovascular Systems, Inc.(a) | | | 30,992 | | | | 1,104,865 | |
| CDW Corp. | | | 9,150 | | | | 1,121,790 | |
| CoreSite Realty Corp. | | | 14,675 | | | | 1,751,608 | |
| EPAM Systems, Inc.(a) | | | 23,450 | | | | 7,244,877 | |
| Equinix, Inc. | | | 1,500 | | | | 1,096,860 | |
| Etsy, Inc.(a) | | | 11,525 | | | | 1,401,325 | |
| Exact Sciences Corp.(a) | | | 11,008 | | | | 1,363,121 | |
| ExlService Holdings, Inc.(a) | | | 18,650 | | | | 1,412,551 | |
| Fastenal Co. | | | 90,600 | | | | 3,916,638 | |
| First Republic Bank | | | 67,200 | | | | 8,476,608 | |
| Five Below, Inc.(a) | | | 17,360 | | | | 2,314,782 | |
| Freshpet, Inc.(a) | | | 5,850 | | | | 669,825 | |
| FTI Consulting, Inc.(a) | | | 8,150 | | | | 802,449 | |
| Genpact, Ltd. | | | 73,902 | | | | 2,540,012 | |
| Goosehead Insurance, Inc., Class A | | | 17,325 | | | | 2,123,005 | |
| HD Supply Holdings, Inc.(a) | | | 32,700 | | | | 1,303,422 | |
| Houlihan Lokey, Inc. | | | 18,600 | | | | 1,166,220 | |
| IDEXX Laboratories, Inc.(a) | | | 4,675 | | | | 1,986,033 | |
| Inphi Corp.(a) | | | 19,325 | | | | 2,700,862 | |
| Kinsale Capital Group, Inc. | | | 7,825 | | | | 1,466,953 | |
| LGI Homes, Inc.(a) | | | 19,575 | | | | 2,092,176 | |
| Littelfuse, Inc. | | | 10,953 | | | | 2,168,037 | |
| Lululemon Athletica, Inc.(a) | | | 7,352 | | | | 2,347,420 | |
| Medallia, Inc.(a) | | | 48,650 | | | | 1,384,093 | |
| Medpace Holdings, Inc.(a) | | | 16,025 | | | | 1,777,814 | |
| Microchip Technology, Inc. | | | 19,075 | | | | 2,004,401 | |
| Monolithic Power Systems, Inc. | | | 5,900 | | | | 1,885,640 | |
| MSCI, Inc. | | | 3,100 | | | | 1,084,504 | |
| Ollie's Bargain Outlet Holdings, Inc.(a) | | | 14,627 | | | | 1,273,865 | |
| Paycom Software, Inc.(a) | | | 10,716 | | | | 3,901,588 | |
| Paylocity Holding Corp.(a) | | | 8,950 | | | | 1,660,404 | |
| PJT Partners, Inc., Class A | | | 39,875 | | | | 2,697,943 | |
| Pluralsight, Inc., Class A(a) | | | 341,059 | | | | 5,354,626 | |
| Pool Corp. | | | 7,950 | | | | 2,781,149 | |
| Power Integrations, Inc. | | | 89,400 | | | | 5,382,774 | |
| PPD, Inc.(a) | | | 36,350 | | | | 1,195,188 | |
| Qualys, Inc.(a) | | | 22,684 | | | | 1,992,789 | |
| Rapid7, Inc.(a) | | | 17,350 | | | | 1,074,486 | |
| Silicon Laboratories, Inc.(a) | | | 20,184 | | | | 2,068,053 | |
| STAAR Surgical Co.(a) | | | 19,375 | | | | 1,404,688 | |
| Sumo Logic, Inc.(a) | | | 22,779 | | | | 393,621 | |
| SVB Financial Group(a) | | | 5,989 | | | | 1,741,002 | |
| Terreno Realty Corp. | | | 25,001 | | | | 1,407,056 | |
| Texas Roadhouse, Inc. | | | 7,900 | | | | 553,237 | |
| Ulta Beauty, Inc.(a) | | | 4,612 | | | | 953,623 | |
| WW Grainger, Inc. | | | 2,725 | | | | 953,804 | |
| | | | | | | | 104,433,054 | |
See Notes to Financial Statements.
| 56 | 1.855.377.7325 | www.GrandeurPeakGlobal.com |
| Grandeur Peak Global Stalwarts Fund | Portfolio of Investments |
October 31, 2020 (Unaudited)
| | | Shares | | | Value
(Note 2) | |
| Vietnam (1.13%) | | | | | | |
| Ho Chi Minh City Development Joint Stock Commercial Bank(a) | | | 714,441 | | | $ | 747,904 | |
| Vietnam Dairy Products JSC | | | 256,144 | | | | 1,196,783 | |
| Vietnam Technological & Commercial Joint Stock Bank(a) | | | 1,089,305 | | | | 1,005,968 | |
| | | | | | | | 2,950,655 | |
| | | | | | | | | |
| TOTAL COMMON STOCKS | | | | | | | | |
| (Cost $174,265,730) | | | | | | | 255,000,541 | |
| | | | | | | | | |
| PREFERRED STOCKS (0.25%) | | | | | | | | |
| United States (0.25%) | | | | | | | | |
| Dataminr Inc - Private Placement(a)(d) | | | 24,262 | | | | 646,097 | |
| | | | | | | | | |
| TOTAL PREFERRED STOCKS | | | | | | | | |
| (Cost $482,814) | | | | | | | 646,097 | |
| | | | | | | | | |
| TOTAL INVESTMENTS (98.25%) | | | | | | | | |
| (Cost $174,748,544) | | | | | | $ | 255,646,638 | |
| | | | | | | | | |
| Other Assets In Excess Of Liabilities (1.75%) | | | | | | | 4,556,083 | |
| | | | | | | | | |
| NET ASSETS (100.00%) | | | | | | $ | 260,202,721 | |
| (a) | Non-Income Producing Security. |
| (b) | Security exempt from registration under Rule 144A of the Securities Act of 1933. These securities may be resold in the ordinary course of business in transactions exempt from registration, normally to qualified institutional buyers. As of October 31, 2020, these securities had a total aggregate market value of $9,557,588, representing 3.67% of net assets. |
| (c) | Security was purchased pursuant to Regulation S under the Securities Act of 1933, which exempts securities offered and sold outside of the United States from registration. Such security cannot be sold in the United States without either an effective registration statement filed pursuant to the Securities Act of 1933, or pursuant to an exemption from registration. As of October 31, 2020, the aggregate market value of these securities was $9,557,588, representing 3.67% of net assets. |
| (d) | As a result of the use of significant unobservable inputs to determine fair value, these investments have been classified as level 3 assets. See also Note 2 to the financial statements for additional information. |
For Fund compliance purposes, the Fund's geographical classifications refer to any one or more of the country sub-classifications used by one or more widely recognized market indexes or ratings group indexes, and/or as defined by Fund management. This definition may not apply for purposes of this report, which may combine sub-classifications for reporting ease. Geographical regions are shown as a percentage of net assets.
| Sector Composition (October 31, 2020) (Unaudited) | |
| Technology | 34.9% |
| Financials | 21.4% |
| Consumer | 18.4% |
| Health Care | 11.8% |
| Industrials | 11.7% |
| Cash, Cash Equivalents, & Other Net Assets | 1.8% |
| Total | 100% |
| Industry Composition (October 31, 2020) (Unaudited) |
| IT Services | 13.4% |
| Semiconductors & Semiconductor Equipment | 10.2% |
| Software | 9.5% |
| Capital Markets | 7.2% |
| Banks | 6.5% |
| Trading Companies & Distributors | 4.1% |
| Pharmaceuticals | 4.0% |
| Professional Services | 3.7% |
| Internet & Direct Marketing Retail | 3.6% |
| Health Care Equipment & Supplies | 3.4% |
| Multiline Retail | 3.3% |
| Life Sciences Tools & Services | 3.2% |
| Textiles, Apparel & Luxury Goods | 2.8% |
| Equity Real Estate Investment Trusts (REITs) | 2.6% |
| Food & Staples Retailing | 2.3% |
| Consumer Finance | 1.9% |
| Real Estate Management & Development | 1.8% |
| Specialty Retail | 1.6% |
| Machinery | 1.6% |
| Food Products | 1.4% |
| Insurance | 1.4% |
| Electronic Equipment, Instruments & Components | 1.3% |
| Hotels, Restaurants & Leisure | 1.2% |
| Biotechnology | 1.1% |
| Distributors | 1.1% |
| Other Industries (each less than 1%) | 4.1% |
| Cash and Other Assets, Less Liabilities | 1.8% |
| Total | 100% |
See Notes to Financial Statements.
| Semi-Annual Report | October 31, 2020 | 57 |
| Grandeur Peak International Opportunities Fund | Portfolio of Investments |
October 31, 2020 (Unaudited)
| | | Shares | | | Value
(Note 2) | |
| COMMON STOCKS (97.01%) | | | | | | | | |
| Argentina (0.75%) | | | | | | | | |
| Globant SA(a) | | | 29,098 | | | $ | 5,255,390 | |
| | | | | | | | | |
| Australia (4.08%) | | | | | | | | |
| Appen, Ltd. | | | 231,700 | | | | 5,277,299 | |
| Fiducian Group, Ltd. | | | 201,848 | | | | 770,435 | |
| HUB24, Ltd. | | | 307,078 | | | | 4,961,706 | |
| Kogan.com, Ltd. | | | 642,667 | | | | 9,303,250 | |
| National Storage REIT | | | 2,348,769 | | | | 2,980,895 | |
| Netwealth Group, Ltd. | | | 199,554 | | | | 2,423,693 | |
| People Infrastructure, Ltd. | | | 1,232,348 | | | | 2,893,394 | |
| | | | | | | | 28,610,672 | |
| | | | | | | | | |
| Bangladesh (0.50%) | | | | | | | | |
| Square Pharmaceuticals, Ltd. | | | 1,504,505 | | | | 3,522,051 | |
| | | | | | | | | |
| Belgium (1.07%) | | | | | | | | |
| Melexis NV | | | 69,064 | | | | 5,257,057 | |
| Warehouses De Pauw CVA | | | 67,534 | | | | 2,262,603 | |
| | | | | | | | 7,519,660 | |
| | | | | | | | | |
| Brazil (2.58%) | | | | | | | | |
| Arco Platform, Ltd., Class A(a) | | | 48,241 | | | | 1,644,053 | |
| Fleury SA | | | 669,000 | | | | 3,203,953 | |
| Locaweb Servicos de Internet SA(a)(b)(c) | | | 661,900 | | | | 7,954,866 | |
| Pagseguro Digital, Ltd., Class A(a) | | | 143,575 | | | | 5,256,281 | |
| | | | | | | | 18,059,153 | |
| | | | | | | | | |
| Britain (15.86%) | | | | | | | | |
| Ascential PLC(a) | | | 1,004,600 | | | | 3,597,759 | |
| B&M European Value Retail SA | | | 2,028,241 | | | | 12,729,111 | |
| boohoo Group PLC(a) | | | 1,559,254 | | | | 5,464,744 | |
| Clinigen Group PLC | | | 442,273 | | | | 3,450,529 | |
| CVS Group PLC | | | 728,400 | | | | 11,654,023 | |
| Dechra Pharmaceuticals PLC | | | 370,600 | | | | 16,765,173 | |
| Diploma PLC | | | 1,079 | | | | 31,070 | |
| Endava PLC, ADR(a) | | | 153,314 | | | | 9,796,765 | |
| FDM Group Holdings PLC | | | 175,900 | | | | 2,270,998 | |
| First Derivatives PLC | | | 77,400 | | | | 2,942,680 | |
| Gamma Communications PLC | | | 175,424 | | | | 3,795,285 | |
| Impax Asset Management Group PLC | | | 784,580 | | | | 5,514,027 | |
| JTC PLC(b)(c) | | | 594,874 | | | | 4,147,247 | |
| K3 Capital Group PLC | | | 810,360 | | | | 1,537,994 | |
| On the Beach Group PLC(b)(c) | | | 1,003,630 | | | | 2,797,008 | |
| Oxford Immunotec Global PLC(a) | | | 418,804 | | | | 4,707,357 | |
| Sabre Insurance Group PLC(b)(c) | | | 783,897 | | | | 2,328,202 | |
| Sanne Group PLC | | | 736,128 | | | | 5,784,635 | |
| Softcat PLC | | | 321,810 | | | | 4,691,249 | |
| St. James's Place PLC | | | 364,352 | | | | 4,246,411 | |
| | | Shares | | | Value
(Note 2) | |
| Britain (continued) | | | | | | | | |
| Volution Group PLC | | | 1,144,000 | | | $ | 2,875,191 | |
| | | | | | | | 111,127,458 | |
| | | | | | | | | |
| Canada (1.86%) | | | | | | | | |
| Gildan Activewear, Inc. | | | 143,800 | | | | 2,978,969 | |
| Pivotree, Inc.(a) | | | 146,700 | | | | 1,156,158 | |
| Richelieu Hardware, Ltd. | | | 159,350 | | | | 4,284,258 | |
| Ritchie Bros Auctioneers, Inc. | | | 31,900 | | | | 1,934,097 | |
| StorageVault Canada, Inc. | | | 1,061,900 | | | | 2,670,093 | |
| | | | | | | | 13,023,575 | |
| | | | | | | | | |
| China (8.05%) | | | | | | | | |
| Baozun, Inc.(a) | | | 333,000 | | | | 4,011,893 | |
| CSPC Pharmaceutical Group, Ltd. | | | 3,479,680 | | | | 3,695,162 | |
| Hangzhou Robam Appliances Co., Ltd., Class A | | | 959,200 | | | | 5,251,190 | |
| Man Wah Holdings, Ltd. | | | 5,231,000 | | | | 7,300,583 | |
| O2Micro International, Ltd., ADR(a) | | | 748,163 | | | | 4,803,206 | |
| Silergy Corp. | | | 259,199 | | | | 15,980,365 | |
| Suofeiya Home Collection Co., Ltd., Class A | | | 1,380,600 | | | | 5,828,286 | |
| TK Group Holdings, Ltd. | | | 7,310,000 | | | | 2,171,085 | |
| Trip.com Group, Ltd., ADR(a) | | | 113,775 | | | | 3,272,169 | |
| WuXi AppTec Co., Ltd., Class H(b)(c) | | | 256,680 | | | | 4,103,877 | |
| | | | | | | | 56,417,816 | |
| | | | | | | | | |
| Colombia (0.48%) | | | | | | | | |
| Parex Resources, Inc.(a) | | | 347,675 | | | | 3,384,632 | |
| | | | | | | | | |
| Finland (0.84%) | | | | | | | | |
| Musti Group Oyj(a) | | | 258,146 | | | | 5,908,069 | |
| | | | | | | | | |
| France (3.37%) | | | | | | | | |
| Alten SA(a) | | | 47,500 | | | | 3,803,243 | |
| Bureau Veritas SA(a) | | | 155,985 | | | | 3,420,481 | |
| Esker SA | | | 56,478 | | | | 9,412,617 | |
| Neurones | | | 50,872 | | | | 1,386,395 | |
| Thermador Groupe | | | 83,436 | | | | 5,615,796 | |
| | | | | | | | 23,638,532 | |
| | | | | | | | | |
| Georgia (0.53%) | | | | | | | | |
| Bank of Georgia Group PLC(a) | | | 65,283 | | | | 759,183 | |
| Georgia Capital PLC(a) | | | 163,711 | | | | 780,517 | |
| TBC Bank Group PLC(a) | | | 183,446 | | | | 2,185,533 | |
| | | | | | | | 3,725,233 | |
| | | | | | | | | |
| Germany (6.74%) | | | | | | | | |
| CANCOM SE | | | 71,700 | | | | 2,834,561 | |
| Dermapharm Holding SE | | | 126,476 | | | | 6,142,400 | |
| Deutsche Industrie REIT AG | | | 61,086 | | | | 1,159,976 | |
| Exasol AG(a) | | | 206,364 | | | | 3,960,678 | |
| Fashionette AG(a) | | | 149,577 | | | | 5,134,670 | |
See Notes to Financial Statements.
| 58 | 1.855.377.7325 | www.GrandeurPeakGlobal.com |
| Grandeur Peak International Opportunities Fund | Portfolio of Investments |
October 31, 2020 (Unaudited)
| | | Shares | | | Value
(Note 2) | |
| Germany (continued) | | | | | | | | |
| Grand City Properties SA | | | 234,452 | | | $ | 5,321,711 | |
| Home24 SE(a) | | | 101,284 | | | | 1,928,969 | |
| Nexus AG | | | 63,706 | | | | 3,549,461 | |
| Norma Group SE | | | 94,103 | | | | 2,919,656 | |
| PATRIZIA AG | | | 300,526 | | | | 6,840,262 | |
| PharmaSGP Holding SE(a) | | | 124,900 | | | | 4,292,058 | |
| QIAGEN NV(a) | | | 66,275 | | | | 3,144,086 | |
| | | | | | | | 47,228,488 | |
| | | | | | | | | |
| Greece (0.14%) | | | | | | | | |
| Sarantis SA | | | 100,600 | | | | 990,031 | |
| | | | | | | | | |
| Hong Kong (1.07%) | | | | | | | | |
| Jacobson Pharma Corp., Ltd.(c) | | | 4,138,000 | | | | 609,935 | |
| Value Partners Group, Ltd. | | | 8,238,000 | | | | 3,609,593 | |
| Vitasoy International Holdings, Ltd. | | | 804,338 | | | | 3,253,472 | |
| | | | | | | | 7,473,000 | |
| | | | | | | | | |
| India (6.35%) | | | | | | | | |
| Bajaj Finance, Ltd. | | | 128,900 | | | | 5,750,030 | |
| Cyient, Ltd. | | | 424,332 | | | | 2,260,952 | |
| EPL, Ltd. | | | 938,089 | | | | 3,139,552 | |
| Gulf Oil Lubricants India, Ltd. | | | 203,478 | | | | 1,810,340 | |
| IndiaMart InterMesh, Ltd.(b)(c) | | | 63,199 | | | | 4,140,290 | |
| L&T Technology Services, Ltd.(b)(c) | | | 125,618 | | | | 2,824,176 | |
| Metropolis Healthcare, Ltd.(b)(c) | | | 395,044 | | | | 10,483,270 | |
| Time Technoplast, Ltd. | | | 2,560,734 | | | | 1,290,727 | |
| WNS Holdings, Ltd., ADR(a) | | | 222,000 | | | | 12,796,080 | |
| | | | | | | | 44,495,417 | |
| | | | | | | | | |
| Indonesia (1.63%) | | | | | | | | |
| Arwana Citramulia Tbk PT | | | 63,783,500 | | | | 2,162,970 | |
| Bank Tabungan Pensiunan Nasional Syariah | | | 8,194,500 | | | | 2,046,239 | |
| Selamat Sempurna Tbk PT | | | 48,677,500 | | | | 4,614,299 | |
| Ultrajaya Milk Industry & Trading Co. Tbk PT | | | 22,958,000 | | | | 2,587,135 | |
| | | | | | | | 11,410,643 | |
| | | | | | | | | |
| Ireland (2.80%) | | | | | | | | |
| Irish Residential Properties | | | | | | | | |
| REIT PLC | | | 5,088,718 | | | | 8,119,381 | |
| Keywords Studios PLC | | | 134,646 | | | | 3,698,801 | |
| Uniphar PLC | | | 2,840,100 | | | | 7,773,121 | |
| | | | | | | | 19,591,303 | |
| | | | | | | | | |
| Israel (0.86%) | | | | | | | | |
| Wix.com, Ltd.(a) | | | 24,258 | | | | 5,999,489 | |
| | | | | | | | | |
| Italy (1.81%) | | | | | | | | |
| DiaSorin SpA | | | 18,968 | | | | 4,164,005 | |
| GVS SpA(a)(b)(c) | | | 67,024 | | | | 944,517 | |
| | | Shares | | | Value
(Note 2) | |
| Italy (continued) | | | | | | | | |
| Interpump Group SpA | | | 146,141 | | | $ | 5,519,943 | |
| Piovan SpA(b)(c) | | | 437,003 | | | | 2,078,300 | |
| | | | | | | | 12,706,765 | |
| | | | | | | | | |
| Japan (14.22%) | | | | | | | | |
| AIT Corp. | | | 362,600 | | | | 3,480,833 | |
| BayCurrent Consulting, Inc. | | | 73,100 | | | | 9,458,431 | |
| Charm Care Corp. | | | 200,200 | | | | 2,151,160 | |
| Create SD Holdings Co., Ltd. | | | 107,600 | | | | 3,470,092 | |
| eGuarantee, Inc. | | | 177,000 | | | | 3,941,868 | |
| Funai Soken Holdings, Inc. | | | 49,600 | | | | 1,072,917 | |
| Future Corp. | | | 184,800 | | | | 3,163,365 | |
| gremz, Inc. | | | 284,000 | | | | 4,982,559 | |
| Japan Lifeline Co., Ltd. | | | 414,100 | | | | 5,343,614 | |
| M&A Capital Partners Co., Ltd.(a) | | | 94,600 | | | | 4,281,402 | |
| MonotaRO Co., Ltd. | | | 88,900 | | | | 4,917,213 | |
| Naigai Trans Line, Ltd. | | | 88,500 | | | | 1,021,830 | |
| Nihon M&A Center, Inc. | | | 106,100 | | | | 6,230,361 | |
| Open Door, Inc.(a) | | | 266,400 | | | | 3,037,307 | |
| Seria Co., Ltd. | | | 188,600 | | | | 7,266,593 | |
| SMS Co., Ltd. | | | 114,700 | | | | 3,377,013 | |
| Strike Co., Ltd. | | | 59,000 | | | | 3,169,468 | |
| Synchro Food Co., Ltd.(a) | | | 556,500 | | | | 1,518,986 | |
| System Information Co., Ltd. | | | 410,500 | | | | 4,634,313 | |
| Systena Corp. | | | 300,000 | | | | 5,443,648 | |
| Syuppin Co., Ltd. | | | 316,400 | | | | 2,581,552 | |
| Trancom Co., Ltd. | | | 88,990 | | | | 6,394,272 | |
| Tsuruha Holdings, Inc. | | | 30,900 | | | | 4,326,774 | |
| YAKUODO Holdings Co., Ltd. | | | 180,600 | | | | 4,425,948 | |
| | | | | | | | 99,691,519 | |
| | | | | | | | | |
| Malaysia (0.24%) | | | | | | | | |
| AEON Credit Service M Bhd | | | 430,437 | | | | 944,935 | |
| Scicom MSC Bhd | | | 3,549,500 | | | | 752,253 | |
| | | | | | | | 1,697,188 | |
| | | | | | | | | |
| Netherlands (1.65%) | | | | | | | | |
| Aalberts NV | | | 267,576 | | | | 8,976,907 | |
| Shop Apotheke Europe NV(a)(b)(c) | | | 15,807 | | | | 2,622,904 | |
| | | | | | | | 11,599,811 | |
| | | | | | | | | |
| New Zealand (0.00%)(d) | | | | | | | | |
| CBL Corp., Ltd.(a)(e) | | | 1,542,256 | | | | 1 | |
| | | | | | | | | |
| Norway (1.81%) | | | | | | | | |
| Medistim ASA | | | 85,511 | | | | 1,860,528 | |
| Nordic Semiconductor ASA(a) | | | 392,000 | | | | 4,123,281 | |
| Sbanken ASA(a)(b)(c) | | | 688,929 | | | | 4,393,021 | |
| Self Storage Group ASA(a) | | | 1,016,072 | | | | 2,339,998 | |
| | | | | | | | 12,716,828 | |
| | | | | | | | | |
| Philippines (1.00%) | | | | | | | | |
| Concepcion Industrial Corp. | | | 3,070,600 | | | | 1,374,691 | |
See Notes to Financial Statements.
| Semi-Annual Report | October 31, 2020 | 59 |
| Grandeur Peak International Opportunities Fund | Portfolio of Investments |
October 31, 2020 (Unaudited)
| | | Shares | | | Value
(Note 2) | |
| Philippines (continued) | | | | | | | | |
| Puregold Price Club, Inc. | | | 5,622,000 | | | $ | 4,791,437 | |
| Wilcon Depot, Inc. | | | 2,886,000 | | | | 853,460 | |
| | | | | | | | 7,019,588 | |
| | | | | | | | | |
| Poland (0.92%) | | | | | | | | |
| Allegro.eu SA(a)(b)(c) | | | 2,193 | | | | 44,568 | |
| Dino Polska SA(a)(b)(c) | | | 79,162 | | | | 4,352,282 | |
| LiveChat Software SA | | | 85,000 | | | | 2,048,452 | |
| | | | | | | | 6,445,302 | |
| | | | | | | | | |
| Singapore (1.37%) | | | | | | | | |
| Riverstone Holdings, Ltd./Singapore | | | 3,442,400 | | | | 9,590,139 | |
| | | | | | | | | |
| South Africa (0.48%) | | | | | | | | |
| Italtile, Ltd. | | | 4,209,423 | | | | 3,375,557 | |
| | | | | | | | | |
| South Korea (1.97%) | | | | | | | | |
| LEENO Industrial, Inc. | | | 45,500 | | | | 4,894,133 | |
| Suprema, Inc.(a) | | | 91,500 | | | | 2,213,127 | |
| Tokai Carbon Korea Co., Ltd. | | | 82,135 | | | | 6,717,165 | |
| | | | | | | | 13,824,425 | |
| | | | | | | | | |
| Sweden (2.09%) | | | | | | | | |
| Beijer Alma AB | | | 161,776 | | | | 2,110,427 | |
| Epiroc AB, Class B | | | 237,600 | | | | 3,401,398 | |
| KNOW IT AB(a) | | | 184,892 | | | | 5,058,500 | |
| Nibe Industrier AB, Class B(a) | | | 37,457 | | | | 901,920 | |
| Sagax AB B | | | 159,528 | | | | 2,505,690 | |
| SwedenCare AB | | | 26,206 | | | | 644,960 | |
| | | | | | | | 14,622,895 | |
| | | | | | | | | |
| Taiwan (2.90%) | | | | | | | | |
| ASPEED Technology, Inc. | | | 49,000 | | | | 2,371,576 | |
| Bioteque Corp. | | | 932,000 | | | | 4,486,187 | |
| Poya International Co., Ltd. | | | 4,000 | | | | 86,393 | |
| Sporton International, Inc. | | | 1,002,003 | | | | 8,010,916 | |
| Test Research, Inc. | | | 1,278,252 | | | | 2,485,738 | |
| TSC Auto ID Technology Co., Ltd. | | | 151,800 | | | | 951,881 | |
| Voltronic Power Technology Corp. | | | 55,650 | | | | 1,908,862 | |
| | | | | | | | 20,301,553 | |
| | | | | | | | | |
| Turkey (0.04%) | | | | | | | | |
| DP Eurasia NV(a)(b)(c) | | | 635,340 | | | | 275,315 | |
| | | | | | | | | |
| United Arab Emirates (0.23%) | | | | | | | | |
| Aramex PJSC | | | 685,796 | | | | 735,917 | |
| Network International Holdings PLC(a)(b)(c) | | | 307,300 | | | | 881,773 | |
| | | | | | | | 1,617,690 | |
| | | Shares | | | Value
(Note 2) | |
| United States (5.06%) | | | | | | | | |
| Bank of NT Butterfield & Son, Ltd. | | | 196,634 | | | $ | 5,202,936 | |
| EPAM Systems, Inc.(a) | | | 54,421 | | | | 16,813,368 | |
| Frontage Holdings Corp.(a)(b)(c) | | | 7,407,000 | | | | 3,262,612 | |
| Genpact, Ltd. | | | 178,443 | | | | 6,133,086 | |
| Lululemon Athletica, Inc.(a) | | | 12,717 | | | | 4,060,411 | |
| | | | | | | | 35,472,413 | |
| | | | | | | | | |
| Vietnam (1.66%) | | | | | | | | |
| Ho Chi Minh City Development Joint Stock Commercial Bank(a) | | | 2,810,419 | | | | 2,942,053 | |
| Vietnam Dairy Products JSC | | | 1,130,347 | | | | 5,281,327 | |
| Vietnam Technological & Commercial Joint Stock Bank(a) | | | 3,677,473 | | | | 3,396,129 | |
| | | | | | | | 11,619,509 | |
| | | | | | | | | |
| TOTAL COMMON STOCKS | | | | | | | | |
| (Cost $458,128,535) | | | | | | | 679,957,110 | |
| | | | | | | | | |
| TOTAL INVESTMENTS (97.01%) | | | | | | | | |
| (Cost $458,128,535) | | | | | | $ | 679,957,110 | |
| | | | | | | | | |
| Other Assets In Excess Of Liabilities (2.99%) | | | | | | | 20,930,624 | |
| | | | | | | | | |
| NET ASSETS (100.00%) | | | | | | $ | 700,887,734 | |
| (a) | Non-Income Producing Security. |
| (b) | Security exempt from registration under Rule 144A of the Securities Act of 1933. These securities may be resold in the ordinary course of business in transactions exempt from registration, normally to qualified institutional buyers. As of October 31, 2020, these securities had a total aggregate market value of $57,634,228, representing 8.22% of net assets. |
| (c) | Security was purchased pursuant to Regulation S under the Securities Act of 1933, which exempts securities offered and sold outside of the United States from registration. Such security cannot be sold in the United States without either an effective registration statement filed pursuant to the Securities Act of 1933, or pursuant to an exemption from registration. As of October 31, 2020, the aggregate market value of these securities was $58,244,163, representing 8.31% of net assets. |
| (d) | Less than 0.005%. |
| (e) | As a result of the use of significant unobservable inputs to determine fair value, these investments have been classified as level 3 assets. See also Note 2 to the financial statements for additional information. |
See Notes to Financial Statements.
| 60 | 1.855.377.7325 | www.GrandeurPeakGlobal.com |
| Grandeur Peak International Opportunities Fund | Portfolio of Investments |
| | October 31, 2020 (Unaudited) |
For Fund compliance purposes, the Fund's geographical classifications refer to any one or more of the country sub-classifications used by one or more widely recognized market indexes or ratings group indexes, and/or as defined by Fund management. This definition may not apply for purposes of this report, which may combine sub-classifications for reporting ease. Geographical regions are shown as a percentage of net assets.
Sector Composition (October 31, 2020) (Unaudited)
| Technology | 27.9% |
| Consumer | 18.4% |
| Health Care | 17.2% |
| Industrials | 17.0% |
| Financials | 14.4% |
| Energy & Materials | 1.4% |
| Communications | 0.7% |
| Cash, Cash Equivalents, & Other Net Assets | 3.0% |
| Total | 100% |
Industry Composition (October 31, 2020) (Unaudited)
| IT Services | 14.1% |
| Semiconductors & Semiconductor Equipment | 6.3% |
| Professional Services | 6.1% |
| Software | 5.1% |
| Capital Markets | 5.1% |
| Pharmaceuticals | 5.1% |
| Health Care Providers & Services | 5.0% |
| Internet & Direct Marketing Retail | 5.0% |
| Health Care Equipment & Supplies | 4.4% |
| Machinery | 3.9% |
| Food & Staples Retailing | 3.0% |
| Banks | 3.0% |
| Multiline Retail | 2.9% |
| Trading Companies & Distributors | 2.7% |
| Household Durables | 2.6% |
| Real Estate Management & Development | 2.5% |
| Equity Real Estate Investment Trusts (REITs) | 2.1% |
| Life Sciences Tools & Services | 2.0% |
| Food Products | 1.6% |
| Specialty Retail | 1.4% |
| Commercial Services & Supplies | 1.3% |
| Building Products | 1.1% |
| Textiles, Apparel & Luxury Goods | 1.0% |
| Other Industries (each less than 1%) | 9.7% |
| Cash and Other Assets, Less Liabilities | 3.0% |
| Total | 100% |
| See Notes to Financial Statements. | |
| Semi-Annual Report | October 31, 2020 | 61 |
| Grandeur Peak International Stalwarts Fund | Portfolio of Investments |
| | October 31, 2020 (Unaudited) |
| | | Shares | | | Value
(Note 2) | |
| COMMON STOCKS (97.67%) | | | | | | | | |
| Argentina (1.38%) | | | | | | | | |
| Globant SA(a) | | | 108,975 | | | $ | 19,681,975 | |
| | | | | | | | | |
| Australia (2.87%) | | | | | | | | |
| Appen, Ltd. | | | 552,500 | | | | 12,583,978 | |
| Domino's Pizza Enterprises, Ltd. | | | 164,200 | | | | 9,780,004 | |
| Kogan.com, Ltd. | | | 371,601 | | | | 5,379,297 | |
| Netwealth Group, Ltd. | | | 1,088,100 | | | | 13,215,571 | |
| | | | | | | | 40,958,850 | |
| | | | | | | | | |
| Belgium (2.04%) | | | | | | | | |
| Melexis NV | | | 197,856 | | | | 15,060,527 | |
| Warehouses De Pauw CVA | | | 419,737 | | | | 14,062,518 | |
| | | | | | | | 29,123,045 | |
| | | | | | | | | |
| Brazil (1.70%) | | | | | | | | |
| Arco Platform, Ltd., Class A(a) | | | 102,475 | | | | 3,492,348 | |
| Fleury SA | | | 756,500 | | | | 3,623,005 | |
| Pagseguro Digital, Ltd., Class A(a) | | | 337,400 | | | | 12,352,214 | |
| Raia Drogasil SA | | | 1,138,400 | | | | 4,789,337 | |
| | | | | | | | 24,256,904 | |
| | | | | | | | | |
| Britain (19.09%) | | | | | | | | |
| Abcam PLC | | | 760,300 | | | | 14,504,773 | |
| Ascential PLC(a) | | | 1,890,500 | | | | 6,770,420 | |
| B&M European Value Retail SA | | | 8,000,100 | | | | 50,208,116 | |
| Big Yellow Group PLC | | | 565,500 | | | | 8,058,931 | |
| boohoo Group PLC(a) | | | 3,884,914 | | | | 13,615,524 | |
| Dechra Pharmaceuticals PLC | | | 1,086,700 | | | | 49,160,048 | |
| Diploma PLC | | | 38,026 | | | | 1,094,981 | |
| Endava PLC, ADR(a) | | | 453,200 | | | | 28,959,480 | |
| Gamma Communications PLC | | | 281,500 | | | | 6,090,232 | |
| Intertek Group PLC | | | 288,600 | | | | 20,788,176 | |
| Sanne Group PLC | | | 3,161,600 | | | | 24,844,458 | |
| Softcat PLC | | | 1,367,535 | | | | 19,935,512 | |
| St. James's Place PLC | | | 2,461,837 | | | | 28,691,959 | |
| | | | | | | | 272,722,610 | |
| | | | | | | | | |
| Canada (2.06%) | | | | | | | | |
| Gildan Activewear, Inc. | | | 596,134 | | | | 12,349,545 | |
| Ritchie Bros Auctioneers, Inc. | | | 281,124 | | | | 17,044,548 | |
| | | | | | | | 29,394,093 | |
| | | | | | | | | |
| China (9.58%) | | | | | | | | |
| Baozun, Inc., Sponsored ADR(a) | | | 222,600 | | | | 8,144,934 | |
| CSPC Pharmaceutical Group, Ltd. | | | 7,024,600 | | | | 7,459,605 | |
| Hangzhou Tigermed Consulting Co., Ltd., Class A | | | 419,250 | | | | 7,787,210 | |
| | | Shares | | | Value
(Note 2) | |
| China (continued) | | | | | | | | |
| Jiangsu Hengrui Medicine Co., Ltd., Class A | | | 354,400 | | | $ | 4,713,708 | |
| Li Ning Co., Ltd. | | | 1,407,000 | | | | 7,333,200 | |
| Silergy Corp. | | | 955,200 | | | | 58,890,831 | |
| Trip.com Group, Ltd., ADR(a) | | | 275,775 | | | | 7,931,289 | |
| WuXi AppTec Co., Ltd., Class H(b)(c) | | | 918,960 | | | | 14,692,608 | |
| Yum China Holdings, Inc. | | | 373,925 | | | | 19,904,028 | |
| | | | | | | | 136,857,413 | |
| | | | | | | | | |
| Denmark (0.27%) | | | | | | | | |
| Ambu A/S, Class B | | | 129,312 | | | | 3,922,086 | |
| | | | | | | | | |
| France (3.63%) | | | | | | | | |
| Alten SA(a) | | | 214,764 | | | | 17,195,784 | |
| BioMerieux | | | 75,050 | | | | 11,174,840 | |
| Bureau Veritas SA(a) | | | 527,346 | | | | 11,563,785 | |
| Eurofins Scientific SE(a) | | | 14,959 | | | | 11,912,118 | |
| | | | | | | | 51,846,527 | |
| | | | | | | | | |
| Germany (5.07%) | | | | | | | | |
| CANCOM SE | | | 108,386 | | | | 4,284,892 | |
| Dermapharm Holding SE | | | 296,564 | | | | 14,402,850 | |
| Grand City Properties SA | | | 798,489 | | | | 18,124,509 | |
| PATRIZIA AG | | | 705,980 | | | | 16,068,786 | |
| Puma SE(a) | | | 136,400 | | | | 11,940,851 | |
| QIAGEN NV(a) | | | 160,900 | | | | 7,633,096 | |
| | | | | | | | 72,454,984 | |
| | | | | | | | | |
| Hong Kong (2.14%) | | | | | | | | |
| Techtronic Industries Co., Ltd. | | | 1,099,500 | | | | 14,809,542 | |
| Vitasoy International Holdings, Ltd. | | | 3,911,000 | | | | 15,819,629 | |
| | | | | | | | 30,629,171 | |
| | | | | | | | | |
| India (8.62%) | | | | | | | | |
| Avenue Supermarts, Ltd.(a)(b)(c) | | | 299,500 | | | | 9,054,696 | |
| Bajaj Finance, Ltd. | | | 698,725 | | | | 31,169,045 | |
| HDFC Bank, Ltd.(a) | | | 977,500 | | | | 15,610,615 | |
| Marico, Ltd. | | | 1,372,658 | | | | 6,609,827 | |
| Metropolis Healthcare, Ltd.(b)(c) | | | 86,500 | | | | 2,295,448 | |
| Titan Co., Ltd. | | | 432,255 | | | | 6,803,341 | |
| WNS Holdings, Ltd., ADR(a) | | | 894,295 | | | | 51,547,164 | |
| | | | | | | | 123,090,136 | |
| | | | | | | | | |
| Indonesia (0.59%) | | | | | | | | |
| Bank Tabungan Pensiunan Nasional Syariah | | | 33,614,900 | | | | 8,393,938 | |
| | | | | | | | | |
| Ireland (2.12%) | | | | | | | | |
| ICON PLC, ADR(a) | | | 93,575 | | | | 16,871,572 | |
| Keywords Studios PLC | | | 487,375 | | | | 13,388,464 | |
| | | | | | | | 30,260,036 | |
| See Notes to Financial Statements. | |
| 62 | 1.855.377.7325 | www.GrandeurPeakGlobal.com |
| Grandeur Peak International Stalwarts Fund | Portfolio of Investments |
| | October 31, 2020 (Unaudited) |
| | | Shares | | | Value
(Note 2) | |
| Israel (1.48%) | | | | | | | | |
| Wix.com, Ltd.(a) | | | 85,200 | | | $ | 21,071,664 | |
| | | | | | | | | |
| Italy (2.02%) | | | | | | | | |
| DiaSorin SpA | | | 52,201 | | | | 11,459,576 | |
| GVS SpA(a)(b)(c) | | | 500,072 | | | | 7,047,123 | |
| Interpump Group SpA | | | 275,527 | | | | 10,407,027 | |
| | | | | | | | 28,913,726 | |
| | | | | | | | | |
| Japan (9.22%) | | | | | | | | |
| BayCurrent Consulting, Inc. | | | 110,300 | | | | 14,271,750 | |
| Japan Lifeline Co., Ltd. | | | 132,100 | | | | 1,704,640 | |
| MonotaRO Co., Ltd. | | | 433,500 | | | | 23,977,635 | |
| Nihon M&A Center, Inc. | | | 618,100 | | | | 36,295,815 | |
| Seria Co., Ltd. | | | 486,800 | | | | 18,755,978 | |
| Systena Corp. | | | 1,419,300 | | | | 25,753,900 | |
| Tsuruha Holdings, Inc. | | | 78,100 | | | | 10,935,955 | |
| | | | | | | | 131,695,673 | |
| | | | | | | | | |
| Netherlands (2.01%) | | | | | | | | |
| Aalberts NV | | | 449,858 | | | | 15,092,285 | |
| Shop Apotheke Europe NV(a)(b)(c) | | | 82,439 | | | | 13,679,358 | |
| | | | | | | | 28,771,643 | |
| | | | | | | | | |
| Norway (0.51%) | | | | | | | | |
| Nordic Semiconductor ASA(a) | | | 696,792 | | | | 7,329,257 | |
| | | | | | | | | |
| Philippines (0.62%) | | | | | | | | |
| Puregold Price Club, Inc. | | | 2,422,700 | | | | 2,064,784 | |
| Wilcon Depot, Inc. | | | 23,051,800 | | | | 6,816,976 | |
| | | | | | | | 8,881,760 | |
| | | | | | | | | |
| Poland (2.10%) | | | | | | | | |
| Allegro.eu SA(a)(b)(c) | | | 397,968 | | | | 8,087,840 | |
| Dino Polska SA(a)(b)(c) | | | 399,072 | | | | 21,940,754 | |
| | | | | | | | 30,028,594 | |
| | | | | | | | | |
| South Korea (0.48%) | | | | | | | | |
| LEENO Industrial, Inc. | | | 63,428 | | | | 6,822,529 | |
| | | | | | | | | |
| Sweden (3.61%) | | | | | | | | |
| AddTech AB, Class B | | | 593,000 | | | | 6,553,288 | |
| EQT AB | | | 1,047,700 | | | | 19,907,521 | |
| Nibe Industrier AB, Class B(a) | | | 313,100 | | | | 7,539,075 | |
| Sagax AB B | | | 583,522 | | | | 9,165,320 | |
| Sweco AB, Class B | | | 166,100 | | | | 8,358,174 | |
| | | | | | | | 51,523,378 | |
| | | | | | | | | |
| Switzerland (1.34%) | | | | | | | | |
| Partners Group Holding AG | | | 21,190 | | | | 19,077,490 | |
| | | | | | | | | |
| Taiwan (2.09%) | | | | | | | | |
| ASPEED Technology, Inc. | | | 156,000 | | | | 7,550,323 | |
| momo.com, Inc. | | | 344,000 | | | | 8,232,403 | |
| | | Shares | | | Value
(Note 2) | |
| Taiwan (continued) | | | | | | | | |
| Voltronic Power Technology Corp. | | | 411,190 | | | $ | 14,104,310 | |
| | | | | | | | 29,887,036 | |
| | | | | | | | | |
| United States (9.49%) | | | | | | | | |
| Ashtead Group PLC | | | 248,300 | | | | 8,972,932 | |
| Bank of NT Butterfield & Son, Ltd. | | | 541,582 | | | | 14,330,260 | |
| EPAM Systems, Inc.(a) | | | 168,675 | | | | 52,112,141 | |
| Genpact, Ltd. | | | 666,450 | | | | 22,905,886 | |
| Lululemon Athletica, Inc.(a) | | | 73,130 | | | | 23,349,678 | |
| Monolithic Power Systems, Inc. | | | 43,275 | | | | 13,830,690 | |
| | | | | | | | 135,501,587 | |
| | | | | | | | | |
| Vietnam (1.54%) | | | | | | | | |
| Ho Chi Minh City Development Joint Stock Commercial Bank(a) | | | 4,000,277 | | | | 4,187,641 | |
| Vietnam Dairy Products JSC | | | 1,724,352 | | | | 8,056,701 | |
| Vietnam Technological & Commercial Joint Stock Bank(a) | | | 7,584,926 | | | | 7,004,643 | |
| Vincom Retail JSC(a) | | | 2,508,030 | | | | 2,758,920 | |
| | | | | | | | 22,007,905 | |
| | | | | | | | | |
| TOTAL COMMON STOCKS | | | | | | | | |
| (Cost $1,054,711,711) | | | | 1,395,104,010 | |
| | | | | | | | | |
| TOTAL INVESTMENTS (97.67%) | | | | | |
| (Cost $1,054,711,711) | | | $ | 1,395,104,010 | |
| | | | | | | | | |
| Other Assets In Excess Of Liabilities (2.33%) | | | | 33,336,687 | |
| | | | | | | | | |
| NET ASSETS (100.00%) | | | $ | 1,428,440,697 | |
| (a) | Non-Income Producing Security. |
| (b) | Security exempt from registration under Rule 144A of the Securities Act of 1933. These securities may be resold in the ordinary course of business in transactions exempt from registration, normally to qualified institutional buyers. As of October 31, 2020, these securities had a total aggregate market value of $76,797,827, representing 5.38% of net assets. |
| (c) | Security was purchased pursuant to Regulation S under the Securities Act of 1933, which exempts securities offered and sold outside of the United States from registration. Such security cannot be sold in the United States without either an effective registration statement filed pursuant to the Securities Act of 1933, or pursuant to an exemption from registration. As of October 31, 2020, the aggregate market value of these securities was $76,797,827, representing 5.38% of net assets. |
| See Notes to Financial Statements. | |
| Semi-Annual Report | October 31, 2020 | 63 |
| Grandeur Peak International Stalwarts Fund | Portfolio of Investments |
| | October 31, 2020 (Unaudited) |
For Fund compliance purposes, the Fund's geographical classifications refer to any one or more of the country sub-classifications used by one or more widely recognized market indexes or ratings group indexes, and/or as defined by Fund management. This definition may not apply for purposes of this report, which may combine sub-classifications for reporting ease. Geographical regions are shown as a percentage of net assets.
Sector Composition (October 31, 2020) (Unaudited)
| Technology | 29.7% |
| Consumer | 22.2% |
| Financials | 17.8% |
| Industrials | 14.8% |
| Health Care | 13.2% |
| Cash, Cash Equivalents, & Other Net Assets | 2.3% |
| Total | 100% |
Industry Composition (October 31, 2020) (Unaudited)
| IT Services | 18.0% |
| Semiconductors & Semiconductor Equipment | 7.7% |
| Capital Markets | 7.4% |
| Professional Services | 5.8% |
| Pharmaceuticals | 5.3% |
| Multiline Retail | 4.8% |
| Internet & Direct Marketing Retail | 4.6% |
| Textiles, Apparel & Luxury Goods | 4.3% |
| Life Sciences Tools & Services | 4.1% |
| Banks | 3.5% |
| Food & Staples Retailing | 3.4% |
| Real Estate Management & Development | 3.2% |
| Software | 3.2% |
| Trading Companies & Distributors | 2.9% |
| Machinery | 2.8% |
| Health Care Equipment & Supplies | 2.5% |
| Consumer Finance | 2.2% |
| Hotels, Restaurants & Leisure | 2.1% |
| Food Products | 1.7% |
| Equity Real Estate Investment Trusts (REITs) | 1.6% |
| Commercial Services & Supplies | 1.2% |
| Biotechnology | 1.0% |
| Other Industries (each less than 1%) | 4.6% |
| Cash and Other Assets, Less Liabilities | 2.3% |
| Total | 100% |
| See Notes to Financial Statements. | |
| 64 | 1.855.377.7325 | www.GrandeurPeakGlobal.com |
| Grandeur Peak US Stalwarts Fund | Portfolio of Investments |
| | October 31, 2020 (Unaudited) |
| | | Shares | | | Value
(Note 2) | |
| COMMON STOCKS (96.72%) | | | | | | | | |
| Argentina (1.74%) | | | | | | | | |
| Globant SA(a) | | | 3,450 | | | $ | 623,105 | |
| | | | | | | | | |
| Britain (3.74%) | | | | | | | | |
| Endava PLC, ADR(a) | | | 13,900 | | | | 888,210 | |
| Oxford Immunotec Global PLC(a) | | | 40,092 | | | | 450,634 | |
| | | | | | | | 1,338,844 | |
| | | | | | | | | |
| Canada (0.75%) | | | | | | | | |
| Ritchie Bros Auctioneers, Inc. | | | 4,425 | | | | 268,288 | |
| | | | | | | | | |
| Germany (0.77%) | | | | | | | | |
| QIAGEN NV(a) | | | 5,792 | | | | 274,772 | |
| | | | | | | | | |
| Hong Kong (1.20%) | | | | | | | | |
| Techtronic Industries Co., Ltd. | | | 32,000 | | | | 431,019 | |
| | | | | | | | | |
| India (3.14%) | | | | | | | | |
| WNS Holdings, Ltd., ADR(a) | | | 19,550 | | | | 1,126,862 | |
| | | | | | | | | |
| Ireland (1.50%) | | | | | | | | |
| ICON PLC, ADR(a) | | | 3,000 | | | | 540,900 | |
| | | | | | | | | |
| Israel (1.45%) | | | | | | | | |
| Wix.com, Ltd.(a) | | | 2,100 | | | | 519,372 | |
| | | | | | | | | |
| United States (82.43%) | | | | | | | | |
| ABIOMED, Inc.(a) | | | 427 | | | | 107,553 | |
| Array Technologies, Inc.(a) | | | 285 | | | | 10,502 | |
| Ashtead Group PLC | | | 6,925 | | | | 250,252 | |
| Bank of NT Butterfield & Son, Ltd. | | | 13,800 | | | | 365,148 | |
| Blackline, Inc.(a) | | | 5,675 | | | | 554,334 | |
| Blackstone Group, Inc., Class A | | | 9,050 | | | | 456,301 | |
| Cardiovascular Systems, Inc.(a) | | | 7,738 | | | | 275,860 | |
| CDW Corp. | | | 2,225 | | | | 272,785 | |
| CoreSite Realty Corp. | | | 4,550 | | | | 543,088 | |
| DexCom, Inc.(a) | | | 525 | | | | 167,780 | |
| EPAM Systems, Inc.(a) | | | 4,350 | | | | 1,343,932 | |
| Equinix, Inc. | | | 750 | | | | 548,430 | |
| Etsy, Inc.(a) | | | 3,575 | | | | 434,684 | |
| Exact Sciences Corp.(a) | | | 3,450 | | | | 427,214 | |
| ExlService Holdings, Inc.(a) | | | 7,175 | | | | 543,435 | |
| Fastenal Co. | | | 16,250 | | | | 702,487 | |
| First Republic Bank | | | 11,350 | | | | 1,431,689 | |
| Five Below, Inc.(a) | | | 3,275 | | | | 436,689 | |
| Freshpet, Inc.(a) | | | 1,100 | | | | 125,950 | |
| FTI Consulting, Inc.(a) | | | 2,750 | | | | 270,765 | |
| Genpact, Ltd. | | | 17,975 | | | | 617,801 | |
| Goosehead Insurance, Inc., Class A | | | 5,925 | | | | 726,050 | |
| Hamilton Lane, Inc., Class A | | | 5,750 | | | | 400,775 | |
| HD Supply Holdings, Inc.(a) | | | 11,175 | | | | 445,436 | |
| | | Shares | | | Value
(Note 2) | |
| United States (continued) | | | | | | | | |
| Heska Corp.(a) | | | 9,350 | | | $ | 1,097,035 | |
| Houlihan Lokey, Inc. | | | 7,550 | | | | 473,385 | |
| IDEXX Laboratories, Inc.(a) | | | 1,285 | | | | 545,893 | |
| Inphi Corp.(a) | | | 3,800 | | | | 531,088 | |
| Kinsale Capital Group, Inc. | | | 2,775 | | | | 520,229 | |
| LeMaitre Vascular, Inc. | | | 16,800 | | | | 545,663 | |
| Lemonade, Inc.(a) | | | 2,546 | | | | 128,038 | |
| LGI Homes, Inc.(a) | | | 5,125 | | | | 547,760 | |
| Littelfuse, Inc. | | | 2,292 | | | | 453,678 | |
| Lululemon Athletica, Inc.(a) | | | 1,705 | | | | 544,389 | |
| Medallia, Inc.(a) | | | 12,550 | | | | 357,048 | |
| Medpace Holdings, Inc.(a) | | | 3,725 | | | | 413,252 | |
| Microchip Technology, Inc. | | | 2,900 | | | | 304,732 | |
| Monolithic Power Systems, Inc. | | | 1,825 | | | | 583,270 | |
| Morningstar, Inc. | | | 1,000 | | | | 190,380 | |
| MSCI, Inc. | | | 550 | | | | 192,412 | |
| NV5 Global, Inc.(a) | | | 3,250 | | | | 182,260 | |
| Old Dominion Freight Line, Inc. | | | 900 | | | | 171,333 | |
| Ollie's Bargain Outlet Holdings, Inc.(a) | | | 4,022 | | | | 350,276 | |
| Paycom Software, Inc.(a) | | | 2,616 | | | | 952,458 | |
| Paylocity Holding Corp.(a) | | | 2,325 | | | | 431,334 | |
| PJT Partners, Inc., Class A | | | 10,150 | | | | 686,749 | |
| Pluralsight, Inc., Class A(a) | | | 60,100 | | | | 943,569 | |
| Pool Corp. | | | 2,050 | | | | 717,152 | |
| Power Integrations, Inc. | | | 13,600 | | | | 818,856 | |
| PPD, Inc.(a) | | | 10,325 | | | | 339,486 | |
| Qualys, Inc.(a) | | | 10,188 | | | | 895,016 | |
| Rapid7, Inc.(a) | | | 2,800 | | | | 173,404 | |
| Rexford Industrial Realty, Inc. | | | 4,400 | | | | 204,424 | |
| Silicon Laboratories, Inc.(a) | | | 4,453 | | | | 456,254 | |
| STAAR Surgical Co.(a) | | | 2,800 | | | | 203,000 | |
| Sumo Logic, Inc.(a) | | | 6,363 | | | | 109,953 | |
| SVB Financial Group(a) | | | 1,455 | | | | 422,969 | |
| Systemax, Inc. | | | 23,025 | | | | 654,601 | |
| Terreno Realty Corp. | | | 9,424 | | | | 530,383 | |
| Texas Roadhouse, Inc. | | | 1,700 | | | | 119,051 | |
| Ulta Beauty, Inc.(a) | | | 2,300 | | | | 475,571 | |
| Veracyte, Inc.(a) | | | 3,250 | | | | 112,645 | |
| WW Grainger, Inc. | | | 1,250 | | | | 437,525 | |
| Zoetis, Inc. | | | 1,741 | | | | 276,036 | |
| | | | | | | | 29,551,497 | |
| | | | | | | | | |
| TOTAL COMMON STOCKS | | | | | |
| (Cost $29,104,030) | | | | 34,674,659 | |
| | | | | | | | | |
| TOTAL INVESTMENTS (96.72%) | | | | | |
| (Cost $29,104,030) | | | $ | 34,674,659 | |
| | | | | | | | | |
| Other Assets In Excess Of Liabilities (3.28%) | | | | 1,176,182 | |
| | | | | | | | | |
| NET ASSETS (100.00%) | | | $ | 35,850,841 | |
| (a) | Non-Income Producing Security. |
| See Notes to Financial Statements. | |
| Semi-Annual Report | October 31, 2020 | 65 |
| Grandeur Peak US Stalwarts Fund | Portfolio of Investments |
| | October 31, 2020 (Unaudited) |
For Fund compliance purposes, the Fund's geographical classifications refer to any one or more of the country sub-classifications used by one or more widely recognized market indexes or ratings group indexes, and/or as defined by Fund management. This definition may not apply for purposes of this report, which may combine sub-classifications for reporting ease. Geographical regions are shown as a percentage of net assets.
Sector Composition (October 31, 2020) (Unaudited)
| Technology | 37.6% |
| Financials | 21.8% |
| Health Care | 16.1% |
| Industrials | 10.7% |
| Consumer | 10.5% |
| Cash, Cash Equivalents, & Other Net Assets | 3.3% |
| Total | 100% |
| Industry Composition (October 31, 2020) (Unaudited) |
| IT Services | 14.1% |
| Software | 14.1% |
| Health Care Equipment & Supplies | 9.5% |
| Semiconductors & Semiconductor Equipment | 7.5% |
| Trading Companies & Distributors | 6.9% |
| Capital Markets | 6.7% |
| Banks | 6.2% |
| Equity Real Estate Investment Trusts (REITs) | 5.1% |
| Life Sciences Tools & Services | 4.4% |
| Insurance | 3.8% |
| Specialty Retail | 2.5% |
| Electronic Equipment, Instruments & Components | 2.0% |
| Distributors | 2.0% |
| Household Durables | 1.5% |
| Textiles, Apparel & Luxury Goods | 1.5% |
| Biotechnology | 1.5% |
| Internet & Direct Marketing Retail | 1.2% |
| Machinery | 1.2% |
| Other Industries (each less than 1%) | 5.0% |
| Cash and Other Assets, Less Liabilities | 3.3% |
| Total | 100% |
| See Notes to Financial Statements. | |
| 66 | 1.855.377.7325 | www.GrandeurPeakGlobal.com |
| Grandeur Peak Funds® | Statements of Assets and Liabilities |
| | October 31, 2020 (Unaudited) |
| | | Grandeur Peak
Emerging Markets
Opportunities Fund | | | Grandeur Peak
Global Contrarian
Fund | | | Grandeur Peak
Global Micro Cap
Fund | |
| ASSETS | | | | | | | | | |
| Investments, at value (Cost - see below) | | $ | 459,508,795 | | | $ | 14,810,326 | | | $ | 42,047,518 | |
| Cash | | | 4,411,939 | | | | 224,074 | | | | 18,013 | |
| Foreign cash, at value (Cost $174,905, $185,650 and $11,299, respectively) | | | 173,936 | | | | 184,441 | | | | 11,299 | |
| Dividends and interest receivable | | | 325,867 | | | | 14,625 | | | | 22,423 | |
| Receivable for investments sold | | | – | | | | – | | | | 157,703 | |
| Receivable for fund shares subscribed | | | 40,997 | | | | 9,789 | | | | 7,600 | |
| Prepaid and other assets | | | 12,736 | | | | 20,652 | | | | 13,698 | |
| Total assets | | | 464,474,270 | | | | 15,263,907 | | | | 42,278,254 | |
| | | | | | | | | | | | | |
| LIABILITIES | | | | | | | | | | | | |
| Payable for investments purchased | | | 549,436 | | | | 249,107 | | | | 148,569 | |
| Foreign capital gains tax | | | 1,972,632 | | | | 12,178 | | | | 144,380 | |
| Payable for fund shares redeemed | | | 2,003,518 | | | | – | | | | – | |
| Advisory fees payable | | | 520,386 | | | | 1,848 | | | | 53,603 | |
| Administration fees payable | | | 39,406 | | | | 42,918 | | | | 15,349 | |
| Custodian fees payable | | | 72,803 | | | | 4,390 | | | | 5,247 | |
| Payable for trustee fees and expenses | | | 13,743 | | | | 303 | | | | 1,002 | |
| Payable for chief compliance officer fee | | | 2,051 | | | | 46 | | | | 329 | |
| Payable for principal financial officer fees | | | 391 | | | | 8 | | | | 23 | |
| Distribution and service fees payable | | | 2,496 | | | | – | | | | – | |
| Payable for transfer agency fees | | | 7,066 | | | | 5,563 | | | | 6,870 | |
| Accrued expenses and other liabilities | | | 34,539 | | | | 19,059 | | | | 22,517 | |
| Total liabilities | | | 5,218,467 | | | | 335,420 | | | | 397,889 | |
| NET ASSETS | | $ | 459,255,803 | | | $ | 14,928,487 | | | $ | 41,880,365 | |
| | | | | | | | | | | | | |
| NET ASSETS CONSISTS OF | | | | | | | | | | | | |
| Paid-in capital (Note 5) | | $ | 335,640,880 | | | $ | 14,177,800 | | | $ | 25,785,601 | |
| Total distributable earnings | | | 123,614,923 | | | | 750,687 | | | | 16,094,764 | |
| NET ASSETS | | $ | 459,255,803 | | | $ | 14,928,487 | | | $ | 41,880,365 | |
| | | | | | | | | | | | | |
| INVESTMENTS, AT COST | | $ | 329,736,823 | | | $ | 14,017,327 | | | $ | 29,470,362 | |
| | | | | | | | | | | | | |
| PRICING OF SHARES | | | | | | | | | | | | |
| Investor Class | | | | | | | | | | | | |
| Net Assets | | $ | 11,312,241 | | | $ | – | | | $ | – | |
| Net Asset Value, offering and redemption price per share | | $ | 13.95 | | | $ | – | | | $ | – | |
| Shares of beneficial interest outstanding | | | 810,814 | | | | – | | | | – | |
| Institutional Class | | | | | | | | | | | | |
| Net Assets | | $ | 447,943,562 | | | $ | 14,928,487 | | | $ | 41,880,365 | |
| Net Asset Value, offering and redemption price per share | | $ | 14.06 | | | $ | 10.97 | | | $ | 15.78 | |
| Shares of beneficial interest outstanding | | | 31,868,094 | | | | 1,360,570 | | | | 2,654,117 | |
| See Notes to Financial Statements. | |
| Semi-Annual Report | October 31, 2020 | 67 |
| Grandeur Peak Funds® | Statements of Assets and Liabilities |
| | October 31, 2020 (Unaudited) |
| | | Grandeur Peak
Global Opportunities
Fund | | | Grandeur Peak
Global Reach Fund | | | Grandeur Peak
Global Stalwarts
Fund | |
| ASSETS | | | | | | | | | |
| Investments, at value (Cost - see below) | | $ | 746,554,454 | | | $ | 277,973,538 | | | $ | 255,646,638 | |
| Cash | | | – | | | | – | | | | 6,013,177 | |
| Deposit with broker for short sales (Note 2) | | | – | | | | 1,000,208 | | | | – | |
| Foreign cash, at value (Cost $283,033, $10,011 and $363,524, respectively) | | | 281,902 | | | | 10,011 | | | | 363,537 | |
| Dividends and interest receivable | | | 440,507 | | | | 192,354 | | | | 175,580 | |
| Receivable for investments sold | | | 4,316,771 | | | | 1,352,747 | | | | 818,604 | |
| Receivable for fund shares subscribed | | | 75,244 | | | | 39,743 | | | | 202,201 | |
| Prepaid and other assets | | | 33,670 | | | | 21,957 | | | | 23,014 | |
| Total assets | | | 751,702,548 | | | | 280,590,558 | | | | 263,242,751 | |
| | | | | | | | | | | | | |
| LIABILITIES | | | | | | | | | | | | |
| Payable to custodian due to overdraft | | | 283,181 | | | | 238,020 | | | | – | |
| Payable for investments purchased | | | 3,064,735 | | | | 710,592 | | | | 2,352,306 | |
| Foreign capital gains tax | | | 1,724,624 | | | | 440,923 | | | | 361,234 | |
| Payable for fund shares redeemed | | | 530,506 | | | | 54,493 | | | | 42,508 | |
| Advisory fees payable | | | 757,707 | | | | 269,236 | | | | 181,749 | |
| Administration fees payable | | | 50,801 | | | | 34,932 | | | | 23,140 | |
| Custodian fees payable | | | 45,046 | | | | 27,199 | | | | 15,821 | |
| Payable for trustee fees and expenses | | | 19,754 | | | | 7,918 | | | | 6,505 | |
| Payable for chief compliance officer fee | | | 2,675 | | | | 1,218 | | | | 948 | |
| Payable for principal financial officer fees | | | 525 | | | | 214 | | | | 158 | |
| Distribution and service fees payable | | | 25,162 | | | | 10,979 | | | | 21,272 | |
| Payable for transfer agency fees | | | 12,848 | | | | 10,249 | | | | 12,669 | |
| Accrued expenses and other liabilities | | | 42,588 | | | | 30,700 | | | | 21,720 | |
| Total liabilities | | | 6,560,152 | | | | 1,836,673 | | | | 3,040,030 | |
| NET ASSETS | | $ | 745,142,396 | | | $ | 278,753,885 | | | $ | 260,202,721 | |
| | | | | | | | | | | | | |
| NET ASSETS CONSISTS OF | | | | | | | | | | | | |
| Paid-in capital (Note 5) | | $ | 450,629,763 | | | $ | 156,721,151 | | | $ | 170,762,164 | |
| Total distributable earnings | | | 294,512,633 | | | | 122,032,734 | | | | 89,440,557 | |
| NET ASSETS | | $ | 745,142,396 | | | $ | 278,753,885 | | | $ | 260,202,721 | |
| | | | | | | | | | | | | |
| INVESTMENTS, AT COST | | $ | 511,561,035 | | | $ | 181,346,980 | | | $ | 174,748,544 | |
| | | | | | | | | | | | | |
| PRICING OF SHARES | | | | | | | | | | | | |
| Investor Class | | | | | | | | | | | | |
| Net Assets | | $ | 110,207,912 | | | $ | 49,788,393 | | | $ | 73,096,944 | |
| Net Asset Value, offering and redemption price per share | | $ | 4.29 | | | $ | 18.56 | | | $ | 18.46 | |
| Shares of beneficial interest outstanding | | | 25,698,211 | | | | 2,682,383 | | | | 3,959,647 | |
| Institutional Class | | | | | | | | | | | | |
| Net Assets | | $ | 634,934,484 | | | $ | 228,965,492 | | | $ | 187,105,777 | |
| Net Asset Value, offering and redemption price per share | | $ | 4.36 | | | $ | 18.68 | | | $ | 18.62 | |
| Shares of beneficial interest outstanding | | | 145,508,448 | | | | 12,260,098 | | | | 10,047,914 | |
| See Notes to Financial Statements. | |
| 68 | 1.855.377.7325 | www.GrandeurPeakGlobal.com |
| Grandeur Peak Funds® | Statements of Assets and Liabilities |
| | October 31, 2020 (Unaudited) |
| | | Grandeur Peak
International
Opportunities Fund | | | Grandeur Peak
International
Stalwarts Fund | | | Grandeur Peak US
Stalwarts Fund | |
| ASSETS | | | | | | | | | |
| Investments, at value (Cost - see below) | | $ | 679,957,110 | | | $ | 1,395,104,010 | | | $ | 34,674,659 | |
| Cash | | | 18,802,054 | | | | 43,029,793 | | | | 1,645,501 | |
| Foreign cash, at value (Cost $478,734, $3,861,149 and $–, respectively) | | | 478,666 | | | | 3,861,289 | | | | – | |
| Dividends and interest receivable | | | 698,554 | | | | 1,019,241 | | | | 6,673 | |
| Receivable for investments sold | | | 899,863 | | | | 6,180,981 | | | | 18,018 | |
| Receivable for fund shares subscribed | | | 4,959,157 | | | | 991,902 | | | | 123,400 | |
| Deferred offering cost | | | – | | | | – | | | | 20,829 | |
| Prepaid and other assets | | | 38,171 | | | | 41,382 | | | | 424 | |
| Total assets | | | 705,833,575 | | | | 1,450,228,598 | | | | 36,489,504 | |
| | | | | | | | | | | | | |
| LIABILITIES | | | | | | | | | | | | |
| Payable for investments purchased | | | 2,317,731 | | | | 18,041,604 | | | | 584,754 | |
| Foreign capital gains tax | | | 1,417,760 | | | | 1,811,273 | | | | – | |
| Payable for fund shares redeemed | | | 316,340 | | | | 769,569 | | | | – | |
| Advisory fees payable | | | 721,230 | | | | 957,875 | | | | 13,206 | |
| Administration fees payable | | | 50,874 | | | | 74,772 | | | | 8,514 | |
| Custodian fees payable | | | 48,377 | | | | 30,413 | | | | 4,113 | |
| Payable for trustee fees and expenses | | | 18,747 | | | | 31,861 | | | | 265 | |
| Payable for chief compliance officer fee | | | 2,650 | | | | 3,684 | | | | 117 | |
| Payable for principal financial officer fees | | | 518 | | | | 745 | | | | 3 | |
| Distribution and service fees payable | | | 11,402 | | | | 21,743 | | | | – | |
| Payable for transfer agency fees | | | 7,100 | | | | 24,252 | | | | 5,218 | |
| Accrued expenses and other liabilities | | | 33,112 | | | | 20,110 | | | | 22,473 | |
| Total liabilities | | | 4,945,841 | | | | 21,787,901 | | | | 638,663 | |
| NET ASSETS | | $ | 700,887,734 | | | $ | 1,428,440,697 | | | $ | 35,850,841 | |
| | | | | | | | | | | | | |
| NET ASSETS CONSISTS OF | | | | | | | | | | | | |
| Paid-in capital (Note 5) | | $ | 453,937,815 | | | $ | 1,089,805,419 | | | $ | 30,066,795 | |
| Total distributable earnings | | | 246,949,919 | | | | 338,635,278 | | | | 5,784,046 | |
| NET ASSETS | | $ | 700,887,734 | | | $ | 1,428,440,697 | | | $ | 35,850,841 | |
| | | | | | | | | | | | | |
| INVESTMENTS, AT COST | | $ | 458,128,535 | | | $ | 1,054,711,711 | | | $ | 29,104,030 | |
| | | | | | | | | | | | | |
| PRICING OF SHARES | | | | | | | | | | | | |
| Investor Class | | | | | | | | | | | | |
| Net Assets | | $ | 48,540,458 | | | $ | 54,449,934 | | | $ | – | |
| Net Asset Value, offering and redemption price per share | | $ | 4.05 | | | $ | 18.65 | | | $ | – | |
| Shares of beneficial interest outstanding | | | 11,991,639 | | | | 2,919,093 | | | | – | |
| Institutional Class | | | | | | | | | | | | |
| Net Assets | | $ | 652,347,276 | | | $ | 1,373,990,763 | | | $ | 35,850,841 | |
| Net Asset Value, offering and redemption price per share | | $ | 4.08 | | | $ | 18.76 | | | $ | 17.14 | |
| Shares of beneficial interest outstanding | | | 159,873,313 | | | | 73,243,219 | | | | 2,091,466 | |
| See Notes to Financial Statements. | |
| Semi-Annual Report | October 31, 2020 | 69 |
| Grandeur Peak Funds® | Statements of Operations |
| | For the Six Months Ended October 31, 2020 (Unaudited) |
| | | Grandeur Peak
Emerging Markets
Opportunities Fund | | | Grandeur Peak
Global Contrarian
Fund | | | Grandeur Peak
Global Micro Cap
Fund | |
| INVESTMENT INCOME | | | | | | | | | |
| Dividends | | $ | 3,848,836 | | | $ | 149,186 | | | $ | 315,909 | |
| Foreign taxes withheld | | | (412,099 | ) | | | (11,544 | ) | | | (30,525 | ) |
| Total investment income | | | 3,436,737 | | | | 137,642 | | | | 285,384 | |
| | | | | | | | | | | | | |
| EXPENSES | | | | | | | | | | | | |
| Investment advisor fees (Note 6) | | | 3,095,844 | | | | 56,256 | | | | 282,268 | |
| Administrative fees | | | 85,148 | | | | 26,604 | | | | 20,441 | |
| Distribution and service fees - Investor Class | | | 13,578 | | | | – | | | | – | |
| Transfer agent fees | | | 20,510 | | | | 15,491 | | | | 19,222 | |
| Professional fees | | | 28,786 | | | | 13,498 | | | | 16,637 | |
| Printing fees | | | 5,181 | | | | 241 | | | | 1,298 | |
| Registration fees | | | 17,533 | | | | 2,909 | | | | 10,607 | |
| Custodian fees | | | 218,703 | | | | 26,778 | | | | 28,772 | |
| Trustee fees and expenses | | | 14,096 | | | | 316 | | | | 1,052 | |
| Chief compliance officer fees | | | 5,768 | | | | 131 | | | | 622 | |
| Principal financial officer fees | | | 1,055 | | | | 24 | | | | 76 | |
| Offering costs | | | – | | | | 16,657 | | | | – | |
| Other expenses | | | 9,529 | | | | 2,570 | | | | 3,060 | |
| Total expenses | | | 3,515,731 | | | | 161,475 | | | | 384,055 | |
| Voluntary waiver of investment advisory fees (Note 6) | | | (64,333 | ) | | | – | | | | – | |
| Less fees waived/reimbursed by investment advisor (Note 6) | | | – | | | | (85,305 | ) | | | (7,027 | ) |
| Total net expenses | | | 3,451,398 | | | | 76,170 | | | | 377,028 | |
| NET INVESTMENT INCOME/(LOSS) | | | (14,661 | ) | | | 61,472 | | | | (91,644 | ) |
| | | | | | | | | | | | | |
| REALIZED AND UNREALIZED GAIN/(LOSS) ON INVESTMENTS | | | | | | | | | | | | |
| Net realized gain on investments | | | 6,035,216 | | | | 411,873 | | | | 3,514,704 | |
| Net realized loss on foreign currency transactions | | | (67,815 | ) | | | (2,792 | ) | | | (3,856 | ) |
| Net realized gain | | | 5,967,401 | | | | 409,081 | | | | 3,510,848 | |
| Net change in unrealized appreciation on investments (net of change in foreign capital gains tax of $1,931,778, $12,178 and $143,666, respectively) | | | 97,264,990 | | | | 1,781,332 | | | | 9,205,114 | |
| Net change in unrealized appreciation/(depreciation) on translation of assets and liabilities in foreign currencies | | | (9,094 | ) | | | (1,740 | ) | | | 207 | |
| Net change in unrealized appreciation | | | 97,255,896 | | | | 1,779,592 | | | | 9,205,321 | |
| NET REALIZED AND UNREALIZED GAIN ON INVESTMENTS AND FOREIGN CURRENCY TRANSACTIONS | | | 103,223,297 | | | | 2,188,673 | | | | 12,716,169 | |
| NET INCREASE IN NET ASSETS RESULTING FROM OPERATIONS | | $ | 103,208,636 | | | $ | 2,250,145 | | | $ | 12,624,525 | |
See Notes to Financial Statements.
| 70 | 1.855.377.7325 | www.GrandeurPeakGlobal.com |
| Grandeur Peak Funds® | Statements of Operations |
For the Six Months Ended October 31, 2020 (Unaudited)
| | | Grandeur Peak
Global Opportunities
Fund | | | Grandeur Peak
Global Reach Fund | | | Grandeur Peak
Global Stalwarts
Fund | |
| INVESTMENT INCOME | | | | | | | | | | | | |
| Dividends | | $ | 3,674,291 | | | $ | 1,835,118 | | | $ | 1,186,053 | |
| Foreign taxes withheld | | | (344,722 | ) | | | (167,047 | ) | | | (72,872 | ) |
| Total investment income | | | 3,329,569 | | | | 1,668,071 | | | | 1,113,181 | |
| | | | | | | | | | | | | |
| EXPENSES | | | | | | | | | | | | |
| Investment advisor fees (Note 6) | | | 4,324,063 | | | | 1,521,124 | | | | 981,198 | |
| Administrative fees | | | 119,636 | | | | 64,332 | | | | 50,026 | |
| Distribution and service fees - Investor Class | | | 134,470 | | | | 59,242 | | | | 126,281 | |
| Transfer agent fees | | | 32,767 | | | | 26,993 | | | | 32,891 | |
| Professional fees | | | 28,148 | | | | 27,043 | | | | 19,986 | |
| Printing fees | | | 13,201 | | | | 8,682 | | | | 5,629 | |
| Registration fees | | | 17,815 | | | | 15,824 | | | | 17,505 | |
| Custodian fees | | | 150,706 | | | | 94,919 | | | | 70,295 | |
| Trustee fees and expenses | | | 20,144 | | | | 8,308 | | | | 7,106 | |
| Chief compliance officer fees | | | 8,092 | | | | 3,477 | | | | 2,957 | |
| Principal financial officer fees | | | 1,495 | | | | 619 | | | | 519 | |
| Other expenses | | | 12,432 | | | | 7,267 | | | | 6,469 | |
| Total expenses | | | 4,862,969 | | | | 1,837,830 | | | | 1,320,862 | |
| Voluntary waiver of investment advisory fees (Note 6) | | | (181,435 | ) | | | – | | | | – | |
| Total net expenses | | | 4,681,534 | | | | 1,837,830 | | | | 1,320,862 | |
| NET INVESTMENT LOSS | | | (1,351,965 | ) | | | (169,759 | ) | | | (207,681 | ) |
| | | | | | | | | | | | | |
| REALIZED AND UNREALIZED GAIN/(LOSS) ON INVESTMENTS | | | | | | | | | | | | |
| Net realized gain on investments | | | 57,289,884 | | | | 22,901,580 | | | | 10,961,188 | |
| Net realized gain/(loss) on foreign currency transactions | | | (74,460 | ) | | | 26,314 | | | | (20,926 | ) |
| Net realized gain | | | 57,215,424 | | | | 22,927,894 | | | | 10,940,262 | |
| Net change in unrealized appreciation on investments (net of change in foreign capital gains tax of $1,724,624, $435,163 and $361,234, respectively) | | | 126,700,267 | | | | 50,255,193 | | | | 48,874,190 | |
| Net change in unrealized appreciation/(depreciation) on translation of assets and liabilities in foreign currencies | | | (568 | ) | | | 1,362 | | | | 963 | |
| Net change in unrealized appreciation | | | 126,699,699 | | | | 50,256,555 | | | | 48,875,153 | |
| NET REALIZED AND UNREALIZED GAIN ON INVESTMENTS AND FOREIGN CURRENCY TRANSACTIONS | | | 183,915,123 | | | | 73,184,449 | | | | 59,815,415 | |
| NET INCREASE IN NET ASSETS RESULTING FROM OPERATIONS | | $ | 182,563,158 | | | $ | 73,014,690 | | | $ | 59,607,734 | |
See Notes to Financial Statements.
| Semi-Annual Report | October 31, 2020 | 71 |
| Grandeur Peak Funds® | Statements of Operations |
For the Six Months Ended October 31, 2020 (Unaudited)
| | Grandeur Peak
International
Opportunities Fund | | Grandeur Peak
International
Stalwarts Fund | | Grandeur Peak US
Stalwarts Fund |
| INVESTMENT INCOME | | | | | | | | | |
| Dividends | $ | 4,343,811 | | $ | 7,025,233 | | $ | 67,663 | |
| Foreign taxes withheld | | (473,355 | ) | | (615,705 | ) | | (238 | ) |
| Total investment income | | 3,870,456 | | | 6,409,528 | | | 67,425 | |
| | | | | | | | | | |
| EXPENSES | | | | | | | | | |
| Investment advisor fees (Note 6) | | 4,040,586 | | | 4,849,787 | | | 75,894 | |
| Administrative fees | | 113,221 | | | 192,910 | | | 13,716 | |
| Distribution and service fees - Investor Class | | 61,675 | | | 131,534 | | | – | |
| Transfer agent fees | | 19,583 | | | 65,398 | | | 15,613 | |
| Professional fees | | 27,870 | | | 29,034 | | | 11,526 | |
| Printing fees | | 9,318 | | | 19,444 | | | 325 | |
| Registration fees | | 19,454 | | | 22,284 | | | – | |
| Custodian fees | | 156,600 | | | 207,869 | | | 15,390 | |
| Trustee fees and expenses | | 18,941 | | | 34,160 | | | 396 | |
| Chief compliance officer fees | | 7,640 | | | 13,298 | | | 252 | |
| Principal financial officer fees | | 1,410 | | | 2,473 | | | 28 | |
| Offering costs | | – | | | – | | | 27,826 | |
| Other expenses | | 12,124 | | | 16,413 | | | 2,319 | |
| Total expenses | | 4,488,422 | | | 5,584,604 | | | 163,285 | |
| Voluntary waiver of investment advisory fees (Note 6) | | (141,419 | ) | | – | | | – | |
| Less fees waived/reimbursed by investment advisor (Note 6) | | – | | | – | | | (61,373 | ) |
| Total net expenses | | 4,347,003 | | | 5,584,604 | | | 101,912 | |
| NET INVESTMENT INCOME/(LOSS) | | (476,547 | ) | | 824,924 | | | (34,487 | ) |
| | | | | | | | | | |
| REALIZED AND UNREALIZED GAIN/(LOSS) ON INVESTMENTS | | | | | | | | | |
| Net realized gain on investments | | 30,060,407 | | | 11,338,629 | | | 233,866 | |
| Net realized gain/(loss) on foreign currency transactions | | 318 | | | (86,923 | ) | | (79 | ) |
| Net realized gain | | 30,060,725 | | | 11,251,706 | | | 233,787 | |
Net change in unrealized appreciation on investments (net of change in foreign capital
gains tax of $1,381,250, $1,811,273 and $0, respectively) | | 140,743,322 | | | 266,268,644 | | | 4,089,392 | |
| Net change in unrealized appreciation/(depreciation) on translation of assets and liabilities in foreign currencies | | 1,974 | | | 11,980 | | | (1 | ) |
| Net change in unrealized appreciation | | 140,745,296 | | | 266,280,624 | | | 4,089,391 | |
| NET REALIZED AND UNREALIZED GAIN ON INVESTMENTS AND FOREIGN CURRENCY TRANSACTIONS | | 170,806,021 | | | 277,532,330 | | | 4,323,178 | |
| NET INCREASE IN NET ASSETS RESULTING FROM OPERATIONS | $ | 170,329,474 | | $ | 278,357,254 | | $ | 4,288,691 | |
| (a) | For the period from March 20, 2020 (Commencement of Operations) to April 30, 2020. |
See Notes to Financial Statements.
| 72 | 1.855.377.7325 | www.GrandeurPeakGlobal.com |
| | Statements of |
| Grandeur Peak Emerging Markets Opportunities Fund | Changes in Net Assets |
| | For the Six Months Ended
October 31, 2020
(Unaudited) | | For the
Year Ended
April 30, 2020 | |
| OPERATIONS | | | | |
| Net investment income/(loss) | $ | (14,661 | ) | $ | 1,293,698 | |
| Net realized gain/(loss) | | 5,967,401 | | | (888,857 | ) |
| Net change in unrealized appreciation/(depreciation) | | 97,255,896 | | | (27,811,796 | ) |
| Net increase/(decrease) in net assets resulting from operations | | 103,208,636 | | | (27,406,955 | ) |
| | | | | | | |
| DISTRIBUTIONS TO SHAREHOLDERS (NOTE 3) | | | | | | |
| Investor Class | | – | | | (8,164 | ) |
| Institutional Class | | – | | | (986,840 | ) |
| Net decrease in net assets from distributions | | – | | | (995,004 | ) |
| | | | | | | |
| CAPITAL SHARE TRANSACTIONS (NOTE 5) | | | | | | |
| Investor Class | | | | | | |
| Proceeds from sales of shares | | 318,466 | | | 451,669 | |
| Distributions reinvested | | – | | | 8,003 | |
| Cost of shares redeemed | | (1,600,759 | ) | | (3,475,235 | ) |
| Redemption fees | | 284 | | | – | |
| Net decrease from capital shares transactions | | (1,282,009 | ) | | (3,015,563 | ) |
| | | | | | | |
| Institutional Class | | | | | | |
| Proceeds from sales of shares | | 20,592,035 | | | 67,811,609 | |
| Distributions reinvested | | – | | | 920,902 | |
| Cost of shares redeemed | | (62,693,961 | ) | | (104,284,799 | ) |
| Redemption fees | | 1,486 | | | 850 | |
| Net decrease from capital shares transactions | | (42,100,440 | ) | | (35,551,438 | ) |
| | | | | | | |
| Net increase/(decrease) in net assets | | 59,826,187 | | | (66,968,960 | ) |
| | | | | | | |
| NET ASSETS | | | | | | |
| Beginning of period | | 399,429,616 | | | 466,398,576 | |
| End of period | $ | 459,255,803 | | $ | 399,429,616 | |
| | | | | | | |
| OTHER INFORMATION | | | | | | |
| Shares Transactions | | | | | | |
| Investor Class | | | | | | |
| Issued | | 23,689 | | | 40,303 | |
| Issued to shareholders in reinvestment of distributions | | – | | | 631 | |
| Redeemed | | (120,962 | ) | | (306,328 | ) |
| Net decrease in share transactions | | (97,273 | ) | | (265,394 | ) |
| | | | | | | |
| Institutional Class | | | | | | |
| Issued | | 1,562,327 | | | 5,981,655 | |
| Issued to shareholders in reinvestment of distributions | | – | | | 72,228 | |
| Redeemed | | (4,633,566 | ) | | (9,192,424 | ) |
| Net decrease in share transactions | | (3,071,239 | ) | | (3,138,541 | ) |
See Notes to Financial Statements.
| Semi-Annual Report | October 31, 2020 | 73 |
| | Statements of |
| Grandeur Peak Global Contrarian Fund | Changes in Net Assets |
| | For the
Six Months Ended
October 31, 2020
(Unaudited) | | For the Period
September 18, 2019
(Commencement of
Operations) to
April 30, 2020 | |
| OPERATIONS | | | | |
| Net investment income | $ | 61,472 | | $ | 43,887 | |
| Net realized gain/(loss) | | 409,081 | | | (524,050 | ) |
| Net change in unrealized appreciation/(depreciation) | | 1,779,592 | | | (1,000,272 | ) |
| Net increase/(decrease) in net assets resulting from operations | | 2,250,145 | | | (1,480,435 | ) |
| | | | | | | |
| DISTRIBUTIONS TO SHAREHOLDERS (NOTE 3) | | | | | | |
| Institutional Class | | – | | | (19,023 | ) |
| Net decrease in net assets from distributions | | – | | | (19,023 | ) |
| | | | | | | |
| CAPITAL SHARE TRANSACTIONS (NOTE 5) | | | | | | |
| Institutional Class | | | | | | |
| Proceeds from sales of shares | | 5,231,821 | | | 12,724,690 | |
| Distributions reinvested | | – | | | 18,940 | |
| Cost of shares redeemed | | (1,415,183 | ) | | (2,384,958 | ) |
| Redemption fees | | 287 | | | 2,203 | |
| Net increase from capital shares transactions | | 3,816,925 | | | 10,360,875 | |
| | | | | | | |
| Net increase in net assets | | 6,067,070 | | | 8,861,417 | |
| | | | | | | |
| NET ASSETS | | | | | | |
| Beginning of period | | 8,861,417 | | | – | |
| End of period | $ | 14,928,487 | | $ | 8,861,417 | |
| | | | | | | |
| OTHER INFORMATION | | | | | | |
| Shares Transactions | | | | | | |
| Institutional Class | | | | | | |
| Issued | | 490,524 | | | 1,260,722 | |
| Issued to shareholders in reinvestment of distributions | | – | | | 1,747 | |
| Redeemed | | (139,279 | ) | | (253,144 | ) |
| Net increase in share transactions | | 351,245 | | | 1,009,325 | |
See Notes to Financial Statements.
| 74 | 1.855.377.7325 | www.GrandeurPeakGlobal.com |
| | Statements of |
| Grandeur Peak Global Micro Cap Fund | Changes in Net Assets |
| | For the
Six Months Ended
October 31, 2020
(Unaudited) | | For the
Year Ended
April 30, 2020 | |
| OPERATIONS | | | | |
| Net investment income/(loss) | $ | (91,644 | ) | $ | 29,619 | |
| Net realized gain | | 3,510,848 | | | 711,242 | |
| Net change in unrealized appreciation/(depreciation) | | 9,205,321 | | | (1,056,838 | ) |
| Net increase/(decrease) in net assets resulting from operations | | 12,624,525 | | | (315,977 | ) |
| | | | | | | |
| DISTRIBUTIONS TO SHAREHOLDERS (NOTE 3) | | | | | | |
| Institutional Class | | – | | | (250,282 | ) |
| Net decrease in net assets from distributions | | – | | | (250,282 | ) |
| | | | | | | |
| CAPITAL SHARE TRANSACTIONS (NOTE 5) | | | | | | |
| Institutional Class | | | | | | |
| Proceeds from sales of shares | | 1,002,604 | | | 2,296,880 | |
| Distributions reinvested | | – | | | 235,712 | |
| Cost of shares redeemed | | (1,380,691 | ) | | (7,986,889 | ) |
| Redemption fees | | – | | | 2 | |
| Net decrease from capital shares transactions | | (378,087 | ) | | (5,454,295 | ) |
| | | | | | | |
| Net increase/(decrease) in net assets | | 12,246,438 | | | (6,020,554 | ) |
| | | | | | | |
| NET ASSETS | | | | | | |
| Beginning of period | | 29,633,927 | | | 35,654,481 | |
| End of period | $ | 41,880,365 | | $ | 29,633,927 | |
| | | | | | | |
| OTHER INFORMATION | | | | | | |
| Shares Transactions | | | | | | |
| Institutional Class | | | | | | |
| Issued | | 71,494 | | | 217,579 | |
| Issued to shareholders in reinvestment of distributions | | – | | | 18,872 | |
| Redeemed | | (100,388 | ) | | (706,293 | ) |
| Net decrease in share transactions | | (28,894 | ) | | (469,842 | ) |
See Notes to Financial Statements.
| Semi-Annual Report | October 31, 2020 | 75 |
| | Statements of |
| Grandeur Peak Global Opportunities Fund | Changes in Net Assets |
| | For the
Six Months Ended
October 31, 2020
(Unaudited) | | For the
Year Ended
April 30, 2020 | |
| OPERATIONS | | | | |
| Net investment income/(loss) | $ | (1,351,965 | ) | $ | 78,438 | |
| Net realized gain | | 57,215,424 | | | 26,694,598 | |
| Net change in unrealized appreciation/(depreciation) | | 126,699,699 | | | (44,213,439 | ) |
| Net increase/(decrease) in net assets resulting from operations | | 182,563,158 | | | (17,440,403 | ) |
| | | | | | | |
| DISTRIBUTIONS TO SHAREHOLDERS (NOTE 3) | | | | | | |
| Investor Class | | – | | | (6,708,303 | ) |
| Institutional Class | | – | | | (30,103,204 | ) |
| Net decrease in net assets from distributions | | – | | | (36,811,507 | ) |
| | | | | | | |
| CAPITAL SHARE TRANSACTIONS (NOTE 5) | | | | | | |
| Investor Class | | | | | | |
| Proceeds from sales of shares | | 5,869,505 | | | 7,454,239 | |
| Distributions reinvested | | – | | | 6,371,304 | |
| Cost of shares redeemed | | (18,074,315 | ) | | (41,539,676 | ) |
| Redemption fees | | 255 | | | 754 | |
| Net decrease from capital shares transactions | | (12,204,555 | ) | | (27,713,379 | ) |
| | | | | | | |
| Institutional Class | | | | | | |
| Proceeds from sales of shares | | 44,011,302 | | | 65,579,216 | |
| Distributions reinvested | | – | | | 28,060,062 | |
| Cost of shares redeemed | | (32,213,514 | ) | | (103,299,952 | ) |
| Redemption fees | | 492 | | | 4,046 | |
| Net increase/(decrease) from capital shares transactions | | 11,798,280 | | | (9,656,628 | ) |
| | | | | | | |
| Net increase/(decrease) in net assets | | 182,156,883 | | | (91,621,917 | ) |
| | | | | | | |
| NET ASSETS | | | | | | |
| Beginning of period | | 562,985,513 | | | 654,607,430 | |
| End of period | $ | 745,142,396 | | $ | 562,985,513 | |
| | | | | | | |
| OTHER INFORMATION | | | | | | |
| Shares Transactions | | | | | | |
| Investor Class | | | | | | |
| Issued | | 1,454,793 | | | 2,224,286 | |
| Issued to shareholders in reinvestment of distributions | | – | | | 1,750,358 | |
| Redeemed | | (4,449,518 | ) | | (12,872,148 | ) |
| Net decrease in share transactions | | (2,994,725 | ) | | (8,897,504 | ) |
| | | | | | | |
| Institutional Class | | | | | | |
| Issued | | 10,757,951 | | | 19,482,616 | |
| Issued to shareholders in reinvestment of distributions | | – | | | 7,604,353 | |
| Redeemed | | (8,223,181 | ) | | (32,775,945 | ) |
| Net increase/(decrease) in share transactions | | 2,534,770 | | | (5,688,976 | ) |
See Notes to Financial Statements.
| 76 | 1.855.377.7325 | www.GrandeurPeakGlobal.com |
| | Statements of |
| Grandeur Peak Global Reach Fund | Changes in Net Assets |
| | For the
Six Months Ended
October 31, 2020
(Unaudited) | | For the
Year Ended
April 30, 2020 | |
| OPERATIONS | | | | |
| Net investment income/(loss) | $ | (169,759 | ) | $ | 490,829 | |
| Net realized gain | | 22,927,894 | | | 10,535,989 | |
| Net change in unrealized appreciation/(depreciation) | | 50,256,555 | | | (15,663,042 | ) |
| Net increase/(decrease) in net assets resulting from operations | | 73,014,690 | | | (4,636,224 | ) |
| | | | | | | |
| DISTRIBUTIONS TO SHAREHOLDERS (NOTE 3) | | | | | | |
| Investor Class | | – | | | (1,188,362 | ) |
| Institutional Class | | – | | | (6,944,162 | ) |
| Net decrease in net assets from distributions | | – | | | (8,132,524 | ) |
| | | | | | | |
| CAPITAL SHARE TRANSACTIONS (NOTE 5) | | | | | | |
| Investor Class | | | | | | |
| Proceeds from sales of shares | | 1,363,697 | | | 7,664,510 | |
| Distributions reinvested | | – | | | 1,160,085 | |
| Cost of shares redeemed | | (4,336,411 | ) | | (24,000,795 | ) |
| Redemption fees | | 583 | | | 243 | |
| Net decrease from capital shares transactions | | (2,972,131 | ) | | (15,175,957 | ) |
| | | | | | | |
| Institutional Class | | | | | | |
| Proceeds from sales of shares | | 6,287,835 | | | 30,887,024 | |
| Distributions reinvested | | – | | | 6,260,838 | |
| Cost of shares redeemed | | (38,891,604 | ) | | (96,958,918 | ) |
| Redemption fees | | 19,448 | | | 1,537 | |
| Net decrease from capital shares transactions | | (32,584,321 | ) | | (59,809,519 | ) |
| | | | | | | |
| Net increase/(decrease) in net assets | | 37,458,238 | | | (87,754,224 | ) |
| | | | | | | |
| NET ASSETS | | | | | | |
| Beginning of period | | 241,295,647 | | | 329,049,871 | |
| End of period | $ | 278,753,885 | | $ | 241,295,647 | |
| | | | | | | |
| OTHER INFORMATION | | | | | | |
| Shares Transactions | | | | | | |
| Investor Class | | | | | | |
| Issued | | 78,057 | | | 602,908 | |
| Issued to shareholders in reinvestment of distributions | | – | | | 72,733 | |
| Redeemed | | (250,186 | ) | | (1,579,288 | ) |
| Net decrease in share transactions | | (172,129 | ) | | (903,647 | ) |
| | | | | | | |
| Institutional Class | | | | | | |
| Issued | | 352,748 | | | 2,095,909 | |
| Issued to shareholders in reinvestment of distributions | | – | | | 391,058 | |
| Redeemed | | (2,257,707 | ) | | (6,457,674 | ) |
| Net decrease in share transactions | | (1,904,959 | ) | | (3,970,707 | ) |
See Notes to Financial Statements.
| Semi-Annual Report | October 31, 2020 | 77 |
| | Statements of |
| Grandeur Peak Global Stalwarts Fund | Changes in Net Assets |
| | For the
Six Months Ended
October 31, 2020
(Unaudited) | | For the
Year Ended
April 30, 2020 | |
| OPERATIONS | | | | |
| Net investment income/(loss) | $ | (207,681 | ) | $ | 97,454 | |
| Net realized gain/(loss) | | 10,940,262 | | | (253,222 | ) |
| Net change in unrealized appreciation/(depreciation) | | 48,875,153 | | | (1,536,586 | ) |
| Net increase/(decrease) in net assets resulting from operations | | 59,607,734 | | | (1,692,354 | ) |
| | | | | | | |
| DISTRIBUTIONS TO SHAREHOLDERS (NOTE 3) | | | | | | |
| Investor Class | | – | | | (1,469,313 | ) |
| Institutional Class | | – | | | (1,886,642 | ) |
| Net decrease in net assets from distributions | | – | | | (3,355,955 | ) |
| | | | | | | |
| CAPITAL SHARE TRANSACTIONS (NOTE 5) | | | | | | |
| Investor Class | | | | | | |
| Proceeds from sales of shares | | 10,804,915 | | | 18,760,212 | |
| Distributions reinvested | | – | | | 1,431,115 | |
| Cost of shares redeemed | | (49,760,829 | ) | | (22,089,480 | ) |
| Redemption fees | | 2,818 | | | 5,329 | |
| Net decrease from capital shares transactions | | (38,953,096 | ) | | (1,892,824 | ) |
| | | | | | | |
| Institutional Class | | | | | | |
| Proceeds from sales of shares | | 54,864,026 | | | 38,109,836 | |
| Distributions reinvested | | – | | | 1,647,207 | |
| Cost of shares redeemed | | (20,227,647 | ) | | (27,260,248 | ) |
| Redemption fees | | 1,237 | | | 20,718 | |
| Net increase from capital shares transactions | | 34,637,616 | | | 12,517,513 | |
| | | | | | | |
| Net increase in net assets | | 55,292,254 | | | 5,576,380 | |
| | | | | | | |
| NET ASSETS | | | | | | |
| Beginning of period | | 204,910,467 | | | 199,334,087 | |
| End of period | $ | 260,202,721 | | $ | 204,910,467 | |
| | | | | | | |
| OTHER INFORMATION | | | | | | |
| Shares Transactions | | | | | | |
| Investor Class | | | | | | |
| Issued | | 618,620 | | | 1,356,611 | |
| Issued to shareholders in reinvestment of distributions | | – | | | 90,922 | |
| Redeemed | | (2,641,383 | ) | | (1,559,169 | ) |
| Net decrease in share transactions | | (2,022,763 | ) | | (111,636 | ) |
| | | | | | | |
| Institutional Class | | | | | | |
| Issued | | 2,893,694 | | | 2,855,814 | |
| Issued to shareholders in reinvestment of distributions | | – | | | 103,990 | |
| Redeemed | | (1,171,037 | ) | | (1,932,732 | ) |
| Net increase in share transactions | | 1,722,657 | | | 1,027,072 | |
See Notes to Financial Statements.
| 78 | 1.855.377.7325 | www.GrandeurPeakGlobal.com |
| | Statements of |
| Grandeur Peak International Opportunities Fund | Changes in Net Assets |
| | For the
Six Months Ended
October 31, 2020
(Unaudited) | | For the
Year Ended
April 30, 2020 | |
| OPERATIONS | | | | |
| Net investment income/(loss) | $ | (476,547 | ) | $ | 1,396,777 | |
| Net realized gain | | 30,060,725 | | | 18,565,541 | |
| Net change in unrealized appreciation/(depreciation) | | 140,745,296 | | | (59,862,701 | ) |
| Net increase/(decrease) in net assets resulting from operations | | 170,329,474 | | | (39,900,383 | ) |
| | | | | | | |
| DISTRIBUTIONS TO SHAREHOLDERS (NOTE 3) | | | | | | |
| Investor Class | | – | | | (1,839,214 | ) |
| Institutional Class | | – | | | (22,483,478 | ) |
| Net decrease in net assets from distributions | | – | | | (24,322,692 | ) |
| | | | | | | |
| CAPITAL SHARE TRANSACTIONS (NOTE 5) | | | | | | |
| Investor Class | | | | | | |
| Proceeds from sales of shares | | 3,446,140 | | | 4,655,083 | |
| Distributions reinvested | | – | | | 1,750,795 | |
| Cost of shares redeemed | | (9,868,860 | ) | | (17,993,458 | ) |
| Redemption fees | | 1,910 | | | 2,029 | |
| Net decrease from capital shares transactions | | (6,420,810 | ) | | (11,585,551 | ) |
| | | | | | | |
| Institutional Class | | | | | | |
| Proceeds from sales of shares | | 64,172,506 | | | 66,126,881 | |
| Distributions reinvested | | – | | | 20,460,565 | |
| Cost of shares redeemed | | (42,365,695 | ) | | (206,920,088 | ) |
| Redemption fees | | 740 | | | 1,152 | |
| Net increase/(decrease) from capital shares transactions | | 21,807,551 | | | (120,331,490 | ) |
| | | | | | | |
| Net increase/(decrease) in net assets | | 185,716,215 | | | (196,140,116 | ) |
| | | | | | | |
| NET ASSETS | | | | | | |
| Beginning of period | | 515,171,519 | | | 711,311,635 | |
| End of period | $ | 700,887,734 | | $ | 515,171,519 | |
| | | | | | | |
| OTHER INFORMATION | | | | | | |
| Shares Transactions | | | | | | |
| Investor Class | | | | | | |
| Issued | | 898,430 | | | 1,502,144 | |
| Issued to shareholders in reinvestment of distributions | | – | | | 495,976 | |
| Redeemed | | (2,497,848 | ) | | (5,810,441 | ) |
| Net decrease in share transactions | | (1,599,418 | ) | | (3,812,321 | ) |
| | | | | | | |
| Institutional Class | | | | | | |
| Issued | | 16,193,011 | | | 21,300,368 | |
| Issued to shareholders in reinvestment of distributions | | – | | | 5,763,539 | |
| Redeemed | | (11,003,463 | ) | | (67,024,606 | ) |
| Net increase/(decrease) in share transactions | | 5,189,548 | | | (39,960,699 | ) |
See Notes to Financial Statements.
| Semi-Annual Report | October 31, 2020 | 79 |
| | Statements of |
| Grandeur Peak International Stalwarts Fund | Changes in Net Assets |
| | For the Six Months Ended
October 31, 2020 | | For the
Year Ended | |
| | (Unaudited) | | April 30, 2020 | |
| OPERATIONS | | | | |
| Net investment income | $ | 824,924 | | $ | 2,199,658 | |
| Net realized gain/(loss) | | 11,251,706 | | | (9,198,168 | ) |
| Net change in unrealized appreciation/(depreciation) | | 266,280,624 | | | (14,970,807 | ) |
| Net increase/(decrease) in net assets resulting from operations | | 278,357,254 | | | (21,969,317 | ) |
| | | | | | | |
| DISTRIBUTIONS TO SHAREHOLDERS (NOTE 3) | | | | | | |
| Investor Class | | – | | | (122,186 | ) |
| Institutional Class | | – | | | (1,992,693 | ) |
| Net decrease in net assets from distributions | | – | | | (2,114,879 | ) |
| | | | | | | |
| CAPITAL SHARE TRANSACTIONS (NOTE 5) | | | | | | |
| Investor Class | | | | | | |
| Proceeds from sales of shares | | 20,819,222 | | | 39,311,307 | |
| Distributions reinvested | | – | | | 60,668 | |
| Cost of shares redeemed | | (77,323,524 | ) | | (27,261,155 | ) |
| Redemption fees | | 3,331 | | | 6,267 | |
| Net increase/(decrease) from capital shares transactions | | (56,500,971 | ) | | 12,117,087 | |
| | | | | | | |
| Institutional Class | | | | | | |
| Proceeds from sales of shares | | 378,815,277 | | | 470,808,042 | |
| Distributions reinvested | | – | | | 1,834,446 | |
| Cost of shares redeemed | | (125,441,787 | ) | | (140,807,902 | ) |
| Redemption fees | | 5,230 | | | 34,124 | |
| Net increase from capital shares transactions | | 253,378,720 | | | 331,868,710 | |
| | | | | | | |
| Net increase in net assets | | 475,235,003 | | | 319,901,601 | |
| | | | | | | |
| NET ASSETS | | | | | | |
| Beginning of period | | 953,205,694 | | | 633,304,093 | |
| End of period | $ | 1,428,440,697 | | $ | 953,205,694 | |
| | | | | | | |
| OTHER INFORMATION | | | | | | |
| Shares Transactions | | | | | | |
| Investor Class | | | | | | |
| Issued | | 1,197,144 | | | 2,693,314 | |
| Issued to shareholders in reinvestment of distributions | | – | | | 3,778 | |
| Redeemed | | (3,991,760 | ) | | (1,896,118 | ) |
| Net increase/(decrease) in share transactions | | (2,794,616 | ) | | 800,974 | |
| | | | | | | |
| Institutional Class | | | | | | |
| Issued | | 20,099,908 | | | 31,956,402 | |
| Issued to shareholders in reinvestment of distributions | | – | | | 113,799 | |
| Redeemed | | (7,074,513 | ) | | (9,910,143 | ) |
| Net increase in share transactions | | 13,025,395 | | | 22,160,058 | |
See Notes to Financial Statements.
| 80 | 1.855.377.7325 | www.GrandeurPeakGlobal.com |
| | Statements of |
| Grandeur Peak US Stalwarts Fund | Changes in Net Assets |
| | | For the Six Months Ended October 31, 2020 (Unaudited) | | | For the Period March 20, 2020 (Commencement of Operations) to April 30, 2020 | |
| OPERATIONS | | | | | | |
| Net investment loss | | $ | (34,487 | ) | | $ | (3,383 | ) |
| Net realized gain | | | 233,787 | | | | 9,572 | |
| Net change in unrealized appreciation | | | 4,089,391 | | | | 1,481,238 | |
| Net increase in net assets resulting from operations | | | 4,288,691 | | | | 1,487,427 | |
| | | | | | | | | |
| CAPITAL SHARE TRANSACTIONS (NOTE 5) | | | | | | | | |
| Institutional Class | | | | | | | | |
| Proceeds from sales of shares | | | 22,975,404 | | | | 7,953,203 | |
| Cost of shares redeemed | | | (838,520 | ) | | | (20,274 | ) |
| Redemption fees | | | 4,505 | | | | 405 | |
| Net increase from capital shares transactions | | | 22,141,389 | | | | 7,933,334 | |
| | | | | | | | | |
| Net increase in net assets | | | 26,430,080 | | | | 9,420,761 | |
| | | | | | | | | |
| NET ASSETS | | | | | | | | |
| Beginning of period | | | 9,420,761 | | | | – | |
| End of period | | $ | 35,850,841 | | | $ | 9,420,761 | |
| | | | | | | | | |
| OTHER INFORMATION | | | | | | | | |
| Shares Transactions | | | | | | | | |
| Institutional Class | | | | | | | | |
| Issued | | | 1,426,632 | | | | 718,380 | |
| Redeemed | | | (51,741 | ) | | | (1,805 | ) |
| Net increase in share transactions | | | 1,374,891 | | | | 716,575 | |
See Notes to Financial Statements.
| Semi-Annual Report | October 31, 2020 | 81 |
| Grandeur Peak Emerging Markets Opportunities Fund | Financial Highlights |
For a Share Outstanding Throughout the Period or Years Presented
| Investor Class | | For the
Six Months
Ended
October 31,
2020
(Unaudited) | | | Year Ended
April 30, 2020 | | | Year Ended
April 30, 2019 | | | Year Ended
April 30, 2018 | | | Year Ended
April 30, 2017 | | | Year Ended
April 30, 2016 | |
| NET ASSET VALUE, BEGINNING OF PERIOD | | $ | 11.07 | | | $ | 11.82 | | | $ | 13.05 | | | $ | 11.55 | | | $ | 9.82 | | | $ | 11.51 | |
| | | | | | | | | | | | | | | | | | | | | | | | | |
| INCOME FROM INVESTMENT OPERATIONS | | | | | | | | | | | | | | | | | | | | | | | | |
| Net investment income/(loss)(a) | | | (0.02 | ) | | | 0.01 | | | | 0.01 | | | | 0.03 | | | | 0.02 | | | | 0.07 | |
| Net realized and unrealized gain/(loss) on investments | | | 2.90 | | | | (0.75 | ) | | | (1.13 | ) | | | 1.47 | | | | 1.75 | | | | (1.41 | ) |
| Total income/(loss) from investment operations | | | 2.88 | | | | (0.74 | ) | | | (1.12 | ) | | | 1.50 | | | | 1.77 | | | | (1.34 | ) |
| | | | | | | | | | | | | | | | | | | | | | | | | |
| DISTRIBUTIONS | | | | | | | | | | | | | | | | | | | | | | | | |
| From net investment income | | | – | | | | (0.01 | ) | | | (0.02 | ) | | | – | | | | (0.04 | ) | | | – | |
| From net realized gain on investments | | | – | | | | – | | | | (0.09 | ) | | | – | | | | – | | | | (0.35 | ) |
| Total distributions | | | – | | | | (0.01 | ) | | | (0.11 | ) | | | – | | | | (0.04 | ) | | | (0.35 | ) |
| | | | | | | | | | | | | | | | | | | | | | | | | |
| REDEMPTION FEES ADDED TO PAID-IN CAPITAL | | | 0.00 | (b) | | | – | | | | 0.00 | (b) | | | – | | | | 0.00 | (b) | | | 0.00 | (b) |
| | | | | | | | | | | | | | | | | | | | | | | | | |
| INCREASE/DECREASE IN NET ASSET VALUE | | | 2.88 | | | | (0.75 | ) | | | (1.22 | ) | | | 1.50 | | | | 1.73 | | | | (1.69 | ) |
| NET ASSET VALUE, END OF PERIOD | | $ | 13.95 | | | $ | 11.07 | | | $ | 11.82 | | | $ | 13.05 | | | $ | 11.55 | | | $ | 9.82 | |
| | | | | | | | | | | | | | | | | | | | | | | | | |
| TOTAL RETURN | | | 26.02 | %(c) | | | (6.29 | )% | | | (8.48 | )% | | | 12.99 | % | | | 18.08 | % | | | (11.62 | )% |
| | | | | | | | | | | | | | | | | | | | | | | | | |
| RATIOS AND SUPPLEMENTAL DATA | | | | | | | | | | | | | | | | | | | | | | | | |
| Net assets, end of period (in 000s) | | $ | 11,312 | | | $ | 10,056 | | | $ | 13,869 | | | $ | 18,668 | | | $ | 18,074 | | | $ | 20,548 | |
| | | | | | | | | | | | | | | | | | | | | | | | | |
| RATIOS TO AVERAGE NET ASSETS | | | | | | | | | | | | | | | | | | | | | | | | |
| Expenses (excluding fees waived/reimbursed by investment advisor) | | | 1.76 | %(d) | | | 1.75 | % | | | 1.77 | % | | | 1.79 | % | | | 1.76 | % | | | 1.77 | % |
| Expenses (including fees waived/reimbursed by investment advisor) | | | 1.74 | %(d) | | | 1.74 | % | | | 1.76 | % | | | 1.78 | % | | | 1.76 | % | | | 1.77 | % |
| Net investment income/(loss) | | | (0.24 | )%(d) | | | 0.09 | % | | | 0.11 | % | | | 0.26 | % | | | 0.21 | % | | | 0.69 | % |
| | | | | | | | | | | | | | | | | | | | | | | | | |
| PORTFOLIO TURNOVER RATE | | | 10 | %(c) | | | 24 | % | | | 34 | % | | | 33 | % | | | 42 | % | | | 40 | % |
| (a) | Per share numbers have been calculated using the average shares method. |
| (b) | Less than $0.005 or ($0.005) per share. |
| See Notes to Financial Statements. | |
| 82 | 1.855.377.7325 | www.GrandeurPeakGlobal.com |
| Grandeur Peak Emerging Markets Opportunities Fund | Financial Highlights |
For a Share Outstanding Throughout the Period or Years Presented
| Institutional Class | | For the
Six Months
Ended
October 31,
2020
(Unaudited) | | | Year Ended
April 30, 2020 | | | Year Ended
April 30, 2019 | | | Year Ended
April 30, 2018 | | | Year Ended
April 30, 2017 | | | Year Ended
April 30, 2016 | |
| NET ASSET VALUE, BEGINNING OF PERIOD | | $ | 11.14 | | | $ | 11.88 | | | $ | 13.12 | | | $ | 11.60 | | | $ | 9.85 | | | $ | 11.52 | |
| | | | | | | | | | | | | | | | | | | | | | | | | |
| INCOME FROM INVESTMENT OPERATIONS | | | | | | | | | | | | | | | | | | | | | | | | |
| Net investment income/(loss)(a) | | | (0.00 | )(b) | | | 0.04 | | | | 0.03 | | | | 0.06 | | | | 0.04 | | | | 0.08 | |
| Net realized and unrealized gain/(loss) on investments | | | 2.92 | | | | (0.75 | ) | | | (1.14 | ) | | | 1.48 | | | | 1.77 | | | | (1.40 | ) |
| Total income/(loss) from investment operations | | | 2.92 | | | | (0.71 | ) | | | (1.11 | ) | | | 1.54 | | | | 1.81 | | | | (1.32 | ) |
| | | | | | | | | | | | | | | | | | | | | | | | | |
| DISTRIBUTIONS | | | | | | | | | | | | | | | | | | | | | | | | |
| From net investment income | | | – | | | | (0.03 | ) | | | (0.04 | ) | | | (0.02 | ) | | | (0.06 | ) | | | – | |
| From net realized gain on investments | | | – | | | | – | | | | (0.09 | ) | | | – | | | | – | | | | (0.35 | ) |
| Total distributions | | | – | | | | (0.03 | ) | | | (0.13 | ) | | | (0.02 | ) | | | (0.06 | ) | | | (0.35 | ) |
| | | | | | | | | | | | | | | | | | | | | | | | | |
| REDEMPTION FEES ADDED TO PAID-IN CAPITAL | | | 0.00 | (b) | | | 0.00 | (b) | | | 0.00 | (b) | | | 0.00 | (b) | | | 0.00 | (b) | | | 0.00 | (b) |
| | | | | | | | | | | | | | | | | | | | | | | | | |
| INCREASE/DECREASE IN NET ASSET VALUE | | | 2.92 | | | | (0.74 | ) | | | (1.23 | ) | | | 1.53 | | | | 1.75 | | | | (1.67 | ) |
| NET ASSET VALUE, END OF PERIOD | | $ | 14.06 | | | $ | 11.14 | | | $ | 11.88 | | | $ | 13.12 | | | $ | 11.60 | | | $ | 9.85 | |
| | | | | | | | | | | | | | | | | | | | | | | | | |
| TOTAL RETURN | | | 26.21 | %(c) | | | (6.03 | )% | | | (8.32 | )% | | | 13.24 | % | | | 18.42 | % | | | (11.44 | )% |
| | | | | | | | | | | | | | | | | | | | | | | | | |
| RATIOS AND SUPPLEMENTAL DATA | | | | | | | | | | | | | | | | | | | | | | | | |
| Net assets, end of period (in 000s) | | $ | 447,944 | | | $ | 389,373 | | | $ | 452,530 | | | $ | 471,260 | | | $ | 398,891 | | | $ | 349,493 | |
| | | | | | | | | | | | | | | | | | | | | | | | | |
| RATIOS TO AVERAGE NET ASSETS | | | | | | | | | | | | | | | | | | | | | | | | |
| Expenses (excluding fees waived/reimbursed by investment advisor) | | | 1.53 | %(d) | | | 1.53 | % | | | 1.53 | % | | | 1.55 | % | | | 1.55 | % | | | 1.55 | % |
| Expenses (including fees waived/reimbursed by investment advisor) | | | 1.50 | %(d) | | | 1.51 | % | | | 1.52 | % | | | 1.54 | % | | | 1.55 | % | | | 1.55 | % |
| Net investment income | | | 0.00 | %(d)(e) | | | 0.29 | % | | | 0.29 | % | | | 0.49 | % | | | 0.35 | % | | | 0.75 | % |
| | | | | | | | | | | | | | | | | | | | | | | | | |
| PORTFOLIO TURNOVER RATE | | | 10 | %(c) | | | 24 | % | | | 34 | % | | | 33 | % | | | 42 | % | | | 40 | % |
| (a) | Per share numbers have been calculated using the average shares method. |
| (b) | Less than $0.005 or ($0.005) per share. |
| (e) | Less than 0.005% of average net assets. |
| See Notes to Financial Statements. | |
| Semi-Annual Report | October 31, 2020 | 83 |
| Grandeur Peak Global Contrarian Fund | Financial Highlights |
For a Share Outstanding Throughout the Periods Presented
| Institutional Class | | For the
Six Months Ended
October 31, 2020
(Unaudited) | | | For the Period
September 18, 2019
(Commencement
of Operations) to
April 30, 2020 | |
| NET ASSET VALUE, BEGINNING OF PERIOD | | $ | 8.78 | | | $ | 10.00 | |
| | | | | | | | | |
| INCOME FROM INVESTMENT OPERATIONS | | | | | | | | |
| Net investment income(a) | | | 0.06 | | | | 0.06 | |
| Net realized and unrealized gain/(loss) on investments | | | 2.13 | | | | (1.25 | ) |
| Total income/(loss) from investment operations | | | 2.19 | | | | (1.19 | ) |
| | | | | | | | | |
| DISTRIBUTIONS | | | | | | | | |
| From net investment income | | | – | | | | (0.01 | ) |
| From net realized gain on investments | | | – | | | | (0.02 | ) |
| Total distributions | | | – | | | | (0.03 | ) |
| | | | | | | | | |
| REDEMPTION FEES ADDED TO PAID-IN CAPITAL | | | 0.00 | (b) | | | 0.00 | (b) |
| | | | | | | | | |
| INCREASE/DECREASE IN NET ASSET VALUE | | | 2.19 | | | | (1.21 | ) |
| NET ASSET VALUE, END OF PERIOD | | $ | 10.97 | | | $ | 8.78 | |
| | | | | | | | | |
| TOTAL RETURN | | | 24.94 | %(c) | | | (11.96 | )%(c) |
| | | | | | | | | |
| RATIOS AND SUPPLEMENTAL DATA | | | | | | | | |
| Net assets, end of period (in 000s) | | $ | 14,928 | | | $ | 8,861 | |
| | | | | | | | | |
| RATIOS TO AVERAGE NET ASSETS | | | | | | | | |
| Expenses (excluding fees waived/ reimbursed by investment advisor) | | | 2.86 | %(d) | | | 4.69 | %(d)(e) |
| Expenses (including fees waived/ reimbursed by investment advisor) | | | 1.35 | %(d) | | | 1.35 | %(d)(e) |
| Net investment income | | | 1.09 | %(d) | | | 1.05 | %(d) |
| | | | | | | | | |
| PORTFOLIO TURNOVER RATE | | | 25 | %(c) | | | 34 | %(c) |
| (a) | Per share numbers have been calculated using the average shares method. |
| (b) | Less than $0.005 or ($0.005) per share. |
| (e) | Expense ratios during startup periods may not be representative of longer term operating periods. |
| See Notes to Financial Statements. | |
| 84 | 1.855.377.7325 | www.GrandeurPeakGlobal.com |
| Grandeur Peak Global Micro Cap Fund | Financial Highlights |
For a Share Outstanding Throughout the Period or Years Presented
| Institutional Class | | For the
Six Months
Ended
October 31,
2020
(Unaudited) | | | Year Ended
April 30, 2020 | | | Year Ended
April 30, 2019 | | | Year Ended
April 30, 2018 | | | Year Ended
April 30, 2017 | | | For the Period
October 21, 2015
(Commencement
of Operations) to
April 30, 2016 | |
| NET ASSET VALUE, BEGINNING OF PERIOD | | $ | 11.05 | | | $ | 11.31 | | | $ | 13.12 | | | $ | 11.98 | | | $ | 10.38 | | | $ | 10.00 | |
| | | | | | | | | | | | | | | | | | | | | | | | | |
| INCOME FROM INVESTMENT OPERATIONS | | | | | | | | | | | | | | | | | | | | | | | | |
| Net investment income/(loss)(a) | | | (0.03 | ) | | | 0.01 | | | | (0.01 | ) | | | (0.00 | )(b) | | | 0.01 | | | | (0.02 | ) |
| Net realized and unrealized gain/(loss) on investments | | | 4.76 | | | | (0.19 | ) | | | (1.08 | ) | | | 2.12 | | | | 1.72 | | | | 0.40 | |
| Total income/(loss) from investment operations | | | 4.73 | | | | (0.18 | ) | | | (1.09 | ) | | | 2.12 | | | | 1.73 | | | | 0.38 | |
| | | | | | | | | | | | | | | | | | | | | | | | | |
| DISTRIBUTIONS | | | | | | | | | | | | | | | | | | | | | | | | |
| From net investment income | | | – | | | | (0.03 | ) | | | – | | | | (0.06 | ) | | | (0.02 | ) | | | – | |
| From net realized gain on investments | | | – | | | | (0.05 | ) | | | (0.72 | ) | | | (0.92 | ) | | | (0.11 | ) | | | – | |
| Total distributions | | | – | | | | (0.09 | ) | | | (0.72 | ) | | | (0.98 | ) | | | (0.13 | ) | | | – | |
| | | | | | | | | | | | | | | | | | | | | | | | | |
| REDEMPTION FEES ADDED TO PAID-IN CAPITAL | | | – | | | | 0.00 | (b) | | | 0.00 | (b) | | | 0.00 | (b) | | | 0.00 | (b) | | | 0.00 | (b) |
| | | | | | | | | | | | | | | | | | | | | | | | | |
| INCREASE/DECREASE IN NET ASSET VALUE | | | 4.73 | | | | (0.27 | ) | | | (1.80 | ) | | | 1.13 | | | | 1.60 | | | | 0.38 | |
| NET ASSET VALUE, END OF PERIOD | | $ | 15.78 | | | $ | 11.05 | | | $ | 11.31 | | | $ | 13.12 | | | $ | 11.98 | | | $ | 10.38 | |
| | | | | | | | | | | | | | | | | | | | | | | | | |
| TOTAL RETURN | | | 42.81 | %(c) | | | (1.62 | )% | | | (7.67 | )% | | | 17.68 | % | | | 16.81 | % | | | 3.80 | %(c) |
| | | | | | | | | | | | | | | | | | | | | | | | | |
| RATIOS AND SUPPLEMENTAL DATA | | | | | | | | | | | | | | | | | | | | | | | | |
| Net assets, end of period (in 000s) | | $ | 41,880 | | | $ | 29,634 | | | $ | 35,654 | | | $ | 41,709 | | | $ | 36,620 | | | $ | 30,735 | |
| | | | | | | | | | | | | | | | | | | | | | | | | |
| RATIOS TO AVERAGE NET ASSETS | | | | | | | | | | | | | | | | | | | | | | | | |
| Expenses (excluding fees waived/ reimbursed by investment advisor) | | | 2.04 | %(d) | | | 2.06 | % | | | 2.05 | % | | | 2.06 | % | | | 2.17 | % | | | 2.30 | %(d)(e) |
| Expenses (including fees waived/ reimbursed by investment advisor) | | | 2.00 | %(d) | | | 2.00 | % | | | 2.00 | % | | | 2.00 | % | | | 2.00 | % | | | 2.00 | %(d)(e) |
| Net investment income/(loss) | | | (0.49 | )%(d) | | | 0.09 | % | | | (0.06 | )% | | | 0.00 | %(f) | | | 0.11 | % | | | (0.41 | )%(d) |
| | | | | | | | | | | | | | | | | | | | | | | | | |
| PORTFOLIO TURNOVER RATE | | | 21 | %(c) | | | 33 | % | | | 37 | % | | | 46 | % | | | 37 | % | | | 8 | %(c) |
| (a) | Per share numbers have been calculated using the average shares method. |
| (b) | Less than $0.005 or ($0.005) per share. |
| (e) | Expense ratios during startup periods may not be representative of longer term operating periods. |
| (f) | Less than 0.005% of average net assets. |
| See Notes to Financial Statements. | |
| Semi-Annual Report | October 31, 2020 | 85 |
| Grandeur Peak Global Opportunities Fund | Financial Highlights |
For a Share Outstanding Throughout the Period or Years Presented
| Investor Class | | For the
Six Months
Ended
October 31,
2020
(Unaudited) | | | Year Ended
April 30, 2020 | | | Year Ended
April 30, 2019 | | | Year Ended
April 30, 2018 | | | Year Ended
April 30, 2017 | | | Year Ended
April 30, 2016 | |
| NET ASSET VALUE, BEGINNING OF PERIOD | | $ | 3.24 | | | $ | 3.48 | | | $ | 3.95 | | | $ | 3.52 | | | $ | 3.01 | | | $ | 3.43 | |
| | | | | | | | | | | | | | | | | | | | | | | | | |
| INCOME FROM INVESTMENT OPERATIONS | | | | | | | | | | | | | | | | | | | | | | | | |
| Net investment income/(loss)(a) | | | (0.01 | ) | | | (0.01 | )(b) | | | (0.00 | )(c) | | | 0.00 | (c) | | | (0.00 | )(b)(c) | | | 0.00 | (c) |
| Net realized and unrealized gain/(loss) on investments | | | 1.06 | | | | (0.03 | ) | | | (0.14 | ) | | | 0.65 | | | | 0.51 | | | | (0.18 | ) |
| Total income/(loss) from investment operations | | | 1.05 | | | | (0.04 | ) | | | (0.14 | ) | | | 0.65 | | | | 0.51 | | | | (0.18 | ) |
| | | | | | | | | | | | | | | | | | | | | | | | | |
| DISTRIBUTIONS | | | | | | | | | | | | | | | | | | | | | | | | |
| From net investment income | | | – | | | | – | | | | (0.00 | )(c) | | | – | | | | – | | | | (0.00 | )(c) |
| From net realized gain on investments | | | – | | | | (0.20 | ) | | | (0.33 | ) | | | (0.22 | ) | | | (0.00 | )(c) | | | (0.24 | ) |
| Total distributions | | | – | | | | (0.20 | ) | | | (0.33 | ) | | | (0.22 | ) | | | (0.00 | )(c) | | | (0.25 | ) |
| | | | | | | | | | | | | | | | | | | | | | | | | |
| REDEMPTION FEES ADDED TO PAID-IN CAPITAL | | | 0.00 | (c) | | | 0.00 | (c) | | | 0.00 | (c) | | | 0.00 | (c) | | | 0.00 | (c) | | | 0.00 | (c) |
| | | | | | | | | | | | | | | | | | | | | | | | | |
| INCREASE/DECREASE IN NET ASSET VALUE | | | 1.05 | | | | (0.24 | ) | | | (0.47 | ) | | | 0.43 | | | | 0.50 | | | | (0.42 | ) |
| NET ASSET VALUE, END OF PERIOD | | $ | 4.29 | | | $ | 3.24 | | | $ | 3.48 | | | $ | 3.95 | | | $ | 3.52 | | | $ | 3.01 | |
| | | | | | | | | | | | | | | | | | | | | | | | | |
| TOTAL RETURN | | | 32.41 | %(d) | | | (1.73 | )% | | | (1.83 | )% | | | 18.41 | % | | | 17.09 | % | | | (5.03 | )% |
| | | | | | | | | | | | | | | | | | | | | | | | | |
| RATIOS AND SUPPLEMENTAL DATA | | | | | | | | | | | | | | | | | | | | | | | | |
| Net assets, end of period (in 000s) | | $ | 110,208 | | | $ | 92,843 | | | $ | 130,745 | | | $ | 188,379 | | | $ | 166,284 | | | $ | 173,156 | |
| | | | | | | | | | | | | | | | | | | | | | | | | |
| RATIOS TO AVERAGE NET ASSETS | | | | | | | | | | | | | | | | | | | | | | | | |
| Expenses (excluding fees waived/ reimbursed by investment advisor) | | | 1.61 | %(e) | | | 1.60 | % | | | 1.61 | % | | | 1.61 | % | | | 1.61 | % | | | 1.62 | % |
| Expenses (including fees waived/ reimbursed by investment advisor) | | | 1.56 | %(e) | | | 1.57 | % | | | 1.57 | % | | | 1.55 | % | | | 1.59 | % | | | 1.62 | % |
| Net investment income/(loss) | | | (0.59 | )%(e) | | | (0.17 | )% | | | (0.12 | )% | | | 0.03 | % | | | (0.06 | )% | | | 0.06 | % |
| | | | | | | | | | | | | | | | | | | | | | | | | |
| PORTFOLIO TURNOVER RATE | | | 22 | %(d) | | | 41 | % | | | 38 | % | | | 29 | % | | | 30 | % | | | 32 | % |
| (a) | Per share numbers have been calculated using the average shares method. |
| (b) | The per share amount does not correspond to activity reflected in the Statement of Operations due to class specific expenses during the period. |
| (c) | Less than $0.005 or ($0.005) per share. |
| See Notes to Financial Statements. | |
| 86 | 1.855.377.7325 | www.GrandeurPeakGlobal.com |
| Grandeur Peak Global Opportunities Fund | Financial Highlights |
For a Share Outstanding Throughout the Period or Years Presented
| Institutional Class | | For the
Six Months
Ended
October 31,
2020
(Unaudited) | | | Year Ended
April 30, 2020 | | | Year Ended
April 30, 2019 | | | Year Ended
April 30, 2018 | | | Year Ended
April 30, 2017 | | | Year Ended
April 30, 2016 | |
NET ASSET VALUE, BEGINNING OF PERIOD | | $ | 3.29 | | | $ | 3.52 | | | $ | 4.00 | | | $ | 3.56 | | | $ | 3.03 | | | $ | 3.46 | |
| | | | | | | | | | | | | | | | | | | | | | | | | |
| INCOME FROM INVESTMENT OPERATIONS | | | | | | | | | | | | | | | | | | | | | | | | |
| Net investment income/(loss)(a) | | | (0.01 | ) | | | 0.00 | (b) | | | 0.00 | (b) | | | 0.01 | | | | 0.01 | | | | 0.01 | |
| Net realized and unrealized gain/(loss) on investments | | | 1.08 | | | | (0.03 | ) | | | (0.14 | ) | | | 0.65 | | | | 0.52 | | | | (0.19 | ) |
| Total income/(loss) from investment operations | | | 1.07 | | | | (0.03 | ) | | | (0.14 | ) | | | 0.66 | | | | 0.53 | | | | (0.18 | ) |
| | | | | | | | | | | | | | | | | | | | | | | | | |
| DISTRIBUTIONS | | | | | | | | | | | | | | | | | | | | | | | | |
| From net investment income | | | – | | | | – | | | | (0.01 | ) | | | (0.00 | )(b) | | | (0.00 | )(b) | | | (0.01 | ) |
| From net realized gain on investments | | | – | | | | (0.20 | ) | | | (0.33 | ) | | | (0.22 | ) | | | (0.00 | )(b) | | | (0.24 | ) |
| Total distributions | | | – | | | | (0.20 | ) | | | (0.34 | ) | | | (0.22 | ) | | | (0.01 | ) | | | (0.25 | ) |
| | | | | | | | | | | | | | | | | | | | | | | | | |
| REDEMPTION FEES ADDED TO PAID-IN CAPITAL | | | 0.00 | (b) | | | 0.00 | (b) | | | 0.00 | (b) | | | 0.00 | (b) | | | 0.00 | (b) | | | 0.00 | (b) |
| | | | | | | | | | | | | | | | | | | | | | | | | |
| INCREASE/DECREASE IN NET ASSET VALUE | | | 1.07 | | | | (0.23 | ) | | | (0.47 | ) | | | 0.44 | | | | 0.52 | | | | (0.43 | ) |
| NET ASSET VALUE, END OF PERIOD | | $ | 4.36 | | | $ | 3.29 | | | $ | 3.52 | | | $ | 4.00 | | | $ | 3.56 | | | $ | 3.03 | |
| | | | | | | | | | | | | | | | | | | | | | | | | |
| TOTAL RETURN | | | 32.52 | %(c) | | | (1.42 | )% | | | (1.84 | )% | | | 18.62 | % | | | 17.81 | % | | | (5.12 | )% |
| | | | | | | | | | | | | | | | | | | | | | | | | |
| RATIOS AND SUPPLEMENTAL DATA | | | | | | | | | | | | | | | | | | | | | | | | |
| Net assets, end of period (in 000s) | | $ | 634,934 | | | $ | 470,142 | | | $ | 523,862 | | | $ | 591,470 | | | $ | 532,946 | | | $ | 452,030 | |
| | | | | | | | | | | | | | | | | | | | | | | | | |
| RATIOS TO AVERAGE NET ASSETS | | | | | | | | | | | | | | | | | | | | | | | | |
| Expenses (excluding fees waived/ reimbursed by investment advisor) | | | 1.36 | %(d) | | | 1.37 | % | | | 1.37 | % | | | 1.36 | % | | | 1.37 | % | | | 1.38 | % |
| Expenses (including fees waived/ reimbursed by investment advisor) | | | 1.31 | %(d) | | | 1.33 | % | | | 1.33 | % | | | 1.31 | % | | | 1.35 | % | | | 1.38 | % |
| Net investment income/(loss) | | | (0.35 | )%(d) | | | 0.05 | % | | | 0.13 | % | | | 0.28 | % | | | 0.18 | % | | | 0.30 | % |
| | | | | | | | | | | | | | | | | | | | | | | | | |
| PORTFOLIO TURNOVER RATE | | | 22 | %(c) | | | 41 | % | | | 38 | % | | | 29 | % | | | 30 | % | | | 32 | % |
| (a) | Per share numbers have been calculated using the average shares method. |
| (b) | Less than $0.005 or ($0.005) per share. |
| See Notes to Financial Statements. | |
| Semi-Annual Report | October 31, 2020 | 87 |
| Grandeur Peak Global Reach Fund | Financial Highlights |
For a Share Outstanding Throughout the Period or Years Presented
| Investor Class | | For the
Six Months
Ended
October 31,
2020
(Unaudited) | | | Year Ended
April 30, 2020 | | | Year Ended
April 30, 2019 | | | Year Ended
April 30, 2018 | | | Year Ended
April 30, 2017 | | | Year Ended
April 30, 2016 | |
| NET ASSET VALUE, BEGINNING OF PERIOD | | $ | 14.12 | | | $ | 14.98 | | | $ | 16.97 | | | $ | 14.52 | | | $ | 12.31 | | | $ | 13.65 | |
| | | | | | | | | | | | | | | | | | | | | | | | | |
| INCOME FROM INVESTMENT OPERATIONS | | | | | | | | | | | | | | | | | | | | | | | | |
| Net investment income/(loss)(a) | | | (0.03 | ) | | | (0.01 | )(b) | | | 0.01 | | | | 0.01 | | | | 0.01 | | | | 0.01 | |
| Net realized and unrealized gain/(loss) on investments | | | 4.47 | | | | (0.44 | ) | | | (0.58 | ) | | | 2.66 | | | | 2.22 | | | | (0.89 | ) |
| Total income/(loss) from investment operations | | | 4.44 | | | | (0.45 | ) | | | (0.57 | ) | | | 2.67 | | | | 2.23 | | | | (0.88 | ) |
| | | | | | | | | | | | | | | | | | | | | | | | | |
| DISTRIBUTIONS | | | | | | | | | | | | | | | | | | | | | | | | |
| From net investment income | | | – | | | | – | | | | (0.00 | ) | | | – | | | | (0.02 | ) | | | (0.01 | ) |
| From net realized gain on investments | | | – | | | | (0.41 | ) | | | (1.42 | ) | | | (0.22 | ) | | | – | | | | (0.45 | ) |
| Total distributions | | | – | | | | (0.41 | ) | | | (1.43 | ) | | | (0.22 | ) | | | (0.02 | ) | | | (0.45 | ) |
| | | | | | | | | | | | | | | | | | | | | | | | | |
| REDEMPTION FEES ADDED TO PAID-IN CAPITAL | | | 0.00 | (c) | | | 0.00 | (c) | | | 0.00 | (c) | | | 0.00 | (c) | | | 0.00 | (c) | | | 0.00 | (c) |
| | | | | | | | | | | | | | | | | | | | | | | | | |
| INCREASE/DECREASE IN NET ASSET VALUE | | | 4.44 | | | | (0.86 | ) | | | (2.00 | ) | | | 2.45 | | | | 2.21 | | | | (1.33 | ) |
| NET ASSET VALUE, END OF PERIOD | | $ | 18.56 | | | $ | 14.12 | | | $ | 14.98 | | | $ | 16.97 | | | $ | 14.52 | | | $ | 12.31 | |
| | | | | | | | | | | | | | | | | | | | | | | | | |
| TOTAL RETURN | | | 31.44 | %(d) | | | (3.31 | )% | | | (1.61 | )% | | | 18.44 | % | | | 18.11 | % | | | (6.45 | )% |
| | | | | | | | | | | | | | | | | | | | | | | | | |
| RATIOS AND SUPPLEMENTAL DATA | | | | | | | | | | | | | | | | | | | | | | | | |
| Net assets, end of period (in 000s) | | $ | 49,788 | | | $ | 40,307 | | | $ | 56,307 | | | $ | 65,923 | | | $ | 67,574 | | | $ | 66,984 | |
| | | | | | | | | | | | | | | | | | | | | | | | | |
| RATIOS TO AVERAGE NET ASSETS | | | | | | | | | | | | | | | | | | | | | | | | |
| Expenses (excluding fees waived/reimbursed by investment advisor) | | | 1.53 | %(e) | | | 1.52 | % | | | 1.52 | % | | | 1.52 | % | | | 1.52 | % | | | 1.60 | % |
| Expenses (including fees waived/reimbursed by investment advisor) | | | 1.53 | %(e) | | | 1.52 | % | | | 1.52 | % | | | 1.52 | % | | | 1.52 | % | | | 1.60 | % |
| Net investment income/(loss) | | | (0.33 | )%(e) | | | (0.04 | )% | | | 0.05 | % | | | 0.06 | % | | | 0.07 | % | | | 0.10 | % |
| | | | | | | | | | | | | | | | | | | | | | | | | |
| PORTFOLIO TURNOVER RATE | | | 15 | %(d) | | | 32 | % | | | 50 | % | | | 43 | % | | | 42 | % | | | 46 | % |
| (a) | Per share numbers have been calculated using the average shares method. |
| (b) | The per share amount does not correspond to activity reflected in the Statement of Operations due to class specific expenses during the period. |
| (c) | Less than $0.005 or ($0.005) per share. |
| See Notes to Financial Statements. | |
| 88 | 1.855.377.7325 | www.GrandeurPeakGlobal.com |
| Grandeur Peak Global Reach Fund | Financial Highlights |
For a Share Outstanding Throughout the Period or Years Presented
| Institutional Class | | For the
Six Months
Ended
October 31,
2020
(Unaudited) | | | Year Ended
April 30, 2020 | | | Year Ended
April 30, 2019 | | | Year Ended
April 30, 2018 | | | Year Ended
April 30, 2017 | | | Year Ended
April 30, 2016 | |
| NET ASSET VALUE, BEGINNING OF PERIOD | | $ | 14.19 | | | $ | 15.04 | | | $ | 17.02 | | | $ | 14.55 | | | $ | 12.33 | | | $ | 13.66 | |
| | | | | | | | | | | | | | | | | | | | | | | | | |
| INCOME FROM INVESTMENT OPERATIONS | | | | | | | | | | | | | | | | | | | | | | | | |
| Net investment income/(loss)(a) | | | (0.01 | ) | | | 0.03 | | | | 0.05 | | | | 0.04 | | | | 0.04 | | | | 0.04 | |
| Net realized and unrealized gain/(loss) on investments | | | 4.50 | | | | (0.45 | ) | | | (0.58 | ) | | | 2.67 | | | | 2.22 | | | | (0.89 | ) |
| Total income/(loss) from investment operations | | | 4.49 | | | | (0.42 | ) | | | (0.53 | ) | | | 2.71 | | | | 2.26 | | | | (0.85 | ) |
| | | | | | | | | | | | | | | | | | | | | | | | | |
| DISTRIBUTIONS | | | | | | | | | | | | | | | | | | | | | | | | |
| From net investment income | | | – | | | | (0.02 | ) | | | (0.03 | ) | | | (0.02 | ) | | | (0.04 | ) | | | (0.03 | ) |
| From net realized gain on investments | | | – | | | | (0.41 | ) | | | (1.42 | ) | | | (0.22 | ) | | | – | | | | (0.45 | ) |
| Total distributions | | | – | | | | (0.43 | ) | | | (1.45 | ) | | | (0.24 | ) | | | (0.04 | ) | | | (0.48 | ) |
| | | | | | | | | | | | | | | | | | | | | | | | | |
| REDEMPTION FEES ADDED TO PAID-IN CAPITAL | | | 0.00 | (b) | | | 0.00 | (b) | | | 0.00 | (b) | | | 0.00 | (b) | | | 0.00 | (b) | | | 0.00 | (b) |
| | | | | | | | | | | | | | | | | | | | | | | | | |
| INCREASE/DECREASE IN NET ASSET VALUE | | | 4.49 | | | | (0.85 | ) | | | (1.99 | ) | | | 2.47 | | | | 2.22 | | | | (1.33 | ) |
| NET ASSET VALUE, END OF PERIOD | | $ | 18.68 | | | $ | 14.19 | | | $ | 15.04 | | | $ | 17.02 | | | $ | 14.55 | | | $ | 12.33 | |
| | | | | | | | | | | | | | | | | | | | | | | | | |
| TOTAL RETURN | | | 31.64 | %(c) | | | (3.09 | )% | | | (1.33 | )% | | | 18.69 | % | | | 18.36 | % | | | (6.18 | )% |
| | | | | | | | | | | | | | | | | | | | | | | | | |
| RATIOS AND SUPPLEMENTAL DATA | | | | | | | | | | | | | | | | | | | | | | | | |
| Net assets, end of period (in 000s) | | $ | 228,965 | | | $ | 200,988 | | | $ | 272,743 | | | $ | 302,269 | | | $ | 258,683 | | | $ | 221,759 | |
| | | | | | | | | | | | | | | | | | | | | | | | | |
| RATIOS TO AVERAGE NET ASSETS | | | | | | | | | | | | | | | | | | | | | | | | |
| Expenses (excluding fees waived/reimbursed by investment advisor) | | | 1.29 | %(d) | | | 1.27 | % | | | 1.27 | % | | | 1.28 | % | | | 1.29 | % | | | 1.35 | % |
| Expenses (including fees waived/reimbursed by investment advisor) | | | 1.29 | %(d) | | | 1.27 | % | | | 1.27 | % | | | 1.28 | % | | | 1.29 | % | | | 1.35 | % |
| Net investment income/(loss) | | | (0.08 | )%(d) | | | 0.21 | % | | | 0.29 | % | | | 0.27 | % | | | 0.28 | % | | | 0.34 | % |
| | | | | | | | | | | | | | | | | | | | | | | | | |
| PORTFOLIO TURNOVER RATE | | | 15 | %(c) | | | 32 | % | | | 50 | % | | | 43 | % | | | 42 | % | | | 46 | % |
| (a) | Per share numbers have been calculated using the average shares method. |
| (b) | Less than $0.005 or ($0.005) per share. |
| See Notes to Financial Statements. | |
| Semi-Annual Report | October 31, 2020 | 89 |
| Grandeur Peak Global Stalwarts Fund | Financial Highlights |
For a Share Outstanding Throughout the Period or Years Presented
| Investor Class | | For the
Six Months
Ended
October 31,
2020
(Unaudited) | | | Year Ended
April 30, 2020 | | | Year Ended
April 30, 2019 | | | Year Ended
April 30, 2018 | | | Year Ended
April 30, 2017 | | | For the Period
September 2,
2015
(Commencement
of Operations) to
April 30, 2016 | |
| NET ASSET VALUE, BEGINNING OF PERIOD | | $ | 14.26 | | | $ | 14.83 | | | $ | 15.06 | | | $ | 12.76 | | | $ | 10.85 | | | $ | 10.00 | |
| | | | | | | | | | | | | | | | | | | | | | | | | |
| INCOME FROM INVESTMENT OPERATIONS | | | | | | | | | | | | | | | | | | | | | | | | |
| Net investment income/(loss)(a) | | | (0.04 | ) | | | (0.01 | )(b) | | | 0.01 | | | | (0.00 | )(c) | | | (0.03 | ) | | | 0.00 | (c) |
| Net realized and unrealized gain/(loss) on investments | | | 4.24 | | | | (0.31 | ) | | | 0.16 | | | | 2.52 | | | | 1.95 | | | | 0.85 | |
| Total income/(loss) from investment operations | | | 4.20 | | | | (0.32 | ) | | | 0.17 | | | | 2.52 | | | | 1.92 | | | | 0.85 | |
| | | | | | | | | | | | | | | | | | | | | | | | | |
| DISTRIBUTIONS | | | | | | | | | | | | | | | | | | | | | | | | |
| From net investment income | | | – | | | | (0.00 | )(c) | | | – | | | | – | | | | (0.01 | ) | | | (0.00 | )(c) |
| From net realized gain on investments | | | – | | | | (0.25 | ) | | | (0.40 | ) | | | (0.22 | ) | | | – | | | | (0.00 | )(c) |
| Total distributions | | | – | | | | (0.25 | ) | | | (0.40 | ) | | | (0.22 | ) | | | (0.01 | ) | | | (0.01 | ) |
| | | | | | | | | | | | | | | | | | | | | | | | | |
| REDEMPTION FEES ADDED TO PAID-IN CAPITAL | | | 0.00 | (c) | | | 0.00 | (c) | | | 0.00 | (c) | | | 0.00 | (c) | | | 0.00 | (c) | | | 0.00 | (c) |
| | | | | | | | | | | | | | | | | | | | | | | | | |
| INCREASE/DECREASE IN NET ASSET VALUE | | | 4.20 | | | | (0.58 | ) | | | (0.23 | ) | | | 2.30 | | | | 1.91 | | | | 0.85 | |
| NET ASSET VALUE, END OF PERIOD | | $ | 18.46 | | | $ | 14.26 | | | $ | 14.83 | | | $ | 15.06 | | | $ | 12.76 | | | $ | 10.85 | |
| | | | | | | | | | | | | | | | | | | | | | | | | |
| TOTAL RETURN | | | 29.45 | %(d) | | | (2.22 | )% | | | 1.78 | % | | | 19.79 | % | | | 17.70 | % | | | 8.55 | %(d) |
| | | | | | | | | | | | | | | | | | | | | | | | | |
| RATIOS AND SUPPLEMENTAL DATA | | | | | | | | | | | | | | | | | | | | | | | | |
| Net assets, end of period (in 000s) | | $ | 73,097 | | | $ | 85,310 | | | $ | 90,400 | | | $ | 92,552 | | | $ | 61,212 | | | $ | 19,131 | |
| | | | | | | | | | | | | | | | | | | | | | | | | |
| RATIOS TO AVERAGE NET ASSETS | | | | | | | | | | | | | | | | | | | | | | | | |
| Expenses (excluding fees waived/ reimbursed by investment advisor) | | | 1.22 | %(e) | | | 1.24 | % | | | 1.27 | % | | | 1.35 | % | | | 1.41 | % | | | 2.06 | %(e)(f) |
| Expenses (including fees waived/ reimbursed by investment advisor) | | | 1.22 | %(e) | | | 1.24 | % | | | 1.27 | % | | | 1.35 | % | | | 1.35 | % | | | 1.35 | %(e)(f) |
| Net investment income/(loss) | | | (0.43 | )%(e) | | | (0.10 | )% | | | 0.05 | % | | | (0.03 | )% | | | (0.23 | )% | | | 0.00 | %(e)(g) |
| | | | | | | | | | | | | | | | | | | | | | | | | |
| PORTFOLIO TURNOVER RATE | | | 23 | %(d) | | | 50 | % | | | 52 | % | | | 30 | % | | | 32 | % | | | 24 | %(d) |
| (a) | Per share numbers have been calculated using the average shares method. |
| (b) | The per share amount does not correspond to activity reflected in the Statement of Operations due to class specific expenses during the period. |
| (c) | Less than $0.005 or ($0.005) per share. |
| (f) | Expense ratios during startup periods may not be representative of longer term operating periods. |
| (g) | Less than 0.005% of average net assets. |
��
| See Notes to Financial Statements. | |
| 90 | 1.855.377.7325 | www.GrandeurPeakGlobal.com |
| Grandeur Peak Global Stalwarts Fund | Financial Highlights |
For a Share Outstanding Throughout the Period or Years Presented
| Institutional Class | | For the
Six Months
Ended
October 31,
2020
(Unaudited) | | | Year Ended
April 30, 2020 | | | Year Ended
April 30, 2019 | | | Year Ended
April 30, 2018 | | | Year Ended
April 30, 2017 | | | For the Period
September 2,
2015
(Commencement
of Operations) to
April 30, 2016 | |
| NET ASSET VALUE, BEGINNING OF PERIOD | | $ | 14.37 | | | $ | 14.93 | | | $ | 15.14 | | | $ | 12.79 | | | $ | 10.87 | | | $ | 10.00 | |
| | | | | | | | | | | | | | | | | | | | | | | | | |
| INCOME FROM INVESTMENT OPERATIONS | | | | | | | | | | | | | | | | | | | | | | | | |
| Net investment income/(loss)(a) | | | (0.02 | ) | | | 0.03 | | | | 0.04 | | | | 0.03 | | | | 0.01 | (b) | | | 0.02 | |
| Net realized and unrealized gain/(loss) on investments | | | 4.27 | | | | (0.31 | ) | | | 0.17 | | | | 2.54 | | | | 1.93 | | | | 0.85 | |
| Total income/(loss) from investment operations | | | 4.25 | | | | (0.28 | ) | | | 0.21 | | | | 2.57 | | | | 1.94 | | | | 0.87 | |
| | | | | | | | | | | | | | | | | | | | | | | | | |
| DISTRIBUTIONS | | | | | | | | | | | | | | | | | | | | | | | | |
| From net investment income | | | – | | | | (0.03 | ) | | | (0.02 | ) | | | – | | | | (0.02 | ) | | | (0.00 | )(c) |
| From net realized gain on investments | | | – | | | | (0.25 | ) | | | (0.40 | ) | | | (0.22 | ) | | | – | | | | (0.00 | )(c) |
| Total distributions | | | – | | | | (0.28 | ) | | | (0.42 | ) | | | (0.22 | ) | | | (0.02 | ) | | | (0.01 | ) |
| | | | | | | | | | | | | | | | | | | | | | | | | |
| REDEMPTION FEES ADDED TO PAID-IN CAPITAL | | | 0.00 | (c) | | | 0.00 | (c) | | | 0.00 | (c) | | | 0.00 | (c) | | | 0.00 | (c) | | | 0.00 | (c) |
| | | | | | | | | | | | | | | | | | | | | | | | | |
| INCREASE/DECREASE IN NET ASSET VALUE | | | 4.25 | | | | (0.56 | ) | | | (0.21 | ) | | | 2.35 | | | | 1.91 | | | | 0.86 | |
| NET ASSET VALUE, END OF PERIOD | | $ | 18.62 | | | $ | 14.37 | | | $ | 14.93 | | | $ | 15.14 | | | $ | 12.79 | | | $ | 10.87 | |
| | | | | | | | | | | | | | | | | | | | | | | | | |
| TOTAL RETURN | | | 29.58 | %(d) | | | (1.98 | )% | | | 2.08 | % | | | 20.14 | % | | | 17.92 | % | | | 8.76 | %(d) |
| | | | | | | | | | | | | | | | | | | | | | | | | |
| RATIOS AND SUPPLEMENTAL DATA | | | | | | | | | | | | | | | | | | | | | | | | |
| Net assets, end of period (in 000s) | | $ | 187,106 | | | $ | 119,600 | | | $ | 108,934 | | | $ | 95,533 | | | $ | 47,811 | | | $ | 17,562 | |
| | | | | | | | | | | | | | | | | | | | | | | | | |
| RATIOS TO AVERAGE NET ASSETS | | | | | | | | | | | | | | | | | | | | | | | | |
| Expenses (excluding fees waived/ reimbursed by investment advisor) | | | 0.97 | %(e) | | | 0.99 | % | | | 1.02 | % | | | 1.10 | % | | | 1.17 | % | | | 1.86 | %(e)(f) |
| Expenses (including fees waived/ reimbursed by investment advisor) | | | 0.97 | %(e) | | | 0.99 | % | | | 1.02 | % | | | 1.10 | % | | | 1.10 | % | | | 1.10 | %(e)(f) |
| Net investment income/(loss) | | | (0.19 | )%(e) | | | 0.17 | % | | | 0.27 | % | | | 0.24 | % | | | 0.05 | % | | | 0.22 | %(e) |
| | | | | | | | | | | | | | | | | | | | | | | | | |
| PORTFOLIO TURNOVER RATE | | | 23 | %(d) | | | 50 | % | | | 52 | % | | | 30 | % | | | 32 | % | | | 24 | %(d) |
| (a) | Per share numbers have been calculated using the average shares method. |
| (b) | The per share amount does not correspond to activity reflected in the Statement of Operations due to class specific expenses during the period. |
| (c) | Less than $0.005 or ($0.005) per share. |
| (f) | Expense ratios during startup periods may not be representative of longer term operating periods. |
| See Notes to Financial Statements. | |
| Semi-Annual Report | October 31, 2020 | 91 |
| Grandeur Peak International Opportunities Fund | Financial Highlights |
For a Share Outstanding Throughout the Period or Years Presented
| Investor Class | | For the
Six Months
Ended
October 31,
2020
(Unaudited) | | | Year Ended
April 30, 2020 | | | Year Ended
April 30, 2019 | | | Year Ended
April 30, 2018 | | | Year Ended
April 30, 2017 | | | Year Ended
April 30, 2016 | |
| NET ASSET VALUE, BEGINNING OF PERIOD | | $ | 3.04 | | | $ | 3.34 | | | $ | 4.10 | | | $ | 3.55 | | | $ | 3.09 | | | $ | 3.42 | |
| | | | | | | | | | | | | | | | | | | | | | | | | |
| INCOME FROM INVESTMENT OPERATIONS | | | | | | | | | | | | | | | | | | | | | | | | |
| Net investment income/(loss)(a) | | | (0.01 | ) | | | 0.00 | (b) | | | 0.00 | (b) | | | 0.01 | | | | 0.01 | | | | 0.01 | |
| Net realized and unrealized gain/(loss) on investments | | | 1.02 | | | | (0.18 | ) | | | (0.38 | ) | | | 0.68 | | | | 0.52 | | | | (0.20 | ) |
| Total income/(loss) from investment operations | | | 1.01 | | | | (0.18 | ) | | | (0.38 | ) | | | 0.69 | | | | 0.53 | | | | (0.19 | ) |
| | | | | | | | | | | | | | | | | | | | | | | | | |
| DISTRIBUTIONS | | | | | | | | | | | | | | | | | | | | | | | | |
| From net investment income | | | – | | | | (0.00 | )(b) | | | (0.01 | ) | | | (0.01 | ) | | | (0.02 | ) | | | (0.01 | ) |
| From net realized gain on investments | | | – | | | | (0.12 | ) | | | (0.37 | ) | | | (0.13 | ) | | | (0.05 | ) | | | (0.13 | ) |
| Total distributions | | | – | | | | (0.12 | ) | | | (0.38 | ) | | | (0.14 | ) | | | (0.07 | ) | | | (0.14 | ) |
| | | | | | | | | | | | | | | | | | | | | | | | | |
| REDEMPTION FEES ADDED TO PAID-IN CAPITAL | | | 0.00 | (b) | | | 0.00 | (b) | | | 0.00 | (b) | | | 0.00 | (b) | | | 0.00 | (b) | | | 0.00 | (b) |
| | | | | | | | | | | | | | | | | | | | | | | | | |
| INCREASE/DECREASE IN NET ASSET VALUE | | | 1.01 | | | | (0.30 | ) | | | (0.76 | ) | | | 0.56 | | | | 0.46 | | | | (0.33 | ) |
| NET ASSET VALUE, END OF PERIOD | | $ | 4.05 | | | $ | 3.04 | | | $ | 3.34 | | | $ | 4.10 | | | $ | 3.55 | | | $ | 3.09 | |
| | | | | | | | | | | | | | | | | | | | | | | | | |
| TOTAL RETURN | | | 33.22 | %(c) | | | (5.79 | )% | | | (7.40 | )% | | | 19.30 | % | | | 17.50 | % | | | (5.53 | )% |
| | | | | | | | | | | | | | | | | | | | | | | | | |
| RATIOS AND SUPPLEMENTAL DATA | | | | | | | | | | | | | | | | | | | | | | | | |
| Net assets, end of period (in 000s) | | $ | 48,540 | | | $ | 41,351 | | | $ | 58,070 | | | $ | 78,686 | | | $ | 78,403 | | | $ | 123,922 | |
| | | | | | | | | | | | | | | | | | | | | | | | | |
| RATIOS TO AVERAGE NET ASSETS | | | | | | | | | | | | | | | | | | | | | | | | |
| Expenses (excluding fees waived/ reimbursed by investment advisor) | | | 1.61 | %(d) | | | 1.61 | % | | | 1.62 | % | | | 1.61 | % | | | 1.61 | % | | | 1.62 | % |
| Expenses (including fees waived/ reimbursed by investment advisor) | | | 1.57 | %(d) | | | 1.58 | % | | | 1.57 | % | | | 1.55 | % | | | 1.58 | % | | | 1.62 | % |
| Net investment income/(loss) | | | (0.37 | )%(d) | | | 0.01 | % | | | 0.11 | % | | | 0.31 | % | | | 0.16 | % | | | 0.45 | % |
| | | | | | | | | | | | | | | | | | | | | | | | | |
| PORTFOLIO TURNOVER RATE | | | 15 | %(c) | | | 27 | % | | | 34 | % | | | 26 | % | | | 30 | % | | | 34 | % |
| (a) | Per share numbers have been calculated using the average shares method. |
| (b) | Less than $0.005 or ($0.005) per share. |
| See Notes to Financial Statements. | |
| 92 | 1.855.377.7325 | www.GrandeurPeakGlobal.com |
| Grandeur Peak International Opportunities Fund | Financial Highlights |
For a Share Outstanding Throughout the Period or Years Presented
| Institutional Class | | For the
Six Months
Ended
October 31,
2020
(Unaudited) | | | Year Ended
April 30, 2020 | | | Year Ended
April 30, 2019 | | | Year Ended
April 30, 2018 | | | Year Ended
April 30, 2017 | | | Year Ended
April 30, 2016 | |
| NET ASSET VALUE, BEGINNING OF PERIOD | | $ | 3.06 | | | $ | 3.36 | | | $ | 4.12 | | | $ | 3.57 | | | $ | 3.11 | | | $ | 3.43 | |
| | | | | | | | | | | | | | | | | | | | | | | | | |
| INCOME FROM INVESTMENT OPERATIONS | | | | | | | | | | | | | | | | | | | | | | | | |
| Net investment income/(loss)(a) | | | (0.00 | )(b) | | | 0.01 | | | | 0.01 | | | | 0.02 | | | | 0.01 | | | | 0.02 | |
| Net realized and unrealized gain/(loss) on investments | | | 1.02 | | | | (0.18 | ) | | | (0.38 | ) | | | 0.67 | | | | 0.52 | | | | (0.20 | ) |
| Total income/(loss) from investment operations | | | 1.02 | | | | (0.17 | ) | | | (0.37 | ) | | | 0.69 | | | | 0.53 | | | | (0.18 | ) |
| | | | | | | | | | | | | | | | | | | | | | | | | |
| DISTRIBUTIONS | | | | | | | | | | | | | | | | | | | | | | | | |
| From net investment income | | | – | | | | (0.01 | ) | | | (0.02 | ) | | | (0.01 | ) | | | (0.02 | ) | | | (0.01 | ) |
| From net realized gain on investments | | | – | | | | (0.12 | ) | | | (0.37 | ) | | | (0.13 | ) | | | (0.05 | ) | | | (0.13 | ) |
| Total distributions | | | – | | | | (0.13 | ) | | | (0.39 | ) | | | (0.14 | ) | | | (0.08 | ) | | | (0.15 | ) |
| | | | | | | | | | | | | | | | | | | | | | | | | |
| REDEMPTION FEES ADDED TO PAID-IN CAPITAL | | | 0.00 | (b) | | | 0.00 | (b) | | | 0.00 | (b) | | | 0.00 | (b) | | | 0.00 | (b) | | | 0.00 | (b) |
| | | | | | | | | | | | | | | | | | | | | | | | | |
| INCREASE/DECREASE IN NET ASSET VALUE | | | 1.02 | | | | (0.30 | ) | | | (0.75 | ) | | | 0.55 | | | | 0.46 | | | | (0.33 | ) |
| NET ASSET VALUE, END OF PERIOD | | $ | 4.08 | | | $ | 3.06 | | | $ | 3.36 | | | $ | 4.12 | | | $ | 3.57 | | | $ | 3.11 | |
| | | | | | | | | | | | | | | | | | | | | | | | | |
| TOTAL RETURN | | | 33.33 | %(c) | | | (5.60 | )% | | | (7.19 | )% | | | 19.38 | % | | | 17.59 | % | | | (5.02 | )% |
| | | | | | | | | | | | | | | | | | | | | | | | | |
| RATIOS AND SUPPLEMENTAL DATA | | | | | | | | | | | | | | | | | | | | | | | | |
| Net assets, end of period (in 000s) | | $ | 652,347 | | | $ | 473,820 | | | $ | 653,241 | | | $ | 813,322 | | | $ | 698,504 | | | $ | 579,371 | |
| | | | | | | | | | | | | | | | | | | | | | | | | |
| RATIOS TO AVERAGE NET ASSETS | | | | | | | | | | | | | | | | | | | | | | | | |
| Expenses (excluding fees waived/ reimbursed by investment advisor) | | | 1.37 | %(d) | | | 1.37 | % | | | 1.37 | % | | | 1.37 | % | | | 1.37 | % | | | 1.38 | % |
| Expenses (including fees waived/ reimbursed by investment advisor) | | | 1.32 | %(d) | | | 1.34 | % | | | 1.32 | % | | | 1.30 | % | | | 1.34 | % | | | 1.38 | % |
| Net investment income/(loss) | | | (0.13 | )%(d) | | | 0.24 | % | | | 0.41 | % | | | 0.54 | % | | | 0.42 | % | | | 0.65 | % |
| | | | | | | | | | | | | | | | | | | | | | | | | |
| PORTFOLIO TURNOVER RATE | | | 15 | %(c) | | | 27 | % | | | 34 | % | | | 26 | % | | | 30 | % | | | 34 | % |
| (a) | Per share numbers have been calculated using the average shares method. |
| (b) | Less than $0.005 or ($0.005) per share. |
See Notes to Financial Statements.
| Semi-Annual Report | October 31, 2020 | 93 |
| Grandeur Peak International Stalwarts Fund | Financial Highlights |
For a Share Outstanding Throughout the Period or Years Presented
| Investor Class | | For the
Six Months
Ended
October 31,
2020
(Unaudited) | | | Year Ended
April 30, 2020 | | | Year Ended
April 30, 2019 | | | Year Ended
April 30, 2018 | | | Year Ended
April 30, 2017 | | | For the Period September 2, 2015 (Commencement of Operations) to
April 30, 2016 | |
| NET ASSET VALUE, BEGINNING OF PERIOD | | $ | 14.40 | | | $ | 14.70 | | | $ | 15.53 | | | $ | 13.04 | | | $ | 11.02 | | | $ | 10.00 | |
| | | | | | | | | | | | | | | | | | | | | | | | | |
| INCOME FROM INVESTMENT OPERATIONS | | | | | | | | | | | | | | | | | | | | | | | | |
| Net investment income/(loss)(a) | | | (0.01 | )(b) | | | 0.01 | | | | 0.04 | | | | 0.05 | | | | 0.02 | | | | 0.03 | |
| Net realized and unrealized gain/(loss) on investments | | | 4.26 | | | | (0.29 | ) | | | (0.53 | ) | | | 2.62 | | | | 2.03 | | | | 0.99 | |
| Total income/(loss) from investment operations | | | 4.25 | | | | (0.28 | ) | | | (0.49 | ) | | | 2.67 | | | | 2.05 | | | | 1.02 | |
| | | | | | | | | | | | | | | | | | | | | | | | | |
| DISTRIBUTIONS | | | | | | | | | | | | | | | | | | | | | | | | |
| From net investment income | | | – | | | | (0.02 | ) | | | (0.05 | ) | | | – | | | | (0.03 | ) | | | – | |
| From net realized gain on investments | | | – | | | | – | | | | (0.29 | ) | | | (0.18 | ) | | | – | | | | – | |
| Total distributions | | | – | | | | (0.02 | ) | | | (0.34 | ) | | | (0.18 | ) | | | (0.03 | ) | | | – | |
| | | | | | | | | | | | | | | | | | | | | | | | | |
| REDEMPTION FEES ADDED TO PAID-IN CAPITAL | | | 0.00 | (c) | | | 0.00 | (c) | | | 0.00 | (c) | | | 0.00 | (c) | | | 0.00 | (c) | | | 0.00 | (c) |
| | | | | | | | | | | | | | | | | | | | | | | | | |
| INCREASE/DECREASE IN NET ASSET VALUE | | | 4.25 | | | | (0.30 | ) | | | (0.83 | ) | | | 2.49 | | | | 2.02 | | | | 1.02 | |
| NET ASSET VALUE, END OF PERIOD | | $ | 18.65 | | | $ | 14.40 | | | $ | 14.70 | | | $ | 15.53 | | | $ | 13.04 | | | $ | 11.02 | |
| | | | | | | | | | | | | | | | | | | | | | | | | |
| TOTAL RETURN | | | 29.51 | %(d) | | | (1.77 | )% | | | (2.69 | )% | | | 20.50 | % | | | 18.68 | % | | | 10.20 | %(d) |
| | | | | | | | | | | | | | | | | | | | | | | | | |
| RATIOS AND SUPPLEMENTAL DATA | | | | | | | | | | | | | | | | | | | | | | | | |
| Net assets, end of period (in 000s) | | $ | 54,450 | | | $ | 82,289 | | | $ | 72,204 | | | $ | 52,478 | | | $ | 31,045 | | | $ | 22,028 | |
| | | | | | | | | | | | | | | | | | | | | | | | | |
| RATIOS TO AVERAGE NET ASSETS | | | | | | | | | | | | | | | | | | | | | | | | |
| Expenses (excluding fees waived/ reimbursed by investment advisor) | | | 1.15 | %(e) | | | 1.17 | % | | | 1.19 | % | | | 1.19 | % | | | 1.27 | % | | | 1.45 | %(e)(f) |
| Expenses (including fees waived/ reimbursed by investment advisor) | | | 1.15 | %(e) | | | 1.17 | % | | | 1.19 | % | | | 1.19 | % | | | 1.27 | % | | | 1.35 | %(e)(f) |
| Net investment income/(loss) | | | (0.07 | )%(e) | | | 0.04 | % | | | 0.26 | % | | | 0.33 | % | | | 0.19 | % | | | 0.44 | %(e) |
| | | | | | | | | | | | | | | | | | | | | | | | | |
| PORTFOLIO TURNOVER RATE | | | 17 | %(d) | | | 32 | % | | | 42 | % | | | 24 | % | | | 37 | % | | | 59 | %(d) |
| (a) | Per share numbers have been calculated using the average shares method. |
| (b) | The per share amount does not correspond to activity reflected in the Statement of Operations due to class specific expenses during the period. |
| (c) | Less than $0.005 or ($0.005) per share. |
| (f) | Expense ratios during startup periods may not be representative of longer term operating periods. |
See Notes to Financial Statements.
| 94 | 1.855.377.7325 | www.GrandeurPeakGlobal.com |
| Grandeur Peak International Stalwarts Fund | Financial Highlights |
For a Share Outstanding Throughout the Period or Years Presented
| Institutional Class | | For the
Six Months
Ended
October 31,
2020
(Unaudited) | | | Year Ended
April 30, 2020 | | | Year Ended
April 30, 2019 | | | Year Ended
April 30, 2018 | | | Year Ended
April 30, 2017 | | | For the Period September 2, 2015 (Commencement of Operations) to
April 30, 2016 | |
| NET ASSET VALUE, BEGINNING OF PERIOD | | $ | 14.46 | | | $ | 14.74 | | | $ | 15.57 | | | $ | 13.06 | | | $ | 11.03 | | | $ | 10.00 | |
| | | | | | | | | | | | | | | | | | | | | | | | | |
| INCOME FROM INVESTMENT OPERATIONS | | | | | | | | | | | | | | | | | | | | | | | | |
| Net investment income(a) | | | 0.01 | | | | 0.05 | | | | 0.07 | | | | 0.08 | | | | 0.04 | | | | 0.04 | |
| Net realized and unrealized gain/(loss) on investments | | | 4.29 | | | | (0.29 | ) | | | (0.54 | ) | | | 2.63 | | | | 2.04 | | | | 0.99 | |
| Total income/(loss) from investment operations | | | 4.30 | | | | (0.24 | ) | | | (0.47 | ) | | | 2.71 | | | | 2.08 | | | | 1.03 | |
| | | | | | | | | | | | | | | | | | | | | | | | | |
| DISTRIBUTIONS | | | | | | | | | | | | | | | | | | | | | | | | |
| From net investment income | | | – | | | | (0.04 | ) | | | (0.07 | ) | | | (0.02 | ) | | | (0.05 | ) | | | (0.00 | )(b) |
| From net realized gain on investments | | | – | | | | – | | | | (0.29 | ) | | | (0.18 | ) | | | – | | | | – | |
| Total distributions | | | – | | | | (0.04 | ) | | | (0.36 | ) | | | (0.20 | ) | | | (0.05 | ) | | | (0.00 | )(b) |
| | | | | | | | | | | | | | | | | | | | | | | | | |
| REDEMPTION FEES ADDED TO PAID-IN CAPITAL | | | 0.00 | (b) | | | 0.00 | (b) | | | 0.00 | (b) | | | 0.00 | (b) | | | 0.00 | (b) | | | 0.00 | (b) |
| | | | | | | | | | | | | | | | | | | | | | | | | |
| INCREASE/DECREASE IN NET ASSET VALUE | | | 4.30 | | | | (0.29 | ) | | | (0.83 | ) | | | 2.52 | | | | 2.03 | | | | 1.03 | |
| NET ASSET VALUE, END OF PERIOD | | $ | 18.76 | | | $ | 14.46 | | | $ | 14.74 | | | $ | 15.57 | | | $ | 13.06 | | | $ | 11.03 | |
| | | | | | | | | | | | | | | | | | | | | | | | | |
| TOTAL RETURN | | | 29.74 | %(c) | | | (1.49 | )% | | | (2.50 | )% | | | 20.79 | % | | | 18.96 | % | | | 10.34 | %(c) |
| | | | | | | | | | | | | | | | | | | | | | | | | |
| RATIOS AND SUPPLEMENTAL DATA | | | | | | | | | | | | | | | | | | | | | | | | |
| Net assets, end of period (in 000s) | | $ | 1,373,991 | | | $ | 870,916 | | | $ | 561,100 | | | $ | 496,358 | | | $ | 265,393 | | | $ | 119,070 | |
| | | | | | | | | | | | | | | | | | | | | | | | | |
| RATIOS TO AVERAGE NET ASSETS | | | | | | | | | | | | | | | | | | | | | | | | |
| Expenses (excluding fees waived/ reimbursed by investment advisor) | | | 0.90 | %(d) | | | 0.92 | % | | | 0.94 | % | | | 0.94 | % | | | 1.02 | % | | | 1.20 | %(d)(e) |
| Expenses (including fees waived/ reimbursed by investment advisor) | | | 0.90 | %(d) | | | 0.92 | % | | | 0.94 | % | | | 0.94 | % | | | 1.02 | % | | | 1.10 | %(d)(e) |
| Net investment income | | | 0.16 | %(d) | | | 0.32 | % | | | 0.51 | % | | | 0.57 | % | | | 0.37 | % | | | 0.60 | %(d) |
| | | | | | | | | | | | | | | | | | | | | | | | | |
| PORTFOLIO TURNOVER RATE | | | 17 | %(c) | | | 32 | % | | | 42 | % | | | 24 | % | | | 37 | % | | | 59 | %(c) |
| (a) | Per share numbers have been calculated using the average shares method. |
| (b) | Less than $0.005 or ($0.005) per share. |
| (e) | Expense ratios during startup periods may not be representative of longer term operating periods. |
See Notes to Financial Statements.
| Semi-Annual Report | October 31, 2020 | 95 |
| Grandeur Peak US Stalwarts Fund | Financial Highlights |
For a Share Outstanding Throughout the Periods Presented
| Institutional Class | | For the
Six Months Ended October 31, 2020 (Unaudited) | | | For the Period
March 20, 2020 (Commencement of Operations) to
April 30, 2020 | |
| NET ASSET VALUE, BEGINNING OF PERIOD | | $ | 13.15 | | | $ | 10.00 | |
| | | | | | | | | |
| INCOME FROM INVESTMENT OPERATIONS | | | | | | | | |
| Net investment loss(a) | | | (0.03 | ) | | | (0.01 | ) |
| Net realized and unrealized gain on investments | | | 4.02 | | | | 3.16 | |
| Total income from investment operations | | | 3.99 | | | | 3.15 | |
| | | | | | | | | |
| REDEMPTION FEES ADDED TO PAID-IN CAPITAL | | | 0.00 | (b) | | | 0.00 | (b) |
| | | | | | | | | |
| INCREASE IN NET ASSET VALUE | | | 3.99 | | | | 3.15 | |
| NET ASSET VALUE, END OF PERIOD | | $ | 17.14 | | | $ | 13.15 | |
| | | | | | | | | |
| TOTAL RETURN | | | 30.34 | %(c) | | | 31.50 | %(c) |
| | | | | | | | | |
| RATIOS AND SUPPLEMENTAL DATA | | | | | | | | |
| Net assets, end of period (in 000s) | | $ | 35,851 | | | $ | 9,421 | |
| | | | | | | | | |
| RATIOS TO AVERAGE NET ASSETS | | | | | | | | |
| Expenses (excluding fees waived/ reimbursed by investment advisor) | | | 1.60 | %(d) | | | 6.23 | %(d)(e) |
| Expenses (including fees waived/ reimbursed by investment advisor) | | | 1.00 | %(d) | | | 1.00 | %(d)(e) |
| Net investment loss | | | (0.34 | )%(d) | | | (0.53 | )%(d) |
| | | | | | | | | |
| PORTFOLIO TURNOVER RATE | | | 13 | %(c) | | | 2 | %(c) |
| (a) | Per share numbers have been calculated using the average shares method. |
| (b) | Less than $0.005 or ($0.005) per share. |
| (e) | Expense ratios during startup periods may not be representative of longer term operating periods. |
See Notes to Financial Statements.
| 96 | 1.855.377.7325 | www.GrandeurPeakGlobal.com |
| Grandeur Peak Funds® | Notes to Financial Statements |
October 31, 2020 (Unaudited)
1. ORGANIZATION
Financial Investors Trust (the “Trust”), a Delaware statutory trust, is an open-end management investment company registered under the Investment Company Act of 1940, as amended (“1940 Act”). As of October 31, 2020, the Trust consists of multiple separate portfolios or series. This semi-annual report describes the Grandeur Peak Emerging Markets Opportunities Fund, Grandeur Peak Global Contrarian Fund, Grandeur Peak Global Micro Cap Fund, Grandeur Peak Global Opportunities Fund, Grandeur Peak Global Reach Fund, Grandeur Peak Global Stalwarts Fund, Grandeur Peak International Opportunities Fund, Grandeur Peak International Stalwarts Fund and Grandeur Peak US Stalwarts Fund (individually a “Fund” and collectively, the “Funds”). The Funds seek long-term growth of capital. The Funds offer Investor Class (except the Grandeur Peak Global Contrarian Fund, Grandeur Peak Global Micro Cap Fund and Grandeur Peak US Stalwarts Fund) and Institutional Class shares.
2. SIGNIFICANT ACCOUNTING POLICIES
The accompanying financial statements were prepared in accordance with accounting principles generally accepted in the United States of America (“U.S. GAAP”). The preparation of financial statements in conformity with U.S. GAAP requires management to make certain estimates and assumptions that affect the reported amounts of assets and liabilities and disclosures of contingent assets and liabilities at the date of the financial statements and the reported amounts of revenue and expenses during the period. Actual results could differ from those estimates. The Funds are considered an investment company for financial reporting purposes under U.S. GAAP and follows the accounting and reporting guidance applicable to investment companies in the Financial Accounting Standards Board Accounting Standards Codification Topic 946. The following is a summary of significant accounting policies consistently followed by the Funds in preparation of their financial statements.
Investment Valuation: The Funds generally value their securities based on market prices determined at the close of regular trading on the New York Stock Exchange (“NYSE”), normally 4:00 p.m. Eastern Time, on each day the NYSE is open for trading.
For equity securities and mutual funds that are traded on an exchange, the market price is usually the closing sale or official closing price on that exchange. In the case of equity securities not traded on an exchange, or if such closing prices are not otherwise available, the securities are valued at the mean of the most recent bid and ask prices on such day. Redeemable securities issued by open-end registered investment companies are valued at the investment company’s applicable net asset value, with the exception of exchange-traded open-end investment companies, which are priced as equity securities.
Equity securities that are primarily traded on foreign securities exchanges are valued at the closing values of such securities on their respective foreign exchanges, except when an event occurs subsequent to the close of the foreign exchange and the close of the NYSE that was likely to have changed such value. In such an event, the fair value of those securities are determined in good faith through consideration of other factors in accordance with procedures established by and under the general supervision of the Board of Trustees of the Trust (the “Board” or the “Trustees”). The Funds will use a fair valuation model provided by an independent pricing service, which is intended to reflect fair value when a security’s value or a meaningful portion of each Fund’s portfolio is believed to have been materially affected by a valuation event that has occurred between the close of the exchange or market on which the security is traded and the close of the regular trading day on the NYSE. The Funds’ valuation procedures set forth certain triggers which instruct when to use the fair valuation model.
Corporate bonds are valued using market models that consider trade data, quotations from dealers and active market makers, relevant yield curve and spread data, creditworthiness, trade data or market information on comparable securities, and other relevant security specific information.
Forward currency exchange contracts have a fair value determined by the prevailing foreign currency exchange daily rates and current foreign currency exchange forward rates. The foreign currency exchange forward rates are calculated using an automated system that estimates rates on the basis of the current day foreign currency exchange rates and forward foreign currency exchange rates supplied by a pricing service.
When such prices or quotations are not available, or when Grandeur Peak Global Advisors, LLC (the “Adviser” or “Grandeur Peak”) believes that they are unreliable, securities may be priced using fair value procedures approved by the Board.
Fair Value Measurements: The Funds disclose the classification of their fair value measurements following a three-tier hierarchy based on the inputs used to measure fair value. Inputs refer broadly to the assumptions that market participants would use in pricing the asset or liability, including assumptions about risk. Inputs may be observable or unobservable. Observable inputs reflect the assumptions market participants would use in pricing the asset or liability that are developed based on market data obtained from sources independent of the reporting entity. Unobservable inputs reflect the reporting entity’s own assumptions about the assumptions market participants would use in pricing the asset or liability that are developed based on the best information available.
| Semi-Annual Report | October 31, 2020 | 97 |
| Grandeur Peak Funds® | Notes to Financial Statements |
October 31, 2020 (Unaudited)
Various inputs are used in determining the value of the Funds’ investments as of the end of the reporting period. When inputs used fall into different levels of the fair value hierarchy, the level in the hierarchy within which the fair value measurement falls is determined based on the lowest level input that is significant to the fair value measurement in its entirety. The designated input levels are not necessarily an indication of the risk or liquidity associated with these investments. These inputs are categorized in the following hierarchy under applicable financial accounting standards:
Level 1 – Unadjusted quoted prices in active markets for identical investments, unrestricted assets or liabilities that the Funds have the ability to access at the measurement date;
Level 2 – Quoted prices which are not active, quoted prices for similar assets or liabilities in active markets or inputs other than quoted prices that are observable (either directly or indirectly) for substantially the full term of the asset or liability; and
Level 3 – Significant unobservable prices or inputs (including the Funds’ own assumptions in determining the fair value of investments) where there is little or no market activity for the asset or liability at the measurement date.
The following is a summary of each Fund’s investments in the fair value hierarchy as of October 31, 2020:
| Investments in Securities at Value | | Level 1 - Quoted
and Unadjusted
Prices | | | Level 2 - Other
Significant
Observable Inputs | | | Level 3 - Significant
Unobservable
Inputs | | Total | |
| Grandeur Peak Emerging Markets Opportunities Fund | | | | | | | | | | | | | | | | |
| Common Stocks | | | | | | | | | | | | | | | | |
| China | | $ | 31,345,053 | | | $ | 78,186,199 | | | $ | – | | | $ | 109,531,252 | |
| Egypt | | | 1,304,416 | | | | 1,640,000 | | | | – | | | | 2,944,416 | |
| Georgia | | | – | | | | 5,911,475 | | | | – | | | | 5,911,475 | |
| Greece | | | 5,940,873 | | | | 3,673,670 | | | | – | | | | 9,614,543 | |
| Hong Kong | | | – | | | | 14,920,952 | | | | – | | | | 14,920,952 | |
| India | | | 16,252,466 | | | | 55,281,722 | | | | – | | | | 71,534,188 | |
| Indonesia | | | – | | | | 16,290,980 | | | | – | | | | 16,290,980 | |
| Kenya | | | – | | | | 3,146,054 | | | | – | | | | 3,146,054 | |
| Malaysia | | | – | | | | 2,174,206 | | | | – | | | | 2,174,206 | |
| Philippines | | | 2,346,136 | | | | 13,209,400 | | | | – | | | | 15,555,536 | |
| Poland | | | 8,150,023 | | | | 9,259,252 | | | | – | | | | 17,409,275 | |
| Singapore | | | – | | | | 1,303,517 | | | | – | | | | 1,303,517 | |
| South Africa | | | 6,060,897 | | | | 5,381,068 | | | | – | | | | 11,441,965 | |
| South Korea | | | – | | | | 32,235,746 | | | | – | | | | 32,235,746 | |
| Taiwan | | | – | | | | 47,421,466 | | | | – | | | | 47,421,466 | |
| Thailand | | | – | | | | 7,180,857 | | | | – | | | | 7,180,857 | |
| Turkey | | | – | | | | 713,399 | | | | – | �� | | | 713,399 | |
| United Arab Emirates | | | – | | | | 678,331 | | | | – | | | | 678,331 | |
| United States | | | 8,365,786 | | | | 3,472,279 | | | | – | | | | 11,838,065 | |
| Vietnam | | | – | | | | 17,939,676 | | | | – | | | | 17,939,676 | |
| Other* | | | 59,722,896 | | | | – | | | | – | | | | 59,722,896 | |
| Total | | $ | 139,488,546 | | | $ | 320,020,249 | | | $ | – | | | $ | 459,508,795 | |
| * | For a detailed country breakdown, see the accompanying Portfolio of Investments. |
| 98 | 1.855.377.7325 | www.GrandeurPeakGlobal.com |
| Grandeur Peak Funds® | Notes to Financial Statements |
October 31, 2020 (Unaudited)
| Investments in Securities at Value | | Level 1 - Quoted
and Unadjusted
Prices | | | Level 2 - Other
Significant
Observable Inputs | | | Level 3 - Significant Unobservable
Inputs | | Total | |
| Grandeur Peak Global Contrarian Fund | | | | | | | | | | | | | | | | |
| Common Stocks | | | | | | | | | | | | | | | | |
| Australia | | $ | – | | | $ | 627,115 | | | $ | – | | | $ | 627,115 | |
| Belgium | | | – | | | | 187,056 | | | | – | | | | 187,056 | |
| Britain | | | 800,982 | | | | 697,887 | | | | – | | | | 1,498,869 | |
| China | | | 172,306 | | | | 615,032 | | | | – | | | | 787,338 | |
| France | | | – | | | | 706,123 | | | | – | | | | 706,123 | |
| Georgia | | | – | | | | 198,832 | | | | – | | | | 198,832 | |
| Germany | | | 143,992 | | | | 242,579 | | | | – | | | | 386,571 | |
| Greece | | | 98,413 | | | | 228,707 | | | | – | | | | 327,120 | |
| Hong Kong | | | – | | | | 451,862 | | | | – | | | | 451,862 | |
| India | | | 224,449 | | | | 608,214 | | | | – | | | | 832,663 | |
| Indonesia | | | – | | | | 526,973 | | | | – | | | | 526,973 | |
| Italy | | | – | | | | 226,288 | | | | – | | | | 226,288 | |
| Japan | | | – | | | | 1,787,736 | | | | – | | | | 1,787,736 | |
| Netherlands | | | – | | | | 146,643 | | | | – | | | | 146,643 | |
| Norway | | | – | | | | 88,788 | | | | – | | | | 88,788 | |
| Philippines | | | 116,141 | | | | 126,161 | | | | – | | | | 242,302 | |
| Singapore | | | – | | | | 212,563 | | | | – | | | | 212,563 | |
| South Korea | | | – | | | | 307,688 | | | | – | | | | 307,688 | |
| Sweden | | | – | | | | 282,272 | | | | – | | | | 282,272 | |
| Taiwan | | | – | | | | 761,889 | | | | – | | | | 761,889 | |
| United Arab Emirates | | | – | | | | 61,166 | | | | – | | | | 61,166 | |
| United States | | | 2,072,187 | | | | 66,085 | | | | – | | | | 2,138,272 | |
| Vietnam | | | – | | | | 640,763 | | | | – | | | | 640,763 | |
| Other* | | | 1,383,434 | | | | – | | | | – | | | | 1,383,434 | |
| Total | | $ | 5,011,904 | | | $ | 9,798,422 | | | $ | – | | | $ | 14,810,326 | |
| * | For a detailed country breakdown, see the accompanying Portfolio of Investments. |
| Semi-Annual Report | October 31, 2020 | 99 |
| Grandeur Peak Funds® | Notes to Financial Statements |
October 31, 2020 (Unaudited)
| Investments in Securities at Value | | Level 1 - Quoted
and Unadjusted
Prices | | | Level 2 - Other Significant
Observable Inputs | | | Level 3 - Significant Unobservable
Inputs | | Total | |
| Grandeur Peak Global Micro Cap Fund | | | | | | | | | | | | | | | | |
| Common Stocks | | | | | | | | | | | | | | | | |
| Australia | | $ | – | | | $ | 3,307,856 | | | $ | – | | | $ | 3,307,856 | |
| Belgium | | | – | | | | 153,792 | | | | – | | | | 153,792 | |
| Britain | | | 2,377,449 | | | | 2,301,444 | | | | – | | | | 4,678,893 | |
| China | | | 609,361 | | | | 619,546 | | | | – | | | | 1,228,907 | |
| Finland | | | – | | | | 1,029,070 | | | | – | | | | 1,029,070 | |
| France | | | – | | | | 1,257,490 | | | | – | | | | 1,257,490 | |
| Georgia | | | – | | | | 131,647 | | | | – | | | | 131,647 | |
| Germany | | | 307,029 | | | | 2,358,138 | | | | – | | | | 2,665,167 | |
| Greece | | | 1,146,920 | | | | 602,222 | | | | – | | | | 1,749,142 | |
| Hong Kong | | | – | | | | 352,851 | | | | – | | | | 352,851 | |
| India | | | 199,196 | | | | 3,182,519 | | | | – | | | | 3,381,715 | |
| Indonesia | | | – | | | | 768,311 | | | | – | | | | 768,311 | |
| Italy | | | – | | | | 224,384 | | | | – | | | | 224,384 | |
| Japan | | | – | | | | 6,771,606 | | | | – | | | | 6,771,606 | |
| Netherlands | | | – | | | | 398,571 | | | | – | | | | 398,571 | |
| New Zealand | | | – | | | | 181,292 | | | | – | | | | 181,292 | |
| Norway | | | – | | | | 941,237 | | | | – | | | | 941,237 | |
| Philippines | | | 313,939 | | | | 248,943 | | | | – | | | | 562,882 | |
| Singapore | | | – | | | | 478,616 | | | | – | | | | 478,616 | |
| South Korea | | | – | | | | 696,241 | | | | – | | | | 696,241 | |
| Sweden | | | 1,170,964 | | | | 1,398,557 | | | | – | | | | 2,569,521 | |
| Taiwan | | | – | | | | 2,196,874 | | | | – | | | | 2,196,874 | |
| Thailand | | | – | | | | 341,345 | | | | – | | | | 341,345 | |
| United States | | | 3,849,222 | | | | 152,115 | | | | – | | | | 4,001,337 | |
| Vietnam | | | – | | | | 394,916 | | | | – | | | | 394,916 | |
| Other* | | | 1,583,855 | | | | – | | | | – | | | | 1,583,855 | |
| Total | | $ | 11,557,935 | | | $ | 30,489,583 | | | $ | – | | | $ | 42,047,518 | |
| * | For a detailed country breakdown, see the accompanying Portfolio of Investments. |
| 100 | 1.855.377.7325 | www.GrandeurPeakGlobal.com |
| Grandeur Peak Funds® | Notes to Financial Statements |
October 31, 2020 (Unaudited)
| Investments in Securities at Value | | Level 1 - Quoted
and Unadjusted
Prices | | | Level 2 - Other Significant
Observable Inputs | | | Level 3 - Significant
Unobservable
Inputs | | Total | |
| Grandeur Peak Global Opportunities Fund | | | | | | | | | | | | | | | | |
| Common Stocks | | | | | | | | | | | | | | | | |
| Australia | | $ | – | | | $ | 10,265,409 | | | $ | – | | | $ | 10,265,409 | |
| Belgium | | | – | | | | 10,578,718 | | | | – | | | | 10,578,718 | |
| Britain | | | 40,277,843 | | | | 71,976,361 | | | | – | | | | 112,254,204 | |
| China | | | 9,224,975 | | | | 38,571,151 | | | | – | | | | 47,796,126 | |
| Finland | | | – | | | | 6,320,667 | | | | – | | | | 6,320,667 | |
| France | | | – | | | | 23,070,009 | | | | – | | | | 23,070,009 | |
| Georgia | | | – | | | | 4,149,164 | | | | – | | | | 4,149,164 | |
| Germany | | | 17,651,585 | | | | 26,486,203 | | | | – | | | | 44,137,788 | |
| Hong Kong | | | – | | | | 7,079,953 | | | | – | | | | 7,079,953 | |
| India | | | 11,004,917 | | | | 29,642,629 | | | | – | | | | 40,647,546 | |
| Indonesia | | | – | | | | 8,722,286 | | | | – | | | | 8,722,286 | |
| Ireland | | | 9,894,330 | | | | 5,087,740 | | | | – | | | | 14,982,070 | |
| Italy | | | 1,599,988 | | | | 10,633,401 | | | | – | | | | 12,233,389 | |
| Japan | | | – | | | | 69,182,172 | | | | – | | | | 69,182,172 | |
| Netherlands | | | 3,744,819 | | | | 14,364,067 | | | | – | | | | 18,108,886 | |
| New Zealand | | | – | | | | – | | | | 1 | | | | 1 | |
| Norway | | | – | | | | 6,078,991 | | | | – | | | | 6,078,991 | |
| Philippines | | | – | | | | 6,665,512 | | | | – | | | | 6,665,512 | |
| Poland | | | 398,117 | | | | 5,541,762 | | | | – | | | | 5,939,879 | |
| Singapore | | | – | | | | 6,878,356 | | | | – | | | | 6,878,356 | |
| South Korea | | | – | | | | 9,658,847 | | | | – | | | | 9,658,847 | |
| Sweden | | | 475,635 | | | | 12,001,552 | | | | – | | | | 12,477,187 | |
| Switzerland | | | – | | | | 2,565,873 | | | | – | | | | 2,565,873 | |
| Taiwan | | | – | | | | 18,787,670 | | | | – | | | | 18,787,670 | |
| Turkey | | | – | | | | 175,029 | | | | – | | | | 175,029 | |
| United States | | | 190,278,836 | | | | 741,139 | | | | – | | | | 191,019,975 | |
| Vietnam | | | – | | | | 10,481,197 | | | | – | | | | 10,481,197 | |
| Other* | | | 43,724,027 | | | | – | | | | – | | | | 43,724,027 | |
| Preferred Stocks* | | | – | | | | – | | | | 2,573,523 | | | | 2,573,523 | |
| Total | | $ | 328,275,072 | | | $ | 415,705,858 | | | $ | 2,573,524 | | | $ | 746,554,454 | |
| * | For a detailed country breakdown, see the accompanying Portfolio of Investments. |
| Semi-Annual Report | October 31, 2020 | 101 |
| Grandeur Peak Funds® | Notes to Financial Statements |
October 31, 2020 (Unaudited)
| Investments in Securities at Value | | Level 1 - Quoted
and Unadjusted
Prices | | | Level 2 - Other Significant
Observable Inputs | | | Level 3 - Significant
Unobservable
Inputs | | Total | |
| Grandeur Peak Global Reach Fund | | | | | | | | | | | | | | | | |
| Common Stocks | | | | | | | | | | | | | | | | |
| Australia | | $ | – | | | $ | 10,085,932 | | | $ | – | | | $ | 10,085,932 | |
| Belgium | | | – | | | | 1,443,140 | | | | – | | | | 1,443,140 | |
| Britain | | | 10,611,115 | | | | 26,876,289 | | | | – | | | | 37,487,404 | |
| China | | | 2,924,545 | | | | 11,718,530 | | | | – | | | | 14,643,075 | |
| Egypt | | | 256,570 | | | | 656,000 | | | | – | | | | 912,570 | |
| Finland | | | – | | | | 1,728,643 | | | | – | | | | 1,728,643 | |
| France | | | – | | | | 7,177,076 | | | | – | | | | 7,177,076 | |
| Germany | | | 3,302,545 | | | | 10,013,227 | | | | – | | | | 13,315,772 | |
| Greece | | | 1,958,804 | | | | 440,943 | | | | – | | | | 2,399,747 | |
| Hong Kong | | | – | | | | 4,137,795 | | | | – | | | | 4,137,795 | |
| India | | | 3,131,293 | | | | 12,092,719 | | | | – | | | | 15,224,012 | |
| Indonesia | | | – | | | | 4,628,106 | | | | – | | | | 4,628,106 | |
| Ireland | | | 4,137,205 | | | | 945,289 | | | | – | | | | 5,082,494 | |
| Italy | | | 397,964 | | | | 2,105,739 | | | | – | | | | 2,503,703 | |
| Japan | | | – | | | | 21,130,088 | | | | – | | | | 21,130,088 | |
| Netherlands | | | 395,365 | | | | 3,023,271 | | | | – | | | | 3,418,636 | |
| New Zealand | | | – | | | | 1,181,494 | | | | 1 | | | | 1,181,495 | |
| Norway | | | 988,391 | | | | 2,514,226 | | | | – | | | | 3,502,617 | |
| Philippines | | | 585,488 | | | | 3,075,644 | | | | – | | | | 3,661,132 | |
| Poland | | | 1,102,068 | | | | 2,784,873 | | | | – | | | | 3,886,941 | |
| South Korea | | | – | | | | 2,546,458 | | | | – | | | | 2,546,458 | |
| Spain | | | – | | | | – | | | | – | | | | – | |
| Sweden | | | 1,986,220 | | | | 7,462,397 | | | | – | | | | 9,448,617 | |
| Switzerland | | | – | | | | 1,320,749 | | | | – | | | | 1,320,749 | |
| Taiwan | | | – | | | | 8,075,418 | | | | – | | | | 8,075,418 | |
| Thailand | | | – | | | | 427,110 | | | | – | | | | 427,110 | |
| United Arab Emirates | | | – | | | | 590,232 | | | | – | | | | 590,232 | |
| United States | | | 72,995,200 | | | | 1,379,468 | | | | – | | | | 74,374,668 | |
| Vietnam | | | – | | | | 3,487,495 | | | | – | | | | 3,487,495 | |
| Other* | | | 18,931,880 | | | | – | | | | – | | | | 18,931,880 | |
| Preferred Stocks* | | | – | | | | – | | | | 1,220,533 | | | | 1,220,533 | |
| Total | | $ | 123,704,653 | | | $ | 153,048,351 | | | $ | 1,220,534 | | | $ | 277,973,538 | |
| * | For a detailed country breakdown, see the accompanying Portfolio of Investments. |
| 102 | 1.855.377.7325 | www.GrandeurPeakGlobal.com |
| Grandeur Peak Funds® | Notes to Financial Statements |
| | October 31, 2020 (Unaudited) |
| Investments in Securities at Value | | Level 1 - Quoted
and Unadjusted
Prices | | | Level 2 - Other
Significant
Observable Inputs | | | Level 3 - Significant
Unobservable
Inputs | | Total | |
| Grandeur Peak Global Stalwarts Fund | | | | | | | | | | | | | | | | |
| Common Stocks | | | | | | | | | | | | | | | | |
| Australia | | $ | – | | | $ | 4,854,892 | | | $ | – | | | $ | 4,854,892 | |
| Belgium | | | – | | | | 3,614,284 | | | | – | | | | 3,614,284 | |
| Britain | | | 5,302,749 | | | | 28,804,189 | | | | – | | | | 34,106,938 | |
| China | | | 3,750,157 | | | | 13,933,972 | | | | – | | | | 17,684,129 | |
| Denmark | | | – | | | | 345,190 | | | | – | | | | 345,190 | |
| France | | | – | | | | 4,437,777 | | | | – | | | | 4,437,777 | |
| Germany | | | 1,830,928 | | | | 5,396,280 | | | | – | | | | 7,227,208 | |
| Hong Kong | | | – | | | | 3,737,505 | | | | – | | | | 3,737,505 | |
| India | | | 7,738,170 | | | | 10,526,778 | | | | – | | | | 18,264,948 | |
| Indonesia | | | – | | | | 1,049,326 | | | | – | | | | 1,049,326 | |
| Ireland | | | 1,721,865 | | | | 1,736,332 | | | | – | | | | 3,458,197 | |
| Italy | | | 724,199 | | | | 2,367,477 | | | | – | | | | 3,091,676 | |
| Japan | | | – | | | | 14,856,282 | | | | – | | | | 14,856,282 | |
| Netherlands | | | 959,474 | | | | 3,021,663 | | | | – | | | | 3,981,137 | |
| Philippines | | | – | | | | 864,816 | | | | – | | | | 864,816 | |
| Poland | | | 1,058,962 | | | | 2,640,663 | | | | – | | | | 3,699,625 | |
| South Korea | | | – | | | | 842,006 | | | | – | | | | 842,006 | |
| Sweden | | | – | | | | 5,502,592 | | | | – | | | | 5,502,592 | |
| Switzerland | | | – | | | | 2,115,720 | | | | – | | | | 2,115,720 | |
| Taiwan | | | – | | | | 3,492,173 | | | | – | | | | 3,492,173 | |
| United States | | | 103,132,105 | | | | 1,300,949 | | | | – | | | | 104,433,054 | |
| Vietnam | | | – | | | | 2,950,655 | | | | – | | | | 2,950,655 | |
| Other* | | | 10,390,411 | | | | – | | | | – | | | | 10,390,411 | |
| Preferred Stocks* | | | – | | | | – | | | | 646,097 | | | | 646,097 | |
| Total | | $ | 136,609,020 | | | $ | 118,391,521 | | | $ | 646,097 | | | $ | 255,646,638 | |
| * | For a detailed country breakdown, see the accompanying Portfolio of Investments. |
| Semi-Annual Report | October 31, 2020 | 103 |
| Grandeur Peak Funds® | Notes to Financial Statements |
| | October 31, 2020 (Unaudited) |
| Investments in Securities at Value | | Level 1 - Quoted
and Unadjusted
Prices | | | Level 2 - Other
Significant
Observable Inputs | | | Level 3 - Significant
Unobservable
Inputs | | Total | |
| Grandeur Peak International Opportunities Fund | | | | | | | | | | | | | | | | |
| Common Stocks | | | | | | | | | | | | | | | | |
| Australia | | $ | – | | | $ | 28,610,672 | | | $ | – | | | $ | 28,610,672 | |
| Belgium | | | – | | | | 7,519,660 | | | | – | | | | 7,519,660 | |
| Britain | | | 34,366,615 | | | | 76,760,843 | | | | – | | | | 111,127,458 | |
| China | | | 12,087,268 | | | | 44,330,548 | | | | – | | | | 56,417,816 | |
| Finland | | | – | | | | 5,908,069 | | | | – | | | | 5,908,069 | |
| France | | | – | | | | 23,638,532 | | | | – | | | | 23,638,532 | |
| Georgia | | | – | | | | 3,725,233 | | | | – | | | | 3,725,233 | |
| Germany | | | 14,196,726 | | | | 29,887,676 | | | | – | | | | 44,084,402 | |
| Hong Kong | | | – | | | | 7,473,000 | | | | – | | | | 7,473,000 | |
| India | | | 12,796,080 | | | | 31,699,337 | | | | – | | | | 44,495,417 | |
| Indonesia | | | – | | | | 11,410,643 | | | | – | | | | 11,410,643 | |
| Ireland | | | 15,892,502 | | | | 3,698,801 | | | | – | | | | 19,591,303 | |
| Italy | | | 944,517 | | | | 11,762,248 | | | | – | | | | 12,706,765 | |
| Japan | | | – | | | | 99,691,519 | | | | – | | | | 99,691,519 | |
| Malaysia | | | – | | | | 1,697,188 | | | | – | | | | 1,697,188 | |
| Netherlands | | | 3,144,086 | | | | 11,599,811 | | | | – | | | | 14,743,897 | |
| New Zealand | | | – | | | | – | | | | 1 | | | | 1 | |
| Norway | | | – | | | | 12,716,828 | | | | – | | | | 12,716,828 | |
| Philippines | | | – | | | | 7,019,588 | | | | – | | | | 7,019,588 | |
| Poland | | | 2,093,020 | | | | 4,352,282 | | | | – | | | | 6,445,302 | |
| Singapore | | | – | | | | 9,590,139 | | | | – | | | | 9,590,139 | |
| South Korea | | | – | | | | 13,824,425 | | | | – | | | | 13,824,425 | |
| Sweden | | | 644,960 | | | | 13,977,935 | | | | – | | | | 14,622,895 | |
| Taiwan | | | – | | | | 20,301,553 | | | | – | | | | 20,301,553 | |
| Turkey | | | – | | | | 275,315 | | | | – | | | | 275,315 | |
| United Arab Emirates | | | – | | | | 1,617,690 | | | | – | | | | 1,617,690 | |
| United States | | | 32,209,801 | | | | 3,262,612 | | | | – | | | | 35,472,413 | |
| Vietnam | | | – | | | | 11,619,509 | | | | – | | | | 11,619,509 | |
| Other* | | | 53,609,878 | | | | – | | | | – | | | | 53,609,878 | |
| Total | | $ | 181,985,453 | | | $ | 497,971,656 | | | $ | 1 | | | $ | 679,957,110 | |
| * | For a detailed country breakdown, see the accompanying Portfolio of Investments. |
| 104 | 1.855.377.7325 | www.GrandeurPeakGlobal.com |
| Grandeur Peak Funds® | Notes to Financial Statements |
| | October 31, 2020 (Unaudited) |
| Investments in Securities at Value | | Level 1 - Quoted
and Unadjusted
Prices | | | Level 2 - Other
Significant
Observable Inputs | | | Level 3 - Significant Unobservable
Inputs | | Total | |
| Grandeur Peak International Stalwarts Fund | | | | | | | | | | | | | | | | |
| Common Stocks | | | | | | | | | | | | | | | | |
| Australia | | $ | – | | | $ | 40,958,850 | | | $ | – | | | $ | 40,958,850 | |
| Belgium | | | – | | | | 29,123,045 | | | | – | | | | 29,123,045 | |
| Britain | | | 35,049,712 | | | | 237,672,898 | | | | – | | | | 272,722,610 | |
| China | | | 35,980,251 | | | | 100,877,162 | | | | – | | | | 136,857,413 | |
| Denmark | | | – | | | | 3,922,086 | | | | – | | | | 3,922,086 | |
| France | | | – | | | | 51,846,527 | | | | – | | | | 51,846,527 | |
| Germany | | | 14,402,850 | | | | 50,419,038 | | | | – | | | | 64,821,888 | |
| Hong Kong | | | – | | | | 30,629,171 | | | | – | | | | 30,629,171 | |
| India | | | 51,547,164 | | | | 71,542,972 | | | | – | | | | 123,090,136 | |
| Indonesia | | | – | | | | 8,393,938 | | | | – | | | | 8,393,938 | |
| Ireland | | | 16,871,572 | | | | 13,388,464 | | | | – | | | | 30,260,036 | |
| Italy | | | 7,047,123 | | | | 21,866,603 | | | | – | | | | 28,913,726 | |
| Japan | | | – | | | | 131,695,673 | | | | – | | | | 131,695,673 | |
| Netherlands | | | 7,633,096 | | | | 28,771,643 | | | | – | | | | 36,404,739 | |
| Norway | | | – | | | | 7,329,257 | | | | – | | | | 7,329,257 | |
| Philippines | | | – | | | | 8,881,760 | | | | – | | | | 8,881,760 | |
| Poland | | | 8,087,840 | | | | 21,940,754 | | | | – | | | | 30,028,594 | |
| South Korea | | | – | | | | 6,822,529 | | | | – | | | | 6,822,529 | |
| Sweden | | | – | | | | 51,523,378 | | | | – | | | | 51,523,378 | |
| Switzerland | | | – | | | | 19,077,490 | | | | – | | | | 19,077,490 | |
| Taiwan | | | – | | | | 29,887,036 | | | | – | | | | 29,887,036 | |
| United States | | | 126,528,655 | | | | 8,972,932 | | | | – | | | | 135,501,587 | |
| Vietnam | | | – | | | | 22,007,905 | | | | – | | | | 22,007,905 | |
| Other* | | | 94,404,636 | | | | – | | | | – | | | | 94,404,636 | |
| Total | | $ | 397,552,899 | | | $ | 997,551,111 | | | $ | – | | | $ | 1,395,104,010 | |
| * | For a detailed country breakdown, see the accompanying Portfolio of Investments. |
| Semi-Annual Report | October 31, 2020 | 105 |
| Grandeur Peak Funds® | Notes to Financial Statements |
| | October 31, 2020 (Unaudited) |
| Investments in Securities at Value | | Level 1 - Quoted
and Unadjusted
Prices | | | Level 2 - Other
Significant
Observable Inputs | | | Level 3 - Significant
Unobservable
Inputs | | Total | |
| Grandeur Peak US Stalwarts Fund | | | | | | | | | | | | | | | | |
| Common Stocks | | | | | | | | | | | | | | | | |
| Hong Kong | | $ | – | | | $ | 431,019 | | | $ | – | | | $ | 431,019 | |
| United States | | | 29,301,245 | | | | 250,252 | | | | – | | | | 29,551,497 | |
| Other* | | | 4,692,143 | | | | – | | | | – | | | | 4,692,143 | |
| Total | | $ | 33,993,388 | | | $ | 681,271 | | | $ | – | | | $ | 34,674,659 | |
| * | For a detailed country breakdown, see the accompanying Portfolio of Investments. |
The following is a reconciliation of the investments in which significant unobservable inputs (Level 3) were used in determining fair value:
| Grandeur Peak Emerging Markets Opportunities Fund | | Foreign
Common Stock | | | Total | |
| Balance as of April 30, 2020 | | $ | 7,060 | | | $ | 7,060 | |
| Accrued Discount/Premium | | | – | | | | – | |
| Realized Gain/(Loss) | | | – | | | | – | |
| Change in Unrealized Appreciation/(Depreciation) | | | (7,060 | ) | | | (7,060 | ) |
| Purchases | | | – | | | | – | |
| Sales Proceeds | | | – | | | | – | |
| Transfer into Level 3 | | | – | | | | – | |
| Transfer out of Level 3 | | | – | | | | – | |
| Balance as of October 31, 2020 | | $ | – | | | $ | – | |
| Net change in unrealized Appreciation/(Depreciation) included in the Statements of Operations attributable to Level 3 investments held at October 31, 2020 | | $ | – | | | $ | – | |
| Grandeur Peak Global Opportunities Fund | | Foreign
Common Stock | | | Preferred Stocks | | | Total | |
| Balance as of April 30, 2020 | | $ | 1 | | | $ | 2,022,675 | | | $ | 2,022,676 | |
| Accrued Discount/Premium | | | – | | | | – | | | | – | |
| Realized Gain/(Loss) | | | – | | | | – | | | | – | |
| Change in Unrealized Appreciation/(Depreciation) | | | – | | | | 550,848 | | | | 550,848 | |
| Purchases | | | – | | | | – | | | | – | |
| Sales Proceeds | | | – | | | | – | | | | – | |
| Transfer into Level 3 | | | – | | | | – | | | | – | |
| Transfer out of Level 3 | | | – | | | | – | | | | – | |
| Balance as of October 31, 2020 | | $ | 1 | | | $ | 2,573,523 | | | $ | 2,573,524 | |
| Net change in unrealized Appreciation/(Depreciation) included in the Statements of Operations attributable to Level 3 investments held at October 31, 2020 | | $ | – | | | $ | 550,848 | | | $ | 550,848 | |
| 106 | 1.855.377.7325 | www.GrandeurPeakGlobal.com |
| Grandeur Peak Funds® | Notes to Financial Statements |
| | October 31, 2020 (Unaudited) |
| Grandeur Peak Global Reach Fund | | Foreign
Common Stock | | | Preferred Stocks | | | Total | |
| Balance as of April 30, 2020 | | $ | – | | | $ | 959,285 | | | $ | 959,285 | |
| Accrued Discount/Premium | | | – | | | | – | | | | – | |
| Realized Gain/(Loss) | | | 1 | | | | – | | | | 1 | |
| Change in Unrealized Appreciation/(Depreciation) | | | – | | | | 261,248 | | | | 261,248 | |
| Purchases | | | – | | | | – | | | | – | |
| Sales Proceeds | | | – | | | | – | | | | – | |
| Transfer into Level 3 | | | – | | | | – | | | | – | |
| Transfer out of Level 3 | | | – | | | | – | | | | – | |
| Balance as of October 31, 2020 | | $ | 1 | | | $ | 1,220,533 | | | $ | 1,220,534 | |
| Net change in unrealized Appreciation/(Depreciation) included in the Statements of Operations attributable to Level 3 investments held at October 31, 2020 | | $ | – | | | $ | 261,248 | | | $ | 261,248 | |
| | | | | | | |
| Grandeur Peak Global Stalwarts Fund | | Preferred Stocks | | | Total | |
| Balance as of April 30, 2020 | | $ | 507,803 | | | $ | 507,803 | |
| Accrued Discount/Premium | | | – | | | | – | |
| Realized Gain/(Loss) | | | – | | | | – | |
| Change in Unrealized Appreciation/(Depreciation) | | | 138,294 | | | | 138,294 | |
| Purchases | | | – | | | | – | |
| Sales Proceeds | | | – | | | | – | |
| Transfer into Level 3 | | | – | | | | – | |
| Transfer out of Level 3 | | | – | | | | – | |
| Balance as of October 31, 2020 | | $ | 646,097 | | | $ | 646,097 | |
| Net change in unrealized Appreciation/(Depreciation) included in the Statements of Operations attributable to Level 3 investments held at October 31, 2020 | | $ | 163,284 | | | $ | 163,284 | |
| Grandeur Peak International Opportunities Fund | | Foreign
Common Stock | | | Total | |
| Balance as of April 30, 2020 | | $ | 1 | | | $ | 1 | |
| Accrued Discount/Premium | | | – | | | | – | |
| Realized Gain/(Loss) | | | – | | | | – | |
| Change in Unrealized Appreciation/(Depreciation) | | | – | | | | – | |
| Purchases | | | – | | | | – | |
| Sales Proceeds | | | – | | | | – | |
| Transfer into Level 3 | | | – | | | | – | |
| Transfer out of Level 3 | | | – | | | | – | |
| Balance as of October 31, 2020 | | $ | 1 | | | $ | 1 | |
| Net change in unrealized Appreciation/(Depreciation) included in the Statements of Operations attributable to Level 3 investments held at October 31, 2020 | | $ | – | | | $ | – | |
Change in unrealized appreciation/depreciation on Level 3 securities is included on the Statements of Operations under Net change in unrealized appreciation/(depreciation) on investments. Realized gain/(loss) on Level 3 securities is included on the Statements of Operations under Net realized gain/(loss) on investments.
| Semi-Annual Report | October 31, 2020 | 107 |
| Grandeur Peak Funds® | Notes to Financial Statements |
| | October 31, 2020 (Unaudited) |
The table below provides additional information about the Level 3 Fair Value Measurements as of October 31, 2020:
Quantitative Information about Level 3 Fair Value Measurements
Grandeur Peak Global Opportunities Fund
| Asset Class | Fair Value (USD)
at 10/31/2020 | Valuation Technique | Unobservable Inputs(a) | Value/Range |
| Preferred Stock | $2,573,524 | Market Approach | Enterprise Value-to-Sales Multiple | 15.9x |
Grandeur Peak Global Reach Fund
| Asset Class | Fair Value (USD)
at 10/31/2020 | Valuation Technique | Unobservable Inputs(a) | Value/Range |
| Preferred Stock | $1,220,534 | Market Approach | Enterprise Value-to-Sales Multiple | 15.9x |
Grandeur Peak Global Stalwarts Fund
| Asset Class | Fair Value (USD)
at 10/31/2020 | Valuation Technique | Unobservable Inputs(a) | Value/Range |
| Preferred Stock | $646,097 | Market Approach | Enterprise Value-to-Sales Multiple | 15.9x |
| (a) | A change to the unobservable input may result in a significant change to the value of the investment as follows: |
| Unobservable Input | Impact to Value if Input Increases | Impact to Value if Input Decreases |
| Enterprise Value-to-Sales Multiple | Increase | Decrease |
Investment Transactions and Investment Income: Investment transactions are accounted for on the date the investments are purchased or sold (trade date). Realized gains and losses from investment transactions are reported on an identified cost which is the same basis the Fund uses for federal income tax purposes. Interest income, which includes accretion of discounts and amortization of premiums, is accrued and recorded as earned. Dividend income is recognized on the ex-dividend date or for certain foreign securities, as soon as information is available to the Funds. All of the realized and unrealized gains and losses and net investment income, are allocated daily to each class in proportion to its average daily net assets.
Cash Management Transactions: The Funds subscribe to the Brown Brothers Harriman & Co. (“BBH”) Cash Management Service (“CMS”), whereby cash balances are automatically swept into overnight offshore demand deposits with either the BBH Grand Cayman branch or a branch of a pre-approved commercial bank. This fully automated program allows the Funds to earn interest on cash balances. Excess cash with deposit institutions domiciled outside of the U.S. are subject to sovereign actions in the jurisdiction of the deposit institution including, but not limited to, freeze, seizure or diminution. Cash balances in the BBH CMS are included on the Statements of Assets and Liabilities under Cash and Foreign Cash, at Value. As of October 31, 2020, the Funds had the following cash balances participating in the BBH CMS:
| Fund | | | |
| Grandeur Peak Emerging Markets Opportunities Fund | | $ | 4,411,939 | |
| Grandeur Peak Global Contrarian Fund | | | 224,074 | |
| Grandeur Peak Global Micro Cap Fund | | | 18,013 | |
| Grandeur Peak Global Opportunities Fund | | | – | |
| Grandeur Peak Global Reach Fund | | | – | |
| Grandeur Peak Global Stalwarts Fund | | | 6,013,177 | |
| Grandeur Peak International Opportunities Fund | | | 18,802,054 | |
| Grandeur Peak International Stalwarts Fund | | | 43,029,793 | |
| Grandeur Peak US Stalwarts Fund | | | 1,645,501 | |
| 108 | 1.855.377.7325 | www.GrandeurPeakGlobal.com |
| Grandeur Peak Funds® | Notes to Financial Statements |
| | October 31, 2020 (Unaudited) |
As of October 31, 2020, the Funds had the following foreign cash balances participating in the BBH CMS (cost and value of foreign cash balances are equal):
| Fund | | | |
| Grandeur Peak Emerging Markets Opportunities Fund | | $ | – | |
| Grandeur Peak Global Contrarian Fund | | | 3,322 | |
| Grandeur Peak Global Micro Cap Fund | | | 93,540 | |
| Grandeur Peak Global Opportunities Fund | | | 32,483 | |
| Grandeur Peak Global Reach Fund | | | 10,011 | |
| Grandeur Peak Global Stalwarts Fund | | | 4,442 | |
| Grandeur Peak International Opportunities Fund | | | 56,107 | |
| Grandeur Peak International Stalwarts Fund | | | 49,186 | |
| Grandeur Peak US Stalwarts Fund | | | – | |
Short Sales: The Funds may make short sales of securities consistent with their strategies. A short sale is a transaction in which a Fund sells a security it does not own in anticipation that the market price of that security will decline.
When a Fund makes a short sale, it must borrow the security sold short and deliver it to the broker dealer through which it made the short sale as collateral for its obligation to deliver the security upon conclusion of the sale. The Fund may have to pay a fee to borrow particular securities and is often obligated to pay over any accrued interest and dividends on such borrowed securities.
If the price of the security sold short increases between the time of the short sale and the time that a Fund replaces the borrowed security, the Fund will incur a loss; conversely, if the price declines, the Fund will realize a capital gain. Any gain will be decreased, and any loss increased, by the transaction costs described above. The successful use of short selling may be adversely affected by imperfect correlation between movements in the price of the security sold short and the securities being hedged.
To the extent that a Fund engages in short sales, it will provide collateral to the broker-dealer and (except in the case of short sales “against the box”) will maintain additional asset coverage in the form of segregated or “earmarked” assets determined to be liquid in accordance with procedures established by the Board and that is equal to the current market value of the securities sold short, or will ensure that such positions are covered by “offsetting” positions, until the Fund replaces the borrowed security. A short sale is “against the box” to the extent that the Fund contemporaneously owns, or has the right to obtain at no added cost, securities identical to those sold short. The Fund may engage in short selling to the extent permitted by the federal securities laws and rules and interpretations thereunder. To the extent a Fund engages in short selling in foreign (non-U.S.) jurisdictions, the Fund will do so to the extent permitted by the laws and regulations of such jurisdiction.
Foreign Securities: The Funds may directly purchase securities of foreign issuers. Investing in securities of foreign issuers involves special risks not typically associated with investing in securities of U.S. issuers. The risks include possible reevaluation of currencies, the inability to repatriate foreign currency, less complete financial information about companies and possible future adverse political and economic developments. Moreover, securities of many foreign issuers and their markets may be less liquid and their prices more volatile than those of securities of comparable U.S. issuers.
Foreign Currency Translation: The books and records of the Funds are maintained in U.S. dollars. Investment valuations and other assets and liabilities initially expressed in foreign currencies are converted each business day into U.S. dollars based upon current exchange rates. Prevailing foreign exchange rates may generally be obtained at the close of the NYSE (normally, 4:00 p.m. Eastern Time). The portion of realized and unrealized gains or losses on investments due to fluctuations in foreign currency exchange rates is not separately disclosed and is included in realized and unrealized gains or losses on investments, when applicable.
Foreign Currency Spot Contracts: The Funds may enter into foreign currency spot contracts to facilitate transactions in foreign securities or to convert foreign currency receipts into U.S. dollars. A foreign currency spot contract is an agreement between two parties to buy and sell currencies at the current market rate, for settlement generally within two business days. The U.S. dollar value of the contracts is determined using current currency exchange rates supplied by a pricing service.
The contract is marked-to-market daily for settlements beyond one day and any change in market value is recorded as an unrealized gain or loss. When the contract is closed, a realized gain or loss is recorded equal to the difference between the value on the open and close date. Losses may arise from changes in the value of the foreign currency, or if the counterparties do not perform under the contract’s terms. The maximum potential loss from such contracts is the aggregate face value in U.S. dollars at the time the contract was opened.
| Semi-Annual Report | October 31, 2020 | 109 |
| Grandeur Peak Funds® | Notes to Financial Statements |
| | October 31, 2020 (Unaudited) |
Trust Expenses: Some expenses of the Trust can be directly attributed to the Funds. Expenses which cannot be directly attributed to the Funds are apportioned among all funds in the Trust based on average net assets of each fund.
Fund and Class Expenses: Expenses that are specific to a Fund or class of shares of a Fund, including distribution fees (Rule 12b-1 fees), are charged directly to that Fund or share class. Expenses that are common to all Funds generally are allocated among the Funds in proportion to their average daily net assets.
Federal Income Taxes: The Funds comply with the requirements under Subchapter M of the Internal Revenue Code of 1986, as amended, applicable to regulated investment companies and intend to distribute substantially all of their net taxable income and net capital gains, if any, each year so that it will not be subject to excise tax on undistributed income and gains. The Funds are not subject to income taxes to the extent such distributions are made.
As of and during the six months ended October 31, 2020, the Funds had a liability for unrecognized capital gains tax. These amounts are disclosed as Foreign Capital Gains Tax on the Statements of Assets and Liabilities. The Funds file U.S. federal, state, and local tax returns as required. The Funds’ tax returns are subject to examination by the relevant tax authorities until expiration of the applicable statute of limitations, which is generally three years after the filing of the tax return for federal purposes and four years for most state returns. Tax returns for open years have incorporated no uncertain tax positions that require a provision for income taxes.
Distributions to Shareholders: Each Fund normally pays dividends and distributes capital gains, if any, on an annual basis. Income dividend distributions are derived from dividends and other income each Fund receives from their investments, including short term capital gains. Long term capital gain distributions are derived from gains realized when each Fund sells a security it has owned for more than a year. Each Fund may make additional distributions and dividends at other times if the portfolio manager believes doing so may be necessary for each Fund to avoid or reduce taxes. The Funds intend to pass through foreign tax credits to shareholders.
Epidemic and Pandemic Risk: Certain countries have been susceptible to epidemics, most recently COVID-19, which has been designated as a pandemic by world health authorities. The outbreak of such epidemics, together with any resulting restrictions on travel or quarantines imposed, could have a negative impact on the economy and business activity globally (including in the countries in which we invest), and thereby could adversely affect the performance of our investments. Furthermore, the rapid development of epidemics could preclude prediction as to their ultimate adverse impact on economic and market conditions, and, as a result, present material uncertainty and risk with respect to us and the performance of our investments.
Libor Risk: In March 2020, the Financial Accounting Standards Board (FASB) issued Accounting Standards Update (“ASU”) No. 2020-04, Reference Rate Reform (Topic 848): Facilitation of the Effects of Reference Rate Reform on Financial Reporting. The Funds’ investments, payment obligations, and financing terms may be based on floating rates, such as the London Interbank Offered Rate, or “LIBOR,” which is the offered rate for short-term Eurodollar deposits between major international banks. Plans are underway to phase out the use of LIBOR by the end of 2021. There remains uncertainty regarding the nature of any replacement rate and the impact of the transition from LIBOR on the Funds’ transactions and the financial markets generally. As such, the potential effect of a transition away from LIBOR on the Funds or the Funds’ investments cannot yet be determined.
| 110 | 1.855.377.7325 | www.GrandeurPeakGlobal.com |
| Grandeur Peak Funds® | Notes to Financial Statements |
| | October 31, 2020 (Unaudited) |
3. TAX BASIS INFORMATION (NOT UPDATED)
Tax Basis of Investments: As of October 31, 2020, the aggregate cost of investments, gross unrealized appreciation/(depreciation) and net unrealized appreciation/(depreciation) for Federal tax purposes was as follows:
| Fund | | Gross
Appreciation
(excess of value
over tax cost) | | | Gross
Depreciation
(excess of tax cost
over value) | | | Net
Unrealized
Appreciation/
(Depreciation) | | | Cost of
Investments
for Income
Tax Purposes | |
| Grandeur Peak Emerging Markets Opportunities Fund | | $ | 164,797,190 | | | $ | (35,242,438 | ) | | $ | 129,554,752 | | | $ | 330,366,813 | |
| Grandeur Peak Global Contrarian Fund | | | 1,764,837 | | | | (971,858 | ) | | | 792,979 | | | | 14,017,347 | |
| Grandeur Peak Global Micro Cap Fund | | | 14,575,343 | | | | (1,998,187 | ) | | | 12,577,156 | | | | 29,470,362 | |
| Grandeur Peak Global Opportunities Fund | | | 270,268,289 | | | | (35,803,715 | ) | | | 234,464,574 | | | | 512,089,880 | |
| Grandeur Peak Global Reach Fund | | | 108,512,132 | | | | (12,279,616 | ) | | | 96,232,516 | | | | 181,741,022 | |
| Grandeur Peak Global Stalwarts Fund | | | 86,167,996 | | | | (5,636,362 | ) | | | 80,531,634 | | | | 175,115,004 | |
| Grandeur Peak International Opportunities Fund | | | 260,374,609 | | | | (39,522,112 | ) | | | 220,852,497 | | | | 459,104,613 | |
| Grandeur Peak International Stalwarts Fund | | | 383,746,923 | | | | (44,743,106 | ) | | | 339,003,817 | | | | 1,056,100,193 | |
| Grandeur Peak US Stalwarts Fund | | | 6,337,993 | | | | (767,364 | ) | | | 5,570,629 | | | | 29,104,030 | |
Tax Basis of Distributions to Shareholders: The character of distributions made during the year from net investment income or net realized gains may differ from its ultimate characterization for federal income tax purposes. Also, due to the timing of dividend distributions, the fiscal year in which amounts are distributed may differ from the fiscal year in which the income or realized gain were recorded by the Funds.
The tax character of distributions paid by the Funds for the fiscal year ended April 30, 2020 were as follows:
| Fund | | Ordinary
Income | | | Long-Term
Capital Gain | |
| Grandeur Peak Emerging Markets Opportunities Fund | | $ | 995,004 | | | $ | – | |
| Grandeur Peak Global Contrarian Fund | | | 19,023 | | | | – | |
| Grandeur Peak Global Micro Cap Fund | | | 25,741 | | | | 224,541 | |
| Grandeur Peak Global Opportunities Fund | | | – | | | | 36,811,507 | |
| Grandeur Peak Global Reach Fund | | | 805,795 | | | | 7,326,729 | |
| Grandeur Peak Global Stalwarts Fund | | | 179,533 | | | | 3,176,422 | |
| Grandeur Peak International Opportunities Fund | | | 1,679,453 | | | | 22,643,239 | |
| Grandeur Peak International Stalwarts Fund | | | 2,114,879 | | | | – | |
| Grandeur Peak US Stalwarts Fund | | | – | | | | – | |
| | | | | | | | | |
The amounts and characteristics of tax basis distributions and composition of distributable earnings/(accumulated losses) are finalized at fiscal year-end. Accordingly, tax basis balances have not been determined as of October 31, 2020.
| Semi-Annual Report | October 31, 2020 | 111 |
| Grandeur Peak Funds® | Notes to Financial Statements |
| | October 31, 2020 (Unaudited) |
4. SECURITIES TRANSACTIONS
The cost of purchases and proceeds from sales of securities (excluding short term securities) during the six months ended October 31, 2020 were as follows:
| Fund | | Purchases of
Securities | | | Proceeds From
Sales of Securities | |
| Grandeur Peak Emerging Markets Opportunities Fund | | $ | 43,638,704 | | | $ | 84,305,412 | |
| Grandeur Peak Global Contrarian Fund | | | 6,613,343 | | | | 2,808,992 | |
| Grandeur Peak Global Micro Cap Fund | | | 8,633,653 | | | | 7,808,787 | |
| Grandeur Peak Global Opportunities Fund | | | 156,635,431 | | | | 149,822,848 | |
| Grandeur Peak Global Reach Fund | | | 41,227,725 | | | | 69,142,704 | |
| Grandeur Peak Global Stalwarts Fund | | | 53,735,500 | | | | 60,320,250 | |
| Grandeur Peak International Opportunities Fund | | | 91,984,347 | | | | 95,483,858 | |
| Grandeur Peak International Stalwarts Fund | | | 397,042,632 | | | | 203,013,386 | |
| Grandeur Peak US Stalwarts Fund | | | 23,704,356 | | | | 2,491,648 | |
5. SHARES OF BENEFICIAL INTEREST
The capitalization of the Trust consists of an unlimited number of shares of beneficial interest with no par value per share. Holders of the shares of the Funds of the Trust have one vote for each share held and a proportionate fraction of a vote for each fractional share. All shares issued and outstanding are fully paid and are transferable and redeemable at the option of the shareholder. Purchasers of the share do not have any obligation to make payments to the Trust or its creditors solely by reason of the purchasers’ ownership of the shares. Shares have no pre-emptive rights.
Shares redeemed within 60 days of purchase may incur a 2% short-term redemption fee deducted from the redemption amount. For the year ended October 31, 2020 and the year ended April 30, 2020, the redemption fees charged by the Funds are presented in the Statements of Changes in Net Assets.
6. MANAGEMENT AND RELATED-PARTY TRANSACTIONS
The Adviser, subject to the authority of the Board, is responsible for the overall management and administration of the Funds’ business affairs. The Adviser manages the investments of the Funds in accordance with the Funds’ investment objective, policies and limitations and investment guidelines established jointly by the Adviser and the Trustees. Pursuant to the Advisory Agreement, (the “Advisory Agreement”), each Fund pays the Adviser an annual management fee based on each Fund’s average daily net assets. The management fee is paid on a monthly basis. The following table reflects the Funds’ advisory fee rates.
| Fund | Advisory Fee |
| Grandeur Peak Emerging Markets Opportunities Fund | 1.35% |
| Grandeur Peak Global Contrarian Fund | 1.00% |
| Grandeur Peak Global Opportunities Fund | 1.25% |
| Grandeur Peak Global Micro Cap Fund | 1.50% |
| Grandeur Peak Global Reach Fund | 1.10% |
| Grandeur Peak Global Stalwarts Fund | 0.80% |
| Grandeur Peak International Opportunities Fund | 1.25% |
| Grandeur Peak International Stalwarts Fund | 0.80% |
| Grandeur Peak US Stalwarts Fund | 0.75% |
| 112 | 1.855.377.7325 | www.GrandeurPeakGlobal.com |
| Grandeur Peak Funds® | Notes to Financial Statements |
| | October 31, 2020 (Unaudited) |
The Adviser has contractually agreed to limit certain of each Fund’s expenses (excluding acquired fund fees and expenses, brokerage expenses, interest expenses, taxes and extraordinary expenses). The following table reflects the Funds’ expense cap.
| Fund | Expense Cap | Term of Expense Limit Agreements |
| Grandeur Peak Emerging Markets Opportunities Fund | | September 1, 2020 – August 31, 2021 / September 1, 2019 – August 31, 2020 |
| Investor Class | 1.95% | |
| Institutional Class | 1.70% | |
| Grandeur Peak Global Contrarian Fund | | September 12, 2019 – August 31, 2021 |
| Institutional Class | 1.35% | |
| Grandeur Peak Global Micro Cap Fund | | September 1, 2020 – August 31, 2021 / September 1, 2019 – August 31, 2020 |
| Institutional Class | 2.00% | |
| Grandeur Peak Global Opportunities Fund | | September 1, 2020 – August 31, 2021 / September 1, 2019 – August 31, 2020 |
| Investor Class | 1.75% | |
| Institutional Class | 1.50% | |
| Grandeur Peak Global Reach Fund | | September 1, 2020 – August 31, 2021 / September 1, 2019 – August 31, 2020 |
| Investor Class | 1.60% | |
| Institutional Class | 1.35% | |
| Grandeur Peak Global Stalwarts Fund | | September 1, 2020 – August 31, 2021 / September 1, 2019 – August 31, 2020 |
| Investor Class | 1.35% | |
| Institutional Class | 1.10% | |
| Grandeur Peak International Opportunities Fund | | September 1, 2020 – August 31, 2021 / September 1, 2019 – August 31, 2020 |
| Investor Class | 1.75% | |
| Institutional Class | 1.50% | |
| Grandeur Peak International Stalwarts Fund | | September 1, 2020 – August 31, 2021 / September 1, 2019 – August 31, 2020 |
| Investor Class | 1.35% | |
| Institutional Class | 1.10% | |
| Grandeur Peak US Stalwarts Fund | | December 23, 2019 - August 31, 2021 |
| Institutional Class | 1.00% | |
Pursuant to these agreements, each Fund will reimburse the Adviser for any previous fee waivers and expense reimbursements made by the Adviser, provided that any such reimbursements made by the Funds to the Adviser will not cause the Funds’ expense limitation to exceed expense limitations in existence at the time the expense was incurred, or at the time of the reimbursement, whichever is lower, and the reimbursement is made within three years after the expenses were incurred. Fees waived/reimbursed by the Adviser for the period or six months ended October 31, 2020 are disclosed in the Statements of Operations.
In addition to the foregoing contractual arrangements, the Adviser has voluntarily agreed, effective September 1, 2020, to waive, with respect to the Grandeur Peak Global Opportunities Fund and the Grandeur Peak International Opportunities Fund, annual management fees to the extent such fees exceed 1.00% on assets above $500 million (the annual management fee rate with respect to such funds will remain 1.25% on the first $500 million in assets). Previously, the Adviser had voluntarily agreed, effective September 1, 2016, to waive, with respect to the Grandeur Peak Global Opportunities Fund and the Grandeur Peak International Opportunities Fund, annual management fees to the extent such fees exceed 1.10% on assets above $500 million (the annual management fee rate with respect to such funds will remain 1.25% on the first $500 million in assets). The Adviser has also voluntarily agreed, effective September 1, 2020, to waive, with respect to the Grandeur Peak Emerging Markets Opportunities Fund, annual management fees to the extent such fees exceed 1.00% on all assets above $400 million (the annual management fee rate with respect to the Fund will remain 1.35% on the first $400 million in assets). Previously, the Adviser had voluntarily agreed, effective January 1, 2018, to waive, with respect to the Grandeur Peak Emerging Markets Opportunities Fund, annual management fees to the extent such fees
| Semi-Annual Report | October 31, 2020 | 113 |
| Grandeur Peak Funds® | Notes to Financial Statements |
| | October 31, 2020 (Unaudited) |
exceed 1.20% on all assets above $400 million (the annual management fee rate with respect to the Fund will remain 1.35% on the first $400 million in assets). These voluntary arrangements may be terminated at any time by the Adviser. Voluntary waivers are not subject to recoupment by the Adviser. Voluntary fees waived by the Adviser for the six months ended October 31, 2020 are disclosed in the Statements of Operations.
For the six months ended October 31, 2020, the fee waivers/reimbursements and/or recoupments, excluding voluntary waivers, were as follows:
| Fund | | Fees Waived/Reimbursed By Adviser | | | Recoupment of Previously Waived Fees By Adviser | |
| Grandeur Peak Emerging Markets Opportunities Fund | | | | | | | | |
| Investor Class | | $ | – | | | $ | – | |
| Institutional Class | | | – | | | | – | |
| Grandeur Peak Global Contrarian Fund | | | | | | | | |
| Institutional Class | | $ | 85,305 | | | $ | – | |
| Grandeur Peak Global Micro Cap Fund | | | | | | | | |
| Institutional Class | | $ | 7,027 | | | $ | – | |
| Grandeur Peak Global Opportunities Fund | | | | | | | | |
| Investor Class | | $ | – | | | $ | – | |
| Institutional Class | | | – | | | | – | |
| Grandeur Peak Global Reach Fund | | | | | | | | |
| Investor Class | | $ | – | | | $ | – | |
| Institutional Class | | | – | | | | – | |
| Grandeur Peak Global Stalwarts Fund | | | | | | | | |
| Investor Class | | $ | – | | | $ | – | |
| Institutional Class | | | – | | | | – | |
| Grandeur Peak International Opportunities Fund | | | | | | | | |
| Investor Class | | $ | – | | | $ | – | |
| Institutional Class | | | – | | | | – | |
| Grandeur Peak International Stalwarts Fund | | | | | | | | |
| Investor Class | | $ | – | | | $ | – | |
| Institutional Class | | | – | | | | – | |
| Grandeur Peak US Stalwarts Fund | | | | | | | | |
| Institutional Class | | $ | 61,373 | | | $ | – | |
| 114 | 1.855.377.7325 | www.GrandeurPeakGlobal.com |
| Grandeur Peak Funds® | Notes to Financial Statements |
October 31, 2020 (Unaudited)
As of October 31, 2020, the balances of recoupable expenses for each Fund were as follows:
| Fund | | Expires 2021 | | | Expires 2022 | | | Expires 2023 | | | Expires 2024 | | | Total | |
| Grandeur Peak Emerging Markets Opportunities Fund | | | |
| Investor Class | | $ | – | | | $ | – | | | $ | – | | | $ | – | | | $ | – | |
| Institutional Class | | | – | | | | – | | | | – | | | | – | | | | – | |
| Grandeur Peak Global Contrarian Fund | | | |
| Institutional Class | | $ | – | | | $ | – | | | $ | 139,213 | | | $ | 85,305 | | | $ | 224,518 | |
| Grandeur Peak Global Micro Cap Fund | | | | | | | | |
| Institutional Class | | $ | 15,105 | | | $ | 25,568 | | | $ | 28,070 | | | $ | 7,027 | | | $ | 75,770 | |
| Grandeur Peak Global Opportunities Fund | | | | | | | | |
| Investor Class | | $ | – | | | $ | – | | | $ | – | | | $ | – | | | $ | – | |
| Institutional Class | | | – | | | | – | | | | – | | | | – | | | | – | |
| Grandeur Peak Global Reach Fund | | | | | | | | |
| Investor Class | | $ | – | | | $ | – | | | $ | – | | | $ | – | | | $ | – | |
| Institutional Class | | | – | | | | – | | | | – | | | | – | | | | – | |
| Grandeur Peak Global Stalwarts Fund | | | | | | | | |
| Investor Class | | $ | – | | | $ | – | | | $ | – | | | $ | – | | | $ | – | |
| Institutional Class | | | – | | | | – | | | | – | | | | – | | | | – | |
| Grandeur Peak International Opportunities Fund | | | | | | | | |
| Investor Class | | $ | – | | | $ | – | | | $ | – | | | $ | – | | | $ | – | |
| Institutional Class | | | – | | | | – | | | | – | | | | – | | | | – | |
| Grandeur Peak International Stalwarts Fund | | | | | | | | |
| Investor Class | | $ | – | | | $ | – | | | $ | – | | | $ | – | | | $ | – | |
| Institutional Class | | | – | | | | – | | | | – | | | | – | | | | – | |
| Grandeur Peak US Stalwarts Fund | | | | | | | | | | | | | | |
| Institutional Class | | $ | – | | | $ | – | | | $ | 33,383 | | | $ | 61,373 | | | $ | 94,756 | |
Administrator Fees and Expenses: ALPS Fund Services, Inc. (“ALPS”) serves as administrator to the Funds and the Funds have agreed to pay expenses incurred in connection with their administrative activities. Pursuant to an Administration Agreement, ALPS provides operational services to the Funds including, but not limited to, fund accounting and fund administration and generally assists in the Funds’ operations. Officers of the Trust are employees of ALPS. The Funds’ administration fee is accrued on a daily basis and paid monthly. Administration fees paid by the Funds for the six months ended October 31, 2020 are disclosed in the Statements of Operations.
ALPS is reimbursed by the Funds for certain out-of-pocket expenses.
Transfer Agent: ALPS serves as transfer, dividend paying and shareholder servicing agent for the Funds. ALPS receives an annual minimum fee, a fee based upon the number of shareholder accounts, and is also reimbursed by the Funds for certain out-of-pocket expenses. Transfer agent fees paid by the Funds for the six months ended October 31, 2020 are disclosed in the Statements of Operations.
Compliance Services: ALPS provides services that assist the Trust’s chief compliance officer in monitoring and testing the policies and procedures of the Trust in conjunction with requirements under Rule 38a-1 under the 1940 Act and receives an annual base fee. ALPS is reimbursed for certain out-of-pocket expenses by the Funds. Compliance service fees paid by the Funds for the six months ended October 31, 2020 are disclosed in the Statements of Operations.
Principal Financial Officer: ALPS receives an annual fee for providing principal financial officer services to the Funds. Principal financial officer fees paid by the Fund for the six months ended October 31, 2020 are disclosed in the Statements of Operations.
Trustees: The fees and expenses of the Trustees of the Board are presented in the Statements of Operations.
| Semi-Annual Report | October 31, 2020 | 115 |
| Grandeur Peak Funds® | Notes to Financial Statements |
October 31, 2020 (Unaudited)
Distributor: ALPS Distributors, Inc. (“ADI” or the “Distributor”) (an affiliate of ALPS) acts as the distributor of the Funds’ shares pursuant to a Distribution Agreement with the Trust. Shares are sold on a continuous basis by ADI as agent for the Funds, and ADI has agreed to use its best efforts to solicit orders for the sale of Funds’ shares, although it is not obliged to sell any particular amount of shares. ADI is not entitled to any compensation for its services as Distributor. ADI is registered as a broker-dealer with the U.S. Securities and Exchange Commission.
Each Fund has adopted a Distribution and Services (Rule 12b-1) Plan pursuant to Rule 12b-1 of the 1940 Act (the “Plan”) for its Investor Class shares. The Plan allows the Funds to use Investor Class assets to pay fees in connection with the distribution and marketing of Investor Class shares and/or the provision of shareholder services to Investor Class shareholders. The Plan permits payment for services in connection with the administration of plans or programs that use Investor Class shares of each Fund as their funding medium and for related expenses. The recipients of such payments may include the Distributor, other affiliates of the Adviser, broker-dealers, financial institutions, plan sponsors and administrators and other financial intermediaries through which investors may purchase shares of the Fund. The Plan permits the Funds to make total payments at an annual rate of up to 0.25% of each Fund’s average daily net assets attributable to its Investor Class shares. The expenses of the Plan are reflected as distribution and service fees in the Statements of Operations.
7. INDEMNIFICATIONS
Under the Trust’s organizational documents, its officers and Trustees are indemnified against certain liability arising out of the performance of their duties to the Trust. Additionally, in the normal course of business, the Trust enters into contracts with service providers that may contain general indemnification clauses, which may permit indemnification to the extent permissible under applicable law. The Trust’s maximum exposure under these arrangements is unknown, as this would involve future claims that may be made against the Trust that have not yet occurred.
| 116 | 1.855.377.7325 | www.GrandeurPeakGlobal.com |
| Grandeur Peak Funds® | Disclosure Regarding Approval of Fund Advisory Agreement |
Grandeur Peak Funds
On September 15, 2020, the Trustees met via electronic means (videoconference)(a) to discuss, among other things, the approval of the Investment Advisory Agreement between the Financial Investors Trust (the “Trust”), with respect to the Grandeur Peak Emerging Markets Opportunities Fund, the Grandeur Peak Global Micro Cap Fund, the Grandeur Peak Global Opportunities Fund, the Grandeur Peak Global Reach Fund, the Grandeur Peak Global Stalwarts Fund, the Grandeur Peak International Opportunities Fund, and the Grandeur Peak International Stalwarts Fund (collectively, the “Grandeur Peak Funds”) and Grandeur Peak Global Advisors, LLC (“Grandeur Peak”), in accordance with Section 15(c) of the 1940 Act. In renewing and approving the Investment Advisory Agreement with Grandeur Peak, on behalf of the Grandeur Peak Funds, the Trustees, including the Independent Trustees, considered the following factors with respect to the Grandeur Peak Funds:
Investment Advisory Fee Rate: The Trustees reviewed and considered the contractual annual advisory fees paid by the Trust, on behalf of the Grandeur Peak Funds, to Grandeur Peak, of 1.50% for the Grandeur Peak Global Micro Cap Fund, 1.35% for the Grandeur Peak Emerging Markets Opportunities Fund, 1.25% for the Grandeur Peak Global Opportunities Fund and for the Grandeur Peak International Opportunities Fund, 1.10% for the Grandeur Peak Global Reach Fund, 0.80% for the Grandeur Peak Global Stalwarts Fund and for the Grandeur Peak International Stalwarts Fund, in light of the extent and quality of the advisory services provided by Grandeur Peak to each such Grandeur Peak Fund.
The Board received and considered information including a comparison of the Investor Class and Institutional Class, as applicable, of each Grandeur Peak Fund’s contractual advisory fee rate with those of funds in the peer group and universe of funds provided by an independent provider of investment company data (the “Data Provider”). The Trustees noted that the contractual advisory fee rate of the Investor Class and Institutional Class, as applicable, of each class of the Grandeur Peak Emerging Markets Opportunities Fund, Grandeur Peak Global Opportunities Fund, Grandeur Peak Global Reach Fund, Grandeur Peak Global Micro Cap Fund, and Grandeur Peak International Opportunities Fund was significantly higher than the Data Provider peer group median; and of each class of the Grandeur Peak Global Stalwarts Fund and the Grandeur Peak International Stalwarts Fund was significantly lower than the Data Provider peer group median.
Total Net Expense Ratios: The Trustees further reviewed and considered that the total net expense ratio of the Investor Class and Institutional Class, as applicable, of each class of the Grandeur Peak Global Opportunities Fund, Grandeur Peak Global Micro Cap Fund, and Grandeur Peak International Opportunities Fund was significantly higher than the Data Provider peer group median; of each class of the Grandeur Peak Emerging Markets Opportunities Fund and Grandeur Peak Global Reach Fund was higher than the Data Provider peer group median; and of each class of the Grandeur Peak Global Stalwarts Fund and Grandeur Peak International Stalwarts Fund was significantly lower than the Data Provider peer group median.
Nature, Extent, and Quality of the Services under the Investment Advisory Agreement: The Trustees received and considered information regarding the nature, extent, and quality of services provided to the Grandeur Peak Funds under the Grandeur Peak Investment Advisory Agreement. The Trustees reviewed certain background materials supplied by Grandeur Peak in its presentation, including its Form ADV.
The Trustees reviewed and considered Grandeur Peak’s investment advisory personnel, its history as an asset manager, and its performance and the amount of assets currently under management by Grandeur Peak and its affiliated entities. The Trustees also reviewed the research and decision-making processes utilized by Grandeur Peak, including the methods adopted to seek to achieve compliance with the investment objectives, policies, and restrictions of the Grandeur Peak Funds.
The Trustees considered the background and experience of Grandeur Peak’s management in connection with the Grandeur Peak Funds, including reviewing the qualifications, backgrounds, and responsibilities of the management team primarily responsible for the day-to-day portfolio management of each such Grandeur Peak Fund and the extent of the resources devoted to research and analysis of actual and potential investments.
The Trustees also reviewed, among other things, Grandeur Peak’s insider trading policies and procedures and its Code of Ethics.
Performance: The Trustees reviewed performance information of the Investor Class and Institutional Class, as applicable, of each of the Grandeur Peak Funds for the 3-month, 1-year, 3-year, 5-year, and since inception periods, as applicable, ended June 30, 2020. That review included a comparison of each Grandeur Peak Fund’s performance to the performance of a group of comparable funds selected by the Data Provider.
The Trustees noted that for the 3-month period, the Institutional Class of the Grandeur Peak Emerging Markets Opportunities Fund had performance that was equal to the Data Provider peer group median; the Investor Class of the Grandeur Peak Emerging Markets Opportunities Fund outperformed the Data Provider peer group median; and each class of each Grandeur Peak Fund significantly outperformed the Data Provider peer group median during the period.
For the 1-year period, the Trustees noted that each class of the Grandeur Peak Emerging Markets Opportunities Fund outperformed the Data Provider peer group median and each other class of the Grandeur Peak Funds significantly outperformed the Data Provider peer group median. The Trustees noted that for the 3-year period, the Investor Class of the Grandeur Peak International Opportunities Fund had performance that was equal to the Data Provider peer group median; the Institutional Class of the Grandeur Peak International Opportunities Fund, the Grandeur Peak Global Micro Cap Fund and each class of the Grandeur Peak Emerging Markets Opportunities Fund outperformed the Data Provider peer group median; and each other class of the remaining Grandeur Peak Funds significantly outperformed the Data Provider peer group median.
| Semi-Annual Report | October 31, 2020 | 117 |
| Grandeur Peak Funds® | Disclosure Regarding Approval of Fund Advisory Agreement |
The Trustees noted that for each Grandeur Peak with a 5-year period, the Investor Class of the Grandeur Peak International Opportunities Fund had performance that was equal to the Data Provider peer group median; the Institutional Class of the Grandeur Peak International Opportunities Fund outperformed the Data Provider peer group median; and both classes of each other Grandeur Peak Fund significantly outperformed the Data Provider peer group median.
Finally, the Trustees noted that for the relevant period since the inception of each Grandeur Peak Fund, both classes of each Grandeur Peak Fund significantly outperformed the Data Provider peer group median.
The Trustees also considered Grandeur Peak’s discussion of its reputation generally and its investment techniques, risk management controls, and decision-making processes.
Comparable Accounts: The Trustees noted certain information provided by Grandeur Peak regarding fees charged to its other clients utilizing a strategy similar to that employed by the Grandeur Peak Funds.
Profitability: The Trustees received and considered a profitability analysis prepared by Grandeur Peak based on the fees payable under the Grandeur Peak Investment Advisory Agreement with respect to the Grandeur Peak Funds.
Economies of Scale: The Trustees considered whether economies of scale in the provision of services to the Grandeur Peak Funds will be passed along to the shareholders under the proposed agreements.
Other Benefits to the Adviser: The Trustees reviewed and considered any other incidental benefits derived or to be derived by Grandeur Peak from its relationship with the Grandeur Peak Funds, including whether soft dollar arrangements were used.
The Trustees, including all of the Independent Trustees, concluded that:
| ● | the contractual advisory fee rate of the Investor Class and Institutional Class, as applicable, of each of the Grandeur Peak Funds was significantly higher than the Data Provider peer group median, but within an acceptable range of, the respective Data Provider peer group medians, except for the Grandeur Peak Global Stalwarts Fund and the Grandeur Peak International Stalwarts Fund whose contractual advisory fee rates were significantly lower than their peer group medians; |
| ● | the total net expense ratio of the Investor Class and Institutional Class, as applicable, of each of the Grandeur Peak Funds was higher or significantly higher than, but within an acceptable range of, the respective Data Provider peer group medians, except for the Grandeur Peak Global Stalwarts Fund and the Grandeur Peak International Stalwarts Fund whose total net expense ratios were significantly lower than their peer group medians; |
| ● | the nature, extent, and quality of services rendered by Grandeur Peak under the Grandeur Peak Investment Advisory Agreement with respect to each Grandeur Peak Fund were adequate; |
| ● | for the period ended June 30, 2020, each class of each of the Grandeur Peak Funds outperformed, significantly outperformed, or had performance that was equal to, the Data Provider peer group median for the 3-month, 1-year, 3-year, 5-year (as applicable), and since inception periods; |
| ● | bearing in mind the limitations of comparing different types of managed accounts and the different levels of service typically associated with such accounts, the fee structures applicable to Grandeur Peak’s other clients employing a comparable strategy to any of the Grandeur Peak Funds were not indicative of any unreasonableness with respect to the advisory fee payable by the Grandeur Peak Funds; |
| ● | the profit, if any, realized by Grandeur Peak in connection with the operation of any of the Grandeur Peak Funds is not unreasonable; and |
| ● | there were no material economies of scale or other incidental benefits accruing to Grandeur Peak in connection with its relationship with any of the Grandeur Peak Funds. |
Based on the Trustees’ deliberations and their evaluation of the information described above, the Trustees, including all of the Independent Trustees, concluded that Grandeur Peak’s compensation for investment advisory services is consistent with the best interests of each of the Grandeur Peak Funds and their shareholders.
| (a) | This meeting was intended to qualify as an “in-person” meeting of the Board pursuant to relief granted by the SEC in response to the COVID-19 outbreak for the purposes of fulfilling the in-person investment advisory agreement approval requirements under Section 15(c) of the 1940 Act (see Investment Company Act Release No. 33817 (Mar. 13, 2020), Investment Company Act Release No. 33824 (Mar. 25, 2020) and Investment Company Act Release No. 33897 (June 19, 2020)). |
| 118 | 1.855.377.7325 | www.GrandeurPeakGlobal.com |
| Grandeur Peak Funds® | Additional Information |
October 31, 2020 (Unaudited)
1. FUND HOLDINGS
The Funds file their complete schedule of portfolio holdings with the Securities and Exchange Commission (SEC) for the first and third quarters of each fiscal year as an exhibit to its reports on Form N-PORT. The Funds’ Form N-PORT reports are available on the SEC's Web site at http://www.sec.gov. The Funds’ Form N-PORT reports are also available upon request by calling 1-855-377-PEAK (7325).
2. FUND PROXY VOTING POLICIES, PROCEDURES AND SUMMARIES
The Funds’ policies and procedures used in determining how to vote proxies and information regarding how the Funds voted proxies relating to portfolio securities during the most recent prior 12-month period ending June 30 are available without charge, (1) upon request, by calling 1-855-377-PEAK (7325) and (2) on the SEC’s website at http://www.sec.gov.
| Semi-Annual Report | October 31, 2020 | 119 |
| Grandeur Peak Funds® | Privacy Policy |
October 31, 2020 (Unaudited)
| Who We Are | |
| Who is providing this notice? | Grandeur Peak Global Opportunities Fund, Grandeur Peak International Opportunities Fund, Grandeur Peak Global Reach Fund, Grandeur Peak Emerging Markets Opportunities Fund, Grandeur Peak Global Micro Cap Fund, Grandeur Peak Global Stalwarts Fund, and Grandeur Peak International Stalwarts Fund. |
| What We Do | |
| How do the Funds protect my personal information? | To protect your personal information from unauthorized access and use, we use security measures that comply with federal law. These measures include computer safeguards and secured files and buildings. |
| How do the Funds collect my personal information? | We collect your personal information, for example, when you |
● open an account ● provide account information or give us your contact information ● make a wire transfer or deposit money |
| Why can't I limit all sharing? | Federal law gives you the right to limit only |
● sharing for affiliates’ everyday business purposes-information about your creditworthiness ● affiliates from using your information to market to you ● sharing for non-affiliates to market to you |
| | State laws and individual companies may give you additional rights to limit sharing. |
| Definitions | |
| Affiliates | Companies related by common ownership or control. They can be financial and nonfinancial companies. |
| Non-affiliates | Companies not related by common ownership or control. They can be financial and nonfinancial companies. |
| ● The Funds does not share with non-affiliates so they can market to you. |
| Joint marketing | A formal agreement between non-affiliated financial companies that together market financial products or services to you. |
| ● The Funds does not jointly market. |
| Other Important Information | |
| California Residents | If your account has a California home address, your personal information will not be disclosed to nonaffiliated third parties except as permitted by applicable California law, and we will limit sharing such personal information with our affiliates to comply with California privacy laws that apply to us. |
| Vermont Residents | The State of Vermont requires financial institutions to obtain your consent prior to sharing personal information that they collect about you with affiliated companies and nonaffiliated third parties other than in certain limited circumstances. Except as permitted by law, we will not share personal information we collect about you with nonaffiliated third parties or other affiliated companies unless you provide us with your written consent to share such information. |
| 120 | 1.855.377.7325 | www.GrandeurPeakGlobal.com |
| Grandeur Peak Funds® | Privacy Policy |
October 31, 2020 (Unaudited)
| FACTS | WHAT DO THE FUNDS DO WITH YOUR PERSONAL INFORMATION? |
| Why? | Financial companies choose how they share your personal information. Federal law gives consumers the right to limit some but not all sharing. Federal law also requires us to tell you how we collect, share, and protect your personal information. Please read this notice carefully to understand what we do. |
| What? | The types of personal information we collect and share depend on the product or service you have with us. This information can include: |
| | ● Social Security number and account transactions |
| | ● Account balances and transaction history |
| | ● Wire transfer instructions |
| How? | All financial companies need to share customers’ personal information to run their everyday business. In the section below, we list the reasons financial companies can share their customers’ personal information; the reasons the Funds choose to share; and whether you can limit this sharing. |
| Reasons we can share your personal information | Do the Funds share: | Can you limit this sharing? |
| For our everyday business purposes — such as to process your transactions, maintain your account(s), respond to court orders and legal investigations, or report to credit bureaus | Yes | No |
| For our marketing purposes — to offer our products and services to you | No | We do not share. |
| For joint marketing with other financial companies | No | We do not share. |
| For our affiliates’ everyday business purposes — information about your transactions and experiences | Yes | No |
| For our affiliates’ everyday business purposes — information about your creditworthiness | No | We do not share. |
| For nonaffiliates to market to you | No | We do not share. |
| Semi-Annual Report | October 31, 2020 | 121 |

SEMI-ANNUAL October 31, 2020
Highland Resolute Fund
Class I RMRGX
| Highland Resolute Fund | Table of Contents |
| | PAGE |
| | |
| Shareholder Letter | 2 |
| Performance Update | 7 |
| Consolidated Disclosure of Fund Expenses | 9 |
| Consolidated Schedule of Investments | 10 |
| Consolidated Statement of Assets and Liabilities | 21 |
| Consolidated Statement of Operations | 22 |
| Consolidated Statements of Changes in Net Assets | 23 |
| Consolidated Financial Highlights | 24 |
| Notes to Consolidated Financial Statements | 26 |
| Additional Information | 37 |
| Privacy Policy | 38 |
1
| Highland Resolute Fund | Shareholder Letter |
| | October 31, 2020 (Unaudited) |
PERFORMANCE:
October 31, 2020
The Highland Resolute Fund (the Fund) underperformed the HFRX Global Hedge Fund Index1 by 4.11% for the 12 months ending October 31, 2020. Contributing the most to the underperformance was a higher beta target within the Beta Sleeve2 and underperformance within the Liquidity Sleeve3. The strategy entered the first quarter with a higher beta target to stocks relative to the index which contributed to the underperformance as risk assets sold off sharply. Within the Liquidity Sleeve, holdings in non-agency residential mortgage backed securities detracted as liquidity in these securities dried up in March. Holdings in high yield also hurt relative return due to material widening in spreads in the beginning of the year. This was partially offset by strong security selection by a multi-strategy relative value manager and event driven manager within the Alpha Sleeve4.
Since inception, the Fund outperformed the HFRX Global Hedge Fund Index by 0.85%, helped by a higher beta to stocks relative to the index and strong security selection from managers within both the Liquidity Sleeve and Alpha Sleeve.
When compared to the peer group (Morningstar Multi-Alternative Universe), the Fund outperformed over the last year and over longer time periods.
COVID-19
COVID-19’s rapid spread across the globe sent markets into a tailspin as investors tried to understand the lasting effects of shutting down the global economy. What ensued was the fastest drawdown in market history, as prices on global equities (as measured by the MSCI AC World Index5) fell 33.6% from the peak on February 19 to the trough on March 23. Since the close of the first quarter, risk markets have led the way.
The adviser put their business continuity plan into place around mid-March. All employees of the adviser have been working remotely and have had no issues operating in the current environment.
2
| Highland Resolute Fund | Shareholder Letter |
| | October 31, 2020 (Unaudited) |
HIGHLAND RESOLUTE FUND
Table 1 notes the performance for the Fund as of quarter end under standard reporting (since inception) as well as of October 31, 2020.
Table 1
Performance (amounts greater than one year are annualized)
| | | | Standardized Performance Data
as of September 30, 2020 | | | Non-Standardized Performance Data
as of October 31, 2020 |
| | YTD | 1-Year | 3-Year | 5-Year | Since Inception
(12/30/11) | YTD | 1-Year | 3-Year | 5-Year | Since Inception
(12/30/11) |
| Highland Resolute Fund | -2.04% | 0.57% | 0.47% | 2.33% | 2.89% | -3.02% | -0.42% | -0.13% | 1.55% | 2.75% |
| Morningstar Multi-Alternative Universe | -2.50% | -0.93% | 0.68% | 1.48% | 1.99% | -3.27% | -1.91% | 0.18% | 1.03% | 1.88% |
| HFRX Global Hedge Fund Index | 1.62% | 4.23% | 1.48% | 2.14% | 1.95% | 1.40% | 3.69% | 1.17% | 1.80% | 1.90% |
| | Gross Expense
Ratio | Less Expense
Waivers | Net Expense
Ratio | Net Ratio ex Dividend & Short Expense |
| Highland Resolute Fund | 2.23% | -1.47% | 0.76% | 0.67% |
Performance data quoted represents past performance. Past performance does not guarantee future results. Investment return and principal value of an investment will fluctuate so that an investor’s shares, when sold or redeemed, may be worth more or less than the original cost. Current performance data may be higher or lower than actual data quoted. For the most current month-end performance data please call 1-855-268-2242.
The Fund has a redemption fee of 2.00% for shares redeemed within the first 90 days of purchase. Performance shown at NAV does not include these sales charges and would have been lower had it been taken into account.
Ratios as of the Prospectus dated August 31, 2020 and may differ from the ratios presented in the Financial Highlights
The Adviser has agreed to waive the portion of its 1.50% Management Fee in excess of any sub-advisory fees paid by the Adviser to sub-advisors in connection with the Fund (“Sub-Advisory Fees”). This agreement (the “Expense Agreement”) is in effect through August 31, 2021. The Adviser may not discontinue this agreement to waive fees prior to August 31, 2021 without the approval by the Fund’s Board of Trustees.
Net Ratio ex Dividend & Short Expense is the Net Expense Ratio less any Dividend and Interest Expense on Securities Sold Short.
Non-standardized performance is any performance period that doesn’t fall on a quarter end.
Portfolio Changes:
No changes were made to the portfolio during the six month period ending October 31, 2020.
Closing:
We continue to seek to add value both in our allocation and manager selection decisions. We appreciate your investment in the Highland Resolute Fund, please feel free to contact us with any questions.
Sincerely,

R. Scott Graham, CFA & Michael T. Lytle, CFA
Portfolio Managers6
| 1 | Representative of the overall composition of the hedge fund universe. |
| 2 | Beta Sleeve is in place to create sensitivity to the overall equity market. |
| 3 | Liquidity Sleeve is in place to have liquidity for rebalancing and redemptions. |
| 4 | Alpha Sleeve is to provide market outperformance. |
| 5 | Represents performance of the full opportunity set of large and mid-cap stocks across developed and emerging markets. |
| 6 | R. Scott Graham and Michael T. Lytle are registered representatives of ALPS Distributors, Inc. CFA Institute Marks are trademarks owned by the CFA Institute. |
| Semi-Annual Report | October 31, 2020 | 3 |
| Highland Resolute Fund | Shareholder Letter |
| | October 31, 2020 (Unaudited) |
Underlying Allocation Weights:
Figure 1 lists the long-term target asset allocation for the Fund as well as the allocation as of October 31, 2020.

Holdings and allocations subject to change and may not reflect the current or future position of the portfolio.
4
| Highland Resolute Fund | Shareholder Letter |
| | October 31, 2020 (Unaudited) |
IMPORTANT NOTES AND DISCLOSURES
Past performance does not guarantee future results.
Fund prices fluctuate as the underlying assets have exposure to market fluctuations and other risks, as described in the Fund’s prospectus. Please call 1-855-268-2242 to obtain current performance information and for the current prospectus and statement of additional information. This material must be preceded or accompanied by a prospectus. Please read the prospectus carefully before investing.
The views of Highland Associates, Inc. and the information discussed in this commentary are as of the date of publication, are subject to change, and may not reflect the writers’ current views. The views expressed are those of the Fund’s adviser only, and represent an assessment of market conditions at a specific point in time, are opinions only and should not be relied upon as investment advice regarding a particular investment or markets in general. Such information does not constitute a recommendation to buy or sell specific securities or investment vehicles. It should not be assumed that any investment will be profitable or will equal the performance of the portfolios or any securities or any sectors mentioned in this letter. The subject matter contained in this letter has been derived from several sources believed to be reliable and accurate at the time of compilation. Neither Highland Associates, Inc. nor the Fund accepts any liability for losses either direct or consequential caused by the use of this information.
The Highland Resolute Fund is distributed by ALPS Distributors, Inc.
The Fund is subject to investment risks, including possible loss of the principal amount invested and therefore is not suitable for all investors. The Fund may not achieve its objectives.
Diversification does not eliminate the risk of experiencing investment losses.
RISKS:
The Fund’s strategy may expose it to the risks of investments in Swap Contracts and Other Investment Companies. These risks include, but are not limited to higher expenses, allocation risk, underlying fund risk, transparency risk, and underlying fund managed portfolio risk. Investments which focus on alternative strategies are subject to increased risk and loss of principal and are not suitable for all investors. Swap Risk involves swap agreements and are subject to counterparty default risk and may not perform as intended. Derivatives Risk involves the exercise of skill and judgment. Derivatives may expire worthless or not perform as expected. Equity risk may cause the value of the securities held by the Fund to fall due to general market and economic conditions, perceptions regarding the industries in which the issuers of securities held by the Fund participate, or factors relating to specific companies in which the Fund invest.
The Fund’s investments in non-U.S. issuers may be even more volatile and may present more risks than investments in U.S. issuers.
Commodity Risk may subject the Funds to greater volatility than traditional investments because of global supply and demand, changes in interest rates, commodity index volatility, and factors affecting a particular industry or commodity. Commodity-linked investments may not move in the same direction and to the same extent as the underlying commodities.
Beta is a measure of the volatility–or systematic risk–of a security or portfolio compared to the market as a whole. Beta is used in the capital asset pricing model (CAPM), which describes the relationship between systematic risk and expected return for assets (usually stocks).
Alpha is referred to as “excess return” or “abnormal rate of return,” which refers to the idea that markets are efficient, and so there is no way to systematically earn returns that exceed the broad market as a whole.
Non-agency residential mortgage–backed securities (RMBS) are private-label RMBS issued by banks, and not by the housing agencies Fannie Mae or Freddie Mac.
The MSCI AC World Index is a market capitalization weighted index designed to provide a broad measure of equity-market performance throughout the world. The Index is maintained by Morgan Stanley Capital International and is comprised of stocks from 23 developed countries and 24 emerging markets. The index figures do not reflect any fees, expense, or taxes. Investors cannot invest directly in an index.
The Morningstar Multi-Alternative Universe is designed to represent the exposure to alternative investment tactics. Funds in this category have the majority of their assets exposed to alternative strategies. An investor’s exposure to different tactics may change slightly over time in response to market movements. Funds in this category include both funds with static allocations to alternative strategies and funds tactically allocating among alternative strategies and asset classes. The gross short exposure is greater than 20%.
| Semi-Annual Report | October 31, 2020 | 5 |
| Highland Resolute Fund | Shareholder Letter |
| | October 31, 2020 (Unaudited) |
The HFRX Global Hedge Fund Index is designed to be representative of the overall composition of the hedge fund universe, and includes convertible arbitrage, distressed securities, equity hedge, equity market neutral, event driven, macro, merger arbitrage, and relative value strategies. The index returns are updated periodically and are subject to change. The returns were accurate as of the date of this publication. Investors cannot invest directly in an index.
Highland Associates, Inc. has agreed to waive the portion of its 1.50% Management Fee in excess of any sub-advisory fees paid by the Adviser to sub-advisors in connection with the Highland Resolute Fund. This agreement is in effect through August 31, 2021. The Adviser may not discontinue this agreement to waive fees without the approval by the Fund’s Board of Trustees.
Ratios as of the Prospectus dated August 31, 2020 and may differ from the ratios presented in the Financial Highlights.
R. Scott Graham and Michael T. Lytle are registered representatives of ALPS Distributors, Inc. CFA Institute Marks are trademarks owned by the CFA Institute.
6
| Highland Resolute Fund | Performance Update |
| | October 31, 2020 (Unaudited) |
Performance (for the period ended October 31, 2020)
Highland Resolute Fund
| Cumulative Total Return(a) | | | | | Since | | |
| (for the period ended October 31, 2020) | 6 Months | 1 Year | 3 Year | 5 Year | Inception* | Gross Ratio(b) | Net Ratio(b) |
| Highland Resolute Fund - Class I - NAV | 7.44% | -0.42% | -0.13% | 1.55% | 2.75% | 2.23% | 0.76% |
| S&P 500® Index(c) | 13.29% | 9.71% | 10.42% | 11.71% | 13.74% | | |
| Dow Jones U.S. Select Dividend Index(d) | 5.23% | -14.86% | -0.36% | 5.58% | 9.08% | | |
| HFRX Global Hedge Fund Index(e) | 5.82% | 3.69% | 1.17% | 1.80% | 1.90% | | |
Performance data quoted represents past performance. Past performance does not guarantee future results. Investment return and principal value of an investment will fluctuate so that an investor’s shares, when sold or redeemed, may be worth more or less than the original cost. Current performance data may be higher or lower than actual data quoted. For the most current month-end performance data please call 1-855-268-2242.
The Fund has a redemption fee of 2.00% for shares redeemed within the first 90 days of purchase. Performance shown at NAV does not include these sales charges and would have been lower had it been taken into account.
The Adviser has agreed to waive the portion of its 1.50% Management Fee in excess of any sub-advisory fees paid by the Adviser to sub-advisors in connection with the Fund (“Sub-Advisory Fees”). This agreement (the “Expense Agreement”) is in effect through August 31, 2021. The Adviser may not discontinue this agreement to waive fees prior to August 31, 2021 without the approval by the Fund’s Board of Trustees.
| * | Fund inception date of 12/30/11. |
| (a) | Excludes adjustments in accordance with accounting principles generally accepted in the United States of America and as such, the net asset value and total return for shareholder transactions reported to the market may differ from the net asset value for financial reporting purposes. |
| (b) | Ratios as of the Prospectus dated August 31, 2020 and may differ from the ratios presented in the Financial Highlights. |
| (c) | The S&P 500® Index is the Standard & Poor's composite index of 500 stocks, a widely recognized, unmanaged index of common stock prices. The index is not actively managed and does not reflect any deduction of fees, expenses or taxes. An investor may not invest directly in an index. |
| (d) | The Dow Jones U.S. Select Dividend Index is an additional index, and represents the country’s top stocks by dividend yield, selected annually and subject to screening and buffering criteria. The index is not actively managed and does not reflect any deductions of fees, expenses or taxes. An investor may not invest directly in an index. |
| (e) | The HFRX Global Hedge Fund Index is an additional index, and is designed to be representative of the overall composition of the hedge fund universe and includes convertible arbitrage, distressed securities, equity hedge, equity market neutral, event driven, macro, merger arbitrage and relative value strategies. The index returns are updated periodically and are subject to change. The returns were accurate as of the date of this publication. The index is not actively managed and does not reflect any deduction of fees, expenses or taxes. An investor may not invest directly in an index. |
The table does not reflect the deduction of taxes that a shareholder would pay on Fund distributions or the redemption of Fund shares.
Top Ten Holdings**
(for the period ended October 31, 2020)
| As a percentage of Net Assets | |
| Vanguard Institutional Index Fund | 24.32% |
| PSAM Highland | 17.41% |
| Melchior Segregated Portfolio | 16.10% |
| PIMCO Income Fund, Institutional Class | 15.27% |
| WABR | 13.09% |
| PIMCO Short-Term Fund, Institutional Class | 12.84% |
| Vanguard S&P 500 ETF | 10.22% |
| BHDG Systematic Trading | |
| Segregated Portfolio | 3.82% |
| United States Treasury Bill | 1.84% |
| U.S. Treasury Note | 1.75% |
| Top Ten Holdings | 116.66% |
| ** | Holdings are subject to change, and may not reflect the current or future position of the portfolio. |
| Semi-Annual Report | October 31, 2020 | 7 |
Highland Resolute Fund | Performance Update |
| | October 31, 2020 (Unaudited) |
Performance of $10,000 Initial Investment (for the period ended October 31, 2020)
Comparison of change in value of a $10,000 investment
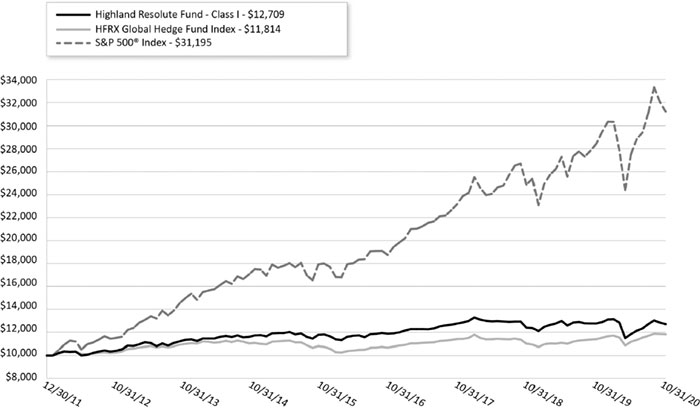
The chart represents historical performance of a hypothetical investment of $10,000 in the Fund since inception. Past performance does not guarantee future results. This chart does not reflect the deduction of taxes that a shareholder would pay on Fund distributions or the redemption of Fund shares.
Investing in the Fund is subject to investment risks, including possible loss of the principal amount invested.
8
| Highland Resolute Fund | Consolidated Disclosure of Fund Expenses |
| | October 31, 2020 (Unaudited) |
As a shareholder of the Fund, you incur two types of costs: (1) transaction costs, including applicable sales charges (loads), redemption fees; and (2) ongoing costs, including management fees, shareholder service fees and other Fund operating expenses. This example is intended to help you understand your ongoing costs (in dollars) of investing in the Fund and to compare these costs with the ongoing costs of investing in other mutual funds.
This example is based on an investment of $1,000 invested at the beginning of the period and held for the six-month period of May 1, 2020 to October 31, 2020.
Actual Expenses. The first line of the table below provides information about actual account values and actual expenses. You may use the information in this line, together with the amount you invested to estimate the expenses that you paid over the period. Simply divide your account value by $1,000 (for example, an $8,600 account value divided by $1,000 = 8.6), then multiply the result by the number in the first line of the table below under the heading titled “Expenses Paid During Period” to estimate the expenses you paid on your account during this period.
Hypothetical Example for Comparison Purposes. The second line of the table below provides information about hypothetical account values and hypothetical expenses based on the Fund’s actual expense ratio and an assumed rate of return of 5% per year before expenses, which is not the Fund’s actual return. The hypothetical account values and expenses may not be used to estimate the actual ending account balance or expenses you paid for the period. You may use this information to compare the ongoing costs of investing in the Fund and other mutual funds. To do so, compare this 5% hypothetical example with the 5% hypothetical examples that appear in the shareholder reports of the other funds.
Please note that the expenses shown in the table below are meant to highlight your ongoing costs only and do not reflect any transactional costs, such as applicable sales charges (loads), redemption fees, or exchange fees. Therefore, the second line of the table below is useful in comparing ongoing costs only and will not help you determine the relative total costs of owning different funds. In addition, if these transactional costs were included, your costs would have been higher.
| Highland Resolute Fund | BEGINNING
ACCOUNT VALUE
05/01/20 | ENDING
ACCOUNT VALUE
10/31/20 | EXPENSE
RATIO(a) | EXPENSES PAID
DURING THE
PERIOD
05/01/20-10/31/20(b) |
| Class I | | | | |
| Actual | $1,000.00 | $1,074.40 | 0.53% | $2.77 |
| Hypothetical (5% return before expenses) | $1,000.00 | $1,022.53 | 0.53% | $2.70 |
| (a) | Annualized, based on the Fund's most recent fiscal half year expenses. |
| (b) | Expenses are equal to the Fund's annualized expense ratio multiplied by the average account value over the period, multiplied by the number of days in the most recent fiscal half-year (184)/365 (to reflect the half-year period). |
| Semi-Annual Report | October 31, 2020 | 9 |
| Highland Resolute Fund | Consolidated Schedule of Investments |
October 31, 2020 (Unaudited)
| Description | | Shares | | | Value
(Note 2) | |
| EXCHANGE TRADED FUNDS (10.23%) | | | | | | | | |
| Vanguard S&P 500 ETF | | | 68,158 | | | $ | 20,435,132 | |
| | | | | | | | | |
| | | | | | | | | |
| TOTAL EXCHANGE TRADED FUNDS | | | | | | | | |
| (Cost $17,772,814) | | | | | | | 20,435,132 | |
| | | | | | | | | |
| OPEN-END MUTUAL FUNDS (52.44%) | | | | | | | | |
| PIMCO Income Fund, Institutional Class | | | 2,609,530 | | | | 30,531,498 | |
| PIMCO Short-Term Fund, Institutional Class | | | 2,596,995 | | | | 25,658,306 | |
| Vanguard Institutional Index Fund | | | 166,536 | | | | 48,616,732 | |
| | | | | | | | 104,806,536 | |
| | | | | | | | | |
| TOTAL OPEN-END MUTUAL FUNDS | | | | | | | | |
| (Cost $97,379,737) | | | | | | | 104,806,536 | |
| Description | | Principal
Amount | | | Value
(Note 2) | |
| GOVERNMENT & AGENCY OBLIGATIONS (1.75%) | | | | | | | | |
U.S. Treasury Note
2.00%, 11/30/2020 | | $ | 3,500,000 | | | | 3,505,004 | |
| | | | | | | | | |
| TOTAL GOVERNMENT & AGENCY OBLIGATIONS | | | | | | | | |
| (Cost $3,505,743) | | | | | | | 3,505,004 | |
| Description | | Shares | | | Value
(Note 2) | |
| Short-Term Investments (12.26%) | | | | | | | | |
| MONEY MARKET FUNDS (3.47%) | | | | | | | | |
| Dreyfus Treasury Cash Management Fund, Institutional Class, 7-day yield, 0.019%(a) | | | 6,945,894 | | | | 6,945,894 | |
| | | | | | | | | |
| U.S. TREASURY BILLS (8.79%) | | | | | | | | |
| 0.048%, 12/31/2020(b) | | | 3,000,000 | | | | 2,999,594 | |
| 0.069%, 01/28/2021(a)(b) | | | 3,500,000 | | | | 3,499,260 | |
| 0.072%, 02/25/2021(b) | | | 3,000,000 | | | | 2,999,090 | |
| 0.095%, 03/25/2021(b) | | | 3,670,000 | | | | 3,668,615 | |
| 0.102%, 08/12/2021(b) | | | 1,400,000 | | | | 1,398,932 | |
| 0.103%, 09/09/2021(a)(b) | | | 3,000,000 | | | | 2,997,184 | |
| | | | | | | | 17,562,675 | |
| TOTAL SHORT-TERM INVESTMENTS | | | | | | | | |
| (Cost $24,504,367) | | | | | | | 24,508,569 | |
| | | | | | | | | |
| TOTAL INVESTMENTS (76.68%) | | | | | | | | |
| (Cost $143,162,661) | | | | | | $ | 153,255,241 | |
| | | | | | | | | |
| SEGREGATED CASH WITH BROKERS (23.68%)(c) | | | | | | | 47,339,283 | |
| | | | | | | | | |
| LIABILITIES IN EXCESS OF OTHER ASSETS (-0.36%) | | | | | | | (721,850 | ) |
| NET ASSETS (100.00%) | | | | | | $ | 199,872,674 | |
| (a) | Security position either entirely or partially held in a segregated account as collateral for written option contracts and total return swaps. Aggregate total fair value of $2,737,178. |
| (b) | Rate shown represents the bond equivalent yield to maturity at date of purchase. |
| (c) | Includes cash which is being held as collateral for written option contracts and total return swap contracts. |
See Notes to Financial Statements.
10
| Highland Resolute Fund | Consolidated Schedule of Investments |
October 31, 2020 (Unaudited)
WRITTEN OPTION CONTRACTS (0.19%)
| | | Counterparty | | | Expiration Date | | Strike Price | | | Contracts | | | Premiums Received | | | Notional Value | | | Value
(Note 2) | |
| Call Option Contracts - (0.01%) | | | | | | | | | | | | | | | | | | | | | | | | | |
| S&P 500® Index | | | | | | | | | | | | | | | | | | | | | | | | | |
| | | | Citigroup | | | 11/05/2020 | | $ | 3,445 | | | (5) | | | $ | 8,745 | | | $ | (1,634,980 | ) | | $ | (2,680 | ) |
| | | | Citigroup | | | 11/06/2020 | | | 3,425 | | | (5) | | | | 8,845 | | | | (1,634,980 | ) | | | (6,370 | ) |
| | | | Citigroup | | | 11/12/2020 | | | 3,475 | | | (5) | | | | 11,645 | | | | (1,634,980 | ) | | | (3,450 | ) |
| | | | Citigroup | | | 11/18/2020 | | | 3,625 | | | (5) | | | | 10,495 | | | | (1,634,980 | ) | | | (875 | ) |
| | | | Citigroup | | | 11/24/2020 | | | 3,575 | | | (5) | | | | 12,995 | | | | (1,634,980 | ) | | | (2,930 | ) |
| | | | Citigroup | | | 11/27/2020 | | | 3,465 | | | (5) | | | | 11,795 | | | | (1,634,980 | ) | | | (20,550 | ) |
| | | | | | | | | | | | | | | | | | | | | | | | | | |
| Put Option Contracts - (0.18%) | | | | | | | | | | | | | | | | | | | | | | | | | |
| S&P 500® Index | | | | | | | | | | | | | | | | | | | | | | | | | |
| | | | Citigroup | | | 11/02/2020 | | | 3,320 | | | (5) | | | | 10,945 | | | | (1,634,980 | ) | | | (26,765 | ) |
| | | | Citigroup | | | 11/03/2020 | | | 3,290 | | | (5) | | | | 8,745 | | | | (1,634,980 | ) | | | (17,535 | ) |
| | | | Citigroup | | | 11/04/2020 | | | 3,175 | | | (5) | | | | 15,495 | | | | (1,634,980 | ) | | | (15,500 | ) |
| | | | Citigroup | | | 11/05/2020 | | | 3,130 | | | (5) | | | | 12,195 | | | | (1,634,980 | ) | | | (12,950 | ) |
| | | | Citigroup | | | 11/06/2020 | | | 3,080 | | | (5) | | | | 14,995 | | | | (1,634,980 | ) | | | (7,000 | ) |
| | | | Citigroup | | | 11/09/2020 | | | 3,275 | | | (5) | | | | 11,495 | | | | (1,634,980 | ) | | | (37,465 | ) |
| | | | Citigroup | | | 11/09/2020 | | | 3,330 | | | (5) | | | | 15,995 | | | | (1,634,980 | ) | | | (59,460 | ) |
| | | | Citigroup | | | 11/12/2020 | | | 3,050 | | | (5) | | | | 17,245 | | | | (1,634,980 | ) | | | (18,380 | ) |
| | | | Citigroup | | | 11/13/2020 | | | 3,275 | | | (5) | | | | 16,195 | | | | (1,634,980 | ) | | | (50,055 | ) |
| | | | Citigroup | | | 11/18/2020 | | | 3,225 | | | (5) | | | | 17,670 | | | | (1,634,980 | ) | | | (43,800 | ) |
| | | | Citigroup | | | 11/24/2020 | | | 3,125 | | | (5) | | | | 19,495 | | | | (1,634,980 | ) | | | (39,400 | ) |
| | | | Citigroup | | | 11/27/2020 | | | 2,960 | | | (5) | | | | 23,195 | | | | (1,634,980 | ) | | | (15,050 | ) |
| | | | | | | | | | | | | | | | | | | | | | | | | | |
| TOTAL WRITTEN OPTION CONTRACTS | | | | | | | | | | | | | | | $ | 248,185 | | | $ | (29,429,640 | ) | | $ | (380,215 | ) |
See Notes to Financial Statements.
| Semi-Annual Report | October 31, 2020 | 11 |
| Highland Resolute Fund | Consolidated Schedule of Investments |
October 31, 2020 (Unaudited)
TOTAL RETURN SWAP CONTRACTS*
| Counterparty | | Reference Obligation | | Notional Amount | | | Value | | | Rate Paid by the Fund | | Reference Rate | | Termination Date | | Unrealized Appreciation/ (Depreciation) | |
| Morgan Stanley | | BHDG Systematic Trading Segregated Portfolio(a) | | $ | 7,631,623 | | | $ | 7,631,629 | | | 65 bps | | N/A | | 09/13/2023 | | $ | 6 | |
| Morgan Stanley | | Melchior Segregated Portfolio(b) | | | 32,188,172 | | | | 32,188,175 | | | 100 bps | | N/A | | 03/19/2021 | | | 3 | |
| Morgan Stanley | | PSAM Highland(c) | | | 34,803,558 | | | | 34,803,565 | | | 215 bps + 1M EURIBOR | | -51 bps | | 06/03/2021 | | | 7 | |
| Morgan Stanley | | WABR(d) | | | 26,166,859 | | | | 26,166,872 | | | 120 bps + 1M LIBOR | | 16 bps | | 09/01/2022 | | | 13 | |
| | | | | $ | 100,790,212 | | | $ | 100,790,241 | | | | | | | | | $ | 29 | |
| * | For the long positions, the Fund receives payments based on any positive return of the Reference Obligation less the rate paid by the Fund. The Fund makes payments on any negative return of such Reference Obligation plus the rate paid by the Fund. For short positions, the Fund receives payments based on any negative return of the Reference Obligation less the rate paid by the fund. The Fund makes payments on any positive return of such Reference Obligation plus the rate paid by the Fund. Payments are made monthly. |
| (a) | BHDG Systematic Trading Segregated Portfolio is a quantitative trend following strategy that uses forward foreign currency contracts. BHDG will employ some short, medium, and long term signals. Interest rate, commodity, equity, and sovereign debt forward foreign currency contracts will be used. Any asset class may have net long or short exposure, and exposures in aggregate may be net long or short. |
| (b) | Melchior Segregated Portfolio is a global equity long/short strategy that uses a long-biased strategy that is focused on cyclical sectors. The strategy has a net exposure that ranges between 50% and 80%, and long exposure varies between 80% and 100%. The strategy is comprised of large cap stocks listed on exchanges of developed and emerging market countries. |
| (c) | PSAM Highland employs an event driven strategy. The fund will primarily make investments in equity special situations and merger arbitrage. The strategy will also opportunistically allocate to liquid high yield credit positions when trading at stressed levels. The strategy will employ gross long exposure of up to 120%, and net exposure will typically vary from 40% to 80%. |
| (d) | WABR incorporates an absolute return oriented approach within a risk parity framework. Active absolute return strategies include fundamental long/short equity, credit relative value, discretionary macro, and equity market neutral strategies. The strategy also maintains a passive risk weighted allocation to equities and fixed income, but each of the three allocations is equally risk weighted subject to a 40% limit on the absolute return allocation. Gross equity long exposure will typically be 140% or less, and net equity exposure will vary between 5% and 35%. |
See Notes to Financial Statements.
12
| Highland Resolute Fund | Consolidated Schedule of Investments |
October 31, 2020 (Unaudited)
BHDG SYSTEMATIC TRADING SEGREGATED PORTFOLIO
| Description | | Counterparty | | Settlement Date | | Fund Receiving | | | U.S. $ Value at October 31,
2020 | | Fund Delivering | | | U.S. $ Value at October 31,
2020 | | | Unrealized Appreciation/ (Depreciation) | | | Percentage of Value | |
| LONG SECURITIES | | | | | | | | | | | | | | | | | | | | | |
| OUTSTANDING FORWARD FOREIGN CURRENCY CONTRACTS |
| | | Morgan Stanley & Co. LLC | | 12/16/2020 | | AUD | | | $ | 809,470 | | JPY | | | $ | 827,823 | | | $ | (18,353 | ) | | | 10.61 | % |
| | | Morgan Stanley & Co. LLC | | 12/16/2020 | | AUD | | | | 1,353,541 | | USD | | | | 1,384,983 | | | | (31,443 | ) | | | 17.74 | % |
| | | Morgan Stanley & Co. LLC | | 12/16/2020 | | CAD | | | | 1,555,935 | | USD | | | | 1,571,972 | | | | (16,037 | ) | | | 20.39 | % |
| | | Morgan Stanley & Co. LLC | | 12/16/2020 | | CHF | | | | 1,302,522 | | USD | | | | 1,306,289 | | | | (3,767 | ) | | | 17.07 | % |
| | | Morgan Stanley & Co. LLC | | 12/16/2020 | | EUR | | | | 950,822 | | PLN | | | | 959,025 | | | | (8,203 | ) | | | 12.46 | % |
| | | Morgan Stanley & Co. LLC | | 12/16/2020 | | EUR | | | | 541,309 | | TRY | | | | 546,082 | | | | (4,773 | ) | | | 7.09 | % |
| | | Morgan Stanley & Co. LLC | | 12/16/2020 | | EUR | | | | 1,998,001 | | USD | | | | 2,022,893 | | | | (24,892 | ) | | | 26.18 | % |
| | | Morgan Stanley & Co. LLC | | 12/16/2020 | | GBP | | | | 1,257,110 | | USD | | | | 1,258,510 | | | | (1,400 | ) | | | 16.47 | % |
| | | Morgan Stanley & Co. LLC | | 12/16/2020 | | HUF | | | | 301,242 | | USD | | | | 312,604 | | | | (11,362 | ) | | | 3.95 | % |
| | | Morgan Stanley & Co. LLC | | 12/16/2020 | | ILS | | | | 1,050,603 | | USD | | | | 1,055,039 | | | | (4,435 | ) | | | 13.77 | % |
| | | Morgan Stanley & Co. LLC | | 12/16/2020 | | INR | | | | 1,309,562 | | USD | | | | 1,323,400 | | | | (13,838 | ) | | | 17.16 | % |
| | | Morgan Stanley & Co. LLC | | 12/16/2020 | | JPY | | | | 947,148 | | AUD | | | | 940,932 | | | | 6,217 | | | | 12.41 | % |
| | | Morgan Stanley & Co. LLC | | 12/16/2020 | | JPY | | | | 1,382,727 | | USD | | | | 1,374,876 | | | | 7,851 | | | | 18.12 | % |
| | | Morgan Stanley & Co. LLC | | 12/16/2020 | | KRW | | | | 749,829 | | USD | | | | 731,219 | | | | 18,610 | | | | 9.83 | % |
| | | Morgan Stanley & Co. LLC | | 12/16/2020 | | MXN | | | | 275,810 | | USD | | | | 272,319 | | | | 3,490 | | | | 3.61 | % |
| | | Morgan Stanley & Co. LLC | | 12/16/2020 | | NOK | | | | 241,570 | | USD | | | | 252,186 | | | | (10,617 | ) | | | 3.17 | % |
| | | Morgan Stanley & Co. LLC | | 12/16/2020 | | NZD | | | | 806,231 | | USD | | | | 811,031 | | | | (4,800 | ) | | | 10.56 | % |
| | | Morgan Stanley & Co. LLC | | 12/16/2020 | | PHP | | | | 748,324 | | USD | | | | 745,310 | | | | 3,014 | | | | 9.81 | % |
| | | Morgan Stanley & Co. LLC | | 12/16/2020 | | PLN | | | | 455,874 | | EUR | | | | 474,381 | | | | (18,507 | ) | | | 5.97 | % |
| | | Morgan Stanley & Co. LLC | | 12/16/2020 | | PLN | | | | 432,985 | | USD | | | | 451,334 | | | | (18,349 | ) | | | 5.67 | % |
| | | Morgan Stanley & Co. LLC | | 12/16/2020 | | RUB | | | | 246,981 | | USD | | | | 255,579 | | | | (8,599 | ) | | | 3.24 | % |
| | | Morgan Stanley & Co. LLC | | 12/16/2020 | | SEK | | | | 816,631 | | USD | | | | 824,010 | | | | (7,379 | ) | | | 10.70 | % |
| | | Morgan Stanley & Co. LLC | | 12/16/2020 | | SGD | | | | 1,611,086 | | USD | | | | 1,612,824 | | | | (1,738 | ) | | | 21.11 | % |
| | | Morgan Stanley & Co. LLC | | 12/16/2020 | | THB | | | | 241,613 | | USD | | | | 240,999 | | | | 613 | | | | 3.17 | % |
| | | Morgan Stanley & Co. LLC | | 12/16/2020 | | TRY | | | | 316,456 | | EUR | | | | 347,811 | | | | (31,356 | ) | | | 4.15 | % |
| | | Morgan Stanley & Co. LLC | | 12/16/2020 | | TRY | | | | 257,770 | | USD | | | | 275,887 | | | | (18,117 | ) | | | 3.38 | % |
| OUTSTANDING FORWARD FOREIGN CURRENCY CONTRACTS Total | | | | 21,961,149 | | | | | | | | | | | | | | 287.76 | % |
| TOTAL LONG | | | | | | | | 21,961,149 | | | | | | | | | | | | | | | |
See Notes to Financial Statements.
| Semi-Annual Report | October 31, 2020 | 13 |
| Highland Resolute Fund | Consolidated Schedule of Investments |
October 31, 2020 (Unaudited)
| Description | | Counterparty | | Settlement Date | | Fund Receiving | | | U.S. $ Value at October 31,
2020 | | Fund Delivering | | | U.S. $ Value at October 31,
2020 | | | Unrealized Appreciation/ (Depreciation) | | | Percentage of Value | |
| SECURITIES SOLD SHORT |
| OUTSTANDING FORWARD FOREIGN CURRENCY CONTRACTS |
| | | Morgan Stanley & Co. LLC | | 12/16/2020 | | JPY | | | $ | (940,932 | ) | AUD | | | $ | (926,246 | ) | | $ | (14,685 | ) | | | -12.14 | % |
| | | Morgan Stanley & Co. LLC | | 12/16/2020 | | USD | | | | (1,341,373 | ) | AUD | | | | (1,327,001 | ) | | | (14,373 | ) | | | -17.39 | % |
| | | Morgan Stanley & Co. LLC | | 12/16/2020 | | USD | | | | (371,138 | ) | BRL | | | | (359,575 | ) | | | (11,563 | ) | | | -4.71 | % |
| | | Morgan Stanley & Co. LLC | | 12/16/2020 | | USD | | | | (1,353,719 | ) | CAD | | | | (1,346,210 | ) | | | (7,509 | ) | | | -17.64 | % |
| | | Morgan Stanley & Co. LLC | | 12/16/2020 | | USD | | | | (637,232 | ) | CHF | | | | (634,773 | ) | | | (2,458 | ) | | | -8.32 | % |
| | | Morgan Stanley & Co. LLC | | 12/16/2020 | | PLN | | | | (474,381 | ) | EUR | | | | (468,606 | ) | | | (5,775 | ) | | | -6.14 | % |
| | | Morgan Stanley & Co. LLC | | 12/16/2020 | | TRY | | | | (347,811 | ) | EUR | | | | (334,467 | ) | | | (13,344 | ) | | | -4.38 | % |
| | | Morgan Stanley & Co. LLC | | 12/16/2020 | | USD | | | | (1,640,833 | ) | EUR | | | | (1,628,327 | ) | | | (12,506 | ) | | | -21.34 | % |
| | | Morgan Stanley & Co. LLC | | 12/16/2020 | | USD | | | | (985,343 | ) | GBP | | | | (988,078 | ) | | | 2,735 | | | | -12.95 | % |
| | | Morgan Stanley & Co. LLC | | 12/16/2020 | | USD | | | | (387,485 | ) | HUF | | | | (380,063 | ) | | | (7,422 | ) | | | -4.98 | % |
| | | Morgan Stanley & Co. LLC | | 12/16/2020 | | USD | | | | (604,266 | ) | ILS | | | | (608,885 | ) | | | 4,619 | | | | -7.98 | % |
| | | Morgan Stanley & Co. LLC | | 12/16/2020 | | USD | | | | (990,443 | ) | INR | | | | (983,874 | ) | | | (6,570 | ) | | | -12.89 | % |
| | | Morgan Stanley & Co. LLC | | 12/16/2020 | | AUD | | | | (827,823 | ) | JPY | | | | (838,041 | ) | | | 10,218 | | | | -10.98 | % |
| | | Morgan Stanley & Co. LLC | | 12/16/2020 | | USD | | | | (417,425 | ) | JPY | | | | (421,034 | ) | | | 3,609 | | | | -5.52 | % |
| | | Morgan Stanley & Co. LLC | | 12/16/2020 | | USD | | | | (254,686 | ) | NOK | | | | (246,709 | ) | | | (7,976 | ) | | | -3.23 | % |
| | | Morgan Stanley & Co. LLC | | 12/16/2020 | | USD | | | | (550,225 | ) | NZD | | | | (549,136 | ) | | | (1,090 | ) | | | -7.20 | % |
| | | Morgan Stanley & Co. LLC | | 12/16/2020 | | USD | | | | (276,807 | ) | PHP | | | | (277,793 | ) | | | 986 | | | | -3.64 | % |
| | | Morgan Stanley & Co. LLC | | 12/16/2020 | | EUR | | | | (959,025 | ) | PLN | | | | (932,729 | ) | | | (26,296 | ) | | | -12.22 | % |
| | | Morgan Stanley & Co. LLC | | 12/16/2020 | | USD | | | | (526,885 | ) | PLN | | | | (514,050 | ) | | | (12,835 | ) | | | -6.74 | % |
| | | Morgan Stanley & Co. LLC | | 12/16/2020 | | USD | | | | (575,109 | ) | RUB | | | | (561,904 | ) | | | (13,205 | ) | | | -7.36 | % |
| | | Morgan Stanley & Co. LLC | | 12/16/2020 | | USD | | | | (560,227 | ) | SEK | | | | (558,569 | ) | | | (1,658 | ) | | | -7.32 | % |
| | | Morgan Stanley & Co. LLC | | 12/16/2020 | | USD | | | | (1,184,280 | ) | SGD | | | | (1,182,753 | ) | | | (1,527 | ) | | | -15.50 | % |
| | | Morgan Stanley & Co. LLC | | 12/16/2020 | | EUR | | | | (546,082 | ) | TRY | | | | (507,335 | ) | | | (38,747 | ) | | | -6.65 | % |
| | | Morgan Stanley & Co. LLC | | 12/16/2020 | | USD | | | | (497,568 | ) | TRY | | | | (459,139 | ) | | | (38,429 | ) | | | -6.02 | % |
| OUTSTANDING FORWARD FOREIGN CURRENCY CONTRACTS Total | | | | (17,035,297 | ) | | | | | | | -223.22 | % |
| TOTAL SHORT | | | | (17,035,297 | ) | | | | | | | | |
| | | | | | | | | | | | | | | | | | | | | | | | | | |
| REMAINING SECURITIES AND CASH | | | | 2,705,778 | | | | | | | | | |
| Grand Total | | | | $ | 7,631,629 | | | | | | | | | |
See Notes to Financial Statements.
14
| Highland Resolute Fund | Consolidated Schedule of Investments |
October 31, 2020 (Unaudited)
MELCHIOR SEGREGATED PORTFOLIO
| Description | | Contracts/ Shares | | Notional Value | | | Value | | | Percentage of Value | | | Counterparty | | Floating Rate/Fixed Rate Amount paid by Fund | | Reference Rate | | Termination Date | | Unrealized Gain (Loss) | |
| LONG SECURITIES EQUITY SWAPS | | | | | | | | | | | | | | | | | | | | | | | | | | |
| ASML HOLDING NV (EOE) | | | | $ | 874,243 | | | $ | 922,747 | | | | 2.87 | % | | Morgan Stanley & Co. LLC | | 55 bps bps + 1M EURIB | | -52 bps | | 3/26/2021 | | $ | (48,504 | ) |
| ASR NEDERLAND NV | | | | | 990,601 | | | | 1,096,406 | | | | 3.41 | % | | Morgan Stanley & Co. LLC | | 55 bps bps + 1M EURIB | | -52 bps | | 3/26/2021 | | | (105,805 | ) |
| AVON RUBBER PLC(LSE) | | | | | 484,533 | | | | 765,992 | | | | 2.38 | % | | Morgan Stanley & Co. LLC | | 55 bps bps + 1M LIBOR | | 5 bps | | 3/26/2021 | | | (281,459 | ) |
| BEFESA SA(GER) | | | | | 425,287 | | | | 485,376 | | | | 1.51 | % | | Morgan Stanley & Co. LLC | | 55 bps bps + 1M EURIB | | -52 bps | | 3/25/2021 | | | (60,089 | ) |
| BOOHOO GROUP PLC | | | | | 1,703,278 | | | | 1,808,353 | | | | 5.62 | % | | Morgan Stanley & Co. LLC | | 55 bps bps + 1M LIBOR | | 4 bps | | 3/26/2021 | | | (105,075 | ) |
| CARREFOUR SA(PAR) | | | | | 1,405,217 | | | | 1,368,947 | | | | 4.25 | % | | Morgan Stanley & Co. LLC | | 55 bps bps + 1M EURIB | | -55 bps | | 3/26/2021 | | | 36,270 | |
| CERVED GROUP SPA | | | | | 569,995 | | | | 517,131 | | | | 1.61 | % | | Morgan Stanley & Co. LLC | | 55 bps bps + 1M EURIB | | -52 bps | | 3/26/2021 | | | 52,864 | |
| CRH PLC(ISE) | | | | | 341,032 | | | | 372,765 | | | | 1.16 | % | | Morgan Stanley & Co. LLC | | 55 bps bps + 1M EURIB | | -52 bps | | 3/26/2021 | | | (31,733 | ) |
| ERSTE GROUP BANK AG(VIE) | | | | | 661,831 | | | | 531,019 | | | | 1.65 | % | | Morgan Stanley & Co. LLC | | 55 bps bps + 1M EURIB | | -52 bps | | 3/26/2021 | | | 130,812 | |
| FERGUSON PLC | | | | | 518,982 | | | | 754,642 | | | | 2.34 | % | | Morgan Stanley & Co. LLC | | 55 bps bps + 1M LIBOR | | 5 bps | | 3/26/2021 | | | (235,660 | ) |
| FINECOBANK SPA(MIL) | | | | | 807,670 | | | | 1,032,556 | | | | 3.21 | % | | Morgan Stanley & Co. LLC | | 55 bps bps + 1M EURIB | | -52 bps | | 3/26/2021 | | | (224,885 | ) |
| FLUIDRA SA(MAD) | | | | | 144,510 | | | | 169,164 | | | | 0.53 | % | | Morgan Stanley & Co. LLC | | 55 bps bps + 1M EURIB | | -52 bps | | 3/26/2021 | | | (24,654 | ) |
| GAMES WORKSHOP GROUP PLC(LSE) | | | | | 436,211 | | | | 810,703 | | | | 2.52 | % | | Morgan Stanley & Co. LLC | | 55 bps bps + 1M LIBOR | | 5 bps | | 3/26/2021 | | | (374,492 | ) |
| GVS SPA(MIL) | | | | | 580,118 | | | | 690,130 | | | | 2.14 | % | | Morgan Stanley & Co. LLC | | 55 bps bps + 1M EURIB | | -52 bps | | 3/26/2021 | | | (110,011 | ) |
| HOWDEN JOINERY GROUP PLC | | | | | 463,065 | | | | 555,120 | | | | 1.72 | % | | Morgan Stanley & Co. LLC | | 55 bps bps + 1M LIBOR | | 5 bps | | 3/26/2021 | | | (92,055 | ) |
| INMOBILIARIA COLONIAL SOCIMI | | | | | 966,810 | | | | 766,245 | | | | 2.38 | % | | Morgan Stanley & Co. LLC | | 55 bps bps + 1M EURIB | | -52 bps | | 3/26/2021 | | | 200,565 | |
| INTERMEDIATE CAPITAL GROUP(LSE) | | | | | 232,947 | | | | 193,361 | | | | 0.60 | % | | Morgan Stanley & Co. LLC | | 55 bps bps + 1M LIBOR | | 5 bps | | 3/26/2021 | | | 39,586 | |
| INTERTRUST NV | | | | | 542,990 | | | | 502,589 | | | | 1.56 | % | | Morgan Stanley & Co. LLC | | 55 bps bps + 1M EURIB | | -52 bps | | 3/26/2021 | | | 40,402 | |
| JUPITER FUND MANAGEMENT(LSE) | | | | | 430,372 | | | | 473,918 | | | | 1.47 | % | | Morgan Stanley & Co. LLC | | 55 bps bps + 1M LIBOR | | 5 bps | | 3/26/2021 | | | (43,546 | ) |
| KORIAN(PAR) | | | | | 769,649 | | | | 651,408 | | | | 2.02 | % | | Morgan Stanley & Co. LLC | | 55 bps bps + 1M EURIB | | -55 bps | | 3/26/2021 | | | 118,241 | |
| LAMDA DEVELOPMENT SA(ATH) | | | | | 363,828 | | | | 326,273 | | | | 1.01 | % | | Morgan Stanley & Co. LLC | | 175 bps bps + 1M EURIB | | -52 bps | | 2/23/2022 | | | 37,555 | |
| LONZA GROUP AG-REG | | | | | 319,435 | | | | 447,799 | | | | 1.39 | % | | Morgan Stanley & Co. LLC | | 55 bps bps + 1M LIBOR | | -81 bps | | 3/26/2021 | | | (128,364 | ) |
| MUSTI GROUP OY | | | | | 685,370 | | | | 812,163 | | | | 2.52 | % | | Morgan Stanley & Co. LLC | | 55 bps bps + 1M EURIB | | -52 bps | | 3/26/2021 | | | (126,793 | ) |
| PIAGGIO & C. S.P.A. | | | | | 305,002 | | | | 369,365 | | | | 1.15 | % | | Morgan Stanley & Co. LLC | | 55 bps bps + 1M EURIB | | -52 bps | | 3/26/2021 | | | (64,363 | ) |
| PROSEGUR CASH SA | | | | | 386,817 | | | | 245,299 | | | | 0.76 | % | | Morgan Stanley & Co. LLC | | 55 bps bps + 1M EURIB | | -55 bps | | 3/26/2021 | | | 141,518 | |
| PRUDENTIAL PLC | | | | | 403,492 | | | | 325,452 | | | | 1.01 | % | | Morgan Stanley & Co. LLC | | 55 bps bps + 1M LIBOR | | 5 bps | | 3/26/2021 | | | 78,041 | |
| RECKITT BENCKISER GROUP PLC(LSE) | | | | | 1,839,246 | | | | 1,789,818 | | | | 5.56 | % | | Morgan Stanley & Co. LLC | | 55 bps bps + 1M LIBOR | | 5 bps | | 3/26/2021 | | | 49,429 | |
| ROBERTET SA | | | | | 746,572 | | | | 918,277 | | | | 2.85 | % | | Morgan Stanley & Co. LLC | | 55 bps bps + 1M EURIB | | -52 bps | | 3/26/2021 | | | (171,705 | ) |
| ROCHE HOLDING AG-GENUSSCHEIN(VTX) | | | | | 2,331,016 | | | | 2,130,981 | | | | 6.62 | % | | Morgan Stanley & Co. LLC | | 55 bps bps + 1M LIBOR | | -81 bps | | 3/26/2021 | | | 200,035 | |
| SOFTWARE AG | | | | | 554,730 | | | | 474,265 | | | | 1.47 | % | | Morgan Stanley & Co. LLC | | 55 bps bps + 1M EURIB | | -52 bps | | 3/25/2021 | | | 80,465 | |
| SOFTWAREONE HOLDING AG | | | | | 691,204 | | | | 651,319 | | | | 2.02 | % | | Morgan Stanley & Co. LLC | | 55 bps bps + 1M LIBOR | | -81 bps | | 3/26/2021 | | | 39,886 | |
| TOMTOM NV(EOE) | | | | | 247,380 | | | | 190,834 | | | | 0.59 | % | | Morgan Stanley & Co. LLC | | 55 bps bps + 1M EURIB | | -52 bps | | 3/26/2021 | | | 56,545 | |
| VIVENDI(PAR) | | | | | 980,386 | | | | 1,240,985 | | | | 3.86 | % | | Morgan Stanley & Co. LLC | | 55 bps bps + 1M EURIB | | -52 bps | | 3/26/2021 | | | (260,599 | ) |
| WORLDLINE SA(PAR) | | | | | 696,714 | | | | 618,821 | | | | 1.92 | % | | Morgan Stanley & Co. LLC | | 55 bps bps + 1M EURIB | | -52 bps | | 3/26/2021 | | | 77,893 | |
| EQUITY SWAPS Total | | | | | 23,900,535 | | | | 25,010,221 | | | | 77.70 | % | | | | | | | | | | | | |
| TOTAL LONG | | | | | | | | | 25,010,221 | | | | | | | | | | | | | | | | | |
See Notes to Financial Statements.
| Semi-Annual Report | October 31, 2020 | 15 |
| Highland Resolute Fund | Consolidated Schedule of Investments |
October 31, 2020 (Unaudited)
| Description | | Contracts/ Shares | | Notional Value | | | Value | | | Percentage of Value | | | Counterparty | | Floating Rate/Fixed Rate Amount paid by Fund | | Reference Rate | | Termination Date | | Unrealized Gain (Loss) | |
| SECURITIES SOLD SHORT | | | | | | | | | | | | | | | | | | | | | | | | | | |
| EQUITY SWAPS | | | | | | | | | | | | | | | | | | | | | | | | | | |
| ARCADIS NV | | | | $ | (141,244 | ) | | $ | (174,510 | ) | | | -0.54 | % | | Morgan Stanley & Co. LLC | | 1D EONIA bps -75 bps | | -47 bps | | 3/26/2021 | | $ | 33,266 | |
| AZIMUT HOLDING SPA | | | | | (223,357 | ) | | | (195,199 | ) | | | -0.61 | % | | Morgan Stanley & Co. LLC | | 1D EONIA bps -50 bps | | -47 bps | | 3/26/2021 | | | (28,158 | ) |
| BLUE PRISM GROUP PLC | | | | | (510,800 | ) | | | (587,089 | ) | | | -1.82 | % | | Morgan Stanley & Co. LLC | | 1D SONIA bps -212.5 bps | | 5 bps | | 3/26/2021 | | | 76,289 | |
| DECHRA PHARMACEUTICALS PLC | | | | | (262,887 | ) | | | (363,612 | ) | | | -1.13 | % | | Morgan Stanley & Co. LLC | | 1D SONIA bps -35 bps | | 5 bps | | 3/26/2021 | | | 100,725 | |
| DJS MID 200 PR | | | | | (3,525,543 | ) | | | (3,379,135 | ) | | | -10.50 | % | | Morgan Stanley & Co. LLC | | 1D EONIA bps -45 bps | | -47 bps | | 7/29/2022 | | | (146,408 | ) |
| DOW JONES STOXX INSURANCE (PRI | | | | | (358,075 | ) | | | (322,945 | ) | | | -1.00 | % | | Morgan Stanley & Co. LLC | | 1D EONIA bps -45 bps | | -47 bps | | 7/29/2022 | | | (35,130 | ) |
| FEVERTREE DRINKS PLC | | | | | (344,805 | ) | | | (299,595 | ) | | | -0.93 | % | | Morgan Stanley & Co. LLC | | 1D SONIA bps -35 bps | | 5 bps | | 3/26/2021 | | | (45,210 | ) |
| KERRY GROUP PLC-A(ISE) | | | | | (716,204 | ) | | | (666,262 | ) | | | -2.07 | % | | Morgan Stanley & Co. LLC | | 1D EONIA bps -35 bps | | -47 bps | | 3/26/2021 | | | (49,942 | ) |
| NETCOMPANY GROUP AS | | | | | (323,578 | ) | | | (308,197 | ) | | | -0.96 | % | | Morgan Stanley & Co. LLC | | 1W CIBOR bps -50 bps | | -37 bps | | 10/31/2022 | | | (15,381 | ) |
| OESTERREICHISCHE POST AG | | | | | (331,352 | ) | | | (301,401 | ) | | | -0.94 | % | | Morgan Stanley & Co. LLC | | 1D EONIA bps -775 bps | | -47 bps | | 3/26/2021 | | | (29,951 | ) |
| ORPEA(PAR) | | | | | (322,023 | ) | | | (259,138 | ) | | | -0.81 | % | | Morgan Stanley & Co. LLC | | 1D EONIA bps -40 bps | | -47 bps | | 3/26/2021 | | | (62,885 | ) |
| SOLARIA ENERGIA Y MEDIO AMBI | | | | | (992,967 | ) | | | (950,122 | ) | | | -2.95 | % | | Morgan Stanley & Co. LLC | | 1D EONIA bps -50 bps | | -47 bps | | 3/26/2021 | | | (42,845 | ) |
| STOXX-DJ SMALL 200 PRICE | | | | | (2,581,141 | ) | | | (2,443,583 | ) | | | -7.59 | % | | Morgan Stanley & Co. LLC | | 1D EONIA bps -66.14614 bps | | -47 bps | | 7/29/2022 | | | (137,558 | ) |
| TEMENOS AG - REG | | | | | (353,801 | ) | | | (264,640 | ) | | | -0.82 | % | | Morgan Stanley & Co. LLC | | 1D SARON bps -40 bps | | -72 bps | | 3/26/2021 | | | (89,160 | ) |
| VARTA AG | | | | | (653,873 | ) | | | (621,405 | ) | | | -1.93 | % | | Morgan Stanley & Co. LLC | | 1D EONIA bps -3400 bps | | -47 bps | | 3/25/2021 | | | (32,468 | ) |
| EQUITY SWAPS Total | | | | | (11,641,651 | ) | | | (11,136,835 | ) | | | -34.60 | % | | | | | | | | | | | | |
| | | | | | | | | | | | | | | | | | | | | | | | | | | |
| INDEX FUTURE CONTRACTS | | | | | | | | | | | | | | | | | | | | | | | | | | |
| EURO STOXX 50 DEC20 | | -103.90 | | | | | | | 295,270 | | | | 0.92 | % | | Morgan Stanley & Co. LLC | | | | | | | | | | |
| INDEX FUTURE CONTRACTS Total | | | | | | | | | 295,270 | | | | 0.92 | % | | | | | | | | | | | | |
| | | | | | | | | | | | | | | | | | | | | | | | | | | |
| TOTAL SHORT | | | | | | | | | (10,841,565 | ) | | | -33.68 | % | | | | | | | | | | | | |
| | | | | | | | | | | | | | | | | | | | | | | | | | | |
| REMAINING SECURITIES AND CASH | | | | | | | | | 18,019,519 | | | | -55.98 | % | | | | | | | | | | | | |
| Grand Total | | | | | | | | $ | 32,188,175 | | | | | | | | | | | | | | | | | |
See Notes to Financial Statements.
16
| Highland Resolute Fund | Consolidated Schedule of Investments |
October 31, 2020 (Unaudited)
PSAM HIGHLAND
| Description | | Contracts/ Shares | | Notional Value | | | Value | | | Percentage of Value | | | Counterparty | | | Floating Rate/Fixed Rate Amount paid by Fund | | Reference Rate | | Termination Date | | Unrealized Gain (Loss) |
| LONG SECURITIES | | | | | | | | | | | | | | | | | | | | | | | | | |
| COMMON STOCKS | | | | | | | | | | | | | | | | | | | | | | | | | |
| AJAX I | | 11,190 | | | | | | $ | 112,798 | | | | 0.32 | % | | | | | | | | | | | |
| CC NEUBERGER PRINCIPAL-CL A | | 13,431 | | | | | | | 132,022 | | | | 0.38 | % | | | | | | | | | | | |
| CF FINANCE ACQUISITION CORP | | 14,294 | | | | | | | 141,371 | | | | 0.41 | % | | | | | | | | | | | |
| CORELOGIC INC | | 8,543 | | | | | | | 657,247 | | | | 1.89 | % | | | | | | | | | | | |
| CROWN HOLDINGS | | 8,059 | | | | | | | 691,489 | | | | 1.99 | % | | | | | | | | | | | |
| DARLING INGREDIENTS INC | | 10,856 | | | | | | | 466,798 | | | | 1.34 | % | | | | | | | | | | | |
| ENERGY HARBOR CORP | | 34,419 | | | | | | | 688,390 | | | | 1.98 | % | | | | | | | | | | | |
| FIRSTENERGY CORP | | 15,452 | | | | | | | 459,247 | | | | 1.32 | % | | | | | | | | | | | |
| GS ACQUISITION HOLDINGS-A | | 15,771 | | | | | | | 156,925 | | | | 0.45 | % | | | | | | | | | | | |
| HP INC | | 6,476 | | | | | | | 116,303 | | | | 0.33 | % | | | | | | | | | | | |
| HUDSON EXECUTIVE INVEST-CL A | | 16,800 | | | | | | | 162,455 | | | | 0.47 | % | | | | | | | | | | | |
| KANSAS CITY SOUTHERN | | 2,513 | | | | | | | 442,601 | | | | 1.27 | % | | | | | | | | | | | |
| L BRANDS | | 3,516 | | | | | | | 112,536 | | | | 0.32 | % | | | | | | | | | | | |
| MCKESSON EUROPE AG | | 46,253 | | | | | | | 1,400,643 | | | | 4.02 | % | | | | | | | | | | | |
| MYOKARDIA INC | | 4,204 | | | | | | | 939,756 | | | | 2.70 | % | | | | | | | | | | | |
| PRIMO WATER ORD | | 40,507 | | | | | | | 507,554 | | | | 1.46 | % | | | | | | | | | | | |
| RESIDEO TECHNOLOGIES INC-W/I | | 49,990 | | | | | | | 503,897 | | | | 1.45 | % | | | | | | | | | | | |
| TIFFANY & CO | | 19,442 | | | | | | | 2,543,746 | | | | 7.31 | % | | | | | | | | | | | |
| VARIAN MEDICAL | | 9,753 | | | | | | | 1,685,307 | | | | 4.84 | % | | | | | | | | | | | |
| WRIGHT MEDICAL GROUP NV | | 83,897 | | | | | | | 2,566,415 | | | | 7.37 | % | | | | | | | | | | | |
| XPO LOGISTICS INC | | 6,606 | | | | | | | 594,523 | | | | 1.71 | % | | | | | | | | | | | |
| COMMON STOCKS Total | | | | | | | | | 15,082,023 | | | | 43.33 | % | | | | | | | | | | | |
| | | | | | | | | | | | | | | | | | | | | | | | | | |
| CORPORATE BONDS | | | | | | | | | | | | | | | | | | | | | | | | | |
| BBDBCN 6 15OCT2022 144A | | 342,296 | | | | | | | 309,835 | | | | 0.89 | % | | | | | | | | | | | |
| BBDBCN 6.125 15JAN2023 144A | | 695,760 | | | | | | | 605,894 | | | | 1.74 | % | | | | | | | | | | | |
| BWA 5 01OCT2025 144A | | 231,176 | | | | | | | 269,470 | | | | 0.77 | % | | | | | | | | | | | |
| FINRSK 6.25 15MAY2026 144A | | 171,986 | | | | | | | 188,659 | | | | 0.54 | % | | | | | | | | | | | |
| FINRSK 8.25 15NOV2026 144A | | 1,158,112 | | | | | | | 1,304,661 | | | | 3.75 | % | | | | | | | | | | | |
| GARSRL 5.125 15OCT2026 144A | | 335,037 | | | | | | | 378,999 | | | | 1.09 | % | | | | | | | | | | | |
| GNW FRN 15NOV2036 | | 553,370 | | | | | | | 216,406 | | | | 0.62 | % | | | | | | | | | | | |
| GTT 7.875 31DEC2024 144A | | 493,621 | | | | | | | 251,115 | | | | 0.72 | % | | | | | | | | | | | |
| HTZ 5.5 15OCT2024 144A | | 886,732 | | | | | | | 352,475 | | | | 1.01 | % | | | | | | | | | | | |
| HTZ 5.5 30MAR2023 REGS | | 111,679 | | | | | | | 111,801 | | | | 0.32 | % | | | | | | | | | | | |
| HTZ 6 15JAN2028 144A | | 332,804 | | | | | | | 131,180 | | | | 0.38 | % | | | | | | | | | | | |
See Notes to Financial Statements.
| Semi-Annual Report | October 31, 2020 | 17 |
| Highland Resolute Fund | Consolidated Schedule of Investments |
October 31, 2020 (Unaudited)
| Description | | Contracts/ Shares | | Notional Value | | | Value | | | Percentage of Value | | | Counterparty | | Floating Rate/Fixed Rate Amount paid by Fund | | Reference Rate | | Termination Date | | Unrealized Gain (Loss) | |
| CORPORATE BONDS (CONTINUED) | | | | | | | | | | | | | | | | | | | | | | | | | | |
| LB 6.875 01NOV2035 | | 827,542 | | | | | | $ | 867,441 | | | | 2.49 | % | | | | | | | | | | | | |
| LB 7.5 15JUN2029 | | 233,409 | | | | | | | 256,944 | | | | 0.74 | % | | | | | | | | | | | | |
| NBR 5.75 01FEB2025 | | 413,212 | | | | | | | 119,574 | | | | 0.34 | % | | | | | | | | | | | | |
| NEWLSQ 15.5 01NOV2023 144A | | 1,145,827 | | | | | | | 1,093,914 | | | | 3.14 | % | | | | | | | | | | | | |
| NEWLSQ 17.5 01MAY2024 144A | | 140,716 | | | | | | | 106,084 | | | | 0.30 | % | | | | | | | | | | | | |
| NUGGET 6.75 15OCT2024 144A | | 732,615 | | | | | | | 622,173 | | | | 1.79 | % | | | | | | | | | | | | |
| PCG 4.75 15FEB2044 | | 290,366 | | | | | | | 303,428 | | | | 0.87 | % | | | | | | | | | | | | |
| PUERTO RICO ELECTRIC POWER AUTH SER WW-R | | 153,559 | | | | | | | 106,647 | | | | 0.31 | % | | | | | | | | | | | | |
| UNIT 8.25 15OCT2023 | | 606,417 | | | | | | | 598,973 | | | | 1.72 | % | | | | | | | | | | | | |
| CORPORATE BONDS Total | | | | | | | | | 8,195,674 | | | | 23.55 | % | | | | | | | | | | | | |
| | | | | | | | | | | | | | | | | | | | | | | | | | | |
| EQUITY SWAPS | | | | | | | | | | | | | | | | | | | | | | | | | | |
| AMPOL LTD | | | | $ | 388,967 | | | | 294,354 | | | | 0.85 | % | | Morgan Stanley & Co. LLC | | 55 bps bps + 1M BBSW- | | 9 bps | | 12/15/2020 | | $ | 94,613 | |
| SHIMACHU CO LTD | | | | | 797,174 | | | | 1,032,484 | | | | 2.97 | % | | Morgan Stanley & Co. LLC | | 55 bps bps + 1M LIBOR | | -8 bps | | 11/24/2021 | | | (235,310 | ) |
| VODAFONE GROUP PLC | | | | | 865,755 | | | | 688,545 | | | | 1.98 | % | | Morgan Stanley & Co. LLC | | 65 bps bps + 1D SONIA | | 5 bps | | 12/15/2021 | | | 177,209 | |
| EQUITY SWAPS Total | | | | | 2,051,895 | | | | 2,015,383 | | | | 5.79 | % | | | | | | | | | | | | |
| TOTAL LONG | | | | | | | | | 25,293,079 | | | | 72.67 | % | | | | | | | | | | | | |
| | | | | | | | | | | | | | | | | | | | | | | | | | | |
| SECURITIES SOLD SHORT | | | | | | | | | | | | | | | | | | | | | | | | | | |
| COMMON STOCKS | | | | | | | | | | | | | | | | | | | | | | | | | | |
| AVIS BUDGET GROUP | | (3,387 | ) | | | | | | (114,047 | ) | | | -0.33 | % | | | | | | | | | | | | |
| SPDR S&P 500 ETF TRUST | | (4,699 | ) | | | | | | (1,534,377 | ) | | | -4.41 | % | | | | | | | | | | | | |
| COMMON STOCKS Total | | | | | | | | | (1,648,424 | ) | | | -4.74 | % | | | | | | | | | | | | |
| | | | | | | | | | | | | | | | | | | | | | | | | | | |
| CORPORATE BONDS | | | | | | | | | | | | | | | | | | | | | | | | | | |
| EIX 3.65 01FEB2050 | | (144,066 | ) | | | | | | (151,306 | ) | | | -0.43 | % | | | | | | | | | | | | |
| FE 3.4 01MAR2050 | | (177,011 | ) | | | | | | (163,591 | ) | | | -0.47 | % | | | | | | | | | | | | |
| HBI 4.875 15MAY2026 144A | | (89,902 | ) | | | | | | (98,958 | ) | | | -0.28 | % | | | | | | | | | | | | |
| CORPORATE BONDS Total | | | | | | | | | (413,855 | ) | | | -1.19 | % | | | | | | | | | | | | |
| | | | | | | | | | | | | | | | | | | | | | | | | | | |
| EQUITY SWAPS | | | | | | | | | | | | | | | | | | | | | | | | | | |
| PEUGEOT S.A. | | | | | (1,261,859 | ) | | | (1,013,655 | ) | | | -2.91 | % | | Morgan Stanley & Co. LLC | | 1D EONIA bps -40 bps | | -47 bps | | 12/15/2021 | | | -248,203 | |
| EQUITY SWAPS Total | | | | | (1,261,859 | ) | | | (1,013,655 | ) | | | -2.91 | % | | | | | | | | | | | | |
| | | | | | | | | | | | | | | | | | | | | | | | | | | |
| TOTAL SHORT | | | | | | | | | (3,075,935 | ) | | | -8.84 | % | | | | | | | | | | | | |
| | | | | | | | | | | | | | | | | | | | | | | | | | | |
| REMAINING SECURITIES AND CASH | | | | | | | | | 12,586,421 | | | | 36.16 | % | | | | | | | | | | | | |
| Grand Total | | | | | | | | $ | 34,803,565 | | | | | | | | | | | | | | | | | |
See Notes to Financial Statements.
18
| Highland Resolute Fund | Consolidated Schedule of Investments |
October 31, 2020 (Unaudited)
WABR
| Description | | Contracts/ Shares | | | Value | | | Percentage of Value | |
| LONG SECURITIES | | | | | | | | | | | | |
| COMMON STOCKS | | | | | | | | | | | | |
| ACTIVISION BLIZZARD ORD (NMS) | | | 1,440 | | | $ | 109,050 | | | | 0.42 | % |
| ALPHABET CL A ORD (NMS) | | | 76 | | | | 122,824 | | | | 0.47 | % |
| AMERICOLD REALTY ORD (NYS) | | | 2,818 | | | | 102,096 | | | | 0.39 | % |
| APPLE ORD (NMS) | | | 905 | | | | 98,518 | | | | 0.38 | % |
| AVAYA HOLDINGS ORD (NYS) | | | 8,193 | | | | 140,920 | | | | 0.54 | % |
| CM LIFE SCIENCES CL A ORD (NMS) | | | 15,610 | | | | 148,451 | | | | 0.57 | % |
| DUPONT DE NEMOURS ORD (NYS) | | | 1,903 | | | | 108,243 | | | | 0.41 | % |
| HITACHI ORD (TYO) | | | 3,073 | | | | 102,810 | | | | 0.39 | % |
| ISHARES IBOXX HIGH YIELD BOND ETF (PSE) | | | 37,644 | | | | 3,157,579 | | | | 12.07 | % |
| ISHARES IBOXX INVT GRADE BOND ETF (PSE) | | | 23,404 | | | | 3,129,817 | | | | 11.96 | % |
| KANSAS CITY SOUTHERN ORD (NYS) | | | 1,317 | | | | 231,977 | | | | 0.89 | % |
| KNIGHT SWIFT TRANSPRTATN CL A ORD (NYS) | | | 3,766 | | | | 143,071 | | | | 0.55 | % |
| LIVERAMP HOLDINGS ORD (NYS) | | | 1,568 | | | | 103,629 | | | | 0.40 | % |
| MICRON TECHNOLOGY ORD (NMS) | | | 2,021 | | | | 101,737 | | | | 0.39 | % |
| MICROSOFT ORD (NMS) | | | 852 | | | | 172,504 | | | | 0.66 | % |
| MYOKARDIA ORD (NMQ) | | | 549 | | | | 122,718 | | | | 0.47 | % |
| NEXTERA ENERGY ORD (NYS) | | | 1,666 | | | | 121,967 | | | | 0.47 | % |
| NORFOLK SOUTHERN ORD (NYS) | | | 520 | | | | 108,741 | | | | 0.42 | % |
| NXP SEMICONDUCTORS ORD (NMS) | | | 1,063 | | | | 143,632 | | | | 0.55 | % |
| PIEDMONT OFFICE REIT CL A ORD (NYS) | | | 9,223 | | | | 105,327 | | | | 0.40 | % |
| PNM RESOURCES ORD (NYS) | | | 2,001 | | | | 100,050 | | | | 0.38 | % |
| QUALCOMM ORD (NMS) | | | 1,338 | | | | 165,056 | | | | 0.63 | % |
| SPIRIT REALTY CAPITAL REIT ORD (NYS) | | | 3,479 | | | | 104,544 | | | | 0.40 | % |
| SYNNEX ORD (NYS) | | | 916 | | | | 120,582 | | | | 0.46 | % |
| UNION PACIFIC ORD (NYS) | | | 863 | | | | 152,916 | | | | 0.58 | % |
| VALE ADR REPTG ONE ORD (NYS) | | | 11,028 | | | | 116,566 | | | | 0.45 | % |
| VERTIV HOLDINGS CL A ORD (NYS) | | | 6,031 | | | | 106,448 | | | | 0.41 | % |
| VIRGIN GALACTIC HOLDINGS CL A ORD (NYS) | | | 5,909 | | | | 102,934 | | | | 0.39 | % |
| XPO LOGISTICS ORD (NYS) | | | 1,278 | | | | 115,020 | | | | 0.44 | % |
| COMMON STOCKS Total | | | | | | | 9,659,727 | | | | 36.92 | % |
| | | | | | | | | | | | | |
| CORPORATE BONDS | | | | | | | | | | | | |
| BESPL EMTN 0.0000% 2021-01-15 | | | 700,000 | | | | 196,321 | | | | 0.75 | % |
| CORPORATE BONDS Total | | | | | | | 196,321 | | | | 0.75 | % |
| | | | | | | | | | | | | |
| TOTAL LONG | | | | | | | 9,856,048 | | | | 37.67 | % |
| | | | | | | | | | | | | |
| SECURITIES SOLD SHORT | | | | | | | | | | | | |
| COMMON STOCKS | | | | | | | | | | | | |
| ABBVIE ORD (NYS) | | | (1,175 | ) | | | (99,992 | ) | | | -0.38 | % |
| CONSOLIDATED EDISON ORD (NYS) | | | (1,482 | ) | | | (116,322 | ) | | | -0.44 | % |
| ELECTRONIC ARTS ORD (NMS) | | | (917 | ) | | | (109,885 | ) | | | -0.42 | % |
| FITBIT CL A ORD (NYS) | | | (19,379 | ) | | | (136,428 | ) | | | -0.52 | % |
| HORMEL FOODS ORD (NYS) | | | (2,440 | ) | | | (118,803 | ) | | | -0.45 | % |
| INVSC QQQ TRUST SRS 1 ETF (NMS) | | | (1,754 | ) | | | (472,493 | ) | | | -1.81 | % |
| ISHARES EXPANDED TECH STW SCTR ETF (BAT) | | | (628 | ) | | | (191,314 | ) | | | -0.73 | % |
| ISHARES RUSSELL 2000 ETF (PCQ) | | | (2,542 | ) | | | (389,154 | ) | | | -1.49 | % |
| ISHARES TRANSPORTATION AVERAGE ETF (BAT) | | | (540 | ) | | | (106,169 | ) | | | -0.41 | % |
| ISHARES US TECHNOLOGY ETF (PSE) | | | (802 | ) | | | (234,777 | ) | | | -0.90 | % |
| PROLOGIS REIT (NYS) | | | (1,072 | ) | | | (106,342 | ) | | | -0.41 | % |
See Notes to Financial Statements.
| Semi-Annual Report | October 31, 2020 | 19 |
| Highland Resolute Fund | Consolidated Schedule of Investments |
October 31, 2020 (Unaudited)
| Description | | Contracts/ Shares | | | Value | | | Percentage of Value | |
| Common STOCKS (CONTINUED) | | | | | | | | | | | | |
| SELECT SECTOR HEALTH CARE SPDR ETF (PSE) | | | (966 | ) | | $ | (98,203 | ) | | | -0.38 | % |
| SELECT SECTOR UTI SELECT SPDR ETF (PSE) | | | (3,595 | ) | | | (224,256 | ) | | | -0.86 | % |
| SPDR FUND CONSUMER STAPLES ETF (PSE) | | | (1,935 | ) | | | (120,473 | ) | | | -0.46 | % |
| SPDR S&P 500 ETF (PSE) | | | (2,417 | ) | | | (789,246 | ) | | | -3.02 | % |
| SPDR S&P SEMICONDUCTOR ETF (PSE) | | | (1,592 | ) | | | (210,972 | ) | | | -0.81 | % |
| STORE CAPITAL ORD (NYS) | | | (4,112 | ) | | | (105,678 | ) | | | -0.40 | % |
| TELADOC HEALTH ORD (NYS) | | | (528 | ) | | | (103,731 | ) | | | -0.40 | % |
| VANECK VECTORS SEMICONDUCTOR ETF (NMS) | | | (594 | ) | | | (103,920 | ) | | | -0.40 | % |
| VANGUARD REAL ESTATE ETF (PSE) | | | (2,501 | ) | | | (191,552 | ) | | | -0.73 | % |
| COMMON STOCKS Total | | | | | | | (4,029,710 | ) | | | -15.40 | % |
| | | | | | | | | | | | | |
| TOTAL SHORT | | | | | | | (4,029,710 | ) | | | -15.40 | % |
| | | | | | | | | | | | | |
| REMAINING SECURITIES AND CASH | | | | | | | 20,340,534 | | | | 77.73 | % |
| Grand total | | | | | | $ | 26,166,872 | | | | | |
Common Abbreviations:
AQR - AQR Capital Management LLC.
BBA - British Bankers Association.
EURIBOR - Euro Interbank Offered Rate.
LIBOR - London Interbank Offered Rate.
PIMCO - Pacific Investment Management Company.
S&P - Standard & Poor’s.
SPDR - Standard & Poor’s Depositary Receipt.
Currency Abbreviations:
AUD - Australian Dollar
BRL - Brazilian Real
CAD - Canada Dollar
CHF - Swiss Franc
EUR - Euro
GBP - Great British Pound
HUF - Hungarian Forint
ILS - Israeli New Shekel
INR - Indian Rupee
JPY - Japan Yen
KRW - South Korean Won
MXN - Mexico Peso
NOK - Norwegian Krone
NZD - New Zealand Dollar
PHP - Philippine Peso
PLN - Poland Zloty
RUB - Russian Ruble
SEK - Swedish Krona
SGD - Singapore Dollar
THB - Thailand Baht
TRY - Turkish Lira
USD - United States Dollar
See Notes to Financial Statements.
20
| Highland Resolute Fund | Consolidated Statement of Assets and Liabilities |
October 31, 2020 (Unaudited)
| ASSETS | | | |
| Investments, at value | | $ | 153,255,241 | |
| Unrealized appreciation on total return swap contracts | | | 29 | |
| Deposits with brokers for total return swap contracts and written options | | | 47,339,283 | |
| Foreign currency, at value (Cost $1,143) | | | 1,203 | |
| Receivable for investments sold | | | 58,830 | |
| Dividends receivable | | | 120,930 | |
| Interest receivable | | | 29,654 | |
| Receivable for total return swap reset | | | 329,013 | |
| Other assets | | | 9,455 | |
| Total assets | | | 201,143,638 | |
| LIABILITIES | | | | |
| Written options, at value (Premiums received 248,185) | | | 380,215 | |
| Investment advisory fees payable | | | 13,472 | |
| Shareholder service fees payable | | | 48,592 | |
| Payable for interest expense on total return swap contracts | | | 547,133 | |
| Payable for investments purchased | | | 47,730 | |
| Trustee fees and expenses payable | | | 22,980 | |
| Chief compliance officer fees payable | | | 11,530 | |
| Principal financial officer fees payable | | | 3,053 | |
| Administration fees payable | | | 76,669 | |
| Transfer agency fees payable | | | 973 | |
| Professional fees payable | | | 79,088 | |
| Custody fees payable | | | 23,477 | |
| Accrued expenses and other liabilities | | | 16,052 | |
| Total liabilities | | | 1,270,964 | |
| NET ASSETS | | $ | 199,872,674 | |
| NET ASSETS CONSIST OF | | | | |
| Paid-in capital (Note 6) | | $ | 218,638,930 | |
| Total distributable earnings/(loss) | | | (18,766,256 | ) |
| NET ASSETS | | $ | 199,872,674 | |
| INVESTMENTS, AT COST | | $ | 143,162,661 | |
| PRICING OF SHARES | | | | |
| Class I: | | | | |
| Net Asset Value, offering and redemption price per share | | $ | 9.97 | |
| Net Assets | | $ | 199,872,674 | |
| Shares of beneficial interest outstanding (unlimited number of shares, no par value common stock authorized) | | | 20,046,812 | |
See Notes to Financial Statements.
| Semi-Annual Report | October 31, 2020 | 21 |
| Highland Resolute Fund | Consolidated Statement of Operations |
For the Six Months Ended October 31, 2020 (Unaudited)
| INVESTMENT INCOME | | | |
| Dividends | | $ | 1,333,657 | |
| Interest | | | 191,619 | |
| Total investment income | | | 1,525,276 | |
| | | | | |
| EXPENSES | | | | |
| Investment advisory fees (Note 7) | | | 1,477,392 | |
| Investment advisory fees-subsidiary | | | 126,899 | |
| Administration fees | | | 212,308 | |
| Transfer agency fees | | | 49,690 | |
| Shareholder service fees | | | | |
| Class I | | | 29,425 | |
| Professional fees | | | 39,564 | |
| Custody fees | | | 35,351 | |
| Reports to shareholders and printing fees | | | 3,101 | |
| Trustee fees and expenses | | | 11,259 | |
| Registration/filing fees | | | 13,063 | |
| Chief compliance officer fees | | | 39,319 | |
| Principal financial officer fees | | | 8,166 | |
| Other | | | 17,326 | |
| Total expenses before waivers | | | 2,062,863 | |
| Less fees waived/reimbursed by investment adviser (Note 7) | | | | |
| Class I | | | (1,409,196 | ) |
| Waiver of investment advisory fees - subsidiary (Note 7) | | | (126,899 | ) |
| Total net expenses | | | 526,768 | |
| NET INVESTMENT INCOME | | | 998,508 | |
| Net realized gain on investments | | | 244,106 | |
| Net realized gain on written options | | | 761,364 | |
| Net realized gain on total return swap contracts | | | 3,517,654 | |
| Net realized gain on foreign currency transactions | | | 13,460 | |
| Total net realized gain | | | 4,536,584 | |
| | | | | |
| Net change in unrealized appreciation on investments | | | 8,043,630 | |
| Net change in unrealized depreciation on written options | | | (162,664 | ) |
| Net change in unrealized appreciation on total return swap contracts | | | 3 | |
| Net change in unrealized depreciation on translation of assets and liabilities in foreign currency transactions | | | (106 | ) |
| Total net change in unrealized appreciation | | | 7,880,863 | |
| NET REALIZED AND UNREALIZED GAIN ON INVESTMENTS | | | 12,417,447 | |
| NET INCREASE IN NET ASSETS RESULTING FROM OPERATIONS | | $ | 13,415,955 | |
See Notes to Financial Statements.
22
| Highland Resolute Fund | Consolidated Statements of Changes in Net Assets |
| | | Six Months Ended October 31, 2020 (Unaudited) | | | For the
Year Ended
April 30, 2020 | |
| OPERATIONS | | | | | | | | |
| Net investment income | | $ | 998,508 | | | $ | 5,499,415 | |
| Net realized gain/(loss) | | | 4,536,584 | | | | (37,178,643 | ) |
| Net change in unrealized appreciation | | | 7,880,863 | | | | 1,872,075 | |
| Net increase/(decrease) in net assets resulting from operations | | | 13,415,955 | | | | (29,807,153 | ) |
| TOTAL DISTRIBUTIONS (NOTE 4) | | | | | | | | |
| Class I | | | – | | | | (3,500,019 | ) |
| Net decrease in net assets from distributions | | | – | | | | (3,500,019 | ) |
| BENEFICIAL INTEREST TRANSACTIONS (NOTE 6) | | | | | | | | |
| Shares sold | | | | | | | | |
| Class I | | | 21,122,856 | | | | 9,378,217 | |
| Dividends reinvested | | | | | | | | |
| Class I | | | – | | | | 3,500,019 | |
| Shares redeemed, net of redemption fees | | | | | | | | |
| Class I | | | (14,466,278 | ) | | | (132,205,860 | ) |
| Net increase/(decrease) in net assets derived from beneficial interest transactions | | | 6,656,578 | | | | (119,327,624 | ) |
| Net increase/(decrease) in Net Assets | | | 20,072,533 | | | | (152,634,796 | ) |
| NET ASSETS: | | | | | | | | |
| Beginning of period | | | 179,800,141 | | | | 332,434,937 | |
| End of period | | $ | 199,872,674 | | | $ | 179,800,141 | |
See Notes to Financial Statements.
| Semi-Annual Report | October 31, 2020 | 23 |
| Highland Resolute Fund | Consolidated Financial Highlights |
For a share outstanding throughout the periods presented
| | | Class I | |
| | | For the Six Months Ended October 31, 2020 (Unaudited) | | | For the
Year Ended April 30, 2020 | | | For the
Year Ended April 30, 2019 | | | For the
Year Ended April 30, 2018(a) | | | For the
Year Ended April 30, 2017(b) | | | For the
Year Ended April 30, 2016 | |
| NET ASSET VALUE, BEGINNING OF PERIOD | | $ | 9.28 | | | $ | 10.30 | | | $ | 10.81 | | | $ | 11.14 | | | $ | 10.75 | | | $ | 11.32 | |
| INCOME/(LOSS) FROM OPERATIONS | | | | | | | | | | | | | | | | | | | | | | | | |
| Net investment income(c) | | | 0.05 | | | | 0.19 | | | | 0.20 | | | | 0.25 | | | | 0.09 | | | | 0.16 | |
| Net realized and unrealized gain/(loss) on investments | | | 0.64 | | | | (1.09 | ) | | | (0.22 | ) | | | 0.38 | | | | 0.45 | | | | (0.39 | ) |
| Total from Investment Operations | | | 0.69 | | | | (0.90 | ) | | | (0.02 | ) | | | 0.63 | | | | 0.54 | | | | (0.23 | ) |
| | | | | | | | | | | | | | | | | | | | | | | | | |
| LESS DISTRIBUTIONS | | | | | | | | | | | | | | | | | | | | | | | | |
| Net investment income | | | – | | | | (0.12 | ) | | | (0.15 | ) | | | (0.77 | ) | | | (0.13 | ) | | | (0.18 | ) |
| Net realized gain on investments | | | – | | | | – | | | | (0.34 | ) | | | (0.19 | ) | | | (0.02 | ) | | | (0.16 | ) |
| Total Distributions | | | – | | | | (0.12 | ) | | | (0.49 | ) | | | (0.96 | ) | | | (0.15 | ) | | | (0.34 | ) |
| NET INCREASE/(DECREASE) IN NET ASSET VALUE | | | 0.69 | | | | (1.02 | ) | | | (0.51 | ) | | | (0.33 | ) | | | 0.39 | | | | (0.57 | ) |
| NET ASSET VALUE, END OF PERIOD | | $ | 9.97 | | | $ | 9.28 | | | $ | 10.30 | | | $ | 10.81 | | | $ | 11.14 | | | $ | 10.75 | |
| TOTAL RETURN(d) | | | 7.44 | % | | | (8.65 | )% | | | 0.22 | % | | | 5.51 | % | | | 5.04 | % | | | (2.02 | )% |
| | | | | | | | | | | | | | | | | | | | | | | | | |
| RATIOS/SUPPLEMENTAL DATA | | | | | | | | | | | | | | | | | | | | | | | | |
| Net assets, End of Period (000s) | | $ | 199,873 | | | $ | 179,800 | | | $ | 332,435 | | | $ | 373,865 | | | $ | 491,811 | | | $ | 686,659 | |
| RATIOS TO AVERAGE NET ASSETS: | | | | | | | | | | | | | | | | | | | | | | | | |
| Operating expenses excluding reimbursement/waiver(e) | | | 1.96 | %(f) | | | 1.90 | %(g)(h) | | | 1.89 | %(g)(h) | | | 1.94 | %(g)(h) | | | 1.77 | %(g)(h) | | | 1.69 | %(g) |
| Operating expenses including reimbursement/waiver(e) | | | 0.53 | %(f) | | | 0.69 | %(g) | | | 0.74 | %(g) | | | 0.82 | %(g) | | | 0.52 | %(g) | | | 0.35 | %(g) |
| Net investment income including reimbursement/waiver(e) | | | 1.01 | %(f) | | | 1.89 | % | | | 1.95 | % | | | 2.24 | % | | | 0.86 | % | | | 1.49 | % |
| PORTFOLIO TURNOVER RATE | | | 15 | %(i) | | | 103 | % | | | 55 | % | | | 79 | % | | | 94 | % | | | 27 | % |
| | | | | | | | | | | | | | | | | | | | | | | | | |
| (a) | Prior to August 31, 2017 the Highland Resolute Fund was known as the Redmont Resolute Fund. |
| (b) | Prior to August 31, 2016 the Highland Resolute Fund was known as the Redmont Resolute Fund II. |
| (c) | Calculated using the average shares method. |
| (d) | Total investment return is calculated assuming a purchase of a common share at the opening of the first day and a sale at closing on the last day of each period reported. Dividends and distributions, if any, are assumed for purposes of this calculation to be reinvested at prices obtained under the Fund’s dividend reinvestment plan. Total returns would have been lower had certain expenses not been waived during the period. Total investment returns do not reflect brokerage commissions, if any, and are not annualized. |
See Notes to Financial Statements.
24
| Highland Resolute Fund | Consolidated Financial Highlights |
For a share outstanding throughout the periods presented
| (e) | The ratios exclude the impact of expenses of the underlying funds in which the Fund invests as represented in the Consolidated Schedule of Investments. |
| (g) | Dividend and interest expense on securities sold short totaled 0.00%, 0.09%, 0.19%, 0.25%, 0.10% and 0.08% of average net assets for the six months ended October 31, 2020 and for the years ended April 30, 2019, 2018, 2017, 2016, and 2015, respectively. |
| (h) | The ratio of operating expenses excluding fee waiver/reimbursements to average net assets is calculated excluding the waived Subsidiary management fee (See Note 7 for additional detail). The ratio inclusive of that fee would be 2.09%, 1.99%, 1.97%, 2.01% and 1.81% for the six months ended October 31, 2020 and for the years ended April 30, 2019, 2018 and 2017, respectively. |
See Notes to Financial Statements.
| Semi-Annual Report | October 31, 2020 | 25 |
| Highland Resolute Fund | Notes to Consolidated Financial Statements |
October 31, 2020 (Unaudited)
1. ORGANIZATION
Financial Investors Trust (the “Trust”), a Delaware statutory trust, is an open-end management investment company registered under the Investment Company Act of 1940, as amended (“1940 Act”). The Trust consists of multiple separate portfolios or series. This semi-annual report describes the Highland Resolute Fund (the “Fund”). Effective August 31, 2017, the Fund changed its name from Redmont Resolute Fund. The Fund seeks to provide long-term total return with reduced volatility and reduced correlation to the conventional stock and bond markets. The Fund offers Class I shares.
Basis of Consolidation: Highland Resolute Cayman (the “Subsidiary”), a Cayman Islands exempted company, is a wholly owned subsidiary of the Fund. The Subsidiary’s investment objective is designed to enhance the ability of the Fund to obtain exposure to equities, financial, currency and commodities markets consistent with the limits of the U.S. federal tax law requirements applicable to registered investment companies. The Subsidiary is subject to substantially the same investment policies and investment restrictions as the Fund. The Subsidiary acts as an investment vehicle for the Fund in order to effect certain commodity-related investments on behalf of the Fund. Investments in the Subsidiary are expected to provide the Fund with exposure to the commodity markets within the limitations of Subchapter M of the Internal Revenue Code of 1986, as amended (the “Code”), and recent IRS revenue rulings, as discussed below under “Federal Income Taxes”. The Fund is the sole shareholder of the Subsidiary pursuant to a subscription agreement, and it is intended that the Fund will remain the sole shareholder and will continue to control the Subsidiary. Under the Articles of Association of the Subsidiary, shares issued by the Subsidiary confer upon a shareholder the right to wholly own and vote at general meetings of the Subsidiary and certain rights in connection with any winding-up or repayment of capital, as well as the right to participate in the profits or assets of the Subsidiary. The Fund may invest up to 25% of its total assets in shares of the Subsidiary. As a wholly owned subsidiary of the Fund, all assets and liabilities, income and expenses of the Subsidiary are consolidated in the financial statements and financial highlights of the Fund collectively referred to as the "financial statements" in these notes to the consolidated financial statements. All investments held by the Subsidiary are disclosed in the accounts of the Fund. As of October 31, 2020, net assets of the Fund were $199,872,674, of which $16,660,321 or 8.33%, represented the Fund’s ownership of all issued shares and voting rights of the Subsidiary. The Fund and the Subsidiary are "commodity pools" under the U.S. Commodity Exchange Act, and Highland Associates, Inc. (the "Adviser") is a "commodity pool operator" registered with and regulated by the Commodities Futures Trading Commission (CFTC).
2. SIGNIFICANT ACCOUNTING POLICIES
The accompanying financial statements were prepared in accordance with accounting principles generally accepted in the United States of America (“U.S. GAAP”). The preparation of financial statements in conformity with U.S. GAAP requires management to make certain estimates and assumptions that affect the reported amounts of assets and liabilities and disclosures of contingent assets and liabilities at the date of the financial statements and the reported amounts of increases and decreases in net assets from operations during the reporting period. Actual results could differ from those estimates. The Fund is considered an investment company for financial reporting purposes under U.S. GAAP and follows the accounting and reporting guidance applicable to investment companies in the Financial Accounting Standards Board Accounting Standards Codification Topic 946 Financial Services – Investment Companies. The following is a summary of significant accounting policies consistently followed by the Fund and Subsidiary in preparation of the financial statements.
Investment Valuation: The Fund generally values its securities based on market prices determined at the close of regular trading on the New York Stock Exchange (“NYSE”), normally 4:00 p.m. Eastern Time, on each day the NYSE is open for trading.
For equity securities and mutual funds that are traded on an exchange, the market price is usually the closing sale or official closing price on that exchange. In the case of equity securities not traded on an exchange, or if such closing prices are not otherwise available, the securities are valued at the mean of the most recent bid and ask prices on such day. Redeemable securities issued by open-end registered investment companies are valued at the investment company’s applicable net asset value, with the exception of exchange-traded open-end investment companies, which are priced as equity securities.
The market price for debt obligations is generally the price supplied by an independent third-party pricing service approved by the Board of Trustees of the Trust (the “Board”), which may use a matrix, formula or other objective method that takes into consideration quotations from dealers, market transactions in comparable investments, market indices and yield curves. If vendors are unable to supply a price, or if the price supplied is deemed to be unreliable, the market price may be determined using quotations received from one or more brokers–dealers that make a market in the security. Municipal securities having a remaining maturity of greater than 60 days, are typically valued at the evaluated bid price formulated by an independent pricing service. Corporate Bonds, U.S. Government & Agency, and U.S. Treasury Bonds & Notes are valued using market models that consider trade data, quotations from dealers and active market makers, relevant yield curve and spread data, creditworthiness, trade data or market information on comparable securities, and other relevant security specific information. Mortgage-related and asset-backed securities are valued based on models that consider trade data, prepayment and default projections, benchmark yield and spread data and
26
| Highland Resolute Fund | Notes to Consolidated Financial Statements |
October 31, 2020 (Unaudited)
estimated cash flows of each tranche of the issuer. Publicly traded foreign government debt securities are typically traded internationally in the over-the-counter market and are valued at the mean between the bid and asked prices as of the close of business of that market.
Futures contracts that are listed or traded on a national securities exchange, commodities exchange, contract market or comparable over the counter market, and that are freely transferrable, are valued at their closing settlement price on the exchange on which they are primarily traded or based upon the current settlement price for a like instrument acquired on the day on which the instrument is being valued. A settlement price may not be used if the market makes a limit move with respect to a particular commodity. Over-the-counter swap contracts for which market quotations are readily available are valued based on quotes received from independent pricing services or one or more dealers that make markets in such securities. Options contracts listed for trading on a securities exchange or board of trade are valued at the last quoted sales price or, in the absence of a sale at the mean of the last bid and asked price.
Forward currency exchange contracts have a fair value determined by the current foreign currency exchange forward rates. The foreign currency exchange forward rates are calculated using an automated system that estimates rates on the basis of the current day foreign currency exchange rates and forward foreign currency exchange rates supplied by a pricing service. Foreign exchange rates and forward foreign currency exchange rates may generally be obtained at the close of the NYSE, normally 4:00 p.m. Eastern Time.
When such prices or quotations are not available, or when the Adviser believes that they are unreliable, securities may be priced using fair value procedures approved by the Board.
Fair Value Measurements: The Fund discloses the classification of its fair value measurements following a three-tier hierarchy based on the inputs used to measure fair value. Inputs refer broadly to the assumptions that market participants would use in pricing the asset or liability, including assumptions about risk. Inputs may be observable or unobservable. Observable inputs reflect the assumptions market participants would use in pricing the asset or liability that are developed based on market data obtained from sources independent of the reporting entity. Unobservable inputs reflect the reporting entity’s own assumptions about the assumptions market participants would use in pricing the asset or liability that are developed based on the best information available.
Various inputs are used in determining the value of the Fund’s investments as of the end of the reporting period. When inputs used fall into different levels of the fair value hierarchy, the level in the hierarchy within which the fair value measurement falls is determined based on the lowest level input that is significant to the fair value measurement in its entirety. The designated input levels are not necessarily an indication of the risk or liquidity associated with these investments. These inputs are categorized in the following hierarchy under applicable financial accounting standards:
Level 1 – Unadjusted quoted prices in active markets for identical investments, unrestricted assets or liabilities that the Fund has the ability to access at the measurement date;
Level 2 – Quoted prices which are not active, quoted prices for similar assets or liabilities in active markets or inputs other than quoted prices that are observable (either directly or indirectly) for substantially the full term of the asset or liability; and
Level 3 – Significant unobservable prices or inputs (including the Fund’s own assumptions in determining the fair value of investments) where there is little or no market activity for the asset or liability at the measurement date.
| Semi-Annual Report | October 31, 2020 | 27 |
| Highland Resolute Fund | Notes to Consolidated Financial Statements |
October 31, 2020 (Unaudited)
The following is a summary of the inputs used to value the Fund’s investments as of October 31, 2020:
Highland Resolute Fund
| Investments in Securities at Value | | Level 1 - Quoted
Prices | | | Level 2 - Other Significant Observable Inputs | | | Level 3 - Significant Unobservable
Inputs | | | Total | |
| Exchange Traded Funds | | $ | 20,435,132 | | | $ | – | | | $ | – | | | $ | 20,435,132 | |
| Open-End Mutual Funds | | | 104,806,536 | | | | – | | | | – | | | | 104,806,536 | |
| Government & Agency Obligations | | | – | | | | 3,505,004 | | | | – | | | | 3,505,004 | |
| Short-Term Investments | | | | | | | | | | | | | | | | |
| Money Market Fund | | | 6,945,894 | | | | – | | | | – | | | | 6,945,894 | |
| U.S. Treasury Bills | | | – | | | | 17,562,675 | | | | – | | | | 17,562,675 | |
| Total | | $ | 132,187,562 | | | $ | 21,067,679 | | | $ | – | | | $ | 153,255,241 | |
| | | | | | | | | | | | | | | | | |
| Other Financial Instruments** | | | | | | | | | | | | | | | | |
| Assets: | | | | | | | | | | | | | | | | |
| Total Return Swap Contracts | | $ | – | | | $ | 29 | | | $ | – | | | $ | 29 | |
| Liabilities: | | | | | | | | | | | | | | | | |
| Written Option Contracts | | | (380,215 | ) | | | – | | | | – | | | | (380,215 | ) |
| Total | | $ | (380,215 | ) | | $ | 29 | | | $ | – | | | $ | (380,186 | ) |
| * | For detailed descriptions, see the accompanying Consolidated Schedule of Investments. |
| ** | Other financial instruments are derivative instruments reflected in the Consolidated Schedule of Investments. The Total Return Swap Contracts shown in the table are reported at their unrealized appreciation/(depreciation) at measurement date, which represents the change in the contract’s value from trade date. |
The changes of the fair value of investments for which the Fund have used Level 3 inputs to determine the fair value are as follows:
| Highland Resolute Fund | | Common Stocks | | | Preferred Stocks | | | Total | |
| Balance as of April 30, 2020 | | $ | 359,388 | | | $ | 2,166,219 | | | $ | 2,525,607 | |
| Accrued Discount/Premium | | | – | | | | – | | | | – | |
| Return of Capital | | | (234,517 | ) | | | (1,413,555 | ) | | | (1,648,072 | ) |
| Realized Gain/(Loss) | | | 193,736 | | | | 1,167,727 | | | | 1,361,463 | |
| Change in Unrealized Appreciation/(Depreciation) | | | 25,542 | | | | 153,957 | | | | 179,499 | |
| Purchases | | | – | | | | – | | | | – | |
| Sales Proceeds | | | (344,149 | ) | | | (2,074,348 | ) | | | (2,418,497 | ) |
| Transfer into Level 3 | | | – | | | | – | | | | – | |
| Transfer out of Level 3 | | | – | | | | – | | | | – | |
| Balance as of October 31, 2020 | | $ | – | | | $ | – | | | $ | – | |
| Net change in unrealized Appreciation/(Depreciation) attributable to Level 3 investments held at October 31, 2020 | | $ | – | | | $ | – | | | $ | – | |
As of October 31, 2020 the Fund did not have any securities that used significant unobservable inputs (Level 3) in determining fair value.
28
| Highland Resolute Fund | Notes to Consolidated Financial Statements |
October 31, 2020 (Unaudited)
Trust Expenses: Some expenses of the Trust can be directly attributed to the Fund. Expenses which cannot be directly attributed to the Fund are apportioned among all funds in the Trust based on average net assets of the Fund.
Federal Income Taxes: The Fund complies with the requirements under Subchapter M of the Internal Revenue Code of 1986, as amended, applicable to regulated investment companies and intends to distribute substantially all of its net taxable income and net capital gains, if any, each year so that the Fund will not be subject to excise tax on undistributed income and gains. The Fund is not subject to income taxes to the extent such distributions are made.
As of and during the six months ended October 31, 2020, the Fund did not have a liability for any unrecognized tax benefits. The Fund files U.S. federal, state, and local tax returns as required. The Fund’s tax returns are subject to examination by the relevant tax authorities until expiration of the applicable statute of limitations, which is generally three years after the filing of the tax return for federal purposes and four years for most state returns. Tax returns for open years have incorporated no uncertain tax positions that require a provision for income taxes. For tax purposes, the Subsidiary is an exempt Cayman Islands investment company and has received an undertaking from the Government of the Cayman Islands exempting it from all local income, profits, and capital gains taxes. No such taxes are levied in the Cayman Islands at the present time. For U.S. income tax purposes, the Subsidiary is a controlled foreign corporation ("CFC") and as such is not subject to U.S. income tax. However, as a wholly-owned CFC, the net income and capital gain of the CFC, to the extent of its earnings and profits, will be included each year in the Fund's taxable income. The Fund recognizes interest and penalties, if any, related to tax liabilities as income tax expense in the Consolidated Statement of Operations.
Concentration of Credit Risk: The Fund places its cash with a banking institution, which is insured by the FDIC. The FDIC limit is $250,000. At various times throughout the year, the amount on deposit may exceed the FDIC limit and subject the Fund to a credit risk. The Fund does not believe that such deposits are subject to any unusual risk associated with investment activities.
Investment Transactions and Investment Income: Investment transactions are accounted for on the date the investments are purchased or sold (trade date basis). Net realized gains and losses from investment transactions are reported on an identified cost basis. Interest income, which includes accretion of discounts and amortization of premiums, is accrued and recorded as earned using the effective yield method. Dividend income is recognized on the ex-dividend date or for withholding taxes or certain foreign securities, as soon as information is available to the Fund. All of the realized and unrealized gains and losses and net investment income, are allocated daily to each class in proportion to its average daily net assets. Withholding taxes on foreign dividends are paid (a portion of which may be reclaimable) or provided for in accordance with the applicable country’s tax rules and rates and are disclosed in the Consolidated Statement of Operations.
Foreign Securities: The Fund may directly purchase securities of foreign issuers. Investing in securities of foreign issuers involves special risks not typically associated with investing in securities of U.S. issuers. The risks include possible re-evaluation of currencies, the inability to repatriate foreign currency, less complete financial information about companies and possible future adverse political and economic developments. Moreover, securities of many foreign issuers and their markets may be less liquid and their prices more volatile than those of securities of comparable U.S. issuers.
Foreign Currency Translation: Values of investments denominated in foreign currencies are converted into U.S. dollars using the current exchange rates each business day (generally 4:00 p.m. Eastern Time). Purchases and sales of investments and dividend income are translated into U.S. dollars using the current prevailing exchange rate on the transaction date. The effect of changes in foreign exchange rates on realized and unrealized gains or losses on securities is reflected as a component of such gains or losses. Transactions in foreign denominated assets may involve greater risks than domestic transactions.
Short Sales: The Fund may make short sales of securities consistent with its strategies. A short sale is a transaction in which a Fund sells a security it does not own in anticipation that the market price of that security will decline.
When a Fund makes a short sale, it must borrow the security sold short and deliver it to the broker dealer through which it made the short sale as collateral for its obligation to deliver the security upon conclusion of the sale. The Fund may have to pay a fee to borrow particular securities and is often obligated to pay over any accrued interest and dividends on such borrowed securities.
| Semi-Annual Report | October 31, 2020 | 29 |
| Highland Resolute Fund | Notes to Consolidated Financial Statements |
October 31, 2020 (Unaudited)
If the price of the security sold short increases between the time of the short sale and the time that a Fund replaces the borrowed security, the Fund will incur a loss; conversely, if the price declines, the Fund will realize a capital gain. Any gain will be decreased, and any loss increased, by the transaction costs described above. The successful use of short selling may be adversely affected by imperfect correlation between movements in the price of the security sold short and the securities being hedged. Losses incurred from engaging in short sales may be unlimited.
To the extent that a Fund engages in short sales, it will provide collateral to the broker-dealer and (except in the case of short sales “against the box”) will maintain additional asset coverage in the form of segregated or “earmarked” assets determined to be liquid in accordance with procedures established by the Board and that is equal to the current market value of the securities sold short, or will ensure that such positions are covered by “offsetting” positions, until the Fund replaces the borrowed security. A short sale is “against the box” to the extent that the Fund contemporaneously owns, or has the right to obtain at no added cost, securities identical to those sold short. The Fund may engage in short selling to the extent permitted by the federal securities laws and rules and interpretations thereunder. To the extent a Fund engages in short selling in foreign (non-U.S.) jurisdictions, the Fund will do so to the extent permitted by the laws and regulations of such jurisdiction.
Distributions to Shareholders: The Fund normally pays dividends and distributes capital gains, if any, on an annual basis. Income dividend distributions are derived from interest and dividends and other income the Fund receives from their investments, including distributions of short term capital gains. Capital gain distributions are derived from gains realized when the Fund sells a security it has owned for more than a year. The Fund may make additional distributions and dividends at other times if its portfolio manager or managers believe doing so may be necessary for the Fund to avoid or reduce taxes.
Epidemic and Pandemic Risk: Certain countries have been susceptible to epidemics, most recently COVID-19, which has been designated as a pandemic by world health authorities. The outbreak of such epidemics, together with any resulting restrictions on travel or quarantines imposed, could have a negative impact on the economy and business activity globally (including in the countries in which we invest), and thereby could adversely affect the performance of our investments. Furthermore, the rapid development of epidemics could preclude prediction as to their ultimate adverse impact on economic and market conditions, and, as a result, present material uncertainty and risk with respect to us and the performance of our investments.
Libor Risk
In March 2020, the Financial Accounting Standards Board (FASB) issued Accounting Standards Update (“ASU”) No. 2020-04, Reference Rate Reform (Topic 848): Facilitation of the Effects of Reference Rate Reform on Financial Reporting. The Fund’s investments, payment obligations, and financing terms may be based on floating rates, such as the London Interbank Offered Rate, or “LIBOR,” which is the offered rate for short-term Eurodollar deposits between major international banks. Plans are underway to phase out the use of LIBOR by the end of 2021. There remains uncertainty regarding the nature of any replacement rate and the impact of the transition from LIBOR on the Fund’s transactions and the financial markets generally. As such, the potential effect of a transition away from LIBOR on the Fund or the Fund’s investments cannot yet be determined.
3. DERIVATIVE INSTRUMENTS
Swap Contracts: The Fund may enter into swap transactions for hedging purposes or to seek to increase total return. At the present time, the Fund primarily enters into swap transactions for the purpose of increasing total return. Risks may arise as a result of the failure of the counterparty to the swap contract to comply with the terms of the swap contract. The loss incurred by the failure of a counterparty is generally limited to the net payment to be received by the Fund and/or the termination value at the end of the contract.
Therefore, the Fund considers the creditworthiness of each counterparty to a contract in evaluating potential credit risk. Additionally, risks may arise from unanticipated movements in interest rates or in the value of the underlying reference asset or index. Entering into these agreements involves, to varying degrees, market risk, liquidity risk and elements of credit, legal and documentation risk that are not directly reflected in the amounts recognized in the Consolidated Statement of Assets and Liabilities.
The Fund invests in total return swaps to obtain exposure to a security or market without owning such security or investing directly in that market or to transfer the risk/return of one market (e.g., fixed income) to another market (e.g., equity) (equity risk and/or interest rate risk). Total return swaps are agreements in which there is an exchange of cash flows whereby one party commits to make payments based on the total return (coupons plus capital gains/losses) of an underlying instrument in exchange for fixed or floating rate interest payments. To the extent the total return of the instrument or index underlying the transaction exceeds or falls short of the offsetting interest rate obligation, the Fund will receive a payment from or make a payment to the counterparty. The Fund may pay or receive cash as collateral on these contracts which may be recorded as an asset and/or liability. The Fund must set aside liquid assets, or engage in other appropriate measures, to cover its obligations under these contracts. Swaps are marked to market daily using either pricing vendor quotations, counterparty prices or model prices and the change in value, if
30
| Highland Resolute Fund | Notes to Consolidated Financial Statements |
October 31, 2020 (Unaudited)
any, is recorded as an unrealized gain or loss. Upfront payments made and/or received by the Fund are recorded as an asset and/or liability and realized gains or losses are recognized ratably over the contract’s term/event, with the exception of forward starting interest rate swaps, whose realized gains or losses are recognized ratably from the effective start date. Periodic payments received or made on swap contracts are recorded as realized gains or losses. Gains or losses are realized upon termination of a swap contract and are recorded on the Consolidated Statement of Operations. Swap agreements held at October 31, 2020 are disclosed in the Consolidated Schedule of Investments.
International Swaps and Derivatives Association, Inc. Master Agreements (“ISDA Master Agreements”) govern OTC financial derivative transactions entered into by the Fund and those counterparties. The ISDA Master Agreements maintain provisions for general obligations, representations, agreements, collateral and events of default or termination. Events of termination include conditions that may entitle counterparties to elect to terminate early and cause settlement of all outstanding transactions under the applicable ISDA Master Agreement. Any election to early terminate could be material to the financial statements.
Option Contracts: The Fund may enter into options transactions for hedging purposes and for non-hedging purposes such as seeking to enhance return. The Fund may write covered put and call options on any stocks or stock indices, currencies traded on domestic and foreign securities exchanges, or futures contracts on stock indices, interest rates and currencies traded on domestic and, to the extent permitted by the CFTC, foreign exchanges. A call option on an asset written by the Fund obligates the Fund to sell the specified asset to the holder (purchaser) at a stated price (the exercise price) if the option is exercised before a specified date (the expiration date). A put option on an asset written by a Fund obligates the Fund to buy the specified asset from the purchaser at the exercise price if the option is exercised before the expiration date. Premiums received when writing options are recorded as liabilities and are subsequently adjusted to the current value of the options written. Premiums received from writing options that expire are treated as realized gains. Premiums received from writing options, which are either exercised or closed, are offset against the proceeds received or amount paid on the transaction to determine realized gains or losses which are recorded on the Consolidated Statement of Operations.
Futures: The Fund may enter into futures contracts for hedging purposes. A futures contract represents a commitment for the future purchase or sale of an asset at a specified price on a specified date. Upon entering into a futures contract, the Fund is required to deposit an initial margin with the broker in an amount equal to a certain percentage of the contract amount. The Fund receives from or pays to the broker, on a daily basis, an amount of cash equal to the daily fluctuation in value of the contract. Such receipts or payments are known as “variation margin,” and are recorded by the Fund as unrealized gains or losses. When the futures contract is closed, the Fund records a gain or loss equal to the difference between the value of the contract at the time it was opened and the value at the time it was closed.
The Fund’s potential losses from the use of futures extend beyond its initial investment in such contracts. The use of futures contracts involves, to varying degrees, elements of market risk in excess of the amount recognized in the Consolidated Statement of Assets and Liabilities. The predominant risk is that the movement of a futures contract’s price may result in a loss, which could render the Fund’s hedging strategy unsuccessful. There is minimal counterparty credit risk since futures contracts are exchange traded and the exchange’s clearinghouse, as counterparty to all exchange traded futures, guarantees the futures against default.
Risk Exposure: The following tables disclose the amounts related to the Fund’s use of derivative instruments.
The effect of derivative instruments on the Consolidated Statements of Assets and Liabilities as of October 31, 2020 was as follows:
| Risk Exposure | | Asset Derivatives Statement of Assets and Liabilities Location | | Fair Value | | | Liability Derivatives Statement of Assets and Liabilities Location | | Fair Value | |
| Highland Resolute Fund | | | | | | | | | | |
| Equity Contracts (Total Return Swap Contracts) | | Unrealized appreciation on total return swap contracts | | $ | 23 | | | N/A | | $ | – | |
| Foreign Exchange Rate Risk (Total Return Swap Contracts) | | Unrealized appreciation on total return swap contracts | | | 6 | | | N/A | | | – | |
| Equity Contracts (Written Options) | | N/A | | | N/A | | | Written options, at value | | | 380,215 | |
| Total | | | | $ | 29 | | | | | $ | 380,215 | |
| Semi-Annual Report | October 31, 2020 | 31 |
| Highland Resolute Fund | Notes to Consolidated Financial Statements |
October 31, 2020 (Unaudited)
The effect of derivative instruments on the Consolidated Statements of Operations for the six months ended October 31, 2020 was as follows:
| Risk Exposure | | Statement of Operations Location | | Realized Gain/(Loss) on Derivatives Recognized in Income | | | Change in Unrealized Appreciation/(Depreciation) on Derivatives Recognized in Income | |
| Highland Resolute Fund | | | | | | | | |
Equity Contracts
(Total Return Swap Contracts) | | Net realized gain/(loss) on total return swap contracts/Net change in unrealized appreciation/(depreciation) on total return swap contracts | | $ | 3,783,024 | | | $ | 3 | |
| Foreign Exchange Rate Risk (Total Return Swap Contracts) | | Net realized gain on total return swap contracts/Net change in unrealized depreciation on total return swap contracts | | | (265,370 | ) | | | – | |
Equity Contracts
(Purchased Options)
| | Net realized loss on investments/Net change in unrealized appreciation/(depreciation) on investments | | | 1,167,727 | | | | – | |
Equity Contracts
(Written Options)
| | Net realized gain on written options/Net change in unrealized appreciation on written options | | | 761,364 | | | | (162,664 | ) |
| Total | | | | $ | 5,446,745 | | | $ | (162,661 | ) |
Volume of Derivative Instruments for the Fund during the six months ended October 31, 2020 was as follows:
| Derivative Type | Unit of Measurement | Monthly Average |
| Equity Contracts (Total Return Swap Contracts) | Notional Quantity | 87,175,329 |
| Foreign Exchange Rate Risk (Total Return Swap Contracts) | Notional Quantity | 7,833,232 |
| Equity Contracts (Written Options) | Contracts | (241,050) |
Certain derivative contracts are executed under either standardized netting agreements or, for exchange-traded derivatives, the relevant contracts for a particular exchange which contain enforceable netting provisions. A derivative netting arrangement creates an enforceable right of set-off that becomes effective, and affects the realization of settlement on individual assets, liabilities and collateral amounts, only following a specified event of default or early termination. Default events may include the failure to make payments or deliver securities timely, material adverse changes in financial condition or insolvency, the breach of minimum regulatory capital requirements, or loss of license, charter or other legal authorization necessary to perform under the contract.
The following table presents financial instruments that are subject to enforceable netting arrangements or other similar agreements as of October 31, 2020:
Highland Resolute Fund
Offsetting of Derivatives Assets
| | | | | | | | | | | | Gross Amounts Not Offset in the
Statement of Assets and Liabilities | |
| | | Gross Amounts of Recognized Assets | | | Gross Amounts
Offset in the Statement of Assets and Liabilities | | | Net Amounts
Presented in the Statement of Assets and Liabilities | | | Financial
Instruments
Available for
Offset(a) | | | Cash
Collateral
Received(a) | | | Net
Receivable
Amount | |
| Total Return Swap Contracts | | $ | 29 | | | $ | – | | | $ | 29 | | | $ | – | | | $ | – | | | $ | 29 | |
| Total | | $ | 29 | | | $ | – | | | $ | 29 | | | $ | – | | | $ | – | | | $ | 29 | |
| (a) | These amounts are limited to the derivative asset/liability balance and, accordingly, do not include excess collateral received/pledged. |
32
| Highland Resolute Fund | Notes to Consolidated Financial Statements |
October 31, 2020 (Unaudited)
4. TAX BASIS INFORMATION
Tax Basis of Investments: As of October 31, 2020, the aggregate cost of investments, gross unrealized appreciation/(depreciation) and net unrealized appreciation for Federal tax purposes were as follows:
| | | Gross Appreciation (excess of value over tax cost) | | | Gross Depreciation (excess of tax cost over value) | | | Net Unrealized Appreciation/(Depreciation) | | | Cost of Investments for Income Tax Purposes | |
| Highland Resolute Fund | | $ | 109,737,572 | | | $ | (101,255,553 | ) | | $ | 8,482,019 | | | $ | 139,709,369 | |
Tax Basis of Distributions to Shareholders: The character of distributions made during the year from net investment income or net realized gains may differ from its ultimate characterization for federal income tax purposes. Also, due to the timing of dividend distributions, the fiscal year in which amounts are distributed may differ from the fiscal year in which the income or realized gain were recorded by the Fund.
The tax character of distributions paid by the Fund for the fiscal year ended April 30, 2020, were as follows:
| Fund | | Ordinary Income | | | Long-Term Capital Gain | |
| Highland Resolute Fund | | $ | 3,500,019 | | | $ | – | |
The Fund elects to defer to the period ending April 30, 2021, capital losses recognized during the period November 1, 2019 through April 30, 2020 in the amount of $23,079,107.
The Fund elects to defer to the period ending April 30, 2021, ordinary losses recognized during the period November 1, 2019 through April 30, 2020 in the amount of $3,141,296.
The amounts and characteristics of tax basis distributions and composition of distributable earnings/(accumulated losses) are finalized at fiscal year-end. Accordingly, tax basis balances have not been determined as of October 31, 2020.
5. SECURITIES TRANSACTIONS
Purchases and sales of securities, excluding short-term securities and U.S. Government Obligations during the six months ended October 31, 2020 were as follows:
| Fund | | Purchases of
Securities | | | Proceeds From
Sales of Securities | |
| Highland Resolute Fund | | $ | 24,956,568 | | | $ | 18,052,791 | |
6. BENEFICIAL SHARE TRANSACTIONS
The capitalization of the Trust consists of an unlimited number of shares of beneficial interest with no par value per share. Holders of the shares of the Fund of the Trust have one vote for each share held and a proportionate fraction of a vote for each fractional share. All shares issued and outstanding are fully paid and are transferable and redeemable at the option of the shareholder. Purchasers of the shares do not have any obligation to make payments to the Trust or its creditors solely by reason of the purchasers’ ownership of the shares. Shares have no pre-emptive rights.
| Semi-Annual Report | October 31, 2020 | 33 |
| Highland Resolute Fund | Notes to Consolidated Financial Statements |
October 31, 2020 (Unaudited)
Transactions in common shares were as follows:
Highland Resolute Fund
| Class I: | | For the Six Months Ended October 31, 2020 (Unaudited) | | | For the Year Ended April 30, 2020 | |
| Common Shares Outstanding - Beginning of Period | | | 19,374,899 | | | | 32,287,022 | |
| Common Shares Sold | | | 2,124,628 | | | | 926,202 | |
| Common Shares Issued as Reinvestment of Dividends | | | – | | | | 340,801 | |
| Common Shares Redeemed | | | (1,452,715 | ) | | | (14,179,126 | ) |
| Common Shares Outstanding - End of Period | | | 20,046,812 | | | | 19,374,899 | |
Shares redeemed within 90 days of purchase may incur a 2% short-term redemption fee deducted from the redemption amount. Redemption fees are reflected in the “Shares redeemed, net of redemption fees” in the Consolidated Statement of Changes in Net Assets. For the six months ended October 31, 2020 and the year ended April 30, 2020, the Fund retained fees as follows:
| Fund | | For the Six Months Ended October 31, 2020 (Unaudited) | | | For the Year Ended April 30, 2020 | |
| Highland Resolute Fund | | $ | – | | | $ | 16 | |
7. MANAGEMENT AND RELATED PARTY TRANSACTIONS
Investment Advisory
The Adviser, subject to the authority of the Board, is responsible for the overall management and administration of the Fund’s business affairs. Pursuant to the Investment Advisory Agreement (the “Advisory Agreement”), the Adviser is entitled to an investment advisory fee, computed daily and payable monthly of 1.50% of the average daily net assets for the Fund. The management fee is paid on a monthly basis.
The Subsidiary has entered into a separate advisory agreement (the “Subsidiary Advisory Agreement”) with the Adviser for the management of the Subsidiary’s portfolio pursuant to which the Subsidiary is obligated to pay the Adviser a management fee at the same rate that the Fund pays the Adviser for investment advisory services provided to the Fund. The Adviser has agreed to waive the advisory fee it receives from the Fund in an amount equal to the management fee paid by the Subsidiary. This waiver may not be terminated or modified without the consent of the Board. This agreement may not be terminated or modified prior to this date except with the approval of the Board. For the six months ended October 31, 2020, this amount equaled $126,899 and is disclosed in the Consolidated Statement of Operations. Fees under the Subsidiary Advisory Agreement are not permitted to be recouped.
The Adviser entered into Investment Sub-Advisory Agreements with Chatham Asset Management, LLC (“Chatham”) and Parametric Portfolio Associates, LLC (“Parametric”). The Adviser determines the allocation of the Fund’s assets among Chatham and Parametric (collectively the “Sub-Advisers”) and other open-end investment companies. The Fund is not required to invest with any minimum number of sub-advisers or open-end investment companies, and does not have minimum or maximum limitations with respect to allocations of assets to the Sub-Advisers, investment strategy or market sector. The Adviser may change the allocation of the Fund’s assets among the available investment options, and may add or remove sub-advisers, at any time. Each Sub-Adviser is responsible for the day-to-day management of its allocated portion of Fund assets. The Adviser has ultimate responsibility, subject to the oversight of the Board of the Fund, to oversee the Sub-Advisers, and to recommend their hiring, termination and replacement.
34
| Highland Resolute Fund | Notes to Consolidated Financial Statements |
October 31, 2020 (Unaudited)
Pursuant to each Investment Sub-Advisory Agreement, the Adviser pays the Sub-Advisers an annual sub-advisory management fee which is based on the Fund’s average quarterly market value of the assets managed by the Sub-Advisers. The Adviser is required to pay all fees due to Sub-Advisers out of the management fee the Adviser receives from the Fund. The following table reflects the Fund’s contractual sub-advisory fee rates.
| Sub-Advisers | Contractual Sub-Advisory Fee |
| Chatham Asset Management, LLC(a) | 1.00% |
| Parametric Portfolio Associates, LLC | 0.30% |
| (a) | Effective May 1, 2020, Chatham Asset Management, LLC, ceased serving as investment Sub-Adviser to the Fund. |
The Adviser has agreed, with respect to the Fund’s Class I shares, to waive the portion of its 1.50% management fee in excess of any sub-advisory fees (as defined in the Prospectus), and effective September 1, 2019, less third-party administrative costs charged to the Adviser in connection with the non-recurring addition of a new investment sub-adviser for the Fund or removal of an existing investment sub-adviser to the Fund. The Adviser may not discontinue this agreement to waive fees prior to August 31, 2020 without the approval of the Fund’s Board of Trustees. The Adviser is not permitted to recoup any amounts waived or reimbursed to the extent actual fees and expenses for a fiscal period are less than the expense limitation cap. Fees waived/reimbursed by the Adviser for the six months ended October 31, 2020 are disclosed in the Consolidated Statement of Operations.
For the six months ended October 31, 2020, the fee waivers and/or reimbursements were as follows:
| | | Fees Waived/ Reimbursed By Adviser | |
| Highland Resolute Fund - Class I | | $ | (1,409,196 | ) |
Administrator Fees and Expenses
ALPS Fund Services, Inc. (“ALPS”) serves as administrator to the Fund, and the Fund has agreed to pay expenses incurred in connection with its administrative activities. Pursuant to an Administration Agreement, ALPS provides operational services to the Fund including, but not limited to, fund accounting and fund administration and generally assists in the Fund’s operations. Officers of the Trust are employees of ALPS. The Fund’s administration fee is accrued on a daily basis and paid monthly. Administration fees paid by the Fund for the six months ended October 31, 2020 are disclosed in the Consolidated Statement of Operations.
ALPS is reimbursed by the Fund for certain out-of-pocket expenses.
Transfer Agent
ALPS serves as transfer, dividend paying and shareholder servicing agent for the Fund. ALPS receives an annual minimum fee, a fee based upon the number of shareholder accounts and is also reimbursed by the Fund for certain out-of-pocket expenses. Transfer agent fees paid by the Fund for the six months ended October 31, 2020 are disclosed in the Consolidated Statement of Operations.
Compliance Services
ALPS provides services that assist the Fund’s chief compliance officer in monitoring and testing the policies and procedures of the Fund in conjunction with requirements under Rule 38a-1 under the 1940 Act and receives an annual base fee. ALPS is reimbursed for certain out-of-pocket expenses by the Fund. Compliance service fees paid by the Fund for the six months ended October 31, 2020 are disclosed in the Consolidated Statement of Operations.
Principal Financial Officer
ALPS receives an annual fee for providing principal financial officer services to the Fund. Principal financial officer fees paid by the Fund for the six months ended October 31, 2020 are disclosed in the Consolidated Statement of Operations.
Distributor
ALPS Distributors, Inc. (“ADI” or the “Distributor”) (an affiliate of ALPS) acts as the distributor of the Fund’s shares pursuant to a Distribution Agreement with the Trust on behalf of the Fund. Shares are sold on a continuous basis by ADI as agent for the Fund, and ADI has agreed to use its best efforts to solicit orders for the sale of Fund’s shares, although it is not obliged to sell any particular amount of shares. ADI is not entitled to any compensation for its services as Distributor. ADI is registered as a broker-dealer with the U.S. Securities and Exchange Commission.
| Semi-Annual Report | October 31, 2020 | 35 |
| Highland Resolute Fund | Notes to Consolidated Financial Statements |
October 31, 2020 (Unaudited)
Shareholder Services Plan
Effective December 12, 2017, the Fund has adopted a Shareholder Services Plan (the “Plan”) with respect to its Class I shares. Under the Plan, the Fund is authorized to pay banks and its affiliates and other institutions, including broker-dealers and Fund affiliates which may include the Distributor, Adviser and/or the transfer agent (“Participating Organizations”), an aggregate fee in an amount not to exceed on an annual basis 0.10% of the average daily net asset value of Class I shares of the Fund attributable to or held in the name of the Participating Organizations for its clients as compensation for providing shareholder service activities, which do not include distribution services pursuant to an agreement with Participating Organizations. Any amount of such payment not paid to the Participating Organizations during the Fund’s fiscal year for such service activities shall be reimbursed to the Fund as soon as practicable. Plan fees are included with distribution and service fees in the Consolidated Statement of Operations. Fees recaptured pursuant to the Plan for the six months ended October 31, 2020 are included as an offset to distribution and service fees as disclosed in the Consolidated Statement of Operations.
Trustees
The fees and expenses of the Trustees of the Board are presented in the Consolidated Statement of Operations.
8. INDEMNIFICATIONS
Under the Trust’s organizational documents, its officers and Trustees are indemnified against certain liability arising out of the performance of their duties to the Trust. Additionally, in the normal course of business, the Trust enters into contracts with service providers that may contain general indemnification clauses which may permit indemnification to the extent permissible under applicable law. The Trust’s maximum exposure under these arrangements is unknown, as this would involve future claims that may be made against the Trust that have not yet occurred.
9. SUBSEQUENT EVENT
Subsequent events after the date of the Consolidated Statement of Assets and Liabilities have been evaluated through the date the financial statements were issued.
36
| Highland Resolute Fund | Additional Information |
October 31, 2020 (Unaudited)
1. FUND HOLDINGS
The Fund files its complete schedule of portfolio holdings with the Securities and Exchange Commission (SEC) for the first and third quarters of each fiscal year on Form N-PORT. The Fund files its complete schedule of portfolio holdings with the SEC for the first and third quarters of each fiscal year as an exhibit to its reports on Form N-PORT. The Fund’s Form N-PORT reports are available on the SEC’s Web site at http://www.sec.gov. The Fund's Form N-PORT reports are also available upon request by calling toll-free (855) 268-2242.
2. FUND PROXY VOTING POLICIES, PROCEDURES AND SUMMARIES
Fund policies and procedures used in determining how to vote proxies and information regarding how each of the Fund voted proxies relating to portfolio securities during the most recent prior 12-month period ending June 30 are available without charge, (1) upon request, by calling (toll-free) (855) 268-2242 and (2) on the SEC’s website at http://www.sec.gov.
| Semi-Annual Report | October 31, 2020 | 37 |
| Highland Resolute Fund | Privacy Policy |
| | October 31, 2020 (Unaudited) |
| Who We Are | | |
| Who is providing this notice? | Highland Resolute Fund |
| What We Do | | |
| How does the Fund protect my personal information? | To protect your personal information from unauthorized access and use, we use security measures that comply with federal law. These measures include computer safeguards and secured files and buildings. |
| How does the Fund collect my personal information? | We collect your personal information, for example, when you |
| | • | open an account |
| | • | provide account information or give us your contact information |
| | • | make a wire transfer or deposit money |
| Why can’t I limit all sharing? | Federal law gives you the right to limit only |
| | • | sharing for affiliates’ everyday business purposes-information about your creditworthiness |
| | • | affiliates from using your information to market to you |
| | • | sharing for non-affiliates to market to you |
| | State laws and individual companies may give you additional rights to limit sharing. |
| Definitions | | |
| Affiliates | Companies related by common ownership or control. They can be financial and nonfinancial companies. |
| Non-affiliates | Companies not related by common ownership or control. They can be financial and nonfinancial companies. |
| | • | The Fund does not share with non-affiliates so they can market to you. |
| Joint marketing | A formal agreement between non-affiliated financial companies that together market financial products or services to you. |
| | • | The Fund does not jointly market. |
| Other Important Information | |
| California Residents | If your account has a California home address, your personal information will not be disclosed to nonaffiliated third parties except as permitted by applicable California law, and we will limit sharing such personal information with our affiliates to comply with California privacy laws that apply to us. |
| Vermont Residents | The State of Vermont requires financial institutions to obtain your consent prior to sharing personal information that they collect about you with affiliated companies and nonaffiliated third parties other than in certain limited circumstances. Except as permitted by law, we will not share personal information we collect about you with nonaffiliated third parties or other affiliated companies unless you provide us with your written consent to share such information. |
| Highland Resolute Fund | Privacy Policy |
| | October 31, 2020 (Unaudited) |
| FACTS | WHAT DOES THE FUND DO WITH YOUR PERSONAL INFORMATION? |
| Why? | Financial companies choose how they share your personal information. Federal law gives consumers the right to limit some but not all sharing. Federal law also requires us to tell you how we collect, share, and protect your personal information. Please read this notice carefully to understand what we do. |
| What? | The types of personal information we collect and share depend on the product or service you have with us. This information can include: |
| | • | Social Security number and account transactions |
| | • | Account balances and transaction history |
| | • | Wire transfer instructions |
| How? | All financial companies need to share customers’ personal information to run their everyday business. In the section below, we list the reasons financial companies can share their customers’ personal information; the reasons the Fund chooses to share; and whether you can limit this sharing. |
| Reasons we can share your personal information | Does the Fund share: | Can you limit this sharing? |
| For our everyday business purposes – such as to process your transactions, maintain your account(s), respond to court orders and legal investigations, or report to credit bureaus | Yes | No |
| For our marketing purposes – to offer our products and services to you | No | We do not share. |
| For joint marketing with other financial companies | No | We do not share. |
| For our affiliates’ everyday business purposes – information about your transactions and experiences | Yes | No |
| For our affiliates’ everyday business purposes – information about your creditworthiness | No | We do not share. |
| For nonaffiliates to market to you | No | We do not share. |
| Semi-Annual Report | October 31, 2020 | 39 |
 | TABLE OF CONTENTS |
| Shareholder Letter | 1 |
| Performance Update | 4 |
| Disclosure of Fund Expenses | 10 |
| Portfolio of Investments | |
| Rondure New World Fund | 11 |
| Rondure Overseas Fund | 14 |
| Statements of Assets and Liabilities | 17 |
| Statements of Operations | 18 |
| Statement of Changes in Net Assets | |
| Rondure New World Fund | 19 |
| Rondure Overseas Fund | 20 |
| Financial Highlights | |
| Rondure New World Fund | 21 |
| Rondure Overseas Fund | 23 |
| Notes to Financial Statements | 25 |
| Additional Information | 32 |
| Disclosure Regarding Approval of Fund Advisory Agreement | 33 |
| Privacy Policy | 35 |
Beginning on January 1, 2021, as permitted by regulations adopted by the U.S. Securities and Exchange Commission, paper copies of the Fund’s annual and semi-annual shareholder reports will no longer be sent by mail, unless you specifically request paper copies of the reports. Instead, the reports will be made available on the Funds’ website at www.rondureglobal.com and you will be notified by mail each time a report is posted and provided with a website link to access the report.
You may, notwithstanding the availability of shareholder reports online, elect to receive all future shareholder reports in paper free of charge. If you invest through a financial intermediary, you can contact your financial intermediary to request that you continue to receive paper copies of your shareholder reports. If you invest directly with the Funds, you can call 1.855.775.3337 to let the Funds know you wish to continue receiving paper copies of your shareholder reports.
If you already elected to receive shareholder reports electronically, you will not be affected by this change and you need not take any action. You may elect to receive shareholder reports and other communications from the Funds electronically anytime by contacting your financial intermediary (such as a broker-dealer or bank) or, if you are a direct investor, by enrolling at www.rondureglobal.com.
| Rondure Funds | Shareholder Letter |
October 31, 2020 (Unaudited)
Dear Fellow Shareholders,
“We cast a shadow on something wherever we stand, and it is no good moving from place to place to save things; because the shadow always follows. Choose a place where you won’t do harm – yes, choose a place where you won’t do very much harm, and stand in it for all you are worth, facing the sunshine.” –E.M. Forster, A Room with a View
A Room with a View
I’ve been living all of my life, to my delight, in rooms with views. It started with saguaro vistas and desert red sunsets in the American southwest. The views changed to the dark blue waters of the Mississippi River, where Mark Twain penned his masterpieces. Airplane windows have cast back green speckled islands, tiny dotted, multi-hued people, and brown parched, rolling roads. Sandstorms against red skies. White-washed buildings against azure seas. A rainstorm in a golden hotel. Solemn shrines of simple weathered-wood and orange temples sprinkled with cackling monkeys.
One of my favorite views is the vista from the family farm in eastern Kansas. It sits on one of the highest bluffs in a flat state. Aptly named Long View Farm, the amber waving wheat, carves a canyon down to the winding deep blue Kansas River. The farm was small and blessed with tattered yellowing books. A picnic table in green grass with a radiant-blue eyed grandmother, who told vivid stories of the black Dust Bowl and the Great Depression.
My favorite book was a gift from my grandmother—Little Women. I never saw Jo March, the powerful female protagonist in Louisa May Alcott’s book, in myself, but I believe my grandmother and father saw Jo in me.
After I graduated from college, I sought out views. I moved to Japan with its white-painted geishas and their girly pink hair pieces against jet black hair. Red lips peaked out of parted hands. Head-tilted downward, hiding chocolate eyes.
When I started work in the finance industry, I added so many people, places, colors, cultures to my views. The one thing that was clear to me was that I was a sponge, sucking up everything I saw. I had no desire to alter what I mainly saw as wonderful in the world, and I loved investing.
On the other hand, as time passed, I started to also see many things I didn’t like in the world, especially as I added frontier countries to a catalog of over 75 countries and thousands of companies visited through the years. The frontier opened my eyes to abject poverty, war, dirty water, sickness, poor education, and corruption. Yet, when I brought this global perspective back to my home countries—the US and Japan—I saw different problems with excess consumption, a lack of good jobs, corruption in politics and business. I also saw many of the same problems in gender and racial bias, an incredible wealth divide, environmental degradation, and lobbies and bribes that seemed to be one in the same to me (one legalized corruption and one just simply corruption but it was all favoritism through money power). Globalization seemed to be amplifying all of these issues in a modern and sad form of manifest destiny—we were repeating many mistakes from the past in a desire to get rich quickly (or to keep all the debt from tumbling down upon us) in a world that seemed to view a US-consumption led model as the only model for development. That model has cast a large shadow over the world—both good and bad.
Frontier was an eye-opener for me. In fact, it brought me back to many of the idealistic views I held as a young person when I marched on campus with my South African history class in protest of Apartheid, built houses for Habitat for Humanity, and worked in harmony with people from all over the world as the President of the East Asian Society. Somewhere along the path of making money, I got too busy to do as much good as I aspired to do.
Rondure is an attempt to do both and impact our industry from the corporate level through building a diverse team of thinkers and from an investment perspective by attempting to Make Money and Do Good (or at least minimize our shadow).
Our firm principles are simple:
| 1. | Make money for our clients. Own companies with sustainable competitive advantages, or in Rondure vernacular Club, Glue, Platform businesses (CGPs). We believe that investing in high-quality companies with strong balance sheets, stable cash flows, high returns on capital, and economic moats at reasonable prices with a long-term view is the best way to generate alpha through market cycles. We also look at risks and opportunities in each country to help ascertain headwinds or tailwinds to compounding. Governance at the individual corporate level is critical in assessing the long-term compounding potential of every company as well. We believe a diverse team will help us achieve these goals. The world is a complex place, and incorporating all perspectives will help us achieve better risk/reward dynamics in the portfolios. |
| Semi-Annual Report | October 31, 2020 | 1 |
| Rondure Funds | Shareholder Letter |
October 31, 2020 (Unaudited)
| 2. | Do Good (or at least try to Do No Harm). Own responsible compounders. We look at the individual problems and opportunities of each country instead of applying developed market standards to the entire world or developing market opportunities to the developed world. We do not believe corporate Environmental, Social, and Governance issues (ESG) can be measured with perfect scientific precision. However complicated financial analysis may be, we think ESG analysis is even more complex. The data is limited and the considerations are multifaceted, so we approach it with a strong dose of humility. We do use data in our research to think about country-level conditions to identify the ES issues most relevant for every company. It is an attempt to be clinical. It is an attempt to avoid modern day colonialization by pressing Western values on different cultures. It is an attempt to see each individual country’s view of the world, as well as the view from our own domicile. Our Responsible Investing philosophy is proprietary and authentic to us at Rondure. We are not checking boxes. |
| 3. | Be great partners (for our clients, our partner firm, Grandeur Peak, our teammates, and our global community). Give our partners all the information they need to maximize the potential of their investments and reach all of their goals. Give them good, thoughtful content to help them with their own investment thinking. Listen to them. Be honest. All of our partners = family. |
Parting Thoughts and Market Outlook
When we look at the year-to-date in the rearview mirror, the coronavirus has cast a shadow across many individuals, businesses, and the global economy, creating one of the most concentrated rallies we have seen since the technology and large capitalization bubble of the late 1990s. Essentially, as of 10/6/2020, in the MSCI EM index (the benchmark for our New World strategy), only a few countries have participated in the positive return year-to-date in the index, and they are namely the big countries, China, Taiwan, and South Korea. These are also the countries that have handled the coronavirus well in the developing world and have seen a more rapid normalization of their economies. In addition, they are countries that export stuff, especially technology, to a world that is now demanding more hardware as individuals set up new office spaces and systems to work from home or learn from home. These countries tend to be exporters to the United States, where stimulus checks also likely led to a pop in demand for the goods these countries make.
In essence, it doesn’t really feel like we have had an emerging markets rally at all so far this year. China, Taiwan, and South Korea, for anyone who has been on the ground in Seoul, Taipei, and Shanghai, feel like developed markets. They also make a lot of the products that sell to other developed markets. Many of the developing economies, countries that are truly poor, are still shut down with many of them cautiously managing the country in favor of health over economy or still wrestling with big outbreaks of the virus. We are approaching them slowly, cautiously, but are also ready to pounce if and when the time comes—when the world stops social distancing.
Comparisons will be tough for the coronavirus beneficiaries next year. It will be hard for them to grow.
Apple was the bellweather stock that started the dip in global markets, including emerging markets, in September. We think the pullback was caused by two factors. First, the valuation had likely gotten a bit ahead of itself, so there was a mean reverting move in the stock, but second, we think investors are starting to look ahead to next year and realize just how hard it is going to be for Apple (or any coronavirus beneficiary) to grow against a 2020 that has worked to its advantage (i.e. a 2020 that has actually boosted demand for Apple’s mature hardware categories like iBook and iPad as it gets a one-time pop from office and school from home set ups).
In essence, the narrow COVID-ON markets of 2020 at least have a hard comparison case for why we might see broader markets in the upcoming months (assuming the market is looking ahead to next year). This demand pop for things like hardware for work and school from anywhere is similar to what happened when demand was pulled forward by Y2K technology replacement cycles in the late 1990s. When 1999 closed, the market broadened, as there was just no way for hardware companies and many ecommerce companies to grow against a banner year in 1999. The tough comps didn’t mean an end to demand (or an end to these companies being good companies), but it simply meant it was impossible to have growth the following year and it was even harder for these beneficiaries to compound in the short run as valuations were extended. We are watching this situation very closely in 2020 as well.
1999 and 2020 will go down in the books as some of the most polarized markets in our lifetimes (2020 will also go down as a polarized global economy and world), and we see a case next year, with tough comparisons for coronavirus beneficiaries (or improvement in treatment for the virus and more stable politics emanating from the US), that the markets broaden, driving a “true” emerging markets rally—and hopefully more inclusive global macroeconomics as COVID-OFF jobs gradually return. The negative case is what happened this quarter with the Apple and US-led global pullback, which ushered in a high correlation market retrenchment: we simply did better as that correction accelerated through holding a high-quality portfolio. International and Emerging Markets, themselves, did better against the US in this pullback as well.
Regardless of whether we have a future of COVID-ON or COVID-OFF, we were pleased with the way the portfolios performed, especially when September ushered in volatility. Even if the markets pull back or we have more wild swings, in the current low global interest rate environment, we
| 2 | 1.855.775.3337 | www.rondureglobal.com |
| Rondure Funds | Shareholder Letter |
October 31, 2020 (Unaudited)
believe our portfolio stocks still look like the better investment for the long haul against bond or cash markets that have record low returns globally. Given all the externalities at the moment (interest-rate induced elongated cycle, political risk, virus risk, high global debt levels, income inequality, environmental issues, etc.), we feel good about sticking to quality compounders for the long run.
Sincerely,
Laura Geritz, CFA
Founder, CEO and Portfolio Manager
The CFA designation is owned by the CFA institute.
The objective of all Rondure Funds is long-term growth of capital.
RISKS: Investing in foreign securities entails special risks, such as currency fluctuations and political uncertainties, which are described in more detail in the prospectus. Investments in emerging and frontier markets are subject to the same risks as other foreign securities and may be subject to greater risks than investments in foreign countries with more established economies and securities markets. Diversification does not eliminate the risk of experiencing investment loses.
Must be preceded or accompanied by a prospectus.
An investor should consider investment objectives, risks, charges, and expenses carefully before investing. To obtain a Rondure Funds prospectus, containing this and other information, visit www.rondureglobal.com or call 1-855-775-3337. Please read it carefully before investing.
The views and information discussed in this commentary are as of the date of publication, are subject to change, and may not reflect the writer's current views. The views expressed represent an assessment of market conditions at a specific point in time, are opinions only and should not be relied upon as investment advice regarding a particular investment or markets in general. Such information does not constitute a recommendation to buy or sell specific securities or investment vehicles. It should not be assumed that any investment will be profitable or will equal the performance of the Funds or any securities or any sectors mentioned herein. The subject matter contained herein has been derived from several sources believed to be reliable and accurate at the time of compilation. The Funds do not accept any liability for losses either direct or consequential caused by the use of this information.
Past performance does not guarantee future results.
Rondure Funds are distributed by ALPS Distributors, Inc. (ADI). ADI is not affiliated with Rondure Global Advisors.
| Semi-Annual Report | October 31, 2020 | 3 |
| Rondure New World Fund | Performance Update |
October 31, 2020 (Unaudited)
Annualized Total Return Performance for the periods ended October 31, 2020
| | | | | Since Inception(a) | Expense Ratio(b) |
| | 6 Months | 1 Year | 3 Year | Gross | Net(c) |
| Rondure New World Fund – Institutional (RNWIX) | 17.82% | 3.37% | 3.42% | 5.18% | 1.43% | 1.10% |
| Rondure New World Fund – Investor (RNWOX) | 17.68% | 3.04% | 3.17% | 4.91% | 1.72% | 1.35% |
| MSCI Emerging Markets Index(d) | 21.22% | 8.62% | 2.32% | 6.44% | | |
Performance data quoted represents past performance. Past performance does not guarantee future results. Investment return and principal value of an investment will fluctuate so that an investor’s shares, when sold or redeemed, may be worth more or less than the original cost. The Fund imposes a 2.00% redemption fee on shares held for less than 60 days. Current performance data may be higher or lower than actual data quoted. For the most current month-end performance data, please call 1-855-775-3337.
The table does not reflect the deduction of taxes a shareholder would pay on Fund distributions or redemption of Fund shares.
Subject to investment risks, including possible loss of the principal amount invested.
Returns for periods less than 1 year are cumulative.
| (a) | Fund inception date of May 1, 2017. |
| (b) | Ratios as of the Prospectus dated August 31, 2020 and may differ from the ratios presented in the Financial Highlights. |
| (c) | Rondure Global Advisors, LLC (the “Advisor”), has agreed to waive and/or reimburse fees or expenses in order to limit Total Annual Fund Operating Expenses After Fee Waiver/ Expense Reimbursement (excluding acquired fund fees and expenses, brokerage expenses, interest expenses, taxes and extraordinary expenses) to 1.35% and 1.10% of the Fund’s average daily net assets for the Fund’s Investor Class Shares and Institutional Class Shares, respectively. This agreement (the “Expense Agreement”) is in effect through August 31, 2021. The Advisor will be permitted to recover, on a class-by-class basis, expenses it has borne through the Expense Agreement to the extent that a Fund’s expenses in later periods fall below the expense cap in effect at the time of waiver or reimbursement. However, such recapture payments may not cause the Fund’s expense ratio (after recapture) to exceed the lesser of (i) the expense cap in effect at the time of the waiver and (ii) the expense cap in effect at the time of the recapture. Notwithstanding the foregoing, the Fund will not be obligated to pay any such deferred fees and expenses more than three years after the date of the waiver or reimbursement. The Expense Agreement may not be terminated or modified by the Advisor prior to August 31, 2021, except with the approval of the Fund’s Board of Trustees. |
| (d) | The MSCI Emerging Markets Index is an unmanaged total return index, reported in U.S. Dollars, based on share prices and reinvested dividends of approximately 800 companies from 24 emerging market countries. The Index is not actively managed and does not reflect any deductions for fees, expense, or taxes. An investor may not invest directly in the Index. |
| 4 | 1.855.775.3337 | www.rondureglobal.com |
| Rondure New World Fund | Performance Update |
October 31, 2020 (Unaudited)
Growth of $10,000 for the period ended October 31, 2020
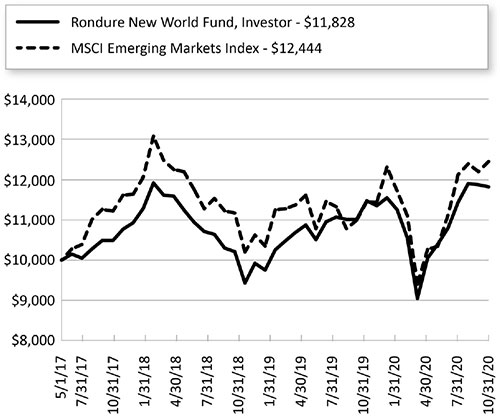
The chart shown above represent a hypothetical investment of $10,000 in the Fund’s Investor Class shares for the period from inception to October 31, 2020. All returns reflect reinvested dividends, but do not reflect the deduction of taxes that an investor would pay on distributions or redemptions.
Investing in the Fund is subject to investment risks, including possible loss of the principal amount invested.
The Fund also offers Institutional Class shares, performance for which is not reflected in the graphs above. The performance of Institutional Class shares may be higher or lower than the performance of the Investor Class shares shown in the graphs above based upon differences in fees paid by shareholders investing in the Investor Class shares and Institutional Class shares.
| Semi-Annual Report | October 31, 2020 | 5 |
| Rondure New World Fund | Performance Update |
October 31, 2020 (Unaudited)
| Regional Allocation (as a % of Net Assets)* | |
| Asia ex Japan | 76.6% |
| North America | 6.5% |
| Africa/Middle East | 6.1% |
| Europe | 3.2% |
| Latin America | 2.3% |
| Cash, Cash Equivalents, & Other Net Assets | 5.3% |
| Total | 100.0% |
| Top 10 Holdings (as a % of Net Assets)* | |
| Taiwan Semiconductor Manufacturing Co., Ltd. | 5.4% |
| Alibaba Group Holding, Ltd. | 4.1% |
| Li Ning Co., Ltd. | 4.1% |
| Yum China Holdings, Inc. | 3.0% |
| Samsung Electronics Co., Ltd. | 2.9% |
| Tata Consultancy Services, Ltd. | 2.6% |
| ANTA Sports Products, Ltd. | 2.5% |
| Vietnam Dairy Products JSC | 2.2% |
| Philippine Seven Corp. | 2.1% |
| Becle SAB de CV | 2.1% |
| Total | 31.0% |
| * | Holdings are subject to change, and may not reflect the current or future position of the portfolio. |
| 6 | 1.855.775.3337 | www.rondureglobal.com |
| Rondure Overseas Fund | Performance Update |
October 31, 2020 (Unaudited)
Annualized Total Return Performance for the periods ended October 31, 2020
| | | | | Since | Expense Ratio(b) |
| | 6 Months | 1 Year | 3 Year | Inception(a) | Gross | Net(c) |
| Rondure Overseas Fund – Institutional (ROSIX) | 15.30% | 3.37% | 3.35% | 6.13% | 1.73% | 0.85% |
| Rondure Overseas Fund – Investor (ROSOX) | 15.09% | 3.12% | 3.11% | 5.90% | 2.06% | 1.10% |
| MSCI EAFE Index(e) | 8.77% | -6.46% | -0.76% | 2.27% | | |
Performance data quoted represents past performance. Past performance does not guarantee future results. Investment return and principal value of an investment will fluctuate so that an investor’s shares, when sold or redeemed, may be worth more or less than the original cost. The Fund imposes a 2.00% redemption fee on shares held for less than 60 days. Current performance data may be higher or lower than actual data quoted. For the most current month-end performance data, please call 1-855-775-3337.
The table does not reflect the deduction of taxes a shareholder would pay on Fund distributions or redemption of Fund shares.
Subject to investment risks, including possible loss of the principal amount invested.
Returns for periods less than 1 year are cumulative.
| (a) | Fund inception date of May 1, 2017. |
| (b) | Ratios as of the Prospectus dated August 31, 2020 and may differ from the ratios presented in the Financial Highlights. |
| (c) | Rondure Global Advisors, LLC (the “Advisor”), has agreed to waive and/or reimburse fees or expenses in order to limit Total Annual Fund Operating Expenses After Fee Waiver/ Expense Reimbursement (excluding acquired fund fees and expenses, brokerage expenses, interest expenses, taxes and extraordinary expenses) to 1.10% and 0.85% of the Fund’s average daily net assets for the Fund’s Investor Class Shares and Institutional Class Shares, respectively. This agreement (the “Expense Agreement”) is in effect through August 31, 2021. The Advisor will be permitted to recover, on a class-by-class basis, expenses it has borne through the Expense Agreement to the extent that a Fund’s expenses in later periods fall below the expense cap in effect at the time of waiver or reimbursement. However, such recapture payments may not cause the Fund’s expense ratio (after recapture) to exceed the lesser of (i) the expense cap in effect at the time of the waiver and (ii) the expense cap in effect at the time of the recapture. Notwithstanding the foregoing, the Fund will not be obligated to pay any such deferred fees and expenses more than three years after the date of the waiver or reimbursement. The Expense Agreement may not be terminated or modified by the Advisor prior to August 31, 2021, except with the approval of the Fund’s Board of Trustees. |
| (d) | Excludes adjustments in accordance with accounting principles generally accepted in the United States of America and as such, the net asset value and total return for shareholder transactions reported to the market may differ from the net asset value for financial reporting purposes. |
| (e) | The MSCI EAFE Index is an unmanaged total return index, reported in U.S. dollars, based on share prices and reinvested net dividends of approximately 1,100 companies from 22 developed market countries excluding the US and Canada. The Index is not actively managed and does not reflect any deductions for fees, expense, or taxes. An investor may not invest directly in the Index. |
| Semi-Annual Report | October 31, 2020 | 7 |
| Rondure Overseas Fund | Performance Update |
October 31, 2020 (Unaudited)
Growth of $10,000 for the period ended October 31, 2020
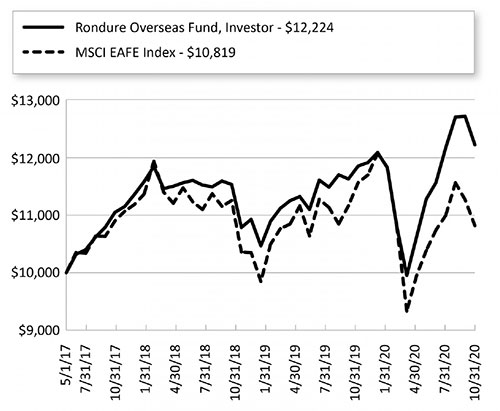
The chart shown above represent a hypothetical investment of $10,000 in the Fund’s Investor Class shares for the period from inception to October 31, 2020. All returns reflect reinvested dividends, but do not reflect the deduction of taxes that an investor would pay on distributions or redemptions.
Investing in the Fund is subject to investment risks, including possible loss of the principal amount invested.
The Fund also offers Institutional Class shares, performance for which is not reflected in the graphs above. The performance of Institutional Class shares may be higher or lower than the performance of the Investor Class shares shown in the graphs above based upon differences in fees paid by shareholders investing in the Investor Class shares and Institutional Class shares.
| 8 | 1.855.775.3337 | www.rondureglobal.com |
| Rondure Overseas Fund | Performance Update |
October 31, 2020 (Unaudited)
| Regional Allocation (as a % of Net Assets)* | |
| Europe | 61.7% |
| Japan | 15.6% |
| North America | 13.7% |
| Australia/New Zealand | 6.7% |
| Asia ex Japan | 2.0% |
| Cash, Cash Equivalents, & Other Net Assets | 0.3% |
| Total | 100.0% |
| Top 10 Holdings (as a % of Net Assets)* | |
| Nestle SA | 4.4% |
| Unilever NV | 3.8% |
| Chocoladefabriken Lindt & Spruengli AG | 2.6% |
| L'Oreal SA | 2.2% |
| Accenture PLC | 2.2% |
| Axfood AB | 2.1% |
| Mastercard, Inc. | 2.1% |
| Diageo PLC | 2.0% |
| Ferrari NV | 2.0% |
| Unicharm Corp. | 1.9% |
| Total | 25.3% |
| * | Holdings are subject to change, and may not reflect the current or future position of the portfolio. |
| Semi-Annual Report | October 31, 2020 | 9 |
| Rondure Funds | Disclosure of Fund Expenses |
October 31, 2020 (Unaudited)
As a shareholder of a Fund, you incur two types of costs: (1) transaction costs, including sales charges (loads) on purchase payments, reinvested dividends, or other distributions; redemption fees; and exchange fees; and (2) ongoing costs, including management fees; distribution and/or service (12b-1) fees; and other Fund expenses. This example is intended to help you understand your ongoing costs (in dollars) of investing in the Fund and to compare these costs with the ongoing costs of investing in other mutual funds.
This example is based on an investment of $1,000 invested at the beginning of the period and held for the entire six-month period of May 1, 2020 through October 31, 2020.
Actual Expenses The first line of the table provides information about actual account values and actual expenses. You may use the information in this line, together with the amount you invested, to estimate the expenses that you paid over the period. Simply divide your account value by $1,000 (for example, an $8,600 account value divided by $1,000 = 8.6), then multiply the result by the number in the first line under the heading “Expenses Paid During Period” to estimate the expenses you paid on your account during this period.
Hypothetical Example for Comparison Purposes The second line of the table provides information about hypothetical account values and hypothetical expenses based on the Fund’s actual expense ratio and an assumed rate of return of 5% per year before expenses, which is not the Fund’s actual return. The hypothetical account values and expenses may not be used to estimate the actual ending account balance or expenses you paid for the period. You may use this information to compare the ongoing costs of investing in the Fund and other mutual funds. To do so, compare this 5% hypothetical example with the 5% hypothetical examples that appear in the shareholder reports of the other funds. Please note that the expenses shown in the table are meant to highlight your ongoing costs only and do not reflect any transactional costs, such as redemption fees or exchange fees. Therefore, the second line of the table is useful in comparing ongoing costs only and will not help you determine the relative total costs of owning different funds. In addition, if these transactional costs were included, your costs would have been higher.
| | Beginning
Account Value
May 1, 2020 | Ending
Account Value
October 31, 2020 | Expense
Ratio(a) | Expenses Paid
During Period
May 1, 2020 -
October 31, 2020(b) |
| Rondure New World Fund | | | | |
| Institutional Class | | | | |
| Actual | $1,000.00 | $1,178.20 | 1.10% | $6.04 |
| Hypothetical (5% return before expenses) | $1,000.00 | $1,019.66 | 1.10% | $5.60 |
| Investor Class | | | | |
| Actual | $1,000.00 | $1,177.80 | 1.35% | $7.41 |
| Hypothetical (5% return before expenses) | $1,000.00 | $1,018.40 | 1.35% | $6.87 |
| Rondure Overseas Fund | | | | |
| Institutional Class | | | | |
| Actual | $1,000.00 | $1,151.80 | 0.85% | $4.61 |
| Hypothetical (5% return before expenses) | $1,000.00 | $1,020.92 | 0.85% | $4.33 |
| Investor Class | | | | |
| Actual | $1,000.00 | $1,150.90 | 1.10% | $5.96 |
| Hypothetical (5% return before expenses) | $1,000.00 | $1,019.66 | 1.10% | $5.60 |
| (a) | The Fund's expense ratios have been annualized based on the Fund's most recent fiscal half-year expenses. |
| (b) | Expenses are equal to the Fund's annualized expense ratio multiplied by the average account value over the period, multiplied by the number of days in the most recent fiscal half-year (184)/365 (to reflect the half-year period). |
| 10 | 1.855.775.3337 | www.rondureglobal.com |
| Rondure New World Fund | Portfolio of Investments |
October 31, 2020 (Unaudited)
| | | Shares | | | Value
(Note 2) | |
| COMMON STOCKS (94.71%) | | | | | | | | |
| Bangladesh (0.55%) | | | | | | | | |
| Square Pharmaceuticals, Ltd. | | | 418,832 | | | $ | 980,487 | |
| | | | | | | | | |
| Brazil (1.91%) | | | | | | | | |
| B3 SA - Brasil Bolsa Balcao | | | 252,400 | | | | 2,235,022 | |
| Raia Drogasil SA | | | 223,500 | | | | 940,282 | |
| TOTVS SA | | | 54,600 | | | | 256,635 | |
| | | | | | | | 3,431,939 | |
| | | | | | | | | |
| China (23.46%) | | | | | | | | |
| Alibaba Group Holding, Ltd., | | | | | | | | |
| Sponsored ADR(a) | | | 9,210 | | | | 2,806,195 | |
| Alibaba Group Holding, Ltd.(a) | | | 119,700 | | | | 4,535,896 | |
| ANTA Sports Products, Ltd. | | | 397,000 | | | | 4,407,158 | |
| China Resources Beer Holdings Co., Ltd. | | | 140,000 | | | | 868,642 | |
| Hengan International Group Co., Ltd. | | | 105,000 | | | | 732,433 | |
| JD.com, Inc., ADR(a) | | | 2,475 | | | | 201,762 | |
| JD.com, Inc.(a) | | | 66,300 | | | | 2,704,279 | |
| Kweichow Moutai Co., Ltd., Class A | | | 4,400 | | | | 1,099,327 | |
| Li Ning Co., Ltd. | | | 1,406,000 | | | | 7,327,988 | |
| New Oriental Education & Technology Group, Inc., Sponsored ADR(a) | | | 1,686 | | | | 270,401 | |
| Shanghai International Airport Co., Ltd., Class A | | | 164,800 | | | | 1,630,352 | |
| Sichuan Swellfun Co., Ltd. | | | 162,400 | | | | 1,608,194 | |
| Tencent Holdings, Ltd. | | | 37,400 | | | | 2,857,571 | |
| TravelSky Technology, Ltd., Class H | | | 409,000 | | | | 862,169 | |
| Trip.com Group, Ltd., ADR(a) | | | 55,885 | | | | 1,607,253 | |
| Tsingtao Brewery Co., Ltd., Class H | | | 389,000 | | | | 3,223,321 | |
| Yum China Holdings, Inc. | | | 99,600 | | | | 5,301,708 | |
| | | | | | | | 42,044,649 | |
| | | | | | | | | |
| Greece (0.51%) | | | | | | | | |
| JUMBO SA | | | 65,642 | | | | 920,057 | |
| | | | | | | | | |
| Hong Kong (3.85%) | | | | | | | | |
| Cafe de Coral Holdings, Ltd. | | | 165,000 | | | | 341,056 | |
| | | Shares | | | Value
(Note 2) | |
| Hong Kong (continued) | | | | | | | | |
| Hong Kong Exchanges & Clearing, Ltd. | | | 73,700 | | | $ | 3,531,609 | |
| Vitasoy International Holdings, Ltd. | | | 750,000 | | | | 3,033,680 | |
| | | | | | | | 6,906,345 | |
| | | | | | | | | |
| India (14.81%) | | | | | | | | |
| 3M India, Ltd.(a) | | | 1,575 | | | | 396,340 | |
| Asian Paints, Ltd. | | | 74,550 | | | | 2,223,594 | |
| Britannia Industries, Ltd. | | | 14,622 | | | | 684,793 | |
| Castrol India, Ltd. | | | 423,000 | | | | 650,277 | |
| Colgate-Palmolive India, Ltd. | | | 46,704 | | | | 955,557 | |
| Dabur India, Ltd. | | | 180,000 | | | | 1,242,175 | |
| Divi’s Laboratories, Ltd. | | | 13,500 | | | | 572,102 | |
| Dr Lal PathLabs, Ltd.(b)(c) | | | 24,000 | | | | 743,384 | |
| HCL Technologies, Ltd. | | | 142,500 | | | | 1,621,309 | |
| HDFC Bank, Ltd.(a) | | | 131,000 | | | | 2,092,062 | |
| Hindustan Unilever, Ltd. | | | 32,590 | | | | 911,228 | |
| Honeywell Automation India, Ltd. | | | 355 | | | | 136,085 | |
| Ipca Laboratories, Ltd. | | | 15,500 | | | | 483,644 | |
| Jubilant Foodworks, Ltd. | | | 123,000 | | | | 3,607,328 | |
| Marico, Ltd. | | | 31,400 | | | | 151,202 | |
| Nestle India, Ltd. | | | 3,718 | | | | 860,513 | |
| Oracle Financial Services Software, Ltd. | | | 20,000 | | | | 848,462 | |
| Pidilite Industries, Ltd. | | | 13,575 | | | | 287,477 | |
| Reliance Industries, Ltd. | | | 38,062 | | | | 1,055,261 | |
| Schaeffler India, Ltd. | | | 23,500 | | | | 1,193,058 | |
| SKF India, Ltd. | | | 24,500 | | | | 487,465 | |
| Tata Consultancy Services, Ltd. | | | 128,915 | | | | 4,646,158 | |
| Tech Mahindra, Ltd. | | | 31,500 | | | | 346,847 | |
| United Breweries, Ltd. | | | 27,500 | | | | 343,556 | |
| | | | | | | | 26,539,877 | |
| | | | | | | | | |
| Indonesia (3.72%) | | | | | | | | |
| Ace Hardware Indonesia Tbk PT | | | 17,144,800 | | | | 1,828,247 | |
| Indofood CBP Sukses Makmur Tbk PT | | | 4,105,200 | | | | 2,696,627 | |
| Multi Bintang Indonesia Tbk PT | | | 515,000 | | | | 319,714 | |
| Unilever Indonesia Tbk PT | | | 3,434,200 | | | | 1,822,484 | |
| | | | | | | | 6,667,072 | |
See Notes to Financial Statements.
| Semi-Annual Report | October 31, 2020 | 11 |
| Rondure New World Fund | Portfolio of Investments |
October 31, 2020 (Unaudited)
| | | Shares | | | Value
(Note 2) | |
| Kenya (1.96%) | | | | | | | | |
| Safaricom PLC | | | 12,374,200 | | | $ | 3,508,273 | |
| | | | | | | | | |
| Malaysia (2.97%) | | | | | | | | |
| Carlsberg Brewery Malaysia Bhd | | | 592,000 | | | | 2,633,105 | |
| Heineken Malaysia Bhd | | | 622,000 | | | | 2,695,915 | |
| | | | | | | | 5,329,020 | |
| | | | | | | | | |
| Mexico (3.97%) | | | | | | | | |
| Becle SAB de CV | | | 1,769,600 | | | | 3,735,002 | |
| Wal-Mart de Mexico SAB de CV | | | 1,392,900 | | | | 3,372,668 | |
| | | | | | | | 7,107,670 | |
| | | | | | | | | |
| Netherlands (0.49%) | | | | | | | | |
| Prosus NV | | | 8,715 | | | | 870,068 | |
| | | | | | | | | |
| Pakistan (0.10%) | | | | | | | | |
| Nestle Pakistan, Ltd. | | | 4,578 | | | | 183,090 | |
| | | | | | | | | |
| Peru (0.38%) | | | | | | | | |
| Inretail Peru Corp | | | 20,196 | | | | 680,605 | |
| | | | | | | | | |
| Philippines (4.71%) | | | | | | | | |
| International Container Terminal Services, Inc. | | | 272,000 | | | | 645,063 | |
| Jollibee Foods Corp. | | | 125,000 | | | | 438,394 | |
| Philippine Seven Corp. | | | 1,678,447 | | | | 3,849,331 | |
| Puregold Price Club, Inc. | | | 1,288,000 | | | | 1,097,718 | |
| San Miguel Food and Beverage, Inc. | | | 567,500 | | | | 748,706 | |
| Wilcon Depot, Inc. | | | 5,601,500 | | | | 1,656,499 | |
| | | | | | | | 8,435,711 | |
| | | | | | | | | |
| Poland (0.59%) | | | | | | | | |
| Dino Polska SA(a)(b)(c) | | | 19,400 | | | | 1,066,601 | |
| | | | | | | | | |
| Russia (1.59%) | | | | | | | | |
| Moscow Exchange MICEX-RTS PJSC | | | 1,689,660 | | | | 2,853,723 | |
| | | | | | | | | |
| South Africa (2.63%) | | | | | | | | |
| Clicks Group, Ltd. | | | 115,400 | | | | 1,673,163 | |
| Distell Group Holdings, Ltd. | | | 69,900 | | | | 349,608 | |
| Naspers, Ltd. | | | 4,511 | | | | 876,302 | |
| | | Shares | | | Value
(Note 2) | |
| South Africa (continued) | | | | | | | | |
| Shoprite Holdings, Ltd. | | | 229,605 | | | $ | 1,818,780 | |
| | | | | | | | 4,717,853 | |
| | | | | | | | | |
| South Korea (4.14%) | | | | | | | | |
| LG Household & Health Care, Ltd. | | | 964 | | | | 1,278,148 | |
| S-1 Corp. | | | 13,800 | | | | 991,801 | |
| Samsung Electronics Co., Ltd. | | | 102,500 | | | | 5,152,227 | |
| | | | | | | | 7,422,176 | |
| | | | | | | | | |
| Sri Lanka (0.77%) | | | | | | | | |
| Lion Brewery Ceylon PLC | | | 472,256 | | | | 1,382,339 | |
| | | | | | | | | |
| Taiwan (9.74%) | | | | | | | | |
| MediaTek, Inc. | | | 31,000 | | | | 736,878 | |
| momo.com, Inc. | | | 43,000 | | | | 1,029,050 | |
| Poya International Co., Ltd. | | | 44,000 | | | | 950,330 | |
| President Chain Store Corp. | | | 284,000 | | | | 2,563,341 | |
| Taiwan FamilyMart Co., Ltd. | | | 274,000 | | | | 2,504,243 | |
| Taiwan Semiconductor Manufacturing Co., Ltd. | | | 640,000 | | | | 9,682,992 | |
| | | | | | | | 17,466,834 | |
| | | | | | | | | |
| Tanzania (0.09%) | | | | | | | | |
| Tanzania Breweries, Ltd. | | | 34,234 | | | | 160,910 | |
| | | | | | | | | |
| Thailand (4.16%) | | | | | | | | |
| Airports of Thailand PCL | | | 721,000 | | | | 1,195,448 | |
| Bangkok Dusit Medical Services PCL | | | 1,987,000 | | | | 1,114,894 | |
| CP ALL PCL | | | 129,000 | | | | 222,074 | |
| Home Product Center PCL | | | 1,620,000 | | | | 724,520 | |
| MK Restaurants Group PCL | | | 525,000 | | | | 765,691 | |
| TOA Paint Thailand PCL | | | 3,321,000 | | | | 3,431,965 | |
| | | | | | | | 7,454,592 | |
| | | | | | | | | |
| Turkey (0.47%) | | | | | | | | |
| BIM Birlesik Magazalar AS | | | 107,600 | | | | 850,736 | |
| | | | | | | | | |
| United Arab Emirates (1.28%) | | | | | | | | |
| Aramex PJSC | | | 2,133,000 | | | | 2,288,889 | |
| | | | | | | | | |
| United States (2.56%) | | | | | | | | |
| Amazon.com, Inc.(a) | | | 305 | | | | 926,026 | |
See Notes to Financial Statements.
| 12 | 1.855.775.3337 | www.rondureglobal.com |
| Rondure New World Fund | Portfolio of Investments |
October 31, 2020 (Unaudited)
| | | Shares | | | Value
(Note 2) | |
| United States (continued) | | | | | | | | |
| Microsoft Corp. | | | 3,800 | | | $ | 769,386 | |
| Starbucks Corp. | | | 13,475 | | | | 1,171,786 | |
| The Walt Disney Co. | | | 14,150 | | | | 1,715,687 | |
| | | | | | | | 4,582,885 | |
| | | | | | | | | |
| Vietnam (3.30%) | | | | | | | | |
| Saigon Beer Alcohol Beverage Corp. | | | 64,520 | | | | 513,039 | |
| Vietnam Dairy Products JSC | | | 846,878 | | | | 3,956,873 | |
| Vincom Retail JSC(a) | | | 1,305,705 | | | | 1,436,321 | |
| | | | | | | | 5,906,233 | |
| | | | | | | | | |
| TOTAL COMMON STOCKS | | | | | | | | |
| (Cost $147,415,613) | | | | | | | 169,758,634 | |
| | | | | | | | | |
| TOTAL INVESTMENTS (94.71%) | | | | | |
| (Cost $147,415,613) | | | | | | $ | 169,758,634 | |
| | | | | | | | | |
| Other Assets In Excess Of Liabilities (5.29%) | | | | 9,480,392 | |
| | | | | | | | | |
| NET ASSETS (100.00%) | | | | | | $ | 179,239,026 | |
| (a) | Non-Income Producing Security. |
| (b) | Security exempt from registration under Rule 144A of the Securities Act of 1933. These securities may be resold in the ordinary course of business in transactions exempt from registration, normally to qualified institutional buyers. As of October 31, 2020, these securities had a total aggregate market value of $1,809,985 representing 1.01% of net assets. |
| (c) | Security was purchased pursuant to Regulation S under the Securities Act of 1933, which exempts securities offered and sold outside of the United States from registration. Such security cannot be sold in the United States without either an effective registration statement filed pursuant to the Securities Act of 1933, or pursuant to an exemption from registration. As of October 31, 2020, the aggregate market value of those securities was $1,809,985, representing 1.01% of net assets. |
| Sector Composition (October 31, 2020) (Unaudited) |
| Consumer | 58.1% |
| Technology | 18.6% |
| Financials | 6.8% |
| Industrials | 5.0% |
| Energy & Materials | 4.1% |
| Health Care | 2.1% |
| Cash, Cash Equivalents, & Other Net Assets | 5.3% |
| Total | 100% |
| Industry Composition (October 31, 2020) (Unaudited) |
| Food & Staples Retailing | 11.5% |
| Beverages | 10.6% |
| Internet & Direct Marketing Retail | 8.2% |
| Food Products | 6.8% |
| Textiles, Apparel & Luxury Goods | 6.6% |
| Hotels, Restaurants & Leisure | 6.5% |
| Semiconductors & Semiconductor Equipment | 5.8% |
| Capital Markets | 4.8% |
| IT Services | 4.2% |
| Chemicals | 3.7% |
| Technology Hardware, Storage & Peripherals | 2.9% |
| Specialty Retail | 2.9% |
| Personal Products | 2.4% |
| Wireless Telecommunication Services | 2.0% |
| Transportation Infrastructure | 1.9% |
| Interactive Media & Services | 1.6% |
| Household Products | 1.5% |
| Air Freight & Logistics | 1.3% |
| Banks | 1.2% |
| Health Care Providers & Services | 1.0% |
| Software | 1.0% |
| Other Industries (each less than 1%) | 6.5% |
| Cash and Other Assets, Less Liabilities | 5.3% |
| Total | 100% |
See Notes to Financial Statements.
| Semi-Annual Report | October 31, 2020 | 13 |
| Rondure Overseas Fund | Portfolio of Investments |
October 31, 2020 (Unaudited)
| | | Shares | | | Value
(Note 2) | |
| COMMON STOCKS (99.65%) | | | | | | | | |
| Australia (5.07%) | | | | | | | | |
| ASX, Ltd. | | | 2,000 | | | $ | 111,989 | |
| Cochlear, Ltd. | | | 998 | | | | 148,956 | |
| CSL, Ltd. | | | 1,274 | | | | 257,930 | |
| Domino’s Pizza Enterprises, Ltd. | | | 2,548 | | | | 151,763 | |
| REA Group, Ltd. | | | 5,906 | | | | 491,154 | |
| Sonic Healthcare, Ltd. | | | 7,170 | | | | 175,615 | |
| | | | | | | | 1,337,407 | |
| | | | | | | | | |
| Austria (1.05%) | | | | | | | | |
| Mayr Melnhof Karton AG | | | 1,700 | | | | 277,704 | |
| | | | | | | | | |
| Belgium (1.23%) | | | | | | | | |
| Lotus Bakeries NV | | | 45 | | | | 176,082 | |
| Melexis NV | | | 600 | | | | 45,631 | |
| Warehouses De Pauw CVA | | | 3,050 | | | | 102,185 | |
| | | | | | | | 323,898 | |
| | | | | | | | | |
| Britain (14.31%) | | | | | | | | |
| Abcam PLC | | | 17,200 | | | | 328,136 | |
| B&M European Value Retail SA | | | 32,987 | | | | 207,024 | |
| Compass Group PLC | | | 10,445 | | | | 142,969 | |
| Diageo PLC | | | 16,296 | | | | 526,654 | |
| Diploma PLC | | | 5,400 | | | | 155,496 | |
| Greggs PLC(a) | | | 4,800 | | | | 80,165 | |
| Halma PLC | | | 4,300 | | | | 131,957 | |
| Intertek Group PLC | | | 2,970 | | | | 213,932 | |
| London Stock Exchange Group PLC | | | 2,967 | | | | 319,838 | |
| Rightmove PLC(a) | | | 31,950 | | | | 255,703 | |
| Softcat PLC | | | 18,789 | | | | 273,900 | |
| Spirax-Sarco Engineering PLC | | | 939 | | | | 137,276 | |
| Unilever NV | | | 17,820 | | | | 1,004,577 | |
| | | | | | | | 3,777,627 | |
| | | | | | | | | |
| Canada (4.87%) | | | | | | | | |
| Alimentation Couche-Tard, Inc., Class B | | | 13,800 | | | | 424,990 | |
| Canadian National Railway Co. | | | 4,002 | | | | 397,557 | |
| Dollarama, Inc. | | | 5,640 | | | | 194,223 | |
| | | Shares | | | Value
(Note 2) | |
| Canada (continued) | | | | | | | | |
| Fortis, Inc. | | | 6,800 | | | $ | 268,621 | |
| | | | | | | | 1,285,391 | |
| | | | | | | | | |
| Denmark (3.71%) | | | | | | | | |
| Coloplast A/S, Class B | | | 2,377 | | | | 347,620 | |
| Novo Nordisk A/S, Class B | | | 5,400 | | | | 344,334 | |
| Royal Unibrew A/S | | | 2,942 | | | | 286,872 | |
| | | | | | | | 978,826 | |
| | | | | | | | | |
| Finland (2.91%) | | | | | | | | |
| Kone Oyj, Class B | | | 3,200 | | | | 254,761 | |
| Olvi Oyj, Class A | | | 9,805 | | | | 512,478 | |
| | | | | | | | 767,239 | |
| | | | | | | | | |
| France (9.36%) | | | | | | | | |
| Air Liquide SA | | | 2,617 | | | | 382,704 | |
| Danone SA | | | 862 | | | | 47,811 | |
| Dassault Systemes SE | | | 1,450 | | | | 247,239 | |
| EssilorLuxottica SA(a) | | | 738 | | | | 91,112 | |
| Hermes International | | | 330 | | | | 307,262 | |
| L’Oreal SA | | | 1,760 | | | | 568,805 | |
| LVMH Moet Hennessy Louis Vuitton SE | | | 766 | | | | 359,060 | |
| Pernod Ricard SA | | | 2,422 | | | | 390,189 | |
| Sodexo SA | | | 1,200 | | | | 77,083 | |
| | | | | | | | 2,471,265 | |
| | | | | | | | | |
| Germany (6.28%) | | | | | | | | |
| adidas AG(a) | | | 1,545 | | | | 459,026 | |
| Beiersdorf AG | | | 1,980 | | | | 207,324 | |
| Carl Zeiss Meditec AG | | | 1,395 | | | | 180,247 | |
| Puma SE(a) | | | 5,410 | | | | 473,607 | |
| SAP SE | | | 1,676 | | | | 178,803 | |
| Symrise AG | | | 1,280 | | | | 157,837 | |
| | | | | | | | 1,656,844 | |
| | | | | | | | | |
| Hong Kong (2.00%) | | | | | | | | |
| Hong Kong Exchanges & Clearing, Ltd. | | | 6,400 | | | | 306,680 | |
| Vitasoy International Holdings, Ltd. | | | 55,000 | | | | 222,470 | |
| | | | | | | | 529,150 | |
| | | | | | | | | |
| Ireland (1.53%) | | | | | | | | |
| ICON PLC, ADR(a) | | | 1,285 | | | | 231,685 | |
See Notes to Financial Statements.
| 14 | 1.855.775.3337 | www.rondureglobal.com |
| Rondure Overseas Fund | Portfolio of Investments |
October 31, 2020 (Unaudited)
| | | Shares | | | Value
(Note 2) | |
| Ireland (continued) | | | | | | | | |
| Kerry Group PLC, Class A | | | 1,445 | | | $ | 172,969 | |
| | | | | | | | 404,654 | |
| | | | | | | | | |
| Italy (3.50%) | | | | | | | | |
| Davide Campari-Milano NV | | | 20,416 | | | | 213,374 | |
| DiaSorin SpA | | | 865 | | | | 189,892 | |
| Ferrari NV | | | 2,924 | | | | 521,616 | |
| | | | | | | | 924,882 | |
| | | | | | | | | |
| Japan (15.65%) | | | | | | | | |
| Asahi Intecc Co., Ltd. | | | 5,500 | | | | 170,435 | |
| Cosmos Pharmaceutical Corp. | | | 700 | | | | 118,888 | |
| Create SD Holdings Co., Ltd. | | | 3,800 | | | | 122,550 | |
| Japan Exchange Group, Inc. | | | 4,400 | | | | 107,418 | |
| Kobayashi Pharmaceutical Co., Ltd. | | | 2,600 | | | | 253,359 | |
| Kusuri no Aoki Holdings Co., Ltd. | | | 1,600 | | | | 127,722 | |
| Matsumotokiyoshi Holdings Co., Ltd. | | | 4,100 | | | | 151,357 | |
| MonotaRO Co., Ltd. | | | 6,500 | | | | 359,526 | |
| Nihon M&A Center, Inc. | | | 7,900 | | | | 463,901 | |
| Nintendo Co., Ltd. | | | 50 | | | | 27,034 | |
| Nippon Paint Holdings Co., Ltd. | | | 1,900 | | | | 171,152 | |
| OBIC Business Consultants Co., Ltd. | | | 3,000 | | | | 161,450 | |
| Oriental Land Co., Ltd. | | | 3,000 | | | | 419,934 | |
| Recruit Holdings Co., Ltd. | | | 3,700 | | | | 140,787 | |
| Secom Co., Ltd. | | | 4,400 | | | | 371,707 | |
| Seria Co., Ltd. | | | 5,300 | | | | 204,204 | |
| Sundrug Co., Ltd. | | | 3,200 | | | | 118,822 | |
| Tsuruha Holdings, Inc. | | | 900 | | | | 126,023 | |
| Unicharm Corp. | | | 11,100 | | | | 513,607 | |
| | | | | | | | 4,129,876 | |
| | | | | | | | | |
| Netherlands (4.09%) | | | | | | | | |
| Akzo Nobel NV | | | 1,500 | | | | 144,282 | |
| ASML Holding NV | | | 1,003 | | | | 362,887 | |
| Euronext NV(b)(c) | | | 2,020 | | | | 210,325 | |
| Heineken NV | | | 2,520 | | | | 223,064 | |
| Prosus NV | | | 1,400 | | | | 139,770 | |
| | | | | | | | 1,080,328 | |
| | | Shares | | | Value
(Note 2) | |
| New Zealand (1.60%) | | | | | | | | |
| Mainfreight, Ltd. | | | 11,859 | | | $ | 422,857 | |
| | | | | | | | | |
| Spain (0.21%) | | | | | | | | |
| Amadeus IT Group SA | | | 1,160 | | | | 55,269 | |
| | | | | | | | | |
| Sweden (3.77%) | | | | | | | | |
| Assa Abloy AB, Class B | | | 10,198 | | | | 218,568 | |
| Axfood AB | | | 23,982 | | | | 557,418 | |
| Essity AB, Class B | | | 4,051 | | | | 117,249 | |
| Indutrade AB(a) | | | 1,985 | | | | 100,499 | |
| | | | | | | | 993,734 | |
| | | | | | | | | |
| Switzerland (9.70%) | | | | | | | | |
| Chocoladefabriken Lindt & Spruengli AG | | | 86 | | | | 681,848 | |
| Givaudan SA | | | 33 | | | | 134,572 | |
| Logitech International SA | | | 600 | | | | 50,515 | |
| Nestle SA | | | 10,430 | | | | 1,173,145 | |
| Partners Group Holding AG | | | 258 | | | | 232,279 | |
| Schindler Holding AG | | | 556 | | | | 142,916 | |
| Sika AG | | | 590 | | | | 145,143 | |
| | | | | | | | 2,560,418 | |
| | | | | | | | | |
| United States (8.81%) | | | | | | | | |
| Accenture PLC, Class A | | | 2,622 | | | | 568,738 | |
| BlackRock, Inc. | | | 535 | | | | 320,578 | |
| Estee Lauder Cos., Inc., Class A | | | 1,315 | | | | 288,853 | |
| Mastercard, Inc., Class A | | | 1,913 | | | | 552,168 | |
| MSCI, Inc. | | | 375 | | | | 131,190 | |
| Visa, Inc., Class A | | | 2,545 | | | | 462,452 | |
| | | | | | | | 2,323,979 | |
| | | | | | | | | |
| TOTAL COMMON STOCKS | | | | | |
| (Cost $22,574,560) | | | | | | | 26,301,348 | |
| | | | | | | | | |
| TOTAL INVESTMENTS (99.65%) | | | | | |
| (Cost $22,574,560) | | | | | | $ | 26,301,348 | |
| | | | | | | | | |
| Other Assets In Excess Of Liabilities (0.35%) | | | | 92,155 | |
| | | | | | | | | |
| NET ASSETS (100.00%) | | | | | | $ | 26,393,503 | |
See Notes to Financial Statements.
| Semi-Annual Report | October 31, 2020 | 15 |
| Rondure Overseas Fund | Portfolio of Investments |
October 31, 2020 (Unaudited)
| (a) | Non-Income Producing Security. |
| (b) | Security exempt from registration under Rule 144A of the Securities Act of 1933. These securities may be resold in the ordinary course of business in transactions exempt from registration, normally to qualified institutional buyers. As of October 31, 2020, these securities had a total aggregate market value of $210,325 representing 0.80% of net assets. |
| (c) | Security was purchased pursuant to Regulation S under the Securities Act of 1933, which exempts securities offered and sold outside of the United States from registration. Such security cannot be sold in the United States without either an effective registration statement filed pursuant to the Securities Act of 1933, or pursuant to an exemption from registration. As of October 31, 2020, the aggregate market value of those securities was $210,325, representing 0.80% of net assets. |
| Sector Composition (October 31, 2020) (Unaudited) | |
| Consumer | 49.8% |
| Technology | 14.6% |
| Industrials | 12.8% |
| Health Care | 9.1% |
| Financials | 7.0% |
| Energy & Materials | 5.4% |
| Utilities | 1.0% |
| Cash, Cash Equivalents, & Other Net Assets | 0.3% |
| Total | 100% |
| Industry Composition (October 31, 2020) (Unaudited) | |
| Food Products | 9.4% |
| Personal Products | 8.8% |
| Beverages | 8.2% |
| IT Services | 7.3% |
| Food & Staples Retailing | 6.6% |
| Capital Markets | 6.6% |
| Textiles, Apparel & Luxury Goods | 6.4% |
| Chemicals | 4.3% |
| Health Care Equipment & Supplies | 3.9% |
| Hotels, Restaurants & Leisure | 3.3% |
| Professional Services | 3.1% |
| Interactive Media & Services | 2.8% |
| Household Products | 2.4% |
| Trading Companies & Distributors | 2.3% |
| Multiline Retail | 2.3% |
| Software | 2.2% |
| Biotechnology | 2.2% |
| Machinery | 2.0% |
| Automobiles | 2.0% |
| Air Freight & Logistics | 1.6% |
| Semiconductors & Semiconductor Equipment | 1.5% |
| Road & Rail | 1.5% |
| Commercial Services & Supplies | 1.4% |
| Pharmaceuticals | 1.3% |
| Containers & Packaging | 1.1% |
| Electric Utilities | 1.0% |
| Other Industries (each less than 1%) | 4.1% |
| Cash and Other Assets, Less Liabilities | 0.3% |
| Total | 100% |
See Notes to Financial Statements.
| 16 | 1.855.775.3337 | www.rondureglobal.com |
| Rondure Funds | Statements of Assets and Liabilities |
October 31, 2020 (Unaudited)
| | | Rondure New World Fund | | | Rondure Overseas Fund | |
| ASSETS | | | | | | | | |
| Investments, at value (Cost - see below) | | $ | 169,758,634 | | | $ | 26,301,348 | |
| Foreign cash, at value (Cost $2 and $4, respectively) | | | 2 | | | | 4 | |
| Cash | | | 646,189 | | | | 167,604 | |
| Dividends and interest receivable | | | 163,489 | | | | 46,380 | |
| Receivable for investments sold | | | 6,383,608 | | | | 118,585 | |
| Receivable for fund shares subscribed | | | 4,577,680 | | | | 10,200 | |
| Receivable due from advisor | | | – | | | | 3,150 | |
| Prepaid and other assets | | | 15,256 | | | | 13,316 | |
| Total assets | | | 181,544,858 | | | | 26,660,587 | |
| | | | | | | | | |
| LIABILITIES | | | | | | | | |
| Payable for investments purchased | | | 1,762,092 | | | | 158,827 | |
| Foreign capital gains tax | | | 267,335 | | | | – | |
| Payable for fund shares redeemed | | | 44,684 | | | | 49,876 | |
| Advisory fees payable | | | 95,113 | | | | – | |
| Administration fees payable | | | 58,095 | | | | 26,309 | |
| Custodian fees payable | | | 21,891 | | | | 6,635 | |
| Payable for professional fees | | | 7,160 | | | | 12,512 | |
| Payable for trustee fees and expenses | | | 3,743 | | | | 490 | |
| Payable for chief compliance officer fee | | | 5,595 | | | | 851 | |
| Payable for principal financial officer fees | | | 2,547 | | | | 361 | |
| Distribution and service fees payable - Investor Class | | | 4,715 | | | | 822 | |
| Payable for transfer agency fees | | | 28,053 | | | | 9,896 | |
| Accrued expenses and other liabilities | | | 4,809 | | | | 505 | |
| Total liabilities | | | 2,305,832 | | | | 267,084 | |
| NET ASSETS | | $ | 179,239,026 | | | $ | 26,393,503 | |
| | | | | | | | | |
| NET ASSETS CONSISTS OF | | | | | | | | |
| Paid-in capital (Note 5) | | $ | 164,592,774 | | | $ | 24,498,768 | |
| Total distributable earnings | | | 14,646,252 | | | | 1,894,735 | |
| NET ASSETS | | $ | 179,239,026 | | | $ | 26,393,503 | |
| | | | | | | | | |
| INVESTMENTS, AT COST | | $ | 147,415,613 | | | $ | 22,574,560 | |
| | | | | | | | | |
| PRICING OF SHARES | | | | | | | | |
| Institutional Class | | | | | | | | |
| Net Assets | | $ | 157,342,282 | | | $ | 22,782,461 | |
| Net Asset Value, offering and redemption price per share | | $ | 11.70 | | | $ | 11.91 | |
| Shares of beneficial interest outstanding | | | 13,445,366 | | | | 1,912,209 | |
| Investor Class | | | | | | | | |
| Net Assets | | $ | 21,896,744 | | | $ | 3,611,042 | |
| Net Asset Value, offering and redemption price per share | | $ | 11.66 | | | $ | 11.90 | |
| Shares of beneficial interest outstanding | | | 1,878,511 | | | | 303,449 | |
See Notes to Financial Statements.
| Semi-Annual Report | October 31, 2020 | 17 |
| Rondure Funds | Statements of Operations |
For the Six Months Ended October 31, 2020 (Unaudited)
| | | Rondure New World Fund | | | Rondure Overseas Fund | |
| INVESTMENT INCOME | | | | | | | | |
| Dividends | | $ | 1,935,999 | | | $ | 160,755 | |
| Foreign taxes withheld | | | (208,126 | ) | | | (17,445 | ) |
| Other Income | | | (16 | ) | | | (70 | ) |
| Total investment income | | | 1,727,857 | | | | 143,240 | |
| | | | | | | | | |
| EXPENSES | | | | | | | | |
| Investment advisor fees (Note 6) | | | 675,054 | | | | 78,740 | |
| Administrative fees | | | 133,558 | | | | 34,605 | |
| Distribution and service fees - Investor Class | | | 26,293 | | | | 3,814 | |
| Transfer agent fees | | | 100,302 | | | | 30,749 | |
| Professional fees | | | 16,383 | | | | 13,263 | |
| Printing fees | | | 10,016 | | | | 1,282 | |
| Registration fees | | | 18,333 | | | | 17,075 | |
| Custodian fees | | | 91,858 | | | | 22,949 | |
| Trustee fees and expenses | | | 3,772 | | | | 524 | |
| Chief compliance officer fees | | | 16,248 | | | | 2,334 | |
| Principal financial officer fees | | | 7,035 | | | | 986 | |
| Other expenses | | | 8,426 | | | | 1,907 | |
| Total expenses | | | 1,107,278 | | | | 208,228 | |
| Less fees waived/reimbursed by investment advisor (Note 6) | | | (206,224 | ) | | | (108,609 | ) |
| Total net expenses | | | 901,054 | | | | 99,619 | |
| NET INVESTMENT INCOME | | | 826,803 | | | | 43,621 | |
| | | | | | | | | |
| REALIZED AND UNREALIZED GAIN/(LOSS) ON INVESTMENTS | | | | | | | | |
| Net realized gain on investments | | | 1,070,052 | | | | 64,809 | |
| Net realized gain/(loss) on foreign currency transactions | | | (7,573 | ) | | | 4,079 | |
| Net realized gain | | | 1,062,479 | | | | 68,888 | |
| Net change in unrealized appreciation on investments (net of change in foreign capital gains tax of $267,335 and $0, respectively) | | | 22,675,342 | | | | 2,636,279 | |
| Net change in unrealized depreciation on translation of assets and liabilities in foreign currencies | | | (2,720 | ) | | | (2,439 | ) |
| Net change in unrealized appreciation | | | 22,672,622 | | | | 2,633,840 | |
| NET REALIZED AND UNREALIZED GAIN ON INVESTMENTS AND FOREIGN CURRENCY TRANSACTIONS | | | 23,735,101 | | | | 2,702,728 | |
| NET INCREASE IN NET ASSETS RESULTING FROM OPERATIONS | | $ | 24,561,904 | | | $ | 2,746,349 | |
See Notes to Financial Statements.
| 18 | 1.855.775.3337 | www.rondureglobal.com |
| Rondure New World Fund | Statement of Changes in Net Assets |
| | | For the
Six Months Ended
October 31, 2020
(Unaudited) | | | For the
Year Ended
April 30, 2020 | |
| OPERATIONS | | | | | | | | |
| Net investment income | | $ | 826,803 | | | $ | 1,090,746 | |
| Net realized gain/(loss) | | | 1,062,479 | | | | (1,261,862 | ) |
| Net change in unrealized appreciation/(depreciation) | | | 22,672,622 | | | | (11,235,316 | ) |
| Net increase/(decrease) in net assets resulting from operations | | | 24,561,904 | | | | (11,406,432 | ) |
| TOTAL DISTRIBUTIONS TO SHAREHOLDERS (NOTE 3) | | | | | | | | |
| From distributable earnings | | | | | | | | |
| Institutional Class | | | – | | | | (1,036,130 | ) |
| Investor Class | | | – | | | | (138,384 | ) |
| Net decrease in net assets from distributions | | | – | | | | (1,174,514 | ) |
| CAPITAL SHARE TRANSACTIONS (NOTE 5) | | | | | | | | |
| Institutional Class | | | | | | | | |
| Proceeds from sales of shares | | | 22,991,562 | | | | 33,531,344 | |
| Distributions reinvested | | | – | | | | 1,015,211 | |
| Cost of shares redeemed | | | (5,611,815 | ) | | | (15,803,966 | ) |
| Redemption fees | | | 2,221 | | | | 15,734 | |
| Net increase from capital shares transactions | | | 17,381,968 | | | | 18,758,323 | |
| Investor Class | | | | | | | | |
| Proceeds from sales of shares | | | 2,298,576 | | | | 6,220,152 | |
| Distributions reinvested | | | – | | | | 138,268 | |
| Cost of shares redeemed | | | (2,070,457 | ) | | | (6,865,062 | ) |
| Redemption fees | | | 348 | | | | 1,211 | |
| Net increase/(decrease) from capital shares transactions | | | 228,467 | | | | (505,431 | ) |
| Net increase in net assets | | | 42,172,339 | | | | 5,671,946 | |
| | | | | | | | | |
| NET ASSETS | | | | | | | | |
| Beginning of period | | | 137,066,687 | | | | 131,394,741 | |
| End of period | | $ | 179,239,026 | | | $ | 137,066,687 | |
| | | | | | | | | |
| OTHER INFORMATION | | | | | | | | |
| Shares Transactions | | | | | | | | |
| Institutional Class | | | | | | | | |
| Issued | | | 1,995,065 | | | | 3,149,600 | |
| Issued to shareholders in reinvestment of distributions | | | – | | | | 88,820 | |
| Redeemed | | | (505,954 | ) | | | (1,543,323 | ) |
| Net increase in share transactions | | | 1,489,111 | | | | 1,695,097 | |
| Investor Class | | | | | | | | |
| Issued | | | 205,670 | | | | 579,043 | |
| Issued to shareholders in reinvestment of distributions | | | – | | | | 12,118 | |
| Redeemed | | | (183,917 | ) | | | (644,762 | ) |
| Net increase/(decrease) in share transactions | | | 21,753 | | | | (53,601 | ) |
See Notes to Financial Statements.
| Semi-Annual Report | October 31, 2020 | 19 |
| Rondure Overseas Fund | Statement of Changes in Net Assets |
| | | For the
Six Months Ended
October 31, 2020
(Unaudited) | | | For the
Year Ended
April 30, 2020 | |
| OPERATIONS | | | | | | | | |
| Net investment income | | $ | 43,621 | | | $ | 185,418 | |
| Net realized gain/(loss) | | | 68,888 | | | | (1,238,043 | ) |
| Net change in unrealized appreciation/(depreciation) | | | 2,633,840 | | | | (141,360 | ) |
| Net increase/(decrease) in net assets resulting from operations | | | 2,746,349 | | | | (1,193,985 | ) |
| TOTAL DISTRIBUTIONS TO SHAREHOLDERS (NOTE 3) | | | | | | | | |
| From distributable earnings | | | | | | | | |
| Institutional Class | | | – | | | | (181,265 | ) |
| Investor Class | | | – | | | | (29,412 | ) |
| Net decrease in net assets from distributions | | | – | | | | (210,677 | ) |
| CAPITAL SHARE TRANSACTIONS (NOTE 5) | | | | | | | | |
| Institutional Class | | | | | | | | |
| Proceeds from sales of shares | | | 4,673,761 | | | | 2,445,201 | |
| Distributions reinvested | | | – | | | | 175,567 | |
| Cost of shares redeemed | | | (1,028,297 | ) | | | (3,488,107 | ) |
| Redemption fees | | | – | | | | 26 | |
| Net increase/(decrease) from capital shares transactions | | | 3,645,464 | | | | (867,313 | ) |
| Investor Class | | | | | | | | |
| Proceeds from sales of shares | | | 1,122,408 | | | | 578,474 | |
| Distributions reinvested | | | – | | | | 29,251 | |
| Cost of shares redeemed | | | (504,920 | ) | | | (1,720,062 | ) |
| Redemption fees | | | 34 | | | | 1,376 | |
| Net increase/(decrease) from capital shares transactions | | | 617,522 | | | | (1,110,961 | ) |
| Net increase/(decrease) in net assets | | | 7,009,335 | | | | (3,382,936 | ) |
| | | | | | | | | |
| NET ASSETS | | | | | | | | |
| Beginning of period | | | 19,384,168 | | | | 22,767,104 | |
| End of period | | $ | 26,393,503 | | | $ | 19,384,168 | |
| | | | | | | | | |
| OTHER INFORMATION | | | | | | | | |
| Shares Transactions | | | | | | | | |
| Institutional Class | | | | | | | | |
| Issued | | | 385,421 | | | | 233,288 | |
| Issued to shareholders in reinvestment of distributions | | | – | | | | 14,841 | |
| Redeemed | | | (94,373 | ) | | | (323,690 | ) |
| Net increase/(decrease) in share transactions | | | 291,048 | | | | (75,561 | ) |
| Investor Class | | | | | | | | |
| Issued | | | 92,258 | | | | 54,253 | |
| Issued to shareholders in reinvestment of distributions | | | – | | | | 2,470 | |
| Redeemed | | | (42,862 | ) | | | (155,568 | ) |
| Net increase/(decrease) in share transactions | | | 49,396 | | | | (98,845 | ) |
See Notes to Financial Statements.
| 20 | 1.855.775.3337 | www.rondureglobal.com |
| Rondure New World Fund – Institutional Class | Financial Highlights |
For a Share Outstanding Throughout the Periods or Years Presented
| Institutional Class | | For the
Six Months Ended October 31, 2020 (Unaudited) | | | Year Ended
April 30, 2020 | | | Year Ended
April 30, 2019 | | | For the Period May 2, 2017 (Commencement of Operations) to April 30, 2018 | |
| NET ASSET VALUE, BEGINNING OF PERIOD | | $ | 9.93 | | | $ | 10.80 | | | $ | 11.25 | | | $ | 10.00 | |
| | | | | | | | | | | | | | | | | |
| INCOME FROM INVESTMENT OPERATIONS | | | | | | | | | | | | | | | | |
| Net investment income(a) | | | 0.06 | | | | 0.09 | | | | 0.09 | | | | 0.05 | |
| Net realized and unrealized gain/(loss) on investments | | | 1.71 | | | | (0.87 | ) | | | (0.45 | ) | | | 1.23 | |
| Total income/(loss) from investment operations | | | 1.77 | | | | (0.78 | ) | | | (0.36 | ) | | | 1.28 | |
| | | | | | | | | | | | | | | | | |
| DISTRIBUTIONS | | | | | | | | | | | | | | | | |
| From net investment income | | | – | | | | (0.09 | ) | | | (0.09 | ) | | | (0.03 | ) |
| From net realized gain on investments | | | – | | | | – | | | | – | | | | (0.00 | )(b) |
| Total distributions | | | – | | | | (0.09 | ) | | | (0.09 | ) | | | (0.03 | ) |
| | | | | | | | | | | | | | | | | |
| REDEMPTION FEES ADDED TO PAID-IN CAPITAL | | | 0.00 | (b) | | | 0.00 | (b) | | | 0.00 | (b) | | | 0.00 | (b) |
| | | | | | | | | | | | | | | | | |
| INCREASE/DECREASE IN NET ASSET VALUE | | | 1.77 | | | | (0.87 | ) | | | (0.45 | ) | | | 1.25 | |
| NET ASSET VALUE, END OF PERIOD | | $ | 11.70 | | | $ | 9.93 | | | $ | 10.80 | | | $ | 11.25 | |
| | | | | | | | | | | | | | | | | |
| TOTAL RETURN | | | 17.82 | %(c) | | | (7.31 | )% | | | (3.09 | )% | | | 12.78 | %(c) |
| | | | | | | | | | | | | | | | | |
| RATIOS AND SUPPLEMENTAL DATA | | | | | | | | | | | | | | | | |
| Net assets, end of period (in 000s) | | $ | 157,342 | | | $ | 118,685 | | | $ | 110,800 | | | $ | 100,760 | |
| | | | | | | | | | | | | | | | | |
| RATIOS TO AVERAGE NET ASSETS | | | | | | | | | | | | | | | | |
| Expenses (excluding fees waived/ reimbursed by investment advisor) | | | 1.35 | %(d) | | | 1.43 | % | | | 1.46 | % | | | 1.62 | %(d) |
| Expenses (including fees waived/ reimbursed by investment advisor) | | | 1.10 | %(d) | | | 1.10 | % | | | 1.10 | % | | | 1.10 | %(d) |
| Net investment income | | | 1.07 | %(d) | | | 0.83 | % | | | 0.87 | % | | | 0.43 | %(d) |
| | | | | | | | | | | | | | | | | |
| PORTFOLIO TURNOVER RATE | | | 15 | %(c) | | | 27 | % | | | 37 | % | | | 13 | %(c) |
| (a) | Per share numbers have been calculated using the average shares method. |
| (b) | Less than $0.005 or ($0.005) per share. |
See Notes to Financial Statements.
| Semi-Annual Report | October 31, 2020 | 21 |
| Rondure New World Fund – Investor Class | Financial Highlights |
For a Share Outstanding Throughout the Periods or Years Presented
| Investor Class | | For the
Six Months Ended October 31, 2020 (Unaudited) | | | Year Ended
April 30, 2020 | | | Year Ended
April 30, 2019 | | | For the Period
May 2, 2017
(Commencement of Operations) to
April 30, 2018 | |
| NET ASSET VALUE, BEGINNING OF PERIOD | | $ | 9.90 | | | $ | 10.78 | | | $ | 11.24 | | | $ | 10.00 | |
| | | | | | | | | | | | | | | | | |
| INCOME FROM INVESTMENT OPERATIONS | | | | | | | | | | | | | | | | |
| Net investment income(a) | | | 0.05 | | | | 0.06 | | | | 0.07 | | | | 0.03 | |
| Net realized and unrealized gain/(loss) on investments | | | 1.71 | | | | (0.87 | ) | | | (0.46 | ) | | | 1.22 | |
| Total income/(loss) from investment operations | | | 1.76 | | | | (0.81 | ) | | | (0.39 | ) | | | 1.25 | |
| | | | | | | | | | | | | | | | | |
| DISTRIBUTIONS | | | | | | | | | | | | | | | | |
| From net investment income | | | – | | | | (0.07 | ) | | | (0.07 | ) | | | (0.01 | ) |
| From net realized gain on investments | | | – | | | | – | | | | – | | | | (0.00 | )(b) |
| Total distributions | | | – | | | | (0.07 | ) | | | (0.07 | ) | | | (0.01 | ) |
| | | | | | | | | | | | | | | | | |
| REDEMPTION FEES ADDED TO PAID-IN CAPITAL | | | 0.00 | (b) | | | 0.00 | (b) | | | 0.00 | (b) | | | 0.00 | (b) |
| | | | | | | | | | | | | | | | | |
| INCREASE/DECREASE IN NET ASSET VALUE | | | 1.76 | | | | (0.88 | ) | | | (0.46 | ) | | | 1.24 | |
| NET ASSET VALUE, END OF PERIOD | | $ | 11.66 | | | $ | 9.90 | | | $ | 10.78 | | | $ | 11.24 | |
| | | | | | | | | | | | | | | | | |
| TOTAL RETURN | | | 17.78 | %(c) | | | (7.56 | )% | | | (3.37 | )% | | | 12.53 | %(c) |
| | | | | | | | | | | | | | | | | |
| RATIOS AND SUPPLEMENTAL DATA | | | | | | | | | | | | | | | | |
| Net assets, end of period (in 000s) | | $ | 21,897 | | | $ | 18,382 | | | $ | 20,595 | | | $ | 24,233 | |
| | | | | | | | | | | | | | | | | |
| RATIOS TO AVERAGE NET ASSETS | | | | | | | | | | | | | | | | |
| Expenses (excluding fees waived/ reimbursed by investment advisor) | | | 1.65 | %(d) | | | 1.72 | % | | | 1.76 | % | | | 1.91 | %(d) |
| Expenses (including fees waived/ reimbursed by investment advisor) | | | 1.35 | %(d) | | | 1.35 | % | | | 1.35 | % | | | 1.35 | %(d) |
| Net investment income | | | 0.83 | %(d) | | | 0.59 | % | | | 0.66 | % | | | 0.24 | %(d) |
| | | | | | | | | | | | | | | | | |
| PORTFOLIO TURNOVER RATE | | | 15 | %(c) | | | 27 | % | | | 37 | % | | | 13 | %(c) |
| (a) | Per share numbers have been calculated using the average shares method. |
| (b) | Less than $0.005 or ($0.005) per share. |
See Notes to Financial Statements.
| 22 | 1.855.775.3337 | www.rondureglobal.com |
| Rondure Overseas Fund – Institutional Class | Financial Highlights |
For a Share Outstanding Throughout the Periods or Years Presented
| Institutional Class | | For the
Six Months Ended October 31, 2020 (Unaudited) | | | Year Ended
April 30, 2020 | | | Year Ended
April 30, 2019 | | | For the Period
May 2, 2017 (Commencement of Operations) to
April 30, 2018 | |
| NET ASSET VALUE, BEGINNING OF PERIOD | | $ | 10.34 | | | $ | 11.11 | | | $ | 11.46 | | | $ | 10.00 | |
| | | | | | | | | | | | | | | | | |
| INCOME FROM INVESTMENT OPERATIONS | | | | | | | | | | | | | | | | |
| Net investment income(a) | | | 0.03 | | | | 0.10 | | | | 0.10 | | | | 0.10 | |
| Net realized and unrealized gain/(loss) on investments | | | 1.54 | | | | (0.76 | ) | | | (0.31 | ) | | | 1.48 | |
| Total income/(loss) from investment operations | | | 1.57 | | | | (0.66 | ) | | | (0.21 | ) | | | 1.58 | |
| | | | | | | | | | | | | | | | | |
| DISTRIBUTIONS | | | | | | | | | | | | | | | | |
| From net investment income | | | – | | | | (0.11 | ) | | | (0.11 | ) | | | (0.04 | ) |
| From net realized gain on investments | | | – | | | | – | | | | (0.03 | ) | | | (0.08 | ) |
| Total distributions | | | – | | | | (0.11 | ) | | | (0.14 | ) | | | (0.12 | ) |
| | | | | | | | | | | | | | | | | |
| REDEMPTION FEES ADDED TO PAID-IN CAPITAL | | | – | | | | 0.00 | (b) | | | 0.00 | (b) | | | 0.00 | (b) |
| | | | | | | | | | | | | | | | | |
| INCREASE/DECREASE IN NET ASSET VALUE | | | 1.57 | | | | (0.77 | ) | | | (0.35 | ) | | | 1.46 | |
| NET ASSET VALUE, END OF PERIOD | | $ | 11.91 | | | $ | 10.34 | | | $ | 11.11 | | | $ | 11.46 | |
| | | | | | | | | | | | | | | | | |
| TOTAL RETURN | | | 15.18 | %(c) | | | (6.06 | )% | | | (1.76 | )% | | | 15.88 | %(c) |
| | | | | | | | | | | | | | | | | |
| RATIOS AND SUPPLEMENTAL DATA | | | | | | | | | | | | | | | | |
| Net assets, end of period (in 000s) | | $ | 22,782 | | | $ | 16,758 | | | $ | 18,845 | | | $ | 14,283 | |
| | | | | | | | | | | | | | | | | |
| RATIOS TO AVERAGE NET ASSETS | | | | | | | | | | | | | | | | |
| Expenses (excluding fees waived/ reimbursed by investment advisor) | | | 1.81 | %(d) | | | 1.73 | % | | | 1.72 | % | | | 2.57 | %(d) |
| Expenses (including fees waived/ reimbursed by investment advisor) | | | 0.85 | %(d) | | | 0.85 | % | | | 0.85 | % | | | 0.85 | %(d) |
| Net investment income | | | 0.42 | %(d) | | | 0.89 | % | | | 0.95 | % | | | 0.92 | %(d) |
| | | | | | | | | | | | | | | | | |
| PORTFOLIO TURNOVER RATE | | | 16 | %(c) | | | 66 | % | | | 40 | % | | | 14 | %(c) |
| (a) | Per share numbers have been calculated using the average shares method. |
| (b) | Less than $0.005 or ($0.005) per share. |
See Notes to Financial Statements.
| Semi-Annual Report | October 31, 2020 | 23 |
| Rondure Overseas Fund – Investor Class | Financial Highlights |
For a Share Outstanding Throughout the Periods or Years Presented
| Investor Class | | For the
Six Months Ended October 31, 2020 (Unaudited) | | | Year Ended
April 30, 2020 | | | Year Ended
April 30, 2019 | | | For the Period
May 2, 2017 (Commencement of Operations) to
April 30, 2018 | |
| NET ASSET VALUE, BEGINNING OF PERIOD | | $ | 10.34 | | | $ | 11.12 | | | $ | 11.48 | | | $ | 10.00 | |
| | | | | | | | | | | | | | | | | |
| INCOME FROM INVESTMENT OPERATIONS | | | | | | | | | | | | | | | | |
| Net investment income(a) | | | 0.01 | | | | 0.07 | | | | 0.08 | | | | 0.09 | |
| Net realized and unrealized gain/(loss) on investments | | | 1.55 | | | | (0.76 | ) | | | (0.32 | ) | | | 1.46 | |
| Total income/(loss) from investment operations | | | 1.56 | | | | (0.69 | ) | | | (0.24 | ) | | | 1.55 | |
| | | | | | | | | | | | | | | | | |
| DISTRIBUTIONS | | | | | | | | | | | | | | | | |
| From net investment income | | | – | | | | (0.09 | ) | | | (0.09 | ) | | | – | |
| From net realized gain on investments | | | – | | | | – | | | | (0.03 | ) | | | (0.08 | ) |
| Total distributions | | | – | | | | (0.09 | ) | | | (0.12 | ) | | | (0.08 | ) |
| | | | | | | | | | | | | | | | | |
| REDEMPTION FEES ADDED TO PAID-IN CAPITAL | | | 0.00 | (b) | | | 0.00 | (b) | | | 0.00 | (b) | | | 0.01 | |
| | | | | | | | | | | | | | | | | |
| INCREASE/DECREASE IN NET ASSET VALUE | | | 1.56 | | | | (0.78 | ) | | | (0.36 | ) | | | 1.48 | |
| NET ASSET VALUE, END OF PERIOD | | $ | 11.90 | | | $ | 10.34 | | | $ | 11.12 | | | $ | 11.48 | |
| | | | | | | | | | | | | | | | | |
| TOTAL RETURN | | | 15.09 | %(c) | | | (6.28 | )% | | | (1.98 | )% | | | 15.63 | %(c) |
| | | | | | | | | | | | | | | | | |
| RATIOS AND SUPPLEMENTAL DATA | | | | | | | | | | | | | | | | |
| Net assets, end of period (in 000s) | | $ | 3,611 | | | $ | 2,626 | | | $ | 3,922 | | | $ | 5,189 | |
| | | | | | | | | | | | | | | | | |
| RATIOS TO AVERAGE NET ASSETS | | | | | | | | | | | | | | | | |
| Expenses (excluding fees waived/ reimbursed by investment advisor) | | | 2.12 | %(d) | | | 2.06 | % | | | 2.04 | % | | | 2.45 | %(d) |
| Expenses (including fees waived/ reimbursed by investment advisor) | | | 1.10 | %(d) | | | 1.10 | % | | | 1.10 | % | | | 1.10 | %(d) |
| Net investment income | | | 0.17 | %(d) | | | 0.61 | % | | | 0.74 | % | | | 0.82 | %(d) |
| | | | | | | | | | | | | | | | | |
| PORTFOLIO TURNOVER RATE | | | 16 | %(c) | | | 66 | % | | | 40 | % | | | 14 | %(c) |
| (a) | Per share numbers have been calculated using the average shares method. |
| (b) | Less than $0.005 or ($0.005) per share. |
See Notes to Financial Statements.
| 24 | 1.855.775.3337 | www.rondureglobal.com |
| Rondure Funds | Notes to Financial Statements |
| | October 31, 2020 (Unaudited) |
1. ORGANIZATION
Financial Investors Trust (the “Trust”), a Delaware statutory trust, is an open-end management investment company registered under the Investment Company Act of 1940, as amended (“1940 Act”). As of October 31, 2020, the Trust consists of multiple separate Portfolios or series. This semi-annual report describes the Rondure New World Fund and the Rondure Overseas Fund (individually a “Fund” and collectively, the “Funds”). The Funds seek long-term growth of capital. The Funds offer Investor Class and Institutional Class shares.
2. SIGNIFICANT ACCOUNTING POLICIES
The accompanying financial statements were prepared in accordance with accounting principles generally accepted in the United States of America (“U.S. GAAP”). The preparation of financial statements in conformity with U.S. GAAP requires management to make certain estimates and assumptions that affect the reported amounts of assets and liabilities and disclosures of contingent assets and liabilities at the date of the financial statements and the reported amounts of revenue and expenses during the period. Actual results could differ from those estimates. The Funds are considered an investment company for financial reporting purposes under U.S. GAAP and follows the accounting and reporting guidance applicable to investment companies in the Financial Accounting Standards Board Accounting Standards Codification Topic 946. The following is a summary of significant accounting policies consistently followed by the Funds in preparation of its financial statements.
Investment Valuation: The Funds generally value their securities based on market prices determined at the close of regular trading on the New York Stock Exchange (“NYSE”), normally 4:00 p.m. Eastern Time, on each day the NYSE is open for trading.
For equity securities and mutual funds that are traded on an exchange, the market price is usually the closing sale or official closing price on that exchange. In the case of equity securities not traded on an exchange, or if such closing prices are not otherwise available, the securities are valued at the mean of the most recent bid and ask prices on such day. Redeemable securities issued by open-end registered investment companies are valued at the investment company’s applicable net asset value, with the exception of exchange-traded open-end investment companies, which are priced as equity securities.
Equity securities that are primarily traded on foreign securities exchanges are valued at the closing values of such securities on their respective foreign exchanges, except when an event occurs subsequent to the close of the foreign exchange and the close of the NYSE that was likely to have changed such value. In such an event, the fair value of those securities are determined in good faith through consideration of other factors in accordance with procedures established by and under the general supervision of the Board of Trustees of the Trust (the “Board” or the “Trustees”). The Funds will use a fair valuation model provided by an independent pricing service, which is intended to reflect fair value when a security’s value or a meaningful portion of each Fund’s portfolio is believed to have been materially affected by a valuation event that has occurred between the close of the exchange or market on which the security is traded and the close of the regular trading day on the NYSE. The Funds’ valuation procedures set forth certain triggers which instruct when to use the fair valuation model.
Forward currency exchange contracts have a fair value determined by the prevailing foreign currency exchange daily rates and current foreign currency exchange forward rates. The foreign currency exchange forward rates are calculated using an automated system that estimates rates on the basis of the current day foreign currency exchange rates and forward foreign currency exchange rates supplied by a pricing service.
When such prices or quotations are not available, or when Rondure Global Advisors, LLC (the “Advisor” or “Rondure”) believes that they are unreliable, securities may be priced using fair value procedures approved by the Board.
Fair Value Measurements: The Funds disclose the classification of their fair value measurements following a three-tier hierarchy based on the inputs used to measure fair value. Inputs refer broadly to the assumptions that market participants would use in pricing the asset or liability, including assumptions about risk. Inputs may be observable or unobservable. Observable inputs reflect the assumptions market participants would use in pricing the asset or liability that are developed based on market data obtained from sources independent of the reporting entity. Unobservable inputs reflect the reporting entity’s own assumptions about the assumptions market participants would use in pricing the asset or liability that are developed based on the best information available.
| Semi-Annual Report | October 31, 2020 | 25 |
| Rondure Funds | Notes to Financial Statements |
| | October 31, 2020 (Unaudited) |
Various inputs are used in determining the value of the Funds’ investments as of the end of the reporting period. When inputs used fall into different levels of the fair value hierarchy, the level in the hierarchy within which the fair value measurement falls is determined based on the lowest level input that is significant to the fair value measurement in its entirety. The designated input levels are not necessarily an indication of the risk or liquidity associated with these investments. These inputs are categorized in the following hierarchy under applicable financial accounting standards:
Level 1 – Unadjusted quoted prices in active markets for identical investments, unrestricted assets or liabilities that the Funds have the ability to access at the measurement date;
Level 2 – Quoted prices which are not active, quoted prices for similar assets or liabilities in active markets or inputs other than quoted prices that are observable (either directly or indirectly) for substantially the full term of the asset or liability; and
Level 3 – Significant unobservable prices or inputs (including the Funds’ own assumptions in determining the fair value of investments) where there is little or no market activity for the asset or liability at the measurement date.
The following is a summary of each Fund’s investments in the fair value hierarchy as of October 31, 2020:
| Investments in Securities at Value | | Level 1 - Quoted and Unadjusted Prices | | Level 2 - Other Significant Observable Inputs | | Level 3 - Significant Unobservable Inputs | | Total |
| Rondure New World Fund | | | | | | | | | | | | | | | | |
| Common Stocks | | | | | | | | | | | | | | | | |
| China | | $ | 10,187,319 | | | $ | 31,857,330 | | | $ | – | | | $ | 42,044,649 | |
| Greece | | | – | | | | 920,057 | | | | – | | | | 920,057 | |
| Hong Kong | | | – | | | | 6,906,345 | | | | – | | | | 6,906,345 | |
| India | | | – | | | | 26,539,877 | | | | – | | | | 26,539,877 | |
| Indonesia | | | – | | | | 6,667,072 | | | | – | | | | 6,667,072 | |
| Kenya | | | – | | | | 3,508,273 | | | | – | | | | 3,508,273 | |
| Malaysia | | | – | | | | 5,329,020 | | | | – | | | | 5,329,020 | |
| Netherlands | | | – | | | | 870,068 | | | | – | | | | 870,068 | |
| Pakistan | | | – | | | | 183,090 | | | | – | | | | 183,090 | |
| Philippines | | | 3,849,331 | | | | 4,586,380 | | | | – | | | | 8,435,711 | |
| Poland | | | – | | | | 1,066,601 | | | | – | | | | 1,066,601 | |
| Russia | | | – | | | | 2,853,723 | | | | – | | | | 2,853,723 | |
| South Africa | | | 4,368,245 | | | | 349,608 | | | | – | | | | 4,717,853 | |
| South Korea | | | – | | | | 7,422,176 | | | | – | | | | 7,422,176 | |
| Sri Lanka | | | – | | | | 1,382,339 | | | | – | | | | 1,382,339 | |
| Taiwan | | | – | | | | 17,466,834 | | | | – | | | | 17,466,834 | |
| Thailand | | | – | | | | 7,454,592 | | | | – | | | | 7,454,592 | |
| Turkey | | | – | | | | 850,736 | | | | – | | | | 850,736 | |
| United Arab Emirates | | | – | | | | 2,288,889 | | | | – | | | | 2,288,889 | |
| Vietnam | | | – | | | | 5,906,233 | | | | – | | | | 5,906,233 | |
| Other* | | | 16,944,496 | | | | – | | | | – | | | | 16,944,496 | |
| Total | | $ | 35,349,391 | | | $ | 134,409,243 | | | $ | – | | | $ | 169,758,634 | |
| 26 | 1.855.775.3337 | www.rondureglobal.com |
| Rondure Funds | Notes to Financial Statements |
| | October 31, 2020 (Unaudited) |
| Investments in Securities at Value | | Level 1 - Quoted and Unadjusted Prices | | Level 2 - Other Significant Observable Inputs | | Level 3 - Significant Unobservable Inputs | | Total |
| Rondure Overseas Fund | | | | | | | | |
| Common Stocks | | | | | | | | | | | | | | | | |
| Australia | | $ | – | | | $ | 1,337,407 | | | $ | – | | | $ | 1,337,407 | |
| Austria | | | – | | | | 277,704 | | | | – | | | | 277,704 | |
| Belgium | | | 45,631 | | | | 278,267 | | | | – | | | | 323,898 | |
| Britain | | | – | | | | 3,777,627 | | | | – | | | | 3,777,627 | |
| Denmark | | | – | | | | 978,826 | | | | – | | | | 978,826 | |
| Finland | | | – | | | | 767,239 | | | | – | | | | 767,239 | |
| France | | | – | | | | 2,471,265 | | | | – | | | | 2,471,265 | |
| Germany | | | – | | | | 1,656,844 | | | | – | | | | 1,656,844 | |
| Hong Kong | | | – | | | | 529,150 | | | | – | | | | 529,150 | |
| Ireland | | | 231,685 | | | | 172,969 | | | | – | | | | 404,654 | |
| Italy | | | – | | | | 924,882 | | | | – | | | | 924,882 | |
| Japan | | | – | | | | 4,129,876 | | | | – | | | | 4,129,876 | |
| Netherlands | | | – | | | | 1,080,328 | | | | – | | | | 1,080,328 | |
| New Zealand | | | – | | | | 422,857 | | | | – | | | | 422,857 | |
| Spain | | | – | | | | 55,269 | | | | – | | | | 55,269 | |
| Sweden | | | – | | | | 993,734 | | | | – | | | | 993,734 | |
| Switzerland | | | 50,515 | | | | 2,509,903 | | | | – | | | | 2,560,418 | |
| Other* | | | 3,609,370 | | | | – | | | | – | | | | 3,609,370 | |
| Total | | $ | 3,937,201 | | | $ | 22,364,147 | | | $ | – | | | $ | 26,301,348 | |
| | |
| * | For a detailed country breakdown, see the accompanying Portfolio of Investments. |
For the six months ended October 31, 2020, the Funds did not have any securities that used significant unobservable inputs (Level 3) in determining fair value.
Investment Transactions and Investment Income: Investment transactions are accounted for on the date the investments are purchased or sold (trade date). Realized gains and losses from investment transactions are reported on an identified cost which is the same basis the Fund uses for federal income tax purposes. Interest income, which includes accretion of discounts and amortization of premiums, is accrued and recorded as earned. Dividend income is recognized on the ex-dividend date or for certain foreign securities, as soon as information is available to the Funds. All of the realized and unrealized gains and losses and net investment income, are allocated daily to each class in proportion to its average daily net assets.
Cash Management Transactions: The Funds subscribe to the Brown Brothers Harriman & Co. (“BBH”) Cash Management Service (“CMS”), whereby cash balances are automatically swept into overnight offshore demand deposits with either the BBH Grand Cayman branch or a branch of a pre-approved commercial bank. This fully automated program allows the Funds to earn interest on cash balances. Excess cash with deposit institutions domiciled outside of the U.S. are subject to sovereign actions in the jurisdiction of the deposit institution including, but not limited to, freeze, seizure or diminution. Cash balances in the BBH CMS are included on the Statements of Assets and Liabilities under Cash and Foreign Cash, at Value. As of October 31, 2020, the Funds had the following cash balances participating in the BBH CMS:
| Fund | | |
| Rondure New World Fund | | $ | 646,189 | |
| Rondure Overseas Fund | | | 166,777 | |
| Semi-Annual Report | October 31, 2020 | 27 |
| Rondure Funds | Notes to Financial Statements |
| | October 31, 2020 (Unaudited) |
As of October 31, 2020, the Funds had the following foreign cash balances participating in the BBH CMS (cost and value of foreign cash balances are equal):
| Fund | | |
| Rondure New World Fund | | $ | 2 | |
| Rondure Overseas Fund | | | 3 | |
Foreign Securities: The Funds may directly purchase securities of foreign issuers. Investing in securities of foreign issuers involves special risks not typically associated with investing in securities of U.S. issuers. The risks include possible reevaluation of currencies, the inability to repatriate foreign currency, less complete financial information about companies and possible future adverse political and economic developments. Moreover, securities of many foreign issuers and their markets may be less liquid and their prices more volatile than those of securities of comparable U.S. issuers.
Foreign Currency Translation: The books and records of the Funds are maintained in U.S. dollars. Investment valuations and other assets and liabilities initially expressed in foreign currencies are converted each business day into U.S. dollars based upon current exchange rates. Prevailing foreign exchange rates may generally be obtained at the close of the NYSE (normally, 4:00 p.m. Eastern Time). The portion of realized and unrealized gains or losses on investments due to fluctuations in foreign currency exchange rates are separately disclosed.
Foreign Currency Spot Contracts: The Funds may enter into foreign currency spot contracts to facilitate transactions in foreign securities or to convert foreign currency receipts into U.S. dollars. A foreign currency spot contract is an agreement between two parties to buy and sell currencies at the current market rate, for settlement generally within two business days. The U.S. dollar value of the contracts is determined using current currency exchange rates supplied by a pricing service.
The contract is marked-to-market daily for settlements beyond one day and any change in market value is recorded as an unrealized gain or loss. When the contract is closed, a realized gain or loss is recorded equal to the difference between the value on the open and close date. Losses may arise from changes in the value of the foreign currency, or if the counterparties do not perform under the contract’s terms. The maximum potential loss from such contracts is the aggregate face value in U.S. dollars at the time the contract was opened.
Trust Expenses: Some expenses of the Trust can be directly attributed to the Funds. Expenses which cannot be directly attributed to the Funds are apportioned among all funds in the Trust based on average net assets of each fund.
Fund and Class Expenses: Expenses that are specific to a Fund or class of shares of a Fund, including distribution fees (Rule 12b-1 fees), are charged directly to that Fund or share class. Expenses that are common to all Funds generally are allocated among the Funds in proportion to their average daily net assets.
Federal Income Taxes: The Funds comply with the requirements under Subchapter M of the Internal Revenue Code of 1986, as amended, applicable to regulated investment companies and intend to distribute substantially all of their net taxable income and net capital gains, if any, each year so that it will not be subject to excise tax on undistributed income and gains. The Funds are not subject to income taxes to the extent such distributions are made.
Distributions to Shareholders: Each Fund normally pays dividends and distributes capital gains, if any, on an annual basis. Income dividend distributions are derived from dividends and other income each Fund receives from their investments, including short term capital gains. Long term capital gain distributions are derived from gains realized when each Fund sells a security it has owned for more than a year. Each Fund may make additional distributions and dividends at other times if the portfolio manager believes doing so may be necessary for each Fund to avoid or reduce taxes. The Funds intend to pass through foreign tax credits to shareholders.
Epidemic and Pandemic Risk: Certain countries have been susceptible to epidemics, most recently COVID-19, which has been designated as a pandemic by world health authorities. The outbreak of such epidemics, together with any resulting restrictions on travel or quarantines imposed, could have a negative impact on the economy and business activity globally (including in the countries in which we invest), and thereby could adversely affect the performance of our investments. Furthermore, the rapid development of epidemics could preclude prediction as to their ultimate adverse impact on economic and market conditions, and, as a result, present material uncertainty and risk with respect to us and the performance of our investments.
| 28 | 1.855.775.3337 | www.rondureglobal.com |
| Rondure Funds | Notes to Financial Statements |
| | October 31, 2020 (Unaudited) |
Libor Risk: In March 2020, the Financial Accounting Standards Board (FASB) issued Accounting Standards Update (“ASU”) No. 2020-04, Reference Rate Reform (Topic 848): Facilitation of the Effects of Reference Rate Reform on Financial Reporting. The Funds' investments, payment obligations, and financing terms may be based on floating rates, such as the London Interbank Offered Rate, or “LIBOR,” which is the offered rate for short-term Eurodollar deposits between major international banks. Plans are underway to phase out the use of LIBOR by the end of 2021. There remains uncertainty regarding the nature of any replacement rate and the impact of the transition from LIBOR on the Funds' transactions and the financial markets generally. As such, the potential effect of a transition away from LIBOR on the Funds or the Funds' investments cannot yet be determined.
3. TAX BASIS INFORMATION
Tax Basis of Investments: As of October 31, 2020, the aggregate cost of investments, gross unrealized appreciation/(depreciation) and net unrealized appreciation/(depreciation) for Federal tax purposes was as follows:
| Fund | | Gross Appreciation (excess of value over tax cost) | | Gross Depreciation (excess of tax cost over value) | | Net Unrealized Appreciation | | Cost of Investments for Income Tax Purposes |
| Rondure New World Fund | | $ | 31,976,645 | | | $ | (9,795,709 | ) | | $ | 22,180,936 | | | $ | 147,577,698 | |
| Rondure Overseas Fund | | | 4,320,512 | | | | (626,321 | ) | | | 3,694,191 | | | | 22,607,157 | |
Tax Basis of Distributions to Shareholders: The character of distributions made during the year from net investment income or net realized gains may differ from its ultimate characterization for federal income tax purposes. Also, due to the timing of dividend distributions, the fiscal year in which amounts are distributed may differ from the fiscal year in which the income or realized gain were recorded by the Funds.
The tax characters of distributions paid by the Funds for the year ended April 30, 2020 were as follows:
| Fund | | Ordinary Income | | Long-Term Capital Gain |
| Rondure New World Fund | | $ | 1,174,514 | | | $ | – | |
| Rondure Overseas Fund | | | 210,677 | | | | – | |
The amounts and characteristics of tax basis distributions and composition of distributable earnings/(accumulated losses) are finalized at fiscal year-end. Accordingly, tax basis balances have not been determined as of October 31, 2020.
4. SECURITIES TRANSACTIONS
The cost of purchases and proceeds from sales of securities (excluding short term securities) during the six months ended October 31, 2020 were as follows:
| Fund | | Purchases of
Securities | | Proceeds From
Sales of Securities |
| Rondure New World Fund | | $ | 31,436,564 | | | $ | 22,735,205 | |
| Rondure Overseas Fund | | | 7,981,371 | | | | 3,593,757 | |
5. SHARES OF BENEFICIAL INTEREST
The capitalization of the Trust consists of an unlimited number of shares of beneficial interest with no par value per share. Holders of the shares of the Funds of the Trust have one vote for each share held and a proportionate fraction of a vote for each fractional share. All shares issued and outstanding are fully paid and are transferable and redeemable at the option of the shareholder. Purchasers of the share do not have any obligation to make payments to the Trust or its creditors solely by reason of the purchasers’ ownership of the shares. Shares have no pre-emptive rights.
| Semi-Annual Report | October 31, 2020 | 29 |
| Rondure Funds | Notes to Financial Statements |
| | October 31, 2020 (Unaudited) |
Shares redeemed within 60 days of purchase may incur a 2% short-term redemption fee deducted from the redemption amount. For the six months ended October 31, 2020, the redemption fees charged by the Funds are presented in the Statement of Changes in Net Assets.
6. MANAGEMENT AND RELATED-PARTY TRANSACTIONS
The Advisor, subject to the authority of the Board, is responsible for the overall management and administration of the Funds’ business affairs. The Advisor manages the investments of the Funds in accordance with the Funds’ investment objective, policies and limitations and investment guidelines established jointly by the Advisor and the Trustees. Pursuant to the Advisory Agreement, (the “Advisory Agreement”), each Fund pays the Advisor an annual management fee based on each Fund’s average daily net assets. The management fee is paid on a monthly basis. The following table reflects the Funds’ advisory fee rates.
| Fund | Advisory Fee |
| Rondure New World Fund | 0.85% |
| Rondure Overseas Fund | 0.70% |
The Advisor has contractually agreed to limit certain of each Fund’s expenses (excluding acquired fund fees and expenses, brokerage expenses, interest expense, taxes and extraordinary expenses). The following table reflects the Funds’ expense cap.
| Fund | Expense Cap | Term of Expense Limit Agreements |
| Rondure New World Fund | | September 1, 2020-August 31, 2021/September 1, 2019-August 31, 2020 |
| Institutional Class | 1.10% | |
| Investor Class | 1.35% | |
| Rondure Overseas Fund | | September 1, 2020-August 31, 2021/September 1, 2019-August 31, 2020 |
| Institutional Class | 0.85% | |
| Investor Class | 1.10% | |
Pursuant to these agreements, the Advisor may seek reimbursement from a Fund for any previous fee waivers and expense reimbursements made by the Advisor, provided that any such reimbursements made by the Funds to the Advisor will not cause the Funds’ expense limitation to exceed expense limitations in existence at the time the expense was incurred, or at the time of the reimbursement, whichever is lower, and the reimbursement is made within three years after the expenses were incurred. Fees waived/reimbursed by Advisor for the six months ended October 31, 2020 are disclosed in the Statements of Operations.
For the six months ended October 31, 2020, the fee waivers/reimbursements and/or recoupments were as follows:
| Fund | | Fees Waived/Reimbursed By Adviser |
| Rondure New World Fund Fund | | |
| Institutional Class | | $ | 174,350 | |
| Investor Class | | | 31,874 | |
| Rondure Overseas Fund Fund | | | | |
| Institutional Class | | $ | 92,987 | |
| Investor Class | | | 15,622 | |
| Fund | | Expires 2021 | | Expires 2022 | | Expires 2023 | | Expires 2024 | | Total |
| Rondure New World Fund | | | | | | | | | | | | | | | | | | | | |
| Institutional Class | | $ | 174,716 | | | $ | 357,945 | | | $ | 385,756 | | | $ | 174,350 | | | $ | 1,092,767 | |
| Investor Class | | | 49,242 | | | | 90,396 | | | | 73,814 | | | | 31,874 | | | | 245,326 | |
| Rondure Overseas Fund | | | | | | | | | | | | | | | | | | | | |
| Institutional Class | | $ | 71,441 | | | $ | 165,269 | | | $ | 162,555 | | | $ | 92,987 | | | $ | 492,252 | |
| Investor Class | | | 21,961 | | | | 42,849 | | | | 33,740 | | | | 15,622 | | | | 114,172 | |
| 30 | 1.855.775.3337 | www.rondureglobal.com |
| Rondure Funds | Notes to Financial Statements |
| | October 31, 2020 (Unaudited) |
Administrator Fees and Expenses
ALPS Fund Services, Inc. (“ALPS”) serves as administrator to the Funds and the Funds have agreed to pay expenses incurred in connection with their administrative activities. Pursuant to an Administration Agreement, ALPS provides operational services to the Funds including, but not limited to, fund accounting and fund administration and generally assists in the Funds’ operations. Officers of the Trust are employees of ALPS. The Funds’ administration fee is accrued on a daily basis and paid monthly. Administration fees paid by the Funds for the six months ended October 31, 2020 are disclosed in the Statements of Operations.
ALPS is reimbursed by the Funds for certain out-of-pocket expenses.
Transfer Agent
ALPS serves as transfer, dividend paying and shareholder servicing agent for the Funds. ALPS receives an annual minimum fee, a fee based upon the number of shareholder accounts, and is also reimbursed by the Funds for certain out-of-pocket expenses. Transfer agent fees paid by the Funds for the six motnhs ended October 31, 2020 are disclosed in the Statements of Operations.
Compliance Services
ALPS provides services that assist the Trust’s chief compliance officer in monitoring and testing the policies and procedures of the Trust in conjunction with requirements under Rule 38a-1 under the 1940 Act and receives an annual base fee. ALPS is reimbursed for certain out-of-pocket expenses by the Funds. Compliance service fees paid by the Funds for the six months ended October 31, 2020 are disclosed in the Statements of Operations.
Principal Financial Officer
ALPS receives an annual fee for providing principal financial officer services to the Funds. Principal financial officer fees paid by the Fund for the six months ended October 31, 2020 are disclosed in the Statements of Operations.
Distributor
ALPS Distributors, Inc. (“ADI” or the “Distributor”) (an affiliate of ALPS) acts as the distributor of the Funds’ shares pursuant to a Distribution Agreement with the Trust. Shares are sold on a continuous basis by ADI as agent for the Funds, and ADI has agreed to use its best efforts to solicit orders for the sale of each Fund’s shares, although it is not obliged to sell any particular amount of shares. ADI is not entitled to any compensation for its services as Distributor. ADI is registered as a broker-dealer with the U.S. Securities and Exchange Commission.
Each Fund has adopted a Distribution and Services (Rule 12b-1) Plan pursuant to Rule 12b-1 of the 1940 Act (the “Plan”) for its Investor Class shares. The Plan allows the Funds to use Investor Class assets to pay fees in connection with the distribution and marketing of Investor Class shares and/or the provision of shareholder services to Investor Class shareholders. The Plan permits payment for services in connection with the administration of plans or programs that use Investor Class shares of each Fund as their funding medium and for related expenses. The recipients of such payments may include the Distributor, other affiliates of the Advisor, broker-dealers, financial institutions, plan sponsors and administrators and other financial intermediaries through which investors may purchase shares of the Fund. The Plan permits the Funds to make total payments at an annual rate of up to 0.25% of each Fund’s average daily net assets attributable to its Investor Class shares. The expenses of the Plan are reflected as distribution and service fees in the Statements of Operations.
Trustees
The fees and expenses of the Trustees of the Board are presented in the Statements of Operations.
7. INDEMNIFICATIONS
Under the Trust’s organizational documents, its officers and Trustees are indemnified against certain liability arising out of the performance of their duties to the Trust. Additionally, in the normal course of business, the Trust enters into contracts with service providers that may contain general indemnification clauses, which may permit indemnification to the extent permissible under applicable law. The Trust’s maximum exposure under these arrangements is unknown, as this would involve future claims that may be made against the Trust that have not yet occurred.
| Semi-Annual Report | October 31, 2020 | 31 |
| Rondure Funds | Additional Information |
October 31, 2020 (Unaudited)
1. FUND HOLDINGS
The Funds file their complete schedule of portfolio holdings with the Securities and Exchange Commission for the first and third quarters of each fiscal year as an exhibit to its reports on Form N-PORT. The Funds’ Form N-PORT reports are available on the Commission’s Web site at http://www.sec.gov. The Funds’ Form N-PORT reports are also available upon request by calling toll-free (855) 775-3337.
2. FUND PROXY VOTING POLICIES, PROCEDURES AND SUMMARIES
The Funds’ policies and procedures used in determining how to vote proxies and information regarding how the Funds voted proxies relating to portfolio securities during the most recent prior 12-month period ending June 30 are available without charge, (1) upon request, by calling (toll-free) 1-855-775-3337 and (2) on the SEC’s website at http://www.sec.gov.
| 32 | 1.855.775.3337 | www.rondureglobal.com |
| Rondure Funds | Disclosure Regarding Approval of Fund Advisory Agreement |
| | October 31, 2020 (Unaudited) |
Rondure Funds
On September 15, 2020, the Trustees via electronic means (videoconference)(a) to discuss, among other things, the approval of the Investment Advisory Agreement between the Financial Investors Trust (the “Trust”), with respect to the Rondure New World Fund and the Rondure Overseas Fund (collectively, the “Rondure Funds”) and Rondure Global Advisors, LLC (“Rondure”), in accordance with Section 15(c) of the 1940 Act. In renewing and approving the Investment Advisory Agreement with Rondure, on behalf of the Rondure Funds, the Trustees, including the Independent Trustees, considered the following factors with respect to the Rondure Funds:
Investment Advisory Fee Rate: The Trustees reviewed and considered the contractual annual advisory fees paid by the Trust, on behalf of the Rondure Funds, to Rondure, of 0.85% for the Rondure New World Fund and 0.70% for the Rondure Overseas Fund, in light of the extent and quality of the advisory services provided by Rondure to each of the Rondure Funds.
The Board received and considered information including a comparison of the Investor Class and Institutional Class of each Rondure Fund’s contractual advisory fee rate with those of funds in the peer group of funds provided by an independent provider of investment company data (the “Data Provider”). The Trustees noted that the contractual advisory fee rate of both classes of the Rondure New World Fund was lower than the Data Provider peer group median, and both classes of the Rondure Overseas Fund was significantly lower than the Data Provider peer group medians.
Total Net Expense Ratios: The Trustees further reviewed and considered that the total net expense ratios of the Institutional Class and the Investor Class of the Rondure New World Fund were equal to and lower than the Data Provider peer group median, respectively, and the total net expense ratio of both classes of the Rondure Overseas Fund was significantly lower than the Data Provider peer group medians.
Nature, Extent, and Quality of the Services under the Investment Advisory Agreement: The Trustees received and considered information regarding the nature, extent, and quality of services provided to the Rondure Funds under the Rondure Investment Advisory Agreement. The Trustees reviewed certain background materials supplied by Rondure in its presentation, including its Form ADV.
The Trustees reviewed and considered Rondure’s investment advisory personnel, its history as an asset manager, and its performance and the amount of assets currently under management by Rondure and its affiliated entities. The Trustees also reviewed the research and decision-making processes utilized by Rondure, including the methods adopted to seek to achieve compliance with the investment objectives, policies, and restrictions of the Rondure Funds.
The Trustees considered the background and experience of Rondure’s management in connection with the Rondure Funds, including reviewing the qualifications, backgrounds, and responsibilities of the management team primarily responsible for the day-to-day portfolio management of each Rondure Fund and the extent of the resources devoted to research and analysis of actual and potential investments.
The Trustees also reviewed, among other things, Rondure’s insider trading policies and procedures and its Code of Ethics.
Performance: The Trustees reviewed performance information for the Investor Class and Institutional Class shares of the Rondure Funds for the 3-month, 1-year, 3-year, and since inception periods ended June 30, 2020. That review included a comparison of each Rondure Fund’s performance to the performance of a group of comparable funds selected by the Data Provider. The Trustees noted that both classes of the Rondure New World Fund outperformed the Data Provider peer group median for the 1-year and 3-year periods and underperformed the Data Provider peer group median for the 3-month and since inception periods, and that the Institutional Class of the Rondure Overseas Fund underperformed the Data Provider peer group median for the 1-year, 3-year, and since inception periods, and significantly underperformed the Data Provider peer group median for the 3-month period, and that the Investor Class of the Rondure Overseas Fund significantly underperformed the Data Provider peer group median for each time period. The Trustees also considered Rondure’s discussion of its reputation generally and its investment techniques, risk management controls, and decision-making processes.
Comparable Accounts: The Trustees noted certain information provided by Rondure regarding fees charged to its other clients utilizing a strategy similar to that employed by the Rondure Funds.
Profitability: The Trustees received and considered a retrospective and projected profitability analysis prepared by Rondure based on the fees payable under the Rondure Investment Advisory Agreement with respect to the Rondure Funds. The Trustees considered the profits, if any, realized by Rondure in connection with the operation of the Rondure Funds.
| Semi-Annual Report | October 31, 2020 | 33 |
| Rondure Funds | Disclosure Regarding Approval of Fund Advisory Agreement |
| | October 31, 2020 (Unaudited) |
Economies of Scale: The Trustees considered whether economies of scale in the provision of services to the Rondure Funds will be passed along to the shareholders under the proposed agreements.
Other Benefits to the Adviser: The Trustees reviewed and considered any other incidental benefits derived or to be derived by Rondure from its relationship with the Rondure Funds, including whether soft dollar arrangements were used.
The Trustees, including all of the Independent Trustees, concluded that:
| ● | the contractual advisory fee rate of both classes of each of the Rondure Funds was lower than or significantly lower than the Data Provider peer group medians; |
| ● | the total net expense ratios of both classes of each of the Rondure Funds was equal to, lower than, or significantly lower than the Data Provider peer group medians; |
| ● | the nature, extent, and quality of services rendered by Rondure under the Rondure Investment Advisory Agreement with respect to each Rondure Fund were adequate; |
| ● | for the period ended June 30, 2020, both classes of the Rondure New World Fund outperformed the Data Provider peer group median for the 1-year and 3-year periods and underperformed the Data Provider peer group median for the 3-month and since inception periods, and that both classes of the Rondure Overseas Fund underperformed or significantly underperformed the Data Provider peer group median for each time period; |
| ● | bearing in mind the limitations of comparing different types of managed accounts and the different levels of service typically associated with such accounts, the fee structures applicable to Rondure’s other clients employing a comparable strategy to any of the Rondure Funds were not indicative of any unreasonableness with respect to the advisory fee payable by the Rondure Funds; |
| ● | the profit, if any, realized by Rondure in connection with the operation of any of the Rondure Funds is not unreasonable; and |
| ● | there were no material economies of scale or other incidental benefits accruing to Rondure in connection with its relationship with any of the Rondure Funds. |
Based on the Trustees’ deliberations and their evaluation of the information described above, the Trustees, including all of the Independent Trustees, concluded that Rondure’s compensation for investment advisory services is consistent with the best interests of each of the Rondure Funds and their shareholders.
| (a) | This meeting was intended to qualify as an "in-person" meeting of the Board pursuant to relief granted by the SEC in response to the COVID-19 outbreak for the purposes of fulfilling the in-person investment advisory agreement approval requirements under Section 15(c) of the 1940 Act (see Investment Company Act Release No. 33817 (Mar. 13, 2020), Investment Company Act Release No. 33824 (Mar. 25, 2020) and Investment Company Act Release No. 33897 (June 19, 2020)). |
| 34 | 1.855.775.3337 | www.rondureglobal.com |
| Rondure Funds | Privacy Policy |
October 31, 2020 (Unaudited)
| Who We Are | | |
| Who is providing this notice? | Rondure New World Fund and Rondure Overseas Fund. |
| What We Do | | |
| How do the Funds protect my personal information? | To protect your personal information from unauthorized access and use, we use security measures that comply with federal law. These measures include computer safeguards and secured files and buildings. |
| How do the Funds collect my personal information? | We collect your personal information, for example, when you |
| | • | open an account |
| | • | provide account information or give us your contact information |
| | • | make a wire transfer or deposit money |
| Why can’t I limit all sharing? | Federal law gives you the right to limit only |
| | • | sharing for affiliates’ everyday business purposes-information about your creditworthiness |
| | • | affiliates from using your information to market to you |
| | • | sharing for non-affiliates to market to you |
| | State laws and individual companies may give you additional rights to limit sharing. |
| Definitions | | |
| Affiliates | Companies related by common ownership or control. They can be financial and nonfinancial companies. |
| Non-affiliates | Companies not related by common ownership or control. They can be financial and nonfinancial companies. |
| | • | The Funds does not share with non-affiliates so they can market to you. |
| Joint marketing | A formal agreement between non-affiliated financial companies that together market financial products or services to you. |
| | • | The Funds does not jointly market. |
| Other Important Information | |
| California Residents | If your account has a California home address, your personal information will not be disclosed to nonaffiliated third parties except as permitted by applicable California law, and we will limit sharing such personal information with our affiliates to comply with California privacy laws that apply to us. |
| Vermont Residents | The State of Vermont requires financial institutions to obtain your consent prior to sharing personal information that they collect about you with affiliated companies and nonaffiliated third parties other than in certain limited circumstances. Except as permitted by law, we will not share personal information we collect about you with nonaffiliated third parties or other affiliated companies unless you provide us with your written consent to share such information. |
| Semi-Annual Report | October 31, 2020 | 35 |
| Rondure Funds | Privacy Policy |
October 31, 2020 (Unaudited)
| FACTS | WHAT DO THE FUNDS DO WITH YOUR PERSONAL INFORMATION? |
| Why? | Financial companies choose how they share your personal information. Federal law gives consumers the right to limit some but not all sharing. Federal law also requires us to tell you how we collect, share, and protect your personal information. Please read this notice carefully to understand what we do. |
| What? | The types of personal information we collect and share depend on the product or service you have with us. This information can include: |
| | • | Social Security number and account transactions |
| | • | Account balances and transaction history |
| | • | Wire transfer instructions |
| How? | All financial companies need to share customers’ personal information to run their everyday business. In the section below, we list the reasons financial companies can share their customers’ personal information; the reasons the Funds choose to share; and whether you can limit this sharing. |
| Reasons we can share your personal information | Do the Funds share: | Can you limit this sharing? |
| For our everyday business purposes – such as to process your transactions, maintain your account(s), respond to court orders and legal investigations, or report to credit bureaus | Yes | No |
| For our marketing purposes – to offer our products and services to you | No | We do not share. |
| For joint marketing with other financial companies | No | We do not share. |
| For our affiliates’ everyday business purposes – information about your transactions and experiences | Yes | No |
| For our affiliates’ everyday business purposes – information about your creditworthiness | No | We do not share. |
| For nonaffiliates to market to you | No | We do not share. |
| 36 | 1.855.775.3337 | www.rondureglobal.com |
| | |

| Contact Us | | |
| Mail: | Rondure Funds, P.O. Box 13664, Denver, CO 80201 | E-Mail: | rondureglobal@alpsinc.com |
| Phone: | 1.855.775.3337 | Web: | www.rondureglobal.com |

TABLE OF CONTENTS
| Letter to Shareholders | 1 |
| Performance Review | |
| Seafarer Overseas Growth and Income Fund | 5 |
| Seafarer Overseas Value Fund | 10 |
| Disclosure of Fund Expenses | 16 |
| Portfolio of Investments | 18 |
| Statements of Assets and Liabilities | 26 |
| Statements of Operations | 27 |
| Statements of Changes in Net Assets | 28 |
| Financial Highlights | 30 |
| Notes to Financial Statements | 38 |
| Additional Information | 47 |
| Privacy Policy | 48 |
Beginning on January 1, 2021, as permitted by regulations adopted by the U.S. Securities and Exchange Commission, paper copies of the Funds’ annual and semi- annual shareholder reports will no longer be sent by mail, unless you specifically request paper copies of the reports. Instead, the reports will be made available on the Funds’ website at seafarerfunds.com, and you will be notified by mail each time a report is posted and provided with a website link to access the report.
If you already elected to receive shareholder reports electronically, you will not be affected by this change, and you need not take any action. You may elect to receive shareholder reports and other communications from the Funds electronically by contacting your financial intermediary or, if you invest directly with the Funds, by logging into your Seafarer Funds account at seafarerfunds.com and enrolling in electronic delivery.
You may elect to receive future shareholder reports in paper format free of charge by contacting your financial intermediary or, if you invest directly with the Funds, by calling (855) 732-9220.
| Seafarer Funds | Letter to Shareholders |
October 31, 2020
LETTER TO SHAREHOLDERS
November 15, 2020
Dear Fellow Shareholders,
It is my pleasure to address you, our clients and shareholders of the Seafarer Funds, as this most unusual year comes to an end. Having communicated with some of you in my role as Co-Portfolio Manager of the Seafarer Overseas Growth and Income Fund, I am honored to be able to share some insights on how Seafarer Capital Partners (“Seafarer,” the adviser to the Funds) is working remotely, and to offer you my thoughts on the current risks and opportunities in the emerging markets. For those of you who do not know me, I joined Seafarer in 2011 after three years of investment banking in the emerging markets followed by eight years of investing in the U.S. high yield bond market.
This semi-annual report covers the first half of the Funds’ 2020-2021 fiscal year (May 1, 2020 to October 31, 2020).
2020 and Update on Seafarer Capital Partners
2020 has been the most extraordinary year of my 20+ year career in financial markets, not just in terms of the public health crisis, but notably for the ways in which companies across the emerging markets have adapted to the challenges, rapidly digitalizing their businesses and recalibrating their future growth prospects.
This year has presented Seafarer with many challenges but working remotely has not been one of them. California’s wildfires and related power outages over the last couple of years spurred us to ensure that Seafarer personnel can effectively and efficiently work from home. Portable backup power banks, mobile hotspots and optional temporary office spaces are some of the business continuity arrangements Seafarer has set up to minimize disruptions to remote work. The investment team remains focused on our core task of in-depth bottom-up company research and security selection. Despite the unusual circumstances of 2020, our research process has stayed very much the same: we have the same weekly schedule (two investment team meetings), and we have the same collaborative process where ideas are presented to and debated by the entire investment team before a new security enters a portfolio. If anything, I have more time to conduct research as I am not on long-haul flights or sitting in choking emerging market traffic for dozens of hours each quarter.
A bright spot of our remote working arrangements is that access to management teams has been easier than anticipated, albeit virtual rather than physical. Companies around the globe have been willing to hold video conferences with our investment team, answering the same questions that would typically be addressed in on-site meetings. Nothing can take the place of on-site research and interaction in order to truly understand the culture and strategy of a company, or the motivations of a management team. However, the effectiveness of video conferencing has allowed our team to stay in close contact with our portfolio holdings as well as conduct in-depth research on prospective investments. As long-term emerging market investors, we are excited to get back to our markets when the borders are open and it is safe to travel. To be clear, we don’t know when travel for our investment team will resume or what the process will look like when it does. Still, I remain eager to again visit these markets that hold so much opportunity.
Heightened Risks in the Emerging Markets Emanating from China
While my confidence in the long-term benefits of investing in the emerging markets remains intact, there are many risks that warrant close monitoring. Two risks of particular concern for me are China’s indebted residential property developers and troubled banking sector. I will discuss each of these risks below.
In June, I published an update to a market commentary entitled China’s Indebted Residential Property Development Sector.1 In that commentary, I highlighted that a large percentage of China’s national budget is tied to the sale of state-owned land-use rights to the highly-indebted residential property developers. The International Monetary Fund projects government revenues from the sale of land-use
| Semi-annual Report – October 31, 2020 | 1 |
| Seafarer Funds | Letter to Shareholders |
October 31, 2020
rights to decrease in the coming years – a growing concern for the nation’s finances.2 Another problem for this sector, in my view, is growing cross-currency risk: China’s residential property developers are expanding U.S. dollar-denominated debts at an alarming rate. With nearly all of property developers’ revenues and costs denominated in renminbi (RMB), this cross-currency liability represents a significant financial risk for these companies.3 Elevated yields for dollar-denominated bonds issued by several of the largest Chinese property developers offer a clear warning signal about these issuers’ financial health. Government funding shortfalls and defaults in the property sector could lead to systemic consequences for China – and the broader emerging markets. I will be closely monitoring the events that transpire in this vital sector of the Chinese economy.
The second risk that looms large in my opinion is the troubled banking sector in China. Chinese banks of all sizes remain under pressure to clean up their balance sheets, write off bad loans and raise capital, but this is hard to do when the government continues to use banks as tools to buttress economic growth. The country’s debt load remains concentrated on the balance sheets of banks, both large and small, a clear indication they are both beholden to and supported by the state. While concerted efforts and real progress have been made in developing China’s capital markets, as evidenced by the successful Stock Connect and Bond Connect programs, the banks remain a key provider of credit to China’s economy.4 This is where moral hazard creeps in: Chinese banks have grown accustomed to making risky loans, sometimes at the behest of the state, on the assumption that the government will bail them out if enough of these loans go bad.5 Beijing continues to demonstrate its capacity and willingness to intervene in order to prevent bank collapse, as shown by several recent bank bailouts, one of which is the May 2020 bailout of the Bank of Gansu. Gansu’s bailout is particularly concerning, as an already financially stretched state-backed entity was forced to raise its stake. As this stake is part of the bank’s capital, and the new equity holder is struggling with liquidity issues of its own, Gansu’s solvency issues hardly seem resolved. China’s dependence on – and support for – distressed banks for credit and growth may yet backfire if too many of them continue to operate in a speculative and unsustainable manner.
With these heightened risks in China adding to a great deal of uncertainty about the health of the global economy, our bottom-up fundamental investment process focused on security selection becomes even more important. It is through that process that we continue to find investment opportunities in the emerging markets amidst rapidly evolving risks and challenges.
Evolving Opportunities in the Emerging Markets
Disruptions caused by COVID-19 are forcing companies to reinvent their business models, alter workforce dynamics and change the way technology is used. COVID-19 has accelerated digitalization in most industries across the globe, notably in healthcare, education and payments. The healthcare industry has seen a boom in online medical consultation as well as related healthcare e-commerce. The education industry has seen intensifying competition and margin pressure as they address the many digitalization needs that have been pulled forward. And the payments industry is entering a new era of financial services where transactions and the many associated services are digitalizing before our eyes. I believe that these changes in the consumption of technology are likely to be permanent, anchored by the accelerated adoption of cloud-based services in both the public and private sectors. All of this creates investment opportunities in the developing world for the dedicated long-term investor: the pandemic has transformed the way industries function, cementing new digital and virtual processes with which we had only previously experimented.
Another opportunity I see is the continued formation of capital markets in the developing world. As mentioned above, China has acted decisively to broaden and deepen its capital markets in order to promote stable economic development. The speed and magnitude of China’s bond market boom over the last several years underscores these efforts.6 I think it is noteworthy that China’s bond markets have functioned well this year, maturing bonds continue to be refinanced – many with the much-needed longer tenors – and more issuers are accessing this market.7 Furthermore, the Chinese bond market may see more interest from the international investor with the recent announcement that foreigners will be allowed to access foreign exchange derivatives products, an essential aspect of bond market investing.8
| 2 | (855) 732-9220 seafarerfunds.com |
| Seafarer Funds | Letter to Shareholders |
October 31, 2020
Equity market development continues at a robust pace in China, with over 300 initial public offerings (IPOs) in Shanghai and Shenzhen this year representing close to 600 billion U.S. dollar (USD) equivalent in IPO listing proceeds.9 More listed companies mean a larger investment universe, and while valuations in the A-share market are inflated to put it mildly, we continue to scour this market for opportunities.10 China now has a vast universe of listed companies, so despite elevated valuations in many sectors, opportunities do exist, and we continue to add Chinese portfolio holdings, focusing on those with attractive valuations and compelling growth prospects.
China continues to open its capital markets to the world, but it must be highlighted that this is being done very much on its own terms. While I was drafting this letter, the Ant Financial IPO was suspended in both Hong Kong and Shanghai amid unexpected material regulatory changes. While China has made a great deal of progress in developing its capital markets, the suspension of what was to be the largest ever IPO just days before pricing is a damaging setback. To me, this event demonstrates that regulation in the country is not objective or rules-based. It also suggests that the Chinese regulators might not let Ant Financial or any other financial technology start up disintermediate the traditional state-controlled banking system that remains so essential to China achieving its economic goals. I believe this unprecedented move raises questions about the future of regulation in China’s financial sector, the reach of the Xi Jinping administration in the economy, and the future of capital markets in China.11 The emerging markets are rife with governments that hastily implement ill-conceived rules and regulations. Our job is to find companies that can thrive despite these difficult environments. Events like the Ant IPO suspension are frustrating but nevertheless inspire us to search harder for durable investment opportunities in these complicated markets.
While China dominates our investment universe, and we spend a great deal of our time looking for investment opportunities there, emerging markets elsewhere continue to provide fertile hunting ground. Brazil is one such country: it is home to a select group of well-run companies that have distinguished themselves over time through continued revenue and earnings growth as well as the fair treatment of minority shareholders. The recent depreciation of the Brazilian real (BRL), down 29.9% year-to-date as of October 31, makes these opportunities even more compelling from a valuation perspective when considered in USD terms.12 While China constitutes close to 42% of the MSCI Emerging Markets Index and at least that amount of the investment team’s time, other emerging markets continue to merit investigation and capital allocation.13 There are more than 4,000 listed companies located outside of China that together have a combined market capitalization of 11.9 trillion USD-equivalent.14 15 16 We continue to find opportunities outside of China in a variety of sectors, including information technology, consumer discretionary, health care and financials.
To conclude, I am proud of how our team has met the challenges of 2020, adjusting to remote work with the benefit of our advanced business continuity preparedness and staying connected with each other through regular video conferences. Seafarer’s investment team continues to manage our portfolios with the same process and philosophy that have been in place since the establishment of the firm nine years ago. With the promise of a vaccine on the horizon and a return to “normalcy” one step closer, it will be wonderful to again travel to our markets and meet with management teams in person. Progress and change in the developing world have happened at an impressive pace this year, and our investment team remains dedicated to discovering new investment opportunities across the globe.
Thank you for entrusting us with your capital. We are honored to serve as your investment adviser in the emerging markets.
Kate Jaquet
Co-Portfolio Manager
Seafarer Capital Partners, LLC
| Semi-annual Report – October 31, 2020 | 3 |
| Seafarer Funds | Letter to Shareholders |
October 31, 2020
The Funds are subject to investment risks, including possible loss of the principal amount invested and therefore are not suitable for all investors. The Funds may not achieve their objectives. Diversification does not ensure a profit or guarantee against loss.
Information on the Seafarer website and references to Seafarer publications are provided for textual reference only, and are not incorporated by reference into this report.
The views and information discussed in this commentary are as of the date of publication, are subject to change, and may not reflect Seafarer’s current views. The views expressed represent an assessment of market conditions at a specific point in time, are opinions only and should not be relied upon as investment advice regarding a particular investment or markets in general. Such information does not constitute a recommendation to buy or sell specific securities or investment vehicles. It should not be assumed that any investment will be profitable or will equal the performance of the portfolios or any securities or any sectors mentioned herein. The subject matter contained herein has been derived from several sources believed to be reliable and accurate at the time of compilation. Seafarer does not accept any liability for losses either direct or consequential caused by the use of this information.
As of October 31, 2020, the Seafarer Funds did not own shares in Bank of Gansu Co., Ltd or Ant Group.
| 1 | www.seafarerfunds.com/commentary/china-residential-property-development-sector |
| 2 | People’s Republic of China: 2019 Article IV Consultation (www.imf.org/en/Publications/CR/Issues/2019/08/08/Peoples-Republic-of-China-2019-Article-IV-Consultation-Press-Release-Staff-Report-Staff-48576), International Monetary Fund, 9 August 2019. |
| 3 | The renminbi (RMB) is the official currency of the People’s Republic of China. |
| 4 | The Stock Connect program consists of trading links that allow offshore, non-domestic-Chinese investors and entities to invest in Chinese A-shares listed on the Shanghai and Shenzhen Exchanges. The Stock Connect also allows Mainland China investors to purchase certain Hong Kong-listed stocks via accounts with the Shanghai and Shenzhen Exchanges. The Bond Connect program is a trading link that allows certain investors from Mainland China and overseas to trade in each other's bond markets through a special mechanism that was designed and implemented by the Hong Kong Stock Exchange. Currently, only Northbound trading is allowed, meaning that foreign investors are able to buy and sell Chinese bonds. Chinese investors are not yet able to trade Hong Kong and overseas bonds, known as Southbound trading. |
| 5 | Moral hazard is a situation where one party to a transaction has a financial incentive to incur extra risk because that party knows (or reasonably guesses) that its counterparty will incur the costs or burdens of such extra risks. |
| 6 | www.seafarerfunds.com/commentary/the-evolution-of-chinas-bond-market |
| 7 | Tenor is the length of time until a loan or a bond is due. For example, a loan is taken out with a two year tenor. After one year passes, the tenor of the loan is one year. |
| 8 | A derivative is a contract whose value is based on the performance of an underlying financial asset, index, or other investment. |
| 9 | An initial public offering (IPO) is the process of offering shares of a private company to the public in a new stock issuance. Public share issuance allows a company to raise capital from public investors. |
| 10 | Chinese A-Shares are a class of securitized common stock in Chinese companies, traded exclusively on Chinese stock exchanges (i.e., Shanghai and Shenzhen), and denominated in renminbi, China’s currency. |
| 11 | Jing Yang and Lingling Wei, “China’s President Xi Jinping Personally Scuttled Jack Ma’s Ant IPO” (www.wsj.com/articles/china-president-xi-jinping-halted-jack-ma-ant-ipo-11605203556), The Wall Street Journal, 12 November 2020. |
| 12 | The Brazilian real (BRL) is the official currency of Brazil. |
| 13 | The MSCI Emerging Markets Index is a free float-adjusted market capitalization index designed to measure equity market performance of emerging markets. Index code: MXEF. It is not possible to invest directly in an index. |
| 14 | This value excludes listed equities with market capitalizations below $250 million. Seafarer rarely considers equities below this threshold. |
| 15 | Market capitalization is the value of a corporation as determined by the market price of its issued and outstanding common stock. |
| 16 | Source: Bloomberg. Data as of 31 October 2020. |
| 4 | (855) 732-9220 seafarerfunds.com |
| Seafarer Overseas Growth and Income Fund | Performance Review |
October 31, 2020
SEAFARER OVERSEAS GROWTH AND INCOME FUND
PERFORMANCE REVIEW
November 15, 2020
This report addresses the first half of the 2020-2021 fiscal year (May 1, 2020 to October 31, 2020) for the Seafarer Overseas Growth and Income Fund (“Growth and Income Fund”).
During the semi-annual period, the Fund returned 20.26%, while the Fund’s benchmark indices, the MSCI Emerging Markets Total Return USD Index and the Morningstar Emerging Markets Net Return USD Index, returned 21.22% and 21.43%, respectively.1 By way of broader comparison, the S&P 500 Index gained 13.29%.
The Fund began the fiscal year with a net asset value (NAV) of $10.36 per share. In June, the Fund paid a semi-annual distribution of $0.072 per share. That payment brought the cumulative distribution per share, as measured from the Fund’s inception, to $3.065.2 The Fund finished the semi-annual period with a value of $12.38 per share.3
* * *
Stock markets around the world surged in this semi-annual period, rebounding from the lows experienced in March after the global onset of the novel coronavirus. The movement in stock prices in the emerging markets was astonishingly rapid, but relatively narrow: during the semi-annual period, 90% of the gains in the MSCI Emerging Markets Index stemmed from only four countries. The gains were heavily concentrated in Chinese shares – which accounted for 54% of the gain, despite averaging only a 41% weight within the index during the period – while Taiwan, South Korea and India collectively made up an additional 36% of the gains. The remaining countries either made small contributions, were listless, or produced a small drag on returns. Gains in China, Taiwan, and South Korea were dominated by internet companies, software companies, and semiconductor manufacturers: these three industries, located in those three East Asian countries, account for a little over of a quarter of the MSCI benchmark, but drove 57% of the returns.
Against this concentrated market backdrop, the sources of the Growth and Income Fund’s contributions to performance were more diversified. South Korea was the single largest source of return, followed by China; thereafter, the Fund saw notable gains in its holdings in Taiwan, Singapore, India, Vietnam, Eastern Europe, and the UAE. We were pleased that the Fund’s portfolio does not seem to be driven by the same, small handful of technology-oriented stocks that dominate the index, or comprise many other investment portfolios.
The Growth and Income Fund’s performance, nearly matching that of the benchmark indices, cannot be definitively attributed to a particular cause. However, I suspect that the primary impetus for the Fund’s gains was the strong underlying fundamental performance of its holdings: according to consensus earnings estimates, the portfolio’s constituents remain on track to generate modest earnings growth for 2020, even as the profits of the MSCI Emerging Market Index’s constituents are expected to contract 13% in aggregate this year.4 Consensus estimates for the Fund’s holdings suggest that the portfolio will see 9% growth in earnings, but this includes a single company (First Pacific, a conglomerate based in Hong Kong) that is progressing from losses last year (which depressed the basis of comparison in 2019) to anticipated profits this year. The resulting “swing” in the portfolio’s aggregate earnings exaggerates the underlying rate of growth; yet we believe it is reasonable to expect that the portfolio might produce 1% to 2% growth once this effect is removed. While this rate of growth is relatively anemic in absolute, it stands out in a year when the broader market is undergoing a material contraction.
Given the Fund’s outsized exposure to South Korean stocks during this period, it is no surprise that several of the top individual contributors to total return are based in Korea. Four long-held and large Korean stocks rose substantially: Samsung SDI (a globally competitive company in battery technologies); Hyundai Mobis (a manufacturer of auto parts and systems); Naver (Korea’s dominant search engine and e-commerce company); and Samsung Electronics (a semiconductor company). Two other top contributors to Fund performance include Alibaba, China’s largest e-commerce company, and
| Semi-annual Report – October 31, 2020 | 5 |
| Seafarer Overseas Growth and Income Fund | Performance Review |
October 31, 2020
Infosys, a leading information technology company. Notably, the Fund substantially reduced its holdings in Alibaba and Naver during the semi-annual period.
The top detractors to total return for this period include two recent additions to the Fund: Ambev SA, one of the largest brewers in South America, and Itaú Unibanco, the largest privately-owned bank in Brazil.
Thank you for entrusting us with your capital. We are honored to serve as your investment adviser in the emerging markets.
Andrew Foster and Paul Espinosa
Portfolio Managers, Seafarer Overseas Growth and Income Fund
Seafarer Capital Partners, LLC
The MSCI Emerging Markets Total Return Index, Standard (Large+Mid Cap) Core, Gross (dividends reinvested), USD is a free float-adjusted market capitalization index designed to measure equity market performance of emerging markets. Index code: GDUEEGF.
The Morningstar Emerging Markets Net Return USD Index measures the performance of emerging markets targeting the top 97% of stocks by market capitalization. The index does not incorporate Morningstar’s environmental, social, or governance (ESG) criteria. Index code: MEMMN.
The S&P 500 Total Return Index is a stock market index based on the market capitalizations of 500 large companies with common stock listed on the NYSE or NASDAQ.
It is not possible to invest directly in an index.
The Fund is subject to investment risks, including possible loss of the principal amount invested and therefore is not suitable for all investors. The Fund may not achieve its objectives. Diversification does not ensure a profit or guarantee against loss.
The views and information discussed in this commentary are as of the date of publication, are subject to change, and may not reflect Seafarer’s current views. The views expressed represent an assessment of market conditions at a specific point in time, are opinions only and should not be relied upon as investment advice regarding a particular investment or markets in general. Such information does not constitute a recommendation to buy or sell specific securities or investment vehicles. It should not be assumed that any investment will be profitable or will equal the performance of the portfolios or any securities or any sectors mentioned herein. The subject matter contained herein has been derived from several sources believed to be reliable and accurate at the time of compilation. Seafarer does not accept any liability for losses either direct or consequential caused by the use of this information.
| 1 | References to the “Fund” pertain to the Fund’s Institutional share class (ticker: SIGIX). The Investor share class (ticker: SFGIX) returned 20.15% during the semi-annual period. |
| 2 | The Fund’s inception date is February 15, 2012. |
| 3 | The Fund’s Investor share class began the fiscal year with a net asset value of $10.31 per share; it paid a semi-annual distribution of $0.070 per share in June; and it finished the semi-annual period with a value of $12.31 per share. |
| 4 | Source: J.P. Morgan, “Emerging Markets Equity Strategy Steering Board,” 01 October 2020. |
| 6 | (855) 732-9220 seafarerfunds.com |
| Seafarer Overseas Growth and Income Fund | Performance Review |
October 31, 2020
Total Returns
| As of October 31, 2020 | 6 Month | 1 Year | 3 Year | 5 Year | 7 Year | Since Inception Annualized(1) | Gross Expense Ratio(2) |
| Investor Class (SFGIX) | 20.15% | 5.64% | 2.10% | 5.84% | 4.01% | 5.54% | 1.03% |
| Institutional Class (SIGIX) | 20.26% | 5.77% | 2.25% | 5.97% | 4.15% | 5.67% | 0.93% |
| MSCI Emerging Markets Total Return USD Index(3) | 21.22% | 8.62% | 2.32% | 8.31% | 3.72% | 3.35% | |
| Morningstar Emerging Markets Net Return USD Index(4) | 21.43% | 7.32% | 2.31% | 7.76% | 3.62% | 3.33% | |
All performance is measured in U.S. dollar terms. For the MSCI index, performance is calculated to reflect the reinvestment of dividends, capital gains, and other corporate actions gross of foreign jurisdiction withholding taxes (i.e., such taxes are ignored). For the Morningstar index, performance is calculated to reflect the reinvestment of dividends, capital gains, and other corporate actions net of foreign jurisdiction withholding taxes. The performance data quoted represents past performance and does not guarantee future results. Future returns may be lower or higher. The investment return and principal value will fluctuate so that an investor's shares, when redeemed, may be worth more or less than the original cost. Prior to August 31, 2016, shares of the Fund redeemed or exchanged within 90 days of purchase were subject to a 2% redemption fee. Performance does not reflect this fee, which if deducted would reduce an individual's return. To obtain the Fund’s most recent month-end performance, visit seafarerfunds.com or call (855) 732-9220.
| 1 | Inception Date: February 15, 2012. |
| 2 | Ratios as of Prospectus dated August 31, 2020. Seafarer Capital Partners, LLC has agreed contractually to waive and/or reimburse fees or expenses in order to limit Total Annual Fund Operating Expenses After Fee Waiver/Expense Reimbursements (inclusive of acquired fund fees and expenses, and exclusive of brokerage expenses, interest expenses, taxes and extraordinary expenses) to 1.15% and 1.05% of the Fund’s average daily net assets for the Investor and Institutional share classes, respectively. This agreement is in effect through August 31, 2021. |
| 3 | The MSCI Emerging Markets Total Return Index, Standard (Large+Mid Cap) Core, Gross (dividends reinvested), USD is a free float-adjusted market capitalization index designed to measure equity market performance of emerging markets. Index code: GDUEEGF. The index is not actively managed and does not reflect any deductions for fees, expense or taxes. An investor may not invest directly in an index. |
| 4 | The Morningstar Emerging Markets Net Return USD Index measures the performance of emerging markets targeting the top 97% of stocks by market capitalization. The index does not incorporate Morningstar’s environmental, social, or governance (ESG) criteria. Index code: MEMMN. The index is not actively managed and does not reflect any deductions for fees, expense or taxes. An investor may not invest directly in an index. |
| Semi-annual Report – October 31, 2020 | 7 |
| Seafarer Overseas Growth and Income Fund | Performance Review |
October 31, 2020
Performance of a $10,000 Investment Since Inception

| * | Inception Date: February 15, 2012. |
The chart shown above represents historical performance of a hypothetical investment of $10,000 in the Fund’s Investor Class shares for the period from inception to October 31, 2020. All returns reflect reinvested dividends and/or distributions, but do not reflect the deduction of taxes that an investor would pay on distributions or redemptions.
The Fund also offers Institutional Class shares, performance of which is not reflected in the chart above. The performance of Institutional Class shares may be higher or lower than the performance of the Investor Class shares shown above based upon differences in fees paid by shareholders investing in the Investor Class shares and Institutional Class shares.
Investment Objective
The Fund seeks to provide long-term capital appreciation along with some current income. The Fund seeks to mitigate adverse volatility in returns as a secondary objective.
Strategy
The Fund invests primarily in the securities of companies located in developing countries. The Fund invests in several asset classes including dividend-paying common stocks, preferred stocks, and fixed-income securities.
The Fund seeks to offer investors a relatively stable means of participating in developing countries’ growth prospects, while attempting to mitigate adverse volatility in returns.
| 8 | (855) 732-9220 seafarerfunds.com |
| Seafarer Overseas Growth and Income Fund | Performance Review |
October 31, 2020
| Portfolio Composition by Region | % Net Assets |
| East & South Asia | 71.7% |
| Emerging Europe | 4.8% |
| Latin America | 8.1% |
| Middle East & Africa | 6.9% |
| Other | 2.0% |
| Cash & Other Assets, Less Liabilities | 6.5% |
| Total | 100.0% |
| Portfolio Composition by Sector | % Net Assets |
| Communication Services | 7.0% |
| Consumer Discretionary | 13.8% |
| Consumer Staples | 10.4% |
| Energy | 1.9% |
| Financials | 14.0% |
| Health Care | 7.5% |
| Industrials | 5.5% |
| Information Technology | 27.9% |
| Materials | 3.0% |
| Utilities | 2.5% |
| Cash & Other Assets, Less Liabilities | 6.5% |
| Total | 100.0% |
| Top 10 Holdings | % Net Assets |
| Samsung Electronics Co., Ltd. | 6.2% |
| Samsung SDI Co., Ltd. | 4.6% |
| Venture Corp., Ltd. | 4.4% |
| Hyundai Mobis Co., Ltd. | 4.2% |
| China Literature, Ltd. | 3.9% |
| Shenzhou International Group Holdings, Ltd. | 3.5% |
| Richter Gedeon Nyrt | 3.4% |
| Ping An Insurance Group Co. of China, Ltd. | 3.2% |
| Rohm Co., Ltd. | 3.1% |
| Infosys, Ltd. | 3.0% |
| Total | 39.5% |
| | |
| Total Number of Holdings | 44 |
Holdings are subject to change, and may not reflect the current or future position of the portfolio.
Source: ALPS Fund Services, Inc.
| Semi-annual Report – October 31, 2020 | 9 |
| Seafarer Overseas Value Fund | Performance Review |
October 31, 2020
SEAFARER OVERSEAS VALUE FUND
PERFORMANCE REVIEW
November 12, 2020
This report addresses the first half of the 2020-2021 fiscal year (May 1, 2020 to October 31, 2020) for the Seafarer Overseas Value Fund (“Value Fund”).
During the semi-annual period, the Fund returned 9.70%, while the Fund’s benchmark indices, the MSCI Emerging Markets Total Return USD Index and the Morningstar Emerging Markets Net Return USD Index, returned 21.22% and 21.43%, respectively.1 By way of broader comparison, the S&P 500 Index gained 13.29%.
The Fund began the fiscal year with a net asset value (NAV) of $9.48 per share. The Fund paid no distributions during the first half of the fiscal year, and it finished the period with a value of $10.40 per share.2
* * *
During this semi-annual period, the Value Fund’s NAV recovered in absolute terms from the market drawdown in the first quarter of 2020. Nevertheless, the sequential performance improvement pales in comparison to that of the benchmark indices. It would be easy to hide behind sweeping statements, such as “value investing is out of favor,” to explain the Fund’s relative performance. However, I am stating in writing that the underlying dynamic of investment return generation through the recognition of attractive valuation is alive and well even within the current growth-oriented market context.
Two examples of value-discovery during the semi-annual period include Amvig Holdings (Structural Shift source of value; Seafarer’s seven sources of value,3 hereafter referenced using parenthesized italics, are defined in Figure 1), a Chinese tobacco packaging manufacturer, and Wilmar International (Asset Productivity and Breakup Value), a Singapore-based edible oils and consumer company. Presumably driven by the low valuation Hong Kong-listed Amvig Holdings shares ascribed to the company’s cash flow, a Chinese private equity fund announced a tender offer for the publicly-listed shares of the company at a 51% premium to the last traded price prior to the announcement. Similarly, the share price of Wilmar International increased significantly in anticipation of the mid-October initial public offering (IPO) of its Chinese subsidiary.4 Both cases represent instances of long-unrecognized value by public market participants being recognized by other types of investors: a private equity fund in the case of Amvig Holdings, and Chinese A-share market participants in the case of Wilmar International.5
| 10 | (855) 732-9220 seafarerfunds.com |
| Seafarer Overseas Value Fund | Performance Review |
October 31, 2020
Figure 1. Sources of Value
Seafarer has identified seven distinct sources of value in emerging markets that may give rise to viable opportunities for long-term, value-oriented investments.
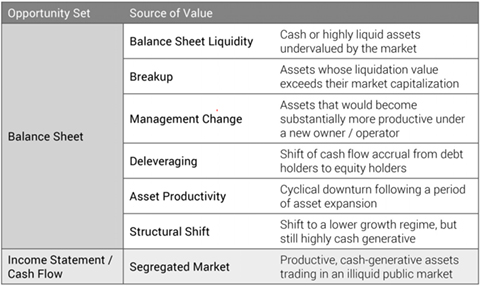
Source: Seafarer
While there is value recognition at the individual stock level, it has proven very difficult to capture it at the strategy level as the stocks propelling the benchmark performance are a narrow set of large capitalization companies operating in the technology industry. Indeed, the Fund’s largest contributor to total return during the semi-annual period is a stock that fits this description: Samsung SDI (Breakup Value), a South Korean battery manufacturer.
For the remaining Fund holdings, one could argue that the pandemic took over from value discovery as the driver of stock prices. An illustrative case is that of another top contributor to performance during the period: First Pacific (Breakup Value), a consumer and infrastructure conglomerate operating in South East Asia. The company ranked among the Fund’s poorest performers during the first few months of 2020, as the market attempted to price the impact of the pandemic. By the end of the semi-annual period, however, once First Pacific disclosed how operations fared to date, its stock price propelled upward.
The same cannot be said of other Fund holdings that depend on their customers’ ability to travel. Two notable detractors to performance during the semi-annual period include Melco International Development (Breakup Value and Asset Productivity), a casino owner and operator in Macau, and Shangri-La (Breakup Value and Asset Productivity), a hotel owner and operator in Asia. Revenue generation at these two companies is severely impacted, and revenue recovery has low visibility. Countervailing considerations related to balance sheet strength and valuation seemed of little concern to the market during the period.
Two additions to the Value Fund during the third quarter of 2020 – Ambev (Structural Shift and Asset Productivity), a Brazil-based Latin American brewer that also operates in Canada, and Itaú Unibanco (Asset Productivity and Breakup Value), the largest privately-owned bank in Brazil – also rank among the top detractors during this period. It is no surprise that Brazil’s woes, as reflected in the approximately 46% devaluation of the currency since early 2017, have provided unusually low valuations for stocks that have historically traded at a premium valuation.6 A more detailed discussion of these two Brazil holdings is available in the Fund’s third quarter 2020 portfolio review.7
| Semi-annual Report – October 31, 2020 | 11 |
| Seafarer Overseas Value Fund | Performance Review |
October 31, 2020
In summary, while the overall performance of the Value Fund relative to the benchmarks in the semi- annual period is disappointing, I would not conclude that either the strategy itself, or value investing more generally, is “dead.” Rather, I see the underlying dynamic that enables value realization to be alive and well. I observe, however, that public equity markets seem focused on the largest and most liquid companies in the benchmarks, at the expense of everything else.
Thank you for entrusting us with your capital. We are honored to serve as your investment adviser in the emerging markets.
Paul Espinosa
Portfolio Manager, Seafarer Overseas Value Fund
Seafarer Capital Partners, LLC
The MSCI Emerging Markets Total Return Index, Standard (Large+Mid Cap) Core, Gross (dividends reinvested), USD is a free float-adjusted market capitalization index designed to measure equity market performance of emerging markets. Index code: GDUEEGF.
The Morningstar Emerging Markets Net Return USD Index measures the performance of emerging markets targeting the top 97% of stocks by market capitalization. The index does not incorporate Morningstar’s environmental, social, or governance (ESG) criteria. Index code: MEMMN.
The S&P 500 Total Return Index is a stock market index based on the market capitalizations of 500 large companies with common stock listed on the NYSE or NASDAQ.
It is not possible to invest directly in an index.
The Fund is subject to investment risks, including possible loss of the principal amount invested and therefore is not suitable for all investors. The Fund may not achieve its objectives. Diversification does not ensure a profit or guarantee against loss.
Information on the Seafarer website and references to Seafarer publications are provided for textual reference only, and are not incorporated by reference into this report.
The views and information discussed in this commentary are as of the date of publication, are subject to change, and may not reflect Seafarer’s current views. The views expressed represent an assessment of market conditions at a specific point in time, are opinions only and should not be relied upon as investment advice regarding a particular investment or markets in general. Such information does not constitute a recommendation to buy or sell specific securities or investment vehicles. It should not be assumed that any investment will be profitable or will equal the performance of the portfolios or any securities or any sectors mentioned herein. The subject matter contained herein has been derived from several sources believed to be reliable and accurate at the time of compilation. Seafarer does not accept any liability for losses either direct or consequential caused by the use of this information.
| 1 | References to the “Fund” pertain to the Fund’s Institutional share class (ticker: SIVLX). The Investor share class (ticker: SFVLX) returned 9.73% during the semi-annual period. |
| 2 | The Fund’s Investor share class began the fiscal year with a net asset value of $9.46 per share. It finished the period with a value of $10.38 per share. |
| 3 | Additional information on Seafarer’s seven sources of value is available in the white paper On Value in the Emerging Markets (www.seafarerfunds.com/value-in-em). |
| 4 | An initial public offering (IPO) is the process of offering shares of a private company to the public in a new stock issuance. Public share issuance allows a company to raise capital from public investors. |
| 5 | Chinese A-Shares are a class of securitized common stock in Chinese companies, traded exclusively on Chinese stock exchanges (i.e., Shanghai and Shenzhen), and denominated in renminbi, China’s currency. If a Seafarer Fund is invested in Chinese A-Shares, please note the following: 1) any reduction or elimination of access to A-Shares could have a material adverse effect on the ability of the Fund to achieve its investment objective; and 2) uncertainties regarding China’s laws governing taxation of income and gains from investments in A-Shares could result in unexpected tax liabilities for the Fund, which could adversely impact Fund returns. |
| 6 | Source: Bloomberg. Data for the period March 31, 2017 to October 31, 2020. |
| 7 | www.seafarerfunds.com/funds/ovl/portfolio-review/2020/09/Q3#allocation |
| 12 | (855) 732-9220 seafarerfunds.com |
| Seafarer Overseas Value Fund | Performance Review |
October 31, 2020
Total Returns
| As of October 31, 2020 | 6 Month | 1 Year | 3 Year | Since Inception Annualized(1) | Net Expense Ratio(2) |
| Investor Class (SFVLX) | 9.73% | (11.06%) | (2.27%) | 3.31% | 1.15% |
| Institutional Class (SIVLX) | 9.70% | (11.00%) | (2.18%) | 3.41% | 1.05% |
| MSCI Emerging Markets Total Return USD Index(3) | 21.22% | 8.62% | 2.32% | 10.40% | |
| Morningstar Emerging Markets Net Return USD Index(4) | 21.43% | 7.32% | 2.31% | 9.73% | |
Gross expense ratio: 1.59% for Investor Class; 1.44% for Institutional Class.2
All performance is measured in U.S. dollar terms. For the MSCI index, performance is calculated to reflect the reinvestment of dividends, capital gains, and other corporate actions gross of foreign jurisdiction withholding taxes (i.e., such taxes are ignored). For the Morningstar index, performance is calculated to reflect the reinvestment of dividends, capital gains, and other corporate actions net of foreign jurisdiction withholding taxes. The performance data quoted represents past performance and does not guarantee future results. Future returns may be lower or higher. The investment return and principal value will fluctuate so that an investor's shares, when redeemed, may be worth more or less than the original cost. Prior to August 31, 2016, shares of the Fund redeemed or exchanged within 90 days of purchase were subject to a 2% redemption fee. Performance does not reflect this fee, which if deducted would reduce an individual's return. To obtain the Fund’s most recent month-end performance, visit seafarerfunds.com or call (855) 732-9220.
| 1 | Inception Date: May 31, 2016. |
| 2 | Ratios as of Prospectus dated August 31, 2020. Seafarer Capital Partners, LLC has agreed contractually to waive and/or reimburse fees or expenses in order to limit Total Annual Fund Operating Expenses After Fee Waiver/Expense Reimbursements (inclusive of acquired fund fees and expenses, and exclusive of brokerage expenses, interest expenses, taxes and extraordinary expenses) to 1.15% and 1.05% of the Fund’s average daily net assets for the Investor and Institutional share classes, respectively. This agreement is in effect through August 31, 2021. |
| 3 | The MSCI Emerging Markets Total Return Index, Standard (Large+Mid Cap) Core, Gross (dividends reinvested), USD is a free float-adjusted market capitalization index designed to measure equity market performance of emerging markets. Index code: GDUEEGF. The index is not actively managed and does not reflect any deductions for fees, expense or taxes. An investor may not invest directly in an index. |
| 4 | The Morningstar Emerging Markets Net Return USD Index measures the performance of emerging markets targeting the top 97% of stocks by market capitalization. The index does not incorporate Morningstar’s environmental, social, or governance (ESG) criteria. Index code: MEMMN. The index is not actively managed and does not reflect any deductions for fees, expense or taxes. An investor may not invest directly in an index. |
| Semi-annual Report – October 31, 2020 | 13 |
| Seafarer Overseas Value Fund | Performance Review |
October 31, 2020
Performance of a $10,000 Investment Since Inception
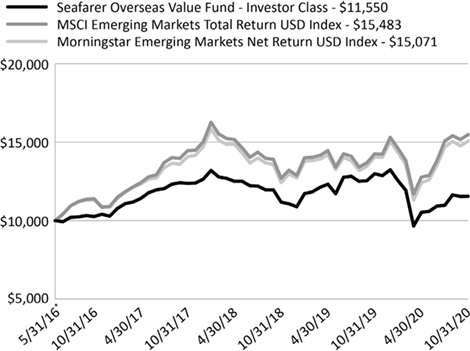
| * | Inception Date: May 31, 2016. |
The chart shown above represents historical performance of a hypothetical investment of $10,000 in the Fund’s Investor Class shares for the period from inception to October 31, 2020. All returns reflect reinvested dividends and/or distributions, but do not reflect the deduction of taxes that an investor would pay on distributions or redemptions.
The Fund also offers Institutional Class shares, performance of which is not reflected in the chart above. The performance of Institutional Class shares may be higher or lower than the performance of the Investor Class shares shown above based upon differences in fees paid by shareholders investing in the Investor Class shares and Institutional Class shares.
Investment Objective
The Fund seeks to provide long-term capital appreciation.
Strategy
The Fund invests primarily in the securities of companies located in developing countries. The Fund invests in several asset classes including common stocks, preferred stocks, and fixed-income securities.
The Fund’s portfolio is comprised of securities identified through a bottom-up security selection process based on fundamental research. The Fund seeks to produce a minimum long-term rate of return by investing in securities priced at a discount to their intrinsic value.
| 14 | (855) 732-9220 seafarerfunds.com |
| Seafarer Overseas Value Fund | Performance Review |
October 31, 2020
| Portfolio Composition by Region | % Net Assets |
| East & South Asia | 62.9% |
| Emerging Europe | 7.9% |
| Latin America | 7.8% |
| Middle East & Africa | 11.5% |
| Other | 3.9% |
| Cash & Other Assets, Less Liabilities | 6.0% |
| Total | 100.0% |
| Portfolio Composition by Sector | % Net Assets |
| Communication Services | 4.1% |
| Consumer Discretionary | 12.1% |
| Consumer Staples | 16.7% |
| Energy | 8.1% |
| Financials | 17.8% |
| Industrials | 13.2% |
| Information Technology | 5.3% |
| Materials | 13.4% |
| Utilities | 3.3% |
| Cash & Other Assets, Less Liabilities | 6.0% |
| Total | 100.0% |
| Top 10 Holdings | % Net Assets |
| First Pacific Co., Ltd. | 6.3% |
| National Central Cooling Co. PJSC | 6.2% |
| Qatar Gas Transport Co., Ltd. | 5.3% |
| Samsung SDI Co., Ltd. | 5.3% |
| Wilmar International, Ltd. | 4.9% |
| China Foods, Ltd. | 4.5% |
| Shangri-La Asia, Ltd. | 4.3% |
| WH Group, Ltd. | 4.3% |
| Mondi PLC | 3.9% |
| Innocean Worldwide, Inc. | 3.8% |
| Total | 48.8% |
| | |
| Total Number of Holdings | 27 |
Holdings are subject to change, and may not reflect the current or future position of the portfolio.
Source: ALPS Fund Services, Inc.
| Semi-annual Report – October 31, 2020 | 15 |
| Seafarer Funds | Disclosure of Fund Expenses |
October 31, 2020 (Unaudited)
DISCLOSURE OF FUND EXPENSES
As a shareholder of a Fund you will incur two types of costs: (1) transaction costs; and (2) ongoing costs, including management fees and other Fund expenses. The following examples are intended to help you understand your ongoing costs (in dollars) of investing in a Fund and to compare these costs with the ongoing costs of investing in other mutual funds. The examples are based on an investment of $1,000 invested on May 1, 2020 and held until October 31, 2020.
Actual Expenses. For each Fund and share class, the first line of the following table provides information about actual account values and actual expenses. You may use the information in this line, together with the amount you invested, to estimate the expenses that you paid over the period. Simply divide your account value by $1,000 (for example, an $8,600 account value divided by $1,000 = 8.6), then multiply the result by the number in the first line under the heading “Expenses Paid During Period” to estimate the expenses you paid on your account during this period.
Hypothetical Example for Comparison Purposes. For each Fund and share class, the second line of the following table provides information about hypothetical account values and hypothetical expenses based on the Fund’s actual expense ratio and an assumed rate of return of 5% per year before expenses, which is not the Fund’s actual return. The hypothetical account values and expenses may not be used to estimate the actual ending account balance or expenses you paid for the period. You may use this information to compare the ongoing costs of investing in the Fund and other mutual funds. To do so, compare this 5% hypothetical example with the 5% hypothetical examples that appear in the shareholder reports of the other mutual funds.
Please note the expenses shown in the following table are meant to highlight your ongoing costs only and do not reflect transaction costs. Therefore, for each Fund and share class, the second line of the following table is useful in comparing ongoing costs only, and will not help you determine the relative total costs of owning different funds. In addition, if these transactional costs were included, your costs would have been higher.
| 16 | (855) 732-9220 seafarerfunds.com |
| Seafarer Funds | Disclosure of Fund Expenses |
October 31, 2020 (Unaudited)
| | Beginning Account Value 05/01/20 | Ending Account Value 10/31/20 | Expense Ratio(a) | Expenses Paid During Period 05/01/20 - 10/31/20(b) |
| SEAFARER OVERSEAS GROWTH AND INCOME FUND | | |
| Investor Class | | | | |
| Actual | $1,000.00 | $1,201.50 | 1.03% | $5.72 |
| Hypothetical (5% return before expenses) | $1,000.00 | $1,020.01 | 1.03% | $5.24 |
| Institutional Class | | | |
| Actual | $1,000.00 | $1,202.60 | 0.93% | $5.16 |
| Hypothetical (5% return before expenses) | $1,000.00 | $1,020.52 | 0.93% | $4.74 |
| SEAFARER OVERSEAS VALUE FUND | | | |
| Investor Class | | | | |
| Actual | $1,000.00 | $1,097.30 | 1.15% | $6.08 |
| Hypothetical (5% return before expenses) | $1,000.00 | $1,019.41 | 1.15% | $5.85 |
| Institutional Class | | | |
| Actual | $1,000.00 | $1,097.00 | 1.05% | $5.55 |
| Hypothetical (5% return before expenses) | $1,000.00 | $1,019.91 | 1.05% | $5.35 |
| (a) | Annualized, based on the Fund's most recent fiscal half year expenses. |
| (b) | Expenses are equal to the Fund's annualized expense ratio multiplied by the average account value over the period, multiplied by the number of days in the most recent fiscal half-year (184)/365 (to reflect the half-year period). |
| Semi-annual Report – October 31, 2020 | 17 |
| Seafarer Overseas Growth and Income Fund | Portfolio of Investments |
October 31, 2020 (Unaudited)
| | Currency | | Shares | | | Value | |
| COMMON STOCKS (87.3%) | | | | | | | | | | |
| Brazil (6.2%) | | | | | | | | | | |
| Ambev SA, ADR | | USD | | | 15,400,000 | | | $ | 32,956,000 | |
| Itau Unibanco Holding SA, ADR | | USD | | | 9,200,000 | | | | 37,628,000 | |
| Odontoprev SA | | BRL | | | 8,500,000 | | | | 18,457,812 | |
| | | | | | | | | | | |
| Total Brazil | | | | | | | | | 89,041,812 | |
| | | | | | | | | | | |
| China / Hong Kong (24.9%) | | | | | | | | | | |
| Alibaba Group Holding, Ltd., Sponsored ADR(a) | | USD | | | 25,000 | | | | 7,617,250 | |
| China Foods, Ltd. | | HKD | | | 84,208,000 | | | | 28,834,872 | |
| China Literature, Ltd.(a) | | HKD | | | 6,800,000 | | | | 55,864,922 | |
| China Yangtze Power Co., Ltd., Class A | | CNY | | | 2,000,000 | | | | 5,673,821 | |
| First Pacific Co., Ltd. | | HKD | | | 92,000,000 | | | | 28,581,436 | |
| Greatview Aseptic Packaging Co., Ltd. | | HKD | | | 35,000,000 | | | | 14,996,443 | |
| Jiangsu Hengrui Medicine Co., Ltd., Class A | | CNY | | | 2,000,000 | | | | 26,601,063 | |
| Pacific Basin Shipping, Ltd. | | HKD | | | 120,000,000 | | | | 17,529,349 | |
| Pico Far East Holdings, Ltd. | | HKD | | | 52,296,000 | | | | 7,573,844 | |
| Ping An Insurance Group Co. of China, Ltd. | | HKD | | | 4,500,000 | | | | 46,528,531 | |
| Shangri-La Asia, Ltd.(a) | | HKD | | | 35,000,000 | | | | 27,539,151 | |
| Shenzhou International Group Holdings, Ltd. | | HKD | | | 2,872,300 | | | | 49,976,233 | |
| WH Group, Ltd. | | HKD | | | 29,600,000 | | | | 23,313,750 | |
| Xinhua Winshare Publishing and Media Co., Ltd., Class H | | HKD | | | 30,002,000 | | | | 18,230,663 | |
| | | | | | | | | | | |
| Total China / Hong Kong | | | | | | | | | 358,861,328 | |
| | | | | | | | | | | |
| Czech Republic (1.3%) | | | | | | | | | | |
| Moneta Money Bank AS | | CZK | | | 8,662,815 | | | | 19,665,447 | |
| | | | | | | | | | | |
| Total Czech Republic | | | | | | | | | 19,665,447 | |
| | | | | | | | | | | |
| Hungary (3.4%) | | | | | | | | | | |
| Richter Gedeon Nyrt | | HUF | | | 2,400,000 | | | | 49,001,934 | |
| | | | | | | | | | | |
| Total Hungary | | | | | | | | | 49,001,934 | |
| | | | | | | | | | | |
| India (3.0%) | | | | | | | | | | |
| Infosys, Ltd., Sponsored ADR | | USD | | | 3,000,000 | | | | 42,810,000 | |
| | | | | | | | | | | |
| Total India | | | | | | | | | 42,810,000 | |
| 18 | (855) 732-9220 seafarerfunds.com |
| Seafarer Overseas Growth and Income Fund | Portfolio of Investments |
October 31, 2020 (Unaudited)
| | | Currency | | Shares | | | Value | |
| Japan (3.1%) | | | | | | | | |
| Rohm Co., Ltd. | | JPY | | | 580,000 | | | $ | 44,594,418 | |
| | | | | | | | | | | |
| Total Japan | | | | | | | | | 44,594,418 | |
| | | | | | | | | | | |
| Mexico (2.0%) | | | | | | | | | | |
| Bolsa Mexicana de Valores SAB de CV | | MXN | | | 11,500,000 | | | | 23,410,414 | |
| Credito Real SAB de CV SOFOM ER(a) | | MXN | | | 9,920,072 | | | | 5,144,417 | |
| | | | | | | | | | | |
| Total Mexico | | | | | | | | | 28,554,831 | |
| | | | | | | | | | | |
| Qatar (1.9%) | | | | | | | | | | |
| Qatar Gas Transport Co., Ltd. | | QAR | | | 37,613,950 | | | | 27,722,545 | |
| | | | | | | | | | | |
| Total Qatar | | | | | | | | | 27,722,545 | |
| | | | | | | | | | | |
| Singapore (6.7%) | | | | | | | | | | |
| Venture Corp., Ltd. | | SGD | | | 4,500,000 | | | | 63,435,449 | |
| Wilmar International, Ltd. | | SGD | | | 11,500,000 | | | | 34,046,314 | |
| | | | | | | | | | | |
| Total Singapore | | | | | | | | | 97,481,763 | |
| | | | | | | | | | | |
| South Africa (2.9%) | | | | | | | | | | |
| Sanlam, Ltd. | | ZAR | | | 14,250,000 | | | | 41,565,992 | |
| | | | | | | | | | | |
| Total South Africa | | | | | | | | | 41,565,992 | |
| | | | | | | | | | | |
| South Korea (17.8%) | | | | | | | | | | |
| Coway Co., Ltd.(a) | | KRW | | | 585,000 | | | | 35,821,038 | |
| Hyundai Mobis Co., Ltd. | | KRW | | | 300,000 | | | | 60,109,097 | |
| Innocean Worldwide, Inc. | | KRW | | | 480,000 | | | | 25,033,879 | |
| Koh Young Technology, Inc. | | KRW | | | 275,000 | | | | 19,353,070 | |
| NAVER Corp. | | KRW | | | 50,347 | | | | 12,882,336 | |
| Orion Corp. | | KRW | | | 320,000 | | | | 30,661,998 | |
| Samsung SDI Co., Ltd. | | KRW | | | 167,000 | | | | 65,787,360 | |
| Sindoh Co., Ltd. | | KRW | | | 400,000 | | | | 7,811,638 | |
| | | | | | | | | | | |
| Total South Korea | | | | | | | | | 257,460,416 | |
| | | | | | | | | | | |
| Taiwan (6.9%) | | | | | | | | | | |
| Accton Technology Corp. | | TWD | | | 4,250,000 | | | | 30,877,483 | |
| Bizlink Holding, Inc. | | TWD | | | 3,100,000 | | | | 23,838,278 | |
| Taiwan Semiconductor Manufacturing Co., Ltd. | | TWD | | | 2,575,000 | | | | 38,958,913 | |
| Semi-annual Report – October 31, 2020 | 19 |
| Seafarer Overseas Growth and Income Fund | Portfolio of Investments |
October 31, 2020 (Unaudited)
| | Currency | | Shares | | | Value | |
| Taiwan (continued) | | | | | | | | | | |
| Voltronic Power Technology Corp. | | TWD | | | 183,753 | | | $ | 6,302,946 | |
| | | | | | | | | | | |
| Total Taiwan | | | | | | | | | 99,977,620 | |
| | | | | | | | | | | |
| Thailand (1.0%) | | | | | | | | | | |
| Bangkok Dusit Medical Services PCL, Class F | | THB | | | 25,000,000 | | | | 14,027,359 | |
| | | | | | | | | | | |
| Total Thailand | | | | | | | | | 14,027,359 | |
| | | | | | | | | | | |
| United Arab Emirates (2.1%) | | | | | | | | | | |
| National Central Cooling Co. PJSC | | AED | | | 46,000,000 | | | | 30,874,808 | |
| | | | | | | | | | | |
| Total United Arab Emirates | | | | | | | | | 30,874,808 | |
| | | | | | | | | | | |
| United Kingdom (2.0%) | | | | | | | | | | |
| Mondi PLC | | GBP | | | 1,500,000 | | | | 28,430,076 | |
| | | | | | | | | | | |
| Total United Kingdom | | | | | | | | | 28,430,076 | |
| | | | | | | | | | | |
| Vietnam (2.1%) | | | | | | | | | | |
| PetroVietnam Gas JSC | | VND | | | 9,800,000 | | | | 29,899,170 | |
| | | | | | | | | | | |
| Total Vietnam | | | | | | | | | 29,899,170 | |
| | | | | | | | | | | |
| TOTAL COMMON STOCKS | | | | | | | | | | |
| (Cost $1,260,764,624) | | | | | | | | | 1,259,969,519 | |
| | | | | | | | | | | |
| PREFERRED STOCKS (6.2%) | | | | | | | | | | |
| South Korea (6.2%) | | | | | | | | | | |
| Samsung Electronics Co., Ltd. | | KRW | | | 2,000,000 | | | | 88,969,820 | |
| | | | | | | | | | | |
| Total South Korea | | | | | | | | | 88,969,820 | |
| | | | | | | | | | | |
| TOTAL PREFERRED STOCKS | | | | | | | | | | |
| (Cost $51,770,386) | | | | | | | | | 88,969,820 | |
| | | | | | | | | | | |
| TOTAL INVESTMENTS | | | | | | | | | | |
| (Cost $1,312,535,010) (93.5%) | | | | | | | | $ | 1,348,939,339 | |
| | | | | | | | | | | |
| Cash and Other Assets, Less Liabilities (6.5%) | | | | | | | | | 93,637,015 | |
| NET ASSETS (100.0%) | | | | | | | | $ | 1,442,576,354 | |
Principal Amount is stated in local currency unless otherwise noted.
| (a) | Non-income producing security. |
| 20 | (855) 732-9220 seafarerfunds.com |
| Seafarer Overseas Growth and Income Fund | Portfolio of Investments |
October 31, 2020 (Unaudited)
| Currency Abbreviations |
| AED | - | United Arab Emirates Dirham |
| BRL | - | Brazil Real |
| CNY | - | China Yuan |
| CZK | - | Czech Republic Koruna |
| HKD | - | Hong Kong Dollar |
| HUF | - | Hungary Forint |
| GBP | - | United Kingdom Pound |
| JPY | - | Japan Yen |
| KRW | - | South Korea Won |
| MXN | - | Mexico Peso |
| QAR | - | Qatar Riyal |
| SGD | - | Singapore Dollar |
| THB | - | Thailand Baht |
| TWD | - | Taiwan New Dollar |
| USD | - | United States Dollar |
| VND | - | Vietnam Dong |
| ZAR | - | South Africa Rand |
For Fund compliance purposes, the Fund's geographical classifications refer to any one or more of the sub- classifications used by one or more widely recognized market indexes or ratings group indexes, and/or as defined by Fund management. This definition may not apply for purposes of this report, which may combine sub-classifications for reporting ease. Geographical regions are shown as a percentage of net assets.
| Semi-annual Report – October 31, 2020 | 21 |
| Seafarer Overseas Growth and Income Fund | Portfolio of Investments |
October 31, 2020 (Unaudited)
| Industry Composition | |
| Electronic Equipment, Instruments & Components | 9.0% |
| Food Products | 8.1% |
| Semiconductors & Semiconductor Equipment | 7.1% |
| Technology Hardware, Storage & Peripherals | 6.7% |
| Media | 6.1% |
| Insurance | 6.1% |
| Pharmaceuticals | 5.2% |
| Auto Components | 4.2% |
| Banks | 4.0% |
| Textiles, Apparel & Luxury Goods | 3.5% |
| IT Services | 3.0% |
| Household Durables | 2.5% |
| Beverages | 2.3% |
| Health Care Providers & Services | 2.3% |
| Communications Equipment | 2.1% |
| Building Products | 2.1% |
| Electrical Equipment | 2.1% |
| Gas Utilities | 2.1% |
| Diversified Financial Services | 2.0% |
| Paper & Forest Products | 2.0% |
| Oil, Gas & Consumable Fuels | 1.9% |
| Hotels, Restaurants & Leisure | 1.9% |
| Capital Markets | 1.6% |
| Distributors | 1.3% |
| Marine | 1.2% |
| Containers & Packaging | 1.0% |
| Other Industries (each less than 1%) | 2.2% |
| Cash and Other Assets, Less Liabilities | 6.5% |
| Total | 100% |
See accompanying Notes to Financial Statements.
| 22 | (855) 732-9220 seafarerfunds.com |
| Seafarer Overseas Value Fund | Portfolio of Investments |
October 31, 2020 (Unaudited)
| | Currency | | Shares | | | Value | |
| COMMON STOCKS (94.0%) | | | | | | | | | | |
| Brazil (6.6%) | | | | | | | | | | |
| Ambev SA, ADR | | USD | | | 372,000 | | | $ | 796,080 | |
| Itau Unibanco Holding SA, ADR | | USD | | | 222,000 | | | | 907,980 | |
| | | | | | | | | | | |
| Total Brazil | | | | | | | | | 1,704,060 | |
| | | | | | | | | | | |
| China / Hong Kong (37.4%) | | | | | | | | | | |
| AMVIG Holdings, Ltd. | | HKD | | | 2,754,000 | | | | 767,319 | |
| China Foods, Ltd. | | HKD | | | 3,387,000 | | | | 1,159,791 | |
| China Yangtze Power Co., Ltd., Class A | | CNY | | | 301,990 | | | | 856,719 | |
| First Pacific Co., Ltd. | | HKD | | | 5,190,000 | | | | 1,612,366 | |
| Giordano International, Ltd. | | HKD | | | 3,200,000 | | | | 509,264 | |
| Greatview Aseptic Packaging Co., Ltd. | | HKD | | | 2,000,000 | | | | 856,940 | |
| Melco International Development, Ltd. | | HKD | | | 549,000 | | | | 891,160 | |
| Pacific Basin Shipping, Ltd. | | HKD | | | 4,600,000 | | | | 671,958 | |
| Pico Far East Holdings, Ltd. | | HKD | | | 538,000 | | | | 77,917 | |
| Shangri-La Asia, Ltd.(a) | | HKD | | | 1,420,000 | | | | 1,117,302 | |
| WH Group, Ltd. | | HKD | | | 1,398,000 | | | | 1,101,102 | |
| | | | | | | | | | | |
| Total China / Hong Kong | | | | | | | | | 9,621,838 | |
| | | | | | | | | | | |
| Czech Republic (3.8%) | | | | | | | | | | |
| Moneta Money Bank AS | | CZK | | | 433,257 | | | | 983,536 | |
| | | | | | | | | | | |
| Total Czech Republic | | | | | | | | | 983,536 | |
| | | | | | | | | | | |
| Georgia (3.0%) | | | | | | | | | | |
| Georgia Capital PLC(a) | | GBP | | | 162,000 | | | | 772,360 | |
| | | | | | | | | | | |
| Total Georgia | | | | | | | | | 772,360 | |
| | | | | | | | | | | |
| Mexico (1.2%) | | | | | | | | | | |
| Credito Real SAB de CV SOFOM ER(a) | | MXN | | | 590,385 | | | | 306,166 | |
| | | | | | | | | | | |
| Total Mexico | | | | | | | | | 306,166 | |
| | | | | | | | | | | |
| Qatar (5.3%) | | | | | | | | | | |
| Qatar Gas Transport Co., Ltd. | | QAR | | | 1,860,000 | | | | 1,370,873 | |
| | | | | | | | | | | |
| Total Qatar | | | | | | | | | 1,370,873 | |
| Semi-annual Report – October 31, 2020 | 23 |
| Seafarer Overseas Value Fund | Portfolio of Investments |
October 31, 2020 (Unaudited)
| | Currency | | Shares | | | Value | |
| Russia (1.0%) | | | | | | | |
| Global Ports Investments PLC, GDR(a) | | USD | | | 100,000 | | | $ | 270,000 | |
| | | | | | | | | | | |
| Total Russia | | | | | | | | | 270,000 | |
| | | | | | | | | | | |
| Singapore (10.6%) | | | | | | | | | | |
| Genting Singapore, Ltd. | | SGD | | | 1,300,000 | | | | 613,881 | |
| HRnetgroup, Ltd. | | SGD | | | 2,500,000 | | | | 860,529 | |
| Wilmar International, Ltd. | | SGD | | | 422,000 | | | | 1,249,352 | |
| | | | | | | | | | | |
| Total Singapore | | | | | | | | | 2,723,762 | |
| | | | | | | | | | | |
| South Korea (9.1%) | | | | | | | | | | |
| Innocean Worldwide, Inc. | | KRW | | | 19,000 | | | | 990,924 | |
| Samsung SDI Co., Ltd. | | KRW | | | 3,450 | | | | 1,359,081 | |
| | | | | | | | | | | |
| Total South Korea | | | | | | | | | 2,350,005 | |
| | | | | | | | | | | |
| United Arab Emirates (6.2%) | | | | | | | | | | |
| National Central Cooling Co. PJSC | | AED | | | 2,368,000 | | | | 1,589,381 | |
| | | | | | | | | | | |
| Total United Arab Emirates | | | | | | | | | 1,589,381 | |
| | | | | | | | | | | |
| United Kingdom (3.9%) | | | | | | | | | | |
| Mondi PLC | | GBP | | | 53,600 | | | | 1,015,901 | |
| | | | | | | | | | | |
| Total United Kingdom | | | | | | | | | 1,015,901 | |
| | | | | | | | | | | |
| Vietnam (5.9%) | | | | | | | | | | |
| Petrovietnam Fertilizer & Chemicals JSC | | VND | | | 1,158,000 | | | | 812,588 | |
| PetroVietnam Technical Services Corp.(a) | | VND | | | 1,263,780 | | | | 710,650 | |
| | | | | | | | | | | |
| Total Vietnam | | | | | | | | | 1,523,238 | |
| | | | | | | | | | | |
| TOTAL COMMON STOCKS | | | | | | | | | | |
| (Cost $28,100,175) | | | | | | | | | 24,231,120 | |
| | | | | | | | | | | |
| TOTAL INVESTMENTS | | | | | | | | | | |
| (Cost $28,100,175) (94.0%) | | | | | | | | $ | 24,231,120 | |
| | | | | | | | | | | |
| Cash and Other Assets, Less Liabilities (6.0%) | | | | | | | | | 1,554,726 | |
| NET ASSETS (100.0%) | | | | | | | | $ | 25,785,846 | |
Principal Amount is stated in local currency unless otherwise noted.
| (a) | Non-income producing security. |
| 24 | (855) 732-9220 seafarerfunds.com |
|
| Seafarer Overseas Value Fund | Portfolio of Investments |
October 31, 2020 (Unaudited)
| Currency Abbreviations |
| AED | - | United Arab Emirates Dirham |
| CNY | - | China Yuan |
| CZK | - | Czech Republic Koruna |
| GBP | - | United Kingdom Pound |
| HKD | - | Hong Kong Dollar |
| KRW | - | South Korea Won |
| MXN | - | Mexico Peso |
| QAR | - | Qatar Riyal |
| SGD | - | Singapore Dollar |
| USD | - | United States Dollar |
| VND | - | Vietnam Dong |
For Fund compliance purposes, the Fund's geographical classifications refer to any one or more of the sub- classifications used by one or more widely recognized market indexes or ratings group indexes, and/or as defined by Fund management. This definition may not apply for purposes of this report, which may combine sub-classifications for reporting ease. Geographical regions are shown as a percentage of net assets.
| Industry Composition | |
| Food Products | 13.6% |
| Hotels, Restaurants & Leisure | 10.2% |
| Banks | 7.3% |
| Containers & Packaging | 6.3% |
| Diversified Financial Services | 6.3% |
| Building Products | 6.2% |
| Oil, Gas & Consumable Fuels | 5.3% |
| Electronic Equipment, Instruments & Components | 5.3% |
| Media | 4.1% |
| Paper & Forest Products | 3.9% |
| Professional Services | 3.3% |
| Independent Power and Renewable Electricity Producers | 3.3% |
| Chemicals | 3.2% |
| Beverages | 3.1% |
| Capital Markets | 3.0% |
| Energy Equipment & Services | 2.8% |
| Marine | 2.6% |
| Specialty Retail | 2.0% |
| Consumer Finance | 1.2% |
| Transportation Infrastructure | 1.1% |
| Cash and Other Assets, Less Liabilities | 6.0% |
| Total | 100% |
See accompanying Notes to Financial Statements.
| Semi-annual Report – October 31, 2020 | 25 |
| Seafarer Funds | Statements of Assets and Liabilities |
| | October 31, 2020 (Unaudited) |
| | | Seafarer
Overseas Growth
and Income Fund | | | Seafarer
Overseas Value
Fund | |
| ASSETS: | | | | | | |
| Investments, at value | | $ | 1,348,939,339 | | | $ | 24,231,120 | |
| Cash | | | 107,061,272 | | | | 1,697,511 | |
| Foreign currency, at value (Cost $1,748,531 and $35,972) | | | 1,748,423 | | | | 35,962 | |
| Receivable for investments sold | | | 3,302,126 | | | | – | |
| Receivable for shares sold | | | 1,738,033 | | | | – | |
| Interest and dividends receivable | | | 528,339 | | | | 664 | |
| Prepaid expenses and other assets | | | 28,799 | | | | 12,669 | |
| Total Assets | | | 1,463,346,331 | | | | 25,977,926 | |
| LIABILITIES: | | | | | | | | |
| Payable for investments purchased | | | 18,129,817 | | | | 118,319 | |
| Administrative fees payable | | | 130,030 | | | | 13,837 | |
| Shareholder service plan fees payable | | | 175,425 | | | | 1,999 | |
| Payable for shares redeemed | | | 867,217 | | | | – | |
| Investment advisory fees payable | | | 945,933 | | | | 3,660 | |
| Payable for chief compliance officer fees | | | 6,367 | | | | 6,367 | |
| Trustee fees and expenses payable | | | 64,955 | | | | 1,543 | |
| Payable for principal financial officer fees | | | 2,014 | | | | 2,014 | |
| Audit and tax fees payable | | | 23,356 | | | | 12,682 | |
| Accrued expenses and other liabilities | | | 424,863 | | | | 31,659 | |
| Total Liabilities | | | 20,769,977 | | | | 192,080 | |
| NET ASSETS | | $ | 1,442,576,354 | | | $ | 25,785,846 | |
| NET ASSETS CONSIST OF: | | | | | | | | |
| Paid-in capital (Note 5) | | $ | 1,392,457,840 | | | $ | 30,247,758 | |
| Total distributable earnings | | | 50,118,514 | | | | (4,461,912 | ) |
| NET ASSETS | | $ | 1,442,576,354 | | | $ | 25,785,846 | |
| INVESTMENTS, AT COST | | $ | 1,312,535,010 | | | $ | 28,100,175 | |
| PRICING OF SHARES | | | | | | | | |
| Investor Class: | | | | | | | | |
| Net Asset Value, offering and redemption price per share | | $ | 12.31 | | | $ | 10.38 | |
| Net Assets | | $ | 174,507,558 | | | $ | 330,453 | |
| Shares of beneficial interest outstanding | | | 14,171,704 | | | | 31,844 | |
| Institutional Class: | | | | | | | | |
| Net Asset Value, offering and redemption price per share | | $ | 12.38 | | | $ | 10.40 | |
| Net Assets | | $ | 1,268,068,796 | | | $ | 25,455,393 | |
| Shares of beneficial interest outstanding | | | 102,469,822 | | | | 2,447,326 | |
See accompanying Notes to Financial Statements.
| 26 | (855) 732-9220 seafarerfunds.com |
| Seafarer Funds | Statements of Operations |
| | Six Months Ended October 31, 2020 (Unaudited) |
| | | Seafarer
Overseas Growth
and Income Fund | | | Seafarer
Overseas Value
Fund | |
| INVESTMENT INCOME: | | | | | | | | |
| Dividends | | $ | 20,480,204 | | | $ | 549,907 | |
| Foreign taxes withheld | | | (908,270 | ) | | | (8,094 | ) |
| Interest and other income | | | 11,305 | | | | 137 | |
| Total investment income | | | 19,583,239 | | | | 541,950 | |
| EXPENSES: | | | | | | | | |
| Investment advisory fees (Note 6) | | | 5,275,243 | | | | 102,273 | |
| Administrative and transfer agency fees | | | 275,439 | | | | 30,029 | |
| Trustee fees and expenses | | | 43,848 | | | | 1,007 | |
| Registration/filing fees | | | 19,052 | | | | 18,993 | |
| Shareholder service plan fees | | | | | | | | |
| Investor Class | | | 123,620 | | | | – | |
| Institutional Class | | | 275,422 | | | | 5,244 | |
| Legal fees | | | 12,944 | | | | 300 | |
| Audit and tax fees | | | 18,805 | | | | 10,931 | |
| Reports to shareholders and printing fees | | | 35,665 | | | | 652 | |
| Custody fees | | | 513,150 | | | | 31,563 | |
| Chief compliance officer fees | | | 12,688 | | | | 12,688 | |
| Principal financial officer fees | | | 3,934 | | | | 3,934 | |
| Insurance expense | | | 11,554 | | | | 301 | |
| Miscellaneous | | | 7,993 | | | | 2,193 | |
| Total expenses | | | 6,629,357 | | | | 220,108 | |
| Less fees waived/reimbursed by investment adviser (Note 6) | | | | | | | | |
| Investor Class | | | – | | | | (805 | ) |
| Institutional Class | | | – | | | | (76,054 | ) |
| Total net expenses | | | 6,629,357 | | | | 143,249 | |
| NET INVESTMENT INCOME: | | | 12,953,882 | | | | 398,701 | |
| Net realized gain on investments | | | 111,569,323 | | | | 77,322 | |
| Net realized loss on foreign currency transactions | | | (328,984 | ) | | | (11,996 | ) |
| Net realized gain | | | 111,240,339 | | | | 65,326 | |
| Net change in unrealized appreciation on investments | | | 123,432,981 | | | | 2,113,367 | |
| Net change in unrealized appreciation/(depreciation) on translation of assets and liabilities in foreign currency transactions | | | (47,323 | ) | | | 1,161 | |
| Net unrealized appreciation | | | 123,385,658 | | | | 2,114,528 | |
| | | | | | | | | |
| NET REALIZED AND UNREALIZED GAIN ON INVESTMENTS AND FOREIGN CURRENCY TRANSLATIONS | | | 234,625,997 | | | | 2,179,854 | |
| NET INCREASE IN NET ASSETS RESULTING FROM OPERATIONS | | $ | 247,579,879 | | | $ | 2,578,555 | |
See accompanying Notes to Financial Statements.
| Semi-annual Report – October 31, 2020 | 27 |
| Seafarer Overseas Growth and Income Fund | Statements of Changes in Net Assets |
| | | Six Months
Ended
October 31, 2020
(Unaudited) | | | Year Ended
April 30, 2020 | |
| OPERATIONS: | | | | | | |
| Net investment income | | $ | 12,953,882 | | | $ | 28,276,405 | |
| Net realized gain/(loss) | | | 111,240,339 | | | | (32,639,922 | ) |
| Net change in unrealized appreciation/(depreciation) | | | 123,385,658 | | | | (125,061,552 | ) |
| Net increase/(decrease) in net assets resulting from operations | | | 247,579,879 | | | | (129,425,069 | ) |
| DISTRIBUTIONS TO SHAREHOLDERS (NOTE 3): | | | | | | | | |
| Total amount of distribution | | | | | | | | |
| Investor Class | | | (1,068,473 | ) | | | (5,408,005 | ) |
| Institutional Class | | | (7,448,277 | ) | | | (35,937,028 | ) |
| Net decrease in net assets from distributions | | | (8,516,750 | ) | | | (41,345,033 | ) |
| BENEFICIAL INTEREST TRANSACTIONS (NOTE 5): | | | | | | | | |
| Shares sold | | | | | | | | |
| Investor Class | | | 14,675,822 | | | | 22,164,876 | |
| Institutional Class | | | 117,884,820 | | | | 325,774,608 | |
| Dividends reinvested | | | | | | | | |
| Investor Class | | | 1,045,568 | | | | 5,308,481 | |
| Institutional Class | | | 5,318,872 | | | | 26,911,893 | |
| Shares redeemed | | | | | | | | |
| Investor Class | | | (24,693,748 | ) | | | (83,481,230 | ) |
| Institutional Class | | | (166,276,578 | ) | | | (407,913,072 | ) |
| Net decrease in net assets derived from beneficial interest transactions | | | (52,045,244 | ) | | | (111,234,444 | ) |
| Net increase/(decrease) in net assets | | | 187,017,885 | | | | (282,004,546 | ) |
| NET ASSETS: | | | | | | | | |
| Beginning of period | | | 1,255,558,469 | | | | 1,537,563,015 | |
| End of period | | $ | 1,442,576,354 | | | $ | 1,255,558,469 | |
| Other Information: | | | | | | | | |
| SHARE TRANSACTIONS: | | | | | | | | |
| Investor Class | | | | | | | | |
| Sold | | | 1,286,385 | | | | 2,037,998 | |
| Distributions reinvested | | | 93,022 | | | | 459,978 | |
| Redeemed | | | (2,143,646 | ) | | | (7,725,123 | ) |
| Net decrease in shares outstanding | | | (764,239 | ) | | | (5,227,147 | ) |
| Institutional Class | | | | | | | | |
| Sold | | | 10,200,739 | | | | 29,550,598 | |
| Distributions reinvested | | | 470,697 | | | | 2,321,132 | |
| Redeemed | | | (14,535,667 | ) | | | (37,912,324 | ) |
| Net decrease in shares outstanding | | | (3,864,231 | ) | | | (6,040,594 | ) |
See accompanying Notes to Financial Statements.
| 28 | (855) 732-9220 seafarerfunds.com |
| Seafarer Overseas Value Fund | Statements of Changes in Net Assets |
| | | Six Months
Ended
October 31, 2020
(Unaudited) | | | Year Ended
April 30, 2020 | |
| OPERATIONS: | | | | | | |
| Net investment income | | $ | 398,701 | | | $ | 926,206 | |
| Net realized gain/(loss) | | | 65,326 | | | | (498,896 | ) |
| Net change in unrealized appreciation/(depreciation) | | | 2,114,528 | | | | (6,055,128 | ) |
| Net increase/(decrease) in net assets resulting from operations | | | 2,578,555 | | | | (5,627,818 | ) |
| DISTRIBUTIONS TO SHAREHOLDERS (NOTE 3): | | | | | | | | |
| Total amount of distribution | | | | | | | | |
| Investor Class | | | – | | | | (10,203 | ) |
| Institutional Class | | | – | | | | (1,187,165 | ) |
| Net decrease in net assets from distributions | | | – | | | | (1,197,368 | ) |
| BENEFICIAL INTEREST TRANSACTIONS (NOTE 5): | | | | | | | | |
| Shares sold | | | | | | | | |
| Investor Class | | | 45,400 | | | | 76,836 | |
| Institutional Class | | | 1,026,529 | | | | 18,676,589 | |
| Dividends reinvested | | | | | | | | |
| Investor Class | | | – | | | | 9,407 | |
| Institutional Class | | | – | | | | 1,179,600 | |
| Shares redeemed | | | | | | | | |
| Investor Class | | | (22,623 | ) | | | (77,747 | ) |
| Institutional Class | | | (7,677,008 | ) | | | (12,380,590 | ) |
| Net increase/(decrease) in net assets derived from beneficial interest transactions | | | (6,627,702 | ) | | | 7,484,095 | |
| Net increase/(decrease) in net assets | | | (4,049,147 | ) | | | 658,909 | |
| NET ASSETS: | | | | | | | | |
| Beginning of period | | | 29,834,993 | | | | 29,176,084 | |
| End of period | | $ | 25,785,846 | | | $ | 29,834,993 | |
| Other Information: | | | | | | | | |
| SHARE TRANSACTIONS: | | | | | | | | |
| Investor Class | | | | | | | | |
| Sold | | | 4,690 | | | | 7,196 | |
| Distributions reinvested | | | – | | | | 805 | |
| Redeemed | | | (2,265 | ) | | | (7,208 | ) |
| Net increase in shares outstanding | | | 2,425 | | | | 793 | |
| Institutional Class | | | | | | | | |
| Sold | | | 103,960 | | | | 1,670,988 | |
| Distributions reinvested | | | – | | | | 100,907 | |
| Redeemed | | | (775,312 | ) | | | (1,177,965 | ) |
| Net increase/(decrease) in shares outstanding | | | (671,352 | ) | | | 593,930 | |
See accompanying Notes to Financial Statements.
| Semi-annual Report – October 31, 2020 | 29 |
Seafarer Overseas Growth and Income Fund
| Investor Class |
| NET ASSET VALUE, BEGINNING OF PERIOD |
| INCOME FROM OPERATIONS: |
| Net investment income(a) |
| Net realized and unrealized gain/(loss) on investments |
| Total from investment operations |
| |
| LESS DISTRIBUTIONS: |
| From net investment income |
| From net realized gains on investments |
| Total distributions |
| REDEMPTION FEES ADDED TO PAID IN CAPITAL |
| NET INCREASE/(DECREASE) IN NET ASSET VALUE |
| NET ASSET VALUE, END OF PERIOD |
| |
| TOTAL RETURN(d) |
| SUPPLEMENTAL DATA: |
| Net assets, end of period (in 000s) |
| RATIOS TO AVERAGE NET ASSETS: |
| Operating expenses excluding reimbursement/waiver |
| Operating expenses including reimbursement/waiver |
| Net investment income including reimbursement/waiver |
| PORTFOLIO TURNOVER RATE(i) |
| (a) | Calculated using the average shares method. |
| (b) | Less than $0.005 per share. |
| (c) | In preparing the financial statements in accordance with U.S. GAAP, management made certain adjustments as required by U.S. GAAP which caused the net asset value for purposes of these financial statements to differ from the net asset value used to process shareholder transactions as of the date of these financial statements. As a result, the net asset value increased from $12.50 to $12.51. |
| (d) | Total returns are for the periods indicated and have not been annualized. In some periods, total returns would have been lower had certain expenses not been waived during the periods. Returns shown do not reflect the deduction of taxes that a shareholder would pay on Fund distributions or the redemption of Fund shares. |
| (e) | Includes adjustments in accordance with U.S. GAAP and as such, the total return for shareholder transactions reported to the market may differ from the total return for financial reporting purposes. As a result, the total return decreased from 8.12% to 8.03%. |
| (f) | Includes adjustments in accordance with U.S. GAAP and as such, the total return for shareholder transactions reported to the market may differ from the total return for financial reporting purposes. As a result, the total return increased from 11.13% to 11.22%. |
| (h) | Effective September 1, 2015, the Adviser agreed to limit expenses to 1.15%. The Adviser agreed to limit expenses to 1.25% for the period September 1, 2014 through August 31, 2015. Prior to September 1, 2014, the Adviser agreed to limit expenses to 1.40%. (See Note 6.) |
| (i) | Portfolio turnover rate for periods less than one full year have not been annualized. |
| 30 | (855) 732-9220 seafarerfunds.com |
Financial Highlights
For a share outstanding through the periods or years presented
Six Months
Ended
October 31, 2020
(Unaudited) | | | Year Ended
April 30, 2020 | | | Year Ended
April 30, 2019 | | | Year Ended
April 30, 2018 | | | Year Ended
April 30, 2017 | | | Year Ended
April 30, 2016 | |
| $ | 10.31 | | | $ | 11.56 | | | $ | 13.11 | | | $ | 12.51 | | | $ | 11.44 | | | $ | 12.64 | |
| | | | | | | | | | | | | | | | | | | | | | | |
| | 0.10 | | | | 0.21 | | | | 0.36 | | | | 0.28 | | | | 0.22 | | | | 0.16 | |
| | 1.97 | | | | (1.15 | ) | | | (1.02 | ) | | | 0.72 | | | | 1.04 | | | | (1.23 | ) |
| | 2.07 | | | | (0.94 | ) | | | (0.66 | ) | | | 1.00 | | | | 1.26 | | | | (1.07 | ) |
| | | | | | | | | | | | | | | | | | | | | | | |
| | (0.07 | ) | | | (0.31 | ) | | | (0.01 | ) | | | (0.37 | ) | | | (0.19 | ) | | | (0.11 | ) |
| | – | | | | – | | | | (0.88 | ) | | | (0.03 | ) | | | – | | | | (0.02 | ) |
| | (0.07 | ) | | | (0.31 | ) | | | (0.89 | ) | | | (0.40 | ) | | | (0.19 | ) | | | (0.13 | ) |
| | – | | | | – | | | | – | | | | – | | | | 0.00 | (b) | | | 0.00 | (b) |
| | 2.00 | | | | (1.25 | ) | | | (1.55 | ) | | | 0.60 | | | | 1.07 | | | | (1.20 | ) |
| $ | 12.31 | | | $ | 10.31 | | | $ | 11.56 | | | $ | 13.11 | | | $ | 12.51 | (c) | | $ | 11.44 | |
| | 20.15 | % | | | (8.44 | %) | | | (4.36 | %) | | | 8.03 | %(e) | | | 11.22 | %(f) | | | (8.39 | %) |
| | | | | | | | | | | | | | | | | | | | | | | |
| $ | 174,508 | | | $ | 154,017 | | | $ | 233,072 | | | $ | 894,241 | | | $ | 877,384 | | | $ | 613,795 | |
| | | | | | | | | | | | | | | | | | | | | | | |
| | 1.03 | %(g) | | | 1.02 | % | | | 0.99 | % | | | 0.97 | % | | | 1.02 | % | | | 1.14 | % |
| | 1.03 | %(g) | | | 1.02 | % | | | 0.99 | % | | | 0.97 | % | | | 1.02 | % | | | 1.14 | %(h) |
| | 1.76 | %(g) | | | 1.88 | % | | | 3.02 | % | | | 2.12 | % | | | 1.88 | % | | | 1.50 | % |
| | 29 | % | | | 29 | % | | | 52 | % | | | 23 | % | | | 14 | % | | | 7 | % |
See accompanying Notes to Financial Statements.
| Semi-annual Report – October 31, 2020 | 31 |
Seafarer Overseas Growth and Income Fund
| Institutional Class |
| NET ASSET VALUE, BEGINNING OF PERIOD |
| INCOME FROM OPERATIONS: |
| Net investment income(a) |
| Net realized and unrealized gain/(loss) on investments |
| Total from investment operations |
| |
| LESS DISTRIBUTIONS: |
| From net investment income |
| From net realized gains on investments |
| Total distributions |
| REDEMPTION FEES ADDED TO PAID IN CAPITAL |
| NET INCREASE/(DECREASE) IN NET ASSET VALUE |
| NET ASSET VALUE, END OF PERIOD |
| |
| TOTAL RETURN(c) |
| SUPPLEMENTAL DATA: |
| Net assets, end of period (in 000s) |
| RATIOS TO AVERAGE NET ASSETS: |
| Operating expenses excluding reimbursement/waiver |
| Operating expenses including reimbursement/waiver |
| Net investment income including reimbursement/waiver |
| PORTFOLIO TURNOVER RATE(f) |
| (a) | Calculated using the average shares method. |
| (b) | Less than $0.005 per share. |
| (c) | Total returns are for the periods indicated and have not been annualized. In some periods, total returns would have been lower had certain expenses not been waived during the periods. Returns shown do not reflect the deduction of taxes that a shareholder would pay on Fund distributions or the redemption of Fund shares. |
| (e) | Effective September 1, 2014, the Adviser agreed to limit expenses to 1.05%. Prior to September 1, 2014, the Adviser agreed to limit expenses to 1.25%. (See Note 6.) |
| (f) | Portfolio turnover rate for periods less than one full year have not been annualized. |
| 32 | (855) 732-9220 seafarerfunds.com |
Financial Highlights
For a share outstanding through the periods or years presented
Six Months
Ended
October 31, 2020
(Unaudited) | | | Year Ended
April 30, 2020 | | | Year Ended
April 30, 2019 | | | Year Ended
April 30, 2018 | | | Year Ended
April 30, 2017 | | | Year Ended
April 30, 2016 | |
| $ | 10.36 | | | $ | 11.61 | | | $ | 13.14 | | | $ | 12.54 | | | $ | 11.46 | | | $ | 12.66 | |
| | | | | | | | | | | | | | | | | | | | | | | |
| | 0.11 | | | | 0.22 | | | | 0.29 | | | | 0.28 | | | | 0.21 | | | | 0.19 | |
| | 1.98 | | | | (1.16 | ) | | | (0.93 | ) | | | 0.73 | | | | 1.07 | | | | (1.26 | ) |
| | 2.09 | | | | (0.94 | ) | | | (0.64 | ) | | | 1.01 | | | | 1.28 | | | | (1.07 | ) |
| | | | | | | | | | | | | | | | | | | | | | | |
| | (0.07 | ) | | | (0.31 | ) | | | (0.01 | ) | | | (0.38 | ) | | | (0.20 | ) | | | (0.12 | ) |
| | – | | | | – | | | | (0.88 | ) | | | (0.03 | ) | | | – | | | | (0.02 | ) |
| | (0.07 | ) | | | (0.31 | ) | | | (0.89 | ) | | | (0.41 | ) | | | (0.20 | ) | | | (0.14 | ) |
| | – | | | | – | | | | – | | | | – | | | | 0.00 | (b) | | | 0.01 | |
| | 2.02 | | | | (1.25 | ) | | | (1.53 | ) | | | 0.60 | | | | 1.08 | | | | (1.20 | ) |
| $ | 12.38 | | | $ | 10.36 | | | $ | 11.61 | | | $ | 13.14 | | | $ | 12.54 | | | $ | 11.46 | |
| | 20.26 | % | | | (8.34 | %) | | | (4.17 | %) | | | 8.08 | % | | | 11.37 | % | | | (8.32 | %) |
| | | | | | | | | | | | | | | | | | | | | | | |
| $ | 1,268,069 | | | $ | 1,101,542 | | | $ | 1,304,491 | | | $ | 2,134,051 | | | $ | 1,500,310 | | | $ | 605,178 | |
| | | | | | | | | | | | | | | | | | | | | | | |
| | 0.93 | %(d) | | | 0.92 | % | | | 0.90 | % | | | 0.87 | % | | | 0.92 | % | | | 1.03 | % |
| | 0.93 | %(d) | | | 0.92 | % | | | 0.90 | % | | | 0.87 | % | | | 0.92 | % | | | 1.03 | %(e) |
| | 1.85 | %(d) | | | 1.91 | % | | | 2.45 | % | | | 2.09 | % | | | 1.82 | % | | | 1.72 | % |
| | 29 | % | | | 29 | % | | | 52 | % | | | 23 | % | | | 14 | % | | | 7 | % |
See accompanying Notes to Financial Statements.
| Semi-annual Report – October 31, 2020 | 33 |
Seafarer Overseas Value Fund
| Investor Class |
| NET ASSET VALUE, BEGINNING OF PERIOD |
| INCOME FROM OPERATIONS: |
| Net investment income(a) |
| Net realized and unrealized gain/(loss) on investments |
| Total from investment operations |
| |
| LESS DISTRIBUTIONS: |
| From net investment income |
| From net realized gains on investments |
| Total distributions |
| NET INCREASE/(DECREASE) IN NET ASSET VALUE |
| NET ASSET VALUE, END OF PERIOD |
| |
| TOTAL RETURN(b) |
| SUPPLEMENTAL DATA: |
| Net assets, end of period (in 000s) |
| RATIOS TO AVERAGE NET ASSETS: |
| Operating expenses excluding reimbursement/waiver |
| Operating expenses including reimbursement/waiver |
| Net investment income including reimbursement/waiver |
| PORTFOLIO TURNOVER RATE(d) |
| (a) | Calculated using the average shares method. |
| (b) | Total returns are for the periods indicated and have not been annualized. In some periods, total returns would have been lower had certain expenses not been waived during the periods. Returns shown do not reflect the deduction of taxes that a shareholder would pay on Fund distributions or the redemption of Fund shares. |
| (d) | Portfolio turnover rate for a period less than one full year has not been annualized. |
| 34 | (855) 732-9220 seafarerfunds.com |
Financial Highlights
For a share outstanding through the periods or years presented
Six Months Ended
October 31, 2020
(Unaudited) | | | Year Ended
April 30, 2020 | | | Year Ended
April 30, 2019 | | | Year Ended
April 30, 2018 | | | May 31, 2016
(Inception)
to April 30, 2017 | |
| $ | 9.46 | | | $ | 11.41 | | | $ | 11.95 | | | $ | 11.30 | | | $ | 10.00 | |
| | | | | | | | | | | | | | | | | | | |
| | 0.13 | | | | 0.29 | | | | 0.29 | | | | 0.35 | | | | 0.12 | |
| | 0.79 | | | | (1.88 | ) | | | (0.51 | ) | | | 0.72 | | | | 1.28 | |
| | 0.92 | | | | (1.59 | ) | | | (0.22 | ) | | | 1.07 | | | | 1.40 | |
| | | | | | | | | | | | | | | | | | | |
| | – | | | | (0.31 | ) | | | (0.29 | ) | | | (0.42 | ) | | | (0.10 | ) |
| | – | | | | (0.05 | ) | | | (0.03 | ) | | | – | | | | – | |
| | – | | | | (0.36 | ) | | | (0.32 | ) | | | (0.42 | ) | | | (0.10 | ) |
| | 0.92 | | | | (1.95 | ) | | | (0.54 | ) | | | 0.65 | | | | 1.30 | |
| $ | 10.38 | | | $ | 9.46 | | | $ | 11.41 | | | $ | 11.95 | | | $ | 11.30 | |
| | | | | | | | | | | | | | | | | | | |
| | 9.73 | % | | | (14.54 | %) | | | (1.50 | %) | | | 9.55 | % | | | 14.15 | % |
| | | | | | | | | | | | | | | | | | | |
| $ | 330 | | | $ | 278 | | | $ | 327 | | | $ | 311 | | | $ | 280 | |
| | | | | | | | | | | | | | | | | | | |
| | 1.66 | %(c) | | | 1.44 | % | | | 1.45 | % | | | 1.80 | % | | | 3.71 | %(c) |
| | 1.15 | %(c) | | | 1.15 | % | | | 1.15 | % | | | 1.15 | % | | | 1.15 | %(c) |
| | 2.67 | %(c) | | | 2.61 | % | | | 2.59 | % | | | 2.91 | % | | | 1.24 | %(c) |
| | 13 | % | | | 25 | % | | | 3 | % | | | 3 | % | | | 0 | % |
See accompanying Notes to Financial Statements.
| Semi-annual Report – October 31, 2020 | 35 |
Seafarer Overseas Value Fund
| Institutional Class |
| NET ASSET VALUE, BEGINNING OF PERIOD |
| INCOME FROM OPERATIONS: |
| Net investment income(a) |
| Net realized and unrealized gain/(loss) on investments |
| Total from investment operations |
| |
| LESS DISTRIBUTIONS: |
| From net investment income |
| From net realized gains on investments |
| Total distributions |
| NET INCREASE/(DECREASE) IN NET ASSET VALUE |
| NET ASSET VALUE, END OF PERIOD |
| |
| TOTAL RETURN(c) |
| SUPPLEMENTAL DATA: |
| Net assets, end of period (in 000s) |
| RATIOS TO AVERAGE NET ASSETS: |
| Operating expenses excluding reimbursement/waiver |
| Operating expenses including reimbursement/waiver |
| Net investment income including reimbursement/waiver |
| PORTFOLIO TURNOVER RATE(g) |
| (a) | Calculated using the average shares method. |
| (b) | In preparing the financial statements in accordance with U.S. GAAP, management made certain adjustments as required by U.S. GAAP which caused the net asset value for purposes of these financial statements to differ from the net asset value used to process shareholder transactions as of the date of these financial statements. As a result, the net asset value decreased from $11.29 to $11.28. |
| (c) | Total returns are for the periods indicated and have not been annualized. In some periods, total returns would have been lower had certain expenses not been waived during the periods. Returns shown do not reflect the deduction of taxes that a shareholder would pay on Fund distributions or the redemption of Fund shares. |
| (d) | Includes adjustments in accordance with U.S. GAAP and as such, the total return for shareholder transactions reported to the market may differ from the total return for financial reporting purposes. As a result, the total return increased from 9.64% to 9.74%. |
| (e) | Includes adjustments in accordance with U.S. GAAP and as such, the total return for shareholder transactions reported to the market may differ from the total return for financial reporting purposes. As a result, the total return decreased from 14.29% to 14.18%. |
| (g) | Portfolio turnover rate for a period less than one full year has not been annualized. |
| 36 | (855) 732-9220 seafarerfunds.com |
Financial Highlights
For a share outstanding through the periods or years presented
Six Months Ended
October 31, 2020
(Unaudited) | | | Year Ended
April 30, 2020 | | | Year Ended
April 30, 2019 | | | Year Ended
April 30, 2018 | | | May 31, 2016
(Inception)
to April 30, 2017 | |
| $ | 9.48 | | | $ | 11.43 | | | $ | 11.96 | | | $ | 11.28 | | | $ | 10.00 | |
| | | | | | | | | | | | | | | | | | | |
| | 0.15 | | | | 0.30 | | | | 0.30 | | | | 0.35 | | | | 0.13 | |
| | 0.77 | | | | (1.88 | ) | | | (0.50 | ) | | | 0.74 | | | | 1.28 | |
| | 0.92 | | | | (1.58 | ) | | | (0.20 | ) | | | 1.09 | | | | 1.41 | |
| | | | | | | | | | | | | | | | | | | |
| | – | | | | (0.32 | ) | | | (0.30 | ) | | | (0.41 | ) | | | (0.13 | ) |
| | – | | | | (0.05 | ) | | | (0.03 | ) | | | – | | | | – | |
| | – | | | | (0.37 | ) | | | (0.33 | ) | | | (0.41 | ) | | | (0.13 | ) |
| | 0.92 | | | | (1.95 | ) | | | (0.53 | ) | | | 0.68 | | | | 1.28 | |
| $ | 10.40 | | | $ | 9.48 | | | $ | 11.43 | | | $ | 11.96 | | | $ | 11.28 | (b) |
| | | | | | | | | | | | | | | | | | | |
| | 9.70 | % | | | (14.47 | %) | | | (1.34 | %) | | | 9.74 | %(d) | | | 14.18 | %(e) |
| | | | | | | | | | | | | | | | | | | |
| $ | 25,455 | | | $ | 29,557 | | | $ | 28,849 | | | $ | 25,291 | | | $ | 9,846 | |
| | | | | | | | | | | | | | | | | | | |
| | 1.62 | %(f) | | | 1.42 | % | | | 1.48 | % | | | 1.76 | % | | | 3.63 | %(f) |
| | 1.05 | %(f) | | | 1.05 | % | | | 1.05 | % | | | 1.05 | % | | | 1.05 | %(f) |
| | 2.94 | %(f) | | | 2.63 | % | | | 2.65 | % | | | 2.90 | % | | | 1.36 | %(f) |
| | 13 | % | | | 25 | % | | | 3 | % | | | 3 | % | | | 0 | % |
See accompanying Notes to Financial Statements.
| Semi-annual Report – October 31, 2020 | 37 |
| Seafarer Funds | Notes to Financial Statements |
| | October 31, 2020 (Unaudited) |
Notes to Financial Statements
1. Organization
Financial Investors Trust (the “Trust”), a Delaware statutory trust, is an open-end management investment company registered under the Investment Company Act of 1940, as amended (“1940 Act”). The Trust consists of multiple separate portfolios or series. This annual report describes the Seafarer Overseas Growth and Income Fund and the Seafarer Overseas Value Fund (individually a “Fund” and collectively, the “Funds”). The Seafarer Overseas Growth and Income Fund seeks to provide long-term capital appreciation along with some current income; it also seeks to mitigate adverse volatility in returns as a secondary objective. The Seafarer Overseas Value Fund seeks to provide long-term capital appreciation. The Funds each offer Investor Class and Institutional Class shares.
2. Significant Accounting Policies
The accompanying financial statements were prepared in accordance with accounting principles generally accepted in the United States of America (“U.S. GAAP”). The preparation of financial statements in conformity with U.S. GAAP requires management to make certain estimates and assumptions that affect the reported amounts of assets and liabilities and disclosures of contingent assets and liabilities at the date of the financial statements and the reported amounts of revenue and expenses during the period. Actual results could differ from those estimates. The Funds are considered an investment company for financial reporting purposes under U.S. GAAP and follow the accounting and reporting guidance applicable to investment companies in the Financial Accounting Standards Board Accounting Standards Codification Topic 946.The following is a summary of significant accounting policies consistently followed by the Funds in preparation of their financial statements.
Investment Valuation
Each Fund generally values its securities based on market prices determined at the close of regular trading on the New York Stock Exchange (“NYSE”), normally 4:00 p.m. Eastern Time, on each day the NYSE is open for trading.
For equity securities and exchange traded funds, the market price is usually the closing sale or official closing price on that exchange. In the case of equity securities not traded on an exchange, or if such closing prices are not otherwise available, the securities are valued at the mean of the most recent bid and ask prices on such day. Redeemable securities issued by open-end registered investment companies are valued at the investment company’s applicable net asset value, with the exception of exchange-traded open-end investment companies, which are priced as equity securities.
Equity securities that are primarily traded on foreign securities exchanges are valued at the closing values of such securities on their respective foreign exchanges, except when an event occurs subsequent to the close of the foreign exchange but before the close of the NYSE, such that the securities’ value would likely change. In such an event, the fair values of those securities are determined in good faith through consideration of other factors in accordance with procedures established by and under the general supervision of the Board of Trustees of the Trust (the “Board” or the “Trustees”). Each Fund uses a fair valuation model provided by an independent pricing service, which is intended to reflect fair value when a security’s value or a meaningful portion of the Fund’s portfolio is believed to have been materially affected by a valuation event that has occurred between the close of the exchange or market on which the security is traded and the close of the regular trading day on the NYSE.
The market price for debt obligations is generally the price supplied by an independent third-party pricing service approved by the Board, which may use a matrix, formula or other objective method that takes into consideration quotations from dealers, market transactions in comparable investments, market indices and yield curves. If vendors are unable to supply a price, or if the price supplied is deemed to be unreliable, the market price may be determined using quotations received from one or more broker-dealers that make a market in the security. Corporate bonds and convertible bonds are valued using market models that consider trade data, quotations from dealers and active market
| 38 | (855) 732-9220 seafarerfunds.com |
| Seafarer Funds | Notes to Financial Statements |
| | October 31, 2020 (Unaudited) |
makers, relevant yield curve and spread data, creditworthiness, trade data or market information on comparable securities, and other relevant security specific information. Publicly traded foreign government debt securities and foreign corporate bonds are typically traded internationally in the over-the-counter market and are valued at the mean between the bid and asked prices as of the close of business of that market.
Forward currency exchange contracts have a market value determined by the prevailing foreign currency exchange daily rates and current foreign currency exchange forward rates. The foreign currency exchange forward rates are calculated using an automated system that estimates rates on the basis of the current day foreign currency exchange rates and forward foreign currency exchange rates supplied by a pricing service.
When such prices or quotations are not available, or when the Trust’s Valuation Committee believes that they are unreliable, securities may be priced using fair value procedures approved by the Board.
Certain foreign countries impose a tax on capital gains which is accrued by each Fund based on unrealized appreciation, if any, on affected securities. The tax is paid when the gain is realized.
Fair Value Measurements
Each Fund discloses the classification of its fair value measurements following a three-tier hierarchy based on the inputs used to measure fair value. Inputs refer broadly to the assumptions that market participants would use in pricing the asset or liability, including assumptions about risk. Inputs may be observable or unobservable. Observable inputs reflect the assumptions market participants would use in pricing the asset or liability. Such inputs are developed based on market data obtained from sources independent of the reporting entity. Unobservable inputs reflect the reporting entity’s own assumptions about the assumptions market participants would use in pricing the asset or liability, which are developed based on the information available and the reporting entity’s best efforts to interpret such information.
Various inputs are used in determining the value of the Funds’ investments as of the end of the reporting period. When inputs used fall into different levels of the fair value hierarchy, the level in the hierarchy within which the fair value measurement falls is determined based on the lowest level input that is significant to the fair value measurement in its entirety. The designated input levels are not necessarily an indication of the risk or liquidity associated with these investments. These inputs are categorized in the following hierarchy under applicable financial accounting standards:
| Level 1 – | Unadjusted quoted prices in active markets for identical investments, unrestricted assets or liabilities that the Funds have the ability to access at the measurement date; |
| Level 2 – | Quoted prices which are not active, quoted prices for similar assets or liabilities in active markets or inputs other than quoted prices that are observable (either directly or indirectly) for substantially the full term of the asset or liability; and |
| Level 3 – | Significant unobservable prices or inputs (including the Funds’ own assumptions in determining the fair value of investments) where there is little or no market activity for the asset or liability at the measurement date. |
| Semi-annual Report – October 31, 2020 | 39 |
| Seafarer Funds | Notes to Financial Statements |
| | October 31, 2020 (Unaudited) |
The following is a summary of the inputs used to value each Fund as of October 31, 2020:
| Investments in Securities at Value(a) | | Level 1 - Quoted Prices | | | Level 2 - Other Significant Observable Inputs | | | Level 3 - Significant Unobservable Inputs | | | Total | |
| Seafarer Overseas Growth and Income Fund | | | | | | | | | | | | | | | | |
| Common Stocks | | | | | | | | | | | | | | | | |
| Brazil | | $ | 89,041,812 | | | $ | – | | | $ | – | | | $ | 89,041,812 | |
| China / Hong Kong | | | 7,617,250 | | | | 351,244,078 | | | | – | | | | 358,861,328 | |
| Czech Republic | | | – | | | | 19,665,447 | | | | – | | | | 19,665,447 | |
| Hungary | | | – | | | | 49,001,934 | | | | – | | | | 49,001,934 | |
| India | | | 42,810,000 | | | | – | | | | – | | | | 42,810,000 | |
| Japan | | | – | | | | 44,594,418 | | | | – | | | | 44,594,418 | |
| Mexico | | | 28,554,831 | | | | – | | | | – | | | | 28,554,831 | |
| Qatar | | | – | | | | 27,722,545 | | | | – | | | | 27,722,545 | |
| Singapore | | | – | | | | 97,481,763 | | | | – | | | | 97,481,763 | |
| South Africa | | | – | | | | 41,565,992 | | | | – | | | | 41,565,992 | |
| South Korea | | | – | | | | 257,460,416 | | | | – | | | | 257,460,416 | |
| Taiwan | | | – | | | | 99,977,620 | | | | – | | | | 99,977,620 | |
| Thailand | | | – | | | | 14,027,359 | | | | – | | | | 14,027,359 | |
| United Arab Emirates | | | – | | | | 30,874,808 | | | | – | | | | 30,874,808 | |
| United Kingdom | | | – | | | | 28,430,076 | | | | – | | | | 28,430,076 | |
| Vietnam | | | – | | | | 29,899,170 | | | | – | | | | 29,899,170 | |
| Preferred Stocks | | | – | | | | 88,969,820 | | | | – | | | | 88,969,820 | |
| Total | | $ | 168,023,893 | | | $ | 1,180,915,446 | | | $ | – | | | $ | 1,348,939,339 | |
| Investments in Securities at Value(a) | | Level 1 - Quoted Prices | | | Level 2 - Other Significant Observable Inputs | | | Level 3 - Significant Unobservable Inputs | | | Total | |
| Seafarer Overseas Value Fund | | | | | | | | | | | | |
| Common Stocks | | | | | | | | | | | | | | | | |
| Brazil | | $ | 1,704,060 | | | $ | – | | | $ | – | | | $ | 1,704,060 | |
| China / Hong Kong | | | 767,319 | | | | 8,854,519 | | | | – | | | | 9,621,838 | |
| Czech Republic | | | – | | | | 983,536 | | | | – | | | | 983,536 | |
| Georgia | | | – | | | | 772,360 | | | | – | | | | 772,360 | |
| Mexico | | | 306,166 | | | | – | | | | – | | | | 306,166 | |
| Qatar | | | – | | | | 1,370,873 | | | | – | | | | 1,370,873 | |
| Russia | | | 270,000 | | | | – | | | | – | | | | 270,000 | |
| Singapore | | | – | | | | 2,723,762 | | | | – | | | | 2,723,762 | |
| South Korea | | | – | | | | 2,350,005 | | | | – | | | | 2,350,005 | |
| United Arab Emirates | | | – | | | | 1,589,381 | | | | – | | | | 1,589,381 | |
| United Kingdom | | | – | | | | 1,015,901 | | | | – | | | | 1,015,901 | |
| Vietnam | | | – | | | | 1,523,238 | | | | – | | | | 1,523,238 | |
| Total | | $ | 3,047,545 | | | $ | 21,183,575 | | | $ | – | | | $ | 24,231,120 | |
| (a) | For detailed descriptions of securities by country, see the accompanying Portfolio of Investments. |
| 40 | (855) 732-9220 seafarerfunds.com |
| Seafarer Funds | Notes to Financial Statements |
| | October 31, 2020 (Unaudited) |
For the six months ended October 31, 2020, the Funds did not have any securities that used significant unobservable inputs (Level 3) in determining fair value.
Investment Transactions and Investment Income
Investment transactions are accounted for on the date the investments are purchased or sold (trade date). Realized gains and losses from investment transactions are reported on an identified cost basis. Interest income, which includes accretion of discounts and amortization of premiums, is accrued and recorded as earned. Dividend income is recognized on the ex-dividend date or for certain foreign securities, as soon as information is available to the Funds. All of the realized and unrealized gains and losses and net investment income are allocated daily to each share class in proportion to its average daily net assets.
Cash Management Transactions
Each of the Funds subscribes to the Brown Brothers Harriman & Co. (“BBH”) Cash Management Service (“CMS”), whereby cash balances are automatically swept into overnight offshore demand deposits with either the BBH Grand Cayman branch or a branch of a pre-approved commercial bank. This fully automated program allows the Funds to earn interest on cash balances. Excess cash with deposit institutions domiciled outside of the U.S. are subject to sovereign actions in the jurisdiction of the deposit institution including, but not limited to, freeze, seizure or diminution. Cash balances in the BBH CMS are included on the Statements of Assets and Liabilities under Cash and Foreign currency, at value. As of October 31, 2020, the Funds had the following cash balances participating in the BBH CMS:
| Fund | | | |
| Seafarer Overseas Growth and Income Fund | | $ | 107,061,272 | |
| Seafarer Overseas Value Fund | | | 1,697,511 | |
As of October 31, 2020, the Funds had the following foreign cash balances participating in the BBH CMS (cost and value of foreign cash balances are equal):
| Fund | | | |
| Seafarer Overseas Growth and Income Fund | | $ | – | |
| Seafarer Overseas Value Fund | | | – | |
Foreign Securities
The Funds may directly purchase securities of foreign issuers. Investing in securities of foreign issuers involves special risks not typically associated with investing in securities of U.S. issuers. The risks include possible revaluation of currencies, the inability to repatriate foreign currency, less complete financial information about companies, and possible future adverse political and economic developments. Moreover, securities of many foreign issuers and their markets may be less liquid and their prices more volatile than those of securities of comparable U.S. issuers.
Foreign Currency Translation
The books and records of the Funds are maintained in U.S. dollars. Investment valuations and other assets and liabilities initially expressed in foreign currencies are converted each business day into U.S. dollars based upon current exchange rates. Prevailing foreign exchange rates may generally be obtained at the close of the NYSE (normally, 4:00 p.m. Eastern Time). The portion of realized and unrealized gains or losses on investments due to fluctuations in foreign currency exchange rates is not separately disclosed and is included in realized and unrealized gains or losses on investments, when applicable.
Foreign Currency Spot Contracts
Each Fund may enter into foreign currency spot contracts to facilitate transactions in foreign securities or to convert foreign currency receipts into U.S. dollars. A foreign currency spot contract is an agreement between two parties to buy and sell currencies at the current market rate, for settlement generally within two business days. The U.S. dollar value of a contract is determined using current
| Semi-annual Report – October 31, 2020 | 41 |
| Seafarer Funds | Notes to Financial Statements |
| | October 31, 2020 (Unaudited) |
currency exchange rates supplied by a pricing service. The contract is marked-to-market daily for settlements beyond one day and any change in market value is recorded as an unrealized gain or loss. When the contract is closed, the Fund records a realized gain or loss equal to the difference between the value on the open and close date. Losses may arise from changes in the value of the foreign currency, or if the counterparties do not perform under the contract’s terms. The maximum potential loss from such contracts is the aggregate face value in U.S. dollars at the time the contract was opened.
Trust Expenses
Some expenses of the Trust can be directly attributed to the Funds. Expenses that cannot be directly attributed to the Funds are apportioned among all funds in the Trust based on the average daily net assets of each fund.
Fund and Class Expenses
Expenses that are specific to a Fund or class of shares of a Fund, including shareholder servicing fees, are charged directly to that Fund or share class. Expenses that are common to all Funds are generally allocated among the Funds in proportion to their average daily net assets.
Income Taxes
Each Fund complies with the requirements under Subchapter M of the Internal Revenue Code of 1986, as amended, applicable to regulated investment companies and intends to distribute substantially all of its net taxable income and net capital gains, if any, each year so that it will not be subject to excise tax on undistributed income and gains. The Funds are not subject to income taxes to the extent such distributions are made.
As of and during the six months ended October 31, 2020, the Funds did not have a liability for any unrecognized tax benefits. The Funds file U.S. federal, state, and local tax returns as required. The Funds’ tax returns are subject to examination by the relevant tax authorities until expiration of the applicable statute of limitations, which is generally three years after the filing due date of the tax return for federal purposes and four years for most state returns. Tax returns for open years have incorporated no uncertain tax positions that require a provision for income taxes.
Distributions to Shareholders
In general, the Seafarer Overseas Growth and Income Fund’s policy is to distribute to its shareholders substantially all net investment income paid out via semi-annual dividends, in June and December. The Seafarer Overseas Value Fund’s policy is to distribute to its shareholders substantially all net investment income via one annual dividend in December. It is also each Fund’s policy to distribute annually all net realized short-term and long-term capital gains, if any, after offsetting any capital loss carryovers. Income dividend distributions are derived from dividends and other income each Fund receives from its investments, including short-term capital gains. Long-term capital gain distributions are derived from gains realized when a Fund sells a security it has owned for more than one year. Each Fund may make additional distributions at other times if the Fund believes doing so may be necessary for the Fund to share tax obligations more ratably and more equitably across shareholders over time.
Epidemic and Pandemic Risk
Certain countries have been susceptible to epidemics, most recently Covid-19, which has been designated as a pandemic by world health authorities. The outbreak of such epidemics, together with any resulting restrictions on travel or quarantines imposed, could have a negative impact on the economy and business activity globally (including in the countries in which the Funds invest), and thereby could adversely affect the performance of the Funds’ investments. Furthermore, the rapid development of epidemics could preclude prediction as to their ultimate adverse impact on economic and market conditions, and, as a result, presents material uncertainty and risk with respect to the performance of the Funds’ investments.
| 42 | (855) 732-9220 seafarerfunds.com |
| Seafarer Funds | Notes to Financial Statements |
| | October 31, 2020 (Unaudited) |
Libor Risk
In March 2020, the Financial Accounting Standards Board (FASB) issued Accounting Standards Update (“ASU”) No. 2020-04, Reference Rate Reform (Topic 848): Facilitation of the Effects of Reference Rate Reform on Financial Reporting. The Funds’ investments, payment obligations, and financing terms may be based on floating rates, such as the London Interbank Offered Rate, or “LIBOR,” which is the offered rate for short-term Eurodollar deposits between major international banks. Plans are underway to phase out the use of LIBOR by the end of 2021. There remains uncertainty regarding the nature of any replacement rate and the impact of the transition from LIBOR on the Funds’ transactions and the financial markets generally. As such, the potential effect of a transition away from LIBOR on the Funds or the Funds’ investments cannot yet be determined.
3. Tax Basis Information
Tax Basis of Investments
As of October 31, 2020, the aggregate cost of investments, gross unrealized appreciation/(depreciation), and net unrealized depreciation for Federal income tax purposes were as follows:
| Fund | | Cost of Investments | | | Gross Unrealized Appreciation | | | Gross Unrealized Depreciation | | | Net Unrealized Appreciation/ (Depreciation) | |
| Seafarer Overseas Growth and Income Fund | | $ | 1,320,598,295 | | | $ | 210,573,004 | | | $ | (182,231,960 | ) | | $ | 28,341,044 | |
| Seafarer Overseas Value Fund | | | 28,110,888 | | | | 2,550,544 | | | | (6,430,312 | ) | | | (3,879,768 | ) |
Tax Basis of Distributions to Shareholders
The character of distributions made during the fiscal year from net investment income or net realized gains may differ from the ultimate characterization for federal income tax purposes. Also, due to the timing of dividend distributions, the fiscal year in which amounts are distributed may differ from the fiscal year in which the income or realized gain is recorded by a Fund.
The tax character of distributions paid by the Funds for the fiscal year ended April 30, 2020 was as follows:
| Fund | | Ordinary Income | | | Long-Term Capital Gain | |
| Seafarer Overseas Growth and Income Fund | | $ | 41,345,033 | | | $ | – | |
| Seafarer Overseas Value Fund | | | 1,063,690 | | | | 133,678 | |
The amounts and characteristics of tax basis distributions and composition of distributable earnings/(accumulated losses) are finalized at fiscal year-end. Accordingly, tax basis balances have not been determined as of October 31, 2020.
| Semi-annual Report – October 31, 2020 | 43 |
| Seafarer Funds | Notes to Financial Statements |
| | October 31, 2020 (Unaudited) |
4. Securities Transactions
The cost of purchases and proceeds from sales of securities excluding short-term securities during the six months ended October 31, 2020 were as follows:
| Fund | | Purchases of Securities | | | Proceeds from Sales of Securities | |
| Seafarer Overseas Growth and Income Fund | | $ | 362,702,534 | | | $ | 453,433,913 | |
| Seafarer Overseas Value Fund | | | 3,094,155 | | | | 8,644,309 | |
5. Shares of Beneficial Interest
The capitalization of the Trust consists of an unlimited number of shares of beneficial interest with no par value per share. Holders of shares of the Funds of the Trust have one vote for each share held and a proportionate fraction of a vote for each fractional share. All shares issued and outstanding are fully paid and are transferable and redeemable at the option of the shareholder. Purchasers of the shares do not have any obligation to make payments to the Trust or its creditors solely by reason of the purchasers’ ownership of the shares. Shares have no pre-emptive rights.
6. Management and Related Party Transactions
The Adviser, subject to the authority of the Board, is responsible for the overall management and administration of the Funds’ business affairs. The Adviser manages the investments of the Funds in accordance with the Funds’ investment objectives, policies, limitations and investment guidelines established jointly by the Adviser and the Trustees. Pursuant to the investment advisory agreement, the Funds, in the aggregate, pay the Adviser an annual management fee of 0.75% of the aggregate average daily net assets of the Funds up to $1.5 billion and 0.70% of the aggregate average daily net assets of the Funds over $1.5 billion. Each Fund pays the Adviser a monthly fee at the annual rate using the applicable management fee calculated based on the Fund’s pro rata share of the Funds’ combined average daily net assets. Prior to August 31, 2016, the Funds paid the Adviser an annual management fee of 0.75% of the aggregate average daily net assets of the Funds.
Effective September 1, 2014, the Adviser contractually agreed to limit certain Fund expenses (excluding brokerage expenses, interest expenses, taxes and extraordinary expenses) to 1.25% and 1.05% of the Funds’ average daily net assets in the Investor and Institutional share classes, respectively, through August 31, 2015. Effective September 1, 2015, the Adviser contractually, through successive one-year agreements, agreed to waive and/or reimburse fees or expenses in order to limit Total Annual Fund Operating Expenses After Fee Waiver / Expense Reimbursements (excluding brokerage expenses, interest expenses, taxes and extraordinary expenses) to 1.15% and 1.05% of the Funds’ average daily net assets for the Investor and Institutional share classes, respectively. The current agreement (the “Expense Agreement”) is in effect through August 31, 2021. The Adviser will be permitted to recover, on a class-by-class basis, expenses it has borne through the Expense Agreement to the extent that the Funds’ expenses in later periods fall below the expense cap in effect at the time of waiver or reimbursement. The Funds will not be obligated to pay any such deferred fees and expenses more than three years after the date of the waiver. This agreement may not be terminated or modified prior to August 31, 2021, except with the approval of the Funds’ Board. During the six months ended October 31, 2020, the Adviser agreed that it will only seek to recoup waived management fees and will not recoup any reimbursed expenses. As of October 31, 2020, the Adviser has recouped all available waived management fees from the Seafarer Overseas Growth and Income Fund.
| 44 | (855) 732-9220 seafarerfunds.com |
| Seafarer Funds | Notes to Financial Statements |
| | October 31, 2020 (Unaudited) |
For the six months ended October 31, 2020, the fee waivers and/or reimbursements were as follows for the Seafarer Overseas Value Fund:
| Fund | | Fees Waived/ Reimbursed By Adviser | | | Recoupment of Past Waived Fees By Adviser | |
| Seafarer Overseas Value Fund | | | | | | |
| Investor Class | | $ | 805 | | | $ | – | |
| Institutional Class | | | 76,054 | | | | – | |
As of October 31, 2020 the balances of recoupable expenses for each class were as follows for the Funds:
| Fund | | Expires 2021 | | | Expires 2022 | | | Expires 2023 | | | Expires 2024 | | | Total | |
| Seafarer Overseas Growth and Income Fund | | | | | | | | | | | | | | | | | |
| Investor Class | | $ | – | | | $ | – | | | $ | – | | | $ | – | | | $ | – | |
| Institutional Class | | | – | | | | – | | | | – | | | | – | | | | – | |
| Seafarer Overseas Value Fund | | | | | | | | | | | | | | | | | |
| Investor Class | | $ | 697 | | | $ | 897 | | | $ | 912 | | | $ | 805 | | | $ | 3,311 | |
| Institutional Class | | | 61,366 | | | | 115,259 | | | | 129,046 | | | | 76,054 | | | | 381,725 | |
Fund Administrator
ALPS Fund Services, Inc. (“ALPS” and the “Administrator”) provides administrative, fund accounting and other services to the Funds under the Administration, Bookkeeping and Pricing Services Agreement with the Trust.
The Funds’ administrative fee is accrued on a daily basis and paid monthly. The Administrator is also reimbursed by the Funds for certain out-of-pocket expenses. Administration fees paid by the Funds for the six months ended October 31, 2020 are disclosed in the Statements of Operations.
Transfer Agent
ALPS serves as transfer, dividend paying and shareholder servicing agent for the Funds (“Transfer Agent”). ALPS is paid an annual base fee per Fund and a fee based on the number of shareholder accounts. The Transfer Agent is also reimbursed by the Funds for certain out-of-pocket expenses. Transfer agent fees paid by the Funds for the six months ended October 31, 2020 are disclosed in the Statements of Operations.
Compliance Services
ALPS provides compliance services to the Funds under the Chief Compliance Officer Services Agreement with the Trust. ALPS provides services that assist the Trust’s chief compliance officer in monitoring and testing the policies and procedures of the Trust in accordance with the requirements of Rule 38a-1 under the 1940 Act. ALPS is paid an annual base fee and is reimbursed for certain out-of-pocket expenses. Compliance service fees paid by the Funds for the six months ended October 31, 2020 are disclosed in the Statements of Operations.
Principal Financial Officer
ALPS provides principal financial officer services to the Funds under the Principal Financial Officer Services Agreement with the Trust. Under this Agreement, ALPS is paid an annual base fee and is reimbursed for certain out-of-pocket expenses. Principal financial officer fees paid by the Funds for the six months ended October 31, 2020 are disclosed in the Statements of Operations.
| Semi-annual Report – October 31, 2020 | 45 |
| Seafarer Funds | Notes to Financial Statements |
| | October 31, 2020 (Unaudited) |
Distributor
ALPS Distributors, Inc. (“ADI” or the “Distributor”) (an affiliate of ALPS) acts as the distributor of the Funds’ shares pursuant to the Distribution Agreement with the Trust. Under a side letter agreement, the Adviser pays ADI an annual base fee per Fund for the distribution services. The Adviser also reimburses ADI for certain out-of-pocket expenses. Shares are sold on a continuous basis by ADI as agent for the Funds, and ADI has agreed to use its best efforts to solicit orders for the sale of the Funds’ shares, although it is not obliged to sell any particular amount of shares. ADI is registered as a broker-dealer with the U.S. Securities and Exchange Commission.
Shareholder Service Plan for Investor Class and Institutional Class Shares
Each Fund has adopted a Shareholder Services Plan (a “Services Plan”) for each of its share classes. Under the Services Plan, each Fund is authorized to enter into shareholder service agreements with investment advisers, financial institutions and other service providers (“Participating Organizations”) to maintain and provide certain administrative and servicing functions in relation to the accounts of shareholders. Shareholder service arrangements typically include processing orders for shares, generating account and confirmation statements, sub-accounting, account maintenance, tax reporting, and disbursing cash dividends as well as other investment or administrative services required for a particular Participating Organizations’ products, programs, platform and accounts. The Services Plan will cause each Fund to pay an aggregate fee, not to exceed on an annual basis 0.15% and 0.05% of the average daily net asset value of the Investor and Institutional share classes, respectively. Such payments will be made on assets attributable to or held in the name of a Participating Organization, on behalf of its clients as compensation for providing service activities pursuant to an agreement with the Participating Organization. Any amount of such payment not paid to a Participating Organization for such service activities shall be reimbursed to the Fund as soon as practicable. Shareholder Services Plan fees paid by the Funds for the six months ended October 31, 2020 are disclosed in the Statements of Operations.
Trustees
The fees and expenses of the Trustees of the Board are presented in the Statements of Operations.
7. Indemnifications
Under the Trust’s organizational documents, its officers and Trustees are indemnified against certain liability arising out of the performance of their duties to the Trust. Additionally, in the normal course of business, the Trust enters into contracts with service providers that may contain general indemnification clauses, which may permit indemnification to the extent permissible under the applicable law. The Trust’s maximum exposure under these arrangements is unknown, as this would involve future claims that may be made against the Trust that have not yet occurred.
| 46 | (855) 732-9220 seafarerfunds.com |
| Seafarer Funds | Additional Information |
| | October 31, 2020 (Unaudited) |
ADDITIONAL INFORMATION
1. Fund Holdings
The Funds file their complete schedule of portfolio holdings with the U.S. Securities and Exchange Commission for the first and third quarters of each fiscal year as an exhibit to their reports on Form N-PORT. The Funds’ Form N-PORT reports are available on the Commission’s Web site at http://www.sec.gov. The Funds’ Form N-PORT reports are also available upon request by calling toll-free (855) 732-9220.
2. Fund Proxy Voting Policies, Procedures and Summaries
The Funds’ policies and procedures used in determining how to vote proxies and information regarding how the Funds voted proxies relating to portfolio securities during the most recent prior 12-month period ending June 30 are available without charge, (1) upon request, by calling toll-free (855) 732-9220 and (2) on the SEC’s website at http://www.sec.gov.
3. Index Provider Disclosure
The Seafarer Funds are not sponsored, endorsed, sold, or promoted by Morningstar, Inc. Morningstar, Inc. makes no representation or warranty, express or implied, to the shareholders of the Funds or any member of the public regarding the advisability of investing in the Funds or the ability of the Morningstar Emerging Markets Net Return U.S. Dollar Index to track general equity market performance of emerging markets.
| Semi-annual Report – October 31, 2020 | 47 |
| Seafarer Funds | Privacy Policy |
| | October 31, 2020 (Unaudited) |
| FACTS | WHAT DO THE FUNDS DO WITH YOUR PERSONAL INFORMATION? |
| Why? | Financial companies choose how they share your personal information. Federal law gives consumers the right to limit some but not all sharing. Federal law also requires us to tell you how we collect, share, and protect your personal information. Please read this notice carefully to understand what we do. |
| What? | The types of personal information we collect and share depend on the product or service you have with us. This information can include: |
| | ● Social Security number and account transactions |
| | ● Account balances and transaction history |
| | ● Wire transfer instructions |
| How? | All financial companies need to share customers’ personal information to run their everyday business. In the section below, we list the reasons financial companies can share their customers’ personal information; the reasons the Funds choose to share; and whether you can limit this sharing. |
| Reasons we can share your personal information | Do we share: | Can you limit this sharing? |
| For our everyday business purposes — such as to process your transactions, maintain your account(s), respond to court orders and legal investigations, or report to credit bureaus | Yes | No |
| For our marketing purposes — to offer our products and services to you | No | We do not share. |
| For joint marketing with other financial companies | No | We do not share. |
| For our affiliates’ everyday business purposes — information about your transactions and experiences | Yes | No |
| For our affiliates’ everyday business purposes — information about your creditworthiness | No | We do not share. |
| For nonaffiliates to market to you | No | We do not share. |
| 48 | (855) 732-9220 seafarerfunds.com |
| Seafarer Funds | Privacy Policy |
| | October 31, 2020 (Unaudited) |
| Who We Are | |
| Who is providing this notice? | Seafarer Overseas Growth and Income Fund and Seafarer Overseas Value Fund. |
| | |
| What We Do | |
| How do the Funds protect my personal information? | To protect your personal information from unauthorized access and use, we use security measures that comply with federal law. These measures include computer safeguards and secured files and buildings. |
| How do the Funds collect my personal information? | We collect your personal information, for example, when you |
| | ● open an account |
| | ● provide account information or give us your contact information |
| | ● make a wire transfer or deposit money |
| Why can’t I limit all sharing? | Federal law gives you the right to limit only |
| | ● sharing for affiliates’ everyday business purposes-information about your creditworthiness |
| | ● affiliates from using your information to market to you |
| | ● sharing for non-affiliates to market to you |
| | State laws and individual companies may give you additional rights to limit sharing. |
| | |
| Definitions | |
| Affiliates | Companies related by common ownership or control. They can be financial and nonfinancial companies. |
| Non-affiliates | Companies not related by common ownership or control. They can be financial and nonfinancial companies. |
| | ● The Funds do not share with non-affiliates so they can market to you. |
| Joint marketing | A formal agreement between non-affiliated financial companies that together market financial products or services to you. |
| | ● The Funds do not jointly market. |
| | |
| Other Important Information | |
| California Residents | If your account has a California home address, your personal information will not be disclosed to nonaffiliated third parties except as permitted by applicable California law, and we will limit sharing such personal information with our affiliates to comply with California privacy laws that apply to us. |
| Vermont Residents | The State of Vermont requires financial institutions to obtain your consent prior to sharing personal information that they collect about you with affiliated companies and nonaffiliated third parties other than in certain limited circumstances. Except as permitted by law, we will not share personal information we collect about you with nonaffiliated third parties or other affiliated companies unless you provide us with your written consent to share such information. |
| Semi-annual Report – October 31, 2020 | 49 |

Table of Contents
| CONTENTS | PAGE |
| Shareholder Letter | 1 |
| Fund Overview | |
| Vulcan Value Partners Fund | 4 |
| Vulcan Value Partners Small Cap Fund | 8 |
| Disclosure of Fund Expenses | |
| Vulcan Value Partners Fund | 6 |
| Vulcan Value Partners Small Cap Fund | 10 |
| Statements of Investments | |
| Vulcan Value Partners Fund | 12 |
| Vulcan Value Partners Small Cap Fund | 15 |
| Statements of Assets and Liabilities | 18 |
| Statements of Operations | 20 |
| Statements of Changes in Net Assets | |
| Vulcan Value Partners Fund | 21 |
| Vulcan Value Partners Small Cap Fund | 22 |
| Financial Highlights | |
| Vulcan Value Partners Fund | 24 |
| Vulcan Value Partners Small Cap Fund | 28 |
| Notes to Financial Statements | 31 |
| Additional Information | 41 |
| Privacy Policy | 42 |
Beginning on January 1, 2021, as permitted by regulations adopted by the U.S. Securities and Exchange Commission, paper copies of the Funds’ annual and semi-annual shareholder reports will no longer be sent by mail, unless you specifically request paper copies of the reports. Instead, the reports will be made available on the Funds’ website at www.vulcanvaluepartners.com and you will be notified by mail each time a report is posted and provided with a website link to access the report.
You may, notwithstanding the availability of shareholder reports online, elect to receive all future shareholder reports in paper free of charge. If you invest through a financial intermediary, you can contact your financial intermediary to request that you continue to receive paper copies of your shareholder reports. If you invest directly with the Funds, you can call 1.877.421.5078 to let the Funds know you wish to continue receiving paper copies of your shareholder reports.
If you already elected to receive shareholder reports electronically, you will not be affected by this change and you need not take any action. You may elect to receive shareholder reports and other communications from the Funds electronically anytime by contacting your financial intermediary (such as a broker-dealer or bank) or, if you are a direct investor, by enrolling at www.vulcanvaluepartners.com.
Shareholder Letter
October 31, 2020 (Unaudited)
PORTFOLIO REVIEW
General
For the six months ended October 31, 2020, Vulcan Value Partners Fund (Investor Class) returned 16.46% and the Vulcan Value Partners Small Cap Fund (Investor Class) returned 10.66%. As you know, we place no weight on short-term results, good or bad, and neither should you. In fact, we have and will continue to willingly make decisions that negatively impact short-term performance when we think we can lower risk and improve our long-term returns. We encourage you to place more weight on our longer term historical results and a great deal of weight on our long-term prospects.
Vulcan Value Partners Fund Review
In the discussion that follows, we highlight a few holdings in the Vulcan Value Partners Fund. There were seven material contributors including Skyworks Solutions Inc., Qorvo Inc., NVIDIA Corp., KKR & Co. Inc., Amazon.com Inc., Facebook Inc., and Alphabet Inc. There were no material detractors.
Skyworks Solutions Inc. and Qorvo Inc. materially contributed to the portfolio during the period. They are the two major providers of radio frequency (RF) systems to mobile device manufacturers and industry leaders in RF systems for the internet of things (IoT). They are benefitting during the pandemic as individuals are even more reliant on mobile communication. This phenomenon is accelerating the transition to 5G which has contributed to Skyworks Solutions’ and Qorvo’s performance.
Although not material by our definition, the largest detractor for the period was Whitbread plc. Whitbread, a leading UK hotel company, owns Premier Inn as well as Beefeater, Brewers Fayre, Table Table and Bar+Block. It currently has approximately 800 hotels across the UK and has opportunities to expand into Germany. Whitbread has a great history of capital allocation and a strong balance sheet with virtually no debt. COVID-19 is negatively impacting its business as most hotels in the UK temporarily shut down during the first wave of COVID-19 and continue to see lower occupancy rates; however, its strong balance sheet should help it endure the current crisis, and we believe Whitbread will continue to grow once the economy is back to normal.
We purchased CoStar Group Inc. during the period. CoStar is the dominant provider of information services in the real estate industry providing data, analytics, and online marketplaces. Approximately half of CoStar’s revenue is derived from CoStar Suite, a subscription-based service that provides a wide variety of data such as property information, lease terms, comps, tenant information, and valuations. CoStar’s competitive moat is the historical and ongoing data it collects. It has over 200,000 clients who depend on CoStar for their workflows. The other half of its revenue is derived from its marketplace segment. Approximately two thirds of the segment are marketplaces for multifamily properties such as Apartments.com which charges a fee to list available apartments. This site has eleven times more traffic than its closest competitor. The other third is from LoopNet which is its platform for leasing and selling commercial real estate and is comparable to the MLS of commercial real estate. LoopNet is modernizing commercial real estate listings, moving from broker-to-broker relationships to online access, and has a direct competitive advantage as it can leverage the data from CoStar Suite. Management continues to create value through acquisitions and, given that real estate is the largest asset class in the U.S., we believe that potential growth for CoStar is tremendous.
| Semi-Annual Report | October 31, 2020 | 1 |
Shareholder Letter
October 31, 2020 (Unaudited)
We sold National Oilwell Varco during the period. National Oilwell Varco has been a disappointing investment for us. Our investment case was based on the belief that demand for National Oilwell Varco’s products was largely independent of oil prices over the long term. National Oilwell Varco’s products are used in harsh environments and are very important to safety and oil field productivity. National Oilwell Varco’s customers reacted to the fall in oil prices by cannibalizing existing equipment and becoming dramatically more efficient than we anticipated, resulting in lower demand for National Oilwell Varco’s products. National Oilwell Varco continues to produce free cash flow, has a strong balance sheet, and will, in our opinion, be a survivor in the current industry shakeout. However, its value has declined, and our original investment case is no longer intact. We used the proceeds from National Oilwell Varco to buy businesses with what we believe are better long-term prospects and deeply discounted prices.
Vulcan Value Partners Small Cap Fund Review
In the discussion that follows, we highlight a few holdings in the Vulcan Value Partners Small Cap Fund. There were five material contributors including Virtus Investment Partners Inc., Cerence Inc., Littelfuse Inc., Herman Miller Inc., Timken Company, Enersys, and Stabilus SA. Material detractors include Ituran Location and Control and Forterra plc.
Virtus Investment Partners, the largest contributor during the period, produced strong returns as it reported its highest gross sales ever during the second quarter. It has had strong investment performance across the company, produced positive net inflows, and net fees have been stable. Virtus and Allianz plan to create a strategic partnership which will add approximately 23 billion dollars to Virtus’ assets under management (AUM). We feel the market underappreciates Virtus’ value, even after its strong performance through the current crisis.
Forterra plc, the largest detractor for the period, is a UK domiciled manufacturer of bricks and blocks for residential homes. It is the second largest brick maker in the UK behind Ibstock, which is also owned in the Fund. There is a structural supply demand imbalance in UK housing. In addition, the UK brick market is also structurally undersupplied. There is not enough domestic capacity to meet demand and the gap is made up of imports, which are more costly to ship and not very profitable. This structural imbalance gives Forterra and Ibstock a cost advantage over imports. COVID-19 has temporarily disrupted Forterra’s customers businesses as some home builders have not been able to operate for a portion of the year. As a result, Forterra’s revenues are temporarily depressed. As the UK economy reopens and homebuilding returns to a normal level, Forterra should benefit. In the meantime, the company’s financial position is strong.
Colliers International Group, a new purchase during the period, is a global commercial real estate services and investment management company. It provides sales and lease brokerage services and outsourcing and advisory services to corporate and institutional clients. Competitors include CBRE, Jones Lang LaSalle, Cushman & Wakefield, and Savills, several of which are owned in the Fund. Its business is capital-light and has generated strong free cash flow. Its excellent management team has a strong track record of capital allocation and is focused on creating shareholder value.
Marcus & Millichap Inc. is a leading national provider of investment real estate brokerage services focusing on commercial real estate investment sales, financing, research, consulting, and advisory services. We sold Marcus & Millichap during the period to redeploy capital into companies with greater margins of safety.
| 2 | www.vulcanvaluepartners.com |
Shareholder Letter
October 31, 2020 (Unaudited)
Closing
We feel our price to value ratios remain compelling as we have continued to find qualifying investments that are trading at significant discounts to our estimate of fair value. Stated simply, a rising tide has not lifted all boats which has continued to create opportunities for long-term investors. Your stable capital, combined with ours, and our shared long-term time horizon enabled us in our efforts to mitigate risk and improve our long-term prospects. We are grateful for you, our client partners, and appreciate the confidence you have placed in us. We look forward to updating you again soon.
C.T. Fitzpatrick
Chief Executive Officer
Vulcan Value Partners, LLC
Past performance does not guarantee future results. The Funds’ prices fluctuate as the underlying assets have exposure to market fluctuations and other risks, as described in the Funds’ prospectus. Please call 877.421.5078 to obtain current performance information and for the current prospectus and statement of additional information. This material must be preceded or accompanied by a prospectus. Please read the prospectus carefully before investing.
The views of the Vulcan Value Partners, LLC and information discussed in this commentary are as of the date of publication, are subject to change, and may not reflect the writer's current views. The views expressed represent an assessment of market conditions at a specific point in time, are opinions only and should not be relied upon as investment advice regarding a particular investment or markets in general. Such information does not constitute a recommendation to buy or sell specific securities or investment vehicles. It should not be assumed that any investment will be profitable or will equal the performance of the Funds or any securities or any sectors mentioned in this letter. The subject matter contained in this letter has been derived from several sources believed to be reliable and accurate at the time of compilation. Neither Vulcan Value Partners, LLC nor the Funds accept any liability for losses either direct or consequential caused by the use of this information.
The Funds are distributed by ALPS Distributors, Inc.
The Funds are subject to investment risks, including possible loss of the principal amount invested and therefore is not suitable for all investors. The Funds may not achieve their objectives.
Diversification does not eliminate the risk of experiencing investment losses.
Internet of things (IoT) is the interconnection via the internet of computing devices embedded in everyday objects, enabling them to send and receive data.
Competitive moat, or economic moat, refers to a business' ability to maintain competitive advantages over its competitors in order to protect its long-term profits and market share from competing firms.
Free cash flow is the amount of cash that a company has left over after it has paid all of its expenses, including investments. Free cash flow yield is a security’s free cash flow divided by its market price.
Margin of Safety is a favorable difference between the price of a company’s shares and the estimated fair value of those shares.
The price to value ratio is a calculation that compares the price of a company’s stock to our appraisal of the company’s intrinsic value.
Fair, or intrinsic, value is our estimate of the price a willing buyer would pay and a willing seller would accept, assuming neither was compelled to enter into a transaction.
| Semi-Annual Report | October 31, 2020 | 3 |
Fund Overview
October 31, 2020 (Unaudited)
VULCAN VALUE PARTNERS FUND
Annualized Total Returns (as of 10/31/20)
| | | | | | | Since Inception* | Expense Ratios(1) |
| | 6 Month | 1 Year | 3 Year | 5 Year | 10 Year | Total | Net(2) |
| Vulcan Value Partners Fund - Investor Class(3) | 16.46% | 4.59% | 9.06% | 9.00% | 11.85% | 11.53% | 1.09% | 1.09% |
| Vulcan Value Partners Fund - Institutional Class | 16.65% | 4.86% | – | – | – | 8.70% | 1.14% | 0.85% |
| S&P 500® Total Return Index(4) | 13.29% | 9.71% | 10.42% | 11.71% | 13.01% | 12.63% | | |
| Russell 1000® Value Index(5) | 7.06% | -7.57% | 1.94% | 5.82% | 9.48% | 9.36% | | |
Performance data quoted represents past performance. Past performance does not guarantee future results. Investment return and principal value of an investment will fluctuate so that an investor’s shares, when sold or redeemed, may be worth more or less than the original cost. The Fund imposes a 2.00% redemption fee on shares held for less than 90 days. Current performance data may be higher or lower than actual data quoted. For the most current month-end performance data, please call 1-877-421-5078.
The table does not reflect the deduction of taxes that a shareholder would pay on Fund distributions or the redemption of Fund shares.
Subject to investment risks, including possible loss of the principal amount invested.
Returns for periods less than 1 year are cumulative.
| * | Inception Dates – Investor Class: 12/30/09, Institutional Class: 5/01/19 |
| (1) | Ratios as of the Prospectus dated August 31, 2020 and may differ from the ratios presented in the Financial Highlights. |
| (2) | Vulcan Value Partners, LLC (“Vulcan” or the “Adviser”) has contractually agreed to limit the Fund’s total annual fund operating expenses (exclusive of Acquired Fund Fees and Expenses, brokerage expenses, interest expense, taxes and extraordinary expenses) to 1.25% and 0.85% of the Fund’s average daily net assets with respect to Investor Class shares and Institutional Class shares, respectively. This agreement (the “Expense Agreement”) is in effect through August 31, 2021. The Adviser will be permitted to recover, on a class-by-class basis, expenses it has borne through the Expense Agreement to the extent that the Fund’s expenses in later periods fall below the expense cap in effect at the time of waiver or reimbursement. Notwithstanding the foregoing, the Fund will not be obligated to pay any such fees and expenses more than three years after the end of the fiscal year in which the fees or expenses were foregone or reimbursed. The Adviser may not discontinue or modify this waiver prior to August 31, 2021 without the approval by the Fund’s Board of Trustees. |
| (3) | The initial share class of the Fund was redesignated as Investor Class shares effective April 23, 2019. |
| (4) | The S&P 500® Total Return Index is an unmanaged index of 500 common stocks chosen for market size, liquidity and industry group representation. It is a market-value weighted index. The Index is not actively managed and does not reflect any deductions for fees, expenses or taxes. An investor may not invest directly in the Index. |
| (5) | The Russell 1000® Value Index is presented here as an additional index, and measures the performance of the large-cap value segment of the U.S. equity universe. It includes those Russell 1000® companies with lower price-to-book ratios and lower expected growth values. The Index is not actively managed and does not reflect any deductions for fees, expenses or taxes. An investor may not invest directly in the Index. |
| 4 | www.vulcanvaluepartners.com |
Fund Overview
October 31, 2020 (Unaudited)
Growth of $10,000 Initial Investment (for the period ended October 31, 2020)
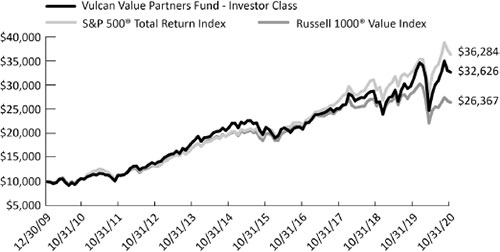
The chart above represents historical performance of a hypothetical investment of $10,000 in the Fund since inception. Past performance does not guarantee future results. This chart does not reflect the deduction of taxes that a shareholder would pay on Fund distributions or the redemption of Fund shares.
Investing in the Fund is subject to investment risks, including possible loss of the principal amount invested.
Industry Allocation (as a % of Net Assets)*
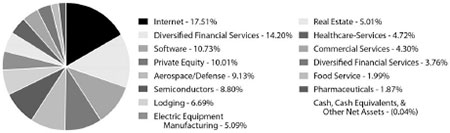
Top Ten Holdings (as a % of Net Assets)*
| TransDigm Group, Inc. | 6.82% |
| Mastercard, Inc. | 6.39% |
| KKR & Co., Inc. | 5.90% |
| Amazon.com, Inc. | 5.72% |
| General Electric Co. | 5.09% |
| Jones Lang LaSalle, Inc. | 5.01% |
| Facebook, Inc. | 5.00% |
| Anthem, Inc. | 4.73% |
| salesforce.com, Inc. | 4.58% |
| Qorvo, Inc. | 4.46% |
| Top Ten Holdings | 53.70% |
| * | Holdings are subject to change, and may not reflect the current or future position of the portfolio. |
| Semi-Annual Report | October 31, 2020 | 5 |
Disclosure of Fund Expenses
October 31, 2020 (Unaudited)
As a shareholder of the Vulcan Value Partners Fund (the “Fund”), you will incur two types of costs: (1) transaction costs, including applicable redemption fees; and (2) ongoing costs, including management fees and other fund operating expenses. The following examples are intended to help you understand your ongoing costs (in dollars) of investing in the Fund and to compare these costs with the ongoing costs of investing in other mutual funds. The examples are based on an investment of $1,000 invested on May 1, 2020 and held until October 31, 2020.
Actual Expenses. The first line of each table below provides information about actual account values and actual expenses. You may use the information in this line, together with the amount you invested, to estimate the expenses that you paid over the period. Simply divide your account value by $1,000 (for example, an $8,600 account value divided by $1,000 = 8.6), then multiply the result by the number in the first line under the heading “Expenses Paid During Period” to estimate the expenses you paid on your account during this period.
Hypothetical Example for Comparison Purposes. The second line of the table below provides information about hypothetical account values and hypothetical expenses based on the Fund’s actual expense ratio and an assumed rate of return of 5% per year before expenses, which is not the Fund’s actual return. The hypothetical account values and expenses may not be used to estimate the actual ending account balance or expenses you paid for the period. You may use this information to compare the ongoing costs of investing in the Fund and other mutual funds. To do so, compare this 5% hypothetical example with the 5% hypothetical examples that appear in the shareholder reports of the other mutual funds.
Please note the expenses shown in the table are meant to highlight ongoing Fund costs only and do not reflect transactional costs, such as redemption fees or exchange fees. Therefore, the second line of the table below is useful in comparing your ongoing costs only, and will not help you determine the relative total costs of owning different funds. In addition, if these transactional costs were included, your costs would have been higher.
Vulcan Value Partners Fund
| | Beginning
Account Value
5/1/20 | Ending
Account Value
10/31/20 | Expense Ratio(a) | Expenses Paid
During period
5/1/20 - 10/31/20(b) |
| VULCAN VALUE PARTNERS FUND | |
| Investor Class | | | | |
| Actual | $1,000.00 | $1,164.60 | 1.09% | $ 5.95 |
| Hypothetical (5% return before expenses) | $1,000.00 | $1,019.71 | 1.09% | $ 5.55 |
| Institutional Class | | | | |
| Actual | $1,000.00 | $1,166.50 | 0.85% | $ 4.64 |
| Hypothetical (5% return before expenses) | $1,000.00 | $1,020.92 | 0.85% | $ 4.33 |
| 6 | www.vulcanvaluepartners.com |
Disclosure of Fund Expenses
October 31, 2020 (Unaudited)
| (a) | The Fund's expense ratios have been annualized based on the Fund's most recent fiscal half-year expenses. |
| (b) | Expenses are equal to the Fund's annualized expense ratio multiplied by the average account value over the period, multiplied by the number of days in the most recent fiscal half-year (184)/365 (to reflect the half-year period). |
| Semi-Annual Report | October 31, 2020 | 7 |
Fund Overview
October 31, 2020 (Unaudited)
VULCAN VALUE PARTNERS SMALL CAP FUND
Annualized Total Returns (as of 10/31/20)
| | | | | | | Since Inception* | Expense Ratios(1) |
| | 6 Month | 1 Year | 3 Year | 5 Year | 10 Year | Total | Net(2) |
| Vulcan Value Partners Small Cap Fund – Investor Class(3) | 10.66% | -19.99% | -5.12% | 1.20% | 7.66% | 8.53% | 1.27% | 1.26% |
| Vulcan Value Partners Small Cap Fund – Institutional Class | 10.81% | -19.79% | – | – | – | -12.82% | 1.33% | 1.01% |
| Russell 2000® Value Index(4) | 12.44% | -13.92% | -4.05% | 3.71% | 7.06% | 7.49% | | |
| Russell 2000® Index(5) | 18.13% | -0.14% | 2.19% | 7.27% | 9.64% | 10.02% | | |
Performance data quoted represents past performance. Past performance does not guarantee future results. Investment return and principal value of an investment will fluctuate so that an investor’s shares, when sold or redeemed, may be worth more or less than the original cost. The Fund imposes a 2.00% redemption fee on shares held for less than 90 days. Current performance data may be higher or lower than actual data quoted. For the most current month-end performance data, please call 1-877-421-5078.
The table does not reflect the deduction of taxes that a shareholder would pay on Fund distributions or the redemption of Fund shares.
Subject to investment risks, including possible loss of the principal amount invested.
Returns for periods less than 1 year are cumulative.
| * | Inception Dates – Investor Class: 12/30/09, Institutional Class: 5/01/19 |
| (1) | Ratios as of the Prospectus dated August 31, 2020 and may differ from the ratios presented in the Financial Highlights. |
| (2) | Vulcan Value Partners, LLC (“Vulcan” or the “Adviser”) has contractually agreed to limit the Fund’s total annual fund operating expenses (exclusive of Acquired Fund Fees and Expenses, brokerage expenses, interest expense, taxes and extraordinary expenses) to 1.25% and 1.00% of the Fund’s average daily net assets with respect to Investor Class shares and Institutional Class shares, respectively. This agreement (the “Expense Agreement”) is in effect through August 31, 2021. The Adviser will be permitted to recover, on a class-by-class basis, expenses it has borne through the Expense Agreement to the extent that the Fund’s expenses in later periods fall below the expense cap in effect at the time of waiver or reimbursement. Notwithstanding the foregoing, the Fund will not be obligated to pay any such fees and expenses more than three years after the end of the fiscal year in which the fees or expenses were foregone or reimbursed. The Adviser may not discontinue or modify this waiver prior to August 31, 2021 without the approval by the Fund’s Board of Trustees. |
| (3) | The initial share class of the Fund was redesignated as Investor Class shares effective April 23, 2019. |
| (4) | The Russell 2000® Value Index is presented here as an additional index, and measures the performance of small-cap value segment of the U.S.equity universe. It includes those Russell 2000® companies with lower price-to-book ratios and lower forecasted growth values. The Index is not actively managed and does not reflect any deductions for fees, expenses or taxes. An investor may not invest directly in the Index. |
| (5) | The Russell 2000® Index is presented here as an additional index, and measures the performance of the small-cap segment of the U.S. equity universe. The Russell 2000® Index is a subset of the Russell 3000® Index representing approximately 8% of the total market capitalization of that index. It includes approximately 2,000 of the smallest securities based on a combination of their market cap and current index membership. The Index is not actively managed and does not reflect any deductions for fees, expenses or taxes. An investor may not invest directly in the Index. |
| 8 | www.vulcanvaluepartners.com |
Fund Overview
October 31, 2020 (Unaudited)
Growth of $10,000 Initial Investment (for the period ended October 31, 2020)
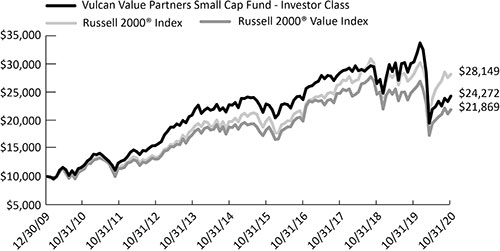
The chart above represents historical performance of a hypothetical investment of $10,000 in the Fund since inception. Past performance does not guarantee future results. This chart does not reflect the deduction of taxes that a shareholder would pay on Fund distributions or the redemption of Fund shares.
Investing in the Fund is subject to investment risks, including possible loss of the principal amount invested.
Industry Allocation (as a % of Net Assets)*
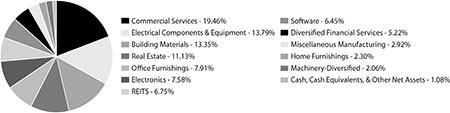
Top Ten Holdings (as a % of Net Assets)*
| Park Hotels & Resorts, Inc. | 6.75% |
| ISS A/S | 6.20% |
| Cushman & Wakefield PLC | 6.18% |
| Forterra PLC | 6.14% |
| EnerSys | 5.76% |
| Virtus Investment Partners, Inc. | 5.22% |
| Jones Lang LaSalle, Inc. | 4.95% |
| Colliers International Group, Inc. | 4.90% |
| Coherent, Inc. | 4.46% |
| ABM Industries, Inc. | 4.40% |
| Top Ten Holdings | 54.96% |
| * | Holdings are subject to change, and may not reflect the current or future position of the portfolio. |
| Semi-Annual Report | October 31, 2020 | 9 |
Disclosure of Fund Expenses
October 31, 2020 (Unaudited)
As a shareholder of the Vulcan Value Partners Small Cap Fund (the “Fund”), you will incur two types of costs: (1) transaction costs, including applicable redemption fees; and (2) ongoing costs, including management fees and other fund operating expenses. The following examples are intended to help you understand your ongoing costs (in dollars) of investing in the Fund and to compare these costs with the ongoing costs of investing in other mutual funds. The examples are based on an investment of $1,000 invested on May 1, 2020 and held until October 31, 2020.
Actual Expenses. The first line of each table below provides information about actual account values and actual expenses. You may use the information in this line, together with the amount you invested, to estimate the expenses that you paid over the period. Simply divide your account value by $1,000 (for example, an $8,600 account value divided by $1,000 = 8.6), then multiply the result by the number in the first line under the heading “Expenses Paid During Period” to estimate the expenses you paid on your account during this period.
Hypothetical Example for Comparison Purposes. The second line of the table below provides information about hypothetical account values and hypothetical expenses based on the Fund’s actual expense ratio and an assumed rate of return of 5% per year before expenses, which is not the Fund’s actual return. The hypothetical account values and expenses may not be used to estimate the actual ending account balance or expenses you paid for the period. You may use this information to compare the ongoing costs of investing in the Fund and other mutual funds. To do so, compare this 5% hypothetical example with the 5% hypothetical examples that appear in the shareholder reports of the other mutual funds.
Please note the expenses shown in the table are meant to highlight ongoing Fund costs only and do not reflect transactional costs, such as redemption fees or exchange fees. Therefore, the second line of the table below is useful in comparing your ongoing costs only, and will not help you determine the relative total costs of owning different funds. In addition, if these transactional costs were included, your costs would have been higher.
Vulcan Value Partners Small Cap Fund
| | Beginning
Account Value
5/1/20 | Ending
Account Value
10/31/20 | Expense Ratio(a) | Expenses Paid
During period
5/1/20 - 10/31/20(b) |
| VULCAN VALUE PARTNERS SMALL CAP FUND | |
| Investor Class | | | | |
| Actual | $1,000.00 | $1,106.60 | 1.25% | $ 6.64 |
| Hypothetical (5% return before expenses) | $1,000.00 | $1,018.90 | 1.25% | $ 6.36 |
| Institutional Class | | | | |
| Actual | $1,000.00 | $1,108.10 | 1.00% | $ 5.31 |
| Hypothetical (5% return before expenses) | $1,000.00 | $1,020.16 | 1.00% | $ 5.09 |
| 10 | www.vulcanvaluepartners.com |
Disclosure of Fund Expenses
October 31, 2020 (Unaudited)
| (a) | The Fund's expense ratios have been annualized based on the Fund's most recent fiscal half-year expenses. |
| (b) | Expenses are equal to the Fund's annualized expense ratio multiplied by the average account value over the period, multiplied by the number of days in the most recent fiscal half-year (184)/365 (to reflect the half-year period). |
| Semi-Annual Report | October 31, 2020 | 11 |
| Statement of Investments | Vulcan Value Partners Fund |
October 31, 2020 (Unaudited)
| | | Shares | | | Value
(Note 2) | |
| COMMON STOCKS (100.04%) | | | | | | | | |
| Communications (17.51%) | | | | | | | | |
| Internet (17.51%) | | | | | | | | |
| Alphabet, Inc., Class C(a) | | | 33,745 | | | $ | 54,700,982 | |
| Amazon.com, Inc.(a) | | | 23,317 | | | | 70,793,910 | |
| Facebook, Inc., Class A(a) | | | 235,439 | | | | 61,946,355 | |
| Wayfair, Inc., Class A(a) | | | 118,556 | | | | 29,405,445 | |
| | | | | | | | 216,846,692 | |
| | | | | | | | | |
| TOTAL COMMUNICATIONS | | | | | | | 216,846,692 | |
| | | | | | | | | |
| Consumer, Cyclical (8.68%) | | | | | | | | |
| Food Service (1.99%) | | | | | | | | |
| Compass Group PLC | | | 1,804,421 | | | | 24,662,057 | |
| | | | | | | | | |
| Lodging (6.69%) | | | | | | | | |
| Hilton Worldwide Holdings, Inc. | | | 574,003 | | | | 50,403,203 | |
| Whitbread PLC | | | 1,168,302 | | | | 32,495,717 | |
| | | | | | | | 82,898,920 | |
| | | | | | | | | |
| TOTAL CONSUMER, CYCLICAL | | | | | | | 107,560,977 | |
| | | | | | | | | |
| Consumer, Non-cyclical (10.89%) | | | | | | | | |
| Commercial Services (4.30%) | | | | | | | | |
| CoStar Group, Inc.(a) | | | 64,614 | | | | 53,216,737 | |
| | | | | | | | | |
| Healthcare-Services (4.72%) | | | | | | | | |
| Anthem, Inc. | | | 214,555 | | | | 58,530,604 | |
| | | | | | | | | |
| Pharmaceuticals (1.87%) | | | | | | | | |
| CVS Health Corp. | | | 412,766 | | | | 23,152,045 | |
| | | | | | | | | |
| TOTAL CONSUMER, NON-CYCLICAL | | | | | | | 134,899,386 | |
| | | | | | | | | |
| Financial (29.22%) | | | | | | | | |
| Diversified Financial Services (14.20%) | | | | | | | | |
| Credit Acceptance Corp.(a) | | | 156,084 | | | | 46,531,762 | |
| Mastercard, Inc., Class A | | | 274,202 | | | | 79,145,665 | |
| Visa, Inc., Class A | | | 275,978 | | | | 50,147,963 | |
| | | | | | | | 175,825,390 | |
| | | | | | | | | |
| Private Equity (10.01%) | | | | | | | | |
| Carlyle Group, Inc. | | | 2,045,021 | | | | 50,961,923 | |
| KKR & Co., Inc., Class A | | | 2,139,552 | | | | 73,065,701 | |
| | | | | | | | 124,027,624 | |
| 12 | www.vulcanvaluepartners.com |
| Vulcan Value Partners Fund | Statement of Investments |
October 31, 2020 (Unaudited)
| | | Shares | | | Value
(Note 2) | |
| Financial (continued) | | | | | | | | |
| Real Estate (5.01%) | | | | | | | | |
| Jones Lang LaSalle, Inc. | | | 549,908 | | | $ | 62,062,617 | |
| | | | | | | | | |
| TOTAL FINANCIAL | | | | | | | 361,915,631 | |
| | | | | | | | | |
| Industrial (14.21%) | | | | | | | | |
| Aerospace/Defense (9.12%) | | | | | | | | |
| HEICO Corp. | | | 305,909 | | | | 28,602,491 | |
| TransDigm Group, Inc. | | | 176,858 | | | | 84,433,778 | |
| | | | | | | | 113,036,269 | |
| | | | | | | | | |
| Electric Equipment Manufacturing (5.09%) | | | | | | | | |
| General Electric Co. | | | 8,494,933 | | | | 63,032,403 | |
| | | | | | | | | |
| TOTAL INDUSTRIAL | | | | | | | 176,068,672 | |
| | | | | | | | | |
| Technology (19.53%) | | | | | | | | |
| Semiconductors (8.80%) | | | | | | | | |
| Qorvo, Inc.(a) | | | 433,290 | | | | 55,183,815 | |
| Skyworks Solutions, Inc. | | | 380,639 | | | | 53,780,484 | |
| | | | | | | | 108,964,299 | |
| | | | | | | | | |
| Software (10.73%) | | | | | | | | |
| Microsoft Corp. | | | 262,197 | | | | 53,087,026 | |
| salesforce.com, Inc.(a) | | | 244,193 | | | | 56,718,708 | |
| SS&C Technologies Holdings, Inc. | | | 391,068 | | | | 23,159,047 | |
| | | | | | | | 132,964,781 | |
| | | | | | | | | |
| TOTAL TECHNOLOGY | | | | | | | 241,929,080 | |
| | | | | | | | | |
| TOTAL COMMON STOCKS | | | | | | | | |
| (Cost $990,568,879) | | | | | | | 1,239,220,438 | |
| Semi-Annual Report | October 31, 2020 | 13 |
| Statement of Investments | Vulcan Value Partners Fund |
October 31, 2020 (Unaudited)
| | | 7-Day Yield | | | Shares | | | Value
(Note 2) | |
| SHORT TERM INVESTMENTS (0.11%) | | | | | | | | | | | | |
| Money Market Fund (0.11%) | | | | | | | | | | | | |
| Invesco Government & Agency Portfolio, Institutional Class | | | 0.010 | % | | | 1,325,196 | | | $ | 1,325,196 | |
| | | | | | | | | | | | | |
| TOTAL SHORT TERM INVESTMENTS | | | | | | | | | | | | |
| (Cost $1,325,196) | | | | | | | | | | | 1,325,196 | |
| | | | | | | | | | | | | |
| TOTAL INVESTMENTS (100.15%) | | | | | | | | | | | | |
| (Cost $991,894,075) | | | | | | | | | | $ | 1,240,545,634 | |
| | | | | | | | | | | | | |
| Liabilities In Excess Of Other Assets (-0.15%) | | | | | | | | | | | (1,905,343 | ) |
| | | | | | | | | | | | | |
| NET ASSETS (100.00%) | | | | | | | | | | $ | 1,238,640,291 | |
| (a) | Non-Income Producing Security. |
For Fund compliance purposes, the Fund's industry classifications refer to any one or more of the industry sub-classifications used by one or more widely recognized market indexes or ratings group indexes, and/or as defined by Fund management. This definition may not apply for purposes of this report, which may combine industry sub-classifications for reporting ease. Industries are shown as a percentage of net assets.
See Accompanying Notes to Financial Statements.
| 14 | www.vulcanvaluepartners.com |
| Vulcan Value Partners Small Cap Fund | Statement of Investments |
October 31, 2020 (Unaudited)
| | | Shares | | | Value
(Note 2) | |
| COMMON STOCKS (98.92%) | | | | | | | | |
| Consumer, Cyclical (10.21%) | | | | | | | | |
| Home Furnishings (2.30%) | | | | | | | | |
| Howden Joinery Group PLC(a) | | | 1,379,313 | | | $ | 11,379,020 | |
| | | | | | | | | |
| Office Furnishings (7.91%) | | | | | | | | |
| Herman Miller, Inc. | | | 586,664 | | | | 17,875,652 | |
| Knoll, Inc. | | | 1,857,817 | | | | 21,290,583 | |
| | | | | | | | 39,166,235 | |
| | | | | | | | | |
| TOTAL CONSUMER, CYCLICAL | | | | | | | 50,545,255 | |
| | | | | | | | | |
| Consumer, Non-cyclical (19.46%) | | | | | | | | |
| Commercial Services (19.46%) | | | | | | | | |
| ABM Industries, Inc. | | | 627,081 | | | | 21,772,252 | |
| Colliers International Group, Inc. | | | 342,009 | | | | 24,241,598 | |
| ISS A/S(a) | | | 2,365,409 | | | | 30,692,588 | |
| Savills PLC(a) | | | 1,817,352 | | | | 19,576,735 | |
| | | | | | | | 96,283,173 | |
| | | | | | | | | |
| TOTAL CONSUMER, NON-CYCLICAL | | | | | | | 96,283,173 | |
| | | | | | | | | |
| Financial (23.10%) | | | | | | | | |
| Diversified Financial Services (5.22%) | | | | | | | | |
| Virtus Investment Partners, Inc. | | | 162,003 | | | | 25,847,579 | |
| | | | | | | | | |
| Real Estate (11.13%) | | | | | | | | |
| Cushman & Wakefield PLC(a) | | | 2,609,262 | | | | 30,580,551 | |
| Jones Lang LaSalle, Inc. | | | 217,210 | | | | 24,514,320 | |
| | | | | | | | 55,094,871 | |
| | | | | | | | | |
| REITS (6.75%) | | | | | | | | |
| Park Hotels & Resorts, Inc. | | | 3,361,868 | | | | 33,383,349 | |
| | | | | | | | | |
| TOTAL FINANCIAL | | | | | | | 114,325,799 | |
| | | | | | | | | |
| Industrial (39.70%) | | | | | | | | |
| Building Materials (13.35%) | | | | | | | | |
| Curtiss-Wright Corp. | | | 185,174 | | | | 15,621,279 | |
| Forterra PLC(a) | | | 12,994,310 | | | | 30,402,544 | |
| Ibstock PLC(a) | | | 9,636,437 | | | | 20,049,382 | |
| | | | | | | | 66,073,205 | |
| | | | | | | | | |
| Electrical Components & Equipment (13.79%) | | | | | | | | |
| Acuity Brands, Inc. | | | 219,884 | | | | 19,600,460 | |
| EnerSys | | | 397,852 | | | | 28,486,203 | |
| Semi-Annual Report | October 31, 2020 | 15 |
| Statement of Investments | Vulcan Value Partners Small Cap Fund |
October 31, 2020 (Unaudited)
| | | Shares | | | Value
(Note 2) | |
| Industrial (continued) | | | | | | | | |
| Electrical Components & Equipment (continued) | | | | | | | | |
| Littelfuse, Inc. | | | 101,887 | | | $ | 20,167,513 | |
| | | | | | | | 68,254,176 | |
| | | | | | | | | |
| Electronics (7.58%) | | | | | | | | |
| Coherent, Inc.(a) | | | 176,307 | | | | 22,063,058 | |
| Ituran Location and Control, Ltd. | | | 1,092,361 | | | | 15,456,908 | |
| | | | | | | | 37,519,966 | |
| | | | | | | | | |
| Machinery-Diversified (2.06%) | | | | | | | | |
| Stabilus SA | | | 180,196 | | | | 10,203,614 | |
| | | | | | | | | |
| Miscellaneous Manufacturing (2.92%) | | | | | | | | |
| Carlisle Cos., Inc. | | | 116,484 | | | | 14,428,873 | |
| | | | | | | | | |
| TOTAL INDUSTRIAL | | | | | | | 196,479,834 | |
| | | | | | | | | |
| Technology (6.45%) | | | | | | | | |
| Software (6.45%) | | | | | | | | |
| ACI Worldwide, Inc.(a) | | | 439,404 | | | | 12,817,414 | |
| Cerence, Inc.(a) | | | 349,553 | | | | 19,078,603 | |
| | | | | | | | 31,896,017 | |
| | | | | | | | | |
| TOTAL TECHNOLOGY | | | | | | | 31,896,017 | |
| | | | | | | | | |
| TOTAL COMMON STOCKS | | | | | | | | |
| (Cost $486,224,493) | | | | | | | 489,530,078 | |
| | | 7-Day Yield | | | Shares | | | Value
(Note 2) | |
| SHORT TERM INVESTMENTS (1.20%) | | | | | | | | | | | | |
| Money Market Fund (1.20%) | | | | | | | | | | | | |
| Invesco Government & Agency Portfolio, Institutional Class | | | 0.010 | % | | | 5,975,581 | | | | 5,975,581 | |
| | | | | | | | | | | | | |
| TOTAL SHORT TERM INVESTMENTS | | | | | | | | | | | | |
| (Cost $5,975,581) | | | | | | | | | | | 5,975,581 | |
| | | | | | | | | | | | | |
| TOTAL INVESTMENTS (100.12%) | | | | | | | | | | | | |
| (Cost $492,200,074) | | | | | | | | | | $ | 495,505,659 | |
| | | | | | | | | | | | | |
| Liabilities In Excess Of Other Assets (-0.12%) | | | | | | | | | | | (624,532 | ) |
| | | | | | | | | | | | | |
| NET ASSETS (100.00%) | | | | | | | | | | $ | 494,881,127 | |
| (a) | Non-Income Producing Security. |
| 16 | www.vulcanvaluepartners.com |
| Vulcan Value Partners Small Cap Fund | Statement of Investments |
October 31, 2020 (Unaudited)
For Fund compliance purposes, the Fund's industry classifications refer to any one or more of the industry sub-classifications used by one or more widely recognized market indexes or ratings group indexes, and/or as defined by Fund management. This definition may not apply for purposes of this report, which may combine industry sub-classifications for reporting ease. Industries are shown as a percentage of net assets.
See Accompanying Notes to Financial Statements.
| Semi-Annual Report | October 31, 2020 | 17 |
Statements of Assets and Liabilities
October 31, 2020 (Unaudited)
| | | Vulcan Value Partners Fund | | | Vulcan Value Partners Small Cap Fund | |
| ASSETS: | | | | | | |
| Investments, at value | | $ | 1,240,545,634 | | | $ | 495,505,659 | |
| Cash | | | 666 | | | | 156 | |
| Foreign currency, at value (Cost $– and $87,920) | | | – | | | | 91,629 | |
| Receivable for investments sold | | | 20,071,499 | | | | 5,729,670 | |
| Receivable for shares sold | | | 4,886,449 | | | | 825,249 | |
| Dividends receivable | | | 3,366,896 | | | | 303,747 | |
| Other assets | | | 21,770 | | | | 12,506 | |
| Total assets | | | 1,268,892,914 | | | | 502,468,616 | |
| | | | | | | | | |
| LIABILITIES: | | | | | | | | |
| Payable for investments purchased | | | 22,687,846 | | | | 5,365,380 | |
| Payable for shares redeemed | | | 6,271,214 | | | | 1,651,475 | |
| Payable to adviser | | | 936,833 | | | | 421,117 | |
| Payable for administration fees | | | 70,933 | | | | 29,859 | |
| Payable for transfer agency fees | | | 19,550 | | | | 18,198 | |
| Payable for delegated transfer agent equivalent services fees | | | 86,502 | | | | 50,043 | |
| Payable for professional fees | | | 25,467 | | | | 17,178 | |
| Payable for trustee fees and expenses | | | 36,853 | | | | 12,394 | |
| Payable for principal financial officer fees | | | 2,075 | | | | 682 | |
| Accrued expenses and other liabilities | | | 115,350 | | | | 21,163 | |
| Total liabilities | | | 30,252,623 | | | | 7,587,489 | |
| NET ASSETS | | $ | 1,238,640,291 | | | $ | 494,881,127 | |
| | | | | | | | | |
| NET ASSETS CONSIST OF: | | | | | | | | |
| | | | | | | | | |
| Paid-in capital (Note 5) | | $ | 931,074,202 | | | $ | 539,193,641 | |
| Total distributable earnings | | | 307,566,089 | | | | (44,312,514 | ) |
| NET ASSETS | | $ | 1,238,640,291 | | | $ | 494,881,127 | |
| | | | | | | | | |
| INVESTMENTS, AT COST | | $ | 991,894,075 | | | $ | 492,200,074 | |
See Accompanying Notes to Financial Statements.
| 18 | www.vulcanvaluepartners.com |
Statements of Assets and Liabilities
October 31, 2020 (Unaudited)
| | | Vulcan Value Partners Fund | | | Vulcan Value Partners Small Cap Fund | |
| PRICING OF SHARES: | | | | | | |
| Investor Class: | | | | | | | | |
| Net Asset Value, offering and redemption price per share | | $ | 22.71 | | | $ | 13.29 | |
| Net Assets | | $ | 498,348,625 | | | $ | 197,367,877 | |
| Shares of beneficial interest outstanding (unlimited number of shares, no par value common stock authorized) | | | 21,943,985 | | | | 14,850,029 | |
| Institutional Class: | | | | | | | | |
| Net Asset Value, offering and redemption price per share | | | 22.77 | | | | 13.33 | |
| Net Assets | | | 740,291,666 | | | | 297,513,250 | |
| Shares of beneficial interest outstanding (unlimited number of shares, no par value common stock authorized) | | | 32,514,642 | | | | 22,312,381 | |
See Accompanying Notes to Financial Statements.
| Semi-Annual Report | October 31, 2020 | 19 |
Statements of Operations
For the Six Months Ended October 31, 2020 (Unaudited)
| | | Vulcan Value Partners Fund | | | Vulcan Value Partners Small Cap Fund | |
| INVESTMENT INCOME: | | | | | | | | |
| Dividends | | $ | 4,376,324 | | | $ | 1,460,404 | |
| Foreign taxes withheld | | | – | | | | (30,076 | ) |
| Total investment income | | | 4,376,324 | | | | 1,430,328 | |
| | | | | | | | | |
| EXPENSES: | | | | | | | | |
| Investment advisory fees (Note 6) | | | 6,569,815 | | | | 2,735,958 | |
| Administrative fees | | | 210,917 | | | | 80,493 | |
| Transfer agency fees | | | 49,519 | | | | 47,387 | |
| Delegated transfer agent equivalent services fees | | | | | | | | |
| Investor Class | | | 16,694 | | | | 10,540 | |
| Institutional Class | | | 232,017 | | | | 102,232 | |
| Professional fees | | | 24,198 | | | | 15,661 | |
| Custodian fees | | | 25,905 | | | | 28,473 | |
| Principal financial officer fees | | | 5,865 | | | | 2,005 | |
| Trustee fees and expenses | | | 39,060 | | | | 13,001 | |
| ReFlow Fees (Note 2) | | | 101,597 | | | | – | |
| Other | | | 68,053 | | | | 37,214 | |
| Total expenses before waiver | | | 7,343,640 | | | | 3,072,964 | |
| Less fees waived/reimbursed by investment adviser (Note 6) | | | | | | | | |
| Investor Class | | | – | | | | (4,377 | ) |
| Institutional Class | | | (1,143,238 | ) | | | (471,680 | ) |
| Total net expenses | | | 6,200,402 | | | | 2,596,907 | |
| NET INVESTMENT LOSS | | | (1,824,078 | ) | | | (1,166,579 | ) |
| | | | | | | | | |
| Net realized gain on investments(a) | | | 87,154,657 | | | | 1,107,160 | |
| Net realized gain/(loss) on foreign currency transactions | | | 55,283 | | | | (14,797 | ) |
| Net realized gain | | | 87,209,940 | | | | 1,092,363 | |
| Net change in unrealized appreciation of investments | | | 111,969,714 | | | | 48,404,682 | |
| Net change in unrealized appreciation on translation of assets and liabilities denominated in foreign currencies | | | 176,076 | | | | 16,410 | |
| Net change in unrealized appreciation | | | 112,145,790 | | | | 48,421,092 | |
| NET REALIZED AND UNREALIZED GAIN ON INVESTMENTS | | | 199,355,730 | | | | 49,513,455 | |
| NET INCREASE IN NET ASSETS RESULTING FROM OPERATIONS | | $ | 197,531,652 | | | $ | 48,346,876 | |
| (a) | See Note 2 for gain/(loss) on In-Kind transactions. |
See Accompanying Notes to Financial Statements.
| 20 | www.vulcanvaluepartners.com |
| Vulcan Value Partners Fund | Statements of Changes in Net Assets |
| | | For the Six
Months Ended
October 31, 2020 (Unaudited) | | | For the
Year Ended
April 30, 2020 | |
| OPERATIONS: | | | | | | |
| Net investment income/(loss) | | $ | (1,824,078 | ) | | $ | 3,207,527 | |
| Net realized gain | | | 87,209,940 | | | | 52,662,922 | |
| Net change in unrealized appreciation/(depreciation) | | | 112,145,790 | | | | (90,186,778 | ) |
| Net increase/(decrease) in net assets resulting from operations | | | 197,531,652 | | | | (34,316,329 | ) |
| | | | | | | | | |
| DISTRIBUTIONS TO SHAREHOLDERS (Note 3): | | | | | | | | |
| Total amount of distribution | | | | | | | | |
| Investor Class | | | – | | | | (32,843,455 | ) |
| Institutional Class(a) | | | – | | | | (33,490,625 | ) |
| Net decrease in net assets from distributions | | | – | | | | (66,334,080 | ) |
| | | | | | | | | |
| SHARE TRANSACTIONS (Note 5): | | | | | | | | |
| Investor Class | | | | | | | | |
| Proceeds from sales of shares | | | 27,083,254 | | | | 181,355,243 | |
| Issued to shareholders in reinvestment of distributions | | | – | | | | 28,416,427 | |
| Cost of shares redeemed, net of redemption fees | | | (107,930,329 | ) | | | (974,172,281 | ) |
| Institutional Class(a) | | | | | | | | |
| Proceeds from sales of shares | | | 102,403,607 | | | | 970,339,907 | |
| Issued to shareholders in reinvestment of distributions | | | – | | | | 31,558,042 | |
| Cost of shares redeemed, net of redemption fees | | | (249,483,391 | ) | | | (152,367,669 | ) |
| Net increase/(decrease) from share transactions | | | (227,926,859 | ) | | | 85,129,669 | |
| | | | | | | | | |
| Net decrease in net assets | | | (30,395,207 | ) | | | (15,520,740 | ) |
| | | | | | | | | |
| NET ASSETS: | | | | | | | | |
| Beginning of year | | | 1,269,035,498 | | | | 1,284,556,238 | |
| End of period | | $ | 1,238,640,291 | | | $ | 1,269,035,498 | |
| (a) | Institutional Class inception date was May 1, 2019. |
See Accompanying Notes to Financial Statements.
| Semi-Annual Report | October 31, 2020 | 21 |
| Vulcan Value Partners Small Cap Fund | Statements of Changes in Net Assets |
| | | For the Six
Months Ended
October 31, 2020 (Unaudited) | | | For the
Year Ended
April 30, 2020 | |
| OPERATIONS: | | | | | | |
| Net investment income/(loss) | | $ | (1,166,579 | ) | | $ | 3,643,849 | |
| Net realized gain/(loss) | | | 1,092,363 | | | | (30,000,442 | ) |
| Net change in unrealized appreciation/(depreciation) | | | 48,421,092 | | | | (118,083,682 | ) |
| Net increase/(decrease) in net assets resulting from operations | | | 48,346,876 | | | | (144,440,275 | ) |
| | | | | | | | | |
| DISTRIBUTIONS TO SHAREHOLDERS (Note 3): | | | | | | | | |
| Total amount of distribution | | | | | | | | |
| Investor Class(a) | | | – | | | | (11,207,675 | ) |
| Institutional Class(b) | | | – | | | | (12,648,479 | ) |
| Net decrease in net assets from distributions | | | – | | | | (23,856,154 | ) |
| | | | | | | | | |
| SHARE TRANSACTIONS (Note 5): | | | | | | | | |
| Investor Class(a) | | | | | | | | |
| Proceeds from sales of shares | | | 57,240,095 | | | | 48,105,590 | |
| Issued to shareholders in reinvestment of distributions | | | – | | | | 9,756,596 | |
| Cost of shares redeemed, net of redemption fees | | | (29,607,216 | ) | | | (371,647,565 | ) |
| Institutional Class(b) | | | | | | | | |
| Proceeds from sales of shares | | | 101,659,519 | | | | 415,146,676 | |
| Issued to shareholders in reinvestment of distributions | | | – | | | | 11,957,260 | |
| Cost of shares redeemed, net of redemption fees | | | (83,636,806 | ) | | | (87,317,255 | ) |
| Net increase from share transactions | | | 45,655,592 | | | | 26,001,302 | |
| | | | | | | | | |
| Net increase/(decrease) in net assets | | | 94,002,468 | | | | (142,295,127 | ) |
| | | | | | | | | |
| NET ASSETS: | | | | | | | | |
| Beginning of year | | | 400,878,659 | | | | 543,173,786 | |
| End of period | | $ | 494,881,127 | | | $ | 400,878,659 | |
| (a) | Prior to April 23, 2019, the Investor class was the initial share class. |
| (b) | Institutional Class inception date was May 1, 2019. |
See Accompanying Notes to Financial Statements.
| 22 | www.vulcanvaluepartners.com |
Intentionally Left Blank
Financial Highlights
For a share outstanding throughout the period or years presented.
| Investor Class |
| NET ASSET VALUE, BEGINNING OF PERIOD |
| INCOME/(LOSS) FROM OPERATIONS: |
| Net investment income/(loss)(a) |
| Net realized and unrealized gain/(loss) on investments |
| Total from investment operations |
| |
| LESS DISTRIBUTIONS TO SHAREHOLDERS: |
| From net investment income |
| From net realized gains on investments |
| Total distributions |
| |
| Redemption fees added to paid-in capital |
| Increase/(decrease) in net asset value |
| NET ASSET VALUE, END OF PERIOD |
| |
| Total return |
| |
| RATIOS AND SUPPLEMENTAL DATA: |
| Net assets, end of period (000's) |
| |
| Ratio of expenses to average net assets without fee waivers/reimbursements |
| Ratio of expenses to average net assets including fee waivers/reimbursements |
| |
| Net investment income/(loss) to average net assets including fee waivers/reimbursements |
| |
| Portfolio turnover rate |
| (a) | Per share numbers have been calculated using the average shares method. |
| (b) | Less than $0.005 per share. |
See Accompanying Notes to Financial Statements.
| 24 | www.vulcanvaluepartners.com |
Vulcan Value Partners Fund
For the Six
Months Ended
October 31, 2020
(Unaudited) | | | For the
Year Ended
April 30, 2020 | | | For the
Year Ended
April 30, 2019 | | | For the Year Ended
April 30, 2018 | | | For the
Year Ended
April 30, 2017 | | | For the
Year Ended
April 30, 2016 | |
| $ | 19.50 | | | $ | 21.05 | | | $ | 21.39 | | | $ | 19.30 | | | $ | 17.17 | | | $ | 19.97 | |
| | | | | | | | | | | | | | | | | | | | | | | |
| | (0.05 | ) | | | 0.03 | | | | 0.08 | | | | 0.09 | | | | 0.18 | | | | 0.20 | |
| | 3.26 | | | | (0.53 | ) | | | 1.13 | | | | 2.35 | | | | 2.18 | | | | (1.51 | ) |
| | 3.21 | | | | (0.50 | ) | | | 1.21 | | | | 2.44 | | | | 2.36 | | | | (1.31 | ) |
| | | | | | | | | | | | | | | | | | | | | | | |
| | | | | | | | | | | | | | | | | | | | | | | |
| | – | | | | 0.00 | (b) | | | (0.13 | ) | | | (0.12 | ) | | | (0.23 | ) | | | (0.13 | ) |
| | – | | | | (1.05 | ) | | | (1.42 | ) | | | (0.23 | ) | | | – | | | | (1.36 | ) |
| | – | | | | (1.05 | ) | | | (1.55 | ) | | | (0.35 | ) | | | (0.23 | ) | | | (1.49 | ) |
| | | | | | | | | | | | | | | | | | | | | | | |
| | 0.00 | (b) | | | 0.00 | (b) | | | 0.00 | (b) | | | 0.00 | (b) | | | 0.00 | (b) | | | 0.00 | (b) |
| | 3.21 | | | | (1.55 | ) | | | (0.34 | ) | | | 2.09 | | | | 2.13 | | | | (2.80 | ) |
| $ | 22.71 | | | $ | 19.50 | | | $ | 21.05 | | | $ | 21.39 | | | $ | 19.30 | | | $ | 17.17 | |
| | | | | | | | | | | | | | | | | | | | | | | |
| | 16.46 | %(c) | | | (3.15 | %) | | | 6.80 | % | | | 12.72 | % | | | 13.85 | % | | | (6.49 | %) |
| | | | | | | | | | | | | | | | | | | | | | | |
| | | | | | | | | | | | | | | | | | | | | | | |
| $ | 498,349 | | | $ | 500,309 | | | $ | 1,284,556 | | | $ | 1,314,519 | | | $ | 1,284,669 | | | $ | 1,528,080 | |
| | | | | | | | | | | | | | | | | | | | | | | |
| | 1.09 | %(d) | | | 1.09 | % | | | 1.08 | % | | | 1.08 | % | | | 1.07 | % | | | 1.08 | % |
| | 1.09 | %(d) | | | 1.09 | % | | | 1.08 | % | | | 1.08 | % | | | 1.07 | % | | | 1.08 | % |
| | (0.43 | %)(d) | | | 0.12 | % | | | 0.38 | % | | | 0.46 | % | | | 1.01 | % | | | 1.10 | % |
| | | | | | | | | | | | | | | | | | | | | | | |
| | 34 | %(c) | | | 80 | % | | | 73 | % | | | 50 | % | | | 49 | % | | | 85 | % |
See Accompanying Notes to Financial Statements.
| Semi-Annual Report | October 31, 2020 | 25 |
| Financial Highlights | Vulcan Value Partners Fund |
For a share outstanding throughout the periods presented.
| Institutional Class | | For the Period May 1, 2020 to
October 31, 2020 | | | For the Period
May 1, 2019
(Inception) to
April 30, 2020 | |
| NET ASSET VALUE, BEGINNING OF PERIOD | | $ | 19.52 | | | $ | 21.02 | |
| INCOME/(LOSS) FROM OPERATIONS: | | | | | | | | |
| Net investment income/(loss)(a) | | | (0.02 | ) | | | 0.09 | |
| Net realized and unrealized gain/(loss) on investments | | | 3.27 | | | | (0.51 | ) |
| Total from investment operations | | | 3.25 | | | | (0.42 | ) |
| | | | | | | | | |
| LESS DISTRIBUTIONS TO SHAREHOLDERS: | | | | | | | | |
| From net investment income | | | – | | | | (0.03 | ) |
| From net realized gains on investments | | | – | | | | (1.05 | ) |
| Total distributions | | | – | | | | (1.08 | ) |
| | | | | | | | | |
| Redemption fees added to paid-in capital | | | 0.00 | (b) | | | 0.00 | (b) |
| Increase/(decrease) in net asset value | | | 3.25 | | | | (1.50 | ) |
| NET ASSET VALUE, END OF PERIOD | | $ | 22.77 | | | $ | 19.52 | |
| | | | | | | | | |
| Total return | | | 16.65 | %(c) | | | (2.83 | %)(c) |
| | | | | | | | | |
| RATIOS AND SUPPLEMENTAL DATA: | | | | | | | | |
| Net assets, end of period (000's) | | $ | 740,292 | | | $ | 768,726 | |
| | | | | | | | | |
| Ratio of expenses to average net assets without fee waivers/reimbursements | | | 1.14 | %(d) | | | 1.14 | %(d) |
| Ratio of expenses to average net assets including fee waivers/reimbursements | | | 0.85 | %(d) | | | 0.85 | %(d) |
| Net investment income/(loss) to average net assets including fee waivers/reimbursements | | | (0.18 | %)(d) | | | 0.40 | %(d) |
| | | | | | | | | |
| Portfolio turnover rate | | | 34 | %(c) | | | 80 | %(c) |
| (a) | Per share numbers have been calculated using the average shares method. |
| (b) | Less than $0.005 per share. |
See Accompanying Notes to Financial Statements.
| 26 | www.vulcanvaluepartners.com |
Intentionally Left Blank
Financial Highlights
For a share outstanding throughout the period or years presented.
| Investor Class |
| NET ASSET VALUE, BEGINNING OF PERIOD |
| INCOME/(LOSS) FROM OPERATIONS: |
| Net investment income/(loss)(a) |
| Net realized and unrealized gain/(loss) on investments |
| Total from investment operations |
| |
| LESS DISTRIBUTIONS TO SHAREHOLDERS: |
| From net investment income |
| From net realized gains on investments |
| Total distributions |
| |
| Redemption fees added to paid-in capital |
| Increase/(decrease) in net asset value |
| NET ASSET VALUE, END OF PERIOD |
| |
| Total return |
| |
| RATIOS AND SUPPLEMENTAL DATA: |
| Net assets, end of period (000's) |
| |
| Ratio of expenses to average net assets without fee waivers/reimbursements |
| Ratio of expenses to average net assets including fee waivers/reimbursements |
| |
| Net investment income/(loss) to average net assets including fee waivers/reimbursements |
| |
| Portfolio turnover rate |
| (a) | Per share numbers have been calculated using the average shares method. |
| (b) | Less than $0.005 per share. |
See Accompanying Notes to Financial Statements.
| 28 | www.vulcanvaluepartners.com |
Vulcan Value Partners Small Cap Fund
For the Six
Months Ended
October 31, 2020
(Unaudited) | | | For the
Year Ended
April 30, 2020 | | | For the
Year Ended
April 30, 2019 | | | For the
Year Ended
April 30, 2018 | | | For the
Year Ended
April 30, 2017 | | | For the
Year Ended
April 30, 2016 | |
| $ | 12.01 | | | $ | 17.31 | | | $ | 19.52 | | | $ | 20.16 | | | $ | 16.58 | | | $ | 18.61 | |
| | | | | | | | | | | | | | | | | | | | | | | |
| | (0.04 | ) | | | 0.12 | | | | 0.10 | | | | 0.02 | | | | 0.03 | | | | 0.10 | |
| | 1.32 | | | | (4.57 | ) | | | 0.38 | | | | 0.59 | | | | 3.61 | | | | (1.05 | ) |
| | 1.28 | | | | (4.45 | ) | | | 0.48 | | | | 0.61 | | | | 3.64 | | | | (0.95 | ) |
| | | | | | | | | | | | | | | | | | | | | | | |
| | | | | | | | | | | | | | | | | | | | | | | |
| | – | | | | (0.08 | ) | | | (0.12 | ) | | | (0.03 | ) | | | (0.06 | ) | | | (0.06 | ) |
| | – | | | | (0.77 | ) | | | (2.57 | ) | | | (1.22 | ) | | | – | | | | (1.02 | ) |
| | – | | | | (0.85 | ) | | | (2.69 | ) | | | (1.25 | ) | | | (0.06 | ) | | | (1.08 | ) |
| | | | | | | | | | | | | | | | | | | | | | | |
| | 0.00 | (b) | | | 0.00 | (b) | | | 0.00 | (b) | | | 0.00 | (b) | | | 0.00 | (b) | | | 0.00 | (b) |
| | 1.28 | | | | (5.30 | ) | | | (2.21 | ) | | | (0.64 | ) | | | 3.58 | | | | (2.03 | ) |
| $ | 13.29 | | | $ | 12.01 | | | $ | 17.31 | | | $ | 19.52 | | | $ | 20.16 | | | $ | 16.58 | |
| | | | | | | | | | | | | | | | | | | | | | | |
| | 10.66 | %(c) | | | (27.28 | %) | | | 4.76 | % | | | 3.08 | % | | | 21.97 | % | | | (5.04 | %) |
| | | | | | | | | | | | | | | | | | | | | | | |
| | | | | | | | | | | | | | | | | | | | | | | |
| $ | 197,368 | | | $ | 153,249 | | | $ | 543,174 | | | $ | 1,196,558 | | | $ | 1,255,606 | | | $ | 1,147,007 | |
| | | | | | | | | | | | | | | | | | | | | | | |
| | 1.26 | %(d) | | | 1.26 | % | | | 1.27 | % | | | 1.24 | % | | | 1.25 | % | | | 1.25 | % |
| | 1.25 | %(d) | | | 1.25 | % | | | 1.25 | % | | | 1.24 | % | | | 1.25 | % | | | 1.25 | % |
| | (0.65 | %)(d) | | | 0.75 | % | | | 0.54 | % | | | 0.08 | % | | | 0.18 | % | | | 0.61 | % |
| | | | | | | | | | | | | | | | | | | | | | | |
| | 38 | %(c) | | | 102 | % | | | 68 | % | | | 68 | % | | | 52 | % | | | 80 | % |
| Semi-Annual Report | October 31, 2020 | 29 |
| Financial Highlights | Vulcan Value Partners Small Cap Fund |
For a share outstanding throughout the periods presented.
| Institutional Class | | For the Period
May 1, 2020 to
October 31, 2020 | | | For the Period
May 1, 2019
(Inception) to
April 30, 2020 | |
| NET ASSET VALUE, BEGINNING OF PERIOD | | $ | 12.03 | | | $ | 17.18 | |
| INCOME/(LOSS) FROM OPERATIONS: | | | | | | | | |
| Net investment income/(loss)(a) | | | (0.03 | ) | | | 0.12 | |
| Net realized and unrealized gain/(loss) on investments | | | 1.33 | | | | (4.41 | ) |
| Total from investment operations | | | 1.30 | | | | (4.29 | ) |
| | | | | | | | | |
| LESS DISTRIBUTIONS TO SHAREHOLDERS: | | | | | | | | |
| From net investment income | | | – | | | | (0.09 | ) |
| From net realized gains on investments | | | – | | | | (0.77 | ) |
| Total distributions | | | – | | | | (0.86 | ) |
| | | | | | | | | |
| Redemption fees added to paid-in capital | | | 0.00 | (b) | | | 0.00 | (b) |
| Increase/(decrease) in net asset value | | | 1.30 | | | | (5.15 | ) |
| NET ASSET VALUE, END OF PERIOD | | $ | 13.33 | | | $ | 12.03 | |
| | | | | | | | | |
| Total return | | | 10.81 | %(c) | | | (26.56 | %)(c) |
| | | | | | | | | |
| RATIOS AND SUPPLEMENTAL DATA: | | | | | | | | |
| Net assets, end of period (000's) | | $ | 297,513 | | | $ | 247,629 | |
| | | | | | | | | |
| Ratio of expenses to average net assets without fee waivers/reimbursements | | | 1.31 | %(d) | | | 1.32 | %(d) |
| Ratio of expenses to average net assets including fee waivers/reimbursements | | | 1.00 | %(d) | | | 1.00 | %(d) |
| Net investment income/(loss) to average net assets including fee waivers/reimbursements | | | (0.40 | %)(d) | | | 0.76 | %(d) |
| | | | | | | | | |
| Portfolio turnover rate | | | 38 | %(c) | | | 102 | %(c) |
| (a) | Per share numbers have been calculated using the average shares method. |
| (b) | Less than $0.005 per share. |
See Accompanying Notes to Financial Statements.
| 30 | www.vulcanvaluepartners.com |
Notes to Financial Statements
October 31, 2020 (Unaudited)
1. ORGANIZATION
Financial Investors Trust (the “Trust”) is organized as a Delaware statutory trust and is registered as an open-end management investment company under the Investment Company Act of 1940, as amended (“1940 Act”). The Trust consists of multiple separate portfolios or series. This semi-annual report describes the Vulcan Value Partners Fund and Vulcan Value Partners Small Cap Fund (each a “Fund” and collectively, the “Funds”). The Funds seek to achieve long-term capital appreciation. The Funds offer Investor Class and Institutional Class shares.
2. SIGNIFICANT ACCOUNTING POLICIES
The accompanying financial statements were prepared in accordance with accounting principles generally accepted in the United States of America (“U.S. GAAP”), including policies specific to investment companies. The preparation of financial statements in conformity with U.S. GAAP requires management to make certain estimates and assumptions that affect the reported amounts of assets and liabilities and disclosures of contingent assets and liabilities at the date of the financial statements and the reported amounts of revenue and expenses during the period. Actual results could differ from those estimates. The Funds are considered an investment company for financial reporting purposes under U.S. GAAP and follows the accounting and reporting guidance applicable to investment companies in the Financial Accounting Standards Board Accounting Standards Codification Topic 946. The following is a summary of significant accounting policies consistently followed by the Funds in preparation of their financial statements.
Investment Valuation: The Funds generally value their securities based on market prices determined at the close of regular trading on the New York Stock Exchange (“NYSE”), normally 4:00 p.m. Eastern Time, on each day the NYSE is open for trading.
For equity securities and mutual funds that are traded on an exchange, the market price is usually the closing sale or official closing price on that exchange. In the case of equity securities not traded on an exchange, or if such closing prices are not otherwise available, the securities are valued at the mean of the most recent bid and ask prices on such day. Redeemable securities issued by open-end registered investment companies are valued at the investment company’s applicable net asset value, with the exception of exchange-traded open-end investment companies, which are priced as equity securities.
The market price for debt obligations is generally the quote supplied by an independent third-party pricing service approved by the Board of Trustees of the Trust (the “Board” or the “Trustees”), which may use a matrix, formula or other objective method that takes into consideration quotations from dealers, market transactions in comparable investments, market indices and yield curves. If vendors are unable to supply a quote, or if the quote supplied is deemed to be unreliable, the market price may be determined using quotations received from one or more broker–dealers that make a market in the security.
Equity securities that are primarily traded on foreign securities exchanges are valued at the preceding closing values of such securities on their respective exchanges, except when an occurrence subsequent to the time a value was so established is likely to have changed such value. In such an event, the fair values of those securities are determined in good faith through consideration of other factors in accordance with procedures established by and under the general supervision of the Board.
| Semi-Annual Report | October 31, 2020 | 31 |
Notes to Financial Statements
October 31, 2020 (Unaudited)
When such prices or quotations are not available, or when Vulcan Value Partners, LLC (the “Adviser”) believes that they are unreliable, securities may be priced using fair value procedures approved by the Board.
Fair Value Measurements: A three-tier hierarchy has been established to classify fair value measurements for disclosure purposes. Inputs refer broadly to the assumptions that market participants would use in pricing the asset or liability, including assumptions about risk. Inputs may be observable or unobservable. Observable inputs are inputs that reflect the assumptions market participants would use in pricing the asset or liability that are developed based on market data obtained from sources independent of the reporting entity. Unobservable inputs are inputs that reflect the reporting entity’s own assumptions about the assumptions market participants would use in pricing the asset or liability that are developed based on the best information available. Various inputs are used in determining the value of each Fund’s investments as of the reporting period end. The designated input levels are not necessarily an indication of the risk or liquidity associated with these investments. These inputs are categorized in the following hierarchy under applicable financial accounting standards:
| Level 1 – | Unadjusted quoted prices in active markets for identical investments, unrestricted assets or liabilities that the Funds have the ability to access at the measurement date; |
| Level 2 – | Quoted prices which are not active, quoted prices for similar assets or liabilities in active markets or inputs other than quoted prices that are observable (either directly or indirectly) for substantially the full term of the asset or liability; and |
| Level 3 – | Significant unobservable prices or inputs (including the Funds’ own assumptions in determining the fair value of investments) where there is little or no market activity for the asset or liability at the measurement date. |
The following is a summary of each input used to value each Fund’s investments as of October 31, 2020:
Vulcan Value Partners Fund:
| Investments in Securities at Value | | Level 1 - Unadjusted Quoted Prices | | | Level 2 - Other Significant Observable Inputs | | | Level 3 - Significant Unobservable Inputs | | | Total | |
| Common Stocks(a) | | $ | 1,239,220,438 | | | $ | – | | | $ | – | | | $ | 1,239,220,438 | |
| Short Term Investments | | | 1,325,196 | | | | – | | | | – | | | | 1,325,196 | |
| TOTAL | | $ | 1,240,545,634 | | | $ | – | | | $ | – | | | $ | 1,240,545,634 | |
Vulcan Value Partners Small Cap Fund:
| Investments in Securities at Value | | Level 1 - Unadjusted Quoted Prices | | | Level 2 - Other Significant Observable Inputs | | | Level 3 - Significant Unobservable Inputs | | | Total | |
| Common Stocks(a) | | $ | 489,530,078 | | | $ | – | | | $ | – | | | $ | 489,530,078 | |
| Short Term Investments | | | 5,975,581 | | | | – | | | | – | | | | 5,975,581 | |
| TOTAL | | $ | 495,505,659 | | | $ | – | | | $ | – | | | $ | 495,505,659 | |
| (a) | For detailed descriptions, see the accompanying Statements of Investments. |
| 32 | www.vulcanvaluepartners.com |
Notes to Financial Statements
October 31, 2020 (Unaudited)
For the six months ended October 31, 2020, the Funds did not have any securities that used significant unobservable inputs (Level 3) in determining fair value.
Investment Transactions and Investment Income: Investment transactions are accounted for on the date the investments are purchased or sold (trade date). Realized gains and losses from investment transactions are reported on an identified cost basis, which is the same basis the Funds use for federal income tax purposes. Interest income, which includes accretion of discounts and amortization of premiums, is accrued and recorded as earned. Dividend income is recognized on the ex-dividend date or, for certain foreign securities, as soon as information is available to the Funds. All of the realized and unrealized gains and losses and net investment income, are allocated daily to each class in proportion to its average daily net assets.
ReFlow Liquidity Program: Each Fund may participate in the ReFlow liquidity program, which is designed to provide an alternative liquidity source for mutual funds experiencing net redemptions of their shares. Pursuant to the program, ReFlow Fund, LLC (“ReFlow”) provides participating mutual funds with a source of cash to meet net shareholder redemptions by standing ready each business day to purchase fund shares up to the value of the net shares redeemed by other shareholders that are to settle the next business day. ReFlow will purchase shares of the Fund at net asset value and will not be subject to any investment minimums. Following purchases of Fund shares, ReFlow then generally redeems those shares when the Fund experiences net subscriptions, at the end of a maximum holding period determined by ReFlow (currently 28 days), or at other times as the Fund may request. ReFlow may choose to redeem its position in the Fund with an in-kind transfer of securities, instead of cash, enabling the Fund to avoid a realization of capital gains on the securities it transfers. ReFlow will not be subject to any short-term redemption fees. While ReFlow holds Fund shares, it will have the same rights and privileges with respect to those shares as any other shareholder. For use of the ReFlow service, a Fund pays a fee to ReFlow each time it purchases Fund shares, calculated by applying to the purchase amount a fee rate determined through an automated daily auction among participating mutual funds. The current minimum fee rate is 0.20% of the value of the Fund shares purchased by ReFlow although the Fund may submit a bid at a higher fee rate if it determines that doing so is in the best interest of Fund shareholders. In accordance with federal securities laws, ReFlow is prohibited from acquiring more than 3% of the outstanding voting securities of a Fund. There is no assurance that ReFlow will have sufficient funds available to meet the Funds’ liquidity needs on a particular day. During the six months ended October 31, 2020, only the Vulcan Value Partner Fund participated in ReFlow. Fees associated with ReFlow are disclosed in the Statements of Operations.
Real Estate Investment Trusts (“REITs”): The Funds may invest a portion of their assets in REITs and are subject to certain risks associated with direct investment in REITs. REITs may be affected by changes in the value of their underlying properties and by defaults by borrowers or tenants. REITs depend generally on their ability to generate cash flow to make distributions to shareowners, and certain REITs have self-liquidation provisions by which mortgages held may be paid in full and distributions of capital returns may be made at any time. In addition, the performance of a REIT may be affected by its failure to qualify for tax-free pass-through of income under the Internal Revenue Code of 1986, as amended (the “Code”), or its failure to maintain exemption from registration under the 1940 Act. A Fund’s investments in REITs may result in such Fund’s receipt of cash in excess of the REITs’ earnings. If the Fund receives such distributions all or a portion of these distributions will constitute a return of capital to such Fund. Receiving a return of capital distribution from REITs will reduce the amount of income available to be distributed to
| Semi-Annual Report | October 31, 2020 | 33 |
Notes to Financial Statements
October 31, 2020 (Unaudited)
Fund shareholders. Income from REITs generally will not be eligible for treatment as qualified dividend income. As the final character of the distributions is not known until reported by the REITs on their 1099s, the Funds utilize an average of the prior year’s reallocation information as an estimate for the current year character of distributions.
Foreign Securities: The Funds may directly purchase securities of foreign issuers. Investing in securities of foreign issuers involves special risks not typically associated with investing in securities of U.S. issuers. The risks include possible reevaluation of currencies, the inability to repatriate foreign currency, less complete financial information about companies and possible future adverse political and economic developments. Moreover, securities of many foreign issuers and their markets may be less liquid and their prices more volatile than those of securities of comparable U.S. issuers.
Foreign Currency Translation: The books and records of the Funds are maintained in U.S. dollars. Investment valuations and other assets and liabilities initially expressed in foreign currencies are converted each business day into U.S. dollars based upon current exchange rates. Prevailing foreign exchange rates may generally be obtained at the close of the NYSE (normally, 4:00 p.m. Eastern Time). The portion of realized and unrealized gains or losses on investments due to fluctuations in foreign currency exchange rates is not separately disclosed and is included in realized and unrealized gains or losses on investments, when applicable.
Trust Expenses: Some expenses of the Trust can be directly attributed to the Funds. Expenses which cannot be directly attributed are apportioned among all funds in the Trust based on average net assets of each fund.
Fund Expenses: Expenses that are specific to a Fund are charged directly to that Fund.
Federal Income Taxes: Each Fund complies with the requirements under Subchapter M of the Internal Revenue Code of 1986, as amended, applicable to regulated investment companies and intends to distribute substantially all of its net taxable income and net capital gains, if any, each year so that it will not be subject to excise tax on undistributed income and gains. The Funds are not subject to income taxes to the extent such distributions are made.
As of and during the six months ended October 31, 2020, the Funds did not have a liability for any unrecognized tax benefits. The Funds file U.S. federal, state, and local tax returns as required. The Fund’s tax returns are subject to examination by the relevant tax authorities until expiration of the applicable statute of limitations, which is generally three years after the filing of the tax return for federal purposes and four years for most state returns. Tax returns for open years have incorporated no uncertain tax positions that require a provision for income taxes.
| 34 | www.vulcanvaluepartners.com |
Notes to Financial Statements
October 31, 2020 (Unaudited)
Distributions to Shareholders: Each Fund normally pays dividends and distributes capital gains, if any, on an annual basis. Income dividend distributions are derived from dividends and other income each Fund receives from its investments, including short-term capital gains. Long term capital gain distributions are derived from gains realized when each Fund sells a security it has owned for more than a year. Each Fund may make additional distributions and dividends at other times if the portfolio manager believes doing so may be necessary for each Fund to avoid or reduce taxes.
Epidemic and Pandemic Risk: Certain countries have been susceptible to epidemics, most recently COVID-19, which has been designated as a pandemic by world health authorities. The outbreak of such epidemics, together with any resulting restrictions on travel or quarantines imposed, could have a negative impact on the economy and business activity globally (including in the countries in which we invest), and thereby could adversely affect the performance of our investments. Furthermore, the rapid development of epidemics could preclude prediction as to their ultimate adverse impact on economic and market conditions, and, as a result, present material uncertainty and risk with respect to us and the performance of our investments.
Libor Risk: In March 2020, the Financial Accounting Standards Board (FASB) issued Accounting Standards Update (“ASU”) No. 2020-04, Reference Rate Reform (Topic 848): Facilitation of the Effects of Reference Rate Reform on Financial Reporting. The Funds’ investments, payment obligations, and financing terms may be based on floating rates, such as the London Interbank Offered Rate, or “LIBOR,” which is the offered rate for short-term Eurodollar deposits between major international banks. Plans are underway to phase out the use of LIBOR by the end of 2021. There remains uncertainty regarding the nature of any replacement rate and the impact of the transition from LIBOR on the Funds’ transactions and the financial markets generally. As such, the potential effect of a transition away from LIBOR on the Funds or the Funds’ investments cannot yet be determined.
3. TAX BASIS INFORMATION
Tax Basis of Investments: As of October 31, 2020, the aggregate cost of investments, gross unrealized appreciation/(depreciation) and net unrealized appreciation for federal tax purposes was as follows:
| | | Vulcan Value Partners Fund | | | Vulcan Value Partners Small Cap Fund | |
| Gross appreciation (excess of value over tax cost) | | $ | 277,135,572 | | | $ | 42,960,756 | |
| Gross depreciation (excess of tax cost over value) | | | (52,202,083 | ) | | | (55,041,446 | ) |
| Net unrealized appreciation | | $ | 224,933,489 | | | $ | (12,080,690 | ) |
| Cost of investments for income tax purposes | | $ | 1,015,612,145 | | | $ | 507,586,350 | |
| Semi-Annual Report | October 31, 2020 | 35 |
Notes to Financial Statements
October 31, 2020 (Unaudited)
Tax Basis of Distributions to Shareholders: The character of distributions made during the year from net investment income or net realized gains may differ from its ultimate characterization for federal income tax purposes. Also, due to the timing of dividend distributions, the fiscal year in which amounts are distributed may differ from the fiscal year in which the income or realized gain were recorded by each Fund.
The tax character of distributions paid by the Funds for the fiscal year ended April 30, 2020 were as follows:
| | | | Ordinary Income | | | Long-Term Capital Gain | |
| 2020 | | | | | | | |
| Vulcan Value Partners Fund | | | $ | 27,684,241 | | | $ | 38,649,839 | |
| Vulcan Value Partners Small Cap Fund | | | | 9,335,803 | | | | 14,520,351 | |
The amounts and characteristics of tax basis distributions and composition of distributable earnings/(accumulated losses) are finalized at fiscal year-end. Accordingly, tax basis balances have not been determined as of October 31, 2020.
4. SECURITIES TRANSACTIONS
The cost of purchases and proceeds from sales of securities (excluding short-term securities and in-kind redemptions) during the six months ended October 31, 2020 were as follows:
| Fund | | Purchases of
Securities | | | Proceeds From
Sales of Securities | |
| Vulcan Value Partners Fund | | $ | 424,716,431 | | | $ | 633,729,945 | |
| Vulcan Value Partners Small Cap Fund | | | 229,154,137 | | | | 169,992,565 | |
5. SHARES OF BENEFICIAL INTEREST
The capitalization of the Trust consists of an unlimited number of shares of beneficial interest with no par value per share. Holders of the shares of the Funds of the Trust have one vote for each share held and a proportionate fraction of a vote for each fractional share. All shares issued and outstanding are fully paid and are transferable and redeemable at the option of the shareholder. Purchasers of the shares do not have any obligation to make payments to the Trust or its creditors solely by reason of the purchasers’ ownership of the shares. Shares have no pre-emptive rights.
Prior to May 14, 2020, shares redeemed within 90 days of purchase may incur a 2% short-term redemption fee deducted from the redemption amount. Effective May 14, 2020, the Funds will no longer impose a redemption fee. The Vulcan Value Partners Fund and the Vulcan Value Partners Small Cap Fund retained $64,738 and $53,717, respectively, for the year ended April 30, 2020.
| 36 | www.vulcanvaluepartners.com |
Notes to Financial Statements
October 31, 2020 (Unaudited)
Transactions in shares of capital stock for the dates listed below were as follows:
Vulcan Value Partners Fund
| | | For the Six
Months Ended
October 31, 2020
(Unaudited) | | | For the
Year Ended
April 30, 2020 | |
| Shares Sold | | | | | | |
| Investor Class | | | 1,234,470 | | | | 8,592,593 | |
| Institutional Class | | | 4,498,292 | | | | 45,052,843 | |
| Shares Issued in Reinvestment of Dividends | | | | | | | | |
| Investor Class | | | – | | | | 1,225,786 | |
| Institutional Class | | | – | | | | 1,358,666 | |
| Less Shares Redeemed | | | | | | | | |
| Investor Class | | | (4,953,719 | ) | | | (45,177,914 | ) |
| Institutional Class | | | (11,362,187 | ) | | | (7,032,973 | ) |
| Net Increase/(Decrease) | | | (10,583,144 | ) | | | 4,019,001 | |
Vulcan Value Partners Small Cap Fund
| | | For the Six
Months Ended
October 31, 2020
(Unaudited) | | | For the
Year Ended
April 30, 2020 | |
| Shares Sold | | | | | | |
| Investor Class | | | 4,422,675 | | | | 3,210,869 | |
| Institutional Class | | | 8,145,103 | | | | 25,839,809 | |
| Shares Issued in Reinvestment of Dividends | | | | | | | | |
| Investor Class | | | – | | | | 550,493 | |
| Institutional Class | | | – | | | | 673,056 | |
| Less Shares Redeemed | | | | | | | | |
| Investor Class | | | (2,334,433 | ) | | | (22,380,086 | ) |
| Institutional Class | | | (6,413,827 | ) | | | (5,931,759 | ) |
| Net Increase | | | 3,819,518 | | | | 1,962,382 | |
6. MANAGEMENT AND RELATED-PARTY TRANSACTIONS
The Adviser, subject to the authority of the Board, is responsible for the overall management and administration of the Funds’ business affairs. The Adviser manages the investments of the Funds in accordance with each Fund’s investment objective, policies and limitations and investment guidelines established jointly by the Adviser and the Board. Pursuant to the Investment Advisory Agreement (the “Advisory Agreement”), the Funds pay the Adviser an annual management fee of 1.00% and 1.15% for Vulcan Value Partners Fund and Vulcan Value Partners Small Cap Fund, respectively, based on each Fund’s average daily net assets. The management fee is paid on a monthly basis.
| Semi-Annual Report | October 31, 2020 | 37 |
Notes to Financial Statements
October 31, 2020 (Unaudited)
The Adviser has contractually agreed to limit the Vulcan Value Partners Fund’s total annual fund operating expenses (exclusive of Acquired Fund Fees and Expenses, brokerage expenses, interest expense, taxes and extraordinary expenses) to 1.25% and 0.85% of the Fund’s average daily net assets with respect to Investor Class shares and Institutional Class shares, respectively.
The Adviser has contractually agreed to limit the Vulcan Value Partners Small Cap Fund’s total annual fund operating expenses (exclusive of Acquired Fund Fees and Expenses, brokerage expenses, interest expense, taxes and extraordinary expenses) to 1.25% and 1.00% of the Fund’s average daily net assets with respect to Investor Class shares and Institutional Class shares, respectively.
These agreements (the “Expense Agreements”) are in effect from September 1, 2020 through August 31, 2021. The prior Expense Agreements were in effect from September 1, 2019 through August 31, 2020. The Adviser will be permitted to recover, on a class-by-class basis, expenses it has borne through the Expense Agreements to the extent that a Fund’s expenses in later periods fall below the expense cap in effect at the time of waiver or reimbursement. Notwithstanding the foregoing, the Funds will not be obligated to pay any such fees and expenses more than three years after the date of the waiver or reimbursement. The Adviser may not discontinue or modify this waiver prior to August 31, 2021 without the approval by the Funds’ Board.
For the six months ended October 31, 2020, the fee waivers and/or reimbursements and recoupment amounts were as follows:
| Fund | | Fees Waived/Reimbursed By Adviser | | | Recoupment of Previously Waived Fees by Adviser | |
| Vulcan Value Partners Fund | | | | | | |
| Investor | | $ | – | | | $ | – | |
| Institutional | | | (1,143,238 | ) | | | – | |
| Vulcan Value Partners Small Cap Fund | | | | | | | | |
| Investor | | | (4,377 | ) | | | – | |
| Institutional | | | (471,680 | ) | | | – | |
As of October 31, 2020, the balances of recoupable expenses for each Fund were as follows:
| Fund | | | Expires 2021 | | | Expires 2022 | | | Expires 2023 | | | Expires 2024 | | | Total | |
| Vulcan Value Partners Fund | | | | | | | | | | | | | | | | | | | | | |
| Investor | | | $ | – | | | $ | – | | | $ | – | | | $ | – | | | $ | – | |
| Institutional | | | | – | | | | – | | | | 1,571,670 | | | | 1,143,238 | | | | 2,714,908 | |
| Vulcan Value Partners Small Cap Fund | | | | | | | | | | | | | | | | | | | | | |
| Investor | | | | – | | | | 83,103 | | | | 43,468 | | | | 4,377 | | | | 130,948 | |
| Institutional | | | | – | | | | – | | | | 594,605 | | | | 471,680 | | | | 1,066,285 | |
| 38 | www.vulcanvaluepartners.com |
Notes to Financial Statements
October 31, 2020 (Unaudited)
Fund Administrator Fees and Expenses: ALPS Fund Services, Inc. (“ALPS”) serves as administrator to the Funds and the Funds have agreed to pay expenses incurred in connection with their administrative activities. Pursuant to an Administration Agreement, ALPS provides operational services to the Funds including, but not limited to fund accounting and fund administration and generally assist in each Fund’s operations. Officers of the Trust are employees of ALPS. The Funds’ administration fee is accrued on a daily basis and paid monthly. Administration fees paid by the Funds for the six months ended October 31, 2020 are disclosed in the Statements of Operations.
ALPS is reimbursed by the Funds for certain out-of-pocket expenses.
Transfer Agent: ALPS serves as transfer, dividend paying and shareholder servicing agent for the Funds. ALPS receives an annual minimum fee, a fee based upon the number of shareholder accounts, and is also reimbursed by the Funds for certain out-of-pocket expenses. Transfer agent fees paid by the Funds for the six months ended October 31, 2020 are disclosed in the Statements of Operations.
Compliance Services: ALPS provides services that assist the Trust’s chief compliance officer in monitoring and testing the policies and procedures of the Trust in conjunction with requirements under Rule 38a-1 under the 1940 Act and receives an annual base fee. ALPS is reimbursed for certain out-of-pocket expenses by the Funds. Vulcan pays this fee on behalf of the Funds.
Principal Financial Officer: ALPS receives an annual fee for providing principal financial officer services to the Funds. Principal financial officer fees paid by the Fund for the six months ended October 31, 2020 are disclosed in the Statements of Operations.
Distributor: ALPS Distributors, Inc. (“ADI” or the “Distributor”) (an affiliate of ALPS) acts as the distributor of each Fund’s shares pursuant to a Distribution Agreement with the Trust. Shares are sold on a continuous basis by ADI as agent for the Funds, and ADI has agreed to use its best efforts to solicit orders for the sale of each Fund’s shares, although it is not obliged to sell any particular amount of shares. ADI is not entitled to any compensation for its services as Distributor. ADI is registered as a broker-dealer with the U.S. Securities and Exchange Commission. Certain intermediaries may charge networking, omnibus account or other administrative fees with respect to transactions in shares of the Funds. Transactions may be processed through the National Securities Clearing Corporation (“NSCC”) or similar systems or processed on a manual basis. These fees are paid by the Funds to the Distributor, which uses such fees to reimburse intermediaries. In the event an intermediary receiving payments from the Distributor on behalf of the Funds converts from a networking structure to an omnibus account structure or otherwise experiences increased costs, fees borne by the Funds may increase. Fees are disclosed on the Statements of Operations as “Delegated transfer agent equivalent services fees”.
Trustees: The fees and expenses of the Trustees of the Board are presented in the Statements of Operations.
| Semi-Annual Report | October 31, 2020 | 39 |
Notes to Financial Statements
October 31, 2020 (Unaudited)
7. INDEMNIFICATIONS
Under the Trust’s organizational documents, its Officers and Trustees are indemnified against certain liability arising out of the performance of their duties to the Trust. Additionally, in the normal course of business, the Trust enters into contracts with service providers that may contain general indemnification clauses which may permit indemnification to the extent permissible under applicable law. The Trust’s maximum exposure under these arrangements is unknown, as this would involve future claims that may be made against the Trust that have not yet occurred.
8. SUBSEQUENT EVENT
Subsequent events after the date of the Statements of Assets and Liabilities have been evaluated through the date the financial statements were issued.
| 40 | www.vulcanvaluepartners.com |
Additional Information
October 31, 2020 (Unaudited)
1. FUND HOLDINGS
The Funds file its complete schedule of portfolio holdings with the Securities and Exchange Commission (SEC) for the first and third quarters of each fiscal year as an exhibit to its reports on Form N-PORT. The Funds’ Form N-PORT reports are available on the SEC's Web site at http://www.sec.gov. The Funds’ Form N-PORT reports are also available upon request by calling (toll-free) (866) 759-5679.
2. FUND PROXY VOTING POLICIES, PROCEDURES AND SUMMARIES
The Funds’ policies and procedures used in determining how to vote proxies and information regarding how the Fund voted proxies relating to portfolio securities during the most recent prior 12-month period ending June 30 are available without charge, (1) upon request, by calling (toll-free) (866)-759-5679 and (2) on the SEC’s website at http://www.sec.gov.
| Semi-Annual Report | October 31, 2020 | 41 |
October 31, 2020 (Unaudited)
| WHO WE ARE | | |
| Who is providing this notice? | Vulcan Value Partners Fund and Vulcan Value Partners Small Cap Fund. |
| WHAT WE DO | | |
| How do the Funds protect my personal information? | To protect your personal information from unauthorized access and use, we use security measures that comply with federal law. These measures include computer safeguards and secured files and buildings. |
| How do the Funds collect my personal information? | We collect your personal information, for example, when you |
| • | open an account |
| • | provide account information or give us your contact information |
| • | make a wire transfer or deposit money |
| Why can’t I limit all sharing? | Federal law gives you the right to limit only |
| • | sharing for affiliates’ everyday business purposes-information about your creditworthiness |
| • | affiliates from using your information to market to you |
| • | sharing for non-affiliates to market to you |
| State laws and individual companies may give you additional rights to limit sharing. |
| 42 | www.vulcanvaluepartners.com |
October 31, 2020 (Unaudited)
| FACTS | WHAT DO THE FUNDS DO WITH YOUR PERSONAL INFORMATION? |
| WHY? | Financial companies choose how they share your personal information. Federal law gives consumers the right to limit some but not all sharing. Federal law also requires us to tell you how we collect, share, and protect your personal information. Please read this notice carefully to understand what we do. |
| WHAT? | The types of personal information we collect and share depend on the product or service you have with us. This information can include: |
| | • | Social Security number and account transactions |
| | • | Account balances and transaction history |
| | • | Wire transfer instructions |
| HOW? | All financial companies need to share customers’ personal information to run their everyday business. In the section below, we list the reasons financial companies can share their customers’ personal information; the reasons the Funds choose to share; and whether you can limit this sharing. |
| Reasons we can share your personal information | Do the Funds share: | Can you limit this sharing? |
For our everyday business purposes –
such as to process your transactions, maintain your account(s), respond to court orders and legal investigations, or report to credit bureaus | Yes | No |
For our marketing purposes –
to offer our products and services to you | No | We do not share. |
| For joint marketing with other financial companies | No | We do not share. |
For our affiliates’ everyday business purposes –
information about your transactions and experiences | Yes | No |
For our affiliates’ everyday business purposes –
information about your creditworthiness | No | We do not share. |
| For non-affiliates to market to you | No | We do not share. |
| Semi-Annual Report | October 31, 2020 | 43 |

The Funds are neither insured nor guaranteed by the U.S. Government, the FDIC, the Federal Reserve Board or any other governmental agency or insurer.
This material must be accompanied or preceded by a prospectus.
Managed Accounts are available only for institutional and private clients of Vulcan Value Partners, LLC, a federally registered investment advisor. Vulcan Value Partners Funds are distributed by ALPS Distributors, Inc. Separately Managed Accounts and related investment advisory services are provided by Vulcan Value Partners, LLC, a federally regulated investment advisor. ALPS Distributors, Inc. is not affiliated with Vulcan Value Partners, LLC.
Item 2. Code of Ethics.
Not applicable to this Report.
Item 3. Audit Committee Financial Expert.
Not applicable to this Report.
Item 4. Principal Accountant Fees and Services.
Not applicable to this Report.
Item 5. Audit Committee of Listed Registrants.
Not applicable to the Registrant.
Item 6. Investments.
| (a) | Schedule of Investments is included as part of the Reports to Stockholders filed under Item 1 of this Form N-CSR. |
Item 7. Disclosure of Proxy Voting Policies and Procedures for Closed-End Management Investment Companies.
Not applicable to the Registrant.
Item 8. Portfolio Managers of Closed-End Management Investment Companies.
Not applicable to the Registrant.
Item 9. Purchases of Equity Securities by Closed-End Management Investment Company and Affiliated Purchasers.
Not applicable to the Registrant.
Item 10. Submission of Matters to a Vote of Security Holders.
There have been no material changes to the procedures by which shareholders may recommend nominees to the Registrant’s Board of Trustees, where those changes were implemented after the Registrant last provided disclosure in response to the requirements of Item 407(c)(2)(iv) of Regulation S-K, or this Item.
Item 11. Controls and Procedures.
| (a) | The Registrant’s principal executive officer and principal financial officer have concluded that the Registrant’s disclosure controls and procedures (as defined in Rule 30a-3(c) under the Investment Company Act of 1940, as amended) are effective based on their evaluation of these controls and procedures as of a date within 90 days of the filing date of this report. |
| (b) | There was no change in the Registrant’s internal control over financial reporting (as defined in Rule 30a-3(d) under the Investment Company Act of 1940, as amended) that occurred during the period covered by this report that has materially affected, or is reasonably likely to materially affect, the Registrant’s internal control over financial reporting. |
Item 12. Disclosure of Securities Lending Activities for Closed-End Management Investment Companies.
Not applicable to the Registrant.
Item 13. Exhibits.
| (a)(1) | Not applicable to this Report. |
| (a)(3) | Not applicable to the Registrant. |
| (a)(4) | Not applicable to the Registrant. |
SIGNATURES
Pursuant to the requirements of the Securities Exchange Act of 1934 and the Investment Company Act of 1940, the Registrant has duly caused this report to be signed on its behalf by the undersigned, thereunto duly authorized.
FINANCIAL INVESTORS TRUST
| By: | /s/ Bradley J. Swenson | |
| | Bradley J. Swenson (Principal Executive Officer) | |
| | President | |
| | | |
| Date: | January 7, 2021 | |
Pursuant to the requirements of the Securities Exchange Act of 1934 and the Investment Company Act of 1940, this report has been signed below by the following persons on behalf of the Registrant and in the capacities and on the dates indicated.
FINANCIAL INVESTORS TRUST
| By: | /s/ Bradley J. Swenson | |
| | Bradley J. Swenson (Principal Executive Officer) | |
| | President | |
| | | |
| Date: | January 7, 2021 | |
| | | |
| By: | /s/ Jennell Panella | |
| | Jennell Panella (Principal Financial Officer) | |
| | Treasurer | |
| | | |
| Date: | January 7, 2021 | |