UNITED STATES
SECURITIES AND EXCHANGE COMMISSION
Washington, D.C. 20549
FORM N-CSR
CERTIFIED SHAREHOLDER REPORT OF REGISTERED
MANAGEMENT INVESTMENT COMPANIES
Investment Company Act file number: 811-08194
FINANCIAL INVESTORS TRUST
(Exact name of registrant as specified in charter)
1290 Broadway, Suite 1100, Denver, Colorado 80203
(Address of principal executive offices) (Zip code)
Karen Gilomen, Esq., Secretary
Financial Investors Trust
1290 Broadway, Suite 1100
Denver, Colorado 80203
(Name and address of agent for service)
Registrant’s telephone number, including area code: 303-623-2577
Date of fiscal year end: October 31
Date of reporting period: November 1, 2017 – April 30, 2018
| Item 1. | Reports to Stockholders. |
TABLE OF
CONTENTS
| Disclosure of Fund Expenses | 1 |
| ALPS | CoreCommodity Management CompleteCommodities® Strategy Fund | |
| Management Commentary | 6 |
| Performance Update | 8 |
| Consolidated Statement of Investments | 10 |
| Consolidated Statement of Assets and Liabilities | 17 |
| Consolidated Statement of Operations | 18 |
| Consolidated Statements of Changes in Net Assets | 19 |
| Consolidated Financial Highlights | 20 |
| ALPS | Kotak India Growth Fund | |
| Management Commentary | 23 |
| Performance Update | 25 |
| Consolidated Statement of Investments | 27 |
| Consolidated Statement of Assets and Liabilities | 29 |
| Consolidated Statement of Operations | 30 |
| Consolidated Statements of Changes in Net Assets | 31 |
| Consolidated Financial Highlights | 32 |
| ALPS | Metis Global Micro Cap Value Fund | |
| Management Commentary | 35 |
| Performance Update | 37 |
| Statement of Investments | 39 |
| Statement of Assets and Liabilities | 43 |
| Statement of Operations | 44 |
| Statements of Changes in Net Assets | 45 |
| Financial Highlights | 46 |
| ALPS | Red Rocks Listed Private Equity Fund | |
| Management Commentary | 49 |
| Performance Update | 51 |
| Statement of Investments | 54 |
| Statement of Assets and Liabilities | 56 |
| Statement of Operations | 57 |
| Statements of Changes in Net Assets | 58 |
| Financial Highlights | 59 |
| ALPS | WMC Research Value Fund | |
| Management Commentary | 63 |
| Performance Update | 64 |
| Statement of Investments | 66 |
| Statement of Assets and Liabilities | 70 |
| Statement of Operations | 71 |
| Statements of Changes in Net Assets | 72 |
| Financial Highlights | 73 |
| Clough China Fund | |
| Management Commentary | 76 |
| Performance Update | 78 |
| Statement of Investments | 80 |
| Statement of Assets and Liabilities | 82 |
| Statement of Operations | 83 |
| Statements of Changes in Net Assets | 84 |
| Financial Highlights | 85 |
| RiverFront Global Allocation Series | |
| Management Commentary | 88 |
| Performance Update | 91 |
| Statements of Investments | 101 |
| Statements of Assets and Liabilities | 106 |
| Statements of Operations | 108 |
| Statements of Changes in Net Assets | 109 |
| Financial Highlights | 114 |
| Notes to Financial Statements | 131 |
| Additional Information | 161 |
| Privacy Policy | 175 |
alpsfunds.com
Disclosure of Fund Expenses
April 30, 2018 (Unaudited)
Examples. As a shareholder of the Funds, you incur two types of costs: (1) transaction costs, including applicable sales charges (loads) and redemption fees; and (2) ongoing costs, including management fees, distribution and service (12b-1) fees, shareholder service fees and other Fund expenses. The following examples are intended to help you understand your ongoing costs (in dollars) of investing in the Funds and to compare these costs with the ongoing costs of investing in other mutual funds. The examples are based on an investment of $1,000 invested on November 1, 2017 and held until April 30, 2018.
Actual Expenses. The first line under each class in the table below provides information about actual account values and actual expenses. You may use the information in this line, together with the amount you invested, to estimate the expenses that you paid over the period. Simply divide your account value by $1,000 (for example, an $8,600 account value divided by $1,000 = 8.6), then multiply the result by the number in the first line under the heading “Expenses Paid During Period November 1, 2017 – April 30, 2018” to estimate the expenses you paid on your account during this period.
Hypothetical Example for Comparison Purposes. The second line under each class in the table below provides information about hypothetical account values and hypothetical expenses based on the Fund’s actual expense ratio and an assumed rate of return of 5% per year before expenses, which is not the Fund’s actual return. The hypothetical account values and expenses may not be used to estimate the actual ending account balance or expenses you paid for the period. You may use this information to compare the ongoing costs of investing in the Funds and other mutual funds. To do so, compare these 5% hypothetical examples with the 5% hypothetical examples that appear in the shareholder reports of the other funds.
Please note that the expenses shown in the table are meant to highlight your ongoing costs only and do not reflect any transactional costs, such as sales charges or redemption fees. Therefore, the second line under each class in the table below is useful in comparing ongoing costs only, and will not help you determine the relative total costs of owning different funds. In addition, if these transactional costs were included, your costs would have been higher.
1 | April 30, 2018
Disclosure of Fund Expenses
April 30, 2018 (Unaudited)
| Beginning Account Value November 1, 2017 | Ending Account Value April 30, 2018 | Expense Ratio(a) | Expenses Paid During Period November 1, 2017 - April 30, 2018(b) | |||||
| ALPS | CoreCommodity Management CompleteCommodities® Strategy Fund(c) | ||||||||
| Investor Class(d) | ||||||||
| Actual | $1,000.00 | $1,086.20 | 1.40% | $7.24 | ||||
| Hypothetical (5% return before expenses) | $1,000.00 | $1,017.85 | 1.40% | $7.00 | ||||
| Class C | ||||||||
| Actual | $1,000.00 | $1,082.90 | 2.05% | $10.59 | ||||
| Hypothetical (5% return before expenses) | $1,000.00 | $1,014.63 | 2.05% | $10.24 | ||||
| Class I | ||||||||
| Actual | $1,000.00 | $1,086.40 | 1.13% | $5.85 | ||||
| Hypothetical (5% return before expenses) | $1,000.00 | $1,019.19 | 1.13% | $5.66 | ||||
| ALPS | Kotak India Growth Fund(e) | ||||||||
| Investor Class(d) | ||||||||
| Actual | $1,000.00 | $1,002.30 | 1.94% | $9.63 | ||||
| Hypothetical (5% return before expenses) | $1,000.00 | $1,015.17 | 1.94% | $9.69 | ||||
| Class C | ||||||||
| Actual | $1,000.00 | $998.70 | 2.60% | $12.88 | ||||
| Hypothetical (5% return before expenses) | $1,000.00 | $1,011.90 | 2.60% | $12.97 | ||||
| Class I | ||||||||
| Actual | $1,000.00 | $1,004.30 | 1.60% | $7.95 | ||||
| Hypothetical (5% return before expenses) | $1,000.00 | $1,016.86 | 1.60% | $8.00 | ||||
| ALPS | Metis Global Micro Cap Value Fund | ||||||||
| Investor Class(d) | ||||||||
| Actual | $1,000.00 | $1,006.60 | 2.07% | $10.30 | ||||
| Hypothetical (5% return before expenses) | $1,000.00 | $1,014.53 | 2.07% | $10.34 | ||||
| Class C | ||||||||
| Actual | $1,000.00 | $1,003.10 | 2.70% | $13.41 | ||||
| Hypothetical (5% return before expenses) | $1,000.00 | $1,011.41 | 2.70% | $13.47 | ||||
| Class I | ||||||||
| Actual | $1,000.00 | $1,008.10 | 1.70% | $8.46 | ||||
| Hypothetical (5% return before expenses) | $1,000.00 | $1,016.36 | 1.70% | $8.50 | ||||
2 | April 30, 2018
Disclosure of Fund Expenses
April 30, 2018 (Unaudited)
| Beginning Account Value November 1, 2017 | Ending Account Value April 30, 2018 | Expense Ratio(a) | Expenses Paid During Period November 1, 2017 - April 30, 2018(b) | |||||
| ALPS | Red Rocks Listed Private Equity Fund | ||||||||
| Investor Class(d) | ||||||||
| Actual | $1,000.00 | $1,019.70 | 1.39% | $6.96 | ||||
| Hypothetical (5% return before expenses) | $1,000.00 | $1,017.90 | 1.39% | $6.95 | ||||
| Class C | ||||||||
| Actual | $1,000.00 | $1,016.50 | 2.09% | $10.45 | ||||
| Hypothetical (5% return before expenses) | $1,000.00 | $1,014.43 | 2.09% | $10.44 | ||||
| Class I | ||||||||
| Actual | $1,000.00 | $1,021.10 | 1.12% | $5.61 | ||||
| Hypothetical (5% return before expenses) | $1,000.00 | $1,019.24 | 1.12% | $5.61 | ||||
| Class R | ||||||||
| Actual | $1,000.00 | $1,018.50 | 1.55% | $7.76 | ||||
| Hypothetical (5% return before expenses) | $1,000.00 | $1,017.11 | 1.55% | $7.75 | ||||
| ALPS | WMC Research Value Fund | ||||||||
| Investor Class(d) | ||||||||
| Actual | $1,000.00 | $1,023.60 | 1.15% | $5.77 | ||||
| Hypothetical (5% return before expenses) | $1,000.00 | $1,019.09 | 1.15% | $5.76 | ||||
| Class C | ||||||||
| Actual | $1,000.00 | $1,018.70 | 1.90% | $9.51 | ||||
| Hypothetical (5% return before expenses) | $1,000.00 | $1,015.37 | 1.90% | $9.49 | ||||
| Class I | ||||||||
| Actual | $1,000.00 | $1,025.60 | 0.90% | $4.52 | ||||
| Hypothetical (5% return before expenses) | $1,000.00 | $1,020.33 | 0.90% | $4.51 | ||||
| Clough China Fund | ||||||||
| Investor Class(d) | ||||||||
| Actual | $1,000.00 | $1,030.70 | 1.95% | $9.82 | ||||
| Hypothetical (5% return before expenses) | $1,000.00 | $1,015.12 | 1.95% | $9.74 | ||||
| Class C | ||||||||
| Actual | $1,000.00 | $1,026.70 | 2.70% | $13.57 | ||||
| Hypothetical (5% return before expenses) | $1,000.00 | $1,011.41 | 2.70% | $13.47 | ||||
| Class I | ||||||||
| Actual | $1,000.00 | $1,031.60 | 1.70% | $8.56 | ||||
| Hypothetical (5% return before expenses) | $1,000.00 | $1,016.36 | 1.70% | $8.50 | ||||
3 | April 30, 2018
Disclosure of Fund Expenses
April 30, 2018 (Unaudited)
| Beginning Account Value November 1, 2017 | Ending Account Value April 30, 2018 | Expense Ratio(a) | Expenses Paid During Period November 1, 2017 - April 30, 2018(b) | |||||
| RiverFront Asset Allocation Aggressive(f) | ||||||||
| Investor Class(d) | ||||||||
| Actual | $1,000.00 | $1,024.70 | 0.94% | $4.72 | ||||
| Hypothetical (5% return before expenses) | $1,000.00 | $1,020.13 | 0.94% | $4.71 | ||||
| Class C | ||||||||
| Actual | $1,000.00 | $1,021.60 | 1.68% | $8.42 | ||||
| Hypothetical (5% return before expenses) | $1,000.00 | $1,016.46 | 1.68% | $8.40 | ||||
| Class I | ||||||||
| Actual | $1,000.00 | $1,026.70 | 0.68% | $3.42 | ||||
| Hypothetical (5% return before expenses) | $1,000.00 | $1,021.42 | 0.68% | $3.41 | ||||
| Investor Class II(g) | ||||||||
| Actual | $1,000.00 | $1,024.80 | 0.93% | $4.67 | ||||
| Hypothetical (5% return before expenses) | $1,000.00 | $1,020.18 | 0.93% | $4.66 | ||||
| Class L | ||||||||
| Actual | $1,000.00 | $1,026.10 | 0.69% | $3.47 | ||||
| Hypothetical (5% return before expenses) | $1,000.00 | $1,021.37 | 0.69% | $3.46 | ||||
| RiverFront Asset Allocation Growth(h) | ||||||||
| Investor Class(d) | ||||||||
| Actual | $1,000.00 | $1,021.20 | 0.92% | $4.61 | ||||
| Hypothetical (5% return before expenses) | $1,000.00 | $1,020.23 | 0.92% | $4.61 | ||||
| Class C | ||||||||
| Actual | $1,000.00 | $1,016.90 | 1.68% | $8.40 | ||||
| Hypothetical (5% return before expenses) | $1,000.00 | $1,016.46 | 1.68% | $8.40 | ||||
| Class I | ||||||||
| Actual | $1,000.00 | $1,022.00 | 0.68% | $3.41 | ||||
| Hypothetical (5% return before expenses) | $1,000.00 | $1,021.42 | 0.68% | $3.41 | ||||
| RiverFront Asset Allocation Growth & Income(i) | ||||||||
| Investor Class(d) | ||||||||
| Actual | $1,000.00 | $1,017.10 | 0.94% | $4.70 | ||||
| Hypothetical (5% return before expenses) | $1,000.00 | $1,020.13 | 0.94% | $4.71 | ||||
| Class C | ||||||||
| Actual | $1,000.00 | $1,014.10 | 1.68% | $8.39 | ||||
| Hypothetical (5% return before expenses) | $1,000.00 | $1,016.46 | 1.68% | $8.40 | ||||
| Class I | ||||||||
| Actual | $1,000.00 | $1,018.30 | 0.68% | $3.40 | ||||
| Hypothetical (5% return before expenses) | $1,000.00 | $1,021.42 | 0.68% | $3.41 | ||||
| RiverFront Asset Allocation Moderate(k) | ||||||||
| Investor Class(d) | ||||||||
| Actual | $1,000.00 | $1,011.50 | 0.94% | $4.69 | ||||
| Hypothetical (5% return before expenses) | $1,000.00 | $1,020.13 | 0.94% | $4.71 | ||||
| Class C | ||||||||
| Actual | $1,000.00 | $1,007.90 | 1.68% | $8.36 | ||||
| Hypothetical (5% return before expenses) | $1,000.00 | $1,016.46 | 1.68% | $8.40 | ||||
| Class I | ||||||||
| Actual | $1,000.00 | $1,012.70 | 0.69% | $3.44 | ||||
| Hypothetical (5% return before expenses) | $1,000.00 | $1,021.37 | 0.69% | $3.46 | ||||
4 | April 30, 2018
Disclosure of Fund Expenses
April 30, 2018 (Unaudited)
| Beginning Account Value November 1, 2017 | Ending Account Value April 30, 2018 | Expense Ratio(a) | Expenses Paid During Period November 1, 2017 - April 30, 2018(b) | |||||
| RiverFront Asset Allocation Income & Growth(j) | ||||||||
| Investor Class(d) | ||||||||
| Actual | $1,000.00 | $998.90 | 0.93% | $4.61 | ||||
| Hypothetical (5% return before expenses) | $1,000.00 | $1,020.18 | 0.93% | $4.66 | ||||
| Class C | ||||||||
| Actual | $1,000.00 | $994.90 | 1.69% | $8.36 | ||||
| Hypothetical (5% return before expenses) | $1,000.00 | $1,016.41 | 1.69% | $8.45 | ||||
| Class I | ||||||||
| Actual | $1,000.00 | $999.90 | 0.68% | $3.37 | ||||
| Hypothetical (5% return before expenses) | $1,000.00 | $1,021.42 | 0.68% | $3.41 | ||||
| (a) | Annualized, based on the Fund's most recent fiscal half year expenses. |
| (b) | Expenses are equal to the Fund's annualized expense ratio multiplied by the average account value over the period, multiplied by the number of days in the most recent fiscal half year (181), divided by 365. |
| (c) | Includes expenses of the CoreCommodity Management Cayman Commodity Fund Ltd. (wholly-owned subsidiary), exclusive of the subsidiary's management fee. |
| (d) | Prior to December 1, 2017, Investor Class was known as Class A. |
| (e) | Includes expenses of the Kotak Mauritius Portfolio (wholly-owned subsidiary). |
| (f) | Prior to February 28, 2018, the RiverFront Asset Allocation Aggressive was known as the RiverFront Global Growth Fund. |
| (g) | Prior to December 1, 2017, Investor Class II was known as Investor Class. |
| (h) | Prior to February 28, 2018, the RiverFront Asset Allocation Growth was known as the RiverFront Global Allocation Fund. |
| (i) | Prior to February 28, 2018, the RiverFront Asset Allocation Growth & Income was known as the RiverFront Dynamic Equity Income Fund. |
| (j) | Prior to February 28, 2018, the RiverFront Asset Allocation Income & Growth was known as the RiverFront Conservative Income Builder Fund. |
| (k) | Prior to February 28, 2018, the RiverFront Asset Allocation Moderate was known as the RiverFront Moderate Growth & Income Fund. |
5 | April 30, 2018
ALPS | CoreCommodity Management CompleteCommodities® Strategy Fund
| Management Commentary | April 30, 2018 (Unaudited) |
The six months ending April 30, 2018 produced a positive return for commodities. The Bloomberg Commodity Total Return Index (BCOMTR), the Fund’s benchmark, ended higher by 4.74% for the period. The ALPS/Core Commodity Management CompleteCommodities® Strategy Fund (the “Fund”) I shares (JCRIX) delivered a net positive return of +8.64% for the period while (Investor Class shares JCRAX) added +8.47% and at Maximum Offering Price (MOP), the C shares (JCRCX) were up +8.14% for the six months. The Fund significantly outperformed its benchmark, Bloomberg Commodity Index Total Return (BCOMTR), by 390, 373, and 340 basis points respectively for each of the fund classes (I, Investor shares, and C) during the period.
The macro-economic environment was mixed during the period. The US Dollar was down – 2.87% as measured by the US Dollar Index. Since most commodity prices are denominated in US Dollars, as the Dollar falls in value, commodity prices tend to rise. The decline in the value of the Dollar was a contributing factor, in our opinion, to the rise in commodity prices. On the other hand, interest rates also rose significantly during the the 6 month period ending April 30. The US 2 Year Note yield rose from 1.57% to 2.49%. Many analysts associate rising interest rates with challenges to price appreciation in many asset classes, including commodities. Commodity prices didn’t respond negatively to the higher interest rates. In fact, they appreciated. We believe the constructive fundamental factors were principally responsible for commodity price outperformance versus simple Dollar influences, while higher interest rates presented no perceptible resistance.
The improving fundamentals were on display in many commodities across most sectors. Certain agricultural commodities enjoyed significant price increases during the past six months. Cocoa prices led the entire asset class rising nearly 35% (34.91%) for the period. Poor and inconsistent rainfall in key growing regions of the Ivory Coast and other West African nations has been responsible for lower supply forecasts. Demand is growing steadily.
Wheat plantings have been amongst the lowest in the last 50+years, especially in the United States. Less than ideal early spring weather conditions provoked concern for this year’s harvests. Wheat prices rose 21.98% in the last six months. Cotton growing conditions in the South and Southwest sections of the US deteriorated as well. Cotton prices rose sharply, up 22.61% from late October 2017.
Oil and oil derivatives appreciated during the past six months. Global inventory draws coupled with improving demand created a situation where both Brent North Sea crude oil (international marker crude) and West Texas Intermediate (WTI) crude oil (domestic marker crude) traded into backwardation. Backwardation occurs when nearby futures prices trade above certain deferred contracts. It’s usually an indication of strong fundamentals and potential price increases. Over the last six months, Brent crude oil climbed by 22.56% while WTI rose by 26.09%. The products derived directly from crude oil were also higher. Reformulated gasoline (RBOB) added 22.99% and heating oil rose 14.29%.
Precious metals prices drifted on either side of unchanged for the period. Gold responded to the decline in the value of the US Dollar, adding 3.83% for the last six months. Silver prices declined slightly, -2.28% for the same time frame.
A few commodities stood out for negative price performance during the period. Sugar prices fell the most in the asset class, down -20.28%. Bumper crops in Vietnam, India, and Indonesia more than satisfied current demand. Live cattle prices fell -15.54%. Benign weather conditions during the winter meant that more animals survived and made it to market. The same calm weather conditions pulled natural gas prices somewhat lower as well, -4.89%.
{The Fund’s top equity holdings at the end of April included (YAR NO) Yara International -12.6% (6 months ending Apr. 30, 2018), Marathon Petroleum Corp. (MPC) +27.1% (6 months ending Apr 30, 2018), The Mosaic Co. (MOS US) +20.9% (6 months ending Apr. 30, 2018), Valero Energy Corp (VLOUS) +43.1% (6 months ending Apr. 30, 2018), Sociedad Quimica y Minera de Chile SA -7.3% (6 months ending Apr. 30, 2018) , Boliden AB (BOL SS) +6.8% (6 months ending Apr. 30, 2018), Marine Harvest ASA (MHG NO) +13.8% (6 months ending Apr. 30, 2018), Ingredion Inc. (INGR) -2.5% (6 months ending Apr. 30, 2018), South 32 Ltd. (S32 AU) +13.1% (6 months ending Apr. 30, 2018), and Bunge Ltd. (BG) +6.4% (6 months ending Apr. 30, 2018).}
U.S. Treasury Inflation Protected Securities (TIPS) and nominal US Treasuries are held by the fund to invest excess cash and as collateral for commodity futures related investments held in our Cayman Island subsidiary. Nominal yields on the benchmark 10 year note stood at 2.38% in the end of October 2017. Rates moved moderately higher, to 2.95%, at the end of April 2018. During this six month period of time, the Federal Reserve raised short term interest rates twice, each by 25 basis points. The rise in 10 year note yields reflects a nearly commensurate amount. Despite the efforts by the Federal Reserve and other central banks to maintain historically low interest rates, we believe we may be nearing the end of what has been a significant multi-year rally in US treasury prices. As a result, we continue to invest in TIPS and nominal US Treasuries with limited duration exposure. At the end of April, the Fund’s fixed income portfolio had a weighted average maturity of 0.9 years.
While the exact composition of the fund changes from time to time in response to structural and value opportunities identified by the Fund’s Policy Committee, the Fund allocated approximately 72% of its assets toward commodity futures related investments and approximately 28% of its assets in commodity equities taking a snapshot at the end of this six month period. The Fund was near fully invested at the end of April.
Commodities continue to perform quietly to the upside. We believe that the fundamental strengthening will continue. On a relative basis, commodities appear inexpensive to other assets that have enjoyed long term appreciation. Consistent and persistent coordinated global growth trends seem to be intact for the near future. That’s good for commodity demand. The failure of many
6 | April 30, 2018
ALPS | CoreCommodity Management CompleteCommodities® Strategy Fund
| Management Commentary | April 30, 2018 (Unaudited) |
companies and sovereign countries to invest the necessary capital over many years to source, transport, and deliver vital commodities to markets may take its toll in terms of future shortages and price spikes. Ultimately, profitable prices induce producers to engage in future projects. Higher commodity prices seem to us both necessary and likely.
Past performance if not indicative of future results. “Bloomberg®” and “Bloomberg Commodity IndexSM” are service marks of Bloomberg L.P. (“Bloomberg”) as the case may be. Source for all Index data: Bloomberg L.P. Global. This document does not constitute an offer of any commodities, securities or investment advisory services. Any such offer may be made only by means of a disclosure document or similar materials which contain a description of material terms and risks. All expressions of opinion are subject to change without notice in reaction to shifting market conditions. Data contained herein from third-party providers is obtained from what are considered reliable sources. However, its accuracy, completeness or reliability cannot be guaranteed. The economic statistics presented herein are subject to revision by the agencies that issue them. Any indices and other financial benchmarks shown are provided for illustrative purposes only, are unmanaged, reflect reinvestment of income and do not reflect the impact of advisory fees. Investors cannot invest directly in an index. All investments are subject to risk.
7 | April 30, 2018
ALPS | CoreCommodity Management CompleteCommodities® Strategy Fund
| Performance Update | April 30, 2018 (Unaudited) |
Performance of $10,000 Initial Investment (as of April 30, 2018)
Comparison of change in value of a $10,000 investment
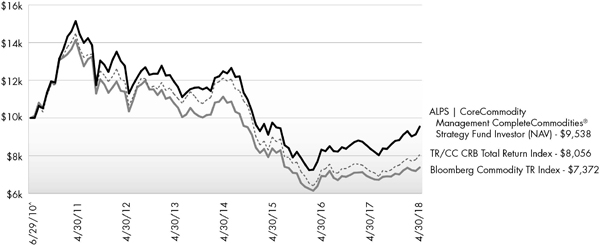
The chart above represents historical performance of a hypothetical investment of $10,000 in the Fund since inception. Past performance does not guarantee future results. This chart does not reflect the deduction of taxes that a shareholder would pay on Fund distributions or the redemption of Fund shares.
Average Annual Total Returns (as of April 30, 2018)
| 6 Month | 1 Year | 3 Year | 5 Year | Since Inception^ | Total Expense Ratio | What You Pay* | |
| Investor# (NAV) | 8.62% | 13.99% | -0.78% | -4.41% | -0.62% | 1.47% | 1.47% |
| Class C (NAV) | 8.29% | 13.21% | -1.46% | -5.02% | -1.22% | 2.07% | 2.07% |
| Class C (CDSC) | 7.29% | 12.21% | -1.46% | -5.02% | -1.22% | ||
| Class I | 8.64% | 14.15% | -0.55% | -4.16% | -0.34% | 1.17% | 1.17% |
| TR/CC CRB Total Return Index 1 | 8.51% | 12.58% | -3.57% | -6.50% | -2.72% | ||
| Bloomberg Commodity TR Index1 | 4.74% | 8.02% | -4.18% | -7.32% | -3.82% |
Performance data quoted represents past performance. Past performance does not guarantee future results. Investment return and principal value of an investment will fluctuate so that an investor's shares, when sold or redeemed, may be worth more or less than the original cost. Current performance data may be higher or lower than actual data quoted. For the most current month-end performance data, please call 1-866-759-5679.
Performance shown at NAV does not include sales charges and would have been lower had it been taken into account. A Contingent Deferred Sales Charge (“CDSC”) of 1.00% may apply to Class C shares redeemed within the first 12 months after a purchase. The Fund imposes a 2.00% redemption fee on shares held for less than 30 days.
Performance less than 1 year is cumulative.
8 | April 30, 2018
ALPS | CoreCommodity Management CompleteCommodities® Strategy Fund
| Performance Update | April 30, 2018 (Unaudited) |
| 1 | Thomson Reuters/CC CRB Total Return Index and the Bloomberg Commodity TR Index (formerly the Dow Jones-UBS Commodity Index) are unmanaged indices used as a measurement of change in commodity market conditions based on the performance of a basket of different commodities. Each index is composed of a different basket of commodities, a different weighting of the commodities in the basket, and a different re-balancing schedule. The indices are not actively managed and do not reflect any deduction for fees, expenses or taxes. An investor may not invest directly in an index. |
| ^ | Fund Inception date of June 29, 2010. |
| * | What You Pay reflects the Advisor’s decision to contractually limit expenses through February 28, 2019. Please see the prospectus for additional information. |
| # | Prior to December 1, 2017, Investor Class was known as Class A. |
Investments in securities of MLPs involve risks that differ from an investment in common stock. MLPs are controlled by their general partners, which generally have conflicts of interest and limited fiduciary duties to the MLP, which may permit the general partner to favor its own interests over the MLPs. The benefit you are expected to derive from the Fund’s investment in MLPs depends largely on the MLPs being treated as partnerships for federal income tax purposes. As a partnership, an MLP has no federal income tax liability at the entity level. Therefore, treatment of one or more MLPs as a corporation for federal income tax purposes could affect the Fund’s ability to meet its investment objective and would reduce the amount of cash available to pay or distribute to you. Legislative, judicial, or administrative changes and differing interpretations, possibly on a retroactive basis, could negatively impact the value of an investment in MLPs and therefore the value of your investment in the Fund.
Investing in commodity-related securities involves risk and considerations not present when investing in more conventional securities. The Fund may be more susceptible to high volatility of commodity markets.
Derivatives generally are more sensitive to changes in economic or market conditions than other types of investments; this could result in losses that significantly exceed the Fund's original investment.
The table does not reflect the deduction of taxes that a shareholder would pay on Fund distributions or the redemption of Fund shares.
This Fund is not suitable for all investors, and is subject to investment risks, including possible loss of the principal amount invested.
There is no guarantee that the Fund will continue to hold any one particular security or stay invested in any one particular company. The composition of the Fund's top holdings is subject to change. Performance figures are historical and reflect the change in share price, reinvested distributions, changes in net asset value, sales charges and capital gains distributions, if any.
Not FDIC Insured – No Bank Guarantee – May Lose Value
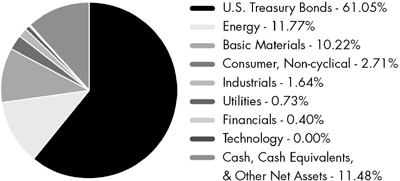
Asset Type Allocation (as a % of Net Assets)†
| Common Stock | 27.25% |
| Government Bonds | 61.05% |
| Master Limited Partnerships | 0.22% |
| Cash, Cash Equivalents, & Other Net Assets | 11.48% |
| Total | 100.00% |
| † | Holdings are subject to change, and may not reflect the current or future position of the portfolio. Table presents approximate values only. |
Industry Sector Allocation (as a % of Net Assets)
9 | April 30, 2018
ALPS | CoreCommodity Management CompleteCommodities® Strategy Fund
| Consolidated Statement of Investments | April 30, 2018 (Unaudited) |
| Shares | Value (Note 2) | |||||||
| COMMON STOCKS (27.25%) | ||||||||
| Argentina (0.08%) | ||||||||
| Adecoagro SA(a) | 50,405 | $ | 389,126 | |||||
| YPF SA, Sponsored ADR | 6,231 | 136,397 | ||||||
| 525,523 | ||||||||
| Australia (1.64%) | ||||||||
| BHP Billiton, Ltd. | 3,582 | 83,463 | ||||||
| BlueScope Steel, Ltd. | 73,800 | 917,301 | ||||||
| Costa Group Holdings, Ltd. | 27,028 | 147,727 | ||||||
| Fortescue Metals Group, Ltd. | 502,640 | 1,725,562 | ||||||
| GrainCorp, Ltd., Class A | 85,256 | 570,605 | ||||||
| Iluka Resources, Ltd. | 60,429 | 534,554 | ||||||
| Incitec Pivot, Ltd. | 328,759 | 940,524 | ||||||
| Independence Group NL | 77,396 | 301,243 | ||||||
| Mineral Resources, Ltd. | 39,759 | 538,786 | ||||||
| Newcrest Mining, Ltd. | 9,051 | 144,117 | ||||||
| Northern Star Resources, Ltd. | 27,843 | 133,945 | ||||||
| Nufarm, Ltd. | 95,715 | 657,179 | ||||||
| Oil Search, Ltd. | 5,201 | 30,698 | ||||||
| OZ Minerals, Ltd. | 133,936 | 932,712 | ||||||
| Regis Resources, Ltd. | 63,582 | 225,936 | ||||||
| Santos, Ltd.(a) | 7,201 | 33,287 | ||||||
| South32, Ltd. | 667,525 | 1,869,471 | ||||||
| Western Areas, Ltd. | 156,235 | 408,147 | ||||||
| Whitehaven Coal, Ltd. | 44,621 | 155,199 | ||||||
| Woodside Petroleum, Ltd. | 13,684 | 331,931 | ||||||
| 10,682,387 | ||||||||
| Austria (0.08%) | ||||||||
| OMV AG | 2,563 | 159,397 | ||||||
| voestalpine AG | 6,748 | 356,187 | ||||||
| 515,584 | ||||||||
| Brazil (0.55%) | ||||||||
| BRF SA, ADR(a) | 86,746 | 618,499 | ||||||
| Cia de Saneamento Basico do Estado de Sao Paulo, ADR | 112,065 | 1,118,409 | ||||||
| Gerdau SA, Sponsored ADR | 116,630 | 544,662 | ||||||
| Petroleo Brasileiro SA, Sponsored ADR(a) | 40,370 | 568,813 | ||||||
| Vale SA, Sponsored ADR | 51,802 | 716,940 | ||||||
| 3,567,323 | ||||||||
| Canada (4.99%) | ||||||||
| Advantage Oil & Gas, Ltd.(a) | 101,900 | 324,601 | ||||||
| Agnico Eagle Mines, Ltd. | 24,705 | 1,039,833 | ||||||
| Alamos Gold, Inc., Class A | 72,378 | 390,841 | ||||||
| ARC Resources, Ltd. | 108,687 | 1,212,195 | ||||||
| Barrick Gold Corp. | 68,228 | 919,031 | ||||||
| Baytex Energy Corp.(a) | 57,800 | 258,850 | ||||||
| Birchcliff Energy, Ltd. | 146,500 | 530,570 | ||||||
| Cameco Corp. | 45,059 | 474,471 | ||||||
| Canadian Energy Services & Technology Corp. | 32,100 | 157,256 | ||||||
| Canadian Solar, Inc.(a) | 19,387 | 303,019 | ||||||
| Cenovus Energy, Inc. | 117,900 | 1,180,882 | ||||||
| Shares | Value (Note 2) | |||||||
| Canada (continued) | ||||||||
| Centerra Gold, Inc.(a) | 111,400 | $ | 680,226 | |||||
| Crescent Point Energy Corp. | 93,378 | 818,180 | ||||||
| Detour Gold Corp.(a) | 86,600 | 625,918 | ||||||
| Encana Corp. | 12,333 | 153,916 | ||||||
| Enerflex, Ltd. | 11,100 | 135,643 | ||||||
| Enerplus Corp. | 61,500 | 713,696 | ||||||
| First Majestic Silver Corp.(a) | 171,061 | 1,108,475 | ||||||
| First Quantum Minerals, Ltd. | 4,500 | 64,839 | ||||||
| Fortuna Silver Mines, Inc.(a) | 92,452 | 526,052 | ||||||
| Franco-Nevada Corp. | 10,944 | 776,586 | ||||||
| Freehold Royalties, Ltd. | 26,200 | 265,479 | ||||||
| Goldcorp, Inc. | 21,802 | 289,749 | ||||||
| Hudbay Minerals, Inc. | 38,900 | 271,765 | ||||||
| Husky Energy, Inc. | 4,513 | 63,128 | ||||||
| IAMGOLD Corp.(a) | 125,702 | 686,333 | ||||||
| Imperial Oil, Ltd. | 15,000 | 466,490 | ||||||
| Ivanhoe Mines, Ltd., Class A(a) | 62,600 | 129,203 | ||||||
| Kelt Exploration, Ltd.(a) | 64,000 | 404,751 | ||||||
| Kinross Gold Corp.(a) | 186,846 | 724,962 | ||||||
| Kirkland Lake Gold, Ltd. | 10,900 | 190,163 | ||||||
| Lundin Mining Corp. | 191,300 | 1,266,443 | ||||||
| McEwen Mining, Inc. | 47,731 | 99,280 | ||||||
| MEG Energy Corp.(a) | 35,900 | 185,658 | ||||||
| New Gold, Inc.(a) | 96,927 | 226,809 | ||||||
| Nutrien, Ltd. | 10,841 | 493,591 | ||||||
| NuVista Energy, Ltd.(a) | 38,600 | 253,435 | ||||||
| OceanaGold Corp. | 141,100 | 380,238 | ||||||
| Osisko Gold Royalties, Ltd. | 29,369 | 286,611 | ||||||
| Pan American Silver Corp. | 66,628 | 1,074,043 | ||||||
| Paramount Resources, Ltd., Class A(a) | 15,300 | 218,427 | ||||||
| Parex Resources, Inc.(a) | 43,000 | 739,803 | ||||||
| Peyto Exploration & Development Corp. | 127,400 | 1,204,592 | ||||||
| PrairieSky Royalty, Ltd. | 21,436 | 475,317 | ||||||
| Precision Drilling Corp.(a) | 89,606 | 318,997 | ||||||
| Pretium Resources, Inc.(a) | 19,286 | 129,795 | ||||||
| Raging River Exploration, Inc.(a) | 147,000 | 817,462 | ||||||
| Sandstorm Gold, Ltd.(a) | 83,620 | 387,161 | ||||||
| Secure Energy Services, Inc. | 42,200 | 265,568 | ||||||
| SEMAFO, Inc.(a) | 28,400 | 88,035 | ||||||
| Seven Generations Energy, Ltd., Class A(a) | 78,700 | 1,122,928 | ||||||
| ShawCor, Ltd. | 12,200 | 236,028 | ||||||
| Spartan Energy Corp.(a) | 79,600 | 394,296 | ||||||
| SSR Mining, Inc.(a) | 87,262 | 891,818 | ||||||
| Suncor Energy, Inc. | 6,500 | 248,569 | ||||||
| Teck Resources, Ltd., Class B | 40,999 | 1,030,305 | ||||||
| TORC Oil & Gas, Ltd. | 28,600 | 162,162 | ||||||
| Torex Gold Resources, Inc.(a) | 22,700 | 233,374 | ||||||
| Tourmaline Oil Corp. | 48,800 | 917,886 | ||||||
| Trican Well Service, Ltd.(a) | 96,300 | 256,510 | ||||||
| Turquoise Hill Resources, Ltd.(a) | 71,705 | 212,964 | ||||||
| Vermilion Energy, Inc. | 29,800 | 1,007,298 | ||||||
| Wheaton Precious Metals Corp. | 32,077 | 666,881 | ||||||
| Whitecap Resources, Inc. | 38,700 | 280,315 | ||||||
10 | April 30, 2018
ALPS | CoreCommodity Management CompleteCommodities® Strategy Fund
| Consolidated Statement of Investments | April 30, 2018 (Unaudited) |
| Shares | Value (Note 2) | |||||||
| Canada (continued) | ||||||||
| Yamana Gold, Inc. | 44,266 | $ | 127,043 | |||||
| 32,586,745 | ||||||||
| Chile (0.32%) | ||||||||
| Sociedad Quimica y Minera de Chile SA, Sponsored ADR | 38,571 | 2,117,162 | ||||||
| China (0.17%) | ||||||||
| CNOOC, Ltd., Sponsored ADR | 3,577 | 604,549 | ||||||
| JinkoSolar Holding Co., Ltd., ADR(a) | 5,556 | 102,119 | ||||||
| PetroChina Co., Ltd., ADR | 5,807 | 427,453 | ||||||
| 1,134,121 | ||||||||
| Colombia (0.15%) | ||||||||
| Ecopetrol SA, Sponsored ADR | 44,505 | 982,670 | ||||||
| Denmark (0.13%) | ||||||||
| FLSmidth & Co. A/S | 6,011 | 372,564 | ||||||
| Vestas Wind Systems A/S | 7,588 | 492,198 | ||||||
| 864,762 | ||||||||
| Faroe Islands (0.14%) | ||||||||
| Bakkafrost P/F | 15,902 | 913,806 | ||||||
| Finland (0.13%) | ||||||||
| Outokumpu OYJ | 68,921 | 447,772 | ||||||
| Outotec OYJ(a) | 43,438 | 396,880 | ||||||
| 844,652 | ||||||||
| France (0.16%) | ||||||||
| TOTAL SA, Sponsored ADR | 16,444 | 1,029,559 | ||||||
| Germany (0.36%) | ||||||||
| K+S AG | 47,872 | 1,411,147 | ||||||
| Nordex SE(a) | 24,833 | 285,489 | ||||||
| Salzgitter AG | 10,429 | 573,912 | ||||||
| SMA Solar Technology AG | 1,775 | 109,640 | ||||||
| 2,380,188 | ||||||||
| Great Britain (0.89%) | ||||||||
| Antofagasta PLC | 9,379 | 125,557 | ||||||
| BP PLC, Sponsored ADR | 29,968 | 1,336,273 | ||||||
| CNH Industrial N.V. | 60,342 | 739,190 | ||||||
| Ensco PLC, Class A | 14,961 | 84,530 | ||||||
| FMC Technologies, Inc. | 8,305 | 273,733 | ||||||
| John Wood Group PLC | 37,393 | 292,709 | ||||||
| Kazakhmys PLC(a) | 6,479 | 82,096 | ||||||
| Petrofac, Ltd. | 12,709 | 105,609 | ||||||
| Rio Tinto PLC, Sponsored ADR | 24,650 | 1,354,518 | ||||||
| Royal Dutch Shell PLC, Class A, Sponsored ADR | 3,991 | 278,970 | ||||||
| Royal Dutch Shell PLC, Class B | 6,862 | 245,762 | ||||||
| Subsea 7 SA | 57,678 | 810,280 | ||||||
| Tullow Oil PLC(a) | 35,921 | 112,603 | ||||||
| 5,841,830 | ||||||||
| Shares | Value (Note 2) | |||||||
| India (0.08%) | ||||||||
| Vedanta Resources PLC | 41,024 | $ | 411,271 | |||||
| Vedanta, Ltd., ADR | 5,981 | 105,983 | ||||||
| 517,254 | ||||||||
| Israel (0.00%)(b) | ||||||||
| Tower Semiconductor, Ltd.(a) | 1 | 15 | ||||||
| Italy (0.05%) | ||||||||
| Eni SpA, Sponsored ADR | 8,929 | 349,749 | ||||||
| Japan (1.73%) | ||||||||
| Daido Steel Co., Ltd. | 4,600 | 249,945 | ||||||
| GS Yuasa Corp. | 108,000 | 582,876 | ||||||
| Hitachi Metals, Ltd. | 48,800 | 560,673 | ||||||
| Inpex Corp. | 57,333 | 735,543 | ||||||
| Japan Petroleum Exploration Co., Ltd. | 19,200 | 500,022 | ||||||
| JFE Holdings, Inc. | 24,800 | 511,449 | ||||||
| Kobe Steel, Ltd. | 60,200 | 623,366 | ||||||
| Kubota Corp. | 101,900 | 1,723,968 | ||||||
| Kurita Water Industries, Ltd. | 18,016 | 585,042 | ||||||
| Maruichi Steel Tube, Ltd. | 16,300 | 558,393 | ||||||
| Megmilk Snow Brand Co., Ltd. | 6,000 | 180,845 | ||||||
| Mitsubishi Materials Corp. | 24,700 | 754,647 | ||||||
| Nippon Suisan Kaisha, Ltd. | 129,600 | 704,193 | ||||||
| Nisshin Steel Co., Ltd. | 29,000 | 386,242 | ||||||
| Sakata Seed Corp. | 15,600 | 572,942 | ||||||
| Sumitomo Forestry Co., Ltd. | 20,659 | 343,372 | ||||||
| Sumitomo Metal Mining Co., Ltd. | 1,200 | 51,570 | ||||||
| Toho Zinc Co., Ltd. | 10,400 | 483,278 | ||||||
| Tokyo Steel Manufacturing Co., Ltd. | 73,400 | 614,352 | ||||||
| UACJ Corp. | 5,400 | 140,730 | ||||||
| Yamato Kogyo Co., Ltd. | 14,400 | 428,101 | ||||||
| 11,291,549 | ||||||||
| Jersey (0.22%) | ||||||||
| Randgold Resources, Ltd., ADR | 17,728 | 1,437,741 | ||||||
| Luxembourg (0.18%) | ||||||||
| APERAM SA | 9,087 | 442,999 | ||||||
| ArcelorMittal(a) | 5,056 | 171,538 | ||||||
| Tenaris SA, ADR | 1,915 | 71,583 | ||||||
| Ternium SA, Sponsored ADR | 11,900 | 472,072 | ||||||
| 1,158,192 | ||||||||
| Mexico (0.28%) | ||||||||
| Grupo Mexico SAB de CV, Series B | 353,583 | 1,170,667 | ||||||
| Industrias Penoles SAB de CV | 30,177 | 634,115 | ||||||
| 1,804,782 | ||||||||
| Monaco (0.03%) | ||||||||
| Endeavour Mining Corp.(a) | 11,200 | 191,123 | ||||||
| Netherlands (0.24%) | ||||||||
| Frank's International N.V. | 41,457 | 289,784 | ||||||
| Fugro N.V.(a) | 27,192 | 430,987 | ||||||
| OCI N.V.(a) | 15,679 | 373,188 | ||||||
11 | April 30, 2018
ALPS | CoreCommodity Management CompleteCommodities® Strategy Fund
| Consolidated Statement of Investments | April 30, 2018 (Unaudited) |
| Shares | Value (Note 2) | |||||||
| Netherlands (continued) | ||||||||
| SBM Offshore N.V. | 27,872 | $ | 468,860 | |||||
| 1,562,819 | ||||||||
| Norway (1.53%) | ||||||||
| Aker BP ASA | 15,889 | 523,276 | ||||||
| Aker Solutions ASA(a)(c) | 31,752 | 215,868 | ||||||
| DNO ASA(a) | 266,580 | 497,119 | ||||||
| Leroy Seafood Group ASA | 124,475 | 915,141 | ||||||
| Marine Harvest ASA | 90,371 | 1,967,427 | ||||||
| Norsk Hydro ASA | 8,367 | 52,211 | ||||||
| Petroleum Geo-Services ASA(a) | 83,795 | 362,033 | ||||||
| Salmar ASA | 16,124 | 753,712 | ||||||
| Statoil ASA | 37,100 | 950,357 | ||||||
| TGS NOPEC Geophysical Co. ASA | 21,048 | 666,941 | ||||||
| Yara International ASA | 72,477 | 3,062,675 | ||||||
| 9,966,760 | ||||||||
| Peru (0.05%) | ||||||||
| Cia de Minas Buenaventura SAA, ADR | 17,919 | 285,808 | ||||||
| Southern Copper Corp. | 795 | 41,984 | ||||||
| 327,792 | ||||||||
| Singapore (0.18%) | ||||||||
| Sembcorp Marine, Ltd. | 61,200 | 98,769 | ||||||
| Wilmar International, Ltd. | 445,761 | 1,095,913 | ||||||
| 1,194,682 | ||||||||
| South Africa (0.50%) | ||||||||
| African Rainbow Minerals, Ltd. | 26,681 | 219,163 | ||||||
| AngloGold Ashanti, Ltd., Sponsored ADR | 53,639 | 481,678 | ||||||
| Exxaro Resources, Ltd. | 59,833 | 534,249 | ||||||
| Gold Fields, Ltd., Sponsored ADR | 347,893 | 1,328,951 | ||||||
| Impala Platinum Holdings, Ltd.(a) | 108,227 | 193,966 | ||||||
| Kumba Iron Ore, Ltd. | 15,133 | 326,018 | ||||||
| Sasol, Ltd. | 2,449 | 88,013 | ||||||
| Sibanye Gold, Ltd., Sponsored ADR | 17,642 | 62,275 | ||||||
| 3,234,313 | ||||||||
| South Korea (0.04%) | ||||||||
| POSCO, Sponsored ADR | 2,732 | 231,810 | ||||||
| Spain (0.01%) | ||||||||
| Acerinox SA | 4,990 | 70,172 | ||||||
| Sweden (0.52%) | ||||||||
| Boliden AB | 59,209 | 2,060,938 | ||||||
| Holmen AB, B Shares | 19,366 | 479,027 | ||||||
| Lundin Petroleum AB(a) | 12,829 | 354,837 | ||||||
| SSAB AB, A Shares | 88,212 | 501,167 | ||||||
| 3,395,969 | ||||||||
| Switzerland (0.23%) | ||||||||
| Bucher Industries AG | 280 | 103,354 | ||||||
| Ferrexpo PLC | 135,944 | 440,000 | ||||||
| Glencore PLC | 36,317 | 175,342 | ||||||
| Shares | Value (Note 2) | |||||||
| Switzerland (continued) | ||||||||
| Noble Corp. PLC(a) | 74,500 | $ | 347,915 | |||||
| Transocean, Ltd.(a) | 31,936 | 395,048 | ||||||
| Weatherford International PLC(a) | 20,498 | 60,469 | ||||||
| 1,522,128 | ||||||||
| United States (11.59%) | ||||||||
| AGCO Corp. | 24,213 | 1,517,671 | ||||||
| AK Steel Holding Corp.(a) | 109,690 | 503,477 | ||||||
| Alcoa Corp.(a) | 2,164 | 110,797 | ||||||
| Allegheny Technologies, Inc.(a) | 2,028 | 53,884 | ||||||
| American States Water Co. | 6,377 | 355,326 | ||||||
| American Water Works Co., Inc. | 20,092 | 1,739,565 | ||||||
| Andersons, Inc. | 11,781 | 384,650 | ||||||
| Antero Resources Corp.(a) | 34,762 | 660,478 | ||||||
| Apache Corp. | 4,072 | 166,748 | ||||||
| Aqua America, Inc. | 27,724 | 974,499 | ||||||
| Archer-Daniels-Midland Co. | 20,259 | 919,353 | ||||||
| Baker Hughes a GE Co. | 13,729 | 495,754 | ||||||
| Basic Energy Services, Inc.(a) | 8,220 | 133,000 | ||||||
| Bristow Group, Inc. | 13,094 | 210,159 | ||||||
| Bunge, Ltd. | 24,207 | 1,748,472 | ||||||
| C&J Energy Services, Inc.(a) | 15,972 | 476,924 | ||||||
| Cabot Oil & Gas Corp. | 18,573 | 444,080 | ||||||
| California Resources Corp.(a) | 12,276 | 312,424 | ||||||
| California Water Service Group | 4,609 | 178,599 | ||||||
| Callon Petroleum Co.(a) | 90,516 | 1,259,078 | ||||||
| Cal-Maine Foods, Inc.(a) | 29,240 | 1,423,988 | ||||||
| Carpenter Technology Corp. | 11,547 | 614,993 | ||||||
| Carrizo Oil & Gas, Inc.(a) | 45,859 | 920,390 | ||||||
| Centennial Resource Development, Inc., Class A(a) | 29,942 | 553,927 | ||||||
| Century Aluminum Co.(a) | 18,820 | 328,785 | ||||||
| CF Industries Holdings, Inc. | 34,478 | 1,337,746 | ||||||
| Chesapeake Energy Corp.(a) | 11,489 | 34,122 | ||||||
| Chevron Corp. | 4,200 | 525,462 | ||||||
| Cimarex Energy Co. | 1,622 | 163,157 | ||||||
| Cliffs Natural Resources, Inc.(a) | 219,931 | 1,631,888 | ||||||
| Coeur Mining, Inc.(a) | 6,101 | 46,185 | ||||||
| Compass Minerals International, Inc. | 11,567 | 778,459 | ||||||
| Concho Resources, Inc.(a) | 3,146 | 494,583 | ||||||
| ConocoPhillips | 6,841 | 448,086 | ||||||
| CONSOL Energy, Inc.(a) | 13,252 | 196,925 | ||||||
| Continental Resources, Inc.(a) | 22,960 | 1,516,738 | ||||||
| Darling Ingredients, Inc.(a) | 39,609 | 678,898 | ||||||
| Deere & Co. | 8,487 | 1,148,546 | ||||||
| Devon Energy Corp. | 10,371 | 376,778 | ||||||
| Diamond Offshore Drilling, Inc.(a) | 3,190 | 58,664 | ||||||
| Diamondback Energy, Inc.(a) | 578 | 74,244 | ||||||
| Dril-Quip, Inc.(a) | 5,399 | 223,789 | ||||||
| Energen Corp.(a) | 11,439 | 748,568 | ||||||
| Energy Recovery, Inc.(a) | 41,392 | 351,418 | ||||||
| EOG Resources, Inc. | 5,059 | 597,822 | ||||||
| EQT Corp. | 7,871 | 395,045 | ||||||
| Exterran Corp.(a) | 3,606 | 105,620 | ||||||
| Extraction Oil & Gas, Inc.(a) | 27,255 | 384,841 | ||||||
| Exxon Mobil Corp. | 10,900 | 847,475 | ||||||
| First Solar, Inc.(a) | 6,824 | 483,890 | ||||||
12 | April 30, 2018
ALPS | CoreCommodity Management CompleteCommodities® Strategy Fund
| Consolidated Statement of Investments | April 30, 2018 (Unaudited) |
| Shares | Value (Note 2) | |||||||
| United States (continued) | ||||||||
| FMC Corp. | 8,636 | $ | 688,548 | |||||
| Forum Energy Technologies, Inc.(a) | 14,276 | 179,878 | ||||||
| Freeport-McMoRan, Inc. | 3,119 | 47,440 | ||||||
| Fresh Del Monte Produce, Inc. | 9,031 | 443,874 | ||||||
| Gulfport Energy Corp.(a) | 1,352 | 12,574 | ||||||
| Halcon Resources Corp.(a) | 103,746 | 557,116 | ||||||
| Halliburton Co. | 564 | 29,886 | ||||||
| Harsco Corp.(a) | 20,191 | 412,906 | ||||||
| Hecla Mining Co. | 188,743 | 722,886 | ||||||
| Helix Energy Solutions Group, Inc.(a) | 35,512 | 274,153 | ||||||
| Helmerich & Payne, Inc. | 4,326 | 300,873 | ||||||
| Hess Corp. | 1,505 | 85,770 | ||||||
| HollyFrontier Corp. | 28,340 | 1,719,955 | ||||||
| Ingredion, Inc. | 15,601 | 1,889,125 | ||||||
| Jagged Peak Energy, Inc.(a) | 27,129 | 388,759 | ||||||
| Kaiser Aluminum Corp. | 4,013 | 395,441 | ||||||
| Kinder Morgan, Inc. | 5,763 | 91,171 | ||||||
| Kosmos Energy, Ltd.(a) | 71,459 | 503,071 | ||||||
| Laredo Petroleum, Inc.(a) | 30,617 | 336,787 | ||||||
| Linn Energy, Inc.(a) | 1,589 | 62,289 | ||||||
| Marathon Oil Corp. | 47,342 | 863,992 | ||||||
| Marathon Petroleum Corp. | 31,343 | 2,347,904 | ||||||
| Matador Resources Co.(a) | 16,791 | 549,737 | ||||||
| McDermott International, Inc.(a) | 76,972 | 508,015 | ||||||
| Monsanto Co. | 9,359 | 1,173,338 | ||||||
| Mosaic Co. | 86,053 | 2,319,128 | ||||||
| Murphy Oil Corp. | 45,632 | 1,373,980 | ||||||
| Nabors Industries, Ltd. | 59,508 | 452,856 | ||||||
| National Oilwell Varco, Inc. | 3,499 | 135,306 | ||||||
| Newfield Exploration Co.(a) | 30,114 | 897,397 | ||||||
| Newmont Mining Corp. | 7,348 | 288,703 | ||||||
| Noble Energy, Inc. | 28,251 | 955,731 | ||||||
| Oasis Petroleum, Inc.(a) | 148,503 | 1,637,988 | ||||||
| Occidental Petroleum Corp. | 1,977 | 152,743 | ||||||
| Oceaneering International, Inc. | 47,381 | 1,006,372 | ||||||
| Oil States International, Inc.(a) | 23,227 | 835,011 | ||||||
| Parsley Energy, Inc., Class A(a) | 14,923 | 448,138 | ||||||
| Patterson-UTI Energy, Inc. | 9,324 | 199,720 | ||||||
| PDC Energy, Inc.(a) | 20,568 | 1,101,211 | ||||||
| Phillips 66 | 10,779 | 1,199,810 | ||||||
| Pilgrim's Pride Corp.(a) | 46,006 | 993,730 | ||||||
| Pioneer Natural Resources Co. | 5,918 | 1,192,773 | ||||||
| Potlatch Corp. REIT | 12,920 | 669,902 | ||||||
| Propetro Holding Corp.(a) | 19,678 | 360,107 | ||||||
| QEP Resources, Inc.(a) | 56,900 | 693,042 | ||||||
| Range Resources Corp. | 26,273 | 363,881 | ||||||
| Rayonier, Inc. REIT | 20,885 | 776,713 | ||||||
| Rexnord Corp.(a) | 48,783 | 1,342,020 | ||||||
| Ring Energy, Inc.(a) | 11,739 | 196,276 | ||||||
| Rowan Cos. PLC, Class A(a) | 56,471 | 815,441 | ||||||
| Royal Gold, Inc. | 5,350 | 475,080 | ||||||
| RPC, Inc. | 26,797 | 482,614 | ||||||
| RSP Permian, Inc.(a) | 24,166 | 1,198,875 | ||||||
| Schlumberger, Ltd. | 8,909 | 610,801 | ||||||
| Schnitzer Steel Industries, Inc., Class A | 18,302 | 538,994 | ||||||
| SJW Group | 6,870 | 415,292 | ||||||
| Southwestern Energy Co.(a) | 26,093 | 106,981 | ||||||
| Shares | Value (Note 2) | |||||||
| United States (continued) | ||||||||
| SRC Energy, Inc.(a) | 32,058 | $ | 353,920 | |||||
| SunCoke Energy, Inc.(a) | 4,214 | 48,419 | ||||||
| Superior Energy Services, Inc.(a) | 12,336 | 132,365 | ||||||
| Tahoe Resources, Inc. | 96,800 | 487,788 | ||||||
| TimkenSteel Corp.(a) | 3,384 | 56,817 | ||||||
| Tyson Foods, Inc., Class A | 5,219 | 365,852 | ||||||
| United States Steel Corp. | 17,190 | 581,538 | ||||||
| US Silica Holdings, Inc. | 14,303 | 430,663 | ||||||
| Valero Energy Corp. | 20,330 | 2,255,207 | ||||||
| W&T Offshore, Inc.(a) | 13,302 | 81,142 | ||||||
| Walter Energy, Inc.(a) | 68,768 | 894 | ||||||
| Weyerhaeuser Co. REIT | 31,393 | 1,154,635 | ||||||
| WildHorse Resource Development Corp.(a) | 11,036 | 288,591 | ||||||
| WPX Energy, Inc.(a) | 24,490 | 418,534 | ||||||
| 75,614,439 | ||||||||
| TOTAL COMMON STOCKS | ||||||||
| (Cost $163,451,318) | 177,857,601 | |||||||
| MASTER LIMITED PARTNERSHIPS (0.22%) | ||||||||
| United States (0.22%) | ||||||||
| Alliance Resource Partners LP | 29,972 | 529,005 | ||||||
| Buckeye Partners LP | 977 | 40,594 | ||||||
| Energy Transfer Partners LP | 3,886 | 70,026 | ||||||
| Enterprise Products Partners LP | 10,676 | 286,544 | ||||||
| Magellan Midstream Partners LP | 2,054 | 135,215 | ||||||
| MPLX LP | 1,555 | 54,938 | ||||||
| Plains All American Pipeline LP | 3,090 | 72,646 | ||||||
| SunCoke Energy Partners LP | 12,203 | 187,316 | ||||||
| Williams Partners LP | 1,242 | 45,209 | ||||||
| 1,421,493 | ||||||||
| TOTAL MASTER LIMITED PARTNERSHIPS | ||||||||
| (Cost $1,908,009) | 1,421,493 | |||||||
| Principal Amount | Value (Note 2) | |||||||
| GOVERNMENT BONDS (61.05%) | ||||||||
| U.S. Treasury Bonds (61.05%) | ||||||||
| United States Treasury Inflation Indexed Bonds | ||||||||
| 0.125%, 4/15/19(d) | $ | 262,998,873 | $ | 261,853,390 | ||||
| United States Treasury Notes 1.500%, 3/31/19 | 56,500,000 | 56,114,873 | ||||||
| 1.625%, 3/31/19(d) | 23,250,000 | 23,115,132 | ||||||
| 1.625%, 7/31/19 | 58,000,000 | 57,478,906 | ||||||
| 398,562,301 | ||||||||
| TOTAL GOVERNMENT BONDS | ||||||||
| (Cost $401,098,119) | 398,562,301 | |||||||
13 | April 30, 2018
ALPS | CoreCommodity Management CompleteCommodities® Strategy Fund
| Consolidated Statement of Investments | April 30, 2018 (Unaudited) |
| Value (Note 2) | ||||
| TOTAL INVESTMENTS (88.52%) | ||||
| (Cost $566,457,446) | $ | 577,841,395 | ||
| Other Assets In Excess Of Liabilities (11.48%)(e) | 74,964,081 | |||
| NET ASSETS - 100.00% | $ | 652,805,476 | ||
| (a) | Non-Income Producing Security. |
| (b) | Less than 0.005%. |
| (c) | These securities initially sold to other parties pursuant to Regulation S under the 1933 Act and subsequently resold to the Fund. At period end, the aggregate market value of those securities was $215,868, representing 0.033% of the Fund's net assets. |
| (d) | Security, or portion of security, is being held as collateral for total return swap contracts and futures contracts aggregating a total market value of $29,364,537. |
| (e) | Includes cash which is being held as collateral for total return swap contracts in the amount of $3,613. |
For Fund compliance purposes, the Fund's industry and geographical classifications refer to any one or more of the industry sub-classifications used by one or more widely recognized market indexes or ratings group indexes, and/or as defined by Fund management. This definition may not apply for purposes of this report, which may combine sub-classifications for reporting ease. Industries and regions are shown as a percent of net assets.
See Notes to Financial Statements.
14 | April 30, 2018
ALPS | CoreCommodity Management CompleteCommodities® Strategy Fund
| Consolidated Statement of Investments | April 30, 2018 (Unaudited) |
FUTURES CONTRACTS
| Description | Counterparty | Position | Contracts | Expiration Date | Notional Amount/Fair Value (Note 2) | Unrealized Appreciation | ||||||||||||||
| Brent Crude Future | Morgan Stanley & Co., LLC | Long | 977 | 05/31/18 | $ | 72,972,130 | $ | 1,251,972 | ||||||||||||
| Coffee 'C' Future | Morgan Stanley & Co., LLC | Long | 37 | 07/19/18 | 1,703,850 | 44,247 | ||||||||||||||
| Copper Future | Morgan Stanley & Co., LLC | Short | (62) | 07/27/18 | (4,764,700 | ) | 100,306 | |||||||||||||
| Gold 100 Oz Future | Morgan Stanley & Co., LLC | Short | (25) | 06/27/18 | (3,298,000 | ) | 37,392 | |||||||||||||
| LME Nickel Future | Morgan Stanley & Co., LLC | Long | 50 | 06/18/18 | 4,086,300 | 53,849 | ||||||||||||||
| Sugar #11 Future | Morgan Stanley & Co., LLC | Long | 231 | 06/29/18 | 3,039,960 | 141,797 | ||||||||||||||
| $ | 73,739,540 | $ | 1,629,563 | |||||||||||||||||
| Description | Counterparty | Position | Contracts | Expiration Date | Notional Amount/Fair Value (Note 2) | Unrealized Depreciation | ||||||||||||||
| LME Copper Future | Morgan Stanley & Co., LLC | Long | 37 | 06/18/18 | $ | 6,283,525 | $ | (28,004 | ) | |||||||||||
| LME Zinc Future | Morgan Stanley & Co., LLC | Long | 12 | 06/18/18 | 938,700 | (22,397 | ) | |||||||||||||
| Platinum Future | Morgan Stanley & Co., LLC | Long | 139 | 07/27/18 | 6,285,580 | (267,898 | ) | |||||||||||||
| Silver Future | Morgan Stanley & Co., LLC | Long | 148 | 07/27/18 | 12,136,740 | (152,826 | ) | |||||||||||||
| WTI Crude Future | Morgan Stanley & Co., LLC | Short | (629) | 05/22/18 | (43,130,530 | ) | (598,961 | ) | ||||||||||||
| $ | (17,485,985 | ) | $ | (1,070,086 | ) | |||||||||||||||
See Notes to Financial Statements.
15 | April 30, 2018
ALPS | CoreCommodity Management CompleteCommodities® Strategy Fund
| Consolidated Statement of Investments | April 30, 2018 (Unaudited) |
TOTAL RETURN SWAP CONTRACTS(a)
| Swap Counterparty | Reference Obligation | Notional Dollars Long/(Short) | Floating Rate/Fixed Amount Paid by Fund | Termination Date | Unrealized Depreciation | |||||||||
| Citigroup | CRB 3m Fwd TR Index ** | $ | 132,687,545 | USB3MTA + 27 bps* | 9/28/2018 | $ | (310 | ) | ||||||
| UBS | CRB 3m Fwd TR Index ** | 76,754,433 | USB3MTA + 32 bps* | 11/30/2018 | (181 | ) | ||||||||
| Societe Generale | CRB 3m Fwd TR Index ** | 70,801,927 | USB3MTA + 35 bps* | 11/30/2018 | (167 | ) | ||||||||
| Bank of America - Merrill Lynch | CRB 3m Fwd TR Index ** | 132,885,821 | USB3MTA + 35 bps* | 6/29/2018 | (3 | ) | ||||||||
| $ | (661 | ) | ||||||||||||
| Total Depreciation | $ | (661 | ) | |||||||||||
| (a) | For long positions in the total return swap, the Fund receives payments based on any positive return of the Reference Obligation less the rate paid by the Fund. The Fund makes payments on any negative return of such Reference Obligations plus the rate paid by the fund. For short positions in the total return swap, the Fund makes payments based on any positive return of the Reference Obligation less the rate paid by the Fund. The Fund receives payments on any negative return of such Reference Obligations plus the rate paid by the Fund. |
| * | United States Auction Results 3 Month Treasury Bill High Discount. Total return swap resets monthly. |
| ** | CRB - Commodity Research Bureau |
See Notes to Financial Statements.
16 | April 30, 2018
ALPS | CoreCommodity Management CompleteCommodities® Strategy Fund
| Consolidated Statement of Assets and Liabilities | April 30, 2018 (Unaudited) |
| ASSETS | ||||
| Investments, at value | $ | 577,841,395 | ||
| Cash | 60,258,438 | |||
| Foreign currency, at value (Cost $292,669) | 286,941 | |||
| Receivable for investments sold | 17,416 | |||
| Receivable for shares sold | 1,765,511 | |||
| Receivable for variation margin on futures contracts | 497,811 | |||
| Receivable due from broker for total return swap contracts | 13,698,572 | |||
| Deposit with broker for futures contracts (Note 3) | 7,748 | |||
| Dividends and interest receivable | 743,183 | |||
| Prepaid expenses and other assets | 12,710 | |||
| Total Assets | 655,129,725 | |||
| LIABILITIES | ||||
| Payable for investments purchased | 17,591 | |||
| Payable due to broker for total return swap contracts | 742,098 | |||
| Payable for shares redeemed | 992,794 | |||
| Payable for foreign capital gains tax | 140 | |||
| Unrealized depreciation on total return swap contracts | 661 | |||
| Investment advisory fees payable | 255,276 | |||
| Administration and transfer agency fees payable | 180,821 | |||
| Distribution and services fees payable | 35,603 | |||
| Trustees' fees and expenses payable | 5,442 | |||
| Professional fees payable | 43,627 | |||
| Accrued expenses and other liabilities | 50,196 | |||
| Total Liabilities | 2,324,249 | |||
| NET ASSETS | $ | 652,805,476 | ||
| NET ASSETS CONSIST OF | ||||
| Paid-in capital | $ | 646,200,399 | ||
| Accumulated net investment income | 586,948 | |||
| Accumulated net realized loss | (5,917,809 | ) | ||
| Net unrealized appreciation | 11,935,938 | |||
| NET ASSETS | $ | 652,805,476 | ||
| INVESTMENTS, AT COST | $ | 566,457,446 | ||
| PRICING OF SHARES | ||||
| Investor Class: | ||||
| Net Asset Value, offering and redemption price per share | $ | 8.09 | ||
| Net Assets | $ | 57,548,297 | ||
| Shares of beneficial interest outstanding (unlimited number of shares, no par value common stock authorized) | 7,113,340 | |||
| Class C: | ||||
| Net Asset Value, offering and redemption price per share(a) | $ | 7.77 | ||
| Net Assets | $ | 9,080,144 | ||
| Shares of beneficial interest outstanding (unlimited number of shares, no par value common stock authorized) | 1,168,117 | |||
| Class I: | ||||
| Net Asset Value, offering and redemption price per share | $ | 8.12 | ||
| Net Assets | $ | 586,177,035 | ||
| Shares of beneficial interest outstanding (unlimited number of shares, no par value common stock authorized) | 72,145,985 | |||
| (a) | Redemption price per share may be reduced for any applicable contingent deferred sales charge. For a description of a possible sales charge, please see the Fund's Prospectus. |
See Notes to Financial Statements.
17 | April 30, 2018
ALPS | CoreCommodity Management CompleteCommodities® Strategy Fund
| Consolidated Statement of Operations | For the Six Months Ended April 30, 2018 (Unaudited) |
| INVESTMENT INCOME | ||||
| Dividends | $ | 1,947,315 | ||
| Foreign taxes withheld on dividends | (126,760 | ) | ||
| Interest and other income, net of premium amortization and accretion of discount | 3,851,593 | |||
| Total Investment Income | 5,672,148 | |||
| EXPENSES | ||||
| Investment advisory fees | 2,413,770 | |||
| Administrative fees | 323,458 | |||
| Transfer agency fees | 277,404 | |||
| Distribution and service fees | ||||
| Investor Class(a) | 88,867 | |||
| Class C | 38,775 | |||
| Professional fees | 23,943 | |||
| Reports to shareholders and printing fees | 30,629 | |||
| State registration fees | 24,046 | |||
| Insurance fees | 1,982 | |||
| Franchise tax expenses | 140 | |||
| Custody fees | 29,962 | |||
| Trustees' fees and expenses | 8,473 | |||
| Repayment of previously waived fees | ||||
| Investor Class(a) | 6,504 | |||
| Class C | 1,029 | |||
| Class I | 46,891 | |||
| Miscellaneous expenses | 11,503 | |||
| Total Expenses | 3,327,376 | |||
| Net Expenses | 3,327,376 | |||
| Net Investment Income | 2,344,772 | |||
| Net realized gain on investments | 4,168,720 | |||
| Net realized gain on futures contracts | 9,494,707 | |||
| Net realized gain on total return swap contracts | 31,642,541 | |||
| Net realized gain on foreign currency transactions | 97 | |||
| Net Realized Gain | 45,306,065 | |||
| Net change in unrealized appreciation on investments | 2,290,782 | |||
| Net change in unrealized depreciation on futures contracts | (1,711,858 | ) | ||
| Net change in unrealized depreciation on total return swap contracts | (541 | ) | ||
| Net change in unrealized depreciation on translation of assets and liabilities denominated in foreign currencies | (5,467 | ) | ||
| Net Change in Unrealized Appreciation | 572,916 | |||
| NET REALIZED AND UNREALIZED GAIN ON INVESTMENTS | 45,878,981 | |||
| NET INCREASE IN NET ASSETS RESULTING FROM OPERATIONS | $ | 48,223,753 | ||
| (a) | Prior to December 1, 2017, Investor Class was known as Class A. |
See Notes to Financial Statements.
18 | April 30, 2018
ALPS | CoreCommodity Management CompleteCommodities® Strategy Fund
Consolidated Statements of Changes in Net Assets
| For the Six Months Ended April 30, 2018 (Unaudited) | For the Year Ended October 31, 2017 | |||||||
| OPERATIONS | ||||||||
| Net investment income | $ | 2,344,772 | $ | 287,848 | ||||
| Net realized gain | 45,306,065 | 6,803,365 | ||||||
| Net change in unrealized appreciation | 572,916 | 14,722,728 | ||||||
| Net Increase in Net Assets Resulting from Operations | 48,223,753 | 21,813,941 | ||||||
| DISTRIBUTIONS | ||||||||
| Dividends to shareholders from net investment income | ||||||||
| Investor Class(a) | (1,159,806 | ) | (15,061 | ) | ||||
| Class C | (187,271 | ) | – | |||||
| Class I | (11,870,472 | ) | (491,956 | ) | ||||
| Net Decrease in Net Assets from Distributions | (13,217,549 | ) | (507,017 | ) | ||||
| BENEFICIAL INTEREST TRANSACTIONS (NOTE 6) | ||||||||
| Shares sold | ||||||||
| Investor Class(a) | 11,081,584 | 29,389,655 | ||||||
| Class C | 1,981,650 | 3,802,844 | ||||||
| Class I | 135,582,066 | 213,799,975 | ||||||
| Dividends reinvested | ||||||||
| Investor Class(a) | 1,099,833 | 12,719 | ||||||
| Class C | 111,922 | – | ||||||
| Class I | 10,390,433 | 450,481 | ||||||
| Shares redeemed, net of redemption fees | ||||||||
| Investor Class(a) | (5,554,226 | ) | (12,292,578 | ) | ||||
| Class C | (1,093,612 | ) | (3,621,065 | ) | ||||
| Class I | (73,996,676 | ) | (215,121,025 | ) | ||||
| Net Increase in Net Assets Derived from Beneficial Interest Transactions | 79,602,974 | 16,421,006 | ||||||
| Net increase in net assets | 114,609,178 | 37,727,930 | ||||||
| NET ASSETS | ||||||||
| Beginning of period | 538,196,298 | 500,468,368 | ||||||
| End of period * | $ | 652,805,476 | $ | 538,196,298 | ||||
| *Including accumulated net investment income of: | $ | 586,948 | $ | 11,459,725 | ||||
| (a) | Prior to December 1, 2017, Investor Class was known as Class A. |
See Notes to Financial Statements.
19 | April 30, 2018
ALPS | CoreCommodity Management CompleteCommodities® Strategy Fund – Investor Class
Consolidated Financial Highlights
Selected data for a share of beneficial interest outstanding throughout the periods indicated:
| For the Six Months Ended April 30, 2018 (Unaudited)(a) | For the Year Ended October 31, 2017 | For the Year Ended October 31, 2016 | For the Year Ended October 31, 2015 | For the Fiscal Period Ended October 31, 2014(b) | For the Year Ended April 30, 2014 | |||||||||||||||||||
| Net asset value, beginning of period(c) | $ | 7.64 | $ | 7.29 | $ | 7.15 | $ | 9.56 | $ | 10.87 | $ | 10.40 | ||||||||||||
| INCOME/(LOSS) FROM INVESTMENT OPERATIONS: | ||||||||||||||||||||||||
| Net investment income/(loss)(d) | 0.02 | (0.01 | )(e) | (0.03 | )(e) | (0.09 | )(e) | 0.00 | (e)(f) | (0.06 | )(e) | |||||||||||||
| Net realized and unrealized gain/(loss) | 0.62 | 0.36 | 0.17 | (2.32 | ) | (1.31 | ) | 0.53 | ||||||||||||||||
| Total from investment operations | 0.64 | 0.35 | 0.14 | (2.41 | ) | (1.31 | ) | 0.47 | ||||||||||||||||
| DISTRIBUTIONS: | ||||||||||||||||||||||||
| From net investment income | (0.19 | ) | (0.00 | )(f) | – | – | – | – | ||||||||||||||||
| Total distributions | (0.19 | ) | (0.00 | )(f) | – | – | – | – | ||||||||||||||||
| REDEMPTION FEES ADDED TO PAID-IN CAPITAL (NOTE 6) | 0.00 | (f) | 0.00 | (f) | 0.00 | (f) | 0.00 | (f) | 0.00 | (f) | 0.00 | (f) | ||||||||||||
| Net increase/(decrease) in net asset value | 0.45 | 0.35 | 0.14 | (2.41 | ) | (1.31 | ) | 0.47 | ||||||||||||||||
| Net asset value, end of period | $ | 8.09 | $ | 7.64 | $ | 7.29 | $ | 7.15 | $ | 9.56 | $ | 10.87 | ||||||||||||
| TOTAL RETURN(g) | 8.62 | % | 4.85 | % | 1.96 | % | (25.21 | )% | (12.05 | )% | 4.52 | % | ||||||||||||
| RATIOS/SUPPLEMENTAL DATA: | ||||||||||||||||||||||||
| Net assets, end of period (000s) | $ | 57,548 | $ | 47,845 | $ | 29,468 | $ | 30,085 | $ | 39,971 | $ | 112,562 | ||||||||||||
| Ratio of expenses to average net assets excluding fee waivers and reimbursements | 1.40 | %(h) | 1.38 | % | 1.41 | % | 1.47 | % | 1.46 | %(h) | 1.50 | % | ||||||||||||
| Ratio of expenses to average net assets including fee waivers and reimbursements | 1.40 | %(h) | 1.38 | % | 1.41 | % | 1.45 | % | 1.45 | %(h) | 1.45 | % | ||||||||||||
| Ratio of net investment income/(loss) to average net assets | 0.59 | %(h) | (0.10 | )% | (0.48 | )% | (1.12 | )% | 0.09 | %(h) | (0.60 | )% | ||||||||||||
| Portfolio turnover rate(i) | 28 | % | 66 | % | 50 | % | 52 | % | 12 | % | 28 | % | ||||||||||||
| (a) | Prior to December 1, 2017, Investor Class was known as Class A. |
| (b) | Effective May 1, 2014, the Board approved changing the fiscal year-end of the Funds from April 30 to October 31. |
| (c) | Per share amounts and ratios to average net assets include income and expenses of the CoreCommodity Management Cayman Commodity Fund Ltd. (wholly-owned subsidiary). |
| (d) | Calculated using the average shares method. |
| (e) | The per share amount does not correspond to activity reflected in the Statement of Operations due to class specific expenses during the period. |
| (f) | Less than $0.005 or ($0.005) per share. |
| (g) | Total returns are for the period indicated and have not been annualized. Total returns would have been lower had certain expenses not been waived during the period. Returns shown do not reflect the deduction of taxes that a shareholder would pay on Fund distributions or the redemption of Fund shares. Returns shown exclude any applicable sales charges. |
| (h) | Annualized. |
| (i) | Portfolio turnover rate for periods less than one full year have not been annualized. |
See Notes to Financial Statements.
20 | April 30, 2018
ALPS | CoreCommodity Management CompleteCommodities® Strategy Fund – Class C
Consolidated Financial Highlights
Selected data for a share of beneficial interest outstanding throughout the periods indicated:
| For the Six Months Ended April 30, 2018 (Unaudited) | For the Year Ended October 31, 2017 | For the Year Ended October 31, 2016 | For the Year Ended October 31, 2015 | For the Fiscal Period Ended October 31, 2014(a) | For the Year Ended April 30, 2014 | |||||||||||||||||||
| Net asset value, beginning of period(b) | $ | 7.36 | $ | 7.07 | $ | 6.98 | $ | 9.39 | $ | 10.71 | $ | 10.31 | ||||||||||||
| INCOME/(LOSS) FROM INVESTMENT OPERATIONS: | ||||||||||||||||||||||||
| Net investment loss(c) | (0.00 | )(d)(e) | (0.06 | )(e) | (0.08 | )(e) | (0.14 | )(e) | (0.04 | )(e) | (0.12 | )(e) | ||||||||||||
| Net realized and unrealized gain/(loss) | 0.59 | 0.35 | 0.17 | (2.27 | ) | (1.28 | ) | 0.52 | ||||||||||||||||
| Total from investment operations | 0.59 | 0.29 | 0.09 | (2.41 | ) | (1.32 | ) | 0.40 | ||||||||||||||||
| DISTRIBUTIONS: | ||||||||||||||||||||||||
| From net investment income | (0.18 | ) | – | – | – | – | – | |||||||||||||||||
| Total distributions | (0.18 | ) | – | – | – | – | – | |||||||||||||||||
| REDEMPTION FEES ADDED TO PAID-IN CAPITAL (NOTE 6) | – | – | – | 0.00 | (d) | 0.00 | (d) | 0.00 | (d) | |||||||||||||||
| Net increase/(decrease) in net asset value | 0.41 | 0.29 | 0.09 | (2.41 | ) | (1.32 | ) | 0.40 | ||||||||||||||||
| Net asset value, end of period | $ | 7.77 | $ | 7.36 | $ | 7.07 | $ | 6.98 | $ | 9.39 | $ | 10.71 | ||||||||||||
| TOTAL RETURN(f) | 8.29 | % | 4.10 | % | 1.29 | % | (25.67 | )% | (12.32 | )% | 3.88 | % | ||||||||||||
| RATIOS/SUPPLEMENTAL DATA: | ||||||||||||||||||||||||
| Net assets, end of period (000s) | $ | 9,080 | $ | 7,642 | $ | 7,260 | $ | 8,335 | $ | 12,534 | $ | 13,996 | ||||||||||||
| Ratio of expenses to average net assets excluding fee waivers and reimbursements | 2.05 | %(g) | 2.05 | % | 2.05 | % | 2.07 | % | 2.07 | %(g) | 2.10 | % | ||||||||||||
| Ratio of expenses to average net assets including fee waivers and reimbursements | 2.05 | %(g) | 2.05 | % | 2.05 | % | 2.05 | % | 2.05 | %(g) | 2.05 | % | ||||||||||||
| Ratio of net investment loss to average net assets | (0.09 | )%(g) | (0.81 | )% | (1.13 | )% | (1.74 | )% | (0.82 | )%(g) | (1.16 | )% | ||||||||||||
| Portfolio turnover rate(h) | 28 | % | 66 | % | 50 | % | 52 | % | 12 | % | 28 | % | ||||||||||||
| (a) | Effective May 1, 2014, the Board approved changing the fiscal year-end of the Funds from April 30 to October 31. |
| (b) | Per share amounts and ratios to average net assets include income and expenses of the CoreCommodity Management Cayman Commodity Fund Ltd. (wholly-owned subsidiary). |
| (c) | Calculated using the average shares method. |
| (d) | Less than $0.005 or ($0.005) per share. |
| (e) | The per share amount does not correspond to activity reflected in the Statement of Operations due to class specific expenses during the period. |
| (f) | Total returns are for the period indicated and have not been annualized. Total returns would have been lower had certain expenses not been waived during the period. Returns shown do not reflect the deduction of taxes that a shareholder would pay on Fund distributions or the redemption of Fund shares. Returns shown exclude any applicable sales charges. |
| (g) | Annualized. |
| (h) | Portfolio turnover rate for periods less than one full year have not been annualized. |
See Notes to Financial Statements.
21 | April 30, 2018
ALPS | CoreCommodity Management CompleteCommodities® Strategy Fund – Class I
Consolidated Financial Highlights
Selected data for a share of beneficial interest outstanding throughout the periods indicated:
| For the Six Months Ended April 30, 2018 (Unaudited) | For the Year Ended October 31, 2017 | For the Year Ended October 31, 2016 | For the Year Ended October 31, 2015 | For the Fiscal Period Ended October 31, 2014(a) | For the Year Ended April 30, 2014 | |||||||||||||||||||
| Net asset value, beginning of period(b) | $ | 7.67 | $ | 7.31 | $ | 7.15 | $ | 9.57 | $ | 10.87 | $ | 10.37 | ||||||||||||
| INCOME/(LOSS) FROM INVESTMENT OPERATIONS: | ||||||||||||||||||||||||
| Net investment income/(loss)(c) | 0.03 | 0.01 | (0.02 | ) | (0.06 | ) | (0.01 | ) | (0.03 | ) | ||||||||||||||
| Net realized and unrealized gain/(loss) | 0.61 | 0.36 | 0.18 | (2.31 | ) | (1.29 | ) | 0.53 | ||||||||||||||||
| Total from investment operations | 0.64 | 0.37 | 0.16 | (2.37 | ) | (1.30 | ) | 0.50 | ||||||||||||||||
| DISTRIBUTIONS: | ||||||||||||||||||||||||
| From net investment income | (0.19 | ) | (0.01 | ) | – | (0.05 | ) | – | – | |||||||||||||||
| Total distributions | (0.19 | ) | (0.01 | ) | – | (0.05 | ) | – | – | |||||||||||||||
| REDEMPTION FEES ADDED TO PAID-IN CAPITAL (NOTE 6) | 0.00 | (d) | 0.00 | (d) | 0.00 | (d) | 0.00 | (d) | 0.00 | (d) | 0.00 | (d) | ||||||||||||
| Net increase/(decrease) in net asset value | 0.45 | 0.36 | 0.16 | (2.42 | ) | (1.30 | ) | 0.50 | ||||||||||||||||
| Net asset value, end of period | $ | 8.12 | $ | 7.67 | $ | 7.31 | $ | 7.15 | $ | 9.57 | $ | 10.87 | ||||||||||||
| TOTAL RETURN(e) | 8.64 | % | 5.03 | % | 2.24 | % | (24.88 | )% | (11.96 | )% | 4.82 | % | ||||||||||||
| RATIOS/SUPPLEMENTAL DATA: | ||||||||||||||||||||||||
| Net assets, end of period (000s) | $ | 586,177 | $ | 482,710 | $ | 463,741 | $ | 362,389 | $ | 393,618 | $ | 266,293 | ||||||||||||
| Ratio of expenses to average net assets excluding fee waivers and reimbursements | 1.13 | %(f) | 1.15 | % | 1.15 | % | 1.17 | % | 1.16 | %(f) | 1.16 | % | ||||||||||||
| Ratio of expenses to average net assets including fee waivers and reimbursements | 1.13 | %(f) | 1.15 | % | 1.15 | % | 1.15 | % | 1.15 | %(f) | 1.15 | % | ||||||||||||
| Ratio of net investment income/(loss) to average net assets | 0.86 | %(f) | 0.08 | % | (0.22 | )% | (0.73 | )% | (0.12 | )%(f) | (0.26 | )% | ||||||||||||
| Portfolio turnover rate(g) | 28 | % | 66 | % | 50 | % | 52 | % | 12 | % | 28 | % | ||||||||||||
| (a) | Effective May 1, 2014, the Board approved changing the fiscal year-end of the Funds from April 30 to October 31. |
| (b) | Per share amounts and ratios to average net assets include income and expenses of the CoreCommodity Management Cayman Commodity Fund Ltd. (wholly-owned subsidiary). |
| (c) | Calculated using the average shares method. |
| (d) | Less than $0.005 or ($0.005) per share. |
| (e) | Total returns are for the period indicated and have not been annualized. Total returns would have been lower had certain expenses not been waived during the period. Returns shown do not reflect the deduction of taxes that a shareholder would pay on Fund distributions or the redemption of Fund shares. |
| (f) | Annualized. |
| (g) | Portfolio turnover rate for periods less than one full year have not been annualized. |
See Notes to Financial Statements.
22 | April 30, 2018
ALPS | Kotak India Growth Fund
| Management Commentary | April 30, 2018 (Unaudited) |
Performance
ALPS | Kotak India Growth Fund (the “Fund”) was launched on February 14, 2011. During the 6-month period ended 30th April 2018 (hereinafter also referred to as “the period”), the Fund’s Class A Shares, INDAX, delivered a total return of 0.23% at Net Asset Value, Class C, INFCX, delivered -0.13% with CDSC, and Class I, INDIX, delivered 0.43%. The fund performed in line with the benchmark Nifty 500 Index (“NSE500 Index”) which returned 0.07% during the period without taking into account sales charges for Class A and C Shares.
The period began with a positive bias for India as India’s ranking rose 30 notches to 100 in the World Bank’s ease of doing business survey for 2018. Later in November, Moody’s upgraded India’s sovereign rating to Baa2 from Baa3, the first upgrade of India’s ratings in 14 years.
Global commodity prices especially crude rallied in this period and developed market yields continued to rise and in particular for India, the spread between the Indian and the US 10yr yields saw a compression. The US Federal Reserve increased the Fed funds rate twice in this period (December, 2017 and March 2018), as expected by markets. Fed officials raised their forecast for 2018 GDP growth from 2.5 percent in December to 2.7 percent, and increased the 2019 expectation from 2.1 percent to 2.4 percent while inflation expectations remained unchanged at 1.9% for CY2018. According to the summary of economic projections that the FOMC releases each quarter, three rate hikes was the baseline for 2018; however, had one more member indicated a higher funds rate, the forecast likely would have gone to four.
The European Central Bank (ECB) did not deliver any surprises at its 26 April monetary policy meeting, leaving its ultra-accommodative monetary policy stance unchanged and refraining from offering any clues on the future of its bond-buying program after September. The main refinancing rate remains at 0.00%, and the marginal lending rate and deposit facility rate at 0.25% and minus 0.40%, respectively. The ECB reiterated that the asset purchases program will continue at a pace of EUR 30 billion per month until September or beyond, if necessary.
The minutes of the April Monetary Policy Committee meeting reinstated the cautious approach of almost all members as inflation uncertainty has increased. Amid increased inflation uncertainty, possible closure of output gap with improved growth and consistent increase in core inflation also appears to worry a few members. Importantly, Dr Patra (vote: 25 bps hike) and Deputy Governor Acharya (vote: pause) emphasized the elevated levels of inflation above the 4% impinging on MPC target commitment. Dr Acharya went on to stress that in order to reinforce the MPC target credibility, he will “likely shift decisively to vote for a beginning of ‘withdrawal of accommodation’ in the next MPC meeting in June.” Dr Ghate argued that MSP-led inflation risks would warrant a follow-up policy response in a systematic way to maintain durability of the 4% inflation target. However, Dr Dholakia’s statements had some soft patches where he still appeared concerned on growth and also
stressed that the second round impact of the HRA increases will not be material.
The Indian union budget for FY2019 was announced on Feb 1, 2018 and the budget offered a modest fiscal stimulus to infrastructure and rural economy. The government has budgeted (1) a 17% increase in taxation revenues, 10% increase in expenditure (10% increase in revenue expenditure and 10% increase in capital expenditure) and (3) Rs800 bn of divestment revenues versus FY2018RE figure of Rs1.0 tn. The government’s FY2018RE GFD/GDP figure stands at 3.5%, modestly above its 3.2% target. The government has introduced 10% long-term capital gains (LTCG) on shares from April 1, 2018 versus nil earlier. However, it will grandfather capital gains up to January 1, 2018. The government budgeted ₹1.6 tn (0.8% of GDP) towards the rural development through allocations in key sectors such as employment guarantee scheme, housing, irrigation, rural roads and connectivity and social welfare schemes targeted towards women and children.
In FY2018, CGST collection was at Rs1.19 tn, SGST collection was at Rs2.91 tn, unallocated IGST was at Rs2.47 tn, and compensation cess was at Rs0.62 tn. This implies GST collection of Rs7.19 tn.
The Government has implemented the e-way bill in most states. Ministry of Finance informed that till April 17 more than 13.3 mn e-way bills have been successfully generated which includes 0.6 mn intra-state e-way bills generated by the six states of Andhra Pradesh, Gujarat, Karnataka, Kerala, Telangana and Uttar Pradesh which rolled out the intra-state e-way bill from April 15. From April 20 six more states (Bihar, Jharkhand, Haryana, Himachal Pradesh, Tripura, and Uttarakhand) would join the system.
Real GDP accelerated to 7.2% in 3QFY18 compared to 6.3% in 2QFY18 suggesting that the economy has started to normalize from the impacts of GST implementation. The real GVA growth picked up to 6.7% from 6.2% in 2QFY18 largely led by pickup in industrial growth (6.8% compared to 5.9% in 2QFY18). Within industry, manufacturing (8.1% from 6.9% in 2QFY18) and construction (6.8% from 2.8% in 2QFY18) were the key contributors. Private consumption growth continued to slow down at 5.6% in 3QFY18, reflected partly in the subdued real rural wages. Gross fixed capital formation (GFCF) grew for the third consecutive quarter, surging by 12% from 6.9% in 2QFY18. CSO revised up its second advance estimate (2nd AE) for FY2018 with the real GDP growth of 6.6% and real GVA growth at 6.4%, compared to the first advance estimate 6.5% and 6.1% respectively.
The IMD forecasted the June-September normal monsoon at 97% of LPA though the probabilities are skewed more towards the weaker side. The IMD sees 42% probability of normal rainfall, 30% of below-normal, 14% of deficient, 12% of above normal, and 2% of excess rainfall.
Portfolio Composition
The fund mandate is flexible to invest across the spectrum of market capitalizations in order to take advantage of any opportunistic
23 | April 30, 2018
ALPS | Kotak India Growth Fund
| Management Commentary | April 30, 2018 (Unaudited) |
mispricing arising from market conditions, valuation differential, earnings growth or liquidity flows.
For the 6-month period ending 30th April 2018, Materials and Industrials were the largest over-weights compared to benchmark, while Information Technology, Healthcare and Utilities were the largest underweights in the portfolio as against the benchmark. In terms of market capitalization focus, as of 30th April 2018, the fund is invested 69.98% in large caps, 21.64% in midcaps and 5.73% in small-caps. Over the last 12 months, exposure to midcap and small-cap companies has remained in the range of 25%-30% of the fund. Thematically, Consumption (at ~34.0% of portfolio) and Financials (at ~29.5% of portfolio) constitute the most bullish themes, while Outsourcing (at ~9.7% of exposure) is the smallest thematic bet in the portfolio as of the period end.
During the period, some of the quality names within our favoured sectors where we initiated new exposure and continue to hold onto the positions are Mahindra & Mahindra and Supreme Industries. We exited Akzo Noble, Allcargo Global, Federal Bank and Orient Cement from the portfolio during the period.
Outlook
Despite the higher oil prices, rupee depreciation, and higher bond yields, the Indian equity markets surprisingly were amongst the best performing markets. Markets were helped by forecast of a good monsoon and the good numbers by Information Technology sector and retail banks that lifted the market sentiments. High frequency indicators, particularly the auto sales numbers, continued to show strong growth and indicate an overall recovery in the economy. However, it’s still early days in the earnings calendar and in our, the market direction, while macro outlook will play its role, will be driven largely by the earnings from here on. Despite the market volatility, we have seen domestic flows continue to be strong. Small investments through Systematic Investments plans (SIPs) have gained traction and now exceed a billion dollar a month run rate.
Over the next couple of weeks, in addition to the earnings season, the outcome of the upcoming state elections in Karnataka will also be a significant event and set the stage for the general election due in Apr 2019. Clearly this will add to volatility in the near term. In the backdrop of a continued slippage on macro indicators, we remain cautious in the near term unless we see a broader earnings recovery or a positive outcome in the Karnataka elections for Mr. Modi’s led ruling BJP party. In the near term, a good Monsoon led rural recovery is the silver lining for the markets.
Mr. Nitin Jain
Fund Manager
NSE500 is an Index of India comprised of the top 500 companies listed on the NSE.
The views of the author and information discussed in this commentary are as of the date of publication, are subject to change, and may not reflect the writer's current views. The views expressed are those of the author only, and represent an assessment of market
conditions at a specific point in time, are opinions only and should not be relied upon as investment advice regarding a particular investment or markets in general. Such information does not constitute a recommendation to buy or sell specific securities or investment vehicles. It should not be assumed that any investment will be profitable or will equal the performance of the fund or any securities or any sectors mentioned in this letter. The subject matter contained in this letter has been derived from several sources believed to be reliable and accurate at the time of compilation. Neither ALPS Advisors, Inc., Kotak Mahindra (UK) Limited, nor the Fund accepts any liability for losses either direct or consequential caused by the use of this information.
Diversification cannot guarantee gain or prevent losses.
24 | April 30, 2018
ALPS | Kotak India Growth Fund
| Performance Update | April 30, 2018 (Unaudited) |
Performance of $10,000 Initial Investment (as of April 30, 2018)
Comparison of change in value of a $10,000 investment
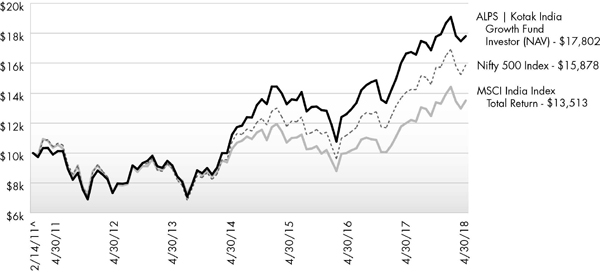
The chart above represents historical performance of a hypothetical investment of $10,000 in the Fund since inception. Past performance does not guarantee future results. This chart does not reflect the deduction of taxes that a shareholder would pay on Fund distributions or the redemption of Fund shares.
Average Annual Total Returns (as of April 30, 2018)
| 6 Month | 1 Year | 3 Year | 5 Year | Since Inception^ | Total Expense Ratio | What You Pay* | |
| Investor# (NAV) | 0.23% | 7.00% | 10.29% | 13.44% | 8.33% | 3.05% | 2.00% |
| Class C (NAV) | -0.13% | 6.23% | 9.54% | 12.64% | 7.60% | 3.69% | 2.60% |
| Class C (CDSC) | -1.10% | 5.23% | 9.54% | 12.64% | 7.60% | ||
| Class I | 0.43% | 7.36% | 10.63% | 13.79% | 8.69% | 2.65% | 1.60% |
| Nifty 500 Index1 | 1.05% | 12.85% | 10.46% | 11.25% | 6.63% | ||
| MSCI India Index Total Return2 | 0.89% | 12.58% | 8.08% | 7.85% | 4.27% |
Performance data quoted represents past performance. Past performance does not guarantee future results. Investment return and principal value of an investment will fluctuate so that an investor’s shares, when sold or redeemed, may be worth more or less than the original cost. Current performance data may be higher or lower than actual data quoted. For the most current month-end performance data, please call 1-866-759-5679.
Performance shown at NAV does not include sales charges and would have been lower had it been taken into account. A Contingent Deferred Sales Charge (“CDSC”) of 1.00% may apply to Class C shares redeemed within the first 12 months after a purchase. The Fund imposes a 2.00% redemption fee on shares held for less than 30 days.
Performance less than 1 year is cumulative.
25 | April 30, 2018
ALPS | Kotak India Growth Fund
| Performance Update | April 30, 2018 (Unaudited) |
| 1 | Nifty 500 Index (formerly the CNX 500 Index) - India's first broad based benchmark of the Indian capital market. The Nifty 500 companies are disaggregated into 72 industry indices. Industry weightages in the index reflect the industry weightages in the market. The index is not actively managed and does not reflect any deduction for fees, expenses or taxes. An investor may not invest directly in an index. |
| 2 | MSCI India Index - designed to measure the performance of the large and mid cap segments of the Indian market. With 64 constituents, the index covers approximately 85% of the Indian equity universe. |
| ^ | Fund inception date of February 14, 2011. |
| * | What You Pay reflects the Advisor's and Sub-Advisor’s decision to contractually limit expenses through February 28, 2019. Please see the prospectus for additional information. |
| # | Prior to December 1, 2017, Investor Class was known as Class A. |
The Fund is “non-diversified” and will generally be more volatile than diversified funds.
The table does not reflect the deduction of taxes that a shareholder would pay on Fund distributions or the redemption of Fund shares.
This Fund is not suitable for all investors and is subject to investment risks, including possible loss of the principal amount invested.
There is no guarantee that the Fund will continue to hold any one particular security or stay invested in any one particular company. The composition of the Fund's top holdings is subject to change. Performance figures are historical and reflect the change in share price, reinvested distributions, changes in net asset value, sales charges and capital gains distributions, if any.
Not FDIC Insured – No Bank Guarantee – May Lose Value
Investing in India involves risk and considerations not present when investing in more established securities markets. The Fund may be more susceptible to economic, market, political and local risks of the region than a fund that is more geographically diversified. Investments in India are subject to a number of risks including, but not limited to, risk of losing some or all of the capital invested, high market volatility, variable market liquidity, geopolitical risks (including political instability), exchange rate fluctuations (between the currency of the fund’s share class and the Indian Rupee), changes in tax regime and restrictions on investment activities of foreign investors.
Top Ten Holdings (as a % of Net Assets) †
| HDFC Bank, Ltd. | 8.43% |
| Infosys, Ltd. | 4.20% |
| Reliance Industries, Ltd. | 3.38% |
| ICICI Bank, Ltd. | 3.33% |
| ITC, Ltd. | 3.24% |
| Housing Development Finance Corp., Ltd. | 3.23% |
| IndusInd Bank, Ltd. | 2.90% |
| Maruti Suzuki India, Ltd. | 2.86% |
| Britannia Industries, Ltd. | 2.41% |
| Axis Bank, Ltd. | 2.37% |
| Top Ten Holdings | 36.35% |
| † | Holdings are subject to change, and may not reflect the current or future position of the portfolio. Table presents approximate values only. |
Industry Sector Allocation (as a % of Net Assets)

26 | April 30, 2018
ALPS | Kotak India Growth Fund
| Consolidated Statement of Investments | April 30, 2018 (Unaudited) |
| Shares | Value (Note 2) | |||||||
| COMMON STOCKS (98.26%) | ||||||||
| Consumer Discretionary (12.00%) | ||||||||
| Auto Components (2.38%) | ||||||||
| Motherson Sumi Systems, Ltd. | 45,297 | $ | 238,882 | |||||
| MRF, Ltd. | 466 | 556,459 | ||||||
| 795,341 | ||||||||
| Automobiles (6.04%) | ||||||||
| Mahindra & Mahindra, Ltd. | 25,000 | 325,862 | ||||||
| Maruti Suzuki India, Ltd. | 7,258 | 955,072 | ||||||
| Tata Motors, Ltd., Class A(a) | 99,407 | 283,559 | ||||||
| TVS Motor Co., Ltd. | 45,300 | 451,122 | ||||||
| 2,015,615 | ||||||||
| Hotels, Restaurants & Leisure (1.45%) | ||||||||
| Jubilant Foodworks, Ltd. | 12,797 | 484,158 | ||||||
| Household Durables (1.33%) | ||||||||
| Crompton Greaves Consumer Electricals, Ltd. | 126,346 | 444,093 | ||||||
| Textiles, Apparel & Luxury Goods (0.80%) | ||||||||
| Arvind, Ltd. | 41,998 | 265,138 | ||||||
| TOTAL CONSUMER DISCRETIONARY | 4,004,345 | |||||||
| Consumer Staples (8.74%) | ||||||||
| Food Products (2.41%) | ||||||||
| Britannia Industries, Ltd. | 9,738 | 803,793 | ||||||
| Personal Products (3.09%) | ||||||||
| Colgate-Palmolive India, Ltd. | 18,729 | 314,472 | ||||||
| Emami, Ltd. | 17,684 | 294,935 | ||||||
| Godrej Consumer Products, Ltd. | 25,434 | 424,223 | ||||||
| 1,033,630 | ||||||||
| Tobacco (3.24%) | ||||||||
| ITC, Ltd. | 257,109 | 1,081,497 | ||||||
| TOTAL CONSUMER STAPLES | 2,918,920 | |||||||
| Energy (5.68%) | ||||||||
| Oil, Gas & Consumable Fuels (5.68%) | ||||||||
| Hindustan Petroleum Corp., Ltd. | 97,670 | 443,864 | ||||||
| Petronet LNG, Ltd. | 95,682 | 324,255 | ||||||
| Reliance Industries, Ltd. | 78,582 | 1,129,328 | ||||||
| 1,897,447 | ||||||||
| TOTAL ENERGY | 1,897,447 | |||||||
| Financials (29.67%) | ||||||||
| Banks (22.34%) | ||||||||
| Axis Bank, Ltd. | 102,673 | 792,271 | ||||||
| HDFC Bank, Ltd. | 96,920 | 2,812,519 | ||||||
| Shares | Value (Note 2) | |||||||
| Banks (continued) | ||||||||
| ICICI Bank, Ltd. | 261,355 | $ | 1,111,763 | |||||
| IndusInd Bank, Ltd. | 34,209 | 968,586 | ||||||
| RBL Bank, Ltd.(b)(c) | 58,799 | 464,817 | ||||||
| State Bank of India | 142,492 | 524,046 | ||||||
| Yes Bank, Ltd. | 144,550 | 780,259 | ||||||
| 7,454,261 | ||||||||
| Consumer Finance (2.64%) | ||||||||
| Bajaj Finance, Ltd. | 10,500 | 298,789 | ||||||
| Bharat Financial Inclusion, Ltd.(a) | 33,590 | 582,775 | ||||||
| 881,564 | ||||||||
| Insurance (1.46%) | ||||||||
| ICICI Prudential Life Insurance Co., Ltd.(b)(c) | 76,569 | 487,363 | ||||||
| Thrifts & Mortgage Finance (3.23%) | ||||||||
| Housing Development Finance Corp., Ltd. | 38,303 | 1,078,674 | ||||||
| TOTAL FINANCIALS | 9,901,862 | |||||||
| Health Care (4.55%) | ||||||||
| Health Care Providers & Services (0.87%) | ||||||||
| HealthCare Global Enterprises, Ltd.(a) | 64,442 | 289,291 | ||||||
| Pharmaceuticals (3.68%) | ||||||||
| Cadila Healthcare, Ltd. (a) | 30,202 | 186,143 | ||||||
| Cipla, Ltd. | 37,038 | 335,823 | ||||||
| Lupin, Ltd. | 24,920 | 302,116 | ||||||
| Sun Pharmaceutical Industries, Ltd. | 51,351 | 405,488 | ||||||
| 1,229,570 | ||||||||
| TOTAL HEALTH CARE | 1,518,861 | |||||||
| Industrials (10.60%) | ||||||||
| Airlines (1.39%) | ||||||||
| InterGlobe Aviation, Ltd.(b)(c) | 22,070 | 462,523 | ||||||
| Building Products (1.42%) | ||||||||
| Kajaria Ceramics, Ltd. | 29,925 | 243,882 | ||||||
| Somany Ceramics, Ltd. | 27,895 | 231,435 | ||||||
| 475,317 | ||||||||
| Construction & Engineering (2.34%) | ||||||||
| Larsen & Toubro, Ltd. | 37,236 | 779,127 | ||||||
| Electrical Equipment (3.75%) | ||||||||
| Amara Raja Batteries, Ltd. | 31,119 | 400,181 | ||||||
| Finolex Cables, Ltd. | 37,765 | 394,558 | ||||||
| V-Guard Industries, Ltd. | 127,597 | 457,340 | ||||||
| 1,252,079 | ||||||||
27 | April 30, 2018
ALPS | Kotak India Growth Fund
| Consolidated Statement of Investments | April 30, 2018 (Unaudited) |
| Shares | Value (Note 2) | |||||||
| Machinery (1.70%) | ||||||||
| Thermax, Ltd. | 14,382 | $ | 244,347 | |||||
| Timken India, Ltd. | 31,458 | 324,331 | ||||||
| 568,678 | ||||||||
| TOTAL INDUSTRIALS | 3,537,724 | |||||||
| Information Technology (9.82%) | ||||||||
| IT Services (9.82%) | ||||||||
| HCL Technologies, Ltd. | 42,638 | 670,954 | ||||||
| Infosys, Ltd. | 78,235 | 1,402,151 | ||||||
| Tata Consultancy Services, Ltd. | 13,562 | 715,893 | ||||||
| Tech Mahindra, Ltd. | 49,007 | 490,297 | ||||||
| 3,279,295 | ||||||||
| TOTAL INFORMATION TECHNOLOGY | 3,279,295 | |||||||
| Materials (15.33%) | ||||||||
| Chemicals (4.33%) | ||||||||
| Berger Paints India, Ltd. | 103,404 | 442,708 | ||||||
| Bodal Chemicals, Ltd. | 109,652 | 193,444 | ||||||
| Gulf Oil Lubricants India, Ltd. | 15,666 | 218,815 | ||||||
| SH Kelkar & Co., Ltd.(b)(c) | 66,806 | 242,366 | ||||||
| Supreme Industries, Ltd. | 16,796 | 346,941 | ||||||
| 1,444,274 | ||||||||
| Construction Materials (7.83%) | ||||||||
| ACC, Ltd. | 13,694 | 324,743 | ||||||
| Century Textiles & Industries, Ltd. | 18,345 | 345,731 | ||||||
| Dalmia Bharat, Ltd. | 7,776 | 354,346 | ||||||
| JK Cement, Ltd. | 28,575 | 427,252 | ||||||
| Ramco Cements, Ltd. | 46,088 | 566,733 | ||||||
| Shree Cement, Ltd. | 1,276 | 323,057 | ||||||
| UltraTech Cement, Ltd. | 4,435 | 272,161 | ||||||
| 2,614,023 | ||||||||
| Metals & Mining (3.17%) | ||||||||
| Jindal Steel & Power, Ltd.(a) | 140,000 | 523,939 | ||||||
| Vedanta, Ltd. | 120,217 | 533,619 | ||||||
| 1,057,558 | ||||||||
| TOTAL MATERIALS | 5,115,855 | |||||||
| Real Estate (1.30%) | ||||||||
| Real Estate Management & Development (1.30%) | ||||||||
| Brigade Enterprises, Ltd. | 103,048 | 433,105 | ||||||
| TOTAL REAL ESTATE | 433,105 | |||||||
| Shares | Value (Note 2) | |||||||
| Telecommunication Services (0.57%) | ||||||||
| Wireless Telecommunication Services (0.57%) | ||||||||
| Bharti Airtel, Ltd. | 31,000 | $ | 189,484 | |||||
| TOTAL TELECOMMUNICATION SERVICES | 189,484 | |||||||
| TOTAL COMMON STOCKS | ||||||||
| (Cost $26,771,447) | 32,796,898 | |||||||
| TOTAL INVESTMENTS (98.26%) | ||||||||
| (Cost $26,771,447) | $ | 32,796,898 | ||||||
| Other Assets In Excess Of Liabilities (1.74%) | 579,515 | |||||||
| NET ASSETS (100.00%) | $ | 33,376,413 | ||||||
| (a) | Non-Income Producing Security. |
| (b) | Security exempt from registration under Rule 144A of the Securities Act of 1933. This security may be resold in transactions exempt from registration, normally to qualified institutional buyers. As of April 30, 2018, the aggregate market value of those securities was $1,657,069, representing 4.96% of net assets. |
| (c) | Securities were purchased pursuant to Regulation S under the Securities Act of 1933, which exempts securities offered and sold outside of the United States from registration. Such securities cannot be sold in the United States without either an effective registration statement filed pursuant to the Securities Act of 1933, or pursuant to an exemption from registration. These securities have been deemed liquid under guidelines approved by the Fund's Board of Trustees. As of April 30, 2018 the aggregate market value of those securities was $1,657,069 representing 4.96% of net assets. |
For Fund compliance purposes, the Fund's industry classifications refer to any one or more of the industry sub-classifications used by one or more widely recognized market indexes or ratings group indexes, and/or as defined by Fund management. This definition may not apply for purposes of this report, which may combine industry sub-classifications for reporting ease. Industries are shown as a percent of net assets.
See Notes to Financial Statements.
28 | April 30, 2018
ALPS | Kotak India Growth Fund
| Consolidated Statement of Assets and Liabilities | April 30, 2018 (Unaudited) |
| ASSETS | ||||
| Investments, at value | $ | 32,796,898 | ||
| Cash | 126,513 | |||
| Foreign currency, at value (Cost $719,392) | 711,012 | |||
| Receivable for investments sold | 8,372 | |||
| Receivable for shares sold | 17,072 | |||
| Income tax receivable | 4,072 | |||
| Prepaid expenses and other assets | 29,744 | |||
| Total Assets | 33,693,683 | |||
| LIABILITIES | ||||
| Payable for shares redeemed | 5,006 | |||
| Payable for foreign capital gains tax | 206,556 | |||
| Investment advisory fees payable | 7,244 | |||
| Administration and transfer agency fees payable | 42,114 | |||
| Distribution and services fees payable | 7,410 | |||
| Trustees' fees and expenses payable | 2,160 | |||
| Professional fees payable | 26,024 | |||
| Accrued expenses and other liabilities | 20,756 | |||
| Total Liabilities | 317,270 | |||
| NET ASSETS | $ | 33,376,413 | ||
| NET ASSETS CONSIST OF | ||||
| Paid-in capital | $ | 27,581,309 | ||
| Accumulated net investment loss | (417,246 | ) | ||
| Accumulated net realized gain | 401,835 | |||
| Net unrealized appreciation | 5,810,515 | |||
| NET ASSETS | $ | 33,376,413 | ||
| INVESTMENTS, AT COST | $ | 26,771,447 | ||
| PRICING OF SHARES | ||||
| Investor Class: | ||||
| Net Asset Value, offering and redemption price per share | $ | 14.15 | ||
| Net Assets | $ | 9,103,231 | ||
| Shares of beneficial interest outstanding (unlimited number of shares, no par value common stock authorized) | 643,427 | |||
| Class C: | ||||
| Net Asset Value, offering and redemption price per share(a) | $ | 13.44 | ||
| Net Assets | $ | 2,446,842 | ||
| Shares of beneficial interest outstanding (unlimited number of shares, no par value common stock authorized) | 182,037 | |||
| Class I: | ||||
| Net Asset Value, offering and redemption price per share | $ | 14.52 | ||
| Net Assets | $ | 21,826,340 | ||
| Shares of beneficial interest outstanding (unlimited number of shares, no par value common stock authorized) | 1,503,667 | |||
| (a) | Redemption price per share may be reduced for any applicable contingent deferred sales charge. For a description of a possible sales charge, please see the Fund's Prospectus. |
See Notes to Financial Statements.
29 | April 30, 2018
ALPS | Kotak India Growth Fund
| Consolidated Statement of Operations | For the Six Months Ended April 30, 2018 (Unaudited) |
| INVESTMENT INCOME | ||||
| Dividends | $ | 84,606 | ||
| Total Investment Income | 84,606 | |||
| EXPENSES | ||||
| Investment advisory fees | 204,568 | |||
| Administrative fees | 72,089 | |||
| Transfer agency fees | 2,035 | |||
| Distribution and service fees | ||||
| Investor Class(a) | 16,291 | |||
| Class C | 11,046 | |||
| Professional fees | �� | 23,760 | ||
| Reports to shareholders and printing fees | 2,669 | |||
| State registration fees | 15,644 | |||
| Insurance fees | 119 | |||
| Custody fees | 38,385 | |||
| Trustees' fees and expenses | 2,331 | |||
| Miscellaneous expenses | 12,677 | |||
| Total Expenses | 401,614 | |||
| Less fees waived/reimbursed by investment advisor (Note 8) | ||||
| Investor Class(a) | (33,144 | ) | ||
| Class C | (7,631 | ) | ||
| Class I | (71,646 | ) | ||
| Net Expenses | 289,193 | |||
| Net Investment Loss | (204,587 | ) | ||
| Net realized gain on investments | 520,604 | |||
| Net realized loss on foreign currency transactions | (30,426 | ) | ||
| Net Realized Gain | 490,178 | |||
| Net change in unrealized depreciation on investments | (262,870 | ) | ||
| Net change in unrealized depreciation on translation of assets and liabilities denominated in foreign currencies | (8,656 | ) | ||
| Net change in unrealized foreign capital gains tax | (66,854 | ) | ||
| Net Change in Unrealized Depreciation | (338,380 | ) | ||
| NET REALIZED AND UNREALIZED GAIN ON INVESTMENTS | 151,798 | |||
| NET DECREASE IN NET ASSETS RESULTING FROM OPERATIONS | $ | (52,789 | ) | |
| (a) | Prior to December 1, 2017, Investor Class was known as Class A. |
See Notes to Financial Statements.
30 | April 30, 2018
ALPS | Kotak India Growth Fund
Consolidated Statements of Changes in Net Assets
| For the Six Months Ended April 30, 2018 (Unaudited) | For the Year Ended October 31, 2017 | |||||||
| OPERATIONS | ||||||||
| Net investment loss | $ | (204,587 | ) | $ | (156,007 | ) | ||
| Net realized gain | 490,178 | 959,177 | ||||||
| Net change in unrealized appreciation/(depreciation) | (338,380 | ) | 4,023,798 | |||||
| Net Increase/(Decrease) in Net Assets Resulting from Operations | (52,789 | ) | 4,826,968 | |||||
| DISTRIBUTIONS | ||||||||
| Dividends to shareholders from net realized gains | ||||||||
| Investor Class(a) | (271,374 | ) | (64,593 | ) | ||||
| Class C | (64,292 | ) | (23,697 | ) | ||||
| Class I | (548,207 | ) | (115,109 | ) | ||||
| Net Decrease in Net Assets from Distributions | (883,873 | ) | (203,399 | ) | ||||
| BENEFICIAL INTEREST TRANSACTIONS (NOTE 6) | ||||||||
| Shares sold | ||||||||
| Investor Class(a) | 1,361,061 | 5,923,581 | ||||||
| Class C | 362,963 | 216,603 | ||||||
| Class I | 4,424,234 | 10,516,245 | ||||||
| Dividends reinvested | ||||||||
| Investor Class(a) | 241,801 | 51,962 | ||||||
| Class C | 63,360 | 23,372 | ||||||
| Class I | 486,210 | 103,156 | ||||||
| Shares redeemed, net of redemption fees | ||||||||
| Investor Class(a) | (1,762,292 | ) | (3,510,751 | ) | ||||
| Class C | (52,639 | ) | (350,672 | ) | ||||
| Class I | (2,380,544 | ) | (3,497,829 | ) | ||||
| Net Increase in Net Assets Derived from Beneficial Interest Transactions | 2,744,154 | 9,475,667 | ||||||
| Net increase in net assets | 1,807,492 | 14,099,236 | ||||||
| NET ASSETS | ||||||||
| Beginning of period | 31,568,921 | 17,469,685 | ||||||
| End of period * | $ | 33,376,413 | $ | 31,568,921 | ||||
| *Including accumulated net investment loss of: | $ | (417,246 | ) | $ | (212,659 | ) | ||
| (a) | Prior to December 1, 2017, Investor Class was known as Class A. |
See Notes to Financial Statements.
31 | April 30, 2018
ALPS | Kotak India Growth Fund – Investor Class
Consolidated Financial Highlights
Selected data for a share of beneficial interest outstanding throughout the periods indicated:
| For the Six Months Ended April 30, 2018 (Unaudited)(a) | For the Year Ended October 31, 2017 | For the Year Ended October 31, 2016 | For the Year Ended October 31, 2015 | For the Fiscal Period Ended October 31, 2014(b) | For the Year Ended April 30, 2014 | ||||||||||||||
| Net asset value, beginning of period(c) | $ | 14.53 | $ | 12.32 | $ | 12.57 | $ | 13.20 | $ | 9.99 | $ | 9.47 | |||||||
| INCOME/(LOSS) FROM INVESTMENT OPERATIONS: | |||||||||||||||||||
| Net investment income/(loss)(d) | (0.10 | ) | (0.10 | ) | (0.09 | ) | (0.14 | ) | 0.01 | (0.02 | ) | ||||||||
| Net realized and unrealized gain | 0.13 | 2.45 | 1.45 | 0.06 | 3.20 | 0.54 | |||||||||||||
| Total from investment operations | 0.03 | 2.35 | 1.36 | (0.08 | ) | 3.21 | 0.52 | ||||||||||||
| DISTRIBUTIONS: | |||||||||||||||||||
| From net investment income | – | – | – | (0.17 | ) | – | – | ||||||||||||
| From net realized gains | (0.41 | ) | (0.14 | ) | (1.61 | ) | (0.38 | ) | – | – | |||||||||
| Total distributions | (0.41 | ) | (0.14 | ) | (1.61 | ) | (0.55 | ) | – | – | |||||||||
| REDEMPTION FEES ADDED TO PAID-IN CAPITAL (NOTE 6) | 0.00 | (e) | 0.00 | (e) | 0.00 | (e) | 0.00 | (e) | 0.00 | (e) | 0.00 | (e) | |||||||
| Net increase/(decrease) in net asset value | (0.38 | ) | 2.21 | (0.25 | ) | (0.63 | ) | 3.21 | 0.52 | ||||||||||
| Net asset value, end of period | $ | 14.15 | $ | 14.53 | $ | 12.32 | $ | 12.57 | $ | 13.20 | $ | 9.99 | |||||||
| TOTAL RETURN(f) | 0.23 | % | 19.45 | % | 13.31 | % | (0.65 | )% | 32.13 | % | 5.49 | % | |||||||
| RATIOS/SUPPLEMENTAL DATA: | |||||||||||||||||||
| Net assets, end of period (000s) | $ | 9,103 | $ | 9,538 | $ | 5,772 | $ | 5,906 | $ | 5,536 | $ | 5,211 | |||||||
| Ratio of expenses to average net assets excluding fee waivers and reimbursements | 2.62 | %(g) | 2.95 | % | 3.83 | % | 3.51 | % | 4.92 | %(g) | 6.51 | % | |||||||
| Ratio of expenses to average net assets including fee waivers and reimbursements | 1.94 | %(g) | 1.90 | % | 1.90 | % | 1.96 | % | 1.90 | %(g) | 1.88 | % | |||||||
| Ratio of net investment income/(loss) to average net assets | (1.43 | )%(g) | (0.74 | )% | (0.86 | )% | (1.03 | )% | 0.19 | %(g) | (0.27 | )% | |||||||
| Portfolio turnover rate(h) | 11 | % | 30 | % | 23 | % | 58 | % | 28 | % | 65 | % | |||||||
| (a) | Prior to December 1, 2017, Investor Class was known as Class A. |
| (b) | Effective May 1, 2014, the Board approved changing the fiscal year-end of the Funds from April 30 to October 31. |
| (c) | Per share amounts and ratios to average net assets include income and expenses of the Kotak Mauritius Portfolio (wholly-owned subsidiary). |
| (d) | Calculated using the average shares method. |
| (e) | Less than $0.005 or ($0.005) per share. |
| (f) | Total returns are for the period indicated and have not been annualized. Total returns would have been lower had certain expenses not been waived during the period. Returns shown do not reflect the deduction of taxes that a shareholder would pay on Fund distributions or the redemption of Fund shares. Returns shown exclude any applicable sales charges. |
| (g) | Annualized. |
| (h) | Portfolio turnover rate for periods less than one full year have not been annualized. |
See Notes to Financial Statements.
32 | April 30, 2018
ALPS | Kotak India Growth Fund – Class C
Consolidated Financial Highlights
Selected data for a share of beneficial interest outstanding throughout the periods indicated:
| For the Six Months Ended April 30, 2018 (Unaudited) | For the Year Ended October 31, 2017 | For the Year Ended October 31, 2016 | For the Year Ended October 31, 2015 | For the Fiscal Period Ended October 31, 2014(a) | For the Year Ended April 30, 2014 | ||||||||||||||
| Net asset value, beginning of period(b) | $ | 13.87 | $ | 11.85 | $ | 12.23 | $ | 12.88 | $ | 9.77 | $ | 9.34 | |||||||
| INCOME/(LOSS) FROM INVESTMENT OPERATIONS: | |||||||||||||||||||
| Net investment loss(c) | (0.14 | ) | (0.18 | ) | (0.16 | ) | (0.21 | ) | (0.03 | ) | (0.09 | ) | |||||||
| Net realized and unrealized gain | 0.12 | 2.34 | 1.39 | 0.05 | 3.14 | 0.52 | |||||||||||||
| Total from investment operations | (0.02 | ) | 2.16 | 1.23 | (0.16 | ) | 3.11 | 0.43 | |||||||||||
| DISTRIBUTIONS: | |||||||||||||||||||
| From net investment income | – | – | – | (0.11 | ) | – | – | ||||||||||||
| From net realized gains | (0.41 | ) | (0.14 | ) | (1.61 | ) | (0.38 | ) | – | – | |||||||||
| Total distributions | (0.41 | ) | (0.14 | ) | (1.61 | ) | (0.49 | ) | – | – | |||||||||
| REDEMPTION FEES ADDED TO PAID-IN CAPITAL (NOTE 6) | – | – | 0.00 | (d) | – | 0.00 | (d) | – | |||||||||||
| Net increase/(decrease) in net asset value | (0.43 | ) | 2.02 | (0.38 | ) | (0.65 | ) | 3.11 | 0.43 | ||||||||||
| Net asset value, end of period | $ | 13.44 | $ | 13.87 | $ | 11.85 | $ | 12.23 | $ | 12.88 | $ | 9.77 | |||||||
| TOTAL RETURN(e) | (0.13 | )% | 18.60 | % | 12.51 | % | (1.34 | )% | 31.83 | % | 4.60 | % | |||||||
| RATIOS/SUPPLEMENTAL DATA: | |||||||||||||||||||
| Net assets, end of period (000s) | $ | 2,447 | $ | 2,140 | $ | 1,925 | $ | 1,965 | $ | 1,497 | $ | 875 | |||||||
| Ratio of expenses to average net assets excluding fee waivers and reimbursements | 3.29 | %(f) | 3.69 | % | 4.54 | % | 4.11 | % | 5.57 | %(f) | 7.26 | % | |||||||
| Ratio of expenses to average net assets including fee waivers and reimbursements | 2.60 | %(f) | 2.60 | % | 2.60 | % | 2.60 | % | 2.60 | %(f) | 2.60 | % | |||||||
| Ratio of net investment loss to average net assets | (2.09 | )%(f) | (1.48 | )% | (1.56 | )% | (1.67 | )% | (0.50 | )%(f) | (1.00 | )% | |||||||
| Portfolio turnover rate(g) | 11 | % | 30 | % | 23 | % | 58 | % | 28 | % | 65 | % | |||||||
| (a) | Effective May 1, 2014, the Board approved changing the fiscal year-end of the Funds from April 30 to October 31. |
| (b) | Per share amounts and ratios to average net assets include income and expenses of the Kotak Mauritius Portfolio (wholly-owned subsidiary). |
| (c) | Calculated using the average shares method. |
| (d) | Less than $0.005 or ($0.005) per share. |
| (e) | Total returns are for the period indicated and have not been annualized. Total returns would have been lower had certain expenses not been waived during the period. Returns shown do not reflect the deduction of taxes that a shareholder would pay on Fund distributions or the redemption of Fund shares. Returns shown exclude any applicable sales charges. |
| (f) | Annualized. |
| (g) | Portfolio turnover rate for periods less than one full year have not been annualized. |
See Notes to Financial Statements.
33 | April 30, 2018
ALPS | Kotak India Growth Fund – Class I
Consolidated Financial Highlights
Selected data for a share of beneficial interest outstanding throughout the periods indicated:
| For the Six Months Ended April 30, 2018 (Unaudited) | For the Year Ended October 31, 2017 | For the Year Ended October 31, 2016 | For the Year Ended October 31, 2015 | For the Fiscal Period Ended October 31, 2014(a) | For the Year Ended April 30, 2014 | ||||||||||||||
| Net asset value, beginning of period(b) | $ | 14.87 | $ | 12.58 | $ | 12.76 | $ | 13.29 | $ | 10.04 | $ | 9.55 | |||||||
| INCOME/(LOSS) FROM INVESTMENT OPERATIONS: | |||||||||||||||||||
| Net investment income/(loss)(c) | (0.08 | ) | (0.06 | ) | (0.06 | ) | (0.09 | ) | 0.03 | 0.00 | (d) | ||||||||
| Net realized and unrealized gain | 0.14 | 2.48 | 1.49 | 0.06 | 3.22 | 0.54 | |||||||||||||
| Total from investment operations | 0.06 | 2.42 | 1.43 | (0.03 | ) | 3.25 | 0.54 | ||||||||||||
| DISTRIBUTIONS: | |||||||||||||||||||
| From net investment income | – | – | – | (0.13 | ) | – | (0.05 | ) | |||||||||||
| From net realized gains | (0.41 | ) | (0.14 | ) | (1.61 | ) | (0.38 | ) | – | – | |||||||||
| Total distributions | (0.41 | ) | (0.14 | ) | (1.61 | ) | (0.51 | ) | – | (0.05 | ) | ||||||||
| REDEMPTION FEES ADDED TO PAID-IN CAPITAL (NOTE 6) | 0.00 | (d) | 0.01 | 0.00 | (d) | 0.01 | 0.00 | (d) | – | ||||||||||
| Net increase/(decrease) in net asset value | (0.35 | ) | 2.29 | (0.18 | ) | (0.53 | ) | 3.25 | 0.49 | ||||||||||
| Net asset value, end of period | $ | 14.52 | $ | 14.87 | $ | 12.58 | $ | 12.76 | $ | 13.29 | $ | 10.04 | |||||||
| TOTAL RETURN(e) | 0.43 | % | 19.68 | % | 13.70 | % | (0.23 | )% | 32.37 | % | 5.70 | % | |||||||
| RATIOS/SUPPLEMENTAL DATA: | |||||||||||||||||||
| Net assets, end of period (000s) | $ | 21,826 | $ | 19,891 | $ | 9,772 | $ | 8,567 | $ | 8,955 | $ | 1,945 | |||||||
| Ratio of expenses to average net assets excluding fee waivers and reimbursements | 2.29 | %(f) | 2.65 | % | 3.54 | % | 3.10 | % | 4.49 | %(f) | 6.28 | % | |||||||
| Ratio of expenses to average net assets including fee waivers and reimbursements | 1.60 | %(f) | 1.60 | % | 1.60 | % | 1.60 | % | 1.60 | %(f) | 1.60 | % | |||||||
| Ratio of net investment income/(loss) to average net assets | (1.08 | )%(f) | (0.45 | )% | (0.56 | )% | (0.67 | )% | 0.50 | %(f) | 0.00 | %(g) | |||||||
| Portfolio turnover rate(h) | 11 | % | 30 | % | 23 | % | 58 | % | 28 | % | 65 | % | |||||||
| (a) | Effective May 1, 2014, the Board approved changing the fiscal year-end of the Funds from April 30 to October 31. |
| (b) | Per share amounts and ratios to average net assets include income and expenses of the Kotak Mauritius Portfolio (wholly-owned subsidiary). |
| (c) | Calculated using the average shares method. |
| (d) | Less than $0.005 or ($0.005) per share. |
| (e) | Total returns are for the period indicated and have not been annualized. Total returns would have been lower had certain expenses not been waived during the period. Returns shown do not reflect the deduction of taxes that a shareholder would pay on Fund distributions or the redemption of Fund shares. |
| (f) | Annualized. |
| (g) | Less than 0.005% or (0.005)% |
| (h) | Portfolio turnover rate for periods less than one full year have not been annualized. |
See Notes to Financial Statements.
34 | April 30, 2018
ALPS | Metis Global Micro Cap Value Fund
| Management Commentary | April 30, 2018 (Unaudited) |
Market Commentary
The S&P Global Broad Market Index of companies with less than $500 million of market capitalization (the S&P Global BMI < $500m) increased +5.29% over the six months ending 4/30/2018.
This period included the tail end of 2017, which continued the positive momentum observed throughout that year, followed by the much more volatile and uncertain first four months of 2018. One of the puzzling aspects of stock markets in 2017 was the low level of volatility across equities worldwide. This was an unprecedented period of quiet in markets, and while the timing of its end was unpredictable, it was nevertheless inevitable. The early months of 2018 saw a return to more normal volatility, signaling possible opportunities ahead in world markets for value-oriented investors.
The market gains late in 2017 stalled in the subsequent four months in 2018, with sentiment swinging rapidly, reflecting the sway of powerful and opposing influences on equity prices. On the positive side, earnings growth remains strong, inflation is relatively subdued, and the effect of the corporate tax cut in the US is still working its way into the market. From a negative perspective, rising interest rates are now an actuality in the US, not a forecast, and Brexit continues to haunt European markets.
The chance of a global trade war (or worse) has increased, with negative impact on some Asian and Emerging Market countries. For micro cap companies however, increases in U.S-focused trade friction should not have material direct impact as these are largely small companies that operate primarily within their local and regional markets. For the 80% of the portfolio that is based outside North America, their average proportion of revenue sourced from the United States is under 2%.
The index increase of just over 5% for the period was substantially achieved by year end 2017. Since then, markets were essentially unchanged, although this disguises some sharp interim moves. Looking at microcap stocks worldwide for the full six months, the Asia/Pacific region took over leadership with an 18% increase, with South Korea the regional stand-out (+32%). Japan (+6%) and the U.S. (+5%) also gained ground. Laggards were Emerging Markets, UK, and Continental Europe, which all posted modest losses. Healthcare was the leading sector (+12%), while the energy sector rose 7% on the back of increasing oil prices.
Fund Review
The ALPS/Metis Global Micro Cap Fund returned +2.3% over the six months ending 4/30/2018, below the benchmark S&P Global BMI < $500 million return of +5.3%.
The underperformance over the period was substantially the result of low exposure to the Healthcare sector. Healthcare is among the most expensive sectors on a valuation basis, and many of the companies do not generate positive cashflow, pushing aggregate valuations outside of the portfolio’s typical investment range. As a result, while the portfolio has exposure to some attractively valued biotech companies, it remains significantly underweight the sector
(2.3% versus 13.4% for the index as of April 30) and hence trailed in returns as Healthcare was the top-performing sector for the six-month period.
Stock selection in Materials and Industrials both contributed positively to returns. The portfolio was overweight in both sectors and saw selected gains in stocks in mining, forest products, construction materials and building products.
Across the regional exposure of the portfolio, the primary detractor from returns was Asia-Pacific, and within that, South Korea. Part of the underperformance was the result of buying into attractively valued stocks as their prices continued to decline, an effect that is not infrequent when establishing positions using the value style of investing. Drilling into the South Korean holdings shows a mixed picture: technology and industrial companies performed well, but this was more than offset by underexposure to Healthcare (as noted previously, an outperforming sector). Overexposure to the country’s Consumer Discretionary sector also detracted, with weaker margins in the strike-hit Auto Components sector, and lower TV-based ad revenue impacting Media companies.
Strategy and Outlook
The Fund is managed using a bottom-up investment approach with valuation being the key criteria. Once an investable opportunity set is assembled, securities are valued along two successive valuation approaches: i) valuation based on the company’s specific global industry, and ii) valuation based on the overall embedded business value of the company. Portfolio construction at Metis is a purely systematic process directly related to the security’s value as determined by the firm’s proprietary scoring system: only those securities with the most attractive valuations are considered for the portfolio. Metis optimizes the portfolio on value to maximize opportunity, resulting in the most attractive stocks to us receiving the greatest weight. Country and industry exposures are a residual of this process.
On a regional basis, the largest portfolio overweight by region is Japan (30.2% weight), where the market is cheap relative to global peers on several valuation metrics, including cashflow and EBITDA. Thus attractive stock values can still be found in Japan. The long-term trend for modest economic growth appears intact, despite a slowdown in the first quarter as higher inflation and lower wage increases impacted consumers. Concerns about a China-US trade war have affected market sentiment, but fiscal policy remains easy and the underlying fundamentals are still solid. In that context, earnings data remains robust and is trending upwards, while manufacturing orders continue to grow helped by strong global capital expenditure spending. This benefits the industrial and cyclical companies that comprise a significant part of the portfolio’s Japanese exposure. Despite some profit-taking by the Fund in Japanese industrials, 9% of the total portfolio remains invested in this segment. If there are no macro-shocks to the regional economies, portfolio companies should be operating in a benign environment for the balance of the year.
35 | April 30, 2018
ALPS | Metis Global Micro Cap Value Fund
| Management Commentary | April 30, 2018 (Unaudited) |
The Asia-Pacific region is also materially overweight, with the primary reason being an increase in exposure to South Korea (now 16.7% weight). The portfolio’s Emerging Market exposure has declined to 12.4%, with Taiwan representing the largest country weight within that segment at 5.0%. South Korea and Taiwan are both “tech-heavy” markets, but portfolio exposure in those countries is broader than just that sector. In South Korea, domestic consumption growth is strong, and Consumer Discretionary and Industrials are well represented in the portfolio. Higher valuations have limited the opportunities in Taiwan. In fact, the portfolio’s 5% weight is well below the index weight of 11%. Consumer Discretionary and Real Estate companies are represented in the portfolio, as well as companies in the Information Technology sector. The portfolio’s holdings in the “Info tech” sector are spread globally, including companies in Japan and the United States, as well as the aforementioned South Korean and Taiwanese holdings. Nevertheless, the sector’s portfolio exposure of 14% is below that of the index (20%) due to a lack of perceived value opportunities across the sector.
North America remains the portfolio’s most significant underweight, with exposure of 19.8% compared to the index weight of 30.7%; this underweight has widened over the past several months, driven by price and valuation shifts. While there appear to be selective opportunities in certain sectors (financials, tech and consumer discretionary), overall the high valuations restrict the portfolio’s exposure to the United States. Elsewhere, the portfolio is modestly overweight in the UK with an offsetting underweight across the aggregate of markets in Continental Europe.
Thank you for your continued support and investment in the ALPS | Metis Global Micro Cap Fund.
Machel Allen, CFA
President and Chief Investment Officer
The views of the author and information discussed in this commentary are as of the date of publication, are subject to change, and may not reflect the writer’s current views. The views expressed are those of the author only, and represent an assessment of market conditions at a specific point in time, are opinions only and should not be relied upon as investment advice regarding a particular investment or markets in general. Such information does not constitute a recommendation to buy or sell specific securities or investment vehicles. It should not be assumed that any investment will be profitable or will equal the performance of the fund(s) or any securities or any sectors mentioned in this letter. The subject matter contained in this letter has been derived from several sources believed to be reliable and accurate at the time of compilation. Neither ALPS Advisors, Inc., Metis Global Partners, LLC, nor the Fund accepts any liability for losses either direct or consequential caused by the use of this information.
Diversification cannot guarantee gain or prevent losses.
36 | April 30, 2018
ALPS | Metis Global Micro Cap Value Fund
| Performance Update | April 30, 2018 (Unaudited) |
Performance of $10,000 Initial Investment (as of April 30, 2018)
Comparison of change in value of a $10,000 investment
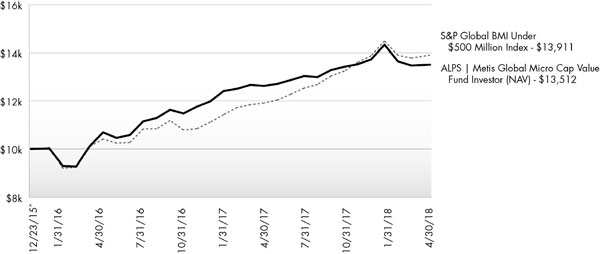
The chart above represents historical performance of a hypothetical investment of $10,000 in the Fund since inception. Past performance does not guarantee future results. This chart does not reflect the deduction of taxes that a shareholder would pay on Fund distributions or the redemption of Fund shares.
Average Annual Total Returns (as of April 30, 2018)
| 6 Month | 1 Year | Since Inception^ | Total Expense Ratio | What You Pay* | |
| ALPS | Metis Global Micro Cap Value Fund – Investor# - NAV | 0.66% | 7.01% | 13.64% | 2.84% | 2.10% |
| ALPS | Metis Global Micro Cap Value Fund - C - NAV | 0.31% | 6.36% | 12.89% | 3.46% | 2.70% |
| ALPS | Metis Global Micro Cap Value Fund - C - CDSC | -0.61% | 5.39% | 12.89% | ||
| ALPS | Metis Global Micro Cap Value Fund - I - NAV | 0.81% | 7.35% | 13.99% | 2.46% | 1.70% |
| S&P Global BMI Under $500 Million Index1 | 5.03% | 16.76% | 15.06% |
Performance data quoted represents past performance. Past performance does not guarantee future results. Investment return and principal value of an investment will fluctuate so that an investor's shares, when sold or redeemed, may be worth more or less than the original cost. Current performance data may be higher or lower than actual data quoted. For the most current month-end performance data, please call 1-866-759-5679.
Performance shown at NAV does not include sales charges and would have been lower had it been taken into account. A Contingent Deferred Sales Charge (“CDSC”) of 1.00% may apply to Class C shares redeemed within the first 12 months after a purchase. The Fund imposes a 2.00% redemption fee on shares held for less than 60 days.
Performance less than 1 year is cumulative.
37 | April 30, 2018
ALPS | Metis Global Micro Cap Value Fund
| Performance Update | April 30, 2018 (Unaudited) |
| 1 | The S&P Global BMI Under $500 Million Index with net dividends is a comprehensive, rules-based index measuring global stock market performance of micro- and small- capitalization companies. It represents all issues in the S&P Global BMI (Broad Market Index (BMI) whose market capitalization at time of index constitution is less than $500 million. The S&P Global <$500M Index includes companies from both developed and emerging nations. An investor may not invest directly in an index. |
| ^ | Fund inception date of December 23, 2015. |
| * | What You Pay reflects the Advisor's decision to contractually limit expenses through February 28, 2019. Please see the prospectus for additional information. |
| # | Prior to December 1, 2017, Investor Class was known as Class A. |
The table does not reflect the deduction of taxes that a shareholder would pay on Fund distributions or the redemption of Fund shares.
This Fund is not suitable for all investors and is subject to investment risks, including possible loss of the principal amount invested.
There is no guarantee that the Fund will continue to hold any one particular security or stay invested in any one particular company. The composition of the Fund's top holdings is subject to change. Performance figures are historical and reflect the change in share price, reinvested distributions, changes in net asset value, sales charges and capital gains distributions, if any.
Effective February 28, 2017 the Fund changed its name from the ALPS | Metis Global Micro Cap Fund to the ALPS | Metis Global Micro Cap Value Fund
Not FDIC Insured – No Bank Guarantee – May Lose Value
Top Ten Holdings (as a % of Net Assets) †
| Woongjin Co., Ltd. | 0.61% |
| Sundaytoz Corp. | 0.60% |
| Arealink Co., Ltd. | 0.55% |
| OFG Bancorp | 0.55% |
| Fossil Group, Inc. | 0.55% |
| AMAG Pharmaceuticals, Inc. | 0.54% |
| American Public Education, Inc. | 0.54% |
| Kwang Myung Electric Co., Ltd. | 0.52% |
| Numis Corp. PLC | 0.52% |
| Chlitina Holding, Ltd. | 0.51% |
| Top Ten Holdings | 5.49% |
| Top Ten Country Allocation (as a % of Net Assets) † | |
| Japan | 30.19% |
| United States | 16.12% |
| South Korea | 16.61% |
| Australia | 6.13% |
| Taiwan | 4.97% |
| United Kingdom | 3.83% |
| Canada | 2.20% |
| Hong Kong | 2.09% |
| China | 1.49% |
| Norway | 1.45% |
| Top Ten Country Allocation | 85.08% |
Industry Sector Allocation (as a % of Net Assets)
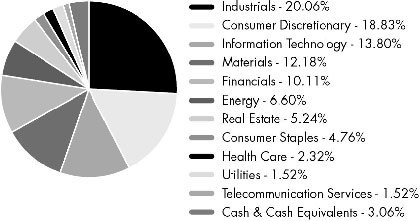
| † | Holdings are subject to change, and may not reflect the current or future position of the portfolio. Tables present indicative values only. Excludes cash & cash equivalents. |
38 | April 30, 2018
ALPS | Metis Global Micro Cap Value Fund
| Statement of Investments | April 30, 2018 (Unaudited) |
| Shares | Value (Note 2) | |||||||
| COMMON STOCKS (96.61%) | ||||||||
| Australia (6.13%) | ||||||||
| Base Resources, Ltd.(a) | 474,989 | $ | 91,187 | |||||
| Cabcharge Australia, Ltd. | 64,609 | 89,419 | ||||||
| Cedar Woods Properties, Ltd. | 20,784 | 95,761 | ||||||
| Isentia Group, Ltd. | 90,633 | 54,411 | ||||||
| Medusa Mining, Ltd.(a) | 234,407 | 98,278 | ||||||
| Monadelphous Group, Ltd. | 5,921 | 71,613 | ||||||
| Monash IVF Group, Ltd. | 94,648 | 83,276 | ||||||
| Myer Holdings, Ltd. | 200,384 | 57,866 | ||||||
| OFX Group, Ltd. | 92,265 | 124,729 | ||||||
| Prime Media Group, Ltd. | 314,061 | 68,360 | ||||||
| Ramelius Resources, Ltd.(a) | 305,349 | 117,853 | ||||||
| Reject Shop, Ltd. | 20,752 | 114,996 | ||||||
| Resolute Mining, Ltd. | 114,505 | 97,790 | ||||||
| Sandfire Resources NL | 15,552 | 92,042 | ||||||
| Select Harvests, Ltd. | 25,599 | 119,855 | ||||||
| Seven West Media, Ltd. | 233,176 | 96,975 | ||||||
| Silver Chef, Ltd. | 17,192 | 44,730 | ||||||
| Tox Free Solutions, Ltd. | 37,053 | 95,960 | ||||||
| Virtus Health, Ltd. | 24,569 | 104,201 | ||||||
| 1,719,302 | ||||||||
| Brazil (0.92%) | ||||||||
| Paranapanema SA(a) | 182,900 | 67,350 | ||||||
| Tegma Gestao Logistica SA | 15,600 | 102,420 | ||||||
| Valid Solucoes e Servicos de Seguranca em Meios de Pagamento e Identificacao SA | 16,400 | 87,075 | ||||||
| 256,845 | ||||||||
| Canada (2.20%) | ||||||||
| Bird Construction, Inc. | 9,959 | 67,327 | ||||||
| Clearwater Seafoods, Inc. | 17,268 | 71,146 | ||||||
| Granite Oil Corp. | 45,149 | 99,865 | ||||||
| Mandalay Resources Corp. | 464,631 | 75,994 | ||||||
| Pizza Pizza Royalty Corp. | 6,817 | 73,429 | ||||||
| Resolute Forest Products, Inc.(a) | 8,550 | 84,645 | ||||||
| Western Energy Services Corp.(a) | 83,326 | 75,931 | ||||||
| Yellow Pages, Ltd.(a) | 12,470 | 68,083 | ||||||
| 616,420 | ||||||||
| Cayman Islands (0.36%) | ||||||||
| Consolidated Water Co., Ltd. | 7,118 | 100,720 | ||||||
| Chile (0.32%) | ||||||||
| PAZ Corp. SA | 55,473 | 88,632 | ||||||
| China (1.49%) | ||||||||
| Boer Power Holdings, Ltd.(a) | 474,000 | 90,749 | ||||||
| Boyaa Interactive International, Ltd.(a) | 234,000 | 91,278 | ||||||
| Jiangnan Group, Ltd. | 1,210,000 | 72,458 | ||||||
| Kangda International Environmental Co., Ltd.(b) | 446,000 | 76,445 | ||||||
| Wisdom Sports Group | 863,000 | 86,150 | ||||||
| 417,080 | ||||||||
| Shares | Value (Note 2) | |||||||
| France (0.90%) | ||||||||
| Neopost SA | 3,133 | $ | 84,539 | |||||
| Sequana SA(a) | 106,100 | 74,040 | ||||||
| Solocal Group(a) | 72,433 | 92,969 | ||||||
| 251,548 | ||||||||
| Germany (0.24%) | ||||||||
| PNE Wind AG | 22,869 | 67,797 | ||||||
| Great Britain (3.83%) | ||||||||
| Ensco PLC, Class A | 14,561 | 82,270 | ||||||
| Foxtons Group PLC | 78,320 | 82,808 | ||||||
| Inland Homes PLC | 96,067 | 85,305 | ||||||
| Interserve PLC(a) | 60,005 | 77,446 | ||||||
| LSL Property Services PLC | 21,069 | 71,808 | ||||||
| Nahl Group PLC | 40,496 | 70,804 | ||||||
| Norcros PLC | 30,468 | 79,696 | ||||||
| Numis Corp. PLC | 26,386 | 146,029 | ||||||
| Trinity Mirror PLC | 73,348 | 85,831 | ||||||
| Utilitywise PLC | 224,122 | 92,565 | ||||||
| Vertu Motors PLC | 157,670 | 108,532 | ||||||
| Wincanton PLC | 27,825 | 91,242 | ||||||
| 1,074,336 | ||||||||
| Hong Kong (2.09%) | ||||||||
| APT Satellite Holdings, Ltd. | 185,500 | 87,921 | ||||||
| Get Nice Holdings, Ltd. | 2,768,000 | 100,083 | ||||||
| Hengdeli Holdings, Ltd. | 1,956,000 | 89,045 | ||||||
| NewOcean Energy Holdings, Ltd.(a) | 386,000 | 90,000 | ||||||
| Playmates Holdings, Ltd. | 696,000 | 96,271 | ||||||
| REXLot Holdings, Ltd.(a) | 23,700,000 | 122,984 | ||||||
| 586,304 | ||||||||
| India (0.93%) | ||||||||
| Ashapura Minechem, Ltd.(a) | 67,685 | 73,788 | ||||||
| Eros International Media, Ltd.(a) | 23,911 | 62,179 | ||||||
| Oriental Bank of Commerce(a) | 39,967 | 55,918 | ||||||
| PTC India, Ltd. | 50,899 | 69,888 | ||||||
| 261,773 | ||||||||
| Indonesia (0.62%) | ||||||||
| Elnusa Tbk PT | 3,206,700 | 96,989 | ||||||
| Kawasan Industri Jababeka Tbk PT | 4,372,129 | 77,188 | ||||||
| 174,177 | ||||||||
| Ireland (0.27%) | ||||||||
| Independent News & Media PLC(a) | 708,346 | 76,986 | ||||||
| Isle Of Man (0.32%) | ||||||||
| Manx Telecom PLC | 33,182 | 89,079 | ||||||
| Israel (0.60%) | ||||||||
| magicJack VocalTec, Ltd.(a) | 11,931 | 100,220 | ||||||
| Perion Network, Ltd.(a) | 95,895 | 68,843 | ||||||
| 169,063 | ||||||||
39 | April 30, 2018
ALPS | Metis Global Micro Cap Value Fund
| Statement of Investments | April 30, 2018 (Unaudited) |
| Shares | Value (Note 2) | |||||||
| Italy (0.61%) | ||||||||
| Digital Bros SpA | 7,521 | $ | 86,234 | |||||
| Safilo Group SpA(a) | 17,096 | 85,710 | ||||||
| 171,944 | ||||||||
| Japan (30.19%) | ||||||||
| Amiyaki Tei Co., Ltd. | 2,100 | 103,136 | ||||||
| Arealink Co., Ltd. | 4,700 | 155,108 | ||||||
| Asanuma Corp. | 31,000 | 113,675 | ||||||
| Asmo Corp. | 12,400 | 74,177 | ||||||
| Chiyoda Integre Co., Ltd. | 4,300 | 98,767 | ||||||
| Computer Institute of Japan, Ltd. | 14,800 | 100,816 | ||||||
| CROOZ, Inc. | 3,700 | 72,894 | ||||||
| Dai Nippon Toryo Co., Ltd. | 6,500 | 91,728 | ||||||
| Daiichi Jitsugyo Co., Ltd. | 2,500 | 76,401 | ||||||
| Ebara Jitsugyo Co., Ltd. | 6,200 | 134,247 | ||||||
| The Eighteenth Bank, Ltd. | 36,000 | 95,229 | ||||||
| ESPEC Corp. | 3,700 | 87,034 | ||||||
| Fujisash Co., Ltd. | 88,500 | 79,945 | ||||||
| Fujitec Co., Ltd. | 6,600 | 91,656 | ||||||
| Fujitsu Frontech, Ltd. | 5,500 | 81,243 | ||||||
| G-7 Holdings, Inc. | 4,600 | 102,040 | ||||||
| GCA Corp. | 9,100 | 80,566 | ||||||
| Hochiki Corp. | 3,900 | 78,385 | ||||||
| Honda Tsushin Kogyo Co., Ltd. | 8,300 | 83,902 | ||||||
| Ichiyoshi Securities Co., Ltd. | 9,100 | 111,360 | ||||||
| Ines Corp. | 9,000 | 96,563 | ||||||
| I-O Data Device, Inc. | 8,600 | 88,897 | ||||||
| Ishihara Sangyo Kaisha, Ltd.(a) | 5,400 | 62,043 | ||||||
| Iwaicosmo Holdings, Inc. | 7,300 | 101,355 | ||||||
| Iwasaki Electric Co., Ltd. | 6,700 | 102,257 | ||||||
| Kato Works Co., Ltd. | 3,000 | 70,236 | ||||||
| Kawai Musical Instruments Manufacturing Co., Ltd. | 3,500 | 113,894 | ||||||
| Koatsu Gas Kogyo Co., Ltd. | 11,200 | 98,637 | ||||||
| Kyowa Leather Cloth Co., Ltd. | 10,700 | 95,543 | ||||||
| Mamezou Holdings Co., Ltd. | 7,800 | 91,781 | ||||||
| Mars Engineering Corp. | 3,800 | 84,727 | ||||||
| Maruyama Manufacturing Co., Inc. | 4,300 | 74,697 | ||||||
| Maruzen Showa Unyu Co., Ltd. | 22,000 | 103,997 | ||||||
| Meiwa Estate Co., Ltd. | 9,000 | 61,784 | ||||||
| The Michinoku Bank, Ltd. | 6,000 | 97,172 | ||||||
| MIMAKI ENGINEERING Co., Ltd. | 8,600 | 67,498 | ||||||
| Mitsubishi Steel Manufacturing Co., Ltd. | 4,000 | 96,653 | ||||||
| Money Partners Group Co., Ltd. | 27,100 | 108,599 | ||||||
| Mory Industries, Inc. | 2,500 | 75,594 | ||||||
| MTI, Ltd. | 15,000 | 89,654 | ||||||
| Nakayama Steel Works, Ltd. | 15,400 | 108,194 | ||||||
| Nichireki Co., Ltd. | 7,600 | 83,430 | ||||||
| Nichirin Co., Ltd. | 5,510 | 134,399 | ||||||
| Nihon Dengi Co., Ltd. | 3,600 | 89,382 | ||||||
| Nihon House Holdings Co., Ltd. | 15,400 | 80,899 | ||||||
| Nihon Nohyaku Co., Ltd. | 15,800 | 102,444 | ||||||
| Nippon Hume Corp. | 14,200 | 108,222 | ||||||
| Nippon Seisen Co., Ltd. | 1,800 | 78,768 | ||||||
| Nissei Plastic Industrial Co., Ltd. | 6,200 | 80,020 | ||||||
| Nittetsu Mining Co., Ltd. | 1,300 | 79,218 | ||||||
| Noritsu Koki Co., Ltd. | 4,000 | 99,922 | ||||||
| Shares | Value (Note 2) | |||||||
| Japan (continued) | ||||||||
| Ohashi Technica, Inc. | 6,700 | $ | 111,069 | |||||
| Osaka Soda Co., Ltd. | 3,300 | 92,187 | ||||||
| Oyo Corp. | 8,100 | 116,155 | ||||||
| Raysum Co., Ltd. | 7,100 | 92,543 | ||||||
| Rheon Automatic Machinery Co., Ltd. | 4,900 | 90,183 | ||||||
| Rion Co., Ltd. | 3,900 | 88,936 | ||||||
| Roland DG Corp. | 3,200 | 74,305 | ||||||
| Ryoden Corp. | 6,000 | 100,620 | ||||||
| Sakai Heavy Industries, Ltd. | 2,500 | 105,964 | ||||||
| San Ju San Financial Group, Inc.(a) | 5,040 | 106,591 | ||||||
| San-Ai Oil Co., Ltd. | 6,500 | 102,330 | ||||||
| Sansha Electric Manufacturing Co., Ltd. | 7,100 | 92,308 | ||||||
| Sanyo Trading Co., Ltd. | 3,800 | 74,645 | ||||||
| Seika Corp. | 3,500 | 88,608 | ||||||
| Shinko Plantech Co., Ltd. | 9,100 | 85,425 | ||||||
| Shinoken Group Co., Ltd. | 4,200 | 127,698 | ||||||
| Showa Shinku Co., Ltd. | 4,100 | 84,169 | ||||||
| Softbrain Co., Ltd. | 27,400 | 110,350 | ||||||
| Studio Alice Co., Ltd. | 3,900 | 87,510 | ||||||
| Sun Frontier Fudousan Co., Ltd. | 8,100 | 97,732 | ||||||
| Tabuchi Electric Co., Ltd.(a) | 37,000 | 95,575 | ||||||
| Tatsuta Electric Wire and Cable Co., Ltd. | 11,700 | 72,236 | ||||||
| Tayca Corp. | 3,500 | 92,103 | ||||||
| Toa Oil Co., Ltd. | 66,000 | 121,824 | ||||||
| Tochigi Bank, Ltd. | 25,300 | 95,867 | ||||||
| Togami Electric Manufacturing Co., Ltd. | 3,600 | 74,156 | ||||||
| Toli Corp. | 23,400 | 83,263 | ||||||
| Tosho Printing Co., Ltd. | 8,500 | 75,710 | ||||||
| The Tottori Bank, Ltd. | 6,100 | 96,814 | ||||||
| Toyo Kanetsu KK | 2,600 | 79,320 | ||||||
| Tsukuba Bank, Ltd. | 28,400 | 98,459 | ||||||
| TYK Corp. | 25,800 | 101,107 | ||||||
| Uchida Yoko Co., Ltd. | 2,600 | 72,486 | ||||||
| Weathernews, Inc. | 3,100 | 97,875 | ||||||
| Wellnet Corp. | 9,300 | 100,004 | ||||||
| West Holdings Corp. | 13,400 | 98,246 | ||||||
| Yachiyo Industry Co., Ltd. | 11,300 | 136,850 | ||||||
| Yotai Refractories Co., Ltd. | 18,500 | 128,536 | ||||||
| Yuasa Trading Co., Ltd. | 2,500 | 79,908 | ||||||
| 8,468,455 | ||||||||
| Malaysia (1.11%) | ||||||||
| Dayang Enterprise Holdings Bhd(a) | 489,500 | 96,671 | ||||||
| KSL Holdings Bhd(a) | 349,200 | 84,552 | ||||||
| Land & General Bhd | 1,923,080 | 82,727 | ||||||
| Media Prima Bhd | 581,100 | 46,819 | ||||||
| 310,769 | ||||||||
| New Zealand (0.32%) | ||||||||
| Steel & Tube Holdings, Ltd. | 63,499 | 89,356 | ||||||
| Norway (1.45%) | ||||||||
| BW Offshore, Ltd.(a) | 21,181 | 115,381 | ||||||
| Fred Olsen Energy ASA(a) | 33,693 | 50,968 | ||||||
| Nordic American Tankers, Ltd. | 39,015 | 73,348 | ||||||
| Otello Corp. ASA(a) | 31,421 | 80,488 | ||||||
40 | April 30, 2018
ALPS | Metis Global Micro Cap Value Fund
| Statement of Investments | April 30, 2018 (Unaudited) |
| Shares | Value (Note 2) | |||||||
| Norway (continued) | ||||||||
| Prosafe SE(a) | 53,023 | $ | 85,593 | |||||
| 405,778 | ||||||||
| Poland (0.80%) | ||||||||
| Amica SA | 2,513 | 85,662 | ||||||
| Getin Holding SA(a) | 243,599 | 65,750 | ||||||
| Getin Noble Bank SA(a) | 221,483 | 72,933 | ||||||
| 224,345 | ||||||||
| Portugal (0.33%) | ||||||||
| Pharol SGPS SA(a) | 278,017 | 91,408 | ||||||
| Qatar (0.32%) | ||||||||
| Qatar Islamic Insurance Co. QSC | 6,173 | 89,670 | ||||||
| Singapore (0.27%) | ||||||||
| CW Group Holdings, Ltd. | 494,000 | 75,529 | ||||||
| South Africa (0.36%) | ||||||||
| PPC, Ltd.(a) | 142,524 | 100,047 | ||||||
| South Korea (16.61%) | ||||||||
| Able C&C Co., Ltd.(a) | 6,042 | 97,004 | ||||||
| Baiksan Co., Ltd. | 16,252 | 90,952 | ||||||
| Bluecom Co., Ltd. | 12,394 | 69,730 | ||||||
| Byucksan Corp. | 26,436 | 102,818 | ||||||
| Cell Biotech Co., Ltd. | 2,418 | 96,148 | ||||||
| Crownhaitai Holdings Co., Ltd. | 7,266 | 112,924 | ||||||
| Dae Hyun Co., Ltd. | 41,506 | 100,155 | ||||||
| Daeyang Electric Co., Ltd.(a) | 6,187 | 77,985 | ||||||
| Dongwon Development Co., Ltd. | 21,658 | 100,393 | ||||||
| Dongyang E&P, Inc. | 8,569 | 93,668 | ||||||
| EcoBio Holdings Co., Ltd.(a) | 9,299 | 81,034 | ||||||
| Han Kuk Carbon Co., Ltd. | 16,983 | 94,888 | ||||||
| Hancom MDS, Inc. | 4,881 | 79,172 | ||||||
| Hansol Holdings Co., Ltd. | 23,520 | 115,871 | ||||||
| Harim Holdings Co., Ltd. | 25,527 | 95,828 | ||||||
| HS R&A Co., Ltd. | 39,844 | 83,139 | ||||||
| Hy-Lok Corp. | 3,957 | 101,903 | ||||||
| HyosungITX Co., Ltd. | 7,840 | 90,744 | ||||||
| Hyundai Engineering Plastics Co., Ltd. | 12,551 | 79,173 | ||||||
| Imarketkorea, Inc. | 11,334 | 95,837 | ||||||
| Initech Co., Ltd. | 10,830 | 87,620 | ||||||
| Interpark Holdings Corp. | 27,273 | 89,302 | ||||||
| Kangnam Jevisco Co., Ltd. | 2,361 | 71,566 | ||||||
| KONA I Co., Ltd.(a) | 7,462 | 70,339 | ||||||
| Kortek Corp. | 5,824 | 90,487 | ||||||
| Kukbo Design Co., Ltd. | 5,342 | 105,502 | ||||||
| Kukdo Chemical Co., Ltd. | 1,598 | 103,382 | ||||||
| Kwang Myung Electric Co., Ltd.(a) | 35,043 | 146,444 | ||||||
| Maeil Holdings Co., Ltd. | 7,079 | 106,379 | ||||||
| Miwon Holdings Co., Ltd.(a) | 2,280 | 94,482 | ||||||
| Namsun Aluminum Co., Ltd.(a) | 107,757 | 118,647 | ||||||
| NEOWIZ HOLDINGS Corp.(a) | 8,444 | 113,697 | ||||||
| Orion Holdings Corp. | 3,885 | 88,729 | ||||||
| SAMHWA Paints Industrial Co., Ltd. | 14,371 | 104,217 | ||||||
| Shares | Value (Note 2) | |||||||
| South Korea (continued) | ||||||||
| Sammok S-Form Co., Ltd. | 7,022 | $ | 101,774 | |||||
| Sangsangin Co., Ltd.(a) | 5,944 | 120,155 | ||||||
| SBS Contents Hub Co., Ltd.(a) | 10,215 | 82,919 | ||||||
| S-Connect Co., Ltd.(a) | 47,143 | 110,633 | ||||||
| SeAH Special Steel Co., Ltd. | 4,964 | 89,708 | ||||||
| Sejoong Co., Ltd.(a) | 28,371 | 73,676 | ||||||
| SH Energy & Chemical Co., Ltd. | 79,543 | 124,739 | ||||||
| SJM Co., Ltd. | 23,470 | 93,502 | ||||||
| Sundaytoz Corp.(a) | 4,029 | 167,834 | ||||||
| Woongjin Co., Ltd.(a) | 40,284 | 169,758 | ||||||
| Woongjin Thinkbig Co., Ltd. | 13,978 | 92,294 | ||||||
| Woori Investment Bank Co., Ltd.(a) | 187,602 | 106,739 | ||||||
| Yoosung Enterprise Co., Ltd. | 23,806 | 74,114 | ||||||
| 4,658,004 | ||||||||
| Spain (0.22%) | ||||||||
| Promotora de Informaciones SA, Class A(a) | 25,699 | 60,517 | ||||||
| Sweden (0.37%) | ||||||||
| Tethys Oil AB | 11,664 | 104,201 | ||||||
| Taiwan (4.97%) | ||||||||
| Ability Enterprise Co., Ltd. | 136,000 | 79,324 | ||||||
| Actron Technology Corp. | 27,000 | 94,480 | ||||||
| Asia Vital Components Co., Ltd. | 81,000 | 73,481 | ||||||
| China General Plastics Corp. | 109,506 | 117,120 | ||||||
| Chlitina Holding, Ltd. | 22,000 | 143,498 | ||||||
| Dyaco International, Inc. | 71,000 | 92,966 | ||||||
| Formosan Rubber Group, Inc. | 185,320 | 93,721 | ||||||
| Hong Pu Real Estate Development Co., Ltd. | 116,000 | 88,421 | ||||||
| Innodisk Corp. | 20,455 | 90,441 | ||||||
| Iron Force Industrial Co., Ltd. | 30,000 | 90,355 | ||||||
| LEE CHI Enterprises Co., Ltd. | 225,000 | 78,823 | ||||||
| Lion Travel Service Co., Ltd. | 20,000 | 73,580 | ||||||
| Quanta Storage, Inc. | 96,000 | 86,961 | ||||||
| Sagittarius Life Science Corp. | 44,000 | 96,416 | ||||||
| Yungshin Construction & Development Co., Ltd. | 85,000 | 94,436 | ||||||
| 1,394,023 | ||||||||
| Thailand (0.71%) | ||||||||
| Hwa Fong Rubber Thailand PCL | 730,784 | 89,380 | ||||||
| Somboon Advance Technology PCL | 158,600 | 108,783 | ||||||
| 198,163 | ||||||||
| Turkey (0.63%) | ||||||||
| Albaraka Turk Katilim Bankasi AS | 223,416 | 86,657 | ||||||
| Sekerbank TAS(a) | 244,108 | 90,956 | ||||||
| 177,613 | ||||||||
| United States (16.12%) | ||||||||
| AMAG Pharmaceuticals, Inc.(a) | 7,410 | 152,276 | ||||||
| American Public Education, Inc.(a) | 3,723 | 150,037 | ||||||
| ARC Document Solutions, Inc.(a) | 42,754 | 94,059 | ||||||
| AutoWeb, Inc.(a) | 6,551 | 23,911 | ||||||
| Avid Technology, Inc.(a) | 17,657 | 79,103 | ||||||
41 | April 30, 2018
ALPS | Metis Global Micro Cap Value Fund
| Statement of Investments | April 30, 2018 (Unaudited) |
| Shares | Value (Note 2) | |||||||
| United States (continued) | ||||||||
| Aware, Inc.(a) | 23,587 | $ | 91,989 | |||||
| Baldwin & Lyons, Inc., Class B | 4,091 | 95,320 | ||||||
| Bravo Brio Restaurant Group, Inc.(a) | 32,045 | 128,180 | ||||||
| Ceco Environmental Corp. | 20,239 | 95,123 | ||||||
| Covenant Transportation Group, Inc., Class A(a) | 3,554 | 98,624 | ||||||
| Crawford & Co., Class B | 8,825 | 70,777 | ||||||
| DHI Group, Inc.(a) | 35,143 | 49,200 | ||||||
| Eastman Kodak Co.(a) | 10,262 | 50,797 | ||||||
| Entercom Communications Corp., Class A | 9,121 | 92,578 | ||||||
| Federated National Holding Co. | 4,835 | 81,712 | ||||||
| First BanCorp.(a) | 18,792 | 135,678 | ||||||
| Fossil Group, Inc.(a) | 10,231 | 152,953 | ||||||
| GNC Holdings, Inc., Class A(a) | 21,467 | 76,208 | ||||||
| Hallador Energy Co. | 9,722 | 63,582 | ||||||
| Hornbeck Offshore Services, Inc.(a) | 28,037 | 100,933 | ||||||
| Huttig Building Products, Inc.(a) | 13,858 | 86,058 | ||||||
| Iconix Brand Group, Inc.(a) | 13,696 | 11,103 | ||||||
| IDT Corp., Class B | 10,621 | 57,566 | ||||||
| JAKKS Pacific, Inc.(a) | 43,664 | 102,610 | ||||||
| LB Foster Co., Class A(a) | 3,630 | 85,487 | ||||||
| Liberty Tax, Inc. | 7,301 | 75,200 | ||||||
| Manning & Napier, Inc. | 23,284 | 72,180 | ||||||
| Matrix Service Co.(a) | 5,302 | 81,651 | ||||||
| Midstates Petroleum Co., Inc.(a) | 5,360 | 74,986 | ||||||
| Natural Grocers by Vitamin Cottage, Inc.(a) | 11,370 | 81,296 | ||||||
| Natural Health Trends Corp. | 6,570 | 121,939 | ||||||
| Nautilus, Inc.(a) | 7,545 | 109,780 | ||||||
| OFG Bancorp | 11,339 | 153,077 | ||||||
| PAM Transportation Services, Inc.(a) | 2,716 | 97,749 | ||||||
| Park-Ohio Holdings Corp. | 2,159 | 81,826 | ||||||
| PDL BioPharma, Inc.(a) | 43,358 | 126,605 | ||||||
| PennyMac Financial Services, Inc., Class A(a) | 4,099 | 84,439 | ||||||
| PHI, Inc.(a) | 7,058 | 88,437 | ||||||
| Powell Industries, Inc. | 2,789 | 83,809 | ||||||
| Rafael Holdings, Inc., Class B(a) | 5,310 | 43,542 | ||||||
| Resources Connection, Inc. | 5,054 | 79,095 | ||||||
| REX American Resources Corp.(a) | 803 | 60,048 | ||||||
| Roadrunner Transportation Systems, Inc.(a) | 10,217 | 21,967 | ||||||
| Saga Communications, Inc., Class A | 2,007 | 74,460 | ||||||
| Sequential Brands Group, Inc.(a) | 59,656 | 115,136 | ||||||
| Timberland Bancorp, Inc. | 3,619 | 118,160 | ||||||
| Travelzoo, Inc.(a) | 8,468 | 96,959 | ||||||
| Ultra Petroleum Corp.(a) | 8,623 | 20,868 | ||||||
| Village Super Market, Inc., Class A | 4,349 | 118,293 | ||||||
| VSE Corp. | 1,955 | 100,272 | ||||||
| Weight Watchers International, Inc.(a) | 1,615 | 113,131 | ||||||
| 4,520,769 | ||||||||
| TOTAL COMMON STOCKS | ||||||||
| (Cost $26,297,545) | 27,090,653 | |||||||
| Shares | Value (Note 2) | |||||||
| PREFERRED STOCKS (0.33%) | ||||||||
| Brazil (0.33%) | ||||||||
| Banco do Estado do Rio Grande do Sul SA, Class B | 16,300 | $ | 93,058 | |||||
| TOTAL PREFERRED STOCKS | ||||||||
| (Cost $24,753) | 93,058 | |||||||
| 7-Day Yield | Shares | Value (Note 2) | ||||||||||
| SHORT TERM INVESTMENTS (2.75%) | ||||||||||||
| Money Market Fund (2.75%) | ||||||||||||
| State Street Institutional Treasury Plus Money Market Fund | 1.611 | % | 772,320 | 772,320 | ||||||||
| TOTAL SHORT TERM INVESTMENTS | ||||||||||||
| (Cost $772,320) | 772,320 | |||||||||||
| TOTAL INVESTMENTS (99.69%) | ||||||||||||
| (Cost $27,094,618) | $ | 27,956,031 | ||||||||||
| Other Assets In Excess Of Liabilities (0.31%) | 86,638 | |||||||||||
| NET ASSETS -100.00% | $ | 28,042,669 | ||||||||||
| (a) | Non-Income Producing Security. |
| (b) | Security exempt from registration under rule 144A of the securities act of 1933. This Security may be resold in transactions exempt from registration, normally to qualified institutional buyers. As of April 30, 2018, the market value of those securities was $76,445 representing 0.27% of the Fund's net assets. |
For Fund compliance purposes, the Fund's industry classifications refer to any one or more of the industry sub-classifications used by one or more widely recognized market indexes or ratings group indexes, and/or as defined by Fund management. This definition may not apply for purposes of this report, which may combine industry sub-classifications for reporting ease. Industries are shown as a percent of net assets.
See Notes to Financial Statements.
42 | April 30, 2018
ALPS | Metis Global Micro Cap Value Fund
| Statement of Assets and Liabilities | April 30, 2018 (Unaudited) |
| ASSETS | ||||
| Investments, at value | $ | 27,956,031 | ||
| Foreign currency, at value (Cost $42,266) | 42,309 | |||
| Receivable for shares sold | 6,000 | |||
| Dividends receivable | 106,272 | |||
| Prepaid expenses and other assets | 27,557 | |||
| Total Assets | 28,138,169 | |||
| LIABILITIES | ||||
| Investment advisory fees payable | 8,939 | |||
| Administration and transfer agency fees payable | 31,782 | |||
| Distribution and services fees payable | 2,571 | |||
| Professional fees payable | 13,499 | |||
| Accrued expenses and other liabilities | 38,709 | |||
| Total Liabilities | 95,500 | |||
| NET ASSETS | $ | 28,042,669 | ||
| NET ASSETS CONSIST OF | ||||
| Paid-in capital | $ | 25,692,701 | ||
| Accumulated net investment loss | (413,477 | ) | ||
| Accumulated net realized gain | 1,903,936 | |||
| Net unrealized appreciation | 859,509 | |||
| NET ASSETS | $ | 28,042,669 | ||
| INVESTMENTS, AT COST | $ | 27,094,618 | ||
| PRICING OF SHARES | ||||
| Investor Class: | ||||
| Net Asset Value, offering and redemption price per share | $ | 11.71 | ||
| Net Assets | $ | 3,942,733 | ||
| Shares of beneficial interest outstanding (unlimited number of shares, no par value common stock authorized) | 336,735 | |||
| Class C: | ||||
| Net Asset Value, offering and redemption price per share(a) | $ | 11.56 | ||
| Net Assets | $ | 522,946 | ||
| Shares of beneficial interest outstanding (unlimited number of shares, no par value common stock authorized) | 45,253 | |||
| Class I: | ||||
| Net Asset Value, offering and redemption price per share | $ | 11.73 | ||
| Net Assets | $ | 23,576,990 | ||
| Shares of beneficial interest outstanding (unlimited number of shares, no par value common stock authorized) | 2,009,773 | |||
| (a) | Redemption price per share may be reduced for any applicable contingent deferred sales charge. For a description of a possible sales charge, please see the Fund's Prospectus. |
See Notes to Financial Statements.
43 | April 30, 2018
ALPS | Metis Global Micro Cap Value Fund
| Statement of Operations | For the Six Months Ended April 30, 2018 (Unaudited) |
| INVESTMENT INCOME | ||||
| Dividends | $ | 274,073 | ||
| Foreign taxes withheld on dividends | (33,899 | ) | ||
| Total Investment Income | 240,174 | |||
| EXPENSES | ||||
| Investment advisory fees | 187,158 | |||
| Administrative fees | 43,239 | |||
| Transfer agency fees | 4,048 | |||
| Distribution and service fees | ||||
| Investor Class(a) | 7,641 | |||
| Class C | 3,208 | |||
| Professional fees | 10,392 | |||
| Reports to shareholders and printing fees | 2,029 | |||
| State registration fees | 17,799 | |||
| Insurance fees | 112 | |||
| Custody fees | 40,715 | |||
| Trustees' fees and expenses | 336 | |||
| Miscellaneous expenses | 12,744 | |||
| Total Expenses | 329,421 | |||
| Less fees waived/reimbursed by investment advisor (Note 8) | ||||
| Investor Class(a) | (8,561 | ) | ||
| Class C | (1,314 | ) | ||
| Class I | (54,299 | ) | ||
| Net Expenses | 265,247 | |||
| Net Investment Loss | (25,073 | ) | ||
| Net realized gain on investments | 1,919,002 | |||
| Net realized gain on foreign currency transactions | 3,593 | |||
| Net Realized Gain | 1,922,595 | |||
| Net change in unrealized depreciation on investments | (1,620,942 | ) | ||
| Net change in unrealized depreciation on translation of assets and liabilities denominated in foreign currencies | (1,592 | ) | ||
| Net change in unrealized foreign capital gains tax | 11,460 | |||
| Net Change in Unrealized Depreciation | (1,611,074 | ) | ||
| NET REALIZED AND UNREALIZED GAIN ON INVESTMENTS | 311,521 | |||
| NET INCREASE IN NET ASSETS RESULTING FROM OPERATIONS | $ | 286,448 | ||
| (a) | Prior to December 1, 2017, Investor Class was known as Class A. |
See Notes to Financial Statements.
44 | April 30, 2018
ALPS | Metis Global Micro Cap Value Fund
Statements of Changes in Net Assets
| For the Six Months Ended April 30, 2018 (Unaudited) | For the Year Ended October 31, 2017(a) | |||||||
| OPERATIONS | ||||||||
| Net investment income/(loss) | $ | (25,073 | ) | $ | 111,449 | |||
| Net realized gain | 1,922,595 | 2,269,274 | ||||||
| Net change in unrealized appreciation/(depreciation) | (1,611,074 | ) | 1,444,006 | |||||
| Net Increase in Net Assets Resulting from Operations | 286,448 | 3,824,729 | ||||||
| DISTRIBUTIONS | ||||||||
| Dividends to shareholders from net investment income | ||||||||
| Investor Class(b) | (53,577 | ) | (29,173 | ) | ||||
| Class C | (7,426 | ) | (3,353 | ) | ||||
| Class I | (337,540 | ) | (328,746 | ) | ||||
| Dividends to shareholders from net realized gains | ||||||||
| Investor Class(b) | (308,654 | ) | (77,685 | ) | ||||
| Class C | (46,249 | ) | (14,930 | ) | ||||
| Class I | (1,848,180 | ) | (694,622 | ) | ||||
| Net Decrease in Net Assets from Distributions | (2,601,626 | ) | (1,148,509 | ) | ||||
| BENEFICIAL INTEREST TRANSACTIONS (NOTE 6) | ||||||||
| Shares sold | ||||||||
| Investor Class(b) | 439,864 | 3,489,628 | ||||||
| Class C | 76,378 | 330,960 | ||||||
| Class I | 517,024 | 8,309,659 | ||||||
| Dividends reinvested | ||||||||
| Investor Class(b) | 313,008 | 99,556 | ||||||
| Class C | 30,524 | 12,443 | ||||||
| Class I | 2,043,927 | 1,005,246 | ||||||
| Shares redeemed, net of redemption fees | ||||||||
| Investor Class(b) | (842,264 | ) | (370,093 | ) | ||||
| Class C | (131,757 | ) | (38,267 | ) | ||||
| Class I | (2,909,365 | ) | (957,624 | ) | ||||
| Net Increase/(Decrease) in Net Assets Derived from Beneficial Interest Transactions | (462,661 | ) | 11,881,508 | |||||
| Net increase/(decrease) in net assets | (2,777,839 | ) | 14,557,728 | |||||
| NET ASSETS | ||||||||
| Beginning of period | 30,820,512 | 16,262,784 | ||||||
| End of period * | $ | 28,042,673 | $ | 30,820,512 | ||||
| *Including accumulated net investment income/(loss) of: | $ | (413,477 | ) | $ | 10,139 | |||
| (a) | Prior to December 1, 2017, Investor Class was known as Class A. |
| (b) | Prior to February 28, 2017 the fund was known as ALPS | Metis Global Micro Cap Fund. |
See Notes to Financial Statements.
45 | April 30, 2018
ALPS | Metis Global Micro Cap Value Fund – Investor Class
Financial Highlights
Selected data for a share of beneficial interest outstanding throughout the periods indicated:
| For the Six Months Ended April 30, 2018 (Unaudited)(a) | For the Year Ended October 31, 2017(b) | For the Period December 24, 2015 (Commencement) to October 31, 2016 | ||||||||||
| Net asset value, beginning of period | $ | 12.69 | $ | 11.48 | $ | 10.00 | ||||||
| INCOME FROM INVESTMENT OPERATIONS: | ||||||||||||
| Net investment income/(loss)(c) | (0.03 | ) | 0.03 | 0.11 | ||||||||
| Net realized and unrealized gain | 0.11 | 1.84 | 1.36 | |||||||||
| Total from investment operations | 0.08 | 1.87 | 1.47 | |||||||||
| DISTRIBUTIONS: | ||||||||||||
| From net investment income | (0.16 | ) | (0.15 | ) | – | |||||||
| From net realized gains | (0.90 | ) | (0.51 | ) | – | |||||||
| Total distributions | (1.06 | ) | (0.66 | ) | – | |||||||
| REDEMPTION FEES ADDED TO PAID-IN CAPITAL (NOTE 6) | – | 0.00 | (d) | 0.01 | ||||||||
| Net increase/(decrease) in net asset value | (0.98 | ) | 1.21 | 1.48 | ||||||||
| Net asset value, end of period | $ | 11.71 | $ | 12.69 | $ | 11.48 | ||||||
| TOTAL RETURN(e) | 0.66 | % | 16.93 | % | 14.80 | % | ||||||
| RATIOS/SUPPLEMENTAL DATA: | ||||||||||||
| Net assets, end of period (000s) | $ | 3,943 | $ | 4,355 | $ | 820 | ||||||
| Ratio of expenses to average net assets excluding fee waivers and reimbursements | 2.47 | %(f) | 2.82 | % | 4.47 | %(f) | ||||||
| Ratio of expenses to average net assets including fee waivers and reimbursements | 2.07 | %(f) | 2.08 | % | 2.10 | %(f) | ||||||
| Ratio of net investment income/(loss) to average net assets | (0.47 | %)(f) | 0.22 | % | 1.12 | %(f) | ||||||
| Portfolio turnover rate(g) | 37 | % | 61 | % | 77 | % | ||||||
| (a) | Prior to December 1, 2017, Investor Class was known as Class A. |
| (b) | Prior to February 28, 2017 the fund was known as ALPS | Metis Global Micro Cap Fund. |
| (c) | Calculated using the average shares method. |
| (d) | Less than $0.005 or ($0.005) per share. |
| (e) | Total returns are for the period indicated and have not been annualized. Total returns would have been lower had certain expenses not been waived during the period. Returns shown do not reflect the deduction of taxes that a shareholder would pay on Fund distributions or the redemption of Fund shares. Returns shown exclude any applicable sales charges. |
| (f) | Annualized. |
| (g) | Portfolio turnover rate for periods less than one full year have not been annualized. |
See Notes to Financial Statements.
46 | April 30, 2018
ALPS | Metis Global Micro Cap Value Fund – Class C
Financial Highlights
Selected data for a share of beneficial interest outstanding throughout the periods indicated:
| For the Six Months Ended April 30, 2018 (Unaudited) | For the Year Ended October 31, 2017(a) | For the Period December 24, 2015 (Commencement) to October 31, 2016 | ||||||||||
| Net asset value, beginning of period | $ | 12.57 | $ | 11.40 | $ | 10.00 | ||||||
| INCOME FROM INVESTMENT OPERATIONS: | ||||||||||||
| Net investment income/(loss)(b) | (0.06 | ) | (0.07 | )(c) | 0.02 | |||||||
| Net realized and unrealized gain | 0.10 | 1.86 | 1.38 | |||||||||
| Total from investment operations | 0.04 | 1.79 | 1.40 | |||||||||
| DISTRIBUTIONS: | ||||||||||||
| From net investment income | (0.15 | ) | (0.11 | ) | – | |||||||
| From net realized gains | (0.90 | ) | (0.51 | ) | – | |||||||
| Total distributions | (1.05 | ) | (0.62 | ) | – | |||||||
| Net increase/(decrease) in net asset value | (1.01 | ) | 1.17 | 1.40 | ||||||||
| Net asset value, end of period | $ | 11.56 | $ | 12.57 | $ | 11.40 | ||||||
| TOTAL RETURN(d) | 0.31 | % | 16.32 | % | 14.00 | % | ||||||
| RATIOS/SUPPLEMENTAL DATA: | ||||||||||||
| Net assets, end of period (000s) | $ | 523 | $ | 600 | $ | 255 | ||||||
| Ratio of expenses to average net assets excluding fee waivers and reimbursements | 3.11 | %(e) | 3.46 | % | 4.91 | %(e) | ||||||
| Ratio of expenses to average net assets including fee waivers and reimbursements | 2.70 | %(e) | 2.70 | % | 2.70 | %(e) | ||||||
| Ratio of net investment income/(loss) to average net assets | (1.02 | %)(e) | (0.59 | %) | 0.18 | %(e) | ||||||
| Portfolio turnover rate(f) | 37 | % | 61 | % | 77 | % | ||||||
| (a) | Prior to February 28, 2017 the fund was known as ALPS | Metis Global Micro Cap Fund. |
| (b) | Calculated using the average shares method. |
| (c) | The per share amount does not correspond to activity reflected in the Statement of Operations due to class specific expenses during the period. |
| (d) | Total returns are for the period indicated and have not been annualized. Total returns would have been lower had certain expenses not been waived during the period. Returns shown do not reflect the deduction of taxes that a shareholder would pay on Fund distributions or the redemption of Fund shares. Returns shown exclude any applicable sales charges. |
| (e) | Annualized. |
| (f) | Portfolio turnover rate for periods less than one full year have not been annualized. |
See Notes to Financial Statements.
47 | April 30, 2018
ALPS | Metis Global Micro Cap Value Fund – Class I
Financial Highlights
Selected data for a share of beneficial interest outstanding throughout the periods indicated:
| For the Six Months Ended April 30, 2018 (Unaudited) | For the Year Ended October 31, 2017(a) | For the Period December 24, 2015 (Commencement) to October 31, 2016 | ||||||||||
| Net asset value, beginning of period | $ | 12.70 | $ | 11.50 | $ | 10.00 | ||||||
| INCOME FROM INVESTMENT OPERATIONS: | ||||||||||||
| Net investment income/(loss)(b) | (0.01 | ) | 0.06 | 0.09 | ||||||||
| Net realized and unrealized gain | 0.11 | 1.86 | 1.41 | |||||||||
| Total from investment operations | 0.10 | 1.92 | 1.50 | |||||||||
| DISTRIBUTIONS: | ||||||||||||
| From net investment income | (0.17 | ) | (0.21 | ) | – | |||||||
| From net realized gains | (0.90 | ) | (0.51 | ) | – | |||||||
| Total distributions | (1.07 | ) | (0.72 | ) | – | |||||||
| REDEMPTION FEES ADDED TO PAID-IN CAPITAL (NOTE 6) | 0.00 | (c) | 0.00 | (c) | – | |||||||
| Net increase/(decrease) in net asset value | (0.97 | ) | 1.20 | 1.50 | ||||||||
| Net asset value, end of period | $ | 11.73 | $ | 12.70 | $ | 11.50 | ||||||
| TOTAL RETURN(d) | 0.81 | % | 17.38 | % | 15.00 | % | ||||||
| RATIOS/SUPPLEMENTAL DATA: | ||||||||||||
| Net assets, end of period (000s) | $ | 23,577 | $ | 25,866 | $ | 15,187 | ||||||
| Ratio of expenses to average net assets excluding fee waivers and reimbursements | 2.13 | %(e) | 2.46 | % | 3.40 | %(e) | ||||||
| Ratio of expenses to average net assets including fee waivers and reimbursements | 1.70 | %(e) | 1.70 | % | 1.70 | %(e) | ||||||
| Ratio of net investment income/(loss) to average net assets | (0.10 | %)(e) | 0.46 | % | 1.04 | %(e) | ||||||
| Portfolio turnover rate(f) | 37 | % | 61 | % | 77 | % | ||||||
| (a) | Prior to February 28, 2017 the fund was known as ALPS | Metis Global Micro Cap Fund. |
| (b) | Calculated using the average shares method. |
| (c) | Less than $0.005 or ($0.005) per share. |
| (d) | Total returns are for the period indicated and have not been annualized. Total returns would have been lower had certain expenses not been waived during the period. Returns shown do not reflect the deduction of taxes that a shareholder would pay on Fund distributions or the redemption of Fund shares. |
| (e) | Annualized. |
| (f) | Portfolio turnover rate for periods less than one full year have not been annualized. |
See Notes to Financial Statements.
48 | April 30, 2018
ALPS | Red Rocks Listed Private Equity Fund
| Management Commentary | April 30, 2018 (Unaudited) |
Record Demand For Private Equity
Investor demand for private equity (PE) continues to be strong as global PE finished 2017 on a robust note with new highs in both fund raising and dry powder. According to Preqin, a private markets data provider, global PE funds raised $453 billion in 2017, surpassing the 2007 record of $414 billion, and now have more than $1 trillion in dry powder to invest in new deals. During 2017, the two largest-ever PE funds (Softbank’s Vision Fund at $97.7 billion and Apollo’s Investment Fund IX at $24.7 billion) and the largest-ever venture capital fund (New Enterprise Associates at $3.3 billion) were raised.
The exit environment for PE continues to be healthy, with increasing valuations and robust gains vs. latest valuations upon exits. PE firms continue to face some challenges in putting dry powder to work, as favorable high valuations upon exit become unfavorable for acquirers. Meanwhile, the global IPO (initial public offering) market continued to improve, with deal values at 5-year highs but with a lower transaction count, a continuation of a trend of larger but fewer IPO transactions.
The US Congress passed significant tax reform in late 2017 which reduced corporate tax rates from 39% to 21% and introduced a 15.5% repatriation tax. With US companies holding an estimated $2.5 trillion of untaxed cash overseas at the end of 2017, we believe that the lower repatriation tax may be a catalyst to increase global M&A as US firms may bring back and invest idle cash via M&A activity. This activity could be significant for PE managers globally, as many own attractive assets that were purchased years ago at lower valuations.
H1 2018 Portfolio Review
For the six months ending April 30, 2018, the ALPS|Red Rocks Listed Private Equity Fund Investor shares (LPEFX) returned 1.97% compared to 3.68% and 1.30% for the MSCI World Index (the fund’s primary benchmark) and the Global Listed Private Equity Index, respectively.
For the 12 months ending April 30, 2018, the Fund returned 14.33% compared to 13.84% and 13.14% for the MSCI World Index and the Global Listed Private Equity Index, respectively.
As of April 30, 2018, the fund’s longer term returns continue to outperform its primary benchmark, with 5-year annualized returns of 10.56% compared to 9.88% for the MSCI World Index. For the Morningstar World Small-Mid Category, the Fund’s I-share was awarded a 4-star rating for 5 year performance.
We added five names during the period and exited seven, ending the quarter with 43 holdings. We have continued with our strategy to build positions in larger private equity managers who have high quality portfolios and a proven ability to create growth and longer term shareholder value, which we believe will provide better risk-adjusted returns given our current outlook.
Net contributors to performance for the period included:
| ● | IAC/Interactive Corp |
| ● | Aurelius Equity Opportunities SE & Co KGaA |
| ● | HBM Healthcare |
Net detractors to performance included:
| ● | Liberty Media Corp |
| ● | GCI Liberty |
| ● | Macquarie Infrastructure Corp |
We continue to highlight the potential advantages of the Fund and its investment focus on listed private equity (LPE) managers who buy and improve small private companies globally. Two points of emphasis are: 1) the size of the LPE companies in the Fund and 2) the size of the private companies owned and managed by LPE firms in the Fund.
LPE companies in the Fund have a median market capitalization of almost $6 billion, which is significantly larger than the $4 billion median market cap of the S&P Mid-cap Index. LPE companies in the fund are sizable, with generally strong balance sheets, access to low-cost capital, and a broad cadre of experienced managers to drive shareholder value.
On a look-through basis, the private companies owned by LPE companies in the Fund have a median valuation of around $400 million, which is about ½ the size of the median of the Russell 2000 Index, a broad index of small companies. Compared to a stand-alone small public company, the private companies owned by LPE companies in the fund have access to low-cost capital, expertise and resources via their LPE owners. And, being smaller, there is potential for accelerated growth.
It is our belief that the simplicity, focus, valuations, and growth potential of these smaller private companies, backed by the balance sheets, access to capital, and expertise of sizable and capable LPE managers provide an attractive set of investment characteristics.
Outlook
Conditions for global growth persist and our long-term outlook is favorable. According to Bloomberg, global mergers and acquisitions (M&A) activity during late 2017 and into the first quarter of 2018 was one of the best starts ever, with U.S. activity up 26% during the past year.
Business confidence and optimism, low inflation, excess cash on corporate balance sheets, the relative stability of U.S. and global economies, corporate income tax cuts, and repatriation provisions of the recently enacted U.S. tax plan are all factors driving M&A activity which could continue for foreseeable future.
49 | April 30, 2018
ALPS | Red Rocks Listed Private Equity Fund
| Management Commentary | April 30, 2018 (Unaudited) |
According to Bloomberg, cash levels for companies in the MSCI World Index are up 31% per share during the past three years, while cash flows from investing are relatively flat, indicating there is significant opportunity to deploy capital in M&A and other activities globally.
Growth rates of private companies in the Fund are generally higher than comparable public companies and we believe that the LPE management teams have the capabilities and experience to continue this growth, with some expectation of opportunistic sales given the current exit environment.
As we have seen in the first half of the fiscal year, uncertainty continues to best characterize current administration with policies that may have any number of both positive and negative potential impacts to global markets.
For longer term private equity investors, short term downward adjustments in private company valuations due to heightened public market volatility provide excellent buying opportunities and may benefit LPE companies in the Fund.
In closing, we appreciate your continued interest and look forward to working with our portfolio companies and managing the Fund on your behalf.
| Andrew Drummond | Kirk McCown, CFA | Wyck Brown, CFA |
| Co-Portfolio Manager | Co-Portfolio Manager | Co-Portfolio Manager |
50 | April 30, 2018
ALPS | Red Rocks Listed Private Equity Fund
| Performance Update | April 30, 2018 (Unaudited) |
Performance of $10,000 Initial Investment (as of April 30, 2018)
Comparison of change in value of a $10,000 investment
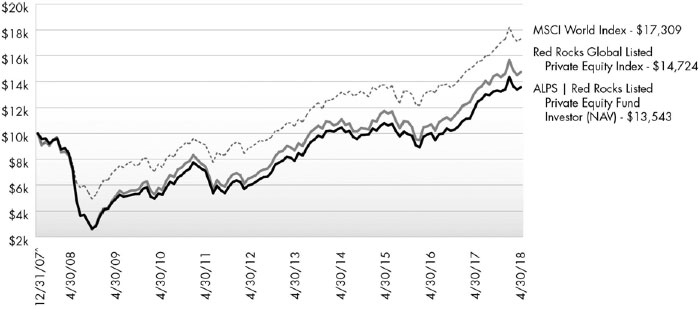
The chart above represents historical performance of a hypothetical investment of $10,000 in the Fund since inception. Past performance does not guarantee future results. This chart does not reflect the deduction of taxes that a shareholder would pay on Fund distributions or the redemption of Fund shares.
Average Annual Total Returns (as of April 30, 2018)
| 6 Month | 1 Year | 3 Year | 5 Year | 10 Year | Since Inception^ | Total Expense Ratio | What You Pay* | |
| Investor# (NAV) | 1.97% | 14.33% | 8.60% | 10.56% | 3.64% | 2.98% | 1.99% | 1.99% |
| Class C (NAV) | 1.65% | 13.50% | 7.84% | 9.84% | 2.85% | 2.20% | 2.65% | 2.65% |
| Class C (CDSC) | 0.75% | 12.50% | 7.84% | 9.84% | 2.85% | 2.20% | ||
| Class I | 2.11% | 14.57% | 8.88% | 10.90% | 3.95% | 3.28% | 1.68% | 1.68% |
| Class R | 1.85% | 14.13% | 8.37% | 10.42% | 3.41% | 2.74% | 2.08% | 2.08% |
| MSCI World Index1 | 3.68% | 13.84% | 8.16% | 9.88% | 6.08% | 5.45% | ||
| Red Rocks Global Listed Private Equity Index2 | 1.30% | 13.14% | 8.59% | 10.29% | 4.45% | 3.82% |
Performance data quoted represents past performance. Past performance does not guarantee future results. Investment return and principal value of an investment will fluctuate so that an investor’s shares, when sold or redeemed, may be worth more or less than the original cost. Current performance data may be higher or lower than actual data quoted. For the most current month-end performance data, please call 1-866-759-5679.
Performance shown at NAV does not include sales charges and would have been lower had it been taken into account. A Contingent Deferred Sales Charge (“CDSC”) of 1.00% may apply to Class C shares redeemed within the first 12 months after a purchase. The Fund imposes a 2.00% redemption fee on shares held for less than 90 days.
Performance less than 1 year is cumulative.
51 | April 30, 2018
ALPS | Red Rocks Listed Private Equity Fund
| Performance Update | April 30, 2018 (Unaudited) |
Performance shown for Class C shares prior to June 30, 2010 reflects the historical performance of the Fund’s Investor shares, calculated using the fees and expenses of Class C shares.
| 1 | MSCI World Index: Morgan Stanley Capital International’s market capitalization weighted index is composed of companies representative of the market structure of 22 developed market countries in North America, Europe and the Asia/Pacific Region. The index is not actively managed and does not reflect any deduction for fees, expenses or taxes. An investor may not invest directly in an index. |
| 2 | The Red Rocks Global Listed Private Equity Index includes securities, ADRs and GDRs of 40 to 75 private equity companies, including business development companies, master limited partnerships and other vehicles whose principal business is to invest in, lend capital to or provide services to privately held companies. The Red Rocks Global Listed Private Equity Index is managed by the Fund’s Sub-Advisor. An investor may not invest directly in an index. |
| ^ | Fund inception date of December 31, 2007 for Investor Class, Class I, and Class R; Fund inception date June 30, 2010 for Class C. |
| * | What You Pay reflects the Advisor's and Sub-Advisor’s decision to contractually limit expenses through February 28, 2019 and Acquired Fund Fees and Expenses of 0.52%. Please see the current prospectus for additional information. |
| # | Prior to December 1, 2017, Investor Class was known as Class A. |
The table does not reflect the deduction of taxes that a shareholder would pay on Fund distributions or the redemption of Fund shares.
This Fund is not suitable for all investors and is subject to investment risks, including possible loss of the principal amount invested.
Listed Private Equity Companies are subject to various risks depending on their underlying investments, which could include, but are not limited to, additional liquidity risk, industry risk, non-U.S. security risk, currency risk, credit risk, managed portfolio risk and derivatives risk (derivatives risk is the risk that the value of the Listed Private Equity Companies’ derivative investments will fall because of pricing difficulties or lack of correlation with the underlying investment).
There are inherent risks in investing in private equity companies, which encompass financial institutions or vehicles whose principal business is to invest in and lend capital to privately held companies. Generally, little public information exists for private and thinly traded companies, and there is a risk that investors may not be able to make a fully informed investment decision.
Listed Private Equity Companies may have relatively concentrated investment portfolios, consisting of a relatively small number of holdings. A consequence of this limited number of investments is that the aggregate returns realized may be adversely impacted by the poor performance of a small number of investments, or even a single investment, particularly if a company experiences the need to write down the value of an investment.
Certain of the Fund’s investments may be exposed to liquidity risk due to low trading volume, lack of a market maker or legal restrictions limiting the ability of the Fund to sell particular securities at an advantageous price and/or time. As a result, these securities may be more difficult to value. Foreign investing involves special risks, such as currency fluctuations and political uncertainty. The Fund invests in derivatives and is subject to the risk that the value of those derivative investments will fall because of pricing difficulties or lack of correlation with the underlying investment.
There is no guarantee that the Fund will continue to hold any one particular security or stay invested in any one particular company. The composition of the Fund's top holdings is subject to change. Performance figures are historical and reflect the change in share price, reinvested distributions, changes in net asset value, sales charges and capital gains distributions, if any.
Not FDIC Insured – No Bank Guarantee – May Lose Value
52 | April 30, 2018
ALPS | Red Rocks Listed Private Equity Fund
| Performance Update | April 30, 2018 (Unaudited) |
| Top Ten Holdings (as a % of Net Assets) † | |
| Aurelius Equity Opportunities SE & Co. KGaA | 5.59% |
| IAC/InterActiveCorp | 5.20% |
| 3i Group PLC | 4.34% |
| HarbourVest Global Private Equity, Ltd. | 4.08% |
| Schouw & Co. AB | 3.86% |
| The Blackstone Group LP | 3.50% |
| Intermediate Capital Group PLC | 3.40% |
| Ackermans & van Haaren N.V. | 3.26% |
| Partners Group Holding AG | 3.11% |
| Brookfield Asset Management, Inc. | 3.09% |
| Top Ten Holdings | 39.43% |
| † | Holdings are subject to change and my not reflect the current or future position of the portfolio. Table presents indicative values only. |
Industry Sector Allocation (as a % of Net Assets)
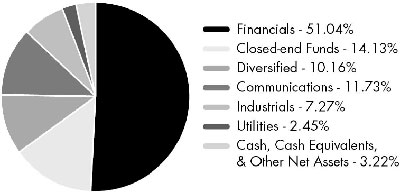
53 | April 30, 2018
ALPS | Red Rocks Listed Private Equity Fund
| Statement of Investments | April 30, 2018 (Unaudited) |
| Shares | Value (Note 2) | |||||||
| CLOSED-END FUNDS (14.13%) | ||||||||
| HarbourVest Global Private Equity, Ltd.(a) | 600,750 | $ | 10,404,323 | |||||
| HBM Healthcare Investments AG, Class A | 45,590 | 7,166,345 | ||||||
| HgCapital Trust PLC | 246,300 | 6,429,316 | ||||||
| NB Private Equity Partners, Ltd. | 226,700 | 3,078,911 | ||||||
| The Pantheon International PLC Fund(a) | 147,100 | 3,949,227 | ||||||
| 31,028,122 | ||||||||
| Riverstone Energy, Ltd.(a) | 298,000 | 4,972,311 | ||||||
| TOTAL CLOSED-END FUNDS | ||||||||
| (Cost $28,982,527) | 36,000,433 | |||||||
| COMMON STOCKS (82.65%) | ||||||||
| Communications (11.73%) | ||||||||
| Internet (5.66%) | ||||||||
| IAC/InterActiveCorp(a) | 81,650 | 13,238,731 | ||||||
| Rocket Internet SE(a)(b)(c) | 40,750 | 1,188,958 | ||||||
| 14,427,689 | ||||||||
| Media (6.07%) | ||||||||
| GCI Liberty, Inc., Class A(a) | 127,800 | 5,699,880 | ||||||
| Liberty Media Corp.-Liberty Formula One, Class A(a) | 100,800 | 2,833,488 | ||||||
| Liberty Media Corp.-Liberty SiriusXM, Class A(a) | 88,966 | 3,716,110 | ||||||
| Naspers, Ltd., Class N | 13,200 | 3,215,778 | ||||||
| 15,465,256 | ||||||||
| TOTAL COMMUNICATIONS | 29,892,945 | |||||||
| Diversified (10.16%) | ||||||||
| Holding Companies-Diversified Operations (10.16%) | ||||||||
| Ackermans & van Haaren N.V. | 46,100 | 8,318,557 | ||||||
| Schouw & Co. AB | 99,900 | 9,826,133 | ||||||
| Wendel SA | 51,200 | 7,732,884 | ||||||
| 25,877,574 | ||||||||
| TOTAL DIVERSIFIED | 25,877,574 | |||||||
| Financials (51.04%) | ||||||||
| Diversified Financial Services (24.28%) | ||||||||
| Berkshire Hathaway, Inc., Class B(a) | 36,273 | 7,027,168 | ||||||
| The Blackstone Group LP | 288,000 | 8,913,600 | ||||||
| Cannae Holdings, Inc.(a) | 255,000 | 5,268,300 | ||||||
| The Carlyle Group LP | 262,000 | 5,371,000 | ||||||
| EXOR N.V. | 64,000 | 4,741,361 | ||||||
| Intermediate Capital Group PLC | 581,300 | 8,661,348 | ||||||
| KKR & Co. LP | 338,000 | 7,077,720 | ||||||
| Pargesa Holding SA | 73,350 | 6,864,805 | ||||||
| Shares | Value (Note 2) | |||||||
| Diversified Financial Services (continued) | ||||||||
| Partners Group Holding AG | 10,875 | $ | 7,931,905 | |||||
| 61,857,207 | ||||||||
| Investment Companies (17.38%) | ||||||||
| 3i Group PLC | 856,000 | 11,049,392 | ||||||
| Ares Capital Corp. | 326,000 | 5,229,040 | ||||||
| Aurelius Equity Opportunities SE & Co. KGaA | 188,548 | 14,249,290 | ||||||
| Eurazeo SA | 66,298 | 5,823,406 | ||||||
| Investor AB, B Shares | 142,000 | 6,181,829 | ||||||
| mutares AG | 81,350 | 1,768,289 | ||||||
| 44,301,246 | ||||||||
| Private Equity (6.29%) | ||||||||
| Altamir | 68,207 | 1,146,471 | ||||||
| Brederode SA | 25,482 | 1,579,681 | ||||||
| Onex Corp. | 90,200 | 6,680,961 | ||||||
| Princess Private Equity Holding, Ltd. | 125,700 | 1,536,928 | ||||||
| Standard Life Private Equity | 1,090,000 | 5,077,350 | ||||||
| 16,021,391 | ||||||||
| Real Estate (3.09%) | ||||||||
| Brookfield Asset Management, Inc., Class A | 198,750 | 7,878,450 | ||||||
| TOTAL FINANCIALS | 130,058,294 | |||||||
| Industrials (7.27%) | ||||||||
| Commercial Services (1.83%) | ||||||||
| Brookfield Business Partners LP | 67,400 | 2,355,942 | ||||||
| Fortress Transportation & Infrastructure Investors LLC | 138,000 | 2,296,320 | ||||||
| 4,652,262 | ||||||||
| Electrical Equipment (1.32%) | ||||||||
| Melrose Industries PLC | 1,077,000 | 3,377,095 | ||||||
| Miscellaneous Manufacturers (4.12%) | ||||||||
| Danaher Corp. | 50,850 | 5,101,272 | ||||||
| Gesco AG | 25,178 | 860,223 | ||||||
| Indus Holding AG | 63,500 | 4,544,533 | ||||||
| 10,506,028 | ||||||||
| TOTAL INDUSTRIALS | 18,535,385 | |||||||
54 | April 30, 2018
ALPS | Red Rocks Listed Private Equity Fund
| Statement of Investments | April 30, 2018 (Unaudited) |
| Shares | Value (Note 2) | |||||||
| Utilities (2.45%) | ||||||||
| Electric (2.45%) | ||||||||
| Brookfield Infrastructure Partners LP | 152,600 | $ | 6,235,236 | |||||
| TOTAL UTILITIES | 6,235,236 | |||||||
| TOTAL COMMON STOCKS | ||||||||
| (Cost $170,199,346) | 210,599,434 | |||||||
| 7-Day Yield | Shares | Value (Note 2) | ||||||||||
| SHORT TERM INVESTMENTS (2.94%) | ||||||||||||
| Money Market Fund (2.94%) | ||||||||||||
| State Street Institutional Treasury Plus Money Market Fund | 1.611 | % | 7,479,538 | 7,479,538 | ||||||||
| TOTAL SHORT TERM INVESTMENTS | ||||||||||||
| (Cost $7,479,538) | 7,479,538 | |||||||||||
| TOTAL INVESTMENTS (99.72%) | ||||||||||||
| (Cost $206,661,411) | $ | 254,079,405 | ||||||||||
| Other Assets In Excess Of Liabilities (0.28%) | 724,061 | |||||||||||
| NET ASSETS (100.00%) | $ | 254,803,466 | ||||||||||
| (a) | Non-Income Producing Security. |
| (b) | Security exempt from registration under Rule 144A of the Securities Act of 1933. This security may be resold in transactions exempt from registration, normally to qualified institutional buyers. As of April 30, 2018, the aggregate market value of those securities was $1,188,958, representing 0.47% of net assets. |
| (c) | Securities were purchased pursuant to Regulation S under the Securities Act of 1933, which exempts securities offered and sold outside of the United States from registration. Such securities cannot be sold in the United States without either an effective registration statement filed pursuant to the Securities Act of 1933, or pursuant to an exemption from registration. These securities have been deemed liquid under guidelines approved by the Fund's Board of Trustees. As of April 30, 2018 the aggregate market value of those securities was $1,188,958 representing 0.47% of net assets. |
For Fund compliance purposes, the Fund's industry classifications refer to any one or more of the industry sub-classifications used by one or more widely recognized market indexes or ratings group indexes, and/or as defined by Fund management. This definition may not apply for purposes of this report, which may combine industry sub-classifications for reporting ease. Industries are shown as a percent of net assets.
See Notes to Financial Statements.
55 | April 30, 2018
ALPS | Red Rocks Listed Private Equity Fund
| Statement of Assets and Liabilities | April 30, 2018 (Unaudited) |
| ASSETS | ||||
| Investments, at value | $ | 254,079,405 | ||
| Foreign currency, at value (Cost $4,479) | 4,479 | |||
| Receivable for shares sold | 144,984 | |||
| Dividends receivable | 939,440 | |||
| Prepaid expenses and other assets | 48,877 | |||
| Total Assets | 255,217,185 | |||
| LIABILITIES | ||||
| Payable for investments purchased | 428 | |||
| Payable for shares redeemed | 184,869 | |||
| Investment advisory fees payable | 83,383 | |||
| Administration and transfer agency fees payable | 45,864 | |||
| Distribution and services fees payable | 49,353 | |||
| Professional fees payable | 31,097 | |||
| Custody fees payable | 10,393 | |||
| Accrued expenses and other liabilities | 8,332 | |||
| Total Liabilities | 413,719 | |||
| NET ASSETS | $ | 254,803,466 | ||
| NET ASSETS CONSIST OF | ||||
| Paid-in capital | $ | 217,504,388 | ||
| Accumulated net investment loss | (13,772,166 | ) | ||
| Accumulated net realized gain | 3,660,638 | |||
| Net unrealized appreciation | 47,410,606 | |||
| NET ASSETS | $ | 254,803,466 | ||
| INVESTMENTS, AT COST | $ | 206,661,411 | ||
| PRICING OF SHARES | ||||
| Investor Class: | ||||
| Net Asset Value, offering and redemption price per share | $ | 7.23 | ||
| Net Assets | $ | 51,656,512 | ||
| Shares of beneficial interest outstanding (unlimited number of shares, no par value common stock authorized) | 7,144,171 | |||
| Class C: | ||||
| Net Asset Value, offering and redemption price per share(a) | $ | 6.85 | ||
| Net Assets | $ | 20,867,058 | ||
| Shares of beneficial interest outstanding (unlimited number of shares, no par value common stock authorized) | 3,047,518 | |||
| Class I: | ||||
| Net Asset Value, offering and redemption price per share | $ | 7.35 | ||
| Net Assets | $ | 177,348,614 | ||
| Shares of beneficial interest outstanding (unlimited number of shares, no par value common stock authorized) | 24,118,742 | |||
| Class R: | ||||
| Net Asset Value, offering and redemption price per share | $ | 6.12 | ||
| Net Assets | $ | 4,931,282 | ||
| Shares of beneficial interest outstanding (unlimited number of shares, no par value common stock authorized) | 805,424 | |||
| (a) | Redemption price per share may be reduced for any applicable contingent deferred sales charge. For a description of a possible sales charge, please see the Fund’s Prospectus. |
See Notes to Financial Statements.
56 | April 30, 2018
ALPS | Red Rocks Listed Private Equity Fund
| Statement of Operations | For the Six Months Ended April 30, 2018 (Unaudited) |
| INVESTMENT INCOME | ||||
| Dividends | $ | 1,720,654 | ||
| Foreign taxes withheld on dividends | (79,673 | ) | ||
| Total Investment Income | 1,640,981 | |||
| EXPENSES | ||||
| Investment advisory fees | 979,525 | |||
| Administrative fees | 94,227 | |||
| Transfer agency fees | 86,067 | |||
| Distribution and service fees | ||||
| Investor Class(a) | 89,037 | |||
| Class C | 100,095 | |||
| Class R | 11,559 | |||
| Professional fees | 18,133 | |||
| Reports to shareholders and printing fees | 18,621 | |||
| State registration fees | 31,834 | |||
| Insurance fees | 726 | |||
| Custody fees | 25,431 | |||
| Trustees’ fees and expenses | 2,327 | |||
| Miscellaneous expenses | 7,404 | |||
| Total Expenses | 1,464,986 | |||
| Net Expenses | 1,464,986 | |||
| Net Investment Income | 175,995 | |||
| Net realized gain on investments | 2,095,661 | |||
| Net realized gain on foreign currency transactions | 24,310 | |||
| Net Realized Gain | 2,119,971 | |||
| Net change in unrealized appreciation on investments | 1,430,666 | |||
| Net change in unrealized depreciation on translation of assets and liabilities denominated in foreign currencies | (5,602 | ) | ||
| Net Change in Unrealized Appreciation | 1,425,064 | |||
| NET REALIZED AND UNREALIZED GAIN ON INVESTMENTS | 3,545,035 | |||
| NET INCREASE IN NET ASSETS RESULTING FROM OPERATIONS | $ | 3,721,030 | ||
| (a) | Prior to December 1, 2017, Investor Class was known as Class A. |
See Notes to Financial Statements.
57 | April 30, 2018
ALPS | Red Rocks Listed Private Equity Fund
Statements of Changes in Net Assets
| For the Six Months Ended April 30, 2018 (Unaudited) | For the Year Ended October 31, 2017 | |||||||
| OPERATIONS | ||||||||
| Net investment income | $ | 175,995 | $ | 3,836,100 | ||||
| Net realized gain | 2,119,971 | 30,771,017 | ||||||
| Net change in unrealized appreciation | 1,425,064 | 23,527,938 | ||||||
| Net Increase in Net Assets Resulting from Operations | 3,721,030 | 58,135,055 | ||||||
| DISTRIBUTIONS | ||||||||
| Dividends to shareholders from net investment income | ||||||||
| Investor Class(a) | (4,590,081 | ) | (809,606 | ) | ||||
| Class C | (1,689,997 | ) | (225,242 | ) | ||||
| Class I | (12,644,889 | ) | (2,414,838 | ) | ||||
| Class R | (444,092 | ) | (50,266 | ) | ||||
| Dividends to shareholders from net realized gains | ||||||||
| Investor Class(a) | (1,602,980 | ) | – | |||||
| Class C | (624,640 | ) | – | |||||
| Class I | (4,282,975 | ) | – | |||||
| Class R | (154,788 | ) | – | |||||
| Net Decrease in Net Assets from Distributions | (26,034,442 | ) | (3,499,952 | ) | ||||
| BENEFICIAL INTEREST TRANSACTIONS (NOTE 6) | ||||||||
| Shares sold | ||||||||
| Investor Class | 9,839,909 | 21,768,592 | ||||||
| Class C | 4,159,560 | 4,263,157 | ||||||
| Class I | 60,491,697 | 50,050,247 | ||||||
| Class R | 1,108,482 | 1,313,352 | ||||||
| Dividends reinvested | ||||||||
| Investor Class | 5,142,819 | 650,227 | ||||||
| Class C | 1,683,239 | 145,779 | ||||||
| Class I | 13,931,101 | 2,078,633 | ||||||
| Class R | 590,986 | 49,633 | ||||||
| Shares redeemed, net of redemption fees | ||||||||
| Investor Class | (13,588,250 | ) | (109,952,100 | ) | ||||
| Class C | (1,915,616 | ) | (3,954,133 | ) | ||||
| Class I | (21,168,848 | ) | (130,375,992 | ) | ||||
| Class R | (485,834 | ) | (792,847 | ) | ||||
| Net Increase/(Decrease) in Net Assets Derived from Beneficial Interest Transactions | 59,789,245 | (164,755,452 | ) | |||||
| Net increase/(decrease) in net assets | 37,475,833 | (110,120,349 | ) | |||||
| NET ASSETS | ||||||||
| Beginning of period | 217,327,633 | 327,447,982 | ||||||
| End of period * | $ | 254,803,466 | $ | 217,327,633 | ||||
| *Including accumulated net investment income/(loss) of: | $ | (13,772,166 | ) | $ | 5,420,898 | |||
| (a) | Prior to December 1, 2017, Investor Class was known as Class A. |
See Notes to Financial Statements.
58 | April 30, 2018
ALPS | Red Rocks Listed Private Equity Fund – Investor Class
Financial Highlights
Selected data for a share of beneficial interest outstanding throughout the periods indicated:
| For the Six Months Ended April 30, 2018 (Unaudited)(a) | For the Year Ended October 31, 2017 | For the Year Ended October 31, 2016 | For the Year Ended October 31, 2015 | For the Fiscal Period Ended October 31, 2014(b) | For the Year Ended April 30, 2014 | |||||||||||||||||||
| Net asset value, beginning of period | $ | 8.05 | $ | 6.29 | $ | 6.76 | $ | 6.61 | $ | 7.00 | $ | 6.05 | ||||||||||||
| INCOME/(LOSS) FROM INVESTMENT OPERATIONS: | ||||||||||||||||||||||||
| Net investment income(c) | 0.00 | (d) | 0.12 | 0.06 | 0.05 | 0.02 | 0.03 | |||||||||||||||||
| Net realized and unrealized gain/(loss) | 0.13 | 1.74 | (0.04 | ) | 0.34 | (0.41 | ) | 1.37 | ||||||||||||||||
| Total from investment operations | 0.13 | 1.86 | 0.02 | 0.39 | (0.39 | ) | 1.40 | |||||||||||||||||
| DISTRIBUTIONS: | ||||||||||||||||||||||||
| From net investment income | (0.70 | ) | (0.10 | ) | (0.22 | ) | (0.22 | ) | – | (0.45 | ) | |||||||||||||
| From net realized gains | (0.25 | ) | – | (0.27 | ) | (0.02 | ) | – | – | |||||||||||||||
| Total distributions | (0.95 | ) | (0.10 | ) | (0.49 | ) | (0.24 | ) | – | (0.45 | ) | |||||||||||||
| REDEMPTION FEES ADDED TO PAID-IN CAPITAL (NOTE 6) | 0.00 | (d) | 0.00 | (d) | 0.00 | (d) | 0.00 | (d) | 0.00 | (d) | 0.00 | (d) | ||||||||||||
| Net increase/(decrease) in net asset value | (0.82 | ) | 1.76 | (0.47 | ) | 0.15 | (0.39 | ) | 0.95 | |||||||||||||||
| Net asset value, end of period | $ | 7.23 | $ | 8.05 | $ | 6.29 | $ | 6.76 | $ | 6.61 | $ | 7.00 | ||||||||||||
| TOTAL RETURN(e) | 1.97 | % | 29.97 | % | 0.76 | % | 6.01 | % | (5.57 | )% | 23.54 | % | ||||||||||||
| RATIOS/SUPPLEMENTAL DATA: | ||||||||||||||||||||||||
| Net assets, end of period (000s) | $ | 51,657 | $ | 55,538 | $ | 128,920 | $ | 193,561 | $ | 203,996 | $ | 205,727 | ||||||||||||
| Ratio of expenses to average net assets excluding fee waivers and reimbursements(f) | 1.39 | %(g) | 1.38 | % | 1.47 | % | 1.47 | % | 1.59 | %(g) | 1.64 | % | ||||||||||||
| Ratio of expenses to average net assets including fee waivers and reimbursements(f) | 1.39 | %(g) | 1.38 | % | 1.47 | % | 1.47 | % | 1.59 | %(g) | 1.64 | % | ||||||||||||
| Ratio of net investment income to average net assets(f) | 0.03 | %(g) | 1.63 | % | 1.07 | % | 0.72 | % | 0.71 | %(g) | 0.46 | % | ||||||||||||
| Portfolio turnover rate(h) | 13 | % | 31 | % | 30 | % | 37 | % | 11 | % | 40 | % | ||||||||||||
| (a) | Prior to December 1, 2017, Investor Class was known as Class A. |
| (b) | Effective May 1, 2014, the Board approved changing the fiscal year-end of the Funds from April 30 to October 31. |
| (c) | Calculated using the average shares method. |
| (d) | Less than $0.005 or ($0.005) per share. |
| (e) | Total returns are for the period indicated and have not been annualized. Total returns would have been lower had certain expenses not been waived during the period. Returns shown do not reflect the deduction of taxes that a shareholder would pay on Fund distributions or the redemption of Fund shares. Returns shown exclude any applicable sales charges. |
| (f) | The ratios exclude the impact of expenses of the underlying funds in which the Fund invests as represented in the Statement of Investments. |
| (g) | Annualized. |
| (h) | Portfolio turnover rate for periods less than one full year have not been annualized. |
See Notes to Financial Statements.
59 | April 30, 2018
ALPS | Red Rocks Listed Private Equity Fund – Class C
Financial Highlights
Selected data for a share of beneficial interest outstanding throughout the periods indicated:
| For the Six Months Ended April 30, 2018 (Unaudited) | For the Year Ended October 31, 2017 | For the Year Ended October 31, 2016 | For the Year Ended October 31, 2015 | For the Fiscal Period Ended October 31, 2014(a) | For the Year Ended April 30, 2014 | |||||||||||||||||||
| Net asset value, beginning of period | $ | 7.66 | $ | 6.04 | $ | 6.53 | $ | 6.43 | $ | 6.83 | $ | 5.92 | ||||||||||||
| INCOME/(LOSS) FROM INVESTMENT OPERATIONS: | ||||||||||||||||||||||||
| Net investment income/(loss)(b) | (0.02 | ) | 0.06 | 0.03 | 0.00 | (c) | (0.00 | )(c) | (0.00 | )(c) | ||||||||||||||
| Net realized and unrealized gain/(loss) | 0.13 | 1.65 | (0.03 | ) | 0.32 | (0.40 | ) | 1.33 | ||||||||||||||||
| Total from investment operations | 0.11 | 1.71 | – | 0.32 | (0.40 | ) | 1.33 | |||||||||||||||||
| DISTRIBUTIONS: | ||||||||||||||||||||||||
| From net investment income | (0.67 | ) | (0.09 | ) | (0.22 | ) | (0.20 | ) | – | (0.42 | ) | |||||||||||||
| From net realized gains | (0.25 | ) | – | (0.27 | ) | (0.02 | ) | – | – | |||||||||||||||
| Total distributions | (0.92 | ) | (0.09 | ) | (0.49 | ) | (0.22 | ) | – | (0.42 | ) | |||||||||||||
| REDEMPTION FEES ADDED TO PAID-IN CAPITAL (NOTE 6) | 0.00 | (c) | 0.00 | (c) | 0.00 | (c) | 0.00 | (c) | 0.00 | (c) | 0.00 | (c) | ||||||||||||
| Net increase/(decrease) in net asset value | (0.81 | ) | 1.62 | (0.49 | ) | 0.10 | (0.40 | ) | 0.91 | |||||||||||||||
| Net asset value, end of period | $ | 6.85 | $ | 7.66 | $ | 6.04 | $ | 6.53 | $ | 6.43 | $ | 6.83 | ||||||||||||
| TOTAL RETURN(d) | 1.65 | % | 28.79 | % | 0.34 | % | 5.14 | % | (5.86 | )% | 22.97 | % | ||||||||||||
| RATIOS/SUPPLEMENTAL DATA: | ||||||||||||||||||||||||
| Net assets, end of period (000s) | $ | 20,867 | $ | 18,981 | $ | 14,784 | $ | 19,300 | $ | 17,193 | $ | 12,200 | ||||||||||||
| Ratio of expenses to average net assets excluding fee waivers and reimbursements(e) | 2.09 | %(f) | 2.13 | % | 2.16 | % | 2.12 | % | 2.15 | %(f) | 2.20 | % | ||||||||||||
| Ratio of expenses to average net assets including fee waivers and reimbursements(e) | 2.09 | %(f) | 2.13 | % | 2.16 | % | 2.12 | % | 2.15 | %(f) | 2.20 | % | ||||||||||||
| Ratio of net investment income/(loss) to average net assets(e) | (0.67 | )%(f) | 0.83 | % | 0.49 | % | 0.06 | % | (0.13 | )%(f) | (0.04 | )% | ||||||||||||
| Portfolio turnover rate(g) | 13 | % | 31 | % | 30 | % | 37 | % | 11 | % | 40 | % | ||||||||||||
| (a) | Effective May 1, 2014, the Board approved changing the fiscal year-end of the Funds from April 30 to October 31. |
| (b) | Calculated using the average shares method. |
| (c) | Less than $0.005 or ($0.005) per share. |
| (d) | Total returns are for the period indicated and have not been annualized. Total returns would have been lower had certain expenses not been waived during the period. Returns shown do not reflect the deduction of taxes that a shareholder would pay on Fund distributions or the redemption of Fund shares. Returns shown exclude any applicable sales charges. |
| (e) | The ratios exclude the impact of expenses of the underlying funds in which the Fund invests as represented in the Statement of Investments. |
| (f) | Annualized. |
| (g) | Portfolio turnover rate for periods less than one full year have not been annualized. |
See Notes to Financial Statements.
60 | April 30, 2018
ALPS | Red Rocks Listed Private Equity Fund – Class I
Financial Highlights
Selected data for a share of beneficial interest outstanding throughout the periods indicated:
| For the Six Months Ended April 30, 2018 (Unaudited) | For the Year Ended October 31, 2017 | For the Year Ended October 31, 2016 | For the Year Ended October 31, 2015 | For the Fiscal Period Ended October 31, 2014(a) | For the Year Ended April 30, 2014 | |||||||||||||||||||
| Net asset value, beginning of period | $ | 8.18 | $ | 6.39 | $ | 6.83 | $ | 6.67 | $ | 7.05 | $ | 6.08 | ||||||||||||
| INCOME/(LOSS) FROM INVESTMENT OPERATIONS: | ||||||||||||||||||||||||
| Net investment income(b) | 0.01 | 0.13 | 0.09 | 0.07 | 0.03 | 0.06 | ||||||||||||||||||
| Net realized and unrealized gain/(loss) | 0.14 | 1.76 | (0.03 | ) | 0.34 | (0.41 | ) | 1.37 | ||||||||||||||||
| Total from investment operations | 0.15 | 1.89 | 0.06 | 0.41 | (0.38 | ) | 1.43 | |||||||||||||||||
| DISTRIBUTIONS: | ||||||||||||||||||||||||
| From net investment income | (0.73 | ) | (0.10 | ) | (0.23 | ) | (0.23 | ) | – | (0.46 | ) | |||||||||||||
| From net realized gains | (0.25 | ) | – | (0.27 | ) | (0.02 | ) | – | – | |||||||||||||||
| Total distributions | (0.98 | ) | (0.10 | ) | (0.50 | ) | (0.25 | ) | – | (0.46 | ) | |||||||||||||
| REDEMPTION FEES ADDED TO PAID-IN CAPITAL (NOTE 6) | 0.00 | (c) | 0.00 | (c) | 0.00 | (c) | 0.00 | (c) | 0.00 | (c) | 0.00 | (c) | ||||||||||||
| Net increase/(decrease) in net asset value | (0.83 | ) | 1.79 | (0.44 | ) | 0.16 | (0.38 | ) | 0.97 | |||||||||||||||
| Net asset value, end of period | $ | 7.35 | $ | 8.18 | $ | 6.39 | $ | 6.83 | $ | 6.67 | $ | 7.05 | ||||||||||||
| TOTAL RETURN(d) | 2.11 | % | 30.09 | % | 1.27 | % | 6.30 | % | (5.39 | )% | 24.02 | % | ||||||||||||
| RATIOS/SUPPLEMENTAL DATA: | ||||||||||||||||||||||||
| Net assets, end of period (000s) | $ | 177,349 | $ | 138,572 | $ | 180,892 | $ | 287,741 | $ | 249,375 | $ | 202,076 | ||||||||||||
| Ratio of expenses to average net assets excluding fee waivers and reimbursements(e) | 1.12 | %(f) | 1.16 | % | 1.18 | % | 1.16 | % | 1.25 | %(f) | 1.25 | % | ||||||||||||
| Ratio of expenses to average net assets including fee waivers and reimbursements(e) | 1.12 | %(f) | 1.16 | % | 1.18 | % | 1.16 | % | 1.25 | %(f) | 1.25 | % | ||||||||||||
| Ratio of net investment income to average net assets(e) | 0.31 | %(f) | 1.85 | % | 1.48 | % | 1.02 | % | 0.85 | %(f) | 0.91 | % | ||||||||||||
| Portfolio turnover rate(g) | 13 | % | 31 | % | 30 | % | 37 | % | 11 | % | 40 | % | ||||||||||||
| (a) | Effective May 1, 2014, the Board approved changing the fiscal year-end of the Funds from April 30 to October 31. |
| (b) | Calculated using the average shares method. |
| (c) | Less than $0.005 or ($0.005) per share. |
| (d) | Total returns are for the period indicated and have not been annualized. Total returns would have been lower had certain expenses not been waived during the period. Returns shown do not reflect the deduction of taxes that a shareholder would pay on Fund distributions or the redemption of Fund shares. |
| (e) | The ratios exclude the impact of expenses of the underlying funds in which the Fund invests as represented in the Statement of Investments. |
| (f) | Annualized. |
| (g) | Portfolio turnover rate for periods less than one full year have not been annualized. |
See Notes to Financial Statements.
61 | April 30, 2018
ALPS | Red Rocks Listed Private Equity Fund – Class R
Financial Highlights
Selected data for a share of beneficial interest outstanding throughout the periods indicated:
| For the Six Months Ended April 30, 2018 (Unaudited) | For the Year Ended October 31, 2017 | For the Year Ended October 31, 2016 | For the Year Ended October 31, 2015 | For the Fiscal Period Ended October 31, 2014(a) | For the Year Ended April 30, 2014 | |||||||||||||||||||
| Net asset value, beginning of period | $ | 6.97 | $ | 5.48 | $ | 5.96 | $ | 5.87 | $ | 6.21 | $ | 5.41 | ||||||||||||
| INCOME/(LOSS) FROM INVESTMENT OPERATIONS: | ||||||||||||||||||||||||
| Net investment income/(loss)(b) | (0.00 | )(c) | 0.09 | 0.06 | 0.03 | 0.01 | 0.02 | |||||||||||||||||
| Net realized and unrealized gain/(loss) | 0.11 | 1.50 | (0.05 | ) | 0.31 | (0.36 | ) | 1.22 | ||||||||||||||||
| Total from investment operations | 0.11 | 1.59 | 0.01 | 0.34 | (0.35 | ) | 1.24 | |||||||||||||||||
| DISTRIBUTIONS: | ||||||||||||||||||||||||
| From net investment income | (0.71 | ) | (0.10 | ) | (0.22 | ) | (0.23 | ) | – | (0.44 | ) | |||||||||||||
| From net realized gains | (0.25 | ) | – | (0.27 | ) | (0.02 | ) | – | – | |||||||||||||||
| Total distributions | (0.96 | ) | (0.10 | ) | (0.49 | ) | (0.25 | ) | – | (0.44 | ) | |||||||||||||
| REDEMPTION FEES ADDED TO PAID-IN CAPITAL (NOTE 6) | – | – | – | 0.00 | (c) | 0.01 | – | |||||||||||||||||
| Net increase/(decrease) in net asset value | (0.85 | ) | 1.49 | (0.48 | ) | 0.09 | (0.34 | ) | 0.80 | |||||||||||||||
| Net asset value, end of period | $ | 6.12 | $ | 6.97 | $ | 5.48 | $ | 5.96 | $ | 5.87 | $ | 6.21 | ||||||||||||
| TOTAL RETURN(d) | 1.85 | % | 29.51 | % | 0.67 | % | 5.87 | % | (5.48 | )% | 23.50 | % | ||||||||||||
| RATIOS/SUPPLEMENTAL DATA: | ||||||||||||||||||||||||
| Net assets, end of period (000s) | $ | 4,931 | $ | 4,236 | $ | 2,852 | $ | 3,068 | $ | 872 | $ | 540 | ||||||||||||
| Ratio of expenses to average net assets excluding fee waivers and reimbursements(e) | 1.55 | %(f) | 1.56 | % | 1.63 | % | 1.60 | % | 1.63 | %(f) | 1.72 | % | ||||||||||||
| Ratio of expenses to average net assets including fee waivers and reimbursements(e) | 1.55 | %(f) | 1.56 | % | 1.63 | % | 1.60 | % | 1.63 | %(f) | 1.72 | % | ||||||||||||
| Ratio of net investment income/(loss) to average net assets(e) | (0.14 | )%(f) | 1.43 | % | 1.05 | % | 0.52 | % | 0.46 | %(f) | 0.36 | % | ||||||||||||
| Portfolio turnover rate(g) | 13 | % | 31 | % | 30 | % | 37 | % | 11 | % | 40 | % | ||||||||||||
| (a) | Effective May 1, 2014, the Board approved changing the fiscal year-end of the Funds from April 30 to October 31. |
| (b) | Calculated using the average shares method. |
| (c) | Less than $0.005 or ($0.005) per share. |
| (d) | Total returns are for the period indicated and have not been annualized. Total returns would have been lower had certain expenses not been waived during the period. Returns shown do not reflect the deduction of taxes that a shareholder would pay on Fund distributions or the redemption of Fund shares. |
| (e) | The ratios exclude the impact of expenses of the underlying funds in which the Fund invests as represented in the Statement of Investments. |
| (f) | Annualized. |
| (g) | Portfolio turnover rate for periods less than one full year have not been annualized. |
See Notes to Financial Statements.
62 | April 30, 2018
ALPS | WMC Research Value Fund
| Management Commentary | April 30, 2018 (Unaudited) |
Market Commentary
U.S. equities rose 3.8% over the six-month period ended April 30, 2018, as measured by the S&P 500 Index. Economic data released during November reflected solid momentum in the US economy. Optimism surrounding the potential for tax cuts coupled with a backdrop of low interest rates and unemployment, a record-high stock market, and rising home values, fueled positive consumer and business sentiment. Tax reform dominated the market narrative in December when it culminated with a US$1.5 trillion tax reform bill signed into law by President Donald Trump.
US equities (-0.8%) posted their first quarterly loss since September 2015 during the first quarter of 2018. Bullish sentiment was exceptionally strong at the beginning of 2018, as better-than-expected corporate profits helped drive the S&P 500 Index to its largest monthly gain since March 2016. A sharp decline in equities at the end of January appeared to be triggered by investors’ concerns about lofty equity valuations and the potential upside risks to inflation, bond yields, and US Federal Reserve policy stemming from pro-growth deregulation, tax cuts, and increased government spending. President Trump sparked fears of a global trade war when he imposed stiff tariffs on imported steel and aluminum and announced plans for tariffs on approximately US$50 billion worth of Chinese goods.
US equities rose 0.4% in April as a record-high percentage of companies exceeded first-quarter earnings estimates. Economic data released during the month indicated that the US economy remained on solid footing. Less favorable economic news included slower GDP growth and softer consumer sentiment.
Fund Review
The fund outperformed its benchmark, the Russell 1000 Value Index, on a gross of fee basis, posting positive relative results in nine of eleven sectors during the period. Stock selection in the consumer staples, industrials, and financials sectors drove relative outperformance, while weaker selection in information technology partially offset these gains.
Top relative contributors included XL Group (financials), Procter & Gamble (not held, consumer staples), and Johnson & Johnson (not held, health care). XL Group, a property and casualty insurance company, was the largest relative contributor during the period. Shares of XL fell during the fourth quarter of 2017 due to the company’s exposure to the hurricane damages in the southern part of the United States. Despite this, we maintained a sizable position and our long-term focus ultimately paid off after AXA announced in early March that they would acquire XL Group for a substantial premium. We eliminated the position into strength following the acquisition announcement. Not holding Procter & Gamble, a global branded consumer goods company, aided relative performance. Shares fell after quarterly results reported in January showed reduced gross margins across products, as sales growth in the company’s beauty business was weighed down by softness in the grooming and baby segments. Not holding Johnson & Johnson, a US-based multinational medical devices, pharmaceutical and consumer
packaged goods manufacturer, also contributed to relative performance as the stock price fell after it was reported that there would be court proceedings in numerous lawsuits claiming its talc products contain asbestos and can cause cancer.
Top relative detractors included Cisco Systems (not held, information technology), Intel (information technology), and PG&E (utilities). Not holding Cisco Systems, a US-based networking systems and communication products provider, hurt relative performance. The company reported quarterly results in February that were ahead of revenue and EPS estimates, provided guidance that was stronger than expected, and announced a strong cash return program. Shares of Intel, a US semiconductor firm, fell sharply in early January following news of a fundamental design flaw in Intel’s processor chips. We eliminated our position in the stock as this had the potential to be a long-term headwind for the company including margin compression due to higher servicing costs, accelerated share losses, potential liability for security breaches, and the intangible cost of management distraction. PG&E, a California-based utility, fell following the Northern California wild fires in October which destroyed over 9,000 properties and caused nearly $10 billion in estimated damages. The stock was down due to the potential liability the company may face. We eliminated our holdings in PG&E.
Strategy and Outlook
Our US macro team expects the US economy to expand at a steady clip and believes growth in 2018 could be bolstered by an expansionary fiscal stance. Consumer confidence is high as the job market is strong, wage gains are reasonable, and home prices are rising. Business investment is starting to rebound and capex intentions are robust. In terms of potential risks, inflation is the wild card. While not the team’s base case, an unexpected rise in inflation could force central banks’ hands toward more aggressive tightening and raise the risk of recession. If the US yield curve flattens further, it would signal tighter financial conditions. Global trade is another risk for markets.
Looking ahead, our Global Industry Analysts remain focused on fundamental, bottom-up stock selection with an eye on how the macro-economic outlook will affect the companies in which they invest. We continue to identify themes and opportunities that will shape future investment decisions.
63 | April 30, 2018
ALPS | WMC Research Value Fund
| Performance Update | April 30, 2018 (Unaudited) |
Performance of $10,000 Initial Investment (as of April 30, 2018)
Comparison of change in value of a $10,000 investment
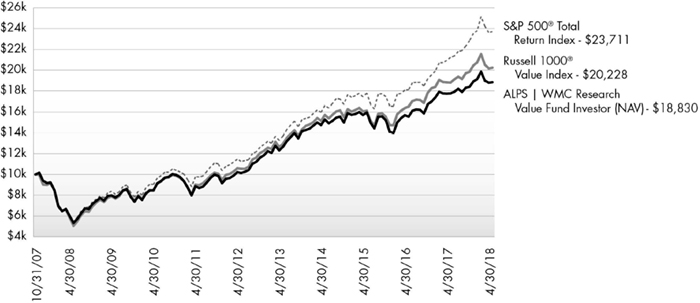
The chart above represents historical performance of a hypothetical investment of $10,000 in the Fund since inception. Past performance does not guarantee future results. This chart does not reflect the deduction of taxes that a shareholder would pay on Fund distributions or the redemption of Fund shares.
Average Annual Total Returns (as of April 30, 2018)
| 6 Month | 1 Year | 3 Year | 5 Year | 10 Year | Since Inception | Total Expense Ratio | What You Pay* | |
| Investor# (NAV) | 2.36% | 6.20% | 5.96% | 9.71% | 6.53% | 9.64% | 1.51% | 1.15% |
| Class C (NAV) | 1.87% | 5.26% | 5.13% | 8.90% | 5.74% | 8.83% | 2.27% | 1.90% |
| Class C (CDSC) | 0.93% | 4.30% | 5.13% | 8.90% | 5.74% | 8.83% | ||
| Class I | 2.56% | 6.54% | 6.21% | 10.00% | 6.80% | 9.89% | 1.26% | 0.90% |
| Russell 1000® Value Index1 | 1.94% | 7.50% | 7.66% | 10.52% | 7.30% | – | ||
| S&P 500® Total Return Index2 | 3.82% | 13.27% | 10.57% | 12.96% | 9.02% | – |
Performance data quoted represents past performance. Past performance does not guarantee future results. Investment return and principal value of an investment will fluctuate so that an investor’s shares, when sold or redeemed, may be worth more or less than the original cost. Current performance data may be higher or lower than actual data quoted. For the most current month-end performance data, please call 1-866-759-5679.
Performance shown at NAV does not include sales charges and would have been lower had it been taken into account. A Contingent Deferred Sales Charge (“CDSC”) of 1.00% may apply to Class C shares redeemed within the first 12 months after a purchase.
Performance less than 1 year is cumulative.
64 | April 30, 2018
ALPS | WMC Research Value Fund
| Performance Update | April 30, 2018 (Unaudited) |
Performance shown for Class C shares prior to June 30, 2010 reflects the historical performance of the Fund’s Investor Class shares, calculated using the fees and expenses of Class C shares.
Effective February 28, 2015 the Fund changed its name from the ALPS | WMC Disciplined Value Fund to the ALPS | WMC Research Value Fund.
The performance shown for the ALPS | WMC Research Value Fund (the “Fund”) for periods prior to August 29, 2009, reflects the performance of the Activa Mutual Funds Trust – Activa Value Fund (as result of a prior reorganization of Activa Mutual Funds Trust – Activa Value Fund into the Fund).
| 1 | The Russell 1000® Value Index measures the performance of those Russell 1000® companies with lower price-to-book ratios and lower forecasted growth values. The index is not actively managed and does not reflect any deduction for fees, expenses or taxes. An investor may not invest directly in an index. |
| 2 | The S&P 500® Index is the Standard & Poor’s composite index of 500 stocks, a widely recognized, unmanaged index of common stock prices. The index is not actively managed and does not reflect any deduction for fees, expenses or taxes. An investor may not invest directly in an index. |
| * | What You Pay reflects the Advisor’s decision to contractually limit expenses through February 28, 2019. Please see the prospectus for additional information. |
| # | Prior to December 1, 2017, Investor Class was known as Class A. |
The table does not reflect the deduction of taxes that a shareholder would pay on Fund distributions or the redemption of Fund shares.
This Fund is not suitable for all investors and is subject to investment risks, including possible loss of the principal amount invested.
There is no guarantee that the Fund will continue to hold any one particular security or stay invested in any one particular company. The composition of the Fund’s top holdings is subject to change. Performance figures are historical and reflect the change in share price, reinvested distributions, changes in net asset value, sales charges and capital gains distributions, if any.
Not FDIC Insured – No Bank Guarantee – May Lose Value
Top Ten Holdings (as a % of Net Assets) †
| Bank of America Corp. | 4.78% |
| JPMorgan Chase & Co. | 3.80% |
| Chevron Corp. | 3.24% |
| Verizon Communications, Inc. | 2.94% |
| Medtronic PLC | 1.84% |
| Edison International | 1.70% |
| NextEra Energy, Inc. | 1.57% |
| PNC Financial Services Group, Inc. | 1.35% |
| American International Group, Inc. | 1.26% |
| UnitedHealth Group, Inc. | 1.24% |
| Top Ten Holdings | 23.72% |
| † | Holdings are subject to change, and may not reflect the current or future position of the portfolio. Table presents indicative values only. |
Industry Sector Allocation (as a % of Net Assets)
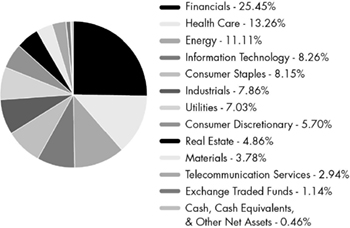
65 | April 30, 2018
ALPS | WMC Research Value Fund
| Statement of Investments | April 30, 2018 (Unaudited) |
| Shares | Value (Note 2) | |||||||
| COMMON STOCKS (98.40%) | ||||||||
| Consumer Discretionary (5.70%) | ||||||||
| Consumer Durables & Apparel (1.43%) | ||||||||
| Lennar Corp., Class A | 4,368 | $ | 231,024 | |||||
| NIKE, Inc., Class B | 7,142 | 488,441 | ||||||
| Skechers U.S.A., Inc., Class A(a) | 2,239 | 63,812 | ||||||
| Tapestry, Inc. | 7,362 | 395,855 | ||||||
| Under Armour, Inc., Class A(a) | 5,719 | 101,569 | ||||||
| 1,280,701 | ||||||||
| Consumer Services (0.52%) | ||||||||
| Hilton Worldwide Holdings, Inc. | 2,921 | 230,292 | ||||||
| MGM Resorts International | 3,905 | 122,695 | ||||||
| Vail Resorts, Inc. | 465 | 106,629 | ||||||
| 459,616 | ||||||||
| Media (2.57%) | ||||||||
| Charter Communications, Inc., Class A(a) | 811 | 220,016 | ||||||
| Cinemark Holdings, Inc. | 3,871 | 151,627 | ||||||
| Comcast Corp., Class A | 27,267 | 855,911 | ||||||
| Interpublic Group of Cos., Inc. | 5,504 | 129,839 | ||||||
| Liberty Media Corp.-Liberty Formula One, Class C(a) | 5,391 | 159,142 | ||||||
| New York Times Co., Class A | 6,207 | 145,554 | ||||||
| Twenty-First Century Fox, Inc., Class A | 7,858 | 287,289 | ||||||
| Viacom, Inc., Class B | 11,672 | 352,028 | ||||||
| 2,301,406 | ||||||||
| Retailing (1.18%) | ||||||||
| Dollar Tree, Inc.(a) | 1,931 | 185,163 | ||||||
| Expedia, Inc. | 971 | 111,801 | ||||||
| TJX Cos., Inc. | 8,909 | 755,929 | ||||||
| 1,052,893 | ||||||||
| TOTAL CONSUMER DISCRETIONARY | 5,094,616 | |||||||
| Consumer Staples (8.15%) | ||||||||
| Food & Staples Retailing (1.05%) | ||||||||
| Costco Wholesale Corp. | 1,402 | 276,418 | ||||||
| Sysco Corp. | 5,009 | 313,263 | ||||||
| Walgreens Boots Alliance, Inc. | 5,306 | 352,584 | ||||||
| 942,265 | ||||||||
| Food, Beverage & Tobacco (5.40%) | ||||||||
| Altria Group, Inc. | 12,707 | 712,990 | ||||||
| Anheuser-Busch InBev N.V., Sponsored ADR | 4,430 | 443,354 | ||||||
| British American Tobacco PLC, Sponsored ADR | 18,128 | 990,151 | ||||||
| Campbell Soup Co. | 9,374 | 382,272 | ||||||
| Constellation Brands, Inc., Class A | 1,304 | 304,002 | ||||||
| Shares | Value (Note 2) | |||||||
| Food, Beverage & Tobacco (continued) | ||||||||
| Fresh Del Monte Produce, Inc. | 2,455 | $ | 120,663 | |||||
| Hormel Foods Corp. | 5,041 | 182,736 | ||||||
| Hostess Brands, Inc.(a) | 18,791 | 264,014 | ||||||
| McCormick & Co., Inc. | 1,714 | 180,673 | ||||||
| PepsiCo, Inc. | 5,709 | 576,266 | ||||||
| Philip Morris International, Inc. | 1,783 | 146,206 | ||||||
| Post Holdings, Inc.(a) | 5,489 | 436,760 | ||||||
| Simply Good Foods Co.(a) | 6,976 | 90,409 | ||||||
| 4,830,496 | ||||||||
| Household & Personal Products (1.70%) | ||||||||
| Coty, Inc., Class A | 46,976 | 815,033 | ||||||
| Unilever N.V. | 12,350 | 705,432 | ||||||
| 1,520,465 | ||||||||
| TOTAL CONSUMER STAPLES | 7,293,226 | |||||||
| Energy (11.11%) | ||||||||
| Energy (11.11%) | ||||||||
| Andeavor | 2,206 | 305,134 | ||||||
| Antero Resources Corp.(a) | 6,205 | 117,895 | ||||||
| Baker Hughes a GE Co. | 12,488 | 450,942 | ||||||
| BP PLC, Sponsored ADR | 16,788 | 748,577 | ||||||
| Centennial Resource Development, Inc., Class A(a) | 3,675 | 67,987 | ||||||
| Chevron Corp. | 23,197 | 2,902,177 | ||||||
| Concho Resources, Inc.(a) | 2,525 | 396,955 | ||||||
| Diamondback Energy, Inc.(a) | 947 | 121,642 | ||||||
| Encana Corp. | 13,238 | 165,210 | ||||||
| EOG Resources, Inc. | 4,324 | 510,967 | ||||||
| Halliburton Co. | 8,214 | 435,260 | ||||||
| Hess Corp. | 7,253 | 413,348 | ||||||
| Kinder Morgan, Inc. | 40,255 | 636,834 | ||||||
| Marathon Petroleum Corp. | 7,216 | 540,551 | ||||||
| Newfield Exploration Co.(a) | 12,522 | 373,156 | ||||||
| ONEOK, Inc. | 3,291 | 198,184 | ||||||
| Pioneer Natural Resources Co. | 1,306 | 263,224 | ||||||
| Suncor Energy, Inc. | 9,885 | 377,904 | ||||||
| Targa Resources Corp. | 3,869 | 181,727 | ||||||
| TransCanada Corp. | 10,216 | 433,669 | ||||||
| WPX Energy, Inc.(a) | 17,000 | 290,530 | ||||||
| TOTAL ENERGY | 9,931,873 | |||||||
| Financials (25.45%) | ||||||||
| Banks (12.03%) | ||||||||
| Bank of America Corp. | 142,944 | 4,276,885 | ||||||
| Huntington Bancshares, Inc. | 25,370 | 378,267 | ||||||
| JPMorgan Chase & Co. | 31,228 | 3,396,982 | ||||||
| KeyCorp | 40,458 | 805,923 | ||||||
| PNC Financial Services Group, Inc. | 8,286 | 1,206,524 | ||||||
| Sterling Bancorp/DE | 1,100 | 26,125 | ||||||
66 | April 30, 2018
ALPS | WMC Research Value Fund
| Statement of Investments | April 30, 2018 (Unaudited) |
| Shares | Value (Note 2) | |||||||
| Banks (continued) | ||||||||
| Zions Bancorporation | 12,208 | $ | 668,388 | |||||
| 10,759,094 | ||||||||
| Diversified Financials (6.98%) | ||||||||
| American Express Co. | 9,685 | 956,394 | ||||||
| BlackRock, Inc. | 690 | 359,835 | ||||||
| Capital One Financial Corp. | 9,941 | 900,853 | ||||||
| Cohen & Steers, Inc. | 9,277 | 372,008 | ||||||
| MGIC Investment Corp.(a) | 8,727 | 87,445 | ||||||
| Morgan Stanley | 9,486 | 489,667 | ||||||
| Northern Trust Corp. | 6,762 | 721,843 | ||||||
| OneMain Holdings, Inc.(a) | 8,835 | 272,560 | ||||||
| Raymond James Financial, Inc. | 9,105 | 817,174 | ||||||
| TD Ameritrade Holding Corp. | 15,312 | 889,474 | ||||||
| Voya Financial, Inc. | 7,247 | 379,380 | ||||||
| 6,246,633 | ||||||||
| Insurance (6.44%) | ||||||||
| Alleghany Corp. | 877 | 503,986 | ||||||
| Allstate Corp. | 3,886 | 380,128 | ||||||
| American International Group, Inc. | 20,110 | 1,126,160 | ||||||
| Assurant, Inc. | 1,963 | 182,206 | ||||||
| Assured Guaranty, Ltd. | 24,188 | 877,783 | ||||||
| Athene Holding, Ltd., Class A(a) | 10,031 | 491,519 | ||||||
| Hartford Financial Services Group, Inc. | 7,475 | 402,454 | ||||||
| Marsh & McLennan Companies, Inc. | 7,570 | 616,955 | ||||||
| MetLife, Inc. | 13,902 | 662,708 | ||||||
| Prudential Financial, Inc. | 4,860 | 516,715 | ||||||
| 5,760,614 | ||||||||
| TOTAL FINANCIALS | 22,766,341 | |||||||
| Health Care (13.26%) | ||||||||
| Health Care Equipment & Services (7.85%) | ||||||||
| Abbott Laboratories | 18,229 | 1,059,652 | ||||||
| Baxter International, Inc. | 7,040 | 489,280 | ||||||
| Boston Scientific Corp.(a) | 12,374 | 355,381 | ||||||
| Cardinal Health, Inc. | 8,396 | 538,771 | ||||||
| Danaher Corp. | 8,235 | 826,135 | ||||||
| HCA Healthcare, Inc. | 3,403 | 325,803 | ||||||
| McKesson Corp. | 4,317 | 674,359 | ||||||
| Medtronic PLC | 20,555 | 1,647,072 | ||||||
| UnitedHealth Group, Inc. | 4,692 | 1,109,189 | ||||||
| 7,025,642 | ||||||||
| Pharmaceuticals, Biotechnology & Life Sciences (5.41%) | ||||||||
| Aduro Biotech, Inc.(a) | 5,757 | 39,723 | ||||||
| Alder Biopharmaceuticals, Inc.(a) | 6,963 | 98,875 | ||||||
| Allergan PLC | 6,212 | 954,474 | ||||||
| Alnylam Pharmaceuticals, Inc.(a) | 930 | 87,913 | ||||||
| AstraZeneca PLC, Sponsored ADR | 18,021 | 640,286 | ||||||
| Shares | Value (Note 2) | |||||||
| Pharmaceuticals, Biotechnology & Life Sciences (continued) | ||||||||
| Bristol-Myers Squibb Co. | 19,421 | $ | 1,012,417 | |||||
| Dermira, Inc.(a) | 3,545 | 32,295 | ||||||
| Five Prime Therapeutics, Inc.(a) | 1,774 | 29,714 | ||||||
| Impax Laboratories, Inc.(a) | 4,945 | 92,966 | ||||||
| Karyopharm Therapeutics, Inc.(a) | 4,314 | 56,427 | ||||||
| Momenta Pharmaceuticals, Inc.(a) | 2,837 | 59,010 | ||||||
| Mylan N.V.(a) | 13,634 | 528,454 | ||||||
| Revance Therapeutics, Inc.(a) | 1,383 | 38,655 | ||||||
| Teva Pharmaceutical Industries, Ltd., Sponsored ADR | 19,045 | 342,429 | ||||||
| Thermo Fisher Scientific, Inc. | 3,918 | 824,151 | ||||||
| 4,837,789 | ||||||||
| TOTAL HEALTH CARE | 11,863,431 | |||||||
| Industrials (7.86%) | ||||||||
| Capital Goods (6.72%) | ||||||||
| AGCO Corp. | 1,504 | 94,271 | ||||||
| AMETEK, Inc. | 3,735 | 260,703 | ||||||
| Boeing Co. | 3,147 | 1,049,713 | ||||||
| Caterpillar, Inc. | 1,263 | 182,327 | ||||||
| Deere & Co. | 1,419 | 192,033 | ||||||
| Eaton Corp. PLC | 6,060 | 454,682 | ||||||
| Fortive Corp. | 3,991 | 280,607 | ||||||
| General Electric Co. | 50,588 | 711,773 | ||||||
| Greenbrier Companies, Inc. | 1,835 | 80,465 | ||||||
| Harris Corp. | 1,454 | 227,435 | ||||||
| Illinois Tool Works, Inc. | 1,475 | 209,479 | ||||||
| Jacobs Engineering Group, Inc. | 1,361 | 79,060 | ||||||
| Lockheed Martin Corp. | 2,734 | 877,177 | ||||||
| Northrop Grumman Corp. | 2,298 | 740,048 | ||||||
| PACCAR, Inc. | 2,813 | 179,104 | ||||||
| Pentair PLC | 5,864 | 394,530 | ||||||
| 6,013,407 | ||||||||
| Commercial & Professional Services (0.21%) | ||||||||
| Equifax, Inc. | 892 | 99,948 | ||||||
| TransUnion(a) | 1,391 | 90,290 | ||||||
| 190,238 | ||||||||
| Transportation (0.93%) | ||||||||
| JetBlue Airways Corp.(a) | 4,921 | 94,434 | ||||||
| Knight-Swift Transportation, Inc. | 2,254 | 87,928 | ||||||
| Norfolk Southern Corp. | 3,914 | 561,542 | ||||||
| Spirit Airlines, Inc.(a) | 2,415 | 86,264 | ||||||
| 830,168 | ||||||||
| TOTAL INDUSTRIALS | 7,033,813 | |||||||
| Information Technology (8.26%) | ||||||||
| Semiconductors & Semiconductor Equipment (3.52%) | ||||||||
| Applied Materials, Inc. | 2,373 | 117,867 | ||||||
67 | April 30, 2018
ALPS | WMC Research Value Fund
| Statement of Investments | April 30, 2018 (Unaudited) |
| Shares | Value (Note 2) | |||||||
| Semiconductors & Semiconductor Equipment (continued) | ||||||||
| Broadcom, Ltd. | 1,127 | $ | 258,556 | |||||
| KLA-Tencor Corp. | 4,267 | 434,125 | ||||||
| Marvell Technology Group, Ltd. | 35,988 | 721,919 | ||||||
| Microchip Technology, Inc. | 5,657 | 473,265 | ||||||
| Micron Technology, Inc.(a) | 7,726 | 355,241 | ||||||
| NVIDIA Corp. | 855 | 192,290 | ||||||
| QUALCOMM, Inc. | 5,663 | 288,870 | ||||||
| Teradyne, Inc. | 9,557 | 311,080 | ||||||
| 3,153,213 | ||||||||
| Software & Services (3.98%) | ||||||||
| Alliance Data Systems Corp. | 1,114 | 226,198 | ||||||
| Autodesk, Inc.(a) | 2,318 | 291,836 | ||||||
| Blucora, Inc.(a) | 4,204 | 109,304 | ||||||
| CACI International, Inc., Class A(a) | 1,642 | 248,024 | ||||||
| eBay, Inc.(a) | 17,075 | 646,801 | ||||||
| Facebook, Inc., Class A(a) | 875 | 150,500 | ||||||
| FleetCor Technologies, Inc.(a) | 1,184 | 245,419 | ||||||
| Genpact, Ltd. | 6,923 | 220,774 | ||||||
| Global Payments, Inc. | 2,142 | 242,153 | ||||||
| Guidewire Software, Inc.(a) | 2,528 | 213,919 | ||||||
| Leidos Holdings, Inc. | 3,759 | 241,441 | ||||||
| SS&C Technologies Holdings, Inc. | 1,909 | 94,782 | ||||||
| Total System Services, Inc. | 1,489 | 125,165 | ||||||
| Visa, Inc., Class A | 2,785 | 353,361 | ||||||
| WEX, Inc.(a) | 905 | 146,538 | ||||||
| 3,556,215 | ||||||||
| Technology Hardware & Equipment (0.76%) | ||||||||
| Flex, Ltd.(a) | 20,314 | 264,082 | ||||||
| NetApp, Inc. | 6,265 | 417,124 | ||||||
| 681,206 | ||||||||
| TOTAL INFORMATION TECHNOLOGY | 7,390,634 | |||||||
| �� | ||||||||
| Materials (3.78%) | ||||||||
| Materials (3.78%) | ||||||||
| Alcoa Corp.(a) | 3,595 | 184,064 | ||||||
| ArcelorMittal(a) | 1,335 | 45,176 | ||||||
| Ardagh Group SA | 3,694 | 75,062 | ||||||
| Ball Corp. | 10,445 | 418,740 | ||||||
| Cabot Corp. | 2,852 | 159,313 | ||||||
| Celanese Corp., Series A | 2,438 | 264,937 | ||||||
| Crown Holdings, Inc.(a) | 2,143 | 106,807 | ||||||
| DowDuPont, Inc. | 10,303 | 651,562 | ||||||
| International Paper Co. | 7,639 | 393,867 | ||||||
| Martin Marietta Materials, Inc. | 183 | 35,643 | ||||||
| PPG Industries, Inc. | 3,033 | 321,134 | ||||||
| Praxair, Inc. | 1,570 | 239,456 | ||||||
| Southern Copper Corp. | 2,212 | 116,816 | ||||||
| Steel Dynamics, Inc. | 3,668 | 164,363 | ||||||
| Vulcan Materials Co. | 394 | 44,006 | ||||||
| Shares | Value (Note 2) | |||||||
| Materials (continued) | ||||||||
| Westlake Chemical Corp. | 1,504 | $ | 160,883 | |||||
| TOTAL MATERIALS | 3,381,829 | |||||||
| Real Estate (4.86%) | ||||||||
| Real Estate (4.86%) | ||||||||
| Alexandria Real Estate Equities, Inc. | 6,187 | 770,715 | ||||||
| American Tower Corp. | 3,230 | 440,443 | ||||||
| Douglas Emmett, Inc. | 17,517 | 652,859 | ||||||
| Equinix, Inc. | 513 | 215,865 | ||||||
| Host Hotels & Resorts, Inc. | 23,061 | 451,073 | ||||||
| Invitation Homes, Inc. | 32,392 | 749,551 | ||||||
| Outfront Media, Inc. | 13,189 | 247,294 | ||||||
| Prologis, Inc. | 4,310 | 279,762 | ||||||
| Public Storage | 1,157 | 233,459 | ||||||
| Simon Property Group, Inc. | 1,963 | 306,895 | ||||||
| TOTAL REAL ESTATE | 4,347,916 | |||||||
| Telecommunication Services (2.94%) | ||||||||
| Telecommunication Services (2.94%) | ||||||||
| Verizon Communications, Inc. | 53,242 | 2,627,493 | ||||||
| TOTAL TELECOMMUNICATION SERVICES | 2,627,493 | |||||||
| Utilities (7.03%) | ||||||||
| Utilities (7.03%) | ||||||||
| Avangrid, Inc. | 15,960 | 841,251 | ||||||
| Edison International | 23,222 | 1,521,505 | ||||||
| Exelon Corp. | 16,957 | 672,854 | ||||||
| NextEra Energy, Inc. | 8,545 | 1,400,611 | ||||||
| NRG Energy, Inc. | 11,411 | 353,741 | ||||||
| Sempra Energy | 9,342 | 1,044,436 | ||||||
| UGI Corp. | 9,262 | 448,188 | ||||||
| TOTAL UTILITIES | 6,282,586 | |||||||
| TOTAL COMMON STOCKS | ||||||||
| (Cost $80,313,065) | 88,013,758 | |||||||
| EXCHANGE TRADED FUNDS (1.14%) | ||||||||
| Vanguard® High Dividend Yield ETF | 12,404 | 1,024,570 | ||||||
| TOTAL EXCHANGE TRADED FUNDS | ||||||||
| (Cost $1,033,584) | 1,024,570 | |||||||
68 | April 30, 2018
ALPS | WMC Research Value Fund
| Statement of Investments | April 30, 2018 (Unaudited) |
| 7-Day Yield | Shares | Value (Note 2) | ||||||||||
| SHORT TERM INVESTMENTS (0.60%) | ||||||||||||
| Short-Term Cash Equivalents (0.60%) | ||||||||||||
| State Street Institutional Treasury Plus Money Market Fund | 1.611 | % | 534,488 | $ | 534,488 | |||||||
| TOTAL SHORT TERM INVESTMENTS | ||||||||||||
| (Cost $534,488) | 534,488 | |||||||||||
| TOTAL INVESTMENTS (100.14%) | ||||||||||||
| (Cost $81,881,137) | $ | 89,572,816 | ||||||||||
| Liabilities In Excess Of Other Assets (-0.14%) | (129,181 | ) | ||||||||||
| NET ASSETS (100.00%) | $ | 89,443,635 | ||||||||||
| (a) | Non-Income Producing Security. |
For Fund compliance purposes, the Fund's industry classifications refer to any one or more of the industry sub-classifications used by one or more widely recognized market indexes or ratings group indexes, and/or as defined by Fund management. This definition may not apply for purposes of this report, which may combine industry sub-classifications for reporting ease. Industries are shown as a percent of net assets.
See Notes to Financial Statements.
69 | April 30, 2018
ALPS | WMC Research Value Fund
| Statement of Assets and Liabilities | April 30, 2018 (Unaudited) |
| ASSETS | ||||
| Investments, at value | $ | 89,572,816 | ||
| Cash | 4,674 | |||
| Receivable for investments sold | 178,472 | |||
| Receivable for shares sold | 200 | |||
| Dividends receivable | 92,611 | |||
| Prepaid expenses and other assets | 21,213 | |||
| Total Assets | 89,869,986 | |||
| LIABILITIES | ||||
| Payable for investments purchased | 300,763 | |||
| Payable for shares redeemed | 41,611 | |||
| Investment advisory fees payable | 20,369 | |||
| Administration and transfer agency fees payable | 24,667 | |||
| Distribution and services fees payable | 10,810 | |||
| Professional fees payable | 17,034 | |||
| Accrued expenses and other liabilities | 11,097 | |||
| Total Liabilities | 426,351 | |||
| NET ASSETS | $ | 89,443,635 | ||
| NET ASSETS CONSIST OF | ||||
| Paid-in capital | $ | 76,786,493 | ||
| Accumulated net investment income | 294,133 | |||
| Accumulated net realized gain | 4,671,322 | |||
| Net unrealized appreciation | 7,691,687 | |||
| NET ASSETS | $ | 89,443,635 | ||
| INVESTMENTS, AT COST | $ | 81,881,137 | ||
| PRICING OF SHARES | ||||
| Investor Class: | ||||
| Net Asset Value, offering and redemption price per share | $ | 8.86 | ||
| Net Assets | $ | 49,312,121 | ||
| Shares of beneficial interest outstanding (unlimited number of shares, no par value common stock authorized) | 5,567,577 | |||
| Class C: | ||||
| Net Asset Value, offering and redemption price per share(a) | $ | 8.41 | ||
| Net Assets | $ | 725,414 | ||
| Shares of beneficial interest outstanding (unlimited number of shares, no par value common stock authorized) | 86,211 | |||
| Class I: | ||||
| Net Asset Value, offering and redemption price per share | $ | 9.12 | ||
| Net Assets | $ | 39,406,100 | ||
| Shares of beneficial interest outstanding (unlimited number of shares, no par value common stock authorized) | 4,322,761 | |||
| (a) | Redemption price per share may be reduced for any applicable contingent deferred sales charge. For a description of a possible sales charge, please see the Fund's Prospectus. |
See Notes to Financial Statements.
70 | April 30, 2018
ALPS | WMC Research Value Fund
| Statement of Operations | For the Six Months Ended April 30, 2018 (Unaudited) |
| INVESTMENT INCOME | ||||
| Dividends | $ | 971,523 | ||
| Foreign taxes withheld on dividends | (5,393 | ) | ||
| Total Investment Income | 966,130 | |||
| EXPENSES | ||||
| Investment advisory fees | 436,564 | |||
| Administrative fees | 73,031 | |||
| Transfer agency fees | 15,144 | |||
| Distribution and service fees | ||||
| Investor Class(a) | 62,980 | |||
| Class C | 3,680 | |||
| Professional fees | 13,186 | |||
| Reports to shareholders and printing fees | 6,303 | |||
| State registration fees | 20,876 | |||
| Insurance fees | 342 | |||
| Custody fees | 6,922 | |||
| Trustees' fees and expenses | 1,020 | |||
| Miscellaneous expenses | 6,388 | |||
| Total Expenses | 646,436 | |||
| Less fees waived/reimbursed by investment advisor (Note 8) | ||||
| Investor Class | (91,174 | ) | ||
| Class C | (1,331 | ) | ||
| Class I | (73,747 | ) | ||
| Net Expenses | 480,184 | |||
| Net Investment Income | 485,946 | |||
| Net realized gain on investments | 4,763,778 | |||
| Net realized gain on foreign currency transactions | 154 | |||
| Net Realized Gain | 4,763,932 | |||
| Net change in unrealized depreciation on investments | (3,025,015 | ) | ||
| Net change in unrealized appreciation on translation of assets and liabilities denominated in foreign currencies | 5 | |||
| Net Change in Unrealized Depreciation | (3,025,010 | ) | ||
| NET REALIZED AND UNREALIZED GAIN ON INVESTMENTS | 1,738,922 | |||
| NET INCREASE IN NET ASSETS RESULTING FROM OPERATIONS | $ | 2,224,868 | ||
| (a) | Prior to December 1, 2017, Investor Class was known as Class A. |
See Notes to Financial Statements.
71 | April 30, 2018
ALPS | WMC Research Value Fund
Statements of Changes in Net Assets
| For the Six Months Ended April 30, 2018 (Unaudited) | For the Year Ended October 31, 2017 | |||||||
| OPERATIONS | ||||||||
| Net investment income | $ | 485,946 | $ | 700,241 | ||||
| Net realized gain | 4,763,932 | 6,788,341 | ||||||
| Net change in unrealized appreciation/(depreciation) | (3,025,010 | ) | 6,711,936 | |||||
| Net Increase in Net Assets Resulting from Operations | 2,224,868 | 14,200,518 | ||||||
| DISTRIBUTIONS | ||||||||
| Dividends to shareholders from net investment income | ||||||||
| Investor Class(a) | (398,850 | ) | (80,213 | ) | ||||
| Class C | (5,253 | ) | (168 | ) | ||||
| Class I | (334,468 | ) | (83,183 | ) | ||||
| Dividends to shareholders from net realized gains | ||||||||
| Investor Class(a) | (3,658,755 | ) | (1,513,166 | ) | ||||
| Class C | (56,802 | ) | (14,169 | ) | ||||
| Class I | (2,905,956 | ) | (1,215,454 | ) | ||||
| Net Decrease in Net Assets from Distributions | (7,360,084 | ) | (2,906,353 | ) | ||||
| BENEFICIAL INTEREST TRANSACTIONS (NOTE 6) | ||||||||
| Shares sold | ||||||||
| Investor Class(a) | 228,763 | 622,292 | ||||||
| Class C | 17,227 | 265,702 | ||||||
| Class I | 2,097,286 | 3,710,822 | ||||||
| Dividends reinvested | ||||||||
| Investor Class(a) | 3,894,647 | 1,521,329 | ||||||
| Class C | 43,320 | 6,826 | ||||||
| Class I | 3,239,582 | 1,297,538 | ||||||
| Shares redeemed | ||||||||
| Investor Class(a) | (1,573,843 | ) | (8,287,816 | ) | ||||
| Class C | (22,249 | ) | (52,206 | ) | ||||
| Class I | (6,139,710 | ) | (10,342,427 | ) | ||||
| Net Increase/(Decrease) in Net Assets Derived from Beneficial Interest Transactions | 1,785,023 | (11,257,940 | ) | |||||
| Net increase/(decrease) in net assets | (3,350,193 | ) | 36,225 | |||||
| NET ASSETS | ||||||||
| Beginning of period | 92,793,828 | 92,757,603 | ||||||
| End of period * | $ | 89,443,635 | $ | 92,793,828 | ||||
| *Including accumulated net investment income of: | $ | 294,133 | $ | 546,758 | ||||
| (a) | Prior to December 1, 2017, Investor Class was known as Class A. |
See Notes to Financial Statements.
72 | April 30, 2018
ALPS | WMC Research Value Fund – Investor Class
Financial Highlights
Selected data for a share of beneficial interest outstanding throughout the periods indicated:
| For the Six Months Ended April 30, 2018 (Unaudited)(a) | For the Year Ended October 31, 2017 | For the Year Ended October 31, 2016 | For the Year Ended October 31, 2015(b) | For the Fiscal Period Ended October 31, 2014(c) | For the Year Ended April 30, 2014 | ||||||||||||||
| Net asset value, beginning of period | $ | 9.40 | $ | 8.37 | $ | 11.57 | $ | 12.54 | $ | 11.92 | $ | 10.01 | |||||||
| INCOME/(LOSS) FROM INVESTMENT OPERATIONS: | |||||||||||||||||||
| Net investment income(d) | 0.04 | 0.06 | 0.06 | 0.06 | 0.03 | 0.06 | |||||||||||||
| Net realized and unrealized gain | 0.20 | 1.24 | 0.08 | 0.23 | 0.59 | 2.09 | |||||||||||||
| Total from investment operations | 0.24 | 1.30 | 0.14 | 0.29 | 0.62 | 2.15 | |||||||||||||
| DISTRIBUTIONS: | |||||||||||||||||||
| From net investment income | (0.08 | ) | (0.01 | ) | (0.02 | ) | (0.06 | ) | – | (0.11 | ) | ||||||||
| From net realized gains | (0.70 | ) | (0.26 | ) | (3.32 | ) | (1.20 | ) | – | (0.13 | ) | ||||||||
| Total distributions | (0.78 | ) | (0.27 | ) | (3.34 | ) | (1.26 | ) | – | (0.24 | ) | ||||||||
| Net increase/(decrease) in net asset value | (0.54 | ) | 1.03 | (3.20 | ) | (0.97 | ) | 0.62 | 1.91 | ||||||||||
| Net asset value, end of period | $ | 8.86 | $ | 9.40 | $ | 8.37 | $ | 11.57 | $ | 12.54 | $ | 11.92 | |||||||
| TOTAL RETURN(e) | 2.36 | % | 15.81 | % | 2.09 | % | 2.57 | % | 5.20 | % | 21.70 | % | |||||||
| RATIOS/SUPPLEMENTAL DATA: | |||||||||||||||||||
| Net assets, end of period (000s) | $ | 49,312 | $ | 49,637 | $ | 49,814 | $ | 55,608 | $ | 59,628 | $ | 59,069 | |||||||
| Ratio of expenses to average net assets excluding fee waivers and reimbursements | 1.51 | %(f) | 1.51 | % | 1.53 | % | 1.49 | % | 1.48 | %(f) | 1.47 | % | |||||||
| Ratio of expenses to average net assets including fee waivers and reimbursements | 1.15 | %(f) | 1.15 | % | 1.15 | %(g) | 1.40 | % | 1.40 | %(f) | 1.40 | % | |||||||
| Ratio of net investment income to average net assets | 0.95 | %(f) | 0.62 | % | 0.66 | % | 0.53 | % | 0.48 | %(f) | 0.52 | % | |||||||
| Portfolio turnover rate(h) | 42 | % | 70 | % | 78 | % | 114 | % | 13 | % | 19 | % | |||||||
| (a) | Prior to December 1, 2017, Investor Class was known as Class A. |
| (b) | Effective February 28, 2015 the Fund changed its name from the ALPS | WMC Disciplined Value Fund to the ALPS | WMC Research Value Fund. |
| (c) | Effective May 1, 2014, the Board approved changing the fiscal year-end of the Funds from April 30 to October 31. |
| (d) | Calculated using the average shares method. |
| (e) | Total returns are for the period indicated and have not been annualized. Total returns would have been lower had certain expenses not been waived during the period. Returns shown do not reflect the deduction of taxes that a shareholder would pay on Fund distributions or the redemption of Fund shares. Returns shown exclude any applicable sales charges. |
| (f) | Annualized. |
| (g) | Effective November 1, 2015 the contractual expense limitation changed from 1.40% to 1.15%. |
| (h) | Portfolio turnover rate for periods less than one full year have not been annualized. |
See Notes to Financial Statements.
73 | April 30, 2018
ALPS | WMC Research Value Fund – Class C
Financial Highlights
Selected data for a share of beneficial interest outstanding throughout the periods indicated:
| For the Six Months Ended April 30, 2018 (Unaudited) | For the Year Ended October 31, 2017 | For the Year Ended October 31, 2016 | For the Year Ended October 31, 2015(a) | For the Fiscal Period Ended October 31, 2014(b) | For the Year Ended April 30, 2014 | ||||||||||||||
| Net asset value, beginning of period | $ | 8.99 | $ | 8.06 | $ | 11.32 | $ | 12.36 | $ | 11.80 | $ | 9.93 | |||||||
| INCOME/(LOSS) FROM INVESTMENT OPERATIONS: | |||||||||||||||||||
| Net investment income/(loss)(c) | 0.01 | (0.01 | ) | (0.01 | ) | (0.03 | ) | (0.02 | ) | (0.02 | ) | ||||||||
| Net realized and unrealized gain | 0.17 | 1.20 | 0.08 | 0.24 | 0.58 | 2.08 | |||||||||||||
| Total from investment operations | 0.18 | 1.19 | 0.07 | 0.21 | 0.56 | 2.06 | |||||||||||||
| DISTRIBUTIONS: | |||||||||||||||||||
| From net investment income | (0.06 | ) | (0.00 | )(d) | (0.01 | ) | (0.05 | ) | – | (0.06 | ) | ||||||||
| From net realized gains | (0.70 | ) | (0.26 | ) | (3.32 | ) | (1.20 | ) | – | (0.13 | ) | ||||||||
| Total distributions | (0.76 | ) | (0.26 | ) | (3.33 | ) | (1.25 | ) | – | (0.19 | ) | ||||||||
| Net increase/(decrease) in net asset value | (0.58 | ) | 0.93 | (3.26 | ) | (1.04 | ) | 0.56 | 1.87 | ||||||||||
| Net asset value, end of period | $ | 8.41 | $ | 8.99 | $ | 8.06 | $ | 11.32 | $ | 12.36 | $ | 11.80 | |||||||
| TOTAL RETURN(e) | 1.87 | % | 15.02 | % | 1.28 | % | 1.87 | % | 4.75 | % | 20.97 | % | |||||||
| RATIOS/SUPPLEMENTAL DATA: | |||||||||||||||||||
| Net assets, end of period (000s) | $ | 725 | $ | 734 | $ | 449 | $ | 870 | $ | 257 | $ | 133 | |||||||
| Ratio of expenses to average net assets excluding fee waivers and reimbursements | 2.26 | %(f) | 2.27 | % | 2.27 | % | 2.24 | % | 2.24 | %(f) | 2.22 | % | |||||||
| Ratio of expenses to average net assets including fee waivers and reimbursements | 1.90 | %(f) | 1.90 | % | 1.90 | %(g) | 2.15 | % | 2.15 | %(f) | 2.15 | % | |||||||
| Ratio of net investment income/(loss) to average net assets | 0.20 | %(f) | (0.15 | )% | (0.07 | )% | (0.22 | )% | (0.30 | )%(f) | (0.23 | )% | |||||||
| Portfolio turnover rate(h) | 42 | % | 70 | % | 78 | % | 114 | % | 13 | % | 19 | % | |||||||
| (a) | Effective February 28, 2015 the Fund changed its name from the ALPS | WMC Disciplined Value Fund to the ALPS | WMC Research Value Fund. |
| (b) | Effective May 1, 2014, the Board approved changing the fiscal year-end of the Funds from April 30 to October 31. |
| (c) | Calculated using the average shares method. |
| (d) | Less than $0.005 or ($0.005) per share. |
| (e) | Total returns are for the period indicated and have not been annualized. Total returns would have been lower had certain expenses not been waived during the period. Returns shown do not reflect the deduction of taxes that a shareholder would pay on Fund distributions or the redemption of Fund shares. Returns shown exclude any applicable sales charges. |
| (f) | Annualized. |
| (g) | Effective November 1, 2015 the contractual expense limitation changed from 2.15% to 1.90%. |
| (h) | Portfolio turnover rate for periods less than one full year have not been annualized. |
See Notes to Financial Statements.
74 | April 30, 2018
ALPS | WMC Research Value Fund – Class I
Financial Highlights
Selected data for a share of beneficial interest outstanding throughout the periods indicated:
| For the Six Months Ended April 30, 2018 (Unaudited) | For the Year Ended October 31, 2017 | For the Year Ended October 31, 2016 | For the Year Ended October 31, 2015(a) | For the Fiscal Period Ended October 31, 2014(b) | For the Year Ended April 30, 2014 | ||||||||||||||
| Net asset value, beginning of period | $ | 9.64 | $ | 8.56 | $ | 11.75 | $ | 12.69 | $ | 12.05 | $ | 10.10 | |||||||
| INCOME/(LOSS) FROM INVESTMENT OPERATIONS: | |||||||||||||||||||
| Net investment income(c) | 0.06 | 0.08 | 0.08 | 0.09 | 0.05 | 0.09 | |||||||||||||
| Net realized and unrealized gain | 0.20 | 1.28 | 0.08 | 0.23 | 0.59 | 2.12 | |||||||||||||
| Total from investment operations | 0.26 | 1.36 | 0.16 | 0.32 | 0.64 | 2.21 | |||||||||||||
| DISTRIBUTIONS: | |||||||||||||||||||
| From net investment income | (0.08 | ) | (0.02 | ) | (0.03 | ) | (0.06 | ) | – | (0.13 | ) | ||||||||
| From net realized gains | (0.70 | ) | (0.26 | ) | (3.32 | ) | (1.20 | ) | – | (0.13 | ) | ||||||||
| Total distributions | (0.78 | ) | (0.28 | ) | (3.35 | ) | (1.27 | ) | – | (0.26 | ) | ||||||||
| Net increase/(decrease) in net asset value | (0.52 | ) | 1.08 | (3.19 | ) | (0.94 | ) | 0.64 | 1.95 | ||||||||||
| Net asset value, end of period | $ | 9.12 | $ | 9.64 | $ | 8.56 | $ | 11.75 | $ | 12.69 | $ | 12.05 | |||||||
| TOTAL RETURN(d) | 2.56 | % | 16.10 | % | 2.24 | % | 2.86 | % | 5.31 | % | 22.11 | % | |||||||
| RATIOS/SUPPLEMENTAL DATA: | |||||||||||||||||||
| Net assets, end of period (000s) | $ | 39,406 | $ | 42,422 | $ | 42,495 | $ | 40,915 | $ | 43,502 | $ | 44,729 | |||||||
| Ratio of expenses to average net assets excluding fee waivers and reimbursements | 1.26 | %(e) | 1.26 | % | 1.28 | % | 1.24 | % | 1.23 | %(e) | 1.22 | % | |||||||
| Ratio of expenses to average net assets including fee waivers and reimbursements | 0.90 | %(e) | 0.90 | % | 0.90 | %(f) | 1.15 | % | 1.15 | %(e) | 1.15 | % | |||||||
| Ratio of net investment income to average net assets | 1.20 | %(e) | 0.87 | % | 0.90 | % | 0.78 | % | 0.74 | %(e) | 0.77 | % | |||||||
| Portfolio turnover rate(g) | 42 | % | 70 | % | 78 | % | 114 | % | 13 | % | 19 | % | |||||||
| (a) | Effective February 28, 2015 the Fund changed its name from the ALPS | WMC Disciplined Value Fund to the ALPS | WMC Research Value Fund. |
| (b) | Effective May 1, 2014, the Board approved changing the fiscal year-end of the Funds from April 30 to October 31. |
| (c) | Calculated using the average shares method. |
| (d) | Total returns are for the period indicated and have not been annualized. Total returns would have been lower had certain expenses not been waived during the period. Returns shown do not reflect the deduction of taxes that a shareholder would pay on Fund distributions or the redemption of Fund shares. |
| (e) | Annualized. |
| (f) | Effective November 1, 2015 the contractual expense limitation changed from 1.15% to 0.90%. |
| (g) | Portfolio turnover rate for periods less than one full year have not been annualized. |
See Notes to Financial Statements.
75 | April 30, 2018
Clough China Fund
| Management Commentary | April 30, 2018 (Unaudited) |
The Clough China Fund (“the Fund”) had a net return of 3.16% for the semi-annual period from November 1, 2017 to April 30, 2018. This compares to 5.36% for the broader market MSCI China Index. From a sector perspective, the Fund’s underweight in the energy and utilities sectors detracted the most from performance, and its overweight exposure to the banking and real estate sectors contributed the most. From an individual stock perspective, our investments in Tencent, China Construction Bank, Industrial and Commercial Bank, Ping An Insurance, and China Resources Land contributed most positively, while investments in Alibaba, China Life Insurance, Hon Hai Precision, China Oilfield Services, and Kunlun Energy detracted the most from performance.
Over the period, the market experienced a bout of volatility, with the market opening 2018 following cues from 2017’s strong performance. By the end of late January 2018, the China market and the Fund were up over 14% in just a few short weeks. Following the U.S.’s lead, though, China was not immune to concerns over rising inflation and interest rates, and promptly gave up much of the year’s gains. Also casting a pall over sentiment was President Trump’s comments regarding the United States’ large and growing trade deficit with China. Fears of a trade war hurt investor sentiment with exporters getting hit hardest. One of our holdings, Man Wah Holdings, which the Fund has owned for an extended period of time, was down peak-to-trough roughly 30% during the reporting period in spite of the fact that its China operations continue to grow over 40% on a revenue basis and will in the coming three years likely overtake the U.S. as the company’s largest market. We continue to hold Man Wah, as we think the real driver of the company’s success is not on its exposure to the U.S., but rather its fast growth in China. On a relative valuation basis, Man Wah, which is listed on the Hong Kong exchange, trades at a large discount to its A-share counterparts listed on China’s Shanghai and Shenzhen exchanges.
It’s difficult to take an unequivocal position on the outcome of the trade situation between the U.S. and China, but there are some facts that are irrefutable. The U.S. has a large trade deficit with China, hitting $375bn in 2017, and China’s “Made in 2025” policy objectives, which were laid out in a speech made by China’s President Xi Jinping in May 2015, are deeply ingrained in China’s state-directed industries. Quick changes to industrial policy do not happen easily and thus it is difficult to see an immediate solution to the U.S.’s demand for a $100bn reduction in China’s trade surplus. As a result, it appears that the relationship between China and the U.S will likely follow a course similar to what we saw in the 1990’s before China ascended into the World Trade Organization (“WTO”). In our view, an all-out trade war is not likely, because it would be detrimental to not only these two economies, but the global economy. Given our view of the most likely outcome, we have primarily focused our portfolio’s exposure to domestically-oriented consumption stocks where we see structural opportunities for growth.
This focus can be seen in some of our top performers over the last six months. Tencent is a stock that we have talked about a lot over
the past years. The company’s dominance as a gaming and social media platform continues to help the company generate very strong revenue and income growth. Unlike some of its competitors in the internet sector, Tencent has been able to sustain growth without compromising margins. It currently remains a core holding for the Fund.
China Construction Bank and Industrial and Commercial Bank of China are two of China’s “Big 4” banks. Both of these stocks were positive contributors to the Fund’s performance for the last semi-annual period. In our view, the markets have overly focused on the risks of a non-performing loan (“NPL”) problem for the banking sector as a whole. We believe that China’s credit situation is far from critical, and with banks trading at substantial discounts to book value, with mid-teens returns on equity and consensus 2019 dividend yields in the low 5% range, there is potentially a tremendous value in these stocks. Our fundamental premise on China’s banking situation is that China has far more flexibility to deal with problem credits than the rest of the world. First of all, Chinese banks are internally funded, with high savings rates. Secondly, the banks and borrowers are for the most part owned by the state. Thus, their ability to work out a mutually beneficial agreement is far easier. Finally, the heart of NPLs is in the industrial sector, and profitability seems to have improved dramatically over the last two years. We think the worst is behind these companies from an NPL perspective. On the revenue front, as the Chinese consumers’ wealth continues to increase, demand for different financial products will grow. This underpins not only the banks’ core lending businesses, but also non-interest income as well. We believe that China Construction Bank and Industrial and Commercial Bank are the best run banks in the country and are significantly undervalued at this time.
Ping An is currently one of our biggest active weights in the Fund. It is China’s largest privately-owned insurance company. There are a number of reasons we are so bullish on Ping An. First of all, the average Chinese consumer has reached a level of wealth where insurance products become a core part of an individual/families’ asset allocation basket. In the past, insurance products were largely savings products, with modest protection components in place. In the last couple of years, regulators have required insurance companies to get back to the basics, and offer more standard insurance protection products. This has a number of positive implications for the industry, but most importantly, China’s insurance industry will look much more like a global insurance entity on an asset and liability side creating an environment of steadier and less volatile growth. Valuations, though, have not reflected this structural change in the business. Ping An also has other factors supporting an upward re-rating from its holdings in a number of its subsidiary companies, which includes one of China’s largest peer-to-peer lenders, and an online physician platform called Ping An Healthcare, which was just listed.
China Resources Land also contributed nicely to Fund performance over the year. In our view, Chinese property is fundamentally misunderstood. In China, as in the United States, there are pockets
76 | April 30, 2018
Clough China Fund
| Management Commentary | April 30, 2018 (Unaudited) |
of strength and weakness in local markets. The press and many investors tend to lump China into one market, when in reality, supply and demand dynamics and affordability are very different among different cities and regions. Additionally, China’s property sector is rapidly consolidating, with the big getting bigger. According to Citigroup, the top 10 developers will account for 28% of property developed in 2017 as compared to 20% in 2016. China Resources Land checks off a number of boxes for us. First of all, it is going to be a consolidator in the market, which should underpin growth. Secondly, the company’s strategy of building a retail podium surrounded by residential property creates a very attractive environment for residents, and finally, the company has focused exposure in markets that we view as attractive. This company trades at single digit earnings growing in the mid-teens, with a dividend yield of over 4.5%.
Now onto those stocks that have most detracted from performance for the Fund over the last semi-annual period.
Alibaba shows up on the Fund’s underperformers list for the first time in recent memory. We have talked about the dynamics and the strength of the Chinese consumer over the years, and in our view, we are still in the relatively early innings of this story. Revenue growth continues to be very strong at Alibaba, with just announced revenue growing 58% from the previous year. The market, though, has focused on the company’s spending in order to generate this growth, as margins continue to decline faster than the market expected. Historically, Alibaba’s bottom-line growth far surpassed revenue growth, whereas now the opposite is occurring. We believe that it will be difficult for the stock to perform under these circumstances, and have thus cut our overweight position relative to the MSCI Index.
China Life Insurance made the list and we own it for many of the reasons that we own Ping An Insurance. The company does not have the benefit of valuable subsidiaries, but trades at a substantial discount to Ping An. The company announced some very strong fiscal year 2017 results, and we believed that the company had turned the corner, but ultimately, this company is state-owned and run, and thus does not have the dynamic leadership that Ping An possesses. We maintain the position, though, as we believe that the company’s execution will move in the right direction over time, and the valuation discount versus its peers is too great for us not to invest.
Hon Hai Precision was a new name to the China Fund. Hon Hai is the world’s largest contract manufacturer based in Taiwan. One of the important factors in the company’s revenue and profits is directly tied to the success of Apple iPhone products. We had taken a position in the company on the back of our view that they would be a major beneficiary of the launch of the iPhone X. Initial indications were positive, with long backlogs of demand for the new phone. However, the company did have initial teething problems on yields on phone production, which negatively impacted the company’s results. As time has passed, it also appears that demand for the
iPhone X was lower than anticipated, further hampering prospects for the company. We have since exited the position.
Finally, we were underweight relative to the MSCI Index in the energy sector and two names that we had exposure to, China Oilfield Services and Kunlun Energy, hurt performance. The energy sector in China is particularly tricky, as the dynamics of the market are driven not only by global oil prices, but also by government policy. Given the opaque nature of government policy, we believe that having a structural underweight in the energy sector makes sense. At this time, we expect that we would generally only consider making a more sizeable investment in the sector if valuations were to better reflect time value.
Thank you for your support. Please let us know if you have any questions.
Brian Chen, Portfolio Manager
Anupam Bose, Portfolio Manager
Chuck Clough, Portfolio Manager
Investments in international and emerging markets securities include exposure to risks such as currency fluctuations, foreign taxes and regulations, and the potential for illiquid markets and political instability.
The views of the authors and information discussed in this commentary are as of the date of publication, are subject to change, and may not reflect the writer's current views. The views expressed are those of the authors only, and represent an assessment of market conditions at a specific point in time, are opinions only and should not be relied upon as investment advice regarding a particular investment or markets in general. Such information does not constitute a recommendation to buy or sell specific securities or investment vehicles. It should not be assumed that any investment will be profitable or will equal the performance of the fund(s) or any securities or any sectors mentioned in this letter. The subject matter contained in this letter has been derived from several sources believed to be reliable and accurate at the time of compilation. Neither ALPS, Advisors, Inc., Clough Capital Partners, LP, nor the Fund accepts any liability for losses either direct or consequential caused by the use of this information.
77 | April 30, 2018
Clough China Fund
| Performance Update | April 30, 2018 (Unaudited) |
Performance of $10,000 Initial Investment (as of April 30, 2018)
Comparison of change in value of a $10,000 investment
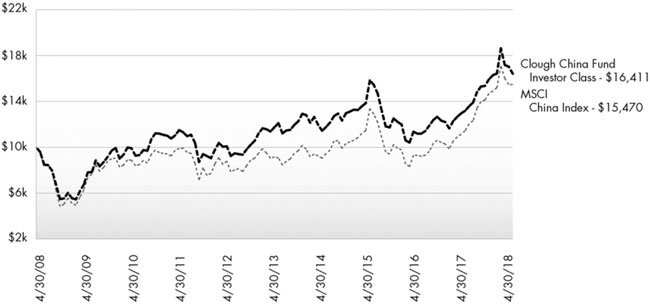
The chart above represents historical performance of a hypothetical investment of $10,000 in the Fund since inception. Past performance does not guarantee future results. This chart does not reflect the deduction of taxes that a shareholder would pay on Fund distributions or the redemption of Fund shares.
Average Annual Total Returns (as of April 30, 2018)
| 6 Month | 1 Year | 3 Year | 5 Year | 10 Year | Since Inception^ | Total Expense Ratio | What You Pay* | |
| Investor# (NAV) | 3.07% | 24.53% | 1.23% | 6.91% | 5.08% | 11.56% | 1.95% | 1.95% |
| Class C (NAV) | 2.67% | 23.61% | 0.48% | 6.10% | 4.27% | 10.73% | 2.70% | 2.70% |
| Class C (CDSC) | 1.67% | 22.61% | 0.48% | 6.10% | 4.27% | 10.73% | ||
| Class I1 (NAV) | 3.16% | 24.85% | 1.58% | 7.25% | 5.45% | 12.00% | 1.70% | 1.70% |
| MSCI China Index2 | 5.36% | 35.27% | 4.96% | 11.07% | 4.46% | 12.23% |
Performance data quoted represents past performance. Past performance does not guarantee future results. Investment return and principal value of an investment will fluctuate so that an investor’s shares, when sold or redeemed, may be worth more or less than the original cost. Current performance data may be higher or lower than actual data quoted. For the most current month-end performance data, please call 1-866-759-5679.
Performance shown at NAV does not include sales charges and would have been lower had it been taken into account. A Contingent Deferred Sales Charge (“CDSC”) of 1.00% may apply to Class C shares redeemed within the first 12 months after a purchase. The Fund imposes a 2.00% redemption fee on shares held for less than 30 days.
Performance less than 1 year is cumulative.
The performance shown for the Clough China Fund for periods prior to January 15, 2010, reflects the performance of the Old Mutual China Fund, a series of Old Mutual Funds I (as a result of a prior reorganization of the Old Mutual China Fund into the Clough China Fund).
| 1 | Prior to close of business on January 15, 2010, Class I was known as Institutional Class of the Old Mutual China Fund. |
| 2 | The Morgan Stanley Capital International (“MSCI”) China Index is constructed according to the MSCI Global Investable Market Index (GIMI) family. The MSCI China Index is part of the MSCI Emerging Markets Index. The index is not actively managed and does not reflect any deduction for fees, expenses or taxes. An investor may not invest directly in an index. |
| ^ | Fund Inception date of December 30, 2005. |
78 | April 30, 2018
Clough China Fund
| Performance Update | April 30, 2018 (Unaudited) |
| * | What You Pay reflects the Advisor’s decision to contractually limit expenses through February 28, 2019. Please see the prospectus for additional information. |
| # | Prior to December 1, 2017, Investor Class was known as Class A. |
The Fund is “non-diversified” and will generally be more volatile than diversified funds.
The table does not reflect the deduction of taxes that a shareholder would pay on Fund distributions or the redemption of Fund shares.
This Fund is not suitable for all investors and is subject to investment risks, including possible loss of the principal amount invested.
There is no guarantee that the Fund will continue to hold any one particular security or stay invested in any one particular company. The composition of the Fund's top holdings is subject to change. Performance figures are historical and reflect the change in share price, reinvested distributions, changes in net asset value, sales charges and capital gains distributions, if any.
Not FDIC Insured – No Bank Guarantee – May Lose Value
Investing in China, Hong Kong and Taiwan involves risk and considerations not present when investing in more established securities markets. The Fund may be more susceptible to the economic, market, political and local risks of these regions than a fund that is more geographically diversified.
Top Ten Holdings (as a % of Net Assets) †
| Tencent Holdings, Ltd. | 20.25% |
| Alibaba Group Holding, Ltd. | 12.09% |
| China Construction Bank Corp. | 8.77% |
| Ping An Insurance Group Co. of China, Ltd. | 6.09% |
| Industrial & Commercial Bank of China, Ltd. | 5.25% |
| Bank of China, Ltd. | 4.20% |
| Baidu, Inc. | 3.19% |
| China Resources Land, Ltd. | 3.00% |
| Autohome, Inc. | 2.34% |
| Country Garden Holdings Co., Ltd. | 2.23% |
| Top Ten Holdings | 67.41% |
| † | Holdings are subject to change, and may not reflect the current or future position of the portfolio. Table presents indicative values only. Excludes cash & cash equivalents. |
Industry Sector Allocation (as a % of Net Assets)
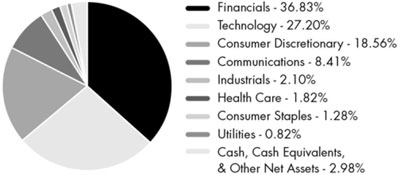
79 | April 30, 2018
Clough China Fund
| Statement of Investments | April 30, 2018 (Unaudited) |
| Shares | Value (Note 2) | |||||||
| COMMON STOCKS (93.02%) | ||||||||
| Communications (8.41%) | ||||||||
| Media (8.41%) | ||||||||
| 58.com, Inc., ADR(a) | 9,300 | $ | 812,727 | |||||
| Autohome, Inc., ADR | 13,200 | 1,287,660 | ||||||
| Baidu, Inc., Sponsored ADR(a) | 7,000 | 1,756,300 | ||||||
| Weibo Corp., Sponsored ADR(a) | 6,800 | 778,736 | ||||||
| 4,635,423 | ||||||||
| TOTAL COMMUNICATIONS | 4,635,423 | |||||||
| Consumer Discretionary (17.38%) | ||||||||
| Consumer Services (1.58%) | ||||||||
| TAL Education Group, ADR | 23,800 | 866,796 | ||||||
| Gaming, Lodging & Restaurants (2.35%) | ||||||||
| Galaxy Entertainment Group, Ltd., Class L | 73,000 | 638,942 | ||||||
| Sands China, Ltd. | 113,600 | 656,538 | ||||||
| 1,295,480 | ||||||||
| Home & Office Products (0.91%) | ||||||||
| Man Wah Holdings, Ltd. | 676,800 | 500,547 | ||||||
| Retail - Discretionary (12.54%) | ||||||||
| Alibaba Group Holding, Ltd., Sponsored ADR(a) | 37,300 | 6,659,542 | ||||||
| ANTA Sports Products, Ltd. | 44,000 | 251,073 | ||||||
| 6,910,615 | ||||||||
| TOTAL CONSUMER DISCRETIONARY | 9,573,438 | |||||||
| Consumer Staples (1.28%) | ||||||||
| Consumer Products (1.28%) | ||||||||
| Orion Corp., Republic of Korea | 6,063 | 703,817 | ||||||
| TOTAL CONSUMER STAPLES | 703,817 | |||||||
| Financials (36.83%) | ||||||||
| Banking (22.36%) | ||||||||
| Agricultural Bank of China, Ltd., Class H | 2,112,000 | 1,190,772 | ||||||
| Bank of China, Ltd., Class H | 4,258,437 | 2,311,612 | ||||||
| China Construction Bank Corp., Class H | 4,614,080 | 4,833,983 | ||||||
| Industrial & Commercial Bank of China, Ltd., Class H | 3,292,967 | 2,890,835 | ||||||
| Postal Savings Bank of China, Ltd., Class H | 1,594,000 | 1,092,053 | ||||||
| 12,319,255 | ||||||||
| Insurance (7.52%) | ||||||||
| China Life Insurance Co., Ltd., Class H | 278,000 | 788,397 | ||||||
| Shares | Value (Note 2) | |||||||
| Insurance (continued) | ||||||||
| Ping An Insurance Group Co. of China, Ltd., Class H | 343,500 | $ | 3,356,476 | |||||
| 4,144,873 | ||||||||
| Real Estate (6.95%) | ||||||||
| China Resources Land, Ltd. | 440,000 | 1,652,520 | ||||||
| Country Garden Holdings Co., Ltd. | 603,000 | 1,229,557 | ||||||
| Longfor Properties Co., Ltd. | 316,000 | 945,072 | ||||||
| 3,827,149 | ||||||||
| TOTAL FINANCIALS | 20,291,277 | |||||||
| Health Care (1.82%) | ||||||||
| Health Care Facilities & Services (1.82%) | ||||||||
| Sinopharm Group Co., Ltd., Class H | 237,600 | 1,001,893 | ||||||
| TOTAL HEALTH CARE | 1,001,893 | |||||||
| Industrials (0.46%) | ||||||||
| Manufactured Goods (0.46%) | ||||||||
| Catcher Technology Co., Ltd. | 23,000 | 255,074 | ||||||
| TOTAL INDUSTRIALS | 255,074 | |||||||
| Technology (26.02%) | ||||||||
| Design, Manufacturing & Distribution (0.52%) | ||||||||
| Pegatron Corp. | 123,000 | 286,771 | ||||||
| Hardware (1.81%) | ||||||||
| Sunny Optical Technology Group Co., Ltd. | 61,100 | 997,008 | ||||||
| Semiconductors (0.56%) | ||||||||
| Nanya Technology Corp. | 99,000 | 308,175 | ||||||
| Software (21.74%) | ||||||||
| NetEase, Inc., ADR | 3,200 | 822,624 | ||||||
| Tencent Holdings, Ltd. | 226,900 | 11,155,068 | ||||||
| 11,977,692 | ||||||||
| Technology Services (1.39%) | ||||||||
| Baozun, Inc., Sponsored ADR(a) | 10,700 | 492,093 | ||||||
| Chinasoft International, Ltd. | 376,000 | 276,328 | ||||||
| 768,421 | ||||||||
| TOTAL TECHNOLOGY | 14,338,067 | |||||||
80 | April 30, 2018
Clough China Fund
| Statement of Investments | April 30, 2018 (Unaudited) |
| Shares | Value (Note 2) | |||||||
| Utilities (0.82%) | ||||||||
| Utilities (0.82%) | ||||||||
| Beijing Enterprises Water Group, Ltd. | 774,000 | $ | 449,371 | |||||
| TOTAL UTILITIES | 449,371 | |||||||
| TOTAL COMMON STOCKS | ||||||||
| (Cost $30,616,150) | 51,248,360 | |||||||
| PARTICIPATION NOTES (4.00%) | ||||||||
| Consumer Discretionary (2.07%) | ||||||||
| Home & Office Products (2.07%) | ||||||||
| Gree Electric Appliances, Inc., Class A (Loan Participation Notes issued by Morgan Stanley Asia Products), expiring 02/16/18(b) | 70,700 | 489,433 | ||||||
| Midea Group Co., Ltd., Class A (Loan Participation Notes issued by Morgan Stanley Asia Products), expiring 5/13/19(b) | 80,100 | 650,062 | ||||||
| 1,139,495 | ||||||||
| TOTAL CONSUMER DISCRETIONARY | 1,139,495 | |||||||
| Industrials (0.76%) | ||||||||
| Electrical Equipment (0.76%) | ||||||||
| Shenzhen Inovance Technology Co., Ltd., Class A (Loan Participation Notes issued by Morgan Stanley Asia Products), expiring 07/06/18(b) | 80,500 | 415,809 | ||||||
| TOTAL INDUSTRIALS | 415,809 | |||||||
| Technology (1.17%) | ||||||||
| Hardware (1.17%) | ||||||||
| Hangzhou Hikvision Digital Technology Co., Ltd., Class A (Loan Participation Notes issued by Morgan Stanley Asia Products), expiring 01/18/19(a)(b) | 106,900 | 646,292 | ||||||
| TOTAL TECHNOLOGY | 646,292 | |||||||
| TOTAL PARTICIPATION NOTES | ||||||||
| (Cost $1,706,101) | 2,201,596 | |||||||
| 7-Day Yield | Shares | Value (Note 2) | ||||||||||
| SHORT TERM INVESTMENTS (0.86%) | ||||||||||||
| Money Market Fund (0.86%) | ||||||||||||
| Blackrock Liquidity Funds, T-Fund | 1.556 | % | 476,930 | $ | 476,930 | |||||||
| TOTAL SHORT TERM INVESTMENTS | ||||||||||||
| (Cost $476,930) | 476,930 | |||||||||||
| TOTAL INVESTMENTS (97.88%) | ||||||||||||
| (Cost $32,799,181) | $ | 53,926,886 | ||||||||||
| Other Assets In Excess Of Liabilities (2.12%) | 1,169,498 | |||||||||||
| NET ASSETS (100.00%) | $ | 55,096,384 | ||||||||||
| (a) | Non-Income Producing Security. |
| (b) | Security exempt from registration under Rule 144A of the Securities Act of 1933. This security may be resold in transactions exempt from registration, normally to qualified institutional buyers. As of April 30, 2018, the aggregate market value of those securities was $2,201,596, representing 4.00% of net assets. |
For Fund compliance purposes, the Fund's industry classifications refer to any one or more of the industry sub-classifications used by one or more widely recognized market indexes or ratings group indexes, and/or as defined by Fund management. This definition may not apply for purposes of this report, which may combine industry sub-classifications for reporting ease. Industries are shown as a percent of net assets.
See Notes to Financial Statements.
81 | April 30, 2018
Clough China Fund
| Statement of Assets and Liabilities | April 30, 2018 (Unaudited) |
| ASSETS | ||||
| Investments, at value | $ | 53,926,886 | ||
| Foreign currency, at value (Cost $1,025,327) | 1,024,841 | |||
| Receivable for investments sold | 501,942 | |||
| Receivable for shares sold | 520 | |||
| Dividends receivable | 1,243 | |||
| Prepaid expenses and other assets | 23,272 | |||
| Total Assets | 55,478,704 | |||
| LIABILITIES | ||||
| Payable for investments purchased | 284,620 | |||
| Payable for shares redeemed | 6,142 | |||
| Investment advisory fees payable | 27,478 | |||
| Administration and transfer agency fees payable | 21,039 | |||
| Distribution and services fees payable | 9,199 | |||
| Professional fees payable | 22,571 | |||
| Accrued expenses and other liabilities | 11,271 | |||
| Total Liabilities | 382,320 | |||
| NET ASSETS | $ | 55,096,384 | ||
| NET ASSETS CONSIST OF | ||||
| Paid-in capital | $ | 36,100,036 | ||
| Accumulated net investment loss | (558,870 | ) | ||
| Accumulated net realized loss | (1,572,001 | ) | ||
| Net unrealized appreciation | 21,127,219 | |||
| NET ASSETS | $ | 55,096,384 | ||
| INVESTMENTS, AT COST | $ | 32,799,181 | ||
| PRICING OF SHARES | ||||
| Investor Class: | ||||
| Net Asset Value, offering and redemption price per share | $ | 27.98 | ||
| Net Assets | $ | 17,710,377 | ||
| Shares of beneficial interest outstanding (unlimited number of shares, no par value common stock authorized) | 633,027 | |||
| Class C: | ||||
| Net Asset Value, offering and redemption price per share(a) | $ | 26.49 | ||
| Net Assets | $ | 6,605,876 | ||
| Shares of beneficial interest outstanding (unlimited number of shares, no par value common stock authorized) | 249,393 | |||
| Class I: | ||||
| Net Asset Value, offering and redemption price per share | $ | 28.66 | ||
| Net Assets | $ | 30,780,131 | ||
| Shares of beneficial interest outstanding (unlimited number of shares, no par value common stock authorized) | 1,074,029 | |||
| (a) | Redemption price per share may be reduced for any applicable contingent deferred sales charge. For a description of a possible sales charge, please see the Fund's Prospectus. |
See Notes to Financial Statements.
82 | April 30, 2018
Clough China Fund
| Statement of Operations | For the Six Months Ended April 30, 2018 (Unaudited) |
| INVESTMENT INCOME | ||||
| Dividends | $ | 41,996 | ||
| Total Investment Income | 41,996 | |||
| EXPENSES | ||||
| Investment advisory fees | 414,914 | |||
| Administrative fees | 53,484 | |||
| Transfer agency fees | 18,639 | |||
| Distribution and service fees | ||||
| Investor Class(a) | 22,972 | |||
| Class C | 34,627 | |||
| Professional fees | 13,655 | |||
| Reports to shareholders and printing fees | 3,304 | |||
| State registration fees | 20,955 | |||
| Insurance fees | 212 | |||
| Custody fees | 12,305 | |||
| Trustees' fees and expenses | 650 | |||
| Miscellaneous expenses | 6,675 | |||
| Total Expenses | 602,392 | |||
| Less fees waived/reimbursed by investment advisor (Note 8) | ||||
| Investor Class(a) | (5,009 | ) | ||
| Class C | (2,781 | ) | ||
| Class I | (14,741 | ) | ||
| Net Expenses | 579,861 | |||
| Net Investment Loss | (537,865 | ) | ||
| Net realized gain on investments | 4,242,268 | |||
| Net realized loss on foreign currency transactions | (13,888 | ) | ||
| Net Realized Gain | 4,228,380 | |||
| Net change in unrealized depreciation on investments | (1,541,512 | ) | ||
| Net change in unrealized appreciation on translation of assets and liabilities denominated in foreign currencies | 3,453 | |||
| Net Change in Unrealized Depreciation | (1,538,059 | ) | ||
| NET REALIZED AND UNREALIZED GAIN ON INVESTMENTS | 2,690,321 | |||
| NET INCREASE IN NET ASSETS RESULTING FROM OPERATIONS | $ | 2,152,456 | ||
| (a) | Prior to December 1, 2017, Investor Class was known as Class A. |
See Notes to Financial Statements.
83 | April 30, 2018
Clough China Fund
Statements of Changes in Net Assets
| For the Six Months Ended April 30, 2018 (Unaudited) | For the Year Ended October 31, 2017 | |||||||
| OPERATIONS | ||||||||
| Net investment income/(loss) | $ | (537,865 | ) | $ | 214,206 | |||
| Net realized gain | 4,228,380 | 3,290,268 | ||||||
| Net change in unrealized appreciation/(depreciation) | (1,538,059 | ) | 10,361,341 | |||||
| Net Increase in Net Assets Resulting from Operations | 2,152,456 | 13,865,815 | ||||||
| DISTRIBUTIONS | ||||||||
| Dividends to shareholders from net investment income | ||||||||
| Investor Class(a) | (47,964 | ) | (16,170 | ) | ||||
| Class I | (177,434 | ) | (86,942 | ) | ||||
| Net Decrease in Net Assets from Distributions | (225,398 | ) | (103,112 | ) | ||||
| BENEFICIAL INTEREST TRANSACTIONS (NOTE 6) | ||||||||
| Shares sold | ||||||||
| Investor Class(a) | 695,205 | 1,280,383 | ||||||
| Class C | 185,905 | 139,824 | ||||||
| Class I | 1,524,800 | 2,433,441 | ||||||
| Dividends reinvested | ||||||||
| Investor Class(a) | 28,723 | 10,603 | ||||||
| Class I | 133,061 | 58,387 | ||||||
| Shares redeemed, net of redemption fees | ||||||||
| Investor Class(a) | (1,026,998 | ) | (6,308,325 | ) | ||||
| Class C | (372,618 | ) | (3,463,943 | ) | ||||
| Class I | (7,323,171 | ) | (8,903,595 | ) | ||||
| Net Decrease in Net Assets Derived from Beneficial Interest Transactions | (6,155,093 | ) | (14,753,225 | ) | ||||
| Net decrease in net assets | (4,228,035 | ) | (990,522 | ) | ||||
| NET ASSETS | ||||||||
| Beginning of period | 59,324,419 | 60,314,941 | ||||||
| End of period * | $ | 55,096,384 | $ | 59,324,419 | ||||
| *Including accumulated net investment income/(loss) of: | $ | (558,870 | ) | $ | 204,393 | |||
| (a) | Prior to December 1, 2017, Investor Class was known as Class A. |
See Notes to Financial Statements.
84 | April 30, 2018
Clough China Fund – Investor Class
Financial Highlights
Selected data for a share of beneficial interest outstanding throughout the periods indicated:
| For the Six Months Ended April 30, 2018 (Unaudited)(a) | For the Year Ended October 31, 2017 | For the Year Ended October 31, 2016 | For the Year Ended October 31, 2015 | For the Fiscal Period Ended October 31, 2014(b) | For the Year Ended April 30, 2014 | ||||||||||||||
| Net asset value, beginning of period | $ | 27.22 | $ | 21.07 | $ | 21.74 | $ | 23.50 | $ | 20.72 | $ | 21.45 | |||||||
| INCOME/(LOSS) FROM INVESTMENT OPERATIONS: | |||||||||||||||||||
| Net investment income/(loss)(c) | (0.26 | ) | 0.08 | 0.04 | 0.12 | 0.45 | 0.12 | ||||||||||||
| Net realized and unrealized gain/(loss) | 1.09 | 6.09 | (0.40 | ) | (0.92 | ) | 2.33 | (0.69 | ) | ||||||||||
| Total from investment operations | 0.83 | 6.17 | (0.36 | ) | (0.80 | ) | 2.78 | (0.57 | ) | ||||||||||
| DISTRIBUTIONS: | |||||||||||||||||||
| From net investment income | (0.07 | ) | (0.02 | ) | (0.31 | ) | (0.50 | ) | – | (0.17 | ) | ||||||||
| From net realized gains | – | – | – | (0.46 | ) | – | – | ||||||||||||
| Total distributions | (0.07 | ) | (0.02 | ) | (0.31 | ) | (0.96 | ) | – | (0.17 | ) | ||||||||
| REDEMPTION FEES ADDED TO PAID-IN CAPITAL (NOTE 6) | 0.00 | (d) | – | 0.00 | (d) | 0.00 | (d) | 0.00 | (d) | 0.01 | |||||||||
| Net increase/(decrease) in net asset value | 0.76 | 6.15 | (0.67 | ) | (1.76 | ) | 2.78 | (0.73 | ) | ||||||||||
| Net asset value, end of period | $ | 27.98 | $ | 27.22 | $ | 21.07 | $ | 21.74 | $ | 23.50 | $ | 20.72 | |||||||
| TOTAL RETURN(e) | 3.07 | % | 29.32 | % | (1.61 | )% | (3.49 | )% | 13.42 | % | (2.69 | )% | |||||||
| RATIOS/SUPPLEMENTAL DATA: | |||||||||||||||||||
| Net assets, end of period (000s) | $ | 17,710 | $ | 17,523 | $ | 18,358 | $ | 25,276 | $ | 30,526 | $ | 31,164 | |||||||
| Ratio of expenses to average net assets excluding fee waivers and reimbursements | 2.00 | %(f) | 2.05 | % | 2.04 | % | 1.98 | % | 2.06 | %(f) | 2.06 | % | |||||||
| Ratio of expenses to average net assets including fee waivers and reimbursements | 1.95 | %(f) | 1.95 | % | 1.95 | % | 1.95 | % | 1.95 | %(f) | 1.95 | % | |||||||
| Ratio of net investment income/(loss) to average net assets | (1.81 | )%(f) | 0.34 | % | 0.18 | % | 0.50 | % | 3.96 | %(f) | 0.55 | % | |||||||
| Portfolio turnover rate(g) | 42 | % | 71 | % | 126 | % | 193 | % | 76 | % | 232 | % | |||||||
| (a) | Prior to December 1, 2017, Investor Class was known as Class A. |
| (b) | Effective May 1, 2014, the Board approved changing the fiscal year-end of the Funds from April 30 to October 31. |
| (c) | Calculated using the average shares method. |
| (d) | Less than $0.005 or ($0.005) per share. |
| (e) | Total returns are for the period indicated and have not been annualized. Total returns would have been lower had certain expenses not been waived during the period. Returns shown do not reflect the deduction of taxes that a shareholder would pay on Fund distributions or the redemption of Fund shares. Returns shown exclude any applicable sales charges. |
| (f) | Annualized. |
| (g) | Portfolio turnover rate for periods less than one full year have not been annualized. |
See Notes to Financial Statements.
85 | April 30, 2018
Clough China Fund – Class C
Financial Highlights
Selected data for a share of beneficial interest outstanding throughout the periods indicated:
| For the Six Months Ended April 30, 2018 (Unaudited) | For the Year Ended October 31, 2017 | For the Year Ended October 31, 2016 | For the Year Ended October 31, 2015 | For the Fiscal Period Ended October 31, 2014(a) | For the Year Ended April 30, 2014 | ||||||||||||||
| Net asset value, beginning of period | $ | 25.80 | $ | 20.10 | $ | 20.72 | $ | 22.53 | $ | 19.94 | $ | 20.71 | |||||||
| INCOME/(LOSS) FROM INVESTMENT OPERATIONS: | |||||||||||||||||||
| Net investment income/(loss)(b) | (0.35 | ) | (0.12 | )(c) | (0.10 | ) | (0.04 | ) | 0.33 | (0.02 | ) | ||||||||
| Net realized and unrealized gain/(loss) | 1.04 | 5.82 | (0.39 | ) | (0.89 | ) | 2.26 | (0.68 | ) | ||||||||||
| Total from investment operations | 0.69 | 5.70 | (0.49 | ) | (0.93 | ) | 2.59 | (0.70 | ) | ||||||||||
| DISTRIBUTIONS: | |||||||||||||||||||
| From net investment income | – | – | (0.13 | ) | (0.42 | ) | – | (0.07 | ) | ||||||||||
| From net realized gains | – | – | – | (0.46 | ) | – | – | ||||||||||||
| Total distributions | – | – | (0.13 | ) | (0.88 | ) | – | (0.07 | ) | ||||||||||
| REDEMPTION FEES ADDED TO PAID-IN CAPITAL (NOTE 6) | – | 0.00 | (d) | 0.00 | (d) | 0.00 | (d) | 0.00 | (d) | 0.00 | (d) | ||||||||
| Net increase/(decrease) in net asset value | 0.69 | 5.70 | (0.62 | ) | (1.81 | ) | 2.59 | (0.77 | ) | ||||||||||
| Net asset value, end of period | $ | 26.49 | $ | 25.80 | $ | 20.10 | $ | 20.72 | $ | 22.53 | $ | 19.94 | |||||||
| TOTAL RETURN(e) | 2.67 | % | 28.36 | % | (2.34 | )% | (4.25 | )% | 12.99 | % | (3.43 | )% | |||||||
| RATIOS/SUPPLEMENTAL DATA: | |||||||||||||||||||
| Net assets, end of period (000s) | $ | 6,606 | $ | 6,610 | $ | 8,352 | $ | 10,395 | $ | 11,575 | $ | 10,866 | |||||||
| Ratio of expenses to average net assets excluding fee waivers and reimbursements | 2.78 | %(f) | 2.85 | % | 2.83 | % | 2.78 | % | 2.87 | %(f) | 2.86 | % | |||||||
| Ratio of expenses to average net assets including fee waivers and reimbursements | 2.70 | %(f) | 2.70 | % | 2.70 | % | 2.70 | % | 2.70 | %(f) | 2.70 | % | |||||||
| Ratio of net investment income/(loss) to average net assets | (2.56 | )%(f) | (0.54 | )% | (0.52 | )% | (0.18 | )% | 3.08 | %(f) | (0.09 | )% | |||||||
| Portfolio turnover rate(g) | 42 | % | 71 | % | 126 | % | 193 | % | 76 | % | 232 | % | |||||||
| (a) | Effective May 1, 2014, the Board approved changing the fiscal year-end of the Funds from April 30 to October 31. |
| (b) | Calculated using the average shares method. |
| (c) | The per share amount does not correspond to activity reflected in the Statement of Operations due to class specific expenses during the period. |
| (d) | Less than $0.005 or ($0.005) per share. |
| (e) | Total returns are for the period indicated and have not been annualized. Total returns would have been lower had certain expenses not been waived during the period. Returns shown do not reflect the deduction of taxes that a shareholder would pay on Fund distributions or the redemption of Fund shares. Returns shown exclude any applicable sales charges. |
| (f) | Annualized. |
| (g) | Portfolio turnover rate for periods less than one full year have not been annualized. |
See Notes to Financial Statements.
86 | April 30, 2018
Clough China Fund – Class I
Financial Highlights
Selected data for a share of beneficial interest outstanding throughout the periods indicated:
| For the Six Months Ended April 30, 2018 (Unaudited) | For the Year Ended October 31, 2017 | For the Year Ended October 31, 2016 | For the Year Ended October 31, 2015 | For the Fiscal Period Ended October 31, 2014(a) | For the Year Ended April 30, 2014 | ||||||||||||||
| Net asset value, beginning of period | $ | 27.92 | $ | 21.60 | $ | 22.28 | $ | 23.97 | $ | 21.11 | $ | 21.82 | |||||||
| INCOME/(LOSS) FROM INVESTMENT OPERATIONS: | |||||||||||||||||||
| Net investment income/(loss)(b) | (0.23 | ) | 0.15 | 0.09 | 0.23 | 0.45 | 0.19 | ||||||||||||
| Net realized and unrealized gain/(loss) | 1.11 | 6.23 | (0.39 | ) | (1.00 | ) | 2.41 | (0.69 | ) | ||||||||||
| Total from investment operations | 0.88 | 6.38 | (0.30 | ) | (0.77 | ) | 2.86 | (0.50 | ) | ||||||||||
| DISTRIBUTIONS: | |||||||||||||||||||
| From net investment income | (0.14 | ) | (0.06 | ) | (0.38 | ) | (0.53 | ) | – | (0.21 | ) | ||||||||
| From net realized gains | – | – | – | (0.46 | ) | – | – | ||||||||||||
| Total distributions | (0.14 | ) | (0.06 | ) | (0.38 | ) | (0.99 | ) | – | (0.21 | ) | ||||||||
| REDEMPTION FEES ADDED TO PAID-IN CAPITAL (NOTE 6) | – | 0.00 | (c) | 0.00 | (c) | 0.07 | 0.00 | (c) | 0.00 | (c) | |||||||||
| Net increase/(decrease) in net asset value | 0.74 | 6.32 | (0.68 | ) | (1.69 | ) | 2.86 | (0.71 | ) | ||||||||||
| Net asset value, end of period | $ | 28.66 | $ | 27.92 | $ | 21.60 | $ | 22.28 | $ | 23.97 | $ | 21.11 | |||||||
| TOTAL RETURN(d) | 3.16 | % | 29.64 | % | (1.31 | )% | (2.99 | )% | 13.55 | % | (2.41 | )% | |||||||
| RATIOS/SUPPLEMENTAL DATA: | |||||||||||||||||||
| Net assets, end of period (000s) | $ | 30,780 | $ | 35,191 | $ | 33,605 | $ | 37,772 | $ | 39,917 | $ | 33,435 | |||||||
| Ratio of expenses to average net assets excluding fee waivers and reimbursements | 1.78 | %(e) | 1.83 | % | 1.82 | % | 1.77 | % | 1.82 | %(e) | 1.81 | % | |||||||
| Ratio of expenses to average net assets including fee waivers and reimbursements | 1.70 | %(e) | 1.70 | % | 1.70 | % | 1.70 | % | 1.70 | %(e) | 1.70 | % | |||||||
| Ratio of net investment income/(loss) to average net assets | (1.56 | )%(e) | 0.61 | % | 0.46 | % | 0.95 | % | 3.89 | %(e) | 0.83 | % | |||||||
| Portfolio turnover rate(f) | 42 | % | 71 | % | 126 | % | 193 | % | 76 | % | 232 | % | |||||||
| (a) | Effective May 1, 2014, the Board approved changing the fiscal year-end of the Funds from April 30 to October 31. |
| (b) | Calculated using the average shares method. |
| (c) | Less than $0.005 or ($0.005) per share. |
| (d) | Total returns are for the period indicated and have not been annualized. Total returns would have been lower had certain expenses not been waived during the period. Returns shown do not reflect the deduction of taxes that a shareholder would pay on Fund distributions or the redemption of Fund shares. |
| (e) | Annualized. |
| (f) | Portfolio turnover rate for periods less than one full year have not been annualized. |
See Notes to Financial Statements.
87 | April 30, 2018
RiverFront Global Allocation Series
| Management Commentary | April 30, 2018 (Unaudited) |
Overview:
Over the past 6 months, markets have been focused on policy decisions globally that would impact interest rates or geopolitical outcomes. In the US, those policy decisions were corporate tax reform, the Fed contemplating rate hikes, and the Trump administration implementing tariffs on foreign goods to try to reduce the trade deficit. Internationally, policy was more focused on monetary accommodation by the European Central Bank (“ECB”) and Bank of Japan (“BOJ”), coupled with geopolitical issues such as trade wars. These policy decisions overall propelled markets higher during the 6-month period; reaching an all-time high in January on the S&P 500 of 2872, then pulling back to re-examine the landscape.
During the last 2 months of 2017, the focus was on the US as the odds of passing corporate tax reform legislation improved. The euphoria of tax reform propelled US markets higher as European markets marked time, and Japan rebounded from its underperformance earlier in the year. We maintained an overweight exposure to developed international markets relative to the US. While the portfolios had exposure to US assets that would benefit from corporate tax reform, our Price Matters™ discipline identified large cap US as slightly overvalued and developed international as undervalued relative to their long-term trends. Additionally, we neutralized our exposure to emerging markets during the fourth quarter as we became more cautious regarding the prospects of the asset class as China’s economy slowed.
Throughout most of the first 4 months of 2018, we continued to maintain an overweight to international markets as domestic equity markets came down from its tax reform induced sugar high in mid- January. In the middle of the first quarter of 2018 we increased our exposure to emerging markets as China’s growth proved to be more resilient than we thought at the end of 2017. The jury is still out on this decision, with the dollar appreciating in March and April. On the fixed income side of the ledger, we shortened the duration of our fixed income holdings as the 10-year Treasury saw yields rise from 2.40% to 2.95% by the end of the period. We continue to believe that the bull market in bonds is over and that the Fed will raise rates three to four times in 2018; putting the 10-year Treasury on a trajectory to yield approximately 3.5% by year-end.
We believe that 2018 will be a year of tug of war between reduced monetary stimulus and faster global growth; with faster growth winning out. Global growth will be driven by pay increases for millennials in the US, labor market reform in Europe, and New Silk Road expenditures in China. Equity markets will move higher in 2018 albeit at a slower pace than experienced in 2017, due to higher valuations and expectations of increased inflation and volatility in our opinion. The bull market has more room to run and we believe that 2018 will reward investors who invest in equities over bonds.
Performance Discussion for the Moderate Growth & Income, Growth, and Aggressive Funds:
The RiverFront Asset Allocation Moderate Growth & Income, Growth, and Aggressive Funds are managed using the same overarching process which is based on our Price Matters® framework. This framework allows the investment managers to develop investment themes that span across the various asset classes in which the funds are invested. As a result, these funds hold
substantially the same securities, but the asset class allocations differ depending on the investment time horizon for each. This results in the performance drivers being the same. In the case of the RiverFront Asset Allocation Moderate Growth & Income, the allocation is 70% equities and 30% fixed income. The RiverFront Asset Allocation Growth fund is managed to a targeted allocation of 80% equities and 20% fixed income. The RiverFront Asset Allocation Aggressive fund is 100% equity. The RiverFront investment managers have the flexibility to make allocations that differ from the benchmark.
In discussing the performance for the RiverFront Funds, it’s important to keep in mind their global allocation mandate. All of the RiverFront offerings have exposure to multi-cap, global equities; our balanced funds have the addition of fixed income. The table below illustrates the disparity of returns across the major indices during the most recent quarter, which resulted in varying degrees of relative performance when compared to the traditional single index, mutual fund benchmark.
| Benchmark Indexes | 6 Months Ended (4/30/2018) |
| S&P 500 Total Return | 3.81% |
| S&P 1000 Total Return | 3.38% |
| MSCI EAFE (Net) | 3.41% |
| MSCI Emerging Markets (Net) | 4.80% |
| MSCI All Country World Index (Net) | 3.56% |
| Barclays US Aggregate | -1.87% |
| BofAML US HY Master II Total Return | -0.23% |
| Barclays US Treasury Index | -1.81% |
| Barclays US Short Treasury Index (1-3M) | 0.65% |
Data as of 4/30/2018
| * | For index definitions see footnotes at the end of the Management Commentary and below the performance data on the following pages. |
| ** | For a complete presentation of RiverFront Mutual Fund and relevant benchmark performance, please refer to the Performance Update on the following pages. |
RiverFront Asset Allocation Growth & Income:
Contributors:
| ● | Selection within domestic equities positively impacted performance. |
| ● | Fund performance benefitted from being underweight fixed income during the period. |
| ● | Selection within emerging equities positively impacted performance. |
Detractors:
| ● | The underweight to domestic equities impacted performance negatively. |
| ● | Selection within developed international negatively impacted performance. |
88 | April 30, 2018
RiverFront Global Allocation Series
| Management Commentary | April 30, 2018 (Unaudited) |
RiverFront Asset Allocation Growth:
Contributors:
| ● | Selection within domestic equities positively impacted performance. |
| ● | Fund performance benefitted from being underweight fixed income during the period. |
| ● | Selection within emerging equities positively impacted performance. |
Detractors:
| ● | The underweight to domestic equities impacted performance negatively. |
| ● | Selection within developed international negatively impacted performance. |
RiverFront Asset Allocation Aggressive:
Contributors:
| ● | Selection within domestic equities positively impacted performance. |
| ● | Selection within emerging equities positively impacted performance. |
Detractors:
| ● | The underweight to domestic equities impacted performance negatively. |
| ● | Selection within developed international negatively impacted. |
Performance Discussion for the Income & Growth and Moderate funds:
The RiverFront Asset Allocation Income & Growth and the RiverFront Asset Allocation Moderate Funds are managed using the same overarching process which is based on our Price Matters® framework. This framework allows the investment managers to develop investment themes that span across the various asset classes in which the Funds are invested. As a result, these Funds hold substantially the same securities, but the asset class allocations differ depending on the investment time horizon for each. This results in the performance drivers being the same. In the case of the RiverFront Asset Allocation Income & Growth Fun, the allocation is 30% equities and 70% fixed income. The RiverFront Asset Allocation Moderate Fund is managed to a targeted allocation of 50% equities and 50% fixed income. The RiverFront investment managers have the flexibility to make allocations that differ from the benchmark.
In discussing the performance for the RiverFront Funds, it’s important to keep in mind their global allocation mandate. All of the RiverFront offerings have exposure to multi-cap, global equities; our balanced funds have the addition of fixed income. The table below illustrates the disparity of returns across the major indices during the most recent quarter, which resulted in varying degrees of relative performance when compared to the traditional single index, mutual fund benchmark.
| Benchmark Indexes | 6 Months Ended (4/30/2018) |
| S&P 500 Total Return | 3.81% |
| S&P 1000 Total Return | 3.38% |
| MSCI EAFE (Net) | 3.41% |
| MSCI Emerging Markets (Net) | 4.80% |
| MSCI All Country World Index (Net) | 3.56% |
| Barclays US Aggregate | -1.87% |
| BofAML US HY Master II Total Return | -0.23% |
| Barclays US Treasury Index | -1.81% |
| Barclays US Short Treasury Index (1-3M) | 0.65% |
Data as of 4/30/2018
| * | For index definitions see footnotes at the end of the Management Commentary and below the performance data on the following pages. |
| ** | For a complete presentation of RiverFront Mutual Fund and relevant benchmark performance, please refer to the Performance Update on the following pages. |
RiverFront Asset Allocation Income & Growth and RiverFront Asset Allocation Moderate funds:
Contributors:
| ● | Fund performance benefitted from being underweight fixed income during the period. |
| ● | Selection within domestic equities and fixed income. |
| ● | The overweight to international had a positive impact on performance. |
Detractors:
| ● | The underweight to domestic equities impacted performance negatively. |
Michael Jones, CFA
Co-Portfolio Manager
Kevin Nicholson, CFA
Co-Portfolio Manager
Deva Meenakshisundaram
Co-Portfolio Manager
Bill Ryder, CFA
Co-Portfolio Manager
89 | April 30, 2018
RiverFront Global Allocation Series
| Management Commentary | April 30, 2018 (Unaudited) |
Past performance is no guarantee of future results. Dividends are not guaranteed and are subject to change or elimination. Investments in international and emerging markets securities include exposure to risks such as currency fluctuations, foreign taxes and regulations, and the potential for illiquid markets and political instability.
The views of the author and information discussed in this commentary are as of the date of publication, are subject to change, and may not reflect the writer's current views. The views expressed are those of the author only, and represent an assessment of market conditions at a specific point in time, are opinions only and should not be relied upon as investment advice regarding a particular investment or markets in general. Such information does not constitute a recommendation to buy or sell specific securities or investment vehicles. It should not be assumed that any investment will be profitable or will equal the performance of the fund(s) or any securities or any sectors mentioned in this letter. The subject matter contained in this letter has been derived from several sources believed to be reliable and accurate at the time of compilation. Neither ALPS Advisors, Inc., RiverFront Investment Group, LLC, nor the Funds accepts any liability for losses either direct or consequential caused by the use of this information.
The S&P 1000® Index combines the S&P MidCap 400® and the S&P SmallCap 600® to form an investable benchmark for the mid- to small-cap segment of the U.S. equity market.
The MSCI EAFE Index is recognized as the pre-eminent benchmark in the United States to measure international equity performance. It comprises the MSCI country indices that represent developed markets outside of North America: Europe, Australasia and the Far East.
The MSCI Emerging Markets Index is a free float-adjusted market capitalization index that is designed to measure equity market performance in the global emerging markets.
The BofAML US HY Master II Total Return Index tracks the performance of US dollar denominated below investment grade corporate debt publicly issued in the US domestic market.
The Barclays U.S. Treasury Index includes public obligations of the U.S. Treasury, excluding Treasury bills and certain special issues, such as state and local government series bonds (SLGs) and U.S. Treasury TIPS.
The Barclays U.S. Short Treasury Index is composed of bonds of investment grade with a maturity between one and three years.
Indices do not reflect deductions for fees, expenses, or taxes.
An investor may not invest directly in an index.
Diversification cannot guarantee gain or prevent losses.
90 | April 30, 2018
RiverFront Asset Allocation Income & Growth
| Performance Update | April 30, 2018 (Unaudited) |
Performance of $10,000 Initial Investment (as of April 30, 2018)
Comparison of change in value of a $10,000 investment
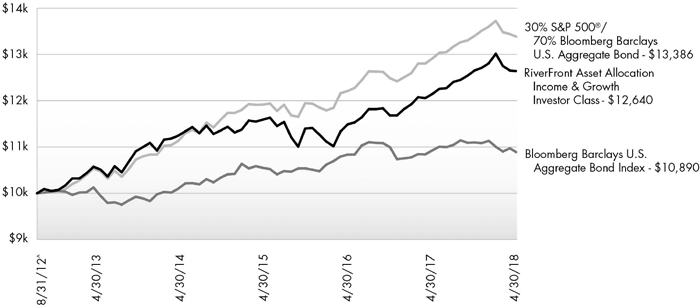
The chart above represents historical performance of a hypothetical investment of $10,000 in the Fund since inception. Past performance does not guarantee future results. This chart does not reflect the deduction of taxes that a shareholder would pay on Fund distributions or the redemption of Fund shares.
Average Annual Total Returns (as of April 30, 2018)
6 Month | 1 Year | 3 Years | 5 Years | Since Inception^ | Total Expense Ratio | What You Pay* | |
| Investor# (NAV) | -0.11% | 4.08% | 2.93% | 3.64% | 4.22% | 1.04% | 1.04% |
| Class C (NAV) | -0.51% | 3.30% | 2.15% | 2.84% | 3.44% | 1.79% | 1.79% |
| Class C (CDSC) | -1.49% | 2.30% | 2.15% | 2.84% | 3.44% | ||
| Class I (NAV) | -0.01% | 4.40% | 3.17% | 3.87% | 4.47% | 0.79% | 0.79% |
| Bloomberg Barclays U.S. Aggregate Bond Index1 | -1.87% | -0.32% | 1.07% | 1.47% | 1.52% | ||
| 30% S&P 500® and 70% Bloomberg Barclays U.S. Aggregate Bond1,2 | -0.12% | 3.67% | 3.96% | 4.91% | 5.28% |
Performance data quoted represents past performance. Past performance does not guarantee future results. Investment return and principal value of an investment will fluctuate so that an investor's shares, when sold or redeemed, may be worth more or less than the original cost. Current performance data may be higher or lower than actual data quoted. For the most current month-end performance data, please call 1-866-759-5679.
Performance shown at NAV does not include sales charges and would have been lower had it been taken into account. A Contingent Deferred Sales Charge (“CDSC”) of 1.00% may apply to Class C shares redeemed within the first 12 months after a purchase.
Performance less than 1 year is cumulative.
91 | April 30, 2018
RiverFront Asset Allocation Income & Growth
| Performance Update | April 30, 2018 (Unaudited) |
| 1 | The Barclays U.S. Aggregate Bond Index is a broad-based benchmark that measures the investment grade, U.S. dollar-denominated, fixed-rate taxable bond market, including Treasuries, government-related and corporate securities, MBS (agency fixed-rate and hybrid ARM passthroughs), ABS, and CMBS. The index is not actively managed and does not reflect any deductions for fees, expenses or taxes. An investor may not invest directly in an index. |
| 2 | The S&P 500® Index is the Standard & Poor's composite index of 500 stocks, a widely recognized, unmanaged index of common stock prices. |
| ^ | Fund inception date of August 31, 2012. |
| * | What You Pay reflects Acquired Fund Fees and Expenses of 0.54%. Please see the prospectus for additional information. |
| # | Prior to December 1, 2017, Investor Class was known as Class A. |
Prior to February 28, 2018, the RiverFront Asset Allocation Income & Growth was known as the RiverFront Conservative Income Builder Fund.
The table does not reflect the deduction of taxes that a shareholder would pay on Fund distributions or the redemption of Fund shares.
This Fund is not suitable for all investors and is subject to investment risks, including possible loss of the principal amount invested.
There is no guarantee that the Fund will continue to hold any one particular security or stay invested in any one particular company. The composition of the Fund's top holdings is subject to change. Performance figures are historical and reflect the change in share price, reinvested distributions, changes in net asset value, sales charges and capital gains distributions, if any.
Not FDIC Insured – No Bank Guarantee – May Lose Value
Top Ten Holdings (as a % of Net Assets) †
| Riverfront Dynamic Core Income ETF | 55.23% |
| Riverfront Dynamic US Dividend Advantage ETF | 14.03% |
| First Trust Riverfront Dynamic Developed International ETF | 9.61% |
| Riverfront Dynamic Unconstrained Income ETF | 8.50% |
| Riverfront Dynamic US Flex-Cap ETF | 7.71% |
| First Trust Riverfront Dynamic Europe ETF | 2.52% |
| First Trust Riverfront Dynamic Asia Pacific ETF | 1.00% |
| Top Ten Holdings | 98.60% |
| † | Holdings are subject to change, and may not reflect the current or future position of the portfolio. Table presents indicative values only. Excludes cash & cash equivalents. |
Portfolio Composition (as a % of Net Assets)
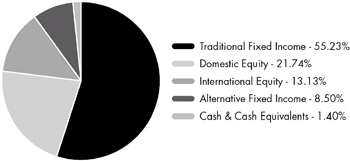
92 | April 30, 2018
RiverFront Asset Allocation Growth & Income
| Performance Update | April 30, 2018 (Unaudited) |
Performance of $10,000 Initial Investment (as of April 30, 2018)
Comparison of change in value of a $10,000 investment

The chart above represents historical performance of a hypothetical investment of $10,000 in the Fund since inception. Past performance does not guarantee future results. This chart does not reflect the deduction of taxes that a shareholder would pay on Fund distributions or the redemption of Fund shares.
Average Annual Total Returns (as of April 30, 2018)
6 Month | 1 Year | 3 Years | 5 Years | Since Inception^ | Total Expense Ratio | What You Pay* | |
| Investor# (NAV) | 1.71% | 10.05% | 5.56% | 7.08% | 7.85% | 1.16% | 1.16% |
| Class C (NAV) | 1.41% | 9.29% | 4.78% | 6.29% | 7.05% | 1.91% | 1.91% |
| Class C (CDSC) | 0.42% | 8.29% | 4.78% | 6.29% | 7.05% | ||
| Class I (NAV) | 1.83% | 10.37% | 5.83% | 7.35% | 8.12% | 0.91% | 0.91% |
| MSCI All Country World Index1 | 3.56% | 14.16% | 7.43% | 8.80% | 9.48% | ||
| 70% ACWI and 30% Bloomberg Barclays U.S. Aggregate Bond1,2 | 1.98% | 9.71% | 5.62% | 6.67% | 7.58% |
Performance data quoted represents past performance. Past performance does not guarantee future results. Investment return and principal value of an investment will fluctuate so that an investor's shares, when sold or redeemed, may be worth more or less than the original cost. Current performance data may be higher or lower than actual data quoted. For the most current month-end performance data, please call 1-866-759-5679.
Performance shown at NAV does not include sales charges and would have been lower had it been taken into account. A Contingent Deferred Sales Charge (“CDSC”) of 1.00% may apply to Class C shares redeemed within the first 12 months after a purchase.
Performance less than 1 year is cumulative.
93 | April 30, 2018
RiverFront Asset Allocation Growth & Income
| Performance Update | April 30, 2018 (Unaudited) |
| 1 | The MSCI ACWI (All Country World Index) is a free float-adjusted market capitalization weighted index that is designed to measure the equity market performance of developed and emerging markets. The MSCI ACWI consists of 45 country indices comprising 24 developed and 21 emerging market country indices. The index includes reinvestment of dividends, net of foreign withholding taxes. The index is not actively managed and does not reflect any deductions for fees, expenses or taxes. An investor may not invest directly in an index. |
| 2 | The Barclays U.S. Aggregate Bond Index is a broad-based benchmark that measures the investment grade, U.S. dollar-denominated, fixed-rate taxable bond market, including Treasuries, government-related and corporate securities, MBS (agency fixed-rate and hybrid ARM passthroughs), ABS, and CMBS. The index is not actively managed and does not reflect any deductions for fees, expenses or taxes. An investor may not invest directly in an index. |
| ^ | Fund inception date of August 2, 2010. |
| * | What You Pay reflects Acquired Fund Fees and Expenses of 0.66%. Please see the prospectus for additional information. |
| # | Prior to December 1, 2017, Investor Class was known as Class A. |
Prior to February 28, 2018, the RiverFront Asset Allocation Growth & Income was known as the RiverFront Dynamic Equity Income Fund.
The table does not reflect the deduction of taxes that a shareholder would pay on Fund distributions or the redemption of Fund shares.
This Fund is not suitable for all investors and is subject to investment risks, including possible loss of the principal amount invested.
There is no guarantee that the Fund will continue to hold any one particular security or stay invested in any one particular company. The composition of the Fund's top holdings is subject to change. Performance figures are historical and reflect the change in share price, reinvested distributions, changes in net asset value, sales charges and capital gains distributions, if any.
Not FDIC Insured – No Bank Guarantee – May Lose Value
Top Ten Holdings (as a % of Net Assets) †
| First Trust Riverfront Dynamic Developed International ETF | 22.65% |
| Riverfront Dynamic US Dividend Advantage ETF | 21.26% |
| Riverfront Dynamic US Flex-Cap ETF | 13.89% |
| First Trust Riverfront Dynamic Europe ETF | 12.37% |
| First Trust Riverfront Dynamic Emerging Markets ETF | 9.99% |
| Riverfront Dynamic Core Income ETF | 7.47% |
| Riverfront Dynamic Unconstrained Income ETF | 7.07% |
| First Trust Riverfront Dynamic Asia Pacific ETF | 2.98% |
| Top Ten Holdings | 97.68% |
| † | Holdings are subject to change, and may not reflect the current or future position of the portfolio. Table presents indicative values only. Excludes cash & cash equivalents. |
Portfolio Composition (as a % of Net Assets)
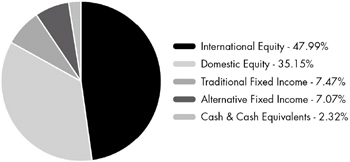
94 | April 30, 2018
RiverFront Asset Allocation Growth
| Performance Update | April 30, 2018 (Unaudited) |
Performance of $10,000 Initial Investment (as of April 30, 2018)
Comparison of change in value of a $10,000 investment
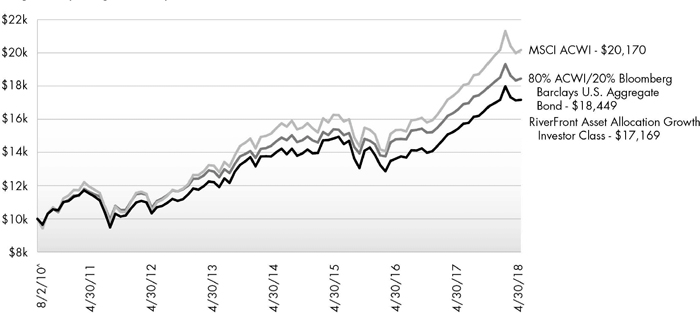
The chart above represents historical performance of a hypothetical investment of $10,000 in the Fund since inception. Past performance does not guarantee future results. This chart does not reflect the deduction of taxes that a shareholder would pay on Fund distributions or the redemption of Fund shares.
Average Annual Total Returns (as of April 30, 2018)
6 Month | 1 Year | 3 Years | 5 Years | Since Inception^ | Total Expense Ratio | What You Pay* | |
| Investor# (NAV) | 2.12% | 11.26% | 4.99% | 6.99% | 7.23% | 1.18% | 1.18% |
| Class C (NAV) | 1.69% | 10.40% | 4.19% | 6.19% | 6.43% | 1.93% | 1.93% |
| Class C (CDSC) | 0.69% | 9.40% | 4.19% | 6.19% | 6.43% | ||
| Class I (NAV) | 2.20% | 11.56% | 5.27% | 7.24% | 7.49% | 0.93% | 0.93% |
| MSCI All Country World Index1 | 3.56% | 14.16% | 7.43% | 8.80% | 9.48% | ||
| 80% ACWI and 20% Bloomberg Barclays U.S. Aggregate Bond1,2 | 2.51% | 11.19% | 6.23% | 7.39% | 8.23% |
Performance data quoted represents past performance. Past performance does not guarantee future results. Investment return and principal value of an investment will fluctuate so that an investor's shares, when sold or redeemed, may be worth more or less than the original cost. Current performance data may be higher or lower than actual data quoted. For the most current month-end performance data, please call 1-866-759-5679.
Performance shown at NAV does not include sales charges and would have been lower had it been taken into account. A Contingent Deferred Sales Charge (“CDSC”) of 1.00% may apply to Class C shares redeemed within the first 12 months after a purchase.
Performance less than 1 year is cumulative.
95 | April 30, 2018
RiverFront Asset Allocation Growth
| Performance Update | April 30, 2018 (Unaudited) |
| 1 | The MSCI ACWI (All Country World Index) is a free float-adjusted market capitalization weighted index that is designed to measure the equity market performance of developed and emerging markets. The MSCI ACWI consists of 45 country indices comprising 24 developed and 21 emerging market country indices. The index includes reinvestment of dividends, net of foreign withholding taxes. The index is not actively managed and does not reflect any deductions for fees, expenses or taxes. An investor may not invest directly in an index. |
| 2 | The Barclays U.S. Aggregate Bond Index is a broad-based benchmark that measures the investment grade, U.S. dollar-denominated, fixed-rate taxable bond market, including Treasuries, government-related and corporate securities, MBS (agency fixed-rate and hybrid ARM passthroughs), ABS, and CMBS. The index is not actively managed and does not reflect any deductions for fees, expenses or taxes. An investor may not invest directly in an index. |
| ^ | Fund inception date of August 2, 2010. |
| * | What You Pay reflects Acquired Fund Fees and Expenses of 0.68%. Please see the prospectus for additional information. |
| # | Prior to December 1, 2017, Investor Class was known as Class A. |
Prior to February 28, 2018, the RiverFront Asset Allocation Growth was known as the RiverFront Global Allocation Fund.
The table does not reflect the deduction of taxes that a shareholder would pay on Fund distributions or the redemption of Fund shares.
This Fund is not suitable for all investors and is subject to investment risks, including possible loss of the principal amount invested.
There is no guarantee that the Fund will continue to hold any one particular security or stay invested in any one particular company. The composition of the Fund's top holdings is subject to change. Performance figures are historical and reflect the change in share price, reinvested distributions, changes in net asset value, sales charges and capital gains distributions, if any.
Not FDIC Insured – No Bank Guarantee – May Lose Value
Top Ten Holdings (as a % of Net Assets) †
| First Trust Riverfront Dynamic Developed International ETF | 27.53% |
| Riverfront Dynamic US Flex-Cap ETF | 22.36% |
| First Trust Riverfront Dynamic Europe ETF | 14.05% |
| Riverfront Dynamic US Dividend Advantage ETF | 11.92% |
| First Trust Riverfront Dynamic Emerging Markets ETF | 11.29% |
| Riverfront Dynamic Unconstrained Income ETF | 5.08% |
| First Trust Riverfront Dynamic Asia Pacific ETF | 3.53% |
| Riverfront Dynamic Core Income ETF | 3.29% |
| Top Ten Holdings | 99.05% |
| † | Holdings are subject to change, and may not reflect the current or future position of the portfolio. Table presents indicative values only. Excludes cash & cash equivalents. |
Portfolio Composition (as a % of Net Assets)
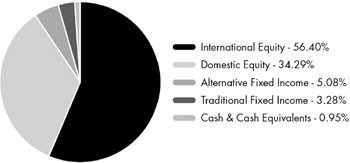
96 | April 30, 2018
RiverFront Asset Allocation Aggressive
| Performance Update | April 30, 2018 (Unaudited) |
Performance of $10,000 Initial Investment (as of April 30, 2018)
Comparison of change in value of a $10,000 investment
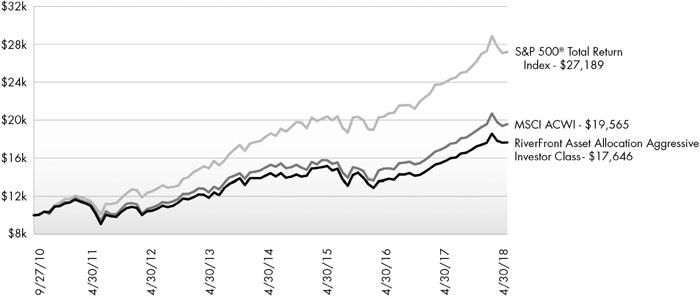
The chart above represents historical performance of a hypothetical investment of $10,000 in the Fund since inception. Past performance does not guarantee future results. This chart does not reflect the deduction of taxes that a shareholder would pay on Fund distributions or the redemption of Fund shares.
Average Annual Total Returns (as of April 30, 2018)
| 6 Month | 1 Year | 3 Years | 5 Years | Since Inception^ | Total Expense Ratio | What You Pay* | |
| Investor# (NAV) | 2.47% | 12.49% | 5.48% | 7.66% | 9.84% | 1.20% | 1.20% |
| Class C (NAV) | 2.16% | 11.68% | 4.71% | 6.88% | 9.03% | 1.95% | 1.95% |
| Class C (CDSC) | 1.18% | 10.68% | 4.71% | 6.88% | 9.03% | ||
| Class I (NAV) | 2.67% | 12.76% | 5.73% | 7.92% | 10.11% | 0.95% | 0.95% |
| Investor II (NAV) | 2.48% | 12.49% | 5.49% | 7.67% | 9.82% | 1.20% | 1.20% |
| Class L1 (NAV) | 2.61% | 12.78% | 5.74% | 7.94% | 10.10% | 0.95% | 0.95% |
| S&P 500® Total Return Index3 | 3.82% | 13.27% | 10.57% | 12.96% | 13.93% | ||
| MSCI All Country World Index2 | 3.56% | 14.16% | 7.43% | 8.80% | 11.67% |
Performance data quoted represents past performance. Past performance does not guarantee future results. Investment return and principal value of an investment will fluctuate so that an investor's shares, when sold or redeemed, may be worth more or less than the original cost. Current performance data may be higher or lower than actual data quoted. For the most current month-end performance data, please call 1-866-759-5679.
Performance shown at NAV does not include sales charges and would have been lower had it been taken into account. A Contingent Deferred Sales Charge (“CDSC”) of 1.00% may apply to Class C shares redeemed within the first 12 months after a purchase.
Performance less than 1 year is cumulative.
97 | April 30, 2018
RiverFront Asset Allocation Aggressive
| Performance Update | April 30, 2018 (Unaudited) |
| 1 | Prior to close of business on September 24, 2010, Class L was known as Institutional Class of the Baird Funds, Inc. - RiverFront Long-Term Growth Fund. |
| 2 | The MSCI ACWI (All Country World Index) is a free float-adjusted market capitalization weighted index that is designed to measure the equity market performance of developed and emerging markets. The MSCI ACWI consists of 45 country indices comprising 24 developed and 21 emerging market country indices. The index includes reinvestment of dividends, net of foreign withholding taxes. The index is not actively managed and does not reflect any deductions for fees, expenses or taxes. An investor may not invest directly in an index. |
| 3 | S&P 500® Total Return Index is the Standard & Poor's composite index of 500 stocks, a widely recognized, unmanaged index of common stock prices. The index is not actively managed and does not reflect any deduction for fees, expenses or taxes. An investor may not invest directly in an index. |
| ^ | Fund inception date of October 28, 2008. |
| * | What You Pay reflects Acquired Fund Fees and Expenses of 0.70%. Please see the prospectus for additional information. |
| # | Prior to December 1, 2017, Investor Class was known as Class A. |
Prior to February 28, 2018, the RiverFront Asset Allocation Aggressive was known as the RiverFront Global Growth Fund.
The Investor Class, Class C, I and L shares performance shown for periods prior to September 27, 2010 reflects the performance of the Baird Funds, Inc. – RiverFront Long-Term Growth Fund’s Institutional Class shares (as result of the reorganization of the Baird Funds, Inc. – RiverFront Long-Term Growth Fund into the Fund).
The Investor II Class performance shown for periods prior to September 27, 2010 reflects the performance of the Baird Funds, Inc. – RiverFront Long-Term Growth Fund’s Investor Class shares (as result of the reorganization of the Baird Funds, Inc. – RiverFront Long-Term Growth Fund into the Fund).
The table does not reflect the deduction of taxes that a shareholder would pay on Fund distributions or the redemption of Fund shares.
This Fund is not suitable for all investors and is subject to investment risks, including possible loss of the principal amount invested.
There is no guarantee that the Fund will continue to hold any one particular security or stay invested in any one particular company. The composition of the Fund's top holdings is subject to change. Performance figures are historical and reflect the change in share price, reinvested distributions, changes in net asset value, sales charges and capital gains distributions, if any.
Not FDIC Insured – No Bank Guarantee – May Lose Value
Top Ten Holdings (as a % of Net Assets) †
| First Trust Riverfront Dynamic Developed International ETF | 33.21% |
| Riverfront Dynamic US Flex-Cap ETF | 21.50% |
| First Trust Riverfront Dynamic Europe ETF | 14.11% |
| First Trust Riverfront Dynamic Emerging Markets ETF | 13.83% |
| Riverfront Dynamic US Dividend Advantage ETF | 10.05% |
| First Trust Riverfront Dynamic Asia Pacific ETF | 5.63% |
| Top Ten Holdings | 98.33% |
| † | Holdings are subject to change, and may not reflect the current or future position of the portfolio. Table presents indicative values only. Excludes cash & cash equivalents. |
Portfolio Composition (as a % of Net Assets)
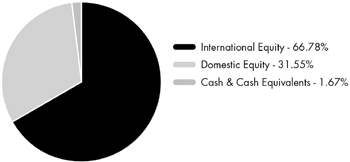
98 | April 30, 2018
RiverFront Asset Allocation Moderate
| Performance Update | April 30, 2018 (Unaudited) |
Performance of $10,000 Initial Investment (as of April 30, 2018)
Comparison of change in value of a $10,000 investment
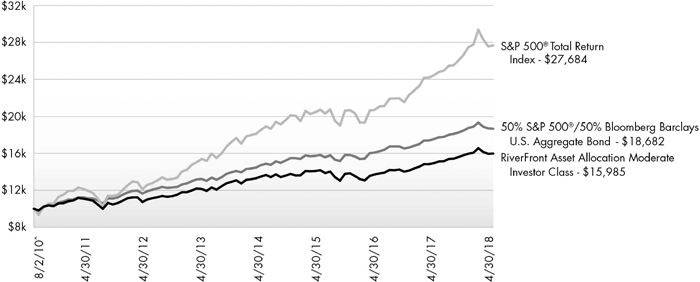
The chart above represents historical performance of a hypothetical investment of $10,000 in the Fund since inception. Past performance does not guarantee future results. This chart does not reflect the deduction of taxes that a shareholder would pay on Fund distributions or the redemption of Fund shares.
Average Annual Total Returns (as of April 30, 2018)
6 Month | 1 Year | 3 Years | 5 Years | Since Inception^ | Total Expense Ratio | What You Pay* | |
| Investor# (NAV) | 1.15% | 6.93% | 4.28% | 5.56% | 6.25% | 1.06% | 1.06% |
| Class C (NAV) | 0.79% | 6.13% | 3.51% | 4.78% | 5.46% | 1.81% | 1.81% |
| Class C (CDSC) | -0.16% | 5.13% | 3.51% | 4.78% | 5.46% | ||
| Class I (NAV) | 1.27% | 7.20% | 4.51% | 5.82% | 6.51% | 0.81% | 0.81% |
| S&P 500® Total Return Index1 | 3.82% | 13.27% | 10.57% | 12.96% | 14.06% | ||
| 50% S&P 500® and 50% Bloomberg Barclays U.S. Aggregate Bond1,2 | 1.03% | 6.38% | 5.87% | 7.21% | 8.41% |
Performance data quoted represents past performance. Past performance does not guarantee future results. Investment return and principal value of an investment will fluctuate so that an investor's shares, when sold or redeemed, may be worth more or less than the original cost. Current performance data may be higher or lower than actual data quoted. For the most current month-end performance data, please call 1-866-759-5679.
Performance shown at NAV does not include sales charges and would have been lower had it been taken into account. A Contingent Deferred Sales Charge (“CDSC”) of 1.00% may apply to Class C shares redeemed within the first 12 months after a purchase.
Performance less than 1 year is cumulative.
99 | April 30, 2018
RiverFront Asset Allocation Moderate
| Performance Update | April 30, 2018 (Unaudited) |
| 1 | S&P 500® Total Return Index is the Standard & Poor's composite index of 500 stocks, a widely recognized, unmanaged index of common stock prices. The index is not actively managed and does not reflect any deduction for fees, expenses or taxes. An investor may not invest directly in an index. |
| 2 | The Barclays U.S. Aggregate Bond Index is a broad-based benchmark that measures the investment grade, U.S. dollar-denominated, fixed-rate taxable bond market, including Treasuries, government-related and corporate securities, MBS (agency fixed-rate and hybrid ARM passthroughs), ABS, and CMBS. The index is not actively managed and does not reflect any deductions for fees, expenses or taxes. An investor may not invest directly in an index. |
| ^ | Fund inception date of August 2, 2010. |
| * | What You Pay reflects Acquired Fund Fees and Expenses of 0.56%. Please see the prospectus for additional information. |
| # | Prior to December 1, 2017, Investor Class was known as Class A. |
Prior to February 28, 2018, the RiverFront Asset Allocation Moderate was known as the RiverFront Moderate Growth & Income Fund.
The table does not reflect the deduction of taxes that a shareholder would pay on Fund distributions or the redemption of Fund shares.
This Fund is not suitable for all investors and is subject to investment risks, including possible loss of the principal amount invested.
There is no guarantee that the Fund will continue to hold any one particular security or stay invested in any one particular company. The composition of the Fund's top holdings is subject to change. Performance figures are historical and reflect the change in share price, reinvested distributions, changes in net asset value, sales charges and capital gains distributions, if any.
Not FDIC Insured – No Bank Guarantee – May Lose Value
Top Ten Holdings (as a % of Net Assets) †
| Riverfront Dynamic Core Income ETF | 27.32% |
| Riverfront Dynamic US Dividend Advantage ETF | 19.86% |
| Riverfront Dynamic US Flex-Cap ETF | 17.78% |
| First Trust Riverfront Dynamic Developed International ETF | 16.48% |
| Riverfront Dynamic Unconstrained Income ETF | 8.43% |
| First Trust Riverfront Dynamic Europe ETF | 5.91% |
| First Trust Riverfront Dynamic Emerging Markets ETF | 1.99% |
| First Trust Riverfront Dynamic Asia Pacific ETF | 1.02% |
| Top Ten Holdings | 98.79% |
| † | Holdings are subject to change, and may not reflect the current or future position of the portfolio. Table presents indicative values only. Excludes cash & cash equivalents. |
Portfolio Composition (as a % of Net Assets)
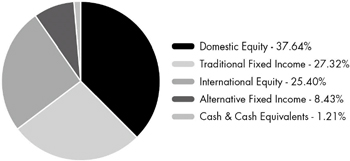
100 | April 30, 2018
RiverFront Asset Allocation Aggressive
| Statement of Investments | April 30, 2018 (Unaudited) |
| Shares | Value (Note 2) | |||||||
| EXCHANGE TRADED FUNDS (98.33%) | ||||||||
| Equity (98.33%) | ||||||||
| First Trust Riverfront Dynamic Asia Pacific ETF(a) | 54,215 | $ | 3,244,226 | |||||
| First Trust Riverfront Dynamic Developed International ETF(a) | 297,961 | 19,120,157 | ||||||
| First Trust Riverfront Dynamic Emerging Markets ETF(a) | 109,515 | 7,966,121 | ||||||
| First Trust Riverfront Dynamic Europe ETF(a) | 123,520 | 8,127,616 | ||||||
| Riverfront Dynamic US Dividend Advantage ETF(a) | 184,224 | 5,790,160 | ||||||
| Riverfront Dynamic US Flex-Cap ETF(a) | 382,105 | 12,381,425 | ||||||
| 56,629,705 | ||||||||
| TOTAL EXCHANGE TRADED FUNDS | ||||||||
| (Cost $57,435,474) | 56,629,705 | |||||||
| 7-Day Yield | Shares | Value (Note 2) | ||||||||||
| SHORT TERM INVESTMENTS (1.75%) | ||||||||||||
| Money Market Fund (1.75%) | ||||||||||||
| State Street Institutional Treasury Plus Money Market Fund | 1.611% | 1,008,942 | 1,008,942 | |||||||||
| TOTAL SHORT TERM INVESTMENTS | ||||||||||||
| (Cost $1,008,942) | 1,008,942 | |||||||||||
| TOTAL INVESTMENTS (100.08%) | ||||||||||||
| (Cost $58,444,416) | $ | 57,638,647 | ||||||||||
| Liabilities In Excess Of Other Assets (-0.08%) | (45,752 | ) | ||||||||||
| NET ASSETS (100.00%) | $ | 57,592,895 | ||||||||||
| (a) | Affiliated Company. See Note 7 in Notes to Financial Statements. |
For Fund compliance purposes, the Fund's industry classifications refer to any one or more of the industry sub-classifications used by one or more widely recognized market indexes or ratings group indexes, and/or as defined by Fund management. This definition may not apply for purposes of this report, which may combine industry sub-classifications for reporting ease. Industries are shown as a percent of net assets.
See Notes to Financial Statements.
101 | April 30, 2018
RiverFront Asset Allocation Growth
| Statement of Investments | April 30, 2018 (Unaudited) |
| Shares | Value (Note 2) | |||||||
| EXCHANGE TRADED FUNDS (99.05%) | ||||||||
| Debt (8.36%) | ||||||||
| Riverfront Dynamic Core Income ETF(a) | 44,982 | $ | 1,074,530 | |||||
| Riverfront Dynamic Unconstrained Income ETF(a) | 65,755 | 1,660,643 | ||||||
| 2,735,173 | ||||||||
| Equity (90.69%) | ||||||||
| First Trust Riverfront Dynamic Asia Pacific ETF(a) | 19,295 | 1,154,613 | ||||||
| First Trust Riverfront Dynamic Developed International ETF(a) | 140,306 | 9,003,436 | ||||||
| First Trust Riverfront Dynamic Emerging Markets ETF(a) | 50,767 | 3,692,792 | ||||||
| First Trust Riverfront Dynamic Europe ETF(a) | 69,809 | 4,593,432 | ||||||
| Riverfront Dynamic US Dividend Advantage ETF(a) | 123,972 | 3,896,440 | ||||||
| Riverfront Dynamic US Flex-Cap ETF(a) | 225,742 | 7,314,763 | ||||||
| 29,655,476 | ||||||||
| TOTAL EXCHANGE TRADED FUNDS | ||||||||
| (Cost $32,827,657) | 32,390,649 | |||||||
7-Day Yield | Shares | Value (Note 2) | ||||||||||
| SHORT TERM INVESTMENTS (1.24%) | ||||||||||||
| Money Market Fund (1.24%) | ||||||||||||
| State Street Institutional Treasury Plus Money Market Fund | 1.611% | 404,813 | 404,813 | |||||||||
| TOTAL SHORT TERM INVESTMENTS | ||||||||||||
| (Cost $404,813) | 404,813 | |||||||||||
| TOTAL INVESTMENTS (100.29%) | ||||||||||||
| (Cost $33,232,470) | $ | 32,795,462 | ||||||||||
| Liabilities In Excess Of Other Assets (-0.29%) | (94,804 | ) | ||||||||||
| NET ASSETS (100.00%) | $ | 32,700,658 | ||||||||||
| (a) | Affiliated Company. See Note 7 in Notes to Financial Statements. |
For Fund compliance purposes, the Fund's industry classifications refer to any one or more of the industry sub-classifications used by one or more widely recognized market indexes or ratings group indexes, and/or as defined by Fund management. This definition may not apply for purposes of this report, which may combine industry sub-classifications for reporting ease. Industries are shown as a percent of net assets.
See Notes to Financial Statements.
102 | April 30, 2018
RiverFront Asset Allocation Growth & Income
| Statement of Investments | April 30, 2018 (Unaudited) |
| Shares | Value (Note 2) | |||||||
| EXCHANGE TRADED FUNDS (97.68%) | ||||||||
| Debt (14.54%) | ||||||||
| Riverfront Dynamic Core Income ETF(a) | 246,026 | $ | 5,877,069 | |||||
| Riverfront Dynamic Unconstrained Income ETF(a) | 220,070 | 5,557,868 | ||||||
| 11,434,937 | ||||||||
| Equity (83.14%) | ||||||||
| First Trust Riverfront Dynamic Asia Pacific ETF(a) | 39,164 | 2,343,574 | ||||||
| First Trust Riverfront Dynamic Developed International ETF(a) | 277,676 | 17,818,469 | ||||||
| First Trust Riverfront Dynamic Emerging Markets ETF(a) | 107,996 | 7,855,629 | ||||||
| First Trust Riverfront Dynamic Europe ETF(a) | 147,854 | 9,728,793 | ||||||
| Riverfront Dynamic US Dividend Advantage ETF(a) | 532,118 | 16,724,469 | ||||||
| Riverfront Dynamic US Flex-Cap ETF(a) | 337,038 | 10,921,110 | ||||||
| 65,392,044 | ||||||||
| TOTAL EXCHANGE TRADED FUNDS | ||||||||
| (Cost $78,089,907) | 76,826,981 | |||||||
| 7-Day Yield | Shares | Value (Note 2) | ||||||||||
| SHORT TERM INVESTMENTS (2.32%) | ||||||||||||
| Money Market Fund (2.32%) | ||||||||||||
| State Street Institutional Treasury Plus Money Market Fund | 1.611% | 1,824,186 | 1,824,186 | |||||||||
| TOTAL SHORT TERM INVESTMENTS | ||||||||||||
| (Cost $1,824,186) | 1,824,186 | |||||||||||
| TOTAL INVESTMENTS (100.00%) | ||||||||||||
| (Cost $79,914,093) | $ | 78,651,167 | ||||||||||
| Liabilities In Excess Of Other Assets (0.00%) | (2,066 | ) | ||||||||||
| NET ASSETS (100.00%) | $ | 78,649,101 | ||||||||||
| (a) | Affiliated Company. See Note 7 in Notes to Financial Statements. |
For Fund compliance purposes, the Fund's industry classifications refer to any one or more of the industry sub-classifications used by one or more widely recognized market indexes or ratings group indexes, and/or as defined by Fund management. This definition may not apply for purposes of this report, which may combine industry sub-classifications for reporting ease. Industries are shown as a percent of net assets.
See Notes to Financial Statements.
103 | April 30, 2018
RiverFront Asset Allocation Moderate
| Statement of Investments | April 30, 2018 (Unaudited) |
| Shares | Value (Note 2) | |||||||
| EXCHANGE TRADED FUNDS (98.79%) | ||||||||
| Debt (35.75%) | ||||||||
| Riverfront Dynamic Core Income ETF(a) | 990,671 | $ | 23,665,149 | |||||
| Riverfront Dynamic Unconstrained Income ETF(a) | 289,052 | 7,300,008 | ||||||
| 30,965,157 | ||||||||
| Equity (63.04%) | ||||||||
| First Trust Riverfront Dynamic Asia Pacific ETF(a) | 14,705 | 879,947 | ||||||
| First Trust Riverfront Dynamic Developed International ETF(a) | 222,589 | 14,283,536 | ||||||
| First Trust Riverfront Dynamic Emerging Markets ETF(a) | 23,668 | 1,721,610 | ||||||
| First Trust Riverfront Dynamic Europe ETF(a) | 77,774 | 5,117,529 | ||||||
| Riverfront Dynamic US Dividend Advantage ETF(a) | 547,308 | 17,201,891 | ||||||
| Riverfront Dynamic US Flex-Cap ETF(a) | 475,324 | 15,402,019 | ||||||
| 54,606,532 | ||||||||
| TOTAL EXCHANGE TRADED FUNDS | ||||||||
| (Cost $86,928,509) | 85,571,689 | |||||||
| 7-Day Yield | Shares | Value (Note 2) | ||||||||||
| SHORT TERM INVESTMENTS (1.33%) | ||||||||||||
| Money Market Fund (1.33%) | ||||||||||||
| State Street Institutional Treasury Plus Money Market Fund | 1.611% | 1,157,220 | 1,157,220 | |||||||||
| TOTAL SHORT TERM INVESTMENTS | ||||||||||||
| (Cost $1,157,220) | 1,157,220 | |||||||||||
| TOTAL INVESTMENTS (100.12%) | ||||||||||||
| (Cost $88,085,729) | $ | 86,728,909 | ||||||||||
| Liabilities In Excess Of Other Assets (-0.12%) | (107,372 | ) | ||||||||||
| NET ASSETS (100.00%) | $ | 86,621,537 | ||||||||||
| (a) | Affiliated Company. See Note 7 in Notes to Financial Statements. |
For Fund compliance purposes, the Fund's industry classifications refer to any one or more of the industry sub-classifications used by one or more widely recognized market indexes or ratings group indexes, and/or as defined by Fund management. This definition may not apply for purposes of this report, which may combine industry sub-classifications for reporting ease. Industries are shown as a percent of net assets.
See Notes to Financial Statements.
104 | April 30, 2018
RiverFront Asset Allocation Income & Growth
| Statement of Investments | April 30, 2018 (Unaudited) |
| Shares | Value (Note 2) | |||||||
| EXCHANGE TRADED FUNDS (98.60%) | ||||||||
| Debt (63.73%) | ||||||||
| Riverfront Dynamic Core Income ETF(a) | 244,438 | $ | 5,839,135 | |||||
| Riverfront Dynamic Unconstrained Income ETF(a) | 35,603 | 899,154 | ||||||
| 6,738,289 | ||||||||
| Equity (34.87%) | ||||||||
| First Trust Riverfront Dynamic Asia Pacific ETF(a) | 1,769 | 105,857 | ||||||
| First Trust Riverfront Dynamic Developed International ETF(a) | 15,824 | 1,015,426 | ||||||
| First Trust Riverfront Dynamic Europe ETF(a) | 4,057 | 266,951 | ||||||
| Riverfront Dynamic US Dividend Advantage ETF(a) | 47,196 | 1,483,370 | ||||||
| Riverfront Dynamic US Flex-Cap ETF(a) | 25,143 | 814,714 | ||||||
| 3,686,318 | ||||||||
| TOTAL EXCHANGE TRADED FUNDS | ||||||||
| (Cost $10,563,671) | 10,424,607 | |||||||
7-Day Yield | Shares | Value (Note 2) | ||||||||||
| SHORT TERM INVESTMENTS (1.55%) | ||||||||||||
| Money Market Fund (1.55%) | ||||||||||||
| State Street Institutional Treasury Plus Money Market Fund | 1.611% | 163,774 | 163,774 | |||||||||
| TOTAL SHORT TERM INVESTMENTS | ||||||||||||
| (Cost $163,774) | 163,774 | |||||||||||
| TOTAL INVESTMENTS (100.15%) | ||||||||||||
| (Cost $10,727,445) | $ | 10,588,381 | ||||||||||
| Liabilities In Excess Of Other Assets (-0.15%) | (15,398 | ) | ||||||||||
| NET ASSETS (100.00%) | $ | 10,572,983 | ||||||||||
(a) | Affiliated Company. See Note 7 in Notes to Financial Statements. |
For Fund compliance purposes, the Fund's industry classifications refer to any one or more of the industry sub-classifications used by one or more widely recognized market indexes or ratings group indexes, and/or as defined by Fund management. This definition may not apply for purposes of this report, which may combine industry sub-classifications for reporting ease. Industries are shown as a percent of net assets.
See Notes to Financial Statements.
105 | April 30, 2018
| RiverFront Global Allocation Series |
| Statements of Assets and Liabilities | April 30, 2018 (Unaudited) |
| RiverFront Asset Allocation Aggressive | RiverFront Asset Allocation Growth | RiverFront Allocation | RiverFront Asset Allocation Moderate | RiverFront Asset Allocation Income & Growth | ||||||||||||||||
| ASSETS | ||||||||||||||||||||
| Investments, at value | $ | 1,008,942 | $ | 404,813 | $ | 1,824,186 | $ | 1,157,220 | $ | 163,774 | ||||||||||
| Investments in affiliates, at value | 56,629,705 | 32,390,649 | 76,826,981 | 85,571,689 | 10,424,607 | |||||||||||||||
| Receivable for shares sold | 9,656 | 5,924 | 63,145 | 16,481 | – | |||||||||||||||
| Dividends and interest receivable | 1,328 | 616 | 2,639 | 1,909 | 205 | |||||||||||||||
| Prepaid expenses and other assets | 1,085 | 682 | 682 | 682 | 682 | |||||||||||||||
| Total Assets | 57,650,716 | 32,802,684 | 78,717,633 | 86,747,981 | 10,589,268 | |||||||||||||||
| LIABILITIES | ||||||||||||||||||||
| Payable for investments purchased | – | – | – | 186 | – | |||||||||||||||
| Payable for shares redeemed | 19,381 | 72,932 | 13,373 | 47,565 | – | |||||||||||||||
| Unitary administrative fees payable | 11,946 | 6,765 | 16,241 | 17,991 | 2,197 | |||||||||||||||
| Administration and transfer agency fees payable | 2,598 | 2,463 | 3,278 | 4,256 | 1,328 | |||||||||||||||
| Distribution and services fees payable | 10,533 | 10,822 | 24,268 | 41,160 | 5,416 | |||||||||||||||
| Trustees' fees and expenses payable | 646 | 356 | 847 | 985 | 118 | |||||||||||||||
| Professional fees payable | 4,377 | 4,258 | 4,451 | 4,656 | 4,164 | |||||||||||||||
| Custody fees payable | 376 | 387 | 999 | 2,059 | 661 | |||||||||||||||
| Printing fees payable | 6,037 | 2,352 | 2,913 | 5,071 | 1,261 | |||||||||||||||
| Accrued expenses and other liabilities | 1,927 | 1,691 | 2,162 | 2,515 | 1,140 | |||||||||||||||
| Total Liabilities | 57,821 | 102,026 | 68,532 | 126,444 | 16,285 | |||||||||||||||
| NET ASSETS | $ | 57,592,895 | $ | 32,700,658 | $ | 78,649,101 | $ | 86,621,537 | $ | 10,572,983 | ||||||||||
| NET ASSETS CONSIST OF | ||||||||||||||||||||
| Paid-in capital | $ | 44,793,594 | $ | 26,206,457 | $ | 65,173,097 | $ | 74,745,733 | $ | 9,855,854 | ||||||||||
| Accumulated net investment income/(loss) | (66,504 | ) | (19,581 | ) | 36,931 | 65,294 | 11,457 | |||||||||||||
| Accumulated net realized gain | 13,671,574 | 6,950,790 | 14,701,999 | 13,167,330 | 844,736 | |||||||||||||||
| Net unrealized depreciation | (805,769 | ) | (437,008 | ) | (1,262,926 | ) | (1,356,820 | ) | (139,064 | ) | ||||||||||
| NET ASSETS | $ | 57,592,895 | $ | 32,700,658 | $ | 78,649,101 | $ | 86,621,537 | $ | 10,572,983 | ||||||||||
| INVESTMENTS, AT COST | $ | 1,008,942 | $ | 404,813 | $ | 1,824,186 | $ | 1,157,220 | $ | 163,774 | ||||||||||
| INVESTMENTS IN AFFILIATES, AT COST | $ | 57,435,474 | $ | 32,827,657 | $ | 78,089,907 | $ | 86,928,509 | $ | 10,563,671 | ||||||||||
See Notes to Financial Statements.
106 | April 30, 2018
| RiverFront Global Allocation Series |
| Statements of Assets and Liabilities (continued) | April 30, 2018 (Unaudited) |
| RiverFront Asset Allocation Aggressive | RiverFront Asset Allocation Growth | RiverFront Asset Allocation Growth & Income | RiverFront Asset Allocation Moderate | RiverFront Allocation | ||||||||||||||||
| PRICING OF SHARES | ||||||||||||||||||||
| Investor Class: | ||||||||||||||||||||
| Net Asset Value, offering and redemption price per share | $ | 16.01 | $ | 14.18 | $ | 14.32 | $ | 11.95 | $ | 10.96 | ||||||||||
| Net Assets | $ | 7,323,582 | $ | 7,731,181 | $ | 13,086,292 | $ | 11,365,621 | $ | 1,062,511 | ||||||||||
| Shares of beneficial interest outstanding (unlimited number of shares, no par value common stock authorized) | 457,432 | 545,401 | 913,568 | 951,145 | 96,932 | |||||||||||||||
| Class C: | ||||||||||||||||||||
| Net Asset Value, offering and redemption price per share(a) | $ | 15.43 | $ | 13.70 | $ | 13.97 | $ | 11.81 | $ | 10.82 | ||||||||||
| Net Assets | $ | 10,041,167 | $ | 11,113,097 | $ | 26,089,631 | $ | 46,772,476 | $ | 6,236,437 | ||||||||||
| Shares of beneficial interest outstanding (unlimited number of shares, no par value common stock authorized) | 650,764 | 811,026 | 1,868,082 | 3,961,893 | 576,154 | |||||||||||||||
| Class I: | ||||||||||||||||||||
| Net Asset Value, offering and redemption price per share | $ | 16.20 | $ | 14.00 | $ | 14.27 | $ | 11.96 | $ | 10.79 | ||||||||||
| Net Assets | $ | 13,833,273 | $ | 13,856,380 | $ | 39,473,178 | $ | 28,483,440 | $ | 3,274,035 | ||||||||||
| Shares of beneficial interest outstanding (unlimited number of shares, no par value common stock authorized) | 854,166 | 990,028 | 2,765,737 | 2,381,683 | 303,387 | |||||||||||||||
| Investor Class II: | ||||||||||||||||||||
| Net Asset Value, offering and redemption price per share | $ | 15.92 | N/A | N/A | N/A | N/A | ||||||||||||||
| Net Assets | $ | 3,194,997 | N/A | N/A | N/A | N/A | ||||||||||||||
| Shares of beneficial interest outstanding (unlimited number of shares, no par value common stock authorized) | 200,719 | N/A | N/A | N/A | N/A | |||||||||||||||
| Class L: | ||||||||||||||||||||
| Net Asset Value, offering and redemption price per share | $ | 16.17 | N/A | N/A | N/A | N/A | ||||||||||||||
| Net Assets | $ | 23,199,876 | N/A | N/A | N/A | N/A | ||||||||||||||
| Shares of beneficial interest outstanding (unlimited number of shares, no par value common stock authorized) | 1,434,671 | N/A | N/A | N/A | N/A | |||||||||||||||
| (a) | Redemption price per share may be reduced for any applicable contingent deferred sales charge. For a description of a possible sales charge, please see the Fund's Prospectus. |
See Notes to Financial Statements.
107 | April 30, 2018
| RiverFront Global Allocation Series |
| Statements of Operations | For the Six Months Ended April 30, 2018 (Unaudited) |
| RiverFront Asset Allocation Aggressive | RiverFront Asset | RiverFront Asset Allocation Growth & Income | RiverFront Asset Allocation Moderate | RiverFront Asset Allocation Income & Growth | ||||||||||||||||
| INVESTMENT INCOME | ||||||||||||||||||||
| Dividends | $ | 539,935 | $ | 283,063 | $ | 689,517 | $ | 813,087 | $ | 104,327 | ||||||||||
| Dividends from affiliated securities | 83,360 | 67,848 | 208,671 | 309,764 | 44,701 | |||||||||||||||
| Total Investment Income | 623,295 | 350,911 | 898,188 | 1,122,851 | 149,028 | |||||||||||||||
| EXPENSES | ||||||||||||||||||||
| Investment advisory fees | 169,822 | 93,008 | 221,717 | 260,937 | 31,047 | |||||||||||||||
| Administrative fees | 20,690 | 11,546 | 26,948 | 31,596 | 4,018 | |||||||||||||||
| Unitary administrative fees | 24,947 | 14,063 | 33,646 | 37,689 | 4,585 | |||||||||||||||
| Transfer agency fees | 2,163 | 1,845 | 3,036 | 4,348 | 526 | |||||||||||||||
| Distribution and service fees | ||||||||||||||||||||
| Investor Class(a) | 10,304 | 9,348 | 17,680 | 15,316 | 1,370 | |||||||||||||||
| Class C | 51,622 | 56,839 | 131,098 | 245,214 | 33,284 | |||||||||||||||
| Investor Class II(b) | 4,165 | – | – | – | – | |||||||||||||||
| Professional fees | 6,806 | 3,680 | 8,709 | 10,970 | 1,286 | |||||||||||||||
| Reports to shareholders and printing fees | 6,971 | 3,299 | 5,347 | 3,485 | 6,386 | |||||||||||||||
| State registration fees | 57,196 | 30,828 | 37,675 | 31,318 | 34,737 | |||||||||||||||
| Insurance fees | 411 | 220 | 521 | 742 | 77 | |||||||||||||||
| Custody fees | 1,634 | 1,541 | 2,395 | 5,689 | 1,157 | |||||||||||||||
| Trustees' fees and expenses | 1,036 | 566 | 1,352 | 1,529 | 190 | |||||||||||||||
| Miscellaneous expenses | 5,573 | 3,760 | 4,964 | 5,061 | 3,163 | |||||||||||||||
| Total Expenses | 363,340 | 230,543 | 495,088 | 653,894 | 121,826 | |||||||||||||||
| Less fees waived/reimbursed by investment advisor (Note 8) | ||||||||||||||||||||
| Investor Class(a) | (12,756 | ) | (11,537 | ) | (14,101 | ) | (10,646 | ) | (4,920 | ) | ||||||||||
| Class C | (15,886 | ) | (17,819 | ) | (25,725 | ) | (42,421 | ) | (30,176 | ) | ||||||||||
| Class I | (21,586 | ) | (22,435 | ) | (38,044 | ) | (26,408 | ) | (14,656 | ) | ||||||||||
| Investor Class II(b) | (5,132 | ) | – | – | – | – | ||||||||||||||
| Class L | (37,117 | ) | – | – | – | – | ||||||||||||||
| Net Expenses | 270,863 | 178,752 | 417,218 | 574,419 | 72,074 | |||||||||||||||
| Net Investment Income | 352,432 | 172,159 | 480,970 | 548,432 | 76,954 | |||||||||||||||
| Net realized gain on investments | 13,763,348 | 7,051,901 | 14,982,167 | 13,248,112 | 856,163 | |||||||||||||||
| Net realized gain/(loss) on investments - affiliated securities | (8,009 | ) | 3,638 | 18,793 | 67,681 | 4,396 | ||||||||||||||
| Net realized gain | 13,755,339 | 7,055,539 | 15,000,960 | 13,315,793 | 860,559 | |||||||||||||||
| Net change in unrealized depreciation on investments | (11,680,144 | ) | (6,108,864 | ) | (12,792,663 | ) | (11,299,184 | ) | (796,074 | ) | ||||||||||
| Net change in unrealized depreciation on investments - affiliated securities | (805,769 | ) | (462,055 | ) | (1,395,534 | ) | (1,583,489 | ) | (165,324 | ) | ||||||||||
| Net change in unrealized depreciation | (12,485,913 | ) | (6,570,919 | ) | (14,188,197 | ) | (12,882,673 | ) | (961,398 | ) | ||||||||||
| NET REALIZED AND UNREALIZED GAIN/(LOSS) ON INVESTMENTS | 1,269,426 | 484,620 | 812,763 | 433,120 | (100,839 | ) | ||||||||||||||
| NET INCREASE/(DECREASE) IN NET ASSETS RESULTING FROM OPERATIONS | $ | 1,621,858 | $ | 656,779 | $ | 1,293,733 | $ | 981,552 | $ | (23,885 | ) | |||||||||
| (a) | Prior to December 1, 2017, Investor Class was known as Class A. |
| (b) | Prior to December 1, 2017, Investor Class II was known as Investor Class. |
See Notes to Financial Statements.
108 | April 30, 2018
RiverFront Asset Allocation Aggressive
Statements of Changes in Net Assets
| For the Six Months Ended April 30, 2018 (Unaudited)(a) | For the Year Ended October 31, 2017 | |||||||
| OPERATIONS | ||||||||
| Net investment income | $ | 352,432 | $ | 628,235 | ||||
| Net realized gain | 13,755,339 | 2,808,836 | ||||||
| Net change in unrealized appreciation/(depreciation) | (12,485,913 | ) | 8,317,596 | |||||
| Net Increase in Net Assets Resulting from Operations | 1,621,858 | 11,754,667 | ||||||
| DISTRIBUTIONS | ||||||||
| Dividends to shareholders from net investment income | ||||||||
| Investor Class(b) | (107,899 | ) | (128,429 | ) | ||||
| Class C | (126,233 | ) | (142,083 | ) | ||||
| Class I | (180,836 | ) | (138,482 | ) | ||||
| Investor Class II(c) | (43,079 | ) | (59,987 | ) | ||||
| Class L | (326,955 | ) | (307,313 | ) | ||||
| Dividends to shareholders from net realized gains | ||||||||
| Investor Class(b) | (229,210 | ) | – | |||||
| Class C | (295,930 | ) | – | |||||
| Class I | (371,759 | ) | – | |||||
| Investor Class II(c) | (91,522 | ) | – | |||||
| Class L | (672,084 | ) | – | |||||
| Net Decrease in Net Assets from Distributions | (2,445,507 | ) | (776,294 | ) | ||||
| BENEFICIAL INTEREST TRANSACTIONS (NOTE 6) | ||||||||
| Shares sold | ||||||||
| Investor Class(b) | 290,489 | 2,063,170 | ||||||
| Class C | 973,726 | 1,240,140 | ||||||
| Class I | 1,308,351 | 5,495,281 | ||||||
| Investor Class II(c) | 30,491 | 153,063 | ||||||
| Class L | 1,473,346 | 3,049,507 | ||||||
| Dividends reinvested | �� | |||||||
| Investor Class(b) | 332,210 | 124,903 | ||||||
| Class C | 403,730 | 134,666 | ||||||
| Class I | 513,505 | 127,093 | ||||||
| Investor Class II(c) | 115,441 | 51,574 | ||||||
| Class L | 994,742 | 302,845 | ||||||
| Shares redeemed | ||||||||
| Investor Class(b) | (2,119,473 | ) | (4,592,296 | ) | ||||
| Class C | (1,548,454 | ) | (4,327,525 | ) | ||||
| Class I | (1,690,956 | ) | (4,213,503 | ) | ||||
| Investor Class II(c) | (348,765 | ) | (2,120,267 | ) | ||||
| Class L | (4,287,788 | ) | (4,915,621 | ) | ||||
| Net Decrease in Net Assets Derived from Beneficial Interest Transactions | (3,559,405 | ) | (7,426,970 | ) | ||||
| Net increase/(decrease) in net assets | (4,383,054 | ) | 3,551,403 | |||||
| NET ASSETS | ||||||||
| Beginning of period | 61,975,949 | 58,424,546 | ||||||
| End of period * | $ | 57,592,895 | $ | 61,975,949 | ||||
| *Including accumulated net investment income/(loss) of: | $ | (66,504 | ) | $ | 366,067 | |||
| (a) | Prior to February 28, 2018, the RiverFront Asset Allocation Aggressive was known as the RiverFront Global Growth Fund. |
| (b) | Prior to December 1, 2017, Investor Class was known as Class A. |
| (c) | Prior to December 1, 2017, Investor Class II was known as Investor Class. |
See Notes to Financial Statements.
109 | April 30, 2018
RiverFront Asset Allocation Growth
Statements of Changes in Net Assets
| For the Six Months Ended April 30, 2018 (Unaudited)(a) | For the Year Ended October 31, 2017 | |||||||
| OPERATIONS | ||||||||
| Net investment income | $ | 172,159 | $ | 329,943 | ||||
| Net realized gain | 7,055,539 | 1,681,636 | ||||||
| Net change in unrealized appreciation/(depreciation) | (6,570,919 | ) | 4,208,911 | |||||
| Net Increase in Net Assets Resulting from Operations | 656,779 | 6,220,490 | ||||||
| DISTRIBUTIONS | ||||||||
| Dividends to shareholders from net investment income | ||||||||
| Investor Class(b) | (77,899 | ) | (90,298 | ) | ||||
| Class C | (114,088 | ) | (183,505 | ) | ||||
| Class I | (168,010 | ) | (208,594 | ) | ||||
| Dividends to shareholders from net realized gains | ||||||||
| Investor Class(b) | (41,352 | ) | – | |||||
| Class C | (68,116 | ) | – | |||||
| Class I | (85,892 | ) | – | |||||
| Net Decrease in Net Assets from Distributions | (555,357 | ) | (482,397 | ) | ||||
| BENEFICIAL INTEREST TRANSACTIONS (NOTE 6) | ||||||||
| Shares sold | ||||||||
| Investor Class(b) | 948,341 | 1,515,630 | ||||||
| Class C | 972,313 | 820,360 | ||||||
| Class I | 1,389,860 | 2,726,015 | ||||||
| Dividends reinvested | ||||||||
| Investor Class(b) | 116,807 | 86,952 | ||||||
| Class C | 170,811 | 168,018 | ||||||
| Class I | 249,708 | 203,096 | ||||||
| Shares redeemed | ||||||||
| Investor Class(b) | (803,573 | ) | (1,801,890 | ) | ||||
| Class C | (1,380,140 | ) | (6,423,546 | ) | ||||
| Class I | (2,983,799 | ) | (4,514,866 | ) | ||||
| Net Decrease in Net Assets Derived from Beneficial Interest Transactions | (1,319,672 | ) | (7,220,231 | ) | ||||
| Net decrease in net assets | (1,218,250 | ) | (1,482,138 | ) | ||||
| NET ASSETS | ||||||||
| Beginning of period | 33,918,908 | 35,401,046 | ||||||
| End of period * | $ | 32,700,658 | $ | 33,918,908 | ||||
| *Including accumulated net investment income/(loss) of: | $ | (19,581 | ) | $ | 168,257 | |||
| (a) | Prior to February 28, 2018, the RiverFront Asset Allocation Growth was known as the RiverFront Global Allocation Fund. |
| (b) | Prior to December 1, 2017, Investor Class was known as Class A. |
See Notes to Financial Statements.
110 | April 30, 2018
RiverFront Asset Allocation Growth & Income
Statements of Changes in Net Assets
| For the Six Months Ended April 30, 2018 (Unaudited)(a) | For the Year Ended October 31, 2017 | |||||||
| OPERATIONS | ||||||||
| Net investment income | $ | 480,970 | $ | 841,529 | ||||
| Net realized gain | 15,000,960 | 3,867,027 | ||||||
| Net change in unrealized appreciation/(depreciation) | (14,188,197 | ) | 8,391,568 | |||||
| Net Increase in Net Assets Resulting from Operations | 1,293,733 | 13,100,124 | ||||||
| DISTRIBUTIONS | ||||||||
| Dividends to shareholders from net investment income | ||||||||
| Investor Class(b) | (80,373 | ) | (226,123 | ) | ||||
| Class C | (127,426 | ) | (246,391 | ) | ||||
| Class I | (252,222 | ) | (416,860 | ) | ||||
| Dividends to shareholders from net realized gains | ||||||||
| Investor Class(b) | (296,279 | ) | – | |||||
| Class C | (590,719 | ) | – | |||||
| Class I | (870,877 | ) | – | |||||
| Net Decrease in Net Assets from Distributions | (2,217,896 | ) | (889,374 | ) | ||||
| BENEFICIAL INTEREST TRANSACTIONS (NOTE 6) | ||||||||
| Shares sold | ||||||||
| Investor Class(b) | 780,098 | 2,098,660 | ||||||
| Class C | 2,355,095 | 2,376,050 | ||||||
| Class I | 11,770,562 | 7,915,259 | ||||||
| Dividends reinvested | ||||||||
| Investor Class(b) | 359,678 | 214,625 | ||||||
| Class C | 684,190 | 225,203 | ||||||
| Class I | 1,070,633 | 377,119 | ||||||
| Shares redeemed | ||||||||
| Investor Class(b) | (7,028,320 | ) | (6,388,976 | ) | ||||
| Class C | (3,102,522 | ) | (12,784,214 | ) | ||||
| Class I | (6,437,114 | ) | (8,400,004 | ) | ||||
| Net Increase/(Decrease) in Net Assets Derived from Beneficial Interest Transactions | 452,300 | (14,366,278 | ) | |||||
| Net decrease in net assets | (471,863 | ) | (2,155,528 | ) | ||||
| NET ASSETS | ||||||||
| Beginning of period | 79,120,964 | 81,276,492 | ||||||
| End of period * | $ | 78,649,101 | $ | 79,120,964 | ||||
| *Including accumulated net investment income of: | $ | 36,931 | $ | 15,982 | ||||
| (a) | Prior to February 28, 2018, the RiverFront Asset Allocation Growth & Income was known as the RiverFront Dynamic Equity Income Fund. |
| (b) | Prior to December 1, 2017, Investor Class was known as Class A. |
See Notes to Financial Statements.
111 | April 30, 2018
RiverFront Asset Allocation Moderate
Statements of Changes in Net Assets
| For the Six Months Ended April 30, 2018 (Unaudited)(a) | For the Year Ended October 31, 2017 | |||||||
| OPERATIONS | ||||||||
| Net investment income | $ | 548,432 | $ | 1,408,898 | ||||
| Net realized gain | 13,315,793 | 6,979,792 | ||||||
| Net change in unrealized appreciation/(depreciation) | (12,882,673 | ) | 5,632,698 | |||||
| Net Increase in Net Assets Resulting from Operations | 981,552 | 14,021,388 | ||||||
| DISTRIBUTIONS | ||||||||
| Dividends to shareholders from net investment income | ||||||||
| Investor Class(b) | (99,580 | ) | (272,881 | ) | ||||
| Class C | (259,491 | ) | (509,175 | ) | ||||
| Class I | (275,751 | ) | (667,961 | ) | ||||
| Dividends to shareholders from net realized gains | ||||||||
| Investor Class(b) | (576,041 | ) | – | |||||
| Class C | (2,292,405 | ) | – | |||||
| Class I | (1,393,561 | ) | – | |||||
| Net Decrease in Net Assets from Distributions | (4,896,829 | ) | (1,450,017 | ) | ||||
| BENEFICIAL INTEREST TRANSACTIONS (NOTE 6) | ||||||||
| Shares sold | ||||||||
| Investor Class(b) | 317,124 | 1,502,648 | ||||||
| Class C | 1,210,161 | 2,821,593 | ||||||
| Class I | 3,900,738 | 8,441,309 | ||||||
| Dividends reinvested | ||||||||
| Investor Class(b) | 622,597 | 237,474 | ||||||
| Class C | 2,252,721 | 425,136 | ||||||
| Class I | 1,559,611 | 549,599 | ||||||
| Shares redeemed | ||||||||
| Investor Class(b) | (2,380,956 | ) | (13,140,898 | ) | ||||
| Class C | (5,781,392 | ) | (21,454,023 | ) | ||||
| Class I | (6,618,931 | ) | (25,714,569 | ) | ||||
| Net Decrease in Net Assets Derived from Beneficial Interest Transactions | (4,918,327 | ) | (46,331,731 | ) | ||||
| Net decrease in net assets | (8,833,604 | ) | (33,760,360 | ) | ||||
| NET ASSETS | ||||||||
| Beginning of period | 95,455,141 | 129,215,501 | ||||||
| End of period * | $ | 86,621,537 | $ | 95,455,141 | ||||
| *Including accumulated net investment income of: | $ | 65,294 | $ | 151,684 | ||||
| (a) | Prior to February 28, 2018, the RiverFront Asset Allocation Moderate was known as the RiverFront Moderate Growth & Income Fund. |
| (b) | Prior to December 1, 2017, Investor Class was known as Class A. |
See Notes to Financial Statements.
112 | April 30, 2018
RiverFront Asset Allocation Income & Growth
Statements of Changes in Net Assets
| For the Six Months Ended April 30, 2018 (Unaudited)(a) | For the Year Ended October 31, 2017 | |||||||
| OPERATIONS | ||||||||
| Net investment income | $ | 76,954 | $ | 122,419 | ||||
| Net realized gain | 860,559 | 456,194 | ||||||
| Net change in unrealized appreciation/(depreciation) | (961,398 | ) | 344,786 | |||||
| Net Increase/(Decrease) in Net Assets Resulting from Operations | (23,885 | ) | 923,399 | |||||
| DISTRIBUTIONS | ||||||||
| Dividends to shareholders from net investment income | ||||||||
| Investor Class(b) | (9,450 | ) | (8,438 | ) | ||||
| Class C | (38,120 | ) | (85,999 | ) | ||||
| Class I | (32,106 | ) | (32,538 | ) | ||||
| Dividends to shareholders from net realized gains | ||||||||
| Investor Class(b) | (17,546 | ) | – | |||||
| Class C | (112,848 | ) | – | |||||
| Class I | (54,209 | ) | – | |||||
| Net Decrease in Net Assets from Distributions | (264,279 | ) | (126,975 | ) | ||||
| BENEFICIAL INTEREST TRANSACTIONS (NOTE 6) | ||||||||
| Shares sold | ||||||||
| Investor Class(b) | 84,373 | 665,209 | ||||||
| Class C | 296,926 | 1,197,684 | ||||||
| Class I | 953,617 | 936,031 | ||||||
| Dividends reinvested | ||||||||
| Investor Class(b) | 26,789 | 7,848 | ||||||
| Class C | 128,589 | 68,273 | ||||||
| Class I | 81,645 | 29,171 | ||||||
| Shares redeemed | ||||||||
| Investor Class(b) | (152,832 | ) | (629,479 | ) | ||||
| Class C | (1,250,014 | ) | (6,175,398 | ) | ||||
| Class I | (457,072 | ) | (597,368 | ) | ||||
| Net Decrease in Net Assets Derived from Beneficial Interest Transactions | (287,979 | ) | (4,498,029 | ) | ||||
| Net decrease in net assets | (576,143 | ) | (3,701,605 | ) | ||||
| NET ASSETS | ||||||||
| Beginning of period | 11,149,126 | 14,850,731 | ||||||
| End of period * | $ | 10,572,983 | $ | 11,149,126 | ||||
| *Including accumulated net investment income of: | $ | 11,457 | $ | 14,179 | ||||
| (a) | Prior to February 28, 2018, the RiverFront Asset Allocation Income & Growth was known as the RiverFront Conservative Income Builder Fund. |
| (b) | Prior to December 1, 2017, Investor Class was known as Class A. |
See Notes to Financial Statements.
113 | April 30, 2018
RiverFront Asset Allocation Aggressive – Investor Class
Financial Highlights
Selected data for a share of beneficial interest outstanding throughout the periods indicated:
For the Six Months Ended April 30, 2018 (Unaudited)(a)(b) | For the Year Ended October 31, 2017 | For the Year Ended October 31, 2016 | For the Year Ended October 31, 2015 | For the Fiscal Period Ended October 31, 2014(c) | For the Year Ended April 30, 2014 | ||||||||||||||
| Net asset value, beginning of period | $ | 16.27 | $ | 13.54 | $ | 13.95 | $ | 15.44 | $ | 15.26 | $ | 14.89 | |||||||
| INCOME/(LOSS) FROM INVESTMENT OPERATIONS: | |||||||||||||||||||
| Net investment income(d) | 0.09 | 0.16 | 0.23 | 0.24 | 0.08 | 0.12 | |||||||||||||
| Net realized and unrealized gain/(loss) | 0.31 | 2.76 | (0.31 | ) | (0.04 | ) | 0.10 | 1.88 | |||||||||||
| Total from investment operations | 0.40 | 2.92 | (0.08 | ) | 0.20 | 0.18 | 2.00 | ||||||||||||
| DISTRIBUTIONS: | |||||||||||||||||||
| From net investment income | (0.21 | ) | (0.19 | ) | (0.20 | ) | (0.25 | ) | – | (0.12 | ) | ||||||||
| From net realized gains | (0.45 | ) | – | (0.13 | ) | (1.44 | ) | – | (1.51 | ) | |||||||||
| Total distributions | (0.66 | ) | (0.19 | ) | (0.33 | ) | (1.69 | ) | – | (1.63 | ) | ||||||||
| Net increase/(decrease) in net asset value | (0.26 | ) | 2.73 | (0.41 | ) | (1.49 | ) | 0.18 | 0.37 | ||||||||||
| Net asset value, end of period | $ | 16.01 | $ | 16.27 | $ | 13.54 | $ | 13.95 | $ | 15.44 | $ | 15.26 | |||||||
| TOTAL RETURN(e) | 2.47 | % | 21.81 | % | (0.57 | )% | 1.34 | % | 1.18 | % | 13.66 | % | |||||||
| RATIOS/SUPPLEMENTAL DATA: | |||||||||||||||||||
| Net assets, end of period (000s) | $ | 7,324 | $ | 8,935 | $ | 9,618 | $ | 18,308 | $ | 16,694 | $ | 16,440 | |||||||
| Ratio of expenses to average net assets excluding fee waivers and reimbursements | 1.25 | %(f) | 1.45 | % | 1.40 | % | 1.38 | % | 1.38 | %(f) | 1.40 | % | |||||||
| Ratio of expenses to average net assets including fee waivers and reimbursements | 0.94 | %(f)(g) | 1.15 | % | 1.15 | % | 1.15 | % | 1.15 | %(f) | 1.15 | % | |||||||
| Ratio of net investment income to average net assets | 1.15 | %(f) | 1.09 | % | 1.77 | % | 1.67 | % | 1.08 | %(f) | 0.76 | % | |||||||
| Portfolio turnover rate(h) | 107 | % | 60 | % | 113 | % | 71 | % | 48 | % | 85 | % | |||||||
| (a) | Prior to December 1, 2017, Investor Class was known as Class A. |
| (b) | Prior to February 28, 2018, the RiverFront Asset Allocation Aggressive was known as the RiverFront Global Growth Fund. |
| (c) | Effective May 1, 2014, the Board approved changing the fiscal year-end of the Funds from April 30 to October 31. |
| (d) | Calculated using the average shares method. |
| (e) | Total returns are for the period indicated and have not been annualized. Total returns would have been lower had certain expenses not been waived during the period. Returns shown do not reflect the deduction of taxes that a shareholder would pay on Fund distributions or the redemption of Fund shares. Returns shown exclude any applicable sales charges. |
| (f) | Annualized. |
| (g) | Effective February 28, 2018, pursuant to the Administrative Services Agreement, the Fund pays an annual unitary administrative fee, which is based on the Fund’s average daily net assets, and will no longer pay a management fee or contractually limit the Fund’s total annual expenses. Refer to Note 8. |
| (h) | Portfolio turnover rate for periods less than one full year have not been annualized. |
See Notes to Financial Statements.
114 | April 30, 2018
RiverFront Asset Allocation Aggressive – Class C
Financial Highlights
Selected data for a share of beneficial interest outstanding throughout the periods indicated:
For the Six Months Ended April 30, 2018 (Unaudited)(a) | For the Year Ended October 31, 2017 | For the Year Ended October 31, 2016 | For the Year Ended October 31, 2015 | For the Fiscal Period Ended October 31, 2014(b) | For the Year Ended April 30, 2014 | ||||||||||||||
| Net asset value, beginning of period | $ | 15.73 | $ | 13.18 | $ | 13.67 | $ | 15.19 | $ | 15.07 | $ | 14.76 | |||||||
| INCOME/(LOSS) FROM INVESTMENT OPERATIONS: | |||||||||||||||||||
| Net investment income(c) | 0.03 | 0.04 | 0.12 | 0.13 | 0.03 | 0.01 | |||||||||||||
| Net realized and unrealized gain/(loss) | 0.31 | 2.68 | (0.30 | ) | (0.04 | ) | 0.09 | 1.86 | |||||||||||
| Total from investment operations | 0.34 | 2.72 | (0.18 | ) | 0.09 | 0.12 | 1.87 | ||||||||||||
| DISTRIBUTIONS: | |||||||||||||||||||
| From net investment income | (0.19 | ) | (0.17 | ) | (0.18 | ) | (0.17 | ) | – | (0.05 | ) | ||||||||
| From net realized gains | (0.45 | ) | – | (0.13 | ) | (1.44 | ) | – | (1.51 | ) | |||||||||
| Total distributions | (0.64 | ) | (0.17 | ) | (0.31 | ) | (1.61 | ) | – | (1.56 | ) | ||||||||
| Net increase/(decrease) in net asset value | (0.30 | ) | 2.55 | (0.49 | ) | (1.52 | ) | 0.12 | 0.31 | ||||||||||
| Net asset value, end of period | $ | 15.43 | $ | 15.73 | $ | 13.18 | $ | 13.67 | $ | 15.19 | $ | 15.07 | |||||||
| TOTAL RETURN(d) | 2.16 | % | 20.87 | % | (1.31 | )% | 0.59 | % | 0.80 | % | 12.84 | % | |||||||
| RATIOS/SUPPLEMENTAL DATA: | |||||||||||||||||||
| Net assets, end of period (000s) | $ | 10,041 | $ | 10,408 | $ | 11,447 | $ | 12,908 | $ | 11,420 | $ | 11,511 | |||||||
| Ratio of expenses to average net assets excluding fee waivers and reimbursements | 1.99 | %(e) | 2.20 | % | 2.16 | % | 2.13 | % | 2.13 | %(e) | 2.15 | % | |||||||
| Ratio of expenses to average net assets including fee waivers and reimbursements | 1.68 | %(e)(f) | 1.90 | % | 1.90 | % | 1.90 | % | 1.90 | %(e) | 1.90 | % | |||||||
| Ratio of net investment income to average net assets | 0.38 | %(e) | 0.29 | % | 0.92 | % | 0.88 | % | 0.38 | %(e) | 0.07 | % | |||||||
| Portfolio turnover rate(g) | 107 | % | 60 | % | 113 | % | 71 | % | 48 | % | 85 | % | |||||||
| (a) | Prior to February 28, 2018, the RiverFront Asset Allocation Aggressive was known as the RiverFront Global Growth Fund. |
| (b) | Effective May 1, 2014, the Board approved changing the fiscal year-end of the Funds from April 30 to October 31. |
| (c) | Calculated using the average shares method. |
| (d) | Total returns are for the period indicated and have not been annualized. Total returns would have been lower had certain expenses not been waived during the period. Returns shown do not reflect the deduction of taxes that a shareholder would pay on Fund distributions or the redemption of Fund shares. Returns shown exclude any applicable sales charges. |
| (e) | Annualized. |
| (f) | Effective February 28, 2018, pursuant to the Administrative Services Agreement, the Fund pays an annual unitary administrative fee, which is based on the Fund’s average daily net assets, and will no longer pay a management fee or contractually limit the Fund’s total annual expenses. Refer to Note 8. |
| (g) | Portfolio turnover rate for periods less than one full year have not been annualized. |
See Notes to Financial Statements.
115 | April 30, 2018
RiverFront Asset Allocation Aggressive – Class I
Financial Highlights
Selected data for a share of beneficial interest outstanding throughout the periods indicated:
For the Six Months Ended April 30, 2018 (Unaudited)(a) | For the Year Ended October 31, 2017 | For the Year Ended October 31, 2016 | For the Year Ended October 31, 2015 | For the Fiscal Period Ended October 31, 2014(b) | For the Year Ended April 30, 2014 | ||||||||||||||
| Net asset value, beginning of period | $ | 16.43 | $ | 13.65 | $ | 14.03 | $ | 15.52 | $ | 15.32 | $ | 14.92 | |||||||
| INCOME/(LOSS) FROM INVESTMENT OPERATIONS: | |||||||||||||||||||
| Net investment income(c) | 0.11 | 0.19 | 0.26 | 0.26 | 0.10 | 0.17 | |||||||||||||
| Net realized and unrealized gain/(loss) | 0.33 | 2.78 | (0.30 | ) | (0.03 | ) | 0.10 | 1.89 | |||||||||||
| Total from investment operations | 0.44 | 2.97 | (0.04 | ) | 0.23 | 0.20 | 2.06 | ||||||||||||
| DISTRIBUTIONS: | |||||||||||||||||||
| From net investment income | (0.22 | ) | (0.19 | ) | (0.21 | ) | (0.28 | ) | – | (0.15 | ) | ||||||||
| From net realized gains | (0.45 | ) | – | (0.13 | ) | (1.44 | ) | – | (1.51 | ) | |||||||||
| Total distributions | (0.67 | ) | (0.19 | ) | (0.34 | ) | (1.72 | ) | – | (1.66 | ) | ||||||||
| Net increase/(decrease) in net asset value | (0.23 | ) | 2.78 | (0.38 | ) | (1.49 | ) | 0.20 | 0.40 | ||||||||||
| Net asset value, end of period | $ | 16.20 | $ | 16.43 | $ | 13.65 | $ | 14.03 | $ | 15.52 | $ | 15.32 | |||||||
| TOTAL RETURN(d) | 2.67 | % | 22.05 | % | (0.31 | )% | 1.51 | % | 1.31 | % | 14.01 | % | |||||||
| RATIOS/SUPPLEMENTAL DATA: | |||||||||||||||||||
| Net assets, end of period (000s) | $ | 13,833 | $ | 13,873 | $ | 10,140 | $ | 16,412 | $ | 13,343 | $ | 11,845 | |||||||
| Ratio of expenses to average net assets excluding fee waivers and reimbursements | 0.99 | %(e) | 1.20 | % | 1.15 | % | 1.29 | % | 1.36 | %(e) | 1.16 | % | |||||||
| Ratio of expenses to average net assets including fee waivers and reimbursements | 0.68 | %(e)(f) | 0.90 | % | 0.90 | % | 0.90 | % | 0.90 | %(e) | 0.90 | % | |||||||
| Ratio of net investment income to average net assets | 1.36 | %(e) | 1.29 | % | 1.98 | % | 1.77 | % | 1.32 | %(e) | 1.13 | % | |||||||
| Portfolio turnover rate(g) | 107 | % | 60 | % | 113 | % | 71 | % | 48 | % | 85 | % | |||||||
| (a) | Prior to February 28, 2018, the RiverFront Asset Allocation Aggressive was known as the RiverFront Global Growth Fund. |
| (b) | Effective May 1, 2014, the Board approved changing the fiscal year-end of the Funds from April 30 to October 31. |
| (c) | Calculated using the average shares method. |
| (d) | Total returns are for the period indicated and have not been annualized. Total returns would have been lower had certain expenses not been waived during the period. Returns shown do not reflect the deduction of taxes that a shareholder would pay on Fund distributions or the redemption of Fund shares. |
| (e) | Annualized. |
| (f) | Effective February 28, 2018, pursuant to the Administrative Services Agreement, the Fund pays an annual unitary administrative fee, which is based on the Fund’s average daily net assets, and will no longer pay a management fee or contractually limit the Fund’s total annual expenses. Refer to Note 8. |
| (g) | Portfolio turnover rate for periods less than one full year have not been annualized. |
See Notes to Financial Statements.
116 | April 30, 2018
RiverFront Asset Allocation Aggressive – Investor Class II
Financial Highlights
Selected data for a share of beneficial interest outstanding throughout the periods indicated:
For the Six Months Ended April 30, 2018 (Unaudited)(a)(b) | For the Year Ended October 31, 2017 | For the Year Ended October 31, 2016 | For the Year Ended October 31, 2015 | For the Fiscal Period Ended October 31, 2014(c) | For the Year Ended April 30, 2014 | ||||||||||||||
| Net asset value, beginning of period | $ | 16.18 | $ | 13.47 | $ | 13.87 | $ | 15.37 | $ | 15.19 | $ | 14.82 | |||||||
| INCOME/(LOSS) FROM INVESTMENT OPERATIONS: | |||||||||||||||||||
| Net investment income(d) | 0.09 | 0.15 | 0.23 | 0.26 | 0.09 | 0.13 | |||||||||||||
| Net realized and unrealized gain/(loss) | 0.31 | 2.75 | (0.30 | ) | (0.07 | ) | 0.09 | 1.87 | |||||||||||
| Total from investment operations | 0.40 | 2.90 | (0.07 | ) | 0.19 | 0.18 | 2.00 | ||||||||||||
| DISTRIBUTIONS: | |||||||||||||||||||
| From net investment income | (0.21 | ) | (0.19 | ) | (0.20 | ) | (0.25 | ) | – | (0.12 | ) | ||||||||
| From net realized gains | (0.45 | ) | – | (0.13 | ) | (1.44 | ) | – | (1.51 | ) | |||||||||
| Total distributions | (0.66 | ) | (0.19 | ) | (0.33 | ) | (1.69 | ) | – | (1.63 | ) | ||||||||
| Net increase/(decrease) in net asset value | (0.26 | ) | 2.71 | (0.40 | ) | (1.50 | ) | 0.18 | 0.37 | ||||||||||
| Net asset value, end of period | $ | 15.92 | $ | 16.18 | $ | 13.47 | $ | 13.87 | $ | 15.37 | $ | 15.19 | |||||||
| TOTAL RETURN(e) | 2.48 | % | 21.77 | % | (0.51 | )% | 1.28 | % | 1.18 | % | 13.73 | % | |||||||
| RATIOS/SUPPLEMENTAL DATA: | |||||||||||||||||||
| Net assets, end of period (000s) | $ | 3,195 | $ | 3,451 | $ | 4,667 | $ | 6,924 | $ | 7,762 | $ | 8,361 | |||||||
| Ratio of expenses to average net assets excluding fee waivers and reimbursements | 1.24 | %(f) | 1.45 | % | 1.40 | % | 1.38 | % | 1.38 | %(f) | 1.41 | % | |||||||
| Ratio of expenses to average net assets including fee waivers and reimbursements | 0.93 | %(f)(g) | 1.15 | % | 1.15 | % | 1.15 | % | 1.15 | %(f) | 1.15 | % | |||||||
| Ratio of net investment income to average net assets | 1.12 | %(f) | 1.04 | % | 1.75 | % | 1.78 | % | 1.14 | %(f) | 0.85 | % | |||||||
| Portfolio turnover rate(h) | 107 | % | 60 | % | 113 | % | 71 | % | 48 | % | 85 | % | |||||||
| (a) | Prior to February 28, 2018, the RiverFront Asset Allocation Aggressive was known as the RiverFront Global Growth Fund. |
| (b) | Prior to December 1, 2017, Investor Class II was known as Investor Class. |
| (c) | Effective May 1, 2014, the Board approved changing the fiscal year-end of the Funds from April 30 to October 31. |
| (d) | Calculated using the average shares method. |
| (e) | Total returns are for the period indicated and have not been annualized. Total returns would have been lower had certain expenses not been waived during the period. Returns shown do not reflect the deduction of taxes that a shareholder would pay on Fund distributions or the redemption of Fund shares. |
| (f) | Annualized. |
| (g) | Effective February 28, 2018, pursuant to the Administrative Services Agreement, the Fund pays an annual unitary administrative fee, which is based on the Fund’s average daily net assets, and will no longer pay a management fee or contractually limit the Fund’s total annual expenses. Refer to Note 8. |
| (h) | Portfolio turnover rate for periods less than one full year have not been annualized. |
See Notes to Financial Statements.
117 | April 30, 2018
RiverFront Asset Allocation Aggressive – Class L
Financial Highlights
Selected data for a share of beneficial interest outstanding throughout the periods indicated:
| For the Six Months Ended April 30, 2018 (Unaudited)(a) | For the Year Ended October 31, 2017 | For the Year Ended October 31, 2016 | For the Year Ended October 31, 2015 | For the Fiscal Period Ended October 31, 2014(b) | For the Year Ended April 30, 2014 | ||||||||||||||
| Net asset value, beginning of period | $ | 16.41 | $ | 13.63 | $ | 14.01 | $ | 15.49 | $ | 15.29 | $ | 14.90 | |||||||
| INCOME/(LOSS) FROM INVESTMENT OPERATIONS: | |||||||||||||||||||
| Net investment income(c) | 0.12 | 0.19 | 0.25 | 0.27 | 0.11 | 0.17 | |||||||||||||
| Net realized and unrealized gain/(loss) | 0.31 | 2.78 | (0.29 | ) | (0.03 | ) | 0.09 | 1.88 | |||||||||||
| Total from investment operations | 0.43 | 2.97 | (0.04 | ) | 0.24 | 0.20 | 2.05 | ||||||||||||
| DISTRIBUTIONS: | |||||||||||||||||||
| From net investment income | (0.22 | ) | (0.19 | ) | (0.21 | ) | (0.28 | ) | – | (0.15 | ) | ||||||||
| From net realized gains | (0.45 | ) | – | (0.13 | ) | (1.44 | ) | – | (1.51 | ) | |||||||||
| Total distributions | (0.67 | ) | (0.19 | ) | (0.34 | ) | (1.72 | ) | – | (1.66 | ) | ||||||||
| Net increase/(decrease) in net asset value | (0.24 | ) | 2.78 | (0.38 | ) | (1.48 | ) | 0.20 | 0.39 | ||||||||||
| Net asset value, end of period | $ | 16.17 | $ | 16.41 | $ | 13.63 | $ | 14.01 | $ | 15.49 | $ | 15.29 | |||||||
| TOTAL RETURN(d) | 2.61 | % | 22.08 | % | (0.31 | )% | 1.59 | % | 1.31 | % | 13.98 | % | |||||||
| RATIOS/SUPPLEMENTAL DATA: | |||||||||||||||||||
| Net assets, end of period (000s) | $ | 23,200 | $ | 25,309 | $ | 22,552 | $ | 26,109 | $ | 24,400 | $ | 25,092 | |||||||
| Ratio of expenses to average net assets excluding fee waivers and reimbursements | 0.99 | %(e) | 1.20 | % | 1.16 | % | 1.04 | % | 1.02 | %(e) | 1.15 | % | |||||||
| Ratio of expenses to average net assets including fee waivers and reimbursements (includes acquired fund fee reimbursements) | 0.69 | %(e)(f) | 0.90 | % | 0.90 | % | 0.90 | % | 0.90 | %(e) | 0.90 | % | |||||||
| Ratio of expenses to average net assets including fee waivers and reimbursements (excludes acquired fund fee reimbursements) | 0.69 | %(e) | 0.90 | % | 0.90 | % | 0.90 | % | 0.90 | %(e) | 0.90 | % | |||||||
| Ratio of net investment income to average net assets | 1.42 | %(e) | 1.27 | % | 1.90 | % | 1.86 | % | 1.37 | %(e) | 1.11 | % | |||||||
| Portfolio turnover rate(g) | 107 | % | 60 | % | 113 | % | 71 | % | 48 | % | 85 | % | |||||||
| (a) | Prior to February 28, 2018, the RiverFront Asset Allocation Aggressive was known as the RiverFront Global Growth Fund. |
| (b) | Effective May 1, 2014, the Board approved changing the fiscal year-end of the Funds from April 30 to October 31. |
| (c) | Calculated using the average shares method. |
| (d) | Total returns are for the period indicated and have not been annualized. Total returns would have been lower had certain expenses not been waived during the period. Returns shown do not reflect the deduction of taxes that a shareholder would pay on Fund distributions or the redemption of Fund shares. |
| (e) | Annualized. |
| (f) | Effective February 28, 2018, pursuant to the Administrative Services Agreement, the Fund pays an annual unitary administrative fee, which is based on the Fund’s average daily net assets, and will no longer pay a management fee or contractually limit the Fund’s total annual expenses. Refer to Note 8. |
| (g) | Portfolio turnover rate for periods less than one full year have not been annualized. |
See Notes to Financial Statements.
118 | April 30, 2018
RiverFront Asset Allocation Growth – Investor Class
Financial Highlights
Selected data for a share of beneficial interest outstanding throughout the periods indicated:
For the Six Months Ended April 30, 2018 (Unaudited)(a)(b) | For the Year Ended October 31, 2017 | For the Year Ended October 31, 2016 | For the Year Ended October 31, 2015 | For the Fiscal Period Ended October 31, 2014(c) | For the Year Ended April 30, 2014 | ||||||||||||||
| Net asset value, beginning of period | $ | 14.12 | $ | 11.91 | $ | 12.20 | $ | 13.14 | $ | 12.97 | $ | 11.93 | |||||||
| INCOME/(LOSS) FROM INVESTMENT OPERATIONS: | |||||||||||||||||||
| Net investment income(d) | 0.08 | 0.15 | 0.21 | 0.22 | 0.08 | 0.10 | |||||||||||||
| Net realized and unrealized gain/(loss) | 0.22 | 2.23 | (0.32 | ) | (0.06 | ) | 0.09 | 1.36 | |||||||||||
| Total from investment operations | 0.30 | 2.38 | (0.11 | ) | 0.16 | 0.17 | 1.46 | ||||||||||||
| DISTRIBUTIONS: | |||||||||||||||||||
| From net investment income | (0.16 | ) | (0.17 | ) | (0.14 | ) | (0.21 | ) | – | (0.09 | ) | ||||||||
| From net realized gains | (0.08 | ) | – | (0.04 | ) | (0.89 | ) | – | (0.33 | ) | |||||||||
| Total distributions | (0.24 | ) | (0.17 | ) | (0.18 | ) | (1.10 | ) | – | (0.42 | ) | ||||||||
| Net increase/(decrease) in net asset value | 0.06 | 2.21 | (0.29 | ) | (0.94 | ) | 0.17 | 1.04 | |||||||||||
| Net asset value, end of period | $ | 14.18 | $ | 14.12 | $ | 11.91 | $ | 12.20 | $ | 13.14 | $ | 12.97 | |||||||
| TOTAL RETURN(e) | 2.12 | % | 20.22 | % | (0.88 | )% | 1.23 | % | 1.31 | % | 12.32 | % | |||||||
| RATIOS/SUPPLEMENTAL DATA: | |||||||||||||||||||
| Net assets, end of period (000s) | $ | 7,731 | $ | 7,452 | $ | 6,467 | $ | 8,456 | $ | 8,372 | $ | 9,098 | |||||||
| Ratio of expenses to average net assets excluding fee waivers and reimbursements | 1.23 | %(f) | 1.52 | % | 1.45 | % | 1.43 | % | 1.50 | %(f) | 1.51 | % | |||||||
| Ratio of expenses to average net assets including fee waivers and reimbursements | 0.92 | %(f)(g) | 1.15 | % | 1.15 | % | 1.15 | % | 1.15 | %(f) | 1.15 | % | |||||||
| Ratio of net investment income to average net assets | 1.16 | %(f) | 1.14 | % | 1.78 | % | 1.71 | % | 1.21 | %(f) | 0.83 | % | |||||||
| Portfolio turnover rate(h) | 110 | % | 56 | % | 124 | % | 71 | % | 47 | % | 95 | % | |||||||
| (a) | Prior to December 1, 2017, Investor Class was known as Class A. |
| (b) | Prior to February 28, 2018, the RiverFront Asset Allocation Growth was known as the RiverFront Global Allocation Fund. |
| (c) | Effective May 1, 2014, the Board approved changing the fiscal year-end of the Funds from April 30 to October 31. |
| (d) | Calculated using the average shares method. |
| (e) | Total returns are for the period indicated and have not been annualized. Total returns would have been lower had certain expenses not been waived during the period. Returns shown do not reflect the deduction of taxes that a shareholder would pay on Fund distributions or the redemption of Fund shares. Returns shown exclude any applicable sales charges. |
| (f) | Annualized. |
| (g) | Effective February 28, 2018, pursuant to the Administrative Services Agreement, the Fund pays an annual unitary administrative fee, which is based on the Fund’s average daily net assets, and will no longer pay a management fee or contractually limit the Fund’s total annual expenses. Refer to Note 8. |
| (h) | Portfolio turnover rate for periods less than one full year have not been annualized. |
See Notes to Financial Statements.
119 | April 30, 2018
RiverFront Asset Allocation Growth – Class C
Financial Highlights
Selected data for a share of beneficial interest outstanding throughout the periods indicated:
For the Six Months Ended April 30, 2018 (Unaudited)(a) | For the Year Ended October 31, 2017 | For the Year Ended October 31, 2016 | For the Year Ended October 31, 2015 | For the Fiscal Period Ended October 31, 2014(b) | For the Year Ended April 30, 2014 | ||||||||||||||
| Net asset value, beginning of period | $ | 13.69 | $ | 11.62 | $ | 11.98 | $ | 12.95 | $ | 12.83 | $ | 11.84 | |||||||
| INCOME/(LOSS) FROM INVESTMENT OPERATIONS: | |||||||||||||||||||
| Net investment income(c) | 0.03 | 0.05 | 0.11 | 0.12 | 0.03 | 0.01 | |||||||||||||
| Net realized and unrealized gain/(loss) | 0.20 | 2.17 | (0.31 | ) | (0.06 | ) | 0.09 | 1.34 | |||||||||||
| Total from investment operations | 0.23 | 2.22 | (0.20 | ) | 0.06 | 0.12 | 1.35 | ||||||||||||
| DISTRIBUTIONS: | |||||||||||||||||||
| From net investment income | (0.14 | ) | (0.15 | ) | (0.12 | ) | (0.14 | ) | – | (0.03 | ) | ||||||||
| From net realized gains | (0.08 | ) | – | (0.04 | ) | (0.89 | ) | – | (0.33 | ) | |||||||||
| Total distributions | (0.22 | ) | (0.15 | ) | (0.16 | ) | (1.03 | ) | – | (0.36 | ) | ||||||||
| Net increase/(decrease) in net asset value | 0.01 | 2.07 | (0.36 | ) | (0.97 | ) | 0.12 | 0.99 | |||||||||||
| Net asset value, end of period | $ | 13.70 | $ | 13.69 | $ | 11.62 | $ | 11.98 | $ | 12.95 | $ | 12.83 | |||||||
| TOTAL RETURN(d) | 1.69 | % | 19.36 | % | (1.61 | )% | 0.46 | % | 0.94 | % | 11.48 | % | |||||||
| RATIOS/SUPPLEMENTAL DATA: | |||||||||||||||||||
| Net assets, end of period (000s) | $ | 11,113 | $ | 11,341 | $ | 14,694 | $ | 17,089 | $ | 14,758 | $ | 14,624 | |||||||
| Ratio of expenses to average net assets excluding fee waivers and reimbursements | 1.99 | %(e) | 2.26 | % | 2.20 | % | 2.18 | % | 2.25 | %(e) | 2.26 | % | |||||||
| Ratio of expenses to average net assets including fee waivers and reimbursements | 1.68 | %(e)(f) | 1.90 | % | 1.90 | % | 1.90 | % | 1.90 | %(e) | 1.90 | % | |||||||
| Ratio of net investment income to average net assets | 0.44 | %(e) | 0.42 | % | 0.95 | % | 0.94 | % | 0.40 | %(e) | 0.05 | % | |||||||
| Portfolio turnover rate(g) | 110 | % | 56 | % | 124 | % | 71 | % | 47 | % | 95 | % | |||||||
| (a) | Prior to February 28, 2018, the RiverFront Asset Allocation Growth was known as the RiverFront Global Allocation Fund. |
| (b) | Effective May 1, 2014, the Board approved changing the fiscal year-end of the Funds from April 30 to October 31. |
| (c) | Calculated using the average shares method. |
| (d) | Total returns are for the period indicated and have not been annualized. Total returns would have been lower had certain expenses not been waived during the period. Returns shown do not reflect the deduction of taxes that a shareholder would pay on Fund distributions or the redemption of Fund shares. Returns shown exclude any applicable sales charges. |
| (e) | Annualized. |
| (f) | Effective February 28, 2018, pursuant to the Administrative Services Agreement, the Fund pays an annual unitary administrative fee, which is based on the Fund’s average daily net assets, and will no longer pay a management fee or contractually limit the Fund’s total annual expenses. Refer to Note 8. |
| (g) | Portfolio turnover rate for periods less than one full year have not been annualized. |
See Notes to Financial Statements.
120 | April 30, 2018
RiverFront Asset Allocation Growth – Class I
Financial Highlights
Selected data for a share of beneficial interest outstanding throughout the periods indicated:
For the Six Months Ended April 30, 2018 (Unaudited)(a) | For the Year Ended October 31, 2017 | For the Year Ended October 31, 2016 | For the Year Ended October 31, 2015 | For the Fiscal Period Ended October 31, 2014(b) | For the Year Ended April 30, 2014 | ||||||||||||||
| Net asset value, beginning of period | $ | 13.94 | $ | 11.73 | $ | 11.99 | $ | 12.92 | $ | 12.75 | $ | 11.72 | |||||||
| INCOME/(LOSS) FROM INVESTMENT OPERATIONS: | |||||||||||||||||||
| Net investment income(c) | 0.10 | 0.18 | 0.22 | 0.22 | 0.09 | 0.13 | |||||||||||||
| Net realized and unrealized gain/(loss) | 0.20 | 2.20 | (0.30 | ) | (0.04 | ) | 0.08 | 1.34 | |||||||||||
| Total from investment operations | 0.30 | 2.38 | (0.08 | ) | 0.18 | 0.17 | 1.47 | ||||||||||||
| DISTRIBUTIONS: | |||||||||||||||||||
| From net investment income | (0.16 | ) | (0.17 | ) | (0.14 | ) | (0.22 | ) | – | (0.11 | ) | ||||||||
| From net realized gains | (0.08 | ) | – | (0.04 | ) | (0.89 | ) | – | (0.33 | ) | |||||||||
| Total distributions | (0.24 | ) | (0.17 | ) | (0.18 | ) | (1.11 | ) | – | (0.44 | ) | ||||||||
| Net increase/(decrease) in net asset value | 0.06 | 2.21 | (0.26 | ) | (0.93 | ) | 0.17 | 1.03 | |||||||||||
| Net asset value, end of period | $ | 14.00 | $ | 13.94 | $ | 11.73 | $ | 11.99 | $ | 12.92 | $ | 12.75 | |||||||
| TOTAL RETURN(d) | 2.20 | % | 20.58 | % | (0.60 | )% | 1.49 | % | 1.33 | % | 12.61 | % | |||||||
| RATIOS/SUPPLEMENTAL DATA: | |||||||||||||||||||
| Net assets, end of period (000s) | $ | 13,856 | $ | 15,126 | $ | 14,240 | $ | 18,739 | $ | 12,895 | $ | 10,521 | |||||||
| Ratio of expenses to average net assets excluding fee waivers and reimbursements | 1.00 | %(e) | 1.27 | % | 1.20 | % | 1.18 | % | 1.26 | %(e) | 1.26 | % | |||||||
| Ratio of expenses to average net assets including fee waivers and reimbursements | 0.68 | %(e)(f) | 0.90 | % | 0.90 | % | 0.90 | % | 0.90 | %(e) | 0.90 | % | |||||||
| Ratio of net investment income to average net assets | 1.45 | %(e) | 1.39 | % | 1.94 | % | 1.83 | % | 1.41 | %(e) | 1.07 | % | |||||||
| Portfolio turnover rate(g) | 110 | % | 56 | % | 124 | % | 71 | % | 47 | % | 95 | % | |||||||
| (a) | Prior to February 28, 2018, the RiverFront Asset Allocation Growth was known as the RiverFront Global Allocation Fund. |
| (b) | Effective May 1, 2014, the Board approved changing the fiscal year-end of the Funds from April 30 to October 31. |
| (c) | Calculated using the average shares method. |
| (d) | Total returns are for the period indicated and have not been annualized. Total returns would have been lower had certain expenses not been waived during the period. Returns shown do not reflect the deduction of taxes that a shareholder would pay on Fund distributions or the redemption of Fund shares. |
| (e) | Annualized. |
| (f) | Effective February 28, 2018, pursuant to the Administrative Services Agreement, the Fund pays an annual unitary administrative fee, which is based on the Fund’s average daily net assets, and will no longer pay a management fee or contractually limit the Fund’s total annual expenses. Refer to Note 8. |
| (g) | Portfolio turnover rate for periods less than one full year have not been annualized. |
See Notes to Financial Statements.
121 | April 30, 2018
RiverFront Asset Allocation Growth & Income – Investor Class
Financial Highlights
Selected data for a share of beneficial interest outstanding throughout the periods indicated:
For the Six Months Ended April 30, 2018 (Unaudited)(a)(b) | For the Year Ended October 31, 2017 | For the Year Ended October 31, 2016 | For the Year Ended October 31, 2015 | For the Fiscal Period Ended October 31, 2014(c) | For the Year Ended April 30, 2014 | |||||||||||||||||||
| Net asset value, beginning of period | $ | 14.48 | $ | 12.38 | $ | 12.63 | $ | 13.10 | $ | 12.97 | $ | 12.24 | ||||||||||||
| INCOME/(LOSS) FROM INVESTMENT OPERATIONS: | ||||||||||||||||||||||||
| Net investment income(d) | 0.09 | 0.17 | 0.21 | 0.25 | 0.09 | 0.17 | ||||||||||||||||||
| Net realized and unrealized gain/(loss) | 0.16 | 2.09 | (0.00 | )(e) | (0.04 | ) | 0.13 | 1.17 | ||||||||||||||||
| Total from investment operations | 0.25 | 2.26 | 0.21 | 0.21 | 0.22 | 1.34 | ||||||||||||||||||
| DISTRIBUTIONS: | ||||||||||||||||||||||||
| From net investment income | (0.09 | ) | (0.16 | ) | (0.21 | ) | (0.22 | ) | (0.09 | ) | (0.17 | ) | ||||||||||||
| From net realized gains | (0.32 | ) | – | (0.25 | ) | (0.46 | ) | – | (0.44 | ) | ||||||||||||||
| Total distributions | (0.41 | ) | (0.16 | ) | (0.46 | ) | (0.68 | ) | (0.09 | ) | (0.61 | ) | ||||||||||||
| Net increase/(decrease) in net asset value | (0.16 | ) | 2.10 | (0.25 | ) | (0.47 | ) | 0.13 | 0.73 | |||||||||||||||
| Net asset value, end of period | $ | 14.32 | $ | 14.48 | $ | 12.38 | $ | 12.63 | $ | 13.10 | $ | 12.97 | ||||||||||||
| TOTAL RETURN(f) | 1.71 | % | 18.37 | % | 1.80 | % | 1.64 | % | 1.66 | % | 11.15 | % | ||||||||||||
| RATIOS/SUPPLEMENTAL DATA: | ||||||||||||||||||||||||
| Net assets, end of period (000s) | $ | 13,086 | $ | 19,123 | $ | 20,227 | $ | 19,769 | $ | 17,275 | $ | 15,374 | ||||||||||||
| Ratio of expenses to average net assets excluding fee waivers and reimbursements | 1.14 | %(g) | 1.37 | % | 1.35 | % | 1.35 | % | 1.39 | %(g) | 1.42 | % | ||||||||||||
| Ratio of expenses to average net assets including fee waivers and reimbursements | 0.94 | %(g)(h) | 1.15 | % | 1.15 | % | 1.15 | % | 1.15 | %(g) | 1.15 | % | ||||||||||||
| Ratio of net investment income to average net assets | 1.28 | %(g) | 1.24 | % | 1.74 | % | 1.98 | % | 1.33 | %(g) | 1.38 | % | ||||||||||||
| Portfolio turnover rate(i) | 116 | % | 63 | % | 129 | % | 75 | % | 45 | % | 99 | % | ||||||||||||
| (a) | Prior to December 1, 2017, Investor Class was known as Class A. |
| (b) | Prior to February 28, 2018, the RiverFront Asset Allocation Growth & Income was known as the RiverFront Dynamic Equity Income Fund. |
| (c) | Effective May 1, 2014, the Board approved changing the fiscal year-end of the Funds from April 30 to October 31. |
| (d) | Calculated using the average shares method. |
| (e) | Less than $0.005 or ($0.005) per share. |
| (f) | Total returns are for the period indicated and have not been annualized. Total returns would have been lower had certain expenses not been waived during the period. Returns shown do not reflect the deduction of taxes that a shareholder would pay on Fund distributions or the redemption of Fund shares. Returns shown exclude any applicable sales charges. |
| (g) | Annualized. |
| (h) | Effective February 28, 2018, pursuant to the Administrative Services Agreement, the Fund pays an annual unitary administrative fee, which is based on the Fund’s average daily net assets, and will no longer pay a management fee or contractually limit the Fund’s total annual expenses. Refer to Note 8. |
| (i) | Portfolio turnover rate for periods less than one full year have not been annualized. |
See Notes to Financial Statements.
122 | April 30, 2018
RiverFront Asset Allocation Growth & Income – Class C
Financial Highlights
Selected data for a share of beneficial interest outstanding throughout the periods indicated:
For the Six Months Ended April 30, 2018 (Unaudited)(a) | For the Year Ended October 31, 2017 | For the Year Ended October 31, 2016 | For the Year Ended October 31, 2015 | For the Fiscal Period Ended October 31, 2014(b) | For the Year Ended April 30, 2014 | |||||||||||||||||||
| Net asset value, beginning of period | $ | 14.16 | $ | 12.15 | $ | 12.44 | $ | 12.97 | $ | 12.84 | $ | 12.13 | ||||||||||||
| INCOME/(LOSS) FROM INVESTMENT OPERATIONS: | ||||||||||||||||||||||||
| Net investment income after reimbursements(c) | 0.04 | 0.07 | 0.13 | 0.15 | 0.04 | 0.08 | ||||||||||||||||||
| Net realized and unrealized gain/(loss) | 0.16 | 2.05 | (0.02 | ) | (0.04 | ) | 0.13 | 1.15 | ||||||||||||||||
| Total from investment operations | 0.20 | 2.12 | 0.11 | 0.11 | 0.17 | 1.23 | ||||||||||||||||||
| DISTRIBUTIONS: | ||||||||||||||||||||||||
| From net investment income | (0.07 | ) | (0.11 | ) | (0.15 | ) | (0.18 | ) | (0.04 | ) | (0.08 | ) | ||||||||||||
| From net realized gains | (0.32 | ) | – | (0.25 | ) | (0.46 | ) | – | (0.44 | ) | ||||||||||||||
| Total distributions | (0.39 | ) | (0.11 | ) | (0.40 | ) | (0.64 | ) | (0.04 | ) | (0.52 | ) | ||||||||||||
| Net increase/(decrease) in net asset value | (0.19 | ) | 2.01 | (0.29 | ) | (0.53 | ) | 0.13 | 0.71 | |||||||||||||||
| Net asset value, end of period | $ | 13.97 | $ | 14.16 | $ | 12.15 | $ | 12.44 | $ | 12.97 | $ | 12.84 | ||||||||||||
| TOTAL RETURN(d) | 1.41 | % | 17.53 | % | 0.97 | % | 0.86 | % | 1.30 | % | 10.34 | % | ||||||||||||
| RATIOS/SUPPLEMENTAL DATA: | ||||||||||||||||||||||||
| Net assets, end of period (000s) | $ | 26,090 | $ | 26,514 | $ | 32,217 | $ | 34,766 | $ | 30,170 | $ | 25,787 | ||||||||||||
| Ratio of expenses to average net assets excluding fee waivers and reimbursements | 1.87 | %(e) | 2.12 | % | 2.10 | % | 2.10 | % | 2.15 | %(e) | 2.18 | % | ||||||||||||
| Ratio of expenses to average net assets including fee waivers and reimbursements | 1.68 | %(e)(f) | 1.90 | % | 1.90 | % | 1.90 | % | 1.90 | %(e) | 1.90 | % | ||||||||||||
| Ratio of net investment income to average net assets | 0.60 | %(e) | 0.51 | % | 1.08 | % | 1.18 | % | 0.60 | %(e) | 0.61 | % | ||||||||||||
| Portfolio turnover rate(g) | 116 | % | 63 | % | 129 | % | 75 | % | 45 | % | 99 | % | ||||||||||||
| (a) | Prior to February 28, 2018, the RiverFront Asset Allocation Growth & Income was known as the RiverFront Dynamic Equity Income Fund. |
| (b) | Effective May 1, 2014, the Board approved changing the fiscal year-end of the Funds from April 30 to October 31. |
| (c) | Calculated using the average shares method. |
| (d) | Total returns are for the period indicated and have not been annualized. Total returns would have been lower had certain expenses not been waived during the period. Returns shown do not reflect the deduction of taxes that a shareholder would pay on Fund distributions or the redemption of Fund shares. Returns shown exclude any applicable sales charges. |
| (e) | Annualized. |
| (f) | Effective February 28, 2018, pursuant to the Administrative Services Agreement, the Fund pays an annual unitary administrative fee, which is based on the Fund’s average daily net assets, and will no longer pay a management fee or contractually limit the Fund’s total annual expenses. Refer to Note 8. |
| (g) | Portfolio turnover rate for periods less than one full year have not been annualized. |
See Notes to Financial Statements.
123 | April 30, 2018
RiverFront Asset Allocation Growth & Income – Class I
Financial Highlights
Selected data for a share of beneficial interest outstanding throughout the periods indicated:
For the Six Months Ended April 30, 2018 (Unaudited)(a) | For the Year Ended October 31, 2017 | For the Year Ended October 31, 2016 | For the Year Ended October 31, 2015 | For the Fiscal Period Ended October 31, 2014(b) | For the Year Ended April 30, 2014 | |||||||||||||||||||
| Net asset value, beginning of period | $ | 14.42 | $ | 12.31 | $ | 12.56 | $ | 13.02 | $ | 12.88 | $ | 12.16 | ||||||||||||
| INCOME/(LOSS) FROM INVESTMENT OPERATIONS: | ||||||||||||||||||||||||
| Net investment income(c) | 0.12 | 0.20 | 0.25 | 0.28 | 0.10 | 0.20 | ||||||||||||||||||
| Net realized and unrealized gain/(loss) | 0.14 | 2.09 | (0.01 | ) | (0.05 | ) | 0.14 | 1.16 | ||||||||||||||||
| Total from investment operations | 0.26 | 2.29 | 0.24 | 0.23 | 0.24 | 1.36 | ||||||||||||||||||
| DISTRIBUTIONS: | ||||||||||||||||||||||||
| From net investment income | (0.09 | ) | (0.18 | ) | (0.24 | ) | (0.23 | ) | (0.10 | ) | (0.20 | ) | ||||||||||||
| From net realized gains | (0.32 | ) | – | (0.25 | ) | (0.46 | ) | – | (0.44 | ) | ||||||||||||||
| Total distributions | (0.41 | ) | (0.18 | ) | (0.49 | ) | (0.69 | ) | (0.10 | ) | (0.64 | ) | ||||||||||||
| Net increase/(decrease) in net asset value | (0.15 | ) | 2.11 | (0.25 | ) | (0.46 | ) | 0.14 | 0.72 | |||||||||||||||
| Net asset value, end of period | $ | 14.27 | $ | 14.42 | $ | 12.31 | $ | 12.56 | $ | 13.02 | $ | 12.88 | ||||||||||||
| TOTAL RETURN(d) | 1.83 | % | 18.75 | % | 2.01 | % | 1.83 | % | 1.88 | % | 11.40 | % | ||||||||||||
| RATIOS/SUPPLEMENTAL DATA: | ||||||||||||||||||||||||
| Net assets, end of period (000s) | $ | 39,473 | $ | 33,484 | $ | 28,833 | $ | 22,780 | $ | 20,997 | $ | 18,254 | ||||||||||||
| Ratio of expenses to average net assets excluding fee waivers and reimbursements | 0.88 | %(e) | 1.12 | % | 1.10 | % | 1.10 | % | 1.15 | %(e) | 1.17 | % | ||||||||||||
| Ratio of expenses to average net assets including fee waivers and reimbursements | 0.68 | %(e)(f) | 0.90 | % | 0.90 | % | 0.90 | % | 0.90 | %(e) | 0.90 | % | ||||||||||||
| Ratio of net investment income to average net assets | 1.60 | %(e) | 1.50 | % | 2.06 | % | 2.21 | % | 1.57 | %(e) | 1.61 | % | ||||||||||||
| Portfolio turnover rate(g) | 116 | % | 63 | % | 129 | % | 75 | % | 45 | % | 99 | % | ||||||||||||
| (a) | Prior to February 28, 2018, the RiverFront Asset Allocation Growth & Income was known as the RiverFront Dynamic Equity Income Fund. |
| (b) | Effective May 1, 2014, the Board approved changing the fiscal year-end of the Funds from April 30 to October 31. |
| (c) | Calculated using the average shares method. |
| (d) | Total returns are for the period indicated and have not been annualized. Total returns would have been lower had certain expenses not been waived during the period. Returns shown do not reflect the deduction of taxes that a shareholder would pay on Fund distributions or the redemption of Fund shares. |
| (e) | Annualized. |
| (f) | Effective February 28, 2018, pursuant to the Administrative Services Agreement, the Fund pays an annual unitary administrative fee, which is based on the Fund’s average daily net assets, and will no longer pay a management fee or contractually limit the Fund’s total annual expenses. Refer to Note 8. |
| (g) | Portfolio turnover rate for periods less than one full year have not been annualized. |
See Notes to Financial Statements.
124 | April 30, 2018
RiverFront Asset Allocation Moderate – Investor Class
Financial Highlights
Selected data for a share of beneficial interest outstanding throughout the periods indicated:
For the Six Months Ended April 30, 2018 (Unaudited)(a)(b) | For the Year Ended October 31, 2017 | For the Year Ended October 31, 2016 | For the Year Ended October 31, 2015 | For the Fiscal Period Ended October 31, 2014(c) | For the Year Ended April 30, 2014 | |||||||||||||||||||
| Net asset value, beginning of period | $ | 12.47 | $ | 11.22 | $ | 11.48 | $ | 12.15 | $ | 11.99 | $ | 11.66 | ||||||||||||
| INCOME/(LOSS) FROM INVESTMENT OPERATIONS: | ||||||||||||||||||||||||
| Net investment income(d) | 0.09 | 0.18 | 0.21 | 0.23 | 0.09 | 0.16 | ||||||||||||||||||
| Net realized and unrealized gain/(loss) | 0.06 | 1.23 | (0.01 | ) | (0.06 | ) | 0.16 | 0.89 | ||||||||||||||||
| Total from investment operations | 0.15 | 1.41 | 0.20 | 0.17 | 0.25 | 1.05 | ||||||||||||||||||
| DISTRIBUTIONS: | ||||||||||||||||||||||||
| From net investment income | (0.10 | ) | (0.16 | ) | (0.21 | ) | (0.20 | ) | (0.09 | ) | (0.16 | ) | ||||||||||||
| From net realized gains | (0.57 | ) | – | (0.25 | ) | (0.64 | ) | – | (0.56 | ) | ||||||||||||||
| Total distributions | (0.67 | ) | (0.16 | ) | (0.46 | ) | (0.84 | ) | (0.09 | ) | (0.72 | ) | ||||||||||||
| Net increase/(decrease) in net asset value | (0.52 | ) | 1.25 | (0.26 | ) | (0.67 | ) | 0.16 | 0.33 | |||||||||||||||
| Net asset value, end of period | $ | 11.95 | $ | 12.47 | $ | 11.22 | $ | 11.48 | $ | 12.15 | $ | 11.99 | ||||||||||||
| TOTAL RETURN(e) | 1.15 | % | 12.67 | % | 1.81 | % | 1.33 | % | 2.12 | % | 9.16 | % | ||||||||||||
| RATIOS/SUPPLEMENTAL DATA: | ||||||||||||||||||||||||
| Net assets, end of period (000s) | $ | 11,366 | $ | 13,311 | $ | 22,679 | $ | 24,402 | $ | 27,598 | $ | 31,033 | ||||||||||||
| Ratio of expenses to average net assets excluding fee waivers and reimbursements | 1.12 | %(f) | 1.33 | % | 1.31 | % | 1.30 | % | 1.31 | %(f) | 1.32 | % | ||||||||||||
| Ratio of expenses to average net assets including fee waivers and reimbursements | 0.94 | %(f)(g) | 1.15 | % | 1.15 | % | 1.15 | % | 1.15 | %(f) | 1.15 | % | ||||||||||||
| Ratio of net investment income to average net assets | 1.53 | %(f) | 1.49 | % | 1.87 | % | 1.97 | % | 1.54 | %(f) | 1.35 | % | ||||||||||||
| Portfolio turnover rate(h) | 109 | % | 56 | % | 132 | % | 110 | % | 42 | % | 98 | % | ||||||||||||
| (a) | Prior to December 1, 2017, Investor Class was known as Class A. |
| (b) | Prior to February 28, 2018, the RiverFront Asset Allocation Moderate was known as the RiverFront Moderate Growth & Income Fund. |
| (c) | Effective May 1, 2014, the Board approved changing the fiscal year-end of the Funds from April 30 to October 31. |
| (d) | Calculated using the average shares method. |
| (e) | Total returns are for the period indicated and have not been annualized. Total returns would have been lower had certain expenses not been waived during the period. Returns shown do not reflect the deduction of taxes that a shareholder would pay on Fund distributions or the redemption of Fund shares. Returns shown exclude any applicable sales charges. |
| (f) | Annualized. |
| (g) | Effective February 28, 2018, pursuant to the Administrative Services Agreement, the Fund pays an annual unitary administrative fee, which is based on the Fund’s average daily net assets, and will no longer pay a management fee or contractually limit the Fund’s total annual expenses. Refer to Note 8. |
| (h) | Portfolio turnover rate for periods less than one full year have not been annualized. |
See Notes to Financial Statements.
125 | April 30, 2018
RiverFront Asset Allocation Moderate – Class C
Financial Highlights
Selected data for a share of beneficial interest outstanding throughout the periods indicated:
For the Six Months Ended April 30, 2018 (Unaudited)(a) | For the Year Ended October 31, 2017 | For the Year Ended October 31, 2016 | For the Year Ended October 31, 2015 | For the Fiscal Period Ended October 31, 2014(b) | For the Year Ended April 30, 2014 | |||||||||||||||||||
| Net asset value, beginning of period | $ | 12.34 | $ | 11.12 | $ | 11.39 | $ | 12.10 | $ | 11.94 | $ | 11.62 | ||||||||||||
| INCOME/(LOSS) FROM INVESTMENT OPERATIONS: | ||||||||||||||||||||||||
| Net investment income after reimbursements(c) | 0.05 | 0.08 | 0.13 | 0.13 | 0.05 | 0.07 | ||||||||||||||||||
| Net realized and unrealized gain/(loss) | 0.05 | 1.24 | (0.02 | ) | (0.06 | ) | 0.16 | 0.89 | ||||||||||||||||
| Total from investment operations | 0.10 | 1.32 | 0.11 | 0.07 | 0.21 | 0.96 | ||||||||||||||||||
| DISTRIBUTIONS: | ||||||||||||||||||||||||
| From net investment income | (0.06 | ) | (0.10 | ) | (0.13 | ) | (0.14 | ) | (0.05 | ) | (0.08 | ) | ||||||||||||
| From net realized gains | (0.57 | ) | – | (0.25 | ) | (0.64 | ) | – | (0.56 | ) | ||||||||||||||
| Total distributions | (0.63 | ) | (0.10 | ) | (0.38 | ) | (0.78 | ) | (0.05 | ) | (0.64 | ) | ||||||||||||
| Net increase/(decrease) in net asset value | (0.53 | ) | 1.22 | (0.27 | ) | (0.71 | ) | 0.16 | 0.32 | |||||||||||||||
| Net asset value, end of period | $ | 11.81 | $ | 12.34 | $ | 11.12 | $ | 11.39 | $ | 12.10 | $ | 11.94 | ||||||||||||
| TOTAL RETURN(d) | 0.79 | % | 11.94 | % | 1.03 | % | 0.52 | % | 1.75 | % | 8.33 | % | ||||||||||||
| RATIOS/SUPPLEMENTAL DATA: | ||||||||||||||||||||||||
| Net assets, end of period (000s) | $ | 46,772 | $ | 51,231 | $ | 63,480 | $ | 70,771 | $ | 66,445 | $ | 63,031 | ||||||||||||
| Ratio of expenses to average net assets excluding fee waivers and reimbursements | 1.86 | %(e) | 2.08 | % | 2.06 | % | 2.05 | % | 2.07 | %(e) | 2.07 | % | ||||||||||||
| Ratio of expenses to average net assets including fee waivers and reimbursements | 1.68 | %(e)(f) | 1.90 | % | 1.90 | % | 1.90 | % | 1.90 | %(e) | 1.90 | % | ||||||||||||
| Ratio of net investment income to average net assets | 0.77 | %(e) | 0.70 | % | 1.14 | % | 1.14 | % | 0.77 | %(e) | 0.59 | % | ||||||||||||
| Portfolio turnover rate(g) | 109 | % | 56 | % | 132 | % | 110 | % | 42 | % | 98 | % | ||||||||||||
| (a) | Prior to February 28, 2018, the RiverFront Asset Allocation Moderate was known as the RiverFront Moderate Growth & Income Fund. |
| (b) | Effective May 1, 2014, the Board approved changing the fiscal year-end of the Funds from April 30 to October 31. |
| (c) | Calculated using the average shares method. |
| (d) | Total returns are for the period indicated and have not been annualized. Total returns would have been lower had certain expenses not been waived during the period. Returns shown do not reflect the deduction of taxes that a shareholder would pay on Fund distributions or the redemption of Fund shares. Returns shown exclude any applicable sales charges. |
| (e) | Annualized. |
| (f) | Effective February 28, 2018, pursuant to the Administrative Services Agreement, the Fund pays an annual unitary administrative fee, which is based on the Fund’s average daily net assets, and will no longer pay a management fee or contractually limit the Fund’s total annual expenses. Refer to Note 8. |
| (g) | Portfolio turnover rate for periods less than one full year have not been annualized. |
See Notes to Financial Statements.
126 | April 30, 2018
RiverFront Asset Allocation Moderate – Class I
Financial Highlights
Selected data for a share of beneficial interest outstanding throughout the periods indicated:
For the Six Months Ended April 30, 2018 (Unaudited)(a) | For the Year Ended October 31, 2017 | For the Year Ended October 31, 2016 | For the Year Ended October 31, 2015 | For the Fiscal Period Ended October 31, 2014(b) | For the Year Ended April 30, 2014 | |||||||||||||||||||
| Net asset value, beginning of period | $ | 12.48 | $ | 11.21 | $ | 11.47 | $ | 12.14 | $ | 11.98 | $ | 11.65 | ||||||||||||
| INCOME/(LOSS) FROM INVESTMENT OPERATIONS: | ||||||||||||||||||||||||
| Net investment income(c) | 0.11 | 0.20 | 0.24 | 0.25 | 0.11 | 0.19 | ||||||||||||||||||
| Net realized and unrealized gain/(loss) | 0.05 | 1.25 | (0.01 | ) | (0.06 | ) | 0.16 | 0.89 | ||||||||||||||||
| Total from investment operations | 0.16 | 1.45 | 0.23 | 0.19 | 0.27 | 1.08 | ||||||||||||||||||
| DISTRIBUTIONS: | ||||||||||||||||||||||||
| From net investment income | (0.11 | ) | (0.18 | ) | (0.24 | ) | (0.22 | ) | (0.11 | ) | (0.19 | ) | ||||||||||||
| From net realized gains | (0.57 | ) | – | (0.25 | ) | (0.64 | ) | – | (0.56 | ) | ||||||||||||||
| Total distributions | (0.68 | ) | (0.18 | ) | (0.49 | ) | (0.86 | ) | (0.11 | ) | (0.75 | ) | ||||||||||||
| Net increase/(decrease) in net asset value | (0.52 | ) | 1.27 | (0.26 | ) | (0.67 | ) | 0.16 | 0.33 | |||||||||||||||
| Net asset value, end of period | $ | 11.96 | $ | 12.48 | $ | 11.21 | $ | 11.47 | $ | 12.14 | $ | 11.98 | ||||||||||||
| TOTAL RETURN(d) | 1.27 | % | 13.05 | % | 2.05 | % | 1.50 | % | 2.25 | % | 9.43 | % | ||||||||||||
| RATIOS/SUPPLEMENTAL DATA: | ||||||||||||||||||||||||
| Net assets, end of period (000s) | $ | 28,483 | $ | 30,913 | $ | 43,056 | $ | 46,350 | $ | 42,081 | $ | 37,832 | ||||||||||||
| Ratio of expenses to average net assets excluding fee waivers and reimbursements | 0.86 | %(e) | 1.08 | % | 1.06 | % | 1.05 | % | 1.07 | %(e) | 1.07 | % | ||||||||||||
| Ratio of expenses to average net assets including fee waivers and reimbursements | 0.69 | %(e)(f) | 0.90 | % | 0.90 | % | 0.90 | % | 0.90 | %(e) | 0.90 | % | ||||||||||||
| Ratio of net investment income to average net assets | 1.75 | %(e) | 1.71 | % | 2.16 | % | 2.16 | % | 1.77 | %(e) | 1.59 | % | ||||||||||||
| Portfolio turnover rate(g) | 109 | % | 56 | % | 132 | % | 110 | % | 42 | % | 98 | % | ||||||||||||
| (a) | Prior to February 28, 2018, the RiverFront Asset Allocation Moderate was known as the RiverFront Moderate Growth & Income Fund. |
| (b) | Effective May 1, 2014, the Board approved changing the fiscal year-end of the Funds from April 30 to October 31. |
| (c) | Calculated using the average shares method. |
| (d) | Total returns are for the period indicated and have not been annualized. Total returns would have been lower had certain expenses not been waived during the period. Returns shown do not reflect the deduction of taxes that a shareholder would pay on Fund distributions or the redemption of Fund shares. |
| (e) | Annualized. |
| (f) | Effective February 28, 2018, pursuant to the Administrative Services Agreement, the Fund pays an annual unitary administrative fee, which is based on the Fund’s average daily net assets, and will no longer pay a management fee or contractually limit the Fund’s total annual expenses. Refer to Note 8. |
| (g) | Portfolio turnover rate for periods less than one full year have not been annualized. |
See Notes to Financial Statements.
127 | April 30, 2018
RiverFront Asset Allocation Income & Growth – Investor Class
Financial Highlights
Selected data for a share of beneficial interest outstanding throughout the periods indicated:
For the Six Months Ended April 30, 2018 | For the Year Ended October 31, 2017 | For the Year Ended October 31, 2016 | For the Year Ended October 31, 2015 | For the Fiscal Period Ended October 31, 2014(c) | For the Year Ended April 30, 2014 | |||||||||||||||||||
| Net asset value, beginning of period | $ | 11.25 | $ | 10.53 | $ | 10.46 | $ | 10.86 | $ | 10.83 | $ | 10.48 | ||||||||||||
| INCOME FROM INVESTMENT OPERATIONS: | ||||||||||||||||||||||||
| Net investment income(d) | 0.10 | 0.16 | 0.18 | 0.18 | 0.07 | 0.13 | ||||||||||||||||||
| Net realized and unrealized gain/(loss) | (0.11 | ) | 0.71 | 0.07 | (0.14 | ) | 0.04 | 0.53 | ||||||||||||||||
| Total from investment operations | (0.01 | ) | 0.87 | 0.25 | 0.04 | 0.11 | 0.66 | |||||||||||||||||
| DISTRIBUTIONS: | ||||||||||||||||||||||||
| From net investment income | (0.10 | ) | (0.15 | ) | (0.16 | ) | (0.15 | ) | (0.08 | ) | (0.12 | ) | ||||||||||||
| From net realized gains | (0.18 | ) | – | (0.02 | ) | (0.29 | ) | – | (0.19 | ) | ||||||||||||||
| Total distributions | (0.28 | ) | (0.15 | ) | (0.18 | ) | (0.44 | ) | (0.08 | ) | (0.31 | ) | ||||||||||||
| Net increase/(decrease) in net asset value | (0.29 | ) | 0.72 | 0.07 | (0.40 | ) | 0.03 | 0.35 | ||||||||||||||||
| Net asset value, end of period | $ | 10.96 | $ | 11.25 | $ | 10.53 | $ | 10.46 | $ | 10.86 | $ | 10.83 | ||||||||||||
| TOTAL RETURN(e) | (0.11 | )% | 8.33 | % | 2.47 | % | 0.40 | % | 0.98 | % | 6.35 | % | ||||||||||||
| RATIOS/SUPPLEMENTAL DATA: | ||||||||||||||||||||||||
| Net assets, end of period (000s) | $ | 1,063 | $ | 1,133 | $ | 1,037 | $ | 1,038 | $ | 1,089 | $ | 1,101 | ||||||||||||
| Ratio of expenses to average net assets excluding fee waivers and reimbursements | 1.83 | %(f) | 1.98 | % | 1.84 | % | 2.06 | % | 2.39 | %(f) | 2.94 | % | ||||||||||||
| Ratio of expenses to average net assets including fee waivers and reimbursements | 0.93 | %(f)(g) | 1.15 | % | 1.15 | % | 1.15 | % | 1.15 | %(f) | 1.15 | % | ||||||||||||
| Ratio of net investment income to average net assets | 1.77 | %(f) | 1.44 | % | 1.68 | % | 1.74 | % | 1.22 | %(f) | 1.27 | % | ||||||||||||
| Portfolio turnover rate(h) | 113 | % | 63 | % | 137 | % | 186 | % | 34 | % | 125 | % | ||||||||||||
| (a) | Prior to December 1, 2017, Investor Class was known as Class A. |
| (b) | Prior to February 28, 2018, the RiverFront Asset Allocation Income & Growth was known as the RiverFront Conservative Income Builder Fund. |
| (c) | Effective May 1, 2014, the Board approved changing the fiscal year-end of the Funds from April 30 to October 31. |
| (d) | Calculated using the average shares method. |
| (e) | Total returns are for the period indicated and have not been annualized. Total returns would have been lower had certain expenses not been waived during the period. Returns shown do not reflect the deduction of taxes that a shareholder would pay on Fund distributions or the redemption of Fund shares. Returns shown exclude any applicable sales charges. |
| (f) | Annualized. |
| (g) | Effective February 28, 2018, pursuant to the Administrative Services Agreement, the Fund pays an annual unitary administrative fee, which is based on the Fund’s average daily net assets, and will no longer pay a management fee or contractually limit the Fund’s total annual expenses. Refer to Note 8. |
| (h) | Portfolio turnover rate for periods less than one full year have not been annualized. |
See Notes to Financial Statements.
128 | April 30, 2018
RiverFront Asset Allocation Income & Growth – Class C
Financial Highlights
Selected data for a share of beneficial interest outstanding throughout the periods indicated:
For the Six Months Ended April 30, 2018 (Unaudited)(a) | For the Year Ended October 31, 2017 | For the Year Ended October 31, 2016 | For the Year Ended October 31, 2015 | For the Fiscal Period Ended October 31, 2014(b) | For the Year Ended April 30, 2014 | |||||||||||||||||||
| Net asset value, beginning of period | $ | 11.12 | $ | 10.44 | $ | 10.37 | $ | 10.81 | $ | 10.77 | $ | 10.51 | ||||||||||||
| INCOME FROM INVESTMENT OPERATIONS: | ||||||||||||||||||||||||
| Net investment income(c) | 0.06 | 0.08 | 0.10 | 0.09 | 0.03 | 0.06 | ||||||||||||||||||
| Net realized and unrealized gain/(loss) | (0.12 | ) | 0.69 | 0.08 | (0.13 | ) | 0.04 | 0.51 | ||||||||||||||||
| Total from investment operations | (0.06 | ) | 0.77 | 0.18 | (0.04 | ) | 0.07 | 0.57 | ||||||||||||||||
| DISTRIBUTIONS: | ||||||||||||||||||||||||
| From net investment income | (0.06 | ) | (0.09 | ) | (0.09 | ) | (0.11 | ) | �� | (0.03 | ) | (0.12 | ) | |||||||||||
| From net realized gains | (0.18 | ) | – | (0.02 | ) | (0.29 | ) | – | (0.19 | ) | ||||||||||||||
| Total distributions | (0.24 | ) | (0.09 | ) | (0.11 | ) | (0.40 | ) | (0.03 | ) | (0.31 | ) | ||||||||||||
| Net increase/(decrease) in net asset value | (0.30 | ) | 0.68 | 0.07 | (0.44 | ) | 0.04 | 0.26 | ||||||||||||||||
| Net asset value, end of period | $ | 10.82 | $ | 11.12 | $ | 10.44 | $ | 10.37 | $ | 10.81 | $ | 10.77 | ||||||||||||
| TOTAL RETURN(d) | (0.51 | )% | 7.42 | % | 1.74 | % | (0.39 | )% | 0.68 | % | 5.49 | % | ||||||||||||
| RATIOS/SUPPLEMENTAL DATA: | ||||||||||||||||||||||||
| Net assets, end of period (000s) | $ | 6,236 | $ | 7,234 | $ | 11,550 | $ | 8,610 | $ | 5,021 | $ | 4,106 | ||||||||||||
| Ratio of expenses to average net assets excluding fee waivers and reimbursements | 2.60 | %(e) | 2.68 | % | 2.60 | % | 2.81 | % | 3.14 | %(e) | 3.73 | % | ||||||||||||
| Ratio of expenses to average net assets including fee waivers and reimbursements | 1.69 | %(e)(f) | 1.90 | % | 1.90 | % | 1.90 | % | 1.90 | %(e) | 1.90 | % | ||||||||||||
| Ratio of net investment income to average net assets | 1.04 | %(e) | 0.77 | % | 0.92 | % | 0.88 | % | 0.47 | %(e) | 0.53 | % | ||||||||||||
| Portfolio turnover rate(g) | 113 | % | 63 | % | 137 | % | 186 | % | 34 | % | 125 | % | ||||||||||||
| (a) | Prior to February 28, 2018, the RiverFront Asset Allocation Income & Growth was known as the RiverFront Conservative Income Builder Fund. |
| (b) | Effective May 1, 2014, the Board approved changing the fiscal year-end of the Funds from April 30 to October 31. |
| (c) | Calculated using the average shares method. |
| (d) | Total returns are for the period indicated and have not been annualized. Total returns would have been lower had certain expenses not been waived during the period. Returns shown do not reflect the deduction of taxes that a shareholder would pay on Fund distributions or the redemption of Fund shares. Returns shown exclude any applicable sales charges. |
| (e) | Annualized. |
| (f) | Effective February 28, 2018, pursuant to the Administrative Services Agreement, the Fund pays an annual unitary administrative fee, which is based on the Fund’s average daily net assets, and will no longer pay a management fee or contractually limit the Fund’s total annual expenses. Refer to Note 8. |
| (g) | Portfolio turnover rate for periods less than one full year have not been annualized. |
See Notes to Financial Statements.
129 | April 30, 2018
RiverFront Asset Allocation Income & Growth – Class I
Financial Highlights
Selected data for a share of beneficial interest outstanding throughout the periods indicated:
For the Six Months Ended April 30, 2018 (Unaudited)(a) | For the Year Ended October 31, 2017 | For the Year Ended October 31, 2016 | For the Year Ended October 31, 2015 | For the Fiscal Period Ended October 31, 2014(b) | For the Year Ended April 30, 2014 | |||||||||||||||||||
| Net asset value, beginning of period | $ | 11.08 | $ | 10.36 | $ | 10.30 | $ | 10.70 | $ | 10.66 | $ | 10.29 | ||||||||||||
| INCOME FROM INVESTMENT OPERATIONS: | ||||||||||||||||||||||||
| Net investment income(c) | 0.11 | 0.18 | 0.19 | 0.19 | 0.07 | 0.15 | ||||||||||||||||||
| Net realized and unrealized gain/(loss) | (0.11 | ) | 0.70 | 0.08 | (0.13 | ) | 0.06 | 0.51 | ||||||||||||||||
| Total from investment operations | (0.00 | ) | 0.88 | 0.27 | 0.06 | 0.13 | 0.66 | |||||||||||||||||
| DISTRIBUTIONS: | ||||||||||||||||||||||||
| From net investment income | (0.11 | ) | (0.16 | ) | (0.19 | ) | (0.17 | ) | (0.09 | ) | (0.10 | ) | ||||||||||||
| From net realized gains | (0.18 | ) | – | (0.02 | ) | (0.29 | ) | – | (0.19 | ) | ||||||||||||||
| Total distributions | (0.29 | ) | (0.16 | ) | (0.21 | ) | (0.46 | ) | (0.09 | ) | (0.29 | ) | ||||||||||||
| Net increase/(decrease) in net asset value | (0.29 | ) | 0.72 | 0.06 | (0.40 | ) | 0.04 | 0.37 | ||||||||||||||||
| Net asset value, end of period | $ | 10.79 | $ | 11.08 | $ | 10.36 | $ | 10.30 | $ | 10.70 | $ | 10.66 | ||||||||||||
| TOTAL RETURN(d) | (0.01 | )% | 8.60 | % | 2.66 | % | 0.60 | % | 1.19 | % | 6.53 | % | ||||||||||||
| RATIOS/SUPPLEMENTAL DATA: | ||||||||||||||||||||||||
| Net assets, end of period (000s) | $ | 3,274 | $ | 2,783 | $ | 2,264 | $ | 2,171 | $ | 2,830 | $ | 1,381 | ||||||||||||
| Ratio of expenses to average net assets excluding fee waivers and reimbursements | 1.58 | %(e) | 1.71 | % | 1.60 | % | 1.80 | % | 2.12 | %(e) | 2.66 | % | ||||||||||||
| Ratio of expenses to average net assets including fee waivers and reimbursements | 0.68 | %(e)(f) | 0.90 | % | 0.90 | % | 0.90 | % | 0.90 | %(e) | 0.90 | % | ||||||||||||
| Ratio of net investment income to average net assets | 2.02 | %(e) | 1.68 | % | 1.90 | % | 1.84 | % | 1.34 | %(e) | 1.49 | % | ||||||||||||
| Portfolio turnover rate(g) | 113 | % | 63 | % | 137 | % | 186 | % | 34 | % | 125 | % | ||||||||||||
| (a) | Prior to February 28, 2018, the RiverFront Asset Allocation Income & Growth was known as the RiverFront Conservative Income Builder Fund. |
| (b) | Effective May 1, 2014, the Board approved changing the fiscal year-end of the Funds from April 30 to October 31. |
| (c) | Calculated using the average shares method. |
| (d) | Total returns are for the period indicated and have not been annualized. Total returns would have been lower had certain expenses not been waived during the period. Returns shown do not reflect the deduction of taxes that a shareholder would pay on Fund distributions or the redemption of Fund shares. |
| (e) | Annualized. |
| (f) | Effective February 28, 2018, pursuant to the Administrative Services Agreement, the Fund pays an annual unitary administrative fee, which is based on the Fund’s average daily net assets, and will no longer pay a management fee or contractually limit the Fund’s total annual expenses. Refer to Note 8. |
| (g) | Portfolio turnover rate for periods less than one full year have not been annualized. |
See Notes to Financial Statements.
130 | April 30, 2018
Notes to Financial Statements
April 30, 2018 (Unaudited)
1. ORGANIZATION
Financial Investors Trust (the “Trust”), a Delaware statutory trust, is an open-end management investment company registered under the Investment Company Act of 1940, as amended (“1940 Act”). The Trust consists of multiple separate portfolios or series. This annual report includes the financial statements and financial highlights of the following 11 funds:ALPS | CoreCommodity Management CompleteCommodities® Strategy Fund, ALPS | Kotak India Growth Fund, ALPS | Metis Global Micro Cap Value Fund (Formerly ALPS | Metis Global Micro Cap Fund), ALPS | Red Rocks Listed Private Equity Fund, ALPS | WMC Research Value Fund, Clough China Fund, RiverFront Asset Allocation Aggressive (Formerly RiverFront Global Growth Fund), RiverFront Asset Allocation Growth (Formerly RiverFront Global Allocation Fund), RiverFront Asset Allocation Growth & Income (Formerly RiverFront Dynamic Equity Income Fund), RiverFront Asset Allocation Moderate (Formerly RiverFront Moderate Growth & Income Fund) and RiverFront Asset Allocation Income & Growth (Formerly RiverFront Conservative Income Builder Fund) (each, a “Fund” and collectively, the “Funds”). The Funds are considered investment companies under U.S. GAAP and follows the accounting and reporting guidance applicable to investment companies in the Financial Accounting Standards Board Accounting Standards Codification Topic 946.
The ALPS | CoreCommodity Management CompleteCommodities® Strategy Fund seeks to maximize real returns (returns after inflation), consistent with prudent investment management. ALPS | Kotak India Growth Fund’s investment goal is long-term capital appreciation. ALPS | Metis Global Micro Cap Value Fund seeks long-term growth of capital. ALPS | Red Rocks Listed Private Equity Fund seeks to maximize total return, which consists of appreciation on its investments and a variable income stream. ALPS | WMC Research Value Fund seeks long-term capital appreciation: dividend income may be a factor in portfolio selection but is secondary to the Fund’s principal objective. The Clough China Fund seeks to provide investors with long-term capital appreciation. Effective February 28, 2018, the RiverFront Asset Allocation Aggressive seeks to achieve long-term capital appreciation, the RiverFront Asset Allocation Growth seeks to provide high total investment return, the RiverFront Asset Allocation Growth & Income seeks to achieve long-term growth and income, the RiverFront Asset Allocation Moderate has two primary investment objectives- it seeks (1) to provide a level of current income that exceeds the average yield on U.S. stocks, and (2) growth of capital, and the RiverFront Asset Allocation Income & Growth seeks to provide current income and potential for that income to grow over time. Prior to February 28, 2018, the RiverFront Asset Allocation Aggressive sought to achieve long-term capital appreciation through a fully managed investment policy utilizing United States and foreign equity securities, debt and money market securities, the combination of which will be varied from time to time both with respect to types of securities and markets in response to changing market and economic trends.The RiverFront Asset Allocation Growth sought to provide high total investment return through a fully managed investment policy utilizing United States and foreign equity securities, debt and money market securities, the combination of which will be varied from time to time both with respect to types of securities and markets in response to changing market and economic trends. Total investment return means the combination of capital appreciation and investment income. The RiverFront Asset Allocation Growth & Income sought to achieve long-term growth and income through a combination of capital appreciation and rising dividend payments that exceed the average yield on global stocks generally. The RiverFront Asset Allocation Moderate had two primary investment objectives. It sought (1) to provide a level of current income that exceeds the average yield on U.S. stocks in general while providing a growing stream of income over the years and (2) growth of capital. The RiverFront Asset Allocation Income & Growth sought to provide current income and potential for that income to grow over time.
The classes of each Fund differ principally in the applicable distribution and shareholder service fees. Shareholders of each class also bear certain expenses that pertain to that particular class. All shareholders bear the common expenses of the Fund and earn income and realized gains/losses from the Fund pro rata based on the average daily net assets of each class, without distinction between share classes. Dividends to shareholders are determined separately for each class based on income and expenses allocable to each class. Realized gain distributions to shareholders are allocated to each class pro rata based on the shares outstanding of each class on the date of distribution. Differences in per share dividend rates generally result from differences in separate class expenses, including distribution and shareholder service fees, if applicable.
Basis of Consolidation for the ALPS | CoreCommodity Management CompleteCommodities® Strategy Fund
CoreCommodity Management Cayman Commodity Fund Ltd. (the “Subsidiary”), a Cayman Islands exempted company, was incorporated on April 23, 2010 and is a wholly owned subsidiary of the ALPS | CoreCommodity Management CompleteCommodities® Strategy Fund (the “CoreCommodity Fund”). The Subsidiary acts as an investment vehicle for the CoreCommodity Fund in order to effect certain commodity-related investments on behalf of the CoreCommodity Fund. CoreCommodity Fund is the sole shareholder of the Subsidiary pursuant to a subscription agreement dated as of June 14, 2010, and it is intended that the CoreCommodity Fund will remain the sole shareholder and will continue to wholly own and control the Subsidiary. Under the Articles of Association of the Subsidiary, shares issued by the Subsidiary confer upon a shareholder the right to vote at general meetings of the Subsidiary and certain rights in connection with any winding-up or repayment of capital, as well as the right to participate in the profits or assets of the Subsidiary. The CoreCommodity Fund may invest up to 25% of its total assets in shares of the Subsidiary. As a wholly owned subsidiary of the CoreCommodity Fund, the financial statements of the Subsidiary are included in the consolidated financial statements and financial highlights of the CoreCommodity Fund. All investments held by the Subsidiary are disclosed in the accounts of the CoreCommodity Fund. As of April 30, 2018, net assets of the CoreCommodity Fund were $652,805,476 of which $131,230,190 or 20.10%, represented the CoreCommodity Fund’s ownership of all issued shares and voting rights of the Subsidiary.
131 | April 30, 2018
Notes to Financial Statements
April 30, 2018 (Unaudited)
Basis of Consolidation for the ALPS | Kotak India Growth Fund
ALPS | Kotak India Growth Fund, (the “Kotak Fund”) invests in the equity securities of Indian companies through its wholly owned, collective investment vehicle, the India Premier Equity Portfolio (the “Portfolio”). The Portfolio is registered with and regulated by the Mauritius Financial Services Commission. The Portfolio was formed for the purpose of facilitating the Kotak Fund’s purchase of securities of a wide selection of Indian companies, consistent with the Kotak Fund’s investment strategies. The Portfolio is a private company limited by shares incorporated under the Mauritius Companies Act 2001. As a wholly owned subsidiary of the Kotak Fund, financial statements of the Portfolio are included in the consolidated financial statements and financial highlights of the Kotak Fund. All investments held by the Portfolio are disclosed in the accounts of the Kotak Fund.
The Portfolio established residency in Mauritius allowing the Kotak Fund to receive the beneficial tax treatment under the Treaty between India and Mauritius. However, due to recently enacted legislation the benefits of the Treaty have been reduced and some gains derived by the Portfolio due to the sale of securities will be subject to taxation in India. On April 1, 2017, the General Anti-Avoidance Rules (“GAAR”) which contain treaty override provisions were enacted. Capital gains on sale of shares acquired on or after April 1, 2017, are taxable in India as per the amended India – Mauritius treaty. The benefit of a lower rate of taxation (50% of the applicable tax rate in India) is provided for the gains on shares arising during the period from April 1, 2017 to March 31, 2019 subject to compliance with the Limitation of Benefit clause.
2. SIGNIFICANT ACCOUNTING POLICIES
The following is a summary of significant accounting policies consistently followed by each Fund in the preparation of its financial statements. Each Fund is considered an investment company for financial reporting purposes, and follows accounting policies in conformity with accounting principles generally accepted in the United States of America (“U.S. GAAP”), including policies specific to investment companies. The preparation of financial statements in conformity with U.S. GAAP requires management to make certain estimates and assumptions that affect the reported amounts of assets and liabilities and disclosures of contingent assets and liabilities at the date of the financial statements and the reported amounts of revenue and expenses during the period. Actual results could differ from those estimates. The following is a summary of significant accounting policies consistently followed by the Funds and subsidiaries, as applicable, in preparation of their financial statements.
Investment Valuation: The Funds generally value their securities based on market prices determined at the close of regular trading on the New York Stock Exchange (“NYSE”), normally 4:00 p.m. Eastern Time, on each day the NYSE is open for trading. For equity securities and mutual funds that are traded on an exchange, the market price is usually the closing sale or official closing price on that exchange.
The market price for debt obligations is generally the price supplied by an independent third-party pricing service approved by the Board, which may use a matrix, formula or other objective method that takes into consideration quotations from dealers, market transactions in comparable investments, market indices and yield curves. If vendors are unable to supply a price, or if the price supplied is deemed to be unreliable, the market price may be determined using quotations received from one or more brokers-dealers that make a market in the security. Investments in non-exchange traded funds are fair valued at their respective net asset values.
Futures contracts that are listed or traded on a national securities exchange, commodities exchange, contract market or comparable over the counter market, and that are freely transferable, are valued at their closing settlement price on the exchange on which they are primarily traded or based upon the current settlement price for a like instrument acquired on the day on which the instrument is being valued. A settlement price may not be used if the market makes a limit move with respect to a particular commodity. Over-the-counter swap contracts are valued based on quotes received from independent pricing services or one or more dealers that make markets in such investments.
Option contracts are valued using the National Best Bid and Offer price (“NBBO”). In the event there is no NBBO price available, option contracts are valued at the mean between the last bid and ask.
Equity securities that are primarily traded on foreign securities exchanges are valued at the closing values of such securities on their respective foreign exchanges, except when an event occurs subsequent to the close of the foreign exchange and the close of the NYSE that was likely to have changed such value. In such an event, the fair value of those securities are determined in good faith through consideration of other factors in accordance with procedures established by and under the general supervision of the Board. The Funds will use a fair valuation model provided by an independent pricing service, which is intended to reflect fair value when a security’s value or a meaningful portion of the Fund’s portfolio is believed to have been materially affected by an valuation event that has occurred between the close of the exchange or market on which the security is traded and the close of the regular trading day on the NYSE.
Forward currency exchange contracts have a value determined by the current foreign currency exchange forward rates. The foreign currency exchange forward rates are calculated using an automated system that estimates rates on the basis of the current day foreign currency exchange
132 | April 30, 2018
Notes to Financial Statements
April 30, 2018 (Unaudited)
rates and forward foreign currency exchange rates supplied by a pricing service. Foreign exchange rates and forward foreign currency exchange rates may generally be obtained at the close of the NYSE, normally 4:00 p.m. Eastern Time.
When such prices or quotations are not available, or when the Fair Value Committee appointed by the Board believes that they are unreliable, securities may be priced using fair value procedures approved by the Board. The fair valuation policies and procedures (“FV Procedures”) have been adopted by the Board for the fair valuation of portfolio assets held by the Fund(s) in the event that (1) market quotations for the current price of a portfolio security or asset are not readily available, or (2) available market quotations that would otherwise be used to value a portfolio security or asset in accordance with the Fund’s Pricing Procedures appear to be unreliable. The Pricing Procedures reflect certain pricing methodologies (or “logics”) that are not “readily available market quotations” and thus are viewed and treated as fair valuations. The Fair Value Committee routinely meets to discuss fair valuations of portfolio securities and other instruments held by the Fund(s).
Fair Value Measurements: The Funds disclose the classification of their fair value measurements following a three-tier hierarchy based on the inputs used to measure fair value. Inputs refer broadly to the assumptions that market participants would use in pricing the asset or liability, including assumptions about risk. Inputs may be observable or unobservable. Observable inputs reflect the assumptions market participants would use in pricing the asset or liability that are developed based on market data obtained from sources independent of the reporting entity. Unobservable inputs reflect the reporting entity’s own assumptions about the assumptions market participants would use in pricing the asset or liability that are developed based on the best information available.
Various inputs are used in determining the value of each Fund’s investments as of the end of the reporting period. When inputs used fall into different levels of the fair value hierarchy, the level in the hierarchy within which the fair value measurement falls is determined based on the lowest level input that is significant to the fair value measurement in its entirety. The designated input levels are not necessarily an indication of the risk or liquidity associated with these investments. These inputs are categorized in the following hierarchy under applicable financial accounting standards:
| Level 1 – | Unadjusted quoted prices in active markets for identical investments, unrestricted assets or liabilities that a Fund has the ability to access at the measurement date; |
| Level 2 – | Quoted prices which are not active, quoted prices for similar assets or liabilities in active markets or inputs other than quoted prices that are observable (either directly or indirectly) for substantially the full term of the asset or liability; and |
| Level 3 – | Significant unobservable prices or inputs (including the Fund��s own assumptions in determining the fair value of investments) where there is little or no market activity for the asset or liability at the measurement date. |
The following is a summary of each Fund’s investments/financial instruments in the fair value hierarchy as of April 30, 2018:
| Investments in Securities at Value | Level 1 - Unadjusted Quoted Prices | Level 2 - Other Significant Observable Inputs | Level 3 - Significant | Total | ||||||||||||
| ALPS | CoreCommodity Management CompleteCommodities® Strategy Fund | ||||||||||||||||
| Common Stocks(a) | 177,857,601 | – | – | 177,857,601 | ||||||||||||
| Master Limited Partnerships(a) | 1,421,493 | – | – | 1,421,493 | ||||||||||||
| Government Bonds | – | 398,562,301 | – | 398,562,301 | ||||||||||||
| Total | $ | 179,279,094 | $ | 398,562,301 | $ | – | $ | 577,841,395 | ||||||||
| Other Financial Instruments | ||||||||||||||||
| Assets | ||||||||||||||||
| Futures Contracts | $ | 1,629,563 | $ | – | $ | – | $ | 1,629,563 | ||||||||
| Liabilities | ||||||||||||||||
| Futures Contracts | (1,070,086 | ) | – | – | (1,070,086 | ) | ||||||||||
| Total Return Swap Contracts | – | (661 | ) | – | (661 | ) | ||||||||||
| Total | $ | 559,477 | $ | (661 | ) | $ | – | $ | 558,816 | |||||||
133 | April 30, 2018
Notes to Financial Statements
April 30, 2018 (Unaudited)
| Investments in Securities at Value | Level 1 - Unadjusted Quoted Prices | Level 2 - Other Significant Observable Inputs | Level 3 - Significant Unobservable Inputs | Total | ||||||||||||
| ALPS | Kotak India Growth Fund | ||||||||||||||||
| Common Stocks | ||||||||||||||||
| Consumer Discretionary | $ | – | $ | 4,004,345 | $ | – | $ | 4,004,345 | ||||||||
| Consumer Staples | – | 2,918,920 | – | 2,918,920 | ||||||||||||
| Energy | – | 1,897,447 | – | 1,897,447 | ||||||||||||
| Financials | – | 9,901,862 | – | 9,901,862 | ||||||||||||
| Health Care | – | 1,518,861 | – | 1,518,861 | ||||||||||||
| Industrials | – | 3,537,724 | – | 3,537,724 | ||||||||||||
| Information Technology | – | 3,279,295 | – | 3,279,295 | ||||||||||||
| Materials | – | 5,115,855 | – | 5,115,855 | ||||||||||||
| Real Estate | – | 433,105 | – | 433,105 | ||||||||||||
| Telecommunication Services | – | 189,484 | – | 189,484 | ||||||||||||
| Total | $ | – | $ | 32,796,898 | $ | – | $ | 32,796,898 | ||||||||
| Investments in Securities at Value | Level 1 - Unadjusted Quoted Prices | Level 2 - Other Significant Observable Inputs | Level 3 - Significant Unobservable Inputs | Total | ||||||||||||
| ALPS | Metis Global Micro Cap Value Fund | ||||||||||||||||
| Common Stocks | ||||||||||||||||
| Australia | $ | 282,908 | $ | 1,436,394 | $ | – | $ | 1,719,302 | ||||||||
| Brazil | 256,845 | – | – | 256,845 | ||||||||||||
| Canada | 616,420 | – | – | 616,420 | ||||||||||||
| Cayman Islands | 100,720 | – | – | 100,720 | ||||||||||||
| Chile | – | 88,632 | – | 88,632 | ||||||||||||
| China | 72,458 | 344,622 | – | 417,080 | ||||||||||||
| France | – | 251,548 | – | 251,548 | ||||||||||||
| Germany | – | 67,797 | – | 67,797 | ||||||||||||
| Great Britain | 911,286 | 163,050 | – | 1,074,336 | ||||||||||||
| Hong Kong | 177,921 | 408,383 | – | 586,304 | ||||||||||||
| India | – | 261,773 | – | 261,773 | ||||||||||||
| Indonesia | – | 174,177 | – | 174,177 | ||||||||||||
| Ireland | 76,986 | – | – | 76,986 | ||||||||||||
| Isle Of Man | 89,079 | – | – | 89,079 | ||||||||||||
| Israel | 169,063 | – | – | 169,063 | ||||||||||||
| Italy | – | 171,944 | – | 171,944 | ||||||||||||
| Japan | 106,591 | 8,361,864 | – | 8,468,455 | ||||||||||||
| Malaysia | 84,552 | 226,217 | – | 310,769 | ||||||||||||
| New Zealand | 89,356 | – | – | 89,356 | ||||||||||||
| Norway | 153,836 | 251,942 | – | 405,778 | ||||||||||||
| Poland | – | 224,345 | – | 224,345 | ||||||||||||
| Portugal | – | 91,408 | – | 91,408 | ||||||||||||
| Qatar | – | 89,670 | – | 89,670 | ||||||||||||
| Singapore | 75,529 | – | – | 75,529 | ||||||||||||
| South Africa | 100,047 | – | – | 100,047 | ||||||||||||
| South Korea | 199,881 | 4,458,123 | – | 4,658,004 | ||||||||||||
| Spain | 60,517 | – | – | 60,517 | ||||||||||||
| Sweden | – | 104,201 | – | 104,201 | ||||||||||||
| Taiwan | – | 1,394,023 | – | 1,394,023 | ||||||||||||
| Thailand | 89,380 | 108,783 | – | 198,163 | ||||||||||||
| Turkey | – | 177,613 | – | 177,613 | ||||||||||||
| United States | 4,520,769 | – | – | 4,520,769 | ||||||||||||
| Preferred Stocks(a) | 93,058 | – | – | 93,058 | ||||||||||||
| Short Term Investments | 772,320 | – | – | 772,320 | ||||||||||||
| Total | $ | 9,099,522 | $ | 18,856,509 | $ | – | $ | 27,956,031 | ||||||||
134 | April 30, 2018
Notes to Financial Statements
April 30, 2018 (Unaudited)
| Investments in Securities at Value | Level 1 - Unadjusted Quoted Prices | Level 2 - Other Significant Observable Inputs | Level 3 - Significant Unobservable Inputs | Total | ||||||||||||
| ALPS | Red Rocks Listed Private Equity Fund | ||||||||||||||||
| Closed-End Funds | $ | 15,376,634 | $ | 20,623,799 | $ | – | $ | 36,000,433 | ||||||||
| Common Stocks(a) | 98,228,435 | 112,370,999 | – | 210,599,434 | ||||||||||||
| Short-Term Investments | 7,479,538 | – | – | 7,479,538 | ||||||||||||
| Total | $ | 121,084,607 | $ | 132,994,798 | $ | – | $ | 254,079,405 | ||||||||
| Investments in Securities at Value | Level 1 - Unadjusted Quoted Prices | Level 2 - Other Significant Observable Inputs | Level 3 - Significant Unobservable Inputs | Total | ||||||||||||
| ALPS | WMC Research Value Fund | ||||||||||||||||
| Common Stocks(a) | $ | 88,013,758 | $ | – | $ | – | $ | 88,013,758 | ||||||||
| Exchange Traded Funds | 1,024,570 | – | – | 1,024,570 | ||||||||||||
| Short Term Investments | 534,488 | – | – | 534,488 | ||||||||||||
| Total | $ | 89,572,816 | $ | – | $ | – | $ | 89,572,816 | ||||||||
| Investments in Securities at Value | Level 1 - Unadjusted Quoted Prices | Level 2 - Other Significant Observable Inputs | Level 3 - Significant Unobservable Inputs | Total | ||||||||||||
| Clough China Fund | ||||||||||||||||
| Common Stocks | ||||||||||||||||
| Communications | $ | 4,635,423 | $ | – | $ | – | $ | 4,635,423 | ||||||||
| Consumer Discretionary | 7,526,338 | 2,047,100 | – | 9,573,438 | ||||||||||||
| Consumer Staples | – | 703,817 | – | 703,817 | ||||||||||||
| Financials | – | 20,291,277 | – | 20,291,277 | ||||||||||||
| Health Care | – | 1,001,893 | – | 1,001,893 | ||||||||||||
| Industrials | – | 255,074 | – | 255,074 | ||||||||||||
| Technology | 1,314,717 | 13,023,350 | – | 14,338,067 | ||||||||||||
| Utilities | – | 449,371 | – | 449,371 | ||||||||||||
| Participation Notes(a) | – | 2,201,596 | – | 2,201,596 | ||||||||||||
| Short Term Investments | 476,930 | – | – | 476,930 | ||||||||||||
| Total | $ | 13,953,408 | $ | 39,973,478 | $ | – | $ | 53,926,886 | ||||||||
| Investments in Securities at Value | Level 1 - Unadjusted Quoted Prices | Level 2 - Other Significant Observable Inputs | Level 3 - Significant Unobservable Inputs | Total | ||||||||||||
| RiverFront Asset Allocation Aggressive | ||||||||||||||||
| Exchange Traded Funds(a) | $ | 56,629,705 | $ | – | $ | – | $ | 56,629,705 | ||||||||
| Short Term Investments | 1,008,942 | – | – | 1,008,942 | ||||||||||||
| Total | $ | 57,638,647 | $ | – | $ | – | $ | 57,638,647 | ||||||||
| Investments in Securities at Value | Level 1 - Unadjusted Quoted Prices | Level 2 - Other Significant Observable Inputs | Level 3 - Significant Unobservable Inputs | Total | ||||||||||||
| RiverFront Asset Allocation Growth | ||||||||||||||||
| Exchange Traded Funds(a) | $ | 32,390,649 | $ | – | $ | – | $ | 32,390,649 | ||||||||
| Short Term Investments | 404,813 | – | – | 404,813 | ||||||||||||
| Total | $ | 32,795,462 | $ | – | $ | – | $ | 32,795,462 | ||||||||
| Investments in Securities at Value | Level 1 - Unadjusted Quoted Prices | Level 2 - Other Significant Observable Inputs | Level 3 - Significant Unobservable Inputs | Total | ||||||||||||
| RiverFront Asset Allocation Growth & Income | �� | |||||||||||||||
| Exchange Traded Funds(a) | $ | 76,826,981 | $ | – | $ | – | $ | 76,826,981 | ||||||||
| Short Term Investments | 1,824,186 | – | – | 1,824,186 | ||||||||||||
| Total | $ | 78,651,167 | $ | – | $ | – | $ | 78,651,167 | ||||||||
135 | April 30, 2018
Notes to Financial Statements
April 30, 2018 (Unaudited)
| Investments in Securities at Value | Level 1 - Unadjusted Quoted Prices | Level 2 - Other Significant Observable Inputs | Level 3 - Significant Unobservable Inputs | Total | ||||||||||||
| RiverFront Asset Allocation Moderate | ||||||||||||||||
| Exchange Traded Funds(a) | $ | 85,571,689 | $ | – | $ | – | $ | 85,571,689 | ||||||||
| Short Term Investments | 1,157,220 | – | – | 1,157,220 | ||||||||||||
| Total | $ | 86,728,909 | $ | – | $ | – | $ | 86,728,909 | ||||||||
| Investments in Securities at Value | Level 1 - Unadjusted Quoted Prices | Level 2 - Other Significant Observable Inputs | Level 3 - Significant Unobservable Inputs | Total | ||||||||||||
| RiverFront Asset Allocation Income & Growth | ||||||||||||||||
| Exchange Traded Funds(a) | $ | 10,424,607 | $ | – | $ | – | $ | 10,424,607 | ||||||||
| Short Term Investments | 163,774 | – | – | 163,774 | ||||||||||||
| Total | $ | 10,588,381 | $ | – | $ | – | $ | 10,588,381 | ||||||||
| (a) | For detailed descriptions of country, sector and/or industry, see the accompanying Statement of Investments or Consolidated Statement of Investments. |
The Funds recognize transfers between levels as of the end of the period. For the six-month period ended April 30, 2018, the Funds did not have any transfers between Level 1 and Level 2 securities, except the ALPS | Metis Global Micro Cap Value Fund. The ALPS | Metis Global Micro Cap Value Fund utilizes a fair value evaluation service with respect to international securities with an earlier market closing than the Fund’s net asset value computation cutoff. When events trigger the use of the fair value evaluation service on a reporting period date, it results in certain securities transferring from a Level 1 to a Level 2 classification. The transfer amounts disclosed in the table below represents the value of the securities as of April 30, 2018 transferred in/(out) of Level 1 and Level 2 during the reporting period that were also held at October 31, 2017.
The ALPS | Metis Global Micro Cap Value Fund had the following transfers between Levels 1 and 2 at April 30, 2018:
| Level 1 - Quoted and Unadjusted Prices | Level 2 - Other Significant Observable Inputs | |||||||||||||||
| Transfers In | Transfers (Out) | Transfers In | Transfers (Out) | |||||||||||||
| Common Stock | $ | 390,473 | $ | (1,724,970 | ) | $ | 1,724,970 | $ | (390,473 | ) | ||||||
| Total | $ | 390,473 | $ | (1,724,970 | ) | $ | 1,724,970 | $ | (390,473 | ) | ||||||
Fund and Class Expenses: Some expenses of the Trust can be directly attributed to a Fund or a specific share class of a Fund. Expenses which cannot be directly attributed are apportioned among all Funds in the Trust based on average net assets of each share class within a Fund.
Federal Income Taxes: The Funds comply with the requirements under Subchapter M of the Internal Revenue Code of 1986, as amended (the “Code”) applicable to regulated investment companies and intend to distribute substantially all of their net taxable income and net capital gains, if any, each year. The Funds are not subject to income taxes to the extent such distributions are made.
The Funds file U.S. federal, state, and local tax returns as required. The Funds’ tax returns are subject to examination by the relevant tax authorities until expiration of the applicable statute of limitations which is generally three years after the filing of the tax return, but may extend to four years in certain jurisdictions. Tax returns for open years have incorporated no uncertain tax positions that require a provision for income taxes.
Distributions to Shareholders: Each Fund, except the RiverFront Asset Allocation Income & Growth, RiverFront Asset Allocation Growth & Income and RiverFront Asset Allocation Moderate normally pays dividends and distributes capital gains, if any, on an annual basis. RiverFront Asset Allocation Income & Growth, RiverFront Asset Allocation Growth & Income and RiverFront Asset Allocation Moderate normally pay dividends, if any, on a quarterly basis and distribute capital gains annually. Income dividend distributions are derived from interest and other income a Fund receives from its investments, including distributions of short-term capital gains. Capital gain distributions are derived from gains realized when a Fund sells a security it has owned for more than a year or from long-term capital gain distributions from underlying investments. Each Fund may make additional distributions and dividends at other times if its portfolio manager or managers believe doing so may be necessary for the Fund to avoid or reduce taxes.
Commodity-Linked Notes: The ALPS | CoreCommodity Management CompleteCommodities® Strategy Fund may invest in commodity-linked notes which are derivative instruments that have characteristics of a debt security and of a commodity-linked derivative. A commodity-linked note typically provides for interest payments and a principal payment at maturity linked to the price movement of the underlying commodity, commodity index or commodity futures or option contract. Commodity-linked notes may be principal protected, partially protected, or offer no
136 | April 30, 2018
Notes to Financial Statements
April 30, 2018 (Unaudited)
principal protection. The value of these notes will rise and fall in response to changes in the underlying commodity or related index or investment. These notes are often leveraged, increasing the volatility of each note’s value relative to the change in the underlying linked index. Commodity index-linked investments may be more volatile and less liquid than the underlying index and their value may be affected by the performance of the commodities as well as other factors, including liquidity, quality, maturity and other economic variables. Commodity-linked notes are typically issued by a bank or other financial institution and are sometimes referred to as structured notes because the terms of the notes may be structured by the issuer and the purchaser of the notes to accommodate the specific investment requirements of the purchaser.
Exchange Traded Funds (ETFs): Each Fund may invest in shares of ETFs and other similar instruments if the investment manager chooses to adjust a Fund’s exposure to the general market or industry sectors and to manage a Fund’s risk exposure. ETFs differ from traditional index funds in that their shares are listed on a securities exchange and can be traded intraday. ETF shares are shares of exchange traded investment companies that are registered under the 1940 Act and hold a portfolio of common stocks designed to track the performance of a particular index. Limitations of the 1940 Act may prohibit a Fund from acquiring more than 3% of the outstanding shares of certain ETFs. Instruments that are similar to ETFs represent beneficial ownership interests in specific “baskets” of stocks of companies within a particular industry sector or group. These securities may also be exchange traded, but unlike ETFs, the issuers of these securities are not registered as investment companies.
The portfolio manager may decide to purchase or sell short ETF shares or options on ETF shares for the same reasons it would purchase or sell (and as an alternative to purchasing or selling) futures contracts – to obtain exposure to the stock market or a particular segment of the stock market, or to hedge a Fund’s portfolio against such exposures. Depending on the market, the holding period and other factors, the use of ETF shares and options thereon can be less costly than the use of index options or stock index futures. In addition, ETF shares and options thereon can typically be purchased in smaller amounts than are available for futures contracts and can offer exposure to market sectors and styles for which there is no suitable or liquid futures contract.
Investment Transactions and Investment Income: Investment transactions are accounted for on the date the investments are purchased or sold (trade date basis). Net realized gains and losses from investment transactions are reported on an identified cost basis. Interest income, which includes accretion of discounts and amortization of premiums, is accrued and recorded as earned. Dividend income is recognized on the ex-dividend date or for certain foreign securities, as soon as information is available to each Fund.
Foreign Securities: Each Fund may directly purchase securities of foreign issuers. Investing in securities of foreign issuers involves special risks not typically associated with investing in securities of U.S. issuers. The risks include possible reevaluation of currencies, the inability to repatriate foreign currency, less complete financial information about companies and possible future adverse political and economic developments.
Moreover, securities of many foreign issuers and their markets may be less liquid and their prices more volatile than those of securities of comparable U.S. issuers.
Foreign Currency Translation: The books and records of the Funds are maintained in U.S. dollars. Investment valuations and other assets and liabilities initially expressed in foreign currencies are converted each business day into U.S. dollars based upon current exchange rates. The portion of realized and unrealized gains or losses on investments due to fluctuations in foreign currency exchange rates is not separately disclosed and is included in realized and unrealized gains or losses on investments, when applicable.
Foreign Currency Spot Contracts: The Funds may enter into foreign currency spot contracts to facilitate transactions in foreign securities or to convert foreign currency receipts into U.S. dollars. A foreign currency spot contract is an agreement between two parties to buy and sell currencies at the current market rate, for settlement generally within two business days. The U.S. dollar value of the contracts is determined using current currency exchange rates supplied by a pricing service. The contract is marked-to-market daily for settlements beyond one day and any change in market value is recorded as an unrealized gain or loss. When the contract is closed, the Fund records a realized gain or loss equal to the difference between the value on the open and close date. Losses may arise from changes in the value of the foreign currency, or if the counterparties do not perform under the contract’s terms. The maximum potential loss from such contracts is the aggregate face value in U.S. dollars at the time the contract was opened.
Real Estate Investment Trusts (“REITs”): The Funds may invest a portion of their assets in REITs and are subject to certain risks associated with direct investment in REITs. REITs may be affected by changes in the value of their underlying properties and by defaults by borrowers or tenants. REITs depend generally on their ability to generate cash flow to make distributions to shareowners, and certain REITs have self-liquidation provisions by which mortgages held may be paid in full and distributions of capital returns may be made at any time. In addition, the performance of a REIT may be affected by its failure to qualify for tax-free pass-through of income under the Internal Revenue Code of 1986, as amended (the “Code”), or its failure to maintain exemption from registration under the 1940 Act. Distributions that the Fund receives from REITs can be classified as ordinary income, capital gain income or return of capital by the REITs that make these distributions to the Fund. However, it is not possible for the Fund to characterize distributions received from REITs during interim periods because the REIT issuers do not report their tax characterizations
137 | April 30, 2018
Notes to Financial Statements
April 30, 2018 (Unaudited)
until subsequent to year end. During interim periods, the REIT distributions are accounted for as ordinary income until the re characterizations are made subsequent to year end.
Treasury Inflation Protected-Securities (“TIPS”): The Funds may invest in TIPS, including structured bonds in which the principal amount is adjusted daily to keep pace with inflation, as measured by the U.S. Consumer Pricing Index for Urban Consumers. The adjustments to principal due to inflation/deflation are reflected as increases/decreases to interest income with a corresponding adjustment to cost. Such adjustments may have a significant impact on a Fund’s distributions and may result in a return of capital to shareholders. The repayment of the original bond principal upon maturity is guaranteed by the full faith and credit of the U.S. Government.
Loan Participations and Assignments: Certain Funds may invest in loan participations and assignments. The Fund considers loan participations and assignments to be investments in debt securities. Loan participations typically will result in the Fund having a contractual relationship only with the lender, not with the borrower. The Fund will have the right to receive payments of principal, interest and any fees to which it is entitled only from the lender selling the participation and only upon receipt by the lender of the payments from the borrower. Under a loan participation, the Fund generally will have no right to enforce compliance by the borrower with the terms of the loan agreement relating to the loan, nor any rights of set-off against the borrower, and the Fund may not benefit directly from any collateral supporting the loan in which it has purchased the participation. As a result, the Fund will assume the credit risk of both the borrower and the lender that is selling the participation. In the event of the insolvency of the lender selling a participation, the Fund may be treated as a general creditor of the lender and may not benefit from any set-off between the lender and the borrower. When the Fund purchases assignments of loans from lenders, the Fund will acquire direct rights against the borrower on the loan, except that under certain circumstances such rights may be more limited than those held by the assigning lender.
Master Limited Partnerships: Certain Funds may invest in MLPs, which are publicly traded partnerships engaged in the transportation, storage and processing of minerals and natural resources. By confining their operations to these specific activities, their interests, or units, are able to trade on public securities exchanges exactly like the shares of a corporation, without entity level taxation. To qualify as a MLP and to not be taxed as a corporation, a partnership must receive at least 90% of its income from qualifying sources as set forth in Section 7704(d) of the Code. These qualifying sources include natural resource based activities such as the processing, transportation and storage of mineral or natural resources. MLPs generally have two classes of owners, the general partner and limited partners. The general partner of an MLP is typically owned by a major energy company, an investment fund, the direct management of the MLP, or is an entity owned by one or more of such parties. The general partner may be structured as a private or publicly traded corporation or other entity. The general partner typically controls the operations and management of the MLP through an up to 2% equity interest in the MLP plus, in many cases, ownership of common units and subordinated units. Limited partners typically own the remainder of the partnership, through ownership of common units, and have a limited role in the partnership’s operations and management. MLPs are typically structured such that common units and general partner interests have first priority to receive quarterly cash distributions up to an established minimum amount (“minimum quarterly distributions” or “MQD”). Common and general partner interests also accrue arrearages in distributions to the extent the MQD is not paid. Once common and general partner interests have been paid, subordinated units receive distributions of up to the MQD; however, subordinated units do not accrue arrearages. Distributable cash in excess of the MQD is paid to both common and subordinated units and is distributed to both common and subordinated units generally on a pro rata basis. The general partner is also eligible to receive incentive distributions if the general partner operates the business in a manner which results in distributions paid per common unit surpassing specified target levels. As the general partner increases cash distributions to the limited partners, the general partner receives an increasingly higher percentage of the incremental cash distributions.
3. DERIVATIVE INSTRUMENTS
As a part of their investment strategy, the Funds are permitted to enter in various types of derivatives contracts. In doing so, the Funds employ strategies in differing combinations to permit them to increase, decrease, or change the level or types of exposure to market factors. Central to those strategies are features inherent in derivatives that make them more attractive for this purpose than equity or debt securities; they require little or no initial cash investment, they focus exposure on only certain selected risk factors, and they may not require the ultimate receipt or delivery of the underlying security (or securities) to the contract. This may allow the Funds to pursue their objectives more quickly and efficiently than if they were to make direct purchases or sales of securities capable of affecting a similar response to market factors.
Cash collateral is being pledged to cover derivative obligations of the Funds and cash collateral received from the counterparty, if any, is reported separately on the Statements of Assets and Liabilities as cash pledged as collateral and cash received as collateral, respectively. Non-cash collateral pledged by the Funds, if any, is noted in the Statements of Investments.
Risk of Investing in Derivatives: The Funds’ use of derivatives can result in losses due to unanticipated changes in the market risk factors and the overall market. In instances where the Funds are using derivatives to decrease, or hedge, exposures to market risk factors for securities held by the Funds, there are also risks that those derivatives may not perform as expected resulting in losses for the combined or hedged positions.
138 | April 30, 2018
Notes to Financial Statements
April 30, 2018 (Unaudited)
Derivatives may have little or no initial cash investment relative to their market value exposure and therefore can produce significant gains or losses in excess of their cost. This use of embedded leverage allows the Fund to increase its market value exposure relative to its net assets and can substantially increase the volatility of the Funds’ performance.
Additional associated risks from investing in derivatives also exist and potentially could have significant effects on the valuation of the derivative and the Funds. Typically, the associated risks are not the risks that the Funds are attempting to increase or decrease exposure to, per their investment objectives, but are the additional risks from investing in derivatives.
Examples of these associated risks are liquidity risk, which is the risk that the Funds will not be able to sell or close out the derivative in a timely manner, and counterparty credit risk, which is the risk that the counterparty will not fulfill its obligation to the Funds. In addition, use of derivatives may increase or decrease exposure to the following risk factors:
Equity Risk: Equity risk relates to the change in value of equity securities as they relate to increases or decreases in the general market. Associated risks can be different for each type of derivative and are discussed by each derivative type in the notes that follow.
Commodity Risk: Exposure to the commodities markets may subject the Funds to greater volatility than investments in traditional securities. Prices of various commodities may also be affected by factors, such as drought, floods, weather, livestock disease, embargoes, tariffs and other regulatory developments, which are unpredictable. The prices of commodities can also fluctuate widely due to supply and demand disruptions in major producing or consuming regions.
Foreign Currency Risk: Currency trading involves significant risks, including market risk, interest rate risk, country risk, counterparty credit risk and short sale risk. Market risk results from the price movement of foreign currency values in response to shifting market supply and demand. Interest rate risk arises whenever a country changes its stated interest rate target associated with its currency. Country risk arises because virtually every country has interfered with international transactions in its currency.
Interest Rate Risk: Interest rate risk is the risk that fixed income securities will decline in value because of changes in interest rates. As nominal interest rates rise, the value of fixed income securities held by the Funds are likely to decrease. Securities with longer durations tend to be more sensitive to changes in interest rates, and are usually more volatile than securities.
Swap Contracts: Each Fund may enter into swap transactions for hedging purposes or to seek to increase total return. At the present time, the CoreCommodity Fund primarily enters into swap transactions for the purpose of increasing total return. Swap agreements may be executed in a multilateral or other trade facility program, such as a registered exchange (“centrally cleared swaps”) or may be privately negotiated in the over-the counter market. The duration of a swap agreement typically ranges from a few weeks to more than one year. In a centrally cleared swap, immediately following execution of the swap agreement, the swap agreement is novated to a central counterparty (the “CCP”) and the Fund’s counterparty on the swap agreement becomes the CCP. Risks may arise as a result of the failure of the counterparty to the swap contract to comply with the terms of the swap contract. The loss incurred by the failure of a counterparty is generally limited to the net payment to be received by the Funds and/or the termination value at the end of the contract. Therefore, the Funds consider the creditworthiness of each counterparty to a contract in evaluating potential credit risk. Although centrally cleared swaps typically present less counterparty risk than non-centrally cleared swaps, a Fund that has entered into centrally cleared swaps is subject to the risk of the failure of the CCP.
Additionally, risks may arise from unanticipated movements in interest rates or in the value of the underlying reference asset or index. Entering into these agreements involves, to varying degrees, market risk, liquidity risk and elements of credit, legal and documentation risk that are not directly reflected in the amounts recognized in the Statements of Assets and Liabilities.
The Funds may pay or receive cash as collateral on these contracts which may be recorded as an asset and/or liability. The Funds must set aside liquid assets, or engage in other appropriate measures, to cover its obligations under these contracts. Swaps are marked to market daily using either pricing vendor quotations, counterparty prices or model prices and the change in value, if any, is recorded as an unrealized gain or loss. Upfront payments made and/or received by the Funds are recorded as an asset and/or liability and realized gains or losses are recognized ratably over the contract’s term/event, with the exception of forward starting interest rate swaps, whose realized gains or losses are recognized ratably from the effective start date. Periodic payments received or made on swap contracts are recorded as realized gains or losses. Gains or losses are realized upon termination of a swap contract and are recorded on the Statement of Operations.
Total return swaps are agreements in which there is an exchange of cash flows whereby one party commits to make payments based on the total return (coupons plus capital gains/losses) of an underlying instrument in exchange for fixed or floating rate interest payments. To the extent the total return of the instrument or index underlying the transaction exceeds or falls short of the offsetting interest rate obligation, the Fund will receive a payment from or make a payment to the counterparty. Credit default swaps are a type of swap agreement in which the protection
139 | April 30, 2018
Notes to Financial Statements
April 30, 2018 (Unaudited)
“buyer” is generally obligated to pay the protection “seller” an upfront and/ or a periodic stream of payments over the term of the contract provided that no credit event, such as a default, on a reference obligation has occurred. Credit default swaps (“CDS”) are typically two-party financial contracts that transfer credit exposure between the two parties. Under a typical CDS, one party (the “seller”) receives pre-determined periodic payments from the other party (the “buyer”). The seller agrees to make compensating specific payments to the buyer if a negative credit event occurs, such as the bankruptcy or default by the issuer of the underlying debt instrument. Swap agreements held at April 30, 2018 are disclosed after the Statement of Investments.
The average notional amount of the swap positions held in the ALPS | CoreCommodity Management CompleteCommodities® Strategy Fund for the six-month period ended April 30, 2018 was $372,924,189.
Futures: Each Fund may invest in futures contracts in accordance with their investment objectives. Each Fund does so for a variety of reasons including for cash management, hedging or non-hedging purposes in an attempt to achieve the Fund’s investment objective. A futures contract provides for the future sale by one party and purchase by another party of a specified quantity of the security or other financial instrument at a specified price and time. A futures contract on an index is an agreement pursuant to which two parties agree to take or make delivery of an amount of cash equal to the difference between the value of the index at the close of the last trading day of the contract and the price at which the index contract was originally written. Futures transactions may result in losses in excess of the amount invested in the futures contract. There can be no guarantee that there will be a correlation between price movements in the hedging vehicle and in the portfolio securities being hedged. An incorrect correlation could result in a loss on both the hedged securities in a Fund and the hedging vehicle so that the portfolio return might have been greater had hedging not been attempted. There can be no assurance that a liquid market will exist at a time when a Fund seeks to close out a futures contract or a futures option position. Lack of a liquid market for any reason may prevent a Fund from liquidating an unfavorable position, and the Fund would remain obligated to meet margin requirements until the position is closed. In addition, a Fund could be exposed to risk if the counterparties to the contracts are unable to meet the terms of their contracts. With exchange traded futures, there is minimal counterparty credit risk to the Funds since futures are exchange traded and the exchange’s clearinghouse, as counterparty to all exchange traded futures, guarantees the futures against default.
When a purchase or sale of a futures contract is made by a Fund, the Fund is required to deposit with its custodian (or broker, if legally permitted) a specified amount of liquid assets (“initial margin”). The margin required for a futures contract is set by the exchange on which the contract is traded and may be modified during the term of the contract. The initial margin is in the nature of a performance bond or good faith deposit on the futures contract that is returned to a Fund upon termination of the contract, assuming all contractual obligations have been satisfied. These amounts are included in Deposit with broker for futures contracts on the Statement of Assets and Liabilities. Each day a Fund may pay or receive cash, called “variation margin,” equal to the daily change in value of the futures contract. Such payments or receipts are recorded for financial statement purposes as unrealized gains or losses by a Fund. Variation margin does not represent a borrowing or loan by a Fund but is instead a settlement between a Fund and the broker of the amount one would owe the other if the futures contract expired. When the contract is closed, a Fund records a realized gain or loss equal to the difference between the value of the contract at the time it was opened and the value at the time it was closed.
The average value of futures contracts held in the ALPS | CoreCommodity Management CompleteCommodities® Strategy Fund for the six-month period ended April 30, 2018 was $46,288,007.
Option Contracts: Each Fund may enter into options transactions for hedging purposes and for non-hedging purposes such as seeking to enhance return. Each Fund may write covered put and call options on any stocks or stock indices, currencies traded on domestic and foreign securities exchanges, or futures contracts on stock indices, interest rates and currencies traded on domestic and, to the extent permitted by the CFTC, foreign exchanges. A call option on an asset written by a Fund obligates the Fund to sell the specified asset to the holder (purchaser) at a stated price (the exercise price) if the option is exercised before a specified date (the expiration date). A put option on an asset written by a Fund obligates the Fund to buy the specified asset from the purchaser at the exercise price if the option is exercised before the expiration date. Premiums received when writing options are recorded as liabilities and are subsequently adjusted to the current value of the options written. Premiums received from writing options that expire are treated as realized gains. Premiums received from writing options, which are either exercised or closed, are offset against the proceeds received or amount paid on the transaction to determine realized gains or losses which are recorded on the Statement of Operations.
140 | April 30, 2018
Notes to Financial Statements
April 30, 2018 (Unaudited)
Derivatives Instruments: The following tables disclose the amounts related to each Fund’s use of derivative instruments.
The effect of derivatives instruments on the Statement of Assets and Liabilities for the six-month period ended April 30, 2018:
| Risk Exposure | Asset Location | Fair Value | Liability Location | Fair Value | ||||||||
| ALPS | CoreCommodity Management CompleteCommodities® Strategy Fund(a) | ||||||||||||
| Commodity Contracts (Futures Contracts) | Unrealized appreciation on futures contracts(b) | 1,629,563 | Unrealized depreciation on futures contracts(b) | (1,070,086 | ) | |||||||
| Commodity Contracts (Total Return Swap Contracts) | Unrealized appreciation on total return swap contracts | – | Unrealized depreciation on total return swap contracts | (661 | ) | |||||||
| Total | $ | 1,629,563 | $ | (1,070,747 | ) | |||||||
| (a) | The ALPS | CoreCommodity Management CompleteCommodities® Strategy Fund consolidates the statements of assets and liabilities. |
| (b) | Represents cumulative appreciation (depreciation) of futures contracts as reported in the Consolidated Statement of Investments. Only the current day's net variation margin is reported within the Consolidated Statement of Assets and Liabilities. |
The effect of derivatives instruments on the Statement of Operations for the six-month period ended April 30, 2018:
| Risk Exposure | Statement of Operations Location | Realized Gain/(Loss) on Derivatives Recognized in Income | Change in Unrealized Appreciation/ (Depreciation) on Derivatives Recognized in Income | |||||||
| ALPS | CoreCommodity Management CompleteCommodities® Strategy Fund(a) | ||||||||||
| Equity and Commodity Contracts (Futures Contracts) | Net realized gain on futures contracts/Net change in unrealized depreciation on futures contracts | 9,494,707 | (1,711,858 | ) | ||||||
| Commodity Contracts (Total Return Swap Contracts) | Net realized gain on total return swap contracts/Net change in unrealized depreciation on total return swap contracts | 31,642,541 | (541 | ) | ||||||
| Total | $ | 41,137,248 | $ | (1,712,399 | ) | |||||
| (a) | The ALPS | CoreCommodity Management CompleteCommodities® Strategy Fund consolidates the statements of operations. |
Certain derivative contracts are executed under either standardized netting agreements or, for exchange-traded derivatives, the relevant contracts for a particular exchange which contain enforceable netting provisions. A derivative netting arrangement creates an enforceable right of set-off that becomes effective, and affects the realization of settlement on individual assets, liabilities and collateral amounts, only following a specified event of default or early termination. Default events may include the failure to make payments or deliver securities timely, material adverse changes in financial condition or insolvency, the breach of minimum regulatory capital requirements, or loss of license, charter or other legal authorization necessary to perform under the contract.
141 | April 30, 2018
Notes to Financial Statements
April 30, 2018 (Unaudited)
The following table presents financial instruments that are subject to enforceable netting arrangements or other similar agreements as of April 30, 2018:
Offsetting of Derivatives Liability
April 30, 2018
| Gross Amounts Not Offset in the Statement of Financial Position | ||||||||||||||||||||||||
| Gross Amounts of Recognized Liabilities | Gross Amounts Offset in the Statement of Assets and Liabilities | Net Amounts Presented in the Statement of Assets and Liabilities | Financial Instruments(a) | Cash Collateral Pledged(a) | Net Amount | |||||||||||||||||||
| ALPS | CoreCommodity Management CompleteCommodities® Strategy Fund | ||||||||||||||||||||||||
| Total Return Swap Contracts | $ | 661 | $ | – | $ | 661 | $ | (661 | ) | $ | – | $ | – | |||||||||||
| Total | $ | 661 | $ | – | $ | 661 | $ | (661 | ) | $ | – | $ | – | |||||||||||
| (a) | These amounts are limited to the derivative asset/liability balance and, accordingly, do not include excess collateral received/pledged. |
4. TAX BASIS INFORMATION
Tax Basis of Distributions to Shareholders: The character of distributions made during the year from net investment income or net realized gains may differ from its ultimate characterization for federal income tax purposes. Also, due to the timing of dividend distributions, the fiscal year in which amounts are distributed may differ from the fiscal year in which the income or realized gain were recorded by a Fund. The amounts and characteristics of tax basis distributions and composition of distributable earnings/(accumulated losses) are finalized at fiscal year-end. Accordingly, tax basis balances have not been determined as of April 30, 2018.
The tax character of distributions paid by the Funds for the Fiscal Year Ended October 31, 2017 were as follows:
| Fund | Ordinary Income | Long-Term Capital Gain | Return of Capital | |||||||||
| ALPS | CoreCommodity Management CompleteCommodities® Strategy Fund | $ | 507,017 | $ | – | – | |||||||
| ALPS | Kotak India Growth Fund | – | 203,399 | – | |||||||||
| ALPS | Metis Global Micro Cap Value Fund | 1,148,509 | – | – | |||||||||
| ALPS | Red Rocks Listed Private Equity Fund | 3,499,952 | – | – | |||||||||
| ALPS | WMC Research Value Fund | 153,642 | 2,752,711 | – | |||||||||
| Clough China Fund | 103,112 | – | – | |||||||||
| RiverFront Asset Allocation Aggressive | 776,294 | – | – | |||||||||
| RiverFront Asset Allocation Growth | 482,397 | – | – | |||||||||
| RiverFront Asset Allocation Growth & Income | 889,374 | – | – | |||||||||
| RiverFront Asset Allocation Moderate | 1,450,017 | – | – | |||||||||
| RiverFront Asset Allocation Income & Growth | 126,975 | – | – | |||||||||
The tax character of distributions paid by the Funds for the Fiscal Year Ended October 31, 2016 were as follows:
| Fund | Ordinary Income | Long-Term Capital Gain | Return of Capital | |||||||||
| ALPS | Kotak India Growth Fund | $ | 431,005 | $ | 1,657,288 | – | |||||||
| ALPS | Red Rocks Listed Private Equity Fund | 17,431,894 | 20,197,928 | – | |||||||||
| ALPS | WMC Research Value Fund | 703,783 | 27,067,576 | – | |||||||||
| Clough China Fund | 1,041,910 | – | – | |||||||||
| RiverFront Asset Allocation Aggressive | 1,138,129 | 742,246 | – | |||||||||
| RiverFront Asset Allocation Growth | 493,350 | 165,999 | – | |||||||||
| RiverFront Asset Allocation Growth & Income | 1,315,134 | 1,636,020 | – | |||||||||
| RiverFront Asset Allocation Moderate | 2,445,173 | 2,965,868 | – | |||||||||
| RiverFront Asset Allocation Income & Growth | 145,507 | 30,599 | – | |||||||||
142 | April 30, 2018
Notes to Financial Statements
April 30, 2018 (Unaudited)
Capital Losses: As of October 31, 2017 the following Funds had capital loss carryforwards which may reduce the Funds’ taxable income arising from future net realized gains on investments, if any, to the extent permitted by the Code and thus may reduce the amount of the distributions to shareholders which would otherwise be necessary to relieve the Funds of any liability for federal tax.
Post-Enactment Capital Losses*:
Capital losses deferred to next tax year were as follows:
| Fund | Short-Term | Long-Term | ||||||
| ALPS | CoreCommodity Management CompleteCommodities® Strategy Fund | $ | 23,471,178 | $ | 25,471,299 | ||||
| Clough China Fund | 4,908,264 | – | ||||||
| * | Post-Enactment Capital Losses arise in fiscal years beginning after December 22, 2010, and exclude any election for late year capital loss (during the period November 1st to December 31st) deferred for the current fiscal year. As a result of the enactment of the Regulated Investment Company Act of 2010, pre-enactment capital loss carryforwards may be more likely to expire unused. Additionally, post-enactment capital losses that are carried forward will retain their character as either short-term or long-term losses rather than being considered all short-term as under previous law. |
Capital loss carryovers used during the period ended October 31, 2017 were:
| Fund | Amount | |||
| ALPS | Red Rocks Listed Private Equity Fund | $ | 7,172,573 | ||
| Clough China Fund | 2,990,016 | |||
| RiverFront Asset Allocation Aggressive | 1,203,607 | |||
| RiverFront Asset Allocation Growth | 1,501,113 | |||
| RiverFront Asset Allocation Growth & Income | 1,876,307 | |||
| RiverFront Asset Allocation Income & Growth | 265,772 | |||
| RiverFront Asset Allocation Moderate | 2,468,558 | |||
The following funds elected to defer to the period ending October 31, 2018, late year ordinary losses:
| Fund | Amount | |||
| ALPS | Kotak India Growth Fund | $ | 112,097 | ||
Unrealized Appreciation and Depreciation on Investments: As of April 30, 2018, the costs of investments for federal income tax purposes and accumulated net unrealized appreciation/(depreciation) on investments were as follows:
| Fund | Gross Appreciation (excess of value over tax cost) | Gross Depreciation (excess of tax cost over value) | Net Unrealized Appreciation/ (Depreciation) | Cost of Investments for Income Tax Purposes | ||||||||||||
| ALPS | CoreCommodity Management CompleteCommodities® Strategy Fund | $ | 441,006,943 | $ | (430,711,397 | ) | $ | 10,295,546 | $ | 568,104,665 | |||||||
| ALPS | Kotak India Growth Fund | 7,304,892 | (1,565,454 | ) | 5,739,438 | 26,850,904 | |||||||||||
| ALPS | Metis Global Micro Cap Value Fund | 3,806,258 | (3,237,827 | ) | 568,431 | 27,387,600 | |||||||||||
| ALPS | Red Rocks Listed Private Equity Fund | 52,191,520 | (4,030,005 | ) | 48,161,515 | 205,917,890 | |||||||||||
| ALPS | WMC Research Value Fund | 11,778,813 | (4,330,309 | ) | 7,448,504 | 82,124,312 | |||||||||||
| Clough China Fund | – | – | – | – | ||||||||||||
| RiverFront Asset Allocation Moderate | (12,035 | ) | (1,356,820 | ) | (1,368,855 | ) | 88,097,764 | |||||||||
| RiverFront Asset Allocation Aggressive | 108,440 | (916,274 | ) | (807,834 | ) | 58,446,481 | ||||||||||
| RiverFront Asset Allocation Growth | 78,441 | (515,449 | ) | (437,008 | ) | 33,232,470 | ||||||||||
| RiverFront Asset Allocation Growth & Income | – | (1,262,926 | ) | (1,262,926 | ) | 79,914,093 | ||||||||||
| RiverFront Asset Allocation Income & Growth | (586 | ) | (139,064 | ) | (139,650 | ) | 10,728,031 | |||||||||
143 | April 30, 2018
Notes to Financial Statements
April 30, 2018 (Unaudited)
5. SECURITIES TRANSACTIONS
Purchases and sales of securities, excluding short-term securities and U.S. Government Obligations during the six-month period ended April 30, 2018 were as follows:
| Fund | Purchases of Securities | Proceeds from Sales of Securities | ||||||
| ALPS | CoreCommodity Management CompleteCommodities® Strategy Fund(a) | $ | 58,365,539 | $ | 34,773,972 | ||||
| ALPS | Kotak India Growth Fund(b) | 5,005,033 | 3,599,244 | ||||||
| ALPS | Metis Global Micro Cap Value Fund | 10,912,123 | 13,800,439 | ||||||
| ALPS | Red Rocks Listed Private Equity Fund | 63,899,079 | 29,054,169 | ||||||
| ALPS | WMC Research Value Fund | 38,814,634 | 44,054,320 | ||||||
| Clough China Fund | 25,059,556 | 32,695,595 | ||||||
| RiverFront Asset Allocation Aggressive | 63,364,094 | 68,196,111 | ||||||
| RiverFront Asset Allocation Growth | 35,514,864 | 36,588,228 | ||||||
| RiverFront Asset Allocation Growth & Income | 89,109,863 | 90,985,902 | ||||||
| RiverFront Asset Allocation Moderate | 97,885,686 | 106,380,322 | ||||||
| RiverFront Asset Allocation Income & Growth | 12,309,135 | 13,298,001 | ||||||
Purchases and sales of U.S. Government Obligations during the Six-Month Period Ended April 30, 2018 were as follows:
| Fund | Purchases of Securities | Proceeds from Sales of Securities | ||||||
| ALPS | CoreCommodity Management CompleteCommodities® Strategy Fund(a) | $ | 190,595,433 | $ | 108,645,200 | ||||
| (a) | Purchases and sales for ALPS | CoreCommodity Management CompleteCommodities® Strategy Fund are consolidated and include the balances of CoreCommodity Management Cayman Commodity Fund, Ltd. (wholly owned subsidiary). |
| (b) | Purchases and sales for ALPS | Kotak India Growth Fund are consolidated and include the balances of Kotak Mauritius Portfolio (wholly owned subsidiary). |
144 | April 30, 2018
Notes to Financial Statements
April 30, 2018 (Unaudited)
6. BENEFICIAL INTEREST TRANSACTIONS
Shares redeemed within 90 days of purchase for ALPS | Red Rocks Listed Private Equity Fund, 60 days of purchase for ALPS | Metis Global Micro Cap Value Fund and 30 days of purchase for ALPS | CoreCommodity Management CompleteCommodities® Strategy Fund, ALPS | Kotak India Growth Fund, and Clough China Fund, may incur a 2% short-term redemption fee deducted from the redemption amount. The ALPS | WMC Research Value Fund, RiverFront Asset Allocation Aggressive, RiverFront Asset Allocation Growth, RiverFront Asset Allocation Growth & Income, RiverFront Asset Allocation Moderate and RiverFront Asset Allocation Income & Growth shares do not incur redemption fees.
Effective December 1, 2017, Class A shares were renamed Investor Class shares for all Funds. Such shares will be offered without an initial sales charge or a contingent deferred sales charge. The RiverFront Asset Allocation Aggressive existing Investor shares were renamed Investor Class II shares.
For the six-month period ended April 30, 2018, the amounts listed below were retained by the Funds. These amounts are reflected in “Shares redeemed” in the Statements of Changes in Net Assets.
| Redemption Fee Retained | ||||||||
| Fund | For the Six Months Ended April 30, 2018 (Unaudited) | For the Year Ended October 31, 2017 | ||||||
| ALPS | CoreCommodity Management CompleteCommodities® Strategy Fund - Investor Class(a) | $ | 134 | $ | 4,451 | ||||
| ALPS | CoreCommodity Management CompleteCommodities® Strategy Fund - Class I | 1,272 | 21,419 | ||||||
| ALPS | Kotak India Growth Fund - Investor Class(a) | 780 | 1,637 | ||||||
| ALPS | Kotak India Growth Fund - Class I | 4 | 5,965 | ||||||
| ALPS | Metis Global Micro Cap Value Fund - Investor Class(a)(b) | – | 98 | ||||||
| ALPS | Metis Global Micro Cap Value Fund - Class I(b) | 4 | 423 | ||||||
| ALPS | Red Rocks Listed Private Equity Fund - Investor Class(a) | 1,506 | 4,962 | ||||||
| ALPS | Red Rocks Listed Private Equity Fund - Class C | 17 | 476 | ||||||
| ALPS | Red Rocks Listed Private Equity Fund - Class I | 11,420 | 35,027 | ||||||
| Clough China Fund - Investor Class(a) | 104 | – | ||||||
| Clough China Fund - Class C | – | 2 | ||||||
| Clough China Fund - Class I | – | 260 | ||||||
| (a) | Prior to December 1, 2017, Investor Class was known as Class A. |
| (b) | The Fund commenced operations on December 24, 2015. |
145 | April 30, 2018
Notes to Financial Statements
April 30, 2018 (Unaudited)
Transactions in shares of capital stock were as follows:
| ALPS | CoreCommodity Management CompleteCommodities® Strategy Fund | ||||||||
| For the Six Months Ended April 30, 2018 (Unaudited) | For the Year Ended October 31, 2017 | |||||||
| Investor Class(a) | ||||||||
| Shares sold | 1,422,347 | 3,889,576 | ||||||
| Dividends reinvested | 149,637 | 1,656 | ||||||
| Shares redeemed | (721,245 | ) | (1,668,511 | ) | ||||
| Net increase in shares outstanding | 850,739 | 2,222,721 | ||||||
| Class C | ||||||||
| Shares sold | 261,893 | 518,522 | ||||||
| Dividends reinvested | 15,808 | – | ||||||
| Shares redeemed | (147,293 | ) | (507,012 | ) | ||||
| Net increase in shares outstanding | 130,408 | 11,510 | ||||||
| Class I | ||||||||
| Shares sold | 17,345,115 | 28,571,916 | ||||||
| Dividends reinvested | 1,409,828 | 58,580 | ||||||
| Shares redeemed | (9,582,202 | ) | (29,134,584 | ) | ||||
| Net increase/(decrease) in shares outstanding | 9,172,741 | (504,088 | ) | |||||
| ALPS | Kotak India Growth Fund | ||||||||
| For the Six Months Ended April 30, 2018 (Unaudited) | For the Year Ended October 31, 2017 | |||||||
| Investor Class(a) | ||||||||
| Shares sold | 92,138 | 451,420 | ||||||
| Dividends reinvested | 17,076 | 4,607 | ||||||
| Shares redeemed | (122,389 | ) | (267,927 | ) | ||||
| Net increase/(decrease) in shares outstanding | (13,175 | ) | 188,100 | |||||
| Class C | ||||||||
| Shares sold | 26,906 | 17,209 | ||||||
| Dividends reinvested | 4,697 | 2,156 | ||||||
| Shares redeemed | (3,878 | ) | (27,512 | ) | ||||
| Net increase/(decrease) in shares outstanding | 27,725 | (8,147 | ) | |||||
| Class I | ||||||||
| Shares sold | 294,074 | 810,244 | ||||||
| Dividends reinvested | 33,509 | 8,955 | ||||||
| Shares redeemed | (161,625 | ) | (258,515 | ) | ||||
| Net increase in shares outstanding | 165,958 | 560,684 | ||||||
146 | April 30, 2018
Notes to Financial Statements
April 30, 2018 (Unaudited)
| ALPS | Metis Global Micro Cap Value Fund | ||||||||
| For the Six Months Ended April 30, 2018 (Unaudited) | For the Year Ended October 31, 2017 | |||||||
| Investor Class | ||||||||
| Shares sold | 36,485 | 293,492 | ||||||
| Dividends reinvested | 26,799 | 8,687 | ||||||
| Shares redeemed | (69,655 | ) | (30,569 | ) | ||||
| Net increase/(decrease) in shares outstanding | (6,371 | ) | 271,610 | |||||
| Class C | ||||||||
| Shares sold | 6,262 | 27,472 | ||||||
| Dividends reinvested | 2,640 | 1,101 | ||||||
| Shares redeemed | (11,372 | ) | (3,231 | ) | ||||
| Net increase/(decrease) in shares outstanding | (2,470 | ) | 25,342 | |||||
| Class I | ||||||||
| Shares sold | 42,469 | 707,127 | ||||||
| Dividends reinvested | 174,844 | 87,697 | ||||||
| Shares redeemed | (243,916 | ) | (79,308 | ) | ||||
| Net increase/(decrease) in shares outstanding | (26,603 | ) | 715,516 | |||||
| ALPS | Red Rocks Listed Private Equity Fund | ||||||||
| For the Six Months Ended April 30, 2018 (Unaudited) | For the Year Ended October 31, 2017 | |||||||
| Investor Class(a) | ||||||||
| Shares sold | 1,333,653 | 3,003,290 | ||||||
| Dividends reinvested | 732,595 | 102,237 | ||||||
| Shares redeemed | (1,821,938 | ) | (16,688,308 | ) | ||||
| Net increase/(decrease) in shares outstanding | 244,310 | (13,582,781 | ) | |||||
| Class C | ||||||||
| Shares sold | 593,577 | 597,701 | ||||||
| Dividends reinvested | 252,360 | 23,898 | ||||||
| Shares redeemed | (276,774 | ) | (592,966 | ) | ||||
| Net increase in shares outstanding | 569,163 | 28,633 | ||||||
| Class I | ||||||||
| Shares sold | 8,059,808 | 6,802,383 | ||||||
| Dividends reinvested | 1,953,871 | 321,770 | ||||||
| Shares redeemed | (2,831,481 | ) | (18,513,141 | ) | ||||
| Net increase/(decrease) in shares outstanding | 7,182,198 | (11,388,988 | ) | |||||
| Class R | ||||||||
| Shares sold | 175,021 | 208,338 | ||||||
| Dividends reinvested | 99,325 | 8,991 | ||||||
| Shares redeemed | (76,738 | ) | (130,252 | ) | ||||
| Net increase in shares outstanding | 197,608 | 87,077 | ||||||
147 | April 30, 2018
Notes to Financial Statements
April 30, 2018 (Unaudited)
| ALPS | WMC Research Value Fund | ||||||||
| For the Six Months Ended April 30, 2018 (Unaudited) | For the Year Ended October 31, 2017 | |||||||
| Investor Class(a) | ||||||||
| Shares sold | 25,379 | 68,781 | ||||||
| Dividends reinvested | 434,186 | 174,464 | ||||||
| Shares redeemed | (174,006 | ) | (915,327 | ) | ||||
| Net increase/(decrease) in shares outstanding | 285,559 | (672,082 | ) | |||||
| Class C | ||||||||
| Shares sold | 2,017 | 31,430 | ||||||
| Dividends reinvested | 5,073 | 814 | ||||||
| Shares redeemed | (2,591 | ) | (6,219 | ) | ||||
| Net increase in shares outstanding | 4,499 | 26,025 | ||||||
| Class I | ||||||||
| Shares sold | 222,449 | 400,927 | ||||||
| Dividends reinvested | 351,365 | 145,301 | ||||||
| Shares redeemed | (649,994 | ) | (1,110,893 | ) | ||||
| Net decrease in shares outstanding | (76,180 | ) | (564,665 | ) | ||||
| Clough China Fund | ||||||||
| For the Six Months Ended April 30, 2018 (Unaudited) | For the Year Ended October 31, 2017 | |||||||
| Investor Class(a) | ||||||||
| Shares sold | 23,381 | 55,498 | ||||||
| Dividends reinvested | 1,040 | 537 | ||||||
| Shares redeemed | (35,064 | ) | (283,590 | ) | ||||
| Net decrease in shares outstanding | (10,643 | ) | (227,555 | ) | ||||
| Class C | ||||||||
| Shares sold | 6,698 | 6,134 | ||||||
| Dividends reinvested | – | – | ||||||
| Shares redeemed | (13,495 | ) | (165,403 | ) | ||||
| Net decrease in shares outstanding | (6,797 | ) | (159,269 | ) | ||||
| Class I | ||||||||
| Shares sold | 52,076 | 103,059 | ||||||
| Dividends reinvested | 4,707 | 2,890 | ||||||
| Shares redeemed | (243,343 | ) | (401,464 | ) | ||||
| Net decrease in shares outstanding | (186,560 | ) | (295,515 | ) | ||||
148 | April 30, 2018
Notes to Financial Statements
April 30, 2018 (Unaudited)
| RiverFront Asset Allocation Aggressive | ||||||||
| For the Six Months Ended April 30, 2018 (Unaudited) | For the Year Ended October 31, 2017 | |||||||
| Investor Class(a) | ||||||||
| Shares sold | 17,930 | 136,919 | ||||||
| Dividends reinvested | 20,763 | 9,084 | ||||||
| Shares redeemed | (130,543 | ) | (307,093 | ) | ||||
| Net decrease in shares outstanding | (91,850 | ) | (161,090 | ) | ||||
| Class C | ||||||||
| Shares sold | 61,640 | 86,083 | ||||||
| Dividends reinvested | 26,131 | 10,065 | ||||||
| Shares redeemed | (98,519 | ) | (302,889 | ) | ||||
| Net decrease in shares outstanding | (10,748 | ) | (206,741 | ) | ||||
| Class I | ||||||||
| Shares sold | 80,878 | 369,904 | ||||||
| Dividends reinvested | 31,757 | 9,170 | ||||||
| Shares redeemed | (102,602 | ) | (277,778 | ) | ||||
| Net increase in shares outstanding | 10,033 | 101,296 | ||||||
| Investor Class II(b) | ||||||||
| Shares sold | 1,906 | 10,915 | ||||||
| Dividends reinvested | 7,256 | 3,773 | ||||||
| Shares redeemed | (21,803 | ) | (147,896 | ) | ||||
| Net decrease in shares outstanding | (12,641 | ) | (133,208 | ) | ||||
| Class L | ||||||||
| Shares sold | 89,004 | 210,187 | ||||||
| Dividends reinvested | 61,594 | 21,882 | ||||||
| Shares redeemed | (258,164 | ) | (344,426 | ) | ||||
| Net decrease in shares outstanding | (107,566 | ) | (112,357 | ) | ||||
| RiverFront Asset Allocation Growth | ||||||||
For the Six Months Ended (Unaudited) | For the October 31, | |||||||
| Investor Class(a) | ||||||||
| Shares sold | 65,881 | 115,445 | ||||||
| Dividends reinvested | 8,226 | 7,192 | ||||||
| Shares redeemed | (56,283 | ) | (138,100 | ) | ||||
| Net increase/(decrease) in shares outstanding | 17,824 | (15,463 | ) | |||||
| Class C | ||||||||
| Shares sold | 70,056 | 64,487 | ||||||
| Dividends reinvested | 12,414 | 14,239 | ||||||
| Shares redeemed | (99,611 | ) | (514,635 | ) | ||||
| Net decrease in shares outstanding | (17,141 | ) | (435,909 | ) | ||||
| Class I | ||||||||
| Shares sold | 98,145 | 215,017 | ||||||
| Dividends reinvested | 17,824 | 17,053 | ||||||
| Shares redeemed | (211,194 | ) | (360,729 | ) | ||||
| Net decrease in shares outstanding | (95,225 | ) | (128,659 | ) | ||||
149 | April 30, 2018
Notes to Financial Statements
April 30, 2018 (Unaudited)
RiverFront Asset Allocation Growth & Income | ||||||||
| For the Six Months Ended April 30, 2018 (Unaudited) | For the Year Ended | |||||||
| Investor Class(a) | ||||||||
| Shares sold | 53,524 | 157,001 | ||||||
| Dividends reinvested | 25,030 | 16,322 | ||||||
| Shares redeemed | (485,880 | ) | (486,851 | ) | ||||
| Net decrease in shares outstanding | (407,326 | ) | (313,528 | ) | ||||
| Class C | ||||||||
| Shares sold | 166,218 | 180,831 | ||||||
| Dividends reinvested | 48,731 | 17,535 | ||||||
| Shares redeemed | (219,294 | ) | (977,253 | ) | ||||
| Net decrease in shares outstanding | (4,345 | ) | (778,887 | ) | ||||
| Class I | ||||||||
| Shares sold | 812,925 | 596,156 | ||||||
| Dividends reinvested | 74,869 | 28,707 | ||||||
| Shares redeemed | (444,894 | ) | (643,862 | ) | ||||
| Net increase/(decrease) in shares outstanding | 442,900 | (18,999 | ) | |||||
| RiverFront Asset Allocation Moderate | ||||||||
| For the Six Months Ended April 30, 2018 (Unaudited) | For the Year Ended October 31, 2017 | |||||||
| Investor Class(a) | ||||||||
| Shares sold | 26,198 | 126,709 | ||||||
| Dividends reinvested | 51,651 | 20,379 | ||||||
| Shares redeemed | (193,742 | ) | (1,102,129 | ) | ||||
| Net decrease in shares outstanding | (115,893 | ) | (955,041 | ) | ||||
| Class C | ||||||||
| Shares sold | 99,637 | 242,966 | ||||||
| Dividends reinvested | 188,987 | 36,880 | ||||||
| Shares redeemed | (477,575 | ) | (1,835,084 | ) | ||||
| Net decrease in shares outstanding | (188,951 | ) | (1,555,238 | ) | ||||
| Class I | ||||||||
| Shares sold | 315,814 | 707,650 | ||||||
| Dividends reinvested | 129,416 | 47,006 | ||||||
| Shares redeemed | (539,975 | ) | (2,117,519 | ) | ||||
| Net decrease in shares outstanding | (94,745 | ) | (1,362,863 | ) | ||||
150 | April 30, 2018
Notes to Financial Statements
April 30, 2018 (Unaudited)
RiverFront Asset Allocation Income & Growth | ||||||||
For the Six Months Ended | For the Year Ended October 31, 2017 | |||||||
| Investor Class(a) | ||||||||
| Shares sold | 7,501 | 60,353 | ||||||
| Dividends reinvested | 2,411 | 731 | ||||||
| Shares redeemed | (13,697 | ) | (58,800 | ) | ||||
| Net increase/(decrease) in shares outstanding | (3,785 | ) | 2,284 | |||||
| Class C | ||||||||
| Shares sold | 27,004 | 110,766 | ||||||
| Dividends reinvested | 11,692 | 6,450 | ||||||
| Shares redeemed | (113,199 | ) | (573,252 | ) | ||||
| Net decrease in shares outstanding | (74,503 | ) | (456,036 | ) | ||||
| Class I | ||||||||
| Shares sold | 86,422 | 86,411 | ||||||
| Dividends reinvested | 7,465 | 2,763 | ||||||
| Shares redeemed | (41,760 | ) | (56,358 | ) | ||||
| Net increase in shares outstanding | 52,127 | 32,816 | ||||||
| (a) | Prior to December 1, 2017, Investor Class was known as Class A. |
| (b) | Prior to December 1, 2017, Investor Class II was known as Investor Class. |
7. AFFILIATED COMPANIES
Funds may invest in certain securities that are considered securities issued by affiliated companies. As defined by the Investment Company Act of 1940, an affiliated person, including an affiliated company, is one in which a Fund owns 5% or more of the outstanding voting securities, or a company which is under common ownership or control with the Fund. The purchases, sales, dividend income, realized gains or losses, change in unrealized gains or losses, shares and value of investments in affiliated companies for the six-month period ended April 30, 2018 were as follows:
| RiverFront Asset Allocation Aggressive | Share Balance as of November 1, 2017 | Purchases | Sales | Share Balance as of April 30, 2018 | Market Value as of April 30, 2018 | Dividend Income | Change in Unrealized Gain/Loss | Realized Gain/Loss | ||||||||||||||||||||||||
| First Trust Riverfront Dynamic Asia Pacific ETF | – | 55,426 | (1,211 | ) | 54,215 | $ | 3,244,226 | $ | 3,220 | $ | (61,794 | ) | $ | (850 | ) | |||||||||||||||||
| First Trust Riverfront Dynamic Developed International ETF | – | 304,190 | (6,229 | ) | 297,961 | 19,120,157 | 28,016 | (11,660 | ) | 1,128 | ||||||||||||||||||||||
| First Trust Riverfront Dynamic Emerging Markets ETF | – | 112,026 | (2,511 | ) | 109,515 | 7,966,121 | 4,011 | (227,791 | ) | (2,173 | ) | |||||||||||||||||||||
| First Trust Riverfront Dynamic Europe ETF | – | 157,982 | (34,462 | ) | 123,520 | 8,127,616 | 12,383 | (13,587 | ) | (1,901 | ) | |||||||||||||||||||||
| Riverfront Dynamic US Dividend Advantage ETF | – | 186,787 | (2,563 | ) | 184,224 | 5,790,160 | 17,436 | (175,013 | ) | (2,148 | ) | |||||||||||||||||||||
| Riverfront Dynamic US Flex-Cap ETF | – | 384,456 | (2,351 | ) | 382,105 | 12,381,425 | 18,294 | (315,924 | ) | (2,065 | ) | |||||||||||||||||||||
| 1,200,867 | (49,327 | ) | $ | 56,629,705 | $ | 83,360 | $ | (805,769 | ) | $ | (8,009 | ) | ||||||||||||||||||||
151 | April 30, 2018
Notes to Financial Statements
April 30, 2018 (Unaudited)
| RiverFront Asset Allocation Growth | Share Balance Balance as of November 1, 2017 | Purchases | Sales | Share Balance as of April 30, 2018 | Market Value as of April 30, 2018 | Dividends | Change in Unrealized Gain (Loss) | Realized Gain/Loss | ||||||||||||||||||||||||
| First Trust Riverfront Dynamic Asia Pacific ETF | – | 19,295 | – | 19,295 | $ | 1,154,613 | $ | 1,121 | $ | (21,992 | ) | $ | – | |||||||||||||||||||
| First Trust Riverfront Dynamic Developed International ETF | – | 161,126 | (20,820 | ) | 140,306 | 9,003,436 | 12,922 | 20,915 | (2,526 | ) | ||||||||||||||||||||||
| First Trust Riverfront Dynamic Emerging Markets ETF | – | 50,767 | – | 50,767 | 3,692,792 | 1,817 | (105,595 | ) | – | |||||||||||||||||||||||
| First Trust Riverfront Dynamic Europe ETF | – | 69,809 | – | 69,809 | 4,593,432 | 6,876 | (7,679 | ) | – | |||||||||||||||||||||||
| Riverfront Dynamic Core Income ETF | – | 58,947 | (13,965 | ) | 44,982 | 1,074,530 | 4,346 | (11,336 | ) | (3,775 | ) | |||||||||||||||||||||
| Riverfront Dynamic Unconstrained Income ETF | – | 65,755 | – | 65,755 | 1,660,643 | 10,848 | (6,904 | ) | – | |||||||||||||||||||||||
| Riverfront Dynamic US Dividend Advantage ETF | – | 123,972 | – | 123,972 | 3,896,440 | 11,619 | (117,773 | ) | – | |||||||||||||||||||||||
| Riverfront Dynamic US Flex-Cap ETF | – | 225,742 | – | 225,742 | 7,314,763 | 10,752 | (186,644 | ) | – | |||||||||||||||||||||||
| Riverfront Strategic Income Fund | 22,165 | – | (22,165 | ) | – | – | 7,547 | (25,047 | ) | 9,939 | ||||||||||||||||||||||
| 775,413 | (56,950 | ) | $ | 32,390,649 | $ | 67,848 | $ | (462,055 | ) | $ | 3,638 | |||||||||||||||||||||
| RiverFront Asset Allocation Growth & Income | Share Balance Balance as of November 1, 2017 | Purchases | Sales | Share Balance as of April 30, 2018 | Market Value as of April 30, 2018 | Dividends | Change in Unrealized Gain (Loss) | Realized Gain/Loss | ||||||||||||||||||||||||
| First Trust Riverfront Dynamic Asia Pacific ETF | – | 39,164 | – | 39,164 | $ | 2,343,574 | $ | 2,275 | $ | (44,639 | ) | $ | – | |||||||||||||||||||
| First Trust Riverfront Dynamic Developed International ETF | – | 277,676 | – | 277,676 | 17,818,469 | 25,574 | (113,847 | ) | – | |||||||||||||||||||||||
| First Trust Riverfront Dynamic Emerging Markets ETF | – | 107,996 | – | 107,996 | 7,855,629 | 3,866 | (224,632 | ) | – | |||||||||||||||||||||||
| First Trust Riverfront Dynamic Europe ETF | – | 147,854 | – | 147,854 | 9,728,793 | 14,564 | (16,264 | ) | – | |||||||||||||||||||||||
| Riverfront Dynamic Core Income ETF | – | 392,703 | (146,677 | ) | 246,026 | 5,877,069 | 23,771 | (61,999 | ) | (39,650 | ) | |||||||||||||||||||||
| Riverfront Dynamic Unconstrained Income ETF | – | 220,070 | – | 220,070 | 5,557,868 | 36,305 | (23,107 | ) | – | |||||||||||||||||||||||
| Riverfront Dynamic US Dividend Advantage ETF | – | 532,118 | – | 532,118 | 16,724,469 | 49,870 | (499,775 | ) | – | |||||||||||||||||||||||
| Riverfront Dynamic US Flex-Cap ETF | – | 337,038 | – | 337,038 | 10,921,110 | 16,053 | (278,663 | ) | – | |||||||||||||||||||||||
| Riverfront Strategic Income Fund | 105,827 | 5,798 | (111,625 | ) | – | – | 36,393 | (132,608 | ) | 58,443 | ||||||||||||||||||||||
| 2,060,417 | (258,302 | ) | $ | 76,826,981 | $ | 208,671 | $ | (1,395,534 | ) | $ | 18,793 | |||||||||||||||||||||
152 | April 30, 2018
Notes to Financial Statements
April 30, 2018 (Unaudited)
| RiverFront Asset Allocation Moderate | Share Balance Balance as of November 1, 2017 | Purchases | Sales | Share Balance as of April 30, 2018 | Market Value as of April 30, 2018 | Dividends | Change in Unrealized Gain (Loss) | Realized Gain/Loss | ||||||||||||||||||||||||
| First Trust Riverfront Dynamic Asia Pacific ETF | – | 14,841 | (136 | ) | 14,705 | $ | 879,947 | $ | 862 | $ | (16,761 | ) | $ | (151 | ) | |||||||||||||||||
| First Trust Riverfront Dynamic Developed International ETF | – | 254,673 | (32,084 | ) | 222,589 | 14,283,536 | 20,780 | (91,262 | ) | (5,670 | ) | |||||||||||||||||||||
| First Trust Riverfront Dynamic Emerging Markets ETF | – | 24,169 | (501 | ) | 23,668 | 1,721,610 | 865 | (49,230 | ) | (400 | ) | |||||||||||||||||||||
| First Trust Riverfront Dynamic Europe ETF | – | 80,076 | (2,302 | ) | 77,774 | 5,117,529 | 7,887 | (8,555 | ) | (1,701 | ) | |||||||||||||||||||||
| Riverfront Dynamic Core Income ETF | – | 1,062,109 | (71,438 | ) | 990,671 | 23,665,149 | 96,246 | (249,649 | ) | (18,850 | ) | |||||||||||||||||||||
| Riverfront Dynamic Unconstrained Income ETF | – | 293,735 | (4,683 | ) | 289,052 | 7,300,008 | 47,965 | (30,351 | ) | (174 | ) | |||||||||||||||||||||
| Riverfront Dynamic US Dividend Advantage ETF | – | 554,670 | (7,362 | ) | 547,308 | 17,201,891 | 51,784 | (518,015 | ) | (5,779 | ) | |||||||||||||||||||||
| Riverfront Dynamic US Flex-Cap ETF | – | 483,468 | (8,144 | ) | 475,324 | 15,402,019 | 22,966 | (392,997 | ) | (6,256 | ) | |||||||||||||||||||||
| Riverfront Strategic Income Fund | 178,038 | – | (178,038 | ) | – | – | 60,409 | (226,669 | ) | 106,662 | ||||||||||||||||||||||
| 2,767,741 | (304,688 | ) | $ | 85,571,689 | $ | 309,764 | $ | (1,583,489 | ) | $ | 67,681 | |||||||||||||||||||||
| RiverFront Asset Allocation Income & Growth | Share Balance Balance as of November 1, 2017 | Purchases | Sales | Share Balance as of April 30, 2018 | Market Value as of April 30, 2018 | Dividends | Change in Unrealized Gain (Loss) | Realized Gain/Loss | ||||||||||||||||||||||||
| First Trust Riverfront Dynamic Asia Pacific ETF | – | 1,791 | (22 | ) | 1,769 | $ | 105,857 | $ | 104 | $ | (2,016 | ) | $ | (26 | ) | |||||||||||||||||
| First Trust Riverfront Dynamic Developed International ETF | – | 16,008 | (184 | ) | 15,824 | 1,015,426 | 1,474 | (6,488 | ) | 17 | ||||||||||||||||||||||
| First Trust Riverfront Dynamic Europe ETF | – | 4,130 | (73 | ) | 4,057 | 266,951 | 407 | (446 | ) | 39 | ||||||||||||||||||||||
| Riverfront Dynamic Core Income ETF | – | 270,148 | (25,710 | ) | 244,438 | 5,839,135 | 23,804 | (61,599 | ) | (6,519 | ) | |||||||||||||||||||||
| Riverfront Dynamic Unconstrained Income ETF | – | 36,179 | (576 | ) | 35,603 | 899,154 | 5,908 | (3,738 | ) | 76 | ||||||||||||||||||||||
| Riverfront Dynamic US Dividend Advantage ETF | – | 47,848 | (652 | ) | 47,196 | 1,483,370 | 4,467 | (43,989 | ) | (586 | ) | |||||||||||||||||||||
| Riverfront Dynamic US Flex-Cap ETF | – | 25,513 | (370 | ) | 25,143 | 814,714 | 1,212 | (20,788 | ) | (295 | ) | |||||||||||||||||||||
| Riverfront Strategic Income Fund | 22,212 | 427 | (22,639 | ) | – | – | 7,325 | (26,260 | ) | 11,690 | ||||||||||||||||||||||
| 402,044 | (50,226 | ) | $ | 10,424,607 | $ | 44,701 | $ | (165,324 | ) | $ | 4,396 | |||||||||||||||||||||
153 | April 30, 2018
Notes to Financial Statements
April 30, 2018 (Unaudited)
8. MANAGEMENT AND RELATED-PARTY TRANSACTIONS
ALPS Advisors, Inc. (“AAI”), subject to the authority of the Board, is responsible for the overall management of the Funds listed below. AAI is an indirect wholly owned subsidiary of DST Systems, Inc. (“DST”), a publicly traded company listed on the New York Stock Exchange. On January 11, 2018, DST entered into an agreement and plan of merger with SS&C Technologies Holdings, Inc. (“SS&C”), a publicly traded company listed on the NASDAQ Global Select Market, and Diamond Merger Sub, Inc., a Delaware corporation and an indirect wholly owned subsidiary of SS&C (“Merger Sub”), pursuant to which Merger Sub will merge with and into DST (the “Transaction”), and as a result DST will become an indirect wholly owned subsidiary of SS&C. The Transaction was completed on April 16, 2018, and resulted in a change of control of AAI.
In order for AAI to continue to serve as the investment adviser and the applicable sub-adviser to serve as investment sub-adviser to the applicable Funds, at an in-person meeting of the Board of Trustees of Financial Investors Trust (the “Trust”) on March 13-14, 2018 (the “Board Meeting”), the Board approved new investment advisory agreements between AAI and the Trust, on behalf of each Fund (together, the “New Advisory Agreements”), and new investment sub-advisory agreements among AAI, the Trust, on behalf of each Fund, and the applicable investment sub-adviser (together, the “New Sub-Advisory Agreements”), subject to shareholder approval (collectively, the “New Agreements”). The 1940 Act requires that investment advisory agreements be approved by a vote of a majority of the outstanding shares of a fund. Therefore, shareholders were asked to approve the New Agreements.
At the Board Meeting, the Board also approved interim investment advisory agreements between AAI and the Trust, on behalf of each Fund, and interim investment sub-advisory agreements among AAI, the Trust, on behalf of each Fund, and the applicable investment sub-adviser (the “Interim Advisory Agreements”). The Interim Advisory Agreements are effective for the earlier of 150 days from the close of the Transaction on April 16, 2018 or the date of shareholder approval of the New Advisory Agreements. Both the New Agreements and the Interim Advisory Agreements are similar in all material respects to the prior advisory agreements.
AAI has delegated daily management of the Funds listed below to the corresponding Sub-Advisor(s) listed in the table below. Each Sub-Advisor manages the investments of the Fund in accordance with its investment objective, policies and limitations and investment guidelines established jointly by AAI and the Board.
| Fund | Sub-Advisor(s) |
| ALPS | CoreCommodity Management CompleteCommodities® Strategy Fund | CoreCommodity Management, LLC |
| ALPS | Kotak India Growth Fund | Kotak Mahindra (UK) Limited |
| ALPS | Metis Global Micro Cap Value Fund | Metis Global Partners, LLC |
| ALPS | Red Rocks Listed Private Equity Fund | Red Rocks Capital, LLC(a) |
| ALPS | WMC Research Value Fund | Wellington Management Company, LLP |
| Clough China Fund | Clough Capital Partners, LP |
| RiverFront Asset Allocation Aggressive | RiverFront Investment Group, LLC |
| RiverFront Asset Allocation Growth | RiverFront Investment Group, LLC |
| RiverFront Asset Allocation Growth & Income | RiverFront Investment Group, LLC |
| RiverFront Asset Allocation Moderate | RiverFront Investment Group, LLC |
| RiverFront Asset Allocation Income & Growth | RiverFront Investment Group, LLC |
| (a) | Red Rocks Capital LLC is a subsidiary of ALPS Advisors, Inc. |
154 | April 30, 2018
Notes to Financial Statements
April 30, 2018 (Unaudited)
Pursuant to the Investment Advisory Agreement (the “Advisory Agreement”), the Funds listed below pay AAI an annual management fee which is based on each Fund’s average daily net assets. The management fee is paid on a monthly basis. The following table reflects the Funds’ contractual management fee rates (expressed as an annual rate).
| Fund | Contractual Management Fee |
| ALPS | CoreCommodity Management CompleteCommodities® Strategy Fund | 0.85% |
| ALPS | Kotak India Growth Fund | 1.25% |
| ALPS | Metis Global Micro Cap Value Fund | 1.25% |
| ALPS | Red Rocks Listed Private Equity Fund | 0.85% |
| ALPS | WMC Research Value Fund | 0.95%(a) |
| Clough China Fund | 1.35% |
| (a) | The contractual management fee is 0.95% for the first $250 million of net assets, 0.85% for the next $250 million of net assets, and 0.75% for net assets in excess of $500 million. |
Effective February 28, 2018, pursuant to the Administrative Services Agreement, the Riverfront Funds listed below pay an annual unitary administrative fee which is based on each Fund’s average daily net assets. The unitary administrative fee is paid on a monthly basis. The following table reflects the Funds’ contractual unitary administrative fee rates (expressed as an annual rate).
| Fund | Contractual Unitary Fee |
| RiverFront Asset Allocation Aggressive | 0.25% |
| RiverFront Asset Allocation Growth | 0.25% |
| RiverFront Asset Allocation Growth & Income | 0.25% |
| RiverFront Asset Allocation Moderate | 0.25% |
| RiverFront Asset Allocation Income & Growth | 0.25% |
Prior to February 28, 2018, pursuant to the prior Investment Advisory Agreement, the Riverfront Funds listed below paid AAI an annual management fee which is based on each Fund’s average daily net assets. The management fee was paid on a monthly basis. The following table reflects the Riverfront Funds’ prior contractual management fee rates (expressed as an annual rate).
| Fund | Contractual Management Fee |
| RiverFront Asset Allocation Aggressive | 0.85% |
| RiverFront Asset Allocation Growth | 0.85% |
| RiverFront Asset Allocation Growth & Income | 0.85% |
| RiverFront Asset Allocation Moderate | 0.85% |
| RiverFront Asset Allocation Income & Growth | 0.85% |
Pursuant to an Investment Sub-advisory Agreement, AAI pays the Sub-Advisors of the Funds listed below an annual sub-advisory management fee which is based on each Fund’s average daily assets. AAI is required to pay all fees due to each Sub-Advisor out of the management fee AAI receives from each Fund listed below. The following table reflects the Funds’ contractual sub-advisory fee rates.
| Fund | Average Daily Net Assets of the Fund | Contractual Sub-Advisory Fee |
| ALPS | CoreCommodity Management CompleteCommodities® Strategy Fund | All Asset Levels | 0.75% |
| ALPS | Kotak India Growth Fund | First $50 Million | 1.15% |
| Over $50 Million | 1.05% | |
| ALPS | Metis Global Micro Cap Value Fund | All Asset Levels | 1.00% |
| ALPS | Red Rocks Listed Private Equity Fund | All Asset Levels | 0.57% |
| ALPS | WMC Research Value Fund | First $250 Million | 0.50% |
| $250 Million - $500 Million | 0.40% | |
| Over $500 Million | 0.30% | |
| Clough China Fund | All Asset Levels | 0.90% |
155 | April 30, 2018
Notes to Financial Statements
April 30, 2018 (Unaudited)
Prior to February 28, 2018 and pursuant to an Investment Sub-advisory Agreement, AAI paid the Sub-Advisor of the Funds listed below an annual sub-advisory management fee which was based on each Fund’s average daily assets. AAI was required to pay all fees due to the Sub-Advisor out of the management fee AAI received from each Fund listed below.
| Fund | Average Daily Net Assets of the Fund | Contractual Sub-Advisory Fee |
| RiverFront Asset Allocation Aggressive | All Asset Levels | 0.60% |
| RiverFront Asset Allocation Growth | All Asset Levels | 0.60% |
| RiverFront Asset Allocation Growth & Income | All Asset Levels | 0.60% |
| RiverFront Asset Allocation Moderate | All Asset Levels | 0.60% |
| RiverFront Asset Allocation Income & Growth | All Asset Levels | 0.60% |
Effective January 1, 2017, Wellington Management Company, LLP temporarily and voluntarily reduced the sub-advisory fee rate on the Fund’s daily net assets of $0 to $250 million by ten basis points. This reduction will remain in effect for 12 months unless terminated earlier by Wellington Management Company, LLP. The other tiers have remained unchanged.
ALPS | CoreCommodity Management CompleteCommodities® Strategy Fund
AAI and CoreCommodity Management LLC have contractually agreed to limit the amount of the Fund’s total annual expenses, exclusive of distribution and service (12b-1) fees, shareholder services fees, acquired fund fees and expenses, brokerage commissions, interest expense, taxes and extraordinary expenses that exceed the following annual rates below.
ALPS | Kotak India Growth Fund
Prior to April 1, 2017, AAI and Kotak Mahindra (UK) Limited have contractually agreed to limit the amount of the Fund’s total annual expenses, exclusive of distribution and service (12b-1) fees, shareholder services fees, acquired fund fees and expenses, brokerage expenses, interest expenses, taxes and extraordinary expenses that exceed the following annual rates below. Effective April 1, 2017, Kotak entered into a Novation Agreement with the Fund, AAI and Kotak Mahindra Asset Management (Singapore) Pte. Ltd. (“KMAMS”), another wholly owned subsidiary of Kotak Mahindra Bank Limited, whereby KMAMS will assume all of Kotak’s rights and obligations under the current Sub-Advisory Agreement.
ALPS | Metis Global Micro Cap Value Fund
AAI and Metis Global Partners, LLC have contractually agreed to limit the amount of the Fund’s total annual expenses, exclusive of distribution and service (12b-1) fees, shareholder services fees, acquired fund fees and expenses, brokerage expenses, interest expense, taxes and extraordinary expenses that exceed the following annual rates below.
ALPS | Red Rocks Listed Private Equity Fund
AAI and Red Rocks Capital LLC have contractually agreed to limit the amount of the Fund’s total annual expenses, exclusive of distribution and service (12b-1) fees, acquired fund fees and expenses, shareholder service fees, brokerage expenses, interest expense, taxes and extraordinary expenses that exceed the following annual rates below.
ALPS | WMC Research Value Fund
AAI has contractually agreed to limit the amount of the Fund’s total annual expenses, exclusive of distribution and service (12b-1) fees, shareholder service fees, acquired fund fees and expenses, brokerage expenses, interest expense, taxes and extraordinary expenses that exceed the following annual rates below.
Clough China Fund
AAI has contractually agreed to limit the amount of the Fund’s total annual expenses, exclusive of acquired fund fees and expenses, interest, taxes, brokerage costs and commissions, dividend and interest expense on short sales, litigation, indemnification and extraordinary expenses as determined under generally accepted accounting principles that exceed the following annual rates below.
156 | April 30, 2018
Notes to Financial Statements
April 30, 2018 (Unaudited)
These agreements are reevaluated on an annual basis. The current agreement runs through February 28, 2019. Fees waived or reimbursed for the six-month period ended April 30, 2018 are disclosed on the Statement of Operations or Consolidated Statement of Operations.
| Fund | Investor Class | Class C | Class I | Investor Class II | Class L | Class R |
| ALPS | CoreCommodity Management CompleteCommodities® Strategy Fund | 1.05% | 1.05% | 1.15% | N/A | N/A | N/A |
| ALPS | Kotak India Growth Fund | 1.60% | 1.60% | 1.60% | N/A | N/A | N/A |
| ALPS | Metis Global Micro Cap Value Fund | 1.70% | 1.70% | 1.70% | N/A | N/A | N/A |
| ALPS | Red Rocks Listed Private Equity Fund | 1.25% | 1.25% | 1.25% | N/A | N/A | 1.25% |
| ALPS | WMC Research Value Fund | 0.90% | 0.90% | 0.90% | N/A | N/A | N/A |
| Clough China Fund | 1.95% | 2.70% | 1.70% | N/A | N/A | N/A |
RiverFront Funds
Prior to February 28, 2018, AAI and Riverfront Investment Group, LLC had contractually agreed to limit the amount of each Fund’s total annual expenses, exclusive of distribution and service (12b-1) fees, shareholder services fees, acquired fund fees and expenses, brokerage commissions, taxes and extraordinary expenses that exceed the following annual rates below.
| Fund | Investor Class | Class C | Class I | Investor Class II | Class L | Class R |
| RiverFront Asset Allocation Aggressive | 0.90% | 0.90% | 0.90% | N/A | N/A | N/A |
| RiverFront Asset Allocation Growth | 0.90% | 0.90% | 0.90% | N/A | N/A | N/A |
| RiverFront Asset Allocation Growth & Income | 0.90% | 0.90% | 0.90% | N/A | N/A | N/A |
| RiverFront Asset Allocation Moderate | 0.90% | 0.90% | 0.90% | 0.90% | 0.90% | N/A |
| RiverFront Asset Allocation Income & Growth | 0.90% | 0.90% | 0.90% | N/A | N/A | N/A |
The Advisor(s) and each Sub-Advisor are permitted to recover expenses they have waived or reimbursed, on a class-by-class basis, through the agreements described above to the extent that expenses in later periods fall below the annual limits set forth in these agreements. Clough China Fund is not obligated to pay any such waived or reimbursed fees and expenses more than one year after the end of the fiscal year in which the fees or expenses were waived or reimbursed. The ALPS | CoreCommodity Management CompleteCommodities® Strategy Fund, ALPS | Kotak India Growth Fund, ALPS | Metis Global Micro Cap Value Fund, ALPS | Red Rocks Listed Private Equity Fund and ALPS | WMC Research Value Fund are not obligated to pay any deferred fees and expenses more than thirty-six months after the date on which the fees was waived or expenses were deferred, as calculated on a monthly basis. As of the six-month period ended April 30, 2018, the Advisor and Sub-Advisor(s) may seek reimbursement of previously waived and reimbursed fees as follows:
| Fund | Expiring in 2018 | Expiring in 2019 | Expiring in 2020 | Expiring in 2021 | Total | |||||||||||||||
| ALPS | CoreCommodity Management CompleteCommodities® Strategy Fund - Investor Class | $ | 295 | N/A | N/A | N/A | $ | 295 | |||||||||||||
| ALPS | CoreCommodity Management CompleteCommodities® Strategy Fund - Class C | 809 | N/A | N/A | N/A | 809 | |||||||||||||||
| ALPS | CoreCommodity Management CompleteCommodities® Strategy Fund - Class I | N/A | N/A | N/A | N/A | N/A | |||||||||||||||
| ALPS | Kotak India Growth Fund - Investor Class | 47,753 | 99,781 | 80,686 | 33,144 | 261,364 | |||||||||||||||
| ALPS | Kotak India Growth Fund - Class C | 15,503 | 36,083 | 22,009 | 7,631 | 81,225 | |||||||||||||||
| ALPS | Kotak India Growth Fund - Class I | 70,465 | 155,959 | 162,405 | 71,646 | 460,475 | |||||||||||||||
| ALPS | Metis Global Micro Cap Value Fund - Investor Class | N/A | 3,182 | 24,598 | 8,561 | 36,341 | |||||||||||||||
| ALPS | Metis Global Micro Cap Value Fund - Class C | N/A | 1,243 | 3,010 | 1,314 | 5,567 | |||||||||||||||
| ALPS | Metis Global Micro Cap Value Fund - Class I | N/A | 172,314 | 174,029 | 54,299 | 400,642 | |||||||||||||||
| ALPS | Red Rocks Listed Private Equity Fund - Investor Class | N/A | N/A | N/A | N/A | N/A | |||||||||||||||
| ALPS | Red Rocks Listed Private Equity Fund - Class C | N/A | N/A | N/A | N/A | N/A | |||||||||||||||
| ALPS | Red Rocks Listed Private Equity Fund - Class I | N/A | N/A | N/A | N/A | N/A | |||||||||||||||
| ALPS | Red Rocks Listed Private Equity Fund - Class R | N/A | N/A | N/A | N/A | N/A | |||||||||||||||
157 | April 30, 2018
Notes to Financial Statements
April 30, 2018 (Unaudited)
| Fund | Expiring in 2018 | Expiring in 2019 | Expiring in 2020 | Expiring in 2021 | Total | |||||||||||||||
| ALPS | WMC Research Value Fund - Investor Class | 30,773 | 190,057 | 187,414 | 91,174 | 499,418 | |||||||||||||||
| ALPS | WMC Research Value Fund - Class C | 582 | 2,075 | 2,406 | 1,331 | 6,394 | |||||||||||||||
| ALPS | WMC Research Value Fund - Class I | 22,510 | 155,578 | 160,027 | 73,747 | 411,862 | |||||||||||||||
| Clough China Fund - Investor Class | 8,677 | 5,009 | N/A | N/A | 13,686 | |||||||||||||||
| Clough China Fund - Class C | 4,907 | 2,781 | N/A | N/A | 7,688 | |||||||||||||||
| Clough China Fund - Class I | 19,168 | 14,741 | N/A | N/A | 33,909 | |||||||||||||||
ALPS | CoreCommodity recovered $54,424 of reimbursed expense during the six-month period ended April 30, 2018.
Effective February 28, 2018, the Riverfront Funds will no longer pay a management fee or contractually limit the amount of each Fund’s total annual expenses.
ALPS Portfolio Solutions Distributor, Inc. (the “Distributor”) acts as the distributor of the Funds’ shares pursuant to a Distribution Agreement with the Trust. Shares are sold on a continuous basis by the Distributor, as agent for the Funds, and the Distributor has agreed to use its best efforts to solicit orders for the sale of Funds’ shares, although it is not obliged to sell any particular amount of shares. The Distributor is not entitled to any compensation for its services. The Distributor is registered as a broker -dealer with the Securities and Exchange Commission. The Funds’ Distributor is also the distributor of the Select Sector SPDR exchange traded funds (the “Underlying Sector ETFs”). As required by exempted relief obtained by the Underlying Sector ETFs, the Advisor(s) will reimburse any applicable Fund an amount equal to the distribution fee received by the Distributor from the Underlying Sector ETFs attributable to such Fund’s investment in the Underlying Sector ETFs, for so long as the Distributor acts as distributor to such Fund and the Underlying Sector ETFs. There were no amounts reimbursed during the Funds’ six-month period ended April 30, 2018.
Distribution and Services (12b-1) Plans
Each Fund has adopted Distribution and Services Plans (the “Plans”) pursuant to Rule 12b-1 of the 1940 Act for its Investor Class, Class C and Class R (ALPS | Red Rocks Listed Private Equity Fund only) and Investor Class II (Asset Allocation Moderate only) shares. A description of the Distribution and Services Plan for the Class C shares of the ALPS | Metis Global Micro Cap Value Fund is provided below. The Plans allows a Fund to use Investor Class, Class C, Class R and Investor Class II assets to pay fees in connection with the distribution and marketing of Investor Class, Class C, Class R and Investor Class II shares and/or the provision of shareholder services to Investor Class, Class C, Class R and Investor Class II shareholders. The Plans permit payment for services in connection with the administration of plans or programs that use Investor Class, Class C, Class R and Investor Class II shares of a Fund, if any, as their funding medium and for related expenses. The Plans permit a Fund to make total payments at an annual rate of up to 0.25% of a Fund’s average daily net assets attributable to its Investor Class and Investor Class II shares, 0.75% of a Fund’s average daily net assets attributable to its Class C shares and 0.50% of the ALPS | Red Rocks Listed Private Equity Fund’s average daily net assets attributable to its Class R shares.
Under the terms of the Plans, the Trust is authorized to make payments to the Distributor for remittance to financial intermediaries, as compensation for distribution and/or shareholder ongoing services performed by such entities for beneficial shareholders of the Fund. The Distributor is entitled to retain some or all fees payable under the Plans in certain circumstances, including when there is no broker of record or when certain qualification standards have not been met by the broker of record.
The ALPS | Metis Global Micro Cap Value Fund has adopted a Distribution and Services Plan (the “Metis Plan”) pursuant to Rule 12b-1 of the 1940 Act for its Class C shares. The Metis Plan permits the Fund to make total payments at an aggregate amount not to exceed 1.00% per annum of the average daily net assets of the Fund’s Class C Shares as follows: (a) an amount equal to the daily equivalent of 0.75% per annum of the net asset value of a Fund’s Class C Shares outstanding on each day, which shall accrue daily and is payable no more frequently than monthly in arrears, as a distribution and marketing fee (the “Distribution Fee”). The Distribution Fee may be used by the Distributor to compensate intermediaries for distribution and sales-related expenses or activities in respect of Class C shares of the Fund; and (b) an amount equal to the daily equivalent of 0.25% per annum of the net asset value of the Fund’s Class C shares outstanding on each day, which shall accrue daily and is payable no more frequently than monthly in arrears, as a service fee (the “Service Fee”). The Service Fee may be used by the Distributor to compensate intermediaries for service-related expenses or activities in respect of Class C shares of the Fund.
Under the terms of the Metis Plan, the Distribution Fee may be retained by the Distributor or used to compensate intermediaries for any activities or expenses primarily intended to finance, directly or indirectly, any activity which is anticipated to result in the sale of Class C shares issued by the Fund. The Service Fee may be used by the Distributor in part for the implementation of shareholder service arrangements or to compensate
158 | April 30, 2018
Notes to Financial Statements
April 30, 2018 (Unaudited)
intermediaries for personal services rendered to Class C shareholders of the Fund and/or maintenance of Class C shareholder accounts (but will generally not be spent on record keeping charges, accounting expenses, transfer agent costs or custodian fees).
The expenses of the Plans and the Metis Plan are reflected as distribution and service fees on the Statement of Operations or Consolidated Statement of Operations. Because these fees are paid out of a Fund’s Class C, Class R and Investor Class assets, if any, on an ongoing basis, over time they will increase the cost of an investment in Class C, Class R and Investor Class shares, if any, and Plan fees may cost an investor more than other types of sales charges.
Shareholder Services Plans
Each Fund has adopted a shareholder services plan with respect to their Investor Class shares (the “Investor Class Shareholder Services Plan”). Under the Investor Class Shareholder Services Plan, the Funds are authorized to compensate certain financial intermediaries, including broker-dealers and Fund affiliates (“Participating Organizations”), an aggregate fee in an amount not to exceed on an annual basis 0.15% for Investor Class shares of the average daily net asset value of Investor Class shares of the Funds attributable to or held in the name of a Participating Organization pursuant to an agreement with a such Participating Organizations (“Agreement”). Each Agreement will set forth the non-distribution related shareholder services to be performed by the Participating Organization for the benefit of a Fund’s shareholders who have elected to have such Participating Organization service their accounts. Any amount of such payment not paid to Participating Organizations during the Fund’s fiscal year for such service activities shall be reimbursed to the Fund as soon as practicable after the end of the fiscal year. Investor Class Shareholder Services Plan fees recaptured pursuant to the Services Plan for the six-month period ended April 30, 2018 are included as an offset to distribution and service fees as disclosed in the Statements of Operations.
Each Fund has adopted a shareholder services plan with respect to its Class C shares (the “Class C Shareholder Services Plan”). Under the Class C Shareholder Services Plan, the Funds are authorized to pay banks and their affiliates and other institutions, including broker-dealers and Fund affiliates (“Participating Organizations”), an aggregate fee in an amount not to exceed on an annual basis 0.25% for Class C shares of the average daily net asset value of the Class C shares attributable to or held in the name of a Participating Organization for its clients as compensation for providing shareholder service activities, which do not include distribution services, pursuant to an agreement with a Participating Organization. Any amount of such payment not paid to Participating Organizations during a Fund’s fiscal year for such service activities shall be reimbursed to the Fund as soon as practicable after the end of the fiscal year. Class C Shareholder Services Plan fees are included with distribution and service fees on the Statements of Operations.
Certain intermediaries may charge networking, omnibus account or other administrative fees with respect to transactions in shares of each Fund. Transactions may be processed through the National Securities Clearing Corporation or similar systems or processed on a manual basis. These fees generally are paid by the Fund to the Distributor, which uses such fees to reimburse intermediaries. In the event an intermediary receiving payments from the Distributor on behalf of the Fund converts from a networking structure to an omnibus account structure or otherwise experiences increased costs, fees borne by the Fund may increase. Networking fees are shown in the Statements of Operations, if applicable to the Fund.
ALPS Fund Services, Inc. (“ALPS”) serves as administrator to the Funds and the Funds have agreed to pay expenses incurred in connection with their administrative activities. Pursuant to an Administrative Agreement, ALPS provides operational services to the Funds including, but not limited to, fund accounting and fund administration and generally assists in the Funds’ operations. Officers of the Trust are employees of ALPS. The Funds’ administration fee is accrued on a daily basis and paid monthly. Administration fees paid by the Funds for the six-month period ended April 30, 2018 are disclosed in the Statement of Operations.
ALPS is reimbursed by the Funds for certain out-of-pocket expenses.
Trustees
The fees and expenses of the independent trustees of the Board are presented in the Statements of Operations
9. INDEMNIFICATIONS
Under the Trust’s organizational documents, its officers and Trustees are indemnified against certain liability arising out of the performance of their duties to the Trust. Additionally, in the normal course of business, the Trust enters into contracts with service providers that may contain general indemnification clauses which may permit indemnification to the extent permissible under applicable law. The Trust’s maximum exposure under these arrangements is unknown, as this would involve future claims that may be made against the Trust that have not yet occurred.
159 | April 30, 2018
Notes to Financial Statements
April 30, 2018 (Unaudited)
10. SUBSEQUENT EVENT
Subsequent to period end, at a Special Meeting of Shareholders of the Funds, held at the offices of ALPS Fund Services, Inc., at 1290 Broadway, Suite 1100, Denver, CO 80203 on May 31, 2018, shareholders of record of the following Funds as of the close of business on April, 2, 2018 voted to approve the following proposals:
Proposal 1: To approve New Advisory Agreements.
| Shares Voted In Favor | Shares Voted Against or Abstentions | |
| CompleteCommodities Strategy Fund | 44,994,966 | 210,832 |
| ALPS | Metis Global Micro Cap Value Fund | 1,334,173 | 3,290 |
| RiverFront Asset Allocation Aggressive | 1,887,867 | 32,085 |
Proposal 2: To approve New Sub-Advisory Agreements.
| Shares Voted In Favor | Shares Voted Against or Abstentions | |
| CompleteCommodities Strategy Fund | 44,956,154 | 249,644 |
| ALPS | Metis Global Micro Cap Value Fund | 1,333,650 | 3,813 |
| RiverFront Asset Allocation Aggressive | 1,890,839 | 29,113 |
Proposal 3: To approve a proposal that would authorize AAI to enter into and materially amend investment sub-advisory agreements in the future with wholly-owned sub-advisers and unaffiliated sub-advisers, with the approval of the Board, but without obtaining additional shareholder approval.
| Shares Voted In Favor | Shares Voted Against or Abstentions | |
| CompleteCommodities Strategy Fund | 44,835,893 | 369,905 |
| ALPS | Metis Global Micro Cap Value Fund | 1,331,218 | 6,245 |
| RiverFront Asset Allocation Aggressive | 1,878,485 | 41,467 |
All other Funds adjourned to a new special shareholder meeting date of June 29, 2018.
160 | April 30, 2018
Additional Information
April 30, 2018 (Unaudited)
1. FUND HOLDINGS
The Funds file their complete schedule of portfolio holdings with the Securities and Exchange Commission (the “SEC”) for the first and third quarters of each fiscal year on Form N-Q within 60 days after the end of the period. Copies of the Funds’ Form N-Q are available without charge on the SEC website at http:// www.sec.gov. You may also review and copy the Form N-Q at the SEC’s Public Reference Room in Washington, D.C. For more information about the operation of the Public Reference Room, please call the SEC at 1-800-SEC-0330.
2. FUND PROXY VOTING POLICIES, PROCEDURES AND SUMMARIES
Fund policies and procedures used in determining how to vote proxies and information regarding how each of the Funds voted proxies relating to portfolio securities during the most recent prior 12-month period ending June 30 are available without charge, (1) upon request, by calling (toll-free) (866) 759-5679 and (2) on the SEC’s website at http://www.sec.gov.
3. DISCLOSURE REGARDING APPROVAL OF FUND ADVISORY AND SUB-ADVISORY AGREEMENTS
ALPS | Red Rocks Listed Private Equity Fund
On March 13-14, 2018, the Trustees met in person to discuss, among other things, the approval of the investment advisory agreement between the Trust, with respect to the ALPS | Red Rocks Listed Private Equity Fund (the “Red Rocks Fund”), and ALPS Advisors, Inc. (“AAI”) (the “Investment Advisory Agreement”), and the investment sub-advisory agreement between Red Rocks Capital LLC (“Red Rocks”) and AAI, with respect to the Red Rocks Fund, in accordance with Section 15(c) of the 1940 Act. The Independent Trustees met with independent legal counsel during executive session and discussed the Investment Advisory Agreement and the Investment Sub-Advisory Agreement and other related materials.
In renewing and approving the Investment Advisory Agreement and the Investment Sub-Advisory Agreement, the Trustees, including the Independent Trustees, considered the following factors:
Investment Advisory and Sub-Advisory Fee Rate: The Trustees reviewed and considered the contractual annual advisory fee paid by the Trust, on behalf of the Red Rocks Fund, to AAI, of 0.85% of the Red Rocks Fund’s daily average net assets, in light of the extent and quality of the advisory services to be provided by AAI to the Red Rocks Fund. The Trustees also reviewed and considered the contractual annual sub-advisory fee paid by AAI to Red Rocks of 2/3 of the contractual annual advisory fee paid by the Trust to AAI, in light of the extent and quality of the advisory services provided by Red Rocks to the Red Rocks Fund. The Trustees also considered information regarding compensation paid to affiliates of AAI under other agreements, such as the Fund Accounting and Administration Agreement with ALPS.
The Board received and considered information including a comparison of the Red Rocks Fund’s contractual and actual management fees (after waivers) with those of funds in the relevant peer expense group and universe of funds provided by an independent provider of investment company data (the “Data Provider”). The Trustees noted that the contractual and actual management fee rates for each class of the Red Rocks Fund were at or above their respective Data Provider expense group average and median.
Total Expense Ratios: The Trustees further reviewed and considered the total expense ratios (after waivers) of 1.380%, 2.130%, 1.159% and 1.560% for the Investor Class, Class C, Class I, and Class R shares, respectively, of the Red Rocks Fund. The Trustees noted that the total expense ratio (after waivers) of each class of the Red Rocks Fund was above its respective Data Provider expense group average and median, except for Investor Class.
Nature, Extent and Quality of the Services under the Investment Advisory and Sub-Advisory Agreements: The Trustees received and considered information regarding the nature, extent and quality of services to be provided to the Red Rocks Fund under the Investment Advisory and Sub-Advisory Agreements. The Trustees reviewed certain background materials supplied by AAI and Red Rocks in their presentations, including their Forms ADV.
The Trustees reviewed and considered AAI’s and Red Rocks’ investment advisory personnel, their history as asset managers and their performance and the amount of assets currently under management by AAI and Red Rocks and their affiliated entities. The Trustees also reviewed the research and decision-making processes utilized by AAI and Red Rocks, including the methods adopted to seek to achieve compliance with the investment objectives, policies and restrictions of the Red Rocks Fund.
The Trustees considered the background and experience of AAI’s and Red Rocks’ management in connection with the Red Rocks Fund, including reviewing the qualifications, backgrounds and responsibilities of the management team primarily responsible for the day-to-day portfolio management of the Red Rocks Fund and the extent of the resources devoted to research and analysis of actual and potential investments.
The Trustees also reviewed, among other things, AAI’s and Red Rocks’ insider trading policies and procedures and their Codes of Ethics.
161 | April 30, 2018
Additional Information
April 30, 2018 (Unaudited)
Performance: The Trustees reviewed performance information for the Red Rocks Fund. That review included a comparison of the Red Rocks Fund’s performance to the performance of a group of comparable funds selected by the Data Provider. The Trustees noted the net total return performance of each class of the Red Rocks Fund, as applicable, was generally above the respective Data Provider performance universe average for the one-, two-, three-, four-, and five year periods ended January 31, 2018 and was below the respective Data Provider performance universe average for the ten-year period ended January 31, 2018. The Trustees also considered Red Rocks’ performance and reputation generally and its investment techniques, risk management controls and decision-making processes.
Comparable Accounts: The Trustees noted certain information provided by Red Rocks regarding fees charged to its other clients utilizing a strategy similar to that employed by the Red Rocks Fund.
Profitability: The Trustees received and considered a retrospective and projected profitability analysis prepared by AAI and Red Rocks based on the fees payable under the Investment Advisory Agreement with AAI and the Sub-Advisory Agreement with Red Rocks, with respect to the Red Rocks Fund. The Trustees considered the profits, if any, anticipated to be realized by AAI and Red Rocks in connection with the operation of the Red Rocks Fund. The Board then reviewed AAI’s and Red Rocks’ financial statements in order to analyze the financial condition and stability and profitability of AAI and Red Rocks.
Economies of Scale: The Trustees considered whether economies of scale in the provision of services to the Red Rocks Fund will be passed along to the shareholders under the agreements.
Other Benefits to the Adviser: The Trustees reviewed and considered any other incidental benefits derived or to be derived by AAI from its relationship with the Red Rocks Fund, including whether soft dollar arrangements were used.
In renewing AAI as the Red Rocks Fund’s investment adviser and Red Rocks as the Red Rocks Fund’s sub-adviser and the fees charged under the Investment Advisory and Sub-Advisory Agreements, the Trustees concluded that no single factor reviewed by the Trustees was identified by the Trustees to be determinative as the principal factor in whether to renew the Investment Advisory and Sub-Advisory Agreements. Further, the Independent Trustees were advised by separate independent legal counsel throughout the process. The Trustees, including all of the Independent Trustees, concluded that:
| ● | the contractual and actual management fee rate (after waivers) for each class of the Red Rocks Fund were at or above their respective Data Provider expense group average and median; |
| ● | Red Rocks’ fees under its sub-advisory agreements are paid directly by AAI; |
| ● | the total expense ratio (after waivers) of each class of the Red Rocks Fund was above its respective Data Provider expense group average and median, except for Investor Class; |
| ● | the nature, extent and quality of services rendered by AAI and Red Rocks under the Investment Advisory and Sub-Advisory Agreements, respectively, with respect to the Red Rocks Fund were adequate; |
| ● | the net total return performance of each class of the Red Rocks Fund, as applicable, was generally above the respective Data Provider performance universe average for the one-, two-, three-, four-, and five year periods ended January 31, 2018 and was below the respective Data Provider performance universe average for the ten-year period ended January 31, 2018; |
| ● | bearing in mind the limitations of comparing different types of managed accounts and the different levels of service typically associated with such accounts, the fee structures applicable to AAI’s and Red Rocks’ other clients employing a comparable strategy to the Red Rocks Fund was not indicative of any unreasonableness with respect to the advisory and sub-advisory fees proposed to be payable by the Red Rocks Fund; |
| ● | the profit, if any, realized or anticipated to be realized by AAI and Red Rocks in connection with the operation of the Red Rocks Fund is not unreasonable to the Red Rocks Fund; and |
| ● | there were no material economies of scale or other incidental benefits accruing to AAI and Red Rocks in connection with their relationship with the Red Rocks Fund. |
Based on the Trustees’ deliberations and their evaluation of the information described above, the Trustees, including all of the Independent Trustees, concluded that AAI’s and Red Rocks’ compensation for investment advisory and sub-advisory services is consistent with the best interests of the Red Rocks Fund and its shareholders.
162 | April 30, 2018
Additional Information
April 30, 2018 (Unaudited)
ALPS | WMC Research Value Fund
On March 13-14, 2018, the Trustees met in person to discuss, among other things, the approval of the investment advisory agreement between the Trust, with respect to the ALPS | WMC Research Value Fund (the “WMC Fund”), and ALPS Advisors, Inc. (“AAI”) (the “Investment Advisory Agreement”), and the investment sub-advisory agreement between AAI, with respect to the WMC Fund, and Wellington Management Company, LLP (“Wellington”) (the “Investment Sub-Advisory Agreement”), in accordance with Section 15(c) of the 1940 Act. The Independent Trustees met with independent legal counsel during executive session and discussed the Investment Advisory Agreement and the Investment Sub-Advisory Agreement and other related materials.
In renewing and approving the Investment Advisory Agreement and the Investment Sub-Advisory Agreement, the Trustees, including the Independent Trustees, considered the following factors:
Investment Advisory and Sub-Advisory Fee Rate: The Trustees reviewed and considered the contractual annual advisory fee paid by the Trust, on behalf of the WMC Fund, to AAI of (i) 0.95% of the WMC Fund’s daily average net assets of $0-$250M; (ii) 0.85% of the WMC Fund’s daily average net assets between $250M-$500M; and (iii) 0.75% of the WMC Fund’s daily average net assets over $500M, in light of the extent and quality of the advisory services provided by AAI to the WMC Fund. The Trustees also reviewed and considered the contractual annual sub-advisory fee paid by AAI to Wellington of (i) 0.50% of the WMC Fund’s daily average net assets of $0-$250M; (ii) 0.40% of the WMC Fund’s daily average net assets between $250M-$500M; and (iii) 0.30% of the WMC Fund’s daily average net assets over $500M, in light of the extent and quality of the advisory services provided by Wellington to the WMC Fund. The Trustees also considered information regarding compensation paid to affiliates of AAI under other agreements, such as the Fund Accounting and Administration Agreement with ALPS.
The Board received and considered information including a comparison of the WMC Fund’s contractual and actual management fees (after waivers) with those of funds in the relevant peer expense group and universe of funds provided by an independent provider of investment company data (the “Data Provider”). The Trustees noted that the contractual management fee rates (after waivers) for each class of the WMC Fund were above their respective Data Provider expense group average and median and the actual management fee rates (after waivers) for Investor Class and Class C were near or below their respective Data Provider expense group average and median and for Class I were above the Data Provider expense group average and median.
Total Expense Ratios: The Trustees further reviewed and considered the total expense ratios (after waivers) of 1.150%, 1.900% and 0.900% for the Investor Class, Class C, and Class I shares, respectively, of the WMC Fund. The Trustees noted that the total expense ratio (after waivers) for Investor Class and Class C shares of the WMC Fund was below its respective Data Provider expense group average and median and the total expense ratio (after waivers) for Class I shares of the WMC Fund was above its respective Data Provider expense group average and median.
Nature, Extent and Quality of the Services under the Investment Advisory and Sub-Advisory Agreements: The Trustees received and considered information regarding the nature, extent and quality of services to be provided to the WMC Fund under the Investment Advisory and Sub-Advisory Agreements. The Trustees reviewed certain background materials supplied by AAI and Wellington in their presentations, including their Forms ADV.
The Trustees reviewed and considered AAI’s and Wellington’s investment advisory personnel, their history as asset managers and their performance and the amount of assets currently under management by AAI and Wellington and their affiliated entities. The Trustees also reviewed the research and decision-making processes utilized by AAI and Wellington, including the methods adopted to seek to achieve compliance with the investment objectives, policies and restrictions of the WMC Fund.
The Trustees considered the background and experience of AAI’s and Wellington’s management in connection with the WMC Fund, including reviewing the qualifications, backgrounds and responsibilities of the management team primarily responsible for the day-to-day portfolio management of the WMC Fund and the extent of the resources devoted to research and analysis of actual and potential investments.
The Trustees also reviewed, among other things, AAI’s and Wellington’s insider trading policies and procedures and their Codes of Ethics.
Performance: The Trustees reviewed performance information for the WMC Fund. That review included a comparison of the WMC Fund’s performance to the performance of a group of comparable funds selected by the Data Provider. The Trustees noted the net total return performance of each class of the WMC Fund was below the respective Data Provider performance universe average for the one-, two-, three-, four, five- and ten-year periods ended January 31, 2018. The Trustees also considered Wellington’s performance and reputation generally and its investment techniques, risk management controls and decision-making processes.
163 | April 30, 2018
Additional Information
April 30, 2018 (Unaudited)
Comparable Accounts: The Trustees noted that Wellington reported managing no other accounts considered to have a comparable investment objective or strategy as that of WMC Fund.
Profitability: The Trustees received and considered a retrospective and projected profitability analysis prepared by AAI and Wellington based on the fees payable under the Investment Advisory Agreement with AAI and the Sub-Advisory Agreement with Wellington, with respect to the WMC Fund. The Trustees considered the profits, if any, anticipated to be realized by AAI and Wellington in connection with the operation of the WMC Fund. The Board then reviewed AAI’s and Wellington’s financial statements in order to analyze the financial condition and stability and profitability of AAI and Wellington.
Economies of Scale: The Trustees considered whether economies of scale in the provision of services to the WMC Fund will be passed along to the shareholders under the agreements.
Other Benefits to the Adviser: The Trustees reviewed and considered any other incidental benefits derived or to be derived by AAI from its relationship with the WMC Fund, including whether soft dollar arrangements were used.
In renewing AAI as the WMC Fund’s investment adviser and Wellington as the WMC Fund’s sub-adviser and the fees charged under the Investment Advisory and Sub-Advisory Agreements, the Trustees concluded that no single factor reviewed by the Trustees was identified by the Trustees to be determinative as the principal factor in whether to renew the Investment Advisory and Sub-Advisory Agreements. Further, the Independent Trustees were advised by separate independent legal counsel throughout the process. The Trustees, including all of the Independent Trustees, concluded that:
| ● | the contractual and actual management fee rate (after waivers) for each class of the WMC Fund were above their respective Data Provider expense group average and median and the actual management fee rates (after waivers) for Investor Class and Class C were near or below their respective Data Provider expense group average and for Class I were above the Data Provider expense group average and median; |
| ● | Wellington’s fees under its sub-advisory agreements are paid directly by AAI; |
| ● | the total expense ratio (after waivers) for Investor Class and Class C shares of the WMC Fund was below its respective Data Provider expense group average and median and the total expense ratio (after waivers) for Class I shares of the WMC Fund was above its respective Data Provider expense group average and median; |
| ● | the nature, extent and quality of services rendered by AAI and Wellington under the Investment Advisory and Sub-Advisory Agreements, respectively, with respect to the WMC Fund were adequate; |
| ● | the net total return performance of each class of the WMC Fund was below the respective Data Provider performance universe average for the one-, two-, three-, four-, five- and ten-year periods ended January 31, 2018; |
| ● | Wellington does not currently manage any other accounts considered to have a comparable investment objective or strategy as that of WMC Fund; |
| ● | the profit, if any, realized or anticipated to be realized by AAI and Wellington in connection with the operation of the WMC Fund is not unreasonable to the WMC Fund; and |
| ● | there were no material economies of scale or other incidental benefits accruing to AAI and Wellington in connection with their relationship with the WMC Fund. |
Based on the Trustees’ deliberations and their evaluation of the information described above, the Trustees, including all of the Independent Trustees, concluded that AAI’s and Wellington’s compensation for investment advisory and sub-advisory services is consistent with the best interests of the WMC Fund and its shareholders.
Clough China Fund
On March 13-14, 2018, the Trustees met in person to discuss, among other things, the approval of the investment advisory agreement between the Trust, with respect to the Clough China Fund (the “China Fund”), and ALPS Advisors, Inc. (“AAI”) (the “Investment Advisory Agreement”), and the investment sub-advisory agreement between AAI and Clough Capital Partners LP (“Clough Capital”) with respect to the China Fund (the “Investment Sub-Advisory Agreement”), in accordance with Section 15(c) of the 1940 Act. The Independent Trustees met with independent legal counsel during executive session and discussed the Investment Advisory Agreement and the Investment Sub-Advisory Agreement and other related materials.
In renewing and approving the Investment Advisory Agreement and the Investment Sub-Advisory Agreement, the Trustees, including the Independent Trustees, considered the following factors:
Investment Advisory and Sub-Advisory Fee Rate: The Trustees reviewed and considered the contractual annual advisory fee paid by the Trust, on behalf of the Clough Fund, to AAI of 1.35% of the Clough Fund’s daily average net assets, in light of the extent and quality of the advisory services
164 | April 30, 2018
Additional Information
April 30, 2018 (Unaudited)
provided by AAI to the Clough Fund. The Trustees also reviewed and considered the contractual annual sub-advisory fee paid by AAI to Clough Capital of 0.90% of the Clough Fund’s daily average net assets, in light of the extent and quality of the advisory services provided by Clough Capital to the Clough Fund. The Trustees also considered information regarding compensation paid to affiliates of AAI under other agreements, such as the Fund Accounting and Administration Agreement with ALPS.
The Board received and considered information including a comparison of the Clough Fund’s contractual and actual management fees (after waivers) with those of funds in the peer expense group and universe of funds provided by an independent provider of investment company data (the “Data Provider”). The Trustees noted that the contractual and actual management fee rate for each class of the Clough Fund was above its respective Data Provider expense group average and median.
Total Expense Ratios: The Trustees further reviewed and considered the total expense ratios (after waivers) of 1.952%, 2.700% and 1.700% for the Investor Class, Class C and Class I shares, respectively, of the China Fund. The Trustees noted that the total expense ratio (after waivers) of each class of the China Fund was above its respective Data Provider expense group average and median.
Nature, Extent and Quality of the Services under the Investment Advisory and Sub-Advisory Agreements: The Trustees received and considered information regarding the nature, extent and quality of services to be provided to the Clough Fund under the Investment Advisory and Sub-Advisory Agreements. The Trustees reviewed certain background materials supplied by AAI and Clough Capital in their presentations, including their Forms ADV.
The Trustees reviewed and considered AAI’s and Clough Capital’s investment advisory personnel, their history as asset managers and their performance and the amount of assets currently under management by AAI and Clough Capital and their affiliated entities. The Trustees also reviewed the research and decision-making processes utilized by AAI and Clough Capital, including the methods adopted to seek to achieve compliance with the investment objectives, policies and restrictions of the Clough Fund.
The Trustees considered the background and experience of AAI’s and Clough Capital’s management in connection with the Clough Fund, including reviewing the qualifications, backgrounds and responsibilities of the management team primarily responsible for the day-to-day portfolio management of the Clough Fund and the extent of the resources devoted to research and analysis of actual and potential investments.
The Trustees also reviewed, among other things, AAI’s and Clough Capital’s insider trading policies and procedures and their Codes of Ethics.
Performance: The Trustees reviewed performance information for the Clough Fund. That review included a comparison of the Clough Fund’s performance to the performance of a group of comparable funds selected by the Data Provider. The Trustees noted the net total return performance of each class of the Clough Fund was above the respective Data Provider performance universe average for the one- and ten-year periods ended January 31, 2018 and generally below the respective Data Provider performance universe average for the two-, three-, four-, and five-year periods ended January 31, 2018. In considering the recent performance of the Clough Fund, the Trustees considered Clough Capital’s statements regarding its expectations for performance in the near term and regarding recent personnel changes at the firm. The Trustees also considered Clough Capital’s performance and reputation generally and its investment techniques, risk management controls and decision-making processes.
Comparable Accounts: The Trustees noted certain information provided by Clough Capital regarding fees charged to its other clients utilizing a strategy similar to that employed by the Clough Fund.
Profitability: The Trustees received and considered a retrospective and projected profitability analysis prepared by AAI and Clough Capital based on the fees payable under the Investment Advisory Agreement with AAI and the Investment Sub-Advisory Agreement with Clough Capital with respect to the Clough Fund. The Trustees considered the profits, if any, anticipated to be realized by AAI and Clough Capital in connection with the operation of the Clough Fund. The Board then reviewed AAI’s and Clough Capital’s financial statements in order to analyze the financial condition and stability and profitability of AAI and Clough Capital.
Economies of Scale: The Trustees considered whether economies of scale in the provision of services to the Clough Fund will be passed along to the shareholders under the agreements.
Other Benefits to the Adviser: The Trustees reviewed and considered any other incidental benefits derived or to be derived by AAI from its relationship with the Clough Fund, including whether soft dollar arrangements were used.
165 | April 30, 2018
Additional Information
April 30, 2018 (Unaudited)
In renewing AAI as the Clough Fund’s investment adviser and Clough Capital as the Clough Fund’s sub-adviser and the fees charged under the Investment Advisory and Sub-Advisory Agreements, the Trustees concluded that no single factor reviewed by the Trustees was identified by the Trustees to be determinative as the principal factor in whether to renew the Investment Advisory and Sub-Advisory Agreements. Further, the Independent Trustees were advised by separate independent legal counsel throughout the process. The Trustees, including all of the Independent Trustees, concluded that:
| ● | the contractual and actual management fee rate for each class of the Clough Fund was above its respective Data Provider expense group average and median; |
| ● | Clough Capital’s fees under its sub-advisory agreements are paid directly by AAI; |
| ● | the total expense ratio (after waivers) of each class of the China Fund was above its respective Data Provider expense group average and median; |
| ● | the nature, extent and quality of services rendered by AAI and Clough Capital under the Investment Advisory and Sub-Advisory Agreements, respectively, with respect to the Clough Fund were adequate; |
| ● | the net total return performance of each class of the Clough Fund was above the respective Data Provider performance universe average for the one- and ten-year periods ended January 31, 2018 and generally below the respective Data Provider performance universe average for the two-, three-, four-, and five-year periods ended January 31, 2018; |
| ● | bearing in mind the limitations of comparing different types of managed accounts and the different levels of service typically associated with such accounts, the fee structures applicable to AAI’s and Clough Capital’s other clients employing a comparable strategy to the Clough Fund was not indicative of any unreasonableness with respect to the advisory and sub-advisory fees proposed to be payable by the Clough Fund; |
| ● | the profit, if any, realized or anticipated to be realized by AAI and Clough Capital in connection with the operation of the Clough Fund is not unreasonable to the Clough Fund; and |
| ● | there were no material economies of scale or other incidental benefits accruing to AAI and Clough Capital in connection with their relationship with the Clough Fund. |
Based on the Trustees’ deliberations and their evaluation of the information described above, the Trustees, including all of the Independent Trustees, concluded that AAI’s and Clough Capital’s compensation for investment advisory and sub-advisory services is consistent with the best interests of the Clough Fund and its shareholders.
ALPS | CoreCommodity Management CompleteCommodites® Strategy Fund
On March 13-14, 2018, the Trustees met in person to discuss, among other things, the approval of the investment advisory agreement between the Trust, with respect to the ALPS | CoreCommodity Management CompleteCommodites® Strategy Fund (the “CoreCommodity Fund”) and ALPS Advisors, Inc. (“AAI”) (the “Investment Advisory Agreement”), and the investment sub-advisory agreement between AAI and CoreCommodity Management LLC (“CoreCommodity”) with respect to the CoreCommodity Fund (the “Investment Sub-Advisory Agreement”), in accordance with Section 15(c) of the 1940 Act. The Independent Trustees met with independent legal counsel during executive session and discussed the Investment Advisory Agreement and the Investment Sub-Advisory Agreement and other related materials.
In renewing and approving the Investment Advisory Agreement and the Investment Sub-Advisory Agreement, the Trustees, including the Independent Trustees, considered the following factors:
Investment Advisory and Sub-Advisory Fee Rate: The Trustees reviewed and considered the contractual annual advisory fee paid by the Trust, on behalf of the CoreCommodity Fund, to AAI, of 0.85% of the CoreCommodity Fund’s daily average net assets, in light of the extent and quality of the advisory services provided by AAI to the CoreCommodity Fund. The Trustees also reviewed and considered the contractual annual sub-advisory fee paid by AAI to CoreCommodity of 0.75% of the CoreCommodity Fund’s daily average net assets, in light of the extent and quality of the advisory services provided by CoreCommodity to the CoreCommodity Fund. The Trustees also considered information regarding compensation paid to affiliates of AAI under other agreements, such as the Fund Accounting and Administration Agreement with ALPS.
The Board received and considered information including a comparison of the CoreCommodity Fund’s contractual and actual management fees (after waivers) with those of funds in the relevant peer expense group and universe of funds provided by an independent provider of investment company data (the “Data Provider”). The Trustees noted that the contractual and actual management fee rate for each class of the CoreCommodity Fund was above its respective Data Provider expense group average and median.
Total Expense Ratios: The Trustees further reviewed and considered the total expense ratios (after waivers) of 1.380%, 2.050% and 1.150% for the Investor Class, Class C and Class I shares, respectively, of the CoreCommodity Fund. The Trustees noted that the total expense ratio (after
166 | April 30, 2018
Additional Information
April 30, 2018 (Unaudited)
waivers) of each class of the CoreCommodity Fund was above its respective Data Provider average and median expense group total expense ratios (after waivers).
Nature, Extent and Quality of the Services under the Investment Advisory and Sub-Advisory Agreements: The Trustees received and considered information regarding the nature, extent and quality of services provided to the CoreCommodity Fund under the Investment Advisory and Sub-Advisory Agreements. The Trustees reviewed certain background materials supplied by AAI and CoreCommodity in their presentations, including their Forms ADV.
The Trustees reviewed and considered AAI’s and CoreCommodity’s investment advisory personnel, their history as asset managers and their performance and the amount of assets currently under management by AAI and CoreCommodity and their affiliated entities. The Trustees also reviewed the research and decision-making processes utilized by AAI and CoreCommodity, including the methods adopted to seek to achieve compliance with the investment objectives, policies and restrictions of the CoreCommodity Fund.
The Trustees considered the background and experience of AAI’s and CoreCommodity’s management in connection with the CoreCommodity Fund, including reviewing the qualifications, backgrounds and responsibilities of the management team primarily responsible for the day-to-day portfolio management of the CoreCommodity Fund and the extent of the resources devoted to research and analysis of actual and potential investments.
The Trustees also reviewed, among other things, AAI’s and CoreCommodity’s insider trading policies and procedures and their Codes of Ethics.
Performance: The Trustees reviewed performance information for the CoreCommodity Fund. That review included a comparison of the CoreCommodity Fund’s performance to the performance of a group of comparable funds selected by the Data Provider. The Trustees noted the net total return performance of each class of the CoreCommodity Fund was generally above the respective Data Provider performance universe average for the one-, two-, three-, four- and five-year periods ended January 31, 2018. The Trustees also considered CoreCommodity’s performance and reputation generally and its investment techniques, risk management controls and decision-making processes.
Comparable Accounts: The Trustees noted certain information provided by CoreCommodity regarding fees charged to its other clients utilizing a strategy similar to that employed by the CoreCommodity Fund.
Profitability: The Trustees received and considered a retrospective and projected profitability analysis prepared by AAI and CoreCommodity based on the fees payable under the Investment Advisory Agreement with AAI and the Investment Sub-Advisory Agreement with CoreCommodity with respect to the CoreCommodity Fund. The Trustees considered the profits, if any, anticipated to be realized by AAI and CoreCommodity in connection with the operation of the CoreCommodity Fund. The Board then reviewed AAI’s and CoreCommodity’s financial statements in order to analyze the financial condition and stability and profitability of AAI and CoreCommodity.
Economies of Scale: The Trustees considered whether economies of scale in the provision of services to the CoreCommodity Fund will be passed along to the shareholders under the agreements.
Other Benefits to the Adviser: The Trustees reviewed and considered any other incidental benefits derived or to be derived by AAI from its relationship with the CoreCommodity Fund, including whether soft dollar arrangements were used.
In renewing AAI as the CoreCommodity Fund’s investment adviser and CoreCommodity as the CoreCommodity Fund’s sub-adviser and the fees charged under the Investment Advisory and Sub-Advisory Agreements, the Trustees concluded that no single factor reviewed by the Trustees was identified by the Trustees to be determinative as the principal factor in whether to renew the Investment Advisory and Sub-Advisory Agreements. Further, the Independent Trustees were advised by separate independent legal counsel throughout the process. The Trustees, including all of the Independent Trustees, concluded that:
| ● | the contractual and actual management fee rate (after waivers) for each class of the CoreCommodity Fund was above its respective Data Provider expense group average and median; |
| ● | CoreCommodity’s fees under its sub-advisory agreements are paid directly by AAI; |
| ● | the total expense ratio (after waivers) of each class of the CoreCommodity Fund was above its respective Data Provider average and median expense group total expense ratios (after waivers); |
| ● | the nature, extent and quality of services rendered by AAI and CoreCommodity under the Investment Advisory and Sub-Advisory Agreements, respectively, with respect to the CoreCommodity Fund were adequate; |
| ● | the net total return performance of each class of the CoreCommodity Fund was generally above the respective Data Provider performance universe average for the one-, two-, three-, four- and five-year periods ended January 31, 2018; |
167 | April 30, 2018
Additional Information
April 30, 2018 (Unaudited)
| ● | bearing in mind the limitations of comparing different types of managed accounts and the different levels of service typically associated with such accounts, the fee structures applicable to AAI’s and CoreCommodity’s other clients employing a comparable strategy to the CoreCommodity Fund was not indicative of any unreasonableness with respect to the advisory and sub-advisory fees proposed to be payable by the CoreCommodity Fund; |
| ● | the profit, if any, realized or anticipated to be realized by AAI and CoreCommodity in connection with the operation of the CoreCommodity Fund is not unreasonable to the CoreCommodity Fund; and |
| ● | there were no material economies of scale or other incidental benefits accruing to AAI and CoreCommodity in connection with their relationship with the CoreCommodity Fund. |
Based on the Trustees’ deliberations and their evaluation of the information described above, the Trustees, including all of the Independent Trustees, concluded that AAI’s and CoreCommodity’s compensation for investment advisory and sub-advisory services is consistent with the best interests of the CoreCommodity Fund and its shareholders.
RiverFront Global Allocation Series
On March 13-14, 2018, the Trustees met in person to discuss, among other things, the approval of the investment advisory agreement between the Trust, with respect to RiverFront Asset Allocation Aggressive, RiverFront Asset Allocation Growth, RiverFront Asset Allocation Growth & Income, RiverFront Asset Allocation Moderate, and RiverFront Asset Allocation Income & Growth (collectively, the “RiverFront Funds”), and ALPS Advisors, Inc. (“AAI”) (the “Investment Advisory Agreement”), and the investment sub-advisory agreement between AAI and RiverFront Investment Group, LLC (“RiverFront”) with respect to the RiverFront Funds (the “Investment Sub-Advisory Agreement”), in accordance with Section 15(c) of the 1940 Act. The Independent Trustees met with independent legal counsel during executive session and discussed the Investment Advisory Agreement and the Investment Sub-Advisory Agreement and other related materials.
In renewing and approving the Investment Advisory Agreement and the Investment Sub-Advisory Agreement, the Trustees, including the Independent Trustees, considered the following factors:
Investment Advisory and Sub-Advisory Fee Rate: Effective February 28, 2018, there are no investment advisory or sub-advisory fees paid with respect to the RiverFront Funds.
Total Expense Ratios: The Trustees further reviewed and considered the total expense ratios (after waivers) of the Investor Class, Class C, Class I, Investor Class II and Class L shares of the RiverFront Funds, including a comparison of such ratios with those of funds in the relevant peer expense group and universe of funds provided by an independent provider of investment company data (the “Data Provider”). The Trustees noted that the total expense ratio (after waivers) of each class of each of the RiverFront Funds were below its respective Data Provider expense group average and median taking into account the removal of the investment advisory and sub-advisory fees.
Nature, Extent and Quality of the Services under the Investment Advisory and Sub-Advisory Agreements: The Trustees received and considered information regarding the nature, extent and quality of services provided to the RiverFront Funds under the Investment Advisory and Sub-Advisory Agreements. The Trustees reviewed certain background materials supplied by AAI and RiverFront in their presentations, including their Forms ADV.
The Trustees reviewed and considered AAI’s and RiverFront’s investment advisory personnel, their history as asset managers and their performance and the amount of assets currently under management by AAI and RiverFront and their affiliated entities. The Trustees also reviewed the research and decision-making processes utilized by AAI and RiverFront, including the methods adopted to seek to achieve compliance with the investment objectives, policies and restrictions of the RiverFront Funds.
The Trustees considered the background and experience of AAI’s and RiverFront’s management in connection with the RiverFront Funds, including reviewing the qualifications, backgrounds and responsibilities of the management team primarily responsible for the day-to-day portfolio management of the RiverFront Funds and the extent of the resources devoted to research and analysis of actual and potential investments.
The Trustees also reviewed, among other things, AAI’s and RiverFront’s insider trading policies and procedures and their Codes of Ethics.
Performance: The Trustees reviewed performance information for the RiverFront Funds. That review included a comparison of each Fund’s performance to the performance of a group of comparable funds selected by the Data Provider. The Trustees noted that the net total return performance of each class of each of RiverFront Asset Allocation Income & Growth and RiverFront Asset Allocation Aggressive was below the respective Data Provider performance universe average for the one-, two-, three-, four- and five-year periods ended January 31, 2018, the net total return performance of Investor Class and Class C of RiverFront Asset Allocation Moderate was generally below the respective Data Provider performance universe average for the one-, two-, three-, four- and five-year periods ended January 31, 2018, the net total return performance of
168 | April 30, 2018
Additional Information
April 30, 2018 (Unaudited)
Class I of RiverFront Asset Allocation Moderate was generally above the respective Data Provider performance universe average for the one-, two-, three-, four- and five-year periods ended January 31, 2018, the net total return performance of each class of RiverFront Asset Allocation Growth & Income was generally above the respective Data Provider performance universe average for the one-, two-, three-, four- and five-year periods ended January 31, 2018, and the net total return performance of each class of RiverFront Asset Allocation Growth & Income, except for Investor Class, was below the respective Data Provider performance universe average for the one-, two-, three-, four- and five-year periods ended January 31, 2018. The Trustees also considered RiverFront’s performance and reputation generally and its investment techniques, risk management controls and decision-making processes.
Comparable Accounts: The Trustees noted certain information provided by RiverFront regarding fees charged to its other clients utilizing a strategy similar to that employed by the RiverFront Funds.
Profitability: The Trustees received and considered a retrospective and projected profitability analysis prepared by AAI and RiverFront based on the fees payable under the Investment Advisory Agreement with AAI and the Investment Sub-Advisory Agreement with RiverFront with respect to the RiverFront Funds. The Trustees considered the profits, if any, anticipated to be realized by AAI and RiverFront in connection with the operation of each RiverFront Fund. The Board then reviewed AAI’s and RiverFront’s financial statements in order to analyze the financial condition and stability and profitability of AAI and RiverFront.
Economies of Scale: The Trustees considered whether economies of scale in the provision of services to the RiverFront Funds will be passed along to the shareholders under the agreements.
Other Benefits to the Adviser: The Trustees reviewed and considered any other incidental benefits derived or to be derived by AAI from its relationship with the RiverFront Funds, including whether soft dollar arrangements were used.
In renewing AAI as the RiverFront Funds’ investment adviser and RiverFront as the RiverFront Funds’ sub-adviser and the fees charged under the Investment Advisory and Sub-Advisory Agreements, the Trustees concluded that no single factor reviewed by the Trustees was identified by the Trustees to be determinative as the principal factor in whether to renew the Investment Advisory and Sub-Advisory Agreements. Further, the Independent Trustees were advised by separate independent legal counsel throughout the process. The Trustees, including all of the Independent Trustees, concluded that:
| ● | effective February 28, 2018, there are no investment advisory or sub-advisory fees paid with respect to the RiverFront Funds; |
| ● | the total expense ratio (after waivers) of each class of each RiverFront Fund was below its respective Data Provider expense group average and median taking into account the removal of the investment advisory or sub-advisory fees; |
| ● | the nature, extent and quality of services rendered by AAI and RiverFront under the Investment Advisory and Sub-Advisory Agreements, respectively, with respect to the RiverFront Funds, as applicable, were adequate; |
| ● | the net total return performance of each class of each of RiverFront Asset Allocation Income & Growth and RiverFront Asset Allocation Aggressive was below the respective Data Provider performance universe average for the one-, two-, three-, four- and five-year periods ended January 31, 2018, the net total return performance of Investor Class and Class C of RiverFront Asset Allocation Moderate was generally below the respective Data Provider performance universe average for the one-, two-, three-, four- and five-year periods ended January 31, 2018, the net total return performance of Class I of RiverFront Asset Allocation Moderate was generally above the respective Data Provider performance universe average for the one-, two-, three-, four- and five-year periods ended January 31, 2018, the net total return performance of each class of RiverFront Asset Allocation Growth & Income was generally above the respective Data Provider performance universe average for the one-, two-, three-, four- and five-year periods ended January 31, 2018, and the net total return performance of each class of RiverFront Asset Allocation Growth & Income, except for Investor Class, was below the respective Data Provider performance universe average for the one-, two-, three-, four- and five-year periods ended January 31, 2018; |
| ● | bearing in mind the limitations of comparing different types of managed accounts and the different levels of service typically associated with such accounts, the fee structures applicable to AAI’s and RiverFront’s other clients employing a comparable strategy to one or more of the RiverFront Funds were not indicative of any unreasonableness with respect to the advisory and sub-advisory fees proposed to be payable by the RiverFront Funds; |
| ● | the profit, if any, realized or anticipated to be realized by AAI and RiverFront in connection with the operation of the RiverFront Funds, as applicable, is not unreasonable to the RiverFront Funds; and |
| ● | there were no material economies of scale or other incidental benefits accruing to AAI and RiverFront in connection with their relationship with the RiverFront Funds. |
169 | April 30, 2018
Additional Information
April 30, 2018 (Unaudited)
Based on the Trustees’ deliberations and their evaluation of the information described above, the Trustees, including all of the Independent Trustees, concluded that AAI’s and RiverFront’s compensation for investment advisory and sub-advisory services is consistent with the best interests of the RiverFront Funds and their shareholders.
ALPS | Kotak India Growth Fund
On March 13-14, 2018, the Trustees met in person to discuss, among other things, the approval of the investment advisory agreement between the Trust, with respect to the ALPS | Kotak India Growth Fund (the “Kotak Fund”), and ALPS Advisors, Inc. (“AAI”) (the “Investment Advisory Agreement”), and the investment sub-advisory agreement between AAI and Kotak Mahindra Asset Management (Singapore) Pte. Ltd. (“Kotak”) (the “Investment Sub-Advisory Agreement”) with respect to the Kotak Fund, in accordance with Section 15(c) of the 1940 Act. The Independent Trustees met with independent legal counsel during executive session and discussed the Investment Advisory Agreement and the Investment Sub-Advisory Agreement and other related materials.
In renewing and approving the Investment Advisory Agreement and the Investment Sub-Advisory Agreement, the Trustees, including the Independent Trustees, considered the following factors:
Investment Advisory and Sub-Advisory Fee Rate: The Trustees reviewed and considered the contractual annual advisory fee paid by the Trust, on behalf of the Kotak Fund, to AAI, of 1.25% of the Kotak Fund’s daily average net assets, in light of the extent and quality of the advisory services provided by AAI to the Kotak Fund. The Trustees also reviewed and considered the contractual annual sub-advisory fee rates paid by AAI to Kotak of 1.15% of the Kotak Fund’s daily average net assets on the first $50 million and 1.05% based on the Kotak Fund’s daily average net assets over $50 million, in light of the extent and quality of the advisory services provided by Kotak to the Kotak Fund. The Trustees also considered information regarding compensation to be paid to affiliates of AAI under other agreements, such as the Fund Accounting and Administration Agreement with ALPS.
The Board received and considered information including a comparison of the Kotak Fund’s contractual and actual management fees (after waivers) with those of funds in the relevant peer expense group and universe of funds provided by an independent provider of investment company data (the “Data Provider”). The Trustees noted that the contractual management fee rate for each class of the Kotak Fund was above its respective Data Provider expense group average and median and the actual management fee rate (after waivers) for each class of the Kotak Fund was below its respective Data Provider expense group average and median.
Total Expense Ratios: The Trustees further reviewed and considered the total expense ratios (after waivers) of 1.901%, 2.599% and 1.599% for the Investor Class, Class C and Class I shares, respectively, of the Kotak Fund. The Trustees noted that the total expense ratio (after waivers) of each class of the Kotak Fund was above its respective Data Provider expense group average and median.
Nature, Extent and Quality of the Services under the Investment Advisory and Sub-Advisory Agreements: The Trustees received and considered information regarding the nature, extent and quality of services to be provided to the Kotak Fund under the Investment Advisory and Sub-Advisory Agreements. The Trustees reviewed certain background materials supplied by AAI and Kotak in their presentations, including their Forms ADV.
The Trustees reviewed and considered AAI’s and Kotak’s investment advisory personnel, their history as asset managers and their performance and the amount of assets currently under management by AAI and Kotak and their affiliated entities. The Trustees also reviewed the research and decision-making processes utilized by AAI and Kotak, including the methods adopted to seek to achieve compliance with the investment objectives, policies and restrictions of the Kotak Fund.
The Trustees considered the background and experience of AAI’s and Kotak’s management in connection with the Kotak Fund, including reviewing the qualifications, backgrounds and responsibilities of the management team primarily responsible for the day-to-day portfolio management of the Kotak Fund and the extent of the resources devoted to research and analysis of actual and potential investments.
The Trustees also reviewed, among other things, AAI’s and Kotak’s insider trading policies and procedures and their Codes of Ethics.
Performance: The Trustees reviewed performance information for the Kotak Fund. That review included a comparison of the Kotak Fund’s performance to the performance of a group of comparable funds selected by the Data Provider. The Trustees noted the net total return performance of each class of the Kotak Fund was generally above the respective Data Provider performance universe average for the two-, three-, four- and five-year periods ended January 31, 2018 and below the respective Data Provider performance universe average for the one-year period ended January 31, 2018. The Trustees also considered Kotak’s performance and reputation generally and its investment techniques, risk management controls and decision-making processes.
170 | April 30, 2018
Additional Information
April 30, 2018 (Unaudited)
Comparable Accounts: The Trustees noted certain information provided by Kotak regarding fees charged to its other clients utilizing a strategy similar to that employed by the Kotak Fund.
Profitability: The Trustees received and considered a retrospective and projected profitability analysis prepared by AAI and Kotak based on the fees payable under the Investment Advisory Agreement with AAI and the Investment Sub-Advisory Agreement with Kotak, with respect to the Kotak Fund. The Trustees considered the profits, if any, anticipated to be realized by AAI and Kotak in connection with the operation of the Kotak Fund. The Board then reviewed AAI’s and Kotak’s financial statements in order to analyze the financial condition and stability and profitability of AAI and Kotak.
Economies of Scale: The Trustees considered whether economies of scale in the provision of services to the Kotak Fund will be passed along to the shareholders under the agreements.
Other Benefits to the Adviser: The Trustees reviewed and considered any other incidental benefits derived or to be derived by AAI from its relationship with the Kotak Fund, including whether soft dollar arrangements were used.
In renewing AAI as the Kotak Fund’s investment adviser and Kotak as the Kotak Fund’s sub-adviser and the fees charged under the Investment Advisory and Sub-Advisory Agreements, the Trustees concluded that no single factor reviewed by the Trustees was identified by the Trustees to be determinative as the principal factor in whether to renew the Investment Advisory and Sub-Advisory Agreements. Further, the Independent Trustees were advised by separate independent legal counsel throughout the process. The Trustees, including all of the Independent Trustees, concluded that:
| ● | the contractual management fee rate for each class of the Kotak Fund was above its respective Data Provider expense group average and median and the actual management fee rate (after waivers) for each class of the Kotak Fund was below its respective Data Provider expense group average and median; |
| ● | Kotak’s fees under its sub-advisory agreements are paid directly by AAI; |
| ● | the total expense ratio (after waivers) of each class of the Kotak Fund was above its respective Data Provider expense group average and median; |
| ● | the nature, extent and quality of services rendered by AAI and Kotak under the Investment Advisory and Sub-Advisory Agreements, respectively, with respect to the Kotak Fund were adequate; |
| ● | the net total return performance of each class of the Kotak Fund was generally above the respective Data Provider performance universe average for the two-, three-, four- and five-year periods ended January 31, 2018 and below the respective Data Provider performance universe average for the one-year period ended January 31, 2018; |
| ● | bearing in mind the limitations of comparing different types of managed accounts and the different levels of service typically associated with such accounts, the fee structures applicable to AAI’s and Kotak’s other clients employing a comparable strategy to the Kotak Fund was not indicative of any unreasonableness with respect to the advisory and sub-advisory fees proposed to be payable by the Kotak Fund; |
| ● | the profit, if any, realized or anticipated to be realized by AAI and Kotak in connection with the operation of the Kotak Fund is not unreasonable to the Kotak Fund; and |
| ● | there were no material economies of scale or other incidental benefits accruing to AAI and Kotak in connection with their relationship with the Kotak Fund. |
Based on the Trustees’ deliberations and their evaluation of the information described above, the Trustees, including all of the Independent Trustees, concluded that AAI’s and Kotak’s compensation for investment advisory and sub-advisory services is consistent with the best interests of the Kotak Fund and its shareholders.
ALPS | Metis Global Micro Cap Value Fund
On March 13-14, 2018, the Trustees met in person to discuss, among other things, the approval of the investment advisory agreement between the Trust, with respect to the ALPS | Metis Global Micro Cap Value Fund (the “Metis Fund”), and ALPS Advisors, Inc. (“AAI”) (the “Investment Advisory Agreement”), and the investment sub-advisory agreement between AAI and Metis Global Partners (“Metis”) (the “Investment Sub-Advisory Agreement”) with respect to the Metis Fund, in accordance with Section 15(c) of the 1940 Act. The Independent Trustees met with independent legal counsel during executive session and discussed the Investment Advisory Agreement and the Investment Sub-Advisory Agreement and other related materials.
In renewing and approving the Investment Advisory Agreement and the Investment Sub-Advisory Agreement, the Trustees, including the Independent Trustees, considered the following factors:
171 | April 30, 2018
Additional Information
April 30, 2018 (Unaudited)
Investment Advisory and Sub-Advisory Fee Rate: The Trustees reviewed and considered the contractual annual advisory fee paid by the Trust, on behalf of the Metis Fund, to AAI, of 1.25% of the Metis Fund’s daily average net assets, in light of the extent and quality of the advisory services provided by AAI to the Metis Fund. The Trustees also reviewed and considered the contractual annual sub-advisory fee rates paid by AAI to Metis of 1.00% of the Metis Fund’s daily average net assets, in light of the extent and quality of the advisory services provided by Metis to the Metis Fund. The Trustees also considered information regarding compensation to be paid to affiliates of AAI under other agreements, such as the Fund Accounting and Administration Agreement with ALPS.
The Board received and considered information including a comparison of the Metis Fund’s contractual and actual management fees (after waivers) with those of funds in the relevant peer expense group and universe of funds provided by an independent provider of investment company data (the “Data Provider”). The Trustees noted that the contractual and actual management fee rate for each class of the Metis Fund was above its respective Data Provider expense group average and median.
Total Expense Ratios: The Trustees further reviewed and considered the total expense ratios (after waivers) of 2.080%, 2.700% and 1.702% for Investor Class, Class C and Class I, respectively, for the Metis Fund. The Trustees noted that the total expense ratio (after waivers) of each class of the Metis Fund was above its respective Data Provider expense group average and median.
Nature, Extent and Quality of the Services under the Investment Advisory and Sub-Advisory Agreements: The Trustees received and considered information regarding the nature, extent and quality of services to be provided to the Metis Fund under the Investment Advisory and Sub-Advisory Agreements. The Trustees reviewed certain background materials supplied by AAI and Metis in their presentations, including their Forms ADV.
The Trustees reviewed and considered AAI’s and Metis’ investment advisory personnel, their history as asset managers and their performance and the amount of assets currently under management by AAI and Metis and their affiliated entities. The Trustees also reviewed the research and decision-making processes utilized by AAI and Metis, including the methods adopted to seek to achieve compliance with the investment objectives, policies and restrictions of the Metis Fund.
The Trustees considered the background and experience of AAI’s and Metis’ management in connection with the Metis Fund, including reviewing the qualifications, backgrounds and responsibilities of the management team primarily responsible for the day-to-day portfolio management of the Metis Fund and the extent of the resources devoted to research and analysis of actual and potential investments.
The Trustees also reviewed, among other things, AAI’s and Metis’ insider trading policies and procedures and their Codes of Ethics.
Performance: The Trustees reviewed performance information for the Metis Fund. That review included a comparison of the Metis Fund’s performance to the performance of a group of comparable funds selected by the Data Provider. The Trustees noted the net total return performance of each class of the Metis Fund was below the respective Data Provider performance universe average for the one- and two-year periods ended January 31, 2018. The Trustees also considered Metis’ performance and reputation generally and its investment techniques, risk management controls and decision-making processes.
Comparable Accounts: The Trustees noted certain information provided by Metis regarding fees charged to its other clients utilizing a strategy similar to that employed by the Metis Fund.
Profitability: The Trustees received and considered a retrospective and projected profitability analysis prepared by AAI and Metis based on the fees payable under the Investment Advisory Agreement with AAI and the Investment Sub-Advisory Agreement with Metis, with respect to the Metis Fund. The Trustees considered the profits, if any, anticipated to be realized by AAI and Metis in connection with the operation of the Metis Fund. The Board then reviewed AAI’s and Metis’ financial statements in order to analyze the financial condition and stability and profitability of AAI and Metis.
Economies of Scale: The Trustees considered whether economies of scale in the provision of services to the Metis Fund will be passed along to the shareholders under the agreements.
Other Benefits to the Adviser: The Trustees reviewed and considered any other incidental benefits derived or to be derived by AAI from its relationship with the Metis Fund, including whether soft dollar arrangements were used.
172 | April 30, 2018
Additional Information
April 30, 2018 (Unaudited)
In renewing AAI as the Metis Fund’s investment adviser and Metis as the Metis Fund’s sub-adviser and the fees charged under the Investment Advisory and Sub-Advisory Agreements, the Trustees concluded that no single factor reviewed by the Trustees was identified by the Trustees to be determinative as the principal factor in whether to renew the Investment Advisory and Sub-Advisory Agreements. Further, the Independent Trustees were advised by separate independent legal counsel throughout the process. The Trustees, including all of the Independent Trustees, concluded that:
| ● | the contractual management fee rate for each class of the Metis Fund was above its respective Data Provider expense group average and median; |
| ● | Metis’ fees under its sub-advisory agreements are paid directly by AAI; |
| ● | total expense ratio (after waivers) of each class of the Metis Fund was above its respective Data Provider expense group average and median; |
| ● | the nature, extent and quality of services rendered by AAI and Metis under the Investment Advisory and Sub-Advisory Agreements, respectively, with respect to the Metis Fund were adequate; |
| ● | the net total return performance of each class of the Metis Fund was below the respective Data Provider performance universe average for the one- and two-year periods ended January 31, 2018; |
| ● | bearing in mind the limitations of comparing different types of managed accounts and the different levels of service typically associated with such accounts, the fee structures applicable to AAI’s and Metis’ other clients employing a comparable strategy to the Metis Fund was not indicative of any unreasonableness with respect to the advisory and sub-advisory fees proposed to be payable by the Metis Fund; |
| ● | the profit, if any, realized or anticipated to be realized by AAI and Metis in connection with the operation of the Metis Fund is not unreasonable to the Metis Fund; and |
| ● | there were no material economies of scale or other incidental benefits accruing to AAI and Metis in connection with their relationship with the Metis Fund. |
Based on the Trustees’ deliberations and their evaluation of the information described above, the Trustees, including all of the Independent Trustees, concluded that AAI’s and Metis’ compensation for investment advisory and sub-advisory services is consistent with the best interests of the Metis Fund and its shareholders.
ALPS | Red Rocks Listed Private Equity Fund, ALPS | WMC Research Value Fund, Clough China Fund, ALPS | CoreCommodity Management CompleteCommodites® Strategy Fund, RiverFront Global Allocation Series, ALPS | Kotak India Growth Fund, and ALPS | Metis Global Micro Cap Value Fund (the “ALPS-Advised Funds”)
As a result of the pending acquisition of DST Systems, Inc. (“DST”) by SS&C Technologies Holdings, Inc. (“SS&C) (the “Transaction”), the Trustees also met in person on March 13-14, 2018 to discuss, among other things, the approval of interim investment advisory and interim investment sub-advisory agreements related to the ALPS-Advised Funds (collectively, the “Interim Agreements”) and new investment advisory and investment sub-advisory agreements related to the ALPS-Advised Funds (collectively, the “New Agreements”). The Trustees, including the Independent Trustees, considered the following factors:
Compensation: The compensation to be received under the Interim Agreements and the New Agreements is the same compensation as is being received under the current investment advisory and investment sub-advisory agreements related to the ALPS-Advised Funds (collectively, the “Current Agreements”).
Nature, Extent, and Quality of the Services: The scope and quality of services under the Interim Agreements and the New Agreements are the same as those under the Current Agreements.
Termination: The Interim Agreements include a provision for termination by the Board or the shareholders upon not more than 10 calendar days’ written notice.
Terms and Conditions: The terms and conditions in the Interim Agreements and New Agreements are substantially the same as those in the Current Agreements, except for the effective and termination dates and the inclusion of specific provisions required by Rule 15a-4 of the 1940 Act for the Interim Agreements.
173 | April 30, 2018
Additional Information
April 30, 2018 (Unaudited)
In determining whether to recommend that shareholders approve the New Agreements, the Trustees, including the Independent Trustees, considered the following factors, but did not identify any single factor as all-important or controlling:
| ● | the terms of the New Agreements, including the fees payable to ALPS Advisors, Inc. (“AAI”) by the ALPS-Advised Funds, are the same as the Current Agreements but for the new commencement dates; |
| ● | assurances from AAI and SS&C that the manner in which the Funds’ assets are managed will not change as a result of the Transaction, that the same people who currently manage the Funds’ assets are expected to continue to do so after the closing of the Transaction (the “Closing”), and that AAI and SS&C will seek to ensure that there is not diminution in the nature, quality and extent of services provided to the Funds by AAI and the sub-advisers; |
| ● | that at the Meeting the Board had evaluated and approved the annual continuance of the Current Agreements, including investment advisory and sub-advisory fee rates; total expense ratios; nature, extent and quality of services; performance; comparable accounts; profitability; economies of scale; and other benefits to AAI and the sub-advisers, and that in light of the lack of change in terms of the agreements (including fees payable) and services to be provided as a result of the Transaction, such factors also supported approval of the New Agreements; |
| ● | the favorable history, reputation, qualifications and background of SS&C; |
| ● | AAI’s and DST’s financial condition; |
| ● | SS&C’s financial condition; |
| ● | that while the operations of AAI are expected to continue with minimal change following the Closing, AAI expects to benefit indirectly from the financial strength and information technology infrastructure of the merged organization; |
| ● | the potential adverse effects on the ALPS-Advised Funds in the event the Transaction is completed and the New Agreements are not approved; |
| ● | the fact that shareholders of the ALPS-Advised Funds will not bear any costs in connection with the Transaction, inasmuch as DST has committed to pay the expenses of the ALPS-Advised Funds in connection with the Transaction, including all expenses in connection with the solicitation of proxies; and |
| ● | that SS&C is aware of the terms of Section 15(f) of the 1940 Act, and that although the Transaction Agreement does not contain a specific covenant in that regard due to the small size of AAI’s business relative to the Transaction, SS&C does not intent to impose, and has committed to the Board to use commercially reasonable efforts not to impose, any unfair burden on the ALPS-Advised Funds as a result of the Transaction. |
174 | April 30, 2018
Privacy Policy
April 30, 2018 (Unaudited)
| FACTS | WHAT DO THE FUNDS DO WITH YOUR PERSONAL INFORMATION? |
| WHY? | Financial companies choose how they share your personal information. Federal law gives consumers the right to limit some but not all sharing. Federal law also requires us to tell you how we collect, share, and protect your personal information. Please read this notice carefully to understand what we do. |
| WHAT? | The types of personal information we collect and share depend on the product or service you have with us. This information can include:
● Social Security number and account transactions ● Account balances and transaction history ● Wire transfer instructions |
| HOW? | All financial companies need to share customers’ personal information to run their everyday business. In the section below, we list the reasons financial companies can share their customers’ personal information; the reasons the Funds choose to share; and whether you can limit this sharing. |
| REASONS WE CAN SHARE YOUR PERSONAL INFORMATION | DO THE FUNDS SHARE: | CAN YOU LIMIT THIS SHARING? |
For our everyday business purposes – such as to process your transactions, maintain your account(s), respond to court orders and legal investigations, or report to credit bureaus | Yes | No |
For our marketing purposes – to offer our products and services to you | No | We do not share. |
| For joint marketing with other financial companies | No | We do not share. |
For our affiliates’ everyday business purposes – information about your transactions and experiences | Yes | No |
For our affiliates’ everyday business purposes – information about your creditworthiness | No | We do not share. |
| For non-affiliates to market to you | No | We do not share. |
175 | April 30, 2018
Privacy Policy
April 30, 2018 (Unaudited)
| WHO WE ARE | |
| Who is providing this notice? | Financial Investors Trust |
| WHAT WE DO | |
| How do the Funds protect my personal information? | To protect your personal information from unauthorized access and use, we use security measures that comply with federal law. These measures include computer safeguards and secured files and buildings. |
| How do the Funds collect my personal information? | We collect your personal information, for example, when you
● open an account ● provide account information or give us your contact information ● make a wire transfer or deposit money |
| Why can’t I limit all sharing? | Federal law gives you the right to limit only
● sharing for affiliates’ everyday business purposes-information about your creditworthiness ● affiliates from using your information to market to you ● sharing for non-affiliates to market to you
State laws and individual companies may give you additional rights to limit sharing. |
| DEFINITIONS | |
| Affiliates | Companies related by common ownership or control. They can be financial and nonfinancial companies. |
| Non-affiliates | Companies not related by common ownership or control. They can be financial and nonfinancial companies.
● The Funds do not share with non-affiliates so they can market to you. |
| Joint marketing | A formal agreement between non-affiliated financial companies that together market financial products or services to you.
● The Funds do not jointly market. |
| OTHER IMPORTANT INFORMATION | |
California Residents | If your account has a California home address, your personal information will not be disclosed to nonaffiliated third parties except as permitted by applicable California law, and we will limit sharing such personal information with our affiliates to comply with California privacy laws that apply to us. |
Vermont Residents | The State of Vermont requires financial institutions to obtain your consent prior to sharing personal information that they collect about you with affiliated companies and nonaffiliated third parties other than in certain limited circumstances. Except as permitted by law, we will not share personal information we collect about you with nonaffiliated third parties or other affiliated companies unless you provide us with your written consent to share such information. |
QUESTIONS? | Call 1-866-759-5679 or go to www.alpsfunds.com |
176 | April 30, 2018
| Item 2. | Code of Ethics. |
Not applicable to this report.
| Item 3. | Audit Committee Financial Expert. |
Not applicable to this report.
| Item 4. | Principal Accountant Fees and Services. |
Not applicable to this report.
| Item 5. | Audit Committee of Listed Registrants. |
Not applicable to the Registrant.
| Item 6. | Investments. |
| (a) | Schedule of Investments is included as part of the Reports to Stockholders filed under Item 1 of this Form N-CSR. |
| (b) | Not applicable. |
| Item 7. | Disclosure of Proxy Voting Policies and Procedures for Closed-End Management Investment Companies. |
Not applicable to the Registrant.
| Item 8. | Portfolio Managers of Closed-End Management Investment Companies. |
Not applicable to the Registrant.
| Item 9. | Purchases of Equity Securities by Closed-End Management Investment Company and Affiliated Purchasers. |
Not applicable to the Registrant.
| Item 10. | Submission of Matters to a Vote of Security Holders. |
There have been no material changes to the procedures by which shareholders may recommend nominees to the Registrant’s Board of Trustees, where those changes were implemented after the Registrant last provided disclosure in response to the requirements of Item 407(c)(2)(iv) of Regulation S-K, or this Item.
| Item 11. | Controls and Procedures. |
| (a) | The Registrant’s principal executive officer and principal financial officer have concluded that the Registrant’s disclosure controls and procedures (as defined in Rule 30a-3(c) under the Investment Company Act of 1940, as amended) are effective based on their evaluation of these controls and procedures as of a date within 90 days of the filing date of this report. |
| (b) | There was no change in the Registrant’s internal control over financial reporting (as defined in Rule 30a-3(d) under the Investment Company Act of 1940, as amended) that occurred during the period covered by this report that has materially affected, or is reasonably likely to materially affect, the Registrant’s internal control over financial reporting. |
| Item 12. | Disclosure of Securities Lending Activities for Closed-End Management Investment Companies. |
Not applicable to the Registrant.
| Item 13. | Exhibits. |
| (a)(1) | Not applicable to this report. |
| (a)(2) | The certifications required by Rule 30a-2(a) of the Investment Company Act of 1940, as amended, and Section 302 of the Sarbanes-Oxley Act of 2002 are attached hereto as Exhibit 99.Cert. |
| (a)(3) | Not applicable. |
| (a)(4) | Not applicable to the Registrant. |
| (b) | The certifications by the Registrant’s principal executive officer and principal financial officer, as required by Rule 30a-2(b) of the Investment Company Act of 1940, as amended, and Section 906 of the Sarbanes-Oxley Act of 2002 are attached hereto as Exhibit 99.906Cert. |
SIGNATURES
Pursuant to the requirements of the Securities Exchange Act of 1934 and the Investment Company Act of 1940, the Registrant has duly caused this report to be signed on its behalf by the undersigned, thereunto duly authorized.
FINANCIAL INVESTORS TRUST
| By: | /s/ Edmund J. Burke | |
| Edmund J. Burke (Principal Executive Officer) | ||
| President | ||
| Date: | July 9, 2018 |
Pursuant to the requirements of the Securities Exchange Act of 1934 and the Investment Company Act of 1940, this report has been signed below by the following persons on behalf of the Registrant and in the capacities and on the dates indicated.
FINANCIAL INVESTORS TRUST
| By: | /s/ Edmund J. Burke | |
| Edmund J. Burke (Principal Executive Officer) | ||
| President | ||
| Date: | July 9, 2018 | |
| By: | /s/ Kimberly R. Storms | |
| Kimberly R. Storms (Principal Financial Officer) | ||
| Treasurer | ||
| Date: | July 9, 2018 |